Investigations of Hepatic Hemodynamics and Alterations in ...
173
Investigations of Hepatic Hemodynamics and Alterations in the NO-cGMP Pathway in an Animal Model of Liver Fibrosis / Cirrhosis Suggest PDE5 Inhibitors as Promising Adjunct in Portal Hypertension Therapy INAUGURALDISSERTATION zur Erlangung des Doktorgrades (Dr. rer. nat.) der Fakultät für Chemie und Pharmazie der Albert-Ludwigs-Universität Freiburg im Breisgau vorgelegt im Jahr 2018 von Denise Schaffner geboren in Breisach am Rhein
Transcript of Investigations of Hepatic Hemodynamics and Alterations in ...

Investigations of Hepatic Hemodynamics and Alterations in the
NO-cGMP Pathway in an Animal Model of Liver Fibrosis / Cirrhosis Suggest PDE5 Inhibitors as Promising Adjunct in Portal Hypertension Therapy
INAUGURALDISSERTATION
zur Erlangung des Doktorgrades (Dr. rer. nat.)
der Fakultät für Chemie und Pharmazie
der Albert-Ludwigs-Universität Freiburg im Breisgau
vorgelegt im Jahr 2018
von
Denise Schaffner
geboren in Breisach am Rhein


Vorsitzender des Promotionsausschusses: Prof. Dr. Stefan Weber
Dekan: Prof. Dr. Manfred Jung
Referentin: Prof. Dr. Irmgard Merfort
Korreferent: Prof. Dr. Wolfgang Kreisel
Drittprüfer: Prof. Dr. Andreas Bechthold
Datum der mündlichen Prüfung: 29. Juni 2018


“With man this is impossible,
but with God all things are possible”
- Matthew 19:26 -


Scientific Activities
Publications D. Schaffner, D. von Elverfeldt, P. Deibert, A. Lazaro, I. Merfort, L. Lutz, J. Neubauer, M.W. Baumstark, W. Kreisel, W. Reichardt:
“Phase-contrast MR flow imaging: A tool to determine hepatic hemodynamics in rats with a healthy, fibrotic, or cirrhotic liver” J Magn Reson Imaging, 46(5), 1526-1534 (2017)
D. Schaffner, A. Lazaro, P. Stoll, P. Deibert, I. Merfort, A. Schmitt-Gräff, M.W. Baumstark, L. Vauth, P. Hasselblatt, W. Kreisel:
„Analysis of the NO-cGMP pathway in experimental liver cirrhosis suggests phosphodiesterase 5 as potential target in portal hypertension therapy” Manuscript in preparation
Short Oral Presentations D. Schaffner, D. von Elverfeldt, P. Deibert, A. Lazaro, I. Merfort, L. Lutz, J. Neubauer, M.W. Baumstark, W. Kreisel, W. Reichardt:
“Effect of Chronic Thioacetamide Treatment on Hepatic Hemodynamic Parameters in Rats: Evaluation by Magnetic Resonance Imaging” United European Gastroenterology (UEG) week 2016, Vienna, Austria
D. Schaffner, A. Lazaro, P. Deibert, I. Merfort, A. Schmitt-Gräff, P. Hasselblatt, W. Kreisel:
„Störungen des NO-cGMP-Systems im Tiermodell einer Leberzirrhose: Implikationen für die Therapie der portalen Hypertonie beim Menschen“ Annual Meeting of the German Society of Gastroenterology, Digestive and Metabolic Diseases (Deutsche Gesellschaft für Gastroenterologie, Verdauungs- und Stoffwechselkrankheiten, DGVS) 2017, Dresden, Germany
Poster Presentations D. Schaffner, D. von Elverfeldt, P. Deibert, A. Lazaro, I. Merfort, L. Lutz, J. Neubauer, M.W. Baumstark, W. Kreisel, W. Reichardt:
“Phase-contrast Magnetic Resonance Flow Imaging: A Tool to Determine Hepatic Hemodynamics in Rats with a Healthy, Fibrotic, or Cirrhotic Liver” Annual Meeting of the International Society for Magnetic Resonance in Medicine (ISMRM) 2017, Honolulu, Hawaii, US
D. Schaffner, A. Lazaro, P. Deibert, M.W. Baumstark, I. Merfort, W. Kreisel:
“Investigation on Hepatic Hemodynamics in Animal Model of Liver Cirrhosis” Day of Research 2017, Faculty of Chemistry and Pharmacy, University Freiburg, Germany
D. Schaffner, A. Lazaro, P. Deibert, I. Merfort, A. Schmitt-Gräff, P. Hasselblatt, W. Kreisel:
“NO-cGMP Pathway Alterations may contribute to Portal Hypertension: Results of a Study in Rats with Liver Fibrosis/Cirrhosis” Annual Meeting of the American Association for the Study of Liver Diseases (AASLD), Liver Meeting 2017, Washington D.C., US
D. Schaffner, A. Lazaro, P. Deibert, I. Merfort, A. Schmitt-Gräff, P. Hasselblatt, W. Kreisel:
“Alterations of the NO-cGMP pathway in thioacetamide-induced liver fibrosis/cirrhosis in rats” United European Gastroenterology (UEG) week 2017, Barcelona, Spain
D. Schaffner, A. Lazaro, P. Deibert, I. Merfort, A. Schmitt-Gräff, P. Hasselblatt, W. Kreisel:
“The NO – cGMP Pathway in Experimental Liver Cirrhosis – Implications for Portal Hypertension Therapy” Day of Research 2017, Faculty of Medicine, University Hospital Freiburg, Germany
D. Schaffner, A. Lazaro, P. Hasselblatt, A. Schmitt-Gräff, M. Grosse-Perdekamp, I. Merfort, P. Deibert, W. Kreisel:
“Overexpression of Phosphodiesterase-5 in Liver Cirrhosis: A Rationale for Novel Therapy in Portal Hypertension” Digestive Disease Week® (DDW) 2018, Washington, D.C., US


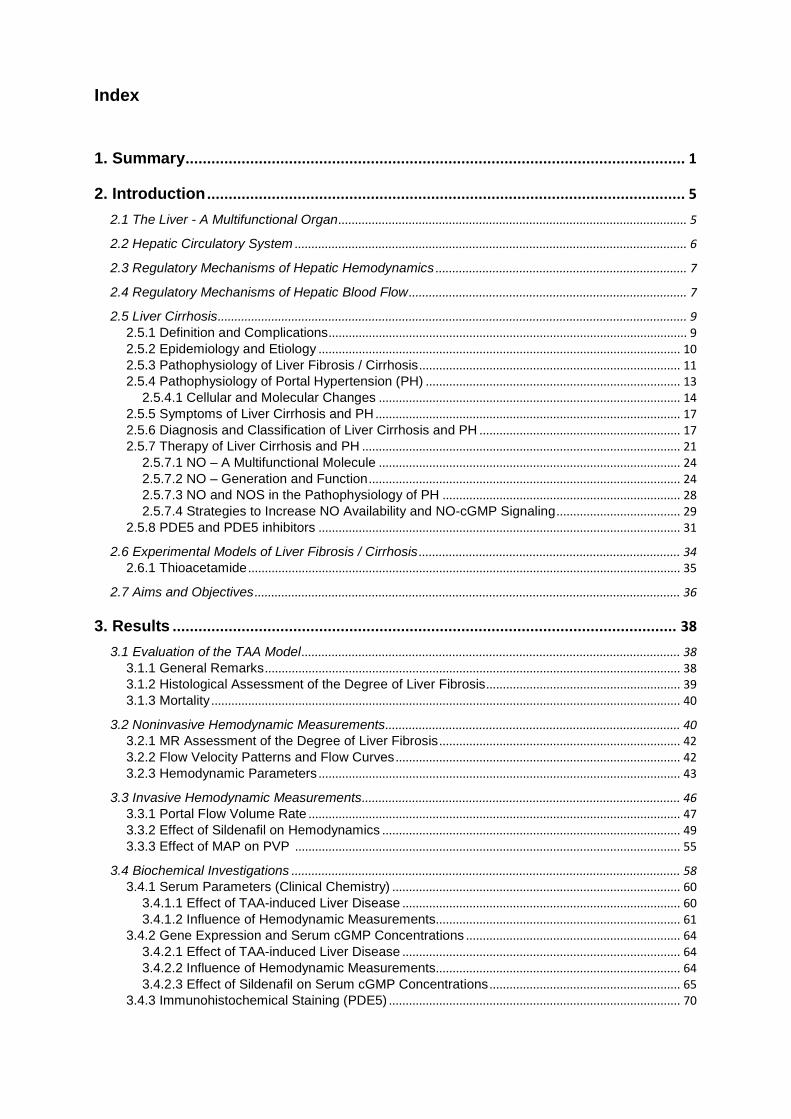
Index 1. Summary .................................................................................................................... 1
2. Introduction ............................................................................................................... 5
2.1 The Liver - A Multifunctional Organ ........................................................................................................ 5
2.2 Hepatic Circulatory System ..................................................................................................................... 6
2.3 Regulatory Mechanisms of Hepatic Hemodynamics ........................................................................... 7
2.4 Regulatory Mechanisms of Hepatic Blood Flow ................................................................................... 7
2.5 Liver Cirrhosis ............................................................................................................................................ 9 2.5.1 Definition and Complications ........................................................................................................... 9 2.5.2 Epidemiology and Etiology ............................................................................................................ 10 2.5.3 Pathophysiology of Liver Fibrosis / Cirrhosis .............................................................................. 11 2.5.4 Pathophysiology of Portal Hypertension (PH) ............................................................................ 13
2.5.4.1 Cellular and Molecular Changes .......................................................................................... 14 2.5.5 Symptoms of Liver Cirrhosis and PH ........................................................................................... 17 2.5.6 Diagnosis and Classification of Liver Cirrhosis and PH ............................................................ 17 2.5.7 Therapy of Liver Cirrhosis and PH ............................................................................................... 21
2.5.7.1 NO – A Multifunctional Molecule .......................................................................................... 24 2.5.7.2 NO – Generation and Function ............................................................................................. 24 2.5.7.3 NO and NOS in the Pathophysiology of PH ....................................................................... 28 2.5.7.4 Strategies to Increase NO Availability and NO-cGMP Signaling ..................................... 29
2.5.8 PDE5 and PDE5 inhibitors ............................................................................................................ 31
2.6 Experimental Models of Liver Fibrosis / Cirrhosis .............................................................................. 34 2.6.1 Thioacetamide ................................................................................................................................. 35
2.7 Aims and Objectives ............................................................................................................................... 36
3. Results ..................................................................................................................... 38
3.1 Evaluation of the TAA Model ................................................................................................................. 38 3.1.1 General Remarks ............................................................................................................................ 38 3.1.2 Histological Assessment of the Degree of Liver Fibrosis .......................................................... 39 3.1.3 Mortality ............................................................................................................................................ 40
3.2 Noninvasive Hemodynamic Measurements ........................................................................................ 40 3.2.1 MR Assessment of the Degree of Liver Fibrosis ........................................................................ 42 3.2.2 Flow Velocity Patterns and Flow Curves ..................................................................................... 42 3.2.3 Hemodynamic Parameters ............................................................................................................ 43
3.3 Invasive Hemodynamic Measurements ............................................................................................... 46 3.3.1 Portal Flow Volume Rate ............................................................................................................... 47 3.3.2 Effect of Sildenafil on Hemodynamics ......................................................................................... 49 3.3.3 Effect of MAP on PVP ................................................................................................................... 55
3.4 Biochemical Investigations .................................................................................................................... 58 3.4.1 Serum Parameters (Clinical Chemistry) ...................................................................................... 60
3.4.1.1 Effect of TAA-induced Liver Disease ................................................................................... 60 3.4.1.2 Influence of Hemodynamic Measurements......................................................................... 61
3.4.2 Gene Expression and Serum cGMP Concentrations ................................................................ 64 3.4.2.1 Effect of TAA-induced Liver Disease ................................................................................... 64 3.4.2.2 Influence of Hemodynamic Measurements......................................................................... 64 3.4.2.3 Effect of Sildenafil on Serum cGMP Concentrations ......................................................... 65
3.4.3 Immunohistochemical Staining (PDE5) ....................................................................................... 70

4. Discussion ............................................................................................................... 72
4.1 Evaluation of the TAA Model ................................................................................................................. 72
4.2 Noninvasive Hemodynamic Measurements ........................................................................................ 74
4.3 Invasive Hemodynamic Measurements ............................................................................................... 78 4.3.1 Portal Flow Volume Rate ............................................................................................................... 78 4.3.2 Effect of Sildenafil on Hemodynamics ......................................................................................... 79 4.3.3 Effect of MAP on PVP .................................................................................................................... 83
4.4 Biochemical Investigations .................................................................................................................... 85
4.5 Concluding Remarks .............................................................................................................................. 90
5. Materials and Methods ........................................................................................... 93
5.1 Materials ................................................................................................................................................... 93 5.1.1 Chemicals, Reagents and Other Matters .................................................................................... 93 5.1.2 Anaesthetics and Drugs ................................................................................................................. 94 5.1.3 Antibodies, Kits, Primer, and Probes ........................................................................................... 94 5.1.4 Consumables ................................................................................................................................... 95 5.1.5 Apparatus ......................................................................................................................................... 97 5.1.6 Software ......................................................................................................................................... 100 5.1.7 Animals ........................................................................................................................................... 100
5.2 Methods .................................................................................................................................................. 101 5.2.1 Laboratory Animals ....................................................................................................................... 101 5.2.2 Induction of Liver Disease with TAA .......................................................................................... 101 5.2.3 Noninvasive Hemodynamic Measurements ............................................................................. 102
5.2.3.1 MR Scanning ......................................................................................................................... 102 5.2.3.2 Data Acquisition / Postprocessing ...................................................................................... 105 5.2.3.3 MR Assessment of the Degree of Liver Fibrosis .............................................................. 106
5.2.4 Invasive Hemodynamic Measurements..................................................................................... 107 5.2.4.1 Operative Procedure ............................................................................................................ 107
5.2.5 Serum Analyses ............................................................................................................................ 111 5.2.5.1 Serum Parameters ................................................................................................................ 111 5.2.5.2 Competitive cGMP Enzyme-linked Immunosorbent Assay (ELISA) ............................. 111
5.2.6 Two-step Quantitative Real-time Polymerase Chain Reaction (qRT-PCR) ......................... 112 5.2.7 Histology ......................................................................................................................................... 117
5.2.7.1 Assessment of the Degree of Liver Fibrosis ..................................................................... 117 5.2.7.2 Immunohistochemical (IHC) PDE5 Staining ..................................................................... 117
5.2.8 Statistics ......................................................................................................................................... 120
6. References .............................................................................................................. 123
7. Attachments ........................................................................................................... 145
7.1 Score sheet to document the body condition of the rats (in German)........................................... 145
7.2 Photo series of the operative procedure............................................................................................ 147
8. Abbreviations ......................................................................................................... 151
9. Content of Figures ................................................................................................. 153
10. Content of Tables ................................................................................................ 155
11. Acknowledgments ............................................................................................... 157
12. Curriculum Vitae .................................................................................................. 159


Summary
1
1. Summary During the last 30 years phosphodiesterase 5 (PDE5) inhibitors had been
successfully integrated in the therapy of diseases with an underlying vascular
impairment, such as erectile dysfunction and pulmonary hypertension. Hence, the
use of PDE5 inhibitors is also considered as promising adjunct in the therapy of
portal hypertension (PH), one of the most crucial complications of liver cirrhosis, a
leading cause of death worldwide.
PH is associated with nitric oxide (NO) deficiency in the intrahepatic vasculature,
resulting in increased sinusoidal intrahepatic resistance. The latter is caused by a
mechanical and a functional component. However, up to now no drugs have been
approved to target the mechanical component, which occurs e.g. in the form of
fibrous connective tissue or regenerative nodules, responsible for around 70% of
increased intrahepatic resistance. The residual 30% is explained by the functional
component, which is determined by sinusoidal vasoreactivity. Impaired sinusoidal
vasoreactivty, in turn, can be caused by alterations in the key parameters of the nitric
nitric oxide-cyclic guanosine monophosphate (NO-cGMP) pathway, a regulator of
vascular tone. PDE5 is one of these key parameters involved in the NO-cGMP
pathway, initiating cGMP inactivation and thus leads to vasoconstriction. Hence,
pharmaceutical inhibition of PDE5 is a promising option to counteract sinusoidal
vasoconstriction and increased intrahepatic resistance. Initial preclinical and clinical
hemodynamic studies however, showed variable results considering the effect of
PDE5 inhibitors. Therefore, in this thesis the potential of PDE5 inhibitors in PH
therapy was further elucidated based on hemodynamic measurements and
biochemical investigations.
A rat model of thioacetamide (TAA)-induced liver fibrosis/cirrhosis was established
and noninvasive magnetic resonance (MR) measurements of hepatic and systemic
hemodynamics in rats with healthy, fibrotic or cirrhotic livers were performed. Liver
disease-induced changes in hemodynamic parameters, emphasizing on portal flow
volume rate, were determined. A significant decrease in portal flow volume rate was
observed in diseased rats, which was validated by subsequent invasive
hemodynamic measurements with a flow probe.

Summary
2
Moreover, dose-dependent effects of the PDE5 inhibitor sildenafil on hepatic and
systemic hemodynamics were investigated using pressure transducers. Acute effects
of administration of either sodium chloride, sildenafil 0.1 mg/kg or sildenafil 1.0 mg/kg
were compared. After high-dosage sildenafil administration (1.0 mg/kg), a trend
towards decreased portal venous pressure (PVP), a significant decrease in heart rate
(HR), and a nonsignificant decrease in mean arterial pressure (MAP) were found in
rats with cirrhotic livers. Hemodynamic data also revealed a significant effect of MAP
on PVP among all subgroups regardless of intervention, suggesting that changes in
systemic blood pressure may lead to changes in hepatic blood pressure.
Additionally, biochemical analyses of the key parameters in the NO-cGMP pathway
were conducted. Hepatic gene expression of the enzymes endothelial and inducible
NO synthase (eNOS, iNOS), soluble guanylyl cyclase subunit a1 and b1 (sGCa1,
sGCb1) and phosphodiesterase 5 (PDE5) was analyzed by qRT-PCR. An up-
regulation of iNOS and a significant overexpression of PDE5 in diseased rats were
observed. Enhanced levels of PDE5 protein expression were confirmed
immunhistochemically. Furthermore, serum cGMP concentrations from carotid
arterial blood samples were determined by ELISA. In diseased rats a slight decrease
was observed, whereas sildenafil administration (1.0 mg/kg) nearly renormalized
serum cGMP concentrations. Finally, studies were performed to evaluate whether the
hemodynamic measurement and the associated operative procedure affected gene
expression or serum cGMP concentrations. A significant decrease in eNOS gene
expression was detected.
In summary, the results of this study contribute to the general understanding of the
pathophysiology of PH and highlight the valuable potential of PDE5 inhibitors as
promising adjunct in PH therapy.

Summary
3
1. ZUSAMMENFASSUNG In den letzten 30 Jahren wurden Phosphodiesterase 5 (PDE5)-Inhibitoren erfolgreich
in die Therapie von Erkrankungen mit einer zugrundeliegenden vaskulären
Beeinträchtigung, wie z.B. erektile Dysfunktion und pulmonale Hypertonie, integriert.
Daher wird der Einsatz von PDE5-Inhibitoren auch in der Therapie der portalen
Hypertension (PH) als vielversprechender Zusatz angesehen. PH ist eine der
wesentlichsten Komplikationen der Leberzirrhose, eine der weltweit führenden
Todesursachen.
PH ist mit einem Stickstoffmonoxid (NO)-Mangel im intrahepatischen Gefäßsystem
assoziiert, was zu einem erhöhten sinusoidalen intrahepatischen Widerstand führt.
Letzteres wird durch eine mechanische und eine funktionelle Komponente
verursacht. Bis jetzt wurden jedoch keine Arzneimittel zugelassen, die auf die
mechanische Komponente abzielen, welche z.B. in Form von fibrösem Bindegewebe
oder regenerativen Knötchen auftritt und für etwa 70% des erhöhten intrahepatischen
Widerstandes verantwortlich ist. Die restlichen 30% erklären sich durch die
funktionelle Komponente, die durch sinusoidale Vasoreaktivität bestimmt wird. Eine
gestörte sinusoidale Vasoreaktivität kann wiederum durch Veränderungen in den
Schlüsselparametern der Stickstoffmonoxid-cyclisches Guanosinmonophosphat (NO-
cGMP)-Signalkaskade, einem Regulator des vaskulären Tonus, verursacht werden.
PDE5 ist einer dieser Schlüsselparameter in der NO-cGMP-Signalkaskade, der für
die Inaktivierung von cGMP verantwortlich ist und somit zur Vasokonstriktion führt.
Aus diesem Grund stellt die pharmazeutische Inhibierung von PDE5 eine
vielversprechende Option dar, um der sinusoidalen Vasokonstriktion und dem
erhöhten intrahepatischen Widerstand entgegenzuwirken. Erste präklinische und
klinische hämodynamische Studien zeigten hinsichtlich der Wirkung von PDE5-
Inhibitoren jedoch unterschiedliche Ergebnisse. Daher wurde in der vorliegenden
Arbeit das Potenzial von PDE5-Inhibitoren in der Therapie der PH auf der Grundlage
von hämodynamischen Messungen sowie biochemischen Analysen untersucht.
Es wurde ein Ratten-Modell der Thioacetamid (TAA)-induzierten Leberfibrose/-
zirrhose etabliert und nichtinvasive Magnetresonanz (MR)-Messungen der
hepatischen und systemischen Hämodynamik in Ratten mit gesunden, fibrotischen
oder zirrhotischen Lebern durchgeführt. Dadurch sollten die durch
Lebererkrankungen induzierten Veränderungen der hämodynamischen Parameter,

Summary
4
unter besonderer Berücksichtigung der portalen Volumenflussrate, bestimmt werden.
Bei erkrankten Ratten konnte eine signifikante Abnahme der portalen
Volumenflussrate, welche durch die nachfolgenden invasiven hämodynamischen
Messungen mit einer Strömungssonde bestätigt wurde, beobachtet werden.
Zudem wurden dosisabhängige Effekte des PDE5-Inhibitors Sildenafil auf die
hepatische und systemische Hämodynamik mittels Drucksensoren untersucht. Die
Effekte einer Verabreichung von entweder Natriumchlorid, Sildenafil 0,1 mg/kg oder
Sildenafil 1,0 mg/kg wurden verglichen. Nach Verabreichung von hoch-dosiertem
Sildenafil (1,0 mg/kg) wurde bei Ratten mit zirrhotischen Lebern ein Trend zu
verringertem Pfortaderdruck (PVP), eine signifikante Abnahme der Herzfrequenz
(HR) und eine nicht signifikante Abnahme des mittleren arteriellen Blutdrucks (MAP)
beobachtet. Zudem wurde anhand der hämodynamischen Daten bei allen
Untergruppen, unabhängig von der Intervention, ein signifikanter Effekt des MAP auf
den PVP ermittelt. Dies deutet darauf hin, dass Veränderungen des systemischen
Blutdrucks zu Veränderungen des hepatischen Blutdrucks führen können.
Darüber hinaus wurden biochemische Analysen der Schlüsselparameter der NO-
cGMP-Signalkaskade durchgeführt. Die hepatische Genexpression der Enzyme
endotheliale und induzierbare NO-Synthase (eNOS, iNOS), lösliche Guanylyl-
Cyclase-Untereinheit a1 und b1 (sGCa1, sGCb1) und Phosphodiesterase 5 (PDE5)
wurde mittels qRT-PCR analysiert. Dabei zeigte sich eine Hochregulation von iNOS
und eine signifikante Überexpression von PDE5 bei erkrankten Ratten. Letzteres
wurde durch immunhistochemische Untersuchungen der PDE5-Proteinexpression
validiert. Außerdem wurden Serum-cGMP-Konzentrationen aus Blutproben der
Halsschlagader mittels ELISA bestimmt. In erkrankten Ratten wurde eine leichte
Abnahme beobachtet. Die Verabreichung von Sildenafil (1,0 mg/kg) führte dagegen
fast zu einer Renormierung der Serum-cGMP-Konzentrationen. Abschließend wurde
untersucht, ob die hämodynamische Messung und der damit verbundene operative
Eingriff die Genexpression oder Serum-cGMP-Konzentrationen beeinflussten.
Hierbei wurde eine signifikante Abnahme der eNOS-Genexpression nachgewiesen.
Zusammenfassend tragen die Ergebnisse dieser Studie zum allgemeinen
Verständnis der Pathophysiologie der PH bei und verdeutlichen das Potenzial von
PDE5-Inhibitoren als vielversprechenden Zusatz in der Therapie der PH.

Introduction
5
2. Introduction 2.1 The Liver - A Multifunctional Organ The liver is the largest gland in the human organism, and the second largest organ
after the skin 1. It is segmented into lobes, reddish-brown in color, and has a soft
consistency. Its central location in the upper-right portion of the abdomen, beneath
the diaphragm and to the right of the stomach, points out its importance for life.
The basic architectural unit of the liver is the hepatic lobule 2, where multiple
essential metabolic, detoxifying, and synthesizing processes take place:
• breaking down nutrients and turning them into energy
• storing glycogen, vitamins, iron and other essential chemicals
• controlling blood composition, i.e. levels of lipids, amino acids and glucose
• detoxifying potentially harmful substances, e.g. drugs and alcohol
• clearing the blood of particles and infections, e.g. toxins and bacteria
• converting ammonia to urea
• synthesizing immunologically active cells, plasma proteins and numerous
hormones
• synthesizing bile to digest lipids
• controlling blood clotting and repair of damaged tissues
To fulfill these tasks, the liver, together with its circulatory system and the associated
biliary duct, has evolved many structural and physiological features that underpin the
broad spectrum of critical functions. One major feature is functional liver tissue, which
encompasses at least seven different cell types. Among those, hepatocytes are the
major parenchymal cells, whereas sinusoidal endothelial cells (SECs),
cholanigocytes, as well as immunologically active cells such as hepatic stellate cells
(HSCs), Kupffer cells (KCs), natural killer cells (NKs) and lymphocytes of different
phenotypes are non-parenchymal cells 3. The most numerous cells are hepatocytes,
comprising 70-85% of the liver tissue 1,4. Other unique features of the liver are its
capacity for self-regeneration and its complex dual circulatory system 2.

Introduction
6
2.2 Hepatic Circulatory System The circulatory system of the liver is supplied by two distinct circulatory routes: the
hepatic artery and the portal vein 5. Each route provides blood of differing
compositions: the hepatic artery delivers well-oxygenated blood, accounting for 25%
of hepatic blood, whereas the residual 75% are supplied by the portal vein, which
delivers deoxygenated, but nutrient-rich blood 6–8. Both routes enter the liver via the
portal tracts, which are components of the hepatic lobules, and finally merge in the
sinusoids (Figure 1). The latter are a specialized network of intrahepatic blood
vessels, representing the hepatic microcirculation system and resembling systemic
capillaries 4.
Sinusoids, which are considered to be the functional vascular unit of the liver, are
composed of SECs, KCs, and HSCs 9,10. SECs form a loose physical barrier between
the blood circulating within the sinusoids and hepatocytes lining the sinusoids 10.
SECs and hepatocytes are in turn separated by the so-called “space of Disse”, where
HSCs are located 4. KCs are mainly located in the sinusoidal lumen, but they can
also make direct contact with the hepatocytes 11.
Figure 1: Schematic diagram of a portal tract (left) and a hepatic sinusoid (right) Original source: Y .Iwakiri et al. 2014: “Vascular pathobiology in chronic liver disease and cirrhosis –
Current status and future dicrections” (https://doi.org/10.1016/j.jhep.2014.05.047)
This article was published under the terms of the Creative Commons Attribution-NonCommercial-No
Derivatives License (CC BY NC ND).
SECs are highly specialized endothelial cells unique to their location 12. In contrast to
other endothelial cells, SECs lack a continuous endothelial lining and exhibit a
fenestration, which makes them the most permeable endothelial cells of the
mammalian organism 12. This “sinusoidal gap” most likely serves to facilitate the

Introduction
7
transport of macromolecules from the blood passing the sinusoidal lumen to the
abluminal located hepatocytes 13. Thus, an efficient exchange of, e.g. oxygen,
nutrients, hormones and inflammatory factors with the hepatocytes can be ensured
before the blood returns to the systemic circulation via the central venules, which
drain into hepatic veins, which in turn ultimately merge in the inferior vena cava 14.
In summary, the liver is a highly vascular organ and has the most complex circulation
of any organ in the body 7. The intrahepatic microvascular system is made up of
several discrete units, including portal venules, hepatic arterioles, sinusoids, and
central venules 13,15. All these vascular trees, as well as the sinusoids, the hepatic
microcirculation, have their own morphological and functional features, which
together determine hepatic hemodynamics 16.
2.3 Regulatory Mechanisms of Hepatic Hemodynamics The term “hemodynamics” refers to the study of the physiological aspects comprising
the blood circulation. The ultimate aim of an adequate blood circulation is to provide
sufficient blood flow to the different tissues of the body in order to sustain optimal
organ and tissue function 17. In the liver, hemodynamic homeostasis ensures
nutrients and hormone fluxes, hepatic clearance and elimination, adequate
oxygenation, as well as cardiovascular stability 5–7. Not only in the liver, but also in
any other organ, regulation of hemodynamics depends on a static component, which
is based on Ohm's Law, a physical principle that can be applied for the flow of any
fluid:
Flow (Q) = pressure gradient (ΔP) / resistance (R) 17.
This static component is superimposed by the dynamic component, which is based
on locally acting regulatory mechanisms and regulatory mechanisms that adjust the
current hemodynamic status to the demands of the organism as a whole 17.
2.4 Regulatory Mechanisms of Hepatic Blood Flow As already mentioned, 75% of the hepatic blood is supplied by the portal vein. But
portal blood flow is in fact simply the sum of outflows of splanchnic organs, which
means that the liver is not capable of regulating portal blood flow directly 7,5.
Introduction
8
However, to counteract acute or chronic changes in portal blood flow, the liver
evolved several interrelated regulatory mechanisms, which primarily influence blood
flow to extrahepatic splanchnic organs 5. As a result, a constant hepatic blood flow-
to- liver mass ratio can be ensured under physiological conditions. The regulatory
mechanisms have been elucidated by Lautt 5 and are summarized in the following:
The first mechanism is vascular compliance, which is based on the physical principle
of a volume-pressure relationship. In general, vascular compliance describes the
extent to which the volume of the vessel passively changes with changes in
pressure. The vessel volume itself is controlled by vasodilation or vasoconstriction.
Thus, a decreased portal flow is followed by a passive decrease in intrahepatic
pressure and furthermore a passive blood extrusion from the huge hepatic blood
reservoir into the central venous circulatory system. Thereby, cardiac output is
increased, which leads to an elevation of blood flow in the splanchnic arteries that
feed the portal venous system. As a consequence the initial flow deficit is, at least
partially, buffered.
Another well-described regulatory mechanism of the liver is the hepatic arterial buffer
response (HABR) 7,18. The key player in the HABR is adenosine, a potent vasodilator
of the hepatic artery. Adenosine is constantly secreted into the space of Mall that
surrounds the terminal branches of the hepatic artery and the portal vein before they
finally merge in the liver sinusoids. If portal flow is decreased, adenosine
accumulates, resulting in dilation of hepatic artery being stimulated. The induced
increase in hepatic arterial flow into the portal vein buffers changes in portal flow on
total hepatic flow. In former publications Lautt (et al) described the HABR to be
capable of compensating a 25% to 60% decrease in portal blood flow 19,20, however,
in a more current publication, he stated that the hepatic arterial buffer capacity is
challenging to quantify 5. Interestingly, the HABR only works unidirectionally, since a
decrease of hepatic arterial flow does not induce an elevation of portal flow 21,7.
Accumulation of adenosine also indirectly mediates the activation of the hepatorenal
reflex via hepatic afferent nerves. This reflex induces a decrease in renal output and
fluid retention, thereby leading to an increase in blood volume, venous return, cardiac
output, and ulitmately splanchnic blood flow.
Introduction
9
Moreover, the liver has a unique way of counteracting severe vasoconstriction.
Looking at the hepatic artery, vasoconstriction leads to decreased hepatic arterial
flow. The portal vein in comparison, responds to local intrahepatic vasoconstriction
by an increase in portal venous pressure (PVP) with no alterations in portal flow,
since portal flow is controlled by the outflow of the splanchnic organs. In addition to
adenosine, nitric oxide (NO) is also a potent vasodilator and antagonist to
vasoconstrictors. NO-induced vasodilation of the portal vein as well as the hepatic
artery occurs when intrahepatic vasoconstriction enhances shear stress. In contrast,
adenosine-induced vasodilation occurs only when vasoconstriction is more systemic
and causes a decrease in portal flow. Its vasodilatory effects, however, seem to be
limited to the hepatic artery.
If all these compensatory mechanisms are not sufficient to maintain hepatic blood
flow homeostasis, in the last resort liver mass is adapted to match the blood demand.
Therefore, hepatocyte proliferation is induced when portal flow is elevated, whereas
hepatocyte apoptosis is induced when portal flow is reduced.
Considering this massive compensatory machinery, it becomes obvious how
significant an adequate hepatic blood flow is to sustain liver function. Nevertheless,
the occurrence of hemodynamic disturbances and vascular insult, e.g. in association
with liver cirrhosis, cannot be excluded 6.
2.5 Liver Cirrhosis 2.5.1 Definition and Complications Liver cirrhosis is a serious chronic liver disease. Its pathogenesis describes a
prolonged and creeping progress characterized by fibrosis development, or scarring,
and structural modifications of the liver architecture 22–24. Secondary to liver cirrhosis,
the occurrence of impaired liver function as well as a characteristic vascular disorder,
namely portal hypertension (PH), is likely 25,26. Impaired liver function leads to
increased blood values of bilirubin and ammonia, and decreased blood values of
albumin, cholinesterase and clotting factors. Along with PH, further complications
emerge, such as ascites, esophageal or gastric varices, variceal bleeding,
spontaneous bacterial peritonitis, or dysfunction of other organs 27–29. The latter can
appear in form of the hepatorenal syndrome, hepatopulmonal syndrome,

Introduction
10
portopulmonal hypertension, cirrhotic cardiomyopathy or hepatic encephalopathy 28,29. Hence, in advanced stages of liver cirrhosis not only is there the risk of needing
a liver transplantation, but the risk of morbidity and mortality also increases
immensely 30,28,23,31.
2.5.2 Epidemiology and Etiology Liver cirrhosis is one of the most frequent chronic liver diseases worldwide that
appears in rich as well as in poor nations 32,33,24. With more than one million deaths
per year (data from 2010), it is the 14th most common cause of death worldwide 34,35.
In central Europe, it is in fact the fourth most common cause of death with around
170 000 deaths per year (data from 2002) 36,37. That makes up approximately 2% of
all deaths worldwide, and also 2% of deaths in Europe 35,32,34. However, it seems
likely that there is a high number of unreported and / or undetected cases as the
initial stage of liver cirrhosis is asymptomatic or the disorder remains undiagnosed 38,39.
Liver cirrhosis can arise as a consequence of a range of chronic stimuli including
toxic, viral, autoimmune, vascular, cholestatic or metabolic diseases (Table 1) 22,40,41,31. Among those, alcoholic and, increasingly non-alcoholic liver diseases
(NAFLD), as well as hepatitis B or C infections, are the most common risk factors 42,43,38,40,36,44,45.
Table 1: Causes of liver cirrhosis
Stimuli Examples
toxic
infectious - viral - others
autoimmune
vascular
cholestatic
metabolic
alcohol-induced steatohepatitis, medications and chemicals
hepatitis B, C, D schistosomiasis and toxoplasmosis
autoimmune hepatitis, primary sclerosing cholangitis and primary biliary cholangitis
right-heart failure, Budd-Chiari syndrome and, Osler disease
bile duct stenosisa and recurrent bacterial cholangitis
non-alcoholic steatohepatitis (NAFLD), hemochromatosis and Wilson’s disease

Introduction
11
2.5.3 Pathophysiology of Liver Fibrosis / Cirrhosis
Liver fibrosis, or scarring, describes a complex wound healing process in response to
acute or chronic liver inflammation and damage. Hence, when hepatocytes undergo
necrosis or apoptosis, the cascade starts and inflammatory signaling by cytokines
and chemokines, recruitment of immunologically active cells, and activation of HCS
are initiated 31. As a consequence, progressive extracellular matrix (ECM) generation
and accumulation in the liver tissue, and simultaneous inhibition of ECM remodeling
and degradation proceed 22,24.
The mechanisms involved in the pathophysiology of liver fibrosis / cirrhosis are
complex and still not completely understood 21,46. However, within a vast integrated
network of cellular and molecular components, the activation of HSCs is described to
be the main boosting factor 47,48,22. The transdifferentiation of quiescent HSCs into
activated HSC, so-called myofibroblasts, is regulated by their interaction with various
cellular and molecular components involved in the wound healing response 47,49.
Myofibroblasts present a cell type that is absent in healthy livers, but accumulates in
diseased livers. They are located in the space of Disse, between the hepatocytes
and the SECs, where they encircle the sinusoids 46,50. The origin of these hepatic
myofibroblasts is still a matter of debate, but it has been described that there are at
least two sources: HSC-derived and portal mesenchymal cell-derived myofibroblasts,
whereby the latter likely occur mainly in biliary disease 50–53.
HSC activation can be divided into the initiation and the perpetuation phase 54,55.
The initiation phase comprises the release of intracellular contents, such as growth
factors, DNA and ROS by stressed or damaged liver cells (hepatocytes, KCs, and
SECs), or infiltrating immunologically active cells 49. These stimuli activate KCs, the
liver-resident macrophages, to secrete cytokines and chemokines. This in turn leads
to the recruitment of bone marrow-derived monocytes into the liver 56. Once they
have reached the liver, the infiltrated monocytes differentiate into macrophages with
an inflammatory, profibrogenic phenotype (Ly6Chi) 57. This provides a rapid and
transient way to expand the macrophage pool in the liver. By secreting cytokines,
chemokines and growth factors, these macrophages promote inflammatory
responses, HSC activation, and hence fibrosis progression. While the bone-marrow
serves as a major source of Ly6Chi monocytes, the spleen serves as a reservoir for

Introduction
12
Ly6Clo monocytes 56, another subset of macrophages with an antifibrogenic or
“patrolling” phenotype (Ly6Clo). Ly6Clo macrophages trigger HSC deactivation,
including apoptosis, senescence and reversion to quiescent HSCs, and are thus
essential for fibrosis regression 56,47,57.
Due to these dual roles, recruited macrophages are major regulators of liver fibrosis
progression and resolution 46,57. However, KCs as well as recruited macrophages can
adopt their phenotype, depending on signals from the hepatic microenvironment,
making the role of the immune system in reversibility of hepatic fibrosis even more
complex 56,57.
The perpetuation phase starts once the HSCs are activated and aim to maintain their
activated phenotype, which is characterized by various changes in cell behavior and
properties. Whereas quiescent HSCs primarily serve as vitamin A reservoirs, the
activated phenotype shows acquisition of ECM-generating, contractile, proliferative,
migratory, immunomodulatory and phagocytic properties and simultaneously a loss
of vitamin A storage capacity 47,50,54.
The activated phenotype of HCSs, the myofibroblasts, are the principle source of
ECM constituents, including collagen. Moreover, myofibroblasts synthesize tissue
inhibitors of matrix metalloproteinases (TIMPs), which are secreted into the
extracellular environment to inhibit matrix metalloproteinases (MMPs), a family of
ECM-degrading enzymes 42. Being released from infiltrating macrophages and KCs,
MMPs are present in the liver even during progressive fibrogenesis, demonstrating
that ECM accumulation by far exceeds its degradation by MMPs 26.
Initially the encapsulation of inflamed or damaged liver tissue by ECM indeed
represents a beneficial mechanism in the wound healing process and ensures liver
repair; however, when the stimulus for wound healing remains sustained persistently,
fibrogenesis escalates. At first fibrosis develops around either portal tracts or central
veins, ultimately forming bridging fibrosis with nodule formation surrounded by thick
bands of fibrous connective tissue 48,26,24. As a consequence of ongoing distortion of
liver architecture, the transition from liver fibrosis into cirrhosis takes place.
Introduction
13
2.5.4 Pathophysiology of Portal Hypertension (PH) Secondary to liver cirrhosis one of the earliest and most crucial complication is PH,
which is characterized by an abnormally increased PVP 58,24,59. Defined clinically, the
term “PH” describes an increase of the hepatic venous pressure gradient (HVPG)
between the portal vein and the inferior vena cava above normal values (≥ 5 mmHg) 60. It is accompanied by distinct alterations not only in the intra-, but also in the
extrahepatic circulation, and underlies most of the clinically significant complications
of liver cirrhosis 61. The intrahepatic, sinusoidal PH (see 2.5.6), the most common
form occurring secondary to liver cirrhosis, will be focused on in the following 62,63.
When considering the pathophysiology of PH the first concept that needs to be
readdressed is the hemodynamic application of Ohm's Law 60:
Flow (Q) = pressure gradient (ΔP) / resistance (R) 17.
By transposing this equation, the pressure gradient (ΔP) is defined as the product of
amount of flow (Q) and resistance (R). Applied to the portal vein that means the
hepatic venous pressure gradient (equivalent to PVP) (ΔP) is directly proportional to
the amount of portal blood inflow (Q) and the intrahepatic resistance opposing this
inflow (R):
Pressure gradient (ΔP) = flow (Q) * resistance (R) 62,60,13.
Hence, from a theoretical point of view, an elevation in PVP can occur secondary to
either an increase in intrahepatic resistance, an increase in portal blood inflow, or
both 60.
After a paradigm shift, initiated in the 1970s, it has meanwhile been widely accepted
that the mechanisms involved in the pathophysiology of PH encompass two main
aspects 64,60,65,66:
1. Increased intrahepatic resistance due to a mechanical and functional component
2. Increased blood inflow into the portal vein due to splanchnic vasodilation
In the initial stage of liver cirrhosis, an elevated PVP occurs as a result of increased
intrahepatic resistance to portal blood flow, which is caused by a mechanical and a
functional component 60,67. The mechanical (or structural) modifications occur in the
form of fibrous connective tissue, regenerative nodules, angiogenesis and vascular

Introduction
14
occlusion, which explain around 70% of the increased intrahepatic resistance,
whereas the functional (or dynamic) change explains at least 30%. Since the latter is
determined by the vasoreactivity of sinusoids, it could as well be spoken of
“sinusoidal vascular tone” or “sinusoidal vascular resistance”.
Along with the progression of liver cirrhosis, splanchnic arterial vasodilatation occurs,
which leads to an elevated flow into the gut and into the portal venous system 68.
Vasodilation furthermore induces an activation of neurohumoral and vasoconstrictive
systems, sodium and water retention, and consequently an increase in blood volume,
cardiac output and heartrate 68. These factors in combination with a decreased
systemic vascular resistance ultimately cause a lowering of systemic blood pressure.
This so-called hyperdynamic circulatory state develops in advanced stages of
cirrhosis and further increases portal blood inflow 69. Concomitant or subsequent to
splanchnic vasodilation the generation of portal-systemic collaterals that are formed
by the opening of pre-existing vessels or angiogenesis, occurs to decompress the
portal system 65,70,71. The extrahepatic collateral formation results in a partial
rerouting of blood flow away from the liver through these collateral vessels into low-
pressure systemic veins, which finally significantly increases the risk of esophageal
or gastric variceal bleeding and systemic circulatory disturbances 72,73.
Taken together, the extrahepatic changes in the splanchnic and systemic circulatory
system do not compensate PH, but rather contribute to its maintenance or even
worsening, and evoke additional complications 74,75. It has therefore been of great
relevance to get deeper insights into the mechanisms causing these alterations in
intra- and extrahepatic circulation. Fortunately, the knowledge of the pathological
mechanisms in PH has become enlarged immensely during the past few decades,
showing that these hemodynamic alterations are caused by a vast integrated network
comprising several components, and which is still not completely understood.
2.5.4.1 Cellular and Molecular Changes Considering the intrahepatic vasculature, a diminished capability to adjust sinusoidal
vascular tone, which defines intrahepatic resistance, occurs that finally leads to
increased intrahepatic resistance. The latter is associated with a number of cellular
changes in vascular smooth muscle cells surrounding branches of the portal vein and

Introduction
15
in sinusoidal cells 76. And although even hepatocytes have been described to
undergo some changes, e.g. loss of microvilli, the most dominant changes are
manifested in sinusoidal cells, i.e. SECs and HSCs 60. Both SECs and HSCs change
on a structural as well as on a functional level, which has been referred to as
pathological sinusoidal remodeling 77. SECs lose their fenestration, resulting in
impaired liver function and alterations in their phenotype 13. The latter causes
endothelial dysfunction, which leads to reduced production of vasodilators and
triggers HSC activation 65. Once HSCs are activated they also alter their phenotype
and show marked contractile and ECM-generating properties, and increased
responsiveness to vasoconstrictors 63.
Under physiological conditions, the adjustment of intrahepatic vascular tone to
prevailing conditions requires a subtle paracrine and autocrine interplay between
SECs and HSCs 12,13. In PH however, massive chronic disorders in this cellular
interplay lead to a constriction of myofibroblasts, resulting in an elevation of vascular
tone and resistance 61,62. (Figure 2)
Considering the extrahepatic vasculature, the adjustment of the vascular tone
depends on the interplay between ECs of the vascular endothelium and vascular
smooth muscle cells. In the context of PH, an extensive vasodilation in splanchnic
and systemic arteries occurs due to functional changes in ECs and vascular smooth
muscle cells 13. Vasodilation is caused by the overproduction of vasodilators in the
ECs and / or the hypocontractility of vascular smooth muscle cells, describing a
decreased vascular responsiveness to vasoconstrictors 65. Moreover, structural
alterations of arteries, the so-called “thinning” of arterial walls, may also contribute to
extrahepatic vasodilation, but this needs further investigation 65.

Introduction
16
Figure 2: Changes in the hepatic sinusoid in response to liver cirrhosis
Original source: Y .Iwakiri et al. 2014: “Vascular pathobiology in chronic liver disease and cirrhosis –
Current status and future dicrections” (https://doi.org/10.1016/j.jhep.2014.05.047)
This article is published under the terms of the Creative Commons Attribution-Non-Commercial-No
Derivatives License (CC BY NC ND).
These dynamic cellular changes are associated with molecular changes, but whether
the latter is the cause or the consequence of cellular changes, has not yet been
clarified. On the molecular level, it has been well described that increased
intrahepatic resistance is associated with massive imbalances in vasoactive
molecules (Table 2). Whereas in the intrahepatic vasculature vasodilators are
decreased and vasoconstrictors are increased, in the extrahepatic vasculature
vasodilators are increased and vasoconstrictors are decreased 64,65. Regarding this
opposing regulation of vascular tone, as a potent vasodilator, NO plays a key role
among the vasoactive molecules involved. Details will be described later (see
2.5.7.3). Moreover, there is evidence that imbalances in growth factor pathways,
involving cytokines such as transforming growth factor b (TGF-b), vascular
endothelial growth factor (VEGF) and platelet derived growth factor (PDGF) are
involved in the pathophysiology of PH as well, particularly in HSC activation and
pathological intra- and extrahepatic angiogenesis 64,13,61.

Introduction
17
Table 2: Vasoactive molecules
Vasodilators Vasoconstrictors
Nitric oxide (NO)
Adenosine
Carbon monoxide (CO)
Glucagon
Endocannabinoid
Prostaglandin
Hydrogen sulfide (H2S)
Endothelin
Angiotensin II
Norepinephrine
Vasopressin
2.5.5 Symptoms of Liver Cirrhosis and PH Since it can take years or even decades until liver cirrhosis causes any obvious signs
or symptoms, it is not surprising that in many affected people the disease remains
undiagnosed. The interval of progression from liver damage to liver cirrhosis seems
to be highly individual despite the same etiology; in some cases, the process can
take 40 years (slow fibrosers), whereas in others it can take less than 15 years (rapid
fibrosers). Accordingly, incidental liver screening tests, i.e. laboratory tests or
examinations using imaging modalities often lead to the diagnosis of liver cirrhosis in
an early stage than the disease itself. In a fairly advanced stage, it is much more
likely that the disease is diagnosed as a consequence of the occurrence of PH and
other clinically significant complications. 78,38,31,39
2.5.6 Diagnosis and Classification of Liver Cirrhosis and PH Once there are symptoms or indications of liver cirrhosis, defining the underlying
etiology and the stage of the disease is essential for the choice of therapy and the
prediction of the prognosis. Liver fibrosis per se can occur as a consequence of any
chronic liver disease regardless of etiology 42,47. However, the predominant
profibrogenic mechanisms, as well as the patterns of parenchymal damage indeed
vary with the etiology of the underlying liver disease 79. The etiology can be identified

Introduction
18
by the patient’s history combined with laboratory tests and histological examinations 39. Histological examinations are furthermore considered to be the reference standard
for the assessment of the degree of liver fibrosis, although this involves the invasive
procedure of a biopsy 80,30. In addition, laboratory tests and imaging modalities, e.g.
ultrasound (US) or magnetic resonance (MR) imaging can be used for the
assessment of the degree of liver fibrosis. In the following, only the reference
standard will be focused on.
Liver biopsy can be carried out from a percutaneous or a transjugular route under
local anesthesia 80. After having taken the liver tissue samples, cross-sections are
performed before liver tissue sections are evaluated histologically. For the evaluation
of the grade, measuring of necro-inflammatory activity, and the stage, measuring
fibrosis and architectural changes, several histological scores exist 81. One example
is the Desmet score (DS) with DS=0: no fibrosis, DS=1: mild fibrosis, DS=2:
moderate fibrosis, DS=3: severe fibrosis, and DS=4: cirrhosis 82. But regardless of
the scoring system used, from a histopathological perspective the diagnosis of
cirrhosis is established once liver fibrosis has reached its terminal stage and the
process is considered “end-stage” 59. Moreover, for many years only liver fibrosis was
regarded as a dynamic, and potentially reversible process, whereas liver cirrhosis
was described as a static and irreversible terminal disease 31,83. However, nowadays
the concept of a dynamic, and at least partly reversible multi-stage process for liver
cirrhosis is being increasingly accepted 38,61,59.
The course of liver cirrhosis can initially be classified into two major stages: a
compensated, or asymptomatic phase, followed by a rapidly progressive
decompensated stage 23. The decompensated stage is defined by the presence of
clinical complication events secondary to PH, such as variceal bleeding, ascites or
hepatic encephalopathy 23,38,59. PH can be categorized according to anatomical
location into either pre-, intra- or posthepatic, with the intrahepatic, sinusoidal PH
being the most common form secondary to liver cirrhosis, regardless of etiology
(Table 3) 62,63. Since prognosis and predictors of death differ between these two
major stages of compensated and decompensated cirrhosis, each of them should be
regarded as separate entities 58. In fact, much effort has been put into the clarification
of the predominant pathogenic mechanisms of PH in each stage, which finally led to
the discovery of further substages of cirrhosis. Referring to recent publications of

Introduction
19
Abrades et al 58, D’Amico et al 84, and Garcia-Tsao et al 68, five prognostic stages
with a significant increase in the risk of death can be proposed (Table 4).
Table 3: Classification of PH according to anatomical location
Classification Subclassification
prehepatic
intrahepatic
posthepatic
- congential portal atresia
- intraluminal obstruction (thrombus, neoplasia)
- extraluminal vascular compression
- presinusoidal
- sinusoidal
- postsinusoidal
- luminal vascular obstruction
- extraluminal vascular compression
Table 4: Stages of liver cirrhosis
Stage Definition
1
2a
2b
3
4
5
compensated cirrhosis with mild PH
compensated cirrhosis with clinically significant PH, no varices
compensated cirrhosis with clinically significant PH, and varices
(no bleeding)
bleeding without other disease complications
first non-bleeding decompensating even
any second decompensating event

Introduction
20
As the majority of complications are caused by PH, the diagnosis of liver cirrhosis
often implicates the necessity to evaluate PVP. In a clinical setting the reference
standard to assess PVP is the hepatic venous pressure gradient (HVPG), which
represents an indirect measurement of PVP. Also non-invasive imaging modalities,
e.g. ultrasound (US) or magnetic resonance (MR) imaging can be used to assess
portal hemodynamics, but not PVP. However, the use of these imaging techniques is
still a matter of debate.
The assessment of the HVPG has essential prognostic relevance that even might
exceed that of histological examinations 80,61. The determination of the HVPG
requires the measurement of two pressure values: the wedged (or occluded) hepatic
venous pressure (WHVP) and the free hepatic venous pressure (FHVP). To measure
WHVP, a balloon catheter is inserted under local anesthesia through the jugular,
femoral or cubital vein into the hepatic vein. Through inflation of the balloon, the
hepatic venous outflow is blocked. After 1 to 2 minutes of blockade, the pressure at
the tip of the catheter finally reflects that of the hepatic sinusoidal pressure. On the
other hand, to measure FHVP, the balloon is deflated at 2 to 3 cm from the hepatic
vein ostium, so that the pressure at the tip of the catheter usually reflects the
pressure in the inferior vena cava.80
HVPG is finally calculated as the difference between WHVP and FHVP and hence
represents the pressure gradient between the portal vein and the intraabdominal
portion of inferior vena cava:
HVPG = WHVP – FHVP. 80,85,86
Since the WHVP, and accordingly the HVPG, is a measure of sinusoidal pressure, it
is important to mention that this measurement does not deliver reliable data with
respect of prehepatic or presinusoidal PH 68. In intrahepatic, sinusoidal PH however,
the HVPG is a reliable diagnostic tool which gives an accurate estimation of PVP. It
can be interpreted as follows: A HVPG < 5 mmHg is considered to be normal,
whereas PH is defined as an HVPG > 5 mmHg, a HVPG > 5 but < 10mmHg being
defined as mild PH, and a HVPG ≥ 10 mmHg as clinically significant PH. Above this
threshold of 10 mmHg, all complications induced by PH are more likely to occur. 24,62,68

Introduction
21
An accurate evaluation of hepatic, but also systemic hemodynamic status in chronic
liver diseases is thus essential for prevention or therapy of PH and its complications.
2.5.7 Therapy of Liver Cirrhosis and PH The main aim in PH therapy is to reduce HVPG to less than 12 mmHg or at least
20% of baseline to reduce the risk of variceal bleeding or rebleeding 38,87,27. To attain
this goal, PH management ideally involves addressing the underlying etiology,
inhibiting fibrosis development and regression, diminishing intrahepatic resistance
and / or splanchnic vasodilation, and treating complications 27,67. According to the
Baveno guidelines, PH management can involve pharmaceutical, endoscopic and
mechanical therapies 88.
As a first step in PH management, correct identification and extinguishing of the
origin of the evil is essential, since clearance or control of the underlying etiology of
liver damage is always the most effective therapy 31,42,89. However, in many affected
people the primary event or relevant mediators cannot be eliminated. In addition,
since affected people commonly only appear at an advanced stage of the disease,
reversal may not be rapid enough to prevent complications 89.
In suspected variceal bleeding, pharmaceutical therapy with vasoactive substances
should be started as soon as possible, before endoscopic therapies, such as band
ligation or sclerosing, are applied 88. In acute esophageal variceal bleeding events
however, a combined pharmaceutical and endoscopic therapy is recommended 88.
When endoscopic therapies are applied, it should be considered that they indeed
help to stop the bleeding, but simultaneously lead to an enhancement of PVP,
thereby worsening PH.
In a very advanced stage, when initial pharmaceutical and endoscopic therapy show
no effect or are likely to show no effect, transjugular intrahepatic portosystemic stent
shunting (TIPS) presents another therapy option 90. This mechanical, minimal
invasive therapy lowers PVP, but at the same time increases the risk of serious side
effects, such as the development of hepatic encephalopathy. In the event that all
these therapies fail, radical treatment by liver transplantation is the only remaining
option to increase survival odds 28,31. Since donors for liver transplantations are rare,
and the current therapy options are far from satisfying, new approaches are urgently
needed 91,92. In the following, the focus will be on pharmaceutical therapies.

Introduction
22
Current pharmaceutical therapy is mainly stratified according to the presence and
characterization of esophageal varices, meaning that a complication rather than the
disease itself is treated 88,90,91. Hence, research and also pharmaceutical companies
have been working intensively on the development of novel drugs to improve PH
therapy. Some aimed at developing antifibrotic drugs to reverse or at least inhibit
fibrogenesis, but no drug has yet been approved for use in humans 42,48,31.
Consequently, treating PH it is still challenging, since up to now the mechanical
component of increased intrahepatic resistance remains mostly irreversible. The
good news is that the functional component of PH can indeed be targeted
pharmaceutically and might potentially improve the future management of PH 42,93.
The functional component of increased intrahepatic resistance can be influenced
positively, either by a decrease in intrahepatic vascular tone, a decrease in
splanchnic vasodilation, or ideally both (Table 5) 67.
The current reference standard in pharmaceutical therapy, i.e. nonselective beta
blockers (NSBBs, beta-adrenergic receptor antagonists), vasopressin derivatives or
intestinal hormones, mainly counteract splanchnic vasodilation. Oral administration of
NSBBs is recommended to prevent bleeding, whereas in acute variceal bleeding
events, vasopressin derivatives or intestinal hormones should be administered
intravenously to stop bleeding 91. However, since these vasoactive substances not
only affect intrahepatic, but also extrahepatic circulation and hence can cause
massive contrary effects, their use has always been a matter of debate 91,94. Looking
for better alternatives, modulating NO availability and / or NO downstream signaling
seem to be promising options, since NO plays a vital role in the pathophysiology of
PH.

Introduction
23
Table 5: Reference standards and potentially novel drugs for PH therapy
Mode of action Drug group and names
reduced splanchnic vasoconstriction
reduced intrahepatic resistance (intrahepatic vascular tone ↓)
- nonselective ß-blockers (NSBBs)
propaponol, nadolol and carvedilol only in acute variceal bleeding events: - vasopressin derivatives
terlipressin
- intestinal hormones
somatostatin and octreotide - organic nitrates
isosorbide mononitrate - ACE-inhibitors / AT1-receptor-blockers
benazepril and captopril / losartan and valsartan - statins (HMG-CoA-reductase-inhibitors)
simvastatin and atorvastatin
- PDE5 inhibitors
sildenafil, udenafil and vardenafil - endothelin-receptor-antagonists
ambrisentan, bosentan and macitentan

Introduction
24
2.5.7.1 NO – A Multifunctional Molecule NO is an unstable free radical with a short biological half-life 95. First of all, NO is
known to be a potent endothelium-derived vasodilator, but it is likewise involved in
various other physiological processes in the cardiovascular, immune, gastrointestinal,
genitourinary, respiratory and nervous systems 96–99.
After NO is generated, it quickly diffuses into surrounding cells, where it can interact
with different reactants, such as transition metals and free radicals, and affect
proteins, nucleic acids, as well as fatty acids 96,100,101. What kind of interactions are
finally favored depends on several factors like the cellular environment, the available
concentration of NO and reactants and the reaction rates 96,98,102,103. Its physiological
effects are caused either directly or indirectly by its reactive and radical nature 96,104,100. Its unique chemistry, specifically the unpaired electron, but also the fact of
nitrogen being able to reach various oxidation states to generate different reactive
nitrogen species (RNS), vastly raises the potential NO effects 101,98. Thus, it is still
challenging to specify its physiological effects in specific cell types or complex
neuronal assembles 105. However, a well-studied and recognized NO target is the
soluble guanylyl cyclase (sGC) 102,106,99, a key cytosolic enzyme in the NO-cGMP
signaling pathway. The activation of this pathway implicates vasodilation and is
therefore essential for vasoregulation, including vascular tone and resistance.
2.5.7.2 NO – Generation and Function The activation of the NO-cGMP pathway takes place once NO is generated and
diffuses into the cytoplasm of surrounding cells, where it binds to the enzyme soluble
guanylyl cyclase (sGC). The interaction of NO with sGC causes a conformational
change, which results in the catalytic conversation of guanosine-5’-triphosphate
(GTP) to cyclic guanosine-3’,5’-monophosphate (cGMP). cGMP, an intracellular
second messenger, triggers various downstream signaling effects, which induce
vasodilatation. (Figure 3)
Indeed, the NO-cGMP pathway is much more complex. The three main enzymatic
steps NO generation, cGMP generation and degradation will be described in more
detail.

Introduction
25
NO generation occurs in a broad number of different cell types; however, to regulate
vascular tone, its synthesis in ECs of the vascular endothelium, and in case of the
corpus cavernosum also in neurons, is particularly important. Both, biomechanical
and biochemical stimuli, such as shear stress, VEGF and bradykinin can precipitate
NO generation 100,107,108,63,109. The synthesis itself can occur in two different ways:
either non-enzymatically from the transformation or degradation of inorganic nitrogen
chemicals in the organism and diet, or enzymatically from the oxidation of L-Arginine
to NO and L-citrulline 95,110. In mammals, the enzymatic redox reaction can be
catalyzed by three different isoforms of the enzyme nitric oxide synthase (NOS),
which were named according to the cell type or condition first described: endothelial
NOS (eNOS), inducible or inflammatory NOS (iNOS) and neuronal NOS (nNOS) 98,102.
All NOSs differ slightly in expression profile and in physiological function: eNOS and
nNOS, are both expressed progressively and generate continuous, but moderate
amounts of NO. eNOS is primarily expressed in ECs and primarily regulates vascular
tone. In addition, it induces vasoprotective and anti-atherosclerotic effects 104. nNOS
is primarily expressed in neurons and skeletal muscle and is responsible for synaptic
plasticity in the central nervous system, central regulation of blood pressure, smooth
muscle relaxation and vasodilation via peripheral nitrergic nerves 98. These nerves
are involved in the relaxation of corpus cavernosum and penile erection 104. iNOS
expression was originally identified in macrophages. Later, however, it was
demonstrated in almost all cell types as a defense mechanism against infections
from invading bacteria, viruses and fungi or against inflammation 97,111,112. Since
iNOS up-regulation is usually a consequence of pathological conditions, induction of
iNOS expression generates huge amounts of NO. The cell-specific roles of iNOS-
derived NO, however, need further investigation. Under physiological conditions,
iNOS expression is minimal or even absent 113,114.
Regarding the liver, eNOS and iNOS are the major players, whereas only little is
known about the role of nNOS in this organ 100, eNOS being primarily expressed in
SECs and in ECs of the portal vein, hepatic artery, central vein, and lymphatic
vessels 100, whereas iNOS can potentially be expressed in almost all hepatic cells 100,115.

Introduction
26
Figure 3: Schematic diagram of the NO-cGMP pathway
eNOS: endothelial nitric oxide synthase, iNOS: inducible nitric oxide synthase, NO: nitrix oxide,
PDE5: phosphodiesterase 5, sGC: soluble guanylyl cyclase, GTP: guanosine-5’-triphosphate;
cGMP: cyclic guanosine-monophosphate (cGMP); GMP: guanosine-monophosphate,
PKG: protein kinase G, (S)EC: (sinusoidal) endothelial cell; HSC: hepatic stellate cell
NOSs are generated as inactive monomers. For activation monomers must dimerize
and bind different cofactors. Tetra-hydrobiopterin (BH4), haem, flavin adenine
dinucleotide (FAD) and flavin mononucleotide (FMN) are cofactors of all three
isoforms 104,98. On binding calmodulin, a calcium-binding protein, the active enzyme
catalyzes the oxidation of L-arginine to NO and L-citrulline. For eNOS and nNOS
calmodulin binding, and hence also enzyme activity, is highly calcium-dependent,
whereas in iNOS calmodulin is bound constitutively 98,101. Moreover, post-
translational modifications and protein-protein-interactions can also regulate NOS
activity 97,98. Finally, NO generation requires molecular oxygen and nicotinamide
adenine dinucleotide phosphate (NADPH) as co-substrates for the oxidation of L-
arginine.
cGMP generation requires direct interaction between NO and the enzyme soluble
guanylyl cyclase (sGC). sGC is a heterodimeric hemoprotein composed of an a- and
b-subunit, which are both required for enzyme activity 116. Two isoforms of each

Introduction
27
subunit exist: a1/a2 for the a-subunit, as well as b1/b2 for the b-subunit, but only
a1/b1 and a2/b1 are active heterodimers. The a1/b1 heterodimer is regarded as the
major sGC isoform, since it is expressed in most mammalian tissues, including liver
tissue 117–119. Essential for sCG activation is an interaction between the heme-binding
domain, located on the b-subunit, and a heme moiety. The heme moiety is a large
heterocyclic ring with a transition metal, building the metal center of sGC.
Once NO is generated and diffused into vascular smooth muscle cells, or in the liver
into HSCs, it induces a conformational change of the sGC heterodimer by binding
avidly to its transition metal (ferrous heme iron), thereby activating sCG, which, in
turn, catalyzes the conversion of guanosine triphosphate (GTP) to cyclic guanosine
monophosphate (cGMP), an intracellular second messenger 106. Increased cGMP
concentrations exert downstream signaling effects by directly modulating various
effector proteins, i.e. cGMP-dependent protein kinases (PKGs), cGMP-hydrolzying
phosphodiesterases (PDEs), as well as cGMP-gated ion channels 120,121.
Two PKG families (PKGI and PKGII) and PDE classes (class I and class II) exist,
whereby PDE class I includes all known mammalian PDEs, which comprise 11
families (PDE1-11) 122,120,123. Only the roles of the cGMP-dependent PKGI family and
the cGMP-selective PDE5 family will be focused on, since their members are key
players in the NO-cGMP pathway 120,124.
An increase of cGMP concentrations induces a decrease in intracellular free calcium
concentrations through multiple mechanisms. First, cGMP is capable of inhibiting
calcium release from intracellular stores; second, it triggers removal and
sequestration of intracellular calcium through calcium pumps; and third, it induces
direct, as well as indirect inhibition of the influx of extracellular calcium through
voltage-gated ion channels 125. As a result, the indirect inhibition of calcium influx is
mediated by PKGI. Upon cGMP binding to allosteric sites in the regulatory domain,
PKGI undergoes a conformational change. This conformational change leads to the
release of the N-terminus inhibition of the kinase domain, and hence to an increase
in phosphotransferase activity of the dimeric enzyme 126,120,125. Thus, PKGI
stimulation results in phosphorylation of several proteins, which results in two
primary effects: first, a decrease in intracellular calcium levels and second, calcium
desensitization of the actin-myosin contractile elements 127.
As a consequence of these cGMP-induced downstream signaling effects, vascular
dilation is initiated, eventually leading to a reduction in vascular tone.

Introduction
28
Moreover, cGMP binds to the high-affinity GAF-A domain of PDE5, thereby
increasing the hydrolytic activity of the dimeric holoenzyme. The hydrolytic activity
can be further promoted through stabilization of the cGMP binding by
phosphorylation at a separate N-terminal site by PKGI 128–130. Once PDE5 is
activated, it initiates the hydrolysis of cGMP into inactive guanosine-5′-
monophosphate (GMP). Hence, rising intracellular cGMP concentrations are
associated with activation of PDE5 as a negative feedback mechanism mediating
cGMP degradation 131. All these feedback mechanisms happen within seconds and
are pivotal in lowering cGMP concentrations to basal levels in the short term after NO
stimulation 120. Prolonged NO exposure and increased cGMP concentrations,
however, seem to induce more persistent modifications at several steps in the NO-
cGMP pathway, including down-regulation of PKGI and up-regulation of PDE5 120.
Knowing about the essential role of NO in terms of vasoregulation, the role of NO
and NOS in the pathophysiology of PH has been investigated extensively.
2.5.7.3 NO and NOS in the Pathophysiology of PH According to currently available data, NO is described as an important molecular
factor involved in the pathophysiology of PH secondary to liver cirrhosis. The
paradoxically controlled intra- and extrahepatic vascular tone is characterized by NO
deficiency in the intrahepatic vasculature and, on the other hand, NO excess in the
extrahepatic vasculature.
Considering the intrahepatic vasculature, a down-regulation of eNOS activity in SECs
is described to be primarily responsible for intrahepatic NO deficiency, whereas data
considering eNOS expression are inhomogeneous described 63,76,132–139. Underlying
causes of the down-regulated eNOS activity can involve different factors, such as
oxidative stress or decreased BH4 synthesis and activity 63,139,140. Furthermore, an
up-regulation of iNOS expression is associated with liver cirrhosis, which can be
stimulated by endotoxins, cytokines and bacterial infections 63,141–144. iNOS
expression can take place in all hepatic cell types, but little can be revealed about
iNOS activity in the different cell types. However, it is known, that iNOS activity is
dependent on several factors such as availability of its substrate arginine and BH4 115. Interestingly, eNOS-derived NO is described to maintain liver homeostasis and
Introduction
29
counteract pathological conditions within the liver 100, while iNOS-derived NO is in
general pathological, and does not seem to cause vasodilation 100. The paradox of
decreased eNOS-derived NO and increased iNOS-derived NO, finally resulting in
increased intrahepatic resistance, might point out that the source of NO and the
surrounding microenvironment strongly influence the NO-induced effects 100. Its
inducible nature as well as the observation that iNOS can act as regulator of other
effectors, e.g. eNOS, increases the potential impact of iNOS massively and needs
further investigation 63,111.
Regarding the extrahepatic vasculature, an up-regulation of primarily eNOS activity,
but also eNOS expression in ECs of the vascular endothelium is assumed to cause
NO excess 64,63,145. The up-regulation of eNOS can be triggered by several stimuli,
e.g. shear stress, VEGF, or increased BH4 synthesis and activity 64,145–147. For iNOS,
however, data are inconsitstent. Some studies have implicated that enhanced iNOS
expression and activity is involved in the vasodilation of the extraheptic vasulature 141,148, whereas others found evidence against the involvement of iNOS 149. It seems
like eNOS- rather than iNOS-derived NO contributes to NO excess in the
extrahepatic vasculature, but equivalent to the intrahepatic vasculature the role of
iNOS-derived NO needs to be clarified further 74,150–152 .
Moreover, NO contributes to angiogenesis and as a result to collateral formation,
which again promotes the progression of PH 63.
Bearing that paradox in mind, the ideal concept for PH therapy should specifically
target intrahepatic vasculature and on site enhance NO availability and / or NO-
cGMP downstream signaling to counteract intrahepatic NO deficiency 60.
2.5.7.4 Strategies to Increase NO Availability and NO-cGMP Signaling To increase NO availability and / or NO-cGMP downstream signaling, different
pharmaceutical strategies can be used (Table 6). However, it must always be kept in
mind that drugs acting within the liver may have extrahepatic effects as well 94.
Hence, testing those, intra- and extrahepatic effects should be subject of scrutiny 91.
In this experimental study, we investigated the effect of PDE5 inhibitors, which act as
indirect stimulators of NO downstream signaling; thus, they will be focused on in the
following.

Introduction
30
Table 6: Reference standards and potentially novel strategies to increase NO
downstream signaling 96
Mode of action Drug group and name
1. NO delivery / generation a) NO-delivering compounds b) NO-releasing compounds c) enhancing endogenous NO generation by promoting eNOS activity d) other drugs that enhance endogenous NO generation by promoting eNOS activity and expression 2. Prevention of NO scavenging by other radicals or transition metals 3. Stimulating NO downstream signaling
- organic nitrates
isosorbide mononitrate (unspecific) - UDCA derivatives
NCX-1000 (UDCA derivative, liver-specific)
- eNOS substrates, cofactors, or the like
L-arginine, L-citrulline and BH4
- statins
Simvastatin and atorvastatin
- ACE inhibitors / AT1 receptor-blockers
Benazepril and captopril / losartan and valsartan
- PDE5 inhibitors
sildenafil, vardenafil, tadalafil and udenafil
- sGC stimulators
riociguat
- sGC activators
cinaciguat and vericiguat

Introduction
31
2.5.8 PDE5 and PDE5 inhibitors The PDE5 family is part of a PDE superfamily. PDEs are in general enzymes that
regulate the concentrations of the intracellular cyclic nucleotides, such as cyclic
adenosine-3’,5’-monophosphate (cAMP) and cyclic guanosine 3’,5’-monophosphate
(cGMP). Cyclic nucleotides act as second messengers and initiate a broad range of
downstream effects. By hydrolyzing cAMP into adenosine-5′-monophosphate (AMP)
and / or cGMP into guanosine-5′-monophosphate (GMP), respectively, PDEs
terminate the cyclic nucleotides’ downstream signaling (see 2.5.7.2).
PDEs can be classified into class I and class II, but since class I contains all known
mammalian PDEs 123, the focus will be on this class. The class I PDE superfamily
comprises 11 families (PDE1-11) involving more than 100 PDE isoforms 153,123. Their
differing substrate specificity allows a further division into three subgroups: some
PDEs are highly cAMP-specific; some are highly cGMP-specific, whereas some are
cAMP- and cGMP-specific (Table 7). Furthermore, they differ in primary structure,
catalytic properties, responses to specific inhibitors, and in cellular as well as
subcellular distribution, although all PDE families are structurally related 153.
Their regulatory key role in combination with the fact that PDEs exist ubiquitously, but
with distinct cellular and subcellular distribution, has made them a favorable target for
pharmaceutical therapies 153,154. The PDE5 inhibitor sildenafil citrate (sildenafil),
better known as Viagra®, is probably the most popular example for a successful
market launch of a PDE targeting drug (Figure 4).

Introduction
32
Table 7: Substrate specificity and distribution of PDE families 155,156
Family Specificity Tissue / Cellular distribution
PDE1 PDE2 PDE3 PDE4 PDE5 PDE6 PDE7 PDE8 PDE9 PDE10 PDE11
cAMP and cGMP cAMP and cGMP cAMP and cGMP cAMP cGMP cGMP cAMP cAMP cGMP cAMP and cGMP cAMP and cGMP
heart, brain, lung and smooth muscle adrenal gland, heart, lung, liver, platelets and endothelial cells heart, smooth muscle, lung, liver, platelets, adipocytes and immunologically active cells brain, Sertolli cells, kidney, liver, heart, smooth muscle, lung, endothelial cells and immunologically active cells smooth muscle, lung, platelets, heart, endothelial cells and brain photoreceptors, pineal gland and lung skeletal muscle, heart, kidney, brain, pancreas and T lymphocytes testes, eye, liver, skeletal muscle, heart, kidney, ovary, brain, T lymphocytes and thyroid kidney, liver, lung and brain testes, brain and thyroid skeletal muscle, prostate, pituitary gland, liver and heart

Introduction
33
Figure 4: Comparison of the structures of cGMP (native molecule) and sildenafil
Figure reprinted with permission of Springer Nature.
Original source: H .Ghofrani et al. 2006: “Sildenafil: from angina to erectile dysfunction to pulmonary
hypertension and beyond”
PDE5 is mainly expressed in smooth muscle cells and is encoded by one gene
PDE5A with three isoforms: PDE5A1, PDE5A2 and PDE5A3 (all 95-100 kDa) 155,157.
Due to its specific hydrolysis of cGMP and its presence in vascular smooth muscle
cells and in platelets, PDE5 was selected 30 years ago to undergo further research in
the context of vasoregulation. In some primilinary preclinical studies, the assumption
that PDE5 inhibitors mediate vasodilating effects could be confirmed 156. The
subsequent approach to use PDE5 inhibitors in diseases caused by vascular
dysfunction was obvious and eventually sildenafil was brought into the clinic as a
potential therapy for angina pectoris 154. The results of the first clinical trial proved the
mode of action of sildenafil by inducing moderate vasodilating effects in patients with
angina pectoris. However, the results of a later second study in healthy persons
showed that co-administration of sildenafil enhanced the vasodilating effects and the
hyperdynamic circulatory state induced by organic nitrates, the standard reference
therapy for angina pectoris at that time 156. Hence, it seemed to be critical to use
sildenafil in patients taking organic nitrates. Furthermore, sildenafil provided no
additional therapeutic effect compared to the available organic nitrates 154. But since
many patients reported penile erection as a side effect of sildenafil treatment, it came
to pass that sildenafil evolved from a potential anti-angina pectoris drug to a therapy
for erectile dysfunction, and more recently also for pulmonary hypertension 156,158.

Introduction
34
Consequently, the use of sildenafil in the context of cirrhotic PH therapy also seems
obvious and was the topic of this experimental study. Therefore, first of all, an
appropriate experimental model had to be established.
2.6 Experimental Models of Liver Fibrosis / Cirrhosis For experimental liver disease research primarily rodents are used as laboratory
animals 159. To induce liver fibrosis / cirrhosis in laboratory animals, the currently
most popular models are treatment with hepatotoxic agents like thioacetamide (TAA)
or carbon tetrachloride (CCl4) and surgical bile duct ligation (BDL).
Considering the toxic models of TAA and CCl4 administration, the available protocols
widely vary in application, frequency and dosage 159,160. Toxic models usually need
more time for the process of liver disease development compared to BDL. The BDL
presents a reliable cholestatic model 159,161, but requires a surgical procedure,
implying potential complications 162, as well as burdensome wound control and
aftercare.
After intensive literature research the model of TAA-induced liver fibrosis / cirrhosis
was used in this study. Thus, focus is placed on this agent in the following.
TAA causes liver disease which resembles human fibrosis and cirrhosis 160,163 and
leads to the development of PH 159. Application can be conducted by intraperitoneal
injection or oral treatment via drinking water. The advantages of oral application are
the ease of administration, noninvasiveness of the procedure 160,163,164, and the
decrease of extrahepatic toxicity due to the first-past effect, enabling a more
consistent intoxication 160. In this study, the model of oral and weight-adapted TAA
treatment according to the protocol previously described by Li et al. 163 was chosen.
Trusting their results, using this model induced a well-developed macronodular
cirrhosis in 90% of the rats after 12 weeks of TAA administration. They additionally
pointed out that the rats’ individual response to TAA intake could be easily evaluated
based on their weekly body weight change. Therefore, adaption of the TAA dosage
referring to the weekly body weight change was recommended to increase the
incidence and a more homogenous production of liver cirrhosis compared to the
administration of a constant TAA dosage. Furthermore, by adapting the TAA dosage,
mortality could be reduced to zero. All these aspects led to the decision to use this
particular TAA model in this study.

Introduction
35
2.6.1 Thioacetamide Thioacetamide (TAA) is a small, polar organosulfur compound, which is soluble in
water and alcohol 165,166. It was originally used to preserve citrus fruits, especially
oranges, due to its fungicidal activity 165,167. Nowadays it is known to be a potent
selective hepatotoxin and carcinogen, which has been used extensively in preclinical
research to develop animal models of acute and chronic liver disease 165,167.
However, although TAA is characterized by high liver-specificity 168, it has also been
described that it can harm other organs, such as the lungs, kidneys, spleen, thymus
and pancreas 165,167,169–171.
A short time after administration TAA accumulates in the liver 172. Provoking TAA
toxicity within the liver, however, requires a metabolic two-step bioactivation. This
bioactivation progress is triggered by hepatic cytochrome P450 enzymes, particularly
cytochrome P4502E1, and flavin-containing monooxygenases (FMO) 165,173,174. As a
result TAA is converted into its initial reactive metabolite TAA-sulfoxide (TAASO),
and subsequently into its ultimate reactive metabolite TAA-sulfdioxide (TAASO2).
Both metabolites induce noxious effects in hepatocytes, resulting in apoptosis,
necrosis and in the development of cholangiocellular carcinoma (CCCs) and
hepatocellular carcinoma (HCCs) 160,165,175. Several studies indicate that the
hepatotoxic effect induced by these metabolites is characterized by inflammation,
HSC activation, enlargement of nucleoli, mitochondrial and cytochrome P450
dysfunction, covalent binding to cellular macromolecules and / or production of
oxidative stress 161,165,168,172,174,176–178. The detailed underlying molecular mechanisms
causing TAA-induced intrahepatic organic and functional damage, however, are
complex and still not completely understood 159,160,168.

Introduction
36
2.7 Aims and Objectives The first aim of this experimental study was to establish and evaluate an animal
model of liver fibrosis / cirrhosis. To induce liver disease the model of oral and
weight-adapted thioacetamide (TAA) application was chosen, in which rats should be
used as laboratory animals. Relative portions of rats with fibrotic and cirrhotic livers,
the presence of cholangiocellular carcinoma (CCCs), and mortality induced by TAA
administration should be quantified.
The second aim was to noninvasively evaluate hepatic and systemic hemodynamic
changes induced by liver fibrosis / cirrhosis in rats with healthy, fibrotic or cirrhotic
livers by magnetic resonance (MR) measurements. Alterations in the parameters
portal cross-sectional area, portal flow velocity, portal flow volume rate, and aortic
flow volume rate should be determined. Moreover, MR data should be used to
investigate whether the degree of liver fibrosis can be assessed using a self-
established MR score. Therefore, a scanning protocol had to be established.
The third aim was to invasively evaluate hepatic and systemic hemodynamic
changes induced by liver fibrosis / cirrhosis. Alterations in the parameters portal flow
volume rate and mean arterial pressure (MAP) should be determined. Portal flow
volume rate should be detected with a flow probe, whereas MAP should be
determined using a pressure transducer. Moreover, results for the portal flow volume
rate between noninvasive and invasive measurements should be compared.
Additional invasive hemodynamic measurements aimed to evaluate hepatic and
systemic hemodynamic changes which are induced by the administration of the
PDE5 inhibitor sildenafil. Acute effects of administration of either sodium chloride,
sildenafil 0.1 mg/kg or sildenafil 1.0 mg/kg on the parameters portal venous pressure
(PVP), mean arterial pressure (MAP), microvascular flow (MF), and heart rate (HR)
over 50 minutes should be examined. PVP, MAP and HR should be measured using
pressure transducers, whereas MF should be determined with a microvascular flow
probe. Moreover, hemodynamic data should be used to investigate the effect of MAP
on PVP over the first 30 minutes. Therefore, a work protocol for the operative
procedure had to be established.

Introduction
37
The fourth aim was to evaluate changes biochemically in the key parameters of the
nitric oxide-cyclic guanosine monophosphate (NO-cGMP) pathway induced by liver
fibrosis / cirrhosis. Alterations in hepatic gene expression of the enzymes endothelial
and inducible NO synthase (eNOS, iNOS), soluble guanylyl cyclase subunit a1 and
b1 (sGCa1, sGCb1) and phosphodiesterase 5 (PDE5) should be analyzed by qRT-
PCR, whereas changes in serum cGMP concentrations from carotid arterial blood
samples should be determined using ELISA. In this context it should also be
evaluated whether the hemodynamic measurement and in particular the associated
operative procedure affected gene expression or serum cGMP concentrations.
Moreover, the effect of sildenafil administration (1.0 mg/kg) on serum cGMP
concentrations should be determined. The main finding(s) of gene expression
analyses should finally be verified by immunohistochemical staining.

Results
38
3. Results 3.1 Evaluation of the TAA Model The model of TAA-induced liver fibrosis / cirrhosis by oral and weight-adapted TAA
administration is one of the commonly used models in preclinical liver research.
However, since recommendations for appropriate TAA exposure time vary, the first
step in the current study was to evaluate this model. Thereby, Dr. Lisa Lutz (Institute of
Clinical Pathology, Medical Center, University of Freiburg) conducted the histological
evaluation of the rats’ liver tissue samples.
3.1.1 General Remarks The model of TAA-induced liver fibrosis / cirrhosis by oral and weight-adapted TAA
administration was easy and safe to perform.
Rats receiving TAA (41 Sprague Dawley and 101 Wistar rats) showed symptoms
which were mostly induced by liver fibrosis / cirrhosis (Table 8). Their level of
discomfort was classified as minor.
Table 8: Symptoms observed in rats during TAA exposure time
on a regular basis: less frequently:
- slightly reduced intake of drinking water
- reduced body weight increase
- drier and light-colored feces
- bloody scabs on the nose
- markedly visible blood vessels in the ears
- yellowness of the skin
- ragged fur
- sensitivity to touch
- frightened behavior
- aggressive behavior
- unsteady gait
- mild ascites

Results
39
3.1.2 Histological Assessment of the Degree of Liver Fibrosis
Table 9: Number of rats sorted by strain and their histological degree of liver fibrosis
with corresponding TAA exposure time
a) Strain: Sprague Dawley
Desmet score 0 1 2 3 4 n total
TAA exposure: 12 weeks 1 15 2 (1) 2 1 (1) 21
TAA exposure: 15 weeks 1 1 (1) 2
TAA exposure: 17 weeks 1 1
TAA exposure: 19 weeks 1 3 (3) 4
TAA exposure: 20 weeks 1 2 (2) 3
TAA exposure: 21 weeks 1 2 (2) 3
TAA exposure: 22 weeks 1 3 (3) 4
TAA exposure: 23 weeks 1 (1) 1
TAA exposure: 24 weeks 1 (1) 1
Group classification CON FIB CIR 40 b) Strain: Wistar
Desmet score 0 1 2 3 4 n total
TAA exposure: 12 weeks 10 7 1 18
TAA exposure: 16 weeks 4 8 18 (1) 17 35 (17) 82
Group classification CON FIB CIR 100
The degree of liver fibrosis was assessed according to the histological Desmet score (DS) 82 with
DS=0: no fibrosis, DS=1: mild fibrosis, DS=2: moderate fibrosis, DS=3: severe fibrosis and DS=4:
cirrhosis. The number of rats developing cholangiocellular carcinoma (CCCs) simultaneously is given
in subscript brackets.

Results
40
Regarding Sprague Dawley rats (Table 9a), all untreated rats and 5% (1/21) of the
rats treated with TAA for 12 weeks had no fibrosis. 5% (1/21) of the rats treated with
TAA for 12 weeks developed cirrhosis. A prolonged TAA exposure time from 15 up
to 24 weeks increased the incidence of cirrhosis to 68% (13/19). Among the Sprague
Dawley rats with a cirrhotic liver, all had CCCs simultaneously. For this reason a
second rat strain was tested subsequently.
Regarding Wistar rats (Table 9b), all untreated rats and 5% (4/82) of the rats treated
with TAA for 16 weeks had no fibrosis. None (0/18) of the rats treated with TAA for
12 weeks, but 43% (35/82) of the rats treated with TAA for 16 weeks developed
cirrhosis. Among the Wistar rats with a cirrhotic liver, 49% (17/35) had CCCs
simultaneously.
In both strains, a TAA exposure time of 12 weeks mainly induced mild fibrosis, but
not cirrhosis. 3% (1/40) of the Sprague Dawley and 4% (4/100) of the Wistar rats
developed no fibrosis or cirrhosis irrespective of TAA exposure time.
3.1.3 Mortality The mortality caused by TAA administration was 1-2%. 2% (1/41) of the Sprague
Dawley and 1% (1/101) of the Wistar rats died within the first week of TAA
administration. In comparison, no mortality (0/133) occurred in the untreated rats.
3.2 Noninvasive Hemodynamic Measurements In order to better characterize the TAA model and to address the lack of a
noninvasive and repeatable assessment of hemodynamics in the preclinical setting,
an MR scanning protocol was established to determine hepatic and systemic
hemodynamic alterations induced by liver fibrosis / cirrhosis. Thereby, MR
measurements were performed in cooperation with the working group of PD Dr.
Dominik von Elverfeldt (Department of Radiology – Medical Physics, Medical Center, University of
Freiburg). Their group member Dr. Wilfried Reichardt conducted the subsequent
postprocessing of MR data. He and Dr. Jakob Neubauer furthermore evaluated the
MR rat liver images with the MR score.
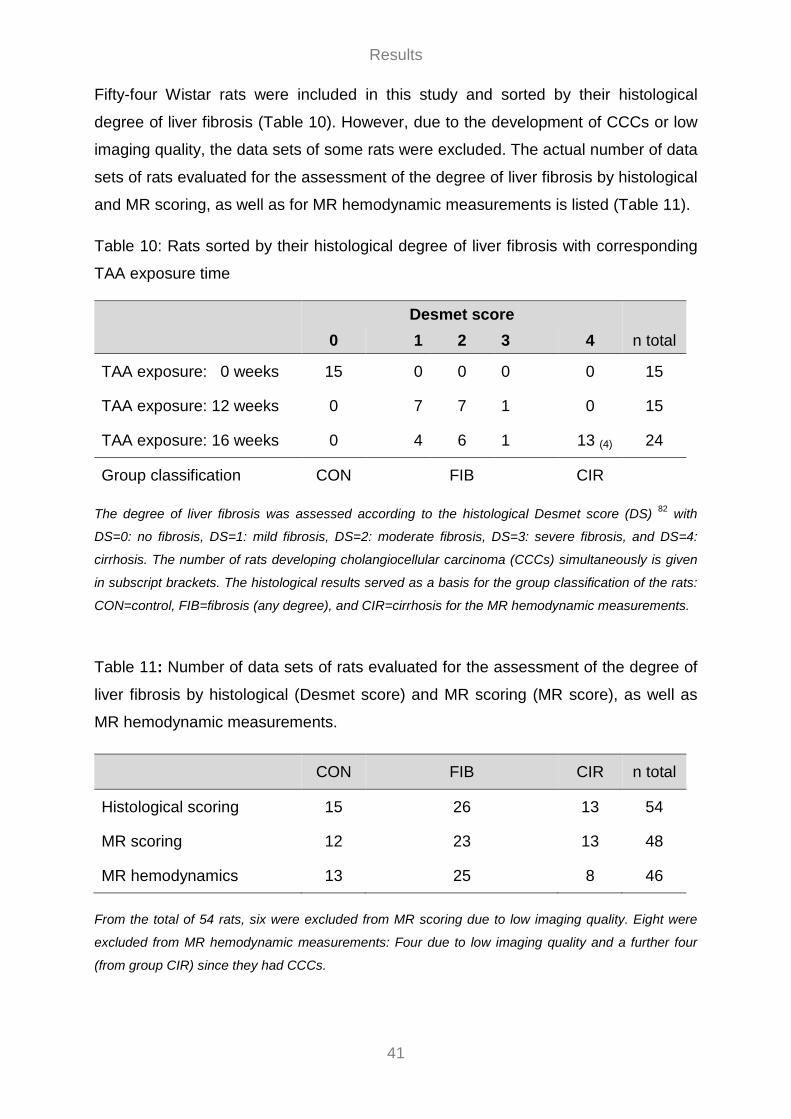
Results
41
Fifty-four Wistar rats were included in this study and sorted by their histological
degree of liver fibrosis (Table 10). However, due to the development of CCCs or low
imaging quality, the data sets of some rats were excluded. The actual number of data
sets of rats evaluated for the assessment of the degree of liver fibrosis by histological
and MR scoring, as well as for MR hemodynamic measurements is listed (Table 11).
Table 10: Rats sorted by their histological degree of liver fibrosis with corresponding
TAA exposure time
Desmet score 0 1 2 3 4 n total
TAA exposure: 0 weeks 15 0 0 0 0 15
TAA exposure: 12 weeks 0 7 7 1 0 15
TAA exposure: 16 weeks 0 4 6 1 13 (4) 24
Group classification CON FIB CIR
The degree of liver fibrosis was assessed according to the histological Desmet score (DS) 82 with
DS=0: no fibrosis, DS=1: mild fibrosis, DS=2: moderate fibrosis, DS=3: severe fibrosis, and DS=4:
cirrhosis. The number of rats developing cholangiocellular carcinoma (CCCs) simultaneously is given
in subscript brackets. The histological results served as a basis for the group classification of the rats:
CON=control, FIB=fibrosis (any degree), and CIR=cirrhosis for the MR hemodynamic measurements.
Table 11: Number of data sets of rats evaluated for the assessment of the degree of
liver fibrosis by histological (Desmet score) and MR scoring (MR score), as well as
MR hemodynamic measurements.
CON FIB CIR n total
Histological scoring 15 26 13 54
MR scoring 12 23 13 48
MR hemodynamics 13 25 8 46
From the total of 54 rats, six were excluded from MR scoring due to low imaging quality. Eight were
excluded from MR hemodynamic measurements: Four due to low imaging quality and a further four
(from group CIR) since they had CCCs.

Results
42
3.2.1 MR Assessment of the Degree of Liver Fibrosis MR scoring of the rat livers (n=48) by two readers showed an interobserver
agreement of 64% or referring to weighted kappa analysis a substantial agreement
(ƙw=0.76). If the histological score is taken as standard, the self-established MR
score has a sensitivity of 89% (32/36) to identify diseased livers and a specificity of
100% (12/12) to identify healthy livers (Figure 5). The accurate assessment of the
degree of liver fibrosis in diseased rats, as well as the detection of CCCs, was not
possible by MR rat liver image evaluation.
Figure 5: Dot plot illustrating the assessment of the degree of liver fibrosis using
histological (Desmet score) and MR scoring (MR score)
3.2.2 Flow Velocity Patterns and Flow Curves Detected flow velocity patterns and flow curves indicate a constant portal and a
pulsatile aortic flow.
A flow velocity pattern and a flow curve (Figure 6a and 6b) for the portal vein and
abdominal aorta of an exemplary rat is shown for selected time points of a cardiac
cycle (16.5 - 115.5 ms). Flow velocities (m/min) in the flow velocity pattern (Figure
6a) are color-coded and depicted with positive values flowing towards the heart
(caudo cranially) and negative values flowing away from the heart (cranio caudally).
Flow volume rates (ml/min) in the flow curve (Figure 6b) are depicted likewise.

Results
43
Figure 6: Color-coded image displaying the flow velocities (m/min) (a) and a diagram
of flow volume rates (ml/min) (b) in the portal vein (red, yellow) and abdominal aorta
(blue) at selected time points of a cardiac cycle
3.2.3 Hemodynamic Parameters For the statistical analysis of the hemodynamic parameters, the remaining 46 rats
were classified into three groups depending on their histologically assessed degree
of liver fibrosis: CON (control, n=13), FIB (fibrosis, n=25), and CIR (cirrhosis, n=8)
(Table 11).
Rats in FIB were tested in advance to determine if TAA exposure time (12 vs 16
weeks) has any influence on the results, but for all parameters investigated only
minimal and nonsignificant differences occurred. Hence, these data were pooled in
one group.
Since the most diseased rats in CIR showed a significant reduction of 8% in body
weight compared to FIB (p=0.006) (Table 12), it was assessed if there is a correlation
between body weight and other parameters of interest. In the total group (n=46), a
poor but significant correlation between body weight and aortic flow volume rate was
found (rs=0.408, p=0.005). The correlations between body weight and portal
hemodynamic parameters (i.e. cross-sectional area, flow velocity and volume rate)
were nonsignificant.
The portal cross-sectional area (=ROI) showed no differences among groups
(p=0.622) (Table 12, Figure 7a). For the mean portal flow velocity, a significant
lowering of 21% in FIB (p=0.006) and a nonsignificant lowering of 17% in CIR
(p=0.105) was found in comparison to CON (Table 12, Figure 7b).

Results
44
Comparing FIB and CIR, the differences were nonsignificant (p=1.000). A correlation
in the total group (n=46) including portal cross-sectional area and mean portal flow
velocity revealed a significant negative correlation (rs=-0.546, p=0.001).
Portal cross-sectional area (=ROI) and the mean portal flow velocity had already
been determined for each rat’s portal vein and abdominal aorta (Table 3). The
corresponding flow volume rates were calculated according to the physical principle
‘Volume rates = Area * Velocity’. Results showed a significant reduction in mean
portal flow volume rate of 20% in FIB (p=0.009) and of 25% in CIR (p=0.024) when
compared to CON (Table 12, Figure 7c). Comparing FIB and CIR, the differences
were nonsignificant (p=1.000). Moreover, there was a trend towards a lower mean
aortic flow volume rate in CIR compared to CON and FIB, but differences among
groups were nonsignificant (p=0.101) (Table 12, Figure 7d).
To determine if portal and aortic flow volume rate are related to one another, these
two parameters were correlated in the total group. A poor but significant correlation
was found (rs=0.353, p=0.016). If healthy rats in CON were exclusively considered,
reflecting a healthy physical state, the correlation coefficient was higher than in the
total group; however, the correlation was nonsignificant (rs=0.407, p=0.168).
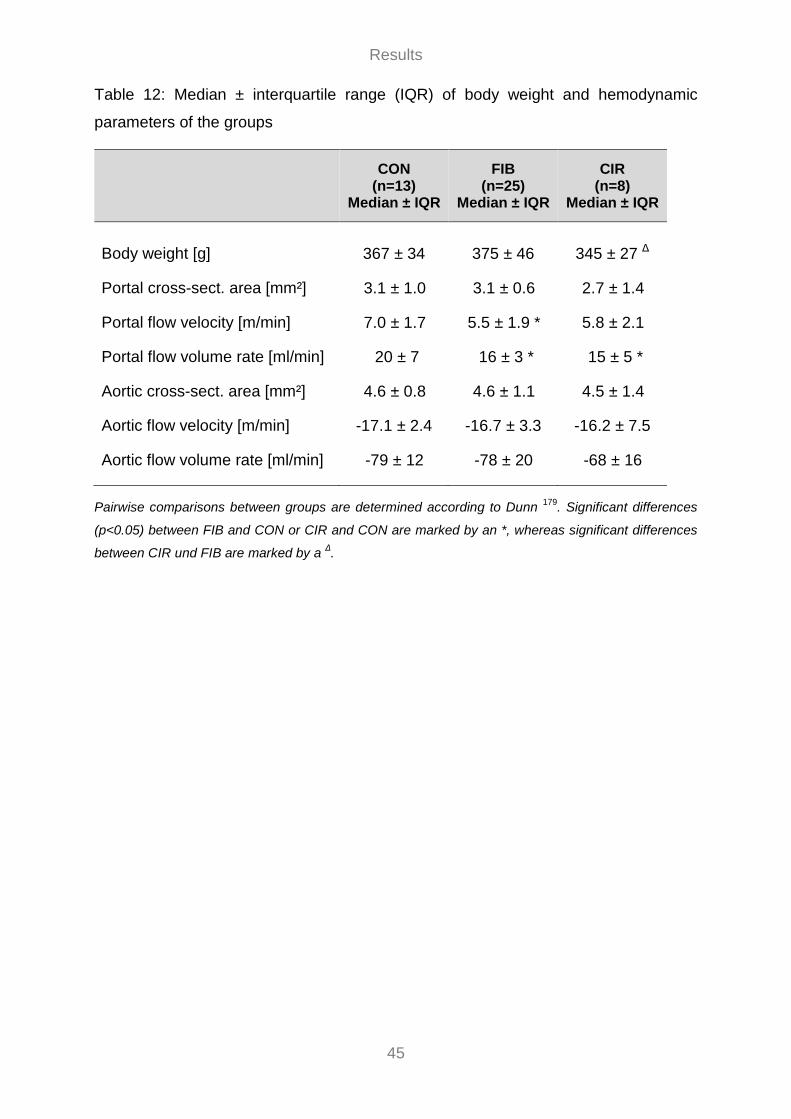
Results
45
Table 12: Median ± interquartile range (IQR) of body weight and hemodynamic
parameters of the groups
CON
(n=13) Median ± IQR
FIB (n=25)
Median ± IQR
CIR (n=8)
Median ± IQR
Body weight [g] 367 ± 34 375 ± 46 345 ± 27 Δ
Portal cross-sect. area [mm²] 3.1 ± 1.0 3.1 ± 0.6 2.7 ± 1.4
Portal flow velocity [m/min] 7.0 ± 1.7 5.5 ± 1.9 * 5.8 ± 2.1
Portal flow volume rate [ml/min] 20 ± 7 16 ± 3 * 15 ± 5 *
Aortic cross-sect. area [mm²] 4.6 ± 0.8 4.6 ± 1.1 4.5 ± 1.4
Aortic flow velocity [m/min] -17.1 ± 2.4 -16.7 ± 3.3 -16.2 ± 7.5
Aortic flow volume rate [ml/min] -79 ± 12 -78 ± 20 -68 ± 16
Pairwise comparisons between groups are determined according to Dunn 179. Significant differences
(p<0.05) between FIB and CON or CIR and CON are marked by an *, whereas significant differences
between CIR und FIB are marked by a Δ.

Results
46
Figure 7: Boxplots showing the distributions of portal cross-sectional area [mm2] (a),
portal flow velocity [m/min] (b), portal and aortic flow volume rate [ml/min] (c and d) in
the groups. Significant differences among groups are corrected for multiple
comparisons and denoted by *p<0.05
3.3 Invasive Hemodynamic Measurements In addition to the noninvasive MR measurements, hepatic and systemic
hemodynamic alterations induced by liver fibrosis / cirrhosis were determined by
invasive hemodynamic measurements. Since portal flow volume rate was measured
in both cases, it was possible to compare the results between invasive and
noninvasive measurements. In the same context the potential of PDE5 inhibitors in
PH management was further elucidated. PDE5 inhibitors are considered as
promising option to treat PH, initial preclinical and clinical hemodynamic studies,
however, showed different results. Therefore, additional invasive hemodynamic
measurements were performed to evaluate hepatic and systemic hemodynamic
changes, induced by acute administration of the PDE5 inhibitor sildenafil. Moreover,
based on these hemodynamic data, the effect of systemic blood pressure on portal

Results
47
blood pressure was determined. Corresponding regression analyses for the latter
were conducted by Thomas Heister (Institute of Medical Biometry and Statistics, Medical
Center, University of Freiburg).
3.3.1 Portal Flow Volume Rate Eighty-three Wistar rats were included in this study and sorted by their histological
degree of liver fibrosis (Table 13). However, due to the development of CCCs, the
data sets of 13 rats in CIR were excluded.
Table 13: Rats sorted by their histological degree of liver fibrosis with corresponding
TAA exposure time
Desmet score 0 1 2 3 4 n total
TAA exposure: 0 weeks 15 0 0 0 0 15
TAA exposure: 16 weeks 0 16 17 10 25(13) 68
Group classification CON FIB CIR
The degree of liver fibrosis was assessed according to the histological Desmet score (DS) 82 with
DS=0: no fibrosis, DS=1: mild fibrosis, DS=2: moderate fibrosis, DS=3: severe fibrosis, and DS=4:
cirrhosis. The number of rats developing cholangiocellular carcinoma (CCCs) simultaneously is given
in subscript brackets.The histological results served as a basis for the group classification of the rats:
CON=control, FIB=fibrosis (any degree),andCIR=cirrhosis for the invasive portal flow volume rate
measurements. However, due to the development of CCCs, the data sets of 13 rats in CIR had to be
excluded.
For the statistical analysis of the hemodynamic parameters, the remaining 70 rats
were classified into three groups depending on their histologically assessed degree
of liver fibrosis: CON (control, n=15), FIB (fibrosis, n=43), and CIR (cirrhosis, n=12).
Since the most diseased rats in CIR showed a significant reduction of 9% in body
weight compared to CON (p=0.006) and a significant reduction of 6% compared to
FIB (p=0.027) (Table 14), it was assessed if there is a correlation between body
weight and other parameters of interest. In the total group (n=70), a poor but
significant correlation between body weight and mean portal flow volume rate
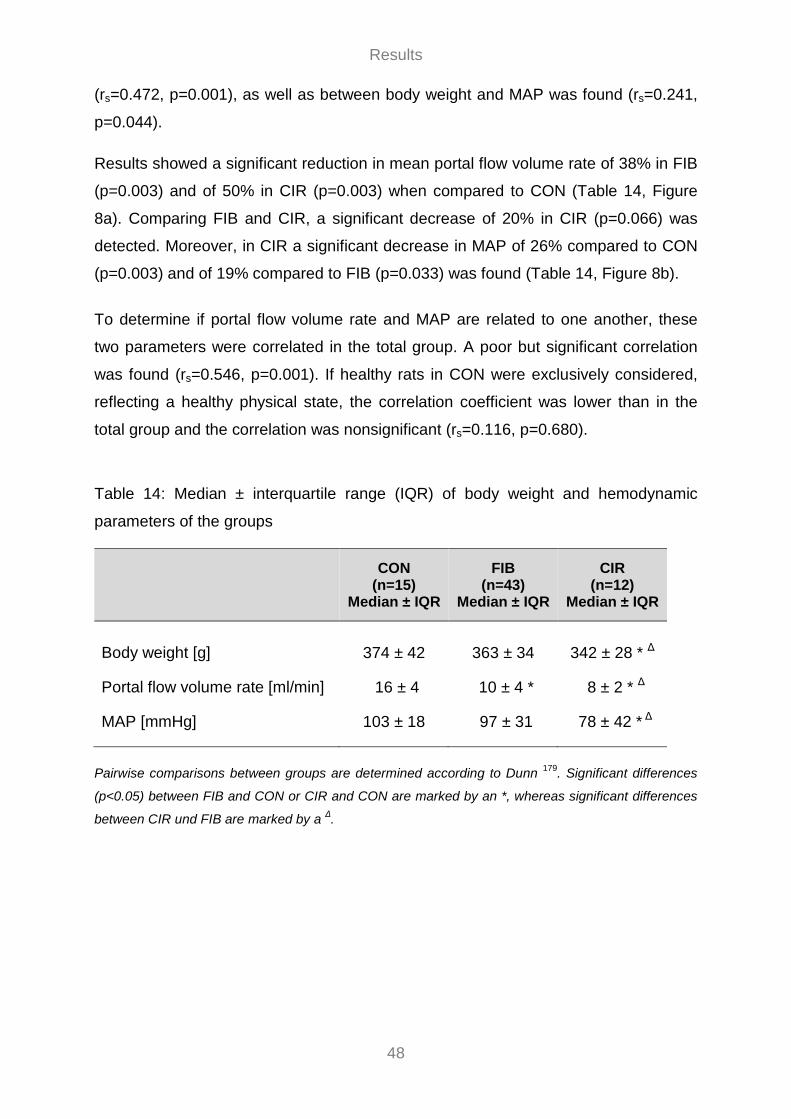
Results
48
(rs=0.472, p=0.001), as well as between body weight and MAP was found (rs=0.241,
p=0.044).
Results showed a significant reduction in mean portal flow volume rate of 38% in FIB
(p=0.003) and of 50% in CIR (p=0.003) when compared to CON (Table 14, Figure
8a). Comparing FIB and CIR, a significant decrease of 20% in CIR (p=0.066) was
detected. Moreover, in CIR a significant decrease in MAP of 26% compared to CON
(p=0.003) and of 19% compared to FIB (p=0.033) was found (Table 14, Figure 8b).
To determine if portal flow volume rate and MAP are related to one another, these
two parameters were correlated in the total group. A poor but significant correlation
was found (rs=0.546, p=0.001). If healthy rats in CON were exclusively considered,
reflecting a healthy physical state, the correlation coefficient was lower than in the
total group and the correlation was nonsignificant (rs=0.116, p=0.680).
Table 14: Median ± interquartile range (IQR) of body weight and hemodynamic
parameters of the groups
CON
(n=15) Median ± IQR
FIB (n=43)
Median ± IQR
CIR (n=12)
Median ± IQR
Body weight [g] 374 ± 42 363 ± 34 342 ± 28 * Δ
Portal flow volume rate [ml/min] 16 ± 4 10 ± 4 * 8 ± 2 * Δ
MAP [mmHg] 103 ± 18 97 ± 31 78 ± 42 * Δ
Pairwise comparisons between groups are determined according to Dunn 179. Significant differences
(p<0.05) between FIB and CON or CIR and CON are marked by an *, whereas significant differences
between CIR und FIB are marked by a Δ.

Results
49
Figure 8: Boxplots showing the distributions of portal flow volume rate [ml/min] (a)
and MAP (b) in the groups. Significant differences among groups are corrected for
multiple comparisons and denoted by *p<0.05
3.3.2 Effect of Sildenafil on Hemodynamics One hundred and ten rats were included in this study and sorted by their histological
degree of liver fibrosis (Table 15), the healthy rats in CON being Sprague Dawley
and the diseased rats in FIB and CIR Wistar rats. However, the data sets of the 2
rats having no fibrosis after 16 weeks of TAA exposure, were excluded. The data
sets of the 12 rats in CIR developing CCCs, were included to maintain a sufficiently
large group size.
Table 15: Rats sorted by their histological degree of liver fibrosis with corresponding
TAA exposure time
Desmet score 0 1 2 3 4 n total
TAA exposure: 0 weeks 55 0 0 0 0 55
TAA exposure: 16 weeks 2 7 15 7 24(12) 55
Group classification CON FIB CIR
The degree of liver fibrosis was assessed according to the histological Desmet score (DS) 82 with
DS=0: no fibrosis, DS=1: mild fibrosis, DS=2: moderate fibrosis, DS=3: severe fibrosis, and DS=4:
cirrhosis. The number of rats developing cholangiocellular carcinoma (CCCs) simultaneously is given
in subscript brackets. The histological results served as a basis for the group classification of the rats:
CON=control, FIB=fibrosis (any degree), and CIR=cirrhosis for the invasive hemodynamic
measurements.
Results
50
For the statistical analysis of the hemodynamic parameters and HR, the remaining
108 rats were classified into three groups depending on their histologically assessed
degree of liver fibrosis: CON (control, n=55), FIB (fibrosis, n=29), and CIR (cirrhosis,
n=24). Each of those had 3 subgroups which are categorized based on intervention
in the form of sodium chloride (NaCl), sildenafil 0.1 mg/kg (Sil 0.1 mg/kg) or sildenafil
1 mg/kg (Sil 1 mg/kg), which was applied in a standardized volume of 600 µl.
All parameters of interest were normalized (PVPrel, MAPrel, MFrel and HRrel) to
compensate differences in absolute values (Table 16) between healthy and diseased
rats, the time point “10 min” being taken as baseline and set to 100% since the
administration of 600 µl liquid volume into the right atrium caused parameter
variations for the next few minutes before they reached a new steady state.
Regarding the course during the measurement interval, a decrease in parameter
values was observed for all subgroups regardless of intervention. The decrease in
PVPrel (%) compared to the decrease in MAPrel (%) becoming more pronounced with
sildenafil and increasing dosage (Figure 9a). CVPrel, respiration raterel and oxygen
saturationrel remained unchanged in all subgroups (data not shown).
The effect of sildenafil was evaluated by comparing the change in parameter values
at time point “60 min” to baseline (“10 min”) (Table 17, Figure 9a and 9b).
In CON intragroup comparisons showed nonsignificant effects of sildenafil on the
parameters PVPrel (p= 0.399), MAPrel (p=0.867), MFrel (p=0.770) and HRrel (p=0.664).
In FIB as well, intragroup comparisons revealed nonsignificant effects of sildenafil on
the parameters PVPrel (p= 0.320), MAPrel (p=0.272), MFrel (p=0.133) and HRrel
(p=0.311). In CIR in contrast, sildenafil caused a trend towards a lower PVPrel, but
intragroup comparisons were nonsignificant (p= 0.088). Moreover, nonsignificant
effects on MAPrel (p=0.915) and MFrel (p=0.974) were determined, whereas for HRrel
a significant decrease of 8% (RMD) in Sil 1mg/kg was found when compared to NaCl
(p=0.024).
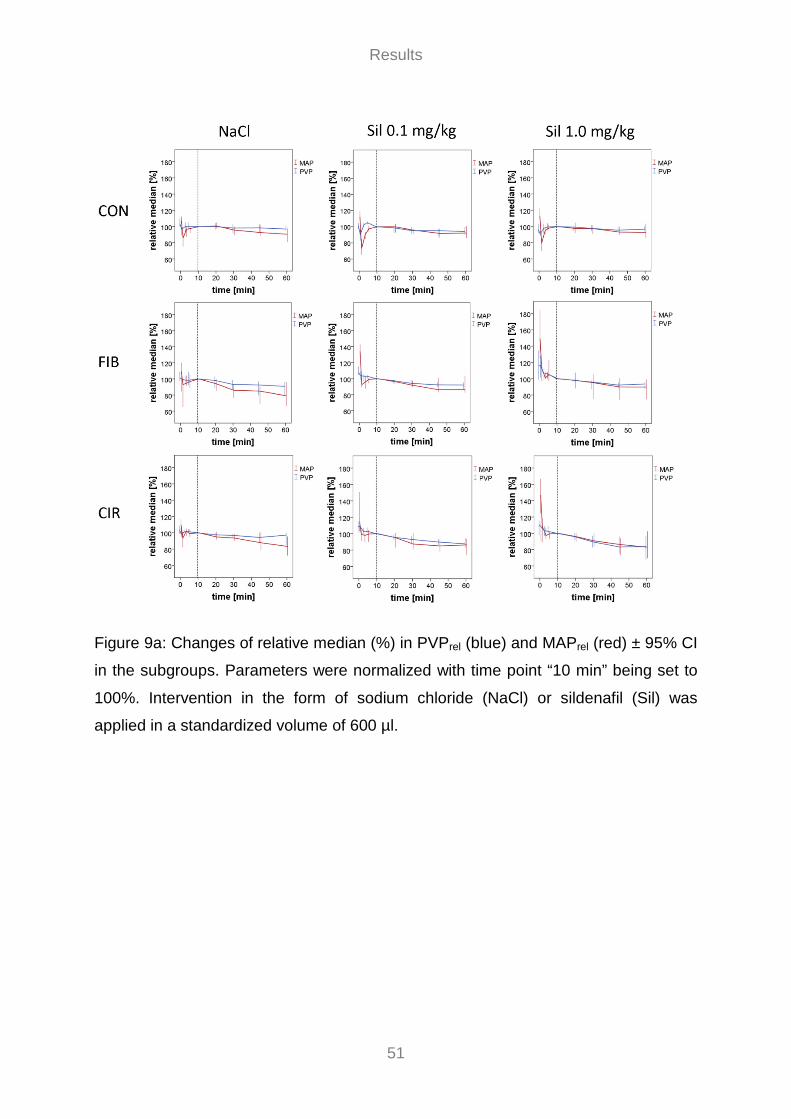
Results
51
Figure 9a: Changes of relative median (%) in PVPrel (blue) and MAPrel (red) ± 95% CI
in the subgroups. Parameters were normalized with time point “10 min” being set to
100%. Intervention in the form of sodium chloride (NaCl) or sildenafil (Sil) was
applied in a standardized volume of 600 µl.
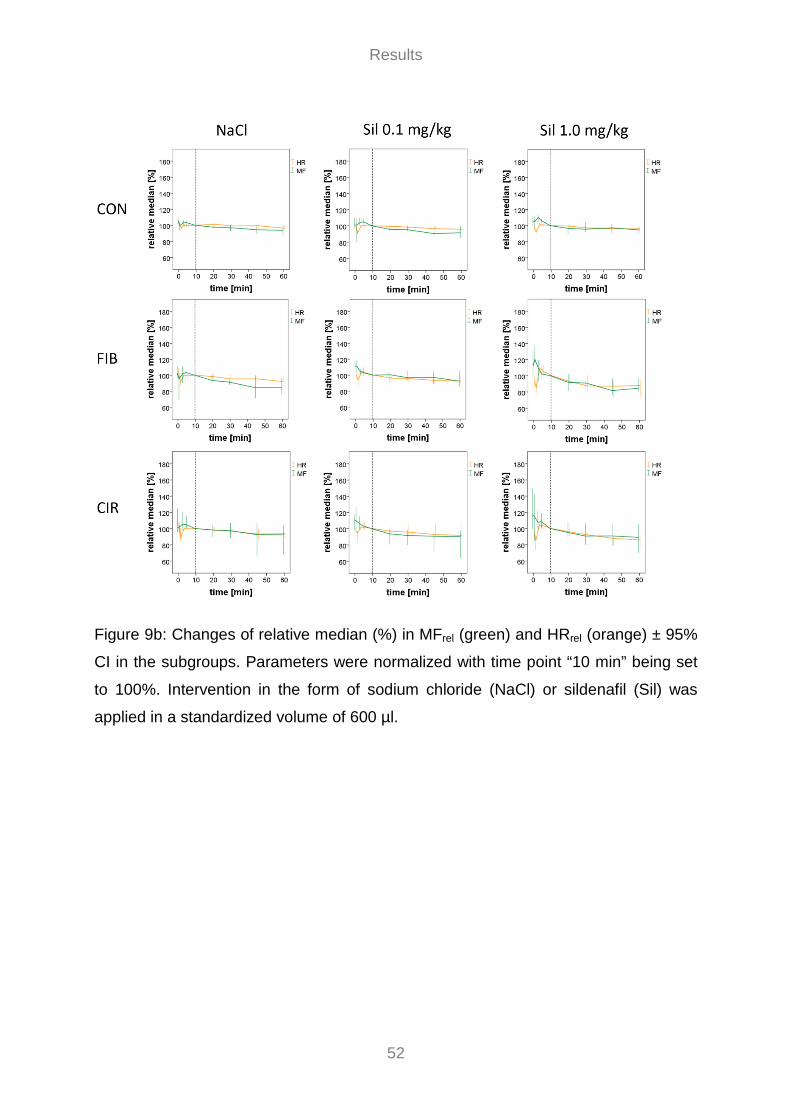
Results
52
Figure 9b: Changes of relative median (%) in MFrel (green) and HRrel (orange) ± 95%
CI in the subgroups. Parameters were normalized with time point “10 min” being set
to 100%. Intervention in the form of sodium chloride (NaCl) or sildenafil (Sil) was
applied in a standardized volume of 600 µl.

Results
53
Table 16: Median ± interquartile range (IQR) of body weight, hemodynamic parameters and HR of the subgroups at time points 0, 10,
30 and 60 min
CON FIB CIR
NaCl
(n=19) Median ± IQR
Sil 0.1 mg/kg (n=18)
Median ± IQR
Sil 1.0 mg/kg (n=18)
Median ± IQR
NaCl (n=7)
Median ± IQR
Sil 0.1 mg/kg (n=15)
Median ± IQR
Sil 1.0 mg/kg (n=7)
Median ± IQR
NaCl (n=7)
Median ± IQR
Sil 0.1 mg/kg (n=7)
Median ± IQR
Sil 1.0 mg/kg (n=10)
Median ± IQR
Body weight [g] 375 ± 15 370 ± 28 380 ± 27 359 ± 35 363 ± 28 361 ± 24 336 ± 40 350 ± 46 337 ± 15
PVP_0 [mmHG] 6.4 ± 0.7 6.6 ± 0.4 6.3 ± 0.7 6.0 ± 0.9 6.2 ± 1.3 6.2 ± 0.9 6.8 ± 1.6 7.5 ± 1.7 7.7 ± 1.1
PVP_10 [mmHG] 6.0 ± 0.9 6.6 ± 0.6 6.6 ± 0.9 5.7 ± 1.2 5.5 ± 1.3 5.1 ± 1.4 6.8 ± 1.4 7.1 ± 1.6 7.1 ± 2.2
PVP_30 [mmHG] 5.9 ± 0.7 6.3 ± 0.7 6.4 ± 0.8 5.3 ± 1.4 5.4 ± 1.3 4.8 ± 1.4 6.5 ± 1.2 6.6 ± 1.0 6.3 ± 1.3
PVP_60 [mmHG] 5.9 ± 0.7 6.3 ± 0.8 6.4 ± 1.1 5.1 ± 1.2 5.2 ± 1.2 4.8 ± 1.5 6.6 ± 2.0 6.3 ± 1.0 5.8 ± 1.2
MAP_0 [mmHG] 89 ± 12 106 ± 14 101 ± 28 65 ± 30 59 ± 21 58 ± 28 49 ± 19 47 ± 15 60 ± 19
MAP_10 [mmHG] 83 ± 20 94 ± 14 85 ± 27 55 ± 25 45 ± 10 42 ± 8 42 ± 11 41 ± 5 38 ± 16
MAP_30 [mmHG] 79 ± 21 88 ± 17 77 ± 21 50 ± 14 43 ± 12 37 ± 6 41 ± 12 35 ± 8 36 ± 8
MAP_60 [mmHG] 76 ± 21 82 ± 23 74 ± 28 44 ± 11 40 ± 8 37 ± 7 38 ± 3 34 ± 5 34 ± 7
MF_0 [flux] 208 ± 68 209 ± 39 206 ± 38 108 ± 46 111 ± 38 112 ± 24 117 ± 44 115 ± 21 107 ± 34
MF_10 [flux] 196 ± 65 215 ± 65 192 ± 44 109 ± 34 102 ± 43 104 ± 32 114 ± 33 106 ± 28 90 ± 22
MF_30 [flux] 195 ± 64 194 ± 57 184 ± 40 96 ± 33 103 ± 44 92 ± 19 110 ± 46 101 ± 19 89 ± 24
MF_60 [flux] 190 ± 56 190 ± 53 181 ± 45 94 ± 17 100 ± 50 85 ± 18 106 ± 52 103 ± 22 80 ± 34
HR_0 [bpm] 373 ± 40 377 ± 47 368 ± 31 320 ± 30 335 ± 30 314 ± 22 307 ± 38 308 ± 76 365 ± 28
HR_10 [bpm] 362 ± 55 383 ± 44 380 ± 50 313 ± 23 339 ± 41 351 ± 29 286 ± 33 316 ± 71 374 ± 22
HR_30 [bpm] 356 ± 57 366 ± 52 373 ± 41 291 ± 20 310 ± 43 310 ± 21 268 ± 40 313 ± 57 350 ± 36
HR_60 [bpm] 347 ± 39 359 ± 43 362 ± 49 284 ± 26 304 ± 41 295 ± 33 254 ± 36 302 ± 47 324 ± 30

Results
54
Table 17: Relative median of differences (RMD) (%) ± interquartile range (IQR) of hemodynamic parameters and HR in the subgroups.
Parameters were normalized with time point “10 min” being set to 100%. RMD was calculated for the 50 min interval (“60 min”
compared to baseline (“10 min”))
CON FIB CIR
NaCl
(n=19) RMD [%] ± IQR
Sil 0.1 mg/kg (n=18)
RMD [%] ± IQR
Sil 1.0 mg/kg (n=18)
RMD [%] ± IQR
NaCl (n=7)
RMD [%] ± IQR
Sil 0.1 mg/kg (n=15)
RMD [%] ± IQR
Sil 1.0 mg/kg (n=7)
RMD [%] ± IQR
NaCl (n=7)
RMD [%] ± IQR
Sil 0.1 mg/kg (n=7)
RMD [%] ± IQR
Sil 1.0 mg/kg (n=10)
RMD [%] ± IQR
PVPrel - 3 ± 7 - 6 ± 10 - 3 ± 6 - 9 ± 11 - 8 ± 8 - 7 ± 6 - 3 ± 7 - 13 ± 7 - 19 ± 26
MAPrel - 10 ± 17 - 8 ± 16 - 7 ± 19 - 21 ± 24 - 14 ± 21 - 10 ± 10 - 17 ± 16 - 14 ± 11 - 17 ± 23
MFrel - 6 ± 14 - 8 ± 16 - 5 ± 8 - 16 ± 16 - 8 ± 19 - 15 ± 10 - 8 ± 10 - 10 ± 8 - 11 ± 26
HRrel - 4 ± 6 - 4 ± 5 - 4 ± 5 - 8 ± 5 - 8 ± 14 - 12 ± 13 - 6 ± 6 - 8 ± 11 - 14 ± 10*
Significant differences (p<0.05) between Sil 0.1mg/kg and CON or Sil 1.0mg/kg and CON are marked by an *. No significant differences between Sil 0.1mg/kg
and Sil 1.0mg/kg were observed.

Results
55
3.3.3 Effect of MAP on PVP 1 Regarding the course of MAP and PVP of the individual rats during the measurement
interval (Figure 10), a change in MAP led to a slightly delayed change in PVP in the
same direction (decrease / increase). Hence, hemodynamic data were also used to
evaluate the effect of MAP on PVP over the first 30 minutes.
For the statistical analysis of the correlation between MAP and PVP, the 108 rats
(Table 15) were classified into nine subgroups as before (see 3.3.2).
All parameters of interest were normalized (PVPrel, MAPrel) to compensate
differences in absolute values (Table 16) between healthy and diseased rats. Since
the correlation of the two parameters was visible, particularly in the first few minutes
in which administration of 600 µl liquid volume into the right atrium caused parameter
variations, time point “0 min” was taken as the baseline and set to 100%.
Figure 10: Course of MAP (black) and PVP (blue) of an exemplary rat after sodium
chloride (NaCl) administration
In CON a significant effect of MAPrel on PVPrel (p=0.001) was found in all subgroups
(Table 18). For every 1% change in MAPrel in the NaCl subgroup, PVPrel varies by
0.35%. 40% of the variation in PVPrel within one rat can be explained by MAP. For
every 1% change in MAPrel in the subgroups Sil 0.1 mg/kg and Sil 1.0 mg/kg, PVPrel
varies by 0.37% and 0.53%, respectively. 46% and 43% of the variation in PVPrel
within one rat can be explained by MAP.
1 Data of this analysis were previously published in the medical dissertation by Adhara Lazaro: “Correlation between mean arterial pressure (MAP) and portal venous pressure (PVP) in rats” (2018).

Results
56
In FIB a significant effect of MAPrel on PVPrel (p=0.001) was found in all subgroups
(Table 18). For every 1% change in MAPrel in the NaCl subgroup, PVPrel varies by
0.52%. 42% of the variation in PVPrel within one rat can be explained by MAP. For
every 1% change in MAPrel in the subgroups Sil 0.1 mg/kg and Sil 1.0 mg/kg, PVPrel
varies by 0.48% and 0.61%, respectively. 46% and 43% of the variation in PVPrel
within one rat can be explained by MAP.
In CIR as well a significant effect of MAPrel on PVPrel (p=0.001) was found in all
subgroups (Table 18). For every 1% change in MAPrel in the NaCl subgroup, PVPrel
varies by 0.32%. 61% of the variation in PVPrel within one rat can be explained by
MAP. For every 1% change in MAPrel in the subgroups Sil 0.1 mg/kg and Sil 1.0
mg/kg, PVPrel varies by 0.32% and 0.39%, respectively. 40% and 23% of the
variation in PVPrel within one rat can be explained by MAP.

Results
57
Table 18: Regression analysis between MAPrel and PVPrel in the subgroups. Parameters were normalized with time point “0 min” being
set to 100%.
The change in PVPrel for every 1% change in MAPrel is described by the regression coefficient (s). Significant effects of MAP on PVP (p<0.05) are marked
by an *. The explained variation (%) within one rat is described by r-squared (r²).
CON FIB CIR
NaCl
(n=19) PVPrel
Sil 0.1 mg/kg (n=18) PVPrel
Sil 1.0 mg/kg (n=18) PVPrel
NaCl (n=7) PVPrel
Sil 0.1 mg/kg (n=15) PVPrel
Sil 1.0 mg/kg (n=7) PVPrel
NaCl (n=7) PVPrel
Sil 0.1 mg/kg (n=7) PVPrel
Sil 1.0 mg/kg (n=10) PVPrel
MAPrel s 0.345* 0.367* 0.532* 0.512* 0.479* 0.612* 0.319* 0.318* 0.388*
MAPrel r2 0.404 0.461 0.431 0.424 0.463 0.431 0.613 0.406 0.234
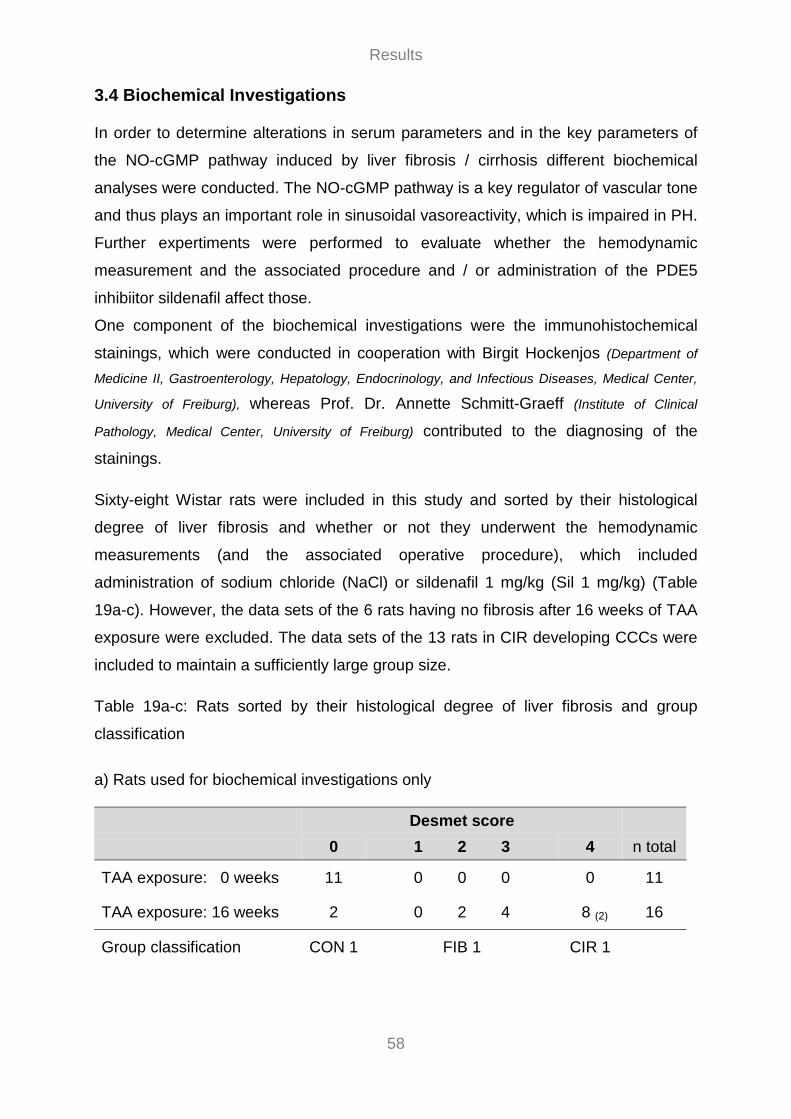
Results
58
3.4 Biochemical Investigations In order to determine alterations in serum parameters and in the key parameters of
the NO-cGMP pathway induced by liver fibrosis / cirrhosis different biochemical
analyses were conducted. The NO-cGMP pathway is a key regulator of vascular tone
and thus plays an important role in sinusoidal vasoreactivity, which is impaired in PH.
Further expertiments were performed to evaluate whether the hemodynamic
measurement and the associated procedure and / or administration of the PDE5
inhibiitor sildenafil affect those.
One component of the biochemical investigations were the immunohistochemical
stainings, which were conducted in cooperation with Birgit Hockenjos (Department of
Medicine II, Gastroenterology, Hepatology, Endocrinology, and Infectious Diseases, Medical Center,
University of Freiburg), whereas Prof. Dr. Annette Schmitt-Graeff (Institute of Clinical
Pathology, Medical Center, University of Freiburg) contributed to the diagnosing of the
stainings.
Sixty-eight Wistar rats were included in this study and sorted by their histological
degree of liver fibrosis and whether or not they underwent the hemodynamic
measurements (and the associated operative procedure), which included
administration of sodium chloride (NaCl) or sildenafil 1 mg/kg (Sil 1 mg/kg) (Table
19a-c). However, the data sets of the 6 rats having no fibrosis after 16 weeks of TAA
exposure were excluded. The data sets of the 13 rats in CIR developing CCCs were
included to maintain a sufficiently large group size.
Table 19a-c: Rats sorted by their histological degree of liver fibrosis and group
classification
a) Rats used for biochemical investigations only
Desmet score 0 1 2 3 4 n total
TAA exposure: 0 weeks 11 0 0 0 0 11
TAA exposure: 16 weeks 2 0 2 4 8 (2) 16
Group classification CON 1 FIB 1 CIR 1

Results
59
b) Rats used for hemodynamic measurements (intervention: NaCl) and
biochemical investigations
Desmet score 0 1 2 3 4 n total
TAA exposure: 16 weeks 2 3 3 1 7 (4) 16
Group classification -- FIB 2 CIR 2
c) Rats used for hemodynamic measurements (intervention: Sil 1mg/kg) and
biochemical investigations (cGMP only)
Desmet score 0 1 2 3 4 n total
TAA exposure: 0 weeks 12 -- -- -- 0 12
TAA exposure: 16 weeks 2 -- -- -- 10 (6) 12
Group classification CON 3 -- CIR 3
The degree of liver fibrosis was assessed according to the histological Desmet score (DS) 82 with
DS=0: no fibrosis, DS=1: mild fibrosis, DS=2: moderate fibrosis, DS=3: severe fibrosis, and DS=4:
cirrhosis. The number of rats developing cholangiocellular carcinoma (CCCs) simultaneously is given
in subscript brackets. The histological results served as a basis for the group classification of the rats:
CON=control, FIB=fibrosis (any degree), and CIR=cirrhosis for biochemical investigations
For the statistical analysis of serum parameters, hepatic gene expression of eNOS,
iNOS, PDE5, sGCa1 and sGCb1, and serum cGMP concentrations, the remaining 61
rats were classified depending on their histologically assessed degree of liver
fibrosis: CON (control), FIB (fibrosis), and CIR (cirrhosis). Depending on whether or
not they underwent the hemodynamic measurement and the respective intervention,
they were subsequently divided into seven subgroups (Table 20). In CON 3 and CIR
3, serum cGMP concentrations were investigated exclusively, while immunohisto-
chemical staining (PDE5) was performed on liver tissue samples of CON 1, CIR 1,
and CIR 2 only.

Results
60
Table 20: Overview subgroups
CON 1 (n=11)
FIB 1 (n=6)
CIR 1 (n=8)
FIB 2 (n=7)
CIR 2 (n=7)
CON 3 (n=12)
CIR 3 (n=10)
TAA [weeks] 0 16 16 16 16 0 16
hemodynamic measurement
no no no yes yes yes yes
intervention -- -- -- NaCl NaCl Sil 1mg/kg Sil 1mg/kg
3.4.1 Serum Parameters (Clinical Chemistry)
3.4.1.1 Effect of TAA-induced Liver Disease To investigate whether the development of liver fibrosis or cirrhosis affects serum
parameters from carotid arterial blood samples, differences among rats with healthy
(CON 1), fibrotic (FIB 1) and cirrhotic livers (CIR 1) were evaluated. Those rats have
not undergone the hemodynamic measurement and the associated operative
procedure; they were exclusively used for biochemical investigations.
In FIB 1 analysis of serum parameters showed a significant decrease of 37% for Glc
(p=0.012), and of 27% (p=0.003) for ALT, as well as a significant increase of 275%
(p=0.003) for Bil compared to CON 1.
In CIR 1 a significant decrease of 42% (p=0.003) for Glc, and of 13% (p=0.003) for
Alb, as well as a significant increase of 400% (p=0.003) for Bil was determined
compared to CON 1.
If exclusively diseased rats in FIB 1 and CIR 1 were considered, no significant
differences between subgroups were observed.
(Table 21 and 22)

Results
61
3.4.1.2 Influence of Hemodynamic Measurements To investigate whether the hemodynamic measurement and the associated operative
procedure leads to changes in serum parameters, differences between diseased rats
which have undergone the hemodynamic measurement (FIB 2 and CIR 2) and those
which have not undergone any (FIB 1 and CIR 1) were ascertained.
In FIB 2 analysis of serum parameters showed a significant increase of 2% (p=0.002)
for Na compared to FIB 1.
In CIR 2 a significant increase of 1% (p=0.020) for Na, and of 12% (p=0.014) for K,
as well as of 139% (p=0.012) for Crea, and a significant decrease of 36% (p=0.032)
for AP was determined when compared to CIR 1.
(Table 21 and 22)

Results
62
Table 21: Median ± interquartile range (IQR) of body weight and serum parameters in
subgroups
CON 1 (n=11)
Median ± IQR
FIB 1 (n=6)
Median ± IQR
CIR 1 (n=8)
Median ± IQR
FIB 2 (n=7)
Median ± IQR
CIR 2 (n=7)
Median ± IQR
body weight [g]
364 ± 22 368 ± 45 340 ± 26 359 ± 35 336 ± 40
Glc [mg/dl]
130 ± 9.0 82 ± 31 75 ± 35 76 ± 19 72 ± 34
Na [mmol/l]
144 ± 4.0 143 ± 2.5 143 ± 4.8 146 ± 4.0 145 ± 4.0
K [mmol/l]
5.4 ± 0.3 5.0 ± 0.4 5.0 ± 0.9 5.4 ± 0.2 5.6 ± 0.4
Bil [mg/dl]
0.08 ± 0.02 0.30 ± 0.20 0.40 ± 0.55 0.20 ± 0.00 0.20 ± 0.10
Crea [mg/dl]
0.32 ± 0.10 0.45 ± 0.09 0.44 ± 0.19 0.98 ± 0.51 1.05 ± 0.20
Alb [g/dl]
3.7 ± 0.2 3.3 ± 0.4 3.2 ± 0.3 3.2 ± 0.5 2.8 ± 0.4
AST [U/l]
161 ± 40 137 ± 51 136 ± 70 148 ± 263 188 ± 56
ALT [U/l]
63 ± 15 46 ± 13 53 ± 13 51 ± 61 55 ± 28
AP [U/l]
189 ± 50 152 ± 61 167 ± 67 86 ± 39 106 ± 31
Body weight and the following serum parameters were determined: glucose (Glc), sodium (Na),
potassium (K), total bilirubin (Bil), creatinine (Crea), albumin (Alb), aspartate aminotransferase (AST),
alanine aminotransferase (ALT), and alkaline phosphatase (AP).
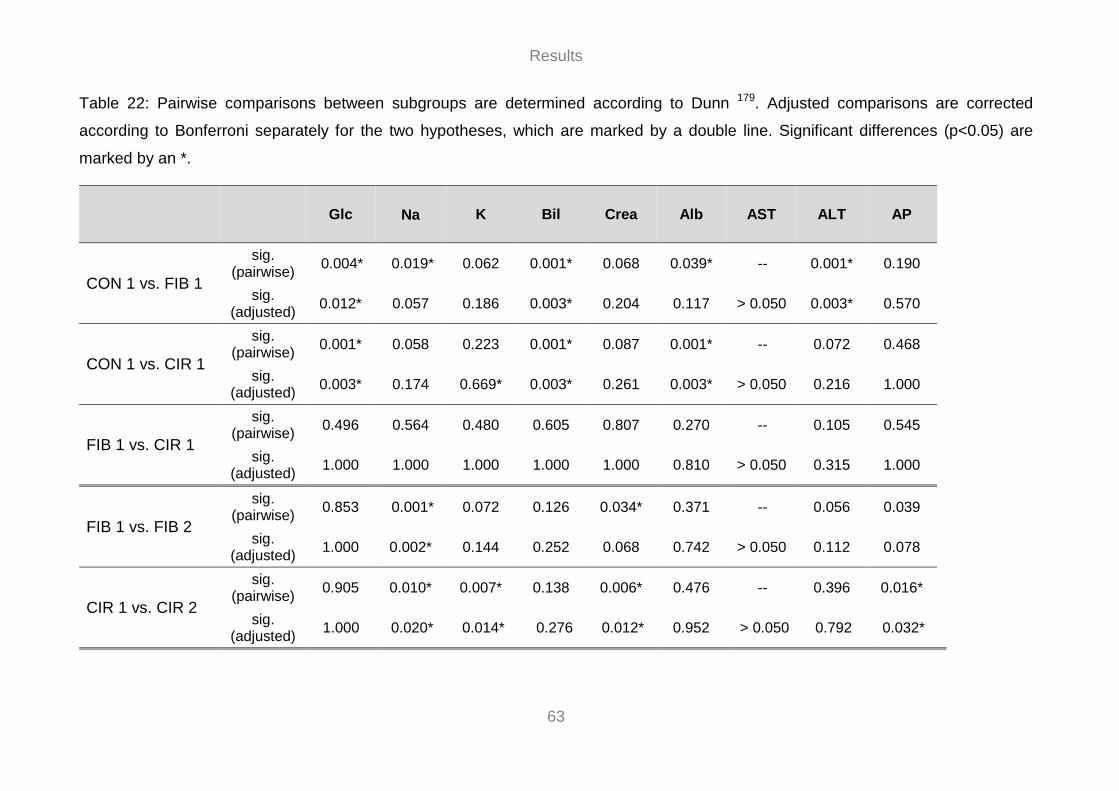
Results
63
Table 22: Pairwise comparisons between subgroups are determined according to Dunn 179. Adjusted comparisons are corrected
according to Bonferroni separately for the two hypotheses, which are marked by a double line. Significant differences (p<0.05) are
marked by an *.
Glc
Na K Bil Crea Alb AST ALT AP
CON 1 vs. FIB 1
sig. (pairwise) 0.004* 0.019* 0.062 0.001* 0.068 0.039* -- 0.001* 0.190
sig. (adjusted) 0.012* 0.057 0.186 0.003* 0.204 0.117 > 0.050 0.003* 0.570
CON 1 vs. CIR 1
sig. (pairwise) 0.001* 0.058 0.223 0.001* 0.087 0.001* -- 0.072 0.468
sig. (adjusted) 0.003* 0.174 0.669* 0.003* 0.261 0.003* > 0.050 0.216 1.000
FIB 1 vs. CIR 1
sig. (pairwise) 0.496 0.564 0.480 0.605 0.807 0.270 -- 0.105 0.545
sig. (adjusted) 1.000 1.000 1.000 1.000 1.000 0.810 > 0.050 0.315 1.000
FIB 1 vs. FIB 2
sig. (pairwise) 0.853 0.001* 0.072 0.126 0.034* 0.371 -- 0.056 0.039
sig. (adjusted) 1.000 0.002* 0.144 0.252 0.068 0.742 > 0.050 0.112 0.078
CIR 1 vs. CIR 2
sig. (pairwise) 0.905 0.010* 0.007* 0.138 0.006* 0.476 -- 0.396 0.016*
sig. (adjusted) 1.000 0.020* 0.014* 0.276 0.012* 0.952 > 0.050 0.792 0.032*

Results
64
3.4.2 Gene Expression and Serum cGMP Concentrations
3.4.2.1 Effect of TAA-induced Liver Disease To investigate whether the development of liver fibrosis or cirrhosis affects hepatic
gene expression and / or serum cGMP concentrations from carotid arterial blood
samples, differences among rats with healthy (CON 1), fibrotic (FIB 1) and cirrhotic
livers (CIR 1) were determined. Those rats have not undergone the hemodynamic
measurement and the associated operative procedure; they were exclusively used
for biochemical investigations.
Gene expression became the higher the more the rats became diseased (CON < FIB
1 < CIR 1). iNOS expression was detected in diseased rats only. Analysis of serum
cGMP concentration showed no such pattern.
In FIB 1 gene expression analysis revealed significantly increased expression of
PDE5 (7.7-fold; p=0.006), and sGCb1 (2.1-fold; p=0.018) compared to CON 1. For
serum cGMP concentrations, a nonsignificant lowering of 34% (p=0.453) was found.
In CIR 1 a significantly increased expression of eNOS (2.2-fold; p=0.003), PDE5 (11-
fold; p=0.003), sGCa1 (1.7-fold; p=0.003) and sGCb1 (3-fold; p=0.003) was
measured when compared to CON 1. Moreover, there was a trend towards a
decrease in cGMP concentrations of 40% (p=0.054).
If exclusively diseased rats in FIB 1 and CIR 1 were considered, no significant
differences between subgroups were assessed.
(Table 23, 24 and 25, Figure 11a-f)
3.4.2.2 Influence of Hemodynamic Measurements To investigate whether the hemodynamic measurement and the associated operative
procedure leads to changes in hepatic gene expression and / or serum cGMP
concentrations from carotid arterial blood samples, differences between diseased
rats which have undergone the hemodynamic measurement (FIB 2 and CIR 2) and
those which have not undergone any (FIB 1 and CIR 1) were determined.
Results
65
In FIB 2 gene expression analysis showed a significant decrease in expression of
eNOS when compared to FIB 1 (p=0.036). For serum cGMP concentrations, a
nonsignificant lowering of 32% (p=1.000) was found.
In CIR 2 as well a significantly decreased expression of eNOS was exposed
compared to CIR 1 (p=0.004), whereas for serum cGMP concentrations a
nonsignificant elevation of 12% (p=0.192) was found.
(Table 23, 24 and 25, Figure 11a-f)
3.4.2.3 Effect of Sildenafil on Serum cGMP Concentrations To investigate whether sildenafil affects serum cGMP concentrations, differences
between rats which received no intervention (CON 1 and CIR 1) or sodium chloride
(NaCl) (CIR 2), and those which received sildenafil 1mg/kg (Sil 1.0 mg/kg) (CON 3
and CIR 3) were determined.
In healthy rats, comparing CON 3 to CON 1, sildenafil led to a significant increase of
64% (p=0.036) in serum cGMP concentrations. A significant increase of 85%
(p=0.027) could also be found in diseased rats when CIR 3 is compared to CIR 1.
Furthermore, in diseased rats, the effect of sildenafil and NaCl on serum cGMP
concentrations was analyzed. By comparing CIR 3 and CIR 2, sildenafil induced a
nonsignificant increase of 65% (p=1.000).
(Table 24 and 25, Figure 11f)

Results
66
Figure 11: Dotplots showing the distributions of hepatic gene expression of the
enzymes eNOS (a), iNOS (b), PDE5 (c), sGCa1(d) and sGCb1(e), as well as
distributions of serum cGMP concentrations [pmol/ml] (f) in the subgroups. Significant
differences among subgroups are corrected for multiple comparisons separately for
the three hypothesis and denoted by *p<0.05. Gene expression levels are given as
fold expression compared to CON 1. Since iNOS expression in CON 1 was below the
detection limit, it was set to “1.0”.

Results
67
Table 23: Mean ± standard deviation (SD) of hepatic enzyme gene expression in the
subgroups. Fold expression is referring to CON 1. qRT-PCRs were performed in
duplicates; thus, values are based on mean values of duplicates.
CON 1 (n=11)
Mean ± SD
FIB 1 (n=6)
Mean ± SD
CIR 1 (n=8)
Mean ± SD
FIB 2 (n=7)
Mean ± SD
CIR 2 (n=7)
Mean ± SD
eNOS [fold exp.] 1.0 ± 0.4 1.5 ± 0.3 2.2 ± 1.0 0.9 ± 0.3 1.0 ± 0.4
iNOS [fold exp.] n.d.1 4.6 ± 3.0 5.3 ± 2.3 10.0 ± 3.0 15.6 ± 8.7
PDE5 [fold exp.] 1.0 ± 1.0 7.7 ± 0.9 11.0 ± 3.1 7.6 ± 2.6 6.1 ± 2.8
sGCa1 [fold exp.] 1.0 ± 0.3 1.4 ± 0.3 1.7 ± 0.4 1.1 ± 0.3 1.4 ± 0.4
sGCb1 [fold exp.] 1.0 ± 0.5 2.1 ± 0.3 3.0 ± 1.3 1.1 ± 0.3 1.4 ± 0.5
1 Since iNOS expression in CON 1 was below the detection limit, it was set to “1.0”

Results
68
Table 24: Median ± interquartile range (IQR) of serum cGMP concentrations in the
subgroups. ELISAs were performed in duplicates; thus, values are based on mean
values of duplicates.
CON 1 (n=11)
Median ±
IQR
FIB 1 (n=6)
Median ±
IQR
CIR 1 (n=8)
Median ±
IQR
FIB 2 (n=7)
Median ±
IQR
CIR 2 (n=7)
Median ±
IQR
CON 3 (n=12)
Median ±
IQR
CIR3 (n=10)
Median ±
IQR
cGMP [pmol/ml]
152 ±
86
100 ±
68
91 ± 22
68 ±
105
102 ±
134
249 ±
153
168 ± 52

Results
69
Table 25: Pairwise comparisons between subgroups are determined according to
Dunn 179. Adjusted comparisons are corrected according to Bonferroni separately for
the three hypotheses, which are marked by a double line. Significant differences
(p<0.05) are marked by an *.
eNOS
iNOS PDE5 sGCa1 sGCb1 cGMP
CON 1 vs. FIB 1
sig. (pairwise) 0.024* -- 0.002* 0.065 0.006* 0.151
sig. (adjusted) 0.072 -- 0.006* 0.195 0.018* 0.453
CON 1 vs. CIR 1
sig. (pairwise) 0.001* -- 0.001* 0.001* 0.001* 0.018*
sig. (adjusted) 0.003* -- 0.003* 0.003* 0.003* 0.054
FIB 1 vs. CIR 1
sig. (pairwise) 0.280 0.732 0.201 0.194 0.267 0.495
sig. (adjusted) 0.840 1.000 0.603 0.582 0.801 1.000
FIB 1 vs. FIB 2
sig. (pairwise) 0.018* 0.461 0.982 0.327 0.119 0.748
sig. (adjusted) 0.036* 0.992 1.000 0.654 0.238 1.000
CIR 1 vs. CIR 2
sig. (pairwise) 0.002* 0.079 0.050 0.171 0.146 0.096
sig. (adjusted) 0.004* 0.158 0.100 0.342 0.292 0.192
CON 1 vs. CON 3
sig. (pairwise) n.m.2 n.m.2 n.m.2 n.m.2 n.m.2 0.012*
sig. (adjusted) n.m.2 n.m.2 n.m.2 n.m.2 n.m.2 0.036*
CIR 1 vs. CIR 3
sig. (pairwise) n.m.2 n.m.2 n.m.2 n.m.2 n.m.2 0.009*
sig. (adjusted) n.m.2 n.m.2 n.m.2 n.m.2 n.m.2 0.027*
CIR 2 vs. CIR 3
sig. (pairwise) n.m.2 n.m.2 n.m.2 n.m.2 n.m.2 0.446
sig. (adjusted) n.m.2 n.m.2 n.m.2 n.m.2 n.m.2 1.000
2 not measured

Results
70
3.4.3 Immunohistochemical Staining (PDE5)
To investigate if the PDE5 overexpression in diseased rats found on the gene
expression level can be verified on the protein expression level, liver tissue samples
of some rats, which have been included in the previous gene expression analyses,
were stained immunohistochemically. Therefore, 4 tissue samples of rats with
healthy (CON1) and cirrhotic livers (CIR 1 and CIR 2) were randomly chosen for
PDE5 staining and cell counts.
Immunohistochemical staining revealed a markedly increased PDE5 protein
expression (brown) in diseased rats in CIR 1 und CIR 2 compared to healthy rats in
CON 1. In contrast, no differences were distinguished between diseased rats which
have undergone the hemodynamic measurement and the associated operative
procedure (CIR 2) and those which have not undergone any (CIR 1).
Considering the distribution in healthy rats in CON 1, PDE5 protein was
predominantly expressed by perivenular hepatocytes around the central vein (zone
3) and to a lesser extent by perisinusodial cells in the parenchyma. In contrast, in
diseased rats in CIR 1 and CIR 2 hepatic zoning got lost, whereas bands of fibrous
connective tissue (septa) were formed. PDE5 protein was expressed nonzonally by
perisinusoidal cells in the parenchyma, but was also present in fibrous connective
tissue (Figure 12).
Subsequent microscopic quantification revealed 3 stained cells per HPF in healthy
rats in CON1, and in diseased rats 23 stained cells per high power field (HPF) for
CIR 1, and 22 stained cells per HPF for CIR 2. This corresponds to a 7.7-fold
increase in CIR 1 and a 7.3-fold increase in CIR 2. Exclusively stained cells in the
parenchyma were included in cell counts, whereas PDE5 staining around the central
vein (CON 1) and in fibrous connective tissue (CIR 1 and CIR 2) was not considered.

Results
71
CON 1 CIR 1 CIR 2
Figure 12: Immunohistochemical PDE5 staining (brown) of liver tissue samples of
rats with healthy (CON 1) and cirrhotic livers (CIR 1 and CIR 2). Rats in CON 1 and
CIR 1 were used for biochemical investigations only, whereas the rats in CIR 2
underwent the hemodynamic measurement and the associated operative procedure.
PC: perisinusoidal cell; HC: hepatocyte, CV: central vein.

Discussion
72
4. Discussion 4.1 Evaluation of the TAA Model The aim of this part of the study was to establish and evaluate the animal model of
TAA-induced liver fibrosis / cirrhosis by oral and weight-adapted TAA administration
described previously by Li et al 163. Relative portions of rats with fibrotic and cirrhotic
livers, the presence of cholangiocellular carcinoma (CCCs), and mortality induced by
TAA administration were quantified.
Two outbred rat strains were investigated: Sprague Dawley and Wistar. In contrast to
inbred strains, which are characterized by a minimal genetic variation, outbred strains
show a broad genetic variation. Outbred strains are used to imitate the genetic
variation, which is a natural and unavoidable occurrence in any population. In
general, outbred strains are considered to be multipurpose models, but their main
fields of applications are pharmaceutical and toxicological studies.
Independent of the strain rats showed various symptoms during TAA exposure time,
mostly associated with liver fibrosis / cirrhosis. However, their level of discomfort was
classified as minor.
A frequently observed symptom was reduced body weight increase, which is in good
agreement with data from previous studies using TAA-treated rodents 160,167.
Moreover, reduced water intake was oberserved once TAA was added into the
drinking water. Three rats shared a cage and a water bottle, making it impossible to
determine each rats’ individual water intake. Regarding the amount of water in the
bottles, it was, however, obvious that the rats noticed the TAA additive and drank
less than untreated rats. As a consequence, 2.5 ml liquid sweetener per 750 ml
drinking water was added to mask the bitter taste of TAA. Assuming an normal
average daily water intake of 30 ml per rat 180 and a TAA dosage of 0.03%, each rat
consumed an average of 9 mg TAA and 0.1 ml liquid sweetener per day. The liquid
sweetener comprised steviol glycosides which, according to the European Food
Safety Authority (EFSA), represented no toxicity or carcinogenicity potential 181. By
adding liquid sweetener, the rats’ water intake increased once again, but was still
slightly lower than the water intake of untreated rats. Furthermore, previous
preclinical studies reported that after an initial peak of serum transaminases (AST

Discussion
73
and ALT) within the first four weeks of oral TAA administration, serum transaminase
levels returned to baseline values regardless of TAA exposure time and degree of
liver fibrosis 160,178. Also in the current study serum parameters analysis revealed the
absence of an increase in transaminase levels after 16 weeks of TAA treatment
regardless of the rats’ degree of liver fibrosis (see 3.4.1).
Considering genetic susceptibility to liver disease, strain differences have been
reported for different models, but for TAA-induced liver disease no systematic
analysis on strain-specific susceptibility has been conducted so far 160,182–187. In the
current study the TAA model was initially established in Sprague Dawley rats. On the
basis of the histological assessment of their degree of liver fibrosis, it has been
shown that a TAA exposure time of 12 weeks, as recommended by Li et al 163, was
insufficient to induce severe liver disease. However, it is a delicate matter to prolong
TAA exposure time since it has been known that TAA is a carcinogen and can lead to
the development of cholongiocellular carcinoma (CCCs) and hepatocellular
carcinoma (HCCs) after chronic administration 167,188. In the current study, the
incidence of Sprague Dawley rats with cirrhotic livers increased with prolonged TAA
exposure time (15 to 24 weeks), but all of them had CCCs simultaneously (HCCs
were not detectable with the staining used). These findings contradict the results of
Yeh et al 167, who also used the model of oral TAA administration to induce liver
disease in Sprague Dawleys, but applied a constant dosage of 0.03%. According to
them, development of CCCs started after 16 weeks, whereas the development of
HCCs occurred earliest after 20 weeks of TAA administration.
Having found that in Sprague Dawley rats the development of liver cirrhosis is
principally associated with the emergence of CCCs, a second rat strain was tested.
Therefore, Wistar rats, the rat strain originally used by Li et al 163, was chosen. This
time TAA exposure time was fixed at 12 and 16 weeks. However, histological
assessment of the degree of liver fibrosis showed that in Wistar rats a TAA exposure
time of 12 weeks is also insufficient to induce severe liver disease. Barely half of the
rats treated with TAA for 16 weeks developed cirrhosis. Thereof half had CCCs
simultaneously. These findings are in good accordance with the experiences made
by Laleman et al 189. According to their results in Wistar rats, TAA exposure time
should be prolonged to 18 weeks to obtain a homogenous and reproducible model of

Discussion
74
liver cirrhosis when following the protocol described by Li et al 163. Moreover, they
observed the development of CCCs and HCCs after 18 weeks of TAA treatment.
Considering mortality in the current study, there was a minor loss of 2 rats out of 142
that died within the first week of TAA administration, probably due to TAA-induced
acute liver failure 76,165,190.
In terms of limitations in the study design, the use of the model of oral TAA
application via the drinking water implicates an unstandardized intake of TAA since
the rats´ water intake varies and can not be controlled. This form of application could
also lead to gastrointestinal tract irritation 159 and thus influence splanchnic
circulation. Moreover, the model should ideally resemble human alcoholic or
hepatitis-associated liver fibrosis / cirrhosis, but this was not evaluated in the current
study.
In conclusion, the model of TAA-induced liver disease by oral and weight-adapted
TAA administration previously described by Li et al 163 caused tolerable physical
burden and minor mortality. A prolonged TAA exposure time of 16 to 18 weeks is
recommendable to attain a high incidence of rats developing a cirrhotic liver.
However, since the degree of liver fibrosis / cirrhosis varies even when TAA
exposure time is standardized, it is reasonable to make a histological evaluation. For
the simultaneous development of CCCs seems to be more common among Sprague
Dawley rats. The frequent presence of CCCs should be considered in biochemical,
hemodynamic and all other studies using this model.
4.2 Noninvasive Hemodynamic Measurements The aim of this part of the study was to noninvasively evaluate hepatic and systemic
hemodynamic changes induced by liver fibrosis / cirrhosis in rats with healthy, fibrotic
or cirrhotic livers by MR measurements. Alterations in the parameters portal cross-
sectional area, portal flow velocity, portal flow volume rate, and aortic flow volume
rate were determined. Moreover, MR data were used to test whether the degree of
liver fibrosis can be assessed using a self-established MR score.

Discussion
75
The idea for this study was born, since at present, the reference standard for
hemodynamic evaluation in clinical practice is the assessment of portal blood
pressure by measuring the HVPG 191,192. However, this technique is an invasive
procedure and involves some degree of inconvenience and risk for the patients.
Moreover chronic liver diseases, as well as the induced hemodynamic alterations
(mainly PH) are heterogeneous and dynamic conditions 38,81. Consequently, a
noninvasive and repeatable assessment of hemodynamics is warranted.
To date, there are few noninvasive modalities that quantify blood flow in clinical
practice. Most of them are based on ultrasound (US) and MR. Both of these
modalities have been investigated whether measurements of portal parameters (e.g.
flow velocity or volume rate) may correlate with the degree of PH with variable results 193–195. Even if technical modalities have substantially advanced over the last
decades, low reproducibility and lack of standardized examination protocols are still
mentioned as limitations of noninvasive techniques 196,197. Thus, preclinical studies
are warranted in order to evaluate and further optimize recently developed clinical
imaging techniques, and to aid in biomedical and pharmaceutical research.
Multi-dimensional phase-contrast MR (PC-MR) imaging is a preferred technique to
determine blood flow in preclinical and clinical studies. Some preclinical
hemodynamic studies in small laboratory animals using multi-dimensional PC-MR
imaging have already been performed, mostly investigating cardiovascular
hemodynamics 198–201. Only a few focus on portal hemodynamic changes induced by
liver cirrhosis 202–204. To address this lack of portal hemodynamic data, two-
dimensional PC-MR (2D PC-MR) imaging, a technique being well-established,
validated and in use for clinical practice and research 205, was chosen to determine
different hemodynamic parameters in this study. Thereby, hemodynamic changes in
the portal vein and the abdominal aorta, as well as morphological changes of the liver
tissue were focused on.
For the MR scoring of the rat livers, an MR approach and a self-established MR
score were used. Therefore, histological criteria 82 were adapted for MR imaging to
determine morphological alterations induced by liver inflammation, fibrosis, or
cirrhosis including liver tissue density, nodules and liver surface 206. From the
diseased rats 11% (4/36) were scored false negative, but all of the healthy rats were
identified as such. The accurate assessment of the degree of liver fibrosis in
Discussion
76
diseased rats, as well as the detection of CCCs was not possible by MR rat liver
image evaluation. Histological evaluation is required instead. Thus, even if histology
remains to be the reference standard, the evaluation of MR rat liver images can be
helpful to noninvasively discriminate between a healthy and a diseased liver,
consequently reducing the unnecessary use of laboratory animals.
Looking at the detected flow velocity patterns for the portal vein and the abdominal
aorta during a cardiac cycle, these reflect the physiological conditions as one would
expect in a venous or arterial vessel: the flow velocity pattern in the portal vein
appears constant, whereas the observed flow velocity pattern in the abdominal aorta
reveals a pulsatile structure. These flow velocity patterns are consistent with those
previously demonstrated by Wang et al 207 for a phantom and preclinical in vivo study
in rats using PC-MR. However, compared to Wang et al, substantially higher field
strength was used in this study (9.4 T vs. 1.5 T); thus, it can be assumed that at least
the same or, even more likely, a better signal-to-noise ratio for the detection of PC-
MR data, and therefore more robust hemodynamic parameters were achieved.
Considering the hemodynamic alterations induced by the chronic treatment of the
hepatotoxic agent TAA, the most distinct alteration in diseased rats in comparison
with healthy rats was the marked reduction of portal flow velocity and volume rate.
Results indicate that in the model of TAA-induced liver disease, the development of
fibrosis is sufficient to cause a significant decrease in portal flow velocity and volume
rate. In contrast, the development of cirrhosis caused no further significant decrease
in portal flow velocity and volume rate.
However, from these results it cannot reliably be concluded that the total liver
perfusion in the diseased rats is diminished. A reduction of portal perfusion can at
least partially be compensated (25%-60%) by an increase of arterial hepatic
perfusion – the so-called hepatic buffer response 7. Parameters of the hepatic artery
were not obtained in this study. Since aortic flow volume rate in diseased rats
remained constant, the reduction of portal flow is not a consequence of a reduced
aortic flow, but most likely an indicator of increased intrahepatic resistance.
The findings of a reduced portal flow velocity and volume rate in diseased rats are
contrary to the results given by Wang et al 207. In their preclinical study, differences in
portal flow volume rate (portal flow velocity data were not shown) between CON and

Discussion
77
FIB, as well as between CON and CIR were nonsignificant. They also investigated
Wistar rats, but used the model of CCl4-induced liver disease.
According to clinical studies, portal perfusion in humans is altered depending on the
degree of liver fibrosis and with advanced PH the portal blood flow may even become
reversed 107,208,209. Furthermore, the portal cross-sectional area may increase with
rising PVP, but the determination of the portal cross-sectional area does not seem to
be a reliable diagnostic indicator for PH 210–212.
In the present study, the portal cross-sectional area of the rats remained constant
even in severely diseased rats. It could be likely that the increase in PVP in the
tested animal model is not pronounced enough to cause a dilation of the portal vein.
In further experiments, it should be clarified to what extent PVP in diseased rats is
indeed enhanced. Moreover, an investigation should be made in which morphological
or biochemical modifications are responsible for the unexpected finding of the strong
portal hemodynamic effect even in rats with fibrotic livers.
In terms of limitations in the study design, the anesthesia, which is unavoidable,
could have added more variability and uncertainty to the measurements 213. The
physical states of the rats during the MR measurement were not perfectly equal for
all of them even if every possible precaution was taken to keep the conditions and
their physical state stable. The procedure itself - the preparation of the rats and the
MR measurement - lasted about 1 h per rat and was performed at different times of
the day.
The main technical causes of errors in the 2D PC-MR technique were possibly the
2D plane application and positioning in the complex liver vasculature, as well as the
Venc setting 205,214.
In conclusion, in rats with fibrotic or cirrhotic livers, markedly reduced portal flow
velocity and volume rate were found compared with rats with healthy livers.
Moreover, the evaluation of the MR rat liver images of the livers enables
differentiation between healthy and diseased livers.

Discussion
78
4.3 Invasive Hemodynamic Measurements 4.3.1 Portal Flow Volume Rate The aim of this part of the study was to invasively evaluate hepatic and systemic
hemodynamic changes induced by liver fibrosis / cirrhosis in rats with healthy, fibrotic
or cirrhotic livers. Alterations in the parameters portal flow volume rate and mean
arterial pressure (MAP) were determined. Portal flow volume rate was measured with
a flow probe, whereas MAP was measured by a pressure transducer. Moreover,
results for the portal flow volume rate between noninvasive and invasive
measurements were compared.
Considering the hemodynamic alterations induced by the chronic treatment of the
hepatotoxic agent TAA, the most distinct alteration in diseased rats in comparison
with healthy rats was the marked reduction of portal flow volume rate and MAP.
Equivalent to the results of the noninvasive measurements, the current findings also
indicate that in the model of TAA-induced liver disease, the development of fibrosis is
sufficient to cause a significant decrease in portal flow volume rate.
However, in contrast to the noninvasive measurements, in which no significant
differences between diseased rats in FIB and CIR were observed, a significant
reduced portal flow volume rate in CIR was detected by invasive measurements
when compared to FIB. Moreover, absolute values for the portal flow volume rate
measured in the groups were around 20 to 47% higher in the noninvasive
measurements. A comparison of methods was not performed due to several reasons:
First, at least partially different rats were used for the noninvasive and invasive
measurements, as well as a different kind of anesthesia. Second, even if rats were
investigated twice, noninvasive and invasive measurements were not performed on
the same day, but with a 2- or 3-day recovery period in between. Third, it is beneficial
to have an arterial reference parameter since changes in the arterial circulatory
system could lead to changes in the venous circulatory system but, whereas for the
noninvasive measurement the abdominal aorta flow volume rate was referred to,
MAP was used as an arterial reference parameter for the invasive measurement
since the anatomical closeness to the vena cava does not allow the positioning of a
flow probe at the abdominal aorta. Hence, the arterial reference parameters differed
between noninvasive and invasive measurements and were not comparable.

Discussion
79
In terms of limitations in the study design, the anesthesia as well as the operative
conditions, which are unavoidable, could have added more variability and uncertainty
to the measurements 213. The physical states of the rats during the MR measurement
were not perfectly equal for all of them even if every possible precaution was taken to
keep the conditions and their physical state stable. The procedure itself – the
preparation of the rats and the portal flow volume rate measurement - lasted about 1
to 1.5 h per rat and was performed at the same time of the day.
The main technical causes of errors in the measurement technique were the size and
positioning of the ultrasonic transit time flow probe, and the loss of the applied
ultrasound gel due to body fluids.
In conclusion, in rats with fibrotic or cirrhotic livers, markedly reduced portal flow
volume rate and MAP were found compared with rats with a healthy liver.
Comparing the results for the portal flow volume rate between noninvasive and
invasive hemodynamic measurements, the same pattern of a liver disease-induced
decrease was found, but absolute values were not equivalent.
4.3.2 Effect of Sildenafil on Hemodynamics The aim of this part of the study was to evaluate hepatic and systemic hemodynamic
changes induced by the administration of the PDE5 inhibitor sildenafil in rats with
healthy, fibrotic or cirrhotic livers. Therefore, additional invasive hemodynamic
measurements were performed to determine the acute effects of administration of
either sodium chloride (NaCl) or sildenafil (Sil 0.1 mg/kg or Sil 1.0 mg/kg) on the
parameters portal venous pressure (PVP), mean arterial pressure (MAP),
microvascular flow (MF), and heart rate (HR) over 50 minutes. PVP, MAP and HR
were measured using pressure transducers, whereas MF was determined with a
microvascular flow probe.
Considering the hemodynamic alterations induced by acute sildenafil administration,
a dose-dependent effect was observed. The most distinct alteration was observed
after high-dosage administration (1mg/kg) in rats with cirrhotic livers, which led to a
trend towards a decreased PVP and was associated with a significant reduction of
HR and a nonsignificant lowering of MAP.

Discussion
80
Looking at PVP, a decrease among all subgroups was determined. In rats with
healthy and fibrotic livers, the decrease was nonsignificant regardless of intervention.
However, in rats with cirrhotic livers sildenafil administration led to a trend towards a
decreased PVP, PVP decreasing more prominently after high-dosage administration.
But while healthy rats were considered to have a physiological PVP, it is hard to
make any statement about how pronounced the elevation in PVP in diseased rats
really was, particularly in association with their markedly lower baseline MAP values
in comparision with healthy rats. On the other hand, the latter could indicate that
those rats have been in a hyperdynamic circulatory state, which is typically a
consequence of PH 74.
For MAP and MF, a nonsignificant decrease was also observed among all subgroups
regardless of intervention. Changes in MAP were measured as administration of
PDE5 inhibitors has been reported to be associated with a decrease in MAP, which
could influence PVP. The decrease in MF, however, occured unexpectedly since
administration of PDE5 inhibitors should lead to sinusoidal vasodilation and hence
increased MF. It might be speculated that the effect of sildenafil on MF has been
covered by the decrease in the residual hemodynamic parameters. Moreover, a
nonsignificant decrease in HR was found among almost all subgroups regardless of
intervention, exclusively in rats with a cirrhotic liver, which received the high-dosage
sildenafil administration (1mg/kg), HR decreased significantly.
In a preclinical study, investigating the effects of PDE5 inhibitors in healthy rats, it
was shown that after acute administration of either sildenafil or vardenafil (1-100
µg/kg, intravenous) PVP remained unchanged or showed a trend towards a decrease 215. A dosage of 10 µg/kg, which was most effective, led to a significant increase in
MF, but at the same time to a significant reduction in MAP. HR remained unaltered
regardless of the dosage applied.
In contrast in the model of BDL-induced liver disease, acute administration of
sildenafil (0.01-10 mg/kg, intravenous or intramesenteric) led to a dose-dependent
increase in PVP and a significant decrease in MAP 216. Diseased rats also tended to
have lower baseline MAP values compared to sham-operated rats, which is
consistent with our observations. The same model was used in another study
considering the effect of a chronic one-week administration of sildenafil (0.25 mg/kg,
2 x daily, oral) 217. Whereas in sham-operated rats no effect was found, in diseased

Discussion
81
rats a nonsignificant decrease in PVP and portal perfusion pressure, and a significant
increase in MF were determined. These findings coincide with the results of a further
study, which also used the model of BDL-induced liver disease, showing that after
chronic administration of the PDE5 inhibitor udenafil (1, 5 or 25 mg/kg; 1 x daily,
oral) for 3 weeks PVP decreased by approximately 30% 218.
In a clinical trial on patients with liver cirrhosis and a significantly elevated HVPG,
acute administration of sildenafil (50 mg, oral) caused no changes in HVPG and HR,
whereas MAP decreased 219. These findings were confirmed by a subsequent study
with a similar study design in patients with compensated cirrhosis (Child A) 220. In a
further study investigating patients with compensated and decompensated liver
cirrhosis (Child A-C), acute administration of sildenafil (50 mg, oral) showed no effect
on PVP, MAP and HR, but induced a significant reduction in intrahepatic resistance 221. Moreover, the effect of an acute and chronic one-week administration of udenafil
(12.5 -100 mg, 1 x daily, oral) was tested in patients with decompensated liver
cirrhosis (Child A-B), a dosage of 75 mg or 100 mg being found to be most effective 222. After one hour HVPG was lowered by 25% (75 mg) or 17% (100 mg)
respectively, whereas after one week HVPG was reduced by 14% (75 mg) or 17%
(100 mg) respectively. By combining the results of these two dosages a significant
reduction in HVPG of 19% in the acute setting and of 16% in the chronic setting was
found, while HR remained unchanged. However, reduced HVPG was associated with
a significant lowering of MAP of 4% in the acute setting and of 6% in the chronic
setting which, according to the authors, was well tolerated by the patients.
In a further pilot study on patients with compensated liver cirrhosis (Child A), acute
administration of vardenafil (10 mg, oral) caused a decrease in HVPG and
intrahepatic resistance in four out of five patients, whereas HR remained constant 223.
Moreover, a recent case-report about a female patient with compensated liver
cirrhosis (Child A) revealed promising results for the chronic use of PDE5 inhibitors 224. In the acute setting, administration of vardenafil (5 mg, 1 x daily, oral) led to a
reduction of HVPG by 13%. For the maintenance medication over the following eight
years with tadalafil (5 mg, 1 x daily, oral), similar effects on HVPG were described.
MAP also slightly decreased in the acute as well as in the chronic treatment phase,
but changes were reported to be clinically irrelevant.
Discussion
82
Taken together, data from preclinical and clinical studies provided promising results
regarding the effect of PDE5 inhibitor administration on PVP (or HVPG), even though
results were partly variable. The associated decrease in MAP seemed to be
tolerable. Only in the current study there was a significant decrease in HR
determined after acute high-dosage sildenafil administration (1mg/kg), which
contradicts all other existing data and needs to be clarified.
Believing the hypothesis that the presence of high PDE5 expression in a particular
tissue should predict the effect of a PDE5 inhibitor 225, the current finding of hepatic
PDE5 overexpression in diseased rats (see 3.4) reveals the need for further
investigations in order to better evaluate drug- and dose-dependent effects of PDE5
inhibitors in the acute and chronic setting. It might be assumed that in particular a
prolonged chronic administration of PDE5 inhibitors could be beneficial to counteract
PDE5 overexpression. However, potential therapy effect heterogeneity should always
be considered since the degree of liver fibrosis / cirrhosis and PH could also
influence the effectiveness of a therapy 58.
In terms of limitations in the study design, administration of 600 µl liquid volume into
the right atrium most likely caused transient cardiac decompensation probably due to
volume overload, which was accompanied by variations in PVP, MAP, MF and HR
during the first minutes of the hemodynamic measurements. After approximately 10
minutes a new steady state was reached. Therefore, timepoint “10 min” was taken as
the baseline value for further calculations. However, that measure did not seem to be
ideal for the NaCl subgroup in FIB since relative median of differences for the
parameters seemed to be markedly lower compared to those in CON and CIR. This
might have influenced the results of intragroup comparisons in FIB. Moreover, the
decrease in parameter values during the measurement interval, which occurred
consistently among all subgroups even in the absence of a vasoactive drug (NaCl
subgroups), indicates that the anesthesia as well as the operative conditions, which
are unavoidable, could have added more variability and uncertainty to the
measurements 213,226. This disruptive factor occurred although pentobarbital was
used for anesthesia, which is described to be one of the best forms of anesthesia for
the performance of invasive blood pressure measurements in rats 227.
The physical states of the rats during the hemodynamic measurement were not
perfectly equal for all of them regardless of every possible precaution taken to keep
the conditions and their physical state stable. The procedure itself – the operative
Discussion
83
procedure of the rats and the hemodynamic measurement - lasted about 2.5 to 3 h
per rat and was performed at the same time of the day. The use of different rat
strains as well as the fact that some of the diseased rats had CCCs could have
influenced the results of the hemodynamic measurements.
The main technical causes of errors in the hemodynamic measurement technique
were the location and a potential clogging of the catheters.
In conclusion, acute high-dosage sildenafil administration (1mg/kg) led to a trend
towards decreased PVP in rats with cirrhotic livers, which were characterized by
hepatic PDE5 overexpression, and furthermore to a significant lowering of HR and a
nonsignificant reduction of MAP. Hence, PDE5 inhibitors might be a promising
adjunct in PH therapy and should be investigated further.
4.3.3 Effect of MAP on PVP The aim of this part of the study was to determine the influence of systemic blood
pressure on portal blood pressure. Therefore, the effect of MAP on PVP over the first
30 minutes was evaluated based on the available hemodynamic data (see 3.3.2).
Considering the course of MAP and PVP of the individual rats, a change in MAP led
to a slightly delayed change in PVP in the same direction (decrease / increase). This
was best visible within the first minutes of measurements, in which hemodynamic
parameters were “manipulated” unintentionally by the bolus injection of 600 µl liquid
volume into the right atrium.
The results showed that the effect of MAP on PVP was significant in all subgroups
regardless of intervention. For every 1% change in MAPrel ,PVPrel varies by 0.32% to
0.61%, which implies a distinct relationship between the change in MAP and the
change in PVP.
These findings are of particular importance regarding the current pharmaceutical
options in PH therapy. As mentioned before (see 2.5.7), the functional component of
increased intrahepatic resistance can be influenced positively, either by a decrease
in intrahepatic vascular tone, a decrease in splanchnic vasodilation, or ideally both 67.
In general, NSBBs, the current cornerstone in pharmaceutical PH therapy, block the
binding of catecholamines, such as norepinephrine and epinephrine, to beta1 and

Discussion
84
beta2 adrenergic receptors 33,228. To lower PVP (HVPG), NSBBs act in two different
ways: whereas a beta1 blockade reduces portal inflow by decreasing the heart rate
and cardiac output, a beta2 blockade leads to unopposed alpha1 activity resulting in
splanchnic vasoconstriction 90. The latter however, seems to be the essential mode
of action 68. In comparison, beta1-selective beta blockers, which only lower cardiac
output, show a less pronounced effect on PVP (HVPG) than NSBBs 229–233.
Unfortunately, not only NSBBs, but most of the drugs used in PH therapy are
vasoactive and do not only affect hepatic, but to some extent systemic
hemodynamics as well. Statins exclusively, best known for their cholesterol lowering
effects, are able to decrease intrahepatic resistance without affecting systemic
hemodynamics simultaneously 66. However, since PH per se is already associated
with splanchnic vasodilation and the development of a hyperdynamic circulatory
state, a further reduction of systemic blood pressure induced by vasoactive drugs is a
matter of concern, especially in advanced stages of the disease 234.
Even the use of NSBBs has been a matter of ongoing controversy due to potential
hemodynamic, but also nonhemodynamic adverse effects in patients with liver
cirrhosis 68,228,235–240. Those side effects led to treatment termination in approximately
15% of patients, whereas another 15% a priori had contraindications to the use of
NSBBs 241. Moreover, 30 to 40% of patients did not show a portal hemodynamic
response to NSBB administration 242,243. In addition, the therapeutic window
hypothesis resulting from a meta-analysis by Krag et al 33 limits their use as well. The
therapeutic window hypothesis states that in patients with liver cirrhosis NSBBs
improve survival only during a certain time window in the disease. This window
opens when medium to large esophageal varices occur 244–246, and closes when a
very advanced stage of liver cirrhosis is reached 87,229,247–249. Since outside this
therapeutic window NSBBs have been described to be potentially ineffective or even
detrimental, it is obvious that novel therapeutic strategies are needed.
Nevertheless, NSBBs might be an excellent example to investigate the correlation
between systemic and hepatic hemodynamics. In a recent review by Tripathi 250, the
changes in HVPG and the associated changes in MAP after acute and chronic
administration of propaponol and carvediol in patients with PH were presented.
These data also suggest a correlation between systemic and hepatic hemodynamics
since after acute or chronic administration of propranolol, a conventional NSBB,

Discussion
85
reduction of HVPG, but also MAP was less pronounced than after acute or chronic
administration of carvediol, a NSBB with an additional alpha1 blocking capacity.
However, whereas those results are based on measurements at selected time points
only, results of the current experimental study were based on continuous invasive
hemodynamic measurements over 30 min, and therefore more robust results were
achieved. Another advantage of this study was the unintentional “manipulation” of
hemodynamics within the first minutes, which best illustrated the correlation between
MAP and PVP. Moreover, even in the absence of a vasoactive drug (NaCl
subgroups) the course of hemodynamic parameters revealed a decrease not only in
MAP but also in PVP, suggesting a correlation between these two parameters, but on
the other hand, indicating that the sildenafil-induced decrease in PVP was also at
least partly a consequence of the lowering of MAP. However, although no intragroup
comparisons were performed, results showed that for a 1% change in MAP the
change in PVP was highest in the subgroups, in which the high dosage of sildenafil
(Sil 1 mg/kg) was applied, which might imply a partly liver-specific effect. Hence,
future studies evaluating the effect of vasoactive drugs on PVP (HVPG) should
distinguish between the portion induced by the decrease in MAP, and the portion that
indeed reflects a liver-specific mode of action. Ideally, the effect on PVP should be
markedly higher than the effect on MAP.
In terms of limitations, reference can be made to those listed above (see 4.3.2).
In conclusion, there is a distinct correlation between MAP and PVP, i.e. between
systemic blood pressure and portal blood pressure. This should be considered in all
other studies evaluating the effect of vasoactive drugs on PVP (HVPG).
4.4 Biochemical Investigations The aim of this part of the study was to evaluate changes biochemically in the key
parameters of the nitric oxide-cyclic guanosine monophosphate (NO-cGMP) pathway
induced by liver fibrosis / cirrhosis in rats with healthy, fibrotic or cirrhotic livers. The
NO-cGMP pathway is a key regulator of vascular tone and thus plays an important
role in sinusoidal vasoreactivity, which is impaired in PH. Alterations in hepatic gene
expression of the enzymes endothelial and inducible NO synthase (eNOS, iNOS),
soluble guanylyl cyclase subunit a1 and b1 (sGCa1, sGCb1) and phospho-

Discussion
86
diesterase 5 (PDE5) were analyzed by qRT-PCR, whereas changes in serum cGMP
concentrations from carotid arterial blood samples were determined using ELISA.
Additionally, blood samples were used to determine serum parameters (clinical
chemistry) for the sake of completeness, but the results will not be discussed further.
In this context, it was also evaluated whether the hemodynamic measurement and in
particular the associated operative procedure affected gene expression or serum
cGMP concentrations. Moreover, the effect of sildenafil administration (1.0 mg/kg) on
serum cGMP concentrations was determined. The main finding of gene expression
analyses was finally confirmed by immunohistochemical staining.
Considering the alterations in the NO-cGMP pathway induced by the chronic
treatment of the hepatotoxic agent TAA, distinct alterations in diseased rats in
comparison with healthy rats were observed. In terms of hepatic gene expression, an
iNOS up-regulation and a marked PDE5 overexpression were detected. The less
pronounced increase in the expression of the residual genes, i.e. eNOS, sGCa1 and
sGCb1, might represent a compensatory mechanism to balance PDE5 over-
expression. The latter was confirmed by immunohistochemical investigation of PDE5
protein expression, which furthermore revealed a loss of hepatic zoning. Serum
cGMP concentrations were slightly decreased in diseased rats, but high-dosage
sildenafil administration (1mg/kg) nearly led to renormalization. Finally, a significant
decrease in eNOS gene expression was detected due to the hemodynamic
measurement and the associated operative procedure.
Regarding hepatic eNOS gene expression, a significant elevation in rats with cirrhotic
livers was found in the current study, whereas eNOS elevation in rats with fibrotic
livers was significant in nonadjusted pairwise comparisons only. As described above
(see 2.5.7.3), other preclinical and clinical studies investigating eNOS gene and / or
protein expression showed inhomogeneous results, including enhanced, unchanged,
or diminished eNOS expression, whereas a down-regulation of eNOS activity, in
particular in SECs, has been consistently described in the context liver cirrhosis 63,76,132–139. Moreover, results revealed that iNOS gene expression was absent in
healthy rats, but up-regulated in diseased rats, which is in good agreement with
findings from other preclinical and clinical studies 251–253. Since iNOS can be
expressed potentially by all hepatic cell types, its activity might vary in dependency
with its localization. The cell-specific role of iNOS-derived NO and its potential impact

Discussion
87
on vascular regulation needs to be clarified further (see 2.5.7.3). So far, up-regulated
iNOS protein expression has been described as not causing vasodilation 100, but
instead has been associated with intrahepatic microvascular dysfunction in some
other animal studies investigating endotoxemia and steatosis 112,254. These
observations make sense in that eNOS and iNOS compete for their common cofactor
BH4, meaning iNOS up-regulation could lead to reduced eNOS activity and hence
HSC activation 255,256.
Looking at sGC, the results showed a slightly increased gene expression in the
current model of TAA-induced liver cirrhosis, which coincides with former preclinical
studies reporting elevated sGC protein expression in the model of CCl4-induced 257
and BDL-induced liver cirrhosis 217. Furthermore, in both models a markedly elevated
expression of PDE5 protein was shown by western blot analyses 257,217, which was
validated by the current immunohistochemical PDE5 staining in the TAA model. In
contrast, sGC activity was found to be significantly decreased in the model of BDL-
induced liver cirrhosis 258, whereas data for PDE5 activity are lacking. Increased sGC
activity, however, occurred regardless of the amount of NO available in the liver,
indicating that with increasing intrahepatic NO deficiency the effect on vascular
regulation might be magnified by reduced cGMP generation 258.
In terms of protein distribution in healthy livers, eNOS has been described to show a
nonzonal distribution in human livers, eNOS being expressed predominantly by
hepatocytes, but also by ECs of hepatic arteries, terminal venules, sinusoids and
biliary epithelium 137, whereas iNOS is normally absent in healthy livers. In rat livers,
sGC showed a zonal distribution, whereby in the parenchyma almost all HSCs
expressed sGC, while the number of sGC-expressing HSCs decreased towards the
central vein 106. No sGC has been expressed in the innermost region around the
central vein, in which in the current study an accumulation of PDE5, expressed by
perivenular hepatocytes, was found.
The opposing enzyme zoning of sGC and PDE5 within a healthy hepatic lobule could
represent a regulatory mechanism to control sinusoidal cGMP concentrations.
Whereas cGMP generation in the parenchyma is maintained by high sGC expression
to ensure appropriate sinusoidal vasoreactivity, it is attenuated towards the central
vein due to reduced sGC expression. The latter, together with the increased PDE5

Discussion
88
expression around the central vein, might serve to inactivate excess cGMP in the
blood before it finally passes from the intrahepatic into the extrahepatic vasculature.
In the context of liver cirrhosis, loss of hepatic zoning and formation of bands
composed of fibrous connective tissue (septa) was observed, leading to altered
enzyme distribution. In diseased human livers, not only eNOS-, but also iNOS protein
showed nonzonal distribution within the hepatic lobule 137,252. Furthermore, Mc
Naughton et al 137 found a translocation of eNOS from hepatocytes to hepatocyte
nuclei. This phenomenon of translocation to cell nuclei has also been described
under other pathological conditions for enzymes and molecules, such as NOS (all
isoforms), sGC and cGMP 259. Data for sGC distribution are lacking, but for PDE5
results of the current study revealed that its expression in diseased rats is not only
markedly up-regulated, but postponed towards the parenchyma and fibrous
connective tissue (septa) (CIR 1 and CIR 2). In the parenchyma, PDE5 was
expressed by different perisinusoidal cells, predominantly HSCs (and / or
myofibroblasts), but also likely by macrophages and SECs. Which cell types in the
fibrous connective tissue express PDE5 has yet to be clarified.
In general, it seems like hepatic zoning is an underrated topic regarding the
pathophysiology of PH, although the concept of hepatic zoning itself and functional
differences between zones is nothing new as exemplified by hepatic enzymes
involved in different metabolic pathways 260,137. For hepatocytes it has also been
described that their functions and gene profiles depend on their location within the
hepatic lobule 261. Consequently, it is obvious that correct hepatic zoning is required
to ensure physiological liver functions, including adequate NO generation and / or
subsequent downstream signaling. Liver cirrhosis, however, is associated with loss of
enzymatic and metabolic zoning due to structural modifications of the liver
architecture. Resulting alterations in expression, activity and distribution of key
enzymes involved in the NO-cGMP pathway and their specific role in the
pathophysiology of PH have never been investigated systemically and should be
clarified further.
Referring to intrahepatic cGMP concentrations, it might be assumed that these
should be decreased in liver cirrhosis due to hepatic PDE5 overexpression, which
leads to an enhanced hydrolysis of cGMP into inactive GMP. In the current study, a
trend towards decreased cGMP concentrations in carotid arterial serum was indeed
Discussion
89
found, but most clinical studies detected increased cGMP concentrations in
association with liver cirrhosis in arterial as well as portal venous blood 262–264. These
opposing results need further clarification, but it might be that cGMP concentrations
depend on the location blood samples are taken from. In the current study, blood
samples were taken from the carotid artery since the blood volume from the portal
vein would not have been sufficient for all serum analyses. One could also speculate
that the rats developed pulmonary hypertension secondary to liver cirrhosis. In turn,
pulmonary hypertension leads to increased PDE5 expression in lung vascular
smooth muscle cells 265,225, which could have contributed to the reduction of cGMP
concentrations in the blood before it eventually reached the carotid artery. After acute
high dosage sildenafil administration (1mg/kg, intravenous) a significant increase in
serum cGMP concentrations in rats with healthy and cirrhotic livers was revealed by
current results. This is in good agreement with findings from a clinical study by Lee et
al 221, showing a significant increase in intraheptic NO and cGMP concentrations
after acute administration of sildenafil (50 mg/d, oral) in patients with liver cirrhosis.
These data were furthermore supplemented by a preclinical study by Lee et al 217 in
the model of BDL-induced liver cirrhosis, in which a one-week administration of
sildenafil (0.25 mg/kg, 2 x daily, oral) led to increased sGC and simultaneously
decreased PDE5 expression, accompanied by a reduction of PVP and portal
perfusion pressure, and a significant increase in MF.
Moreover, further experiments were performed in the current study to evaluate
whether the hemodynamic measurement and the associated operative procedure
affected gene expression or serum cGMP concentrations. A significant decrease in
eNOS gene expression was detected that might have influenced hepatic
hemodynamic parameters. This finding should be considered in all other invasive
hemodynamic studies.
In terms of limitations in the study design, qRT-PCR data does not allow any
conclusion about the enzymes’ activity. Moreover, cGMP concentration determined in
carotid arterial serum does not necessarily reflect cGMP concentrations in portal
venous serum or intrahepatic cellular cGMP concentrations. Carotid arterial serum
was taken to ensure an adequate amount of serum for serum parameter analyses
and ELISA.

Discussion
90
For the microscopic quantification of the PDE5, stained liver tissue samples only
stained cells in the parenchyma were counted (see 3.4.3).
In conclusion, this part of the study contributes to the understanding of the
pathophysiology of PH and particularly its functional component. Not only marked
alterations in the key parameters of the NO-cGMP pathway, a key regulator of
vascular tone, but also loss of hepatic zoning were found in association with liver
cirrhosis. These changes support the hypothesis that sinusoids remain in a
contractile state, thereby contributing to PH.
4.5 Concluding Remarks The ongoing interest in PDE research since their discovery coincides with the
development of their inhibitors 122. The fact that PDEs exist ubiquitously in every cell
in the body, but with distinct cellular and subcellular distribution of the 11 PDE
families, provided new opportunities for selective therapeutic targets 154. For diseases
with an underlying vascular impairment, notably PDE5 has been described to
represent a promising target due to its presence in vascular smooth muscle cells and
in platelets, and its specific hydrolysis of cGMP 266.
Regarding the historical development of PDE5 inhibitors, sildenafil synthesized by
Pfizer was the first potent und selective PDE5 inhibitor that was finally marketed for
the therapy of erectile dysfunction 156, but zaprinast was the first compound ever
described for selective inhibition of PDE5 267. In vitro studies investigating human
corpus cavernosum tissue showed a sildenafil effect, which was around 240-fold
more potent at inhibiting PDE5 than zaprinast 268. Later on, two further PDE5
inhibitors, vardenafil and tadalafil, were developed and also approved for treatment of
erectile dysfunction and pulmonary hypertension 117,269,270,154. But whereas PDE5
inhibitors had been successfully launched in the therapy of erectile dysfunction and
pulmonary hypertension, their use in the management of PH still needs approval.
For this reason, in the current study the potential of PDE5 inhibitors in PH therapy
was further elucidated in the animal model of TAA-induced liver fibrosis/ cirrhosis. As
a basis, liver disease-induced hemodynamic changes in this model were determined,
before additional hemodynamic measurements were conducted to evaluate the
changes induced by the administration of the PDE5 inhibitor sildenafil. Moreover,

Discussion
91
biochemical analyses of alterations in the key parameters of the NO-cGMP pathway
were performed to extend the general understanding of the pathophysiology of PH,
emphasizing on the functional component. In summary, current findings suggest that
administration of PDE5 inhibitors might at least partly correct the intrahepatic
dysregulation of the NO-cGMP pathway and the associated changes in hepatic
hemodynamics. Hence, PDE5 inhibitors could present a promising adjunct in PH
therapy.
As a future perspective, the use of PDE5 inhibitors as an antifibrotic drug should also
be taken into account since a preliminary preclinical study showed that chronic
administration of the PDE5 inhibitor udenafil over 3 weeks exhibited antifibrotic
effects, probably due to HSC deactivation 218. Equivalent to the effects induced by
chronic administration of PDE5 inhibitors, chronic administration of sGC activators
also led to a decrease in PVP and antfibrotic effects in some initial preclinical studies 91,271,272. Thus, a combined therapy of PDE5 inhibitors and sGC activators could also
represent a favorable adjunct in PH therapy. Another interesting approach for a
future use of PDE5 inhibitors is the sinusoidal pressure hypothesis, which states that
an elevation of sinusoidal pressure is the major upstream event that initiates fibrosis 21. This hypothesis contradicts the commonly accepted opinion that pressure
changes are exclusively a consequence of liver cirrhosis, but assuming it turns out to
be true, the potential of PDE5 inhibitors would be further extended.
When it comes to clinical use of PDE5 inhibitors however, differences in clinical
pharmacology should be considered. For sildenafil, vardenafil and tadalafil
differences regarding pharmacokinetics and pharmacodynamics has been well
described in a review by Mehrotra et al 273. In short, sildenafil and vardenafil are very
similar in terms of their chemical structure, while tadalafil has a markedly different
structure 274. These chemical similarities and differences are reflected in the clinical
pharmacokinetics and pharmacodynamics of these compounds, which lead to
substance-specific properties 273,274. Appreciation of the latter is needed to ensure a
rational dosage and compound selection based on the individual needs of the patient 275. Moreover, treatment with PDE5 inhibitors can implicate adverse events, such as
headache, flushing, dyspepsia, rhinitis, and visual disturbances 155,276,154,277. The
latter were reported in particular in association with sildenafil and vardenafil
administration, and are most likely caused by their nonselectivity towards PDE6, an

Discussion
92
enzyme located in the retina 278,279,154. Tadalafil, on the other hand, shows a clearly
higher selectivity towards PDE5 relative to PDE6, which might explain the lower
frequency of visual disturbances associated with tadalafil administration 273,277. In
general, however, the use of PDE5 inhibitors for the treatment of erectile dysfunction
or pulmonary hypertension has been reported to be safe, effective and well-tolerated 280,270,277,281. Should they become approved prospectively for the treatment of PH in
liver cirrhosis patients, it should be considered that drug safety in this particular
setting is a more delicate matter. Since marked changes in terms of drug disposition,
metabolism, excretion and elimination might occur as a consequence of liver
cirrhosis, it can be challenging to determine how best to prescribe drugs, including
PDE5 inhibitors, or to predict drug-drug interactions in these patients 282–284.

Materials and Methods
93
5. Materials and Methods 5.1 Materials 5.1.1 Chemicals, Reagents and Other Matters
Chemicals / Reagents Manufacturer
b-mercaptoethanol (98+%)
EDTA (ethylenediamine tetraacetic
acid disodium) (99+%)
Entellan® mounting medium
ethanol (100%)
formalin solution
(neutral buffered, 10%)
hematoxylin
Histoacyrl®
InvitrogenTM SYBR® Green
phosphate buffered saline (PBS)
stevia liquid sweetener
thioacetamide
tris (trishydroxymethylamio-
methane) (99.8+%)
Tween® 20 solution
Sigma-Aldrich, Schnelldorf, Germany
Serva Electrophoresis, Heidelberg, Germany
Merck Chemicals, Darmstadt, Germany
Honeywell, Morris Plains, New Jersey
Sigma-Aldrich, Schnelldorf, Germany
Sigma-Aldrich, Schnelldorf, Germany
B. Braun Melsungen, Melsungen, Germany
Thermo Fisher Scientific, Waltham,
Massachusetts
Oxoide, Hampshire, England
Borchers fine food, Oyten, Germany
Sigma-Aldrich, Schnelldorf, Germany
Sigma-Aldrich, Schnelldorf, Germany
PanReac AppliChem, Darmstadt, Germany

Materials and Methods
94
5.1.2 Anaesthetics and Drugs
Anaesthetics / Drugs Manufacturer
Forene®
Heparin sodium (25000 I.E./5 ml)
Jonosteril®
Pentobarbital sodium
Pancuronium bromide (2mg/ml)
Revatio® (0.8mg/ml)
sodium chloride (0,9%)
AbbVie, Wiesbaden, Germany
ratiopharm, Ulm, Germany
Fresenius Kabi, Bad Homburg, Germany
Fagron, Barsbüttel, Germany
Inresa Arzneimittel, Freiburg, Germany
Pfizer, Berlin, Germany
B. Braun Melsungen, Melsungen, Germany
5.1.3 Antibodies, Kits, Primer, and Probes
Antibodies / Kits / Primer / Probes Manufacturer
anti-PDE5a-antibody (ab64179)
cDNA synthesis kit
cGMP ELISA kit (ab133052)
Dako EnVision® +, System-HRP
(DAB) kit
dNTP mix (10mM each)
primer
RNeasy® Plus Mini kit
Taq DNA polymerase kit
(Taq DNA polymerase: 500 units)
Abcam, Cambridge, UK
Thermo Fisher Scientific, Waltham,
Massachusetts
Abcam, Cambridge, UK
Dako, Glostrup, Denmark
Thermo Fisher Scientific, Waltham,
Massachusetts
Microsynth, Balgach, Switzerland
Qiagen, Hilden, Germany
InvitrogenTM, Thermo Fisher Scientific,
Waltham, Massachusetts

Materials and Methods
95
5.1.4 Consumables
Consumables Manufacturer
Bepanthen® eye and nose cream
catheter
(Tygon® R3607, ID 1.14 mm)
catheter PE-10
(PE, ID 0.28mm)
catheter PE-50
(Portex®, ID 0.58mm)
Cellstar® serological pipette
(5ml, 10ml, 50ml)
Cellstar® centrifuge tube
(15ml, 50ml)
cotton swab
culture dish (sterile, ID 60mm)
Discofix® C three-way tap
electrode gel
Eppendorf® reaction vessel
(1.5ml)
face mask
Feather® standard scalpel (sterile)
Foliodress® head cover
gauze compress (sterile)
Graseby® respiration sensor
gigasept® FF(new) disinfection
Bayer, Leverkusen, Germany
IDEX Health & Science, Wertheim, Germany
Becton Dickinson Primary Care Diagnostics,
Sparks, Maryland
Smiths medical International, Kent, UK
Greiner Bio-One, Frickenhausen, Germany
Greiner Bio-One, Frickenhausen, Germany
neoLab Migge, Heidelberg, Germany
Carl Roth, Karlsruhe, Germany
B. Braun Melsungen, Melsungen, Germany
Gello Geltechnik, Ahaus, Germany
Eppendorf, Hamburg, Germany
3M Health Care, St. Paul, Minneapolis
pfmmedical, Osaka, Japan
Hartmann, Heidenheim, Germany
Fuhrmann, Much, Germany
Medicare Health & Living, Kilmacanogue,
Ireland
Schülke & Mayr, Norderstedt, Germany

Materials and Methods
96
Infuvalve® non-return valve
KendallTM neonatal ECG
electrodes H207PG
Kodan® tincture disinfection
(forte, colorless)
LightCycler® 480, 96 well plate
LightCycler® 480, cover sheeting
Omnifix® F Solo syringes (1ml)
Omnifix® Solo syringes
(5ml, 10ml)
Original-Perfusor® syringes (50ml)
Original-Perfusor® line (2m)
Mini-Spike® filter (green)
mirco tube (1.5ml)
MoliNea® operation pad
Microtouch® latex cloves
(powder-free)
Microtouch® Nitratex® nitrile
cloves (powder-free)
Parafilm M®
pipette tips (10µl)
pipette tips (diverse)
reaction vessel (1.5ml)
sample tube
(2ml, DNA-, DNase-, RNA-free)
silicone hose (ID 5mm)
B. Braun Melsungen, Melsungen, Germany
Covidien-Medtronic, Minneapolis, Minnesota
Schülke & Mayr, Norderstedt, Germany
Roche, Basel, Switzerland
Roche, Basel, Switzerland
B. Braun Melsungen, Melsungen, Germany
B. Braun Melsungen, Melsungen, Germany
B. Braun Melsungen, Melsungen, Germany
B. Braun Melsungen, Melsungen, Germany
B. Braun Melsungen, Melsungen, Germany
Sarstedt, Nümbrecht, Germany
Paul Hartmann, Heidenheim, Germany
Ansell, Brussels, Belgium
Ansell, Brussels, Belgium
Bemis, Neenah, Wisconsin
Biozym Scientific, Oldendorf, Germany
Mettler-Toledo Rainin, Oakland, California
Greiner Bio-One, Frickenhausen, Germany
Biozym Scientific, Oldendorf, Germany
Ketterer & Liebherr, Freiburg, Germany

Materials and Methods
97
Seraflex® (EP 1.5 / USP 4/0)
screw caps with sealing ring
(yellow, DNA-, DNase-, RNA-free)
screw caps (white)
Sterican® cannula (22G, 30G)
surgical instruments
ultrasound gel Caleo
Versatus® peripheral venous
catheter (26G)
QIAshredder
QIAxpert slide
Serag-Wiessner, Naila, Germany
Biozym Scientific, Oldendorf, Germany
Sarstedt, Nümbrecht, Germany
B. Braun Melsungen, Melsungen, Germany
Aesculap, Tuttlingen, Germany
Caesar & Loretz, Hilden, Germany
Terumo, Eschborn, Germany
Qiagen, Hilden, Germany
Qiagen, Hilden, Germany
5.1.5 Apparatus
Apparatus Manufacturer
Data acquisition system
(HSE-USB-HAEMODYN)
DPC MicroMix 5 shaker
ECG and respiration monitoring
and gating system Model 1030
Eppendorf® table centrifuge
5417C
Eppendorf® table centrifuge
5424R
Eppendorf® Thermomixer
Compact
Eppendorf® Multipipette® plus
Hugo Sachs Elektronik - Havard Apparatus,
March-Hugstetten, Germany
DPC systems, Benbrook, Texas
SA instruments, Stony Brook, New York
Eppendorf, Hamburg, Germany
Eppendorf, Hamburg, Germany
Eppendorf, Hamburg, Germany
Eppendorf, Hamburg, Germany

Materials and Methods
98
Eppendorf® pipettes (diverse)
freezer (-20°C)
freezer (-80°C)
hair clipper / trimmer QC5115
Heraeus® Megafuge® 1.0
universal centrifuge
Ice-maker
IKA® magnetic mixer
(COMBIMAG RET)
isoflurane vapor 19.3
LightCycler® 480
laser doppler blood flow monitor
DRT4 with a Titanium tipped low
profile disc probe type DP8C
liquid nitrogen container (TR11)
microwave
MouseOx®Plus pulse oximeter
system
MR scanner BioSpec 94/21 URS
(preclinical, 9.4T)
operating light KL 1500 LCD
operation table rat type 872H with
homeothermic controller type 874
(230 vac)
oven 400 HY-E
Perfusor® fm syringe pump
Eppendorf, Hamburg, Germany
Liebherr, Ochsenhausen, Germany
Heraeus, Hanau, Germany
Philips, Singapore, Singapore
Thermo Fisher Scientific, Waltham,
Massachusetts
Hoshizaki Europe, Amsterdam, Netherlands
IKA-Werke, Staufen, Germany
Drägerwerk, Lübeck, Germany
Roche, Basel, Switzerland
Moor Instruments, Devon, UK
KGW-Isotherm, Karlsruhe, Germany
Siemens, Munich, Germany
Starr Life Sciences, Oakmont, Pennsylvania
Bruker, Ettlingen, Germany
Schott, Mainz, Germany
Hugo Sachs Elektronik - Havard Apparatus,
March-Hugstetten, Germany
Bachofer, Reutlingen, Germany
B. Braun Melsungen, Melsungen, Germany
Materials and Methods
99
Pipetboy pro (pipetting aid)
Pipetman® pipettes (diverse)
pressure infusion cuff (500ml)
pressure transducer ATP300
(arterial)
pressure transducer P75 type 379
(venous)
QIAxpert spectrophotometer
quadrature volume rat coil
BioSpin MRI (Item: RF RES 400 1
H 112/072 QUAD TR AD)
rodent ventilator type 7025
Rotiolabo® Economy magnetic
bars
TAM-A plugsys transducer
amplifier module type 705/1
Transonic® animal research
flowmeter T206 series with
perivascular flow probe type 2.5S
Vortex-Genie2
water recirculator
µQuantTM spectrophotometer
Zeiss Axioplan microscope
Integra Biosciences, Biebertal, Germany
Gilson, Middelton, Wisconsin
Droh, Mainz, Germany
Hugo Sachs Elektronik - Havard Apparatus,
March-Hugstetten, Germany
Hugo Sachs Elektronik - Havard Apparatus,
March-Hugstetten, Germany
Qiagen, Hilden, Germany
Bruker, Ettlingen, Germany
Ugo Basile, Gemonio, Italy
Carl Roth, Karlsruhe, Germany
Hugo Sachs Elektronik - Havard Apparatus,
March-Hugstetten, Germany
Transonic Systems, Ithaka, New York
Scientific Industries, Bohemia, New York
supplied from Bruker, Ettlingen, Germany
Bio Tek Instruments, Bad Friedrichshall,
Germany
Carl Zeiss Microscopy, Göttingen, Germany

Materials and Methods
100
5.1.6 Software
Software Manufacturer
HSE-Basic Data Acquisition
Software (BDAS) 1.5
KC4
LightCycler® 480 Software 1.5
MatLab® 14b
ParaVision 5.1
PC-sam 32
SPSS® software 23.0 / 24.0
STATA® software 14
QIAxpert Software 2.2.0.21
Hugo Sachs Elektronik - Havard Apparatus,
March-Hugstetten, Germany
Bio Tek Instruments, Bad Friedrichshall,
Germany
Roche, Basel, Switzerland
MathWorks, Natick, Massachusetts
Bruker, Ettlingen, Germany
SA instruments, Stony Brook, New York
IBM, Armonk, New York
StataCorp LLC, Lakeway Drive, Texas
Qiagen, Hilden, Germany
5.1.7 Animals
Animals Manufacturer
Sprague Dawley rats
Wistar rats
Charles River, Sulzfeld, Germany
Charles River, Sulzfeld, Germany

Materials and Methods
101
5.2 Methods
5.2.1 Laboratory Animals The laboratory animal research protocol was approved by the local institutional
animal care and use committee (Regierungspräsidium Freiburg, ref. no.: G-13/89)
Animal care was performed in accordance to the rules and regulations of the German
animal protection law and the animal care guidelines of the European community
(2010/63/EU). A total of 275 male rats, specifically 147 Sprague Dawley and 128
Wistar rats (Charles River) were studied (Table 26). All of them were clearly
recognizable from their permanent and unique identifiers using an ear punch code.
Rats were housed in individually ventilated cages in a laboratory animal facility and
received daily human care. Their body condition was documented at least three
times a week according to a self-established score sheet (see 7.1). All rats had free
access to food and water and were exposed to a 12:12-h light–dark cycle at an
ambient temperature of 22-25 °C.
Before starting any experiments, the rats were allowed to acclimatize to the ambient
conditions for at least one week.
5.2.2 Induction of Liver Disease with TAA 133 rats were left untreated, whereas 142 rats received thioacetamide (TAA) (Sigma-
Aldrich) to induce liver disease (Table 26). The protocol of liver fibrosis / cirrhosis
induction described previously by Li et al 163 was used. TAA was administered orally
via drinking water for 12 to 24 weeks. 2.5 ml liquid sweetener (stevia liquid
sweetener) was added per 750 ml drinking water to mask the bitter taste of TAA.
Starting with an initial dosage of 0.03% TAA (30 mg TAA / 100 ml) in the first week,
TAA administration was continued with an individual TAA dosage adjusted weekly
according to each rat’s body weight change. If a rat gained or lost more than 20 g
body weight per week, the dosage was increased or decreased by 0.015%
accordingly. An increase of the TAA dosage by 0.015% was done in rats with an
overall body weight increase of more than 60 g.

Materials and Methods
102
Table 26: Number of untreated and TAA-treated rats sorted by strain
Strain Untreated TAA-treated n total
Sprague Dawley 106 41 147
Wistar 27 101 128
n total 133 142 275
5.2.3 Noninvasive Hemodynamic Measurements 5.2.3.1 MR Scanning Before MR scanning was started rats were fasted for 1.5 h to avoid prandial effects
on portal flow parameters. Anesthesia was initiated in an animal induction chamber
using a mixture of 3% isoflurane (Forene®) and 97% oxygen. It was maintained with
an animal nose mask applied with a mixture of 1.5% isoflurane (Forene®) and 98.5%
oxygen at a flow rate of 0.6 l/min. Eye cream (Bepanthen® eye and nose cream) was
applied on the eyes of the rats to prevent desiccation. ECG electrode pads
(KendallTM neonatal ECG electrodes H207PGT) with applied conductive gel
(electrode gel) were fixed on the forepaws, and a respiration sensor (Graseby®) on
the abdomen. Both were connected with a monitoring and gating system (Model
1030). ECG and respiration rate (spontaneous breathing) were continuously
monitored by the corresponding software (PC-sam 32). The body temperature was
not determined, but a warm water recirculator (supplied from Bruker) was used to
keep it stable at 37 ± 0.5 °C during the measurement. Then rats were scanned using
a 9.4 T preclinical scanner (BioSpec 94/21 URS), a dedicated quadrature volume rat
coil with an inner diameter of 68 mm (BioSpin MRI, Item: RF RES 400 1 H 112/072
QUAD TR AD) and the corresponding software (ParaVision 5.1). (Figure 13)

Materials and Methods
103
Figure 13: Preparation of the rat for the MR measurements and insertion into
MR scanner
The following scanning protocol was tested for the evaluation of MR rat liver images
to assess the degree of liver fibrosis and to determine the cross-sectional areas and
mean flow velocities of the rats’ portal vein and abdominal aorta:
To get a morphological overview for the planning of the measurements, several
localizers were used in multiple orientations (Figure 1). Then an ECG- and
respiratory-gated T1-RARE axial sequence was acquired to determine the
morphological alterations induced by liver inflammation, fibrosis, or cirrhosis. These
included liver tissue density, nodules and liver surface. Parameters for the T1-RARE
were FoV: 4.5 x 6 cm, MTX: 256 x 336, TE/TR: 8.87 ms / 1555 ms, slice thickness: 1
mm and spatial resolution: 0.0176 x 0.0179 cm/pixel.
The T1-RARE was also used for the planning of the two flow-sensitive 2D PC-MR
sequences measuring the hemodynamic parameters in the portal vein and the
abdominal aorta in a single slice perpendicular to the respective vessels (Figure 14).
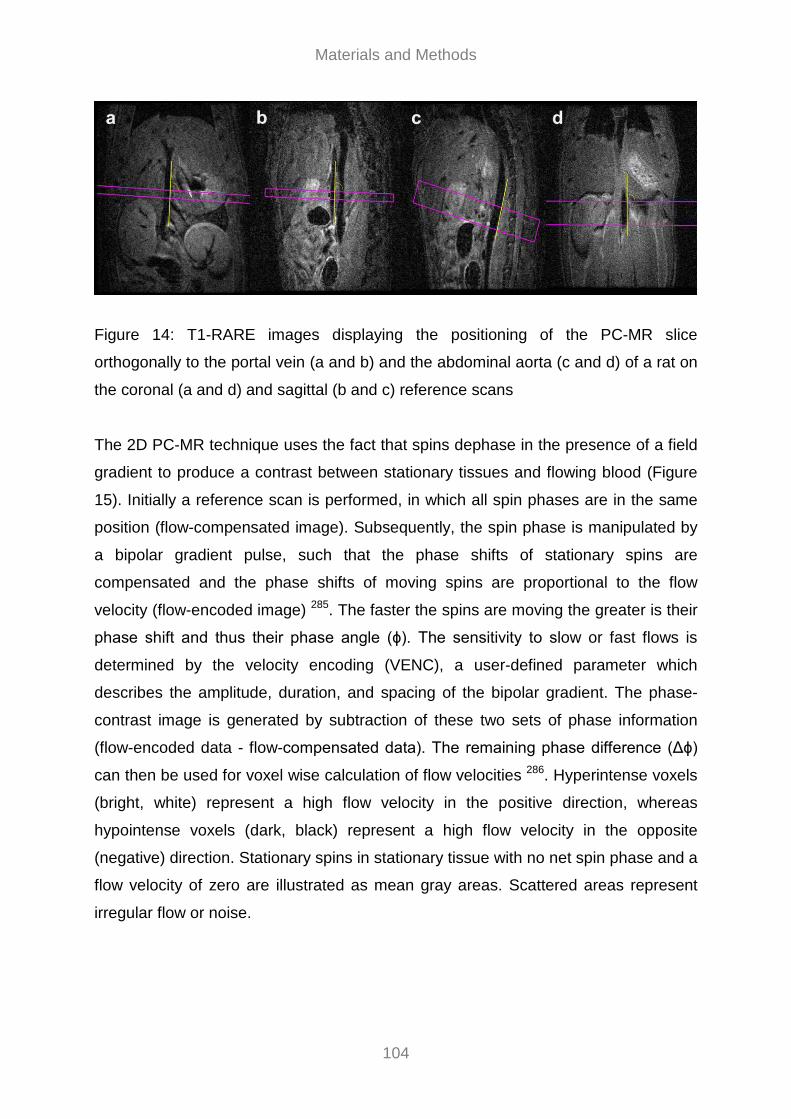
Materials and Methods
104
Figure 14: T1-RARE images displaying the positioning of the PC-MR slice
orthogonally to the portal vein (a and b) and the abdominal aorta (c and d) of a rat on
the coronal (a and d) and sagittal (b and c) reference scans
The 2D PC-MR technique uses the fact that spins dephase in the presence of a field
gradient to produce a contrast between stationary tissues and flowing blood (Figure
15). Initially a reference scan is performed, in which all spin phases are in the same
position (flow-compensated image). Subsequently, the spin phase is manipulated by
a bipolar gradient pulse, such that the phase shifts of stationary spins are
compensated and the phase shifts of moving spins are proportional to the flow
velocity (flow-encoded image) 285. The faster the spins are moving the greater is their
phase shift and thus their phase angle (ϕ). The sensitivity to slow or fast flows is
determined by the velocity encoding (VENC), a user-defined parameter which
describes the amplitude, duration, and spacing of the bipolar gradient. The phase-
contrast image is generated by subtraction of these two sets of phase information
(flow-encoded data - flow-compensated data). The remaining phase difference (Δϕ)
can then be used for voxel wise calculation of flow velocities 286. Hyperintense voxels
(bright, white) represent a high flow velocity in the positive direction, whereas
hypointense voxels (dark, black) represent a high flow velocity in the opposite
(negative) direction. Stationary spins in stationary tissue with no net spin phase and a
flow velocity of zero are illustrated as mean gray areas. Scattered areas represent
irregular flow or noise.
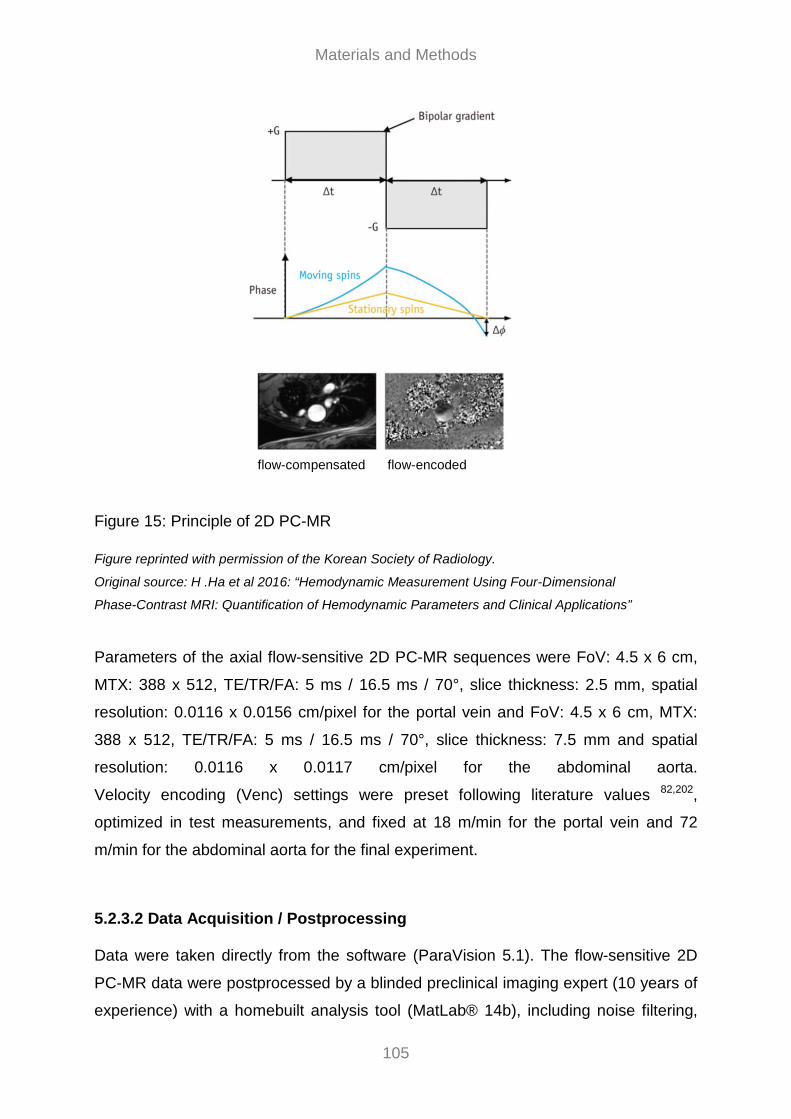
Materials and Methods
105
Figure 15: Principle of 2D PC-MR Figure reprinted with permission of the Korean Society of Radiology.
Original source: H .Ha et al 2016: “Hemodynamic Measurement Using Four-Dimensional
Phase-Contrast MRI: Quantification of Hemodynamic Parameters and Clinical Applications”
Parameters of the axial flow-sensitive 2D PC-MR sequences were FoV: 4.5 x 6 cm,
MTX: 388 x 512, TE/TR/FA: 5 ms / 16.5 ms / 70°, slice thickness: 2.5 mm, spatial
resolution: 0.0116 x 0.0156 cm/pixel for the portal vein and FoV: 4.5 x 6 cm, MTX:
388 x 512, TE/TR/FA: 5 ms / 16.5 ms / 70°, slice thickness: 7.5 mm and spatial
resolution: 0.0116 x 0.0117 cm/pixel for the abdominal aorta.
Velocity encoding (Venc) settings were preset following literature values 82,202,
optimized in test measurements, and fixed at 18 m/min for the portal vein and 72
m/min for the abdominal aorta for the final experiment.
5.2.3.2 Data Acquisition / Postprocessing Data were taken directly from the software (ParaVision 5.1). The flow-sensitive 2D
PC-MR data were postprocessed by a blinded preclinical imaging expert (10 years of
experience) with a homebuilt analysis tool (MatLab® 14b), including noise filtering,
flow-compensated flow-encoded

Materials and Methods
106
correction for eddy currents and Maxwell terms, as well as velocity antialiasing 287.
2D PC-MR slices which were positioned orthogonally to the portal vein and the
abdominal aorta enabled the selection of the region of interest (ROI) of the two
vessels. Since ROI is equivalent to the vessel’s cross-sectional area, it was multiplied
by the corresponding flow velocity to calculate the flow volume rate (‘Volume rate =
Area * Velocity’) of the portal vein and the abdominal aorta for a cardiac cycle.
5.2.3.3 MR Assessment of the Degree of Liver Fibrosis Rat livers were scored via T1-RARE cross-sectional images based on morphological
hallmarks such as increased nodularity and irregular tissue appearance. The self-
established MR score is derived from the semiquantitative histological five-level
Desmet score (see 5.2.7.1). Only a four-level scoring system was used for the MR
score, as the difference between the first two levels described in the Desmet score is
not detectable with an MR approach. A blinded preclinical imaging expert performed
the evaluation of the MR rat liver images with the MR score (Figure 16): MR score=0:
no visible irregularities, MR score=1: minor irregularities and small nodular structures,
MR score=2: more prominent irregularities, solitary medium sized to large nodular
structures, and MR score=3: severe irregularities and prominent nodular structures
throughout the liver.
An independent and blinded radiologist repeated the MR scoring of the rat livers to
assess interobserver variability.

Materials and Methods
107
Figure 16: T1-RARE images showing morphological hallmarks of the MR score, such
as increased nodularity and irregular tissue appearance (arrows) with MR score=0:
no visible irregularities (a), MR score=1: minor irregularities and small nodules (b),
MR score=2: more prominent irregularities and medium-sized nodules (c), and MR
score=3: severe irregularities and prominent nodules (d)
5.2.4 Invasive Hemodynamic Measurements 5.2.4.1 Operative Procedure Before the invasive hemodynamic measurements were started rats were fasted for
1.5 h to avoid prandial effects on portal flow parameters. If rats have already passed
the MR measurements, they were again invasively measured two or three days after
scanning. Anesthesia was initiated in an animal induction chamber using a mixture of
3% isoflurane (Forene®) and 97% oxygen. It was maintained by an intraperitoneally
injected bolus of 0.3 - 0.4 ml pentobarbital [125 mg/ml] (pentobarbital sodium). After
having verified the depth of anesthesia, rats were shaved (hair clipper / trimmer
QC5115) and fixed on a homeothermic controlled operating table (Typ 872H), which
kept body temperature stable at 37 ± 0.5 °C. Vital parameters (i.e. heart and
respiration rates (HR), oxygen saturation) were determined by a pulse oximeter
(MouseOx®Plus) which was fixed on a hind paw.

Materials and Methods
108
After thorough disinfection (Kodan®) of the front neck region, a tracheotomy was
performed and a tracheal cannula was inserted. Since rats were mechanically
ventilated [50 breaths/min] (Rodent Ventilator Typ 7025), a muscle relaxation was
induced by intraperitoneal injection of 0.5 ml pancuronium [0.4 mg/ml] (pancuronium
bromide) to prevent spontaneous breathing.
To monitor central venous pressure (CVP) the right external jugular vein was
exposed and cannulated with PE-10 tubing (Becton Dickinson), which was positioned
near the right atrium. A second PE-10 tubing was inserted and was used to
compensate evaporative losses during the surgical procedure by a continuous
infusion of isotone electrolyte solution [1 ml/h] (Jonosteril®). The electrolyte solution
was enriched with pentobarbital [15 mg/ml] to ensure continuous anesthesia. Both
tubings were fixed with a ligature. To monitor mean arterial pressure (MAP) the left
carotid artery was exposed and cannulated with PE-50 tubing (Portex®). This tubing
was fixed with a ligature and was also used for the blood withdrawal at the end of
measurements (Figure 17). The surgical site around the front neck region was then
covered with wet gauze compress to avoid drying.
After thorough disinfection (Kodan®) of the abdomen, a median laparotomy (Figure
17) was performed and the portal vein was exposed. To measure the portal flow
volume rate an ultrasonic transit time flow probe (Transonic Animal Research
Flowmeter T206 with perivascular flow probe type 2.5S) was placed at the portal
vein, loosely encircling the vessel, before ultrasound gel (Caelo) was applied. After a
stabilization period of 10 to 15 minutes portal flow volume rate was measured over
five minutes without any intervention given, but presupposing a stable MAP.
The flow probe consists of a probe body which houses two ultrasonic transducers
and a probe reflector. The latter is positioned on one side of the vessel of interest,
whereas the two transducers are positioned on the opposite side. The first transducer
emits an ultrasonic beam that traverse the full width of the vessel. This beam is then
reflected by the probe reflector and captured by the second transducer. The time the
beam needs to travel from the first to the second transducer is termed “transit time”.
Basically, the beams traveling back and forth alternately cross the flowing blood in
upstream and downstream direction. During the upstream measurement the beam
travels against flow, and the resulting transit time is increased by a flow-dependent
factor. In contrast, during the downstream measurement, the beam travels with flow,

Materials and Methods
109
and the resulting transit time is reduced by the same flow dependent factor. The
subtraction of the upstream from the downstream integrated transit times provides an
accurate measure of the flow volume rate. Since the transit time is determined across
the cross section of the vessel, the flow volume rate is determined independently of
the vessel diameter 288.
To monitor portal venous pressure (PVP) the ultrasonic transit time flow probe was
removed and a peripheral venous catheter (Versatus®) was inserted into the portal
vein and fixed with a tissue adhesive (Histoacyrl®). In addition, a microvascular flow
probe (Laser Doppler blood flow monitor DRT4 with a Titanium tipped low profile disc
probe type DP8C) was set on the surface of the left liver lobe to determine
microvascular flow (MF). Thereby a laser beam (785 nm) emitted from the optic fiber
penetrates the liver tissue starting from the liver surface. The laser light emitted
interacts randomly with both, moving objects (primarily erythrocytes) and stationary
tissue. If the light hits a moving erythrocyte it is reflected in a different frequency and
magnitude of the wavelength (scatter) than it is emitted, i.e. a Doppler shift occurs. In
contrast, if the light is reflected from stationary tissue it remains unchanged. The light
changes induced by moving erythrocytes are detected by a photosensitive optic fiber
on the liver surface and returned to a photodetector and the signal processing
electronics. The Laser-Doppler system analyses the Doppler shift and calculates flux
values, a quantity proportional to the product of the average velocity of the
erythrocytes and their number concentration. Hence, erythrocyte motion in the
outmost layer of liver tissue was measured continuously. To provide consistent
measurements for all tissue types, the probes were calibrated with a motility standard
supplied with the monitoring system. The motility standard consists of a low
concentration of polystyrene microspheres in water undergoing thermal motion
(Brownian motion).

Materials and Methods
110
Figure 17: Insertion of catheter for MAP measurements and laparotomy.
A more detailed photo series of the operative procedure has been attached (see 7.2).
As a second measure, in addition to the homeothermic controlled operating table, the
torso of the rats was covered with aluminum foil to prevent it from becoming
hypothermic. After a stabilization period of 10 to 15 minutes, basal values of all
parameters were obtained and the intervention was administered through the second
CVP-tubing. The intervention was either sodium chloride (B. Braun Melsungen,
Melsungen, Germany) or sildenafil (Revatio®, Pfizer, Berlin, Germany). Rats were
randomly allocated in one of three intervention groups: sodium chloride (NaCl),
sildenafil 0.1 mg/kg (Sil 0.1 mg/kg) or sildenafil 1 mg/kg (Sil 1mg/kg). To minimize
hemodynamic alterations due to plasma volume changes, the intervention was
applied in a standardized volume of 600 µl.
To monitor arterial and venous pressures invasively, a solid column of liquid
connecting blood to the pressure transducer (ATP300 (arterial) or P75 type 379
(venous)) is required. Therefore tubings are be pre-filled with a heparinized isotone
electrolyte solution (Jonosteril®). The heparin sodium prevents occlusion of the
tubing due to thrombosis. The liquid within the tubing is in contact with a flexible
diaphragm which is located within the pressure transducer. The diaphragm moves in
response to the transmitted pressure waveform. The pressure transducer then
converts this movement into a proportional electrical signal (voltage, e.g.
5mV/V/mmHg), being enhanced by an amplifier module and send to the data
acquisition system (HSE-USB-HAEMODYN).

Materials and Methods
111
The high calibration point of the pressure transducers was calibrated with a pressure
manometer at 100 mmHg. Zero point calibration was performed 1 cm above the
operating table (heart height) by opening the pressure transducer to atmospheric
pressure and electronically zeroing the system.
Using the data acquisition system (HSE-USB-HAEMODYN) and the corresponding
software (HSE-Basic Data Acquisition Software (BDAS) 1.5) all measured
parameters were monitored continuously. Portal flow volume rate was recorded over
5 minutes before the intervention was applied. All other parameters (i.e. heart and
respiration rate, oxygen saturation rate, CVP, MAP, PVP, microvascular flow) were
recorded over 60 minutes starting from time point “0min”. Right after determining
baseline values the intervention took place. Data were taken directly from the
software (BDAS).
5.2.5 Serum Analyses
5.2.5.1 Serum Parameters At the end of the invasive hemodynamic measurements blood samples were taken
via the left carotid artery. Serum was used for the analysis of the following serum
parameters by semi-automated clinical routine methods: glucose (Glc), sodium (Na),
potassium (K), total bilirubin (Bil), creatinine (Crea), albumin (Alb), aspartate amino-
transferase (AST), alanine aminotransferase (ALT), and alkaline phosphatase (AP).
5.2.5.2 Competitive cGMP Enzyme-linked Immunosorbent Assay (ELISA) A second serum sample was stored at −80 °C until used for the quantification of
cGMP concentrations. After defrosting, an in vitro competitive ELISA was performed
according to the manufacturers’ instructions of the cGMP ELISA kit (Abcam
ab133052). In total, two kits, including one 96 well plate each, were used. Each
sample was assayed in duplicates. In each set of experiments a standard curve was
assayed for calibration using standard serial dilution. In addition to the serum
samples, a negative control (blank) and two positive controls (two different standard
samples) were included. One out of these two positive controls was applied in six
replicates to determined inter- and intra-assay variability.

Materials and Methods
112
A goat anti-rabbit IgG capture antibody (secondary antibody) has been precoated
onto the wells. 100 µl of standard or serum samples (undiluted, non-acetylated) were
incubated togheter with 50 µl of an alkaline phosphatase (AP)-conjugated cGMP
antigen and 50 µl of a polyclonal rabbit cGMP antibody (primary antibody) per well at
room temperature for two hours on a plate shaker at 500 rpm. Thereby the AP-
labeled antigens from the conjugate and the unlabeled antigens from the serum
sample compete for binding to the target specific antibody (primary antibody) which
in turn binds to the capture antibody (secondary antibody).
After incubation, the excess reagents (unbound antibodies and other biological
materials) were removed by three wash steps using each 400 µl wash buffer per well.
Then 200 µl of substrate solution were applied and incubated at room temperature
for one hour without shaking. As a phosphatase substrate p-Nitrophenylphosphate
(pNpp) is used, which turns yellow, when dephosphorylated by ALP. The intensity of
the color change is inversely proportional to the amount of cGMP in the well. To
quench the enzyme reaction, 50 µl stop solution were pipetted into each well.
Immediately after, optical density absorbance at 405 nm was read using a scanning
microplate spectrophotometer (µQuantTM) and the corresponding software (KC4).
The fluorescence data were taken directly from the software (KC4). Since each
sample was assayed in duplicates, mean values of cGMP concentration were
determined and used for further statistical calculations.
5.2.6 Two-step Quantitative Real-time Polymerase Chain Reaction (qRT-PCR) Sample preparation, mRNA extraction, and cDNA synthesis At the end of the invasive hemodynamic measurements, the left lateral lobe of each
rat’s liver was excised, cut into pieces, snap frozen in liquid nitrogen, and stored at
−80 °C until used for qRT-PCR. qRT-PCR was used to quantified hepatic gene
expression of endothelial and inducible NO synthase (eNOS and iNOS),
phosphodiesterase 5 (PDE5), soluble guanylate cyclase subunits a1 and b1 (sGCa1
and sGCb1). Therefore appropriate primer pairs (Table 27) were designed in
advance using NCBI Primer-BLAST (www.ncbi.nlm.nih.gov/tools/primer-blast), which
were then manufactured (Microsynth).

Materials and Methods
113
Table 27: Nucleotide sequences of forward and reverse primers.
Gene Forward primer (5´-3´) Reverse primer (5´-3´) Product length (bp)
eNOS 5'-AAGTGGGCAGCATCACCTAC-3´
5´-GCCTGGGAACCACTCCTTTT-3´
211
iNOS 5´-CTCACTGGGACTGCACAGAA-3´
5´-TGTTGAAGGGTGTCGTGAAA-3´
128
PDE5 5´-GCGGAGGAAGAAACAAGGGA-3´
5´-ATCGGCAAAGAACCTCGTGT-3´
196
sGCa1 5´-GCCCCACGACATACAGGTTA-3´
5´-GCGGCTCACTAATCTACCCC-3´
229
sGCb1 5´-AATTACGGTCCCGAGGTGTG-3´
5´-ACCAGCATTGAGGTTGAGGAC-3´
147
18sRNA (reference)
5´-GTAACCCGTTGAACCCCATT-3´
5´-CCATCCAATCGGTAGTAGCG-3´
151
srsf4 (reference)
5´-GGTTCTGGACGCAGTGGATA-3´
5´-CTCCTTCGTTTTTGCGTCCC-3´
193
Hepatic total mRNA extraction was performed according the manufacturer’s
instructions of the mRNA extraction kit (RNeasy® Mini Kit).
For mRNA extraction RNase-free materials, water and ethanol were used, since the
thermostable and ubiquitous occurring RNase leads to a rapid mRNA degradation. In
addition a thorough disinfection of the work area using ethanol (70%) was essential.
Initially, a maximum of 20 µg liver tissue was placed in a tube filled with 350 µl buffer
(RLT), containing 1% b-mercaptoethanol. In there, the tissue was ground with a
thoroughly disinfected pestle. After tissue disruption, the lysate was pipetted directly
into an eliminator column (QIAshredder) and centrifuged (2 min / 15.000 rpm / 24 °C)
for homogenization. Then 350 µl ethanol (70%) were added to the cleared lysate and
mixed by pipetting. 700 µl of the sample were pipetted directly into a spin column
(RNeasy®) and centrifuged (10 sec / 10.000 rpm / 24 °C). The flow-through was
discarded. 700 μl buffer (RW1) were added to the spin column and centrifuged (15
sec / 10.000 rpm / 24 °C) to wash the spin column membrane. After centrifugation,
the spin column was removed carefully avoiding contact with the flow-through which
was then discarded. In the next step, 500 μl buffer (RPE), diluted with ethanol
(100%), were added to the spin column and centrifuged (15 sec / 10.000 rpm / 24
°C). Again the flow-through was discarded. This wash step was repeated with a
longer centrifugation (2 min / 10.000 rpm / 24 °C) to dry the spin column membrane.

Materials and Methods
114
Hence, it was ensured that no ethanol was carried over during RNA elution, since
residual ethanol could interfere with downstream reactions. After centrifugation, the
spin column was removed carefully avoiding contact with the flow-through and placed
into a new collection tube. Finally 50 µl RNase-free water was added directly to the
spin column membrane and centrifuged (1.5 min / 10.000 rpm / 24 °C) to elute the
mRNA.
In the next step, the capillary channels of a disposable microfluidic slide (QIAxpert
slide) were loaded with 4 µl of each mRNA sample. mRNA concentration was
determined using a microfluidic spectrophotometer (QIAxpert reader) and the
corresponding software (QIAxpert Software 2.2.0.21). No additional mRNA
purification was needed.
The reverse transcription of mRNA into cDNA as well as the PCR amplification was
performed according to the manufacturer’s instructions of the RT-PCR kit (First
Strand cDNA Synthesis Kit).
For cDNA synthesis 1 µg hepatic mRNA and 1µl random hexamer primer were
pipetted into a reaction vessel before RNase-free water was added up to a final total
volume of 11 µl. The components were mixed by pipetting.
Then a master mix was prepared containing the following components (amounts are
given per well):
• 4 µl 5x reaction buffer
• 1 µl RiboLock RNase inhibitor (20U/µl)
• 2 µl 10 mM dNTP mix
• 2 µl M-MuLV reverse transcriptase (20U/µl)
Again the components were mixed by pipetting before 11 µl of the mRNA / primer
mixture were added to 9 µl of the master mix. Once again components were mixed
by pipetting. Afterwards samples were incubated for 5 min at 25 °C, 60 min at 37 °C
and for 5 min at 70 °C. After sample incubation, 20 µl of RNase-free water were
added and components were mixed by pipetting. The resulting final total volume of
40 µl of first strand cDNA synthesis reaction mixture was stored at -20 °C until used
for subsequent qRT-PCR runs.

Materials and Methods
115
qRT-PCR For the qRT-PCR runs a second master mix was prepared containing the following
components (amounts are given per well):
• 2 µl PCR buffer
• 0.3 µl 10 mM dNTP mix
• 1.25 µl 50 mM MgCl2
• 2 µl DMSO
• 0.25 µl forward primer
• 0.25 µl reverse primer
• 0.2 µl Taq DNA polymerase
• 0.2 µl SYBER Green
• 12.55 µl RNase-free water
The components were mixed by pipetting before 1 µl of the defrosted first strand
cDNA synthesis reaction mixture was added to 19 µl of the master mix. Again
components were mixed by pipetting. Hence, PCR runs were carried out in a final
total volume of 20 μl. In total, five 96 well plates were used. Each sample was
assayed in duplicates. Furthermore, a negative control (water bidest blank) was
included in each set of experiments. The PCR runs were performed under defined
thermocycling conditions (Table 28) using a thermocycler (LightCyler® 480) and the
corresponding software (LightCycler® 480 Software 1.5).
Table 28: Thermocycling conditions for qRT-PCR runs
Step Temperature Time
initial denaturation for one cycle
denaturation
annealing for 40 cycles
elongation
94 °C
94 °C
60 °C
72 °C
3 min
30 sec
30 sec
40 sec
melt-curve gradient from 65 °C - 95 °C in 0.5 °C
increments (5 sec each)

Materials and Methods
116
During the PCR run cDNA amplification is detected in real time by accumulation of an
emitted fluorescence signal. First, during the denaturation step, all double-stranded
DNA (dsDNA) is separated into single-stranded DNA (ssDNA) which prevents
occurrence of a fluorescence signal. During the annealing step the forward and
reverse primers hybridize to the template cDNA strands and form little segments of
dsDNA. The SYBER Green binding dye immediately intercalates into all dsDNA
present in the sample. During the elongation step the DNA polymerase starts to
elongate these new dsDNA segments and more SYBER Green can intercalate. At
the end of each elongation step, when the maximum amount of SYBER Green has
intercalated, the fluorescence signal is measured (excitation at 465 nm / detection at
510 nm). This fluorescence signal is proportional to the amount of dsDNA
synthesized. However, the presence of a perpetual background fluorescence signal
has to be taken into account for the quantification of cDNA amplification. Therefore it
is essential to assess the Ct (threshold cycle) which marks the beginning of the
exponential increase of the reaction curve and is defined as the number of cycles
being required for the fluorescence signal to cross the background fluorescence
signal (threshold). The Ct is inversely proportional to the amount of cDNA present in
the sample. This method, however, assumes that the PCR is operating at 100%
efficiency, meaning the amount of cDNA doubles with each amplification cycle.
Since SYBER Green intercalates nonspecifically into all dsDNA present, a final melt-
curve step was included post-PCR to ensure that there are no nonspecific
amplification products.
The fluorescence data were taken directly from the software (LightCycler® 480
Software 1.5). Levels of gene expression were quantified relatively with the
comparative Ct method 289. To use the comparative Ct method, a validation
experiment was run in advance to show that the efficiencies of the gene
amplifications of the target (gene of interest) and the reference (endogenous control)
are approximately equivalent. Thereby the need of a standard curve for calibration
was eliminated.
Since each sample was assayed in duplicates, mean Ct values for all target and
reference genes were calculated (Ct). The individual mRNA levels in the samples
were normalized for the two reference genes 18sRNA (a ribosomal subunit) and
srsf4 (a splicing factor) by calculating the difference between Ct target gene and Ct

Materials and Methods
117
reference gene (ΔCt). Both reference genes were expressed stably in all groups. The
result was finally calculated as “fold expression” of the samples in terms of the
control as 2-ΔΔCt which is defined as follows:
2-ΔΔCt = [(Ct target gene - Ct reference gene (ΔCt)) sample A
- [(Ct target gene - Ct reference gene) sample B (ΔCt))] 290.
5.2.7 Histology
5.2.7.1 Assessment of the Degree of Liver Fibrosis Instantly at the end of the invasive hemodynamic measurements, the median lobe of
each rat’s liver was excised. A cross-section of the median lobe was fixed in 10%
neutral buffered formalin (Sigma-Aldrich) and embedded in paraffin. Serial step
sections were semi-automatically stained for hematoxylin-eosin, sirius red, reticulin,
periodic acid-schiff diastase and iron. Fibrosis was evaluated semiquantitatively
according to the five-level score described previously by Desmet et al 82. A blinded
pathologist performed the cross-sections and the histological evaluation of the liver
tissue sections with the Desmet score (DS): DS=0: no fibrosis, DS=1: mild fibrosis,
DS=2: moderate fibrosis, DS=3: severe fibrosis, and DS=4: cirrhosis.
In addition, the development of cholangiocellular carcinoma (CCCs) was determined
based on histomorphological criteria (i.e. degree of cytological atypia and
desmoplastic stroma reaction).
5.2.7.2 Immunohistochemical (IHC) PDE5 Staining Paraffin-embedded liver tissue sections were furthermore used for PDE5 protein
detection and localization. Therefore, immunohistochemical staining was performed
with an polyclonal rabbit anti-PDE5A-antibody (Abcam ab64179) using the polymer
chain two-step indirect technique according to the manufacturers’ instructions of the
Dako EnVision® +, System-HRP (DAB) kit (Dako).
Deparaffinization / Rehydration
To enable staining the paraffin-embedded sections had to be deparaffinized and
rehydrated first. Therefore sections were heated overnight at 60 °C in an oven
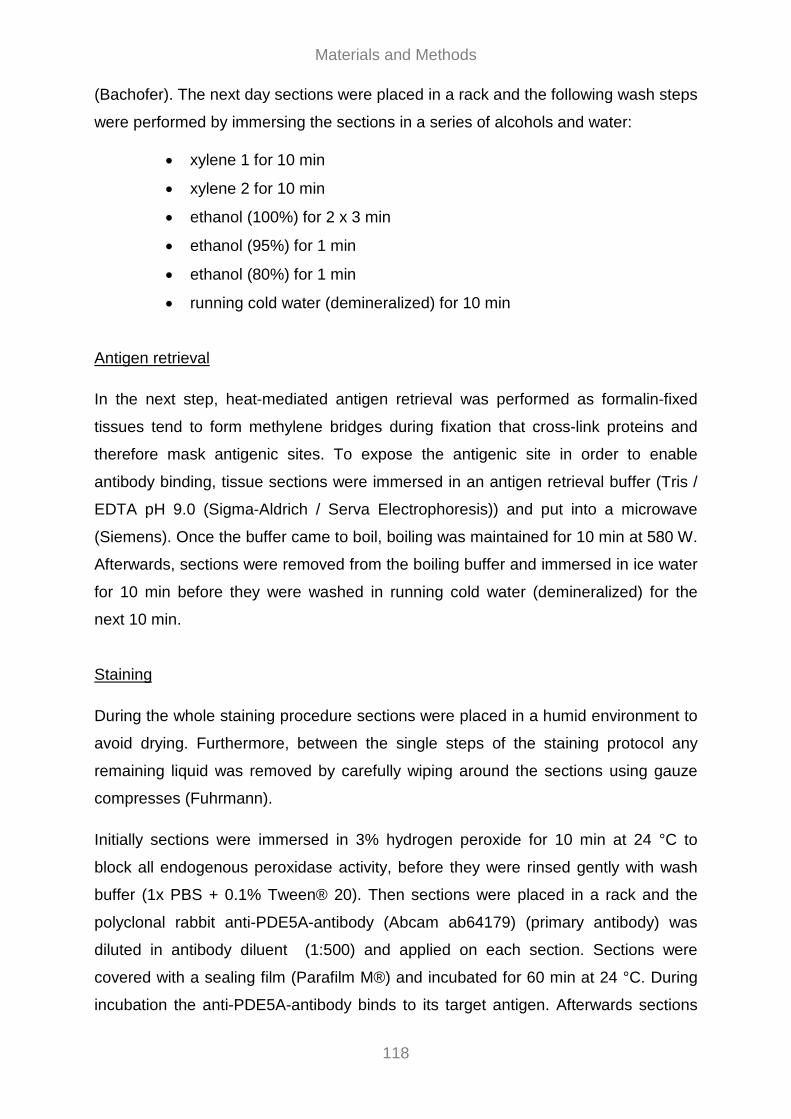
Materials and Methods
118
(Bachofer). The next day sections were placed in a rack and the following wash steps
were performed by immersing the sections in a series of alcohols and water:
• xylene 1 for 10 min
• xylene 2 for 10 min
• ethanol (100%) for 2 x 3 min
• ethanol (95%) for 1 min
• ethanol (80%) for 1 min
• running cold water (demineralized) for 10 min
Antigen retrieval
In the next step, heat-mediated antigen retrieval was performed as formalin-fixed
tissues tend to form methylene bridges during fixation that cross-link proteins and
therefore mask antigenic sites. To expose the antigenic site in order to enable
antibody binding, tissue sections were immersed in an antigen retrieval buffer (Tris /
EDTA pH 9.0 (Sigma-Aldrich / Serva Electrophoresis)) and put into a microwave
(Siemens). Once the buffer came to boil, boiling was maintained for 10 min at 580 W.
Afterwards, sections were removed from the boiling buffer and immersed in ice water
for 10 min before they were washed in running cold water (demineralized) for the
next 10 min.
Staining
During the whole staining procedure sections were placed in a humid environment to
avoid drying. Furthermore, between the single steps of the staining protocol any
remaining liquid was removed by carefully wiping around the sections using gauze
compresses (Fuhrmann).
Initially sections were immersed in 3% hydrogen peroxide for 10 min at 24 °C to
block all endogenous peroxidase activity, before they were rinsed gently with wash
buffer (1x PBS + 0.1% Tween® 20). Then sections were placed in a rack and the
polyclonal rabbit anti-PDE5A-antibody (Abcam ab64179) (primary antibody) was
diluted in antibody diluent (1:500) and applied on each section. Sections were
covered with a sealing film (Parafilm M®) and incubated for 60 min at 24 °C. During
incubation the anti-PDE5A-antibody binds to its target antigen. Afterwards sections
Materials and Methods
119
were rinsed gently with wash buffer (1x PBS (Oxoide) + 0.1% Tween® 20 (PancReac
AppliChem)) before 1 to 2 drops of a peroxidase labelled polymer, which was
conjugated to a goat anti-rabbit IgG capture antibody (secondary antibody), were
applied on each section. Sections were covered with a sealing film (Parafilm M®) and
incubated for 60 min at 24 °C. During incubation the capture antibody reacts with the
anti-PDE5A-antibody, which has already bound to its target antigen. The labelled
polymer does not contain avidin or biotin, thus any nonspecific staining as a
consequence of endogenous avidin-biotin activity in the liver is eliminated or
significantly reduced. Afterwards sections were rinsed gently with wash buffer (1x
PBS (Oxoide) + 0.1% Tween® 20 (PancReac AppliChem)). In the next step
substrate-chromogen solution (DAB) was applied on each section and incubated for
10 min at 24 °C. During incubation antibody binding is visualized on the basis of the
occurring brown color reaction. Once more sections were rinsed gently with wash
buffer (1x PBS + 0.1% Tween® 20). (Figure 18)
Figure 18: Principle of the polymer two-step indirect technique for immunhisto-
chemical staining.
Figure reprinted with permission of Sudhanshu Goyal, employee of BioGenex.
Original source: http://www.biogenex.com/us/detection-systems (July 24, 2017)
To provide contrast that helps the primary stain stand out, a hematoxylin nuclear
counterstaining step was performed in which sections were incubated in filtered
hematoxylin (Sigma-Aldrich) for 5 min at 24 °C.

Materials and Methods
120
Dehydration
After the hematoxylin counterstaining sections were dehydrated. Therefore the
following wash steps were performed by immersing the sections in water and a
series of alcohols:
• running cold water (demineralized) for 5 min
• ethanol (80%) for 5 min
• ethanol (95%) for 5 min
• ethanol (100%) for 2 x 5 min
• xylene 2 for 10 min
• xylene 1 for 10 min
Finally, sections were mounted and coverslipped using a mounting medium
(Entellan®).
Microscopic analysis
For microscopic quantification (Zeiss Axioplan microscope) the number of stained
cells was counted in 20 random high power-fields (HPF) (400x magnification) for
each sample. Exclusively stained cells in the parenchyma were included in cell
counts, whereas PDE5 staining around the central vein (CON 1) and in fibrous
connective tissue (CIR 1 and CIR 2) was not considered.
5.2.8 Statistics Results were expressed as median ± interquartile range (IQR). Only results of the
qRT-PCR experiments were expressed as mean ± standard deviation (SD) to enable
the quantification of gene expression with the comparative Ct method.
To determine differences among groups or subgroups for the measured parameters,
the non-parametric Kruskal-Wallis test was used. Post-hoc pairwise comparisons
between groups or subgroups 179 were corrected for multiple comparisons according
to Bonferroni. For reasons of consistency the non-parametric Kruskal-Wallis test and
post-hoc pairwise comparisons with Bonferroni correction were also used for the
qRT-PCR experiments. A two-tailed p-value of < 0.05 was considered as statistically
significant.
Materials and Methods
121
For statistical analyses SPSS® software 23.0 (IBM Corp., Armonk, New York) was
used, only the regression analysis was calculated with STATA® software 14
(StataCorp LLC, Lakeway Drive, Texas).
Specific statistic information for each part of the study will be described in the
following.
Non-invasive hemodynamic measurements
To assess interobserver variability (2 readers) of the self-established MR score, a
weighted kappa analysis was performed. The kappa coefficient (ƙw) indicates the
strength of agreement and was categorized as follows: 0–0.20: slight; 0.21–0.40: fair;
0.41–0.60: moderate; 0.61–0.80: substantial; and 0.81–1.00: almost perfect 291.
Correlations were calculated using Spearman’s rank correlation coefficient (rs).
Invasive hemodynamic measurement
Invasive portal flow volume rate measurement
Correlations were calculated using Spearman’s rank correlation coefficient (rs).
Effect of sildenafil on hemodynamics
All parameters were normalized (PVPrel, MAPrel, MFrel and HRrel, CVPrel, respiration
raterel and oxygen saturationrel) to compensate differences in absolute values
between healthy and diseased rats. Thereby, time point “10 min” was taken as
baseline and set to 100% since the administration of 600 µl liquid volume into the
right atrium caused parameter variations for the next few minutes.
To evaluate the effect of sildenafil the change in parameter values at time point “60
min” compared to baseline (“10 min”) was determined by calculating relative median
of differences (RMD).
To illustrate the course of parameters during the measurement interval data of time
points 0, 1, 3, 5, 10, 20, 30, 45 and 60 min were chosen.

Materials and Methods
122
Effect of MAP on PVP
All parameters were normalized (PVPrel, MAPrel) to compensate differences in
absolute values between healthy and diseased rats. Thereby, time point “0 min” was
taken as baseline and set to 100%. The effect of MAP on PVP was evaluated by
linear regression analysis, including changes from baseline (“0 min”) for every
recorded time stamp (1 time stamp = 2 sec) over the first 30 minutes.
The change in PVPrel for every 1% change in MAPrel is described by the regression
coefficient (s), whereas the explained variation (%) within one rat is described by r-
squared (r²).
Biochemical investigations
Levels of gene expression were quantified relatively with the comparative Ct method 289. The individual mRNA levels in the samples were normalized for two reference
genes. Analyses of both, gene expressions and cGMP concentrations, were
performed in duplicates. Mean values of duplicates were used for further statistical
analyses.
For microscopic quantification of the immunohistochemical stainings, the number of
PDE5 stained cells was counted in 20 random high power fields (HPF) for each
tissue sample. Mean values of stained cells per HPF were used for further statistical
analyses.
123
6. References 1. Gao, B., Xu, M.-J. & Zhou, Z. Hepatocytes: a key cell type for innate immunity. Cellular &
Molecular Immunology 13, 301 (2015).
2. Si-Tayeb, K., Lemaigre, F. P. & Duncan, S. A. Organogenesis and Development of the Liver.
Developmental Cell 18, 175–189 (2010).
3. Muriel, P. Liver Pathophysiology: Therapies and Antioxidants. (Academic Press, 2017).
4. Brunt, E. M. et al. Pathology of the liver sinusoids. Histopathology 64, 907–920 (2014).
5. Lautt, W. W. Regulatory processes interacting to maintain hepatic blood flow constancy:
Vascular compliance, hepatic arterial buffer response, hepatorenal reflex, liver regeneration,
escape from vasoconstriction. Hepatol Res 37, 891–903 (2007).
6. Hilscher, M. & Sanchez, W. Congestive hepatopathy. Clinical Liver Disease 8, 68–71 (2016).
7. Eipel, C., Abshagen, K. & Vollmar, B. Regulation of hepatic blood flow: The hepatic arterial
buffer response revisited. World J Gastroenterol 16, 6046–6057 (2010).
8. Lautt, W. W. Hepatic Circulation: Physiology and Pathophysiology. (Morgan & Claypool Life
Sciences, 2009).
9. Rockey, D. C. The Molecular Basis of Portal Hypertension. Trans. Am. Clin. Climatol. Assoc.
128, 330–345 (2017).
10. Maini, M. K. & Knolle, P. A. Living in the liver: hepatic infections. Nature Reviews Immunology
12, 201 (2012).
11. Crispe, I. N. Hepatic T cells and liver tolerance. Nature Reviews Immunology 3, 51 (2003).
12. Poisson, J. et al. Liver sinusoidal endothelial cells: Physiology and role in liver diseases. Journal
of Hepatology 66, 212–227 (2017).
13. Iwakiri, Y., Shah, V. & Rockey, D. C. Vascular pathobiology in chronic liver disease and cirrhosis
– Current status and future directions. J Hepatol 61, 912–924 (2014).
14. Wake, K. & Sato, T. “The Sinusoid” in the Liver: Lessons Learned from the Original Definition by
Charles Sedgwick Minot (1900). Anat. Rec. 298, 2071–2080 (2015).
15. Rockey, D. C. Vascular mediators in the injured liver. Hepatology 37, 4–12 (2003).
16. Debbaut, C. et al. Analyzing the human liver vascular architecture by combining vascular
corrosion casting and micro-CT scanning: a feasibility study. J Anat 224, 509–517 (2014).
17. De Hert, S. Physiology of hemodynamic homeostasis. Best Practice & Research Clinical
Anaesthesiology 26, 409–419 (2012).
124
18. Gülberg, V., Haag, K., Rössle, M. & Gerbes, A. L. Hepatic arterial buffer response in patients
with advanced cirrhosis. Hepatology 35, 630–634 (2002).
19. Lautt, W. W., Legare, D. J. & d’Almeida, M. S. Adenosine as putative regulator of hepatic arterial
flow (the buffer response). Am. J. Physiol. 248, H331-338 (1985).
20. Lautt, W. W. Relationship between hepatic blood flow and overall metabolism: the hepatic
arterial buffer response. Fed. Proc. 42, 1662–1666 (1983).
21. Mueller, S. Does pressure cause liver cirrhosis? The sinusoidal pressure hypothesis. World J
Gastroenterol 22, 10482–10501 (2016).
22. Elpek, G. Ö. Cellular and molecular mechanisms in the pathogenesis of liver fibrosis: An update.
World J Gastroenterol 20, 7260–7276 (2014).
23. Zamora Nava, L. E., Aguirre Valadez, J., Chávez-Tapia, N. C. & Torre, A. Acute-on-chronic liver
failure: a review. Ther Clin Risk Manag 10, 295–303 (2014).
24. Pinzani, M., Rosselli, M. & Zuckermann, M. Liver cirrhosis. Best Practice & Research Clinical
Gastroenterology 25, 281–290 (2011).
25. Jepsen, P. Comorbidity in cirrhosis. World J Gastroenterol 20, 7223–7230 (2014).
26. Traber, P. G. et al. Regression of Fibrosis and Reversal of Cirrhosis in Rats by Galectin
Inhibitors in Thioacetamide-Induced Liver Disease. PLoS One 8, (2013).
27. Tetangco, E. P., Silva, R. & Lerma, E. Portal hypertension: Etiology, evaluation, and
management. Disease-a-Month doi:10.1016/j.disamonth.2016.08.001
28. Møller, S. & Bendtsen, F. Complications of cirrhosis. A 50 years flashback. Scandinavian Journal
of Gastroenterology 50, 763–780 (2015).
29. Puoti, C. The use of vasoconstrictors in patients with liver cirrhosis: how, when, why. Clinical
Management Issues 6, 105–115 (2012).
30. Ebrahimi, H., Naderian, M. & Sohrabpour, A. A. New Concepts on Pathogenesis and Diagnosis
of Liver Fibrosis; A Review Article. Middle East J Dig Dis 8, 166–178 (2016).
31. Cohen-Naftaly, M. & Friedman, S. L. Current status of novel antifibrotic therapies in patients with
chronic liver disease. Therap Adv Gastroenterol 4, 391–417 (2011).
32. Byass, P. The global burden of liver disease: a challenge for methods and for public health. BMC
Med 12, 159 (2014).

125
33. Krag, A., Wiest, R., Albillos, A. & Gluud, L. L. The window hypothesis: haemodynamic and non-
haemodynamic effects of β-blockers improve survival of patients with cirrhosis during a window
in the disease. Gut 61, 967–969 (2012).
34. Lozano, R. et al. Global and regional mortality from 235 causes of death for 20 age groups in
1990 and 2010: a systematic analysis for the Global Burden of Disease Study 2010. Lancet 380,
2095–2128 (2012).
35. Mokdad, A. A. et al. Liver cirrhosis mortality in 187 countries between 1980 and 2010: a
systematic analysis. BMC Med 12, (2014).
36. Blachier, M., Leleu, H., Peck-Radosavljevic, M., Valla, D.-C. & Roudot-Thoraval, F. The burden
of liver disease in Europe: A review of available epidemiological data. Journal of Hepatology 58,
593–608 (2013).
37. Zatoński, W. A. et al. Liver Cirrhosis Mortality in Europe, with Special Attention to Central and
Eastern Europe. EAR 16, 193–201 (2010).
38. Tsochatzis, E. A., Bosch, J. & Burroughs, A. K. Liver cirrhosis. The Lancet 383, 1749–1761
(2014).
39. Schuppan, D. & Afdhal, N. H. Liver Cirrhosis. Lancet 371, 838–851 (2008).
40. Wiegand, J. & Berg, T. The Etiology, Diagnosis and Prevention of Liver Cirrhosis. Dtsch Arztebl
Int 110, 85–91 (2013).
41. Hernandez-Gea, V. & Friedman, S. L. Pathogenesis of Liver Fibrosis. Annual Review of
Pathology: Mechanisms of Disease 6, 425–456 (2011).
42. Fallowfield, J. A. Future mechanistic strategies for tackling fibrosis – an unmet need in liver
disease. Clin Med 15, s83–s87 (2015).
43. Cojocariu, C., Trifan, A.-V., Gîrleanu, I. & Stanciu, C. Alcoholic liver disease--epidemiology and
risk factors. Rev Med Chir Soc Med Nat Iasi 118, 910–917 (2014).
44. Starr, S. P. & Raines, D. Cirrhosis: Diagnosis, Management, and Prevention. AFP 84, 1353–
1359 (2011).
45. Rehm, J. et al. Alcohol as a risk factor for liver cirrhosis: A systematic review and meta-analysis.
Drug and Alcohol Review 29, 437–445 (2010).
46. Zhang, C.-Y., Yuan, W.-G., He, P., Lei, J.-H. & Wang, C.-X. Liver fibrosis and hepatic stellate
cells: Etiology, pathological hallmarks and therapeutic targets. World J Gastroenterol 22, 10512–
10522 (2016).

126
47. Tsuchida, T. & Friedman, S. L. Mechanisms of hepatic stellate cell activation. Nat Rev
Gastroenterol Hepatol 14, 397–411 (2017).
48. Seki, E. & Brenner, D. A. Recent advancement of molecular mechanisms of liver fibrosis. J
Hepatobiliary Pancreat Sci 22, 512–518 (2015).
49. Weiskirchen, R. & Tacke, F. Liver fibrosis: Which mechanisms matter? Clinical Liver Disease 8,
94–99 (2016).
50. Pellicoro, A., Ramachandran, P., Iredale, J. P. & Fallowfield, J. A. Liver fibrosis and repair:
immune regulation of wound healing in a solid organ. Nat Rev Immunol 14, 181–194 (2014).
51. Lemoinne, S., Cadoret, A., El Mourabit, H., Thabut, D. & Housset, C. Origins and functions of
liver myofibroblasts. Biochimica et Biophysica Acta (BBA) - Molecular Basis of Disease 1832,
948–954 (2013).
52. Dranoff, J. A. & Wells, R. G. Portal fibroblasts: Underappreciated mediators of biliary fibrosis.
Hepatology 51, 1438–1444 (2010).
53. Cassiman, D., Libbrecht, L., Desmet, V., Denef, C. & Roskams, T. Hepatic stellate
cell/myofibroblast subpopulations in fibrotic human and rat livers. J. Hepatol. 36, 200–209
(2002).
54. Lee, U. E. & Friedman, S. L. Mechanisms of Hepatic Fibrogenesis. Best Pract Res Clin
Gastroenterol 25, 195–206 (2011).
55. Friedman, S. L. Mechanisms of Disease: mechanisms of hepatic fibrosis and therapeutic
implications. Nature Clinical Practice Gastroenterology & Hepatology 1, 98–105 (2004).
56. Tacke, F. Targeting hepatic macrophages to treat liver diseases. J. Hepatol. 66, 1300–1312
(2017).
57. Trautwein, C., Friedman, S. L., Schuppan, D. & Pinzani, M. Hepatic fibrosis: Concept to
treatment. Journal of Hepatology 62, S15–S24 (2015).
58. Abraldes, J. G. & Garcia-Tsao, G. The Design of Clinical Trials in Portal Hypertension. Semin.
Liver Dis. 37, 73–84 (2017).
59. Garcia-Tsao, G., Friedman, S., Iredale, J. & Pinzani, M. Now There Are Many (Stages) Where
Before There Was One: In Search of a Pathophysiological Classification of Cirrhosis. Hepatology
51, 1445–1449 (2010).

127
60. Bosch, J., Groszmann, R. J. & Shah, V. H. Evolution in the understanding of the
pathophysiological basis of portal hypertension: How changes in paradigm are leading to
successful new treatments. J Hepatol 62, S121–S130 (2015).
61. Kim, M. Y., Baik, S. K. & Lee, S. S. Hemodynamic alterations in cirrhosis and portal
hypertension. Korean J Hepatol 16, 347–352 (2010).
62. Bloom, S., Kemp, W. & Lubel, J. Portal hypertension: pathophysiology, diagnosis and
management. Intern Med J 45, 16–26 (2015).
63. Hu, L. S., George, J. & Wang, J. H. Current concepts on the role of nitric oxide in portal
hypertension. World J Gastroenterol 19, 1707–1717 (2013).
64. Fernandez, M. Molecular pathophysiology of portal hypertension. Hepatology 61, 1406–1415
(2015).
65. Iwakiri, Y. Pathophysiology of Portal Hypertension. Clin Liver Dis 18, 281–291 (2014).
66. Buob, S., Johnston, A. n. & Webster, C. r. l. Portal Hypertension: Pathophysiology, Diagnosis,
and Treatment. Journal of Veterinary Internal Medicine 25, 169–186 (2011).
67. Gracia-Sancho, J., Maeso-Díaz, R. & Bosch, J. Pathophysiology and a Rational Basis of
Therapy. Dig Dis 33, 508–514 (2015).
68. Garcia-Tsao, G., Abraldes, J. G., Berzigotti, A. & Bosch, J. Portal hypertensive bleeding in
cirrhosis: Risk stratification, diagnosis, and management: 2016 practice guidance by the
American Association for the study of liver diseases. Hepatology 65, 310–335 (2017).
69. Iwakiri, Y. & Groszmann, R. J. The hyperdynamic circulation of chronic liver diseases: From the
patient to the molecule. Hepatology 43, S121–S131 (2006).
70. Sieber, C. C., Sumanovski, L. T., Stumm, M., van der Kooij, M. & Battegay, E. In vivo
angiogenesis in normal and portal hypertensive rats: role of basic fibroblast growth factor and
nitric oxide. Journal of Hepatology 34, 644–650 (2001).
71. Sumanovski, L. T., Battegay, E., Stumm, M., van der Kooij, M. & Sieber, C. C. Increased
angiogenesis in portal hypertensive rats: Role of nitric oxide. Hepatology 29, 1044–1049 (1999).
72. Bandali, M. F. et al. Portal hypertension: Imaging of portosystemic collateral pathways and
associated image-guided therapy. World Journal of Gastroenterology 23, 1735–1746 (2017).
73. Gana, J. C., Serrano, C. A. & Ling, S. C. Angiogenesis and portal-systemic collaterals in portal
hypertension. Ann Hepatol 15, 303–313 (2016).
128
74. Bolognesi, M., Di Pascoli, M., Verardo, A. & Gatta, A. Splanchnic vasodilation and hyperdynamic
circulatory syndrome in cirrhosis. World J Gastroenterol 20, 2555–2563 (2014).
75. Licata, A. et al. Clinical implications of the hyperdynamic syndrome in cirrhosis. European
Journal of Internal Medicine 25, 795–802 (2014).
76. Huang, H.-C. et al. Role of Hepatic Nitric Oxide Synthases in Rats with Thioacetamide-induced
Acute Liver Failure and Encephalopathy. Journal of the Chinese Medical Association 70, 16–23
(2007).
77. Thabut, D. & Shah, V. Intrahepatic angiogenesis and sinusoidal remodeling in chronic liver
disease: New targets for the treatment of portal hypertension? Journal of Hepatology 53, 976–
980 (2010).
78. Mura, V. L., Nicolini, A., Tosetti, G. & Primignani, M. Cirrhosis and portal hypertension: The
importance of risk stratification, the role of hepatic venous pressure gradient measurement.
World J Hepatol 7, 688–695 (2015).
79. Pinzani, M. Pathophysiology of Liver Fibrosis. Dig Dis 33, 492–497 (2015).
80. Procopet, B. & Berzigotti, A. Diagnosis of cirrhosis and portal hypertension: imaging, non-
invasive markers of fibrosis and liver biopsy. Gastroenterol Rep (Oxf) 5, 79–89 (2017).
81. Kim, M. Y., Jeong, W. K. & Baik, S. K. Invasive and non-invasive diagnosis of cirrhosis and
portal hypertension. World J Gastroenterol 20, 4300–4315 (2014).
82. Desmet, V. J., Gerber, M., Hoofnagle, J. H., Manns, M. & Scheuer, P. J. Classification of chronic
hepatitis: Diagnosis, grading and staging. Hepatology 19, 1513–1520 (1994).
83. Sohrabpour, A. A., Mohamadnejad, M. & Malekzadeh, R. Review article: the reversibility of
cirrhosis. Aliment. Pharmacol. Ther. 36, 824–832 (2012).
84. D’Amico, G. et al. Competing risks and prognostic stages of cirrhosis: a 25-year inception cohort
study of 494 patients. Aliment Pharmacol Ther 39, 1180–1193 (2014).
85. Silva-Junior, G. et al. The prognostic value of hepatic venous pressure gradient in patients with
cirrhosis is highly dependent on the accuracy of the technique. Hepatology 62, 1584–1592
(2015).
86. Kumar, M. et al. Hepatic venous pressure gradient as a predictor of fibrosis in chronic liver
disease because of hepatitis B virus. Liver International 28, 690–698 (2008).
87. Tripathi, D. Drugs used in therapy of portal hypertension. Clinical Liver Disease 1, 136–138
(2012).

129
88. de Franchis, R. Revising consensus in portal hypertension: Report of the Baveno V consensus
workshop on methodology of diagnosis and therapy in portal hypertension. Journal of
Hepatology 53, 762–768 (2010).
89. Schuppan, D. Liver fibrosis: Common mechanisms and antifibrotic therapies. Clinics and
Research in Hepatology and Gastroenterology 39, S51–S59 (2015).
90. Bari, K. & Garcia-Tsao, G. Treatment of portal hypertension. World J Gastroenterol 18, 1166–
1175 (2012).
91. Schwabl, P. & Laleman, W. Novel treatment options for portal hypertension. Gastroenterol Rep
(Oxf) 5, 90–103 (2017).
92. Fallowfield, J. & Hayes, P. Pathogenesis and treatment of hepatic fibrosis: is cirrhosis
reversible? Clin Med 11, 179–183 (2011).
93. Berzigotti, A. Advances and challenges in cirrhosis and portal hypertension. BMC Med 15,
(2017).
94. Sauerbruch, T. & Trebicka, J. Future therapy of portal hypertension in liver cirrhosis – a guess.
F1000Prime Rep 6, (2014).
95. Zhang, Y.-Q. et al. New progress in roles of nitric oxide during hepatic ischemia reperfusion
injury. World J Gastroenterol 23, 2505–2510 (2017).
96. Lundberg, J. O., Gladwin, M. T. & Weitzberg, E. Strategies to increase nitric oxide signalling in
cardiovascular disease. Nat Rev Drug Discov 14, 623–641 (2015).
97. Shu, X. et al. Endothelial nitric oxide synthase in the microcirculation. Cell Mol Life Sci 72, 4561–
4575 (2015).
98. Vallance, P. & Leiper, J. Blocking NO synthesis: how, where and why? Nat Rev Drug Discov 1,
939–950 (2002).
99. Moncada, S., Palmer, R. M. & Higgs, E. A. Biosynthesis of nitric oxide from L-arginine. A
pathway for the regulation of cell function and communication. Biochem. Pharmacol. 38, 1709–
1715 (1989).
100. Iwakiri, Y. & Kim, M. Y. NITRIC OXIDE IN LIVER DISEASES. Trends Pharmacol Sci 36, 524–
536 (2015).
101. Adams, L., Franco, M. C. & Estevez, A. G. Reactive nitrogen species in cellular signaling. Exp
Biol Med (Maywood) 240, 711–717 (2015).

130
102. Hanafy, K. A., Krumenacker, J. S. & Murad, F. NO, nitrotyrosine, and cyclic GMP in signal
transduction. Med. Sci. Monit. 7, 801–819 (2001).
103. Murad, F. Signal Transduction Using Nitric Oxide and Cyclic Guanosine Monophosphate. JAMA
276, 1189–1192 (1996).
104. Förstermann, U. & Sessa, W. C. Nitric oxide synthases: regulation and function. Eur Heart J 33,
829–837 (2012).
105. Moroz, L. L. & Kohn, A. B. Parallel evolution of Nitric Oxide signaling: Diversity of synthesis &
memory pathways. Front Biosci (Landmark Ed) 16, 2008–2051 (2011).
106. Theilig, F. et al. Cellular Distribution and Function of Soluble Guanylyl Cyclase in Rat Kidney and
Liver. JASN 12, 2209–2220 (2001).
107. Maruyama, H. et al. Non-invasive assessment of portal hypertension and liver fibrosis using
contrast-enhanced ultrasonography. Hepatol Int 10, 267–276 (2015).
108. Cokić, V. P. et al. Bradykinin stimulation of nitric oxide production is not sufficient for gamma-
globin induction. Srp Arh Celok Lek 142, 189–196 (2014).
109. Fleming, I. Molecular mechanisms underlying the activation of eNOS. Pflugers Arch - Eur J
Physiol 459, 793–806 (2010).
110. Bescós, R., Sureda, A., Tur, J. A. & Pons, A. The effect of nitric-oxide-related supplements on
human performance. Sports Med 42, 99–117 (2012).
111. Nathan, C. Inducible nitric oxide synthase: what difference does it make? J Clin Invest 100,
2417–2423 (1997).
112. La Mura, V. et al. Liver sinusoidal endothelial dysfunction after LPS administration: A role for
inducible-nitric oxide synthase. Journal of Hepatology 61, 1321–1327 (2014).
113. Bektas, S. et al. The effects of tadalafil and pentoxifylline on apoptosis and nitric oxide synthase
in liver ischemia/reperfusion injury. The Kaohsiung Journal of Medical Sciences 32, 339–347
(2016).
114. Lee, J., Bae, E. H., Ma, S. K. & Kim, S. W. Altered Nitric Oxide System in Cardiovascular and
Renal Diseases. Chonnam Med J 52, 81–90 (2016).
115. Iwakiri, Y. Nitric oxide in liver fibrosis: The role of inducible nitric oxide synthase. Clinical and
Molecular Hepatology, Clinical and Molecular Hepatology 21, 319–325 (2015).
116. Harteneck, C., Koesling, D., Söling, A., Schultz, G. & Böhme, E. Expression of soluble guanylyl
cyclase. Catalytic activity requires two enzyme subunits. FEBS Lett. 272, 221–223 (1990).
131
117. Wobst, J., Kessler, T., Dang, T. A., Erdmann, J. & Schunkert, H. Role of sGC-dependent NO
signalling and myocardial infarction risk. J. Mol. Med. 93, 383–394 (2015).
118. Dupont, L. L., Glynos, C., Bracke, K. R., Brouckaert, P. & Brusselle, G. G. Role of the nitric
oxide–soluble guanylyl cyclase pathway in obstructive airway diseases. Pulmonary
Pharmacology & Therapeutics 29, 1–6 (2014).
119. Okamoto, H. Molecular cloning of a novel variant of the rat soluble guanylate cyclase β2 subunit.
The International Journal of Biochemistry & Cell Biology 36, 472–480 (2004).
120. Francis, S. H., Busch, J. L. & Corbin, J. D. cGMP-Dependent Protein Kinases and cGMP
Phosphodiesterases in Nitric Oxide and cGMP Action. Pharmacol Rev 62, 525–563 (2010).
121. Zhang, Y. et al. The regulatory role of the NO/cGMP signal transduction cascade during larval
attachment and metamorphosis of the barnacle Balanus (=Amphibalanus) amphitrite. Journal of
Experimental Biology 215, 3813–3822 (2012).
122. Levy, I., Horvath, A., Azevedo, M., de Alexandre, R. B. & Stratakis, C. A. Phosphodiesterase
function and endocrine cells: links to human disease and roles in tumor development and
treatment. Curr Opin Pharmacol 11, 689–697 (2011).
123. Corbin, J. D. & Francis, S. H. Cyclic GMP Phosphodiesterase-5: Target of Sildenafil. J. Biol.
Chem. 274, 13729–13732 (1999).
124. Rybalkin, S. D., Yan, C., Bornfeldt, K. E. & Beavo, J. A. Cyclic GMP Phosphodiesterases and
Regulation of Smooth Muscle Function. Circulation Research 93, 280–291 (2003).
125. Tsai, E. J. & Kass, D. A. Cyclic GMP signaling in cardiovascular pathophysiology and
therapeutics. Pharmacol Ther 122, 216–238 (2009).
126. Kim, J. J. et al. Crystal Structure of PKG I:cGMP Complex Reveals a cGMP-Mediated Dimeric
Interface that Facilitates cGMP-induced Activation. Structure 24, 710–720 (2016).
127. Yang, J., Clark, J. W., Bryan, R. M. & Robertson, C. S. Mathematical modeling of the nitric
oxide/cGMP pathway in the vascular smooth muscle cell. American Journal of Physiology -
Heart and Circulatory Physiology 289, H886–H897 (2005).
128. Fajardo, A. M., Piazza, G. A. & Tinsley, H. N. The Role of Cyclic Nucleotide Signaling Pathways
in Cancer: Targets for Prevention and Treatment. Cancers (Basel) 6, 436–458 (2014).
129. Heikaus, C. C. et al. Solution Structure of the cGMP Binding GAF Domain from
Phosphodiesterase 5. J Biol Chem 283, 22749–22759 (2008).

132
130. Bender, A. T. & Beavo, J. A. Cyclic Nucleotide Phosphodiesterases: Molecular Regulation to
Clinical Use. Pharmacol Rev 58, 488–520 (2006).
131. Krawutschke, C., Koesling, D. & Russwurm, M. Cyclic GMP in Vascular Relaxation: Export Is of
Similar Importance as Degradation. Arterioscler. Thromb. Vasc. Biol. 35, 2011–2019 (2015).
132. Trebicka, J. et al. Atorvastatin lowers portal pressure in cirrhotic rats by inhibition of RhoA/Rho-
kinase and activation of endothelial nitric oxide synthase. Hepatology 46, 242–253 (2007).
133. Leung, T.-M. et al. Endothelial nitric oxide synthase is a critical factor in experimental liver
fibrosis. Int J Exp Pathol 89, 241–250 (2008).
134. Mookerjee, R. P. et al. Increased gene and protein expression of the novel eNOS regulatory
protein NOSTRIN and a variant in alcoholic hepatitis. Gastroenterology 132, 2533–2541 (2007).
135. Goh, B. J., Tan, B. T., Hon, W. M., Lee, K. H. & Khoo, H. E. Nitric oxide synthase and heme
oxygenase expressions in human liver cirrhosis. World J Gastroenterol 12, 588–594 (2006).
136. Yuan, G.-J. et al. Expression and activity of inducible nitric oxide synthase and endothelial nitric
oxide synthase correlate with ethanol-induced liver injury. World J. Gastroenterol. 12, 2375–
2381 (2006).
137. McNaughton, L. et al. Distribution of nitric oxide synthase in normal and cirrhotic human liver.
Proc Natl Acad Sci U S A 99, 17161–17166 (2002).
138. Yokomori, H. et al. Enhanced Expression of Endothelin B Receptor at Protein and Gene Levels
in Human Cirrhotic Liver. Am J Pathol 159, 1353–1362 (2001).
139. García-Pagán, J.-C., Gracia-Sancho, J. & Bosch, J. Functional aspects on the pathophysiology
of portal hypertension in cirrhosis. Journal of Hepatology 57, 458–461 (2012).
140. Vairappan, B. Endothelial dysfunction in cirrhosis: Role of inflammation and oxidative stress.
World J Hepatol 7, 443–459 (2015).
141. Ferguson, J. W. et al. Inducible nitric oxide synthase activity contributes to the regulation of
peripheral vascular tone in patients with cirrhosis and ascites. Gut 55, 542–546 (2006).
142. Albillos, A. et al. Increased lipopolysaccharide binding protein in cirrhotic patients with marked
immune and hemodynamic derangement. Hepatology 37, 208–217 (2003).
143. Bauer, T. M. et al. Small intestinal bacterial overgrowth in human cirrhosis is associated with
systemic endotoxemia. Am J Gastroenterol 97, 2364–2370 (2002).
144. Guarner, C. et al. Increased serum nitrite and nitrate levels in patients with cirrhosis:
Relationship to endotoxemia. Hepatology 18, 1139–1143 (1993).

133
145. Wiest, R. Splanchnic and systemic vasodilation: the experimental models. J. Clin. Gastroenterol.
41 Suppl 3, S272-287 (2007).
146. Abraldes, J. G. et al. Mild increases in portal pressure upregulate vascular endothelial growth
factor and endothelial nitric oxide synthase in the intestinal microcirculatory bed, leading to a
hyperdynamic state. American Journal of Physiology - Gastrointestinal and Liver Physiology 290,
G980–G987 (2006).
147. Hori, N., Wiest, R. & Groszmann, R. J. Enhanced release of nitric oxide in response to changes
in flow and shear stress in the superior mesenteric arteries of portal hypertensive rats.
Hepatology 28, 1467–1473 (1998).
148. Vallance, P. & Moncada, S. Hyperdynamic circulation in cirrhosis: a role for nitric oxide? The
Lancet 337, 776–778 (1991).
149. Fernández, M. et al. Evidence against a role for inducible nitric oxide synthase in the
hyperdynamic circulation of portal-hypertensive rats. Gastroenterology 108, 1487–1495 (1995).
150. Wiest, R., Shah, V., Sessa, W. C. & Groszmann, R. J. NO overproduction by eNOS precedes
hyperdynamic splanchnic circulation in portal hypertensive rats. American Journal of
Physiology-Gastrointestinal and Liver Physiology 276, G1043–G1051 (1999).
151. Ho, H.-L. & Huang, H.-C. Molecular mechanisms of circulatory dysfunction in cirrhotic portal
hypertension. Journal of the Chinese Medical Association 78, 195–203 (2015).
152. Malyshev, E., Tazi, K. A., Moreau, R. & Lebrec, D. Discrepant effects of inducible nitric oxide
synthase modulation on systemic and splanchnic endothelial nitric oxide synthase activity and
expression in cirrhotic rats. J. Gastroenterol. Hepatol. 22, 2195–2201 (2007).
153. Azevedo, M. F. et al. Clinical and Molecular Genetics of the Phosphodiesterases (PDEs). Endocr
Rev 35, 195–233 (2014).
154. Boswell-Smith, V., Spina, D. & Page, C. P. Phosphodiesterase inhibitors. Br J Pharmacol 147,
S252–S257 (2006).
155. Keravis, T. & Lugnier, C. Cyclic nucleotide phosphodiesterase (PDE) isozymes as targets of the
intracellular signalling network: benefits of PDE inhibitors in various diseases and perspectives
for future therapeutic developments. Br J Pharmacol 165, 1288–1305 (2012).
156. Ghofrani, H. A., Osterloh, I. H. & Grimminger, F. Sildenafil: from angina to erectile dysfunction to
pulmonary hypertension and beyond. Nat Rev Drug Discov 5, 689–702 (2006).

134
157. Lin, C.-S. Tissue expression, distribution, and regulation of PDE5. International Journal of
Impotence Research 16, 3901207 (2004).
158. Ölmestig, J. N. E., Marlet, I. R., Hainsworth, A. H. & Kruuse, C. Phosphodiesterase 5 inhibition
as a therapeutic target for ischemic stroke: A systematic review of preclinical studies. Cell.
Signal. 38, 39–48 (2017).
159. Liedtke, C. et al. Experimental liver fibrosis research: update on animal models, legal issues and
translational aspects. Fibrogenesis Tissue Repair 6, 19 (2013).
160. Wallace, M. C. et al. Standard Operating Procedures in Experimental Liver Research:
Thioacetamide model in mice and rats. Lab. Anim. 49, 21–29 (2015).
161. Ingawale, D. K., Mandlik, S. K. & Naik, S. R. Models of hepatotoxicity and the underlying cellular,
biochemical and immunological mechanism(s): A critical discussion. Environmental Toxicology
and Pharmacology 37, 118–133 (2014).
162. Delire, B., Stärkel, P. & Leclercq, I. Animal Models for Fibrotic Liver Diseases: What We Have,
What We Need, and What Is under Development. J Clin Transl Hepatol 3, 53–66 (2015).
163. Li, X., Benjamin, I. S. & Alexander, B. Reproducible production of thioacetamide-induced
macronodular cirrhosis in the rat with no mortality. J. Hepatol. 36, 488–493 (2002).
164. Kreft, B. et al. Evaluation of different models of experimentally induced liver cirrhosis for MRI
research with correlation to histopathologic findings. Invest Radiol 34, 360–366 (1999).
165. Akhtar, T. & Sheikh, N. An overview of thioacetamide-induced hepatotoxicity. Toxin Reviews 32,
43–46 (2013).
166. Sarma, D. et al. Covalent modification of lipids and proteins in rat hepatocytes and in vitro by
thioacetamide metabolites. Chem. Res. Toxicol. 25, 1868–1877 (2012).
167. Yeh, C.-N., Maitra, A., Lee, K.-F., Jan, Y.-Y. & Chen, M.-F. Thioacetamide-induced intestinal-
type cholangiocarcinoma in rat: an animal model recapitulating the multi-stage progression of
human cholangiocarcinoma. Carcinogenesis 25, 631–636 (2004).
168. Staňková, P. et al. The toxic effect of thioacetamide on rat liver in vitro. Toxicology in Vitro 24,
2097–2103 (2010).
169. Barker, E. A. & Smuckler, E. A. Nonhepatic Thioacetamide Injury. Am J Pathol 71, 409–418
(1973).
170. Barker, E. A. & Smuckler, E. A. Nonhepatic Thioacetamide Injury. Am J Pathol 74, 575–590
(1974).
135
171. Al-Bader, A. a. et al. Thioacetamide induced changes in trace elements and kidney damage. J.
Trace Elem. Exp. Med. 12, 1–14 (1999).
172. Won, Y.-S. et al. Genetically obese (ob/ob) mice are resistant to the lethal effects of
thioacetamide hepatotoxicity. Toxicology and Applied Pharmacology 291, 38–45 (2016).
173. Jw, L. et al. Role of metabolism by flavin-containing monooxygenase in thioacetamide-induced
immunosuppression. Toxicol Lett 136, 163–172 (2003).
174. Ramaiah, S. K., Apte, U. & Mehendale, H. M. Cytochrome P4502E1 Induction Increases
Thioacetamide Liver Injury in Diet-Restricted Rats. Drug Metab Dispos 29, 1088–1095 (2001).
175. Koen, Y. M. et al. Protein Targets of Thioacetamide Metabolites in Rat Hepatocytes. Chem. Res.
Toxicol. 26, 564–574 (2013).
176. Malaguarnera, G. Toxic hepatitis in occupational exposure to solvents. World Journal of
Gastroenterology 18, 2756 (2012).
177. Xie, Y. et al. Cytochrome P450 Dysregulations in Thioacetamide-Induced Liver Cirrhosis in Rats
and the Counteracting Effects of Hepatoprotective Agents. Drug Metab Dispos 40, 796–802
(2012).
178. Salguero Palacios, R. et al. Activation of hepatic stellate cells is associated with cytokine
expression in thioacetamide-induced hepatic fibrosis in mice. Lab Invest 88, 1192–1203 (2008).
179. Dunn, O. J. Multiple Comparisons Using Rank Sums. Technometrics 6, 241–252 (1964).
180. Laaksonen, K. et al. Food and water intake, growth, and adiposity of Sprague-Dawley rats with
diet board for 24 months. Laboratory Animals 47, 245–256 (2013).
181. EFSA Panel on Food Additives and Nutrient Sources added to Food (ANS). Scientific Opinion on
the safety of steviol glycosides for the proposed uses as a food additive. EFSA Journal 8, n/a-n/a
(2010).
182. Shi, Z., Wakil, A. E. & Rockey, D. C. Strain-specific differences in mouse hepatic wound healing
are mediated by divergent T helper cytokine responses. Proc Natl Acad Sci U S A 94, 10663–
10668 (1997).
183. Lee, S. W., Kim, S. H., Min, S. O. & Kim, K. S. Ideal Experimental Rat Models for Liver
Diseases. Korean J Hepatobiliary Pancreat Surg 15, 67–77 (2011).
184. Yanguas, S. C. et al. Experimental models of liver fibrosis. Arch Toxicol 90, 1025–1048 (2016).
185. Kulkarni, S. G., Duong, H., Gomila, R., Mehendale, H. M. & Conway, E. A. Strain differences in
tissue repair response to 1,2-dichlorobenzene. Arch Toxicol 70, 714–723 (1996).
136
186. DeNucci, S. M. et al. Rat Strain Differences in Susceptibility to Alcohol-Induced Chronic Liver
Injury and Hepatic Insulin Resistance. Gastroenterology Research and Practice 2010, e312790
(2010).
187. Tryndyak, V. et al. Interstrain differences in the severity of liver injury induced by a choline- and
folate-deficient diet in mice are associated with dysregulation of genes involved in lipid
metabolism. FASEB J 26, 4592–4602 (2012).
188. Minicis, S. D. et al. Liver carcinogenesis: Rodent models of hepatocarcinoma and
cholangiocarcinoma. Dig Liver Dis 45, 450–459 (2013).
189. Laleman, W. et al. A stable model of cirrhotic portal hypertension in the rat: thioacetamide
revisited. European Journal of Clinical Investigation 36, 242–249 (2006).
190. Koblihová, E., Mrázová, I., Vernerová, Z. & Ryska, M. Acute liver failure induced by
thioacetamide: selection of optimal dosage in Wistar and Lewis rats. Physiol Res 63, 491–503
(2014).
191. Abraldes, J. G., Araujo, I. K., Turón, F. & Berzigotti, A. Diagnosing and monitoring cirrhosis: Liver
biopsy, hepatic venous pressure gradient and elastography. Gastroenterol Hepatol 35, 488–495
(2012).
192. Bosch, J., Abraldes, J. G., Berzigotti, A. & García-Pagan, J. C. The clinical use of HVPG
measurements in chronic liver disease. Nat Rev Gastroenterol Hepatol 6, 573–582 (2009).
193. Annet, L. et al. Hepatic Flow Parameters Measured with MR Imaging and Doppler US:
Correlations with Degree of Cirrhosis and Portal Hypertension. Radiology 229, 409–414 (2003).
194. de Franchis, R. & Dell’Era, A. Invasive and noninvasive methods to diagnose portal hypertension
and esophageal varices. Clin Liver Dis 18, 293–302 (2014).
195. Zardi, E. M., Di Matteo, F. M., Pacella, C. M. & Sanyal, A. J. Invasive and non-invasive
techniques for detecting portal hypertension and predicting variceal bleeding in cirrhosis: a
review. Ann Med 46, 8–17 (2014).
196. Van Beers, B. E., Daire, J.-L. & Garteiser, P. New imaging techniques for liver diseases. Journal
of Hepatology 62, 690–700 (2015).
197. Yzet, T. et al. Hepatic vascular flow measurements by phase contrast MRI and doppler
echography: A comparative and reproducibility study. J. Magn. Reson. Imaging 31, 579–588
(2010).

137
198. Skårdal, K., Espe, E. K., Zhang, L., Aronsen, J. M. & Sjaastad, I. Three-Directional Evaluation of
Mitral Flow in the Rat Heart by Phase-Contrast Cardiovascular Magnetic Resonance. PLOS
ONE 11, e0150536 (2016).
199. Bovenkamp, P. R. et al. Velocity mapping of the aortic flow at 9.4 T in healthy mice and mice
with induced heart failure using time-resolved three-dimensional phase-contrast MRI (4D PC
MRI). MAGMA 28, 315–327 (2015).
200. Dall’Armellina, E. et al. Improved method for quantification of regional cardiac function in mice
using phase-contrast MRI. Magn Reson Med 67, 541–551 (2012).
201. Amirbekian, S. et al. In vivo assessment of blood flow patterns in abdominal aorta of mice with
MRI: implications for AAA localization. Am J Physiol Heart Circ Physiol 297, H1290–H1295
(2009).
202. Wang, Y., Booth, C. J., Kim, H., Qiu, M. & Constable, R. T. Evaluation of hepatic fibrosis with
portal pressure gradient in rats. Magn. Reson. Med. 61, 1185–1192 (2009).
203. Kubo, H., Harada, M., Ishikawa, M. & Nishitani, H. Hemodynamic changes with liver fibrosis
measured by dynamic contrast-enhanced MRI in the rat. Magn Reson Med Sci 5, 65–71 (2006).
204. Kim, H. et al. Induced Hepatic Fibrosis in Rats: Hepatic Steatosis, Macromolecule Content,
Perfusion Parameters, and Their Correlations—Preliminary MR Imaging in Rats. Radiology 247,
696–705 (2008).
205. Srichai, M. B., Lim, R. P., Wong, S. & Lee, V. S. Cardiovascular applications of phase-contrast
MRI. AJR Am J Roentgenol 192, 662–675 (2009).
206. Dodd, G. D., Baron, R. L., Oliver, J. H. & Federle, M. P. Spectrum of imaging findings of the liver
in end-stage cirrhosis: part I, gross morphology and diffuse abnormalities. AJR Am J Roentgenol
173, 1031–1036 (1999).
207. Wang, Y., Booth, C. J., Kim, H., Qiu, M. & Constable, R. T. Evaluation of hepatic fibrosis with
portal pressure gradient in rats. Magn. Reson. Med. 61, 1185–1192 (2009).
208. Kok, T. et al. The value of Doppler ultrasound in cirrhosis and portal hypertension. Scand. J.
Gastroenterol. Suppl. 230, 82–88 (1999).
209. Iranpour, P. et al. Altered Doppler flow patterns in cirrhosis patients: an overview.
Ultrasonography 35, 3–12 (2016).
210. Goyal, N., Jain, N., Rachapalli, V., Cochlin, D. L. & Robinson, M. Non-invasive evaluation of liver
cirrhosis using ultrasound. Clinical Radiology 64, 1056–1066 (2009).

138
211. George, S. M., Eckert, L. M., Martin, D. R. & Giddens, D. P. Hemodynamics in Normal and
Diseased Livers: Application of Image-Based Computational Models. Cardiovasc Eng Tech 6,
80–91 (2014).
212. Wu, C.-C. Ultrasonographic Evaluation of Portal Hypertension and Liver Cirrhosis. Journal of
Medical Ultrasound 16, 188–193 (2008).
213. Reverter, E. et al. Impact of deep sedation on the accuracy of hepatic and portal venous
pressure measurements in patients with cirrhosis. Liver Int 34, 16–25 (2014).
214. Stankovic, Z. Four-dimensional flow magnetic resonance imaging in cirrhosis. World J
Gastroenterol 22, 89–102 (2016).
215. Halverscheid, L. et al. Phosphodiesterase-5 inhibitors have distinct effects on the hemodynamics
of the liver. BMC Gastroenterology 9, 69 (2009).
216. Colle, I., De Vriese, A. S., Van Vlierberghe, H., Lameire, N. H. & DeVos, M. Systemic and
splanchnic haemodynamic effects of sildenafil in an in vivo animal model of cirrhosis support for
a risk in cirrhotic patients. Liver Int. 24, 63–68 (2004).
217. Lee, K.-C. et al. Administration of a low dose of sildenafil for 1 week decreases intrahepatic
resistance in rats with biliary cirrhosis: the role of NO bioavailability. Clinical Science 119, 45–55
(2010).
218. Choi, S.-M. et al. Effect of udenafil on portal venous pressure and hepatic fibrosis in rats. A novel
therapeutic option for portal hypertension. Arzneimittelforschung 59, 641–646 (2009).
219. Clemmesen, J. O. et al. Sildenafil does not influence hepatic venous pressure gradient in
patients with cirrhosis. World J Gastroenterol 14, 6208–6212 (2008).
220. Tandon, P. et al. Sildenafil has no effect on portal pressure but lowers arterial pressure in
patients with compensated cirrhosis. Clin Gastroenterol Hepatol 8, 546–549 (2010).
221. Lee, K.-C. et al. Acute administration of sildenafil enhances hepatic cyclic guanosine
monophosphate production and reduces hepatic sinusoid resistance in cirrhotic patients.
Hepatology Research 38, 1186–1193 (2008).
222. Kreisel, W. et al. The phosphodiesterase-5-inhibitor udenafil lowers portal pressure in
compensated preascitic liver cirrhosis. A dose-finding phase-II-study. Dig Liver Dis 47, 144–150
(2015).
139
223. Deibert, P. et al. Effect of vardenafil, an inhibitor of phosphodiesterase-5, on portal
haemodynamics in normal and cirrhotic liver -- results of a pilot study. Aliment. Pharmacol. Ther.
23, 121–128 (2006).
224. Deibert, P. et al. Beneficial long term effect of a phosphodiesterase-5-inhibitor in cirrhotic portal
hypertension: A case report with 8 years follow-up. World J Gastroenterol 24, 438–444 (2018).
225. Corbin, J. D., Beasley, A., Blount, M. A. & Francis, S. H. High lung PDE5: A strong basis for
treating pulmonary hypertension with PDE5 inhibitors. Biochemical and Biophysical Research
Communications 334, 930–938 (2005).
226. Lee, S. S., Girod, C., Braillon, A., Hadengue, A. & Lebrec, D. Hemodynamic characterization of
chronic bile duct-ligated rats: effect of pentobarbital sodium. American Journal of Physiology-
Gastrointestinal and Liver Physiology 251, G176–G180 (1986).
227. Parasuraman, S. & Raveendran, R. Measurement of invasive blood pressure in rats. J
Pharmacol Pharmacother 3, 172–177 (2012).
228. Moctezuma‐Velazquez Carlos, Kalainy Sylvia & Abraldes Juan G. Beta‐blockers in patients with
advanced liver disease: Has the dust settled? Liver Transplantation 23, 1058–1069 (2017).
229. Ge, P. S. & Runyon, B. A. The changing role of beta-blocker therapy in patients with cirrhosis. J.
Hepatol. 60, 643–653 (2014).
230. Westaby, D., Bihari, D. J., Gimson, A. E., Crossley, I. R. & Williams, R. Selective and non-
selective beta receptor blockade in the reduction of portal pressure in patients with cirrhosis and
portal hypertension. Gut 25, 121–124 (1984).
231. Bosch, J. & García-Pagán, J. C. Complications of cirrhosis. I. Portal hypertension. J. Hepatol.
32, 141–156 (2000).
232. Hillon, P. et al. Comparison of the effects of a cardioselective and a nonselective beta-blocker on
portal hypertension in patients with cirrhosis. Hepatology 2, 528–531 (1982).
233. Mills, P. R. et al. Comparison of three adrenoreceptor blocking agents in patients with cirrhosis
and portal hypertension. Gut 25, 73–78 (1984).
234. La Mura, V., Tosetti, G., Primignani, M. & Salerno, F. Use of non-selective beta blockers in
cirrhosis: The evidence we need before closing (or not) the window. World J Gastroenterol 21,
2265–2268 (2015).
235. Reiberger, T. & Mandorfer, M. Beta adrenergic blockade and decompensated cirrhosis. Journal
of Hepatology 66, 849–859 (2017).

140
236. Rodríguez, S. et al. A Nitric Oxide-Donating Statin Decreases Portal Pressure with a Better
Toxicity Profile than Conventional Statins in Cirrhotic Rats. Scientific Reports 7, 40461 (2017).
237. Ferrarese, A., Zanetto, A., Germani, G., Burra, P. & Senzolo, M. Rethinking the role of non-
selective beta blockers in patients with cirrhosis and portal hypertension. World J Hepatol 8,
1012–1018 (2016).
238. Garcia-Pagán, J. C. Portal hypertension: Nonselective β-blockers in patients with refractory
ascites. Nature Reviews Gastroenterology & Hepatology 8, 10–11 (2011).
239. Mandorfer, M. et al. Nonselective β Blockers Increase Risk for Hepatorenal Syndrome and
Death in Patients With Cirrhosis and Spontaneous Bacterial Peritonitis. Gastroenterology 146,
1680–1690.e1 (2014).
240. Mandorfer, M. & Reiberger, T. Beta blockers and cirrhosis, 2016. Digestive and Liver Disease
49, 3–10 (2017).
241. Garcia-Tsao, G. & Lim, J. Management and Treatment of Patients With Cirrhosis and Portal
Hypertension: Recommendations From the Department of Veterans Affairs Hepatitis C Resource
Center Program and the National Hepatitis C Program. The American Journal of
Gastroenterology 104, 1802–1829 (2009).
242. Tripathi, D. & Hayes, P. C. Beta-blockers in portal hypertension: new developments and
controversies. Liver Int. 34, 655–667 (2014).
243. Heebøll, S. et al. Propranolol treatment of portal hypertension in cirrhosis patients is better the
higher the untreated pressure: a single-centre prospective experience. Scandinavian Journal of
Gastroenterology 48, 969–973 (2013).
244. Lebrec, D., Poynard, T., Hillon, P. & Benhamou, J. P. Propranolol for prevention of recurrent
gastrointestinal bleeding in patients with cirrhosis: a controlled study. N. Engl. J. Med. 305,
1371–1374 (1981).
245. Pascal, J. P. & Cales, P. Propranolol in the prevention of first upper gastrointestinal tract
hemorrhage in patients with cirrhosis of the liver and esophageal varices. N. Engl. J. Med. 317,
856–861 (1987).
246. Qi, X.-S. et al. Nonselective beta-blockers in cirrhotic patients with no or small varices: A meta-
analysis. World J Gastroenterol 21, 3100–3108 (2015).
247. D’Amico, G., Malizia, G. & Bosch, J. Beta-blockers in 2016: Still the safest and most useful drugs
for portal hypertension? Hepatology 63, 1771–1773 (2016).

141
248. Ge, P. S. & Runyon, B. A. Treatment of Patients with Cirrhosis. N. Engl. J. Med. 375, 767–777
(2016).
249. Provencher, S. et al. Deleterious effects of beta-blockers on exercise capacity and
hemodynamics in patients with portopulmonary hypertension. Gastroenterology 130, 120–126
(2006).
250. Tripathi, D. & Hayes, P. C. Beta-blockers in portal hypertension: new developments and
controversies. Liver International 34, 655–667 (2014).
251. Tache, D.-E. et al. Inducible nitric oxide synthase expression (iNOS) in chronic viral hepatitis and
its correlation with liver fibrosis. Rom J Morphol Embryol 55, 539–543 (2014).
252. Atik, E., Onlen, Y., Savas, L. & Doran, F. Inducible nitric oxide synthase and histopathological
correlation in chronic viral hepatitis. International Journal of Infectious Diseases 12, 12–15
(2008).
253. Wei, C.-L., Hon, W.-M., Lee, K.-H. & Khoo, H.-E. Temporal expression of hepatic inducible nitric
oxide synthase in liver cirrhosis. World J Gastroenterol 11, 362–367 (2005).
254. Pasarín, M. et al. Insulin resistance and liver microcirculation in a rat model of early NAFLD.
Journal of Hepatology 55, 1095–1102 (2011).
255. Matei, V. et al. The eNOS cofactor tetrahydrobiopterin improves endothelial dysfunction in livers
of rats with CCl4 cirrhosis. Hepatology 44, 44–52 (2006).
256. Dai, Y., Cui, J., Cun, Y. & Shi, A. Tetrahydrobiopterin ameliorates hepatic ischemia-reperfusion
Injury by coupling with eNOS in mice. J. Surg. Res. 176, e65-71 (2012).
257. Loureiro-Silva, M. R., Iwakiri, Y., Abraldes, J. G., Haq, O. & Groszmann, R. J. Increased
phosphodiesterase-5 expression is involved in the decreased vasodilator response to nitric oxide
in cirrhotic rat livers. Journal of Hepatology 44, 886–893 (2006).
258. Davies, N. A. et al. Hepatic guanylate cyclase activity is decreased in a model of cirrhosis: a
quantitative cytochemistry study. FEBS Lett. 580, 2123–2128 (2006).
259. Villanueva, C. & Giulivi, C. Subcellular and cellular locations of nitric-oxide synthase isoforms as
determinants of health and disease. Free Radic Biol Med 49, 307–316 (2010).
260. Gebhardt, R. & Matz-Soja, M. Liver zonation: Novel aspects of its regulation and its impact on
homeostasis. World J Gastroenterol 20, 8491–8504 (2014).
261. DUNCAN, A. W., DORRELL, C. & GROMPE, M. Stem Cells and Liver Regeneration.
Gastroenterology 137, 466–481 (2009).

142
262. Bezinover, D. et al. Association between plasma cyclic guanosine monophosphate levels and
hemodynamic instability during liver transplantation. Liver Transpl 19, 191–198 (2013).
263. Montoliu, C. et al. Correlation of nitric oxide and atrial natriuretic peptide changes with altered
cGMP homeostasis in liver cirrhosis. Liver International 25, 787–795 (2005).
264. Kirstetter, P. et al. Plasma concentrations of cyclic 3’, 5’-guanosine monophosphate in patients
with cirrhosis: relationship with atrial natriuretic peptide and haemodynamics. J. Gastroenterol.
Hepatol. 12, 233–236 (1997).
265. Montani, D. et al. Phosphodiesterase type 5 inhibitors in pulmonary arterial hypertension. Adv
Therapy 26, 813 (2009).
266. Kukreja, R. C. et al. Emerging new uses of phosphodiesterase-5 inhibitors in cardiovascular
diseases. Exp Clin Cardiol 16, e30–e35 (2011).
267. Lugnier, C., Schoeffter, P., Le Bec, A., Strouthou, E. & Stoclet, J. C. Selective inhibition of cyclic
nucleotide phosphodiesterases of human, bovine and rat aorta. Biochemical Pharmacology 35,
1743–1751 (1986).
268. Ballard, S. A. et al. EFFECTS OF SILDENAFIL ON THE RELAXATION OF HUMAN CORPUS
CAVERNOSUM TISSUE IN VITRO AND ON THE ACTIVITIES OF CYCLIC NUCLEOTIDE
PHOSPHODIESTERASE ISOZYMES. The Journal of Urology 159, 2164–2171 (1998).
269. Rubin, L. J. et al. Long-term Treatment With Sildenafil Citrate in Pulmonary Arterial
Hypertension: The SUPER-2 Study. Chest 140, 1274–1283 (2011).
270. Buckley, M. S., Staib, R. L., Wicks, L. M. & Feldman, J. P. Phosphodiesterase-5 inhibitors in
management of pulmonary hypertension: safety, tolerability, and efficacy. Drug Healthc Patient
Saf 2, 151–161 (2010).
271. Xie, G. et al. Role of Differentiation of Liver Sinusoidal Endothelial Cells in Progression and
Regression of Hepatic Fibrosis in Rats. Gastroenterology 142, 918–927.e6 (2012).
272. Knorr, A. et al. Nitric oxide-independent activation of soluble guanylate cyclase by BAY 60-2770
in experimental liver fibrosis. Arzneimittelforschung 58, 71–80 (2008).
273. Mehrotra, N., Gupta, M., Kovar, A. & Meibohm, B. The role of pharmacokinetics and
pharmacodynamics in phosphodiesterase-5 inhibitor therapy. Int J Impot Res 19, 253–264
(2006).

143
274. Gupta Manish, Kovar Andreas & Meibohm Bernd. The Clinical Pharmacokinetics of
Phosphodiesterase‐5 Inhibitors for Erectile Dysfunction. The Journal of Clinical Pharmacology
45, 987–1003 (2005).
275. Francis, S. H., Morris, G. Z. & Corbin, J. D. Molecular mechanisms that could contribute to
prolonged effectiveness of PDE5 inhibitors to improve erectile function. International Journal of
Impotence Research 20, 333–342 (2008).
276. McMurray, J. G., Feldman, R. A., Auerbach, S. M., DeRiesthal, H. & Wilson, N. Long-term safety
and effectiveness of sildenafil citrate in men with erectile dysfunction. Ther Clin Risk Manag 3,
975–981 (2007).
277. Setter, S. M., Iltz, J. L., Fincham, J. E., Campbell, R. K. & Baker, D. E. Phosphodiesterase 5
inhibitors for erectile dysfunction. Ann Pharmacother 39, 1286–1295 (2005).
278. Aversa, A. Systemic and metabolic effects of PDE5-inhibitor drugs. World J Diabetes 1, 3–7
(2010).
279. Foresta, C. et al. Expression of the PDE5 enzyme on human retinal tissue: new aspects of PDE5
inhibitors ocular side effects. Eye 22, 144–149 (2008).
280. Jing, Z.-C. et al. Vardenafil in pulmonary arterial hypertension: a randomized, double-blind,
placebo-controlled study. Am. J. Respir. Crit. Care Med. 183, 1723–1729 (2011).
281. Morales, A., Gingell, C., Collins, M., Wicker, P. A. & Osterloh, I. H. Clinical safety of oral
sildenafil citrate (VIAGRA) in the treatment of erectile dysfunction. Int. J. Impot. Res. 10, 69-73;
discussion 73-74 (1998).
282. Palatini, P. & De Martin, S. Pharmacokinetic drug interactions in liver disease: An update. World
J Gastroenterol 22, 1260–1278 (2016).
283. Huang, S. A. & Lie, J. D. Phosphodiesterase-5 (PDE5) Inhibitors In the Management of Erectile
Dysfunction. P T 38, 407–419 (2013).
284. Lewis, J. H. & Stine, J. G. Review article: prescribing medications in patients with cirrhosis - a
practical guide. Aliment. Pharmacol. Ther. 37, 1132–1156 (2013).
285. Moran, P. R., Moran, R. A. & Karstaedt, N. Verification and evaluation of internal flow and
motion. True magnetic resonance imaging by the phase gradient modulation method. Radiology
154, 433–441 (1985).
286. O’Donnell, M. NMR blood flow imaging using multiecho, phase contrast sequences. Med. Phys.
12, 59–64 (1985).
144
287. Walker, P. G. et al. Semiautomated method for noise reduction and background phase error
correction in MR phase velocity data. J. Magn. Reson. Imaging 3, 521–530 (1993).
288. Bednarik, J. A. & May, C. N. Evaluation of a transit-time system for the chronic measurement of
blood flow in conscious sheep. Journal of Applied Physiology 78, 524–530 (1995).
289. Pfaffl, M. W. A new mathematical model for relative quantification in real-time RT–PCR. Nucleic
Acids Res 29, e45 (2001).
290. Schmittgen, T. D. & Livak, K. J. Analyzing real-time PCR data by the comparative CT method.
Nat. Protocols 3, 1101–1108 (2008).
291. Landis, J. R. & Koch, G. G. The Measurement of Observer Agreement for Categorical Data.
Biometrics 33, 159–174 (1977).

145
7. Attachments
7.1 Score sheet to document the body condition of the rats (in German)
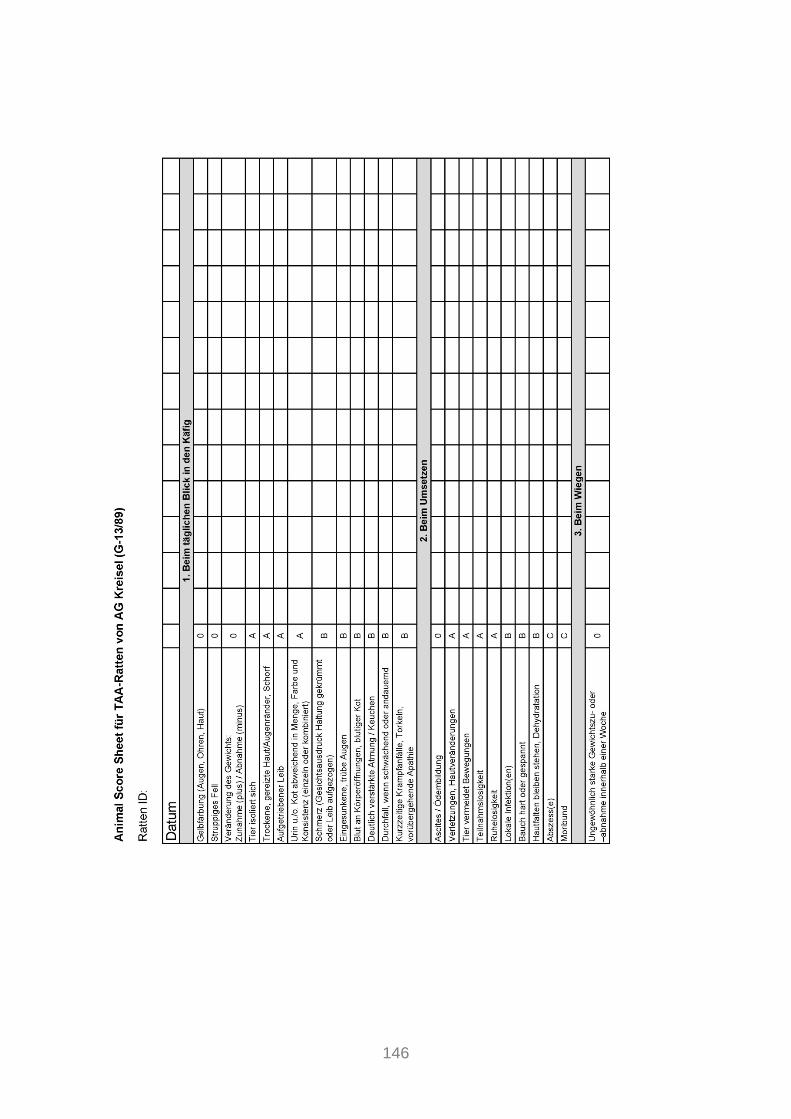
146

147
7.2 Photo series of the operative procedure
a) Operation table
b) Tracheotomy

148
c) Insertion of venous catheters
d) Insertion of arterial catheters
e) Laparotomy

149
f) Exposure of the portal vein and positioning of the flow probe
g) Insertion portal vein catheter
h) Positioning microvascular flow probe

150
i) Apparatuses and monitoring system
j) Blood sample collection

151
8. Abbreviations Alb albumin
ALT alanine aminotransferase
AP alkaline phosphatase
AST aspartate aminotransferase
BDL bile duct ligation
BH4 tetra-hydrobiopterin
Bil bilirubin
Ca calcium
cAMP cyclic adenosine guanosine monophosphate
CCC cholangiocellular carcinoma
CCl4 carbon tetrachloride
cGMP cyclic guanosine monophosphate
Crea creatinine
EC endothelial cell
ECM extracellular matrix
ELISA enzyme-linked immunosorbent assay
eNOS endothelial nitric oxide synthase
FAD flavin adenine dinucleotide
FHVP free hepatic venous pressure
FMN flavin mononucleotide
FMO flavin-containing monooxygenase
Glc glucose
HABR hepatic arterial buffer response
HCC hepatocellular carcinoma
HPF high power field
HSC hepatic stellate cell
HR heart rate
HVPG hepatic venous pressure gradient
iNOS inducible nitric oxide synthase
K potassium
KC Kupffer cell
Ly6Chi macrophages with a profibrogenic phenotype
Ly6clo macrophages with an antifibrogenic phenotype

152
MAP mean arterial pressure
MF microvascular flow
MMP matrix metalloproteinase
MR magnetic resonance
Na sodium
NaCl sodium chloride
n.d. not detectable
NK natural killer cell
n.m. not measured
NO nitric oxide
NO-cGMP nitric oxide-cyclic guanosine monophosphate
NOS nitric oxide synthase
NSBB nonselective beta-blocker, beta-adrenergic receptor antagonists
PDE phosphodiesterase
PDGF platelet derived growth factor
PH portal hypertension
PKG protein kinase G
PVP portal venous pressure
qRT-PCR quantitative real-time polymerase chain reaction
ROS reactive oxygen species
SEC sinusoidal endothelial cell
sGC soluble guanylyl cyclase
sGCa1 soluble guanylyl cyclase (alpha1 subunit)
sGCb1 soluble guanylyl cyclase (beta1 subunit)
Sil sildenafil
TAA thioacetamide
TAASO TAA-sulfoxide
TAASO2 TAA-sulfdioxide
TGF-b transforming growth factor beta
TIMP tissue inhibitors of matrix metalloproteinases
TIPS transjugular intrahepatic portosystemic stent shunting
US ultrasound
VEGF vascular endothelial growth factor
WHVP wedged hepatic venous pressure

153
9. Content of Figures Figure 1: Schematic diagram of a portal tract and a hepatic sinusoid
Figure 2: Changes in the hepatic sinusoid in response to liver cirrhosis
Figure 3: Schematic diagram of the NO-cGMP pathway
Figure 4: Comparison of the structures of cGMP and sildenafil
Figure 5: Dot plot illustrating the assessment of the degree of liver fibrosis using
histological (Desmet score) and MR scoring (MR score)
Figure 6: Color-coded image displaying the flow velocities (m/min) (a) and a
diagram of flow volume rates (ml/min) (b) in the portal vein (red, yellow)
and abdominal aorta (blue) at selected time points of a cardiac cycle
Figure 7: Boxplots showing the distributions of portal cross-sectional area [mm2]
(a), portal flow velocity [m/min] (b), portal and aortic flow volume rate
[ml/min] (c and d) in the groups
Figure 8: Boxplots showing the distributions of portal flow volume rate [ml/min] (a)
and MAP (b) in the groups
Figure 9a: Changes of relative median (%) in PVPrel and MAPrel ± 95% CI in the
subgroups
Figure 9b: Changes of relative median (%) in MFrel and HRrel ± 95% CI in the
subgroups
Figure 10: Course of MAP (black) and PVP (blue) of an exemplary rat after sodium
chloride (NaCl) administration
Figure 11: Dotplots showing the distributions of hepatic gene expression of the
enzymes eNOS (a), iNOS (b), PDE5 (c), sGCa1(d) and sGCb1(e), as
well as distributions of serum cGMP concentrations [pmol/ml] (f) in the
subgroups
Figure 12: Immunohistochemical PDE5 staining (brown) of liver tissue samples of
rats with healthy (CON 1) and cirrhotic livers (CIR 1 and CIR 2)
Figure 13: Preparation of the rat for the MR measurements and insertion into
MR scanner
Figure 14: T1-RARE images displaying the positioning of the PC-MR slice
orthogonally to the portal vein (a and b) and the abdominal aorta (c and
d) of a rat on the coronal (a and d) and sagittal (b and c) reference
scans
Figure 15: Principle of 2D PC-MR

154
Figure 16: T1-RARE images showing morphological hallmarks of the MR score
Figure 17: Insertion of catheter for MAP measurements and laparotomy
Figure 18: Prinicple of the polymer two-step indirect technique for
immunhistochemical staining
155
10. Content of Tables Table 1: Causes of liver cirrhosis
Table 2: Vasoactive molecules
Table 3: Classification of PH according to anatomical location
Table 4: Stages of liver cirrhosis
Table 5: Reference standards and potentially novel drugs for PH therapy
Table 6: Reference standards and potentially novel strategies to increase
NO downstream signaling
Table 7: Substrate specificity and distribution of PDE families
Table 8: Symptoms observed in rats during TAA exposure time
Table 9: Number of rats sorted by strain and their histological degree of liver
fibrosis with corresponding TAA exposure time
Table 10: Rats sorted by their histological degree of liver fibrosis with
corresponding TAA exposure time
Table 11: Number of data sets of rats evaluated for the assessment of the degree
of liver fibrosis by histological (Desmet score) and MR scoring (MR
score), as well as MR hemodynamic measurements.
Table 12: Median ± interquartile range (IQR) of body weight and hemodynamic
parameters of the groups
Table 13: Rats sorted by their histological degree of liver fibrosis with
corresponding TAA exposure time
Table 14: Median ± interquartile range (IQR) of body weight and hemodynamic
parameters of the groups
Table 15: Rats sorted by their histological degree of liver fibrosis with
corresponding TAA exposure time
Table 16: Median ± interquartile range (IQR) of body weight, hemodynamic
parameters and HR of the subgroups at time points 0, 10, 30 and 60min
Table 17: Relative median of differences (RMD) (%) ± interquartile range (IQR) of
hemodynamic parameters and HR in the subgroups
Table 18: Regression analysis between MAPrel and PVPrel in the subgroups
Table 19: Rats sorted by their histological degree of liver fibrosis and group
classification
Table 20: Overview subgroups

156
Table 21: Median ± interquartile range (IQR) of body weight and serum
parameters in subgroups
Table 22: Pairwise comparisons between subgroups
Table 23: Mean ± standard deviation (SD) of hepatic enzyme gene expression in
the subgroups
Table 24: Median ± interquartile range (IQR) of serum cGMP concentrations in the
subgroups
Table 25: Pairwise comparisons between subgroups
Table 26: Number of untreated and TAA-treated rats sorted by strain
Table 27: Nucleotide sequences of forward and reverse primers
Table 28: Thermocycling conditions for qRT-PCR runs

157
11. Acknowledgments The present dissertation was performed in the Institute for Exercise- und Occupational
Medicine, Medical Center, University of Freiburg. So I would like to thank the medical director
of the institute, Prof. Dr. Peter Deibert, for his support and for providing the topic and
workplaces for my research.
In addition, I would like to express my sincere gratitude to my advisor Prof. Dr.
Wolfgang Kreisel (Department of Medicine II, Gastroenterology, Hepatology, Endocrinology, and
Infectious Diseases, Medical Center, University of Freiburg) for the continuous support of my
PhD study and related research, for his jokes, patience, motivation, and immense
knowledge. His guidance and our discussions helped me in all the time of research
and writing of this thesis. Although he has already been retired, he spent a lot of time
for this project and our small working group; therefore I will be always grateful to him.
Besides my advisor, I would like to thank the rest of my thesis committee, in
particular Prof. Dr. Irmgard Merfort (Department of Pharmaceutical Biology and Biotechnology,
University of Freiburg) for her support, her insightful comments and encouragement, but
also for her questions, which incented me to widen my research from various
perspectives.
Furthermore, I would like to thank all my lab colleagues: PD Dr. Manfred Baumstark,
Sabine Jotterand, Sabine Linser-Haar, Heidrun Zurmoehle, and Sabine Well-
Zimmermann (Institute for Exercise- und Occupational Medicine, Medical Center, University of
Freiburg). Hereby, my sincere thanks goes to PD Dr. Manfred Baumstark who advised
me with all statistical matters. I really admired his knowledge covering so many
different areas, so that in the end he was not only a colleague but also a mentor.
Moreover, I thank Sabine Jotterand who thought me how to perform ELISA
experiments and who together with her teammate, Sabine Linser-Haar, was always
willing to help with organizational matters in the lab. I also thank Heidrun Zurmoehle
and Sabine Well-Zimmermann who ordered all material I needed.
Very special thanks also goes to my former teammate and meanwhile friend, Dr.
Adhara Lazaro (previously: Institute for Exercise- und Occupational Medicine, Medical Center,
University of Freiburg) for the inspiring discussions on technical as well as private topics,
for the tough times we were working together before deadlines, and for all the fun we
have had in these 2.5 years. It has been a pleasure to work with her.
158
I am also very thankful for the excellent and reliable cooperation with the animal care
attendants Claudia Bravo, Monika Kolterjahn and Lisa Zota (Center for Experimental
Models and Transgenic Service, Medical Center, University of Freiburg).
A special thanks also goes to Dr. Patrick Stoll (previously: Anesthesiology and Critical Care,
Medical Center, University of Freiburg) who taught me how to perform the anesthesia and
the operative procedure for the invasive hemodynamic measurements.
I also thank Dr. Lisa Lutz and Prof. Dr. Annette Schmitt-Graeff (Institute of Clinical
Pathology, Medical Center, University of Freiburg). Dr. Lisa Lutz conducted the histological
evaluation of the rats’ liver tissue samples, whereas Prof. Dr. Annette Schmitt-Graeff
contributed to the diagnosing of the immunhistochemical PDE5 staining.
In addition, a special mention goes to PD Dr. Dominik von Elverfeldt, Dr. Wilfried
Reichardt, Dr. Jakob Neubauer, Annette Merkle and Michaela Schaeper (Department of
Radiology – Medical Physics, Medical Center, University of Freiburg). In cooperation with this
team the MR measurements were performed. Dr. Wilfried Reichardt also conducted
the postprocessing of MR data. Furthermore, he and Dr. Jakob Neubauer evaluated
the MR rat liver images with the MR score.
A gratidude also goes out to Prof. Dr. Hasselblatt, Isabel Schulien, and Birgit
Hockenjos (Department of Medicine II, Gastroenterology, Hepatology, Endocrinology, and Infectious
Diseases, Medical Center, University of Freiburg) who provided me an opportunity to
temporarily join their team. They taught me how to perform and evaluated qRT-PCR
experiments (including the primer design) and assisted me with the immuno-
histochemical stainings.
I also thank Thomas Heister (Institute of Medical Biometry and Statistics, Medical Center,
University of Freiburg) for the conduct of the regression analyses to evaluate the effect of
MAP on PVP.
Moreover, I am grateful to my family members and friends who supported me
mentally throughout writing this dissertation and in general.
And last, but for sure not least, I thank God for the strength, health, perseverance,
and patience he gave me during these years which have been real challenging
sometimes.

159
12. Curriculum Vitae This page contains personal information and is therefore not part of the online
publication.