Investigations on Protein Adsorption to Coated Glass Vials · Dissertation zur Erlangung des...
132
Dissertation zur Erlangung des Doktorgrades der Fakultät für Chemie und Pharmazie der Ludwig-Maximilians-Universität München Investigations on Protein Adsorption to Coated Glass Vials Kerstin Höger aus Regensburg, Deutschland 2014
Transcript of Investigations on Protein Adsorption to Coated Glass Vials · Dissertation zur Erlangung des...

Dissertation zur Erlangung des Doktorgrades
der Fakultät für Chemie und Pharmazie
der Ludwig-Maximilians-Universität München
Investigations on Protein Adsorption to
Coated Glass Vials
Kerstin Höger
aus
Regensburg, Deutschland
2014

Erklärung
Diese Dissertation wurde im Sinne von § 7 der Promotionsordnung vom 28. November 2011
von Herrn Prof. Dr. Wolfgang Frieß betreut.
Eidesstattliche Versicherung
Diese Dissertation wurde eigenständig und ohne unerlaubte Hilfe erarbeitet.
München, 31. Januar 2014
_______________________
(Kerstin Höger)
Dissertation eingereicht am 31. Januar 2014
1. Gutachter: Prof. Dr. Wolfgang Frieß
2. Gutachter: Prof. Dr. Gerhard Winter
Mündliche Prüfung am 19. März 2014

Für meine Eltern

Acknowledgments
This thesis was prepared at the Department of Pharmacy, Pharmaceutical Technology
and Biopharmaceutics at the Ludwig-Maximilians-Universität in Munich under the
supervision of Prof. Dr. Wolfgang Frieß.
First of all I would like to express my deepest gratitude to my supervisor Prof. Dr.
Wolfgang Frieß for giving me the opportunity to join his research group. I am very thankful
for your scientific support and advice and the possibility to present my work on various
conferences. Your encouragements, patience and enthusiastic way were invaluable during my
time in your lab. I really enjoyed the pleasant and motivating atmosphere in your group.
I also would like to thank Prof. Dr. Gerhard Winter, the leader of the chair, for
creating excellent working conditions and for initiating and organizing numerous social
activities. Thank you a lot for being the co-referee of this thesis.
My thanks are also going to Dr. Sarah Küchler, who made way for the collaboration
with the group of Prof. Dr. Rainer Haag at the FU Berlin. I received great support from her,
especially on the experiments on protein adsorption to polyglycerol coated vials and on paper
writing.
I would like to acknowledge SCHOTT AG Mainz for providing the siliconized vials
for my experiments. Thanks to Wolfgang Streu and Dr. Robert Hormes for their information
on the siliconized containers. Furthermore I would like to thank Dr. Clemens Ottermann for
providing the glass platelets for the zeta potential measurements and especially Dr. Holger
Röhl for his advice and help.
Merck Serono is gratefully acknowledged for their generous material support. I would
like to thank Dr. Daniel Schwartz for his support with my work.
From the FU Berlin I deeply thank Prof. Dr. Rainer Haag for the possibility to join in
the research about protein adsorption to polyglycerol-coated vials. I would like to thank
Tobias Becherer for the preparation of the vials, the QCM-measurements and the great
collaboration and discussions during paper writing. Thanks also to Wei Qiang for preparing
the coated and labeled vials.
I want to thank Anton Paar GmbH for the possibility to perform zeta potential
measurements on the SurPASS and Dr. Thomas Luxbacher for his support and advice.
From the TU Munich I want to thank Prof. Dr. Ulrich Kulozik for the possibility to
perform the contact angle measurements. I also want to thank Wolfgang Holzmüller who gave
me great support with the measurements.
I also want to thank several students who helped me with experiments during my
research. In particular I want to thank Veronika Fischbacher and Marlene Burisch for doing a
great job in the lab. Thanks are also going to Safia Achour-Hayek and Lars Heinzel for their
help.
My special thanks go to my colleagues in the groups of Prof. Frieß and Prof. Winter
for the good time we spent together and the relaxed atmosphere. I always enjoyed our coffee
breaks with lots of cake, the interesting discussions and our social activities. In particular I
want to mention Lars, Winnie, Sarah C., Sarah Z., Julia, Philipp, Tim, Eva and Verena. Thank
you for the good time we had together, for your support and your friendship. I also want to
thank Imke for her general support and advice during these years, Winnie and Philipp for their
IT advice and Tim for his technical support. Furthermore, I want to thank Johannes for his
kind introduction to the analysis of protein adsorption. My special thanks go to Kristine, who
visited me every Wednesday evening, and to Eva, who became my close friends. Thank you
for all the time together.
I deeply thank my parents and my brother Nils. Without their encouragement and
support I would never have come so far.
Finally, I would like to thank Berni for his never ending support, encouragement and
patience over the last years. Thank you for always being there for me and for your love.

Table of Contents
Chapter I
General Introduction and Objectives of the Thesis
1 General Introduction ............................................................................................................... 1
Protein Adsorption to Solid Surfaces and Related Risks ............................................... 1 1.1
Primary Packaging Materials for Parenteral Drugs ....................................................... 2 1.2
1.2.1 Glass ................................................................................................................... 2
1.2.2 Siliconization of Glass ........................................................................................ 3
1.2.3 Further Materials, Coatings and Surface Modifications used for Parenteral
Packaging ............................................................................................................ 5
Mechanisms and Driving Forces for Protein Adsorption .............................................. 6 1.3
Factors Influencing Protein Adsorption ......................................................................... 8 1.4
2 Objectives of the Thesis ....................................................................................................... 10
3 References ............................................................................................................................ 11
Chapter II
IgG1 and Lysozyme Adsorption to Type I Borosilicate Glass Vials and
Siliconized Vials
1 Introduction .......................................................................................................................... 18
2 Materials and Methods ......................................................................................................... 19
Materials....................................................................................................................... 19 2.1
2.1.1 Chemicals ......................................................................................................... 19
2.1.2 Protein Formulation .......................................................................................... 20
2.1.2.1 Monoclonal IgG1 ................................................................................ 20
2.1.2.2 Hen Egg White Lysozyme................................................................... 20
2.1.3 Vials and Closure Systems ............................................................................... 21
2.1.4 Vial Fragments.................................................................................................. 21
2.1.5 Glass Powder .................................................................................................... 21
2.1.6 Siliconized Glass Powder ................................................................................. 22
2.1.7 Siliconized and Non-coated Fiolax® Glass Slides ............................................ 22
Methods ........................................................................................................................ 22 2.2
2.2.1 Adsorption Process ........................................................................................... 22
2.2.2 HP-SEC ............................................................................................................ 23
2.2.2.1 Non-native HP-SEC ............................................................................ 23
2.2.2.2 Native HP-SEC .................................................................................... 23
2.2.3 Surface Tension Measurements ........................................................................ 24
2.2.4 UV-Spectroscopy .............................................................................................. 24
2.2.5 Fluorescence Microscopy ................................................................................. 24
2.2.6 Electrophoretic Mobility Measurements .......................................................... 24
2.2.6.1 Experiments with IgG1 ....................................................................... 24
2.2.6.2 Experiments with Lysozyme ............................................................... 25
2.2.7 Streaming Potential Measurements .................................................................. 25
2.2.8 Contact Angle Measurements ........................................................................... 25
2.2.9 Fluorescence Spectroscopy ............................................................................... 26
2.2.10 Light Obscuration ............................................................................................. 26
2.2.11 Visible Particle Inspection ................................................................................ 26
2.2.12 Turbidity Measurements ................................................................................... 26
2.2.13 Static Light Scattering ...................................................................................... 26
2.2.14 Isoelectric Focusing .......................................................................................... 27
2.2.15 Specific Surface Area Analysis ........................................................................ 27
2.2.16 Calculation of the Change in Electrokinetic Charge Density ........................... 27
2.2.17 Calculation of the Change in Interfacial Tension ............................................. 28
3 Results and Discussion ......................................................................................................... 29
IgG1 Adsorption to Type I Borosilicate Glass Vials and Siliconized Vials ................ 29 3.1
3.1.1 Charge Characterization and Electrostatic Interactions of IgG1 and
Siliconized Glass .............................................................................................. 29
3.1.2 Investigation of Adsorption of IgG1 to Borosilicate Glass and Siliconized
Glass by Static Contact Angle Measurements .................................................. 31
3.1.3 Influence of Formulation pH and Ionic Strength on IgG1 Adsorption to
Siliconized Glass Vials ..................................................................................... 34
3.1.3.1 Adsorbed IgG1 Quantity as a Function of pH ..................................... 34
3.1.3.2 Influence of Ionic Strength on IgG1 Adsorption ................................. 36
3.1.4 Electrostatic Interactions within the Adsorption Interface ............................... 38
3.1.5 Influence of Non-ionic Surfactants on IgG1 Adsorption ................................. 40
3.1.6 Influence of Sugars and Polyols on IgG1 Adsorption ...................................... 43
3.1.7 Long-term Adsorption of IgG1 to Borosilicate Glass Vials and Siliconized
Glass Vials ........................................................................................................ 46
Lysozyme Adsorption to Borosilicate Glass Vials and Siliconized Glass Vials ......... 52 3.2
3.2.1 Charge Characterization of Lysozyme and the Glass Surface.......................... 52
3.2.2 Influence of pH on Lysozyme Adsorption ....................................................... 53
3.2.3 Influence of Ionic Strength on Lysozyme Adsorption ..................................... 55
3.2.4 Isotherm Considerations ................................................................................... 58
4 Conclusion ............................................................................................................................ 61
5 References ............................................................................................................................ 63

Chapter III
Polyglycerol Coatings of Glass Vials for Protein Resistance
1 Introduction .......................................................................................................................... 74
2 Materials and Methods ......................................................................................................... 75
Chemicals ..................................................................................................................... 75 2.1
Synthesis and Analytics ............................................................................................... 76 2.2
2.2.1 Azide Functionalized HPG(OMe) (4c) ............................................................. 77
2.2.2 Amine Functionalized HPG(OMe) (4d) ........................................................... 77
2.2.3 Triethoxysilyl Modified HPG(OMe) (4) .......................................................... 77
Glass Coating Procedure .............................................................................................. 78 2.3
Protein Solutions .......................................................................................................... 79 2.4
Protein Adsorption Testing .......................................................................................... 79 2.5
Stability Testing of the HPG(OH)-Coating toward pH Change via QCM-D .............. 80 2.6
Protein Stability after Storage ...................................................................................... 81 2.7
Tests of Significance .................................................................................................... 82 2.8
3 Results .................................................................................................................................. 82
Effect of Different Polyglycerol Coatings on IgG1 and hGH Adsorption .................. 82 3.1
Influence of Sterilisation on Polyglycerol Coatings .................................................... 84 3.2
Long-Term Effect of Polyglycerol Coating on Protein Adsorption ............................ 84 3.3
Effect of HPG(OH)-Coating on IgG1 Stability in Solution ......................................... 85 3.4
Stability Testing of the HPG(OH)-Coating toward pH Change via QCM-D .............. 87 3.5
4 Discussion ............................................................................................................................. 89
5 Conclusion ............................................................................................................................ 92
6 References ............................................................................................................................ 93
Chapter IV
Adsorption of IgG1 and its F(ab’)2 and Fc Fragment to Type I Borosilicate
Glass Vials and Siliconized Vials – Influence of pH and Ionic Strength
1 Introduction .......................................................................................................................... 98
2 Materials and Methods ......................................................................................................... 99
Chemicals ..................................................................................................................... 99 2.1
IgG1 Antibody ............................................................................................................. 99 2.2
Fc Fragments .............................................................................................................. 100 2.3
F(ab’)2 Fragments ...................................................................................................... 100 2.4
Vials and Closure Systems ......................................................................................... 101 2.5
Adsorption Process .................................................................................................... 101 2.6
UV-Spectroscopy ....................................................................................................... 102 2.7

HP-SEC ...................................................................................................................... 102 2.8
Determination of the Molar Extinction Coefficient of Fc and F(ab’)2 Fragments ..... 102 2.9
Micro BCA-Assay...................................................................................................... 103 2.10
SDS-PAGE................................................................................................................. 103 2.11
Isoelectric Focusing ................................................................................................... 104 2.12
3 Results and Discussion ....................................................................................................... 104
Adsorption of IgG1, F(ab’)2 and Fc Fragment ........................................................... 104 3.1
3.1.1 Adsorption to Borosilicate Glass Vials .......................................................... 104
3.1.2 Adsorption to Siliconized Glass Vials ............................................................ 109
Simultaneous Adsorption of F(ab’)2/ Fc Fragments and Orientation 3.2
Considerations ............................................................................................................ 109
4 Conclusion .......................................................................................................................... 112
5 References .......................................................................................................................... 114
Chapter V
Summary of the Thesis...........................................................................................................117

List of Abbreviations
AI adsorption index
AUC area under the curve
BET Brunauer, Emmett, Teller
bis-ANS 8-anilino-1-naphtalene-sulfonate
BSA bovine serum albumine
c concentration
CD cyclodextrin
ceq equilibrium concentration
CMC critical micelle concentration
COC cyclic olefin copolymer
COP cyclic olefin polymer
∆adsσek change of electrokinetic charge density upon adsorption
d pathlength of the cuvette
dh hydrodynamic diameter
ε molar extinction coefficient
εo permittivity of the free space
εr permittivity of the medium
η viscosity of the solution
EDTA ethylene diamine tetraacetate
EMBOSS european molecular biology open software suite
F Faraday constant
F(ab’) fragment, antigen binding
F(ab’)2 fragment, antigen binding, dimer
Fc fragment, crystallizable
FDA Food and Drug Administration
Г mass protein per surface area
γl surface tension of the liquid phase
Гmax maximum surface concentration
Гpl adsorption plateau value
Гpl(pH)max adsorption plateau value at pH of maximum adsorption
γs surface tension of the solid phase
γsl interfacial tension between the solid and the liquid phase

G Gibbs energy
H enthalpy
HCl hydrochloric acid
hGH human Growth Hormone
HLB hydrophilic lipophilic balance
HP-β-CD hydroxypropyl-β-cyclodextrin
HPG(OH) hyperbranched polyglycerol
HPG(OMe) hyperbranched methoxylated polyglycerol
I ionic strength
IEF isoelectric focusing
IEP isoelectric point
IgG immunoglobulin G
κ-1 Debye length
Km median binding affinity
λ wavelength of the light
LPG(OMe) linear methoxylated polyglycerol
µe electrophoretic mobility
MW molecular weight
MWCO molecular weight cut off
mPEG poly(ethylene glycol) methyl ether
n number of amino acids in a protein sequence, heterogeneity index
NA Avogadro´s number
NaCl sodium chloride
NaOH sodium hydroxide
OEG oligo (ethylene glycol)
P 188 poloxamer 188
p level of significance
p pressure
PBS phosphate buffered saline
PDMS poly(dimethylsiloxane)
PEG poly(ethylene glycol)
PG polyglycerol
Ph. Eur. European Pharmacopoeia
pI isoelectric point

PICVD Plasma Impulse Chemical Vapor Deposition
pKa dissociation constant
PS 80 polysorbate 80
QCM-D quartz crystal microbalance with dissipation
R gas constant, correlation coefficient
RNase ribonuclease
σek electrokinetic charge density
S entropy
SAM self-assembled monolayer
SDS sodium dodecyl sulfate
SDS-PAGE sodium dodecyl sulfate polyacrylamide gel electrophoresis
SE-HPLC size exclusion high performance liquid chromatography
τ ´ adhesion tension of a surfactant or protein solution
τ ° adhesion tension of water or saline
[τ ´-τ °] adsorption index
θ contact angle
T temperature
ζ zeta potential
z valency of the ions


Chapter I
General Introduction and Objectives of the Thesis
1 GENERAL INTRODUCTION
Protein Adsorption to Solid Surfaces and Related Risks 1.1
Adsorption of proteins to solid surfaces is a phenomenon observed in a variety of fields and
processes. Due to their surface-activity, protein molecules are able to interact with various
surfaces. The specific properties of protein, surface and the surrounding liquid determine the
extent to which adsorption may occur. For therapeutic protein formulations, adsorption is a
critical point during processing, storage, and even during patient administration of the
finished product. Glass and plastics, two of the most common materials for processing
materials and storage containers, are well-known to adsorb significant quantities of protein [1-
3]. This may lead to a loss in protein content, especially for low-concentrated protein
solutions where the relative percentage loss is particularly high. Protein adsorption is a well-
known phenomenon e.g. for insulin [1, 4], secretin [5] and Factor VIII [6]. Handling the loss
of the biologic in the final dosage form is the main challenge for drug manufacturers. One
strategy to overcome this problem is the overfilling of containers, either by applying a higher
filling volume, a higher concentration or both [7]. This allows maintaining the necessary
dosage after passivation of the surface with the drug product. The disadvantage of this
strategy is the higher cost, especially for expensive protein based drugs [7]. Optimization of
the protein formulation in regard to adsorption prevention presents an alternative approach.
Excipients such as surfactants [2] or carbohydrates [8] may be added to reduce adsorptive
losses, and the formulation may be adapted in terms of pH value and ionic strength. However,
these adjustments must not endanger long-term stability and biocompatibility of the
formulation. Furthermore, the proper selection of containers for processing, transport and
storage is a possible approach to decrease the loss of protein content or activity due to

2 Chapter I
adsorption. Various container materials such as glass, plastics, and coated materials are
offered, but up to now, no material provides universal adsorption prevention for all protein
drugs.
Besides the loss of protein, structural alterations in the protein due to adsorption were reported
[9-11]. Additionally, protein adsorption was observed to potentially initiate protein
aggregation [12] which poses the risk of immunogenic reactions toward the drug product [13].
Thus, investigating the factors influencing protein adsorption and the involved mechanisms is
important to find suitable approaches for the above mentioned issues.
Primary Packaging Materials for Parenteral Drugs 1.2
For parenteral drugs, the primary packaging material has to fulfill higher requirements
compared to topical or oral drug formulations. The Food and Drug Administration (FDA) of
the United States of America published a Guidance for Industry concerning “Container
closure systems for packaging human drugs and biologics" [14]. According to this document,
suitability of a packaging system comprises the protection of, and compatibility with the
dosage form, safety and proper performance function. Adsorption of the active drug substance
and a related potency loss may constitute a compatibility problem if unacceptable quality
changes take place [14]. Therefore, stability testing is usually performed in the packaging
system intended for final use. The majority of small volume injectable formulations is stored
in vials, followed by syringes, ampoules and cartridges, whereas bottles and bags are used for
larger volumes [15]. Still, one of the most commonly used materials is glass, but also plastic
vials and different coatings and surface modifications for special applications are available on
the market.
1.2.1 Glass
For parenteral drugs, mainly type I borosilicate glass is used. This glass has a high chemical
resistance, low leachability and a low thermal expansion coefficient [15], is formable and
tight toward gases and liquids. Furthermore, the production of glass containers is possible in a
highly reproducible quality. The thermal stability of this material allows a time and cost
saving sterilization and depyrogenation by dry heat at high temperatures, which is a major
advantage compared to plastics such as cyclic olefin copolymers (COC) or polypropylene.
Although the glass surface is basically chemically resistant, reactions with water, acids and
alkalines may lead to leaching and extraction of glass components. Borosilicate glass is
mainly composed of silicone dioxide and boric oxide with low levels of other oxides which

General Introduction and Objectives of the Thesis 3
are not contributing to network formation, such as sodium and aluminum oxides [15]. At
acidic conditions, network modifying ions from the glass, e.g. Na+, K+ or Ca+ are exchanged
against protons from an aqueous solution [16]. This loss of hydronium ions during leaching
leads to rising pH values in the product solution and potential instabilities of biomolecules.
Alkaline attack of the glass surface which is also known as etching [17] leads to the
disintegration of the SiO network and finally to decomposition of the glass [16]. Water leads
to a leaching of ions and ion exchange between the solution and the glass [16]. Finally, glass
flaking may occur due to the delamination of glass which is embedded at the inner glass
surface [15]. These flakes consist of alkali borates which recondensed during the final glass
preparation after migration to the inner surface and evaporation [15]. This glass instability
gained considerable attention by the authorities [18] as well as glass container manufacturers
[19] and caused several product recalls in the last years [20]. Several factors are associated
with the risk of delamination, some of them presented in an advisory of the US FDA [18]:
(a) the manufacturing process of vials and canes may strongly influence the glass chemical
resistance [21]. Vials manufactured by molding show a higher resistance than vials formed
from glass tubing [17]; (b) alkaline formulations and certain buffers pH ≥ 7, e.g. phosphate,
citrate or tartrate buffers increase the risk of delamination [15]; (c) long storage times,
(d) terminal sterilization and (e) surface treatment with sulfate, e.g. ammonium sulfate were
shown to increase the chance of delamination [17]. Vial forming processes at lower heating
rate and temperature to reduce the migration of alkali ions to the glass surface are one
possible approach to generate surfaces with a potentially lower propensity for delamination
[17]. Furthermore, coating of the inner vial surface with SiO2 can avoid delamination [19].
Due to the variety of product formulations and processing conditions, no general test will
serve for individual risk assessment but container testing and additional container screening
during stability studies will be necessary [19].
1.2.2 Siliconization of Glass
The use of silicones in pharmaceutical manufacturing as antifoames, tubing material and for
the siliconization of container surfaces has been well established for many years. Already in
1949, the siliconization of pharmaceutical containers was patented by Goldman [22]. Coatings
with silicone provide advantages such as a good drainage of the solution from the vial wall
and thus a better dosage [23], an easy movement of rubber closures e. g. in feeding machines,
and reduction of the force for plunger movement in syringes [15]. One of the most common
silicone fluids applied for the coating of parenteral packaging components is

4 Chapter I
Polydimethylsiloxane (PDMS) (Figure I-1a). Endcapped with a trimethylsiloxy-group, some
Polydimethylsiloxanes meet the requirements of Dimethicone NF [24], Dimethicone Ph. Eur.
[25] (Figure I-1b), or the monograph “Silicone oil used as a lubricant” Ph. Eur. [26].
Mundry summarized the typical steps of a siliconization process and the most important
influencing factors using silicone oil emulsions [27]: Before siliconization, the containers are
cleaned by flushing with water for injections and dried with pressurized air. Subsequently, the
silicone oil emulsion is applied by spraying or flushing. Excess aerosol or emulsion is sucked
up and the silicone oil is baked in a heating tunnel. This step simultaneously includes the
sterilization and depyrogenation of the containers. Important variables for this process
comprise the type of the silicone oil, the concentration and composition of the silicone oil
emulsion, the temperature and time of the baking step, as well as the glass of the containers.
In this regard, especially the glass composition and hydrolytic resistance are of importance
[27]. Instead of spraying of the silicone oil (emulsion), dipping or wiping may also be
applied [28]. Baking of applied silicone fluid with dry heat removes hydration moisture from
the surface and ensures a good association of the coating with the substrate surface [28].
Applying silicone oil emulsions, heating is necessary to destruct the contained emulsifier and
thus enable a spreading of the PDMS on the surface [27]. During heat-curing, the emulsifiers
are removed by pyrolysis or hydrolysis and water evaporates [27]. Trimethylsiloxy-
endblocked PDMS fluids are typically considered chemically inert and stable concerning
decomposition at temperatures below 150 °C, but certain metals and higher temperatures may
influence their decomposition and reactivity [28]. Formaldehyde and low-molecular weight
siloxanes may be generated at > 150 °C when silicone oil is heated to about 200 °C [29].
Heat-curing at temperatures below 250 °C for less than 2 h for substrates coated with silicone
fluids is therefore recommended by some PDMS suppliers to reduce the formation of
formaldehyde [28], whereas in industrial processes, higher temperatures at reduced baking
times are applied as well. From a literature review, Mundry concluded that silicone oil
emulsions and curing temperatures between 300-350 °C for 10-30 min. should be applied to
obtain optimal siliconization results [27]. Due to the low reactivity of silicones and their
(a) (b)
Figure I-1: Chemical structure of (a) polydimethylsiloxane (PDMS) and (b) Dimethicone
(trimethylsiloxy-endcapped PDMS).

General Introduction and Objectives of the Thesis 5
stability, sterilization by dry heat and steam autoclaving as well as gassing by ethylene oxide
and radiation in low doses is possible [28]. Using silicone oil coatings implies the risk of
silicone (micro)droplets in the product solution [15, 30]. In therapeutic protein formulations,
this may increase the risk of product-droplet interactions [15] and potential protein
aggregation [31]. Minimizing the applied amount of silicone oil is therefore essential [28].
Due to their growing relevance as coated packaging material for injectables, siliconized glass
vials were chosen for adsorption studies with IgG1 and lysozyme.
1.2.3 Further Materials, Coatings and Surface Modifications used for
Parenteral Packaging
Besides glass vials, plastic vials of cyclic olefins such as cyclic olefin copolymer (COC) and
cyclic olefin polymer (COP) have been developed for the packaging of injectables [15].
Compared to polypropylene and polyethylene, these materials provide advantages like high
transparency, the absence of extractable metal ions and low levels of organics which may be
extracted [32]. Although plastic containers exhibit advantages compared to glass vials e.g. a
resistance to breakage and a reduced release of leachables (for COC and COP) [15], their use
is not very common. Some reasons are the higher costs of these vials [32] and the challenges
arising from their transfer into an aseptic environment: In contrast to glass vials which are
conveyed through a heating tunnel directly into an aseptic area, plastic vials are obtained pre-
sterilized (e.g. by irradiation) and have to be transferred aseptically [15]. Furthermore, the low
weight of these vials compared to glass vials makes their transport on conveyers and their
handling difficult, and the potential of product-container interactions over shelf-life periods of
several years is still rising concerns [15].
Another option to improve the properties of the packaging materials is the coating of a glass
or plastic container. One common coating is the siliconization as presented in section 1.2.2.
Coating of glass vials with thin layers of SiO2 by Plasma Impulse Chemical Vapor Deposition
(PICVD) strongly reduces the interaction between the vial surface and the drug [16]. Besides
these marketed products, there is great effort on the development of further protein repellent
surface coatings to reduce the adsorption of proteins. Poly- or oligoethylene glycol
(PEG/OEG)-based coatings are one of the most popular and best investigated coatings [33-
35]. The excellent protein repellent effects of these coatings were ascribed to a steric
repulsion or excluded volume mechanism [36] or the formation of a structurally stable
interfacial water layer [34]. Further investigated surface modifications include coatings with
polyglycerols [37-39], zwitterionic self-assembled monolayers and polymers [40, 41],

6 Chapter I
carbohydrate-derived polymers [42] and dextran [43]. Besides the ability to prevent the
adsorption of proteins, a variety of other factors decide about the feasibility of a coating for
industrial primary packaging materials for injectables. These include the possibility for
sterilization, stability of the coating over 2-3 years, non-toxic properties of the coating and
low costs [7]. Furthermore, the coating quality must be verifiable to 100% [7]. These
requirements are met only by a minority of promising coatings. Polyglycerols with different
side groups constitute a new and innovative coating material. Glass vials coated with these
materials as a potential candidate were therefore investigated for their adsorption preventing
properties.
Mechanisms and Driving Forces for Protein Adsorption 1.3
Proteins are amphiphilic, surface-active molecules which may adsorb to liquid-gas and solid-
liquid interfaces. The mechanism of protein adsorption to and desorption from a solid surface
involves several steps, which are schematically depicted in Figure I-2 and were thoroughly
described by Norde [44]. Convection and diffusion transport the protein from solution toward
the sorbent surface (1), where the molecules may adsorb (2). The rate constant for this
deposition is thereby influenced by the surface coverage and any barriers opposing attachment
e.g. due to electrostatic repulsion. Once the protein attached on the surface, it structurally
relaxes (3), optimizing its interaction with the surface [44]. Changes in the protein´s
secondary structure may occur upon adsorption [10, 45]. Finally, adsorbed molecules may
Figure I-2: Schematic process of protein adsorption to a solid surface adapted from
Norde [44]. The relaxation degree of the adsorbed protein molecules is indicated by the
asterisks.

General Introduction and Objectives of the Thesis 7
detach (4) and are transported back toward the solution (5) [44]. Protein adsorption to solid
surfaces was found to be almost irreversible [46, 47] or only partially reversible [48] upon
rinsing with buffer. The reversibility of adsorption largely depends on the system studied.
After desorption from the sorbent surface, the detached molecules may potentially restructure
to their native state (6) [44].
At constant pressure p and temperature T, protein adsorption requires a decrease of the
systems´ Gibbs energy G independent of the adsorption mechanism and kinetics [49]. The
change of the Gibbs energy G due to the adsorption process can be written as
∆ G ∆ H T∆ S 0
where H and S represent the enthalpy and entropy [44]. Analysis of the adsorption induced
change in Gibbs energy caused by different interaction types thus represents one possible
approach to investigate the reasons for protein adsorption [49]. In the following, the most
important factors determining protein adsorption, (A) electrostatic interactions, (B) hydration
changes, (C) dispersion interactions and (D) structural rearrangements, will be briefly
presented.
(A) One important driving force for adsorption is the interaction between electrical double
layers [44] which is also known as electrostatic interactions. The sorbent surface and the
protein are usually electrically charged. Coions and counterions surround them in an aqueous
medium and an electrical double layer is formed from this countercharge and the surface
charges of protein or sorbent [44]. Upon adsorption, when the protein comes close to the
surface, a superposition of their electrical double layers takes place and the position of the
counterions is readjusted [50]. It is clear that this interaction is especially favorable when
protein and sorbent surface bear net charges of different sign and electrostatically attract each
other.
(B) Besides electrostatic interactions, changes in the state of hydration may be another driving
force for adsorption [44]. Major parts of the protein’s outer surface are composed of charged
and polar protein residues since the solvation of these groups compared to hydrophobic
protein parts is more easy [51], whereas apolar protein side-chains are by trend buried inside
the protein molecule [52]. The hydration of surface exposed apolar protein patches can be
avoided by aggregate formation or adsorption of the protein to a non-aqueous interface,

8 Chapter I
leading to a rise in entropy and thus a lowering of the Gibbs energy [49]. Dehydration of
hydrophobic protein patches can thus constitute a driving force for protein adsorption.
According to Norde, ∆adsG by dehydration is higher than by a redistribution of charges for the
majority of hydrophobic surfaces, which is why adsorption to hydrophobic surfaces can be
observed for all proteins even when the conditions are electrostatically unfavorable [50].
(C) Dispersion interactions are another possible driving force for protein adsorption to solid
surfaces. In materials, intermolecular long-range van der Waals forces emerge from dipole
interactions and consist of three contributing forces, namely the Keesom force, the London
force and the Debye force [53]. Except for the Keesom force which can also be repulsive, van
der Waals forces are attractive [53]. The adsorption induced change in Gibbs energy due to
dispersion interactions depends on the protein dimensions and the space between sorbent
surface and protein [44].
(D) Finally, structural rearrangements of the protein may act as a driving force for adsorption
[44]. Main parts of a protein´s interior consist of hydrophobic protein parts [51]. Upon contact
of a protein with a non-aqueous surface, the importance of intramolecular hydrophobic
interactions, which stabilize α-helices or β-sheets, decreases and apolar patches which were
previously located inside the protein core may orientate toward the non-aqueous sorbent
surface [44]. Conformational changes upon adsorption such as decreased α-helical structures
for BSA [54] or a decreased content of β-sheets combined with increased fractions of random
coil and α-helices for IgG on a hydrophobic surface were reported [10]. It was postulated that
an increasing entropy due to structural rearrangements is the main reason for spontaneous
protein adsorption [55].
Factors Influencing Protein Adsorption 1.4
Protein adsorption to solid sorbent surfaces is a complex process which is mainly determined
by the properties of the protein and the sorbent surface. For therapeutic proteins, the
adsorption conditions and the composition of the formulation also play an important role.
Norde established the classification of proteins according to their structural stability upon
adsorption to surfaces [56]: “Hard” proteins adsorb only under electrostatically attractive
conditions to polar surfaces and the structural changes involved are low. “Soft” proteins
undergo stronger structural changes upon adsorption, potentially with a decrease of ordered
structures, and the increase in conformational entropy allows adsorption to polar surfaces

General Introduction and Objectives of the Thesis 9
even under electrostatically adverse conditions. However, this entropy gain by adsorption as a
driving force applies only for globular proteins, whereas for polymers of loose structures,
adsorption involves entropy losses [56]. Besides this structural aspect, the adsorption behavior
of a protein depends on its hydrophilicity or hydrophobicity, and the net charge, which was
already discussed in the previous chapter. At this point it has to be added that adsorption was
frequently observed not only at attractive electrostatic, but also at repulsive conditions [57,
58]. This is where not only the net charge, but also the charge distribution of the components
becomes important for adsorption. Kamiyama & Israelachvili suggested that the number of
ionic bonds between discrete, oppositely charged groups on sorbent and adsorbate determines
adsorption [57]. Furthermore, the protein IEP was found to essentially determine adsorption,
as for a variety of proteins and sorbent surfaces a rough correspondence with the pH of
maximum adsorption was found [59-62]. Amongst others, this trend was ascribed to a low
intermolecular repulsion at the pI and high adsorption rates, not allowing reorientation of the
molecules [63] and increasing structural perturbations in the molecules away from the pI [62].
Besides these aspects, the orientation of the molecules at a surface may be related to the
adsorbed amount [64]. Furthermore, the sorbent properties such as the hydrophilicity and
hydrophobicity, the surface charge, density and roughness, or the movement of surface bound
polymer chains may influence adsorption which will not be further discussed here.
Besides the two components protein and sorbent surface, the formulation conditions are an
important factor influencing the adsorption of therapeutically applied proteins. These include
the pH and ionic strength of the solution, buffer composition, surfactants, polyols and sugars.
The pH value of a solution determines the net charge of the protein and the sorbent and thus
the electrostatic attractive or repulsive forces in between the protein molecules and between
protein and sorbent surface. High salt concentrations may screen these electrostatic
interactions and thus influence the adsorbed amount [65]. Some surfactants can reduce the
protein adsorption to surfaces [2, 66] or remove already adsorbed protein [67]. Besides,
protein adsorption was also shown to be influenced by polyols and sugars [8, 66]. IgG1
adsorption to siliconized vials was investigated considering these formulation relevant classes
of excipients.

10 Chapter I
2 OBJECTIVES OF THE THESIS
The aim of this thesis was to investigate the adsorption of a monoclonal IgG1 antibody and
the model protein lysozyme to vials as primary packaging material. In this work, the main
focus was set on siliconized glass vials as commercially used coated vials, on non-coated
glass vials, and new polyglycerol-coated glass vials which are not yet on the market. The first
main objective was to investigate the influence of different formulation parameters such as pH
value, ionic strength, surfactants, sugars and polyols on the adsorption of IgG1 to siliconized
vials (chapter II). Electrostatic and hydrophobic interactions as driving force were evaluated.
Furthermore, the protein adsorption during long-term storage over several months was taken
into account. Finally, the adsorption behavior of the model protein lysozyme onto glass vials
and siliconized vials was investigated. The second main goal was to evaluate the suitability of
new polyglycerol coated vials as protein repellent packaging material at different formulation
conditions considering also different vial sterilization methods and long-term storage
(chapter III). Finally, the role of the Fc and F(ab´)2 fragment for the adsorption of the IgG1
antibody should be investigated (chapter IV). The focus was set on the adsorption of the
separated fragments and a correlation with possible molecular orientations. In summary, this
thesis should evaluate the main factors influencing the adsorbed protein amount especially of
IgG1 and the protein repellent potential of different glass coatings.

General Introduction and Objectives of the Thesis 11
3 REFERENCES
[1] C. Petty, N.L. Cunningham, Insulin adsorption by glass infusion bottles, poly(vinyl chloride) infusion containers, and intravenous tubing, Anesthesiology, 40 (1974) 406-410.
[2] M.R. Duncan, J.M. Lee, M.P. Warchol, Influence of surfactants upon protein/peptide adsorption to glass and polypropylene, Int. J. Pharm., 120 (1995) 179-188.
[3] H. Grohganz, M. Rischer, M. Brandl, Adsorption of the decapeptide Cetrorelix depends both on the composition of dissolution medium and the type of solid surface, Eur. J. Pharm. Sci., 21 (2004) 191-196.
[4] J.C. McElnay, D.S. Elliott, P.F. D'Arcy, Binding of human insulin to burette administration sets, Int. J. Pharm., 36 (1987) 199-203.
[5] J. Ogino, K. Noguchi, K. Terato, Adsorption of Secretin on Glass Surfaces, Chem. Pharm. Bull. (Tokyo), 27 (1979) 3160-3163.
[6] McLeod, Walker, Zheng, Hayward, Loss of factor VIII activity during storage in PVC containers due to adsorption, Haemophilia, 6 (2000) 89-92.
[7] D. Haines, L. Burzio, M. Bicker, R. Hormes, H. Koller, J. Buki, Method of preparing a macromolecule deterrent surface on a pharmaceutical package, United States Patent US 8,025,915, September 27 2011.
[8] J.R. Wendorf, C.J. Radke, H.W. Blanch, Reduced protein adsorption at solid interfaces by sugar excipients, Biotechnol. Bioeng., 87 (2004) 565-573.
[9] A. Kondo, J. Mihara, Comparison of Adsorption and Conformation of Hemoglobin and Myoglobin on Various Inorganic Ultrafine Particles, J. Colloid Interface Sci., 177 (1996) 214-221.
[10] A.W.P. Vermeer, M.G.E.G. Bremer, W. Norde, Structural changes of IgG induced by heat treatment and by adsorption onto a hydrophobic Teflon surface studied by circular dichroism spectroscopy, Biochim. Biophys. Acta, Gen. Subj., 1425 (1998) 1-12.
[11] S.T. Tzannis, W.J. Hrushesky, P.A. Wood, T.M. Przybycien, Irreversible inactivation of interleukin 2 in a pump-based delivery environment, Proc. Natl. Acad. Sci. U. S. A., 93 (1996) 5460-5465.
[12] E.Y. Chi, J. Weickmann, J.F. Carpenter, M.C. Manning, T.W. Randolph, Heterogeneous nucleation-controlled particulate formation of recombinant human platelet-activating factor acetylhydrolase in pharmaceutical formulation, J. Pharm. Sci., 94 (2005) 256-274.
[13] A.S. Rosenberg, Effects of protein aggregates: an immunologic perspective, AAPS J., 8 (2006) E501-507.
[14] CDER/CBER, Guidance for industry: Container closure systems for packaging human drugs and biologics: chemistry, manufacturing, and controls documentation, in, U.S.

12 Chapter I
Department of Health and Human Services Food and Drug Administration, Center for Drug Evaluation and Research (CDER), Center for Biologics Evaluation and Research (CBER), Rockville, MD, 1999, pp. 41.
[15] G.A. Sacha, W. Saffell-Clemmer, K. Abram, M.J. Akers, Practical fundamentals of glass, rubber, and plastic sterile packaging systems, Pharm. Dev. Technol., 15 (2010) 6-34.
[16] S. AG, SCHOTT Type I plus [Online]: SCHOTT AG, Available: www.schott.com/pharmaceutical_packaging/german/download/flyer_type_i_plus.pdf [Accessed July 28 2013].
[17] R.D. Ennis, R. Pritchard, C. Nakamura, M. Coulon, T. Yang, G.C. Visor, W.A. Lee, Glass Vials for Small Volume Parenterals: Influence of Drug and Manufacturing Processes on Glass Delamination, Pharm. Dev. Technol., 6 (2001) 393-405.
[18] US Food and Drug Administration, Advisory to Drug Manufacturers: Formation of Glass Lamellae in Certain Injectable Drugs [Online], 2011, Available: http://www.fda.gov/Drugs/DrugSafety/ucm248490.htm#_ftn6 [Accessed July 24 2013].
[19] Two ways to Minimize the Delamination Risk of Glass Containers, in: Newsflash Pharmaceutical Packaging, SCHOTT Schweiz AG, 2012.
[20] US Food and Drug Administration, Available: http://www.fda.gov/Safety/Recalls/default.htm [Accessed July 24 2013].
[21] R. Iacocca, M. Allgeier, Corrosive attack of glass by a pharmaceutical compound, J. Mater. Sci., 42 (2007) 801-811.
[22] R. Goldman, Drain-clear container for aqueous-vehicle liquid pharmaceutical preparations, United States Patent US 2,504,482, April 18 1950.
[23] A. Colas, Silicones in Pharmaceutical Applications [Online], 2001, Available: http://www.dowcorning.com/content/publishedlit/51-993a-01.pdf [Accessed January 23 2013].
[24] Dimethicone, in: USP36-NF31, 1998
[25] 0138 Dimethicone, in: European Pharmacopoeia, 2011
[26] 3.1.8 Silicone oil used as a lubricant, in: European Pharmacopoeia, 2011
[27] T. Mundry, 1999, Einbrennsilikonisierung bei pharmazeutischen Glaspackmitteln - Analytische Studien eines Produktionsprozesses, Thesis, Humboldt-Universität zu Berlin.
[28] A. Colas, J. Siang, K. Ulman, Silicones in pharmaceutical applications. Part 5: Siliconization of Parenteral Packaging Components [Online], 2006, Available: http://www3.dowcorning.com/content/publishedlit/52-1090-01.pdf [Accessed May 19 2013].
General Introduction and Objectives of the Thesis 13
[29] L. Shin-Etsu Chemical Co., Technical data: Shin-Etsu silicone, Silicone Fluid KF-96 [Online], 2004, Available: www.silicone.jp/e/catalog/pdf/kf96_e.pdf [Accessed July 26 2013].
[30] D.K. Sharma, P. Oma, S. Krishnan, Silicone microdroplets in protein formulations-Detection and enumeration, Pharm. Technol., 33 (2009) 74-79.
[31] L.S. Jones, A. Kaufmann, C.R. Middaugh, Silicone oil induced aggregation of proteins, J. Pharm. Sci., 94 (2005) 918-927.
[32] W. Dirk, A question of use [Online], 2011: SAMEDAN LTD Pharmaceutical Publishers, Available: http://www.samedanltd.com/magazine/15/issue/157/article/3018 [Accessed May 20 2013].
[33] K.L. Prime, G.M. Whitesides, Self-assembled organic monolayers: model systems for studying adsorption of proteins at surfaces, Science, 252 (1991) 1164-1167.
[34] P. Harder, M. Grunze, R. Dahint, G.M. Whitesides, P.E. Laibinis, Molecular Conformation in Oligo(ethylene glycol)-Terminated Self-Assembled Monolayers on Gold and Silver Surfaces Determines Their Ability To Resist Protein Adsorption, J. Phys. Chem. B, 102 (1998) 426-436.
[35] S. Pasche, J. Vörös, H.J. Griesser, N.D. Spencer, M. Textor, Effects of Ionic Strength and Surface Charge on Protein Adsorption at PEGylated Surfaces, J. Phys. Chem. B, 109 (2005) 17545-17552.
[36] J.D. Andrade, V. Hlady, Protein adsorption and materials biocompatibility: A tutorial review and suggested hypotheses, in: Biopolymers/Non-Exclusion HPLC, Springer Berlin Heidelberg, 1986, pp. 1-63.
[37] M. Weinhart, T. Becherer, N. Schnurbusch, K. Schwibbert, H.-J. Kunte, R. Haag, Linear and Hyperbranched Polyglycerol Derivatives as Excellent Bioinert Glass Coating Materials, Adv. Eng. Mater., 13 (2011) B501-B510.
[38] K. Höger, T. Becherer, W. Qiang, R. Haag, W. Frieß, S. Küchler, Polyglycerol coatings of glass vials for protein resistance, Eur. J. Pharm. Biopharm., 85 (2013) 756-764.
[39] C. Siegers, M. Biesalski, R. Haag, Self-Assembled Monolayers of Dendritic Polyglycerol Derivatives on Gold That Resist the Adsorption of Proteins, Chem. Eur. J., 10 (2004) 2831-2838.
[40] Y. Chang, S.-C. Liao, A. Higuchi, R.-C. Ruaan, C.-W. Chu, W.-Y. Chen, A Highly Stable Nonbiofouling Surface with Well-Packed Grafted Zwitterionic Polysulfobetaine for Plasma Protein Repulsion, Langmuir, 24 (2008) 5453-5458.
[41] S. Chen, J. Zheng, L. Li, S. Jiang, Strong Resistance of Phosphorylcholine Self-Assembled Monolayers to Protein Adsorption: Insights into Nonfouling Properties of Zwitterionic Materials, J. Am. Chem. Soc., 127 (2005) 14473-14478.

14 Chapter I
[42] H. Urakami, Z. Guan, Living Ring-Opening Polymerization of a Carbohydrate-Derived Lactone for the Synthesis of Protein-Resistant Biomaterials, Biomacromolecules, 9 (2008) 592-597.
[43] R.A. Frazier, G. Matthijs, M.C. Davies, C.J. Roberts, E. Schacht, S.J.B. Tendler, Characterization of protein-resistant dextran monolayers, Biomaterials, 21 (2000) 957-966.
[44] W. Norde, Proteins at solid surfaces, in: A. Baszkin, W. Norde (Eds.), Physical Chemistry of Biological Interfaces, Marcel Dekker Inc., Basel 2000, pp. 115-135.
[45] P. Roach, D. Farrar, C.C. Perry, Interpretation of Protein Adsorption: Surface-Induced Conformational Changes, J. Am. Chem. Soc., 127 (2005) 8168-8173.
[46] N. Dixit, K.M. Maloney, D.S. Kalonia, Application of quartz crystal microbalance to study the impact of pH and ionic strength on protein–silicone oil interactions, Int. J. Pharm., 412 (2011) 20-27.
[47] E. Brynda, M. Houska, F. Lednický, Adsorption of human fibrinogen onto hydrophobic surfaces: The effect of concentration in solution, J. Colloid Interface Sci., 113 (1986) 164-171.
[48] M. Rabe, D. Verdes, M. Rankl, G.R.J. Artus, S. Seeger, A Comprehensive Study of Concepts and Phenomena of the Nonspecific Adsorption of β-Lactoglobulin, ChemPhysChem, 8 (2007) 862-872.
[49] C.A. Haynes, W. Norde, Globular proteins at solid/liquid interfaces, Colloids Surf., B, 2 (1994) 517-566.
[50] W. Norde, Adsorption of proteins at solid-liquid interfaces, Cells Mater., 5 (1995) 97-112.
[51] J.S. Laurence, C.R. Middaugh, Fundamental Structures and Behaviors of Proteins, in: W. Wang, C.J. Roberts (Eds.), Aggregation of Therapeutic Proteins, John Wiley & Sons, Inc., Hoboken, New Jersey, 2010.
[52] B. Alberts, A. Johnson, J. Lewis, The Shape and Structure of Proteins, in: Mol. Biol. Cell, Garland Science, New York, 2002, http://www.ncbi.nlm.nih.gov/books/NBK26830/.
[53] R.H. French, Origins and Applications of London Dispersion Forces and Hamaker Constants in Ceramics, J. Am. Ceram. Soc., 83 (2000) 2117-2146.
[54] A. Kondo, S. Oku, K. Higashitani, Structural changes in protein molecules adsorbed on ultrafine silica particles, J. Colloid Interface Sci., 143 (1991) 214-221.
[55] W. Norde, J. Lyklema, Why proteins prefer interfaces, J. Biomater. Sci., Polym. Ed., 2 (1991) 183-202.
[56] W. Norde, My voyage of discovery to proteins in flatland ...and beyond, Colloids Surf., B, 61 (2008) 1-9.

General Introduction and Objectives of the Thesis 15
[57] Y. Kamiyama, J. Israelachvili, Effect of pH and salt on the adsorption and interactions of an amphoteric polyelectrolyte, Macromolecules, 25 (1992) 5081-5088.
[58] X. Zhu, H. Fan, D. Li, Y. Xiao, X. Zhang, Protein adsorption and zeta potentials of a biphasic calcium phosphate ceramic under various conditions, J. Biomed. Mater. Res., Part B, 82B (2007) 65-73.
[59] W. Norde, F. MacRitchie, G. Nowicka, J. Lyklema, Protein adsorption at solid-liquid interfaces: Reversibility and conformation aspects, J. Colloid Interface Sci., 112 (1986) 447-456.
[60] J. Buijs, P.A.W. van den Berg, J.W.T. Lichtenbelt, W. Norde, J. Lyklema, Adsorption Dynamics of IgG and Its F(ab')2 and Fc Fragments Studied by Reflectometry, J. Colloid Interface Sci., 178 (1996) 594-605.
[61] P. Bagchi, S.M. Birnbaum, Effect of pH on the adsorption of immunoglobulin G on anionic poly(vinyltoluene) model latex particles, J. Colloid Interface Sci., 83 (1981) 460-478.
[62] P. Van Dulm, W. Norde, J. Lyklema, Ion participation in protein adsorption at solid surfaces, J. Colloid Interface Sci., 82 (1981) 77-82.
[63] M.G.E.G. Bremer, J. Duval, W. Norde, J. Lyklema, Electrostatic interactions between immunoglobulin (IgG) molecules and a charged sorbent, Colloids Surf., A, 250 (2004) 29-42.
[64] J. Buijs, J.W.T. Lichtenbelt, W. Norde, J. Lyklema, Adsorption of monoclonal IgGs and their F(ab')2 fragments onto polymeric surfaces, Colloids Surf., B, 5 (1995) 11-23.
[65] K.L. Jones, C.R. O’Melia, Protein and humic acid adsorption onto hydrophilic membrane surfaces: effects of pH and ionic strength, J. Membr. Sci., 165 (2000) 31-46.
[66] J. Mathes, 2010, Protein Adsorption to Vial Surfaces: Quantification, Structural and Mechanistic Studies, Thesis, Ludwig-Maximilians Universität München.
[67] M. Feng, A.B. Morales, A. Poot, T. Beugeling, A. Bantjes, Effects of Tween 20 on the desorption of proteins from polymer surfaces, J. Biomater. Sci., Polym. Ed., 7 (1995) 415-424.


Chapter II
IgG1 and Lysozyme Adsorption to Type I Borosilicate
Glass Vials and Siliconized Vials
Parts of this chapter as is are intended for publication:
Kerstin Höger, Johannes Mathes, Wolfgang Frieß
IgG1 adsorption to siliconized glass vials – influence of pH, ionic strength and nonionic
surfactants
Abstract
It was the aim of this study to investigate the adsorption of IgG1 and the model protein
lysozyme to type I borosilicate glass vials and siliconized vials. In detail, the influence of the
formulation parameters pH value, ionic strength and excipients such as nonionic surfactants,
sucrose, mannitol and HP-β-CD on the adsorbed amount of IgG1 was determined. The pH-
dependent adsorption trends were attributed to the varying importance of electrostatic and
hydrophobic interactions as driving forces for adsorption. The influence of these forces was
evaluated by determining the zeta potential of protein and sorbent surface by electrophoretic
mobility measurements and the calculation of the charge transfer between the protein-sorbent
interface and the formulation. Furthermore, IgG1 adsorption during long-term storage of the
formulation in vials was considered by correlating the protein’s physical and chemical
stability and the adsorbed amount for up to 6 months. pH- and ionic strength dependence of
adsorption to glass vials and siliconized vials and the influence of protein and sorbent surface
charge were further investigated for the model protein lysozyme.

18 Chapter II
1 INTRODUCTION
Protein adsorption is a common phenomenon in a multitude of different fields in nature and
plays an important role in many biological processes, but it often causes problems in
analytical and industrial processes. For pharmaceutical protein formulations, nonspecific
protein adsorption gives rise to major concerns when the protein drug molecules get in contact
with process materials such as filters, tubings, bags or the final primary packaging. With more
than 50% of the market, vials are the most frequently used small volume containers for
injectable formulations, followed by syringes and cartridges which account for 25-30% of the
products [1]. Besides unmodified vials, siliconized glass vials play the major roles despite the
efforts in bringing plastics forward. The lubricating properties of silicone oil are used to
facilitate manufacturing processes and product functionalities, such as to provide easy
transport of rubber closures in feeding machines, to reduce the plunger friction in syringes [1],
to allow complete drainage of a liquid formulation from vials and better dosage [2].
Polydimethylsiloxane is the most commonly used silicone oil due to its good wetting
properties, physicochemical stability and biocompatibility. Nevertheless, an increased
potential for protein aggregation was found in the presence of silicone oil [3]. A basic
understanding of the interaction mechanism of proteins with a siliconized surface is therefore
essential for the use of siliconized containers and the prevention of adverse effects. The
formulation stability of proteins in presence of silicone oil droplets has been investigated
frequently, including analysis of protein loss, potentially due to protein adsorption to silicone
oil droplets, and its reduction by surfactants [4] as well as studies on the influence of buffer
composition on monomer loss [5]. Protein adsorption to silicone-coated solid surfaces was
investigated by quartz crystal microbalance in presence of surfactants [6, 7] and varying pH
and ionic strength [8]. Nevertheless, there are few studies investigating protein adsorption to
siliconized glass surfaces as present in siliconized syringes or vials.
In general, the sorbent itself influences the adsorption process by the transfer of ions, by
overlapping of the electrical double layers of the surface and the adsorbing protein, as well as
by surface dehydration [9]. As observed for various proteins and surfaces, the electrostatic
interactions between surface and protein as well as amongst protein molecules and thus
adsorption are strongly influenced by the formulation pH and ionic strength [8, 10].
Consequently, determination of the electrokinetic properties, which allow conclusions about
the charge state of protein and surface, can be used to interpret and predict the adsorption
behavior of a protein in terms of electrostatic interactions. Additionally, the effect of ion
incorporation into the protein-sorbent interface can be investigated by calculation of the

IgG1 and Lysozyme Adsorption to Type I Borosilicate Glass Vials and Siliconized Vials 19
charge transfer ∆adsσek between the adsorption layer and the surrounding solution [11] and
correlated with the adsorption behavior.
In pharmaceutical protein formulations, polyols and sugars as well as nonionic surfactants are
typically added to stabilize the protein in solution [12-14]. Furthermore, some surfactants
were shown to prevent adsorption to solid surfaces [15] and to remove already adsorbed
protein molecules from various surfaces [16, 17], depending on the properties of the surface,
the protein, and the surfactant. Finally, the concentration of the surfactant in solution
influences the adsorbed protein amount [18, 19].
This study investigates the adsorption of an IgG1 antibody to siliconized vials and borosilicate
glass vials as commercially relevant primary packaging materials with focus on the
formulation parameters pH, ionic strength, nonionic surfactants, polyols and sugars.
Furthermore, adsorption after long-term storage was investigated. The zeta potential of the
protein and the siliconized surface and the charge uptake ∆adsσek were determined in
dependence of the pH and used to interpret the adsorption behavior of IgG1 in terms of
electrostatic interactions. Additionally, the effect of ionic strength on the protein adsorption
was investigated and related to the interactions between the surface and the protein and in
between the protein molecules. Furthermore, the adsorption suppressing effect of two
formulation relevant nonionic surfactants on siliconized vials was analyzed. Finally,
determination of an ‘adsorption index’ from protein and buffer contact angles was evaluated
as a predictive tool for IgG1 adsorption. Besides adsorption experiments with IgG1, the
adsorption of the model protein lysozyme to borosilicate glass vials and siliconized vials was
investigated with focus on pH, ionic strength and electrostatic conditions. Thus, the study
should provide a better mechanistic understanding of protein adsorption on relevant
pharmaceutical containers and conditions and enable to select the appropriate formulation
composition to minimize protein adsorption.
2 MATERIALS AND METHODS
Materials 2.1
2.1.1 Chemicals
NaH2PO4 and sucrose were purchased from Merck Chemicals (Darmstadt, Germany).
Na2HPO4, sodium-dodecyl sulfate (SDS) and Nile Red were obtained from Sigma-Aldrich
Chemie GmbH (Munich, Germany). NaCl, NaOH and HCl were purchased from VWR

20 Chapter II
International (Darmstadt, Germany). NaOH used for experiments with lysozyme was from
AppliChem GmbH (Darmstadt, Germany), polysorbate 80 Ph. Eur. (PS 80) was purchased
from Caelo (Hilden, Germany) and poloxamer 188 Ph. Eur. (P 188) was from BASF
(Ludwigshafen, Germany). Dow Corning 365, 35% Dimethicone NF Emulsion
(polydimethylsiloxane (PDMS)) was from Dow Corning Corp. (MI, USA). D-(+)-Mannitol
was from Riedel-de-Haen (Honeywell Specialty Chemicals Seelze GmbH, Seelze, Germany)
and hydroxypropyl-β-cyclodextrin (Cavasol W7 HP Pharma) was obtained from Wacker
Chemie AG (Burghausen, Germany).
2.1.2 Protein Formulation
2.1.2.1 Monoclonal IgG1
A 2 mg/ml IgG1 antibody solution in 10 mM phosphate buffer containing 145 mM NaCl
(pH 7.2) was kindly donated by Merck Serono (Darmstadt, Germany). The formulation was
dialyzed into 10 mM phosphate buffer using a Vivaflow® 50 tangential flow cartridge
(Sartorius-Stedim Biotech, Goettingen, Germany) with a 30 kDa MWCO polyethersulfone
membrane and the protein concentration was determined by UV-spectroscopy. Variable ionic
strengths of the solutions were obtained by adding NaCl, followed by pH adjustment with
1 M NaOH or HCl. A consistent ionic strength of 170 mM at different solution pH values was
obtained finally by adding adequate amounts of NaCl to the dialyzed solution. Electrophoretic
mobility measurements were performed with 6 mg/ml antibody dialyzed into a 10 mM NaCl
solution. For adsorption of IgG1 onto siliconized glass particles, the concentration of IgG1
formulated in 10 mM phosphate buffer pH 4-9 was adjusted so that an equilibrium
concentration of about 2 mg/ml resulted after the adsorption process. Ultrapure water
(PurelabPlus UV/UF system, ELGA, Celle, Germany) was applied for all buffers and all
solutions were filtered through a 0.2 µm polyethersulfone membrane filter (Pall GmbH,
Dreieich, Germany). All excipients and chemicals used were of analytical grade.
2.1.2.2 Hen Egg White Lysozyme
Hen egg white lysozyme chloride was purchased as dialyzed, white, amorphous powder from
Dalian Greensnow Egg Products Development Co., Ltd. (Dalian, China). To remove
excessive chloride from the powder, the lyophilisate was dissolved and dialyzed against
10 mM phosphate buffer using Vivaflow® 50 tangential flow cartridges (Sartorius-Stedim
Biotech, Goettingen, Germany) with a 5 kDa MWCO polyethersulfone membrane. pH and

IgG1 and Lysozyme Adsorption to Type I Borosilicate Glass Vials and Siliconized Vials 21
ionic strength adjustments were performed as for IgG1 (section 2.1.2.1). The protein solutions
were filtered through a 0.2 µm polyethersulfone membrane filter (Pall GmbH, Dreieich,
Germany) before use. For adsorption experiments on glass particles, the concentration of
lysozyme formulated in 10 mM PBS pH 4-11 was adjusted so that an equilibrium
concentration of about 10 mg/ml resulted after the adsorption process.
2.1.3 Vials and Closure Systems
Adsorption experiments were performed in pre-siliconized (Dow Corning 365) and baked 2R
Fiolax® glass vials and non-coated Fiolax® borosilicate glass vials which were kindly
provided by SCHOTT AG (Mainz, Germany). The vials were washed with ultrapure water of
80 °C in a vial washing machine FAW 500 (Bausch & Stroebel GmbH & Co. KG, Ilshofen,
Germany). Siliconized vials were autoclaved at 121 °C, 2 bar for 15 minutes, non-coated
glass vials were heat sterilized at 250 °C for 1 h. After filling, the vials were closed with
Fluorotec® stoppers and sealed with Flip-Off® seals (West Pharmaceutical Services,
Eschweiler, Germany). The inner surface area of a vial covered with protein formulation was
calculated as 13.4 cm² for a filling volume of 3.5 ml [18].
2.1.4 Vial Fragments
Vial fragments for the contact angle measurements were generated from 6R Fiolax®
borosilicate glass vials, pre-siliconized (Dow Corning 365) and baked 6R Fiolax® Clear glass
vials as well as 6R TopLyoTM vials. Siliconized and non-siliconized glass vials were pre-
processed as described in section 2.1.3. TopLyoTM vials were pretreated as bare glass vials.
Flinders of at least 1 x 1 cm were cut off the cylinder of the vial with a DREMEL® 300 series
rotary tool (DREMEL Europe, Breda, The Netherlands). The flinders were cleaned from
adherent glass dust with pressurized air.
2.1.5 Glass Powder
Borosilicate glass powder was prepared by shattering Fiolax® glass vials and milling in a
Pulverisette® 5 laboratory planetary mill (Fritsch GmbH, Idar-Oberstein, Germany). The
particle fraction ≤ 45 µm was collected by fractionation in a sieve tower. Subsequently, the
particles were washed with ultrapure water, dried at 90 °C and heat sterilized at 250 °C.
Particles for experiments with lysozyme were again washed extensively before use until the
washing media reached a pH of about 7. For electrophoretic mobility measurements, a non-

22 Chapter II
sedimenting particle fraction was used that was obtained from the supernatant of a particle
suspension after 2 h sedimentation.
For experiments with IgG1, the previously washed and sterilized glass powder was again
cleaned before use by immersion in 1 M NaOH and subsequent washing in water.
Subsequently, the particles were heat sterilized at 200 °C for 1 h. For electrophoretic mobility
measurements, the non-sedimenting glass particle fraction after centrifugation dispersed in
10 mM NaCl was used.
2.1.6 Siliconized Glass Powder
For siliconization, 1 g of glass powder prepared for experiments with IgG1 was incubated
with 3 ml of a 0.5% PDMS emulsion for 30 min. After evaporation of the fluid at 150 °C the
powder was cured at 200 °C for 1 h. The fraction ≤ 25 µm was collected and washed by
suspending and centrifuging in water. For electrophoretic mobility measurements, the non-
sedimenting glass particle fraction after centrifugation dispersed in 10 mM NaCl was used.
2.1.7 Siliconized and Non-coated Fiolax® Glass Slides
Coated and non-coated Fiolax® glass slides of the same glass composition as Fiolax®
borosilicate glass vials with the dimension of 20 x 10 mm were kindly prepared by Schott AG
(Mainz, Germany). Siliconized slides were obtained by immersion of Fiolax® glass slides in
Dow Corning 365.
Methods 2.2
2.2.1 Adsorption Process
The adsorption process on vials followed the procedure described by Mathes & Friess [10].
The pre-processed 2R vials were filled with 3.5 ml of a 2 mg/ml IgG1 solution or 10 mg/ml
lysozyme solution, closed, sealed, and incubated at 25 °C for 24 h (n=3). The vials were
emptied and rinsed four times with the corresponding formulation buffer. For the desorption
of bound protein, 3.5 ml of 10 mM PBS containing 145 mM NaCl and 0.05% sodium dodecyl
sulfate (SDS), pH 7.2, were filled into each vial. The vials were closed and stored overnight at
25 °C.
For the adsorption of IgG1 to siliconized glass particles, the particles were incubated in
protein solutions of different pH value for 24 h while gently shaken repeatedly (n=3). After
centrifugation, the supernatant was removed and the particles were washed four times by

IgG1 and Lysozyme Adsorption to Type I Borosilicate Glass Vials and Siliconized Vials 23
resuspending and centrifuging with 10 mM NaCl solution of the same pH as the formulation
buffer. The non-sedimenting glass particle fraction in the supernatant after centrifugation at
1000 g for 1 min, dispersed in 10 mM NaCl of the formulation pH, was used for
electrophoretic mobility measurements. Lysozyme containing particle suspensions were
repeatedly homogenized on a laboratory vortex mixer during the 24 h incubation time. For
further processing, the supernatant containing not sedimented particles was collected 2 h after
the last mixing step. This particle fraction was washed with NaCl solution as described above.
2.2.2 HP-SEC
2.2.2.1 Non-native HP-SEC
Quantitative analysis of the desorbed protein was performed via HP-SEC on an Agilent 1100
HPLC device with an Agilent 1200 fluorescence detector (Agilent Technologies GmbH,
Boeblingen, Germany) using a TSKgel SWXL guard column and a 3000SWXL SEC-column
(Tosoh Bioscience GmbH, Stuttgart, Germany) with a flow rate of 0.75 ml/min for sample
separation. 400 µl of the protein solution were injected and the intrinsic protein fluorescence
was detected at λex/λem 280 nm/334 nm. Desorption buffer was used as mobile phase. A
calibration line of 0.1-10 µg/ml IgG1 or 0.05-20 µg lysozyme, respectively, was included in
each HPLC batch. Agilent ChemStation Software Rev. B 02.01 was used for manual
integration of the chromatograms.
2.2.2.2 Native HP-SEC
Protein aggregates and fragments in the protein solutions were quantified via HP-SEC
(equipment see 2.2.2.1) with UV-detection at λex 280 nm. 10 mM PBS containing 145 mM
NaCl, pH 7.2, served as eluent. Protein aggregates, monomer and fragments were separated
on a TSKgel SWXL guard column (Tosoh Bioscience GmbH, Stuttgart, Germany) and a
YMC-Pack Diol-300 SEC-column (YMC Europe GmbH, Dinslaken, Germany) at a flow rate
of 0.5 ml/min, applying an injection volume of 100 µl with a sample concentration of
2 mg/ml. Agilent ChemStation Software Rev. B 02.01 was used for manual integration of the
chromatograms. The content of monomer, aggregates and fragments was calculated in percent
of the total protein content of the reference.

24 Chapter II
2.2.3 Surface Tension Measurements
Surface tension measurements were performed on a Kruess tensiometer K100 MK2 (Kruess
GmbH, Hamburg, Germany) with a Wilhelmy plate at 25 °C. The critical micelle
concentration (CMC) was determined by an automatic titration of a concentrated surfactant
solution in 10 mM PBS pH 7.2 with pure buffer (n=2). The surface tension was measured
concentration dependent and the CMC was calculated using the Kruess laboratory desk
software 3.0. Surface tension values for calculation of the adhesion tension were determined
with a curved Wilhelmy plate. A sample volume of 0.9 ml was filled in a steel vessel and the
surface tension was recorded for 10 min (n ≥ 2).
2.2.4 UV-Spectroscopy
UV-spectroscopy for protein quantification was performed on a NanoDrop 2000
spectrophotometer (PEQLab Biotechnology GmbH, Erlangen, Germany) at 280 nm, applying
an extinction coefficient of 1.40 cm²/mg, typical for antibodies. For lysozyme, an extinction
coefficient of 2.65 cm²/mg was applied [20].
2.2.5 Fluorescence Microscopy
The silicone coating on the glass particles was visualized by fluorescence microscopy
(Biozero BZ-8000, Keyence GmbH, Neu-Isenburg, Germany). The particles were stained
with 0.01 mg/ml Nile Red in acetone. Bright view or a TexasRed filter system with λex/λem
560 nm/630 nm with 10-fold magnification was used to visualize the particle shape or the
silicone coating, respectively. The exposure time for the fluorescence was set to 1/200 s so
that fluorescence was only visible for the siliconized glass powder but not for the non-
siliconized reference.
2.2.6 Electrophoretic Mobility Measurements
2.2.6.1 Experiments with IgG1
The electrophoretic mobility of glass particles, siliconized glass particles and IgG1 molecules
(6 mg/ml) in 10 mM NaCl was determined by dynamic light scattering with a Zetasizer Nano
ZS (Malvern Instruments GmbH, Herrenberg, Germany). All measurements were performed
at constantly 50 mV in disposable zeta cells. A viscosity as of water was assumed for the
solutions. The pH was adjusted automatically by a Malvern MPT-2 autotitrator in a range of
pH 2-10 with 0.1 M NaOH and 0.1 M HCl. For siliconized and non-coated glass particles

IgG1 and Lysozyme Adsorption to Type I Borosilicate Glass Vials and Siliconized Vials 25
with a large ratio of the particle size to the Debye length κ-1, the Helmholtz-Smoluchowski
equation was applied for computation [21]. The ζ-potential of IgG1 was calculated according
to the Hueckel approximation for small particles. Values of non-coated glass powder were
obtained as an average of three measurements per pH value of one sample (n=1). For
siliconized particles and IgG1, at least two samples with three measurements each per pH
value were titrated and used for the calculation of the electrokinetic charge density (n=2). Zeta
potentials of protein-covered siliconized particles were measured directly in 10 mM NaCl
solutions of defined pH values (n≥2).
2.2.6.2 Experiments with Lysozyme
Zeta potential titrations of bare glass particles (n=2) and lysozyme (10 mg/ml) (n=3) in
10 mM NaCl were determined in a pH range of 2-12 adjusted with 0.25 M NaOH or 0.25 M
HCl at constantly 50 mV (equipment and calculations compare section 2.2.6.1). The
electrokinetic mobility of lysozyme-covered glass particles was measured directly in 10 mM
NaCl solutions of defined pH values at 150 mV (n=3).
2.2.7 Streaming Potential Measurements
Streaming potential measurements were performed on a SurPASS Electrokinetic Analyzer
(Anton Paar GmbH, Graz, Austria) and an adjustable gap cell with planar slides of
20 x 10 mm. Streaming potentials were measured in 1 mM KCl. Each glass sample was
titrated in the range from pH 3 to pH 9 with 0.05 M NaOH or HCl, respectively, starting the
titrations at neutral pH. Values were obtained as an average of four measurements per pH
value. Zeta potentials were calculated from the measured streaming potentials based on the
Helmholtz-Smoluchowski equation.
2.2.8 Contact Angle Measurements
Contact angles of the protein solutions or buffer on glass flinders were measured with a
DSA 100 (A. Kruess Optronic GmbH, Hamburg, Germany). The glass fragments were placed
horizontally on the sample table in a small transparent plastic chamber to avoid evaporation.
Using a pipette, a 3 µl droplet of the sample solution was carefully placed on the deepest point
of the curvature of the flinders (n ≥ 3). The droplet was video recorded for 700 seconds at a
record rate of 0.36 frames per second. Contact angles after 10 min were calculated from the
videos by manual adjustment of the base line and circle fitting using the Kruess software
DSA 3.
26 Chapter II
2.2.9 Fluorescence Spectroscopy
Fluorescence spectra of protein and buffer were recorded with a Varian Cary Eclipse
fluorescence spectrophotometer (Varian Deutschland GmbH, Darmstadt, Germany) in a
10 x 10 mm fluorescence quartz cuvette at 25 °C. Extrinsic fluorescence was measured in the
presence of 5 µM bis-ANS at λex 385 nm and λem 420 – 700 nm. A protein concentration of
0.05 mg/ml was applied, corresponding to an absorption of 0.07 at the excitation wavelength,
as an absorption < 0.1 at λex is required to avoid the inner filter effect [22]. Before the
measurements, the system was blanked with the corresponding buffer solution. Random noise
of the extrinsic fluorescence spectra was smoothed by moving average through 12 points.
2.2.10 Light Obscuration
Subvisible particle analysis was performed via light obscuration with a PAMAS SVSS-35
(PAMAS GmbH, Rutesheim, Germany). Three fractions of 0.3 ml of each sample with 0.3 ml
pre-run volume were analyzed [23]. The system was flushed with ultrapure water before each
measurement until less than 100 particles per ml in total and no particles ≥ 10 µm were
detected. PAMAS PMA software was used for data analysis and the amount of particles is
given in cumulative particles per ml protein solution.
2.2.11 Visible Particle Inspection
The solutions were inspected visually in front of a dark background and a light source for
visible particles.
2.2.12 Turbidity Measurements
Turbidity of the solutions was measured using a Nephla laboratory turbidimeter (Hach Lange
GmbH, Düsseldorf, Germany). Light scattering was detected at an angle of 90 ° in turbidity
glass cuvettes, applying a filling volume of 1.7 ml. Each sample was measured twice after
rotating the cuvette in the holder.
2.2.13 Static Light Scattering
The size distribution of siliconized particle fractions was analyzed on a Horiba LA-950
system (Retsch Technology GmbH, Haan, Germany) by static light scattering according to the
Mie Theory. For the measurements, the siliconized glass powder was suspended in 10 mM

IgG1 and Lysozyme Adsorption to Type I Borosilicate Glass Vials and Siliconized Vials 27
NaCl solution and the particle size was determined based on particle volume. Data analysis
and calculations were performed using the LA-950 software.
2.2.14 Isoelectric Focusing
The isoelectric point of IgG1 was determined by isoelectric focusing (IEF) using precast
SERVALYT PRECOTES® 6-9 IEF plates with a thickness of 300 µm. 10 µl per sample with
a concentration of 0.5 mg/ml adjusted by dilution with ultrapure water and SERVA Liquid
Mix IEF marker 3-10 (SERVA Electrophoresis GmbH, Heidelberg, Germany) were applied to
the gel. Electrophoresis was performed at 2000 V and 6 mA at 5 °C. The gels were stained
with SERVA Blue W (SERVA Electrophoresis GmbH, Heidelberg, Germany).
2.2.15 Specific Surface Area Analysis
The specific surface area of the siliconized particles was determined with an Autosorb 1
system (Quantachrome, GmbH & Co. KG, Odelzhausen). The sample was outgassed for at
least 15 h at 25 °C before the physisorption of krypton. Specific surface area analysis of non-
siliconized particles used for adsorption experiments with lysozyme was performed by
nitrogen gas sorption with a NOVA 4000e system (Quantachrome GmbH & Co. KG,
Odelzhausen).
2.2.16 Calculation of the Change in Electrokinetic Charge Density
Derived from the theory of diffuse double layers, the electrokinetic charge density σek of
siliconized particles, protein molecules and protein covered siliconized particles was
calculated from the ζ-potential by Eq. (1) [21]:
σ 8ε εcRT sinh zFζ 2RT⁄ (1)
εo represents the dielectric permittivity of vacuum and ε the relative dielectric constant of the
medium. The concentration of the z-z electrolyte is given by c, R is the gas constant, T the
absolute temperature and F the Faraday constant. For ε a value of water was assumed.
According to the principle of electroneutrality, the charge uptake ∆adsσek due to adsorption is
given by Eq. (2) [11, 24]:
28 Chapter II
∆ σ σ IgG/silicon. glass) σ silicon. glass) σ IgG1) ∙ Γ ∙ A (2)
σek represents the charge density per unit surface area at the slipping layer of the complex
IgG1/siliconized glass (IgG1/silicon. glass), of the siliconized glass particles (silicon. glass) or
the IgG1 molecule (IgG1) in solution [11]. Г equals the mass of IgG1 adsorbed per unit
surface area and A the surface area per unit mass protein according to Eq. (3) [11]:
A ∙ (3)
The term 4πr2 represents the surface area of one IgG1 molecule of approximately 335 nm2
when a hydrodynamic radius r of 5.16 nm and a spherical shape of the molecules is assumed
[10]. A molecular weight Mw of 152 kDa for IgG1 was applied and NA equals the Avogadro´s
number. Values of Г for the calculation of ∆adsσek were taken as an approximation from the
pH-dependent adsorption at an ionic strength of 40 mM.
2.2.17 Calculation of the Change in Interfacial Tension
When a drop of a liquid is placed on a surface, its shape will depend on the properties of the
liquid, the surface and the surrounding air [25]. The relationship between the contact angle θ
and the surface tension of the liquid γl, the surface tension of the solid γs and the interfacial
tension between solid and liquid γsl is described by the equation of Young:
γ ∙ cos θ γ γ (4)
From this equation, the adhesion tension τ of a protein or surfactant solution (index ´) or of
pure water / saline (index °) can be derived [26]:
τ γ′ ∙ cos θ (5)
τ° γ° ∙ cos θ° (6)
Vogler defined the difference in adhesion tension between a protein and its solvent solution
[τ ´-τ °] as the adsorption index (AI) [26].
τ τ° γ ∙ cos θ γ° ∙ cos θ° (7)
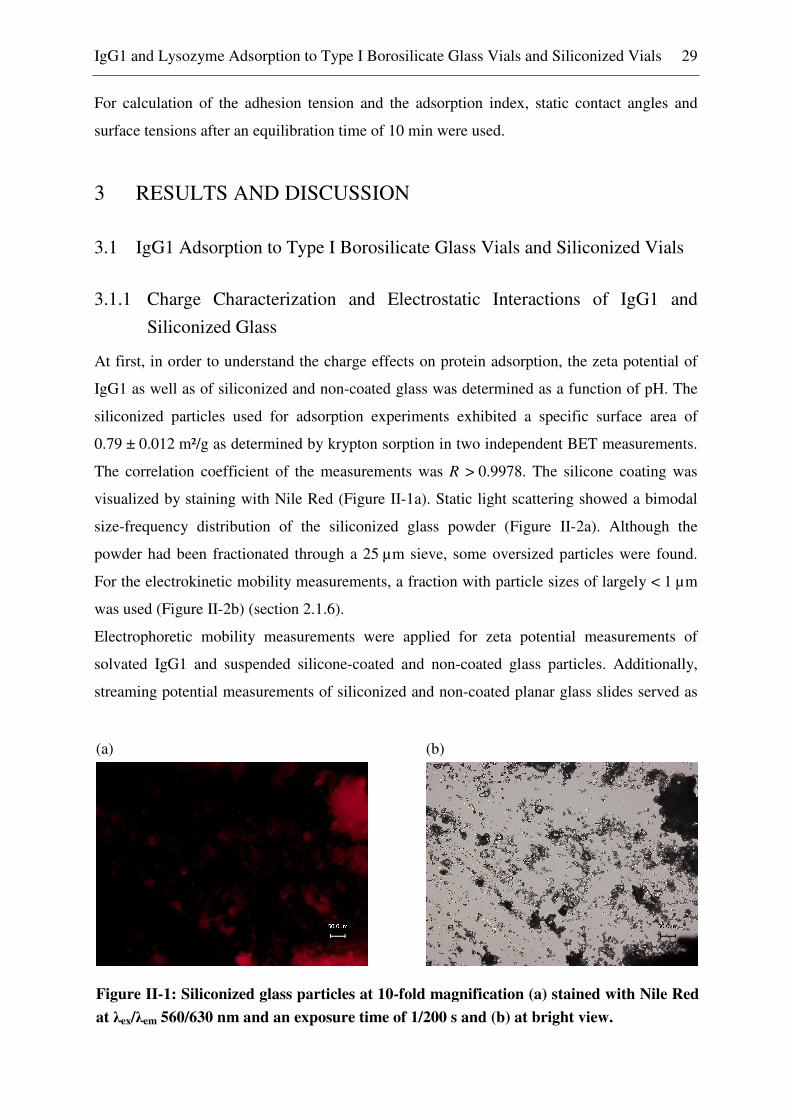
IgG1 and Lysozyme Adsorption to Type I Borosilicate Glass Vials and Siliconized Vials 29
For calculation of the adhesion tension and the adsorption index, static contact angles and
surface tensions after an equilibration time of 10 min were used.
3 RESULTS AND DISCUSSION
IgG1 Adsorption to Type I Borosilicate Glass Vials and Siliconized Vials 3.1
3.1.1 Charge Characterization and Electrostatic Interactions of IgG1 and
Siliconized Glass
At first, in order to understand the charge effects on protein adsorption, the zeta potential of
IgG1 as well as of siliconized and non-coated glass was determined as a function of pH. The
siliconized particles used for adsorption experiments exhibited a specific surface area of
0.79 ± 0.012 m²/g as determined by krypton sorption in two independent BET measurements.
The correlation coefficient of the measurements was R > 0.9978. The silicone coating was
visualized by staining with Nile Red (Figure II-1a). Static light scattering showed a bimodal
size-frequency distribution of the siliconized glass powder (Figure II-2a). Although the
powder had been fractionated through a 25 µm sieve, some oversized particles were found.
For the electrokinetic mobility measurements, a fraction with particle sizes of largely < 1 µm
was used (Figure II-2b) (section 2.1.6).
Electrophoretic mobility measurements were applied for zeta potential measurements of
solvated IgG1 and suspended silicone-coated and non-coated glass particles. Additionally,
streaming potential measurements of siliconized and non-coated planar glass slides served as
(a) (b)
Figure II-1: Siliconized glass particles at 10-fold magnification (a) stained with Nile Red
at λex/λem 560/630 nm and an exposure time of 1/200 s and (b) at bright view.

30 Chapter II
a reference method. For the IgG1 in solution, a titration curve typical for proteins was
obtained with a pI of 7.8 (Figure II-3a). The PDMS-coated glass particles exhibited a more
positive zeta potential in the examined pH-range compared to non-coated glass particles.
Starting at approx. 13 mV at pH 2, the zeta potential of siliconized glass decreased to a pI of
3.4 and continued to a minimum of about -32 mV at pH 8.4. The non-coated glass particles
with a pI of less than 2 showed a negative surface charge in the whole pH range between 2
and 10 due to the dissociation of silanol groups at the glass surface. The zeta potential
determined from streaming potential measurements for the planar siliconized glass surface
was qualitatively in good agreement with the data for the siliconized particles. A pI of 3.6 was
(a) (b)
Figure II-2: Frequency distribution of siliconized particles fractionated through a 25 µm
sieve (a) and of the non-sedimenting particle fraction (b).
(a) (b)
Figure II-3: Zeta potential of glass (∆), siliconized glass ( ) and IgG1 ();
(a) determined by electrokinetic mobility measurements of coated and non-coated glass
particles and IgG1 in 10 mM NaCl solution; (b) determined by streaming potential
measurements of coated and non-coated planar glass slides in 1 mM KCl solution.
0.1 1 10 100 10000
2
4
6
8
10
Fre
quen
cy (
%)
Particle diameter (µm)
0
20
40
60
80
100
Cum
ulat
ive
freq
uenc
y (%
)
0.1 1 10 100 10000
10
20
30
Fre
quen
cy (
%)
Particle diameter (µm)
0
20
40
60
80
100
Cum
ulat
ive
freq
uenc
y (%
)
2 3 4 5 6 7 8 9 10
-60-50-40-30-20-10
010203040
7.8
Zet
a po
tent
ial
(mV
)
pH
3.4
2 3 4 5 6 7 8 9 10
-60-50-40-30-20-10
010203040
Zet
a po
tent
ial
(mV
)
pH
3.6

IgG1 and Lysozyme Adsorption to Type I Borosilicate Glass Vials and Siliconized Vials 31
determined for siliconized glass slides (Figure II-3b). In the tested pH range of 3 to 9, the pI
of uncoated glass slides was not reached. With increasing pH, the titration curves reached a
minimum of about -49 to -52 mV. Discrepancies of the zeta potentials obtained from
electrophoretic mobility measurements and streaming potential measurements may be due to
the different measurement techniques and surface morphologies as well as the slightly higher
electrolyte concentration used for electrophoretic mobility measurements.
In literature, the pI of silica is found at approx. 2 [10, 27] but may vary in a range between
pH < 1.5 and approx. 6, depending on the concentration and type of salt in the solution [27,
28]. In contrast, the pI of pure silicone oil droplets in solution was found near pH 5.0 [29].
Song et al. determined the pI of PDMS-coated glass slides in low concentrated NaCl solution
and phosphate buffer at approximately pH 4.5 - 5 [30] and Roth et al. found a pI of PDMS-
coated silicon wafers at approx. 4 - 4.5 [31]. Thus the pI determined for our PDMS-coated
glass particles is slightly lower than the pI reported in literature. After silylation of the glass
surface with PDMS, a small fraction of silanol groups was found remaining at the surface
[32]. Thus, the dissociation of residual silanol groups and the adsorption of ions from solution
determine the zeta potential of a PDMS-coated surface. Consequently, the pI of the coated
surface will be located between the pI of the uncoated surface and of pure silicone oil in
solution. The lower pI of our siliconized glass surfaces compared to literature indicates that a
rather thin silicone layer was formed and that a fraction of silanol groups characterizes the
surface.
3.1.2 Investigation of Adsorption of IgG1 to Borosilicate Glass and Siliconized
Glass by Static Contact Angle Measurements
The adsorption of proteins is influenced by the sorbent surface characteristics such as
hydrophobicity, electrical state and the specific surface area [24]. Numerous studies showed
that hydrophobic surfaces in general adsorb more protein than hydrophilic ones [33-36].
Several approaches were made to align the protein adsorption to sorbent surface properties,
e.g. to surface energy [37]. Vogler suggested that the surface energy does not directly control
the biological response on a surface, but rather the water reactivity and structure which then
influences reactions such as cell adhesion and protein adsorption [26]. Therefore, he
correlated an index of solid-liquid interfacial tensions [τ ´-τ °], which quantifies adsorption, to
the wettability τ ° of a surface and found a linear correlation [26, 38]. According to Vogler´s
theory of the ‘adsorption map’, values of [τ ´-τ °] > 0 or [τ ´-τ °] ≤ 0 can be assigned to

32 Chapter II
surfaces supporting or repelling adsorption, respectively [26] and the map can be used to
predict the adsorption behavior on surfaces [38].
To evaluate whether the siliconized and the bare glass surface support the adsorption of IgG1
according to this theory, the adsorption index (AI) [τ ´-τ °] and the adhesion tension τ ° for
both surfaces was determined for 2 mg/ml IgG1 solutions and the corresponding buffer
according to Eq. (6) and (7). Measurements were performed with solutions of pH 4 as the
adsorbed amount and thus the sensitivity of the measurements was expected to be higher than
at pH 7.2 (Figure II-4a, b). In contrast to Vogler et al. who determined advancing and
receding contact angles [38], static contact angles were determined in our experimental setup.
As a compromise between sufficiently long adsorption time and reasonable measurement
duration, contact angles and surface tensions were recorded 10 min after placing the droplet
onto the surface. After this time, adsorption reached more than 70% of the plateau value on
both siliconized and bare glass vials (Figure II-4a, b) so that changes of the contact angle due
to adsorption could be expected. Figure II-5a shows the adsorption map for IgG1 in 10 mM
PBS pH 4. The borders of the depicted parallelogram represent the practically possible
adsorption indices [τ ´-τ °] calculated from the measured surface tension of the protein
solution and practically (for surfactants) observed maximal possible (θ ´→ 120 °) or minimal
(θ ´→ 0 °) values of the contact angle of the protein solution [38]. The corresponding τ °
values were calculated from the measured surface tension γl° and the theoretical contact angle
θ ° of the corresponding solvent. The intersecting line indicates the situation of identical
contact angles of the protein solution and the pure solvent (θ ´= θ °) [38]. For borosilicate
(a) (b)
Figure II-4: Adsorption kinetics of IgG1 to borosilicate glass vials (a) and siliconized
glass vials (b) at pH 4 ( ) and pH 7.2 (∆); incubation at 25 °C, 2 mg/ml in 10 mM
phosphate buffer with 170 mM ionic strength (n=3, *n=2).
0 5 10 15 20 250123456789
Ads
orbe
d am
ount
(m
g/m
²)
Adsorption time (h)0 5 10 15 20 25
0123456789
*
Ads
orbe
d am
ount
(m
g/m
²)
Adsorption time (h)
*

IgG1 and Lysozyme Adsorption to Type I Borosilicate Glass Vials and Siliconized Vials 33
glass vials and siliconized glass vials, the AI was in the negative range slightly above or
below the (θ ´= θ °) line (Figure II-5b) without a significant difference between the contact
angles of protein solution and pure solvent. Thus, the contact angle measurements did not
indicate adsorption. In contrast, the AI of TopLyoTM vials was positive with a significant
difference between θ ´ and θ ° (p < 0.05). As mentioned above, this may indicate that only the
TopLyoTM vials were hydrophobic enough to support adsorption. However, significant
adsorption of IgG1 was found also on siliconized and bare glass vials (Figure II-4a, b). To
explain this kind of discrepancy, Vogler proposed that on hydrophilic surfaces, adsorption
occurs rather by association of the solute with an incorporated aqueous layer than by
physicochemical binding to the surface involving a change of the interfacial tension [26].
In conclusion, the prediction of IgG1 adsorption to siliconized and bare glass vials by
calculation of the adsorption index is not feasible for our experimental setup. A clear
interpretation of the obtained results depicted in Figure II-5 is difficult due to the high
standard deviations of the contact angles and thus of τ ° and the AI. This may derive from the
measurement technique applied for the contact angle measurements. Most surfaces such as
glass show hysteresis of the contact angles due to roughness and chemical heterogeneities, so
that advancing as well as receding contact angles are necessary to thoroughly characterize the
wettability of a solid surface [38]. However, our experimental setup enabled only static
measurements. The manual application of the droplet on the surface and the curvature of the
fragment itself may also have influenced the droplet shape.
(a) (b)
Figure II-5: Adsorption map of IgG1 2 mg/ml in 10 mM phosphate buffer with 170 mM
ionic strength, pH 4, including TopLyoTM
vials, siliconized vials and borosilicate glass
vials; (a) with adsorption boundaries; (b) enlarged section with calculated values.
-40 -20 0 20 40 60 80
-100
-50
0
50
100
Θ´→ 120°
Θ´→ 0°
Θ´= Θ°
τ° (mN/m)
τ´-τ
° (m
N/m
)
-20 -10 0 10 20 30 40 50 60 70
-20
-15
-10
-5
0
5
10
15
20
ToplyoTM
siliconized glass Fiolax
glass
Ads
orpt
ion
inde
x τ´
-τ°
(mN
/m)
Adhesion tension of buffer τ° (mN/m)
Θ´= Θ°

34 Chapter II
3.1.3 Influence of Formulation pH and Ionic Strength on IgG1 Adsorption to
Siliconized Glass Vials
3.1.3.1 Adsorbed IgG1 Quantity as a Function of pH
The influence of pH on IgG1 adsorption to siliconized glass vials was investigated between
pH 2 and 12 (Figure II-6). Adsorption experiments were performed at a concentration of
2 mg/ml IgG1, at which adsorption plateau values (Гpl) for IgG1 on siliconized vials were
reached (Figure II-7). The pH-dependent adsorption exhibited a bell-shaped curve as
commonly found for protein adsorption at solid-liquid interfaces [10, 39, 40] with an
adsorption maximum at a pH of 4 to 5 with about 5.0-5.2 mg/m² (Figure II-6). A second
maximum was found around the pI of the protein (7.8) at pH 7 to 9 with adsorption values of
about 4.5 mg/m². With further increasing pH the adsorption level dropped sharply. At pH 12,
no adsorption could be detected. Thus, for the IgG1 antibody the adsorption maximum was
not located at the pI of the protein but at acidic pH conditions. As shown by electrophoretic
mobility measurements, the pIs of the siliconized surface and the antibody are both located
within the investigated pH range (Figure II-3a). As a consequence, repulsive or attractive
electrostatic interactions between the protein and the surface as well as intermolecular
repulsive forces may contribute to the adsorption process at different pH values. In the pH
range between the pI of siliconized glass of approx. 3.4 and the pI of the antibody of
approx. 7.8, protein and sorbent were oppositely charged. At pH 4 to 5 the two partners
carried substantial charge of similar absolute value but opposite algebraic sign, resulting in a
strong electrostatic attraction. At lower solution pH, the protein net charge and thus the
Figure II-6: Adsorption of IgG1 to siliconized glass vials depending on formulation pH;
incubation time 24 h at 25 °C, 2 mg/ml in 10 mM phosphate buffer with 170 mM ionic
strength (n=3).
1 2 3 4 5 6 7 8 9 10 11 120
1
2
3
4
5
6
7
Ads
orbe
d am
ount
(m
g/m
²)
pH

IgG1 and Lysozyme Adsorption to Type I Borosilicate Glass Vials and Siliconized Vials 35
intermolecular repulsion increased, leading to reduced IgG1 adsorption. Electrostatic
repulsion between protein and sorbent at pH values below the pI of siliconized glass finally
resulted in significantly reduced adsorbed amounts. Nevertheless, considerable adsorption
was still found below pH 3.4 which can be attributed to hydrophobic protein-surface
interactions. At pH values above the adsorption maximum, the decreased protein charge led to
reduced adsorption due to the low electrostatic attraction.
Adsorption maxima at pH values below the pI of the protein were also reported by Salgin et
al. and Mathes & Friess [10, 41]. In contrast, Norde et al. observed a coincidence of the
adsorption maximum with the region of the protein pI [42]. It was suggested that structural
perturbations in the protein molecules lead to reduced adsorbed amounts at pH values away
from the pI [42, 43]. Furthermore, high adsorbed amounts of IgG around the pI were
explained by a low intermolecular repulsion and high adsorption rates in this pH region [39].
In the mentioned literature studying the pH-dependence of protein adsorption, in most cases a
single adsorption maximum was observed, e.g. for the adsorption of monoclonal IgG1 to
hydrophilic borosilicate glass vials [10]. In contrast, the adsorption profile for IgG1 on
hydrophobic siliconized glass vials showed a second local maximum around the pI of the
protein at pH 7-9. Due to the low protein charge at this pH, electrostatic interactions with the
surface contributed only marginally to adsorption. On the other hand, hydrophobic
interactions with the siliconized surface were increased, and on hydrophobic surfaces, the
decrease in Gibbs energy due to surface dehydration dominates over the changes by
electrostatic effects [44]. Therefore, adsorption of proteins to surfaces exhibiting hydrophobic
domains can be observed in general even when the electrostatic conditions are unfavorable
Figure II-7: Adsorption isotherm of IgG1 at pH 4.0 () and pH 7.2 ( ) on siliconized
glass vials in 10 mM phosphate buffer with 170 mM ionic strength adjusted with NaCl
and incubation at 25 °C (n=3).
0 500 1000 1500 20000123456789
Ads
orbe
d am
ount
(m
g/m
²)
Equilibrium concentration (µg/ml)
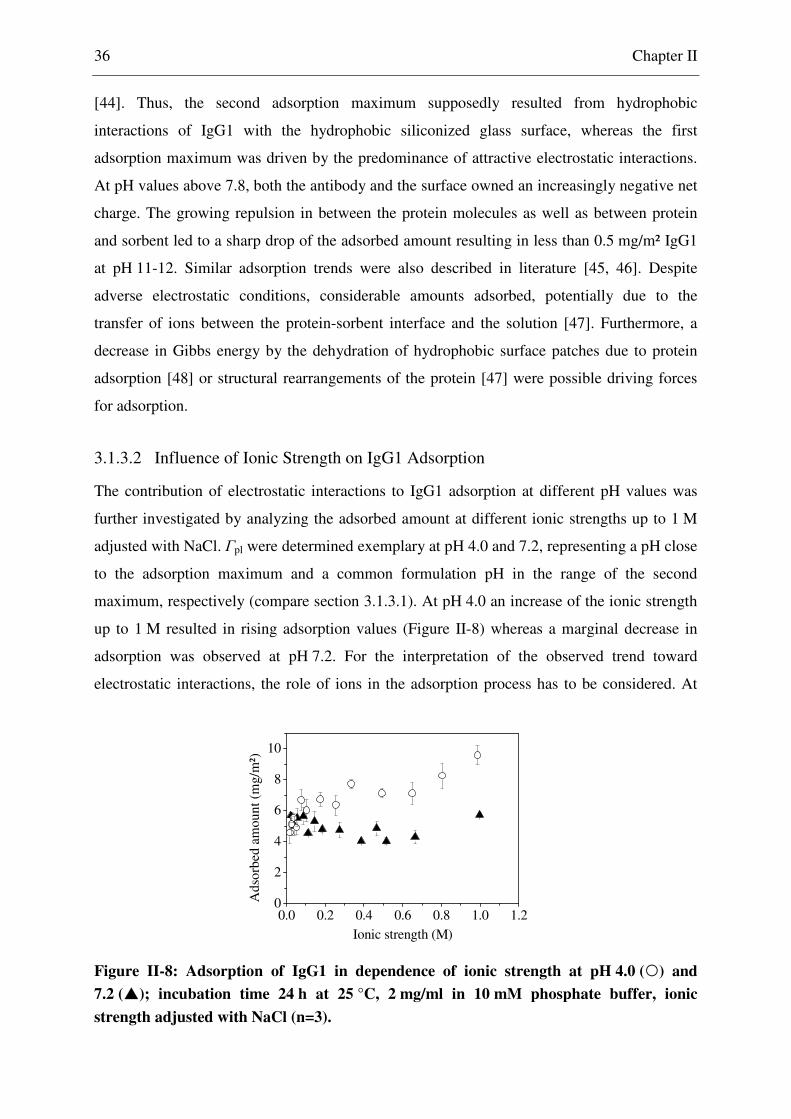
36 Chapter II
[44]. Thus, the second adsorption maximum supposedly resulted from hydrophobic
interactions of IgG1 with the hydrophobic siliconized glass surface, whereas the first
adsorption maximum was driven by the predominance of attractive electrostatic interactions.
At pH values above 7.8, both the antibody and the surface owned an increasingly negative net
charge. The growing repulsion in between the protein molecules as well as between protein
and sorbent led to a sharp drop of the adsorbed amount resulting in less than 0.5 mg/m² IgG1
at pH 11-12. Similar adsorption trends were also described in literature [45, 46]. Despite
adverse electrostatic conditions, considerable amounts adsorbed, potentially due to the
transfer of ions between the protein-sorbent interface and the solution [47]. Furthermore, a
decrease in Gibbs energy by the dehydration of hydrophobic surface patches due to protein
adsorption [48] or structural rearrangements of the protein [47] were possible driving forces
for adsorption.
3.1.3.2 Influence of Ionic Strength on IgG1 Adsorption
The contribution of electrostatic interactions to IgG1 adsorption at different pH values was
further investigated by analyzing the adsorbed amount at different ionic strengths up to 1 M
adjusted with NaCl. Гpl were determined exemplary at pH 4.0 and 7.2, representing a pH close
to the adsorption maximum and a common formulation pH in the range of the second
maximum, respectively (compare section 3.1.3.1). At pH 4.0 an increase of the ionic strength
up to 1 M resulted in rising adsorption values (Figure II-8) whereas a marginal decrease in
adsorption was observed at pH 7.2. For the interpretation of the observed trend toward
electrostatic interactions, the role of ions in the adsorption process has to be considered. At
Figure II-8: Adsorption of IgG1 in dependence of ionic strength at pH 4.0 () and
7.2 ( ); incubation time 24 h at 25 °C, 2 mg/ml in 10 mM phosphate buffer, ionic
strength adjusted with NaCl (n=3).
0.0 0.2 0.4 0.6 0.8 1.0 1.20
2
4
6
8
10
Ads
orbe
d am
ount
(m
g/m
²)
Ionic strength (M)

IgG1 and Lysozyme Adsorption to Type I Borosilicate Glass Vials and Siliconized Vials 37
high salt concentrations, the screening of intermolecular repulsive forces can increase the
adsorption whereas the shielding of attractive electrostatic interactions between protein and
sorbent may reduce the adsorption [46]. Increasing adsorbed amounts with rising ionic
strength at pH 4.0 thus indicated the shielding of predominantly intermolecular repulsive
forces that limited the packing density on the surface, rather than a screening of electrostatic
attractive forces. At pH 7.2, the electrostatic attraction toward the hydrophobic surface but
also the intermolecular repulsion was negligible due to the low net charge of the protein. The
weak effect of ionic strength on IgG1 adsorption at pH 7.2 thus underlined the minor
importance of electrostatic interactions for the adsorption process and suggested superiority of
hydrophobic interactions with the siliconized surface. A similar trend was also found for IgG1
adsorption to hydrophobic COP plastic vials at pH 7.2 and was ascribed to the predominance
of dispersion forces and hydrophobic interactions for adsorption and the minor importance of
electrostatic interactions between the protein molecules [10].
In section 3.1.3.1, the pH of maximum adsorption was determined at the basis of an
adsorption profile at an ionic strength of I = 170 mM and correlated with zeta potential
measurements performed at much lower ionic strength. However, the ionic strength dependent
adsorption study showed that predictions of the adsorbed amount at a certain ionic strength
over a large pH range are difficult. Therefore, the pH-dependent adsorption was additionally
determined at a lower ionic strength of I = 40 mM to allow a better comparison with results of
the zeta potential measurements.
Compared to the adsorption profile obtained at I = 170 mM, the curve at I = 40 mM was
shifted toward higher pH values in the range of pH 2-7 with the adsorption maximum at
Figure II-9: Adsorption of IgG1 to siliconized glass vials depending on formulation pH
at 40 mM (∆) or 170 mM ( ) ionic strength adjusted with NaCl; incubation time 24 h at
25 °C, 2 mg/ml in 10 mM phosphate buffer (n=3, *n=2).
1 2 3 4 5 6 7 8 9 10 11 120
1
2
3
4
5
6
7
Ads
orbe
d am
ount
(m
g/m
²)
pH
*

38 Chapter II
pH 6-7 instead of pH 4-5 (Figure II-9). At pH values above pHmax, the adsorption curves at
both ionic strengths virtually matched so that the second maximum observed at I = 170 mM
was reduced to a shoulder. At pH 12, adsorption could not be quantified anymore. A shift of
the adsorption maximum toward higher pH values at decreased ionic strength was also
described for IgG on silica [49, 50] as well as on borosilicate glass vials [10]. The new
adsorption maximum at pH 6-7 resulted from a charge state of IgG1 allowing sufficient
attractive electrostatic interactions with the surface but comparably low intermolecular
repulsion so that a dense occupation of the surface with protein molecules was possible.
Around the pI of IgG1, the influence of ionic strength on adsorption was low due to the
dominance of hydrophobic and dispersion interactions with the surface and low
intermolecular repulsive forces. At acidic pH values, the reduced adsorption at decreased
ionic strength confirmed the trend observed previously in Figure II-8.
3.1.4 Electrostatic Interactions within the Adsorption Interface
When a protein adsorbs to a sorbent, the electrical fields of both components overlap [51].
Charge redistribution takes place, which was thoroughly investigated by Norde and Lyklema
[44, 48]. If the charges of sorbent and protein do not compensate each other, the accumulation
of net charge in the contact region between both components leads to an energetically
unfavorable, high electrostatic potential [44]. To prevent such an excess of net charge, an
exchange of low-molecular-weight-ions between the adsorption layer and the surrounding
solution may take place [44]. However, the unfavorable chemical effect of the incorporation
of ions counteracts adsorption [48]. Thus, maximum adsorption affinity is found when no ions
are additionally incorporated into the contact region [44]. Determination of the pH-dependent
charge transfer ∆adsσek between the solution and the protein-sorbent interface thus is a helpful
tool to interpret the location of Гpl(pH)max. ∆adsσek can be calculated from the zeta potentials of
the protein, the sorbent and the protein-sorbent complex as well as the adsorbed amount per
unit surface area Гpl(pH) [11] as defined in section 2.2.16, Eq. (2). Zeta potentials of protein
covered particles were determined in the pH range of 4-9 and compared to that of solvated
protein and siliconized particles (Figure II-10). The values of the protein-particle complex
were expected to lie in between the curves of the uncoated particles and the protein due to a
partial coverage of the negatively charged siliconized surface with positively charged protein
molecules. In fact, the resulting curve with a pI of 7.7 strongly resembled the curve of the
protein with a pI of 7.8. The similar pIs of the protein and the protein-covered particles
indicated a vast compensation of the negative charge of the sorbent surface by adsorbed

IgG1 and Lysozyme Adsorption to Type I Borosilicate Glass Vials and Siliconized Vials 39
counterions [11] or by the positive charges of the protein. ∆adsσek was calculated from the zeta
potentials determined in 10 mM NaCl solutions. Гpl(pH) were taken as an approximation from
the pH-dependent adsorption at an ionic strength of I = 40 mM (Figure II-9).
In Figure II-11, ∆adsσek for the adsorption of IgG1 to siliconized glass particles is depicted.
With increasing pH, the curve rose from negative to positive ∆adsσek values. Intersection with
the x-axis at approx. pH 7.0 indicated energetically favorable adsorption conditions at this pH
with a minimum incorporation of additional ions into the adsorption layer. Negative values of
∆adsσek in the pH range from 4.0 to 7.0 indicated an additional uptake of negatively charged
ions to compensate the positive charges of the adsorbed protein, whereas further cations were
incorporated above pH 7.0 [11]. If charge neutrality in the interface is assumed to be the
driving factor for protein adsorption, maximum adsorption affinity for IgG1 adsorption in
Figure II-10: Zeta potential of siliconized glass particles ( ), IgG1 () and siliconized
particles with adsorbed IgG1 ( ) in 10 mM NaCl solution.
Figure II-11: Charge transfer (∆adsσek) between the adsorbed layer and the surrounding
liquid; ∆adsσek calculated according to Eq. (2); Гpl(pH) taken from pH-dependent
adsorption at 40 mM ionic strength. Standard deviations were calculated by applying
the Gaussian error propagation.
2 3 4 5 6 7 8 9 10
-40
-30
-20
-10
0
10
20
30
40
Zet
a po
tent
ial
(mV
)
pH
7.7
3 4 5 6 7 8 9 10-5
-4
-3
-2
-1
0
1
2
3
∆ad
sσek
(µ
C .
cm-2
)
pH
7.0

40 Chapter II
10 mM NaCl was expected at pH 7.0. Decreasing the ionic strength from 170 mM to 40 mM
already shifted the adsorption maximum from pH 4-5 to pH 6-7. Thus, a further shift toward
pH 7 in 10 mM NaCl solution and a correspondence of the adsorption maximum with
∆adsσek = 0 may be expected. A correlation of the adsorption maximum at low ionic strength
with the pH of minimal charge uptake into the protein-sorbent interface was also observed by
Mathes & Friess [10]. Elgersma reported a coincidence of the adsorption maximum with the
pI of protein-covered particles for bovine serum albumin on different latices [11], whereas
Buijs et al. determined the maximum adsorption of F(ab’)2 at pH values between the pI of the
protein and the protein-particle complex [52]. Thus, a clear correlation between the adsorption
maximum, the pH of minimal charge uptake and the pI of the protein-sorbent complex was
not generally found but is a conceivable concept.
3.1.5 Influence of Non-ionic Surfactants on IgG1 Adsorption
In the following, the influence of polysorbate 80 (PS 80) and poloxamer 188 (P 188) on IgG1
adsorption to siliconized and non-siliconized vials at pH 4.0 and 7.2 was investigated. Both
non-ionic surfactants are approved for parenteral use. As protein stabilization against
aggregation by surfactants was shown to depend on the molar ratio of surfactant and protein
[53, 54], the detergents were added to the IgG1 formulation at surfactant:protein molar ratios
of 1:10 up to a surfactant excess of 1000:1.
On siliconized glass vials, both surfactants effectively suppressed IgG1 adsorption. At pH 7.2
(a) (b)
Figure II-12: Influence of polysorbate 80 () and poloxamer 188 ( ) on adsorption of
IgG1 to siliconized glass vials at pH 7.2 (a) and pH 4.0 (b); 2 mg/ml in 10 mM phosphate
buffer with 170 mM ionic strength; incubation time 24 h at 25 °C. Values depicted with
(×) could not be quantified anymore (n=3, *n=2, °n ≥ 1).
0.01 0.1 1 10 100 10000
2
4
6
8
10
12
*
Ads
orbe
d am
ount
(m
g/m
²)
Molar ratio (surfactant : IgG1)
°
Ref. 0.01 0.1 1 10 100 10000
2
4
6
8
10
12
**
Ref.
Ads
orbe
d am
ount
(m
g/m
²)
Molar ratio (surfactant : IgG1)

IgG1 and Lysozyme Adsorption to Type I Borosilicate Glass Vials and Siliconized Vials 41
and molar ratios of 10:1 and higher, adsorption was reduced by at least 95% to values which
could not be quantified any more (Figure II-12a). In contrast, a molar ratio of 100:1 PS 80 or
P 188 was necessary at pH 4.0 to reduce adsorption by approx. 83% or 63%, respectively
(Figure II-12b). No results could be obtained for a molar ratio of 1000:1 P 188 so that the
maximum effect could not be determined.
Most nonionic surfactants are supposed to mainly interact with the sorbent surface [55] and
their adsorption preventing effect was ascribed to the formation of a detergent layer at the
sorbent surface [16]. However, a direct interaction of nonionic surfactants with specific
protein sites was observed in some cases [55]. Therefore, an interaction of the nonionic
surfactants with hydrophobic protein sites may be considered, preventing hydrophobic
interactions with other proteins [53] or surfaces. Interestingly, low concentrations of P 188 led
to increased adsorption at pH 4.0. A similar effect was described previously for protein
adsorption in presence of SDS [56]. The authors related this phenomenon to a binding of the
surfactant to the protein, leading to an increased adsorption by changes in the protein
structure, or to an increased hydrophobicity of the protein-surfactant complex. Moreover, it
was suggested that surfactants at low concentration may increase the surface hydrophobicity
and thus the protein adsorption [55]. Both mechanisms were assumed to contribute to the
observed effect on siliconized glass vials.
At pH 7.2, strong hydrophobic interactions were supposed to dominate adsorption of the
marginally charged protein to the negatively charged but hydrophobic siliconized glass
surface (see section 3.1.3.1). Shielding of hydrophobic protein sites and of the sorbent surface
by nonionic surfactants efficiently reduced the adsorption of IgG1 at this pH. At pH 4.0, the
adsorption was reduced to a much lower extent than at pH 7.2. This indicated an only
marginal suppression of the strong electrostatic interactions between protein and sorbent at
this pH by PS 80 and P 188.
At pH 7.2, P 188 was found superior to PS 80 in suppressing IgG1 adsorption, whereas the
inverse trend was observed at pH 4.0. It was shown that the ability of nonionic surfactants to
prevent protein adsorption decreased with an increased content of hydrophilic domains of the
detergent [15]. PS 80 with an HLB value of 15 is more hydrophobic than P 188 which
exhibits an HLB value above 24 (Table II-1). Therefore, PS 80 was expected to interact
stronger with hydrophobic protein surface residues than P 188 and to suppress adsorption with
higher efficiency. However this trend was only observed at pH 4.0. Furthermore, PS 80 and
P 188 exhibit great differences in their critical micelle concentration (CMC). For PS 80, the
CMC in PBS pH 7.2 was determined at a concentration of 0.0017% (w/v), corresponding to a

42 Chapter II
molar ratio of surfactant:protein of about 1:1 (Table II-2). P 188 exhibits a CMC of
0.4032-1.0032% in water [57, 58], corresponding to a surfactant:protein ratio higher than
10:1. Values for the CMC of P 188 were derived from literature as a determination at 25 °C in
PBS by surface tension measurements was not possible. At pH 7.2, maximum adsorption
suppression was reached close to the CMC of both surfactants whereas no clear correlation
was found for adsorption at pH 4.0. Overall, no general correlation was found between the
CMC and the concentration of maximum adsorption suppression. It also needs to be
considered that P 188 may show a slower adsorption at the water / silicone oil interface than
PS 80 due to its lower diffusion coefficient [6]. This makes a faster formation of a detergent
film at the buffer/vial interface by PS 80 and a superior prevention of IgG1 adsorption
conceivable.
Both surfactants were found efficient in suppressing IgG1 adsorption to siliconized glass vials
at a standard ionic strength of 170 mM. Furthermore, as described in section 3.1.3.2, a
Table II-1: Surfactant characteristics of polysorbate 80 and poloxamer 188.
Polysorbate 80 (PS 80) Poloxamer 188 (P 188)
aCMC (in % (w/v)) d0.0017±0.00058 e0.4032-1.0032% [57, 58] bHLB value 15 [59] > 24 [57, 58] cMW (g/mol) 1310 8600 [60]
acritical micelle concentration (CMC) bhydrophilic lipophilic balance (HLB) cmolecular weight dCMC determined in 10 mM PBS, 145 mM NaCl pH 7.2 at 25 °C eCMC determined in water, values derived from literature
Table II-2: Molar ratios of surfactant and protein and corresponding concentrations in
percent (w/v).
Molar ratio
surfactant:proteina
Corresponding surfactant concentration in percent (w/v)
Polysorbate 80 (PS 80) Poloxamer 188 (P 188)
1:10 0.00017 0.0011
1:1 0.0017 0.011
10:1 0.017 0.11
100:1 0.17 1.1
1000:1 1.7 11
aactual molar ratios in experiments may deviate slightly from the theoretical value
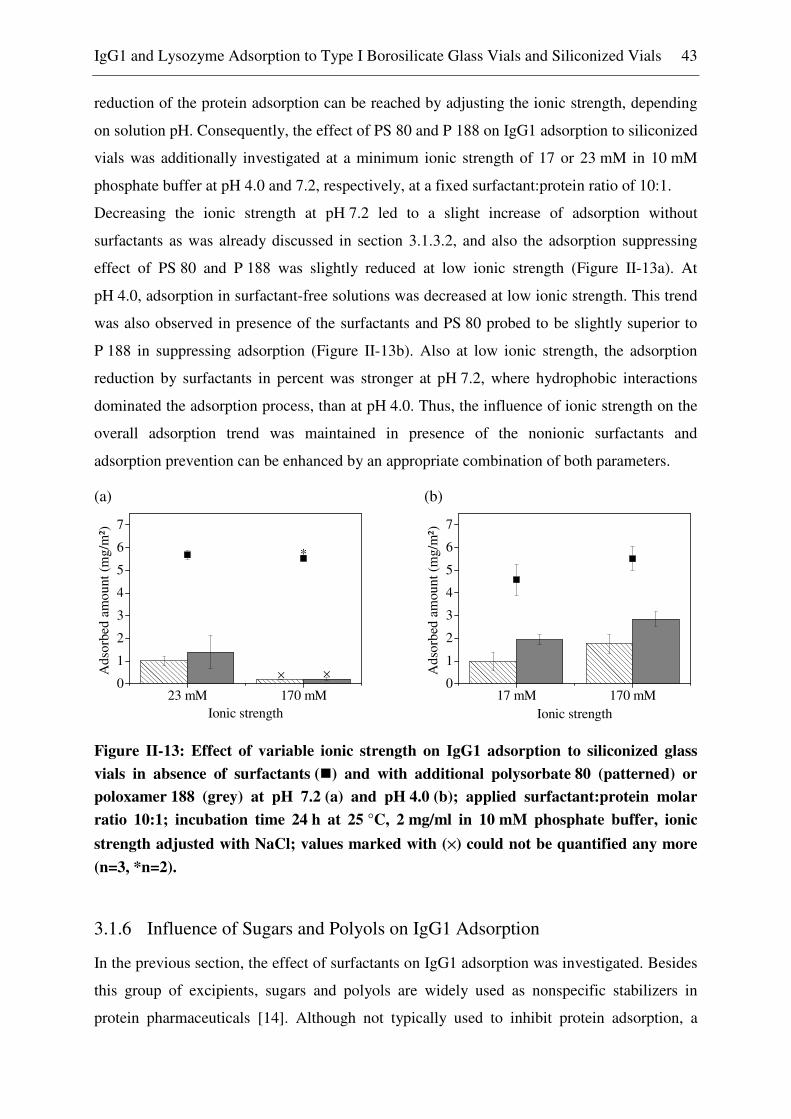
IgG1 and Lysozyme Adsorption to Type I Borosilicate Glass Vials and Siliconized Vials 43
reduction of the protein adsorption can be reached by adjusting the ionic strength, depending
on solution pH. Consequently, the effect of PS 80 and P 188 on IgG1 adsorption to siliconized
vials was additionally investigated at a minimum ionic strength of 17 or 23 mM in 10 mM
phosphate buffer at pH 4.0 and 7.2, respectively, at a fixed surfactant:protein ratio of 10:1.
Decreasing the ionic strength at pH 7.2 led to a slight increase of adsorption without
surfactants as was already discussed in section 3.1.3.2, and also the adsorption suppressing
effect of PS 80 and P 188 was slightly reduced at low ionic strength (Figure II-13a). At
pH 4.0, adsorption in surfactant-free solutions was decreased at low ionic strength. This trend
was also observed in presence of the surfactants and PS 80 probed to be slightly superior to
P 188 in suppressing adsorption (Figure II-13b). Also at low ionic strength, the adsorption
reduction by surfactants in percent was stronger at pH 7.2, where hydrophobic interactions
dominated the adsorption process, than at pH 4.0. Thus, the influence of ionic strength on the
overall adsorption trend was maintained in presence of the nonionic surfactants and
adsorption prevention can be enhanced by an appropriate combination of both parameters.
3.1.6 Influence of Sugars and Polyols on IgG1 Adsorption
In the previous section, the effect of surfactants on IgG1 adsorption was investigated. Besides
this group of excipients, sugars and polyols are widely used as nonspecific stabilizers in
protein pharmaceuticals [14]. Although not typically used to inhibit protein adsorption, a
(a) (b)
Figure II-13: Effect of variable ionic strength on IgG1 adsorption to siliconized glass
vials in absence of surfactants ( ) and with additional polysorbate 80 (patterned) or
poloxamer 188 (grey) at pH 7.2 (a) and pH 4.0 (b); applied surfactant:protein molar
ratio 10:1; incubation time 24 h at 25 °C, 2 mg/ml in 10 mM phosphate buffer, ionic
strength adjusted with NaCl; values marked with (×) could not be quantified any more
(n=3, *n=2).
23 mM 170 mM0
1
2
3
4
5
6
7
×Ads
orbe
d am
ount
(m
g/m
²)
Ionic strength
*
×
17 mM 170 mM0
1
2
3
4
5
6
7
Ads
orbe
d am
ount
(m
g/m
²)
Ionic strength
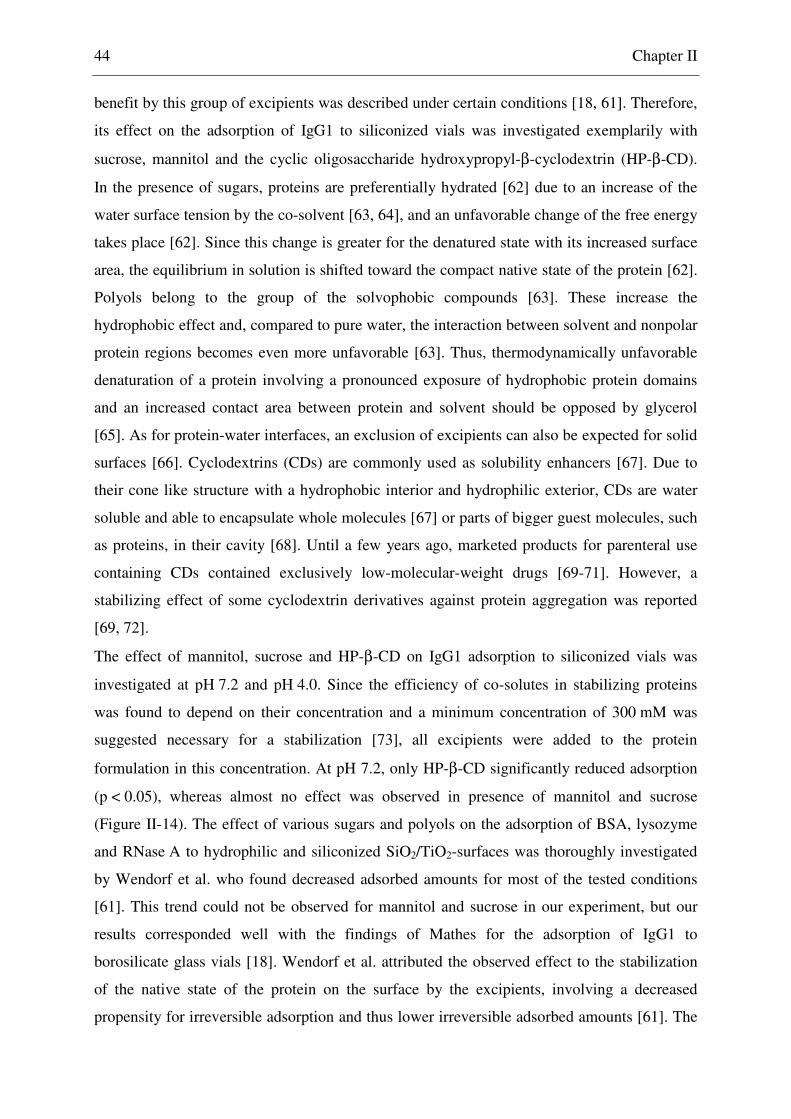
44 Chapter II
benefit by this group of excipients was described under certain conditions [18, 61]. Therefore,
its effect on the adsorption of IgG1 to siliconized vials was investigated exemplarily with
sucrose, mannitol and the cyclic oligosaccharide hydroxypropyl-β-cyclodextrin (HP-β-CD).
In the presence of sugars, proteins are preferentially hydrated [62] due to an increase of the
water surface tension by the co-solvent [63, 64], and an unfavorable change of the free energy
takes place [62]. Since this change is greater for the denatured state with its increased surface
area, the equilibrium in solution is shifted toward the compact native state of the protein [62].
Polyols belong to the group of the solvophobic compounds [63]. These increase the
hydrophobic effect and, compared to pure water, the interaction between solvent and nonpolar
protein regions becomes even more unfavorable [63]. Thus, thermodynamically unfavorable
denaturation of a protein involving a pronounced exposure of hydrophobic protein domains
and an increased contact area between protein and solvent should be opposed by glycerol
[65]. As for protein-water interfaces, an exclusion of excipients can also be expected for solid
surfaces [66]. Cyclodextrins (CDs) are commonly used as solubility enhancers [67]. Due to
their cone like structure with a hydrophobic interior and hydrophilic exterior, CDs are water
soluble and able to encapsulate whole molecules [67] or parts of bigger guest molecules, such
as proteins, in their cavity [68]. Until a few years ago, marketed products for parenteral use
containing CDs contained exclusively low-molecular-weight drugs [69-71]. However, a
stabilizing effect of some cyclodextrin derivatives against protein aggregation was reported
[69, 72].
The effect of mannitol, sucrose and HP-β-CD on IgG1 adsorption to siliconized vials was
investigated at pH 7.2 and pH 4.0. Since the efficiency of co-solutes in stabilizing proteins
was found to depend on their concentration and a minimum concentration of 300 mM was
suggested necessary for a stabilization [73], all excipients were added to the protein
formulation in this concentration. At pH 7.2, only HP-β-CD significantly reduced adsorption
(p < 0.05), whereas almost no effect was observed in presence of mannitol and sucrose
(Figure II-14). The effect of various sugars and polyols on the adsorption of BSA, lysozyme
and RNase A to hydrophilic and siliconized SiO2/TiO2-surfaces was thoroughly investigated
by Wendorf et al. who found decreased adsorbed amounts for most of the tested conditions
[61]. This trend could not be observed for mannitol and sucrose in our experiment, but our
results corresponded well with the findings of Mathes for the adsorption of IgG1 to
borosilicate glass vials [18]. Wendorf et al. attributed the observed effect to the stabilization
of the native state of the protein on the surface by the excipients, involving a decreased
propensity for irreversible adsorption and thus lower irreversible adsorbed amounts [61]. The

IgG1 and Lysozyme Adsorption to Type I Borosilicate Glass Vials and Siliconized Vials 45
stabilizing effect of sugars and polyols on a high concentrated IgG1 formulation of pH 6 was
investigated by Matheus [74]. In this study, the chemical stability of the formulation was only
marginally improved by sucrose and mannitol, which might explain the unchanged adsorption
of IgG1 to siliconized vials at pH 7.2.
Since a strong pH-dependence could be observed in previous adsorption experiments, the
effect of the excipients was additionally investigated at pH 4.0. Both mannitol and sucrose
increased the adsorbed amount whereas adsorption was almost unchanged with HP-β-CD
(Figure II-14). On the one hand, the influence of potential sugar adsorption to the surface may
be considered to explain the observed phenomenon. Binding of carbohydrates to negatively
charged mica accompanied by a reduction of the long-range electrostatic double-layer force
and reduced surface charge was shown by Claesson et al. [75]. However, this would result in
a decreased electrostatic attraction of IgG1 to the surface also at pH 4.0 and thus rather to
decreased adsorbed amounts. For some polyols and sugars, a slightly increased adsorption of
IgG1 at low excipient concentrations but reduced adsorption at high concentrations of 1 M
was also found by Mathes on borosilicate glass vials at pH 4 [18]. In silicone oil-water
emulsions, a slightly increased protein loss in solution in presence of sucrose was found by
Ludwig et al., potentially due to an increased adsorption to silicone oil droplets [4]. The
authors ascribed this to the exclusion of sucrose from the silicone oil-water interface.
According to Mahler et al., the exclusion of excipients may lead to a stabilization of proteins
in solution but also to a destabilization of proteins at interfaces [66]. Adsorption in a
destabilized state may lead to an increased spreading of the molecules on the surface and thus
reduced adsorbed amounts, but also an enhanced adsorption via surface exposed hydrophobic
Figure II-14: Influence of 300 mM sucrose, mannitol and HP-ß-CD on IgG1 adsorption
to siliconized glass vials at pH 7.2 (grey) and pH 4.0 (patterned); 2 mg/ml in 10 mM
phosphate buffer with 170 mM ionic strength; incubation time 24 h at 25 °C (n=3,
* n=2); reference values as in Figure II-12.
Ref. sucrose mannitol HP-ß-CD0
2
4
6
8
10
12
Ads
orbe
d am
ount
(m
g/m
²)
Excipient
*

46 Chapter II
patches may be hypothesized. The stabilizing effect of preferential hydration was shown to
depend on the pH value for some proteins due to changed dimensions of the molecules [62].
However, dynamic light scattering measurements revealed only a minor dependence of the
hydrodynamic diameter of IgG1 on the pH value [18], so that the different adsorption
behavior at different pH values could rather not be ascribed to this aspect. A decrease of
intermolecular electrostatic repulsion by the preferential exclusion and thus higher adsorbed
amounts at pH 4 may just be speculated.
HP-β-CD significantly reduced adsorption at pH 7.2, but did not affect adsorption at pH 4.0.
As mentioned above, cyclodextrins may incorporate hydrophobic protein residues in their
interior. Hydrophobic interactions of the protein with the surface may thus be reduced,
leading to decreased adsorption values at pH 7.2. Since the influence of HP-β-CD on
electrostatic interactions is supposed to be low, the main driving force for adsorption at
pH 4.0 and thus the adsorbed amounts were almost unchanged. In conclusion, several aspects
might explain the effect of sucrose, mannitol and HP-β-CD on IgG1 adsorption behavior but
further studies are necessary to investigate and proof the mechanism.
3.1.7 Long-term Adsorption of IgG1 to Borosilicate Glass Vials and
Siliconized Glass Vials
The contact time of pharmaceutical protein formulations with different process materials
varies between several hours to days until the product is filled into the final primary
packaging in that it is stored for months or years. Most studies investigating protein
adsorption comprise only short time intervals of several minutes up to 24 h [33, 76, 77]
whereas longer time intervals are considered rarely [78, 79]. Therefore, we investigated the
adsorption of IgG1 to vials for up to 6 months as a relevant storage time for protein
formulations. The filled vials were stored at 2-8 °C and additionally at 25 °C and 40 °C,
corresponding to the temperatures for long-term and accelerated stability studies
recommended by the ICH-guideline Q1A(R2). The adsorbed amount was determined after
24 h, 7 days, 1, 3 and 6 months. Besides siliconized vials, also type I borosilicate glass vials
were included in the study to investigate the influence of the sorbent surface and the
adsorption mechanism on long-term adsorption trends.
During storage for up to 6 months, adsorption from protein solutions pH 7.2 changed slightly
at all temperatures on borosilicate and siliconized vials compared to adsorption after 24 h
(Figure II-15b, Figure II-16b). Marginal changes were also observed for adsorption to
borosilicate glass vials at pH 8.6 (Figure II-15c) and at pH 4.0, 2-8 °C and 25 °C (Figure
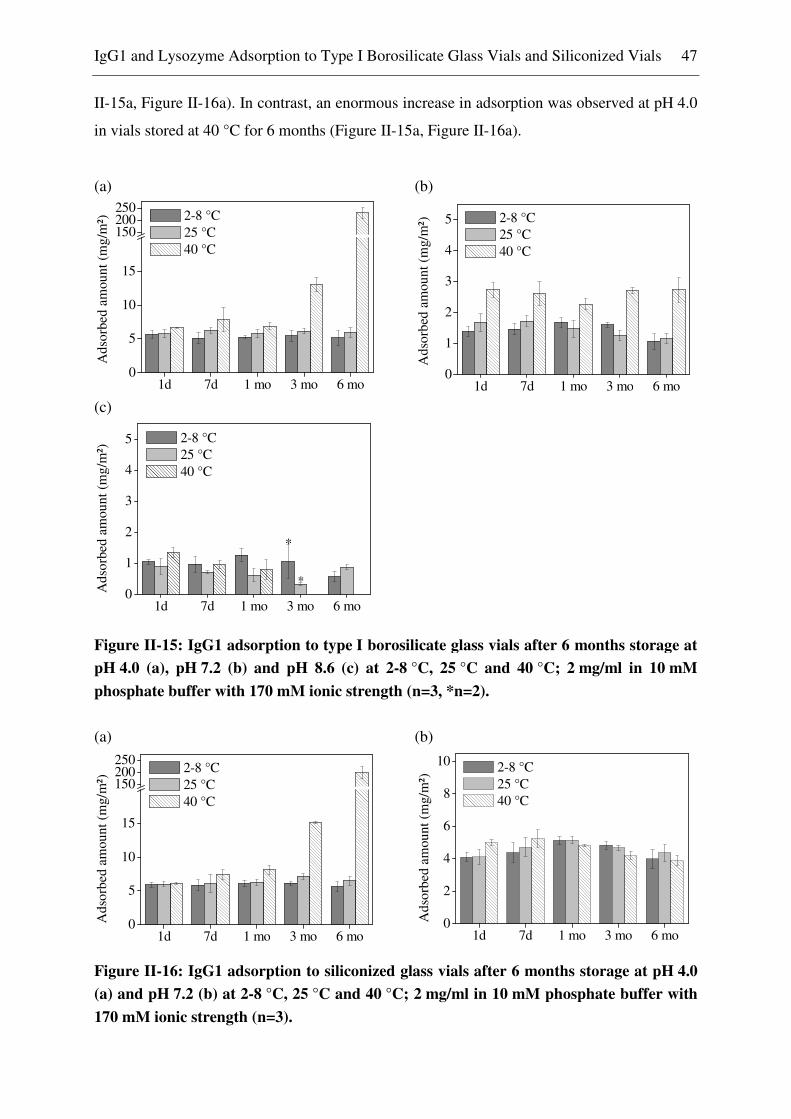
IgG1 and Lysozyme Adsorption to Type I Borosilicate Glass Vials and Siliconized Vials 47
II-15a, Figure II-16a). In contrast, an enormous increase in adsorption was observed at pH 4.0
in vials stored at 40 °C for 6 months (Figure II-15a, Figure II-16a).
(a) (b)
(c)
Figure II-15: IgG1 adsorption to type I borosilicate glass vials after 6 months storage at
pH 4.0 (a), pH 7.2 (b) and pH 8.6 (c) at 2-8 °C, 25 °C and 40 °C; 2 mg/ml in 10 mM
phosphate buffer with 170 mM ionic strength (n=3, *n=2).
(a) (b)
Figure II-16: IgG1 adsorption to siliconized glass vials after 6 months storage at pH 4.0
(a) and pH 7.2 (b) at 2-8 °C, 25 °C and 40 °C; 2 mg/ml in 10 mM phosphate buffer with
170 mM ionic strength (n=3).
1d 7d 1 mo 3 mo 6 mo0
5
10
15
150200250
Ads
orbe
d am
ount
(m
g/m
²) 2-8 °C 25 °C 40 °C
1d 7d 1 mo 3 mo 6 mo0
1
2
3
4
5 2-8 °C 25 °C 40 °C
Ads
orbe
d am
ount
(m
g/m
²)
1d 7d 1 mo 3 mo 6 mo0
1
2
3
4
5
*
Ads
orbe
d am
ount
(m
g/m
²)
2-8 °C 25 °C 40 °C
*
1d 7d 1 mo 3 mo 6 mo0
5
10
15
150200250
Ads
orbe
d am
ount
(m
g/m
²)
2-8 °C 25 °C 40 °C
1d 7d 1 mo 3 mo 6 mo0
2
4
6
8
10
Ads
orbe
d am
ount
(m
g/m
²)
2-8 °C 25 °C 40 °C

48 Chapter II
As stated in section 3.1.3.1, pH-dependent variations in the adsorbed amount can be ascribed
to different driving forces for adsorption. However, the strong increase in adsorption at
pH 4.0/40 °C was rather not derived only from a different adsorption mechanism than at
pH 7.2 but instead from protein instability. High temperature or an unsuitable pH value may
lead to aggregation [80, 81], and also deamidation processes are influenced by these
parameters [82]. Therefore, the samples after 6 months storage were investigated for potential
instabilities that may influence the adsorption behavior.
In all formulations stored at 40 °C but especially at pH 4.0, the HP-SEC monomer content
was strongly decreased in favor to increased amounts of higher molecular weight aggregates
and fragments (Figure II-17a, b). Furthermore, the total amount of protein in these samples of
pH 4.0 was reduced, which can be related to protein particles and insoluble aggregates that
were too large to be eluted through the column [83]. As SEC is limited to particles of up to
approx. 0.02 µm [84], light obscuration was applied to detect particles larger than 1 µm. In all
formulations, the number of particles was increased compared to the reference but was
extremely high for solutions of pH 4.0/40 °C (Figure II-19a, b). Solutions of pH 7.2 and 8.6
still met the specifications of Ph. Eur. for subvisible particles in parenteral solutions with less
than 6000 counts for particles ≥ 10 µm and less than 600 counts ≥ 25 µm per container [85],
whereas solutions of pH 4.0 partially exceeded this threshold. Additionally, the turbidity of all
formulations stored at 40 °C was increased (Figure II-19a, b).
The tertiary structure of the protein was investigated by extrinsic fluorescence measurements
with bis-ANS. This dye is weakly fluorescent in a polar environment [86] but exhibits a high
fluorescence accompanied by a blue shift of the emission maximum upon exposure to a non-
(a) (b)
Figure II-17: Content of monomer, aggregates and fragments of IgG1 solutions stored in
type I borosilicate glass vials (a) or siliconized glass vials (b) for 6 months (n=3) at
different temperatures.
t=0 2-8 25 40 2-8 25 40 2-8 250
20
40
60
80
100
Storage temperature (°C)
pH 8.6pH 7.2pH 4.0
Con
tent
(%
)
aggregate monomer fragment
t=0 2-8 25 40 2-8 25 400
20
40
60
80
100pH 7.2pH 4.0
Con
tent
(%
)
Storage temperature (°C)

IgG1 and Lysozyme Adsorption to Type I Borosilicate Glass Vials and Siliconized Vials 49
(a) (b)
Figure II-18: Extrinsic fluorescence spectra of IgG1 solutions after 6 months storage at
pH 4.0, pH 7.2, and pH 8.6 in type I borosilicate glass vials (a) and siliconized glass vials
(b) in presence of 5 µM bis-ANS (n ≥ 2, *n=1); storage temperatures 2-8 °C, 25 °C and
40 °C; native IgG1 formulated in 170 mM PBS pH 7.2.
(a)
(b)
Figure II-19: Turbidity and number of particles determined in IgG1 solutions stored in
type I glass vials (a) and siliconized glass vials (b) for 6 months at different temperatures
(n=3, *n=2,×n=1).
0
10
20
30406080
100120
0
10
20
30
50
100
150
200
Wavelength (nm)650550
pH 8.6pH 7.2
Inte
nsit
y
pH 4.0
450 450 550 650 450 550 650 650550450 450 550 650Wavelength (nm)
40 °C 25 °C 2-8 °C native IgG1
40 °C 25 °C 2-8 °C native IgG1
Inte
nsit
y
pH 7.2pH 4.0
*
t=0 2-8 25 40 2-8 25 40 2-8 250
5000
10000
15000
20000
25000
6000080000
**
*×
pH 8.6pH 7.2pH 4.0
Par
ticl
es p
er m
l
Storage temperature (°C)
≥ 1 µm ≥ 10 µm ≥ 25 µm
×
0
1
2
3
4
5
Tur
bidi
ty (
FN
U)
t=0 2-8 25 40 2-8 25 400
5000
10000
15000
20000
25000
6000080000
×
×
Par
ticl
es p
er m
l
Storage temperature (°C)
0
1
2
3
4
5
pH 7.2pH 4.0
Tur
bidi
ty (
FN
U)
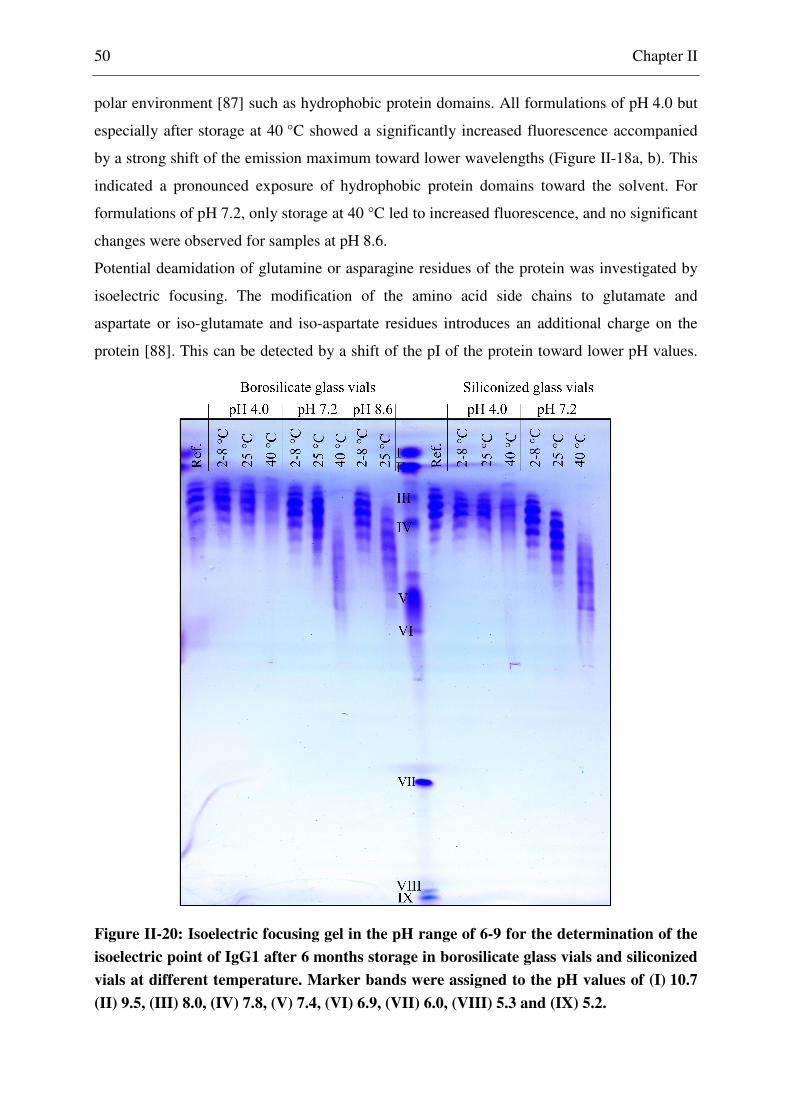
50 Chapter II
polar environment [87] such as hydrophobic protein domains. All formulations of pH 4.0 but
especially after storage at 40 °C showed a significantly increased fluorescence accompanied
by a strong shift of the emission maximum toward lower wavelengths (Figure II-18a, b). This
indicated a pronounced exposure of hydrophobic protein domains toward the solvent. For
formulations of pH 7.2, only storage at 40 °C led to increased fluorescence, and no significant
changes were observed for samples at pH 8.6.
Potential deamidation of glutamine or asparagine residues of the protein was investigated by
isoelectric focusing. The modification of the amino acid side chains to glutamate and
aspartate or iso-glutamate and iso-aspartate residues introduces an additional charge on the
protein [88]. This can be detected by a shift of the pI of the protein toward lower pH values.
Figure II-20: Isoelectric focusing gel in the pH range of 6-9 for the determination of the
isoelectric point of IgG1 after 6 months storage in borosilicate glass vials and siliconized
vials at different temperature. Marker bands were assigned to the pH values of (I) 10.7
(II) 9.5, (III) 8.0, (IV) 7.8, (V) 7.4, (VI) 6.9, (VII) 6.0, (VIII) 5.3 and (IX) 5.2.

IgG1 and Lysozyme Adsorption to Type I Borosilicate Glass Vials and Siliconized Vials 51
After 6 months storage, the pI of IgG1 was unchanged in all formulations stored at 2-8 °C
(Figure II-20). Samples of pH 7.2/40 °C and pH 8.6/25 °C showed a strong shift of the pI
toward lower pH values. A slight shift at pH 7.2/25 °C was observed for solutions stored in
siliconized vials. This trend corresponds with findings in literature, where increased
deamidation of asparagine was found at neutral or basic pH values and increased temperature
[82]. In formulations of pH 4.0, no change of the protein pI and thus no deamidation occurred
independent of the storage temperature.
In general, only slight differences were observed between corresponding formulations stored
in siliconized or bare glass vials. The increase in adsorption in solutions of pH 4.0/40 °C
correlated with the extent of particulate formation and unfolding whereas this correlation was
not this clear at 25 °C and 2-8 °C. Aggregates or monomers with exposed hydrophobic
surface residues should show an increased adsorption affinity. A changed surface activity of
protein molecules at elevated temperature and an increased adsorption tendency of the
denatured molecules was also proposed by Arnebrandt et al. [89]. Furthermore, the adsorption
of protein clusters even on a surface with pre-adsorbed protein was previously reported by
Rabe et al. for hydrophobic surfaces [90]. On the other hand, protein aggregation induced by
interaction of the protein with the sorbent surface was reported in several cases [91, 92].
Initial adsorption, nucleation and subsequent formation of larger aggregates was proposed as a
possible mechanism [91]. However, this probably requires a rather large sorbent surface for
contact with the protein as this phenomenon was observed only after the addition of non-
proteinogenic particles to the solution [91] and the onset and occurance of aggregation was
dependent on the particle number and hydrophobicity [92]. In our case, the surface area of
about 13.4 cm² wetted by the protein solution in a 2R vial was rather small. Furthermore, the
very similar increase in adsorption at pH 4.0/40 °C on both the hydrophobic siliconized and
the hydrophilic borosilicate glass surface rather indicates a largely surface-independent
aggregation process at acidic pH and elevated temperature. At pH 7.2, the increased
aggregation and unfolding tendency at 40 °C storage could not be clearly correlated with an
increase in adsorption (Figure II-15b, Figure II-16b). Whether this applied for pH 8.6 could
not be clarified since the protein stability and adsorption at 40 °C was investigated only up to
1 month at this pH. Although no considerable difference in formulation stability was observed
between solutions stored in borosilicate and siliconized glass vials, the influence of the
temperature on adsorption was slightly different at pH 7.2 (Figure II-15b, Figure II-16b). It
may be speculated, that different adsorption kinetics on the hydrophobic and the hydrophilic
surface led to this observation.

52 Chapter II
Lysozyme Adsorption to Borosilicate Glass Vials and Siliconized Glass 3.2
Vials
In the previous sections, the adsorption of a monoclonal IgG1 antibody to siliconized vials
and also borosilicate glass vials was investigated. Since electrostatic interactions and protein
charge were shown to strongly influence the adsorption behavior, further adsorption
experiments were performed with a protein with a different isoelectric point. Lysozyme is a
small, globular protein with a molecular weight of about 14.4-14.6 kDa [47, 93]. It belongs to
the group of ‘hard’ proteins that have a high structural stability [94] and was shown to adsorb
to various surfaces by mainly electrostatic and hydrophobic interactions [33, 47, 95].
3.2.1 Charge Characterization of Lysozyme and the Glass Surface
As already performed for monoclonal IgG1 and siliconized particles (compare section 3.1.1),
the zeta potential of lysozyme and borosilicate glass was determined to investigate the
influence of electrostatic interactions for adsorption. The borosilicate glass particles had a
specific surface area of about 0.72 m²/g determined by a BET measurement using nitrogen as
adsorbing gas. For the electrokinetic mobility measurements, the non-sedimenting particle
fraction was used. Lysozyme exhibited a typical protein titration curve with an isoelectric
point at about pH 10.1 (Figure II-21a). In most cases, the pI of lysozyme was reported in a pH
range of about pH 11.0 to 11.6 [47, 96-98] but also at approx. pH 9 [99]. Thus, the determined
pI of lysozyme is in the range reported in literature. In addition, the theoretical protein charge
(a) (b)
Figure II-21: Zeta potential of lysozyme ( ) (n=3) and its theoretical protein charge
calculated from the protein sequence (dotted line) (a) and zeta potential of borosilicate
glass particles (n=2) (b); zeta potentials determined by electrophoretic mobility
measurements in 10 mM NaCl solution.
2 3 4 5 6 7 8 9 10 11 12-50-40-30-20-10
01020304050
Zet
a po
tent
ial
(mV
)
pH
-30
-20
-10
0
10
20
30
10.1
11.1
Pro
tein
cha
rge
(uni
ts)
2 3 4 5 6 7 8 9 10 11 12-80
-60
-40
-20
0
20
40
2.8
Zet
a po
tent
ial
(mV
)
pH

IgG1 and Lysozyme Adsorption to Type I Borosilicate Glass Vials and Siliconized Vials 53
was calculated from the amino acid composition of the protein with the European Molecular
Biology Open Software Suite (EMBOSS) [100] using the hen egg white lysozyme sequence
derived from the Research Collaboratory for Structural Bioinformatics (RCSB) protein data
bank (ID 1LYZ). The calculated curve showed roughly the same trend as the experimentally
obtained one but exhibited a higher pI at approx. pH 11.1 (Figure II-21a). The borosilicate
glass surface exhibited a negative zeta potential at pH values above 2.8 (Figure II-21b) due to
the dissociation of silanol groups. Thus, the lysozyme molecules and the glass surface were
oppositely charged in the pH range between 2.8 and 10.1.
3.2.2 Influence of pH on Lysozyme Adsorption
All experiments were performed at a lysozyme concentration of 10 mg/ml and an adsorption
time of 24 h, after which equilibrium adsorption conditions were almost reached (Figure
II-22). At first, the pH-dependent adsorption of lysozyme to borosilicate glass vials was
investigated (Figure II-23a). A bell-shaped pH-dependency with steadily increasing
adsorption from pH 2 to 9 was observed, followed by a strong drop of the curve at pH 10. No
values are depicted for formulations of higher pH values since visible precipitation of the
protein was observed soon after pH adjustment.
Between pH 3 and the adsorption maximum at pH 9, lysozyme and the glass surface are
oppositely charged and thus electrostatically attract each other. With increasing pH, the
protein charge and thus the electrostatic attraction toward the negatively charged glass surface
progressively decreased. Concurrently, the electrostatic repulsion between the molecules on
the surfaces decreased, allowing a denser occupation of the surface. The simultaneous
increase of adsorption with decreasing protein charge up to pH 9 thus strongly suggests that
Figure II-22: Adsorption kinetics of lysozyme to type I borosilicate glass vials in 10 mM
phosphate buffer with 170 mM ionic strength; incubation time 24 h at 25 °C (n=3).
0 5 10 15 20 250.0
0.5
1.0
1.5
2.0
Ads
orbe
d am
ount
(m
g/m
²)
Adsorption time (h)

54 Chapter II
mainly the intermolecular repulsion on the surface was the limiting factor for lysozyme
adsorption. According to this concept, high adsorbed amounts were expected at the pI of
lysozyme, where the intermolecular repulsion is virtually zero. However, the adsorbed
amount dropped sharply at pH 10. This may indicate that a certain attractive electrostatic
interaction with the sorbent surface is necessary for pronounced adsorption. In the state of
zero net charge, adsorption presumably took place mainly due to surface dehydration and
dispersive interactions with the surface. A similar pH-dependency of lysozyme adsorption
with adsorption maxima slightly below the pI of the protein was previously reported for
various sorbent materials [94, 101]. The pH-dependent adsorption behavior of lysozyme was
ascribed to a decreasing importance of electrostatic interactions for adsorption with increasing
pH and the strong influence of lateral electrostatic intermolecular repulsion [102]. Vinu et al.
further underlined the dominance of hydrophobic interactions close to the pI of the protein
[101].
On siliconized glass vials, adsorption was investigated only at exemplary pH values. A similar
pH-dependence as on bare glass vials was observed with the adsorption maximum at slightly
lower pH values between 7 and 9 (Figure II-23b). An exact statement is not possible as
adsorption was tested at larger pH intervals than on borosilicate vials. In section 3.1.1 it was
shown that also the siliconized surface exhibited a negative surface charge over a large pH
range. Therefore, similar charge interactions as on borosilicate glass vials were assumed. In
general, slightly higher adsorption was found on the hydrophobic surface. This was ascribed
to the increased contribution of hydrophobic interactions on these vials because the
dehydration of hydrophobic patches due to adsorption is energetically favorable [48].
(a) (b)
Figure II-23: Adsorption of lysozyme to type I borosilicate glass vials (a) and siliconized
glass vials (b) depending on formulation pH in 10 mM PBS with 170 mM ionic strength;
incubation time 24 h at 25 °C (n=3).
2 3 4 5 6 7 8 9 100
1
2
3
4
Ads
orbe
d am
ount
(m
g/m
²)
pH4 7 9 10
0
1
2
3
4
Ads
orbe
d am
ount
(m
g/m
²)
pH

IgG1 and Lysozyme Adsorption to Type I Borosilicate Glass Vials and Siliconized Vials 55
In contrast to our findings and those described by van der Veen et al., several publications
reported a correspondence of the pI with the pH of maximum adsorption for a variety of
proteins and surfaces [40, 49]. Some explanations for this phenomenon were already given in
section 3.1.3.1. Van der Veen et al. hypothesized, that the adsorption maximum of lysozyme
may instead correspond with the pI of the protein/sorbent complex [94]. Such a correlation
was previously reported in approximation e.g. for BSA on polystyrene particles [11]. Figure
II-24 depicts the zeta potential of the lysozyme-borosilicate glass complex between pH 4 and
pH 11. The curve with an isoelectric point at about pH 6.5 is located in between the curves of
the bare glass particles and the dissolved lysozyme. This indicates that the negative sorbent
surface charges are partially compensated by the positive charges of the protein and adsorbed
counterions. However, a correspondence of the pI of the protein-sorbent complex with the
adsorption maximum was not found. Net charge neutrality of the protein-covered surface does
thus not explain the location of the adsorption maximum. It may be rather concluded, that the
adsorption maximum slightly below the protein pI resulted from an equilibrium of low
intermolecular repulsion and a sufficient electrostatic attraction toward the (siliconized) glass
surface, potentially with a certain contribution of hydrophobic interactions.
3.2.3 Influence of Ionic Strength on Lysozyme Adsorption
To further investigate the influence of intermolecular and protein-sorbent electrostatic
interactions on lysozyme adsorption, the adsorbed amount at increasing ionic strengths up to
1 M was determined on borosilicate glass vials. Experiments were performed at exemplary
pH values of 4.0, 7.2, 9.0 and 10.0, representing adsorption conditions of very high and high
Figure II-24: Zeta potential of borosilicate glass particles ( ) (n=1), lysozyme () and
borosilicate glass particles with adsorbed lysozyme ( ) (n ≥ 2) in 10 mM NaCl solution.
2 3 4 5 6 7 8 9 10 11 12-80
-60
-40
-20
0
20
40
60
10.12.8
Zet
a po
tent
ial
(mV
)
pH
6.5

56 Chapter II
positive protein charge, at the adsorption maximum or close to the pI of lysozyme,
respectively.
At pH 4.0, adsorption increased with ionic strength (Figure II-25). Due to the positive protein
net charge, the lysozyme molecules are electrostatically attracted toward the negatively
charged glass surface. With increasing ion concentration, this attraction but also the strong
repulsion between the molecules, which opposes the overall adsorption process, is screened.
The simultaneous increase of lysozyme adsorption with ionic strength indicates that mainly
the intermolecular repulsion determined the adsorbed amount of lysozyme to borosilicate
glass vials at high protein charge, as was already suggested in the previous section. At pH 7.2
and pH 9.0, where lysozyme was marginally charged, the adsorbed amount decreased with
increasing ionic strength (Figure II-25).
This indicates that the shielding effect of ions predominantly reduced attractive electrostatic
forces between the protein and the glass surface rather than intermolecular repulsive forces at
these pH values. Close to the pI at pH 10.0, adsorption was assumed to be rather independent
of electrostatic interactions due to the almost neutral net charge of lysozyme. However, the
decrease in adsorption with increasing ionic strength indicated the presence of attractive
electrostatic interactions between the protein and the sorbent. Although exhibiting a neutral
net charge, a protein molecule may exhibit positively and negatively charged patches on the
surface. Kamyama & Israelachvili suggested that the adsorption of amphoteric
polyelectrolytes is determined by the distribution of charges on sorbent surface and polymer
rather than by the average charge, and by the formation of discrete ionic bonds between
oppositely charged groups [103]. Similarly, Yadav et al. proposed that attractive protein-
Figure II-25: Adsorption of lysozyme in dependence of ionic strength at pH 4.0 (),
pH 7.2 (), pH 9.0( ) and pH 10.0 ( ); incubation time 24 h at 25 °C, 10 mg/ml in
10 mM phosphate buffer, ionic strength adjusted with NaCl (n=3).
0.0 0.2 0.4 0.6 0.8 1.00
1
2
3
4
Ads
orbe
d am
ount
(m
g/m
²)
Ionic strength (M)

IgG1 and Lysozyme Adsorption to Type I Borosilicate Glass Vials and Siliconized Vials 57
protein interactions found between overall positively charged monoclonal antibodies resulted
from the distribution of surface charges [104]. Ionic strength dependent adsorption of
lysozyme thus showed, that also close to the pI of the molecule, attractive electrostatic
interactions with the surface influence the adsorbed amount. Decreasing lysozyme adsorption
in formulations of pH > 5 with increasing ionic strength was also previously reported for
silica [105], glass particles [106] and SiO2/TiO2 surfaces [107]. This was ascribed to reduced
electrostatic attractions due to a shielding of lysozyme and sorbent charges [107]. As can be
observed in Figure II-25, a further increase of the ionic strength from about 0.4 M to 1.0 M
hardly influenced the adsorbed amount at all tested pH values, indicating that a further
shielding of electrostatic interactions did not render the adsorption process more favorable.
In a further step, the influence of ionic strength on the location of the adsorption maximum of
lysozyme on borosilicate glass vials was investigated. Reduction of the ionic strength from
170 mM to 40 mM led to a shift of the adsorption maximum from pH 9 to about pH 6 to 7
(Figure II-26a). In fact, increased adsorbed amounts in the pH range between about 7 and 10
and a shift of the adsorption maximum toward higher pH values were expected from the
previously described experiment. A shift of the maximum in this direction had already been
observed for IgG1 in section 3.1.3.2 and was reported in literature for lysozyme [94] and
other proteins [10, 49, 50]. It may be assumed that the adsorption maximum at 40 mM ionic
strength resulted from a favorable interplay of large enough electrostatic attraction toward the
surface and sufficiently low intermolecular repulsion. On siliconized vials, Г(pH)max at
(a) (b)
Figure II-26: Adsorption of lysozyme to type I borosilicate glass vials (a) and siliconized
glass vials (b) depending on formulation pH at a formulation ionic strength of
40 mM (∆) or 170 mM ( ) adjusted with NaCl; incubation time 24 h at 25 °C (n=3,
*n=2).
2 3 4 5 6 7 8 9 100
1
2
3
4
Ads
orbe
d am
ount
(m
g/m
²)
pH
*
4 7 9 100
1
2
3
4
Ads
orbe
d am
ount
(m
g/m
²)
pH

58 Chapter II
40 mM ionic strength was located approximately at the same or slightly higher pH than at
170 mM ionic strength, thus confirming the trends reported in literature (Figure II-26b). In
conclusion, the adsorption maximum on siliconized vials presumably resulted from a very low
intermolecular repulsion combined with sufficiently high electrostatic attraction toward the
sorbent surface as suggested for bare glass vials.
3.2.4 Isotherm Considerations
One of the most popular methods to describe protein adsorption affinities to surfaces is an
adsorption isotherm in which the adsorbed amount Γ is plotted against the equilibrium
concentration ceq. Several mathematical models were developed and are commonly used to
analyze protein isotherms [108-110]. One of the first approaches which was often used for
protein isotherm interpretations [111, 112] is the equation of Langmuir [113]:
Γ (8)
Γ represents the adsorbed amount per surface area, Γmax the maximum adsorbed amount and
ceq the equilibrium concentration of the protein in solution. K is a constant and was e.g.
interpreted as bonding energy coefficient [113]. Originally developed for the description of
gas adsorption to solid surfaces [114], the Langmuir equation was mentioned inappropriate to
describe the adsorption of proteins from solution due to the difference in adsorption
mechanism for small molecules and macromolecules [115]. Furthermore, the Freundlich
model was used to describe adsorption isotherms of proteins [116, 117] by the power function
Γ K ∙ c (9)
in which K represents the Freundlich equilibrium constant and n the isotherm power term
[109]. This model is used in a strictly empirical sense but may be of theoretical interest to
describe the adsorption to surfaces which are energetically heterogeneous [108]. Finally, the
Langmuir-Freundlich equation [113]
Γ (10)
considers heterogeneous bonding energies with the bonding energy coefficients following a
Gaussian-like distribution [113]. Km represents the median binding affinity and n the

IgG1 and Lysozyme Adsorption to Type I Borosilicate Glass Vials and Siliconized Vials 59
heterogeneity index [118]. Values of n < 1 apply for heterogeneous materials whereas
homogeneous materials exhibit a value of n = 1, leading to a reduction of Eq. 10 to the
Langmuir equation (Eq. 8) [118]. Mathematically equivalent to the Langmuir-Freundlich
equation is the Hill equation [119]. Assuming a homogeneous surface it allows the
interpretation of cooperative adsorption processes due to lateral interactions. In this case, the
parameter n expresses the degree of cooperativity, indicating positive cooperativity for values
n > 1 [119]. Thus, fitting of adsorption isotherms according to Eq. 10 allows no interpretation
of the parameter n in terms of surface heterogeneity and adsorption cooperativity at the same
time under the same assumptions.
Lysozyme adsorption isotherms were determined in a bulk solution concentration range
between 0.005 and 2 mg/ml (Figure II-27a) (here mentioned as isotherm I) and between 0.1
and 20 mg/ml (isotherm II) (Figure II-27b). The isotherms were fitted using the Langmuir, the
Freundlich, and the Langmuir-Freundlich equation. Obtained values for the parameters are
listed in Table II-3.
None of the models clearly fitted adsorption isotherm I best, just the correlation coefficients
obtained were slightly better for the Langmuir and the Langmuir-Freundlich equation than for
the Freundlich equation. Transformation of the data by the Scatchard plot (Γ/ceq versus Γ) or
the semi-reciprocal plot (ceq/Γ versus ceq) [120] did only show a linear trend for the latter
equation (data not shown). This implies that the assumptions of the Langmuir model, (a)
(a) (b)
Figure II-27: Adsorption isotherms of lysozyme on borosilicate glass vials at equilibrium
concentrations in a range of approximately (a) 0.005-2.0 mg/ml and (b) 0.1-20 mg/ml,
determined at pH 7.2 in 10 mM phosphate buffer with 170 mM ionic strength;
incubation time 24 h at 25 °C (n=3); isotherms were fitted by nonlinear curve
approximation applying the Langmuir, the Freundlich or the Langmuir-Freundlich
model.
0 500 1000 1500 20000.0
0.5
1.0
1.5
2.0
Langmuir-Freundlich Langmuir FreundlichA
dsor
bed
amou
nt (
mg/
m²)
Equilibrium concentration (µg/ml)
0 5 10 15 200
1
2
3
4
5
Langmuir Freundlich
Ads
orbe
d am
ount
(m
g/m
²)
Equilibrium concentration (mg/ml)

60 Chapter II
equilibrium between adsorbed and free molecules, (b) monolayer adsorption, (c) energetic
equivalence of adsorption sites, and (d) the absence of intermolecular interactions [121], are
not fulfilled for lysozyme adsorption to borosilicate glass vials in the concentration range of
isotherm I. Luo & Andrade stated that the Langmuir model is not suitable to describe the
adsorption of proteins and ascribed this to the different adsorption mechanisms of
macromolecules compared to small molecules: proteins bind via multiple sites, potentially
irreversibly, and cooperative interactions play a role [115]. Furthermore, most surfaces are
heterogeneous [115]. Therefore, the isotherm was further interpreted by the results obtained
from fitting by the Langmuir-Freundlich equation. As mentioned above, the obtained values
of n < 1 (Table II-3) may indicate heterogeneity of the borosilicate glass surface.
Interpretation of n according to the Hill equation, assuming a homogeneous surface, did not
indicate positive cooperativity of lysozyme adsorption.
In contrast to isotherm I, the isotherm for bulk concentrations between 0.1 and 20 mg/ml
could not be fitted by the Langmuir-Freundlich equation. Best fits were obtained by the
Freundlich model (Figure II-27b), which is only used in an empirical sense and reflects a
continuous increase of the adsorbed amount with the bulk concentration [108].
The poor fitting of both isotherms by the Langmuir model may be ascribed to the
intermolecular interactions between lysozyme molecules as outlined in the previous sections,
multilayer adsorption or to the phenomena mentioned by Luo & Andrade as stated above.
Adsorption isotherms exhibiting steps, as observed for isotherm II in the range of about
1.5-3.5 mg/ml, were previously reported and considered to derive from conformational
changes of the adsorbed protein molecules [122] or a change in the molecular orientation with
surface coverage [24].
Table II-3: Results of nonlinear curve fitting of adsorption isotherms of lysozyme on
borosilicate glass vials at pH 7.2 applying different fitting models.
Langmuir model parameters
Freundlich model parameters
Langmuir-Freundlich model parameters
c (bulk)
(mg/ml)
Γmaxa
(mg/m²)
Ka
(ml/g)
Γmaxa
(mg/m²)
na Γmax
a
(mg/m²)
na Km
a
(ml/g)
0.005-2 1.26 0.49 0.93 0.05 1.29 0.73 0.65
0.1-20 2.95 9.84 2.24 0.16 n.a.b n.a.b n.a.b
aobtained by nonlinear least square fit according to Levenberg-Marquardt algorithm bvalues not computable

IgG1 and Lysozyme Adsorption to Type I Borosilicate Glass Vials and Siliconized Vials 61
4 CONCLUSION
IgG1 adsorption to siliconized glass vials was shown to be highly dependent on formulation
pH and ionic strength. Determination of the charge characteristics of the protein molecules
and the siliconized glass surface was used to interpret the contribution of electrostatic
interactions to the adsorption process. Higher amounts of adsorbed protein were found for pH
values at which opposing charges of the protein and the surface led to attractive electrostatic
conditions. Calculation of the charge transfer between the protein-sorbent interface and the
surrounding solution upon adsorption allowed further insight into the electrostatic interactions
influencing the adsorption process. The pH of maximum adsorption could be correlated to the
minimal ion uptake into the interfacial region between protein and sorbent surface.
Electrostatic interactions are thus supposed to govern adsorption at pH values below the pI of
IgG1. The occurrence of a second local adsorption maximum around the pI of the protein was
ascribed to a pronounced influence of hydrophobic interactions. This assumption was
supported by the marginal influence of ionic strength on adsorption at pH 7.2 compared to
distinct changes in protein adsorption at pH 4.0. Addition of the nonionic surfactants P 188
and PS 80 resulted in almost complete suppression of adsorption at pH 7.2, and a strong but
less pronounced effect at pH 4.0. From these results it can be concluded that electrostatic
interactions contribute substantially to IgG1 adsorption to siliconized glass vials especially at
acidic pH values. At these conditions, a decrease of the ionic strength is a rather effective
additional tool to reduce protein adsorption to packaging materials. Close to the protein’s pI,
additionally hydrophobic interactions drive adsorption to a remarkable extent. Adsorption of
IgG1 decreased only slightly by the addition of sucrose, mannitol or HP-β-CD or even
increased. Determination of an ‘adsorption index’ was found to be not suitable to predict the
adsorption behavior of IgG1 to different vial surfaces with the applied experimental setup. In
contrast, a clear dependency of the adsorbed amount on the physical and chemical stability of
the IgG1 solution could be demonstrated by analyzing the adsorption of IgG1 after long-term
storage of the formulation in siliconized and bare glass vials.
Investigation of the pH- and ionic strength dependent adsorption of lysozyme as a model
protein to borosilicate glass vials and siliconized vials showed a strong dependence on lateral
electrostatic interactions. Adsorption isotherms could be fitted by applying the Langmuir-
Freundlich or the Freundlich model, depending on the investigated concentration range of the
isotherm. From the adsorption experiments with lysozyme and IgG1 it can be summarized,
that especially electrostatic interactions strongly contributed to the adsorption behavior of
both proteins to borosilicate glass vials and siliconized vials. This understanding enables a

62 Chapter II
more rational design of protein formulations to be packaged in (siliconized) vials or prefilled
syringes.

IgG1 and Lysozyme Adsorption to Type I Borosilicate Glass Vials and Siliconized Vials 63
5 REFERENCES
[1] G.A. Sacha, W. Saffell-Clemmer, K. Abram, M.J. Akers, Practical fundamentals of glass, rubber, and plastic sterile packaging systems, Pharm. Dev. Technol., 15 (2010) 6-34.
[2] A. Colas, Silicones in Pharmaceutical Applications [Online], 2001, Available: http://www.dowcorning.com/content/publishedlit/51-993a-01.pdf [Accessed January 23 2013].
[3] L.S. Jones, A. Kaufmann, C.R. Middaugh, Silicone oil induced aggregation of proteins, J. Pharm. Sci., 94 (2005) 918-927.
[4] D.B. Ludwig, J.F. Carpenter, J.-B. Hamel, T.W. Randolph, Protein adsorption and excipient effects on kinetic stability of silicone oil emulsions, J. Pharm. Sci., 99 (2010) 1721-1733.
[5] R. Thirumangalathu, S. Krishnan, M.S. Ricci, D.N. Brems, T.W. Randolph, J.F. Carpenter, Silicone oil- and agitation-induced aggregation of a monoclonal antibody in aqueous solution, J. Pharm. Sci., 98 (2009) 3167-3181.
[6] J. Li, S. Pinnamaneni, Y. Quan, A. Jaiswal, F. Andersson, X. Zhang, Mechanistic Understanding of Protein-Silicone Oil Interactions, Pharm. Res., 29 (2012) 1689-1697.
[7] N. Dixit, K. Maloney, D. Kalonia, Protein-Silicone Oil Interactions: Comparative Effect of Nonionic Surfactants on the Interfacial Behavior of a Fusion Protein, Pharm. Res., 30 (2013) 1848-1859.
[8] N. Dixit, K.M. Maloney, D.S. Kalonia, Application of quartz crystal microbalance to study the impact of pH and ionic strength on protein–silicone oil interactions, Int. J. Pharm., 412 (2011) 20-27.
[9] W. Norde, J. Lyklema, Thermodynamics of protein adsorption. Theory with special reference to the adsorption of human plasma albumin and bovine pancreas ribonuclease at polystyrene surfaces, J. Colloid Interface Sci., 71 (1979) 350-366.
[10] J. Mathes, W. Friess, Influence of pH and ionic strength on IgG adsorption to vials, Eur. J. Pharm. Biopharm., 78 (2011) 239-247.
[11] A.V. Elgersma, R.L.J. Zsom, W. Norde, J. Lyklema, The adsorption of bovine serum albumin on positively and negatively charged polystyrene latices, J. Colloid Interface Sci., 138 (1990) 145-156.
[12] N.B. Bam, T.W. Randolph, J.L. Cleland, Stability of protein formulations: investigation of surfactant effects by a novel EPR spectroscopic technique, Pharm. Res., 12 (1995) 2-11.
[13] T. Arakawa, Y. Kita, Protection of bovine serum albumin from aggregation by Tween 80, J. Pharm. Sci., 89 (2000) 646-651.

64 Chapter II
[14] W. Wang, Instability, stabilization, and formulation of liquid protein pharmaceuticals, Int. J. Pharm., 185 (1999) 129-188.
[15] M.R. Duncan, J.M. Lee, M.P. Warchol, Influence of surfactants upon protein/peptide adsorption to glass and polypropylene, Int. J. Pharm., 120 (1995) 179-188.
[16] M. Feng, A.B. Morales, A. Poot, T. Beugeling, A. Bantjes, Effects of Tween 20 on the desorption of proteins from polymer surfaces, J. Biomater. Sci., Polym. Ed., 7 (1995) 415-424.
[17] S. Welin-Klintström, A. Askendal, H. Elwing, Surfactant and Protein Interactions on Wettability Gradient Surfaces, J. Colloid Interface Sci., 158 (1993) 188-194.
[18] J. Mathes, 2010, Protein Adsorption to Vial Surfaces: Quantification, Structural and Mechanistic Studies, Thesis, Ludwig-Maximilians Universität München.
[19] M. Zhang, M. Ferrari, Reduction of albumin adsorption onto silicon surfaces by Tween 20, Biotechnol. Bioeng., 56 (1997) 618-625.
[20] L.N. Arnaudov, R. de Vries, Thermally Induced Fibrillar Aggregation of Hen Egg White Lysozyme, Biophys. J., 88 (2005) 515-526.
[21] J. Lyklema, Elektrische Doppelschichten: Elektrostatik und Elektrodynamik, Chem. Ing. Tech., 71 (1999) 1364-1369.
[22] R.H. Pain, Determining the Fluorescence Spectrum of a Protein, in: Current Protocols in Protein Science, John Wiley & Sons, Inc., 2001.
[23] J.C. Kasper, D. Schaffert, M. Ogris, E. Wagner, W. Friess, Development of a lyophilized plasmid/LPEI polyplex formulation with long-term stability-A step closer from promising technology to application, J. Controlled Release, 151 (2011) 246-255.
[24] C.A. Haynes, W. Norde, Globular proteins at solid/liquid interfaces, Colloids Surf., B, 2 (1994) 517-566.
[25] R. Tadmor, Line Energy and the Relation between Advancing, Receding, and Young Contact Angles, Langmuir, 20 (2004) 7659-7664.
[26] E.A. Vogler, Structure and reactivity of water at biomaterial surfaces, Adv. Colloid Interface Sci., 74 (1998) 69-117.
[27] M. Kosmulski, Positive Electrokinetic Charge of Silica in the Presence of Chlorides, J. Colloid Interface Sci., 208 (1998) 543-545.
[28] G.V. Franks, Zeta Potentials and Yield Stresses of Silica Suspensions in Concentrated Monovalent Electrolytes: Isoelectric Point Shift and Additional Attraction, J. Colloid Interface Sci., 249 (2002) 44-51.
[29] Y. Gu, D. Li, The ζ-Potential of Silicone Oil Droplets Dispersed in Aqueous Solutions, J. Colloid Interface Sci., 206 (1998) 346-349.
[30] J. Song, J.F.L. Duval, M.A. Cohen Stuart, H. Hillborg, U. Gunst, H.F. Arlinghaus, G.J. Vancso, Surface Ionization State and Nanoscale Chemical Composition of UV-

IgG1 and Lysozyme Adsorption to Type I Borosilicate Glass Vials and Siliconized Vials 65
Irradiated Poly(dimethylsiloxane) Probed by Chemical Force Microscopy, Force Titration, and Electrokinetic Measurements, Langmuir, 23 (2007) 5430-5438.
[31] J. Roth, V. Albrecht, M. Nitschke, C. Bellmann, F. Simon, S. Zschoche, S. Michel, C. Luhmann, K. Grundke, B. Voit, Surface Functionalization of Silicone Rubber for Permanent Adhesion Improvement, Langmuir, 24 (2008) 12603-12611.
[32] V.M. Litvinov, H. Barthel, J. Weis, Structure of a PDMS Layer Grafted onto a Silica Surface Studied by Means of DSC and Solid-State NMR, Macromolecules, 35 (2002) 4356-4364.
[33] M. Malmsten, Ellipsometry studies of the effects of surface hydrophobicity on protein adsorption, Colloids Surf., B, 3 (1995) 297-308.
[34] K. Wannerberger, S. Welin-Klintström, T. Arnebrant, Activity and Adsorption of Lipase from Humicola lanuginosa on Surfaces with Different Wettabilities, Langmuir, 13 (1997) 784-790.
[35] R.J. Marsh, R.A.L. Jones, M. Sferrazza, Adsorption and displacement of a globular protein on hydrophilic and hydrophobic surfaces, Colloids Surf., B, 23 (2002) 31-42.
[36] H. Elwing, S. Welin, A. Askendal, U. Nilsson, I. Lundström, A wettability gradient method for studies of macromolecular interactions at the liquid/solid interface, J. Colloid Interface Sci., 119 (1987) 203-210.
[37] A. Michiardi, C. Aparicio, B.D. Ratner, J.A. Planell, J. Gil, The influence of surface energy on competitive protein adsorption on oxidized NiTi surfaces, Biomaterials, 28 (2007) 586-594.
[38] E.A. Vogler, D.A. Martin, D.B. Montgomery, J. Graper, H.W. Sugg, A graphical method for predicting surfactant and protein adsorption properties, Langmuir, 9 (1993) 497-507.
[39] M.G.E.G. Bremer, J. Duval, W. Norde, J. Lyklema, Electrostatic interactions between immunoglobulin (IgG) molecules and a charged sorbent, Colloids Surf., A, 250 (2004) 29-42.
[40] P. Bagchi, S.M. Birnbaum, Effect of pH on the adsorption of immunoglobulin G on anionic poly(vinyltoluene) model latex particles, J. Colloid Interface Sci., 83 (1981) 460-478.
[41] S. Salgin, S. Takaç, T.H. Özdamar, Adsorption of bovine serum albumin on polyether sulfone ultrafiltration membranes: Determination of interfacial interaction energy and effective diffusion coefficient, J. Membr. Sci., 278 (2006) 251-260.
[42] W. Norde, F. MacRitchie, G. Nowicka, J. Lyklema, Protein adsorption at solid-liquid interfaces: Reversibility and conformation aspects, J. Colloid Interface Sci., 112 (1986) 447-456.
[43] P. Van Dulm, W. Norde, J. Lyklema, Ion participation in protein adsorption at solid surfaces, J. Colloid Interface Sci., 82 (1981) 77-82.

66 Chapter II
[44] W. Norde, Adsorption of proteins at solid-liquid interfaces, Cells Mater., 5 (1995) 97-112.
[45] X. Zhu, H. Fan, D. Li, Y. Xiao, X. Zhang, Protein adsorption and zeta potentials of a biphasic calcium phosphate ceramic under various conditions, J. Biomed. Mater. Res., Part B, 82B (2007) 65-73.
[46] K.L. Jones, C.R. O’Melia, Protein and humic acid adsorption onto hydrophilic membrane surfaces: effects of pH and ionic strength, J. Membr. Sci., 165 (2000) 31-46.
[47] T. Arai, W. Norde, The behavior of some model proteins at solid-liquid interfaces 1. Adsorption from single protein solutions, Colloids Surf., 51 (1990) 1-15.
[48] W. Norde, J. Lyklema, Why proteins prefer interfaces, J. Biomater. Sci., Polym. Ed., 2 (1991) 183-202.
[49] J. Buijs, P.A.W. van den Berg, J.W.T. Lichtenbelt, W. Norde, J. Lyklema, Adsorption Dynamics of IgG and Its F(ab')2 and Fc Fragments Studied by Reflectometry, J. Colloid Interface Sci., 178 (1996) 594-605.
[50] H. Xu, J.R. Lu, D.E. Williams, Effect of Surface Packing Density of Interfacially Adsorbed Monoclonal Antibody on the Binding of Hormonal Antigen Human Chorionic Gonadotrophin, J. Phys. Chem. B, 110 (2006) 1907-1914.
[51] W. Norde, J. Lyklema, The adsorption of human plasma albumin and bovine pancreas ribonuclease at negatively charged polystyrene surfaces: III. Electrophoresis, J. Colloid Interface Sci., 66 (1978) 277-284.
[52] J. Buijs, J.W.T. Lichtenbelt, W. Norde, J. Lyklema, Adsorption of monoclonal IgGs and their F(ab')2 fragments onto polymeric surfaces, Colloids Surf., B, 5 (1995) 11-23.
[53] N.B. Bam, J.L. Cleland, J. Yang, M.C. Manning, J.F. Carpenter, R.F. Kelley, T.W. Randolph, Tween protects recombinant human growth hormone against agitation-induced damage via hydrophobic interactions, J. Pharm. Sci., 87 (1998) 1554-1559.
[54] D.K. Chou, R. Krishnamurthy, T.W. Randolph, J.F. Carpenter, M.C. Manning, Effects of Tween 20® and Tween 80® on the stability of Albutropin during agitation, J. Pharm. Sci., 94 (2005) 1368-1381.
[55] M. Wahlgren, Karlsson, C. A. C., Welin-Klintstroem, S., Interactions between proteins and surfactants at solid interfaces, Surfactant Sci. Ser., 110 (2003) 321-343.
[56] M.C. Wahlgren, T. Arnebrant, The concentration dependence of adsorption from a mixture of β-lactoglobulin and sodium dodecyl sulfate onto methylated silica surfaces, J. Colloid Interface Sci., 148 (1992) 201-206.
[57] A.V. Kabanov, E.V. Batrakova, D.W. Miller, Pluronic® block copolymers as modulators of drug efflux transporter activity in the blood–brain barrier, Adv. Drug Delivery Rev., 55 (2003) 151-164.

IgG1 and Lysozyme Adsorption to Type I Borosilicate Glass Vials and Siliconized Vials 67
[58] E. Batrakova, H.-Y. Han, V. Alakhov, D. Miller, A. Kabanov, Effects of Pluronic Block Copolymers on Drug Absorption in Caco-2 Cell Monolayers, Pharm. Res., 15 (1998) 850-855.
[59] T.M. Göppert, R.H. Müller, Polysorbate-stabilized solid lipid nanoparticles as colloidal carriers for intravenous targeting of drugs to the brain: Comparison of plasma protein adsorption patterns, J. Drug Target., 13 (2005) 179-187.
[60] F. B, Poloxamers (1) Lutrol® F 68 (Poloxamer 188) [Online], 1999: http://worldaccount.basf.com/wa/NAFTA/Catalog/Pharma/doc4/BASF/exact/lutrol_f_68/.pdf?title=Poloxamers%20%281%29%20Lutrol%20F%2068%20%28Poloxamer%20188%29.&asset_type=pi/pdf&language=EN&urn=urn:documentum:eCommerce_sol_EU:09007bb28001ac1e.pdf, [Accessed March 10 2013].
[61] J.R. Wendorf, C.J. Radke, H.W. Blanch, Reduced protein adsorption at solid interfaces by sugar excipients, Biotechnol. Bioeng., 87 (2004) 565-573.
[62] T. Arakawa, S.N. Timasheff, Stabilization of protein structure by sugars, Biochemistry, 21 (1982) 6536-6544.
[63] S.N. Timasheff, Solvent effects on protein stability: Current Opinion in Structural Biology, Curr. Opin. Struct. Biol., 2 (1992) 35-39.
[64] J.C. Lee, S.N. Timasheff, The stabilization of proteins by sucrose, J. Biol. Chem., 256 (1981) 7193-7201.
[65] K. Gekko, S.N. Timasheff, Mechanism of protein stabilization by glycerol: preferential hydration in glycerol-water mixtures, Biochemistry, 20 (1981) 4667-4676.
[66] H.-C. Mahler, S. Fischer, T.W. Randolph, J.F. Carpenter, Protein aggregation and particle formation: Effects of formulation, interfaces, and drug product manufacturing operations, in: W. Wang, C.J. Roberts (Eds.), Aggregation of therapeutic proteins, John Wiley & Sons, Inc., Hoboken, New Jersey, 2010.
[67] T. Loftsson, M.E. Brewster, Pharmaceutical applications of cyclodextrins. 1. Drug solubilization and stabilization, J. Pharm. Sci., 85 (1996) 1017-1025.
[68] T. Serno, R. Geidobler, G. Winter, Protein stabilization by cyclodextrins in the liquid and dried state, Adv. Drug Delivery Rev., 63 (2011) 1086-1106.
[69] T. Serno, J.F. Carpenter, T.W. Randolph, G. Winter, Inhibition of agitation-induced aggregation of an IgG-antibody by hydroxypropyl-β-cyclodextrin, J. Pharm. Sci., 99 (2010) 1193-1206.
[70] M.E. Davis, M.E. Brewster, Cyclodextrin-based pharmaceutics: past, present and future, Nat. Rev. Drug Discov., 3 (2004) 1023-1035.
[71] J. Peeters, P. Neeskens, J.P. Tollenaere, P. Van Remoortere, M.E. Brewster, Characterization of the interaction of 2-hydroxypropyl-β-cyclodextrin with itraconazole at pH 2, 4, and 7, J. Pharm. Sci., 91 (2002) 1414-1422.
68 Chapter II
[72] S. Tavornvipas, S. Tajiri, F. Hirayama, H. Arima, K. Uekama, Effects of hydrophilic cyclodextrins on aggregation of recombinant human growth hormone, Pharm. Res., 21 (2004) 2369-2376.
[73] T. Arakawa, S.J. Prestrelski, W.C. Kenney, J.F. Carpenter, Factors affecting short-term and long-term stabilities of proteins, Adv. Drug Delivery Rev., 10 (1993) 1-28.
[74] S. Matheus, 2006, Development of High Concentration cetuximab Formulations using Ultrafiltration and Precipitation Techniques, Thesis, Ludwig-Maximilians-Universität München.
[75] P.M. Claesson, H.K. Christenson, J.M. Berg, R.D. Neuman, Interactions between Mica Surfaces in the Presence of Carbohydrates, J. Colloid Interface Sci., 172 (1995) 415-424.
[76] T. Wei, S. Kaewtathip, K. Shing, Buffer Effect on Protein Adsorption at Liquid/Solid Interface, J. Phys. Chem. C, 113 (2009) 2053-2062.
[77] Y. Tie, C. Calonder, P.R. Van Tassel, Protein adsorption: Kinetics and history dependence, J. Colloid Interface Sci., 268 (2003) 1-11.
[78] McLeod, Walker, Zheng, Hayward, Loss of factor VIII activity during storage in PVC containers due to adsorption, Haemophilia, 6 (2000) 89-92.
[79] J. Deere, E. Magner, J.G. Wall, B.K. Hodnett, Mechanistic and Structural Features of Protein Adsorption onto Mesoporous Silicates, J. Phys. Chem. B, 106 (2002) 7340-7347.
[80] E.Y. Chi, S. Krishnan, T.W. Randolph, J.F. Carpenter, Physical Stability of Proteins in Aqueous Solution: Mechanism and Driving Forces in Nonnative Protein Aggregation, Pharm. Res., 20 (2003) 1325-1336.
[81] W. Wang, Protein aggregation and its inhibition in biopharmaceutics, Int. J. Pharm., 289 (2005) 1-30.
[82] R.M. Daniel, M. Dines, H.H. Petach, The denaturation and degradation of stable enzymes at high temperatures, Biochem. J., 317 (1996) 1-11.
[83] S. Zölls, R. Tantipolphan, M. Wiggenhorn, G. Winter, W. Jiskoot, W. Friess, A. Hawe, Particles in therapeutic protein formulations, Part 1: Overview of analytical methods, J. Pharm. Sci., 101 (2012) 914-935.
[84] S.K. Singh, N. Afonina, M. Awwad, K. Bechtold-Peters, J.T. Blue, D. Chou, M. Cromwell, H.-J. Krause, H.-C. Mahler, B.K. Meyer, L. Narhi, D.P. Nesta, T. Spitznagel, An industry perspective on the monitoring of subvisible particles as a quality attribute for protein therapeutics, J. Pharm. Sci., 99 (2010) 3302-3321.
[85] 3.1.8 Silicone oil used as a lubricant, in: European Pharmacopoeia, 2011
[86] A.L. Smoot, M. Panda, B.T. Brazil, A.M. Buckle, A.R. Fersht, P.M. Horowitz, The Binding of Bis-ANS to the Isolated GroEL Apical Domain Fragment Induces the Formation of a Folding Intermediate with Increased Hydrophobic Surface Not Observed in Tetradecameric GroEL, Biochemistry, 40 (2001) 4484-4492.

IgG1 and Lysozyme Adsorption to Type I Borosilicate Glass Vials and Siliconized Vials 69
[87] A.O. Grillo, K.L. Edwards, R.S. Kashi, K.M. Shipley, L. Hu, M.J. Besman, C.R. Middaugh, Conformational origin of the aggregation of recombinant human factor VIII, Biochemistry, 40 (2001) 586-595.
[88] K. Ahrer, A. Jungbauer, Chromatographic and electrophoretic characterization of protein variants, J. Chromatogr., B, 841 (2006) 110-122.
[89] T. Arnebrant, K. Barton, T. Nylander, Adsorption of α-lactalbumin and β-lactoglobulin on metal surfaces versus temperature, J. Colloid Interface Sci., 119 (1987) 383-390.
[90] M. Rabe, D. Verdes, S. Seeger, Surface-induced spreading phenomenon of protein clusters, Soft Matter, 5 (2009) 1039-1047.
[91] E.Y. Chi, J. Weickmann, J.F. Carpenter, M.C. Manning, T.W. Randolph, Heterogeneous nucleation-controlled particulate formation of recombinant human platelet-activating factor acetylhydrolase in pharmaceutical formulation, J. Pharm. Sci., 94 (2005) 256-274.
[92] V. Sluzky, J.A. Tamada, A.M. Klibanov, R. Langer, Kinetics of insulin aggregation in aqueous solutions upon agitation in the presence of hydrophobic surfaces, Proc. Natl. Acad. Sci. U. S. A., 88 (1991) 9377-9381.
[93] R. Cegielska-Radziejewska, G. Leśnierowski, J. Kijowski, Properties and application of egg white lysozyme and its modified preparations - a review., Pol. J. Food Nutr. Sci., 58 (2008) 5-10.
[94] M. van der Veen, W. Norde, M.C. Stuart, Electrostatic interactions in protein adsorption probed by comparing lysozyme and succinylated lysozyme, Colloids Surf., B, 35 (2004) 33-40.
[95] J. Buijs, V. Hlady, Adsorption Kinetics, Conformation, and Mobility of the Growth Hormone and Lysozyme on Solid Surfaces, Studied with TIRF, J. Colloid Interface Sci., 190 (1997) 171-181.
[96] A. Salis, M.S. Bhattacharyya, M. Monduzzi, Specific Ion Effects on Adsorption of Lysozyme on Functionalized SBA-15 Mesoporous Silica, J. Phys. Chem. B, 114 (2010) 7996-8001.
[97] D.E. Kuehner, J. Engmann, F. Fergg, M. Wernick, H.W. Blanch, J.M. Prausnitz, Lysozyme Net Charge and Ion Binding in Concentrated Aqueous Electrolyte Solutions, J. Phys. Chem. B, 103 (1999) 1368-1374.
[98] Y.J. Yao, K.S. Khoo, M.C.M. Chung, S.F.Y. Li, Determination of isoelectric points of acidic and basic proteins by capillary electrophoresis, J. Chromatogr. A, 680 (1994) 431-435.
[99] L. Palacio, C.C. Ho, P. Prádanos, A. Hernández, A.L. Zydney, Fouling with protein mixtures in microfiltration: BSA–lysozyme and BSA–pepsin, J. Membr. Sci., 222 (2003) 41-51.
[100] P. Rice, I. Longden, A. Bleasby, EMBOSS: The European Molecular Biology Open Software Suite, Trends Genet., 16 (2000) 276-277.

70 Chapter II
[101] A. Vinu, V. Murugesan, M. Hartmann, Adsorption of Lysozyme over Mesoporous Molecular Sieves MCM-41 and SBA-15: Influence of pH and Aluminum Incorporation, J. Phys. Chem. B, 108 (2004) 7323-7330.
[102] T.J. Su, J.R. Lu, R.K. Thomas, Z.F. Cui, J. Penfold, The Effect of Solution pH on the Structure of Lysozyme Layers Adsorbed at the Silica−Water Interface Studied by Neutron Reflection, Langmuir, 14 (1998) 438-445.
[103] Y. Kamiyama, J. Israelachvili, Effect of pH and salt on the adsorption and interactions of an amphoteric polyelectrolyte, Macromolecules, 25 (1992) 5081-5088.
[104] S. Yadav, T.M. Laue, D.S. Kalonia, S.N. Singh, S.J. Shire, The Influence of Charge Distribution on Self-Association and Viscosity Behavior of Monoclonal Antibody Solutions, Mol. Pharm., 9 (2012) 791-802.
[105] F.K. Onwu, S.P.I. Ogah, Adsorption of lysozyme onto silica and polystyrene surfaces in aqueous medium, Afr. J. Biotechnol., 10 (2011) 3014-3021.
[106] F. Hussein, 2007, Untersuchung verschiedener Einflüsse auf die Proteinadsorption an Primärpackmitteln, Thesis, Technische Universität Carolo-Wilhelmina zu Braunschweig.
[107] J.R. Wendorf, C.J. Radke, H.W. Blanch, The role of electrolytes on protein adsorption at a hydrophilic solid-water interface, Colloids Surf., B, 75 (2010) 100-106.
[108] S. Sharma, G.P. Agarwal, Interactions of Proteins with Immobilized Metal Ions: A Comparative Analysis Using Various Isotherm Models, Anal. Biochem., 288 (2001) 126-140.
[109] L.C.L. Aquino, E.A. Miranda, I.S. Duarte, P.T.V. Rosa, S.M.A. Bueno, Adsorption of human immunoglobulin G onto ethacrylate and histidine-linked methacrylate, Braz. J. Chem. Eng., 20 (2003) 251-262.
[110] R.D. Johnson, F.H. Arnold, The temkin isotherm describes heterogeneous protein adsorption, Biochim. Biophys. Acta, Protein Struct. Mol. Enzymol, 1247 (1995) 293-297.
[111] J.E. Lee, S.S. Saavedra, Molecular Orientation in Heme Protein Films Adsorbed to Hydrophilic and Hydrophobic Glass Surfaces, Langmuir, 12 (1996) 4025-4032.
[112] N. Bouropoulos, J. Moradian–Oldak, Analysis of Hydroxyapatite Surface Coverage by Amelogenin Nanospheres Following the Langmuir Model for Protein Adsorption, Calcif. Tissue Int., 72 (2003) 599-603.
[113] S.-C. Tsai, K.-W. Juang, Y.-L. Jan, Sorption of cesium on rocks using heterogeneity-based isotherm models, J. Radioanal. Nucl. Chem., 266 (2005) 101-105.
[114] I. Langmuir, The Adsorption of Gases on Plane Surfaces of Glass, Mica and Platinum, J. Am. Chem. Soc., 40 (1918) 1361-1403.
[115] Q. Luo, J.D. Andrade, Cooperative Adsorption of Proteins onto Hydroxyapatite, J. Colloid Interface Sci., 200 (1998) 104-113.

IgG1 and Lysozyme Adsorption to Type I Borosilicate Glass Vials and Siliconized Vials 71
[116] T.P. Johnston, Adsorption of Recombinant Human Granulocyte Colony Stimulating Factor (rhG-CSF) to Polyvinyl Chloride, Polypropylene, and Glass: Effect of Solvent Additives, PDA J. Pharm. Sci. Technol., 50 (1996) 238-245.
[117] H.P. Jennissen, Evidence for negative cooperativity in the adsorption of phosphorylase b on hydrophobic agaroses, Biochemistry, 15 (1976) 5683-5692.
[118] R.J. Umpleby, S.C. Baxter, Y. Chen, R.N. Shah, K.D. Shimizu, Characterization of Molecularly Imprinted Polymers with the Langmuir−Freundlich Isotherm, Anal. Chem., 73 (2001) 4584-4591.
[119] L.K. Koopal, W.H. van Riemsdijk, J.C.M. de Wit, M.F. Benedetti, Analytical Isotherm Equations for Multicomponent Adsorption to Heterogeneous Surfaces, J. Colloid Interface Sci., 166 (1994) 51-60.
[120] Q. Lan, A.S. Bassi, J.-X. Zhu, A. Margaritis, A modified Langmuir model for the prediction of the effects of ionic strength on the equilibrium characteristics of protein adsorption onto ion exchange/affinity adsorbents, Chem. Eng. J. (Amsterdam, Neth.), 81 (2001) 179-186.
[121] T. Zuyi, C. Taiwei, On the Applicability of the Langmuir Equation to Estimation of Adsorption Equilibrium Constants on a Powdered Solid from Aqueous Solution, J. Colloid Interface Sci., 231 (2000) 8-12.
[122] W. Norde, J. Lyklema, The adsorption of human plasma albumin and bovine pancreas ribonuclease at negatively charged polystyrene surfaces: I. Adsorption isotherms. Effects of charge, ionic strength, and temperature, J. Colloid Interface Sci., 66 (1978) 257-265.

Chapter III
Polyglycerol Coatings of Glass Vials for Protein Resistance
The following chapter has been published in the European Journal of Pharmaceutics and
Biopharmaceutics and the reproduction in this thesis is permitted by the journal:
Kerstin Höger1*, Tobias Becherer2*, Wei Qiang2, Rainer Haag2, Wolfgang Frieß1, Sarah
Küchler1
Polyglycerol coatings of glass vials for protein resistance
Eur. J. of Pharm. Biopharm., 85 (2013) 756-764
1Department for Pharmacy, Pharmaceutical Technology and Biopharmaceutics, Ludwig-
Maximilians University, Munich, Germany 2Department for Organic Chemistry, Freie Universität Berlin, Germany
*both authors contributed equally
Polyglycerol synthesis, analytics, vial coating and QCM-measurements were performed by
Tobias Becherer. Wei Qiang contributed to vial coating.
Abstract
Proteins are surface active molecules which undergo non-specific adsorption when getting in
contact with surfaces such as the primary packaging material. This process is critical as it may
cause a loss of protein content or protein aggregation. To prevent unspecific adsorption,
protein repellent coatings are of high interest. We describe the coating of industrial relevant
borosilicate glass vials with linear methoxylated polyglycerol, hyperbranched polyglycerol
and hyperbranched methoxylated polyglycerol. All coatings provide excellent protein

74 Chapter III
repellent effects. The hyperbranched, non-methoxylated coating performed best. The protein
repellent properties were maintained also after applying industrial relevant sterilization
methods (≥ 200 °C). Marginal differences in antibody stability between formulations stored in
bare glass vials and coated vials were detected after 3 months storage; the protein repellent
effect remained largely stable.
Here we describe a new material suitable for the coating of primary packaging material of
proteins which significantly reduces the protein adsorption and, thus, could present an
interesting new possibility for biomedical applications.
1 INTRODUCTION
Therapeutic antibodies are of great relevance for the treatment of various severe diseases such
as cancer or autoimmune diseases [1]. The adsorption of therapeutic proteins on surfaces e.g.
in the production line or in the storage containers poses challenges. Possible consequences
might be the loss of the protein content [2] but also potential protein aggregation [3]
accompanied by the risk of immunological reactions leading to a reduced therapeutic effect or
severe adverse effects [4].
Consequently, substantial research efforts are made aiming for reduced protein adsorption to
various materials [5]. In general, protein adsorption is driven by the interaction between
electrical double layers and changes in the hydration state but also dispersion interactions [6].
To a certain extent, the ionic strength or the pH of the protein formulations may be adapted
and excipients can be added [7]. Nevertheless, the mandatory preservation of the protein
stability and the necessary physiological acceptability limits such changes [7].
Borosilicate glass is still a common material for the primary packaging of parenteral drugs.
Aiming for increased protein resistance, material surface modifications by chemical strategies
such as coating with dextran [8], carbohydrate-derived polymers [9], zwitterionic self-
assembled monolayers and polymers [10, 11] have been tested. Chapman et al. mentioned
several characteristics of functional groups on SAMs that showed good protein repellent
properties [12]. Besides containing hydrogen bond accepting and polar groups, they do not
incorporate hydrogen bond donators and they exhibit no net charge [12]. Furthermore,
flexible aliphatic polyether elements, a branched structure, hydrophilic groups [13] and a
stable layer of interfacial water [14] were related to a good protein resistance. Poly(ethylene
glycol) (PEG) and oligo(ethylene glycol) (OEG) exhibit excellent protein repelling effects
[15, 16] and unify many of those properties. The exact mechanism of the protein repellent

Polyglycerol Coatings of Glass Vials for Protein Resistance 75
effect of PEG is still ambiguous. Currently, steric repulsion due to the polymer chains [17]
and the ability to strongly bind water in the interface [14] are the favored theories. However,
the main drawbacks of PEG are its thermal instability at temperatures ≥ 195 °C [13] and its
sensitivity toward oxidation [18, 19] putting the coating as well as the drug stability at risk.
Good thermal stability of the coating material is important for pharmaceutical industrial
applications as basic sterilization processes such as heat sterilization are performed at
temperatures ≥ 200 °C. Due to these limitations, the search for alternative materials is still
ongoing. In 2004, monolayers of dendritic polyglycerol (PG) derivatives were described to
reduce unspecific protein adsorption comparable to PEG [13]. In contrast to PEG, PG exhibits
higher thermal and oxidative stability [13]. Decomposition of PEG starts at 195 °C whereas
PG is stable up to 226 °C [13]. Besides dendritic PG structures, chemical modifications such
as linear poly(methyl glycerol) and linear polyglycerols are also highly effective in terms of
cell and protein resistance [20]. Nevertheless, until today, the suitability of those promising
polymers for pharmaceutical industrial applications in terms of protein resistance has not been
tested.
In this study, the coating procedure of industrial relevant type I glass vials serving as primary
packaging material of protein formulations with linear methoxylated (LPG(OMe)),
hyperbranched (HPG(OH)) and hyperbranched methoxylated (HPG(OMe)) polyglycerol
based monolayers are described. We investigated the effects on protein adsorption using an
IgG model antibody and human Growth Hormone (hGH). The impact of pH, ionic strength,
and the suitability for industry-relevant sterilization methods (heat sterilization and
autoclaving) on the protein resistance is presented. Furthermore, coating stability, long-term
storage stability and its influence on the protein structure are described.
2 MATERIALS AND METHODS
Chemicals 2.1
All chemicals and solvents were reagent or HPLC grade, used as received and purchased from
Sigma (Steinheim, Germany) unless stated otherwise. Dialysis was performed in regenerated
cellulose tubes from Spectrum laboratories (Spectra/ Por® 6 Dialysis membrane, molecular
weight cut-off (MWCO) 1000 g·mol-1, purchased from Roth, Karlsruhe, Germany). The
deionized water used was purified using a Millipore water purification system with a
minimum resistivity of 18.0 MΩ·cm. NaH2PO4 and glycine were purchased from Merck
Chemicals (Darmstadt, Germany), Na2HPO4, Na-dodecylsulfate and bis-ANS were obtained
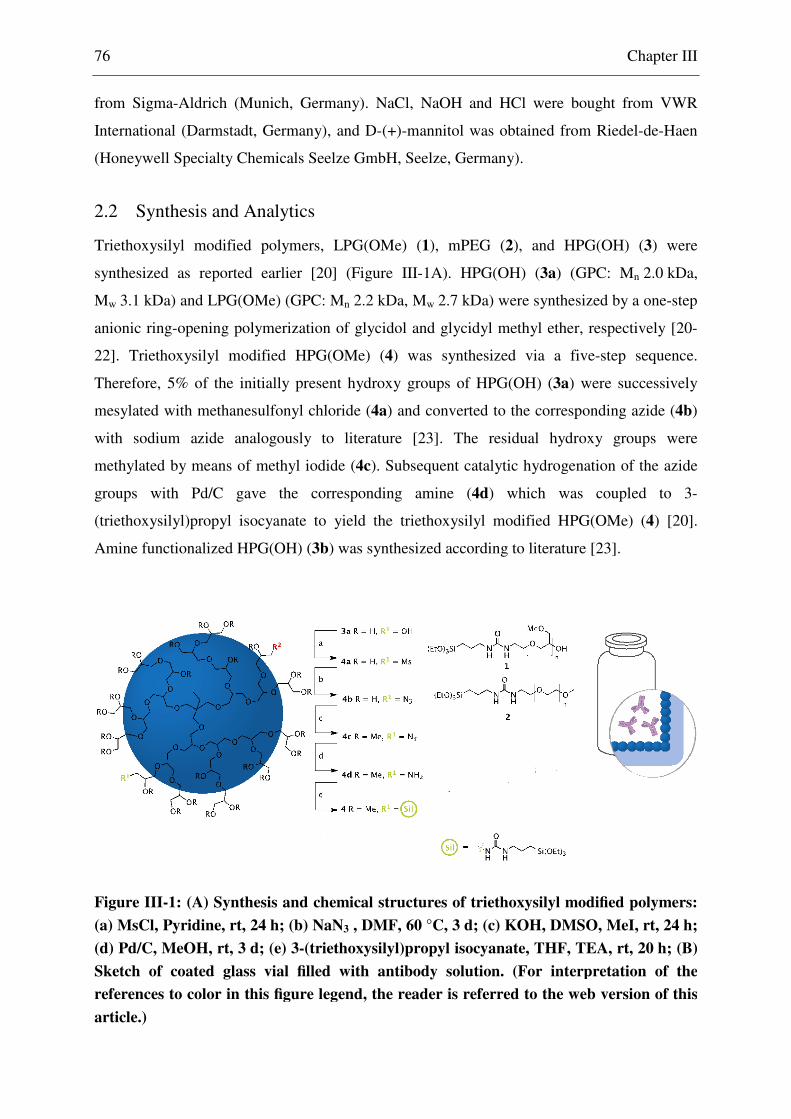
76 Chapter III
from Sigma-Aldrich (Munich, Germany). NaCl, NaOH and HCl were bought from VWR
International (Darmstadt, Germany), and D-(+)-mannitol was obtained from Riedel-de-Haen
(Honeywell Specialty Chemicals Seelze GmbH, Seelze, Germany).
Synthesis and Analytics 2.2
Triethoxysilyl modified polymers, LPG(OMe) (1), mPEG (2), and HPG(OH) (3) were
synthesized as reported earlier [20] (Figure III-1A). HPG(OH) (3a) (GPC: Mn 2.0 kDa,
Mw 3.1 kDa) and LPG(OMe) (GPC: Mn 2.2 kDa, Mw 2.7 kDa) were synthesized by a one-step
anionic ring-opening polymerization of glycidol and glycidyl methyl ether, respectively [20-
22]. Triethoxysilyl modified HPG(OMe) (4) was synthesized via a five-step sequence.
Therefore, 5% of the initially present hydroxy groups of HPG(OH) (3a) were successively
mesylated with methanesulfonyl chloride (4a) and converted to the corresponding azide (4b)
with sodium azide analogously to literature [23]. The residual hydroxy groups were
methylated by means of methyl iodide (4c). Subsequent catalytic hydrogenation of the azide
groups with Pd/C gave the corresponding amine (4d) which was coupled to 3-
(triethoxysilyl)propyl isocyanate to yield the triethoxysilyl modified HPG(OMe) (4) [20].
Amine functionalized HPG(OH) (3b) was synthesized according to literature [23].
Figure III-1: (A) Synthesis and chemical structures of triethoxysilyl modified polymers:
(a) MsCl, Pyridine, rt, 24 h; (b) NaN3 , DMF, 60 °C, 3 d; (c) KOH, DMSO, MeI, rt, 24 h;
(d) Pd/C, MeOH, rt, 3 d; (e) 3-(triethoxysilyl)propyl isocyanate, THF, TEA, rt, 20 h; (B)
Sketch of coated glass vial filled with antibody solution. (For interpretation of the
references to color in this figure legend, the reader is referred to the web version of this
article.)

Polyglycerol Coatings of Glass Vials for Protein Resistance 77
2.2.1 Azide Functionalized HPG(OMe) (4c)
Azide functionalized HPG(OH) (4b) (2000 g·mol-1, 12.3 g, 6.2 mmol) was dissolved in dry
DMSO (200 mL) under inert gas atmosphere and KOH (41.7 g, 744 mmol, 120 eq. (4
eq./OH)) was added. The resulting suspension was vigorously stirred and cooled in a water
bath. After slow addition of methyl iodide (52.8 g, 23.2 mL, 372 mmol, 60 eq. (2 eq./OH)) the
mixture was stirred for 24 h under inert gas atmosphere. The reaction was quenched by the
addition of water, concentrated under reduced pressure, and subsequently dried in high
vacuum. The resulting residue was treated by water, and the compound was repeatedly
extracted with DCM. The combined organic layers were dried under reduced pressure to yield
a yellow honeylike product (12.7 g, 79%). 1H NMR (400 MHz; CDCl3): δ = 3.64-3.43 (m, 200 H, PG-backbone, secondary –OCH3);
3.34 (s, 43 H, primary -OCH3); 1.41-1.34 (m, 2 H, CH2CH3 of starter); 0.81 (t, 3 H, CH2CH3
of starter) ppm. 13C NMR (700 MHz; CDCl3): δ = 79.6-79.2, 78.9-78.5, 72.7-72.6, 72.4-72.2,
72.0-71.0, 70.6-69.3 (PG-backbone); 59.3-59.2 (primary –OCH3); 58.2-57.9 (secondary -
OCH3); 60.8-60.5 (CHN3); 52.0, 51.6 (CH2N3); 23.7 (CH2CH3 of starter); 7.7 (CH2CH3 of
starter) ppm. IR νmax/cm-1: 3361; 2876; 2098; 1460; 1355; 1274; 1196; 1089; 961; 832; 677.
2.2.2 Amine Functionalized HPG(OMe) (4d)
Azide functionalized HPG(OMe) (4c) (2500 g·mol-1, 12.7 g, 4.9 mmol) was dissolved in
MeOH. Pd/C (20 wt%, 2.5 g) was added an the mixture was stirred for 3 d under H2-
atmosphere (5 bar) at rt. The reaction mixture was filtered through Celite® and concentrated in
vacuo to give a yellow honeylike product (11.3 g, 89%). 1H NMR (400 MHz; CDCl3): δ = 3.64-3.42 (m, 200 H, PG-backbone, secondary –OCH3);
3.33 (s, 43 H, primary -OCH3); 1.36-1.32 (m, 2 H, CH2CH3 of starter); 0.81 (t, 3 H, CH2CH3
of starter) ppm. 13C NMR (700 MHz; CDCl3): δ = 79.5-79.1, 78.8-78.3, 72.6-72.5, 72.3-72.1,
71.8-70.9, 70.3-69.6 (PG-backbone); 59.2-59.1 (primary –OCH3); 58.0-57.8 (secondary -
OCH3); 50.9-50.7 (CHNH2); 43.2-42.7 (CH2NH2); 23.7 (CH2CH3 of starter); 7.7 (CH2CH3 of
starter) ppm. IR νmax/cm-1: 3362; 2875; 1643; 1461; 1356; 1262; 1196; 1085; 960; 832; 679.
2.2.3 Triethoxysilyl Modified HPG(OMe) (4)
Triethoxysilyl modified HPG(OMe) (4) was synthesized analogously to literature [20].
Therefore amine functionalized HPG(OMe) (4d) (2500 g·mol-1, 4 g, 1.5 mmol) was dissolved
in dry THF (100 mL) under inert gas atmosphere in a teflon flask. While stirring at rt TEA
(0.61 g, 0.83 mL, 6 mmol) and 3-(triethoxysilyl)propyl isocyanate (0.59 g, 0.59 mL,

78 Chapter III
2.4 mmol) were added successively and the reaction was allowed to proceed for 20 h. The
mixture was concentrated under reduced pressure and subsequently dialysed against EtOH to
yield 4 as yellow honeylike product (3.5 g, 86%). 1H NMR (700 MHz; CDCl3): δ = 5.17 (brs, 2 H, 2 x NH); 3.73 (q, 6 H, SiOCH2CH3); 3.63-
3.34 (m, 203 H, PG-backbone, secondary –OCH3); 3.29 (s, 43 H, primary -OCH3); 3.08-3.00
(m, 4 H, 2 x CH2NH); 1.54-147 (m, 2 H, SiCH2CH2CH2NH); 1.32-1.26 (m, 2 H, CH2CH3 of
starter); 0.76 (t, 3 H, CH2CH3 of starter); 0.54 (t, 2 H, SiCH2CH2CH2NH) ppm. 13C NMR
(700 MHz; CDCl3): δ = 158.7 (C=O); 79.5-79.2, 78.8-78.5, 72.6.-72.3, 71.7-71.0, 70.2-69.8
(PG-backbone, NHCH2CH2CH2O); 59.3-59.1 (primary –OCH3); 58.4-58.2 (OCH2CH3); 58.0-
57.7 (secondary –OCH3); 43.2-42.7 (NHCH2CH2CHO, SiCH2CH2CH2NH); 23.7 (CH2CH3 of
starter); 23.0 (SiCH2CH2CH2NH); 18.3 (OCH2CH3); 7.7 (CH2CH3 of starter) ppm. IR
νmax/cm-1: 3360; 2878; 1644; 1460; 1356; 1261; 1196; 1085; 956; 915; 832; 683. 1H and 13C NMR spectra were recorded on a Jeol ECX spectrometer operating at 400 MHz
and a Bruker Avance 3 operating at 700 MHz, respectively at concentrations of 100 mg·mL-1.
The chemical shifts are reported in δ (ppm) values and were referenced to indicated solvents.
IR spectra were recorded on a Nicolet Avatar 32 FT-IR with Smart iTR accessory. GPC
measurements were performed on an Agilent 1100 Series instrument including a refractive
index detector. PS standards in THF and Pullulane standards in water have been used for
calibration. The measurements were run in THF and in an aqueous sodium nitrate solution
(0.1 M), respectively (1 mL min-1, 20 °C), using an array of Suprema Lux 100, Suprema 1000
and Suprema Lux 3000 columns (dimensions: 8 x 300 mm, particle size: 10 µm, PSS, Mainz,
Germany).
Glass Coating Procedure 2.3
2R Fiolax® glass vials were coated according to a modified procedure described by Weinhart
et al. [20]. The vials were cleaned and chemically activated by immersion into freshly
prepared piranha solution (H2SO4:H2O2 = 3:1) for 30 min, followed by thoroughly rinsing
with Milli-Q water and ethanol. Subsequently, the vials were filled up to the neck with an
ethanolic solution containing the respective triethoxysilyl modified polymer (0.1·10-3 M·cm-2
glass surface) and 30% v/v 1 M aqueous acetic acid. The vials were sealed with DuraSeal®
(Carl Roth, Karlsruhe, Germany) to prevent evaporation and placed in an oven at 40 °C for
12 h. After cooling down to room temperature the vials were thoroughly rinsed with ethanol
and dried in a stream of N2.

Polyglycerol Coatings of Glass Vials for Protein Resistance 79
For QCM-D measurements, quartz crystal sensors with a silicon dioxide layer (QSX 303, Q-
Sense AB, Gothenburg, Sweden) were cleaned and chemically activated by immersion into a
5:1:1 mixture of Milli-Q water, ammonia solution, and H2O2 for 7 min at 70°C, rinsed with
Milli-Q water and ethanol, and placed in a glass vial containing an ethanolic solution of the
respective triethoxysilyl modified polymer (0.1·10-3 M·cm-2 glass surface) and 30% v/v 1 M
aqueous acetic acid, closed with a cap, and placed in an oven at 40 °C for 12 h. Afterwards
the quartz crystal sensors were thoroughly rinsed with ethanol and dried in a stream of N2.
Protein Solutions 2.4
For adsorption experiments, a 2 mg/ml IgG1 solution in 10 mM phosphate buffer adjusted to
varying ionic strength up to 170 mM with NaCl, was used as standard protein formulation.
The pH value was adjusted by addition of 1 M NaOH or HCl. Human Growth Hormone
(hGH) for adsorption experiments was obtained from Genotropin® MiniQuick 0.6 I.E. and
1.2 I.E. single-use syringes (Pharmacia & Upjohn). After reconstitution of the lyophilisates
and dilution with corresponding formulation buffer, the solutions contained 0.8 mg/ml hGH,
formulated in 1.5 mM NaH2PO4, 0.70 mM Na2HPO4, 11.19 mM glycine and 274.25 mM
mannitol. All protein solutions were filtered through a 0.2 µm polyethersulfone membrane
filter (Pall GmbH, Dreieich, Germany) before use. Ultrapure water (0.055 lS/cm) for all
applications was obtained from a Purelab Plus UV/UF system (ELGA LabWater, Celle,
Germany).
Protein Adsorption Testing 2.5
Adsorption experiments were performed in 2R Fiolax® type I borosilicate glass vials uncoated
or coated with HPG(OH), HPG(OMe), LPG(OMe) or mPEG. Prior to testing, all vials were
washed with ultrapure water at 80 °C. For standard adsorption testing, the vials were filled
with 3.5 ml of a 2 mg/ml IgG1 solution or 1 ml of 0.8 mg/ml hGH solution, closed with
Fluorotec® stoppers, sealed with Flip-Off® seals (West Pharmaceutical Services Deutschland
GmbH & Co. KG) and incubated at 25 °C for 24 h (Figure III-1B). The inner surface area of a
vial covered with protein formulation was calculated as 13.4 cm² or 5.06 cm² for a filling
volume of 3.5 ml or 1 ml, respectively. After incubation, the vials were emptied using a
syringe. Subsequently, each vial was rinsed four times with the corresponding formulation
buffer. For desorption of bound protein, 3.5 ml (1 ml for vials with hGH) of 10 mM PBS
containing 145 mM NaCl and 0.05% SDS (pH 7.2) were filled into each of the vials, which
were closed and stored overnight at 25 °C [24]. Desorbed protein was quantified via size-
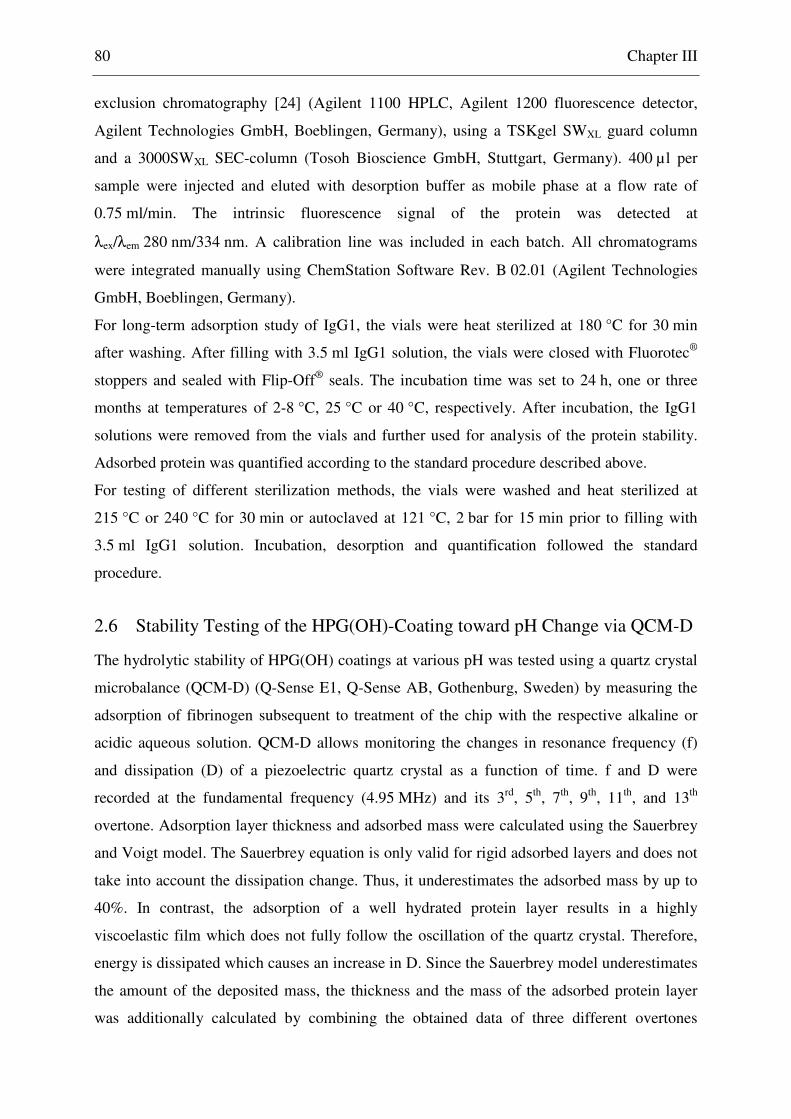
80 Chapter III
exclusion chromatography [24] (Agilent 1100 HPLC, Agilent 1200 fluorescence detector,
Agilent Technologies GmbH, Boeblingen, Germany), using a TSKgel SWXL guard column
and a 3000SWXL SEC-column (Tosoh Bioscience GmbH, Stuttgart, Germany). 400 µl per
sample were injected and eluted with desorption buffer as mobile phase at a flow rate of
0.75 ml/min. The intrinsic fluorescence signal of the protein was detected at
λex/λem 280 nm/334 nm. A calibration line was included in each batch. All chromatograms
were integrated manually using ChemStation Software Rev. B 02.01 (Agilent Technologies
GmbH, Boeblingen, Germany).
For long-term adsorption study of IgG1, the vials were heat sterilized at 180 °C for 30 min
after washing. After filling with 3.5 ml IgG1 solution, the vials were closed with Fluorotec®
stoppers and sealed with Flip-Off® seals. The incubation time was set to 24 h, one or three
months at temperatures of 2-8 °C, 25 °C or 40 °C, respectively. After incubation, the IgG1
solutions were removed from the vials and further used for analysis of the protein stability.
Adsorbed protein was quantified according to the standard procedure described above.
For testing of different sterilization methods, the vials were washed and heat sterilized at
215 °C or 240 °C for 30 min or autoclaved at 121 °C, 2 bar for 15 min prior to filling with
3.5 ml IgG1 solution. Incubation, desorption and quantification followed the standard
procedure.
Stability Testing of the HPG(OH)-Coating toward pH Change via QCM-D 2.6
The hydrolytic stability of HPG(OH) coatings at various pH was tested using a quartz crystal
microbalance (QCM-D) (Q-Sense E1, Q-Sense AB, Gothenburg, Sweden) by measuring the
adsorption of fibrinogen subsequent to treatment of the chip with the respective alkaline or
acidic aqueous solution. QCM-D allows monitoring the changes in resonance frequency (f)
and dissipation (D) of a piezoelectric quartz crystal as a function of time. f and D were
recorded at the fundamental frequency (4.95 MHz) and its 3rd, 5th, 7th, 9th, 11th, and 13th
overtone. Adsorption layer thickness and adsorbed mass were calculated using the Sauerbrey
and Voigt model. The Sauerbrey equation is only valid for rigid adsorbed layers and does not
take into account the dissipation change. Thus, it underestimates the adsorbed mass by up to
40%. In contrast, the adsorption of a well hydrated protein layer results in a highly
viscoelastic film which does not fully follow the oscillation of the quartz crystal. Therefore,
energy is dissipated which causes an increase in D. Since the Sauerbrey model underestimates
the amount of the deposited mass, the thickness and the mass of the adsorbed protein layer
was additionally calculated by combining the obtained data of three different overtones

Polyglycerol Coatings of Glass Vials for Protein Resistance 81
(n = 3, 5, 7) based on the Voigt model using the software package Qtools (version 3.0.15.553,
Q-Sense AB, Gothenburg, Sweden). For intact coatings, where almost no protein adsorption
occurred, the Voigt model does not fit well the measured data as it overestimates the thickness
and mass by a factor of 10. Therefore, in these cases only the data calculated by the Sauerbrey
model is shown.
Phosphate buffered saline (PBS, 10 x concentrated) (Lonza, Köln, Germany), was diluted to a
1 x concentration by Milli-Q, passed through a 0.22 µm filter, and degassed prior to use.
Fibrinogen solutions were prepared at concentrations of 1 mg/ml in PBS (pH 7.4). Alkaline
and acidic aqueous solutions were prepared by adjusting the pH by adding NaOH (1 M) and
HCl (1 M) respectively.
All measurements were performed twice under dynamic conditions at flow rates of
0.1 ml/min according to the following protocol on HPG(OH) coated and bare quartz crystal
sensors: injection of (i) Milli-Q water (0.2 mL), (ii) NaOHaq and HClaq of pH 4, 8.5, 10, 11.5
or 12.5 , respectively (3 ml), (iii) Milli-Q water (2 ml), (iv) PBS (1 ml), (v) fibrinogen (2.5 ml,
1 mg/ml), (vi) PBS (1 ml). The density of the adsorbed fibrinogen layer was assumed to be
1200 kg·m-3, the fluid density 1000 kg·m-3, and the fluid viscosity 0.001 kg·ms-1.
Protein Stability after Storage 2.7
The stability of the IgG1 formulation (10 mM PBS, 145 mM NaCl, pH 7.2) after 3 months
storage was investigated in regard to changes in tertiary structure via extrinsic fluorescence
and for particle formation. Spectra of 0.05 mg/ml IgG1 solutions with 5 µM bis-ANS were
recorded with a Varian Cary Eclipse fluorescence spectrophotometer (Varian Deutschland
GmbH, Darmstadt, Germany) at λex 385 nm and λem 420 – 700 nm in 10 x 10 mm
fluorescence quartz cuvettes at 25 °C. A solution of IgG1 heat stressed at 75 °C for 15 min
was used as control for unfolded protein.
Particle formation in the protein solution was investigated by HP-SEC, turbidity
measurements as well as visible and subvisible particle analysis. Protein aggregates and
fragments in the protein solutions were quantified via HP-SEC (equipment see 2.5) using a
YMC-Pack Diol-300 SEC-column (YMC Europe GmbH, Dinslaken, Germany) and a TSKgel
SWXL guard column (Tosoh Bioscience GmbH, Stuttgart, Germany) with UV-detection at
λex 280 nm. 100 µl of each sample with a concentration of 2 mg/ml was eluted with 10 mM
PBS containing 145 mM NaCl, pH 7.2. The content of aggregates, monomer and fragments in
the sample solutions was calculated in percent of the total protein content of the reference.
Turbidity of the solutions was measured using a Nephla laboratory turbidimeter (Hach Lange

82 Chapter III
GmbH, Düsseldorf, Germany). Light scattering was detected at an angle of 90 ° in glass
cuvettes, applying a filling volume of 1.7 ml. Visible particle inspection was performed by
visual control of the solution in front of a dark background and a light source. Subvisible
particle analysis was performed via light obscuration with a PAMAS SVSS-35 (PAMAS
GmbH, Rutesheim, Germany). Three fractions of 0.3 ml of each sample with 0.3 ml pre-run
volume were analyzed [25]. The system was rinsed with ultrapure water before each
measurement until no particles larger than 10 µm and less than 100 particles per ml in total
were measured. Amount and diameter of particles were determined by the PAMAS PMA
software and are presented in cumulative particles per ml protein solution.
Tests of Significance 2.8
The means of two populations were tested for equality by a two-tailed T-test for independent
samples. Statistical significance is given on the levels p < 0.05, p < 0.01 and p < 0.001.
Statistics are depicted in the figures only for differences discussed in the text.
3 RESULTS
Effect of Different Polyglycerol Coatings on IgG1 and hGH Adsorption 3.1
To investigate the effect of LPG(OMe), HPG(OH) and HPG(OMe) coatings on protein
adsorption, the adsorption of IgG1 at different formulation pH and ionic strength conditions
was quantified and compared to the adsorption to non-coated type I glass vials. The pH values
of 4 and 7.2 were selected to evaluate the influence of protein charge on IgG1 adsorption. At
these pH values, the antibody exhibits a very strong or strong positive charge (pI of the
protein ~8.5). The influence of ionic strength on both intermolecular protein interactions as
well as protein surface interactions was taken into account by investigating adsorption at low
(22 mM) and high (170 mM) ionic strength. At pH 4/170 mM, a high IgG1 adsorption of
4.2 mg/m² to type I glass vials was found, compared to less than 2 mg/m² at pH 7.2 (Figure
III-2). At pH 4/22 mM, adsorption was lower than at 170 mM ionic strength. This
corresponds to the pH and ionic strength dependent protein adsorption behavior described in
the literature [24]. At all three conditions, IgG1 adsorption was significantly suppressed
(p < 0.01) by all tested polyglycerol coatings (Figure III-2). The pH and ionic strength effect
on the protein adsorption as seen for non-coated glass vials were of marginal relevance for the
PG-coated vials. Adsorption to HPG(OH)-coated vials tended to be lower than to
methoxylated HPG-coated vials, but the effect was not always significant.

Polyglycerol Coatings of Glass Vials for Protein Resistance 83
We also tested the adsorption of the therapeutic protein human Growth Hormone (hGH) to
HPG(OH)-coated vials (Figure III-3) because this coating was superior compared to other
PG-coatings at some conditions. The tests were based on the composition of the commercially
available formulation of Genotropin® MiniQuick 0.6 I.E. aiming for highly relevant
conditions. Again, the amount of hGH adsorbed was significantly lower on the HPG(OH)-
coated vials compared to non-coated glass vials (Figure III-3). At 25 °C, hGH adsorption of
2.62 mg/m² to type I glass vials was reduced to 0.72 mg/m² by the HPG(OH)-coating. The
higher adsorption to glass vials observed after storage at 25 °C compared to 2-8 °C was not
observed with the HPG(OH)-coated vials.
Figure III-2: IgG1 adsorption to type I borosilicate glass vials, HPG(OH)-, HPG(OMe)-
and LPG(OMe)-coated glass vials at different pH values and ionic strength (*p < 0.05,
**p < 0.01, ***p < 0.001). n=3.
Figure III-3: Adsorption of hGH to type I glass vials and HPG(OH)-coated vials after
24 h incubation time at 2-8 °C and 25 °C (*p < 0.05, **p < 0.01), n=3.
type I glass HPG(OH) HPG(OMe) LPG(OMe)0
1
2
3
4
5
6
**
***
***
***
***
***
******
***
Ads
orbe
d am
ount
(m
g/m
²)
pH 4, 170 mM pH 4, 22 mM pH 7.2, 170 mM
2-8 °C 25 °C0.0
0.5
1.0
1.5
2.0
2.5
3.0
3.5
**
Ads
orbe
d am
ount
(m
g/m
²)
Incubation temperature
type I glass HPG(OH)
*

84 Chapter III
Influence of Sterilisation on Polyglycerol Coatings 3.2
For parenteral pharmaceutical products and for various other applications, sterilized vials are
mandatory. Consequently, the protein repellent properties of the HPG(OH)-, HPG(OMe)-,
and LPG(OMe)-coatings were tested after 30 min heat sterilization at 215 °C and 240 °C.
Additionally, the effect of autoclaving (121 °C, 2 bar, 15 min) on the coating stability was
investigated. mPEG served as reference.
Sterilization with dry heat for 30 min at 215 °C resulted in only slight changes of IgG1
adsorption for the HPG-coated vials. In contrast, adsorption to LPG(OMe) and mPEG-coated
vials clearly increased (Figure III-4), indicating thermal damage, presumably decomposition
of the coating. Sterilization at 240 °C led to increased adsorption to all coatings, due to the
expected thermal instability of all PG-coatings. The results indicated higher resistance of
HPG(OH)- and HPG(OMe)-coating at temperatures above 195 °C compared to mPEG and
LPG(OMe). Again, protein adsorption was most efficiently suppressed on HPG(OH)-coated
vials. Autoclaving of the vials did not cause an essential increase in IgG1 adsorption to
HPG(OH)-, HPG(OMe)- and LPG(OMe)-coated vials compared to the non-sterilized vials
(Figure III-4). Adsorption values for autoclaved mPEG-coated vials were below the range of
the calibration line (data not shown).
Long-Term Effect of Polyglycerol Coating on Protein Adsorption 3.3
To test the stability of the protein repellent effects of the PG coating, IgG1 adsorption to
HPG(OH)-coated vials up to 3 months was investigated. Again, we opted for the HPG(OH)
Figure III-4: Adsorption of IgG1 to type I borosilicate glass vials, HPG(OH)-,
HPG(OMe)-, LPG(OMe)- and mPEG-coated glass vials after heat sterilization and
autoclaving (*p < 0.05, **p < 0.01, ***p < 0.001), n ≥ 2.
non-sterilized 215 °C30 min
240 °C30 min
autoclaved0
1
2
3
4
** *****
*********
*****
**
Ads
orbe
d am
ount
(m
g/m
²)
type I glass HPG(OH) HPG(OMe) LPG(OMe) mPEG
*

Polyglycerol Coatings of Glass Vials for Protein Resistance 85
coated vials as they showed the best protein repellent effects and stability in the previous
tests. IgG1 adsorption to type I borosilicate glass vials did not change significantly for
1 month (Figure III-5). After 3 months, the amount adsorbed at 2-8 °C and 40 °C was slightly
higher than at 25 °C, but without statistical significance. IgG1 adsorption to HPG(OH)-coated
vials was significantly lower than on type I glass vials at all temperatures and time points.
IgG1 adsorption remained constant for 1 month. After 3 months, adsorption at 40 °C was
significantly increased. A tendency to higher protein adsorption levels at 2-8 °C after
3 months might be speculated but the difference to the 24 h and 1 month data was not
significant (p < 0.05).
Effect of HPG(OH)-Coating on IgG1 Stability in Solution 3.4
To ensure protein stability upon prolonged exposure to HPG(OH)-coated vials, we analyzed
protein solutions after 3 months storage for visual appearance, subvisible particles, the
occurrence of aggregates and fragments as well as changes in protein structure by extrinsic
fluorescence spectroscopy. All solutions were visually unchanged. Turbidity measurements
revealed only marginal changes compared to a fresh IgG1 solution. The counts of particles
≥ 10 µm and ≥ 25 µm were found to be slightly increased compared to the IgG1 starting
solution, but were still significantly below the pharmacopoeial acceptance level of less than
6000 particles ≥ 10 µm and 600 particles ≥ 25 µm per container [26] which equals 3.5 ml for
the applied 2R vials and did not differ significantly between the vial species at the same
storage temperatures (Figure III-6). The monomer content analyzed by HP-SEC remained
Figure III-5: Adsorption of IgG1 to type I glass vials (A) and HPG(OH)-coated vials (B)
after storage for up to 3 months at different temperatures (*p < 0.05, **p < 0.01,
***p < 0.001), n=3, samples marked with ×: n=2.
24 h 1 month 3 months 24 h 1 month 3 months0.0
0.5
1.0
1.5
2.0
2.5
3.0 *
**
Storage time
A
Ads
orbe
d am
ount
(m
g/m
²)
2-8 °C 25 °C 40 °C
B
*×

86 Chapter III
constant at about 94-96% (Figure III-7) and only samples stored at 40 °C showed a slightly
enhanced fragmentation for both vial species.
The tertiary structure of IgG1 was analyzed by extrinsic fluorescence spectroscopy using bis-
ANS as dye. The almost non-fluorescent dye exhibits a strong fluorescence in contact with a
nonpolar environment such as hydrophobic domains in proteins [27]. Samples stored in type I
glass vials and HPG(OH)-coated vials showed an equally pronounced, slight shift of the
Figure III-6: Turbidity and number of particles determined in IgG1 solutions stored in
type I glass vials (A) and HPG(OH)-coated vials (B) for 3 months at different
temperatures, n=3.
Figure III-7: Content of monomer, aggregates and fragments in IgG1 solutions stored in
type I glass vials (A) and HPG(OH)-coated vials (B) for 3 months at different
temperatures. Values given in percent of the total protein content of the reference. n=3,
samples marked with ×: n=2.
t=0 2-8 °C 25 °C 40 °C 2-8 °C 25 °C 40 °C0
50
100
800
1200
1600
2000
Storage temperature
B
Par
ticl
es p
er m
l
≥ 1 µm ≥ 10 µm ≥ 25 µm
A
0.0
0.2
0.4
0.6
0.8
1.0
1.2
1.4
Tur
bidi
ty (
FN
U)
t=0 2-8 °C 25 °C 40 °C 2-8 °C 25 °C 40 °C
0
2
4
6
8
90
100
110
×
×
×
×
×
×
Storage temperature
BA
Con
tent
(%
)
aggregate monomer fragment

Polyglycerol Coatings of Glass Vials for Protein Resistance 87
fluorescence maximum and slightly increased fluorescence intensity compared to the native
antibody (Figure III-8). Storage at different temperatures did not change the extrinsic
fluorescence. A heat stressed reference was included as a control to illustrate increased bis-
ANS fluorescence due to protein unfolding with a distinct blue shift of the maximum from
about 525 nm to about 494 nm.
Stability Testing of the HPG(OH)-Coating toward pH Change via QCM-D 3.5
The stability of HPG(OH) modified glass surfaces toward hydrolysis was tested by measuring
the protein repellent effect of coated quartz crystals after treatment with aqueous solutions in
the pH range from 4 to 12.5 by QCM-D. Hydrolytic cleavage of the siloxane bonds which
link the polymer to the glass surface causes a loss of the tethered polymer, resulting in an
increased protein adsorption. Values from QCM-D measurements as well as calculated values
using the Sauerbrey and Voigt model are summarized in Table III-1. Typical plots of ∆f and
∆D are shown in Figure III-9 a and b. Fibrinogen served as model protein for these
experiments due to its high adsorption tendency to various surfaces [28, 29]. Thus, a high
sensitivity of the measurements toward changes in the surface properties was ensured.
Furthermore, fibrinogen had been previously used to investigate adsorption to PG-coated
surfaces [20, 30] allowing good comparability of the results.
The total mass measured by QCM-D includes both the mass of the adsorbed fibrinogen and of
the associated water, i.e., water trapped in cavities, the hydration layer, and hydrodynamically
Figure III-8: Fluorescence spectra of IgG1 solutions after 3 months storage in type I
glass vials (A) and HPG(OH)-coated vials (B) in presence of 5 µM bis-ANS; storage
temperature 2-8 °C (----), 25 °C (·····), 40 °C (). Samples n=3, heat stressed and native
reference n=1.
450 500 550 600 6500
5
10
20
30
450 500 550 600 650
2-8 °C 25 °C 40 °C
B heat stressed IgG1
Int
ensi
ty
heat stressed IgG1A
native IgG1
native IgG1
Emission wavelength (nm)

88 Chapter III
coupled water [31]. Since the associated water content of an adsorbed fibrinogen layer can
account for up to 70% of the detected mass, the values given in Table III-1 are considerably
higher than adsorbed masses determined with optical techniques [29]. Taking into account
this high water percentage of the adsorbed layer the results obtained by QCM-D are in good
agreement with our previous protein adsorption studies on glass slides using fluorescence
microscopy [20].
At pH 7.4, no protein adsorption occurred. After treatment with aqueous solution at pH 4 and
8.5 the amount of adsorbed fibrinogen was almost identical to the amount adsorbed onto
untreated HPG(OH) modified glass surfaces (Figure III-9a and b). These results suggest that
HPG(OH) modified glass surfaces are not susceptible toward hydrolysis under typically used
protein formulation conditions. In contrast, at pH 10, the siloxane bond is more susceptible to
hydrolysis, which becomes evident from the increased fibrinogen adsorption. By gradually
increasing the pH leading to a loss of the HPG(OH) functionalization, the amount of adsorbed
fibrinogen further increased. At pH 12.5 it reached the same level as fibrinogen adsorption to
bare SiO2 (Figure III-9a and b).
Table III-1: QCM-D results for testing hydrolytic stability of HPG(OH)-silyl (3) coatings
on quartz crystal sensors after injection of 2.5 mL fibrinogen (1 mg·ml-1
). Normalized
data for the 3rd overtone are shown (∆f3/3). Thickness and mass of the adsorbed
fibrinogen layer were calculated according to the Voigt and the Sauerbrey model,
respectively.
pH ∆f3/3 [Hz] ∆D3
[10-6]
Average thickness of
adsorbed fibrinogen layer
[nm]
Mass of adsorbed fibrinogen
layera [mg/m2]
Sauerbrey Voigt Sauerbrey Voigt
4.0 -1.38±0.08 0.81±0.02 0.21±0.01 - 0.24±0.01 -
8.5 -1.34±0.12 0.69±0.05 0.20±0.01 - 0.24±0.02 -
10 -25.76±0.73 5.36±1.50 3.84±0.11 5.98±0.30 4.61±0.13 7.24±0.27
11.5 -68.31±0.90 14.74±0.41 10.01±17 15.50±0.79 12.23±0.18 18.60±0.93
12.5 -117.30±1.40 16.32±0.28 17.49±0.21 24.38±1.22 20.99±0.25 27.80±1.46
7.4 -1.56±0.17 0.89±0.11 0.23±0.03 - 0.27±0.03 -
bare SiO2 -108.30±2.08 11.29±1.37 16.15±0.31 27.15±6.96 21.67±1.93 32.57±8.35
aThe total mass of the adsorbed fibrinogen layer includes the mass of the associated water, i.e.
water trapped in cavities, the hydration layer, and hydrodynamically coupled water [29, 31].
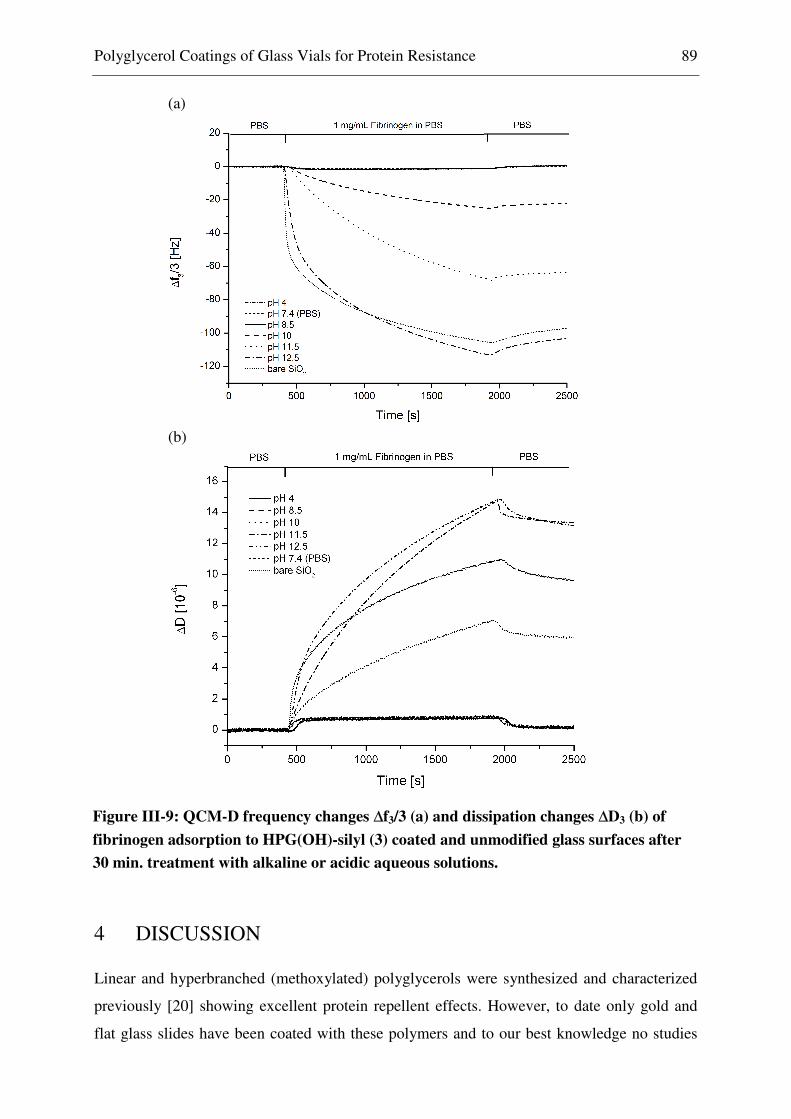
Polyglycerol Coatings of Glass Vials for Protein Resistance 89
4 DISCUSSION
Linear and hyperbranched (methoxylated) polyglycerols were synthesized and characterized
previously [20] showing excellent protein repellent effects. However, to date only gold and
flat glass slides have been coated with these polymers and to our best knowledge no studies
(a)
(b)
Figure III-9: QCM-D frequency changes ∆f3/3 (a) and dissipation changes ∆D3 (b) of
fibrinogen adsorption to HPG(OH)-silyl (3) coated and unmodified glass surfaces after
30 min. treatment with alkaline or acidic aqueous solutions.

90 Chapter III
on relevant packaging material such as glass vials have been conducted. Therefore, we tested
the protein adsorption to industrial relevant type I borosilicate glass vials coated with linear
methoxylated (LPG(OMe)), hyperbranched (HPG(OH)) and hyperbranched methoxylated
(HPG(OMe)) polyglycerol, and the coating stability to elucidate its feasibility for the
application in the pharmaceutical industry.
Exemplary QCM-D measurements performed on HPG(OH)-coated quartz crystals revealed a
very good coating stability (Table III-1, Figure III-9). At pH values above 10, fibrinogen
adsorption increased significantly due to hydrolytic cleavage of the siloxane bond and a loss
of the coating. Nevertheless, these alkaline pH values are not relevant for typical
pharmaceutical protein formulations. Therefore, further protein adsorption experiments were
performed at formulation relevant pH values between 4 and 7.2.
Protein adsorption was reduced significantly using the PG-coated vials compared to
conventional glass vials. Furthermore, these coatings reduced the impact of the pH and of the
ionic strength on the protein adsorption (Figure III-2). In contrast, using bare glass (vials) the
unspecific protein adsorption strongly depends on these parameters (Figure III-2). Mathes et
al. investigated the adsorption of IgG1 to borosilicate glass vials and found similar adsorption
trends in regard to pH and ionic strength [24]. The author ascribed these trends to the
interplay of attractive electrostatic protein-sorbent interactions and intermolecular repulsion
on the surface which are both influenced by the ionic strength. Borosilicate glass was found to
be negatively charged at pH values above pH 2.3 [24], whereas our antibody exhibited a very
strong or strong positive charge at pH 4 and 7.2 respectively (pI~8.5). This stronger positive
charge of the antibody at pH 4 thus supposedly led to increased electrostatic attraction and
higher adsorbed amounts compared to pH 7.2. On the other hand, electrostatic repulsion
between the molecules at pH 4 was increased due to the high positive charge of the protein.
Decreasing the ionic strength at pH 4 from 170 mM to 22 mM resulted in a decreased
shielding of this repulsion by ions in solution and thus to reduced adsorbed amounts, a trend
which was described previously [24]. On PG-coated vials, the coating screened the charge of
the surface and thus electrostatic attraction between the protein and sorbent. Similarly, Pasche
et al. suggested that PEG layers of sufficient thickness facilitate the shielding of charges in the
interface and thus contribute to adsorption prevention [32]. Hence, the marginal influence of
pH and ionic strength on IgG1 adsorption to PG-coated vials may be related to the effective
suppression of electrostatic interactions between the surface and the protein.
Besides protein repellent effects also good thermal stability of the coating material is
important as basic industrial sterilization processes such as heat sterilization are normally

Polyglycerol Coatings of Glass Vials for Protein Resistance 91
performed at temperatures ≥ 200 °C. Effective suppression of the protein adsorption can only
be expected when the protein repelling coating is still intact and stable after the sterilization.
Those preconditions cannot be met by PEG as its decomposition onset is at 195 °C. In
contrast, polyglycerol is thermally stable up to 226 °C [13]. Our data clearly showed
consistent protein resistance of the HPG-coatings after sterilization at 215 °C but increased
adsorption to LPG(OMe)- and mPEG-coated vials compared to the non-sterilized vials
(Figure III-4). The reduced repellent effects after sterilization at 240 °C may be ascribed to
the onset of thermal decomposition that was observed above 226 °C for PG [13] although the
protein resistance was still superior to the uncoated glass vials. Nevertheless, more detailed
studies on the thermal stability of our coatings are needed.
In previous studies, LPG(OMe) exhibited a better protein resistance than HPG(OH) [20]. In
comparison, our adsorption studies showed a superiority of HPG(OH) at low ionic strength
(Figure III-2). This trend was confirmed after sterilization of the vials at 215 °C (Figure III-4).
In contrast to our experiments, Weinhart et al. studied the protein adsorption on flat glass
slides at one ionic strength and without considering industrially mandatory sterilization
processes and storage stability [20]. Hence, the deviation of the obtained results supposedly
resulted from the different protein formulations but also from the processing of the coated
vials before adsorption. This underlines the importance of industrial relevant conditions
during the testing of new coating materials. For all adsorption experiments with IgG1,
saturation conditions and thus an unchanged adsorption mechanism should be provided.
Adsorption isotherms of IgG showed adsorption plateau values at equilibrium concentrations
of about 1 to 2 mg/ml [7, 33]. Therefore, we chose a concentration of 2 mg/ml IgG1 for the
adsorption experiments. In comparison, hGH adsorption plateaus were possibly not reached at
a concentration of 0.8 mg/ml in the original formulation.
Stability of the coating material in vials filled with formulation is another prerequisite for a
primary packaging material of sensitive drugs. QCM measurements and adsorption
experiments showed excellent protein repellent effects for the range pH 4-8.5. Nevertheless,
the incubation times during these experiments were only 30 min and 24 h. Partial hydrolysis
of the coating can occur over weeks and months which is even more relevant for
pharmaceutical packaging material. Therefore, IgG1 adsorption onto HPG(OH)-coated vials
was investigated for a longer period. Even after 3 month storage of IgG1 we did not see
significant changes in the protein repellent effects of our coating material HPG(OH) for
storage at 2-8 °C and 25 °C, a trend to a slight increase could be speculated (Figure III-5). In
terms of protein stability, the focus lay on protein aggregates as they may cause severe

92 Chapter III
immunological reactions or affect the efficacy of the drug [34]. In our study, we did not detect
considerable differences in soluble aggregates, subvisible and visible particles and extrinsic
fluorescence between formulations stored in coated and non-coated vials (Figure III-6, Figure
III-7 and Figure III-8), indicating that the HPG(OH)-coating material did not impair protein
stability.
5 CONCLUSION
In conclusion, we describe the successful coating of type I borosilicate glass vials, which are
the main primary packaging material for many biomacromolecular drugs including proteins,
with polyglycerols. Especially the hyperbranched, hydroxy-terminated polyglycerol coatings
exhibit excellent protein resistant effects also after sterilization and long-time storage.
Therefore, it is a highly promising candidate for the improvement of biomedical packaging
materials.
Due to the high protein concentrations used in this study, the relative protein loss was rather
low. Nevertheless, the evaluation of protein repellent materials is of high importance as the
protein loss can be substantial in low concentrated protein formulations. Finally, the potential
for the formation of aggregates and thus an increased risk of immune responses [4] due to
adsorption is presumably independent of the relative protein loss from solution.
Polyglycerol Coatings of Glass Vials for Protein Resistance 93
6 REFERENCES
[1] W. Wang, S. Singh, D.L. Zeng, K. King, S. Nema, Antibody structure, instability, and formulation, J. Pharm. Sci., 96 (2007) 1-26.
[2] McLeod, Walker, Zheng, Hayward, Loss of factor VIII activity during storage in PVC containers due to adsorption, Haemophilia, 6 (2000) 89-92.
[3] E.Y. Chi, J. Weickmann, J.F. Carpenter, M.C. Manning, T.W. Randolph, Heterogeneous nucleation-controlled particulate formation of recombinant human platelet-activating factor acetylhydrolase in pharmaceutical formulation, J. Pharm. Sci., 94 (2005) 256-274.
[4] A.S. Rosenberg, Effects of protein aggregates: an immunologic perspective, AAPS J., 8 (2006) E501-507.
[5] H. Otsuka, Nanofabrication of Nonfouling Surfaces for Micropatterning of Cell and Microtissue, Molecules, 15 (2010) 5525-5546.
[6] W. Norde, Proteins at solid surfaces, in: A. Baszkin, W. Norde (Eds.), Physical Chemistry of Biological Interfaces, Marcel Dekker Inc., Basel 2000, pp. 115-135.
[7] J. Mathes, 2010, Protein Adsorption to Vial Surfaces: Quantification, Structural and Mechanistic Studies, Thesis, Ludwig-Maximilians Universität München.
[8] R.A. Frazier, G. Matthijs, M.C. Davies, C.J. Roberts, E. Schacht, S.J.B. Tendler, Characterization of protein-resistant dextran monolayers, Biomaterials, 21 (2000) 957-966.
[9] H. Urakami, Z. Guan, Living Ring-Opening Polymerization of a Carbohydrate-Derived Lactone for the Synthesis of Protein-Resistant Biomaterials, Biomacromolecules, 9 (2008) 592-597.
[10] Y. Chang, S.-C. Liao, A. Higuchi, R.-C. Ruaan, C.-W. Chu, W.-Y. Chen, A Highly Stable Nonbiofouling Surface with Well-Packed Grafted Zwitterionic Polysulfobetaine for Plasma Protein Repulsion, Langmuir, 24 (2008) 5453-5458.
[11] S. Chen, J. Zheng, L. Li, S. Jiang, Strong Resistance of Phosphorylcholine Self-Assembled Monolayers to Protein Adsorption: Insights into Nonfouling Properties of Zwitterionic Materials, J. Am. Chem. Soc., 127 (2005) 14473-14478.
[12] R.G. Chapman, E. Ostuni, S. Takayama, R.E. Holmlin, L. Yan, G.M. Whitesides, Surveying for Surfaces that Resist the Adsorption of Proteins, J. Am. Chem. Soc., 122 (2000) 8303-8304.
[13] C. Siegers, M. Biesalski, R. Haag, Self-Assembled Monolayers of Dendritic Polyglycerol Derivatives on Gold That Resist the Adsorption of Proteins, Chem. Eur. J., 10 (2004) 2831-2838.
[14] P. Harder, M. Grunze, R. Dahint, G.M. Whitesides, P.E. Laibinis, Molecular Conformation in Oligo(ethylene glycol)-Terminated Self-Assembled Monolayers on

94 Chapter III
Gold and Silver Surfaces Determines Their Ability To Resist Protein Adsorption, J. Phys. Chem. B, 102 (1998) 426-436.
[15] K.L. Prime, G.M. Whitesides, Self-assembled organic monolayers: model systems for studying adsorption of proteins at surfaces, Science, 252 (1991) 1164-1167.
[16] Z. Yang, J.A. Galloway, H. Yu, Protein Interactions with Poly(ethylene glycol) Self-Assembled Monolayers on Glass Substrates: Diffusion and Adsorption, Langmuir, 15 (1999) 8405-8411.
[17] J.D. Andrade, V. Hlady, Protein adsorption and materials biocompatibility: A tutorial review and suggested hypotheses, in: Biopolymers/Non-Exclusion HPLC, Springer Berlin Heidelberg, 1986, pp. 1-63.
[18] E. Ostuni, R.G. Chapman, R.E. Holmlin, S. Takayama, G.M. Whitesides, A Survey of Structure−Property Relationships of Surfaces that Resist the Adsorption of Protein, Langmuir, 17 (2001) 5605-5620.
[19] D.A. Herold, K. Keil, D.E. Bruns, Oxidation of polyethylene glycols by alcohol dehydrogenase, Biochem. Pharmacol., 38 (1989) 73-76.
[20] M. Weinhart, T. Becherer, N. Schnurbusch, K. Schwibbert, H.-J. Kunte, R. Haag, Linear and Hyperbranched Polyglycerol Derivatives as Excellent Bioinert Glass Coating Materials, Adv. Eng. Mater., 13 (2011) B501-B510.
[21] A. Sunder, R. Hanselmann, H. Frey, R. Mülhaupt, Controlled Synthesis of Hyperbranched Polyglycerols by Ring-Opening Multibranching Polymerization, Macromolecules, 32 (1999) 4240-4246.
[22] A. Sunder, R. Mülhaupt, R. Haag, H. Frey, Hyperbranched Polyether Polyols: A Modular Approach to Complex Polymer Architectures, Adv. Mater., 12 (2000) 235-239.
[23] S. Roller, H. Zhou, R. Haag, High-loading polyglycerol supported reagents for Mitsunobu- and acylation-reactions and other useful polyglycerol derivatives, Mol. Diversity, 9 (2005) 305-316.
[24] J. Mathes, W. Friess, Influence of pH and ionic strength on IgG adsorption to vials, Eur. J. Pharm. Biopharm., 78 (2011) 239-247.
[25] J.C. Kasper, D. Schaffert, M. Ogris, E. Wagner, W. Friess, Development of a lyophilized plasmid/LPEI polyplex formulation with long-term stability-A step closer from promising technology to application, J. Controlled Release, 151 (2011) 246-255.
[26] 2.9.19 Particulate contamination: sub-visible particles, in: European Pharmacopoeia, 2011
[27] A.O. Grillo, K.L. Edwards, R.S. Kashi, K.M. Shipley, L. Hu, M.J. Besman, C.R. Middaugh, Conformational origin of the aggregation of recombinant human factor VIII, Biochemistry, 40 (2001) 586-595.

Polyglycerol Coatings of Glass Vials for Protein Resistance 95
[28] E. Ostuni, R.G. Chapman, R.E. Holmlin, S. Takayama, G. Whitesides, A Survey of Structure-Property Relationships of Surfaces that Resist the Adsorption of Protein, Langmuir, 17 (2001) 5605-5620.
[29] G. Anand, F. Zhang, R.J. Linhardt, G. Belfort, Protein-Associated Water and Secondary Structure Effect Removal of Blood Proteins from Metallic Substrates, Langmuir, 27 (2010) 1830-1836.
[30] M. Wyszogrodzka, R. Haag, Study of Single Protein Adsorption onto Monoamino Oligoglycerol Derivatives: A Structure−Activity Relationship, Langmuir, 25 (2009) 5703-5712.
[31] F. Höök, J. Vörös, M. Rodahl, R. Kurrat, P. Böni, J.J. Ramsden, M. Textor, N.D. Spencer, P. Tengvall, J. Gold, B. Kasemo, A comparative study of protein adsorption on titanium oxide surfaces using in situ ellipsometry, optical waveguide lightmode spectroscopy, and quartz crystal microbalance/dissipation, Colloids Surf., B, 24 (2002) 155-170.
[32] S. Pasche, J. Vörös, H.J. Griesser, N.D. Spencer, M. Textor, Effects of Ionic Strength and Surface Charge on Protein Adsorption at PEGylated Surfaces, J. Phys. Chem. B, 109 (2005) 17545-17552.
[33] A.W.P. Vermeer, C.E. Giacomelli, W. Norde, Adsorption of IgG onto hydrophobic teflon. Differences between the Fab and Fc domains, Biochim. Biophys. Acta, Gen. Subj., 1526 (2001) 61-69.
[34] H.-C. Mahler, W. Friess, U. Grauschopf, S. Kiese, Protein aggregation: Pathways, induction factors and analysis, J. Pharm. Sci., 98 (2009) 2909-2934.


Chapter IV
Adsorption of IgG1 and its F(ab’)2 and Fc Fragment to Type I
Borosilicate Glass Vials and Siliconized Vials – Influence of
pH and Ionic Strength
The following chapter is intended for publication:
Kerstin Höger, Wolfgang Frieß
Adsorption of IgG1 and its F(ab’)2 and Fc Fragment to Type I Borosilicate Glass Vials and
Siliconized Vials – Influence of pH and Ionic Strength
Abstract
The unspecific adsorption of therapeutic proteins to process materials or the primary
packaging may lead to major concerns such as reduced drug concentration, protein
aggregation or denaturation. Therefore, it is crucial to understand the mechanisms underlying
the adsorption process. This study focuses on the adsorption of the F(ab’)2 and the Fc
fragment of a monoclonal IgG1 antibody to borosilicate glass vials and siliconized glass vials
as relevant containers for liquid pharmaceutical formulations. The adsorption behavior of the
fragments and IgG1 was investigated at different pH and ionic strength conditions to evaluate
the contribution of electrostatic interactions to the adsorption process. On borosilicate glass
vials, the adsorption of IgG1 and the fragments was found to be strongly dependent on pH and
ionic strength, a trend that was especially pronounced for F(ab’)2. The largely higher adsorbed
amounts and the lower ionic strength dependence at basic pH values on siliconized vials
showed the importance of hydrophobic interactions for adsorption of IgG1 and the fragments
on this hydrophobic surface. In a competitive adsorption of Fc and F(ab’)2, the total adsorbed
amount protein on borosilicate glass vials was lower than the corresponding IgG1 adsorption.

98 Chapter IV
On siliconized vials, Fc / F(ab’)2 adsorption was found comparably high at some formulation
conditions. The found adsorbed amounts of IgG1 and the fragments were correlated with
calculated adsorption values for different molecular surface orientations. It was postulated,
that IgG1, F(ab’)2 and Fc in a weakly charged state attach preferentially with the hinge region
of the antibody to the hydrophobic siliconized glass surface. For highly charged IgG1,
adsorption in an end-on conformation was suggested due to the high surface coverage found
on borosilicate glass vials and siliconized glass vials.
1 INTRODUCTION
The adsorption of proteins to a variety of surfaces is a common phenomenon in nature which
plays an important role in many biological processes. For pharmaceutical protein
formulations, major problems may arise from the nonspecific binding of proteins to e.g. filters
and tubings during processing, but also from the adsorption to the primary packaging
material. Besides syringes that comprise about 25-30% of the containers for small volume
injectables, more than 50% of these formulations are packed in vials [1]. As the transfer of
plastic vials in an aseptic environment is a challenging task [1], the majority of the
formulations is stored in glass vials or also siliconized vials. A thorough understanding of the
mechanism of protein adsorption to these packaging materials is crucial to prevent adverse
effects, which may lead to instabilities of the formulation. In the last decades, the influence of
different formulation parameters such as pH, ionic strength and surfactants on protein
adsorption was investigated in detail [2-5]. In particular, there has been a constant growth in
research on the adsorption of antibodies to various surfaces [6-8], as monoclonal antibodies
comprise a growing group of biopharmaceuticals on the market [9].
It is well known that protein adsorption to surfaces is governed e.g. by electrostatic or
hydrophobic interactions [6, 10, 11]. However, there are many different opinions about the
orientation of antibodies on hydrophilic and hydrophobic surfaces. Three main conformations
have been postulated, which include the preferential binding of the antibody via the Fc
fragment, the F(ab’)2 fragment or involving the hinge region of the antibody. One argument
for Fc-mediated adsorption was the binding of anti-F(ab’)2 to adsorbed IgG [12]. Buijs et al.
investigated the adsorption of IgG, F(ab’)2 and Fc and concluded that IgG adsorbed
preferentially with the Fc fragment since the Gibbs energy barrier for adsorption was much
higher for F(ab’)2 than for IgG in some cases [13]. He further suggested adsorption of IgG1
by its Fc part at some conditions due to the low structural stability of this fragment [14]. In

Adsorption of IgG1 and its F(ab’)2 and Fc Fragment 99
contrast, Vermeer suggested a binding of IgG to hydrophobic Teflon by its more hydrophobic
Fab’ fragment [15]. Finally, in some recent studies it was suggested, that IgG adsorbs neither
with Fab’ nor Fc to hydrophobic surfaces, but attaches primarily with the hinge region and
parts of the Fc fragment [7, 16].
In most of these investigations, model surfaces or hydrophobic membranes were used to study
the adsorption of IgG and its fragments. The present study examines the adsorption behavior
of IgG1, the F(ab’)2 and the Fc fragment to borosilicate glass vials and siliconized glass vials
as relevant pharmaceutical packaging materials. The adsorption of the proteins was
investigated at different pH values and ionic strengths to evaluate the influence of electrostatic
and hydrophobic interactions on the adsorption process. Moreover, the total adsorbed amount
of protein in a competitive adsorption of the Fc and F(ab’)2 fragment was investigated.
Finally, the calculated theoretical surface concentration for different orientations of the
molecules on the surface was correlated with the found adsorbed amounts of IgG1. This
allowed us to evaluate the possible orientations of IgG1 on siliconized glass vials and
borosilicate glass vials at different pH and ionic strength.
2 MATERIALS AND METHODS
Chemicals 2.1
Trometamol was obtained from Merck KGaA (Darmstadt, Germany) and NaH2PO4 was from
Merck Chemicals (Darmstadt, Germany). Na2HPO4, sodium dodecyl sulfate (SDS), cysteine,
ethylene diamine tetraacetate (EDTA), iodoacetamide as well as the papain suspension from
papaya latex and pepsin from porcine gastric mucosa were purchased from Sigma-Aldrich
Chemie GmbH (Munich, Germany). NaCl, NaOH and HCl were purchased from VWR
International (Darmstadt, Germany).
IgG1 Antibody 2.2
The 2 mg/ml IgG1 antibody formulated in 10 mM phosphate buffer and 145 mM NaCl
(pH 7.2) was kindly donated by Merck Serono (Darmstadt, Germany). For an adjustment of
the ionic strength, the formulation was dialyzed in 10 mM phosphate buffer pH 7.2, using a
Vivaflow® 50 tangential flow cartridge (Sartorius-Stedim Biotech, Goettingen, Germany)
with a 30 kD MWCO polyethersulfone membrane. The concentration of the protein solution
was determined by UV-spectroscopy. For adsorption experiments at different pH values, the

100 Chapter IV
pH was adjusted by addition of 1 M NaOH or HCl and a consistent ionic strength of 170 mM
was adjusted by adding adequate amounts of NaCl to the dialyzed solution.
Fc Fragments 2.3
Fc fragments were generated by digestion of the antibody with papain. Prior to digestion, the
IgG1 antibody was dialyzed into a digestion buffer containing 100 mM trometamol, 10 mM
cysteine and 40 mM EDTA, pH 7.4, using Vivaflow® cartridges with a 30 kDa MWCO
polyethersulfone membrane (Sartorius AG, Goettingen, Germany). The IgG1 concentration
was measured by UV-spectroscopy and adjusted to 2 mg/ml. Just before use, the papain
suspension was diluted with 5 mM cysteine buffer to a final concentration of 1 mg/ml, and
10 µg papain per mg IgG1 were added to the antibody solution. The mixture was incubated
for 5-7 h at 37 °C until at least 95% of the protein molecules were digested. Then the reaction
was stopped by addition of iodoacetamide to a final concentration of 30 mM. In-process
controls were performed by HP-SEC. Fc fragments were separated from the digestion mixture
on an ÄKTApurifier 10 (GE Healthcare Europe GmbH, Freiburg, Germany) with a Pierce®
Protein A Chromatography Cartridge (Thermo Fisher Scientific Inc., IL, USA). The column
was equilibrated with binding buffer consisting of 100 mM phosphate and 3 M NaCl, pH 9, at
a flow rate of 1 ml/min. After injection of the digestion mixture, Fab’ fragments were
immediately eluted from the column. Fc fragments and non-digested IgG1 antibody were
eluted from the column by applying a gradient toward 100% elution buffer containing
100 mM phosphate, pH 3, and were collected by an automated fraction collector (Frac-920,
GE Healthcare Europe GmbH, Freiburg, Germany). UV-absorption at 280 nm was used to
detect eluted protein. Subsequently, the Fc fragments were dialyzed extensively against
10 mM phosphate buffer pH 7.2 using Vivaspin® centrifuge tubes with a 10 kDa MWCO
polyethersulfone membrane (Sartorius AG, Goettingen, Germany). A purity of about 95% Fc
with small quantities of residual larger fragments was found in non-denaturing HP-SEC and
was visualized by SDS-PAGE (Figure IV-1a). The isoelectric point of the Fc fragment was
determined by IEF in a pH range of 6.5-7.6 (Figure IV-1b). pH and ionic strength adjustments
were performed as described for the IgG1 antibody solution.
F(ab’)2 Fragments 2.4
For the preparation of F(ab’)2 fragments, the IgG1 antibody was dialyzed into a digestion
buffer containing 100 mM Na-acetate, pH 3.5, using Vivaflow® cartridges with a 30 kDa
MWCO polyethersulfone membrane (Sartorius AG, Goettingen, Germany). The protein

Adsorption of IgG1 and its F(ab’)2 and Fc Fragment 101
concentration was measured by UV-spectroscopy and adjusted to 2 mg/ml. 10 µg pepsin
dissolved in digestion buffer were added per mg IgG1. For digestion, the reaction solution
was incubated at 37 °C for 1 h and subsequently stopped by addition of 3 M tris buffer to a
final pH of 8.8. For adsorption experiments, the solution was dialyzed extensively against
10 mM phosphate buffer pH 7.2 to remove smaller fragments and pepsin from the solution.
The purity of the F(ab’)2 fraction was found to be about 96% in non-denaturing HP-SEC with
some smaller fragments remaining from digestion which was also shown by SDS-PAGE
(Figure IV-1a). The isoelectric point was determined to be in a pH range of 7.6-8.3 (Figure
IV-1b). Both pH and ionic strength adjustments were performed as described for the IgG1
antibody solution.
Vials and Closure Systems 2.5
Adsorption experiments were performed in pre-siliconized (Dow Corning 365) and baked 2R
glass vials and bare Fiolax® glass vials which were kindly provided by SCHOTT AG (Mainz,
Germany). All vials were washed with ultrapure water of 80 °C in a vial washing machine
FAW 500 (Bausch&Stroebel GmbH & Co. KG, Ilshofen, Germany). Subsequently,
siliconized vials were autoclaved at 121 °C, 2 bar for 15 minutes whereas Fiolax® glass vials
were heat sterilized at 250 °C for 1 h. After filling, the vials were closed with Fluorotec®
stoppers and sealed with Flip-Off® seals (West Pharmaceutical Services, Eschweiler,
Germany). The inner surface area of a vial covered with protein formulation was calculated as
5.06 cm² for a filling volume of 1 ml.
Adsorption Process 2.6
The adsorption process followed the procedure described by Mathes & Friess [6]. For
adsorption testing of the individual fragments or IgG1, 1 ml protein solution containing IgG1,
F(ab’)2 or Fc fragment in equal molar concentration, corresponding to 1 mg/ml IgG1,
0.66 mg/ml F(ab’)2 fragment or 0.33 mg/ml Fc fragment, was filled into the pre-processed
vials (n=2). The simultaneous adsorption of F(ab’)2 and Fc fragment was investigated with
solutions containing 0.66 mg/ml F(ab’)2 fragment and 0.33 mg/ml Fc fragment (n=2). After
filling, the vials were closed, sealed and incubated at 25 °C for 24 h. The vials were emptied
using a syringe with an injection needle. Each vial was rinsed four times with corresponding
formulation buffer. For desorption of bound protein, 1 ml of 10 mM PBS containing 145 mM
NaCl and 0.05% sodium dodecyl sulfate, pH 7.2, was filled into each vial. The vials were
closed and stored overnight at 25 °C.

102 Chapter IV
UV-Spectroscopy 2.7
UV-spectroscopy to determine the concentration of the protein solutions was performed on an
Agilent 8453 UV/VIS spectrophotometer (Agilent Technologies GmbH, Boeblingen,
Germany) in 10 x 10 mm quartz cuvettes at λ = 280 nm / 25 °C. For IgG1 an extinction
coefficient of 1.4 cm²/mg for antibodies was applied. For concentration determination of the
F(ab’)2 or Fc fragment, the experimentally determined extinction coefficients of 1.45 cm²/mg
or 1.51 cm²/mg, respectively, were applied.
HP-SEC 2.8
In-process controls of IgG1 digestion with papain or pepsin as well as purity analysis of the
fragments were performed by HP-SEC on an Agilent 1100 HPLC device with an Agilent UV-
detector (Agilent Technologies GmbH, Boeblingen, Germany) using a YMC-Pack Diol-300
SEC-column (YMC Europe GmbH, Dinslaken, Germany) for sample separation. 10 mM
phosphate buffer containing 145 mM NaCl, pH 7.2, was used as eluent. A flow rate
0.5 ml/min was applied with UV-detection at 280 nm. Agilent ChemStation Software
Rev. B 02.01 was used for manual integration of the chromatograms. The purity of the Fc and
F(ab’)2 fractions was determined by calculating the percentage of the AUC of each fragment
from the total AUC of the digestion mixture (n ≥ 1).
Quantitative analysis of the desorbed protein was performed using a YMC-Pack Diol-300
SEC-column (YMC Europe GmbH, Dinslaken, Germany) for sample separation. Intrinsic
protein fluorescence was detected at λex/λem 280 nm/334 nm. Desorption buffer was used as
mobile phase. For the quantification of IgG1 or the separated fragments, a calibration line of
each of the proteins was included in an HPLC batch. For protein quantification in samples
containing Fc and F(ab’)2, a calibration line with different ratios of Fc and F(ab’)2 as well as
pure Fc and pure F(ab’)2 was included in each HPLC batch. The chromatograms were
integrated manually using the Agilent ChemStation Software Rev. B 02.01.
Determination of the Molar Extinction Coefficient of Fc and F(ab’)2 2.9
Fragments
The molar extinction coefficient ε of Fc and F(ab’)2 fragments was calculated from
experimentally obtained values according to the following equation:
ε ∙
(1)

Adsorption of IgG1 and its F(ab’)2 and Fc Fragment 103
c constitutes the molar concentration of the analyte obtained by micro BCA-assay, A280 is the
corresponding UV-absorption of the solution at 280 nm (n=3) and d equals the pathlength of
the cuvette. The experimentally obtained values were confirmed by calculation of the
theoretical molar extinction coefficients from the protein sequence applying equation (2). This
equation is based on experimentally determined intrinsic extinction coefficients of tryptophan,
tyrosine and cystine residues and their number n in the protein sequence [17, 18]:
ε 5540n 1480n 134n (2)
The sequence of the fragments was obtained from the amino acid sequence of the full
antibody under consideration of the cleavage sites of papain between histidine-threonine in
the upper hinge region for the Fc fragment [19, 20] or pepsin between leucine-leucine for the
F(ab’)2 fragment in the lower hinge region [20], respectively. The theoretical extinction
coefficients were calculated as 1.45, 1.44 and 1.46 cm²/mg for IgG1, Fc and F(ab’)2 and an
assumed molecular weight of 150, 50 and 100 kDa, respectively.
Micro BCA-Assay 2.10
The protein concentration of Fc and F(ab’)2 in 10 mM phosphate buffer pH 7.2 was
determined with a micro BCA protein assay kit (Thermo Fisher Scientific Inc., IL, USA).
From each fragment solution, two dilutions were prepared in triplet each and analyzed in a
96-well plate with UV-detection at 562 nm. A 6-point calibration line of non-fragmented
IgG1 in a concentration range of 2.5-40 µg/ml was used as reference for quantification.
SDS-PAGE 2.11
The digestion products were analyzed by SDS-PAGE using NuPAGE® 7% tris-acetate gels
(Life Technologies GmbH, Darmstadt, Germany). Samples were diluted with formulation
buffer to 0.0125 mg/ml and heat denatured at 95 °C for 20 min. A Mark12™ Unstained
Standard (Life Technologies GmbH, Darmstadt, Germany) was applied for band
identification. Electrophoresis was performed at a consistent current of 0.04 A for approx.
1.5 h, followed by silver staining with a SilverQuest™ Silver Staining Kit (Life Technologies
GmbH, Darmstadt, Germany).

104 Chapter IV
Isoelectric Focusing 2.12
The isoelectric point of IgG1, Fc and F(ab’)2 fragments was determined by isoelectric
focusing (IEF) using precast SERVALYT PRECOTES® 6-9 IEF plates with a thickness of
300 µm. 10 µl per sample with a concentration of 0.5 mg/ml adjusted by dilution with
ultrapure water and SERVA Liquid Mix IEF marker 3-10 (SERVA Electrophoresis GmbH,
Heidelberg, Germany) were applied to the gel. Electrophoresis was performed at 2000 V and
6 mA at 5 °C. The gels were stained with SERVA Blue W (SERVA Electrophoresis GmbH,
Heidelberg, Germany).
3 RESULTS AND DISCUSSION
Adsorption of IgG1, F(ab’)2 and Fc Fragment 3.1
The adsorption behavior of IgG1 and the individual Fc and F(ab’)2 fragments to borosilicate
glass vials and siliconized glass vials was investigated using solutions of equimolar
concentration. Adsorption was tested at the pH values 4.0, 7.2 and 8.6, so that the impact of
different charge states of the molecules on the adsorption process could be examined. To
investigate the influence of electrostatic interactions in between the protein molecules as well
as between the protein and the sorbent, the adsorption was additionally determined at two
different ionic strength levels of 40 mM and 170 mM.
3.1.1 Adsorption to Borosilicate Glass Vials
At first, the adsorption behavior of IgG1, the F(ab’)2 and the Fc fragment on borosilicate glass
vials is presented. All proteins showed the same pH- and ionic strength-dependent adsorption
behavior at the tested conditions (Figure IV-2a). Maximum adsorption was found at pH 4.0,
decreasing via pH 7.2 toward pH 8.6. Increasing the ionic strength from 40 mM to 170 mM
led to enhanced adsorption at pH 4.0, whereas adsorption was reduced at pH 7.2 and 8.6.
Compared to IgG1 and Fc, these changes were more pronounced for F(ab’)2. At most of the
conditions, the adsorbed amount of the fragments was lower than of the full IgG1. The mass
of adsorbed Fc was remarkably high and exceeded the F(ab’)2 adsorption at pH 7.2 and 8.6.
At pH 8.6 and 170 mM ionic strength, F(ab’)2 adsorption could not be quantified anymore.
Adsorption maxima at pH values below the pI were reported for several proteins [6, 21].
Isoelectric focussing showed 6 to 7 characteristic isoforms in the pH range from about 7.6 to
8.2 for IgG1 (Figure IV-1b). The F(ab’)2 fragment exhibited 4 to 5 distinct bands in a similar
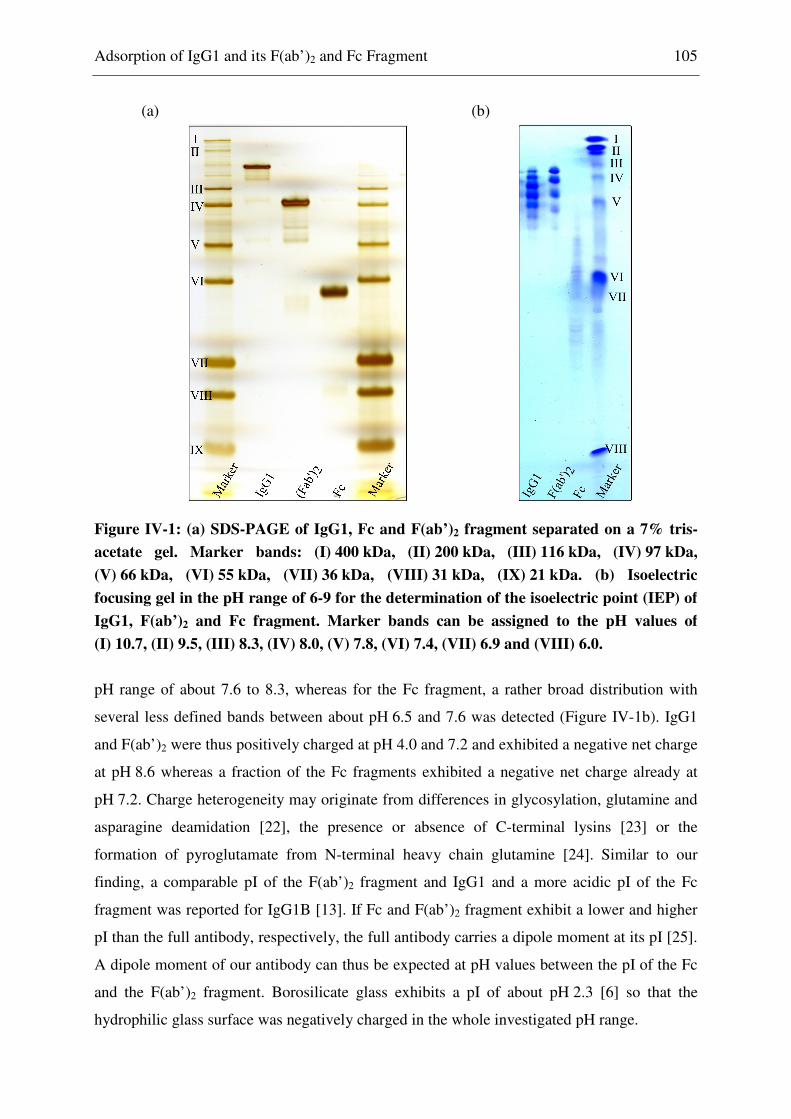
Adsorption of IgG1 and its F(ab’)2 and Fc Fragment 105
pH range of about 7.6 to 8.3, whereas for the Fc fragment, a rather broad distribution with
several less defined bands between about pH 6.5 and 7.6 was detected (Figure IV-1b). IgG1
and F(ab’)2 were thus positively charged at pH 4.0 and 7.2 and exhibited a negative net charge
at pH 8.6 whereas a fraction of the Fc fragments exhibited a negative net charge already at
pH 7.2. Charge heterogeneity may originate from differences in glycosylation, glutamine and
asparagine deamidation [22], the presence or absence of C-terminal lysins [23] or the
formation of pyroglutamate from N-terminal heavy chain glutamine [24]. Similar to our
finding, a comparable pI of the F(ab’)2 fragment and IgG1 and a more acidic pI of the Fc
fragment was reported for IgG1B [13]. If Fc and F(ab’)2 fragment exhibit a lower and higher
pI than the full antibody, respectively, the full antibody carries a dipole moment at its pI [25].
A dipole moment of our antibody can thus be expected at pH values between the pI of the Fc
and the F(ab’)2 fragment. Borosilicate glass exhibits a pI of about pH 2.3 [6] so that the
hydrophilic glass surface was negatively charged in the whole investigated pH range.
(a) (b)
Figure IV-1: (a) SDS-PAGE of IgG1, Fc and F(ab’)2 fragment separated on a 7% tris-
acetate gel. Marker bands: (I) 400 kDa, (II) 200 kDa, (III) 116 kDa, (IV) 97 kDa,
(V) 66 kDa, (VI) 55 kDa, (VII) 36 kDa, (VIII) 31 kDa, (IX) 21 kDa. (b) Isoelectric
focusing gel in the pH range of 6-9 for the determination of the isoelectric point (IEP) of
IgG1, F(ab’)2 and Fc fragment. Marker bands can be assigned to the pH values of
(I) 10.7, (II) 9.5, (III) 8.3, (IV) 8.0, (V) 7.8, (VI) 7.4, (VII) 6.9 and (VIII) 6.0.

106 Chapter IV
At pH 4, IgG1 and both fragments exhibited a strong positive net charge and were
electrostatically attracted toward the negatively charged glass surface. At the same time, the
strong intermolecular repulsion opposed adsorption. This repulsion, but also the electrostatic
attraction toward the sorbent surface may be reduced at higher salt concentrations [26].
Higher adsorbed amounts at an ionic strength of 170 mM compared to 40 mM reflected a
prevalent reduction of intermolecular repulsive forces by ions in our experiment (Figure
IV-2a).
(a)
(b)
Figure IV-2: Adsorption of IgG1, Fc and F(ab’)2 fragment to type I borosilicate glass
vials (a) and siliconized glass vials (b) at different pH and ionic strength; incubation time
24 h at 25 °C; solutions contained equimolar protein concentration in 10 mM phosphate
buffer at 40 mM (grey bars) or 170 mM (striped bars) ionic strength (n=2). Adsorbed
amounts of samples labeled with star (*) could not be quantified any more.
4.0 7.2 8.6 4.0 7.2 8.6 4.0 7.2 8.60
2
4
6
8
10
12
*
Fc-fragmentF(ab´)2-fragmentIgG1
Ads
orbe
d am
ount
(m
g/m
²)
pH
40 mM 170 mM
4.0 7.2 8.6 4.0 7.2 8.6 4.0 7.2 8.60
2
4
6
8
10
12 IgG1
40 mM 170 mM
Fc-fragmentF(ab´)2-fragment
Ads
orbe
d am
ount
(m
g/m
²)
pH
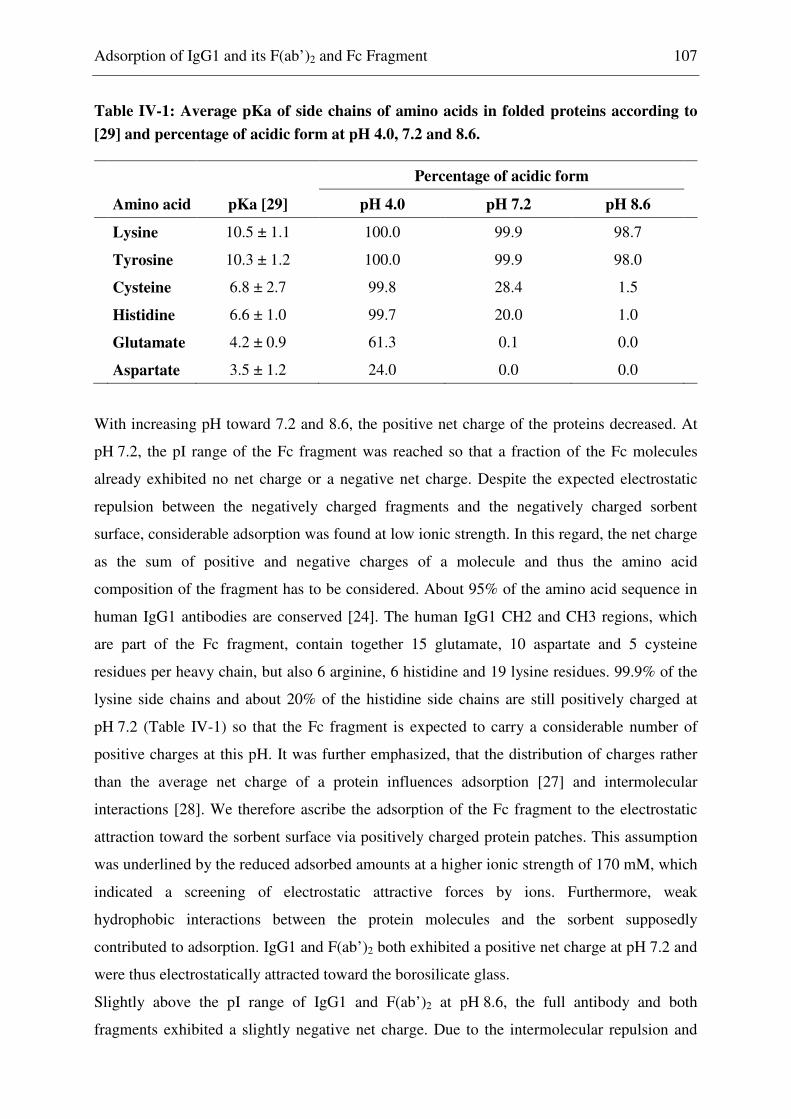
Adsorption of IgG1 and its F(ab’)2 and Fc Fragment 107
With increasing pH toward 7.2 and 8.6, the positive net charge of the proteins decreased. At
pH 7.2, the pI range of the Fc fragment was reached so that a fraction of the Fc molecules
already exhibited no net charge or a negative net charge. Despite the expected electrostatic
repulsion between the negatively charged fragments and the negatively charged sorbent
surface, considerable adsorption was found at low ionic strength. In this regard, the net charge
as the sum of positive and negative charges of a molecule and thus the amino acid
composition of the fragment has to be considered. About 95% of the amino acid sequence in
human IgG1 antibodies are conserved [24]. The human IgG1 CH2 and CH3 regions, which
are part of the Fc fragment, contain together 15 glutamate, 10 aspartate and 5 cysteine
residues per heavy chain, but also 6 arginine, 6 histidine and 19 lysine residues. 99.9% of the
lysine side chains and about 20% of the histidine side chains are still positively charged at
pH 7.2 (Table IV-1) so that the Fc fragment is expected to carry a considerable number of
positive charges at this pH. It was further emphasized, that the distribution of charges rather
than the average net charge of a protein influences adsorption [27] and intermolecular
interactions [28]. We therefore ascribe the adsorption of the Fc fragment to the electrostatic
attraction toward the sorbent surface via positively charged protein patches. This assumption
was underlined by the reduced adsorbed amounts at a higher ionic strength of 170 mM, which
indicated a screening of electrostatic attractive forces by ions. Furthermore, weak
hydrophobic interactions between the protein molecules and the sorbent supposedly
contributed to adsorption. IgG1 and F(ab’)2 both exhibited a positive net charge at pH 7.2 and
were thus electrostatically attracted toward the borosilicate glass.
Slightly above the pI range of IgG1 and F(ab’)2 at pH 8.6, the full antibody and both
fragments exhibited a slightly negative net charge. Due to the intermolecular repulsion and
Table IV-1: Average pKa of side chains of amino acids in folded proteins according to
[29] and percentage of acidic form at pH 4.0, 7.2 and 8.6.
Percentage of acidic form
Amino acid pKa [29] pH 4.0 pH 7.2 pH 8.6
Lysine 10.5 ± 1.1 100.0 99.9 98.7
Tyrosine 10.3 ± 1.2 100.0 99.9 98.0
Cysteine 6.8 ± 2.7 99.8 28.4 1.5
Histidine 6.6 ± 1.0 99.7 20.0 1.0
Glutamate 4.2 ± 0.9 61.3 0.1 0.0
Aspartate 3.5 ± 1.2 24.0 0.0 0.0

108 Chapter IV
the electrostatic repulsion between the negatively charged protein and the sorbent surface,
reduced adsorbed amounts could be expected. However, Fc adsorption was only marginally
lower than at pH 7.2. This may be ascribed to the almost unchanged protonation degree of
lysine compared to pH 7.2 (Table IV-1), enabling electrostatic attraction of the molecules
toward the sorbent via positively charged protein patches. Furthermore, a contribution of
hydrophobic interactions to adsorption of the molecules can be assumed. Compared to IgG1
and Fc, the adsorbed amount of F(ab’)2 was very low at pH 8.6 which indicated a very weak
electrostatic and hydrophobic attraction of this fragment toward the surface. Due to the
variable part of the F(ab’)2 fragment, larger differences in sequence between different IgG1
antibodies may occur. Several lysine residues in the CH1 region of human IgG1 imply also
for this fragment the possibility to adsorb via positively charged protein patches to the
negatively charged glass surface. However, these positive charges may be buried in the
interior of the molecule or outweighed by negative charges in the variable part.
Our IgG1 and F(ab’)2 exhibited a comparable pI and adsorption trend which has been
similarly described in literature for other antibodies and their fragments on different surfaces
[30]. In our experiment, also the Fc fragment showed basically the same adsorption behavior.
In contrast, Buijs et al. found a marginal pH- and ionic strength-dependence of Fc adsorption
to silica and methylated silica and ascribed it to the low influence of protein-sorbent
interactions on Fc adsorption [13]. Lower pH-effects on the adsorption of Fc than of F(ab’) in
a competitive adsorption were further ascribed to the dominance of hydrophobic forces for Fc
adsorption [31].
On borosilicate glass vials, Fc adsorption was by trend slightly higher at pH 7.2 and 8.6 and
slightly less dependent on ionic strength than adsorption of F(ab’)2. Therefore it may be
hypothesized that IgG1 adsorption is driven rather by the Fc fragment, especially at slightly
basic pH values. Adsorption of IgG with the Fc fragment was also proposed by Nagaoka for a
hydrophobic surface [12]. In addition, Buijs determined a much higher Gibbs energy barrier
for the adsorption of F(ab’)2 than for IgG on silica at some conditions and suggested that the
IgG molecule attaches preferentially with the Fc fragment onto the surface [13]. Furthermore
it was shown that membrane-bound IgG was able to bind antigen from solution [32, 33]. In
contrast, Vermeer et al. suggested a preferential adsorption of IgG2b to hydrophobic Teflon
particles with the F(ab’) fragments which exhibited a higher hydrophobicity [15]. We
considered this orientation rather unlikely for the very hydrophilic glass, because lower
adsorbed amounts were found for the F(ab’)2 fragment than for the Fc fragment at pH 7.2
and 8.6.

Adsorption of IgG1 and its F(ab’)2 and Fc Fragment 109
3.1.2 Adsorption to Siliconized Glass Vials
Similar to borosilicate glass vials, almost no difference between the fragments and IgG1 in the
pH- and ionic strength-dependent adsorption behavior was observed on siliconized glass vials.
Again, maximum adsorption was found at pH 4.0 with lower, rather similar adsorbed amounts
at pH 7.2 and pH 8.6 (Figure IV-2b). Increasing the ionic strength from 40 mM to 170 mM
led to increased adsorption at pH 4.0 for all protein molecules, but was most pronounced for
F(ab’)2. This effect was marginal at pH 7.2 and 8.6.
Siliconized glass shows a pI of about pH 3.4 (Chapter II3.1.1) and thus exhibits a negative net
charge over the tested pH range of 4.0 to 8.6. In contrast to the hydrophilic glass surface, the
siliconized glass surface allows strong hydrophobic interactions with the proteins in addition
to electrostatic interactions. This was demonstrated by the largely higher adsorbed amounts of
IgG1 and the fragments on the siliconized surface compared to borosilicate glass, especially at
pH 7.2 and 8.6. The minor importance of electrostatic interactions for adsorption at these
higher pH values was underlined by the low effect of changing ionic strength on the adsorbed
amount. Similarly, Buijs et al. stated that the adsorption of IgG and its F(ab’)2 fragment to
hydrophobic latices is mainly governed by hydrophobic interactions but is still influenced by
electrostatic forces [30]. At pH 7.2 and 8.6, the adsorbed amount of Fc and F(ab’)2 did not
differ noticeably, so that no conclusion about the preferential orientation of adsorbed IgG1 on
this basis could be drawn. In contrast, the strong increase in IgG1 adsorption at pH 4.0 with
higher ionic strength was also observed for the F(ab’)2 fragment but was only marginal for the
Fc part. In the following section, the possible steric reasons for the similarity in adsorbed
amounts of Fc, F(ab’)2 and IgG1 on siliconized vials will be discussed.
Simultaneous Adsorption of F(ab’)2/ Fc Fragments and Orientation 3.2
Considerations
Besides the separate adsorption of the fragments, the total protein adsorption from solutions
containing Fc and F(ab’)2 fragments in equimolar concentration was investigated. Overall, the
adsorption of the Fc / F(ab’)2 mixtures to siliconized and bare borosilicate glass vials showed
a similar dependency on pH and ionic strength as the full antibody and the individual
fragments (Figure IV-3a, b). However, on borosilicate glass vials, the adsorbed protein mass
from the Fc / F(ab’)2 mixture was consistently lower than that of the full IgG1 (Figure IV-3a),
whereas on siliconized glass vials the adsorption of the mixture was in some cases almost the
same or even higher (Figure IV-3b).

110 Chapter IV
Besides the interplay of attractive and repulsive forces between protein and sorbent and in
between the protein molecules, the adsorbed amount of protein on a surface is also related to
the orientation of the molecules on the surface. As shown in Figure IV-4, the maximum
surface coverage of IgG1 and its fragments at different surface conformations can be
calculated in approximation from the dimensions of crystallized F(ab’) and Fc [30], assuming
a 100% coverage of the sorbent surface area with protein.
According to the calculated values in Figure IV-4, adsorbed amounts of IgG1 higher than
approximately 2.9 mg/m² require an end-on orientation of the molecules (orientation A, B) or
multilayer coverage. On borosilicate glass vials this applies at pH 4.0 as well as at
pH 7.2 / 40 mM ionic strength, whereas at the other formulation conditions, also a side-on
orientation (Figure IV-4, orientation D, E) of the molecules was possible. This means that at
conditions of high electrostatic attraction between IgG1 and the surface but also high
intermolecular repulsion, a small contact area between proteins and sorbent, as obtained in an
end-on orientation, was sufficient for adsorption. At less attractive conditions, a side-on
orientation of the molecules may be required to increase the interaction with the surface.
For adsorption of isolated F(ab’)2, at pH 7.2 and 8.6 all surface orientations were possible
based on the adsorbed amount. At pH 4.0 / 40 mM ionic strength and under the precondition
of monolayer coverage, the measured adsorbed amount required F(ab’)2 adsorption in a rather
collapsed conformation (orientation F) if adsorption in a comparable conformation as in the
full antibody is assumed. Due to the strong inter- and intramolecular repulsion at this
(a) (b)
Figure IV-3: Total adsorbed protein amount from mixtures of F(ab’)2 and Fc fragment
to type I borosilicate glass vials (a) and siliconized glass vials (b) at different pH and
ionic strength (grey bars). Adsorbed amounts of IgG1 are depicted as reference ( );
incubation time 24 h at 25 °C; solutions contained equal molar concentration of Fc and
(Fab’)2 in 10 mM phosphate buffer with 40 mM or 170 mM ionic strength (n=2).
4 7.2 8.6 4 7.2 8.60123456789 170 mM40 mM
Ads
orbe
d am
ount
(m
g/m
²)
pH4 7.2 8.6 4 7.2 8.6
0123456789 170 mM40 mM
Ads
orbe
d am
ount
(m
g/m
²)
pH

Adsorption of IgG1 and its F(ab’)2 and Fc Fragment 111
formulation condition, however, (partial) adsorption of the molecules in a stretched
orientation (orientation H) or in multilayers seems more likely. This stretched conformation H
was suggested by Buijs et al. for F(ab’)2 at increased protein charge density when the F(ab’)
units electrostatically repel each other [30]. At 170 mM ionic strength, the molecules
supposedly adsorbed in a stretched orientation (H) or formed multilayers. For the Fc
fragment, adsorption in all theoretical orientations was considered possible based on the
adsorbed amount.
Assuming an exclusively flat-on adsorption of the antibody (orientation E) and a comparable
orientation of the isolated fragments (orientations I and K), adsorbed amounts of
< 1.8-2 mg/m² for all proteins were required which applied at pH 7.2 and 8.6 at 170 mM ionic
strength. In general, the total protein adsorption from Fc / F(ab’)2 mixtures did not reach the
IgG1 adsorption level (Figure IV-3a) which might be ascribed to different possible packing
densities or different molecular orientations of the proteins. The orientation of Fc and F(ab’)2
Figure IV-4: Surface conformations and calculated adsorbed amount Γ in mg/m² for
adsorbed IgG1 (A-E), F(ab’)2 fragment (F-I) and Fc fragment (J, K). Calculated
adsorbed amounts and schematic drawing of orientations A-C and E-I are reproduced
and adapted from [30]. Side-on orientation D with one F(ab’) fragment directed toward
the solution was adapted from Wiseman & Frank [34]. Calculations of adsorbed
amounts of orientations D, J and K are based on the dimensions of crystallized F(ab’)
(8.2 x 5.0 x 3.8 nm³) and Fc (7.0 x 6.3 x 3.1 nm³) as used by Buijs et al. [30], applying a
molecular weight of 50, 100 and 150 kDa for Fc, F(ab’)2 and IgG1. Calculations are
based on the assumption of a 100% possible surface coverage with protein.

112 Chapter IV
in the simultaneous adsorption will not be considered further as this will depend on the
fragment ratio on the surface which cannot be hypothesized.
On siliconized glass vials, at pH 4.0 the antibody molecules can be assumed to adsorb in an
end-on orientation as well. The rather high IgG1 adsorption of 2.6-3.3 mg/m² (Figure IV-2b)
at pH 7.2 and 8.6 allowed an end-on adsorption but also a side-on adsorption of IgG1 with
one F(ab’) pointing toward the solution (orientation D as suggested by [34]) for the majority
of the molecules. Considering the similar adsorbed amounts of IgG1, Fc and F(ab’)2 at pH 7.2
and 8.6, adsorption in a certain conformation which is favored on the hydrophobic siliconized
glass surface may be speculated. Recent publications proposed the adsorption of IgG to
hydrophobic membranes with the hinge region and a part of the Fc fragment [7, 16]. Sun et al.
concluded this from the ability of membrane-bound IgG to bind Protein A and antigen, and
from the antigen binding by separated, adsorbed F(ab’)2 fragment [16]. An adsorption of Fc,
F(ab’)2 and the antibody with the hinge region, as proposed in literature, may actually explain
the similar adsorbed amounts of the proteins as observed on siliconized vials. At pH 7.2 and
8.6, the adsorbed amounts of Fc and F(ab’)2 between 2.0 and 3.0 mg/m² theoretically allow (at
least largely) adsorption of both fragments with the hinge region. Although adsorption of
IgG1 at these pH values exclusively via the hinge region was not possible, a mix of initially
adsorbed IgG1 molecules preferentially with their middle region and further end-on
adsorption may be considered. An initial flat-on adsorption of IgG1 to a hydrophobic
membrane and further adsorption in various vertical surface orientations with increasing
surface coverage was also suggested by Wiseman & Frank [34]. Thus it may be concluded,
that on siliconized vials a preferential adsorption with the hinge region of the antibody is an
option for the orientation of weakly charged IgG1 on the surface.
4 CONCLUSION
In this study the adsorption behavior of IgG1, the F(ab’)2 and the Fc fragment on borosilicate
glass vials and siliconized glass vials was investigated in dependence of pH and ionic
strength. On both vial qualities, the adsorption maxima of the different proteins were found at
an acidic pH value due to strong attractive electrostatic interactions between the protein and
the negatively charged sorbent. On borosilicate glass, a strong dependence of adsorption on
pH and ionic strength was observed. In contrast, the contribution of hydrophobic interactions
to the adsorption process on siliconized vials led to quite high adsorbed amounts even when
the proteins exhibited only a weak or neutral net charge. On both surfaces, adsorption of the

Adsorption of IgG1 and its F(ab’)2 and Fc Fragment 113
Fc fragment could be observed even at electrostatic repulsive conditions between protein and
sorbent surface. Different molecular orientations of IgG1 were considered in dependence of
the adsorbed amounts measured on borosilicate glass and siliconized glass. Protein net charge
and surface charge distribution are specific properties of each individual antibody. The
obvious importance of these parameters for adsorption in our experiments thus implies that
found adsorption trends cannot be simply transferred to other antibodies or are easily
predictable just from pI determination.

114 Chapter IV
5 REFERENCES
[1] G.A. Sacha, W. Saffell-Clemmer, K. Abram, M.J. Akers, Practical fundamentals of glass, rubber, and plastic sterile packaging systems, Pharm. Dev. Technol., 15 (2010) 6-34.
[2] F.Y. Oliva, L.B. Avalle, O.R. Cámara, C.P. De Pauli, Adsorption of human serum albumin (HSA) onto colloidal TiO2 particles, Part I, J. Colloid Interface Sci., 261 (2003) 299-311.
[3] O. Joshi, J. McGuire, Adsorption behavior of lysozyme and Tween 80 at hydrophilic and hydrophobic silica-water interfaces, Appl. Biochem. Biotechnol., 152 (2009) 235-248.
[4] M. van der Veen, W. Norde, M.C. Stuart, Electrostatic interactions in protein adsorption probed by comparing lysozyme and succinylated lysozyme, Colloids Surf., B, 35 (2004) 33-40.
[5] M.R. Duncan, J.M. Lee, M.P. Warchol, Influence of surfactants upon protein/peptide adsorption to glass and polypropylene, Int. J. Pharm., 120 (1995) 179-188.
[6] J. Mathes, W. Friess, Influence of pH and ionic strength on IgG adsorption to vials, Eur. J. Pharm. Biopharm., 78 (2011) 239-247.
[7] D. Yu, R. Ghosh, Method for Studying Immunoglobulin G Binding on Hydrophobic Surfaces, Langmuir, 26 (2009) 924-929.
[8] H. Xu, X. Zhao, J.R. Lu, D.E. Williams, Relationship between the Structural Conformation of Monoclonal Antibody Layers and Antigen Binding Capacity, Biomacromolecules, 8 (2007) 2422-2428.
[9] G. Walsh, Biopharmaceuticals: recent approvals and likely directions, Trends Biotechnol., 23 (2005) 553-558.
[10] M. Malmsten, Ellipsometry studies of the effects of surface hydrophobicity on protein adsorption, Colloids Surf., B, 3 (1995) 297-308.
[11] M.G.E.G. Bremer, J. Duval, W. Norde, J. Lyklema, Electrostatic interactions between immunoglobulin (IgG) molecules and a charged sorbent, Colloids Surf., A, 250 (2004) 29-42.
[12] S. Nagaoka, K. Ashiba, H. Kawakami, Interaction between biocomponents and surface modified fluorinated polyimide, Mater. Sci. Eng., C, 20 (2002) 181-185.
[13] J. Buijs, P.A.W. van den Berg, J.W.T. Lichtenbelt, W. Norde, J. Lyklema, Adsorption Dynamics of IgG and Its F(ab')2 and Fc Fragments Studied by Reflectometry, J. Colloid Interface Sci., 178 (1996) 594-605.
[14] J. Buijs, D.D. White, W. Norde, The effect of adsorption on the antigen binding by IgG and its F(ab')2 fragments, Colloids Surf., B, 8 (1997) 239-249.

Adsorption of IgG1 and its F(ab’)2 and Fc Fragment 115
[15] A.W.P. Vermeer, C.E. Giacomelli, W. Norde, Adsorption of IgG onto hydrophobic teflon. Differences between the Fab and Fc domains, Biochim. Biophys. Acta, Gen. Subj., 1526 (2001) 61-69.
[16] X. Sun, D. Yu, R. Ghosh, Study of hydrophobic interaction based binding of immunoglobulin G on synthetic membranes, J. Membr. Sci., 344 (2009) 165-171.
[17] H. Mach, C.R. Middaugh, R.V. Lewis, Statistical determination of the average values of the extinction coefficients of tryptophan and tyrosine in native proteins, Anal. Biochem., 200 (1992) 74-80.
[18] L.A. Kueltzo, C.R. Middaugh, Ultraviolet Absorption Spectroscopy, in: W. Jiscoot, D. Crommelin (Eds.), Methods for structural analysis of protein pharmaceuticals, American Association of pharmaceutical scientists, 2005.
[19] A.C. Wang, I.Y. Wang, Cleavage sites of human IgGl immunoglobulin by papain, Immunochemistry, 14 (1977) 197-200.
[20] R.J. Brezski, R.E. Jordan, Cleavage of IgGs by proteases associated with invasive diseases: an evasion tactic against host immunity?, mAbs, 2 (2010) 212-220.
[21] S. Salgin, S. Takaç, T.H. Özdamar, Adsorption of bovine serum albumin on polyether sulfone ultrafiltration membranes: Determination of interfacial interaction energy and effective diffusion coefficient, J. Membr. Sci., 278 (2006) 251-260.
[22] W. Jiskoot, E.C. Beuvery, A.M. de Koning, J. Herron, D.A. Crommelin, Analytical Approaches to the Study of Monoclonal Antibody Stability, Pharm. Res., 7 (1990) 1234-1241.
[23] K. Ahrer, A. Jungbauer, Chromatographic and electrophoretic characterization of protein variants, J. Chromatogr., B, 841 (2006) 110-122.
[24] R.J. Harris, S.J. Shire, C. Winter, Commercial manufacturing scale formulation and analytical characterization of therapeutic recombinant antibodies, Drug Dev. Res., 61 (2004) 137-154.
[25] J. Zhou, H.-K. Tsao, Y.-J. Sheng, S. Jiang, Monte Carlo simulations of antibody adsorption and orientation on charged surfaces, J. Chem. Phys., 121 (2004) 1050-1057.
[26] K.L. Jones, C.R. O’Melia, Protein and humic acid adsorption onto hydrophilic membrane surfaces: effects of pH and ionic strength, J. Membr. Sci., 165 (2000) 31-46.
[27] Y. Kamiyama, J. Israelachvili, Effect of pH and salt on the adsorption and interactions of an amphoteric polyelectrolyte, Macromolecules, 25 (1992) 5081-5088.
[28] S. Yadav, T.M. Laue, D.S. Kalonia, S.N. Singh, S.J. Shire, The Influence of Charge Distribution on Self-Association and Viscosity Behavior of Monoclonal Antibody Solutions, Mol. Pharm., 9 (2012) 791-802.
[29] A. Kessel, N. Ben-Tal, Introduction to Proteins: Structure, Function, and Motion, CRC Press, Taylor & Francis Group, 2011.

116 Chapter IV
[30] J. Buijs, J.W.T. Lichtenbelt, W. Norde, J. Lyklema, Adsorption of monoclonal IgGs and their F(ab')2 fragments onto polymeric surfaces, Colloids Surf., B, 5 (1995) 11-23.
[31] H. Kawaguchi, K. Sakamoto, Y. Ohtsuka, T. Ohtake, H. Sekiguchi, H. Iri, Fundamental study on latex reagents for agglutination tests, Biomaterials, 10 (1989) 225-229.
[32] R. Ghosh, Membrane chromatographic immunoassay method for rapid quantitative analysis of specific serum antibodies, Biotechnol. Bioeng., 93 (2006) 280-285.
[33] W.L. Hoffman, A.A. Jump, P.J. Kelly, A.O. Ruggles, Binding of antibodies and other proteins to nitrocellulose in acidic, basic, and chaotropic buffers, Anal. Biochem., 198 (1991) 112-118.
[34] M.E. Wiseman, C.W. Frank, Antibody Adsorption and Orientation on Hydrophobic Surfaces, Langmuir, 28 (2011) 1765-1774.

Chapter V
Summary of the Thesis
Adsorption of therapeutic proteins to pharmaceutical packaging materials leads to several
problems such as a loss in protein concentration and potential protein aggregation. These and
the arising consequences, e. g. increased costs and immunogenic risks, were presented in
detail in the general introduction. The two major possibilities to avoid protein adsorption are
the adaption of the formulation and the selection of an appropriate packaging material,
potentially with a suitable coating. This thesis focuses on the protein adsorption to coated
glass vials, especially siliconized glass vials as a commercial, widely used container, but also
to vials coated with protein repellent polyglycerol. Two IgG1 antibodies as therapeutically
relevant proteins and lysozyme as a model protein were used for the adsorption studies and
their adsorption behavior to the coated vials and bare glass vials was investigated.
In chapter II, the influence of various formulation parameters on the adsorption of a
monoclonal IgG1 antibody to siliconized vials and glass vials was investigated. Maximum
adsorption at an acidic pH value between the isoelectric points of the sorbent surface and the
protein demonstrated the importance of attractive electrostatic conditions for the adsorbed
amount. Calculation of the charge transfer between the protein-sorbent interface and the
surrounding solution showed a correlation between the minimum ion uptake into the interface
and the pH of maximum adsorption. A second adsorption maximum around the pI of IgG1
was ascribed to hydrophobic protein-sorbent interactions. In addition, adsorption in presence
of common excipients such as nonionic surfactants, sugars and polyols, as well as at different
ionic strength was investigated. Both tested surfactants polysorbate 80 and poloxamer 188
efficiently reduced IgG1 adsorption to siliconized vials. Long-term storage of IgG1 at
different pH values and temperatures revealed a correlation between the stability of the
protein formulation and the adsorbed amount. For lysozyme, maximum adsorption close to
the pI of the protein demonstrated the prevalent importance of the intermolecular electrostatic
repulsion for the adsorbed amount of this protein.

118 Chapter V
Protein adsorption to new, polyglycerol coated vials was investigated in chapter III. All
coatings efficiently suppressed IgG1 adsorption to the vials at different pH values and ionic
strength. Especially the hyperbranched, non-methoxylated polyglycerol (HPG(OH))-coated
vials showed excellent protein resistant properties even after long-time storage with protein
solution and after sterilization. Polyglycerol coated vials are thus a promising candidate for
the packaging of biopharmaceuticals.
Antibodies are molecules with different subunits which may influence the adsorption behavior
of the whole molecule. Therefore, the IgG1 antibody was cleaved and the adsorption behavior
of the isolated Fc and F(ab’)2 fragments was investigated in siliconized and non-coated glass
vials in chapter IV. The influence of electrostatic and hydrophobic interactions on adsorption
was evaluated by quantifying the adsorbed amount at different pH and ionic strength. On
glass vials, especially electrostatic interactions influenced the adsorption pattern of IgG1 and
the fragments, whereas hydrophobic interactions dominated the adsorption behavior on
siliconized vials when the molecules were weakly charged. Possible molecular orientations
were aligned with the adsorbed amount and an end-on adsorption for highly charged IgG1
was suggested. For siliconized vials, adsorption with the middle region of the antibody at
basic pH conditions was hypothesized.
In summary, the described investigations on protein adsorption to various coated glass
surfaces demonstrated the influence of the formulation composition, the protein and sorbent
charge and the protein stability on the adsorption behavior. Especially the pH value and the
ionic strength were found to affect the adsorbed amount. The study shows that by choosing
appropriate excipients or new coatings such as polyglycerols, the formulation scientist can
effectively minimize the unspecific protein adsorption to packaging materials. Finally, this
thesis may encourage further investigations on the understanding and prevention of protein
adsorption phenomena and the development of new protein repellent packaging materials.