Is exible work precarious? A study based on the 4th ... · isation (= deregulation) of labour...
77
Wirtschafts- und Sozialwissenschaftliches Institut in der Hans-B¨ ockler-Stiftung, D¨ usseldorf Is flexible work precarious? A study based on the 4th European survey of working conditions 2005 1 Andranik S. Tangian WSI-Diskussionspapier Nr. 153 June 2007 Privatdozent Dr. Dr.Sc. Andranik Tangian WSI in der Hans B¨ ockler Stiftung Hans-B¨ ockler-Straße 39 D-40476 D¨ usseldorf Tel: +49 211 7778-259 Fax: +49 211 7778-190 [email protected] WSI-Diskussionspapiere (Print) ISSN 1861-0625 WSI-Diskussionspapiere (Internet) ISSN 1861-0633 http: www.boeckler.de/pdf/p wsi diskp 153 e.pdf 1 Paper at the Conference of the European Foundation for the Improvement of Living and Work- ing Conditions together with the Hans B¨ ockler Foundation Flexicurity: Eine Perspektive f¨ ur flexible Arbeitsm¨ arkte und soziale Sicherheit?, Berlin, July 5–6, 2007. The author thanks Hartmut Seifert for numerous discussions, useful suggestions, and comments to the draft of the paper.
Transcript of Is exible work precarious? A study based on the 4th ... · isation (= deregulation) of labour...
Wirtschafts- und Sozialwissenschaftliches Institut
in der Hans-Bockler-Stiftung, Dusseldorf
Is flexible work precarious?
A study based on the 4th European
survey of working conditions 20051
Andranik S. Tangian
WSI-Diskussionspapier Nr. 153
June 2007
Privatdozent Dr. Dr.Sc. Andranik TangianWSI in der Hans Bockler StiftungHans-Bockler-Straße 39D-40476 DusseldorfTel: +49 211 7778-259Fax: +49 211 [email protected]
WSI-Diskussionspapiere (Print) ISSN 1861-0625
WSI-Diskussionspapiere (Internet) ISSN 1861-0633
http: www.boeckler.de/pdf/p wsi diskp 153 e.pdf
1Paper at the Conference of the European Foundation for the Improvement of Living and Work-ing Conditions together with the Hans Bockler Foundation Flexicurity: Eine Perspektive fur flexible
Arbeitsmarkte und soziale Sicherheit?, Berlin, July 5–6, 2007. The author thanks Hartmut Seifert fornumerous discussions, useful suggestions, and comments to the draft of the paper.

2
Abstract
The analysis of interaction of flexibility and precariousness of work shows that the moreflexible employment, the more it is precarious. For this purpose, two families of indices,of flexible work and of precarious work, are defined basing on the Fourth European Surveyof Working Conditions 2005 by the European Foundation for the Improvement of Livingand Working Conditions (2007a). Two methodologies of constructing composite indicatorsare applied, of the Hans Bockler Foundation, and of the OECD. Both methodologies givevery similar results. After the indices have been constructed, the dependence betweenflexibility and precariousness of work is established by regression analysis with statisticalcertainty.
Besides, it is revealed that the institutional regulation of employment does not nec-essarily imply the adequate factual effect. For instance, Turkey and Greece with a verystrict employment protection legislation have a high labour market flexibility due to alarge fraction of employees who work with no contract.
Among other things, it is shown that the employment flexibility has the strongestnegative effect on the employability. It implies serious arguments against the recentreconsideration of the function of social security attempted by the European Commissionwithin the flexicurity discourse. The suggested shift from income security towards a highemployability cannot be consistently implemented. Our study provides empirical evidencethat a high employability can be hardly attained under flexible employment.
Keywords: Flexicurity, labour flexibility, precarious work, composite indicators, Euro-pean Commission, European Employment Strategy.
JEL Classification:C43 — Index Numbers and Aggregation, C51 — Model Construction and Estimation,J21 — Labor Force and Employment, Size, and Structure, J88 — Public Policy.
3

4
Contents
1 Introduction 71.1 Flexicurity . . . . . . . . . . . . . . . . . . . . . . . . . . . . . . . . . . . . 71.2 Ambiguity in understanding flexicurity . . . . . . . . . . . . . . . . . . . . 81.3 Reconsidering the role of social security . . . . . . . . . . . . . . . . . . . . 91.4 About the given work . . . . . . . . . . . . . . . . . . . . . . . . . . . . . . 10
2 Operationalization of flexibility and precariousness of work 122.1 The 4th European Working Conditions Survey . . . . . . . . . . . . . . . . 122.2 Data structure . . . . . . . . . . . . . . . . . . . . . . . . . . . . . . . . . . 12
3 Individual indices of flexibility and precariousness of work 173.1 Re-coding . . . . . . . . . . . . . . . . . . . . . . . . . . . . . . . . . . . . 173.2 Normalizing (HBS methodology) . . . . . . . . . . . . . . . . . . . . . . . 183.3 Standardizing (OECD methodology) . . . . . . . . . . . . . . . . . . . . . 183.4 Weighting . . . . . . . . . . . . . . . . . . . . . . . . . . . . . . . . . . . . 193.5 First-level and second-level aggregate indices . . . . . . . . . . . . . . . . . 193.6 Methodological reservations . . . . . . . . . . . . . . . . . . . . . . . . . . 20
4 Country indices 214.1 Evaluating countries with respect to survey questions . . . . . . . . . . . . 214.2 Evaluating countries with respect to partial indices . . . . . . . . . . . . . 214.3 Evaluating countries with respect to aggregate indices . . . . . . . . . . . . 22
5 Analysis 235.1 Institutional and factual flexibility of work . . . . . . . . . . . . . . . . . . 235.2 Dependence of precariousness and flexibility of work in Europe . . . . . . . 265.3 Impact of flexibility of work on employability . . . . . . . . . . . . . . . . . 265.4 Dependence of precariousness and flexibility of work in European countries 315.5 Dependence of precariousness and flexibility of work in social groups . . . . 31
6 Conclusions 37
7 References 74
5

6
1 Introduction
1.1 Flexicurity
A spectre is haunting Europe — the spectre of flexicurity2. Indeed, as Keune and Jepsen(2007: 5) write,
Within a very short period of time, flexicurity has become one of the morefashionable elements of the European political discourse addressing social andeconomic policies in general and employment policies in particular. Whereas,until the end of 2004, the concept of flexicurity was discussed largely in a smallacademic circle, today it is at the top of the European agenda.
What is flexicurity, and why did the notion get such a popularity?Fexicurity is generally explained as a policy which should make compatible flexibil-
isation (= deregulation) of labour markets aimed at increasing the competitiveness ofEuropean economy with the European tradition of welfare state based on strong employ-ment security and social security. It can be metaphorically characterized by analogy withthe motto of Prague Spring in 1968 ’socialism with a human face’:
Flexicurity is flexibilization of labour markets with ’a human face’, that is, compen-sated by some social security advantages, in particular, for the groups affected.
The main distinction captured by this metaphorical definition is that flexicurity differsfrom unconditional deregulation by introducing compensatory measures in social securityand employment activation. Respectively, flexicurity is considered as a flexibility–securitytrade-off, that is, as a policy of social compromise (Wilthagen and Tros 2004). Specificunderstandings (definitions) of flexicurity may depend on the country, flexibilization stepssuggested, the tempo of deregulation, the nature of the social advantages proposed, andestimates of their compensatory equivalence. A consensus in balancing these factors is nota purely academic question but rather, like collective agreements, an issue for negotiationbetween social partners: governments, employers, and trade unions.
Historically, the word flexicurity was introduced by a member of the Dutch ScientificCouncil of Government Policy, Professor Hans Adriaansens, and the Dutch Minister ofSocial Affairs, Ad Melkert (Labour Party); see Wilthagen and Tros (2004: 173). Inthe autumn of 1995, Adriaansens launched this catchphrase in speeches and interviews,having defined it as a shift from job security towards employment security. He suggestedcompensating the decreasing job security (fewer permanent jobs and easier dismissals) byimproving employment opportunities and social security. For instance, a relaxation of theemployment protection legislation was supposed to be counterbalanced by providing betterconditions for temporary and part-time workers, supporting life-long professional trainingto facilitate job changes, more favourable regulation of working time and additional socialbenefits.
In December 1995, Ad Melkert presented a memorandum Flexibility and Security,proposing the relaxation of employment protection legislation for permanent employees,
2The paraphrase of the beginning of The Manifesto of the Communist Party by Marx and Engels(1848): A spectre is haunting Europe — the spectre of communism (Ein Gespenst geht um in Europa —das Gespenst des Kommunismus).
7
provided that temporary workers were awarded regular employment status, without how-ever adopting the concept of flexicurity as such. By the end of 1997, the Dutch parliamenthad accepted the flexibility/security proposals and shaped them into laws which came intoforce in 1999.
The OECD (2004b: 97–98) ascribes the origins of flexicurity to Denmark with itsweak employment protection, highly developed social security, and high job availability;see Madsen (2004), Breedgaard et al. (2005). (It is often concealed, however, that therole of employment protection legislation in Denmark is replaced by the intermediationof trade unions which are strongest in Europe with the density 80% in 2004 (EuropeanFoundation 2007b: 6)).
Regardless of the origins of the expression flexicurity, both countries are recognised as’good-practice examples’ (Braun 2001, van Oorschot 2001, Kok et al. 2004) and inspiredthe international flexicurity debate. Although some authors still consider flexicurity aspecifically Dutch/Danish phenomenon (Gorter 2000), the idea spread throughout Europewithin a few years (WSI 2000); for a selection of recent international contributions seeJepsen and Klammer (2004).
The EU made reference to this concept first at the Lisbon summit of 2000 (Vielle andWalthery 2003: 2; Keller and Seifert 2004: 227, Kok et al. 2004). After the meeting inVillach in January 2006 (European Commission 2006a), flexicurity became a top themein the European Commission. At present, the concept is formally stated both in Guide-line No. 21 of the Integrated Guidelines for Growth and Jobs for 2005–2008, and in therefocused Lisbon Strategy; see Trio Presidency Discussion Paper on Flexicurity (2007).
In November 2006 the European Commission (2006c) issued the Green Paper: Mod-ernising Labour Law to Meet the Challenges of the 21st Century. It is aimed at initiatingan open debate on legislating the flexicurity labour market policy. The results of the de-bate should be reflected in a Commission Communication on flexicurity planned for June2007, ’which will set out to develop the arguments in favour of the ”flexicurity” approachand to outline a set of common principles by the end of 2007 to help Member States steerthe reform efforts’ (European Commission 2006c: 4–5).
1.2 Ambiguity in understanding flexicurity
It may look surprising that, though flexicurity is getting to be adopted as a Europeanpolicy, there exists neither its ’official’ definition, nor even an unambiguous idea of it,to say nothing of steering and monitoring instruments (Seifert 2007). It is well seenin Chapter 2 on flexicurity in Employment in Europe 2006 by the European Commision(2006b) which cites the academic definition by Wilthagen and Tros (2004) and benchmarkscountries with the OECD partial quite controversial indicators of social security.
Neither flexicurity is defined in the Green Paper cited, where the word is first intro-duced in quotation marks as a metaphor (p. 4) and afterwards is used without. Avoidingto formulate a definition, the Green Paper refers nevertheless to three examples: theDutch Flexibility and Security Act 1999 already mentioned, the Austrian Severance Act(Abfertigungsrecht) 2002, which launched a kind of firing insurance to facilitate dismissalsand labour market transitions, and the June 2006 Spanish decree easing the conversionof temporary labour contracts into open-ended ones with reduced dismissal costs (Euro-pean Commission 2006c: 10). These reforms enhance labour market flexibility and at thesame time provide some advantages for certain types of employees; see EIRO (2007) for
8
details. These examples should additionally convince other Member States to pursue theflexicurity policy and to implement corresponding legislation changes.
The same lack of definition was recognized at the Expert meeting on flexicurity strate-gies and the implications of their adoption at the European level on the occasion ofGerman-Portugal-Slovenian presidency in the EU organized by the Portugal governmentin Lisbon on September 25, 2006. The major questions to be discussed there were just onavailable definitions and monitoring instruments; for the full list of questions see Tangian(2006). That is, the policy to be adopted at the European level is still ill-defined andsupported by no empirical feedback.
Several previous studies of the Hans Bockler Foundation attempted to bridge this gapby operationally defining flexicurity and applying this definition to empirically analyseits development in Europe. For this purpose, flexicurity indices for European countrieswere derived from several types of data available from OECD, European Commission,and Eurostat. The results were not encouraging. Contrary to theoretical considerationsand political promises, the current deregulation of European labour markets is not ade-quately compensated by improvements in social security. Flexibilisation has resulted ina disproportional increase in the number of atypically employed (= other than perma-nent full-time, such as part-time, fixed-term) and self-employed (Eurostat 2005, Schmidand Gazier 2002, Seifert and Tangian 2006). The quantitative analysis of the advan-tages/disadvantages of flexicurity with respect to the size of the groups affected revealsrather negative trends. The account of advantages and disadvantages shows that the gainsare smaller than the losses and the winners are fewer than the losers (Tangian 2005–2007).
1.3 Reconsidering the role of social security
The empirical studies of the Hans-Bockler Foundation on flexicurity were based on thetraditional definition of social security. However, as emphasized in Employment in Europe2006 by the European Commission (2006b: 78):
The main trust of the EU recommendation on flexicurity is to encourage ashift . . . towards employment security. . . . In particular, investing in humancapital is vital both to improve the long-term employment prospects and theemployment security of the individual, and also to enhance the competitivenessand adaptability of the labour force. . .
Keune and Jepsen (2007: 14) emphasize that, in the context of flexicurity discourse,the European Commission reconsiders the very idea of social security. Namely, instead ofincome security, the European Commission puts forward the employability as its keystone:
Employability is seen as the key for individuals to be able to make transitionsfrom job to job, and from unemployment or inactivity to employment. Indi-viduals derive security from employability, since it improves their employmentchances. As Barroso put it: It is a fact of life that people may experiencespells of unemployment but, by improving their skills, they will be in a posi-tion to find a new job as quickly as possible (2006 European Year of Workers’Mobility Launch Conference, Brussels, 20 February 2006).
. . . Summarising, the Commissions flexicurity concept calls for (i) higher flex-ibility through the increased use of flexible contracts and the limiting of job
9
protection; and (ii) increased security through lifelong learning which is sup-posed to improve employability.
According to the aim of flexicurity, the flexibilisation should improve firms’ perfor-mance, which in turn should foster production and animate labour markets, creating’more and better jobs’, as declared at the EU Lisbon summit 2000. The ’better jobs’are not specified but likely follow the ILO (1999) concept of decent work, ‘the convergingfocus of all [ILO’s] four strategic objectives: the promotion of rights at work; employment;social protection; and social dialogue’, where employability plays one of central roles.
To make the idea of decent work clearer, the ILO report cited juxtaposes decent andprecarious work, another new notion which got a particular attention of policy makersand scholars. As the opposite to decent work, precarious work is characterized by lowerincome, lower employment stability, lower employability, and lower integration in socialsecurity schemata; for details see Keller and Seifert (2006).
Due to the lack of unambiguous definition, politicians and scholars use the word flex-icurity, but charge it with their own meaning. Thus, within the flexicurity debate, theEuropean Commission refers to social security, normally associated with income secu-rity, but means something different. To reconcile the broad public with the deregulationof labour markets without providing an equivalent income compensation, the commonunderstanding of social security is redefined and fitted to the current policy needs. Inthe new context, the role of social security is essentially linked to employability which isclosely related to decent–precarious employment.
It follows that flexicurity, instead of compensating the deregulation by advantages inincome security (as it sounds) should compensate it by a high employability (reformu-lated goal of social security), or, more generally, offering decent employment rather thanprecarious work. Indeed, to get through these puzzling linguistic tricks, one has to bereally deeply involved in the debate!
1.4 About the given work
Therefore, to analyse the consistency of flexicurity policy in its new understanding, onehas to investigate the impact of flexibility on the decentness—precariousness of work.According to the flexicurity concept, flexible work should in no case be precarious andimply a lower employability, on the contrary, employability should increase to compensatethe negative effects of flexibilisation.
To perform the analysis, two groups of indices, of flexibility and of precariousnessof work, including employability, are defined. The statistical data are from the FourthEuropean Working Conditions Survey 2005 (European Foundation 2007a) which covers31 European countries. The necessity of summary indices for certain groups of questionsof the European surveys of working conditions has been emphasized as early as in thereport by the European Foundation (1997) where a heuristic approach to their estimationhas been outlined, however, with no mathematical model, or specific examples.
In constructing the indices of flexibility and precariousness of work, we apply twomethodologies. The first one has been developed in the Hans Bockler Foundation andimplemented in several applications. Among other things, it has been used to constructcomposite indicators of working conditions, in particular of flexibility of working time,basing on the previous Third European Survey of Working Conditions of the European
10
Foundation; see Tangian (2005, 2007). The papers cited also describe the relation of thismethodology to other existing ones.
For comparisons, we construct the same indices with the methodology of the JointResearch Center of the European Commission and OECD; see European Commission(2002), OECD (2002, 2003), OECD–JRC (2005), Munda and Nardo (2003), Pastille(2002), Saisana, Saltelli and Tarantola (2005), Saltelli (2003), and Sendzimir (2004). Itsmain distinction is a special scaling procedure which will be described below.
The empirical analysis with both methodologies reveals very similar trends. It defini-tively disproves the belief that flexibilisation of work can be compensated by high em-ployability. It turns out that flexibilization and employability are even little compatiblewith each other. There is a statistically significant correlation between flexibility andprecariousness of work with the most strong negative impact just on employability.
It implies serious arguments against the reconsideration of the function of social se-curity attempted by the European Commission within the flexicurity discourse. Thesuggested shift from income security towards a high employability cannot be consistentlyimplemented. Our study provides empirical evidence that a high employability can behardly attained under flexible employment.
We conclude that even the reconsideration of traditional understanding of Europeansocial security fails to make flexibilisation acceptable from the standpoint of social objec-tives. Instead of experimenting with people, the Commission should rather carry out aprofound comprehensive analysis of the consequences of the reforms recommended.
11
2 Operationalization of flexibility and precariousness
of work
2.1 The 4th European Working Conditions Survey
Our goal is to define several composite indices for every employee, characterizing thedegree of flexibility and precariousness of his/her work. Then we shall analyze flexibilityand precariousness of work as well as their interdependence by analyzing these indices.
As already mentioned, the statistical data are taken from the Fourth European WorkingConditions Survey of the European Foundation (2007a) which is based on a questionnairewith over 200 questions related to various aspects of working conditions (Ibid.: 109–134). A number of questions are devoted to the degree of flexibility and to the degree ofprecariousness of work.
In the Survey, 29860 persons from 31 European countries (EU-25 and Bulgaria, Croa-tia, Romania, Turkey, Norway, and Switzerland) were interviewed by national institutes(Ibid.: 107–108) in the period from 19th September to 30th November 2005 (Ibid.: 93).Each country is represented by ca. 1000 interviews, except for Cyprus, Estonia, Malta,Luxembourg, and Slovenia with about 600 interviews each. The interviewed persons wereselected by the method of random walk (Ibid.: 94).
Nevertheless, the Survey has a certain bias in the data collected. It is explained by thedifficulty in accessing some persons and by the inapplicability of the Eurostat definitionof employment ‘to real-life situations, especially in less standard-industrial types of em-ployment such as agricultural work, family business, etc.’ (Ibid.: 95). In particular, thebias manifests itself in income of respondents which national means deviate significantlyfrom official statistical figures. The Survey uses harmonized units — income of deciles(10%-population groups ordered by income, Ibid.: 99), so that every national averageshould be close to 5.5. However, the Belgian national average of respondents is 7.63; seeSheet O of Table 3 at the end of the paper. For as many as 798 respondents, such a highfigure is very unlikely to occur by chance alone. It rather results from underrepresentinglow-income groups.
For our analysis, only employees are retained. Trainees, self-employed, and unem-ployed are excluded. It is done according to the interview questions q3a and q3b on theemployment status. The number of persons considered is thereby reduced to 23788.
2.2 Data structure
The data structure for the model is represented in Table 1. The answers of individualsconstitute the rows of the table numbered from 1 to 23788. The columns contain codedanswers of individuals to the survey questions relevant to our study. The selected questionsare grouped into three sections.
Classifiers. This section consists of the questions which are not used in constructingthe indices but are necessary to classify individuals by country, by industrial branch,by gender, etc., for comparative analysis of countries and social groups.
• Country (variable countcod of the data set): BE—Belgium, CZ—Czech Re-public, DK—Denmark, DE—Germany, etc.
12
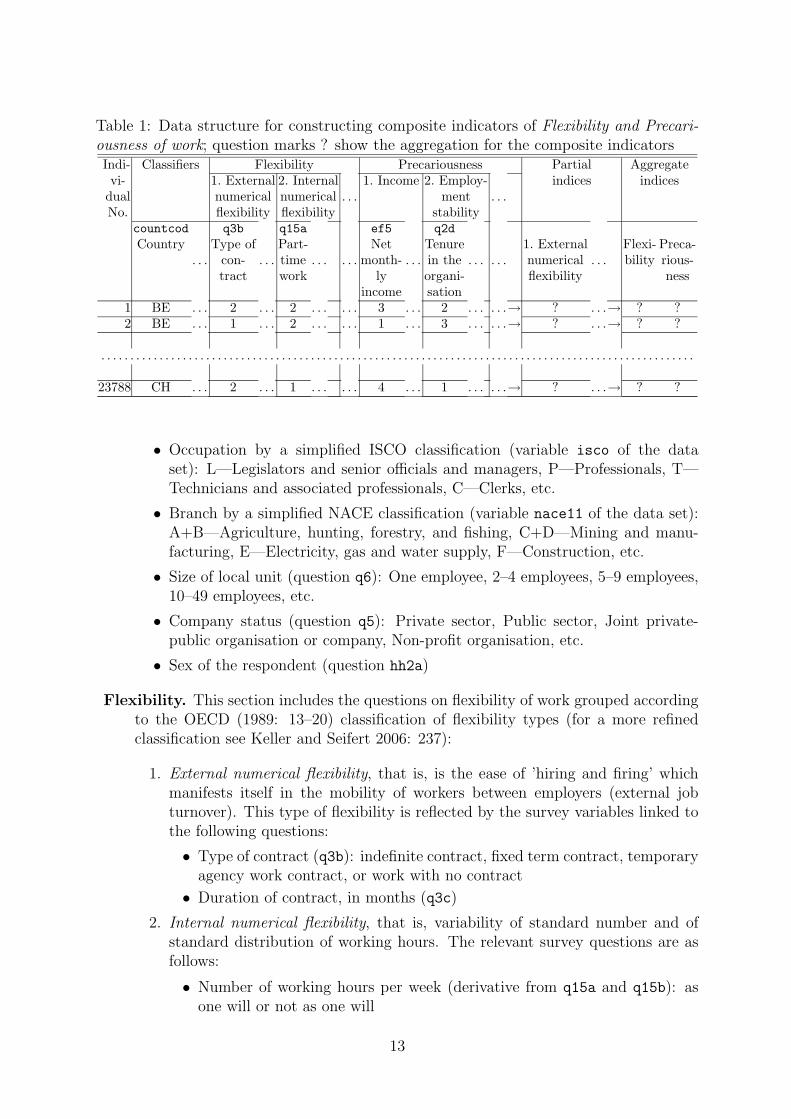
Table 1: Data structure for constructing composite indicators of Flexibility and Precari-ousness of work; question marks ? show the aggregation for the composite indicatorsIndi- Classifiers Flexibility Precariousness Partial Aggregatevi-
dualNo.
1. Externalnumericalflexibility
2. Internalnumericalflexibility
. . .1. Income 2. Employ-
mentstability
. . .indices indices
countcod
Country. . .
q3b
Type ofcon-tract
. . .
q15a
Part-timework
. . . . . .
ef5
Netmonth-
lyincome
. . .
q2d
Tenurein theorgani-sation
. . . . . .1. Externalnumericalflexibility
. . .Flexi-bility
Preca-rious-ness
1 BE . . . 2 . . . 2 . . . . . . 3 . . . 2 . . . . . .→ ? . . .→ ? ?2 BE . . . 1 . . . 2 . . . . . . 1 . . . 3 . . . . . .→ ? . . .→ ? ?
. . . . . . . . . . . . . . . . . . . . . . . . . . . . . . . . . . . . . . . . . . . . . . . . . . . . . . . . . . . . . . . . . . . . . . . . . . . . . . . . . . . . . . . . . . . . . . . . . . . . . .
23788 CH . . . 2 . . . 1 . . . . . . 4 . . . 1 . . . . . .→ ? . . .→ ? ?
• Occupation by a simplified ISCO classification (variable isco of the dataset): L—Legislators and senior officials and managers, P—Professionals, T—Technicians and associated professionals, C—Clerks, etc.
• Branch by a simplified NACE classification (variable nace11 of the data set):A+B—Agriculture, hunting, forestry, and fishing, C+D—Mining and manu-facturing, E—Electricity, gas and water supply, F—Construction, etc.
• Size of local unit (question q6): One employee, 2–4 employees, 5–9 employees,10–49 employees, etc.
• Company status (question q5): Private sector, Public sector, Joint private-public organisation or company, Non-profit organisation, etc.
• Sex of the respondent (question hh2a)
Flexibility. This section includes the questions on flexibility of work grouped accordingto the OECD (1989: 13–20) classification of flexibility types (for a more refinedclassification see Keller and Seifert 2006: 237):
1. External numerical flexibility, that is, is the ease of ’hiring and firing’ whichmanifests itself in the mobility of workers between employers (external jobturnover). This type of flexibility is reflected by the survey variables linked tothe following questions:
• Type of contract (q3b): indefinite contract, fixed term contract, temporaryagency work contract, or work with no contract
• Duration of contract, in months (q3c)
2. Internal numerical flexibility, that is, variability of standard number and ofstandard distribution of working hours. The relevant survey questions are asfollows:
• Number of working hours per week (derivative from q15a and q15b): asone will or not as one will
13
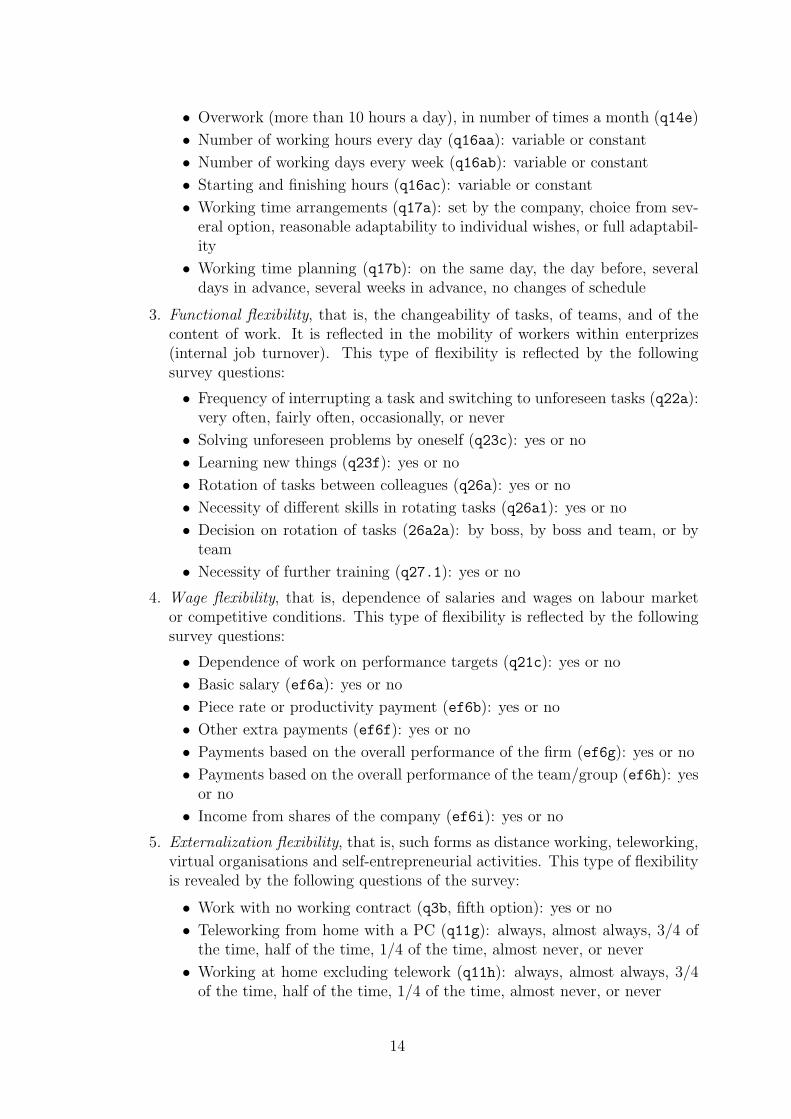
• Overwork (more than 10 hours a day), in number of times a month (q14e)
• Number of working hours every day (q16aa): variable or constant
• Number of working days every week (q16ab): variable or constant
• Starting and finishing hours (q16ac): variable or constant
• Working time arrangements (q17a): set by the company, choice from sev-eral option, reasonable adaptability to individual wishes, or full adaptabil-ity
• Working time planning (q17b): on the same day, the day before, severaldays in advance, several weeks in advance, no changes of schedule
3. Functional flexibility, that is, the changeability of tasks, of teams, and of thecontent of work. It is reflected in the mobility of workers within enterprizes(internal job turnover). This type of flexibility is reflected by the followingsurvey questions:
• Frequency of interrupting a task and switching to unforeseen tasks (q22a):very often, fairly often, occasionally, or never
• Solving unforeseen problems by oneself (q23c): yes or no
• Learning new things (q23f): yes or no
• Rotation of tasks between colleagues (q26a): yes or no
• Necessity of different skills in rotating tasks (q26a1): yes or no
• Decision on rotation of tasks (26a2a): by boss, by boss and team, or byteam
• Necessity of further training (q27.1): yes or no
4. Wage flexibility, that is, dependence of salaries and wages on labour marketor competitive conditions. This type of flexibility is reflected by the followingsurvey questions:
• Dependence of work on performance targets (q21c): yes or no
• Basic salary (ef6a): yes or no
• Piece rate or productivity payment (ef6b): yes or no
• Other extra payments (ef6f): yes or no
• Payments based on the overall performance of the firm (ef6g): yes or no
• Payments based on the overall performance of the team/group (ef6h): yesor no
• Income from shares of the company (ef6i): yes or no
5. Externalization flexibility, that is, such forms as distance working, teleworking,virtual organisations and self-entrepreneurial activities. This type of flexibilityis revealed by the following questions of the survey:
• Work with no working contract (q3b, fifth option): yes or no
• Teleworking from home with a PC (q11g): always, almost always, 3/4 ofthe time, half of the time, 1/4 of the time, almost never, or never
• Working at home excluding telework (q11h): always, almost always, 3/4of the time, half of the time, 1/4 of the time, almost never, or never
14
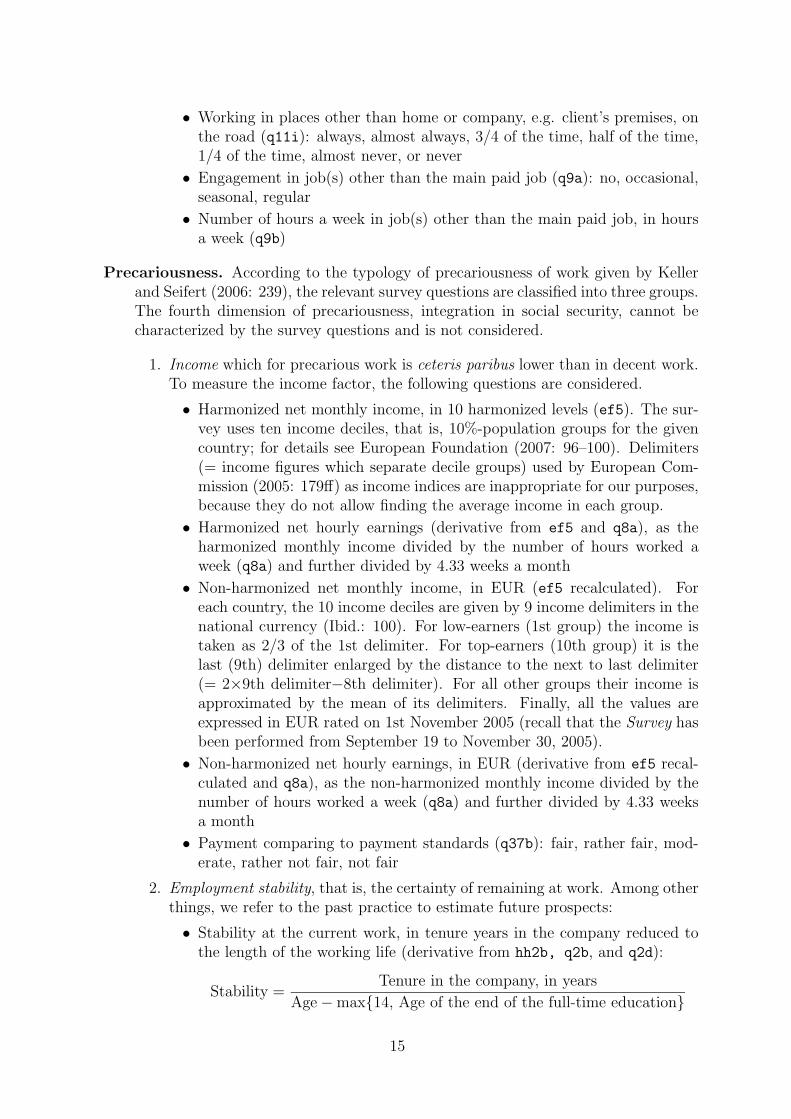
• Working in places other than home or company, e.g. client’s premises, onthe road (q11i): always, almost always, 3/4 of the time, half of the time,1/4 of the time, almost never, or never
• Engagement in job(s) other than the main paid job (q9a): no, occasional,seasonal, regular
• Number of hours a week in job(s) other than the main paid job, in hoursa week (q9b)
Precariousness. According to the typology of precariousness of work given by Kellerand Seifert (2006: 239), the relevant survey questions are classified into three groups.The fourth dimension of precariousness, integration in social security, cannot becharacterized by the survey questions and is not considered.
1. Income which for precarious work is ceteris paribus lower than in decent work.To measure the income factor, the following questions are considered.
• Harmonized net monthly income, in 10 harmonized levels (ef5). The sur-vey uses ten income deciles, that is, 10%-population groups for the givencountry; for details see European Foundation (2007: 96–100). Delimiters(= income figures which separate decile groups) used by European Com-mission (2005: 179ff) as income indices are inappropriate for our purposes,because they do not allow finding the average income in each group.
• Harmonized net hourly earnings (derivative from ef5 and q8a), as theharmonized monthly income divided by the number of hours worked aweek (q8a) and further divided by 4.33 weeks a month
• Non-harmonized net monthly income, in EUR (ef5 recalculated). Foreach country, the 10 income deciles are given by 9 income delimiters in thenational currency (Ibid.: 100). For low-earners (1st group) the income istaken as 2/3 of the 1st delimiter. For top-earners (10th group) it is thelast (9th) delimiter enlarged by the distance to the next to last delimiter(= 2×9th delimiter−8th delimiter). For all other groups their income isapproximated by the mean of its delimiters. Finally, all the values areexpressed in EUR rated on 1st November 2005 (recall that the Survey hasbeen performed from September 19 to November 30, 2005).
• Non-harmonized net hourly earnings, in EUR (derivative from ef5 recal-culated and q8a), as the non-harmonized monthly income divided by thenumber of hours worked a week (q8a) and further divided by 4.33 weeksa month
• Payment comparing to payment standards (q37b): fair, rather fair, mod-erate, rather not fair, not fair
2. Employment stability, that is, the certainty of remaining at work. Among otherthings, we refer to the past practice to estimate future prospects:
• Stability at the current work, in tenure years in the company reduced tothe length of the working life (derivative from hh2b, q2b, and q2d):
Stability =Tenure in the company, in years
Age − max{14, Age of the end of the full-time education}
15
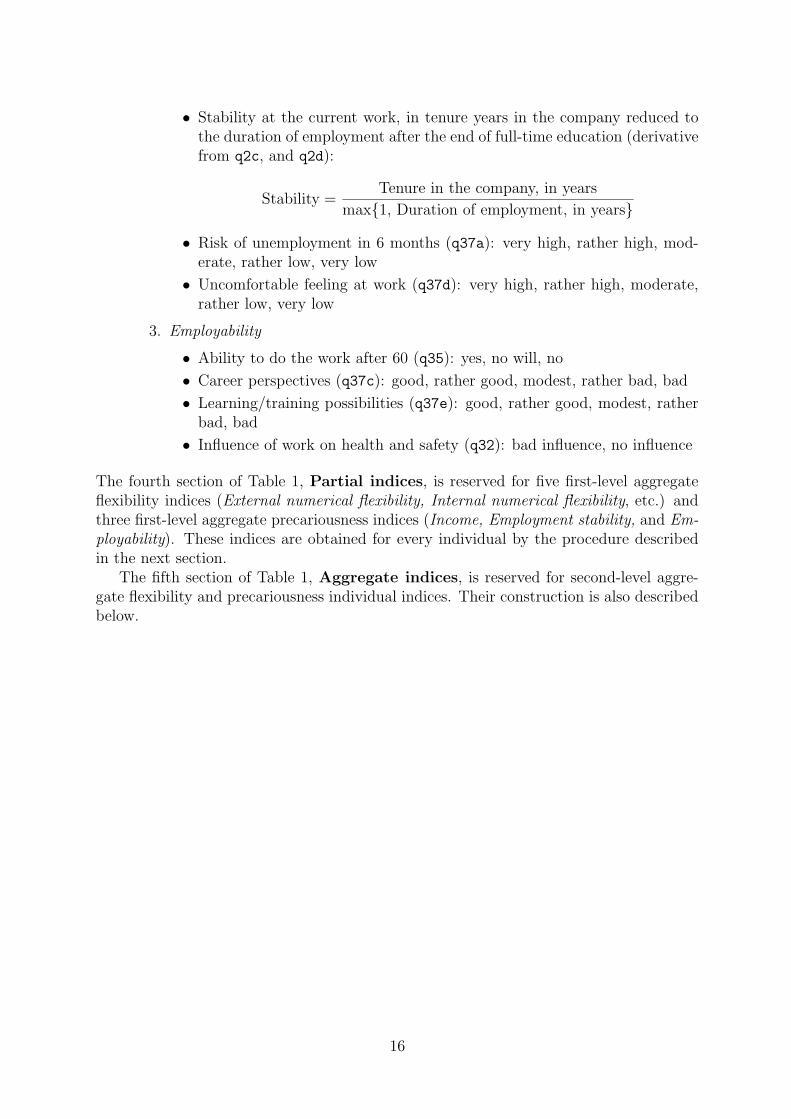
• Stability at the current work, in tenure years in the company reduced tothe duration of employment after the end of full-time education (derivativefrom q2c, and q2d):
Stability =Tenure in the company, in years
max{1, Duration of employment, in years}
• Risk of unemployment in 6 months (q37a): very high, rather high, mod-erate, rather low, very low
• Uncomfortable feeling at work (q37d): very high, rather high, moderate,rather low, very low
3. Employability
• Ability to do the work after 60 (q35): yes, no will, no
• Career perspectives (q37c): good, rather good, modest, rather bad, bad
• Learning/training possibilities (q37e): good, rather good, modest, ratherbad, bad
• Influence of work on health and safety (q32): bad influence, no influence
The fourth section of Table 1, Partial indices, is reserved for five first-level aggregateflexibility indices (External numerical flexibility, Internal numerical flexibility, etc.) andthree first-level aggregate precariousness indices (Income, Employment stability, and Em-ployability). These indices are obtained for every individual by the procedure describedin the next section.
The fifth section of Table 1, Aggregate indices, is reserved for second-level aggre-gate flexibility and precariousness individual indices. Their construction is also describedbelow.
16
3 Individual indices of flexibility and precariousness
of work
Recall that a composite indicator is a weighted sum of several low-level indicators whichweights reflect their relative importance (= substitution rates). The main task is bringingdifferent answer formats (yes/no, multiple cases, successive grades, numbers) to a unifyingscale which would allow a meaningful summation of the answers.
Describe the construction of the indices step-by-step.
3.1 Re-coding
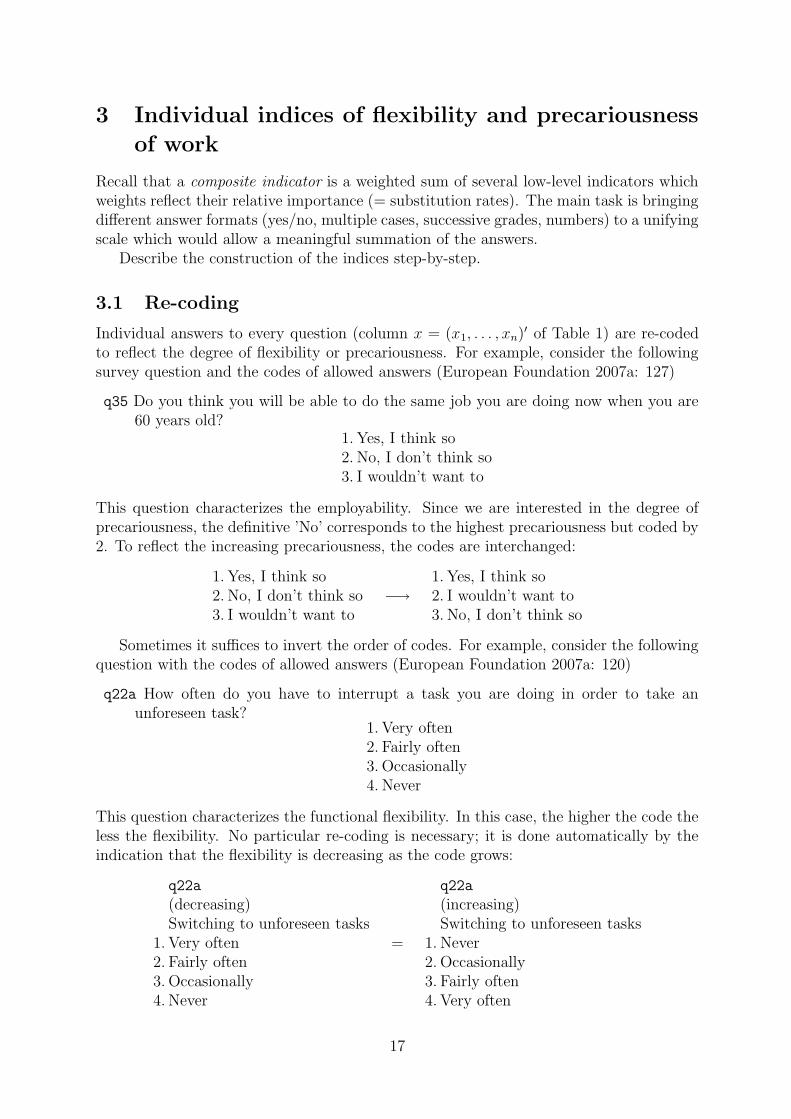
Individual answers to every question (column x = (x1, . . . , xn)′ of Table 1) are re-codedto reflect the degree of flexibility or precariousness. For example, consider the followingsurvey question and the codes of allowed answers (European Foundation 2007a: 127)
q35 Do you think you will be able to do the same job you are doing now when you are60 years old?
1. Yes, I think so2. No, I don’t think so3. I wouldn’t want to
This question characterizes the employability. Since we are interested in the degree ofprecariousness, the definitive ’No’ corresponds to the highest precariousness but coded by2. To reflect the increasing precariousness, the codes are interchanged:
1. Yes, I think so2. No, I don’t think so3. I wouldn’t want to
−→1. Yes, I think so2. I wouldn’t want to3. No, I don’t think so
Sometimes it suffices to invert the order of codes. For example, consider the followingquestion with the codes of allowed answers (European Foundation 2007a: 120)
q22a How often do you have to interrupt a task you are doing in order to take anunforeseen task?
1. Very often2. Fairly often3. Occasionally4. Never
This question characterizes the functional flexibility. In this case, the higher the code theless the flexibility. No particular re-coding is necessary; it is done automatically by theindication that the flexibility is decreasing as the code grows:
q22a
(decreasing)Switching to unforeseen tasks
1. Very often2. Fairly often3. Occasionally4. Never
=
q22a
(increasing)Switching to unforeseen tasks
1. Never2. Occasionally3. Fairly often4. Very often
17
3.2 Normalizing (HBS methodology)
The next step is scaling re-coded variables (columns of codes in Table 1) in a commensu-rable way. Every variable is either normalized or standardized, depending on the method-ology. The HBS methodology uses the normalization, that is, bringing the variable rangeto [0; 100]. For this purpose, every variable x (column of Table 1) is transformed in
y =x − xmin
xmax − xmin
· 100% .
The effect of this procedure is that the re-scaled indicator takes values between 0 and100, so that y means the percentage of the absolute maximum. For instance, the answers1, 2, 3, and 4 to the above cited question q22a are normalized to values 0, 33, 67, and100%. This scale allows to interpret values of the indices in absolute terms like good orbad, very flexible, or not at all flexible, etc.
Normalization is not applicable to data with outliers — occasional deviations from‘typical’ values. In this case normalization makes the ‘typical’ values almost indistin-guishable. For instance, suppose that numerous ‘typical’ observations are all locatedaround 0 and a single outlier is equal to 1. Then the normalization clusters the ‘typical’observations, attributing them almost equally low values.
The data of the Survey do not contain outliers, because the codes of answers to surveyquestions are restricted to a few given values. Continuous variables of large range arecalibrated. For instance, income is restricted to 10 deciles (European Foundation 2007a:99). Therefore, normalization can be consistently applied.
3.3 Standardizing (OECD methodology)
An alternative scaling is recommended by the OECD. Every variable is standardized, thatis, reduced to the zero-mean and re-scaled to make its standard deviation equal to 1, and(optionally) expressed in %. For this purpose, every variable x = (x1, . . . , xn)′ — columnof Table 1 — is transformed to
y =x − µ
σ· 100% (standardized variable expressed in %) (1)
where
µ =1
n
n∑
i=1
xi (empirical mean)
σ =
√
√
√
√
1
n − 1
n∑
i=1
(xi − µ)2 (unbiased empirical standard deviation) .
The 0 value of y corresponds to the mean of the variable x, and 100% — to its ‘averagedeviation from the mean’.
Unlike normalization, this method can well discriminate between closely located ‘typ-ical’ values even in the presence of outliers. In this case the small standard deviationfactually enlarges the min–max range and ‘moves’ the ‘typical’ values from each other.
At the same time, standardization relativizes ‘good’ and ‘bad’ values. For example,some indicator A (say, for flexibility) can have high and some indicator B (say, for precar-iousness) can have low values. After standardization, all the values are no longer high or
18
low but medium. For instance, it is impossible to say that flexibile work is little precarious.The only conclusion could be that, for instance, a more flexible work is more precarious.Therefore standardization is adapted rather for benchmarking than for evaluation.
3.4 Weighting
Taking into account advantages and limitations of normalization and standardization,it makes sense to construct indices by both methods. Under both methods, low-levelindividual indices are summarized with or without weights. It should be emphasizedhowever that standardization, changing the effective range of variables, always introducesequalizing weights.
In our model, the summation of recoded normalized or standardized individual answersis performed with equal weights of questions (with reservations for the standardizationwhich implicitly imposes equalizing weights). The reasons are threefold. Firstly, unequalweights need special motivation, and we have none.
Secondly, if certain questions get higher weights then the opinions of those for whomthese questions are of particular importance are overrepresented. For instance, certainfirms can be most interested in external numerical flexibility, others in internal numericalflexibility. Therefore, assigning a higher weight to external numerical flexibility, one firmsare favored at the price of underrepresenting the opinion of others.
Thirdly, it is a statistical tradition to accept the equal distribution (weights) by default,unless no other information is available; such an assumption satisfies the principle ofmaximal likelihood; see Kendall and Moran (1963). According to OECD–JRC (2005:21), ‘most composite indicators rely on equal weighting, i.e., all variables are given thesame weight’.
3.5 First-level and second-level aggregate indices
The first-level aggregate indices, called partial indices, are collected in the fourth sectionof Table 1. Its every column is the mean (= weighted sum with equal coefficients) of thecolumns of low-level indices from the corresponding table section. In case of the OECDmethod the partial indices are additionally standardized column-by column.
For instance, the column External numerical flexibility in the fourth section of Table 1is the normalized sum of the columns Type of contract, etc., from the first section Externalnumerical flexibility. Under the OECD method, the resulting column is standardized.
The second-level aggregate indices of flexibility and precariousness of work constitutecolumns of the fifth section of Table 1. They are constructed from relevant partial indicesexactly in the same way as partial indices are constructed from low-level indicators.
The interpretation of the individual aggregate and partial indices is as follows. Underthe HBS method, a partial index means the average (coded) response of the individualto the questions of the corresponding section of Table 1. 0 and 100 are attained if all thequestions are answered in the most extreme way.
Under the OECD method, a composite indicator is interpreted as a weighted sumof low-level variables, with the weights being inversely proportional to their standarddeviations. Those with smaller deviations get higher weights and thereby become com-mensurable with the variables with large deviations.
19
3.6 Methodological reservations
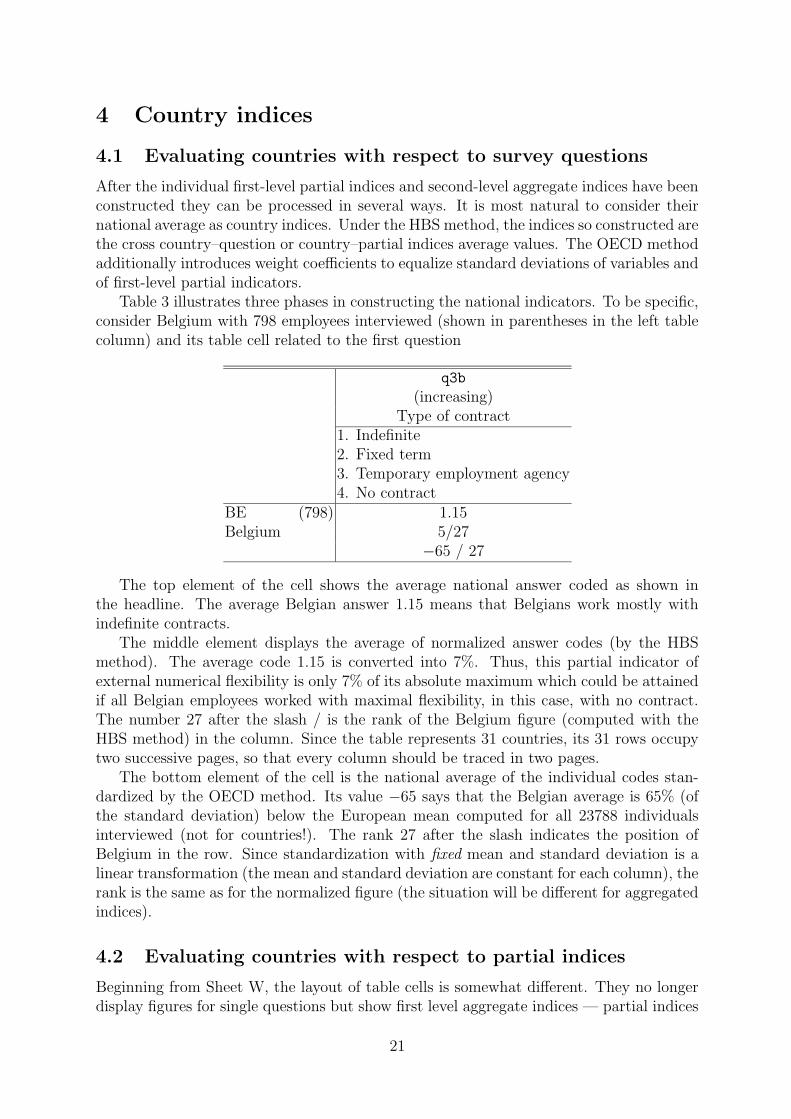
Standardization is a nonlinear non-monotonic transformation. It can happen that answersto a question improve (= the codes increase) but the standardized codes do not. Forexample assume that four individuals answer to a question with possible answers 0, 1, or2 and afterwards all improve their answers:
0001
all answers improve−→
1222
.
After the standardization by formula (1), these codes in % look as follows
−50−50−50
150
some codes decrease−→
−1505050
50
The mean does not grow either (the standardized mean is always equal to 0), so noimprovement can be detected but rather a decline.
Under multiple aggregation, standardization performs indirect weighting of interme-diate aggregates. Due to the non-monotonicity, smaller partial indices (intermediate ag-gregates) can result in a greater final index, and greater partial indices — in a smallerfinal index. It will manifest itself in Figure 2 in Section 4.
Such misleading effects occur under significant variations of individual answers (e.g.in different countries). If variables do not change much then the standardization can beapproximated by its first-order Taylor expansion which is a linear function. Linear func-tions are monotonic, and indices with linear properties are free from the inconsistenciesmentioned. Therefore, the OECD method can be well used locally under one-level aggre-gation. Under multi-level aggregation with successive standardizations, as in our model,results of the OECD method can be difficult to interpret.
20
4 Country indices
4.1 Evaluating countries with respect to survey questions
After the individual first-level partial indices and second-level aggregate indices have beenconstructed they can be processed in several ways. It is most natural to consider theirnational average as country indices. Under the HBS method, the indices so constructed arethe cross country–question or country–partial indices average values. The OECD methodadditionally introduces weight coefficients to equalize standard deviations of variables andof first-level partial indicators.
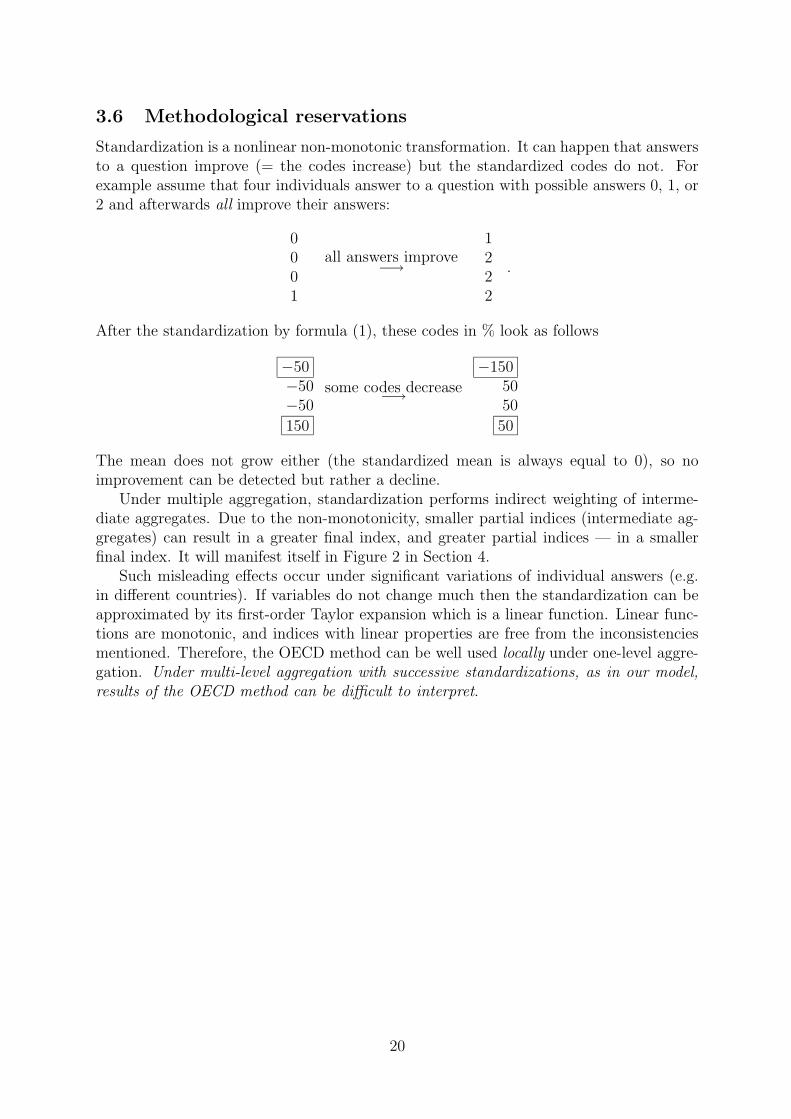
Table 3 illustrates three phases in constructing the national indicators. To be specific,consider Belgium with 798 employees interviewed (shown in parentheses in the left tablecolumn) and its table cell related to the first question
q3b
(increasing)Type of contract
1. Indefinite2. Fixed term3. Temporary employment agency4. No contract
BE (798) 1.15Belgium 5/27
−65 / 27
The top element of the cell shows the average national answer coded as shown inthe headline. The average Belgian answer 1.15 means that Belgians work mostly withindefinite contracts.
The middle element displays the average of normalized answer codes (by the HBSmethod). The average code 1.15 is converted into 7%. Thus, this partial indicator ofexternal numerical flexibility is only 7% of its absolute maximum which could be attainedif all Belgian employees worked with maximal flexibility, in this case, with no contract.The number 27 after the slash / is the rank of the Belgium figure (computed with theHBS method) in the column. Since the table represents 31 countries, its 31 rows occupytwo successive pages, so that every column should be traced in two pages.
The bottom element of the cell is the national average of the individual codes stan-dardized by the OECD method. Its value −65 says that the Belgian average is 65% (ofthe standard deviation) below the European mean computed for all 23788 individualsinterviewed (not for countries!). The rank 27 after the slash indicates the position ofBelgium in the row. Since standardization with fixed mean and standard deviation is alinear transformation (the mean and standard deviation are constant for each column), therank is the same as for the normalized figure (the situation will be different for aggregatedindices).
4.2 Evaluating countries with respect to partial indices
Beginning from Sheet W, the layout of table cells is somewhat different. They no longerdisplay figures for single questions but show first level aggregate indices — partial indices
21
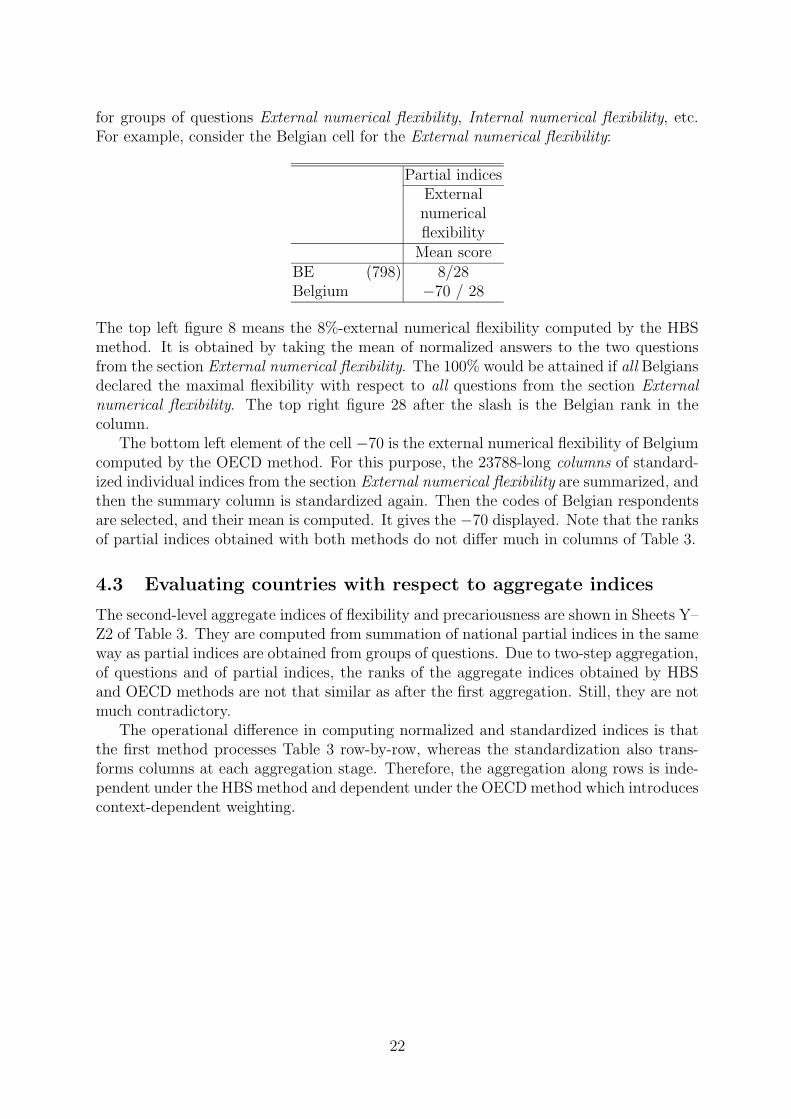
for groups of questions External numerical flexibility, Internal numerical flexibility, etc.For example, consider the Belgian cell for the External numerical flexibility:
Partial indicesExternalnumericalflexibility
Mean scoreBE (798) 8/28Belgium −70 / 28
The top left figure 8 means the 8%-external numerical flexibility computed by the HBSmethod. It is obtained by taking the mean of normalized answers to the two questionsfrom the section External numerical flexibility. The 100% would be attained if all Belgiansdeclared the maximal flexibility with respect to all questions from the section Externalnumerical flexibility. The top right figure 28 after the slash is the Belgian rank in thecolumn.
The bottom left element of the cell −70 is the external numerical flexibility of Belgiumcomputed by the OECD method. For this purpose, the 23788-long columns of standard-ized individual indices from the section External numerical flexibility are summarized, andthen the summary column is standardized again. Then the codes of Belgian respondentsare selected, and their mean is computed. It gives the −70 displayed. Note that the ranksof partial indices obtained with both methods do not differ much in columns of Table 3.
4.3 Evaluating countries with respect to aggregate indices
The second-level aggregate indices of flexibility and precariousness are shown in Sheets Y–Z2 of Table 3. They are computed from summation of national partial indices in the sameway as partial indices are obtained from groups of questions. Due to two-step aggregation,of questions and of partial indices, the ranks of the aggregate indices obtained by HBSand OECD methods are not that similar as after the first aggregation. Still, they are notmuch contradictory.
The operational difference in computing normalized and standardized indices is thatthe first method processes Table 3 row-by-row, whereas the standardization also trans-forms columns at each aggregation stage. Therefore, the aggregation along rows is inde-pendent under the HBS method and dependent under the OECD method which introducescontext-dependent weighting.
22
5 Analysis
5.1 Institutional and factual flexibility of work
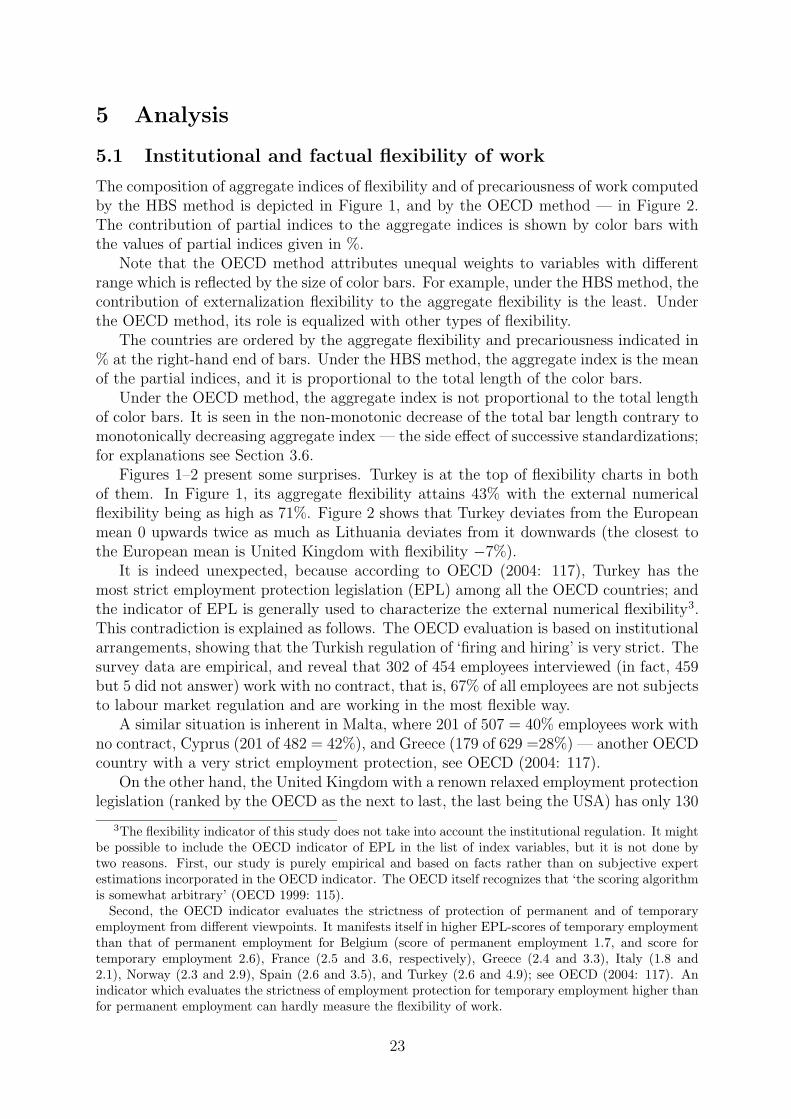
The composition of aggregate indices of flexibility and of precariousness of work computedby the HBS method is depicted in Figure 1, and by the OECD method — in Figure 2.The contribution of partial indices to the aggregate indices is shown by color bars withthe values of partial indices given in %.
Note that the OECD method attributes unequal weights to variables with differentrange which is reflected by the size of color bars. For example, under the HBS method, thecontribution of externalization flexibility to the aggregate flexibility is the least. Underthe OECD method, its role is equalized with other types of flexibility.
The countries are ordered by the aggregate flexibility and precariousness indicated in% at the right-hand end of bars. Under the HBS method, the aggregate index is the meanof the partial indices, and it is proportional to the total length of the color bars.
Under the OECD method, the aggregate index is not proportional to the total lengthof color bars. It is seen in the non-monotonic decrease of the total bar length contrary tomonotonically decreasing aggregate index — the side effect of successive standardizations;for explanations see Section 3.6.
Figures 1–2 present some surprises. Turkey is at the top of flexibility charts in bothof them. In Figure 1, its aggregate flexibility attains 43% with the external numericalflexibility being as high as 71%. Figure 2 shows that Turkey deviates from the Europeanmean 0 upwards twice as much as Lithuania deviates from it downwards (the closest tothe European mean is United Kingdom with flexibility −7%).
It is indeed unexpected, because according to OECD (2004: 117), Turkey has themost strict employment protection legislation (EPL) among all the OECD countries; andthe indicator of EPL is generally used to characterize the external numerical flexibility3.This contradiction is explained as follows. The OECD evaluation is based on institutionalarrangements, showing that the Turkish regulation of ‘firing and hiring’ is very strict. Thesurvey data are empirical, and reveal that 302 of 454 employees interviewed (in fact, 459but 5 did not answer) work with no contract, that is, 67% of all employees are not subjectsto labour market regulation and are working in the most flexible way.
A similar situation is inherent in Malta, where 201 of 507 = 40% employees work withno contract, Cyprus (201 of 482 = 42%), and Greece (179 of 629 =28%) — another OECDcountry with a very strict employment protection, see OECD (2004: 117).
On the other hand, the United Kingdom with a renown relaxed employment protectionlegislation (ranked by the OECD as the next to last, the last being the USA) has only 130
3The flexibility indicator of this study does not take into account the institutional regulation. It mightbe possible to include the OECD indicator of EPL in the list of index variables, but it is not done bytwo reasons. First, our study is purely empirical and based on facts rather than on subjective expertestimations incorporated in the OECD indicator. The OECD itself recognizes that ‘the scoring algorithmis somewhat arbitrary’ (OECD 1999: 115).
Second, the OECD indicator evaluates the strictness of protection of permanent and of temporaryemployment from different viewpoints. It manifests itself in higher EPL-scores of temporary employmentthan that of permanent employment for Belgium (score of permanent employment 1.7, and score fortemporary employment 2.6), France (2.5 and 3.6, respectively), Greece (2.4 and 3.3), Italy (1.8 and2.1), Norway (2.3 and 2.9), Spain (2.6 and 3.5), and Turkey (2.6 and 4.9); see OECD (2004: 117). Anindicator which evaluates the strictness of employment protection for temporary employment higher thanfor permanent employment can hardly measure the flexibility of work.
23
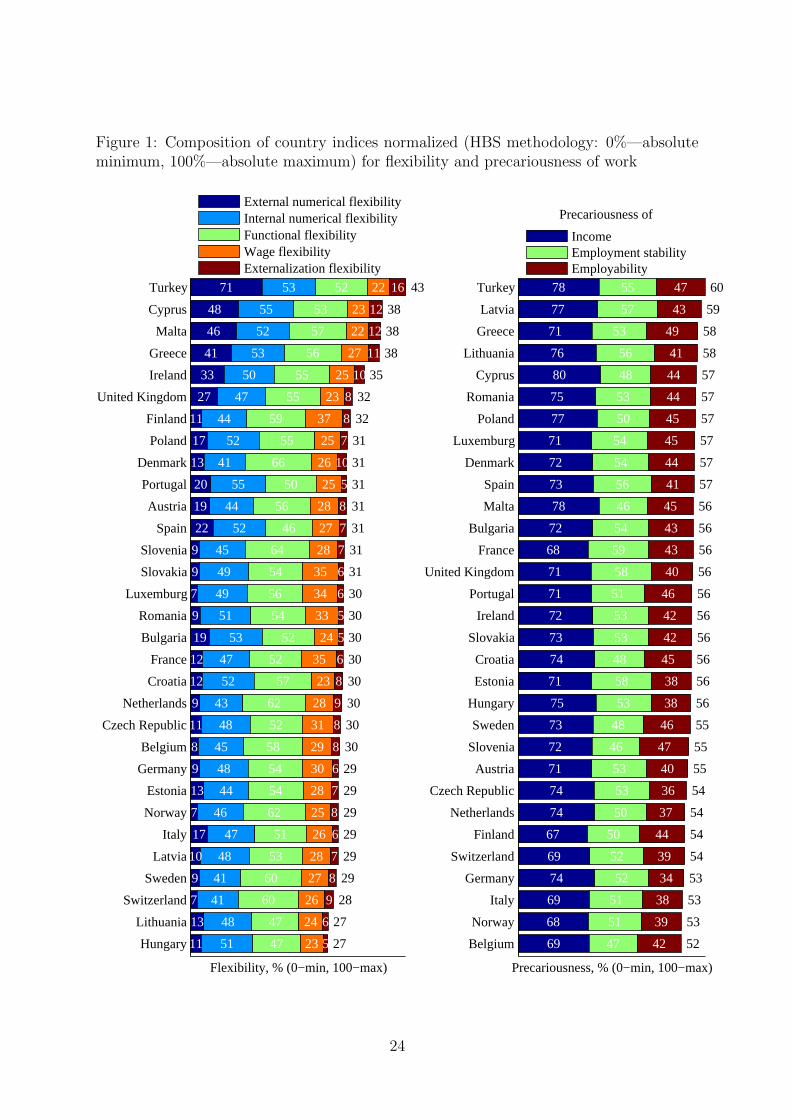
Figure 1: Composition of country indices normalized (HBS methodology: 0%—absoluteminimum, 100%—absolute maximum) for flexibility and precariousness of work
Hungary
Lithuania
Switzerland
Sweden
Latvia
Italy
Norway
Estonia
Germany
Belgium
Czech Republic
Netherlands
Croatia
France
Bulgaria
Romania
Luxemburg
Slovakia
Slovenia
Spain
Austria
Portugal
Denmark
Poland
Finland
United Kingdom
Ireland
Greece
Malta
Cyprus
Turkey
Flexibility, % (0−min, 100−max)
11 51 47 23 5 27
13 48 47 24 6 27
7 41 60 26 9 28
9 41 60 27 8 29
10 48 53 28 7 29
17 47 51 26 6 29
7 46 62 25 8 29
13 44 54 28 7 29
9 48 54 30 6 29
8 45 58 29 8 30
11 48 52 31 8 30
9 43 62 28 9 30
12 52 57 23 8 30
12 47 52 35 6 30
19 53 52 24 5 30
9 51 54 33 5 30
7 49 56 34 6 30
9 49 54 35 6 31
9 45 64 28 7 31
22 52 46 27 7 31
19 44 56 28 8 31
20 55 50 25 5 31
13 41 66 26 1031
17 52 55 25 7 31
11 44 59 37 8 32
27 47 55 23 8 32
33 50 55 25 10 35
41 53 56 27 11 38
46 52 57 22 12 38
48 55 53 23 12 38
71 53 52 22 16 43
External numerical flexibilityInternal numerical flexibilityFunctional flexibilityWage flexibilityExternalization flexibility
Belgium
Norway
Italy
Germany
Switzerland
Finland
Netherlands
Czech Republic
Austria
Slovenia
Sweden
Hungary
Estonia
Croatia
Slovakia
Ireland
Portugal
United Kingdom
France
Bulgaria
Malta
Spain
Denmark
Luxemburg
Poland
Romania
Cyprus
Lithuania
Greece
Latvia
Turkey
Precariousness, % (0−min, 100−max)
69 47 42 52
68 51 39 53
69 51 38 53
74 52 34 53
69 52 39 54
67 50 44 54
74 50 37 54
74 53 36 54
71 53 40 55
72 46 47 55
73 48 46 55
75 53 38 56
71 58 38 56
74 48 45 56
73 53 42 56
72 53 42 56
71 51 46 56
71 58 40 56
68 59 43 56
72 54 43 56
78 46 45 56
73 56 41 57
72 54 44 57
71 54 45 57
77 50 45 57
75 53 44 57
80 48 44 57
76 56 41 58
71 53 49 58
77 57 43 59
78 55 47 60
Precariousness of
IncomeEmployment stabilityEmployability
24
Figure 2: Composition of country indices standardized (OECD methodology: 0%—mean,100%—standard deviation) for flexibility and precariousness of work
Lithuania
Hungary
Italy
Germany
Sweden
Switzerland
Bulgaria
Estonia
Latvia
Austria
France
Portugal
Norway
Spain
Czech Republic
Romania
Belgium
Croatia
Netherlands
Luxemburg
United Kingdom
Poland
Denmark
Slovenia
Finland
Slovakia
Ireland
Malta
Greece
Cyprus
Turkey
Flexibility, % (0−mean, 100−std.dev.)
−35 15 −169−107 −81 −147
−50 83 −151−105−121−136
−10 −27 −83 −35 −115−98
−61 −11 −27 3 −91 −85
−65−191 104 −4 29 −79
−77−183 118 −16 49 −79
2 110 −97 −76 −168−70
−34 −88 −16 20 −20 −65
−57 28 −63 −17 38 −49
2 −131 21 15 −2 −39
−42 −40 −68 164 −88 −36
11 140 −92 −58 −138−32
−76 −71 144 −32 39 −31
27 94 −186 −8 −47 −29
−50 11 −85 89 10 −28
−59 96 −22 56 −117−25
−70 −72 78 51 48 −17
−45 70 48 −104 30 −17
−60 −134 141 22 74 −15
−78 2 18 164 −84 −11
56 −18 −6 −92 −11 −7
−11 91 −2 −46 −3 10
−32 −175 222 −8 124 22
−63 −57 169 106 −39 24
−48 −90 86 174 2 28
−63 38 −36 282 −76 43
101 31 5 −22 58 97
184 92 51 −110 137 189
148 122 18 −27 127 192
199 144 −41 −113 159 192
356 121 −80 −168 279 297
External numerical flexibilityInternal numerical flexibilityFunctional flexibilityWage flexibilityExternalization flexibility
Norway
Switzerland
Belgium
Finland
Netherlands
Germany
Sweden
Italy
Ireland
Denmark
Luxemburg
Austria
Slovenia
Czech Republic
France
Hungary
Cyprus
Greece
Croatia
Portugal
Bulgaria
Estonia
United Kingdom
Malta
Spain
Slovakia
Poland
Romania
Lithuania
Latvia
Turkey
Precariousness, % (0−mean, 100−std.dev.)
−264 −54 −45 −271
−197 −20 −37 −195
−94 −159 19 −136
−148 −87 103 −129
−44 −80 −121 −110
−19 −9 −203 −90
−67 −135 113 −72
−27 −6 −120 −67
−85 15 44 −55
−107 27 115 −46
−117 67 111 −41
−2 20 −65 −16
21 −169 92 −13
89 40 −211 23
−66 206 25 27
98 −7 −147 35
66 −114 68 39
−23 15 160 40
68 −119 79 41
30 −51 122 49
45 43 −17 51
57 138 −149 52
4 142 −7 54
101 −171 89 56
37 107 −28 62
77 37 −36 69
127 −61 29 99
95 25 27 103
98 131 −57 116
115 128 −28 142
133 99 79 182
Precariousness of
IncomeEmployment stabilityEmployability
25
of 876 (= 15%) employees with no contract. Since a relaxed employment protection is stillmore restrictive than none, the United Kingdom with the aggregate flexibility 32% (bythe HBS method; in the estimation by the OECD method it is even under the Europeanmean!) finds itself behind Turkey whose strict legislation is factuall applicable to 1/3 ofemployees only.
Thereby factual and institutional situations drastically differ. The empirical reality isquite far from the institutional picture!
5.2 Dependence of precariousness and flexibility of work in Eu-rope
Figures 3–4 show the location of European countries on the flexibility–precariousnessplane. The regression line in Figure 3 (for the HBS method) computed for 31 Europeancountries shows an increase of the precariousness of work as its flexibility increases. Theregression line has the degree of steepness 28%; see the first regression equation beyond theplot. The negligible small PF = 0.34% excludes the 0-hypothesis, that the real inclinationof the line can be zero.
The country-regression line for the indices constructed by the OECD method in Fig-ure 4 has the degree of steepness 26%, but the countries are located somewhat differently,and the P-value PF = 15.84%.
The second regression line in both plots is fitted to 23788 individuals. It is less steep,having the degree of steepness 12% and 7% for the indices computed by the HBS andOECD methods, respectively (see the second equation over the plots). However, due to amuch larger number of observations than for countries the P-value PF = 0.0000 is negli-gibly small, so that the fact of positive correlation between flexibility and precariousnessof work is statistically certain under both HBS and OECD methods.
Thus, the regression analysis reveals a positive dependence between flexibility and pre-cariousness of work all over Europe.
5.3 Impact of flexibility of work on employability
A more detailed analysis of the impact of flexibility of work on its precariousness isdisplayed in Table 2.
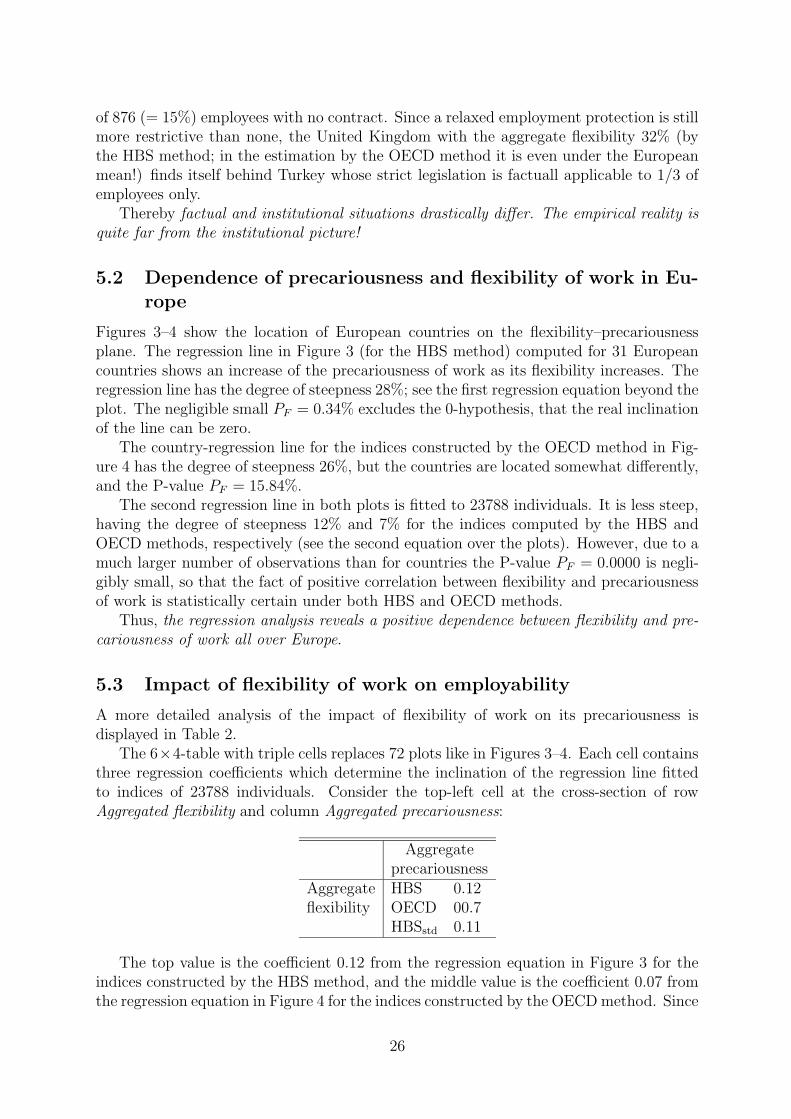
The 6×4-table with triple cells replaces 72 plots like in Figures 3–4. Each cell containsthree regression coefficients which determine the inclination of the regression line fittedto indices of 23788 individuals. Consider the top-left cell at the cross-section of rowAggregated flexibility and column Aggregated precariousness:
Aggregateprecariousness
Aggregate HBS 0.12flexibility OECD 00.7
HBSstd 0.11
The top value is the coefficient 0.12 from the regression equation in Figure 3 for theindices constructed by the HBS method, and the middle value is the coefficient 0.07 fromthe regression equation in Figure 4 for the indices constructed by the OECD method. Since
26
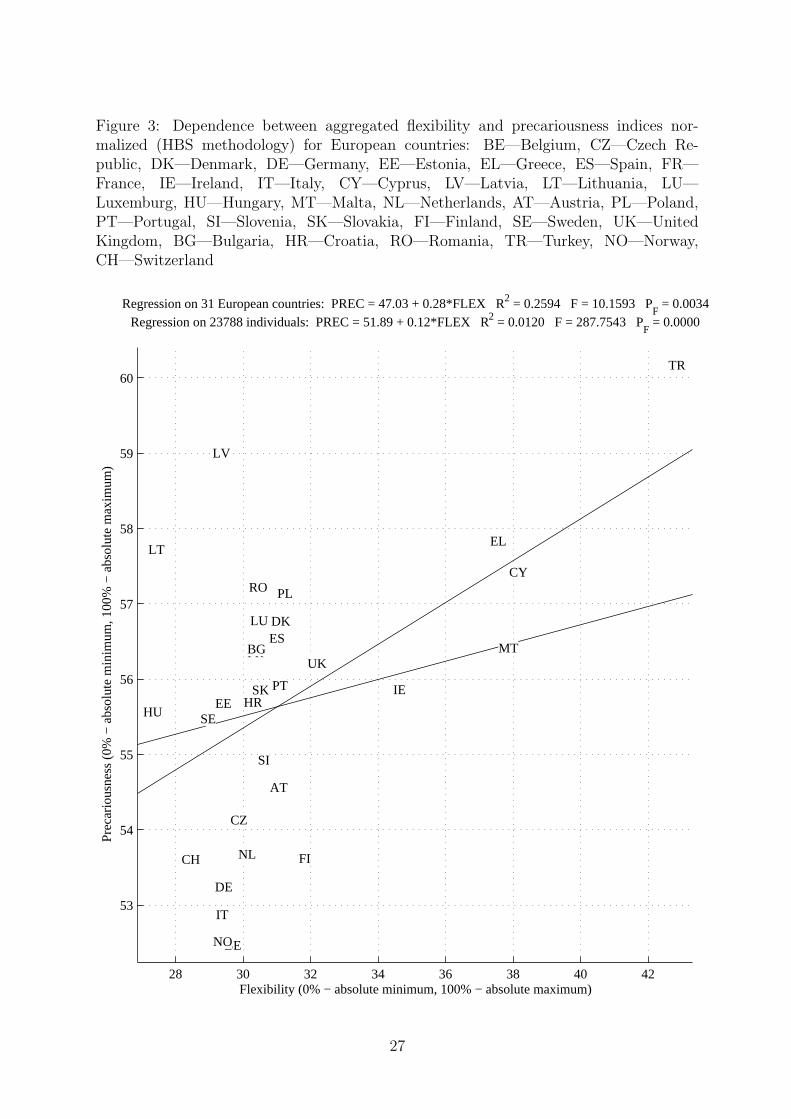
Figure 3: Dependence between aggregated flexibility and precariousness indices nor-malized (HBS methodology) for European countries: BE—Belgium, CZ—Czech Re-public, DK—Denmark, DE—Germany, EE—Estonia, EL—Greece, ES—Spain, FR—France, IE—Ireland, IT—Italy, CY—Cyprus, LV—Latvia, LT—Lithuania, LU—Luxemburg, HU—Hungary, MT—Malta, NL—Netherlands, AT—Austria, PL—Poland,PT—Portugal, SI—Slovenia, SK—Slovakia, FI—Finland, SE—Sweden, UK—UnitedKingdom, BG—Bulgaria, HR—Croatia, RO—Romania, TR—Turkey, NO—Norway,CH—Switzerland
28 30 32 34 36 38 40 42
53
54
55
56
57
58
59
60
Flexibility (0% − absolute minimum, 100% − absolute maximum)
Pre
cario
usne
ss (
0% −
abs
olut
e m
inim
um, 1
00%
− a
bsol
ute
max
imum
)
Regression on 31 European countries: PREC = 47.03 + 0.28*FLEX R2 = 0.2594 F = 10.1593 PF = 0.0034
Regression on 23788 individuals: PREC = 51.89 + 0.12*FLEX R2 = 0.0120 F = 287.7543 PF = 0.0000
BE
CZ
DK
DE
EE
EL
ESFR
IE
IT
CY
LV
LT
LU
HU
MT
NL
AT
PL
PT
SI
SK
FI
SE
UKBG
HR
RO
TR
NO
CH
27
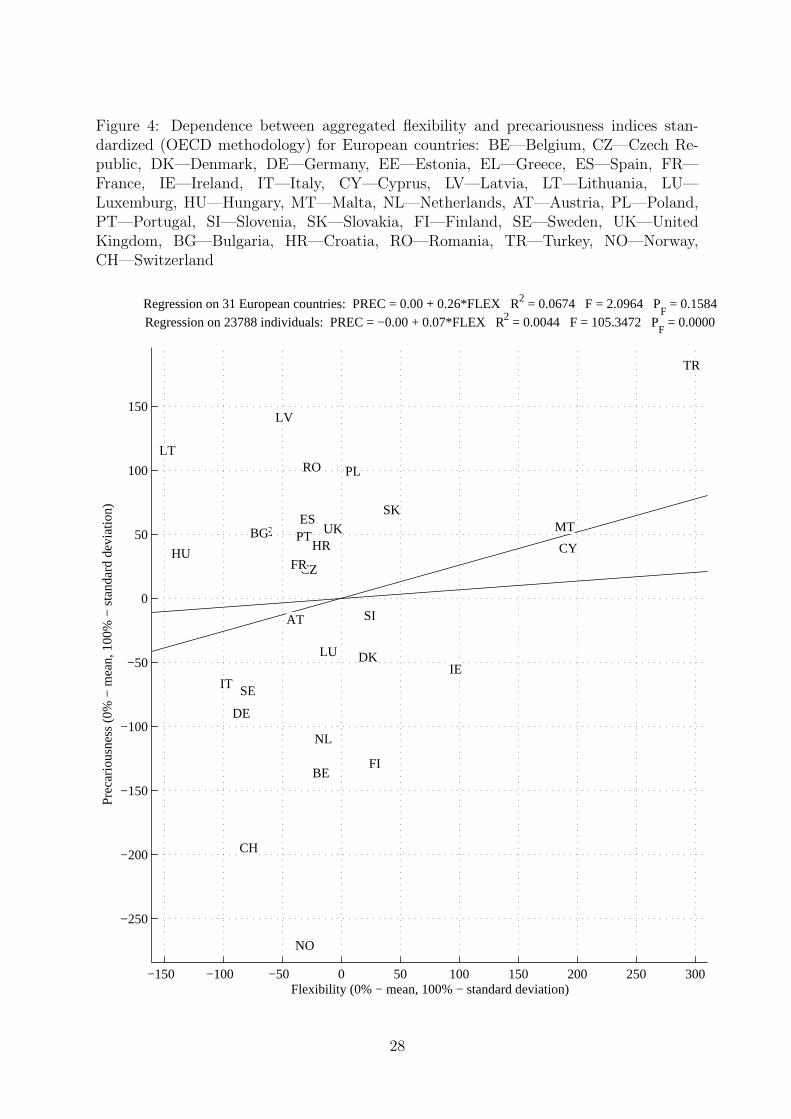
Figure 4: Dependence between aggregated flexibility and precariousness indices stan-dardized (OECD methodology) for European countries: BE—Belgium, CZ—Czech Re-public, DK—Denmark, DE—Germany, EE—Estonia, EL—Greece, ES—Spain, FR—France, IE—Ireland, IT—Italy, CY—Cyprus, LV—Latvia, LT—Lithuania, LU—Luxemburg, HU—Hungary, MT—Malta, NL—Netherlands, AT—Austria, PL—Poland,PT—Portugal, SI—Slovenia, SK—Slovakia, FI—Finland, SE—Sweden, UK—UnitedKingdom, BG—Bulgaria, HR—Croatia, RO—Romania, TR—Turkey, NO—Norway,CH—Switzerland
−150 −100 −50 0 50 100 150 200 250 300
−250
−200
−150
−100
−50
0
50
100
150
Flexibility (0% − mean, 100% − standard deviation)
Pre
cario
usne
ss (
0% −
mea
n, 1
00%
− s
tand
ard
devi
atio
n)
Regression on 31 European countries: PREC = 0.00 + 0.26*FLEX R2 = 0.0674 F = 2.0964 PF = 0.1584
Regression on 23788 individuals: PREC = −0.00 + 0.07*FLEX R2 = 0.0044 F = 105.3472 PF = 0.0000
BE
CZ
DK
DE
EEEL
ES
FR
IEIT
CY
LV
LT
LU
HU
MT
NL
AT
PL
PT
SI
SK
FI
SE
UKBGHR
RO
TR
NO
CH
28
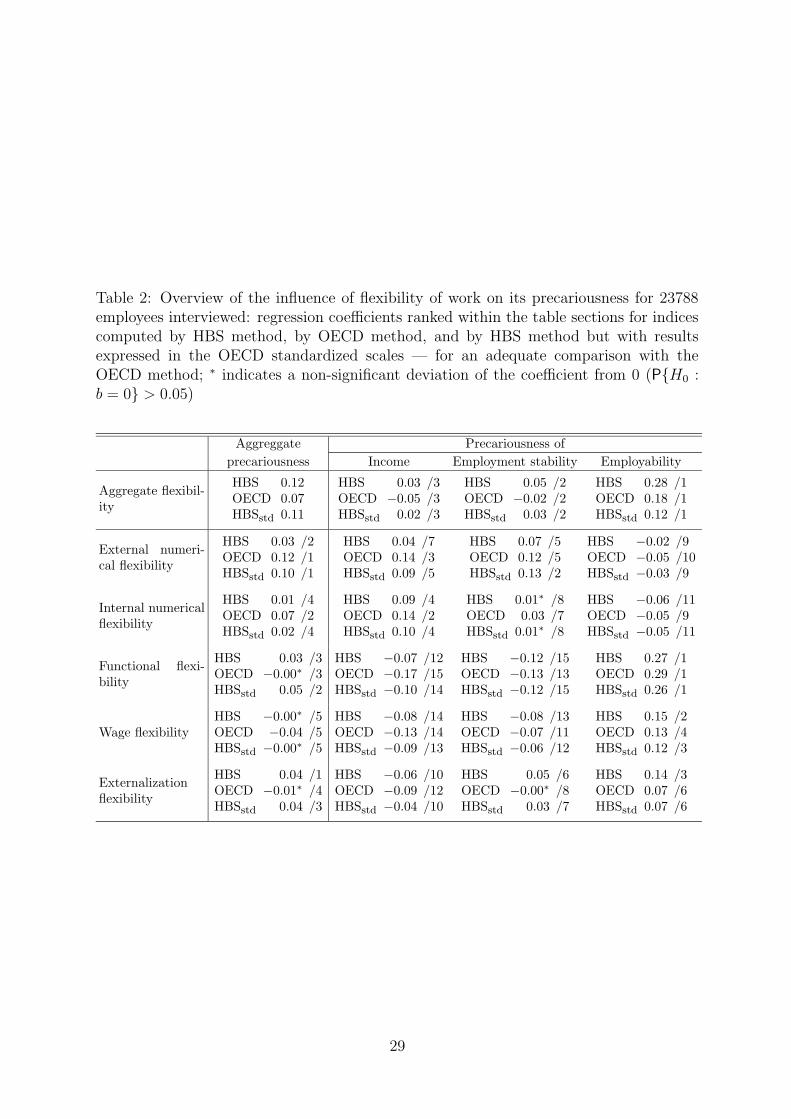
Table 2: Overview of the influence of flexibility of work on its precariousness for 23788employees interviewed: regression coefficients ranked within the table sections for indicescomputed by HBS method, by OECD method, and by HBS method but with resultsexpressed in the OECD standardized scales — for an adequate comparison with theOECD method; ∗ indicates a non-significant deviation of the coefficient from 0 (P{H0 :b = 0} > 0.05)
Aggreggate Precariousness of
precariousness Income Employment stability Employability
Aggregate flexibil-ity
HBS 0.12OECD 0.07HBSstd 0.11
HBS 0.03 /3OECD −0.05 /3HBSstd 0.02 /3
HBS 0.05 /2OECD −0.02 /2HBSstd 0.03 /2
HBS 0.28 /1OECD 0.18 /1HBSstd 0.12 /1
External numeri-cal flexibility
HBS 0.03 /2OECD 0.12 /1HBSstd 0.10 /1
HBS 0.04 /7OECD 0.14 /3HBSstd 0.09 /5
HBS 0.07 /5OECD 0.12 /5HBSstd 0.13 /2
HBS −0.02 /9OECD −0.05 /10HBSstd −0.03 /9
Internal numericalflexibility
HBS 0.01 /4OECD 0.07 /2HBSstd 0.02 /4
HBS 0.09 /4OECD 0.14 /2HBSstd 0.10 /4
HBS 0.01∗ /8OECD 0.03 /7HBSstd 0.01∗ /8
HBS −0.06 /11OECD −0.05 /9HBSstd −0.05 /11
Functional flexi-bility
HBS 0.03 /3OECD −0.00∗ /3HBSstd 0.05 /2
HBS −0.07 /12OECD −0.17 /15HBSstd −0.10 /14
HBS −0.12 /15OECD −0.13 /13HBSstd −0.12 /15
HBS 0.27 /1OECD 0.29 /1HBSstd 0.26 /1
Wage flexibilityHBS −0.00∗ /5OECD −0.04 /5HBSstd −0.00∗ /5
HBS −0.08 /14OECD −0.13 /14HBSstd −0.09 /13
HBS −0.08 /13OECD −0.07 /11HBSstd −0.06 /12
HBS 0.15 /2OECD 0.13 /4HBSstd 0.12 /3
Externalizationflexibility
HBS 0.04 /1OECD −0.01∗ /4HBSstd 0.04 /3
HBS −0.06 /10OECD −0.09 /12HBSstd −0.04 /10
HBS 0.05 /6OECD −0.00∗ /8HBSstd 0.03 /7
HBS 0.14 /3OECD 0.07 /6HBSstd 0.07 /6
29
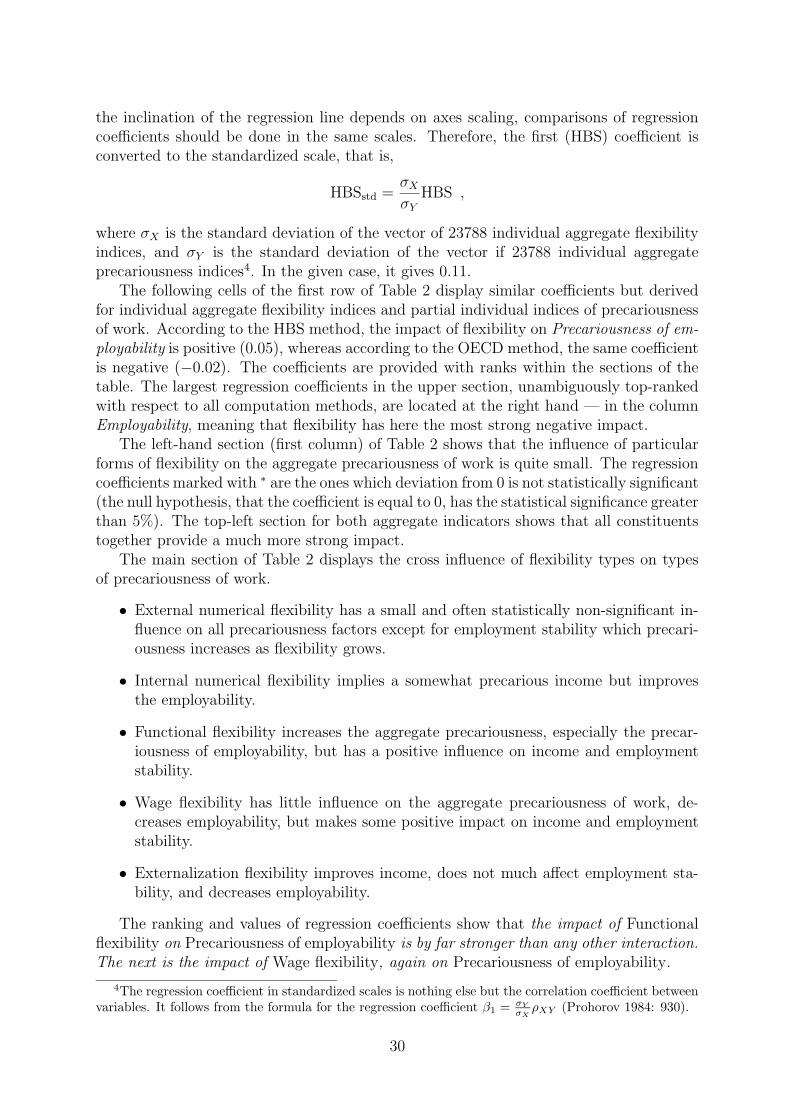
the inclination of the regression line depends on axes scaling, comparisons of regressioncoefficients should be done in the same scales. Therefore, the first (HBS) coefficient isconverted to the standardized scale, that is,
HBSstd =σX
σY
HBS ,
where σX is the standard deviation of the vector of 23788 individual aggregate flexibilityindices, and σY is the standard deviation of the vector if 23788 individual aggregateprecariousness indices4. In the given case, it gives 0.11.
The following cells of the first row of Table 2 display similar coefficients but derivedfor individual aggregate flexibility indices and partial individual indices of precariousnessof work. According to the HBS method, the impact of flexibility on Precariousness of em-ployability is positive (0.05), whereas according to the OECD method, the same coefficientis negative (−0.02). The coefficients are provided with ranks within the sections of thetable. The largest regression coefficients in the upper section, unambiguously top-rankedwith respect to all computation methods, are located at the right hand — in the columnEmployability, meaning that flexibility has here the most strong negative impact.
The left-hand section (first column) of Table 2 shows that the influence of particularforms of flexibility on the aggregate precariousness of work is quite small. The regressioncoefficients marked with ∗ are the ones which deviation from 0 is not statistically significant(the null hypothesis, that the coefficient is equal to 0, has the statistical significance greaterthan 5%). The top-left section for both aggregate indicators shows that all constituentstogether provide a much more strong impact.
The main section of Table 2 displays the cross influence of flexibility types on typesof precariousness of work.
• External numerical flexibility has a small and often statistically non-significant in-fluence on all precariousness factors except for employment stability which precari-ousness increases as flexibility grows.
• Internal numerical flexibility implies a somewhat precarious income but improvesthe employability.
• Functional flexibility increases the aggregate precariousness, especially the precar-iousness of employability, but has a positive influence on income and employmentstability.
• Wage flexibility has little influence on the aggregate precariousness of work, de-creases employability, but makes some positive impact on income and employmentstability.
• Externalization flexibility improves income, does not much affect employment sta-bility, and decreases employability.
The ranking and values of regression coefficients show that the impact of Functionalflexibility on Precariousness of employability is by far stronger than any other interaction.The next is the impact of Wage flexibility, again on Precariousness of employability.
4The regression coefficient in standardized scales is nothing else but the correlation coefficient betweenvariables. It follows from the formula for the regression coefficient β1 = σY
σX
ρXY (Prohorov 1984: 930).
30
5.4 Dependence of precariousness and flexibility of work in Eu-ropean countries
Figure 5 is a visual representation of a version of Table 2. It represents the values ofregression coefficients computed with the HBS method only, providing the coefficients for31 countries separately. The countries are ordered by the decreasing dependence betweenaggregate indices in the top-left plot, corresponding to the top-left section of Table 2); thefigure is too large for a single page and continues row-by-row on subsequent pages. Theplots demonstrate the same trends as Table 2. As one can see, the strongest dependenceof precariousness of work on its flexibility is inherent in Norway, Germany, Poland andCroatia. The results for the indices constructed by the OECD method are similar, andwe do not provide them here.
Since the number of employees interviewed in each country is about 400–800, which ismuch less than the total 23788, the statistical significance of the null-hypothesis (that theregression coefficient is equal to 0) is no longer negligibly small. The regression coefficientswhich deviation from 0 is statistically not significant (P-value> 5%) are printed in greycolor.
Note that Turkey with highest flexibility and highest precariousness of work (Fig-ures 1–2) does not show a statistically significant dependence between both indices. Atthe same time, Norway with a relatively low flexibility and lowest precariousness of work(Figure 1–2), has the strongest dependence between both factors.
We conclude that, a high average flexibility and precariousness of work in a countrydo not necessarily imply their high interdependence within the country.
5.5 Dependence of precariousness and flexibility of work in so-cial groups
Figures 6–11 summarize the results of regression analysis with the indices constructedby the HBS method for different European social groups (plots based on the indicesconstructed with the OECD method are similar):
Figure 6 displays the regression coefficients computed for social groups classified byoccupation (simplified ISCO classification): L—Legislators and senior officialsand managers, P—Professionals, T—Technicians and associated professionals, C—Clerks, S—Service/shop/market sales workers, A—Agricultural and fishery skilledworkers, W—Craft and related trades workers, O—Operators of machines and plantsand assemblers, E—Elementary occupations, M—Military and armed forces.
Figure 7 displays the regression coefficients computed for social groups classified byindustry branch (simplified NACE classification): A+B—Agriculture, hunt-ing, forestry, and fishing, C+D—Mining and manufacturing, E—Electricity, gasand water supply, F—Construction, G—Wholesale and retail trade, repair of mo-tor vehicles and household goods, H—Hotels and restaurants, I—Transport, storageand communication, J—Financial intermediation, K—Real estate, renting and busi-ness activities, L—Public administration and defence; compulsory social security,M+N—Education, health and social work.
31
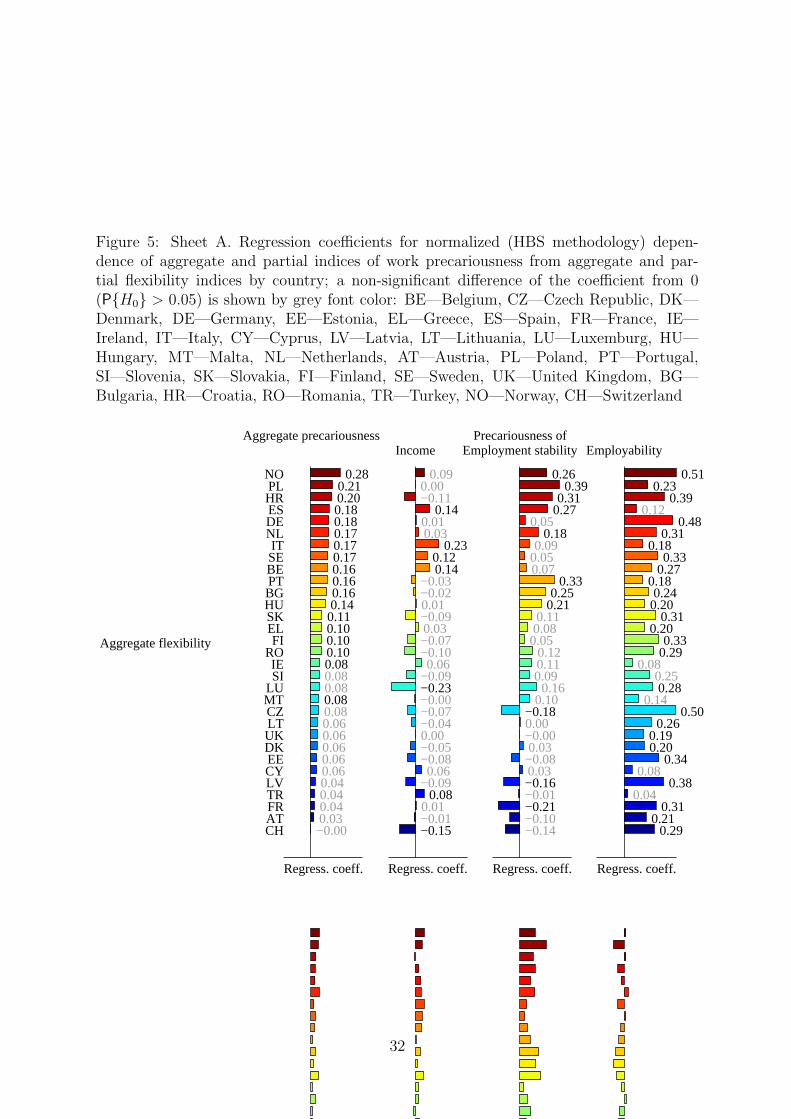
Figure 5: Sheet A. Regression coefficients for normalized (HBS methodology) depen-dence of aggregate and partial indices of work precariousness from aggregate and par-tial flexibility indices by country; a non-significant difference of the coefficient from 0(P{H0} > 0.05) is shown by grey font color: BE—Belgium, CZ—Czech Republic, DK—Denmark, DE—Germany, EE—Estonia, EL—Greece, ES—Spain, FR—France, IE—Ireland, IT—Italy, CY—Cyprus, LV—Latvia, LT—Lithuania, LU—Luxemburg, HU—Hungary, MT—Malta, NL—Netherlands, AT—Austria, PL—Poland, PT—Portugal,SI—Slovenia, SK—Slovakia, FI—Finland, SE—Sweden, UK—United Kingdom, BG—Bulgaria, HR—Croatia, RO—Romania, TR—Turkey, NO—Norway, CH—Switzerland
Aggregate flexibilityAggregate flexibility
Aggregate precariousness
Regress. coeff.
NO 0.28PL 0.21HR 0.20ES 0.18DE 0.18NL 0.17IT 0.17SE 0.17BE 0.16PT 0.16BG 0.16HU 0.14SK 0.11EL 0.10FI 0.10
RO 0.10IE 0.08SI 0.08
LU 0.08MT 0.08CZ 0.08LT 0.06UK 0.06DK 0.06EE 0.06CY 0.06LV 0.04TR 0.04FR 0.04AT 0.03CH −0.00
Income
Regress. coeff.
0.090.00−0.11
0.140.010.03
0.230.120.14
−0.03−0.020.01−0.090.03−0.07−0.100.06
−0.09−0.23−0.00−0.07−0.040.00−0.05−0.080.06
−0.090.08
0.01−0.01−0.15
Precariousness ofEmployment stability
Regress. coeff.
0.260.39
0.310.27
0.050.18
0.090.050.07
0.330.25
0.210.110.080.05
0.120.110.090.16
0.10−0.180.00−0.000.03−0.080.03−0.16−0.01−0.21−0.10−0.14
Employability
Regress. coeff.
0.510.23
0.390.12
0.480.31
0.180.33
0.270.180.240.20
0.310.20
0.330.29
0.080.250.28
0.140.50
0.260.190.20
0.340.08
0.380.04
0.310.21
0.29
32
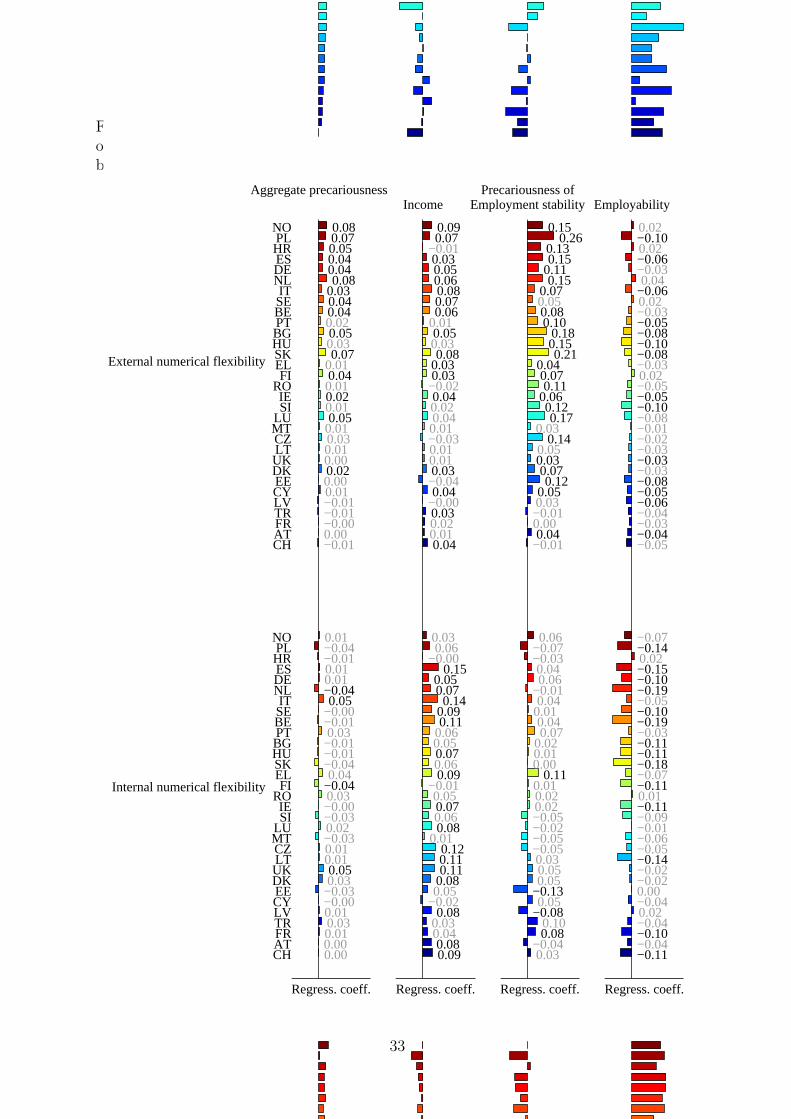
Figure 5: Sheet B. Regression coefficients for normalized (HBS methodology) dependenceof aggregate and partial indices of work precariousness from aggregate and partial flexi-bility indices by country
Internal numerical flexibility
External numerical flexibilityExternal numerical flexibility
Internal numerical flexibility
Aggregate precariousness
Regress. coeff.
NO 0.08PL 0.07HR 0.05ES 0.04DE 0.04NL 0.08IT 0.03SE 0.04BE 0.04PT 0.02BG 0.05HU 0.03SK 0.07EL 0.01FI 0.04
RO 0.01IE 0.02SI 0.01
LU 0.05MT 0.01CZ 0.03LT 0.01UK 0.00DK 0.02EE 0.00CY 0.01LV −0.01TR −0.01FR −0.00AT 0.00CH −0.01
NO 0.01PL −0.04HR −0.01ES 0.01DE 0.01NL −0.04IT 0.05SE −0.00BE −0.01PT 0.03BG −0.01HU −0.01SK −0.04EL 0.04FI −0.04
RO 0.03IE −0.00SI −0.03
LU 0.02MT −0.03CZ 0.01LT 0.01UK 0.05DK 0.03EE −0.03CY −0.00LV 0.01TR 0.03FR 0.01AT 0.00CH 0.00
Income
Regress. coeff.
0.090.07
−0.010.030.050.060.080.070.06
0.010.050.030.08
0.030.03−0.020.040.020.040.01−0.030.010.010.03−0.040.04
−0.000.030.020.010.04
0.030.06
−0.000.15
0.050.070.14
0.090.11
0.060.050.070.060.09
−0.010.050.070.060.08
0.010.120.110.11
0.080.05
−0.020.08
0.030.040.080.09
Precariousness ofEmployment stability
Regress. coeff.
0.150.26
0.130.15
0.110.15
0.070.050.080.10
0.180.150.21
0.040.070.11
0.060.120.17
0.030.14
0.050.030.070.12
0.050.03−0.010.000.04
−0.01
0.06−0.07−0.030.040.06
−0.010.040.010.040.07
0.020.010.00
0.110.010.020.02−0.05−0.02−0.05−0.050.030.050.05
−0.130.05
−0.080.100.08
−0.040.03
Employability
Regress. coeff.
0.02−0.100.02−0.06−0.030.04
−0.060.02−0.03−0.05−0.08−0.10−0.08−0.030.02−0.05−0.05−0.10−0.08−0.01−0.02−0.03−0.03−0.03−0.08−0.05−0.06−0.04−0.03−0.04−0.05
−0.07−0.140.02−0.15−0.10−0.19−0.05−0.10−0.19−0.03−0.11−0.11−0.18−0.07−0.110.01−0.11−0.09−0.01−0.06−0.05−0.14−0.02−0.020.00−0.040.02−0.04−0.10−0.04−0.11
33
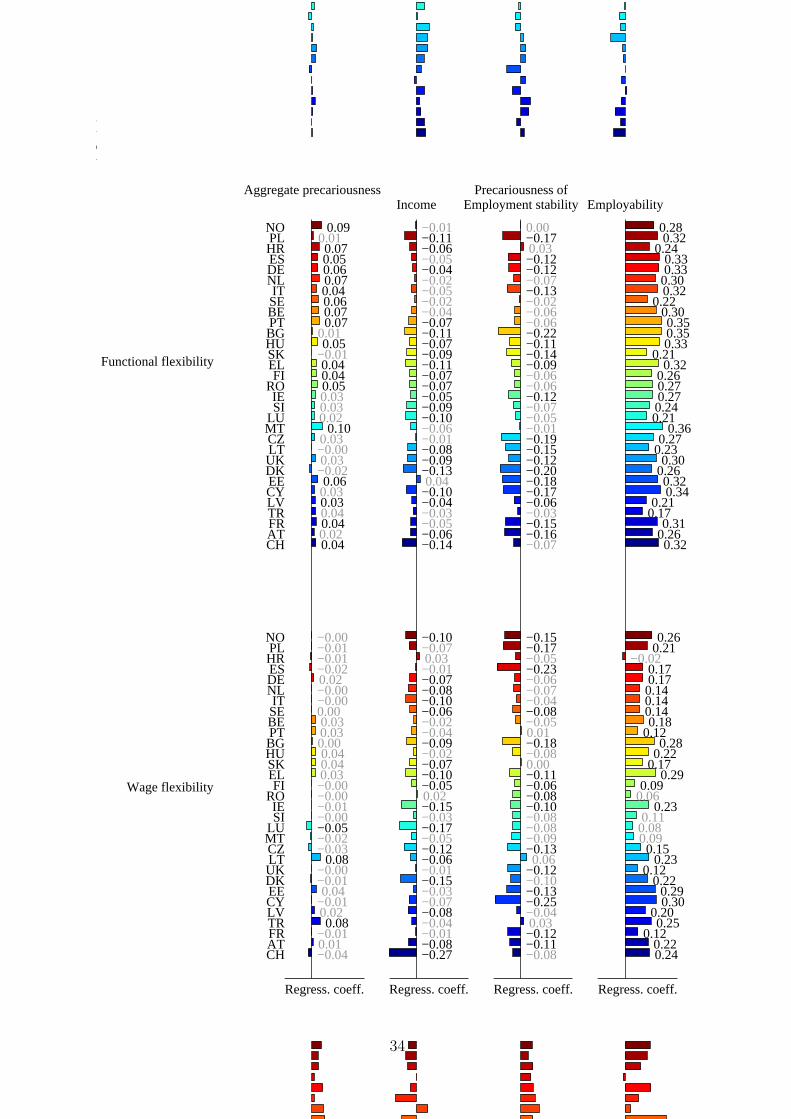
Figure 5: Sheet C. Regression coefficients for normalized (HBS methodology) dependenceof aggregate and partial indices of work precariousness from aggregate and partial flexi-bility indices by country
Wage flexibility
Functional flexibilityFunctional flexibility
Wage flexibility
Aggregate precariousness
Regress. coeff.
NO 0.09PL 0.01HR 0.07ES 0.05DE 0.06NL 0.07IT 0.04SE 0.06BE 0.07PT 0.07BG 0.01HU 0.05SK −0.01EL 0.04FI 0.04
RO 0.05IE 0.03SI 0.03
LU 0.02MT 0.10CZ 0.03LT −0.00UK 0.03DK −0.02EE 0.06CY 0.03LV 0.03TR 0.04FR 0.04AT 0.02CH 0.04
NO −0.00PL −0.01HR −0.01ES −0.02DE 0.02NL −0.00IT −0.00SE 0.00BE 0.03PT 0.03BG 0.00HU 0.04SK 0.04EL 0.03FI −0.00
RO −0.00IE −0.01SI −0.00
LU −0.05MT −0.02CZ −0.03LT 0.08UK −0.00DK −0.01EE 0.04CY −0.01LV 0.02TR 0.08FR −0.01AT 0.01CH −0.04
Income
Regress. coeff.
−0.01−0.11−0.06−0.05−0.04−0.02−0.05−0.02−0.04−0.07−0.11−0.07−0.09−0.11−0.07−0.07−0.05−0.09−0.10−0.06−0.01−0.08−0.09−0.130.04
−0.10−0.04−0.03−0.05−0.06−0.14
−0.10−0.070.03−0.01−0.07−0.08−0.10−0.06−0.02−0.04−0.09−0.02−0.07−0.10−0.050.02−0.15−0.03−0.17−0.05−0.12−0.06−0.01−0.15−0.03−0.07−0.08−0.04−0.01−0.08−0.27
Precariousness ofEmployment stability
Regress. coeff.
0.00−0.170.03−0.12−0.12−0.07−0.13−0.02−0.06−0.06−0.22−0.11−0.14−0.09−0.06−0.06−0.12−0.07−0.05−0.01−0.19−0.15−0.12−0.20−0.18−0.17−0.06−0.03−0.15−0.16−0.07
−0.15−0.17−0.05−0.23−0.06−0.07−0.04−0.08−0.050.01−0.18−0.080.00−0.11−0.06−0.08−0.10−0.08−0.08−0.09−0.130.06
−0.12−0.10−0.13−0.25−0.040.03−0.12−0.11−0.08
Employability
Regress. coeff.
0.280.32
0.240.330.330.300.32
0.220.300.350.350.33
0.210.32
0.260.270.270.240.21
0.360.27
0.230.30
0.260.320.34
0.210.17
0.310.260.32
0.260.21
−0.020.170.170.140.140.140.18
0.120.28
0.220.17
0.290.09
0.060.23
0.110.080.090.15
0.230.12
0.220.290.30
0.200.25
0.120.220.24
34
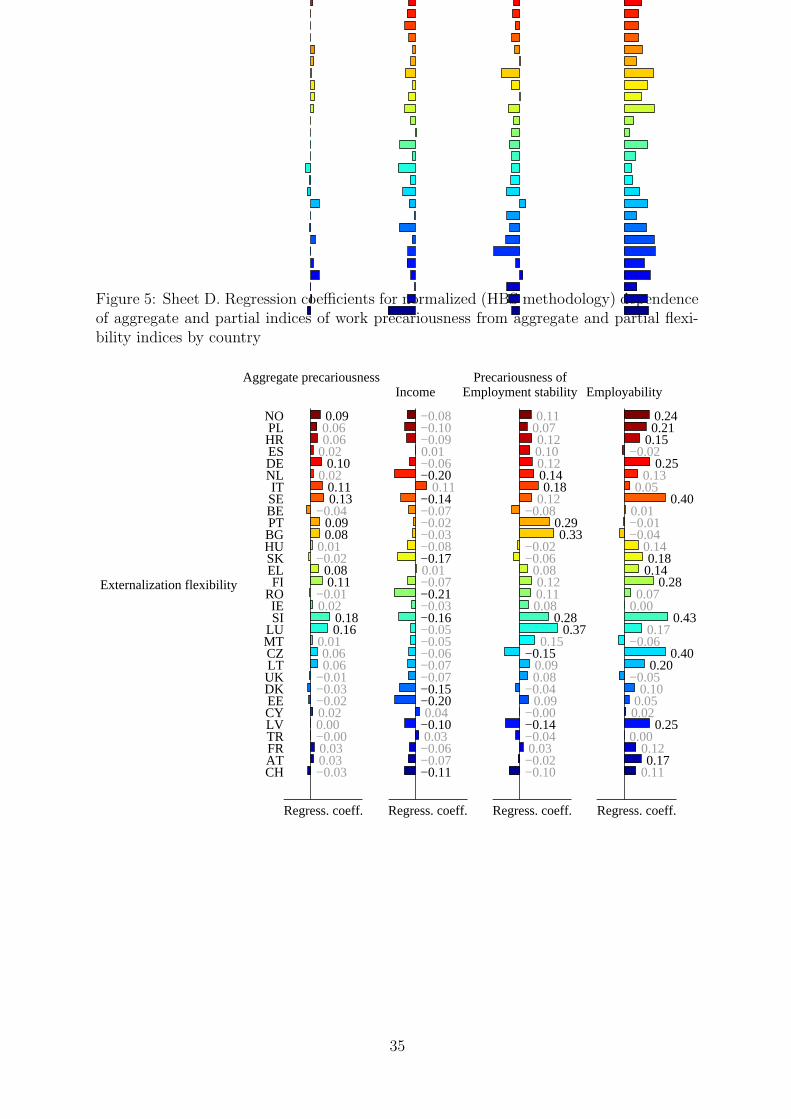
Figure 5: Sheet D. Regression coefficients for normalized (HBS methodology) dependenceof aggregate and partial indices of work precariousness from aggregate and partial flexi-bility indices by country
Externalization flexibilityExternalization flexibility
Aggregate precariousness
Regress. coeff.
NO 0.09PL 0.06HR 0.06ES 0.02DE 0.10NL 0.02IT 0.11SE 0.13BE −0.04PT 0.09BG 0.08HU 0.01SK −0.02EL 0.08FI 0.11
RO −0.01IE 0.02SI 0.18
LU 0.16MT 0.01CZ 0.06LT 0.06UK −0.01DK −0.03EE −0.02CY 0.02LV 0.00TR −0.00FR 0.03AT 0.03CH −0.03
Income
Regress. coeff.
−0.08−0.10−0.090.01−0.06−0.20
0.11−0.14−0.07−0.02−0.03−0.08−0.170.01−0.07−0.21−0.03−0.16−0.05−0.05−0.06−0.07−0.07−0.15−0.200.04
−0.100.03−0.06−0.07−0.11
Precariousness ofEmployment stability
Regress. coeff.
0.110.070.120.100.120.140.18
0.12−0.08
0.290.33
−0.02−0.06
0.080.120.110.08
0.280.37
0.15−0.15
0.090.08
−0.040.09
−0.00−0.14−0.040.03−0.02−0.10
Employability
Regress. coeff.
0.240.21
0.15−0.02
0.250.13
0.050.40
0.01−0.01−0.04
0.140.180.14
0.280.07
0.000.43
0.17−0.06
0.400.20
−0.050.10
0.050.02
0.250.00
0.120.17
0.11
35
Figure 8 displays the regression coefficients computed for social groups classified by sizeof local unit: 1—One employee, 3—2–4 employees, 7—5–9 employees, 30—10–49employees, 70—50–99 employees, 150—100–249 employees, 300—250–499 employ-ees, 500+ —500 and over.
Figure 9 displays the regression coefficients computed for social groups classified bysector: Prv—Private sector, Pub—Public sector, P-P—Joint private-public organ-isation or company, NGO—Non-profit sector, NGO, O—Other.
Figure 10 displays the regression coefficients computed for social groups classified bygender: men or women.
Figure 11 displays the regression coefficients computed for social groups classified bytype of contract: P—Permanently employed, F—Fixed-term employed, T— Tem-porary employment agency workers, N—Work with no contract.
This figure needs some comments. All regression coefficients in the row Externalnumerical flexibility, except for the group ’F—Fixed-term employed’ are NaN (= nota number), because they cannot be computed. The partial index External numericalflexibility is derived from two survey questions: q3b ‘Type of contract’ and q3cr
‘Duration of contract’. All respondents from every social group selected give thesame answer to the first question: the respondents from the group of permanentlyemployed answer that they have indefinite contract, the respondents from the groupof fixed-term employed answer that they have a temporary contract, etc. The secondquestion, on the duration of contract, is answered only by fixed-term employed(so conditioned by the Survey). Therefore, the partial index External numericalflexibility is variable only within the group of fixed-term employed, and estimatingthe regression coefficients for other groups makes no sense. Such a situation occurs,because question q3b used in constructing the indices takes the role of classifier.
All the figures demonstrate that, regardless of the selection of social groups, Functionalflexibility, Wage flexibility, and, eventually, Externalization flexibility have the most strongnegative impact on Employability.
36
6 Conclusions
1. Composite indices of flexibility and precariousness of work and of their aspects areconstructed by methodologies of the Hans Bockler Foundation, and of the OECD.Both families of indices show that the institutional regulation of employment doesnot necessarily imply the adequate factual effect. For instance, Turkey and Greecewith a strict employment protection legislation have a high labour market flexibilitydue to a large fraction of employees who work with no contract.
2. The analysis of interaction of flexibility and precariousness indices shows that themore flexible employment, the more it is precarious. The employment flexibility hasthe most negative effect on the employability.
3. It implies serious arguments against the recent reconsideration of the function of so-cial security attempted by the European Commission. A shift from income securitytowards a high employability within the flexicurity strategy cannot be consistentlyimplemented. Our study provides empirical evidence that a high employability canhardly attained under flexible employment.
37
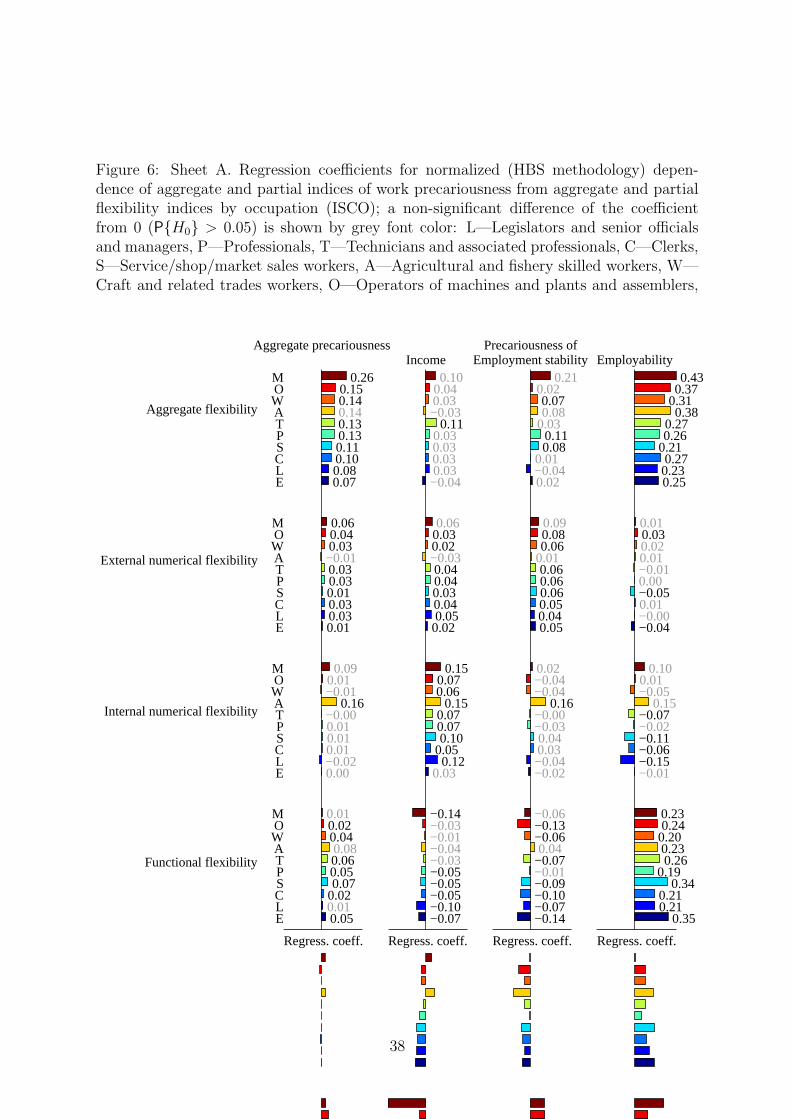
Figure 6: Sheet A. Regression coefficients for normalized (HBS methodology) depen-dence of aggregate and partial indices of work precariousness from aggregate and partialflexibility indices by occupation (ISCO); a non-significant difference of the coefficientfrom 0 (P{H0} > 0.05) is shown by grey font color: L—Legislators and senior officialsand managers, P—Professionals, T—Technicians and associated professionals, C—Clerks,S—Service/shop/market sales workers, A—Agricultural and fishery skilled workers, W—Craft and related trades workers, O—Operators of machines and plants and assemblers,E—Elementary occupations, M—Military and armed forces
Functional flexibility
Internal numerical flexibility
External numerical flexibility
Aggregate flexibilityAggregate flexibility
External numerical flexibility
Internal numerical flexibility
Functional flexibility
Aggregate precariousness
Regress. coeff.
M 0.26O 0.15W 0.14A 0.14T 0.13P 0.13S 0.11C 0.10L 0.08E 0.07
M 0.06O 0.04W 0.03A −0.01T 0.03P 0.03S 0.01C 0.03L 0.03E 0.01
M 0.09O 0.01W −0.01A 0.16T −0.00P 0.01S 0.01C 0.01L −0.02E 0.00
M 0.01O 0.02W 0.04A 0.08T 0.06P 0.05S 0.07C 0.02L 0.01E 0.05
Income
Regress. coeff.
0.100.040.03−0.03
0.110.030.030.030.03−0.04
0.060.030.02−0.030.040.040.030.040.050.02
0.150.070.06
0.150.070.070.10
0.050.12
0.03
−0.14−0.03−0.01−0.04−0.03−0.05−0.05−0.05−0.10−0.07
Precariousness ofEmployment stability
Regress. coeff.
0.210.020.070.08
0.030.110.08
0.01−0.040.02
0.090.080.06
0.010.060.060.060.050.040.05
0.02−0.04−0.04
0.16−0.00−0.030.040.03−0.04−0.02
−0.06−0.13−0.060.04
−0.07−0.01−0.09−0.10−0.07−0.14
Employability
Regress. coeff.
0.430.37
0.310.38
0.270.26
0.210.270.230.25
0.010.030.020.01−0.010.00−0.050.01−0.00−0.04
0.100.01−0.05
0.15−0.07−0.02−0.11−0.06−0.15−0.01
0.230.240.200.230.26
0.190.34
0.210.21
0.35
38
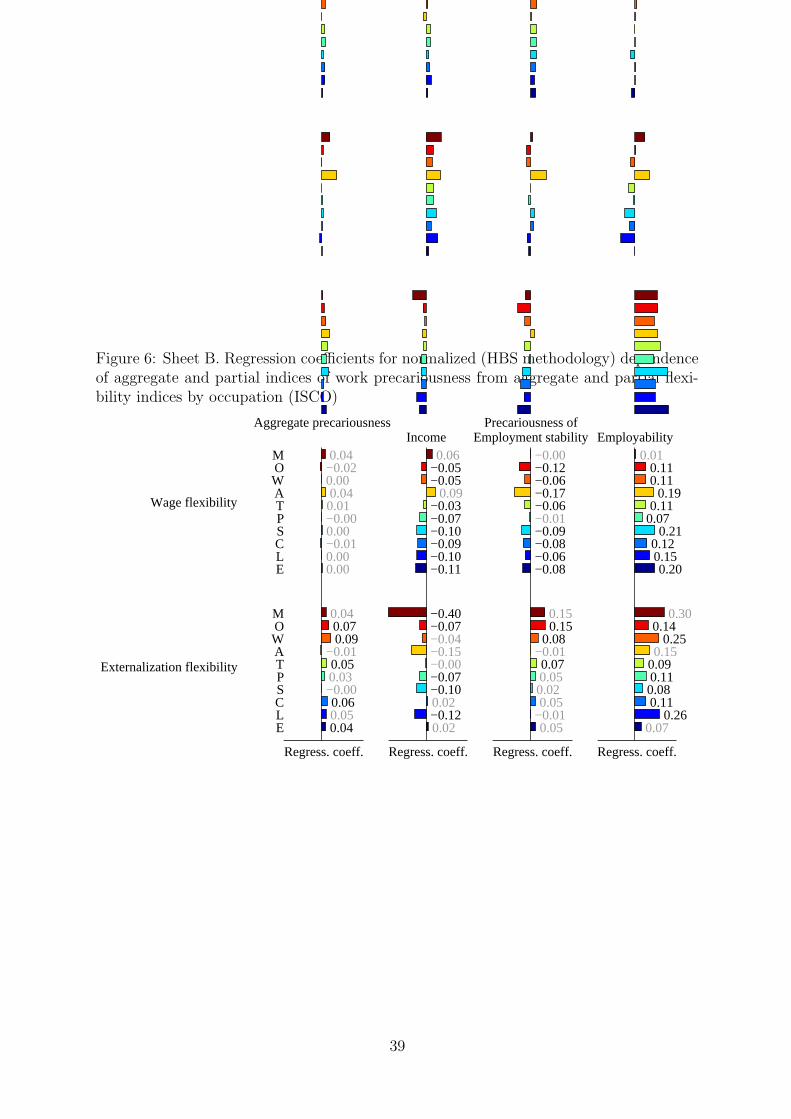
Figure 6: Sheet B. Regression coefficients for normalized (HBS methodology) dependenceof aggregate and partial indices of work precariousness from aggregate and partial flexi-bility indices by occupation (ISCO)
Externalization flexibility
Wage flexibilityWage flexibility
Externalization flexibility
Aggregate precariousness
Regress. coeff.
M 0.04O −0.02W 0.00A 0.04T 0.01P −0.00S 0.00C −0.01L 0.00E 0.00
M 0.04O 0.07W 0.09A −0.01T 0.05P 0.03S −0.00C 0.06L 0.05E 0.04
Income
Regress. coeff.
0.06−0.05−0.05
0.09−0.03−0.07−0.10−0.09−0.10−0.11
−0.40−0.07−0.04−0.15−0.00−0.07−0.100.02−0.120.02
Precariousness ofEmployment stability
Regress. coeff.
−0.00−0.12−0.06−0.17−0.06−0.01−0.09−0.08−0.06−0.08
0.150.15
0.08−0.010.070.050.020.05
−0.010.05
Employability
Regress. coeff.
0.010.110.11
0.190.11
0.070.21
0.120.150.20
0.300.14
0.250.15
0.090.110.080.11
0.260.07
39
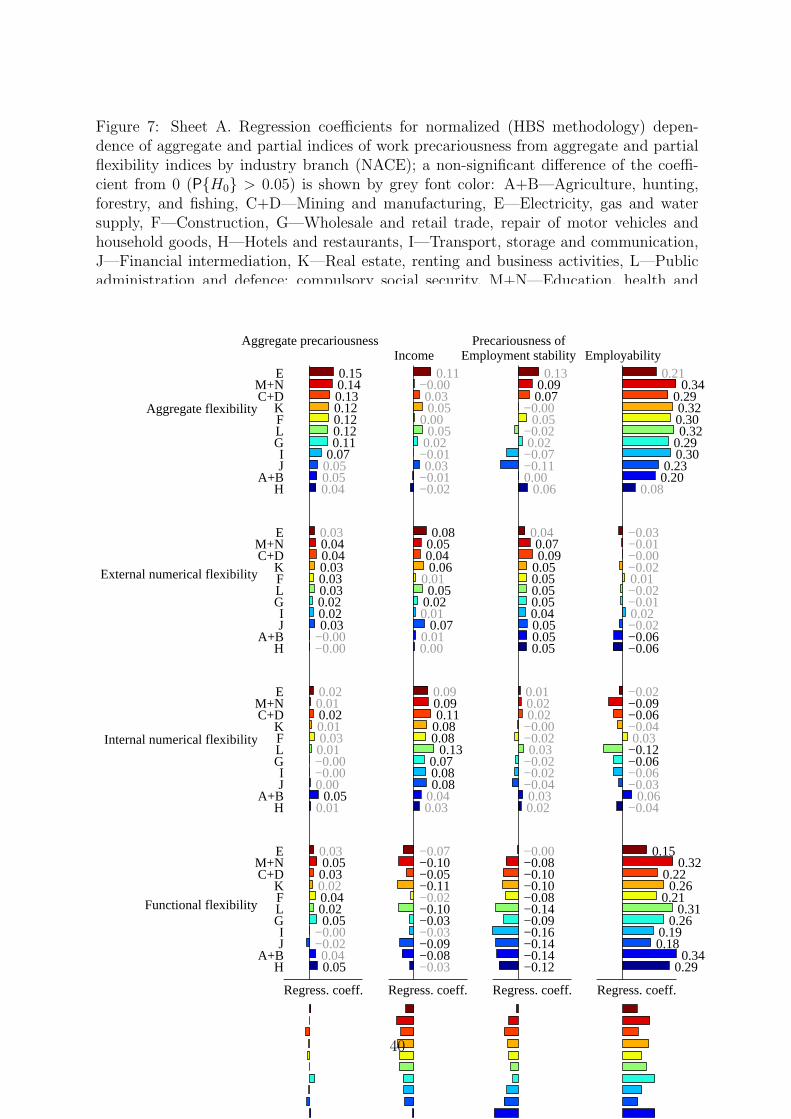
Figure 7: Sheet A. Regression coefficients for normalized (HBS methodology) depen-dence of aggregate and partial indices of work precariousness from aggregate and partialflexibility indices by industry branch (NACE); a non-significant difference of the coeffi-cient from 0 (P{H0} > 0.05) is shown by grey font color: A+B—Agriculture, hunting,forestry, and fishing, C+D—Mining and manufacturing, E—Electricity, gas and watersupply, F—Construction, G—Wholesale and retail trade, repair of motor vehicles andhousehold goods, H—Hotels and restaurants, I—Transport, storage and communication,J—Financial intermediation, K—Real estate, renting and business activities, L—Publicadministration and defence; compulsory social security, M+N—Education, health andsocial work
Functional flexibility
Internal numerical flexibility
External numerical flexibility
Aggregate flexibilityAggregate flexibility
External numerical flexibility
Internal numerical flexibility
Functional flexibility
Aggregate precariousness
Regress. coeff.
E 0.15M+N 0.14C+D 0.13
K 0.12F 0.12L 0.12G 0.11I 0.07J 0.05
A+B 0.05H 0.04
E 0.03M+N 0.04C+D 0.04
K 0.03F 0.03L 0.03G 0.02I 0.02J 0.03
A+B −0.00H −0.00
E 0.02M+N 0.01C+D 0.02
K 0.01F 0.03L 0.01G −0.00I −0.00J 0.00
A+B 0.05H 0.01
E 0.03M+N 0.05C+D 0.03
K 0.02F 0.04L 0.02G 0.05I −0.00J −0.02
A+B 0.04H 0.05
Income
Regress. coeff.
0.11−0.000.030.05
0.000.05
0.02−0.010.03
−0.01−0.02
0.080.050.040.06
0.010.05
0.020.01
0.070.010.00
0.090.090.11
0.080.08
0.130.070.080.08
0.040.03
−0.07−0.10−0.05−0.11−0.02−0.10−0.03−0.03−0.09−0.08−0.03
Precariousness ofEmployment stability
Regress. coeff.
0.130.090.07
−0.000.05
−0.020.02
−0.07−0.110.00
0.06
0.040.070.09
0.050.050.050.050.040.050.050.05
0.010.020.02
−0.00−0.020.03
−0.02−0.02−0.040.030.02
−0.00−0.08−0.10−0.10−0.08−0.14−0.09−0.16−0.14−0.14−0.12
Employability
Regress. coeff.
0.210.34
0.290.320.300.32
0.290.30
0.230.20
0.08
−0.03−0.01−0.00−0.020.01−0.02−0.010.02−0.02−0.06−0.06
−0.02−0.09−0.06−0.040.03
−0.12−0.06−0.06−0.03
0.06−0.04
0.150.32
0.220.26
0.210.31
0.260.190.18
0.340.29
40
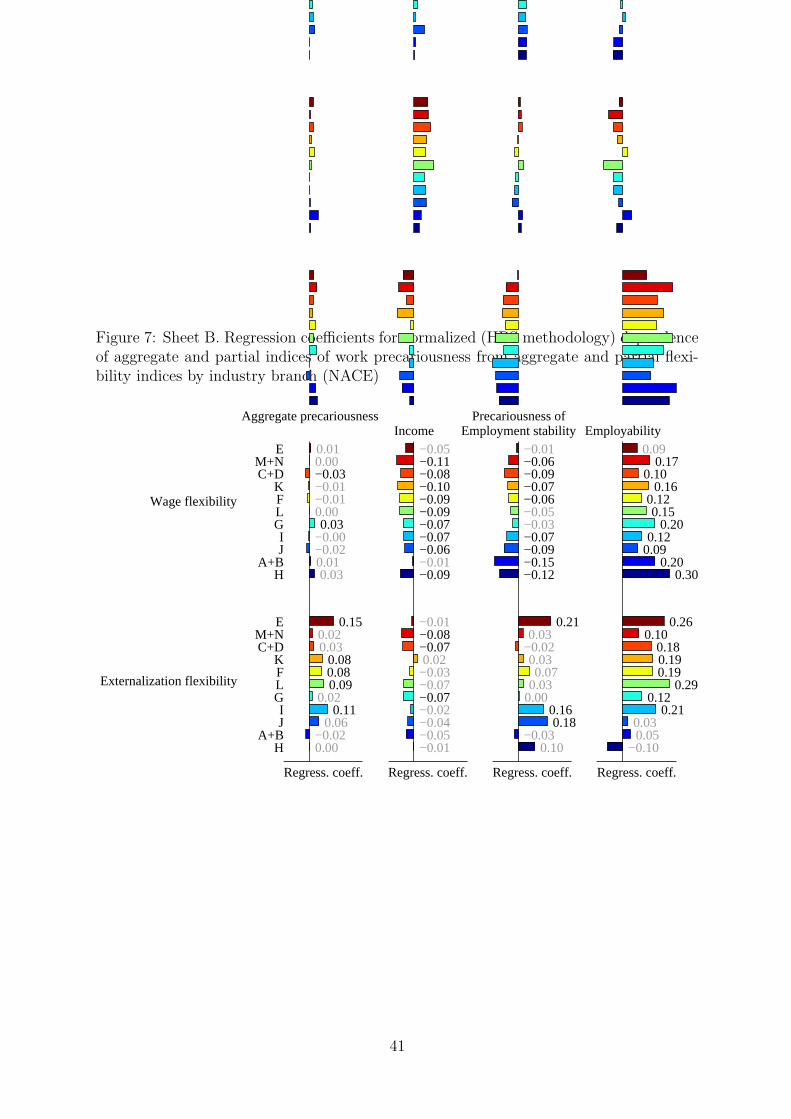
Figure 7: Sheet B. Regression coefficients for normalized (HBS methodology) dependenceof aggregate and partial indices of work precariousness from aggregate and partial flexi-bility indices by industry branch (NACE)
Externalization flexibility
Wage flexibilityWage flexibility
Externalization flexibility
Aggregate precariousness
Regress. coeff.
E 0.01M+N 0.00C+D −0.03
K −0.01F −0.01L 0.00G 0.03I −0.00J −0.02
A+B 0.01H 0.03
E 0.15M+N 0.02C+D 0.03
K 0.08F 0.08L 0.09G 0.02I 0.11J 0.06
A+B −0.02H 0.00
Income
Regress. coeff.
−0.05−0.11−0.08−0.10−0.09−0.09−0.07−0.07−0.06−0.01−0.09
−0.01−0.08−0.070.02−0.03−0.07−0.07−0.02−0.04−0.05−0.01
Precariousness ofEmployment stability
Regress. coeff.
−0.01−0.06−0.09−0.07−0.06−0.05−0.03−0.07−0.09−0.15−0.12
0.210.03
−0.020.030.07
0.030.00
0.160.18
−0.030.10
Employability
Regress. coeff.
0.090.17
0.100.16
0.120.15
0.200.12
0.090.20
0.30
0.260.10
0.180.190.19
0.290.12
0.210.030.05
−0.10
41
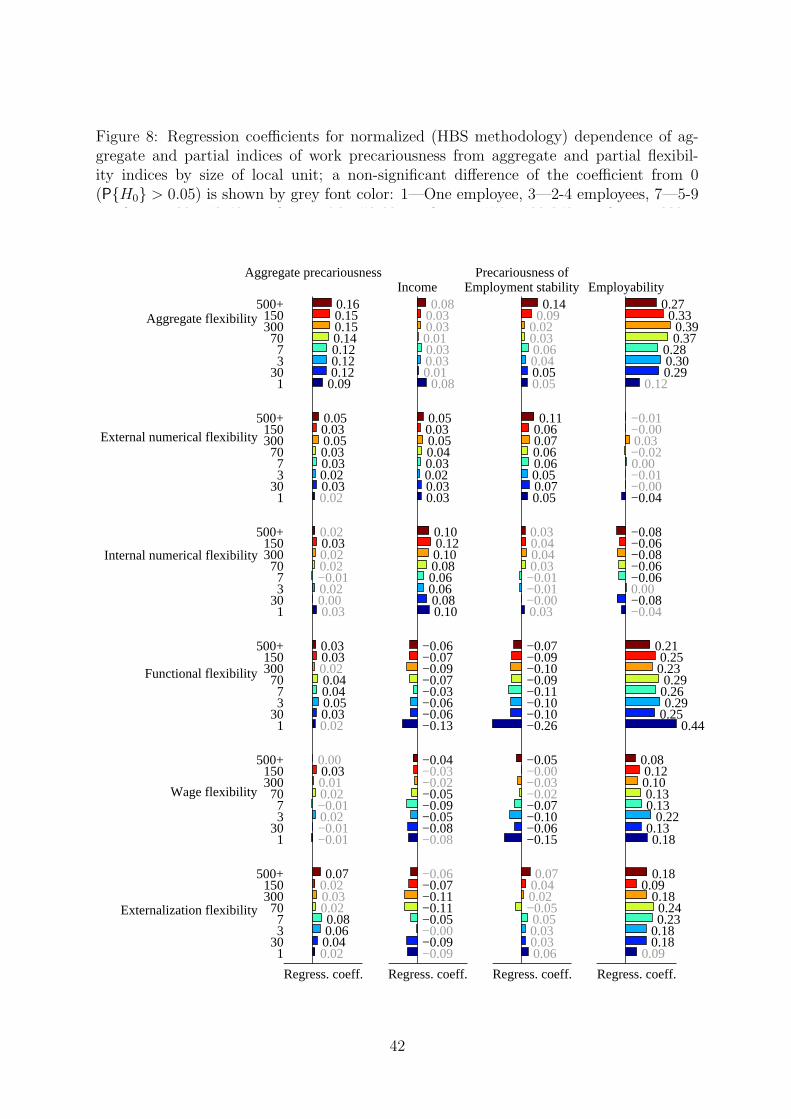
Figure 8: Regression coefficients for normalized (HBS methodology) dependence of ag-gregate and partial indices of work precariousness from aggregate and partial flexibil-ity indices by size of local unit; a non-significant difference of the coefficient from 0(P{H0} > 0.05) is shown by grey font color: 1—One employee, 3—2-4 employees, 7—5-9employees, 30—10-49 employees, 70—50-99 employees, 150—100-249 employees, 300—250-499 employees, 500+—500 and over
Externalization flexibility
Wage flexibility
Functional flexibility
Internal numerical flexibility
External numerical flexibility
Aggregate flexibilityAggregate flexibility
External numerical flexibility
Internal numerical flexibility
Functional flexibility
Wage flexibility
Externalization flexibility
Aggregate precariousness
Regress. coeff.
500+ 0.16150 0.15300 0.1570 0.147 0.123 0.12
30 0.121 0.09
500+ 0.05150 0.03300 0.0570 0.037 0.033 0.02
30 0.031 0.02
500+ 0.02150 0.03300 0.0270 0.027 −0.013 0.02
30 0.001 0.03
500+ 0.03150 0.03300 0.0270 0.047 0.043 0.05
30 0.031 0.02
500+ 0.00150 0.03300 0.0170 0.027 −0.013 0.02
30 −0.011 −0.01
500+ 0.07150 0.02300 0.0370 0.027 0.083 0.06
30 0.041 0.02
Income
Regress. coeff.
0.080.030.030.010.030.030.01
0.08
0.050.030.050.040.030.020.030.03
0.100.120.100.080.060.060.080.10
−0.06−0.07−0.09−0.07−0.03−0.06−0.06−0.13
−0.04−0.03−0.02−0.05−0.09−0.05−0.08−0.08
−0.06−0.07−0.11−0.11−0.05−0.00−0.09−0.09
Precariousness ofEmployment stability
Regress. coeff.
0.140.09
0.020.030.060.040.050.05
0.110.060.070.060.060.050.070.05
0.030.040.040.03
−0.01−0.01−0.000.03
−0.07−0.09−0.10−0.09−0.11−0.10−0.10−0.26
−0.05−0.00−0.03−0.02−0.07−0.10−0.06−0.15
0.070.040.02−0.050.050.030.030.06
Employability
Regress. coeff.
0.270.330.390.37
0.280.300.29
0.12
−0.01−0.000.03−0.020.00−0.01−0.00−0.04
−0.08−0.06−0.08−0.06−0.060.00−0.08−0.04
0.210.250.230.290.260.29
0.250.44
0.080.120.100.130.13
0.220.130.18
0.180.09
0.180.240.23
0.180.18
0.09
42
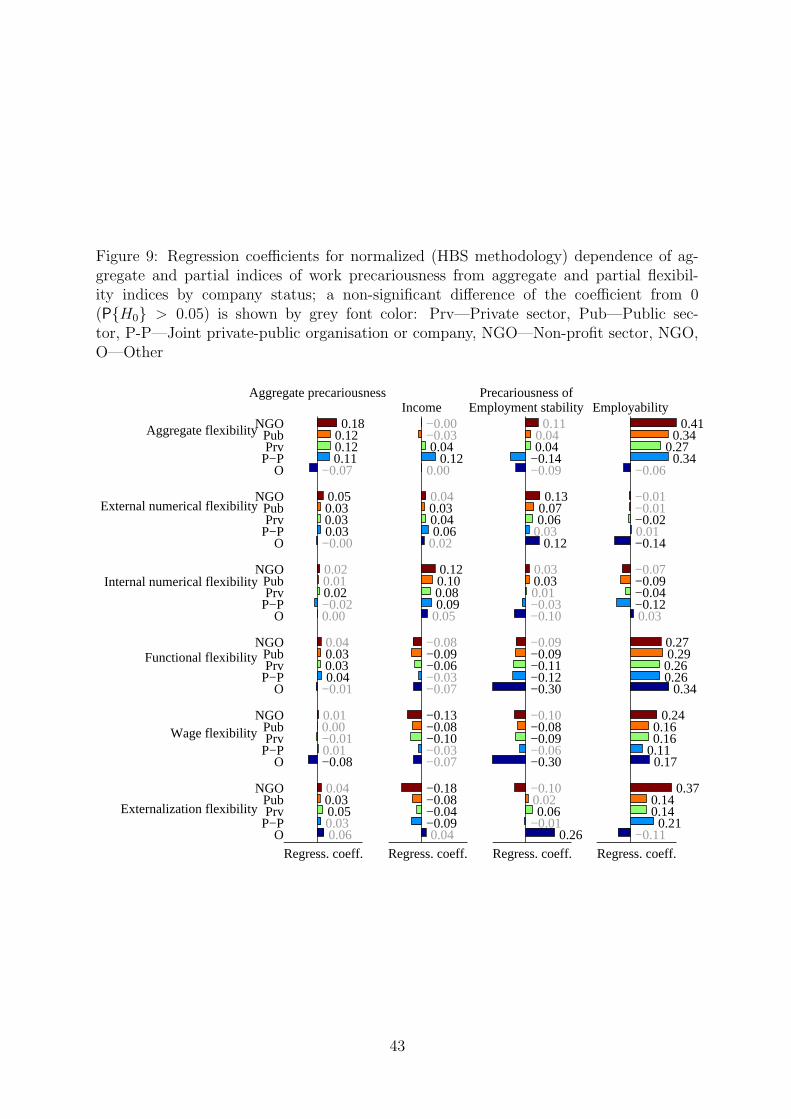
Figure 9: Regression coefficients for normalized (HBS methodology) dependence of ag-gregate and partial indices of work precariousness from aggregate and partial flexibil-ity indices by company status; a non-significant difference of the coefficient from 0(P{H0} > 0.05) is shown by grey font color: Prv—Private sector, Pub—Public sec-tor, P-P—Joint private-public organisation or company, NGO—Non-profit sector, NGO,O—Other
Externalization flexibility
Wage flexibility
Functional flexibility
Internal numerical flexibility
External numerical flexibility
Aggregate flexibilityAggregate flexibility
External numerical flexibility
Internal numerical flexibility
Functional flexibility
Wage flexibility
Externalization flexibility
Aggregate precariousness
Regress. coeff.
NGO 0.18Pub 0.12Prv 0.12
P−P 0.11O −0.07
NGO 0.05Pub 0.03Prv 0.03
P−P 0.03O −0.00
NGO 0.02Pub 0.01Prv 0.02
P−P −0.02O 0.00
NGO 0.04Pub 0.03Prv 0.03
P−P 0.04O −0.01
NGO 0.01Pub 0.00Prv −0.01
P−P 0.01O −0.08
NGO 0.04Pub 0.03Prv 0.05
P−P 0.03O 0.06
Income
Regress. coeff.
−0.00−0.030.04
0.120.00
0.040.030.040.06
0.02
0.120.100.080.09
0.05
−0.08−0.09−0.06−0.03−0.07
−0.13−0.08−0.10−0.03−0.07
−0.18−0.08−0.04−0.090.04
Precariousness ofEmployment stability
Regress. coeff.
0.110.040.04
−0.14−0.09
0.130.070.06
0.030.12
0.030.030.01−0.03−0.10
−0.09−0.09−0.11−0.12−0.30
−0.10−0.08−0.09−0.06−0.30
−0.100.020.06
−0.010.26
Employability
Regress. coeff.
0.410.34
0.270.34
−0.06
−0.01−0.01−0.020.01−0.14
−0.07−0.09−0.04−0.120.03
0.270.290.260.26
0.34
0.240.160.16
0.110.17
0.370.140.140.21
−0.11
43
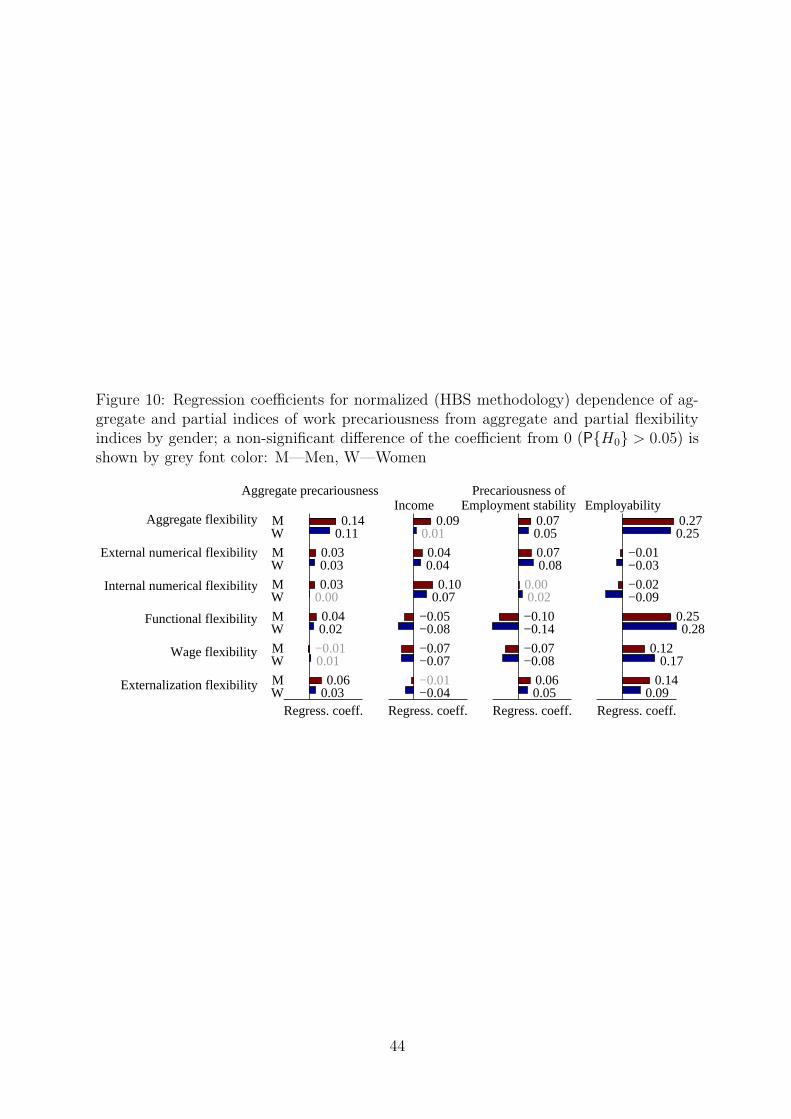
Figure 10: Regression coefficients for normalized (HBS methodology) dependence of ag-gregate and partial indices of work precariousness from aggregate and partial flexibilityindices by gender; a non-significant difference of the coefficient from 0 (P{H0} > 0.05) isshown by grey font color: M—Men, W—Women
Externalization flexibility
Wage flexibility
Functional flexibility
Internal numerical flexibility
External numerical flexibility
Aggregate flexibilityAggregate flexibility
External numerical flexibility
Internal numerical flexibility
Functional flexibility
Wage flexibility
Externalization flexibility
Aggregate precariousness
Regress. coeff.
M 0.14W 0.11
M 0.03W 0.03
M 0.03W 0.00
M 0.04W 0.02
M −0.01W 0.01
M 0.06W 0.03
Income
Regress. coeff.
0.090.01
0.040.04
0.100.07
−0.05−0.08
−0.07−0.07
−0.01−0.04
Precariousness ofEmployment stability
Regress. coeff.
0.070.05
0.070.08
0.000.02
−0.10−0.14
−0.07−0.08
0.060.05
Employability
Regress. coeff.
0.270.25
−0.01−0.03
−0.02−0.09
0.250.28
0.120.17
0.140.09
44
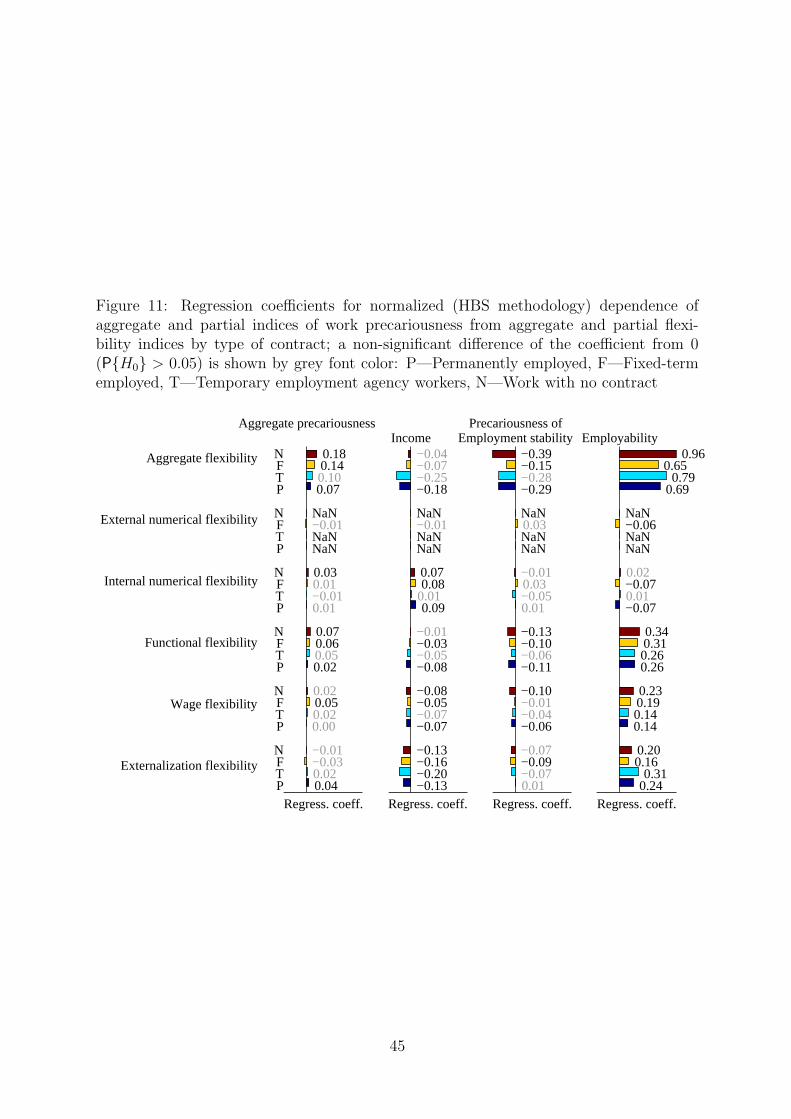
Figure 11: Regression coefficients for normalized (HBS methodology) dependence ofaggregate and partial indices of work precariousness from aggregate and partial flexi-bility indices by type of contract; a non-significant difference of the coefficient from 0(P{H0} > 0.05) is shown by grey font color: P—Permanently employed, F—Fixed-termemployed, T—Temporary employment agency workers, N—Work with no contract
Externalization flexibility
Wage flexibility
Functional flexibility
Internal numerical flexibility
External numerical flexibility
Aggregate flexibilityAggregate flexibility
External numerical flexibility
Internal numerical flexibility
Functional flexibility
Wage flexibility
Externalization flexibility
Aggregate precariousness
Regress. coeff.
N 0.18F 0.14T 0.10P 0.07
N NaNF −0.01T NaNP NaN
N 0.03F 0.01T −0.01P 0.01
N 0.07F 0.06T 0.05P 0.02
N 0.02F 0.05T 0.02P 0.00
N −0.01F −0.03T 0.02P 0.04
Income
Regress. coeff.
−0.04−0.07−0.25−0.18
NaN−0.01NaNNaN
0.070.08
0.010.09
−0.01−0.03−0.05−0.08
−0.08−0.05−0.07−0.07
−0.13−0.16−0.20−0.13
Precariousness ofEmployment stability
Regress. coeff.
−0.39−0.15−0.28−0.29
NaN0.03NaNNaN
−0.010.03−0.050.01
−0.13−0.10−0.06−0.11
−0.10−0.01−0.04−0.06
−0.07−0.09−0.070.01
Employability
Regress. coeff.
0.960.65
0.790.69
NaN−0.06NaNNaN
0.02−0.070.01−0.07
0.340.310.260.26
0.230.190.140.14
0.200.16
0.310.24
45
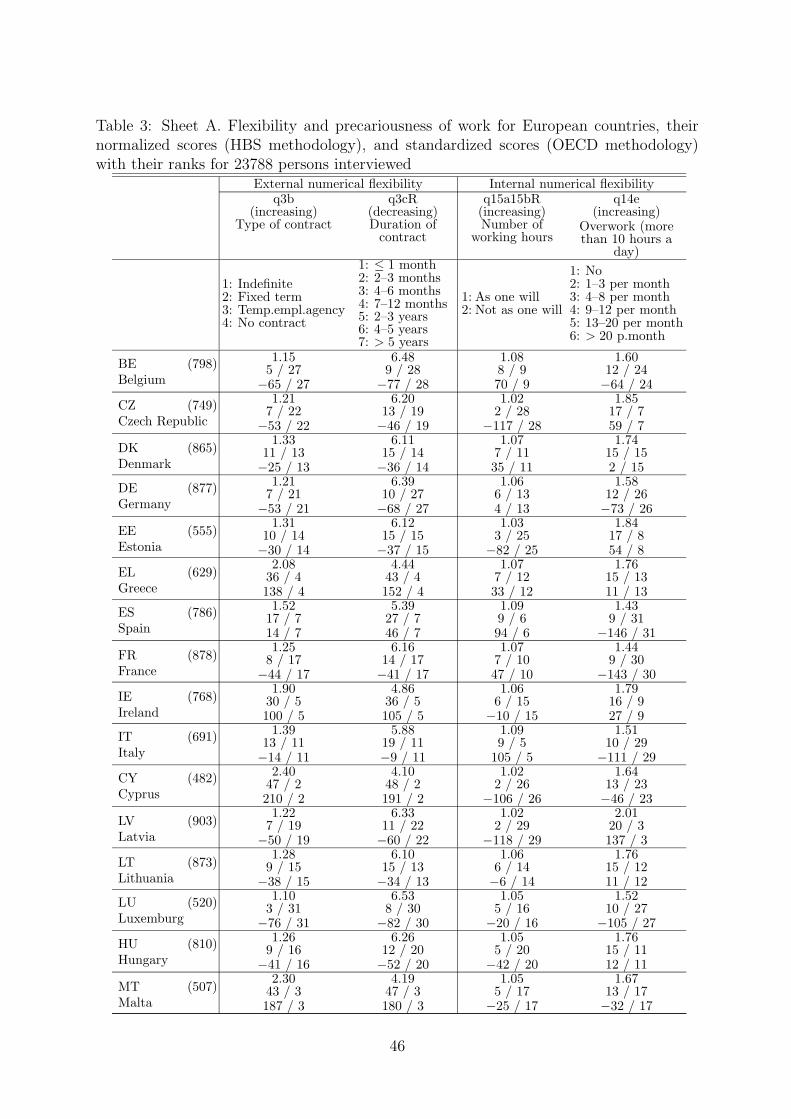
Table 3: Sheet A. Flexibility and precariousness of work for European countries, theirnormalized scores (HBS methodology), and standardized scores (OECD methodology)with their ranks for 23788 persons interviewed
External numerical flexibility Internal numerical flexibilityq3b
(increasing)Type of contract
q3cR(decreasing)Duration of
contract
q15a15bR(increasing)Number of
working hours
q14e(increasing)
Overwork (morethan 10 hours a
day)
1: Indefinite2: Fixed term3: Temp.empl.agency4: No contract
1: ≤ 1 month2: 2–3 months3: 4–6 months4: 7–12 months5: 2–3 years6: 4–5 years7: > 5 years
1: As one will2: Not as one will
1: No2: 1–3 per month3: 4–8 per month4: 9–12 per month5: 13–20 per month6: > 20 p.month
BE (798)Belgium
1.155 / 27
−65 / 27
6.489 / 28
−77 / 28
1.088 / 970 / 9
1.6012 / 24−64 / 24
CZ (749)Czech Republic
1.217 / 22
−53 / 22
6.2013 / 19−46 / 19
1.022 / 28
−117 / 28
1.8517 / 759 / 7
DK (865)Denmark
1.3311 / 13−25 / 13
6.1115 / 14−36 / 14
1.077 / 1135 / 11
1.7415 / 152 / 15
DE (877)Germany
1.217 / 21
−53 / 21
6.3910 / 27−68 / 27
1.066 / 134 / 13
1.5812 / 26−73 / 26
EE (555)Estonia
1.3110 / 14−30 / 14
6.1215 / 15−37 / 15
1.033 / 25
−82 / 25
1.8417 / 854 / 8
EL (629)Greece
2.0836 / 4138 / 4
4.4443 / 4152 / 4
1.077 / 1233 / 12
1.7615 / 1311 / 13
ES (786)Spain
1.5217 / 714 / 7
5.3927 / 746 / 7
1.099 / 694 / 6
1.439 / 31
−146 / 31
FR (878)France
1.258 / 17
−44 / 17
6.1614 / 17−41 / 17
1.077 / 1047 / 10
1.449 / 30
−143 / 30
IE (768)Ireland
1.9030 / 5100 / 5
4.8636 / 5105 / 5
1.066 / 15
−10 / 15
1.7916 / 927 / 9
IT (691)Italy
1.3913 / 11−14 / 11
5.8819 / 11−9 / 11
1.099 / 5
105 / 5
1.5110 / 29
−111 / 29
CY (482)Cyprus
2.4047 / 2210 / 2
4.1048 / 2191 / 2
1.022 / 26
−106 / 26
1.6413 / 23−46 / 23
LV (903)Latvia
1.227 / 19
−50 / 19
6.3311 / 22−60 / 22
1.022 / 29
−118 / 29
2.0120 / 3137 / 3
LT (873)Lithuania
1.289 / 15
−38 / 15
6.1015 / 13−34 / 13
1.066 / 14−6 / 14
1.7615 / 1211 / 12
LU (520)Luxemburg
1.103 / 31
−76 / 31
6.538 / 30
−82 / 30
1.055 / 16
−20 / 16
1.5210 / 27
−105 / 27
HU (810)Hungary
1.269 / 16
−41 / 16
6.2612 / 20−52 / 20
1.055 / 20
−42 / 20
1.7615 / 1112 / 11
MT (507)Malta
2.3043 / 3187 / 3
4.1947 / 3180 / 3
1.055 / 17
−25 / 17
1.6713 / 17−32 / 17
46
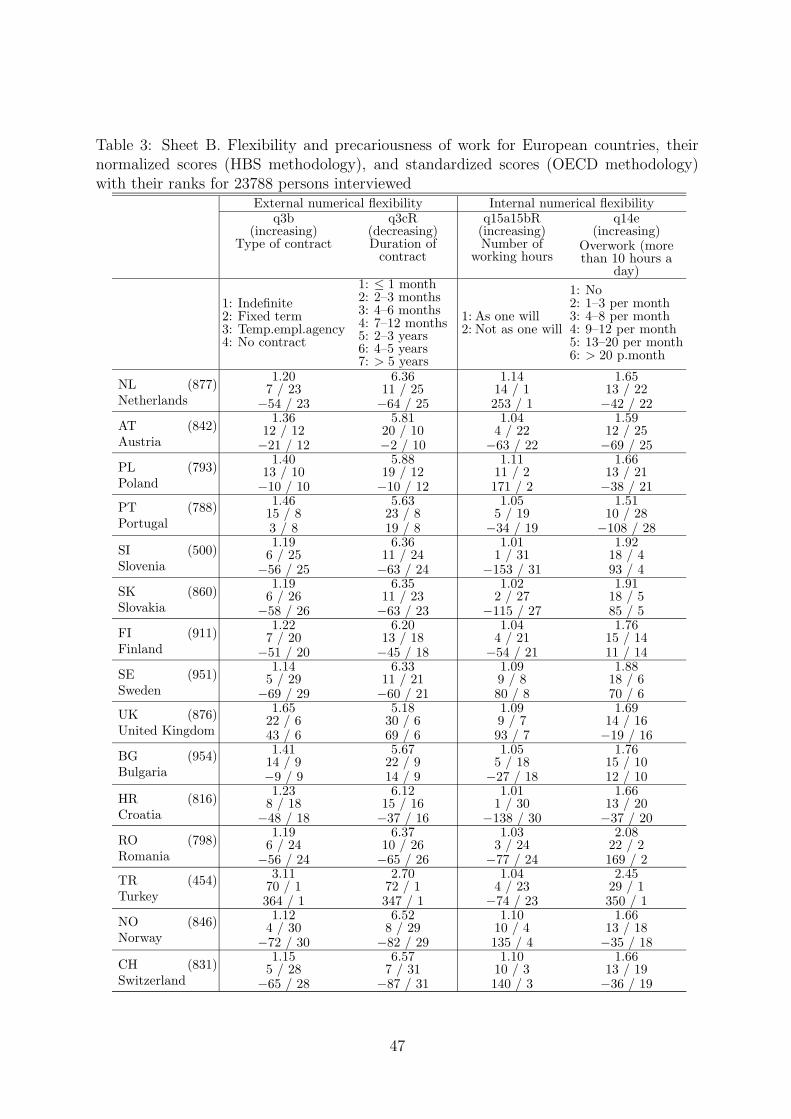
Table 3: Sheet B. Flexibility and precariousness of work for European countries, theirnormalized scores (HBS methodology), and standardized scores (OECD methodology)with their ranks for 23788 persons interviewed
External numerical flexibility Internal numerical flexibilityq3b
(increasing)Type of contract
q3cR(decreasing)Duration of
contract
q15a15bR(increasing)Number of
working hours
q14e(increasing)
Overwork (morethan 10 hours a
day)
1: Indefinite2: Fixed term3: Temp.empl.agency4: No contract
1: ≤ 1 month2: 2–3 months3: 4–6 months4: 7–12 months5: 2–3 years6: 4–5 years7: > 5 years
1: As one will2: Not as one will
1: No2: 1–3 per month3: 4–8 per month4: 9–12 per month5: 13–20 per month6: > 20 p.month
NL (877)Netherlands
1.207 / 23
−54 / 23
6.3611 / 25−64 / 25
1.1414 / 1253 / 1
1.6513 / 22−42 / 22
AT (842)Austria
1.3612 / 12−21 / 12
5.8120 / 10−2 / 10
1.044 / 22
−63 / 22
1.5912 / 25−69 / 25
PL (793)Poland
1.4013 / 10−10 / 10
5.8819 / 12−10 / 12
1.1111 / 2171 / 2
1.6613 / 21−38 / 21
PT (788)Portugal
1.4615 / 83 / 8
5.6323 / 819 / 8
1.055 / 19
−34 / 19
1.5110 / 28
−108 / 28
SI (500)Slovenia
1.196 / 25
−56 / 25
6.3611 / 24−63 / 24
1.011 / 31
−153 / 31
1.9218 / 493 / 4
SK (860)Slovakia
1.196 / 26
−58 / 26
6.3511 / 23−63 / 23
1.022 / 27
−115 / 27
1.9118 / 585 / 5
FI (911)Finland
1.227 / 20
−51 / 20
6.2013 / 18−45 / 18
1.044 / 21
−54 / 21
1.7615 / 1411 / 14
SE (951)Sweden
1.145 / 29
−69 / 29
6.3311 / 21−60 / 21
1.099 / 880 / 8
1.8818 / 670 / 6
UK (876)United Kingdom
1.6522 / 643 / 6
5.1830 / 669 / 6
1.099 / 793 / 7
1.6914 / 16−19 / 16
BG (954)Bulgaria
1.4114 / 9−9 / 9
5.6722 / 914 / 9
1.055 / 18
−27 / 18
1.7615 / 1012 / 10
HR (816)Croatia
1.238 / 18
−48 / 18
6.1215 / 16−37 / 16
1.011 / 30
−138 / 30
1.6613 / 20−37 / 20
RO (798)Romania
1.196 / 24
−56 / 24
6.3710 / 26−65 / 26
1.033 / 24
−77 / 24
2.0822 / 2169 / 2
TR (454)Turkey
3.1170 / 1364 / 1
2.7072 / 1347 / 1
1.044 / 23
−74 / 23
2.4529 / 1350 / 1
NO (846)Norway
1.124 / 30
−72 / 30
6.528 / 29
−82 / 29
1.1010 / 4135 / 4
1.6613 / 18−35 / 18
CH (831)Switzerland
1.155 / 28
−65 / 28
6.577 / 31
−87 / 31
1.1010 / 3140 / 3
1.6613 / 19−36 / 19
47
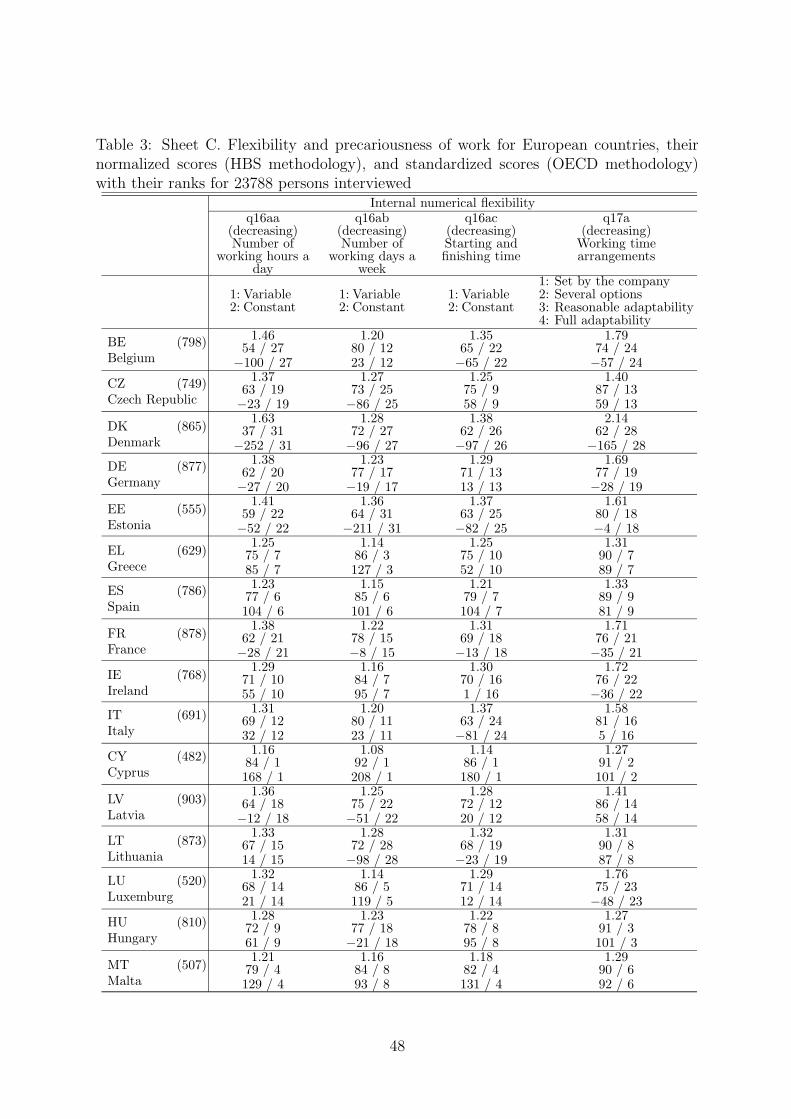
Table 3: Sheet C. Flexibility and precariousness of work for European countries, theirnormalized scores (HBS methodology), and standardized scores (OECD methodology)with their ranks for 23788 persons interviewed
Internal numerical flexibilityq16aa
(decreasing)Number of
working hours aday
q16ab(decreasing)Number of
working days aweek
q16ac(decreasing)Starting andfinishing time
q17a(decreasing)
Working timearrangements
1: Variable2: Constant
1: Variable2: Constant
1: Variable2: Constant
1: Set by the company2: Several options3: Reasonable adaptability4: Full adaptability
BE (798)Belgium
1.4654 / 27
−100 / 27
1.2080 / 1223 / 12
1.3565 / 22−65 / 22
1.7974 / 24−57 / 24
CZ (749)Czech Republic
1.3763 / 19−23 / 19
1.2773 / 25−86 / 25
1.2575 / 958 / 9
1.4087 / 1359 / 13
DK (865)Denmark
1.6337 / 31
−252 / 31
1.2872 / 27−96 / 27
1.3862 / 26−97 / 26
2.1462 / 28
−165 / 28
DE (877)Germany
1.3862 / 20−27 / 20
1.2377 / 17−19 / 17
1.2971 / 1313 / 13
1.6977 / 19−28 / 19
EE (555)Estonia
1.4159 / 22−52 / 22
1.3664 / 31
−211 / 31
1.3763 / 25−82 / 25
1.6180 / 18−4 / 18
EL (629)Greece
1.2575 / 785 / 7
1.1486 / 3127 / 3
1.2575 / 1052 / 10
1.3190 / 789 / 7
ES (786)Spain
1.2377 / 6104 / 6
1.1585 / 6101 / 6
1.2179 / 7104 / 7
1.3389 / 981 / 9
FR (878)France
1.3862 / 21−28 / 21
1.2278 / 15−8 / 15
1.3169 / 18−13 / 18
1.7176 / 21−35 / 21
IE (768)Ireland
1.2971 / 1055 / 10
1.1684 / 795 / 7
1.3070 / 161 / 16
1.7276 / 22−36 / 22
IT (691)Italy
1.3169 / 1232 / 12
1.2080 / 1123 / 11
1.3763 / 24−81 / 24
1.5881 / 165 / 16
CY (482)Cyprus
1.1684 / 1168 / 1
1.0892 / 1208 / 1
1.1486 / 1180 / 1
1.2791 / 2101 / 2
LV (903)Latvia
1.3664 / 18−12 / 18
1.2575 / 22−51 / 22
1.2872 / 1220 / 12
1.4186 / 1458 / 14
LT (873)Lithuania
1.3367 / 1514 / 15
1.2872 / 28−98 / 28
1.3268 / 19−23 / 19
1.3190 / 887 / 8
LU (520)Luxemburg
1.3268 / 1421 / 14
1.1486 / 5119 / 5
1.2971 / 1412 / 14
1.7675 / 23−48 / 23
HU (810)Hungary
1.2872 / 961 / 9
1.2377 / 18−21 / 18
1.2278 / 895 / 8
1.2791 / 3101 / 3
MT (507)Malta
1.2179 / 4129 / 4
1.1684 / 893 / 8
1.1882 / 4131 / 4
1.2990 / 692 / 6
48
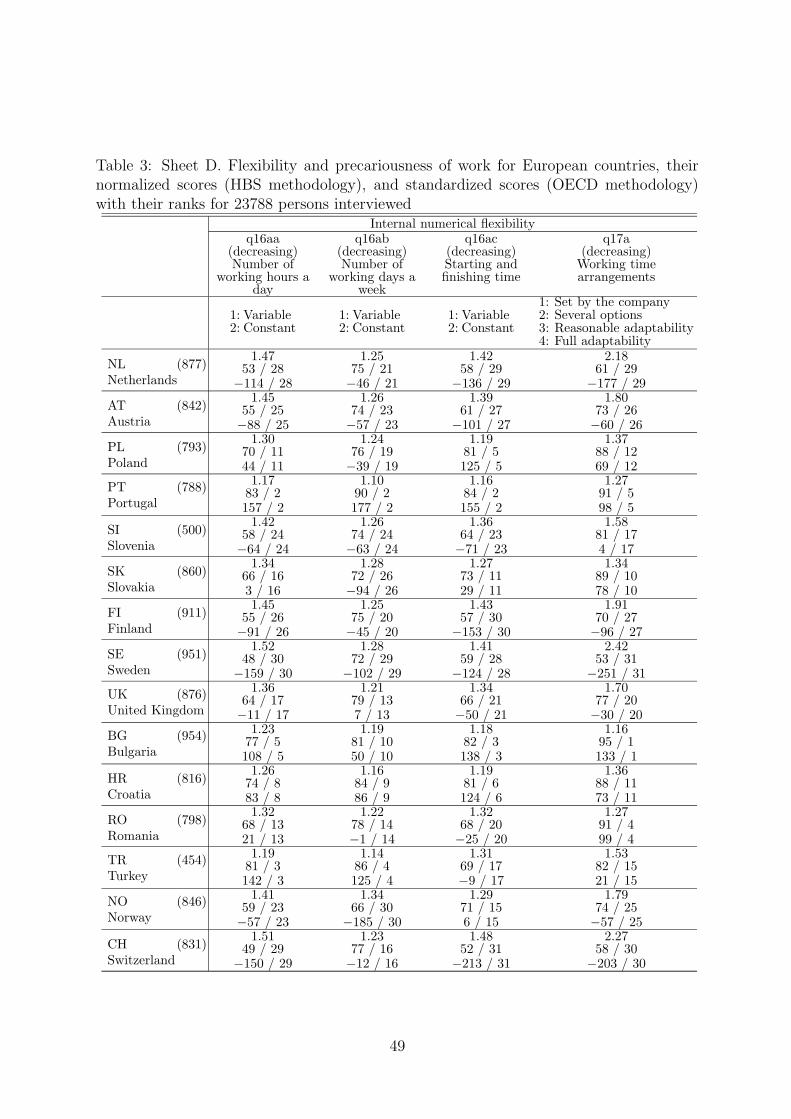
Table 3: Sheet D. Flexibility and precariousness of work for European countries, theirnormalized scores (HBS methodology), and standardized scores (OECD methodology)with their ranks for 23788 persons interviewed
Internal numerical flexibilityq16aa
(decreasing)Number of
working hours aday
q16ab(decreasing)Number of
working days aweek
q16ac(decreasing)Starting andfinishing time
q17a(decreasing)
Working timearrangements
1: Variable2: Constant
1: Variable2: Constant
1: Variable2: Constant
1: Set by the company2: Several options3: Reasonable adaptability4: Full adaptability
NL (877)Netherlands
1.4753 / 28
−114 / 28
1.2575 / 21−46 / 21
1.4258 / 29
−136 / 29
2.1861 / 29
−177 / 29
AT (842)Austria
1.4555 / 25−88 / 25
1.2674 / 23−57 / 23
1.3961 / 27
−101 / 27
1.8073 / 26−60 / 26
PL (793)Poland
1.3070 / 1144 / 11
1.2476 / 19−39 / 19
1.1981 / 5125 / 5
1.3788 / 1269 / 12
PT (788)Portugal
1.1783 / 2157 / 2
1.1090 / 2177 / 2
1.1684 / 2155 / 2
1.2791 / 598 / 5
SI (500)Slovenia
1.4258 / 24−64 / 24
1.2674 / 24−63 / 24
1.3664 / 23−71 / 23
1.5881 / 174 / 17
SK (860)Slovakia
1.3466 / 163 / 16
1.2872 / 26−94 / 26
1.2773 / 1129 / 11
1.3489 / 1078 / 10
FI (911)Finland
1.4555 / 26−91 / 26
1.2575 / 20−45 / 20
1.4357 / 30
−153 / 30
1.9170 / 27−96 / 27
SE (951)Sweden
1.5248 / 30
−159 / 30
1.2872 / 29
−102 / 29
1.4159 / 28
−124 / 28
2.4253 / 31
−251 / 31
UK (876)United Kingdom
1.3664 / 17−11 / 17
1.2179 / 137 / 13
1.3466 / 21−50 / 21
1.7077 / 20−30 / 20
BG (954)Bulgaria
1.2377 / 5108 / 5
1.1981 / 1050 / 10
1.1882 / 3138 / 3
1.1695 / 1133 / 1
HR (816)Croatia
1.2674 / 883 / 8
1.1684 / 986 / 9
1.1981 / 6124 / 6
1.3688 / 1173 / 11
RO (798)Romania
1.3268 / 1321 / 13
1.2278 / 14−1 / 14
1.3268 / 20−25 / 20
1.2791 / 499 / 4
TR (454)Turkey
1.1981 / 3142 / 3
1.1486 / 4125 / 4
1.3169 / 17−9 / 17
1.5382 / 1521 / 15
NO (846)Norway
1.4159 / 23−57 / 23
1.3466 / 30
−185 / 30
1.2971 / 156 / 15
1.7974 / 25−57 / 25
CH (831)Switzerland
1.5149 / 29
−150 / 29
1.2377 / 16−12 / 16
1.4852 / 31
−213 / 31
2.2758 / 30
−203 / 30
49
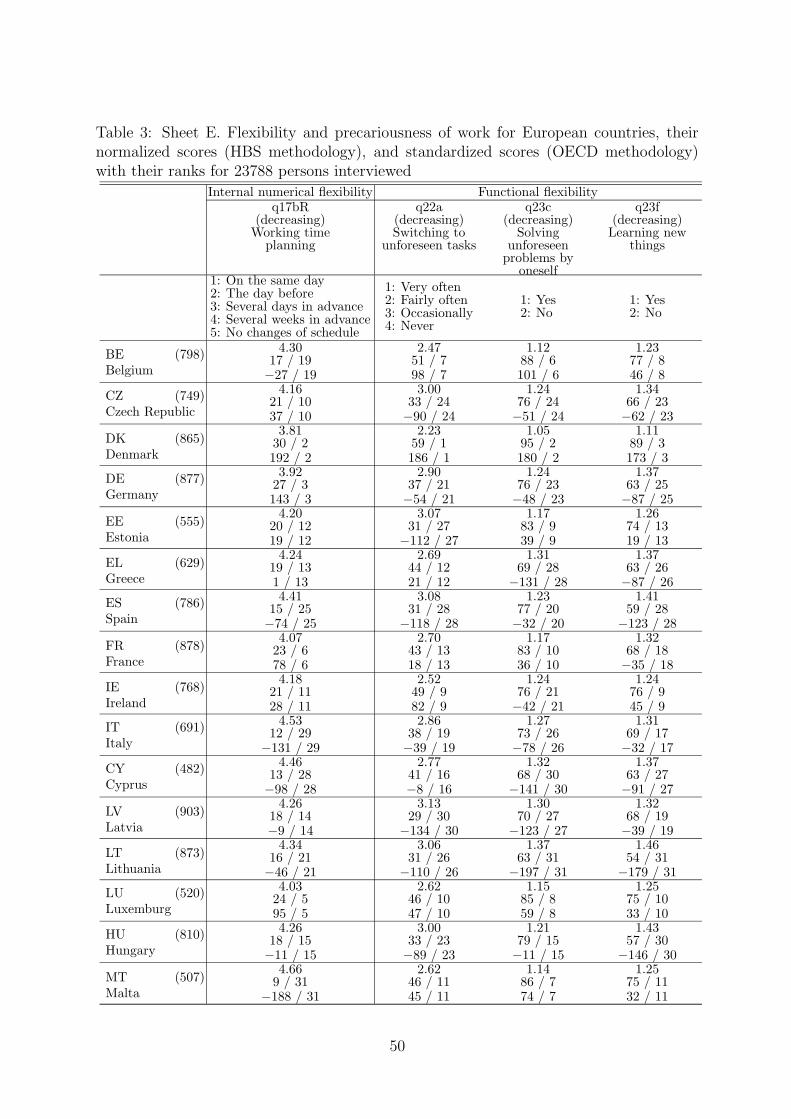
Table 3: Sheet E. Flexibility and precariousness of work for European countries, theirnormalized scores (HBS methodology), and standardized scores (OECD methodology)with their ranks for 23788 persons interviewed
Internal numerical flexibility Functional flexibilityq17bR
(decreasing)Working time
planning
q22a(decreasing)Switching to
unforeseen tasks
q23c(decreasing)
Solvingunforeseen
problems byoneself
q23f(decreasing)Learning new
things
1: On the same day2: The day before3: Several days in advance4: Several weeks in advance5: No changes of schedule
1: Very often2: Fairly often3: Occasionally4: Never
1: Yes2: No
1: Yes2: No
BE (798)Belgium
4.3017 / 19−27 / 19
2.4751 / 798 / 7
1.1288 / 6101 / 6
1.2377 / 846 / 8
CZ (749)Czech Republic
4.1621 / 1037 / 10
3.0033 / 24−90 / 24
1.2476 / 24−51 / 24
1.3466 / 23−62 / 23
DK (865)Denmark
3.8130 / 2192 / 2
2.2359 / 1186 / 1
1.0595 / 2180 / 2
1.1189 / 3173 / 3
DE (877)Germany
3.9227 / 3143 / 3
2.9037 / 21−54 / 21
1.2476 / 23−48 / 23
1.3763 / 25−87 / 25
EE (555)Estonia
4.2020 / 1219 / 12
3.0731 / 27
−112 / 27
1.1783 / 939 / 9
1.2674 / 1319 / 13
EL (629)Greece
4.2419 / 131 / 13
2.6944 / 1221 / 12
1.3169 / 28
−131 / 28
1.3763 / 26−87 / 26
ES (786)Spain
4.4115 / 25−74 / 25
3.0831 / 28
−118 / 28
1.2377 / 20−32 / 20
1.4159 / 28
−123 / 28
FR (878)France
4.0723 / 678 / 6
2.7043 / 1318 / 13
1.1783 / 1036 / 10
1.3268 / 18−35 / 18
IE (768)Ireland
4.1821 / 1128 / 11
2.5249 / 982 / 9
1.2476 / 21−42 / 21
1.2476 / 945 / 9
IT (691)Italy
4.5312 / 29
−131 / 29
2.8638 / 19−39 / 19
1.2773 / 26−78 / 26
1.3169 / 17−32 / 17
CY (482)Cyprus
4.4613 / 28−98 / 28
2.7741 / 16−8 / 16
1.3268 / 30
−141 / 30
1.3763 / 27−91 / 27
LV (903)Latvia
4.2618 / 14−9 / 14
3.1329 / 30
−134 / 30
1.3070 / 27
−123 / 27
1.3268 / 19−39 / 19
LT (873)Lithuania
4.3416 / 21−46 / 21
3.0631 / 26
−110 / 26
1.3763 / 31
−197 / 31
1.4654 / 31
−179 / 31
LU (520)Luxemburg
4.0324 / 595 / 5
2.6246 / 1047 / 10
1.1585 / 859 / 8
1.2575 / 1033 / 10
HU (810)Hungary
4.2618 / 15−11 / 15
3.0033 / 23−89 / 23
1.2179 / 15−11 / 15
1.4357 / 30
−146 / 30
MT (507)Malta
4.669 / 31
−188 / 31
2.6246 / 1145 / 11
1.1486 / 774 / 7
1.2575 / 1132 / 11
50
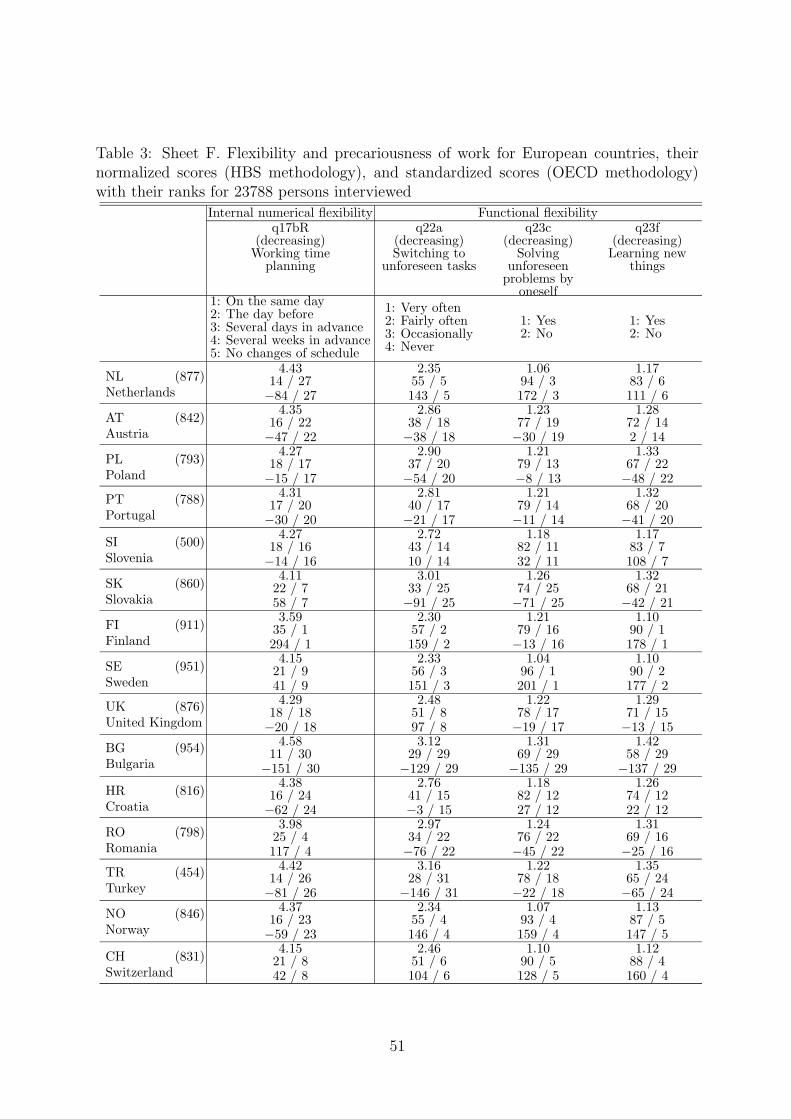
Table 3: Sheet F. Flexibility and precariousness of work for European countries, theirnormalized scores (HBS methodology), and standardized scores (OECD methodology)with their ranks for 23788 persons interviewed
Internal numerical flexibility Functional flexibilityq17bR
(decreasing)Working time
planning
q22a(decreasing)Switching to
unforeseen tasks
q23c(decreasing)
Solvingunforeseen
problems byoneself
q23f(decreasing)Learning new
things
1: On the same day2: The day before3: Several days in advance4: Several weeks in advance5: No changes of schedule
1: Very often2: Fairly often3: Occasionally4: Never
1: Yes2: No
1: Yes2: No
NL (877)Netherlands
4.4314 / 27−84 / 27
2.3555 / 5143 / 5
1.0694 / 3172 / 3
1.1783 / 6111 / 6
AT (842)Austria
4.3516 / 22−47 / 22
2.8638 / 18−38 / 18
1.2377 / 19−30 / 19
1.2872 / 142 / 14
PL (793)Poland
4.2718 / 17−15 / 17
2.9037 / 20−54 / 20
1.2179 / 13−8 / 13
1.3367 / 22−48 / 22
PT (788)Portugal
4.3117 / 20−30 / 20
2.8140 / 17−21 / 17
1.2179 / 14−11 / 14
1.3268 / 20−41 / 20
SI (500)Slovenia
4.2718 / 16−14 / 16
2.7243 / 1410 / 14
1.1882 / 1132 / 11
1.1783 / 7108 / 7
SK (860)Slovakia
4.1122 / 758 / 7
3.0133 / 25−91 / 25
1.2674 / 25−71 / 25
1.3268 / 21−42 / 21
FI (911)Finland
3.5935 / 1294 / 1
2.3057 / 2159 / 2
1.2179 / 16−13 / 16
1.1090 / 1178 / 1
SE (951)Sweden
4.1521 / 941 / 9
2.3356 / 3151 / 3
1.0496 / 1201 / 1
1.1090 / 2177 / 2
UK (876)United Kingdom
4.2918 / 18−20 / 18
2.4851 / 897 / 8
1.2278 / 17−19 / 17
1.2971 / 15−13 / 15
BG (954)Bulgaria
4.5811 / 30
−151 / 30
3.1229 / 29
−129 / 29
1.3169 / 29
−135 / 29
1.4258 / 29
−137 / 29
HR (816)Croatia
4.3816 / 24−62 / 24
2.7641 / 15−3 / 15
1.1882 / 1227 / 12
1.2674 / 1222 / 12
RO (798)Romania
3.9825 / 4117 / 4
2.9734 / 22−76 / 22
1.2476 / 22−45 / 22
1.3169 / 16−25 / 16
TR (454)Turkey
4.4214 / 26−81 / 26
3.1628 / 31
−146 / 31
1.2278 / 18−22 / 18
1.3565 / 24−65 / 24
NO (846)Norway
4.3716 / 23−59 / 23
2.3455 / 4146 / 4
1.0793 / 4159 / 4
1.1387 / 5147 / 5
CH (831)Switzerland
4.1521 / 842 / 8
2.4651 / 6104 / 6
1.1090 / 5128 / 5
1.1288 / 4160 / 4
51
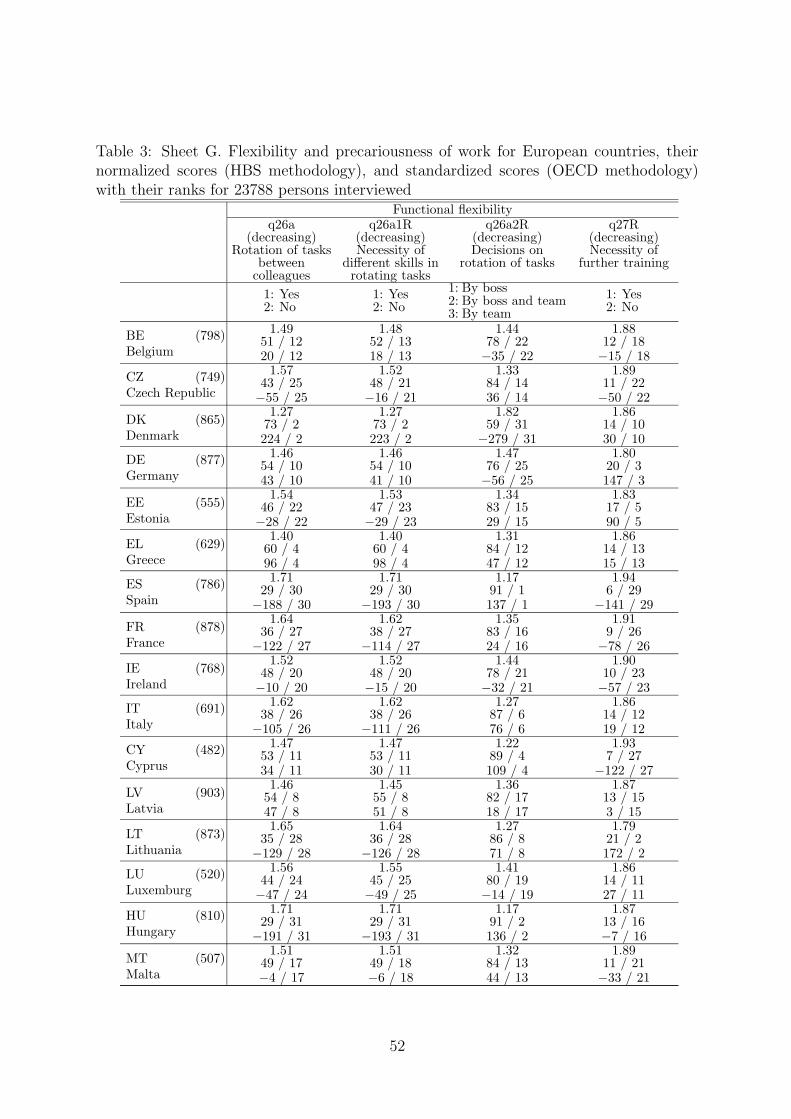
Table 3: Sheet G. Flexibility and precariousness of work for European countries, theirnormalized scores (HBS methodology), and standardized scores (OECD methodology)with their ranks for 23788 persons interviewed
Functional flexibilityq26a
(decreasing)Rotation of tasks
betweencolleagues
q26a1R(decreasing)Necessity of
different skills inrotating tasks
q26a2R(decreasing)Decisions on
rotation of tasks
q27R(decreasing)Necessity of
further training
1: Yes2: No
1: Yes2: No
1: By boss2: By boss and team3: By team
1: Yes2: No
BE (798)Belgium
1.4951 / 1220 / 12
1.4852 / 1318 / 13
1.4478 / 22−35 / 22
1.8812 / 18−15 / 18
CZ (749)Czech Republic
1.5743 / 25−55 / 25
1.5248 / 21−16 / 21
1.3384 / 1436 / 14
1.8911 / 22−50 / 22
DK (865)Denmark
1.2773 / 2224 / 2
1.2773 / 2223 / 2
1.8259 / 31
−279 / 31
1.8614 / 1030 / 10
DE (877)Germany
1.4654 / 1043 / 10
1.4654 / 1041 / 10
1.4776 / 25−56 / 25
1.8020 / 3147 / 3
EE (555)Estonia
1.5446 / 22−28 / 22
1.5347 / 23−29 / 23
1.3483 / 1529 / 15
1.8317 / 590 / 5
EL (629)Greece
1.4060 / 496 / 4
1.4060 / 498 / 4
1.3184 / 1247 / 12
1.8614 / 1315 / 13
ES (786)Spain
1.7129 / 30
−188 / 30
1.7129 / 30
−193 / 30
1.1791 / 1137 / 1
1.946 / 29
−141 / 29
FR (878)France
1.6436 / 27
−122 / 27
1.6238 / 27
−114 / 27
1.3583 / 1624 / 16
1.919 / 26
−78 / 26
IE (768)Ireland
1.5248 / 20−10 / 20
1.5248 / 20−15 / 20
1.4478 / 21−32 / 21
1.9010 / 23−57 / 23
IT (691)Italy
1.6238 / 26
−105 / 26
1.6238 / 26
−111 / 26
1.2787 / 676 / 6
1.8614 / 1219 / 12
CY (482)Cyprus
1.4753 / 1134 / 11
1.4753 / 1130 / 11
1.2289 / 4109 / 4
1.937 / 27
−122 / 27
LV (903)Latvia
1.4654 / 847 / 8
1.4555 / 851 / 8
1.3682 / 1718 / 17
1.8713 / 153 / 15
LT (873)Lithuania
1.6535 / 28
−129 / 28
1.6436 / 28
−126 / 28
1.2786 / 871 / 8
1.7921 / 2172 / 2
LU (520)Luxemburg
1.5644 / 24−47 / 24
1.5545 / 25−49 / 25
1.4180 / 19−14 / 19
1.8614 / 1127 / 11
HU (810)Hungary
1.7129 / 31
−191 / 31
1.7129 / 31
−193 / 31
1.1791 / 2136 / 2
1.8713 / 16−7 / 16
MT (507)Malta
1.5149 / 17−4 / 17
1.5149 / 18−6 / 18
1.3284 / 1344 / 13
1.8911 / 21−33 / 21
52
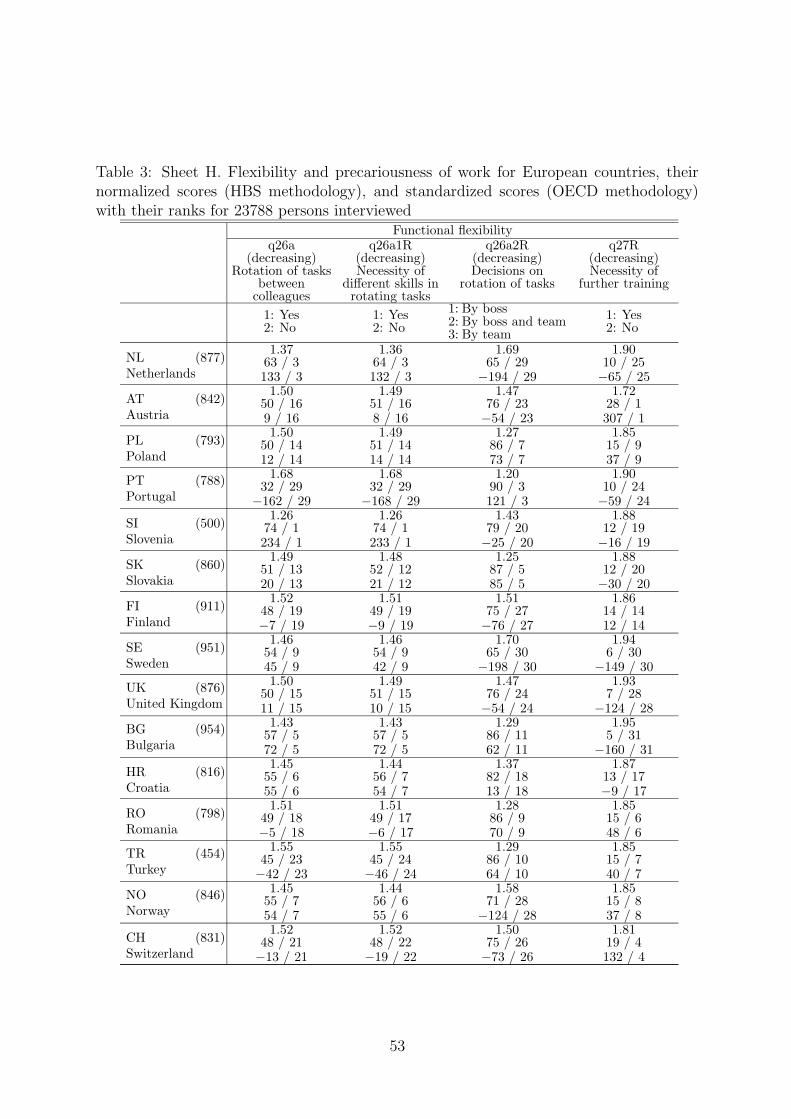
Table 3: Sheet H. Flexibility and precariousness of work for European countries, theirnormalized scores (HBS methodology), and standardized scores (OECD methodology)with their ranks for 23788 persons interviewed
Functional flexibilityq26a
(decreasing)Rotation of tasks
betweencolleagues
q26a1R(decreasing)Necessity of
different skills inrotating tasks
q26a2R(decreasing)Decisions on
rotation of tasks
q27R(decreasing)Necessity of
further training
1: Yes2: No
1: Yes2: No
1: By boss2: By boss and team3: By team
1: Yes2: No
NL (877)Netherlands
1.3763 / 3133 / 3
1.3664 / 3132 / 3
1.6965 / 29
−194 / 29
1.9010 / 25−65 / 25
AT (842)Austria
1.5050 / 169 / 16
1.4951 / 168 / 16
1.4776 / 23−54 / 23
1.7228 / 1307 / 1
PL (793)Poland
1.5050 / 1412 / 14
1.4951 / 1414 / 14
1.2786 / 773 / 7
1.8515 / 937 / 9
PT (788)Portugal
1.6832 / 29
−162 / 29
1.6832 / 29
−168 / 29
1.2090 / 3121 / 3
1.9010 / 24−59 / 24
SI (500)Slovenia
1.2674 / 1234 / 1
1.2674 / 1233 / 1
1.4379 / 20−25 / 20
1.8812 / 19−16 / 19
SK (860)Slovakia
1.4951 / 1320 / 13
1.4852 / 1221 / 12
1.2587 / 585 / 5
1.8812 / 20−30 / 20
FI (911)Finland
1.5248 / 19−7 / 19
1.5149 / 19−9 / 19
1.5175 / 27−76 / 27
1.8614 / 1412 / 14
SE (951)Sweden
1.4654 / 945 / 9
1.4654 / 942 / 9
1.7065 / 30
−198 / 30
1.946 / 30
−149 / 30
UK (876)United Kingdom
1.5050 / 1511 / 15
1.4951 / 1510 / 15
1.4776 / 24−54 / 24
1.937 / 28
−124 / 28
BG (954)Bulgaria
1.4357 / 572 / 5
1.4357 / 572 / 5
1.2986 / 1162 / 11
1.955 / 31
−160 / 31
HR (816)Croatia
1.4555 / 655 / 6
1.4456 / 754 / 7
1.3782 / 1813 / 18
1.8713 / 17−9 / 17
RO (798)Romania
1.5149 / 18−5 / 18
1.5149 / 17−6 / 17
1.2886 / 970 / 9
1.8515 / 648 / 6
TR (454)Turkey
1.5545 / 23−42 / 23
1.5545 / 24−46 / 24
1.2986 / 1064 / 10
1.8515 / 740 / 7
NO (846)Norway
1.4555 / 754 / 7
1.4456 / 655 / 6
1.5871 / 28
−124 / 28
1.8515 / 837 / 8
CH (831)Switzerland
1.5248 / 21−13 / 21
1.5248 / 22−19 / 22
1.5075 / 26−73 / 26
1.8119 / 4132 / 4
53
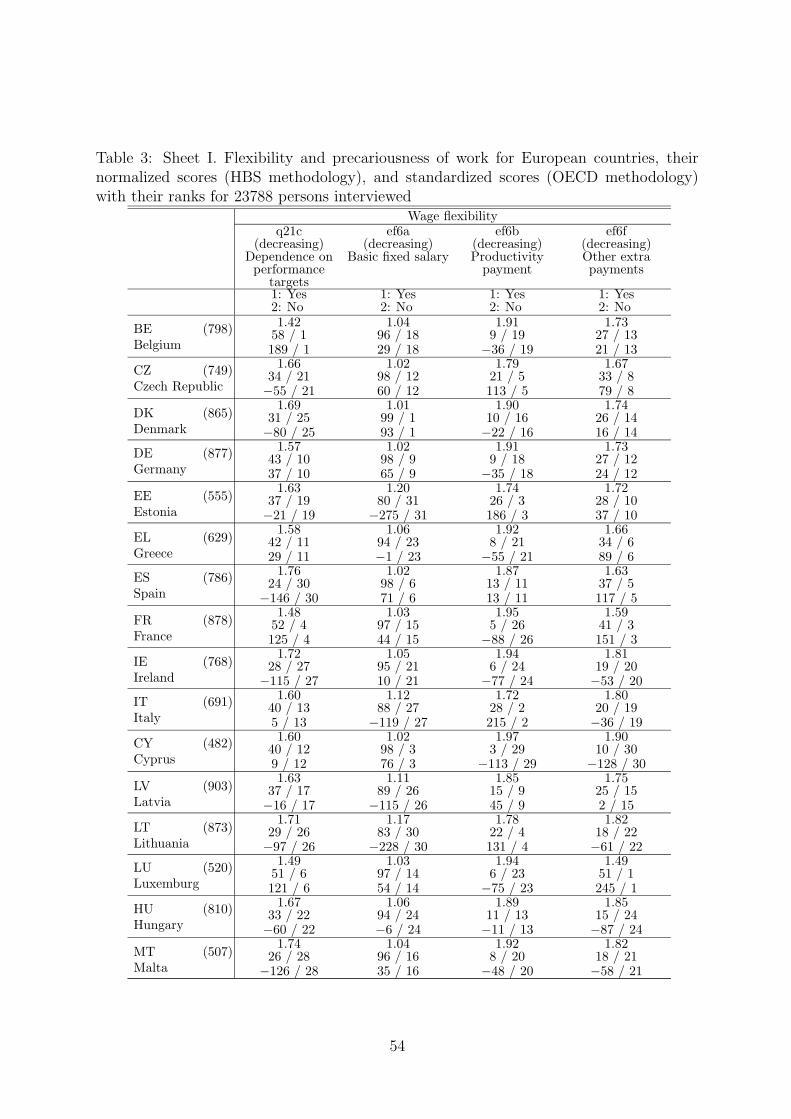
Table 3: Sheet I. Flexibility and precariousness of work for European countries, theirnormalized scores (HBS methodology), and standardized scores (OECD methodology)with their ranks for 23788 persons interviewed
Wage flexibilityq21c
(decreasing)Dependence onperformance
targets
ef6a(decreasing)
Basic fixed salary
ef6b(decreasing)Productivity
payment
ef6f(decreasing)Other extrapayments
1: Yes2: No
1: Yes2: No
1: Yes2: No
1: Yes2: No
BE (798)Belgium
1.4258 / 1189 / 1
1.0496 / 1829 / 18
1.919 / 19
−36 / 19
1.7327 / 1321 / 13
CZ (749)Czech Republic
1.6634 / 21−55 / 21
1.0298 / 1260 / 12
1.7921 / 5113 / 5
1.6733 / 879 / 8
DK (865)Denmark
1.6931 / 25−80 / 25
1.0199 / 193 / 1
1.9010 / 16−22 / 16
1.7426 / 1416 / 14
DE (877)Germany
1.5743 / 1037 / 10
1.0298 / 965 / 9
1.919 / 18
−35 / 18
1.7327 / 1224 / 12
EE (555)Estonia
1.6337 / 19−21 / 19
1.2080 / 31
−275 / 31
1.7426 / 3186 / 3
1.7228 / 1037 / 10
EL (629)Greece
1.5842 / 1129 / 11
1.0694 / 23−1 / 23
1.928 / 21
−55 / 21
1.6634 / 689 / 6
ES (786)Spain
1.7624 / 30
−146 / 30
1.0298 / 671 / 6
1.8713 / 1113 / 11
1.6337 / 5117 / 5
FR (878)France
1.4852 / 4125 / 4
1.0397 / 1544 / 15
1.955 / 26
−88 / 26
1.5941 / 3151 / 3
IE (768)Ireland
1.7228 / 27
−115 / 27
1.0595 / 2110 / 21
1.946 / 24
−77 / 24
1.8119 / 20−53 / 20
IT (691)Italy
1.6040 / 135 / 13
1.1288 / 27
−119 / 27
1.7228 / 2215 / 2
1.8020 / 19−36 / 19
CY (482)Cyprus
1.6040 / 129 / 12
1.0298 / 376 / 3
1.973 / 29
−113 / 29
1.9010 / 30
−128 / 30
LV (903)Latvia
1.6337 / 17−16 / 17
1.1189 / 26
−115 / 26
1.8515 / 945 / 9
1.7525 / 152 / 15
LT (873)Lithuania
1.7129 / 26−97 / 26
1.1783 / 30
−228 / 30
1.7822 / 4131 / 4
1.8218 / 22−61 / 22
LU (520)Luxemburg
1.4951 / 6121 / 6
1.0397 / 1454 / 14
1.946 / 23
−75 / 23
1.4951 / 1245 / 1
HU (810)Hungary
1.6733 / 22−60 / 22
1.0694 / 24−6 / 24
1.8911 / 13−11 / 13
1.8515 / 24−87 / 24
MT (507)Malta
1.7426 / 28
−126 / 28
1.0496 / 1635 / 16
1.928 / 20
−48 / 20
1.8218 / 21−58 / 21
54
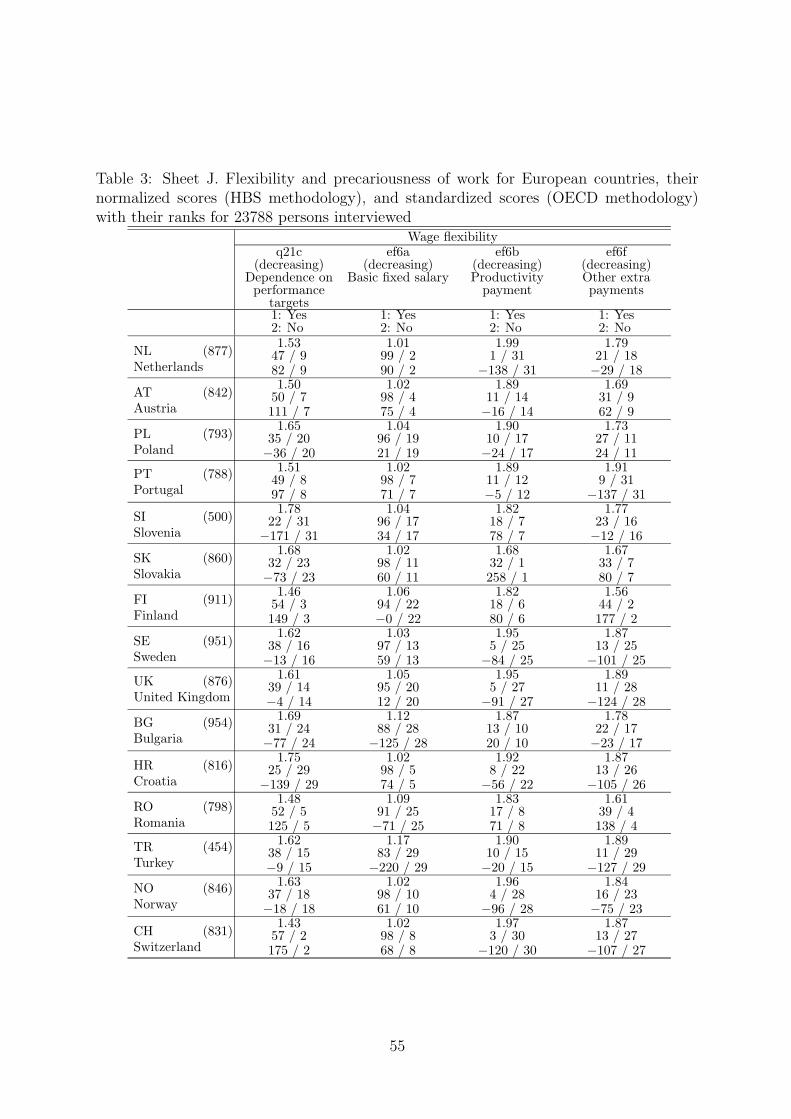
Table 3: Sheet J. Flexibility and precariousness of work for European countries, theirnormalized scores (HBS methodology), and standardized scores (OECD methodology)with their ranks for 23788 persons interviewed
Wage flexibilityq21c
(decreasing)Dependence onperformance
targets
ef6a(decreasing)
Basic fixed salary
ef6b(decreasing)Productivity
payment
ef6f(decreasing)Other extrapayments
1: Yes2: No
1: Yes2: No
1: Yes2: No
1: Yes2: No
NL (877)Netherlands
1.5347 / 982 / 9
1.0199 / 290 / 2
1.991 / 31
−138 / 31
1.7921 / 18−29 / 18
AT (842)Austria
1.5050 / 7111 / 7
1.0298 / 475 / 4
1.8911 / 14−16 / 14
1.6931 / 962 / 9
PL (793)Poland
1.6535 / 20−36 / 20
1.0496 / 1921 / 19
1.9010 / 17−24 / 17
1.7327 / 1124 / 11
PT (788)Portugal
1.5149 / 897 / 8
1.0298 / 771 / 7
1.8911 / 12−5 / 12
1.919 / 31
−137 / 31
SI (500)Slovenia
1.7822 / 31
−171 / 31
1.0496 / 1734 / 17
1.8218 / 778 / 7
1.7723 / 16−12 / 16
SK (860)Slovakia
1.6832 / 23−73 / 23
1.0298 / 1160 / 11
1.6832 / 1258 / 1
1.6733 / 780 / 7
FI (911)Finland
1.4654 / 3149 / 3
1.0694 / 22−0 / 22
1.8218 / 680 / 6
1.5644 / 2177 / 2
SE (951)Sweden
1.6238 / 16−13 / 16
1.0397 / 1359 / 13
1.955 / 25
−84 / 25
1.8713 / 25
−101 / 25
UK (876)United Kingdom
1.6139 / 14−4 / 14
1.0595 / 2012 / 20
1.955 / 27
−91 / 27
1.8911 / 28
−124 / 28
BG (954)Bulgaria
1.6931 / 24−77 / 24
1.1288 / 28
−125 / 28
1.8713 / 1020 / 10
1.7822 / 17−23 / 17
HR (816)Croatia
1.7525 / 29
−139 / 29
1.0298 / 574 / 5
1.928 / 22
−56 / 22
1.8713 / 26
−105 / 26
RO (798)Romania
1.4852 / 5125 / 5
1.0991 / 25−71 / 25
1.8317 / 871 / 8
1.6139 / 4138 / 4
TR (454)Turkey
1.6238 / 15−9 / 15
1.1783 / 29
−220 / 29
1.9010 / 15−20 / 15
1.8911 / 29
−127 / 29
NO (846)Norway
1.6337 / 18−18 / 18
1.0298 / 1061 / 10
1.964 / 28
−96 / 28
1.8416 / 23−75 / 23
CH (831)Switzerland
1.4357 / 2175 / 2
1.0298 / 868 / 8
1.973 / 30
−120 / 30
1.8713 / 27
−107 / 27
55
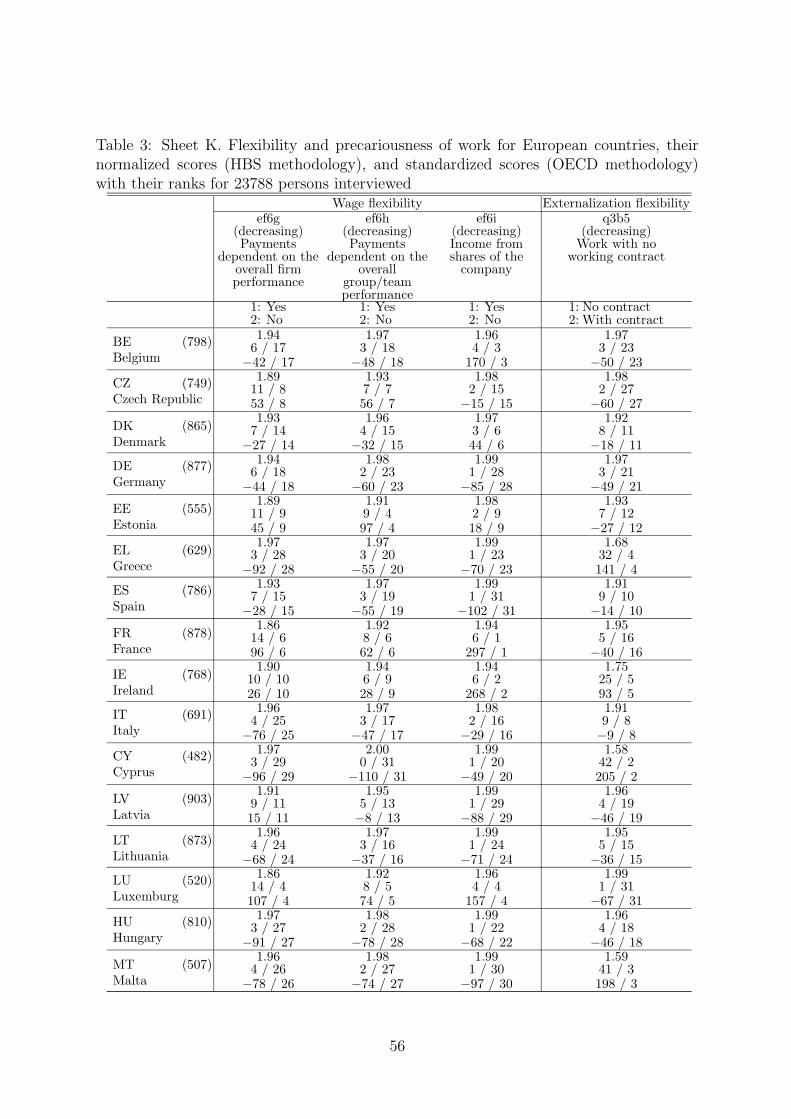
Table 3: Sheet K. Flexibility and precariousness of work for European countries, theirnormalized scores (HBS methodology), and standardized scores (OECD methodology)with their ranks for 23788 persons interviewed
Wage flexibility Externalization flexibilityef6g
(decreasing)Payments
dependent on theoverall firmperformance
ef6h(decreasing)Payments
dependent on theoverall
group/teamperformance
ef6i(decreasing)Income fromshares of the
company
q3b5(decreasing)
Work with noworking contract
1: Yes2: No
1: Yes2: No
1: Yes2: No
1: No contract2: With contract
BE (798)Belgium
1.946 / 17
−42 / 17
1.973 / 18
−48 / 18
1.964 / 3
170 / 3
1.973 / 23
−50 / 23
CZ (749)Czech Republic
1.8911 / 853 / 8
1.937 / 756 / 7
1.982 / 15
−15 / 15
1.982 / 27
−60 / 27
DK (865)Denmark
1.937 / 14
−27 / 14
1.964 / 15
−32 / 15
1.973 / 644 / 6
1.928 / 11
−18 / 11
DE (877)Germany
1.946 / 18
−44 / 18
1.982 / 23
−60 / 23
1.991 / 28
−85 / 28
1.973 / 21
−49 / 21
EE (555)Estonia
1.8911 / 945 / 9
1.919 / 497 / 4
1.982 / 918 / 9
1.937 / 12
−27 / 12
EL (629)Greece
1.973 / 28
−92 / 28
1.973 / 20
−55 / 20
1.991 / 23
−70 / 23
1.6832 / 4141 / 4
ES (786)Spain
1.937 / 15
−28 / 15
1.973 / 19
−55 / 19
1.991 / 31
−102 / 31
1.919 / 10
−14 / 10
FR (878)France
1.8614 / 696 / 6
1.928 / 662 / 6
1.946 / 1
297 / 1
1.955 / 16
−40 / 16
IE (768)Ireland
1.9010 / 1026 / 10
1.946 / 928 / 9
1.946 / 2
268 / 2
1.7525 / 593 / 5
IT (691)Italy
1.964 / 25
−76 / 25
1.973 / 17
−47 / 17
1.982 / 16
−29 / 16
1.919 / 8−9 / 8
CY (482)Cyprus
1.973 / 29
−96 / 29
2.000 / 31
−110 / 31
1.991 / 20
−49 / 20
1.5842 / 2205 / 2
LV (903)Latvia
1.919 / 1115 / 11
1.955 / 13−8 / 13
1.991 / 29
−88 / 29
1.964 / 19
−46 / 19
LT (873)Lithuania
1.964 / 24
−68 / 24
1.973 / 16
−37 / 16
1.991 / 24
−71 / 24
1.955 / 15
−36 / 15
LU (520)Luxemburg
1.8614 / 4107 / 4
1.928 / 574 / 5
1.964 / 4
157 / 4
1.991 / 31
−67 / 31
HU (810)Hungary
1.973 / 27
−91 / 27
1.982 / 28
−78 / 28
1.991 / 22
−68 / 22
1.964 / 18
−46 / 18
MT (507)Malta
1.964 / 26
−78 / 26
1.982 / 27
−74 / 27
1.991 / 30
−97 / 30
1.5941 / 3198 / 3
56
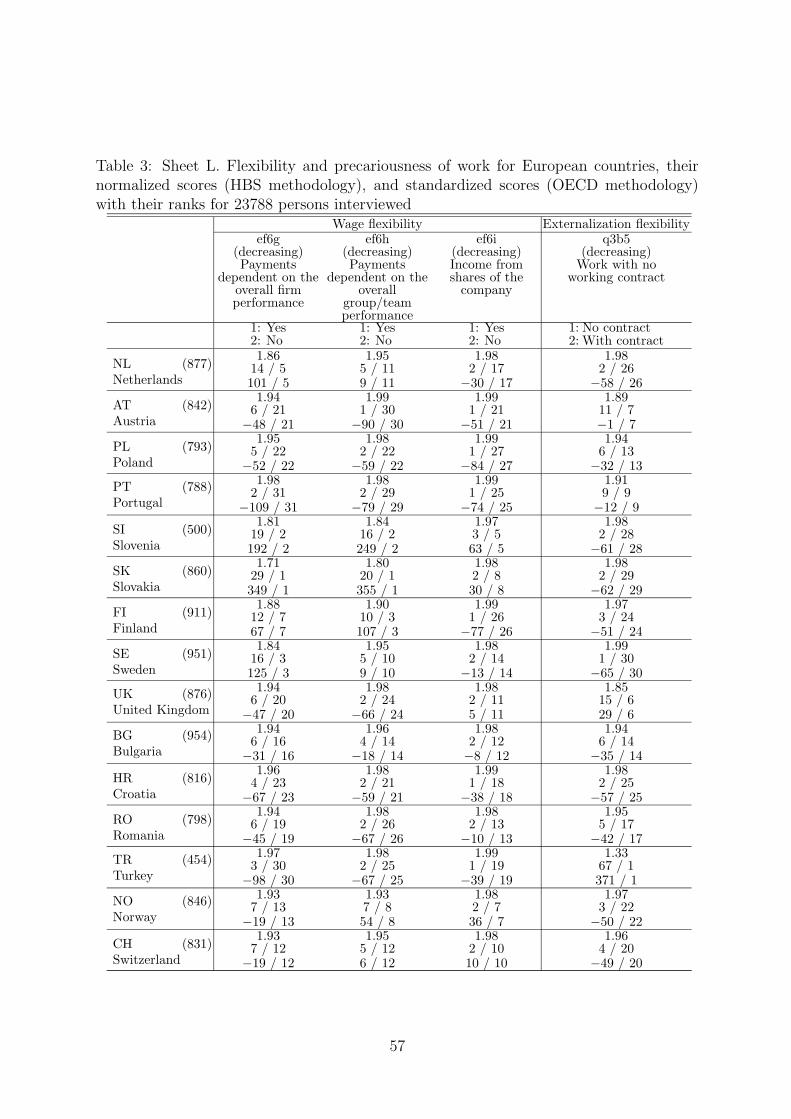
Table 3: Sheet L. Flexibility and precariousness of work for European countries, theirnormalized scores (HBS methodology), and standardized scores (OECD methodology)with their ranks for 23788 persons interviewed
Wage flexibility Externalization flexibilityef6g
(decreasing)Payments
dependent on theoverall firmperformance
ef6h(decreasing)Payments
dependent on theoverall
group/teamperformance
ef6i(decreasing)Income fromshares of the
company
q3b5(decreasing)
Work with noworking contract
1: Yes2: No
1: Yes2: No
1: Yes2: No
1: No contract2: With contract
NL (877)Netherlands
1.8614 / 5101 / 5
1.955 / 119 / 11
1.982 / 17
−30 / 17
1.982 / 26
−58 / 26
AT (842)Austria
1.946 / 21
−48 / 21
1.991 / 30
−90 / 30
1.991 / 21
−51 / 21
1.8911 / 7−1 / 7
PL (793)Poland
1.955 / 22
−52 / 22
1.982 / 22
−59 / 22
1.991 / 27
−84 / 27
1.946 / 13
−32 / 13
PT (788)Portugal
1.982 / 31
−109 / 31
1.982 / 29
−79 / 29
1.991 / 25
−74 / 25
1.919 / 9
−12 / 9
SI (500)Slovenia
1.8119 / 2192 / 2
1.8416 / 2249 / 2
1.973 / 563 / 5
1.982 / 28
−61 / 28
SK (860)Slovakia
1.7129 / 1349 / 1
1.8020 / 1355 / 1
1.982 / 830 / 8
1.982 / 29
−62 / 29
FI (911)Finland
1.8812 / 767 / 7
1.9010 / 3107 / 3
1.991 / 26
−77 / 26
1.973 / 24
−51 / 24
SE (951)Sweden
1.8416 / 3125 / 3
1.955 / 109 / 10
1.982 / 14
−13 / 14
1.991 / 30
−65 / 30
UK (876)United Kingdom
1.946 / 20
−47 / 20
1.982 / 24
−66 / 24
1.982 / 115 / 11
1.8515 / 629 / 6
BG (954)Bulgaria
1.946 / 16
−31 / 16
1.964 / 14
−18 / 14
1.982 / 12−8 / 12
1.946 / 14
−35 / 14
HR (816)Croatia
1.964 / 23
−67 / 23
1.982 / 21
−59 / 21
1.991 / 18
−38 / 18
1.982 / 25
−57 / 25
RO (798)Romania
1.946 / 19
−45 / 19
1.982 / 26
−67 / 26
1.982 / 13
−10 / 13
1.955 / 17
−42 / 17
TR (454)Turkey
1.973 / 30
−98 / 30
1.982 / 25
−67 / 25
1.991 / 19
−39 / 19
1.3367 / 1371 / 1
NO (846)Norway
1.937 / 13
−19 / 13
1.937 / 854 / 8
1.982 / 736 / 7
1.973 / 22
−50 / 22
CH (831)Switzerland
1.937 / 12
−19 / 12
1.955 / 126 / 12
1.982 / 1010 / 10
1.964 / 20
−49 / 20
57
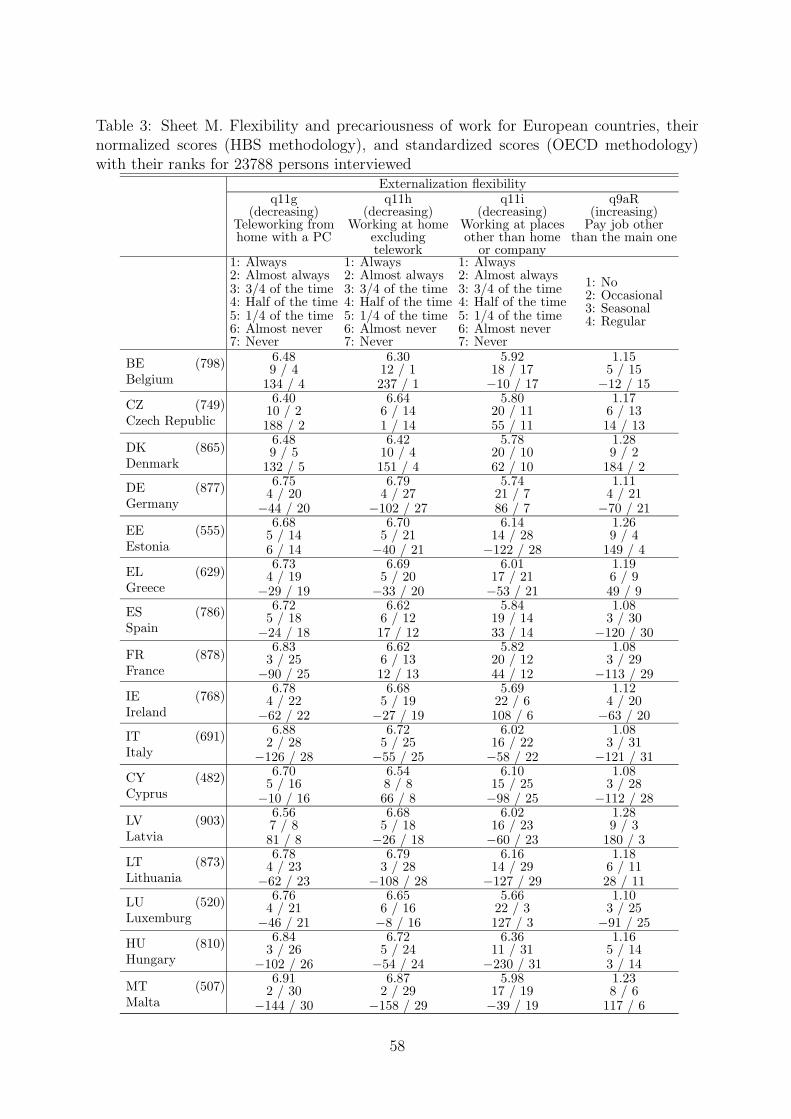
Table 3: Sheet M. Flexibility and precariousness of work for European countries, theirnormalized scores (HBS methodology), and standardized scores (OECD methodology)with their ranks for 23788 persons interviewed
Externalization flexibilityq11g
(decreasing)Teleworking fromhome with a PC
q11h(decreasing)
Working at homeexcludingtelework
q11i(decreasing)
Working at placesother than home
or company
q9aR(increasing)
Pay job otherthan the main one
1: Always2: Almost always3: 3/4 of the time4: Half of the time5: 1/4 of the time6: Almost never7: Never
1: Always2: Almost always3: 3/4 of the time4: Half of the time5: 1/4 of the time6: Almost never7: Never
1: Always2: Almost always3: 3/4 of the time4: Half of the time5: 1/4 of the time6: Almost never7: Never
1: No2: Occasional3: Seasonal4: Regular
BE (798)Belgium
6.489 / 4
134 / 4
6.3012 / 1237 / 1
5.9218 / 17−10 / 17
1.155 / 15
−12 / 15
CZ (749)Czech Republic
6.4010 / 2188 / 2
6.646 / 141 / 14
5.8020 / 1155 / 11
1.176 / 1314 / 13
DK (865)Denmark
6.489 / 5
132 / 5
6.4210 / 4151 / 4
5.7820 / 1062 / 10
1.289 / 2
184 / 2
DE (877)Germany
6.754 / 20
−44 / 20
6.794 / 27
−102 / 27
5.7421 / 786 / 7
1.114 / 21
−70 / 21
EE (555)Estonia
6.685 / 146 / 14
6.705 / 21
−40 / 21
6.1414 / 28
−122 / 28
1.269 / 4
149 / 4
EL (629)Greece
6.734 / 19
−29 / 19
6.695 / 20
−33 / 20
6.0117 / 21−53 / 21
1.196 / 949 / 9
ES (786)Spain
6.725 / 18
−24 / 18
6.626 / 1217 / 12
5.8419 / 1433 / 14
1.083 / 30
−120 / 30
FR (878)France
6.833 / 25
−90 / 25
6.626 / 1312 / 13
5.8220 / 1244 / 12
1.083 / 29
−113 / 29
IE (768)Ireland
6.784 / 22
−62 / 22
6.685 / 19
−27 / 19
5.6922 / 6108 / 6
1.124 / 20
−63 / 20
IT (691)Italy
6.882 / 28
−126 / 28
6.725 / 25
−55 / 25
6.0216 / 22−58 / 22
1.083 / 31
−121 / 31
CY (482)Cyprus
6.705 / 16
−10 / 16
6.548 / 866 / 8
6.1015 / 25−98 / 25
1.083 / 28
−112 / 28
LV (903)Latvia
6.567 / 881 / 8
6.685 / 18
−26 / 18
6.0216 / 23−60 / 23
1.289 / 3
180 / 3
LT (873)Lithuania
6.784 / 23
−62 / 23
6.793 / 28
−108 / 28
6.1614 / 29
−127 / 29
1.186 / 1128 / 11
LU (520)Luxemburg
6.764 / 21
−46 / 21
6.656 / 16−8 / 16
5.6622 / 3127 / 3
1.103 / 25
−91 / 25
HU (810)Hungary
6.843 / 26
−102 / 26
6.725 / 24
−54 / 24
6.3611 / 31
−230 / 31
1.165 / 143 / 14
MT (507)Malta
6.912 / 30
−144 / 30
6.872 / 29
−158 / 29
5.9817 / 19−39 / 19
1.238 / 6
117 / 6
58
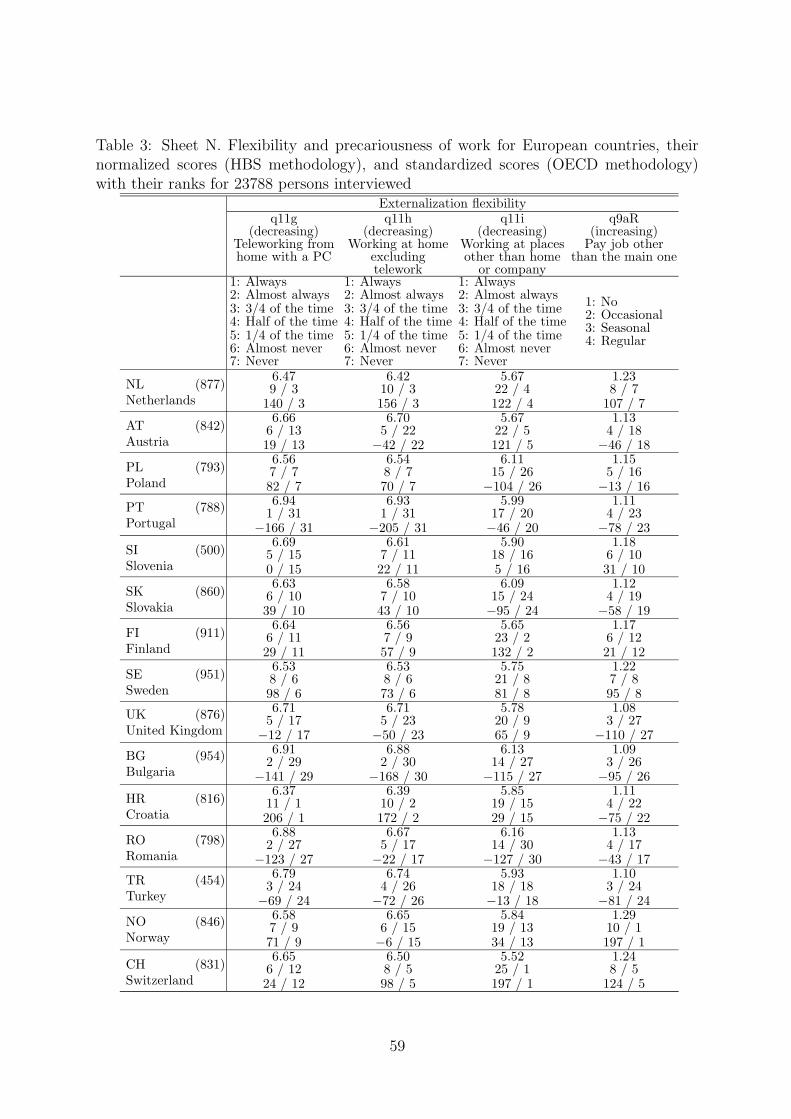
Table 3: Sheet N. Flexibility and precariousness of work for European countries, theirnormalized scores (HBS methodology), and standardized scores (OECD methodology)with their ranks for 23788 persons interviewed
Externalization flexibilityq11g
(decreasing)Teleworking fromhome with a PC
q11h(decreasing)
Working at homeexcludingtelework
q11i(decreasing)
Working at placesother than home
or company
q9aR(increasing)
Pay job otherthan the main one
1: Always2: Almost always3: 3/4 of the time4: Half of the time5: 1/4 of the time6: Almost never7: Never
1: Always2: Almost always3: 3/4 of the time4: Half of the time5: 1/4 of the time6: Almost never7: Never
1: Always2: Almost always3: 3/4 of the time4: Half of the time5: 1/4 of the time6: Almost never7: Never
1: No2: Occasional3: Seasonal4: Regular
NL (877)Netherlands
6.479 / 3
140 / 3
6.4210 / 3156 / 3
5.6722 / 4122 / 4
1.238 / 7
107 / 7
AT (842)Austria
6.666 / 1319 / 13
6.705 / 22
−42 / 22
5.6722 / 5121 / 5
1.134 / 18
−46 / 18
PL (793)Poland
6.567 / 782 / 7
6.548 / 770 / 7
6.1115 / 26
−104 / 26
1.155 / 16
−13 / 16
PT (788)Portugal
6.941 / 31
−166 / 31
6.931 / 31
−205 / 31
5.9917 / 20−46 / 20
1.114 / 23
−78 / 23
SI (500)Slovenia
6.695 / 150 / 15
6.617 / 1122 / 11
5.9018 / 165 / 16
1.186 / 1031 / 10
SK (860)Slovakia
6.636 / 1039 / 10
6.587 / 1043 / 10
6.0915 / 24−95 / 24
1.124 / 19
−58 / 19
FI (911)Finland
6.646 / 1129 / 11
6.567 / 957 / 9
5.6523 / 2132 / 2
1.176 / 1221 / 12
SE (951)Sweden
6.538 / 698 / 6
6.538 / 673 / 6
5.7521 / 881 / 8
1.227 / 895 / 8
UK (876)United Kingdom
6.715 / 17
−12 / 17
6.715 / 23
−50 / 23
5.7820 / 965 / 9
1.083 / 27
−110 / 27
BG (954)Bulgaria
6.912 / 29
−141 / 29
6.882 / 30
−168 / 30
6.1314 / 27
−115 / 27
1.093 / 26
−95 / 26
HR (816)Croatia
6.3711 / 1206 / 1
6.3910 / 2172 / 2
5.8519 / 1529 / 15
1.114 / 22
−75 / 22
RO (798)Romania
6.882 / 27
−123 / 27
6.675 / 17
−22 / 17
6.1614 / 30
−127 / 30
1.134 / 17
−43 / 17
TR (454)Turkey
6.793 / 24
−69 / 24
6.744 / 26
−72 / 26
5.9318 / 18−13 / 18
1.103 / 24
−81 / 24
NO (846)Norway
6.587 / 971 / 9
6.656 / 15−6 / 15
5.8419 / 1334 / 13
1.2910 / 1197 / 1
CH (831)Switzerland
6.656 / 1224 / 12
6.508 / 598 / 5
5.5225 / 1197 / 1
1.248 / 5
124 / 5
59
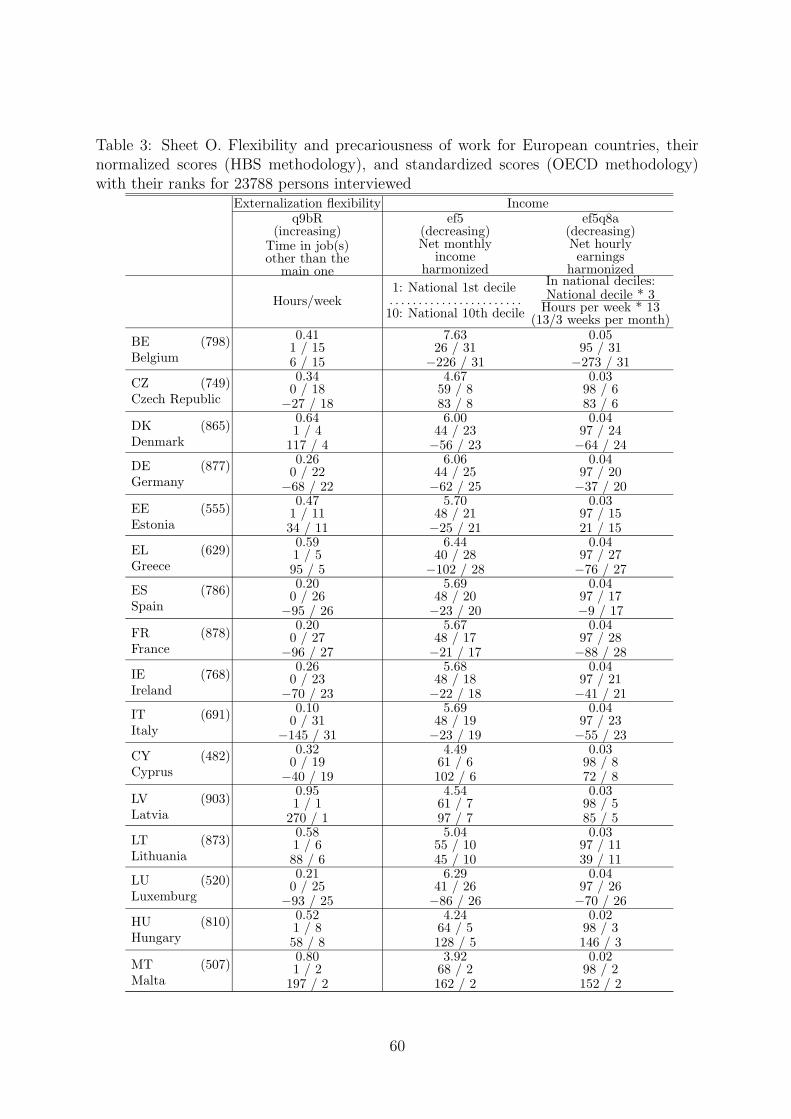
Table 3: Sheet O. Flexibility and precariousness of work for European countries, theirnormalized scores (HBS methodology), and standardized scores (OECD methodology)with their ranks for 23788 persons interviewed
Externalization flexibility Incomeq9bR
(increasing)Time in job(s)other than the
main one
ef5(decreasing)Net monthly
incomeharmonized
ef5q8a(decreasing)Net hourlyearnings
harmonized
Hours/week1: National 1st decile. . . . . . . . . . . . . . . . . . . . . . .10: National 10th decile
In national deciles:National decile * 3
Hours per week * 13(13/3 weeks per month)
BE (798)Belgium
0.411 / 156 / 15
7.6326 / 31
−226 / 31
0.0595 / 31
−273 / 31
CZ (749)Czech Republic
0.340 / 18
−27 / 18
4.6759 / 883 / 8
0.0398 / 683 / 6
DK (865)Denmark
0.641 / 4
117 / 4
6.0044 / 23−56 / 23
0.0497 / 24−64 / 24
DE (877)Germany
0.260 / 22
−68 / 22
6.0644 / 25−62 / 25
0.0497 / 20−37 / 20
EE (555)Estonia
0.471 / 1134 / 11
5.7048 / 21−25 / 21
0.0397 / 1521 / 15
EL (629)Greece
0.591 / 595 / 5
6.4440 / 28
−102 / 28
0.0497 / 27−76 / 27
ES (786)Spain
0.200 / 26
−95 / 26
5.6948 / 20−23 / 20
0.0497 / 17−9 / 17
FR (878)France
0.200 / 27
−96 / 27
5.6748 / 17−21 / 17
0.0497 / 28−88 / 28
IE (768)Ireland
0.260 / 23
−70 / 23
5.6848 / 18−22 / 18
0.0497 / 21−41 / 21
IT (691)Italy
0.100 / 31
−145 / 31
5.6948 / 19−23 / 19
0.0497 / 23−55 / 23
CY (482)Cyprus
0.320 / 19
−40 / 19
4.4961 / 6102 / 6
0.0398 / 872 / 8
LV (903)Latvia
0.951 / 1
270 / 1
4.5461 / 797 / 7
0.0398 / 585 / 5
LT (873)Lithuania
0.581 / 688 / 6
5.0455 / 1045 / 10
0.0397 / 1139 / 11
LU (520)Luxemburg
0.210 / 25
−93 / 25
6.2941 / 26−86 / 26
0.0497 / 26−70 / 26
HU (810)Hungary
0.521 / 858 / 8
4.2464 / 5128 / 5
0.0298 / 3146 / 3
MT (507)Malta
0.801 / 2
197 / 2
3.9268 / 2162 / 2
0.0298 / 2152 / 2
60
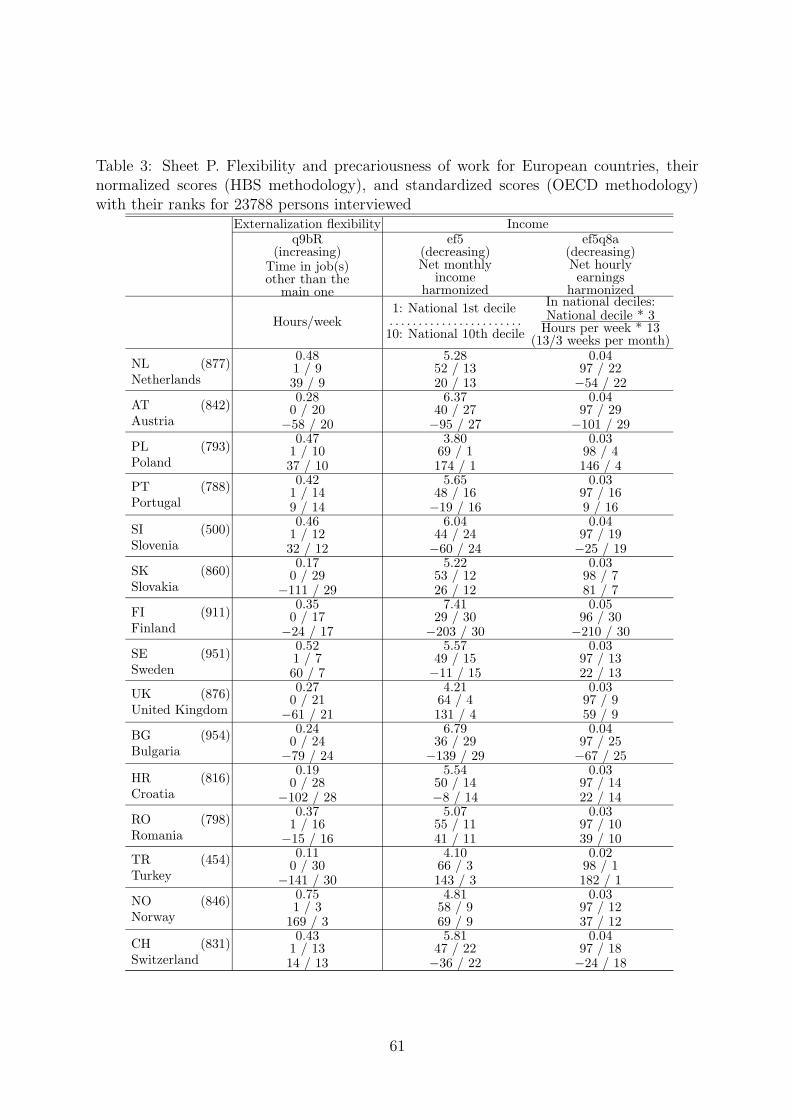
Table 3: Sheet P. Flexibility and precariousness of work for European countries, theirnormalized scores (HBS methodology), and standardized scores (OECD methodology)with their ranks for 23788 persons interviewed
Externalization flexibility Incomeq9bR
(increasing)Time in job(s)other than the
main one
ef5(decreasing)Net monthly
incomeharmonized
ef5q8a(decreasing)Net hourlyearnings
harmonized
Hours/week1: National 1st decile. . . . . . . . . . . . . . . . . . . . . . .10: National 10th decile
In national deciles:National decile * 3
Hours per week * 13(13/3 weeks per month)
NL (877)Netherlands
0.481 / 939 / 9
5.2852 / 1320 / 13
0.0497 / 22−54 / 22
AT (842)Austria
0.280 / 20
−58 / 20
6.3740 / 27−95 / 27
0.0497 / 29
−101 / 29
PL (793)Poland
0.471 / 1037 / 10
3.8069 / 1174 / 1
0.0398 / 4146 / 4
PT (788)Portugal
0.421 / 149 / 14
5.6548 / 16−19 / 16
0.0397 / 169 / 16
SI (500)Slovenia
0.461 / 1232 / 12
6.0444 / 24−60 / 24
0.0497 / 19−25 / 19
SK (860)Slovakia
0.170 / 29
−111 / 29
5.2253 / 1226 / 12
0.0398 / 781 / 7
FI (911)Finland
0.350 / 17
−24 / 17
7.4129 / 30
−203 / 30
0.0596 / 30
−210 / 30
SE (951)Sweden
0.521 / 760 / 7
5.5749 / 15−11 / 15
0.0397 / 1322 / 13
UK (876)United Kingdom
0.270 / 21
−61 / 21
4.2164 / 4131 / 4
0.0397 / 959 / 9
BG (954)Bulgaria
0.240 / 24
−79 / 24
6.7936 / 29
−139 / 29
0.0497 / 25−67 / 25
HR (816)Croatia
0.190 / 28
−102 / 28
5.5450 / 14−8 / 14
0.0397 / 1422 / 14
RO (798)Romania
0.371 / 16
−15 / 16
5.0755 / 1141 / 11
0.0397 / 1039 / 10
TR (454)Turkey
0.110 / 30
−141 / 30
4.1066 / 3143 / 3
0.0298 / 1182 / 1
NO (846)Norway
0.751 / 3
169 / 3
4.8158 / 969 / 9
0.0397 / 1237 / 12
CH (831)Switzerland
0.431 / 1314 / 13
5.8147 / 22−36 / 22
0.0497 / 18−24 / 18
61
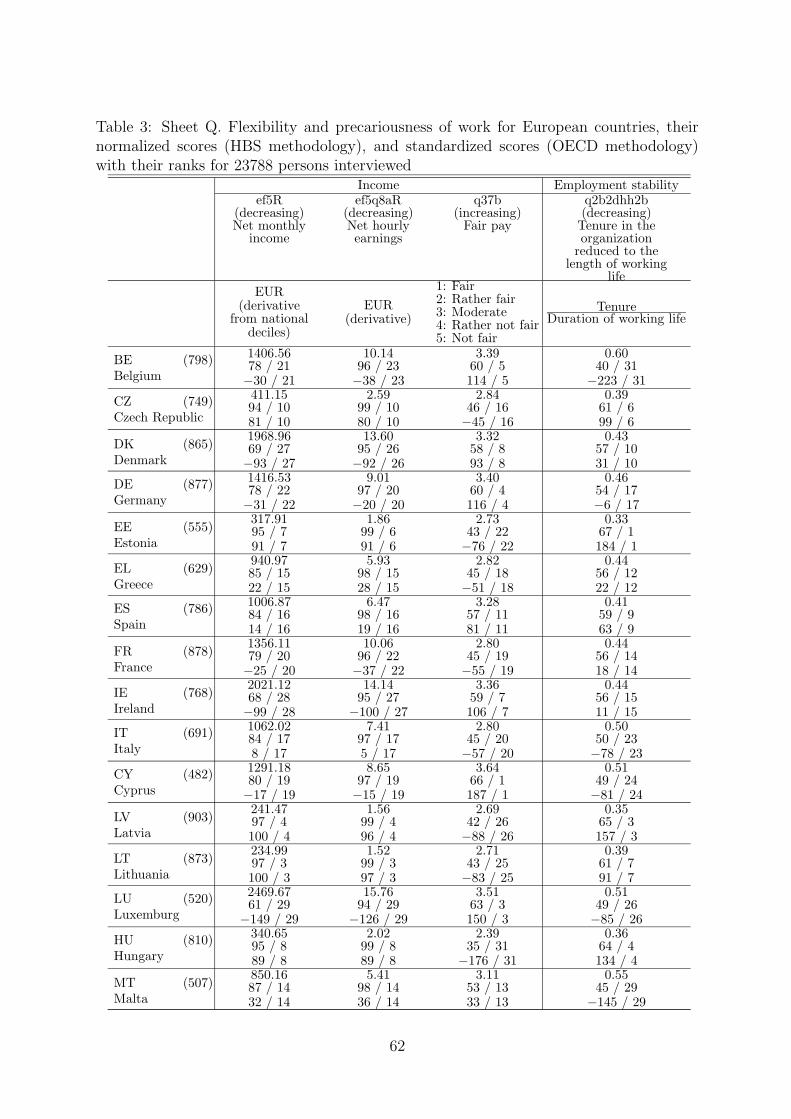
Table 3: Sheet Q. Flexibility and precariousness of work for European countries, theirnormalized scores (HBS methodology), and standardized scores (OECD methodology)with their ranks for 23788 persons interviewed
Income Employment stabilityef5R
(decreasing)Net monthly
income
ef5q8aR(decreasing)Net hourlyearnings
q37b(increasing)
Fair pay
q2b2dhh2b(decreasing)Tenure in theorganization
reduced to thelength of working
lifeEUR
(derivativefrom national
deciles)
EUR(derivative)
1: Fair2: Rather fair3: Moderate4: Rather not fair5: Not fair
TenureDuration of working life
BE (798)Belgium
1406.5678 / 21−30 / 21
10.1496 / 23−38 / 23
3.3960 / 5114 / 5
0.6040 / 31
−223 / 31
CZ (749)Czech Republic
411.1594 / 1081 / 10
2.5999 / 1080 / 10
2.8446 / 16−45 / 16
0.3961 / 699 / 6
DK (865)Denmark
1968.9669 / 27−93 / 27
13.6095 / 26−92 / 26
3.3258 / 893 / 8
0.4357 / 1031 / 10
DE (877)Germany
1416.5378 / 22−31 / 22
9.0197 / 20−20 / 20
3.4060 / 4116 / 4
0.4654 / 17−6 / 17
EE (555)Estonia
317.9195 / 791 / 7
1.8699 / 691 / 6
2.7343 / 22−76 / 22
0.3367 / 1184 / 1
EL (629)Greece
940.9785 / 1522 / 15
5.9398 / 1528 / 15
2.8245 / 18−51 / 18
0.4456 / 1222 / 12
ES (786)Spain
1006.8784 / 1614 / 16
6.4798 / 1619 / 16
3.2857 / 1181 / 11
0.4159 / 963 / 9
FR (878)France
1356.1179 / 20−25 / 20
10.0696 / 22−37 / 22
2.8045 / 19−55 / 19
0.4456 / 1418 / 14
IE (768)Ireland
2021.1268 / 28−99 / 28
14.1495 / 27
−100 / 27
3.3659 / 7106 / 7
0.4456 / 1511 / 15
IT (691)Italy
1062.0284 / 178 / 17
7.4197 / 175 / 17
2.8045 / 20−57 / 20
0.5050 / 23−78 / 23
CY (482)Cyprus
1291.1880 / 19−17 / 19
8.6597 / 19−15 / 19
3.6466 / 1187 / 1
0.5149 / 24−81 / 24
LV (903)Latvia
241.4797 / 4100 / 4
1.5699 / 496 / 4
2.6942 / 26−88 / 26
0.3565 / 3157 / 3
LT (873)Lithuania
234.9997 / 3100 / 3
1.5299 / 397 / 3
2.7143 / 25−83 / 25
0.3961 / 791 / 7
LU (520)Luxemburg
2469.6761 / 29
−149 / 29
15.7694 / 29
−126 / 29
3.5163 / 3150 / 3
0.5149 / 26−85 / 26
HU (810)Hungary
340.6595 / 889 / 8
2.0299 / 889 / 8
2.3935 / 31
−176 / 31
0.3664 / 4134 / 4
MT (507)Malta
850.1687 / 1432 / 14
5.4198 / 1436 / 14
3.1153 / 1333 / 13
0.5545 / 29
−145 / 29
62
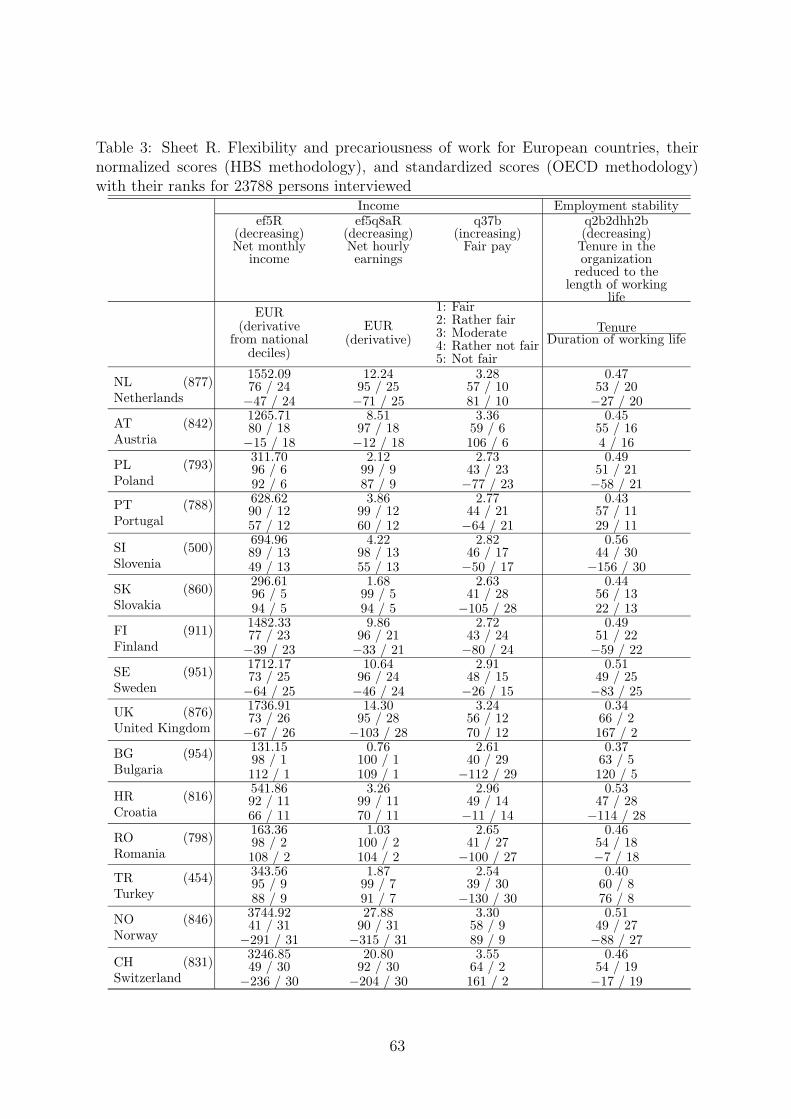
Table 3: Sheet R. Flexibility and precariousness of work for European countries, theirnormalized scores (HBS methodology), and standardized scores (OECD methodology)with their ranks for 23788 persons interviewed
Income Employment stabilityef5R
(decreasing)Net monthly
income
ef5q8aR(decreasing)Net hourlyearnings
q37b(increasing)
Fair pay
q2b2dhh2b(decreasing)Tenure in theorganization
reduced to thelength of working
lifeEUR
(derivativefrom national
deciles)
EUR(derivative)
1: Fair2: Rather fair3: Moderate4: Rather not fair5: Not fair
TenureDuration of working life
NL (877)Netherlands
1552.0976 / 24−47 / 24
12.2495 / 25−71 / 25
3.2857 / 1081 / 10
0.4753 / 20−27 / 20
AT (842)Austria
1265.7180 / 18−15 / 18
8.5197 / 18−12 / 18
3.3659 / 6106 / 6
0.4555 / 164 / 16
PL (793)Poland
311.7096 / 692 / 6
2.1299 / 987 / 9
2.7343 / 23−77 / 23
0.4951 / 21−58 / 21
PT (788)Portugal
628.6290 / 1257 / 12
3.8699 / 1260 / 12
2.7744 / 21−64 / 21
0.4357 / 1129 / 11
SI (500)Slovenia
694.9689 / 1349 / 13
4.2298 / 1355 / 13
2.8246 / 17−50 / 17
0.5644 / 30
−156 / 30
SK (860)Slovakia
296.6196 / 594 / 5
1.6899 / 594 / 5
2.6341 / 28
−105 / 28
0.4456 / 1322 / 13
FI (911)Finland
1482.3377 / 23−39 / 23
9.8696 / 21−33 / 21
2.7243 / 24−80 / 24
0.4951 / 22−59 / 22
SE (951)Sweden
1712.1773 / 25−64 / 25
10.6496 / 24−46 / 24
2.9148 / 15−26 / 15
0.5149 / 25−83 / 25
UK (876)United Kingdom
1736.9173 / 26−67 / 26
14.3095 / 28
−103 / 28
3.2456 / 1270 / 12
0.3466 / 2167 / 2
BG (954)Bulgaria
131.1598 / 1112 / 1
0.76100 / 1109 / 1
2.6140 / 29
−112 / 29
0.3763 / 5120 / 5
HR (816)Croatia
541.8692 / 1166 / 11
3.2699 / 1170 / 11
2.9649 / 14−11 / 14
0.5347 / 28
−114 / 28
RO (798)Romania
163.3698 / 2108 / 2
1.03100 / 2104 / 2
2.6541 / 27
−100 / 27
0.4654 / 18−7 / 18
TR (454)Turkey
343.5695 / 988 / 9
1.8799 / 791 / 7
2.5439 / 30
−130 / 30
0.4060 / 876 / 8
NO (846)Norway
3744.9241 / 31
−291 / 31
27.8890 / 31
−315 / 31
3.3058 / 989 / 9
0.5149 / 27−88 / 27
CH (831)Switzerland
3246.8549 / 30
−236 / 30
20.8092 / 30
−204 / 30
3.5564 / 2161 / 2
0.4654 / 19−17 / 19
63
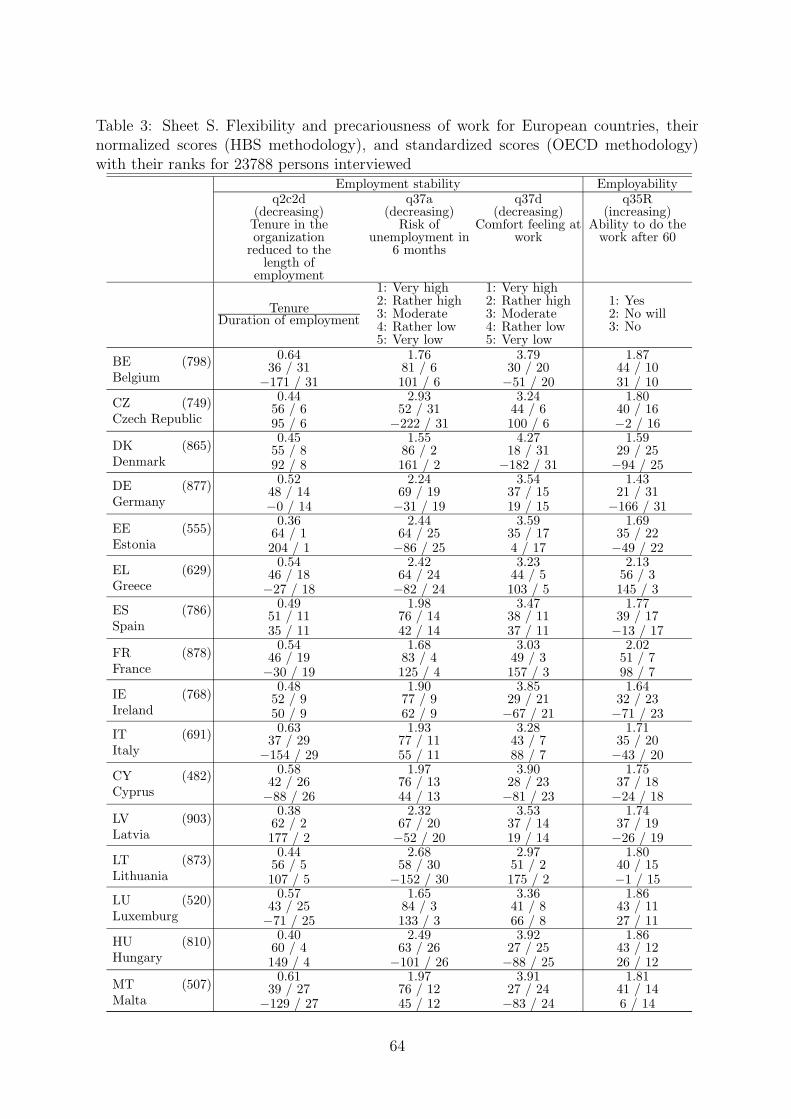
Table 3: Sheet S. Flexibility and precariousness of work for European countries, theirnormalized scores (HBS methodology), and standardized scores (OECD methodology)with their ranks for 23788 persons interviewed
Employment stability Employabilityq2c2d
(decreasing)Tenure in theorganization
reduced to thelength of
employment
q37a(decreasing)
Risk ofunemployment in
6 months
q37d(decreasing)
Comfort feeling atwork
q35R(increasing)
Ability to do thework after 60
TenureDuration of employment
1: Very high2: Rather high3: Moderate4: Rather low5: Very low
1: Very high2: Rather high3: Moderate4: Rather low5: Very low
1: Yes2: No will3: No
BE (798)Belgium
0.6436 / 31
−171 / 31
1.7681 / 6101 / 6
3.7930 / 20−51 / 20
1.8744 / 1031 / 10
CZ (749)Czech Republic
0.4456 / 695 / 6
2.9352 / 31
−222 / 31
3.2444 / 6100 / 6
1.8040 / 16−2 / 16
DK (865)Denmark
0.4555 / 892 / 8
1.5586 / 2161 / 2
4.2718 / 31
−182 / 31
1.5929 / 25−94 / 25
DE (877)Germany
0.5248 / 14−0 / 14
2.2469 / 19−31 / 19
3.5437 / 1519 / 15
1.4321 / 31
−166 / 31
EE (555)Estonia
0.3664 / 1204 / 1
2.4464 / 25−86 / 25
3.5935 / 174 / 17
1.6935 / 22−49 / 22
EL (629)Greece
0.5446 / 18−27 / 18
2.4264 / 24−82 / 24
3.2344 / 5103 / 5
2.1356 / 3145 / 3
ES (786)Spain
0.4951 / 1135 / 11
1.9876 / 1442 / 14
3.4738 / 1137 / 11
1.7739 / 17−13 / 17
FR (878)France
0.5446 / 19−30 / 19
1.6883 / 4125 / 4
3.0349 / 3157 / 3
2.0251 / 798 / 7
IE (768)Ireland
0.4852 / 950 / 9
1.9077 / 962 / 9
3.8529 / 21−67 / 21
1.6432 / 23−71 / 23
IT (691)Italy
0.6337 / 29
−154 / 29
1.9377 / 1155 / 11
3.2843 / 788 / 7
1.7135 / 20−43 / 20
CY (482)Cyprus
0.5842 / 26−88 / 26
1.9776 / 1344 / 13
3.9028 / 23−81 / 23
1.7537 / 18−24 / 18
LV (903)Latvia
0.3862 / 2177 / 2
2.3267 / 20−52 / 20
3.5337 / 1419 / 14
1.7437 / 19−26 / 19
LT (873)Lithuania
0.4456 / 5107 / 5
2.6858 / 30
−152 / 30
2.9751 / 2175 / 2
1.8040 / 15−1 / 15
LU (520)Luxemburg
0.5743 / 25−71 / 25
1.6584 / 3133 / 3
3.3641 / 866 / 8
1.8643 / 1127 / 11
HU (810)Hungary
0.4060 / 4149 / 4
2.4963 / 26
−101 / 26
3.9227 / 25−88 / 25
1.8643 / 1226 / 12
MT (507)Malta
0.6139 / 27
−129 / 27
1.9776 / 1245 / 12
3.9127 / 24−83 / 24
1.8141 / 146 / 14
64
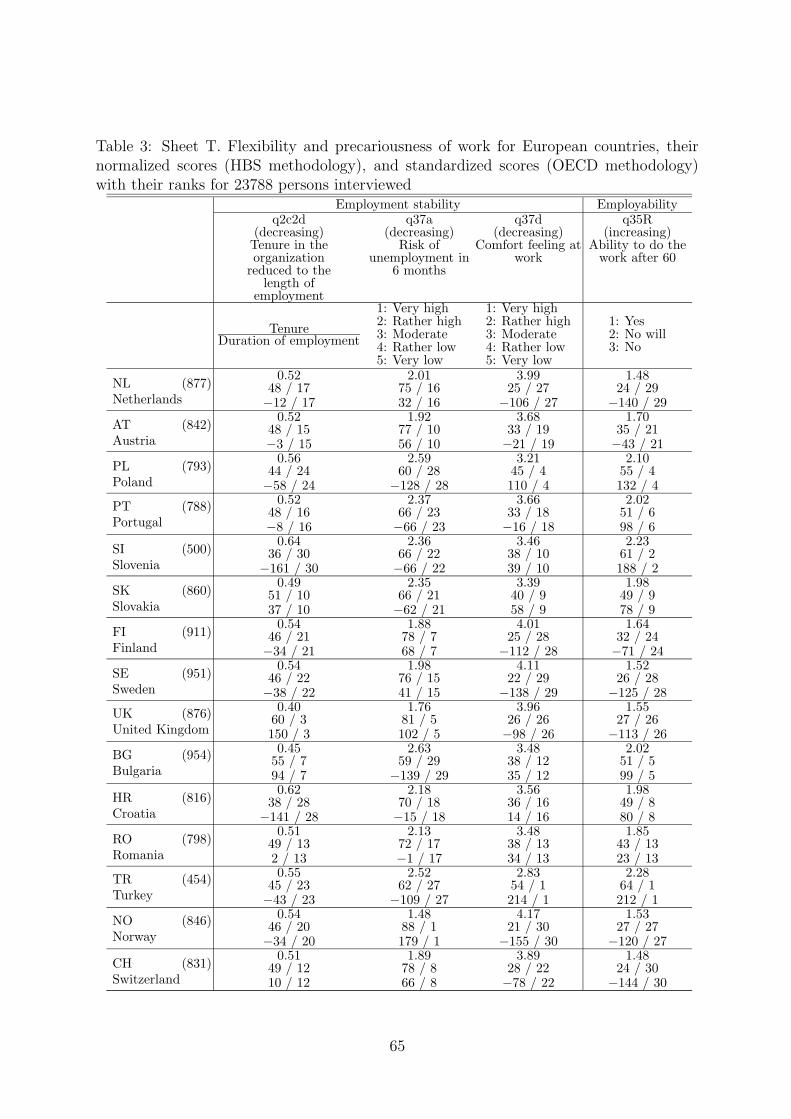
Table 3: Sheet T. Flexibility and precariousness of work for European countries, theirnormalized scores (HBS methodology), and standardized scores (OECD methodology)with their ranks for 23788 persons interviewed
Employment stability Employabilityq2c2d
(decreasing)Tenure in theorganization
reduced to thelength of
employment
q37a(decreasing)
Risk ofunemployment in
6 months
q37d(decreasing)
Comfort feeling atwork
q35R(increasing)
Ability to do thework after 60
TenureDuration of employment
1: Very high2: Rather high3: Moderate4: Rather low5: Very low
1: Very high2: Rather high3: Moderate4: Rather low5: Very low
1: Yes2: No will3: No
NL (877)Netherlands
0.5248 / 17−12 / 17
2.0175 / 1632 / 16
3.9925 / 27
−106 / 27
1.4824 / 29
−140 / 29
AT (842)Austria
0.5248 / 15−3 / 15
1.9277 / 1056 / 10
3.6833 / 19−21 / 19
1.7035 / 21−43 / 21
PL (793)Poland
0.5644 / 24−58 / 24
2.5960 / 28
−128 / 28
3.2145 / 4110 / 4
2.1055 / 4132 / 4
PT (788)Portugal
0.5248 / 16−8 / 16
2.3766 / 23−66 / 23
3.6633 / 18−16 / 18
2.0251 / 698 / 6
SI (500)Slovenia
0.6436 / 30
−161 / 30
2.3666 / 22−66 / 22
3.4638 / 1039 / 10
2.2361 / 2188 / 2
SK (860)Slovakia
0.4951 / 1037 / 10
2.3566 / 21−62 / 21
3.3940 / 958 / 9
1.9849 / 978 / 9
FI (911)Finland
0.5446 / 21−34 / 21
1.8878 / 768 / 7
4.0125 / 28
−112 / 28
1.6432 / 24−71 / 24
SE (951)Sweden
0.5446 / 22−38 / 22
1.9876 / 1541 / 15
4.1122 / 29
−138 / 29
1.5226 / 28
−125 / 28
UK (876)United Kingdom
0.4060 / 3150 / 3
1.7681 / 5102 / 5
3.9626 / 26−98 / 26
1.5527 / 26
−113 / 26
BG (954)Bulgaria
0.4555 / 794 / 7
2.6359 / 29
−139 / 29
3.4838 / 1235 / 12
2.0251 / 599 / 5
HR (816)Croatia
0.6238 / 28
−141 / 28
2.1870 / 18−15 / 18
3.5636 / 1614 / 16
1.9849 / 880 / 8
RO (798)Romania
0.5149 / 132 / 13
2.1372 / 17−1 / 17
3.4838 / 1334 / 13
1.8543 / 1323 / 13
TR (454)Turkey
0.5545 / 23−43 / 23
2.5262 / 27
−109 / 27
2.8354 / 1214 / 1
2.2864 / 1212 / 1
NO (846)Norway
0.5446 / 20−34 / 20
1.4888 / 1179 / 1
4.1721 / 30
−155 / 30
1.5327 / 27
−120 / 27
CH (831)Switzerland
0.5149 / 1210 / 12
1.8978 / 866 / 8
3.8928 / 22−78 / 22
1.4824 / 30
−144 / 30
65
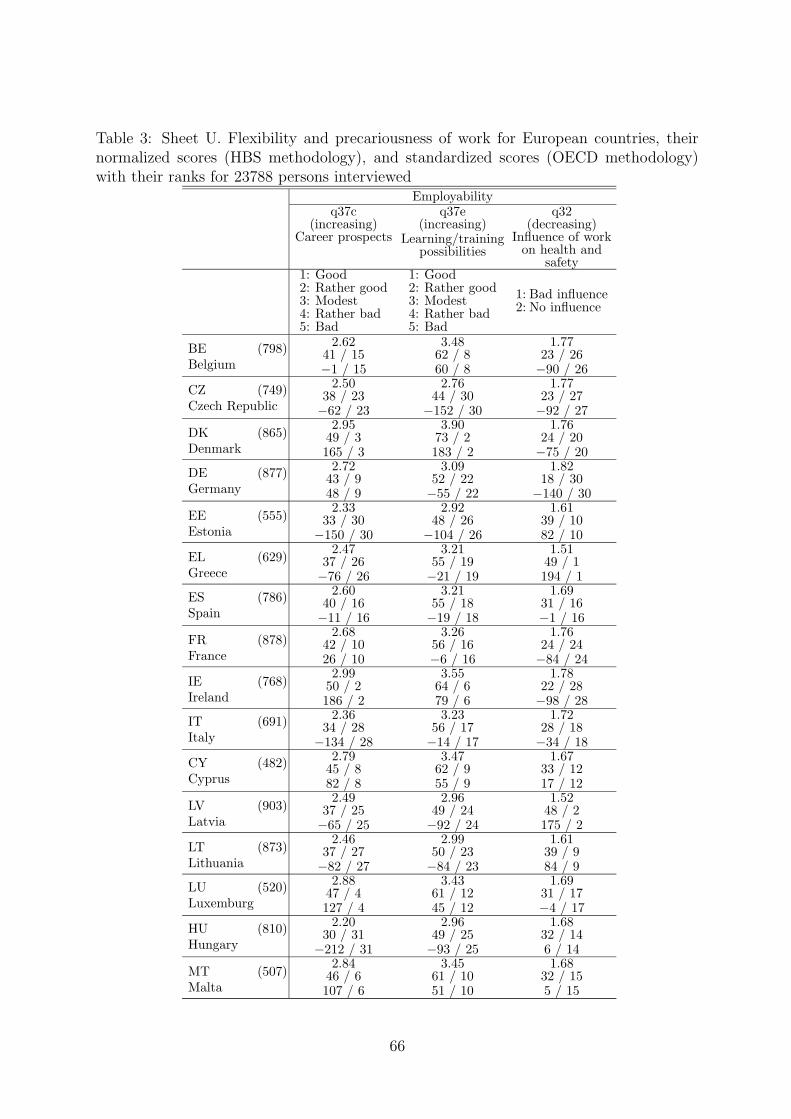
Table 3: Sheet U. Flexibility and precariousness of work for European countries, theirnormalized scores (HBS methodology), and standardized scores (OECD methodology)with their ranks for 23788 persons interviewed
Employabilityq37c
(increasing)Career prospects
q37e(increasing)
Learning/trainingpossibilities
q32(decreasing)
Influence of workon health and
safety1: Good2: Rather good3: Modest4: Rather bad5: Bad
1: Good2: Rather good3: Modest4: Rather bad5: Bad
1: Bad influence2: No influence
BE (798)Belgium
2.6241 / 15−1 / 15
3.4862 / 860 / 8
1.7723 / 26−90 / 26
CZ (749)Czech Republic
2.5038 / 23−62 / 23
2.7644 / 30
−152 / 30
1.7723 / 27−92 / 27
DK (865)Denmark
2.9549 / 3165 / 3
3.9073 / 2183 / 2
1.7624 / 20−75 / 20
DE (877)Germany
2.7243 / 948 / 9
3.0952 / 22−55 / 22
1.8218 / 30
−140 / 30
EE (555)Estonia
2.3333 / 30
−150 / 30
2.9248 / 26
−104 / 26
1.6139 / 1082 / 10
EL (629)Greece
2.4737 / 26−76 / 26
3.2155 / 19−21 / 19
1.5149 / 1194 / 1
ES (786)Spain
2.6040 / 16−11 / 16
3.2155 / 18−19 / 18
1.6931 / 16−1 / 16
FR (878)France
2.6842 / 1026 / 10
3.2656 / 16−6 / 16
1.7624 / 24−84 / 24
IE (768)Ireland
2.9950 / 2186 / 2
3.5564 / 679 / 6
1.7822 / 28−98 / 28
IT (691)Italy
2.3634 / 28
−134 / 28
3.2356 / 17−14 / 17
1.7228 / 18−34 / 18
CY (482)Cyprus
2.7945 / 882 / 8
3.4762 / 955 / 9
1.6733 / 1217 / 12
LV (903)Latvia
2.4937 / 25−65 / 25
2.9649 / 24−92 / 24
1.5248 / 2175 / 2
LT (873)Lithuania
2.4637 / 27−82 / 27
2.9950 / 23−84 / 23
1.6139 / 984 / 9
LU (520)Luxemburg
2.8847 / 4127 / 4
3.4361 / 1245 / 12
1.6931 / 17−4 / 17
HU (810)Hungary
2.2030 / 31
−212 / 31
2.9649 / 25−93 / 25
1.6832 / 146 / 14
MT (507)Malta
2.8446 / 6107 / 6
3.4561 / 1051 / 10
1.6832 / 155 / 15
66
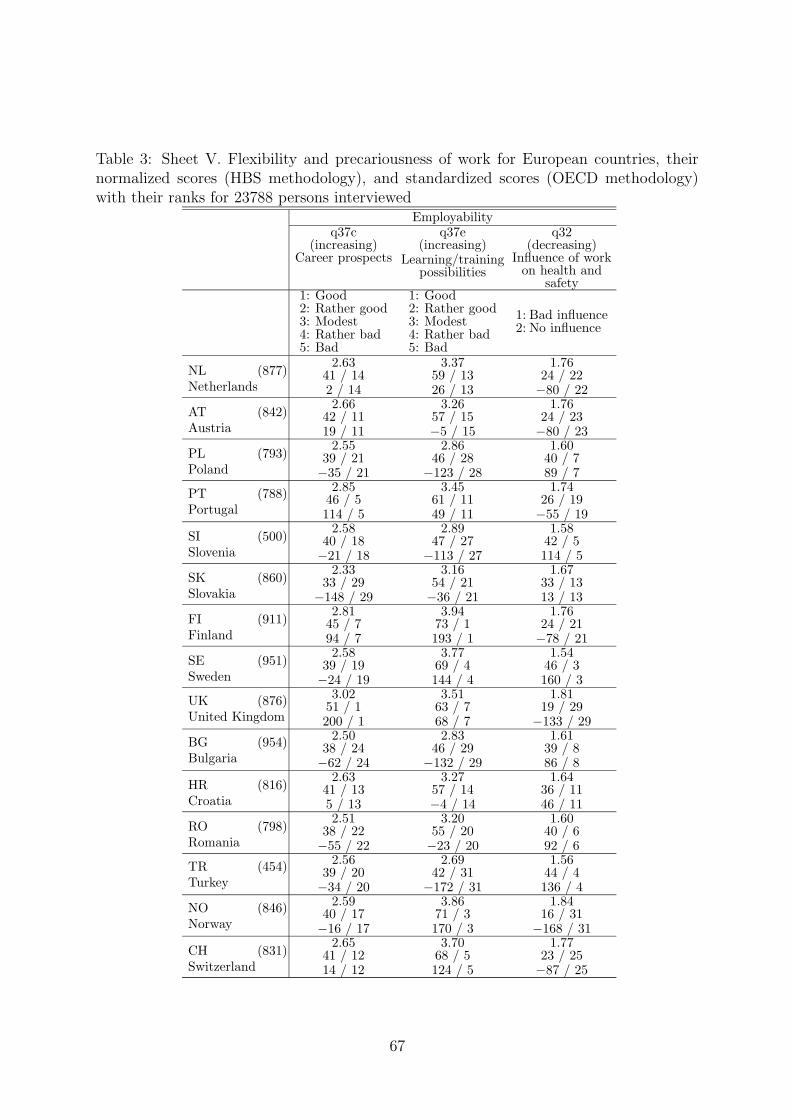
Table 3: Sheet V. Flexibility and precariousness of work for European countries, theirnormalized scores (HBS methodology), and standardized scores (OECD methodology)with their ranks for 23788 persons interviewed
Employabilityq37c
(increasing)Career prospects
q37e(increasing)
Learning/trainingpossibilities
q32(decreasing)
Influence of workon health and
safety1: Good2: Rather good3: Modest4: Rather bad5: Bad
1: Good2: Rather good3: Modest4: Rather bad5: Bad
1: Bad influence2: No influence
NL (877)Netherlands
2.6341 / 142 / 14
3.3759 / 1326 / 13
1.7624 / 22−80 / 22
AT (842)Austria
2.6642 / 1119 / 11
3.2657 / 15−5 / 15
1.7624 / 23−80 / 23
PL (793)Poland
2.5539 / 21−35 / 21
2.8646 / 28
−123 / 28
1.6040 / 789 / 7
PT (788)Portugal
2.8546 / 5114 / 5
3.4561 / 1149 / 11
1.7426 / 19−55 / 19
SI (500)Slovenia
2.5840 / 18−21 / 18
2.8947 / 27
−113 / 27
1.5842 / 5114 / 5
SK (860)Slovakia
2.3333 / 29
−148 / 29
3.1654 / 21−36 / 21
1.6733 / 1313 / 13
FI (911)Finland
2.8145 / 794 / 7
3.9473 / 1193 / 1
1.7624 / 21−78 / 21
SE (951)Sweden
2.5839 / 19−24 / 19
3.7769 / 4144 / 4
1.5446 / 3160 / 3
UK (876)United Kingdom
3.0251 / 1200 / 1
3.5163 / 768 / 7
1.8119 / 29
−133 / 29
BG (954)Bulgaria
2.5038 / 24−62 / 24
2.8346 / 29
−132 / 29
1.6139 / 886 / 8
HR (816)Croatia
2.6341 / 135 / 13
3.2757 / 14−4 / 14
1.6436 / 1146 / 11
RO (798)Romania
2.5138 / 22−55 / 22
3.2055 / 20−23 / 20
1.6040 / 692 / 6
TR (454)Turkey
2.5639 / 20−34 / 20
2.6942 / 31
−172 / 31
1.5644 / 4136 / 4
NO (846)Norway
2.5940 / 17−16 / 17
3.8671 / 3170 / 3
1.8416 / 31
−168 / 31
CH (831)Switzerland
2.6541 / 1214 / 12
3.7068 / 5124 / 5
1.7723 / 25−87 / 25
67
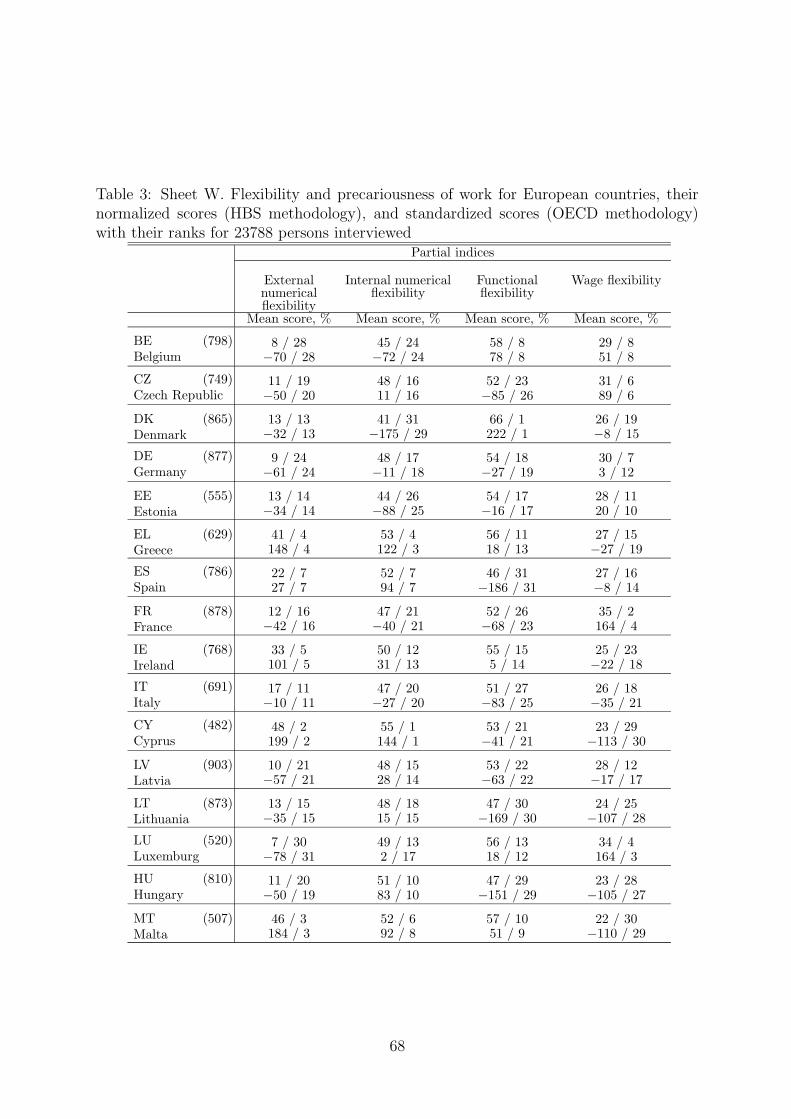
Table 3: Sheet W. Flexibility and precariousness of work for European countries, theirnormalized scores (HBS methodology), and standardized scores (OECD methodology)with their ranks for 23788 persons interviewed
Partial indices
Externalnumericalflexibility
Internal numericalflexibility
Functionalflexibility
Wage flexibility
Mean score, % Mean score, % Mean score, % Mean score, %
BE (798)Belgium
8 / 28−70 / 28
45 / 24−72 / 24
58 / 878 / 8
29 / 851 / 8
CZ (749)Czech Republic
11 / 19−50 / 20
48 / 1611 / 16
52 / 23−85 / 26
31 / 689 / 6
DK (865)Denmark
13 / 13−32 / 13
41 / 31−175 / 29
66 / 1222 / 1
26 / 19−8 / 15
DE (877)Germany
9 / 24−61 / 24
48 / 17−11 / 18
54 / 18−27 / 19
30 / 73 / 12
EE (555)Estonia
13 / 14−34 / 14
44 / 26−88 / 25
54 / 17−16 / 17
28 / 1120 / 10
EL (629)Greece
41 / 4148 / 4
53 / 4122 / 3
56 / 1118 / 13
27 / 15−27 / 19
ES (786)Spain
22 / 727 / 7
52 / 794 / 7
46 / 31−186 / 31
27 / 16−8 / 14
FR (878)France
12 / 16−42 / 16
47 / 21−40 / 21
52 / 26−68 / 23
35 / 2164 / 4
IE (768)Ireland
33 / 5101 / 5
50 / 1231 / 13
55 / 155 / 14
25 / 23−22 / 18
IT (691)Italy
17 / 11−10 / 11
47 / 20−27 / 20
51 / 27−83 / 25
26 / 18−35 / 21
CY (482)Cyprus
48 / 2199 / 2
55 / 1144 / 1
53 / 21−41 / 21
23 / 29−113 / 30
LV (903)Latvia
10 / 21−57 / 21
48 / 1528 / 14
53 / 22−63 / 22
28 / 12−17 / 17
LT (873)Lithuania
13 / 15−35 / 15
48 / 1815 / 15
47 / 30−169 / 30
24 / 25−107 / 28
LU (520)Luxemburg
7 / 30−78 / 31
49 / 132 / 17
56 / 1318 / 12
34 / 4164 / 3
HU (810)Hungary
11 / 20−50 / 19
51 / 1083 / 10
47 / 29−151 / 29
23 / 28−105 / 27
MT (507)Malta
46 / 3184 / 3
52 / 692 / 8
57 / 1051 / 9
22 / 30−110 / 29
68
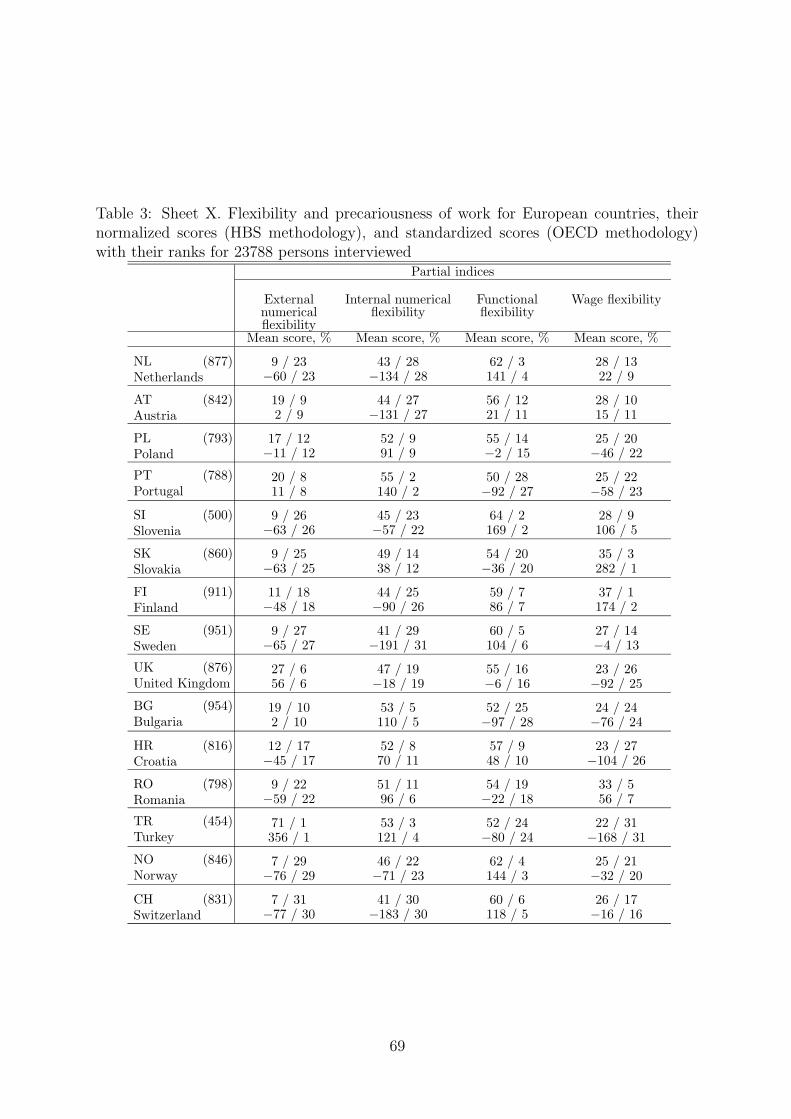
Table 3: Sheet X. Flexibility and precariousness of work for European countries, theirnormalized scores (HBS methodology), and standardized scores (OECD methodology)with their ranks for 23788 persons interviewed
Partial indices
Externalnumericalflexibility
Internal numericalflexibility
Functionalflexibility
Wage flexibility
Mean score, % Mean score, % Mean score, % Mean score, %
NL (877)Netherlands
9 / 23−60 / 23
43 / 28−134 / 28
62 / 3141 / 4
28 / 1322 / 9
AT (842)Austria
19 / 92 / 9
44 / 27−131 / 27
56 / 1221 / 11
28 / 1015 / 11
PL (793)Poland
17 / 12−11 / 12
52 / 991 / 9
55 / 14−2 / 15
25 / 20−46 / 22
PT (788)Portugal
20 / 811 / 8
55 / 2140 / 2
50 / 28−92 / 27
25 / 22−58 / 23
SI (500)Slovenia
9 / 26−63 / 26
45 / 23−57 / 22
64 / 2169 / 2
28 / 9106 / 5
SK (860)Slovakia
9 / 25−63 / 25
49 / 1438 / 12
54 / 20−36 / 20
35 / 3282 / 1
FI (911)Finland
11 / 18−48 / 18
44 / 25−90 / 26
59 / 786 / 7
37 / 1174 / 2
SE (951)Sweden
9 / 27−65 / 27
41 / 29−191 / 31
60 / 5104 / 6
27 / 14−4 / 13
UK (876)United Kingdom
27 / 656 / 6
47 / 19−18 / 19
55 / 16−6 / 16
23 / 26−92 / 25
BG (954)Bulgaria
19 / 102 / 10
53 / 5110 / 5
52 / 25−97 / 28
24 / 24−76 / 24
HR (816)Croatia
12 / 17−45 / 17
52 / 870 / 11
57 / 948 / 10
23 / 27−104 / 26
RO (798)Romania
9 / 22−59 / 22
51 / 1196 / 6
54 / 19−22 / 18
33 / 556 / 7
TR (454)Turkey
71 / 1356 / 1
53 / 3121 / 4
52 / 24−80 / 24
22 / 31−168 / 31
NO (846)Norway
7 / 29−76 / 29
46 / 22−71 / 23
62 / 4144 / 3
25 / 21−32 / 20
CH (831)Switzerland
7 / 31−77 / 30
41 / 30−183 / 30
60 / 6118 / 5
26 / 17−16 / 16
69
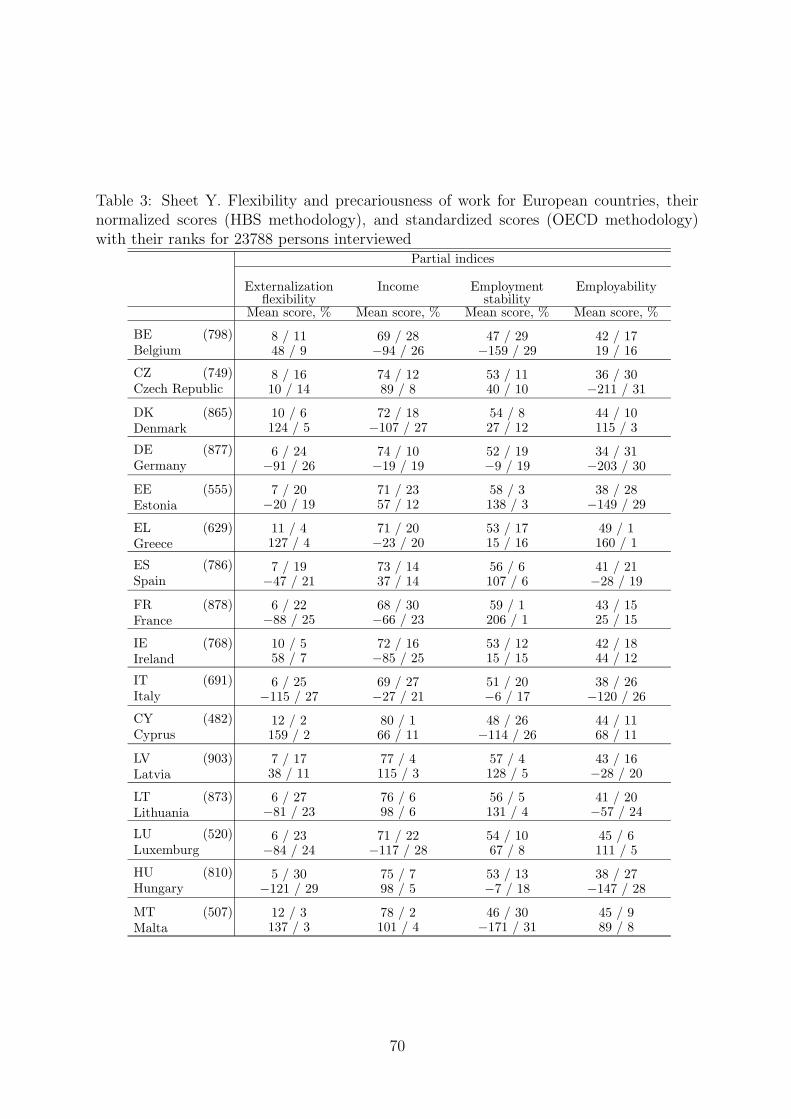
Table 3: Sheet Y. Flexibility and precariousness of work for European countries, theirnormalized scores (HBS methodology), and standardized scores (OECD methodology)with their ranks for 23788 persons interviewed
Partial indices
Externalizationflexibility
Income Employmentstability
Employability
Mean score, % Mean score, % Mean score, % Mean score, %
BE (798)Belgium
8 / 1148 / 9
69 / 28−94 / 26
47 / 29−159 / 29
42 / 1719 / 16
CZ (749)Czech Republic
8 / 1610 / 14
74 / 1289 / 8
53 / 1140 / 10
36 / 30−211 / 31
DK (865)Denmark
10 / 6124 / 5
72 / 18−107 / 27
54 / 827 / 12
44 / 10115 / 3
DE (877)Germany
6 / 24−91 / 26
74 / 10−19 / 19
52 / 19−9 / 19
34 / 31−203 / 30
EE (555)Estonia
7 / 20−20 / 19
71 / 2357 / 12
58 / 3138 / 3
38 / 28−149 / 29
EL (629)Greece
11 / 4127 / 4
71 / 20−23 / 20
53 / 1715 / 16
49 / 1160 / 1
ES (786)Spain
7 / 19−47 / 21
73 / 1437 / 14
56 / 6107 / 6
41 / 21−28 / 19
FR (878)France
6 / 22−88 / 25
68 / 30−66 / 23
59 / 1206 / 1
43 / 1525 / 15
IE (768)Ireland
10 / 558 / 7
72 / 16−85 / 25
53 / 1215 / 15
42 / 1844 / 12
IT (691)Italy
6 / 25−115 / 27
69 / 27−27 / 21
51 / 20−6 / 17
38 / 26−120 / 26
CY (482)Cyprus
12 / 2159 / 2
80 / 166 / 11
48 / 26−114 / 26
44 / 1168 / 11
LV (903)Latvia
7 / 1738 / 11
77 / 4115 / 3
57 / 4128 / 5
43 / 16−28 / 20
LT (873)Lithuania
6 / 27−81 / 23
76 / 698 / 6
56 / 5131 / 4
41 / 20−57 / 24
LU (520)Luxemburg
6 / 23−84 / 24
71 / 22−117 / 28
54 / 1067 / 8
45 / 6111 / 5
HU (810)Hungary
5 / 30−121 / 29
75 / 798 / 5
53 / 13−7 / 18
38 / 27−147 / 28
MT (507)Malta
12 / 3137 / 3
78 / 2101 / 4
46 / 30−171 / 31
45 / 989 / 8
70
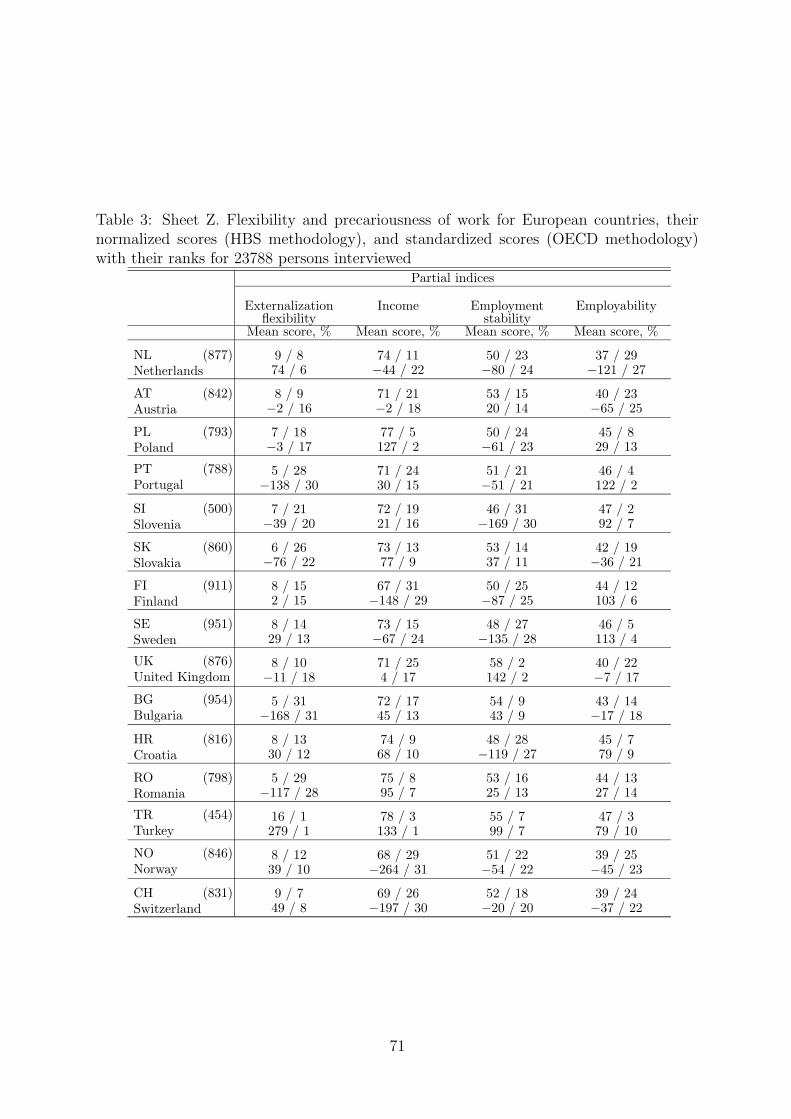
Table 3: Sheet Z. Flexibility and precariousness of work for European countries, theirnormalized scores (HBS methodology), and standardized scores (OECD methodology)with their ranks for 23788 persons interviewed
Partial indices
Externalizationflexibility
Income Employmentstability
Employability
Mean score, % Mean score, % Mean score, % Mean score, %
NL (877)Netherlands
9 / 874 / 6
74 / 11−44 / 22
50 / 23−80 / 24
37 / 29−121 / 27
AT (842)Austria
8 / 9−2 / 16
71 / 21−2 / 18
53 / 1520 / 14
40 / 23−65 / 25
PL (793)Poland
7 / 18−3 / 17
77 / 5127 / 2
50 / 24−61 / 23
45 / 829 / 13
PT (788)Portugal
5 / 28−138 / 30
71 / 2430 / 15
51 / 21−51 / 21
46 / 4122 / 2
SI (500)Slovenia
7 / 21−39 / 20
72 / 1921 / 16
46 / 31−169 / 30
47 / 292 / 7
SK (860)Slovakia
6 / 26−76 / 22
73 / 1377 / 9
53 / 1437 / 11
42 / 19−36 / 21
FI (911)Finland
8 / 152 / 15
67 / 31−148 / 29
50 / 25−87 / 25
44 / 12103 / 6
SE (951)Sweden
8 / 1429 / 13
73 / 15−67 / 24
48 / 27−135 / 28
46 / 5113 / 4
UK (876)United Kingdom
8 / 10−11 / 18
71 / 254 / 17
58 / 2142 / 2
40 / 22−7 / 17
BG (954)Bulgaria
5 / 31−168 / 31
72 / 1745 / 13
54 / 943 / 9
43 / 14−17 / 18
HR (816)Croatia
8 / 1330 / 12
74 / 968 / 10
48 / 28−119 / 27
45 / 779 / 9
RO (798)Romania
5 / 29−117 / 28
75 / 895 / 7
53 / 1625 / 13
44 / 1327 / 14
TR (454)Turkey
16 / 1279 / 1
78 / 3133 / 1
55 / 799 / 7
47 / 379 / 10
NO (846)Norway
8 / 1239 / 10
68 / 29−264 / 31
51 / 22−54 / 22
39 / 25−45 / 23
CH (831)Switzerland
9 / 749 / 8
69 / 26−197 / 30
52 / 18−20 / 20
39 / 24−37 / 22
71
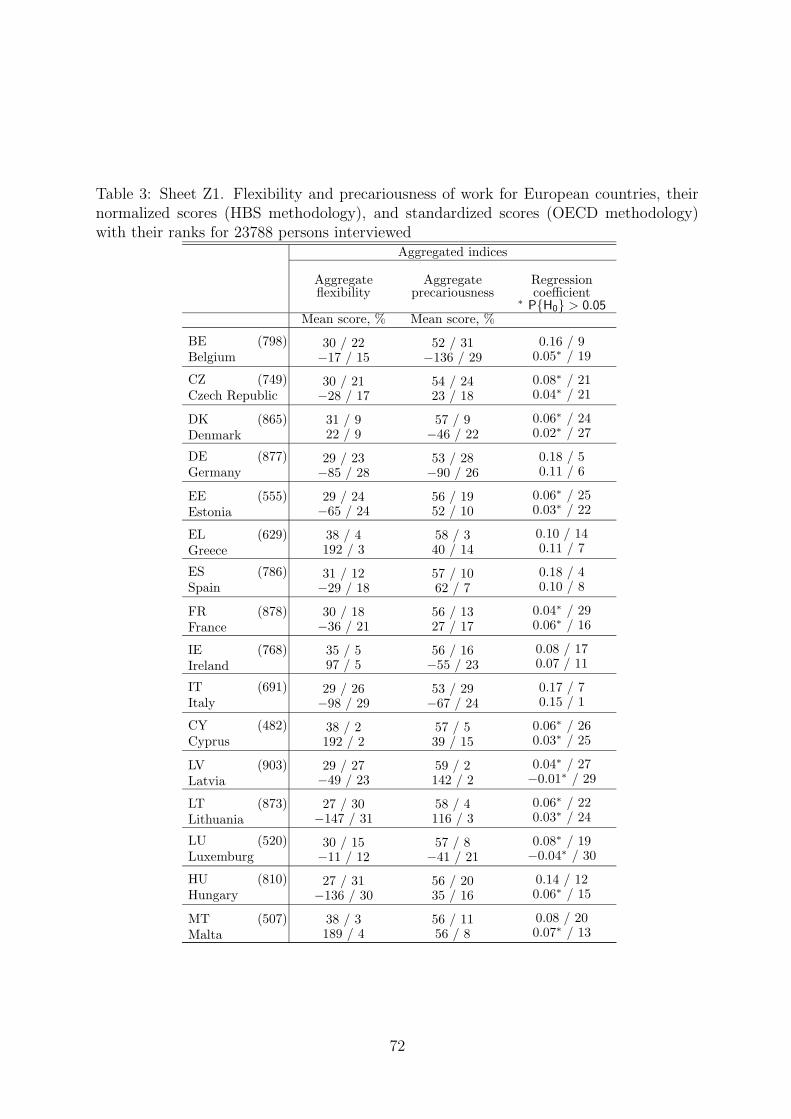
Table 3: Sheet Z1. Flexibility and precariousness of work for European countries, theirnormalized scores (HBS methodology), and standardized scores (OECD methodology)with their ranks for 23788 persons interviewed
Aggregated indices
Aggregateflexibility
Aggregateprecariousness
Regressioncoefficient
∗P{H0} > 0.05
Mean score, % Mean score, %
BE (798)Belgium
30 / 22−17 / 15
52 / 31−136 / 29
0.16 / 90.05∗ / 19
CZ (749)Czech Republic
30 / 21−28 / 17
54 / 2423 / 18
0.08∗ / 210.04∗ / 21
DK (865)Denmark
31 / 922 / 9
57 / 9−46 / 22
0.06∗ / 240.02∗ / 27
DE (877)Germany
29 / 23−85 / 28
53 / 28−90 / 26
0.18 / 50.11 / 6
EE (555)Estonia
29 / 24−65 / 24
56 / 1952 / 10
0.06∗ / 250.03∗ / 22
EL (629)Greece
38 / 4192 / 3
58 / 340 / 14
0.10 / 140.11 / 7
ES (786)Spain
31 / 12−29 / 18
57 / 1062 / 7
0.18 / 40.10 / 8
FR (878)France
30 / 18−36 / 21
56 / 1327 / 17
0.04∗ / 290.06∗ / 16
IE (768)Ireland
35 / 597 / 5
56 / 16−55 / 23
0.08 / 170.07 / 11
IT (691)Italy
29 / 26−98 / 29
53 / 29−67 / 24
0.17 / 70.15 / 1
CY (482)Cyprus
38 / 2192 / 2
57 / 539 / 15
0.06∗ / 260.03∗ / 25
LV (903)Latvia
29 / 27−49 / 23
59 / 2142 / 2
0.04∗ / 27−0.01∗ / 29
LT (873)Lithuania
27 / 30−147 / 31
58 / 4116 / 3
0.06∗ / 220.03∗ / 24
LU (520)Luxemburg
30 / 15−11 / 12
57 / 8−41 / 21
0.08∗ / 19−0.04∗ / 30
HU (810)Hungary
27 / 31−136 / 30
56 / 2035 / 16
0.14 / 120.06∗ / 15
MT (507)Malta
38 / 3189 / 4
56 / 1156 / 8
0.08 / 200.07∗ / 13
72
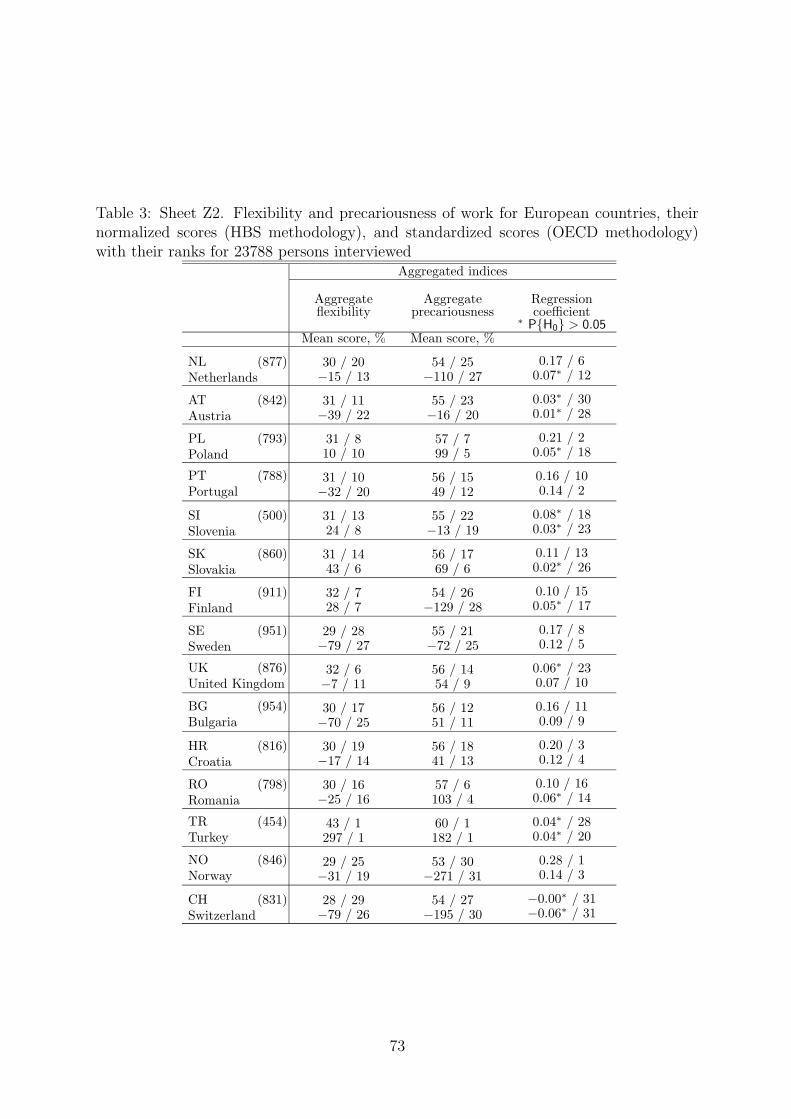
Table 3: Sheet Z2. Flexibility and precariousness of work for European countries, theirnormalized scores (HBS methodology), and standardized scores (OECD methodology)with their ranks for 23788 persons interviewed
Aggregated indices
Aggregateflexibility
Aggregateprecariousness
Regressioncoefficient
∗P{H0} > 0.05
Mean score, % Mean score, %
NL (877)Netherlands
30 / 20−15 / 13
54 / 25−110 / 27
0.17 / 60.07∗ / 12
AT (842)Austria
31 / 11−39 / 22
55 / 23−16 / 20
0.03∗ / 300.01∗ / 28
PL (793)Poland
31 / 810 / 10
57 / 799 / 5
0.21 / 20.05∗ / 18
PT (788)Portugal
31 / 10−32 / 20
56 / 1549 / 12
0.16 / 100.14 / 2
SI (500)Slovenia
31 / 1324 / 8
55 / 22−13 / 19
0.08∗ / 180.03∗ / 23
SK (860)Slovakia
31 / 1443 / 6
56 / 1769 / 6
0.11 / 130.02∗ / 26
FI (911)Finland
32 / 728 / 7
54 / 26−129 / 28
0.10 / 150.05∗ / 17
SE (951)Sweden
29 / 28−79 / 27
55 / 21−72 / 25
0.17 / 80.12 / 5
UK (876)United Kingdom
32 / 6−7 / 11
56 / 1454 / 9
0.06∗ / 230.07 / 10
BG (954)Bulgaria
30 / 17−70 / 25
56 / 1251 / 11
0.16 / 110.09 / 9
HR (816)Croatia
30 / 19−17 / 14
56 / 1841 / 13
0.20 / 30.12 / 4
RO (798)Romania
30 / 16−25 / 16
57 / 6103 / 4
0.10 / 160.06∗ / 14
TR (454)Turkey
43 / 1297 / 1
60 / 1182 / 1
0.04∗ / 280.04∗ / 20
NO (846)Norway
29 / 25−31 / 19
53 / 30−271 / 31
0.28 / 10.14 / 3
CH (831)Switzerland
28 / 29−79 / 26
54 / 27−195 / 30
−0.00∗ / 31−0.06∗ / 31
73
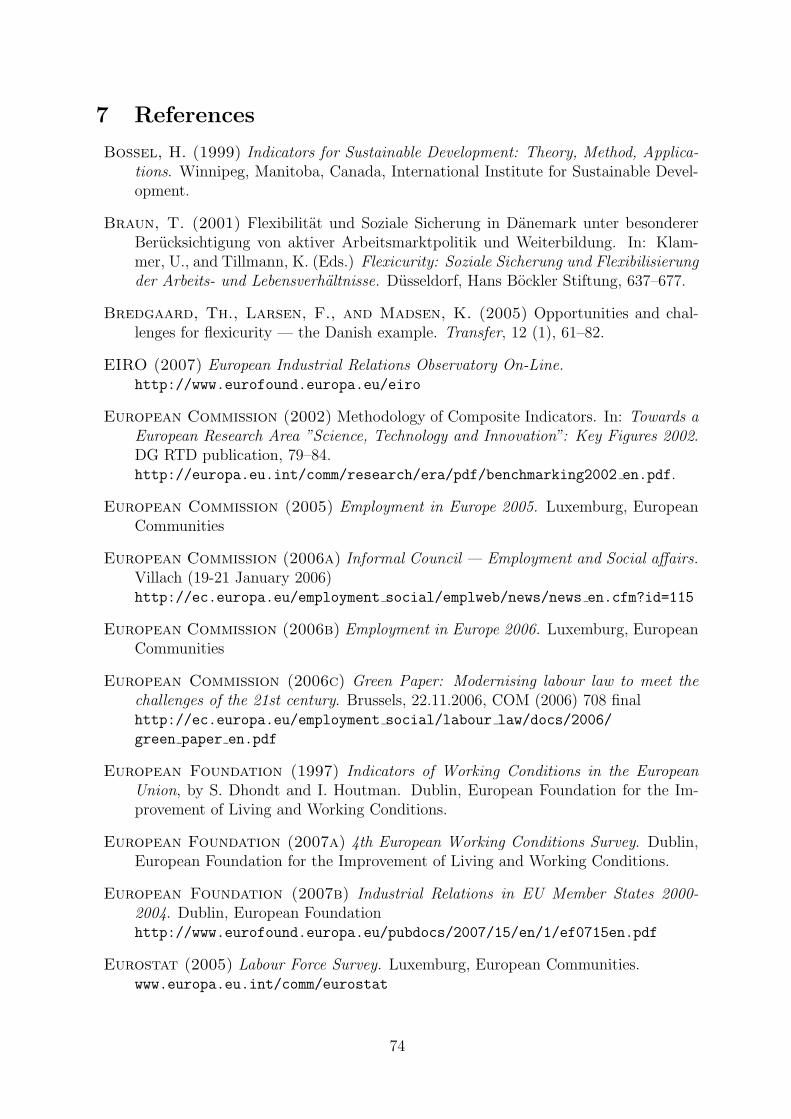
7 References
Bossel, H. (1999) Indicators for Sustainable Development: Theory, Method, Applica-tions. Winnipeg, Manitoba, Canada, International Institute for Sustainable Devel-opment.
Braun, T. (2001) Flexibilitat und Soziale Sicherung in Danemark unter besondererBerucksichtigung von aktiver Arbeitsmarktpolitik und Weiterbildung. In: Klam-mer, U., and Tillmann, K. (Eds.) Flexicurity: Soziale Sicherung und Flexibilisierungder Arbeits- und Lebensverhaltnisse. Dusseldorf, Hans Bockler Stiftung, 637–677.
Bredgaard, Th., Larsen, F., and Madsen, K. (2005) Opportunities and chal-lenges for flexicurity — the Danish example. Transfer, 12 (1), 61–82.
EIRO (2007) European Industrial Relations Observatory On-Line.http://www.eurofound.europa.eu/eiro
European Commission (2002) Methodology of Composite Indicators. In: Towards aEuropean Research Area ”Science, Technology and Innovation”: Key Figures 2002.DG RTD publication, 79–84.http://europa.eu.int/comm/research/era/pdf/benchmarking2002 en.pdf.
European Commission (2005) Employment in Europe 2005. Luxemburg, EuropeanCommunities
European Commission (2006a) Informal Council — Employment and Social affairs.Villach (19-21 January 2006)http://ec.europa.eu/employment social/emplweb/news/news en.cfm?id=115
European Commission (2006b) Employment in Europe 2006. Luxemburg, EuropeanCommunities
European Commission (2006c) Green Paper: Modernising labour law to meet thechallenges of the 21st century. Brussels, 22.11.2006, COM (2006) 708 finalhttp://ec.europa.eu/employment social/labour law/docs/2006/
green paper en.pdf
European Foundation (1997) Indicators of Working Conditions in the EuropeanUnion, by S. Dhondt and I. Houtman. Dublin, European Foundation for the Im-provement of Living and Working Conditions.
European Foundation (2007a) 4th European Working Conditions Survey. Dublin,European Foundation for the Improvement of Living and Working Conditions.
European Foundation (2007b) Industrial Relations in EU Member States 2000-2004. Dublin, European Foundationhttp://www.eurofound.europa.eu/pubdocs/2007/15/en/1/ef0715en.pdf
Eurostat (2005) Labour Force Survey. Luxemburg, European Communities.www.europa.eu.int/comm/eurostat
74
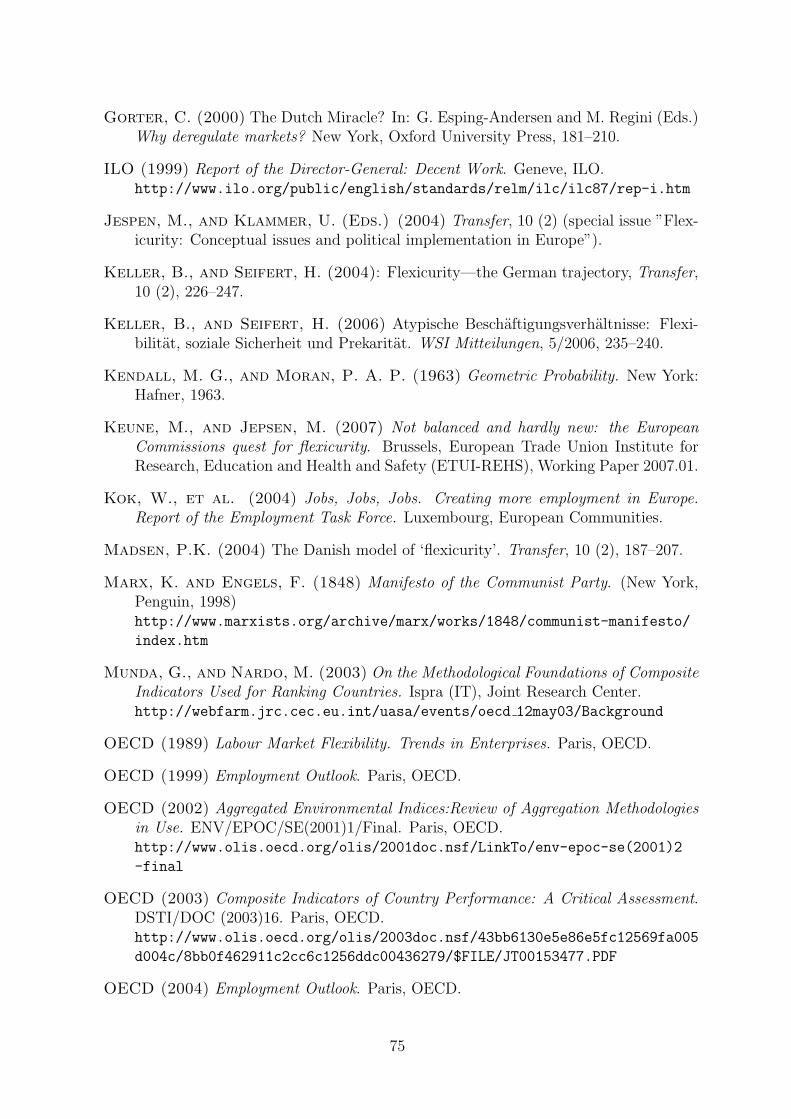
Gorter, C. (2000) The Dutch Miracle? In: G. Esping-Andersen and M. Regini (Eds.)Why deregulate markets? New York, Oxford University Press, 181–210.
ILO (1999) Report of the Director-General: Decent Work. Geneve, ILO.http://www.ilo.org/public/english/standards/relm/ilc/ilc87/rep-i.htm
Jespen, M., and Klammer, U. (Eds.) (2004) Transfer, 10 (2) (special issue ”Flex-icurity: Conceptual issues and political implementation in Europe”).
Keller, B., and Seifert, H. (2004): Flexicurity—the German trajectory, Transfer,10 (2), 226–247.
Keller, B., and Seifert, H. (2006) Atypische Beschaftigungsverhaltnisse: Flexi-bilitat, soziale Sicherheit und Prekaritat. WSI Mitteilungen, 5/2006, 235–240.
Kendall, M. G., and Moran, P. A. P. (1963) Geometric Probability. New York:Hafner, 1963.
Keune, M., and Jepsen, M. (2007) Not balanced and hardly new: the EuropeanCommissions quest for flexicurity. Brussels, European Trade Union Institute forResearch, Education and Health and Safety (ETUI-REHS), Working Paper 2007.01.
Kok, W., et al. (2004) Jobs, Jobs, Jobs. Creating more employment in Europe.Report of the Employment Task Force. Luxembourg, European Communities.
Madsen, P.K. (2004) The Danish model of ‘flexicurity’. Transfer, 10 (2), 187–207.
Marx, K. and Engels, F. (1848) Manifesto of the Communist Party. (New York,Penguin, 1998)http://www.marxists.org/archive/marx/works/1848/communist-manifesto/
index.htm
Munda, G., and Nardo, M. (2003) On the Methodological Foundations of CompositeIndicators Used for Ranking Countries. Ispra (IT), Joint Research Center.http://webfarm.jrc.cec.eu.int/uasa/events/oecd 12may03/Background
OECD (1989) Labour Market Flexibility. Trends in Enterprises. Paris, OECD.
OECD (1999) Employment Outlook. Paris, OECD.
OECD (2002) Aggregated Environmental Indices:Review of Aggregation Methodologiesin Use. ENV/EPOC/SE(2001)1/Final. Paris, OECD.http://www.olis.oecd.org/olis/2001doc.nsf/LinkTo/env-epoc-se(2001)2
-final
OECD (2003) Composite Indicators of Country Performance: A Critical Assessment.DSTI/DOC (2003)16. Paris, OECD.http://www.olis.oecd.org/olis/2003doc.nsf/43bb6130e5e86e5fc12569fa005
d004c/8bb0f462911c2cc6c1256ddc00436279/$FILE/JT00153477.PDF
OECD (2004) Employment Outlook. Paris, OECD.
75
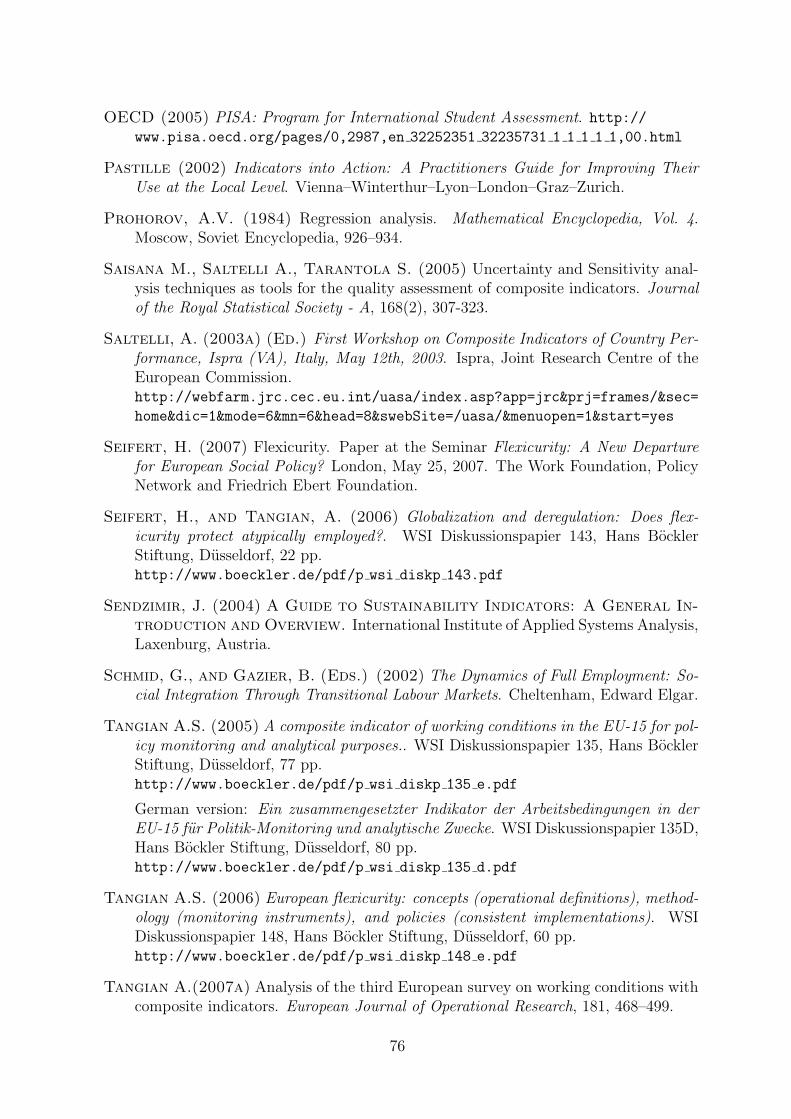
OECD (2005) PISA: Program for International Student Assessment. http://www.pisa.oecd.org/pages/0,2987,en 32252351 32235731 1 1 1 1 1,00.html
Pastille (2002) Indicators into Action: A Practitioners Guide for Improving TheirUse at the Local Level. Vienna–Winterthur–Lyon–London–Graz–Zurich.
Prohorov, A.V. (1984) Regression analysis. Mathematical Encyclopedia, Vol. 4.Moscow, Soviet Encyclopedia, 926–934.
Saisana M., Saltelli A., Tarantola S. (2005) Uncertainty and Sensitivity anal-ysis techniques as tools for the quality assessment of composite indicators. Journalof the Royal Statistical Society - A, 168(2), 307-323.
Saltelli, A. (2003a) (Ed.) First Workshop on Composite Indicators of Country Per-formance, Ispra (VA), Italy, May 12th, 2003. Ispra, Joint Research Centre of theEuropean Commission.http://webfarm.jrc.cec.eu.int/uasa/index.asp?app=jrc&prj=frames/&sec=
home&dic=1&mode=6&mn=6&head=8&swebSite=/uasa/&menuopen=1&start=yes
Seifert, H. (2007) Flexicurity. Paper at the Seminar Flexicurity: A New Departurefor European Social Policy? London, May 25, 2007. The Work Foundation, PolicyNetwork and Friedrich Ebert Foundation.
Seifert, H., and Tangian, A. (2006) Globalization and deregulation: Does flex-icurity protect atypically employed?. WSI Diskussionspapier 143, Hans BocklerStiftung, Dusseldorf, 22 pp.http://www.boeckler.de/pdf/p wsi diskp 143.pdf
Sendzimir, J. (2004) A Guide to Sustainability Indicators: A General In-troduction and Overview. International Institute of Applied Systems Analysis,Laxenburg, Austria.
Schmid, G., and Gazier, B. (Eds.) (2002) The Dynamics of Full Employment: So-cial Integration Through Transitional Labour Markets. Cheltenham, Edward Elgar.
Tangian A.S. (2005) A composite indicator of working conditions in the EU-15 for pol-icy monitoring and analytical purposes.. WSI Diskussionspapier 135, Hans BocklerStiftung, Dusseldorf, 77 pp.http://www.boeckler.de/pdf/p wsi diskp 135 e.pdf
German version: Ein zusammengesetzter Indikator der Arbeitsbedingungen in derEU-15 fur Politik-Monitoring und analytische Zwecke. WSI Diskussionspapier 135D,Hans Bockler Stiftung, Dusseldorf, 80 pp.http://www.boeckler.de/pdf/p wsi diskp 135 d.pdf
Tangian A.S. (2006) European flexicurity: concepts (operational definitions), method-ology (monitoring instruments), and policies (consistent implementations). WSIDiskussionspapier 148, Hans Bockler Stiftung, Dusseldorf, 60 pp.http://www.boeckler.de/pdf/p wsi diskp 148 e.pdf
Tangian A.(2007a) Analysis of the third European survey on working conditions withcomposite indicators. European Journal of Operational Research, 181, 468–499.
76
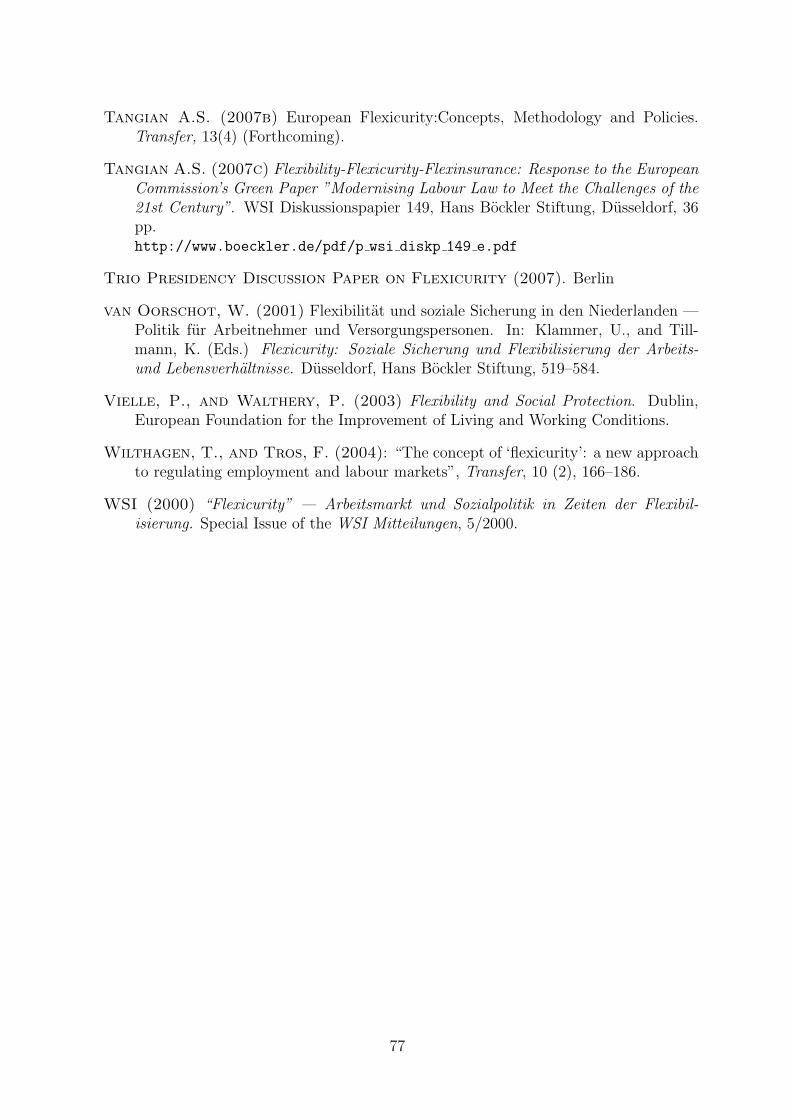
Tangian A.S. (2007b) European Flexicurity:Concepts, Methodology and Policies.Transfer, 13(4) (Forthcoming).
Tangian A.S. (2007c) Flexibility-Flexicurity-Flexinsurance: Response to the EuropeanCommission’s Green Paper ”Modernising Labour Law to Meet the Challenges of the21st Century”. WSI Diskussionspapier 149, Hans Bockler Stiftung, Dusseldorf, 36pp.http://www.boeckler.de/pdf/p wsi diskp 149 e.pdf
Trio Presidency Discussion Paper on Flexicurity (2007). Berlin
van Oorschot, W. (2001) Flexibilitat und soziale Sicherung in den Niederlanden —Politik fur Arbeitnehmer und Versorgungspersonen. In: Klammer, U., and Till-mann, K. (Eds.) Flexicurity: Soziale Sicherung und Flexibilisierung der Arbeits-und Lebensverhaltnisse. Dusseldorf, Hans Bockler Stiftung, 519–584.
Vielle, P., and Walthery, P. (2003) Flexibility and Social Protection. Dublin,European Foundation for the Improvement of Living and Working Conditions.
Wilthagen, T., and Tros, F. (2004): “The concept of ‘flexicurity’: a new approachto regulating employment and labour markets”, Transfer, 10 (2), 166–186.
WSI (2000) “Flexicurity” — Arbeitsmarkt und Sozialpolitik in Zeiten der Flexibil-isierung. Special Issue of the WSI Mitteilungen, 5/2000.
77