ZF Friedrichshafen AG Cherrystrasse SNAP SWITCHES Example ...
econstor www.econstor.eu
Der Open-Access-Publikationsserver der ZBW – Leibniz-Informationszentrum WirtschaftThe Open Access Publication Server of the ZBW – Leibniz Information Centre for Economics
Standard-Nutzungsbedingungen:
Die Dokumente auf EconStor dürfen zu eigenen wissenschaftlichenZwecken und zum Privatgebrauch gespeichert und kopiert werden.
Sie dürfen die Dokumente nicht für öffentliche oder kommerzielleZwecke vervielfältigen, öffentlich ausstellen, öffentlich zugänglichmachen, vertreiben oder anderweitig nutzen.
Sofern die Verfasser die Dokumente unter Open-Content-Lizenzen(insbesondere CC-Lizenzen) zur Verfügung gestellt haben sollten,gelten abweichend von diesen Nutzungsbedingungen die in der dortgenannten Lizenz gewährten Nutzungsrechte.
Terms of use:
Documents in EconStor may be saved and copied for yourpersonal and scholarly purposes.
You are not to copy documents for public or commercialpurposes, to exhibit the documents publicly, to make thempublicly available on the internet, or to distribute or otherwiseuse the documents in public.
If the documents have been made available under an OpenContent Licence (especially Creative Commons Licences), youmay exercise further usage rights as specified in the indicatedlicence.
zbw Leibniz-Informationszentrum WirtschaftLeibniz Information Centre for Economics
Mölleryd, Bengt G.; Markendahl, Jan
Conference Paper
The value of spectrum and the impact of thebreakthrough for mobile data: The case of India,Sweden and Thailand
19th ITS Biennial Conference 2012, Bangkok, Thailand, 18 - 21 November 2012: MovingForward with Future Technologies: Opening a Platform for All
Provided in Cooperation with:International Telecommunications Society (ITS)
Suggested Citation: Mölleryd, Bengt G.; Markendahl, Jan (2012) : The value of spectrum andthe impact of the breakthrough for mobile data: The case of India, Sweden and Thailand, 19thITS Biennial Conference 2012, Bangkok, Thailand, 18 - 21 November 2012: Moving Forwardwith Future Technologies: Opening a Platform for All
This Version is available at:http://hdl.handle.net/10419/72479
The 19th ITS Biennial Conference 2012
“Moving Forward with Future Technologies:
Opening a Platform for All”
18 - 21 November 2012, Thailand
THE VALUE OF SPECTRUM AND THE IMPACT OF THE
BREAKTHROUGH FOR MOBILE DATA – THE CASE OF INDIA,
SWEDEN AND THAILANDBengt G Mölleryd*, Jan Markendahl**
*Ph.D. (corresponding author). PTS, Swedish Post and Telecom Authority
** Ph.D. Wireless@KTH, Royal Institute of Technology
E-mail: [email protected]
1
Paper submitted to the 19th ITS Biennial Conference Bangkok 18-21 Nov 2012
THE VALUE OF SPECTRUM AND THE IMPACT OF THE
BREAKTHROUGH FOR MOBILE DATA – THE CASE OF INDIA,
SWEDEN AND THAILAND
Bengt G Mölleryd1, Ph.D. (corresponding author). PTS, Swedish Post and Telecom
Authority, P.O. Box 5398, SE-102 49 Stockholm, Sweden, email: [email protected]
Jan Markendahl, Ph.D. Wireless@KTH, Royal Institute of Technology, Electrum 229,
SE-164 40 Kista, Sweden, email: [email protected]
ABASTRACT
This paper presents an analysis of the marginal value of spectrum with a focus on
mobile broadband and illustrated by three country cases: India, Sweden and Thailand.
The paper use an engineering valuation approach, which refers to savings that can be
achieved by acquiring appropriate amount of spectrum rather than to deploy additional
sites, to estimate the marginal value of spectrum. It is complemented with a discounted
cash flow valuation (DCF) in order to estimate the net present value of spectrum.
Valuation of spectrum is a complex issue given that the value is depending upon the
availability of spectrum, national spectrum regulation, competitive situation on the
market and expectations about the growth of the mobile business. The paper is addressing
three research questions: 1) What is the engineering value of spectrum in two country
cases, 2) what is the DCF value of 3G spectrum in Thailand, and 3) what do the paid
levels at spectrum auctions imply for the marginal value of spectrum.
The methodology applied to calculate the engineering value is based on a comparison
of different network deployment options using different amounts of spectrum. As
spectrum and sites are substitutes it enables us to calculate how many additional sites that
are required in order to compensate for an incremental allocation of spectrum. Moreover,
the paper compare estimates of the marginal value of spectrum with prices paid at a
number of spectrum auctions presented as the value per MHz per population. The
contribution of the paper is the development of an approach and estimates of the marginal
value for spectrum which could be of interest for regulators when setting reserve prices
on spectrum. It could also be an input to corporate spectrum strategies and a contribution
to the development of valuation approaches on spectrum.
1 Bengt G Mölleryd is also a guest researcher at wireless@kth, Royal Institute of
Technology, Stockholm
2
INTRODCUTION – SPECTRUM ALLOCATION AND PRICES
As telecommunications is seen as a vehicle for growth most governments has set out
broadband (including both fixed and mobile) targets. In October 2011, the Indian
government published a National Telecom Policy which aims to reach broadband speeds
of 2 Mbps by 2015 and at least 100 Mbps thereafter.2 Europe has set out to provide fast
broadband with speeds above 30 Mbps for all Europeans by 2020 and ultra-fast
broadband with speeds above 100 Mbps for 50% of all European households by 2020. 3
Thailand’s telecom master plan aims to achieve coverage of 85% of the population for
data services before 2017.4
Given that it requires significantly more capital expenditures to deploy fiber access
networks compared to mobile networks mobile communication is set to be instrumental
in fulfilling the broadband targets. In markets with undeveloped fixed networks and
limited deployment of fiber mobile is set to play a key role. This will reinforce the
significance of spectrum, which is underscored by the global diffusion of smartphones,
which will be available to larger segments of the market when prices are coming down
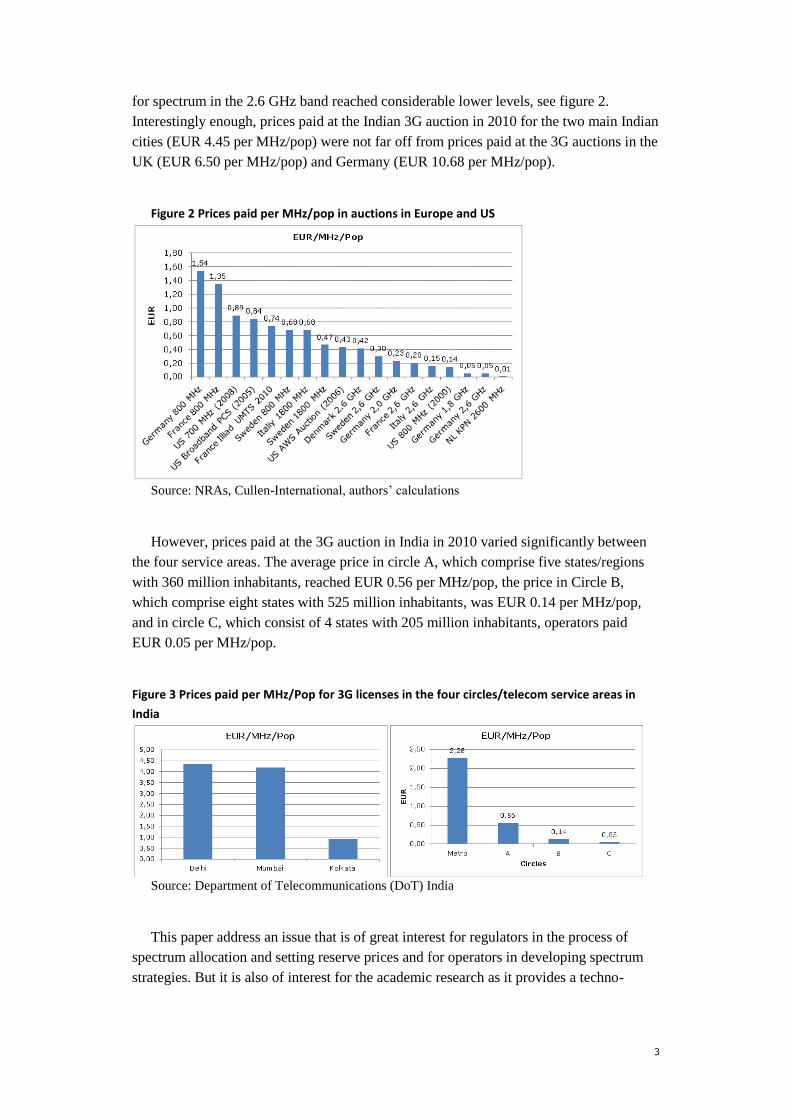
under EUR 100. Access to spectrum for operators varies considerable between different
countries, which is illustrated by the fact that operators in India on average have 2x15
MHz while operators in Sweden in average have 2x70 MHz. The enhanced role for
spectrum turns spectrum allocation into decisive events for mobile operators.
Figure 1 Average amount of spectrum per operator (downlink)5
Source: NRAs, Cullen-International, operator reports, authors’ calculations
An estimate of the value of spectrum could be derived from auction prices paid by
operators. The outcome of spectrum auctions regarding the 800 MHz-band show that
operators in Germany and France paid EUR 1.54 and EUR 1.35 per MHz/pop6
respectively, while the Swedish operators in average paid EUR 0.68 per MHz/pop. Prices
2 Government of India, Draft National Telecom Policy 2011, October 2011 3 EU-Commission, A Digital Agenda for Europe, 19.05 2010. Com(2010) 245 4 Thailand Telecommunications Master plan,
http://www.nbtc.go.th/wps/portal/Eng/Aboutus/History/MasterPlan 5 The presented numbers are based on the total amount of spectrum mobile operators
have in the different countries, and then calculated as a market share weighted average
per country. 6 The amount and price of spectrum is presented using the metric “price per MHz
normalized with the population” (EUR/MHz/pop)
3
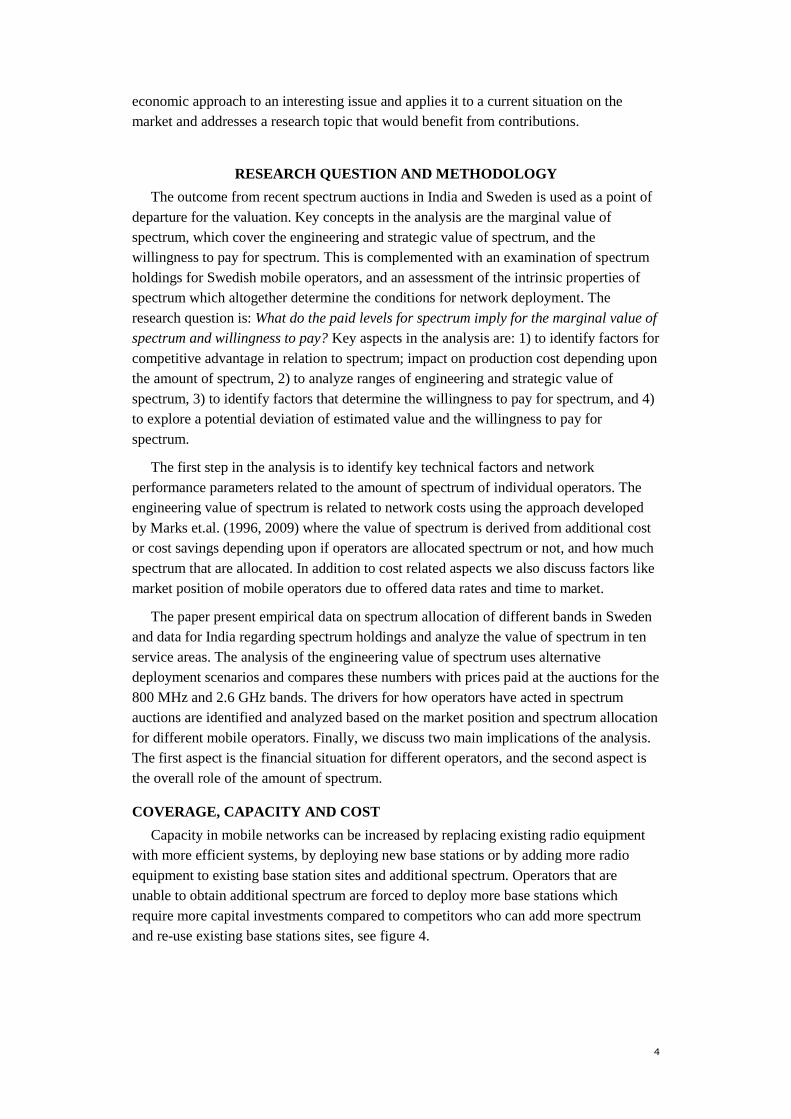
for spectrum in the 2.6 GHz band reached considerable lower levels, see figure 2.
Interestingly enough, prices paid at the Indian 3G auction in 2010 for the two main Indian
cities (EUR 4.45 per MHz/pop) were not far off from prices paid at the 3G auctions in the
UK (EUR 6.50 per MHz/pop) and Germany (EUR 10.68 per MHz/pop).
Figure 2 Prices paid per MHz/pop in auctions in Europe and US
Source: NRAs, Cullen-International, authors’ calculations
However, prices paid at the 3G auction in India in 2010 varied significantly between
the four service areas. The average price in circle A, which comprise five states/regions
with 360 million inhabitants, reached EUR 0.56 per MHz/pop, the price in Circle B,
which comprise eight states with 525 million inhabitants, was EUR 0.14 per MHz/pop,
and in circle C, which consist of 4 states with 205 million inhabitants, operators paid
EUR 0.05 per MHz/pop.
Figure 3 Prices paid per MHz/Pop for 3G licenses in the four circles/telecom service areas in
India
Source: Department of Telecommunications (DoT) India
This paper address an issue that is of great interest for regulators in the process of
spectrum allocation and setting reserve prices and for operators in developing spectrum
strategies. But it is also of interest for the academic research as it provides a techno-
4
economic approach to an interesting issue and applies it to a current situation on the
market and addresses a research topic that would benefit from contributions.
RESEARCH QUESTION AND METHODOLOGY
The outcome from recent spectrum auctions in India and Sweden is used as a point of
departure for the valuation. Key concepts in the analysis are the marginal value of
spectrum, which cover the engineering and strategic value of spectrum, and the
willingness to pay for spectrum. This is complemented with an examination of spectrum
holdings for Swedish mobile operators, and an assessment of the intrinsic properties of
spectrum which altogether determine the conditions for network deployment. The
research question is: What do the paid levels for spectrum imply for the marginal value of
spectrum and willingness to pay? Key aspects in the analysis are: 1) to identify factors for
competitive advantage in relation to spectrum; impact on production cost depending upon
the amount of spectrum, 2) to analyze ranges of engineering and strategic value of
spectrum, 3) to identify factors that determine the willingness to pay for spectrum, and 4)
to explore a potential deviation of estimated value and the willingness to pay for
spectrum.
The first step in the analysis is to identify key technical factors and network
performance parameters related to the amount of spectrum of individual operators. The
engineering value of spectrum is related to network costs using the approach developed
by Marks et.al. (1996, 2009) where the value of spectrum is derived from additional cost
or cost savings depending upon if operators are allocated spectrum or not, and how much
spectrum that are allocated. In addition to cost related aspects we also discuss factors like
market position of mobile operators due to offered data rates and time to market.
The paper present empirical data on spectrum allocation of different bands in Sweden
and data for India regarding spectrum holdings and analyze the value of spectrum in ten
service areas. The analysis of the engineering value of spectrum uses alternative
deployment scenarios and compares these numbers with prices paid at the auctions for the
800 MHz and 2.6 GHz bands. The drivers for how operators have acted in spectrum
auctions are identified and analyzed based on the market position and spectrum allocation
for different mobile operators. Finally, we discuss two main implications of the analysis.
The first aspect is the financial situation for different operators, and the second aspect is
the overall role of the amount of spectrum.
COVERAGE, CAPACITY AND COST
Capacity in mobile networks can be increased by replacing existing radio equipment
with more efficient systems, by deploying new base stations or by adding more radio
equipment to existing base station sites and additional spectrum. Operators that are
unable to obtain additional spectrum are forced to deploy more base stations which
require more capital investments compared to competitors who can add more spectrum
and re-use existing base stations sites, see figure 4.
5
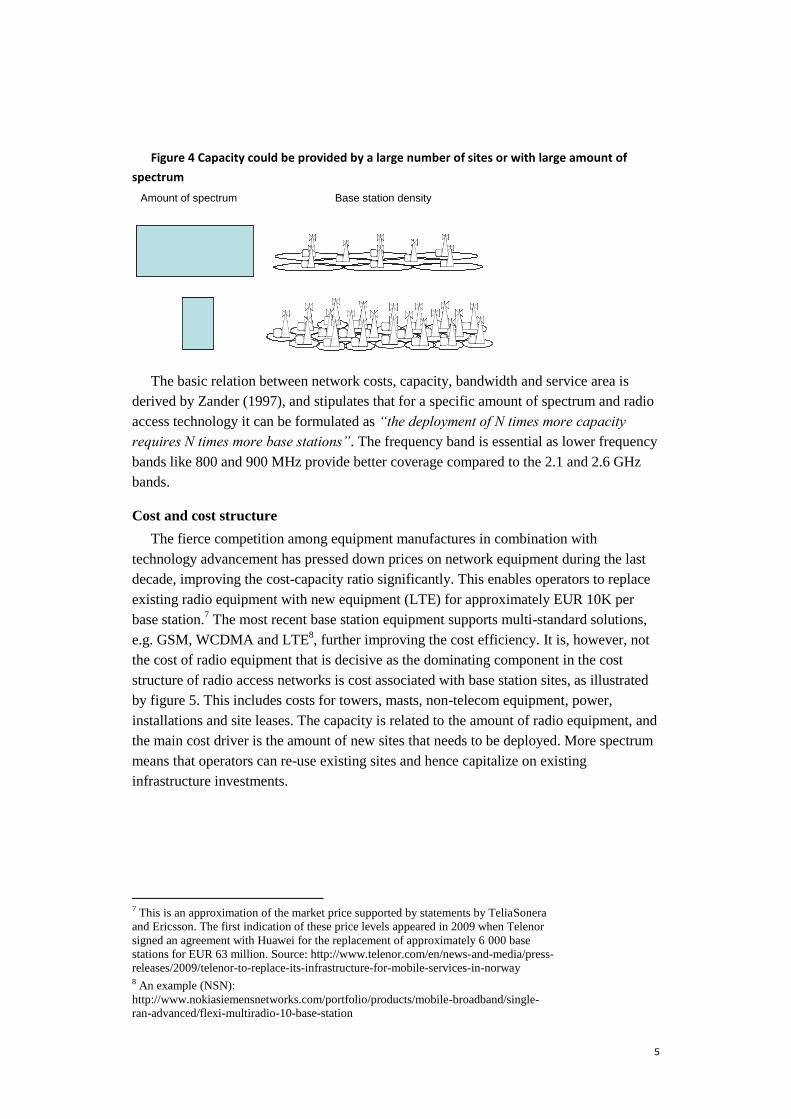
Figure 4 Capacity could be provided by a large number of sites or with large amount of
spectrum
The basic relation between network costs, capacity, bandwidth and service area is
derived by Zander (1997), and stipulates that for a specific amount of spectrum and radio
access technology it can be formulated as “the deployment of N times more capacity
requires N times more base stations”. The frequency band is essential as lower frequency
bands like 800 and 900 MHz provide better coverage compared to the 2.1 and 2.6 GHz
bands.
Cost and cost structure
The fierce competition among equipment manufactures in combination with
technology advancement has pressed down prices on network equipment during the last
decade, improving the cost-capacity ratio significantly. This enables operators to replace
existing radio equipment with new equipment (LTE) for approximately EUR 10K per
base station.7 The most recent base station equipment supports multi-standard solutions,
e.g. GSM, WCDMA and LTE8, further improving the cost efficiency. It is, however, not
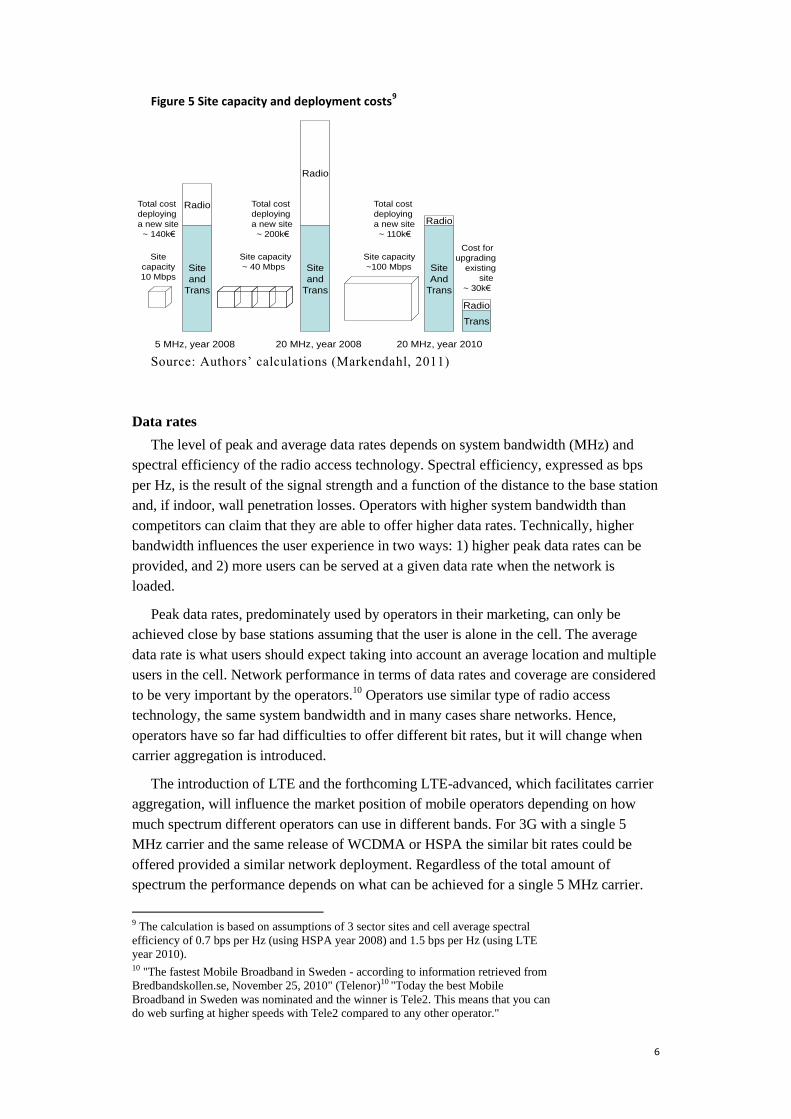
the cost of radio equipment that is decisive as the dominating component in the cost
structure of radio access networks is cost associated with base station sites, as illustrated
by figure 5. This includes costs for towers, masts, non-telecom equipment, power,
installations and site leases. The capacity is related to the amount of radio equipment, and
the main cost driver is the amount of new sites that needs to be deployed. More spectrum
means that operators can re-use existing sites and hence capitalize on existing
infrastructure investments.
7 This is an approximation of the market price supported by statements by TeliaSonera
and Ericsson. The first indication of these price levels appeared in 2009 when Telenor
signed an agreement with Huawei for the replacement of approximately 6 000 base
stations for EUR 63 million. Source: http://www.telenor.com/en/news-and-media/press-
releases/2009/telenor-to-replace-its-infrastructure-for-mobile-services-in-norway 8 An example (NSN):
http://www.nokiasiemensnetworks.com/portfolio/products/mobile-broadband/single-
ran-advanced/flexi-multiradio-10-base-station
Amount of spectrum Base station density
6
Figure 5 Site capacity and deployment costs9
Source: Authors’ calculations (Markendahl, 2011)
Data rates
The level of peak and average data rates depends on system bandwidth (MHz) and
spectral efficiency of the radio access technology. Spectral efficiency, expressed as bps
per Hz, is the result of the signal strength and a function of the distance to the base station
and, if indoor, wall penetration losses. Operators with higher system bandwidth than
competitors can claim that they are able to offer higher data rates. Technically, higher
bandwidth influences the user experience in two ways: 1) higher peak data rates can be
provided, and 2) more users can be served at a given data rate when the network is
loaded.
Peak data rates, predominately used by operators in their marketing, can only be
achieved close by base stations assuming that the user is alone in the cell. The average
data rate is what users should expect taking into account an average location and multiple
users in the cell. Network performance in terms of data rates and coverage are considered
to be very important by the operators.10
Operators use similar type of radio access
technology, the same system bandwidth and in many cases share networks. Hence,
operators have so far had difficulties to offer different bit rates, but it will change when
carrier aggregation is introduced.
The introduction of LTE and the forthcoming LTE-advanced, which facilitates carrier
aggregation, will influence the market position of mobile operators depending on how
much spectrum different operators can use in different bands. For 3G with a single 5
MHz carrier and the same release of WCDMA or HSPA the similar bit rates could be
offered provided a similar network deployment. Regardless of the total amount of
spectrum the performance depends on what can be achieved for a single 5 MHz carrier.
9 The calculation is based on assumptions of 3 sector sites and cell average spectral
efficiency of 0.7 bps per Hz (using HSPA year 2008) and 1.5 bps per Hz (using LTE
year 2010). 10 "The fastest Mobile Broadband in Sweden - according to information retrieved from
Bredbandskollen.se, November 25, 2010" (Telenor)10 "Today the best Mobile
Broadband in Sweden was nominated and the winner is Tele2. This means that you can
do web surfing at higher speeds with Tele2 compared to any other operator."
Radio
Radio
Site
and
Trans
Site
and
Trans
5 MHz, year 2008 20 MHz, year 2008 20 MHz, year 2010
Site capacity
~100 Mbps
Site capacity
~ 40 Mbps
Site
capacity
10 Mbps
Radio
Site
And
Trans
Radio
Trans
Cost for
upgrading
existing
site
~ 30k€
Total cost
deploying
a new site
~ 110k€
Total cost
deploying
a new site
~ 200k€
Total cost
deploying
a new site
~ 140k€
7
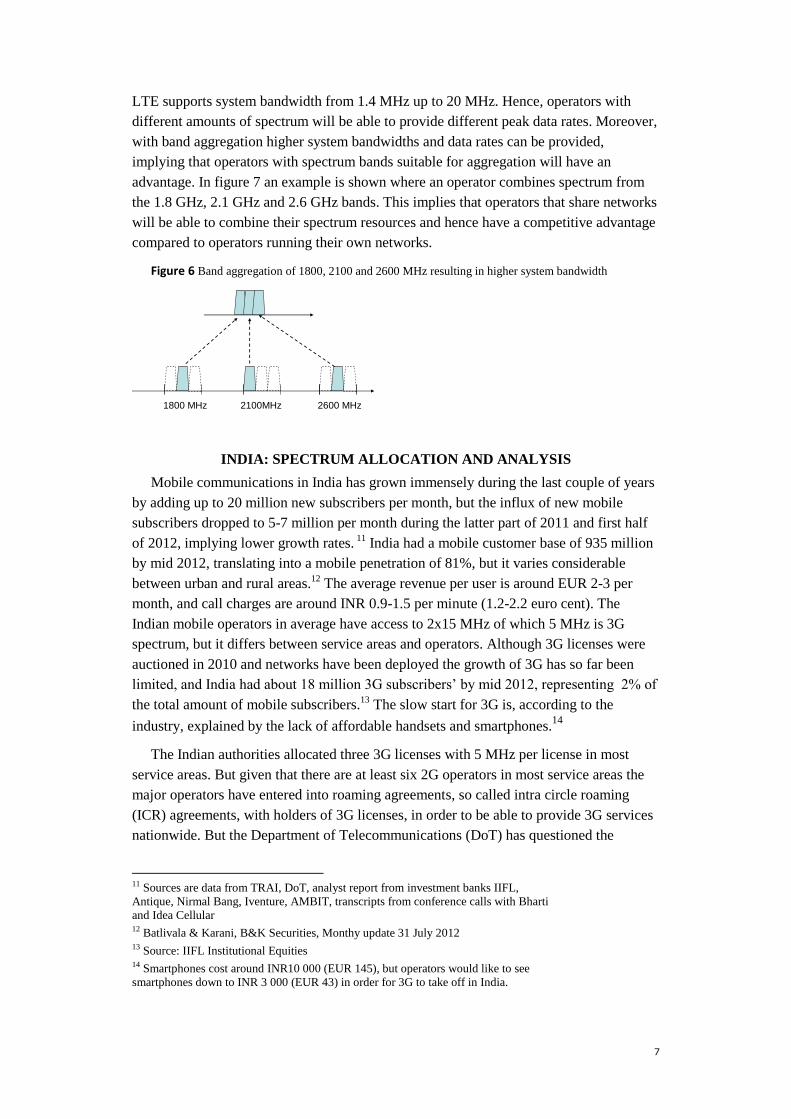
LTE supports system bandwidth from 1.4 MHz up to 20 MHz. Hence, operators with
different amounts of spectrum will be able to provide different peak data rates. Moreover,
with band aggregation higher system bandwidths and data rates can be provided,
implying that operators with spectrum bands suitable for aggregation will have an
advantage. In figure 7 an example is shown where an operator combines spectrum from
the 1.8 GHz, 2.1 GHz and 2.6 GHz bands. This implies that operators that share networks
will be able to combine their spectrum resources and hence have a competitive advantage
compared to operators running their own networks.
Figure 6 Band aggregation of 1800, 2100 and 2600 MHz resulting in higher system bandwidth
INDIA: SPECTRUM ALLOCATION AND ANALYSIS
Mobile communications in India has grown immensely during the last couple of years
by adding up to 20 million new subscribers per month, but the influx of new mobile
subscribers dropped to 5-7 million per month during the latter part of 2011 and first half
of 2012, implying lower growth rates. 11
India had a mobile customer base of 935 million
by mid 2012, translating into a mobile penetration of 81%, but it varies considerable
between urban and rural areas.12
The average revenue per user is around EUR 2-3 per
month, and call charges are around INR 0.9-1.5 per minute (1.2-2.2 euro cent). The
Indian mobile operators in average have access to 2x15 MHz of which 5 MHz is 3G
spectrum, but it differs between service areas and operators. Although 3G licenses were
auctioned in 2010 and networks have been deployed the growth of 3G has so far been
limited, and India had about 18 million 3G subscribers’ by mid 2012, representing 2% of
the total amount of mobile subscribers.13
The slow start for 3G is, according to the
industry, explained by the lack of affordable handsets and smartphones.14
The Indian authorities allocated three 3G licenses with 5 MHz per license in most
service areas. But given that there are at least six 2G operators in most service areas the
major operators have entered into roaming agreements, so called intra circle roaming
(ICR) agreements, with holders of 3G licenses, in order to be able to provide 3G services
nationwide. But the Department of Telecommunications (DoT) has questioned the
11 Sources are data from TRAI, DoT, analyst report from investment banks IIFL,
Antique, Nirmal Bang, Iventure, AMBIT, transcripts from conference calls with Bharti
and Idea Cellular 12 Batlivala & Karani, B&K Securities, Monthy update 31 July 2012 13 Source: IIFL Institutional Equities 14 Smartphones cost around INR10 000 (EUR 145), but operators would like to see
smartphones down to INR 3 000 (EUR 43) in order for 3G to take off in India.
900 MHz 1800 MHz 2100MHz 2600 MHz
Higher bandwidth by use of aggregation
8
roaming agreements which initiated legal processes by the end of 2011. On back of a
limited availability of fixed broadband, 2G data with GPRS and EDGE have been the
primary carriers for mobile data. But given that non-voice revenues generates 15% of
total mobile revenues, of which SMS makes up the half, the revenue stream from the
estimated 350 million mobile internet users have so far been limited.
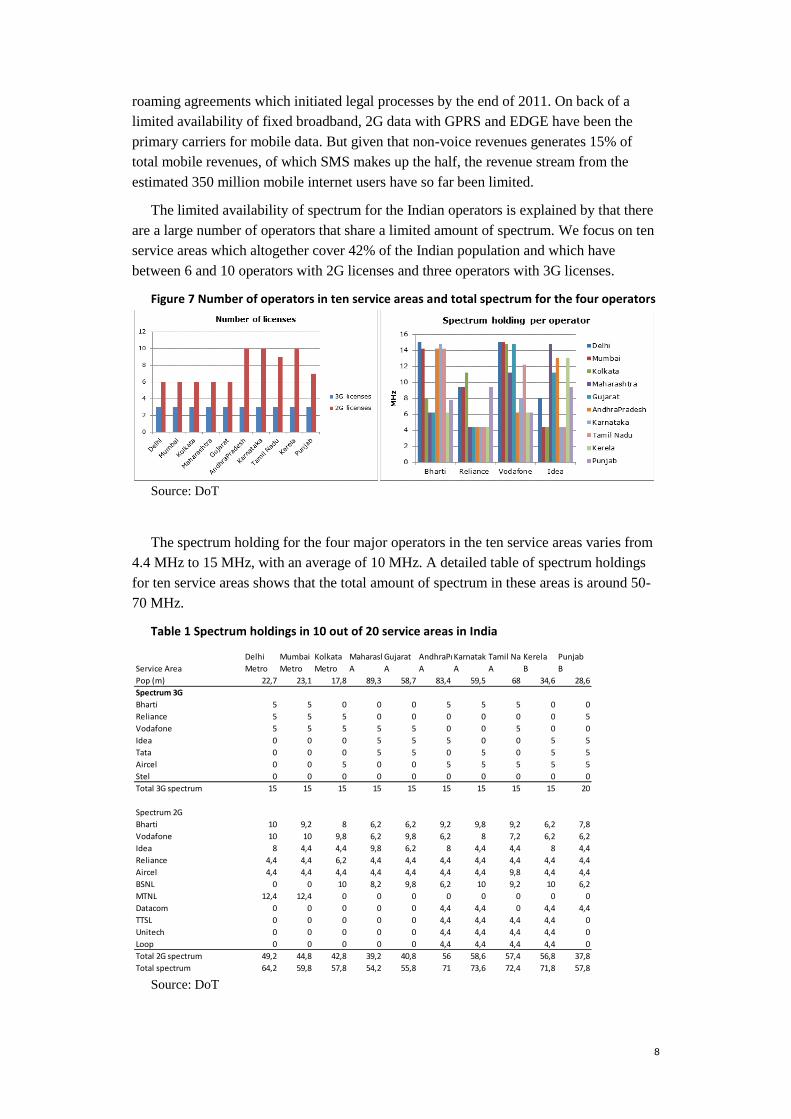
The limited availability of spectrum for the Indian operators is explained by that there
are a large number of operators that share a limited amount of spectrum. We focus on ten
service areas which altogether cover 42% of the Indian population and which have
between 6 and 10 operators with 2G licenses and three operators with 3G licenses.
Figure 7 Number of operators in ten service areas and total spectrum for the four operators
Source: DoT
The spectrum holding for the four major operators in the ten service areas varies from
4.4 MHz to 15 MHz, with an average of 10 MHz. A detailed table of spectrum holdings
for ten service areas shows that the total amount of spectrum in these areas is around 50-
70 MHz.
Table 1 Spectrum holdings in 10 out of 20 service areas in India
Source: DoT
Delhi Mumbai Kolkata MaharashtraGujarat AndhraPradeshKarnatakaTamil NaduKerela Punjab
Service Area Metro Metro Metro A A A A A B B
Pop (m) 22,7 23,1 17,8 89,3 58,7 83,4 59,5 68 34,6 28,6
Spectrum 3G
Bharti 5 5 0 0 0 5 5 5 0 0
Reliance 5 5 5 0 0 0 0 0 0 5
Vodafone 5 5 5 5 5 0 0 5 0 0
Idea 0 0 0 5 5 5 0 0 5 5
Tata 0 0 0 5 5 0 5 0 5 5
Aircel 0 0 5 0 0 5 5 5 5 5
Stel 0 0 0 0 0 0 0 0 0 0
Total 3G spectrum 15 15 15 15 15 15 15 15 15 20
Spectrum 2G
Bharti 10 9,2 8 6,2 6,2 9,2 9,8 9,2 6,2 7,8
Vodafone 10 10 9,8 6,2 9,8 6,2 8 7,2 6,2 6,2
Idea 8 4,4 4,4 9,8 6,2 8 4,4 4,4 8 4,4
Reliance 4,4 4,4 6,2 4,4 4,4 4,4 4,4 4,4 4,4 4,4
Aircel 4,4 4,4 4,4 4,4 4,4 4,4 4,4 9,8 4,4 4,4
BSNL 0 0 10 8,2 9,8 6,2 10 9,2 10 6,2
MTNL 12,4 12,4 0 0 0 0 0 0 0 0
Datacom 0 0 0 0 0 4,4 4,4 0 4,4 4,4
TTSL 0 0 0 0 0 4,4 4,4 4,4 4,4 0
Unitech 0 0 0 0 0 4,4 4,4 4,4 4,4 0
Loop 0 0 0 0 0 4,4 4,4 4,4 4,4 0
Total 2G spectrum 49,2 44,8 42,8 39,2 40,8 56 58,6 57,4 56,8 37,8
Total spectrum 64,2 59,8 57,8 54,2 55,8 71 73,6 72,4 71,8 57,8
9
On back of the limited availability of spectrum and with only three 3G licenses
available in most circles it was a fierce competition on spectrum which resulted in auction
prices significantly higher than the reserve price set by the authorities. The mobile
operators paid the equivalent of EUR 0.27 up to EUR 4.36 per MHz/pop.
Table 2 Prices paid at the 3G auction in India October 2010
Source: DoT
INDIA –ENGINEERING VALUE
On back of the prices paid at the 3G-auction in 2010, the intense debate about 2G
spectrum and the value of spectrum in India it is motivated to calculate the marginal value
of spectrum for the Indian market. The analysis is explorative as it is based on a number
of assumptions, like the number of cell sites in each service area and the share of
geographical area that networks in different service areas covers. We therefore
incorporate a sensitivity analysis on key parameters.
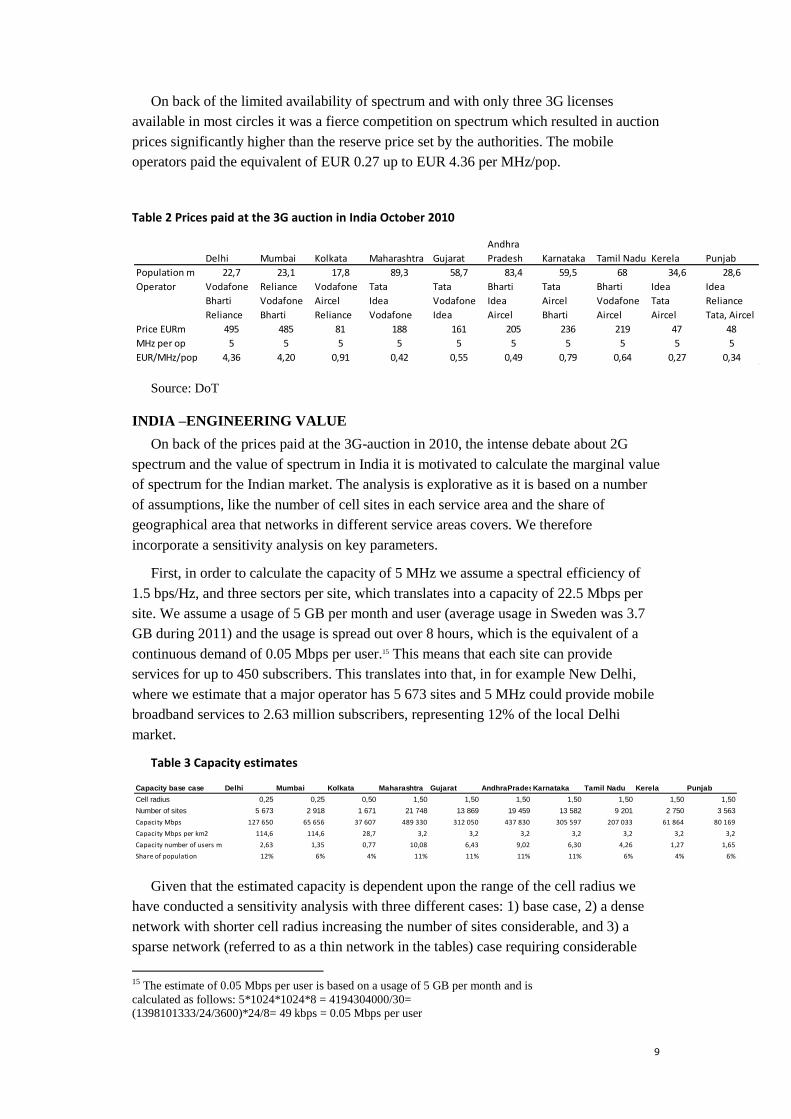
First, in order to calculate the capacity of 5 MHz we assume a spectral efficiency of
1.5 bps/Hz, and three sectors per site, which translates into a capacity of 22.5 Mbps per
site. We assume a usage of 5 GB per month and user (average usage in Sweden was 3.7
GB during 2011) and the usage is spread out over 8 hours, which is the equivalent of a
continuous demand of 0.05 Mbps per user.15 This means that each site can provide
services for up to 450 subscribers. This translates into that, in for example New Delhi,
where we estimate that a major operator has 5 673 sites and 5 MHz could provide mobile
broadband services to 2.63 million subscribers, representing 12% of the local Delhi
market.
Table 3 Capacity estimates
Given that the estimated capacity is dependent upon the range of the cell radius we
have conducted a sensitivity analysis with three different cases: 1) base case, 2) a dense
network with shorter cell radius increasing the number of sites considerable, and 3) a
sparse network (referred to as a thin network in the tables) case requiring considerable
15 The estimate of 0.05 Mbps per user is based on a usage of 5 GB per month and is
calculated as follows: 5*1024*1024*8 = 4194304000/30=
(1398101333/24/3600)*24/8= 49 kbps = 0.05 Mbps per user
Delhi Mumbai Kolkata Maharashtra Gujarat
Andhra
Pradesh Karnataka Tamil Nadu Kerela Punjab
Population m 22,7 23,1 17,8 89,3 58,7 83,4 59,5 68 34,6 28,6
Operator Vodafone Reliance Vodafone Tata Tata Bharti Tata Bharti Idea Idea
Bharti Vodafone Aircel Idea Vodafone Idea Aircel Vodafone Tata Reliance
Reliance Bharti Reliance Vodafone Idea Aircel Bharti Aircel Aircel Tata, Aircel
Price EURm 495 485 81 188 161 205 236 219 47 48
MHz per op 5 5 5 5 5 5 5 5 5 5
EUR/MHz/pop 4,36 4,20 0,91 0,42 0,55 0,49 0,79 0,64 0,27 0,34
Capacity base case Delhi Mumbai Kolkata Maharashtra Gujarat AndhraPradeshKarnataka Tamil Nadu Kerela Punjab
Cell radius 0,25 0,25 0,50 1,50 1,50 1,50 1,50 1,50 1,50 1,50
Number of sites 5 673 2 918 1 671 21 748 13 869 19 459 13 582 9 201 2 750 3 563
Capacity Mbps 127 650 65 656 37 607 489 330 312 050 437 830 305 597 207 033 61 864 80 169
Capacity Mbps per km2 114,6 114,6 28,7 3,2 3,2 3,2 3,2 3,2 3,2 3,2
Capacity number of users m 2,63 1,35 0,77 10,08 6,43 9,02 6,30 4,26 1,27 1,65
Share of population 12% 6% 4% 11% 11% 11% 11% 6% 4% 6%
10
fewer sites. The following table illustrates that the sparse network could provide services
for up to 2% of the Delhi market while the base case could support 12% and the dense
network case could provide services for up to 32% of Delhi market.
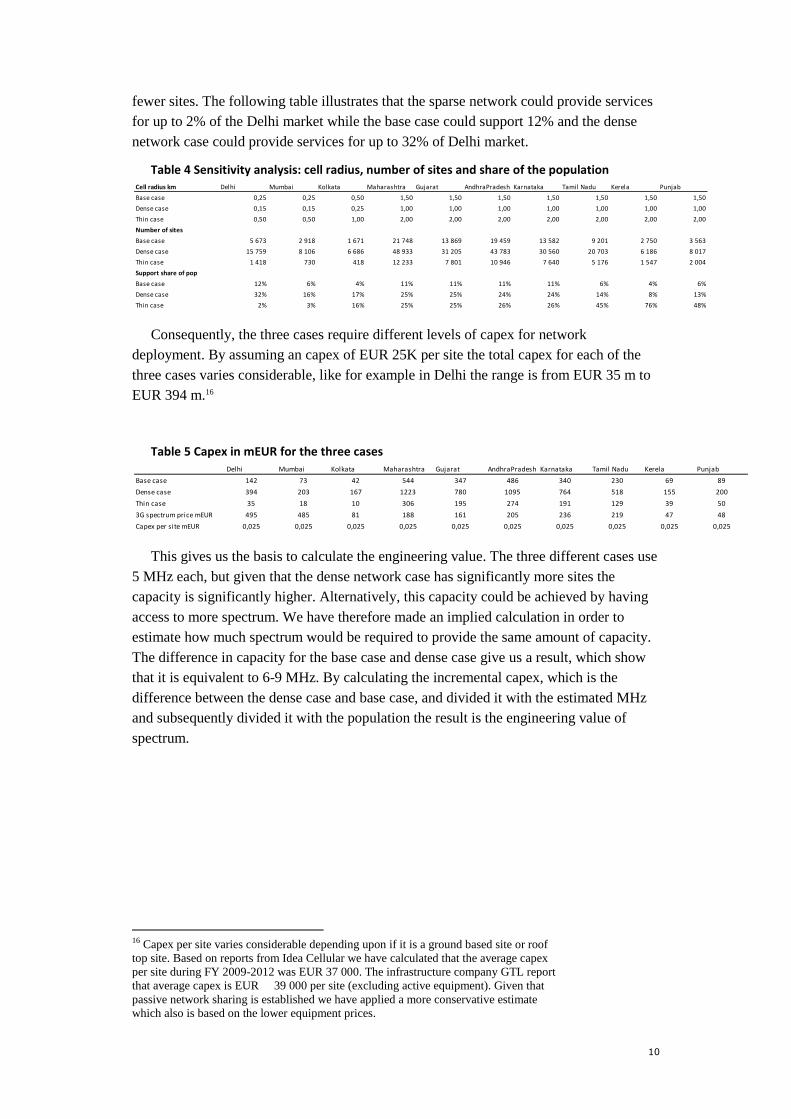
Table 4 Sensitivity analysis: cell radius, number of sites and share of the population
Consequently, the three cases require different levels of capex for network
deployment. By assuming an capex of EUR 25K per site the total capex for each of the
three cases varies considerable, like for example in Delhi the range is from EUR 35 m to
EUR 394 m.16
Table 5 Capex in mEUR for the three cases
This gives us the basis to calculate the engineering value. The three different cases use
5 MHz each, but given that the dense network case has significantly more sites the
capacity is significantly higher. Alternatively, this capacity could be achieved by having
access to more spectrum. We have therefore made an implied calculation in order to
estimate how much spectrum would be required to provide the same amount of capacity.
The difference in capacity for the base case and dense case give us a result, which show
that it is equivalent to 6-9 MHz. By calculating the incremental capex, which is the
difference between the dense case and base case, and divided it with the estimated MHz
and subsequently divided it with the population the result is the engineering value of
spectrum.
16 Capex per site varies considerable depending upon if it is a ground based site or roof
top site. Based on reports from Idea Cellular we have calculated that the average capex
per site during FY 2009-2012 was EUR 37 000. The infrastructure company GTL report
that average capex is EUR 39 000 per site (excluding active equipment). Given that
passive network sharing is established we have applied a more conservative estimate
which also is based on the lower equipment prices.
Cell radius km Delhi Mumbai Kolkata Maharashtra Gujarat AndhraPradesh Karnataka Tamil Nadu Kerela Punjab
Base case 0,25 0,25 0,50 1,50 1,50 1,50 1,50 1,50 1,50 1,50
Dense case 0,15 0,15 0,25 1,00 1,00 1,00 1,00 1,00 1,00 1,00
Thin case 0,50 0,50 1,00 2,00 2,00 2,00 2,00 2,00 2,00 2,00
Number of sites
Base case 5 673 2 918 1 671 21 748 13 869 19 459 13 582 9 201 2 750 3 563
Dense case 15 759 8 106 6 686 48 933 31 205 43 783 30 560 20 703 6 186 8 017
Thin case 1 418 730 418 12 233 7 801 10 946 7 640 5 176 1 547 2 004
Support share of pop
Base case 12% 6% 4% 11% 11% 11% 11% 6% 4% 6%
Dense case 32% 16% 17% 25% 25% 24% 24% 14% 8% 13%
Thin case 2% 3% 16% 25% 25% 26% 26% 45% 76% 48%
Delhi Mumbai Kolkata Maharashtra Gujarat AndhraPradesh Karnataka Tamil Nadu Kerela Punjab
Base case 142 73 42 544 347 486 340 230 69 89
Dense case 394 203 167 1223 780 1095 764 518 155 200
Thin case 35 18 10 306 195 274 191 129 39 50
3G spectrum price mEUR 495 485 81 188 161 205 236 219 47 48
Capex per site mEUR 0,025 0,025 0,025 0,025 0,025 0,025 0,025 0,025 0,025 0,025
11
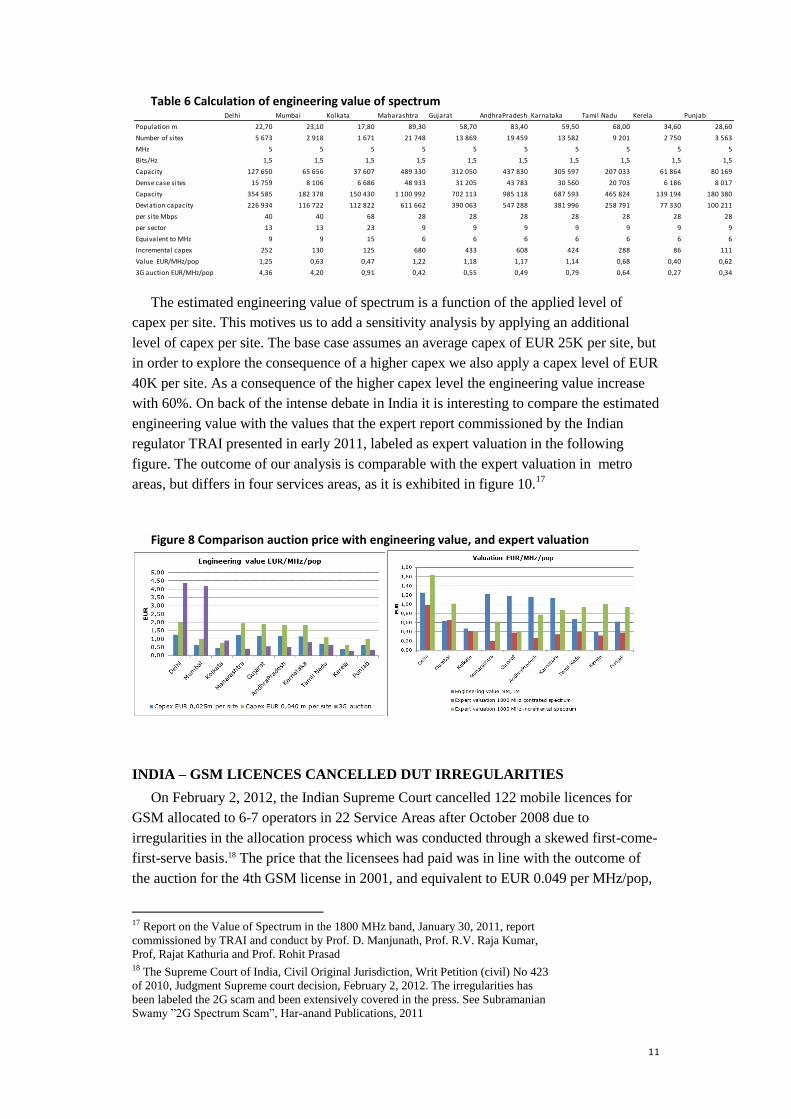
Table 6 Calculation of engineering value of spectrum
The estimated engineering value of spectrum is a function of the applied level of
capex per site. This motives us to add a sensitivity analysis by applying an additional
level of capex per site. The base case assumes an average capex of EUR 25K per site, but
in order to explore the consequence of a higher capex we also apply a capex level of EUR
40K per site. As a consequence of the higher capex level the engineering value increase
with 60%. On back of the intense debate in India it is interesting to compare the estimated
engineering value with the values that the expert report commissioned by the Indian
regulator TRAI presented in early 2011, labeled as expert valuation in the following
figure. The outcome of our analysis is comparable with the expert valuation in metro
areas, but differs in four services areas, as it is exhibited in figure 10.17
Figure 8 Comparison auction price with engineering value, and expert valuation
INDIA – GSM LICENCES CANCELLED DUT IRREGULARITIES
On February 2, 2012, the Indian Supreme Court cancelled 122 mobile licences for
GSM allocated to 6-7 operators in 22 Service Areas after October 2008 due to
irregularities in the allocation process which was conducted through a skewed first-come-
first-serve basis.18 The price that the licensees had paid was in line with the outcome of
the auction for the 4th GSM license in 2001, and equivalent to EUR 0.049 per MHz/pop,
17 Report on the Value of Spectrum in the 1800 MHz band, January 30, 2011, report
commissioned by TRAI and conduct by Prof. D. Manjunath, Prof. R.V. Raja Kumar,
Prof, Rajat Kathuria and Prof. Rohit Prasad 18 The Supreme Court of India, Civil Original Jurisdiction, Writ Petition (civil) No 423
of 2010, Judgment Supreme court decision, February 2, 2012. The irregularities has
been labeled the 2G scam and been extensively covered in the press. See Subramanian
Swamy ”2G Spectrum Scam”, Har-anand Publications, 2011
Delhi Mumbai Kolkata Maharashtra Gujarat AndhraPradesh Karnataka Tamil Nadu Kerela Punjab
Population m 22,70 23,10 17,80 89,30 58,70 83,40 59,50 68,00 34,60 28,60
Number of sites 5 673 2 918 1 671 21 748 13 869 19 459 13 582 9 201 2 750 3 563
MHz 5 5 5 5 5 5 5 5 5 5
Bits/Hz 1,5 1,5 1,5 1,5 1,5 1,5 1,5 1,5 1,5 1,5
Capacity 127 650 65 656 37 607 489 330 312 050 437 830 305 597 207 033 61 864 80 169
Dense case sites 15 759 8 106 6 686 48 933 31 205 43 783 30 560 20 703 6 186 8 017
Capacity 354 585 182 378 150 430 1 100 992 702 113 985 118 687 593 465 824 139 194 180 380
Deviation capacity 226 934 116 722 112 822 611 662 390 063 547 288 381 996 258 791 77 330 100 211
per site Mbps 40 40 68 28 28 28 28 28 28 28
per sector 13 13 23 9 9 9 9 9 9 9
Equivalent to MHz 9 9 15 6 6 6 6 6 6 6
Incremental capex 252 130 125 680 433 608 424 288 86 111
Value EUR/MHz/pop 1,25 0,63 0,47 1,22 1,18 1,17 1,14 0,68 0,40 0,62
3G auction EUR/MHz/pop 4,36 4,20 0,91 0,42 0,55 0,49 0,79 0,64 0,27 0,34
12
comparing to the average EUR 0.44 per MHz/pop that the 3G auction reached in 2010.
The Supreme Court’s decision stated that the spectrum holders could hold the spectrum
for another four months when the spectrum should be re-auctioned. But the process has
been delayed and the auction is due to occur in the latter part of 2012. The
Telecommunication Regulatory Authority (TRAI) was assigned by the Supreme Court to
make recommendations for the auction and present reserve prices, which makes up a
price floor for the spectrum.
TRAI’s view on the value of spectrum is that it “is a function of the business potential
and profitability outlook for the services that are to be offered using the spectrum. For
determining the true economic value of spectrum through auction, fixing reserve price for
various spectrum bands closer to their fair market value is crucial.”19 TRAI presented
reserve prices in April 2012. TRAI determined that the reserve price for spectrum in the
1800 MHz band should be a factor 0.8 of the price reached in the 3G spectrum auction in
2010. But as the number of base stations required for the coverage of the same area is
lower in UMTS 1800 compared to UMTS 2100 the price should, according to TRAI, be
adjusted with 1.2. Given that UMTS 2100 compared to UMTS 900 require 2.1 more sites
to cover the same area compared to UMTS 2100 the reserve price in the 800 and 900
MHz bands should, according to TRAI, be at least 2 times that of the 1800 MHz band.
And the reserve price for the 700 MHz band should, according to TRAI, be around 4
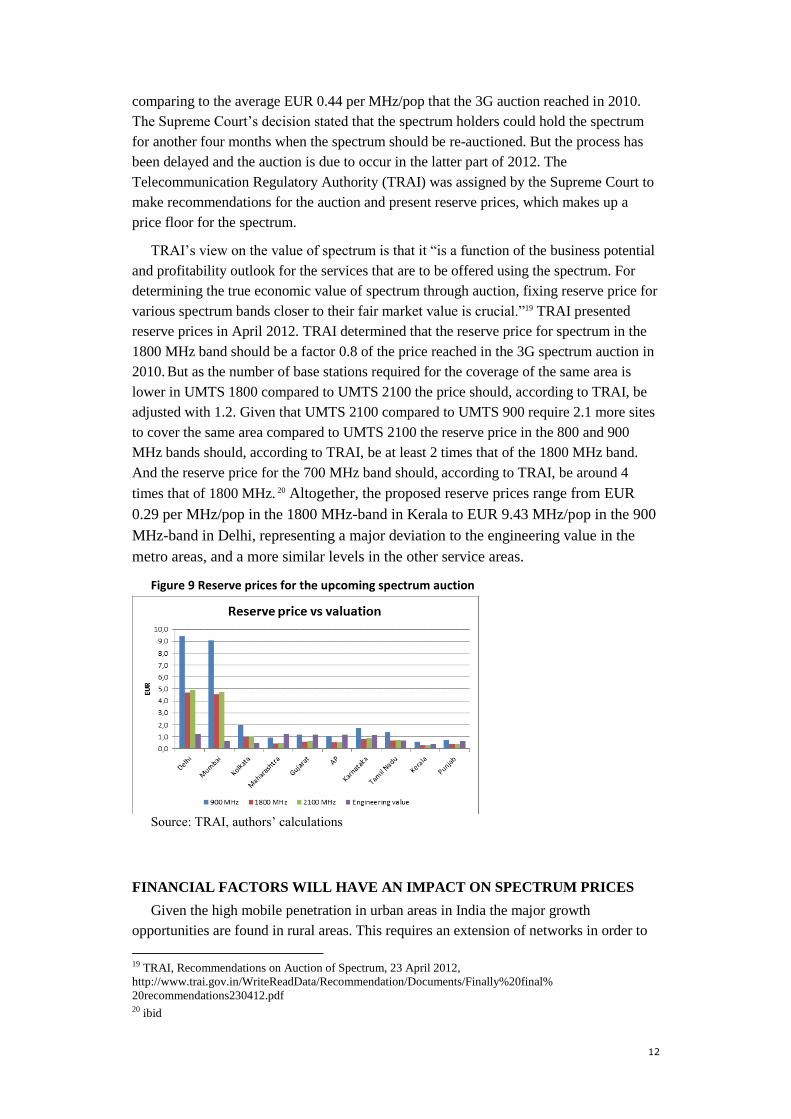
times that of 1800 MHz. 20 Altogether, the proposed reserve prices range from EUR
0.29 per MHz/pop in the 1800 MHz-band in Kerala to EUR 9.43 MHz/pop in the 900
MHz-band in Delhi, representing a major deviation to the engineering value in the
metro areas, and a more similar levels in the other service areas.
Figure 9 Reserve prices for the upcoming spectrum auction
Source: TRAI, authors’ calculations
FINANCIAL FACTORS WILL HAVE AN IMPACT ON SPECTRUM PRICES
Given the high mobile penetration in urban areas in India the major growth
opportunities are found in rural areas. This requires an extension of networks in order to
19 TRAI, Recommendations on Auction of Spectrum, 23 April 2012,
http://www.trai.gov.in/WriteReadData/Recommendation/Documents/Finally%20final%
20recommendations230412.pdf 20 ibid
13
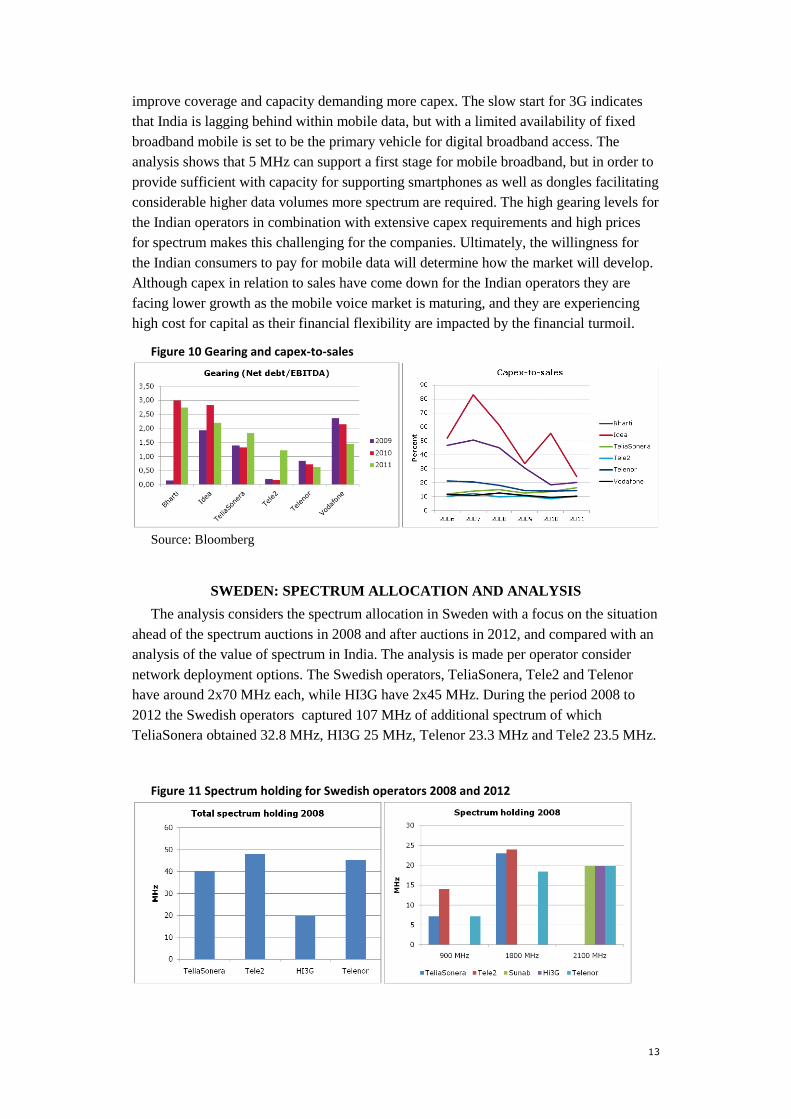
improve coverage and capacity demanding more capex. The slow start for 3G indicates
that India is lagging behind within mobile data, but with a limited availability of fixed
broadband mobile is set to be the primary vehicle for digital broadband access. The
analysis shows that 5 MHz can support a first stage for mobile broadband, but in order to
provide sufficient with capacity for supporting smartphones as well as dongles facilitating
considerable higher data volumes more spectrum are required. The high gearing levels for
the Indian operators in combination with extensive capex requirements and high prices
for spectrum makes this challenging for the companies. Ultimately, the willingness for
the Indian consumers to pay for mobile data will determine how the market will develop.
Although capex in relation to sales have come down for the Indian operators they are
facing lower growth as the mobile voice market is maturing, and they are experiencing
high cost for capital as their financial flexibility are impacted by the financial turmoil.
Figure 10 Gearing and capex-to-sales
Source: Bloomberg
SWEDEN: SPECTRUM ALLOCATION AND ANALYSIS
The analysis considers the spectrum allocation in Sweden with a focus on the situation
ahead of the spectrum auctions in 2008 and after auctions in 2012, and compared with an
analysis of the value of spectrum in India. The analysis is made per operator consider
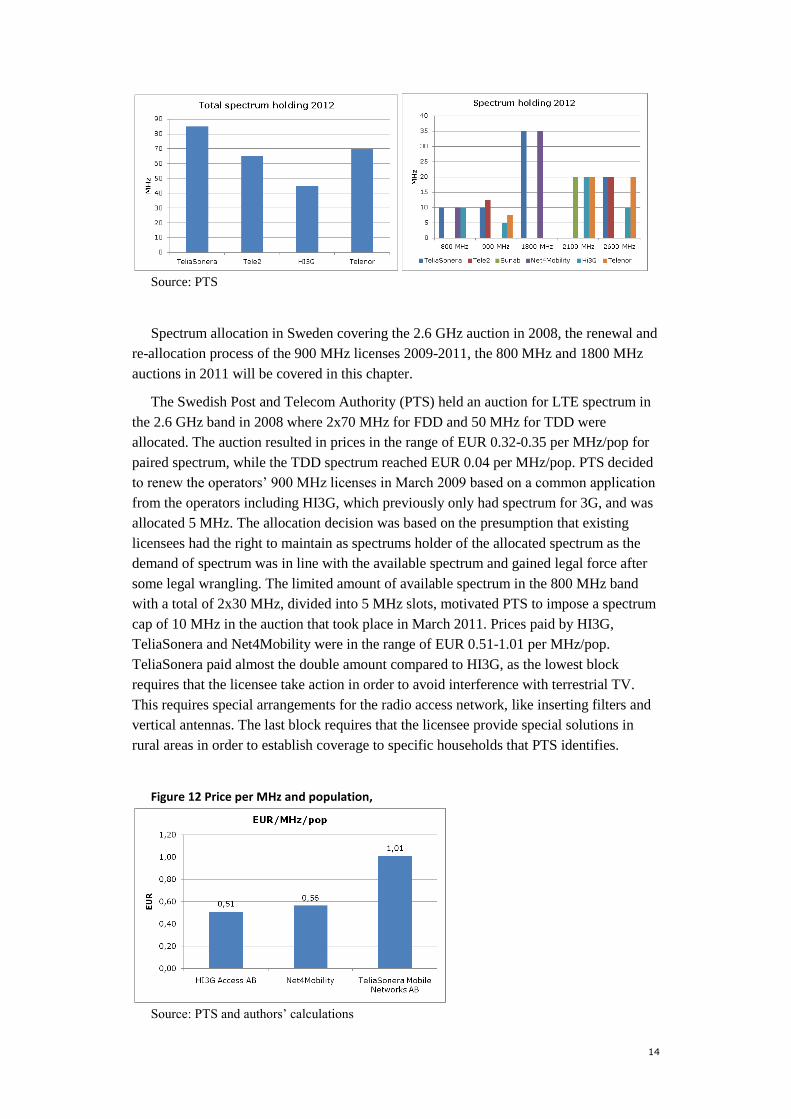
network deployment options. The Swedish operators, TeliaSonera, Tele2 and Telenor
have around 2x70 MHz each, while HI3G have 2x45 MHz. During the period 2008 to
2012 the Swedish operators captured 107 MHz of additional spectrum of which
TeliaSonera obtained 32.8 MHz, HI3G 25 MHz, Telenor 23.3 MHz and Tele2 23.5 MHz.
Figure 11 Spectrum holding for Swedish operators 2008 and 2012
14
Source: PTS
Spectrum allocation in Sweden covering the 2.6 GHz auction in 2008, the renewal and
re-allocation process of the 900 MHz licenses 2009-2011, the 800 MHz and 1800 MHz
auctions in 2011 will be covered in this chapter.
The Swedish Post and Telecom Authority (PTS) held an auction for LTE spectrum in
the 2.6 GHz band in 2008 where 2x70 MHz for FDD and 50 MHz for TDD were
allocated. The auction resulted in prices in the range of EUR 0.32-0.35 per MHz/pop for
paired spectrum, while the TDD spectrum reached EUR 0.04 per MHz/pop. PTS decided
to renew the operators’ 900 MHz licenses in March 2009 based on a common application
from the operators including HI3G, which previously only had spectrum for 3G, and was
allocated 5 MHz. The allocation decision was based on the presumption that existing
licensees had the right to maintain as spectrums holder of the allocated spectrum as the
demand of spectrum was in line with the available spectrum and gained legal force after
some legal wrangling. The limited amount of available spectrum in the 800 MHz band
with a total of 2x30 MHz, divided into 5 MHz slots, motivated PTS to impose a spectrum
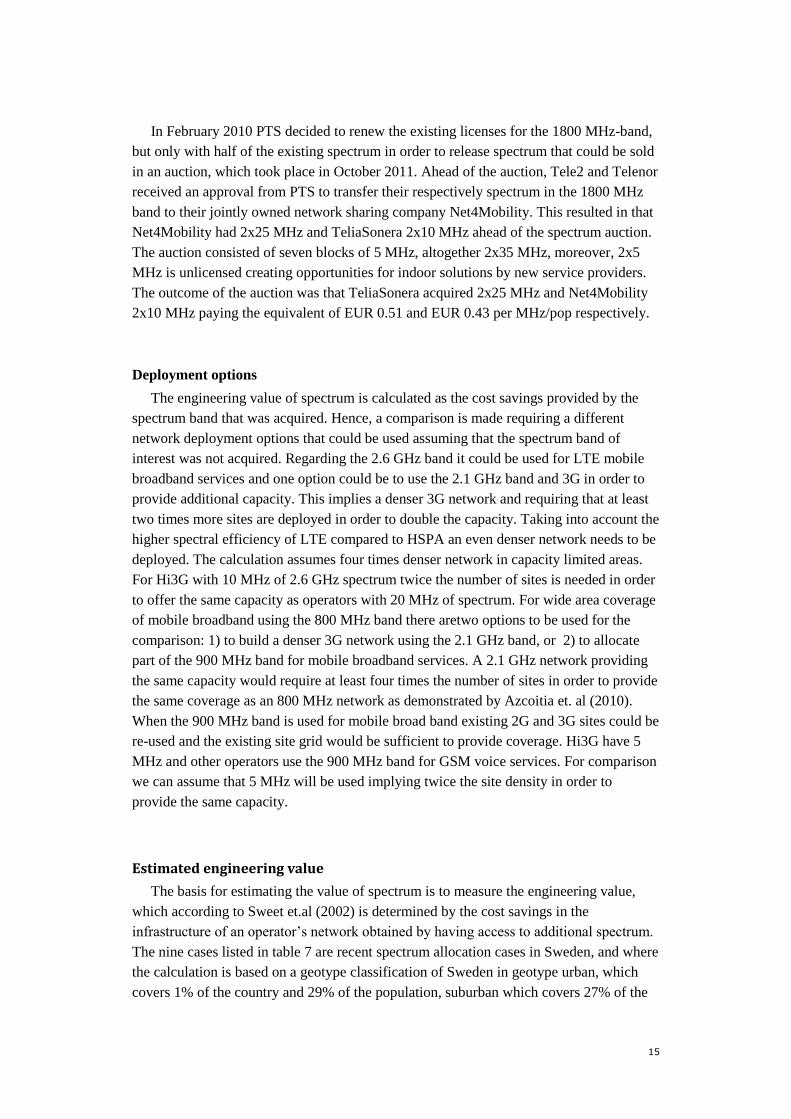
cap of 10 MHz in the auction that took place in March 2011. Prices paid by HI3G,
TeliaSonera and Net4Mobility were in the range of EUR 0.51-1.01 per MHz/pop.
TeliaSonera paid almost the double amount compared to HI3G, as the lowest block
requires that the licensee take action in order to avoid interference with terrestrial TV.
This requires special arrangements for the radio access network, like inserting filters and
vertical antennas. The last block requires that the licensee provide special solutions in
rural areas in order to establish coverage to specific households that PTS identifies.
Figure 12 Price per MHz and population,
Source: PTS and authors’ calculations
15
In February 2010 PTS decided to renew the existing licenses for the 1800 MHz-band,
but only with half of the existing spectrum in order to release spectrum that could be sold
in an auction, which took place in October 2011. Ahead of the auction, Tele2 and Telenor
received an approval from PTS to transfer their respectively spectrum in the 1800 MHz
band to their jointly owned network sharing company Net4Mobility. This resulted in that
Net4Mobility had 2x25 MHz and TeliaSonera 2x10 MHz ahead of the spectrum auction.
The auction consisted of seven blocks of 5 MHz, altogether 2x35 MHz, moreover, 2x5
MHz is unlicensed creating opportunities for indoor solutions by new service providers.
The outcome of the auction was that TeliaSonera acquired 2x25 MHz and Net4Mobility
2x10 MHz paying the equivalent of EUR 0.51 and EUR 0.43 per MHz/pop respectively.
Deployment options
The engineering value of spectrum is calculated as the cost savings provided by the
spectrum band that was acquired. Hence, a comparison is made requiring a different
network deployment options that could be used assuming that the spectrum band of
interest was not acquired. Regarding the 2.6 GHz band it could be used for LTE mobile
broadband services and one option could be to use the 2.1 GHz band and 3G in order to
provide additional capacity. This implies a denser 3G network and requiring that at least
two times more sites are deployed in order to double the capacity. Taking into account the
higher spectral efficiency of LTE compared to HSPA an even denser network needs to be
deployed. The calculation assumes four times denser network in capacity limited areas.
For Hi3G with 10 MHz of 2.6 GHz spectrum twice the number of sites is needed in order
to offer the same capacity as operators with 20 MHz of spectrum. For wide area coverage
of mobile broadband using the 800 MHz band there aretwo options to be used for the
comparison: 1) to build a denser 3G network using the 2.1 GHz band, or 2) to allocate
part of the 900 MHz band for mobile broadband services. A 2.1 GHz network providing
the same capacity would require at least four times the number of sites in order to provide
the same coverage as an 800 MHz network as demonstrated by Azcoitia et. al (2010).
When the 900 MHz band is used for mobile broad band existing 2G and 3G sites could be
re-used and the existing site grid would be sufficient to provide coverage. Hi3G have 5
MHz and other operators use the 900 MHz band for GSM voice services. For comparison
we can assume that 5 MHz will be used implying twice the site density in order to
provide the same capacity.
Estimated engineering value
The basis for estimating the value of spectrum is to measure the engineering value,
which according to Sweet et.al (2002) is determined by the cost savings in the
infrastructure of an operator’s network obtained by having access to additional spectrum.
The nine cases listed in table 7 are recent spectrum allocation cases in Sweden, and where
the calculation is based on a geotype classification of Sweden in geotype urban, which
covers 1% of the country and 29% of the population, suburban which covers 27% of the
16
country and 59% of the population and rural which cover 73% of the geographical area
and 12% of the population.
Table 7 Estimation of engineering value for nine Swedish cases
Source: PTS, authors’ calculations
The estimated capex levels for sites in the different geotypes urban, suburban and rural
are EUR 0.04m, EUR 0.089 and EUR 0.11m respectively. The cell radius is from 0.6 km
up to 12 km depending upon frequency band and geotype. The spectral efficiency is
assumed to be 1 bps/Hz for HSPA and 1.5 bits/Hz for LTE.21 The estimated engineering
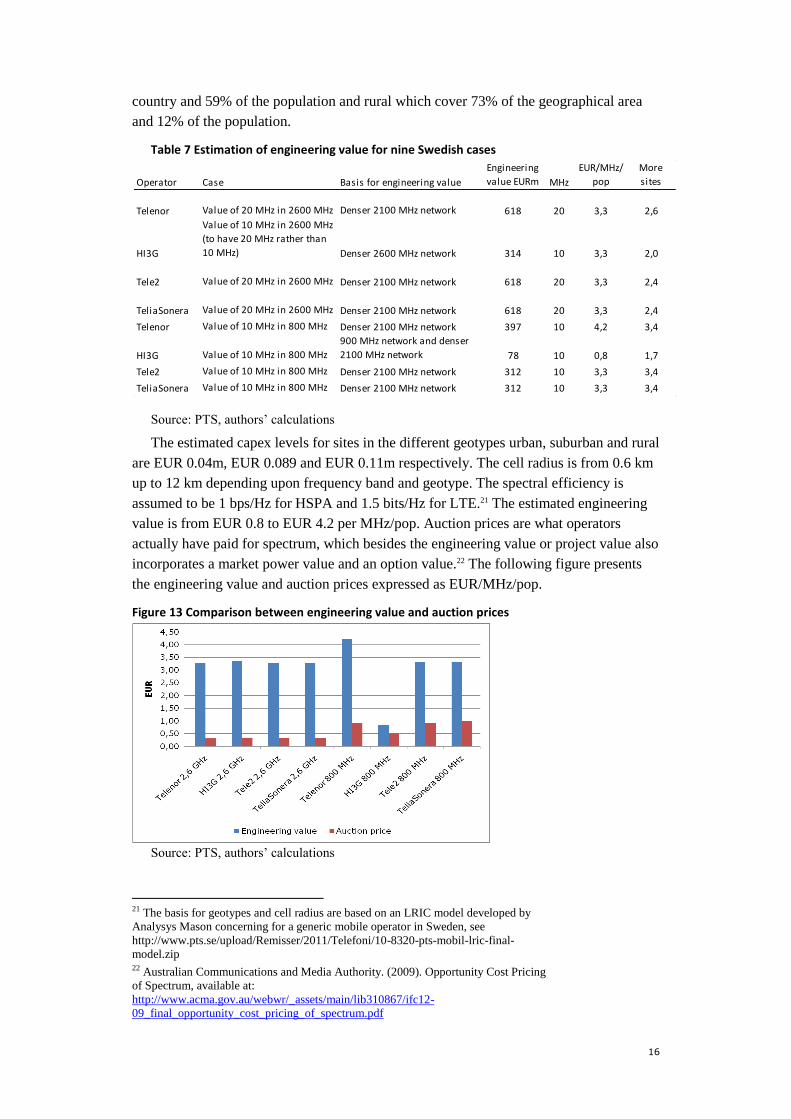
value is from EUR 0.8 to EUR 4.2 per MHz/pop. Auction prices are what operators
actually have paid for spectrum, which besides the engineering value or project value also
incorporates a market power value and an option value.22 The following figure presents
the engineering value and auction prices expressed as EUR/MHz/pop.
Figure 13 Comparison between engineering value and auction prices
Source: PTS, authors’ calculations
21 The basis for geotypes and cell radius are based on an LRIC model developed by
Analysys Mason concerning for a generic mobile operator in Sweden, see
http://www.pts.se/upload/Remisser/2011/Telefoni/10-8320-pts-mobil-lric-final-
model.zip 22 Australian Communications and Media Authority. (2009). Opportunity Cost Pricing
of Spectrum, available at:
http://www.acma.gov.au/webwr/_assets/main/lib310867/ifc12-
09_final_opportunity_cost_pricing_of_spectrum.pdf
Operator Case Basis for engineering value
Engineering
value EURm MHz
EUR/MHz/
pop
More
sites
Telenor Value of 20 MHz in 2600 MHz Denser 2100 MHz network 618 20 3,3 2,6
HI3G
Value of 10 MHz in 2600 MHz
(to have 20 MHz rather than
10 MHz) Denser 2600 MHz network 314 10 3,3 2,0
Tele2 Value of 20 MHz in 2600 MHz Denser 2100 MHz network 618 20 3,3 2,4
TeliaSonera Value of 20 MHz in 2600 MHz Denser 2100 MHz network 618 20 3,3 2,4
Telenor Value of 10 MHz in 800 MHz Denser 2100 MHz network 397 10 4,2 3,4
HI3G Value of 10 MHz in 800 MHz
900 MHz network and denser
2100 MHz network 78 10 0,8 1,7
Tele2 Value of 10 MHz in 800 MHz Denser 2100 MHz network 312 10 3,3 3,4
TeliaSonera Value of 10 MHz in 800 MHz Denser 2100 MHz network 312 10 3,3 3,4
17
In order to explain the deviation between the engineering value and auction prices,
which is a factor from 1.5 up to 10, three arguments could be highlighted: 1) The value of
spectrum that are derived from spectrum auctions depends, according to Beard et al.
(2011), critically on allocation choices, like for example rules decided by the regulator to
exclude incumbents or formal spectrum caps. This implies that auction prices only partly
reflect the underlying value of spectrum. 2) The transition from the regime of control and
command to spectrum trading has only partly taken place. This limits competition on
spectrum and thereby prices on spectrum auctions. 3) Operators’ valuation of spectrum
and their willingness to pay for spectrum are influenced by network strategy where
network sharing and potential spectrum sharing contribute to hold down auction prices on
spectrum. And research conducted by Bulow et al (2009) has found that the levels of the
allocated budgets for auction teams appointed by operators predominately influence the
outcome of the final price. Altogether, the analysis of the engineering value gives an
input to the valuation of the marginal value of spectrum. The deviation between auction
prices, which could be seen as the level of operators willingness to pay for spectrum, and
the estimated engineering value indicate that the auction prices for the Swedish case does
not truly reflect the marginal value of spectrum as the calculation of the engineering value
of spectrum indicate.
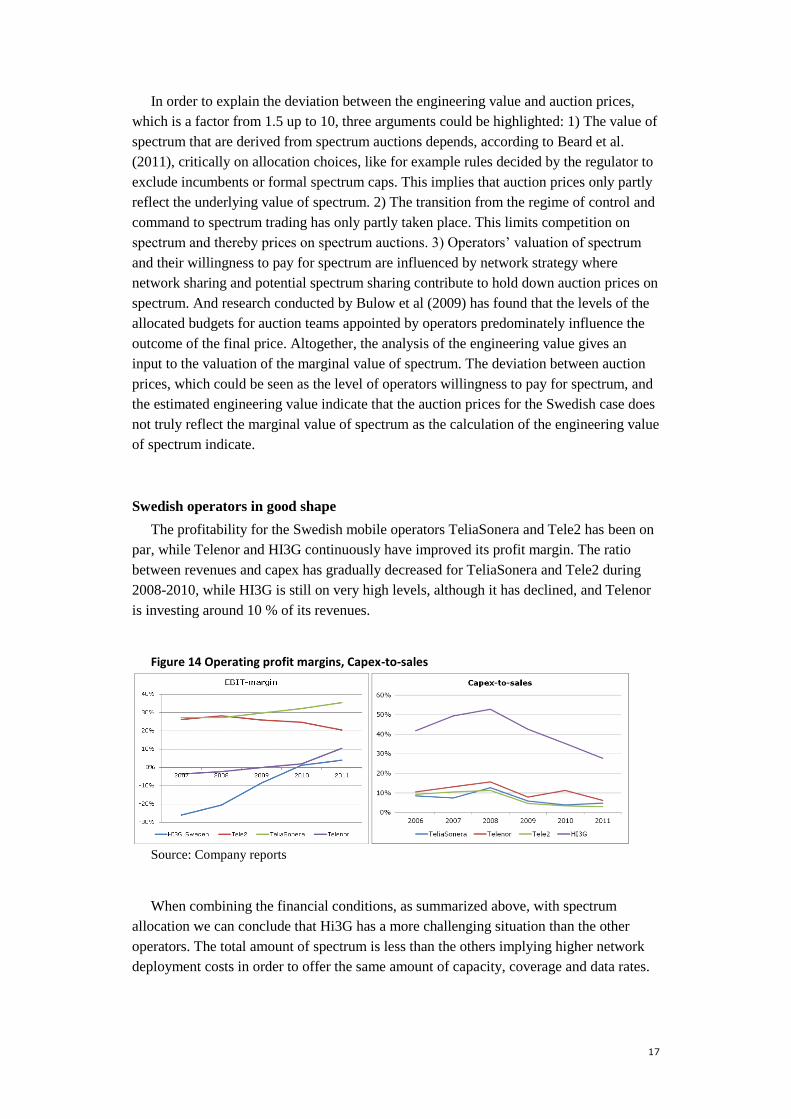
Swedish operators in good shape
The profitability for the Swedish mobile operators TeliaSonera and Tele2 has been on
par, while Telenor and HI3G continuously have improved its profit margin. The ratio
between revenues and capex has gradually decreased for TeliaSonera and Tele2 during
2008-2010, while HI3G is still on very high levels, although it has declined, and Telenor
is investing around 10 % of its revenues.
Figure 14 Operating profit margins, Capex-to-sales
Source: Company reports
When combining the financial conditions, as summarized above, with spectrum
allocation we can conclude that Hi3G has a more challenging situation than the other
operators. The total amount of spectrum is less than the others implying higher network
deployment costs in order to offer the same amount of capacity, coverage and data rates.
18
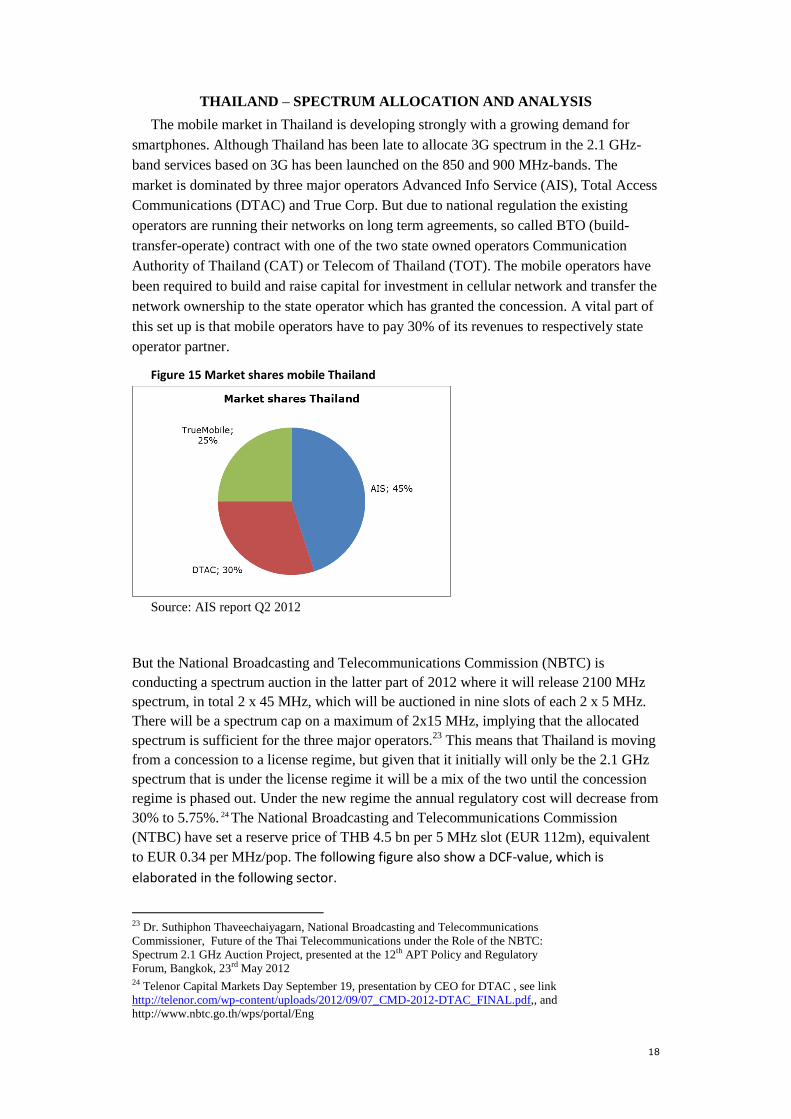
THAILAND – SPECTRUM ALLOCATION AND ANALYSIS
The mobile market in Thailand is developing strongly with a growing demand for
smartphones. Although Thailand has been late to allocate 3G spectrum in the 2.1 GHz-
band services based on 3G has been launched on the 850 and 900 MHz-bands. The
market is dominated by three major operators Advanced Info Service (AIS), Total Access
Communications (DTAC) and True Corp. But due to national regulation the existing
operators are running their networks on long term agreements, so called BTO (build-
transfer-operate) contract with one of the two state owned operators Communication
Authority of Thailand (CAT) or Telecom of Thailand (TOT). The mobile operators have
been required to build and raise capital for investment in cellular network and transfer the
network ownership to the state operator which has granted the concession. A vital part of
this set up is that mobile operators have to pay 30% of its revenues to respectively state
operator partner.
Figure 15 Market shares mobile Thailand
Source: AIS report Q2 2012
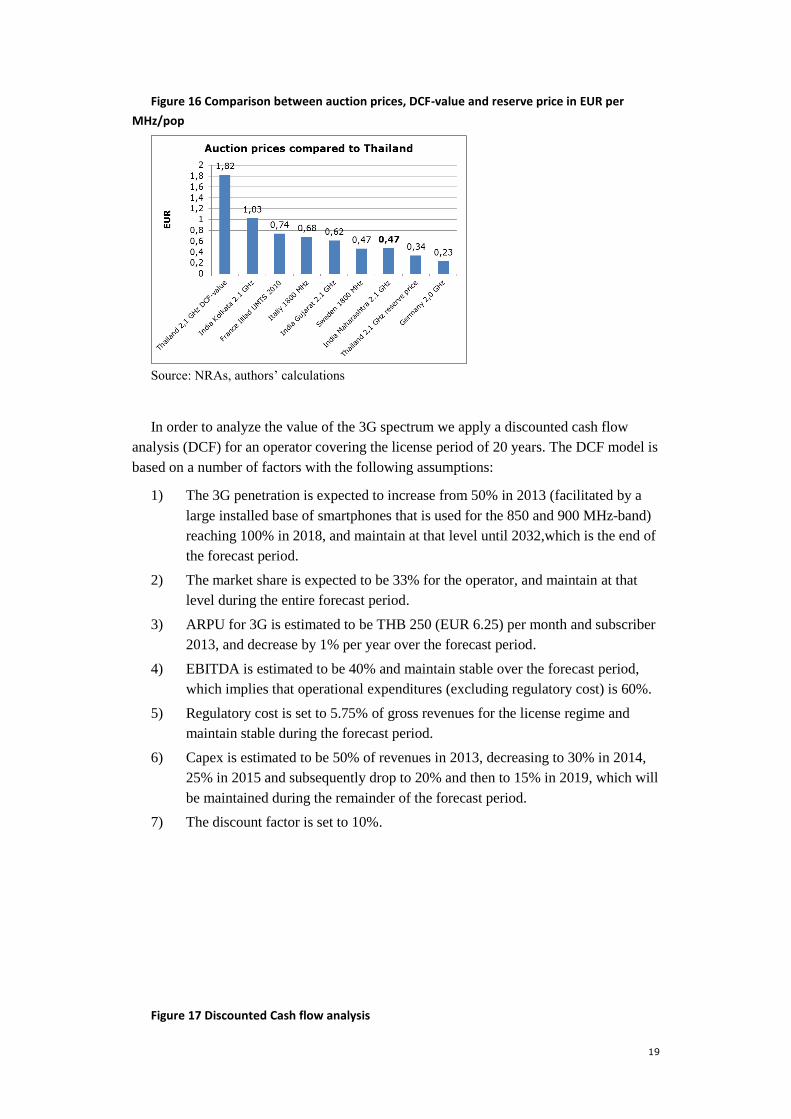
But the National Broadcasting and Telecommunications Commission (NBTC) is
conducting a spectrum auction in the latter part of 2012 where it will release 2100 MHz
spectrum, in total 2 x 45 MHz, which will be auctioned in nine slots of each 2 x 5 MHz.
There will be a spectrum cap on a maximum of 2x15 MHz, implying that the allocated
spectrum is sufficient for the three major operators.23
This means that Thailand is moving
from a concession to a license regime, but given that it initially will only be the 2.1 GHz
spectrum that is under the license regime it will be a mix of the two until the concession
regime is phased out. Under the new regime the annual regulatory cost will decrease from
30% to 5.75%. 24 The National Broadcasting and Telecommunications Commission
(NTBC) have set a reserve price of THB 4.5 bn per 5 MHz slot (EUR 112m), equivalent
to EUR 0.34 per MHz/pop. The following figure also show a DCF-value, which is
elaborated in the following sector.
23 Dr. Suthiphon Thaveechaiyagarn, National Broadcasting and Telecommunications
Commissioner, Future of the Thai Telecommunications under the Role of the NBTC:
Spectrum 2.1 GHz Auction Project, presented at the 12th APT Policy and Regulatory
Forum, Bangkok, 23rd May 2012 24 Telenor Capital Markets Day September 19, presentation by CEO for DTAC , see link
http://telenor.com/wp-content/uploads/2012/09/07_CMD-2012-DTAC_FINAL.pdf,, and
http://www.nbtc.go.th/wps/portal/Eng
19
Figure 16 Comparison between auction prices, DCF-value and reserve price in EUR per
MHz/pop
Source: NRAs, authors’ calculations
In order to analyze the value of the 3G spectrum we apply a discounted cash flow
analysis (DCF) for an operator covering the license period of 20 years. The DCF model is
based on a number of factors with the following assumptions:
1) The 3G penetration is expected to increase from 50% in 2013 (facilitated by a
large installed base of smartphones that is used for the 850 and 900 MHz-band)
reaching 100% in 2018, and maintain at that level until 2032,which is the end of
the forecast period.
2) The market share is expected to be 33% for the operator, and maintain at that
level during the entire forecast period.
3) ARPU for 3G is estimated to be THB 250 (EUR 6.25) per month and subscriber
2013, and decrease by 1% per year over the forecast period.
4) EBITDA is estimated to be 40% and maintain stable over the forecast period,
which implies that operational expenditures (excluding regulatory cost) is 60%.
5) Regulatory cost is set to 5.75% of gross revenues for the license regime and
maintain stable during the forecast period.
6) Capex is estimated to be 50% of revenues in 2013, decreasing to 30% in 2014,
25% in 2015 and subsequently drop to 20% and then to 15% in 2019, which will
be maintained during the remainder of the forecast period.
7) The discount factor is set to 10%.
Figure 17 Discounted Cash flow analysis
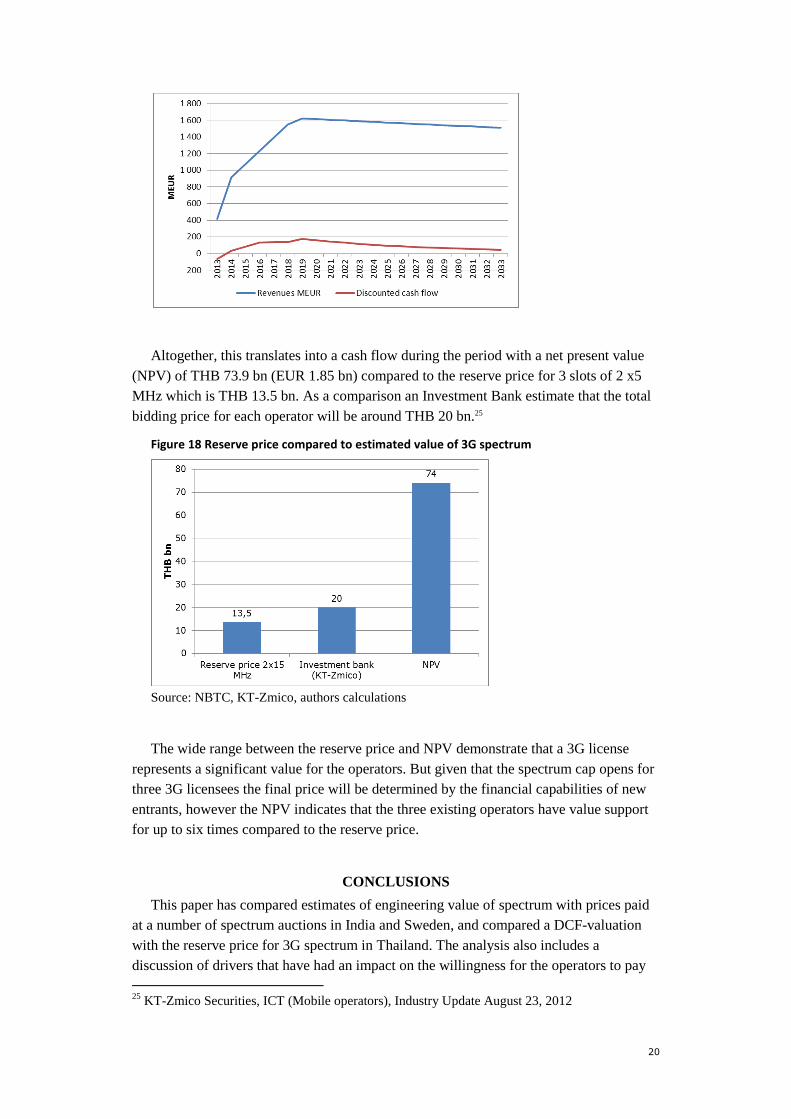
20
Altogether, this translates into a cash flow during the period with a net present value
(NPV) of THB 73.9 bn (EUR 1.85 bn) compared to the reserve price for 3 slots of 2 x5
MHz which is THB 13.5 bn. As a comparison an Investment Bank estimate that the total
bidding price for each operator will be around THB 20 bn.25
Figure 18 Reserve price compared to estimated value of 3G spectrum
Source: NBTC, KT-Zmico, authors calculations
The wide range between the reserve price and NPV demonstrate that a 3G license
represents a significant value for the operators. But given that the spectrum cap opens for
three 3G licensees the final price will be determined by the financial capabilities of new
entrants, however the NPV indicates that the three existing operators have value support
for up to six times compared to the reserve price.
CONCLUSIONS
This paper has compared estimates of engineering value of spectrum with prices paid
at a number of spectrum auctions in India and Sweden, and compared a DCF-valuation
with the reserve price for 3G spectrum in Thailand. The analysis also includes a
discussion of drivers that have had an impact on the willingness for the operators to pay
25
KT-Zmico Securities, ICT (Mobile operators), Industry Update August 23, 2012
21
for spectrum. The paper makes the assumption that auction prices are an expression for
what operators are prepared to pay for spectrum. But given that the engineering value of
spectrum predominately is higher than prices paid at auctions it could be seen as there is a
valuation gap. However, auction prices are determined by the competition on the scarce
resource and how much competition is prepared to pay for spectrum. The analysis has
demonstrated that the production cost is impacted by how much spectrum an operator has
access to and given that HSPA is not facilitating larger carriers than 5 MHz spectrum has
not yet played the key role to differentiate services that operators are marketing. This
implies that the strategic importance of spectrum has not yet made a fundamental impact
on the market. However, the valuation of spectrum is determined by where it is located in
the spectrum band, whether it is possible to block other operators from aggregating
adjacent bands. The analysis has underscored that radio spectrum is a vital asset and
resource for mobile network operators and with more spectrum, i.e. wider bandwidth
operators can offer higher capacity and data rates. This implies that spectrum will be
instrumental in the competitive positioning when LTE will be introduced. Operators
strive to have as much spectrum as its competitors as less spectrum means that it has to
deploy more sites in order to provide the same capacity and that only lower data rates can
be provided. The analysis has shown that the fierce competition on spectrum in India has
pushed up prices, a development which will be further underscored when the diffusion of
smart phones will take-off.
Concluding, the paper has shown the significant role spectrum is playing on the
mobile broadband market, and its impact on the level of capital investments made by
operators. The significance of spectrum will be reinforced with the introduction of LTE
Advanced which will facilitate carrier aggregation making spectrum to an even more
important factor for the competition and the strategic positioning of operators. Ultimately
regulators have to release more spectrum in order to increase the availability for operators
and making it possible for mobile communication to play a key role in achieving the
broadband targets.
Acknowledgement: The research has been conducted with financial support provided
by wireless@kth.
22
REFERENCES
Azcoitia, S.A., Fernandez, M.A.M.,Verdura, L.M.G. (2010). Using bottom-up LRIC
models to calculate radio spectrum value for mobile operators. 9th Conference on
Telecommunications Internet and Media Techno Economics (CTTE).
Australian Communications and Media Authority. (2009). Opportunity Cost Pricing of
Spectrum. Public consultation on administrative pricing for spectrum based on
opportunity cost. Available at
http://www.acma.gov.au/webwr/_assets/main/lib310867/ifc12-
09_final_opportunity_cost_pricing_of_spectrum.pdf
Bulow, L., Levin, J., Milgrom, P. (2009). Winning Play in Spectrum Auctions, Working
Paper 14765, National Bureau of Economic Research. Available at
http://www.nber.org/papers/w14765
Doyle, C. (2004). The Economics of Spectrum Pricing. Warwick Business School,
January.
http://www.itu.int/osg/spu/stn/spectrum/spectrum_resources/spectrum_reform/Doyle_UR
SI.pdf
European Commission, (2010). Communication from the Commission to the European
Parliament, the Council, the European Economic and Social Committee, and the
Committee of the Regions. A Digital Agenda for Europe, 19.05 2010. Com (2010) 245
Government of India (2011). Draft National Telecom Policy 2011, October
Johansson, K. (2007). Cost Effective Deployment Strategies for Heterogeneous Wireless
Networks. PhD Dissertation, Royal Institute of Technology, Stockholm.
Manjunath, D., Kumar Raja, R.V., Kathuria, R., Prasad, R. (2011). Report on the 2010
Value of Spectrum in the 1800 MHz band, January 30. Commissioned by the Telecom
Regulatory Authority of India (TRAI)
Markendahl, J. (2011). Mobile Network Operators and Cooperation - A Tele-economic
study of infrastructure sharing and mobile payments services. PhD Dissertation, Royal
Institute of Technology, Stockholm. Available at
http://www.impgroup.org/dissertations.php
Marks, P., Pearson, K., Williamson, B., Hansell, P., Burns, J. (2009). Estimating the
commercial trading value of spectrum. A Ofcom report by Plum Consulting. Available at
http://www.plumconsulting.co.uk/pdfs/Plum_July09_Commercial_trading_value_of_spe
ctrum.pdf
Marks P., Viehoff, I., Saadat, U., Webb. W. (1996). Study into the use of spectrum
pricing.
Appendices 1 and 2: Case Studies, Report prepared by NERA and Smith for the
Radiocommunications Agency. Available at:
http://www.ofcom.org.uk/static/archive/ra/topics/spectrumprice/documents/smith/smith1.
htm
Mölleryd, B.G., Markendahl, J., Mäkitalo, Ö. (2010). Spectrum valuation derived from
network deployment and strategic positioning with different levels of spectrum in 800
MHz. In Proceedings of 8th Biennial and Silver Anniversary ITS Conference, Tokyo,
June.
Mölleryd, B.G., Markendahl, J., Mäkitalo, Ö., Werding, J. (2010). Mobile broadband
expansion calls for more spectrum or base stations - analysis of value of spectrum and the
role of spectrum aggregation. in Proceedings of 21st European Regional ITS Conf,
Copenhagen, Sept.

23
Mölleryd, B.G., Markendahl, J. (2011). Valuation of spectrum for mobile broadband
services – Engineering value versus willingness to pay. Presented at 22nd
European
Regional ITS Conference Budapest, 18-21 September. Available at:
http://www.econstor.eu/bitstream/10419/52146/1/672544792.pdf
Mölleryd, B.G., Markendahl, J. (2012). Valuation of spectrum for mobile broadband
services – The Case of Sweden and India, Presented at the Regional ITS India Conference
New Delhi Feb 22-24, 2012
Supreme Court of India. (2012) Civil Original Jurisdiction, Writ Petition (civil) No 423
of 2010, Judgment Supreme court decision, February 2, 2012.
Swamy. S. (2011). 2G Spectrum Scam. Har-anand Publications
Sweet, R.I., Viehoff, D., Linardatosc, N., Kalouptsidis. C. (2002). Marginal value-based
pricing of additional spectrum assigned to cellular telephony operators. Information
Economics and Policy 14:3, Pages 371-384.
Thaveechaiyagarn, Suthiphon, National Broadcasting and Telecommunications
Commissioner, Future of the Thai Telecommunications under the Role of the NBTC:
Spectrum 2.1 GHz Auction Project, presented at the 12th APT Policy and Regulatory
Forum, Bangkok, 23rd
May 2012
TRAI, Recommendations on Auction of Spectrum, 23 April 2012
Zander, J. (1997). On the cost structure of Future Wireless networks. Proceedings of
IEEE VTC ’97, Phoenix, AZ, May 5-7.
![Ioana DĂRĂBAN (TIMIȘ)...rem 4.8, Theorem 4.9, Examples 6.8-6.10, Example 6.11, Example 6.12, Definition 7.22 and Theorem 7.12. Most of them were published in [158] (Timi, I., On](https://static.fdokument.com/doc/165x107/6095202dd89f566a9a15615e/ioana-drban-timi-rem-48-theorem-49-examples-68-610-example-611.jpg)