
Light Addressable Gold Electrodes · Oberflächendefekte der QDs führen zu langlebigen...
133
Light Addressable Gold Electrodes Dissertation zur Erlangung des Doktorgrades der Naturwissenschaften (Dr. rer. nat.) dem Fachbereich Physik der Philipps-Universität Marburg vorgelegt von Waqas Khalid aus Pakistan Marburg/Lahn, 2011
Transcript of Light Addressable Gold Electrodes · Oberflächendefekte der QDs führen zu langlebigen...
Light Addressable Gold Electrodes
Dissertation
zur
Erlangung des Doktorgrades
der Naturwissenschaften
(Dr. rer. nat.)
dem
Fachbereich Physik
der Philipps-Universität Marburg
vorgelegt von
Waqas Khalid
aus
Pakistan
Marburg/Lahn, 2011

Vom Fachbereich Physik der Philipps-Universität
Als Dissertation angenommen am
Erstgutachter: Prof. Dr. Wolfgang J. Parak
Zweitgutachter: Prof. Dr. Gregor Witte
Tag der mündlichen Prüfung:
i
Zusammenfassung Das Ziel dieser Dissertation war die Herstellung von Licht unterstützten potentiometrischen Sensoren (engl. Light Amplified Potentiometric sensors, LAPS) mit Halbleiter Nanopartikeln (Quantenpunkte) anstelle einer kontinuierlichen Halbleiterschicht. Quantenpunkte (engl. Quantum Dots, QDs) eignen sich hierfür besonders aufgrund ihrer überragenden fluoreszierenden, elektrischen und katalytischen Eigenschaften. Im Gegensatz zu Sensoren mit einer kontinuierlichen Halbleiterschicht sind diese Sensoren klein, leicht und zudem ist der Stromverbrauch sehr viel geringer. Hierzu wurden die QDs auf einem Gold-Substrat (Au-Substrat) mit Hilfe von Benzo-1,4-dithiol (BDT) immobilisiert. Zunächst wurde eine selbstorganisierte Monolage (engl. self-assembled monolayer, SAM) von BDT auf dem Au-Substrat gebildet. Die Leitfähigkeit des Au-Substrates verringert sich dramatisch aufgrund des gebildeten SAM. Über die BDT-Moleküle wurden die QDs auf dem Au-Substrat verankert. Bei der Anregung der auf der Au-Oberfläche immobilisierten QDs (QD/Au) durch UV Licht werden Elektron-Loch-Paare in den QDs generiert. Oberflächendefekte der QDs führen zu langlebigen Elektron-Loch-Paaren. Bei Anlegen eines gewissen Spannung an die Au-Oberfläche können Elektronen durch die BDT Schicht tunneln und von den QDs abgegeben oder aufgenommen werden. Daher kann ein Kathoden- oder Anodenstrom, abhängig vom Richtpotential, bei gleichzeitiger Beleuchtung beobachtet werden. Ohne die Beleuchtung wirkt die QD/Au Elektrode als Isolator. Zur Verbesserung des Aufbaus wurden verschiedene Modifikationen, wie verschiedene Substrate (Au aus Lösung abgeschieden auf Glas oder Glimmer Platten und aufgedampft auf SiO2/Si Oberflächen) und verschiedene Dithiol-Moleküle (geschütztes und ungeschütztes Biphenyl-4,4'-dithiol und geschütztes und ungeschütztes 4,4'-Dimercaptostilbene) vorgenommen und untersucht. Auch wurden verschiedene QD Immobilisierungstechniken (normale Inkubation, Drehbeschichtung, Schichtweise Adsorption von Polyelektrolyten (engl. layer by layer assembly, LbL) und Hitzeimmobilisierung) eingesetzt. Mit diesem Aufbau können elektrochemisch verschiedene Analyten detektiert werden, je nach eingearbeiteten QDs. Cadmiumsulfid (CdS) QDs können beispielsweise 4- Aminophenol, ein Produkt der enzymatischen Reaktion von alkaliner Phosphatase mit p-Aminophenylphosphat, nachweisen. Anschließend wurde diese Reaktion mit einer CdS/Au Elektrode untersucht wobei einerseits die Enzym-Substrat Reaktion in der Elektrolytlösung stattfand und andererseits das Enzym mittels LbL auf der Oberfläche der QDs fixiert wurde. Mit einer anderen Art von CdS-FePt Dimer QDs wurde der Nachweis von Wasserstoffperoxid (H2O2) erbracht. Bei der normalen CdS/Au Elektrode wurde kein Einfluss durch H2O2 festgestellt, lediglich bei Anwesenheit von Pt innerhalb der QDs wurde H2O2 über die Redox Reaktion selbst bei einer Spannung von -100mV detektiert.

ii
Abstract
The main objective carried out in this dissertation was to fabricate Light Amplified Potentiometric sensors (LAPS) based upon the semiconductor nanoparticles (quantum dots) instead of its bulk form. Quantum dots (QDs) were opted for this device fabrication because of their superior fluorescent, electric and catalytic properties. Also in comparison to their bulk counterparts they will make device small, light weighted and power consumption is much lower.
QDs were immobilized on a Au substrate via 1,4 benzene dithiol (BDT) molecule. Initially a self-assembled monolayer (SAM) of BDT was established on Au substrate. Because of SAM, the conductivity of Au substrate decreased dramatically. Furthermore QDs were anchored with the help of BDT molecule on Au substrate. When QDs immobilized on Au substrate (QD/Au) via BDT molecule were irradiated with UV-visible light, electron-hole pairs were generated in QDs. The surface defect states in QDs trapped the excited electrons and long lived electron-hole pairs were formed. By the application of an appropriate bias potential on Au substrate the electrons could be supplied or extracted from the QDs via tunneling through BDT. Thus a cathodic or anodic current could be observed depending upon bias potential under illumination. However without light illumination the QD/Au electrode remained an insulator.
To improve the device different modifications were made, including different substrates (Au evaporated on glass, Au evaporated on mica sheets and Au sputtered on SiO2/Si) and different dithiol molecules (capped and uncapped biphenyl 4,4’ dithiol and capped and uncapped 4,4’ dimercaptostilbenes) were tried. Also different QD immobilization techniques (normal incubation, spin coating, layer by layer assembly (LbL) of polyelectrolytes and heat immobilization) were employed.
This device was able to detect electrochemically different analytes depending upon the QDs incorporated. For example CdS QDs were able to detect 4-Aminophenol, a product of an enzymatic reaction of Alkaline Phosphatase with p-Aminophenyl Phosphate. Subsequently this reaction was observed at CdS/Au electrode, by enzyme-substrate reaction within the electrolyte solution, and also by immobilizing the enzyme on top of QDs via LbL assembly of polyelectrolytes. With another kind of CdS-FePt dimer QDs, detection of hydrogen peroxide (H2O2) was demonstrated. Only at CdS/Au electrode there was no impact made by H2O2 but with the presence of Pt within QDs H2O2 was detected via reduction even at a bias potential of -100mV.

iii
Dedicated to Mom, Dad and Raazia
iv
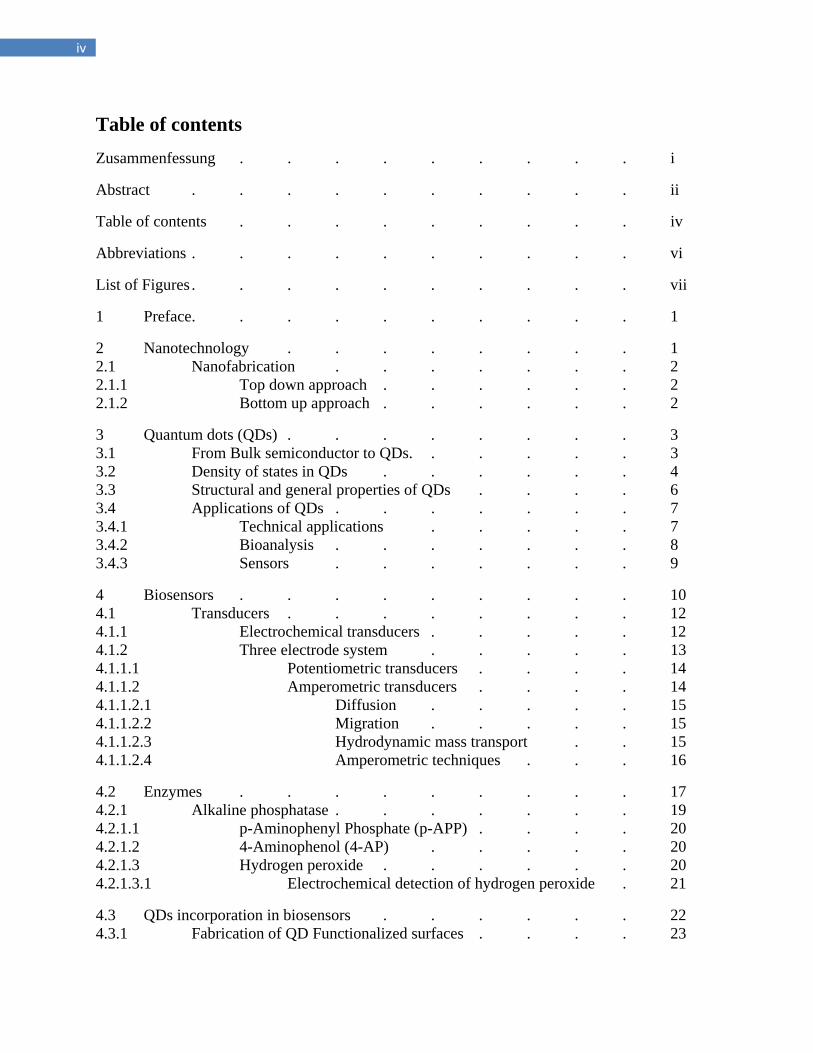
Table of contents Zusammenfessung . . . . . . . . . i
Abstract . . . . . . . . . . ii
Table of contents . . . . . . . . . iv
Abbreviations . . . . . . . . . . vi
List of Figures . . . . . . . . . . vii
1 Preface . . . . . . . . . . 1
2 Nanotechnology . . . . . . . . 1 2.1 Nanofabrication . . . . . . . 2 2.1.1 Top down approach . . . . . . 2 2.1.2 Bottom up approach . . . . . . 2
3 Quantum dots (QDs) . . . . . . . . 3 3.1 From Bulk semiconductor to QDs. . . . . . 3 3.2 Density of states in QDs . . . . . . 4 3.3 Structural and general properties of QDs . . . . 6 3.4 Applications of QDs . . . . . . . 7 3.4.1 Technical applications . . . . . 7 3.4.2 Bioanalysis . . . . . . . 8 3.4.3 Sensors . . . . . . . 9
4 Biosensors . . . . . . . . . 10 4.1 Transducers . . . . . . . . 12 4.1.1 Electrochemical transducers . . . . . 12 4.1.2 Three electrode system . . . . . 13 4.1.1.1 Potentiometric transducers . . . . 14 4.1.1.2 Amperometric transducers . . . . 14 4.1.1.2.1 Diffusion . . . . . 15 4.1.1.2.2 Migration . . . . . 15 4.1.1.2.3 Hydrodynamic mass transport . . 15 4.1.1.2.4 Amperometric techniques . . . 16
4.2 Enzymes . . . . . . . . . 17 4.2.1 Alkaline phosphatase . . . . . . . 19 4.2.1.1 p-Aminophenyl Phosphate (p-APP) . . . . 20 4.2.1.2 4-Aminophenol (4-AP) . . . . . 20 4.2.1.3 Hydrogen peroxide . . . . . . 20 4.2.1.3.1 Electrochemical detection of hydrogen peroxide . 21
4.3 QDs incorporation in biosensors . . . . . . 22 4.3.1 Fabrication of QD Functionalized surfaces . . . . 23

v
4.3.1.1 Covalent coupling . . . . . . 24 4.3.1.1.1 Self Assembled monolayers (SAM) . . . 24 4.3.1.2 Non-covalent attachments . . . . . 25 4.3.1.2.1 Layer by layer Assembly (LbL) . . . 25 4.3.1.2.2 Surface patterening of QDs . . . . 26
5 Conclusion and perspectives . . . . . . . 27
6 List of Publications and Author’s contribution . . . . 29
7 References . . . . . . . . . 30
8 Appendix . . . . . . . . . a
Acknowledgements . . . . . . . . . b-1
Academic Career . . . . . . . . . c

vi
List of Abbreviations:
Light amplified potentiometric sensor LAPS Nanoparticles NPs Quantum dots QDs Light emitting diode LED Gold Au 1,4 Benzene dithiol BDT Self-assembled monolayers SAMs Layer by layer LbL Single walled carbon nanotube SWCNT Förster Resonance energy transfer FRET Alkaline Phosphatase ALP p-nitrophenyl phosphate p-NPP p-aminophenyl phosphate p-APP 4-aminophenol 4-AP Quinone Amine QI
vii
List of Figures:
Figure 1: Comparison of quantization of density of states page 4
Figure 2: Effect of size reduction on band gap of semiconductor material page 7
Figure 3: Schematics of QD LED page 8
Figure 4: In vivo imaging with QDs page 9
Figure 5: FRET between Cy5 acceptor and QD donor page 9
Figure 6: QDs scaled as a function of their emission wavelength page 10
Figure 7: Elements and selected components of a typical biosensor page 11
Figure 8: Schematics of a three electrode system page 13
Figure 9: Typical cyclic voltammetry (CV) of a reversible redox system page 16
Figure 10: Alkaline Phosphatase page 19
Figure 11: Oxidation and reduction currents via QD mediation page 23
Figure 12: Immobilization of QDs on glass substrate page 24
Figure 13: Schematic representation of Layer by layer (LbL) assembly page 26
Figure 14: Stepwise preparation of multiple particles arrays page 27
Figure 15: Schematics of multi analyte detection on a single substrate page 28

Introduction
1 Introduction
1 Preface: It is a commutative work which consists of two major parts: an introductory chapter which reviews different topics that are a part of this research work and the publications that summarize results.
The introduction chapter first reviews nanotechnology and methods to fabricate nanoparticles of different materials. Then it surveys the quantization effects in solids at low dimensions, e.g. how semiconductor nanoparticels (NPs) or quantum dots (QDs) attain way superior photo-physical properties in comparison to bulk semiconductor. Applications of QDs in diverse fields are summarized. Biosensors; their principle parts and detection mechanisms are reviewed. Incorporation of QDs within biosensors, their advantages and their potential applications are discussed.
The second part of this dissertation enlists author’s publications that summarize results and contribution to this research field.
2 Nanotechnology: The unit of nanometer (nm) derives its prefix nano from a Greek word meaning dwarf or extremely small. The materials with at least one characteristic dimension between 1-100nm are termed as nanomaterials. At such small dimensions, due to a number of reasons, the properties of the materials are governed by atomic and quantum phenomena, which is not the case in the bulk materials.
1nm spans 3-5 atoms lined up in a row. For a crystal composed of a few atoms, the number of atoms lying at the crystal’s surface will be a significant fraction of the total number of atoms within the crystal. So the physical, chemical and electronic properties of the nanomaterials are different from their bulk counter parts. This variation in properties arises from the surface effects and quantum size effects [1].
In case of metals for example, nanoparticles (NPs) of gold of diameter~100nm or smaller appear red (not golden) when suspended in colorless media [2, 3]. Gold NPs of diameter less than 3nm are no longer noble and un-reactive, but can catalyze chemical reactions [4, 5]. Similarly the catalytic activity of the silver NPs is strongly dependent on particle size [6, 7]. As far as magnetic materials like ferro-magnets are concerned the coercivity increases with decreasing the particle size, however below a critical size dC it decreases abruptly giving rise to super para-magnetism [8]. Also depending upon the method and conditions used to prepare single walled carbon nanotubes (SWCNT), they can be metallic in nature [9]. They can possess conductivity greater than copper due to the un-scattered nature of electron transport along a SWCNT [10].
The semiconductor NPs have optical properties which are tunable by changing the composition or size of NP. For this reason they are exploited for many applications from fluorescent tags [11] to lasers [12], from LED [13] to solar cells [14], impacting dramatically the development of electronic and optical devices. The research on nanostructures has been a flourishing field in chemistry, physics and material science. Because of their unique and versatile properties these NPs are probably the most studied systems.
2 Introduction
The branch that manipulates the all above mentioned and many other properties of matter at nanoscale, to create new materials, structures and devices, is termed as nanotechnology. In fact nanotechnology has revolutionized many fronts of daily life like; new medical treatment strategies and tools are under consideration (targeted drug delivery and MRI contrast agents [15]), stronger and lighter materials (carbon nanotubes) [16], magnetic iron based alloys reduce loss of energy transmission [17] and numerous more.
2.1 Nanofabrication:
Nanofabrication methods can be divided roughly into two groups: top down and bottom up methods. Top down methods start with patterns made on a larger scale and reduce its lateral dimensions before forming nanostructures. On the other hand bottom up methods begin with atom or molecules to build up nanostructures, in some cases through smart use of self-organization.
2.1.1 Top down approach:
The top down approach has its foundation for example in lithographic techniques, in which a bulk material is selectively degraded to produce smaller, often patterned, features. For example in case of micro-lithography, light is shone through a mask to selectively etch either a positive or negative pattern into surface, yielding the desired topography. Size reductions to nanolithography are driven in large part by the computer industry, responding to the demand of smaller resistors and stronger computing power. To reach feature size <100 nm, researchers rely on shorter wavelength of light or even e-beam lithography techniques. Top down processing can also be generated through selective chemical etching, although this relies much more on the initial properties of the bulk material.
2.1.2 Bottom up approach:
In bottom up methods, the atoms and molecules are assembled into the smallest nanostructures (dimensions of typically 2 to 10 nm), by carefully controlled chemical reactions, which make this technique cheaper as compared to the lithographic method.
Self-assembly of atoms and molecules into nanostructures can be classified as a bottom up method. In nature self-assembly is often used to make complex structures. At present the mastery of self-assembly is limited to relatively simple systems. To achieve complex systems hierarchical self-assembly can assist, where the products of one self-assembly step is a base for the next one. The formation of self-assembled monolayers (SAM), that are produced when a substance spontaneously forms a molecular monolayer on a surface, could be successfully combined with standard lithographic methods to achieve large scale and better controlled structure.
In one type of bottom up synthesis, individual molecules are triggered to self-assemble into larger objects with nanoscale dimensions. The formation of micelles from individual charged lipids is a classic example of this method. In such systems, aggregate shape and size are pre-programmed through the specific features of the component molecules, often through the inclusion of selectively compatible and incompatible components. When we deliberately create molecules with such opposing segments (e.g. hydrophilic and hydrophobic; rigid and flexible; directional hydrogen-bonding or π- π stacking; etc.), multiple molecules are forced to reduce
3 Introduction
their entropic/enthalpic balance through aggregation. Substantial advances have been made in this field of ´´supramolecular self-assembly`` over the past 30 years.
Bottom up methods are also used, for instance, for the fabrication of carbon nanotubes (CNT) and nanoparticles. CNT can be produced by evaporation of solid carbon in an arc discharge, laser ablation or catalytic decomposition of fullerene [18].
3 Quantum Dots: Semiconductive nanoparticles, having sizes comparable with the bulk exciton Bohr radius (usually less than 20 nm) are often called quantum dots (QDs). For QDs one cannot only control the electron number, but also engineer their shape and their electronic density. The ability to control the energy states of the electrons by applying a voltage has lead to the exotic idea of a material whose chemical nature could be modified at will, making it emulate different elements, such as lead one time then the gold the next --- effectively programmable matter.
3.1 From Bulk Semiconductor to a Quantum Dot
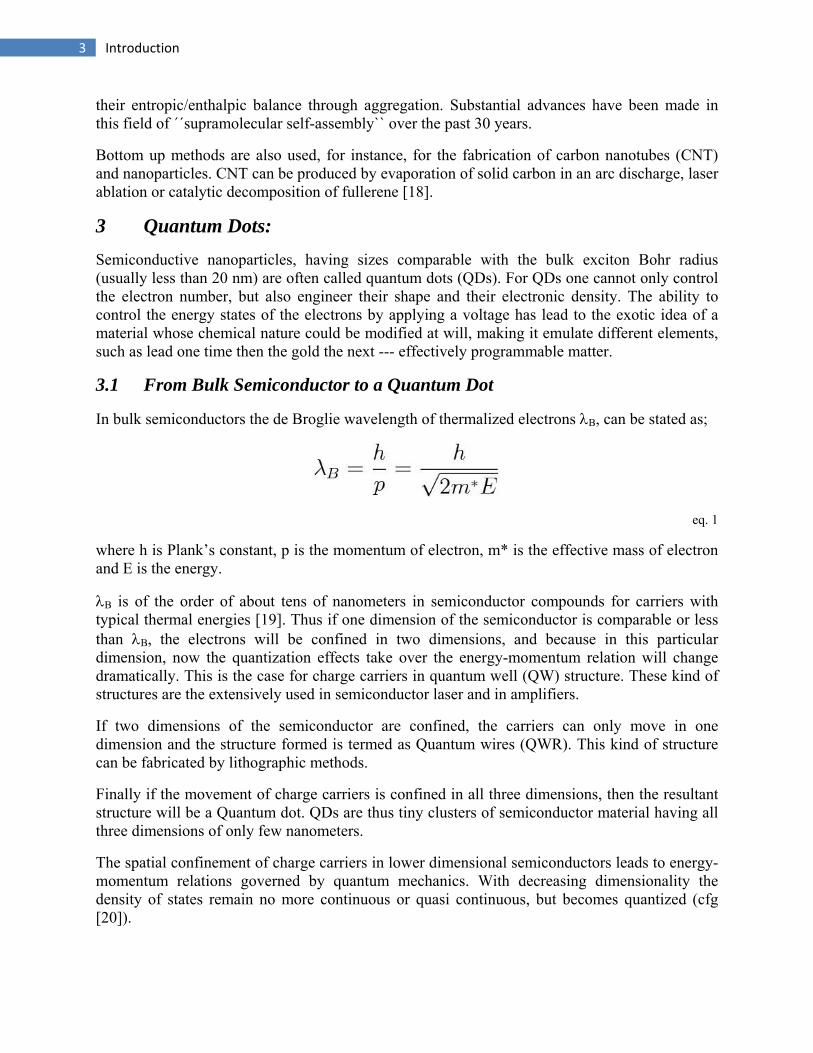
In bulk semiconductors the de Broglie wavelength of thermalized electrons λB, can be stated as;
eq. 1
where h is Plank’s constant, p is the momentum of electron, m* is the effective mass of electron and E is the energy.
λB is of the order of about tens of nanometers in semiconductor compounds for carriers with typical thermal energies [19]. Thus if one dimension of the semiconductor is comparable or less than λB, the electrons will be confined in two dimensions, and because in this particular dimension, now the quantization effects take over the energy-momentum relation will change dramatically. This is the case for charge carriers in quantum well (QW) structure. These kind of structures are the extensively used in semiconductor laser and in amplifiers.
If two dimensions of the semiconductor are confined, the carriers can only move in one dimension and the structure formed is termed as Quantum wires (QWR). This kind of structure can be fabricated by lithographic methods.
Finally if the movement of charge carriers is confined in all three dimensions, then the resultant structure will be a Quantum dot. QDs are thus tiny clusters of semiconductor material having all three dimensions of only few nanometers.
The spatial confinement of charge carriers in lower dimensional semiconductors leads to energy-momentum relations governed by quantum mechanics. With decreasing dimensionality the density of states remain no more continuous or quasi continuous, but becomes quantized (cfg [20]).

4 Introduction
Figure 1. Comparison of the quantization of density of states: (a) bulk, (b) quantum well, (c) quantum wire, (d) quantum dot. The conduction and valence bands split into overlapping subbands, that get successively narrower as the electron motion is restrict (taken from ´Fundamental of Photonics`)
In case of QDs the charge carriers occupy only a restricted set of energy states, just like electrons in an atom. For this reason QDs are sometimes referred to as ‘artificial atoms’, though QDs actually contain hundreds of thousands of atoms. The advantage is that, unlike atoms, QDs can be attached with the electrodes, using techniques like lithography [21], self-assembled monolayers (SAMs) [22] and electrochemical deposition [23] etc. Therefore QDs are excellent tools to study atomic like properties.
3.2 Density of states in QDs
In semiconductors in bulk form, some energy level are forbidden, defining the so called band gap, which is different for each bulk material. The band gap can also be defined as the energy required to create an electron hole pair at rest with respect to the lattice, and far enough apart so that their Coulomb attraction can be overcome. The electron-hole pair termed as exciton has a binding energy of a few meV. The pair acts as a single hydrogenic pair and is free to move in a perfect crystal. In other words such excitations are not spatially bound to a region smaller than the natural charge separation distance (Exciton Bohr radius rB). According to the Bohr’s hydrogen model the energy of exciton bound state is;
eq. 2
5 Introduction
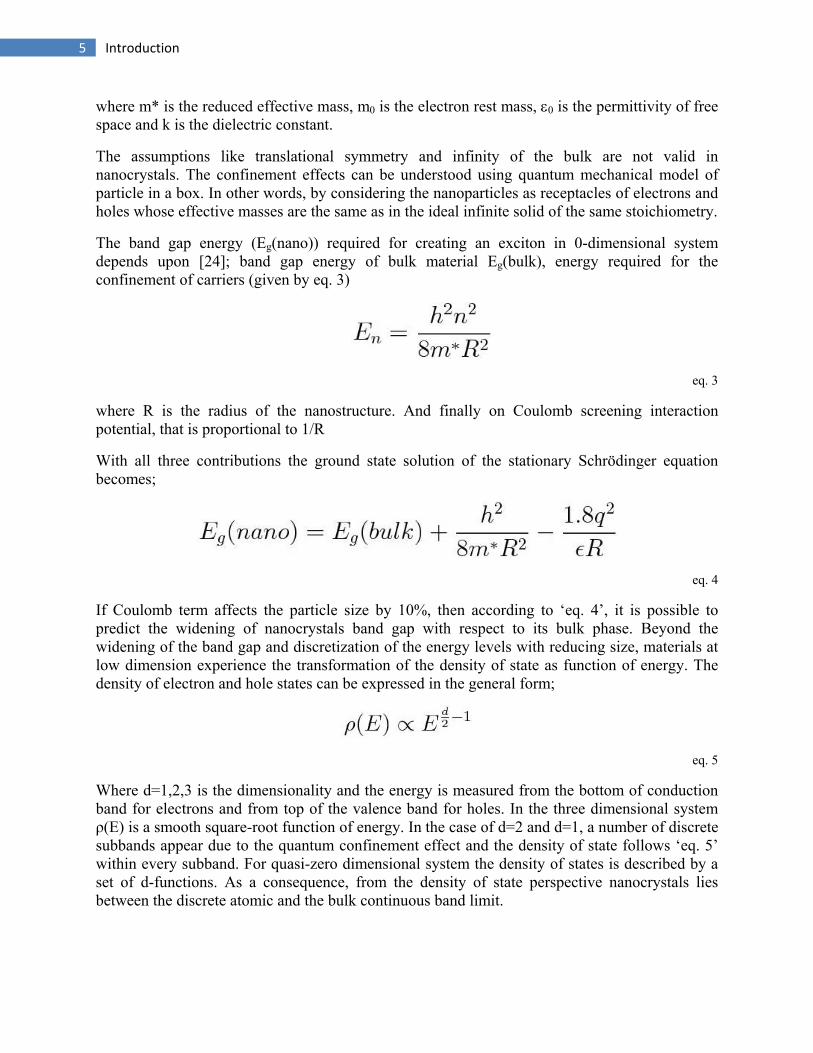
where m* is the reduced effective mass, m0 is the electron rest mass, ε0 is the permittivity of free space and k is the dielectric constant.
The assumptions like translational symmetry and infinity of the bulk are not valid in nanocrystals. The confinement effects can be understood using quantum mechanical model of particle in a box. In other words, by considering the nanoparticles as receptacles of electrons and holes whose effective masses are the same as in the ideal infinite solid of the same stoichiometry.
The band gap energy (Eg(nano)) required for creating an exciton in 0-dimensional system depends upon [24]; band gap energy of bulk material Eg(bulk), energy required for the confinement of carriers (given by eq. 3)
eq. 3
where R is the radius of the nanostructure. And finally on Coulomb screening interaction potential, that is proportional to 1/R
With all three contributions the ground state solution of the stationary Schrödinger equation becomes;
eq. 4
If Coulomb term affects the particle size by 10%, then according to ‘eq. 4’, it is possible to predict the widening of nanocrystals band gap with respect to its bulk phase. Beyond the widening of the band gap and discretization of the energy levels with reducing size, materials at low dimension experience the transformation of the density of state as function of energy. The density of electron and hole states can be expressed in the general form;
eq. 5
Where d=1,2,3 is the dimensionality and the energy is measured from the bottom of conduction band for electrons and from top of the valence band for holes. In the three dimensional system ρ(E) is a smooth square-root function of energy. In the case of d=2 and d=1, a number of discrete subbands appear due to the quantum confinement effect and the density of state follows ‘eq. 5’ within every subband. For quasi-zero dimensional system the density of states is described by a set of d-functions. As a consequence, from the density of state perspective nanocrystals lies between the discrete atomic and the bulk continuous band limit.
6 Introduction
The macroscopic properties of nanocrystals such as the inherent size dependence of optical signals are also the result of free energy variation. The nanoparticles are typically made up of ten to thousand of atoms. The atoms get arrange so that very high surface to volume ratio exists in comparison to bulk materials. The surface atoms contribute proportionally to the total free energy, thus the nanocrystals exhibit different thermodynamic properties with respect to their bulk counterparts. By changing the crystal size it is possible to manipulate the free energy of nanocrystals.
3.3 Structural and general properties of QDs:
The combination of low dimensionality and larger surface contribution has different effects on nanoparticle properties while compared with the bulk state [25].
The melting temperature of nanocrystals is lower than bulk phase of a material [26], [27]. This occurs because of the fact that surface energy in the liquid phase is always lower than solid phase. Consequently the surface atoms reach to the liquid state earlier, where they can minimize their energy. The decrease in the melting temperature varies as the inverse of the nanocrystals radius.
On the other hand on application of a progressive pressure nanocrystals can prove more rigid than bulk material again because of energy minimization they will be much more closely packed. But in bulk, if there are any defects (point, linear or planar), they can propagate within the lattice and under the application of a pressure the whole structure can be deformed.
The energy required to add successive charges onto an extended (bulk) crystal does not vary, but in a nanocrystal the presence of one charge acts to prevent the addition of another. So in metallic or semiconductive nanoparticles current-voltage curves of individual crystals resemble an additive step function, like a staircase. This effect is called coulomb blockage. Coulomb blockage scales as 1/R, with R being the radius of confined structure.
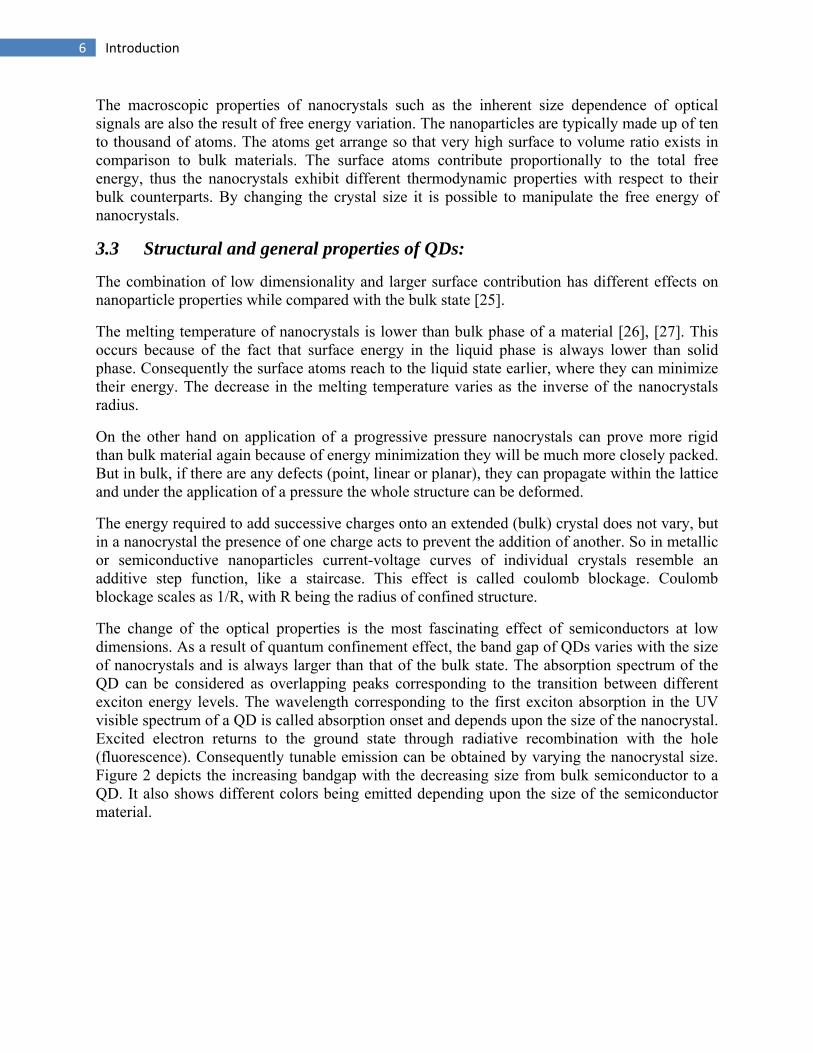
The change of the optical properties is the most fascinating effect of semiconductors at low dimensions. As a result of quantum confinement effect, the band gap of QDs varies with the size of nanocrystals and is always larger than that of the bulk state. The absorption spectrum of the QD can be considered as overlapping peaks corresponding to the transition between different exciton energy levels. The wavelength corresponding to the first exciton absorption in the UV visible spectrum of a QD is called absorption onset and depends upon the size of the nanocrystal. Excited electron returns to the ground state through radiative recombination with the hole (fluorescence). Consequently tunable emission can be obtained by varying the nanocrystal size. Figure 2 depicts the increasing bandgap with the decreasing size from bulk semiconductor to a QD. It also shows different colors being emitted depending upon the size of the semiconductor material.
7 Introduction
Figure 2: Schematic of the effect of the decreased size of the box on the increased energy gap of a semiconductor quantum dot, and the resultant luminescent color change from bulk materials (left) to small nanocrystals (right) (taken from sigma aldrich) [28]
QDs are characterized by narrow emission profile which is generally required for minimum overlap of emitted colors. This is one of many advantages of QDs over organic fluorophores. The bandwidth of the emission spectra expressed as full width at half maxima (FWHM) gets larger with the increasing size distribution of the QDs. Moreover it depends upon the temperature and the natural spectral line width of the QDs.
3.4 Applications of QDs:
QDs have found many applications in diverse fields like optoelectronics, nanophotonics, sensing or biology [27, 29-40].
3.4.1 Technical applications:
These applications are inspired from their attractive optical and electronic properties. The ability to tailor QDs (their shape, size and surface functionalization), improved the performance of QDs within these applications. For example the surface passivation enables higher quantum yields (QY) for QDs and therefore makes them brighter biolabels, higher stability to photo-oxidation results in a long lived device. In optoelectronic because of these superior properties QDs are employed for light emitting diodes (LEDs) [27, 41-44], solar cells [45-48] and lasers [49, 50]. QDs have potential advantage as light-absorbing materials. Efficient charge transfer from the nanocrystals to the conduction band of the wide bandgap semiconductor (TiO2, ZnO, Ta2O5) [51] in combination with high excitation coefficients in the visible spectral range makes them attractive for Grätzel type solar cell.

8 Introduction
Figure 3: (a) scheme of QD-LED device, (b) schematic diagram showing the structure of a QD-LED with an emissive layer consisting of 25 µm wide stripes of green and red QD monolayers (taken from Kim et al.)[41].
Another significant application for IR-emitting nanocrystals (HgTe, InAs/CdSe) is their use as optical amplifier media for telecommunication systems based on a silica fiber which has optimal transmission windows in the 1.3 and 1.5 micron regions of the IR spectrum.
3.4.2 Bioanalysis:
Novel QDs materials can be attained via surface functionalization with different functional ligands in the surface. These ligands could be responsive to an external stimulus to provide sensors, or to be able to bind to relevant biomolecule to provide luminescent biomarkers. QDs are widely used as fluorescent probes and labels in biology. Because QDs are size-tunable, the narrow emission spectra combined with broad absorption spectra, they are often used in multiplexed detection where a single excitation light source is used, and light from multiple labels of different target biomolecules or cellular compartment is spectrally filtered and collected.
It’s critical that the surface modification and functionalization are not only compatible with physiological conditions and biological environments but also to maintain nanocrystal stability. Long term stability of luminescence against photobleaching/photooxidation and bioinertness makes QDs superior compared to organic dyes and fluorescent proteins [34, 52]. QDs have successfully been used in immunochemistry [32, 33], DNA microarrays [53], imaging of live cells [34, 54, 55] or imaging in-vivo of the blood flow [56]. A potential hindrance for in-vivo or living cell research is cyto-toxicity caused by the QDs [57]. However silicon carbide QDs are non-toxic and do not need any functionalization [58].

9 Introduction
Figure 4: (a) simultaneous in vivo imaging of multicolor QD-encoded microbeads (taken from Hu et al.) [59] and (b) Non-toxic silicon carbide QDs having a very bright contrast in flourescence images (taken from Botsoa et al.) [58].
3.4.3 Sensors:
Chemical surface engineering of QDs gives them the potential of being optical transducers in sensing. QDs have been used in detection of biomolecules, simple organic molecules or inorganic molecules as well as sensors for temperature and pH [60-63]. In microfluidic devices they are used as traces in flow velocimetry [64, 65] or even as gas sensors [66]. Most of these sensing applications are based on signal transduction via fluorescence resonance energy transfer (FRET) or photoinduced electron transfer (PET) phenomena [39, 40].
In FRET the excitation energy from a donor species is transferred to an acceptor species. QDs in the FRET donor-acceptor couple can act as donors or acceptors [39, 40]. The sensing principle is based upon the physical separation between the donor and acceptor as well as on their spectral overlap, i.e. for the process of FRET to occur both the donor and acceptor species must lie in close proximity to each other and emission of the donor must overlap with the absorption of acceptor. The luminescent switching mechanism based on FRET can be exploited in detection of small organic molecules [60].
Electron transfer processes play a crucial role in molecular signaling in biological systems, in solar energy harvesting in natural and artificial systems or in photocatalysis. Upon light illumination both the electron in the conduction band and hole in the valance band take part in the electron transfer processes [67]. Due to PET, the QD luminescence is effectively quenched. This modulation of the luminescence by PET can be exploited in the sensing application [39, 40, 67]
Figure 5: Fluorescence emission from Cy5 due to FRETbetween Cy5 acceptors and a Quantum Dot donor in ananosensor assembly (taken from Zhang et al.).
10 Introduction
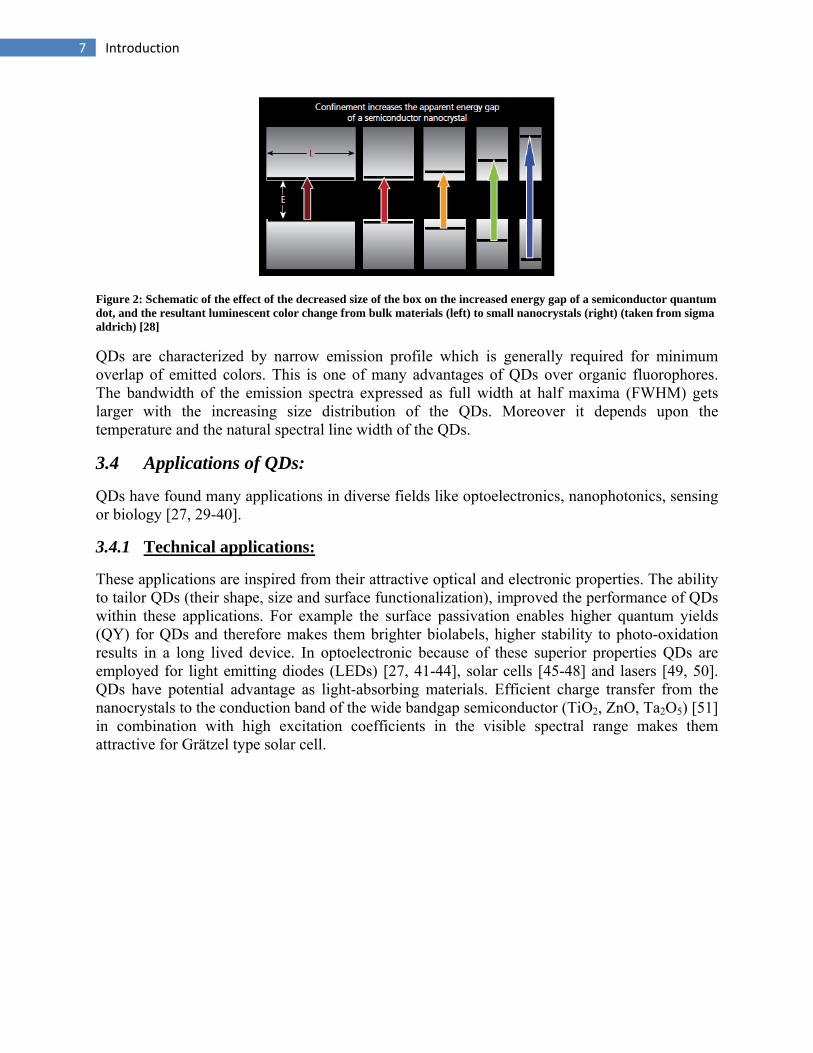
Figure 6: Selected Quantum Dot core materials scaled as a function of their emission wavelength superimposed over the spectrum. Representative areas of biological interest are also presented (taken from medintz et al.) [68].
4 Biosensors: Biosensors can be defined as devices that intimately associate a biological/biomimetic sensing element with a transducer [69]. These analytical instruments with exclusive capacities combine a recognition power, which naturally exists, in biological systems with sensitivity, flexibility and user-friendliness of advanced microelectronic transducer devices [70, 71]. The role of the latter in a biosensor is to convert an observed change, either physical or chemical into a measurable signal. The magnitude of this signal (usually electrical) is proportional to the concentration of a specific chemical or a set of chemicals. The first biosensor was the one that combined an electrochemical transducer (Clark amperometric oxygen electrode) with enzyme (glucose oxidase) as the sensing element for glucose detection [72]. The Clark electrode is a polarographic electrode used for measuring the concentration of oxygen in blood and gases. The sample is brought into contact with a membrane (usually polypropylene or PTFE - Teflon) through which oxygen diffuses into a measurement chamber containing potassium chloride solution. In the chamber there are two electrodes: one is a reference silver/silver chloride electrode and another is a platinum electrode coated with glass to expose only a tiny area of platinum (e.g. 20 μm diameters). The electric current flow between the two electrodes when polarized with a voltage of 600-800 mV determines the oxygen concentration in the solution [73]. The principal components of a biosensor are demonstrated in Figure 7 [74].

11 Introduction
Figure 7: Elements and selected component of a typical biosensor (taken from Grieshaber et al.)
Among the bioreceptor elements enzymes are by far the most important. The reason for this lies in the fact that these molecules provide not only the recognition of analyte-substrate, but also have the catalytic function important for the amplification of the signal [75]. Enzymes are quite flexible molecules and have various complex conformations with sometimes different catalytic activity [76]. The recognition of analytes by these elements is far superior to most chemical recognition systems. Some enzymes are even able to distinguish between stereoisomers of the analyte. Biosensors also provide short response times and in many cases allow real time measurements. The nature of biosensors allows miniaturization and integration into portable instruments, making biosensors an ideal choice for on-site measurements. Biological elements can be unstable under harsh conditions, which cause the slow commercialization of many biosensors [77].
The clinical market for biosensors is dominated by one type of enzyme electrode, which is available from different manufacturers in different forms [78, 79]. The glucose enzyme biosensor enjoys outstanding success, because of its huge demand. Diabetics need to measure their glucose level in blood at least 3-4 times a day. Also, diabetes is a very common disease costing the US health system over $ 140 billion per year. This creates a large market for a small, cheap and portable glucose detection device that allows measurement in small samples of blood. The sensor should also be easy to use and, if possible, disposable.
In general biosensors are classified either by their biological element or the transducer used. In some cases the immobilization method used to attach the biological element to the transducer is used for classification.

12 Introduction
4.1 Transducers:
A transducer is a device that is activated by energy from one system and supplies energy to a second system [80]. In biosensors this means that energy produced directly or indirectly by a biological reaction is generally converted into an electrical signal. Main transducers used in biosensors are electrochemical, optical, piezoelectric and thermal transducers.
The biological elements can be very important for right choice of transducer. Enzymatic reactions are easily monitored, electrochemically or thermometrically, whereas mass sensitive devices are usually not used for enzymatic biosensor. On the other hand, piezoelectric sensors can detect affinity reactions of antigen and antibody or DNA without a label. Other transducers frequently require some sort of label for affinity measurements.
4.1.1 Electrochemical transducers:
Various electrochemical techniques have been employed in biosensors. These methods include amperometry, potentiometry, impedance and conductivity methods. By far the most popular techniques are amperometry and potentiometry. Comparison of different electrochemical transducers used in biosensors [81].
Type of energy transduction
Advantages Disadvantages
Potentiometric Translation is relatively easy
Easily miniaturized
Requires reference electrode
Limited linear range
often pH sensitive
Amperometric Wide variety of biochemical redox mechanisms as basics for signal generation
Easily miniaturized
Good dynamic range, controllable by membrane thickness
Relatively good sensitivity
Requires reference electrode
Multiple membranes or enzymes may be necessary for required selectivity and
sensitivity
Conductimetric Easy to fabricate
No reference electrode required
Low frequency/ Amplitude source
Non selective unless used in array format
13 Introduction
4.1.2 Three Electrode System:
In two electrode system the current between the two electrodes as well as the applied potential can be measured. The problem though is that there are three regions over which the potential drop occurs: two electrode-solution interfaces and the solution. Only the potential drop over the whole system can be estimated in two electrode systems, but only the potential drop at working electrode cannot be estimated.
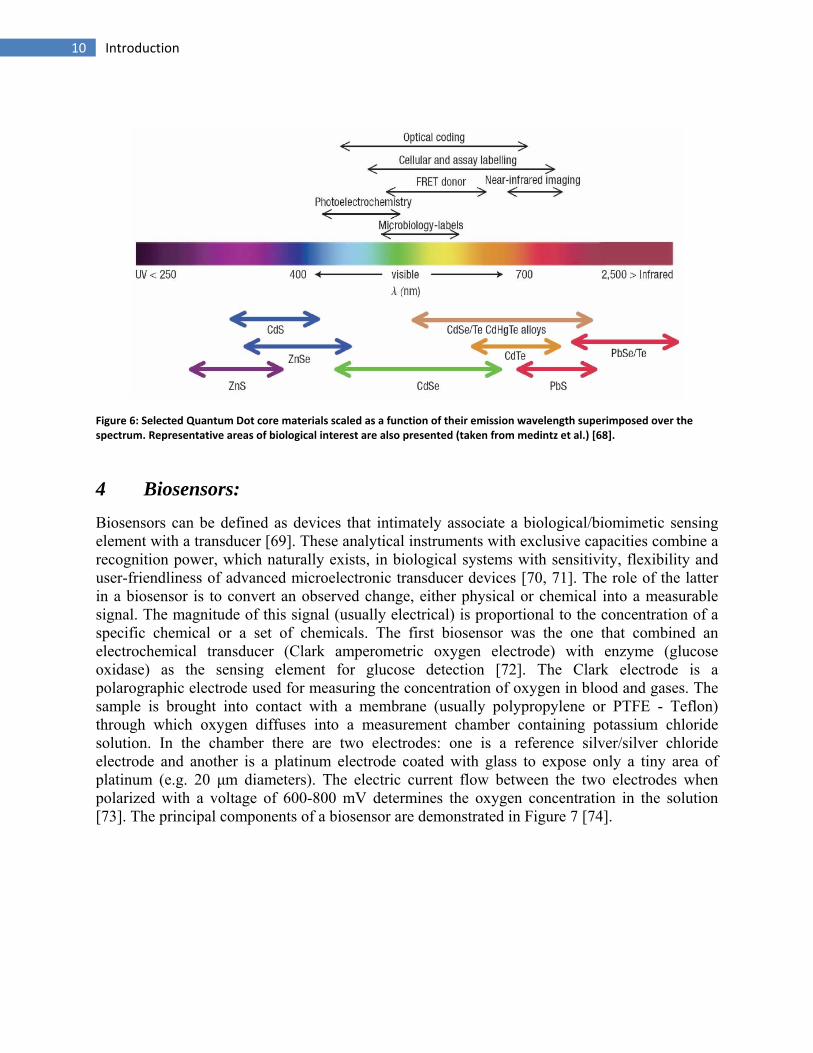
In all electrochemical experiments, the reactions of interest occur at the surface of the working electrode. Therefore, we are interested in controlling the potential drop across the interface between the surface of the working electrode and the solution (i.e., the interfacial potential). However, it is impossible to control or measure this interfacial potential without placing another electrode in the solution. Thus, two interfacial potentials must be considered, neither of which can be measured independently. Hence, one requirement for this counter electrode is that its interfacial potential remains constant, so that any changes in the cell potential produce identical changes in the working electrode interfacial potential.
An electrode whose potential does not vary with current is referred to an ideal non-polarizable electrode, and is characterized by a vertical region on a current vs. potential plot. However, there is no electrode that behaves in this way (although some approach ideal non-polarizable behavior at low currents). Consequently, the interfacial potential of the counter electrode in the two-electrode system discussed above varies as current is passed through the cell. This problem is overcome by using a three-electrode system, in which the functions of the counter electrode are divided between the reference and auxiliary electrodes; that is, the potential between the working and reference electrodes is controlled and the current passes between the working and auxiliary electrodes. The current passing through the reference electrode is further diminished by using a high-input-impedance operational amplifier for the reference electrode input.
The reference electrode is directly connected with the ‘–’ input of operational amplifier ‘1’. No current flows through the reference electrode. The purpose is to ensure that the voltage difference between the reference electrode and working electrode always remains constant. Operational amplifier ‘2’ has a variable resistor mounted between the - input and output of operational amplifier ‘2’ to increase the sensitivity of the instrument.
Figure 8: Schematics of a three electrode system
14 Introduction
Circuit layout can be seen in the ‘Figure: 8’ Operation amplifier ‘1’ acts as voltage follower circuit whose output goes to the counter electrode, e.g. Pt wire. Operational amplifier ‘2’ serves as current-to-voltage converter. This setup is interfaced normally with a computer.
4.1.1.1 Potentiometric transducers:
For this class, transduction mechanism is based on measuring the interfacial potential at an electrode surface resulting from the chemical reaction between the analyte species and an Ion Selective Electrode (ISE) [82]. The voltage arising from such electrochemical reaction is measured at zero current against reference electrodes such as Ag/AgCl. The Nernst potential of the pH glass electrode is described by the Nicolsky-Eisenman equation, of which the generalized form for ISE is as follows [83]:
eq. 6
where E represents the potential, R the universal gas constant, T temperature, F Faraday constant, za followed and zi interfering ion valence, aa activity of measured and ai activity of interfering ion and Ka,i represents the selectivity coefficient. The glass pH electrode composed of a glass membrane is the widely used ISE for the determination of hydrogen ions (pH) in solution. Several gas sensors have also been developed using ISEs over the past few years for the detection of harmful gaseous pollutants such as CO2, CO, NOx, SOx, H2, Cl2, NH3 etc [84-86].
Ion selective electrodes are based on potentiometric measurements and can be used for mainly enzyme based biosensor. The change in pH due to enzyme activity for example can be easily monitored with a pH sensitive ISE. The potential that develops across an ion selective membrane is measured.
The first potentiometric biosensor was developed by Guilbault and Montalvo for Urea in 1969 [87]. More recent potentiometric devices are based on field-effect transistor (FET) devices.
4.1.1.2 Amperometric transducers:
The principle of these transducers is based on the measurement of a steady state current produced when a constant potential is applied. This current can be related to an electrochemical species that is consumed or produced by the biological element.
The biosensor can be realized with relatively simple instrumentation. The electrochemical set-up normally consists of working electrodes (such as gold, platinum, glassy carbon, graphite or a carbon paste), a reference electrode such as Ag/AgCl, and an auxiliary electrode often made of carbon or platinum. The constant potential is applied by a potentiostat.
Amperometry is probably the most common detection method in biosensors due to its simplicity and sensitivity. The biological element can be directly immobilized on the electrode and is very often an enzyme. During the enzymatic reaction an electrochemically active species can be
15 Introduction
produced or consumed by the enzyme and this specie can be oxidized or reduced at the electrode. In the ideal case, the measured current is directly proportional to the analyte concentration.
The signal generated from amperometric detection depends on the number of redox active molecules that are transported to the electrode surface. Such molecules dissolved in solution can be brought into contact with the electrode surface principally by diffusion, migration, and hydrodynamic flow.
4.1.1.2.1 Diffusion:
It is a phenomenon based on the random movement of inert particles that causes a system to decay to a state of maximum uniformity, and can be represented mathematically by Fick’s second law:
eq. 7
where φ is the concentration of the diffusing molecule, t is time, D is the diffusion coefficient, and is the gradient operator. The observable effect of diffusion is that particles move from areas of high concentration to areas of low concentration. In the context of amperometry, an electron transfer occurs at the electrode surface, creating a concentration gradient. In the case of an oxidation, the oxidized species diffuses away from the surface, while more of the oxidizable species diffuses to the electrode surface. The current that results from this system, as long as the bulk concentration does not change significantly, is known as the limiting current.
4.1.1.2.2 Migration:
It is the movement of charged particles (ions) due to the influence of an electric field. Positively charged particles are attracted to a negatively charged electrode, and vice versa. While this effect is very important in some situations, it is generally undesired in most electrochemical measurements, as it introduces an additional source of signal variation. The effects of migration are often reduced by adding an inert electrolyte, often called a supporting electrolyte, in high concentration relative to the analyte to decrease the electric field strength near the electrode.
4.1.1.2.3 Hydrodynamic mass transport:
This transport is caused by the movement of solution, typically by stirring, flowing solution over the electrode, or rotating the electrode within the solution. Electrochemical detection is very sensitive to movement of the solution over the electrode because convection can be orders of magnitude faster than diffusion. While this is a limitation in some situations, controlled flow and diffusive mixing can be used to greatly enhance the detectable current by increasing the flux of redox active molecules to the electrode surface. Electrochemical assays typically use stirring, flow injection analysis [88], or rotating disk electrodes [89] to increase the observed limiting current over that of plain diffusion.
16 Introduction
4.1.1.2.4 Amperometric techniques:
Amperometry based sensors are used for detecting species in a solution which can undergo oxidation or reduction resulting in a current that is governed by Faraday’s law and laws of mass transport [82]. Cyclic voltametry (CV) and Linear sweep voltametry (LSV) are the most common voltametric techniques used to detect elctroactive species present in the solution.
In LSV a potential is swept linearly with time and corresponding current due to electron transfer to or from the analyte species to the electrode is measured.
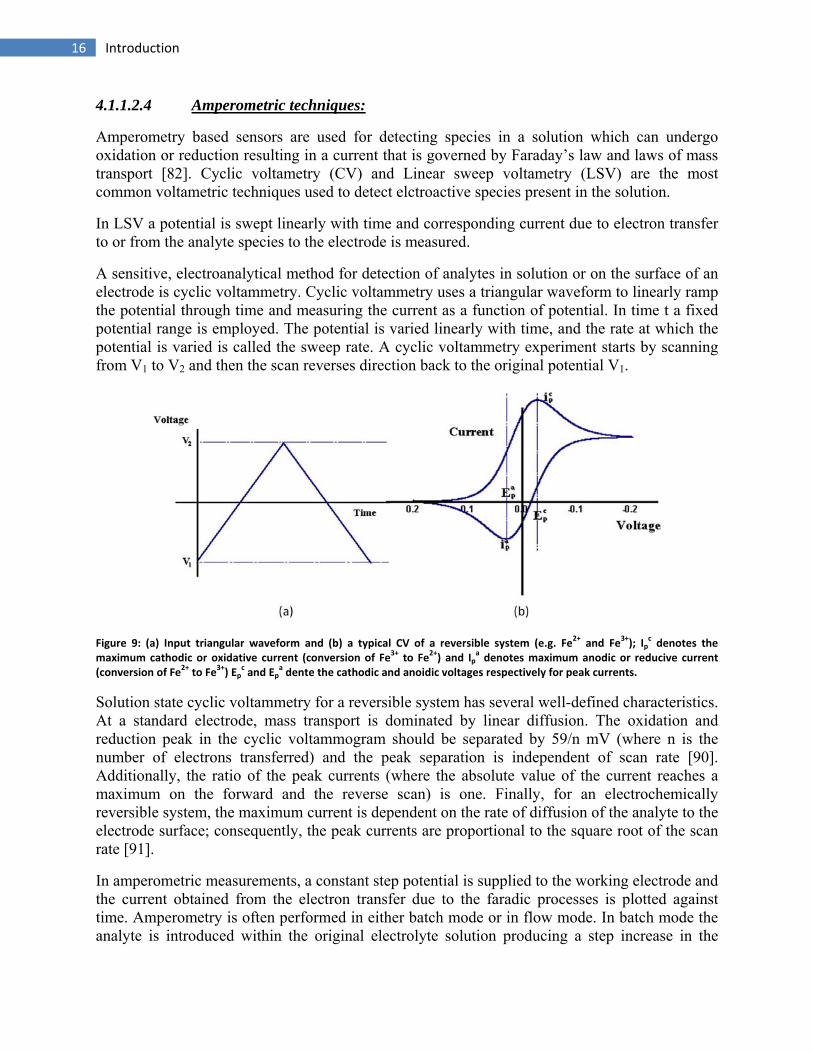
A sensitive, electroanalytical method for detection of analytes in solution or on the surface of an electrode is cyclic voltammetry. Cyclic voltammetry uses a triangular waveform to linearly ramp the potential through time and measuring the current as a function of potential. In time t a fixed potential range is employed. The potential is varied linearly with time, and the rate at which the potential is varied is called the sweep rate. A cyclic voltammetry experiment starts by scanning from V1 to V2 and then the scan reverses direction back to the original potential V1.
Figure 9: (a) Input triangular waveform and (b) a typical CV of a reversible system (e.g. Fe2+ and Fe3+); Ipc denotes the
maximum cathodic or oxidative current (conversion of Fe3+ to Fe2+) and Ipa denotes maximum anodic or reducive current
(conversion of Fe2+ to Fe3+) Epc and Ep
a dente the cathodic and anoidic voltages respectively for peak currents.
Solution state cyclic voltammetry for a reversible system has several well-defined characteristics. At a standard electrode, mass transport is dominated by linear diffusion. The oxidation and reduction peak in the cyclic voltammogram should be separated by 59/n mV (where n is the number of electrons transferred) and the peak separation is independent of scan rate [90]. Additionally, the ratio of the peak currents (where the absolute value of the current reaches a maximum on the forward and the reverse scan) is one. Finally, for an electrochemically reversible system, the maximum current is dependent on the rate of diffusion of the analyte to the electrode surface; consequently, the peak currents are proportional to the square root of the scan rate [91].
In amperometric measurements, a constant step potential is supplied to the working electrode and the current obtained from the electron transfer due to the faradic processes is plotted against time. Amperometry is often performed in either batch mode or in flow mode. In batch mode the analyte is introduced within the original electrolyte solution producing a step increase in the
17 Introduction
current. In flow mode the analyte is injected into the electrolyte stream, which is in continuous contact with the working electrode. As the injected analyte reaches the working electrode it undergoes oxidation or reduction, thereby giving a peak current.
Electrochemical sensors can be used to determine various substances present in solution or electrolyte. These sensors have diverse applications in fields ranging from medicine [77] to environmental monitoring [92]. In addition to solution detection of analytes, there are also electrochemical sensors for detecting toxic gases such as carbon monoxide, hydrogen sulfide, chlorine, nitrogen and sulfur oxides [84, 85].
4.2 Enzymes:
Enzymes are biological catalysts responsible for most chemical reactions in living organisms. Their main task is to initiate or accelerate reactions that would otherwise not take place, or only very slowly at the moderate temperatures, predominant in organisms. They also slow down reactions, if necessary, or split them up in separate parts to control the heat evolution of the exothermic reactions. Otherwise, the uncontrolled heat evolution could lead to cell death.
Enzymes are the most commonly used biocatalysts in biosensors. Electrochemical biocatalytic sensors using enzymes have dominated the biosensor market for years with oxi-reductases being the most important enzymes (e.g. glucose oxidase) [77]. Some enzymes like urease are highly specific for one compound [93]. Other enzymes on the other hand are specific for a whole group of substrates. Alkaline Phosphatase (ALP) for example can cleave the phosphate group from a wide range of mono-phosphate esters.
The structure of enzymes is mainly made up of a single peptide chain, but the active molecule can be a separate molecule, embedded in the polypeptide backbone. Only certain molecules are allowed to access the active site, so that specificity of enzyme is mainly determined by access through the protein shell and the binding site, and not by the active site itself.
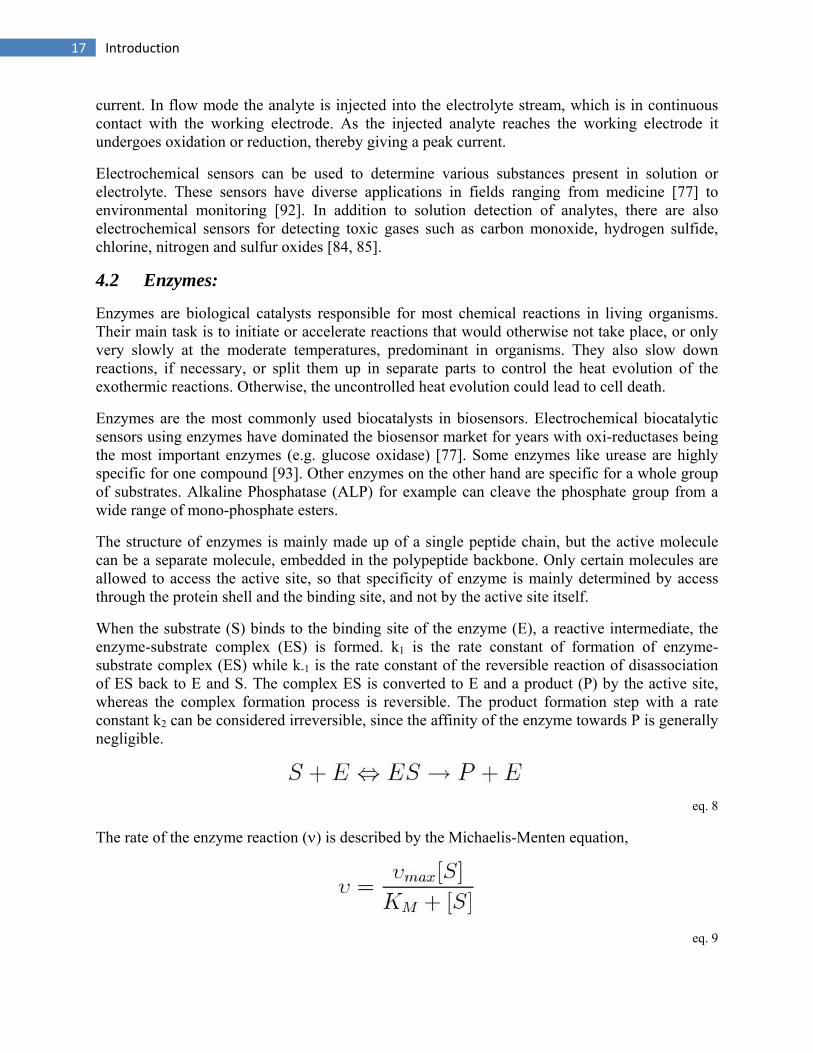
When the substrate (S) binds to the binding site of the enzyme (E), a reactive intermediate, the enzyme-substrate complex (ES) is formed. k1 is the rate constant of formation of enzyme-substrate complex (ES) while k-1 is the rate constant of the reversible reaction of disassociation of ES back to E and S. The complex ES is converted to E and a product (P) by the active site, whereas the complex formation process is reversible. The product formation step with a rate constant k2 can be considered irreversible, since the affinity of the enzyme towards P is generally negligible.
eq. 8
The rate of the enzyme reaction (ν) is described by the Michaelis-Menten equation,
eq. 9

18 Introduction
KM represents the Michaelis-Menten constant, and νmax is the maximum rate of enzymatic reaction, under the condition that the active site if the enzyme is saturated (substrate excess).
eq. 10
eq. 11
Under suitable conditions, enzymes are very stable and can work for weeks or months with very high turnover rates. One single enzyme can convert between 103 to 108 substrate molecules per minute.
During enzymatic reactions, substrates are consumed and products are formed. These compounds can be monitored by suitable transducers. In case of glucose oxidase, these compounds are O2 and H2O2, which are easily detected. Some enzymes have additional active areas, where so-called cofactors, e.g. NADH, are required for optimal enzyme activity [88]. Many enzymes also require metal ions for their catalytic activity.
There are two main applications for enzymes in the biosensors. They can either be used as catalytic biosensors or markers in affinity biosensors, such as immunosensors and DNA sensors.
In catalytic enzyme sensors the concentration of enzyme (E) is constant and the substrate (S) concentration is much smaller than KM. The velocity ν is only dependent on the substrate concentration.
When E is used as label for antibodies or DNA strands, the substrate must be used in access and the concentration of E is the only limiting factor in ‘eq. 9’ the reaction is of first order for enzyme concentration. Since enzyme can convert hundreds of substrate molecules per second, they are highly efficient chemical amplifiers for the detection of other molecules [94].
Enzymes are sensitive to temperature changes. Increasing temperature increases the reaction rate, but at elevated temperatures the protein structure denatures, mostly irreversible, leaving the enzyme inactive. For most enzymes this critical temperature starts between 40°C and 50°C, however few enzymes can possess high thermal stability above 100°C.
Enzymes consist of amino acids and therefore sensitive to pH. ALP for example works best in alkaline pH and loses activity in acidic media.
Enzyme reactions can be inhibited by various species. Inhibition may be irreversible, allowing the enzyme to regain full activity after dissociation from the inhibitor. These inhibitors can competitively block the active site or alter the enzyme activity by other mechanisms. Other inhibitors inhibit the enzyme and deactivate it irreversibly. These irreversible inhibitors can work
19 Introduction
in different ways, for example blocking the binding site, reacting with the central metal ion or denaturing the enzyme.
Enzyme inhibition sensors have been reported for the detection of toxic compounds and heavy metal ions and are based on the selective inhibition of enzymes [77].
4.2.1 Alakaline Phosphatase:
Alkaline Phosphatases are a group of enzymes found primarily in the liver and bone. There are also small amounts present in cells lining the intestines, the placenta, and the kidney (in the proximal convoluted tubules) [95]. The primary importance of measuring alkaline phosphatase is to check the possibility of bone disease or liver disease.
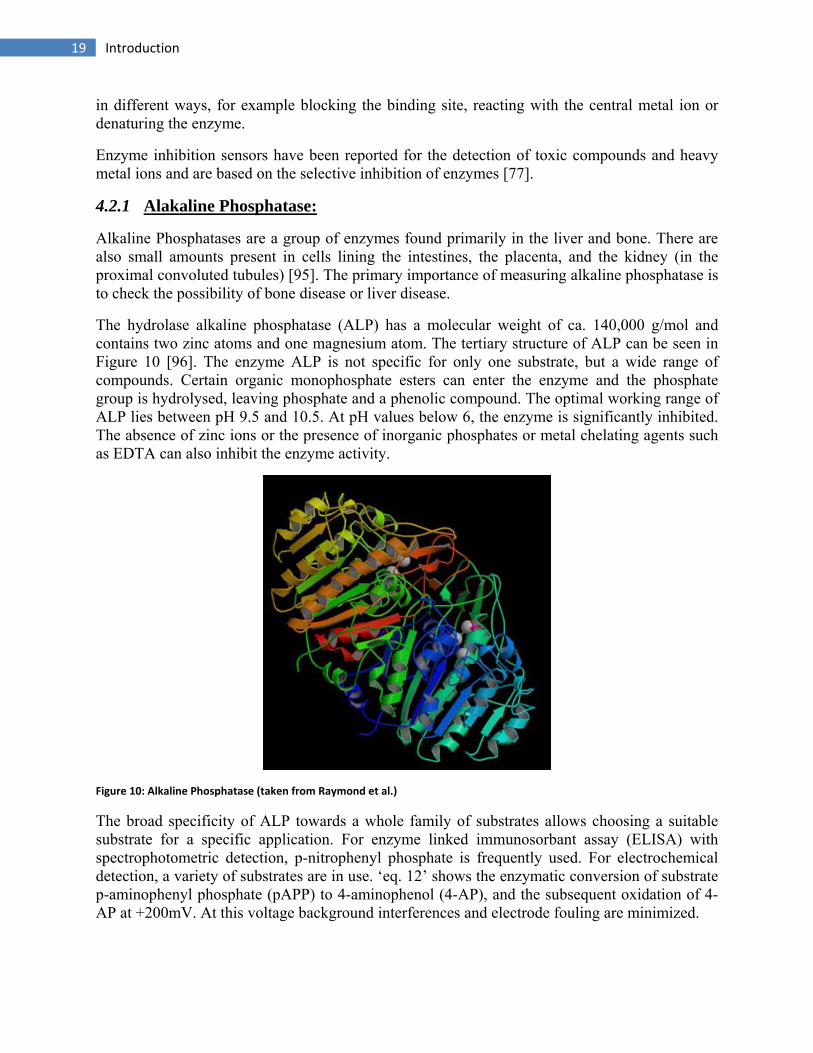
The hydrolase alkaline phosphatase (ALP) has a molecular weight of ca. 140,000 g/mol and contains two zinc atoms and one magnesium atom. The tertiary structure of ALP can be seen in Figure 10 [96]. The enzyme ALP is not specific for only one substrate, but a wide range of compounds. Certain organic monophosphate esters can enter the enzyme and the phosphate group is hydrolysed, leaving phosphate and a phenolic compound. The optimal working range of ALP lies between pH 9.5 and 10.5. At pH values below 6, the enzyme is significantly inhibited. The absence of zinc ions or the presence of inorganic phosphates or metal chelating agents such as EDTA can also inhibit the enzyme activity.
Figure 10: Alkaline Phosphatase (taken from Raymond et al.)
The broad specificity of ALP towards a whole family of substrates allows choosing a suitable substrate for a specific application. For enzyme linked immunosorbant assay (ELISA) with spectrophotometric detection, p-nitrophenyl phosphate is frequently used. For electrochemical detection, a variety of substrates are in use. ‘eq. 12’ shows the enzymatic conversion of substrate p-aminophenyl phosphate (pAPP) to 4-aminophenol (4-AP), and the subsequent oxidation of 4-AP at +200mV. At this voltage background interferences and electrode fouling are minimized.

20 Introduction
eq. 12
eq. 13
4.2.1.1 p-Amino Phenyl Phosphate:
pAPP was synthesized following the protocol from Frew et al [97]. For this purpose p-Nitrophenyl Phosphate (pNPP) was used, which is another substrate for enzyme ALP [98]. 10 g of pNPP was dissolved in 23.81 ml of distilled water and the pH was adjusted to 9 by addition of 10% NaOH. Then 21.71 g of Na2S•9H2O was added and the solution was heated to 90-95°C for 1 hour. The solution was then allowed to cool down. After cooling the solution, concentrated HCl was added to obtain a very low pH ~ 0. The solution was allowed to cool down and the pH was then adjusted to 4-5 with 25% NaOH. Then, the solution was filtered and the filtrate was washed with boiling methanol. The product was finally obtained in the form of crystals. pAPP is a much better substrate for ALP than pNPP [99] and it can be detected at much lower potential than pNPP, which allows for reducing noise caused by high bias potentials.
4.2.1.2 4-Aminophenol:
4-aminophenol (4AP) is the product of the enzymatic reaction of the enzyme alkaline phosphatase (ALP) and its substrate p-aminophenyl phosphate (pAPP). 4AP is not very stable [100]. It oxidizes quickly under light and regular atmosphere conditions.
eq. 14
4.2.1.3 Hydrogen peroxide
Hydrogen peroxide (H2O2) is one of the most important products or substrate of enzyme catalysed oxidation reactions [101, 102]. Most common enzymes used in biosensors are oxidases, which catalyse the model oxidation reactions:
eq. 15
21 Introduction
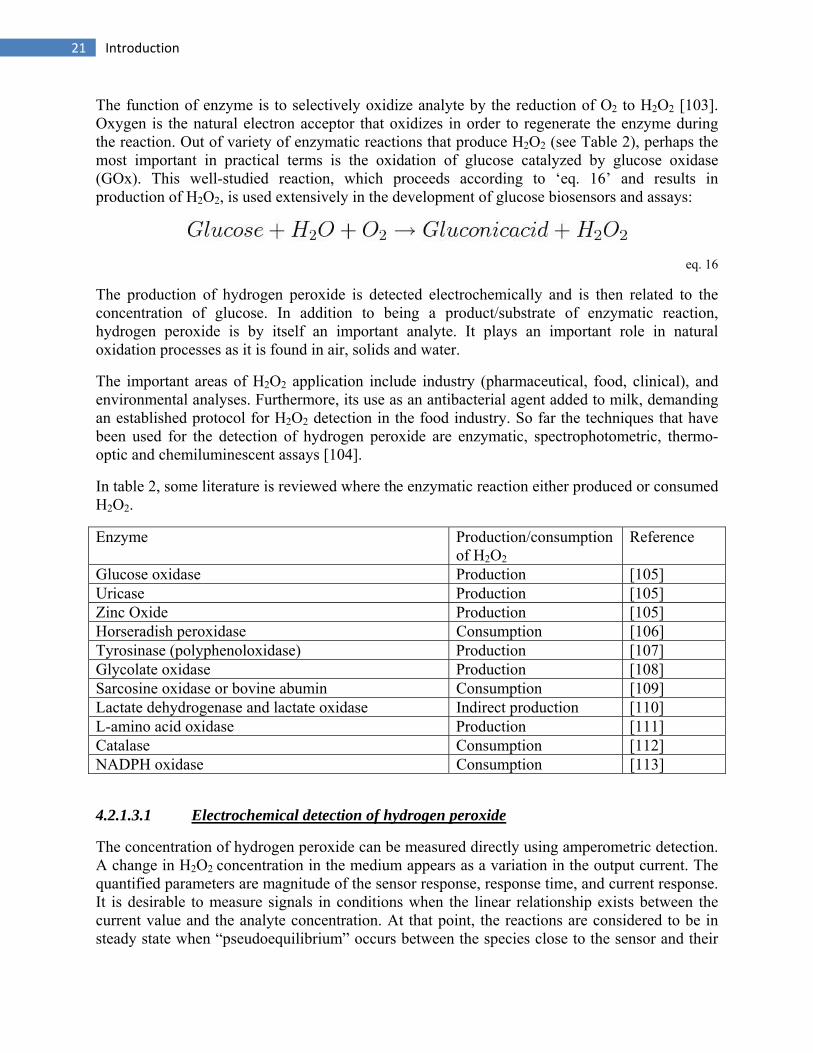
The function of enzyme is to selectively oxidize analyte by the reduction of O2 to H2O2 [103]. Oxygen is the natural electron acceptor that oxidizes in order to regenerate the enzyme during the reaction. Out of variety of enzymatic reactions that produce H2O2 (see Table 2), perhaps the most important in practical terms is the oxidation of glucose catalyzed by glucose oxidase (GOx). This well-studied reaction, which proceeds according to ‘eq. 16’ and results in production of H2O2, is used extensively in the development of glucose biosensors and assays:
eq. 16
The production of hydrogen peroxide is detected electrochemically and is then related to the concentration of glucose. In addition to being a product/substrate of enzymatic reaction, hydrogen peroxide is by itself an important analyte. It plays an important role in natural oxidation processes as it is found in air, solids and water.
The important areas of H2O2 application include industry (pharmaceutical, food, clinical), and environmental analyses. Furthermore, its use as an antibacterial agent added to milk, demanding an established protocol for H2O2 detection in the food industry. So far the techniques that have been used for the detection of hydrogen peroxide are enzymatic, spectrophotometric, thermo-optic and chemiluminescent assays [104].
In table 2, some literature is reviewed where the enzymatic reaction either produced or consumed H2O2.
Enzyme Production/consumption of H2O2
Reference
Glucose oxidase Production [105] Uricase Production [105] Zinc Oxide Production [105] Horseradish peroxidase Consumption [106] Tyrosinase (polyphenoloxidase) Production [107] Glycolate oxidase Production [108] Sarcosine oxidase or bovine abumin Consumption [109] Lactate dehydrogenase and lactate oxidase Indirect production [110] L-amino acid oxidase Production [111] Catalase Consumption [112] NADPH oxidase Consumption [113]
4.2.1.3.1 Electrochemical detection of hydrogen peroxide
The concentration of hydrogen peroxide can be measured directly using amperometric detection. A change in H2O2
concentration in the medium appears as a variation in the output current. The quantified parameters are magnitude of the sensor response, response time, and current response. It is desirable to measure signals in conditions when the linear relationship exists between the current value and the analyte concentration. At that point, the reactions are considered to be in steady state when “pseudoequilibrium” occurs between the species close to the sensor and their
22 Introduction
consumption at the indicative electrode. One of the serious problems associated with measurement of complex analytes is the possible interference of the redox species present in the sample. Several methods have been reported which aimed at reducing level of interference. These methods include use of perm-selective coatings [114, 115], use of artificial mediators [72], or selective electrocatalysis [116, 117].The use of mediators or selective electrocatalysis helps to lower the detection potential to the level when the majority of interfering species are electroinactive [118].
Hydrogen peroxide can be reduced at the platinum electodes. Detection of hydrogen peroxide in this case depends on temperature, pH and the oxidation status of the platinum electrodes. The research has proved that the oxidation of H2O2 requires a stable oxidized surface for the reproducibility of the detection [109]. The difficulty with the application of these electrodes lies in relatively high price required for their manufacturing and in the high potential required for oxidation. The potential required to dismute (simultaneous oxidation and reduction) hydrogen peroxide on electrode is + 600 - +1200 mV versus a saturated calomel electrode (SCE) [119]. The potential depends greatly on the nature of the working electrode (platinum, gold, graphite, graphite-polymer composite, etc.). On platinum the oxidation potential is +400 mV [120], which is quite high and needs to be reduced in order to avoid any interference coming from real samples [121]. On carbon electrodes, which are much cheaper than platinum electrodes, the oxidation potential for hydrogen peroxide is even higher (>700mV) [121].
Further reduction of the oxidation potential and enhancement of sensor signal can be achieved by using an enzyme, such as horseradish peroxidase [122]. The simplest electrode type is the one that consists of a layer of peroxidase molecules adsorbed on the electrode surface [123]. The sensor response, measured at the lowering overpotential of 0.6V vs SCE consists of the change in reduction current which is proportional to peroxide concentration. A variety of mediators - small organic molecules capable of lowering the redox potential can be used for facilitating electron transfer between the enzyme catalytic centre and electrode. Mediated amperometric biosensors also have an advantage over non-mediated enzyme electrodes, since the mediator could replace oxygen as an electron acceptor. Hydrogen peroxide detection is known to be affected by oxygen concentration, since the gas is a co-substrate of oxidase-catalyzed reactions (eq. 17).
eq. 17
4.3 Quantum dots incorporation in Biosensors:
QDs have a tremendous attraction because of their unique optical, electrical, thermal and catalytic properties in the field of biosensors. The surface of the QDs can be modified with different functionalizations [124]. The conjugates of QD-ligands make these NPs behave as optical transducers, which can recognize the events occurring at their surfaces [125, 126].
QDs can be used to investigate the biological dynamic processes, such as electron transfer quenching as photophysical probing mechanisms. QD based FRET nanosensors will be particularly appealing for intracellular sensing, where their high photo bleaching thresholds and substantial reduction in direct excitation of dye and fluorescent protein acceptors could permit

23 Introduction
the monitoring of intracellular processes over longer periods of time. [127]. QDs have been shown to be very efficient FRET donors with organic fluorophores, due to the large overlap between the quantum dot emission wavelength and the absorption spectra of the dyes [128, 129]. As the emission characteristics of the QDs can be continuously tuned so it is possible to create a FRET donor for any number of organic dyes that emit between approximately 510 and 640 nm [129-131].
Illuminating the QDs with light makes them photoexcited and the electrons from their valance band jump to their conduction band, resulting in electron-hole pairs or excitons. The electron-hole pairs either recombine radiatively by generating a photon or the electron gets trapped into a surface defect and a long lived electron-hole pair is generated. If the electron of this pair gets transferred to solution solubilized acceptor, and the valance band hole is neutralized by obtaining an electron from the electrode, the cathodic current gets registered. The process can occur in a reverse manner i.e. if a solution solubilized donor donates the electron to compensate the valance band hole and the electron from the conduction band of the QD jump to the electrode an anodic current can be observed (Figure: 11) . So the QDs are photoelectrochemically active [132].
Figure 11: (a) oxidation current and (b) reduction current mediated by QDs
For diverse purposes and conveniences to monitor electrochemical reactions it is feasible to immobilized QDs on the planar substrates. For example in order to observe the redox-reactions of enzymes or proteins mediated by QDs, one needs immobilized QDs on an electrode which have the capacity to conduct.
4.3.1 Fabrication of Quantum Dot functionalized surfaces
Immobilization of QDs onto planar surfaces is important in fabrication of photonic devices and in the design of various sensing platforms. There are two main methods for the deposition of QDs on surfaces. The first method involves covalent coupling between the chemical groups present on the substrate and the functional groups located at the QD surface. The second method is based on non-specific interactions between the substrate and the surface or the nanoparticles, e.g. physio-sorption, electrostatic layer by layer assembly (LbL) etc.

24 Introduction
4.3.1.1 Covalent coupling:
Covalent attachment of nanoparticles is irreversible and usually stable QD layers are obtained. An example of this approach is the coupling of carboxylate-functionalized QDs to amine- terminated glass substrates resulting in relatively dense QD film (Figure 12) [133, 134]. Among other covalent couplings Self assembled monolayers (SAMs) of dithiol molecules is very convenient method to immobilize QDs on planar metal substrates.
Figure 12: immobilization of carboxylate‐functionalized QDs to amine‐ terminated glass substrate (taken from Xu et al.)
4.3.1.1.1 Self-Assembled monolayers:
Another common way to immobilize QDs on gold surfaces is, via self-assembled monolayers (SAMs) of dithiol molecules [135, 136]. One sulfur atom in these functional groups is strongly chemisorbed to gold and the other one assists the anchoring of QD. Piezoelectric and SPR biosensors are mainly based on immobilization of species onto gold surfaces. Gold surfaces can also be found for impedance or amperometric sensors.
eq. 18
The gold sulphur bond is described differently in various publications. In Spangler and Tyler for example, the bond was found to be in-between an electrostatic and covalent bond [137]. In other work, the character and strength of the bond was found to depend on the sulfur compound [138]. The di-sulfur bond in disulfide was found to break down easier than the sulfur-hydrogen bond in thiols. However, thiols were reported to bind to gold under evolution of hydrogen [139].
Thiols, disulphides and sulphides can have simple alkane chains and resulting in non- functionalized SAMs but they can also have a variety of reactive groups. The sulfur chemisorption is not exclusive to gold, but silver, platinum or copper exhibit similar tendencies. The gold surface is a preferred one, when it comes to biosensors, because it has the third best electrical conductivity of all metals at room temperature and its inertness prevent the formation of insulating surface oxides [140, 141]. The monolayer is formed by exposing the gold surface to a solution of thiols. The solvent used is dependent on the sulfur compound. Densely packed monolayers can be observed after one hour, but for highly ordered monolayers a much longer time is usually required. The gold sulfur bond is so strong that even the impurities at the gold
25 Introduction
surface are removed by SAMs [135]. Highly ordered SAMs can be observed, especially for non-functionalized linear alkane thiols with carbon chains longer than 10 atoms. The monolayer is stabilized by van der Waals force in-between the methyl groups [142].
Highly ordered monolayers of SAMs can also be achieved for thiols which are not very long by capping-decapping mechanism. For this technique one side of the dithiol molecule is capped with the acetyl group so that only one side is free to chemisorb on the gold surface [143]. In this way highly ordered SAMs can be established. The decapping of the dithiol molecule or the removal of acetyl group can be performed by a mixture of NaOH and ethanolic solution. Another very effective method to immobilize the dithiol molecules is by immobilizing them on Au surfaces at elevated temperatures. Highly ordered and uniform monolayers can be obtained by this method [144].
For techniques like capacitance measurements, the insulating monolayer is required. Thiols undergo spontaneous chemisorption to form monolayers with high thermal, mechanical and chemical stability. The ability of many thiols and disulfides with different functional groups and spacer length, as well as the ability to form mixed monolayers allows the formation of tailored SAMs for immobilization of QDs. Furthermore depending on the functional group of the SAM, various residues of the biomolecules can be targeted.
Another technique to immobilize the QDs is to modify the QDs surface with the dithiol molecules. This can be achieved via ligand exchange of the surfactants of the QDs by the sulfides of the dithiol molecule. In this way QDs can reside on top of the gold substrate by the chemisorption of the other terminal sulfur molecule on gold surface. However, the ordering of the QDs on top of gold is not very efficient though.
4.3.1.2 Non-covalent Attachments:
4.3.1.2.1 Layer by layer (LbL) adsorption of polyelectrolytes:
Non-covalent attachments of QDs on planar surfaces can be achieved by processes like layer by layer assembly [145, 146], hydrogen bond formation [147] or supramolecular host-guest chemistry.
Owing to the simplicity of the electrostatic assembly this method has been widely used to fabricate multilayered structures including QDs (Figure 13). To be able to use QDs in LbL assembly, the QDs need to be functionalized with charged ligands [146]. Polyelectrolytes are usually the second component of the assembly. The difference in size, morphology and effective charge densities between the multilayer components significantly affect the fabrication process. Additionally, the electrostatically assembled structures are very sensitive to pH, ionic strength, hydrogen bonding and to the concentration of the nanoparticles and of the polyelectrolyte.
26 Introduction
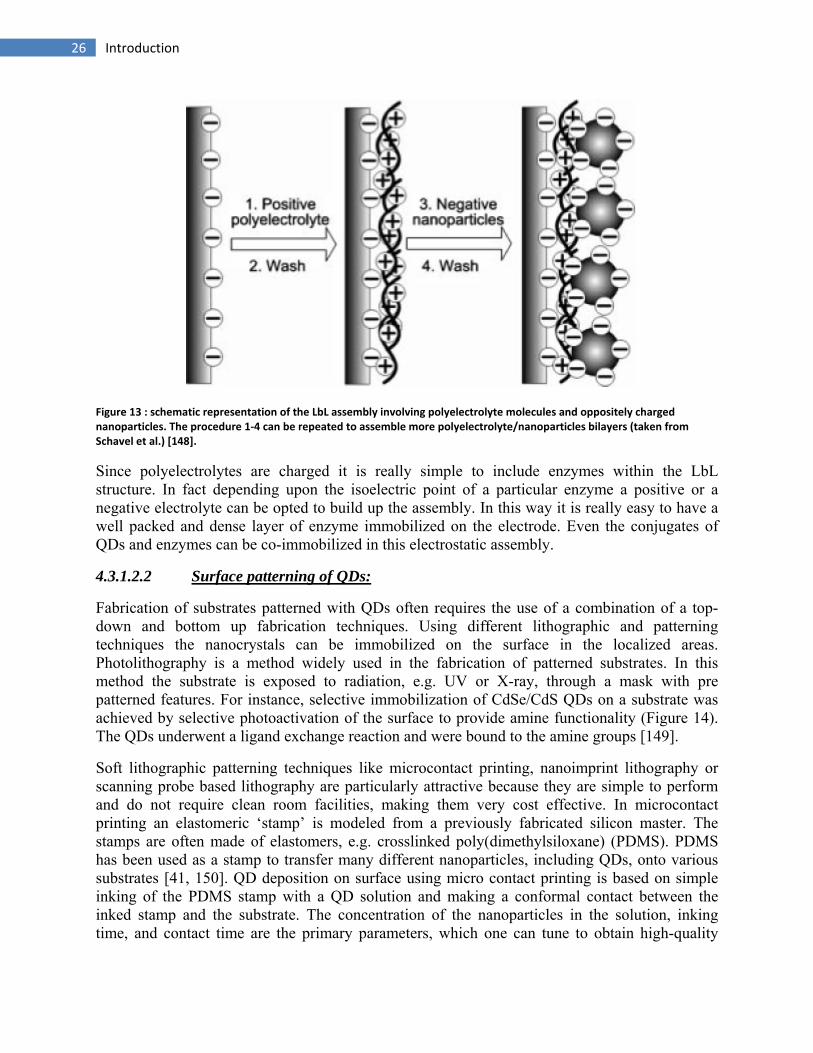
Figure 13 : schematic representation of the LbL assembly involving polyelectrolyte molecules and oppositely charged nanoparticles. The procedure 1‐4 can be repeated to assemble more polyelectrolyte/nanoparticles bilayers (taken from Schavel et al.) [148].
Since polyelectrolytes are charged it is really simple to include enzymes within the LbL structure. In fact depending upon the isoelectric point of a particular enzyme a positive or a negative electrolyte can be opted to build up the assembly. In this way it is really easy to have a well packed and dense layer of enzyme immobilized on the electrode. Even the conjugates of QDs and enzymes can be co-immobilized in this electrostatic assembly.
4.3.1.2.2 Surface patterning of QDs:
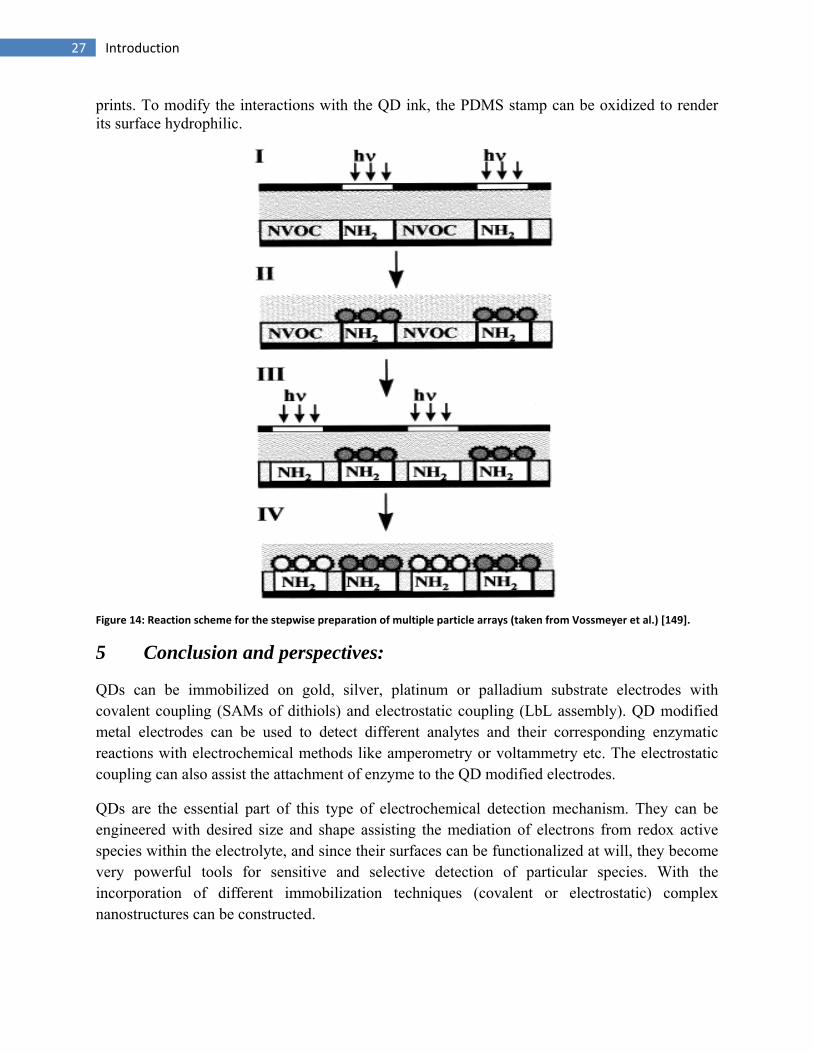
Fabrication of substrates patterned with QDs often requires the use of a combination of a top- down and bottom up fabrication techniques. Using different lithographic and patterning techniques the nanocrystals can be immobilized on the surface in the localized areas. Photolithography is a method widely used in the fabrication of patterned substrates. In this method the substrate is exposed to radiation, e.g. UV or X-ray, through a mask with pre patterned features. For instance, selective immobilization of CdSe/CdS QDs on a substrate was achieved by selective photoactivation of the surface to provide amine functionality (Figure 14). The QDs underwent a ligand exchange reaction and were bound to the amine groups [149].
Soft lithographic patterning techniques like microcontact printing, nanoimprint lithography or scanning probe based lithography are particularly attractive because they are simple to perform and do not require clean room facilities, making them very cost effective. In microcontact printing an elastomeric ‘stamp’ is modeled from a previously fabricated silicon master. The stamps are often made of elastomers, e.g. crosslinked poly(dimethylsiloxane) (PDMS). PDMS has been used as a stamp to transfer many different nanoparticles, including QDs, onto various substrates [41, 150]. QD deposition on surface using micro contact printing is based on simple inking of the PDMS stamp with a QD solution and making a conformal contact between the inked stamp and the substrate. The concentration of the nanoparticles in the solution, inking time, and contact time are the primary parameters, which one can tune to obtain high-quality
27 Introduction
prints. To modify the interactions with the QD ink, the PDMS stamp can be oxidized to render its surface hydrophilic.
Figure 14: Reaction scheme for the stepwise preparation of multiple particle arrays (taken from Vossmeyer et al.) [149].
5 Conclusion and perspectives:
QDs can be immobilized on gold, silver, platinum or palladium substrate electrodes with covalent coupling (SAMs of dithiols) and electrostatic coupling (LbL assembly). QD modified metal electrodes can be used to detect different analytes and their corresponding enzymatic reactions with electrochemical methods like amperometry or voltammetry etc. The electrostatic coupling can also assist the attachment of enzyme to the QD modified electrodes.
QDs are the essential part of this type of electrochemical detection mechanism. They can be engineered with desired size and shape assisting the mediation of electrons from redox active species within the electrolyte, and since their surfaces can be functionalized at will, they become very powerful tools for sensitive and selective detection of particular species. With the incorporation of different immobilization techniques (covalent or electrostatic) complex nanostructures can be constructed.
28 Introduction
Since the selectivity to detect a particular analyte depends upon the material of the QD. Alongside functionalizations it is also possible to synthesize hybrid systems of metal-semiconductor or magnetic-semiconductor QDs [151]. Hybrid QDs not only give versatility but also allow constructing a compact system.
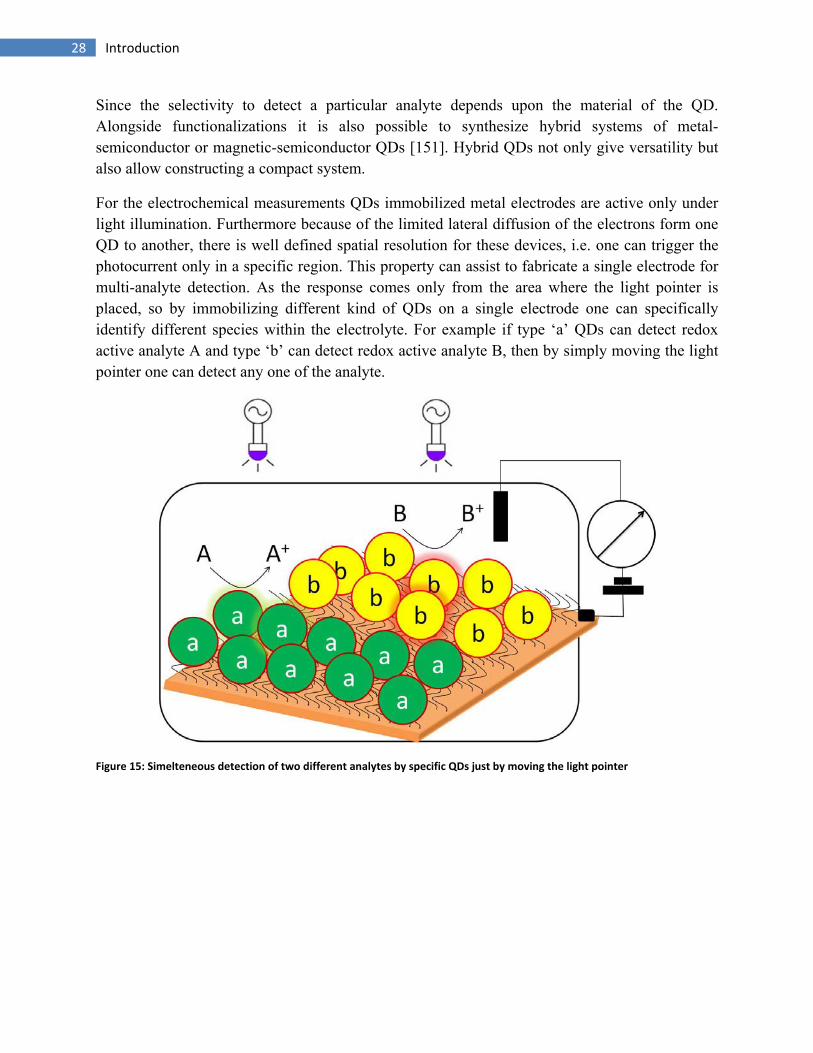
For the electrochemical measurements QDs immobilized metal electrodes are active only under light illumination. Furthermore because of the limited lateral diffusion of the electrons form one QD to another, there is well defined spatial resolution for these devices, i.e. one can trigger the photocurrent only in a specific region. This property can assist to fabricate a single electrode for multi-analyte detection. As the response comes only from the area where the light pointer is placed, so by immobilizing different kind of QDs on a single electrode one can specifically identify different species within the electrolyte. For example if type ‘a’ QDs can detect redox active analyte A and type ‘b’ can detect redox active analyte B, then by simply moving the light pointer one can detect any one of the analyte.
Figure 15: Simelteneous detection of two different analytes by specific QDs just by moving the light pointer

29 Introduction
6 List of publications and Author’s contribution:
A Waqas Khalid, Gero Göbel, Dominik Hühn, Jose Maria Montenegro, Pialr Rivera Gil, Fred Lisdat, Wolfgang J. Parak. ´´Light triggered detection of aminophenyl phosphate with a quantum dot based enzyme electrode``. (Submitted in SMALL)
Electrode preparation, synthesis of p-aminophenyl phosphate, optical characterization of QDs by UV-Vis and fluorescence spectrometer, attachment of enzyme via layer by layer assembly on QD modified gold electrode and data evaluation.
B Zhao Yue, Waqas Khalid, Marco Zanella, Azhar Zahoor Abbasi, Andrea Pfreundt, Pilar
Rivera Gil, Kirsten Schubert, Fred Lisdat, Wolfgang J. Parak.´´Evaluation of quantum dots applied as switchable layerin a light-controlled electrochemical sensor.``Anal. Bioanal. Chem. 2010, 396, 1095-1103.
Electrode preparation, optical characterization of QDs by UV-Vis and fluorescence spectrometer and data evaluation.
C Kirsten Schubert, Waqas Khalid, Zhao Yue, Wolfgang J. Parak, Fred Lisdat. ´´Quantum
Dot-Modified Electrode for the Detection of NAD-Dependent Dehydrogenase Reactions``. Langmuir, 2010, 26, 1395-1400.
Synthesis of QDs and optical characterization by UV-Vis and fluorescence spectrometer. D Gero Göbel, Kirsten Schubert, Ivo W. Schubart, Waqas Khalid, Wolfgang J. Parak, Fred
Lisdat. ´´ Enhanced photocurrent generation with quantum dots containing multilayers on gold``. Electrochimica Acta, 2011, 56, 6397-6400.
Ligand exchange of QDs resulting in the phase transformation of QDs from toluene to phosphate buffer solution and optical characterization by UV-Vis and fluorescence spectrometer.
E Johannes Tanne, Daniel Schäfer, Waqas Khalid, Wolfgang J. Parak, Fred Lisdat. ´´Light
controlled bioelectrochemical sensor based on CdSe/ZnS quantum dots``. (Submitted in Analytical Chemistry)
Synthesis and phase transformation of QDs and optical characterization by UV-Vis and fluorescence spectrometer.
F Waqas Khalid, Mira El Helou, T Murböck, Jose Maria Montenegro, Kirsten Schubert, Gero Göbel, Fred Lisdat, Gregor Witte, Wolfgang J. Parak, ´´ Immobilization of quantum dots via different self assembled monolayers and their application as a light-controlled sensor for the detection of hydrogen peroxide`` (in preperation).
Electrode preparation, synthesis of capped dithiol molecules, optical characterization of QDs by UV-Vis and fluorescence spectrometer and data evaluation.

30 Introduction
7 References:
1. Zhang, J.Z., Ultrafast studies of electron dynamics in semiconductor and metal colloidal nanoparticles: Effects of size and surface. Accounts of Chemical Research, 1997. 30(10): p. 423‐429.
2. El‐Sayed, M.A., Some interesting properties of metals confined in time and nanometer space of different shapes. Accounts of Chemical Research, 2001. 34(4): p. 257‐264.
3. Daniel, M.C. and D. Astruc, Gold nanoparticles: Assembly, supramolecular chemistry, quantum‐size‐related properties, and applications toward biology, catalysis, and nanotechnology. Chemical Reviews, 2004. 104(1): p. 293‐346.
4. Valden, M., X. Lai, and D.W. Goodman, Onset of catalytic activity of gold clusters on titania with the appearance of nonmetallic properties. Science, 1998. 281(5383): p. 1647‐1650.
5. Chen, M.S. and D.W. Goodman, The structure of catalytically active gold on titania. Science, 2004. 306(5694): p. 252‐255.
6. Jiang, Z.J., C.Y. Liu, and L.W. Sun, Catalytic properties of silver nanoparticles supported on silica spheres. Journal of Physical Chemistry B, 2005. 109(5): p. 1730‐1735.
7. Zhou, Q., et al., Two‐dimensional assembly of silver nanoparticles for catalytic reduction of 4‐nitroaniline. Thin Solid Films, 2008. 516(6): p. 953‐956.
8. Chakraverty, S. and M. Bandyopadhyay, Coercivity of magnetic nanoparticles: a stochastic model. Journal of Physics‐Condensed Matter, 2007. 19(21).
9. Jishi, R.A., M.S. Dresselhaus, and G. Dresselhaus, SYMMETRY PROPERTIES OF CHIRAL CARBON NANOTUBES. Physical Review B, 1993. 47(24): p. 16671‐16674.
10. Li, J., et al., Electronic properties of multiwalled carbon nanotubes in an embedded vertical array. Applied Physics Letters, 2002. 81(5): p. 910‐912.
11. Resch‐Genger, U., et al., Quantum dots versus organic dyes as fluorescent labels. Nature Methods, 2008. 5(9): p. 763‐775.
12. Bimberg, D., Quantum dots for lasers, amplifiers and computing. Journal of Physics D‐Applied Physics, 2005. 38(13): p. 2055‐2058.
13. Park, N.M., T.S. Kim, and S.J. Park, Band gap engineering of amorphous silicon quantum dots for light‐emitting diodes. Applied Physics Letters, 2001. 78(17): p. 2575‐2577.
14. Aroutiounian, V., et al., Quantum dot solar cells. Journal of Applied Physics, 2001. 89(4): p. 2268‐2271.
15. Sun, C., J.S.H. Lee, and M.Q. Zhang, Magnetic nanoparticles in MR imaging and drug delivery. Advanced Drug Delivery Reviews, 2008. 60(11): p. 1252‐1265.
16. Moniruzzaman, M. and K.I. Winey, Polymer nanocomposites containing carbon nanotubes. Macromolecules, 2006. 39(16): p. 5194‐5205.
17. Hasegawa, R., Advances in amorphous and nanocrystalline magnetic materials. Journal of Magnetism and Magnetic Materials, 2006. 304(2): p. 187‐191.
18. Baddour, C. and C. Briens, Carbon nanotube synthesis: A review. International Journal of Chemical Reactor Engineering, 2005. 3.
19. Hamad, S. and C.R.A. Catlow, Computational study of the relative stabilities of ZnS clusters, for sizes between 1 and 4 nm. Journal of Crystal Growth, 2006. 294(1): p. 2‐8.
20. Bahaa E. A. Saleh and M.C. Teich, Fundamental of Photonics. 1991.
31 Introduction
21. Rosi, N.L. and C.A. Mirkin, Nanostructures in biodiagnostics. Chemical Reviews, 2005. 105(4): p. 1547‐1562.
22. Du, D., et al., Development of acetylcholinesterase biosensor based on CdTe quantum dots modified cysteamine self‐assembled monolayers. Journal of Electroanalytical Chemistry, 2008. 623(1): p. 81‐85.
23. Granot, E., F. Patolsky, and I. Willner, Electrochemical assembly of a CdS semiconductor nanoparticle monolayer on surfaces: Structural properties and photoelectrochemical applications. Journal of Physical Chemistry B, 2004. 108(19): p. 5875‐5881.
24. Brus, L.E., ON THE DEVELOPMENT OF BULK OPTICAL‐PROPERTIES IN SMALL SEMICONDUCTOR CRYSTALLITES. Journal of Luminescence, 1984. 31‐2(DEC): p. 381‐384.
25. Alivisatos, A.P., Scaling law for structural metastability in semiconductor nanocrystals. Berichte Der Bunsen‐Gesellschaft‐Physical Chemistry Chemical Physics, 1997. 101(11): p. 1573‐1577.
26. Alivisatos, A.P., Perspectives on the physical chemistry of semiconductor nanocrystals. Journal of Physical Chemistry, 1996. 100(31): p. 13226‐13239.
27. Colvin, V.L., M.C. Schlamp, and A.P. Alivisatos, LIGHT‐EMITTING‐DIODES MADE FROM CADMIUM SELENIDE NANOCRYSTALS AND A SEMICONDUCTING POLYMER. Nature, 1994. 370(6488): p. 354‐357.
28. http://www.sigmaaldrich.com/etc/medialib/docs/Aldrich/Brouchre/al material matters v2n1.Par.0001.File.tmp/al material matters v2n1.pdf
29. Klein, D.L., et al., A single‐electron transistor made from a cadmium selenide nanocrystal. Nature, 1997. 389(6652): p. 699‐701.
30. Coe, S., et al., Electroluminescence from single monolayers of nanocrystals in molecular organic devices. Nature, 2002. 420(6917): p. 800‐803.
31. McDonald, S.A., et al., Solution‐processed PbS quantum dot infrared photodetectors and photovoltaics. Nature Materials, 2005. 4(2): p. 138‐U14.
32. Chan, W.C.W. and S.M. Nie, Quantum dot bioconjugates for ultrasensitive nonisotopic detection. Science, 1998. 281(5385): p. 2016‐2018.
33. Bruchez, M., et al., Semiconductor nanocrystals as fluorescent biological labels. Science, 1998. 281(5385): p. 2013‐2016.
34. Dubertret, B., et al., In vivo imaging of quantum dots encapsulated in phospholipid micelles. Science, 2002. 298(5599): p. 1759‐1762.
35. Gao, X.H., et al., In vivo cancer targeting and imaging with semiconductor quantum dots. Nature Biotechnology, 2004. 22(8): p. 969‐976.
36. Michalet, X., et al., Quantum dots for live cells, in vivo imaging, and diagnostics. Science, 2005. 307(5709): p. 538‐544.
37. Medintz, I.L., et al., Self‐assembled nanoscale biosensors based on quantum dot FRET donors. Nature Materials, 2003. 2(9): p. 630‐638.
38. Anikeeva, N., et al., Quantum dot/peptide‐MHC biosensors reveal strong CD8‐dependent cooperation between self and viral antigens that augment the T cell response. Proceedings of the National Academy of Sciences of the United States of America, 2006. 103(45): p. 16846‐16851.
39. Raymo, F.M. and I. Yildiz, Luminescent chemosensors based on semiconductor quantum dots. Physical Chemistry Chemical Physics, 2007. 9(17): p. 2036‐2043.
32 Introduction
40. Somers, R.C., M.G. Bawendi, and D.G. Nocera, CdSe nanocrystal based chem‐/bio‐sensors. Chemical Society Reviews, 2007. 36(4): p. 579‐591.
41. Kim, L., et al., Contact Printing of Quantum Dot Light‐Emitting Devices. Nano Letters, 2008. 8(12): p. 4513‐4517.
42. Dabbousi, B.O., et al., ELECTROLUMINESCENCE FROM CDSE QUANTUM‐DOT POLYMER COMPOSITES. Applied Physics Letters, 1995. 66(11): p. 1316‐1318.
43. Schlamp, M.C., X.G. Peng, and A.P. Alivisatos, Improved efficiencies in light emitting diodes made with CdSe(CdS) core/shell type nanocrystals and a semiconducting polymer. Journal of Applied Physics, 1997. 82(11): p. 5837‐5842.
44. Kudera, S., et al., Sequential growth of magic‐size CdSe nanocrystals. Advanced Materials, 2007. 19(4): p. 548‐+.
45. Nozik, A.J., Quantum dot solar cells. Physica E‐Low‐Dimensional Systems & Nanostructures, 2002. 14(1‐2): p. 115‐120.
46. Plass, R., et al., Quantum dot sensitization of organic‐inorganic hybrid solar cells. Journal of Physical Chemistry B, 2002. 106(31): p. 7578‐7580.
47. Huynh, W.U., J.J. Dittmer, and A.P. Alivisatos, Hybrid nanorod‐polymer solar cells. Science, 2002. 295(5564): p. 2425‐2427.
48. Wang, P., et al., Photoinduced charge transfer and efficient solar energy conversion in a blend of a red polyfluorene copolymer with CdSe nanoparticles. Nano Letters, 2006. 6(8): p. 1789‐1793.
49. Huffaker, D.L., et al., 1.3 mu m room‐temperature GaAs‐based quantum‐dot laser. Applied Physics Letters, 1998. 73(18): p. 2564‐2566.
50. Hotchandani, S. and P.V. Kamat, CHARGE‐TRANSFER PROCESSES IN COUPLED SEMICONDUCTOR SYSTEMS ‐ PHOTOCHEMISTRY AND PHOTOELECTROCHEMISTRY OF THE COLLOIDAL CDS‐ZNO SYSTEM. Journal of Physical Chemistry, 1992. 96(16): p. 6834‐6839.
51. Vogel, R., P. Hoyer, and H. Weller, QUANTUM‐SIZED PBS, CDS, AG2S, SB2S3, AND BI2S3 PARTICLES AS SENSITIZERS FOR VARIOUS NANOPOROUS WIDE‐BANDGAP SEMICONDUCTORS. Journal of Physical Chemistry, 1994. 98(12): p. 3183‐3188.
52. Jayagopal, A., P.K. Russ, and F.R. Haselton, Surface engineering of quantum dots for in vivo vascular Imaging. Bioconjugate Chemistry, 2007. 18(5): p. 1424‐1433.
53. Giraud, G., et al., Fluorescence Lifetime Imaging of Quantum Dot Labeled DNA Microarrays. International Journal of Molecular Sciences, 2009. 10(4): p. 1930‐1941.
54. Jaiswal, J.K., et al., Long‐term multiple color imaging of live cells using quantum dot bioconjugates. Nature Biotechnology, 2003. 21(1): p. 47‐51.
55. Dahan, M., et al., Diffusion dynamics of glycine receptors revealed by single‐quantum dot tracking. Science, 2003. 302(5644): p. 442‐445.
56. Larson, D.R., et al., Water‐soluble quantum dots for multiphoton fluorescence imaging in vivo. Science, 2003. 300(5624): p. 1434‐1436.
57. Derfus, A.M., W.C.W. Chan, and S.N. Bhatia, Probing the cytotoxicity of semiconductor quantum dots. Nano Letters, 2004. 4(1): p. 11‐18.
58. Botsoa, J., et al., Application of 3C‐SiC quantum dots for living cell imaging. Applied Physics Letters, 2008. 92(17).
33 Introduction
59. Hu, Y., et al., Nanodevices in diagnostics. Wiley Interdisciplinary Reviews‐Nanomedicine and Nanobiotechnology, 2011. 3(1): p. 11‐32.
60. Goldman, E.R., et al., A hybrid quantum dot‐antibody fragment fluorescence resonance energy transfer‐based TNT sensor. Journal of the American Chemical Society, 2005. 127(18): p. 6744‐6751.
61. Jin, W.J., et al., Photoactivated luminescent CdSe quantum dots as sensitive cyanide probes in aqueous solutions. Chemical Communications, 2005(7): p. 883‐885.
62. Fernandez‐Arguelles, M.T., et al., Surface‐modified CdSe quantum dots for the sensitive and selective determination of Cu(II) in aqueous solutions by luminescent measurements. Analytica Chimica Acta, 2005. 549(1‐2): p. 20‐25.
63. Tomasulo, M., et al., pH‐sensitive ligand for luminescent quantum dots. Langmuir, 2006. 22(24): p. 10284‐10290.
64. Guasto, J.S., P. Huang, and K.S. Breuer, Statistical particle tracking velocimetry using molecular and quantum dot tracer particles. Experiments in Fluids, 2006. 41(6): p. 869‐880.
65. Guasto, J.S. and K.S. Breuer, Simultaneous, ensemble‐averaged measurement of near‐wall temperature and velocity in steady micro‐flows using single quantum dot tracking. Experiments in Fluids, 2008. 45(1): p. 157‐166.
66. Lin, Y.H., et al., A study of quantum confinement properties of photogenerated charges in ZnO nanoparticles by surface photovoltage spectroscopy. Journal of Physical Chemistry B, 2004. 108(10): p. 3202‐3206.
67. Burda, C., et al., Chemistry and properties of nanocrystals of different shapes. Chemical Reviews, 2005. 105(4): p. 1025‐1102.
68. Medintz, I.L., et al., Quantum dot bioconjugates for imaging, labelling and sensing. Nature Materials, 2005. 4(6): p. 435‐446.
69. Ronkainen, N.J., H.B. Halsall, and W.R. Heineman, Electrochemical biosensors. Chem Soc Rev, 2010. 39(5): p. 1747‐63.
70. Dennison, M.J. and A.P.F. Turner, BIOSENSORS FOR ENVIRONMENTAL MONITORING. Biotechnology Advances, 1995. 13(1): p. 1‐12.
71. O'Connell, P.J. and G.G. Guilbault, Future trends in biosensor research. Analytical Letters, 2001. 34(7): p. 1063‐1078.
72. Cass, A.E.G., et al., FERROCENE‐MEDIATED ENZYME ELECTRODE FOR AMPEROMETRIC DETERMINATION OF GLUCOSE. Analytical Chemistry, 1984. 56(4): p. 667‐671.
73. Voss, D.O., J.C. Cowles, and M. Bacila, A NEW OXYGEN ELECTRODE MODEL FOR THE POLAROGRAPHIC ASSAY OF CELLULAR AND MITOCHONDRIAL RESPIRATION. Anal Biochem, 1963. 6: p. 211‐22.
74. Grieshaber, D., et al., Electrochemical biosensors ‐ Sensor principles and architectures. Sensors, 2008. 8(3): p. 1400‐1458.
75. Wolfbeis, O.S., OPTICAL SENSING BASED ON ANALYTE RECOGNITION BY ENZYMES, CARRIERS AND MOLECULAR‐INTERACTIONS. Analytica Chimica Acta, 1991. 250(1): p. 181‐201.
76. Gorton, L., CARBON‐PASTE ELECTRODES MODIFIED WITH ENZYMES, TISSUES, AND CELLS. Electroanalysis, 1995. 7(1): p. 23‐45.

34 Introduction
77. Tothill, I.E., Biosensors developments and potential applications in the agricultural diagnosis sector. Computers and Electronics in Agriculture, 2001. 30(1‐3): p. 205‐218.
78. Magner, E., Trends in electrochemical biosensors. Analyst, 1998. 123(10): p. 1967‐1970. 79. Connolly, P., CLINICAL DIAGNOSTICS OPPORTUNITIES FOR BIOSENSORS AND
BIOELECTRONICS. Biosensors & Bioelectronics, 1995. 10(1‐2): p. 1‐6. 80. Coulet, P.R. and L.J. Blum, BIOLUMINESCENCE CHEMILUMINESCENCE BASED SENSORS.
Trac‐Trends in Analytical Chemistry, 1992. 11(2): p. 57‐61. 81. Thevenot, D.R., et al., Electrochemical biosensors: Recommended definitions and
classification. Analytical Letters, 2001. 34(5): p. 635‐659. 82. Stetter, J.R., W.R. Penrose, and S. Yao, Sensors, chemical sensors, electrochemical
sensors, and ECS. Journal of the Electrochemical Society, 2003. 150(2): p. S11‐S16. 83. Pohanka, M. and P. Skladai, Electrochemical biosensors ‐ principles and applications.
Journal of Applied Biomedicine, 2008. 6(2): p. 57‐64. 84. Chambon, L., et al., A metallic oxide gas sensor array for a selective detection of the CO
and NH3 gases. Sensors and Actuators B‐Chemical, 1999. 60(2‐3): p. 138‐147. 85. Currie, J.F., A. Essalik, and J.C. Marusic, Micromachined thin film solid state
electrochemical CO2, NO2 and SO2 gas sensors. Sensors and Actuators B‐Chemical, 1999. 59(2‐3): p. 235‐241.
86. Shimizu, Y. and N. Yamashita, Solid electrolyte CO2 sensor using NASICON and perovskite‐type oxide electrode. Sensors and Actuators B‐Chemical, 2000. 64(1‐3): p. 102‐106.
87. Guilbaul.Gg and J.G. Montalvo, A UREA‐SPECIFIC ENZYME ELECTRODE. Journal of the American Chemical Society, 1969. 91(8): p. 2164‐&.
88. Gao, H.Y., et al., Capillary enzyme immunoassay with electrochemical detection for determining indole‐3‐acetic acid in tomato embryos. Fresenius Journal of Analytical Chemistry, 1999. 364(1‐2): p. 170‐174.
89. Wijayawardhana, C.A., H.B. Halsall, and R. Heineman, Micro volume rotating disk electrode (RDE) amperometric detection for a bead‐based immunoassay. Analytica Chimica Acta, 1999. 399(1‐2): p. 3‐11.
90. Cunningh.Aj and Underwoo.Al, CYCLIC VOLTAMMETRY OF PYRIDINE NUCLEOTIDES AND A SERIES OF NICOTINAMIDE MODEL COMPOUNDS. Biochemistry, 1967. 6(1): p. 266‐&.
91. Mabbott, G.A., AN INTRODUCTION TO CYCLIC VOLTAMMETRY. Journal of Chemical Education, 1983. 60(9): p. 697‐702.
92. Barry, R.C., et al., Nanotechnology‐based electrochemical sensors for biomonitoring chemical exposures. Journal of Exposure Science and Environmental Epidemiology, 2009. 19(1): p. 1‐18.
93. Hellerman, L., M.E. Perkins, and W.M. Clark, Urease activity as influenced by oxidation and reduction. Proceedings of the National Academy of Sciences of the United States of America, 1933. 19: p. 855‐860.
94. Ngo, T.T. and H.M. Lenhoff, ENZYMES AS VERSATILE LABELS AND SIGNAL AMPLIFIERS FOR MONITORING IMMUNOCHEMICAL REACTIONS. Molecular and Cellular Biochemistry, 1982. 44(1): p. 3‐12.
95. http://www.drkaslow.com/html/alkaline_phosphatase.html. 96. http://www.vet.uga.edu/VPP/clerk/raymond/index.php.
35 Introduction
97. Frew, J.E., et al., MEASUREMENT OF ALKALINE‐PHOSPHATASE ACTIVITY BY ELECTROCHEMICAL DETECTION OF PHOSPHATE‐ESTERS ‐ APPLICATION TO AMPEROMETRIC ENZYME‐IMMUNOASSAY. Journal of Electroanalytical Chemistry, 1989. 266(2): p. 309‐316.
98. Neumann, H. and Vanvreed.M, AN IMPROVED ALKALINE PHOSPHATASE DETERMINATION WITH P‐NITROPHENYL PHOSPHATE. Clinica Chimica Acta, 1967. 17(2): p. 183‐&.
99. Tang, H.T., et al., P‐AMINOPHENYL PHOSPHATE ‐ AN IMPROVED SUBSTRATE FOR ELECTROCHEMICAL ENZYME‐IMMUNOASSAY. Analytica Chimica Acta, 1988. 214(1‐2): p. 187‐195.
100. Bauer, C.G., et al., Zeptomole‐detecting biosensor for alkaline phosphatase in an electrochemical immunoassay for 2,4‐dichlorophenoxyacetic acid. Analytical Chemistry, 1996. 68(15): p. 2453‐2458.
101. Tang, J.L., et al., Lipid membrane immobilized horseradish peroxidase biosensor for amperometric determination of hydrogen peroxide. Biosensors & Bioelectronics, 2003. 18(7): p. 867‐872.
102. Davis, G., ELECTROCHEMICAL TECHNIQUES FOR THE DEVELOPMENT OF AMPEROMETRIC BIOSENSORS. Biosensors, 1985. 1(2): p. 161‐178.
103. Vreeke, M., R. Maidan, and A. Heller, HYDROGEN‐PEROXIDE AND BETA‐NICOTINAMIDE ADENINE‐DINUCLEOTIDE SENSING AMPEROMETRIC ELECTRODES BASED ON ELECTRICAL CONNECTION OF HORSERADISH‐PEROXIDASE REDOX CENTERS TO ELECTRODES THROUGH A 3‐DIMENSIONAL ELECTRON RELAYING POLYMER NETWORK. Analytical Chemistry, 1992. 64(24): p. 3084‐3090.
104. Akgol, S. and E. Dinckaya, A novel biosensor for specific determination of hydrogen peroxide: catalase enzyme electrode based on dissolved oxygen probe. Talanta, 1999. 48(2): p. 363‐367.
105. Schumb, W.E., C.N. Stratterfield, and R.L. Wentworth, Hydrogen peroxide. 1995: Van Nostrand Reinhold, New York, N. Y.
106. Vijayakumar, A., et al., Comparison of carbon paste electrodes modified with native and polyethylene glycol derivatized horseradish peroxidases for the amperometric monitoring of H2O2. Sensors and Actuators B: Chemical, 1996. 37(1‐2): p. 97‐102.
107. Petit, C., A. Gonzalez‐Cortes, and J.M. Kauffmann, Preparation and characterization of a new enzyme electrode based on solid paraffin and activated graphite particles. Talanta, 1995. 42(11): p. 1783‐1789.
108. Hale, P.D., et al., Amperometric glycolate sensors based on glycolate oxidase and polymeric electron transfer mediators. Analytica Chimica Acta, 1990. 228: p. 31‐37.
109. Erlenkötter, A., M. Kottbus, and G.‐C. Chemnitius, Flexible amperometric transducers for biosensors based on a screen printed three electrode system. Journal of Electroanalytical Chemistry, 2000. 481(1): p. 82‐94.
110. Young, S.J., et al., The non‐specific inhibition of enzymes by environmental pollutants: a study of a model system towards the development of electrochemical biosensor arrays. Biosensors and Bioelectronics, 2001. 16(9‐12): p. 887‐894.

36 Introduction
111. Setford, S.J., S.F. White, and J.A. Bolbot, Measurement of protein using an electrochemical bi‐enzyme sensor. Biosensors and Bioelectronics, 2002. 17(1‐2): p. 79‐86.
112. Varma, S. and C.K. Mitra, Bioelectrochemical studies on catalase modified glassy carbon paste electrodes. Electrochemistry Communications, 2002. 4(2): p. 151‐157.
113. Zhou, M., et al., A Stable Nonfluorescent Derivative of Resorufin for the Fluorometric Determination of Trace Hydrogen Peroxide: Applications in Detecting the Activity of Phagocyte NADPH Oxidase and Other Oxidases. Analytical Biochemistry, 1997. 253(2): p. 162‐168.
114. Sasso, S.V., et al., Electropolymerized 1,2‐diaminobenzene as a means to prevent interferences and fouling and to stabilize immobilized enzyme in electrochemical biosensors. Analytical Chemistry, 1990. 62(11): p. 1111‐1117.
115. Zhang, Y., et al., Elimination of the Acetaminophen Interference in an Implantable Glucose Sensor. Analytical Chemistry, 1994. 66(7): p. 1183‐1188.
116. Johnston, D.A., M.F. Cardosi, and D.H. Vaughan, The electrochemistry of hydrogen peroxide on evaporated gold/palladium composite electrodes. Manufacture and electrochemical characterization. Electroanalysis, 1995. 7(6): p. 520‐526.
117. Newman, J.D., et al., Catalytic Materials, Membranes, and Fabrication Technologies Suitable for the Construction of Amperometric Biosensors. Analytical Chemistry, 1995. 67(24): p. 4594‐4599.
118. Arjsiriwat, S., et al., Metal‐dispersed conducting polymer‐coated electrode used for oxidase‐based biosensors. Electrochemistry Communications, 2000. 2(6): p. 441‐444.
119. Hendry, S.P., I.J. Higgins, and J.V. Bannister, Amperometric biosensors. Journal of Biotechnology, 1990. 15(3): p. 229‐238.
120. Hall, S.B., E.A. Khudaish, and A.L. Hart, Electrochemical oxidation of hydrogen peroxide at platinum electrodes. Part 1. An adsorption‐controlled mechanism. Electrochimica Acta, 1997. 43(5‐6): p. 579‐588.
121. Morales, A., et al., Hydrogen peroxide amperometric biosensor based on a peroxidase‐graphite‐epoxy biocomposite. Analytica Chimica Acta, 1996. 332(2‐3): p. 131‐138.
122. Turner., A.P.F., Advances in Biosensors. Vol. 2. 1992: JAI Press. 123. Ruzgas, T., et al., Peroxidase‐modified electrodes: Fundamentals and application.
Analytica Chimica Acta, 1996. 330(2‐3): p. 123‐138. 124. Xing, Y., et al., Bioconjugated quantum dots for multiplexed and quantitative
immunohistochemistry. Nature Protocols, 2007. 2(5): p. 1152‐1165. 125. Willner, I., B. Willner, and E. Katz, Biomolecule‐nanoparticle hybrid systems for
bioelectronic applications. Bioelectrochemistry, 2007. 70(1): p. 2‐11. 126. Baron, R., B. Willner, and I. Willner, Biomolecule‐nanoparticle hybrids as functional units
for nanobiotechnology. Chemical Communications, 2007(4): p. 323‐332. 127. D. M. Willard and A.V. Orden, Nature Materials, 2003. 2: p. 575‐576. 128. Tran, P.T., et al., Use of luminescent CdSe‐ZnS nanocrystal bioconjugates in quantum
dot‐based nanosensors. Physica Status Solidi B‐Basic Research, 2002. 229(1): p. 427‐432. 129. Clapp, A.R., et al., Fluorescence resonance energy transfer between quantum dot donors
and dye‐labeled protein acceptors. Journal of the American Chemical Society, 2004. 126(1): p. 301‐310.

37 Introduction
130. Niebling, T., et al., Excitation dynamics in polymer‐coated semiconductor quantum dots with integrated dye molecules: The role of reabsorption. Journal of Applied Physics, 2009. 106(10).
131. Clapp, A.R., I.L. Medintz, and H. Mattoussi, Forster resonance energy transfer investigations using quantum‐dot fluorophores. Chemphyschem, 2006. 7(1): p. 47‐57.
132. Kamat, P.V., Meeting the clean energy demand: Nanostructure architectures for solar energy conversion. Journal of Physical Chemistry C, 2007. 111(7): p. 2834‐2860.
133. Shavel, A., N. Gaponik, and A. Eychmuller, Covalent linking of CdTe nanocrystals to amino‐functionalized surfaces. Chemphyschem, 2005. 6(3): p. 449‐451.
134. Xu, H., et al., Recognition‐directed orthogonal self‐assembly of polymers and nanoparticles on patterned surfaces. Journal of the American Chemical Society, 2006. 128(10): p. 3162‐3163.
135. Wink, T., et al., Self‐assembled monolayers for biosensors. Analyst, 1997. 122(4): p. R43‐R50.
136. Vaughan, R.D., C.K. O'Sullivan, and G.G. Guilbault, Sulfur based self‐assembled monolayers (SAM's) on piezoelectric crystals for immunosensor development. Fresenius Journal of Analytical Chemistry, 1999. 364(1‐2): p. 54‐57.
137. Spangler, B.D. and B.J. Tyler, Capture agents for a quartz crystal microbalance‐continuous flow biosensor: functionalized self‐assembled monolayers on gold. Analytica Chimica Acta, 1999. 399(1‐2): p. 51‐62.
138. Nuzzo, R.G., B.R. Zegarski, and L.H. Dubois, FUNDAMENTAL‐STUDIES OF THE CHEMISORPTION OF ORGANOSULFUR COMPOUNDS ON AU(111) ‐ IMPLICATIONS FOR MOLECULAR SELF‐ASSEMBLY ON GOLD SURFACES. Journal of the American Chemical Society, 1987. 109(3): p. 733‐740.
139. Himmel, H.J. and C. Woll, Preparation of thin organic films. Chemie in Unserer Zeit, 1998. 32(6): p. 294‐300.
140. Rodgers, P.J. and S. Amemiya, Cyclic voltammetry at micropipet electrodes for the study of ion‐transfer kinetics at liquid/liquid interfaces. Analytical Chemistry, 2007. 79(24): p. 9276‐9285.
141. Yang, N.J. and X.X. Wang, Thin self‐assembled monolayer for voltarnmetrically monitoring nicotinic acid in food. Colloids and Surfaces B‐Biointerfaces, 2008. 61(2): p. 277‐281.
142. Gooding, J.J. and D.B. Hibbert, The application of alkanethiol self‐assembled monolayers to enzyme electrodes. Trac‐Trends in Analytical Chemistry, 1999. 18(8): p. 525‐533.
143. Azzam, W., et al., Bonding and orientation in self‐assembled monolayers of oligophenyldithiols on Au substrates. Langmuir, 2002. 18(21): p. 7766‐7769.
144. Azzam, W. and C. Woll, In The Direction of Perfect Design of Self‐Assembled Monolayers: Scanning Tunneling Microscopy Study of SAMs Made of Decanethiol on Au(111). Jordan Journal of Chemistry, 2006. 1(2): p. 143‐154.
145. Kotov, N.A., I. Dekany, and J.H. Fendler, LAYER‐BY‐LAYER SELF‐ASSEMBLY OF POLYELECTROLYTE‐SEMICONDUCTOR NANOPARTICLE COMPOSITE FILMS. Journal of Physical Chemistry, 1995. 99(35): p. 13065‐13069.
146. Jaffar, S., et al., Layer‐by‐layer surface modification and patterned electrostatic deposition of quantum dots. Nano Letters, 2004. 4(8): p. 1421‐1425.
38 Introduction
147. Baron, R., et al., Hydrogen‐bonded CdS nanoparticle assemblies on electrodes for photoelectrochemical applications. Angewandte Chemie‐International Edition, 2005. 44(26): p. 4010‐4015.
148. Shavel, A., N. Gaponik, and A. Eychmuller, The assembling of semiconductor nanocrystals. European Journal of Inorganic Chemistry, 2005(18): p. 3613‐3623.
149. Vossmeyer, T., et al., Combinatorial approaches toward patterning nanocrystals. Journal of Applied Physics, 1998. 84(7): p. 3664‐3670.
150. Pattani, V.P., et al., Microcontact printing of quantum dot bioconjugate arrays for localized capture and detection of biomolecules. Biomedical Microdevices, 2008. 10(3): p. 367‐374.
151. Zanella, M., et al., Growth of colloidal nanoparticles of group II‐VI and IV‐VI semiconductors on top of magnetic iron‐platinum nanocrystals. Journal of Materials Chemistry, 2008. 18(36): p. 4311‐4317.

Appendix
a

Waqas Khalid1, Gero Göbel2, Dominik Hühn1, Jose Maria Montenegro1, Pilar Rivera Gil1, Fred Lisdat2, Wolfgang J. Parak1*
1Fachbereich Physik and WZMW, Philipps Universität Marburg, Germany
2 Biosystems Technology, University of Applied Sciences Wildau, Wildau, Germany
*corresponding author: [email protected]
Light triggered detection of aminophenyl phosphate with a quantum dot based enzyme electrode
Abstract:
An electrochemical sensor for p-aminophenyl phosphate (pAPP) is reported. It is based on the electrochemical conversion of 4-aminophenol (4AP) at a quantum dot (QD) modified electrode under illumination. Without illumination no electron transfer and thus no oxidation of 4AP can occur. pAPP as substrate is converted by the enzyme alkaline phosphatase (ALP) to generate 4AP as a product. The QDs are coupled via 1, 4 benzene dithiol (BDT) linkage to the surface of a gold electrode and thus allow potential-controlled photocurrent generation. The photocurrent is modified by the enzyme reaction providing access to the substrate detection. In order to develop a photobioelectrochemical sensor the enzyme is immobilized on top of the photo-switchable layer of the QDs. Different immobilization strategies of the enzyme ALP are compared. Enzymatic activity and thus the photocurrent can be described by Michaelis Menten kinetics. pAPP is detected within the range of 25 μM – 1 mM.
A-1
Introduction:
Colloidal quantum dots (QDs), which are fluorescent semiconductor nanoparticles, have recently brought impact to various disciplines, as has been highlighted in various review articles [1]. QDs have been recently discussed also as new building block for the construction of electrochemical sensors [2-4]. Upon optical illumination (below the wavelength of the first exciton peak QDs have a a continuous absorption spectrum, with a local maximum at the exciton peak [5]) electron hole pairs are generated inside QDs. Due to these charge carriers electrons can be transferred to or from the QDs. QDs thus can be oxidized / reduced and can serve as light-controlled redox active element and can be integrated in electrochemical signal chains [6]. The key advantage hereby is that the redox reaction of the QD surface can be virtually switched on and off by light. QD have been also used as elements of signal transduction of enzymatic reactions [7].
In the present work we wanted to apply QDs as light-controlled redox active element for the enzymatic detection of p-aminophenyl phosphate (pAPP) with alkaline phosphatase (ALP). ALP is a widely used enzyme in bioanalysis as it has a high turnover rate and broad substrate specificity [8]. The enzyme is particularly interesting as label for immunoassays [9]. Very sensitive substrate recycling schemes have been also reported [10]. Four different groups of substrates are known for ALP: i) ß-glycerophosphate and hexose phosphate [11], phenyl phosphate [12] and ß-naphthyl phosphate[13], iii) p-nitrophenyl phosphate [14] and phenolphthalein diphosphate [15], 4-methyl-umbellipheryl phosphate [16] and p-aminophenyl phosphate (pAPP) [17], and iv) phosphoenol pyruvate [18]. Electrochemical detection has been reported for a number of ALP substrates [19], in particular for phenyl phosphate. However, pAPP is claimed to be a better substrate for ALP than phenyl phosphate, as its product 4-aminophenol (4AP) is more easily oxidizable than phenol, which is the product of phenyl phosphate, as it does not foul the electrode even at higher concentrations, and as it has a rather reversible electrochemical behavior [17]. For this reason we chose pAPP as substrate in the present study. Readout of the enzymatic reaction was performed with the QD-modified electrode [2]. We hereby put particular interest in the way of immobilization of ALP on the electrode. In previous work the enzymes were suspended in the solution above the sensor electrode [2, 4]. Here we go a step further and directly immobilize the enzyme on the QD-modified electrode. This was done in order to investigate whether a specific enzymatic reaction can be coupled with a photoinitiated reaction at a QD modified electrode in a way that the recognition element is integrated with the transducer. The potential advantage of light-triggered detection would be the possibility of spatially resolved detection [20, 21].
Materials and Methods:
A-2
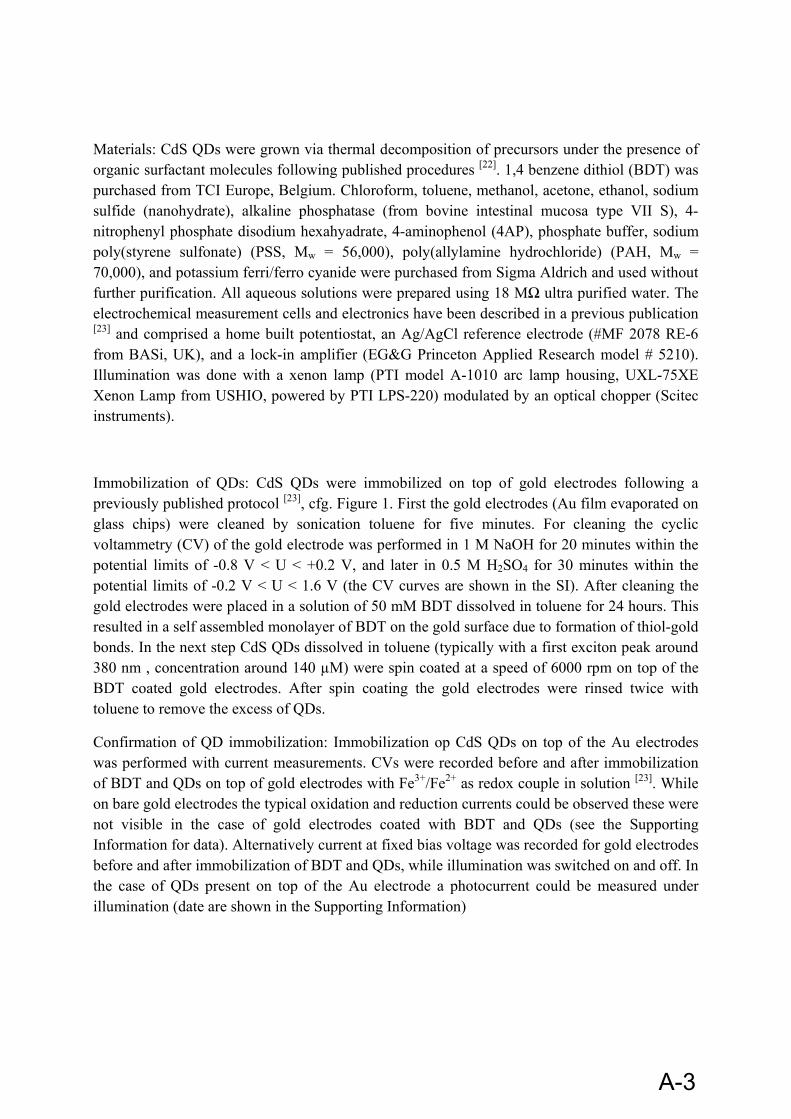
Materials: CdS QDs were grown via thermal decomposition of precursors under the presence of organic surfactant molecules following published procedures [22]. 1,4 benzene dithiol (BDT) was purchased from TCI Europe, Belgium. Chloroform, toluene, methanol, acetone, ethanol, sodium sulfide (nanohydrate), alkaline phosphatase (from bovine intestinal mucosa type VII S), 4-nitrophenyl phosphate disodium hexahyadrate, 4-aminophenol (4AP), phosphate buffer, sodium poly(styrene sulfonate) (PSS, Mw = 56,000), poly(allylamine hydrochloride) (PAH, Mw = 70,000), and potassium ferri/ferro cyanide were purchased from Sigma Aldrich and used without further purification. All aqueous solutions were prepared using 18 MΩ ultra purified water. The electrochemical measurement cells and electronics have been described in a previous publication [23] and comprised a home built potentiostat, an Ag/AgCl reference electrode (#MF 2078 RE-6 from BASi, UK), and a lock-in amplifier (EG&G Princeton Applied Research model # 5210). Illumination was done with a xenon lamp (PTI model A-1010 arc lamp housing, UXL-75XE Xenon Lamp from USHIO, powered by PTI LPS-220) modulated by an optical chopper (Scitec instruments).
Immobilization of QDs: CdS QDs were immobilized on top of gold electrodes following a previously published protocol [23], cfg. Figure 1. First the gold electrodes (Au film evaporated on glass chips) were cleaned by sonication toluene for five minutes. For cleaning the cyclic voltammetry (CV) of the gold electrode was performed in 1 M NaOH for 20 minutes within the potential limits of -0.8 V < U < +0.2 V, and later in 0.5 M H2SO4 for 30 minutes within the potential limits of -0.2 V < U < 1.6 V (the CV curves are shown in the SI). After cleaning the gold electrodes were placed in a solution of 50 mM BDT dissolved in toluene for 24 hours. This resulted in a self assembled monolayer of BDT on the gold surface due to formation of thiol-gold bonds. In the next step CdS QDs dissolved in toluene (typically with a first exciton peak around 380 nm , concentration around 140 µM) were spin coated at a speed of 6000 rpm on top of the BDT coated gold electrodes. After spin coating the gold electrodes were rinsed twice with toluene to remove the excess of QDs.
Confirmation of QD immobilization: Immobilization op CdS QDs on top of the Au electrodes was performed with current measurements. CVs were recorded before and after immobilization of BDT and QDs on top of gold electrodes with Fe3+/Fe2+ as redox couple in solution [23]. While on bare gold electrodes the typical oxidation and reduction currents could be observed these were not visible in the case of gold electrodes coated with BDT and QDs (see the Supporting Information for data). Alternatively current at fixed bias voltage was recorded for gold electrodes before and after immobilization of BDT and QDs, while illumination was switched on and off. In the case of QDs present on top of the Au electrode a photocurrent could be measured under illumination (date are shown in the Supporting Information)
A-3

Five different geometries for enzyme immobilization: In order to observe the enzymatic reaction of ALP and pAPP the enzyme ALP was either directly added to the bath solution (S) or immobilized on top of the QD layer (I). All geometries are depicted in Figure 2. In the simplest case (S0) the Au electrodes with spin coated QD layer were directly without further modification. For the next geometry (S1) a polyelectrolyte layer of PAH was coated on top of the CdS QD layer mediated by electrostatic attraction by immersing the QD coated Au electrode in a solution of PAH for 5 minutes (0.02 M monomer concentration, pH = 6.5, 0.5 M NaCl) [23, 24]. Unbound excess PAH was removed by rinsing. PAH is positively charged. We speculate that the QD layer is not tight so that PAH is attracted by the negatively charged underlying BDT monolayer. Stability after rinsing confirmed stable deposition of PAH. To this configuration a second polyelectrolyte layer (S2) of PSS could be added by immersing the PAH coated QD-Au electrode (S1) for 5 minutes in a solution of PSS (0.02 M monomer concentration, pH = 6.5, 0.5 M NaCl), followed by a rinsing step to remove unbound PSS. PSS is negatively charged and thus electrostatically attracted by the PAH layer [24]. In all three geometries (S0, S1, S2) ALP was added directly to the solution on top of the electrode without any direct attachment. We also tried to directly immobilize ALP on the electrodes. For this purpose QD coated Au electrodes were first modified with a PAH layer, leading to a positively charged surface (S1). To this negatively charged ALP [25] was added by 5 minutes immersion in a solution of ALP (120 units / ml, pH = 7.8, 10 mM phosphate buffer). Attachment of ALP to PAH was mediated by electrostatic interaction (I1). In order to increase the amount of immobilized ALP the coating procedure was repeated (I2). The electrodes with one layer of ALP were immersed again for 5 minutes in a solution of PAH, followed by rinsing, and then for 5 minutes in a solution of ALP followed by rinsing. This step-wise multilayer assembly mediated by electrostatic interaction [24] lead to two layers of ALP on top of the QD coated Au electrodes. Layer-by-layer assembly was confirmed with fluorescence labeled polyelectrolytes (data see Supporting Information).
Electrochemical measurements of dose-response curves: A constant bias voltage U was applied and the base line photocurrent I0 was measured in phosphate buffer solution (pH 7.8) by switching illumination on and off with mechanical shutter, see Figure 3. Then the electrochemical cell was rinsed twice and a known amount of 4AP (product of ALP) or pAPP (substrate for ALP) was added and the photocurrent I was measured again. Also hereby illumination was switched on and off several times with a mechanical shutter. For the next measurement the cell was again rinsed twice, an increasing amount of 4AP or pAPP was added, and the photocurrent I was measured while switching on and off the illumination. With this procedure the response in photocurrent I(c) = I(c) - I0 to different concentrations of 4AP or pAPP was determined, see Figure 3. The resulting dose-response curves are plotted in Figures 4-5.
A-4

Results and Discussion:
Detection of 4AP and sensor principle: First we have investigated whether the CdS modified gold electrode can be used as transducer to the analysis of 4AP – the reaction product of ALP reaction. For this purpose the electrode potential U was varied and the current I was measured under pulsed illumination. A clear response of the photocurrent to the presence of 4AP was found indicating that the QD electrode provides a suitable surface for 4AP oxidation (cfg. Figure 3). Since the electrochemical behavior of 4AP is well know the reaction can be given:
(Eq. 1)
A maximum of photocurrent was detected for an applied bias potential of +200 mV against Ag/AgCl, 3M KCL (data are shown in the Supporting Information). For this reason all following measurements were performed at fixed bias U = +200 mV. On the basis of the sensitivity of the QD electrode for 4AP we wanted to construct a photoelectrochemical sensor. A sketch of our sensor concept is depicted in Figure 1. In presence of ALP pAPP is hydrolyzed to 4AP and HPO4
2- (cfg. Eq. 2) which is subsequently converted at the electrode under illumination.
(Eq. 2)
The actual sensor electrode was composed out of QDs which were coupled via a 1,4 benzene dithiol (BDT) layer on top of a gold film electrode. A bias voltage U = +200 mV was applied and the corresponding current I was recorded. Upon illumination of the QDs electron-hole pairs were generated. Electron transfer could take place in between CdS QDs and the 4AP/QI - redox couple in solution and in between the QDs and the electrode. Thus the QDs could be used as a light-triggered interlayer to transfer electrons from the redox couple, present in solution to the electrode. The energetical situation of the electron transfer pathway is depicted in Figure 1b/c. 4AP could be only oxidized to 4QI if the two released electrons could be transferred to an energetically lower level. In case the bias U applied to a gold electrode was not positive enough (i.e. its Fermi level was above the energy of the 4AP/4QI redox couple), no oxidation of 4AP could occur (cfg. Figure 1b). However, if at the same bias illuminated QDs were used oxidation of 4AP was possible (cfg. Figure 1c). Upon illumination electrons in the QDs were excited from the valence band (VB) to the conduction band (CB), resulting in electrons (e-) and holes (h+). The holes were trapped in defect states (DS) [26] at the surface of the QDs. 4AP could now be oxidized to 4QI upon transferring the electrons to the QDs where they recombined with the holes. In turn electrons were transferred from the CB of the QDs to the gold electrode, thus creating an oxidation current I.
A-5
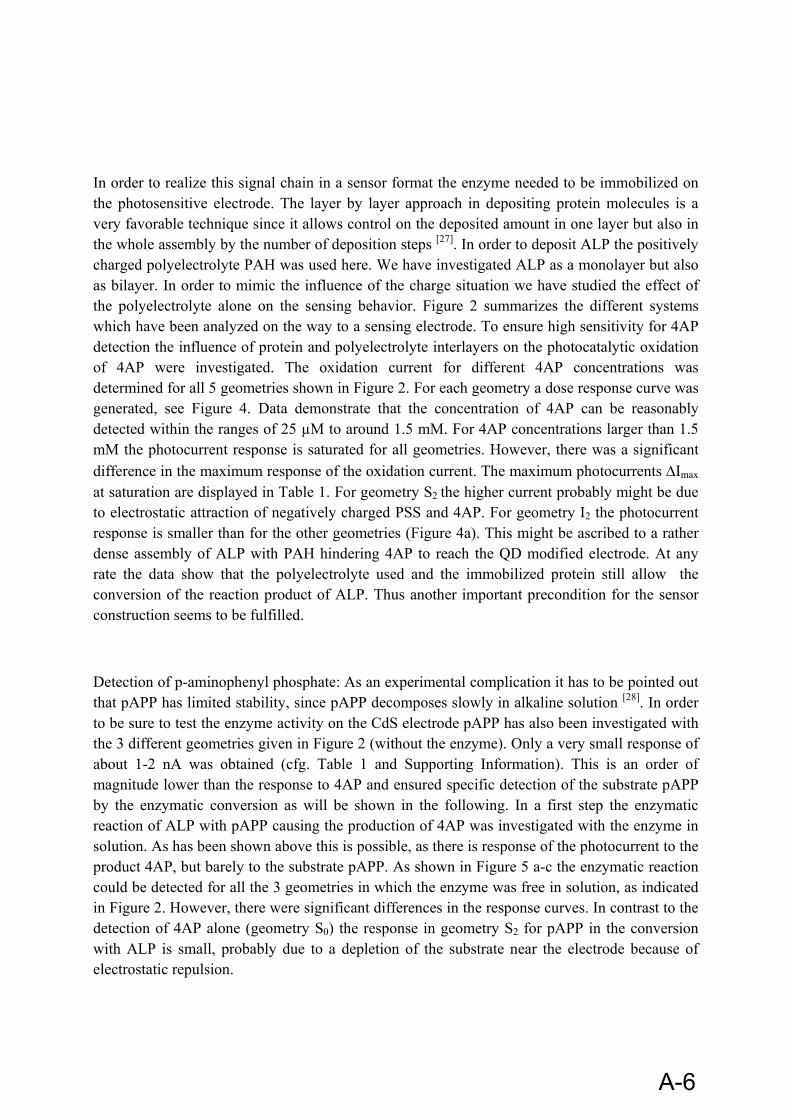
In order to realize this signal chain in a sensor format the enzyme needed to be immobilized on the photosensitive electrode. The layer by layer approach in depositing protein molecules is a very favorable technique since it allows control on the deposited amount in one layer but also in the whole assembly by the number of deposition steps [27]. In order to deposit ALP the positively charged polyelectrolyte PAH was used here. We have investigated ALP as a monolayer but also as bilayer. In order to mimic the influence of the charge situation we have studied the effect of the polyelectrolyte alone on the sensing behavior. Figure 2 summarizes the different systems which have been analyzed on the way to a sensing electrode. To ensure high sensitivity for 4AP detection the influence of protein and polyelectrolyte interlayers on the photocatalytic oxidation of 4AP were investigated. The oxidation current for different 4AP concentrations was determined for all 5 geometries shown in Figure 2. For each geometry a dose response curve was generated, see Figure 4. Data demonstrate that the concentration of 4AP can be reasonably detected within the ranges of 25 µM to around 1.5 mM. For 4AP concentrations larger than 1.5 mM the photocurrent response is saturated for all geometries. However, there was a significant difference in the maximum response of the oxidation current. The maximum photocurrents Imax at saturation are displayed in Table 1. For geometry S2 the higher current probably might be due to electrostatic attraction of negatively charged PSS and 4AP. For geometry I2 the photocurrent response is smaller than for the other geometries (Figure 4a). This might be ascribed to a rather dense assembly of ALP with PAH hindering 4AP to reach the QD modified electrode. At any rate the data show that the polyelectrolyte used and the immobilized protein still allow the conversion of the reaction product of ALP. Thus another important precondition for the sensor construction seems to be fulfilled.
Detection of p-aminophenyl phosphate: As an experimental complication it has to be pointed out that pAPP has limited stability, since pAPP decomposes slowly in alkaline solution [28]. In order to be sure to test the enzyme activity on the CdS electrode pAPP has also been investigated with the 3 different geometries given in Figure 2 (without the enzyme). Only a very small response of about 1-2 nA was obtained (cfg. Table 1 and Supporting Information). This is an order of magnitude lower than the response to 4AP and ensured specific detection of the substrate pAPP by the enzymatic conversion as will be shown in the following. In a first step the enzymatic reaction of ALP with pAPP causing the production of 4AP was investigated with the enzyme in solution. As has been shown above this is possible, as there is response of the photocurrent to the product 4AP, but barely to the substrate pAPP. As shown in Figure 5 a-c the enzymatic reaction could be detected for all the 3 geometries in which the enzyme was free in solution, as indicated in Figure 2. However, there were significant differences in the response curves. In contrast to the detection of 4AP alone (geometry S0) the response in geometry S2 for pAPP in the conversion with ALP is small, probably due to a depletion of the substrate near the electrode because of electrostatic repulsion.
A-6

In a final step the enzyme has been immobilized in a single and double layer as depicted in Fig. 2d and e. By this method the biospecific recognition element is part of the device and no substances have to be added to the solution despite the molecule to be detected here pAPP. In the case of geometry I2 the maximum photocurrent response is relatively low (Figure 5e). This corresponds directly to the control experiments in which 4AP has been detected directly (Figure 4e). The ALP / polyelectrolyte layers seem to hinder diffusion of 4AP to the QD surface. However, for electrodes with a single layer of ALP fixed with the polyelectrolyte PAH a very well defined response to the enzyme substrate is obtained. This shows that the concept of a photobioelectrochemical sensor can be realized with the example of ALP. Sensitivity for pAPP detection could be provided in the range from 25 M to 1.5 mM. We want to point out that the aim of this paper was not the development for a practical sensor for for direct pAPP detection in real samples, but rather to demonstrate the proof of concept for a photo-triggered enzyme sensor (of the first generation). In order to further analyze the response behavior quantitatively the dose response curves were fitted with the Michaelis–Menten equation, cfg. Eq. 3 [29]. Hereby we assumed that the rate of the enzymatic reaction v was proportional to the oxidation current I, and thus v/vmax = I/Imax, whereby vmax is the maximum reaction rate. KM is the (effective) Michaelis-Menten constant. This constant is a measure for the affinity of the enzyme to the substrate based on the rate constants within the reaction. Values are given in Table 1.
I / Imax = c(pAPP) / (KM + c(pAPP)) (Eq. 3)
In literature KM values of 0.48 mV [30] and 0.056 mV [31] have been reported, which are in the same order of magnitude as the values detected in our work. It has to be pointed out that in case of the presence of polyelectrolyte layers and enzyme immobilization the KM values as reported in our study have to be considered as apparent KM values. It has been reported that apparent KM values increase due to increased diffusion barrier for the substrate [32]. Comparison of the Imax values as obtained for direct detection of 4AP (Figure 4) and detection of 4AP after enzymatic degradation of pAPP to 4AP shows that both oxidation signals (detected at the same geometry and provided abundance of enzyme) are quite similar. This is in good agreement with the detection principle proposed.
In summary the developed sensor as illustrated in Fig. 2 with the design d) by immobilizing the ALP via a the polyelectrolyte PAH provides a detection system for the enzyme substrate in the concentration range from 0.025 to 1 mM.
Conclusions:
A light controlled bioelectrochemical sensor for pAPP has been demonstrated. By using QDs as interlayer on gold 4AP could be oxidized and thus detected via a corresponding photocurrent in case the QDs were illuminated. This provides the basis for spatially resolved measurements [21]
A-7
by illuminating and reading only the area of interest of an electrode which is non-structured, but modified with different enzyme systems. The approach presented here allows for observing enzymatic reactions which yield 4AP as product. We have demonstrated this for the substrate pAPP and the enzyme ALP. A crucial point for such measurements is to ensure high local enzyme concentration and specificity for the detection of the enzymatic product. By using a polyelectrolyte layer of PAH the enzyme ALP could be immobilized on the electrode surface, retaining enzymatic activity. However, polyelectrolyte layers can also hinder diffusion of the molecule to be detected 4AP to the QD surface, thus hindering detection. For this reason permeability of the polyelectrolyte layers has been studied here for the respective molecule.
Acknowledgements:
This work was supported by the German Research Foundation (DFG, grants PA 794/3-1, LI706/2-1).
A-8
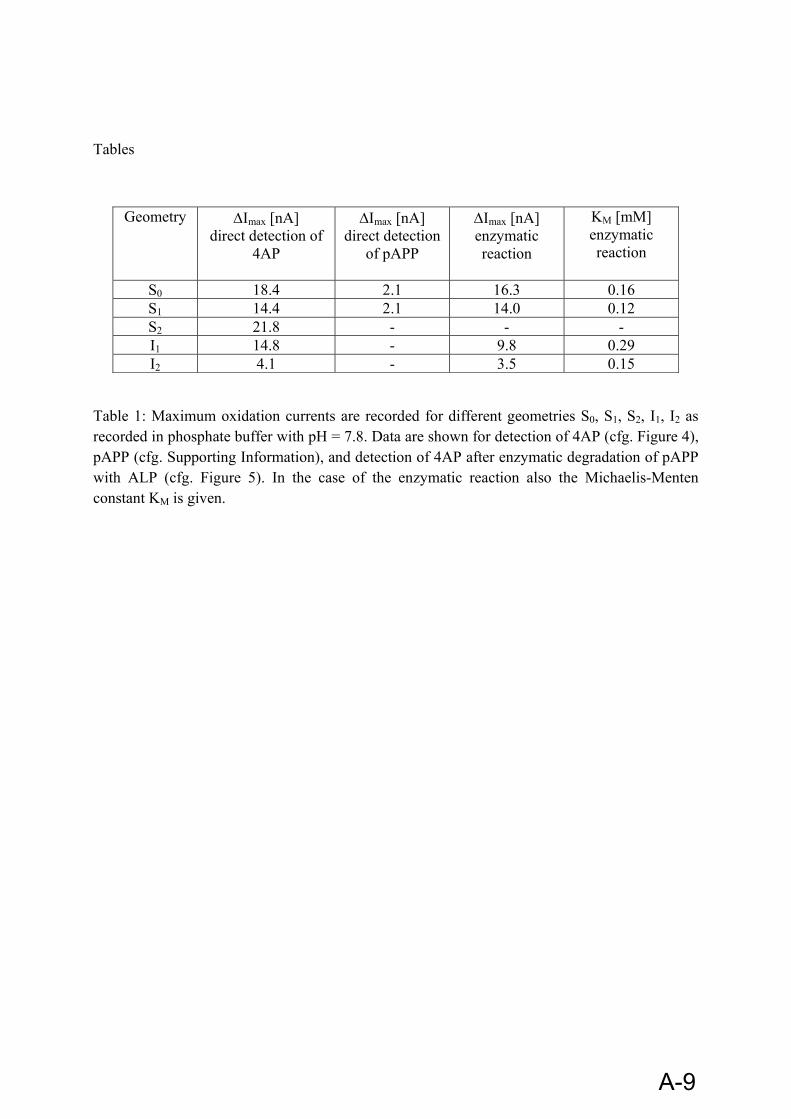
Tables
Geometry Imax [nA] direct detection of
4AP
Imax [nA] direct detection
of pAPP
Imax [nA] enzymatic reaction
KM [mM] enzymatic reaction
S0 18.4 2.1 16.3 0.16 S1 14.4 2.1 14.0 0.12 S2 21.8 - - - I1 14.8 - 9.8 0.29 I2 4.1 - 3.5 0.15
Table 1: Maximum oxidation currents are recorded for different geometries S0, S1, S2, I1, I2 as recorded in phosphate buffer with pH = 7.8. Data are shown for detection of 4AP (cfg. Figure 4), pAPP (cfg. Supporting Information), and detection of 4AP after enzymatic degradation of pAPP with ALP (cfg. Figure 5). In the case of the enzymatic reaction also the Michaelis-Menten constant KM is given.
A-9

Figures
Figure 1: a) Sketch of the detection scheme. A bias voltage U is applied to a Au electrode versus an Ag/AgCl reference electrode in the bath solution. The Au electrode is coated with CdS QDs which are attached via a BDT layer. pAPP is in solution degraded by ALP to 4AP. Upon illumination of the QDs electron hole pairs are generated. This leads to oxidation of 4AP to 4QI on the QD surface, whereby electrons are transferred to the QD. Electrons are passed to the Au electrode and can be detected as oxidation current I. b) Without QDs as redox mediator oxidation of 4AP can't happen in case the bias potential U is not positive enough. Energy levels E are shown. For oxidation the Fermi level EF of the Au electrode would need to be lower than the energy level at which electrons upon oxidation of 4AP are released. c) Illuminated QDs can act as redox mediator. Defect states (DS) at the QD surface (which are energetically above the valance band VB) prevent light generated electron hole pairs from immediate recombination. In this way electrons resulting from the oxidation of 4AP to 4QI can be transferred to the DS of the QD. In turn electrons from the conduction band (CB) can be drained via the BDT layer to the gold electrode, which is detected as oxidation / photocurrent.
A-10
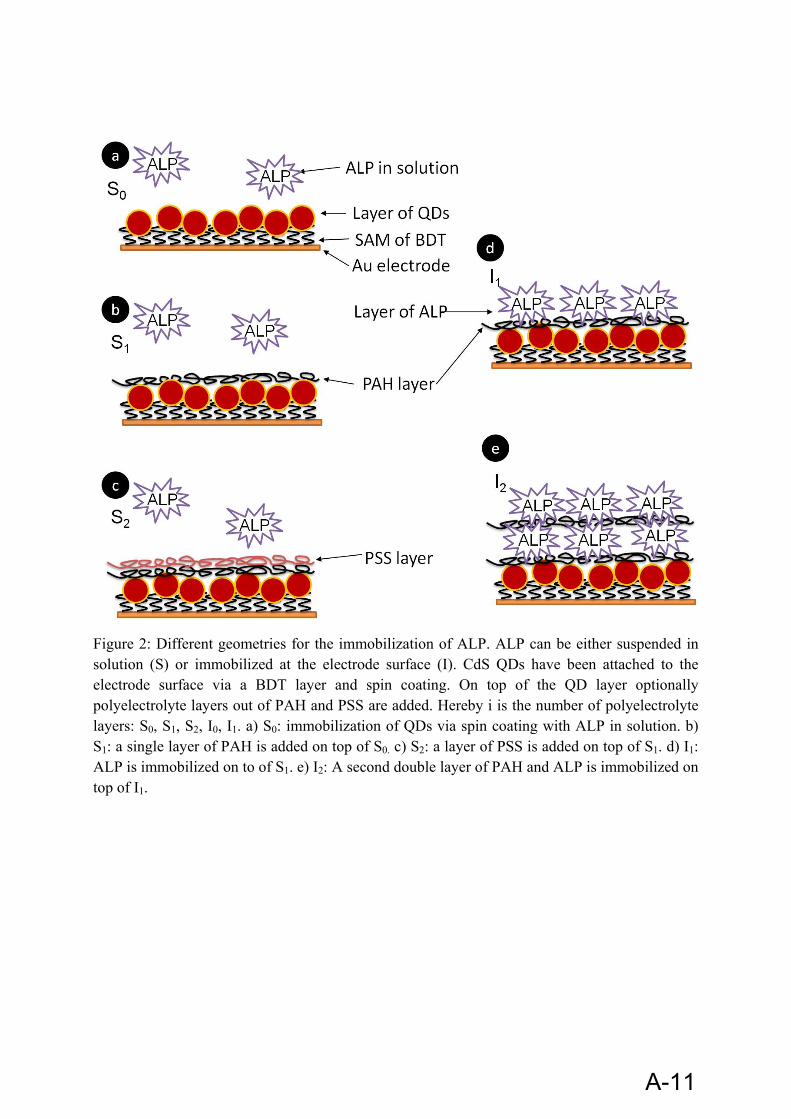
Figure 2: Different geometries for the immobilization of ALP. ALP can be either suspended in solution (S) or immobilized at the electrode surface (I). CdS QDs have been attached to the electrode surface via a BDT layer and spin coating. On top of the QD layer optionally polyelectrolyte layers out of PAH and PSS are added. Hereby i is the number of polyelectrolyte layers: S0, S1, S2, I0, I1. a) S0: immobilization of QDs via spin coating with ALP in solution. b) S1: a single layer of PAH is added on top of S0. c) S2: a layer of PSS is added on top of S1. d) I1: ALP is immobilized on to of S1. e) I2: A second double layer of PAH and ALP is immobilized on top of I1.
A-11
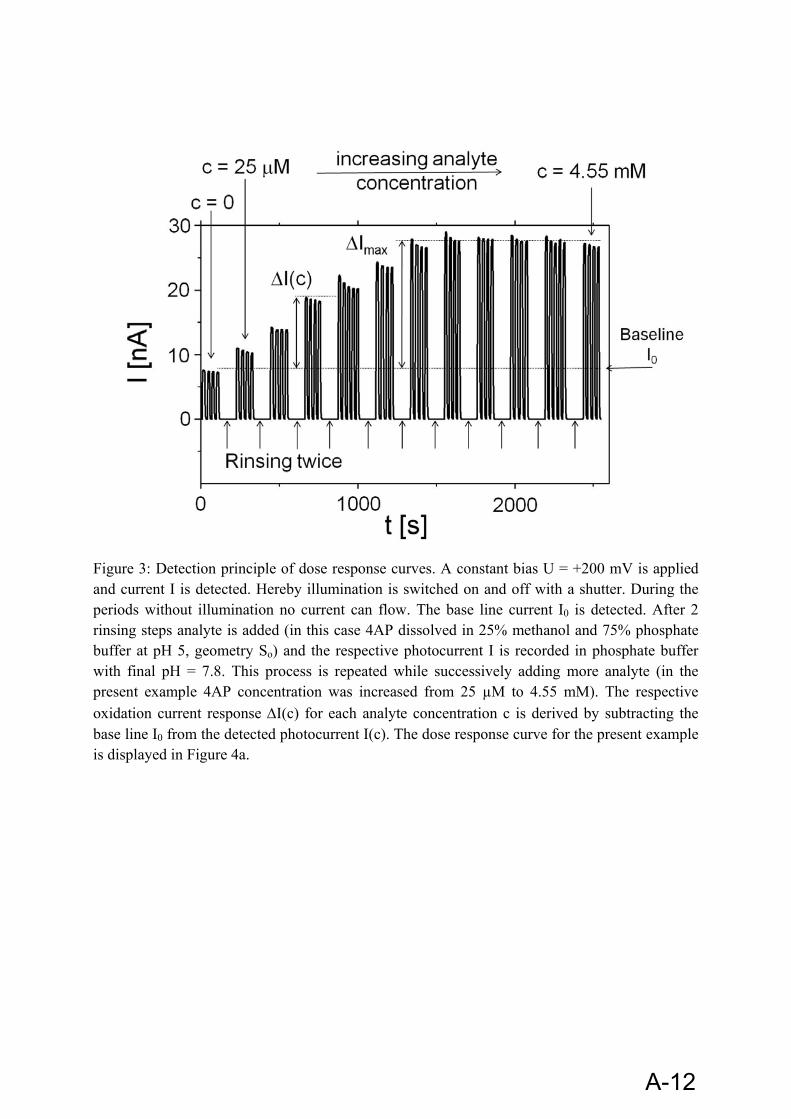
Figure 3: Detection principle of dose response curves. A constant bias U = +200 mV is applied and current I is detected. Hereby illumination is switched on and off with a shutter. During the periods without illumination no current can flow. The base line current I0 is detected. After 2 rinsing steps analyte is added (in this case 4AP dissolved in 25% methanol and 75% phosphate buffer at pH 5, geometry So) and the respective photocurrent I is recorded in phosphate buffer with final pH = 7.8. This process is repeated while successively adding more analyte (in the present example 4AP concentration was increased from 25 µM to 4.55 mM). The respective oxidation current response I(c) for each analyte concentration c is derived by subtracting the base line I0 from the detected photocurrent I(c). The dose response curve for the present example is displayed in Figure 4a.
A-12
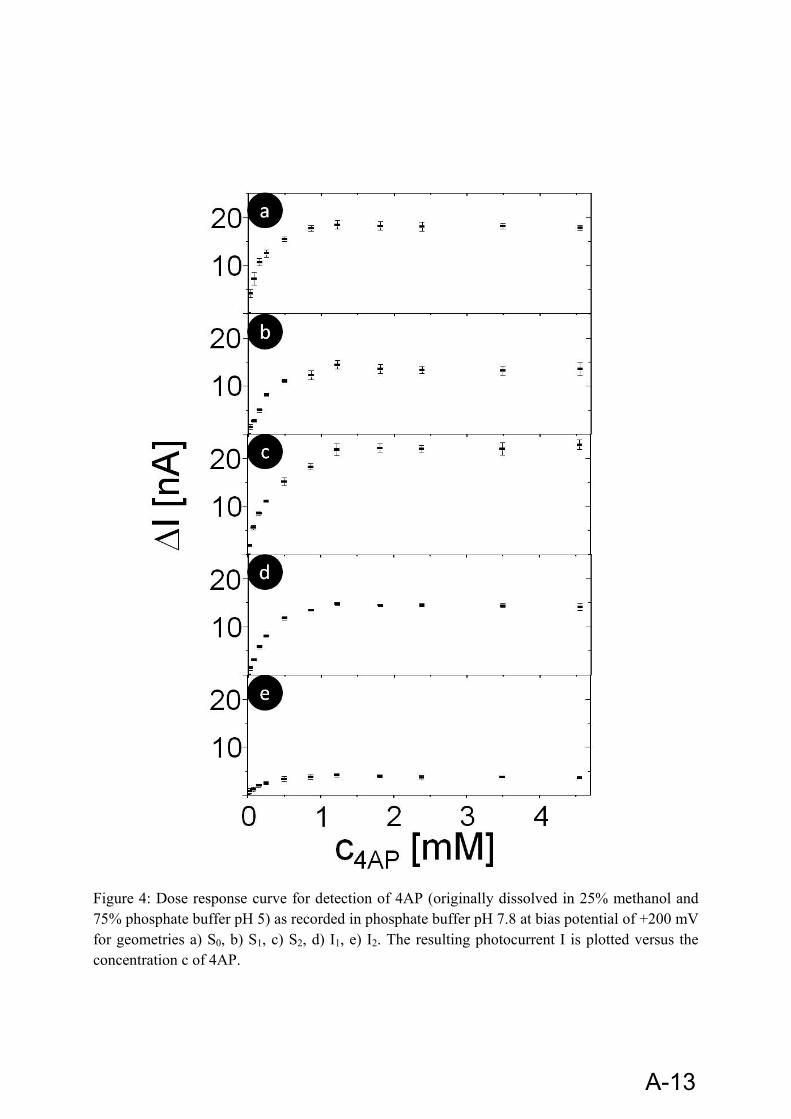
Figure 4: Dose response curve for detection of 4AP (originally dissolved in 25% methanol and 75% phosphate buffer pH 5) as recorded in phosphate buffer pH 7.8 at bias potential of +200 mV for geometries a) S0, b) S1, c) S2, d) I1, e) I2. The resulting photocurrent I is plotted versus the concentration c of 4AP.
A-13
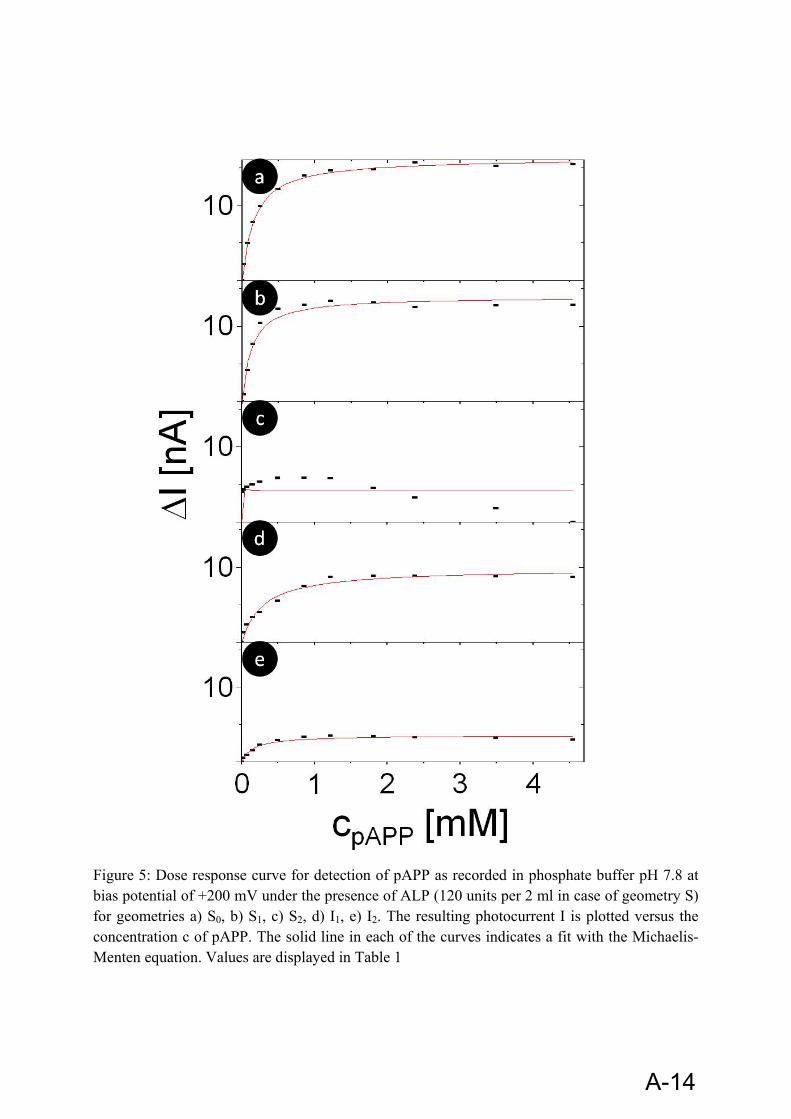
Figure 5: Dose response curve for detection of pAPP as recorded in phosphate buffer pH 7.8 at bias potential of +200 mV under the presence of ALP (120 units per 2 ml in case of geometry S) for geometries a) S0, b) S1, c) S2, d) I1, e) I2. The resulting photocurrent I is plotted versus the concentration c of pAPP. The solid line in each of the curves indicates a fit with the Michaelis-Menten equation. Values are displayed in Table 1
A-14
References:
[1] C. Wang, X. Gao, X. G. Su, Analytical And Bioanalytical Chemistry 2010, 397, 1397; F. Pinaud, S. Clarke, A. Sittner, M. Dahan, Nature Methods 2010, 7, 275; U. Resch‐Genger, M. Grabolle, S. Cavaliere‐Jaricot, R. Nitschke, T. Nann, Nat Meth 2008, 5, 763; F. Zhang, Z. Ali, F. Amin, A. Riedinger, W. J. Parak, Analytical And Bioanalytical Chemistry 2010, 397, 935; W. J. Parak, T. Pellegrino, C. Plank, Nanotechnology 2005, 16, R5.
[2] C. Stoll, S. Kudera, W. J.Parak, F. Lisdat, Small 2006, 2, 741. [3] E. Katz, M. Zayats, I. Willner, F. Lisdat, Chemical Communications 2006, 1395; C. Stoll, C. Gehring,
K. Schubert, M. Zanella, W. J. Parak, F. Lisdata, Biosensors and Bioelectronics 2008, 24, 260; Q. Liu, X. B. Lu, J. Li, X. Yao, J. H. Li, Biosensors & Bioelectronics 2007, 22, 3203; Z. Wang, Q. Xu, H. Q. Wang, Q. Yang, J. H. Yu, Y. D. Zhao, Sensors And Actuators B‐Chemical 2009, 138, 278; L. H. Tang, Y. H. Zhu, X. L. Yang, J. J. Sun, C. Z. Li, Biosensors & Bioelectronics 2008, 24, 319.
[4] K. Schubert, W. Khalid, Z. Yue, W. J. Parak, F. Lisdat, Langmuir 2010, 26, 1395. [5] M. G. Bawendi, M. L. Steigerwald, L. E. Brus, Annu. Rev. Phys. Chem. 1990, 41, 477. [6] E. Kucur, J. Riegler, G. A. Urban, T. Nann, Journal of Chemical Physics 2003, 119, 2333; O. Ehlert, A.
Tiwari, T. Nann, Journal Of Applied Physics 2006, 100; E. Kucur, W. Bucking, S. Arenz, R. Giernoth, T. Nann, Chemphyschem 2006, 7, 77.
[7] C. M. Niemeyer, ANGEW CHEM INT EDIT 2003, 42, 5796; I. Willner, B. Basnar, B. Willner, Febs Journal 2007, 274, 302.
[8] O. Bagel, B. Limoges, B. Schollhorn, C. Degrand, Analytical Chemistry 1997, 69, 4688. [9] C. Nistor, J. Emneus, Analytical Communications 1998, 35, 417; M. P. Kreuzer, C. K. O'Sullivan, G.
G. Guilbault, Analytica Chimica Acta 1999, 393, 95. [10] M. Campas, M. G. Olteanu, J. L. Marty, Sensors And Actuators B‐Chemical 2008, 129, 263; U.
Wollenberger, F. Schubert, F. W. Scheller, Sensors And Actuators B‐Chemical 1992, 7, 412. [11] A. Bodansky, Journal Of Biological Chemistry 1933, 101, 93; G. Y. Shinowara, L. M. Jones, H. L.
Reinhart, Journal Of Biological Chemistry 1942, 142, 921; N. W. Tietz, A. Green, Clinica Chimica Acta 1964, 9, 392.
[12] P. R. N. Kind, E. J. King, Journal Of Clinical Pathology 1954, 7, 322; E. J. King, A. R. Armstrong, Canadian Medical Association Journal 1934, 31, 376.
[13] A. M. Seligman, H. H. Chauncey, M. M. Nachlas, L. H. Manheimer, H. A. Ravin, Journal Of Biological Chemistry 1951, 190, 7.
[14] O. A. Bessey, O. H. Lowry, M. J. Brock, Journal Of Biological Chemistry 1946, 164, 321. [15] J. Fischl, S. Segal, S. Rabiah, Clinical Chemistry 1967, 13, 941; C. Huggins, P. Talalay, Journal Of
Biological Chemistry 1945, 159, 399. [16] H. N. Fernley, P. G. Walker, Biochemical Journal 1965, 97, 95. [17] H. T. Tang, C. E. Lunte, H. B. Halsall, W. R. Heineman, Analytica Chimica Acta 1988, 214, 187. [18] F. Fischer, G. Siebert, Klinische Wochenschrift 1961, 39, 202. [19] C. J. McNeil, I. J. Higgins, J. V. Bannister, Biosensors 1987, 3, 199; K. R. Wehmeyer, H. B. Halsall, W.
R. Heineman, C. P. Volle, I. W. Chen, Analytical Chemistry 1986, 58, 135. [20] H. M. McConnell, J. C. Owicki, J. W. Parce, D. L. Miller, G. T. Baxter, H. G. Wada, S. Pitchford,
Science 1992, 257, 1906; S. Licht, N. Myung, Y. Sun, Analytical Chemistry 1996, 68, 954; M. George, W. J. Parak, I. Gerhardt, W. Moritz, F. Kaesen, H. Geiger, I. Eisele, H. E. Gaub, Sensors and Actuators A 2000, 83, 149.
[21] W. J. Parak, U. G. Hofmann, H. E. Gaub, J. C. Owicki, Sensors and Actuators A 1997, 63, 47.
A-15
[22] S. Kudera, L. Carbone, M. F. Casula, R. Cingolani, A. Falqui, E. Snoeck, W. J. Parak, L. Manna, Nanoletters 2005, 5, 445.
[23] Z. Yue, W. Khalid, M. Zanella, A. Z. Abbasi, A. Pfreundt, P. Rivera Gil, K. Schubert, F. Lisdat, W. J. Parak, Analytical and Bioanalytical Chemistry 2010, 396, 1095.
[24] G. Decher, Science 1997, 277, 1232. [25] A. L. Latner, M. E. Parsons, A. W. Skillen, Biochemical Journal 1970, 118, 299; Q. Xie, D. H. Alpers,
Physiological Genomics 2000, 3, 1. [26] S. F. Wuister, C. D. Donega, A. Meijerink, Journal of Physical Chemistry B 2004, 108, 17393. [27] G. Decher, J. Schlenoff, Multilayer Thin Films: Sequential Assembly of Nanocomposite Materials,
Wiley VCH, 2002; F. Lisdat, R. Dronov, H. Mohwald, F. W. Scheller, D. G. Kurth, Chemical Communications 2009, 274.
[28] E. P. Gil, H. T. Tang, H. B. Halsall, W. R. Heineman, A. S. Misiego, Clinical Chemistry 1990, 36, 662. [29] F. A. Hommes, Archives Of Biochemistry And Biophysics 1962, 96, 28. [30] A. G. Gehring, J. D. Brewster, P. L. Irwin, S. I. Tu, L. J. Van Houten, Journal Of Electroanalytical
Chemistry 1999, 469, 27. [31] R. Q. Thompson, G. C. Barone, H. B. Halsall, W. R. Heineman, Analytical Biochemistry 1991, 192,
90. [32] S. Neugebauer, L. Stoica, D. Guschin, W. Schuhmann, Microchimica Acta 2008, 163, 33.
A-16
Waqas Khalid1, Gero Göbel2, Dominik Hühn1, Jose Maria Montenegro1, Pilar Rivera Gil1, Fred Lisdat2, Wolfgang J. Parak1*
1Fachbereich Physik and WZMW, Philipps Universität Marburg, Germany
2 Biosystems Technology, University of Applied Sciences Wildau, Wildau, Germany
*corresponding author: [email protected]
Light triggered detection of aminophenyl phosphate with a quantum dot based enzyme electrode
SUPPORTING INFORMATION
(1) Cleaning of Gold Electrodes
(2) Immobilization of quantum dots (QDs) on the electrode surface
(3) Confirmation of QD immobilization
(4) Detection of 4-aminophenol (4AP) and p-aminophenyl phosphate (pAPP)
(5) Immobilization of ALP in polyelectrolyte layers on top of the QD layer
(6) Set-up for the detection of photocurrents
A-17

(1) Cleaning of Gold Electrodes.
Gold electrodes were prepared by sputtering first 20 nm film of TiO2 followed by a 100 nm film of Au on glass slides. After sonication in toluene for five minutes eventual oxide layers on top of the gold surface were removed by cyclic voltammetry (CV) in 0.1 M NaOH from -0.8 to +0.2 V, following by CV in 0.5 M H2SO4 from -0.2 to +1.6 V. After CV the gold electrodes were rinsed vigorously with water and then dried with the nitrogen flow. CV traces are shown in Figure SI-1.
Figure SI-1: Cyclic voltammetry of bare gold electrodes in (a) NaOH and (b) H2SO4. The current I is plotted versus the applied bias voltage U (versus an Ag/AgCl reference electrode). No illumination / lock-in dectection was used.
A-18
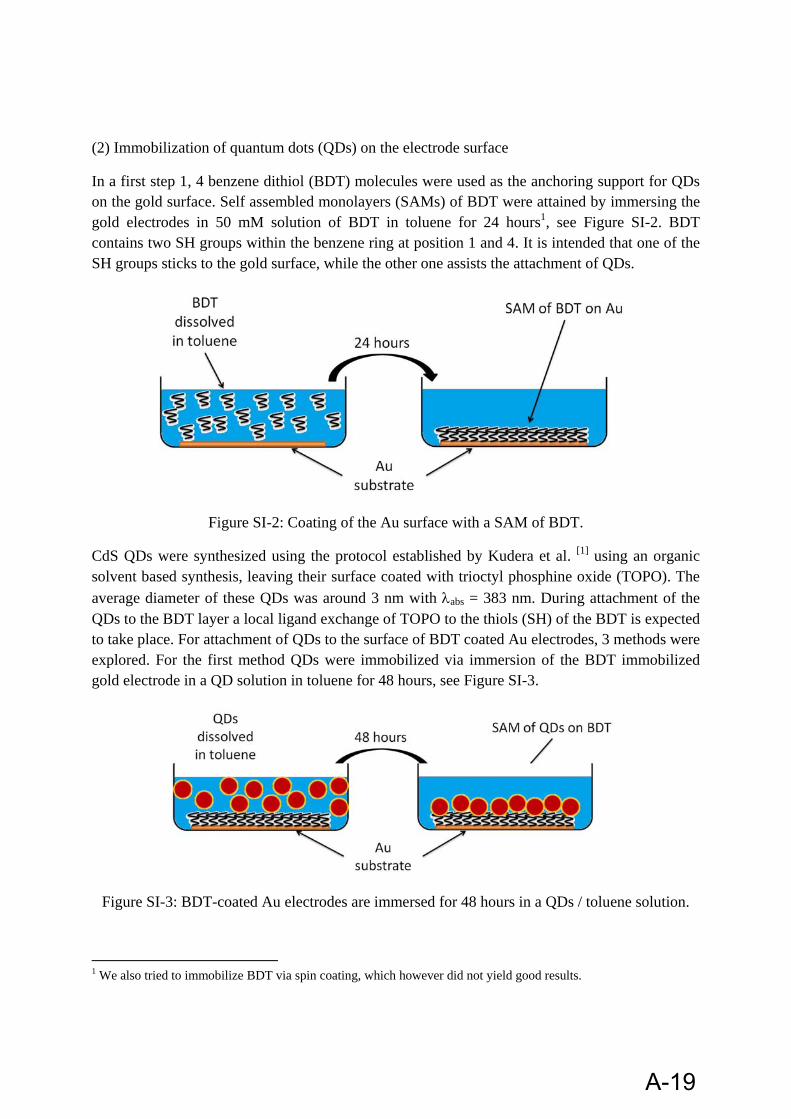
(2) Immobilization of quantum dots (QDs) on the electrode surface
In a first step 1, 4 benzene dithiol (BDT) molecules were used as the anchoring support for QDs on the gold surface. Self assembled monolayers (SAMs) of BDT were attained by immersing the gold electrodes in 50 mM solution of BDT in toluene for 24 hours1, see Figure SI-2. BDT contains two SH groups within the benzene ring at position 1 and 4. It is intended that one of the SH groups sticks to the gold surface, while the other one assists the attachment of QDs.
Figure SI-2: Coating of the Au surface with a SAM of BDT.
CdS QDs were synthesized using the protocol established by Kudera et al. [1] using an organic solvent based synthesis, leaving their surface coated with trioctyl phosphine oxide (TOPO). The average diameter of these QDs was around 3 nm with abs = 383 nm. During attachment of the QDs to the BDT layer a local ligand exchange of TOPO to the thiols (SH) of the BDT is expected to take place. For attachment of QDs to the surface of BDT coated Au electrodes, 3 methods were explored. For the first method QDs were immobilized via immersion of the BDT immobilized gold electrode in a QD solution in toluene for 48 hours, see Figure SI-3.
Figure SI-3: BDT-coated Au electrodes are immersed for 48 hours in a QDs / toluene solution.
1 We also tried to immobilize BDT via spin coating, which however did not yield good results.
A-19
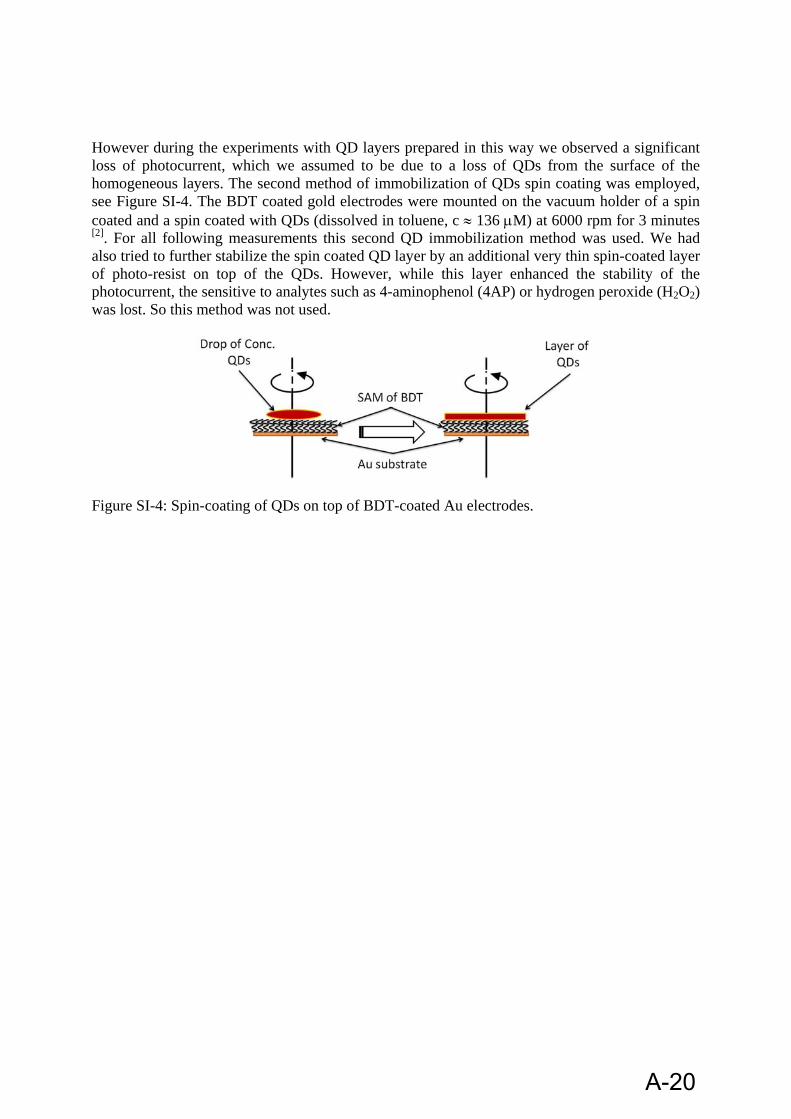
However during the experiments with QD layers prepared in this way we observed a significant loss of photocurrent, which we assumed to be due to a loss of QDs from the surface of the homogeneous layers. The second method of immobilization of QDs spin coating was employed, see Figure SI-4. The BDT coated gold electrodes were mounted on the vacuum holder of a spin coated and a spin coated with QDs (dissolved in toluene, c 136 M) at 6000 rpm for 3 minutes [2]. For all following measurements this second QD immobilization method was used. We had also tried to further stabilize the spin coated QD layer by an additional very thin spin-coated layer of photo-resist on top of the QDs. However, while this layer enhanced the stability of the photocurrent, the sensitive to analytes such as 4-aminophenol (4AP) or hydrogen peroxide (H2O2) was lost. So this method was not used.
Figure SI-4: Spin-coating of QDs on top of BDT-coated Au electrodes.
A-20

(3) Confirmation of QD immobilization
Immobilization of QDs on BDT coated Au electrodes was confirmed with i) CV in hexacyanoferrate solution and ii) via photocurrent detection. In Figure SI-5 voltammograms recorded in 0.1 M phosphate buffer and with ferri / ferrocyanide (50 mM Fe(CN)6
3- and 50 mM Fe(CN)6
4-) are shown. On the bare Au electrode the characteristic oxidation and reduction peaks
are visible (Eo
= 0.361 V vs. NHE at 25 ºC). At positive bias U around 0.4 V Fe(II) is oxidized to Fe(III). In contrast, virtually no oxidation or reduction peaks were recorded for the Au electrodes with BTD / QD layer. In addition there was a decrease of the charging current of about 30 times compared to bare Au electrodes, indicating the presence of the BDT / QD layer.
Figure SI-5: Cyclic voltammograms in phosphate buffer and hexacyanoferrate (a) with bare Au electrodes and (b) with QDs immobilized on BDT-coated Au electrodes. No illumination / lock-in dectection was used.
Alternatively we confirmed QD immobilization via photocurrent detection. In Figure SI-6 the currents upon illumination are shown at an applied bias potential of U = +200 mV. In Figure SI-6 (a) pulses of light are illuminated on bare Au electrode but no photocurrent can be observed, however upon illuminating the light pulses on QDs immobilized Au electrodes photocurrent can be observed as shown in Figure SI-6 (b). This goes on to show that a layer of QDs is located on Au surface.
A-21
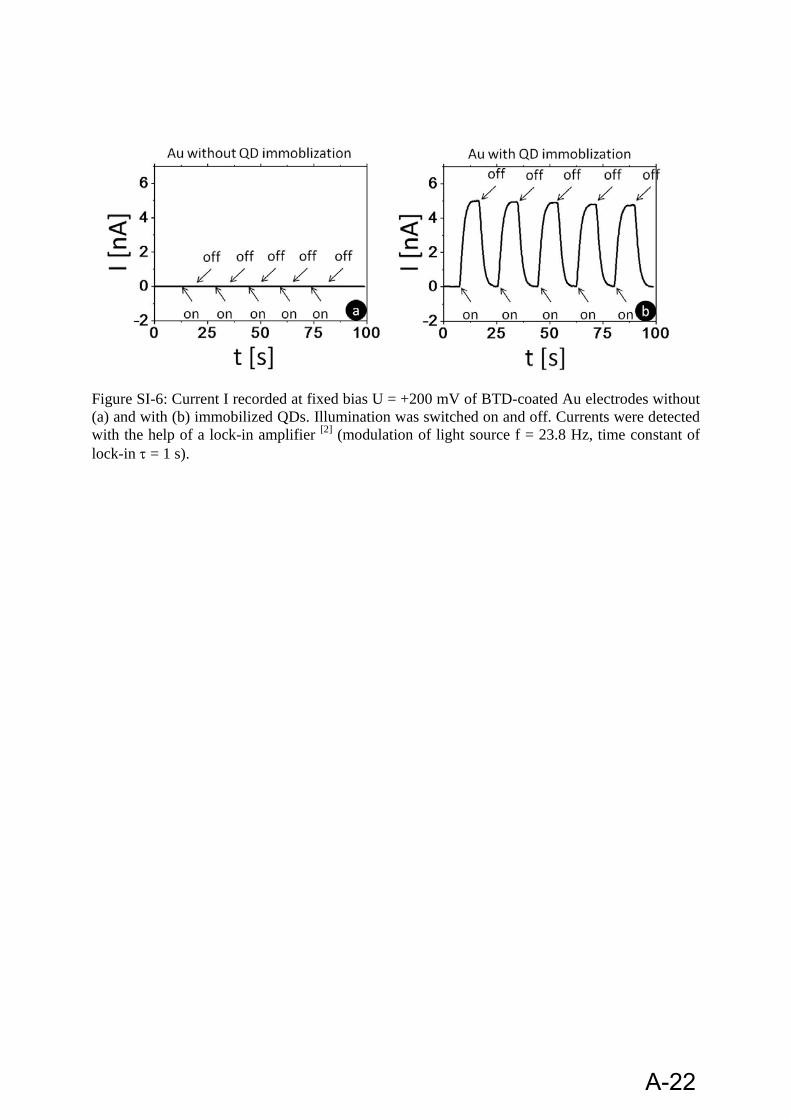
Figure SI-6: Current I recorded at fixed bias U = +200 mV of BTD-coated Au electrodes without (a) and with (b) immobilized QDs. Illumination was switched on and off. Currents were detected with the help of a lock-in amplifier [2] (modulation of light source f = 23.8 Hz, time constant of lock-in = 1 s).
A-22
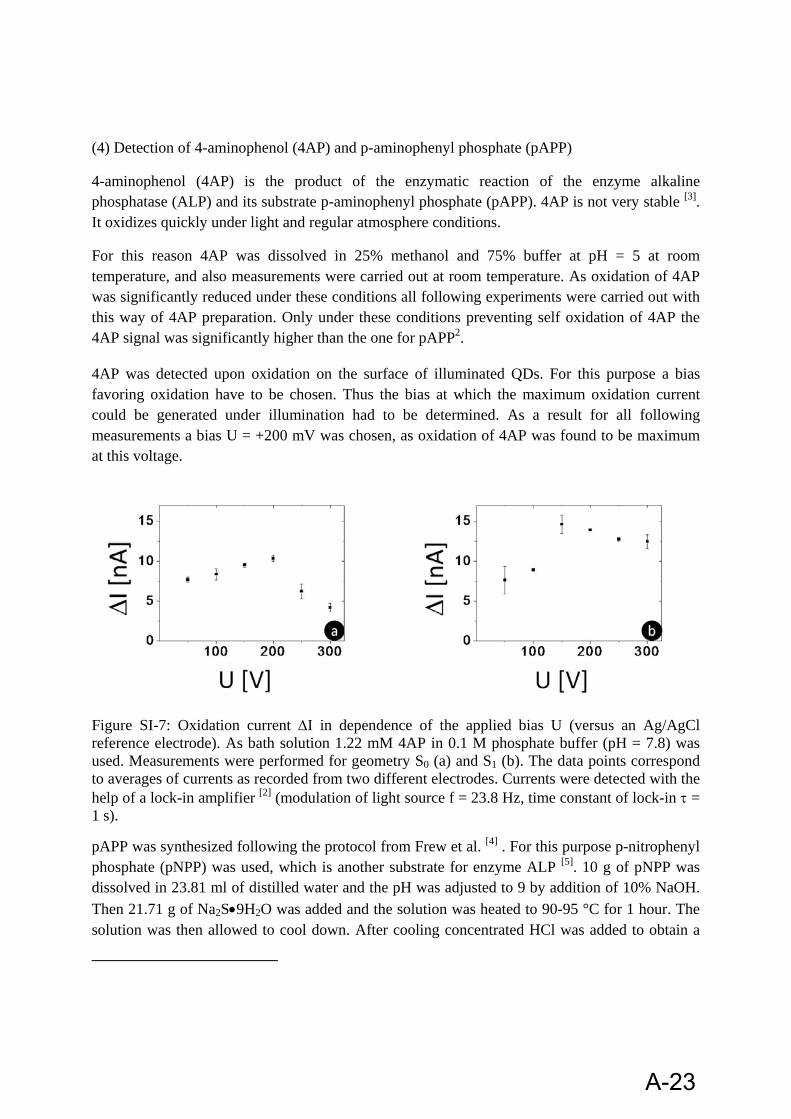
(4) Detection of 4-aminophenol (4AP) and p-aminophenyl phosphate (pAPP)
4-aminophenol (4AP) is the product of the enzymatic reaction of the enzyme alkaline phosphatase (ALP) and its substrate p-aminophenyl phosphate (pAPP). 4AP is not very stable [3]. It oxidizes quickly under light and regular atmosphere conditions.
For this reason 4AP was dissolved in 25% methanol and 75% buffer at pH = 5 at room temperature, and also measurements were carried out at room temperature. As oxidation of 4AP was significantly reduced under these conditions all following experiments were carried out with this way of 4AP preparation. Only under these conditions preventing self oxidation of 4AP the 4AP signal was significantly higher than the one for pAPP2.
4AP was detected upon oxidation on the surface of illuminated QDs. For this purpose a bias favoring oxidation have to be chosen. Thus the bias at which the maximum oxidation current could be generated under illumination had to be determined. As a result for all following measurements a bias U = +200 mV was chosen, as oxidation of 4AP was found to be maximum at this voltage.
Figure SI-7: Oxidation current I in dependence of the applied bias U (versus an Ag/AgCl reference electrode). As bath solution 1.22 mM 4AP in 0.1 M phosphate buffer (pH = 7.8) was used. Measurements were performed for geometry S0 (a) and S1 (b). The data points correspond to averages of currents as recorded from two different electrodes. Currents were detected with the help of a lock-in amplifier [2] (modulation of light source f = 23.8 Hz, time constant of lock-in = 1 s).
pAPP was synthesized following the protocol from Frew et al. [4] . For this purpose p-nitrophenyl phosphate (pNPP) was used, which is another substrate for enzyme ALP [5]. 10 g of pNPP was dissolved in 23.81 ml of distilled water and the pH was adjusted to 9 by addition of 10% NaOH. Then 21.71 g of Na2S9H2O was added and the solution was heated to 90-95 °C for 1 hour. The solution was then allowed to cool down. After cooling concentrated HCl was added to obtain a
A-23

very low pH ~ 0. The solution was allowed to cool down and the pH was then adjusted to 4-5 with 25% NaOH. Then, the solution was filtered and the filtrate was washed with boiling methanol. The product was finally obtained in the form of crystals. pAPP is a much better substrate for ALP than pNPP [6], and it can be detected at much lower potential than pNPP, which allows for reducing noise caused by high bias potentials.
Dose response curves for 4AP and pAPP for different geometries are shown in Figure SI-8 and Figure SI-9. In geometry S2 the dose response curve for pAPP differed from the expected shape. Since the polyelectrolyte layers are charged there might be the possibility of some impurity molecules accumulating at the charged PSS layer. It was noteworthy however that only the polyelectrolyte PSS was causing this, as PAH immobilized in geometry S1 did not have any effect. As control for impurities besides pAPP as synthesized in our group also pAPP from Diagno Swiss was used, which yielded the same results.
Figure SI-8: Dose response curves for 4AP (black) and pAPP (red) measured in 0.1 M phosphate buffer with pH 7.8 for geometries S0 (a), S1 (b), S2 (c). Currents were detected with the help of a lock-in amplifier [2] (modulation of light source f = 23.8 Hz, time constant of lock-in = 1 s).
A-24

Figure SI-9: Dose response curves for 4AP (black) and pAPP (red) measured in 0.1 M phosphate buffer with pH 7.8 for geometries I1 (a), and I2 (b). Currents were detected with the help of a lock-in amplifier [2] (modulation of light source f = 23.8 Hz, time constant of lock-in = 1 s).
A-25

(5) Immobilization of ALP in polyelectrolyte layers on top of the QD layer
In order to observe attachment of the enzyme ALP to the PAH layers we conjugated ALP with FITC dye. As shown in Figure SI-11 we observed that ALP conjugated with FITC caused an increasing fluorescence signal with increasing number of PAH + ALP double layers (geometries Ii, with the number of PAH + ALP double layers i).
Figure SI-10: a) Fluorescence spectra F() of electrodes with i PAH + ALP double layers. The fluorescence is due to FITC labeling of ALP. b) Maximum of fluorescence plotted versus the number of PAH + ALP double layers i.
A-26
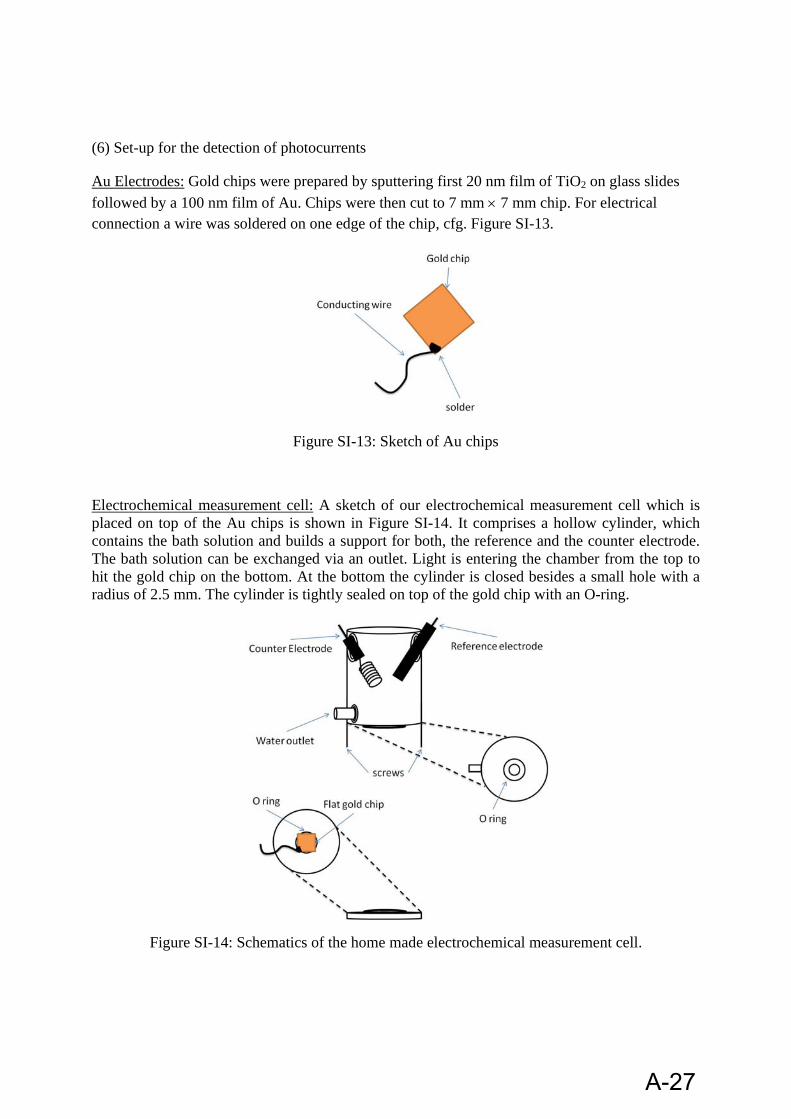
(6) Set-up for the detection of photocurrents
Au Electrodes: Gold chips were prepared by sputtering first 20 nm film of TiO2 on glass slides followed by a 100 nm film of Au. Chips were then cut to 7 mm 7 mm chip. For electrical connection a wire was soldered on one edge of the chip, cfg. Figure SI-13.
Figure SI-13: Sketch of Au chips
Electrochemical measurement cell: A sketch of our electrochemical measurement cell which is placed on top of the Au chips is shown in Figure SI-14. It comprises a hollow cylinder, which contains the bath solution and builds a support for both, the reference and the counter electrode. The bath solution can be exchanged via an outlet. Light is entering the chamber from the top to hit the gold chip on the bottom. At the bottom the cylinder is closed besides a small hole with a radius of 2.5 mm. The cylinder is tightly sealed on top of the gold chip with an O-ring.
Figure SI-14: Schematics of the home made electrochemical measurement cell.
A-27

Light Source: As light source a Xe arc lamp with em = 300 – 700 nm, controlled by a lamp power supply LPS 220 by Photon Technology International was used.
Lenses for focusing the light pointer: To focus the light from the arc lamp to the electrochemical cell a convex and a plano-convex lens along with a 45° mirror were used as shown in Figure SI-16. All three components were purchased from Linos Germany.
Optical chopper: An optical chopper (Scitec instruments) was introduced in the light path before the lens to modulate the incident light at a desired frequency.
Lock-in Amplifier: An EG&G lock-in amplifier (Model # 5210) was used to improve the signal to the noise ratio. The reference frequency for the lock in was the modulation frequency used for the chopper. The lock-in was connected to the current output I of the three electrode system. The output of the lock in was interfaced with a PC and read by a serial port reader, cfg. Figure SI-16.
Three electrode system: In the three electrode system the operational amplifier provides a constant potential at which working electrode (WE, in our case the Au chip) is set to ground. A fixed potential is applied to the reference electrode (RE, in our case the Ag/AgCl electrode). The counter electrode (CE, a platinum wire) lies at a higher or lower potential in comparison to the WE. The CE generates the current by oxidizing or reducing the redox pairs in solution.
Figure SI-15: Schematics of a three electrode system
The essential components of our system were three electrodes and a microcomputer with an interface card for digital to analog (DAC) and analog to digital (ADC) conversion. A Ag/AgCl saturated RE, a spiral like platinum CE, and a gold chip WE were assembled within the electrochemical cell as shown in Figure SI-14. Two operational amplifiers OP1 and OP2 were
A-28

mounted within the three electrode system. The voltage UExt (= the bias voltage U in the cyclic voltammograms) was applied by the DAC at the + input of OP1. The RE was directly connected with the – input of OP1. No current flows through the RE and IOP1 is zero. The purpose is to ensure that the voltage difference between the RE and WE always remains constant (at bias voltage U = Uext). OP2 has a variable resistor mounted between the - input and output of OP2 to increase the sensitivity of the instrument. This arrangement is called current to the voltage converter. The output of OP2 is measured with the ADC or the lock-in amplifier. The output is proportional to the current I = IWk through the WE and CE. A ± 2 V input and output range is set for the DAC and ADC lab board. Input and output resolutions was 16 bit.
Block Diagram: The electrochemical cell and the three electrode system were placed into a Faraday’s cage to shield against external static electric fields. The light from the light source was focused with a convex lens. In between the convex lens and the light source a chopper was installed to modulate the light at desired frequency. The incident light was aligned after passing through the lens. The resulting light beam was focused with the help of a plano-convex lens on the surface of the QD coated Au chip inside the electrochemical measurement cell
Figure SI-16: Block diagram of the setup
A-29

References:
[1] S. Kudera, L. Carbone, M. F. Casula, R. Cingolani, A. Falqui, E. Snoeck, W. J. Parak, L. Manna, Nanoletters 2005, 5, 445.
[2] Z. Yue, W. Khalid, M. Zanella, A. Z. Abbasi, A. Pfreundt, P. Rivera Gil, K. Schubert, F. Lisdat, W. J. Parak, Analytical and Bioanalytical Chemistry 2010, 396, 1095.
[3] C. G. Bauer, A. V. Eremenko, E. EhrentreichForster, F. F. Bier, A. Makower, H. B. Halsall, W. R. Heineman, F. W. Scheller, Analytical Chemistry 1996, 68, 2453.
[4] J. E. Frew, N. C. Foulds, J. M. Wilshere, N. J. Forrow, M. J. Green, Journal Of Electroanalytical Chemistry 1989, 266, 309.
[5] H. Neumann, Vanvreed.M, Clinica Chimica Acta 1967, 17, 183. [6] H. T. Tang, C. E. Lunte, H. B. Halsall, W. R. Heineman, Analytica Chimica Acta 1988, 214, 187.
A-30
ORIGINAL PAPER
Evaluation of quantum dots applied as switchable layerin a light-controlled electrochemical sensor
Zhao Yue & Waqas Khalid & Marco Zanella & Azhar Zahoor Abbasi &Andrea Pfreundt & Pilar Rivera Gil & Kirsten Schubert & Fred Lisdat &Wolfgang J. Parak
Received: 9 October 2009 /Revised: 15 November 2009 /Accepted: 24 November 2009 /Published online: 30 December 2009# Springer-Verlag 2009
Abstract Gold electrodes with switchable conductance arecreated by coating the gold surface with different colloidalquantum dots. For the quantum dot immobilization, a dithiolcompound was used. By polarizing the electrode and applyinga light pointer, local photocurrents were generated. Theperformance of this setup was characterized for a variety ofdifferent nanoparticle materials regarding drift and signal-to-noise ratio. We varied the following parameters: quantum dotmaterials and immobilization protocol. The results indicatethat the performance of the sensor strongly depends on howthe quantum dots are bound to the gold electrode. The bestresults were obtained by inclusion of an additional polyelec-trolyte film, which had been fabricated using layer-by-layerassembly.
Keywords Light-addressable potentiometric sensor .
Quantum dots . Photocurrent
Introduction
In standard sensor arrays, each active spot typically needsto be connected with one individual wire. As the number ofrequired wires of an n×n sensor matrix scales with n2,sensor arrays with a large number of active spots aretechnologically challenging [1]. For this reason, severalresearch groups have worked toward sensors in which theactive spot where the measurement takes place is selectedvia optical illumination instead of hardware wiring. Thebasic idea of such a light-addressable potentiometric sensor(LAPS) is rather simple [2, 3]. The original surface of aLAPS electrode comprises a semiconductor and insulatorlayer. Due to the bad conductivity of the insulator, no DCcurrent flow is possible. However, if parts of the device areoptically illuminated with a modulated light source, thelocal AC conductivity goes up due to the creation ofelectron-hole pairs. This creates a local short circuit whichand thus defines the active spot, where an AC photocurrentcan flow [1, 3]. By scanning a light pointer along the sensorsurface, any site can be selectively defined as active spot atwhich the measurement is supposed to take place [4–7].
By immobilizing different enzymes at distinct locationsof the sensor surface, different enzymatic reactions could bedetected by subsequently switching the light pointer to thedifferent locations to read out the respective electrochem-ical signal via measurement of the local photocurrent [8–17]. The lateral resolution, i.e., the size of the smallestpossible active spot which can be achieved, is on the orderof a few micrometers to a few tens of micrometers. This is
Zhao Yue and Waqas Khalid contributed equally to this study.
Z. Yue :W. Khalid :M. Zanella :A. Z. Abbasi :A. Pfreundt :P. Rivera Gil :W. J. ParakDepartment of Physics, Philipps University Marburg,35037 Marburg, Germany
Z. YueDepartment of Electronics, Nankai University,300071 Tianjin, China
K. Schubert : F. LisdatBiosystems Technology, University of Applied Sciences Wildau,1574 Wildau, Germany
W. J. Parak (*)Wissenschaftliches Zentrum für Materialwissenschaften,Philipps University Marburg,35037 Marburg, Germanye-mail: [email protected]
Anal Bioanal Chem (2010) 396:1095–1103DOI 10.1007/s00216-009-3347-y
B-1
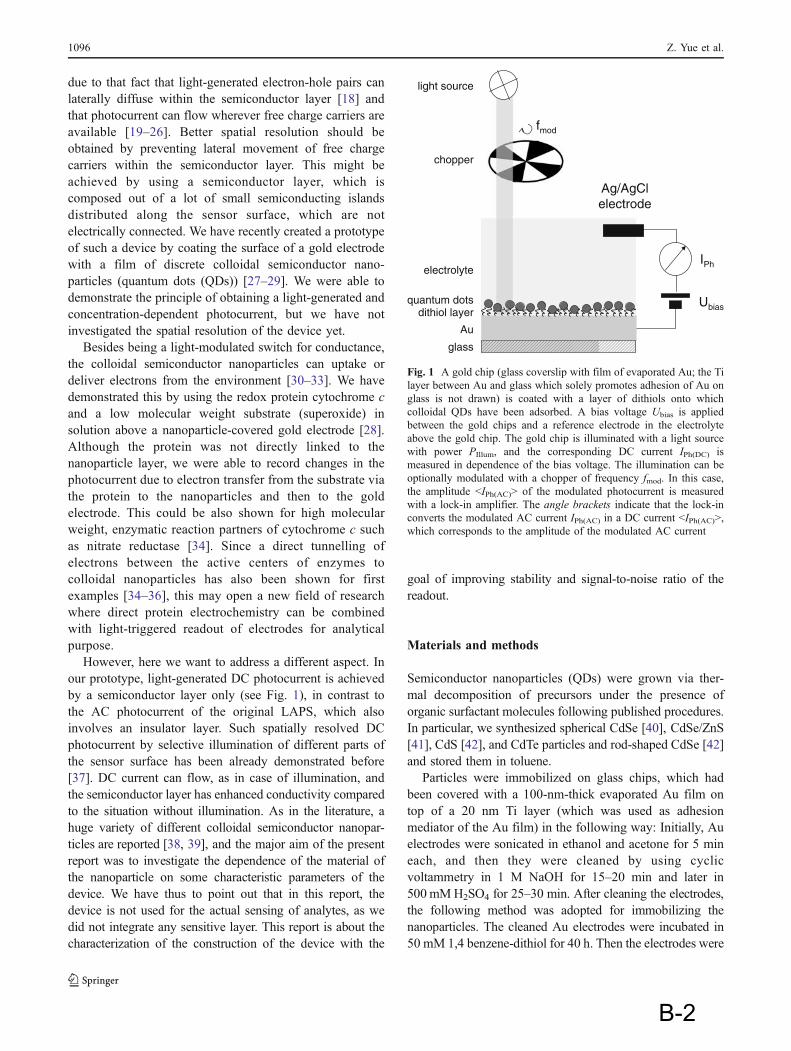
due to that fact that light-generated electron-hole pairs canlaterally diffuse within the semiconductor layer [18] andthat photocurrent can flow wherever free charge carriers areavailable [19–26]. Better spatial resolution should beobtained by preventing lateral movement of free chargecarriers within the semiconductor layer. This might beachieved by using a semiconductor layer, which iscomposed out of a lot of small semiconducting islandsdistributed along the sensor surface, which are notelectrically connected. We have recently created a prototypeof such a device by coating the surface of a gold electrodewith a film of discrete colloidal semiconductor nano-particles (quantum dots (QDs)) [27–29]. We were able todemonstrate the principle of obtaining a light-generated andconcentration-dependent photocurrent, but we have notinvestigated the spatial resolution of the device yet.
Besides being a light-modulated switch for conductance,the colloidal semiconductor nanoparticles can uptake ordeliver electrons from the environment [30–33]. We havedemonstrated this by using the redox protein cytochrome cand a low molecular weight substrate (superoxide) insolution above a nanoparticle-covered gold electrode [28].Although the protein was not directly linked to thenanoparticle layer, we were able to record changes in thephotocurrent due to electron transfer from the substrate viathe protein to the nanoparticles and then to the goldelectrode. This could be also shown for high molecularweight, enzymatic reaction partners of cytochrome c suchas nitrate reductase [34]. Since a direct tunnelling ofelectrons between the active centers of enzymes tocolloidal nanoparticles has also been shown for firstexamples [34–36], this may open a new field of researchwhere direct protein electrochemistry can be combinedwith light-triggered readout of electrodes for analyticalpurpose.
However, here we want to address a different aspect. Inour prototype, light-generated DC photocurrent is achievedby a semiconductor layer only (see Fig. 1), in contrast tothe AC photocurrent of the original LAPS, which alsoinvolves an insulator layer. Such spatially resolved DCphotocurrent by selective illumination of different parts ofthe sensor surface has been already demonstrated before[37]. DC current can flow, as in case of illumination, andthe semiconductor layer has enhanced conductivity comparedto the situation without illumination. As in the literature, ahuge variety of different colloidal semiconductor nanopar-ticles are reported [38, 39], and the major aim of the presentreport was to investigate the dependence of the material ofthe nanoparticle on some characteristic parameters of thedevice. We have thus to point out that in this report, thedevice is not used for the actual sensing of analytes, as wedid not integrate any sensitive layer. This report is about thecharacterization of the construction of the device with the
goal of improving stability and signal-to-noise ratio of thereadout.
Materials and methods
Semiconductor nanoparticles (QDs) were grown via ther-mal decomposition of precursors under the presence oforganic surfactant molecules following published procedures.In particular, we synthesized spherical CdSe [40], CdSe/ZnS[41], CdS [42], and CdTe particles and rod-shaped CdSe [42]and stored them in toluene.
Particles were immobilized on glass chips, which hadbeen covered with a 100-nm-thick evaporated Au film ontop of a 20 nm Ti layer (which was used as adhesionmediator of the Au film) in the following way: Initially, Auelectrodes were sonicated in ethanol and acetone for 5 mineach, and then they were cleaned by using cyclicvoltammetry in 1 M NaOH for 15–20 min and later in500 mMH2SO4 for 25–30 min. After cleaning the electrodes,the following method was adopted for immobilizing thenanoparticles. The cleaned Au electrodes were incubated in50 mM 1,4 benzene-dithiol for 40 h. Then the electrodes were
chopper
fmod
electrolyte
quantum dotsdithiol layer
Au
glass
light source
Ag/AgClelectrode
Ubias
IPh
Fig. 1 A gold chip (glass coverslip with film of evaporated Au; the Tilayer between Au and glass which solely promotes adhesion of Au onglass is not drawn) is coated with a layer of dithiols onto whichcolloidal QDs have been adsorbed. A bias voltage Ubias is appliedbetween the gold chips and a reference electrode in the electrolyteabove the gold chip. The gold chip is illuminated with a light sourcewith power PIllum, and the corresponding DC current IPh(DC) ismeasured in dependence of the bias voltage. The illumination can beoptionally modulated with a chopper of frequency fmod. In this case,the amplitude <IPh(AC)> of the modulated photocurrent is measuredwith a lock-in amplifier. The angle brackets indicate that the lock-inconverts the modulated AC current IPh(AC) in a DC current <IPh(AC)>,which corresponds to the amplitude of the modulated AC current
1096 Z. Yue et al.
B-2
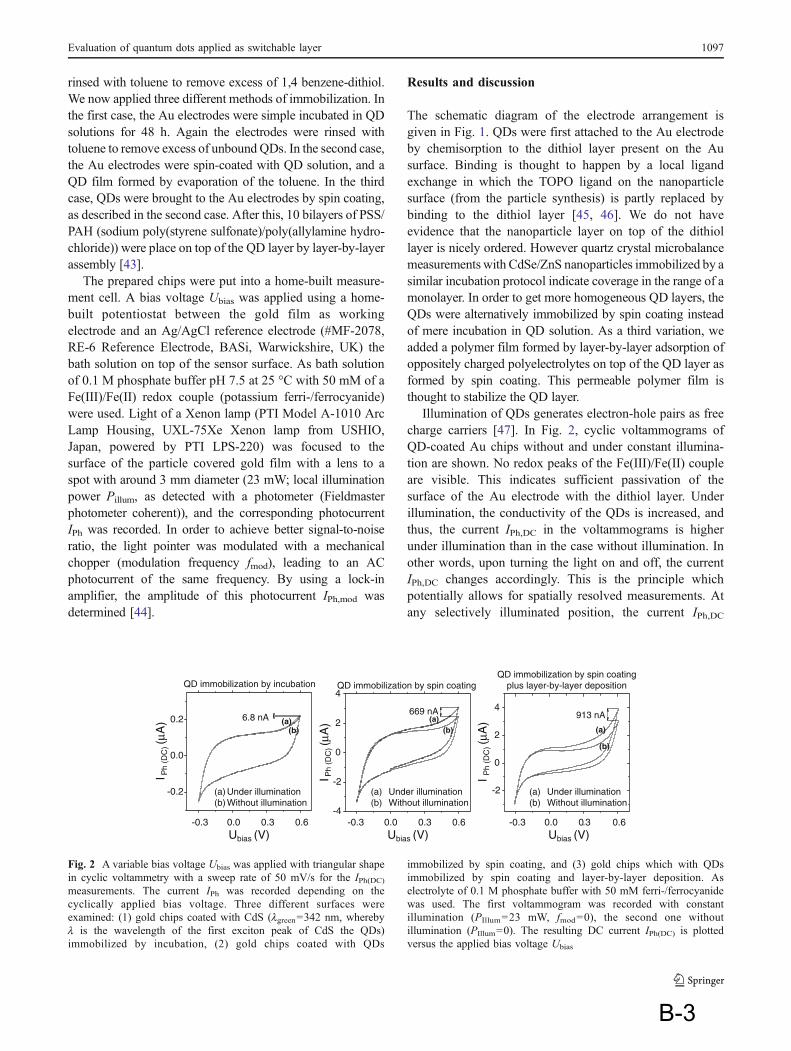
rinsed with toluene to remove excess of 1,4 benzene-dithiol.We now applied three different methods of immobilization. Inthe first case, the Au electrodes were simple incubated in QDsolutions for 48 h. Again the electrodes were rinsed withtoluene to remove excess of unbound QDs. In the second case,the Au electrodes were spin-coated with QD solution, and aQD film formed by evaporation of the toluene. In the thirdcase, QDs were brought to the Au electrodes by spin coating,as described in the second case. After this, 10 bilayers of PSS/PAH (sodium poly(styrene sulfonate)/poly(allylamine hydro-chloride)) were place on top of the QD layer by layer-by-layerassembly [43].
The prepared chips were put into a home-built measure-ment cell. A bias voltage Ubias was applied using a home-built potentiostat between the gold film as workingelectrode and an Ag/AgCl reference electrode (#MF-2078,RE-6 Reference Electrode, BASi, Warwickshire, UK) thebath solution on top of the sensor surface. As bath solutionof 0.1 M phosphate buffer pH 7.5 at 25 °C with 50 mM of aFe(III)/Fe(II) redox couple (potassium ferri-/ferrocyanide)were used. Light of a Xenon lamp (PTI Model A-1010 ArcLamp Housing, UXL-75Xe Xenon lamp from USHIO,Japan, powered by PTI LPS-220) was focused to thesurface of the particle covered gold film with a lens to aspot with around 3 mm diameter (23 mW; local illuminationpower Pillum, as detected with a photometer (Fieldmasterphotometer coherent)), and the corresponding photocurrentIPh was recorded. In order to achieve better signal-to-noiseratio, the light pointer was modulated with a mechanicalchopper (modulation frequency fmod), leading to an ACphotocurrent of the same frequency. By using a lock-inamplifier, the amplitude of this photocurrent IPh,mod wasdetermined [44].
Results and discussion
The schematic diagram of the electrode arrangement isgiven in Fig. 1. QDs were first attached to the Au electrodeby chemisorption to the dithiol layer present on the Ausurface. Binding is thought to happen by a local ligandexchange in which the TOPO ligand on the nanoparticlesurface (from the particle synthesis) is partly replaced bybinding to the dithiol layer [45, 46]. We do not haveevidence that the nanoparticle layer on top of the dithiollayer is nicely ordered. However quartz crystal microbalancemeasurements with CdSe/ZnS nanoparticles immobilized by asimilar incubation protocol indicate coverage in the range of amonolayer. In order to get more homogeneous QD layers, theQDs were alternatively immobilized by spin coating insteadof mere incubation in QD solution. As a third variation, weadded a polymer film formed by layer-by-layer adsorption ofoppositely charged polyelectrolytes on top of the QD layer asformed by spin coating. This permeable polymer film isthought to stabilize the QD layer.
Illumination of QDs generates electron-hole pairs as freecharge carriers [47]. In Fig. 2, cyclic voltammograms ofQD-coated Au chips without and under constant illumina-tion are shown. No redox peaks of the Fe(III)/Fe(II) coupleare visible. This indicates sufficient passivation of thesurface of the Au electrode with the dithiol layer. Underillumination, the conductivity of the QDs is increased, andthus, the current IPh,DC in the voltammograms is higherunder illumination than in the case without illumination. Inother words, upon turning the light on and off, the currentIPh,DC changes accordingly. This is the principle whichpotentially allows for spatially resolved measurements. Atany selectively illuminated position, the current IPh,DC
-0.3 0.0 0.3 0.6
-2
0
2
4
(b)
(a)
-0.3 0.0 0.3 0.6-4
-2
0
2
4
(b)(a)
-0.3 0.0 0.3 0.6
-0.2
0.0
0.2(b)
(a)
I Ph
(DC
) (µ
A)
Ubias (V)
I Ph
(DC
) (µ
A)
I Ph
(DC
) (µ
A)
Ubias (V) Ubias (V)
6.8 nA
(a) Under illumination(b) Without illumination
(a) Under illumination(b) Without illumination
669 nA
(a) Under illumination(b) Without illumination
913 nA
QD immobilization by incubation QD immobilization by spin coatingQD immobilization by spin coating
plus layer-by-layer deposition
Fig. 2 A variable bias voltage Ubias was applied with triangular shapein cyclic voltammetry with a sweep rate of 50 mV/s for the IPh(DC)measurements. The current IPh was recorded depending on thecyclically applied bias voltage. Three different surfaces wereexamined: (1) gold chips coated with CdS (lgreen=342 nm, wherebyl is the wavelength of the first exciton peak of CdS the QDs)immobilized by incubation, (2) gold chips coated with QDs
immobilized by spin coating, and (3) gold chips which with QDsimmobilized by spin coating and layer-by-layer deposition. Aselectrolyte of 0.1 M phosphate buffer with 50 mM ferri-/ferrocyanidewas used. The first voltammogram was recorded with constantillumination (PIllum=23 mW, fmod=0), the second one withoutillumination (PIllum=0). The resulting DC current IPh(DC) is plottedversus the applied bias voltage Ubias
Evaluation of quantum dots applied as switchable layer 1097
B-3

0 50 100 150 2000 50 100 150 2000
2
4
6
8
10
12
0
2
4
6
8
10
12
I DC
(nA
)
<I P
h (A
C)>
(nA
)
T (s) T (s)
Without Lockin amplifier With Lockin amplifiera b
Fig. 3 A constant bias voltage Ubias=200 mV was applied to goldchips with CdS QDs (lgreen=342 nm, whereby l is the wavelength ofthe first exciton peak of CdS QDs) immobilized via spin coating. Thechips were in contact with 0.1 M phosphate buffer, pH 7.5. a The lightwas switched on (PIllum=23 mW) and off (PIllum=0) in intervals of10 s each, and the photocurrent IPh(DC) was recorded against time.
Note that the change in current upon switching on and off the lightpointer is significantly higher than the constant background current,which is due to bypassing the QD switch. b The light was modulated(fmod=23.8 Hz) and switched on (PIllum=23 mW) and off (PIllum=0) inintervals of 10 s each, and the amplitude of the resulting photocurrent<IPh(AC)> was recorded against time with a lock-in amplifier
0 100 200
0
10
20
-1000 -500 0 500 1000
0.000
0.002
0.004
Spherical CdS
-1000 -500 0 500 1000
0.000
0.002
0.004
Spherical CdSe
-1000 -500 0 500 1000
0.000
0.002
0.004
Spherical CdSe/ZnS
-1000 -500 0 500 1000
0.000
0.002
0.004
Spherical CdTe, rod-shaped CdSe
-1000 -500 0 500 1000
0.000
0.002
0.004
Spherical CdS, different QD immobilization
techniques
<I P
h (A
C)>
(nA
)
Ubias (mV) Ubias (mV)
Ubias (mV)Ubias (mV)Ubias (mV)
T (s)
(∆ I dr
ift/I m
ax)/
∆ t (
s-1 )
(∆ I dr
ift/I m
ax)/
∆t (
s-1 )
(∆ I dr
ift/I m
ax)/
∆ t (
s-1 )
(∆I d
rift/I
max
)/ ∆
t (s-
1 )
(∆I d
rift/I
max
)/ ∆
t (s-
1 )
∆ Idr
ift
Imax
∆ t
CdSe redCdSe orangeCdSe yellowCdSe green
CdSe/ZnS redCdSe/ZnS orangeCdSe/ZnS yellowCdSe/ZnS green
CdTeCdSe rod
CdS greenCdS orangeCdS red
Normal IncubationSpin CoatedSpin Coated + LbL
Fig. 4 A constant bias voltage Ubias was applied to gold chips withimmobilized QDs. The chips were in contact with 0.1 M phosphatebuffer, pH 7.5. The chips were illuminated with modulated light(fmod=23.8 Hz), and the amplitude of the resulting photocurrent<IPh(AC)> was determined with a lock-in amplifier. Within the timeinterval Δt of a few minutes, the light source was four times switchedon (PIllum=23 mW) and off (PIllum=0), whereby time traces of<IPh(AC)> were recorded. From these data, the influence of drift on thephotocurrent was derived as (ΔIdrift/Imax)/Δt. Here Imax is the initialamplitude of the photocurrent <IPh(AC)>, and ΔIdrift is the loss incurrent during the time interval Δt. (ΔIdrift/Imax)/Δt values at differentapplied bias voltages Ubias obtained on chips with nanoparticles madeout of different materials are displayed: spherical CdSe lred=588 nm,
lorange=560 nm, lyellow=532 nm, and lgreen=515 nm; spherical CdSe/ZnS lred=596 nm, lorange=570 nm, lyellow=540 nm, and lgreen=521 nm, rod-shaped CdSe lrods=665 nm; spherical CdTe l=441 nm;spherical CdS lred=426 nm, lorange=369 nm, and lgreen=342 nm;whereby l is the wavelength of the first exciton peak of the respectiveQDs. The QDs were immobilized to the Au electrode by incubation.Only in the last image was a comparison of different immobilizationmethods given. Spherical CdS QDs (lgreen=342 nm) were immobilizedby incubation, immobilized by spin coating, and immobilized by spincoating and layer-by-layer deposition, respectively. The values are theaverage of measurements performed on different devices at differentdays and their standard deviation as error bar
1098 Z. Yue et al.
B-4

would increase in dependence on the electrode potentialapplied. To directly measure the difference in currentΔIPh,DC= IPh,DC
(illuminated)−IPh,DC(dark) without the back-ground DC current, the lock-in technique can be advanta-geously employed. For this purpose, the light is periodicallyturned on and off with the modulation frequency fmod,and the amplitude of the thus modulated photocurrent<IPh,AC>/ΔIPh,DC is detected. In Fig. 3, photocurrentmeasurements under modulated illumination are shown.As expected, the amplitude of the modulated photocurrentroughly corresponds to the difference in DC current withand without illumination. The lock-in technique has theadvantage to remove the DC background current (i.e.,<IPh,AC
(dark)>=0) and thus part of the initial drift, and itreduces the noise level. Thus the lock-in technique shouldbe very useful for spatially resolved measurements.
The aim of this study was now to investigate theinfluence of the material of the QDs and the way of theirimmobilization on the photocurrent behavior. As can beseen in Fig. 2, QD layers made by spin coating (with or
without additional polymer film) lead to significantlyhigher currents. In the experiments with QD layers madeby incubation and spin coating (without the additionalpolymer film), a decrease of the photocurrent can be seen inthe first subsequent measurements. One explanation mightbe a loss of QDs upon measurements. No significant loss inphotocurrent upon repetitive measurements was seen in thecase of spin-coated QDs with additional layer-by-layerassembly of a polymer film on top of them. These dataalready indicate that incubation of the QDs on the goldelectrode plays a crucial role in the performance of thedevice. The data shown in Fig. 2 suggest that immobilizationof QDs with spin coating increases the amount of detectablephotocurrent and that the additional polymer film above theQD layer shows some stabilizing effect.
For more detailed analysis, three parameters were testedfor chips prepared with different nanoparticles and withdifferent immobilization methods: drift of the photocurrent,noise level of the photocurrent, and influence of theillumination intensity onto the photocurrent. We used
-1000 -500 0 500 1000
0.0
0.1
0.2
0.3
0 150 300
0
5
10
15
560 564
12.0
nA
s
-1000 -500 0 500 1000
0.0
0.1
0.2
0.3
Spherical CdS
Spherical CdSe Spherical CdSe/ZnS
Spherical CdTe, rod-shaped CdSe
Spherical CdS, different QD immobilization
techniques
Ubias (mV) Ubias (mV)T (s)
<I P
h (A
C)>
(nA
)
Ubias (mV)Ubias (mV)Ubias (mV)
∆ Ino
ise
/Im
ean
CdSe redCdSe orangeCdSe yellowCdSe green
CdS
e/Z
nS r
edC
dSe/
ZnS
ora
nge
CdS
e/Z
nS y
ello
wC
dSe/
ZnS
gre
en
CdTeCdSe rod
CdS greenCdS orangeCdS red
Normal IncubationSpin CoatedSpin Coated + LbL
∆ Inoise
Imean
-1000 -500 0 500 1000
0.0
0.1
0.2
0.3
-1000 -500 0 500 1000
0.0
0.1
0.2
0.3
-1000 -500 0 500 1000
0.0
0.1
0.2
0.3
∆ Ino
ise
/Im
ean
∆ Ino
ise
/Im
ean
∆ Ino
ise
/Im
ean
∆ Ino
ise
/Im
ean
Fig. 5 A constant bias voltage Ubias was applied to gold chips withimmobilized QDs. The chips were in contact with 0.1 M phosphatebuffer, pH 7.5. The chips were illuminated with modulated light(fmod=23.8 Hz), and the amplitude of the resulting photocurrent<IPh(AC)> was determined with a lock-in amplifier. Following thedetermination of drift, the signal-to-noise ratio was determined for alldifferent chips and bias voltages. The light source was switched on(PIllum=23 mW), and the mean amplitude of the photocurrent Imean
and the height of fluctuations ΔInoise was determined. Using thesedata, we derived the relative noise level as ΔInoise/Imean. The graphsshow the ΔInoise/Imean values as obtained for several bias voltagesUbias on chips with nanoparticles made out of different materials:spherical CdSe lred=588 nm, lorange=560 nm, lyellow=532 nm, and
lgreen=515 nm; spherical CdSe/ZnS lred=596 nm, lorange=570 nm,lyellow=540 nm, and lgreen=521 nm; rod-shaped CdSe lrods=665 nm;spherical CdTe l=441 nm; spherical CdS lred=426 nm, lorange=369 nm, and lgreen=342 nm; whereby l is the wavelength of the firstexciton peak of the respective QDs. The QDs were immobilized to theAu electrode by incubation. Only in the last image was comparison ofdifferent immobilization methods given. Spherical CdS QDs (lgreen=342 nm) were immobilized by incubation, immobilized by spincoating, and immobilized by spin coating and layer-by-layer deposition,respectively. The values are the average of measurements performed ondifferent devices at different days and their standard deviation as errorbar
Evaluation of quantum dots applied as switchable layer 1099
B-5

spherical CdSe, CdS, CdTe, and CdSe/ZnS particles and rod-shaped CdS particles. For probing the mode of immobiliza-tion, spherical CdS particles were immobilized with QDs bymere incubation, with spin coating, and spin coating withadditional adsorption of a layer-by-layer assembled polymerfilm. As the photocurrent is dependent on the appliedelectrode polarization, the experiments were done at differentbias voltages Ubias. All measurements were performed intriplicate for the different chips. The measurement cycle andthe results for the different QD materials and incubationmethods are summarized in Figs. 4, 5, and 6.
We first characterized drift, as it was found that duringthe first light pulses, the photocurrent shows a running inbehavior. In order to characterize this drift, the chips wereinvestigated with the following cycle: Firstly, the lightsource which was modulated with a chopper was four timesswitched on and off, while the amplitude of the photocur-rent was measured. The change in the amplitude of thephotocurrent Idrift during this cycle was determined andnormalized to the maximum amplitude Imax, and the timeinterval Δt in which the light was switched on and off fourtimes. In this way, we got (ΔIdrift/Imax)/Δt as parameter for
the temporal stability of the sensor readout. As can be seenfrom the results presented in Fig. 4 for all investigatednanoparticles, there was drift in the amplitude of thephotocurrent over time. The effect is particularly pronouncedwhen rather large photocurrents are generated, i.e., underhighly negative and highly positive polarization (Ubias<<0and Ubias>>0; see Fig. 4). The initial drift behavior isobviously a general property of this system and notdependent on the nature of the QDs. As all QDs have theirfirst exciton peak between 300 and 600 nm, illuminationwith a Xenon lamp with continuous spectrum facilitatesexcitation of electron-hole pairs in all cases. In contrast, wefound an influence of the immobilization method on thestability of the photocurrent. Coating of the QD layer with alayer-by-layer assembled polymer film drastically reduceddrift compared to the other modes of QD immobilization, inparticular for negative polarization (Ubias<<0). We speculatethat the creation or saturation of surface states at the QDsurface may appear as one reason for this time-dependentbehavior. Another reason might be the loss of QDs from theelectrode surface. The fact that the photocurrent is morestable upon the presence of a polymer film on top of the QDs
0
20
40
60
25 30 35 40
1.0
1.2
1.4
250 20 40 60 30 35 40
1.0
1.2
1.4
T (s)
25 30 35 40
1.0
1.2
1.4
25 30 35 40
1.0
1.2
1.4
25 30 35 40
1.0
1.2
1.4
<I P
h (A
C)>
(nA
)
Spherical CdSSpherical CdTe, rod-shaped
CdSe &CdS
Spherical CdS, differentQD immobilization
techniques
Spherical CdSe Spherical CdSe/ZnS
PIllum (mW) PIllum (mW)
PIllum (mW)PIllum (mW)PIllum (mW)
PIllum(1) PIllum(2) PIllum(3)
∆ Im
ean/
∆ Im
ean(
1)
∆ Im
ean/
∆ Im
ean(
1)∆ I
mea
n/∆ I
mea
n(1)
∆Im
ean/
∆ Im
ean(
1)
∆Im
ean/
∆ Im
ean(
1)
CdSe redCdSe orangeCdSe yellowCdSe green
CdSe/ZnS redCdSe/ZnS orangeCdSe/ZnS yellowCdSe/ZnS green
CdS rodCdSe rodCdTe
CdS greenCdS orangeCdS red
Normal IncubationSpin CoatedSpin Coated + LbL
Imean (1) Imean (2) Imean (3)
23.5 mW30 mW
38 mW
Fig. 6 A constant bias voltage Ubias=200 mV was applied to goldchips with immobilized QDs. The chips were in contact with 0.1 Mphosphate buffer, pH 7.5. The chips were illuminated with modulatedlight (fmod=23.8 Hz), and the amplitude of the resulting photocurrent<IPh(AC)> was determined with a lock-in amplifier. The light sourcewas turned on three times for several tens of seconds with differentillumination power (PIllum=23, 30, and 38 mW), and thecorresponding mean value Imean of the amplitude of the photocurrent<IPh(AC)> was determined. From the three data points, ΔImean(i)/ΔImean(1) (i=1, 2, 3) was determined. These values are plotted forchips made with different QDs: spherical CdSe lred=588 nm, lorange=
560 nm, lyellow=532 nm, and lgreen=515 nm; spherical CdSe/ZnSlred=596 nm, lorange=570 nm, lyellow=540 nm, and lgreen=521 nm;rod-shaped CdSe lrods=665 nm; spherical CdTe l=441 nm; sphericalCdS lred=426 nm, lorange=369 nm, and lgreen=342 nm; whereby l isthe wavelength of the first exciton peak of the respective QDs. TheQDs were immobilized to the Au electrode by incubation. Only in thelast image was a comparison of different immobilization methodsgiven. Spherical CdS QDs (lgreen=342 nm) were immobilized byincubation, immobilized by spin coating, and immobilized by spincoating and layer-by-layer deposition, respectively
1100 Z. Yue et al.
B-6

suggests that this polymer film reduces loss of QDs from theelectrode. In all cases, drift was strongest in the beginning ofmeasurements. This offers the possibility to perform a pre-conditioning with several light pulses before a stablephotocurrent is generated. After equilibration, stable photo-currents can be generated rather for a long time. Forexample, permanent illumination of a QD electrode withCdSe/ZnS nanoparticles for 1 h resulted only in a currentdecrease of about 10%.
Second, in order to characterize the noise behavior, themodulated light source was switched on, and fluctuations inthe recorded amplitude of the photocurrent ΔInoise wererecorded. Normalization of the noise to the averageamplitude (i.e., the mean value) of the photocurrent Imean
led to the noise level ΔInoise/Imean. Results are presented inFig. 5. Noise is highest for very negative bias voltages,where also high photocurrents are flowing. ΔInoise/Imean
also peaks around Ubias≈0. This is due to the fact that themean photocurrent Imean is very low at this point. Again, thebiggest influence is the mode of QD immobilization. QDsimmobilized by spin coating with addition polymer film ontop of them showed the lowest noise profile, in particular atvery low and very high bias.
Third, for the investigation of the light power influence,the modulated light was turned on and off three times withdifferent illumination intensities PIllum, and the respectivemean amplitudes of the photocurrent Imean were determined.In all cases, the photocurrent rose linearly with theillumination power; see Fig. 6. This indicates that thevariation in charge carrier generation inside the QDs can befollowed by the electron transfer reaction to the electrode inall cases. Thus, this step seems to be not the limiting one atleast for the light intensities tested.
Comparison of all three parameters for the chips withQDs of different materials does not lead to highlysignificant different values. This can be understood by thefact that in this study we were using white-light illumination ina spectral range at which all QDs sufficiently absorb light. Onthe other hand, we found an improvement upon addition of apolymer film on top of the QD layer. This film reduced initialdrift and noise, in particular at very negative bias voltages. Inall cases, the stability and the signal-to-noise ratio of thephotocurrent were best for small positive and negative biasvoltages of only a few hundred millivolts. This suggests theoperation range for future measurements.
Conclusions
Using QDs as light-controlled switch for spatially resolvedmeasurements has been demonstrated to be a feasibleconcept. In this work, we have investigated drift, i.e.,missing stability in the sensor readout after preparation, to
be one important shortcoming of the sensor. This effect islikely to be caused intrinsically by the sensor readout.Photocurrents are thought to oxidize or reduce the QDs andrespective surface states as well the interconnecting dithiollayer. Also a loss of QDs from the sensor surface cannot beruled out. We have demonstrated that the addition of apolymer film on top of the QDs can significantly reduce aswell initial current drift as noise. This might be due to thefact that the polymer film prevents loss of the underlyingQDs from the Au electrode. Also the changed chemicalenvironment by the polymer might change the filling up ofsurface states or might reduce particle–particle communi-cation. In terms of using the device for detection ofanalytes, the presence of the polymer film will imposecertain restrictions. While similar polymer films have beendemonstrated to be permeable for small analytes [48, 49],certainly bigger molecules would not be able to reach theQDs as they would not be able to penetrate the polymerfilm. However, this also could be turned to an advantage.Enzymes can be conveniently integrated in the polymerfilm in between the different layers [50, 51]. This wouldoffer a convenient way to immobilize enzymes directly ontop of the QD layer. Small analytes as substrate couldpermeate the network of the polymer film, reach theenzymes, and get processed to the product, which wouldbe finally detected as local photocurrent. By immobilizationof different enzymes at different regions of the sensorsurface, the advantage of the possibility of spatiallyresolved measurements could be finally put into practice.
Acknowledgments This work was funded by the German ResearchFoundation (DFG grants Pa 794/3-1 and Li 706/2-1).
References
1. George M, Parak WJ, Gaub HE (2000) Highly integrated surfacepotential sensors. Sens Actuators, B 69:266–275
2. McConnell HM, Owicki JC, Parce JW, Miller DL, Baxter GT, WadaHG, Pitchford S (1992) The cytosensor microphysiometer: biologicalapplications of silicon technology. Science 257:1906–1912
3. Owicki JC, Bousse L, Hafeman D, Kirk GL, Olson JD, Wada HG,Parce JW (1994) The light-addressable potentiometric sensor:principles and biological applications. Annu Rev Biophys BiomolStruct 23:87–113
4. Engström O, Carlsson A (1983) Scanned light technique for theinvestigation of insulator–semiconductor interfaces. J Appl Physi54:5245–5251
5. Löfdahl M, Eriksson M, Lundström I (2000) Chemical images.Sens Actuators, B 70:77–82
6. Lundström I, Erlandsson R, Frykman U, Hedborg E, Spetz A,Sundgren H,Welin S,Winquist F (1991) Artificial ‘olfactory’ imagesfrom a chemical sensor using a light-pulse technique. Nature 352:47–50
7. Schoning MJ, Wagner T, Wang C, Otto R, Yoshinobu T (2005)Development of a handheld 16 channel pen-type LAPS forelectrochemical sensing. Sens Actuators, B 108:808–814
Evaluation of quantum dots applied as switchable layer 1101
B-7

8. Hafeman DG, Parce JW, McConnell HM (1988) Light-addressablepotentiometric sensor for biochemical systems. Science 240:1182–1185
9. Adami M, Piras L, Lanzi M, Fanigliulo A, Vakula S, Nicolini C(1994) Monitoring of enzymatic activity and quantitative measure-ments of substrates by means of a newly designed silicon-basedpotentiometric sensor. Sens Actuators, B 18–19:178–182
10. Bousse L, Kirk G, Sigal G (1990) Biosensors for detection ofenzymes immobilized in microvolume reaction chambers. SensActuators, B 1:555–560
11. Bousse L, Owicki JC, Parce JW (1992) Biosensors with micro-volume reaction chambers. Chemical Sensor Technology 4:145–166
12. Eklund SE, Taylor D, Kozlov E, Prokop A, Cliffel DE (2004) Amicrophysiometer for simultaneous measurement of changes inextracelular glucose, lactate, oxygen, and acidification rate. AnalChem 76:519–527
13. Ismail ABM, Yoshinobu T, Iwasaki H, Sugihara H, Yukimasa T,Hirata I, Iwata H (2003) Investigation on light-addressablepotentiometric sensor as a possible cell–semiconductor hybrid.Biosens Bioelectron 18:1509–1514
14. Lee WE, Thompson HG, Hall JG, Bader DE (2000) Rapiddetection and identification of biological and chemical agents byimmunoassay, gene probe assay and enzyme inhibition using asilicon-based biosensor. Biosens Bioelectron 14:795–804
15. Piras L, Adami M, Fenu S, Dovis M, Nicolini C (1996)Immunoenzymatic application of a redox potential biosensor.Anal Chim Acta 335:127–135
16. Poghossion A, Yoshinobu T, Simonis A, Ecken H, Lüth H,Schöning MJ (2001) Penicillin detection by means of field-effectbased sensors: ENFET, capacitive EIS sensor or LAPS? SensActuators, B 78:237–242
17. Stein B, George M, Gaub HE, Behrends JC, Parak WJ (2003)Spatially resolved monitoring of the cellular metabolic activitywith a semiconductor-based biosensor. Biosens Bioelectron18:31–41
18. Bousse L, Mostarshed S, Hafeman D, Sartore M, Adami M,Nicolini C (1994) Investigation of carrier transports throughsilicon wafers by photocurrent measurements. J Appl Physi75:4000–4008
19. George M, Parak WJ, Gerhardt I, Moritz W, Kaesen F, Geiger H,Eisele I, Gaub HE (2000) Investigation of the spatial resolution ofthe light-addressable potentiometric sensor (LAPS). Sens Actuators,A 83:149–249
20. Parak WJ, Hofmann UG, Gaub HE, Owicki JC (1997) Lateralresolution of light addressable potentiometric sensors: anexperimental and theoretical investigation. Sens Actuators, A63:47–57
21. Moritz W, Gerhardt I, Roden D, Xu M, Krause S (2000)Photocurrent measurements for laterally resolved interface char-acterization. Fresenius' J Anal Chem 367:329–333
22. Ito Y (1998) High-spatial resolution LAPS. Sens Actuators, B52:107–111
23. Moritz W, Yoshinobu T, Finger F, Krause S, Martin-Fernandez M,Schöning MJ (2004) High resolution LAPS using amorphoussilicon as the semiconductor material. Sens Actuators, B 103:436–441
24. Nakao M, Inoue S, Oishi R, Yoshinobu T, Iwasaki H (1995)Observation of microorganism colonies using a scanning-laser-beam pH-sensing microscope. J Ferment Bioeng 79:163–166
25. Nakao M, Inoue S, Yoshinobu T, Iwasaki H (1996) High-resolution pH imaging sensor for microscopic observation ofmicroorganisms. Sens Actuators, B 34:234–239
26. Yoshinobu T, Iwasaki H, Ui Y, Furuichi K, Ermolenko Y,Mourzina Y, Wagner T, Näther N, Schöning MJ (2005) The
light-addressable potentiometric sensor for multi-ion sensing andimaging. Methods 37:94–102
27. Stoll C, Kudera S, Parak WJ, Lisdat F (2006) Quantum dots ongold: electrodes for photoswitchable cytochrome c electrochemistry.Small 2:741–743
28. Stoll C, Gehring C, Schubert K, Zanella M, Parak WJ, Lisdat F(2008) Photoelectrochemical signal chain based on quantum dotson gold—sensitive to superoxide radicals in solution. BiosensBioelectron 24:260–265
29. Schubert K, Khalid W, Yue Z, Parak WJ, Lisdat F (2009)Quantum-dot-modified electrode in combination with NADH-dependent dehydrogenase reactions for substrate analysis. Langmuir.doi:10.1021/la902499e
30. Kucur E, Bucking W, Arenz S, Giernoth R, Nann T (2006)Heterogeneous charge transfer of colloidal nanocrystals in ionicliquids. ChemPhysChem 7:77–81
31. Kucur E, Riegler J, Urban GA, Nann T (2003) Determination ofquantum confinement in CdSe nanocrystals by cyclic voltammetry. JChem Phys 119:2333–2337
32. Zayats M, Willner I (2008) Photoelectrochemical and opticalapplications of semiconductor quantum dots for bioanalysis. AdvBiochem Eng Biotechnol 109:255–283
33. Willner I, Baron R, Willner B (2007) Integrated nanoparticle–biomolecule systems for biosensing and bioelectronics. BiosensBioelectron 22:1841–1852
34. Katz E, Zayats M, Willner I, Lisdat F (2006) Controlling thedirection of photocurrents by means of CdS nanoparticles andcytochrome c-mediated biocatalytic cascades. Chem Commun1395–1397
35. Xiao Y, Patolsky F, Katz E, Hainfeld JF, Willner I (2003)“Plugging into enzymes”: nanowiring of redox enzymes by agold nanoparticle. Science 299:1877–1881
36. Ju HX, Liu SQ, Ge BX, Lisdat F, Scheller FW (2002)Electrochemistry of cytochrome c immobilized on colloidal goldmodified carbon paste electrodes and its electrocatalytic activity.Electroanalysis 14:141–147
37. Licht S, Myung N, Sun Y, Light A (1996) Addressable photo-electrochemical cyanide sensor. Anal Chem 68:954–959
38. Kudera S, Carbone L, Carlino E, Cingolani R, Cozzoli PD, MannaL (2007) Synthesis routes for the growth of complex nano-structures. Physica E-Low-Dimensional Systems & Nanostructures37:128–133
39. Kumar S, Nann T (2006) Shape control of II–VI semiconductornanomaterials. Small 2:316–329
40. Reiss P, Bleuse J, Pron A (2002) Highly luminescent CdSe/ZnSecore/shell nanocrystals of low size dispersion. Nano Lett 2:781–784
41. Dabbousi BO, Rodriguez-Viejo J, Mikulec FV, Heine JR,Mattoussi H, Ober R, Jensen KF, Bawendi MG (1997) (CdSe)ZnS core-shell quantum dots: synthesis and characterization of asize series of highly luminescent nanocrystallites. J Phys Chem B101:9463–9475
42. Kudera S, Carbone L, Casula MF, Cingolani R, Falqui A, SnoeckE, Parak WJ, Manna L (2005) Selective growth of PbSe on one orboth tips of colloidal semiconductor nanorods. Nano Lett 5:445–449
43. Decher G (1997) Fuzzy nanoassemblies: toward layered polymericmulticomposites. Science 277:1232–1237
44. Uchida H, Zhang WY, Katsube T (1996) High speed chemicalimage sensor with digital LAPS system. Sens Actuators, B34:446–449
45. Hu K, Brust M, Bard AJ (1998) Characterization and surfacecharge measurement of self-assembled CdS nanoparticle films.Chem Mater 10:1160–1165
46. von Holt B, Kudera S, Weiss A, Schrader TE, Manna L, ParakWJ, Braun M (2008) Ligand exchange of CdSe nanocrystals
1102 Z. Yue et al.
B-8

probed by optical spectroscopy in the visible and mid-IR. J MaterChem 18:2728–2732
47. Bakkers EPAM, Reitsma E, Kelly JJ, Vanmaekelbergh D (1999)Excited-state dynamics in CdS quantum dots adsorbed on a metalelectrode. J Phys Chem B 103(14):2781–2788
48. Kreft O, Muñoz_Javier A, Sukhorukov GB, Parak WJ (2007)Polymer microcapsules as mobile local pH-sensors. J Mater Chem17:4471–4476
49. Beissenhirtz MK, Scheller FW, Lisdat F (2004) A superoxidesensor based on a multilayer cytochrome c electrode. Anal Chem76:4665–4671
50. Caruso F, Schüler C (2000) Enzyme multilayers on colloid particles:assembly, stability, and enzymatic activity. Langmuir 16:9595–9603
51. Lisdat F, Dronov R,Mohwald H, Scheller FW,KurthDG (2009) Self-assembly of electro-active protein architectures on electrodes for theconstruction of biomimetic signal chains. Chem Commun 274–283
Evaluation of quantum dots applied as switchable layer 1103
B-9

DOI: 10.1021/la902499e 1395Langmuir 2010, 26(2), 1395–1400 Published on Web 09/17/2009
pubs.acs.org/Langmuir
© 2009 American Chemical Society
Quantum-Dot-Modified Electrode in Combination with NADH-DependentDehydrogenase Reactions for Substrate Analysis
Kirsten Schubert,† Waqas Khalid,‡ Zhao Yue,‡ Wolfgang J. Parak,‡ and Fred Lisdat*,†
†Biosystems Technology, University of Applied Sciences Wildau, Bahnhofstrasse 1, 15745 Wildau, Germany,and ‡Biophotonics, Philips-Universit€at Marburg, Renthof 7, 35037 Marburg, Germany
Received July 10, 2009. Revised Manuscript Received August 21, 2009
A quantum dot-electrode system was developed which allows the sensitive detection of NADH (nicotinamideadenine dinucleotide). The colloidal semiconductive CdSe/ZnS nanocrystals (quantum dots) are attached to goldby chemisorption via a dithiol compound. The current signal can be triggered by illumination of the quantum-dot-modified electrode surface. Because of photoexcitation, electron-hole pairs are generated in the quantum dots,which can be detected as anodic or cathodic photocurrent. The immobilization of the nanocrystals is verifiedby amperometric photocurrent and quartz crystal microbalance (QCM) measurements. This study shows that CdSe/ZnS quantum dot-modified electrodes allow concentration dependent NADH detection in the range of 20 μM to2 mM already at rather low potentials (around 0 V vs. Ag/AgCl, 1 M KCl). Therefore such electrodes can be used incombination with NADH-producing enzyme reactions for the light-triggered analysis of the respective substrates ofthe biocatalyst. It can be shown that glucose detection is feasible with such an electrode system and photocurrentmeasurements.
Introduction
Nanostructuring of surfaces is an intensively investigated areaalready for several years. Nanostructured devices can exhibitimproved properties such as an enhanced catalytic activity orsensitivity.1-3 Small and defined structures can be achieved bydifferent approaches including the use ofmolecular self-assembly,thin polymer layers, and nanoparticles.4-8
Because of their size, nanoparticles can exhibit modifiedphysical properties in contrast to their bulk materials. Therefore,they are increasingly incorporated in analytical detection systemsand sensors.1,2,6,9-11 Beside metal nanocrystals and carbon nano-tubes also semiconductive nanoparticles have attracted con-siderable interest. Because of unique photophysical propertiesquantum dots are suitable as optical labels for biosensing. Theyfeature high fluorescence quantum yields, size-dependent lumi-nescence properties, and significant higher stability against pho-tobleaching in contrast to organic fluorophores.12-15 Differentsynthesis ways and chemical surface modifications with different
ligands and capping agents provide the possibility of effectivecoupling of quantum dots to biomolecules and surfaces and thedevelopment of hybrid systems.10,12,16-19 These properties andthe similar dimensions of semiconductive nanocrystals to biomo-lecules have led to applications as photonic labels in bioanalyticalsystems. Thus, quantum dots have been used in numerousbiorecognition systems,20,21 such as immunoassays22,23 or thedetection of nucleic acids.24-26
Semiconductive nanocrystals have also unique electronic fea-tures. Photogenerated excitons may electrically communicatewith electrode surfaces and lead to an anodic or cathodic photo-current. Excited conduction-band electrons of the quantum dotscan be transferred to an electrode or to an electron acceptor insolution. Electrons can also be transferred from an electrode ora solubilized electron donor to valence-bandholes in the quantumdots. Therefore, a quantum dot layer between the electrode and aredox system can be used for a light-triggered read-out of theelectron transfer reaction with the electrode. However, until nowonly a few systems have been developed. One example arequantum dot-DNA hybrid systems for DNA sensing and the*Corresponding author: e-mail [email protected], Tel þ49(0)
3375508456, Fax þ49(0)3375508578.(1) Katz, E.; Willner, I.; Wang, J. Electroanalysis 2004, 16, 19–44.(2) Wang, J. Small 2005, 1, 1036–1043.(3) Chen, D.; Wang, G.; Li, J. H. J. Phys. Chem. C 2007, 111, 2351–2367.(4) Lisdat, F.; Dronov, R.; M€ohwald, H.; Scheller, F. W.; Kurth, D. G. Chem.
Commun. 2009, 274–283.(5) Luo, X. L.; Killard, A. J.; Smyth,M. R.Chem.;Eur. J. 2007, 13, 2138–2143.(6) Willner, I.; Basnar, B.; Willner, B. FEBS J. 2007, 274, 302–309.(7) Xiao, Y. H.; Li, C. M. Electroanalysis 2008, 20, 648–662.(8) Scodeller, P.; Flexer, V.; Szamocki, R.; Calvo, E. J.; Tognalli, N.; Troiani,
H.; Fainstein, A. J. Am. Chem. Soc. 2008, 130, 12690–12697.(9) Lin, C. A. J.; Liedl, T.; Sperling, R. A.; Fernandez-Arguelles, M. T.; Costa-
Fernandez, J. M.; Pereiro, R.; Sanz-Medel, A.; Chang, W. H.; Parak, W. J. J.Mater. Chem. 2007, 17, 1343–1346.(10) Gill, R.; Zayats, M.; Willner, I. Angew. Chem. 2008, 120, 7714–7736.
Angew. Chem., Int. Ed. 2008, 47, 7602-7625.(11) De, M.; Ghosh, P. S.; Rotello, V. M. Adv. Mater. 2008, 20, 4225–4241.(12) Chan,W.C.W.;Maxwell, D. J.; Gao, X.H.; Bailey, R. E.; Han,M.Y.; Nie,
S. M. Curr. Opin. Biotechnol. 2002, 13, 40–46.(13) Brus, L. Appl. Phys. A: Mater. Sci. Process. 1991, 53, 465–474.(14) Alivisatos, A. P. Science 1996, 271, 933–937.(15) Reiss, P.; Protiere, M.; Li, L. Small 2009, 5, 154–168.
(16) Pellegrino, T.; Kudera, S.; Liedl, T.; Javier, A. M.; Manna, L.; Parak, W. J.Small 2005, 1, 48–63.
(17) Negi, D. P. S.; Chanu, T. I. Nanotechnology 2008, 19, DOI 10.1088/0957-4484/19/46/465503.
(18) von Holt, B.; Kudera, S.; Weiss, A.; Schrader, T. E.; Manna, L.; Parak, W.J.; Braun, M. J. Mater. Chem. 2008, 18, 2728–2732.
(19) Freeman, R.; Willner, I. Nano Lett. 2009, 9, 322–326.(20) Sapsford, K. E.; Pons, T.; Medintz, I. L.; Mattoussi, H. Sensors 2006, 6,
925–953.(21) Klostranec, J. M.; Chan, W. C. W. Adv. Mater. 2006, 18, 1953–1964.(22) Goldman, E. R.; Clapp, A. R.; Anderson, G. P.; Uyeda, H. T.; Mauro, J.
M.; Medintz, I. L.; Mattoussi, H. Anal. Chem. 2004, 76, 684–688.(23) Hoshino, A.; Fujioka, K.; Manabe, N.; Yamaya, S.; Goto, Y.; Yasuhara,
M.; Yamamoto, K. Microbiol. Immunol. 2005, 49, 461–470.(24) Gerion, D.; Chen, F. Q.; Kannan, B.; Fu, A. H.; Parak, W. J.; Chen, D. J.;
Majumdar, A.; Alivisatos, A. P. Anal. Chem. 2003, 75, 4766–4772.(25) Pathak, S.; Choi, S. K.; Arnheim, N.; Thompson, M. E. J. Am. Chem. Soc.
2001, 123, 4103–4104.(26) Kim, J. H.; Chaudhary, S.; Ozkan, M. Nanotechnology 2007, 18, DOI
10.1088/0957-4484/18/19/195105.
C-1

1396 DOI: 10.1021/la902499e Langmuir 2010, 26(2), 1395–1400
Article Schubert et al.
engineering of organized nanostructures.1,27-29 The interaction ofimmobilized semiconductivenanocrystalswithproteinshasalsobeendemonstrated in a few electrochemical studies. The electrochemicalreaction of surface-fixed quantum dots with redox active proteinssuch as cytochrome c can influence the photocurrent as shown in ourprevious study.30 Additionally, this photocurrent can be controlledby interaction of cytochrome c with superoxide radicals31 as wellas lactate dehydrogenase and nitrate reductase in solution.32 Anenzymatic reaction can also be observed by the detection of thecatalytic products at the nanoparticle-modified electrode.33
SinceNADHparticipates in the enzymatic reaction of over 300dehydrogenases, it is a very interesting candidate for followingenzyme reactions amperometrically.34 Thus, it can be used for thedevelopment of electrochemical biosensors. The redox potentialof NADH/NADþ is -0.32 V vs SHE. However, for the electro-chemical oxidation of NADH at untreated electrodes an over-potential of more than 1 V is necessary.34 In this potential rangemany other redox active species are oxidizable.35 A further majorproblem is the electrode fouling during the oxidation process ofNADH due to the formation of dimers or stable adducts withreaction intermediates.36,37 To overcome the mentioned pro-blems, several pretreatments of the electrode surface have beendeveloped.38-41 A very convenient way is the modification of thesurface with low molecular weight mediators such as mono- orpolyaromatic compounds.34,42-45 In more recent studies theeffective application of nanoparticles as electrocatalyst for theoxidation of NADH was also demonstrated.46-48
In this study we want to demonstrate the applicability ofquantum dots for NADH sensing. This is based on the immobi-lization of CdSe/ZnS nanocrystals on gold. The use of quantumdots on the electrode provides a photoswitchable interlayerallowing the spatial read-out of the sensor surface. This providesthe basis for the combination of the CdSe/ZnS electrode with aNADH-producing enzyme reaction for the light-triggered detec-tion of the corresponding substrate. It will be shown that glucosedetection is possible with such an electrode system by photo-current measurements.
Experimental Section
Materials. 1,4-Benzenedithiol (BDT) was purchased fromAlfa Aesar (Karlsruhe, Germany). Chloroform, toluene, metha-nol, all buffer salts, pyrroloquinoline quinone (PQQ), N-ethyl-N0-(3-(dimethylamino)propyl)carbodiimidehydrochloride (EDC),and glucose dehydrogenase (EC 1.1.1.47, GDH) fromPseudomo-nas sp. were purchased from Sigma-Aldrich (Taufkirchen,Germany) and used without further purification. All aqueoussolutions were prepared using 18 MΩ ultrapurified water(Millipore GmbH, Germany).
The CdSe/ZnS nanoparticles were synthesized according to aprocedure describedpreviously.52,53After the synthesis, theCdSe/ZnS quantum dots were coated with trioctylphosphine oxide(TOPO) and were diluted in chloroform. According to the tableof Yu et al., spherical TOPO-capped CdSe (and thus in approx-imation also BDT-capped CdSe/ZnS) with an absorption max-imum at 518 nm are associated with a molecular extinctioncoefficient of 70000 M-1 cm-1 and a diameter of the inorganicCdSe/ZnS part of 2.5 nm.54
Electrode Preparation. For cleaning the Au electrodes (fromBASi, UK) were polished with Al2O3 powder of decreasing grainsize (1, 0.05 μm) for 4 min each. Then they were voltammetricallycycled in 1 M NaOH (-800 to þ200 mV vs Ag/AgCl, 1 M KCl,scan rate 300 mV s-1) and in 0.5MH2SO4 (-250 mV toþ1.75 VvsAg/AgCl, 1MKCl, scan rate 300mV s-1). The electrodes wererinsed between with ultrapure water and after the last cleaningstep with ultrapure water and ethanol.
If not specified otherwise, the quantum dots were first modifiedwith a dithiol and afterward immobilized on the gold electrodes(Au-[QD-BDT]). For ligand exchange 5 μMCdSe/ZnS nanocryst-als were incubated with 100 mM 1,4-benzenedithiol in chloroformat 40 C and shaken for 3 h. After adding methanol with a volumeratio of 1:1 the solution was centrifuged at 10000 rpm for 9 min,resulting in a pellet of CdSe/ZnS nanocrystals and a clear super-natant. The nanocrystals were resuspended in toluene.
Freshly cleaned gold electrodes were incubated with benzene-dithiol-capped CdSe/ZnS nanocrystals at room temperature for24 h. The quantum dot solution was placed in an Eppendorf tubeabove the electrode. The electrodes were shaken during theincubation. After incubation the gold electrodes were rinsed withtoluene to remove weakly attached nanocrystals.
In case of the attachment of TOPO-capped CdSe/ZnS nano-particles first the gold electrodes were incubated with 1,4-benzene-dithiol in chloroform at 40 C for 3 h and rinsed with chloroformafterward. Then BDT-modifiedAu electrodes were incubated withTOPO-capped CdSe/ZnS nanocrystal solution (chloroform) atroom temperature for 24 h. The quantum dot solution was placedabove the electrode. The electrodes were also shaken duringincubation. After incubation the gold electrodes were rinsed withchloroform to remove weakly attached nanocrystals.
QCM chips (ICM) with a resonance frequency of 10 MHz(diameter = 5.1 mm) were cleaned in piranha solution (H2O2:H2SO4 1:2 v/v) for 10min and rinsed with water and ethanol. Forthemodificationof theQCMchips the sameprocedureswereusedas for the golddisk electrodes. The incubation stepswere done in ahomemade batch cell.
For the modification of the electrode system (Au-[QD-BDT])with the mediator pyrroloquinoline quinone (PQQ) it wascoupled to the BDT-modified quantum dots. For this the QD-modified gold electrodes (Au-[QD-BDT]) were incubated with
(27) Willner, I.; Patolsky, F.; Wasserman, J. Angew. Chem., Int. Ed. 2001, 40,1861–1864.(28) Freeman, R.; Gill, R.; Beissenhirtz, M.; Willner, I. Photochem. Photobiol.
Sci. 2007, 6, 416–422.(29) Gill, R.; Patolsky, F.; Katz, E.; Willner, I. Angew. Chem. 2005, 117, 4630–
4633. Angew. Chem., Int. Ed. 2005, 44, 4554-4557.(30) Stoll, C.; Kudera, S.; Parak, W. J.; Lisdat, F. Small 2006, 2, 741–743.(31) Stoll, C.; Gehring, C.; Schubert, K.; Zanella, M.; Parak, W. J.; Lisdat, F.
Biosens. Bioelectron. 2008, 24, 260–265.(32) Katz, E.; Zayats, M.; Willner, I.; Lisdat, F. Chem. Commun. 2006, 1395–
1397.(33) Pardo-Yissar, V.; Katz, E.; Wasserman, J.; Willner, I. J. Am. Chem. Soc.
2003, 125, 622–623.(34) Katakis, I.; Dominguez, E. Mikrochim. Acta 1997, 126, 11–32.(35) Gorton, L. J. Chem. Soc., Faraday Trans. 1 1986, 82, 1245–1258.(36) Jaegfeldt, H. Bioelectrochem. Bioenerg. 1981, 8, 355–370.(37) Jaegfeldt, H.; Kuwana, T.; Johansson, G. J. Am. Chem. Soc. 1983, 105,
1805–1814.(38) Blaedel, W. J.; Jenkins, R. A. Anal. Chem. 1975, 47, 1337–1343.(39) Lau, C.; Flechsig, G.U.;Grundler, P.;Wang, J.Anal. Chim. Acta 2005, 554,
74–78.(40) Nagy, G.; Kapui, I.; Gorton, L. Sens. Actuators, B 1995, 24, 323–327.(41) Munteanu, F. D.; Mano, N.; Kuhn, A.; Gorton, L. Bioelectrochemistry
2002, 56, 67–72.(42) Persson, B.; Gorton, L. J. Electroanal. Chem. 1990, 292, 115–138.(43) Gorton, L. Electroanalysis 1995, 7, 23–45.(44) Prodromidis, M. I.; Karayannis, M. I. Electroanalysis 2002, 14, 241–261.(45) Fukuzumi, S.; Nishizawa, N.; Tanaka, T. J. Org. Chem. 1984, 49, 3571–
3578.(46) Raj, C. R.; Jena, B. K. Chem. Commun. 2005, 2005–2007.(47) Jena, B. K.; Raj, C. R. Anal. Chem. 2006, 78, 6332–6339.(48) Huang, J.; Wang, D.; Hou, H.; You, T. Adv. Funct. Mater. 2008, 18, 441–
448.(49) Komoto, A.; Maenosono, S. J. Chem. Phys. 2006, 125, DOI 10.1063/
1.2338804.
(50) Striolo, A.; Ward, J.; Prausnitz, J. M.; Parak, W. J.; Zanchet, D.; Gerion,D.; Milliron, D.; Alivisatos, A. P. J. Phys. Chem. B 2002, 106, 5500–5505.
(51) Katz, E.; Lotzbeyer, T.; Schlereth, D. D.; Schuhmann, W.; Schmidt, H. L.J. Electroanal. Chem. 1994, 373, 189–200.
(52) Reiss, P.; Bleuse, J.; Pron, A. Nano Lett. 2002, 2, 781–784.(53) Dabbousi, B. O.; RodriguezViejo, J.; Mikulec, F. V.; Heine, J. R.;
Mattoussi, H.; Ober, R.; Jensen, K. F.; Bawendi, M. G. J. Phys. Chem. B 1997,101, 9463–9475.
(54) Yu, W. W.; Qu, L. H.; Guo, W. Z.; Peng, X. G. Chem. Mater. 2003, 15,2854–2860.
C-2
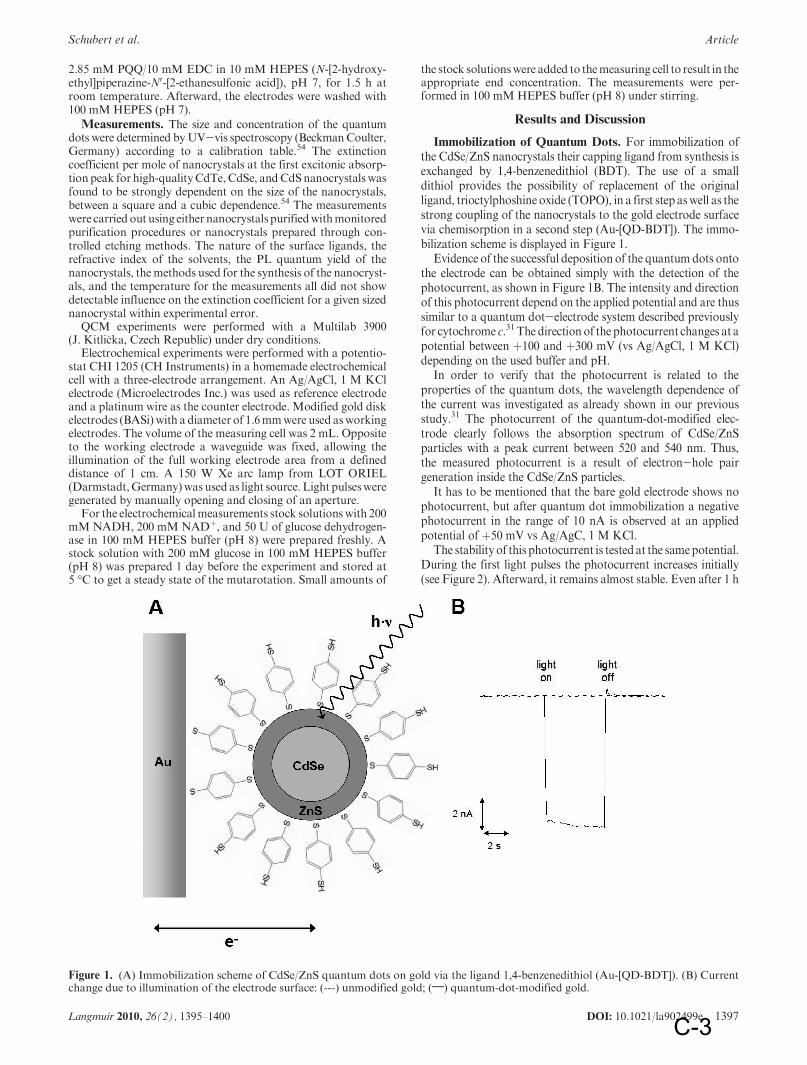
DOI: 10.1021/la902499e 1397Langmuir 2010, 26(2), 1395–1400
Schubert et al. Article
2.85 mM PQQ/10 mM EDC in 10 mM HEPES (N-[2-hydroxy-ethyl]piperazine-N0-[2-ethanesulfonic acid]), pH 7, for 1.5 h atroom temperature. Afterward, the electrodes were washed with100 mMHEPES (pH 7).
Measurements. The size and concentration of the quantumdots were determined byUV-vis spectroscopy (BeckmanCoulter,Germany) according to a calibration table.54 The extinctioncoefficient per mole of nanocrystals at the first excitonic absorp-tionpeak for high-qualityCdTe,CdSe, andCdSnanocrystalswasfound to be strongly dependent on the size of the nanocrystals,between a square and a cubic dependence.54 The measurementswere carried out using eithernanocrystals purifiedwithmonitoredpurification procedures or nanocrystals prepared through con-trolled etching methods. The nature of the surface ligands, therefractive index of the solvents, the PL quantum yield of thenanocrystals, themethods used for the synthesis of the nanocryst-als, and the temperature for the measurements all did not showdetectable influence on the extinction coefficient for a given sizednanocrystal within experimental error.
QCM experiments were performed with a Multilab 3900(J. Kitlicka, Czech Republic) under dry conditions.
Electrochemical experiments were performed with a potentio-stat CHI 1205 (CH Instruments) in a homemade electrochemicalcell with a three-electrode arrangement. An Ag/AgCl, 1 M KClelectrode (Microelectrodes Inc.) was used as reference electrodeand a platinum wire as the counter electrode. Modified gold diskelectrodes (BASi) with a diameter of 1.6mmwere used asworkingelectrodes. The volume of the measuring cell was 2 mL. Oppositeto the working electrode a waveguide was fixed, allowing theillumination of the full working electrode area from a defineddistance of 1 cm. A 150 W Xe arc lamp from LOT ORIEL(Darmstadt,Germany)wasusedas light source. Light pulsesweregenerated by manually opening and closing of an aperture.
For the electrochemicalmeasurements stock solutionswith 200mMNADH, 200 mMNADþ, and 50 U of glucose dehydrogen-ase in 100 mM HEPES buffer (pH 8) were prepared freshly. Astock solution with 200 mM glucose in 100 mM HEPES buffer(pH 8) was prepared 1 day before the experiment and stored at5 C to get a steady state of the mutarotation. Small amounts of
the stock solutionswere added to themeasuring cell to result in theappropriate end concentration. The measurements were per-formed in 100 mMHEPES buffer (pH 8) under stirring.
Results and Discussion
Immobilization of Quantum Dots. For immobilization ofthe CdSe/ZnS nanocrystals their capping ligand from synthesis isexchanged by 1,4-benzenedithiol (BDT). The use of a smalldithiol provides the possibility of replacement of the originalligand, trioctylphoshine oxide (TOPO), in a first step aswell as thestrong coupling of the nanocrystals to the gold electrode surfacevia chemisorption in a second step (Au-[QD-BDT]). The immo-bilization scheme is displayed in Figure 1.
Evidence of the successful deposition of the quantum dots ontothe electrode can be obtained simply with the detection of thephotocurrent, as shown in Figure 1B. The intensity and directionof this photocurrent depend on the applied potential and are thussimilar to a quantum dot-electrode system described previouslyfor cytochrome c.31 The direction of the photocurrent changes at apotential between þ100 and þ300 mV (vs Ag/AgCl, 1 M KCl)depending on the used buffer and pH.
In order to verify that the photocurrent is related to theproperties of the quantum dots, the wavelength dependence ofthe current was investigated as already shown in our previousstudy.31 The photocurrent of the quantum-dot-modified elec-trode clearly follows the absorption spectrum of CdSe/ZnSparticles with a peak current between 520 and 540 nm. Thus,the measured photocurrent is a result of electron-hole pairgeneration inside the CdSe/ZnS particles.
It has to be mentioned that the bare gold electrode shows nophotocurrent, but after quantum dot immobilization a negativephotocurrent in the range of 10 nA is observed at an appliedpotential of þ50 mV vs Ag/AgC, 1 M KCl.
The stability of this photocurrent is tested at the samepotential.During the first light pulses the photocurrent increases initially(see Figure 2). Afterward, it remains almost stable. Even after 1 h
Figure 1. (A) Immobilization scheme of CdSe/ZnS quantum dots on gold via the ligand 1,4-benzenedithiol (Au-[QD-BDT]). (B) Currentchange due to illumination of the electrode surface: (---) unmodified gold; (;) quantum-dot-modified gold.
C-3
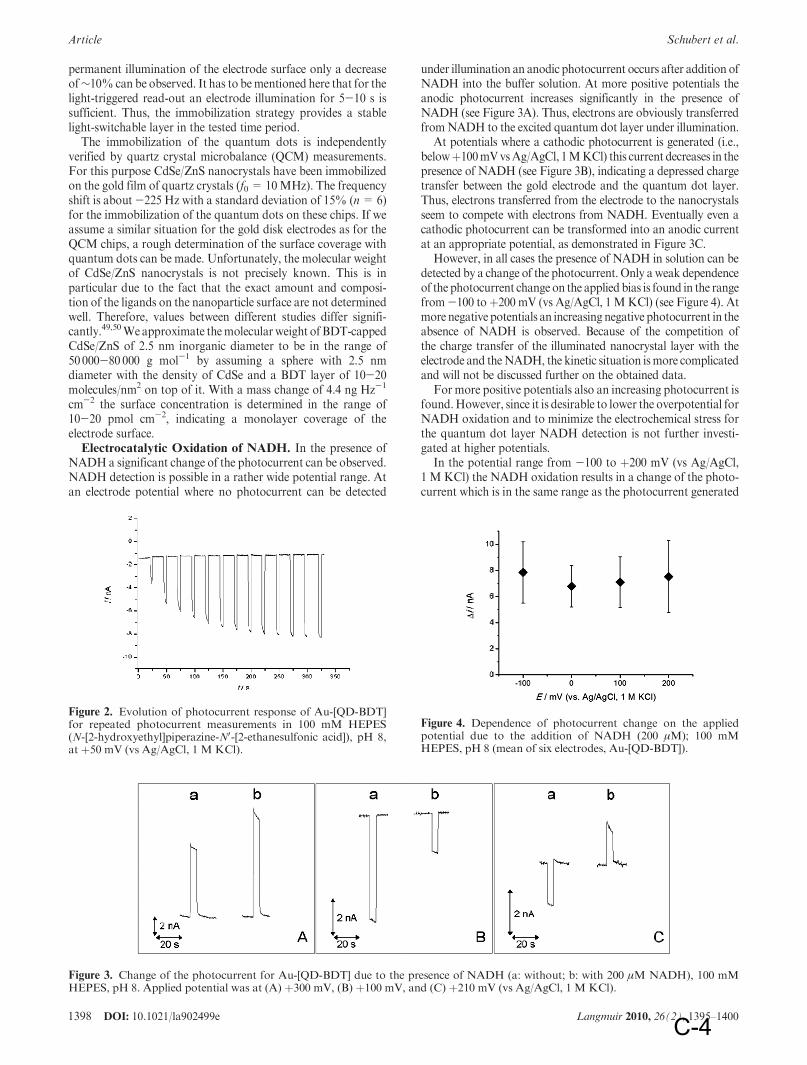
1398 DOI: 10.1021/la902499e Langmuir 2010, 26(2), 1395–1400
Article Schubert et al.
permanent illumination of the electrode surface only a decreaseof∼10%can be observed. It has to bementioned here that for thelight-triggered read-out an electrode illumination for 5-10 s issufficient. Thus, the immobilization strategy provides a stablelight-switchable layer in the tested time period.
The immobilization of the quantum dots is independentlyverified by quartz crystal microbalance (QCM) measurements.For this purpose CdSe/ZnS nanocrystals have been immobilizedon the gold film of quartz crystals (f0 = 10MHz). The frequencyshift is about-225 Hz with a standard deviation of 15% (n= 6)for the immobilization of the quantum dots on these chips. If weassume a similar situation for the gold disk electrodes as for theQCM chips, a rough determination of the surface coverage withquantum dots can be made. Unfortunately, the molecular weightof CdSe/ZnS nanocrystals is not precisely known. This is inparticular due to the fact that the exact amount and composi-tion of the ligands on the nanoparticle surface are not determinedwell. Therefore, values between different studies differ signifi-cantly.49,50Weapproximate themolecularweight ofBDT-cappedCdSe/ZnS of 2.5 nm inorganic diameter to be in the range of50000-80 000 g mol-1 by assuming a sphere with 2.5 nmdiameter with the density of CdSe and a BDT layer of 10-20molecules/nm2 on top of it. With a mass change of 4.4 ng Hz-1
cm-2 the surface concentration is determined in the range of10-20 pmol cm-2, indicating a monolayer coverage of theelectrode surface.Electrocatalytic Oxidation of NADH. In the presence of
NADHa significant change of the photocurrent can be observed.NADH detection is possible in a rather wide potential range. Atan electrode potential where no photocurrent can be detected
under illumination an anodic photocurrent occurs after addition ofNADH into the buffer solution. At more positive potentials theanodic photocurrent increases significantly in the presence ofNADH (see Figure 3A). Thus, electrons are obviously transferredfromNADH to the excited quantum dot layer under illumination.
At potentials where a cathodic photocurrent is generated (i.e.,belowþ100mVvsAg/AgCl, 1MKCl) this current decreases in thepresence of NADH (see Figure 3B), indicating a depressed chargetransfer between the gold electrode and the quantum dot layer.Thus, electrons transferred from the electrode to the nanocrystalsseem to compete with electrons from NADH. Eventually even acathodic photocurrent can be transformed into an anodic currentat an appropriate potential, as demonstrated in Figure 3C.
However, in all cases the presence of NADH in solution can bedetected by a change of the photocurrent. Only a weak dependenceof the photocurrent change on the applied bias is found in the rangefrom-100 toþ200 mV (vs Ag/AgCl, 1MKCl) (see Figure 4). Atmore negative potentials an increasing negative photocurrent in theabsence of NADH is observed. Because of the competition ofthe charge transfer of the illuminated nanocrystal layer with theelectrode and theNADH, the kinetic situation ismore complicatedand will not be discussed further on the obtained data.
For more positive potentials also an increasing photocurrent isfound.However, since it is desirable to lower the overpotential forNADH oxidation and to minimize the electrochemical stress forthe quantum dot layer NADH detection is not further investi-gated at higher potentials.
In the potential range from -100 to þ200 mV (vs Ag/AgCl,1 M KCl) the NADH oxidation results in a change of the photo-current which is in the same range as the photocurrent generated
Figure 3. Change of the photocurrent for Au-[QD-BDT] due to the presence of NADH (a: without; b: with 200 μM NADH), 100 mMHEPES, pH 8. Applied potential was at (A) þ300 mV, (B) þ100 mV, and (C) þ210 mV (vs Ag/AgCl, 1 M KCl).
Figure 4. Dependence of photocurrent change on the appliedpotential due to the addition of NADH (200 μM); 100 mMHEPES, pH 8 (mean of six electrodes, Au-[QD-BDT]).
Figure 2. Evolution of photocurrent response of Au-[QD-BDT]for repeated photocurrent measurements in 100 mM HEPES(N-[2-hydroxyethyl]piperazine-N0-[2-ethanesulfonic acid]), pH 8,at þ50 mV (vs Ag/AgCl, 1 M KCl).
C-4

DOI: 10.1021/la902499e 1399Langmuir 2010, 26(2), 1395–1400
Schubert et al. Article
in the absence of NADH. The only weak dependence of thephotocurrent change on the applied potential at the electrodeshows that the NADH oxidation can not simply be enhanced bythe applied bias. It is obviously determined by the catalyticproperties of the semiconductor nanoparticles.
It has also to be emphasized that the nanoparticle modifiedelectrode cannot be used for H2O2 detection;another potentialproduct of oxidoreductase reactions. Here the nanoparticlesprovide no suitable surface for the oxidation of this enzymaticbyproduct.
Since the change of the photocurrent is caused by the electro-chemical reaction of NADH at the quantum-dot-modified elec-trode such a nanoparticle-based system can be used for theeffective detection of NADH and thus provides the basis for theconstruction of a sensor system. In the following all measure-ments are done atþ50 mV (vs Ag/AgCl, 1MKCl) to avoid largebackground signals in the absence of the analyte.
The sensitivity for NADH can be obtained in the range of20 μM to 2 mM as can be seen in Figure 5B. The concentrationdependence shows saturation behavior. Thus, it is similar to thephotocurrent change in the presence of cytochrome c withmercaptopropionic acid-modified CdSe/ZnS quantum dot elec-trodes as shown previously.31
Control experiments prove that thenanoparticle ligandbenzene-dithiol does not participate as mediator in the electron transferprocess from NADH to the CdSe/ZnS quantum dots. Goldelectrodes simply modified with benzenedithiol show only a veryweak photocurrent (less than-1 nA atþ50mV vsAg/AgCl, 1MKCl) and no significant change of it in the presence of 1 mMNADH.
In order to investigate the influence of the nanoparticle surfacemodification a different electrode system is prepared, as illu-strated in Figure 5A. Gold electrodes are modified first withbenzenedithiol, and thenCdSe/ZnS nanocrystals are immobilizedin a second step (Au-BDT-[QD/TOPO]). That means that theoriginal ligand of the quantum dots, trioctylphosphine oxide(TOPO), is still at the surface and exposed to the solution. Suchan electrode system shows a rather similar change of the photo-current in the presence of NADH compared to electrodes withnanocrystals whose ligands are exchanged by benzenedithiol first(Au-[QD-BDT]), as can be seen in Figure 5B.
Therefore, electrons seem to be transferred directly fromNADH to the CdSe/ZnS nanoparticles. But it cannot be excludedthat the electron transfer reaction is supported byBDTbecause ofits aromatic structure (particularly under illumination).
It is also investigated whether NADH detection can be en-hanced by means of a known mediator of NADH electrochem-istry;pyrroloquinoline quinone (PQQ). Thus, the quantum dotsare additionally modified with PQQ after the immobilization atthe gold electrode because of its known interaction withNADH.51 However, PQQ modification results in no significantenhancement of the photocurrent change compared to PQQ-freeAu-CdSe/ZnS electrodes. Thus, the application of this surface-bound mediator provides no improvement and is not necessaryfor the electrocatalytic detection of NADH.Combination of Quantum Dots with a Dehydrogenase
Reaction.NADH is involved in many dehydrogenase reactions.The concentration of NADH can be sensed by photocurrentmeasurements as described above. Thus, the quantumdot-electrode system can be used to follow such catalytic reac-tions. The amount of NADH produced in an enzymatic catalysisdepends directly on the concentration of the substrate.
In order to demonstrate the feasibility of the concept, glucosedehydrogenase (Pseudomonas sp.) is chosen as biocatalyst.This dehydrogenase catalyzes the reaction of β-D-glucose toD-glucono-1,5-lactone while reducing its cofactor NADþ toNADH. This principle is illustrated in Figure 6.
Photocurrent measurements with quantum-dot-modified goldelectrodes before and after addition of glucose without theenzyme show no change of the signal in the potential rangefrom -100 to þ200 mV (vs Ag/AgCl, 1 M KCl), which can beseen exemplarily in Figure 7.
Thus, glucose cannot be oxidized directly at the quantum-dot-modified gold electrode. But in the additional presence of theenzyme glucose dehydrogenase and its cofactor NADþ a con-centration dependent change of the photocurrent can be detectedwith the nanoparticle-based system developed here. This is pre-sented inFigure 8. Thus, the glucose signal is converted toNADHby electron transfer via the enzyme, and subsequently NADH isdetected by the electron transfer to the illuminated quantum dots.The concentration range for glucose detection is rather similar tothat of NADH. Sensitivity for glucose is observed up to 1 mM.
Figure 5. (A) Schemes of two different electrode systems: (a) Au-BDT-[QD/TOPO] and (b) Au-[QD-BDT]. (B) Change of the photocurrentfor the two different electrode systems due to the addition ofNADH (f) for (a) and ([) for (b), in 100mMHEPES buffer pH8 atþ50mV vsAg/AgCl, 1 M KCl (mean of three electrodes).
C-5

1400 DOI: 10.1021/la902499e Langmuir 2010, 26(2), 1395–1400
Article Schubert et al.
In summary, it can be stated that by the combination of a specificbiocatalyst and a quantum-dot-modified electrode a bioanalytical
signal chain can be constructed which can be switched on byillumination of the sensor surface.
Conclusions
Ananostructured electrode on the basis of CdSe/ZnS quantumdots is developed for the sensitive measurement of the enzymecofactor NADH. The light-triggered read-out of NADH con-centrations in solution can be shown for the first time with thissystem.
The immobilization of the semiconductive nanoparticles via adithiol compound on gold electrodes can be proved by recordingof a photocurrent. Electron-hole pairs are generated in semi-conductive nanocrystals by photoexcitation, resulting in a chargetransfer when the electrode is polarized. Anodic or cathodicphotocurrents can bedetecteddepending on the applied potential.The nanocrystal immobilization is also verified by quartz crystalmircobalance (QCM) measurements. The frequency shift indi-cates a coverage of the electrode surface by about a monolayer ofCde/ZnS nanoparticles.
In the presence ofNADHa change of the photocurrent occurs,depending on the concentration of NADH. The detection waspossible in the range from 20 μM to 2 mM. It has to beemphasized that a rather low electrode potential needs to beapplied with this nanoparticles-based system.
It is also shown that CdSe/ZnS nanocrystal-modified goldelectrodes can be used for the light-triggered analysis of substratesof NADH-producing enzyme reactions. The detection of glucoseusing glucose dehydrogenase is demonstrated successfully as anexample.
Acknowledgment. This work is financially supported by theDeutscheForschungsgemeinschaft,Germany (Project Li 706/2-1,PA 794/3-1).
Figure 7. Photocurrent response of the quantum-dot-modifiedelectrode without the enzyme GDH ( 3 3 3 ) without and (;) in thepresence of 500 μM glucose in 100 mM HEPES buffer, pH 8,at þ50 mV (vs Ag/AgCl, 1 M KCl).
Figure 6. Scheme of glucose detection at quantum-dot-modified gold electrodes due to the catalytic production of NADH by the enzymeglucose dehydrogenase (GDH) in solution.
Figure 8. Change of the photocurrent of a quantum-dot-modifiedelectrode (Au-[QD-BDT]) due to the addition of glucose in thepresence of 50 U GDH, 1 mMNADþ in 100 mMHEPES buffer,pH 8, atþ50mV (vs Ag/AgCl, 1MKCl), mean of four electrodes.
C-6
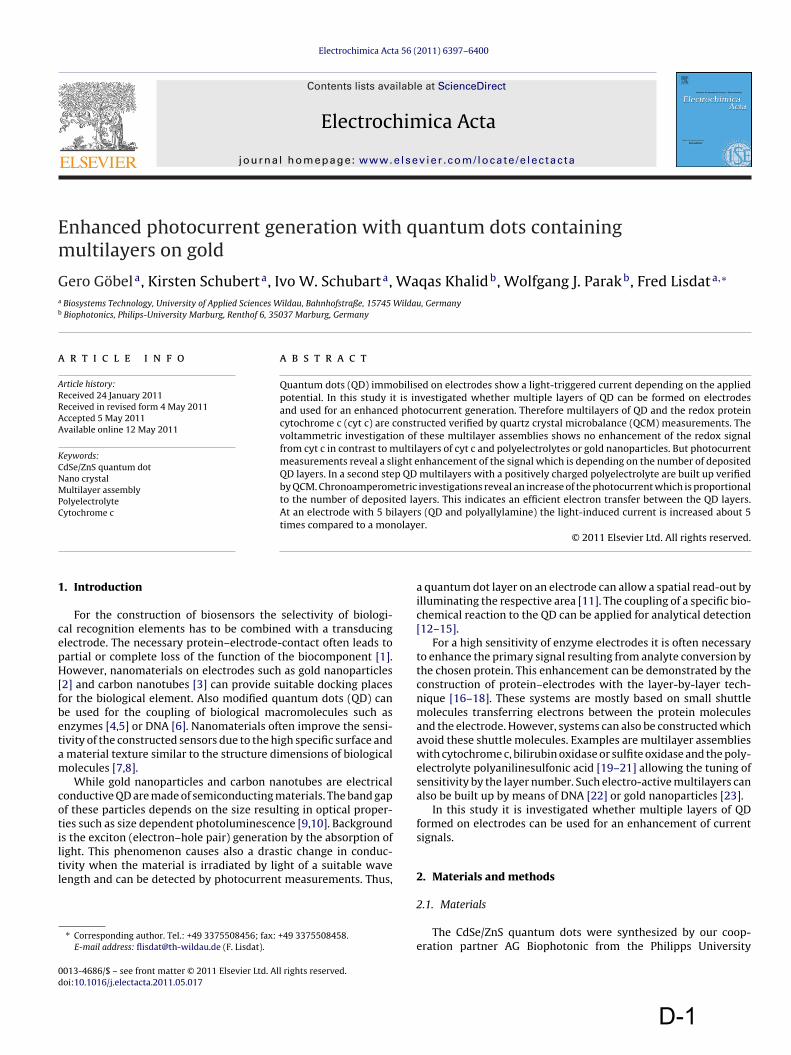
Em
Ga
b
a
ARRAA
KCNMPC
1
cepH[fbetam
cotiltl
0d
Electrochimica Acta 56 (2011) 6397– 6400
Contents lists available at ScienceDirect
Electrochimica Acta
jou rn al hom epa ge: www.elsev ier .com/ locate /e lec tac ta
nhanced photocurrent generation with quantum dots containingultilayers on gold
ero Göbela, Kirsten Schuberta, Ivo W. Schubarta, Waqas Khalidb, Wolfgang J. Parakb, Fred Lisdata,∗
Biosystems Technology, University of Applied Sciences Wildau, Bahnhofstraße, 15745 Wildau, GermanyBiophotonics, Philips-University Marburg, Renthof 6, 35037 Marburg, Germany
r t i c l e i n f o
rticle history:eceived 24 January 2011eceived in revised form 4 May 2011ccepted 5 May 2011vailable online 12 May 2011
eywords:
a b s t r a c t
Quantum dots (QD) immobilised on electrodes show a light-triggered current depending on the appliedpotential. In this study it is investigated whether multiple layers of QD can be formed on electrodesand used for an enhanced photocurrent generation. Therefore multilayers of QD and the redox proteincytochrome c (cyt c) are constructed verified by quartz crystal microbalance (QCM) measurements. Thevoltammetric investigation of these multilayer assemblies shows no enhancement of the redox signalfrom cyt c in contrast to multilayers of cyt c and polyelectrolytes or gold nanoparticles. But photocurrent
dSe/ZnS quantum dotano crystalultilayer assembly
olyelectrolyteytochrome c
measurements reveal a slight enhancement of the signal which is depending on the number of depositedQD layers. In a second step QD multilayers with a positively charged polyelectrolyte are built up verifiedby QCM. Chronoamperometric investigations reveal an increase of the photocurrent which is proportionalto the number of deposited layers. This indicates an efficient electron transfer between the QD layers.At an electrode with 5 bilayers (QD and polyallylamine) the light-induced current is increased about 5times compared to a monolayer.
. Introduction
For the construction of biosensors the selectivity of biologi-al recognition elements has to be combined with a transducinglectrode. The necessary protein–electrode-contact often leads toartial or complete loss of the function of the biocomponent [1].owever, nanomaterials on electrodes such as gold nanoparticles
2] and carbon nanotubes [3] can provide suitable docking placesor the biological element. Also modified quantum dots (QD) cane used for the coupling of biological macromolecules such asnzymes [4,5] or DNA [6]. Nanomaterials often improve the sensi-ivity of the constructed sensors due to the high specific surface and
material texture similar to the structure dimensions of biologicalolecules [7,8].While gold nanoparticles and carbon nanotubes are electrical
onductive QD are made of semiconducting materials. The band gapf these particles depends on the size resulting in optical proper-ies such as size dependent photoluminescence [9,10]. Backgrounds the exciton (electron–hole pair) generation by the absorption of
ight. This phenomenon causes also a drastic change in conduc-ivity when the material is irradiated by light of a suitable waveength and can be detected by photocurrent measurements. Thus,∗ Corresponding author. Tel.: +49 3375508456; fax: +49 3375508458.E-mail address: [email protected] (F. Lisdat).
013-4686/$ – see front matter © 2011 Elsevier Ltd. All rights reserved.oi:10.1016/j.electacta.2011.05.017
© 2011 Elsevier Ltd. All rights reserved.
a quantum dot layer on an electrode can allow a spatial read-out byilluminating the respective area [11]. The coupling of a specific bio-chemical reaction to the QD can be applied for analytical detection[12–15].
For a high sensitivity of enzyme electrodes it is often necessaryto enhance the primary signal resulting from analyte conversion bythe chosen protein. This enhancement can be demonstrated by theconstruction of protein–electrodes with the layer-by-layer tech-nique [16–18]. These systems are mostly based on small shuttlemolecules transferring electrons between the protein moleculesand the electrode. However, systems can also be constructed whichavoid these shuttle molecules. Examples are multilayer assemblieswith cytochrome c, bilirubin oxidase or sulfite oxidase and the poly-electrolyte polyanilinesulfonic acid [19–21] allowing the tuning ofsensitivity by the layer number. Such electro-active multilayers canalso be built up by means of DNA [22] or gold nanoparticles [23].
In this study it is investigated whether multiple layers of QDformed on electrodes can be used for an enhancement of currentsignals.
2. Materials and methods
2.1. Materials
The CdSe/ZnS quantum dots were synthesized by our coop-eration partner AG Biophotonic from the Philipps University
D-1

6 ica Acta 56 (2011) 6397– 6400
ieh(rfi(
c
2
cpatmac2sEp
w0m00sfect
do
2
qa(Ai
esSMtwicpa
3
cT
Fig. 1. Process of the multilayer formation with cyt c and MPA-modified CdSe/ZnSquantum dots followed by quartz crystal microbalance during the assembling ina flow cell (40 l/min). P – 5 mM sodium phosphate, pH 5; cyt c – 20 M cyt c in
398 G. Göbel et al. / Electrochim
n Marburg according to the established procedure from Reisst al. and Dabbousi et al. [24,25]. Cytochrome c from horse-eart (cyt c), mercapto undecanol (MU), mercaptoundecanoic acidMUA), mercaptopropionic acid (MPA), polyallylamine hydrochlo-ide (PAA), hydrogen peroxide and potassium chloride are providedrom Sigma–Aldrich, Germany. Sulphuric acid, sodium hydrox-de and potassium hydrogenphosphate are purchased from RothGermany).
For all solutions the water is purified by the water system “ultralear direct” from SG Water (Germany).
.2. Electrode preparation for multilayer assembly
For the QD multilayer characterisation by the means of quartzrystal microbalance (QCM) the chip is treated consecutively withiranha-solution (1 part hydrogen peroxide, 3 parts sulphuric acid),cetone, isopropanol and piranha-solution for each 15 min. Thenhe QCM-chip is incubated in an ethanolic solution with 5 mM
ercaptoundecanoic acid and 15 mM mercaptoundecanol for 2 dt RT. To assemble the multilayer on the MUA/MU-modified QCM-hip a flow cell is used with a flow rate of 40 l/min. Alternating0 M cyt c or 20 M PAA and 3 M QD in a 5 mM sodium potas-ium phosphate, pH 5 are applied for 5 min to adsorb each layer.ach adsorption step is followed by 5 min long rinsing with thehosphate buffer.
For the electrochemical investigations the gold electrodes areet polished consecutively with aluminium oxide (1 m and
.05 m), treated by ultrasound for 10 min and cleaned by voltam-etric cycling in 1 M NaOH (−0.8 to 0.2 V vs Ag/AgCl, 1 M KCl;
.3 V/s) and 0.5 M H2SO4 (−0.25 to 1.75 V vs Ag/AgCl, 1 M KCl;
.3 V/s). Afterwards the electrodes are immersed in an aqueousolution with 5 mM mercaptopropionic acid and 15 mM methanolor 4 h. For the QD/cyt c multilayer construction the MPA-modifiedlectrodes are incubated in 3 M QD suspension and in 20 M cyt
each for 20 min in 5 mM potassium phosphate, pH 5. These lastwo steps are repeated for the deposition of each further bilayer.
The assembling of the QD layers with the polyelectrolyte PAA isone in the same way as described for cyt c using a polymer solutionf 20 M polyallylamine hydrochloride.
.3. QCM and electrochemical measurements
The successive deposition of each single layer is verified by theuartz crystal microbalance Multilab 39000 from Kitilcak (CZ) with
10 MHz-quartz chip from International Crystal Manufacturingdiameter of 5 mm) in a flow cell (8 l, manufactured in-house).s pump a Minipuls, Model M312 from Abimed Gilson (Germany)
s applied.The electrochemical characteristics of the QD modified
lectrodes are examined with a three electrode-arrangement con-isting of the working gold electrode (2.01 mm2) by Bioanalyticalystems Ltd. (UK), an Ag/AgCl, 1 M KCl reference electrode byicroelectrodes Inc. (USA) and a platinum wire as counter elec-
rode employing the potentiostat CHI1205 (USA). A xenon lampith a fibre optic cable from LOT Oriel (Germany) is used for the
llumination of the QD modified electrodes. The measurementsoncerning the multilayer construction are carried out in a 100 mMotassium phosphate buffer, pH 7 at 0.2 V vs Ag/AgCl (cyt c and PAA)nd at −0.1 V vs Ag/AgCl (PAA).
. Results and discussion
In the first set of experiments multilayer of the redox proteinyt c and CdSe/ZnS-QD have been constructed and investigated.herefore the original hydrophobic ligand trioctylphosphine oxide
5 mM sodium phosphate, pH 5; QD – MPA modified CdSe/ZnS quantum dots in 5 mMsodium phosphate, pH 5. Inset: assembly of a multilayer electrode consisting of cytc and QD.
from the QD synthesis is exchanged by a charged ligand. Mercapto-propionic acid (MPA) allows the introduction of a negative chargeon the surface of the QD and thus a multilayer construction withpositively charged cyt c by electrostatic interactions. FurthermoreMPA provides a suitable surface for electron exchange with cytc [12]. Measurements by quartz crystal microbalance (QCM) areused to test the feasibility of the assembly construction using thelayer-by-layer technique (Fig. 1).
In the course of these investigations 1 mM and 5 mM sodiumphosphate buffers with pH 5 and pH 7 are examined. It could bedemonstrated that pH value and ionic strength have a pronouncedinfluence for the multilayer construction. In 1 mM sodium phos-phate pH 7 a high amount of cyt c can be electrostatically boundbut after the adsorption of the QD 1/3 of the before bound cyt c isremoved obviously by the QD. However, the successful build-up ofthis multilayer assembly is proved by the small frequency decreaseafter the each cyt c/QD adsorption cycle. If sodium phosphate bufferof a lower pH (5) or a higher ionic strength (5 mM) is applied theassembly of the multilayer construction can be improved (highertotal mass deposition). The most stable deposition of cyt c and QDlayers is achieved with a 5 mM sodium phosphate buffer at pH5. Under these conditions for each QD layer a frequency shift ofabout 160 Hz can be observed which would correspond to a massdeposition of 140 ng if the model of a rigid layer is applied.
After this the multilayer assembly is prepared onto athiol-modified gold electrode (MUA/MU) and is investigatedvoltammetrically. In contrast to multilayer assemblies of cyt c andpolyaniline sulfonic acid, DNA or gold nanoparticles [19,22,23] noenhancement of the cyt c signal can be found with increasing layernumbers. Even under illumination no increase of the cyt c signalcan be detected. There is a small current enhancement at poten-tials above the oxidation of cyt c and a slightly enhanced negativecurrent below this potential indicating photocurrent generation(Fig. 2). For the established cyt c multilayer systems (with the abovementioned building blocks) the electron exchange between the cytc molecules is discussed as the main mechanism of electron trans-port [26]. However, the results here demonstrate that the proteinsignal is not enhanced, probably because the cyt c–cyt c electron
exchange is hindered.The cyt c/QD multilayers are further examined under a con-stant polarisation of 0.2 V vs Ag/AgCl, 1 M KCl and short lightpulses. The indicated photocurrent generation can be confirmed.
D-2

G. Göbel et al. / Electrochimica Acta 56 (2011) 6397– 6400 6399
120
80light on
0
40light off
I/nA
-100
-40
0 100 200 300 400E/mV
F5i
Tsiiitbtbltsbmfig
cmtd
Fel
Fig. 4. Process of multilayer assembly using PAA and MPA-modified CdSe/ZnS-QDfollowed by quartz crystal microbalance in a flow cell (40 l/min). P – 5 mM sodiumphosphate, pH 5; PAA – 20 M polyallylamine hydrochloride in 5 mM potassium
ig. 2. Cyclic voltammograms of an Au/MPA/cyt c[(MPA-)QD/cyt c]x electrode with (MPA-)QD/cyt c layers with (gray curve) and without illumination (black curve)
n 100 mM potassium phosphate, pH 7 (scan rate 0.1 V/s).
he results obtained are verified by at least 3 independent mea-urements. Because of positive polarisation an anodic photocurrents detected. Fig. 3 illustrates the change of the photocurrent signaln dependence on the number of the cyt c/QD layers. The increasen numbers of cyt c/QD bilayers from 1 to 5 enhances the pho-ocurrent by a factor of 2. This may indicate the electron transferetween the QD layers and the gold electrode. Under light the exci-on generation in the QD immobilised in the different layers cane used for an amplified photocurrent compared to a QD mono-
ayer. However, obviously not all deposited QD can contribute tohe photocurrent since the enhancement in current signal is muchmaller than the increase in deposited amount of QD detectedy QCM. This implicates that electron transfer between the illu-inated QD layers is possible, but the redox protein cyt c is not
acilitating this process and thus a large portion of QD immobilisedn the layered architecture is not contributing to the photocurrenteneration.
In a second set of experiments cyt c is replaced by the positivelyharged polyelectrolyte polyallylamine (PAA) for the arrange-
ent of the QD in multiple layers. QCM measurements show thathis multilayer assembly can be realised (Fig. 4). The successiveecrease of the frequency detected after the alternating contact
10
6
8 5
3
50 s
2
41
ΔI/n
A
-2
0
t/s
ig. 3. Photocurrent measurements of an Au/MPA, MeOH/cyt c[(MPA-)QD/cyt c]x
lectrode with an increasing number of deposited QD/cyt c bilayers (1, 3, 5) withight pulses of 5 s, E = 0.2 V (vs Ag/AgCl, 1 M KCl).
phosphate, pH 5; QD – MPA modified CdSe/ZnS quantum dots in 5 mM sodiumphosphate, pH 5. Inset: build-up of the multilayer architecture for an electrode withPAA and quantum dots.
of the QCM-chip with PAA and QD solutions confirms the con-secutive deposition of each QD and PAA single layer resulting ina multilayer architecture. The amount of the deposited QD exceedsthe mass of deposited PAA; the mass of the each accumulatedQD and PAA layer is nearly constant and corresponds to a fre-quency shift of 750 Hz and 100 Hz respectively. Compared to the cytc/QD assembly the amount of deposited QD is significantly higher(by factor 5).
Prepared on electrodes the QD assemblies with PAA reveal anenhancement of the current signal under illumination. At a polari-sation of 0.2 V vs Ag/AgCl the light-induced current of an electrodewith 5 bilayers is increased about 5 times compared to a mono-layer electrode (Fig. 5). Measurements at −0.1 V vs Ag/AgCl exhibita cathodic photocurrent. Also under these conditions the pho-tocurrent is increasing with the deposited amount of QD (datanot shown). The magnitude and enhancement of the light-inducedcurrents of this multilayer construction is significantly increased
compared to assemblies with the redox protein cyt c. An electrodewith 5 QD/PAA bilayers reveals a photocurrent of 50 nA while anelectrode assembled by 5 QD/cyt c coatings can achieve only 7 nA.605
40
505
3
50 s
10
20
30 3
1
ΔI/n
A
-10
0
t/s
Fig. 5. Photocurrrent measurements of an Au/MPA/PAA[(MPA)-QD/PAA]x electrodewith an increasing number of deposited PAA/QD bilayers (1, 3, 5) under illuminationin 100 mM potassium phosphate, pH 7 at E = 0.2 V (vs Ag/AgCl, 1 M KCl).
D-3
6 ica A
Titssafmtti[
4
tntPamstb
eSihnt
attts
[[[
[[[[[[[
[
[
[
[[[
400 G. Göbel et al. / Electrochim
his indicates that an efficient electron transfer between the QDs possible. In conclusion of these investigations it can be statedhat for a high photocurrent – tunable by the number of depositionteps – a high amount of immobilised QD and rather thin interlayerseem to be essential. Interestingly the small redox protein acting in
biological system as efficient electron shuttling molecule cannotacilitate electron transfer between the QD, probably by restricted
obility within the layered system because of strong adsorption tohe MPA modified surface. A similar behaviour has been found withhe highly charged polyelectrolyte PSS allowing efficient proteinmmobilisation but no electron transfer between the cyt c layers27].
. Conclusions
The construction of multiple layers with QD and the redox pro-ein cyt c does not enhance the voltammetric cyt c-signal with theumber of layers of the assembly. Obviously only molecules nearhe electrode surface can exchange electrons with the electrode.hotocurrent measurements show an increase of the QD gener-ted current with the number of deposited layers. Although QCMeasurements reveal a constant QD amount with each deposition
tep the light generated photocurrent does not increase propor-ional. This indicates that cyt c cannot facilitate the electron transferetween the QD layers.
QD multilayered architecture can be also built by use of the poly-lectrolyte PAA. Here a much higher amount of QD can be found.uch an assembly reveals a proportional increase of the light-nduced current with the number of deposited layers. Obviouslyere an electron exchange between the immobilised and illumi-ated QD is feasible in contrast to cyt c containing systems wherehis process seems to be hindered.
In summary a QD based electrode system can be constructednd its properties can be tuned in a controlled way. Since pho-
ocurrent measurements can be used for sensorial purpose, e.g., inhe detection of redox active substances, the higher amount of elec-rode contacted QD can be beneficially used for enhanced analyticalignals.[
[
cta 56 (2011) 6397– 6400
Acknowledgement
The financial support by the Deutsche Forschungsgemeinschaft,Germany is gratefully acknowledged (DFG-project LI706/2-1 andPA794/3-1).
References
[1] S.Q. Liu, D. Leech, H.X. Ju, Anal. Lett. 36 (2003) 1.[2] S.J. Guo, E.K. Wang, Anal. Chim. Acta 598 (2007) 181.[3] M. Trojanowicz, TRAC – Trends Anal. Chem. 25 (2006) 480.[4] M.K. So, C.J. Xu, A.M. Loening, S.S. Gambhir, J.H. Rao, Nat. Biotechnol. 24 (2006)
339.[5] C. Stoll, S. Kudera, W.J. Parak, F. Lisdat, SMALL 2 (2006) 741.[6] W.J. Parak, D. Gerion, D. Zanchet, A.S. Woerz, T. Pellegrino, C. Micheel, S.C.
Williams, M. Seitz, R.E. Bruehl, Z. Bryant, C. Bustamante, C.R. Bertozzi, A.P.Alivisatos, Chem. Mater. 14 (2002) 2113.
[7] T. Xu, N. Zhang, H.L. Nichols, D.L. Shi, X.J. Wen, Mater. Sci. Eng. C – Bio. S 27(2007) 579.
[8] N.J. Wittenberg, C.L. Haynes, Wiley Interdiscipl. Rev. Nanomed. Nanobiotech-nol. 1 (2009) 237.
[9] A.P. Alivisatos, J. Phys. Chem. -US 100 (1996) 13226.10] W.C.W. Chan, S.M. Nie, Science 281 (1998) 2016.11] S. Licht, N. Myung, Y. Sun, Anal. Chem. 68 (1996) 954.12] C. Stoll, C. Gehring, K. Schubert, M. Zanella, W.J. Parak, F. Lisdat, Biosens. Bio-
electron. 24 (2008) 260.13] K. Schubert, W. Khalid, Z. Yue, W.J. Parak, F. Lisdat, Langmuir 26 (2010) 1395.14] I. Willner, B. Basnar, B. Willner, FEBS J. 274 (2007) 302.15] S.J. Guo, S.J. Dong, TRAC – Trends Anal. Chem. 28 (2009) 96.16] M. Campas, C. O’Sullivan, Anal. Lett. 36 (2003) 2551.17] K. Ariga, T. Nakanishi, T. Michinobu, J. Nanosci. Nanotechnol. 6 (2006) 2278.18] J.F. Rusling, R.J. Forster, J. Colloid Interface Sci. 262 (2003) 1.19] M.K. Beissenhirtz, F.W. Scheller, W.F.M. Stöcklein, D.G. Kurth, H. Möhwald, F.
Lisdat, Angew. Chem. Int. Ed. 43 (2004) 4357.20] R. Dronov, D.G. Kurth, H. Möhwald, F.W. Scheller, F. Lisdat, Angew. Chem. Int.
Ed. 47 (2008) 3000.21] R. Dronov, D.G. Kurth, H. Möhwald, R. Spricigo, S. Leimkuehler, U. Wollenberger,
K.V. Rajagopalan, F.W. Scheller, F. Lisdat, J. Am. Chem. Soc. 130 (2008) 1122.22] D. Sarauli, J. Tanne, D. Schäfer, I.W. Schubart, F. Lisdat, Electrochem. Commun.
11 (2009) 2288.23] S.M. Bonk, F. Lisdat, Biosens. Bioelectron. 25 (2009) 739.24] P. Reiss, J. Bleuse, A. Pron, Nano Lett. 2 (2002) 781.25] B.O. Dabbousi, J. RodriguezViejo, F.V. Mikulec, J.R. Heine, H. Mattoussi, R. Ober,
K.F. Jensen, M.G. Bawendi, J. Phys. Chem. B 101 (1997) 9463.26] F. Lisdat, R. Dronov, H. Möhwald, F.W. Scheller, D.G. Kurth, Chem. Commun.
(2009) 274.27] M.K. Beissenhirtz, B. Kafka, D. Schäfer, M. Wolny, F. Lisdat, Electroanalysis 17
(2005) 1931.
D-4
Light controlled bioelectrochemical sensor based on CdSe/ZnS quantum dots
J. Tanne1, D. Schäfer1, W. Khalid2, W. Parak2, F. Lisdat1 1 Biosystems Technology, Technical University Wildau, 15745 Wildau, Germany 2 Philips University Marburg, Marburg, Germany
Abstract
This study reports on the oxygen sensitivity of quantum dot electrodes modified with
CdSe/ZnS nanocrystals. The photocurrent behaviour is analysed in dependence on pH and
applied potential by potentiostatic and potentiodynamic measurements. On the basis of the
influence of the oxygen content in solution on the photocurrent generation the enzymatic
activity of glucose oxidase is evaluated in solution. In order to construct a
photobioelectrochemical sensor which can be read out by illuminating the respective electrode
area two different immobilisation methods for the fixation of the biocatalyst have been
investigated. Both covalent crosslinking and layer-by-layer deposition of GOD by means of
the polyelectrolyte polyallylamine hydrochloride show that a sensor construction is possible.
The sensing properties of such kind of electrodes are drastically influenced by the amount and
density of the enzyme on top of the quantum dot layer. Particularly advantageous this can be
adjusted by the layer by layer technique. By depositing 4 bilayers [GOD/PAH]4 on the
CdSe/ZnS electrode a fast responding sensor for the concentration range 0,1mM - 5 mM
glucose can be prepared. This opens the door to a multi-analyte detection with a non-
structured sensing electrode, localized enzymes and spatial read out by light.
E-1

Introduction
Nanostructures have gained a center stage of interest for bioanalytical systems since the last
decade1,2,3,4. Among the various nanostructures, nanoparticles are of special interest caused by
the modified and new chemical and physical properties compared to the bulk material and the
high surface to volume ratio5. For metal nanoparticle and carbon nanotubes particularly the
high electrocatalytic activities are beneficial6,7. They are often used for direct contacts with
enzymes as recognition elements within biosensors8; thus the response for a sensitive and
selective substrate detection can be enhanced9,10.
Furthermore semiconductive quantum dots (QDs) are intensively studied for several years due
to their unique photophysical properties. Especially II-VI-semiconductor (e.g. CdSe, CdS,
HgS, ZnS, ZnSe ) have got into focus of research11,12. The QDs are often passivated by a
second semiconductor material (e.g. ZnS13,14) to protect the core from oxidation and
bleaching15. The band gap energy of this shell is higher in order to confine the exciton
generation and relaxation to the core and thus increase the quantum yield13,14,16.
When QDs are illuminated, an electron-hole pair is generated in the conduction and valence
band, respectively17. The relaxation of the charge carriers can be radiant, whereby the emitted
light is a function of the band gap energy. The band gap energy increases with decreasing
diameter of the QDs due to quantum confinement18. Thus the wavelength of the emitted light
can be triggered by the particle size. This size effect, the broad absorption spectra and the
high resistance against chemical and photodegradation make them much more suitable for
biological labeling than organic dyes16,19. Furthermore the surface ligands, which are used for
the QD-synthesis, can be exchanged by other molecules in order to integrate functional
groups20. This also gives access to an increase in hydrophylicity, making the QDs more
favourable for labeling of biomolecules16,21. Applications have shown in immunosensing22,
labeling nucleic acids23,24,25, proteins26,27 and peptides28,29. It was even possible to detect the
photoluminescence of QDs in cells28,30,31, tissues and living organism without interference
from auto fluorescence of the tissue32.
Beside the fluorescence detection, QDs can be used for Förster-Resonance-Energy-Transfer
(FRET) systems allowing for the detection of biomolecular interactions and binding events33.
This has been demonstrated eg. for proteins34,35 and DNA36,37.
Due to the generation of charge carriers, QDs can also be used for electrochemical sensor
systems. Depending on the applied potential an anodic or cathodic photocurrent can be
generated, respectively. The former is caused by electron transfer from the conduction band of
the QD to the electrode. The latter one is generated by the electron transfer from the electrode
E-2
to the valence band of the QDs38. The photocurrent can be enhanced by reactions with redox
active species in solution. For example, reaction products of the acetylcholine esterase
reaction39 and mediators such as ferri-/ferrocyanide38 could be detected. The photocurrent can
even be switched by the introduction of cyt c38,40. Besides different enzymes were combined
with QD-modified electrodes41,42,43. Not for all systems a direct electron transfer between the
protein and the QDs is necessary; often systems rely on the detection of reaction product as
exemplified e.g. for NADH allowing the detection of dehydrogenase based catalysis43.
The different systems investigated so far show a significant photocurrent already in the pure
buffer solution. Together with the findings on the oxygen influence on the
photoluminescence44,45,46,47 this can be seen as an indication that oxygen act as electron
acceptor upon illumination. Thus, it has been shown that enzyme activation by reactive
oxygen species occurs when CdSe nanoparticles are photosensitized48.
In this study CdSe/ZnS-electrodes are analysed in more detail with respect to the influence of
oxygen on the photocurrent. Based on these results oxygen consuming enzyme reactions are
combined with the QD electrode and the system is used for sensitive substrate detection.
Different immobilization strategies of glucose oxidase (GOD) are investigated to ensure
efficient oxygen depletion in the enzyme layer during glucose conversion. This allows the
construction of a photobioelectrochemical sensor which can be read out by spatially resolved
illumination of the respective sensor surface.
Experimental Section
Materials
Argon comes by Air Liquide (Düsseldorf, Germany). 1,4-Benzendithiol (97%; BDT) is
acquired from Alfa Aesar (Karlsruhe, Germany). di-Sodium hydrogen phosphate anhydrous,
(N-[2-Hydroxyyethyl]piperazine-N’-[2-ethansulfonic acid]) (99,5%; HEPES), citric acid
monohydrate, 2,2’-Azino-bis-(3-ethylbenzothiazoline-6-sulfonic acid) diammonium salt
(99%, ABTS), glutaraldehyde (Grade II 25%), toluene, peroxidase from horseradish (EC
1.11.1.7, HRP), glucose oxidase (EC 1.1.3.4, GOD) from Asp. niger and poly(allylamin
hydrochloride) are purchased from Sigma-Aldrich (Steinheim, Germany). Methanol (99,9%,
≤ 50ppm H2O), α-D(+)-glucose monohydrate, sulfonic acid (96%); hydrogen peroxide (50%)
are bought from Roth (Karlsruhe, Germany). N-[γ-maleimidobutyryloxy]sulfosuccinimide
E-3
ester (98-100%, Sulfo-GMBS) is obtained from Pierce (Rockford, USA). Buffer solutions are
prepared with ultra pure water (Ultra Clear Direct, Siemens Water Technologies).
CdSe/ZnS nanoparticles are synthesized by an established protocol13,49. The QDs are coated
with trioctylphosphine oxide (TOPO) and dissolved in water free toluene. The QDs are
synthesized with a concentration of about 16µM and a diameter of ca. 2.5nm.
Electrode Cleaning
Au electrodes (5mm diameter BASi, UK) are polished with Al2O3 powder of decreasing grain
size (1, 0.05 µm) for 4min each. Afterwards the electrodes are sonicated for 10min. Then,
each electrode electrochemically cleaned with cyclic voltammetry in 1M NaOH (-800 to
+200mV vs Ag/AgCl, 1M KCl, 300mV s-1) and in 0.5M H2SO4 (-250mV to +1.75V vs
Ag/AgCl, 1M KCl, scan rate 300mVs-1). The electrodes are rinsed after each step with
ultrapure water and additionally with ethanol after the last cycling.
QCM chips with a resonance frequency of 8MHz (diameter = 5.1mm, International Crystal
Manufacturing, Oklahoma/USA) are cleaned in piranha solution (H2O2:H2SO4 1:3) for 10min
and rinsed with water and ethanol. The QCM-chips are incubated with 100mM BDT over
night in a homemade chamber at 4°C.
Electrode modification
For exchange of the TOPO on the QDs, 10µM CdSe/ZnS nanocrystals are incubated with
100mM 1,4-benzenedithiol in toluene (water free) at 40°C and shaking (400rpm) for 3h. After
adding methanol with a volume ratio of 1:1 the solution is centrifuged at 14.500rpm for
25min with a miniSpin from Eppendorf. Only the QDs in the pellet are resuspended in water
free toluene. The BDT-capped CdSe/ZnS are filled in Eppendorf tubes and put on top of the
cleaned Au electrodes and incubated at room temperature for 24h on a shaker (1000rpm).
Eventually the gold electrodes are rinsed with toluene to remove weakly attached
nanocrystals.
Immobilisation of GOD
For the covalent coupling of GOD onto the Au-[QD-BDT], the electrodes are first incubated
with 20µl of 8mM Sulfo-GMBS/25mM sodium phosphate buffer (pH 7.5) for 30min at room
temperature and after washing with buffer with 20µl of 200µM GOD/100mM citrate-
phosphate buffer (pH 4.2, CiP) for 1h. For the analysis of the adsorption of the enzyme, the
E-4
same procedure is used without Sulfo-GMBS. Before the measurement the electrodes are
washed in 100mM CiP pH 4.2.
The formation of an enzyme network is achieved by incubation of 20µl GOD/100mM CiP
(pH 4.2) on the QD-modified electrode. GOD concentration is varied: 200µM, 400µM and
2mM in 100mM CiP pH 4.2. Then 20µl of 0.05% glutaraldehyde/100mM CiP (pH 4.2) are
added to the solution for covalent cross-linking. Before the measurement the electrodes are
washed with 100mM CiP.
For the assembly of [GOD/PAH]n-multilayers (n:2,4,6) the QD-modified electrodes are
15min incubated in GOD-solution (150µl; 2mM sodium phosphate buffer pH 7). Different
GOD concentrations are used: 400µM and 2mM. Subsequently, after a short washing step, the
electrodes are incubated in a 0.02 monomol/l poly(allylamin hydrochloride) (PAH) (the term
monomol refers to the molar concentration of one monomer of the polyelectrolyte) (150µl,
2mM sodium phosphate buffer pH 7). The pH of the polyelectrolyte solution is adjusted to pH
7. After a washing step the electrodes are again incubated in the GOD-solution. With this
layer-by-layer adsorption method different layers are assembled. Before measuring, the
electrodes are washed in 2mM sodium phosphate buffer pH 7.
For mass sensitive analysis the same procedure is used in a flow cell. The BDT-modified
QCM-Chips are exposed to a GOD solution in 2mM sodium phosphate buffer (pH 7) and to
0.02mol/l PAH/2mM sodium phosphate buffer (pH 7) in alternating steps. In between a
washing step is performed in order to remove unbound molecules.
Measurements
All photocurrent measurements are done in 100mM HEPES. For linear sweep voltammetry
and amperometric measurements a CH Instruments electrochemical analyzer is used. The
experiments are performed in a homemade electrochemical cell with a three-electrode
arrangement. An Ag/AgCl, 1M KCl electrode (Microelectrodes Inc.) is used as a reference
electrode and a platinum wire as a counter electrode. The QD-modified gold electrode is the
working electrode. Opposite to the working electrode a 150-Watt light source is placed for
illumination of the electrode from a defined distance of 1cm with a halogen reflector lamp
from Schott (Mainz, Germany).
Mass sensitive analysis is performed by an EQCM device from CH Instruments. The QCM-
chips are mounted in a flow cell with an inner volume of 8µl out of acrylic glass and
connected with a pump (Minipuls 3, model M312, Abimed Gilson, Langfeld, Germany). The
E-5

values of wave propagation rate, density of the quartz, diameter of the electrode and shear
modulus are cq= 3330m/s; rq=2.65g/cm3; d= 5mm; µq= 2.947·106N/cm2.
For the analysis of the O2 reduction of QDs LSV- and amperometric photocurrent
measurements are applied. First the electrodes are measured in air-saturated buffer. For LSV-
measurements the potential changed from -500mV up to 100mV. For amperometric
measurements the potential is fixed at -350mV. After analysis of the photocurrent in air-
saturated buffer, the electrodes are studied in argon-purged buffer. After that the electrodes
are measured again in air-saturated buffer.
For the test of different oxygen concentrations, different ratios of argon-purged and air-
saturated buffer are used.
The evaluation of the influence of different GOD activities on the photocurrent is performed
by amperometric photocurrent measurement in 100mM HEPES pH 6.8. After adding 30mM
glucose different activities of the enzyme are added and light pulses are given regularly to the
system.
The glucose solution is prepared 1 day before measurement allowing mutarotation
equilibrium. In order to establish different concentrations in the solution different amounts
from the stock solution are added to the measuring cell. After a short mixing with a pipette
light pulses are applied and the photocurrent measured.
Results & Discussion
Investigation of the O2-dependency of the photocurrent. As previously shown, the photo
luminescence of CdSe/ZnS-nanoparticles is influenced by the oxygen concentration42. This
gives the backround for a closer look at the oxygen influence on the photocurrent of the
CdSe/ZnS nanoparticle electrode. The QDs are functionalizied with benzendithiol and
immobilized on gold. The cathodic photocurrent of QD-electrodes is measured in air saturated
and argon purged buffer. Figure 1A shows a linear-sweep-voltammogramm of the electrode
under argon and air. During illumination a photocurrent is generated, which is dependent on
the applied potential. In both buffer solutions a photocurrent generation is possible, while it is
clearly smaller in oxygen-free solution. This points to the fact, that oxygen can be reduced by
the generated electrons during illumination of the nanocrystals. The oxygen-dependent part of
the photocurrent is calculated as the difference between the photocurrent in both solutions and
is shown in Fig. 1C. It can be seen, that not only the overall photocurrent but also the oxygen-
dependent part increases with decreasing potential. Fig. 1B illustrates schematically the
E-6

electron transfer steps during the illumination of QD-electrode. Electrons from the conduction
band of the QDs can reduce oxygen dissolved in the buffer. The hole generated in the valence
band of the QDs can be filled through electron transfer from the electrode.
[Figure 1]
In further studies the potential of -350mV vs. Ag/AgCl; 1M KCl is chosen as working
potential for the photocurrent measurements. After preparation and first time use of the QD-
electrode the generated photocurrents show an increase of about 10% within the first 6-8 light
pulses before they get stable.
To investigate the pH influence the photocurrent is measured at different pH values. This is
shown in Fig. 2A. Measurements in basic and neutral pH-solutions result in the highest values
for the oxygen-dependent photocurrent. In acidic pH however, the results show a smaller
current - this is valid not only for the overall photocurrent but also for the oxygen dependent
part (Fig. 2B). Obviously the recombination of the charge carriers is enhanced under these
conditions, probably on the particle surface. The results of amperometric measurements are
confirmed by LSV-measurements at different pH values.
[Figure 2]
In further studies the dependence of the photocurrent on different oxygen concentrations is
evaluated at neutral pH. At –350mV (vs Ag/AgCl) the cathodic photocurrent of CdSe/ZnS-
modified electrodes is measured in argon purged buffer. After the detection of a stable signal,
the buffer is partially exchanged by air-saturated buffer and the photocurrent is measured.
While the oxygen concentration rises with addition of air this buffer, the photocurrent
increases too. The studies evidence a linear dependence of the oxygen sensitive photocurrent
at pH 7 and 8. The inset of Fig. 2B shows this dependence of the photocurrent.
In conclusion of the measurements with solutions of different oxygen concentrations, it can be
stated, that the QDs provide a catalytic layer for the oxygen reduction under illumination.
This oxygen sensitivity provides the basis for the combination of QD-modified electrodes
with enzymatic reactions.
Evaluation of the solution activity of glucose oxidase. The biocatalyst glucose oxidase
(GOD) can oxidize its substrate by the reduction of O2. Thus the photocurrent of QD-
E-7
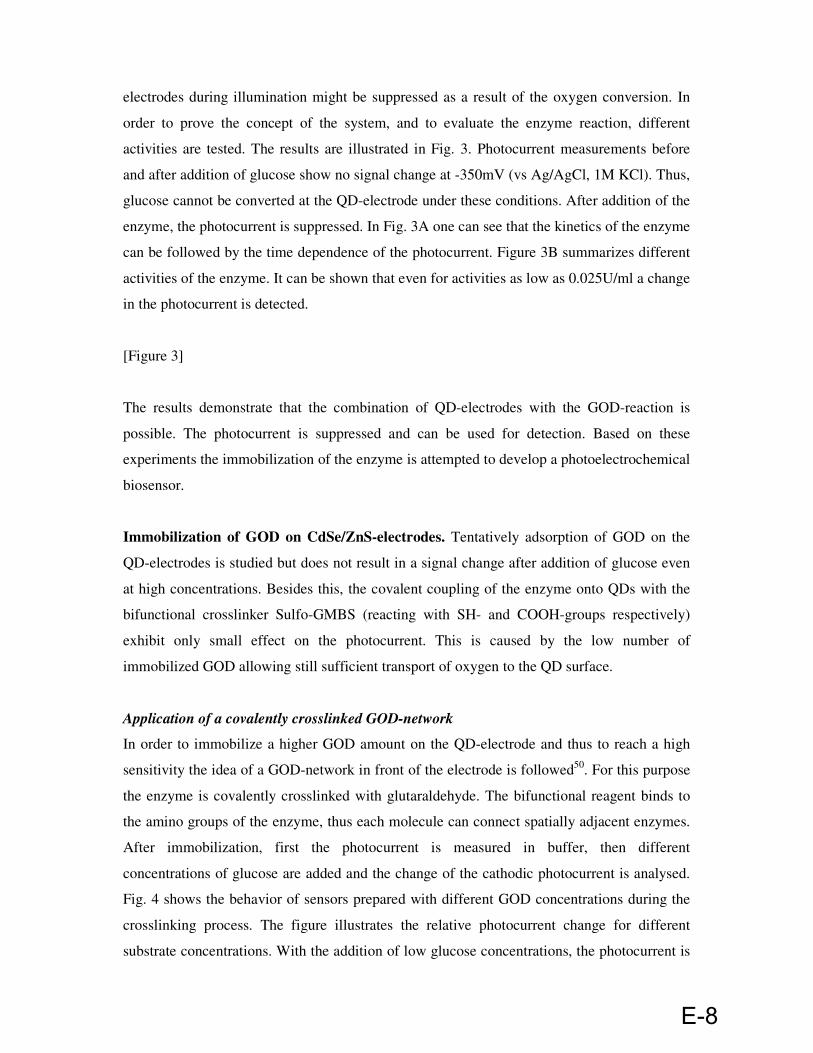
electrodes during illumination might be suppressed as a result of the oxygen conversion. In
order to prove the concept of the system, and to evaluate the enzyme reaction, different
activities are tested. The results are illustrated in Fig. 3. Photocurrent measurements before
and after addition of glucose show no signal change at -350mV (vs Ag/AgCl, 1M KCl). Thus,
glucose cannot be converted at the QD-electrode under these conditions. After addition of the
enzyme, the photocurrent is suppressed. In Fig. 3A one can see that the kinetics of the enzyme
can be followed by the time dependence of the photocurrent. Figure 3B summarizes different
activities of the enzyme. It can be shown that even for activities as low as 0.025U/ml a change
in the photocurrent is detected.
[Figure 3]
The results demonstrate that the combination of QD-electrodes with the GOD-reaction is
possible. The photocurrent is suppressed and can be used for detection. Based on these
experiments the immobilization of the enzyme is attempted to develop a photoelectrochemical
biosensor.
Immobilization of GOD on CdSe/ZnS-electrodes. Tentatively adsorption of GOD on the
QD-electrodes is studied but does not result in a signal change after addition of glucose even
at high concentrations. Besides this, the covalent coupling of the enzyme onto QDs with the
bifunctional crosslinker Sulfo-GMBS (reacting with SH- and COOH-groups respectively)
exhibit only small effect on the photocurrent. This is caused by the low number of
immobilized GOD allowing still sufficient transport of oxygen to the QD surface.
Application of a covalently crosslinked GOD-network
In order to immobilize a higher GOD amount on the QD-electrode and thus to reach a high
sensitivity the idea of a GOD-network in front of the electrode is followed50. For this purpose
the enzyme is covalently crosslinked with glutaraldehyde. The bifunctional reagent binds to
the amino groups of the enzyme, thus each molecule can connect spatially adjacent enzymes.
After immobilization, first the photocurrent is measured in buffer, then different
concentrations of glucose are added and the change of the cathodic photocurrent is analysed.
Fig. 4 shows the behavior of sensors prepared with different GOD concentrations during the
crosslinking process. The figure illustrates the relative photocurrent change for different
substrate concentrations. With the addition of low glucose concentrations, the photocurrent is
E-8
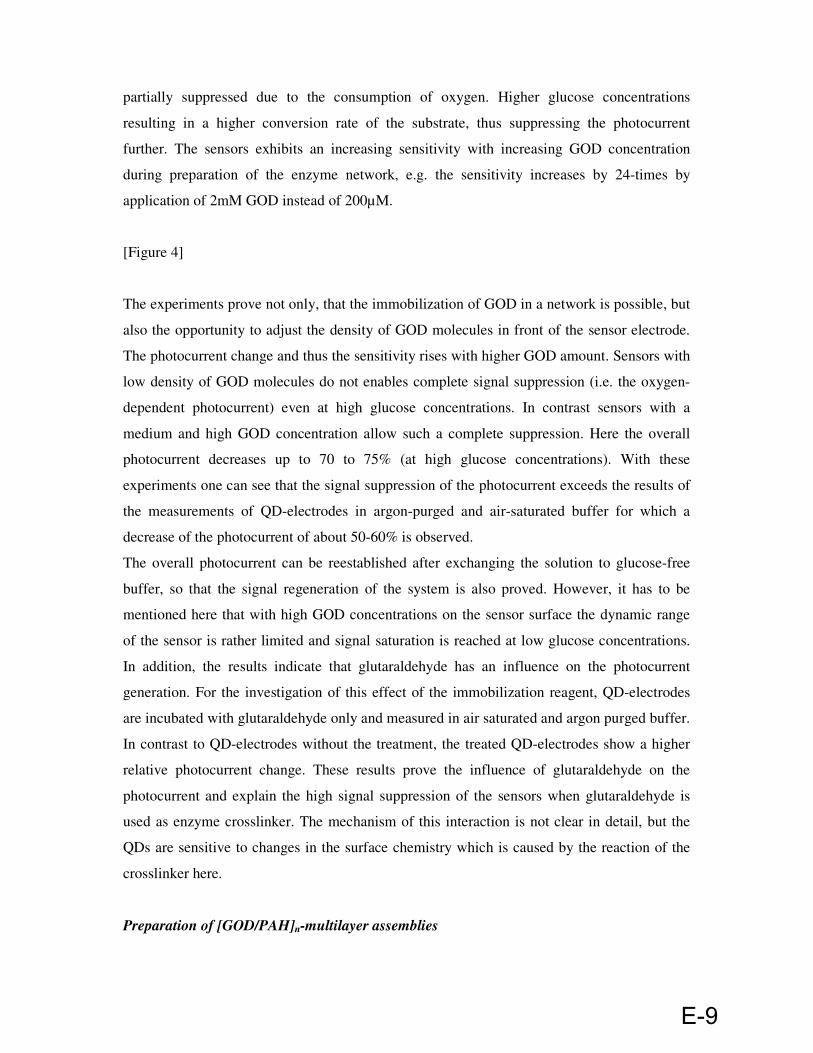
partially suppressed due to the consumption of oxygen. Higher glucose concentrations
resulting in a higher conversion rate of the substrate, thus suppressing the photocurrent
further. The sensors exhibits an increasing sensitivity with increasing GOD concentration
during preparation of the enzyme network, e.g. the sensitivity increases by 24-times by
application of 2mM GOD instead of 200µM.
[Figure 4]
The experiments prove not only, that the immobilization of GOD in a network is possible, but
also the opportunity to adjust the density of GOD molecules in front of the sensor electrode.
The photocurrent change and thus the sensitivity rises with higher GOD amount. Sensors with
low density of GOD molecules do not enables complete signal suppression (i.e. the oxygen-
dependent photocurrent) even at high glucose concentrations. In contrast sensors with a
medium and high GOD concentration allow such a complete suppression. Here the overall
photocurrent decreases up to 70 to 75% (at high glucose concentrations). With these
experiments one can see that the signal suppression of the photocurrent exceeds the results of
the measurements of QD-electrodes in argon-purged and air-saturated buffer for which a
decrease of the photocurrent of about 50-60% is observed.
The overall photocurrent can be reestablished after exchanging the solution to glucose-free
buffer, so that the signal regeneration of the system is also proved. However, it has to be
mentioned here that with high GOD concentrations on the sensor surface the dynamic range
of the sensor is rather limited and signal saturation is reached at low glucose concentrations.
In addition, the results indicate that glutaraldehyde has an influence on the photocurrent
generation. For the investigation of this effect of the immobilization reagent, QD-electrodes
are incubated with glutaraldehyde only and measured in air saturated and argon purged buffer.
In contrast to QD-electrodes without the treatment, the treated QD-electrodes show a higher
relative photocurrent change. These results prove the influence of glutaraldehyde on the
photocurrent and explain the high signal suppression of the sensors when glutaraldehyde is
used as enzyme crosslinker. The mechanism of this interaction is not clear in detail, but the
QDs are sensitive to changes in the surface chemistry which is caused by the reaction of the
crosslinker here.
Preparation of [GOD/PAH]n-multilayer assemblies
E-9

With the development of an enzyme-network a high amount of GOD can be immobilized on
the QD-electrodes. This allows enhanced signals for the substrate detection. However, the
arrangement of the enzyme is not well controlled and additionally the QD behavior is slightly
changed by the crosslinker. In order to develop a more gentle and better defined
immobilization the alternating deposition of GOD and positivley charged poly(allylamine
hydrochloride) (PAH) is used. The layer-by-layer assembly enables not only to prepare
defined structures, but also a better control of the GOD amount. To study the conditions of the
assembly of the oppositely charged components the deposition of each layer is analyzed by
QCM measurements. This technique is well suited to evaluate the concentration of
polyelectrolyte/protein-multilayers51,52,53.
Thus, quartz crystals are modified with BDT and fixed in a flow cell. Alternating flush of
GOD and PAH in 2mM sodium phosphate buffer pH 7 allows a successful assembly which is
followed up to four bilayers. Figure 5A illustrates this. One can see a decreasing frequency
with every deposition step. The negative charge density of the protein at neutral pH is
obviously sufficient for a successful adsorption to the positively charged polyelectrolyte. This
evidences that the deposition of multiple GOD layers through electrostatic interaction with
PAH is possible. From the measurements one can also see that the amount of deposited GOD
is rather constant for the different adsorption steps.
Figure 5
In further studies QD-electrodes are modified with the [GOD/PAH]n-multilayers and the
behaviour of the oxygen dependent photocurrent is analyzed. Fig. 5B shows the results of
sensors which differ in the number of [GOD/PAH]n-layers. The figure illustrates the relative
photocurrent change in dependence on the glucose concentration. One can clearly see an
enhanced signal with increasing numbers of GOD layers. The results demonstrate that GOD
in the different layers is accessible and glucose can diffuse rather freely through the layers.
This means also that glucose is not completely converted by the outer enzyme layer and also
inner layers contribute to the signal generation (up to 4 layers). The density of GOD
molecules in the multilayer architecture is high enough to ensure sufficient oxygen depletion
although oxygen diffuses faster than glucose. This point of view is supported by comparing
multilayer electrodes which have been prepared with the same number of PAH/GOD layers
(4) but with a lower GOD concentration (400µM instead of 2mM). Here the photocurrent can
only be suppressed to a value of about 60% (at a glucose concentration of 20mM) in
E-10
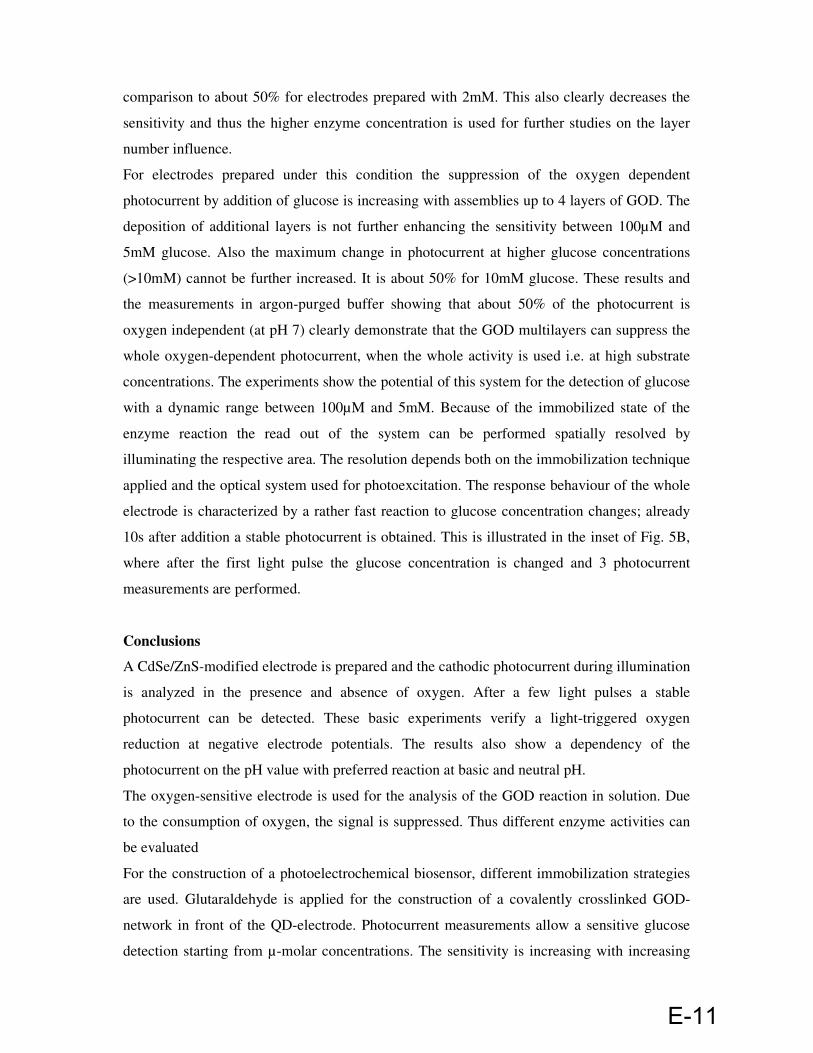
comparison to about 50% for electrodes prepared with 2mM. This also clearly decreases the
sensitivity and thus the higher enzyme concentration is used for further studies on the layer
number influence.
For electrodes prepared under this condition the suppression of the oxygen dependent
photocurrent by addition of glucose is increasing with assemblies up to 4 layers of GOD. The
deposition of additional layers is not further enhancing the sensitivity between 100µM and
5mM glucose. Also the maximum change in photocurrent at higher glucose concentrations
(>10mM) cannot be further increased. It is about 50% for 10mM glucose. These results and
the measurements in argon-purged buffer showing that about 50% of the photocurrent is
oxygen independent (at pH 7) clearly demonstrate that the GOD multilayers can suppress the
whole oxygen-dependent photocurrent, when the whole activity is used i.e. at high substrate
concentrations. The experiments show the potential of this system for the detection of glucose
with a dynamic range between 100µM and 5mM. Because of the immobilized state of the
enzyme reaction the read out of the system can be performed spatially resolved by
illuminating the respective area. The resolution depends both on the immobilization technique
applied and the optical system used for photoexcitation. The response behaviour of the whole
electrode is characterized by a rather fast reaction to glucose concentration changes; already
10s after addition a stable photocurrent is obtained. This is illustrated in the inset of Fig. 5B,
where after the first light pulse the glucose concentration is changed and 3 photocurrent
measurements are performed.
Conclusions
A CdSe/ZnS-modified electrode is prepared and the cathodic photocurrent during illumination
is analyzed in the presence and absence of oxygen. After a few light pulses a stable
photocurrent can be detected. These basic experiments verify a light-triggered oxygen
reduction at negative electrode potentials. The results also show a dependency of the
photocurrent on the pH value with preferred reaction at basic and neutral pH.
The oxygen-sensitive electrode is used for the analysis of the GOD reaction in solution. Due
to the consumption of oxygen, the signal is suppressed. Thus different enzyme activities can
be evaluated
For the construction of a photoelectrochemical biosensor, different immobilization strategies
are used. Glutaraldehyde is applied for the construction of a covalently crosslinked GOD-
network in front of the QD-electrode. Photocurrent measurements allow a sensitive glucose
detection starting from µ-molar concentrations. The sensitivity is increasing with increasing
E-11

GOD concentration used for the crosslinking. However, glutaraldehyde is influencing the
sensitivity of the QDs and reproducibility in preparation is moderate.
The alternating assembly of negatively charged GOD and a positively charged polyelectrolyte
enables the development of a multilayer system through electrostatic interaction. QCM
measurements demonstrate a constant amount of deposited GOD for each layer. Photocurrent
measurements with varying glucose concentrations evidence the accessibility of GOD within
the layers and show increasing response with increasing layer number. A [GOD/PAH]4-
multilayer electrode uses the full range of the oxygen dependent photocurrent. With a short
response time and a dynamic range between 100µM and 5mM glucose this system is a useful
biosensor for glucose. The investigations demonstrate the feasibility of the concept of a light-
triggered read out of a sensor surface based on a QD-layer and a coupled enzyme architecture.
Acknowledgement:
Financial support by the DFG is gratefully acknowledged (projects LI706/2-1, PA794/3-1).
E-12

-500 -400 -300 -200 -100 00.0
0.5
1.0
1.5
2.0
2.5
3.0
3.5
4.0
no
rm ∆
I Pho
to
potential [mV]
(C)
-500 -400 -300 -200 -100 0 100
-150
-100
-50
0 b
cu
rre
nt
[nA
]
potential [mV]
(A)
a
Fig. 1
(B)
E-13
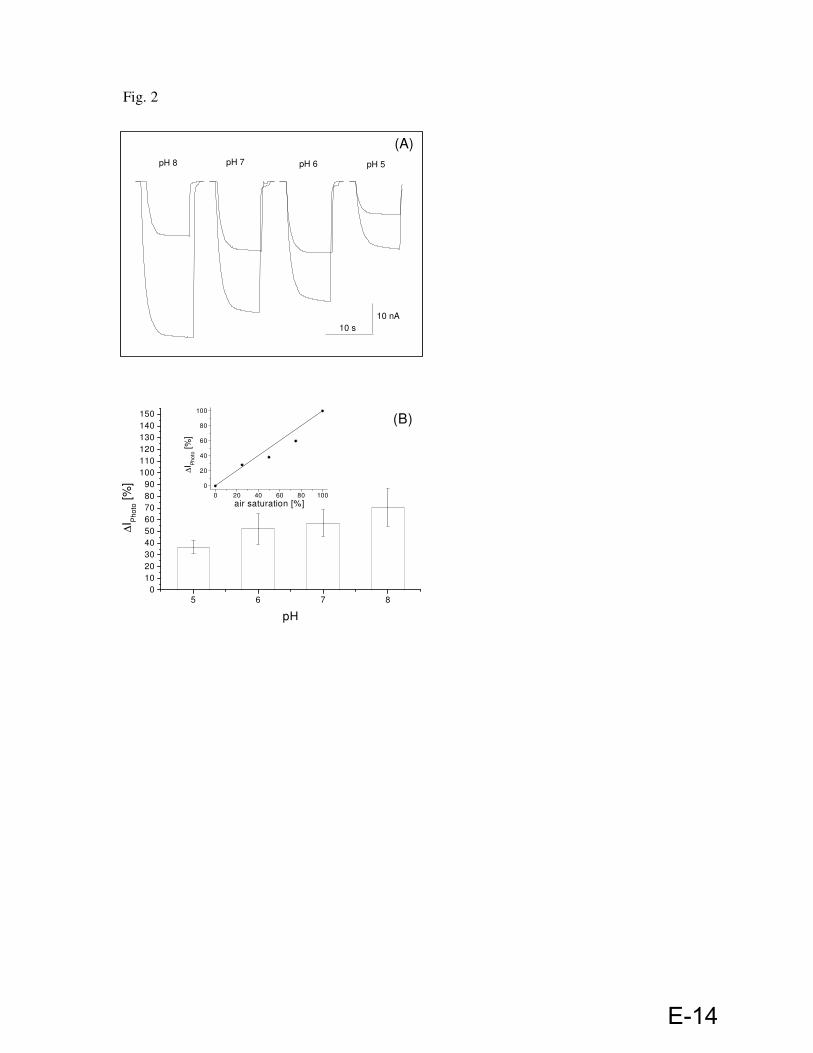
Fig. 2
(A)
10 s
pH 5pH 6pH 7pH 8
10 nA
5 6 7 80
10
20
30
40
50
60
70
80
90
100
110
120
130
140
150(B)
∆I P
hoto [
%]
pH
0 20 40 60 80 100
0
20
40
60
80
100
∆I P
ho
to [
%]
air saturation [%]
E-14
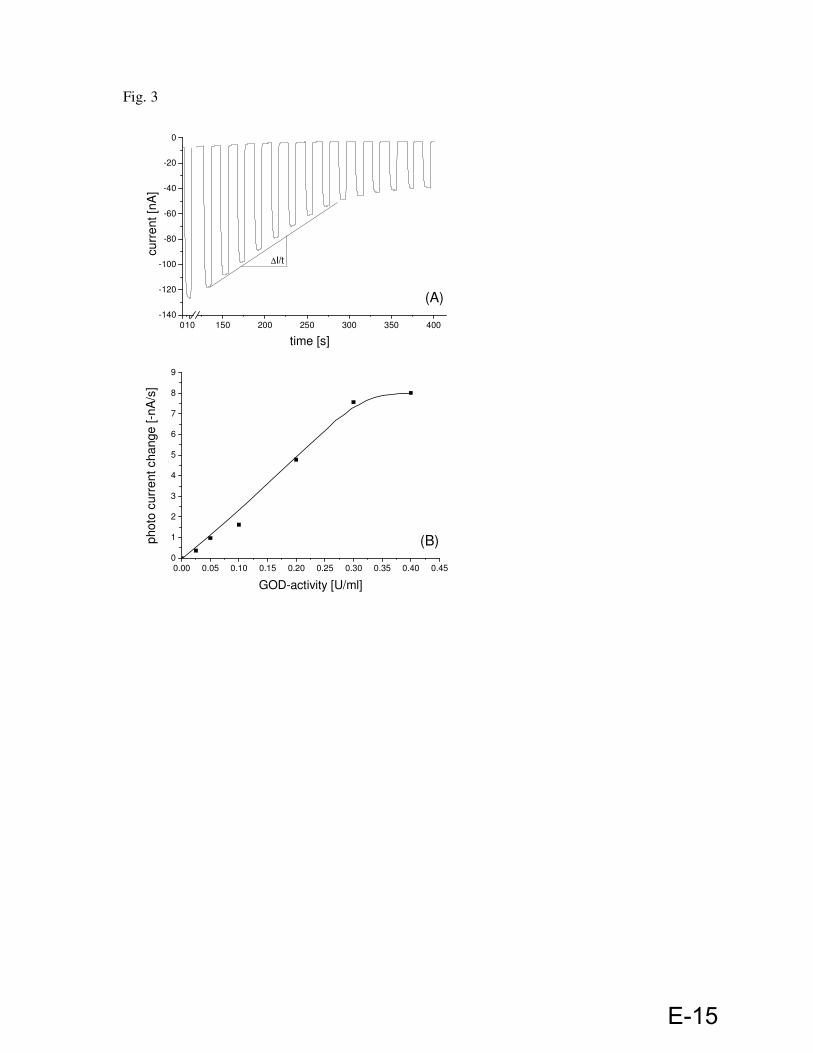
Fig. 3
0.00 0.05 0.10 0.15 0.20 0.25 0.30 0.35 0.40 0.450
1
2
3
4
5
6
7
8
9
photo
curr
ent change [-n
A/s
]
GOD-activity [U/ml]
(B)
010 150 200 250 300 350 400-140
-120
-100
-80
-60
-40
-20
0
∆I/t
(A)
time [s]
cu
rre
nt
[nA
]
E-15

Fig.4
0.00 0.25 0.50 0.75 1.00 1.25 1.50 1.75 2.000
25
50
75
100
c
aphoto
curr
ent
[%]
glucose [mM]
b
E-16
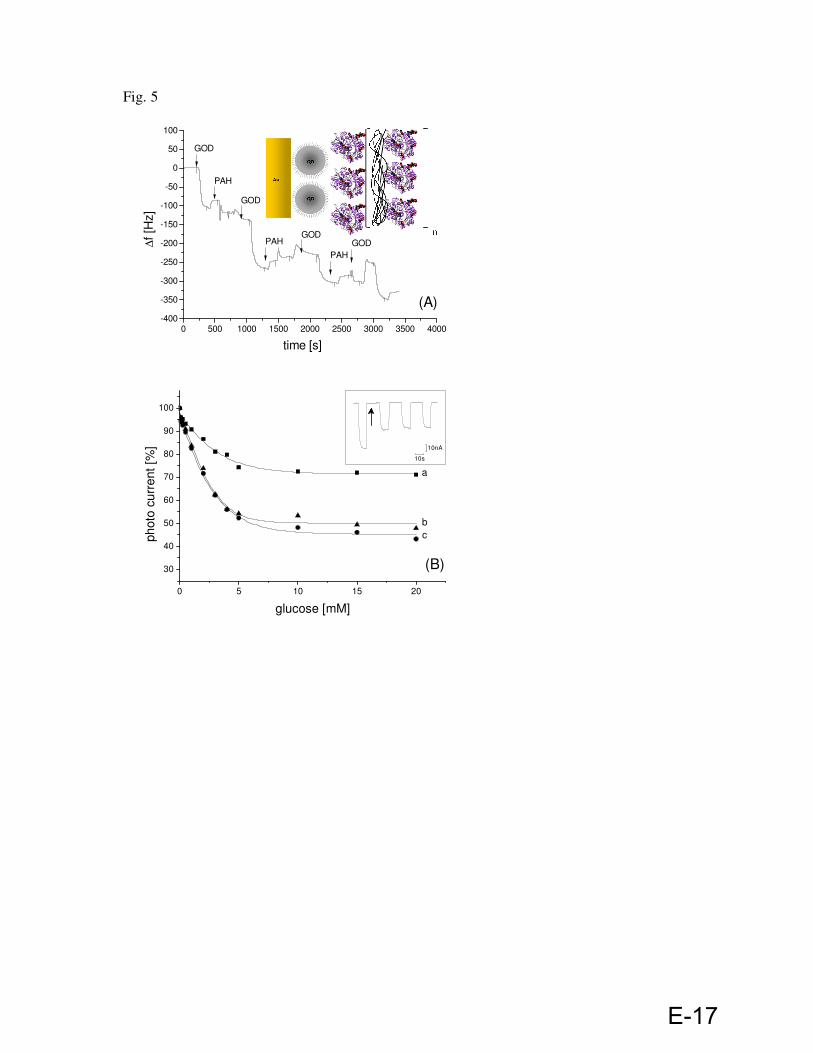
Fig. 5
0 500 1000 1500 2000 2500 3000 3500 4000-400
-350
-300
-250
-200
-150
-100
-50
0
50
100
PAH
PAH
PAH
GODGOD
GOD
∆f
[Hz]
time [s]
GOD
(A)
0 5 10 15 20
30
40
50
60
70
80
90
100
c
b
ph
oto
cu
rre
nt
[%]
glucose [mM]
a
(B)
10nA
10s
E-17

Captions
Fig. 2. (A) LS-Voltammogramm of a Au-[QD-BDT] electrode in argon-purged buffer (a) and
in air-saturated buffer (b) (100mM HEPES; pH 8; 1mV/s; between –500 and +100mV vs.
Ag/AgCl, 1M KCl); (B) Normalized photocurrent differences in the absence and presence of
oxygen (∆IPhoto) in dependence of the oxygen concentration (error bars results from 4
independent sensor electrodes, normalization to the current change at +30mV vs. Ag/AgCl);
(C) Illustration of the electron transfer steps after illumination of the QD-electrode.
Fig. 3. (A) Photocurrent measurements of Au-[QD-BDT] electrodes at constant potential in
argon-purged buffer (a) and air- saturated buffer (b) in dependence on solution pH (100mM
HEPES; tL= 10s; E= -350mV vs. Ag/AgCl, 1M KCl); (B) Relative signal change after
removing O2 from the air-saturated solution at different pH-values (error bars results from 4
independent sensor electrodes); Inset: Dependency of the photocurrent change on the oxygen
amount in solution (relative to air saturation) at physiological pH (100mM HEPES; pH 7)
Fig. 3. (A) Photocurrent measurement of a Au-[QD-BDT] electrode in 30mM glucose and
after addition of GOD (100mM HEPES; pH 6.8; tL= 10s; E= -350mV vs. Ag/AgCl, 1M KCl);
(B) Rate of the oxygen-dependent photocurrent change for different GOD-activities.
Fig. 4. Suppression of the photocurrent of a Au-[QD-BDT] electrode with a cross-linked
GOD-network prepared with different enzyme concentrations in dependence on glucose
concentration; (a) 200µM GOD; (b) 400µM GOD; (c) 2mM GOD (100mM HEPES; pH 6.8;
tL= 10s; E= -350mV vs. Ag/AgCl, 1M KCl).
Fig. 5. (A) Mass sensitive analysis of [GOD/PAH]n-multilayer formation on BDT-modified
quartz chips in 2mM sodium phosphate buffer (flow rate 40µl/min) (right); Inset: Schematic
illustration of the multilayer assembly of [GOD/PAH]n on a BDT-modified gold electrode of
a quartz crystal. (B) Relative change of the photocurrent of Au-[QD-BDT] electrodes with
immobilized [GOD/PAH]n-layers with increasing glucose concentration, (a) [GOD/PAH]2,
(b) [GOD/PAH]4, (c) [GOD/PAH]6 (100mM HEPES pH 6.8; tL= 10s; E= -350mV vs.
Ag/AgCl, 1M KCl); Inset: Photocurrent behaviour of an electrode with 4 bilayers
[GOD/PAH]4 in air saturated buffer without glucose (light pulse 1) and after addition of 4mM
glucose (light pulses 2-4, the arrow marks the addition of glucose).
E-18
References:
(1) Umar, A.; Rahman, M. M.; Al-Hajry, A.; Hahn, Y.-B. Electrochemistry
Communications 2009, 11, 278–281 (2) Lahiff, E.; Lynam, C.; Gilmartin, N.; O’Kennedy, R.; Diamond, D. Anal Bioanal
Chem. 2010, 398,1575–1589 (3) Bonanni, A.; del Valle, M. Anal. Chim. Acta 2010, 678, 7–17 (4) Kang, X.; Mai, Z.; Zuo, X.; Cai, P.; Mo, J. Anal. Biochem. 2007, 369, 71–79 (5) Dittmeyer, R.; Keim, W.; Reysa, ‚G.; Oberholz, A. Chemische Technik: Prozesse und
Produkte. Band 2: Neue Technologie. (Wiley-VCH, Weinheim) 2004
(6) Shipway, A., N.; Katz, E.; Willner, I. CHEMPHYSCHEM 2000, 1, 18-52 (7) Lohmüller, T.; Aydin, D.; Schwieder, M.; Morhard, C.; Louban, I.; Pacholski, C.;
Spatz, J. P. Biointerphases 2011, 6(1), 1934-8630 (8) Xiao, Y. and Li, C. M. Electroanalysis 2008, 20(6), 648 – 662 (9) Zayats, M.; Katz, E.; Willner, I. J. Am. Chem. Soc. 2002, 124, 10, 2120-2121 (10) Willner, I.; Basnar, B.; Willner, B. FEBS Journal 2007, 274, 302–309 (11) Esteves, A. C. C.; Trindade, T. Current Opinion in Solid State and Materials
Science, 2002, 6, 347–353 (12) Murray, C. B.; Noms, D. J.; Bawendi, M. G. J. Am. Chem. Soc. 1993, 115,
8706-8715 (13) Dabbousi, B. O.; Rodriguez-Viejo, J.; Mikulec, F. V.; Heine, J. R.; Mattoussi,
H.; Ober, R.; Jensen, K. F.; Bawendi, M. G. J. Phys. Chem. B 1997, 101, 9463-9475 (14) Hines, M. A.; Guyot-Sionnest, P. J. Phys. Chem. 1996, 100, 468-471 (15) Talapin, D. V.; Rogach, A. L.; Kornowski, A.; Haase, M.; Weller, H. Nano
Lett. 2001, 1(4), 207-211 (16) Medinitz, I. L.; Uyeda, H. T.; Goldman, E. R.; Mattoussi, H. Nat. Mat. 2005, 4,
435-445 (17) Wannier, G. H. Phys. Rev. 1937, 52, 193-197 (18) Alivisatos A. P. Science 1996, 271, 933-937 (19) Chan, W. C. W.; Maxwell, D. J.; Gao, X.; Bailey, R. E.; Han, M.; Nie, S. Curr.
Opt. in Biotech. 2002, 13(1), 40-46
(20) Pellegrino, T.; Kudera, S.; Liedl, T.; Muñoz Javier, A.; Manna, L.; Parak, W. J. small, 2005,1, 48-63
(21) Bruchez M.; Moronne, M.; Gin, P.; Weiss,S.; Alivisatos, A. P. Science 1998,
281, 2013-2016 (22) Seydack, M. Biosens. and Bioelec. 2005, 20, 2454-2469 (23) Ma, L.; Wu, S. M.; Huang, J.; Ding, Y.; Pang, D. W.; Li, L. Chromosoma
2008, 117(2),181-187 (24) Algar, W. R.; Massey, M.; Krull, U. J. Trends in Anal. Chem: 2009, 28(3),
292-306 (25) Bardi, G.; Malvindi, M. A.; Gherardini, L.; Costa, M.; Pompa, P. P.; Cingolani,
R.; Pizzorusso, T. Biomat. 2010, 31, 6555-6566 (26) Chan, W. C. W. and Nie, S. Science 1998, 281, 2016–2018
E-19
(27) Mattoussi, H.; Mauro, M.; Goldman, E. R.; Anderson, G. P.; Sundar, V. C.; Mikulec, F. V.; Bawendi, M. G. J. Am. Chem. Soc. 2000, 122, 12142-12150
(28) Pinaud, F.; King, D.; Moore, H-P.; Weiss S. J. Am. Chem. Soc. 2004, 126, 6115-6123
(29) Clarke, S.; Pinaud, F.; Beutel, O.; You, C.; Piehler, J.; Dahan, M. Nano Lett. 2010, 10, 2147-2154
(30) Wu, X.; Liu, H.; Liu, J.; Haley,K. N.; Treadway, J. A.; Larson, J. P.; Ge, N.; Peale, F.; Bruchez, M. P. Nat. Biotech. 2003, 21, 41-46
(31) Parak, W. J.; Boudreau, R.; Le Gros, M.; Gerion, D.; Zanchet, D.; Micheel, C. M.; Williams, S. C.; Alivisatos, A. P.; Larabell, C. A. Advanced Materials, 2002, 14, 882-885
(32) Åkerman, M. E.; Chan, W. C. W.; Laakkonen, P.; Bhatia, S. N.; Ruoslahti, E. Proc Natl Acad Sci U S A. 2002, 99(20),12617-21
(33) Ha, T. METHODS 2001, 25(1), 78–86 (34) Medinitz I. L.; Clapp, A. R.; Mattoussi, H.; Goldman, E. R.; Fisher, B.; Mauro,
J. M. Nat. Mater. 2003, 2, 630-638 (35) Kang‚W. J.; Ko, M. H.; Lee, D. S.; Kim, S. Proteomics- Clin. App. 2009,
3(12), 1383-1388 (36) Boeneman, K.; Deschamps, J. R.; Buckhout-White, S.; Prasuhn, D. E.; Blanco-
Canosa, J. B.; Dawson, P. E.; Stewart, M. H.; Susumu, K.; Goldman, E. R.; Ancona, M.; Medintz, I. L. ACS Nano 2010, 4(12), 7253–7266
(37) Bailey, V. J.; Easwaran, H.; Zhang, Y.; Griffiths, E.; Belinsky S. A.; Herman, J. G.; Baylin, S. B.; Carraway, H. E.; Wang, T.-H. Genome Research 2009, 19,1455-1461
(38) Stoll, Ch.; Kudera, S.; Parak, W. J.; Lisdat small 2006, 2, 6, 741 – 743 (39) Pardo-Yissar, V.; Katz, E.; Wassermann, J.; Willner, I. J. AM. CHEM. SOC.
2003, 125, 622-623 (40) Katz, E.; Zayats, M.; Willner, I.; Lisdat, F. Chem. Commun. 2006, 1395–1397 (41) Stoll, Ch.; Gehring, C.; Schubert, K.; Zanella, M.; Parak, W. J.; Lisdat, F.
Biosens. and Bioelec. 2008, 24, 260–265 (42) Sun, J.; Zhu, Y.; Yang, X.; Li, C. Particuology 2009, 7, 347–352 (43) Schubert, K.; Khalid, W.; Yue, Z.; Parak, W.J.; Lisdat, F. Langmuir 2010,
26(2), 1395–1400 (44) Van Sark, W. G. J. H. M.; Frederix, P. L. T. M.; Van den Heuvel, D. J.;
Gerritsen, H. C. J. Phys. Chem. B 2001, 105, 8281-8284 (45) Van Sark, W. G. J. H. M.; Frederix, P. L. T. M.; Bol, A. A.; Gerritsen, H. C.;
Meijerink CHEMPHYSCHEM 2002, 3, 871 - 879 (46) Koberling, F.; Mews, A.; Basche, T. Adv. Mater. 2001, 13(9) 672-676 (47) Kloepfer, J. A.; Bradforth, S. E.; Nadeau, J. L. J. Phys. Chem. B 2005, 109,
9996-10003 (48) Ipe, B. I.; Niemeyer, C. M. Angew. Chem. 2006, 118, 519-522 (49) Reiss, P.; Bleuse, J.; Pron, A. Nano Lett. 2002, 2, 781-784 (50) G. Göbel, T.Dietz, F. Lisdat Electroanalysis 2010, 22, 1581-1585
E-20

(51) Lisdat, F.; Dronov, R.; Möhwald, H.; Scheller, F.W.; Kurth, D.G. Chemical
Communications 2009, 3, 274-283 (52) D. Sarauli; J. Tanne; D. Schäfer; I. W. Schubart; F. Lisdat Electrochemistry
Communications 2009, 11, 2288-2291
(53) D.Sarauli, J. Tanne, C. Xu, B. Schulz, L. Trnkova, F. Lisdat Physical
Chemistry Chemical Physics 2010, 12, 14271-14277
E-21
Immobilization of quantum dots via different self assembled monolayers and their application as a light-controlled sensor for the detection of hydrogen peroxide
W. Khalid1$, M. El Helou1$, T. Murböck1, J. M. Montenegro Martos1, K. Schubert2, G. Göbel2, F. Lisdat2, G. Witte1*, W. J. Parak1* 1 Fachbereich Physik and WZMW, Philipps Universität Marburg, Marburg, Germany 2 Biosystems Technology, Technical University of Applied Sciences Wildau, Germany $ both authors contributed equally to this study * corresponding authors: [email protected] [email protected] Abstract A light-addressable gold electrode modified with CdS and FePt or with CdS@FePt nanoparticles via an interfacial dithiol layer is presented. XPS measurents reveal trans-stilbenedithiol as good choice for high quality self assembled monolayers, in case they are formed at elevated temperatures. Prescence of FePt serves as catalytic sites for the reduction of hydrogen peroxide to water. Thus the use of hybrid nanoparticle layers allows for hydrogen peroxide detection.
F-1

Introduction Most commonly spatial resolution in electrochemical sensors is achieved by structured surfaces, e.g. arrays of electrodes. One alternative is addressing individual points on an unstructured electrode by light. The concept of such light-addressable electrodes has been introduced already decades ago [1-3]. Hereby illumination of selected spots on the electrode surface generates a local photocurrent and thus by scanning a light pointer across the sensor surface different positions can be addressed, i.e. spatially resolved measurements are possible [4], cf. Figure 1a. Traditionally such light-addressable sensors have been designed as microfabricated silicon chips, typically in doped silicon - silicon oxide / silicon nitride geometry. Essential is a semiconductor layer in which light-generated electron-hole pairs can be generated as local charge carriers with the light pointer. In the last year attempts have been reported to create similar set-ups, however by placing a layer of semiconductor nanoparticles (quantum dots, QDs) on the surface of gold electrodes via conductive dithiols a linker [5, 6]. Such geometry has potentially several advantages. First QD layers can be easily deposited on gold surfaces and no microfabrication facilities are required. Second, due to the small size of the QDs in principle better spatial resolution could be obtained. Third, besides semiconductor nanoparticles (QDs) also other types of nanoparticles (NPs) could be added on top of the gold electrode, which could for example specifically trigger catalytic reactions. Functionality of such QD modified gold electrodes as electrochemical sensors has been demonstrated before and also applied to the detection of enzymatic reactions [7, 8]. Though attempts have been made to quantitatively optimize the QD layer on the gold surface and thus to improve sensor performance [9], still a conclusive picture of the structure of this interfacial layer is missing. Though in most images such NP layers are depicted as homogeneous self assemble monolayer (SAM), so far no detailed data exist which would support such statement about the geometry. In this work the importance of this junction is systematically studied for the case of different SAMs of dithiols on top of different electrode substrates in order to emphasize the importance of defined structures on device performance and to understand and optimize such sensors. This has to be also seen in the more general context of investigating the structure of NP layers on top of plane surfaces. In addition this work demonstrates the ability of making NP layers of different materials. Besides semiconducting NPs, which serve as switch for light-controlled detection, also other NPs can be used, which for example locally catalyze reactions at the electrode surface. In the present case we demonstrate detection of H2O2 via catalytic degradation at the surface of FePt NPs. Results and discussion Self assembled monolayer (SAMs) of severl dithiols (benzenedithiol (BDT), biphenyldithiol (BPDT), biphenyldithiol monoacetylated (BPDTAc-1), trans-stilbenedithiol (StDT), and trans-stilbenedithiol monoacetylated (StDTAc-1), cf. Figure 1b) were formed on 3 types of Au substrates (Au evaporated on glass substrates with an intermediate TiO2 layer, Au on mica, and polycrystalline gold on SiO2, cf. Figure 1c) by immersing the substrates in the dithiol solutions. Dithols potentiall might bind with both thiol groups to gold surface. For this reason monoacetylation was performed, in order to protect one of the thiol groups of the dithiols, so that only the free thiol can react with the gold surface. The structure of the SAMs (on top of Au@SiO2 substrates) was investigated with X-ray photoelectron emission spectrocopy (XPS). For BDT on polycrystalline gold on SiO2 (which has been used in our previous studies for assembly of NPs on top of Au substrates), a wide XPS signal was observed in the S 2p region (Eex=650 eV, cf. Figure SI-II.2a), which could not be resolved for identification of thiolates or thiols. This monolayer therefore had clearly undergone oxidation of thiolates. The XPS result clearly demonstrate poor SAM quality, of low coverage and high density of defects. For BPDT SAMs on Au@SiO2 the S 2p spectrum as taken at Eex=350 eV
F-2

shows a fit of three doublets referring to three chemical species of sulfur (data cf. SI Figure SI-II.2a). In general, the peak of higher intensity corresponds to the S 2p3/2 und the one of less intensity to the S 2p1/2 signal with an intensity ratio of 2:1. The major peaks were detected at 162 eV and 163.4 eV and were assigned to thiolates (R–S–Au) and thiols (R–S–H), respectively. As the thiolate species dominates the thiol, molecules in this case were lying on the gold surface and partially had form dithiolates. The SAMs in this case were not well-ordered and the exposed thiolates could be rapidly oxidized (by O2 under UV light) to sulfonates located at binding energies of 165.2 eV and 168.5 eV. Atomic sulfur, also denoted as sulfide (S–Au), could be clearly detected at 161.2 eV and evidenced a contaminated gold surface and damaged SAMs by X-ray radiation. By capping one S–H group of BPDT by an acetate group, the anchoring of the remaining thiol was privileged, exhibiting higher affinity to gold than the acetate group, and, hence, yielded an improved quality of SAMs (cf. Figure SI-2b). The thiol signal at 163.4 eV (red) of distinctly higher intensity than thiolates at 162 eV (green) substantiated an exposed thiol group and a shielded thiolate group, thus indicating well-defined upright oriented SAMs. Atomic sulfur at 161 eV and oxidized sulfur species at binding energies higher than 165 eV were consequently attenuated. After decapping the end group, interestingly no or vanishingly little contamination or further damage of the thiolates was observed (cf. Figure SI-2c) and a remarkable thiol signal at 163.5 eV accompanied by a rather low intensity of the thiolate peak at 162.1 eV was assessed. This enhanced packing of the decapped biphenyldithiols on Au/SiO2 can be explained by the less steric end group (–S–C(O)–CH3 vs. –S–H) aiding in more densely packed SAMs than the capped one being upright standing as well. At this point, the capping resulted in well-ordered BPDT monolayers; however, the band gap of the SAM junction is crucial for charge transfer from QDs through the organic layer to the gold electrode. Such biphenyl molecules possess a band gap of 4.1 eV at 4.2 K. For device applications a different class of dithiols of much lower gap has been employed, called stilbenes. A stilbene molecule exhibits a gap of 2.14 eV at T = 77 K. Therefore, we have investigated also stilbenedithiols on the same electrodes (Au@SiO2) with XPS. In Figure 2a, the deposited stilbenedithiols at room temperature show a similar spectrum as in the case of BPDT (cf. Figure SI-II.2a). Three species of reduced sulfur were identified: atomic sulfur at 161.2 eV in blue, thiolate (R–S–Au) at 162.1 eV in green and thiol (R–S–H) at 163.4 eV in red. Hence, oxidation of sulfur in form of sulfonates was existent as well (in gray, binding energy 165.5 eV and 168.2eV). This monolayer possessed many defects and more likely a lying phase had been formed on the gold electrode. Its noteworthy, that the thiolate signal was higher than the thiol peak, implying a dominant binding of both thiols of one molecule on gold, thus inducing a lying phase on such monolayers. When one thiol group prior to SAM formation had been protected by an acetate group, their thiolates on Au/SiO2 revealed improved self-assembly with less damaged SAMs and other impurities (cf. Figure 2b, blue peak at 161.2 eV and gray peaks at 165.5 eV and 168 eV). These features were significantly less after deprotecting the sulfur end group (cf. Figure 2c). It’s also noteworthy, that the green peak representing the thiolate S 2p XP signal in the decapped stilbene dithiols was attenuated, elucidating a more upright orientation, and hence, thicker organic film, as in the case of BPDTAc-1 and decapped BPDT (cf. Figures SI-II.2b,c). For best device application, the fraction of impurities, which behave as charge traps, and densely packed SAMs is desired. In recent studies, annealing thiolate samples in nitrogen at elevated temperatures on Au(111) (75 °C) has shown significant refinement of SAM formation [10];[11]. In this work, this has been applied for StDT on Au@SiO2, where samples in thiol solution at 348 K have been prepared. Surprisingly, the S 2p XP signal demonstrated a prominent improvement in the monolayer. Negligible impurities and well-defined SAMs had been formed. Moreover, the XPS signal ratio of thiol S 2p3/2 to Au 4f7/2 in Figures 2c and 2d was around 1:4.7 and 1:3.1, respectively, giving rise to a more densely packed molecular film in tempered thiol solution compared to room temperature preparation. The fact that the thiol to thiolate ratio is lower in the case of room temperature StDT/Au@SiO2 (3:1, whereas 5:1 for hot substrates) as illustrated in Figures 2c and 2d indicates a lower attenuation of thiolate
F-3
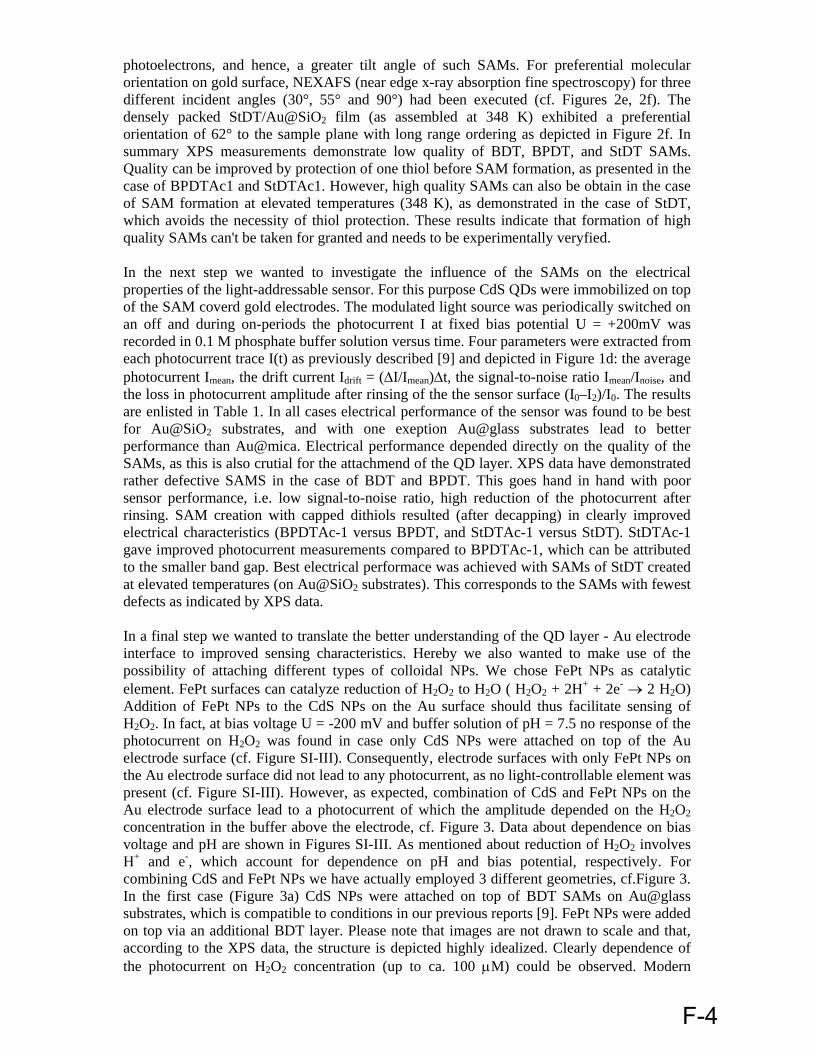
photoelectrons, and hence, a greater tilt angle of such SAMs. For preferential molecular orientation on gold surface, NEXAFS (near edge x-ray absorption fine spectroscopy) for three different incident angles (30°, 55° and 90°) had been executed (cf. Figures 2e, 2f). The densely packed StDT/Au@SiO2 film (as assembled at 348 K) exhibited a preferential orientation of 62° to the sample plane with long range ordering as depicted in Figure 2f. In summary XPS measurements demonstrate low quality of BDT, BPDT, and StDT SAMs. Quality can be improved by protection of one thiol before SAM formation, as presented in the case of BPDTAc1 and StDTAc1. However, high quality SAMs can also be obtain in the case of SAM formation at elevated temperatures (348 K), as demonstrated in the case of StDT, which avoids the necessity of thiol protection. These results indicate that formation of high quality SAMs can't be taken for granted and needs to be experimentally veryfied. In the next step we wanted to investigate the influence of the SAMs on the electrical properties of the light-addressable sensor. For this purpose CdS QDs were immobilized on top of the SAM coverd gold electrodes. The modulated light source was periodically switched on an off and during on-periods the photocurrent I at fixed bias potential U = +200mV was recorded in 0.1 M phosphate buffer solution versus time. Four parameters were extracted from each photocurrent trace I(t) as previously described [9] and depicted in Figure 1d: the average photocurrent Imean, the drift current Idrift = (ΔI/Imean)Δt, the signal-to-noise ratio Imean/Inoise, and the loss in photocurrent amplitude after rinsing of the the sensor surface (I0–I2)/I0. The results are enlisted in Table 1. In all cases electrical performance of the sensor was found to be best for Au@SiO2 substrates, and with one exeption Au@glass substrates lead to better performance than Au@mica. Electrical performance depended directly on the quality of the SAMs, as this is also crutial for the attachmend of the QD layer. XPS data have demonstrated rather defective SAMS in the case of BDT and BPDT. This goes hand in hand with poor sensor performance, i.e. low signal-to-noise ratio, high reduction of the photocurrent after rinsing. SAM creation with capped dithiols resulted (after decapping) in clearly improved electrical characteristics (BPDTAc-1 versus BPDT, and StDTAc-1 versus StDT). StDTAc-1 gave improved photocurrent measurements compared to BPDTAc-1, which can be attributed to the smaller band gap. Best electrical performace was achieved with SAMs of StDT created at elevated temperatures (on Au@SiO2 substrates). This corresponds to the SAMs with fewest defects as indicated by XPS data. In a final step we wanted to translate the better understanding of the QD layer - Au electrode interface to improved sensing characteristics. Hereby we also wanted to make use of the possibility of attaching different types of colloidal NPs. We chose FePt NPs as catalytic element. FePt surfaces can catalyze reduction of H2O2 to H2O ( H2O2 + 2H+ + 2e- → 2 H2O) Addition of FePt NPs to the CdS NPs on the Au surface should thus facilitate sensing of H2O2. In fact, at bias voltage U = -200 mV and buffer solution of pH = 7.5 no response of the photocurrent on H2O2 was found in case only CdS NPs were attached on top of the Au electrode surface (cf. Figure SI-III). Consequently, electrode surfaces with only FePt NPs on the Au electrode surface did not lead to any photocurrent, as no light-controllable element was present (cf. Figure SI-III). However, as expected, combination of CdS and FePt NPs on the Au electrode surface lead to a photocurrent of which the amplitude depended on the H2O2 concentration in the buffer above the electrode, cf. Figure 3. Data about dependence on bias voltage and pH are shown in Figures SI-III. As mentioned about reduction of H2O2 involves H+ and e-, which account for dependence on pH and bias potential, respectively. For combining CdS and FePt NPs we have actually employed 3 different geometries, cf.Figure 3. In the first case (Figure 3a) CdS NPs were attached on top of BDT SAMs on Au@glass substrates, which is compatible to conditions in our previous reports [9]. FePt NPs were added on top via an additional BDT layer. Please note that images are not drawn to scale and that, according to the XPS data, the structure is depicted highly idealized. Clearly dependence of the photocurrent on H2O2 concentration (up to ca. 100 μM) could be observed. Modern
F-4

synthesis protocols also allow for the production of hybrid NPs, such as CdS NPs grown on top of FePt NPs [12, 13]. In this way combination of two materials with different functionalities in one particle is possible. In Figure 3b the sensor response of CdS@FePt NPs immobilized via BDT on top of Au@glass electrodes is shown. In comparison to the mixed assembly of CdS and FePt NPs (Figure 3a) a 2-3 times higher response to H2O2 could be observed. This can be easily understood. Upon reduction of H2O2 electrons need to be transferred from the FePt NPs (the location where the reduction takes place) to H2O. Source of the electrons are the CdS NPs, which in turn receive electrons from the Au electrode via the conductive dithiol SAM. Effectively electrons are injected from the Au electrode for reduction of H2O2, which results in a photocurrent with negative sign (cf. Figure 1a and Figure 3). In the case of CdS@FePt NPs electrons can flow directly from the CdS to the FePt domain without having to cross an external interface. In case of co-assembly of CdS and FePt NPs electrons need to be transferred from the CdS NPs to the FePt NPs via BDT molecules, which reduces the intensitry of the photocurrent. As pointed out in the XPS characterization of the SAMs and in the electrical characterization best performance would be expected using StDT as linker and Au@SiO2 as substrate. However, the dose-reponse curve of the photocurrent versus H2O2 concentration did not change to the geometry with BDT on top of Au@glass (cf. Figures 3b and 3c). Having a closer look at the photocurrent measurement at low H2O2 reveals that the error bars in photocurrent are lower in the case ot StDT on top of BDT, which can be understood by the better signal to noise ratio. Consequently StDT monolayers on top of Au@SiO2 substrates would allow for a lower H2O2 concentration as detection limit. Discussion: We have demonstrated that the quality of the SAMs intefacing the QD layer with the gold electrode has a direct influence on the electrical properties of the sensor. Quality of SAMs can be improved either by first capping one of the thiols, or by immobilization at elevated temperatures, and by careful selection of the molecule towards electrical properties such as the intrinsic bandgap. Still the structure of the actual NP layer on top of the SAM needs to be investigated in further studies. We furthermore have demonstrated that inclusion of other types of NPs facilitates new detection modalities. In the present case FePt NPs, either co-immobilized with the CdS NPs or CdS@FePt hybrid NPs have been used as catalytic sites for the detection of H2O2. This can be the basis of a set of biosensors involving enzymes with H2O2 as product. Materials and Methods: CdS [14], FePt [13, 15], and CdS@FePt [12, 13]NPs have been synthesized according to previously published protocols. Au@mica substrates were based on mica sheets. Au@glass substrates were based on TiO2 evaporated on glass slides. Au@SiO2 substrates were based on silicon wafers as purchased from Silchem. Wafers werea rinsed thoroughly with acetone and 2-propanol and dried in a nitrogen stream. The clean substrates were placed in a POLARON sputter-coater and coated with 14 nm Au from a Au plate under argon atmosphere of p=8⋅10-2 mbar. SAMs of dithiols on top opf the substrates were prepared by immersing the substrates in thiol solution for 24 h, subsequent thoroughly rinsing with dichloromethane, and drying in a nitrogen stream. If not specified otherwise ,the substrates were immersed at room temperature. The dithiols were dissolved at a concentration of 100 nM in dichloromethane or toluene. Synthesis and decapping of BPDT-Ac1 thiolates on Au has been reported elsewhere[16], as has the synthesis and decapping of StDTAc-1[16]. XPS (x-ray photoelectron spectroscopy) data were carried out at the HESGM synchrotron beamline of
F-5

BESSY II in Berlin at several photon energies / excitation energies (Eex) in the range 350–700 eV at a base pressure p ≤ 1⋅10-9 mbar. The XP spectra were reported as a function of the binding energy and were cross-calibrated with the Au 4f7/2 binding energy at a peak of 84.0 eV. Electrical characterization of the NP covered electrodes was performed as previously described elsewhere [9]. Dose-response curves of the dependence of the photocurrent from hydrogen peroxide were recorded. All experimental protocols and several characterizations measurements are described in detail in the Supporting Information. Acknowledgements This work was supported in part by the German Research Foundation (DFG, grant PA 794/3-1 to WJP and LI706/2-1 to FL) and by the European Commission (EC, grant Nandiatream to WJP). WK acknowlegdes financíal support by the HEC Pakistan / DAAD Germany. The authors are grateful to Dr. Abbasi Azhar for help in the nanoparticle synthesis and for recording the TEM images.
F-6

Figures
Figure 1. a) Set-up of the light controlled electrode comprising a NP layer on top of a gold electrode with an interfacial dithiol layer, an applied bias voltage, and a modulated light source. b) Schematic illustration of the different dithiols: benzenedithiol (BDT), biphenyldithiol (BPDT), biphenyldithiol monoacetylated (BPDTAc-1), trans-stilbenedithiol (StDT), and trans-stilbenedithiol monoacetylated (StDTAc-1). c) Schematic illustration of the geometry of the different used gold substrates: Au@glass, Au@mica, and Au@SiO2. d) Photocurrent I recorded over time at fixed bias potential U = - 200 mV. Within the first Δt = 60 s the modulated light source was three times switched on and off. Afterwards the light source was switched on for around 200 s. From the traces the following parameters were extracted: the maximum photocurrent at the beginning Imax, the loss in photocurrent ΔIdrift during the period Δt in which the light source had been switched on and off 3 times, the mean photocurrent Imean as recorded during the cycle in which the light was switched on, and the noise ΔInoise during the same period.
F-7

Figure 2. a-d) S 2p XP spectra at Eex=350 eV of the following SAMs on Au/SiO2: a) StDT; b) capped StDT (or StDTAc-1); c) decapped StDTAc-1; d) StDT prepared in thiol solution at 348 K (hot StDT). The emission intensity Iem is plotted versus the binding energy Ebind. e-f) NEXAFS at C1s edge of e) StDT at room temperature; f) StDT at 348 K. The intensity I is plotted versus the hν.
F-8
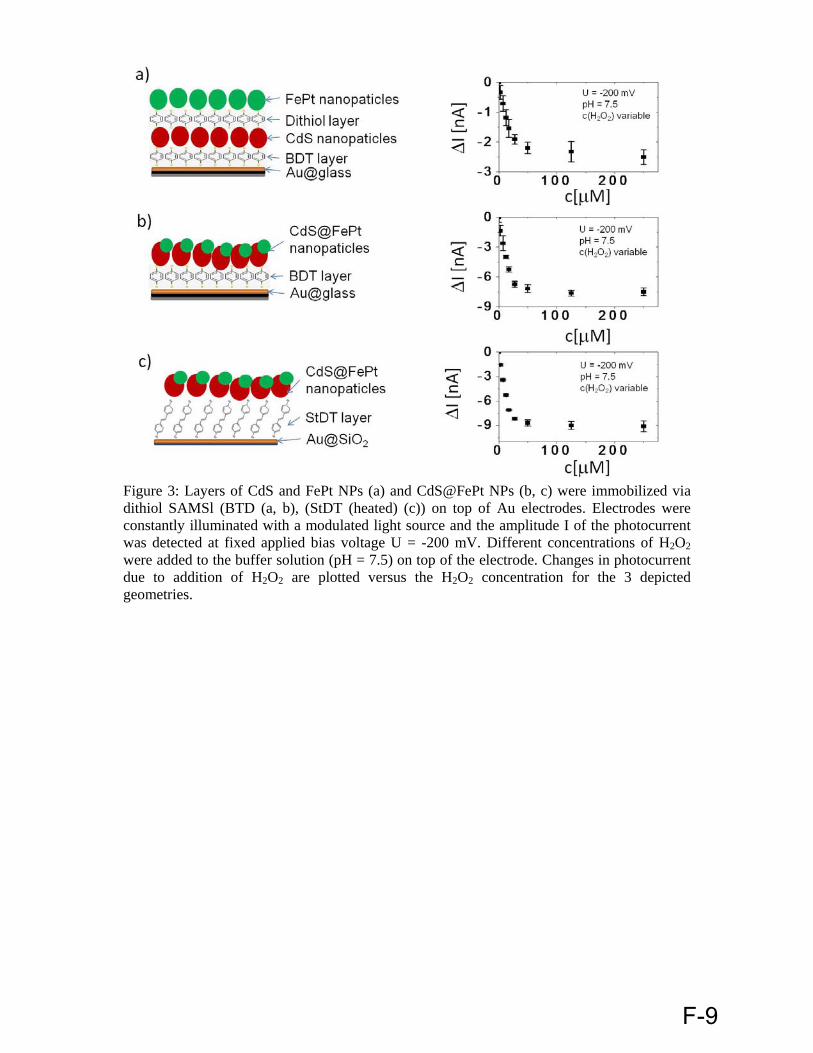
Figure 3: Layers of CdS and FePt NPs (a) and CdS@FePt NPs (b, c) were immobilized via dithiol SAMSl (BTD (a, b), (StDT (heated) (c)) on top of Au electrodes. Electrodes were constantly illuminated with a modulated light source and the amplitude I of the photocurrent was detected at fixed applied bias voltage U = -200 mV. Different concentrations of H2O2 were added to the buffer solution (pH = 7.5) on top of the electrode. Changes in photocurrent due to addition of H2O2 are plotted versus the H2O2 concentration for the 3 depicted geometries.
F-9

Tables
dithiol molecule
substrate Imean [nA] Idrift = (ΔI/Imean) /Δt
[s-1]
Imean/Inoise (I0–I2)/I0 [%]
BDT
Au@mica 0.27 ± 0.034 5.1 × 10⁻² ± 1.8 × 10⁻²
5.68 ± 0.98 68.1 ± 2
Au@glass 0.67 ± 0.15 2.5 × 10⁻² ± 3.5 × 10⁻³
17.25 ± 2.54 52.3 ± 2.34
Au@SiO2 1.56 ± 0.3 4.84 × 10⁻⁴ ± 2.22 × 10⁻⁴
55 ± 8 30.5 ± 4.43
BPDT
Au@mica 0.065± 0.019 4.8 × 10⁻² ± 1.2 × 10⁻²
3.52 ± 1.08 100
Au@glass 0.00§ - - - Au@SiO2 0.62 ± 0.095 3.8 × 10⁻⁴
± 2.4 × 10⁻⁴ 10.37 ± 1.71 32.1 ± 0.68
BPDTAc-1*
Au@mica 0.11 ± 0.02 6.8 × 10⁻²
± 6.2 × 10⁻³ 15.54 ± 1.6 47.3 ± 1.78
Au@glass 0.3 ± 0.07 3.4 × 10⁻²
± 5.6 × 10⁻³ 26.7 ± 6.86 26.5 ± 4.85
Au@SiO2 1.76 1.3 × 10⁻⁴ 47.62 22.2
StDt
Au@mica 0.37 ± .066 2.5 × 10⁻²
± 7 × 10⁻³ 20.25 ± 5.63 35.6 ± 5.3
Au@glass 1.08 ± 0.11 4.1 × 10⁻²
± 8.1 × 10⁻³ 39.99 ± 6.2 21.7 ± 5.2
Au@SiO2 1.57 ± 0.14 2.9 × 10⁻⁴ ± 1.3 × 10⁻⁴
48.9 ± 6.16 12.4 ± 1.11
StDtAc-1*
Au@mica 0.51 ± 0.12 1.9 × 10⁻² ± 7.6 × 10⁻³
13.84 ± 3.14 46.6 ± 4.1
Au@glass 1.45 ± 0.45 1.3 × 10⁻² ± 3.7 × 10⁻³
38.46 ± 12.6 30.3 ± 2.3
Au@SiO2 2.51 ± 0.135 1.7 × 10⁻⁴ ± 1.35 × 10⁻⁵
137 ± 4.95 4.42 ± 0.64
StDt (heated) Au@SiO2 8.84 ± 0.5 8.4 × 10⁻⁵ ± 4.8 × 10⁻⁶
262.8 ± 15.2 1.01 ± 0.06
Table 1: Electrical characterization of CdS NPs on top of SAMs of different dithiol molecules on top of different electrode substrates. The definition of the parameters is given in Figure 1d. All measurements have been replicated with 2 different electrodes and data represent mean values with the corresponding standard deviation. *The capping had been removed after assembly of the dithiol SAM, before attachement of the QDs. §The photocurrent was below the detection limit.
F-10
References 1. Engström, O. and A. Carlsson, Scanned light technique for the investigation of
insulator-semiconductor interfaces. Journal of Applied Physics, 1983. 54(9): p. 5245 - 5251.
2. Hafeman, D.G., J.W. Parce, and H.M. McConnell, Light-Addressable Potentiometric Sensor for Biochemical Systems. Science, 1988. 240: p. 1182 - 1185.
3. Licht, S., N. Myung, and Y. Sun, A Light Addressable Photoelectrochemical Cyanide Sensor. Analytical Chemistry, 1996. 68(6): p. 954 - 959.
4. Parak, W.J., et al., Lateral Resolution of Light Addressable Potentiometric Sensors: An Experimental and Theoretical Investigation. Sensors and Actuators A, 1997. 63: p. 47-57.
5. Stoll, C., et al., Quantum Dots on Gold:Electrodes For Photoswitchable Cytochrome c Electrochemistry. SMALL, 2006. 2(6): p. 741-743.
6. Katz, E., et al., Controlling the direction of photocurrents by means of CdS nanoparticles and cytochrome c-mediated biocatalytic cascades. Chemical Communications, 2006(13): p. 1395-1397.
7. Stoll, C., et al., Photoelectrochemical signal chain based on quantum dots on gold—Sensitive to superoxide radicals in solution. Biosensors and Bioelectronics, 2008. 24: p. 260-265.
8. Schubert, K., et al., Quantum-Dot-Modified Electrode in Combination with NADH-Dependent Dehydrogenase Reactions for Substrate Analysis. Langmuir, 2010. 26(2): p. 1395-1400.
9. Yue, Z., et al., Evaluation of quantum dots applied as switchable layer in a light-controlled electrochemical sensor. Analytical and Bioanalytical Chemistry, 2010. 396(3): p. 1095-1103.
10. Cyganik, P., et al., Competition as a design concept: Polymorphism in self-assembled monolayers of biphenyl-based thiols. Journal Of The American Chemical Society, 2006. 128(42): p. 13868-13878.
11. Qi, Y.B., et al., Influence of Molecular Ordering on Electrical and Friction Properties of omega-(trans-4-Stilbene)Alkylthiol Self-Assembled Monolayers on Au (111). Langmuir, 2010. 26(21): p. 16522-16528.
12. Gu, H., et al., Facile One-Pot Synthesis of Bifunctional Heterodimers of Nanoparticles: A Conjugate of Quantum Dot and Magnetic Nanoparticles. Journal of the American Chemical Society, 2004. 126(18): p. 5664-5665.
13. Zanella, M., et al., Growth of colloidal nanoparticles of group II-VI and IV-VI semiconductors on top of magnetic iron-platinum nanocrystals. Journal of Materials Chemistry, 2008. 18: p. 4311-4317.
14. Kudera, S., et al., Selective growth of PbSe on one or both tips of colloidal semiconductor nanorods. Nanoletters, 2005. 5(3): p. 445-449.
15. Sun, S., et al., Monodisperse FePt Nanoparticles and Ferromagnetic FePt Nanocrystal Superlattices. Science, 2000. 287(March 17): p. 1989-1992.
16. Niklewski, A., et al., Fabrication of self-assembled monolayers exhibiting a thiol-terminated surface. Langmuir, 2004. 20(20): p. 8620-8624.
F-11

Acknowledgements All Praises to Almighty ALLAH, the most Benign and Merciful, and the lord of the entire Universe, Who enabled me to undertake and execute this research work. I offer my humblest and sincerest words of thanks to his Holy Prophet Hazrat Muhammad (peace be upon Him) Who is forever a torch of guidance and knowledge for humanity.
I feel highly privileged here to have the honor to acknowledge my supervisor, Prof. Dr. Wolfgang J. Parak, under whose supervision, this research work has been carried out. I am grateful to him for allowing me to work in the laboratory with freedom which has enabled me to think independently and develop a positive approach. He has always been there like a true mentor and has guided me in every step of this arduous path. Without his guidance it would be impossible for me to be where I stand today.
I would also like to thank Prof. Dr. Fred Lisdat and Prof. Dr. Gregor Witte for their time, valuable suggestions and their substantial contributions to this work. Without these cooperations, major parts of this work would not have been realized. Their scientific input has made my research work more cohesive.
My greatest thanks to Zhao Yue, Kirsten Schubert and Mira el Helou for helping me understand so many things, which at the beginning looked terrible to the least.
Many thanks to Dr. Jose Maria Montenegro for all the tremendous support he provided for my work and guiding me in synthesis of thiol molecules and helping me understand the NMR spectra.
I would like to extend my sincere gratitude to Dr. Mathias Bonn and all the people at electronic and machine shop for their help.
My sincere thanks to Mrs. Sigrid Thomas and to Ms Stefanie Kramer for the support in the administrative work and thanks to Andreas Rentzos for solving all my computer related problems.
Great thanks to Dr. Jose Maria Montenegro and Faheem Amin for the proof reading of my thesis and also to Christian Pfeiffer for translating the abstract of my thesis in German.
I feel great pleasure in expressing my deep sense of obligation for the cordial cooperation extended by all my former and present group members, who made the atmosphere pleasant and great with BBQ’s, parties, kicker tournaments, poker. I wish you all the best in life.
I cannot miss to oblige my friends in Pakistan, who have always inspired me and supported me without fearing the consequences. Asif and Ikram I owe you a lot and I wish you guys happiest and prettiest (especially for Ikram) future.
I was really lucky to find the company of Zulqurnain rather ‘bhai’, Faheem, ‘chota bhai’ and Imran Wajid. My gratitude and so many thanks for all the masti and fun we had, all the games of RANG and BARAT. For all the new experiences which I would never go for, if you were not
b-1

encouraging me. It was all like a family with Samia bhabi, Rayan and Hira Bhabi. Thanks for your support.
Without the support of my funding agencies, this research would not have been possible. HEC, Pakistan and DAAD, Germany are gratefully acknowledged.
I have no words to thank my Mom, Dad and sisters who showered affection, support and guidance and made me what I am today. Mom, even though I haven’t been with your side for all these years you always have given me support and love. I really appreciate it from the bottom of my heart.
Last but not least, my wife, Raazia and my coming baby, words are not enough to express my gratitude for you. Thank you for love and patience. Thank you, Raazia, for all the care during the preparation of this thesis.
b-2

Academic carrier
2007 – Current Doctorate from Philipps Universität Marburg; AG Biophotonics, Marburg, Germany.
2004 – 2006 M. Phil in Physics from Quaid-i-Azam University; Department of Physics, Islamabad, Pakistan.
2002 – 2004 Masters in Physics from Quaid-i-Azam University; Department of Physics, Islamabad, Pakistan.
2000 – 2002 Graduation in Maths and Physics from Punjab University; Lahore, Pakistan.
1998 – 2000 Higher Secondary from Govt. Collage Asghar - Mall, Rawalpindi, Pakistan.
c