Magnetic Properties of 3d and 4f - Freie...
155
Magnetic Properties of 3d and 4f Ferromagnets Studied by X-Ray Absorption Spectroscopy im Fachbereich Physik der Freien Universit¨ at Berlin eingereichte Dissertation von Claudia Sorg Oktober 2005
Transcript of Magnetic Properties of 3d and 4f - Freie...
Magnetic Properties of 3d and 4f
Ferromagnets Studied by
X-Ray Absorption Spectroscopy
im Fachbereich Physik
der Freien Universitat Berlin
eingereichte Dissertation
von
Claudia Sorg
Oktober 2005

Sorg, Claudia: Magnetic Properties of 3d and 4f Ferromagnets Studied by X-Ray Absorption Spectroscopy / Claudia Sorg. – Als Ms. gedr.. – Berlin : dissertation.de – Verlag im Internet GmbH, 2006 Zugl.: Berlin, Freie Univ., Diss., 2005 ISBN 3-86624-097-X Gutachter: 1. Prof. Dr. Klaus Baberschke
2. Prof. William Brewer, PhD Tag der Einreichung: 14.10.2005 Tag der Disputation: 23.11.2005
Bibliografische Information der Deutschen Bibliothek Die Deutsche Bibliothek verzeichnet diese Publikation in der Deutschen Nationalbibliografie; detaillierte bibliografische Daten sind im Internet über <http://dnb.ddb.de> abrufbar. dissertation.de – Verlag im Internet GmbH 2006 Alle Rechte, auch das des auszugsweisen Nachdruckes, der auszugsweisen oder vollständigen Wiedergabe, der Speicherung in Datenverarbeitungsanlagen, auf Datenträgern oder im Internet und der Übersetzung, vorbehalten. Es wird ausschließlich chlorfrei gebleichtes Papier (TCF) nach DIN-ISO 9706 verwendet. Printed in Germany. dissertation.de - Verlag im Internet GmbH Pestalozzistraße 9 10625 Berlin URL: http://www.dissertation.de

Abstract
In this thesis, the magnetism of ultrathin ferromagnetic films of Fe, Co, and Ni as well
as the magnetism of single crystals of the rare earth elements Gd, Tb, and Dy have
been studied by means of X-ray absorption spectroscopy. To support measurements
even in an applied magnetic field, a new water-cooled coil system has been developed
and installed in the UHV chamber.
The electronic structure of ultrathin ferromagnetic films of Fe, Co, and Ni has been
investigated by near edge X-ray absorption fine structure (NEXAFS) spectra. Oxy-
gen as surfactant has been used to tailor the structural properties of these ultrathin
films. The obtained X-ray magnetic circular dichroism (XMCD) spectra at the O
K edge show that the surfactant O acquires an induced orbital moment parallel
to the spin and orbital moment of the ferromagnetic film. Ab initio calculations
reproduce the experimental spectra and yield the size of spin and orbital moments.
Thickness-dependent XMCD investigations at the L2,3 edges have been carried out
in the case of Ni grown with O as surfactant. These experiments show that the total
magnetization of the thinnest Ni films is reduced on the Cu(100) surface compared
to the bulk value. On the more open Cu(110) surface the magnetization is enhanced,
mainly due to the orbital moment.
Two-dimensional spin fluctuations and the interlayer exchange coupling (IEC) have
been studied on Co/Cu/Ni/Cu(100) trilayers. Using XMCD, the influence of the
IEC on the element-specific Ni magnetization has been investigated as a function
of temperature. The quasi-critical temperature T ∗C,Ni of Ni in the trilayer is in-
creased by ∆TC,Ni compared to the Curie temperature TC,Ni of the single Ni film.
The experiments together with calculations show the shift ∆TC,Ni as a function of
both the Ni thickness dNi and the Cu thickness dCu. A three-dimensional plot of
the full dependence ∆TC,Ni/TC,Ni (dNi, dCu) results. Therefore, a relation between
∆TC,Ni/TC,Ni and the coupling strength Jinter has been derived with the help of a the-
oretical model including spin fluctuations. Calculations of ∆TC,Ni/TC,Ni (dNi, dCu)
match the experimental findings.

iv Abstract
Temperature-dependent XMCD spectra at the L2,3 edges of the rare earth elements
Gd, Tb, and Dy have been measured. In this work high purity single crystals have
been used which do not include additional complex interactions as they occur in
compounds. The obtained XMCD spectra contain contributions of dipole transi-
tions (E1: 2p → 5d) and quadrupolar transitions (E2: 2p → 4f). Therefore, it is
possible to investigate the magnetism of 5d and 4f states in a single experiment.
In this thesis, it is demonstrated that the contributions of 5d and 4f to the to-
tal magnetization can be separated by calculating the spectra for T = 0 using the
FEFF code. Furthermore, the experiments have revealed that the relative intensi-
ties of the different spectroscopic features of the XMCD change as a function of the
temperature.

Kurzfassung
In dieser Arbeit wurde sowohl der Magnetismus ultradunner, ferromagnetischer Fe-,
Co- und Ni-Filme als auch der Magnetismus von Einkristallen der Seltenen Erden
Gd, Tb und Dy mittels Rontgenabsorptionsspektroskopie untersucht. Im Rahmen
dessen wurde fur die vorhandene UHV-Apparatur ein neues, wassergekuhltes Spulen-
system entwickelt, um Messungen auch im angelegten Magnetfeld zu ermoglichen.
Die elektronische Struktur der ultradunnen, ferromagnetischen Fe-, Co- und Ni-
Filme wurde mit Rontgenabsorptionsspektren im Nahkantenbereich (NEXAFS) un-
tersucht. Dabei wurde Sauerstoff als Surfactant eingesetzt, um die strukturellen
Eigenschaften der Filme zu verbessern. Die mittels magnetischem Rontgenzirkular-
dichroismus (XMCD) gemessenen Spektren an der Sauerstoff-K-Kante zeigen, dass
im Sauerstoff-Surfactant ein orbitales Moment parallel zu Spin- und Bahnmoment
des jeweiligen ferromagnetischen Films induziert wird. Die Großen der Spin- und
Bahnmomente ergeben sich aus ab-initio-Rechnungen, die die experimentellen Spek-
tren sehr gut reproduzieren. Dickenabhangige XMCD-Untersuchungen an den L2,3-
Kanten wurden an Ni-Filmen durchgefuhrt, die mit O-Surfactant gewachsen wurden.
Diese Experimente zeigen, dass die Gesamtmagnetisierung des dunnsten Ni-Films
auf der Cu(100)-Oberflache gegenuber der Magnetisierung von Ni im Volumen re-
duziert ist. Auf der offeneren Cu(110)-Oberflache ist die Gesamtmagnetisierung des
dunnsten Ni-Films erhoht. Aus der Analyse ergibt sich, dass das Bahnmoment einen
erheblichen Anteil dieser Erhohung tragt.
Zweidimensionale Spin-Fluktuationen und die Interlagenaustauschkopplung Jinter
wurden an Co/Cu/Ni/Cu(100)-Dreifachlagen untersucht. Mit der XMCD-Methode
wurde der Einfluss von Jinter auf die elementspezifische Ni-Magnetisierung tempera-
turabhangig bestimmt. Die quasi-kritische Temperatur T ∗C,Ni des Ni in der Dreifach-
lage ist um ∆TC,Ni hoher als die Curie-Temperatur TC,Ni des einfachen Ni-Films. Die
Experimente in Kombination mit Theorie zeigen die Verschiebung ∆TC,Ni als Funk-
tion der beiden Schichtdicken dNi und dCu der Ni- bzw. Cu-Schicht. Es ergibt sich ein
dreidimensionaler Graph, der die vollstandige Abhangigkeit ∆TC,Ni/TC,Ni (dNi, dCu)
darstellt. Die dafur notwendige Beziehung zwischen ∆TC,Ni/TC,Ni und Jinter konnte

vi Kurzfassung
im Rahmen eines theoretischen Modells bestimmt werden, das die erhohten Spin-
Fluktuationen in zweidimensionalen Systemen berucksichtigt. Rechnungen der Tem-
peraturverschiebung ∆TC,Ni/TC,Ni (dNi, dCu) in diesem Modell stimmen mit den ex-
perimentellen Beobachtungen uberein.
XMCD-Spektren an den L2,3-Kanten der Seltenen Erden Gd, Tb und Dy wurden
temperaturabhangig gemessen. In dieser Arbeit wurden fur diese Messungen einele-
mentare Einkristalle verwendet, die keine zusatzlichen Wechselwirkungen beinhal-
ten, wie sie in komplexen Verbindungen auftreten. Die gemessenen XMCD-Spektren
enthalten Beitrage sowohl von Dipol-Ubergangen (E1: 2p → 5d) als auch von Qua-
drupol-Ubergangen (E2: 2p → 4f). Deshalb kann der Magnetismus der 5d- und der
4f -Zustande im selben Experiment untersucht werden, die jedoch in der Analyse
voneinander getrennt werden mussen. In dieser Arbeit wird gezeigt, dass durch die
Berechnung der Spektren bei T = 0 mit Hilfe des FEFF-Codes die Trennung der ma-
gnetischen Beitrage der 5d- und 4f -Zustande moglich ist. Daruber hinaus haben die
Experimente ergeben, dass sich die Linienform der XMCD-Spektren in Abhangigkeit
von der Temperatur andert.

Contents
Abstract iii
Kurzfassung v
1 Introduction 1
2 Ferromagnetism and X-Ray Absorption Spectroscopy 5
2.1 Interaction of X-Rays with Matter . . . . . . . . . . . . . . . . . . . . 6
2.2 Information in X-Ray Absorption Spectra . . . . . . . . . . . . . . . 9
2.3 Analysis of XAS and XMCD Spectra . . . . . . . . . . . . . . . . . . 13
2.4 Magnetic Coupling in Ultrathin Films . . . . . . . . . . . . . . . . . . 16
3 Experimental Details 19
3.1 General Remarks on Synchrotron Radiation Sources . . . . . . . . . . 19
3.2 Measurements in the Soft X-Ray Regime at BESSY . . . . . . . . . . 21
3.3 Design and Characterization of a Water-Cooled Coil System for UHV 27
3.4 Measurements in the Hard X-Ray Regime at the ESRF . . . . . . . . 31
4 Oxygen as a Surfactant and the Magnetism of Fe, Co, and Ni films 33
4.1 Summary of Previous Research . . . . . . . . . . . . . . . . . . . . . 34
4.2 On the Growth and Structure . . . . . . . . . . . . . . . . . . . . . . 40
4.3 On the Electronic Structure . . . . . . . . . . . . . . . . . . . . . . . 44
4.4 On the Magnetism . . . . . . . . . . . . . . . . . . . . . . . . . . . . 49
4.5 Induced Magnetism at the O Site . . . . . . . . . . . . . . . . . . . . 55
4.6 Comparison to Theory . . . . . . . . . . . . . . . . . . . . . . . . . . 59
5 Spin Fluctuations in Two-Dimensional Co/Cu/Ni Trilayers 63
5.1 Motivation . . . . . . . . . . . . . . . . . . . . . . . . . . . . . . . . . 64
5.2 Summary of Related Research . . . . . . . . . . . . . . . . . . . . . . 66
5.3 Element-Specific Magnetization Curves . . . . . . . . . . . . . . . . . 69
5.4 New Improved Investigations Close to the Curie Temperature . . . . 71
5.5 Determination of Model Parameters: The Intralayer Coupling . . . . 80

viii Contents
5.6 Simultaneous Consideration of Spacer and FM Film Thickness . . . . 88
6 Detailed Analysis of XMCD at the L2,3 Edges of Gd, Tb, and Dy 93
6.1 Quadrupolar and Dipolar Transitions at L2,3 Edges of 4f Elements –
Previous Research . . . . . . . . . . . . . . . . . . . . . . . . . . . . . 94
6.2 Measured XAS and XMCD . . . . . . . . . . . . . . . . . . . . . . . 94
6.3 Temperature-Dependent XMCD Spectra . . . . . . . . . . . . . . . . 99
6.4 Comparison of Experiment and FEFF Results . . . . . . . . . . . . . 100
7 Conclusions 105
A Note on the Use of Units 109
B Additional Notes on the New Coil System 111
B.1 Geometry of the New Coil System with Respect to Helmholtz Geometry111
B.2 Operation of the New Coil System in Pulse Mode . . . . . . . . . . . 111
B.3 Choice of the PTFE Shrink Tube . . . . . . . . . . . . . . . . . . . . 112
Bibliography 113
List of Acronyms and Symbols 131
List of Publications and Contributions to Conferences 133
Curriculum Vitae 137
Zusammenfassung 139
Acknowledgment 143
Index 145

Chapter 1
Introduction
Magnetic nanostructures are the heart of modern storage media. Miniaturization
of devices leads to further reduction of structural dimensions. Systems which are
dominated by interfaces rather than volume show new magnetic properties. How-
ever, many questions about the fundamental mechanisms leading to these properties
remain unsolved. It is crucial to identify the contribution of each element contained
in such materials and to determine the spin and orbital moments. This is possible
with methods based on X-ray absorption spectroscopy (XAS). Furthermore, XAS
can distinguish transitions of different character to excited states, e.g. dipolar and
quadrupolar transitions, while many other well-established techniques, e.g. vibrat-
ing sample magnetometry (VSM), ferromagnetic resonance (FMR), magneto-optical
Kerr effect (MOKE), and superconducting quantum interference device (SQUID)
magnetometry determine an average of all magnetic contributions. X-ray absorption
spectra provide element-specific and shell-selective information about the samples.
Electronic properties may be investigated by near edge X-ray absorption fine struc-
ture (NEXAFS) spectra [1]. Magnetic properties are obtained from spin-dependent
X-ray absorption spectra exploiting the X-ray magnetic circular dichroism (XMCD)
[2, 3].
In this thesis, three main questions of magnetic nanostructures are addressed. (i)
How does oxygen as a surfactant influence the electronic and magnetic properties of
ultrathin ferromagnetic films? (ii) What happens in trilayer systems at the transi-
tion to two-dimensional layers where spin fluctuations become important? (iii) Can
the 4f and 5d magnetism of rare earth elements systematically be separated and
calculated quantitatively, also as a function of the temperature?
In the first part of the thesis, the influence of oxygen as a surfactant on the electronic
and magnetic properties of Fe, Co, and Ni films on Cu single crystals is studied. The
surfactant is adsorbed onto the clean substrate surfaces before the ferromagnetic

2 Chapter 1 Introduction
(FM) film is grown. If a material acts as a surfactant, it will “float” on the surface
of the growing film, thereby reducing the surface free energy and improving the
layer-by-layer growth [4–6]. By NEXAFS at the O K edge and the L2,3 edges of
the FMs, the electronic structure is elucidated. Do the ferromagnets form an oxide
when grown with oxygen as surfactant? How does the electronic structure of the
surfactant grown film compare to the one of the clean films? Does, for example,
a charge transfer between O and 3d FM states occur? Concerning the magnetism,
the relevant questions to be answered in this thesis are: Is there a difference in the
magnetization of the surfactant grown films and the clean ones? Is this difference,
if it occurs, mainly caused by the spin or the orbital contribution? Does the FM
film induce a magnetic moment in the oxygen? If so, how large are the spin and the
orbital moments?
The second topic concerns ultrathin films of Ni and Co combined in Co/Cu/Ni
trilayers on a Cu(100) substrate. These trilayers serve as a prototype system to
study the effect of the interlayer exchange coupling (IEC) which couples the two
FM layers across the nonmagnetic (NM) Cu spacer [7–11]. The influence of the IEC
on the FM layers is especially interesting in the two-dimensional (2D) limit of the
FM film thickness with enhanced spin fluctuations. 2D effects do not only become
important when miniaturizing technological devices down to the physical limits, but
they are also interesting from a fundamental point of view. In this part of the
study, special advantage is taken from the in situ preparation and measurement
of the samples. First, the magnetization of a Cu-capped Ni film is investigated.
Then, the IEC is “switched on” by depositing the Co film on top of the identical
Cu/Ni/Cu(100) sample. This ensures that any change in the element-specific Ni
magnetization may be addressed to the influence of the IEC. Indeed, in the trilayer
the quasi-critical temperature of the Ni layer T ∗C,Ni is shifted by ∆TC,Ni to higher T
compared to the Curie temperature TC,Ni of the single Ni film [12, 13]. In the past,
two effects in these trilayers have been studied and discussed separately: (i) the shift
∆TC,Ni/TC,Ni as a function of the Ni thickness dNi [14] and (ii) the coupling strength
Jinter as a function of the spacer thickness dCu [7, 15]. However, one interesting
question has not been answered yet: What will happen if both effects are considered
simultaneously? Especially, when reducing both dCu and dNi, the two effects will
compete in determining the magnetization of the Ni layer. What is the resulting Ni
magnetization in this ultrathin limit? This means that experimental investigations
in this thin thickness range as well as a relation between the coupling strength Jinter
and the temperature shift ∆TC,Ni/TC,Ni are needed.

3
In the third part of this thesis, the focus is turned to XMCD studies of the rare
earth elements Gd, Tb, and Dy. They are a good example of materials in which the
magnetic moments of different shells and their interactions play an important role.
The largest part of the magnetization is carried by the highly localized 4f moments.
The ferromagnetic order among the 4f states is mediated by the delocalized 5d
conduction electrons which carry an induced magnetic moment. Since XMCD is
shell-selective it is in principle suitable to study the 5d magnetism separately from
one of the 4f states. Unfortunately, complications occur because XMCD spectra
at the L2,3 edges of the rare earth elements contain contributions of dipolar (E1:
2p → 5d) and of quadrupolar (E2: 2p → 4f) transitions which partly overlap
[16–18]. The goal of the present study is beyond the simple prove of existence of
E2 transitions at the L2,3 edges of rare earth elements. The questions are: How
can the dipolar contributions be separated from the quadrupolar ones in measured
spectra? To what extend is the calculation of E1 and E2 contributions possible?
Single crystals of the single elements Gd, Tb, and Dy are used to investigate the
systematics of the rare earth XMCD at the L2,3 edges. Such single crystals do
not include additional complex interactions of the different species contained in
compounds as they were used to obtain most of the existing XMCD data of rare
earth elements in literature.
The thesis is organized as follows: The next chapter introduces the basic principles of
X-ray absorption spectroscopy and X-ray magnetic circular dichroism. The standard
normalization procedure and analysis are presented there. In Chapter 3 details about
the experimental setup inside the UHV chamber, the sample preparation, and the
beamlines used at BESSY and the ESRF are given. Furthermore, it includes details
about a new water-cooled coil system that has been designed and set into operation.
Three chapters with the results follow. Chapter 4 explains the investigations of
ultrathin films of Fe, Co, and Ni grown with O surfactant. Chapter 5 discusses the
Co/Cu/Ni trilayers and the two-dimensional spin fluctuations. Chapter 6 presents
the systematics of the temperature-dependent XMCD of Gd, Tb, and Dy. Finally,
Chapter 7 summarizes the results of this work. The appendix contains a note on
the use of units in this thesis and some additional information on the coil system
that goes beyond the scope of Chapter 3.

4 Chapter 1 Introduction

Chapter 2
Ferromagnetism and X-Ray
Absorption Spectroscopy
X-ray magnetic circular dichroism (XMCD) is a magneto-optical effect. Magneto-
optical effects occur due to the influence of the magnetic properties of a system on
its spectroscopic and optical properties, for a review see Ref. [19]. In the regime
of visible light magneto-optical effects are known since Faraday and Kerr. They
discovered that the polarization vector of light rotates upon transmission through
or reflection at magnetic matter. The magneto-optical Kerr effect (MOKE) is nowa-
days commonly exploited in conventional magnetization measurements with linearly
polarized laser light. The basic principle of MOKE is the different absorption of left
and right circularly polarized light. Considering that a linear polarization state may
be described by a linear combination of the two circular polarization states, the ini-
tially linearly polarized beam is elliptically polarized after reflection at the surface of
the magnetic sample. The Kerr ellipticity is a direct measure of the magnetization of
the sample. With low energy photons of a few electron volts the optical transitions
of solids are always within the valence band. The information obtained is influ-
enced by both initial and final state densities. Various groups tried to find similar
magneto-optical effects in the X-ray regime since the beginning of the last century.
However, experimental success suffered from the lack of an appropriate X-ray source.
Erskine and Stern predicted by their calculations in 1975 that a magneto-optical ef-
fect in X-ray absorption of circularly polarized light, i.e. XMCD, at the M2,3 edges
of ferromagnetic Ni should exist [20]. With the availability of synchrotron radiation
sources providing X-rays with tunable energy and polarization, the group of Schutz
finally evidenced XMCD in an experiment at the K edge of a Fe foil in 1987 [21].
In the X-ray regime a well-defined core level may be chosen for the initial state – in
contrast to the ones of experiments in the visible regime. The initial state is highly
6 Chapter 2 Ferromagnetism and X-Ray Absorption Spectroscopy
localized and described by the quantum numbers of the core level. The transitions
occur into the valence band or the continuum whose density of states is scanned by
the energy of the incoming photons. According to the selection rules, the possible
types of final states are determined by the chosen initial state. Thus, methods based
on X-ray absorption like XMCD provide shell-selective information. Moreover, they
are also element-selective because the energy of the core levels is characteristic for
the different elements. Therefore, XMCD has proven very useful for the understand-
ing of complex magnetic structures where the contribution of each constituent can
be probed individually.
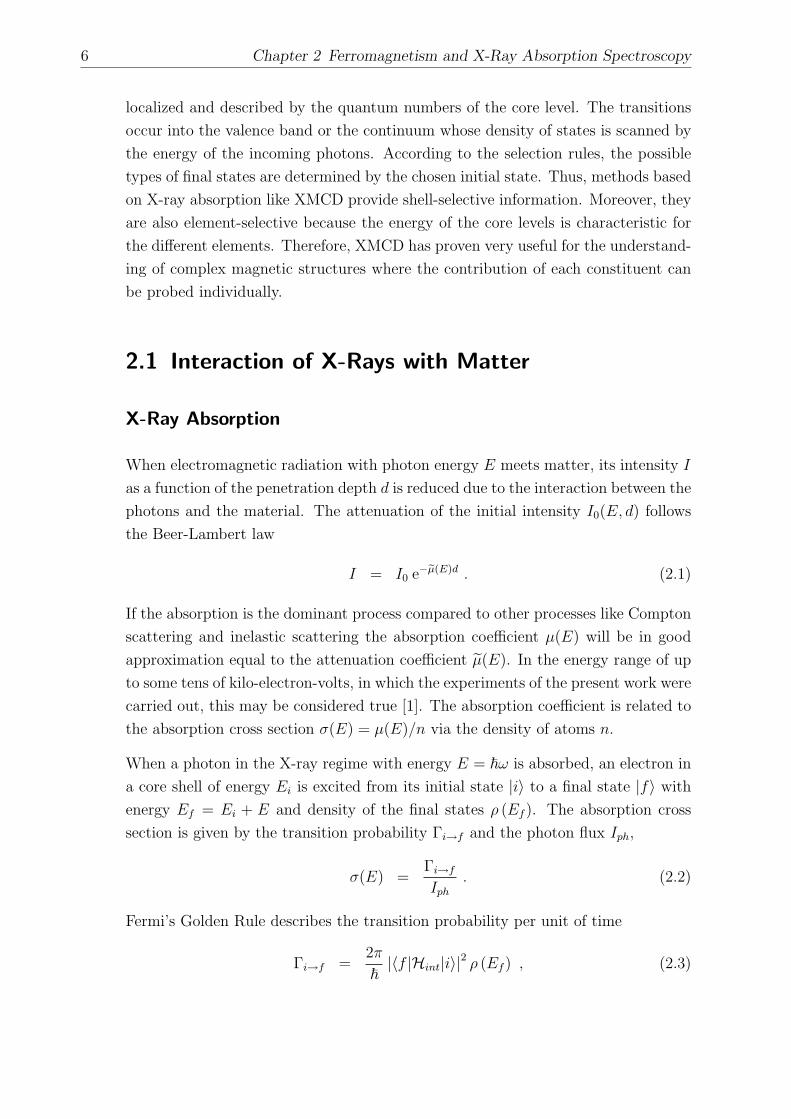
2.1 Interaction of X-Rays with Matter
X-Ray Absorption
When electromagnetic radiation with photon energy E meets matter, its intensity I
as a function of the penetration depth d is reduced due to the interaction between the
photons and the material. The attenuation of the initial intensity I0(E, d) follows
the Beer-Lambert law
I = I0 e−eµ(E)d . (2.1)
If the absorption is the dominant process compared to other processes like Compton
scattering and inelastic scattering the absorption coefficient µ(E) will be in good
approximation equal to the attenuation coefficient µ(E). In the energy range of up
to some tens of kilo-electron-volts, in which the experiments of the present work were
carried out, this may be considered true [1]. The absorption coefficient is related to
the absorption cross section σ(E) = µ(E)/n via the density of atoms n.
When a photon in the X-ray regime with energy E = ~ω is absorbed, an electron in
a core shell of energy Ei is excited from its initial state |i〉 to a final state |f〉 with
energy Ef = Ei + E and density of the final states ρ (Ef ). The absorption cross
section is given by the transition probability Γi→f and the photon flux Iph,
σ(E) =Γi→f
Iph
. (2.2)
Fermi’s Golden Rule describes the transition probability per unit of time
Γi→f =2π
~|〈f |Hint|i〉|2 ρ (Ef ) , (2.3)

2.1 Interaction of X-Rays with Matter 7
where Hint is the interaction operator reflecting a time-dependent perturbation of
the Hamiltonian H0 of the atom. The Hamiltonian of an electron with charge e and
mass m in an electromagnetic field described by the vector potential ~A (~r, t) and the
scalar potential ϕ (~r, t) is
H = H0 +Hint =1
2m
(~i∇− e
c~A (~r, t)
)2
+ ϕ (~r, t)
= H0 −e
2mc~A (~r, t) · ~
i∇+
e2
2mc2~A (~r, t)2 (2.4)
within the Coulomb gauge (∇ · ~A = 0). Expressing the vector potential of the
incoming photons by plane waves with amplitude A0, wave vector ~k, frequency ω
and polarization vector ~ε the interaction operator becomes
Hint = − e~i2mc
A0 ~ε ei(~k~r−ωt) · ∇ , (2.5)
where the last term of Eq. (2.4), which reflects two photon annihilation/excitation
processes, is neglected. Expanding the exponential factor of Eq. (2.5) one obtains
A0 ε ei(~k~r−ωt) = A0 ε e−iωt
(1− i~k~r +
1
2(i~k~r)2 + . . .
). (2.6)
In the dipole approximation the expansion is truncated after the first term. This
corresponds to the electric dipole (E1) transitions. Considering further terms(~k~r
)n
means to include the electric 2n+1-pole (En + 1) and magnetic 2n-pole (Mn) transi-
tions [22].
Characteristic jumps in the absorption spectra result from the consecutive excitation
of the core levels. They occur at photon energies that correspond to the energy
difference of the according level to the Fermi level. These edges will be labeled K, L1,
L2, L3, M1, . . . , if the inital state is |2s〉, |2p1/2〉, |2p3/2〉, |3s1/2〉, . . . , respectively.
In principle, the absorption coefficient will be characterized by the transition matrix
element, if appropriate descriptions of the initial and final states exist. Due to
their localization the initial core states have an atomic character with well defined
quantum numbers. The description of the final states is in general more difficult.
The excitation of an electron in an atom affects the other electrons which may
interact among each other and with the created core hole [23, 24]. Weakly correlated
systems may be treated within the independent particle model neglecting screening
effects and the core hole. Then the final states are given by the ground state of the
system.
The possible types of final states are determined by the atomic-like initial states of
quantum numbers j, m, `, and s according to the selection rules
8 Chapter 2 Ferromagnetism and X-Ray Absorption Spectroscopy
(i) for electric dipole (E1) transitions
∆j = 0, ±1; ∆s = 0; ∆` = ±1; ∆m =
+1 left circular
0 linear
−1 right circular
(2.7)
(ii) for electric quadrupole (E2) transitions
∆j = 0, ±1, ±2; ∆s = 0; ∆` = 0, ±2; ∆m = 0, ±1, ±2; (2.8)
However, if ` (|i〉) = 0, then ` (|f〉) = 0 is not allowed for E2 transitions.
Detection Methods
There are various possibilities to measure the X-ray absorption coefficient. Depend-
ing on the measuring conditions and especially the samples themselves one method
may be more appropriate than the others [1]. A direct measurement of the absorp-
tion cross section is through the detection of the photon flux before and after the
sample. Such kinds of transmission experiments are probably the most reliable [25],
but they are rarely possible especially in the soft X-ray regime due to the strong
absorption. Hardly any sample is transparent to a sufficient extent in the X-ray
regime. However, some examples exist where the transmission has directly been de-
termined, e.g. at the L2,3 edges of thin Fe and Co films of 50− 70 A on a 1µm thick
semi-transparent parylene substrate [25]. A major advantage of such transmission
experiments is that they are not sensitive to the surface only, but probe the entire
sample. In most of the experiments secondary effects are exploited to determine the
absorption coefficient. The excited states decay via X-ray fluorescence and the Auger
effect. In both cases, the probability of emission (X-ray or electron) will be directly
proportional to the absorption probability under certain conditions. Thus, detecting
the fluorescence photons or the Auger electrons yields the absorption coefficient.
In a quantitative analysis of the total electron yield (TEY) it has been shown that
the TEY will be proportional to the absorption coefficient, if the absorption length of
the incoming photons is much larger than the average escape depth of the photoelec-
trons [26]. This proportionality has been tested and confirmed in various examples,
e.g. [27, 28]. When measuring at grazing incidence, saturation effects have to be
taken into account in the analysis of the spectra [27, 29, 30]. The probing depth
of secondary electrons is around 20 A [31], which makes the detection via TEY
surface sensitive. One possibility to record TEY is by using a channeltron electron

2.2 Information in X-Ray Absorption Spectra 9
multiplier close to the sample. The drawback of this method is that channeltrons
suffer from static magnetic fields. Therefore, they are only suitable for investigations
in remanence. Another possibility is to record the sample drain current with the
help of an electrometer in the range of picoampere. This method is chosen in the
experimental setup for measurements at BESSY (Berliner Elektronenspeicherring-
Gesellschaft fur Synchrotronstrahlung m. b. H.), as described in Chapter 3. In this
situation the sample must be highly electrically insulated which requests low level
DC measurements. For measurements in applied magnetic fields the proper escape
of the secondary electrons may be guaranteed by an extraction grid close to the
sample [2]. Thus, it is possible to measure element-specific hysteresis loops by TEY
detection [28, 32].
Besides TEY detection, fluorescence yield (FY) detection is another method of choice
for the investigation of nontransparent samples. FY detection is used, for example,
for absorption measurements at the ID12 beamline at the ESRF (European Syn-
chrotron Radiation Facility, see Sec. 3.4). In comparison to Auger electrons, fluo-
rescence photons are not sensitive to an external magnetic field when they escape
from a sample. Furthermore, fluorescence detection has the advantage that it is
also applicable to insulating materials [1]. Due to the larger escape depth of the
fluorescence photons, in general, the probing depth is much larger than in TEY.
Thus, by FY bulk properties of the sample may be investigated. If dilute samples
or thin films are investigated, the FY signal will be directly proportional to the
absorption coefficient. For concentrated bulk samples the FY signal can exhibit a
strong nonlinearity [33, 34]. These self-absorption effects result from the attenu-
ation of the penetrating and escaping X-ray radiation while propagating through
the sample. It has been shown that these self-absorption effects in FY can fully be
corrected [33]. FY decreases with decreasing atomic number and Auger transitions
are the dominant decay channel [2]. Therefore, TEY detection is, in general, applied
more commonly for absorption measurements of the lighter elements in the soft X-
ray regime whereas FY is used for elements with larger atomic number in the hard
X-ray regime.
2.2 Information in X-Ray Absorption Spectra
X-ray absorption spectra are typically divided into two regions. In their near edge
region up to approximately 50 eV above the edge the near edge X-ray absorption
fine-structure (NEXAFS), also referred to as XANES (X-ray absorption near edge
10 Chapter 2 Ferromagnetism and X-Ray Absorption Spectroscopy
structure), is determined. The extended X-ray absorption fine-structure (EXAFS)
is measured in an energy range of up to several hundred eV above the edge. Though
the two have the same physical origin and can be measured with the same experimen-
tal setup, this distinction is convenient for the interpretation. NEXAFS is strongly
sensitive to the local bonding of the absorbing atom [1]. It changes, for example,
with the oxidation state. EXAFS is used to determine the distances, coordination
number, and species of the neighbors of the absorbing atom. It results from the
backscattering of the photoelectron at neighboring atoms. Also the so-called em-
bedded atom EXAFS (AXAFS) which stems from scattering at charge densities
between the atoms was revealed in the extended energy range [35]. The weak scat-
tering and short mean free path of the excited photoelectrons in the EXAFS regime
allow an analysis by a single-scattering theory. The structural parameters are de-
rived by Fourier transform techniques. In Ref. [36] a review is given. In the near edge
regime strong scattering and a longer mean free path of the photoelectrons require
the application of a multiple scattering theory. The magnetic EXAFS (MEXAFS)
is the counter part of XMCD in the extended energy range [37–42]. They both
yield magnetic information from the difference of the absorption spectra for the two
relative orientations of photon spin and sample magnetization. The work presented
in this thesis is mainly restricted to the near edge region.
NEXAFS
Experimental NEXAFS spectra provide a sensitive fingerprint of the local structure
of the absorbing atom, in particular when recorded for different angles ϕ between
the photon wave vector of the incoming X-rays and the surface of the sample [1, 43].
They have proven useful especially for atoms and molecules adsorbed on surfaces.
With the help of full multiple scattering NEXAFS calculations different possible
surface structures may be distinguished [43]. The absorption coefficient can be
interpreted as a direct measure of the angular momentum projected density of un-
occupied states (LDOS) [19, 44]. This may be easily understood from the simple
picture that an electron can only be excited if it “finds” an empty final state. Thus,
the more unoccupied final states there are the more electrons can be excited and the
more photons are absorbed, which means larger X-ray absorption coefficient.
2.2 Information in X-Ray Absorption Spectra 11
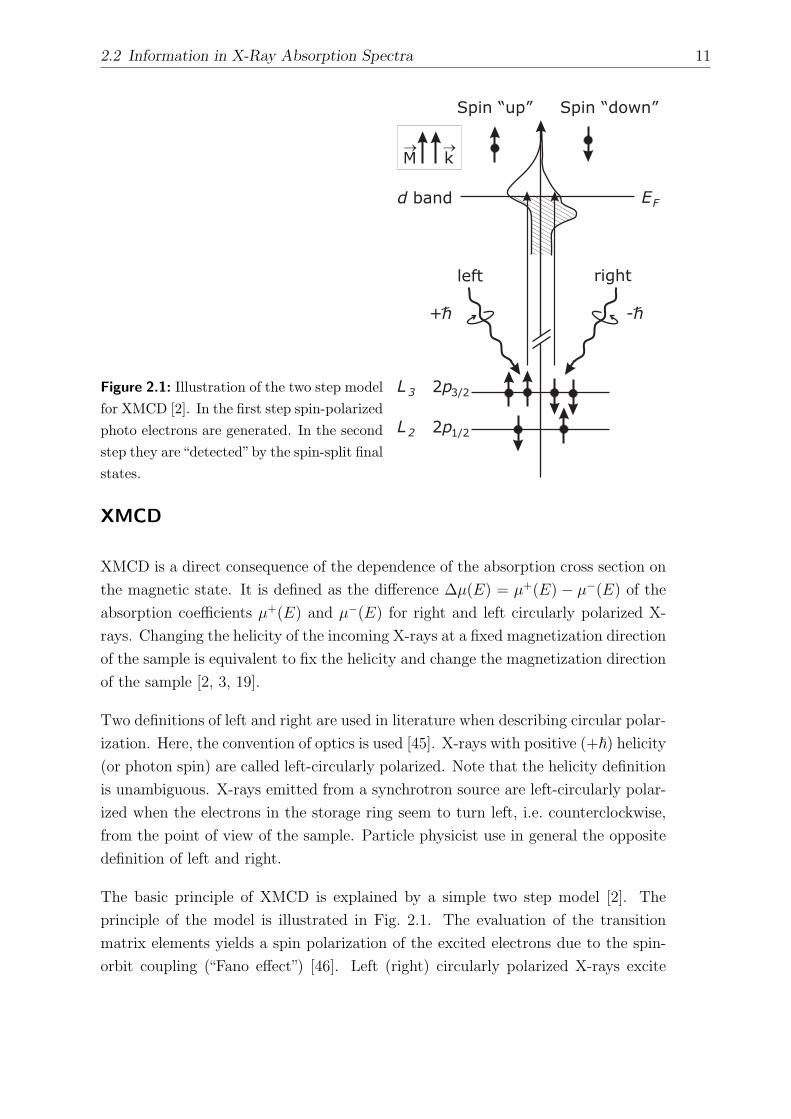
Figure 2.1: Illustration of the two step modelfor XMCD [2]. In the first step spin-polarizedphoto electrons are generated. In the secondstep they are“detected”by the spin-split finalstates.
Spin “up” Spin “down”
left
d band
right
EF
-h+h
L3
L2
2p3/2
2p1/2
M
k
XMCD
XMCD is a direct consequence of the dependence of the absorption cross section on
the magnetic state. It is defined as the difference ∆µ(E) = µ+(E) − µ−(E) of the
absorption coefficients µ+(E) and µ−(E) for right and left circularly polarized X-
rays. Changing the helicity of the incoming X-rays at a fixed magnetization direction
of the sample is equivalent to fix the helicity and change the magnetization direction
of the sample [2, 3, 19].
Two definitions of left and right are used in literature when describing circular polar-
ization. Here, the convention of optics is used [45]. X-rays with positive (+~) helicity
(or photon spin) are called left-circularly polarized. Note that the helicity definition
is unambiguous. X-rays emitted from a synchrotron source are left-circularly polar-
ized when the electrons in the storage ring seem to turn left, i.e. counterclockwise,
from the point of view of the sample. Particle physicist use in general the opposite
definition of left and right.
The basic principle of XMCD is explained by a simple two step model [2]. The
principle of the model is illustrated in Fig. 2.1. The evaluation of the transition
matrix elements yields a spin polarization of the excited electrons due to the spin-
orbit coupling (“Fano effect”) [46]. Left (right) circularly polarized X-rays excite

12 Chapter 2 Ferromagnetism and X-Ray Absorption Spectroscopy
more spin-up (spin-down) electrons from the 2p3/2 level. The opposite is the case
for the 2p1/2 level. This happens in the first step. In the second step, the final states
determined by the selection rules act as a spin detector. The quantization axis of
the detector is given by the magnetization direction. For maximum dichroic effect,
the magnetization needs to be aligned parallel to the photon wave vector. If there
is an angle ϑ between the two, the XMCD signal will be scaled by cos ϑ. Ignoring
spin-orbit coupling for the final states, a ratio of 2:1 for the white line intensities of
the L3 edge and the L2 edge is expected for unpolarized radiation, reflecting just
the number of sublevels of the 2p3/2 and 2p1/2 shell. For the XMCD a ratio of
∆µL3 : ∆µL2 = −1 : 1 occurs in absence of spin-orbit coupling of the final states
[19, 20].
Spin and orbital moments are related to the integrated areas of the XMCD and the
isotropic XAS by the integral sum rules. In its form for general edges as developed
by Thole and Carra the orbital sum rule is [47]∫j++j−
dE(µ+ − µ−)∫j++j−
dE(µ+ + µ− + µ0)=
1
2
`(` + 1) + 2− c(c + 1)
`(` + 1)(4` + 2− n)〈Lz〉 , (2.9)
and the spin sum rule is [48]∫j+ dE(µ+ − µ−)− [(c + 1)/c]
∫j−
dE(µ+ − µ−)∫j++j−
dE(µ+ + µ− + µ0)
=`(` + 1)− 2− c(c + 1)
3c(4` + 2− n)〈Sz〉
+`(` + 1)[`(` + 1) + 2c(c + 1) + 4]− 3(c− 1)2(c + 2)2
6lc(` + 1)(4` + 2− n)〈Tz〉 , (2.10)
where c is the orbital quantum number of the initial state and ` the one of the final
state, 〈Sz〉, 〈Lz〉, and 〈Tz〉 are the expectation values of the spin operator, orbital
operator, and the magnetic dipole operator, respectively. For metallic systems the
spin-orbit coupling is weak an its influence on 〈Tz〉 can be neglected. The number
of unoccupied final states in the valence shell which contains n electrons is given by
(4` + 2 − n). The two spin-orbit split edges are denoted by j+ and j−, µ+ and µ−
represent the measured helicity-dependent absorption coefficients. Eqs. (2.9) and
(2.10) become much handier when considered for specific edges. This is shown in
Sec. 2.3 for the cases of K and L2,3 edges.
Deriving the sum rules Thole and Carra made several assumptions. For the L2,3
edges the most important ones are, that only dipole transitions are included, p–s
transitions, the exchange splitting of the core levels, and the energy dependence of
2.3 Analysis of XAS and XMCD Spectra 13
the wave functions are not considered, and the asphericity of the core states and
the difference of d3/2 and d5/2 are ignored. Therefore, it is important to verify the
applicability of the sum rules in each case. For the 3d ferromagnets Fe, Co, and Ni
they hold in good approximation. However, for the early 3d transition metals Ti,
V, Cr, and Mn the limited validity of the sum rules is evident [23, 49, 50].
2.3 Analysis of XAS and XMCD Spectra
To obtain the spin-averaged XAS and the XMCD, the absorption is measured as a
function of the photon energy both for parallel and antiparallel orientation of the
photon spin and the magnetization of the sample. The analysis of the spectra is
shown here using the absorption at the L2,3 edges of the 3d ferromagnet Ni as an
example. The other cases, i.e. the O K edge of 3d FMs grown with O surfactant
discussed in Chapter 4 and the L2,3 edges of the 4f elements discussed in Chapter 6,
are analyzed likewise. Most of the analysis can be done with the help of the XMCD
filemanager and the SATEFF code by A. Scherz [23]. The underlying principles are
explained in the following.
The measured raw absorption spectra are normalized to the incoming photon flux.
The remaining linear background is fitted by a linear function in the pre-edge region
and removed by subtraction of this linear function. Thus, one obtains a pair of
absorption spectra µ+(E) and µ−(E) for parallel and antiparallel orientation of
photon spin and sample magnetization, respectively. The isotropic XAS, often also
called the “white line”, is then given by
µ(E) =1
2
(µ+(E) + µ−(E)
)(2.11)
and the XMCD according to the definition above
∆µ(E) = µ+(E)− µ−(E) . (2.12)
The contribution of linearly polarized light µ0 to the isotropic XAS can be neglected
for the systems studied in this work because the linear dichroism of metals is by
orders of magnitude smaller than the circular dichroism [51]. The spectra contain
contributions of the dipole transitions 2p → d (resonance-like peaks), 2p → s and
to the continuum (step-like increase). For the application of the sum rules the
contributions of transitions into s and p states (∼ 2% for the 3d FMs) and into the

14 Chapter 2 Ferromagnetism and X-Ray Absorption Spectroscopy
4
2
0
0
-1
10
0
0
-5
840 860 880 900
norm
.XAS/X
MCD
(arb
.units)
inte
gra
ted
XAS/X
MCD
(arb
.units
)
E (eV)
A + A3 2
1/2( + ) + -
continuum
= -+ -
A + A3 2
A - 2 A3 2
L integration range2L3
Figure 2.2: Illustration of the application of the sum rules. The case of bulk-like Niis shown as an example. Top: Normalized isotropic XAS (solid line) together with theintegration (dashed line) and the contribution of the continuum (gray line). Bottom:XMCD (solid line) and integrals needed for the sum rule analysis (dashed lines). Theintegration ranges are marked at the top of the graph.
continuum have to be removed. The continuum is approximated by an ad hoc step
function [25] of the Fermi-type
µstep = h
(1− 2
3
1
1 + e(E−EL3−ε)/δ
− 1
3
1
1 + e(E−EL2−ε)/δ
), (2.13)
where ε is the position of the step with respect to the position EL2,3 of the maxima of
the XAS intensity at the L2,3 edges, δ is the step width and h the total step height.
For the 3d FMs, ε and δ are determined from a measured reference spectrum of
a bulk-like film such that the application of the sum rules yields the values from
literature for the magnetic moments. Finally, the spectra are normalized to unity,
to obtain the absorption and the magnetic information on a per atom basis. When
measured at grazing incidence (3d FMs, Chapters 4 and 5) or by FY (rare earth
elements, Chapter 6), the spectra are corrected for saturation effects [23, 29, 30,
52].

2.3 Analysis of XAS and XMCD Spectra 15
For the application of the sum rules to determine spin and orbital moments, the
normalized XAS and XMCD spectra have to be integrated in the range of the con-
sidered edges. Therefore, the continuum contribution has to be subtracted from the
isotropic spectrum. For the L2,3 edges c = 1 and ` = 2 enter in the sum rules in their
general form of Eqs. (2.9) and (2.10). Defining the number of d holes nh = 4`+2−n
and the integrated areas of the XAS and the XMCD
∆Ai =
∫Li
∆µdE , Ai =
∫Li
(1
2
(µ+ + µ−
)− µstep
)dE , i = 2, 3 (2.14)
the orbital sum rule recasts to
〈Sz〉 =1
2
nh
Pc cos ϑ
∆A3 − 2∆A2
A3 + A2
− 7
2〈Tz〉 . (2.15)
The spin sum rule becomes
〈Lz〉 =2
3
nh
Pc cos ϑ
∆A3 + ∆A2
A3 + A2
. (2.16)
The factor 1/(Pc cos ϑ) accounts for the fact that the XMCD signal scales with the
degree Pc of circular polarization and the angle ϑ between the X-ray beam and the
magnetization of the sample. An example for the application of the sum rules is
given in Fig. 2.2 for the specific case of bulk-like Ni. The upper panel shows the
normalized XAS (solid black line), the step-function (gray line) and the integral over
the XAS of which the step-function has been subtracted (dashed line). The lower
panel shows the normalized XMCD (solid line) and the two integrals of it as they
enter into the sum rules of Eqs. (2.16) and (2.15) (dashed lines). Note that the
respective scale for the integrals is given on the right hand side.
If the initial state level is not spin-orbit split, as for example at K edges, the XMCD
will yield only information about the orbital moment. In the orbital sum rule the
integrals are taken only over the single edge j with the areas A of the XAS and ∆A
of XMCD. The spin sum rule is no longer properly defined because the initial states
are not spin-orbit split. This situation occurs at K edges where c = 0 and ` = 1.
One obtains
〈Lz〉 =nh
Pc cos ϑ
∆A
A(2.17)
for the orbital sum rule.
The magnetization M of the sample is obtained from the spin magnetic moment
mS, the orbital magnetic moment mL, and the atom density n
M = n (mS + mL) = −n (2 〈Sz〉+ 〈Lz〉) µB . (2.18)
16 Chapter 2 Ferromagnetism and X-Ray Absorption Spectroscopy
If only the total magnetization is to be examined without separation into spin and
orbital moments, it is sufficient to evaluate the asymmetry of the XMCD ∆A3/A3.
Assuming that the ratio of orbital to spin magnetic moment does not change, this
asymmetry is in good approximation proportional to the magnetization and can thus
be used to determine the temperature-dependence of the magnetization. To obtain
the magnetization in absolute units, the XAS and XMCD of a bulk-like film with
known magnetization are measured. From the ratio ∆A3/A3 of this bulk-like film
and its known magnetization the scaling factor can be determined.
A further quantity which is often evaluated is the ratio of orbital to spin moment,
e.g. [53, 54]. It is given by the relation:
mL
mS
=2
3
∆A3 + ∆A2
∆A3 − 2∆A2
(2.19)
In this ratio, uncertainties of the number of holes and the degree of circular polar-
ization cancel out.
2.4 Magnetic Coupling in Ultrathin Films
For the description of magnetic ordering phenomena, mainly two general models are
applied: the Hubbard model based on a band structure description and in general
applied to itinerant magnetic systems, and the Heisenberg model assuming localized
spins and therefore in general used for localized systems. For the magnetism of
the 3d transition metals, that represent an intermediate case between localized and
fully itinerant systems, theoretical models of both types were applied and could
successfully describe experimental findings. An example are the coupled Co/Cu/Ni
trilayers. Both the calculations within a Hubbard model of Ref. [55] and within a
Heisenberg model of Ref. [14] compare well with experimental findings.
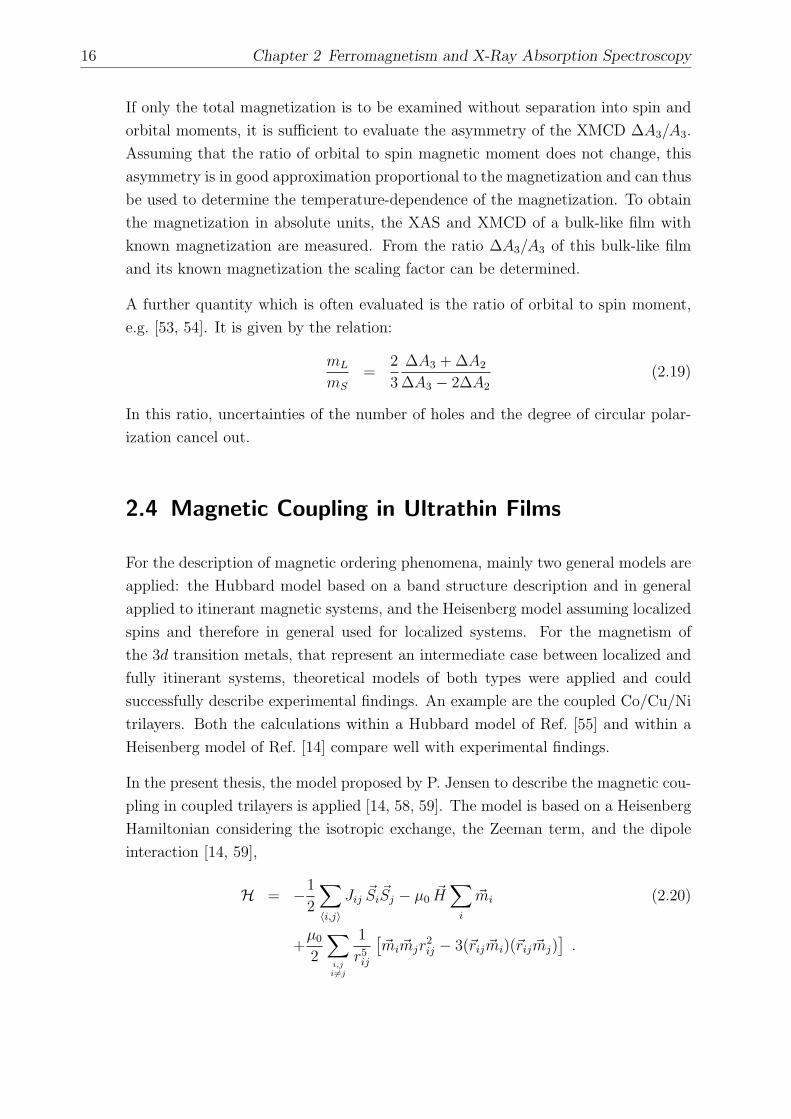
In the present thesis, the model proposed by P. Jensen to describe the magnetic cou-
pling in coupled trilayers is applied [14, 58, 59]. The model is based on a Heisenberg
Hamiltonian considering the isotropic exchange, the Zeeman term, and the dipole
interaction [14, 59],
H = −1
2
∑〈i,j〉
Jij~Si
~Sj − µ0~H
∑i
~mi (2.20)
+µ0
2
∑i,ji6=j
1
r5ij
[~mi ~mjr
2ij − 3(~rij ~mi)(~rij ~mj)
].

2.4 Magnetic Coupling in Ultrathin Films 17
Figure 2.3:
Sketch of the investigated Co/Cu/Ni/Cu(100) tri-layers and the underlying assumptions for the the-oretical model. For the Ni film the exchange ofthe interface (J interface
Ni ) and the interior film lay-ers (J interior
Ni ) are distinguished, whereas for the Colayer a constant exchange JCo is assumed. TheNi and Co spins next to the spacer layer are cou-pled by the interlayer exchange Jinter. Magneticmoments are taken from experiments [56, 57].
Co
Cu
Ni
1.81B
0.31B
0.61B
0.31B
JCo
Jinter
JNiinterface
JNiinterior
Cu (100)
In Chapter 5 the specific case of Co/Cu/Ni/Cu(100) trilayers is considered. An
fcc(100) thin film system with thickness d = dNi + dCo is assumed. ~Si denotes a
localized quantum spin with spin number S = 1 on lattice site i. The magnetic
moment of the spin ~Si is set to the layer-dependent values ~mi = mi~Si/S determined
in experiments and given in Fig. 2.3 [56, 57]. According to the situation in the
real samples, an in-plane magnetization 〈~Si〉 = ~Mi(T ) parallel to the external mag-
netic field ~H is assumed. The distance between sites i and j is given by |~rij| = rij,
µ0 is the vacuum permeability. The wave vector-dependent lattice sums are deter-
mined by the so-called “Ewald summation technique” [60]. Due to competing lattice
anisotropies and dipole interaction, the single Ni/Cu(100) thin film system exhibits
a spin reorientation behavior with increasing thickness and temperature [61, 62].
The surface anisotropy and the dipole coupling prefer an in-plane magnetization,
the strain-induced lattice anisotropy of the interior film layers prefers a perpendic-
ular one. The considered thicknesses in Chapter 5 are always chosen such that an
in-plane magnetization of the Ni film occurs. As long as an in-plane magnetization
exists, considering explicitly a lattice anisotropy as discussed in detail in Ref. [63] will
not vary the results significantly. The reason is that for a 2D ferromagnet the Curie
temperature depends only logarithmically on the actual values of the anisotropies
[64]. Thus, for simplicity no additional lattice anisotropy is taken into account here.
The isotropic exchange interaction Jij couples nearest neighbor spins in the same
layer and between adjacent layers (Fig. 2.3). To account for the hybridization effects
in particular at the Ni/Cu interfaces where the magnetic moment of Ni is consid-
erably reduced [56, 65], different exchange couplings are assumed for the interface
J interfaceNi and the interior film layers J interior
Ni . For the Co layer an averaged value JCo is
used for all Co spin pairs since (i) in Co the effect is less pronounced than in Ni, (ii)
18 Chapter 2 Ferromagnetism and X-Ray Absorption Spectroscopy
the reduction of the Co moment at the Co/Cu interface is approximately canceled
out by the enhancement of the moment in the topmost layer facing vacuum [57].
Finally, (iii) assuming layer-resolved values for Co will hardly change the results
obtained for the Ni magnetization. The Ni and Co layers are coupled by Jinter across
the Cu spacer layer, where for simplicity a single Ni spin at the Ni/Cu-interface is
coupled to a single Co spin at the Co/Cu-interface. A dispersion of the IEC is not
considered.
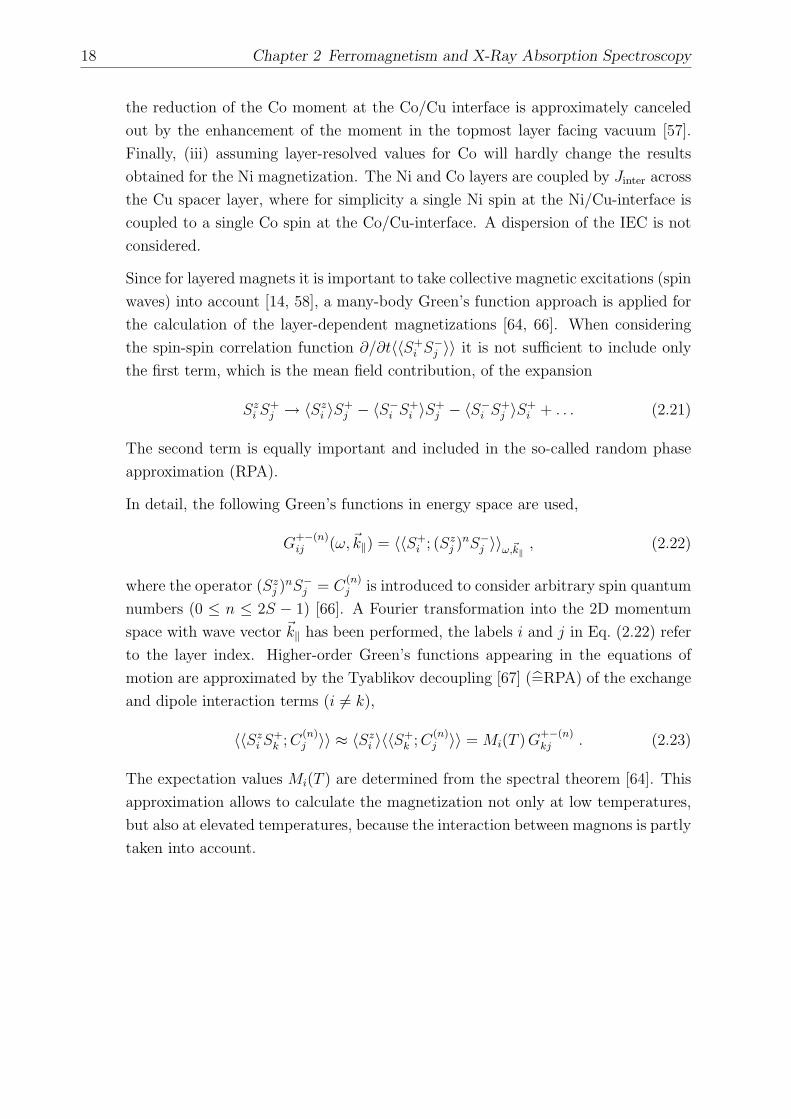
Since for layered magnets it is important to take collective magnetic excitations (spin
waves) into account [14, 58], a many-body Green’s function approach is applied for
the calculation of the layer-dependent magnetizations [64, 66]. When considering
the spin-spin correlation function ∂/∂t〈〈S+i S−
j 〉〉 it is not sufficient to include only
the first term, which is the mean field contribution, of the expansion
Szi S
+j → 〈Sz
i 〉S+j − 〈S−
i S+i 〉S+
j − 〈S−i S+
j 〉S+i + . . . (2.21)
The second term is equally important and included in the so-called random phase
approximation (RPA).
In detail, the following Green’s functions in energy space are used,
G+−(n)ij (ω,~k‖) = 〈〈S+
i ; (Szj )
nS−j 〉〉ω,~k‖
, (2.22)
where the operator (Szj )
nS−j = C
(n)j is introduced to consider arbitrary spin quantum
numbers (0 ≤ n ≤ 2S − 1) [66]. A Fourier transformation into the 2D momentum
space with wave vector ~k‖ has been performed, the labels i and j in Eq. (2.22) refer
to the layer index. Higher-order Green’s functions appearing in the equations of
motion are approximated by the Tyablikov decoupling [67] (=RPA) of the exchange
and dipole interaction terms (i 6= k),
〈〈Szi S
+k ; C
(n)j 〉〉 ≈ 〈Sz
i 〉〈〈S+k ; C
(n)j 〉〉 = Mi(T ) G
+−(n)kj . (2.23)
The expectation values Mi(T ) are determined from the spectral theorem [64]. This
approximation allows to calculate the magnetization not only at low temperatures,
but also at elevated temperatures, because the interaction between magnons is partly
taken into account.

Chapter 3
Experimental Details
The experiments of the present work were carried out at modern third generation
synchrotron sources. This chapter describes details of the experiments. The first
section concerns the measurements at the L2,3 edges of the classical ferromagnets Ni,
Co, and Fe, as well as at the O K edge in the energy range of 500 eV . E . 1000 eV.
Ultrathin films of Fe, Co, and Ni combined in Co/Cu/Ni trilayers or grown with O
as a surfactant were prepared in UHV and measured in situ. Besides a summary
of the characteristic features of the beamline, details of the UHV chamber and the
sample preparation are given. The second section of this chapter describes details
about the new water-cooled in situ coil system which has been constructed and
set into operation in the existing UHV chamber during the work for the present
thesis. Finally, the last section is about the beamline and the experimental chamber
provided at the ESRF which were used to investigate single crystals of the rare earth
metals Gd, Tb, and Dy at their L2,3 edges (7 keV . E . 9 keV).
3.1 General Remarks on Synchrotron Radiation
Sources
Synchrotron radiation is very popular for scientific applications because it is available
in a large photon energy range from the far infrared (E < 0.5 eV) to the very hard
X-ray regime (E ≈ 106 eV), see e.g. Refs. [69, 70]. At the beginning, this radiation
was only an undesirable side effect at accelerators used by the particle physicists.
When electrons (or other particles) travel on an orbit, they emit electromagnetic
radiation and loose kinetic energy. Since the idea that the emitted radiation of these
particle accelerators may be exploited as well [71], great development has taken place
until with today’s synchrotrons of the third generation bright light sources with a
20 Chapter 3 Experimental Details
s
s
g
e-
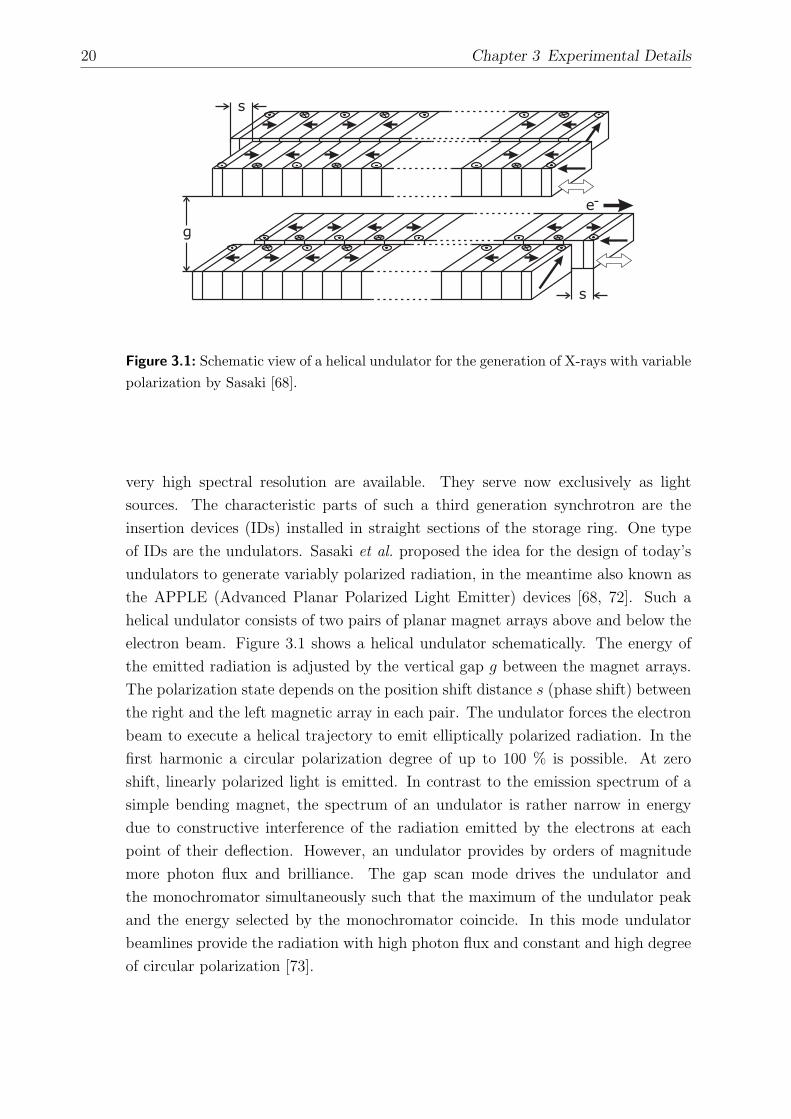
Figure 3.1: Schematic view of a helical undulator for the generation of X-rays with variablepolarization by Sasaki [68].
very high spectral resolution are available. They serve now exclusively as light
sources. The characteristic parts of such a third generation synchrotron are the
insertion devices (IDs) installed in straight sections of the storage ring. One type
of IDs are the undulators. Sasaki et al. proposed the idea for the design of today’s
undulators to generate variably polarized radiation, in the meantime also known as
the APPLE (Advanced Planar Polarized Light Emitter) devices [68, 72]. Such a
helical undulator consists of two pairs of planar magnet arrays above and below the
electron beam. Figure 3.1 shows a helical undulator schematically. The energy of
the emitted radiation is adjusted by the vertical gap g between the magnet arrays.
The polarization state depends on the position shift distance s (phase shift) between
the right and the left magnetic array in each pair. The undulator forces the electron
beam to execute a helical trajectory to emit elliptically polarized radiation. In the
first harmonic a circular polarization degree of up to 100 % is possible. At zero
shift, linearly polarized light is emitted. In contrast to the emission spectrum of a
simple bending magnet, the spectrum of an undulator is rather narrow in energy
due to constructive interference of the radiation emitted by the electrons at each
point of their deflection. However, an undulator provides by orders of magnitude
more photon flux and brilliance. The gap scan mode drives the undulator and
the monochromator simultaneously such that the maximum of the undulator peak
and the energy selected by the monochromator coincide. In this mode undulator
beamlines provide the radiation with high photon flux and constant and high degree
of circular polarization [73].

3.2 Measurements in the Soft X-Ray Regime at BESSY 21
pre-
pump
ion
getter
pump
TSP
I section0
x, y
z
valves
lHe flow
cryostat
LEED
evaporators
CMA
manipulator
viewport
to beamline
filamentbox
sample
holder (Ta)
Cu single
crystal
Cu block
saphire
Cu block
cryostat
heater
lHe flow
cryostat
drain current
& HV
thermocouples
with
shielding
turbo
molecular
pump
Figure 3.2: Sketch of the UHV chamber used for the XAS and XMCD measurements inthe soft X-ray regime at BESSY. The magnification shows the sample holder in detail.
3.2 Measurements in the Soft X-Ray Regime at
BESSY
Investigations by XAS and XMCD at the L2,3 edges of 3d ferromagnets and at the O
K edge were carried out at BESSY (Berliner Elektronenspeicherring-Gesellschaft fur
Synchrotronstrahlung m. b. H.) in Berlin-Adlershof (electron energy 1.7 GeV) [74].
In this case the need of soft X-rays requires a UHV chamber with the equipment for
the sample preparation that can be directly attached to the vacuum of the beamline.
In this section details of the UHV chamber which was used for the experiments in the
soft X-ray regime, the sample holder, the preparation of the samples, the beamlines,
and the general data acquisition procedure are described.
22 Chapter 3 Experimental Details
The UHV Chamber
The experimental station for the measurements in the soft X-ray regime at BESSY
is a cylinder-like UHV chamber made of stainless steel [75] as illustrated in Fig. 3.2.
In the upper part it contains commercial standard equipment for the preparation of
ultrathin films and their characterization: a sputter gun, a leak valve for O2 dosage,
and evaporators, a rear view system for low energy electron diffraction (LEED)
and a cylindrical mirror analyzer (CMA) for Auger electron spectroscopy (AES).
The chamber is attached to the beamline such that in the lower part the X-ray
absorption can be measured. The coil system for generating a magnetic field is
mounted there. Details of the coil system are described in Sec. 3.3. Furthermore,
the chamber contains standard components for creating and controlling the vacuum
itself. This includes a turbo molecular pump with a pre-pump, an ion getter pump
with a titanium sublimation pump (TSP), an ion gauge, and a quadrupole mass
analyzer. Additionally, a cold cathode provides a live pressure signal required by
the BESSY interlock system for the safety of the machine. The base pressure of the
chamber is typically in the low 1× 10⁻¹⁰ mbar range.
The sample holder is a u-shaped bended tantalum plate mounted at the cooling tip
of a `He-flow cryostat (see Fig. 3.2). It has been designed to combine the require-
ments of a delicate experiment with those of a robust system, reliable and easy to
handle at a research facility where only strictly limited beamtime is available. The
compact design helps to reduce vibrations of the sample holder due to the `He-flow
while cooling. Two crystals are mounted back to back of each other on the Ta plate.
A chromel/alumel thermocouple is plugged to the side of each crystal. The thermo-
couple wires are insulated with macor tubes and electrically shielded with aluminum
foil. The electric shielding is necessary to keep the induced noise on the sample cur-
rent low. A commercial feedback heating system stabilizes the temperature of the
samples in the range 25 K ≤ Tsample ≤ 300 K within 1 K during the measurements.
The vacuum of the chamber itself serves at the same time as the insulation vacuum
for the cryostat. For the low-level drain current measurements the samples have to
be highly insulated from ground (Rsample > 200 GΩ). Therefore, a sapphire plate
is used which at the same time guarantees a good thermal contact to the cooling
tip of the cryostat. Especially the feedthroughs of the cables are sources of trouble.
They are located close to the entry point of the transfer tube for the liquid helium
at the top of the cryostat. During the cooling they tend to become cold and attract
the water vapor from the air. This reduces the resistance of the sample and hinders
high quality measurements. Therefore, a thin heating wire is winded around the

3.2 Measurements in the Soft X-Ray Regime at BESSY 23
flanges that contain the relevant feedthroughs. To bring the sample to the different
positions for preparation and measurement all three room directions x, y, z, and
the polar angle ϕ can be adjusted via a manipulator with a differentially pumped
rotary feedthrough.
In principle, the chamber itself provides the possibility to measure a signal propor-
tional to the intensity I0 of the incident light: the photocurrent of a gold grid. This
I0 section was used together with the former pulse coil for remanent measurements
[23]. Due to the geometric constraint it cannot be used together with the new coil
system. Anyway, even if it still fitted in its old position, it would not be suitable
for measurements in an applied magnetic field because its position close to the coil
leads to a dramatic influence of this field on the photocurrent and thereby hinders
the measurement of a proper I0-signal. At the concerned beamlines at BESSY this
problem is easily circumvented by taking the photocurrent of either the last refo-
cusing mirror or a gold grid (90 % transmission) in the beamline. The gold grid
can be moved into the beam just before the last mirror via a linear motion. In
each beamtime one of the two possibilities was chosen depending on which of them
showed less noise.
Sample Preparation
Ultrathin films of the classical ferromagnets Fe, Co, and Ni on Cu single crystals were
prepared and measured in situ in the UHV chamber described above. The Cu sub-
strates, Cu(100) and Cu(110), were cleaned in a conventional way by repeated cycles
of Ar+ sputtering at 45 degrees incidence and subsequent annealing to T ≈ 800 K by
electron bombardment at the back side of the sample. The accelerating voltage of
the Ar ions was 3 kV in the first cycle for the Cu(100) crystal. In all following cycles
1 kV was used. The Cu(110) crystal was only sputtered at 1 kV. This procedure
cleaned the surface of the crystals (also from old films on them) and healed it from
imperfections [76]. Characterizing experiments by STM have shown that a mean
terrace size of at least 100 nm can be achieved on the crystals used in the present
experiments [77]. The films of Fe, Co, and Ni were evaporated from high-purity
rods in a commercial electron beam evaporator. Cu was evaporated by the same
procedure from high-purity material in a Mo crucible. Special care was taken not
to deposit any metallic material onto the side of the insulating sapphire plate. The
pressure inside the chamber stayed below p < 4 × 10⁻¹⁰ mbar during evaporation.
The film thickness was calibrated with AES and MEED. Where suitable, the L2,3
24 Chapter 3 Experimental Details
(d)(c)(b)(a)
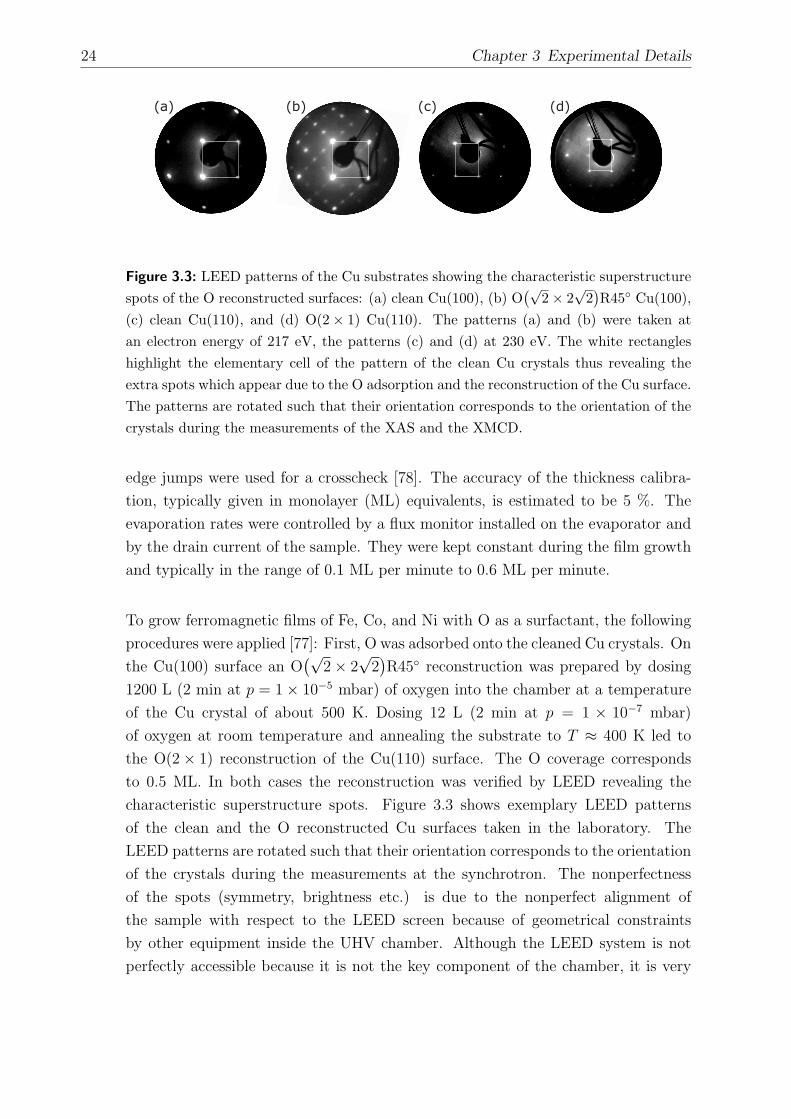
Figure 3.3: LEED patterns of the Cu substrates showing the characteristic superstructurespots of the O reconstructed surfaces: (a) clean Cu(100), (b) O
(√2× 2
√2)R45 Cu(100),
(c) clean Cu(110), and (d) O(2× 1) Cu(110). The patterns (a) and (b) were taken atan electron energy of 217 eV, the patterns (c) and (d) at 230 eV. The white rectangleshighlight the elementary cell of the pattern of the clean Cu crystals thus revealing theextra spots which appear due to the O adsorption and the reconstruction of the Cu surface.The patterns are rotated such that their orientation corresponds to the orientation of thecrystals during the measurements of the XAS and the XMCD.
edge jumps were used for a crosscheck [78]. The accuracy of the thickness calibra-
tion, typically given in monolayer (ML) equivalents, is estimated to be 5 %. The
evaporation rates were controlled by a flux monitor installed on the evaporator and
by the drain current of the sample. They were kept constant during the film growth
and typically in the range of 0.1 ML per minute to 0.6 ML per minute.
To grow ferromagnetic films of Fe, Co, and Ni with O as a surfactant, the following
procedures were applied [77]: First, O was adsorbed onto the cleaned Cu crystals. On
the Cu(100) surface an O(√
2× 2√
2)R45 reconstruction was prepared by dosing
1200 L (2 min at p = 1× 10⁻⁵ mbar) of oxygen into the chamber at a temperature
of the Cu crystal of about 500 K. Dosing 12 L (2 min at p = 1 × 10⁻⁷ mbar)
of oxygen at room temperature and annealing the substrate to T ≈ 400 K led to
the O(2× 1) reconstruction of the Cu(110) surface. The O coverage corresponds
to 0.5 ML. In both cases the reconstruction was verified by LEED revealing the
characteristic superstructure spots. Figure 3.3 shows exemplary LEED patterns
of the clean and the O reconstructed Cu surfaces taken in the laboratory. The
LEED patterns are rotated such that their orientation corresponds to the orientation
of the crystals during the measurements at the synchrotron. The nonperfectness
of the spots (symmetry, brightness etc.) is due to the nonperfect alignment of
the sample with respect to the LEED screen because of geometrical constraints
by other equipment inside the UHV chamber. Although the LEED system is not
perfectly accessible because it is not the key component of the chamber, it is very
3.2 Measurements in the Soft X-Ray Regime at BESSY 25
valuable to crosscheck the properties of the specific samples that are measured at
the synchrotron. The ferromagnetic films of Fe, Co, and Ni were finally evaporated
in the usual way onto the O reconstructed Cu surface.
Data Acquisition
The absorption of the samples was detected via the TEY by measuring the sample
current. As explained in Sec. 2.1, the absorption will be proportional to the sample
current if certain conditions are fulfilled. For a simultaneous determination of the
incoming photon flux I0, either the photocurrent of a gold grid in the incident beam
or of the last mirror of the beamline (see above) was recorded. The measured XAS
were divided by the I0 signal, corrected for a linear background at the pre-edge and
normalized to the edge jump. The XMCD spectra were obtained by either reversing
the magnetization of the films or the helicity of the incident X-rays and taking the
difference between the X-ray absorption coefficients for the two directions. By this
cross-check an artificial magnetic background in the magnetic dichroism could be
ruled out. In many cases, artificial magnetic background signals are reversed when
the helicity of the incident light is reversed. Therefore, these background signals can
often be removed from the XMCD signal by averaging an equal number of spectra
taken with each helicity. Such backgrounds are typically below one percent of the
XMCD, if they occurred at all. Since XMCD always probes the projection of the
magnetization onto the direction of the incident X-rays, samples with an out-of-plane
magnetization were measured at an angle ϕ = 90 between the surface of the sample
and the photon wave vector, whereas samples with an in-plane magnetization were
measured at grazing incidence of ϕ = 20. The spectra were analyzed according
to the details described in Sec. 2.3. This has either been done with the help of the
XMCD filemanager and the SATEFF code by A. Scherz [23] or with the commercially
available software Origin 7 by OriginLab Corporation. The data recording itself was
done with the EMP/2 software developed at BESSY. This software together with
the data acquisition computer from BESSY enables the users to record their signals
by TTL-counter, voltage or current measurement. At the user’s choice these signals
are written to a data file along with the current of the storage ring, monochromator
position, and lifetime. This data file is a simple ASCII-file and can be processed
later in almost every standard data analysis software like e.g. Origin or any home-
made analysis programs. Via the EMP/2 program the monochromator and the
undulator are remote controlled. Thus, it is possible to scan the energy of the
incoming photons with a user-defined density of points, lately even with the so-

26 Chapter 3 Experimental Details
April 14, 1999 UE56/2-PGM-1SSY EB
8(3*0
,' 8(3*003* %/SKRQHBBBBBBBBB
&217$&73(5621 EXLOGLQJ URRP SKRQH ID[ HPDLOM. Weiß (BESSY) 15.8 110 4940 4850 [email protected]*)K. Horn (CRG) FHI 8413-5640 8413-5603 [email protected]
*) Prof. Dr. K. Horn, Fritz-Haber-Institut der Max-Planck-Gesellschaft, Faradayweg 4-6, D-14195 Berlin, Germany
35(/,0,1$5<7,0(6&+('8/( start of commissioning start of user operation
January 1999 April 1999
237,&$//$<287VFKHPDWLF
330000 17000 23000 24000 34000 3500016000
wallundulator exit
UE56/2-PGM-1top view
side view
174o174o
sample
16000 1000 6000 1000 8000 1000 1000
174 o
U1
U2
distance between elements [mm]
distance to source point [mm]
1000
25000
MM M
M
12 3
4
G
chopper
UE56toroidalmirror
planemirror
cylindricalmirror
plane grating400/1200
/ mm
slitconicalmirror
premonochromator optics M1 : toroidal mirror, horizontal deflection, 2Θ=174°, platinum coated, watercooled, vertical collimation, horizontal focusing on sample.
monochromator principle:plane grating monochromator with collimated lightoptical components:M2: plane mirror, vertical deflection, 2Θ= 155-180°, platinum coated, watercooledG1,2: plane gratings, vertical deflection, 2Θ= 155-180°, gold coated, watercooledM3: cylindrical mirror, horizontal deflection, 2Θ=174°, platinum coated,vertical focusing on exit slit
E [eV] d[1/mm] R [mm] coatingG1 89-1328 400 ∞ AuG2 89-1328 1200 ∞ Au
exit slit slit setting: 0-2000 µmon line laser diffraction slitwidth monitor
postmonochromator optics M3: conical mirror, horizontal deflection, 2Θ= 174°, platinum coated, verticaldemagnification (1 : 1) of exit slit
reference [1] K.J.S Sawhney, F. Senf, M. Scheer, F. Schäfers, J. Bahrdt, A. Gaupp, andW. Gudat, Nucl. Instr. Meth. A, (1997) 395-402
Figure 3.4: Schematic layout of the UE56-PGM beamlines at BESSY [79].
called regions, i.e. different density of points in different energy ranges within the
same scan. To record M(T ) the timescan mode was used. In this mode, the photon
energy is set to a constant value and the various signals are recorded as a function
of time at user-defined time intervals. A number of other modes of operation are
available in the EMP/2 software, but they were not used for the present work.
The UE56-PGM Beamlines
The source of the UE56-PGM beamlines is a Sasaki type elliptical undulator [68, 72]
with high remanent NdFeB permanent magnets. The emission of these undulators in
the third harmonics provide the X-rays in the energy range needed for the XAS and
XMCD experiments in the range of the L2,3 edges of the 3d ferromagnets and the O K
edge. The beamlines are equipped with a collimated plane grating monochromator
(PGM) [80] and refocusing mirrors. Figure 3.4 shows schematically the layout of
the UE56-PGM beamlines. Three beamlines of this type have been built up and
commissioned at BESSY [81]: The first one is UE56/1-PGM maintained by BESSY
staff members. Currently it is modified for slicing experiments and tests with regard
to time-resolved experiments. The two other beamlines of this type, UE56/2-PGM1
and UE56/2-PGM2, are maintained by the Max-Planck-society. During the work for
this thesis all three beamlines have been used (UE56/1 only before its modification).
As they are absolutely equivalent they will just be referred to as the UE56-PGM
beamlines. They are designed to preserve the high degree of circular polarization
Pc emitted by the undulator, (Pc > 0.8 for most of the energy range), to have
spectral purity with low higher-order content, and to provide high photon flux at high
resolution. The tables used to control the undulator have been optimized such that
3.3 Design and Characterization of a Water-Cooled Coil System for UHV 27
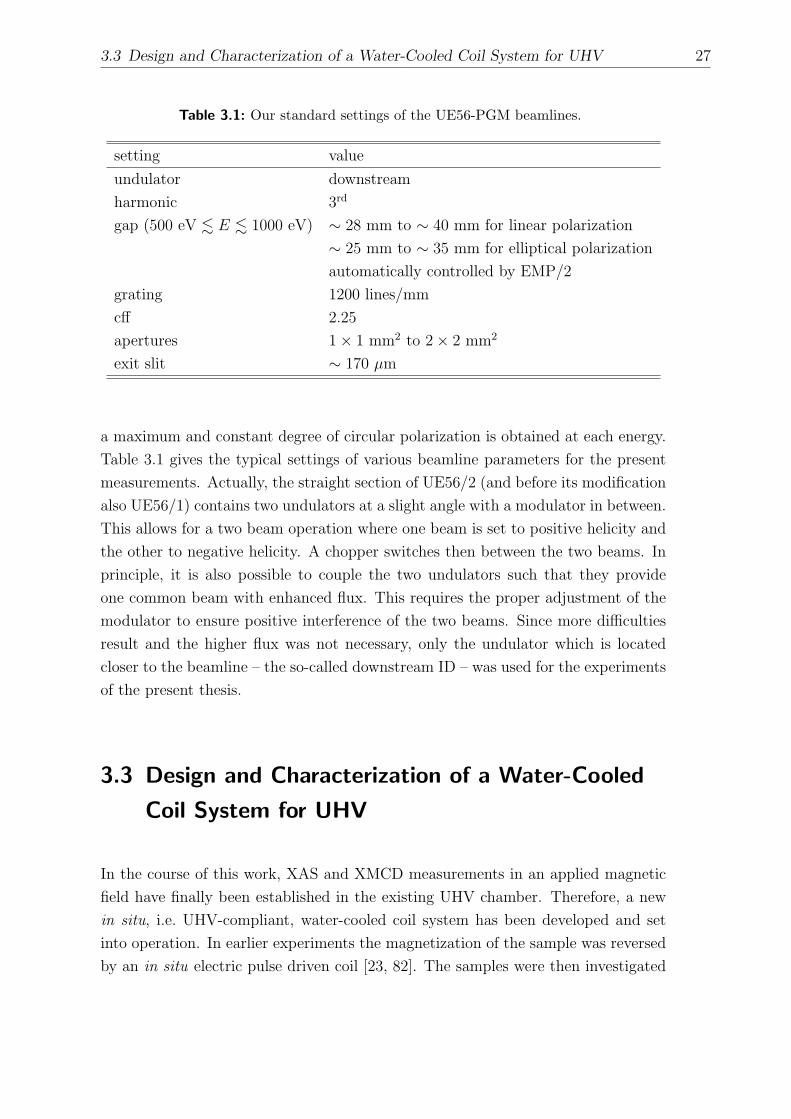
Table 3.1: Our standard settings of the UE56-PGM beamlines.
setting value
undulator downstream
harmonic 3rd
gap (500 eV . E . 1000 eV) ∼ 28 mm to ∼ 40 mm for linear polarization
∼ 25 mm to ∼ 35 mm for elliptical polarization
automatically controlled by EMP/2
grating 1200 lines/mm
cff 2.25
apertures 1× 1 mm2 to 2× 2 mm2
exit slit ∼ 170 µm
a maximum and constant degree of circular polarization is obtained at each energy.
Table 3.1 gives the typical settings of various beamline parameters for the present
measurements. Actually, the straight section of UE56/2 (and before its modification
also UE56/1) contains two undulators at a slight angle with a modulator in between.
This allows for a two beam operation where one beam is set to positive helicity and
the other to negative helicity. A chopper switches then between the two beams. In
principle, it is also possible to couple the two undulators such that they provide
one common beam with enhanced flux. This requires the proper adjustment of the
modulator to ensure positive interference of the two beams. Since more difficulties
result and the higher flux was not necessary, only the undulator which is located
closer to the beamline – the so-called downstream ID – was used for the experiments
of the present thesis.
3.3 Design and Characterization of a Water-Cooled
Coil System for UHV
In the course of this work, XAS and XMCD measurements in an applied magnetic
field have finally been established in the existing UHV chamber. Therefore, a new
in situ, i.e. UHV-compliant, water-cooled coil system has been developed and set
into operation. In earlier experiments the magnetization of the sample was reversed
by an in situ electric pulse driven coil [23, 82]. The samples were then investigated

28 Chapter 3 Experimental Details
extractor
pole
piece
linear motion
insolated
Cu tube
Figure 3.5: Part of the technical drawing of the new water-cooled coil system showingthe overall assembly (left) and photograph before final installation on the UHV chamber(right). For the complete drawings see [78].
in remanence. In principle, measurements in small static magnetic fields H were
possible but only up to µ0H ≈ 4 mT to prevent the coil from overheating.
Construction
The basic idea for the design of the new coil system is based on the setup of an
existing coil system which is installed on the XMCD chamber at the beamline D1011
at MAX-lab in Lund (Sweden) [83]. The main feature is to make the windings out
of Cu tubes which on the one hand carry the current and on the other hand allow
for a steady water flow inside of them. A Teflon (PTFE) shrink tube insulates
the windings from each other. It is suitable for UHV since it does not degas even
during bakeout of the chamber and it can more or less easily be applied to the
Cu tubes. The main goal of the new design was to obtain a maximum magnetic
field at the position of the sample. As a part of his diploma thesis, M. Bernien
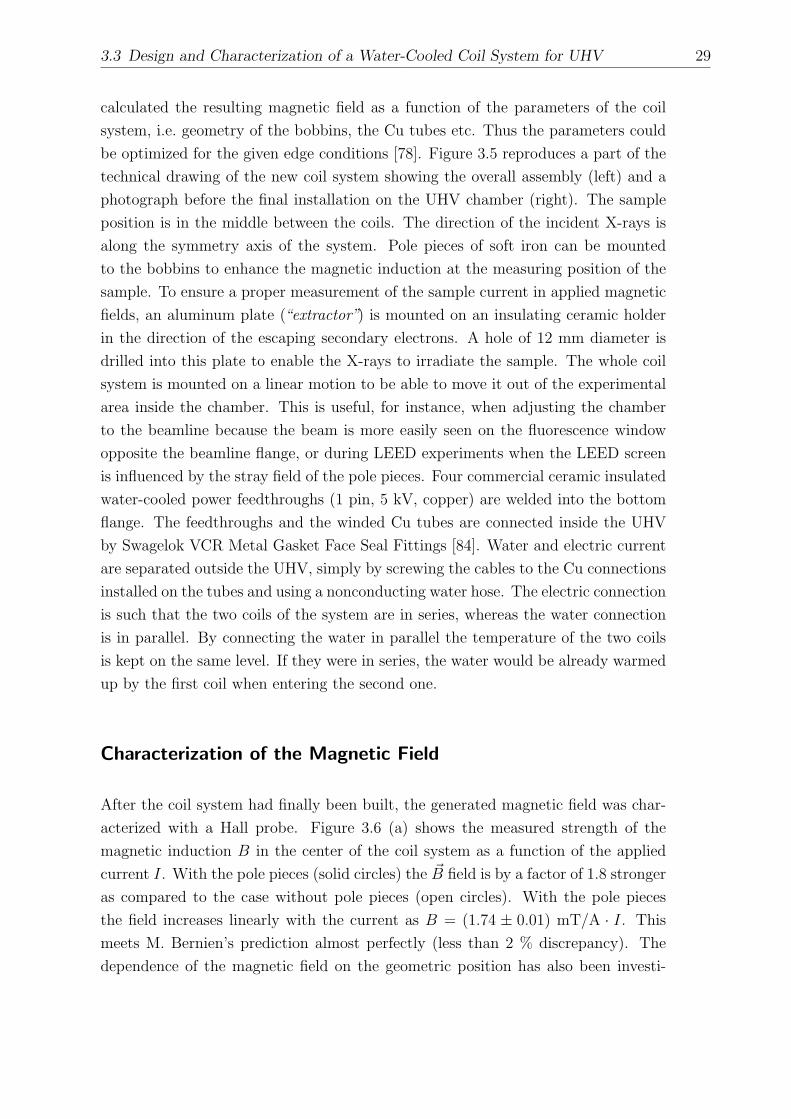
3.3 Design and Characterization of a Water-Cooled Coil System for UHV 29
calculated the resulting magnetic field as a function of the parameters of the coil
system, i.e. geometry of the bobbins, the Cu tubes etc. Thus the parameters could
be optimized for the given edge conditions [78]. Figure 3.5 reproduces a part of the
technical drawing of the new coil system showing the overall assembly (left) and a
photograph before the final installation on the UHV chamber (right). The sample
position is in the middle between the coils. The direction of the incident X-rays is
along the symmetry axis of the system. Pole pieces of soft iron can be mounted
to the bobbins to enhance the magnetic induction at the measuring position of the
sample. To ensure a proper measurement of the sample current in applied magnetic
fields, an aluminum plate (“extractor”) is mounted on an insulating ceramic holder
in the direction of the escaping secondary electrons. A hole of 12 mm diameter is
drilled into this plate to enable the X-rays to irradiate the sample. The whole coil
system is mounted on a linear motion to be able to move it out of the experimental
area inside the chamber. This is useful, for instance, when adjusting the chamber
to the beamline because the beam is more easily seen on the fluorescence window
opposite the beamline flange, or during LEED experiments when the LEED screen
is influenced by the stray field of the pole pieces. Four commercial ceramic insulated
water-cooled power feedthroughs (1 pin, 5 kV, copper) are welded into the bottom
flange. The feedthroughs and the winded Cu tubes are connected inside the UHV
by Swagelok VCR Metal Gasket Face Seal Fittings [84]. Water and electric current
are separated outside the UHV, simply by screwing the cables to the Cu connections
installed on the tubes and using a nonconducting water hose. The electric connection
is such that the two coils of the system are in series, whereas the water connection
is in parallel. By connecting the water in parallel the temperature of the two coils
is kept on the same level. If they were in series, the water would be already warmed
up by the first coil when entering the second one.
Characterization of the Magnetic Field
After the coil system had finally been built, the generated magnetic field was char-
acterized with a Hall probe. Figure 3.6 (a) shows the measured strength of the
magnetic induction B in the center of the coil system as a function of the applied
current I. With the pole pieces (solid circles) the ~B field is by a factor of 1.8 stronger
as compared to the case without pole pieces (open circles). With the pole pieces
the field increases linearly with the current as B = (1.74 ± 0.01) mT/A · I. This
meets M. Bernien’s prediction almost perfectly (less than 2 % discrepancy). The
dependence of the magnetic field on the geometric position has also been investi-
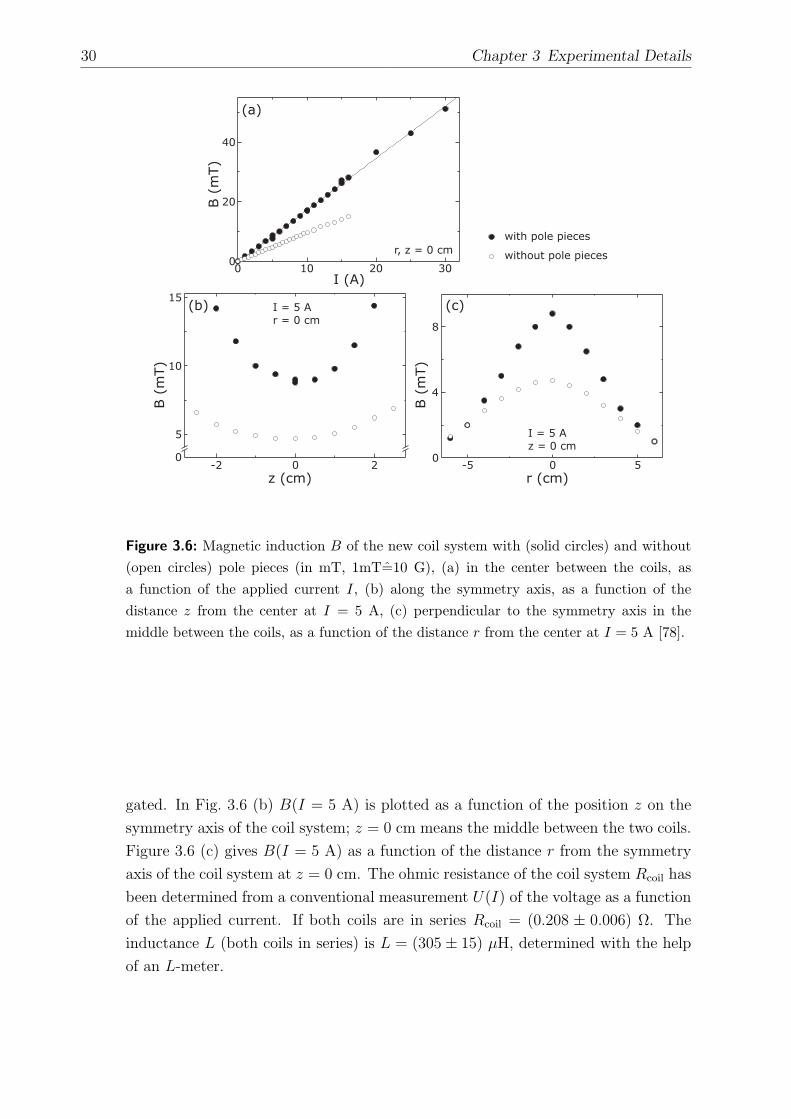
30 Chapter 3 Experimental Details
with pole pieces
without pole pieces
8
4
0-5 0 5
r (cm)
B(m
T)
I = 5 A
z = 0 cm
(c)15
10
5
0-2 0 2
z (cm)
B(m
T)
I = 5 A
r = 0 cm
(b)
30201000
20
40
I (A)
B(m
T)
r, z = 0 cm
(a)
Figure 3.6: Magnetic induction B of the new coil system with (solid circles) and without(open circles) pole pieces (in mT, 1mT=10 G), (a) in the center between the coils, asa function of the applied current I, (b) along the symmetry axis, as a function of thedistance z from the center at I = 5 A, (c) perpendicular to the symmetry axis in themiddle between the coils, as a function of the distance r from the center at I = 5 A [78].
gated. In Fig. 3.6 (b) B(I = 5 A) is plotted as a function of the position z on the
symmetry axis of the coil system; z = 0 cm means the middle between the two coils.
Figure 3.6 (c) gives B(I = 5 A) as a function of the distance r from the symmetry
axis of the coil system at z = 0 cm. The ohmic resistance of the coil system Rcoil has
been determined from a conventional measurement U(I) of the voltage as a function
of the applied current. If both coils are in series Rcoil = (0.208 ± 0.006) Ω. The
inductance L (both coils in series) is L = (305± 15) µH, determined with the help
of an L-meter.

3.4 Measurements in the Hard X-Ray Regime at the ESRF 31
3.4 Measurements in the Hard X-Ray Regime at the
ESRF
Single crystals of Gd, Tb, and Dy were investigated at the ID12 Circular Polariza-
tion Beamline at the ESRF (European Synchrotron Radiation Facility) in Grenoble,
France (electron energy 6.03 GeV) [85]. The samples were provided by the group
of T. A. Lograsso at Ames Laboratory, Iowa State University. The elements were
cleaned and arc melted under an argon atmosphere and the elements drop cast into
a copper chill cast mold. The single crystals were then grown from the drop cast
ingots by the strain anneal method and cut crystallographically oriented to disks of
approximately 10 mm diameter and 2 mm thickness. For the investigations of these
elements at their L2,3 edges hard X-rays and a large magnetic field (µ0H up to 7 T)
to overcome the shape anisotropy of the samples are necessary.
The ID12 beamline is a window-less beamline that provides X-rays in the hard X-
ray regime with variable polarization [86]. Historically, it was called ID12A and
shared its source with a second beamline ID12B also providing X-rays with variable
polarization, but in the soft X-ray regime. However, the interaction of the two
beamlines was at some point no longer acceptable also due to the growing demand
by users for more beamtime. The ID12B branch has been moved to a different
straight section and is now known as the “Dragon Beamline” ID08.
Figure 3.7 shows the layout of the ID12 beamline schematically [87]. The straight
section of ID 12 contains three helical undulators: ElectroMagnet/Permanent mag-
net Hybrid Undulator (EMPHU), HELIOS-II, and APPLE-II. They complement
each other to cover the energy range from 2 keV up to 20 keV. According to the
required energy range one of the undulators was used in each experiment following
the advice of the beamline scientists. If possible, the EMPHU was preferred be-
cause this novel undulator allows for fast switching of the polarization state with a
helicity reversal time of ∼ 160 ms [88]. Thus, the helicity of the incident light can
be switched at each energy point, taking the complete XMCD spectra in one single
energy scan. Therefore, the XMCD spectra do not suffer from long term drifts of
the beam e.g. due to instabilities of the electron beam in the storage ring.
A UHV-compatible double-crystal monochromator with fixed exit is the essential
part of the beamline. The pair of Si〈111〉 crystals is kept at 130 K by cooled He
gas. The main drawback of the monochromator is its polarization transfer which
depends strongly on the angle of the incident light. XMCD measurements in the
lower energy range of the beamline are hindered by the fact that the degree of

32 Chapter 3 Experimental Details
Helical
UndulatorHFM-DFM
Fixed Exit
Monochromator
Si(111)
QWP VF-2M
I0If E
H
Backscattering
Geometry
Figure 3.7: Schematic layout of the ID12 beamline at the ESRF. Abbreviations:HFMDFM = horizontally focusing and deflecting mirrors; QWP = quarter-wave plateassembly; VF-2M = vertically focusing double mirror; I0 = photodiode intensity monitor;If = photodiodes to detect the fluorescence yield [87].
circular polarization drops to almost zero between 2.5 keV and 3 keV. In this energy
range the monochromator crystal has to be operated close to the Brewster angle of
Si〈111〉 and thus acts as a linear polarizer. Throughout the beamline the X-rays
travel various pin holes, slits, and focusing units that serve to prepare the beam
properly. The design of the beamline offers the possibility to measure a large variety
of dichroic effects in the X-ray regime. Many of these effects have been established
in experiments at ID12 [87].
A superconducting magnet in the chamber installed on the beamline provides a
magnetic field ~H with µ0H ≤ 7 T. The chamber possesses a load lock that enables
the users to change the sample without breaking the vacuum of the chamber itself.
The sample is clamped to the sample holder by a strong metal plate. This plate has
a hole in its middle so that the X-rays reach the surface of the sample. With the help
of a `He-flow cryostat the sample temperature can be controlled and stabilized down
to T ≈ 2 K. The fluorescence yield is detected by four PNN+ Si photodiodes together
with a digital lock-in technique [89]. Using photodiodes as a detector has several
advantages: Apart from being fully UHV-compatible they are hardly influenced by
magnetic fields which is essential for XMCD measurements. Moreover, they are
highly efficient and linear in the X-ray range and provide a fast response time.
The measurements are computer-controlled via the SPECS software. The same
system records the data and writes them to ASCII-files. In the same manner as for
the measurements at BESSY, the data are analyzed with the help of the analysis
programs by A. Scherz [23] and Origin 7.

Chapter 4
The Role of Oxygen as a Surfactant
for the Magnetism of Fe, Co, and Ni
Films
Modern technological devices and nanostructures consist not only of materials in
their natural phases. More and more artificial structures with custom-made proper-
ties are designed and incorporated in these devices. It is clear that magnetic mate-
rials are of special interest for the development of any magnetic devices like today’s
storage media. Their magnetic properties may dramatically be influenced by min-
imal structural changes. If the nearest neighbor distance varies by (0.03− 0.05) A
only, the magnetic anisotropy energy may change by a factor of 100 or 1000 [61, 90].
One well established method to fabricate such artificial structures is nowadays the
surfactant assisted growth. It was shown that using oxygen as a surfactant improves
the layer-wise and pseudomorphic growth of ultrathin films of Fe, Co, and Ni on Cu
substrates. Surfactants may help adsorbates to wet the substrate [5, 6, 91, 92].
They float on top of the deposited layers and thereby reduce the surface free energy
[93]. In this chapter the magnetic properties of ferromagnetic films of Fe, Co, and
Ni which were grown with oxygen as a surfactant are presented. It is shown how
the surfactant influences the magnetism of the ferromagnets themselves. Moreover,
the basic physical effect of induced magnetism at the surfactant site, which is the
oxygen in the present case, is discussed in detail.
After a short summary of the status of research prior to this work in Sec. 4.1,
growth and structure of the samples as they were used in the present XAS and
XMCD experiments are described in Sec. 4.2. As the first part of the study, the case
of Ni grown on Cu(100) and Cu(110) with O as surfactant is investigated thickness-
dependently in comparison to the case without surfactant. Taking advantage of
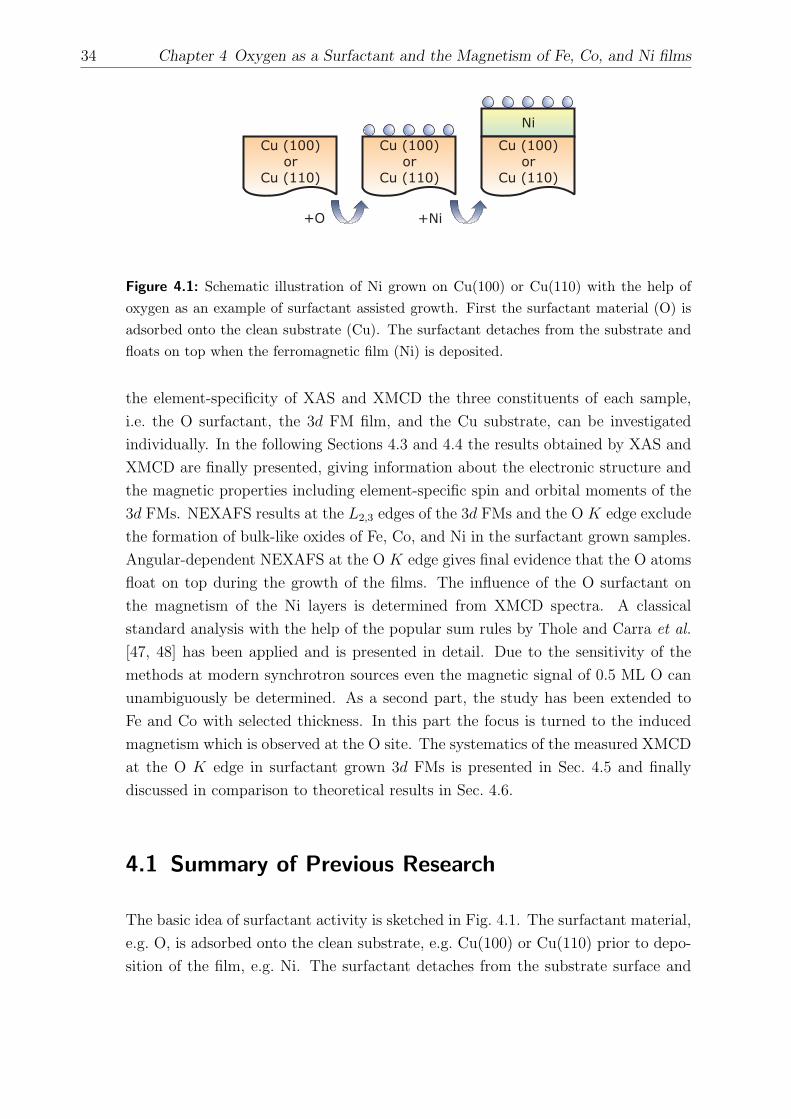
34 Chapter 4 Oxygen as a Surfactant and the Magnetism of Fe, Co, and Ni films
+Ni+O
Ni
Cu (100)
or
Cu (110)
Cu (100)
or
Cu (110)
Cu (100)
or
Cu (110)
Figure 4.1: Schematic illustration of Ni grown on Cu(100) or Cu(110) with the help ofoxygen as an example of surfactant assisted growth. First the surfactant material (O) isadsorbed onto the clean substrate (Cu). The surfactant detaches from the substrate andfloats on top when the ferromagnetic film (Ni) is deposited.
the element-specificity of XAS and XMCD the three constituents of each sample,
i.e. the O surfactant, the 3d FM film, and the Cu substrate, can be investigated
individually. In the following Sections 4.3 and 4.4 the results obtained by XAS and
XMCD are finally presented, giving information about the electronic structure and
the magnetic properties including element-specific spin and orbital moments of the
3d FMs. NEXAFS results at the L2,3 edges of the 3d FMs and the O K edge exclude
the formation of bulk-like oxides of Fe, Co, and Ni in the surfactant grown samples.
Angular-dependent NEXAFS at the O K edge gives final evidence that the O atoms
float on top during the growth of the films. The influence of the O surfactant on
the magnetism of the Ni layers is determined from XMCD spectra. A classical
standard analysis with the help of the popular sum rules by Thole and Carra et al.
[47, 48] has been applied and is presented in detail. Due to the sensitivity of the
methods at modern synchrotron sources even the magnetic signal of 0.5 ML O can
unambiguously be determined. As a second part, the study has been extended to
Fe and Co with selected thickness. In this part the focus is turned to the induced
magnetism which is observed at the O site. The systematics of the measured XMCD
at the O K edge in surfactant grown 3d FMs is presented in Sec. 4.5 and finally
discussed in comparison to theoretical results in Sec. 4.6.
4.1 Summary of Previous Research
The basic idea of surfactant activity is sketched in Fig. 4.1. The surfactant material,
e.g. O, is adsorbed onto the clean substrate, e.g. Cu(100) or Cu(110) prior to depo-
sition of the film, e.g. Ni. The surfactant detaches from the substrate surface and

4.1 Summary of Previous Research 35
0.1
0.15
0.2
0.25
5 10 15 20 25 30 35 40
R(nm
)a
d (ML)Ni
(a)
0 4 8 12 16 20 24
0.06
0.08
0.1
0.12
0.14
d (ML)Ni
R(nm
)q
(b)
Figure 4.2: (a) Arithmetic mean roughness of Ni films grown on Cu(100) with (triangles)and without (circles) O surfactant. The line serves as a guide to the eye [5, 77]. (b) Meansquared roughness of Ni films grown on Cu(110) with (triangles) and without (circles) Osurfactant [77].
floats on top of the growing film. Thus, it can keep its activity as growth proceeds.
At the same time no impurities must be introduced in the growing layers. Numerous
combinations of substrate, film, and surfactant materials exist where the structure
of the ultrathin film has been improved due to the surfactant assisted growth. Ex-
amples are lead as a surfactant for Co on Cu(111) [94], arsenic as a surfactant for
Ge on Si(100) [93], oxygen as a surfactant for Co on Cu(110) [92], for Co on Fe(100)
[95], for Fe on Cu(100) [91], for Fe on single crystalline Fe(100)/MgO(100) [96, 97],
and for Ni on Cu(100) [4–6, 98–101].
One of the most popular metallic substrates for ferromagnetic films is the Cu(100)
surface. Both structure and magnetism of Fe, Co, and Ni on this surface have been
discussed in numerous publications, e.g. [61, 102–105]. Recently, it has been shown
that in Ni/Cu(100) oxygen acts efficiently as a surfactant material [4–6]. The layer-
by-layer growth mode is extended to a much larger thickness with the help of O
as a surfactant. Calculations have shown that the reason is the reduction of the
long-range electrostatic (Madelung) energy, when the O atoms float on top of the Ni
film [5]. Auger electron spectra suggest that the O stays on top of the growing films.
No reduction of the O signal has been observed in the Ni films on O/Cu(100) while
the Cu signal is damped away rapidly when Ni is evaporated. The surface of the
Ni films, was characterized in detail by LEED and scanning tunneling microscope
(STM) experiments [5, 77].
One important result of the STM experiments is the thickness-dependent surface
roughness of the films. Fig. 4.2 (a) reproduces the arithmetic mean roughness Ra
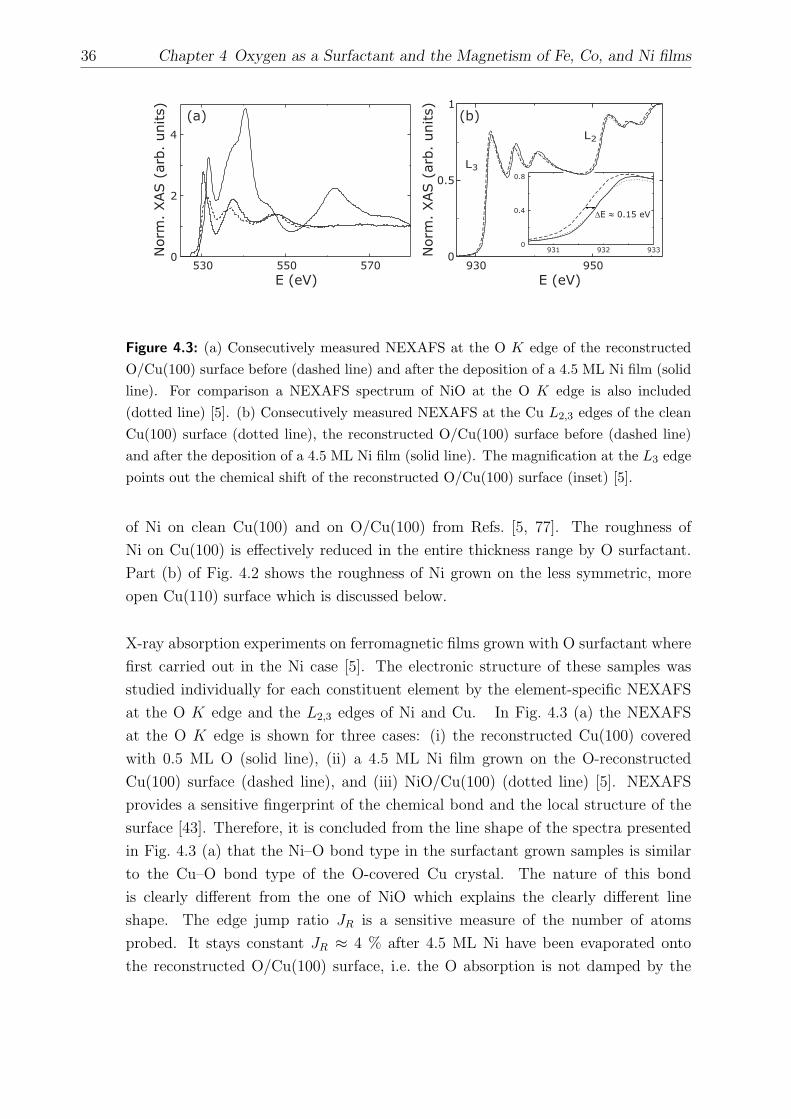
36 Chapter 4 Oxygen as a Surfactant and the Magnetism of Fe, Co, and Ni films
Norm
.XAS
(arb.
units)
0
2
4
E (eV)
530 550 570
(a)
Norm
.XAS
(arb.
units)
931 932 9330
0.4
0.8
E 0.15 eV
9509300
0.5
1
E (eV)
L2
L3
(b)
Figure 4.3: (a) Consecutively measured NEXAFS at the O K edge of the reconstructedO/Cu(100) surface before (dashed line) and after the deposition of a 4.5 ML Ni film (solidline). For comparison a NEXAFS spectrum of NiO at the O K edge is also included(dotted line) [5]. (b) Consecutively measured NEXAFS at the Cu L2,3 edges of the cleanCu(100) surface (dotted line), the reconstructed O/Cu(100) surface before (dashed line)and after the deposition of a 4.5 ML Ni film (solid line). The magnification at the L3 edgepoints out the chemical shift of the reconstructed O/Cu(100) surface (inset) [5].
of Ni on clean Cu(100) and on O/Cu(100) from Refs. [5, 77]. The roughness of
Ni on Cu(100) is effectively reduced in the entire thickness range by O surfactant.
Part (b) of Fig. 4.2 shows the roughness of Ni grown on the less symmetric, more
open Cu(110) surface which is discussed below.
X-ray absorption experiments on ferromagnetic films grown with O surfactant where
first carried out in the Ni case [5]. The electronic structure of these samples was
studied individually for each constituent element by the element-specific NEXAFS
at the O K edge and the L2,3 edges of Ni and Cu. In Fig. 4.3 (a) the NEXAFS
at the O K edge is shown for three cases: (i) the reconstructed Cu(100) covered
with 0.5 ML O (solid line), (ii) a 4.5 ML Ni film grown on the O-reconstructed
Cu(100) surface (dashed line), and (iii) NiO/Cu(100) (dotted line) [5]. NEXAFS
provides a sensitive fingerprint of the chemical bond and the local structure of the
surface [43]. Therefore, it is concluded from the line shape of the spectra presented
in Fig. 4.3 (a) that the Ni–O bond type in the surfactant grown samples is similar
to the Cu–O bond type of the O-covered Cu crystal. The nature of this bond
is clearly different from the one of NiO which explains the clearly different line
shape. The edge jump ratio JR is a sensitive measure of the number of atoms
probed. It stays constant JR ≈ 4 % after 4.5 ML Ni have been evaporated onto
the reconstructed O/Cu(100) surface, i.e. the O absorption is not damped by the

4.1 Summary of Previous Research 37
Ni. This is, besides the AES results, a further indication, that the O floats on top
of the growing Ni film. Additional theoretical investigations in Ref. [5] support this
hypothesis. Final evidence is given by angular-dependent NEXAFS measurements
as they are discussed in the present thesis in Sec. 4.3. A reversible chemical shift
at the Cu L2,3 edges shown in Fig. 4.3 (b) proves that the O atoms detach from
the Cu surface upon Ni deposition. A small shift in energy of ∆E ≈ 0.15 eV is
observed comparing the L2,3 edges of the clean Cu(100) crystal (dotted line) to the
one reconstructed by O (dashed line). This shift disappears when Ni is evaporated
on top (solid line). The reversing of the modifications induced by the O indicates
that the Cu–O bonds break when Ni is deposited. The fact that no bulk-like NiO
is formed becomes also clear from the line shape of the XAS at the Ni L2,3 edges.
Furthermore, a charge transfer from Ni to O is determined from an increase in the
intensity at the Ni L3 edge. This will be discussed in detail in Sec. 4.3 in comparison
with the new results on Ni grown on the Cu(110) surface.
Surfactant activity of oxygen has also been studied on Ni on the more anisotropic
Cu(110) surfaces [98]. On the more open and more reactive Cu(110) surface a three-
dimensional (3D) growth of ferromagnetic Ni is observed by STM throughout the
whole thickness range [98]. It has been suggested that, like on the Cu(100), also
on the Cu(110) surface O acts as a surfactant and stays always on top when Ni is
deposited. The symmetry of the LEED pattern taken after the Ni deposition does
not change with respect to the (2× 1) O/Cu(110) surface. This indicates that the
unit cell on top of the Ni film still results from added Ni–O rows and the O is located
at the surface. Hence, in the case of the open (110) surface the Ni metal surface
keeps the O-induced reconstruction of the Cu substrate – unlike in the case of the
more symmetric (100) surface.
The investigations of Ni on Cu(110) and the idea of using O as a surfactant in this
case were inspired by the results for Co on this Cu(110) surface published before
[106, 107]. It has been reported that O works excellent as a surfactant for Co on
Cu(110). Without surfactant it always shows a 3D growth. Using O as a surfactant
Co grows layer-by-layer with a flat surface [106, 107].
Structure and magnetism of Co on Cu(100) without surfactant is, like in the case of
Ni/Cu(100), well studied, see e.g. [61, 102]. No reports in literature exist about Co on
Cu(100) grown with O surfactant. This is most likely due to the fact that Co grows
already quite flat and layer-by-layer on the Cu(100) surface [108]. Therefore, no
advantage is expected from a structural point of view when using O as a surfactant.

38 Chapter 4 Oxygen as a Surfactant and the Magnetism of Fe, Co, and Ni films
However, the O surfactant may be used to tailor the magnetization by changing the
surface anisotropy energy in the same manner as for Ni [6].
Finally, Fe/Cu(100) is the most complicated case of a 3d FM on Cu(100). Due to
its lattice parameters Fe grows less well on Cu(100) than Ni or Co. In the first 4
layers it adapts the fcc structure of the Cu substrate and grows pseudomorphically
in a tetragonally distorted layer structure. In the thickness range 4 − 10 ML it
undergoes a structural transition and relaxes to its own bulk crystal structure which
is bcc [109, 110].
Talking about magnetism in ultrathin films one of the first investigated properties is
often any type of thickness-dependent spin reorientation transition (SRT). Table 4.1
summarizes the direction of the easy axis of magnetization of various ferromagnetic
systems on Cu substrates, with and without O surfactant at room temperature. In
general, the SRT in ultrathin 3d FM films from in-plane to out-of-plane magnetiza-
tion will occur at a lower thickness, if O is used as a surfactant. In some cases, e.g.
Ni on Cu(110) the SRT has only been observed in presence of O surfactant [77, 113].
This change is attributed to a reduction of the magnetic surface anisotropy energy
by the surfactant [4, 6]. Furthermore, for Ni/Cu(100) also a temperature-dependent
change of the thickness at which the SRT occurs has been observed [62]. Even if
Cu is evaporated on top of a surfactant-grown Ni film, the oxygen will keep its sur-
factant activity and float on top of the Cu cap. If the Ni film is covered with Cu,
the SRT will happen at dNi = 6.5 ML, no matter whether it has been grown with or
without O surfactant [101]. With the knowledge of the easy axis, the magnetization
of the films can easily been aligned parallel to the photon wave vector and the mag-
netic field in XMCD measurements. For all three elements Fe, Co, and Ni XAS and
XMCD are well known in the clean case [23, 52, 120]. Bulk-like samples of them were
grown on Cu(100) and investigated systematically at the UE56-PGM beamlines at
BESSY [23]. Thus, they serve as references for the present investigations that are
discussed in the following sections. Induced magnetism on light elements in contact
with ferromagnets has been observed by XMCD for atomic oxygen on Co films [121]
and molecular CO on Ni [122] and Co [123] films. In these cases the oxygen and CO,
respectively, were adsorbed onto the surfaces after the FM films had been grown.
Also at the carbon K edge of Fe/C multilayers [124] magnetic dichroism has been
observed in reflectance. All these experiments show that XMCD technique provides
the sensitivity to detect these small induced magnetic signals of small amounts of
light elements.

4.1 Summary of Previous Research 39
Table 4.1: Overview of ultrathin 3d ferromagnets and their easy axes of magnetizationwith and without O surfactant. The direction of the easy magnetization axis at roomtemperature is given in the various ranges of the thickness dFM of the ferromagnetic filmas it is reported in the literature.
sample dFM (ML) easy axis references
Ni/Cu(100) below 7− 11 in-plane parallel 〈110〉 [4, 101, 111, 112]
& 7 out-of-plane [111, 112]
& 9 out-of-plane [101]
& 11 out-of-plane [4]
Ni/O/Cu(100) . 5 in-plane [4, 6]
& 5 out-of-plane [4, 6]
Ni/Cu(110) 10− 30 in-plane parallel 〈111〉 [113]
Ni/O/Cu(110) . 5 in-plane parallel 〈110〉 this work ∗
7− 35 out-of-plane [77, 114]
≥ 35 slowly tilting back in-plane [114]
Co/Cu(100) 1.5− 20 in-plane parallel 〈110〉 [115, 116]
Co/O/Cu(100) in-plane parallel 〈110〉 this work +
Co/Cu(110) 11− 30 in-plane parallel 〈001〉 [117]
Co/O/Cu(110) . 30 in-plane parallel 〈001〉 [117]
Fe/Cu(100) < 4 out-of-plane [109]
4− 11 helical [118, 119]
> 11 in-plane [109]
Fe/O/Cu(100) . 4 out-of-plane this work ++
∗ The experiments of the present work suggest this easy axis: 4.5 ML show an XMCD
signal in-plane parallel 〈110〉 smaller than the bulk one. No XMCD was observed in
the 〈100〉 and the out-of-plane direction. A final prove, i.e. measurement of the full
angular dependence, is missing.+ The results of the present work suggest that like in the case of Co/O/Cu(110) the
easy axis is not changed by the O surfactant.++ At 5 ML no XMCD was observed out-of-plane or in-plane parallel 〈110〉. The
vanishing magnetization in the entire thickness range of Fe on O/Cu(100) reported
in [91] is due to the sample treatment (Cu-capping and ex situ measurements).
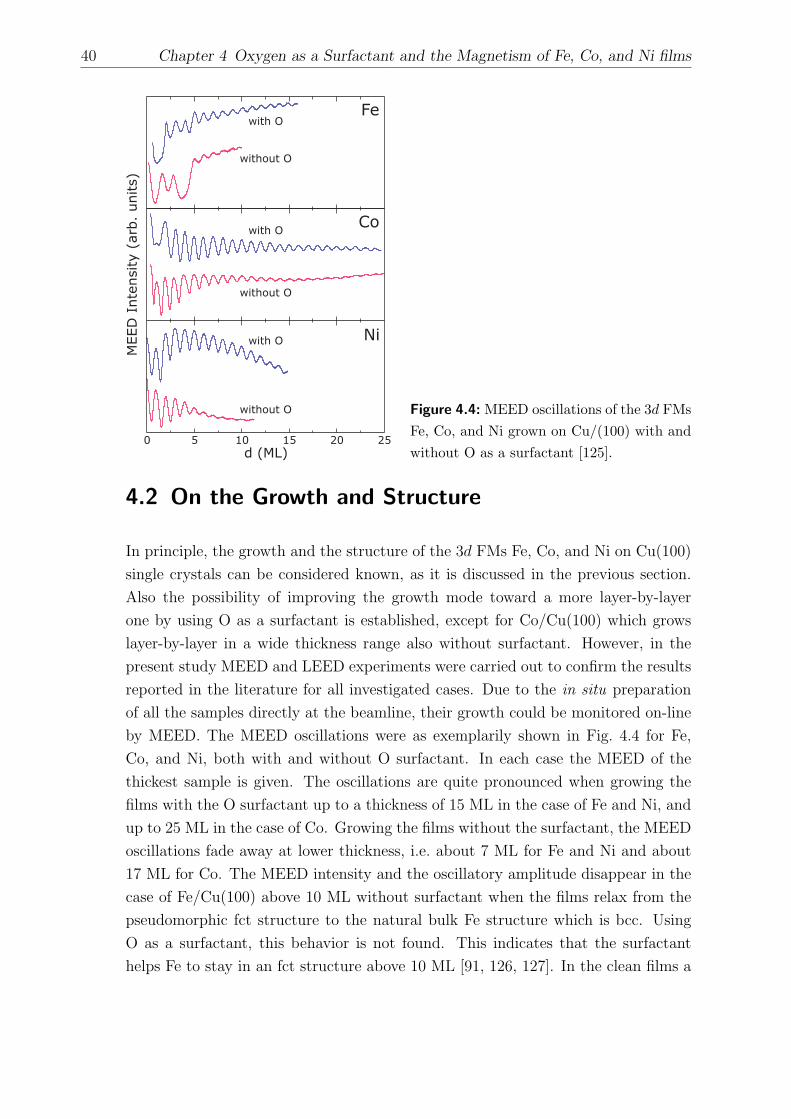
40 Chapter 4 Oxygen as a Surfactant and the Magnetism of Fe, Co, and Ni films
0 5 10 15 20 25
d (ML)
Ni
Co
Fe
without O
with O
without O
with O
without O
with OM
EED
Intensity
(arb.
units)
Figure 4.4: MEED oscillations of the 3d FMsFe, Co, and Ni grown on Cu/(100) with andwithout O as a surfactant [125].
4.2 On the Growth and Structure
In principle, the growth and the structure of the 3d FMs Fe, Co, and Ni on Cu(100)
single crystals can be considered known, as it is discussed in the previous section.
Also the possibility of improving the growth mode toward a more layer-by-layer
one by using O as a surfactant is established, except for Co/Cu(100) which grows
layer-by-layer in a wide thickness range also without surfactant. However, in the
present study MEED and LEED experiments were carried out to confirm the results
reported in the literature for all investigated cases. Due to the in situ preparation
of all the samples directly at the beamline, their growth could be monitored on-line
by MEED. The MEED oscillations were as exemplarily shown in Fig. 4.4 for Fe,
Co, and Ni, both with and without O surfactant. In each case the MEED of the
thickest sample is given. The oscillations are quite pronounced when growing the
films with the O surfactant up to a thickness of 15 ML in the case of Fe and Ni, and
up to 25 ML in the case of Co. Growing the films without the surfactant, the MEED
oscillations fade away at lower thickness, i.e. about 7 ML for Fe and Ni and about
17 ML for Co. The MEED intensity and the oscillatory amplitude disappear in the
case of Fe/Cu(100) above 10 ML without surfactant when the films relax from the
pseudomorphic fct structure to the natural bulk Fe structure which is bcc. Using
O as a surfactant, this behavior is not found. This indicates that the surfactant
helps Fe to stay in an fct structure above 10 ML [91, 126, 127]. In the clean films a
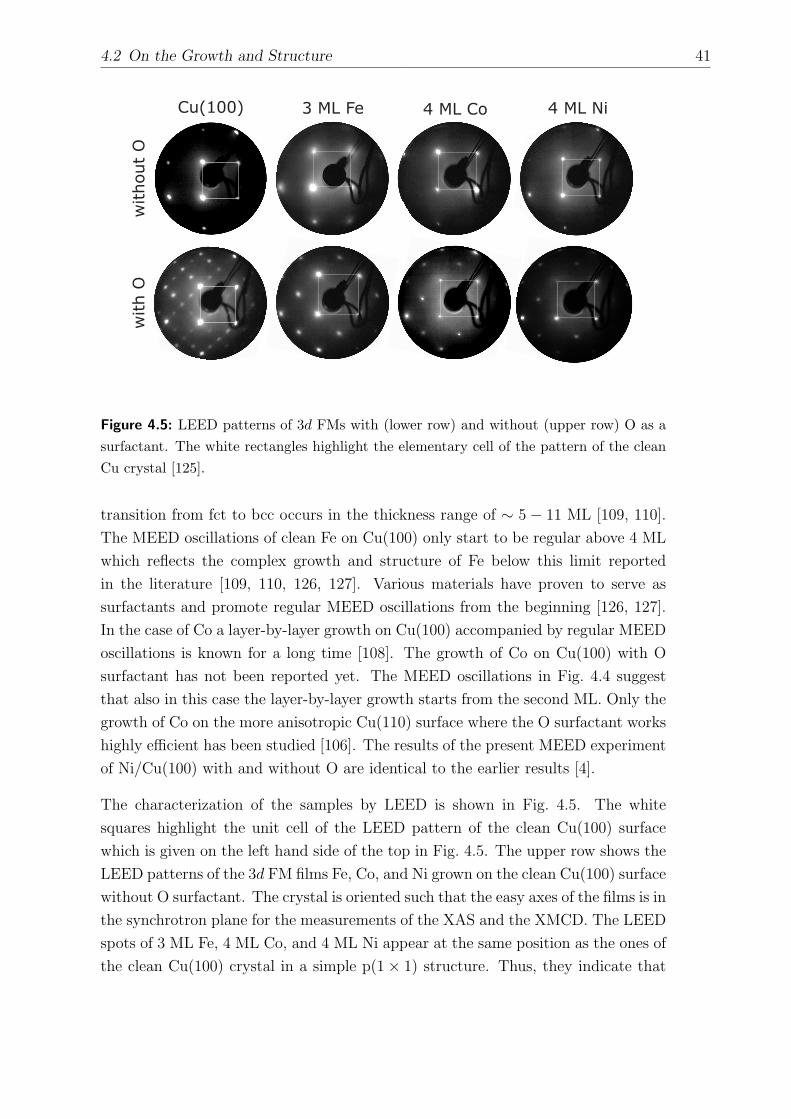
4.2 On the Growth and Structure 41
Cu(100) 3 ML Fe 4 ML Co 4 ML Ni
with
Ow
ithout
O
Figure 4.5: LEED patterns of 3d FMs with (lower row) and without (upper row) O as asurfactant. The white rectangles highlight the elementary cell of the pattern of the cleanCu crystal [125].
transition from fct to bcc occurs in the thickness range of ∼ 5 − 11 ML [109, 110].
The MEED oscillations of clean Fe on Cu(100) only start to be regular above 4 ML
which reflects the complex growth and structure of Fe below this limit reported
in the literature [109, 110, 126, 127]. Various materials have proven to serve as
surfactants and promote regular MEED oscillations from the beginning [126, 127].
In the case of Co a layer-by-layer growth on Cu(100) accompanied by regular MEED
oscillations is known for a long time [108]. The growth of Co on Cu(100) with O
surfactant has not been reported yet. The MEED oscillations in Fig. 4.4 suggest
that also in this case the layer-by-layer growth starts from the second ML. Only the
growth of Co on the more anisotropic Cu(110) surface where the O surfactant works
highly efficient has been studied [106]. The results of the present MEED experiment
of Ni/Cu(100) with and without O are identical to the earlier results [4].
The characterization of the samples by LEED is shown in Fig. 4.5. The white
squares highlight the unit cell of the LEED pattern of the clean Cu(100) surface
which is given on the left hand side of the top in Fig. 4.5. The upper row shows the
LEED patterns of the 3d FM films Fe, Co, and Ni grown on the clean Cu(100) surface
without O surfactant. The crystal is oriented such that the easy axes of the films is in
the synchrotron plane for the measurements of the XAS and the XMCD. The LEED
spots of 3 ML Fe, 4 ML Co, and 4 ML Ni appear at the same position as the ones of
the clean Cu(100) crystal in a simple p(1× 1) structure. Thus, they indicate that

42 Chapter 4 Oxygen as a Surfactant and the Magnetism of Fe, Co, and Ni films
oxygen first metal layer second metal layer
E
Ni on O/Cu(100)
[01 ]1
[011]
O/Cu(100)Ni/Cu(100)
Ni on O/Cu(110)Ni/Cu(110)
[001]
[1
0]
1
O/Cu(110)
Figure 4.6: Schematic representation of the surfaces of the various samples: Ni/Cu(100)(top left), O/Cu(100) (top middle), Ni on O/Cu(100) (top right), Ni/Cu(110) (bottomleft), O/Cu(110) (bottom middle), and Ni on O/Cu(110) (bottom right). The surfacesof the clean Cu(100) and Cu(110) crystals have the same structure as Ni/Cu(100) andNi/Cu(110), respectively. The (2× 1) reconstruction of O/Cu(100) exists in two domains,the missing rows appearing along the two equivalent directions rotated by 90 relative toeach other. The sketch shows only one domain.Small shaded circles: oxygen atoms, large open circles: atoms of the first metal layer, i.e.Ni and Cu, respectively, full circles: atoms of the second metal layer. The directions ofthe crystals and the electric field vector ~E are given according to the measuring geometryof the XAS and the XMCD.

4.2 On the Growth and Structure 43
all three elements grow pseudomorphically thereby adapting the fcc surface of the
substrate crystal. In the upper row of Fig. 4.6 the corresponding hard sphere models
in the case of Ni on the Cu(100) surface are shown. The directions of the crystals and
the electric field vector ~E are given according to the measuring geometry of the XAS
and the XMCD. In the lower row of LEED patterns in Fig. 4.5 on the left hand side,
the pattern of the Cu(100) crystal after dosing 1200 L of O is shown. Various extra
spots appear due to the O adsorption and the(√
2× 2√
2)R45 reconstruction of
the Cu surface. Besides, in the lower row in Fig. 4.5 the LEED patterns of the three
elements Fe, Co, and Ni grown with O surfactant on Cu(100) are reproduced. They
exhibit a c(2× 2) superstructure. In accordance with the observations in the case of
Ni [5] this indicates that the oxygen atoms are located in a fourfold hollow site with
c(2× 2) symmetry, as also illustrated in Fig. 4.6. Unlike on the surface of the Cu
crystal after O adsorption, a reconstruction of the metal film surface does not occur
when the O surfactant floats on top. Earlier works, e.g. by Thomassen et al. [109],
report a (4× 1) and (5× 1) structures in the LEED patterns of Fe/Cu(100) in the
thickness range below 5 ML. In the LEED pattern of clean Fe/Cu(100) in Fig. 4.5
these superstructures are not visible. This may be due to reasons given in a recent
work by Bernhard et al. [128] who found that the reconstruction is not necessarily
visible on very flat and clean substrates. As discussed in Chapter 3, the crystals used
in the present experiment exhibit a mean terrace size of at least 100 nm. Hence,
the crystal can be considered extremely flat within the probing area of the LEED.
The lower row of hard sphere models in Fig. 4.6 represents the surfaces when Ni is
grown on the anisotropic Cu(110) surface. In the clean case without O surfactant
Ni adapts also here the fcc structure of the Cu substrate. There is no difference in
the LEED patterns between the clean Cu(110) substrate and the Ni/Cu(110) film
without O surfactant. When adsorbing O onto the Cu(110) surface a “missing row”
reconstruction of the metal surface is formed which – unlike in the case of Cu(100)
– does not disappear when the Ni is deposited. Thus, in this case the LEED spots
of the Ni film grown with O surfactant appear at the same positions as for the O-
covered Cu(110) crystal. (For the LEED patterns of the Cu(110) and the O/Cu(110)
surfaces see Fig. 3.3.)
To determine the nearest neighbor distance Rnn of the O atoms to the Ni atoms of the
topmost layer the surface extended X-ray absorption fine structure (SEXAFS) at the
O K edge of 15 ML Ni grown with O surfactant on Cu(100) has been analyzed. The
SEXAFS oscillations kχ(k) at room temperature and normal incidence of the X-rays
are plotted in Fig. 4.7 (a). The SEXAFS is mainly determined by a single frequency
corresponding to Rnn, which becomes clear from the Fourier transform |FT [k · χ(k)]|

44 Chapter 4 Oxygen as a Surfactant and the Magnetism of Fe, Co, and Ni films
0
0.2
0.4
FT[k
(k)]
(arb.
units)
4 6 8
R ( )Å
2 100
(b)
k(k)
()
Å
-1
k ( )Å-1
0.5
0
-0.5
4 6 8
(a)
Figure 4.7:
(a) SEXAFS oscillations kχ(k) at roomtemperature and normal X-ray incidenceand (b) the corresponding Fourier trans-form |FT [kχ(k)]| of a 15 ML Ni film grownwith O surfactant on Cu(100) as obtainedfrom the experiment (solid line) and thefitting results of the nearest neighbor scat-tering shell (dashed line) [125].
of the experimental SEXAFS wiggles (solid line in Fig. 4.7 (b)). The nearest neighbor
distance is determined by fitting the data (FEFFIT [129]) with a theoretical standard
calculated with the FEFF8 code [130]. The dashed line in Fig. 4.7 (b) represents the
FEFFIT result for the nearest neighbor scattering shell. From this fitting procedure
a nearest neighbor O–Cu distance of Rnn = (1.85± 0.03) A results. Assuming that
the tetragonally distorted Ni film adopts the Cu in-plane lattice constant aCu =
3.61 A, a height of h = 0.41 A of the oxygen atoms above the first Ni layer follows
from Rnn. These results agree well with the theoretically determined values of Ref. [5]
and the ones recently calculated by R. Q. Wu [125]. The determination of the height
of the oxygen atoms is crucial because it turns out that the calculated size of the
magnetic moments of the Ni atoms on the surface as well as the one of the induced
moment in the surfactant oxygen sensitively depend on h (see Sec. 4.6).
4.3 On the Electronic Structure
NEXAFS spectra were recorded at the O K edge and the L2,3 edges of Fe, Co, and
Ni, respectively to study the electronic structure of the surfactant grown samples.
The angular dependence of the XAS at the O K edge provides clear evidence that the
oxygen floats at the surface of the Ni film. Figure 4.8 shows this angular-dependent
XAS of a bulk-like Ni film grown on the O/Cu(110) surface. These spectra were
recorded with linearly polarized light ( ~E vector perpendicular to the[110
]direction,
i.e. “along the Ni–O rows”) at an angle ϕ = 90 (normal incidence, solid line) and
ϕ = 20 (grazing incidence, dashed line) between the incident X-rays and the surface
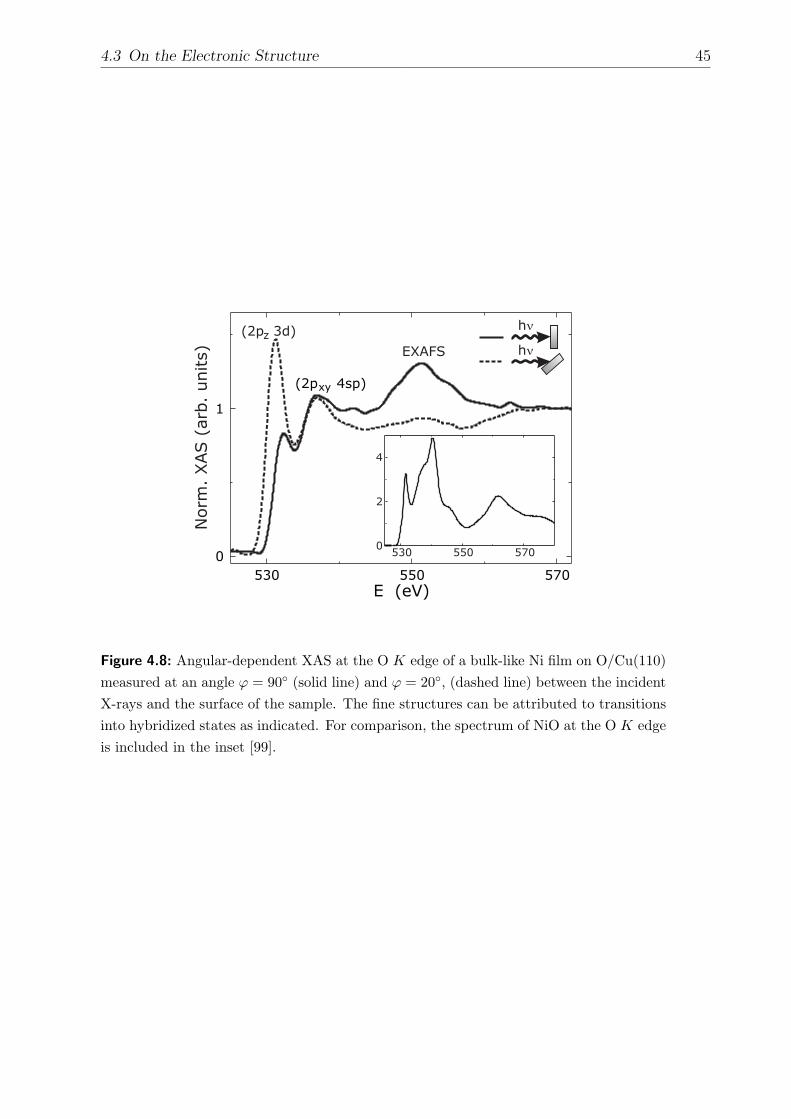
4.3 On the Electronic Structure 45
Norm
.XAS
(arb.
units)
0
1
E (eV)
530 550 570
530 550 5700
2
4
xy(2p 4sp)
z(2p 3d)
EXAFS
h
h
Figure 4.8: Angular-dependent XAS at the O K edge of a bulk-like Ni film on O/Cu(110)measured at an angle ϕ = 90 (solid line) and ϕ = 20, (dashed line) between the incidentX-rays and the surface of the sample. The fine structures can be attributed to transitionsinto hybridized states as indicated. For comparison, the spectrum of NiO at the O K edgeis included in the inset [99].
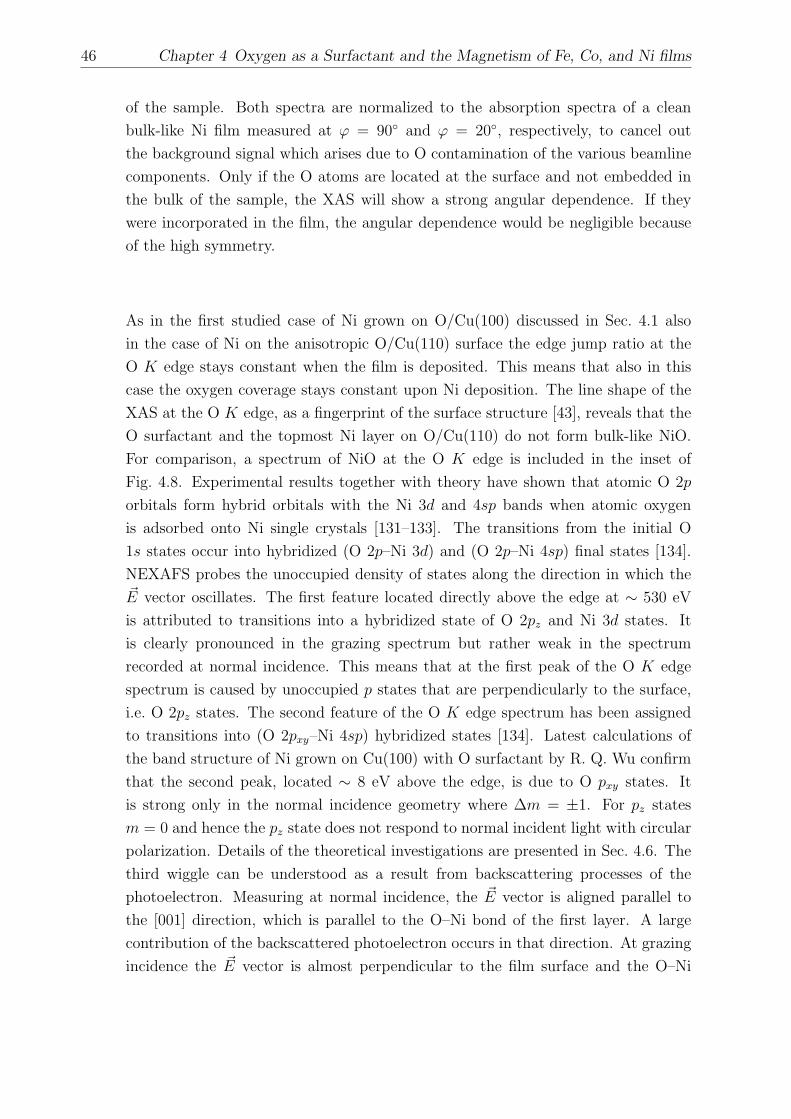
46 Chapter 4 Oxygen as a Surfactant and the Magnetism of Fe, Co, and Ni films
of the sample. Both spectra are normalized to the absorption spectra of a clean
bulk-like Ni film measured at ϕ = 90 and ϕ = 20, respectively, to cancel out
the background signal which arises due to O contamination of the various beamline
components. Only if the O atoms are located at the surface and not embedded in
the bulk of the sample, the XAS will show a strong angular dependence. If they
were incorporated in the film, the angular dependence would be negligible because
of the high symmetry.
As in the first studied case of Ni grown on O/Cu(100) discussed in Sec. 4.1 also
in the case of Ni on the anisotropic O/Cu(110) surface the edge jump ratio at the
O K edge stays constant when the film is deposited. This means that also in this
case the oxygen coverage stays constant upon Ni deposition. The line shape of the
XAS at the O K edge, as a fingerprint of the surface structure [43], reveals that the
O surfactant and the topmost Ni layer on O/Cu(110) do not form bulk-like NiO.
For comparison, a spectrum of NiO at the O K edge is included in the inset of
Fig. 4.8. Experimental results together with theory have shown that atomic O 2p
orbitals form hybrid orbitals with the Ni 3d and 4sp bands when atomic oxygen
is adsorbed onto Ni single crystals [131–133]. The transitions from the initial O
1s states occur into hybridized (O 2p–Ni 3d) and (O 2p–Ni 4sp) final states [134].
NEXAFS probes the unoccupied density of states along the direction in which the~E vector oscillates. The first feature located directly above the edge at ∼ 530 eV
is attributed to transitions into a hybridized state of O 2pz and Ni 3d states. It
is clearly pronounced in the grazing spectrum but rather weak in the spectrum
recorded at normal incidence. This means that at the first peak of the O K edge
spectrum is caused by unoccupied p states that are perpendicularly to the surface,
i.e. O 2pz states. The second feature of the O K edge spectrum has been assigned
to transitions into (O 2pxy–Ni 4sp) hybridized states [134]. Latest calculations of
the band structure of Ni grown on Cu(100) with O surfactant by R. Q. Wu confirm
that the second peak, located ∼ 8 eV above the edge, is due to O pxy states. It
is strong only in the normal incidence geometry where ∆m = ±1. For pz states
m = 0 and hence the pz state does not respond to normal incident light with circular
polarization. Details of the theoretical investigations are presented in Sec. 4.6. The
third wiggle can be understood as a result from backscattering processes of the
photoelectron. Measuring at normal incidence, the ~E vector is aligned parallel to
the [001] direction, which is parallel to the O–Ni bond of the first layer. A large
contribution of the backscattered photoelectron occurs in that direction. At grazing
incidence the ~E vector is almost perpendicular to the film surface and the O–Ni

4.3 On the Electronic Structure 47
Figure 4.9: NEXAFS at the O K edge ofthe 3d ferromagnets grown on Cu(100)with oxygen as a surfactant at normal(ϕ = 90, solid line) and grazing (ϕ =20, dashed line) incidence of the X-rays[125].
530 550 570
0
0.5
1.0
Ni
0
0.5
1.0
1.5
Co
0
0.5
1.0
Fe
Norm
alized
XAS
(arb.
units)
E (eV)
h
h
rows of the first layer. In that case, the effective coordination number is smaller and
hardly any response from the scattered photoelectron is visible.
The systematic trends in the electronic structure across the series of the 3d FMs are
evident from the angular-dependent NEXAFS of 3 ML Fe, 4 ML Co, and 15 ML
Ni grown on Cu(100) with O surfactant (Fig. 4.9). The spectra are measured at
normal (ϕ = 90, solid line) and grazing (ϕ = 20, dashed line) incidence of the X-
rays. The NEXAFS of Co was recorded with linearly polarized X-rays, the ~E vector
aligned perpendicular to the [011] direction. In the case of Ni and Fe the isotropic
XAS which is the average of the XAS recorded with circular polarized light of the
two helicities is shown. All spectra in Fig. 4.9 are normalized to the absorption of
the clean Cu(100) substrate measured at ϕ = 90 and ϕ = 20, respectively. Their
edge jumps are normalized to unity. The edge jump ratio is constant within the
experimental error bar and amounts JR ≈ 6 %. The clear angular dependence of
the spectra occurs for all the 3d films. Thus, the conclusions drawn therefrom in
the case of Ni are valid also in the case of Fe and Co. (i) The oxygen atoms detach

48 Chapter 4 Oxygen as a Surfactant and the Magnetism of Fe, Co, and Ni films
852 854
4
2
L2
L3
E (eV)
Norm
.XAS
(arb.
units)
850 870 890
0
2
4
L3
Figure 4.10: Normalized XAS at the Ni L2,3 edges of 18 ML Ni/Cu(110) (solid line) and6.5 ML (dotted line) Ni on O/Cu(110). For comparison, a spectrum of NiO is also included(dashed line). The inset shows the variation of the intensity of the spectra at the L3 edgedue to the charge transfer from Ni to O [99].
from the substrate crystal and float to the top of the film. (ii) No bulk-like oxide
with the ferromagnet is formed since this would mean to incorporate the O into the
film which would reduce the angular dependence. (iii) The spectral features and
their angular dependence in the NEXAFS at the O K edge are very similar for all
three FMs. Thus, the local structure and the local bonding of the surfactant oxygen
atoms to the 3d FM atom are alike. The differences in the line shape between the
spectra of the films on the two Cu surfaces especially at the second and third peak
reflect the differences in the local structure of the O atoms on the two surfaces. This
becomes clear from the hard sphere models of Fig. 4.6. On the Cu(110) surface
the Ni–O bond is exactly parallel to the ~E vector whereas for the Cu(100) surface
there is an angle of 45 between the ~E vector and the bond of the O and its nearest
neighbor Ni atom.
Before turning to the magnetic properties of the surfactant grown 3d FMs in the next
section, the properties of the electronic structure at the L2,3 edges are to be discussed
now. Figure 4.10 shows the normalized XAS of 6.5 ML epitaxially grown Ni on the
(2× 1) O/Cu(110) surface (dotted line) and 18 ML Ni on clean Cu(110) (solid line)
in the energy range of the Ni L2,3 edges. Additionally, a spectrum of NiO is included
(dashed line). The intensity of the XAS at the Ni L2,3 edges is increased in both

4.4 On the Magnetism 49
the NiO and the Ni film grown on O/Cu(110). The inset shows this enhancement
enlarged at the L3 edge. The enhanced XAS intensity is caused by a charge transfer
from Ni to O states, which results in an increase of the number of Ni d holes nh
(nh = 1.45 per atom for Ni bulk [135]), because the transitions from initial 2p states
at the Ni L2,3 edges occur into unoccupied 3d states which NEXAFS probes. Two
effects influence the white line intensity of the Ni XAS spectra of the surfactant
grown films. (i) A charge transfer from Cu to Ni at the Ni/Cu interface leads to
reduction of the XAS intensity of Ni on Cu substrates [135]. (ii) As discussed, an
additional charge transfer occurs from the Ni film to the O surfactant. Since an
increase of the white line intensity is observed, the charge transfer from Ni to O
is larger than the one from Cu to Ni. Comparing the clean Ni films to the ones
grown on the O-reconstructed Cu surface, the difference is to be attributed to the
influence of the oxygen. The number of d holes per Ni atom nh averaged over the
entire Ni film is in good approximation proportional to the integral over the XAS
[53, 135]. The the proportionality factor is obtained from the integral of the XAS of
a bulk-like sample with known number of d holes. Integrating yields nh = 1.50(6)
per atom for the 6.5 ML Ni film grown on O/Cu(110). The charge transfer from Ni
to O is similar to the one observed in Ni films on O/Cu(100) where nh = 1.52(6)
per atom for 4.5 ML Ni on O/Cu(100) was determined [5]. Furthermore, like at the
O K edge, the line shape excludes the formation of bulk-like NiO. The intensity at
the maxima of the Ni L2,3 edges is significantly enhanced compared to the cases of
clean and surfactant grown Ni films on Cu because in NiO the largest charge transfer
from Ni to O occurs. In between the edges the absorption decreases down to the
continuum background. The reason for this may be that the Ni d band is narrower
in NiO than in Ni metal as it may be expected for the more localized 3d states of
the ionic Ni–O bond in NiO.
4.4 On the Magnetism
Talking about magnetism of the surfactant grown Fe, Co, and Ni films on Cu(100)
it is most evident to study the magnetism of the FMs themselves first. The present
section deals with this topic. However, similar to O adsorbed onto a Co film [121]
the oxygen atoms on the surfactant grown films may acquire an induced magnetic
moment. The advantage in this case is that the L2,3 edges of the 3d FMs as well
as the O K edge are located in the soft X-ray regime. Hence, both the induced
magnetism in the surfactant and the magnetic properties of the FM films can be
probed in the same experiment as shown in Fig. 4.11 for the case of Co. The

50 Chapter 4 Oxygen as a Surfactant and the Magnetism of Fe, Co, and Ni films
E (eV)
Norm
.XAS
/XM
CD
(arb.
units)
530 540 780 790 800 810
-2
0
2
4
6+
Co L3edge
O K edge
30
Co L2edge
-
XMCD
Figure 4.11: Normalized X-ray absorption coefficient and XMCD at the O K edge andCo L2,3 edges of the surfactant grown Co film. The XMCD at the O K edge has beenscaled by a factor of 30 for clear visibility [99].
absorption coefficient for left and right circular polarized light (dashed and dotted
lines) and the XMCD (solid lines) at the O K edge and the Co L2,3 edges are plotted.
The XAS are normalized to unity at each edge. A clear XMCD signal is observed at
the Co L2,3 edges. At the O K edge a difference between the absorption coefficient
for left and right circular polarized light can hardly be made out by eye. However,
due to the sensitivity at the UE56-PGM beamlines also a tiny XMCD signal at the
O K edge can be revealed after their subtraction (note the scaling factor for the
O K edge XMCD). The appearance of this signal shows that indeed the Co film
induces a magnetic moment in the surfactant oxygen. This induced magnetism at
the O site is discussed in detail in the subsequent Sec. 4.5.
First, the case of Ni shall be discussed in detail as a function of the thickness of the
films. The results obtained on the two surfaces, i.e. the highly symmetric Cu(100)
and the more anisotropic and open Cu(110) surface are compared. The investigations
are mainly restricted to a thickness range where the easy magnetization direction of
Ni is perpendicular to the surface of the sample. The measurements were therefore
carried out at normal incidence, because XMCD probes the projection of the mag-
netization onto the direction of the ~k vector of the incoming photons. In the rarely
studied case of Ni on the Cu(110) surface the question of in-plane easy axis has not

4.4 On the Magnetism 51
E (eV)
Norm
.XM
CD
(arb.
units)
850 870 890
-1
0
0
-1
851 853
L3 L20.4
0.2
0 869 871
Figure 4.12: Normalized XMCD spectra at the Ni L2,3 edges of 18 ML Ni/Cu(110) (solidline), 6.5 ML Ni on O/Cu(110) (dotted line), and 5.5 ML Ni on O/Cu(100) (dashed line)at T = 30 K. The inset shows the variation of the intensity of the spectra at the L3 edge[99].
yet been finally clarified. Therefore, magnetic moments cannot be reliably deduced
from XMCD measurements for in-plane magnetized samples.
In Fig. 4.12 the XMCD of thin Ni films grown with O surfactant slightly above the
SRT, i.e. with easy axis perpendicular to the surface of the samples, are compared
to clean bulk-like Ni (solid line). The most striking observation is the difference
between the Ni films of the two different Cu substrate surfaces. The inset shows the
variation of the intensity of the spectra at the L3 edge. The XMCD signal of 5.5
ML Ni on O/Cu(100) (dashed line) is reduced compared to the thick Ni film. In
contrast, on O/Cu(110) 6.5 ML Ni (dotted line) show an enhanced XMCD signal. 18
ML Ni/Cu(110) have been chosen as the example with bulk-like XMCD. The other
investigated thick Ni films with and without O surfactant on the two Cu surfaces (12
ML clean Ni/Cu(100), 18 ML clean Ni/Cu(110), and 18 ML Ni on O/Cu(110) – not
included in Fig. 4.12) do not show any significant differences in their XMCD spectra
within 5 %. Hysteresis loops of perpendicularly magnetized Ni films grown with
O surfactant taken by polar MOKE at room temperature show square-like shapes
on both the Cu(110) surface (shown in Fig. 4.13) [77, 99] and the Cu(100) surface
[4, 77]. The magnetic signal at remanence is the same as in saturation ensuring

52 Chapter 4 Oxygen as a Surfactant and the Magnetism of Fe, Co, and Ni films
bulk
0
200
400
600
0 6 10 14 18
M(kA/m
)
d (ML)Ni
-1
Kerr
Ellip
tic
ity
(arb.
units)
H (kA/m)
-2 0 2
1
0
8 ML
13 ML
20 ML
Figure 4.13: Magnetization as a function of the Ni film thickness obtained from the XMCDspectra for Ni on O/Cu(110) (solid circles) and Ni on O/Cu(100) (open circles) [99]. Themagnetization of the reference sample (solid diamond for Ni/Cu(110), open diamond forNi/Cu(100)) was fixed to the value for Ni bulk (marked by the dashed line) as describedin the text. The inset shows square-like hysteresis loops of Ni on O/Cu(110) measured bypolar MOKE at room temperature [77].
a single domain state of the films. The magnetization of films with out-of-plane
magnetization can hence safely be transferred into magnetic moments.
As explained in Sec. 2.3, the magnetization of the Ni films is proportional to the
ratio ∆A3/A3 of the integrated areas at the Ni L3 edge of the normalized XAS (A3)
and the XMCD spectra (∆A3). The proportionality factor is determined by calcu-
lating ∆A3/A3 of 18 ML Ni grown on the clean Cu(110) and assuming a Ni bulk
magnetization MbulkNi = 528 kA/m. On the Cu(100) a 12 ML Ni film serves as the
reference. The change of the number of Ni d holes nh is also taken into account.
Figure 4.13 shows the Ni magnetization as a function of the Ni thickness comparing
the results on the two surfaces: Ni on O/Cu(110) (solid circles) and on O/Cu(100)
(open circles). The magnetization values of the reference samples are included as
diamonds (solid for Ni on Cu(110), open for Ni on Cu(100)). The discussion will be
started with the more studied Cu(100) surface. Down to 6.5 ML Ni on O/Cu(100)
the magnetization does not change within the error bar and remains at the bulk
value. As may already be observed at first glance in the XMCD spectra, the mag-
netization decreases below 6.5 ML. Compared to the bulk, the Ni magnetization is

4.4 On the Magnetism 53
reduced by ∼ 18% for 5.5 ML Ni on O/Cu(100). Assuming the magnetic moments
for inner Ni layers (mbulkNi = 0.61µB) and the Ni-Cu interface (minterface
Ni = 0.31µB)
[56], one may estimate the reduction to be in the order of up to ∼ 50% for the
magnetic moment in the surface layer of the 5.5 ML sample. It is known that the
magnetic moment of Ni at an interface to Cu is reduced [56, 65]. Looking at the
surface layer of clean Ni/Cu(100) facing vacuum an increased magnetic moment is
observed. No change in the total magnetization results for thin films of Ni/Cu(100)
compared to bulk Ni, because the reduction at the interface is compensated by the
enhancement at the surface [56]. Here in the case of surfactant grown films, 5.5 ML
Ni on O/Cu(100) show a reduction of the magnetization signal compared to bulk Ni.
This means effectively that the O surfactant lowers the surface magnetic moment.
In the case of Ni films on the reconstructed O/Cu(110) just the opposite compared
to Ni on O/Cu(100) is found: the total magnetization increases with decreasing
Ni thickness. The magnetization of 6.5 ML Ni on O/Cu(110) is approximately 9%
larger than the bulk value, although a reduction of similar size as on Cu(100) is
also expected for the Ni moment at an interface to Cu(110) [65]. This means that
Ni films on O/Cu(110) show an enhanced surface magnetization. The magnetic
moment of the surface layer is estimated at msurfNi ≈ 0.9 µB, which is ∼ 48% larger
than Ni bulk. Assuming that O has a similar influence on the Ni magnetization
on the two surfaces, an additional mechanism is needed that leads to the observed
enhancement on O/Cu(110). The main difference observed in the STM experiments
between Ni films on the two surfaces is their roughness, in particular at 6–8 ML. As
summarized in Sec. 4.1, Ni films grow layer-by-layer on the O/Cu(100) throughout
the entire thickness range whereas for the Ni on O/Cu(110) the roughness shows
a local maximum at 6–8 ML (Fig. 4.2). Several works have reported similar cor-
relations between surface roughness and magnetic properties, e.g. magnetic surface
anisotropy, giant magnetoresistance, and coercive field [136–139].
A full detailed sum rule analysis elucidates the magnetic moments of the investi-
gated Ni films. For Ni the sum rules have proven to be applicable. The complete
procedure with its limitations is discussed in Sec. 2.3. First of all, the ratio mL/meffS
is considered. Here, the contribution of the magnetic dipole term 〈Tz〉 contained
in the spin sum rule is not separated. Only an effective spin moment is obtained.
In Table 4.2 the values mL/meffS of Ni films on the two Cu surfaces are given. In
the considered thickness range the ratio stays constant for Ni on O/Cu(100). This
agrees with investigations of Ni films on Co/Cu(100) where an increase of the ratio
is observed only at a Ni thickness lower than 2 ML [53]. The authors of Ref. [53] find
mL/meffS = 0.12 for a 10 ML Ni film. In general, the tetragonal distortion of ultrathin
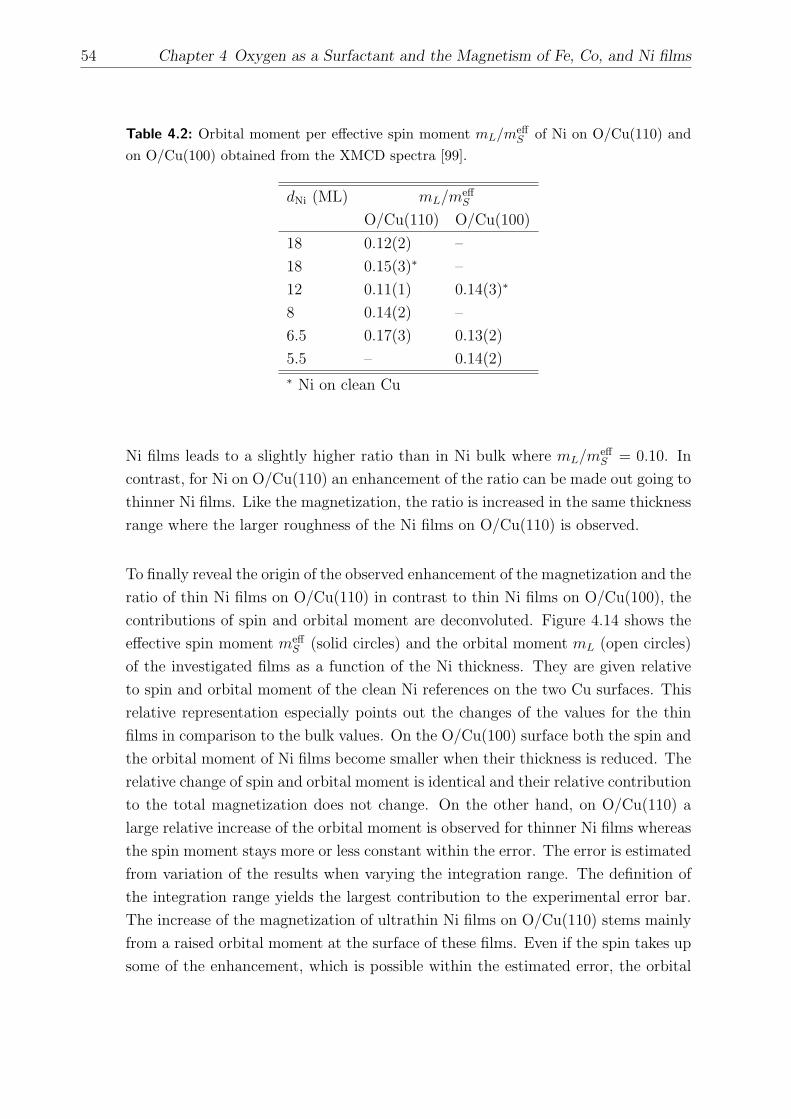
54 Chapter 4 Oxygen as a Surfactant and the Magnetism of Fe, Co, and Ni films
Table 4.2: Orbital moment per effective spin moment mL/meffS of Ni on O/Cu(110) and
on O/Cu(100) obtained from the XMCD spectra [99].
dNi (ML) mL/meffS
O/Cu(110) O/Cu(100)
18 0.12(2) –
18 0.15(3)∗ –
12 0.11(1) 0.14(3)∗
8 0.14(2) –
6.5 0.17(3) 0.13(2)
5.5 – 0.14(2)
∗ Ni on clean Cu
Ni films leads to a slightly higher ratio than in Ni bulk where mL/meffS = 0.10. In
contrast, for Ni on O/Cu(110) an enhancement of the ratio can be made out going to
thinner Ni films. Like the magnetization, the ratio is increased in the same thickness
range where the larger roughness of the Ni films on O/Cu(110) is observed.
To finally reveal the origin of the observed enhancement of the magnetization and the
ratio of thin Ni films on O/Cu(110) in contrast to thin Ni films on O/Cu(100), the
contributions of spin and orbital moment are deconvoluted. Figure 4.14 shows the
effective spin moment meffS (solid circles) and the orbital moment mL (open circles)
of the investigated films as a function of the Ni thickness. They are given relative
to spin and orbital moment of the clean Ni references on the two Cu surfaces. This
relative representation especially points out the changes of the values for the thin
films in comparison to the bulk values. On the O/Cu(100) surface both the spin and
the orbital moment of Ni films become smaller when their thickness is reduced. The
relative change of spin and orbital moment is identical and their relative contribution
to the total magnetization does not change. On the other hand, on O/Cu(110) a
large relative increase of the orbital moment is observed for thinner Ni films whereas
the spin moment stays more or less constant within the error. The error is estimated
from variation of the results when varying the integration range. The definition of
the integration range yields the largest contribution to the experimental error bar.
The increase of the magnetization of ultrathin Ni films on O/Cu(110) stems mainly
from a raised orbital moment at the surface of these films. Even if the spin takes up
some of the enhancement, which is possible within the estimated error, the orbital

4.5 Induced Magnetism at the O Site 55
Ni on O/Cu(110)
(a)
0 6 10 14 18
0.5
1.0
1.5
d (ML)Ni
refe
rence
msam
ple
m/
Sm
Lm
0 6 10 140.6
0.8
1.0
1.2
refe
rence
msam
ple
m/
d (ML)Ni
Ni on O/Cu(100)
(b)
Sm
Lm
Figure 4.14: Orbital (solid circles) and effective spin (open circles) moment of Ni on the Oreconstructed substrate relative to spin and orbital moment of bulk-like Ni on the clean Cusubstrate [99]. (a) Ni on O/Cu(110), reference: 18 ML Ni/Cu(110), (b) Ni on O/Cu(100),reference: 12 ML Ni/Cu(100).
moment must take up around 50 % of the total enhancement. This is quite a lot
considering that the orbital moment is only 10−15 % of the spin moment. In general,
a reduced coordination number leads to an unquenching of the orbital moment. At
the rougher surface, the coordination of the surface atoms is reduced compared to
a flat film. Hence, the increase of the orbital moment may be attributed to the
rougher growth of these films.
Summarizing, the influence of O surfactant growth on the magnetic properties of
a ferromagnetic film has been evidenced by XMCD measurements using Ni on Cu
substrates as an example. Especially, spin and orbital contributions have been sepa-
rated by applying the integral sum rules. In the following section the focus is turned
to the magnetic properties of the surfactant O itself.
4.5 Induced Magnetism at the O Site
It was shown by investigation of the XMCD at the O K edge in the group of
T. Ohta that a magnetic moment will be induced in 0.5 ML oxygen if adsorbed onto
a ferromagnetic Co film [121]. The sensitivity of the XMCD technique is sufficiently
good to detect the XMCD signal that occurs due to the induced orbital moment in
0.5 ML oxygen. At the beginning of the preceding section it is already mentioned
that the same observation of induced magnetism at the O site can be made in Co
films grown with O surfactant on Cu(100) (Fig. 4.11). When adsorbing oxygen onto
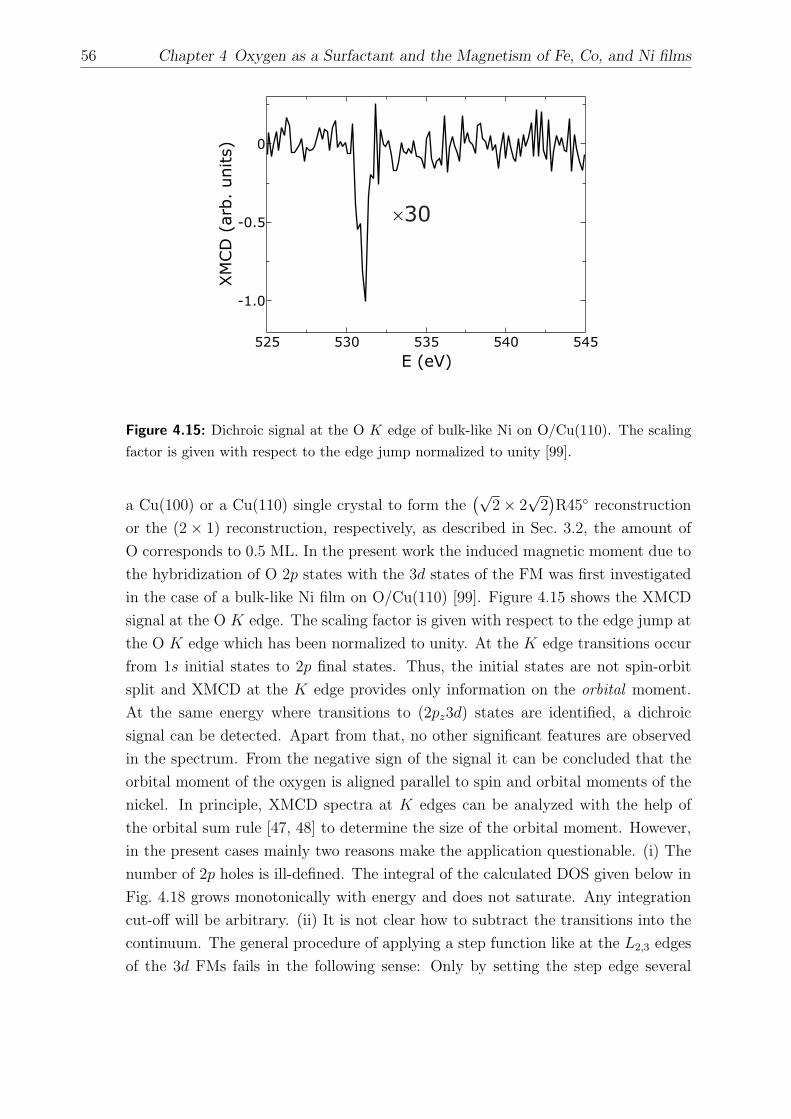
56 Chapter 4 Oxygen as a Surfactant and the Magnetism of Fe, Co, and Ni films
525 530 535 540 545
-1.0
-0.5
0
XM
CD
(arb.
units)
E (eV)
30
Figure 4.15: Dichroic signal at the O K edge of bulk-like Ni on O/Cu(110). The scalingfactor is given with respect to the edge jump normalized to unity [99].
a Cu(100) or a Cu(110) single crystal to form the(√
2× 2√
2)R45 reconstruction
or the (2× 1) reconstruction, respectively, as described in Sec. 3.2, the amount of
O corresponds to 0.5 ML. In the present work the induced magnetic moment due to
the hybridization of O 2p states with the 3d states of the FM was first investigated
in the case of a bulk-like Ni film on O/Cu(110) [99]. Figure 4.15 shows the XMCD
signal at the O K edge. The scaling factor is given with respect to the edge jump at
the O K edge which has been normalized to unity. At the K edge transitions occur
from 1s initial states to 2p final states. Thus, the initial states are not spin-orbit
split and XMCD at the K edge provides only information on the orbital moment.
At the same energy where transitions to (2pz3d) states are identified, a dichroic
signal can be detected. Apart from that, no other significant features are observed
in the spectrum. From the negative sign of the signal it can be concluded that the
orbital moment of the oxygen is aligned parallel to spin and orbital moments of the
nickel. In principle, XMCD spectra at K edges can be analyzed with the help of
the orbital sum rule [47, 48] to determine the size of the orbital moment. However,
in the present cases mainly two reasons make the application questionable. (i) The
number of 2p holes is ill-defined. The integral of the calculated DOS given below in
Fig. 4.18 grows monotonically with energy and does not saturate. Any integration
cut-off will be arbitrary. (ii) It is not clear how to subtract the transitions into the
continuum. The general procedure of applying a step function like at the L2,3 edges
of the 3d FMs fails in the following sense: Only by setting the step edge several

4.5 Induced Magnetism at the O Site 57
Figure 4.16: XMCD at the O K
edge of the 3d ferromagnets grown onCu(100) with oxygen as a surfactant[125].
525 530 535 540
-0.05
0
x3
-0.05
0
-0.05
0
Norm
alized
XM
CD
(arb
.units)
E (eV)
Fe
Co
Ni
h
h
h
eV above the O K edge and by assuming a very broad step it is possible to avoid
apparent negative contributions, which of course would be nonphysical. Thereby
the determination of the integrated area becomes arbitrary.
The orientation of the spin moments of Ni and O is not straightforward evident. It
cannot be directly compared to the situation of NiO, where one usually discusses
the antiparallel orientation of the Ni spins to each other in terms of superexchange.
Since there is no experimental access to the O spin moment the question whether
the coupling of the Ni and O spin moments is ferromagnetic or antiferromagnetic
cannot be answered from the experiment. Theoretical investigations of spin-resolved
density of states predict a parallel alignment of the induced O spin moment to the
Ni spin moment [6]. Concluding, the situation of the O as a surfactant for Ni on
Cu(100) is similar to O adsorbed on ultrathin Co films [121]. The sign and the order
of magnitude of the XMCD signal at the O K edge are the same in both cases.
To study the systematics of the induced magnetism a the O site, films of all three
FM 3d elements have been grown on Cu(100) with the help of O surfactant. The

58 Chapter 4 Oxygen as a Surfactant and the Magnetism of Fe, Co, and Ni films
thickness has been chosen such that all films are FM at room temperature. Thus, in-
vestigations at low temperature are not necessary to detect the induced magnetism.
The XMCD signal of the induced moment is very small, only about 8 percent nor-
malized to the oxygen edge jump (Jr ≈ 6%). Any additional noise as it may occur at
low temperatures, e.g. caused by vibrations due to the flowing liquid helium, has to
be avoided. The measurements remain, however, quite demanding for the setup of
the beamline. Various pairs of the two directions of the magnetization are measured
at positive and negative helicity. At least four good ones of them are averaged in
each case.
In Fig. 4.16 the XMCD signals at the O K edge of all three elements Fe, Co,
and Ni are plotted. The XMCD at the O K edge is much sharper (about 1 eV
FWHM) compared to the XMCD at the L2,3 edges of the FMs. In all three cases
it is located at 530 eV, i.e. the energy where the NEXAFS shows a sharp structure
that originates from hybridized 2pz3d states. This indicates that only the O 2pz
orbitals are polarized which hybridize with the 3d band of the FM. Furthermore,
the excellent statistics even allows for the identification of a small asymmetry in
the O XMCD, the small positive contribution located at about 532 eV. The main
contribution is negative in all three cases revealing that the induced orbital moment
is aligned parallel to the spin and orbital moments of the ferromagnetic films. At
538 eV, no XMCD signal is detected. The conclusion of this is that the O pxy states
are not magnetically polarized, only the O 2pz states.
The XMCD signal at the O K edge is largest in the case of Co and smallest in the
case of Ni. To explain this finding two effects have to be taken into account. (i)
One may expect that the magnetic moment of the FM film determines the size of
the induced moment and thus the size of the XMCD signal at the O K edge. That
would mean that Fe (total bulk magnetic moment: mbulktot = 2.1 µB/atom) induces the
largest signal, followed by Co (mtot = 1.6µB/atom) and Ni (mbulktot = 0.6µB/atom).
(ii) Only the O 2pz orbitals are polarized which are probed stronger at grazing X-
ray incidence (see Fig. 4.9). Since the Co film is magnetized in the film plane, the
sample is measured at grazing incidence and therefore the largest O K edge XMCD
is determined for this case, followed by Fe and Ni (please note the enlargement
factor for Ni), which are measured at normal X-ray incidence. The line shape of
the O K edge XMCD spectra is similar in all three cases. It compares well to
the ones reported in literature at the O K edge for atomic oxygen adsorbed on Co
films [121] and molecular CO on Ni [122] and Co [123] films. Furthermore, similarly
sharp dichroic features are detected in reflectance at the carbon K edge of Fe/C
multilayers [124].

4.6 Comparison to Theory 59
Figure 4.17: Top: CalculatedXAS and XMCD at the O K
edge of the O surfactant onthe fcc Fe(100) (dash-2-dottedline), Co(100) (dashed line), andNi(100) (dotted line) surfaces.Bottom: Comparison of measured(solid line) and calculated (dot-ted line) XAS and XMCD of theO surfactant on the Ni(100) film.Note that there is no scaling fac-tor between experiment and cal-culation. The scale of the XASis given on the left hand side, theone of the XMCD on the righthand side [125].
-2
0
2
-0.05
0
0.05
530 540 550
-2
0
2
-0.02
0
0.02
E (eV)
Norm
alized
XAS
(arb.
units)
Norm
aliz
ed
XM
CD
(arb.
units)
Fe
Co
Ni
Experiment
Theory
4.6 Comparison to Theory
The accompanying theoretical investigations have been carried out by R. Q. Wu,
at the University of California in Irvine, USA. Density functional calculations for O
adsorption on fcc Fe(100), Co(100), and Ni(100) surfaces have been conducted using
the “thin-film full potential linearized augmented plane wave” (FLAPW) method
[140, 141]. To account for the geometry of the samples, a c(2× 2) oxygen layer is
placed on top of a 7-layer slab of 3d atoms. The lattice parameter in the lateral
plane is fixed to the one of bulk Cu (a = 3.61 A). The vertical positions of all
the atoms are optimized in an energy minimization procedure guided by the atomic
forces calculated from first principles. Both the local density approximation (LDA)
[142] and the generalized gradient approximation (GGA) [143, 144] are adopted
to describe the exchange correlation interaction. The LDA calculations yield an
optimized distance between the oxygen atom and its nearest Fe, Co, and Ni neighbor,
respectively, of Rnn = (1.85 − 1.86) A depending on the 3d element. A distance of
Rnn = 1.93A results from GGA calculations. The LDA result agrees well with
the experimentally determined value from the SEXAFS data in Sec. 4.2. Thus,
the NEXAFS and XMCD spectra are calculated with LDA. In general, LDA yields
better results for oxides, whereas GGA is the method of choice for metals. A priori

60 Chapter 4 Oxygen as a Surfactant and the Magnetism of Fe, Co, and Ni films
Table 4.3: Calculated spin magnetic moments and orbital magnetic moments induced inthe oxygen in 3d FM films grown with O surfactant.
mS (µB/atom) mL (µB/atom)
Fe 0.053 0.0024
Co 0.132 0.0047
Ni 0.053 0.0021
it is not clear which of the methods is suited best in the present case where a metal
is in contact with an oxide-like surface. Considering the NEXAFS results excluding
the formation of bulk-like oxides at the surface, one might expect that GGA fits
better. For that reason GGA was chosen in the earlier calculations of Ref. [6], when
the SEXAFS results presented in Fig. 4.7 had not been know yet. It is known that
GGA overestimates lattice sizes of oxides. The calculations here of O on 3d FMs
reveal that it also does so on a surface in this case. The positions of the FM 3d atoms
are nevertheless optimized with GGA, because for them the gradient corrections are
crucial. In presence of O some displacement of the atoms in the subsurface layer
occurs. For example, the subsurface Fe atom right beneath the O adatom goes
inwards by 0.08 A in O/Fe(100), whereas the other Fe atoms remain at their bulk
positions. The interlayer distance between adjacent 3d layers is, depending on the
element, (1.73− 1.75) A in agreement with I(V )-LEED results [77].
The top panel of Fig. 4.17 shows the calculated XAS and XMCD spectra. In the cal-
culations only dipole transitions are treated. The spectra are convoluted by Doniach-
Sunjic shapes of 0.45 eV width for lifetime broadening [145], and the theoretical
spectra are shifted by 25 eV in energy to accommodate the core hole relaxation
effect. The bottom panel of Fig. 4.17 presents the experimental data for Ni grown
on O/Cu(100) together with the theoretical results. All spectroscopic features, i.e.
the peak structures and the ratio between XAS and XMCD are well reproduced.
Note also that there is no scaling factor between experiment and calculation. This
indicates that the model used in the calculations represents the atomic arrangements
in experimental samples very well.
The calculated spin and orbital moments projected into the O muffin-tin sphere
are summarized in Table 4.3. The O atoms also influence the magnetization of the
surface 3d atoms. The spin magnetic moment of a surface Ni atom is msurfNi = 0.26 µB,
less than half of the one of an interior Ni atom with minnerNi = (0.66−0.69) µB. These

4.6 Comparison to Theory 61
-10 -5 0 5 10
-1
0
1
DO
S(states/eV.a
tom
.spin
)
E - E (eV)F
Fe
Co
Ni
0.2
0
-0.2
0 2
Figure 4.18: Calculated density of O p states. Positive and negative values represent statesin the majority and minority spin channels, respectively. The energy E is given relativeto the energy EF of the Fermi level. The inset shows the region close to EF [125].
values compare with the ones of a Ni/Cu interface where minterfaceNi = 0.31µB and
minnerNi = 0.61 µB have been determined experimentally [56]. Due to the fact that in
an earlier publication [6] only GGA calculations were carried out, the values of the
magnetic moments here differ from the ones reported earlier. In fact, the magnetic
moments and the XMCD spectra depend sensitively on the height of oxygen atom
on the substrates. When the GGA structure (h = 0.68 A) is adopted, for example,
the spin and orbital magnetic moments of O in O/Ni(100) are 0.17µB and 0.0025µB,
respectively. Consequently, the XMCD peak is larger than that shown in Fig. 4.17.
The agreement of the calculated XMCD and the measured one reveals that indeed
the LDA result of Rnn = (1.85 − 1.86) A for the O–3d bond length should be
considered to be the better one. Furthermore, the core hole relaxation does not
significantly affect the profile of the XAS and the XMCD [146].
Although the induced spin and orbital magnetic moments of O are small, the XMCD
is sizable for all three systems. When comparing the energy position of the XMCD
to the plot of the density of states (DOS) with O–2p features shown in Fig. 4.18,
it becomes evident that these XMCD peaks stem from the substrate induced states
right above the Fermi level. These states show a strong spin polarization and have
an imbalance in the m = 1 and m = −1 compositions of their wave functions.
This is mainly because of the large spin-orbit coupling inherited from the substrate

62 Chapter 4 Oxygen as a Surfactant and the Magnetism of Fe, Co, and Ni films
atoms. In the calculation the position of these states shift to the higher energy
side in a sequence as O/Ni(100), O/Co(100), and O/Fe(100). In the experiment
this shift is hardly visible (see e.g. the difference between data for O/Fe(100) and
O/Ni(100)). The two other main peaks in Fig. 4.18, (7 − 8) eV and (17 − 19) eV
above Ef , show a very small exchange splitting and a weak resonance with the
substrate states. Subsequently, they are only visible in the XAS but not in XMCD.
Finally, the calculations confirm that the states 7 − 8 eV above the Fermi energy
are px,y features, as deduced from the dependence of their intensity on the angle of
incidence. Concluding, the calculations reproduce the measured spectra quite well.
Thus, the theoretical results confirm and complement the experimental findings by
providing, for instance, the magnetic moments.

Chapter 5
Importance of Enhanced Spin
Fluctuations in Two-Dimensional
Co/Cu/Ni Trilayers
Magnetic multilayers have become important for current research since they show
a large number of magnetic effects that are not present in bulk material. Their
relevance for technological applications due to their magnetic properties is nowadays
well accepted (see e.g. Ref. [147]). In the present chapter, two effects in magnetic
multilayers – spin fluctuations and the interlayer exchange coupling (IEC) – are
discussed from a fundamental point of view. The main question is what happens
when the two are considered simultaneously in the limit of 2D layers.
Coupled Co/Cu/Ni trilayers on a Cu(100) single crystal are used as a prototype
system. The element specificity of the XMCD technique is especially valuable for
the investigation of the trilayers because it reveals the magnetic behavior of each
ferromagnetic constituent individually. It is demonstrated how to take advantage
of XMCD to study temperature-dependent magnetization curves and thereby the
Curie temperature. Moreover, due to the in situ preparation and measurement
under UHV conditions it is possible to investigate the identical Ni film both with
and without IEC. For this purpose, a Ni film capped with a Cu layer of the desired
thickness is prepared and characterized first. Then, the Co film is deposited on top.
Now the Ni film can be reinvestigated under the influence of the IEC with strength
Jinter. Four characteristic temperatures are identified: the Curie temperature of
the single Ni film TC,Ni, the Curie temperature of the single Co film TC,Co, and the
two temperatures at which the individual Ni and Co magnetizations in the trilayer
vanish, T ∗C,Ni and T ∗
C,Co, respectively. The temperature T ∗C,Ni of the Ni film in the
trilayer is considerably larger by ∆TC,Ni than TC,Ni of a single Ni film with the same

64 Chapter 5 Spin Fluctuations in Two-Dimensional Co/Cu/Ni Trilayers
thickness. In general, the IEC influences also the Co film. However, since the Co is
much stronger than the Ni, the influence of the Ni on the Co is small. The Ni layer is
much more suitable to observe the effect, also because its Curie temperature is easily
tunable in a wide and convenient temperature regime up to room temperature. Thus,
the technique gives unique insight in how each ferromagnetic (FM) layer contributes
to the global behavior of the trilayer system. The experimental results together with
a theoretical model contribute to the understanding of the interplay between spin
fluctuations and IEC in magnetic multilayers.
The chapter starts with a detailed description of the motivation for the new investi-
gations of the two-dimensional (2D) magnetic Co/Cu/Ni trilayers. A short summary
of related research follows. Since a considerable number of publications by the group
about the X-ray experiments previously carried out on coupled trilayers and IEC
exists, a review of them is given separately in Sec. 5.3. Then, the new improved
experiments and how they complement the earlier findings is explained in Sec. 5.4.
The experimental results are analyzed within the theoretical model introduced in
Sec. 2.4. Section 5.5 describes the determination of some model parameters from
experimental observations. This completes the theoretical model such that the de-
sired combination of two well-known effects, i.e. the oscillatory IEC as a function of
the Cu-spacer thickness dCu and the 2D character of the magnetization as a function
of the Ni thickness dNi, become possible. The summary of all, i.e. the full depen-
dence ∆TC,Ni/TC,Ni as a function of both dNi and dCu is presented in a comprehensive
two-parameter plot in Sec. 5.6. This combination is only possible after deducing the
shift ∆TC,Ni/TC,Ni as a function of the coupling strength Jinter which – in contrast
to earlier findings in a mean field (MF) description – turns out to be nonlinear.
5.1 Motivation
In general, coupled trilayers consist of two ferromagnetic layers (FM1 and FM2) and
a nonmagnetic spacer (NM) in-between. They are the simplest type of multilayer
which exhibits an indirect coupling via a nonmagnetic spacer layer. The two effects
of spin fluctuations and IEC compete with each other and may dramatically influence
the critical behavior of the trilayers. Fig. 5.1 illustrates the situation schematically.
The strong interrelation of spin fluctuations and IEC is in particular interesting in
the 2D limits of the thickness of FM1 and NM, dFM1 and dNM, respectively, as indi-
cated by the arrows, i.e. dFM1 → 0 and dNM → 0. Spin fluctuations (or collective spin
excitations) become important when a ferromagnetic layer is reduced in thickness

5.1 Motivation 65
(b) TC, Ni
FM1 (Ni)
FM2 (Co)
NM (Cu)
dFM1
dNM
2D
spin
fluctu
ations Jinter
?
dNM
Jinter
dFM1
spin fluctuations
FM1M (T)(a)
Figure 5.1: (a) Schematic illustration of two important effects in magnetic trilayers: (i)the spin fluctuations mainly determined by dFM1, and (ii) the IEC mainly determined bydNM. The two effects compete to finally determine MFM1 in the limit of low dFM1 anddFM2 [148]. (b) Schematic illustration of a ferromagnetic cross wedge trilayer. ∆TC,Ni iscontrolled by two independent parameters: (i) the IEC depending on dNM, and (ii) thethickness dFM1, while dFM2 is kept constant [59].
down to the 2D limit. In this case the correlation length and the thickness of the
ferromagnet may reach the same order of magnitude. The coupling between spins
then occurs only along paths in a 2D plane – the third dimension is lost for pos-
sible coupling paths. Thus, enhanced spin fluctuations diminish the magnetization
of ultrathin FM films at a finite temperature. Their Curie temperature is reduced
according to the finite size scaling (see e.g. [61, 102, 149]). As indicated on the left
hand side of the graph in Fig. 5.1 (a), larger spin fluctuations lower the magnetiza-
tion MFM1 of FM1 when its thickness dFM1 is reduced. The right hand side of the
graph illustrates the second effect which leads to the opposite, i.e. an enhancement
of the magnetization: The strength Jinter of the IEC is mainly determined by the
thickness dNM of NM. Disregarding the oscillatory contribution, |Jinter| will become
larger if dNM is reduced. Due to the IEC some of the “lost” coupling is regained,
the spin fluctuations are suppressed and the magnetization increases. Thus, it is
clear that the result of the competition between the spin fluctuations in 2D and the
IEC when both dFM1 and dNM are reduced can only be fully described when the two
effects are considered in conjunction. Of course, in a full description, the oscillatory
behavior of the IEC has to be included, too.
Up to now, numerous investigations of the IEC exist that treat either the dependence
on the thickness of FM1 or the spacer thickness separately. The oscillatory character
of the IEC (ferromagnetic, FM, or antiferromagnetic, AFM, coupling between FM1
and FM2) as a function of the spacer thickness dNM is theoretically described [7, 8,
66 Chapter 5 Spin Fluctuations in Two-Dimensional Co/Cu/Ni Trilayers
150, 151] and confirmed by experiments [15, 152]. The final goal of the investigations
presented in this chapter is to combine the two effects as it is schematically indicated
in the three-dimensional plot in Fig. 5.1 (b). In wedge samples it is possible to scan
the thickness of one of the layers while the others are kept constant. Along the
x-axis in Fig. 5.1 (b) the thickness of the ferromagnetic layer FM1 is varied. The
increasing strength Jinter of the IEC with decreasing dNM is represented on the y-
axis. The z-axis of the schematic diagram shows ∆TC,Ni as a measure of the spin-spin
correlations, since this is the quantity which is directly accessible in the temperature-
dependent XMCD experiments. Experiments have shown that ∆TC,Ni oscillates as
a function of the spacer thickness in the same manner as the IEC does [153, 154].
The relative shift ∆TC,Ni/TC,Ni of the critical temperature is larger than it has ever
been observed in bulk magnetism. The first interpretations of this behavior have
been carried out within mean field descriptions which turn out to be insufficient
[14]. Collective spin excitations have to be taken into account in a more advanced
theoretical description.
5.2 Summary of Related Research
Since Grunberg et al. have reported evidence for antiferromagnetic coupling of Fe
layers across Cr interlayers [155] the systematics of this indirect coupling have at-
tracted dramatic interest. Oscillations of the coupling through spacer layers have
been reported for many different systems as a function of the spacer thickness, e.g.
Ref. [156]. Recently, a continuous and reversible tuning of the coupling via hydrogen
has been observed in Fe/V multilayers [157]. The interest in exchange coupled mul-
tilayers increased furthermore due to the discovery of the giant magnetoresistance
(GMR) effect which is the main effect by which the data in today’s hard disks is
read. The relation of IEC and GMR is explained in detail for instance in Ref. [9].
However, the transport properties and GMR are not a topic of this present thesis
and will not further be discussed.
Figure 5.2 reproduces the well-known results considering the two dependencies on
dCu and dNi separately. On the left hand side, ∆TC,Ni/TC,Ni (dNi) as discussed in
Ref. [14] is plotted. The shift δTC,Ni/TC,Ni becomes larger the thinner the Ni. A
mean field description cannot reproduce the size of the shift found in experiments.
Assuming a realistic coupling strength of Jinter = 310 µeV (solid line in Fig. 5.2)
in MF results in a relative shift in the order of 5 % only. Applying the more
advanced random phase approximation (RPA) which takes collective spin excitations

5.2 Summary of Related Research 67
interJ
310 eV
86 eV
MF
RPA
0 2 4 60
0.5
1.0
1.5
d (ML)Ni
T
/T
C,N
iC,N
i
-20 -60
-40
-20
20
40
60
0
2 3 4 5 6 7 8 9
-10
10
20
0
Cu/Ni/Cu/Ni/Cu(001)
Ni/Cu/Co/Cu(001)
J(
eV/atom
)
inter
J(
eV/atom
)
inter
d (ML)Cu
Figure 5.2: Review of the known dependencies ∆TC,Ni/TC,Ni (dNi) (left) Ref. [14], andJinter (dCu) (right) Ref. [15]. If Jinter > 0 the magnetizations of the two FM layers arealigned parallel whereas if Jinter < 0 they are aligned antiparallel.
into account, the experimental findings can be explained [14]. On the right hand
side of Fig. 5.2 the strength of the IEC is plotted as a function of the Cu spacer
thickness as calculated by Bruno [150] and measured by FMR [15]. If Jinter > 0 the
magnetizations of the two FM layers will be aligned in parallel whereas if Jinter < 0
they will be aligned antiparallel.
FMR provides the unique possibility to experimentally determine Jinter in absolute
units [158] and thus complements the picture obtained by XMCD of the indirect
coupling across a nonmagnetic spacer layer. The IEC provokes two resonance modes
in FMR spectra, the acoustical and the optical mode, corresponding to an in-phase
and an out-of-phase precession of the magnetizations in the two FM layers [159].
Ref. [160] provides a detailed review of FMR studies of the interlayer exchange
coupling in ultrathin magnetic films. FMR is also the technique which has been
mainly used to study the temperature dependence of the IEC experimentally [161,
162]. With the help of theory the origin of the temperature dependence may be
revealed [162, 163]. The different mechanisms which are known to be present in
such coupled trilayers, i.e. (i) the spacer effect due to the Fermi surface in the spacer
layer, and (ii) the magnetic effect caused by the excitation and interaction of spin
waves, may be separated [164]. Furthermore, analyzing the line width of the FMR
spectra a spin-pumping effect has been evidenced in coupled trilayers recently [165].
It has been shown that the line width of such FMR spectra may be influenced by
the temperature shift ∆TC,Ni of the Ni [166].

68 Chapter 5 Spin Fluctuations in Two-Dimensional Co/Cu/Ni Trilayers
At T = 0 the oscillatory dependence of the IEC on the spacer thickness dCu is
described by Bruno’s expression [7, 8] as a sum of sine functions over the Fermi
wave vectors kn
Jinter(dCu) =∑
n
An
d2Cu
sin(kndCu + φn) , (5.1)
with amplitudes An and phase shifts φn. This form of Bruno’s expression is called
the asymptotic expansion and has been derived under the assumption of large spacer
thickness. In Ref. [151] Bruno provides an extension, the “pre-asymptotic correc-
tions”. There, a further term of the approximation is included to improve the validity
for thin spacer thickness below ∼ 20 ML. However, the comparison of experimental
results, e.g. FMR measurements [15], to Eq. (5.1) reveal a good overall agreement
even without the correction. Moreover, the pre-asymptotic corrections introduce
more parameters that are not known a priori and would have to be determined
from a fit to the experiments. Of course, more fitting parameters make the results
less reliable. Therefore, the extension is not applied in the present work. In the
calculations for a Cu(100) spacer the superposition of two oscillations with periods
Λn = 2π/kn and phase shifts φn has been determined: the short-period oscillation
with Λ1 = 2.56 ML and φ1 = π/2 and the long-period oscillation with Λ2 = 5.88 ML
and φ2 = π. They have been confirmed by experiments [153, 167]. For the ratio
of the amplitudes, measurements find A1/A2 = 1.3(5) [167]. Considering these val-
ues, the only remaining parameter is the absolute value A1 in Eq. (5.1). A second
example where Bruno’s equation in the form of Eq. (5.1) was successfully applied
is Fe/Au/Fe(100) [168, 169]. The authors of Refs. [168, 169] model the coupling in
Fe/Au/Fe also by the sum of two sine waves and derive the phases, amplitudes, and
oscillation periods within the model. Thus, they are able to describe their exper-
imental data obtained by scanning electron microscopy with polarization analysis
(SEMPA) in the studied range of 0− 65 ML Au without the pre-asymptotic correc-
tion [168]. Only for spacers of Au thinner than ∼ 2− 3 ML they find FM coupling
across the spacer whereas the model predicts AFM coupling.
Special situations will occur in coupled trilayers if the easy axes of the two FM
layers are perpendicular to each other, i.e. one in-plane and the other one out-of-
plane. Their magnetization directions are determined by the competition between
the anisotropy energy and the coupling energy. Depending on the thickness of the
two FMs, spin reorientation between collinear and noncollinear arrangement of their
magnetization occurs and a canted Ni magnetization is observed. Although a single
Co/Cu(100) film will always have an in-plane easy axis, the Co magnetization can
be turned out-of-plane by the indirect coupling to a perpendicular magnetized Ni
5.3 Element-Specific Magnetization Curves 69
film [170–173]. In the present thesis the studies were restricted to the case of parallel
easy axes because Ni/Cu(100) never has an easy axis perpendicular to the surface of
the sample and a Curie temperature of below room temperature at the same time.
However, it is necessary for the present study to determine the Ni magnetization
close to the Curie temperature. Thus, if this temperature is considerably above
room temperature interdiffusion will happen and destroy the sample. This same
problem of interdiffusion hinders also a measurement close to the Curie temperature
of the second FM, i.e. the Co, in the present study. In a recent theoretical work
bilayers of two strongly coupled FM films have been investigated within a mean field
description [174]. They show that the coupling influences the Curie temperatures of
both films which then in the bilayer show a common TC. However, the major effect
of giant spin fluctuations in 2D ferromagnets, as present in the trilayers investigated
here, is evidenced at the temperature at which the Ni magnetization vanishes.
5.3 Element-Specific Magnetization Curves
Co/Cu/Ni trilayers have been used as a prototype system to study the IEC since
the first pioneering experiments in the group [12, 175–178]. These experiments are
summarized in this section. They revealed a separate onset of the magnetization
of the two FM layers. Depending on the Ni and Co film thickness three different
situations may occur: (i) TC,Ni < TC,Co [12, 179, 180], (ii) TC,Ni > TC,Co [181],
and (iii) TC,Ni ∼ TC,Co [182]. The corresponding boundaries between the different
cases have been determined by photoemission electron microscopy in cross-wedged
Co/Cu/Ni/Cu(100) trilayers. Element-specific magnetic domain images were taken
to reveal above which thickness magnetic ordering of the ferromagnetic layers is
observed at room temperature [183]. The temperatures at which the individual Co
and Ni magnetization vanish coincide with two peaks in the ac-susceptibility χ(T )
[12, 14, 58, 184]. This brought up the academic question if the system had two Curie
temperatures T ∗C,Ni and T ∗
C,Co [185]. In the uncoupled case the susceptibility diverges
at TC,Ni whereas in presence of a nonvanishing IEC, it shows a resoncance-like peak.
Thus, in a strict thermodynamical sense the trilayers do not show a phase transition
at T ∗C,Ni. The true phase transition of the whole trilayer happens at T ∗
C,Co where both
the Ni and the Co susceptibility show a singularity [58]. However, in a practical
situation it makes sense to call T ∗C,Ni a quasi-critical temperature [12, 13]. Bergqvist
et al. have calculated the spin-spin correlations for a trilayer with TC,Ni < TC,Co.
They find that the spin-spin correlations above T ∗C,Ni are very small and indeed the
Ni magnetization, which is the order parameter, practically vanishes [186].

70 Chapter 5 Spin Fluctuations in Two-Dimensional Co/Cu/Ni Trilayers
The IEC induces a strong magnetization into the material with the lower Curie tem-
perature [12, 14, 55, 180–183, 187]. If TC,Ni < TC,Co then TC,Ni will be shifted up
to T ∗C,Ni by ∆TC,Ni = T ∗
C,Ni − TC,Ni. The shift is always directed toward higher tem-
peratures, independent of the relative alignment (parallel or antiparallel) of the Ni
and Co magnetizations [153, 188]. It turned out that the relative shift ∆TC,Ni/TC,Ni
becomes more pronounced for thinner Ni films [14].
All XMCD measurements of Co/Cu/Ni/Cu(100) trilayers prior to the work of the
present thesis have been carried out in magnetic remanence. In fact, a single domain
state is expected to be the ground state of an ultrathin FM with magnetization in
the film plane [189]. Nevertheless, the formation of magnetic domains near the
ordering temperature could not be ruled out. Remanent investigations of 4− 8 ML
Ni/Cu(100), that are in-plane magnetized, have shown that magnetic domains exist
in a wide temperature range of T ≈ 100 − 300 K [190]. Such domains result in a
reduced or vanishing net magnetization, which hampers the accurate determination
of the ordering temperature. A vanishing net magnetization is a necessary but not
sufficient condition for phase transition from the FM to the paramagnetic (PM) state
[191]. The authors of Ref. [192] find that the magnetization determined for Cu/Ni
bilayers in the early experiments is too low compared to their calculations. They
suggest that this may be due to the fact that the bilayers are not fully saturated.
However, all other experimental findings are fully confirmed by their investigations of
Co/Cu/Ni trilayers and Cu/Ni bilayers on Cu(100) by their first-principles Green’s
function technique and fixed-spin-moment method. In the early experiments the
thickness of the Ni layer was usually kept above ∼ 4 ML, only two thinner cases of
dNi = 3 ML and dNi = 3.5 ML exist [181]. The largest effects are however expected
in the limit of low thickness. Therefore, the investigations presented in this work
are carried out in a small applied magnetic field and include samples down to 2 ML
Ni.
In many investigations the magnetism of the FM films has been treated in a static
manner within a mean field theory (MFT). This description is insufficient to explain
the effects of magnetic correlations in these ultrathin films [14, 55, 191, 193]. If
collective spin excitations (spin waves) are not considered in the theoretical model,
the large temperature shift will only be reproduced by assuming unphysically large
coupling values [180, 194]. With reasonable values of the coupling, higher order
contributions have to be taken into account to describe the experimental findings.
In a localized picture this has been done using a Green’s function theory (GFT)
with random phase approximation (RPA) within a Heisenberg model [14, 58]. A
second theoretical study uses the so-called spectral density approach within an itin-
5.4 New Improved Investigations Close to the Curie Temperature 71
erant single-band Hubbard model to describe the magnetism of coupled trilayers
[55]. Here as well, the simplest approximation, which is the Stoner description,
would not be sufficient to reproduce the experiments. Although an itinerant model
is possibly more appropriate for 3d transition metals, the results of both approaches
are in good agreement with the experiments yielding a strong shift ∆TC,Ni to higher
values after the Co film has been evaporated on top, i.e., after the exchange coupling
has been switched on. So it is not only the static exchange field of FM2 which acts
on the magnetization of FM1. Static exchange fields of realistic values will shift
TC,Ni only by a few kelvin. Furthermore, the theoretical investigations revealed that
the shift ∆TC,Ni is related to the strength Jinter of the IEC, i.e., the stronger the
coupling the larger the shift. Therefore, it is also expected that ∆TC,Ni follows the
oscillatory behavior of the IEC as a function of the spacer thickness. Indeed this has
been observed experimentally [153, 154]. In a simple mean field picture, as it has
been applied in this case up to now, Jinter and ∆TC,Ni depend linearly on each other
[153, 154]. Since a MFT fails to reproduce the experimental ∆TC,Ni, using it to de-
termine ∆TC,Ni (Jinter) is also questionable. As will be shown in Sec. 5.6 considering
the spin fluctuations appropriately, a nonlinear dependence follows from the Green’s
function approach applied by Jensen. Both theoretical pictures, the GFT consider-
ing localized spins in a Heisenberg model as well as the itinerant Hubbard model
considering the band structure of the trilayers, expect a tail in the temperature-
dependent Ni magnetization near the ordering temperature [14, 55, 58]. However,
this tail was not observed in the earlier experiments [13, 52]. The clarification of this
discrepancy between experiment and theory is crucial because it contributes to the
understanding of the temperature dependence of the interlayer exchange coupling.
The absence of the Ni tail would imply that Jinter vanishes when the magnetization
of one FM component in the trilayer vanishes. Of course it is always more difficult
to determine a vanishing quantity like MNi at TC,Ni or T ∗C,Ni, respectively, than to
investigate a diverging one like e.g. the susceptibility.
5.4 New Improved Investigations Close to the Curie
Temperature
Since in the present case the formation of magnetic domains cannot completely be
ruled out when measuring in remanence only, the possibility to study X-ray ab-
sorption and XMCD with applied magnetic fields has been established in the UHV
chamber as described in Chapter 3. New improved investigations of the coupled tri-

72 Chapter 5 Spin Fluctuations in Two-Dimensional Co/Cu/Ni Trilayers
760 800 840 880
-2
0
2
E (eV)
XM
CD
(arb.
units)
x 2
Co Ni
Cu (100)
2.8 ML Ni
3 ML Cu
2 ML Co
Cu (100)
2.8 ML Ni
6.2 ML Cu
2 ML Co
Figure 5.3: Two examples of the full XMCD spectra at both the Co and the Ni L2,3 edges[78]. The XMCD signal at the L3 edge of Co is negative in both cases whereas the sign ofthe Ni XMCD depends on the thickness of the Cu spacer layer, thus revealing the relativeorientation of the element specific Ni and Co magnetizations. Only one line is shown forCo since the two are identical within the experimental noise.

5.4 New Improved Investigations Close to the Curie Temperature 73
layers have been carried out by applying a weak magnetic field ~H with µ0H ≈ 4 mT.
This field is on the one hand large enough to suppress the formation of magnetic
domains close to TC,Ni, on the other hand it is small enough not to cause a sizable
field induced magnetization in the Ni film [179, 180]. The thickness of the layers is
chosen such that all measurements can be done in a convenient temperature range
T . 330 K to avoid considerable interdiffusion. The substrate crystal was oriented
such that the XMCD was measured along the [110] direction, which is the easy
magnetization direction of Co/Cu/Ni/Cu(100) trilayers. In Fig. 5.3 two examples
of the full XMCD spectra at both the Co and the Ni L2,3 edges are plotted. The
graph shows nicely that the sign of the Ni XMCD signal depends on the thickness
of the Cu spacer layer, thus revealing if the element specific magnetizations of Co
and Ni are aligned parallel or antiparallel by the IEC.
In the new investigations the Ni thickness has been lowered down to dNi ≈ 2 ML.
Particular attention has been drawn to the Ni magnetization near the Ni Curie
temperature. Concerning the question of presence or absence of a tail of the Ni
magnetization in the coupled trilayer systems, the Ni magnetization has to be in-
vestigated thoroughly close to the Curie temperature. Investigating MNi(T ) close
to TC,Ni (or T ∗C,Ni) requires the measurement of small magnetic signals with a suf-
ficiently high density of temperature points. The progress achieved with the new
undulator beamlines at third generation synchrotrons has very much improved the
technical possibilities. Taking advantage of the high photon flux and the high and
constant degree of circular polarization in the desired energy range small XMCD
signals near the Curie temperature can be determined more precisely. Better statis-
tics can be obtained in shorter time and therefore, measuring MNi(T ) close to T ∗C,Ni
with a relatively high density of data points has become feasible.
In the early experiments several full energy-dependent XMCD spectra were recorded
and averaged at each temperature to determine the magnetization. Due to the
improved synchrotron technique it is now possible to apply a “time scan procedure”
to determine the temperature-dependent magnetization curve. At each temperature
the absorption signal is recorded as a function of time for the two directions of
magnetization at two fixed energy positions: (i) at the maximum of the L3 edge
and (ii) in the pre-edge region where the XMCD signal is zero. In this way both
absorptions signals are measured many times and their values are obtained as the
average of many data points. A corresponding example of the raw time scan data is
shown in Fig. 5.4. As discussed in Sec. 2.3 the temperature-dependent magnetization
can be derived from the ratio ∆A3/A3. Since for the 3d FMs neither the ratio
of orbital and spin moment nor the line shape of the XMCD spectrum depends

74 Chapter 5 Spin Fluctuations in Two-Dimensional Co/Cu/Ni Trilayers
0.7
0.9
2.0
2.2
0 100 200
-4
0
4
Yie
ld(arb.
units)
Time (s)
pre-edge
L edge3
H
(m
T)
0
Figure 5.4: Illustration of the time scan procedure to determine M(T ). The upper panelshows the absorption signal at the L3 edge and in the pre-edge region as a function oftime as it was directly measured. The lower panel shows µ0H of the corresponding staticmagnetic field ~H which was applied [78].
on the temperature, the magnetization curve can be determined from the helicity-
dependent absorption signals at the maximum of the L3 edge µ±L3and in the pre-edge
region µ±pre via
M ∝(µ+
L3− µ+
pre)− (µ−L3− µ−pre)
12
((µ+
L3− µ+
pre) + (µ−L3− µ−pre)
) . (5.2)
The normalization to the signal in the pre-edge region is necessary to zero out any
artificial magnetic background. An artificial magnetic background may occur due
to small stray fields inside the chamber. Such backgrounds are usually below one
percent of the XMCD signal at the L3 edge maximum. In many cases like, for
instance, the one shown in Fig. 5.4, they do not occur at all. To determine the
absolute value of the magnetization the full energy-dependent XMCD is recorded
and analyzed solely at the lowest temperature.
In principle, the time scan procedure can also be applied to measure element-specific
hysteresis loops. Then the absorption signal is recorded along with the voltage at the
coil while the current in the coil is steadily changed. The voltage of the coil can be
converted to the magnetic field and thus the magnetization plotted as a function of
the magnetic field. For a more careful determination of the magnetic field a current
measurement with the help of a precise shunt in series with the coils is advisable.

5.4 New Improved Investigations Close to the Curie Temperature 75
0 100 200 3000
0.2
0.4
T (K)
M(arb.
units)
Ni
5 ML Cu
6 ML Ni
Cu (100)
281 K
265 K
184 K
0.2
0
-0.2
H (mT)
M(arb.
units)
Ni
-4 -2 0 2 4
0
Figure 5.5: Temperature-dependent Ni magnetization of a Cu/Ni/Cu(100) bilayer systemin a constant applied magnetic field ~H with µ0H = 4 mT (= 40 G, open circles), and atremanence (solid squares). The dashed lines serve as guides to the eyes. The inset showsthe Ni hysteresis from which the remanent magnetization has been determined at threedifferent temperatures [179].
From the voltage at this shunt the current can be determined more precisely and
from this current the magnetic field of the coils. However, under the given conditions
for the present experiments, the temperature of the coils and thus their resistance
varied only very little. The error introduced by the temperature variation is much
lower than the one due to the calibration of the magnetic field.
Figure 5.5 shows the magnetization of a 6 ML Ni film on Cu(100) covered with 5 ML
Cu. Two cases of the temperature-dependent magnetization are given: (i) MNi(T )
in an applied magnetic field ~H with µ0H = 4 mT (= 40 G) as obtained from the
time scan procedure (open circles) and (ii) MNi(T ) in remanence (solid squares)
as determined from the element-specific hysteresis loops given in the inset. At
T = 184 K the magnetization saturates for µ0H & 3 mT. At temperatures T &
200 K the magnetization in a field with µ0H = 4 mT decreases less than the one
in zero field. Such a behavior occurs if magnetic domains are formed near the
Curie temperature of these films [195]. In the present case a magnetic field with
µ0H ≈ 3 mT (= 30 G) is sufficient to ensure a single domain state even close to the
Ni Curie temperature without inducing considerable magnetization in addition. It is
true, that the proper magnetization curve is given by the spontaneous magnetization,
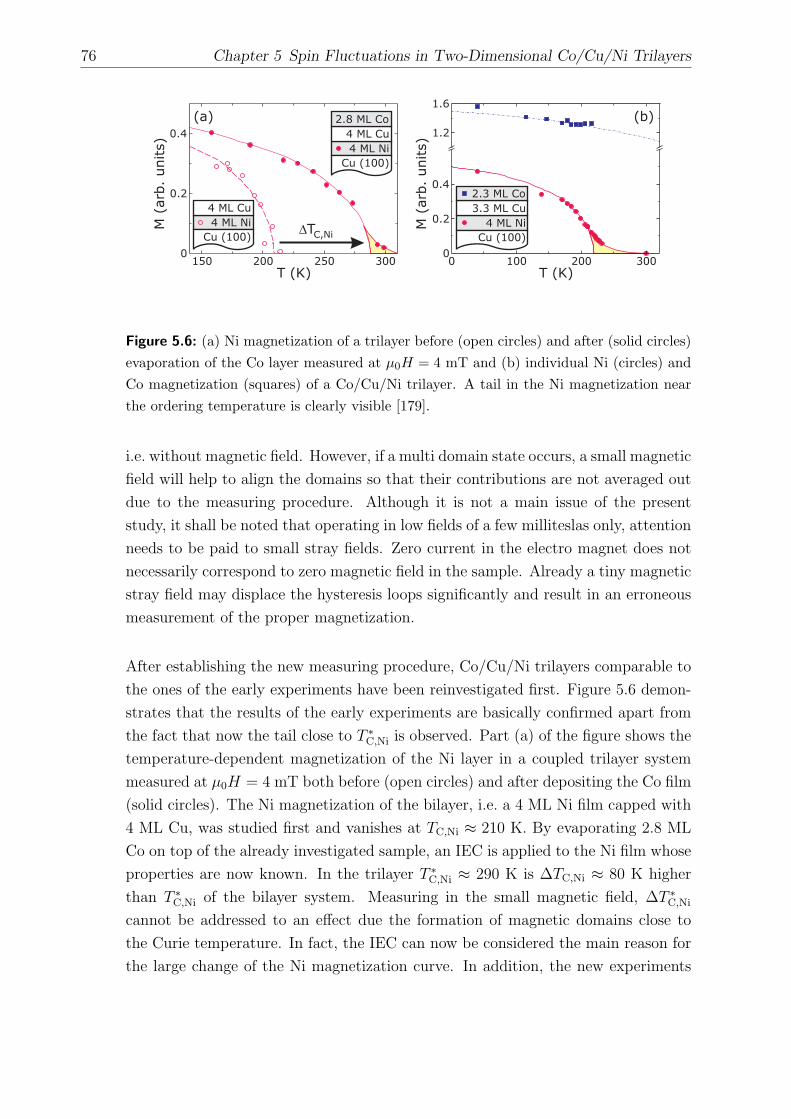
76 Chapter 5 Spin Fluctuations in Two-Dimensional Co/Cu/Ni Trilayers
M(arb.
units)
100 200 3000
0.2
0.4
1.2
1.6
0
T (K)
4 ML Ni
3.3 ML Cu
Cu (100)
2.3 ML Co
(b)
TC,Ni
0.2
0.4
200 250 3000
150
T (K)
M(arb.
units)
4 ML Ni
4 ML Cu
Cu (100)
2.8 ML Co
4 ML Ni
4 ML Cu
Cu (100)
(a)
Figure 5.6: (a) Ni magnetization of a trilayer before (open circles) and after (solid circles)evaporation of the Co layer measured at µ0H = 4 mT and (b) individual Ni (circles) andCo magnetization (squares) of a Co/Cu/Ni trilayer. A tail in the Ni magnetization nearthe ordering temperature is clearly visible [179].
i.e. without magnetic field. However, if a multi domain state occurs, a small magnetic
field will help to align the domains so that their contributions are not averaged out
due to the measuring procedure. Although it is not a main issue of the present
study, it shall be noted that operating in low fields of a few milliteslas only, attention
needs to be paid to small stray fields. Zero current in the electro magnet does not
necessarily correspond to zero magnetic field in the sample. Already a tiny magnetic
stray field may displace the hysteresis loops significantly and result in an erroneous
measurement of the proper magnetization.
After establishing the new measuring procedure, Co/Cu/Ni trilayers comparable to
the ones of the early experiments have been reinvestigated first. Figure 5.6 demon-
strates that the results of the early experiments are basically confirmed apart from
the fact that now the tail close to T ∗C,Ni is observed. Part (a) of the figure shows the
temperature-dependent magnetization of the Ni layer in a coupled trilayer system
measured at µ0H = 4 mT both before (open circles) and after depositing the Co film
(solid circles). The Ni magnetization of the bilayer, i.e. a 4 ML Ni film capped with
4 ML Cu, was studied first and vanishes at TC,Ni ≈ 210 K. By evaporating 2.8 ML
Co on top of the already investigated sample, an IEC is applied to the Ni film whose
properties are now known. In the trilayer T ∗C,Ni ≈ 290 K is ∆TC,Ni ≈ 80 K higher
than T ∗C,Ni of the bilayer system. Measuring in the small magnetic field, ∆T ∗
C,Ni
cannot be addressed to an effect due the formation of magnetic domains close to
the Curie temperature. In fact, the IEC can now be considered the main reason for
the large change of the Ni magnetization curve. In addition, the new experiments

5.4 New Improved Investigations Close to the Curie Temperature 77
show the tail which is predicted by theory, both in the itinerant approach [55] and
the localized Heisenberg model [14]. Part (b) of Fig. 5.6 shows the element-specific
and temperature-dependent Ni and Co magnetization curves of a second example
of a trilayer system. Since it has been measured with a larger density of points
especially close to T ∗C,Ni the line shape of the Ni magnetization becomes evident. In
principle, with the theoretical model by P. Jensen described in Sec. 2.4, it is possible
to exploit the line shape by fitting MNi(T ). The various coupling parameters are
then obtained as fitting parameters. However, it is shown in Sec. 5.5 how some of
the model parameters can be obtained in a more restrictive way thus leaving less
free fitting parameters.
Knowing these first results of the improved measurements, more detailed experi-
ments and analysis have finally been tackled. As already explained above in detail,
the aim was on the one hand to extend the investigated Ni thickness range down to
dNi = 2 ML and on the other hand to analyze and interpret the results with simul-
taneous consideration of two known effects in trilayer systems – the 2D character
determined by dNi and the oscillatory dependence of the IEC on dCu. Figure 5.7
shows one example of a new experiment with all the details concerned to character-
ize the IEC and the critical behavior close to the Curie temperature. The results
of the experiments are given by the various symbols: open circles for MNi(T ) in the
Cu/Ni/Cu(100) bilayer before the evaporation of Co, i.e. without IEC, solid circles
for MNi(T ) and solid squares for MCo(T ) after the evaporation of Co on top. The
solid and dot-dashed lines are guides to the eye. The influence of the IEC is obvious
from the experimental data and shows the expected behavior. The Ni magnetization
has become larger in a wide temperature range after the Co film was deposited. Even
in a temperature range where MNi was zero within the experimental error before, it
has gained considerable magnitude and the expected tail is clearly visible.
For the further analysis the characteristic Ni temperatures of the two cases need
to be determined, i.e. T ∗C,Ni for the full trilayer and TC,Ni for the corresponding
Cu/Ni/Cu(100) bilayer system. This is done with the help of a standard magnetiza-
tion curve which has been obtained from various measurements of thin Ni/Cu(100)
films in the thickness range 3 − 5 ML [13]. The temperature-dependent magneti-
zation curves of these Ni films were plotted in reduced units M/M0 (T/TC,Ni) and
averaged to provide the standard magnetization curve. The curve follows Bloch’s
law in the low temperature range where the temperature dependence of the magne-
tization results from thermal excitation of spin waves and a power law close TC,Ni
according to the theory of second order phase transitions [78]. Fitting this stan-
dard curve to the data points of MNi(T ) of a Cu/Ni/Cu(100) sample yields TC,Ni

78 Chapter 5 Spin Fluctuations in Two-Dimensional Co/Cu/Ni Trilayers
M(kA/m
)
0 60 120 180 2400
100
200
300
1200
1600
T (K)
Cu (100)
2.8 ML Ni
3 ML Cu
2 ML Co
38 K
TC,Ni
TC,Ni
TC,Ni*
Cu (100)
2.8 ML Ni
3 ML Cu
Figure 5.7: Ni (circles) and Co (squares) magnetizations MNi(T ) and MCo(T ) as obtainedfrom XMCD measurements. The influence of the IEC on the Ni magnetization becomesobvious when comparing MNi(T ) before (open circles) and after (closed circles) the depo-sition of the Co film. The solid and dot-dashed lines are guides to the eye. A standard Nimagnetization curve (see text) is fitted to the Ni data points (dashed and dotted lines),yielding TC,Ni and T ∗
C,Ni [59].

5.4 New Improved Investigations Close to the Curie Temperature 79
0 100 200 3000
100
200
300
M(k
A/m
)
T (K)
70 K 67 K 77 K
Cu (100)
ML Ni
4.2 ML Cu
3 ML Co
2.1
3.1
4.2
Figure 5.8: MNi(T ) in a trilayer (solid symbols) with a Ni staircase and constant dCu
and dCo. The curves of MNi(T ) are given as expected for Cu-capped Ni films with thesame thickness (dotted lines). The resulting temperature shift ∆TC,Ni due to the IEC isindicated by the arrows [148].
with an accuracy of a few kelvin (dashed line in Fig. 5.7). Determining T ∗C,Ni of the
Co/Cu/Ni/Cu(100) trilayer is less evident due to the presence of the tail. There-
fore, the same standard magnetization curve is fitted to the data points of MNi(T )
in the trilayer (dotted line in Fig. 5.7). The point at which the fitted standard curve
meets the x-axis is identified with the temperature T ∗C,Ni. This T ∗
C,Ni is identical to
the temperature of the maximum of the calculated susceptibility [14, 78]. By the
procedure of fitting the standard magnetization curve, ∆TC,Ni ≈ 38 K is determined
for the example given in Fig. 5.7. An alternative would be to use the inflection
point of the temperature-dependent magnetization as it has been done in the earlier
theoretical work [14, 58]. For the measured curves this is hardly possible because
the experimental data points have an error, many more of them would be needed,
and no analytical function is known to describe MNi(T ) in the trilayer.
The shift ∆TC,Ni as well as the strength of the IEC may depend sensitively on
the thickness of each of the three layers. To ensure that the observations can be
attributed exclusively to the change of one parameter, namely the thickness of one
particular constituent, staircase trilayer samples were prepared. In these samples
one constituent has macroscopic steps of ∼ 2 mm width, each with a different
thickness. The other two layers have a constant thickness over the whole sample
area. Figure 5.8 shows the temperature-dependent magnetization of the three Ni
80 Chapter 5 Spin Fluctuations in Two-Dimensional Co/Cu/Ni Trilayers
steps in a sample with constant dCu = 4.2 ML and dCo = 3 ML (solid symbols,
Ni thickness as specified in the figure). In the case of this trilayer sample with a
staircase Ni layer the Cu/Ni bilayer systems have not been measured separately due
to the limited beamtime. Therefore, TC,Ni is taken from a fit to all measured Curie
temperatures as a function of the thickness, TC,Ni(d) according to a finite size scaling
[196]
TC,Ni(dNi)
T bulkC,Ni
= 1− C0 d−1/νNi (5.3)
where ν is a critical exponent and C0 a system-dependent constant. The Curie tem-
perature of bulk Ni is T bulkC,Ni = 627 K. The new experiments reveal Curie temperatures
of the Cu-capped Ni films that are approx. 30 K higher than in earlier experiments
[197]. The early experiments were carried out in remanence only and probably suf-
fered from the formation of magnetic domains close to TC,Ni. For the present case
of Cu-capped Ni films C0 = 1.67 and ν = 1.46 have been determined [78]. Since
besides the reduction of the coordination number also a reduction of the magnetic
moments at the interfaces affects the Curie temperature here, ν cannot be directly
identified with the critical exponent of theoretical predictions. Calculations predict
values in the range of 0.5 to 1 depending on the model used. These values are smaller
than our result because the theoretical models consider only the decrease of the co-
ordination [196]. The dotted lines in Fig. 5.8 represent the temperature-dependent
magnetizations as they are expected for the corresponding bilayer systems according
to the finite size scaling of TC,Ni (dNi). The absolute temperature shift ∆TC,Ni does
not vary much. The relative shift ∆TC,Ni/TC,Ni becomes larger for the thinner Ni
film because TC,Ni of the thinner Ni film is smaller. The characteristic temperatures
of the staircase sample of Fig. 5.8 are summarized in Table 5.1 together with the
ones of all other investigated samples. The results are sorted in three groups: (i)
the dependence on the Ni film thickness dNi, (ii) the dependence on the Cu spacer
thickness dCu, and (iii) some dependence on the Co film thickness dCo. Some samples
are listed twice in the table to facilitate the comparison.
5.5 Determination of Model Parameters: The
Intralayer Coupling
The theoretical model introduced in Sec. 2.4 contains three coupling parameters: the
strength of the intralayer couplings JNi and JCo and the strength of the interlayer
exchange coupling Jinter. JNi and JCo describe the coupling between spins within
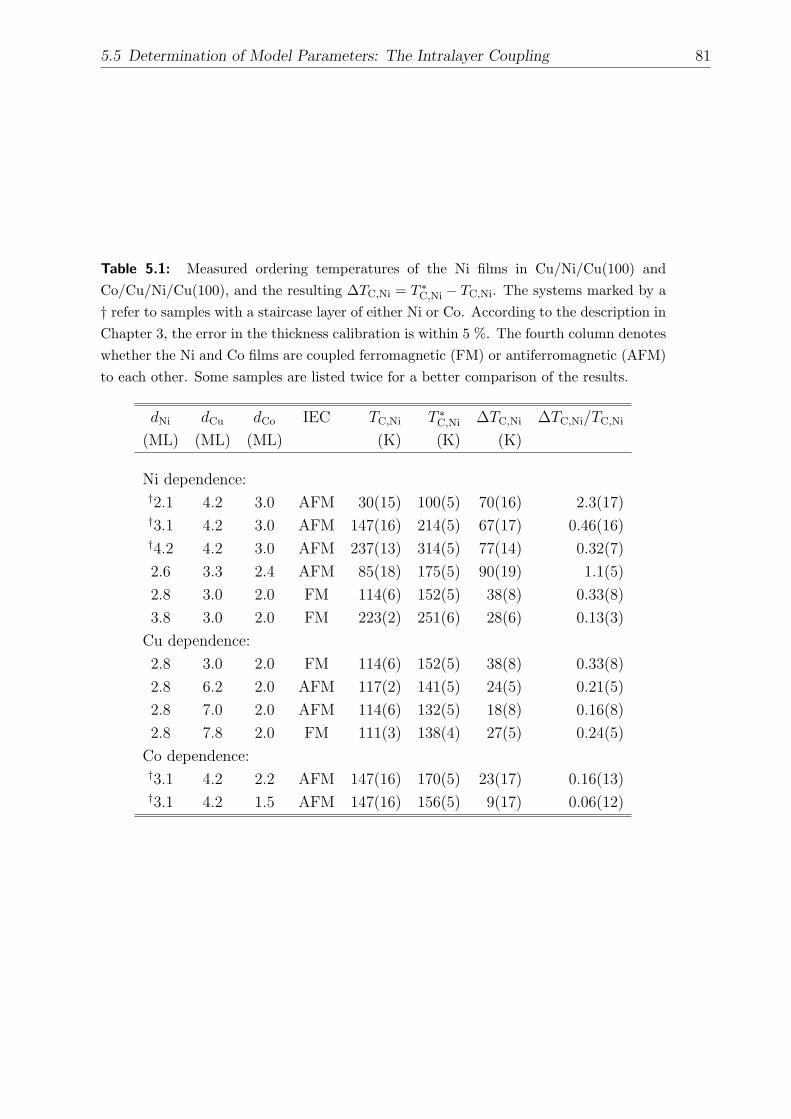
5.5 Determination of Model Parameters: The Intralayer Coupling 81
Table 5.1: Measured ordering temperatures of the Ni films in Cu/Ni/Cu(100) andCo/Cu/Ni/Cu(100), and the resulting ∆TC,Ni = T ∗
C,Ni − TC,Ni. The systems marked by a† refer to samples with a staircase layer of either Ni or Co. According to the description inChapter 3, the error in the thickness calibration is within 5 %. The fourth column denoteswhether the Ni and Co films are coupled ferromagnetic (FM) or antiferromagnetic (AFM)to each other. Some samples are listed twice for a better comparison of the results.
dNi dCu dCo IEC TC,Ni T ∗C,Ni ∆TC,Ni ∆TC,Ni/TC,Ni
(ML) (ML) (ML) (K) (K) (K)
Ni dependence:†2.1 4.2 3.0 AFM 30(15) 100(5) 70(16) 2.3(17)†3.1 4.2 3.0 AFM 147(16) 214(5) 67(17) 0.46(16)†4.2 4.2 3.0 AFM 237(13) 314(5) 77(14) 0.32(7)
2.6 3.3 2.4 AFM 85(18) 175(5) 90(19) 1.1(5)
2.8 3.0 2.0 FM 114(6) 152(5) 38(8) 0.33(8)
3.8 3.0 2.0 FM 223(2) 251(6) 28(6) 0.13(3)
Cu dependence:
2.8 3.0 2.0 FM 114(6) 152(5) 38(8) 0.33(8)
2.8 6.2 2.0 AFM 117(2) 141(5) 24(5) 0.21(5)
2.8 7.0 2.0 AFM 114(6) 132(5) 18(8) 0.16(8)
2.8 7.8 2.0 FM 111(3) 138(4) 27(5) 0.24(5)
Co dependence:†3.1 4.2 2.2 AFM 147(16) 170(5) 23(17) 0.16(13)†3.1 4.2 1.5 AFM 147(16) 156(5) 9(17) 0.06(12)
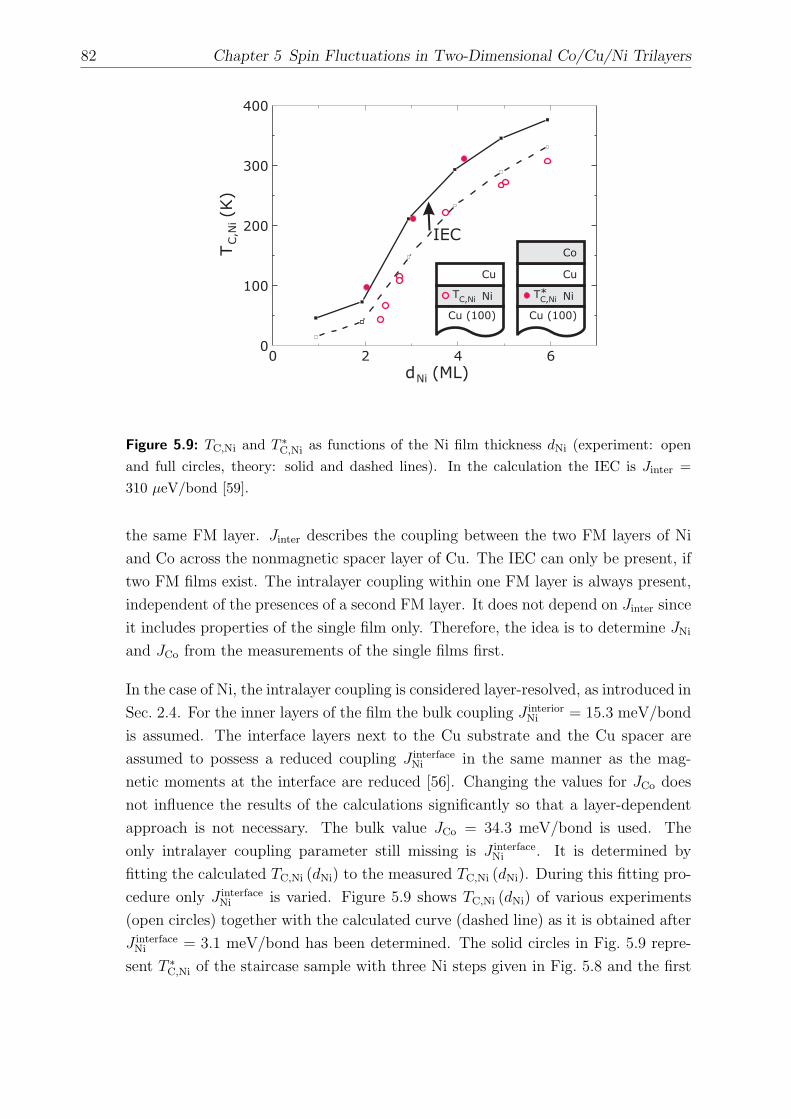
82 Chapter 5 Spin Fluctuations in Two-Dimensional Co/Cu/Ni Trilayers
0 2 4 60
100
200
300
400
d (ML)Ni
T(K)
C,N
iIEC
Cu (100)
Ni
Cu
Co
TC,Ni*
Cu (100)
Ni
Cu
TC,Ni
Figure 5.9: TC,Ni and T ∗C,Ni as functions of the Ni film thickness dNi (experiment: open
and full circles, theory: solid and dashed lines). In the calculation the IEC is Jinter =310 µeV/bond [59].
the same FM layer. Jinter describes the coupling between the two FM layers of Ni
and Co across the nonmagnetic spacer layer of Cu. The IEC can only be present, if
two FM films exist. The intralayer coupling within one FM layer is always present,
independent of the presences of a second FM layer. It does not depend on Jinter since
it includes properties of the single film only. Therefore, the idea is to determine JNi
and JCo from the measurements of the single films first.
In the case of Ni, the intralayer coupling is considered layer-resolved, as introduced in
Sec. 2.4. For the inner layers of the film the bulk coupling J interiorNi = 15.3 meV/bond
is assumed. The interface layers next to the Cu substrate and the Cu spacer are
assumed to possess a reduced coupling J interfaceNi in the same manner as the mag-
netic moments at the interface are reduced [56]. Changing the values for JCo does
not influence the results of the calculations significantly so that a layer-dependent
approach is not necessary. The bulk value JCo = 34.3 meV/bond is used. The
only intralayer coupling parameter still missing is J interfaceNi . It is determined by
fitting the calculated TC,Ni (dNi) to the measured TC,Ni (dNi). During this fitting pro-
cedure only J interfaceNi is varied. Figure 5.9 shows TC,Ni (dNi) of various experiments
(open circles) together with the calculated curve (dashed line) as it is obtained after
J interfaceNi = 3.1 meV/bond has been determined. The solid circles in Fig. 5.9 repre-
sent T ∗C,Ni of the staircase sample with three Ni steps given in Fig. 5.8 and the first
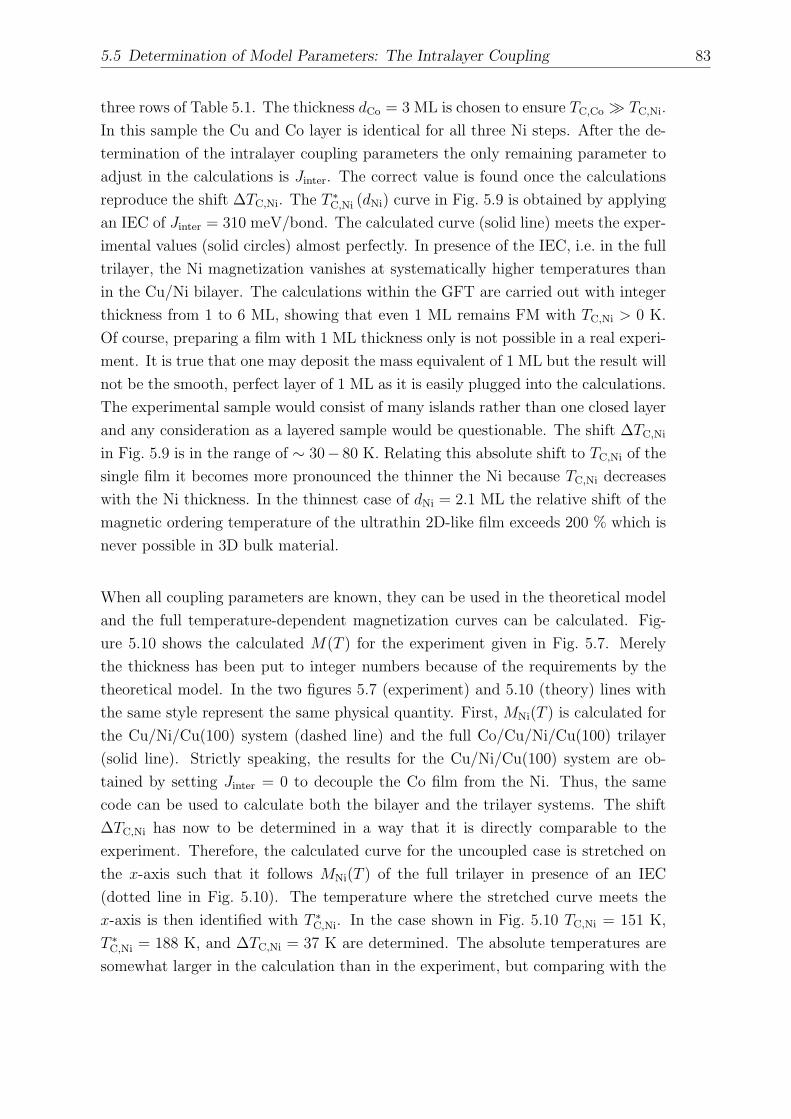
5.5 Determination of Model Parameters: The Intralayer Coupling 83
three rows of Table 5.1. The thickness dCo = 3 ML is chosen to ensure TC,Co TC,Ni.
In this sample the Cu and Co layer is identical for all three Ni steps. After the de-
termination of the intralayer coupling parameters the only remaining parameter to
adjust in the calculations is Jinter. The correct value is found once the calculations
reproduce the shift ∆TC,Ni. The T ∗C,Ni (dNi) curve in Fig. 5.9 is obtained by applying
an IEC of Jinter = 310 meV/bond. The calculated curve (solid line) meets the exper-
imental values (solid circles) almost perfectly. In presence of the IEC, i.e. in the full
trilayer, the Ni magnetization vanishes at systematically higher temperatures than
in the Cu/Ni bilayer. The calculations within the GFT are carried out with integer
thickness from 1 to 6 ML, showing that even 1 ML remains FM with TC,Ni > 0 K.
Of course, preparing a film with 1 ML thickness only is not possible in a real experi-
ment. It is true that one may deposit the mass equivalent of 1 ML but the result will
not be the smooth, perfect layer of 1 ML as it is easily plugged into the calculations.
The experimental sample would consist of many islands rather than one closed layer
and any consideration as a layered sample would be questionable. The shift ∆TC,Ni
in Fig. 5.9 is in the range of ∼ 30− 80 K. Relating this absolute shift to TC,Ni of the
single film it becomes more pronounced the thinner the Ni because TC,Ni decreases
with the Ni thickness. In the thinnest case of dNi = 2.1 ML the relative shift of the
magnetic ordering temperature of the ultrathin 2D-like film exceeds 200 % which is
never possible in 3D bulk material.
When all coupling parameters are known, they can be used in the theoretical model
and the full temperature-dependent magnetization curves can be calculated. Fig-
ure 5.10 shows the calculated M(T ) for the experiment given in Fig. 5.7. Merely
the thickness has been put to integer numbers because of the requirements by the
theoretical model. In the two figures 5.7 (experiment) and 5.10 (theory) lines with
the same style represent the same physical quantity. First, MNi(T ) is calculated for
the Cu/Ni/Cu(100) system (dashed line) and the full Co/Cu/Ni/Cu(100) trilayer
(solid line). Strictly speaking, the results for the Cu/Ni/Cu(100) system are ob-
tained by setting Jinter = 0 to decouple the Co film from the Ni. Thus, the same
code can be used to calculate both the bilayer and the trilayer systems. The shift
∆TC,Ni has now to be determined in a way that it is directly comparable to the
experiment. Therefore, the calculated curve for the uncoupled case is stretched on
the x-axis such that it follows MNi(T ) of the full trilayer in presence of an IEC
(dotted line in Fig. 5.10). The temperature where the stretched curve meets the
x-axis is then identified with T ∗C,Ni. In the case shown in Fig. 5.10 TC,Ni = 151 K,
T ∗C,Ni = 188 K, and ∆TC,Ni = 37 K are determined. The absolute temperatures are
somewhat larger in the calculation than in the experiment, but comparing with the

84 Chapter 5 Spin Fluctuations in Two-Dimensional Co/Cu/Ni Trilayers
3 ML Cu
3 ML Ni
Cu (100)
3 ML Ni
3 ML Cu
Cu (100)
2 ML Co
TC,Ni T
C,Ni
TC,Ni*
1500
1000
300
200
100
00 50 100 150 200
T (K)
M(kA/m
)
Figure 5.10: Calculated Ni magnetization of a single Ni film (dashed line) and of a Nifilm coupled to a Co film (solid line) as a function of the temperature, corresponding tothe experiment shown in Fig. 5.7. The dot-dashed line refers to the Co magnetization.Jinter = 86 µeV/bond is used. An external magnetic field ~H with µ0H = 4 mT causes thesmall tail in the calculated Ni magnetization of the bilayer. By applying MNi(Jinter = 0),T ∗
C,Ni (dotted line) and ∆TC,Ni = 37 K are identified (see text) [59].

5.5 Determination of Model Parameters: The Intralayer Coupling 85
2D
3D
0 1 2 3 4 5 60
0.5
1.0
T / TC,Ni
M/
M(T
=0)
Ni
Ni
4.0
4.2
3.1
2.6
2.1
6
5
4
3
21
Theory / Experiment
d (ML)Ni
Figure 5.11: Magnetization MNi(T )/MNi(T = 0) as a function of the relative temperatureT/TC,Ni(dNi) scaled by the corresponding Curie temperature of the Cu-capped Ni films.For the calculations Jinter = 310 µeV/bond and dCo = 3 ML are used. The cases with aNi thickness of 2.1, 2.6, 3.1, and 4.2 ML are given in Table 5.1. The top-down triangles(dNi = 4.0 ML) represent a case without IEC (Jinter = 0) [59].
curves given in Fig. 5.9 this discrepancy can be explained by the slightly different
thickness. The calculated shift is identical within the accuracy to the experimen-
tal finding of Fig. 5.7 where ∆TC,Ni = 38 K. Indeed the shift is the important
quantity from which the coupling strength is determined, in the case of Fig. 5.10
Jinter = 86 µeV/bond ∼= 1 K/bond. The full dependence of ∆TC,Ni (Jinter) is dis-
cussed in the next Sec. 5.6. It is needed for the final goal to combine the influence of
the IEC as a function of dNi with the one of dCu. The determined value of the IEC
is of the same order of magnitude as obtained by ferromagnetic resonance (FMR)
[152].
The temperature dependence of the Ni magnetization has been studied in theory
and experiment for different Ni thickness. The results are summarized in Fig. 5.11.
To point out that the IEC influences the Ni magnetization most in the thinnest Ni
films, MNi normalized to MNi (T = 0) is plotted as a function of T normalized to
TC,Ni (Jinter = 0). The GFT calculations (lines) as well as the experiments (symbols)
show that MNi close to the Curie temperature of the bilayer, i.e. at T/TC,Ni = 1 in
Fig. 5.11, is more enhanced the thinner the Ni film. The tail is most pronounced for
the thinnest Ni (theory: 1 ML Ni, dotted line; experiment: 2.1 ML Ni, solid circles).
The static exchange field of the Co film is not sufficient to explain this finding [198].

86 Chapter 5 Spin Fluctuations in Two-Dimensional Co/Cu/Ni Trilayers
0
100
200
300
400
T(K)
0 10 20 30
J (meV)Co
TC,Co
TC,Ni
TC,Ni*
TC,Co*
TC
Figure 5.12: Calculated phase diagram of the Co/Cu/Ni trilayer system. The Curietemperatures TC, TC,Ni, and TC,Co, and the quasi-critical temperatures T ∗
C,Ni and T ∗C,Co
are shown as a function of the exchange coupling JCo in the Co film [59].
A higher order contribution, i.e. the second term of Eq. (2.21) has to be taken into
account in the calculations, i.e. spin-spin correlations in the GFT. The results of the
four experiments with a Ni thickness of 2.1, 2.6, 3.1, and 4.2 ML are the ones given
in the first four rows of Table 5.1. Three of them are part of the same staircase
sample and thus have the same Cu and Co thickness. The one with dNi = 2.6 ML
has slightly different Cu and Co thickness, but it fits into the series given in Fig. 5.11.
All four cases have a comparable IEC. Of course, preparing samples with exactly
identical IEC is hardly possible in any experiment since strictly speaking also the
thickness of the FMs influence the IEC, although the main contribution is by dCu
[150, 199]. Thus, in the present study Jinter is assumed to be in good approximation
constant when dCu is constant. In general, the oscillatory coupling depends also
on the thickness of the Co layer on top, but to less extend. The change of the
magnetization of the trilayers can be seen by comparing their MNi(T ) to the one
with the top-down triangles (dNi = 4.0 ML) which represents a case without IEC
(Jinter = 0). Although the experimental and theoretical results differ in the 3D to
2D crossover by approximately 1 ML, they show the same trend and the overall
agreement is clearly visible.
The theoretical model applied here includes simplifications in various points. How-
ever, it gives major insight into the physics of the trilayers without introducing

5.5 Determination of Model Parameters: The Intralayer Coupling 87
the full complexity of a more advanced itinerant theory of 3d ferromagnetism. To
demonstrate the capability of the model, a phase diagram of the Co/Cu/Ni trilayer
system has been calculated. It is shown in Fig. 5.12. The different characteristic
temperatures of the trilayer TC, TC,Ni, T ∗C,Ni, TC,Co, and T ∗
C,Co are plotted as func-
tions of the direct exchange coupling JCo in the top Co film. In the calculations
dNi = 3 ML, dCo = 2 ML, and Jinter = 310 µeV/bond were entered. Lets first
discuss the boundaries of the diagram: JCo = 0 corresponds to a system without
Co, yielding TC,Ni = 150 K of a 3 ML Ni film covered with Cu. It is trivial that
in this case T ∗C,Ni = TC,Ni and the Curie temperature TC of the whole system coin-
cides with the one of Ni. The other limit of the diagram is at JCo ≈ 34 meV/bond
which corresponds to a realistic exchange coupling of 2 ML Co [180]. In this case
T ∗C,Ni = 216 K of the trilayer is larger than TC,Ni of the Cu-capped Ni film without
Co due to the IEC. The characteristic temperatures of Co, TC,Co and T ∗C,Co, are both
well above the characteristic temperatures of Ni. Since here the Ni film is much
weaker than the Co, the Curie temperature TC,Co of the single Co film and T ∗C,Co of
the Co in the trilayer coincide. The Curie temperature of the whole system is always
identical to the one of the ferromagnet with the larger quasi-critical temperature in
the trilayer, i.e. on the right hand side of the diagram TC = T ∗C,Co. The two edges of
the diagram represent the situation of the experiments of the present work: Before
the evaporation of the Co film, the left hand side (JCo = 0) is valid, whereas after Co
has been deposited the right hand side (JCo ≈ 34 meV/bond) where TC,Co > T ∗C,Ni
illustrates the facts. In between the edges a variety of possible situations can be
considered. The whole T–JCo plane is separated into four areas by the curves of the
quasi-critical temperatures T ∗C,Ni (dash-dotted line) and T ∗
C,Co (dashed line). These
areas are differently hatched. (i) In the area below the dash-dotted line, hatched
with lines of one direction, the Ni film is FM. (ii) In the area below the dashed line,
hatched with lines of the other direction, the Co film is FM. (iii) In the area where
the two hatchings overlap to a crossed hatching, both the Ni and the Co film are
FM. (iv) In the white area without any hatching, both films are PM and the whole
trilayer is above its transition temperature TC. To summarize short: where one
hatching is present, one film is FM and the other one is PM, where both hatchings
overlap both films are FM, and where there is no hatching at all both films are PM.
In the hatched areas three relevant cases can be distinguished: (i) If JCo . 9 meV
the quasi-critical temperature of Co T ∗C,Co < TC,Ni. TC,Co is shifted up to T ∗
C,Co by
the IEC. Interestingly, even a small increase of TC,Ni to T ∗C,Ni is visible. (ii) In the
range of 9 meV . JCo . 13 meV the two quasi-critical temperatures T ∗C,Co and T ∗
C,Ni
coincide. They are both increased compared to the Curie temperatures of the single

88 Chapter 5 Spin Fluctuations in Two-Dimensional Co/Cu/Ni Trilayers
Ni and Co films. (iii) In the region JCo & 13 meV where TC,Co > T ∗C,Ni the largest
increase of TC,Ni is observed.
5.6 Simultaneous Consideration of Spacer and FM
Film Thickness
Up to now the results of the new improved experiments and the accompanying
calculations of the temperature-dependent magnetization have been explained and
discussed. In this last section of the chapter the final and most important aim of the
new investigations is presented: The oscillatory behavior of the IEC as a function
of the Cu spacer thickness is simultaneously considered together with its growing
influence when approaching the 2D limit as a function of the Ni thickness. Looking
again at the well-known and often discussed results of Fig. 5.2, one important fact has
to be pointed out: On the y-axis two different quantities are plotted in the two cases:
the coupling strength Jinter and the shift ∆TC,Ni/TC,Ni. Therefore, it is essential to
express ∆TC,Ni/TC,Ni as a function of Jinter, before the desired combination of the
two known effects can be accomplished. In earlier works a linear dependence has
been derived in a MFT [153]. However, since MFT does not satisfy the description
of the temperature shift ∆TC,Ni, it is appropriate to find an improved description of
∆TC,Ni (Jinter) within the GFT.
The shift ∆TC,Ni is always toward higher temperature, independent of the relative
alignment (FM or AFM) of the individual Ni and Co magnetizations. Their relative
orientation is reflected in the sign of Jinter, i.e. Jinter > 0 for FM and Jinter < 0 for
AFM coupling. For the present study, the relative temperature shift ∆TC,Ni/TC,Ni
has been calculated as a function of |Jinter| for Ni films with 1 ML ≤ dNi ≤ 6 ML. In
the calculations here, it is assumed that the variation of dCu only influences Jinter,
and not the intralayer couplings JCo and JNi. As Fig. 5.13 shows the dependence
is clearly nonlinear. These results indicate again that magnetic fluctuations are
efficiently suppressed even by relatively small coupling strengths.
Knowing the relation between ∆TC,Ni/TC,Ni and |Jinter| finally provides the possibility
for the desired combination: The influence of the spin fluctuations visualized in the
relative shift ∆TC,Ni/TC,Ni, depends on the one hand on dNi (2D character of FM1).
On the other hand it depends on the strength of the IEC, i.e. |Jinter|. Combining both
variables with the help of the relation given in Fig. 5.13, the 3D plot as anticipated
at the beginning can be established. The result is a curved surface of ∆TC,Ni/TC,Ni =

5.6 Simultaneous Consideration of Spacer and FM Film Thickness 89
Ni
1 ML
2 ML
3 ML
4 ML
5 ML
6 ML
0 200 4000
1
2
|J | ( eV/atom)inter
TT
C,N
i/
C,N
i
Figure 5.13: Relative temperature shift ∆TC,Ni/TC,Ni of the Ni magnetization as a functionof the strength of the IEC |Jinter|. Different Ni film thickness is assumed as indicated [59].
f (dNi, dCu). Figure 5.14 shows this final result of the calculation together with the
experimental findings. The experimental data of Table 5.1 together with results of
earlier investigations are shown as full dots and in the projection to the dNi–dCu
plane (open circles). The results are sorted according to the thickness of the Co
film: dCo = 2 ML in Fig. 5.14 (a) and dCo = 3 ML in Fig. 5.14 (b). The zero plane
is given by Jinter = 0 with a shift ∆TC,Ni = 0. Of course, the shift is indeed always
positive. However, the illustration has been chosen such that regions with a parallel
alignment of the magnetizations of the two FM layers (Jinter > 0, above the zero
plane) are distinguished from the ones with an antiparallel alignment (Jinter < 0,
below the zero plane).
The envelope of ∆TC,Ni/TC,Ni as a function of dCu decreases approximately as d−2Cu
for dNi ≥ 5 ML. For thinner Ni films ∆TC,Ni/TC,Ni decreases more softly because
of the nonlinear dependence on Jinter. The experimental and theoretical shifts
∆TC,Ni/TC,Ni agree reasonably well for dNi ≥ 3 ML and dCo = 2 ML (Fig. 5.14 (a)).
For dCo = 3 ML (Fig. 5.14 (b)) the experimental shifts are much larger than the
theoretical ones, especially for a Ni thickness below 3 ML. By matching the cal-
culated relative temperature shifts ∆TC,Ni/TC,Ni to the experimental data, the IEC
can be quantitatively derived. Assuming the various quantities in Bruno’s expres-
sion as explained in Sec. 5.2 (Λ1 = 2.56 ML, φ1 = π/2, Λ2 = 5.88 ML, φ2 = π,

90 Chapter 5 Spin Fluctuations in Two-Dimensional Co/Cu/Ni Trilayers
1
3
1
0 AFM
FM
0.5
2 4 6 8 10
2 4 6
1
1
1
2
0
/T
C,N
iT
C,N
i
5
(a)
(b)
3
5
dNi (ML)
/T
C,N
iT
C,N
i
dCu (ML) dNi (ML)
AFM
FM
dCu (ML)
Figure 5.14: Two-parameter plot of the relative temperature shift ∆TC,Ni/TC,Ni (dNi, dCu)for Co/Cu/Ni/Cu(100) trilayers as a function of the Ni film thickness dNi and the thicknessdCu of the Cu spacer layer with (a) dCo = 2 ML and (b) dCo = 3 ML [59].

5.6 Simultaneous Consideration of Spacer and FM Film Thickness 91
and A1/A2 = 1.3(5)), the amplitude of the short-period oscillation in Bruno’s ex-
pression Eq. (5.1) is obtained to be A1 (dCo = 2 ML) = 1.0 meV/bond by fitting the
experimental results of Fig. 5.14 (a). This value corresponds to a coupling energy of
Jinter (T = 0, dCu = 5 ML) = 63 µeV/bond. This value fairly agrees with results of
FMR measurements with dCo = 2 ML [152]. For a proper comparison the FMR data,
which were recorded at room temperature, have to be extrapolated to T = 0. De-
termining A1 for dCo = 3 ML (by fitting to the experimental data of Fig. 5.14 (b) by
the same procedure) yields a 10 times larger value as compared to the previous case.
Such a large variation of A1 (dCo) is not expected when just increasing the thickness
of the Co film. The difference between the results for 2 ML and 3 ML Co indicates,
that the whole set of experimental data cannot yet be fitted with one unique set
of parameters in the calculations. However, the basic picture of the interpretation
fits for both cases. Further studies are needed to get a unified set of principal pa-
rameters. Various improvements, and most likely a combination of them, may be
possible. First of all, the samples consist of extremely thin layers which are not as
flat and smooth as assumed for the calculations. It is a general problem that the
easy to handle samples in theory have perfect surfaces and interfaces whereas the ex-
perimentalist can hardly produce them. Samples in the experiment always include
inhomogeneities. The difficulties become most pronounced at very low thickness,
because the relative contribution of the interfaces is larger the thinner the layers.
Therefore, at very low thickness, e.g. in Fig. 5.14 (a) at 2 ML Cu and in Fig. 5.14 (b)
at approx. 2 ML Ni, the experimental results can hardly be brought into agreement
with the calculations. In the extreme case of an only 2 ML thin spacer the coupling
is experimentally found to be FM whereas Bruno’s model predicts AFM coupling.
This same discrepancy occurs for Fe/Au/Fe [168]. Isaev et al. however find FM
coupling between Ni and Co across a 1 ML Cu spacer in their calculations and
thus agree with the experimental findings [192]. Roughness and a noninteger film
thickness might sensitively change ∆TC,Ni and Jinter, in particular when approaching
the ultrathin film limit for both Ni and Cu, where the largest influence on the Ni
magnetization is expected. It has been shown that roughness may play a crucial role
for the IEC [200]. Thus, one useful but difficult task for the theorists would be to
introduce roughness and maybe also interdiffusion at the interfaces in their samples.
However, also other aspects of the theory may need further consideration. In the
simple model used, only the direct intralayer coupling of Ni is separated into a bulk
and an interface component (J interiorNi and J interface
Ni ). A more advanced model might
include a complete thickness dependence of JCo and JNi. Such a variation due to
quantum well states has been determined [201, 202]. Furthermore, using a Heisen-
berg Hamiltonian with localized spins represents an approximation to the present

92 Chapter 5 Spin Fluctuations in Two-Dimensional Co/Cu/Ni Trilayers
itinerant-electron magnets Ni and Co, although such a model reproduces a number
of important features, e.g. Bloch’s T 3/2 law for the decrease of the bulk magnetiza-
tion, a Curie-Weiss behavior of the susceptibility for T > TC, etc. Moreover, the
applied Tyablikov decoupling could underestimate the effect of spin fluctuations in
particular for 2D systems, which should be tested by improved approximations be-
yond RPA [203]. It should be noted that the present theoretical calculation and the
recently published one in Ref. [63] will give quantitatively satisfactory results if the
anisotropies are much smaller than the exchange coupling. However, for ultrathin
films out-of-plane magnetocrystalline anisotropies may be important. Schwieger et
al. consider exchange and magnetic anisotropy equally important in their theory
[63]. Future treatments within this theory are advisable to further analyze the ex-
perimental results of this work. In conclusion however, fair agreement between the
experimental results and the calculations even in the simplified model show the im-
portance of spin fluctuations in the coupled trilayers especially at thin thickness.
Furthermore, the desired combination of the two dependencies on dNi and dCu and
their simultaneous consideration has been accomplished.

Chapter 6
Detailed Analysis of XMCD at the
L2,3 Edges of Gd, Tb, and Dy
In this chapter the systematics of the detailed fine structure of XMCD at the L2,3
edges of Gd, Tb, and Dy is investigated. The three elements are characterized by
their partly, however, more than half filled 4f shell. Their large magnetic moment
arises mostly from the highly localized 4f orbitals which have negligible overlap on
neighboring sites. The exchange interaction between the 4f electrons is mediated
by the polarization of the 5d conduction band [204]. Since XMCD spectroscopy is a
shell-selective method for magnetic measurements it provides a useful tool for study-
ing the 5d magnetism directly and separately from the 4f magnetism which is up to
10 times stronger than the 5d one. Interpretation of XMCD at the L2,3 edges of rare
earth elements is a matter of discussion since the first spectra have been published
[205]. At the beamlines of today’s synchrotron sources, rich and detailed fine struc-
tures in the XMCD at the L2,3 edges of rare earth elements can be revealed. One
reason for additional fine structure features is the importance of electric quadrupole
(E2) transitions for the X-ray absorption of the rare earth elements. Further anal-
ysis of the rare earth XMCD as, for example, determining magnetic moments like
it its possible for the 3d ferromagnets by the integral sum rules, is rarely discussed.
Is it possible to understand the line shape of the spectra and extract the magnetic
information out of them? The first, and most important, step to answer this ques-
tion is to carefully measure and properly normalize XMCD spectra. Most of the
XMCD data of rare earth elements available up to now stem from measurements of
compounds. These compounds are in general complex structures including various
interactions. This may well introduce additional complication in the fine structure
of the spectra. Therefore, measurements on high purity single crystals have been
carried out in the present work. The series of Gd, Tb, and Dy has been chosen as
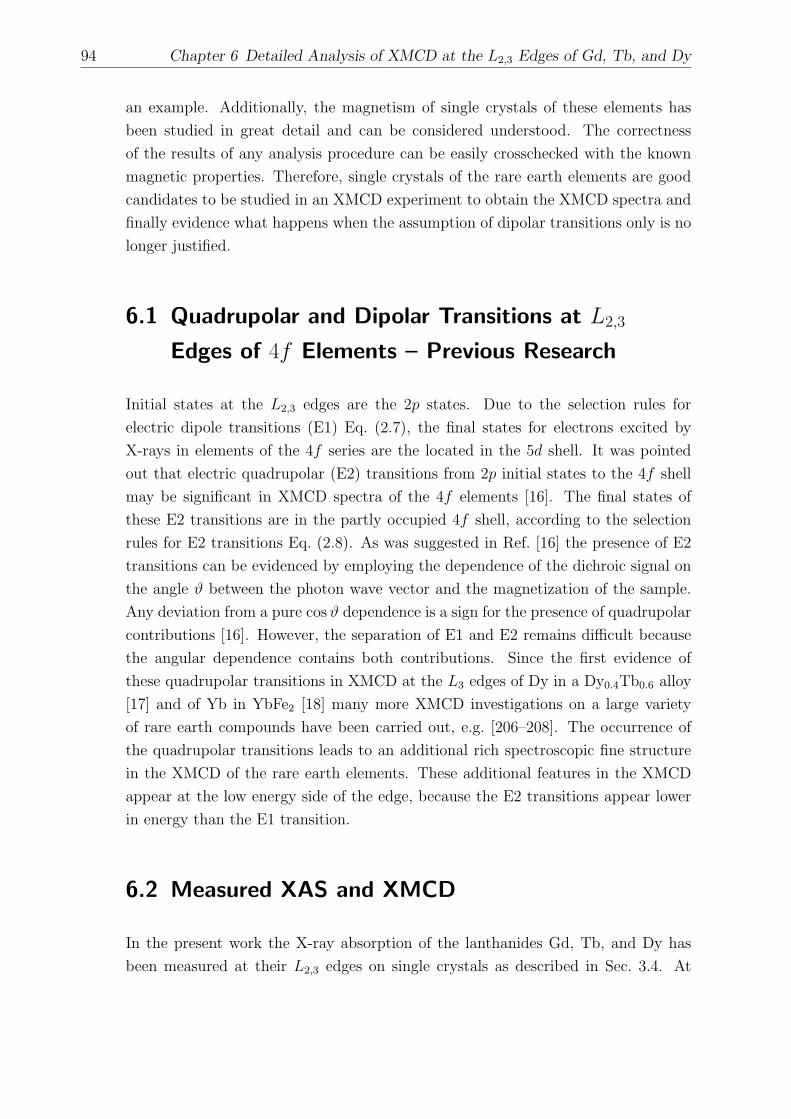
94 Chapter 6 Detailed Analysis of XMCD at the L2,3 Edges of Gd, Tb, and Dy
an example. Additionally, the magnetism of single crystals of these elements has
been studied in great detail and can be considered understood. The correctness
of the results of any analysis procedure can be easily crosschecked with the known
magnetic properties. Therefore, single crystals of the rare earth elements are good
candidates to be studied in an XMCD experiment to obtain the XMCD spectra and
finally evidence what happens when the assumption of dipolar transitions only is no
longer justified.
6.1 Quadrupolar and Dipolar Transitions at L2,3
Edges of 4f Elements – Previous Research
Initial states at the L2,3 edges are the 2p states. Due to the selection rules for
electric dipole transitions (E1) Eq. (2.7), the final states for electrons excited by
X-rays in elements of the 4f series are the located in the 5d shell. It was pointed
out that electric quadrupolar (E2) transitions from 2p initial states to the 4f shell
may be significant in XMCD spectra of the 4f elements [16]. The final states of
these E2 transitions are in the partly occupied 4f shell, according to the selection
rules for E2 transitions Eq. (2.8). As was suggested in Ref. [16] the presence of E2
transitions can be evidenced by employing the dependence of the dichroic signal on
the angle ϑ between the photon wave vector and the magnetization of the sample.
Any deviation from a pure cos ϑ dependence is a sign for the presence of quadrupolar
contributions [16]. However, the separation of E1 and E2 remains difficult because
the angular dependence contains both contributions. Since the first evidence of
these quadrupolar transitions in XMCD at the L3 edges of Dy in a Dy0.4Tb0.6 alloy
[17] and of Yb in YbFe2 [18] many more XMCD investigations on a large variety
of rare earth compounds have been carried out, e.g. [206–208]. The occurrence of
the quadrupolar transitions leads to an additional rich spectroscopic fine structure
in the XMCD of the rare earth elements. These additional features in the XMCD
appear at the low energy side of the edge, because the E2 transitions appear lower
in energy than the E1 transition.
6.2 Measured XAS and XMCD
In the present work the X-ray absorption of the lanthanides Gd, Tb, and Dy has
been measured at their L2,3 edges on single crystals as described in Sec. 3.4. At

6.2 Measured XAS and XMCD 95
Gd
Tb
Dy
Norm. XAS/XMCD (arb. units)
E(keV)
-0.0
4
-0.0
2 0 0
0.5
1.0
7.2
27.2
77.9
07.9
57.5
07.5
58.2
58.3
08.5
78.6
27.8
07.8
5
XM
CD
XAS
Figure 6.1: Normalized XAS (dashed line) and XMCD (solid line) at the L2,3 edges of Gd(T = 10 K, µ0H = 3 T), Tb (T = 4 K, µ0H = 7 T), and Dy (T = 5 K, µ0H = 5 T). They-scale for the XAS is given above the axis break, the y-scale for the XMCD below. Thearrows in the case of Tb mark the E2 contributions.

96 Chapter 6 Detailed Analysis of XMCD at the L2,3 Edges of Gd, Tb, and Dy
room temperature all three elements have a hexagonal closed packed (hcp) structure.
They are cut such that the c-axis for Gd, the b-axis for Tb, and the a-axis for Dy
are aligned perpendicular to the surface. In the cases of Tb and Dy these would be
the crystallographic easy axis of magnetization in bulk material [209, 210]. For bulk
Gd the crystallographic easy axis would be on a cone around the c-axis [210, 211].
However, all three samples exhibit a huge shape anisotropy. Therefore, a field of
up to 7 T is applied to overcome the shape anisotropy and align the magnetization
perpendicular to the surface during the measurements at normal incidence.
Figure 6.1 shows the spin-averaged XAS (dashed line, y-scale above break) and the
XMCD (solid line, y-scale below break) of the three elements Gd, Tb, and Dy at
low temperature. The XAS are normalized to a total edge jump of 1. The size of
the XMCD is given according to this normalized scale. Since the two edges are well
separated in energy they have been measured individually with the high density of
data points to clearly identify all the spectral fine structure in the XMCD. The L3
edge to L2 edge step ratio is determined from a long scan with a lower density of
data points including both edges. This step ratio is found to vary for the three
elements. It is 1.55 : 1, 1.75 : 1, and 1.6 : 1 for Gd, Tb, and Dy, respectively.
Although the difference in the absorption spectra for the two helicities µ+(E) and
µ−(E) can hardly be made out by eye (not shown in Fig. 6.1), clear XMCD spectra
can be determined. Detailed fine structures are revealed. These fine structures are
more clearly visible in Fig. 6.2 where they are discussed in detail. In the present
Fig. 6.1 a broader overview is given. In the XAS the beginning of the EXAFS
wiggles can be seen right above the edges. Although the extended energy range is
not a focal point of the present thesis it is worth mentioning that in the extended
energy range the magnetic EXAFS is observed. For rare earth metals the intensity
of the magnetic EXAFS in comparison to the XMCD signal near the edge is much
larger than for example for the 3d transition metals. The MEXAFS of the rare earth
elements is essentially proportional to the total 4f magnetic moment, whereas in
the NEXAFS reagion the XMCD is dominated by dipole transitions to the spin-
polarized 5d densities of states. However, the 5d moment is only a small friction
of the 4f moment. This explains the relative scales of the XMCD to MEXAFS
intensities which are different at the L2,3 edges of 3d FMs, cf. [212]. For details
about the magnetic EXAFS in rare earth elements see Refs. [37, 213].
The most remarkable observation in the XMCD of Fig. 6.1 is that the main contri-
bution of the signals is positive at the L3 edge and negative at the L2 edge. This
main contribution to the XMCD corresponds to the dichroism of the electric dipole

6.3 Temperature-Dependent XMCD Spectra 97
transitions. From a simple estimation with the help of the spin sum rule Eq. (2.16)
one concludes that the spin of the 5d moments is aligned antiparallel to the one of
the 4f moments. However, this conclusion is at odds with classical magnetometry
measurements for the following reason: the magnetic moment of Gd, Tb, and Dy
metal is 7.63µB, 9.34µB, and 10.33µB, respectively [209, 210, 214, 215]. Assuming
that in the solid one of the 4f electrons from the atomic configuration is trans-
fered into the 5d shell, it follows from Hund’s rule that the 4f contribution is at
maximum 7µB, 9µB, and 10µB for Gd, Tb, and Dy, respectively. Strictly speaking,
Hund’s rules have been derived for the atomic case. However, they have proven
good approximations also for solids in many cases and the 4f moment in the solids
will not be larger than in the free atom. Therefore, from classical measurements of
the magnetic moment it follows that the 5d moment of Gd, Tb, and Dy is aligned
parallel to the 4f moment and has a size of at least 0.63µB, 0.34µB, and 0.33µB, re-
spectively. These discrepancies are explained by the neglect of the spin dependence
of the transition matrix elements when deriving the sum rules [47, 48, 216]. Only
if the transition matrix elements are independent of the spin, the XMCD spectra
will reflect the profile of the difference of the density of states for spin-up and spin-
down electrons. In general however, this is not true, since the exchange potential of
spin-up 4f electrons is attractive for the spin-up 5d states whereas the 5d spin-down
states are not so affected [204, 216, 217]. Therefore, applying the original integral
sum rules may yield questionable results for Gd, Tb, and Dy.
Slightly below the edges, the quadrupolar (E2) contributions to the XMCD occur
with opposite sign as the dipolar contributions. In the case of Tb they are marked by
arrows in Fig. 6.1. They appear at lower energy than the edges themselves because
of the strong attractive Coulomb interaction between the localized 4f electrons and
the 2p core hole in the final state [218]. These quadrupolar contributions are more
pronounced at the L3 edge than at the L2 edge. Only for Tb it can be clearly made
out also at the L2 edge. At the L3 edge it seems to become larger with increasing
f -count. The explanation why the quadrupolar peak is negative at the L3 edge
is the following: in general, X-rays with positive helicity generate more spin-up
electrons at the L3 edge, whereas those with negative helicity generate more spin-
down electrons. Since all spin-up 4f states are occupied, transitions from 2p to 4f
states, i.e. the E2 transitions, occur mainly for negative helicity. Thus, the XMCD
of the E2 transitions will be negative.
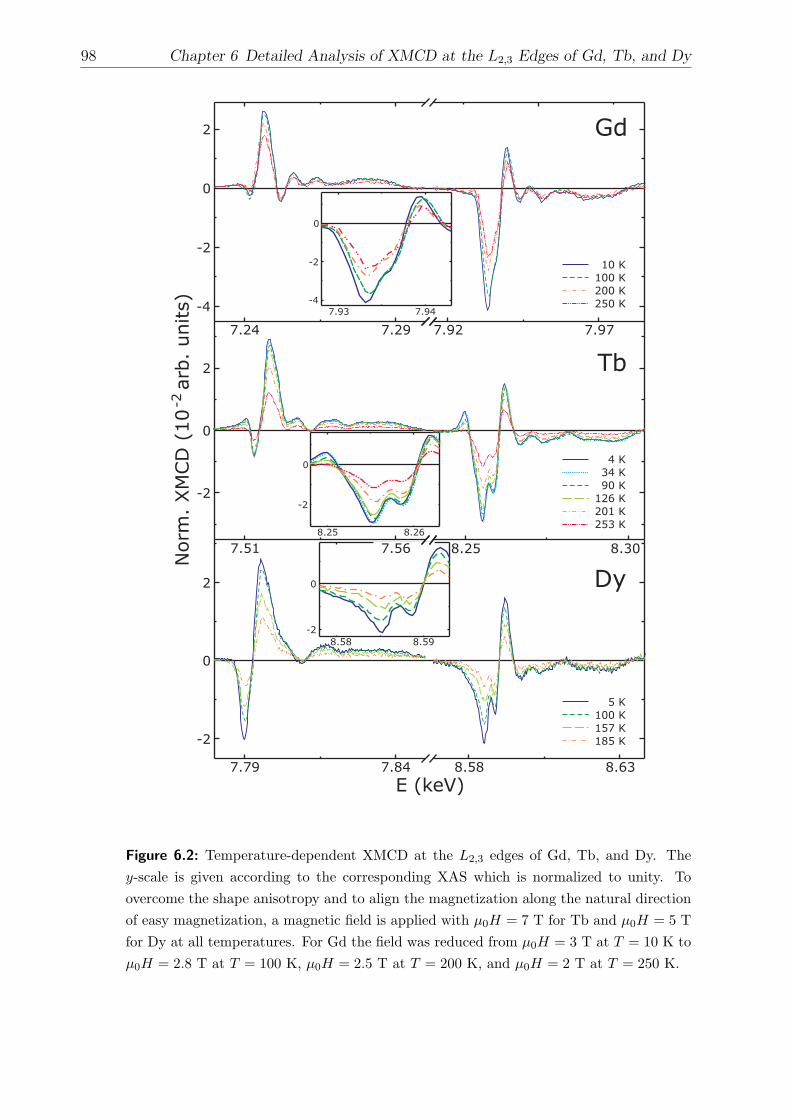
98 Chapter 6 Detailed Analysis of XMCD at the L2,3 Edges of Gd, Tb, and Dy
0
-2
8.58 8.59
0
-2
8.25 8.26
5 K
100 K
157 K
185 K
4 K
34 K
90 K
126 K
201 K
253 K
10 K
100 K
200 K
250 K
Gd
Tb
Dy
-2
0
2
-2
0
2
-4
-2
0
2
7.24 7.29 7.92 7.97
7.51 7.56 8.25 8.30
7.79 7.84 8.58 8.63
E (keV)
Norm
.XM
CD
(10
arb
.units)
-2
0
-2
-4
7.93 7.94
Figure 6.2: Temperature-dependent XMCD at the L2,3 edges of Gd, Tb, and Dy. They-scale is given according to the corresponding XAS which is normalized to unity. Toovercome the shape anisotropy and to align the magnetization along the natural directionof easy magnetization, a magnetic field is applied with µ0H = 7 T for Tb and µ0H = 5 Tfor Dy at all temperatures. For Gd the field was reduced from µ0H = 3 T at T = 10 K toµ0H = 2.8 T at T = 100 K, µ0H = 2.5 T at T = 200 K, and µ0H = 2 T at T = 250 K.

6.3 Temperature-Dependent XMCD Spectra 99
Table 6.1: Temperature TC at which in zero magnetic field Gd undergoes a phase transitionFM-PM, Tb and Dy a transition FM-helical. At TN the magnetic phases of Tb and Dygo from helical to PM. In Tb and Dy the helical phase is suppressed by a magnetic fieldlarger than HC and a transition FM-PM occurs at TN [210, 219].
element TC TN µ0HC
Gd 293 K – –
Tb 220 K 230 K < 0.1 T
Dy 88 K 178 K 1.2 T
6.3 Temperature-Dependent XMCD Spectra
After discussing the general features of the XAS and XMCD at low temperature, the
focus is now turned to the details in the temperature-dependent XMCD spectra. In
Fig. 6.2 the temperature-dependent XMCD of the three elements is plotted. Due to
the performance of the beamline the spectra have an excellent signal-to-noise ratio.
The high energy resolution allows to identify the detailed spectroscopic features.
The spectra have been measured in a range from low temperature T up to the FM-
PM transition temperature in each case. These characteristic temperatures as they
occur in zero magnetic field are summarized in Table 6.1. In zero magnetic field
Tb and Dy show a helical magnetic phase for TC < T < TN. However, since the
measurements have been carried out in an applied magnetic field strong enough to
overcome the shape anisotropy of the samples, this helical phase is suppressed. For
each sample the magnetization as a function of the applied field has been determined
before measuring the XMCD. From this, the field strength was chosen such that the
samples are magnetically saturated during the XMCD measurements. For Tb it
was set to µ0H = 7 T, for Dy to µ0H = 5 T at all temperatures. In the case
of Gd the field was reduced from µ0H = 3 T at T = 10 K to µ0H = 2.8 T at
T = 100 K, µ0H = 2.5 T at T = 200 K, and µ0H = 2 T at T = 250 K. In an
applied magnetic field the magnetization vanishes at slightly higher temperatures
than given in Table 6.1 [209, 215, 220]. Therefore, XMCD signals are still observed
at the highest temperature points given in Fig. 6.2 for Tb and Dy, which are above
the transition temperature to the PM phase.
The relative intensities of the different spectral features vary as temperature changes.
At different photon energies different temperature dependencies of the XMCD are
observed. This becomes obvious especially from the insets that show enlargements

100 Chapter 6 Detailed Analysis of XMCD at the L2,3 Edges of Gd, Tb, and Dy
of the L2 edges. Thus, for the rare earth elements, Gd, Tb, and Dy, the temperature
dependence is more complex than for the 3d FMs. In the cases of Co and Ni, for
example, the XMCD scales in intensity with the magnetization as a function of
the temperature without changing its line shape. This fact has been exploited to
determine the element-specific M(T ) of the coupled trilayers in Chapter 5 from a
single spectral feature of the XMCD spectrum. The question is, of course, what
causes the change of the relative intensities in the XMCD spectra of the rare earth
elements. Possibly, the reason lies in a temperature-dependent change of the DOS.
Final clarification could result from temperature-dependent calculations of the DOS,
which at present cannot be carried out.
6.4 Comparison of Experiment and FEFF Results
To further analyze the measured XMCD spectra at low T calculations within the
local spin density functional approximation (LDA) were carried out within this work
using the version 8.2 of the FEFF code [130]. The theory allows to “switch on and
off”the quadrupolar contributions in addition to the dipolar ones. Taking advantage
of this possibility, the E1 and E2 contributions can be separated by the calculations.
Since the 4f bands are very narrow in energy in the three investigated elements,
the default atomic configuration was redefined to “solid state” configuration to help
convergence. Dirac-Harra self-energy was used to reproduce the peak separation
for both XMCD and XAS. The calculated XMCD spectra are shown in Fig. 6.3
together with the measured ones. The calculated curves are scaled down by a factor
in the order of 2 − 3 to match the experimental data. To account for the non-self-
consistency of the FEFF code with respect to the spin, the energy axes have been
adjusted by less than 5 eV in each case. Apart from the fact that the calculated
spectra are slightly too broad directly at the edge, they reproduce the fine structure
of the experiment quite well. Even the double structure at the L2 edge of Tb and
Dy is resolved. In the case of Gd the higher energy peak of this double structure
reduces to a shoulder in the measured spectra. Also in the calculation its intensity
is reduced, even though the reduction is less pronounced than in the experiment.
The calculations confirm the quadrupolar contributions with opposite sign than
the dipolar ones at the low energy side of the edges in all three cases. The E2
contributions can thus be attributed to the corresponding peaks in the measured
spectra. At the L2 edges of Gd and Dy the E2 contribution merges into the onset
of the E1 contribution and can hardly be seen by eye from the experiments. Apart
from one peak in the pre-edge region, the XMCD of the quadrupolar transitions does

6.4 Comparison of Experiment and FEFF Results 101
Table 6.2: Crystal parameters of Gd, Tb, and Dy [221].
element a b c
Gd (hcp) 3.63 A 5.78 A
Tb (hcp) 3.60 A 5.70 A
Tb (cmcm, T < 220 K) 3.59 A 6.26 A 5.72 A
Dy (hcp) 3.59 A 5.65 A
Dy (cmcm, T < 86 K) 3.60 A 6.18 A 5.68 A
not show any further structure. This reflects the fact that the 4f states, which are
the final states for the E2 transitions, are well localized and have a narrow energy
band.
In the calculations of Fig. 6.3 hexagonal-closed-packed (hcp) structures with the
parameters listed in Table 6.2 have been assumed. Strictly speaking, these are
the crystal structures of bulk Gd, Tb, and Dy at room temperature. For Tb and
Dy a structural transition to a orthorhombic structure of the cmcm space group
are reported at T = 220 K and T = 86 K, respectively [219]. These are about
the temperatures at which the magnetic phase transition from the helical phase to
FM occurs in zero magnetic field. As it is known, for instance, from the ultrathin
ferromagnetic films on Cu single crystals, small changes of the nearest neighbor
distance by a few hundredth of an angstrom may change the magnetic anisotropy
dramatically (Chapter 4). The question is to what extent the structural change
influences the XMCD spectra. In general, in earlier investigations no structural
change at low temperature was considered.
Figure 6.4 shows a comparison of the calculated XMCD of Dy assuming a hcp (solid
line) or an orthorhombic (dashed line) structure with the corresponding parameters
given in Table 6.4. The calculations assuming hcp structure seem to satisfy the
experiments (dotted line) better. Two possible reasons may lead to this finding.
(i) The samples are measured in an applied static magnetic field. There are sev-
eral reports about rather significant magnetostrictive effects in rare earth elements
[222, 223]. It is unclear what happens to the crystal structure of the specific samples
in the given conditions of the present experiment. Possibly the crystal structure is
affected by the large magnetic field. (ii) The FEFF code is based on a LDA proce-
dure which in general is more reliable for delocalized states than for very localized
ones probed close to the edge. However, assuming the hcp structure, the calcula-
tions yield satisfactory results even close to the edge. In general, FEFF yields best

102 Chapter 6 Detailed Analysis of XMCD at the L2,3 Edges of Gd, Tb, and Dy
E (keV)
Norm
.XM
CD
(10
arb.
units)
-2
-2
0
2
7.51 7.56 8.25 8.30
Tb
-2
0
2
7.79 7.84 8.58 8.63
Dy
Experiment
Theory E1
Theory E2
-4
-2
0
2
7.24 7.29 7.92 7.97
Gd
Figure 6.3: Comparison of the measured XMCD spectra of Gd, Tb, and Dy at low tem-perature to the spectra obtained from FEFF calculations.

6.4 Comparison of Experiment and FEFF Results 103
-2
0
2
7.80 7.85 8.60 8.65
E (eV)
Norm
.XM
CD
(10
arb
.units)
-2
E1
E2
E1
E2
Figure 6.4: Comparison of FEFF results assuming hcp (solid line) or orthorhombic (dashedline) structure for Dy together with the measured spectra (dotted line).
results in the extended energy range where the difference between the calculations
for two structures seems to be less pronounced. Especially the E1 contributions
are affected by the structural change. Hardly any difference occurs for the E2 con-
tributions. Magnetostriction affects the hybridization between nearest neighbors.
This hybridization occurs among the 5d states. Thus, magnetostrictive effects are
expected to become obvious in the E1 transitions. Due to their high localization the
4f moments and thus the E2 transitions are not influenced. Detailed analysis and
FEFF calculations of the EXAFS would possibly enlighten the crystal structure in
the specific samples of the present experiments.
Summarizing, high quality temperature-dependent XMCD spectra have been ob-
tained from measuring single crystals of Gd, Tb, and Dy at their L2,3 edges. They
have been compared to FEFF calculations to systematically identify the E1 and
E2 contributions, which are equally important for transitions at the L2,3 edges of
the three investigated elements. In the future the spectra should be compared to
temperature-dependent calculated spectra, to identify the origin of the temperature
dependence of the line shape. However, at present including temperature depen-
dence in the calculations remains a challenge for theory to calculate the experimental
spectra.

104 Chapter 6 Detailed Analysis of XMCD at the L2,3 Edges of Gd, Tb, and Dy
Chapter 7
Conclusions
In this thesis, XAS and XMCD were applied to study the magnetism of ultrathin
ferromagnetic films of Fe, Co, and Ni, and of single crystals of the rare earth elements
Gd, Tb, and Dy. In all cases, the experimental results have been compared to
theory.
Tailoring the growth of 3d ferromagnets by O as a surfactant was exploited to in-
fluence their magnetism. Fe, Co, and Ni films were grown with and without O
surfactant on single crystalline Cu substrates. At first, the electronic structure has
been investigated. NEXAFS spectra, providing a fingerprint of the chemical bond,
reveal that no bulk-like oxides with the FMs are formed. The angular dependence
of the NEXAFS at the O K edge gives final evidence that the O atoms, which have
been initially adsorbed onto the clean Cu surface, float on top as the growth of the
FM films proceeds. Choosing Ni as an example, a charge transfer from the 3d states
of the FM to the 2p states of the O has been determined from NEXAFS spectra
at the Ni L2,3 edges. Taking advantage of the element-specificity of XMCD, not
only the influence of the O surfactant on the magnetism of the FMs themselves has
been elucidated, but also the induced magnetism of the surfactant O was investi-
gated by XMCD at the O K edge. The magnetic information that can be obtained
from XMCD spectra at the O K edge is limited. Due to the missing spin-orbit
splitting of the initial 1s state, XMCD at K edges yields only information about
the orbital magnetism. Therefore, the systematics of the induced magnetism at
the O site in surfactant grown samples has been studied for the three FM elements
in comparison to ab initio calculations. Accompanying calculations reproduce the
measured spectra and provide the spin-resolved density of states, the spin moments,
and the orbital moments. To study the influence of the O surfactant on the FM
layers in detail, Ni was chosen as an example for a series of thickness-dependent
measurements. Ni films of different thickness above the SRT, i.e. with an easy axis

106 Chapter 7 Conclusions
of magnetization perpendicular to the sample surface, were grown on Cu(100) and
Cu(110). The behavior of the total magnetization for the thinnest films is different
on the two surfaces. Growing Ni with O surfactant on Cu(100), the total magneti-
zation is reduced below the bulk value whereas on the more open Cu(110) surface
it is enhanced. This difference in the magnetic behavior is attributed to a different
surface roughness. A detailed analysis with the help of the integral sum rules has
shown that this enhancement is mainly caused by the orbital moment of the Ni. In
the rougher film the orbital moment of the surface atoms is less quenched because
of their reduced effective coordination.
In the second part of this work Co/Cu/Ni/Cu(100) trilayers were chosen as a pro-
totype system to study the influence of the IEC and the importance of enhanced
2D spin fluctuations. Since the two FM layers are of different elements, XMCD
is especially suitable to study the magnetic behavior of them separately. The IEC
results in a change of the element-specific magnetizations of the FM constituents.
In the present study the Ni thickness was reduced down to ∼ 2 ML, considerably
lower than in earlier investigations. In this very thin thickness range the tempera-
ture shift ∆TC,Ni/TC,Ni is most pronounced. It may be up to more than 200 % at
dNi ≈ 2 ML. Such an enormous shift of a critical temperature is never attained in
bulk material. It is known that a mean field description is insufficient to describe
the magnetic behavior of trilayers in the ultrathin limit. Spin-spin correlations (spin
fluctuations) have to be taken into account to properly describe the temperature
shift ∆TC,Ni/TC,Ni. With the help of theory including spin fluctuations it was possi-
ble to successfully derive a relation between the shift ∆TC,Ni/TC,Ni and the coupling
strength Jinter. In contrast to earlier findings in MF, this dependence turns out to
be nonlinear. Only with this relation it has become possible to combine the two
dependencies ∆TC,Ni/TC,Ni (dNi) and Jinter (dCu) which were always discussed sepa-
rately in the past. As a result a two-parameter plot (Fig. 5.14) is presented in this
thesis. The theoretical curve is well in agreement with the experimental findings.
In connection with the investigations of the trilayer systems, measurements of the
total electron yield in an applied magnetic field have been established in the existing
UHV chamber. A water-cooled coil system was designed and set into operation in
the course of this work. With this new coil system measurements in a static magnetic
field ~H of up to µ0H ≈ 50 mT have become possible.
In the third part of this thesis, the shell selectivity of XMCD was exploited to
investigate the interplay between the magnetism of the 5d conduction electrons and
the localized 4f states in rare earth elements. Besides the dipole transitions (E1:

107
2p → 5d), quadrupolar transitions (E2: 2p → 4f) are equally important for the
X-ray absorption at the L2,3 edges of these elements. Due to the states involved,
investigations at the L2,3 edges reveal information about the two contributions in
one single experiment. In contrast to many existing XMCD results on complex
compounds, the systematics of the rare earth XMCD was studied on single crystals
in the present work. Single crystals do not include additional complex interactions
of different species like in a compound. For the series of the rare earth elements Gd,
Tb, and Dy high quality temperature-dependent XMCD spectra have been obtained.
These spectra contain detailed fine structures in their spectroscopic features. In
contrast to the XMCD of the 3d FMs, the relative intensities of these features change
as a function of the temperature. The low temperature spectra were compared to
ab initio calculations using the FEFF code. In this framework contributions to the
XMCD from dipolar and quadrupolar transitions can be systematically identified.
However, it remains a challenge for theory to describe and reproduce the temperature
dependence of the spectra.
Concluding, this thesis has shown that by investigating the spin-averaged and spin-
dependent X-ray absorption spectra, the delicate interplay of different magnetic
contributions, as they are relevant for nanostructures, may be identified and sepa-
rated. By combining experiment and theory, they lead to an advanced insight into
the magnetic properties of the investigated systems.

108 Chapter 7 Conclusions

Appendix A
Note on the Use of Units
Magnetic units are not used consistently in literature. In general, in this thesis the
use of the modern SI units is preferred. A magnetic field ~H is characterized by
the quantity µ0H given in tesla, which strictly speaking is a magnetic induction B.
A magnetic field with µ0H = 100 mT in vacuum corresponds to H = 1 kOe in
the older but still commonly used cgs system. Magnetizations are given in kA/m
where 1 kA/m in SI units corresponds to 1 G in cgs units. For atomic distances the
convenient unit angstrom (1 A= 10−10 m) is used like in many recent publications.
The problems that occur due to different unit systems are a man-made and do not
influence the physics themselves.

110 Appendix A Note on the Use of Units

Appendix B
Additional Notes on the New Coil
System
B.1 Geometry of the New Coil System with Respect
to Helmholtz Geometry
A pair of two identical coils are in Helmholtz geometry if they are separated by a
distance equal to their radius. Then the field in a certain area between them is a
nearly spatially uniform magnetic field. The radius of the new coil system is Ri =
18 mm, the outer radius is Ra = 65 mm. Thus the mean radius is Rm = 41.5 mm.
Their distance is D = 68 mm. This means they are further away from each other
than in the ideal Helmholtz geometry. However, the calibration measurements (see
Chapter 3) show a satisfactory homogeneity of the magnetic field at the sample
position.
B.2 Operation of the New Coil System in Pulse Mode
Operation of the system in pulse mode is in general possible with the existing mag-
netic field pulse generation electronics by sudden discharge of a capacitor. Therefore,
one has to be aware that the whole electric system, i.e. the pulse generation electron-
ics together with the coil system, is an RCL oscillator, and in the strongly damped
case the condition (4L) / (CR2) < 1 has to be fulfilled. Since the inductance L of
the coil system and the capacity C of the electronics are given, the ohmic resistance
R has to be adjusted by installing a series resistance RS in the feed cable. The
capacity of the available electronics is C = 5 mF. The ohmic resistance Rcoil and

112 Appendix B Additional Notes on the New Coil System
the inductance L of the new coil system (both coils in series) have been measured.
They are L = (305± 15) µH and Rcoil = (0.208± 0.006) Ω. Since also the maximum
current is limited by the components of the electronics RS = 0.47Ω has been chosen
for a first test. The maximum current can be obtained from the time dependence
of the current I(t) = C ddt
UC(t) which is determined by the voltage UC(t) of the
discharging capacitor. It is given by
I(t) =U0 · e−
R2L
(γ−1)t
Rγ·(1− e−
RL
t)
, γ =
√1− 4L
CR2. (B.1)
B.3 Choice of the PTFE Shrink Tube
PTFE shrink tube is used to electrically insulate the Cu tubes. During the construc-
tion of the coil system it turned out that PTFE shrink tube is delicate to handle.
Therefore, it is useful to buy it directly from a manufacturer, where one has the possi-
bility to get in contact with the corresponding technician. The PTFE shrink tube fi-
nally used was bought from IFK-ISOFLUOR GmbH, Neuss (http://www.isofluor.de).
The type of the tube is “AWG 11 TW 2:1”. A shrinking rate of 2:1 is preferable.
A tube with a shrinking rate of 2:1 ends up tighter on the Cu than a tube which
shrinks 4:1.

Bibliography
[1] J. Stohr: NEXAFS Spectroscopy. Vol. 25, Springer, Berlin Heidelberg (1992).
[2] J. Stohr: X-ray magnetic ciruclar dichroism spectroscopy of transition metal thinfilms. J. Electr. Spectr. and Rel. Phenom. 75, 253 (1995).
[3] J. Stohr: Exploring the microscopic origin of magnetic anisotropies with X-ray mag-netic circular dichroism (XMCD) spectroscopy. J. Magn. Magn. Mat. 200, 470 (1999).
[4] J. Lindner, P. Poulopoulos, R. Nunthel, E. Kosubek, H. Wende, and K. Baberschke:Improved growth and the spin reorientation transition of Ni on
(√2× 2
√2)R45 re-
constructed O/Cu(001). Surf. Sci. 523, L65 (2003).
[5] R. Nunthel, T. Gleitsmann, P. Poulopoulos, A. Scherz, J. Lindner, E. Kosubek, Ch.Litwinski, Z. Li, H. Wende, K. Baberschke, S. Stolbov, and T. S. Rahman: Epitax-ial growth of Ni on Cu(001) with the assistance of O-surfactant and its magnetismcompared to Ni/Cu(001). Surf. Sci. 531, 53 (2003).
[6] J. Hong, R. Q. Wu, J. Lindner, E. Kosubek, and K. Baberschke: Manipulation of SpinReorientation Transition by Oxygen Surfactant Growth: A Combined Theoretical andExperimental Approach. Phys. Rev. Lett. 92, 147202 (2004).
[7] P. Bruno and C. Chappert: Oscillatory Coupling between Ferromagnetic Layers Sep-arated by a Nonmagnetic Metal Spacer. Phys. Rev. Lett. 67, 1602 (1991).
[8] P. Bruno and C. Chappert: Oscillatory Coupling between Ferromagnetic Layers Sep-arated by a Nonmagnetic Metal Spacer [Phys. Rev. Lett. 67, 1602 (1991)]. Phys. Rev.Lett. 67, 2592 (1991).
[9] A. Fert, P. Grunberg, A. Barthelemy, F. Petroff, and W. Zinn: Layered magneticstructures: interlayer exchange coupling and giant magnetoresistance. J. Magn. Magn.Mat. 140, 1 (1995).
[10] B. Heinrich and J. A. C. Bland: Ultrathin Magnetic Structures II. Springer, Berlin(1994).
[11] J. A. C. Bland and B. Heinrich: Ultrathin Magnetic Structures III. Springer, Berlin(2005).
114 Bibliography
[12] U. Bovensiepen, F. Wilhelm, P. Srivastava, P. Poulopoulos, M. Farle, A. Ney, andK. Baberschke: Two Susceptibility Maxima and Element Specific Magnetizations inIndirectly Coupled Ferromagnetic Layers. Phys. Rev. Lett. 81, 2368 (1998).
[13] P. Poulopoulos and K. Baberschke: Phase Transitions in Coupled Two-DimensionalFerromagnetic Layers. Lecture Notes in Physics 580, 283 (2001).
[14] P. J. Jensen, K. H. Bennemann, P. Poulopoulos, M. Farle, F. Wilhelm, and K. Baber-schke: Enhanced induced magnetization in coupled magnetic trilayers in the presenceof spin fluctuations. Phys. Rev. B 60, R14994 (1999).
[15] J. Lindner and K. Baberschke: Ferromagnetic resonance in coupled ultrathin films. J.Phys: Cond. Matter 15, S465 (2003).
[16] P. Carra and M. Altarelli: Dichroism in the x-ray absorption spectra of magneticallyordered systems. Phys. Rev. Lett. 64, 1286 (1990).
[17] J. C. Lang, G. Srajer, C. Detlefs, A. I. Goldman, H. Konig, X. Wang, B. N. Harmon,and R. W. McCallum: Confirmation of Quadrupolar Transitions in Circular MagneticX-Ray Dichroism at the Dysprosium LIII Edge. Phys. Rev. Lett. 74, 4935 (1995).
[18] C. Giorgetti, E. Dartyge, C. Brouder, F. Baudelet, C. Meyer, S. Pizzini, A. Fontaine,and R.-M. Galera: Quadrupolar Effect in X-Ray Magnetic Circular Dichroism. Phys.Rev. Lett. 75, 3186 (1995).
[19] H. Ebert: Magneto-optical effects in transition metal systems. Rep. Prog. Phys. 59,1665 (1996).
[20] J. L. Erskine and E. A. Stern: Calculation of the M23 magneto-optical absorptionspectrum of ferromagnetic nickel. Phys. Rev. B 12, 5016 (1975).
[21] G. Schutz, W. Wagner, W. Wilhelm, P. Kienle, R. Zeller, R. Frahm, and G. Materlik:Absorption of circularly polarized x rays in iron. Phys. Rev. Lett. 58, 737 (1987).
[22] B. K. Agarwal: X-Ray Spectroscopy. Vol. 15, Springer, Berlin (1979).
[23] A. Scherz: Spin-dependent X-ray Absorption Spectroscopy of 3d Transition Metals:Systematics and Applications. Ph. D. thesis, Freie Universitat Berlin, Dissertation.de-Verlag im Internet GmbH, Berlin, ISBN 3-89825-779-7 (2004).
[24] A. Scherz, E. K. U. Gross, H. Appel, C. Sorg, K. Baberschke, H. Wende, and K. Burke:Measuring the kernel of time-dependent density functional theory with x-ray absorp-tion spectroscopy of 3d transition metals. Phys. Rev. Lett. submitted (2005).
[25] C. T. Chen, Y. U. Idzerda, H.-J. Lin, N. V. Smith, G. Meigs, E. Chaban, G. H.Ho, E. Pellegrin, and F. Sette: Experimental Confirmation of the X-Ray MagneticCircular Dichroism Sum Rules for Iron and Cobalt. Phys. Rev. Lett. 75, 152 (1995).

Bibliography 115
[26] W. Gudat and C. Kunz: Close Similarity between Photoelectric Yield and Photoab-sorption Spectra in the Soft-X-Ray Range. Phys. Rev. Lett. 29, 169 (1972).
[27] W. L. O’Brien and B. P. Tonner: Orbital and spin sum rules in x-ray magnetic circulardichroism. Phys. Rev. B 50, 12672 (1994).
[28] J. Vogel and M. Sacchi: Polarization and angular dependence of the L2,3 absorptionedges in Ni(110). Phys. Rev. B 49, 3230 (1994).
[29] J. Hunter-Dunn, D. Arvanitis, N. Martensson, M. Tischer, F. May, M. Russo, andK. Baberschke: An angle-dependent magnetic circular X-ray dichroism study ofCo/Cu(100): experiment versus theory. J. Phys: Cond. Matter 7, 1111 (1995).
[30] R. Nakajima, J. Stohr, and Y. U. Idzerda: Electron-yield saturation effects in L-edgex-ray magnetic circular dichroism spectra of Fe, Co, and Ni. Phys. Rev. B 59, 6421(1999).
[31] W. L. O’Brien and B. P. Tonner: Surface-enhanced magnetic moment and ferromag-netic ordering of Mn ultrathin films on fcc Co(001). Phys. Rev. B 50, 2963 (1994).
[32] E. Goering, A. Fuss, W. Weber, J. Will, and G. Schutz: Element specific x-ray mag-netic circular dichroism magnetization curves using total electron yield. J. Appl. Phys.88, 5920 (2000).
[33] L. Troger, D. Arvanitis, K. Baberschke, H. Michaelis, U. Grimm, and E. Zschech:Full correction of the self-absorption in soft-fluorescence extended x-ray-absorptionfine structure. Phys. Rev. B 46, 3283 (1992).
[34] S. Eisebitt, T. Boske, J.-E. Rubensson, and W. Eberhardt: Determination of absorp-tion coefficients for concentrated samples by fluorescence detection. Phys. Rev. B 47,14103 (1993).
[35] H. Wende, Ch. Litwinski, A. Scherz, T. Gleitsmann, Z. Li, C. Sorg, K. Baberschke,A. Ankudinov, J. J. Rehr, and Ch. Jung: A systematic study of embedded atomEXAFS: the (2× 1)O/Cu(110) reconstruction as an ideal prototype system. J. Phys:Cond. Matter 15, 5197 (2003).
[36] J. J. Rehr and R. C. Albers: Theoretical approaches to x-ray absorption fine structure.Rev. Mod. Phys. 72, 621 (2000).
[37] H. Wende, A. Scherz, C. Sorg, Z. Li, P. Poulopoulos, K. Baberschke, A. Ankudinov,J. J. Rehr, F. Wilhelm, N. Jaouen, A. Rogalev, D. L. Schlagel, and T. A. Lograsso:Temperature Dependence of Magnetic EXAFS for Rare Earth Elements. Phys. ScriptaT115, 600 (2005).
[38] A. L. Ankudinov, J. J. Rehr, H. Wende, and K. Baberschke: Information in MagneticEXAFS. Phys. Scripta T115, 651 (2005).

116 Bibliography
[39] P. Srivastava, L. Lemke, H. Wende, R. Chauvistre, N. Haack, K. Baberschke,J. Hunter-Dunn, D. Arvanitis, N. Martensson, A. Ankudinov, and J. J. Rehr: Mag-netic extended x-ray absorption fine structure at the L3,2 edges of Fe and Co onCu(001). J. Appl. Phys. 83, 7025 (1998).
[40] H. Wende, J. W. Freeland, V. Chakarian, Y. U. Idzerda, L. Lemke, and K. Baber-schke: Probing local magnetic disorder by investigating spin dependent photoelectronscattering. J. Appl. Phys. 83, 7028 (1998).
[41] E. Dartyge, F. Baudelet, C. Brouder, A. Fontaine, C. Giorgetti, J.-P. Kappler,G. Krill, M. F. Lopez, and S. Pizzini: Hard X-rays magnetic EXAFS. Physica B208&209, 751 (1995).
[42] H. Ebert, V. Popescu, D. Ahlers, G. Schutz, L. Lemke, H. Wende, P. Srivastava, andK. Baberschke: Theoretical and experimental investigations on the magnetic EXAFSat the K- and L2,3-edges of bcc-Fe. Europhys. Lett. 42, 295 (1998).
[43] D. Norman, J. Stohr, R. Jaeger, P. J. Durham, and J. B. Pendry: Determinationof Local Atomic Arrangements at Surfaces from Near-Edge X-Ray-Absorption Fine-Structure Studies: O on Ni(100). Phys. Rev. Lett. 51, 2052 (1983).
[44] A. I. Nesvizhskii, A. L. Ankudinov, and J. J. Rehr: Normalization and convergenceof x-ray absorption sum rules. Phys. Rev. B 63, 94412 (2001).
[45] E. Hecht: Optics. Benjamin Cummings, (2001).
[46] U. Fano: Spin Orientation of Photoelectrons Ejected by Circularly Polarized Light.Phys. Rev. 178, 131 (1969).
[47] B. T. Thole, P. Carra, F. Sette, and G. van der Laan: X-Ray Circular Dichroism asa Probe of Orbital Magnetism. Phys. Rev. Lett. 68, 1943 (1992).
[48] P. Carra, B. T. Thole, M. Altarelli, and X. Wang: X-Ray Circular Dichroism andLocal Magnetic Fields. Phys. Rev. Lett. 70, 694 (1993).
[49] A. Scherz, H. Wende, K. Baberschke, J. Minar, D. Benea, and H. Ebert: Relationbetween L2,3 XMCD and the magnetic ground-state properties for the early 3d elementV. Phys. Rev. B 66, 184401 (2002).
[50] A. Scherz, H. Wende, C. Sorg, K. Baberschke, J. Minar, D. Benea, and H. Ebert:Limitations of intergral XMCD sum-rules for the early 3d elements. Phys. ScriptaT115, 586 (2005).
[51] M. M. Schwickert, G. Y. Guo, M. A. Tomaz, W. L. O’Brien, and G. R. Harp: X-raymagnetic linear dichroism in absorption at the L edge of metallic Co, Fe, Cr, and V.Phys. Rev. B 58, R4289 (1998).

Bibliography 117
[52] F. Wilhelm: Magnetic Properties of Ultrathin Films, Coupled Trilayers and 3d/5dMultilayers studied by X-ray Magnetic Circular Dichroism. Ph. D. thesis, Freie Uni-versitat Berlin, Dissertation.de-Verlag im Internet GmbH, Berlin, ISBN 3-89825-177-2(2000).
[53] S. S. Dhesi, H. A. Durr, G. van der Laan, E. Dudzik, and N. B. Brookes: Electronicand magnetic structure of thin Ni films on Co/Cu(001). Phys. Rev. B 60, 12852(1999).
[54] W. D. Brewer, A. Scherz, C. Sorg, H. Wende, K. Baberschke, P. Bencok, and S. Frota-Pessoa: Direct Observation of Orbital Magnetism in Cubic Solids. Phys. Rev. Lett.93, 77205 (2004).
[55] J. H. Wu, T. Herrmann, M. Potthoff, and W. Nolting: Theoretical approach to theCurie temperature shift in FM1/NM/FM2/SUB (ferromagnetic metal 1/nonmagneticmetal/ferromagnetic metal 2/substrate) systems. J. Phys: Cond. Matter 12, 2847(2000).
[56] A. Ney, A. Scherz, P. Poulopoulos, K. Lenz, H. Wende, K. Baberschke, F. Wilhelm,and N. B. Brookes: Clarification of contesting results for the total magnetic momentof Ni/Cu(001). Phys. Rev. B 65, 24411 (2002).
[57] A. Ney, P. Poulopoulos, and K. Baberschke: Surface and interface magnetic momentsof Co/Cu(001). Europhys. Lett. 54, 820 (2001).
[58] P. J. Jensen, K. H. Bennemann, K. Baberschke, P. Poulopoulos, and M. Farle: Magne-tization and susceptibility of coupled ferromagnetic trilayers calculated with a Green’sfunction type theory. J. Appl. Phys. 87, 6692 (2000).
[59] A. Scherz, C. Sorg, M. Bernien, N. Ponpandian, K. Baberschke, H. Wende, and P. J.Jensen: Importance of giant spin fluctuations in two-dimensional magnetic trilayers.Phys. Rev. B 72, 054447 (2005).
[60] P. J. Jensen: Rapid evaluation of oscillating lattice sums. Ann. Physik (Leipzig) 6,317 (1997).
[61] P. Poulopoulos and K. Baberschke: Magnetism in thin films. J. Phys: Cond. Matter11, 9495 (1999).
[62] M. Farle, W. Platow, A. N. Anisimov, P. Poulopoulos, and K. Baberschke: Anomalousreorientation phase transition of the magnetization in fct Ni/Cu(001). Phys. Rev. B56, 5100 (1997).
[63] S. Schwieger, J. Kienert, and W. Nolting: Theory of field-induced spin reorientationtransition in thin Heisenberg films. Phys. Rev. B 71, 024428 (2005).
118 Bibliography
[64] S. V. Tyablikov: Methods in the quantum theory of magnetism. Plenum Press, NewYork (1967).
[65] A. M. N. Niklasson, B. Johansson, and H. L. Skriver: Interface magnetism of 3dtransition metals. Phys. Rev. B 59, 6373 (1999).
[66] H. B. Callen: Green Function Theory of Ferromagnetism. Phys. Rev. 130, 890 (1963).
[67] S. V. Tyablikov: Ukr. Mat. Zh 11, 287 (1959).
[68] S. Sasaki, K. Miyata, and T. Takada: A New Undulator for Generating VariablyPolarized Radiation. Jpn. J. Appl. Phys. 31, L1794 (1992).
[69] H. Winick: Synchrotron Radiation Research. Plenum Press, New York (1980).
[70] H. Wiedemann: Synchrotron Radiation. Springer, Berlin (2003).
[71] D. H. Tomboulian and P. L. Hartman: Spectral and Angular Distribution of UltravioletRadiation from the 300-MeV Cornell Synchrotron. Phys. Rev. 102, 1423 (1956).
[72] S. Sasaki: Analyses for a planar variably-polarizing undulator. Nucl. Instrum. Meth.A 347, 83 (1994).
[73] A. Rogalev, V. Gotte, J. Goulon, C. Gauthier, J. Chavanne, and P. Elleaume: XAFSand X-MCD spectroscopies with undulator gap scan. J. Synchrotron Rad. 5, 989(1998).
[74] BESSY - Berliner Elektronenspeicherring-Gesellschaft fur Synchrotronstrahlung m.b. H., URL: http://www.bessy.de (2005).
[75] N. Haack: NEXAFS-Untersuchungen an adsorbierten Molekulen und dunnen Nickel-Filmen. Ph. D. thesis, Freie Universitat Berlin, unpublished, (1999).
[76] M. Ritter, M. Stindtmann, M. Farle, and K. Baberschke: Nanostructuring of theCu(001) surface by ion bombardment: a STM study. Surf. Sci. 348, 243 (1996).
[77] R. Nunthel: Wachstum und Magnetismus dunner 3d Metalle auf Cu-Substraten, Ein-fluß von O als Surfactant. Ph. D. thesis, Freie Universitat Berlin, Dissertation.de-Verlag im Internet GmbH, Berlin, ISBN 3-89825-826-2 (2004).
[78] M. Bernien: Spinfluktuationen in gekoppelten, magnetischen Schichten: eine tempe-raturabhangige Rontgenzirkulardichroismus-Studie. Diplom thesis, unpublished, FreieUniversitat Berlin (2004).
[79] K. J. S. Sawhney, F. Senf, M. Scheer, F. Schafers, J. Bahrdt, A. Gaupp, and W. Gudat:A novel undulator-based PGM beamline for circularly polarised synchrotron radiationat BESSY II. Nucl. Instrum. Meth. A 390, 395 (1997).

Bibliography 119
[80] R. Follath and F. Senf: New plane-grating monochromators for third generation syn-chrotron radiation light sources. Nucl. Instrum. Meth. A 390, 388 (1997).
[81] M. R. Weiss, R. Follath, K. J. S. Sawhney, F. Senf, J. Bahrdt, W. Frentrup, A. Gaupp,S. Sasaki, M. Scheer, H.-C. Mertins, D. Abramsohn, F. Schafers, W. Kuch, andW. Mahler: The Elliptically Polarised Undulator Beamlines at BESSY II. Nucl. In-strum. Meth. A 467, 449 (2001).
[82] A. Scherz: Magnetischer Rontgenzirkulardichroismus an ultrdunnen magnetischenFilmen der 3d Ubergangsmetalle Kobalt und Nickel: Temperaturabhangige Messun-gen an Ein- und Dreischichtsystemen. Diplom thesis, unpublished, Freie UniversitatBerlin (2000).
[83] MAX-lab D1011, URL: http://maxsun5.maxlab.lu.se/beamlines/bld1011/ (2005).
[84] Swagelok company, URL: http://www.swagelok.com (corporate office, US),http://www.swagelok.de (Germany), (2005).
[85] ESRF - The European Synchtrotron Radiation Facility, URL: http://www.esrf.fr(2005).
[86] J. Goulon, A. Rogalev, C. Gauthier, C. Goulon-Ginet, S. Paste, R. Signorato, C. Neu-mann, L. Varga, and C. Malgrange: Instrumentation Developments for X-ray Linearand Circular Dichroism at the ESRF Beamline ID12A. J. Synchrotron Rad. 5, 232(1998).
[87] J. Goulon, A. Rogalev, F. Wilhelm, N. Jaouen, C. Goulon-Ginet, and C. Brouder:Optical activity probed with x-rays. J. Phys: Cond. Matter 15, S633 (2003).
[88] J. Chavanne, P. Elleaume, and P. Van Vaerenbergh: A novel fast switching lin-ear/helical undulator. in: Proc. 6th EPAC, p. 317 (1998).
[89] C. Gauthier, G. Goujon, S. Feite, E. Moguiline, L. Braicovich, N. B. Brookes, andJ. Goulon: Modulated detection of multibeam dichroism using photodiodes. Physica B208&209, 232 (1995).
[90] O. Hjortstam, K. Baberschke, J. M. Wills, B. Johansson, and O. Eriksson: Magneticanisotropy and magnetostriction in tetragonal and cubic Ni. Phys. Rev. B 55, 15026(1997).
[91] L. Li, A. Kida, M. Ohnishi, and M. Matsui: Surfactant effect of oxygen in epitaxialγ-Fe/Cu(001)-O
(2√
2×√
2R45). Surf. Sci. 493, 120 (2001).
[92] W. F. Egelhoff, P. J. Chen, C. J. Powell, M. D. Stiles, R. D. McMichael, J. H. Judy,K. Takano, and A. E. Berkowitz: Oxygen as a surfactant in the growth of giantmagnetoresistance spin valves. J. Appl. Phys. 82, 6142 (1997).

120 Bibliography
[93] M. Copel, M. C. Reuter, E. Kaxiras, and R. M. Tromp: Surfactants in EpitaxialGrowth. Phys. Rev. Lett. 63, 632 (1989).
[94] J. Camarero, T. Graf, J. J. de Miguel, R. Miranda, W. Kuch, M. Zharnikov,A. Dittschar, C. M. Schneider, and J. Kirschner: Surfactant-Mediated Modificationof the Magnetic Properties of Co/Cu(111) Thin Films and Superlattices. Phys. Rev.Lett. 76, 4428 (1996).
[95] L. Duo, R. Bertacco, G. Isella, F. Ciccacci, and M. Richter: Electronic and magneticproperties of the Co/Fe(001) interface and the role of oxygen. Phys. Rev. B 61, 15294(2000).
[96] F. Bisio, R. Moroni, M. Canepa, L. Mattera, R. Bertacco, and F. Ciccacci: Struc-tural versus Magnetic Properties at the Surface of Fe Films during Oxygen-AssistedHomoepitaxial Growth. Phys. Rev. Lett. 83, 4868 (1999).
[97] M. Nyvlt, F. Bisio, J. Franta, C. L. Gao, H. Petek, and J. Kirschner: Surface Mag-netism during Oxygen-Aided Fe Homoepitaxy. Phys. Rev. Lett. 95, 127201 (2005).
[98] R. Nunthel, J. Lindner, P. Poulopoulos, and K. Baberschke: The influence of substratepreoxidation on the growth of Ni on Cu(110). Surf. Sci. 566-568, 100 (2004).
[99] C. Sorg, N. Ponpandian, A. Scherz, H. Wende, R. Nunthel, T. Gleitsmann, andK. Baberschke: The magnetism of ultrathin Ni films grown with O surfactant. Surf.Sci. 565, 197 (2004).
[100] M. Farle: Ferromagnetic Ni monolayers grown with an O surfactant. Surf. Sci. 575,1 (2005).
[101] T. Nakagawa, H. Watanabe, and T. Yokoyama: Opposite spin reorientation transi-tions driven by a magnetic orbital moment: Ultrathin Ni films on Cu surfaces. Phys.Rev. B 71, 235403 (2005).
[102] K. Baberschke: The magnetism of nickel monolayers. Appl. Phys. A 62, 417 (1996).
[103] W. Platow, U. Bovensiepen, P. Poulopoulos, M. Farle, K. Baberschke, L. Hammer,S. Walter, S. Muller, and K. Heinz: Structure of ultrathin Ni/Cu(001) films as afunction of film thickness, temperature, and magnetic order. Phys. Rev. B 59, 12641(1999).
[104] K. Heinz, S. Muller, and L. Hammer: Crystallography of ultrathin iron, cobalt andnickel films grown epitaxially on copper. J. Phys: Cond. Matter 11, 9437 (1999).
[105] J. Shen, J. Giergiel, and J. Kirschner: Growth and morphology of Ni/Cu(100) ultra-thin films: An in situ study using scanning tunneling microscopy. Phys. Rev. B 52,8454 (1995).

Bibliography 121
[106] C. Tolkes, R. Struck, R. David, P. Zeppenfeld, and G. Comsa: Surfactant-InducedLayer-by-Layer Growth on a Highly Anisotropic Substrate: Co/Cu(110). Phys. Rev.Lett. 80, 2877 (1998).
[107] C. Tolkes, R. Struck, R. David, P. Zeppenfeld, and G. Comsa: Preparation of atom-ically flat Co(110) films on Cu(110). Appl. Phys. Lett. 73, 1059 (1998).
[108] J. J. de Miguel, A. Cebollada, J. M. Gallego, S. Ferrer, R. Miranda, C. M. Schneider,P. Bressler, J. Garbe, K. Bethke, and J. Kirschner: Characterization of the growthprocesses and magnetic properties of thin ferromagnetic cobalt films on Cu(100). Surf.Sci. 211-212, 732 (1989).
[109] J. Thomassen, F. May, B. Feldmann, M. Wuttig, and H. Ibach: Magnetic live surfacelayers in Fe/Cu(100). Phys. Rev. Lett. 69, 3831 (1992).
[110] S. Muller, P. Bayer, C. Reischl, K. Heinz, B. Feldmann, H. Zillgen, and M. Wuttig:Structural Instability of Ferromagnetic fcc Fe Films on Cu(100). Phys. Rev. Lett. 74,765 (1995).
[111] B. Schulz and K. Baberschke: Crossover from in-plane to perpendicular magnetiza-tion in ultrathin Ni/Cu(001) films. Phys. Rev. B 50, 13467 (1994).
[112] F. Huang, M. T. Kief, G. J. Mankey, and R. F. Willis: Magnetism in the few-monolayers limit: A surface magneto-optic Kerr-effect study of the magnetic behaviorof ultrathin films of Co, Ni, and Co-Ni alloys on Cu(100) and Cu(111). Phys. Rev.B 49, 3962 (1994).
[113] M. Sacchi, A. Mirone, and S. Iacobucci: Soft X-ray resonant magnetic scatteringfrom thin Ni layers on Cu(110). Surf. Sci. 442, 349 (1999).
[114] M. Wahl, Th. Herrmann, N. Esser, and W. Richter: Structure and magneto opticalproperties of ferromagnetic Ni films grown on Cu(110). phys. stat. sol. (c) 0, 3002(2003).
[115] C. M. Schneider, P. Bressler, P. Schuster, J. Kirschner, J. J. de Miguel, and R. Mi-randa: Curie temperature of ultrathin films of fcc-cobalt epitaxially grown on atomi-cally flat Cu(100) surfaces. Phys. Rev. Lett. 64, 1059 (1990).
[116] P. Krams, F. Lauks, R. L. Stamps, B. Hillebrands, and G. Guntherodt: Magneticanisotropies of ultrathin Co(001) films on Cu(001). Phys. Rev. Lett. 69, 3674 (1992).
[117] W. L. Ling, Z. Q. Qiu, O. Takeuchi, D. F. Ogletree, and M. Salmeron: Effect ofoxygen surfactant on the magnetic and structural properties of Co films grown onCu(110). Phys. Rev. B 63, 24408 (2001).
[118] D. Li, M. Freitag, J. Pearson, Z. Q. Qiu, and S. D. Bader: Magnetic phases ofultrathin Fe grown on Cu(100) as epitaxial wedges. Phys. Rev. Lett. 72, 3112 (1994).
122 Bibliography
[119] T. Kraft, P. M. Marcus, and M. Scheffler: Atomic and magnetic structure of fccFe/Cu(100). Phys. Rev. B 49, 11511 (1994).
[120] A. Scherz, H. Wende, and K. Baberschke: Fine structure of X-ray magnetic circulardichroism for early 3d transition metals. Appl. Phys. A 78, 843 (2004).
[121] K. Amemiya, T. Yokoyama, Y. Yonamoto, D. Matsumura, and T. Ohta: O K-edgex-ray magnetic circular dichroism of atomic O adsorbed on an ultrathin Co/Cu(100)film: Comparison with molecular CO on Co/Cu(100). Phys. Rev. B 64, 132405(2001).
[122] T. Yokoyama, K. Amemiya, M. Miyachi, Y. Yonamoto, D. Matsumura, and T. Ohta:K-edge magnetic circular dichroism of O in CO/Ni/Cu(001): Dependence on sub-strate magnetic anisotropy and its interpretation. Phys. Rev. B 62, 14191 (2000).
[123] K. Amemiya, T. Yokoyama, Y. Yonamoto, M. Miyachi, Y. Kitajima, and T. Ohta:Observation of O K-Edge X-Ray Magnetic Circular Dichroism of CO Adsorbed on anUltrathin Co/Cu(001) Film. Jpn. J. Appl. Phys. 39, L63 (2000).
[124] H.-Ch. Mertins, S. Valencia, W. Gudat, P. M. Oppeneer, O. Zaharko, and H. Grim-mer: Direct observation of local ferromagnetism on carbon in C/Fe multilayers. Eu-rophys. Lett. 66, 743 (2004).
[125] C. Sorg, N. Ponpandian, M. Bernien, K. Baberschke, H. Wende, and R. Q. Wu:Induced Magnetism of Oxygen in Surfactant Grown Fe, Co, and Ni Monolayers. Phys.Rev. B submitted (2005).
[126] A. Kirilyuk, J. Giergiel, J. Shen, and J. Kirschner: Unusual surfactant effect andthe stability of pseudomorphic γ-Fe films. Phys. Rev. B 52, R11672 (1995).
[127] A. Kirilyuk, J. Giergiel, J. Shen, M. Straub, and J. Kirschner: Growth of stabilizedγ-Fe films and their magnetic properties. Phys. Rev. B 54, 1050 (1996).
[128] T. Bernhard, M. Baron, M. Gruyters, and H. Winter: Surface Structure of UltrathinFe Films on Cu(001) Revisited. Phys. Rev. Lett. 95, 087601 (2005).
[129] M. Newville, B. Ravel, D. Haskel, J. J. Rehr, E. A. Stern, and Y. Yacoby: Analysisof multiple-scattering XAFS data using theoretical standards. Physica B: CondensedMatter 208-209, 154 (1995).
[130] A. L. Ankudinov, B. Ravel, J. J. Rehr, and S. D. Conradson: Real-space multiple-scattering calculation and interpretation of x-ray-absorption near-edge structure.Phys. Rev. B 58, 7565 (1998).

Bibliography 123
[131] E. O. F. Zdansky, A. Nilsson, H. Tillborg, O. Bjorneholm, N. Martensson, J. N.Andersen, and R. Nyholm: Electronic structure of atomic adsorbates from x-ray-absorption spectroscopy: Threshold effects and higher excited states. Phys. Rev. B 48,2632 (1993).
[132] H. Tillborg, A. Nilsson, T. Wiell, N. Wassdahl, N. Martensson, and J. Nordgren:Electronic structure of atomic oxygen adsorbed on Ni(100) and Cu(100) studied bysoft-x-ray emission and photoelectron spectroscopies. Phys. Rev. B 47, 16464 (1993).
[133] R. W. Godby, G. A. Benesh, R. Haydock, and V. Heine: Local-orbital analysis ofthe oxygen-nickel(001) bond from self-consistent electronic structure. Phys. Rev. B32, 655 (1985).
[134] F. May, M. Tischer, D. Arvanitis, M. Russo, J. Hunter-Dunn, H. Henneken,H. Wende, R. Chauvistre, N. Martensson, and K. Baberschke: Modifications of theelectronic and magnetic properties of ultrathin Ni/Cu(100) films induced by stepwiseoxidation. Phys. Rev. B 53, 1076 (1996).
[135] P. Srivastava, N. Haack, H. Wende, R. Chauvistre, and K. Baberschke: Modificationsof the electronic structure of Ni/Cu(001) as a function of the film thickness. Phys.Rev. B 56, R4398 (1997).
[136] C.-R. Chang and Y. F. Chiang: Magnetic surface anisotropy of a spin array. Phys.Rev. B 48, 12783 (1993).
[137] J. W. Freeland, K. Bussmann, P. Lubitz, Y. U. Idzerda, and C.-C. Kao: Probinginterfacial and bulk magnetic hysteresis in roughened CoFe thin films. Appl. Phys.Lett. 73, 2206 (1998).
[138] E. E. Fullerton, D. M. Kelly, J. Guimpel, I. K. Schuller, and Y. Bruynseraede:Roughness and giant magnetoresistance in Fe/Cr superlattices. Phys. Rev. Lett. 68,859 (1992).
[139] P. Poulopoulos, J. Lindner, M. Farle, and K. Baberschke: Changes of magneticanisotropy due to roughness: a quantitative scanning tunneling microscopy study onNi/Cu(001). Surf. Sci. 437, 277 (1999).
[140] E. Wimmer, H. Krakauer, M. Weinert, and A. J. Freeman: Full-potential self-consistent linearized-augmented-plane-wave method for calculating the electronicstructure of molecules and surfaces: O2 molecule. Phys. Rev. B 24, 864 (1981).
[141] M. Weinert, E. Wimmer, and A. J. Freeman: Total-energy all-electron density func-tional method for bulk solids and surfaces. Phys. Rev. B 26, 4571 (1982).
[142] L. Hedin and B. I. Lundqvist: Explicit local exchange-correlation potentials. J. Phys.C: Solid State Phys. 4, 2064 (1971).

124 Bibliography
[143] J. P. Perdew, K. Burke, and M. Ernzerhof: Generalized Gradient ApproximationMade Simple. Phys. Rev. Lett. 77, 3865 (1996).
[144] J. P. Perdew, K. Burke, and Y. Wang: Generalized gradient approximation for theexchange-correlation hole of a many-electron system. Phys. Rev. B 54, 16533 (1996).
[145] S. Doniach and M. Sunjic: Many-electron singularity in X-ray photoemission and X-ray line spectra from metals. Journal of Physics C: Solid State Physics 3, 285 (1970).
[146] R. Q. Wu: Mn Distribution and Spin Polarization in Ga1−xMnxAs. Phys. Rev. Lett.94, 207201 (2005).
[147] B. Heinrich and J. A. C. Bland: Ultrathin Magnetic Structures IV. Springer, Berlin(2005).
[148] H. Wende, C. Sorg, M. Bernien, A. Scherz, P. J. Jensen, N. Ponpandian, andK. Baberschke: Spin fluctuations in coupled two-dimensional magnetic trilayers. phys.stat. sol. (c) in press (2005).
[149] U. Bovensiepen, P. Poulopoulos, M. Farle, and K. Baberschke: The Curie tempera-ture in ultrathin Ni/Cu(001) films determined by ac susceptibility and MOKE. Surf.Sci. 402-404, 396 (1998).
[150] P. Bruno: Theory of interlayer magnetic coupling. Phys. Rev. B 52, 411 (1995).
[151] P. Bruno: Interlayer exchange coupling: Preasymptotic corrections. Eur. Phys. J. B11, 83 (1999).
[152] R. Hammerling, J. Zabloudil, P. Weinberger, J. Lindner, E. Kosubek, R. Nunthel,and K. Baberschke: Interlayer exchange coupling and magnetic anisotropy in proto-type trilayers: Ab initio theory versus experiment. Phys. Rev. B 68, 92406 (2003).
[153] A. Ney, F. Wilhelm, M. Farle, P. Poulopoulos, P. Srivastava, and K. Baberschke:Oscillations of the Curie temperature and interlayer exchange coupling in magnetictrilayers. Phys. Rev. B 59, R3938 (1999).
[154] G. Bayreuther, F. Bensch, and V. Kottler: Quantum oscillations of properties inmagnetic multilayers. J. Appl. Phys. 79, 4509 (1996).
[155] P. Grunberg, R. Schreiber, Y. Pang, M. B. Brodsky, and H. Sowers: Layered Mag-netic Structures: Evidence for Antiferromagnetic Coupling of Fe Layers across CrInterlayers. Phys. Rev. Lett. 57, 2442 (1986).
[156] S. S. P. Parkin: Systematic Variation of the Strength and Oscillation Period ofIndirect Magnetic Exchange Coupling through the 3d, 4d, and 5d Transition Metals.Phys. Rev. Lett. 67, 3598 (1991).
Bibliography 125
[157] V. Leiner, K. Westerholt, A. M. Blixt, H. Zabel, and B. Hjorvarsson: MagneticSuperlattices with Variable Interlayer Exchange Coupling: A New Approach for theInvestigation of Low-Dimensional Magnetism. Phys. Rev. Lett. 91, 37202 (2003).
[158] J. Lindner, E. Kosubek, P. Poulopoulos, K. Baberschke, and B. Heinrich: Interlayerexchange coupling: an in situ investigation via ferromagnetic resonance. J. Magn.Magn. Mat. 240, 220 (2002).
[159] J. Lindner, Z. Kollonitsch, E. Kosubek, M. Farle, and K. Baberschke: In situ de-tection of two ferromagnetic resonance modes in coupled Ni/Cu/Co/Cu(001) trilayerstructures. Phys. Rev. B 63, 94413 (2001).
[160] J. Lindner and K. Baberschke: In situ ferromagnetic resonance: an ultimate tool toinvestigate the coupling in ultrathin magnetic films. J. Phys: Cond. Matter 15, R193(2003).
[161] Z. Zhang, L. Zhou, P. E. Wigen, and K. Ounadjela: Using Ferromagnetic Resonanceas a Sensitive Method to Study Temperature Dependence of Interlayer Exchange Cou-pling. Phys. Rev. Lett. 73, 336 (1994).
[162] J. Lindner, C. Rudt, E. Kosubek, P. Poulopoulos, K. Baberschke, P. Blomquist,R. Wappling, and D. L. Mills: T 3/2 Dependence of the Interlayer Exchange Couplingin Ferromagnetic Multilayers. Phys. Rev. Lett. 88, 167206 (2002).
[163] S. Schwieger and W. Nolting: Origin of the temperature dependence of interlayerexchange coupling in metallic trilayers. Phys. Rev. B 69, 224413 (2004).
[164] S. Schwieger, J. Kienert, and W. Nolting: Temperature dependence of interlayerexchange coupling: Spin waves versus spacer effects. Phys. Rev. B 71, 174441 (2005).
[165] K. Lenz, T. Tolinski, J. Lindner, E. Kosubek, and K. Baberschke: Evidence of spin-pumping effect in the ferromagnetic resonance of coupled trilayers. Phys. Rev. B 69,144422 (2004).
[166] T. Tolinski, K. Lenz, J. Lindner, E. Kosubek, C. Sorg, M. Bernien, A. Scherz,H. Wende, and K. Baberschke: Interlayer exchange coupling and damping processesin coupled trilayer systems. 40, 164 (2004).
[167] W. Weber, R. Allenspach, and A. Bischof: Exchange Coupling across Cu(100): AHigh-Precision Study. Europhys. Lett. 31, 491 (1995).
[168] J. Unguris, R. J. Celotta, and D. T. Pierce: Oscillatory exchange coupling inFe/Au/Fe(100). J. Appl. Phys. 75, 6437 (1994).
[169] J. Unguris, R. J. Celotta, and D. T. Pierce: Determination of the Exchange CouplingStrengths for Fe/Au/Fe. Phys. Rev. Lett. 79, 2734 (1997).

126 Bibliography
[170] W. Kuch, X. Gao, and J. Kirschner: Competition between in-plane and out-of-planemagnetization in exchange-coupled magnetic films. Phys. Rev. B 65, 64406 (2002).
[171] W. Kuch: Layer-resolved microscopy of magnetic domains in multi-layered systems.Appl. Phys. A 76, 665 (2003).
[172] K. Lenz, E. Kosubek, T. Tolinski, J. Lindner, and K. Baberschke: In situ ferromag-netic resonance in coupled ultrathin trilayers with perpendicularly oriented easy axes.J. Phys: Cond. Matter 15, 7175 (2003).
[173] K. Lenz, T. Tolinski, E. Kosubek, J. Lindner, and K. Baberschke: Oscillations ofthe interlayer exchange coupling in trilayers with non-collinear easy axes. phys. stat.sol. (c) 1, 3260 (2004).
[174] J. Wu, G. S. Dong, and X. Jin: Temperature-dependent magnetization in a ferro-magnetic bilayer consisting of two materials with different Curie temperatures. Phys.Rev. B 70, 212406 (2004).
[175] P. Srivastava, F. Wilhelm, A. Ney, M. Farle, H. Wende, N. Haack, G. Ceballos, andK. Baberschke: Magnetic moments and Curie temperatures of Ni and Co thin filmsand coupled trilayers. Phys. Rev. B 58, 5701 (1998).
[176] F. May, T. Tischer, D. Arvanitis, J. Hunter Dunn, H. Henneken, H. Wende, R. Chau-vistre, and K. Baberschke: Magnetic Coupling of Ni, Cu and Co Bi- and TrilayersProbed by Magnetic Circular X-ray Dichroism. J. Phys. IV France 7, C2-389 (1997).
[177] F. Wilhelm, P. Srivastava, A. Ney, N. Haack, G. Ceballos, M. Farle, and K. Baber-schke: Influence of exchange coupling on the Ni magnetization in Co/Cu/Ni trilayers.J. Magn. Magn. Mat. 198-199, 458 (1999).
[178] F. May, P. Srivastava, M. Farle, U. Bovensiepen, H. Wende, R. Chauvistre, andK. Baberschke: Element-specific Curie temperatures of Ni/Cu/Co trilayers. J. Magn.Magn. Mat. 177-181, 1220 (1998).
[179] C. Sorg, A. Scherz, H. Wende, T. Gleitsmann, Z. Li, S. Ruttinger, Ch. Litwinski, andK. Baberschke: Co/Cu/Ni trilayers near their Curie temperature studied by XMCD.Phys. Scripta T115, 638 (2005).
[180] P. J. Jensen, C. Sorg, A. Scherz, M. Bernien, K. Baberschke, and H. Wen-de: Comment on ”‘Magnetic Phase Transition in Co/Cu/Ni/Cu(100) andCo/Fe/Ni/Cu(100)”’. Phys. Rev. Lett. 94, 039703 (2005).
[181] A. Scherz, F. Wilhelm, U. Bovensiepen, P. Poulopoulos, H. Wende, and K. Baber-schke: Separate Curie temperatures in magnetic trilayers and the effect of spin fluc-tuations. J. Magn. Magn. Mat. 236, 1 (2001).

Bibliography 127
[182] A. Scherz, F. Wilhelm, P. Poulopoulos, H. Wende, and K. Baberschke: Element-specific magnetization curves and crossover in Co/Cu/Ni/Cu(001) trilayers studiedby XMCD. J. Synchrotron Rad. 8, 472 (2001).
[183] C. Won, Y. Z. Wu, A. Scholl, A. Doran, N. Kurahashi, H. W. Zhao, and Z. Q. Qiu:Magnetic Phase Transition in Co/Cu/Ni/Cu(100) and Co/Fe/Ni/Cu(100). Phys.Rev. Lett. 91, 147202 (2003).
[184] P. Poulopoulos, U. Bovensiepen, M. Farle, and K. Baberschke: AC susceptibility: asensitive probe of interlayer coupling. J. Magn. Magn. Mat. 212, 17 (2000).
[185] U. Bovensiepen, F. Wilhelm, P. Srivastava, P. Poulopoulos, M. Farle, and K. Baber-schke: Do Exchange Coupled Ferromagnetic Monolayers Show Different Curie Tem-peratures?. phys. stat. sol. (a) 173, 153 (1999).
[186] L. Bergqvist and O. Eriksson, private communication.
[187] R. W. Wang and D. L. Mills: Onset of long-range order in superlattices: Mean-fieldtheory. Phys. Rev. B 46, 11681 (1992).
[188] R. B. Griffiths: Rigorous Results and Theorems. in: Phase Transition and CriticalPhenomena, edited by C. Domb and M. S. Green, Academic Press (1972).
[189] R. Allenspach: Ultrathin films: magnetism on the microscopic scale. J. Magn. Magn.Mat. 129, 160 (1994).
[190] R. Ramchal, A. K. Schmid, M. Farle, and H. Poppa: Magnetic domain-wall structurein Ni/Cu(001) films imaged by spin-polarized low-energy electron microscopy. Phys.Rev. B 68, 54418 (2003).
[191] D. Kerkmann, D. Pescia, and R. Allenspach: Two-Dimensional Magnet at CurieTemperature: Epitaxial Layers of Co on Cu(100). Phys. Rev. Lett. 68, 686 (1992).
[192] E. I. Isaev, L. V. Pourovskii, A. M. N. Niklasson, Yu. Kh. Vekilov, Johansson. B.,and I. A. Abrikosov: Magnetic properties of a Co/Cu/Ni trilayer on the Cu(100)surface. Phys. Rev. B 65, 024435 (2001).
[193] C. H. Back, Ch. Wursch, A. Vaterlaus, U. Ramsperger, U. Maier, and D. Pescia:Experimental confirmation of universality for a phase transition in two dimensions.Nature 378, 597 (1995).
[194] C. Won, Y.Z. Wu, N. Kurahashi, H. W. Zhao, and Z. Q. Qiu: Won et al. Reply.Phys. Rev. Lett. 94, 039704 (2005).
[195] P. Poulopoulos, M. Farle, U. Bovensiepen, and K. Baberschke: Evidence for domainformation near the Curie temperature in ultrathin Ni/Cu(001) films with perpendic-ular anisotropy. Phys. Rev. B 55, R11961 (1997).

128 Bibliography
[196] H. E. Stanley: Introduction to Phase Transitions and Critical Phenomena. OxfordClarendon Press, (1971).
[197] F. Wilhelm, U. Bovensiepen, A. Scherz, P. Poulopoulos, A. Ney, H. Wende, G. Ce-ballos, and K. Baberschke: Manipulation of the Curie temperature and the magneticmoments of ultrathin Ni and Co films by Cu-capping. J. Magn. Magn. Mat. 222, 163(2000).
[198] M. Donath, D. Scholl, H. C. Siegmann, and E. Kay: Quasi-two-dimensional ferro-magnetism in polycrystalline Fe. Phys. Rev. B 43, 3164 (1991).
[199] P. J. H. Bloemen, M. T. Johnson, M. T. H. van de Vorst, R. Coehoorn, J. J. deVries, R. Jungblut, J. Aan de Stegge, A. Reinders, and W. J. M. de Jonge: Magneticlayer thickness dependence of the interlayer exchange coupling in (001) Co/Cu/Co.Phys. Rev. Lett. 72, 764 (1994).
[200] J. Kudrnovsky, V. Drchal, I. Turek, M. Sob, and P. Weinberger: Interlayer magneticcoupling: Effect of interface roughness. Phys. Rev. B 53, 5125 (1996).
[201] M. Pajda, J. Kudrnovsky, I. Turek, V. Drchal, and P. Bruno: Oscillatory CurieTemperature of Two-Dimensional Ferromagnets. Phys. Rev. Lett. 85, 5424 (2000).
[202] C. Rudt, A. Scherz, and K. Baberschke: Oscillatory Curie temperature in ultrathinferromagnets: experimental evidence. J. Magn. Magn. Mat. 285, 95 (2005).
[203] P. Henelius, P. Frobrich, P. J. Kuntz, C. Timm, and P. J. Jensen: Quantum MonteCarlo simulation of thin magnetic films. Phys. Rev. B 66, 094407 (2002).
[204] B. N. Harmon and A. J. Freeman: Spin-polarized energy-band structure, conduction-electron polarization, spin densities, and the neutron magnetic form factor of ferro-magnetic gadolinium. Phys. Rev. B 10, 1979 (1974).
[205] G. Schutz, M. Knulle, R. Wienke, W. Wilhelm, W. Wagner, P. Kienle, and R. Frahm:Spin-dependent photoabsorption at the L-edges of ferromagnetic Gd and Tb metal. Z.Phys. B 73, 67 (1988).
[206] R. M. Galera and A. Rogalev: Hard x-ray magnetic circular dichroism in GdNi5 andTbNi5 single crystals. J. Appl. Phys. 85, 4889 (1999).
[207] F. Garcia, L. C. Sampaio, A. Y. Takeuchi, H. Tolentino, and A. Fontaine: X-ray mag-netic circular dichroism temperature dependent study of RCo2 compounds. J. Appl.Phys. 87, 5881 (2000).
[208] J. B. Goedkoop, J. C. Fuggle, B. T. Thole, G. van der Laan, and G. A. Sawatzky:Magnetic x-ray dichroism of rare-earth materials. J. Appl. Phys. 64, 5595 (1988).

Bibliography 129
[209] D. E. Hegland, S. Legvold, and F. H. Spedding: Magnetization and Electrical Re-sistivity of Terbium Single Crystals. Phys. Rev. 131, 158 (1963).
[210] D. R. Lide: CRC Handbook of Chemistry and Physics. CRC Press, Boca Raton(1995).
[211] W. E. Corner and B. K. Tanner: The easy direction of magnetization in gadolinium.J. Phys. C: Solid State Phys. 9, 627 (1975).
[212] H. Wende: Extended X-ray Absorption Fine Structure Spectroscopy of Surfaces andThin Films: Local Structure, Dynamic and Magnetic Properties. Ph. D. thesis, FreieUniversitat Berlin, Verlag Dr. Koster, Berlin, ISBN ISBN 3-89574-341-0 (1999).
[213] H. Wende: Recent advances in x-ray absorption spectroscopy. Rep. Prog. Phys. 67,2105 (2004).
[214] L. W. Roeland, G. J. Cock, F. A. Muller, A. C. Moleman, K. A. McEwen, R. G.Jordan, and D. W. Jones: Conduction electron polarization of gadolinium metal. J.Phys. F: Met. Phys. 5, L233 (1975).
[215] D. R. Behrendt, S. Legvold, and F. H. Spedding: Magnetic Properties of DysprosiumSingle Crystals. Phys. Rev. 109, 1544 (1958).
[216] A. L. Ankudinov, J. J. Rehr, H. Wende, A. Scherz, and K. Baberschke: Spin-dependent sum rules for X-ray absorption spectra. Europhys. Lett. 66, 441 (2004).
[217] X. Wang, T. C. Leung, B. N. Harmon, and P. Carra: Circular magnetic x-raydichroism in the heavy rare-earth metals. Phys. Rev. B 47, 9087 (1993).
[218] P. Carra, B. N. Harmon, B. T. Thole, M. Altarelli, and G. A. Sawatzky: Magneticx-ray dichroism in gadolinium metal. Phys. Rev. Lett. 66, 2495 (1991).
[219] Landolt-Bornstein: Numerical data and functional relationships in science and tech-nology. Vol. III/19d1, Springer, Berlin (1991).
[220] H. E. Nigh, S. Legvold, and F. H. Spedding: Magnetization and Electrical Resistivityof Gadolinium Single Crystals. Phys. Rev. 132, 1092 (1963).
[221] Landolt-Bornstein: Numerical data and functional relationships in science and tech-nology. Vol. III/6, Springer, Berlin (1991).
[222] F. J. Darnell: Temperature Dependence of Lattice Parameters for Gd, Dy, and Ho.Phys. Rev. 130, 1825 (1963).
[223] F. J. Darnell: Lattice Parameters of Terbium and Erbium at Low Temperatures.Phys. Rev. 132, 1098 (1963).

130 Bibliography

List of Acronyms and Symbols
2D two-dimensional
∆A2, ∆A3 integrated area of the XMCD at the L2, L3 edge
µ absorption coefficient
ϕ angle between photon wave vector and surface of the sample
ϑ angle between photon wave vector and magnetization of the sample
A2, A3 integrated area of the isotropic XAS at the L2, L3 edge
AES Auger electron spectroscopy
AFM antiferromagnet
AXAFS atomic extended X-ray absorption fine structure
BESSY Berliner Elektronenspeicherring-Gesellschaft fur Synchrotronstrah-
lung m. b. H.bcc body centered cubic
CMA cylindrical mirror analyzer
d thickness
dCo, dCu, dNi thickness of the Co, Cu, Ni layer in a Co/Cu/Ni trilayer
DOS density of states
E photon energy
EF Fermi energy
ESRF European Synchrotron Radiation Facility
EXAFS extended X-ray absorption fine structure
fcc face centered cubic
fct face centered tetragonal
FM ferromagnet
FMR ferromagnetic resonance
FY fluorescence yield
GFT Green’s functions theory
GGA generalized gradient approximation
hcp hexagonal closed packed
IEC interlayer exchange coupling
Jinter strength of the IEC

132 List of Acronyms and Symbols
JCo intra-layer coupling of Co
J interfaceNi intra-layer coupling of the Ni interface layer
J interiorNi intra-layer coupling of the inner Ni layers
LDA local density approximation
LEED low energy electron diffraction
M magnetization
mL orbital magnetic moment
mS spin magnetic moment
meffS effective spin moment including 〈Tz〉-term
MNi magnetization of the Ni in a Co/Cu/Ni trilayer
MAE magnetic anisotropy energy
MEXAFS magnetic EXAFS
MF(T) mean field (theory)
ML monolayer(s)
MEED medium energy electron diffraction
MOKE magneto-optic Kerr-effect
nh number of holes
NEXAFS near edge X-ray absorption fine structure
NM nonmagnet
Pc degree of circular polarization
PGM plane grating monochromator
PM paramagnet
RPA random phase approximation
SEXAFS surface EXAFS
SQUID superconducting quantum interference device
STM scanning tunneling microscope
T temperature
TC Curie temperature
TC,Co, TC,Ni Curie temperature of a single Co, Ni film
T ∗C,Co, T ∗
C,Ni quasi-critical temperature of Co, Ni in a Co/Cu/Ni trilayer
TEY total electron yield
UHV ultra high vacuum
VSM vibrating sample magnetometer
XAS X-ray absorption spectroscopy
XMCD X-ray magnetic circular dichroism
List of Publications and
Contributions to Conferences
I. Refereed Publications
1. H. Wende, Ch. Litwinski, A. Scherz, T. Gleitsmann, Z. Li, C. Sorg, K. Baber-
schke, A. Ankudinov, J. J. Rehr, and Ch. Jung
A systematic study of embedded atom EXAFS: The (2×1)O/Cu(110) recon-
struction as an ideal prototype system
J. Phys.: Condens. Matter 15, 5197 (2003).
2. A. Scherz, H. Wende, C. Sorg, K. Baberschke, J. Minar, D. Benea, and H.
Ebert
Limitations of intergral XMCD sum-rules for the early 3d elements
Conference Proceedings XAFS XII, Malmo Sweden, June 2003,
Physica Scripta T115, 586 (2005).
3. C. Sorg, A. Scherz, H. Wende, T. Gleitsmann, Ch. Litwinski, S. Ruttinger, Z.
Li, and K. Baberschke
Co/Cu/Ni trilayers near their Curie temperature studied by XMCD
Conference Proceedings XAFS XII, Malmo Sweden, June 2003,
Physica Scripta T115, 638 (2005).
4. H. Wende, A. Scherz, C. Sorg, Z. Li, P. Poulopoulos, K. Baberschke, A.
Ankudinov, J. J. Rehr, F. Wilhelm, N. Jaouen, A. Rogalev, D. L. Schlagel,
and T. A. Lograsso
Temperature dependence of magnetic EXAFS for rare earth elements
Conference Proceedings XAFS XII, Malmo Sweden, June 2003,
Physica Scripta T115, 600 (2005).
5. W. D. Brewer, A. Scherz, C. Sorg, H. Wende, K. Baberschke, P. Bencok, and
S. Frota-Pessoa

134 List of Publications and Contribution to Conferences
Direct Observation of Orbital Magnetism in Cubic Solids
Phys. Rev. Lett. 93, 077205 (2004).
6. C. Sorg, N. Ponpandian, A. Scherz, H. Wende, R. Nunthel, T. Gleitsmann,
and K. Baberschke
The magnetism of ultrathin Ni films grown with O surfactant
Surf. Sci. 565, 197 (2004).
7. T. Tolinski, K. Lenz, J. Lindner, E. Kosubek, C. Sorg, M. Bernien, A. Scherz,
H. Wende, and K. Baberschke
Interlayer exchange coupling and damping processes in coupled trilayer systems
School on nanostructured systems, B edlewo Poland, September 2003,
Molecular Physics Reports 40, 164 (2004).
8. P. J. Jensen, C. Sorg, A. Scherz, M. Bernien, K. Baberschke, and H. Wende
Comment on “Magnetic phase transition in Co/Cu/Ni/Cu(100) and
Co/Fe/Ni/Cu(100)” February 26, 2004
Phys. Rev. Lett. 94, 039703 (2005).
9. A. Scherz, C. Sorg, M. Bernien, N. Ponpandian, K. Baberschke, H. Wende,
and P. J. Jensen
Importance of giant spin fluctuations in coupled magnetic trilayers
Phys. Rev. B 72, 054447 (2005).
10. H. Wende, C. Sorg, M. Bernien, A. Scherz, P. J. Jensen, N. Ponpandian, and
K. Baberschke
Spin fluctuations in coupled two-dimensional magnetic trilayers
Conference Proceedings Physics of Magnetism, Poznan Poland, June 2005
Phys. Stat. Sol. (b) 243, 165 (2006).
11. A. Scherz, E. K. U. Gross, H. Appel, C. Sorg, K. Baberschke, H. Wende, and
K. Burke
Measuring the kernel of time-dependent density functional theory with X-ray
absorption spectroscopy of 3d transition metals
Phys. Rev. Lett. 95, 253006 (2005).
12. C. Sorg, N. Ponpandian, M. Bernien, K. Baberschke, H. Wende, and R. Q.
Wu
Induced Magnetism of Oxygen in Surfactant Grown Fe, Co, and Ni Monolayers
Phys. Rev. B 73, 064409 (2006).

List of Publications and Contribution to Conferences 135
II. Highlights and Annual Reports of Synchrotron Facilities
1. A. Scherz, H. Wende, C. Sorg, K. Baberschke, J. Minar, D. Benea, and H.
Ebert
New concept to study magnetic behavior of early 3d elements
BESSY – Highlights, p. 8 (2002).
2. H. Wende, A. Scherz, G. Ceballos, C. Sorg, K. Baberschke, A. Ankudinov, J.J.
Rehr, F. Wilhelm, A. Rogalev, D.L. Schlagel, and T.A. Lograsso
Quadrupolar and Dipolar Contributions to XMCD at the Tb L3,2-edges: Ex-
periment versus Theory
ESRF – Highlights, p. 84 (2003).
3. W. D. Brewer, A. Scherz, C. Sorg, H. Wende, K. Baberschke, P. Bencok, and
S. Frota-Pessoa
Direct Observation of Orbital Magnetism in Cubic Solids
ESRF - Highlights, p. 96 (2004).
4. T. Gleitsmann, A. Scherz, Ch. Litwinski, C. Sorg, Z. Li, H. Wende, and K.
Baberschke
NEXAFS investigation of ultrathin Ni films grown on oxygen induced recon-
structed(√
2× 2√
2)R45 O/Cu(001)
Annual report BESSY (2002).
5. C. Sorg, A. Scherz, H. Wende, M. Bernien, T. Gleitsmann, Z. Li, S. Ruttinger,
Ch. Litwinski, and K. Baberschke
Co/Cu/Ni trilayers close to their Curie temperature: An XMCD study
Annual report BESSY (2003).
6. H. Wende, Ch. Litwinski, A. Scherz, T. Gleitsman, Z. Li, C. Sorg, K. Baber-
schke, A. Ankudinov, J. J. Rehr, and Ch. Jung
A systematic study of embedded atom EXAFS: the (2 × 1)O/Cu(110) recon-
struction as an ideal prototype system
Annual report BESSY (2003).
7. C. Sorg, N. Ponpandian, A. Scherz, M. Bernien, R. Nunthel, T. Gleitsmann,
K. Baberschke, and H. Wende
NEXAFS and XMCD of ultrathin Ni films grown with O surfactant
Annual report BESSY (2004).

136 List of Publications and Contribution to Conferences
III. Contributions to Conferences and Workshops
1. Poster, 12th International Conference on X-ray Absorption Fine Structure,
(XAFS XII) Co/Cu/Ni trilayers near their Curie temperature studied by XMCD
Malmo, Sweden (June 2003).
2. Poster, International Workshop on X-Ray Spectroscopies of Magnetic Solids
(XRMS-2003)
Co/Cu/Ni trilayers close their Curie temperatures: An XMCD study
Berlin, Germany (December 2003).
3. Talk, Fruhjahrstagung des Arbeitskreises Festkorperphysik (AKF) der DPG
Co/Cu/Ni-Dreilagen nahe ihrer Curie-Temperaturen: Untersuchungen mittels
magnetischem Rontgenzirkulardichroismus
Regensburg, Germany (March 2004).
4. Poster, 338th Wilhelm and Else Heraeus Seminar ”‘Nanomagnetism: New In-
sights with Synchrotron Radiation”’
The influence of O surfactant growth on the magnetism of ultrathin Ni films
Physikzentrum Bad Honnef, Germany (January 2005).
5. Talk, 69. Jahrestagung der Deutschen Physikalischen Gesellschaft
Ultrathin Ni films grown with O surfactant: Structure and Magnetism
Berlin, Germany (March 2005).
6. Talk, 23rd European Conference on Surface Science (ECOSS 23)
Spin fluctuations in two-dimensional coupled ferromagnetic films
Berlin, Germany (September 2005).
Curriculum Vitae
I. Personal Data
Name: Claudia Sorg
Nationality: German
Place and Date of
Birth:
Bad Vilbel, Germany, January 12th, 1977
Permanent Address: Freie Universitat Berlin
Institut fur Experimentalphysik
Arnimallee 14
D-14195 Berlin
Germany
phone: ++49-30-838 56144
fax: ++49-30-838 53646
email: [email protected]
II. Educational Qualifications and Research Experience
1983 to 1989 Ernst-Reuter-Schule, Bad Vilbel
1989 to 1996 Georg-Buchner-Gymnasium, Bad Vilbel
October 1993 to
December 1993
Lycee Banville, Moulins, France
June 1996 Abitur
October 1996 to
December 2001
Studies of physics at the Johann Wolfgang Goethe-
Universitat, Frankfurt (Main)

138 Curriculum Vitae
August 1998 Diplom-Vorprufung in physics
August 1998 to
August 2001
User support at the computer center of the J. W. Goethe-
Universitat
September 1999 to
July 2001
Diploma thesis Ladungstragerdynamik in dem magnetis-
chen Perowskit La0,67Ca0,33MnO3 at the Physikalisches In-
stitut, Johann Wolfgang Goethe-Universitat, Frankfurt
(Main); advisor: Prof. Dr. H. Roskos
December 2001 Diplom in physics
since April 2002 Ph. D. work in Prof. Dr. K. Baberschke’s group
October 2002 to July
2003
Tutor of an exercise course for students of the 3rd semester
Zusammenfassung
Im Rahmen dieser Arbeit wurden Rontgenabsorptionsspektroskopie (XAS) und ma-
gnetischer Rontgenzirkulardichroismus (XMCD) an ultradunnen, ferromagnetischen
Fe-, Co- und Ni-Filmen und an Einkristallen der Seltenen Erd-Elemente Gd, Tb und
Dy untersucht. Die experimentellen Ergebnisse wurden jeweils mit theoretischen
Rechnungen verglichen.
Es ist bekannt, dass das Wachstum von 3d-Ferromagneten mit Hilfe von Sauerstoff
als Surfactant verbessert werden kann. Dazu wird zunachst Sauerstoff auf der ge-
reinigten Substratoberflache adsorbiert und erst danach der ferromagnetische (FM)
Film aufgewachsen. In der vorliegenden Arbeit wurde dieser Effekt genutzt, um den
Magnetismus ultradunner FM Filme zu beeinflussen. Fe-, Co- und Ni-Filme wurden
mit und ohne Sauerstoff als Surfactant auf einkristallinen Cu-Substraten prapariert.
Rontgenabsorptionsspektren im Nahkantenbereich (NEXAFS) erlauben Ruckschlus-
se auf die elektronische Struktur der untersuchten Filme. Die NEXAFS-Spektren
zeigen eine fur die jeweilige chemische Bindung charakteristische Linienform. Aus
der Linienform von NEXAFS-Spektren der mit Sauerstoff-Surfactant gewachsenen
Filme konnte geschlossen werden, dass keine volumenartigen Oxide mit dem jewei-
ligen Ferromagneten entstehen. Die Winkelabhangigkeit der NEXAFS-Spektren an
der O-K-Kante zeigt hier, dass die Sauerstoff-Atome, die zuvor auf die saubere
Cu-Oberflache aufgebracht worden sind, wahrend des Filmwachstums stets an der
Oberflache des Films bleiben. Am Beispiel von Ni wurde aus den NEXAFS-Spektren
an den Ni-L2,3-Kanten ein Ladungstransfer von 3d-Zustanden des Ferromagneten zu
den 2p-Zustanden des Sauerstoffs bestimmt. Aufgrund der Elementspezifitat des
XMCD kann sowohl der Einfluss des Sauerstoffs auf den Magnetismus der ferroma-
gnetischen Filme selbst als auch der induzierte Magnetismus am Sauerstoff unter-
sucht werden. XMCD an der O-K-Kante weist den induzierten Magnetismus des
Sauerstoffs nach. Da keine Spin-Bahn-Aufspaltung des 1s Anfangszustands vorliegt,
ist die magnetische Information, die aus XMCD-Spektren an K-Kanten gewonnen
werden kann, auf das Bahnmoment beschrankt. Deshalb wurden zusatzlich Rech-
nungen im Rahmen einer ab initio Theorie durchgefuhrt. Die berechneten Spektren
stimmen sehr gut mit den experimentellen Beobachtungen uberein. Daruber hinaus

140 Zusammenfassung
liefern die Rechnungen neben der spin-aufgelosten Zustandsdichte, auch die Spin-
und die Bahnmomente. Um zudem den Einfluss des Sauerstoffs auf die ferroma-
gnetischen Schichten selbst im Detail zu untersuchen, wurden am Beispiel von Ni
dickenabhangige Messungen durchgefuhrt. Ni-Filme verschiedener Dicken oberhalb
des Spinreorientierungsubergangs, d. h. Filme mit einer leichten Magnetisierungs-
richtung senkrecht zur Filmebene, wurden auf Cu(100) und Cu(110) prapariert. Die
Gesamtmagnetisierung verhalt sich auf den beiden Oberflachen unterschiedlich: Ni-
Filme, die mit Sauerstoff als Surfactant auf Cu(100) aufgewachsen worden sind,
zeigen fur geringere Dicken eine Magnetisierung, deren Betrag unterhalb dessen von
volumenartigem Ni liegt. Auf der offeneren Cu(110)-Oberflache wird jedoch eine
erhohte Magnetisierung in den dunneren Filmen beobachtet. Dieser Unterschied im
magnetischen Verhalten wird der unterschiedlichen Oberflachenrauigkeit zugeschrie-
ben. Eine detaillierte Analyse mit Hilfe der integralen Summenregeln zeigt, dass die
Erhohung der Ni-Magnetisierung auf Cu(110) vornehmlich von einer Erhohung des
Bahnmoments herruhrt. Auf der raueren Oberflache ist aufgrund der reduzierten
effektiven Koordination das Bahnmoment der Oberflachenatome weniger stark aus-
geloscht.
Im zweiten Teil der Arbeit wurden Co/Cu/Ni-Dreifachlagen untersucht. Sie dienen
als Prototypsystem fur Vielfachschichten, in denen eine Interlagenaustauschkopp-
lung Jinter auftritt. Diese koppelt die beiden ferromagnetischen (FM) Schichten aus
Co und Ni uber die nicht magnetische Cu-Zwischenschicht. Mittels XMCD wur-
den der Einfluss von Jinter und die Bedeutung der erhohten Spinfluktuationen in
zweidimensionalen Systemen untersucht. Fur die beiden FM Schichten wurden un-
terschiedliche Elemente benutzt, um von der Elementspezifitat der XMCD-Methode
profitieren zu konnen. Diese ermoglicht es, das magnetische Verhalten der beiden
FM Schichten individuell und unabhangig voneinander zu studieren. Die Interla-
genaustauschkopplung bewirkt eine deutliche Veranderung der elementspezifischen,
temperaturabhangigen Magnetisierungskurve M(T ) in der Dreifachlage gegenuber
den Einzelfilmen. Bei der Untersuchung des Einflusses von Jinter auf M(T ) kommt
der in-situ-Praparation und -Messung der Proben eine besondere Bedeutung zu.
Zuerst wurde die Magnetisierung eines mit Cu bedeckten Ni-Films gemessen. Da-
nach wurde die Interlagenaustauschkopplung zugeschaltet, indem der Co-Film auf
die identische Cu/Ni/Cu(100)-Probe aufgewachsen wurde. Damit konnte sicherge-
stellt werden, dass jede Veranderung der elementspezifischen Ni-Magnetisierung auf
den Einfluss von Jinter zuruckzufuhren ist. Bei einer derartigen Vorgehensweise zeigt
sich, dass die quasi-kritische Temperatur der Ni-Schicht T ∗C,Ni in der Dreifachlage
um ∆TC,Ni uber der Curie-Temperatur TC,Ni des einfachen Ni-Films liegt. In der

141
vorliegenden Arbeit wurde die Ni-Dicke auf bis zu ∼ 2 Monolagen (ML) reduziert,
was noch deutlich unterhalb der in fruheren Arbeiten verwendeten Dicken ist. Bei
diesen extrem dunnen Ni-Lagen ist die Temperaturverschiebung ∆TC,Ni/TC,Ni am
deutlichsten ausgepragt. Sie kann fur dNi ≈ 2 ML uber 200 % betragen. Solch eine
enorme Verschiebung einer kritischen Temperatur ist in Volumenmaterialien undenk-
bar. Es ist seit einiger Zeit bekannt, dass eine theoretische Beschreibung dieses ma-
gnetischen Verhaltens ultradunner Filme nur gelingt, wenn Spin-Spin-Korrelationen
(Spin-Fluktuationen) in der Theorie enthalten sind. Eine Beschreibung in einer sta-
tischen Molekularfeldnaherung ist daher unzureichend. Mit Hilfe eines theoretischen
Modells, das die Spin-Fluktuationen berucksichtigt, ist es im Rahmen einer Kollabo-
ration mit P. Jensen gelungen, fur die Interpretation der Ergebnisse der vorliegenden
Arbeit eine Relation zwischen ∆TC,Ni/TC,Ni und Jinter herzustellen. Im Unterschied
zu fruheren Resultaten in Molekularfeldnaherung zeigte sich, dass die beiden Großen
∆TC,Ni/TC,Ni und Jinter nicht linear voneinander abhangen. Damit wurde es erstmals
moglich, die beiden Abhangigkeiten ∆TC,Ni/TC,Ni (dNi) und Jinter (dCu) zu kombinie-
ren und gemeinsam zu betrachten. In der Vergangenheit wurden beide Abhangig-
keiten unabhangig voneinander diskutiert. Als Ergebnis wird in dieser Arbeit eine
dreidimensionale Grafik prasentiert, die die gewolbte Flache als Resultat der Theo-
rie und die experimentellen Ergebnisse enthalt. Die theoretische Kurve ist in guter
Ubereinstimmung mit den experimentellen Beobachtungen.
Im Zusammenhang mit den Untersuchungen der Dreifachlagen wurden im Rahmen
dieser Arbeit Messungen der Elektronenausbeute im angelegten Magnetfeld in der
vorhandenen UHV-Apparatur etabliert. Dafur wurde ein wassergekuhltes Spulensys-
tem entwickelt und erfolgreich in Betrieb genommen. Mit dem neuen Spulensystem
sind nun auch Messungen im statischen Magnetfeld H mit bis zu µ0H ≈ 50 mT
moglich.
Im letzten Teil der Arbeit wurde die Schalenspezifitat der XMCD-Methode genutzt,
um das Zusammenwirken des Magnetismus der 5d-Leitungselektronen und der loka-
lisierten 4f -Zustande in den Selten-Erd-Elementen Gd, Tb und Dy zu studieren. In
diesen Materialien wird der großte Anteil an der Magnetisierung von den stark loka-
lisierten 4f -Momenten getragen. Die ferromagnetische Ordnung dieser 4f -Momente
untereinander wird durch die delokalisierten 5d-Leitungselektronen vermittelt, die
selbst ein induziertes magnetisches Moment tragen. Neben den Dipolubergangen
(E1: 2p → 5d) tragen Quadrupolubergange (E2: 2p → 4f) entscheidend zu dichro-
ischen Signal an den L2,3-Kanten dieser Elemente bei. Aufgrund der am Ubergang
beteiligten Anfangs- und Endzustande liefern XMCD-Messungen an den L2,3-Kanten
Informationen sowohl uber die Beitrage der 5d-Zustande als auch derjenigen der 4f -

142 Zusammenfassung
Zustande. Im Gegensatz zu vielen existierenden XMCD-Daten komplexer Verbin-
dungen wurde die Systematik des XMCD Seltener Erden in der vorliegenden Arbeit
an Einkristallen studiert. In den zahlreichen Verbindungen der Seltenen Erden treten
zusatzliche komplexe Wechselwirkungen zwischen den verschiedenen beteiligten Ele-
menten auf, die in den einelementigen Einkristallen nicht vorkommen. Fur die Reihe
Gd, Tb und Dy wurden die gemessenen temperaturabhangigen XMCD-Spektren
gezeigt und diskutiert. Diese Spektren beinhalten eine Vielzahl von Feinstrukturen.
Anders als bei den 3d Ferromagneten andert sich die relative Intensitat der verschie-
denen spektroskopischen Beitrage und damit die Linienform der XMCD-Spektren in
Abhangigkeit von der Temperatur. Die bei tiefen Temperaturen gemessenen Spek-
tren wurden mit ab initio Rechnungen verglichen, die mittels des FEFF-Codes im
Rahmen dieser Arbeit durchgefuhrt wurden. Damit konnen die Beitrage aus dipola-
ren und quadrupolaren Ubergangen zum XMCD bei tiefen Temperaturen systema-
tisch identifiziert und analysiert werden. Es bleibt jedoch eine Herausforderung fur
die Theorie, die Temperaturabhangigkeit der Spektren zu berechnen.
In dieser Arbeit wurde gezeigt, wie aus spin-gemittelten und spin-abhangigen Ront-
genabsorptionsspektren die verschiedenen magnetischen Beitrage eines Systems iden-
tifiziert und getrennt werden konnen. Die experimentellen Daten decken sich mit Er-
gebnissen theoretischer Untersuchnungen. Man gelangt dadurch zu einem deutlich
besseren Verstandnis der magnetischen Eigenschaften der untersuchten Systeme.
Acknowledgment
Last but not least, I wish to allocate some space to say “Thank you” to everybody
who contributed in her or his way to the success of my thesis.
First of all, I thank Prof. Dr. Klaus Baberschke for the initial phone call when he
offered me a position in the babgroup. This opened me the opportunity to spend a
fruitful PhD time. By his guidance he has made me learn how to work successfully
on the edge of modern research in physics.
I also thank Prof. William Brewer, PhD for co-assessing this thesis, his steady
interest in the progress of the work and his helpful suggestions for improvement.
In the “BESSY-crew”, we struggled together to keep the chamber running. I say
thank you for innumerable sputtering cycles, many thin films, discussions about
physics and the rest of the life during endless days and nights not only at BESSY.
Dr. Andreas Scherz introduced me to many secrets of UHV, beamlines, XAS, XMCD,
and avoiding water fountains in the experimental hall. He reminded us all of not to
forget the coffee. I am grateful to PD Dr. Heiko Wende for sharing his experience,
for explaining basic physics and discussing the latest results, for accomplishing lots
of administrative work, and finally for organizing money to pay new equipment
and my position. Matthias Bernien contributed to the trilayer business during his
diploma studies also by his complex questions even at 5 a.m. after a long night shift.
Thanks to his skills to handle all the integrals and to correctly feed Mathematica
we successfully optimized the design of the new coil system. Dr. N. Ponpandian
exercised a lot of patience and finally made the shrink tube do what it was supposed
to do: shrinking.
Dr. Kilian Lenz knows useful answers to so many questions. He handled the painful
job of system administration and user support. Thank you for disinfecting the
BESSY-PC when it returned “sick” from Adlershof. Ela Kosubek as the “good soul”
provided many small technical tricks of all kinds – too many to mention them here.
Dr. Panos Poulopoulos contributed to the measurements at the ESRF. I thank
everyone in the (ex-)babgroup and the new “kuchgroup”, Dr. Jurgen Lindner, Dr.

144 Acknowledgment
Christoph Rudt, Dr. Ramona Nunthel, Dr. Tomasz Tolinski, Radu Abrudan, Dr.
Keiki Fukumoto, and Prof. Dr. Wolfgang Kuch for challenging questions, a helping
hand or two, and contributing to the pleasant working atmosphere.
I acknowledge Dr. Peter Jensen, Prof. Dr. Ruqian Wu, and Dr. Alex Ankudinov for
their collaboration and contributions from the theoretical point of view.
Successful beamtimes are only possible with the valuable help by the beamline scien-
tists and technical staff at the synchrotron facilities. I wish to mention in particular
Birgitt Zada, Dr. Friedmar Senf, and Helmut Pfau from BESSY and the ID12 Team
at the ESRF Dr. Fabrice Wilhelm, Dr. Andrej Rogalev, and Dr. Nicolas Jaouen.
Also the work by the “shipping company” Herr Bottcher, Herr Christiansen, and
Herr Aufrecht was of great value, because the local public transportation company
does not accept UHV chambers for luggage.
Herr Muller and his team in the mechanical workshop always made a good job.
Uwe Lipowski as the current technician of the group helped as well as his predecessor
Wolfgang Wisny who, although retired and very busy, was always willing to set the
pulse-electronics back into proper operation.
Dr. Jonathan Hunter-Dunn explained and discussed the coil system installed in the
XMCD chamber at MAXlab. His ideas helped tremendously in designing the new
water-cooled coil system for our chamber. At this point I should not forget to add
my thankfulness to the strong men of the babgroup for mounting and unmounting
the heavyweight before it finally had proven its UHV compliance.
The German Federal Ministry of Education and Research (Bundesministerium fur
Bildung und Forschung) financially supported this work (05 KS1 KEB/4 and 05
KS4 KEB/5).
Finally, I am very happy to have people outside the world of physics to add here:
my parents Annerose and Theo who always have a tea ready when I return home,
my “little” brother Jens who knows best how to pack vans, my friend Sabine who
stays up late at night for phone calls even if she has a meeting early next morning,
and Torben who made me follow him to Berlin, encourages me to see the dark side
of life less dark and turns the bright side of life even brighter.
Thank you all!

Index
A
Analysis of XAS and XMCD . . . . . . 13
B
beamline
at the ESRF. . . . . . . . . . . . . . . . . . .31
BESSY . . . . . . . . . . . . . . . . . . . . . . . . 26
BESSY - fig. . . . . . . . . . . . . . . . . . . .26
BESSY. . . . . . . . . . . . . . . . . . . . . . . . . . . . 21
chamber - fig. . . . . . . . . . . . . . . . . . .21
UHV chamber . . . . . . . . . . . . . . . . . 22
Bruno’s expression. . . . . . . . . . . . . . . . .68
C
calculations
3d FMs with O surfactant . . . . . 59
chamber - fig. . . . . . . . . . . . . . . . . . . . . . 21
circular polarization
definition . . . . . . . . . . . . . . . . . . . . . . 11
Co/Cu/Ni trilayers
magnetization . . . . . . . . . . . . . . . . . 69
Ni magnetization - fig. . . . . . . . . 76
scheme for model - fig. . . . . . . . . . 17
XMCD spectra - fig. . . . . . . . . . . . 72
coil system . . . . . . . . . . . . . . . . . . . . . . . . 27
magnetic field . . . . . . . . . . . . . . . . . 29
magnetic field - fig. . . . . . . . . . . . . 30
sketch and photograph - fig. . . . 28
Curie temperature
Ni, thickness-dep. - fig. . . . . . . . . 82
D
data acquisition . . . . . . . . . . . . . . . . . . . 25
detection methods . . . . . . . . . . . . . . . . . . 8
determining T ∗C,Ni
experiment . . . . . . . . . . . . . . . . . . . . 77
theory . . . . . . . . . . . . . . . . . . . . . . . . . 83
dipole transitions . . . . . . . . . . . . . . . . . . 94
DOS, surfactant grown FMs - fig. . . 61
Dy XMCD, calculated - fig.. . . . . . .103
E
easy axis
3d FMs - overview . . . . . . . . . . . . . 39
ESRF . . . . . . . . . . . . . . . . . . . . . . . . . . . . . 31
EXAFS . . . . . . . . . . . . . . . . . . . . . . . . . . . 10
F
FEFF calculations . . . . . . . . . . . . . . . .100
Fermi’s Golden Rule . . . . . . . . . . . . . . . . 6
finite size scaling . . . . . . . . . . . . . . . . . . 65
fluorescence yield . . . . . . . . . . . . . . . . . . . 9
G
gap scan mode . . . . . . . . . . . . . . . . . . . . 20
H
Heisenberg model

146 Index
for Co/Cu/Ni. . . . . . . . . . . . . . . . . .16
I
ID12 . . . . . . . . . . . . . . . . . . . . . . . . . . . . . . 31
ID12 at the ESRF - schematic. - fig.32
insertion device . . . . . . . . . . . . . . . . . . . . 20
L
LEED
3d FMs- fig. . . . . . . . . . . . . . . . . . . . 41
Cu substrates - fig. . . . . . . . . . . . . 24
M
magnetic moments
induced in O . . . . . . . . . . . . . . . . . . 60
magnetization
3D to 2D “tails” - fig. . . . . . . . . . . 85
calculated, T -dependent - fig. . . 84
Co/Cu/Ni trilayers . . . . . . . . . . . . 69
determination by XMCD . . . . . . 16
identifying TC ’s - fig. . . . . . . . . . . 78
MEED
3d FMs . . . . . . . . . . . . . . . . . . . . . . 40 f.
3d FMs - fig. . . . . . . . . . . . . . . . . . . 40
N
NEXAFS. . . . . . . . . . . . . . . . . . . . . . . . . . 10
O K edge . . . . . . . . . . . . . . . . . . . . . 36
3dFMs O K edge . . . . . . . . . . . . . . 47
Cu L2,3 edges . . . . . . . . . . . . . . . . . . 36
Ni L2,3 edges . . . . . . . . . . . . . . . . . . 36
O K edge and Cu L2,3 edges - fig.
36
Ni L2,3 edges XAS - fig. . . . . . . . . . . . .48
Ni magnetization
Ni thickness-dep. - fig. . . . . . . . . . 52
Co/Cu/Ni trilayer - fig. . . . . . . . . 76
Cu-capped Ni - fig. . . . . . . . . . . . . 75
staircase sample - fig. . . . . . . . . . . 79
O
O K edge
3d FMs - fig. . . . . . . . . . . . . . . . . . . 47
O K edge XAS - fig. . . . . . . . . . . . . . . .45
orbital moment
Ni on O/Cu - fig. . . . . . . . . . . . . . . 55
P
phase diagram of Co/Cu/Ni - fig. . . 86
Q
quadrupole transitions . . . . . . . . . . . . . 94
R
random phase approximation . . . . . . 18
rare earth
XMCD: exp. vs. FEFF - fig. . 102
samples. . . . . . . . . . . . . . . . . . . . . . . .31
XAS and XMCD - fig. . . . . . . . . . 95
XMCD T -dep. - fig. . . . . . . . . . . . 98
roughness of Ni on Cu. - fig. . . . . . . . 35
S
sample holder . . . . . . . . . . . . . . . . . . . . . 22
sample holder - fig. . . . . . . . . . . . . . . . . 21
sample preparation . . . . . . . . . . . . . . . . 23
selection rules . . . . . . . . . . . . . . . . . . . . . . 7
SEXAFS . . . . . . . . . . . . . . . . . . . . . . . . . . 43
of Ni on O/Cu(100) - fig. . . . . . . 44
spin moment
Ni on O/Cu - fig. . . . . . . . . . . . . . . 55
spin-spin correlation function . . . . . . 18
standard magnetization curve. . . . . .77
step function . . . . . . . . . . . . . . . . . . . . . . 14
Index 147
sum rule application - fig. . . . . . . . . . .14
sum rules
K edge . . . . . . . . . . . . . . . . . . . . . . . . 15
L2,3 edges . . . . . . . . . . . . . . . . . . . . . 15
general edges . . . . . . . . . . . . . . . . . . 12
surfactant
LEED of 3d FMs - fig. . . . . . . . . . 41
MEED of 3d FMs - fig. . . . . . . . . 40
Surfaces, schematic - fig. . . . . . . . 42
surfactant assisted growth - fig. . . . . 34
synchrotron radiation . . . . . . . . . . . . . . 19
T
time scan
procedure to determine M(T ). .73
procedure to determine M(T ) - fig.
74
total electron yield. . . . . . . . . . . . . . . . . .8
trilayer
competing effects - fig. . . . . . . . . . 65
two step model . . . . . . . . . . . . . . . . . . . . 11
two step model - fig. . . . . . . . . . . . . . . . 11
U
UE56/1, UE56/2 . . . . . . . . . . . . . . . . . . 26
undulator . . . . . . . . . . . . . . . . . . . . . . . . . 20
undulator - fig. . . . . . . . . . . . . . . . . . . . . 20
X
X-ray absorption . . . . . . . . . . . . . . . . . . . 6
XAS
O K edge and Co L2,3 edges - fig.
50
O K edge, exp. vs. theory . . . . . 59
XAS, XMCD, O K edge - fig. . . . . . 59
XMCD . . . . . . . . . . . . . . . . . . . . . . . . . . . . 11
3dFM at O K edge - fig. . . . . . . 57
Ni L2,3 edges - fig. . . . . . . . . . . . . . 51
O K edge - fig. . . . . . . . . . . . . . . . . 56
O K edge and Co L2,3 edges . . . 50
O K edge, exp. vs. theory . . . . . 59