Mary C. Daly · PDF file · 2016-06-18Institute for the Study of Labor Protecting...
51
econstor www.econstor.eu Der Open-Access-Publikationsserver der ZBW – Leibniz-Informationszentrum Wirtschaft The Open Access Publication Server of the ZBW – Leibniz Information Centre for Economics Standard-Nutzungsbedingungen: Die Dokumente auf EconStor dürfen zu eigenen wissenschaftlichen Zwecken und zum Privatgebrauch gespeichert und kopiert werden. Sie dürfen die Dokumente nicht für öffentliche oder kommerzielle Zwecke vervielfältigen, öffentlich ausstellen, öffentlich zugänglich machen, vertreiben oder anderweitig nutzen. Sofern die Verfasser die Dokumente unter Open-Content-Lizenzen (insbesondere CC-Lizenzen) zur Verfügung gestellt haben sollten, gelten abweichend von diesen Nutzungsbedingungen die in der dort genannten Lizenz gewährten Nutzungsrechte. Terms of use: Documents in EconStor may be saved and copied for your personal and scholarly purposes. You are not to copy documents for public or commercial purposes, to exhibit the documents publicly, to make them publicly available on the internet, or to distribute or otherwise use the documents in public. If the documents have been made available under an Open Content Licence (especially Creative Commons Licences), you may exercise further usage rights as specified in the indicated licence. zbw Leibniz-Informationszentrum Wirtschaft Leibniz Information Centre for Economics Burkhauser, Richard V.; Daly, Mary C.; Ziebarth, Nicolas R. Working Paper Protecting Working-Age People with Disabilities: Experiences of Four Industrialized Nations IZA Discussion Papers, No. 9186 Provided in Cooperation with: Institute for the Study of Labor (IZA) Suggested Citation: Burkhauser, Richard V.; Daly, Mary C.; Ziebarth, Nicolas R. (2015) : Protecting Working-Age People with Disabilities: Experiences of Four Industrialized Nations, IZA Discussion Papers, No. 9186 This Version is available at: http://hdl.handle.net/10419/114053
Transcript of Mary C. Daly · PDF file · 2016-06-18Institute for the Study of Labor Protecting...
econstor www.econstor.eu
Der Open-Access-Publikationsserver der ZBW – Leibniz-Informationszentrum WirtschaftThe Open Access Publication Server of the ZBW – Leibniz Information Centre for Economics
Standard-Nutzungsbedingungen:
Die Dokumente auf EconStor dürfen zu eigenen wissenschaftlichenZwecken und zum Privatgebrauch gespeichert und kopiert werden.
Sie dürfen die Dokumente nicht für öffentliche oder kommerzielleZwecke vervielfältigen, öffentlich ausstellen, öffentlich zugänglichmachen, vertreiben oder anderweitig nutzen.
Sofern die Verfasser die Dokumente unter Open-Content-Lizenzen(insbesondere CC-Lizenzen) zur Verfügung gestellt haben sollten,gelten abweichend von diesen Nutzungsbedingungen die in der dortgenannten Lizenz gewährten Nutzungsrechte.
Terms of use:
Documents in EconStor may be saved and copied for yourpersonal and scholarly purposes.
You are not to copy documents for public or commercialpurposes, to exhibit the documents publicly, to make thempublicly available on the internet, or to distribute or otherwiseuse the documents in public.
If the documents have been made available under an OpenContent Licence (especially Creative Commons Licences), youmay exercise further usage rights as specified in the indicatedlicence.
zbw Leibniz-Informationszentrum WirtschaftLeibniz Information Centre for Economics
Burkhauser, Richard V.; Daly, Mary C.; Ziebarth, Nicolas R.
Working Paper
Protecting Working-Age People with Disabilities:Experiences of Four Industrialized Nations
IZA Discussion Papers, No. 9186
Provided in Cooperation with:Institute for the Study of Labor (IZA)
Suggested Citation: Burkhauser, Richard V.; Daly, Mary C.; Ziebarth, Nicolas R. (2015) :Protecting Working-Age People with Disabilities: Experiences of Four Industrialized Nations, IZADiscussion Papers, No. 9186
This Version is available at:http://hdl.handle.net/10419/114053
DI
SC
US
SI
ON
P
AP
ER
S
ER
IE
S
Forschungsinstitut zur Zukunft der ArbeitInstitute for the Study of Labor
Protecting Working-Age People with Disabilities:Experiences of Four Industrialized Nations
IZA DP No. 9186
July 2015
Richard V. BurkhauserMary C. DalyNicolas Ziebarth
Protecting Working-Age People with Disabilities:
Experiences of Four Industrialized Nations
Richard V. Burkhauser Cornell University, University of Melbourne and IZA
Mary C. Daly
Federal Reserve Bank of San Francisco, IZA and USC Schaeffer Center
Nicolas Ziebarth Cornell University, IZA and DIW Berlin
Discussion Paper No. 9186 July 2015
IZA
P.O. Box 7240 53072 Bonn
Germany
Phone: +49-228-3894-0 Fax: +49-228-3894-180
E-mail: [email protected]
Any opinions expressed here are those of the author(s) and not those of IZA. Research published in this series may include views on policy, but the institute itself takes no institutional policy positions. The IZA research network is committed to the IZA Guiding Principles of Research Integrity. The Institute for the Study of Labor (IZA) in Bonn is a local and virtual international research center and a place of communication between science, politics and business. IZA is an independent nonprofit organization supported by Deutsche Post Foundation. The center is associated with the University of Bonn and offers a stimulating research environment through its international network, workshops and conferences, data service, project support, research visits and doctoral program. IZA engages in (i) original and internationally competitive research in all fields of labor economics, (ii) development of policy concepts, and (iii) dissemination of research results and concepts to the interested public. IZA Discussion Papers often represent preliminary work and are circulated to encourage discussion. Citation of such a paper should account for its provisional character. A revised version may be available directly from the author.

IZA Discussion Paper No. 9186 July 2015
ABSTRACT
Protecting Working-Age People with Disabilities: Experiences of Four Industrialized Nations*
Although industrialized nations have long provided public protection to working-age individuals with disabilities, the form has changed over time. The impetus for change has been multi-faceted: rapid growth in program costs; greater awareness that people with impairments are able and willing to work; and increased recognition that protecting the economic security of people with disabilities might best be done by keeping them in the labor market. Here we describe the evolution of disability programs in four countries: Germany, the Netherlands, Sweden, and the United States. We show how growth in the receipt of publically provided disability benefits has fluctuated over time and discuss how policy choices played a role. Based on our descriptive comparative analysis we summarize shared experiences that potentially benefit policymakers in all countries. JEL Classification: I10, I13, J14, J18 Keywords: disability, disability insurance, cross-country comparison, Germany, US Corresponding author: Mary C. Daly Federal Reserve Bank of San Francisco 101 Market St., Mail Stop 1130 San Francisco, CA 94105 USA E-mail: [email protected]
* Burkhauser received partial funding for his work on this paper from the Rehabilitation Research and Training Center on Disability Statistics and Demographics at Hunter College, which is funded by the National Institute on Disability and Rehabilitation Research (NIDRR, Federal Award # H133B120006). The contents of this paper do not necessarily represent the policy of NIDRR and readers should not assume endorsement by the Federal Government (Edgar, 75.620 (b)) or the Federal Reserve Bank of San Francisco or the Federal Reserve Board of Governors. We thank Jan Maarten van Sonsbeek for data on the Netherlands, Marten Palme and Lisa Laun for data on Sweden, and Dr. Lueg as well as Ms. Kühnapfel from the German Insurance Association (Gesamtverband der Deutschen Versicherungswirtschaft) for their data on private disability insurance policies and other background information on Germany. We also thank Benjamin Bradshaw, Aline Passlack, and Catherine van der List for excellent research assistance. We have no financial interests that constitute a conflict of interest with this research.

3
1. Introduction
All industrialized nations provide some form of public protection to working-age
individuals with disabilities. In their early manifestations, these programs focused on easing the
financial consequences of disability by providing cash assistance in lieu of full-time work. Over
time a number of nations have moved away from simple cash assistance to emphasize pro-work
programs designed to help individuals with disabilities maintain their labor market connections.
On balance these changes have reflected concerns about rapid growth in program rolls as well as
increased awareness that many individuals with disabilities can remain productively in the labor
market.
In this paper, we describe the evolution of disability programs in four countries: Germany,
the Netherlands, Sweden, and the United States. We select these countries as examples of nations
with similar goals but very different approaches to achieving them. We begin by comparing trends
in disability recipiency across countries. We find that all four countries experienced pronounced
fluctuations in disability recipiency rates over the past 40 years. We show that these fluctuations
are difficult to explain based on the relatively stable paths of variables such as health and
population composition. We go on to describe changes in disability policy in each country and
show that these changes are well correlated with the ups and downs in country disability recipiency
rates. We interpret these correlations as suggestive of a link between policy and disability
recipiency and summarize shared lessons that can be gleaned from the experiences in each nation.
Although our paper is simply a descriptive comparative analysis, it highlights the similarities of
experiences across nations and underscores the potential benefit of learning from other countries’
policy reform efforts when tackling the challenges associated with providing social protection to
those with disabilities.
4
2. Disability Program Growth across Countries
The number of workers receiving disability-based social insurance has increased
substantially in most industrialized nations over the past forty years. Population growth accounts
for part of this increase, but disability caseloads as a share of the working age population age—
known as the disability recipiency rate—also have risen substantially.1 This can be seen in Figure
1, which shows the total number of persons receiving long-term categorical disability income
benefits as a share of the working-age population in our four countries.2 This is the most critical
number to policymakers since it measures the magnitude of the fiscal burden that these disability
programs place on country finances.3 We show values beginning in 1970 through the last year of
public data in each country.4 We provide a more detailed description of the data in Appendix A.
Figure 1 plots the level of disability recipiency (disability beneficiaries as a share of the
working-age population) over time for each country. In 1970, disability recipiency rates in our
three EU nations were considerably higher: 4.2 percent in Germany, 2.4 percent in the Netherlands
1Pattison and Waldron (2013) argue that population growth explains the bulk of the rise in
disability recipiency (the Disability Insurance (DI) program) in the U.S. Duggan and Imbermans
(2009) and Burkhauser et al. (2014) remove the influence of population growth and consider the
factors that explain the remaining rise in the program. Since population growth alone would not
put additional financial pressure on the system, knowing what these other factors are is critical to
policymakers tasked with funding the system. Most recently Liebman (2015) argues that most of
the increase in the DI incidence rate, controlling for other factors including unemployment rates,
occurred in the 1980s. Since then this controlled measure of incidence has leveled off, but at a
substantially higher rate than in the early 1970s.
2The U.S. disability recipiency rate only includes beneficiaries receiving Social Security Disability
Insurance (DI). When SSI-disabled adults and DI program beneficiaries are combined, the level
of the U.S. disability recipiency rate is higher, but the patterns over time are roughly the same.
This point is demonstrated in Burkhauser et al. (2013), Figure 2.
3The fiscal burden of disability programs comes from the fact that beneficiaries receive income
support and they generally do not contribute to the tax base since they are largely out of the labor
force.
4Disability caseloads data are made public with a considerable lag in some countries. Hence we
cannot fully document how the Global Financial Crisis affected recipiency rates in all countries.
5
and 3.5 percent in Sweden, than they were in the U.S. (1.2 percent). Since then disability recipiency
rates have risen substantially in each country with the exception of Germany. However, as the
figure highlights, they have done so along significantly different trajectories.
To see these dynamics more clearly, Table 1 provides average annual growth rates in
disability recipiency by decade and over the entire sample. As the table shows, disability
recipiency rates rose in all countries during the 1970s, with especially rapid growth in the
Netherlands and more modest growth in Germany. In contrast, in the 1980s, recipiency rates grew
more modestly and even fell in the U.S. and Germany. By the 1990s, growth in the Netherlands
and Germany ended and disability recipiency rates, on balance, fell over the decade. During the
2000s, disability recipiency rates continued to fall in the Netherlands and Germany and grew less
quickly in Sweden. Growth in the U.S. slowed slightly but remained quite high relative to the EU
countries in our sample.
The final average (1970-final) shows that smoothing through the fluctuations in growth
that have occurred over the decades, the U.S. experienced the highest average annual growth rate
over the sample period. The rapid growth in our three EU countries brought on program reforms
and a tempering or reversal of the path of disability recipiency. In contrast, with the exception of
the 1980s, growth in U.S. disability recipiency has been nearly continuous over the sample period.
Of course one possible explanation for the differences in growth across countries is that
health and population characteristics have evolved differently for each nation over time. To
understand the extent to which these factors might account for the growth in disability recipiency
shown in Figure 1 and Table 1, we compare trends in self-reported health across countries and
more formally evaluate the role that demographics and other changes in the population eligible for
disability benefits might account for trends in disability recipiency rates. We begin by examining

6
trends in self-reported health over time and across countries. Although prone to response biases,
which are well documented in the literature, the strength of the self-reported health measure is its
availability across countries and over time.5 McGee et al. (1999) show that self-reported health is
highly correlated with objective health measures and is a very reliable indicator of mortality.
Figure 2 contains OECD data on self-reported health status for each of our countries. The
plot shows the percentage of the population aged 45-64 in each country reporting that they are in
very good or good health on a survey that asks respondents to state whether they are in very good,
good, fair, or poor health. Since the incidence of disability increases with age this is the most
relevant age group for examining the role of health in disability benefit trends.
Although there are persistent differences across countries in the percent of individuals
reporting very good or good health, there is little variation over time within countries. Over the
past ten years the overall prevalence of very good or good health among working-age populations
has remained relatively steady in each country. The relative stability of the health measure in each
of our sample countries suggests that changes in the prevalence of impairments in the working-
age population is unlikely to account for the bulk of the within and across country fluctuations in
disability recipiency rates found in Figure 1 and Table 1. Findings reported in Börsch-Supan and
Jürges (2012) come to the same conclusions.
A second reason disability recipiency rates may have varied across countries over time is
that the eligible populations in those nations may have evolved differently. Examples of this
include increased labor force participation among women in the U.S., which increased the share
5Some of the differences across countries may relate to the age structure of the population. Older
populations report lower rates of good health than younger populations. Remaining differences
likely owe to reporting differences that are idiosyncratic to each country (e.g. Jürges 2007,
Ziebarth, 2010a; Van Soest et al, 2011).
7
of women eligible for Social Security Disability Insurance (DI) benefits. However, previous
research has found that accounting for these factors cannot fully explain the differences in levels
and trends across countries. See: for example Burkhauser et al. (2014) and OECD (2010).
If neither health nor population characteristics can account for all of the cross-country
differences in disability recipiency rates, either levels or trends, then what does? An obvious
possibility is policy.6 In what follows we show how changes in disability policy and its
implementation in each country are correlated with the dynamics of disability recipiency rates we
documented in Figure 1. While our comparative descriptive analysis falls short of establishing a
causal effect of policy on the disability rolls, it is suggestive of the potential impact of policy design
on the trends in disability benefit receipt across and within the countries in our sample.
6We are not the first to make this point. The OECD (2010) summary of disability program growth
across OECD nations concludes that policy rather than population characteristics are behind the
rapid expansion of disability benefit receipt in most nations. The point is also emphasized by Autor
and Duggan (2010) and Burkhauser and Daly (2011, 2012) for the U.S. and Burkhauser, Daly,
McVicar, and Wilkins (2014) cross-nationally, and Duggan and Imberman (2009). Liebman
(2015) acknowledges that policy can matter but argues this is less the case for the U.S. since the
1990s.
8
3. Disability Policy and Program Growth
In industrialized nations, social protection from income loss associated with disability is
just one part of a broader social safety net designed to protect working age individuals from the
loss of labor market income. Countries also provide protection to those who lose market income
for other reasons such as unemployment or old age.
In general, countries provide this protection in tiers associated with the expectations of
employment for different groups. The first tier provides universal, long-term, needs-based cash
transfers that guarantee a social minimum income to all families. The second tier provides cash
support to those available for employment and expected to work, but who are temporarily
unemployed. These benefits are usually conditional on past work, limited in duration, and may be
needs-based. The third tier targets benefits to those not expected to work—the aged, disabled,
etc.—and can either be needs-based or based on past earnings. Since recipients of these benefits
are not expected to return to employment, benefits are typically higher and not time limited.
When these tiers provide substantially different amounts of income and their categories are
mutable, a considerable responsibility falls on program gatekeepers to consistently determine who
should come onto the program. For retirement programs this is straightforward; age is an arbitrary
but easily verifiable eligibility marker. Eligibility determinations by program gatekeepers will be
straightforward and program caseloads will be predictable based on knowable trends in population
composition.
Disability is more difficult. Unlike retirement, there is no precise definition or easily
verifiable marker for determining categorical eligibility for long-term disability benefits.
Moreover, disability is not a static concept and social conceptualizations of disability evolve over
time. For example, over the past 20 years the medical model of disability underlying categorical

9
disability programs in most OECD countries has been rejected and replaced by a conceptualization
that recognizes that the social environment is as important as health in determining an individual’s
ability to participate in society (WHO, 2001).7 Under this model, “work disability” is a changeable
state that depends on a number of factors, including an individual’s health-based impairment, the
level of accommodation offered in the workplace, and the relative economic rewards associated
with working or exiting the labor force to receive disability benefits.
The fluid nature of the disability category has meant that changes to disability policy
parameters such as who is covered for program benefits, the level of benefits—both absolutely and
relative to alternative programs or wage earnings—and the breadth and severity of the qualifying
conditions can influence caseload growth and disability recipiency rates. This potential is
especially acute in the context of reductions in other forms of social protection or changes in the
broader economy.
For example, in a number of industrialized nations, the relative value of disability benefits
has risen significantly over time, as policymakers have cut payments or imposed stricter eligibility
criteria on other benefit programs including unemployment insurance and general welfare.
Structural changes in the economy including the declining job and wage prospects for low-skilled
workers also have made disability benefits more attractive as means of long-term income support.
Finally, disability benefits have increasingly become an option for displaced or long-term
unemployed workers dislocated during economic downturns. Since very few disability
beneficiaries ever return to the labor market, the growth in the rolls that occurs during and after
7There is no clear consensus on the most appropriate conceptualization of disability, although the
most widely used is the World Health Organization’s (WHO) International Classification of
Disability, Health, and Functioning (WHO, 2001). Burkhauser and Schroeder (2007) propose a
method to harmonize classifications in surveys.
10
recessions account for some of the long-term increase in disability recipiency rates. These rates
then remain elevated until these recession induced cohorts of beneficiaries age out of the system
or die. For a more detailed discussion of these issues in OECD nations see OECD (2010).
Below we discuss how disability program designs and changes in disability policy
parameters in three EU countries (Germany, the Netherlands, and Sweden) and in the U.S. are
related to disability recipiency rates in each country. When relevant we also discuss how these
policy structures may have interacted with macroeconomic conditions and the broader social safety
net to account for growth in the disability rolls. For reference, Figure 3 (Panels A through D) show
disability recipiency rates along with major policy changes over time for each country. Table 2
provides key information about the current state of disability programs in each nation.
3.1 The German Experience
Germany, like most European nations, has a long-standing first-tier, universal needs-based
cash transfer program that provides a guaranteed social minimum income floor to all its citizens.
Benefits are funded out of general revenues. Major reforms in 2004 fundamentally altered
Germany’s Tier I program to impose job search and job training requirements on beneficiaries.8
In general, Tier I beneficiaries are considered “able to work” and part of the active labor force in
Germany.9 Benefits levels are set nationally and vary across individuals based on household size
and composition.
8The 2004 reforms created the Arbeitslosengeld II program, generally referred to as “Hartz IV”
(Sozialgesetzbuch II, “Social Code Book II”). For more information about the reforms see: (e.g.
Eichhorst et al. 2008, Konle-Seidl 2012). 9People are considered to be “able to work” if they are judged to be able to work at least 3 hours
per day. A relatively small share of people receive Sozialhilfe (Hilfe zum Lebensunterhalt) (“Social
Assistance Benefits”) of a similar amount but have no job search requirement and are not
11
Germany also provides second and third tier benefits. Second tier benefits consist primarily
of unemployment insurance (UI). To receive unemployment benefits workers must have been
employed for at least 24 months prior to applying. Unemployed workers under the age of 50 are
paid benefits (Arbeitslosengeld I) for up to 12 months. After age 50 the maximum duration
increases gradually with age such that workers who are age 58 at the start of their unemployment
spell receive up to 24 months of benefits. For workers without children, the replacement rate for
unemployment benefits is 60 percent of the average monthly wage earnings over the previous year;
unemployed workers with children receive 67 percent of prior earnings. Unemployment benefits
are funded by payroll taxes up to the annual social insurance ceiling of €72,600 ($87,000).10
Employers and employees each pay 1.5 percent of the gross wage.
Third tier benefits in Germany include the Statutory Old-Age Pension Scheme (OAP) and
the Work Disability Pension (WDP) for both partially and totally disabled workers. Both programs
pay benefits to workers who have paid into the systems during their work life. Similar to UI,
employers and employees are each subject to a payroll tax—9.35 percent—of their monthly gross
wage up to the social insurance contribution ceiling. In 2014, total WDP benefits per month were
about €11 billion, or 4.2 percent of total OPA/WDP spending (DRV, 2014 a, b and c; BMAS,
2014).11
considered to be in the labor force (§§27-40 SGB XII). These beneficiaries are typically “long-
term unemployed” and classified as temporarily not able to work 3 hours per day.
10 In the eastern states of Germany, the rates are the same but the annual social insurance ceiling
is lower--€62,400 ($75,000).
11 The figure of €11 billion is based on an indirect calculation multiplying the €78,689 partial
WDP beneficiaries with their annual average cash benefit of €5,844 and adding the 1,224,177
full WDP beneficiaries and their average annual benefit received of €8,604 (DRV, a b & c 2014).

12
In Germany, like other EU countries, workers also are eligible for both short- and long-
term statutory sickness insurance benefits.12 While these benefits can be the gateway to WDP they
are not considered Tier 3 programs since they are time limited. Employers are required to provide
short-term sickness benefits. Workers who are determined to be eligible for short-term sick
benefits (up to six weeks) receive 100 percent of their net wages (Ziebarth and Karlsson, 2010,
2014).13 Workers with longer spells are reevaluated for access to long-term sickness benefits.
These benefits are publically funded and replace 70 percent of net wages and can be paid for up to
78 weeks. See: Ziebarth (2009, 2013) for additional more details.
Germany had the highest recipiency rates in the early 1970s of the four countries we
compare in Figure 1. One reason for these higher rates was a change in WDP rules in 1969 that
allowed partially disabled workers to receive full WDP benefits, if they were unable to find a job
(Burkhauser and Hirvonen, 1989). Further expansions in 1972 extended coverage to housewives
and the self-employed and allowed disabled workers to transition to the retirement program at age
62 without an actuarial reduction in benefits. As can be seen in Panel A of Figure 3, in the aftermath
of the reforms, disability recipiency rose significantly, peaking at 5.8 percent in 1984.
A substantial tightening of WDP coverage criteria followed this rapid growth in recipiency
rates. WDP reforms in the early 1980s limited coverage to workers who had paid payroll taxes into
the system over the past 3 out of 5 years and had accumulated at least five years of market work
experience. Since many housewives did not meet these “market work criteria,” this greatly
12 Similar to the Workers Compensation program in the U.S., Germany also has a separate
Statutory Accident Insurance (SAI) program covering temporary and permanent work absences
in case of work accidents or diseases. But unlike the U.S. it is administered at the federal rather
than the state level. 13 Short-term sick leave benefits were cut to 80 percent of wages in October 1996 but this cost
saving reform was politically unsustainable and was reversed in 1999. For a discussion see
Ziebarth and Karlsson (2014).
13
curtailed their WDP coverage. Hence a large fraction of the decline in disability recipiency rates
during this period was due to the reduction in access for women working outside the paid labor
market. (See: RKI, 2006 and Börsch-Supan and Jürges, 2012 for a more detailed discussion.) In
the aftermath of these system coverage reforms growth in disability recipiency turned negative
(Table 1), more than undoing the increases in disability recipiency rates over the previous decades
(Figure 3, Panel A).
Additional reforms were launched in the 1990s and 2000s. Actuarial reductions and caps
on the earnings of WDP beneficiaries were introduced in 1996. Börsch-Supan and Jürges (2012)
report that new male WDP beneficiaries fell from an average of about 150,000 per year prior to
these reforms to 75,000 per year thereafter. This 50 percent per year reduction in the inflow of new
male beneficiaries onto the program contributed to the decline in disability recipiency rates over
the rest of the decade evidenced in Figure 3 Panel A and Table 1.14
Another round of structural WDP reforms were introduced in 2001. Most important was
the tightening in the work-limited eligibility standard from “being unable to work in the occupation
in which one was trained—effectively in the last job or a comparable job in terms of the skills it
required, the wages it paid and its prestige”—to “being unable to work in any job available in the
economy”. As we will describe later, this reform made eligibility for WDP insurance benefits
stricter than the criteria for the typical private market disability benefit. Following this policy
change inflows (men and women combined) onto the WDP program decreased further, falling
from 200,000 in 2001 to 160,000 in 2005. This slow but steady decline in new beneficiaries is
14Note that the figures reflect the stock of all beneficiaries. As such, even large declines in the flow
of new beneficiaries, only gradually translate into declines in the overall disability recipiency rate.

14
linked to additional declines in the overall disability recipiency rate in Germany (Krause et al.
2013, DRV 2014b).
WDP reforms in 2004 continued to focus on reducing the flow of new recipients onto the
program. However, the attention of these reductions shifted away from tightening WDP eligibility
requirements and towards promoting worker accommodation on the job. Specifically, the reforms
mandated that employers provide workplace reintegration in the event of a work-limiting
impairment. Indeed, the law requires that when an impaired worker exhausts his/her short-term
sickness benefits (six weeks) and is being considered for longer-term sickness benefits, employers
must coordinate a plan that includes input from: the sick-listed employee, WDP experts, the
appropriate worker council, and the workplace physician. The plan is meant to ensure that the
worker’s temporary disability can be overcome and to prevent future reductions in work capacity.
The experience of Germany over the past four decades is a useful illustration of the role
that policy decisions can play on the dynamics of disability recipiency rates. When Germany was
expanding both the coverage and generosity of disability benefits, recipiency rates were high and
rising relative to other countries. WDP program growth subsequently declined in the aftermath of
reforms that limited access, made benefits less attractive and required employers to implement a
workplace reintegration program. Germany is the only country in our sample whose disability
recipiency rate is now below its 1970 level. As can be seen in the bottom row of Table 1, annual
growth rates over the entire period of our analysis (1970 to our most recent year of data) averaged
-0.73 percent in Germany compared to +2.69 percent in the Netherlands, +2.3 percent in Sweden
and +3.1 percent in the U.S.
Private Disability Insurance. Notably, the policy changes in Germany that reduced the size
of the public WDP program were correlated with an increase in the market for private disability
15
insurance (Figure 4). This private market insurance generally provides benefits to covered workers
who have established that a health shock led to reduced work capacity in the current (or a
comparable) occupation—a less difficult level of work incapacity to meet for benefit eligibility
than the one imposed by WDP since 2001. As shown in Figure 4, the number of new private
disability insurance policies in Germany grew slowly from 1976 through the mid-1990s. But
growth increased substantially around the introduction of actuarial reductions and caps on the
earnings of WDP beneficiaries in 1996. Growth in new private policies increased further in 2001.
This is the year that WDP eligibility was limited to workers who were unable to perform any work
in the economy.15 In 2012, 61 percent of employed men and 42 percent of employed women were
covered by private disability insurance (Statistika, 2014).16
While the expansion of private disability insurance suggests that many Germans responded
to the reductions in WDP benefits by purchasing alternative private policies, to our knowledge no
research on this substitution has been published. Even if individuals are augmenting the WDP
program with private insurance, the substitution is likely not perfect. Private disability insurance
plans are experience rated and individually underwritten. Private disability insurance follows
private insurance law and is based on a private contract between the insurer and the insured, which
specifies the conditions for the insured risk individually. Premiums depend on age, medical
15Conversations with German Association of Insurers (GDV) representatives confirm that no
industry-specific supply-side factors have been driving this trend.
16Beneficiaries of private disability insurance may also receive WDP benefits if they are eligible.
This contrasts with the U.S. market where private insurers may reduce payments dollar for dollar
for recipients of public Social Security Disability Insurance. This means that private insurers in
Germany have more of an incentive to return beneficiaries to work than do those in the U.S. (See
Burkhauser and Daly 2011 for a fuller discussion of this point.)

16
diagnoses, and occupation. As a result, premiums can be high for high-risk occupations and
applicants may be denied coverage.
3.2 The Netherlands17
As in Germany, the disability system in the Netherlands contains both a social insurance
program that protects workers against lost labor earnings and a program that provides a social
minimum for disabled adults with little or no work history. A separate social minimum scheme for
the disabled self-employed ended in 2004. The Dutch social insurance program (WAO/WIA)
provides cash transfers to working-age men and women based on lost labor earnings. The
Netherlands does not have a separate program similar to Workers’ Compensation in Germany,
Sweden or the U.S. Rather it has a longer-term disability transfer program that, together with
sickness benefits all private firms must offer, provides a comprehensive system of both partial and
total disability benefits to workers regardless of how or where their disability occurred. The Dutch
also have a categorical disability-based welfare program (Wajong) that, unlike the general welfare
scheme, is not means tested. This program is similar to the SSI-disabled adults program in the U.S.
that it targets men and women whose disabilities occurred prior to their entrance into the labor
force and are severe enough that they have not engaged in full-time employment as adults. (See
Table 2 for details of the disability program in the Netherlands.)
The Dutch disability program grew rapidly over the 1970s. This was a time when the
system provided relatively generous benefits (Figure 3, Panel B). In the 1970s, government
payments from the universal sickness benefit—essentially a universal short-term disability system,
17A longer version of this summary of the Dutch system can be found in Burkhauser and Daly
2011.

17
replaced up to 80 percent of net-of-tax wage earnings for up to one year. And most employees (90
percent) had the rest of their net-of-tax earnings replaced by collective-bargaining agreements with
their employers. These disability replacement rates were far in excess of comparable programs in
the U.S. and many other European nations. Sickness benefits were payable for up to twelve
months. After one year, employees still receiving benefits were eligible for disability benefit
screening. Workers with chronic conditions that caused a reduction in their capacity to perform
work commensurate with their job training and work history were eligible for disability benefits.
Those judged fully disabled were eligible for benefits equal to 80 percent of their previous before-
tax earnings. Those judged partially disabled (those with some residual earnings capacity) were
eligible for partial benefits; the minimum degree of impairment for eligibility was 15 percent.
In a significant loosening of access to full disability benefits in the mid-1970s, Dutch courts
determined that unless disability evaluators could prove otherwise, they were required to attribute
a partially disabled worker’s lack of employment to discriminatory behavior. The result was that
it became “administrative practice” to treat unemployed, partially disabled persons as if they were
fully disabled. That interpretation of the law made assessing lost earnings capacity unnecessary
beyond the minimum 15 percent, since that became sufficient to entitle a person to full benefits.
This essentially made the Dutch partial disability system a very generous full disability program.
During this period, the adjusted disability recipiency rate in the Netherlands grew 11.45 percent
per year (Table 1 and Figure 3, Panel B).
Reforms initiated between 1982 and 1987 were the first of three major efforts over the next
two decades to regain control of the Dutch disability transfer system. By 1985, a series of cuts in
the replacement rate effectively lowered it from 80 percent of before-tax income to 70 percent of
after-tax income for both new entrants and current beneficiaries. In 1987 the labor market

18
consideration rule was completely abolished. Despite the legal ban on including labor-market
considerations in their assessments, disability adjudicators still tended either to grant or deny full
benefits. Denial rates remained quite low, suggesting that the legal change did not stop the de facto
use of labor-market considerations in the adjudication process. Nonetheless these changes were
accompanied by slower growth in disability recipiency in the 1980s that brought the Netherlands
more in line with disability growth in Sweden.
In 1994, the Dutch government introduced several additional reforms including measures
to further tighten eligibility criteria. And in a new policy, private firms were made responsible for
an employee’s first six weeks of sick pay. The introduction of some privatization of the disability
system was new in the Netherlands and represented a change in policy intended to encourage firms
to provide accommodation, rehabilitation, and continued employment opportunities to workers as
an alternative to moving them onto long-term cash benefits. The mandate that firms would bear
the full responsibility for sick pay was extended from six weeks to one year in 1996. Despite these
reforms, the decline in the Dutch disability recipiency rate stopped in 1997 and began to slowly
climb.
In 2002, the Dutch disability system began to phase in the third and most significant set of
reforms. These reforms culminated in the establishment of a new disability insurance scheme in
2004—WIA—which replaced the WAO scheme that had been in place since 1967. These systemic
reforms fundamentally altered disability policy in the Netherlands. The reforms deliberately made
work rather than cash benefits the expectation and enforced this by increasing the incentives of
both employees and their employers to invest more time and effort in accommodation and
rehabilitation following the onset of a disability.

19
Foremost among the reforms was the extension from one year to two years of the mandate
that firms (including small employers) bear full responsibility for employees’ sick pay. These
changes effectively meant that during the first two years following a health shock, workers were
the responsibility of the firm and not eligible for long-term government provided disability
benefits. During these two years, employers were required to allow workers receiving sickness
benefits to remain with the firm; dismal was allowed only for employees who refused to cooperate
in a reasonable work-resumption plan.
The reforms also gave firms a list of prescribed rehabilitation and accommodation activities
that they (via a private occupational health agency) had to provide to assist workers in remaining
on the job or finding alternative employment. When the two years were complete, workers were
allowed to apply for long-term disability benefits, but they were required to provide documentation
regarding return-to-work efforts during the two-year period. In 2007, nearly 14 percent of
disability insurance claims were returned to employers and the employer continued to be
responsible for employing the worker until the claim was processed or the worker had returned to
the old or a new job.
Reforms at the front end of the process were accompanied by significant reforms in the
longer-term benefit program. All employers were made to pay for the full and permanent disability
program through a uniform pay-as-you-go premium rate. Employers also had to pay to fund the
publicly run partial disability program, but they could opt out of it by enrolling their workers with
a private insurer instead. Either way, employers had to pay experience-rated premiums that
covered the first ten years of partial disability benefit receipt. After ten years, the financial burden
would shift to the uniform pay-as-you-go rates that also cover the fully and permanently disabled
and the stock of current beneficiaries under the old system.
20
Borghans, Gielen, and Luttmer (2014) provide evidence that the reduction in benefits for
current Dutch disability insurance recipients in the reforms of 1992/1993 lead to both their
increased use of alternative social welfare programs and greater earnings from employment over
the next decade. They argue that, on average, increased income from these two alternative sources
fully offset the cut in their DI benefits. While it is still too early to determine the full effect of more
recent policy changes on the Dutch disability beneficiary population, Van Sonsbeek and Gradus
(2011) provides the first micro-simulation of the consequences of the post-2002 round of policy
changes discussed above. They estimate that the combined impact of the introduction of
experience rating together with the introduction of the statutory Gatekeeper Protocol and stricter
examinations will reduce the projected long-term number of disability beneficiaries by 600,000
and that the introduction of the new WIA scheme will further reduce that projected number by
250,000 by 2040, as compared to a “no-change scenario.” Koning and Lindeboom (2015) provide
the most recent review of the consequences of the Dutch disability reforms on program enrollment
and a review of the literature on this topic.
Overall, the research on the effectiveness of the Dutch disability reforms supports the ideas
that policy design matters for the outcomes of individuals with impairments and suggests that with
assistance many workers who experience a health shock can remain productively in the labor
market.
3.3 Sweden
Like most European nations Sweden has a long-standing first-tier, universal needs-based
cash transfer program that provides a guaranteed social minimum income floor to all its citizens.
This first-tier protection is funded out of general revenues and is available to everyone who lives

21
or works in Sweden. Although benefits provide minimum income to anyone in need, applicants
apply for benefits based on income and particular circumstances, such as disability, parental needs,
or old age. Benefits are set nationally and indexed to keep pace with the price level.
Sweden also provides second and third tier benefits. The second tier in Sweden includes
unemployment insurance benefits, which include both a mandatory and voluntary component. The
mandatory component is paid for by all employers and replaces a minimum fraction of wages for
covered workers. The number of weeks covered by unemployment insurance has fluctuated over
time but is generally longer than in the U.S. Most individuals also are covered by voluntary
unemployment insurance which is negotiated between firms and trade unions. Somewhat uniquely
among the countries we review, Sweden also has many private options for unemployment
insurance; these may be purchased individually or through an employer.
Sweden provides third tier benefits, including old-age pensions and sickness and disability
benefits, through a combination of programs. For those with an earnings history the bulk of the
protection is provided based on a social insurance program that, as in the U.S., is financed by
statutory employer and employee contributions. Many employers in Sweden also pay into
occupational-based insurance and pension programs on behalf of their employees. Participation in
these schemes is driven by competitive forces or collective bargaining agreements with unions but
a majority of employers in Sweden participate in these programs. See Table 2 for more details
about the Swedish disability system.
As in the Netherlands, the Swedish disability program was relatively generous and
expanding rapidly in the 1970s (see Table 1). The first level of protection for Swedish workers
with health problems is a sickness benefit. In the 1970s, sickness benefits replaced about 90 percent
of expected earnings for individuals with “abnormal physical or mental conditions” that reduced
22
their normal work capacity by at least 25 percent. Workers claiming sickness absence for more
than eight days were required to get a certificate from a doctor. This was primarily facilitated by
the individual’s doctor with no centralized screening or standards.
After one year, employees still receiving benefits could apply for long-term disability
insurance. Workers with functional limitations that caused a reduction in their capacity to perform
work commensurate with their job training and work history were eligible for disability benefits.
Benefits were awarded for partial (50 percent) and full disability. For those under age 60, benefits
included rehabilitation and vocational training. For those 60 and older, beneficiaries were provided
income support. Like sickness benefits, disability benefits were very generous replacing the vast
majority of expected lost earnings.
Over the course of the 1970s, standards for obtaining long-term disability benefits were
also loosened to make it easier for the long-term unemployed to move onto the program. For
workers of all ages, unemployment spells of more than one year were added to the list of criteria
considered in the disability screening process. For workers over age 60, long-term unemployed
became a sufficient condition for moving onto disability benefits, even without a certifiable
functional limitation. Similar to the Dutch case, these changes meant that the disability benefit
program was increasingly being used as a very generous long-term unemployment insurance
program.18
Generous benefits and easier access correlated with steady growth in disability recipiency
rates over the 1970s and 1980s (Figure 3, Panel C). These features also left the program vulnerable
to growth related to the serious recession in the early 1990s. As shown in Figure 3, Panel C,
18Econometric studies of the Swedish system support this view. See for example Rebick, 1994;
Larrson 2002.
23
following the foreign exchange crisis in 1990 and ensuing deep recession, disability recipiency
rates surged. Policymakers responded by lowering the replacement rates on sickness benefits,
making employers pay for the first 14 days of sickness absence, and removing the pure labor
market criteria for disability benefits for older workers. With these changes to policy and an
improving economy, disability recipiency rates stabilized for most of the rest of the decade. That
said, they remained quite high and at a level that policymakers argued was unsustainable. As such,
additional policy reforms were made throughout the 1990s. These reforms were designed to
increase the employer cost of worker sickness absence and increase the threshold for workers
applying for sickness and/or disability benefits.19
Facing increasing fiscal pressures and a renewal of disability recipiency rate growth
(Figure 3, Panel C), in 2000 the Swedish government proposed much more sweeping reforms to
the sickness and disability system. Despite considerable opposition from various advocacy groups,
significant reforms were put into place over the remainder of the decade. The driving principle
behind the reforms was that work support, rather than cash assistance in lieu of work, was the
primary goal of disability policy.
This general principle translated into a number of important specific reforms. In 2003, the
government merged the sickness benefits and disability systems and began a series of changes to
standardize and enforce the administration of these now joint systems. Most notable among them
was the centralization of screening processes. Up until this point, certification for sickness benefits
had been variable as had disability benefit allowance rates. Although rehabilitation and vocational
19The Swedish government made numerous changes to sickness benefit replacement rates, the
number of days the employer paid for employee sickness absence, and the number of days the
worker had to wait before receiving sickness benefits (Andren 2003). In addition, policymakers
removed most of the special allowances for disability insurance afforded to unemployed and older
workers Jönsson, Palme, Svensson 2011.
24
training were goals, many doctors and regional disability gatekeepers focused on providing income
support rather than employment retraining. By centralizing the process and developing
standardized protocols for granting cash benefits, policymakers were better able to regulate the
gatekeepers and enforce the strategy of promoting participation in work before offering cash
benefits. Although it is too early to judge the effectiveness, the idea is that this standardization will
temper the link between regional economic conditions and disability recipiency that had
historically been present.
In addition to standardizing the screening process, the merger of the sickness and disability
programs forced disability gatekeepers to become actively involved early in the process. By getting
vocational and rehabilitation experts involved early, at the sickness benefit stage, policymakers
intended to stem the flow of new applicants to the long-term disability program. To aid in this
process, sickness benefits were capped at one year, and beneficiaries were evaluated for work
ability at 180 days of absence. Only those who could show that they had no capacity to perform
any job were allowed to remain on the program for the full year. In addition, employers were
required to work with disability administrators to create a rehabilitation plan. And gatekeepers
were given the power to demand that employers provide certification about the types of
accommodations they made for the worker. In the aftermath of these reforms, the use of sickness
benefits declined as did the flow of new beneficiaries onto the long-term disability system. This
correlation between policy changes and declines in benefit use, to our knowledge, has not been
causally established in published research.
In 2008 the Swedish government undertook an additional series of reforms to its sickness
and long-term disability programs (these reforms are detailed in Hartman 2011 and OECD 2009).
These reforms were meant to further curb growth in the rolls and more actively return newly
25
impaired workers to back to the labor market. The 2008 reforms went beyond engaging
gatekeepers and employers and focuses on individuals with disabilities. New rules aimed at
strengthening the incentives for individuals with disabilities to work and improving their
opportunities to do so. The principal reform was the establishment of a new timeline for the
provision of rehabilitation services under the sickness absence program with checkpoints closely
aligned with assessment of work capacity and a reduction of the cash value of sickness benefits
for those who did not return to work. In addition to adding more checkpoints, the reforms also
front-loaded the evaluations so that they were being done at 3-, 6-, and 12-month increments. The
earlier checkpoints provided rehabilitation, counseling and assessment much closer to the onset of
an impairment when return to work was more likely.
After the reforms, new sickness program entrants returned to work more quickly and
reduced their overall time on the program (Hartman 2011). In contrast, few of those already on the
sickness program when the new reforms were initiated ever returned to work. When their sickness
benefits ended they simply moved onto other social assistance programs. These findings provide
support for the idea that early intervention matters. Waiting even one year following the onset of
impairment significantly reduces the chance that rehabilitation will result in a return to work. The
disability reforms put in place by the Swedish government late in the 2000s appear to have helped
curb growth in disability recipiency rates in the nation (Figure 3, Panel C).
3.4 The U.S. Experience
Unlike the three EU countries discussed above, the United States has no first-tier, universal
needs-based cash transfer program that provides a guaranteed social minimum income floor to all
its citizens. The Supplemental Security Income (SSI) program, which is limited to the aged,
26
disabled adults and parents of disabled children, is the only long-term needs-based cash transfer
program.20, 21 The only other major categorical needs-based cash transfer program in the U.S. is
Temporary Assistance for Needy Families (TANF), which is targeted at single mothers and
provides an even lower guaranteed income level and the guarantee is limited to 5 years.
The second tier in the U.S. includes unemployment insurance benefits, which replace a
fraction of wages for covered workers for short periods of time. In normal economic times,
unemployment benefits can last up to 26 weeks. During recessions, this maximum is often
extended and it rose to 99 weeks in the aftermath of the Global Financial Crisis. Unemployment
insurance benefits are generally higher than SSI or TANF benefits.
The social security old-age retirement (OAI) and disability (DI) programs make up the
third tier of benefits in the U.S.; they provide social insurance to workers who have paid social
security taxes over their working life.22 To be eligible for benefits, workers must have accumulated
sufficient quarters of coverage, as defined in the Social Security Administration’s pension rules.
These requirements are sufficiently strict to limit OAI and DI benefits to those with substantial
attachments to the labor market. (For a summary of the benefit requirements and rules, see Social
Security Administration 2013b.) Benefit levels from these programs are based on past earnings
20SSI is similar in design to the Dutch categorical disability-based welfare program (Wajong) but
its income guarantee level is substantially lower than either.
21The SSI aged and disabled adults programs share the same categorical eligibility criteria applied
for the earnings based retirement or Old-Age Insurance (OAI) and Disability Insurance (DI)
programs. Individuals with sufficiently low earnings records may jointly qualify for OAI and SSI
aged benefits and for DI and SSI disabled adult benefits. This said, these programs are generally
treated separately by policymakers.
22 Autor et al. (2014) provide a detailed analysis and discussion of the private disability insurance
market in the U.S., which is significantly smaller than the private market in Germany.
27
and can be substantially higher than the social minimum level of benefits guaranteed by the SSI
aged and disability programs.
Eligibility for DI benefits requires applicants to meet a federal disability standard applied
by administrative evaluators and adjudicators located in each state. The criteria are in principle
quite strict. Eligibility requires that a worker be “unable to perform any substantial gainful activity
on any job in the economy for at least one year”. There is no benefit for partial disability. Disability
benefits are intended to be a last-resort for those with permanent and total impairments. See Table
2 for more details on the U.S. DI program.
Although the written eligibility criteria have not changed over time, their implementation
has and in a direction that has increased the number of working-aged adults receiving disability
benefits. Indeed, many of the disability recipiency rate fluctuations shown in Figure 1 and Table 1
line up with changes in Social Security Administration (SSA) policy that made it easier or harder
to gain entry to the DI rolls. For example, rapid disability recipiency rate growth in the 1970s
aligns with Congressional actions that increased the replacement rate for a disabled worker with
median earnings from 35 to 49 percent (Figure 3, Panel D). In the late 1970s and early 1980s
disability recipiency rates fell, first because program gatekeepers were urged to more strictly
interpret existing rules, and then because Congress in 1980 required SSA to reevaluate all current
recipients to see if they still met the medical standards. This rule change, which was rigorously
enforced by SSA at the start of the new Reagan administration, resulted in a drop in the DI rolls
despite a major recession—the substantial drop in normalized adjusted disability recipiency rates
in the U.S. between 1978 and 1983 are in stark contrast to the sizable growth in these values before
1978 and after 1990 (Figure 3, Panel D).
28
By 1983 the widespread reevaluation of those already on DI was halted as the courts and
then Congress restricted the SSA’s power to reevaluate beneficiaries. Furthermore, in 1984,
responding to a backlash against restrictive cuts imposed in the Social Security Disability
Amendments of 1980, policymakers expanded the ways in which a person could medically qualify
for the DI program. The 1984 legislation moved away from a strict medical listing determination
of eligibility to one that also considered an applicant’s overall medical condition and ability to
work. In addition, the legislation allowed for symptoms of mental illness and pain to be counted
when assessing DI eligibility, regardless of whether the person had a verifiable medical diagnosis
(Figure 3, Panel D).23
The expansion of eligibility to more difficult to measure impairments that do not precisely
meet the medical listings means that SSA has increasingly been tasked with making more
subjective decisions about the impact that presenting impairments might have on an applicant’s
work ability. For applicants who do not meet or exceed the medical listings, program
administrators consider a set of vocational criteria. While these vocational criteria have been in
place over the history of the DI program, their use by program gatekeepers to determine benefit
eligibility has risen dramatically since 1991. Currently, they are used to justify the majority of new
awards, especially among those with the more difficult to determine conditions of mental illness
and musculoskeletal conditions—the primary condition of more than 50 percent of all newly
enrolled beneficiaries (Burkhauser and Daly, 2011).
One consequence of expanding eligibility beyond identifiable medical listings is that DI
applicants and gatekeepers have much more of a role in determining program growth. For example,
over time the cyclical sensitivity of DI application rates has risen considerably. Applications rise
23See Berkowitz and Burkhauser, 1996 for more discussion of these changes and their effects.
29
during recessions and fall during periods of economic growth (see Rupp and Stapleton, 1995;
Stapleton, D., Coleman, K., Dietrich, K., and Livermore, G. 1998; Black, Daniel, and Sanders,
2002; Autor and Duggan, 2003; Liebman, 2015). But as can be seen in Figure 3, Panel D, increased
applications generally result in an increase in disability recipiency rates which do not subside as
economic conditions improve, since once on, very few beneficiaries ever leave the program.
In addition to the cyclical sensitivity of disability applications and awards, there is evidence
that there has been a secular rise in the number of workers who apply over time related to the
unintentional increase in the replacement rates of DI for low wage workers (Autor and Duggan,
2003). Bound and Burkhauser (1999) provide an early review of the literature on the labor supply
effects of disability insurance. Since then researchers have consistently found a negative effect of
DI program work constraints on employment—see especially Chen and van der Klaauw, 2008 and
von Wachter, Song, and Manchester, 2011. Again, since few beneficiaries ever leave the rolls to
return to work, the surge in disability recipient rates associated with business cycle fluctuations or
economic restructuring has generally translated into a long-term increase in disability recipiency
rate in the working age population.
Finally, there is evidence that the strictness of DI gatekeepers also varies. Maestas, Mullen,
and Strand (2013) using SSA administrative records estimate that 23 percent of applicants are
initially accepted or denied based on whether they were assigned an easier or a stricter DDS
gatekeeper rather than on differences in the status of their health or impairment status.
3.5 Why Has the German Experience Been so Different?
As seen in Figure 1 and discussed above, recipiency rates in Germany’s WDP program fell
between 1984 and reunification in 1989 and have almost continuously done so since then. This

30
pattern stands in contrast to the Netherlands, Sweden and the U.S. where recipiency rates have
increased considerable since the 1970s. While the rates in the Netherlands and Sweden have come
down from recent peaks of 7.4 percent in 2003 (Netherlands) and 9.6 percent in 2005 (Sweden)
they have reached a new record high of 4.2 percent in the U.S. in 2011. As a result Germany now
has the lowest recipiency rates of government provided disability insurance benefits among these
four nations.
What accounts for the decline in Germany both in its rates over time and relative to other
countries? Our read of the data is that the relatively restrictive coverage and eligibility conditions
that Germany has imposed over time have shifted the costs of disability insurance coverage,
especially since to 2001, to individuals and their employers. This shift is evident in the fact that
over 60 percent of male and 40 percent of female employees contract for private disability
insurance to augment their public insurance coverage. In addition, WDP benefits, when available,
have declined in value over time. This reduction in the social safety net for workers with
disabilities has been cited as contributing to the high poverty rates among public disability
beneficiary households fall below the poverty line (Krause et al. 2013).
Another more positive reason for the decline is Germany has increasingly moved towards
a model of “Rehabilitation before Pension” emphasizing the overall focus on maintaining work
ability. As a result, Germany has one of the largest medical rehabilitation markets. In 2011, 1.9
million rehabilitation therapies were prescribed and a total of €8.9 billion are annually spent (cf.
Ziebarth, 2010b, 2014). This commitment to rehabilitation while workers are receiving temporary
earning replacement as part of their sickness benefits may have played a role in curbing growth in
the WDP program.
31
Finally, the German social insurance scheme is part of a larger context of protections and
expectations for worker with disabilities. Germany has a coexisting Disability Classification
System (DCS) which is codified in Social Code Book IX (SGB IX) and entitled “Rehabilitation
and Participation of Handicapped Workers.”24 This DCS system identifies citizens with health
impairments and assigns them a handicap rating by medically-based impairment categories. Only
permanent health impairments lead to a classification. For example, a mild form of Parkinson
disease without imbalance issues but “mild motion disorders” yields a disability degree of 30-40
percent whereas more severe forms of Parkinson lead to degrees of 50 percent and above (BMAS,
2009). A person with a rating of 50 percent and above is officially classified as “severely
handicapped.”25 The SGB IX then provides disadvantage compensations (Nachteilsausgleich) for
severely handicapped people such as: special income tax deductions, the ability to retire two years
earlier without deductions, or parking lots for wheelchair users. Effectively, all WDP beneficiaries
are eligible for these benefits without any loss of WDP benefits before retirement since WDP is
not means tested.26
In fact, almost 1 million people who are officially classified as severely handicapped work
full time in Germany (BA 2014). This outcome may be related, at least partly, to the quota system
that mandates employers with more than 19 full-time employees to ensure that at least 5 percent
24 Before 2001, this was the Schwerbehindertengesetz.
25 People with handicap ratings from 30 to 50percent who have difficulty finding a job can apply
for the workplace quota system described below.
26 Aarts et al. (1998) and Börsch-Supan and Jürges (2012) discuss pathways from early retirement
to full retirement in the German system. Börsch-Supan and Jürges (2012) focus exclusively on
Germany and provide a detailed discussion of its pathways to retirement. Unlike the WDP,
Nachteilsausgleich offers those defined as severely handicapped a pathway to retirement two years
earlier than non-handicapped people without actuarial penalty. In the context of our three tier
system we view this option as a tier 1 benefit equal to the deductions that are typically applied in
case of early retirement, i.e. 7.2 percent of the last wage.
32
of their employees are classified as severely handicapped. Employers not complying with the quota
must pay a monthly penalty (Ausgleichsabgabe) of €290 per unoccupied workplace. This
effectively means that a small business with 20 full-time employees has to hire one severely
handicapped worker or pay an annual penalty of $4,500. Lalive et al. 2013, using data from
Austria, which has a similar quota system, show that it significantly increases the employment of
handicapped people.27
4. What Can We Take From These Experiences?
An important issue that policymakers face in all countries facing the challenges of
providing protection for workers with disabilities is that, disability programs, even if not generous,
are essential income for many individuals. In countries where other components of the social safety
net are weaker or less generous, disability benefit programs are even more difficult to challenge.
The U.S. experience highlights this point.
However, the policy outcomes of Germany, the Netherlands and Sweden we have
discussed show that this is a very static view which assumes that in the absence of benefits,
individuals with disabilities would remain out of the labor market, dependent on other forms of
public or private assistance for support. Disability reforms in these countries over the last decade
provide suggestive empirical support that increased employment will occur when pro-work
policies replace policies that have had the opposite effect. Their reform experience shows that a
significant number of people with disabilities, who would otherwise have moved onto long-term
cash benefits, were able, with reasonable levels of support, to return to work (OECD 2010). While
it is always the case that tightening the criteria for disability benefits runs the risk of denying
27Unlike for other countries, there is a notable absence of research on the German disability system and in particular
the behavioral effects of policy choices.

33
disability benefits to those who will not be able to find work, on balance the EU experience
suggests that reasonable pro-work policies will both substantially reduce disability recipiency rates
and increase the employment of those who would otherwise have been on the long-term disability
rolls.
Another concern is that programs like disability insurance are especially important in
economic downturns where individuals with limited work capacity are not only more likely to be
laid off but less likely to find a new job. Past experience of EU countries, especially Germany and
The Netherlands, which intentionally or unintentionally used this logic to turn their long-term
disability programs into more general unemployment programs, suggests that it can be a very
expensive and ultimately ineffective policy decision. Indeed, many EU nations continue to struggle
to regain control over their disability systems which for many decades have been used as long-
term unemployment insurance programs. A key message from the EU experience is that explicitly
divorcing long-term “unemployability” insurance from disability insurance is critical to effectively
targeting resources towards both populations.
Together the experiences of other nations suggest that it is possible to balance the
competing goals of providing social insurance against adverse health shocks during working-age
and maximizing the work effort of all working-age adults with and without disabilities. Past
disability policies in both the United States and EU countries have focused more on the former
than the latter, resulting in rapid growth in disability transfer populations that outpaced growth in
the economy. Efforts to shift to more pro-work policies over the last decade in Europe suggest that
fundamental disability reforms, if done well, can lower projected long-term costs for taxpayers,
make the job of disability administrators less difficult, and importantly, improve the short- and
long-run opportunities of people with disabilities.
34
References
Andren, D. 2003. Sickness-Related Absenteeism and Economic Incentives in Sweden: A History
of Reforms.
https://www.cesifogroup.de/pls/guestci/download/CESifo%20DICE%20Report%202003/
CESifo%20DICE%20Report%203/2003/dicereport3-03-reform-models-3.pdf,
last accessed January 10, 2015.
Andren, D. 2014. Does Part-Time Sick Leave Help Individuals with Mental Disorders Recover
Lost Work Capacity? Journal of occupational rehabilitation, 24 (2), 344-360.
Aarts, L. J. M., Burkhauser, R. V. and de Jong P. R. 1998. Convergence: A Comparison of
European and United States Disability Policy.” Terry Thomason, John Burton, and
Douglas Hyatt (eds.), New Approaches to Disability in the Work Place. IRRA Research
Volume, pp. 299-338.
Association of German Insurers (DGV) (2015): Statistical Yearbooks of German Insurance,
http://www.en.gdv.de/2014/11/property-casualty-insurance-with-record-claims-
expenditure/, last accessed on May 13, 2015, and additional data and information upon
request.
Autor, D. H., Katz, L. F., and Kearney, M. S. 2008. Trends in US Wage Inequality: Revising the
Revisionists. The Review of Economics and Statistics, 90(2), 300-323.
Autor, D. H. and Duggan, M. G. 2003. The Rise in Disability Recipiency and the Decline in
Unemployment. The Quarterly Journal of Economics, 118(1): 157–205.
Autor, D. H., and Duggan, M. G. 2006. The Growth in the Social Security Disability Rolls: A
Fiscal Crisis Unfolding. Journal of Economic Perspectives, 20, 71–96.
Autor, D. H. and Duggan, M. G. 2010. Supporting Work: A Proposal for Modernizing the U.S.
Disability Insurance System, The Hamilton Project and Center for American Progress:
Washington, D.C.
Autor, D. H., Duggan, M. and Gruber, J. 2014. Moral Hazard and Claims Deterrence in Private
Disability Insurance, American Economic Journal: Applied Economics, 6(4): 110-141.
Berkowitz, E. D., and Burkhauser, R. V. 1996. A United States Perspective on Disability
Programs. In Aarts, L. J. M., Burkhauser, R. V. and de Jong, P. R. (Eds.), Curing the
Dutch Disease: An International Perspective on Disability Policy Reform, (pp. 71–92).
Aldershot, Great Britain: Avebury, Ashgate Publishing Ltd.
Black, D, Daniel, K, and Sanders, S. 2002. The Impact of Economic Conditions on Participation
in Disability Programs: Evidence from the coal boom and bust. American Economic
Review, 92, 27–50.

35
Borghans, L., Gielen, A.C. and Luttmer, E.F.P. 2014. Social Support Substitution and the
Earnings Rebound: Evidence from a Regression Discontinuity in Disability Insurance
Reform. American Economic Journal: Economic Policy, 6(4): 34-70.
Börsch-Supan, A. and Roth, H. 2011. Work Disability and Health over the Life Course, in
Börsch-Supan, Axel, Brandt, Martina, Hank, Karsten, and Schröder, Mathis: The
Individual and the Welfare State, Springer Berlin Heidelberg, pp. 215-224.
Börsch-Supan, A. and Jürges, H. 2012. Disability, Pension Reform, and Early Retirement in
Germany," NBER Chapters, in: Wise, D. A. Social Security Programs and Retirement
around the World: Historical Trends in Mortality and Health, Employment, and
Disability Insurance Participation, pp. 277-300.
Bundesagentur für Arbeit (BA) 2014. Arbeitsmarket in Zahlen: Beschäftigungsstatistik,
Schwerbehinderte Menschen in Beschäftigung (Anzeigeverfahren SGB IX) Deutschland
2012, https://statistik.arbeitsagentur.de/ last accessed on January 11, 2015.
Bundesministerium für Arbeit und Soziales (BMAS) 2014. Rentenversicherungsbericht 2014,
www.bmas.de, last accessed on January 11, 2015.
Bundesministerium für Arbeit und Soziales (BMAS) 2009. Versorgungsmedizin-Verordnung,
http://www.bmas.de/DE/Service/Publikationen/k710-anhaltspunkte-fuer-die-aerztliche-
gutachtertaetigkeit.html, last accessed on January 11, 2015.
Burkhauser, R. V. 1991. Lessons from the West German Approach to Disability Policy. Carolyn
L. Weaver (ed.), Disability and Work: Incentives, Rights and Opportunities. Washington,
DC: American Enterprise Institute Press, (1991), pp. 83-87.
Burkhauser, R. V. and Petri H. 1989. United States Disability Policy in a Time of Economic
Crisis: A Comparison with Sweden and the Federal Republic of Germany, The Milbank
Quarterly, 67(2): 166-194.
Burkhauser, R. V. and Schroeder, M. 2007. A Method for Comparing the Economic Outcomes
of the Working-Age Population with Disabilities in Germany and the United States.”
Schmollers Jahrbuch: Journal of Applied Social Science Studies, 127 (2): 227-258.
Burkhauser, R. V. and Daly, M. C. 1994 The Economic Consequences of Disability: A
Comparison of German and American People with Disabilities, Journal of Disability
Policy Studies, 5(1) (1994): 25-52
Burkhauser, R. V. and Daly, M. C. 2011. The Declining Work and Welfare of People with
Disabilities: What Went Wrong and a Strategy for Change, AEI Press, Washington, D.C.
Burkhauser, R. V. and Daly, M. C. 2012. ‘Social Security Disability Insurance: Time for
Fundamental Change’, Journal of Policy Analysis and Management, 31(2): 454–461.
36
Burkhauser, R. V., Daly, M. C., McVicar, D., and Wilkens, R. 2014. ‘Disability benefit growth
and disability reform in the US: lessons from other OECD nations’, IZA Journal of Labor
Policy, 3: 4.
Chen, S. and van der Klaauw, W. 2008. The Work Disincentive Effects of trhe Disability
Insurance Program in the 1990s. Journal of Econometrics, 142(2): 757-784.
Daly, M., Lucking, B. and Schwabish, J. 2013, Explaining the Rapid Growth in Social Security
Disability Insurance rolls, Federal Reserve Bank of San Francisco, San Francisco,
California.
Deutsche Rentenversicherung (DRV) 2012. Rentenversicherung in Zeitreihen 2011, Kapitel 15,
Chronik, http://forschung.deutsche-rentenversicherung.de/., last accessed on January 11,
2015.
Deutsche Rentenversicherung (DRV) 2014a. Rentenversicherung in Zahlen 2014,
http://www.deutsche-
rentenversicherung.de/cae/servlet/contentblob/238692/publicationFile/61815/01_rv_in_z
ahlen_2013.pdf, last accessed on January 11, 2015.
Deutsche Rentenversicherung (DRV) 2014b. Erwerbsminderungsrente: Das Netz für alle Fälle,
9th edition, http://www.deutsche-
rentenversicherung.de/Allgemein/de/Inhalt/5_Services/03_broschueren_und_mehr/01_br
oschueren/01_national/erwerbsminderungsrente_das_netz_fuer_alle_faelle.html, , last
accessed on January 11, 2015.
Deutsche Rentenversicherung (DRV) 2014c. Statistik der Deutschen Rentenversicherung,
Rentenbestand am 31.12.2013, Band 197 http://www.deutsche-rentenversicherung.de/
last accessed on January 11, 2015.
Duggan, M. and Imberman, S. 2009. Why Are the Disability Rolls Skyrocketing? The
Contribution of Population Characteristics, Economic Conditions, and Program
Generosity, in David Cutler and David Wise, Health at Older Ages: The Causes and
Consequences of Declining Disability among the Elderly. Chicago, IL: University of
Chicago Press.
Eichhorst, W. and Grienberger-Zingerle, M. and Konle-Seidl, R. 2008. Activation Policies in
Germany: From Status Protection to Basic Income Support, in: Eichhorst, Werner and
Kaufmann, Otto and Konle-Seidl, Regina: Bringing the Jobless into Work? p. 17-67.
Franke and Bornberg, 2014. Berufsunfähigkeitsversicherung verliert an Bedeutung,
http://www.franke-bornberg.de/uploads/media/Berufsunfaehigkeits-
Versicherungs_verliert_an_Bedeutung.pdf, last accessed on January 12, 2015.

37
Goss, S.2013. “Testimony by Steve Goss, Chief Actuary, Social Security Administration before
the House Committee on Ways and Means, Subcommittee on Social Security,” March
14, 2013.
Hartman, L. 2011. “Swedish Policies for the Disabled: What Do We Know About the
Effects?”Mimeo, prepared for the “Labour Activation in a Time of High Unemployment”
November 13-15, 2011, hosted jointly by the University of Maryland and the OECD.
http://umdcipe.org/conferences/LaborActivationParis/Papers/Laura%20Heartmans%20dr
aft%20paper_11_1108.pdf, last accessed October 18, 2012.
Høgelund, J., Holm, A., and McIntosh, J., 2010. Does graded return-to-work improve sick-listed
workers' chance of returning to regular working hours? Journal of Health Economics,
29(1): 158-169.
Jönsson, L., Palme, M., and Svensson, I. 2011. Disability Insurance, Population Health and
Employment in Sweden (No. w17054). National Bureau of Economic Research.
Jürges, H. 2007. True health vs. response styles: exploring cross-country differences in self-
reported health. Health Economics, 16(2), 163-178.
Kemptner, D. 2014. Erwerbsminderung als Armutsrisiko, DIW Roundup: Politik im Fokus 8,
DIW Berlin, German Institute for Economic Research.
Koning, P. and Lindeboom, M. 2015. The Rise and Fall of Disability Insurance Enrollment in the
Netherlands. Journal of Economic Perspectives, 29(2): 151-172.
Konle-Seidl, R. 2012. Unemployment Assistance in Germany, International labor brief, 10(9):
13.
Krause, P., Ehrlich, U. and Möhring, K. (2013), Erwerbsminderungsrentner: sinkende
Leistungen und wachsende Einkommensunterschiede im Alter, DIW Wochenbericht,
80(24): 3-9.
Lalive, R., Wuellrich, J.-P. and Zweimüller, J. 2013. Do Financial Incentives Affect Firms’
Demand For Disabled Workers?" Journal of the European Economic Association, 11(1):
25-58.
Larsson, L. 2002. Sick of Being Unemployed? Interactions Between Unemployment and
Sickness Insurance in Sweden, Working paper 2002:6, Institute for Labour Market Policy
Evaluation (IFAU), Uppsala.
Liebman, J. B. 2015. Understanding the Increase in Disability Insurance Benefits Receipt in the
United States. Journal of Economic Perspectives, 29(2): 123-150.
Lewin-VHI. (1995). Labor market conditions, socioeconomic factors and the growth of
applications and awards for SSDI and SSI disability benefits. Final Report. Washington DC:

38
The Office of the Assistant Secretary for Planning and Evaluation, U.S. Department of
Health and Human Services and the Social Security Administration.
Maestas, N., Mullen, K. J. and Strand, A. 2013. Does Disability Insurance Receipt Discourage
Work? Using Examiner Assignment to Estimate Causal Effects of SSDI Receipt,
American Economics Review 103(5): 1797-1829.
Marin, B., Prinz, C., & Queisser, M. (2004). Transforming disability welfare policies. Ashgate.
Markussen, S., Mykletun, A. and Røed, K. 2012. The Case for Presenteeism — Evidence from
Norway's Sickness Insurance Program, Journal of Public Economics, 96(11): 959-972.
McGee, D. L., Liao, Y., Cao, G., Cooper, R. S. 1999. Self-Reported Health Status and Mortality
in a Multiethnic US Cohort. American Journal of Epidemiology. 149, 41–46.
National Audit Office 2010. ‘Support to incapacity benefits claimants through Pathways to
Work.’ London: National Audit Office.
Organization for Economic Co-operation and Development (OECD) 2003. Transforming
Disability into Ability, OECD, Paris, http://www.keepeek.com/Digital-Asset-
Management/oecd/social-issues-migration-health/transforming-disability-into-
ability_9789264158245-en#page1
Organization for Economic Co-operation and Development (OECD) 2009. Sickness, Disability
and Work: Keeping on Track in the Economic Downturn—Background Paper, OECD,
Paris, viewed May 2013, www.oecd.org/dataoecd/42/15/42699911.pdf
Organization for Economic Co-operation and Development (OECD) 2010. Sickness, Disability
and Work: Breaking the Barriers: A Synthesis of Findings across OECD Countries,
OECD Publishing. DOI: 10.1787/9789264088856-en
Pattison, D., & Waldron, H. 2013. Growth in New Disabled-Worker Entitlements, 1970–2008.
Social Security Bulletin, 73(4), 25.
Prinz, C. and William T. 2009. Sickness and Disability Benefit Programmes: What is Driving
Policy Convergence. International Social Security Review, Special Issue: Policy learning
and social protection, 62: 41–61.
Rebick, M. 1994. Social Security and Older Workers' Labor Market Responsiveness: The United
States, Japan and Sweden, in: R. Blank, ed., Social Protection versus Economic
Flexibility: Is There a Trade-Off? (University of Chicago Press, Chicago).
Reno, V. P. and Ekman, L. D. 2012. Disability Insurance is Part of the Solution, Not a Cause of
Work Disability: Response to Burkhauser and Daly Journal of Policy Analysis and
Management, 31: 471–474.

39
Riphahn, R. T. 1997. Disability Retirement and Unemployment - Substitute Pathways for Labour
Force Exit? An empirical test for the case of Germany, Applied Economics, 29(5), 551-
561.
Riphahn, R. T. 1999. Disability Retirement among German Men in the 1980s, Industrial and
Labor Relations Review, 52(4): 628-647.
Robert Koch Institut (RKI) 2006. Gesundheitsbedingte Frühberentung, Gesundheitsbericht-
erstattung des Bundes, Heft 30, Statistisches Bundesamt.
http://www.rki.de/DE/Content/Gesundheitsmonitoring/Gesundheitsberichterstattung/The
menhefte/fruehberentung_inhalt.html, last accessed on January 11, 2015.
Rupp, K., and Stapleton, D. 1995. Determinants of the Growth in the Social Security
Administration’s Disability Programs: An overview. Social Security Bulletin. 58: 43-
70.
Social Security Administration 2013a. How You Earn Credits, Washington, D.C., viewed May
2013, <http://www.ssa.gov/pubs/EN-05-10072.pdf>.
Social Security Administration 2013b, The 2013 Annual Report of the Board of Trustees of the
Federal Old-Age and Survivors Insurance and Federal Disability Insurance Trust Funds,
Washington, D.C., viewed May 2013, <http://www.ssa.gov/oact/tr/2013/tr2013.pdf>.
Statistika, 2014. Anteil der Berufstaetigen in Deutschland, die eine Berufsunfaehigkeits-
versicherung abgeschlossen haben.
http://de.statista.com/statistik/daten/studie/237869/umfrage/umfrage-zum-abschluss-
einer-berufsunfaehigkeitsversicherung-nach-geschlecht/, last accessed on January 15,
2015.
Stapleton, D., Coleman, K., Dietrich, K., & Livermore, G. (1998). Empirical analyses of DI and
SSI application and award growth. In K. Rupp & D. Stapleton, Eds. Growth in disability
benefits (pp. 31 – 92). Kalamazoo, Michigan: W.E. Upjohn Institute for Employment
Research.
Van Soest, A., Tatiana A., Kapteyn, A. and Smith, J. P. 2011. Self-Reported Disability and
Reference Groups,NBER Chapters, in: Investigations in the Economics of Aging, pages
237-264. National Bureau of Economic Research, Inc.
Van Sonsbeek, J. M. and Gradus, R. 2011. Estimating the Effects of Recent Disability Reforms
in The Netherlands, Tinbergen Institute Discussion Papers 11-121/3, Tinbergen Institute.
von Wachter, T., Song, J. and Manchester, J. 2011. Trends in Employment and Earnings of
Allowed and Rejected Applicants to the Social Security Disability Insurance Program.
American Economic Review. 101(7): 3308-3329.

40
World Health Organization (WHO) 2001, International Classification of Disability, Health and
Functioning, Geneva, Switzerland.
Ziebarth, N. R. 2009.Langzeitkranke verlieren durch Kürzung des Krankengeldes fünf
Milliarden Euro, DIW Wochenbericht, German Institute for Economic Research, 76(20):
326-332.
Ziebarth, N.R., 2010a. Measurement of Health, Health Inequality, and Reporting Heterogeneity.
Social Science & Medicine. 71(1), 116–124.
Ziebarth, N. R. 2010b. Estimating Price Elasticities of Convalescent Care Programmes,” The
Economic Journal, 120(545): 816-844.
Ziebarth, N. R. and Karlsson, M. 2010. A Natural Experiment on Sick Pay Cuts, Sickness Absence,
and Labor Costs, Journal of Public Economics, 94(11-12): 1108-1122.
Ziebarth, N. R. 2013. Long-Term Absenteeism and Moral Hazard – Evidence from a Natural
Experiment,Labour Economics, 42: 277-292.
Ziebarth, N. R. 2014. Assessing the Effectiveness of Health Care Cost Containment Measures:
Evidence from the Market for Rehabilitation Care, International Journal of Health Care
Finance & Economics, 14(1): 41-67.
Ziebarth, N. R. and Karlsson, M. 2014. The Effects of Expanding the Generosity of the Statutory
Sickness Absence Insurance, Journal of Applied Econometrics, 29(2): 208-230.
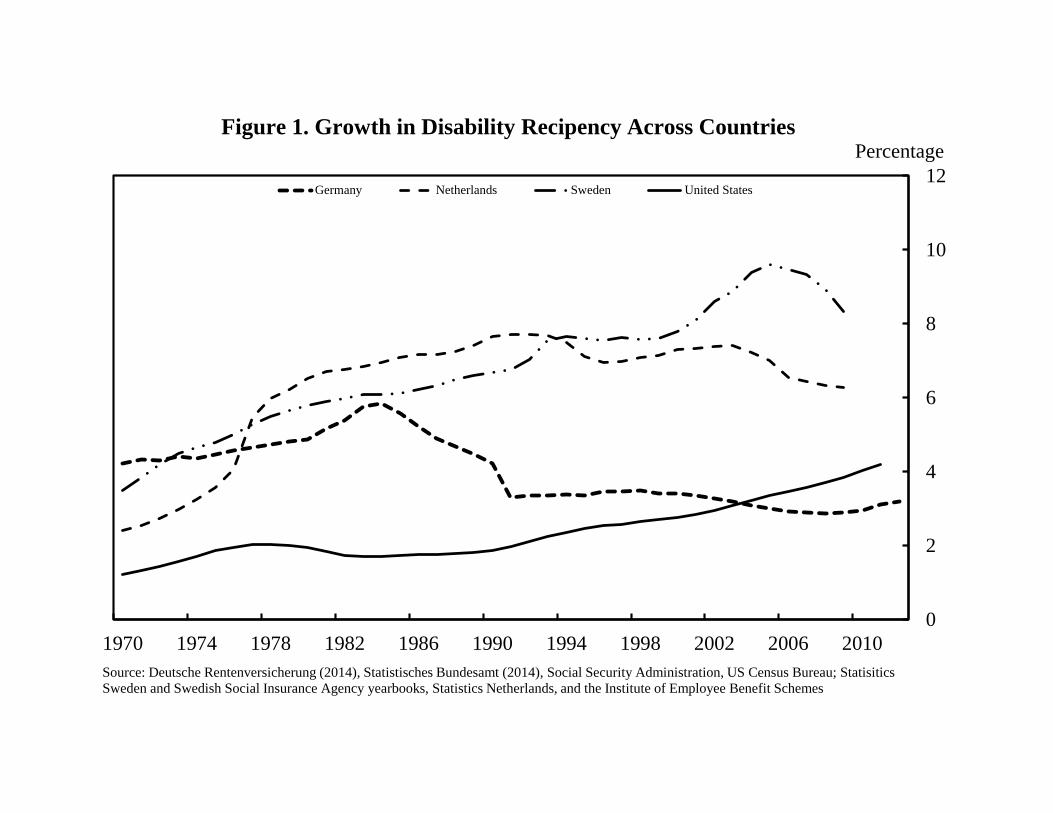
0
2
4
6
8
10
12
1970 1974 1978 1982 1986 1990 1994 1998 2002 2006 2010
Germany Netherlands Sweden United States
Source: Deutsche Rentenversicherung (2014), Statistisches Bundesamt (2014), Social Security Administration, US Census Bureau; Statisitics
Sweden and Swedish Social Insurance Agency yearbooks, Statistics Netherlands, and the Institute of Employee Benefit Schemes
Figure 1. Growth in Disability Recipency Across CountriesPercentage

42
50
55
60
65
70
75
80
85
90
95
100
1980 1983 1986 1989 1992 1995 1998 2001 2004 2007 2010
Germany Great Britian Netherlands Sweden United States
Source: Organization for Economic Co-operation and Development, OECD Health Data, http://stats.oecd.org
Figure 2. Trends in Self-Reported Health Across Countries, Age 45-64percent population reporting good or very
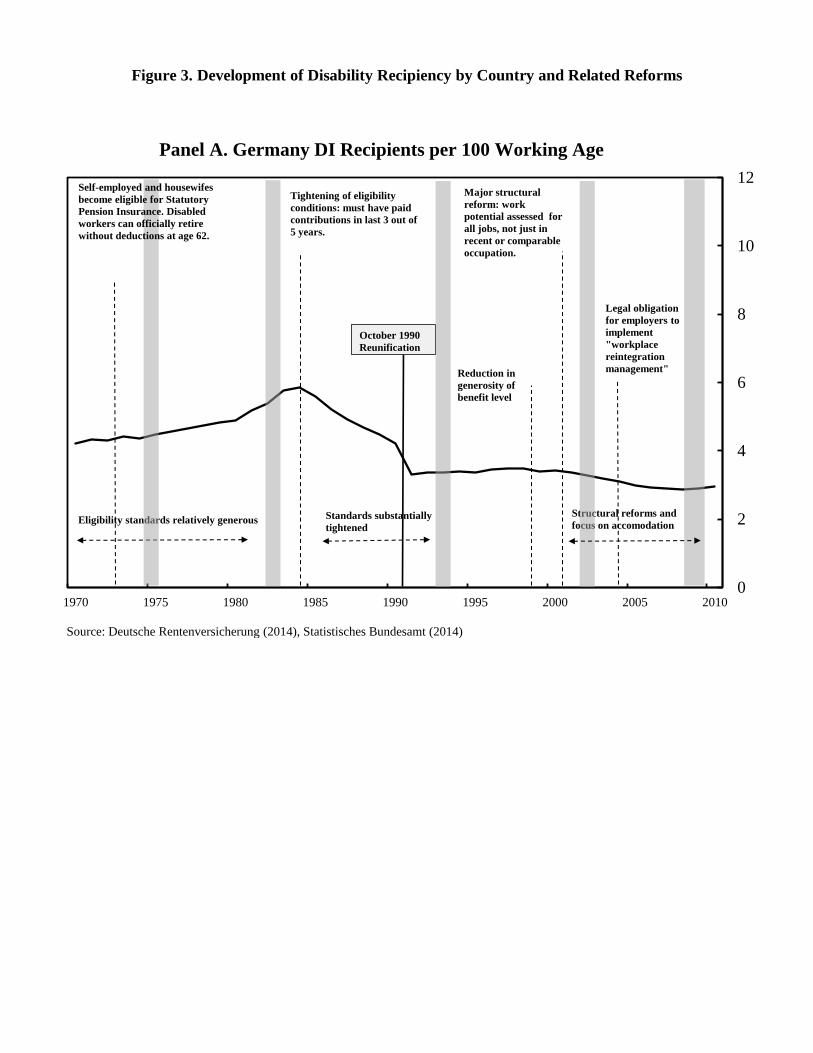
Figure 3. Development of Disability Recipiency by Country and Related Reforms
0
2
4
6
8
10
12
1970 1975 1980 1985 1990 1995 2000 2005 2010
Source: Deutsche Rentenversicherung (2014), Statistisches Bundesamt (2014)
Panel A. Germany DI Recipients per 100 Working Age
Eligibility standards relatively generous
Tightening of eligibility
conditions: must have paid
contributions in last 3 out of
5 years.
Reduction in
generosity of
benefit level
Legal obligation
for employers to
implement
"workplace
reintegration
management"
Major structural
reform: work
potential assessed for
all jobs, not just in
recent or comparable
occupation.
Standards substantially
tightened
Structural reforms and
focus on accomodation
October 1990
Reunification
Self-employed and housewifes
become eligible for Statutory
Pension Insurance. Disabled
workers can officially retire
without deductions at age 62.
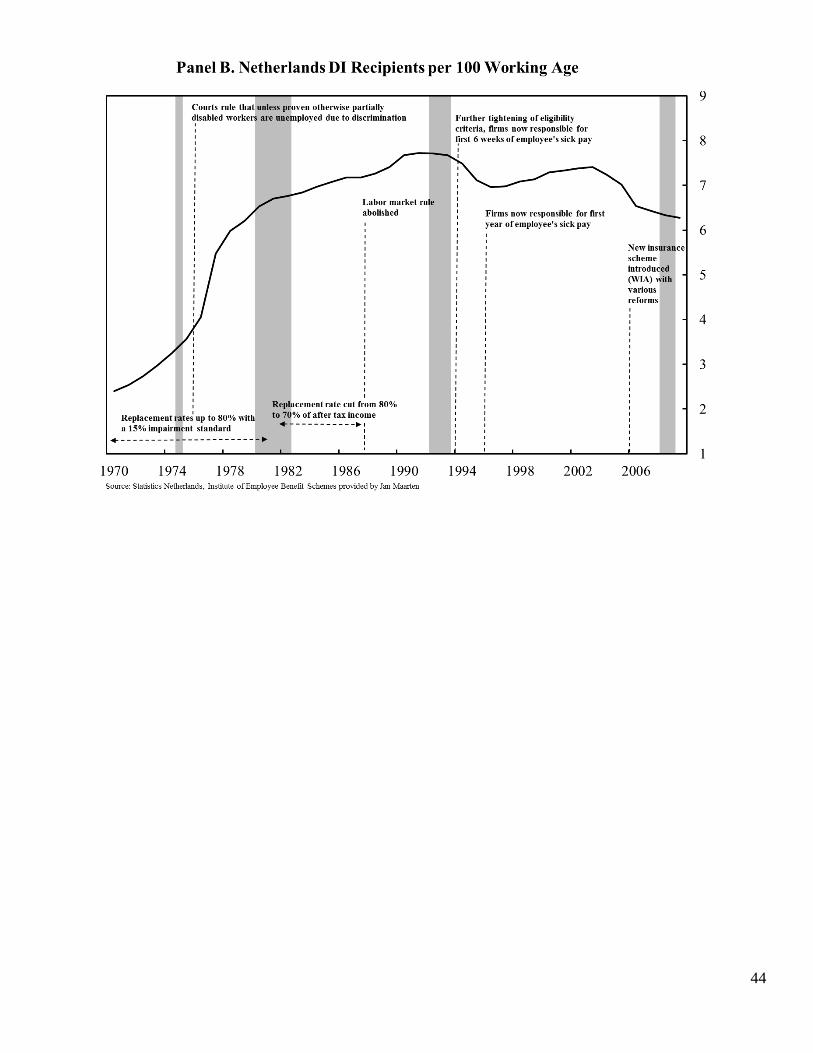
44
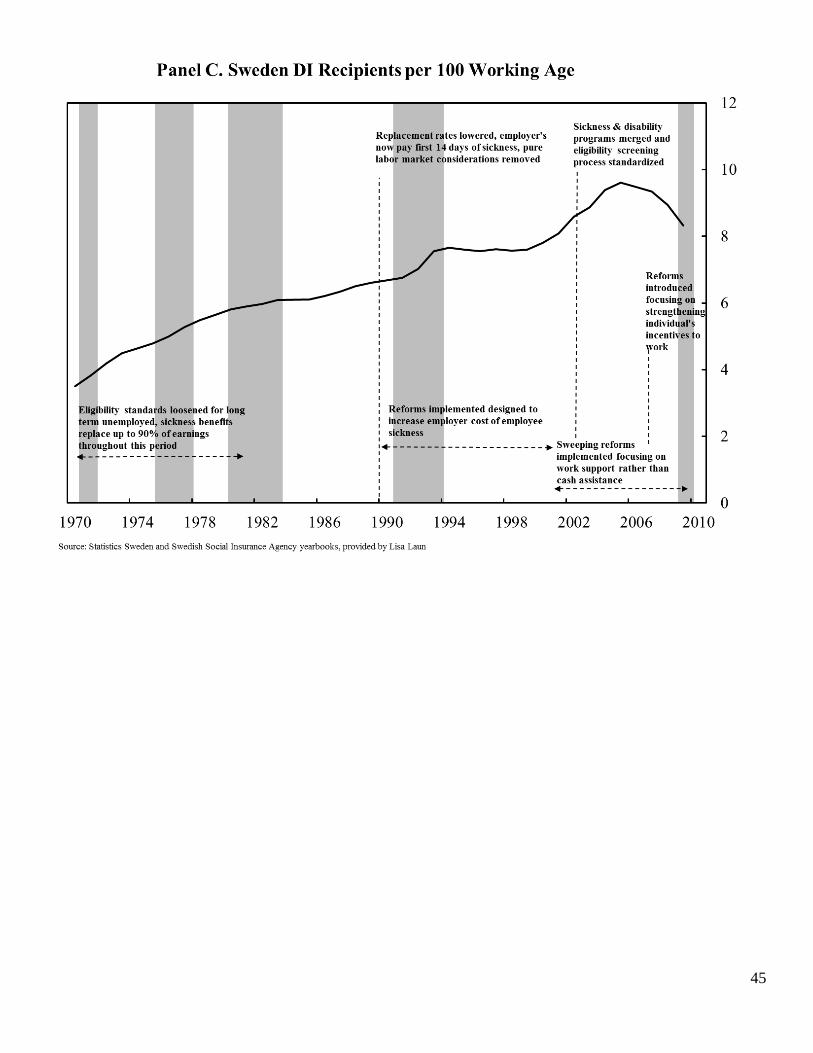
45
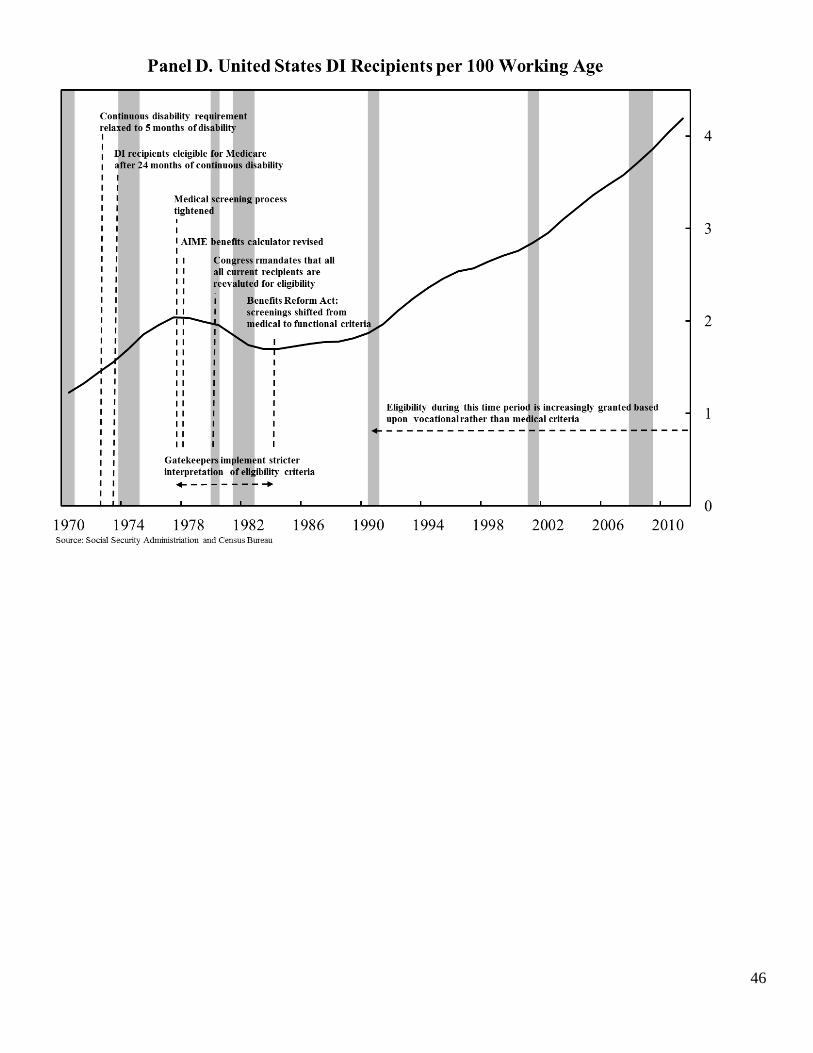
46
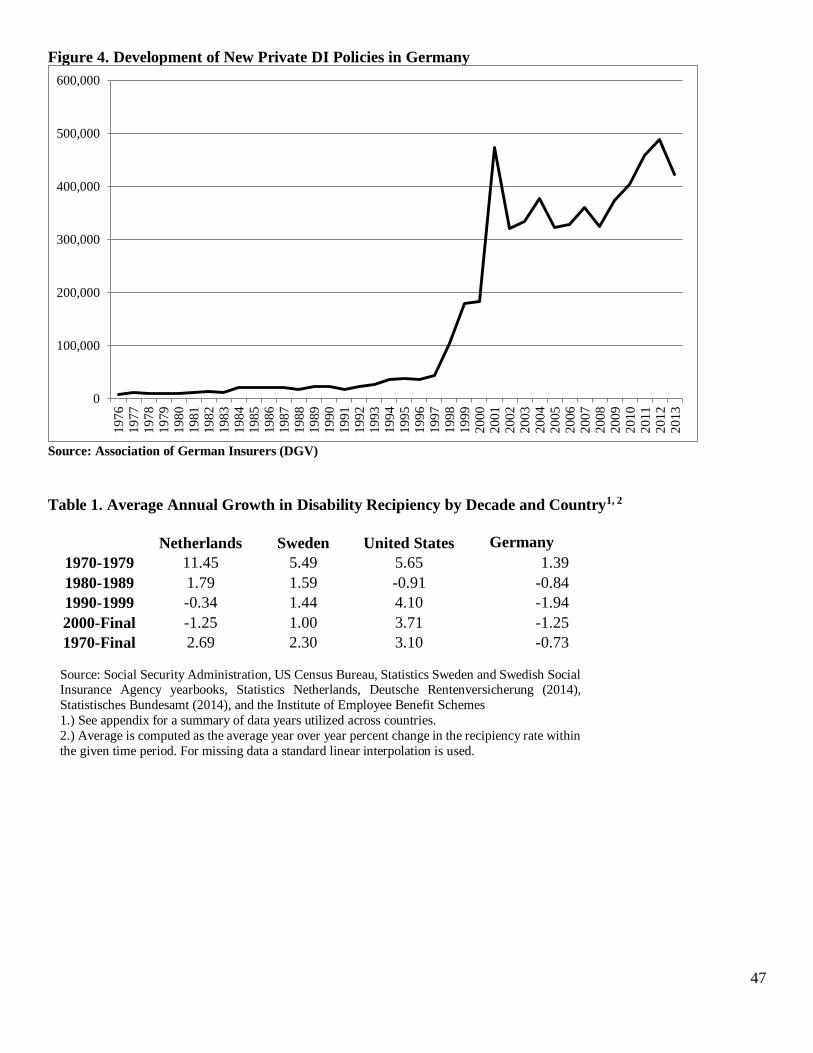
47
Figure 4. Development of New Private DI Policies in Germany
Source: Association of German Insurers (DGV)
Table 1. Average Annual Growth in Disability Recipiency by Decade and Country1, 2
Netherlands Sweden United States Germany
1970-1979 11.45 5.49 5.65 1.39
1980-1989 1.79 1.59 -0.91 -0.84
1990-1999 -0.34 1.44 4.10 -1.94
2000-Final -1.25 1.00 3.71 -1.25
1970-Final 2.69 2.30 3.10 -0.73
Source: Social Security Administration, US Census Bureau, Statistics Sweden and Swedish Social Insurance Agency yearbooks, Statistics Netherlands, Deutsche Rentenversicherung (2014),
Statistisches Bundesamt (2014), and the Institute of Employee Benefit Schemes
1.) See appendix for a summary of data years utilized across countries.
2.) Average is computed as the average year over year percent change in the recipiency rate within
the given time period. For missing data a standard linear interpolation is used.
0
100,000
200,000
300,000
400,000
500,000
600,000
19
76
19
77
19
78
19
79
19
80
19
81
19
82
1983
19
84
19
85
19
86
19
87
1988
19
89
19
90
19
91
19
92
19
93
19
94
19
95
1996
19
97
19
98
19
99
20
00
2001
20
02
20
03
20
04
20
05
20
06
20
07
20
08
2009
20
10
20
11
20
12
20
13

Table 2. Disability Program Parameters Across Countries as of 2013 Netherlands Sweden Germany United States
Summary of
Benefits Program
Merged sickness program with a disability program which makes a strict distinction between fully and partially disabled. Those fully disabled receive
guaranteed income until age 65 while partially disabled workers receive benefits conditional on work history and incapacity level determined by doctor.
Merged sickness program with a disability system with disability benefits granted only to those deemed to have permanent reductions in work
capacity.
Merged sickness program with a disability program which makes a distinction between fully and partially disabled. Disability is determined by ability to work between 3 and 6
(partial), and less than 3 (full) hours per day. Coverage restricted to those who have paid social security taxes over their working lives with benefit levels tied to past earnings.
No mandatory sickness program. Only those fully and permanently disabled eligible for benefits. Coverage restricted to those who have paid social
security taxes over their working lives with benefit levels tied to past earnings.
Full or Partial
Benefits Program
Program differentiates between full (IVA) and partial disability (WGA) and awards benefits accordingly (see above).
Workers may receive sickness benefits in the event of a sickness (with approval of a doctor), however disability insurance is only granted to
those with a serious and permanent impairment that reduces work ability.
Program differentiates between full and partial disability and awards benefits accordingly (see above). Coexisting employer mandate for businesses >19 employees: employ at least
5percent severely disabled or pay penalty.
Disability program designed to be a last resort program for those with permanent and total disabilities.
Eligibility Criteria Applicants must meet with designated doctor (either a company doctor or agency) who evaluate incapacity. Several evaluations are carried out by integration supervisors on a rolling
timeline during the initial two year sickness period.
Sickness benefits are awarded for first 14 days with a doctors approval and reevaluated along a rolling timeline with worker "check-ins". Disability benefits are only awarded after the SIA
determines work capacity is permanently reduced.
Employer mandate guarantees 100percent sick pay for first 6 weeks. Ongoing sickness is insured by statutory long-term sick pay---80percent of gross wage---up to 78 weeks. Legal obligation for employer "workplace
reintegration management" during long-term sickness since 2004. DI applicants must present diagnoses documenting inability to work at least 6 hours/day. Basic social insurance principle: "Rehabilitation before Pension."
Full disability program requiring applicants to be unable to perform any substantial gainful activity for at least one year.
Benefits Conditional
on Contributions?
Yes. Benefits levels are conditional on past earnings, number of weeks worked before, and the percentage of earnings
the worker is deemed capable of earning currently with impairment.
There are two types of benefits awarded. A universally guaranteed pension provides assistance to all those
residing in Sweden. The earnings related pension is contingent upon weeks of work and past earnings.
Yes, 3 out of last 5 years of coverage necessary before onset of disability. Waiting period of 5 years
Yes, sufficient quarters of coverage necessary as defined described in Social Security Administration 2013b.
Other Income
Programs for the
Disabled
Means tested Social Assistance Program (SA) with benefit equal to minimum
wage
Assistance Allowance, Car Allowance and other programs are designed to
accommodate those who have severe, long-term disabilities meeting specific criteria
Specific income tax deductions, 2 years of earlier regular retirement, subsidized public
transportation and other public services designed to accommodate those who have long-term disabilities meeting specific criteria.
Workers Comp and SSI and private disability insurance
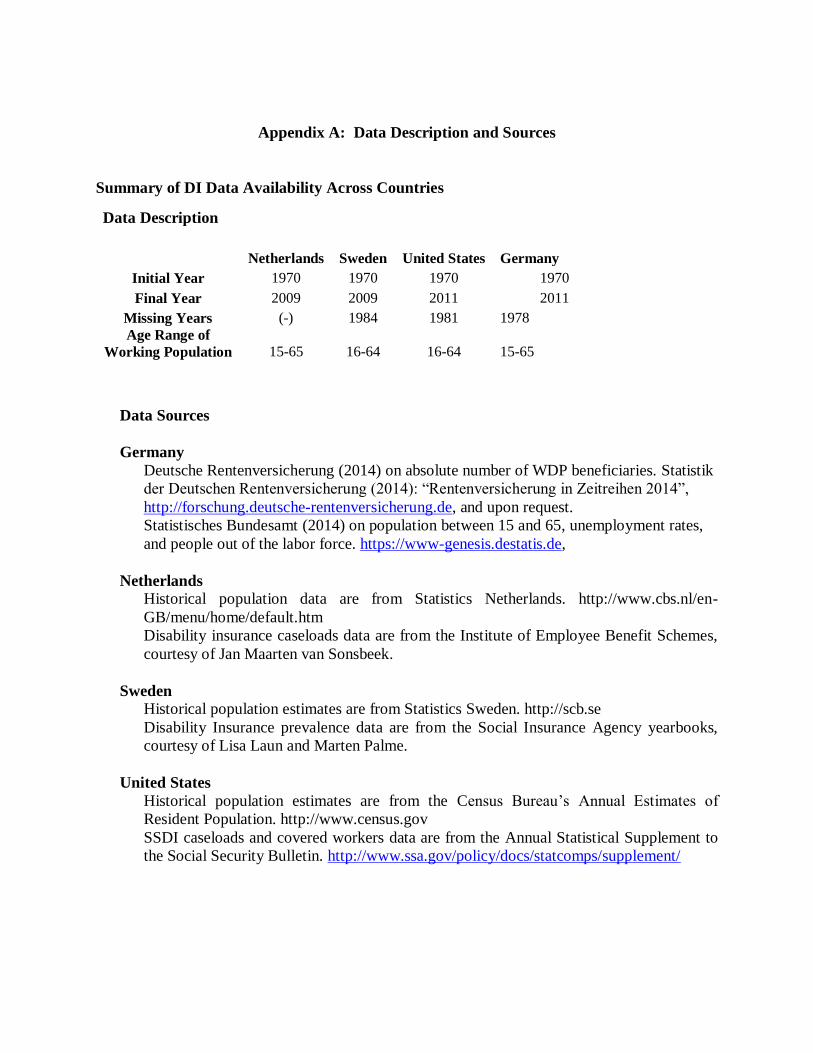
Appendix A: Data Description and Sources
Summary of DI Data Availability Across Countries
Data Description
Netherlands Sweden United States Germany
Initial Year 1970 1970 1970 1970
Final Year 2009 2009 2011 2011
Missing Years (-) 1984 1981 1978
Age Range of
Working Population 15-65 16-64 16-64 15-65
Data Sources
Germany
Deutsche Rentenversicherung (2014) on absolute number of WDP beneficiaries. Statistik
der Deutschen Rentenversicherung (2014): “Rentenversicherung in Zeitreihen 2014”,
http://forschung.deutsche-rentenversicherung.de, and upon request.
Statistisches Bundesamt (2014) on population between 15 and 65, unemployment rates,
and people out of the labor force. https://www-genesis.destatis.de,
Netherlands
Historical population data are from Statistics Netherlands. http://www.cbs.nl/en-
GB/menu/home/default.htm
Disability insurance caseloads data are from the Institute of Employee Benefit Schemes,
courtesy of Jan Maarten van Sonsbeek.
Sweden
Historical population estimates are from Statistics Sweden. http://scb.se
Disability Insurance prevalence data are from the Social Insurance Agency yearbooks,
courtesy of Lisa Laun and Marten Palme.
United States
Historical population estimates are from the Census Bureau’s Annual Estimates of
Resident Population. http://www.census.gov
SSDI caseloads and covered workers data are from the Annual Statistical Supplement to
the Social Security Bulletin. http://www.ssa.gov/policy/docs/statcomps/supplement/