
Investigations on the effect of entomopathogenic fungi on whiteflies

Masterarbeit
Experimental investigations and
design of a new apparatus
for measurement of emissions from stored pellets
ausgeführt zum Zwecke der Erlangung des akademischen Grades eines
Diplom - Ingenieurs
unter der Leitung von
Univ.Prof. Dipl.-Ing. Dr.techn. Hermann Hofbauer
E166 - Inst. f. Verfahrenstechnik, Umwelttechnik und Techn. Biowissenschaften
und
Dipl.-Ing. Waltraud Emhofer
Bioenergy 2020+
A - 3250 Wieselburg
eingereicht an der Technischen Universität Wien
Fakultät für Maschinenwesen und Betriebswirtschaft
von
Verena Trinkel
0626756
9125 Kühnsdorf, Nord 5
Wien, am 01.10.2012
Die approbierte Originalversion dieser Diplom-/Masterarbeit ist an der Hauptbibliothek der Technischen Universität Wien aufgestellt (http://www.ub.tuwien.ac.at). The approved original version of this diploma or master thesis is available at the main library of the Vienna University of Technology (http://www.ub.tuwien.ac.at/englweb/).

ii
Acknowledgments
First of all I would like to thank the company bioenergy2020+ for giving me the
opportunity to write this thesis at their location in Wieselburg. I would also like to
give my thanks to Dipl.- Ing. Waltraud Emhofer who supervised this work.
I'd like to thank Prof. Hermann Hofbauer who supported this work as my su-
pervisor.
I am very grateful for my parents, Gerda and Johann, who supported my studies
in Vienna and who always hand out me helpful advices whenever needed. I also
would like to thank my sister, Tina, for her support and our discussions.

iii
Contents
1 Introduction 5
2 Scope of the work 7
3 Theoretical background 7
3.1 Denition . . . . . . . . . . . . . . . . . . . . . . . . . . . . . . . . . . . . 7
3.2 Emissions from pellets during storage . . . . . . . . . . . . . . . . . . . . . 9
3.2.1 Toxicity of emissions . . . . . . . . . . . . . . . . . . . . . . . . . . 9
3.2.1.1 Carbon monoxide . . . . . . . . . . . . . . . . . . . . . . . 10
3.2.1.2 Volatile organic compounds . . . . . . . . . . . . . . . . . 10
3.2.2 Mechanisms for the release of emissions during storage . . . . . . . 11
3.2.2.1 Auto-oxidation . . . . . . . . . . . . . . . . . . . . . . . . 12
3.2.2.2 Biomass decomposition . . . . . . . . . . . . . . . . . . . 14
3.2.3 Inuences on the emission during storage . . . . . . . . . . . . . . . 14
3.2.3.1 Condition of raw material . . . . . . . . . . . . . . . . . . 15
3.2.3.2 Duration of storage . . . . . . . . . . . . . . . . . . . . . . 15
3.2.3.3 Storage temperature . . . . . . . . . . . . . . . . . . . . . 16
3.2.3.4 Headspace volume . . . . . . . . . . . . . . . . . . . . . . 17
3.2.3.5 Moisture content of pellets . . . . . . . . . . . . . . . . . . 18
3.2.3.6 Wood species . . . . . . . . . . . . . . . . . . . . . . . . . 19
4 Experiment for the auto-oxidation of fatty acids as a reason for emission
from pellets 20
4.1 Used equipment and material . . . . . . . . . . . . . . . . . . . . . . . . . 20
4.2 Test procedure . . . . . . . . . . . . . . . . . . . . . . . . . . . . . . . . . 21
5 Pretest 23
5.1 Used equipment . . . . . . . . . . . . . . . . . . . . . . . . . . . . . . . . . 23
5.2 Raw material . . . . . . . . . . . . . . . . . . . . . . . . . . . . . . . . . . 24
iv
5.3 Test procedure . . . . . . . . . . . . . . . . . . . . . . . . . . . . . . . . . 25
5.4 Processing of data . . . . . . . . . . . . . . . . . . . . . . . . . . . . . . . . 26
5.5 Discussion of storage test setup . . . . . . . . . . . . . . . . . . . . . . . . 28
6 Laboratory reactor 29
6.1 Requirements . . . . . . . . . . . . . . . . . . . . . . . . . . . . . . . . . . 30
6.2 Measurement technology . . . . . . . . . . . . . . . . . . . . . . . . . . . . 33
6.2.1 Gas analysis . . . . . . . . . . . . . . . . . . . . . . . . . . . . . . . 34
6.2.2 Sensors . . . . . . . . . . . . . . . . . . . . . . . . . . . . . . . . . . 40
6.2.3 Data logging system . . . . . . . . . . . . . . . . . . . . . . . . . . 42
6.3 Gas-mixing-station . . . . . . . . . . . . . . . . . . . . . . . . . . . . . . . 42
7 Results and discussion 43
7.1 Results and discussion of the experiment for auto-oxidation of fatty acids . 43
7.2 Results and discussion of pretests . . . . . . . . . . . . . . . . . . . . . . . 44
7.2.1 Comparison of shavings . . . . . . . . . . . . . . . . . . . . . . . . 44
7.2.2 Comparison of shavings and pellets . . . . . . . . . . . . . . . . . . 49
7.3 Results and discussion of the new designed laboratory reactor . . . . . . . 53
8 Conclusion and outlook 54
v
List of Figures
1 Number of newly installed pellet boilers in Austria < 100kW per year [3] . 5
2 Production capacity (Produktionskapazität), production (Produktion) and
consumption (Verbrauch) of pellets in Austria [3] . . . . . . . . . . . . . . 6
3 Specication of wood pellets for non-industrial use [1] . . . . . . . . . . . 8
4 Classication of organic pollutants [17] . . . . . . . . . . . . . . . . . . . . 11
5 General scheme of the chemical wood components [19] . . . . . . . . . . . 12
6 Principle path of fatty acids auto-oxidation [20] . . . . . . . . . . . . . . . 13
7 Carbon dioxide (CO2) concentrations as a function of storage time at dif-
ferent storage temperatures using British Columbia wood pellets [12] . . . 16
8 Carbon monoxide (CO) concentrations as a function of storage time at
dierent storage temperatures using British Columbia wood pellets [12] . . 17
9 Emission factor of CO2 over time at dierent temperatures and relative
humidity (closed symbols: no water present; open symbols: water present
at the bottom) [22] . . . . . . . . . . . . . . . . . . . . . . . . . . . . . . . 18
10 Emission factor of CH4 over time at dierent temperatures and relative
humidity (closed symbols: no water present; open symbols: water present
at the bottom) [22] . . . . . . . . . . . . . . . . . . . . . . . . . . . . . . . 19
11 Filling material . . . . . . . . . . . . . . . . . . . . . . . . . . . . . . . . . 22
12 Used measuring adapter . . . . . . . . . . . . . . . . . . . . . . . . . . . . 23
13 Principle of measurement with the measuring adapter . . . . . . . . . . . . 23
14 Run of CO during experiment number 1 . . . . . . . . . . . . . . . . . . . 27
15 Drawing of the designed laboratory reactor with following utilities:1 - mea-
surement points for temperatures, 2 - inlet of reactor, 3 - outlet of reactor,
4 - measurement port for GC, 5 - measurement point for humidity, 6 -
measurement point for pressure, 7 - lter layer for GC, 8 - plug, 9 - sparger
plate . . . . . . . . . . . . . . . . . . . . . . . . . . . . . . . . . . . . . . . 33
16 Schematic of data handling system . . . . . . . . . . . . . . . . . . . . . . 34

vi
17 Schematic of GC system (Trägergas = carrier gas, Druckregelung = pres-
sure regulation, Strömungsregler = current controller, Injektionsspritze =
syringe, Probe = sample, Injektorheizung = injector heating, Säulenofen
=column oven, Kapillartrennsäule = column, Säulenausgang, exit of col-
umn, Detektor = detector, Datenverarbeitung = data processing) [35] . . . 35
18 Types of columns [35] . . . . . . . . . . . . . . . . . . . . . . . . . . . . . . 36
19 Types of stationary phases [35] . . . . . . . . . . . . . . . . . . . . . . . . 37
20 Cross section of a thermal conductivity detector [34] . . . . . . . . . . . . . 38
21 Wheatstone bridge circuit (Trägergas = carrier gas, Trägergas plus Analyte
= carrier gas plus analyte [35] . . . . . . . . . . . . . . . . . . . . . . . . . 38
22 Flame ionization detector [35] (Zündspule = ignition coil, Sammelelektrode
(Kathode) = collector electrode (cathode), Flammendüse (Anode) = ame
jet (anode), Luft = air, Wassersto = hydrogen, Ausgang der GC - Säule
= exit of the GC column, Trägergas plus Moleküle mit C-C- und C-H-
Bindungen = carrier gas with C-C- and C-H-bonds . . . . . . . . . . . . . 39
23 Scheme of the gas-mixing-station . . . . . . . . . . . . . . . . . . . . . . . 42
24 Run of CO and VOC of auto-oxidation of linoleic acid . . . . . . . . . . . . 43
25 CO emission rates [mgCO/kgowd/day] from miscanthus shavings and ash
tree shavings over storage time . . . . . . . . . . . . . . . . . . . . . . . . . 45
26 VOC emission rates [mgV OC/kgowd/day] from miscanthus shavings and ash
tree shavings over storage time . . . . . . . . . . . . . . . . . . . . . . . . . 45
27 CO emission rates [mgCO/kgowd/day] from larch shavings and spruce shav-
ings over storage time . . . . . . . . . . . . . . . . . . . . . . . . . . . . . . 46
28 VOC emission rates [mgV OC/kgowd/day] from larch shavings and spruce
shavings over storage time . . . . . . . . . . . . . . . . . . . . . . . . . . . 47
29 CO emission rates from miscanthus-, ash tree-, larch- and spruce shavings
over storage time . . . . . . . . . . . . . . . . . . . . . . . . . . . . . . . . 48
30 VOC emission rates from miscanthus-, ash tree-, larch- and spruce shavings
over storage time . . . . . . . . . . . . . . . . . . . . . . . . . . . . . . . . 48
31 CO emission rates in [mgCO/kgowd/day] from miscanthus pellets and mis-
canthus shavings over storage time . . . . . . . . . . . . . . . . . . . . . . 49

vii
32 VOC emission rates [mgV OC/kgowd/day] from miscanthus pellets and mis-
canthus shavings over storage time . . . . . . . . . . . . . . . . . . . . . . 50
33 CO emission rates [mgCO/kgowd/day] from dierent kinds of pellets and
shavings over storage time . . . . . . . . . . . . . . . . . . . . . . . . . . . 51
34 VOC emission rates [mgV OC/kgowd/day] from dierent kinds of pellets and
shavings over storage time . . . . . . . . . . . . . . . . . . . . . . . . . . . 52
35 Scheme of the new designed laboratory setup . . . . . . . . . . . . . . . . . 53

viii
List of Tables
1 "Concentration - eect - relationship" for impairment of health due to
exposition of VOC [18] . . . . . . . . . . . . . . . . . . . . . . . . . . . . . 11
2 Characteristics FID . . . . . . . . . . . . . . . . . . . . . . . . . . . . . . . 21
3 Characteristics NGA . . . . . . . . . . . . . . . . . . . . . . . . . . . . . . 21
4 Used raw materials in storage tests . . . . . . . . . . . . . . . . . . . . . . 24
5 Water content and density of used material . . . . . . . . . . . . . . . . . . 25
6 Fatty acid content of pellets and shavings . . . . . . . . . . . . . . . . . . . 52

ix
Abbreviations, formula symbols, chemical formulas,
units
Abbreviations
V OC volatile organic compounds
TV OC total volatile organic compounds
V V OC very volatile organic compounds
SV OC semivolatile organic compounds
POM particular organic matter
PC personal computer
GC gas chromatography
FID ame ionization detector
TCD thermal conductivity detector
NPD nitrogen-phosphorus detector
FPD ame photometric detector
ECD electron capture detector
owd ovendry weight
V Z reference cell
MZ measurement cell
WCOT wall-coated open-tubular column
PLOT porous-layer open-tubular column
SCOT support-coated open-tubular column
RTD resistive temperature device
PELD polyethylene low density
MFC mass ow controller
NDIR nondispersive infrared sensor
PTFE Polytetraourethylene
Formular symbols
V volume m3
m mass kg
% density kgm3
C concentration %
x
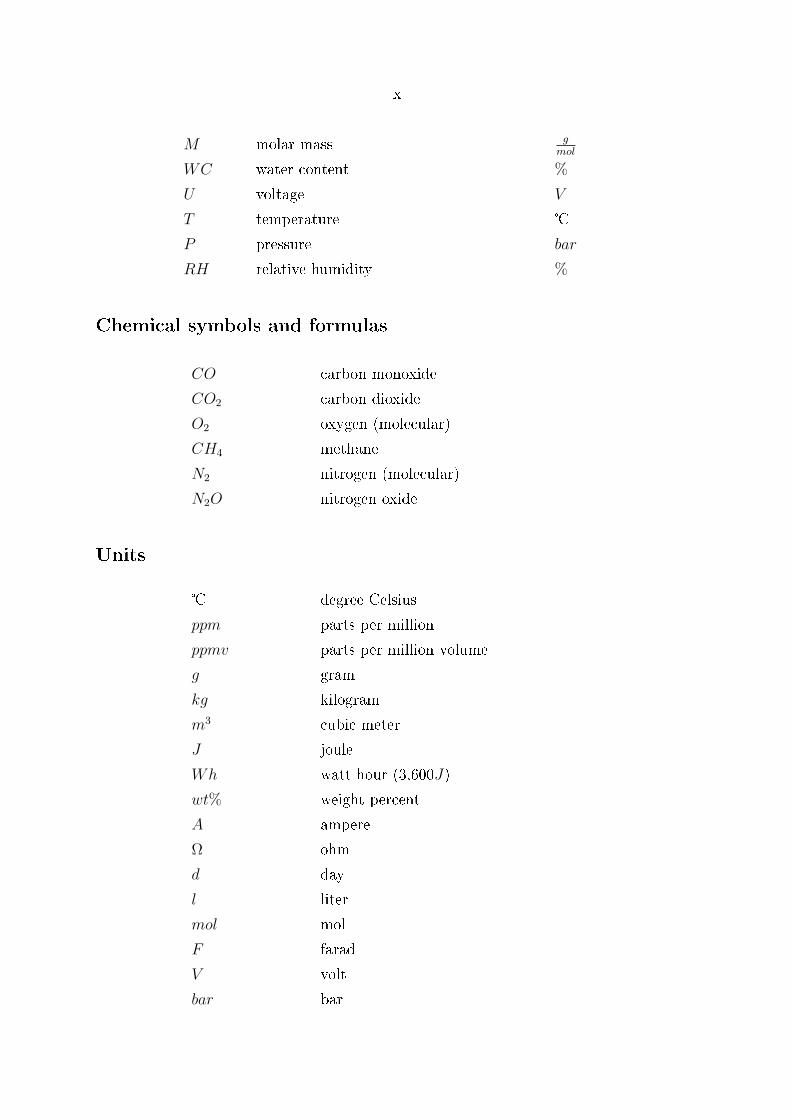
M molar mass gmol
WC water content %
U voltage V
T temperature
P pressure bar
RH relative humidity %
Chemical symbols and formulas
CO carbon monoxide
CO2 carbon dioxide
O2 oxygen (molecular)
CH4 methane
N2 nitrogen (molecular)
N2O nitrogen oxide
Units
degree Celsius
ppm parts per million
ppmv parts per million volume
g gram
kg kilogram
m3 cubic meter
J joule
Wh watt hour (3,600J)
wt% weight percent
A ampere
Ω ohm
d day
l liter
mol mol
F farad
V volt
bar bar

xi
Indices
ar as received
odw oven dry weight
CO carbon monoxide
V OC volatile organic compounds

1
Kurzfassung
Pellets haben auf Grund der gleichbleibenden Brennstoqualität Vorteile wie beispiel-
sweise eine hohe Energiedichte oder den einfachen Transport. Daher zählen heute Pellets
zu einem attraktiven Brennsto für Industrie als auch für private Haushalte. Die Anzahl
der jährlich neu installierten Pelletsöfen steigt daher in Österreich von Jahr zu Jahr.
Während der Lagerung von Pellets werden gesundheitsschädliche Emissionen freigesetzt.
Durch diese Emissionen kam es in der Vergangenheit bereits zu einigen Unfällen, bei denen
sogar Menschen starben. Aus der Literatur sind aktuell nur wenige Informationen zum
Auftreten und zur Zusammensetzung der Emissionen von Pellets während der Lagerung
verfügbar. Darüber hinaus sind die Freisetzungsreaktionen an der Oberäche von Pellets
sowie die Faktoren, die diese Reaktionen begünstigen, nur teilweise bekannt.
Das Ziel dieser Diplomarbeit war es, einen Laborreaktor zu konstruieren, um den
chemischen Freisetzungsmechanismus, der für die Entstehung der Emissionen von Pel-
lets während der Lagerung verantwortlich ist, zu untersuchen. Der Reaktor wurde auf
Basis einer Literaturstudie sowie mit Hilfe von praktischen Experimenten ausgelegt. An-
hand der Literaturrecherche wurden Einussfaktoren, die die Menge an Emissionen beein-
ussen, deniert: Die Holzart, die für die Pelletsproduktion verwendet wird, die Beschaf-
fenheit des verwendeten Materials, die Lagerdauer, die Lagertemperatur, der Wassergehalt
der Pellets, und der zur Verfügung stehende Sauerstogehalt im Lagerraum. Ein Experi-
ment zur Untersuchung der Auto-oxidation von Fettsäuren als Ursache für die Emission
von Pellets wurde durchgeführt.
Die praktischen Versuche wurden mit verschiedenen Holzarten an einen bereits bestehen-
den Laboraufbau durchgeführt. Dieser Aufbau bestand aus Laborglasaschen, die als
Lagerungsbehälter dienten. Zur Emissionsmessung wurden ein Infrarot-Gasanalysator
sowie ein Flammenionendetektor verwendet. Auf Basis dieser Experimente wur-
den folgende Dezite dieses Aufbaus deniert: der Mangel an Temperatur- und
Druckmessstellen, die fehlende Möglichkeit den Reaktor zu kühlen und zu heizen als auch,
dass das verwendete Messequipment stark verbesserungswürdig war. Durch die Kombi-
nation der Ergebnisse aus der Literaturrecherche und den praktischen Versuchen, wurde
der Laborreaktor konstruiert. Dieser Laboraufbau bietet die Möglichkeit, die Temper-
atur, den Druck sowie die relative Feuchte im Reaktor zu messen. Die Emissionsmessung
wurde mittels eines Gaschromatographen, der speziell für diese Anwendung ausgelegt ist,
realisiert. Der Reaktor muss zur Probennahme nicht mehr geönet werden und bietet nun
auch die Möglichkeit die Lagertemperatur zu variieren. Mit Hilfe einer für diese Anwen-

2
dung ausgelegten Gasmischstation kann eine denierte Atmosphäre im Reaktor eingestellt
werden. Darüber hinaus kann das Gas auch befeuchtet werden.
Zusätzlich zur Konstruktion des Laborreaktors wurden die Ergebnisse der Experimente
diskutiert und mit bereits bei Bioenergy 2020+ durchgeführten Versuchen verglichen.

3
Abstract
Wood pellets have a consistent fuel quality which provides many advantages such as the
ease of transport and a high energy density. Thus, pellets have become a suitable fuel
in private households and industry. The number of newly installed furnaces in Austria is
steadily increasing every year.
During the storage of the pellets, poisonous emissions are released. These emissions
caused severe accidents in the past, and even resulted in the deaths of people. From
the literature, only limited information on the occurrence and the composition of pellets
emissions is available. However, the releasing mechanisms of the emissions as well as their
promoting factors are not well understood.
The aim of this diploma thesis was to design a laboratory reactor to investigate the chem-
ical mechanisms, which cause the emissions from pellets during storage. The laboratory
reactor was constructed on the basis of a literature research and practical experiments.
From the literature research, the following factors inuencing the type and amount of
emissions were dened: the species of wood used for pellet production, the conditions of
the raw material, the duration of storage, the storage temperature of pellets, the moisture
content of pellets and the available oxygen in the storage room. An experiment for the
auto-oxidation of fatty acids as mechanism for the appearance of emission from pellets was
performed and discussed. The practical experiments were performed with dierent raw
materials with an existing experimental setup. This setup consisted of laboratory glass
bottles, an infrared gas analyzer and a ame ionization detector. The glass bottles were
used to store the raw materials and the emission measurement were performed with the
infrared gas analyzer and a ame ionization detector. From these experiments, a number
of shortcomings were discovered: the lack of temperature and pressure measurement, the
lack of the possibility to heat and cool the reactor, improper measurement equipment
for the emission measurement was used. By combining both, the literature study and
the practical experiments, a laboratory reactor was designed. This reactor provides the
possibility to measure the temperature, the pressure as well as the possibility to analyze
the emissions with a gas chromatograph, which was especially designed for the chemical
properties of the emissions expected. Furthermore, the laboratory reactor does not need
to be opened to start the emission measurements. Another improvement is that it is
possible to heat and to cool the reactor, which will allow to test the eect of storage
temperature on the amount of emissions and on the emission rates. A specially designed
gas mixing station guarantees the production of a dened atmosphere. The option to

4
moister the gas will allow to test the inuence of humidity on the emissions from pellets
during storage.
In addition the design of the laboratory reactor, the results from the experiments with the
laboratory glass bottles as storage were discussed and compared with former experiments
carried out at Bioenergy 2020+.

5
1 Introduction
Pellets have a consistent fuel quality, which includes low moisture content, high energy
density and homogeneous size and shape. The high requirements for the quality of pellets
provide advantages such as the ease of transportation and the possibility to design fully
automatic biomass furnaces. Pellets, therefore, provide a similar comfort to common oil
and gas heating systems. Thus, pellets have become a suitable fuel for dierent elds of
applications, ranging from stoves and central heating systems up to large-scale plants. [1]
The number of newly installed pellet boilers per year in Austria has been growing in the
last 15 years from around 400 in 1997 to more than 10 000 in 2011 (see gure 1). The
decrease in sales number in the year 2007 is related to a price peak of pellets in 2006. In
the year 2008 the amount of new installed furnaces rises according to the increasing oil
and gas prices. [2]
Figure 1: Number of newly installed pellet boilers in Austria < 100kW per year [3]
Similarly, the annual production capacity as well as the production and consumption of
pellets has been increasing steadily (see gure 2).

6
Figure 2: Production capacity (Produktionskapazität), production (Produktion) and con-
sumption (Verbrauch) of pellets in Austria [3]
Safety and health concerns have a high priority during the pellet production, handling
and storage. In pellets, as in any other types of biomass, decomposition processes take
place. During these processes carbon monoxide (CO), carbon dioxide (CO2), methane
(CH4) as well as hydrocarbons are emitted. This o-gassing phenomenon has to be taken
serious during transportation, handling and storage. [1]
The o-gassing phenomenon has been investigated for the rst time after some accidents,
which occurred on board pellet storage vessels during the unloading process. Melin et. al.
(2008) reported accidents on two pellets transport ships in the years 2002 and 2006. [4]
Svedberg (2008) reported a further accident in the Port of Helsingborg. This accident
occurred during the discharging of wood pellets from a vessel and led to the death of one
seaman, one seriously injured stevedore and several slightly injured rescue workers. [5]
More recently, in January 2010, a man died in an indoor pellets storage from carbon
monoxide poisoning [6] and in 2011 a young woman in Switzerland died due to carbon
monoxide poisoning in a pellets storage. Whether the source of carbon monoxide was
o-gassing reactions from pellets or if its source was a backburning incident is unclear. [7]
In order to avoid such incidents, in the future, there is an urgent need to investigate the
o-gassing phenomenon of pellets:
The reaction kinetics and the predictability of the total amount of the emissions have to
be investigated.
7
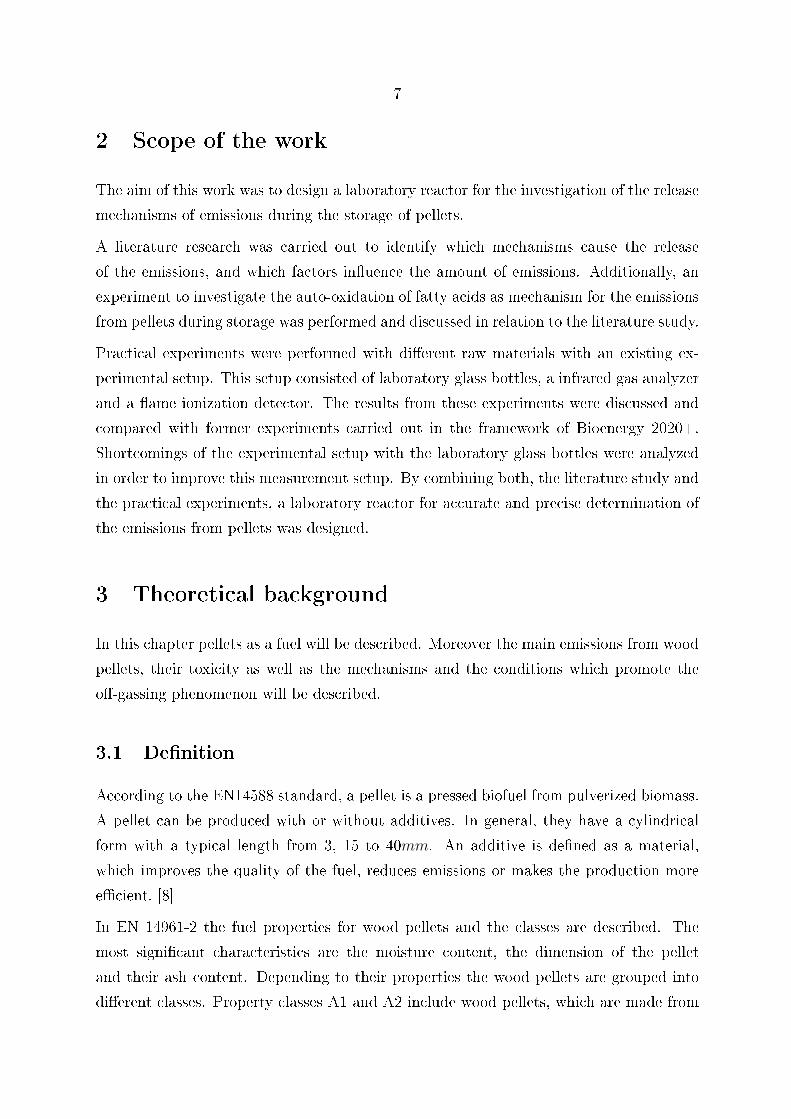
2 Scope of the work
The aim of this work was to design a laboratory reactor for the investigation of the release
mechanisms of emissions during the storage of pellets.
A literature research was carried out to identify which mechanisms cause the release
of the emissions, and which factors inuence the amount of emissions. Additionally, an
experiment to investigate the auto-oxidation of fatty acids as mechanism for the emissions
from pellets during storage was performed and discussed in relation to the literature study.
Practical experiments were performed with dierent raw materials with an existing ex-
perimental setup. This setup consisted of laboratory glass bottles, a infrared gas analyzer
and a ame ionization detector. The results from these experiments were discussed and
compared with former experiments carried out in the framework of Bioenergy 2020+.
Shortcomings of the experimental setup with the laboratory glass bottles were analyzed
in order to improve this measurement setup. By combining both, the literature study and
the practical experiments, a laboratory reactor for accurate and precise determination of
the emissions from pellets was designed.
3 Theoretical background
In this chapter pellets as a fuel will be described. Moreover the main emissions from wood
pellets, their toxicity as well as the mechanisms and the conditions which promote the
o-gassing phenomenon will be described.
3.1 Denition
According to the EN14588 standard, a pellet is a pressed biofuel from pulverized biomass.
A pellet can be produced with or without additives. In general, they have a cylindrical
form with a typical length from 3, 15 to 40mm. An additive is dened as a material,
which improves the quality of the fuel, reduces emissions or makes the production more
ecient. [8]
In EN 14961-2 the fuel properties for wood pellets and the classes are described. The
most signicant characteristics are the moisture content, the dimension of the pellet
and their ash content. Depending to their properties the wood pellets are grouped into
dierent classes. Property classes A1 and A2 include wood pellets, which are made from

8
virgin wood and chemically untreated wood residues. Fuels with slightly higher ash and
nitrogen content belong to A2. Property class B describes chemically treated industrial
wood by-products, residues and used wood are also allowed. Standards for non-woody
pellets are listed in part 6 of the EN 14961. [1], [9] The properties of the classes A1, A2
and B are listed in gure 3:
Figure 3: Specication of wood pellets for non-industrial use [1]

9
3.2 Emissions from pellets during storage
During storage, pellets emit mainly the following gases [1]:
Carbon monoxide
Carbon dioxide
Methane
Aldehydes and ketones including hexanal and pentanal in addition to acetone and
methanol
These components were detected in several studies:
Svedberg et. al. (2004) performed measurements of the emissions from wood pellets. The
pellets were stored in warehouses, in domestic storage rooms or during the laboratory
tests in galvanized steel canisters. The results of these measurements showed that the
dominant organic compounds were aldehydes, acetone and methanol. Beside that, carbon
monoxide was found. The main aldehyde was found to be hexanal. [10]
Arshadi et. al. (2009) investigated the emission of volatile aldehydes and ketones from
wood pellets. During the storage of pellets, the following aldehydes/ketones were detected:
methanal, ethanal, acrolein, 2-propanone, propanal, butanal, benzaldehyde, pentanal,
toloulaldehyde, hexanal, octanal, and nonanal. Beside the aldehydes/ketones, fatty/resin
acids were identied. The fatty/resin acids were rst extracted in a soxhlet apparatus
with a mixture of petroleum ether and acetone and afterwards analyzed by GC-MS. The
main resin acids were found to be dehydroabietic acid and 7-oxo-dehydroabietic acid. [11]
Kuang et. al. (2008) investigated also the o-gas phenomena during the storage of pellets:
the main components were CO, CO2, and CH4. [12]
3.2.1 Toxicity of emissions
As already mentioned in chapter 1 accidents in connection with o-gassing from pel-
lets have happened. Therefore, the toxicity of the emissions from pellets will be briey
described below.

10
3.2.1.1 Carbon monoxide
Carbon monoxide is an odorless, tasteless and colorless gas. [13] The human health is
aected by CO because it blocks the transmission of O2 in blood. Carbon monoxide is
bound to hemoglobin to from carboxyhemoglobin (COHb). Compared to O2 the anity
of CO to bond to hemoglobin is more than 200 times bigger. [14]
When humans are exposed to a concentration of 200ppm for 2 to 3 hours, a slight
headache will occur. A concentration of 400ppm causes headache in the forehead after 1
to 2 hours spreading quickly over the whole head. If the concentration reaches 800ppm,
dizziness and sickness after 45 minutes is the consequence and after an exposure of 2
hours consciousness will be. A concentration of 1600ppm for 2 hours will lead to death. [15]
Currently, there are no regulations dening the maximal carbon monoxide concentration
in pellet storage rooms. Only the need for the use of special cover plates to ensure a
gas exchange between the storage room and the environment is regulated in the standard
ÖNorm M 7137. [3]
In the directive, VDI 2053, the CO concentration at the workplace is limited to 60ppm
during a 15 minute period . In regulations for car parcs, the concentration level is set to
100ppm as an average half-hourly value. It is recommended, that this value should be
reduced to a level of 60ppm as an average quarter-hourly value. [16]
3.2.1.2 Volatile organic compounds
At small concentrations (up to 25 mg/m3) VOC can cause sensory eects. Sensory eects
include sensory irritation, dryness, weak inammatory irritations of eyes, nose, airways
and skin. Higher concentrations of volatile organic compounds will lead to serious health
eects such as headache and neurotoxic eects.
The mixture of volatile organic compounds is often expressed as total volatile organic
compounds (TVOC), which include very volatile organic compounds (VVOC), volatile
organic compounds (VOC), semivolatile organic compounds (SVOC) and organic com-
pounds associated with particular matter or particular organic matter (POM) (see gure
4). [17]

11
Figure 4: Classication of organic pollutants [17]
In table 1 possible eects on human health are listed. Below a concentration of 0,20
mg/m3 there is no impact on the human well-being. With increasing concentration
impairments of human well-being occur. Concentrations above 25mg/m3 cause headache
and can lead to neurotoxic eects.
Table 1: "Concentration - eect - relationship" for impairment of health due to exposition
of VOC [18]
TVOC-concentraion [mg/m3] Eect
<0,20 No impact on the human well-being
0,20 - 3,0 Irritation or impairment well-being possible, if in-
teraction with other exposition parameters is given
3,0 - 25 Exposition shows eect on human well-being; pos-
sibility of headache if interaction with other expo-
sition parameters is given
>25 Headache; other neurotoxic eects possible
3.2.2 Mechanisms for the release of emissions during storage
In the literature two main mechanisms are described to be responsible for the formation
of emissions from pellets:
Auto-oxidation
Decomposition
These mechanisms will be described in detail in the following chapters.

12
3.2.2.1 Auto-oxidation
In this chapter rst the chemical components of wood will be indicated. Next the auto-
oxidation process as mechanism for the release of emission from pellets will be discussed.
Chemical components of wood
Wood consists of macromolecular substances and low-molecular-weight substances. The
macromolecular substances are the main cell wall components such as cellulose, polyoses
(hemicelluloses) and lignin, which are present in all woods. The proportions and chemical
composition of lignin and hemicelluloses is dierent in softwood and hard wood, while
cellulose is a uniform component in all woods. The low-molecular-weight substances are
extractives and mineral substances, which are generally more related to special wood
species in kind and amount. (see gure 5)
Figure 5: General scheme of the chemical wood components [19]
Cellulose: It is the major wood component and makes up approximately one half of both
softwoods and hardwoods. It is a linear high-molecular-weight polymer built up exclu-
sively of β-D-glucose. It is the main structural component of the plant cell walls.
Polyoses (hemicelluloses): They are in close association with cellulose in the cell wall. The
main constituents of polyoses are ve neutral sugars: hexoses glucose, mannose, galactose
and pentoses xylose and arabinose. The molecular chains are much shorter then in cellu-
lose, have side groups and are branched in some cases.
Lignin: The molecules of lignin are build up quite dierently from those of polysaccha-
rides. They consist of an aromatic system composed of phenylpropane units. There are
structural dierences between softwood and hardwood lignin. Moreover, there is more
lignin in softwoods than in hardwoods.

13
Organic matter: The main groups of extractives are: Aromatic compounds (for example
tanning compounds, stilbenes, lignans, avonoids), terpenes, aliphatic acids (saturated
and unsaturated higher fatty acids), alcohols.
Inorganic matter: In woods from temperate zones the elements potassium, calcium and
magnesium are predominantly. [19]
Auto-oxidation process
The auto-oxidation process may start after sawing, as damage to cells causes lipids to
hydrolyze to free lipid acids, which are more easily oxidized. Free radicals can be produced
by light photons and by metals. Another option is the spontaneous reaction. Such a
reaction have materials with a readily abstractable hydrogen. After the oxidation process
has started, the reaction is self-catalyzed and will continue until all radicals have been
neutralized. [20]
Hexanal and other alkanals are probably formed by oxidative degradation of natural lipids
in wood. Hexanal, as a major volatile component, is formed from linoleic acid or its esters
by radical-induced oxidation by oxygen. Such reactions can be catalyzed through a so
called auto-oxidation process. Carbon monoxide may also be formed through the auto-
oxidative degradation of fats. [10]
A principle pathway for the auto-oxidation reaction is shown in gure 6.
Figure 6: Principle path of fatty acids auto-oxidation [20]

14
Emhofer and Pointner (2009) argue that auto-oxidation as the mechanism for the release
of emissions is most likely. In closed storage system decreasing oxygen concentrations can
be observed, as the chemical reaction consumes oxygen. Furthermore, the emission rate
increases with increasing storage temperatures (see also 3.2.3.3).The chemical reactions
are favored at higher temperatures. Beside that the fatty acid content of pellets decreases
during storage as are the emission rates for CO and VOC. This is consistent with the hy-
pothesis that chemical reactions are consuming the reactants while forming the products,
in this case the emissions. [21]
Also, Kuang et. al. (2009) described that the chemical process via auto-oxidative degra-
dation of fats and fatty acids may be the dominant mechanism for the o-gassing phe-
nomenon. This statement was again based on the fact that the emission rate increases
steadily with increasing temperature. [22]
3.2.2.2 Biomass decomposition
The decomposition of biomass during storage was described in several articles as a reason
for the formation of emission.
Meijer and Gast (2004) described a biological decomposition process up to a temperature
of 75 . At temperatures above 75 a chemical oxidation process occurred. According
to Meijer and Gast, only CO2 is formed during the process of biological decomposition.
CO will be formed at higher temperatures as a result of chemical oxidation. [23]
Kuang et. al. (2009) discussed the possibility that the decomposition of biomass may be
relevant for the emissions: The biological process may peak at a certain temperature, and
above this certain temperatures decreases when bacteria and fungi perish. [22]
Lehtikangas (2000) discovered a microbiological growth on the surface of pellets after
storaging them for three months. These pellets had a relatively high moisture content of
about 21% before storage, which is probably the reason for the microbiological contami-
nation. [24] However nowadays the moisture content of pellets is limited to a maximum
of 10wt% according to the standard EN 14961-2. [9]
Because of this regulation the biomass decomposition process can be considered as a non
decisive mechanism for the emissions from pellets during storage.
3.2.3 Inuences on the emission during storage
The rate of o-gassing is a function of the temperature, the properties of the raw material,
pretreatment of the raw material and the pelletising equipment used. [1]

15
Therefore, the pretreatment of the raw material, the duration of storage, the storage
temperature and the used wood species inuence the amount of emission produced.
3.2.3.1 Condition of raw material
The moisture content of the raw material is amongst other things an important impact
factor for the process of densication. Therefore, an optimal moisture content has to
be achieved according to the pelletising technology and the applied raw material. [1]
The drying process takes place at temperatures between 100 and 120 to obtain a
moisture content of 10 to 12%. During the drying process, monoterpenes and other
volatile compounds are released. [25]
The release of VOC is rapid early in the drying process. The amount of the VOC emissions
will increase rapidly at the beginning and then level out. The drying temperature eects
the release rate and the total amount of VOC emitted from sawdust. [26]
Granström (2010) reported that the process of drying and pelletizing hastens the hexanal
formation. During the drying and pelletizing processes the extractives of the wood have
been exposed to oxygen and high temperatures and are likely to contain fatty acid hy-
droperoxides as well as unsaturated fatty acids. The hexanal formation may be due to
an accumulation of semi-stable fatty acids hydroperoxides during the propagation stage
of auto-oxidation. [20]
When optimizing the drying temperature in the pellet production it might be possible to
reduce the amount of volatile organic compounds. Whether there is any impact on the
formation of CO was not a content of the study from Arshadi and Gref (2005). [25]
3.2.3.2 Duration of storage
During storage of sawdust, the amount of fatty acids and resin acids decline, which implies
that the longer the storage periods of pellets are the less amounts of emissions will be
released. [25]
Ganström (2010) investigated the emissions of volatile organic compounds during the
storage of undried sawdust, dried sawdust, and wood pellets. As material scots pine was
chosen. The pellets which were used in Ganströms (2010) study were made from scots
pine sawdust ve days after the drying process. Hexanal was detected after only a few
days of storage. The hexanal content reached the maximum 25 days after drying (20
days after pelleting) at 26 mg/kg(owd). When the maximum was reached, the hexanal
decreased to less then 1 mg/kg(owd) after three month of storage. Because of the result

16
that after three month hardly any hexanal emissions were measured, it was postulated
that for the domestic exposure from pellet storage would mostly be a problem the storage
of pellets in which the used raw material is 2 to 3 month old. [20]
3.2.3.3 Storage temperature
The inuence of the storage temperature was investigated by Kuang et. al. (2008, 2009)
[12], [22] and by Tumuluru et. al. (2010) [27]. Pellets were stored at dierent temperatures
and the concentration of emissions during storing were measured. When the pellets were
stored around room temperature, the emissions increased linear with the time. Above 40
the emissions increased exponentially. [22] A comparison of the maximum concentration
of CO2, CO, CH4 showed that the concentrations of these gases were always higher at a
storage temperature above room temperature. The increase of the amount of the emissions
depending on the storage temperature can be seen in gure 7 and 8.
Figure 7: Carbon dioxide (CO2) concentrations as a function of storage time at dierent
storage temperatures using British Columbia wood pellets [12]
17
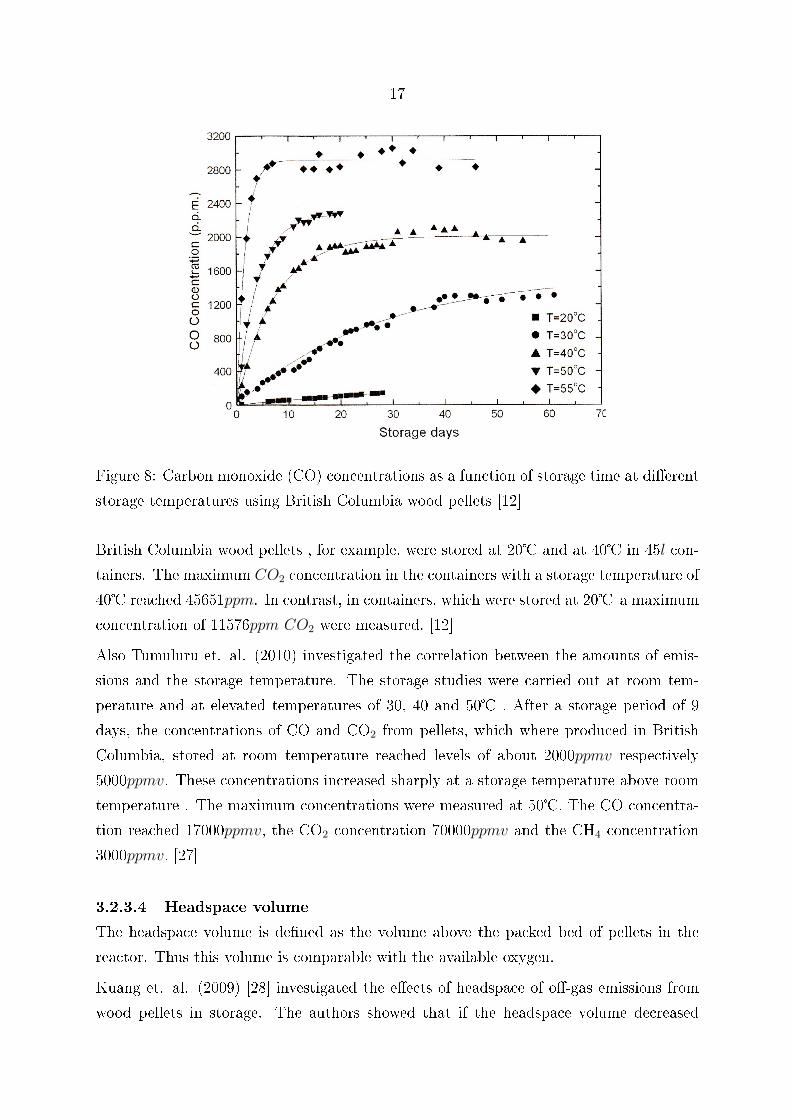
Figure 8: Carbon monoxide (CO) concentrations as a function of storage time at dierent
storage temperatures using British Columbia wood pellets [12]
British Columbia wood pellets , for example, were stored at 20 and at 40 in 45l con-
tainers. The maximum CO2 concentration in the containers with a storage temperature of
40 reached 45651ppm. In contrast, in containers, which were stored at 20 a maximum
concentration of 11576ppm CO2 were measured. [12]
Also Tumuluru et. al. (2010) investigated the correlation between the amounts of emis-
sions and the storage temperature. The storage studies were carried out at room tem-
perature and at elevated temperatures of 30, 40 and 50 . After a storage period of 9
days, the concentrations of CO and CO2 from pellets, which where produced in British
Columbia, stored at room temperature reached levels of about 2000ppmv respectively
5000ppmv. These concentrations increased sharply at a storage temperature above room
temperature . The maximum concentrations were measured at 50. The CO concentra-
tion reached 17000ppmv, the CO2 concentration 70000ppmv and the CH4 concentration
3000ppmv. [27]
3.2.3.4 Headspace volume
The headspace volume is dened as the volume above the packed bed of pellets in the
reactor. Thus this volume is comparable with the available oxygen.
Kuang et. al. (2009) [28] investigated the eects of headspace of o-gas emissions from
wood pellets in storage. The authors showed that if the headspace volume decreased

18
the maximal concentrations of CO, CO2 and CH4 decreased. Additionally, the lower the
headspace volume, the lower was the oxygen concentration after a storage time of 25
days. [22], [28]
3.2.3.5 Moisture content of pellets
Kuang et. al. (2009) suggested that the moisture content is an important factor inu-
encing the o-gas emissions from wood pellets in storage. A high moisture content may
cause higher emissions of gases such as CO2, CO and CH4 during storage. [22]
In gures 9 and 10, the emission factors for CO2 and CH4 over time are shown. Open
symbols show the trend of the emission factor for pellets with a higher moisture content
in the experimental storage container. To raise the relative humidity in the container a
500ml dish was lled with water and placed at the bottom. The pellets were stored on a
screen installed above the dish.
The maximum emission factors for CO2, CO and CH4 were higher at higher relative
humidity. The dierence in the amount of emissions between low and high relative
humidity were more signicant for CO2 and CH4 than for CO, respectively. [22]
Figure 9: Emission factor of CO2 over time at dierent temperatures and relative humidity
(closed symbols: no water present; open symbols: water present at the bottom) [22]

19
Figure 10: Emission factor of CH4 over time at dierent temperatures and relative humid-
ity (closed symbols: no water present; open symbols: water present at the bottom) [22]
3.2.3.6 Wood species
Wood properties are eecting the o-gassing emissions. Kuang et. al. (2008) studied the
emissions from ve dierent materials: switchgrass, BC (British Columbia) wood pellets,
nes of BC wood pellets, European wood pellets and European torreed woodchips. The
materials were stored over a time period of 27 to 56 days at 20 and 40. The concentra-
tions of CO2, CO and CH4 were measured. The amount of emissions from all materials
mentioned aboves increased as the storage temperature increased. Moreover the pelletized
material emitted more CO, CO2 and CH4. [12]
Emhofer and Pointner [21] investigated the inuence of used wood species on the emissions
in their experiments. Their results clearly showed that the emissions are depending on
the type of wood, that was used for the pellet production. [21]

20
4 Experiment for the auto-oxidation of fatty acids as a
reason for emission from pellets
As already described in chapter 3.2.2.1, auto-oxidation of fatty acids may lead to emissions
from pellets.
Svedberg et. al. (2008) described an experiment where they explored the hypothesis
that oxidative degradation of fatty acids occurs and identied the gaseous emissions. The
predominant unsaturated fatty acids in wood is linoleic acid. For their study they needed
a large quantity of the fatty acid. Thus, Svedberg et. al. (2008) used for the experiments
linseed oil. [5] This type of oil was used because its major constitutes are triglyceride
esters, including palmitic acid (6-7%), stearic acid (3-6%), oleic acid (14-24%), linolenic
acid (48-60%) and linoleic acid (14-19%). [29] The linseed oil was stored in a sealed 1 l
plastic bottle. The samples were taken from the headspace of the bottle with an airtight
syringe and analyzed with fourier transform infrared spectroscopy (FTIR). As a result CO
as well as VOC was found, which support the hypothesis that degradation of fatty acids
occurs and may explain the formation of gaseous compounds identied in the atmosphere
above wood pellets. [5]
Juita et. al. (2011, 2012) also investigated the compounds in the vapor space of linseed
oil. As a result, the following VOC were identied: aldehydes, ketones, carboxylic acids,
alcohols, and furans. They also reported that these compounds arise in oxidation of
linolenic and linoleic chains. [30] They also identied CO as an oxidation product. [29]
Thus, an experiment was carried out, to proof the possibility if the emissions from wood
pellets are a reasons of auto-oxidation of fatty acids.
4.1 Used equipment and material
The following equipment were used in these experiments:
Laboratory glass bottles with a volume of 2l
Measurement adapter
Flame ionization detector (FID), specied in table 2
21
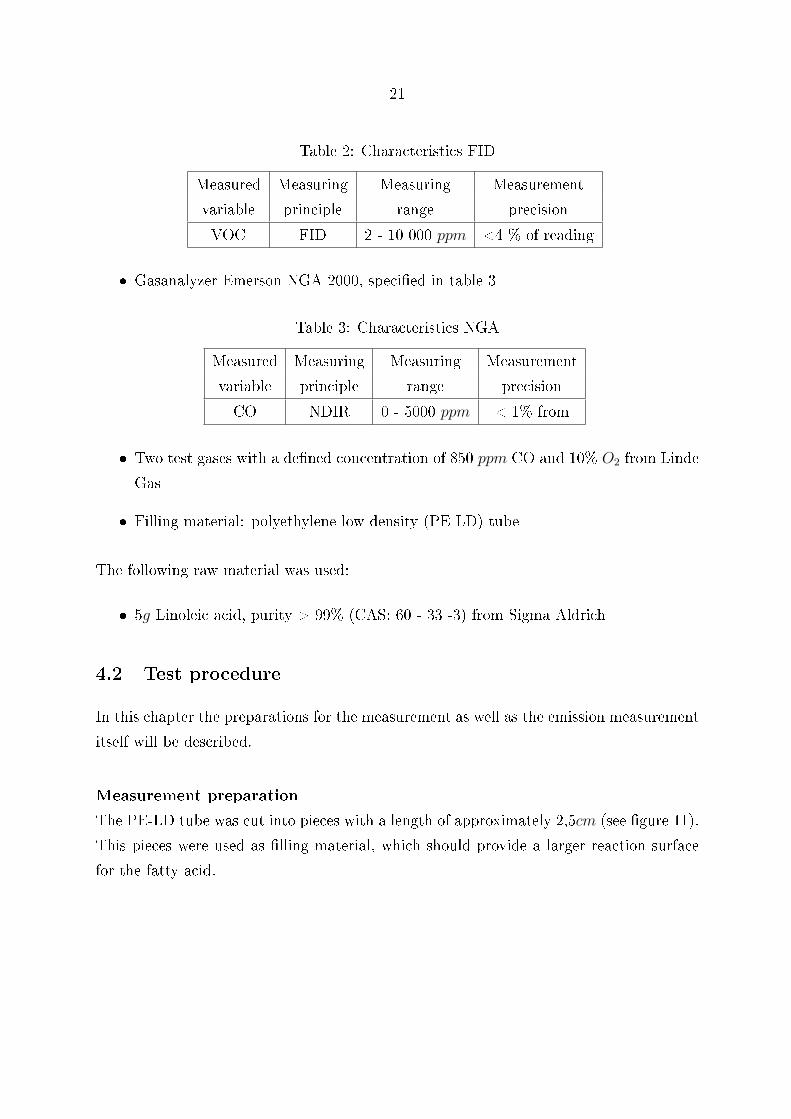
Table 2: Characteristics FID
Measured Measuring Measuring Measurement
variable principle range precision
VOC FID 2 - 10 000 ppm <4 % of reading
Gasanalyzer Emerson NGA 2000, specied in table 3
Table 3: Characteristics NGA
Measured Measuring Measuring Measurement
variable principle range precision
CO NDIR 0 - 5000 ppm < 1% from
Two test gases with a dened concentration of 850 ppm CO and 10% O2 from Linde
Gas
Filling material: polyethylene low density (PE LD) tube
The following raw material was used:
5g Linoleic acid, purity > 99% (CAS: 60 - 33 -3) from Sigma Aldrich
4.2 Test procedure
In this chapter the preparations for the measurement as well as the emission measurement
itself will be described.
Measurement preparation
The PE-LD tube was cut into pieces with a length of approximately 2,5cm (see gure 11).
This pieces were used as lling material, which should provide a larger reaction surface
for the fatty acid.

22
Figure 11: Filling material
Part of the lling material was lled in a glasbottle and the linoleic acid was sprayed
onto it. Then the bottle was shaken to distribute the linoleic acid on the lling material.
Afterwards some more lling material was given into the bottle and the procedure with
the linoleic acid was repeated a second time. Reference measurements were performed
with another bottle which contained the lling material only. The bottles were air tight
closed and stored at a constant temperature of 21,5 for four days.
Before the emission measurement was started, the measurement data were proofed with
two test gases, which had a dened concentration of 850 ppm CO respectively 10 % O2.
This procedure was done because instead of the measurement pump of the NGA the pump
of the FID was used. This caused that the pressure in the measuring cell of the NGA was
not that high than during the calibration, at which the pressure is usually 1 bar.
Emission measurement
For the emission measurement the bottle was opened and connected via a special designed
measuring adapter and a silicon tube with the gas analyzer (NGA), which enables the
measuring of CO in a range of ppm. The gas sample was fed from the NGA to the FID
to analyze the total amount of volatile organic compounds.
The exchange of the screw cap of the bottle and the measuring adapter must be quickly
performed to insure that the gas exchange of the atmosphere in the bottle with the
environment is as small as possible.
The measuring adapter was designed in that way that fresh air was fed at the bottom

23
into the bottle and the assay was taken at the top. This principle is shown in gure 13.
Figure 12 shows the measuring adapter.
Figure 12: Used measuring adapter Figure 13: Principle of measurement with
the measuring adapter
The resolution of the data logging was one value per second. The measuring data was
stored in a "csv"-le and further processed with "Excel".
5 Pretest
In this chapter storage experiments will be described. During storage tests the emissions
of carbon monoxide and the total volatile organic compounds from dierent raw materials
were measured.
For these observations several materials were used: miscanthus spans, miscanthus pellets,
ash shavings, larch shavings and spruce shavings.
Moreover, this experimental work was carried out to evaluate an already existing labo-
ratory setup and to evaluate the improvement opportunities for the design of the new
laboratory reactor.
5.1 Used equipment
For the storage experiments with glass bottles the following equipment were used:
Laboratory glass bottles with a volume of 5l respectively 2l

24
Measurement adapter
FID
Gasanalyzer Emerson, NGA 2000
Test gases with a dened concentration of 850 ppm CO respectively 10% O2
The properties of the used measurement devices were already described in chapter 4.1.
5.2 Raw material
For the experiments, several types of pellets and shavings were chosen.The following
table (see table 4) shows the types of raw material used, the amount of bottles which
were used, the used mass as well as the starting date of storage:
Table 4: Used raw materials in storage tests
Material Bottle Amount Experiment Mass
Volume [l] of bottles number [kg]
Miscanthus shavings 5 3
1 0,9882
2 0,9949
3 0,9479
Ash tree shavings 5 3
4 0,8950
5 0,9009
6 0,9257
Miscanthus pellets 5 2
7 2,0995
8 2,0973
2 1
9 0,8316
Larch shavings 5 3
10 0,8004
11 0,7861
12 0,8149

25
Spruce shavings 5 3
13 0,2796
14 0,3314
15 0,3130
5.3 Test procedure
The raw materials were lled into laboratory glass bottles. The bottles were air tight
closed and stored in an air-conditioned room at 21,5 for four weeks.
At the beginning of the experiment the moisture content was analyzed. According to the
standard ÖNORM EN 14 774 - 2 [31], 100g of each material were dried in a laboratory
drying oven at 105 ±2 till constant weight.
The density of the raw materials, which is needed for the calculation for the emission
rates from the dierent raw materials, was taken from literature (see table 5). It has to
be noticed, that the bulk density varies depending on the moisture content as described
in El Bassam and Huisman [32]. Thus, the values taken from the literature are only
approximate values. To use more exact bulk densities for the calculation, which will be
described in chapter 5.4, the densities had to be determined through experiments.
Table 5: Water content and density of used material
Material Moisture content [%]1 Bulk density [ kgm3 ]
Miscanthus shavings 9,71 3002
Ash tree shavings 12,53 7003
Miscanthus pellets 5,84 12664
Larch shavings 13,80 6003
Spruce shavings 8,62 4603
1The moisture content was measured when the bottles were lled and after the experimental time of
four weeks. For the calculation the averaged value was used.2Bulk density used from: The bulk density varies depending on the moisture content of the material.
Thus the bulk density ranges from 300 to 500 kgm3 . The moisture content depends on the harvest date.
The moisture content of the green plant, cropped in September is 50 - 60%. During winter the moisture
content decreases and reaches levels of 25 - 40% in early spring. [32] The used miscanthus shavings have
a very low moisture content of about 11,69% at the beginning of the experiment3Bulk density used from: [33]4Bulk density used from: Experiments which were carried out at Bioenergy2020+
26
After a storage time of three days the rst measurement took place.
The procedure was the same as already described in chapter 4.2
The duration of an measurement was approximately 15min.
When the measurement was nished the bottle was purged with compressed air and air
tight closed and stored for another three days. Then the measurement was repeated. The
measurements took place over a period of four weeks.
After this time the moisture content was analyzed once more according to the ÖNORM
EN 14 774 - 2 as described before. This was done because the purges of the bottles
with compressed air caused a decrease of the water content of the used material. For the
calculation the averaged moisture content was used.
5.4 Processing of data
Every measurement took place for about 15 min, as described before. From the obtained
measurement data a three minutes interval was chosen.
An example shows gure 14. This graph was received during the rst measurement of
experiment number 1. The measurement data from the interval which is marked in gure
14 were averaged and corrected. The correction was necessary because in the experiment
the pump of the FID was used instead of the pump from the NGA gas analyzer. This
causes a lower pressure in the measuring cell of the NGA than necessary as already
described in chapter 4.2. The correction factor was determined through the measuring of
the test gas with a dened concentration of 850 ppmCO. The measured value was lower
than 850 ppm. Thus, the correction factor was dened as: "dened concentration of the
test gas/ measurement value of test gas". The averaged and corrected value was further
used to determine the amount of CO per kilogram dry fuel per day.

27
Figure 14: Run of CO during experiment number 1
An example of the calculation for CO is given below.
First of all, the pellet respectively the shaving volume in the laboratory bottle was
calculated. Therefore, the bulk density from table 5 was used.
VPellet/Shaving =mPellet/Shaving[kg]
%Bulk
[kgm3
] =0, 9885[kg]
300[ kgm3 ]
= 0, 00329[m3] (1)
Next the volume of air within the bottle is received through calculation 2:
VAir = VBottle − VPellet/Shaving = 0, 005[m3]− 0, 00329[m3] = 0, 00171[m3] (2)
With VAir and the average concentration value of CO the volume of CO in the bottle was
calculated. In this example the average concentration value of CO is 48 ppm.

28
VCO = C[ppm] · VAir[m3] = 48[ppm] · 0, 00171[m3] =
= 48, 37[ppm] · 10−6 · (0, 00171 · 106)[ml] = 0, 08271[ml] (3)
With the volume of CO the amount of gas in the bottle in mg was reckoned with the
ideal gas volume (VidealGas = 22, 414 lmol
) and the molar mass of CO (MCO = 28 gmol
):
mCO =VCO[ml]
VidealGas
[l
mol
] ·MCO
[ g
mol
]=
0, 08271[ml]
(22, 414 ∗ 103)[
mlmol
] · (28 · 103)[mgmol
]=
= 0, 10333[mg] (4)
Then the mass of CO was divided by the storage time and by the used amount of fuel:
mCO[mg]
t[d] ·mPellet/Shaving[kg]=
0, 10333[mg]
3, 23[d] · 0, 9882[kg]= 0, 0324
[mg]CO
[kg]fuel · [d](5)
Finally, the water content was eliminated:
0, 0324[mg]CO
[kg]fuel · [d]· 100
100−WC[%]= 0, 0324
[mg]CO
[kg]fuel · [d]· 100
100− 9, 71[%]=
= 0, 0359[mg]CO
[kg]fuelodw · [d](6)
The calculation for VOC per kilogram dry fuel per day was done in the same way. In this
case the molar mass from propane was used.
5.5 Discussion of storage test setup
During the storage experiments with the laboratory glass bottles some disadvantages of
the used laboratory setup were noticed:

29
With the already known experimental setup it was necessary to open the bottle to
x the measuring adapter to start the measurement. This exchange should be done
as quickly as possible as already described in chapter 5.3. However, there might be
an inuence on the result because of the mixing of the gas in the bottles with air.
The new setup must allow the measurement of the emissions without the need of
opening the storage vessel.
It is not possible to heat or to cool the laboratory glass bottles. Thus, the new
experimental design must allow to heat respectively to cool the reactor.
It was not possible to measure the temperatures in the bottles. Therefore, the
experimental setup must enable the measurement of the temperatures in the middle
of the pellets bed as well as near the reactor wall to check if there is a change in
the bed temperature. Moreover, the temperature measurement is necessary because
the new laboratory rector should provide the possibility of cooling and heating, as
mentioned before. The measurement data must be saved via a data logging system.
Also the pressure in the bottles could not be measured. In an improved measurement
design, also the pressure measurement values must be saved with the help of a data
logging system. With this data it will be possible to recognize if the o-gassing
reactions have an inuence on the pressure in the vessel.
The gas analysis must be improved. In the old setup the infrared gas analyzer as
well as the FID usually need volume ow rates of about 25 lhrespectively 1 l
min.
Because of the relatively small gas volume in the bottles and the need that the new
reactor should have similar size the new measurement equipment should work with
a small probe volume ow rate.
6 Laboratory reactor
To obtain more reliable and reproduceable measurement data from storage tests a new
laboratory reactor was designed. The construction is based on the literature research
(chapter 3) and the pretests (chapter 5). In the following several requirements were
dened. Moreover the size of the reactor as well as the chosen measurement technology
is described.
30
6.1 Requirements
For the reactor design the following requirements were dened:
Two work modes: The reactor must work as a closed system or as ow reactor.
This two work modes are required to investigate the inuence of availability of
oxygen during the storage time. As already described in chapter 3.2.3.4 the oxygen
concentration in storages have an inuence on the concentration of the emissions.
If the reactor works as a closed system, there is a dened amount of oxygen in the
reactor available. The oxygen concentration will decrease during the time of storage.
The second mode, ow reactor, ensures that the oxygen level is constant during the
experiment.
Temperature in the reactor: It must be possible to heat, to cool and to keep the
reactor at a constant temperature. These requirements are of interest because the
storage temperature has also an eect on the amount of emissions. As described
in chapter 3.2.3.3 the higher the temperature the higher the emissions. Therefore,
it is of interest to heat the reactor. The possibility to cool the reactor allows to
investigate if the emissions getting less at lower temperatures.
Temperature measurement: The temperature must be measurable in the mid of the
packed bed as well as near the reactor jacket. Furthermore, the temperatures at
the bottom and at the top of the pellets bed are of interest. These measurement
points are needed to monitor the bed temperature if the reactor is heated, cooled
or insulated.
Material: As material for the reactor stainless steal was chosen. This material does
not eect side reactions. Moreover the reactor can easily be heated and cooled.
Amount of pellets: The reactor design must allow to use a variable amount of pellets.
Therefore, it is possible to vary the hight of the sparger plate on which the pellets
are stored (see gure 15). So the used mass of wood pellets can be freely chosen
and it is possible to proof if there is an inuence on the emissions if more material
is used or not.
Furthermore, the emissions of pellets during storage are also depending on the type
of raw material (see chapter 3.2.3.6). Beside the emissions of industrial produced
pellets, which are commonly used in domestic heating systems, also emission from
pellets produced out of alternative raw materials like for example miscanthus or
31
wheat straw can be investigated. Non industrial pellets are often available only in
small amounts.
Thus the ability of variation of the used amount of pellets is a necessary requirement.
Atmosphere in the reactor: The atmosphere in the reactor must be adjustable. If
the reactor is working as a ow reactor the gas which is normally passing through
the reactor is technical air but can easily varied as well. In the closed system the
atmosphere can vary. As gases technical air, nitrogen and oxygen or a desired
mixture ratio of nitrogen and oxygen will be used. The variation of the atmosphere
allows to investigate the inuences on for example oxygen concentration on the
amount of emission or if there are less emissions if the atmosphere in the reactor is
100% nitrogen.
Size of reactor: For the provision of the reactor volume the following arguments are
decisive:
From former investigations the emission rates are approximately known ( see
[21]). Thus the reactor volume was chosen in a similar size due to the former
laboratory settings.
It must be possible to measure also the emission of small amounts and dierent
kinds of pellets. Former experiments showed that the emission rate depends on
the type of raw material used for the pelletizing process. (see chapter 3.2.3.6)
Moreover also non industrial pellets should be investigated, which are often
not available in large amounts.
Humidity: The humidity of the atmosphere in the reactor must be adjustable. If the
humidity of the atmosphere changes also the moisture content of the stored pellets
will change. This setting option helps to investigate if a change of the moisture
content of pellets inuences the emissions during storage as described in chapter
3.2.3.5
Emission measurement: The following emissions have to be measurable:
CO in a range of: 0 - 10 000ppm
CO2 in a range of: 0- 5%
O2 in a range of: 10 -30 %
Total amount of VOC in a range of: 0 - 5000ppm
32
For the emission measurement a gas chromatograph (GC) will be used.
Pressure and humidity measurement: Pressure and humidity should be measurable
at the top of the reactor. The humidity content must be measurable because the
inuence of moisture content of pellets on the emissions will be examined. The
measurement of pressure in the reactor is of interest because it is not well known
if there is an underpressure in the system as a result of the reactions which lead to
the emissions.
Data logging system: Temperatures, humidity and pressure measurement data must
be logged for further processing. Data from GC will also be logged due to the GC
data handling program.
In the following gure (see gure 15) a scheme of the laboratory reactor is shown. There
the measurement points for the temperatures, humidity and pressure are marked. Also
the connection to the gas chromatography as well as the inlet and outlet of the reactor
are depicted.

33
Figure 15: Drawing of the designed laboratory reactor with following utilities:1 - measure-
ment points for temperatures, 2 - inlet of reactor, 3 - outlet of reactor, 4 - measurement
port for GC, 5 - measurement point for humidity, 6 - measurement point for pressure, 7
- lter layer for GC, 8 - plug, 9 - sparger plate
6.2 Measurement technology
As already mentioned in chapter 6.1 the pressure, the humidity, the temperatures and
the gas composition in the reactor must be measured. All measurement equipment is
connected to a computer, which also allows further processing of the received data. (see
gure 16)

34
Figure 16: Schematic of data handling system
The chosen measurement technologies will be characterized shortly.
6.2.1 Gas analysis
For analyzing the emissions from pellets during the storage a gas chromatograph was
chosen. A gas chromatograph needs only small sample volumes. This is important to
keep the reactor size in a laboratory range. Moreover the measurement precision is high.
Characteristics of the chosen gas chromatograph:
Carrier gas: Helium
Detectors: FID, TCD
In the following an overview of gas chromatography system will be given. Furthermore,
the properties of the chosen equipment will be described in more detail.
Functionality of a gas chromatograph
Gas chromatography is a separation process, which basic operating principle involves
volatilization of the sample in a heated inlet or injector, followed by separation of the
mixture in a special column. [34]
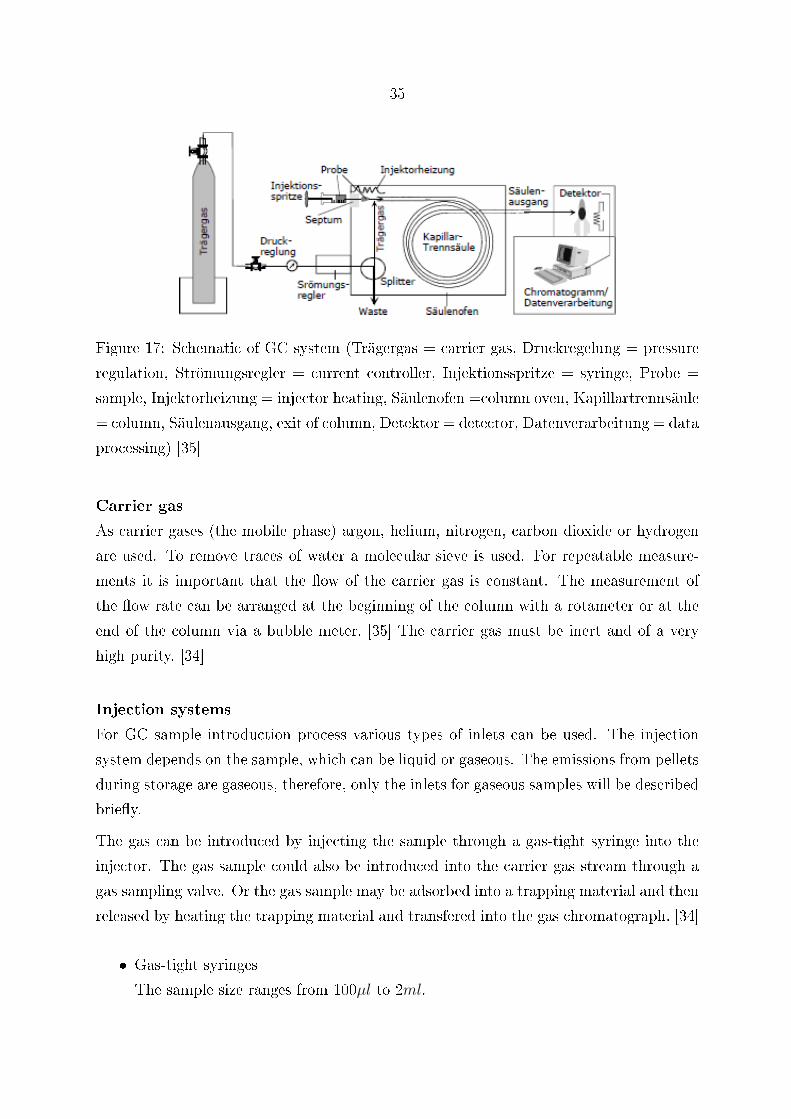
In the following gure (see gure 17) a schematic of a typical GC is shown. Main compo-
nents are the carrier gas supply, regulation for pressure and ow, heated injection system,
the separation column with the oven, the detection system as well as the evaluation
unit. [35]
35
Figure 17: Schematic of GC system (Trägergas = carrier gas, Druckregelung = pressure
regulation, Strömungsregler = current controller, Injektionsspritze = syringe, Probe =
sample, Injektorheizung = injector heating, Säulenofen =column oven, Kapillartrennsäule
= column, Säulenausgang, exit of column, Detektor = detector, Datenverarbeitung = data
processing) [35]
Carrier gas
As carrier gases (the mobile phase) argon, helium, nitrogen, carbon dioxide or hydrogen
are used. To remove traces of water a molecular sieve is used. For repeatable measure-
ments it is important that the ow of the carrier gas is constant. The measurement of
the ow rate can be arranged at the beginning of the column with a rotameter or at the
end of the column via a bubble meter. [35] The carrier gas must be inert and of a very
high purity. [34]
Injection systems
For GC sample introduction process various types of inlets can be used. The injection
system depends on the sample, which can be liquid or gaseous. The emissions from pellets
during storage are gaseous, therefore, only the inlets for gaseous samples will be described
briey.
The gas can be introduced by injecting the sample through a gas-tight syringe into the
injector. The gas sample could also be introduced into the carrier gas stream through a
gas sampling valve. Or the gas sample may be adsorbed into a trapping material and then
released by heating the trapping material and transfered into the gas chromatograph. [34]
Gas-tight syringes
The sample size ranges from 100µl to 2ml.
36
Gas sampling valves
Gas sampling valves are installed on the top of the GC, usually in their own sepa-
rately controlled heating oven.
Column
The separation occurs within a heated hollow tube (the column) that contains a stationary
phase. The components of the injected sample are carried onto the column by the carrier
gas. The stationary phase retards the components selectively. [34] The columns are made
out of stainless steal or glass. The inner surface of the column is coated with the stationary
phase. [35]
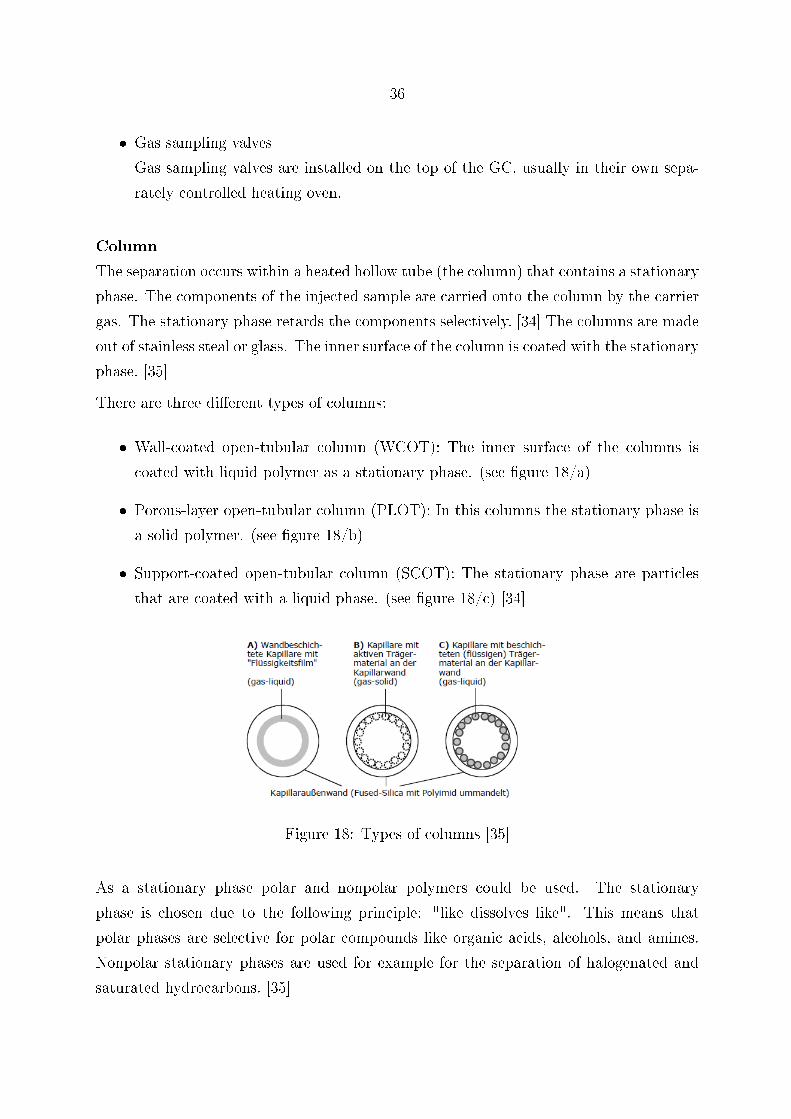
There are three dierent types of columns:
Wall-coated open-tubular column (WCOT): The inner surface of the columns is
coated with liquid polymer as a stationary phase. (see gure 18/a)
Porous-layer open-tubular column (PLOT): In this columns the stationary phase is
a solid polymer. (see gure 18/b)
Support-coated open-tubular column (SCOT): The stationary phase are particles
that are coated with a liquid phase. (see gure 18/c) [34]
Figure 18: Types of columns [35]
As a stationary phase polar and nonpolar polymers could be used. The stationary
phase is chosen due to the following principle: "like dissolves like". This means that
polar phases are selective for polar compounds like organic acids, alcohols, and amines.
Nonpolar stationary phases are used for example for the separation of halogenated and
saturated hydrocarbons. [35]
37
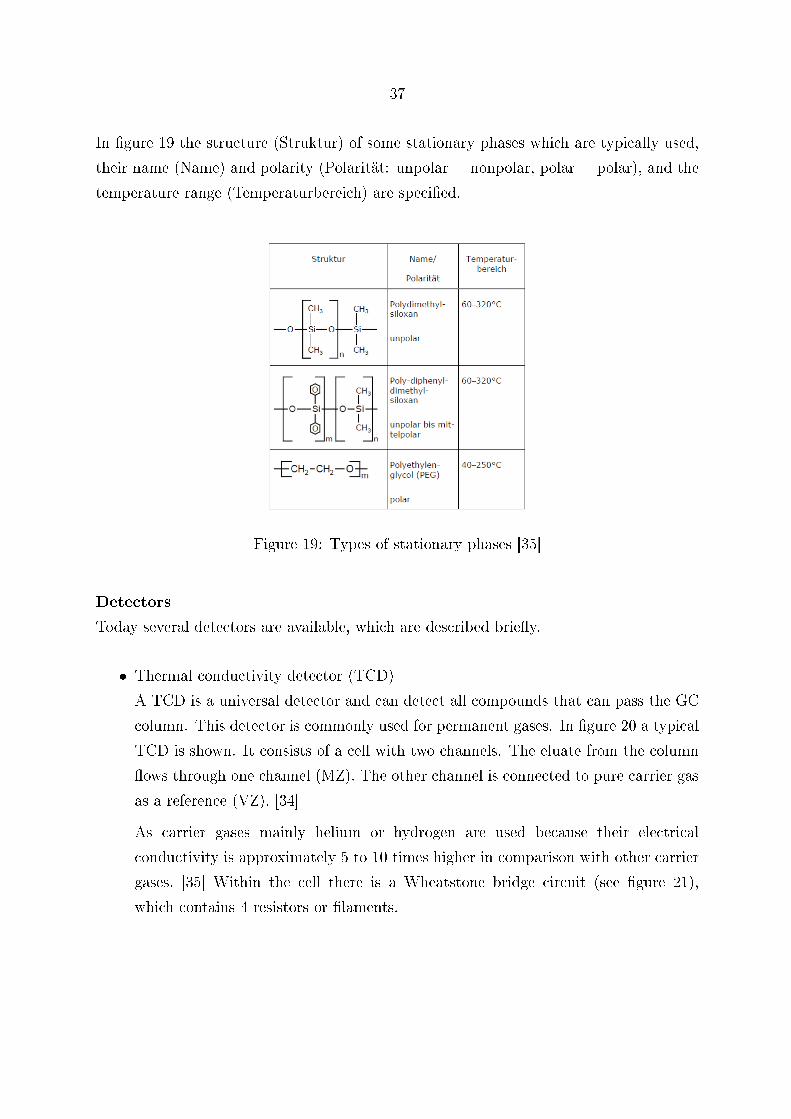
In gure 19 the structure (Struktur) of some stationary phases which are typically used,
their name (Name) and polarity (Polarität: unpolar = nonpolar, polar = polar), and the
temperature range (Temperaturbereich) are specied.
Figure 19: Types of stationary phases [35]
Detectors
Today several detectors are available, which are described briey.
Thermal conductivity detector (TCD)
A TCD is a universal detector and can detect all compounds that can pass the GC
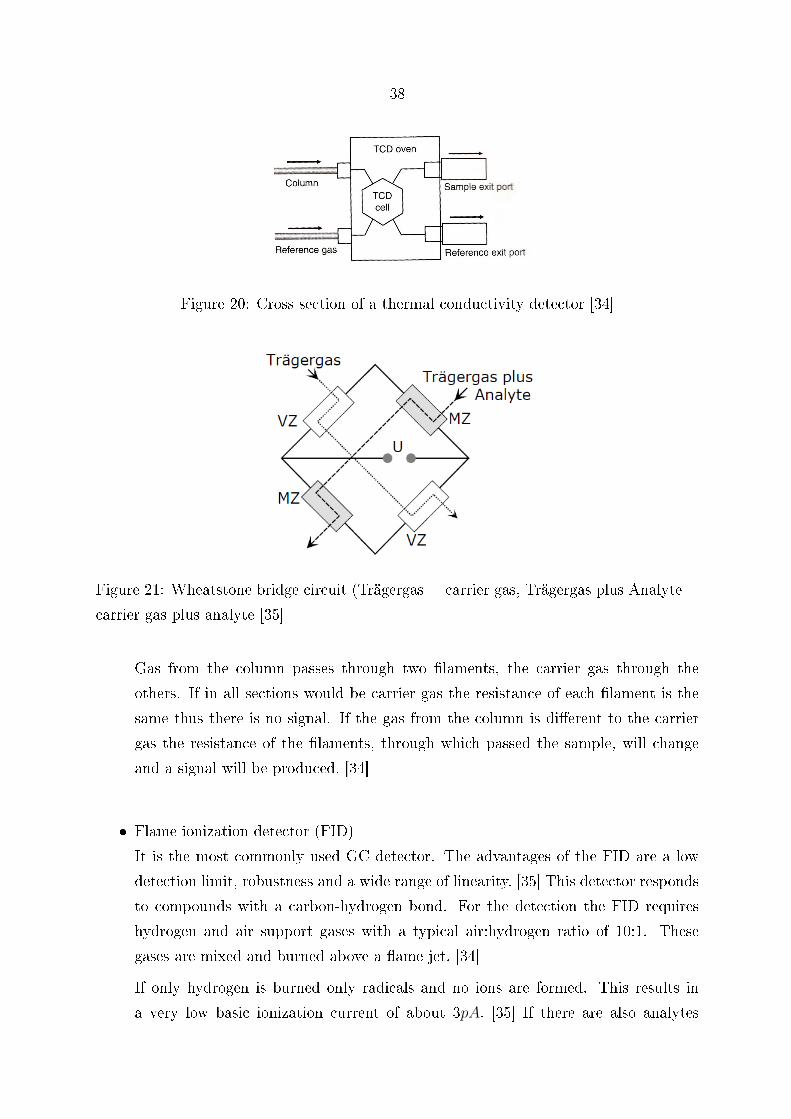
column. This detector is commonly used for permanent gases. In gure 20 a typical
TCD is shown. It consists of a cell with two channels. The eluate from the column
ows through one channel (MZ). The other channel is connected to pure carrier gas
as a reference (VZ). [34]
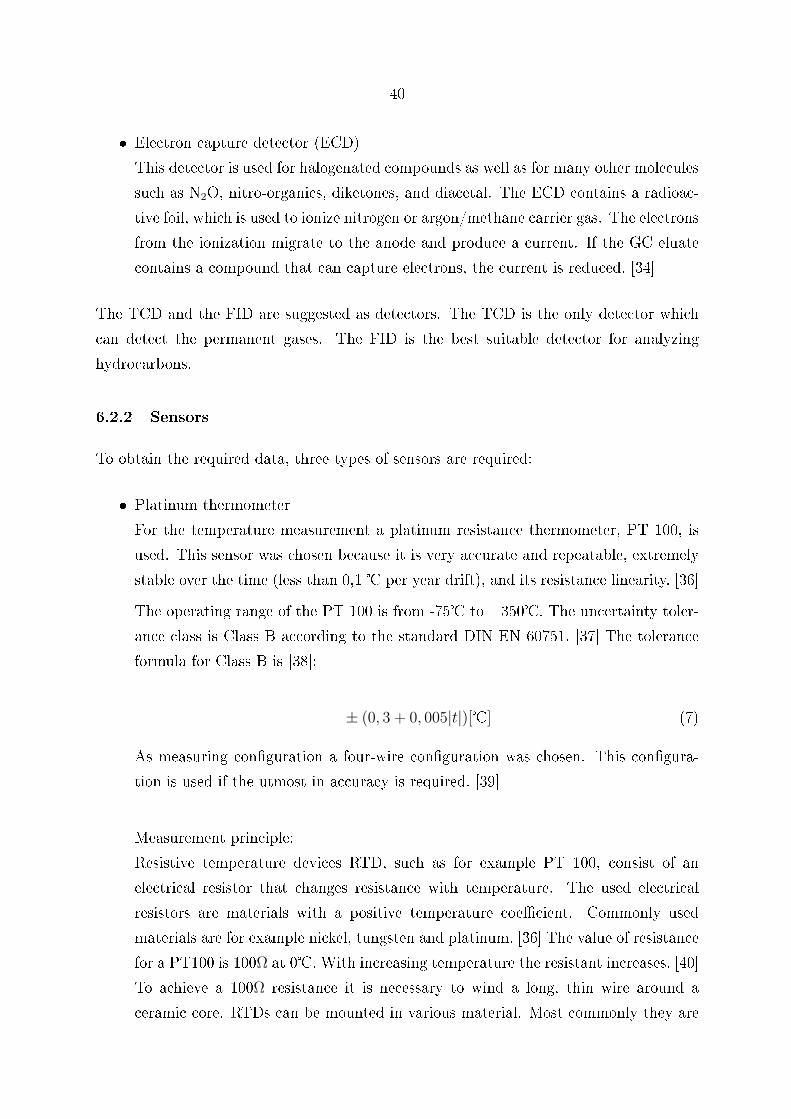
As carrier gases mainly helium or hydrogen are used because their electrical
conductivity is approximately 5 to 10 times higher in comparison with other carrier
gases. [35] Within the cell there is a Wheatstone bridge circuit (see gure 21),
which contains 4 resistors or laments.
38
Figure 20: Cross section of a thermal conductivity detector [34]
Figure 21: Wheatstone bridge circuit (Trägergas = carrier gas, Trägergas plus Analyte =
carrier gas plus analyte [35]
Gas from the column passes through two laments, the carrier gas through the
others. If in all sections would be carrier gas the resistance of each lament is the
same thus there is no signal. If the gas from the column is dierent to the carrier
gas the resistance of the laments, through which passed the sample, will change
and a signal will be produced. [34]
Flame ionization detector (FID)
It is the most commonly used GC detector. The advantages of the FID are a low
detection limit, robustness and a wide range of linearity. [35] This detector responds
to compounds with a carbon-hydrogen bond. For the detection the FID requires
hydrogen and air support gases with a typical air:hydrogen ratio of 10:1. These
gases are mixed and burned above a ame jet. [34]
If only hydrogen is burned only radicals and no ions are formed. This results in
a very low basic ionization current of about 3pA. [35] If there are also analytes

39
burned ions are produced. The electrons which are formed in the ame causes a
current ow in the gab between the jet tip (anode) and the electrode (cathode),
which is amplied and used as signal. [34]
Figure 22: Flame ionization detector [35] (Zündspule = ignition coil, Sammelelektrode
(Kathode) = collector electrode (cathode), Flammendüse (Anode) = ame jet (anode),
Luft = air, Wassersto = hydrogen, Ausgang der GC - Säule = exit of the GC column,
Trägergas plus Moleküle mit C-C- und C-H-Bindungen = carrier gas with C-C- and C-
H-bonds
Nitrogen-phosphorus detector (NPD)
The detector responds to compounds in a sample that contains nitrogen and/or
phosphorus. As support gases air and hydrogen are required. This gases surround
the heated rubidium sulfate bed. The current in the plasma of vaporized rubidium
ions increases if nitrogen and phosphorus compounds are present. The reaction with
phosphorus compounds is slower than with nitrogen compounds. [34]
Flame photometric detector (FPD)
This detector is primarily used for detection of volatile organic and inorganic
molecules containing sulfur and phosphorus. The analyte is burned in a hydro-
gen/air ame and chemiluminescent products are formed. With optical lters to
select wavelengths specic to the element of interest and a photomultiplier tube the
compounds containing sulfur and phosphorus can be selectively detected. [34]
40
Electron capture detector (ECD)
This detector is used for halogenated compounds as well as for many other molecules
such as N2O, nitro-organics, diketones, and diacetal. The ECD contains a radioac-
tive foil, which is used to ionize nitrogen or argon/methane carrier gas. The electrons
from the ionization migrate to the anode and produce a current. If the GC eluate
contains a compound that can capture electrons, the current is reduced. [34]
The TCD and the FID are suggested as detectors. The TCD is the only detector which
can detect the permanent gases. The FID is the best suitable detector for analyzing
hydrocarbons.
6.2.2 Sensors
To obtain the required data, three types of sensors are required:
Platinum thermometer
For the temperature measurement a platinum resistance thermometer, PT 100, is
used. This sensor was chosen because it is very accurate and repeatable, extremely
stable over the time (less than 0,1 per year drift), and its resistance linearity. [36]
The operating range of the PT 100 is from -75 to +350. The uncertainty toler-
ance class is Class B according to the standard DIN EN 60751. [37] The tolerance
formula for Class B is [38]:
± (0, 3 + 0, 005|t|)[] (7)
As measuring conguration a four-wire conguration was chosen. This congura-
tion is used if the utmost in accuracy is required. [39]
Measurement principle:
Resistive temperature devices RTD, such as for example PT 100, consist of an
electrical resistor that changes resistance with temperature. The used electrical
resistors are materials with a positive temperature coecient. Commonly used
materials are for example nickel, tungsten and platinum. [36] The value of resistance
for a PT100 is 100Ω at 0. With increasing temperature the resistant increases. [40]
To achieve a 100Ω resistance it is necessary to wind a long, thin wire around a
ceramic core. RTDs can be mounted in various material. Most commonly they are
41
mounted in a closed-end stainless steal tube. The tube is packed with vibration
damping or heat transfer material such as ceramic powder. [36]
Pressure transmitter
The operating range of the pressure transmitter is from 0 to 1,6 bar. As measure-
ment device a piezo-resistive element is used. [41]
Measurement principle:
Piezo-resistive pressure sensors contain a sensing element made up of a silicon chip.
This chip contains a circular silicon diaphragm and four piezoresistors. The resistors
refer to the change in resistance caused by strain when pressure is applied to the
diaphragm. Due to the amount of pressure applied to the diaphragm the resistor
values change. The change in pressure is converted into a change in resistance. The
four resistors are connected in a "Wheatstone Bridge". [42]
Humidity
The selected sensor is a combination of a humity sensor and a temperature sensor.
The working range of humidity sensor is from 0 % to 100% relative humidity.
Moreover the temperature is measured with a PT1000 (class A, DIN EN 60751) in
range of -40 to +120 . For the humidity measurement the accuracy is ± 1,3 %
relative humidity (RH), for the temperature ± 0,2 . [43]
Measurement principle:
With the chosen humidity sensor it is possible to measure the relative humidity
(RH), which is described as the ratio of the moisture content of air compared to the
saturated moisture level at the same temperature or pressure. [44]
For the laboratory setup, a capacitive sensor is used. This sensor type is operating
accurately down to 0% RH. Furthermore, it has a low temperature eect. Thus this
type is often used over wide temperature ranges without temperature compensation.
In a capacitive RH sensor, change in dielectric constant is almost directly propor-
tional to relative humidity. For 1% RH change, the typical change in capacitance is
0,2 - 0,5 pF . This sensors are able to fully recover from condensations. Moreover,
they resist chemical vapors. [44]
42
6.2.3 Data logging system
To continuously monitor the temperature, the pressure and the humidity, a data logging
system from Deln is used. The used system provides 24 analog inputs, 6 analog outputs,
2 digital outputs and 28 bit digital input/outputs.
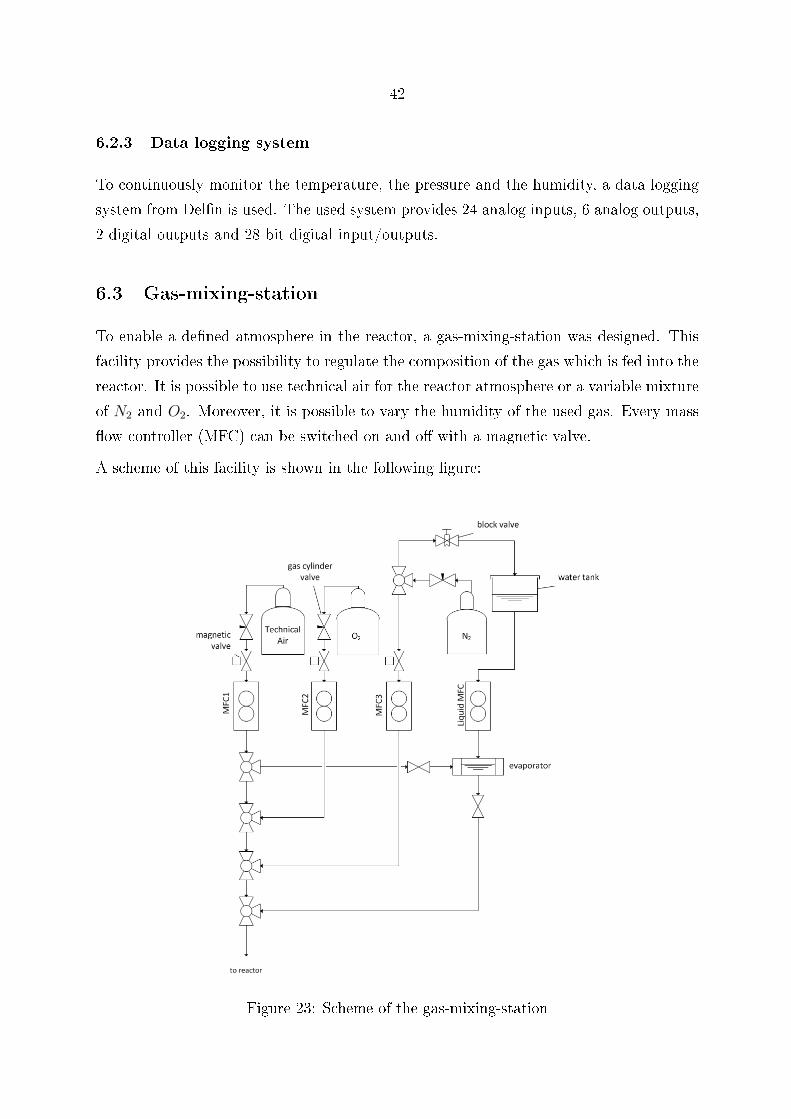
6.3 Gas-mixing-station
To enable a dened atmosphere in the reactor, a gas-mixing-station was designed. This
facility provides the possibility to regulate the composition of the gas which is fed into the
reactor. It is possible to use technical air for the reactor atmosphere or a variable mixture
of N2 and O2. Moreover, it is possible to vary the humidity of the used gas. Every mass
ow controller (MFC) can be switched on and o with a magnetic valve.
A scheme of this facility is shown in the following gure:
Figure 23: Scheme of the gas-mixing-station
43
7 Results and discussion
In this chapter the results of all experiments will be described and discussed.
7.1 Results and discussion of the experiment for auto-oxidation
of fatty acids
The following gure shows the measurement data of the experiment with the linoleic
acid, which is described in chapter 4. It can be seen (see gure 24) that already 5g of this
unsaturated fatty acid leads to emissions of VOC and CO due to auto-oxidation. The
maximum of CO was about 195ppm, the one of VOC was close to 900ppm.
Figure 24: Run of CO and VOC of auto-oxidation of linoleic acid
This result shows that auto-oxidation is most likely the mechanism which leads to emis-
sions from pellets.
It is still unknown if the emissions from fatty acids are decreasing during storage. This
question could be answered by an experiment with four bottles. These bottles should be
lled with lling material and the linoleic acid distributed in the glass bottles. After four
days of storage the measurement of the emissions from the fatty acid should start. Every
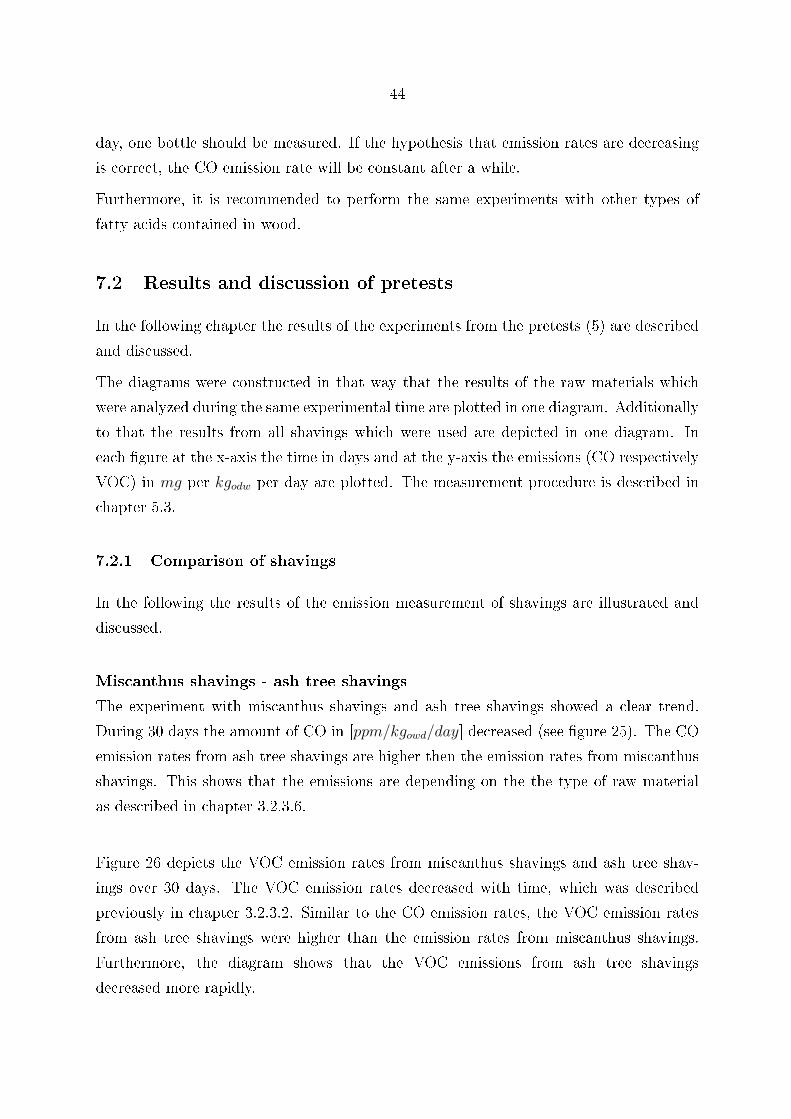
44
day, one bottle should be measured. If the hypothesis that emission rates are decreasing
is correct, the CO emission rate will be constant after a while.
Furthermore, it is recommended to perform the same experiments with other types of
fatty acids contained in wood.
7.2 Results and discussion of pretests
In the following chapter the results of the experiments from the pretests (5) are described
and discussed.
The diagrams were constructed in that way that the results of the raw materials which
were analyzed during the same experimental time are plotted in one diagram. Additionally
to that the results from all shavings which were used are depicted in one diagram. In
each gure at the x-axis the time in days and at the y-axis the emissions (CO respectively
VOC) in mg per kgodw per day are plotted. The measurement procedure is described in
chapter 5.3.
7.2.1 Comparison of shavings
In the following the results of the emission measurement of shavings are illustrated and
discussed.
Miscanthus shavings - ash tree shavings
The experiment with miscanthus shavings and ash tree shavings showed a clear trend.
During 30 days the amount of CO in [ppm/kgowd/day] decreased (see gure 25). The CO
emission rates from ash tree shavings are higher then the emission rates from miscanthus
shavings. This shows that the emissions are depending on the the type of raw material
as described in chapter 3.2.3.6.
Figure 26 depicts the VOC emission rates from miscanthus shavings and ash tree shav-
ings over 30 days. The VOC emission rates decreased with time, which was described
previously in chapter 3.2.3.2. Similar to the CO emission rates, the VOC emission rates
from ash tree shavings were higher than the emission rates from miscanthus shavings.
Furthermore, the diagram shows that the VOC emissions from ash tree shavings
decreased more rapidly.

45
Figure 25: CO emission rates [mgCO/kgowd/day] from miscanthus shavings and ash tree
shavings over storage time
Figure 26: VOC emission rates [mgV OC/kgowd/day] from miscanthus shavings and ash
tree shavings over storage time
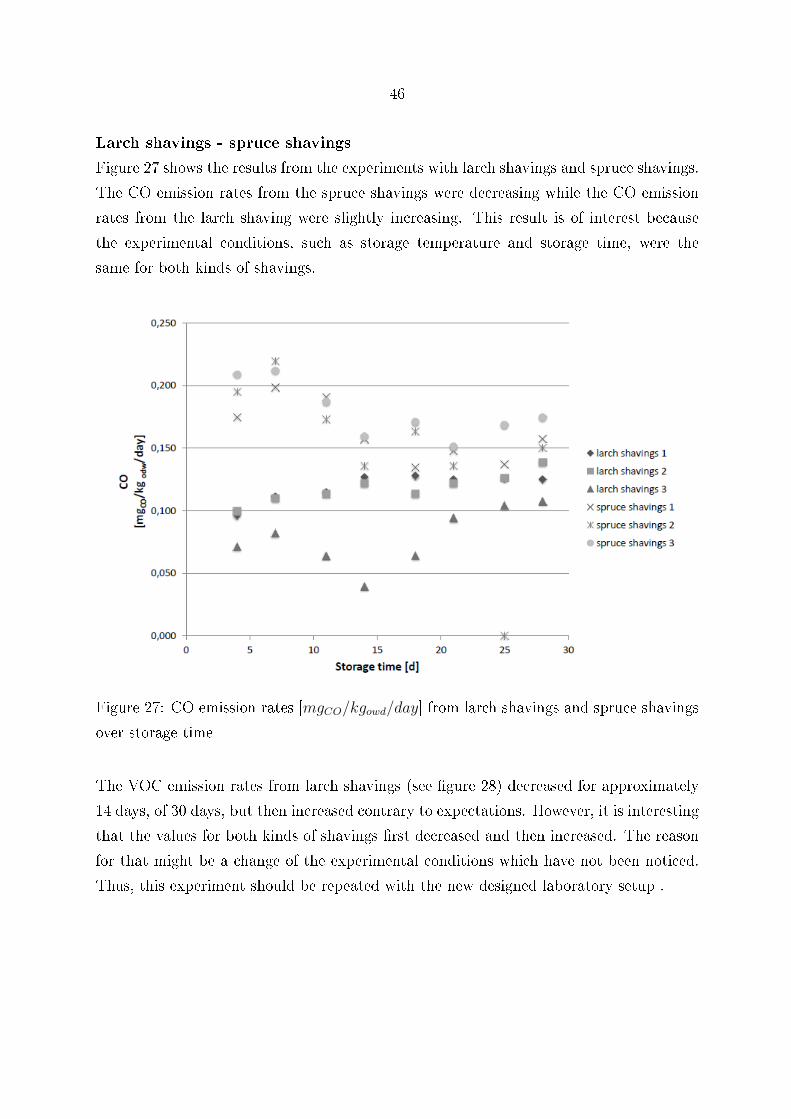
46
Larch shavings - spruce shavings
Figure 27 shows the results from the experiments with larch shavings and spruce shavings.
The CO emission rates from the spruce shavings were decreasing while the CO emission
rates from the larch shaving were slightly increasing. This result is of interest because
the experimental conditions, such as storage temperature and storage time, were the
same for both kinds of shavings.
Figure 27: CO emission rates [mgCO/kgowd/day] from larch shavings and spruce shavings
over storage time
The VOC emission rates from larch shavings (see gure 28) decreased for approximately
14 days, of 30 days, but then increased contrary to expectations. However, it is interesting
that the values for both kinds of shavings rst decreased and then increased. The reason
for that might be a change of the experimental conditions which have not been noticed.
Thus, this experiment should be repeated with the new designed laboratory setup .

47
Figure 28: VOC emission rates [mgV OC/kgowd/day] from larch shavings and spruce shav-
ings over storage time
Miscanthus -, ash tree -, larch - and spruce shavings
In gure 29 and 30, CO and VOC emission rates from all used materials are plotted.
CO as well as VOC emission rates in ppm/kgdryfuel/day are dierent depending on the
kind of raw material (see gure 29 and 30). The CO and VOC emission rates over the
storage time are the highest for spruce shavings, followed by larch shavings and ash tree
shavings. Miscanthus shavings show the lowest CO and VOC emission rates.
Especially the dierences of emissions from miscanthus shavings compared to the emission
from spruce shavings are of interest. If the mechanism for formation of the emission is
auto-oxidation, as suggested in chapter 3.2.2.1, then the reason for the dierence in the
amount of emission rates result from dierent amount of fatty acids. The amount of fatty
acids in spruce is about 0,78wt% (based on oven dry wight). [19] The fatty acid content
of miscanthus (winter dry plant) is about 0,03wt% [45]. (The fatty acid content is stated
in mass percent based on oven dry wight of the wood species)
However, there is no explanation for the increase of VOC emissions from spruce- and larch
shavings after some time.

48
Figure 29: CO emission rates from miscanthus-, ash tree-, larch- and spruce shavings over
storage time
Figure 30: VOC emission rates from miscanthus-, ash tree-, larch- and spruce shavings
over storage time

49
7.2.2 Comparison of shavings and pellets
Below the results from the experiment which miscanthus pellets and shaving will be
discussed. Furthermore, they will be compared with former performed measurements.
Miscanthus shavings - miscanthus pellets
In gure 31 the results from the emission measurements from miscanthus shavings and
miscanthus pellets are shown. There is a decrease of CO emission rates from pellets as
well from shavings as described in detail in chapter 3.2.3.2. The trend in gure 31 is
similar to that in gure 25.
The CO emission rates from miscanthus shavings are lower compared to those from
miscanthus pellets.
Figure 31: CO emission rates in [mgCO/kgowd/day] from miscanthus pellets and miscant-
hus shavings over storage time
Figure 32 shows the VOC emission rates from miscanthus pellets and miscanthus shavings
over the experimental time. Except from some outliers, a slight trend is visible. The
VOC emission rates were decreasing with the time. Only the measurement points from
the miscanthus pellets have values above 0,007 mg/kgowd/d although the conditions

50
were the same as for miscanthus shavings. The reason for this deviation is unknown at
present.
Figure 32: VOC emission rates [mgV OC/kgowd/day] from miscanthus pellets and miscant-
hus shavings over storage time
In the next two diagrams (gure 33, gure 34) the emission rates of CO and VOC from
pine -, larch- and spruce- pellets and shavings over the storage time are shown. The
emission rates resulted from former experiments carried out at Bioenergy 2020+. In
these experiments the same experimental setup was used as described in chapter 5, but
the experimental time was only one week instead of four weeks. However, the trend
that CO as well as the VOC emission rates are decreasing is visible. The CO and VOC
emission rates are not only depending on the wood species but also the emission rates
from shavings and pellets of the same wood species are dierent. The CO emission rates
from the pellets are clearly higher than the emission rates from the shavings from the
same wood species. This trend is not visible for the VOC emission rates.
These results conrm the result obtained in the storage tests with miscanthus shavings
and miscanthus pellets (see gure 31 and gure 32). Also Kuang et. al.(2008) observed
that pelletized materials emit more gases than non-pelletized material. As a reason

51
they mentioned, that perhaps the heat treatment during the manufacturing process of
pellets opens the porous structure of wood and thereby increases the surface area of the
material. [12] Thus, there must be an inuence on the amount of emission resulting from
the pelletizing process.
Figure 33: CO emission rates [mgCO/kgowd/day] from dierent kinds of pellets and shav-
ings over storage time

52
Figure 34: VOC emission rates [mgV OC/kgowd/day] from dierent kinds of pellets and
shavings over storage time
In the experiments also the fatty acid content was analyzed. In table 6 the fatty acid
content and the maximal CO emission rate of the used materials are listed. The table
entries were sorted from the material with the least CO emission rate to the material
with the highest CO emission rate.
Table 6: Fatty acid content of pellets and shavings
Wood species Maximal CO emission rate Fatty acid content
[mgCO/kgodw/day] [wt%]
larch shavings 0,056 0,161
spruce shavings 0,240 0,088
larch pellets 0,297 0,073
pine shavings 0,434 0,131
spruce pellets 0,629 0,040
pine pellets 2,878 0,081
The shavings of all wood species have higher fatty acid contents then the pellets from
these wood species. But although the shavings have higher fatty acid contents, the CO

53
emission rates are lower than the CO emission rates from the pellets. Moreover, there is
no correlation between the CO emission rates and the fatty acid contents.
7.3 Results and discussion of the new designed laboratory reactor
The reactor and the necessary measurement setup was designed to meet the dened exper-
imental requirements based on the results of the literature research and the pretest. The
most suitable measurement devices were chosen. For the temperature measurement PT
100 sensors, for the pressure measurement a sensor with a piezo-resistive element and for
the humidity measurement a capacitive sensor will be used. The emission measurements
will be carried out with a gas chromatograph as already described in chapter 6.2.
Unfortunately the gas chromatograph had a very long time of delivery, which was not fore-
seeable at the beginning of the work. Thus, it was not possible to carry out measurements
with the new designed laboratory reactor within in this master thesis.
Figure 35: Scheme of the new designed laboratory setup
However, gure 35 shows a scheme of the new laboratory design. This setup will be as-
sembled in an air-conditioned laboratory room. Thus, during the storage and the emission
measurements the temperature will be constant at 21,5 . All gases, which are needed
for the operation of the gas chromatograph, are stored in a gas cylinder cabinet. The
gas cylinders are connected via stainless steel tubes with the GC. For the connection

54
between the reactor and the GC also a stainless steel tube is used. All other connections
are realized with PTFE tubes. Magnetic valves at the inlet and outlet of the reactor are
needed to close the reactor if it is used as a closed system and for the gas sampling. If
the reactor is working as a closed system, it will be purged with technical air for about
30 min with a pressure of 1 bar. After this time both magnetic valves will be closed
simultaneously to ensure that the pressure during storage is 1 bar. For the gas sampling
to the GC at least atmospheric pressure in the reactor is needed. It can be expected that
the reactions, which lead to the emissions during storage, will lead to the reduction of
the storage pressure. Therefore, it will be necessary to pump additional nitrogen into
the reactor before a GC measurement takes place to increase the pressure to atmospheric
level. The magnetic valve at the inlet of the reactor will open till the pressure sensor
detects 1,013 bar. Then the magnetic valve at the inlet of the reactor will close and the
magnetic valve to the gas chromatograph will open. However, the actual gas sampling
method will have to be specied once the gas chromatograph is delivered.
8 Conclusion and outlook
A laboratory reactor was designed based on (1) the literature research and on (2) exper-
imental tests.
From literature search the following factors that inuences the design of the reactor were
found:
Wood species which is used for pellet production
Condition of the raw material
Duration of storage of pellets
Storage temperature of pellets
Moisture content of pellets
Available oxygen during storage
On the basis of the literature research also the release mechanisms, auto-oxidation and
biomass decomposition, for the emission from pellets were discussed. According to the
auto-oxidation as release mechanism an experiment with a fatty acid was carried out. The
results showed that CO and VOC emission are products of the auto-oxidation reactions.

55
The storage experiments were performed with dierent raw materials with an existing
experimental setup. This setup consisted of laboratory glass bottles, an infrared gas
analyzer and a ame ionization detector. The glass bottles were used to store the raw
materials, and the emission measurement were performed with the infrared gas analyzer
and a ame ionization detector. The following shortcomings of this experimental setup
were found:
For the emission measurements, the infrared gas analyzer and the ame ionization
detector required a very high sample volume. The sample volume, however, was
limited to the volume of the glass bottles.
It was not possible to heat or cool the laboratory glass bottles. Therefore, the
inuence the storage temperature on the amount of emission from the pellets could
not be measured.
It was not possible to measure the pressure inside the glass bottles. Therefore,
any changes in pressure during the storage period could not be measured. If, for
example, there would be an underpressure inside the bottles, the concentration of
emissions inside the bottles would decrease when the bottles were opened in order
to x the measurement adapter. This in turn would have a highly negative impact
on the measurement values.
Additional to the analysis of the shortcomings of the used measurement setup, the results
from the measurements of the dierent raw materials were discussed. The measurement
results from the experiments with the glass bottle setup showed that the emission rates
from CO and VOC are decreasing over the time for all wood species. The hight value of
the emission rates depended on the wood species. Moreover, it was discovered that the CO
emission rates from pellets are higher than the CO emission rates from shavings from the
same wood species. This trend was not visible for the VOC emission rates. Furthermore,
the pelletizing process must have an inuence on the amount of CO emissions. However,
there was no correlation found between the fatty acid content of pellets and of shavings
of the dierent wood species and the CO emission rate. Therefore, further investigations
are needed where not only the total amount of fatty acids are considered but also the
amount of specic fatty acids are concerned.
Based on ndings of the literature study and the practical experiments, the laboratory
reactor was designed. For the temperature measurement inside the reactor, PT 100
sensors were chosen. These kinds of temperature sensors provide a very good linearity

56
and accuracy in the required measurement range. To investigate whether the emission
reactions lead to an underpressure inside the reactor, a capacitive pressure sensor is used.
For the emission measurement, a gas chromatograph was chosen because it is working
with very small sample volumes in the µl range. Furthermore, the newly designed
laboratory reactor does not need to be opened to start the emission measurements.
Another improvement is that it is possible to heat and to cool the reactor, which will
allow to test the eect of storage temperature on the amount of emissions and on the
emission rate. A specially designed gas mixing station guarantees the production of a
dened atmosphere. The option to moister the gas will allow to test the inuence of
humidity on the emission from pellets during the storage.
With the new designed laboratory reactor experiments will be carried out, in which the
inuencing factors will be discovered. Moreover, pellets from dierent wood species will
be used to dene which wood species release more or less emissions. Additional to that,
the experiments for the auto-oxidation of fatty acids will be pursued to investigate if the
CO and VOC emission rates are decreasing or increasing over the time.

57
References
[1] I. Obernberger and G. Thek. The Pellet Handbook; The production and thermal
utilisation of biomass pellets. earthscan, London; Washington DC, 2010.
[2] Umweltbundesamt. Klimaschutzbericht 2010. Wien, 2010.
[3] proPellets Austria. Netzwerk zur Föderung und Verbreitung von Pelletsheizungen.
http://www.propellets.at. Accessed: 21-May-2012, 12:00.
[4] S. Melin, U. Svedberg, and J. Samuelsson. Emissions from Woodpellets During Ocean
Transportation. Pellet Assosciation of Canada, 2008.
[5] U. Svedberg, J. Samuelsson, and S. Melin. Hazardous O-Gassing of Carbon Monox-
ide and Oxygen Depletion during Ocean Transportation of Wood Pellets. Annals of
Occupational Hygiene, 52:259 266, 2008.
[6] TGA Fachplaner. TGA Newsletter. http://www.tga-fachplaner.de/
TGA-Newsletter-2010-2/Warnung-vor-Kohlenmonoxid-im-Pelletlager,
QUlEPTI3MjgxOCZNSUQ9MzAwMDI.html. Accessed: 21-May-2012, 12:30.
[7] Schweizer Holzzeitung. Kohlenmonoxid im Pelletslager
- junge Frau gestorben. http://www.holz-portal.ch/
kohlenmonoxid-im-pelletslager-junge-frau-gestorben/150/89/35903. Ac-
cessed: 22-May-2012, 16:00.
[8] EN 14588:2010. Feste Biobrennstoe -Terminologie, Denitionen und Beschreibun-
gen. 2010.
[9] EN 14961-2:2011. Feste Biobrennstoe - Brennstospezikationen und -klassen - Teil
2: Holzpellets für nichtindustrielle Verwendung. 2011.
[10] U. Svedberg, H. Högberg, J. Högberg, and B. Galle. Emission of Hexanal and Carbon
Monoxide from Storage of Wood Pellets, a Potential Occupational and Domestic
Health Hazard. Annals of Occupational Hygiene, 48:339 349, 2004.
[11] M. Arshadi, P. Geladi, R. Gref, and P. Fjällström. Emission of Volatile Aldehydes
and Ketones fromWood Pellets under Controlled Conditions. Annals of Occupational
Hygiene, 53:797 805, 2009.
58
[12] X. Kuang, J. Tumuluru, X. Bi, S. Sokhansanj, C. Lim, and S. Melin. Characteriza-
tion and Kinetics Study of O-Gas Emissions from Stored Wood Pellets. Annals of
Occupational Hygiene, 52:675683, 2008.
[13] J. Salvato, N. Nemerow, and F. Agardy. Environmental Engineering. 5 edition, 2003.
[14] Committee on carbon monoxide episodes in meteorological and tropographical areas
National Research Council. The Ongoing Challenge of Managing Carbon Monoxide
Pollution in Fairbanks, Alaska. National Academy Press, Washington, 2002.
[15] Schornsteinfegerinnung Koblenz. Toxische Wirkung von Kohlenmonoxid. http:
//www.schornsteinfeger-innung-koblenz.de/bilder_rlp/files/co2.pdf. Ac-
cessed: 04-June-2012, 08:00.
[16] VDI2053. VDI Richtlinie 2053 - Raumlufttechnische Anlagen für Garagen. 2004.
[17] L. Molhave. Total Volatile Organic Compounds (TVOC) in Indoor Air Quality
Investigations. Indoor Air, 7:225 240, 1997.
[18] B. Seifert. Richtwerte für die Innenraumluft, Die Beurteilung der Innenraumluftqual-
ität mit Hilfe der Summe der üchtigen organischen Verbindungen (TVOC-Wert).
Bundesgesundheitsblatt - Gesundheitsforschung - Gesundheitsschutz, 42:270 278,
1999.
[19] D. Fengel and G. Wegener. Wood: Chemistry, Ultrastructure, Reactions. Verlag
Kessel, Remagen, 2003.
[20] K. Granström. Emissions of Hexanal and Terpenes during Storage of Solid Wood
Fuels. Forest Products Journal, 60:2732, 2010.
[21] W. Emhofer and C. Pointner. Lagertechnik und Sicherheit bei der Pelletslagerung -
Endbericht zu den Ergebnissen aus den AP 2, 4, 5 und 6. Technical report, bioen-
ergy2020+, 2009.
[22] X. Kuang, J. Tumuluru, X. Bi, C. Lim, S. Sokhansanj, and S. Melin. Rate and
Peak Concentrations of O-Gas Emissions in Stored Wood Pellets - Sensitivities to
Temperature, Relative Humidity, and Headspace Volume. Annals of Occupational
Hygiene, 53:789769, 2009.
[23] R. Meijer and C. Gast. Spontaneous combustion of biomass: Experimental study into
guidelines to avoid and control this phenomenon. 2nd World Biomass Conference,
2004.

59
[24] P. Lehtikangas. Storage eects on pelletised sawdust, logging residues and bark.
Biomass & Bioenergy, 19:287 293, 2000.
[25] M. Arshadi and R. Gref. Emission of volatile organic compounds from softwood
pellets during storage. Forest Products Journal, 55:132 135, 2005.
[26] M. Ståhl, K. Granström, and R. Renström. Industrial processes for biomass drying
and their eects on the quality properties of wood pellets. Biomass & Bioenergy,
27:621 628, 2004.
[27] J. Tumuluru, X. Kuang, S. Sokhansanj, C. Lim, T. Bi, and S. Melin. Development
of a laboratory studies on the o-gassing of wood pellets. Canadian Biosystems
Engineering, 52:8.18.9, 2010.
[28] X. Kuang, J. Tumuluru, S. Sokhansanj, C. Lim, X. Bi, and S. Melin. Eects of
Headspace and Oxygen Level on O-gas Emissions from Wood Pellets in Storage.
Annals of Occupational Hygiene, 53:807813, 2009.
[29] Juita, B. Dlugogorski, E. Kennedy, and J. Mackie. Oxidation Reactions and Spon-
taneous Ignition of Linseed Oil. Proc. Combust. Inst., 33:2625 2632, 2011.
[30] Juita, B. Dlugogorski, E. Kennedy, and J. Mackie. Identication and Quantitation of
Volatile Organic Compounds from Oxidation of Linseed Oil. Ind. Eng. Chem. Res.,
51:5645 5652, 2012.
[31] DIN EN14772 2:2010. Feste Biobrennstoe - Bestimmung des Wassergehaltes - Ofen-
trocknung - Teil 2: Gesamtgehalt an Wasser - Vereinfachtes Verfahren. 2010.
[32] N. El Bassam and W. Huisman. Harvesting and Storage of Miscanthus. In Jonnes
M. B. and Walsh M.: Miscanthus: For Energy and Fibre, chapter 6, pages 86 108.
James and James (Science Publishers) Ldt, 2001.
[33] DIN68364:2003. Kennwerte von Holz; Rohdichte, Elastizitätsmodul und Festigkeiten.
2003.
[34] D. Sparkman, Z. Penton, and F. Kitson. Gas Chromatography and Mass Spectrome-
try: A Practical Guide. Academic Press, Oxfort, 2011.
[35] M. H. Gey. Instrumentelle Analytik und Bioanalytik: Biosubstanzen, Trennmethoden,
Strukturanalytik, Applikationen. Springer-Verlag, Berlin, Heidelberg, 2008.

60
[36] J. Fontes. Temperature Sensors. In Wilson J.S.: Sensor technology handbook, chap-
ter 20, pages 531 561. Elsevier, 2005.
[37] TC Direct. für Temperatur -Sensoren, -Messung und -Regelung. http://www.
tcdirect.de. Accessed: 04-September-2012, 16:00.
[38] DIN EN 60751:2009. Industrielle Platin-Widerstandsthermometer und Platin-
Temperatursensoren. 2009.
[39] C. Dames. Resistance Temperature Detectors. In Encyclopedia of Microuidics and
Nanouidics, chapter 18, pages 1782 1790. Springer-Verlag, 2008.
[40] E. Hering and G. Schönfelder. Sensoren in Wissenschaft und Technik; Funktionsweise
und Einsatzgebiete. Vieweg+Teubner Verlag, Wiesbaden, 2012.
[41] Jumo. Druckmessumformer. http://www.jumo.at/produkte/druck/
druckmessumformer/404366/jumo-dtrans-p. Accessed: 04-September-2012,
15:00.
[42] G. Harman. Pressure Sensors. In Wilson J.S.: Sensor technology handbook, chap-
ter 16, pages 411 465. Elsevier, 2005.
[43] E+E Elektronik. Feuchtemessumformer für Industrieanwendun-
gen. http://www.epluse.com/de/produkte/feuchtemesstechnik/
feuchtemessumformer-fuer-industrieanwendungen/ee23/. Accessed: 10-
September-2012, 11:00.
[44] J. Fontes. Humidity Sensors. InWilson J.S.: Sensor technology handbook, chapter 12,
pages 271 284. Elsevier, 2005.
[45] W. Lange. Die Extraktstoe von Riesengras (Miscanthus sinensis Anderss.). Holz-
forschung, 46:277 282, 1992.