Metabolic Profiling of Alpine and Ecuadorian Lichens
19
Molecules 2015, 20, 18047-18065; doi:10.3390/molecules201018047 molecules ISSN 1420-3049 www.mdpi.com/journal/molecules Article Metabolic Profiling of Alpine and Ecuadorian Lichens Verena K. Mittermeier 1 , Nicola Schmitt 1 , Lukas P. M. Volk 1 , Juan Pablo Suárez 2 , Andreas Beck 3,4, * and Wolfgang Eisenreich 1, * 1 Lehrstuhl für Biochemie, Technische Universität München, Lichtenberg-Str. 4, D-85747 Garching, Germany; E-Mails: [email protected] (V.K.M.); [email protected] (N.S.); [email protected] (L.P.M.V.) 2 Departamento de Ciencias Naturales, Universidad Técnica Particular de Loja, San Cayetano Alto s/n, C.P. 11 01 608 Loja, Ecuador; E-Mail: [email protected] 3 Department of Lichenology and Bryology, Botanische Staatssammlung München, Menzinger Str. 67, D-80638 München, Germany 4 GeoBio-Center, Ludwig-Maximilians Universität München, Richard-Wagner-Str. 10, D-80333 München, Germany * Authors to whom correspondence should be addressed; E-Mails: [email protected] (A.B.); [email protected] (W.E.); Tel.: +49-89-17861266 (A.B.); +49-89-289-13336 (W.E.). Academic Editor: Derek J. McPhee Received: 14 August 2015 / Accepted: 24 September 2015 / Published: 1 October 2015 Abstract: Non-targeted 1 H-NMR methods were used to determine metabolite profiles from crude extracts of Alpine and Ecuadorian lichens collected from their natural habitats. In control experiments, the robustness of metabolite detection and quantification was estimated using replicate measurements of Stereocaulon alpinum extracts. The deviations in the overall metabolite fingerprints were low when analyzing S. alpinum collections from different locations or during different annual and seasonal periods. In contrast, metabolite profiles observed from extracts of different Alpine and Ecuadorian lichens clearly revealed genus- and species-specific profiles. The discriminating functions determining cluster formation in principle component analysis (PCA) were due to differences in the amounts of genus-specific compounds such as sticticin from the Sticta species, but also in the amounts of ubiquitous metabolites, such as sugar alcohols or trehalose. However, varying concentrations of these metabolites from the same lichen species e.g., due to different environmental conditions appeared of minor relevance for the overall cluster formation in PCA. The OPEN ACCESS
Transcript of Metabolic Profiling of Alpine and Ecuadorian Lichens
Molecules 2015, 20, 18047-18065; doi:10.3390/molecules201018047
molecules ISSN 1420-3049
www.mdpi.com/journal/molecules
Article
Metabolic Profiling of Alpine and Ecuadorian Lichens
Verena K. Mittermeier 1, Nicola Schmitt 1, Lukas P. M. Volk 1, Juan Pablo Suárez 2,
Andreas Beck 3,4,* and Wolfgang Eisenreich 1,*
1 Lehrstuhl für Biochemie, Technische Universität München, Lichtenberg-Str. 4, D-85747 Garching,
Germany; E-Mails: [email protected] (V.K.M.); [email protected] (N.S.);
[email protected] (L.P.M.V.) 2 Departamento de Ciencias Naturales, Universidad Técnica Particular de Loja, San Cayetano Alto s/n,
C.P. 11 01 608 Loja, Ecuador; E-Mail: [email protected] 3 Department of Lichenology and Bryology, Botanische Staatssammlung München,
Menzinger Str. 67, D-80638 München, Germany 4 GeoBio-Center, Ludwig-Maximilians Universität München, Richard-Wagner-Str. 10,
D-80333 München, Germany
* Authors to whom correspondence should be addressed;
E-Mails: [email protected] (A.B.); [email protected] (W.E.);
Tel.: +49-89-17861266 (A.B.); +49-89-289-13336 (W.E.).
Academic Editor: Derek J. McPhee
Received: 14 August 2015 / Accepted: 24 September 2015 / Published: 1 October 2015
Abstract: Non-targeted 1H-NMR methods were used to determine metabolite profiles
from crude extracts of Alpine and Ecuadorian lichens collected from their natural habitats.
In control experiments, the robustness of metabolite detection and quantification was
estimated using replicate measurements of Stereocaulon alpinum extracts. The deviations in
the overall metabolite fingerprints were low when analyzing S. alpinum collections from
different locations or during different annual and seasonal periods. In contrast, metabolite
profiles observed from extracts of different Alpine and Ecuadorian lichens clearly revealed
genus- and species-specific profiles. The discriminating functions determining cluster formation
in principle component analysis (PCA) were due to differences in the amounts of
genus-specific compounds such as sticticin from the Sticta species, but also in the amounts
of ubiquitous metabolites, such as sugar alcohols or trehalose. However, varying concentrations
of these metabolites from the same lichen species e.g., due to different environmental
conditions appeared of minor relevance for the overall cluster formation in PCA. The
OPEN ACCESS
Molecules 2015, 20 18048
metabolic clusters matched phylogenetic analyses using nuclear ribosomal DNA (nrDNA)
internal transcribed spacer (ITS) sequences of lichen mycobionts, as exemplified for the
genus Sticta. It can be concluded that NMR-based non-targeted metabolic profiling is a
useful tool in the chemo-taxonomy of lichens. The same approach could also facilitate the
discovery of novel lichen metabolites on a rapid and systematical basis.
Keywords: metabolomics; principle component analysis; chemotaxonomy; Sticta;
Stereocaulon; sticticin
1. Introduction
Metabolomics is a technology that is based on the non-targeted analysis of small-sized metabolic
intermediates or products in complex biological fluids or crude extracts using state-of-the-art
spectroscopy on a quantitative basis (e.g., GC/MS, LC/MS and 1H-NMR). The various methods can
provide complementary data and, therefore, a combination of MS- and NMR-based fingerprints results
in the most comprehensive set of metabolites. Typically, the spectroscopic fingerprints are then interpreted
by multivariate statistical methods, such as principle component analysis (PCA) in conjunction with
pattern recognition and signal assignment techniques. As a result of this analysis, specific metabolic sets
or single metabolic markers are correlated with the genetic backgrounds and/or environmental factors.
For example, metabolomics has been applied to provide the basis for chemo-systematic analyses of
microorganisms, to discover new natural products, to elucidate metabolic fluxes in the organisms under
study, to better understand the dynamics of metabolic networks in response to abiotic or biotic triggers,
or to identify novel markers in the diagnosis of disease (for recent reviews, see [1–3]).
It can be assumed that these metabolomics techniques also benefit the analysis of lichens on
the basis of their unique metabolic compositions. Indeed, hundreds of lichen-specific metabolites have
been isolated and characterized during the last decades by classical chromatographic and spectroscopic
methods [4–6]. Most of these lichen compounds belong to polyketides, polyphenols, quinones and
terpenoids, presumably of fungal origin. On the other hand, well-known and ubiquitous sugars and sugar
alcohols (e.g., mannitol, arabitol, ribitol, and sucrose) have been described as abundant components in
many lichen species under study (for a review, see [7]). Interestingly, sugar alcohols were found at
increased concentrations when the same lichens were collected under dry conditions [8]. Therefore, the
chemo-taxonomy of field-collected lichens on the basis of non-targeted methods has to consider
environmental factors that can hardly be controlled. Thus, it is no surprise that multivariate non-targeted
methods have only rarely been used to characterize lichens on the basis of specific metabolite profiles [9].
In this paper, we have now used NMR-based metabolomics to assess the power and limits of
the non-targeted methodology in the analysis of lichens. In a pilot experiment, we have first analyzed
the reproducibility of metabolic fingerprints from the Alpine lichen, Stereocaulon alpinum Laurer,
collected at different habitats, heights, seasons, and external conditions. Optimized protocols were then
developed and used to characterize a set of Ecuadorian lichens with a special focus on Sticta species.
Multivariate analysis revealed the specificity of the metabolic fingerprints of most lichens under study.
Some of the genus-specific metabolic markers could subsequently be identified by multi-dimensional
Molecules 2015, 20 18049
NMR spectroscopy of the crude extracts without prior purification. The relevance of the study was
underlined by comparison of cluster formation due to metabolic and genomic patterns, as exemplified
for an array of Sticta species.
2. Results and Discussion
2.1. Metabolic Fingerprinting of Lichens
2.1.1. Optimization of Extraction Protocols and Analytical Methods for the Non-Targeted Analysis
of Lichens
Selecting and controlling the parameters in collecting, storing, and extracting the organisms
under study is crucial when performing non-targeted, unbiased metabolomic analyses, since these steps
are known to have fundamental effects on the metabolite profiles, as shown by many studies with
microorganisms or higher organisms. Using a given collection of the Alpine lichen, Stereocaulon alpinum,
we, therefore, first compared metabolite profiles in extracts using various solvents and procedures including
extraction under reflux or at room temperature, or applying mechanical cell disruption.
For this purpose, we extracted standard amounts (30 mg, dry weight) of S. alpinum under reflux or in
the cold using methanol or hexane as solvent. Alternatively, we mechanically disrupted the same amount
suspended in methanol. The extracts were then subjected to 1H-NMR spectroscopy at 27 °C using
repetition rates of about 10 s and 30° pulses in the NMR experiment. The NMR spectra of each of these
samples showed well-defined patterns including sharp signals with applicable signal-to-noise ratios.
Thus, the same amount of lichen thallus mass (30 mg, dry weight) was used in the following analyses.
Replicate NMR measurements of extracts from the same sample displayed virtually identical spectra
indicating the robustness of the quantitative NMR approach and the validity of the parameters in the
measurements. Moreover, the 1H-NMR spectra of S. alpinum samples obtained by the different
extraction procedures were also highly similar when using a given solvent (i.e., methanol or hexane)
indicating that the principle compounds characterizing the NMR profiles were obtained at similar
amounts by each of the used methods. On this basis, we extracted all lichen samples described below
with hexane or methanol, respectively, under reflux for 40 min (hexane) or 20 min (methanol). We are
aware that this procedure gives rise to complete or partial degradation of some metabolic intermediates,
such as sugar phosphates. However, since we focused our analysis on stable metabolites, this protocol
appeared applicable.
2.1.2. Quality Control: Reproducibility of Metabolic Profiles in Extracts of Stereocaulon alpinum
In the next step, we compared the 1H-NMR fingerprints of these extracts using collections of
S. alpinum from different locations, years or seasons. Whereas the spectra of the hexane extracts were
virtually identical displaying major signals due to the presence of atranorin [10], the spectra of the
methanolic extracts were qualitatively similar, but some signals in the spectral region between three and
five ppm tentatively assigned to sugars or sugar alcohols were different in their relative sizes. Notably,
the signal patterns in the spectral region between five and 10 ppm were identical in all of the samples
under study. It can be concluded that multivariate analyses based on NMR signal patterns between three

Molecules 2015, 20 18050
and five ppm in the methanolic extracts could reveal environmental factors such as dryness, whereas
analyses using patterns in the hexane extracts or the down-field NMR-region of the methanolic extracts
could reflect genus-specific profiles.
2.2. Comparative Metabolic Profiling of Different Ecuadorian Lichens
Metabolic Fingerprinting by 1H-NMR
Hexane Extracts
Figure 1 shows the 1H-NMR spectra of the hexane extracts of some Ecuadorian lichens collected at
different heights above sea-level. The spectra were sorted by the genera of lichens and the heights at
which they were collected. The signals around 0.8 ppm and 1.2 ppm were due to impurities from the
solvent and were therefore not considered in the subsequent comparative analyses. Since most of the
hexane extracts exhibited only weak NMR signals, the Ecuadorian lichens under investigation contained
hydrophobic substances only at low concentrations regardless of their species or habitat. Notably, this was
in sharp contrast to the hexane extracts from S. alpinum displaying intense signals due to atranorin (top
trace in Figure 1). As an exception of Ecuadorian lichens, some minor down-field shifted signals were
detected in the extract of Cora sp. 2 collected at 3000 m, but not in Cora sp. 1 from the habitat at 2000 m.
Figure 1. 1H-NMR spectra of hexane extracts of S. alpinum (top trace) and some Ecuadorian
lichens between 0.0 and 13.0 ppm. “Unspecific” signals due to solvents were omitted. Spectra
were scaled to the signal intensity of CHCl3 from the solvent.
Molecules 2015, 20 18051
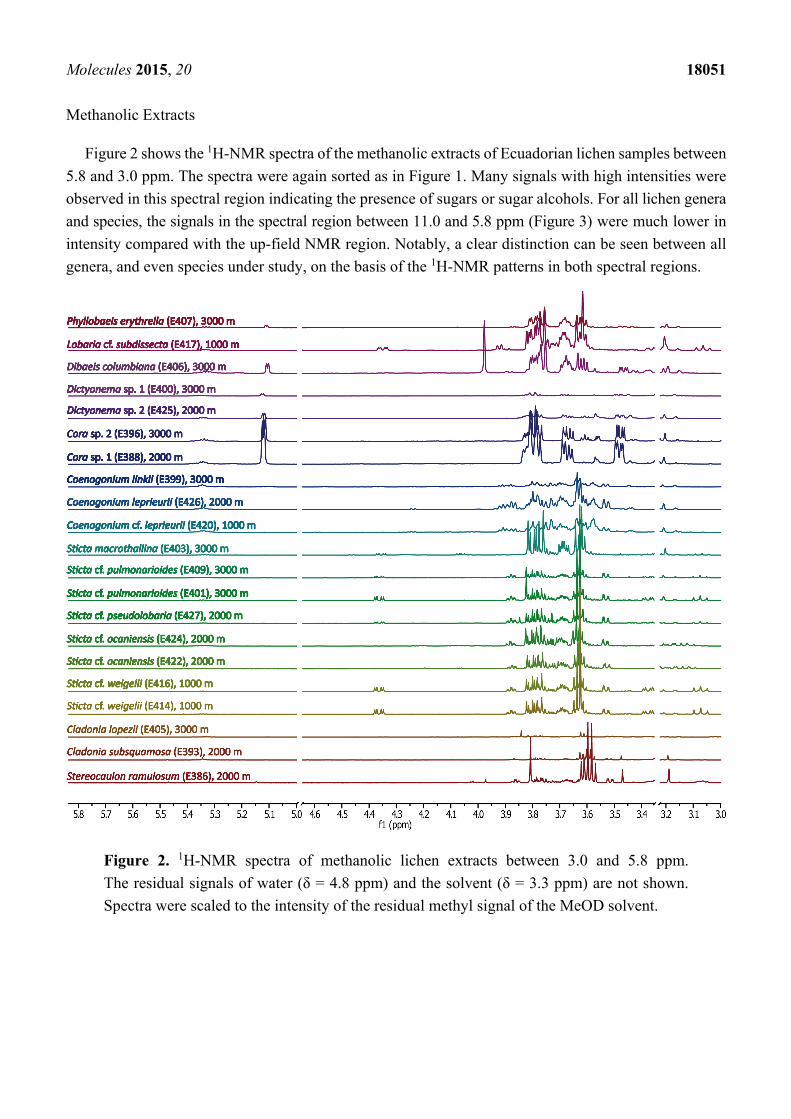
Methanolic Extracts
Figure 2 shows the 1H-NMR spectra of the methanolic extracts of Ecuadorian lichen samples between
5.8 and 3.0 ppm. The spectra were again sorted as in Figure 1. Many signals with high intensities were
observed in this spectral region indicating the presence of sugars or sugar alcohols. For all lichen genera
and species, the signals in the spectral region between 11.0 and 5.8 ppm (Figure 3) were much lower in
intensity compared with the up-field NMR region. Notably, a clear distinction can be seen between all
genera, and even species under study, on the basis of the 1H-NMR patterns in both spectral regions.
Figure 2. 1H-NMR spectra of methanolic lichen extracts between 3.0 and 5.8 ppm.
The residual signals of water (δ = 4.8 ppm) and the solvent (δ = 3.3 ppm) are not shown.
Spectra were scaled to the intensity of the residual methyl signal of the MeOD solvent.
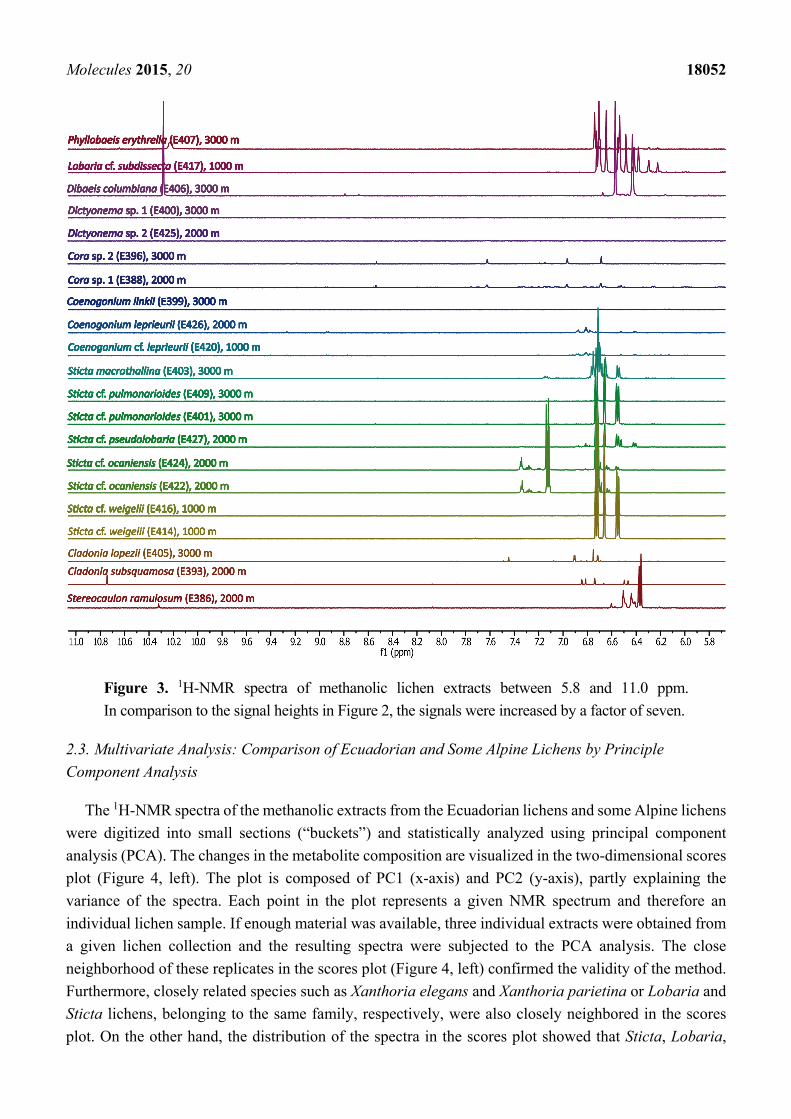
Molecules 2015, 20 18052
Figure 3. 1H-NMR spectra of methanolic lichen extracts between 5.8 and 11.0 ppm.
In comparison to the signal heights in Figure 2, the signals were increased by a factor of seven.
2.3. Multivariate Analysis: Comparison of Ecuadorian and Some Alpine Lichens by Principle
Component Analysis
The 1H-NMR spectra of the methanolic extracts from the Ecuadorian lichens and some Alpine lichens
were digitized into small sections (“buckets”) and statistically analyzed using principal component
analysis (PCA). The changes in the metabolite composition are visualized in the two-dimensional scores
plot (Figure 4, left). The plot is composed of PC1 (x-axis) and PC2 (y-axis), partly explaining the
variance of the spectra. Each point in the plot represents a given NMR spectrum and therefore an
individual lichen sample. If enough material was available, three individual extracts were obtained from
a given lichen collection and the resulting spectra were subjected to the PCA analysis. The close
neighborhood of these replicates in the scores plot (Figure 4, left) confirmed the validity of the method.
Furthermore, closely related species such as Xanthoria elegans and Xanthoria parietina or Lobaria and
Sticta lichens, belonging to the same family, respectively, were also closely neighbored in the scores
plot. On the other hand, the distribution of the spectra in the scores plot showed that Sticta, Lobaria,

Molecules 2015, 20 18053
Phyllobaeis, and Cora were clearly separated from the other lichens in PC2. Moreover, PC2 partly
separated the two basidiolichen genera Cora and Dictyonema.
Figure 4. Scores plot (on the left side) and loadings plot (on the right side) of Ecuadorian
and some Alpine lichens. Scores plot: each spot represents one 1H-NMR spectrum (three
technical replicates of each sample). Biological replicates are distinguished by the following
way: 388.1 designates the first biological replicate of lichen #388. Loadings plot: each dot
denotes the mean value of the bucket.
Visual inspection and comparison of the NMR spectra had already indicated that the metabolite
composition was at least not greatly affected by the growth location (see above). This conclusion was
confirmed by the fact that no clear separation between Alpine and Ecuadorian lichens could be observed.
Rather, the detected clusters in the scores plot indicated that the profiles were mostly determined by the
genus and/or family of the lichen under study.
To investigate the specific differences in the scores plot, the loadings plot (Figure 4, right) was now
examined. The separation of both Cora/Dictyonema species was caused by buckets at 5.13, 3.88, 3.83,
3.78, 3.63, 3.53, 3.48, and 2.93 ppm, which were tentatively assigned to 1H-NMR signals of trehalose,
arabitol, mannitol, ribitol, and ornithine [11]. Indeed, both species contained lower amounts of sugar
alcohols, but higher amounts of trehalose in comparison to the other lichens under study (see below).

Molecules 2015, 20 18054
The peaks at 6.73, 6.68, 6.53, and 3.08 ppm explained the separation between Sticta, Lobaria,
Phyllobaeis, and the other lichens. These buckets covered the signals for sticticin [12] in Sticta and
Lobaria, and probably norstictic acid, in Phyllobaeis [13].
2.4. Identification of Marker Compounds by NMR
2.4.1. Sugars and Sugar Alcohols
In order to verify some of the tentative 1H-NMR assignments for sugars and sugar alcohols,
we compared the complex NMR data with authentic reference compounds, e.g., trehalose, mannitol,
ribitol, and arabitol measured under the same conditions as for the crude extracts, i.e., using deuterated
methanol as solvent. This was especially important since the available spectral NMR libraries are based
on measurements in D2O. Due to the specific signal patterns of these compounds, the comparisons
resulted in solid assignments (Figure 5), as exemplified for trehalose in #E388 (Cora sp. 1) and arabitol
and mannitol in #E414 (Sticta cf. weigelii Isert), also confirming the GC-MS analyses described below.
Figure 5. 1H-NMR spectra of different reference compounds in comparison with methanolic
lichen extracts of Sticta and Cora.
2.4.2. Lichen-Specific Compounds
Many of the major signals detected in the crude extracts of the lichens under investigation could not
be easily assigned on the basis of the observed chemical shifts and patterns. This was expected since
many of the specific lichen compounds are not found in the standard NMR libraries. Especially
metabolites causing signals due to aromatic compounds could not be assigned to a known structure.
Therefore, we have performed two-dimensional NMR experiments using the crude extracts without prior
purification to enable structure determination of the major compounds, i.e., causing the main signals that

Molecules 2015, 20 18055
could not be assigned by comparison with reference materials. As an example, Figure 6 shows the
two-dimensional HMBC spectrum of the methanolic extract of #E414 (Sticta cf. weigelii). The chemical
shifts and the coupling patterns of the signals in the “aromatic region” clearly indicated that one of the
major metabolites in the Sticta extract was a 1,3,4-substituted aromatic compound. The detected
correlation patterns in conjunction with COSY, NOESY, and HMBC data (Table 1) left no doubt that
the major signals marked in Figure 6 were due to the presence of sticticin, a well-known alkaloid in
Sticta species [5,12].
Figure 6. Two-dimensional NMR analysis of crude lichen extracts. Section of the HMBC
spectrum of the methanolic extract from #E414 (Sticta cf. weigelii). The structure of sticticin
is shown in the inset. 13C- and 1H-NMR spectra of the crude extract of #E414 are shown as
projections with assignments of the sticticin signals.
The assignment was further confirmed by a close inspection of the detected peak at 33.97 min in the
GC-MS run of the sample (Figures 7 and 8; Table 2), as well as by the conversion of sticticin into caffeic
acid methyl ester after adding sodium hydroxide to the crude extract of #E414. In the hydrolysate, the
characteristic methylene groups of methyl caffeate were detected (data not shown).

Molecules 2015, 20 18056
Table 1. NMR data of sticticin on the basis of the detected signals using the crude extract of
#E414 (Sticta cf. weigelii).
Position 1H (ppm) Integral Multiplicity JH,H a (Hz) 13C (ppm) Correlations Observed
COSY HMBC NOESY
5 6.72 1 d 8.1 (6) 116.67 H(6)
2 6.66 1 d 2.1 (6) 117.42 H(3′), H(5), H(6) H(3′)
6 6.55 1 dd 8.1 (5); 2.1 (2) 121.79 H(5) H(3′), H(5), H(2) H(3′)
2′ 4.36 1 dd 12.1 (3′); 4.1 (3′) 77.06 H(3′) H(3′)
1″ 3.63 1 s 53.56
1′′′ 3.32 nd s 52.97 H(2′)
3′ 3.38 1 dd 12.5 (3′); 4.1 (2′) 33.35 H(2′), H(3′) H(2), H(2′), H(1′′′)
3′ 3.07 1 t 12.1 (2′) 33.35 H(2′), H(3′) H(2), H(2′), H(1′′′)
1′ 164.74 H(3′), H(2′), H(1″)
3 146.88 H(5), H(2)
4 146.29 H(5), H(2), H(6)
1 125.05 H(5), H(3′)
a Coupling partners are given in parentheses; nd, not determined due to signal overlap; d, doublet; dd, doublet
of doublets; s, singlet and t, triplet.
Figure 7. Mass spectrum of disilylated sticticin.
Table 2. MS data of disilylated sticticin.
Fragment Ion m/z
Disilylated sticticin-CH3Cl [M]+ 383 [M − CH3]+ 368
[M − C(1′)OOCH3]+ 324 [M − C(1′)OOCH3C(2′)HN(CH3)2]+ 267
[C(1′)OOCH3C(2′)HN(CH3)2]+ 116 [Si(CH3)3]+ 73
2.5. Identification of Marker Compounds by GC-MS
To further identify key metabolites in the methanolic extracts, the metabolite profiling was
now accomplished by GC/MS using the MSTFA-derivatives of the NMR samples. Figure 8 shows
chromatograms of representative runs illustrating that all lichens except of Cora/Dictyonema species
contained mannitol and arabitol at high concentrations. Furthermore, the photobiont-specific polyols,
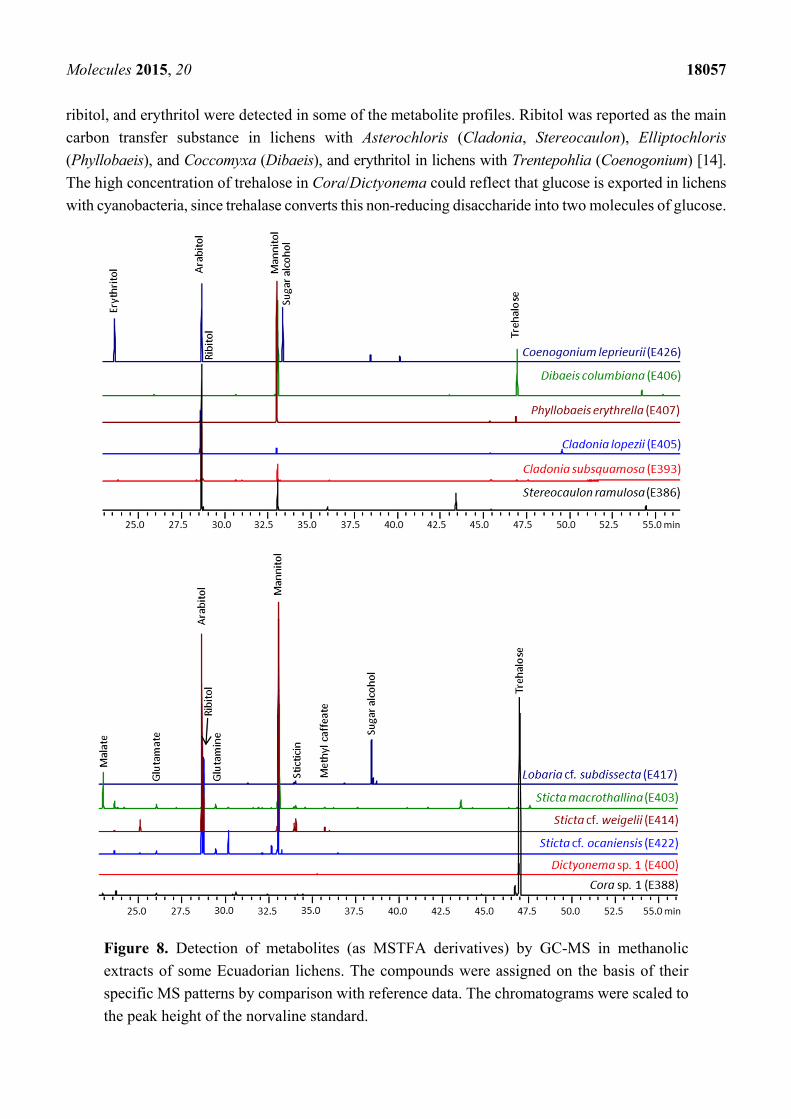
Molecules 2015, 20 18057
ribitol, and erythritol were detected in some of the metabolite profiles. Ribitol was reported as the main
carbon transfer substance in lichens with Asterochloris (Cladonia, Stereocaulon), Elliptochloris
(Phyllobaeis), and Coccomyxa (Dibaeis), and erythritol in lichens with Trentepohlia (Coenogonium) [14].
The high concentration of trehalose in Cora/Dictyonema could reflect that glucose is exported in lichens
with cyanobacteria, since trehalase converts this non-reducing disaccharide into two molecules of glucose.
Figure 8. Detection of metabolites (as MSTFA derivatives) by GC-MS in methanolic
extracts of some Ecuadorian lichens. The compounds were assigned on the basis of their
specific MS patterns by comparison with reference data. The chromatograms were scaled to
the peak height of the norvaline standard.

Molecules 2015, 20 18058
In addition, the comparison of Sticta samples showed that mannitol was the most abundant metabolite
in wet lichens, whereas higher amounts of arabitol than mannitol were found in lichens collected under
dry conditions (for example, #E422 as shown in Figure 8, but also #E424). Indeed, these differences were
also evident in the PCA scores plot (Figure 4). These results confirmed that mannitol may protect lichens
against water loss, whereas arabitol is a more readily mobilizable reserve [15].
In contrast to sugars and sugar alcohols, free amino acids were only extracted at low concentrations.
Among amino acids, glutamine, glutamate, and alanine were the most abundant ones. The relatively high
level of glutamate and glutamine supports the suggestion that they function as main nitrogen storage
compounds in lichens [16].
2.6. Taxon Analyses with Molecular Methods
In order to evaluate the genetic diversity of the sampled Sticta specimens, molecular investigations
of the mycobiont ITS nrDNA region have been conducted as described in Section 3.3. The resulting
phylogram (Figure 9A) depicts similar groupings like the multivariate analysis of the metabolic content
in the methanolic extracts of these specimens (Figure 9B). The genetically and morphologically most
peculiar species is S. macrothallina Moncada and Coca (#E403), recognized by its much broader lobes.
The specimens of S. cf. ocaniensis Moncada and Simijaca (#E422, #E424) group together and form a
branch including the closely related S. cf. pseudolobaria Moncada and Coca (#E427)—both belonging
to the S. canariensis-clade [17]—but with low support only. All three specimens are located within the
same subsquare in the PCA analysis as well. The specimens of S. pulmonarioides Moncada and Coca
(#E401, #E409) form a well-supported group with the specimens of S. cf. weigelii (#E414, #E416).
Again these groups are also represented in the PCA analysis of metabolic compounds, with the minor
exception of S. pulmonarioides (#E401) which seems closer to S. cf. weigelii regarding its metabolic
compounds, but due to material restrictions only one biological replicate could be analyzed and all
samples from these lichens are grouped in the left half of the PCA graph.
Figure 9. Cont.

Molecules 2015, 20 18059
Figure 9. nrITS DNA phylogeny (A) and PCA of the lichen metabolites in the methanolic
extracts (B) for representative specimens of the genus Sticta. Corresponding colors were
used to indicate the same lichen species in (A) and (B).
3. Experimental Section
3.1. Chemicals
The following compounds were obtained commercially from the suppliers given in brackets:
L-arabitol, meso-erythritol (Alfa Aesar, Karlsruhe, Germany); n-hexane (98.2% purity; Merck,
Darmstadt, Germany); methanol (99.8% purity; VWR, Leuven, Belgium); D-mannitol, L-ornithine,
ribitol, D-trehalose (Sigma-Aldrich, Steinheim, Germany). Deuterated solvents were obtained from
Euriso-Top (Gif-Sur-Yvette, France).
3.2. Lichen Collection and Storage
Lichens have been collected in Southern Ecuador in August 2012 or January 2011 (AB_E139).
Environmental factors for the different altitudinal collecting sites in Ecuador are given in detail by
Bendix et al. [18]. Alpine lichens were collected in Tyrol (Obergurgl, Austria) in 15th of September
2012 (cloudy) from heights of 2.000–2.700 m a.s.l. (temperature, 10–14 °C). Collecting details are given
in Table 3.

Molecules 2015, 20 18060
Table 3. Collection details for the lichen specimens of this study.
Species Col. Nr. Locality Col. Date
Cladonia lopezii AB_E405 Podocarpus National Park, Cajanuma; ca. 3000 m a.s.l. 17 August.2012
Cladonia rangiferina Zirbenwald, Obergurgl, ca. 2.100 m a.s.l. 15 September 2012
Cladonia subsquamosa AB_E393 Podocarpus National Park, San Francisco; ca. 2000 m a.s.l. 16 August 2012
Coenogonium cf. leprieurii AB_E420 Podocarpus National Park, Bombuscaro; ca. 1000 m a.s.l. 20 August 2012
Coenogonium leprieurii AB_E426 Podocarpus National Park, San Francisco; ca. 2000 m a.s.l. 21 August 2012
Coenogonium linkii AB_E399 Podocarpus National Park, Cajanuma; ca. 3000 m a.s.l. 17 August 2012
Dibaeis columbiana AB_E406 Podocarpus National Park, Cajanuma; ca. 3000 m a.s.l. 17 August 2012
Cora sp. 1 AB_E388 Podocarpus National Park, San Francisco; ca. 2000 m a.s.l. 16 August 2012
Cora sp. 2 AB_E396 Podocarpus National Park, Cajanuma; ca. 3000 m a.s.l. 17 August 2012
Dictyonema sp. 1 AB_E400 Podocarpus National Park, Cajanuma; ca. 3000 m a.s.l. 17 August 2012
Dictyonema sp. 2 AB_E425 Podocarpus National Park, San Francisco; ca. 2000 m a.s.l. 21 August 2012
Herpothallon sp. AB_E139 Podocarpus National Park, San Francisco; ca. 2000 m a.s.l. 22 January 2011
Lobaria cf. subdissecta AB_E417 Podocarpus National Park, Bombuscaro; ca. 1000 m a.s.l. 20 August 2012
Phyllobaeis erythrella AB_E407 Podocarpus National Park, Cajanuma; ca. 3000 m a.s.l. 17 August 2012
Rhizocarpon geographicum Rotmoostal, Obergurgl, ca. 2300 m a.s.l. 15 September 2012
Solorina crocea Zirbenwald, Obergurgl, ca. 2100 m a.s.l. 15 September 2012
Stereocaulon alpinum Rotmoosferner, Obergurgl, ca. 2700 m a.s.l. 15 September 2012
Stereocaulon ramulosum AB_E386 Podocarpus National Park, San Francisco; ca. 2000 m a.s.l. 16 August 2012
Sticta macrothallina AB_E403 Podocarpus National Park, Cajanuma; ca. 3000 m a.s.l. 17 August 2012
Sticta cf. ocaniensis AB_E422 Podocarpus National Park, San Francisco; ca. 2000 m a.s.l. 21 August 2012
Sticta cf. ocaniensis AB_E424 Podocarpus National Park, San Francisco; ca. 2000 m a.s.l. 21 August 2012
Sticta cf. pseudolobaria AB_E427 Podocarpus National Park, San Francisco; ca. 2000 m a.s.l. 21 August 2012
Sticta cf. pulmonarioides AB_E401 Podocarpus National Park, Cajanuma; ca. 3000 m a.s.l. 17 August 2012
Sticta cf. pulmonarioides AB_E409 Podocarpus National Park, Cajanuma; ca. 3000 m a.s.l. 17 August 2012
Sticta cf. weigelii AB_E414 Podocarpus National Park, Bombuscaro; ca. 1000 m a.s.l. 19 August 2012
Sticta cf. weigelii AB_E416 Podocarpus National Park, Bombuscaro; ca. 1000 m a.s.l. 20 August 2012
Thamnolia vermicularis Rotmoosferner, Obergurgl, ca. 2700 m a.s.l. 15 September 2012
Xanthoria elegans Rotmoostal, Orbergurgl, ca. 1700 m a.s.l. 15 September 2012
Xanthoria parietina Rotmoostal, Orbergurgl, ca. 1500 m a.s.l. 15 September 2012
3.3. Taxon Analyses
In order to evaluate the genetic diversity of the sampled Sticta specimens molecular investigations of
the mycobiont ITS nrDNA region have been conducted as described in Beck and Mayr [19]. Basically,
DNA has been isolated using the PCR Template Preparation Kit from Roche (Cat No. 11 796 828 001)
following the manufacturers protocol, but grinding the lichen carefully using a micro–pestle in liquid
nitrogen before adding the lysis buffer. 10–50 mg of air-dried lichen material has been used for the DNA
extraction. 1 µL of a 1:20 dilution of the obtained DNA solution has been used for PCR using fungal
primers and ITS4m. All PCR products were purified with the Macherey–Nagel columns (Macherey–Nagel,
Düren, Germany) and labeled with Big Dye Terminator v3.1 Kit (Applied Biosystems). Cycle
sequencing was 30 cycles of: 95 °C for 10 s, 50 °C for 15 s, 60 °C for 3 min. Post-sequencing cleanup
was performed using gelfiltration with Sephadex G–50 Superfine (GE Healthcare, Freiburg, Germany;
Cat. No. 17–0041–01) following the manufacturer’s protocol. Forward and reverse strand sequences
Molecules 2015, 20 18061
were detected in an ABI 3730 48 capillary automatic sequencer (Applied Biosystems) and assembled
using the Staden package [20]. Double-stranded sequences were aligned manually using Gendoc [21].
All sequences used are detailed in Table 4. Maximum Parsimony (MP) and Maximum Likelihood (ML)
searches were conducted using the program PAUP Version 4.0b10 [22]. All characters of the ITS1 and
ITS2 region, but not the 5.8S nrDNA, have been included for these calculations. To select the nucleotide
substitution model and parameters for the ML searches, a hierarchical likelihood ratio test was carried out
as implemented in jModelTest 2.1.5 [23,24]. The optimal model was selected under the Akaike information
criterion (TrN+G). Heuristic searches have been conducted with 10,000 random–addition–sequence
(RAS) replicates, TBR (tree bisection reconnection) branch swapping, Multrees option in effect, saving
all trees and collapsing branches with maximum length equal to zero. Statistical support in all trees was
assessed by bootstrap analysis (BS; [25]) using 10,000 bootstrap replicates with five random–addition
sequences per replicate, but with the multree option not in effect.
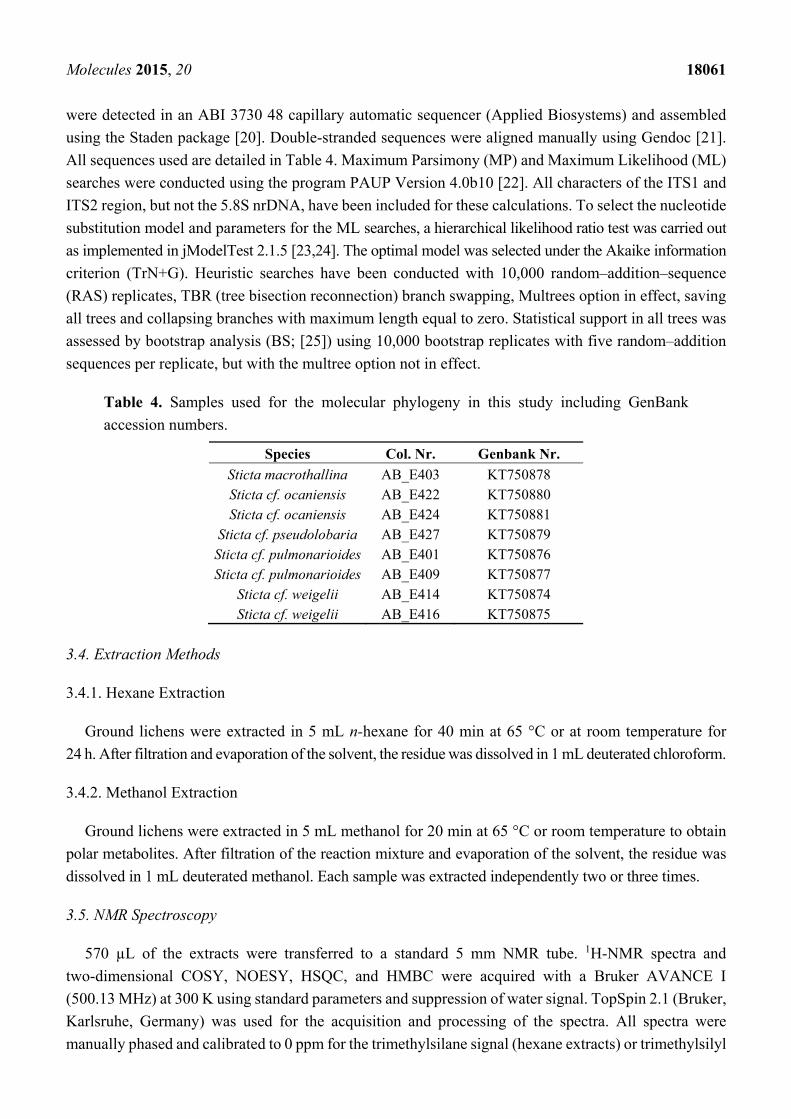
Table 4. Samples used for the molecular phylogeny in this study including GenBank
accession numbers.
Species Col. Nr. Genbank Nr.
Sticta macrothallina AB_E403 KT750878 Sticta cf. ocaniensis AB_E422 KT750880 Sticta cf. ocaniensis AB_E424 KT750881
Sticta cf. pseudolobaria AB_E427 KT750879 Sticta cf. pulmonarioides AB_E401 KT750876 Sticta cf. pulmonarioides AB_E409 KT750877
Sticta cf. weigelii AB_E414 KT750874 Sticta cf. weigelii AB_E416 KT750875
3.4. Extraction Methods
3.4.1. Hexane Extraction
Ground lichens were extracted in 5 mL n-hexane for 40 min at 65 °C or at room temperature for
24 h. After filtration and evaporation of the solvent, the residue was dissolved in 1 mL deuterated chloroform.
3.4.2. Methanol Extraction
Ground lichens were extracted in 5 mL methanol for 20 min at 65 °C or room temperature to obtain
polar metabolites. After filtration of the reaction mixture and evaporation of the solvent, the residue was
dissolved in 1 mL deuterated methanol. Each sample was extracted independently two or three times.
3.5. NMR Spectroscopy
570 µL of the extracts were transferred to a standard 5 mm NMR tube. 1H-NMR spectra and
two-dimensional COSY, NOESY, HSQC, and HMBC were acquired with a Bruker AVANCE I
(500.13 MHz) at 300 K using standard parameters and suppression of water signal. TopSpin 2.1 (Bruker,
Karlsruhe, Germany) was used for the acquisition and processing of the spectra. All spectra were
manually phased and calibrated to 0 ppm for the trimethylsilane signal (hexane extracts) or trimethylsilyl
Molecules 2015, 20 18062
propionate signal (methanol extracts), respectively. Furthermore, baseline correction was conducted. For
the measurement of reference compounds, 10 mg were dissolved in 1 mL deuterated methanol and the
solution was vortexed for 2 min. Then, the solution was centrifuged at 7000 U/min for 5 min and 570 µL
of the supernatant was transferred into a NMR tube and measured as described above.
3.6. PCA
Principal component analysis was performed with the 1H-NMR spectra of methanolic lichen extracts
using AMIX version 3.9.13 (Bruker, Karlsruhe, Germany). For this purpose, the spectra were divided
into equally sized buckets with a width of 0.05 ppm within the region of 12.0 ppm to 0.0 ppm using the
advanced bucketing command. Each bucket was then integrated and a data matrix was constructed with
each row representing a sample (i.e., spectrum) and each column representing a variable (i.e., bucket).
Rows were scaled to total intensity and the resulting values were used for PCA. The regions between
4.87–4.80, 3.37–3.12, 2.17–2.12, and 1.50–0.80 ppm were excluded due to the presence of residual
water, methanol, acetone, and solvent impurity signals, respectively. Mean PCA scores were calculated
and graphed. Influential buckets in the PCA scores were analyzed using the 2D loadings plots and the
peaks within these buckets were identified by comparison with reference data.
3.7. GC-MS
Equivalents (200 µL) of the methanolic extracts were dried under N2 flow at room temperature after
addition of 10 µL 5 mM D-norvaline. Then, the samples were derivatized with 20 mg·mL−1
methoxyamine hydrochloride (in pyridine) at 40 °C for 1.5 h under shaking. Next, after another drying
step using N2 flow, the samples were treated with 100 µL N-methyl-N-(trimethylsilyl)-trifluoroacetamide
(with 1% trimethylchlorosilane; MSTFA) at 55 °C for 30 min shaking. The MSTFA solution was
subjected to GC-MS analysis without further preparation. The measurements were performed on a GC
2010 Gas Chromatograph and a GCMS-QP 2010 Plus mass spectrometer coupled to a QP-5000 mass
selective detector (Shimadzu, Duisburg, Germany) working with electron impact (EI) ionisation at 70 eV
and scanning from m/z 50 to m/z 800. A Silica capillary column Equity TM-5 (30 m × 0.25 mm × 0.25 µm
film thickness) from Supelco Inc. (Bellefonte, PA, USA) was used. An aliquot of derivatives of the
metabolites was injected in 1:10 split mode at 260 °C and a helium inlet pressure of 76.1 kPa. The
interface temperature was 260 °C and the helium column flow was 1.19 mL/min. The column was
developed at 70 °C for 5 min and then with a temperature gradient of 5 °C/min to a final temperature of
340 °C that was held for 2 min. The system was operating the GC-MS solution Ver. 2 software
(Shimadzu, Duisburg, Germany) and the identification of the metabolites was carried out by using the
NIST05 and NIST05s mass spectral reference library (Shimadzu, Duisburg, Germany).
4. Conclusions
Metabolite fingerprinting by NMR-spectroscopy showed that a set of Ecuadorian lichens under study
contained only few hydrophobic metabolites regardless of their species or habitat. On the other hand,
polar metabolites were extracted in high concentrations and metabolite fingerprinting indicated that the
polar metabolome is not, or at least not greatly, affected by the growth location. In contrast, genera, and
Molecules 2015, 20 18063
even species, were clearly differentiated on the basis of metabolite profiles. Additionally, distinct
phenotypes could be distinguished by their chemical fingerprints, which corresponded nicely to
phylogenetic groups obtained in the analysis of nrITS DNA data.
Lichen-specific metabolites can also be directly assigned by careful analysis of two-dimensional
NMR experiments using the crude lichen extracts as exemplified for the alkaloid sticticin. The example
shows that the multivariate method can be combined with targeted analyses aimed at a facile and rapid
assignment of major lichen compounds. In all lichens, characteristic sugars or polyols, which are
presumably transferred from the photobiont to the fungus or formed immediately from transferred carbon
compounds, were present as shown by the non-targeted and targeted analyses.
The method combination described in this study appears generally valid for a chemo-taxonomic
analysis of lichens. Moreover, the non-targeted approach could benefit the rapid discovery of hitherto
unidentified lichen metabolites, at least of the major compounds present in crude extracts, on a
systematic basis.
Acknowledgments
Support from a grant of the German Science Foundation (DFG) to AB, BE3825/4-1, is
gratefully acknowledged.
Author Contributions
W.E. and A.B. conceived and designed the experiments; V.K.M., N.S., and L.P.M.V. performed
the chemical and A.B. the genetic experiments; V.K.M., N.S., L.P.M.V., A.B., and W.E. analyzed the
data; J.P.S. contributed reagents/materials/analysis tools; W.E., A.B., and V.K.M. wrote the paper.
Conflict of Interests
The authors declare no conflict of interest.
References
1. Wu, C.; Kim, H.K.; van Wezel, G.P.; Choi, Y.H. Metabolomics in the natural products field—A
gateway to novel antibiotics. Drug Discov. Today 2015, 13, 11–17.
2. Zamboni, N.; Saghatelian, A.; Patti, G.J. Defining the metabolome: Size, flux, and regulation.
Mol. Cell 2015, 58, 699–706.
3. Töpfer, N.; Kleessen, S.; Nikoloski, Z. Integration of metabolomics data into metabolic networks.
Front. Plant Sci. 2015, 6, doi:10.3389/fpls.2015.00049.
4. Elix, J.A. Biochemistry and secondary metabolites. In Lichen Biology; Nash, T.H., III, Ed.;
University Press: Cambridge, UK, 1996; pp. 154–180.
5. Huneck, S.; Yoshimura, I. Identification of Lichen Substances; Springer: Berlin, Germany, 1996;
pp. 1–494.
6. Stocker-Wörgötter, E. Metabolic diversity of lichen forming ascomycetous fungi: Culturing,
polyketide and shikimate metabolite production, and PKS genes. Nat. Prod. Rep. 2008, 25,
188–200.
Molecules 2015, 20 18064
7. Eisenreich, W.; Knispel, N.; Beck, A. Advanced methods for the study of the chemistry and the
metabolism of lichens. Phytochem. Rev. 2011, 10, 445–456.
8. Rees, T.A.V.; Stewart, A.; Coddington, J.M. A 13C-NMR study of major soluble metabolites in
New Zealand lichens. In Endocytobiology IV: 4th International Colloquium on Endocytobiology
and Symbiosis; Nardon, P., Gianinazzi-Pearson, V., Grenier, A.M., Margulis, L., Smith, D.C., Eds.;
Institute National de la Recherche Agronomique: Paris, France, 1990; pp. 169–174.
9. Alcantara, G.B.; Honda, N.K.; Ferreira, M.M.C.; Ferreira, A.G. Chemometric analysis applied in 1H HR-MAS NMR and FT-IR data for chemotaxonomic distinction of intact lichen samples.
Anal. Chim. Acta 2007, 595, 3–8.
10. König, G.M.; Wright, A.D. 1H- and 13C-NMR and biological activity investigations of four
lichen-derived compounds. Phytochem. Anal. 1999, 10, 279–284.
11. Wishart, D.S.; Jewison, T.; Guo, A.C.; Wilson, M.; Knox, C.; Liu, Y.; Djoumbou, Y.; Mandal, R.;
Aziat, F.; Dong, E.; et al. HMDB 3.0—The Human Metabolome Database in 2013. Nucleic Acids Res.
2013, 41, D801–D807.
12. Bernard, T.; Joucla, M.; Goas, G.; Hamelin, J. Caractérisation de la sticticine chez le lichen
Lobaria laetevirens. Phytochemistry 1980, 19, 1967–1969.
13. Sundholm, E.G.; Huneck, S. 13C-NMR-spectra of lichen depsides, depsidones and depsones. 2.
Compounds of the β-orcinol series. Chem. Scr. 1981, 18, 233–236.
14. Richardson, D.H.S.; Smith, D.C. Lichen physiology. IX. Carbohydrate movement from the
Trebouxia symbiont of Xanthoria aureola to the fungus. New Phytol. 1968, 67, 61–68.
15. Armstrong, R.A.; Smith, S.N. The levels of ribitol, arabitol and mannitol in individual lobes of the
lichen Parmelia conspersa (Ehrh. ex Ach.) Ach. Environ. Exp. Bot. 1994, 34, 253–260.
16. Jäger, H.J.; Weigel, H.J. Amino acid metabolism in lichens. Bryologist 1978, 81, 107–113.
17. Moncada, B.; Lücking R.; Suárez, A. Molecular phylogeny of the genus Sticta (lichenized
Ascomycota: Lobariaceae) in Colombia. Fungal Divers. 2014, 64, 205–231.
18. Bendix, J.; Rollenbeck, R.; Richter, M.; Fabian, P.; Emck, P. Climate. In Gradients in a Tropical
Mountain Ecosystem of Ecuador; Beck, E., Bendix, J., Kottke, I., Makeschin, F., Mosandl, R., Eds.;
Ecological Studies 198; Springer-Verlag: Berlin, Germany; Heidelberg, Germany, 2008; pp. 63–73.
19. Beck, A.; Mayr, C. Nitrogen and carbon isotope variability in the green-algal lichen
Xanthoria parietina and their implications on mycobiont-photobiont interactions. Ecol. Evol. 2012,
2, 3132–3144.
20. Staden Package. Available online: http://staden.sourceforge.net (accessed on 1 October 2015).
21. Gendoc. Available online: http://www.nrbsc.org/downloads (accessed on 1 October 2015).
22. Swofford, D.L. PAUP: Phylogenetic Analysis Using Parsimony (and Other Methods), Version 4;
Sinauer Associates: Sunderland, MA, USA, 2000; pp. 1–128.
23. Guindon, S.; Gascuel, O. A simple, fast and accurate method to estimate large phylogenies by
maximum likelihood. Syst. Biol. 2003, 52, 696–704.
24. Darriba, D.; Taboada, G.L.; Doallo, R.; Posada, D. jModelTest 2: More models, new heuristics and
parallel computing. Nat. Methods 2012, 9, doi:10.1038/nmeth.2109.

Molecules 2015, 20 18065
25. Felsenstein, J. Confidence-limits on phylogenies: An approach using the bootstrap. Evolution 1985,
39, 783–791.
Sample Availability: Samples of the compounds are available from the authors upon request.
© 2015 by the authors; licensee MDPI, Basel, Switzerland. This article is an open access article
distributed under the terms and conditions of the Creative Commons Attribution license
(http://creativecommons.org/licenses/by/4.0/).