Micronization of Proteins by Jet Milling
156
Micronization of Proteins by Jet Milling Dissertation zur Erlangung des Doktorgrades der Naturwissenschaften (Dr. rer. nat.) der Fakultät Chemie und Pharmazie der Universität Regensburg vorgelegt von Axel Ehmer aus Hünfeld 2009
Transcript of Micronization of Proteins by Jet Milling

Micronization of Proteins
by
Jet Milling
Dissertation
zur Erlangung des Doktorgrades der Naturwissenschaften
(Dr. rer. nat.)
der Fakultät Chemie und Pharmazie
der Universität Regensburg
vorgelegt von
Axel Ehmer
aus Hünfeld
2009

Diese Doktorarbeit entstand in der Zeit von August 2004 bis September 2009 am Lehrstuhl
für Pharmazeutische Technologie an der Universität Regensburg.
Die Arbeit wurde von Herrn Prof. Dr. Achim Göpferich angeleitet.
Promotionsgesuch eingereicht am: 23. Oktober 2009
Datum der mündlichen Prüfung: 01. Dezember 2009
Prüfungsausschuss: Vorsitzender: Prof. Dr. Franz
Erstgutachter: Prof. Dr. Göpferich
Zweitgutachter: Prof. Dr. Schlossmann
Drittprüfer: Prof. Dr. Heilmann

Meiner Familie
in Liebe und Dankbarkeit gewidmet

―The most exciting phrase to hear in science, the one that heralds new discoveries, is not
‗Eureka!‘ (I found it!) but ‗That's funny ...‘ ‖
Isaac Asimov

Table of Contents
Chapter 1 Introduction and Goals of the Thesis 7
Chapter 2 Materials and Methods 31
Chapter 3 Customizing the Jet Mill 43
Chapter 4 Size Reduction of Proteins by Jet Milling 53
Chapter 5 Impact of Jet Milling on Bovine Insulin 71
Chapter 6 Impact of Jet Milling on Hen egg-white Lysozyme 79
Chapter 7 Impact of Jet Milling on BSA 91
Chapter 8 Lipid Microparticles by Jet Milling 109
Chapter 9 Summary and Conclusion 123
Chapter 10 References 127
Appendices
Abbreviations 142
Additional Data for the Experimental Design 145
Curriculum vitae 151
List of Publications 152
Acknowledgements 154


Chapter 1
Introduction
and
Goals of the Thesis

Chapter 1 Introduction and Goals of the Thesis
8
Introduction
Powders are not only intermediate products, but they have a significant impact on drug
performance or are used directly as dosage forms. Particle size and size distribution are very
important characteristics of powders having significant effects on flowability [1], dissolution
properties [2], release kinetics [3] etc. Therefore, particle engineering is a very important step
in the processing of pharmaceutical solids. For many applications particles with special
requirements, like sizes in the lower micrometer range, are needed. The positive effects of
micronization on the solubility of poorly soluble drugs [4], the homogeneous distribution
within long term release matrices [5] or effective pulmonary application [6] are just some
examples. Several methods for the processing of pharmaceutical powders are available and
very well validated. However, only few detailed studies exist for micronization of proteins.
Proteins belong to a group of drugs so-called biopharmaceuticals (recombinant proteins,
monoclonal antibodies and nucleic acid-based drugs) [7], which were established on the
market during the last decades. Starting with the approval of the first recombinant insulin in
the early 1980s, biopharmaceuticals have more and more been used as highly potent drugs.
Facilitated by advances in molecular biology and immunology and description of diseases at
the molecular level rational drug design was enabled [8]. And due to the improvement of
biotechnical methods to modify DNA there are now virtually unlimited options to create
recombinant proteins for every demand. Especially in the fields of cancer, diabetes, growth
disturbances, hemophilia and hepatitis [7], new therapeutic options were made possible by the
development of biopharmaceutical drugs. The immense variability in structure and the
possibility to evoke very specific effects in the body are the most salient characteristics of
biopharmaceuticals.
But as always, there are two sides of the coin: stability problems of the amino acids backbone
especially in presence of water are well known. Proteins are prone to many different types of
chemical degradation e.g. deamidation, hydrolysis, β-elimination, oxidation or disulfide
exchange [9]. Additionally, physical changes in the secondary or tertiary structure e.g. by
unfolding are fatal for the bioactivity of proteins [10]. Another drawback is the fact that the
Holy Grail, the oral administration of these drugs, has still not been found. The challenges are
e.g. digestive enzymes, intestinal flora, acetic gastric environment and the hindered absorption
[11], which block this preferred way of application. Therefore, as long as no satisfying
solutions are available, innovative new ways of application have to be found for these
challenging molecules. Creating alternatives to the parenteral delivery with its unpleasant

Introduction and Goals of the Thesis Chapter 1
9
injections and short administration intervals was the focus in drug delivery research during the
last years. Several new ways of application were developed, like nasal [12], pulmonary [13],
buccal [14], ocular [15], rectal [16], implantable long term release systems [3], needle free
powder injections [17] and transdermal delivery [18]. For most of these applications proteins
are not only processed in solid state but also delivered as a solid. This concept is based on the
dramatically increased stability of proteins in solid state compared to solutions [19]. From the
beginning of protein galenics most protein drugs were stored as freeze dried solids being
disssolved before parenteral application. So longer shelf lives were obtained. However, for the
new administration strategies not only the stability of the solid drugs but also the properties of
the solid itself played an important role. Now being delivered in solid form protein drugs had
to fulfill the same requirements as any other pharmaceutical powder e.g. flowability, particle
size and size distribution of the protein particles. Especially pulmonary delivery or
incorporation into long term release systems has special demands on these powder
characteristics. A particle is no longer seen as a passive carrier, but rather as an essential part
of the drug delivery system [20]. Hence processes have to be found, which allow the
production of micron sized protein particles. Ideally existing micronization methods can be
used from the powder processing of small molecular drugs, but maintaining their bioactivity
during these sometimes harsh processes is a challenging task.
Chapter 1 Introduction and Goals of the Thesis
10
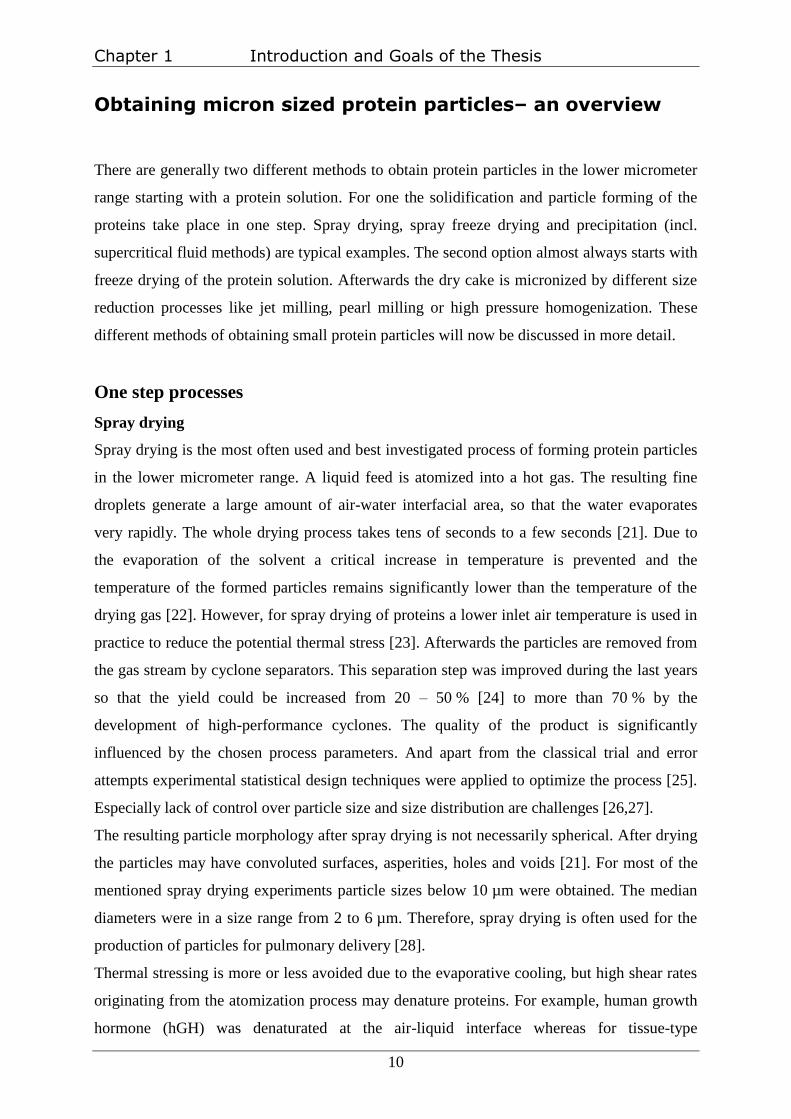
Obtaining micron sized protein particles– an overview
There are generally two different methods to obtain protein particles in the lower micrometer
range starting with a protein solution. For one the solidification and particle forming of the
proteins take place in one step. Spray drying, spray freeze drying and precipitation (incl.
supercritical fluid methods) are typical examples. The second option almost always starts with
freeze drying of the protein solution. Afterwards the dry cake is micronized by different size
reduction processes like jet milling, pearl milling or high pressure homogenization. These
different methods of obtaining small protein particles will now be discussed in more detail.
One step processes
Spray drying
Spray drying is the most often used and best investigated process of forming protein particles
in the lower micrometer range. A liquid feed is atomized into a hot gas. The resulting fine
droplets generate a large amount of air-water interfacial area, so that the water evaporates
very rapidly. The whole drying process takes tens of seconds to a few seconds [21]. Due to
the evaporation of the solvent a critical increase in temperature is prevented and the
temperature of the formed particles remains significantly lower than the temperature of the
drying gas [22]. However, for spray drying of proteins a lower inlet air temperature is used in
practice to reduce the potential thermal stress [23]. Afterwards the particles are removed from
the gas stream by cyclone separators. This separation step was improved during the last years
so that the yield could be increased from 20 – 50 % [24] to more than 70 % by the
development of high-performance cyclones. The quality of the product is significantly
influenced by the chosen process parameters. And apart from the classical trial and error
attempts experimental statistical design techniques were applied to optimize the process [25].
Especially lack of control over particle size and size distribution are challenges [26,27].
The resulting particle morphology after spray drying is not necessarily spherical. After drying
the particles may have convoluted surfaces, asperities, holes and voids [21]. For most of the
mentioned spray drying experiments particle sizes below 10 µm were obtained. The median
diameters were in a size range from 2 to 6 µm. Therefore, spray drying is often used for the
production of particles for pulmonary delivery [28].
Thermal stressing is more or less avoided due to the evaporative cooling, but high shear rates
originating from the atomization process may denature proteins. For example, human growth
hormone (hGH) was denaturated at the air-liquid interface whereas for tissue-type
Introduction and Goals of the Thesis Chapter 1
11
plasminogen activator (t-PA) no negative effects were detectable [29]. Pure lysozyme lost
about 10 % and catalase lost nearly 50 % of their initial bioactivity [30]. To overcome these
problems different excipients for stabilization of proteins during and after the spray drying
process were tested. By adding sucrose, trehalose, polyvinyl alcohol and mixtures thereof
lysozyme and catalase retained almost full activity. Lactose showed good stabilization of a
recombinant humanized anti-IgE monoclonal antibody [31] and combinations of lactose with
dipamitoylphosphatidylcholine prevented the dimerization of hGH by spray drying [32].
Surfactants were recognized as useful tools to prevent the accumulation of proteins at the air-
liquid interface of the atomized droplets. Due to their amphiphilic character proteins normally
tend to concentrate on the surface of these droplets and are then prone to aggregation and
unfolding. Added surfactants displace the proteins and promote their stability [33].
While spray drying is the best established method for preparation of micron sized protein
particles, a disadvantage may be the high amounts of excipients that are necessary to stabilize
the proteins during the process.
Spray freeze drying (SFD)
The principle of SFD was first introduced in 1990 [34]. Similar to spray drying a solution is
atomized, but instead of rapid drying by hot air the droplets are sprayed into a vessel
containing a cryogenic liquid, such as liquid nitrogen. While traveling through the cryogenic
gas the droplets begin to freeze [35] and are completely frozen after entering the liquid
cryogen. After freeze drying micron size particles were obtained [36].
Due to the absence of hot air drying no solvent evaporation takes place and the resulting
porous particles keep their spherical shape [17]. An advantage is the high product yield. At
identical spraying conditions SFD resulted in larger (8 – 10 µm) but more porous particles
with a larger specific surface area than at spray drying (3 µm) [37]. Nevertheless, particle size
and morphology can be strongly influenced by varying the process parameters [38].
Similar to spray drying problems with protein aggregation and denaturation can occur. Ziegler
et al. [17] determined a constant loss of 30 % bioactivity of catalase due to the SFD process.
By systematically studying the effect of the separate steps of the process (spraying, freezing,
drying) the large gas-liquid interface in the spraying step was identified as the primary cause
of protein aggregation of recombinant human interferon-γ [39] and lysozyme [40]. During the
freezing step concentrations of protein and other solutes like electrolytes increase markedly in
the remaining unfrozen solution, which further contributes to protein aggregation and

Chapter 1 Introduction and Goals of the Thesis
12
denaturation [41]. Therefore, modifications were developed to minimize the time of exposure
to the air liquid interface during the atomization step and increasing the freezing velocity.
It was not the new concept to spray the protein solution on top of the cryogenic liquid but
directly in the cryogenic liquid by using an insulated nozzle. It was first developed for
enhancing the dissolution of poorly soluble drugs [42]. The ultra rapid freezing of the formed
droplets prevents phase separation and also prevents crystal growth in frozen water. By spray
freezing into liquid (SFL) an amorphous glass is formed before any relaxation events take
place in the concentrated solution [41].
The particle morphology was quite similar to SFD particles. Very porous particles with large
specific surface areas were optained. Yu et al. produced particles of insulin and BSA with a
median diameter of 5 µm. By sonication in methylene chloride BSA particles were further
micronized to about 0.4 µm [40,43].
Comparing results from SFD and SFL showed a significant increase in protein activity and
stability for protein particles produced by SFL. The monomer loss of BSA was reduced from
about 5 % for SFD to 0.5 % for SFL [44], for the enzyme lysozyme 97 % activity for SFL
made particles and 86 % for SFD made ones were obtained [40]. For insulin which tends to
deamidation and aggregation no differences in stability compared to the bulk substance were
determined [43]. Even for fragile lactate dehydrogenase (LDH) 98 % bioactivity were
measured after SFL, which was similar to the freeze dried control and significantly higher
than after SFD where about 80 % activity were determined [45]. This effect was attributed to
the very short exposure time to the gas-liquid interface which was 2 orders of magnitude
faster than for SFD.
SFD and SFL are a further development of spray drying and the higher expense seems to be
justified by the good results.
Precipitation of protein crystals
Precipitation was one of the first methods to purify proteins or to obtain protein crystals for
structural analysis. Generally, proteins are precipitated by the reduction of solubility due to
the addition of specific compounds or the change in process conditions. Salting-out,
precipitation by polyelectrolytes and nonionic polymers, isoelectric precipitation and addition
of organic solvents are common methods. Detailed information about crystallization
conditions and crystal data for several thousand proteins can be found in the Biological
Macromolecular Crystallization Database (BMCD) [46]. However, these data originated
mainly from approaches to generate X-ray quality crystals for structural analysis, but for the
Introduction and Goals of the Thesis Chapter 1
13
use in pharmaceutical formulations the aims are quite different. Narrow size distribution, high
yield and quick processing are challenges for the use of precipitation in pharmaceutical
processes [47].
There are different hints that proteins in crystallized form are more stable than in their
amorphous form [48,49]. The crystalline form is thermodynamically more stable, which is the
reason for the lower stability and higher reactivity of amorphous substances [50].
Additionally, it is possible to influence the release behavior by modifying crystal properties
due to different excipients or by utilizing possible crystal polymorphisms [51]. In spite of
these advantages with exception of insulin nearly no protein is used in crystallized form in
pharmaceutics. Reasons for this are 1. the hard to be controlled crystallization process which
often results in broad size distributions and 2. that not all proteins cannot easily be
crystallized.
Lee et al. produced uniform spherical microcrystals of α-lactalbumin of 1-2 µm by using a
pH-shift method in presence of PEG as a stabilizer [52]. Three monoclonal antibodies
(rutiximab, trastuzumab and infliximab) were successfully crystallized by Yang et al. [53]. As
precipitation agents different amounts and types of PEG and salts were utilized. Depending on
the conditions needles, rice-shaped crystals or star clusters formed in a quite homogenous
way. The obtained size range was between 10 to 60 µm. All antibodies retained their full
stability and activity. Reichert et al. patented a method to produce crystalline interferon alpha
for pulmonary delivery [54]. The protein was dissolved in zinc acetate/sodium acetate
containing medium at 4°C. Crystallization was achieved by using a temperature induction
method. It was increased over 6 hours up to 22°C and maintained there for 5 days. The
resulting crystal sizes ranged from 100 to less than 1 µm. After further processing it was
possible to isolate a fraction with an average diameter of 1.8 µm. The bioactivity of interferon
was not distinguishable from the unprocessed control.
These are some promising results but as mentioned before the practical use in drug
formulation has not yet been established.
Supercritical fluid technology
Supercritical fluids (SCFs) are gases or liquids at temperatures and pressures above their
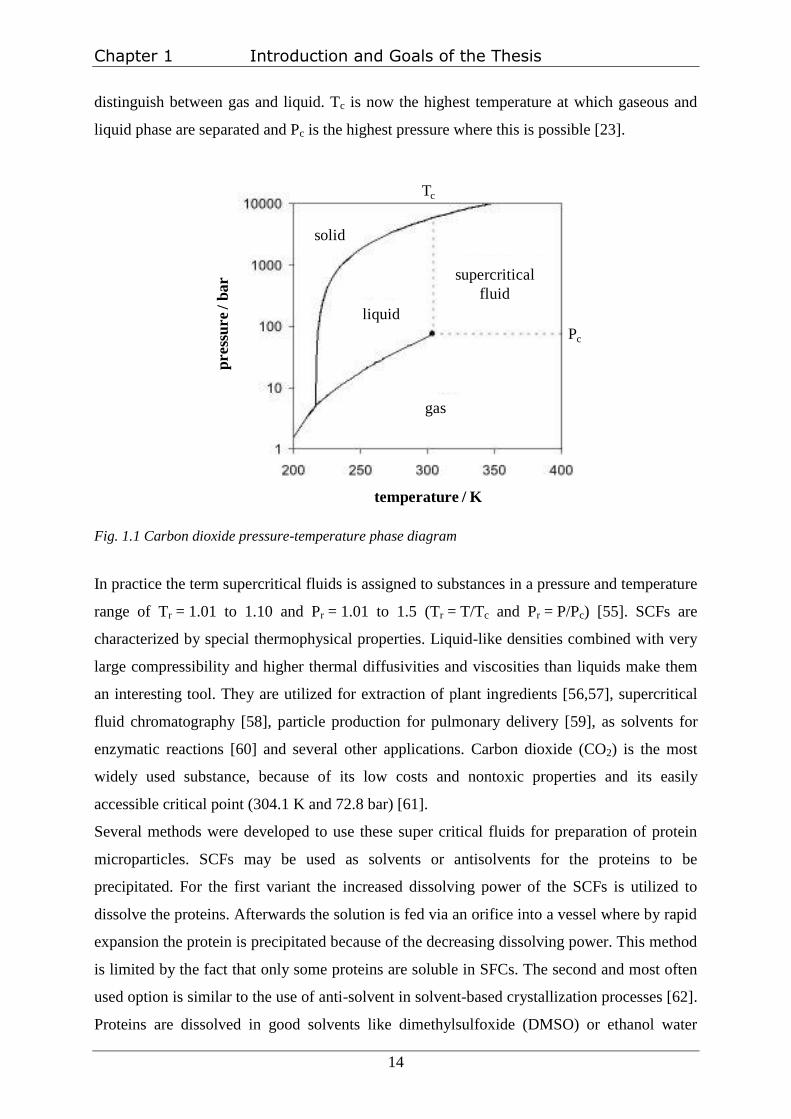
critical points (critical temperature Tc, critical pressure Pc). The 3-phase diagram indicates that
the higher the temperature of a gas is the higher the pressure has to be to liquefy it (fig 1.1).
At high pressures the density of the gaseous phase increased so much that it is impossible to
Chapter 1 Introduction and Goals of the Thesis
14
distinguish between gas and liquid. Tc is now the highest temperature at which gaseous and
liquid phase are separated and Pc is the highest pressure where this is possible [23].
Fig. 1.1 Carbon dioxide pressure-temperature phase diagram
In practice the term supercritical fluids is assigned to substances in a pressure and temperature
range of Tr = 1.01 to 1.10 and Pr = 1.01 to 1.5 (Tr = T/Tc and Pr = P/Pc) [55]. SCFs are
characterized by special thermophysical properties. Liquid-like densities combined with very
large compressibility and higher thermal diffusivities and viscosities than liquids make them
an interesting tool. They are utilized for extraction of plant ingredients [56,57], supercritical
fluid chromatography [58], particle production for pulmonary delivery [59], as solvents for
enzymatic reactions [60] and several other applications. Carbon dioxide (CO2) is the most
widely used substance, because of its low costs and nontoxic properties and its easily
accessible critical point (304.1 K and 72.8 bar) [61].
Several methods were developed to use these super critical fluids for preparation of protein
microparticles. SCFs may be used as solvents or antisolvents for the proteins to be
precipitated. For the first variant the increased dissolving power of the SCFs is utilized to
dissolve the proteins. Afterwards the solution is fed via an orifice into a vessel where by rapid
expansion the protein is precipitated because of the decreasing dissolving power. This method
is limited by the fact that only some proteins are soluble in SFCs. The second and most often
used option is similar to the use of anti-solvent in solvent-based crystallization processes [62].
Proteins are dissolved in good solvents like dimethylsulfoxide (DMSO) or ethanol water
Tc
Pc
supercritical
fluid
solid
gas
supercritical
fluid
liquid
temperature / K
press
ure
/ b
ar
Introduction and Goals of the Thesis Chapter 1
15
mixtures. The high solubility of supercritical CO2 in these solvents leads to volume expansion
when the fluids get into contact. Due to this the solvent density is reduced and the solvation
capacity drops which leads to nucleation and particle precipitation [22].
Different proteins were tested at different process conditions. Cyclosporine particles of
150 nm were obtained by rapid expansion, but the particles were highly aggregated [63].
Insulin and catalase were micronized down to 3 µm respectively smaller 1 µm by using CO2
as an antisolvent [64].
Muhrer and Mazotti investigated the effect of different parameters on the size of lysozyme
particles precipitated from a DMSO solution. The resulting amorphous particles had a size of
about 250 nm, but were aggregated to particles of 20-30 µm with no big influence of any
process parameter. After the process 75 % biological activity relative to the standard material
was retained [65]. Thiering et al. described the relation between process temperature and
lysozyme bioactivity, which was decreased to 60 % by increasing the temperature from 25 to
45°C [66]. Insulin precipitated from DMSO formed particles with 90 % smaller than 4 µm.
The FT-IR spectra showed an increase of β-sheet content with concomitant decrease in α-
helix contents. However, after dissolving the particles in 0.01 M HCl the spectra were nearly
identical to the commercial powder [67]. Bioactivity tests in rats showed no difference to the
unprocessed insulin [68].
Bustami et al. sprayed an aqueous solution of lysozyme and rhDNase into pressurized CO2
with a mole fraction of 0.2 ethanol added. Lysozyme retained all bioactivity, but rhDNase was
totally denatured. No monomers of rhDNase could be detected after processing at 45°C. Even
after lowering the temperature to 20°C two-thirds were denatured, which was related to the
acetic environment in this process [69].
This relatively new technique seems to be quite promising, but the process is complex and
applicable to a few proteins only.
Two step processes
Lyophilization
Lyophilization or freeze-drying is the most common and best investigated method to obtain
solid proteins. However, the resulting solids have to be further processed to get
homogeneously distributed particles in the micrometer range and freeze drying is just the first
of the two preparation steps. The process of freeze-drying is very well investigated and often
reviewed in literature [19,70–75]. Therefore, this process will not be discussed in detail here,
as it would exceed the scope of this thesis. The critical steps during the three process stages

Chapter 1 Introduction and Goals of the Thesis
16
(freezing, primary drying and secondary drying), e.g. by freezing and drying stresses like
solute concentration, formation of ice crystals, pH changes and effect of different excipients,
are well known and often reviewed but still not totally understood [19,76]. Wang stated, that
in order to get the optimal result for each protein it takes an enormous amount of time and
labor, because there is no single, short and mature pathway to follow in formulating such a
product [19]. This might be true for all protein processing methods.
Anyhow, even by taking the potential risks into account, lyophilization is a very useful and
well analyzed method to obtain stable solid proteins and most commercially available proteins
are freeze-dried powders.
Co-lyopilization of proteins with poly(ethylene glycol) (PEG)
Morita et al. developed a method to conceive spherical protein microparticles after
lyophilization in presence of PEG 6000 [77]. PEG was chosen because of its solubility in
different media, which allows the co-lyophilization with proteins in an aqueous media and the
complete removal with an organic solvent afterwards. Secondly, PEG served as a phase
separation inducer. Protein and PEG have to be mixed in a protein specific ratio and then
solved in water to form a clear solution. During the freezing process protein and PEG are
separated in a continuous PEG-phase and a disperse protein-phase. Afterwards the PEG phase
is removed by methylene chloride and the protein microparticles remain.
The resulting spherical particles had a narrow size distribution with an average particle size of
3-4 µm and high purity for BSA, superoxide dismutase and horseradish peroxidase. The
activity of superoxide dismutase and horseradish peroxidase was completely maintained after
the process. Castellanos et al. investigated the activity of γ-chymotrypsin after encapsulation
of the protein particles in PLGA microsperes and 92 % of the initial activity was measured
[78]. Koennings et al. described the incorporation of interleukin-18 particles produced by co-
lyphilization into lipidic matrices without any loss in bioactivity [79]. The method was also
adapted for the preparation of dextran microspheres. Depending on molecular weight of PEG
and dextran particles in the range of 200 nm to 10 µm were obtained [80].
This method seems to be very useful for the processing of very small amounts of proteins.
Milling
Size reduction of solids by milling is the oldest method to obtain small particles and is a basic
operation in the processing of many powdered pharmaceutical excipients or drugs.
Introduction and Goals of the Thesis Chapter 1
17
Nevertheless, for the production of protein microparticles these techniques are applied quite
rarely until now.
Jet milling
Micronization by jet milling is the most common method to produce particles in the lower
micrometer range. In brief, the raw material with a maximum size of about 1 to 2 mm is
introduced into the milling chamber via a gas stream. Within the milling chamber a circular
gas stream accelerates the particles which are micronized by collision with each other or with
the wall of the chamber. The ground particles are removed from the milling chamber by the
gas stream, while the larger ones stay inside due to centrifugal forces.
Platz et al. described the jet milling of different proteins after freeze drying [81]. After
micronization of human growth hormone 40 % of the powder was insoluble in water. It was
possible to reduce this fraction to 2.5 to 7.5 % by exchanging some silver soldered joints and
copper gas lines with more inert materials like stainless steel. Interferone-β was freeze dried
with different mixtures of human serum albumin, NaCl and sorbitol. 50 % of the micronized
particles were smaller than 3 µm and the mixture containing the sorbitol withstood the milling
without significant loss of activity while the activity of the other mixtures was reduced by
about 35 %. For granulocyte-colony stimulating factor soluble aggregates were detected after
jet milling. Adding sorbitol to the protein solution before freeze drying reduced these
aggregates to less than 4 %. By using HPLC no degradation of the protein was visible.
Phillips et al. investigated the effect of the milling pressure on 5 amorphous proteins and
peptides [82]. The improvement in size reduction by increasing the pressure was visible for all
proteins but the dimension of the effect was different. For all tested materials mean particle
sizes between 1.5 and 3.5 µm were measured. No impact on initial or long term storage
stability or on the bioactivity was determined.
Horseradish peroxidase was jet milled after co-precipitation with carbomer [83]. The activity
of the protein was significantly reduced by the milling process, but the author stated that the
way of co-precipitation had a much greater effect on protein stability than the milling process
itself. It is worth while mentioning that after grinding the powder for 10 min in a mortar
nearly no remaining activity of the peroxidase was measurable.
Insulin was micronized in combination with sodium caprate as an absorption enhancer for
pulmonary application [84]. The mixture was milled down to an average size of 2 µm and
significant plasma insulin levels of insulin and a drop in glucose concentration were measured
after pulmonary application to five dogs. Similar results were found for the pulmonary
Chapter 1 Introduction and Goals of the Thesis
18
activity of salmon calcitonin which was micronized after freeze drying with lactose and
absorption enhancers. Particle sizes of 4 µm were achieved and significant blood levels of
calcitonin were determined within rats [85].
Jet milling is besides spray drying the gold standard for the production of inhalable particles
of small molecular drugs. For the processing of proteins and peptides the results are quite
different and the reasons for the loss of activity of some proteins is not clear yet and has to be
further investigated before it will be regularly used for these substances, too.
Tribomechanical milling
Tribomechanics is a field in physics which deals with phenomena occurring during fine
milling under dynamic conditions. The milling equipment consists of two rotor discs placed
against each other. On each disc several concentric rings of metal teeth are placed. During the
milling process the discs rotate in opposite directions (10.000 – 22.000 rpm) while the product
enters the center of the discs via an air stream. By collision and friction size reduction takes
place.
The system was tested in food industry on different whey protein powders with 60 % (WPC-
60) respectively 80 % (WPC-80) protein content at a feed rate of 5 kg/min and rotor speeds
between 16.000 and 22.000 rpm [86]. The resulting particle size decreased with increasing
rotor speeds. For WPC-60 the average size was reduced from 59.7 µm to 13.3 – 17.8 µm and
for the WPC-80 from 76.7 µm down to 45.1 – 46.6 µm. While solubility of the WPC-60
powder in water increased even a little bit from 88 % to about 90 % the solubility of the
WPC-80 powder with the higher protein content decreased from 85 % to about 76 %.
Additionally changes in the rheological properties of the milled powder were determined [87].
For pharmaceutical applications the size reduction potential is not high enough and the
changes in protein integrity have to be further investigated. Furthermore, the needed amounts
of powder are very large and not practicable for the small amount of expensive protein drugs.
Media pearl milling
In this process a liquid is used as a medium during milling. A rotating milling chamber is
filled with small pearls with a diameter of 0.6 to 1.1 mm. The protein is suspended in the
liquid and circulates from a reservoir to the milling chamber. In most cases the whole setup
was combined with a cryostat for cooling.
Lizio et al. micronized cetrorelix acetate suspended in heptafluoropropane (HFA 227) [88].
The milling chamber and pearls were provided with abrasion resistant materials, such as

Introduction and Goals of the Thesis Chapter 1
19
iridium-stabilized ZrO2. During the process the system was cooled down to -44°C or -60°C.
Resulting cetrorelix particles had an average diameter of 2.1 µm and were absolutely stable
under the used conditions. Due to the modified materials no contaminants from the process
were detected.
Irngartinger et al. performed also experiments with cetrorelix acetat with nearly the same
setup [26]. The milling setup was cooled down to -70°C by using ethanol 96 % as coolant.
Particles with a diameter of 1.58 µm were obtained and again no degradation products could
be determined.
This process seems to be useful to directly produce suitable suspensions for pressurized
metered dose inhalers. For other applications the use of a dispersion medium may be a
disadvantage.
High pressure homogenization
High pressure homogenization is a well known method for the preparation of stable
nanoemulsions [89] and nanosuspensions [90] or for the preparation of solid lipid
nanoparticles [91]. A disperse system (emulsion or suspension) is forced through a small slit
by applying high pressure up to 1500 bar. During the passage of the small slit the dynamic
pressure increases while the static pressure decreases, which was described by Bernoulli. If
the static pressure falls below the vapor pressure of the liquid it begins to boil. Behind the slit
the static pressure suddenly increases and the small gas bubbles implode. This cavitation
effect originates high forces which disrupt the emulsion droplets or solid particles.
Maschke et al. tested this process for the micronization of insulin suspended in miglyol®812
[92]. The insulin crystals were micronized at different pressures and the homogenization
process was repeated up to 6 homogenization cycles. The average particle size was reduced
from 15.8 µm to 3.7 µm after homogenizing 6 times at 1500 bar. By HPLS-MS no
degradation products were visible and full bioactivity was determined in a chondrocyte
proliferation assay.
The results for insulin are promising, but results for other more sensitive proteins have to be
determined before the process can be finally evaluated.
Chapter 1 Introduction and Goals of the Thesis
20
Summary
For the production of small protein particles numerous methods and techniques were
developed or modified. Achieving the desired particle sizes and size distributions does not
seem to be the major problem, maintaining protein stability and bioactivity are the challenges.
Adding excipients for the stabilization of sensitive proteins is the commonly used and good
working solution at the moment. Each process has its own advantages and disadvantages and
no method can really outrun the others. The use of organic solvents is always critical and has
to be carefully evaluated to prevent contamination of the final product. Cost and time
consumption are important factors which have an impact on the development, too. It also
depends on the form in which your purchased protein is available. If it is a solution the on-
step methods may be favored and if it is already available as a powder it would be a good idea
to avoid the critical dissolving step and process the powder directly.
At the moment for each protein and each application it is more or less a trial and error process
to find the optimal method.
Introduction and Goals of the Thesis Chapter 1
21
Jet milling – theoretical background
Jet milling is a well established micronization method and the process has been investigated
since the 1950s and is besides hammer mills and ball mills the most often used technique for
ultrafine grinding (<10 µm) [93]. So the principles of size reduction are well known for this
method and it is applied to many different substances ranging from technical powders, like
laser printer toner [94], to pharmaceutical drugs for pulmonary applications [95]. The often
mentioned advantages are achievable particle sizes below 10 µm, very low risk of product
contamination e.g. by attrition or lubricants and grinding of heat sensitive materials due to the
cooling effect of the expanding gas stream. Nevertheless, only few results exist for the
micronization of proteins.
To understand the size reduction processes and identify important parameters, which may
have an impact on the micronized product concerning particle size and stability, knowledge
about the theoretical background is indispensable [96].
Assembly of a jet mill
A jet mill consists of a cylindrical milling chamber with 4 to 8 nozzles implemented into its
wall (fig. 1.2). The nozzles are symmetrically aligned with an angle between 52°-60° [97] so
that a circular gas stream with high rotational speed results within the chamber, when pressure
is applied. Additionally a feed injection nozzle is installed. Due to the existing negative
relative pressure above the venturi nozzle the added powder is continuously introduced into
the milling chamber with the gas stream. Inter-particle collisions and impact on the wall of the
milling chamber are the size reduction mechanisms. The ground particles are carried out of
the milling chamber with the gas stream and are collected in a cyclone separator. It is a main
difference to other grinding methods that jet mills contain no moving parts, which reduces the
risk of product contamination by attrition or by lubricants.

Chapter 1 Introduction and Goals of the Thesis
22
Fig.1.2: Milling chamber of a jet mill: (1) Nozzle, (2) gas outlet, (3) grinding zone, (4) separation
zone, (5) circular gas stream, (6) jet of gas out of nozzles (dotted line)
Particles in a gas stream
The principle of micronization by jet milling is the collision of particles within a fast gas jet.
The processes responsible for size reduction and separation within the milling chamber were
investigated intensively in the 1960s by Rumpf and Kuerten [98,99]. By using
triboluminescent substances like sucrose it was possible to have a closer look on the size
reduction mechanisms. Triboluminescent substances emit light during size reduction due to
the formation of an electrical field between the breakage surfaces. The light emission pattern
during the milling process was analyzed by using a transparent milling chamber. Figure 1.2
illustrates the different detected areas in a milling chamber during the milling process.
Size reduction mainly takes place at the backside of the gas streams coming out of the
nozzles. Due to the circular motion of gas within the milling chamber, these jets are deformed
(fig. 1.3) and within the resulting vortices at the backside, the probability of collisions of
particles with different relative velocities dramatically increases.
α1
2
3
6
5
4
1
1
1
3
3
3

Introduction and Goals of the Thesis Chapter 1
23
Fig. 1.3: jet of gas in a cross flow (adapted from Abramovich [100]) (1) cross flow, (2) gas jet out of
nozzle, (3) vortical gas streams
For size reduction special prerequisites for collisions have to be fulfilled and the relative
velocities of the colliding particles have to be large enough. Collisions are possible if the
average free path length (averaged distance between two single particles) between the
particles is smaller than their flight path length (distance the particle will fly starting with a
specific velocity taking air resistance into account). If you start from the assumption that the
velocity of the particles is spatial equally distributed within the chamber, the average free path
length can be calculated by equation 1.1:
𝝀 ≈𝒙
𝟏𝟎∗(𝟏−𝒒) (1.1)
[𝜆 ] = 𝑚 average free path length
𝑥 = 𝑚 particle diameter
𝑞 particle free volume portion on chamber volume
Flight path length of particles is described by equation 1.2 [101]:
𝒔𝟎 =𝒙𝟐∗𝝆𝒔∗𝝂𝟎
𝟏𝟖∗𝜼 (1.2)
[𝑠0] = 𝑚 flight path length
𝑥 = 𝑚 particle diameter
[𝜌𝑠] = 𝑘𝑔 ∗ 𝑚−3 density of solid
1
2
3

Chapter 1 Introduction and Goals of the Thesis
24
𝜈0 = 𝑚 ∗ 𝑠−1 particle velocity at time zero
𝜂 = 𝑃𝑎 ∗ 𝑠 dynamic viscosity of milling gas
Fig. 1.4 shows average free path lengths and flight path length depending on particle size at
different typical velocities and loading of the milling chamber for jet milling.
Fig. 1.4: maximal flight path length (S0) and average free path length ( ) depending on the size x of
spherical particles (ρ=1 g/cm3) in air (20°C) [102]
It becomes obvious that there is a natural grinding limit by using jet milling. If the flight path
length gets shorter than the average free path length, no collisions will take place or the
velocities are much too low to initiate particle breakage. For typical conditions in a jet mill the
grinding limit is at about 0.1 to 1 µm, depending on the applied pressure, type of milling gas
and used substance. The grinding process is influenced by the frequency of collisions and the
intensity of these collisions. Therefore, the results depend on the concentration of solid in the
milling chamber and on the impact velocity. Hence, the feed rate is an important parameter to
facilitate a successful milling process. It has to be high enough to allow inter-particle
collisions, but if it is too high, on the one side the acceleration before impact is too short and
on the other side the gas stream is slowed down and the milling process is not efficient.
In the center of the circular milling chamber you find the separation area (fig. 1.2 (4)).
Particles are affected by the gas flow, which leaves the chamber, and by occurring centrifugal
forces. The gas stream leads the particles to the center of the milling chamber to the outlet
0,01
0,1
1
10
100
1000
10000
0,1 1 10 100 1000 10000 100000
x / µm
S0,
/ m
mλ
s0
λ

Introduction and Goals of the Thesis Chapter 1
25
opening, while the centrifugal forces resulting from the circular motion push the particles to
the periphery. Theoretically a particle size limit can be calculated where 50 % of particles
leave the milling chamber, while the other 50 % stay within the milling chamber for further
micronization. Assuming laminar flow around the particles the drag force can be expressed by
the equation of Stokes [103]. This leads to the following equation (3) for this size limit [104]:
𝒙𝒍𝒊𝒎 = 𝟏𝟖∗𝜼∗𝝂𝒓∗𝒓𝒊
𝝆𝒔−𝝆𝒈 ∗𝒖𝒊𝟐 (1.3)
[𝑥𝑙𝑖𝑚 ] = 𝑚 particle size limit
𝜂 = 𝑃𝑎 ∗ 𝑠 dynamic viscosity of milling gas
𝜈𝑟 = 𝑚 ∗ 𝑠−1 radial velocity
𝑟𝑖 = 𝑚 radius
[𝜌𝑠] = 𝑘𝑔 ∗ 𝑚−3 density of solid
𝜌𝑔 = 𝑘𝑔 ∗ 𝑚−3 density of milling gas
𝑢𝑖 = 𝑚 ∗ 𝑠−1 circumferential speed at a circle of radius ri
Based on this process small particles below the limit are removed out of the milling chamber,
while large ones are hold back for further grinding. Therefore, jet milling results in narrow
particle size distributions as milling and size fractioning are combined in one process. This
separation mechanism however, is influenced by the angle of the nozzles in the milling
chamber; the particle size limit is lowered with higher circumferential speed and with lower
radial velocity at the outlet. A compromise has to be found between large angles, which allow
good acceleration of the particles, and low angles, which are necessary for a good separation
step [96]. Angles between 52° and 60° were found to be optimal for jet mill grinding [97].
Particle breakage
As mentioned before, the prerequisites for particle collisions must be fulfilled to facilitate size
reduction, but not every collision results in breakage of the two particles. Conditions for and
processes during particle breakage will be described in the following part.
The powder particles are accelerated by the gas stream. When collisions with other particles
take place, elastic deformations are the consequence. Thus tension areas are induced, which
concentrate on small cracks or flaws within the particle. If the tension exceeds a critical value
crack extension occurs. It was demonstrated that treating particles with blasts before

Chapter 1 Introduction and Goals of the Thesis
26
micronization enhances the milling result by inducing microcracks [105], proving the
importance of these flaws for particle breakage.
Two prerequisites have to be fulfilled that particle breakage takes place: the differential and
the integral breakage condition [106]. To start the fracture the crack extension force must
exceed the surface energy of the created surfaces (differential breakage condition). The crack
is only able to propagate through the whole particle if the complete needed energy is stored
within the tension field (integral breakage condition), because the crack propagation is so fast
that no further energy can be supplied from the surrounding.
In practice however, the needed fracture energy is orders of magnitude larger than the surface
energy of the just created surface areas. Most of the applied energy is consumed by structural
changes, kinetic energy of the formed fragments, emission of light (triboluminescence) and
heat consumption. Especially during crack propagation high temperatures may occur at the
new created surfaces. For ground glass up to 3200 K were measured at the breakage area
[107]. After the propagation of the crack however, the surfaces cool down very rapidly within
less than 10-6
seconds [108]
Grinding limit
As described before, one limiting factor for particle size reduction by jet milling is dependent
on average free path length and flight path length, which determines the likelihood of
collisions. Another limiting factor is the particle size itself. The smaller the particles the
smaller is the probability of cracks and flaws, which are essential prerequisites for particle
breakage. Therefore, it can be observed, that the particle strength increases while the particle
size decreases, which can be explained by more and more perfect crystal structures. The
particle strength is defined as the ratio of the force acting on the particle at the breakage point
divided by a nominal particle cross-section [109]. For example, the particle strength of a
10 µm quartz particle is 350 MPa. This value raises up to 800 MPa for a 5 µm particle.
Another reason for this size depending effect is that the particles have to be big enough to
store the elastic energy needed for the particle breakage. The critical size is described by
equation (1.4) [108]:
𝒍 ≥𝜷
𝑾𝒃𝑽=
𝟐∗𝒆∗𝜷
𝝈𝒃𝟐 (1.4)
𝛽 = 𝐽 ∗ 𝑚−2 surface energy
𝑙 = 𝑚 particle size
Introduction and Goals of the Thesis Chapter 1
27
𝑊𝑏𝑉 = 𝐽 𝑚−3 breakage energy related to the volume
𝑒 = 𝐽 𝑚−3 Young´s modulus
𝜎𝑏 = 𝐽 𝑚−3 breakage tension
For most particles this limit is below one micrometer, but often instant reagglomeration takes
place increasing the measured particle sizes [106].
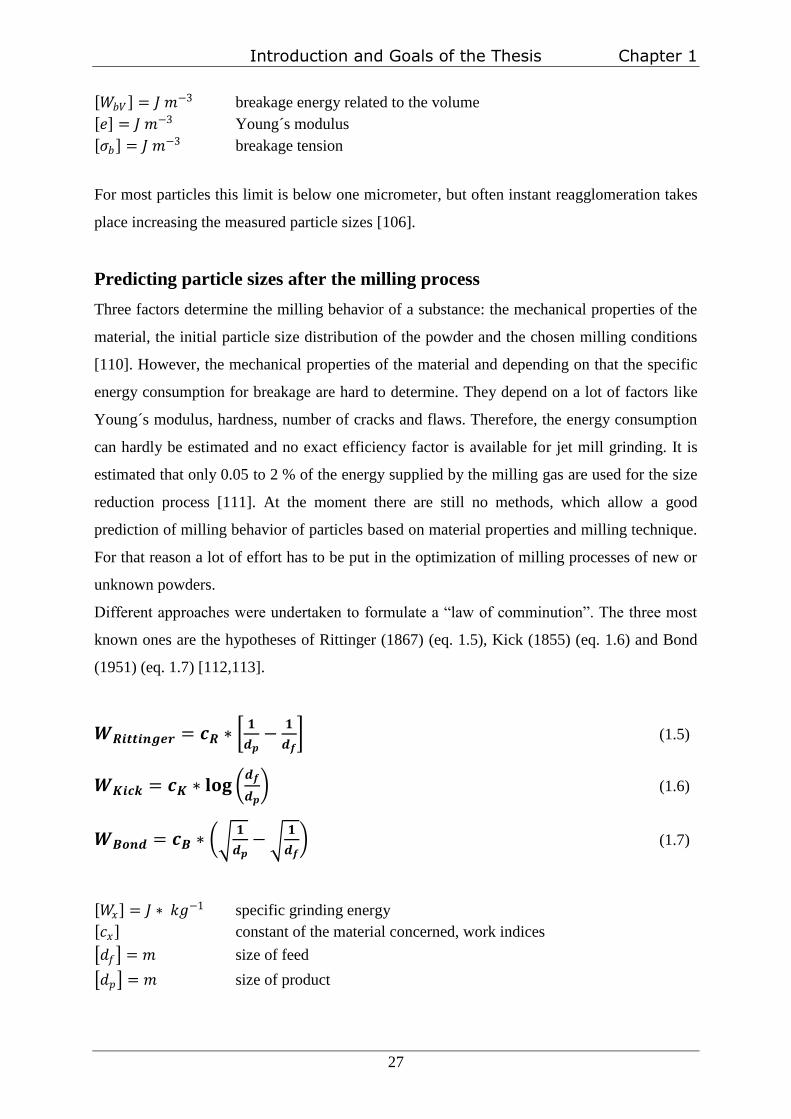
Predicting particle sizes after the milling process
Three factors determine the milling behavior of a substance: the mechanical properties of the
material, the initial particle size distribution of the powder and the chosen milling conditions
[110]. However, the mechanical properties of the material and depending on that the specific
energy consumption for breakage are hard to determine. They depend on a lot of factors like
Young´s modulus, hardness, number of cracks and flaws. Therefore, the energy consumption
can hardly be estimated and no exact efficiency factor is available for jet mill grinding. It is
estimated that only 0.05 to 2 % of the energy supplied by the milling gas are used for the size
reduction process [111]. At the moment there are still no methods, which allow a good
prediction of milling behavior of particles based on material properties and milling technique.
For that reason a lot of effort has to be put in the optimization of milling processes of new or
unknown powders.
Different approaches were undertaken to formulate a ―law of comminution‖. The three most
known ones are the hypotheses of Rittinger (1867) (eq. 1.5), Kick (1855) (eq. 1.6) and Bond
(1951) (eq. 1.7) [112,113].
𝑾𝑹𝒊𝒕𝒕𝒊𝒏𝒈𝒆𝒓 = 𝒄𝑹 ∗ 𝟏
𝒅𝒑−
𝟏
𝒅𝒇 (1.5)
𝑾𝑲𝒊𝒄𝒌 = 𝒄𝑲 ∗ 𝐥𝐨𝐠 𝒅𝒇
𝒅𝒑 (1.6)
𝑾𝑩𝒐𝒏𝒅 = 𝒄𝑩 ∗ 𝟏
𝒅𝒑−
𝟏
𝒅𝒇 (1.7)
𝑊𝑥 = 𝐽 ∗ 𝑘𝑔−1 specific grinding energy
𝑐𝑥 constant of the material concerned, work indices
𝑑𝑓 = 𝑚 size of feed
𝑑𝑝 = 𝑚 size of product

Chapter 1 Introduction and Goals of the Thesis
28
These ―laws of comminution‖ are useful tools for the extrapolation of milling results, but their
scope is limited and the best-fitting equation has to be chosen for each single experimental
setup. The material constants have to be determined experimentally, which means a lot of
effort. A large list exists for the Bond work indices, which is the reason why it is the most
popular one of these three hypotheses [114]. Nevertheless, no exact estimations of the
grinding energy are available until now, which is certainly attributed to the fact that energy
loss occurs throughout all milling processes, what is not taken into account for these
estimations.
Due to this gap, a field of research formed to solve this problem starting from a theoretical
statistical approach. Nearly all of them are based on two different processes. First, the
―selection function‖ that describes the fraction of particles destroyed in an experiment.
Second, the ―breakage function‖ describing the size distribution of the fragments after
breakage, not considering the undestroyed particles [115]. Again the main problem is to find
easy ways of obtaining all necessary particle properties like size of initial flaws, hardness or
surface energy.
Several groups are working in this field [110,115–119]. The results are quite promising, but
the transfer to practical applications in pharmaceutical industry will take a longer time.
Therefore, still experimental optimization has to be performed for every new substance or
machine. A possibility to reduce time and costs for these experiments may be the utilization
of statistical experimental design, which is used for process optimization in many other fields.
Introduction and Goals of the Thesis Chapter 1
29
Goals of the thesis
To meet the demand of the pharmaceutical industry to process and deliver proteins in solid
state it is necessary to establish methods, which allow a customized particle design. As
abovementioned jet milling is one of the most effective micronization methods, but its
potential for the micronization of proteins has not yet been tested to the full extend. Therefore,
the aim of this thesis was to provide more information about the jet milling of proteins. For
this investigation three important points have to be considered:
1. Which particle size distributions can be obtained by jet milling and is there a difference
between different proteins?
2. Which are the important process parameters and how can the process be optimized to
improve the size reduction and size distribution?
3. Are there any negative effects on stability or activity of the investigated proteins due to the
milling process?
To address these questions, first of all the setup of the jet mill had to be optimized. One big
problem was to deal with the air humidity in standard lab environment. It is well known that it
leads to agglomeration of micronized particles (e.g. powdered sugar) and also may influence
the activity and stability of processed proteins [120]. Additionally a cryogenic grinding setup
as an additional investigated parameter had to be developed and evaluated, which also
reinforces the need for the exclusion of humidity. These customization steps are described in
chapter 3.
As mentioned before, many pharmaceutical applications demand protein particle sizes below
10 µm. For many of the low molecular weight drugs this is performed by jet milling, but for
protein drugs only very few investigations exist. Are there detectable differences between
different proteins? Are crystalline or amorphous proteins micronized differently? These
questions were investigated by using three model proteins with known properties and
different characteristics: bovine insulin, hen egg white lysozyme and bovine serum albumin.
Their size distributions were analyzed after milling by laser light diffraction analysis and were
verified by scanning electron microscopy of the resulting protein powder. The effect of
milling pressure, number of milling cycles and of the milling gas temperature on the resulting
particle size was analyzed by using statistical experimental design (chapter 4).

Chapter 1 Introduction and Goals of the Thesis
30
Nevertheless, particle size is only one important parameter. For proteins the conservation of
chemical and structural stability and of their bioactivity is even more important. Therefore,
the proteins were analyzed for changes after the milling process by HPLC, MALDI ToF, CD-
and fluorescence spectroscopy. Lysozyme and insulin were chosen as model proteins, because
for both well established bioactivity assays are available. The bioactivity of insulin was tested
in cell culture experiments, where the dose dependent effect of insulin on the proliferation and
quality of the extracellular matrix of chondrocytes was utilized (chapter 5). The enzymatic
activity of lysozyme was tested by using the well established micrococcus assay (chapter 6).
For BSA, chosen because of its wide spread use and higher molecular weight, it occurred that
changes in its solubility in water were the most prominent altered property due to the jet
milling process and the main hurdle for further investigations (chapter 7). If it was possible,
the effects of the micronization process on the investigated parameters of the proteins would
be analyzed by using the statistical experimental design to identify the impact of the single
milling parameters.
Inspired by different methods for the preparation of lipid microparticles, like solvent
evaporation and spray congealing methods and difficulties to obtain small and homogeneous
distributed particles, the suitability of jet milling for this task was tested. Additionally the easy
measurable heat effects on lipid powders were utilized to get a closer look on the impact of jet
milling on heat sensitive substances. Glycerol tripalmitate (Dynasan 116®) was jet milled at
different conditions and afterwards characterized by laser light diffraction, scanning electron
microscopy and DSC measurements (chapter 8).

Chapter 2
Materials
and
Methods

Chapter 2 Materials and Methods
32
Materials
Bovine insulin crystals were a gift from Sanofi-Aventis (Frankfurt, Germany), chicken egg
white lysozyme lyophilized powder, albumin from bovine serum (BSA), albumin from bovine
serum essentially fatty acid free, l-glutathione oxidized and l-glutathione reduced were
purchased from Sigma Aldrich (Taufkirchen, Germany). We acquired the HPLC-grade
acetonitrile from Baxter (Deventer, The Netherlands), trifluoroacetic acid (TFA) from Riedel-
De-Haen (Sigma Aldrich, Taufkirchen, Germany) and isobutanol from Merck-Schuchardt
(Hohenbrunn, Germany). Water was double-distilled and filtered through a cellulose nitrate
filter (pore size 0.2 µm, from Sartorius, Göttingen, Germany) prior to use. Glycerol
tripalmitate (Dynasan116®) was purchased from Sasol AG (Witten, Germany). Thrombin was
provided by Baxter (Unterschleißheim, Germany) and bovine fibrinogen, lyophilized
micrococcus lysodeikticus cells ATCC No. 4698, calcium chloride, potassiumphosphat
buffer, 8-anilino-1-naphtalenesolfonic acid ammonium salt (ANS), Ellman´s reagent 5,5´-
dithiobis(2-nitrobenzoic acid) (DTNB) and dieethylenetriamine-pentacetic acid (Detapac)
were purchased from Sigma-Aldrich (Taufkirchen, Germany). Knee joints from 3-month-old
bovine calves were obtained from a local abattoir within 12–18 h of slaughter. Type II
collagenase and papainase were purchased from Worthington (CellSystem, St. Katharinen,
Germany). Dulbecco's Modified Eagle's Medium (DMEM) with 4.5 g/l glucose, fetal bovine
serum (FBS), MEM non-essential amino acid solution, penicillin, streptomycin, HEPES
buffer, and phosphate buffer solution (PBS) were obtained from Gibco (Karlsruhe, Germany).
149 μm pore size polypropylene filters were purchased from Spectrum (Rancho Dominguez,
CA, USA). Hoechst 33258 dye was obtained from Polysciences (Warrington, PA, USA). All
cell culture plastics were purchased from Corning Costar (Bodenheim, Germany).
Methods
Storage of sugar at 75 % rel. humidity
In order to store micronized sugar exactly at 75 % rel. humidity a saturated sodium chloride
solution was prepared in a chromatography chamber. The humidity was allowed to equilibrate
for one day. The open vial with the micronized sugar was inserted in the chamber and stored
for one day. Afterwards the sugar was dried under vacuum and SEM pictures were taken.

Materials and Methods Chapter 2
33
Micronization of proteins by jet milling
For micronization a modified MC One® jet mill (Jetpharma, Balerna, Switzerland) was used.
The mill was equipped with a custom made cryogenic cooling device and a temperature
measurement unit (N9001 thermometer with air temperature sensor, Comark Limited,
Stevanage, UK). For cryogenic grinding the milling gas was piped through a coiled tube
inserted into a dewar vessel filled with liquid nitrogen. Therefore, it was possible to cool the
milling gas down to approximately -60°C. Temperature of milling gas was measured within
the gas stream shortly behind the milling chamber. To exclude effects of air humidity [121],
the complete experimental setup was integrated in an isolator filled with dry nitrogen
atmosphere (RH <2 %; hygrometer testo 608-H2, Testo, Lenzkirch, Germany). Nitrogen with
a purity of 99.999 % was used as the milling gas. For each experiment 500 mg of protein was
micronized. The milling pressure ranged from 6 to 14 bar (the feeding pressure was kept 1 bar
above to prevent blow back of the powder). The feeding rate was kept constant at a rate of
120 mg/min for all experiments to allow milling at all used milling pressures without
accommodating the feed rate.
Micronization of glycerol tripalmitate
Before micronization glycerol tripalmitate was carefully ground by using an agate mortar and
was sieved through a 1000 µm mesh to obtain particles which were able to pass the feed
opening of the jet mill. 600 mg of were fed to the mill (120 mg/min) and ground at different
milling pressures.
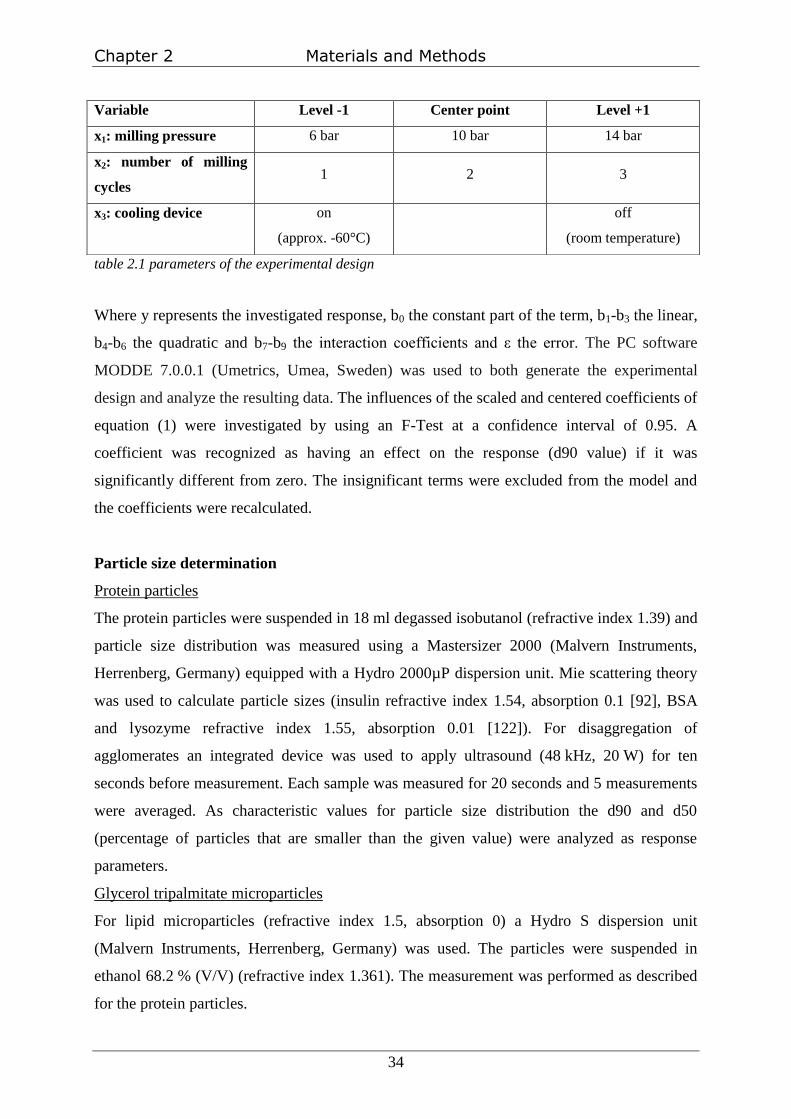
Experimental design
A full factorial face centered central composite design (CCF) was performed to investigate the
effect of three different process parameters on resulting particle size. The effects of milling
pressure, number of milling cycles and temperature of the milling gas were analyzed. Milling
pressure and number of milling cycles were investigated on three levels. Milling gas
temperature was defined as an uncontrolled factor to take fluctuations during different cycles
into account. Table I provides a survey of the varied parameters and conditions. Overall, 22
individual experiments were performed for each protein (table 2.1); the first half at room
temperature, the second part of experiments at about -60°C. Coefficients based on quadratic
polynomial equation (2.1) were estimated by using Partial least Squares (PLS) fitting.
y=b0+b1x1+b2x2+b3x3+b4x12+b5x2
2+b6x3
2+b7x1x2+b8x1x3+b9x2x3+ε (2.1)
Chapter 2 Materials and Methods
34
table 2.1 parameters of the experimental design
Where y represents the investigated response, b0 the constant part of the term, b1-b3 the linear,
b4-b6 the quadratic and b7-b9 the interaction coefficients and ε the error. The PC software
MODDE 7.0.0.1 (Umetrics, Umea, Sweden) was used to both generate the experimental
design and analyze the resulting data. The influences of the scaled and centered coefficients of
equation (1) were investigated by using an F-Test at a confidence interval of 0.95. A
coefficient was recognized as having an effect on the response (d90 value) if it was
significantly different from zero. The insignificant terms were excluded from the model and
the coefficients were recalculated.
Particle size determination
Protein particles
The protein particles were suspended in 18 ml degassed isobutanol (refractive index 1.39) and
particle size distribution was measured using a Mastersizer 2000 (Malvern Instruments,
Herrenberg, Germany) equipped with a Hydro 2000µP dispersion unit. Mie scattering theory
was used to calculate particle sizes (insulin refractive index 1.54, absorption 0.1 [92], BSA
and lysozyme refractive index 1.55, absorption 0.01 [122]). For disaggregation of
agglomerates an integrated device was used to apply ultrasound (48 kHz, 20 W) for ten
seconds before measurement. Each sample was measured for 20 seconds and 5 measurements
were averaged. As characteristic values for particle size distribution the d90 and d50
(percentage of particles that are smaller than the given value) were analyzed as response
parameters.
Glycerol tripalmitate microparticles
For lipid microparticles (refractive index 1.5, absorption 0) a Hydro S dispersion unit
(Malvern Instruments, Herrenberg, Germany) was used. The particles were suspended in
ethanol 68.2 % (V/V) (refractive index 1.361). The measurement was performed as described
for the protein particles.
Variable Level -1 Center point Level +1
x1: milling pressure 6 bar 10 bar 14 bar
x2: number of milling
cycles 1 2 3
x3: cooling device on
(approx. -60°C)
off
(room temperature)

Materials and Methods Chapter 2
35
Changes in particle size during storage of BSA
To investigate if there is a change in particle size during the storage in the freezer, we
measured the particle size of each sample of BSA directly after the micronization process and
after four weeks of storage in the freezer at about -20°C under nitrogen atmosphere by using
the described protocol for the size measurement by laser light diffraction.
Morphology of micronized particles
Pictures were taken by using a scanning electron microscope (JSM 840; Jeol, Japan) at 3kV.
The particles were fixed on aluminum stups using conductive carbon tape (LeitTabs; Plannet
GmbH, Germany) and coated with gold by sputtering three times for 20 seconds (SEM
Autocoating unit E2500; Polaron equipment LTD, UK).
HPLC analysis of the model proteins
All proteins and peptides were analyzed for changes due to the micronization process by
HPLC. A HPLC System with a degasser (Knauer, Berlin, Germany), LC-10AT pump, FCV-
10ATvp gradient mixer, SIL-10Advp autosampler, CTO-6a oven, SPD-10AV UV-Detector,
RF-551 fluorescence detector and SCL-10Avp controller (all from Shimadzu, Duisburg,
Germany) and a C18-reversed phase precolumn (LC318, 4.6x20 mm; Supelco, Bellefonte,
USA) combined with an analytical C18-reversed phase column (Supelcosil, LC318,
4.6x250 mm; Supelco) was used.
Insulin
Chemical stability of bovine insulin was determined by a previously described method [92].
One milligram of insulin was dissolved in 1 ml 0.01 M HCl. 50 µl of this solution were
injected into the HPLC system at 37°C. During measurement, a linear gradient was applied
(mobile phase A: 90 % H2O, 10 % acetonitrile, 0.1 % TFA; mobile phase B: 90 %
acetonitrile, 10 % H2O and 0.1 % TFA; flow rate of 1 ml/min). The fraction of phase B was
increased from 20 % to 36 % over 22 min (total run time 30 min). Signals were recorded
using UV detection (210 nm and 274 nm).
Lysozyme
One milligram of lysozyme was dissolved in 1 ml bidistilled water. 50 µl were injected into
the HPLC system at 40°C. The same mobile phases as for insulin were used, but phase B
changed from 25 % to 40 % over 35 min (total run time 40 min). Signals were recorded using
UV detection (210 nm and 274 nm).

Chapter 2 Materials and Methods
36
BSA
Five milligrams of BSA were dissolved in 1 ml bidistilled water. 50 µl were injected into the
HPLC system at 40°C. Mobile phase A consists of water and 0.1 % TFA, phase B of 90 %
acetonitrile, 10 % water and 0.1 % TFA. The analytical run started with 3 min with 27 % of
phase B. Afterwards the fraction of phase B was increased from 27 % to 54 % over 12 min.
The concentration was kept at this concentration for additional 10 min. Signals were recorded
using UV detection (210 nm and 274 nm).
GSH
2.5 milligrams of GSH were dissolved in 1 ml bidistilled water. 50 µl were injected into the
HPLC system at 40°C. Mobile phase A consists of water and 0.1 % TFA, phase B of 90 %
acetonitrile, 10 % water and 0.1 % TFA. The analytical run started with 100 % phase A for
3 min. Afterwards the fraction of phase B was increased to 20 % during 17 min and was kept
at this concentration for 5 min. At the end phase B was reduced to 0 % in 1 min and the run
was finished after total time of 30 min. Signals were recorded by UV absorption at 210 nm.
MALDI analysis of insulin and lysozyme
As matrix α-cyanohydroxy-cinnamic acid dissolved in 50 % acetonitrile and 0.1 % TFA was
used. Protein was solved in 0.1 % TFA and diluted in the matrix to a concentration of 5 µM.
Samples were analyzed with Maldi ToF/ToF (4700 Proteomics Analyzer; Applied
biosystems, USA) in linear mode.
Determination of insulin-bioactivity
Bioactivity of three differently treated samples of micronized insulin were investigated using
a three-dimensional chondrocyte cell culture system utilizing fibrin gels as a carrier as
described elsewhere [123]. These groups are: insulin micronized three times at 6 bar at room
temperature, insulin micronized three times at 14 bar at room temperature and insulin
micronized three times with 14 bar with cool milling gas. Two groups one without insulin and
one with untreated insulin were used as controls. For all groups three experiments were
performed (n=3). The effect of the insulin samples on cell proliferation due to interaction with
the IGF receptor was investigated. In brief, primary chondrocytes where isolated from the
surface of the femoral patellar groove of a three-month-old bovine calve. The cartilage was
enzymatically digested overnight in DMEM containing 4.5 g/l glucose, 10 % FBS, 584 mg/l
glutamine, 0.1 mM MEM non-essential amino acids, 10 mM HEPES, 0.4 mM proline,
50 mg/ml ascorbic acid, 50 U/ml penicillin, 50 mg/ml streptomycin, and 470 U/ml of type II
Materials and Methods Chapter 2
37
collagenase. The digest was repipetted, filtered through a 149 µm mesh, and washed three
times with PBS. The cell number was determined using a hemocytometer. 1x10⁻⁶
freshly
isolated chondrocytes were resuspended in a fibrinogen solution (fibrinogen 50 mg/ml, CaCl2
20 mM at pH of 7.0). Gels were formed by adding the same volume of thrombin solution.
Each resulting fibrin disc (diameter 5 mm, thickness 2 mm) was put in a six-well plate and
covert with 4 ml culture media containing 0.5 or 2.5 µg/ml of each insulin (control without
insulin). The constructs were cultivated for 5 weeks, changing culture media three times a
week. Afterwards the cell-fibrin constructs were analyzed. The constructs were weighed
(=wet weight) and cut in parts. One section of each construct was lyophilized, then digested
with 1ml of a papainase solution (3.2 U/ml in buffer) for 18 h at 60°C and used for the
determination of cell number. The cell number per construct was determined by measuring
DNA content using Hoechst 33258 dye [124]. Another section of each construct was
successively fixed with a mixture of glutaraldehyde and formaldehyde for histological
analysis. The samples were embedded in paraffin and cross-sectioned into 5 µm sections.
After deparaffinization sections were stained with safranin-O.
Determination of lysozyme-bioactivity
The activity of lysozyme was analyzed using a method described by Shugar [125]. Lysozyme
was dissolved in 66 mM potassiumphosphat buffer at pH 6.24. 100 µl of this solution were
mixed with 2.5 ml cell suspension of micrococcus lysodeicticus. The decrease in absorption at
450 nm wavelength due to lyses of the cells was measured in 12 second-intervals for 1 min
(Uvikon; Kontron Instruments, UK). The kinetic rate, indicating the enzyme activity, was
obtained from the slope of the linear part of the curve. Activity was calculated using a
calibration curve measured with a solution of unprocessed lysozyme of the same batch.
Additionally some samples were tested in the presence of 1 mM Detapac to complex possibly
present iron.
Obtaining lysozyme crystals
In order to obtain lysozyme crystals a batch crystallization method described by Elkordy et al.
[49] was used. 4 g of lysozyme were dissolved in 100 ml of 0.1M sodium acetat buffer
pH 4.6. In another bottle 100 ml of a 10% sodium chloride solution were prepared. Both
solutions were filtered using a sterile filter with pores of 0.2 µm. After mixing both solutions
the mixture was stored for 24 h in the fridge at 4°C. Then the suspension was filtered by using

Chapter 2 Materials and Methods
38
a 0.4 µm filter and the remainder was washed with isopropanol. Afterwards it was dried in the
glovebox at a rel. humidity <2% for 24 h.
Determination of the water insoluble fraction of BSA
For the solubility determination of BSA approximately 10 mg of the micronized BSA samples
were weighed into eppendorf cups of known weight. For the PEG BSA mixtures an amount
corresponding to approximately 10 mg of pure BSA was weighed into the cups. Afterwards
2 ml of water were added. Every 20 min the cup was vortexed for 5 seconds. After one hour
the mixture was centrifuged at 13 000 rpm for 10 min. The supernatant was removed and 1 ml
water was added to the remainder. Every 10 min it was vortexed for 5 seconds. After 30 min
it was centrifuged again. This step was repeated three times. Afterwards the remainder was
freeze dried and the eppendorf cup was weighed again after this process. As control samples
without BSA and with unprocessed BSA were used.
Finding a solvent for the insoluble BSA fraction
To perform further analysis of the insoluble fraction occurring after jet milling BSA a suitable
solvent had to be found. 10 mg of the micronized BSA powder were mixed with 2 ml of a
solvent or solvent mixture. Every 10 min it was homogenized on a vortex shaker for 10 s.
After one hour the vessel was controlled for not dissolved particles.
List of tested solvents:
-water
-isopropanol
-ethanol 68 %
-acetonitril
-ethanol 68 %, acetonitril 1:1
-89 % water, 10 % acetonitril, 1 % TFA
-6 M urea
-6 M guanidine HCl
-0.1 % SDS
-10 mM dithioreythritol + 1 mM EDTA
-6 M urea + 10 mM dithioreythritol + 1 mM EDTA
-6 M guanidine HCl + 10 mM dithioreythritol + 1 mM EDTA
-0.1 % SDS + 10 mM dithioreythritol + 1 mM EDTA
Materials and Methods Chapter 2
39
Determiation of free sulfhydryl (SH) groups for BSA
The experiment was performed analog to the description of Aitken and Learmonth [126].
Unprocessed BSA was dissolved in 0.1 N phosphate buffer pH 8 at a concentration of
50 mg/ml. 3 ml of buffer were added into a cuvet. 100 µl of 10mM solution of Ellman´s
reagent 5,5´-dithiobis(2-nitrobenzoic acid) (DTNB) were added. Finally 200 µl of the protein
solution were added and the absorption of the anion (TNB2-
) was measured at 412 nm. The
concentration of thiols was calculated from the molar absorbance of the TNB anion
(E412TNB2-
= 1.415*104 cm
-1M
-1).
Blocking the free sulfhydryl group of BSA
The free sulfhydryl group of bovine serum albumin was alkylated with iodoacetamide
according to a modified literature procedure [127]. The pH of a BSA solution (15 mg/ml) was
raised to 8 with 0.1 N NaOH. The reaction vessel was covered with aluminum foil and then
approximately 2 mol of iodoacetamide per mol of sulfhydryl were added. The mixture was
allowed to react for one hour at room temperature, while stirred with a magnetic stirring bar.
Afterwards the mixture was centrifuged in a Vivaspin 20® vessel with a cutoff filter of
30 000 Da at 4°C. The remainder was washed with water three times. A control group without
the addition of iodoacetamide was analyzed, too, to evaluate the effect of the process on the
protein.
Co-lyophilization of BSA with PEG
1 g of different ratios of PEG 10 000 and BSA were dissolved in 10 ml of bidistilled water.
The solutions were frozen at -25°C within a benchtop freeze-dryer (Beta 2-16 with LMC-2
system control, Christ, Osterode, Germany). Afterwards the frozen samples were freeze dried
at 6°C and 0.12 mbar for 24 hours. For complete drying the temperature was increased to
20°C for additional 6 hours. The vacuum was removed by filling the chamber with dry
nitrogen. The samples were stored at -20°C for further analysis.
Investigating changes in the secondary structure of insulin and lysozyme by CD
spectroscopy
To investigate changes in secondary structure of the proteins due to the micronization process
circular dichroism spectroscopy (spectropolarimeter J-710, Jasco, Gross-Umstadt, Germany)
was used. CD spectra of protein solutions (15 µM in 66mM phosphate buffer pH 6.24) were
recorded 190 nm to 260 nm at a scanspeed of 20 nm/min and temperature of 22°C in a quartz

Chapter 2 Materials and Methods
40
cuvette with 0.1 cm path length. Five measurements were accumulated to reduce noise.
Afterwards the secondary structure composition was estimated by using the CDNN algorithm
[128] (CD spectra deconvolution software CDNN 2.1).
Measurement of intrinsic fluorescence
Lysozyme and BSA (0.1 mM) were dissolved in 10 mM phosphate buffer at pH 6.2.
Measurements were performed using a LS55 fluorescence spectrometer (PerkinElmer,
Waltham, USA) at 295 nm (excitation wavelength, slit = 5 nm), 300 – 500 nm (emission
wavelength, slit = 5 nm) and scanspeed of 10 nm/s. For insulin measurements a stock solution
in 0.01 M hydrochloric acid was prepared, which was diluted with phosphate buffer to
concentration of 0.1 mM. The excitation wavelength for insulin was 280 nm because it does
not contain any tryptophan. Fluorescence emission spectra were measured in the range from
290 to 450 nm. Four measurements were accumulated and the background measured with
pure buffer was subtracted.
For BSA a stock solution was prepared and the insoluble fraction was removed by
centrifugation. Afterwards the concentration of BSA was determined by UV measurements at
280 nm using solutions with known concentration as reference.
Measurement of surface hydrophobicity
A method described by Lechevalier et al. was used to determine the surface hydrophobicity of
proteins [129]. ANS is a probe multiplying its fluorescence intensity when it is in a
hydrophobic environment and is therefore often utilized to investigate surface properties of
macromolecules in solution. Each sample was dissolved in phosphate buffer (10 mM, pH 7) at
6 different concentrations in the range of 0.005 – 0.05%. Insulin was dissolved in 0.01 M
hydrochloric acid before dilution in phosphate buffer. 15 µl of an 8 mM ANS solution were
added to 1 ml protein solution. The maximal fluorescence intensity of ANS was measured for
5 s at 470 nm emission wavelength (excitation at 390 nm). Excitation and emission slits were
10 nm and a cutoff filter of 430 nm was used. The fluorescence intensity was plotted against
the protein concentration and the slope was calculated by linear regression analysis as an
index of protein surface hydrophobicity (PSH). The relative surface hydrophobicity (RSH)
was calculated as follows:
RSH = (PSH of sample)/(PSH of control)
Materials and Methods Chapter 2
41
Determination of iron content by inductively coupled plasma – optical emission
spectroscopy (ICP-OES)
ICP measurements were performed to investigate, whether there was an increase of iron
content within the protein powder due to the micronization process. For these measurements a
JY40+ from Jobin Yvon (Unterhaching, Germany) with argon as plasma gas (16 l/min) and as
carrier gas (2 l/min) was used. A specific amount of lysozyme was dissolved in 10 ml water.
Calibration of the instrument was performed by using iron(III)chloride standards of 1, 10 and
100 ppm.
FT-IR measurements
For FT-IR measurements a Tensor 27 spectrometer (Bruker, Ettlingen, Germany) with a
single reflection ATR unit (Harrik MVP, Harrik Scientific, New York, USA) was used. For
measurement the not micronized samples were ground in an agate mortar while the
micronized ones were used without further processing. The samples were measured from
4000 – 600 cm-1
wave number. For each sample 100 interferograms were collected and
averaged using a resolution of 4 cm-1
. Second-derivative spectra were created using the OPUS
4 software (Bruker, Ettlingen, Germany). Afterwards the data was transferred to GRAMS 8.0
software (Thermo Fisher Scientific Inc.). With GRAMS, each spectrum was attenuated to the
amide I region (1700 – 1610 cm-1
), baseline corrected and normalized to an area of unity
[130]. The area under each band was correlated to different protein secondary structures as
described by Krimm et al. [131]
Differential scanning calorimetric (DSC) measurements of micronized lipid
Micronized lipid microparticles were analyzed for structural changes by differential scanning
calorimetry (DSC 2920, TA Instruments, Alzenau, Germany). 2 to 4 mg of each sample were
weighed into AutoDSC aluminium sample pans (TA Instruments, Alzenau, Germany) and
sealed with the TA Instuments encapsulating press. An empty sealed pan served as reference.
The samples were equilibrated for 10 min at -20°C and the measurement was performed
applying a heating rate of 5 K/min up to 100°C.
Statistics
Data were analyzed by applying ANOVA and then Tukey´s test. All measurements were
performed in triplicate. The design of experiment data was analyzed by using MODDE
7.0.0.1 Software (Umetrics, Umea, Sweden).


Chapter 3
Customizing
the
Jet Mill
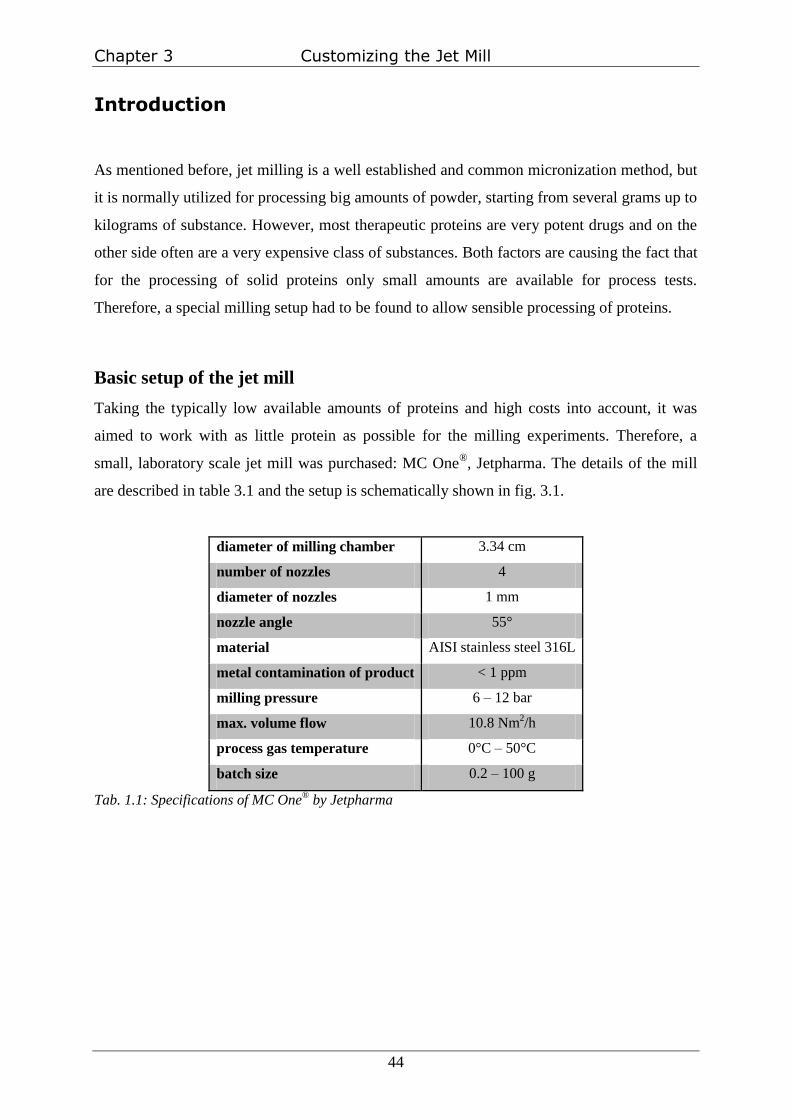
Chapter 3 Customizing the Jet Mill
44
Introduction
As mentioned before, jet milling is a well established and common micronization method, but
it is normally utilized for processing big amounts of powder, starting from several grams up to
kilograms of substance. However, most therapeutic proteins are very potent drugs and on the
other side often are a very expensive class of substances. Both factors are causing the fact that
for the processing of solid proteins only small amounts are available for process tests.
Therefore, a special milling setup had to be found to allow sensible processing of proteins.
Basic setup of the jet mill
Taking the typically low available amounts of proteins and high costs into account, it was
aimed to work with as little protein as possible for the milling experiments. Therefore, a
small, laboratory scale jet mill was purchased: MC One®, Jetpharma. The details of the mill
are described in table 3.1 and the setup is schematically shown in fig. 3.1.
diameter of milling chamber 3.34 cm
number of nozzles 4
diameter of nozzles 1 mm
nozzle angle 55°
material AISI stainless steel 316L
metal contamination of product < 1 ppm
milling pressure 6 – 12 bar
max. volume flow 10.8 Nm2/h
process gas temperature 0°C – 50°C
batch size 0.2 – 100 g
Tab. 1.1: Specifications of MC One® by Jetpharma

Customizing the Jet Mill Chapter 3
45
Fig. 3.1: schematic diagram of the used jet mill: (1) milling chamber, (2) product collection container
with cyclone separator, (3) exhaust gas filtration unit, (4) product feed by venturi injector, (5) gas feed
for venturi injector, (6) gas feed for milling chamber, (7) control device for applied pressure on
milling chamber and venturi.
It is a so-called ―pancake‖ mill regarding the flat circular milling chamber. The whole mill is
made off stainless steel and completely decomposable for easy cleaning. The connections
between the different parts are sealed by Teflon (PTFE) gaskets. Jetpharma specifies that
small batch grinding down to 200 milligrams of powder is possible with good yield.
Although, this setup seemed to be very good, some modifications had to be installed in order
to optimize the setup for protein grinding. In chapter 1 the negative effect of grinding on some
proteins is described and therefore, some additional parameters should be tested for their
stabilizing effect on the investigated proteins.
In consideration of the sensitive product it can be assumed that the high temperatures created
on the particle surfaces by impact breakage [107] may have a negative effect on product
stability and activity. Therefore, the effect of cryogenic grinding on proteins should be
investigated. Cryogenic grinding is seldom used in pharmaceutical industry because of its
high costs [132]. The main applications for cryogenic grinding are the milling of heat
sensitive substances like plants for food industry [133], grinding of herbs for medicinal usage
[134] or the milling of elastic, rubber-like substances [135] or recycling of rubber tires [136].
At low temperatures the brittleness of many elastic or ductile materials is dramatically
increased thus the mechanical size reduction process is improved [137]. The major
1
2
34
5
6
7
8

Chapter 3 Customizing the Jet Mill
46
disadvantages as mentioned before are the much higher costs due to the special equipment
and the consumption of liquid nitrogen [138]. However, for proteins both mentioned
advantages may be possible, so that the higher costs may be outweighed by a better grinding
performance and more stable products.
Cryogenic setup
In order to facilitate cryogenic grinding by jet milling the temperature within the milling
chamber had to be cooled down below -50°C e.g. by liquid nitrogen. The lower temperature
limit of the integrated valves of the MC One®
is 0°C (tab. 1.1). Therefore, the cooling had to
take place by bypassing the valves to assure safe work with the jet mill. For the remaining
parts the low temperatures were not expected to be a problem, because they are made of steel
and Teflon.
The first idea was adding liquid nitrogen parallel to the product feed into the milling chamber
(fig. 3.2). A tank containing liquid nitrogen was installed right next to the opening for the
powder feed. Powder and liquid nitrogen were blown into the milling chamber by the venturi
nozzle.
Fig. 3.2: First cryogenic setup; (9) temperature sensor, (10) liquid nitrogen tank
Measuring the milling gas temperature just behind the milling chamber (fig. 3.2(9)) results in
a temperature of -20 to -30°C. Lower temperatures could not be obtained. A problem occurred
10
9

Customizing the Jet Mill Chapter 3
47
due to the fact that liquid nitrogen entered the milling chamber and evaporated there by
disturbing the normal gas flow. For this reason results from this setup were not comparable
with the experiments at room temperature, because possible differences may have been
provoked by the temperature difference or by uncontrollable turbulences in the gas flow.
To overcome these problems no liquid nitrogen was added into the mill, but the gas pipes for
the milling chamber and the venturi injector were modified. The pipes were elongated and
each fitted into liquid nitrogen-containing tanks (fig. 3.3).
Fig. 3.3: second cryogenic setup. (11) Gas feed for milling chamber within liquid nitrogen tank, (12)
gas feed for venturi injector within liquid nitrogen tank
Testing the new setup at different milling pressures resulted in temperatures of about -60°C
(fig. 3.4). Small temperature differences at the different pressures are due to the cooling effect
of the expanding gas in the milling chamber, which is higher at higher pressures.
1112
11 12

Chapter 3 Customizing the Jet Mill
48
Fig. 3.4: milling gas temperatures at standard conditions compared to temperatures with use of the
cryogenic setup at different milling pressures
The next step was to exclude air humidity from the whole process to avoid negative effects on
particle size due to agglomeration and on stability and activity of the micronized protein
powder [120].
Excluding air humidity
During this test phase the need for humidity exclusion got very prominent. Due to the cold
temperatures humidity condensed not only on the cold machine parts but also on the
micronized product. To investigate the effect of humidity on the resulting powder 500 mg of
sugar as a cheap test substance was micronized. In order to exclude humidity from the product
two options were tested. First, 10 ml of isobutanol were filled in the product collection
container (fig. 3.1(2)), so that the product is directly collected in the particle size measurement
media without any contact with the surrounding air. The second option was to integrate the
whole jet mill setup in a glovebox filled with a dry nitrogen atmosphere (fig. 3.5). A
hygrometer was installed within the glovebox to check the air humidity permanently. All
experiments within the glovebox were performed at rel. humidity lower than 2 %. After
micronization the samples were stored in a desiccator for one day.
-80
-60
-40
-20
0
20
40
6 bar 10 bar 14 bar 6 bar 10 bar 14 bar
tem
per
atu
re /
C
standard conditions cooling of milling gas
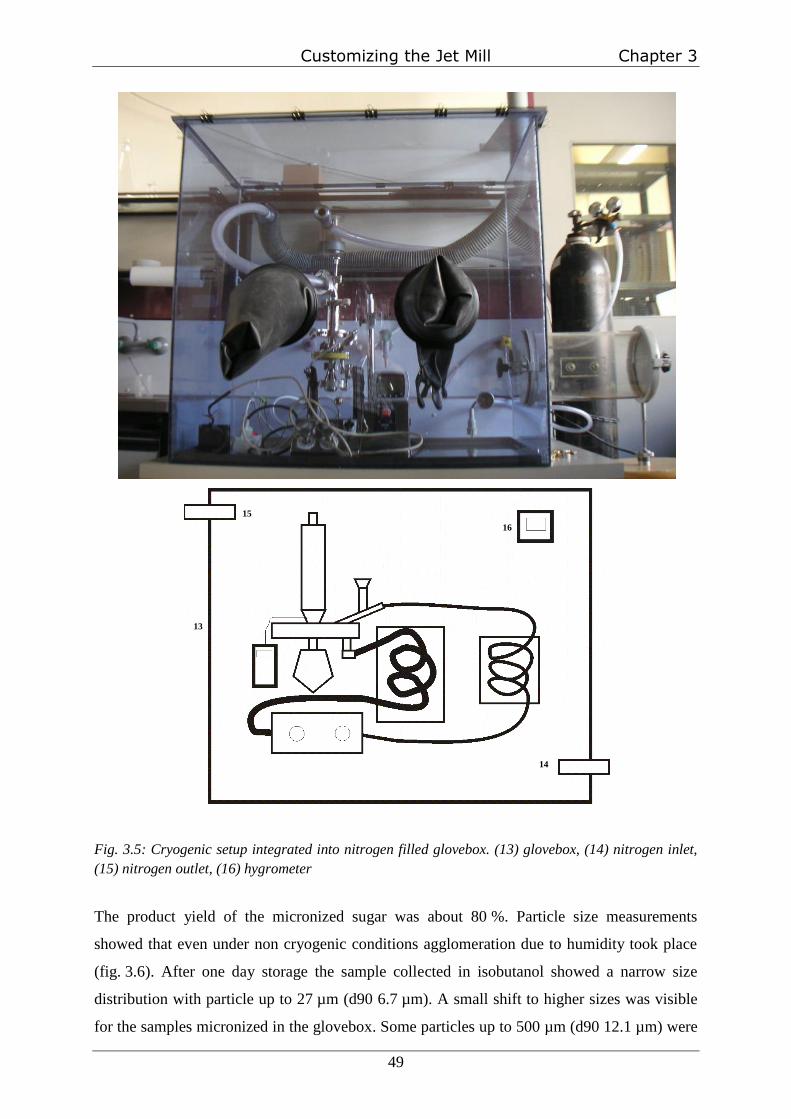
Customizing the Jet Mill Chapter 3
49
Fig. 3.5: Cryogenic setup integrated into nitrogen filled glovebox. (13) glovebox, (14) nitrogen inlet,
(15) nitrogen outlet, (16) hygrometer
The product yield of the micronized sugar was about 80 %. Particle size measurements
showed that even under non cryogenic conditions agglomeration due to humidity took place
(fig. 3.6). After one day storage the sample collected in isobutanol showed a narrow size
distribution with particle up to 27 µm (d90 6.7 µm). A small shift to higher sizes was visible
for the samples micronized in the glovebox. Some particles up to 500 µm (d90 12.1 µm) were
14
15
16
13

Chapter 3 Customizing the Jet Mill
50
detectable. Under normal ambient conditions a clear shift to higher particles sizes was
detectable with a d90 value of 123 µm. This demonstrated the effect of humidity on the
resulting particle size.
Fig. 3.6: size distribution of sugar micronized under different conditions at 8 bar after 1 day storage
in an desiccator
To illustrate the consequences of air humidity on micronized sugar one sample was stored one
day at 75 % rel humidity, was vacuum dried afterwards and SEM micrographs were taken
(fig. 3.7).
Fig. 3.7: SEM pictures of micronized sugar a) stored at dry conditions and b) stored at 75 % rel.
humidity
0.1 1 10 100 1000 2000
particle size / µm
0
1
2
3
4
5
6
7
8
9
10
vo
lum
e/ %
directly collected in isobutanol
micronized under dry nitrogen atmosphere
micronized under normal conditions
Customizing the Jet Mill Chapter 3
51
The differences were obvious, no sharp edges were detectable anymore and the particle
surfaces appeared very smooth. Single particles were still identifiable, but solid connections
were formed. Due to the humidity the single particles visible in fig. 3.7 a) were irreversibly
agglomerated (fig. 3.7 b)), which is a good explanation for the particle growth detected by
laser light diffraction. However, for proteins not only agglomeration would be a problem, it is
well known that humidity also results in degradation or denaturation of proteins [139,140].
Therefore, all the following experiments were performed with the milling setup integrated
within the glovebox.
Summary
Overall a jet milling system was established, which allowed the micronization of very small
batches down to 200 mg with yield of about 80 % and cryogenic grinding at temperatures of
about -60°C. Air humidity was recognized as a critical factor for micronization processes;
therefore, it was totally excluded from the whole milling process, so that no impact on particle
sizes or stability and activity data of the proteins should be expected.


Chapter 4
Size Reduction
of
Proteins
by
Jet Milling

Chapter 4 Size Reduction of Proteins by Jet Milling
54
Introduction
The most important outcomes for size reduction obviously are resulting particle size and size
distribution of the product. Additionally, important factors for the suitability of such a process
are controllability and reproducibility to guarantee unchanged quality of the product.
But even if the process is well characterized, for establishing the processing of a new
substance or class of substances the process has to be validated from scratch on. Different
properties like hardness, density, brittleness, size etc. of a new material make the transfer of
parameters of other substances very difficult. Therefore, the establishment of size reduction
processes and defining the right parameters for a new substance is very time- and in most
cases also substance-consuming. This is especially true by using the traditional COST
approach (changing one separate factor at a time) to optimize a process and find the optimal
adjustments of the variable parameters. Especially when interactions between the investigated
parameters exist, the probability of indicating an optimum far from the real optimum is high
[141].
To overcome this problem statistical factorial design, also called Design of Experiments
(DoE), for the planning of the single experiments was developed. With this approach all
relevant parameters are varied simultaneously. By optimizing the experimental setup it is
possible to reduce the number of necessary experiments without significant loss of
information. The obtained data can be analyzed to yield valid and objective conclusions for
the investigated parameters and interactions can be revealed. In principle DoE can be applied
for the optimization of all processes with process relevant parameters, which can be varied on
specific levels. Because of these advantages this method was established in many kinds of
different fields like biotechnology [142,143], material sciences [144] and engineering [145].
In spite of these advantages the progress in displacing the COST-approach is not that fast.
However, even in new guidelines e.g. of the ICH these methods are incorporated [146].
Therefore, DoE was applied to investigate the jet milling process of proteins for the
identification and optimization of important process parameters. The suitability of the process
was investigated by processing three different model proteins: bovine insulin, hen egg-white
lysozyme and bovine serum albumin (BSA). Differing in molecular weight, structure, particle
size and particle morphology these well characterized proteins should give a good impression
of the impact of jet milling on this class of drugs. A closer look on the characteristics of the
Size Reduction of Proteins by Jet Milling Chapter 4
55
three substances will be given at the beginning of the following chapters 5 – 7, where the
focus is on the impact of the micronization process on chemical stability, structure and
bioactivity.
In this chapter the influence of the three process parameters milling gas pressure, number of
milling cycles and temperature of the milling gas on particle size, size distribution and particle
morphology was investigated.
Chapter 4 Size Reduction of Proteins by Jet Milling
56
Results and Discussion
Particle size and size distribution
The yield of the proteins after one milling cycle starting with 500 mg was at about 83 %.
After 3 cycles it was possible to regain 40 % of the initially applied amount.
To investigate the efficiency of the micronization process the resulting particle size
distribution of each milling experiment was determined. Milling gas pressure, number of
milling cycles and temperature of the milling gas were varied on specific levels (tab. 4.1).
Figures 4.1 to 4.3 show typical size distributions for the investigated proteins. Detailed
information about the obtained sizes is shown in table 4.2 for each experiment. For all three
proteins particle sizes drastically decreased and the process resulted in very narrow size
distributions. Using one milling cycle at 6 bar the d90 value of insulin was reduced from
30.19 µm to 6.13 µm and for three cycles at 14 bar 3.30 µm were achieved. The much larger
and broader distributed lysozyme and BSA particles (d90 of 673.66 µm and 919 µm) were
micronized to 8.56 µm by milling once at 6 bar and to 4.07 µm at 3x14 bar for lysozyme and
to 21.5 µm and 6.48 µm for BSA respectively. A small rest of coarser particles after milling
lysozyme and BSA one time at 6 bar was traceable (fig. 4.2 and 4.3), which is probably due to
the larger particles of the bulk material. Nevertheless, most d50 values were in the range of 2
to 5 µm. These sizes are comparable to results in other publications where mean particle sizes
of 3 µm for IFN-β containing sorbitol [81], sizes between 1.5 and 3.5 µm for five different
proteins and peptides [82] and 2 µm and 4 µm, respectively, for insulin and calcitonin [84]
were determined after jet milling. For the model proteins higher pressure and more milling
cycles led to smaller particle sizes. With higher pressure more energy was provided to the
milling chamber likely contributing to the smaller particle sizes. The most effective milling
cycle regarding size reduction was the first one. Additional grinding cycles only had a small
impact on the d50 value but the d90 was further decreased indicating a narrower size
distribution (see table 4.2). A prerequisite for breakages of particles by all milling processes
are existing cracks and flaws within the particles. With decreasing particle size the probability
of those imperfections is reduced [147]. Therefore, there is a so-called grinding limit where
only plastic deformation and no further breakage can take place [148]. This limit seemed to be
at a d90 between 3 and 5 µm for the investigated proteins using this experimental setup,
which corresponds to the results in the other studies. Furthermore, the residence time of small
particles within the milling chamber is much shorter than that of larger ones, because they are
taken out of the milling chamber with the gas stream much faster while the larger ones are
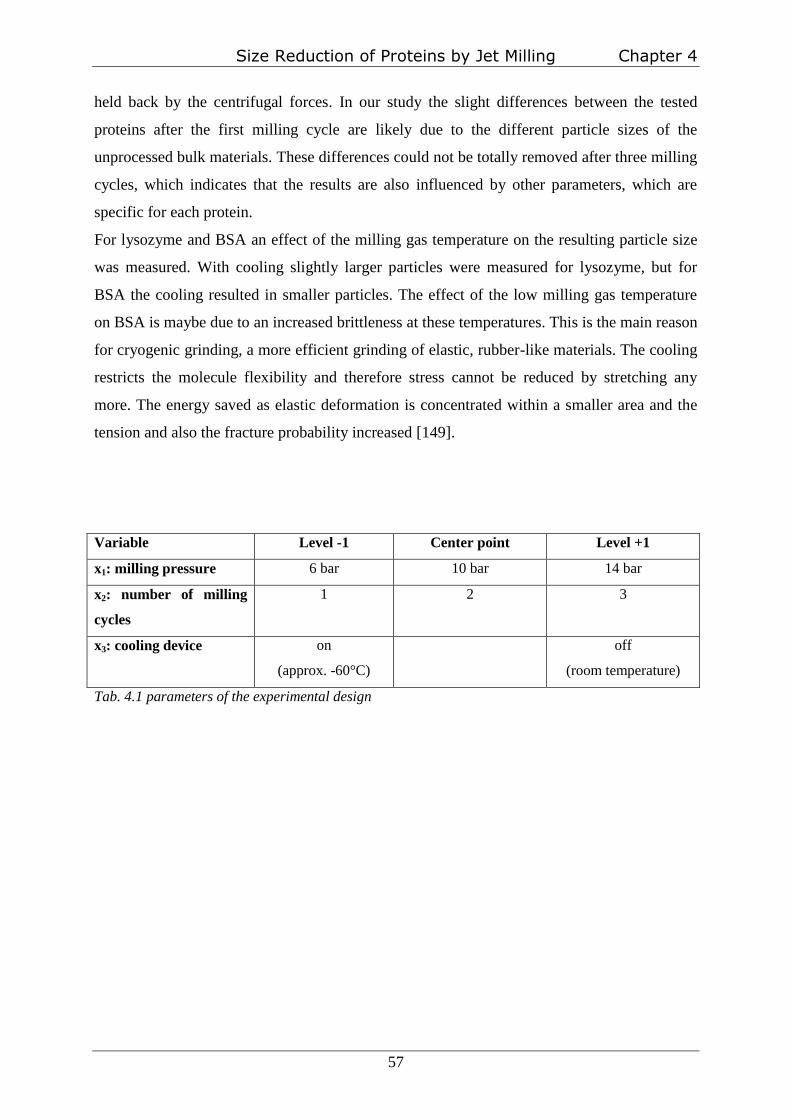
Size Reduction of Proteins by Jet Milling Chapter 4
57
held back by the centrifugal forces. In our study the slight differences between the tested
proteins after the first milling cycle are likely due to the different particle sizes of the
unprocessed bulk materials. These differences could not be totally removed after three milling
cycles, which indicates that the results are also influenced by other parameters, which are
specific for each protein.
For lysozyme and BSA an effect of the milling gas temperature on the resulting particle size
was measured. With cooling slightly larger particles were measured for lysozyme, but for
BSA the cooling resulted in smaller particles. The effect of the low milling gas temperature
on BSA is maybe due to an increased brittleness at these temperatures. This is the main reason
for cryogenic grinding, a more efficient grinding of elastic, rubber-like materials. The cooling
restricts the molecule flexibility and therefore stress cannot be reduced by stretching any
more. The energy saved as elastic deformation is concentrated within a smaller area and the
tension and also the fracture probability increased [149].
Variable Level -1 Center point Level +1
x1: milling pressure 6 bar 10 bar 14 bar
x2: number of milling
cycles
1 2 3
x3: cooling device on
(approx. -60°C)
off
(room temperature)
Tab. 4.1 parameters of the experimental design

Chapter 4 Size Reduction of Proteins by Jet Milling
58
Tab. 4.2 results of the micronization experiments
22
21
20
19
18
17
16
15
14
13
12
11
10
9
8
7
6
5
4
3
2
1
exp
erimen
t
10
10
10
10
10
14
6
14
6
14
6
10
10
10
10
10
14
6
14
6
14
6
presu
ure
2
2
2
3
1
2
2
3
3
1
1
2
2
2
3
1
2
2
3
3
1
1
cycles
-65
-64
-67
-73
-63
-65
-64
-67
-65
-61
-53
12
12
12
11
12
9
46
8
15
8
15
insu
lin
temp
eratu
re
-59
-60
-57
-61
-53
-66
-58
-64
-57
-65
-58
13
14
13
13
15
8
17
10
16
8
17
lyso
zym
e
-57
-59
-59
-61
-53
-66
-58
-64
-57
-65
-58
13
14
13
13
15
8
17
10
16
8
17
BS
A
4.4
4
4.1
8
3.5
8
3.3
3
4.4
4
3.8
7
5.8
9
3.5
1
5.0
6
4.1
8
7.1
3
3.5
2
3.6
4
3.9
4
3.4
7
4.4
0
3.7
8
5.3
2
3.3
0
4.9
2
5.4
7
6.1
9
insu
lin
d9
0
6.9
3
6.0
7
6.6
0
5.2
2
9.8
0
5.6
4
7.6
2
4.9
3
7.0
6
7.6
2
11
.99
5.6
2
4.8
1
4.9
2
4.3
7
7.3
6
4.6
8
6.2
8
4.0
7
5.2
8
5.2
6
8.6
0
lyso
zym
e
9.5
1
9.4
3
7.2
4
6.7
0
12
.80
7.3
0
9.8
4
6.8
5
7.9
5
9.7
1
15
.13
8.1
2
8.4
4
7.3
8
6.5
3
11
.38
6.9
2
12
.64
6.4
8
10
.64
8.8
7
21
.50
BS
A
2.4
4
2.3
5
2.1
4
2.0
2
2.5
4
2.3
5
3.1
8
2.0
8
2.7
2
2.3
6
3.3
9
2.1
2
2.1
3
2.2
6
2.0
6
2.5
0
2.2
4
2.7
7
2.0
0
2.6
2
2.8
4
3.0
6
insu
lin
d5
0
3.6
3
3.0
7
3.6
1
2.7
8
4.7
7
2.8
7
4.0
4
2.6
1
3.7
9
3.3
9
5.0
5
2.8
9
2.7
0
2.7
0
2.4
4
3.2
6
2.5
0
3.3
6
2.2
2
2.7
6
2.9
0
3.8
7
lyso
zym
e
4.7
2
4.6
9
3.6
5
3.7
3
5.5
4
3.6
0
5.2
5
3.6
0
4.3
9
3.6
3
6.4
7
4.3
6
4.5
2
3.9
1
3.6
5
4.9
9
3.8
9
6.4
6
3.7
7
5.6
3
4.6
5
8.7
7
BS
A
1.3
43
1.2
97
1.1
13
1.0
84
1.2
25
1.0
90
1.3
99
1.1
62
1.4
01
1.2
71
1.7
04
1.1
18
1.1
95
1.2
39
1.1
58
1.2
66
1.1
80
1.4
98
1.1
31
1.4
30
1.4
72
1.6
20
insu
lin
spa
n
1.4
08
1.4
62
1.2
90
1.3
46
1.5
82
1.4
75
1.3
59
1.3
91
1.3
38
1.7
63
1.9
34
1.4
59
1.2
35
1.2
88
1.2
59
1.7
32
1.3
62
1.3
41
1.3
14
1.4
22
1.2
52
1.7
39
lyso
zym
e
1.5
18
1.5
11
1.4
58
1.2
24
1.8
65
1.4
72
1.3
76
1.3
65
1.2
67
2.1
74
1.9
17
1.3
34
1.3
47
1.3
55
1.2
09
1.7
82
1.2
15
1.4
86
1.1
37
1.3
95
1.3
88
2.6
0
BS
A

Size Reduction of Proteins by Jet Milling Chapter 4
59
Fig. 4.1 size distributions of insulin micronized without cooling
Fig. 4.2 size distributions of lysozyme micronized without cooling
Fig. 4.3 size distribution of BSA after micronization without cooling
0.1 1 10 100 1000 2000
particle size / µm
0
1
2
3
4
5
6
7
8
9
10
11
12
13
14
15
vo
lum
e/
%insulin bulk material
insulin 1x6 bar
insulin 3x14 bar
0.1 1 10 100 1000 2000
particle size / µm
0
1
2
3
4
5
6
7
8
9
10
11
12
13
14
15
vo
lum
e/
%
lysozyme bulk material
lysozyme 1x6 barlysozyme 3x14 bar
0.1 1 10 100 1000 2000
particle size / µm
0
1
2
3
4
5
6
7
8
9
10
11
12
13
14
15
vo
lum
e/
%
BSA bulk material
BSA 1x6 bar
BSA 3x14 bar

Chapter 4 Size Reduction of Proteins by Jet Milling
60
Particle morphology
To verify the results measured by laser light diffraction SEM micrographs were taken from
the micronized protein powders. SEM pictures (fig. 4.4, 4.5 and 4.6) show the protein
particles before milling and after one micronization cycle at 6 and after three cycles at 14 bar
without and with cooling. It is clearly visible that in spite of the very different morphology of
the bulk material, after micronization the resulting particles look very similar. For insulin it
was obvious that the nearly cubic crystals of the raw material were no more detectable after
micronization. The micronization process resulted in very small and sometimes rounded
fragments. The rounded shape of the jet milled particles is the typical particle morphology
after jet milling and is assigned to attrition of the particles on each other or the walls of the
mill [83,150]. This also explains the increasing incidence of these rounded particles with
higher number of milling cycles. There is no difference in morphology between the samples
ground without and with cooling. Obviously, the pictures confirm the particle size
measurements by laser light diffraction.

Size Reduction of Proteins by Jet Milling Chapter 4
61
Fig. 4.4 SEM pictures of insulin micronized under different conditions compared to the bulk material
10 µm 10 µm
10 µm 10 µm
10 µm 10 µm
10 µm 10 µm
10 µm 10 µm
insulin bulk material
insulin 1x6 bar
insulin 3x14 bar
insulin 1x6 bar
milled at cryogenic
conditions
insulin 3x14 bar
milled at cryogenic
conditions

Chapter 4 Size Reduction of Proteins by Jet Milling
62
Fig. 4.5 SEM pictures of lysozyme micronized under different conditions compared to the bulk
material
1 mm
10 µm 10 µm
10 µm 10 µm
10 µm 10 µm
10 µm 10 µm
lysozyme bulk material
lysozyme 1x6 bar
lysozyme 3x14 bar
lysozyme 1x6 bar
milled at cryogenic
conditions
lysozyme 3x14 bar
milled at cryogenic
conditions

Size Reduction of Proteins by Jet Milling Chapter 4
63
Fig. 4.6 SEM pictures of BSA micronized under different conditions compared to the bulk material
1 mm
10 µm10 µm
10 µm 10 µm
10 µm10 µm
10 µm 10 µm
BSA bulk material
BSA 1x6 bar
BSA 3x14 bar
BSA 1x6 bar milled
at cryogenic con-
ditions
BSA 3x14 bar
milled at cryogenic
conditions

Chapter 4 Size Reduction of Proteins by Jet Milling
64
Analysis of the results by DoE
By using statistical analyses it was possible to fit a mathematical model based on equation 2.1
to the data obtained from the particle size (d90 value) measurements after micronization. The
factors milling pressure (x1), number of milling cycles (x2) and temperature of the milling gas
(x3) were taken into account. It was obvious that higher milling pressure and higher number of
milling cycles were decreasing the resulting d90 value for all three proteins, indicated by the
negative coefficients. Differences were calculated for the significance of the other
coefficients. Especially the impact of the milling gas temperature differed as mentioned
before, which is reflected in the resulting equations, too. For insulin the temperature effect
was not significantly different from zero and was therefore excluded from the model, but for
lysozyme a small loss in milling efficiency was measured for the samples milled at
temperatures about -60°C. The negative coefficient (x3) indicates that by raising the
temperature from low to high level smaller particle sizes are obtained. In contrast to these
results lower temperatures improved the milling efficiency for the jet milling of BSA. It is
noticeable that for insulin a quite simple model was obtained with only two significant
factors, one quadratic coefficient and no interactions between the three factors could be
detected and therefore were excluded from the model. While for lysozyme all three factors
had a significant impact and for BSA additionally all quadratic coefficients and even two
interactions showed an effect on the d90 value.
insulin:
y=0.5879-0.0791x1-0.0643x2+0.0892x12 (4.1)
lysozyme:
y=0.7681-0.0649x1-0.0793x2-0.0537x3+0.0228x22 (4.2)
BSA:
y=1.1160-0.1038x1-0.1119x2+0.0217x3+0.0504x12+0.0399x2
2-0.2698x3
2+0.0417x1x2-0.0941x1x3 (4.3)
The 3D surface response diagrams, visualizing these results and the impact of the different
parameters on the d90 value, are shown in figures 4.7 – 4.11. The different impact of the
milling gas temperature on the resulting particle size of lysozyme and BSA is clearly visible.
For insulin temperature was excluded as an insignificant factor. Therefore, it was possible to
display the calculated results according to equation 4.1 in only one diagram. The mentioned

Size Reduction of Proteins by Jet Milling Chapter 4
65
grinding limit is visible by the decreasing slope of the diagrams with higher pressure and
higher number of milling cycles.
The quality of the fit of the models is described by R2, the fraction of the variation of the
response explained by the model, and Q2, the fraction of the variation of the response that can
be predicted by the model. Therefore, R2 is an overestimated measure, and Q
2 is an
underestimated measure of the goodness of fit of the model. Large Q2, 0.7 or larger, indicates
that the model has good predictive ability and will have small prediction errors [141]. The
model fitted for insulin resulted in R2 = 0.893 and Q
2 = 0.821, for lysozyme in R
2 = 0.945 and
Q2 = 0.903 and for BSA R
2 = 0.959 and Q
2 = 0.909 were calculated. These are very good
parameters for the calculated models, which allows the prediction of particle sizes with new
parameter combinations within the investigated range. These results also confirm that the
selection of the investigated milling parameters included in the experimental setup was
reasonable. As most material properties like hardness, brittleness and number and size of
initial flaws, which are mentioned in chapter 1, are not known and hard to determine, it was
not possible to correlate the differences of the equations of the calculated models to any
material properties. Therefore, further experiments with new proteins are necessary.
Fig. 4.7 Surface response diagram of insulin (d90 value)
MODDE 7 - 05.04.2009 11:30:18

Chapter 4 Size Reduction of Proteins by Jet Milling
66
Fig. 4.8 Surface response diagram of lysozyme (d90 value) at room temperature
Fig. 4.9 Surface response diagram of lysozyme (d90 value) at cryogenic conditions
MODDE 7 - 05.04.2009 11:32:52
temperature = 17
MODDE 7 - 05.04.2009 11:35:37
temperature = -66

Size Reduction of Proteins by Jet Milling Chapter 4
67
Fig. 4.10 Surface response diagram of BSA (d90 value) at room temperature
Fig. 4.11 Surface response diagram of BSA (d90 value) at cryogenic conditions
MODDE 7 - 05.04.2009 11:37:54
temperature = 17
MODDE 7 - 05.04.2009 11:39:55
temperature = -66

Chapter 4 Size Reduction of Proteins by Jet Milling
68
Changes in particle size during storage
A problem of some milled products is that during storage particle growth due to the activated
surfaces of the particles appears [151]. The comparison of the particle sizes of the freshly
milled samples with the results of the same sample after 4 weeks of storage at -20°C verified
that the particles are stable during storage. Figure 4.12. shows the results for the micronized
BSA powder samples. No particle growth or aggregation could be detected after measuring
the particles by laser light diffraction.
Fig.4.12 d90 value of micronized BSA directly after jet milling and after 4 weeks of storage
1x6 bar 2x6 bar 3x6 bar 1x14 bar 2x14 bar 3x14 bar0
5
10
15
20
25
d9
0 /
µm
size after 4 weeks storage at -20 C
size directly after micronization

Size Reduction of Proteins by Jet Milling Chapter 4
69
Summary
For all three proteins jet milling proved to be a powerful tool for size reduction. The yield of
about 80% per milling cycle is very good taking the very small amount of milled substance
into account. In most cases particle size distributions with a d90 value below 10 µm were
achieved. Based on the resulting size distribution curves the particle size of the bulk material
was identified as one factor having a significant effect on the resulting distribution. By
applying statistical experimental design it was possible to describe the impact of the different
factors qualitatively and quantitatively. The occurring differences between the tested proteins
could not completely be explained, but were a good indicator for the complexity of the
process. Nevertheless, the chosen factors milling pressure, number of milling cycles and
milling gas temperature proved to be the most important factors of the process, because being
indicated by the R2 and Q
2 values, which are close to 1, nearly all effects could be described
by these parameters. Finally, the storage stability of the micronized protein powders was
demonstrated, which is an important factor for using these powders as drugs.


Chapter 5
Impact
of
Jet Milling
on
Bovine Insulin

Chapter 5 Impact of Jet Milling on Insulin
72
Introduction
Insulin is one of the most important and best investigated proteins and can be called in many
ways the prototypic biopharmaceutical [152]. Its success is based on different factors, it was
quite easily available in good purity even before recombinant protein production had been
developed and on the other side the epidemiology of diabetes mellitus itself. The WHO
estimates that in 2030 more than 350 million people will be suffering from diabetes, which
makes insulin research an urgent and financially promising topic. Therefore many research
groups are working on the processing and delivery of insulin [92,153,154]. Insulin is so far
the only protein administered in crystalline form and was the first biopharmaceutical
approved for delivery by the pulmonary route [13]. Therefore, insulin is the optimal
therapeutic protein for testing the suitability of jet milling for the micronization of proteins.
Insulin is an anabolic hormone with an important role in glucose and fat metabolism. The
bovine insulin used for our experiments consists of 51 amino acids organized in two peptide
chains A and B. Interchain disulfide bonds are located between the cysteines at positions A7
and B7 and between positions A20 and B19. An intrachain disulfide bond occurs between the
cysteines at A6 and A11. Bovine insulin differs from human insulin at the following
positions: alanine for threonine at A8, valine for isoleucine at A10, and alanine for threonine
at the carboxyl terminal of the B-chain [155]. For bioactivity testings a chondrocyte cell assay
is available [123].

Impact of Jet Milling on Insulin Chapter 5
73
Results and discussion
Chemical stability of insulin
First the impact of the jet milling process on the chemical stability of bovine insulin was
investigated. HPLC experiments were performed to detect occurring degradation products.
Figure 5.1 shows the results of these experiments.
Fig. 5.1 RP-HPLC chromatogram of insulin at a detector wavelength of 210 nm
No differences between the unprocessed control and the samples micronized sample could be
detected. For all samples a main peak at 17.4 min and a small side peak appeared (retention
time 18.1 min). The main peak was assigned to insulin and the small peak was identified as
desamidoinsulin in an earlier study by Maschke et al. [92]. The ratio between these two peaks
did not change comparing the unprocessed bulk material with the samples jet milled once at
6 bar or three times at 14 bar. Similar results were found for the analysis of the samples by
MALDI-ToF (fig. 5.2). The spectra of the bulk material and powder three times micronized at
14 bar showed no significant differences. The main peak was at a molecular mass of
5736.0 Da for the unprocessed material and at 4735.8 Da for the micronized sample.
Overall the chemical stability of bovine insulin did not seem to be influenced by the
micronization process in a jet mill.
inte
nsi
ty/
vo
lts
-0.6
-0.4
-0.2
0.0
0.2
0.4
0.6
0.8
1.0
insulin bulk material
insulin 1x6 bar
insulin 3x14 bar
time / min
5 10 15 20 25
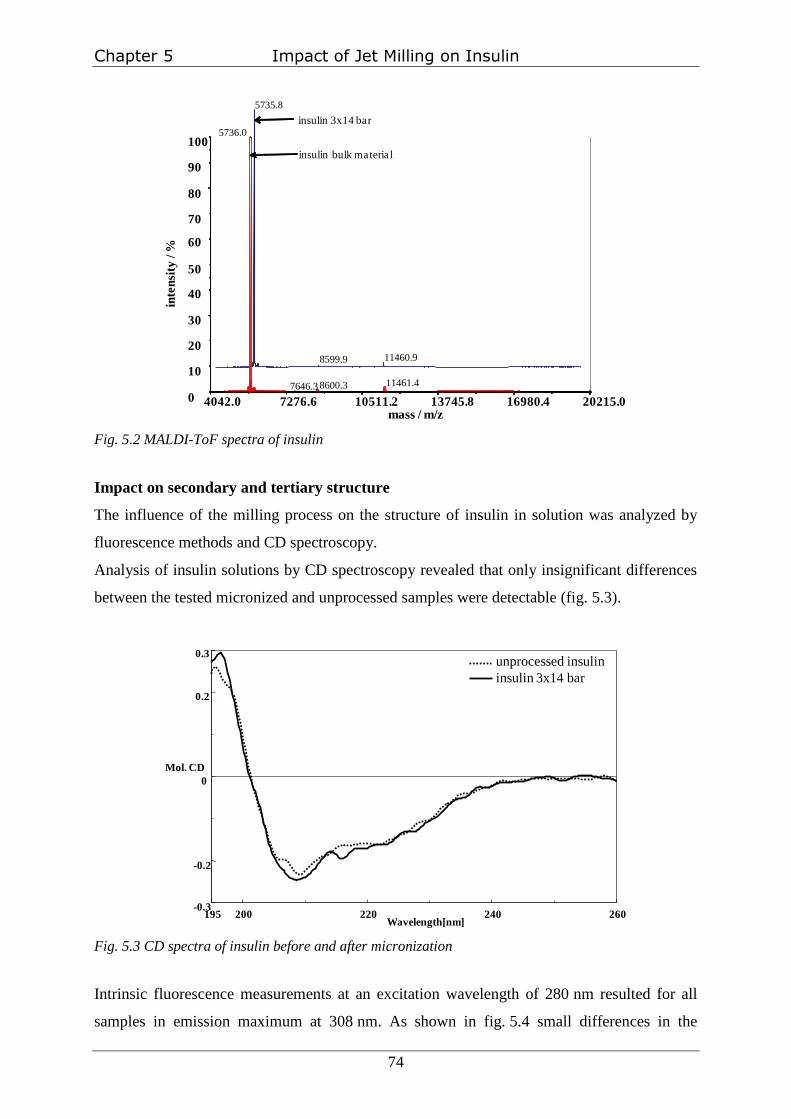
Chapter 5 Impact of Jet Milling on Insulin
74
Fig. 5.2 MALDI-ToF spectra of insulin
Impact on secondary and tertiary structure
The influence of the milling process on the structure of insulin in solution was analyzed by
fluorescence methods and CD spectroscopy.
Analysis of insulin solutions by CD spectroscopy revealed that only insignificant differences
between the tested micronized and unprocessed samples were detectable (fig. 5.3).
Fig. 5.3 CD spectra of insulin before and after micronization
Intrinsic fluorescence measurements at an excitation wavelength of 280 nm resulted for all
samples in emission maximum at 308 nm. As shown in fig. 5.4 small differences in the
4042.0 7276.6 10511.2 13745.8 16980.4 20215.0mass / m/z
0
10
20
30
40
50
60
70
80
90
100
inte
nsi
ty/ %
5736.0
11461.48600.37646.3
8599.9 11460.9
5735.8
insulin 3x14 bar
insulin bulk material
-0.3
0.3
-0.2
0
0.2
195 260200 220 240
Mol. CD
Wavelength[nm]
unprocessed insulin
insulin 3x14 bar

Impact of Jet Milling on Insulin Chapter 5
75
maximum intensity were detected. Tyrosin fluorescence intensity dropped from 522 for the
control to 487 for the samples micronized three times at 14 bar. Normally the two tyrosins in
position A14 and A19 produce no fluorescence, because they are buried in the hydrophobic
core and H-bonded to carbonyls [156]. Therefore, changes in the environment of the tyrosin
residues in positions B16 and B26 have to be responsible for the reduced intensity after
micronization. This effect can be caused by carbonyls or disulfide bonds which changed their
relative position to these residues.
Fig. 5.4 intrinsic fluorescence of insulin at 308 nm upon excitation at 280 nm (p<0.05)
For further investigations the relative surface hydrophobicity of the protein in solution was
analyzed by addition of a fluorescent probe (ANS). Again small differences were detected.
The surface hydrophobicity of the sample micronized three times at 14 bar increased by 12 %
compared to the unprocessed bulk material (fig 5.5).
0
100
200
300
400
500
600
insulin bulk insulin 3x14 bar
flu
oresc
en
ce in
ten
sity
*
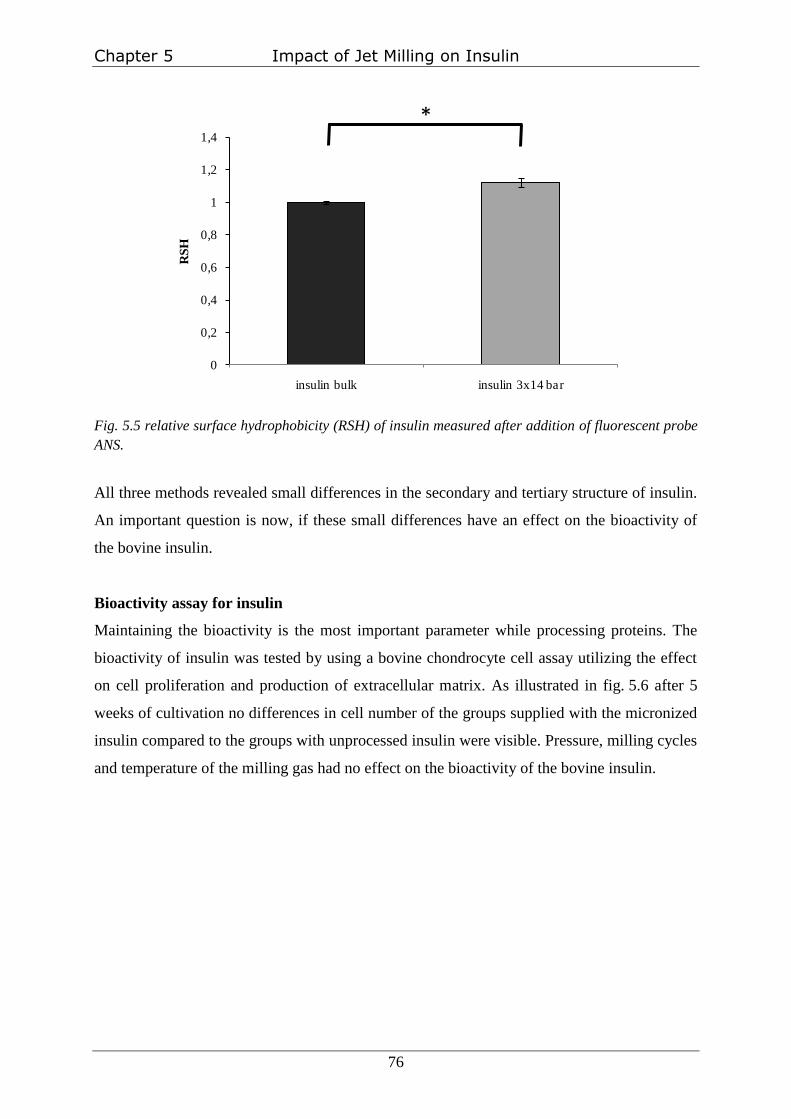
Chapter 5 Impact of Jet Milling on Insulin
76
Fig. 5.5 relative surface hydrophobicity (RSH) of insulin measured after addition of fluorescent probe
ANS.
All three methods revealed small differences in the secondary and tertiary structure of insulin.
An important question is now, if these small differences have an effect on the bioactivity of
the bovine insulin.
Bioactivity assay for insulin
Maintaining the bioactivity is the most important parameter while processing proteins. The
bioactivity of insulin was tested by using a bovine chondrocyte cell assay utilizing the effect
on cell proliferation and production of extracellular matrix. As illustrated in fig. 5.6 after 5
weeks of cultivation no differences in cell number of the groups supplied with the micronized
insulin compared to the groups with unprocessed insulin were visible. Pressure, milling cycles
and temperature of the milling gas had no effect on the bioactivity of the bovine insulin.
0
0,2
0,4
0,6
0,8
1
1,2
1,4
insulin bulk insulin 3x14 bar
RS
H
*

Impact of Jet Milling on Insulin Chapter 5
77
Fig. 5.6 cell number of chondrocytes after 5 weeks of cultivation after having added different samples
of insulin at two concentrations
Additionally, histological cross sections of the chondrocyte containing fibrin gels were
stained with safranin-O in order to visualize the glycosaminoglycans (GAG), an important
compound of the extracellular matrix. As shown in fig. 5.7 the intensity of the red staining is
much higher in the insulin containing groups. But no difference between unprocessed and
micronized insulin supplied groups was visible, which supports the results of the cell number
analysis.
Fig. 5.7 Histological cross-sections after 5 weeks of cultivation, stained red for glycosaminoglycans
(GAG) with safranin-O. a) Without insulin (control), b) with unprocessed insulin 2.5 µg/ml and c)
with insulin micronized 3 times at 14 bar 2.5 µg/ml.
0
2
4
6
8
10
12
1 2 (0.5) 2 (2.5) 3 (0.5) 3 (2.5) 4 (0.5) 4 (2.5) 5 (0.5) 5 (2.5)
cell
nu
mb
er / m
io
*
unprocessed
insulin
0.5 2.5
insulin
3x6 bar
no cooling
insulin
3x14 bar
no cooling
insulin
3x14 bar
with cooling
without
insulin
0.5 0.5 0.52.5 2.5 2.5 µg/ml
a) b) c)

Chapter 5 Impact of Jet Milling on Insulin
78
Summary and conclusion
The micronization process seems to have only a small impact on the crystalline insulin.
Analysis by HPLC and MALDI-ToF revealed no changes in the chemical structure and
stability of the insulin molecules. Small changes were detected by fluorescence analysis. The
intrinsic fluorescence was reduced and the relative surface hydrophobicity (RSH) increased,
indicating small alterations in the tertiary structure of insulin. Nevertheless, these changes had
no influence on the bioactivity of insulin tested in a chondrocyte cell assay. Nevertheless,
regarding the sensitivity of the cell culture assay, which is lower than e.g. for an enzymatic
assay, an impact of jet milling on insulin bioactivity cannot totally be excluded.
Overall, the jet milling process seems to be a suitable method for the micronization of insulin
and is a promising approach for the preparation of micron sized protein particles.
Chapter 6
Impact
of
Jet Milling
on
Hen egg-white Lysozyme

Chapter 6 Impact of Jet Milling on Lysozyme
80
Introduction
Lysozyme is an often used model in protein research [5,157,158]. Its properties and structure
are very well investigated, because since the 1960s it has been in the focus of protein research
[159–161]. Additionally its bioactivity is easyly accessible by measuring the lysis of
micrococcus luteus cells turbidimetrically [125]. Therefore, lysozyme was chosen as a model
substance for our jet milling experiments.
Lysozymes are a group of enzymes defined as 1,4-β-N-acetylmuramidases cleaving the
glycosidic bond between the C-1 of N-acetylmuramic acid and the C-4 of N-acetyl-
glucosamine in the bacterial peptidoglycan [161]. They are found in many tissues and
secretions of vertebrates, invertebrates as well as bacteria, phages and plants. In the human
body the highest concentration can be found within the tear fluid. As the main function a basic
defense against infections is assumed.
Chicken egg white lysozyme is a single chain polypeptide of 129 amino acids cross-linked
with four disulfide bridges, containing 3 tyrosine, 6 tryptophan and 2 methionine [162]
resulting in a molecular weight of 14307 Da.
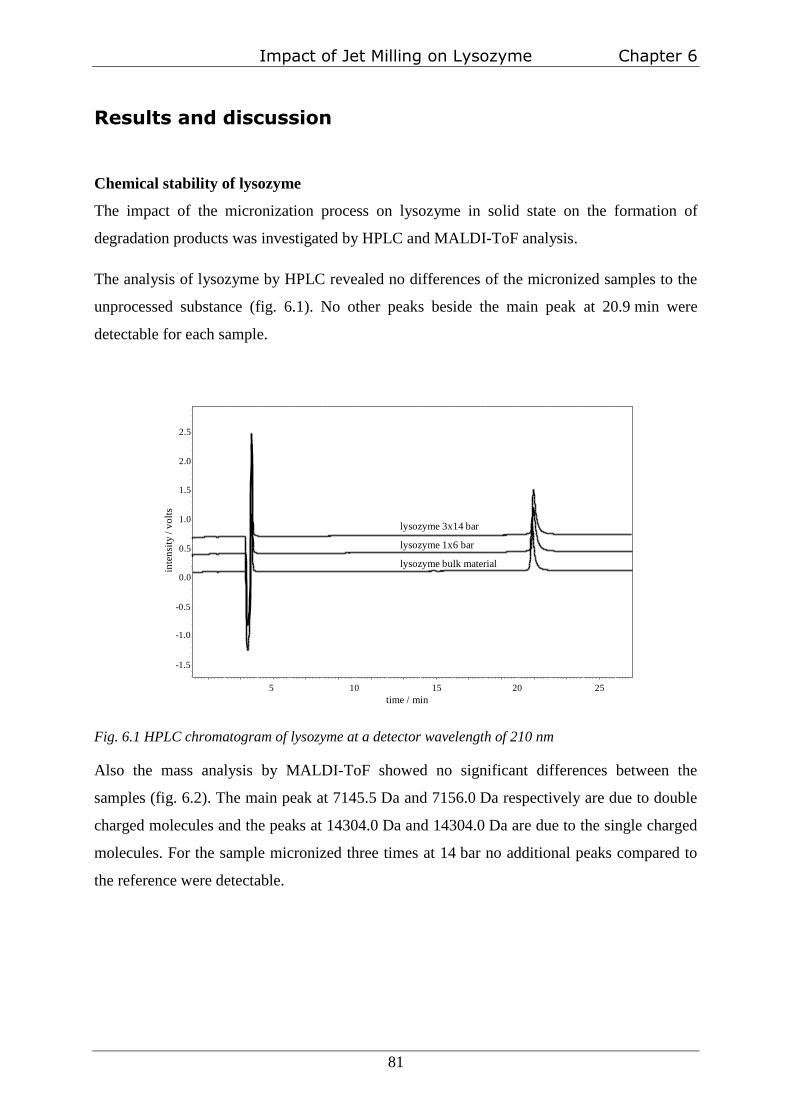
Impact of Jet Milling on Lysozyme Chapter 6
81
Results and discussion
Chemical stability of lysozyme
The impact of the micronization process on lysozyme in solid state on the formation of
degradation products was investigated by HPLC and MALDI-ToF analysis.
The analysis of lysozyme by HPLC revealed no differences of the micronized samples to the
unprocessed substance (fig. 6.1). No other peaks beside the main peak at 20.9 min were
detectable for each sample.
Fig. 6.1 HPLC chromatogram of lysozyme at a detector wavelength of 210 nm
Also the mass analysis by MALDI-ToF showed no significant differences between the
samples (fig. 6.2). The main peak at 7145.5 Da and 7156.0 Da respectively are due to double
charged molecules and the peaks at 14304.0 Da and 14304.0 Da are due to the single charged
molecules. For the sample micronized three times at 14 bar no additional peaks compared to
the reference were detectable.
inte
nsi
ty/
vo
lts
-1.5
-1.0
-0.5
0.0
0.5
1.0
1.5
2.0
2.5
lysozyme bulk material
lysozyme 1x6 bar
lysozyme 3x14 bar
105 15 20 25
time / min
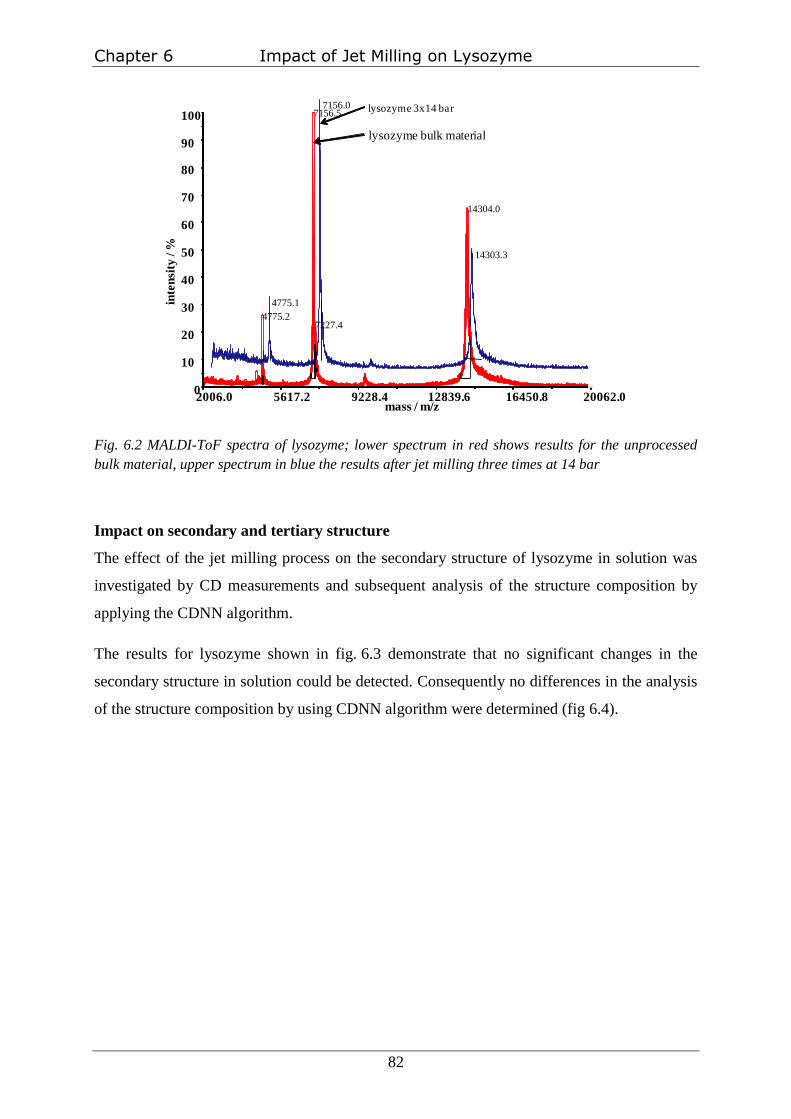
Chapter 6 Impact of Jet Milling on Lysozyme
82
Fig. 6.2 MALDI-ToF spectra of lysozyme; lower spectrum in red shows results for the unprocessed
bulk material, upper spectrum in blue the results after jet milling three times at 14 bar
Impact on secondary and tertiary structure
The effect of the jet milling process on the secondary structure of lysozyme in solution was
investigated by CD measurements and subsequent analysis of the structure composition by
applying the CDNN algorithm.
The results for lysozyme shown in fig. 6.3 demonstrate that no significant changes in the
secondary structure in solution could be detected. Consequently no differences in the analysis
of the structure composition by using CDNN algorithm were determined (fig 6.4).
2006.0 5617.2 9228.4 12839.6 16450.8 20062.0mass / m/z
0
10
20
30
40
50
60
70
80
90
100 7156.5
14304.0
4775.27227.4
7156.0
14303.3
4775.1
lysozyme 3x14 bar
lysozyme bulk material
inte
nsi
ty/ %

Impact of Jet Milling on Lysozyme Chapter 6
83
Fig. 6.3 CD spectra of lysozyme (control, 1x14bar, 2x14bar, 3x14bar)
control 1x14 bar 2x14 bar 3x14 bar
Helix 21.0%±1.68 21.4%±2.38 21.1%±2.44 20.9%±2.25
Antiparallel 19.7%±1.52 18.6%±1.73 19.1%±2.06 19.5%±1.98
Parallel 5.5%±0.10 5.5%±0.05 5.4%±0.06 5.5%±0.05
Beta-Turn 18.4%±0.29 18.1%±0.33 18.3%±0.37 18.3±0.33
Random Coil 33.1%±1.11 33.1%±2.01 30.4%±6.29 33.0%±1.65
Fig. 6.4 Results of secondary structure composition analysis by CDNN algorithm
Similar to insulin lysozyme was analyzed by two different fluorescence methods for changes
in tertiary structure. The intrinsic fluorescence measurements were performed at a wavelength
of 295 nm for the excitation of the 6 tryptophan residues. The maximum of the tryptophan
fluorescence was at about 394.5 nm for all samples and depending on the number of milling
cycles the intensity was reduced from 200 for the control to 175 measured for the sample
milled three times at 14 bar (fig. 6.5). Possible reasons for a reduction of tryptophan
fluorescence are that the residues are now in a more hydrophobic environment, quenched by
disulfide bonds or a greater distance to tyrosin residues, which can intensify tryptophane
fluorescence via nonradiative energy transfer, if the distance between them is smaller than 10-
18Ǻ [163].
-900
100
-800
-600
-400
-200
0
200 260225 250
Mo
l. C
D
Wavelength [nm]

Chapter 6 Impact of Jet Milling on Lysozyme
84
Fig. 6.5 Intrinsic fluorescence of lysozyme at an excitation wavelength of 295 nm (p<0.05)
After having added ANS as a hydrophobic probe the relative surface hydrophobicity of the
protein in solution was determined. A 12-fold increase of relative surface hydrophobicity
indicates dramatic changes in the tertiary structure of lysozyme (fig. 6.6). Nevertheless, by
comparing the secondary structure of the reconstituted micronized proteins with that of the
native proteins in solution measured by circular dichroism spectroscopy no significant
changes were visible. This observation of an increasing surface hydrophobicity without
changes in secondary structure of lysozyme was already described by Lechevalier et al. [129].
Fig. 6.6 Relative surface hydrophobicity (RSH) of lysozyme in solution with ANS as hydrophobic
probe (p<0.05)
160
170
180
190
200
210
control 1x14 bar 2x14 bar 3x14 bar
flu
ore
scen
ce in
ten
sity
*
0
2
4
6
8
10
12
14
16
control 1x14 bar 2x14 bar 3x14 bar
RS
H
*
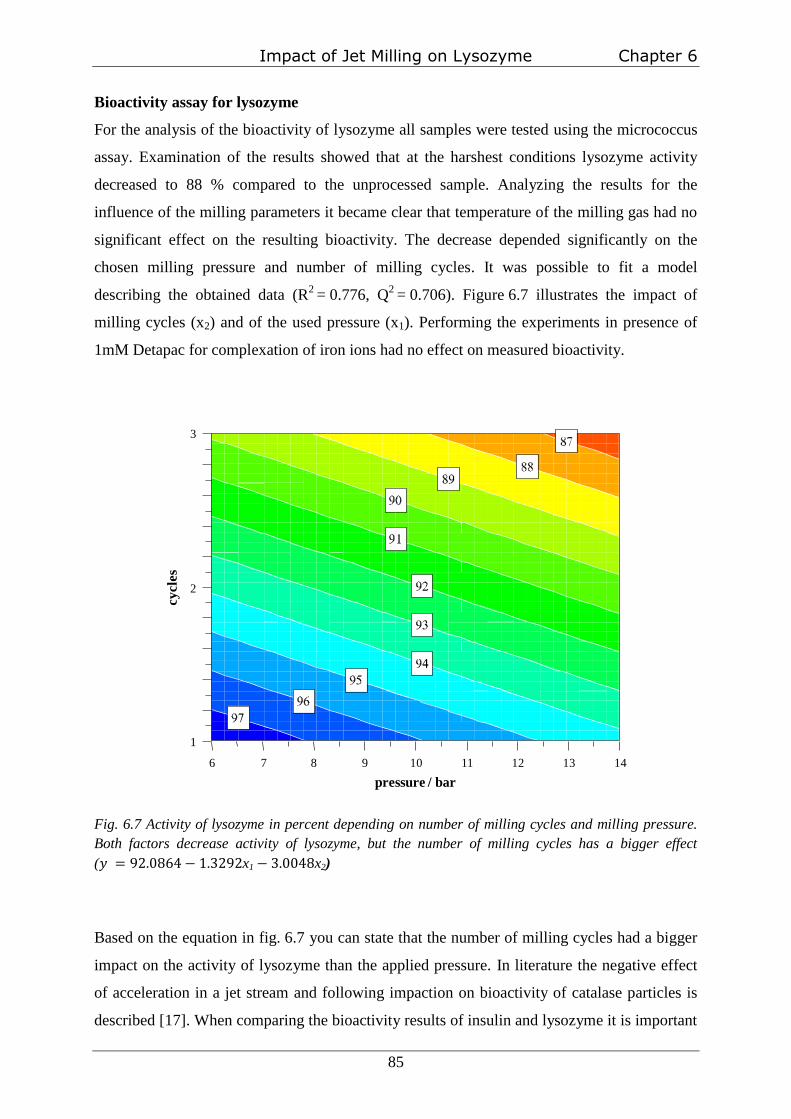
Impact of Jet Milling on Lysozyme Chapter 6
85
Bioactivity assay for lysozyme
For the analysis of the bioactivity of lysozyme all samples were tested using the micrococcus
assay. Examination of the results showed that at the harshest conditions lysozyme activity
decreased to 88 % compared to the unprocessed sample. Analyzing the results for the
influence of the milling parameters it became clear that temperature of the milling gas had no
significant effect on the resulting bioactivity. The decrease depended significantly on the
chosen milling pressure and number of milling cycles. It was possible to fit a model
describing the obtained data (R2
= 0.776, Q2
= 0.706). Figure 6.7 illustrates the impact of
milling cycles (x2) and of the used pressure (x1). Performing the experiments in presence of
1mM Detapac for complexation of iron ions had no effect on measured bioactivity.
Fig. 6.7 Activity of lysozyme in percent depending on number of milling cycles and milling pressure.
Both factors decrease activity of lysozyme, but the number of milling cycles has a bigger effect
(𝑦 = 92.0864 − 1.3292x1 − 3.0048x2)
Based on the equation in fig. 6.7 you can state that the number of milling cycles had a bigger
impact on the activity of lysozyme than the applied pressure. In literature the negative effect
of acceleration in a jet stream and following impaction on bioactivity of catalase particles is
described [17]. When comparing the bioactivity results of insulin and lysozyme it is important
1
2
3
6 147 8 9 10 11 12 13
pressure / bar
cycle
s

Chapter 6 Impact of Jet Milling on Lysozyme
86
to keep in mind that the sensitivity of the enzymatic assay of lysozyme is much higher than
for the chondrocyte cell assay of insulin. Nevertheless, for insulin the mechanical stress in the
jet mill seemed not to influence its bioactivity. One reason for these different results could be
the much larger lysozyme particles in the beginning. Due to this fact particles had to undergo
many more breakage events to reach the same sizes as determined for insulin. During
breakage events temperatures of several hundred Kelvin may occur at the newly created
surfaces [107], which may lead to persisting changes in the molecules at the particle surface.
Determination of the iron content
Another factor which may decrease the bioactivity of lysozyme and cause a drop in
fluorescence intensity is metal wear of the mill components. The iron content was measured
for selected lysozyme samples by ICP-OES. A slight increase depending on the number of
milling cycles was detected (fig. 6.8). The content of the unprocessed control sample was
6.32 ppm, which increased to 8.9 ppm after three cycles at 14bar.
Fig. 6.8 Iron content of lysozyme powder determined by ICP-OES measurements (p<0.05)
Platz et al. described that after micronization of human growth hormone 40 % of the powder
was insoluble in water [81]. It was possible to reduce this fraction to 2.5 to 7.5 % by
0
1
2
3
4
5
6
7
8
9
10
control 1x14 2x14 3x14
iro
n c
on
ten
t /
pp
m
*
*

Impact of Jet Milling on Lysozyme Chapter 6
87
exchanging some silver soldered joints and copper gas lines with more inert materials like
stainless steel. However, with the used setup for these experiments only stainless steel and
PTFE came in contact with the proteins. An effect of iron, which is the essential element in
stainless steel, on lysozyme was described by Sellak et al. [164]. It was published that
lysozyme is able to bind iron and is then much more sensitive to damages by radicals which
results in a loss of bioactivity. Additionally, a decrease in tryptophan fluorescence was
described. However, these results were described for concentrations higher than 1800 ppm
and our results showed only a small increase from 6 to 9 ppm of iron content within the
milled powder, which is probably due to attrition in the milling chamber. As mentioned
before the addition of an iron complexing agent (Detapac) to the tested protein solutions did
not show any improvement in lysozyme bioactivity. Therefore, a reduction of the bioactivity
of lysozyme by metal contamination due to attrition can be neglected.
Impact of jet milling on lysozyme crystals
Another interesting question was, if the solid state itself has an effect on the protein stability.
As described before, no loss in activity was determined for the crystalline insulin but for the
freeze dried lysozyme. Therefore, the impact of the jet milling process on lysozyme crystals
was tested, too.
The crystals, obtained by a method described in chapter 2, showed a broad size distribution
between 1 and 1000 µm with a d90 value of 85.6 µm (fig. 6.9). After one cycle at 14 bar the
d90 was reduced to 6.9 µm with some coarser particles still present. Three cycles at 14 bar
resulted in narrow distribution with a d90-value of 4.3 µm, which is slightly smaller than for
the freeze dried powder.
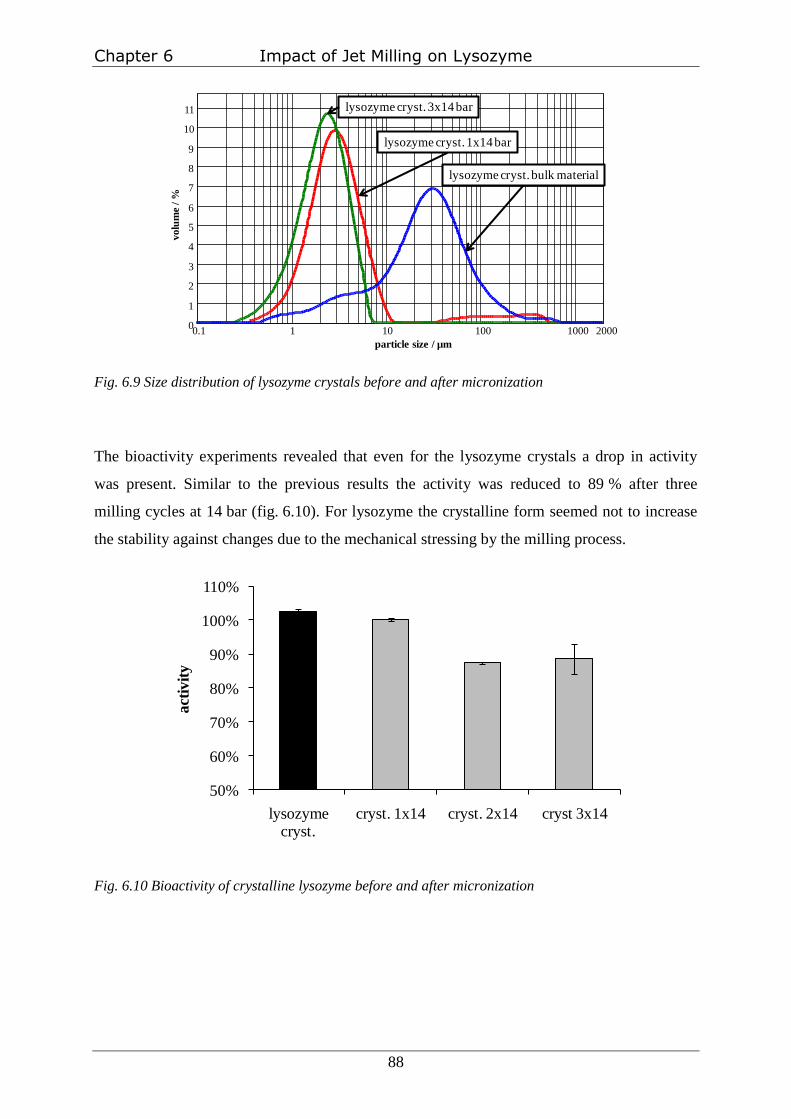
Chapter 6 Impact of Jet Milling on Lysozyme
88
Fig. 6.9 Size distribution of lysozyme crystals before and after micronization
The bioactivity experiments revealed that even for the lysozyme crystals a drop in activity
was present. Similar to the previous results the activity was reduced to 89 % after three
milling cycles at 14 bar (fig. 6.10). For lysozyme the crystalline form seemed not to increase
the stability against changes due to the mechanical stressing by the milling process.
Fig. 6.10 Bioactivity of crystalline lysozyme before and after micronization
0.1 1 10 100 1000 2000
particle size / µm
0
1
2
3
4
5
6
7
8
9
10
11
vo
lum
e/
%lysozyme cryst. bulk material
lysozyme cryst. 1x14 bar
lysozyme cryst. 3x14 bar
50%
60%
70%
80%
90%
100%
110%
lysozyme cryst.
cryst. 1x14 cryst. 2x14 cryst 3x14
act
ivit
y

Impact of Jet Milling on Lysozyme Chapter 6
89
Summary and conclusion
The experiments with lysozyme revealed that the chemical stability was not influenced by the
micronization process. By HPLC and MALDI-ToF no changes due to the milling process
were determined. Also no significant differences in the secondary structure analyzed by CD
spectroscopy were visible. However, by fluorescence measurements significant differences
between bulk material and the micronized powder were detected indicating changes in the
tertiary structure of the protein. The intrinsic fluorescence due to tryptophane decreased by
about 12% and the surface hydrophobicity (RSH) in solution increased 12-fold compared to
the reference. These changes seemed to be the reason for the drop in activity determined after
micronization. Higher iron content due to attrition in the milling chamber was excluded as a
reason for this decrease. This effect was not influenced by the solid state of lysozyme. The
investigated crystals showed similar results as the freeze dried form.
As a conclusion it can be stated that there are structural changes within the protein molecules
induced by the jet milling process resulting in a decrease in bioactivity. As the most critical
parameter seems to be the number of milling cycles, repeated milling should be avoided.
Chapter 6 Impact of Jet Milling on Lysozyme
90

Chapter 7
Impact
of
Jet Milling
on
BSA
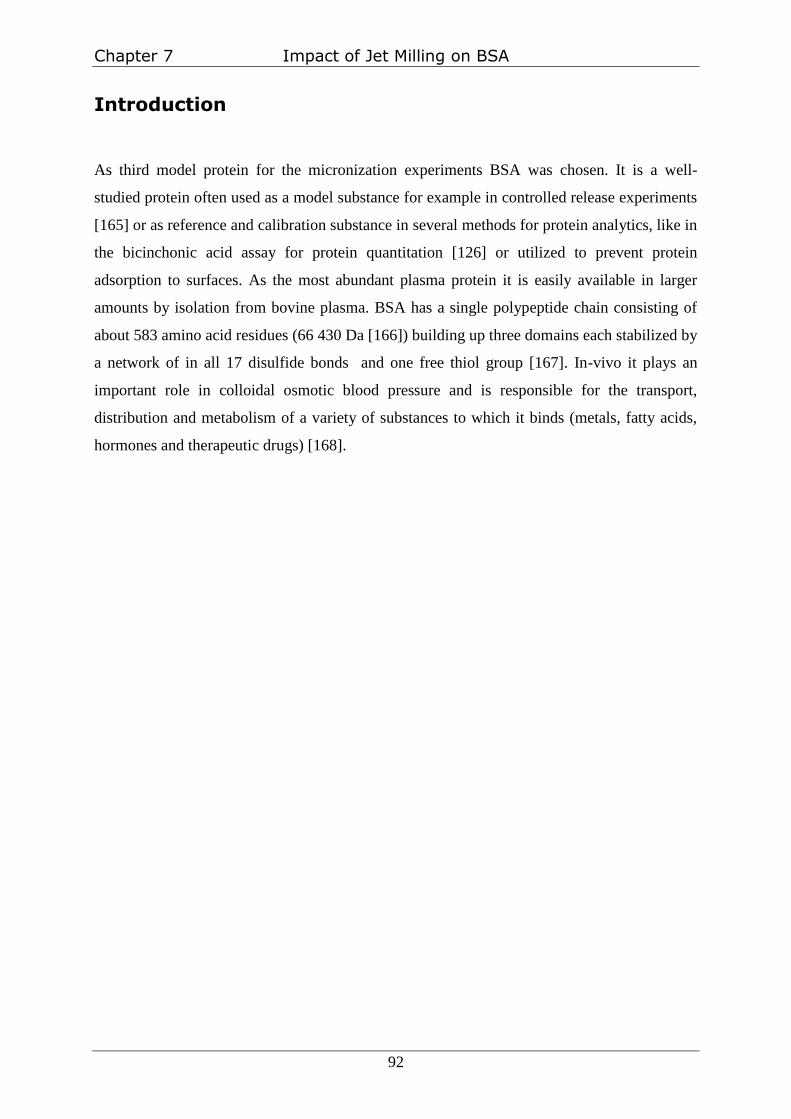
Chapter 7 Impact of Jet Milling on BSA
92
Introduction
As third model protein for the micronization experiments BSA was chosen. It is a well-
studied protein often used as a model substance for example in controlled release experiments
[165] or as reference and calibration substance in several methods for protein analytics, like in
the bicinchonic acid assay for protein quantitation [126] or utilized to prevent protein
adsorption to surfaces. As the most abundant plasma protein it is easily available in larger
amounts by isolation from bovine plasma. BSA has a single polypeptide chain consisting of
about 583 amino acid residues (66 430 Da [166]) building up three domains each stabilized by
a network of in all 17 disulfide bonds and one free thiol group [167]. In-vivo it plays an
important role in colloidal osmotic blood pressure and is responsible for the transport,
distribution and metabolism of a variety of substances to which it binds (metals, fatty acids,
hormones and therapeutic drugs) [168].
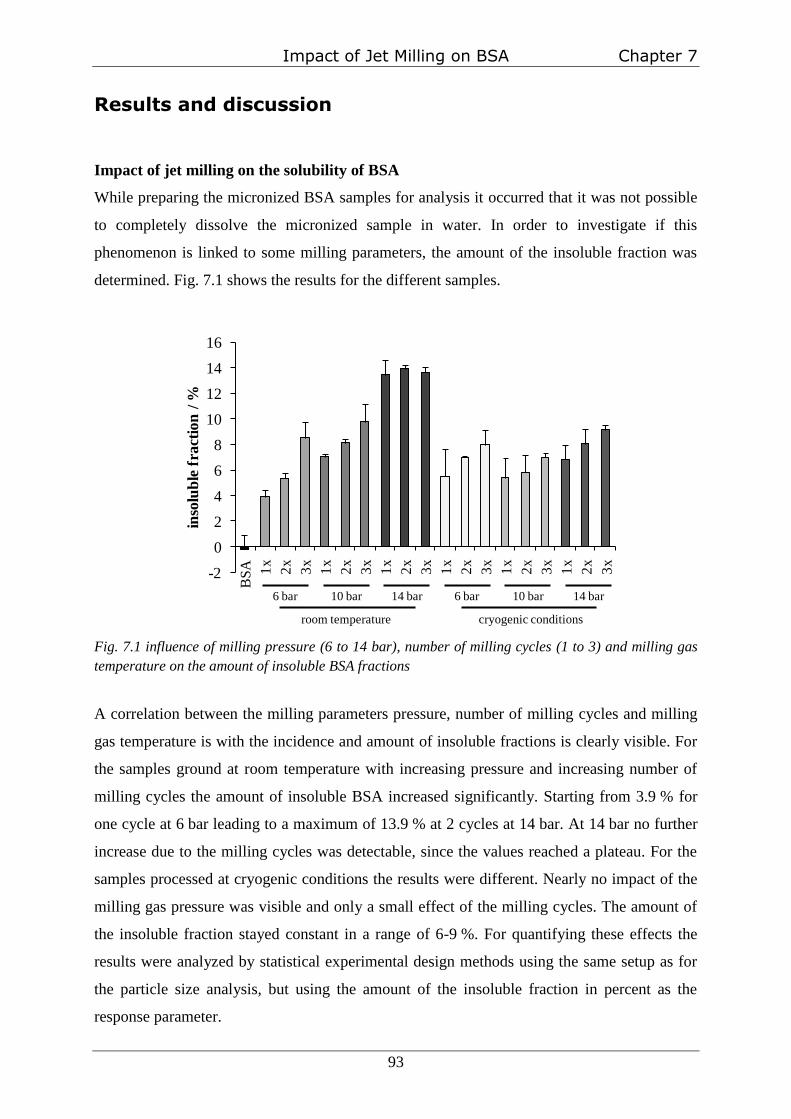
Impact of Jet Milling on BSA Chapter 7
93
Results and discussion
Impact of jet milling on the solubility of BSA
While preparing the micronized BSA samples for analysis it occurred that it was not possible
to completely dissolve the micronized sample in water. In order to investigate if this
phenomenon is linked to some milling parameters, the amount of the insoluble fraction was
determined. Fig. 7.1 shows the results for the different samples.
Fig. 7.1 influence of milling pressure (6 to 14 bar), number of milling cycles (1 to 3) and milling gas
temperature on the amount of insoluble BSA fractions
A correlation between the milling parameters pressure, number of milling cycles and milling
gas temperature is with the incidence and amount of insoluble fractions is clearly visible. For
the samples ground at room temperature with increasing pressure and increasing number of
milling cycles the amount of insoluble BSA increased significantly. Starting from 3.9 % for
one cycle at 6 bar leading to a maximum of 13.9 % at 2 cycles at 14 bar. At 14 bar no further
increase due to the milling cycles was detectable, since the values reached a plateau. For the
samples processed at cryogenic conditions the results were different. Nearly no impact of the
milling gas pressure was visible and only a small effect of the milling cycles. The amount of
the insoluble fraction stayed constant in a range of 6-9 %. For quantifying these effects the
results were analyzed by statistical experimental design methods using the same setup as for
the particle size analysis, but using the amount of the insoluble fraction in percent as the
response parameter.
6 bar 10 bar 14 bar 6 bar 10 bar 14 bar
room temperature cryogenic conditions
-2
0
2
4
6
8
10
12
14
16
BS
A 1x
2x
3x
1x
2x
3x
1x
2x
3x
1x
2x
3x
1x
2x
3x
1x
2x
3x
inso
lub
le f
ract
ion
/ %
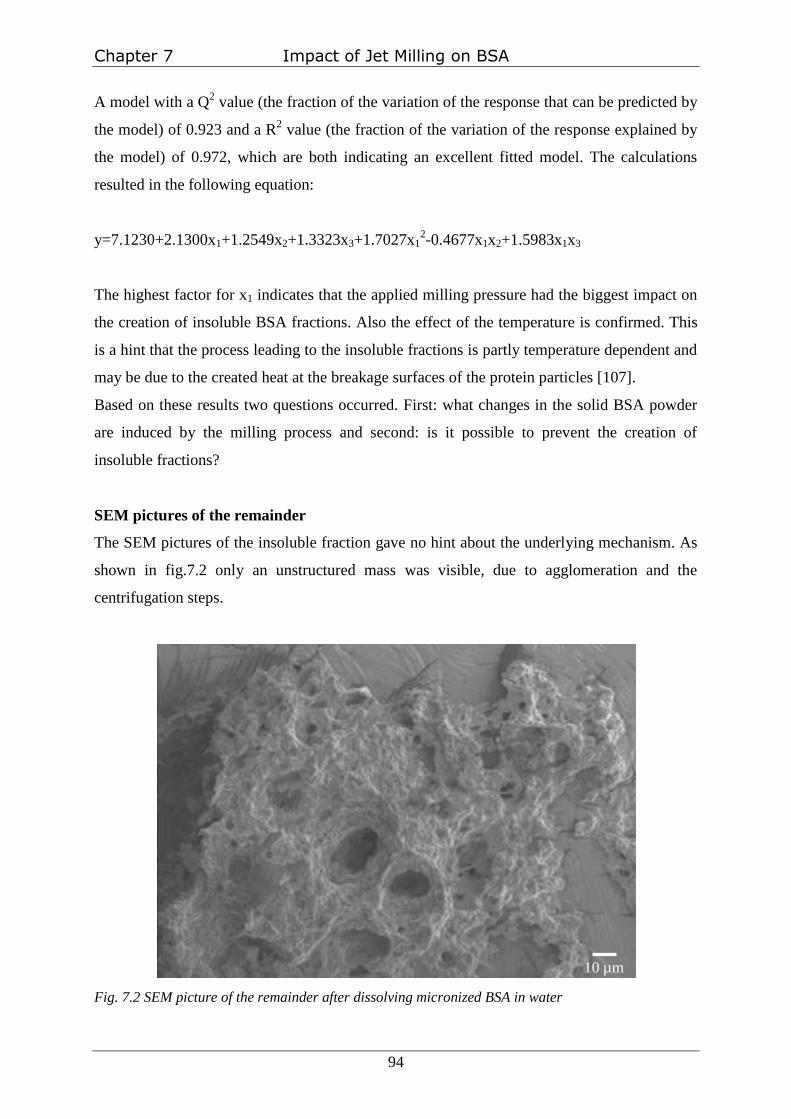
Chapter 7 Impact of Jet Milling on BSA
94
A model with a Q2 value (the fraction of the variation of the response that can be predicted by
the model) of 0.923 and a R2 value (the fraction of the variation of the response explained by
the model) of 0.972, which are both indicating an excellent fitted model. The calculations
resulted in the following equation:
y=7.1230+2.1300x1+1.2549x2+1.3323x3+1.7027x12-0.4677x1x2+1.5983x1x3
The highest factor for x1 indicates that the applied milling pressure had the biggest impact on
the creation of insoluble BSA fractions. Also the effect of the temperature is confirmed. This
is a hint that the process leading to the insoluble fractions is partly temperature dependent and
may be due to the created heat at the breakage surfaces of the protein particles [107].
Based on these results two questions occurred. First: what changes in the solid BSA powder
are induced by the milling process and second: is it possible to prevent the creation of
insoluble fractions?
SEM pictures of the remainder
The SEM pictures of the insoluble fraction gave no hint about the underlying mechanism. As
shown in fig.7.2 only an unstructured mass was visible, due to agglomeration and the
centrifugation steps.
Fig. 7.2 SEM picture of the remainder after dissolving micronized BSA in water
10 µm

Impact of Jet Milling on BSA Chapter 7
95
Dissolution tests with the water insoluble BSA fractions
To identify the changes within the BSA several solvents were tested in order to get the
remainder into solution. The results showed that the water-insoluble BSA fraction was
dissolved only by a combination of denaturizing and reducing agents. 6M urea or 6M
guanidine HCl both in combination with 10mM dithioerythritol and 1mM EDTA were the
only suitable solvents. For all other setups only the appearance of the sediment differed. In
hydrophilic environment like water big flakes formed and in more lipophilic media the
powder particles stayed separated. This indicates that the insoluble particles had a more
lipophilic surface and wettability may be part of the problem. Nevertheless, only the
combination with a reducing agent like dithioerythritol resulted in a clear solution. The fact
that dithioerythritol alone was not able to dissolve the protein aggregates implied that the
wettability of the particles by this solution was too low or that not all the disulfide bonds were
accessible and only the combination with the denaturizing agents loosened the aggregates.
Therefore, chemical reactions like a disulfide interchange were possible explanations for the
creation of insoluble fractions. Similar results are known for the moisture-induced
aggregation of BSA Liu et al. [169].
Nevertheless, the found solvents were not suitable for performing further analysis, because
the molecule structure had been totally destroyed und all disulfide bonds had been broken up
so that no differences between the samples were detectable. Therefore, further experiments
were needed to investigate if sulfhydryl groups are responsible for the creation of the
insoluble fraction.
Determination and blocking of free SH-groups
BSA contains 17 disulfide bonds and one free thiol group of a cysteine residue. This
facilitates the possibility of a thiol-disulfide interchange by a nucleophilic attack of an ionized
thiol on a disulfide linkage resulting in covalent protein aggregates. Therefore, the idea was to
block the free thiol groups and investigate the effect on the solubility properties after
micronization.
As described in chapter 2 the determination of free thiol groups was performed by using
Ellman´s reagent. Fig. 7.3 shows the free thiol groups per molecule BSA before and after S-
alkylation by iodoacetamide determined by this method. BSA provides 0.4 free SH-groups
per molecule, which matches the values described in literature [165]. The fraction without a
free sulfhydryl group is due to interaction with plasma cysteine and a less content with

Chapter 7 Impact of Jet Milling on BSA
96
glutathion [170,171]. By S-alkylation the content was reduced to 0.05 free SH-groups per
molecule.
Fig. 7.3 SH-groups per molecule BSA. Left bar shows results for unprocessed BSA, middle bar shows
effect of S-alkylation by iodoacetamide, right bar shows impact of the preparation process for S-
alkylation without addition of iodoacetamide.
This modified BSA was now micronized at 14 bar one to three times. The unmodified BSA
was micronized, too, because a new batch of BSA was used for these experiments. The
following analysis of solubility in water showed that no significant difference between the
samples was obtained (fig. 7.4). The slightly lower values compared to Fig. 7.1 are due to the
used new batch of BSA despite the fact that for the old batch only 0.15 free thiols per
molecule BSA were measured.
Therefore, the impact of the free SH-group on the creation of insoluble fractions by thiol
disulfide interchange can be neglected.
0
0.1
0.2
0.3
0.4
0.5
BSA BSA + iodoacet. BSA - iodoacet.
free
SH
-gro
up
s p
er m
ole
cule
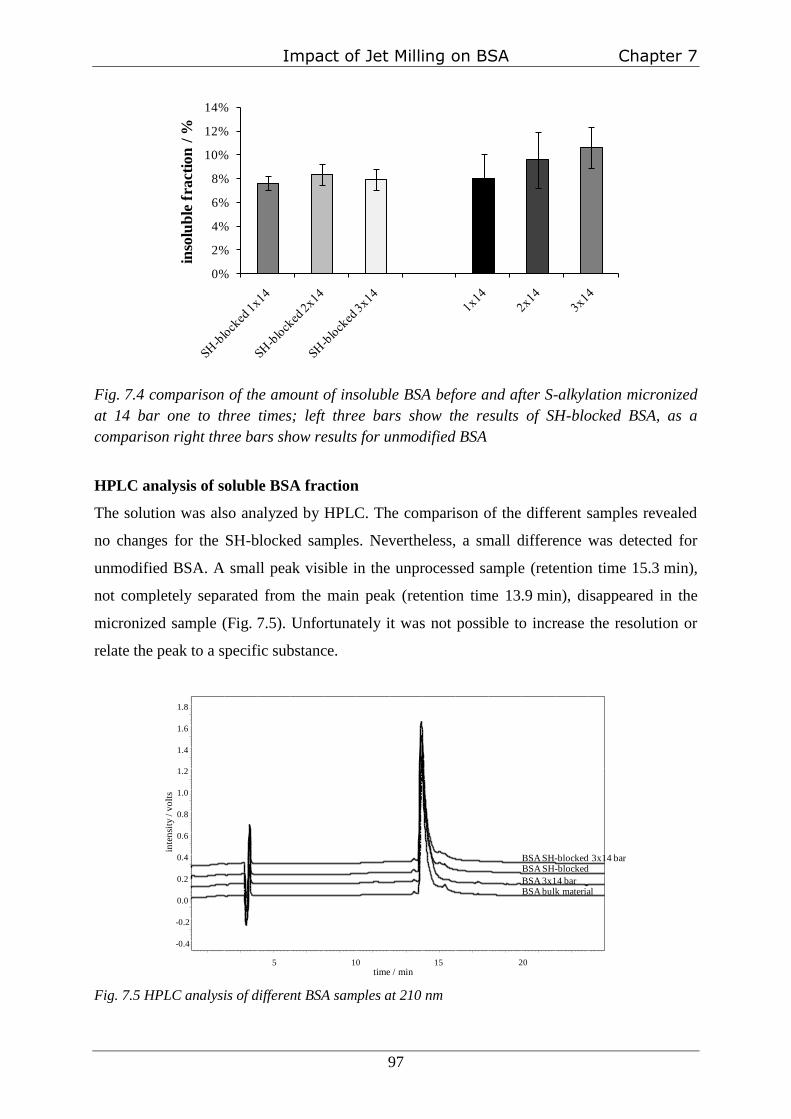
Impact of Jet Milling on BSA Chapter 7
97
Fig. 7.4 comparison of the amount of insoluble BSA before and after S-alkylation micronized
at 14 bar one to three times; left three bars show the results of SH-blocked BSA, as a
comparison right three bars show results for unmodified BSA
HPLC analysis of soluble BSA fraction
The solution was also analyzed by HPLC. The comparison of the different samples revealed
no changes for the SH-blocked samples. Nevertheless, a small difference was detected for
unmodified BSA. A small peak visible in the unprocessed sample (retention time 15.3 min),
not completely separated from the main peak (retention time 13.9 min), disappeared in the
micronized sample (Fig. 7.5). Unfortunately it was not possible to increase the resolution or
relate the peak to a specific substance.
Fig. 7.5 HPLC analysis of different BSA samples at 210 nm
0%
2%
4%
6%
8%
10%
12%
14%
inso
lub
le f
ract
ion
/ %
-0.4
-0.2
0.0
0.2
0.4
0.6
0.8
1.0
1.2
1.4
1.6
1.8
BSA bulk materialBSA 3x14 bar
BSA SH-blockedBSA SH-blocked 3x14 bar
inte
nsi
ty/
vo
lts
time / min105 15 20

Chapter 7 Impact of Jet Milling on BSA
98
Micronization of l-glutathione (GSH)
In order to investigate if oxidative processes involving the free SH-group are responsible for
the formation of intermolecular disulfide bonds, micronization experiments were performed
with l-glutathione, a small and easy to analyze peptide with a free SH-group. For such a small
peptide the probability of reactions should be increased and the formed aggregates should be
soluble in water and therefore accessible to analytical methods.
The reduced form of GSH containing the free SH-group was micronized 3 times at 14 bar and
afterwards was analyzed for changes by using the thiol assay and HPLC. Fig. 7.5 shows the
free SH-groups per molecule of the unprocessed bulk material (GSH red) compared to the
reference of the oxidized form (GSH ox) and to the three times micronized sample of the
reduced form.
Fig. 7.5 Free thiol content per molecule GSH of the reduced (GSH red) and oxidized form (GSH ox)
compared to the jet milled reduced form
No changes after the jet milling process compared to the unprocessed reference were visible.
These results were confirmed by the results of the HPLC analysis of these samples (fig. 7.6).
For the reduced form, one main peak related to the monomer with the free thiol groups and a
small peak identical to the oxidized form was detected. After micronization the same
chromatogram was obtained with no additional peaks and no changes in the peak to peak
ratio.
-0,2
0
0,2
0,4
0,6
0,8
1
1,2
GSH red GSH ox GSH 3x14 bar
free
SH
-gro
up
s p
er m
ole
cule
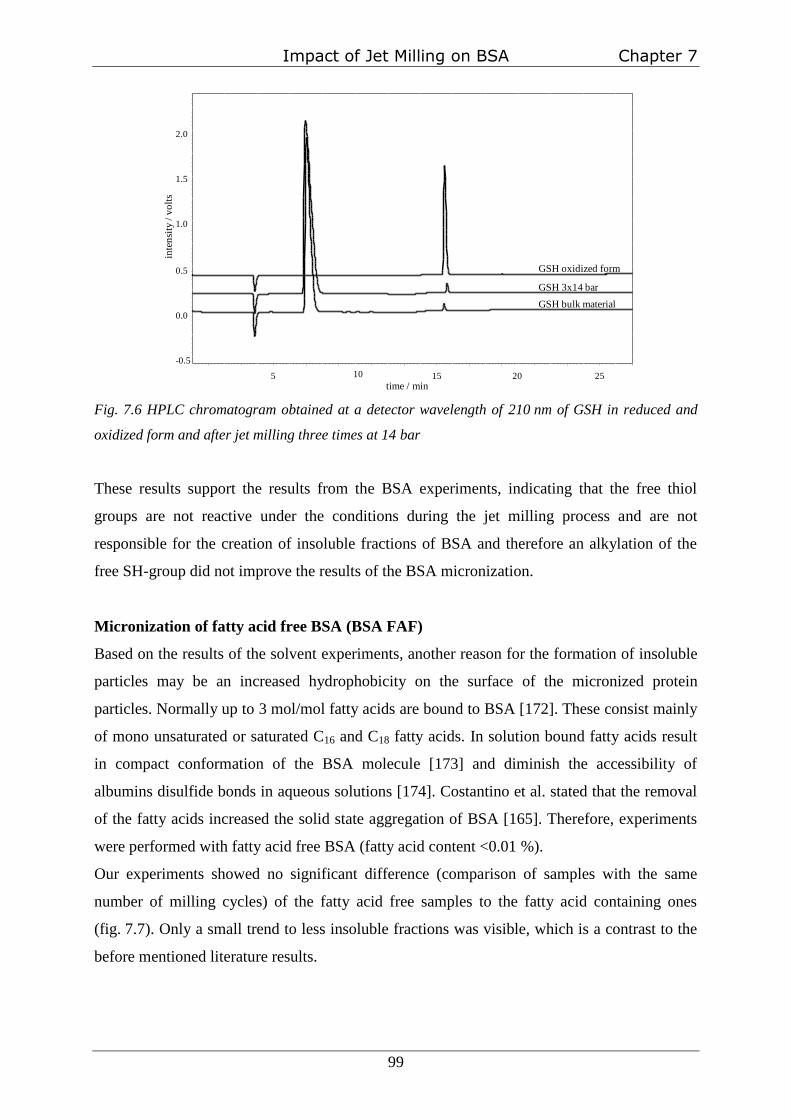
Impact of Jet Milling on BSA Chapter 7
99
Fig. 7.6 HPLC chromatogram obtained at a detector wavelength of 210 nm of GSH in reduced and
oxidized form and after jet milling three times at 14 bar
These results support the results from the BSA experiments, indicating that the free thiol
groups are not reactive under the conditions during the jet milling process and are not
responsible for the creation of insoluble fractions of BSA and therefore an alkylation of the
free SH-group did not improve the results of the BSA micronization.
Micronization of fatty acid free BSA (BSA FAF)
Based on the results of the solvent experiments, another reason for the formation of insoluble
particles may be an increased hydrophobicity on the surface of the micronized protein
particles. Normally up to 3 mol/mol fatty acids are bound to BSA [172]. These consist mainly
of mono unsaturated or saturated C16 and C18 fatty acids. In solution bound fatty acids result
in compact conformation of the BSA molecule [173] and diminish the accessibility of
albumins disulfide bonds in aqueous solutions [174]. Costantino et al. stated that the removal
of the fatty acids increased the solid state aggregation of BSA [165]. Therefore, experiments
were performed with fatty acid free BSA (fatty acid content <0.01 %).
Our experiments showed no significant difference (comparison of samples with the same
number of milling cycles) of the fatty acid free samples to the fatty acid containing ones
(fig. 7.7). Only a small trend to less insoluble fractions was visible, which is a contrast to the
before mentioned literature results.
-0.5
0.0
0.5
1.0
1.5
2.0
GSH bulk material
GSH 3x14 bar
GSH oxidized form
inte
nsi
ty/
vo
lts
time / min5 1510 20 25
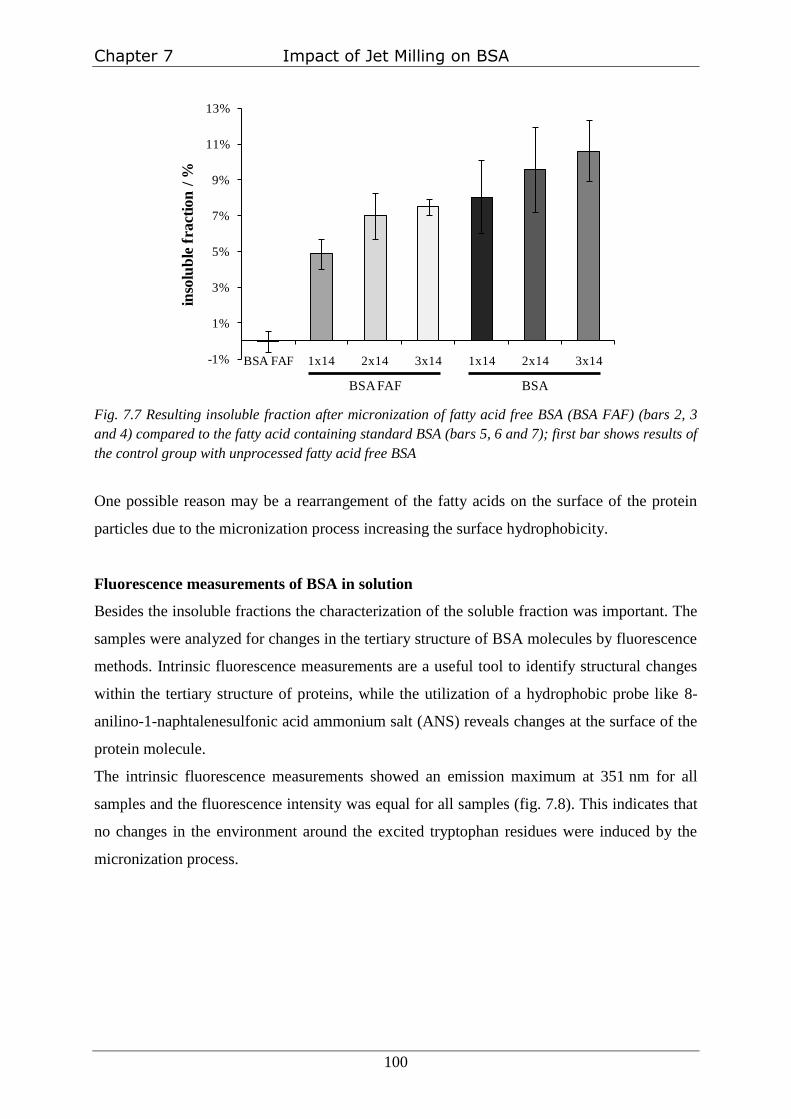
Chapter 7 Impact of Jet Milling on BSA
100
Fig. 7.7 Resulting insoluble fraction after micronization of fatty acid free BSA (BSA FAF) (bars 2, 3
and 4) compared to the fatty acid containing standard BSA (bars 5, 6 and 7); first bar shows results of
the control group with unprocessed fatty acid free BSA
One possible reason may be a rearrangement of the fatty acids on the surface of the protein
particles due to the micronization process increasing the surface hydrophobicity.
Fluorescence measurements of BSA in solution
Besides the insoluble fractions the characterization of the soluble fraction was important. The
samples were analyzed for changes in the tertiary structure of BSA molecules by fluorescence
methods. Intrinsic fluorescence measurements are a useful tool to identify structural changes
within the tertiary structure of proteins, while the utilization of a hydrophobic probe like 8-
anilino-1-naphtalenesulfonic acid ammonium salt (ANS) reveals changes at the surface of the
protein molecule.
The intrinsic fluorescence measurements showed an emission maximum at 351 nm for all
samples and the fluorescence intensity was equal for all samples (fig. 7.8). This indicates that
no changes in the environment around the excited tryptophan residues were induced by the
micronization process.
-1%
1%
3%
5%
7%
9%
11%
13%
BSA FAF 1x14 2x14 3x14 1x14 2x14 3x14
inso
lub
le f
ract
ion
/ %
BSA FAF BSA

Impact of Jet Milling on BSA Chapter 7
101
Fig. 7.8 intrinsic fluorescence intensity measured at a wavelength of 351 nm of BSA before and after
micronization; first bar shows results of the unprocessed BSA in comparison to samples micronized at
a pressure of 14 bar one to three times at room temperature (bars 2, 3 and 4) and at cryogenic
conditions (bars 5, 6 and 7)
The surface hydrophobicity of the BSA molecules in solution was investigated by addition of
ANS as a hydrophobic probe. In a hydrophobic environment, e.g. by hydrophobic amino acids
on the surface of the protein, the fluorescence intensity of ANS is increased. The calculated
relative surface hydrophobicity (RSH) revealed a significant decrease of hydrophobicity for
the micronized samples compared to the unprocessed bulk material (fig. 7.9).
Fig. 7.9 Relative surface hydrophobicity (RSH) of BSA in solution; samples were jet milled at 14 bar
one to three times at room temperature (bars 2, 3 and 4) and cryogenic conditions (bars 5, 6 and 7)
compared to unprocessed BSA (left bar)
0
100
200
300
400
500
600
700
800
BSA 1x14 2x14 3x14 1x14 2x14 3x14
flou
resc
ence
inte
nsi
ty
room temperature cryogenic conditions
0
0,2
0,4
0,6
0,8
1
1,2
BSA 1x14 2x14 3x14 1x14 2x14 3x14
RS
H
room temperature cryogenic conditions
1.2
1
0.8
0.6
0.4
0.2
0
*
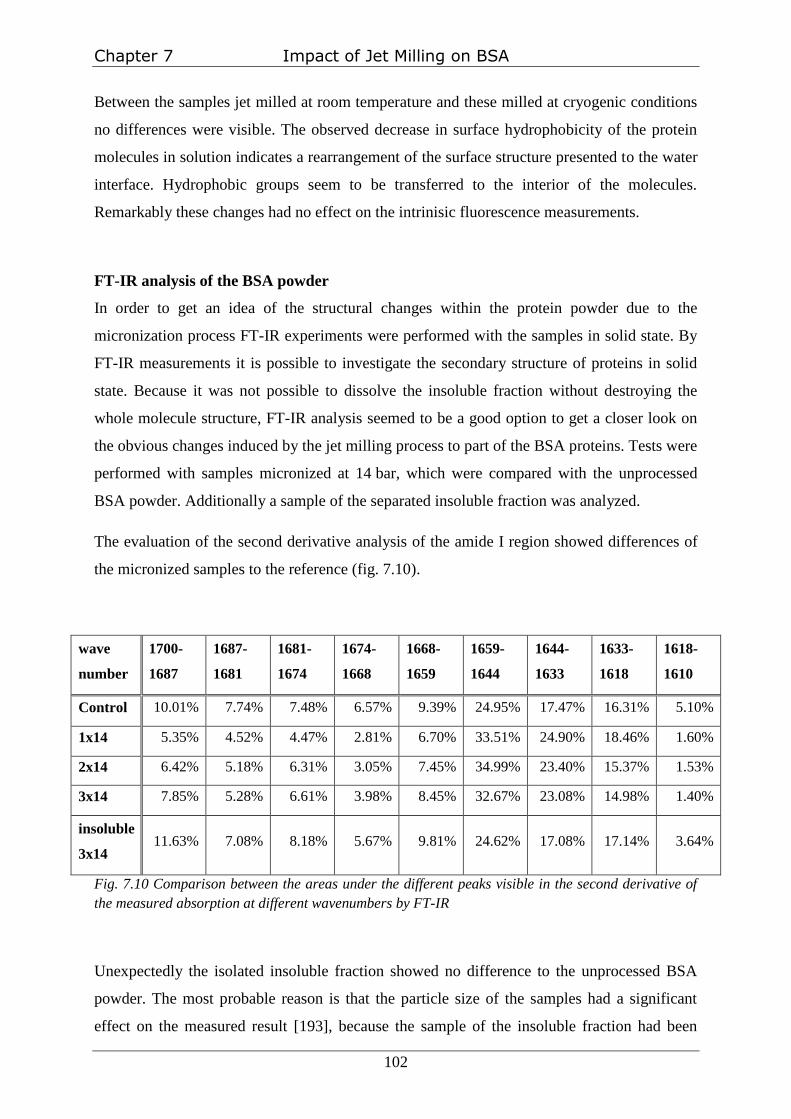
Chapter 7 Impact of Jet Milling on BSA
102
Between the samples jet milled at room temperature and these milled at cryogenic conditions
no differences were visible. The observed decrease in surface hydrophobicity of the protein
molecules in solution indicates a rearrangement of the surface structure presented to the water
interface. Hydrophobic groups seem to be transferred to the interior of the molecules.
Remarkably these changes had no effect on the intrinisic fluorescence measurements.
FT-IR analysis of the BSA powder
In order to get an idea of the structural changes within the protein powder due to the
micronization process FT-IR experiments were performed with the samples in solid state. By
FT-IR measurements it is possible to investigate the secondary structure of proteins in solid
state. Because it was not possible to dissolve the insoluble fraction without destroying the
whole molecule structure, FT-IR analysis seemed to be a good option to get a closer look on
the obvious changes induced by the jet milling process to part of the BSA proteins. Tests were
performed with samples micronized at 14 bar, which were compared with the unprocessed
BSA powder. Additionally a sample of the separated insoluble fraction was analyzed.
The evaluation of the second derivative analysis of the amide I region showed differences of
the micronized samples to the reference (fig. 7.10).
wave
number
1700-
1687
1687-
1681
1681-
1674
1674-
1668
1668-
1659
1659-
1644
1644-
1633
1633-
1618
1618-
1610
Control 10.01% 7.74% 7.48% 6.57% 9.39% 24.95% 17.47% 16.31% 5.10%
1x14 5.35% 4.52% 4.47% 2.81% 6.70% 33.51% 24.90% 18.46% 1.60%
2x14 6.42% 5.18% 6.31% 3.05% 7.45% 34.99% 23.40% 15.37% 1.53%
3x14 7.85% 5.28% 6.61% 3.98% 8.45% 32.67% 23.08% 14.98% 1.40%
insoluble
3x14 11.63% 7.08% 8.18% 5.67% 9.81% 24.62% 17.08% 17.14% 3.64%
Fig. 7.10 Comparison between the areas under the different peaks visible in the second derivative of
the measured absorption at different wavenumbers by FT-IR
Unexpectedly the isolated insoluble fraction showed no difference to the unprocessed BSA
powder. The most probable reason is that the particle size of the samples had a significant
effect on the measured result [193], because the sample of the insoluble fraction had been

Impact of Jet Milling on BSA Chapter 7
103
obtained after centrifugation in water in order to separate it from the soluble fraction. The
result was a flake-like structure. Although the samples were ground in an agate mortar before
measurement no sizes below 10 µm were achieved like for the micronized samples.
Co-lyophilization of BSA with poly(ethylene glycol) (PEG)
So far three possible reasons for the formation of insoluble BSA fractions were discussed.
First, the heat created during the milling process, indicated by the reduced amount of
insoluble particles after jet milling under cryogenic conditions. Second, the formation of BSA
aggregates and third, an increase of surface hydrophobicity of the particles. To inhibit these
phenomenons the idea was to embed BSA into poly(ethylene glycol) (PEG) as a so-called
bulking agent [175]. On the one side it would minimize the intermolecular contact between
single BSA molecules and on the other side it could result in a hydrophilization of the
resulting particles. To investigate the effect, BSA was mixed at different ratios with PEG
10 000, dissolved in water and freeze-dried afterwards. The freeze-dried powder was
micronized in the jet mill under the same conditions as the pure BSA samples.

Chapter 7 Impact of Jet Milling on BSA
104
Fig. 7.11 SEM micrographs of BSA PEG mixtures after freeze-drying and after micronization
100 µm 10 µm
100 µm
100 µm
100 µm
100 µm 10 µm
10 µm
10 µm
10 µm
after freeze-drying micronized 3x at 14 bar
BSA
BSA : PEG
9 : 1
BSA : PEG
1 : 1
BSA : PEG
1 : 9
PEG

Impact of Jet Milling on BSA Chapter 7
105
Particle size analysis revealed that depending on the ratio of BSA and PEG the d90-value
changed. The higher the PEG content was the larger were the resulting particle sizes
(fig. 7.12). Fluctuations after one milling cycle are mostly due to differences in the particle
size distribution of the starting material after freeze-drying.
Fig. 7.12 Particle size (d90-value) after micronization at 14 bar for the different BSA PEG mixtures
Afterwards the amount of the insoluble fraction for the different samples was analyzed. It
appeared that with increasing PEG ratio this fraction was decreased and at a ratio BSA to
PEG of 2:1 no insoluble particles were detectable anymore (fig. 7.13).
Fig. 7.13 Determination of the insoluble fraction of the different BSA PEG mixtures after
micronization
0
2
4
6
8
10
12
14
16
18
d9
0 /
µm
1x14 bar 2x14 bar 3x14 bar
BSA:PEG ratio
9:1
5:1
2:1
1:1
1:2
-4%
-2%
0%
2%
4%
6%
8%
10%
12%
14%
Chapter 7 Impact of Jet Milling on BSA
106
This effect of PEG is probably due to the combination of the aforementioned effects of
separating the BSA molecules and keeping the particles hydrophilic. Additionally the fact that
with a higher amount of PEG more heat of the grinding process is transferred to PEG
molecules than to BSA. That increased the protection of the BSA molecules furthermore.
Impact of Jet Milling on BSA Chapter 7
107
Summary and conclusion
Due to the micronization of BSA by jet milling insoluble fractions of protein powder were
created. Depending on the milling parameters the amount of this fraction reached up to 14 %.
Three possible reasons for this phenomenon were discussed and investigated. First, the
influence of possible heat creation on the particle surface during the particle breakage was
confirmed by the positive effect of cryogenic milling gas temperatures on the reduction of the
insoluble fraction. Second, thiol group reactions were investigated. Based on the fact that the
remainder was only soluble by the combination of denaturizing and reducing agents, a thiol
disulfide interchange as described by literature [169] was probable. Nevertheless, blocking the
crucial free thiol group did not improve the milling results. Experiments with l-glutathion
revealed that no oxidation of SH-groups took place caused by the applied milling conditions.
Third, an increased surface hydrophobicity was suggested, but fluorescence measurements in
solution were contradictory to this assumption. Nevertheless, micronization of fatty acid free
BSA improved the results slightly.
No analytical method was found to characterize the insoluble fraction in detail. By dissolving
the remainder with denaturizing and reducing agents the structure of the protein was totally
destroyed and no hints for former changes were detectable. Unfortunately FT-IR
measurements seemed to be influenced more by the particle size of the samples than by
structural changes.
Nevertheless, besides the lowering of the milling gas temperature the mixture of BSA with
PEG as a bulking agent was successful in lowering the amount of the insoluble fraction.
Additionally it facilitated another parameter for controlling the final particle size.

Chapter 8
Lipid Microparticles
by
Jet Milling
Chapter 8 Lipid Microparticles by Jet Milling
110
Introduction
As mentioned in chapter 1, release systems which deliver proteins for several days or even
months are investigated. They are one option of enhancing the compliance with protein drugs
of the patients. Optimally, these devices are easily administrable and consist of a material that
has an adjustable release profile, is biocompatible, biodegradable and does not harm but rather
stabilizes the sensitive protein drugs. Several materials were tested during the last three
decades, e.g. containing: (1) natural materials, like albumin, cellulose, chitosan, hyaluronic
acid, dextran and starch; (2) synthetic polymers, like polyanhydrides, polyamides, polyesters
and polyorthoesters; (3) hydrogels, consisting of alginates, collagen, fibrin or gelatine [176];
and (4) lipid materials, like cholesterol, fatty acids, lecithin, waxes, dipalmitoyl-
phospatidylcholin, mono- and triglycerides [177]. They were applied as nano- or
microparticles, cylindrical implants or scaffolds for tissue engineering, which are just some of
the tested formulations.
Synthetic polymers like poly(lactid-co-glycolic acid) (PLGA) are most often used at the
moment. They can be easily customized and have a defined structure and therefore well-
defined degradation pathways [178]. Their acceptable biocompatibility is well investigated
[179,180] and many are approved by the FDA. Nevertheless, some drawbacks in combination
with protein drugs occurred. During the preparation steps high shear forces, temperature
increase and the use of organic solvents are often necessary [181] and proteins may be harmed
by the occurring interfaces [182]. Additionally, during the erosion of the polymers the
microenvironment within the devices often changes. A drop of the pH, an increase of the
osmotic pressure and acylating degradation products [183] are fatal factors for protein
stability and bioactivity.
Lipid materials, like triglycerides, are one alternative group of materials for the development
of controlled release drug delivery devices. They are generally recognized as biocompatible
and biodegradable [184] due to the fact that they are substances physiologically found in the
body. Several proteins, e.g. insulin [185], somatostatin [186], thymocartin [187], Interleukin-
18 [79] and BSA [188] have been incorporated in different lipid formulation, like compressed
cylinders or microparticles resulting in protein release over days or even months.
Triglycerides proved to be promising material for protein release without the induction of
protein degradation.
Nevertheless, the production of protein containing microparticle formulations tends to be a
critical and difficult process. Especially formed interfaces and high shear forces during the

Lipid Microparticles by Jet Milling Chapter 8
111
preparation step are very critical for protein stability. Solvent evaporation, melt dispersion
techniques [189] or spray drying of O/W emulsions or of organic lipid solutions [190] are
prone to harm proteins. So several excipients have to be added to maintain protein stability or
increase encapsulation efficiency. Therefore, there are approaches to incorporate proteins into
microparticles as solids. Maschke et al. encapsulated insulin into lipid microparticles with an
average diameter of 230 µm by spray congealing of a protein suspension in molten lipid
without any loss in protein integrity [185]. Nevertheless, structure modifications of the lipid
were detected after this process due to the rapid freezing of the molten mass, which leads to
recrystallization and structural change during storage and protein release.
Due to these observations the idea of jet milling of lipids to obtain microparticles was born.
Jet milling is a well known method for powder micronization and is often indicated for the
processing of heat sensitive substances. However, high temperatures occurring on the
breakage surface are possible [107]. When micronizing lipids some questions should be
investigated:
1. Is it possible to micronize lipids, as very soft substances, by jet milling and establishing it
as an alternative method for lipid microparticle preparation?
2. How are the particle properties influenced by the milling process? Are there changes in
structure or modification of the investigated lipid?
3. Is it possible to correlate these changes to process parameters of the milling process, like
milling gas temperature, and may lipids be utilized as model substances to analyze
energetic effects of jet mill grinding on products?
Some experiments were performed to get a basic understanding of the underlying processes.

Chapter 8 Lipid Microparticles by Jet Milling
112
Results and Discussion
Particle size and size distribution
The sieved glycerol tripalmitate was micronized at 4 bar at room temperature and under
cryogenic conditions with a milling gas temperature of -65°C. Measurements by laser light
diffraction revealed that after one milling cycle particles with a d50 value of 34.5 µm at room
temperature and 24.5 µm after cryogenic grinding were obtained (fig. 8.1 and 8.2 upper
graphics). However, the size distribution was very broad with particles up to 1000 µm
indicating a large fraction of non-milled particles. The result was improved by repeated
stressing of the lipid powder. After 3 milling cycles narrow size distributions with an average
diameter of 9.7 µm at room temperature and 8.3 µm for the cryomilling experiments were
determined. For both setups the d90 value was below 20 µm after the three milling cycles.
These results clearly show that for glycerol tripalmitate one milling cycle did not lead to a
sufficient particle size reduction. Glycerol tripalmitate is quite a soft material which tends to
deform plastically without initiating cracks due to mechanical stressing. Repeated stressing
may induce an embrittlement of the substance and enhance the size reduction process [101].
Another factor influencing the resulting particle size was the milling gas temperature.
Especially after the first milling cycle the difference was obvious, with d50 values discerning
by 10 µm. The relatively low melting point of glycerol tripalmitate (onset 62.71°C, maximum
64.79°C) may be one reason why it tended to deform more plastically due to impact grinding
at room temperature than at a milling gas temperature of -65°C. This effect is exploited for
the cryogenic grinding of some rubber-like materials [136].
Particle size measurements were repeated after three weeks of storage at room temperature
and compared to the aforementioned results, which were measured on the day of production.
An increase of particle size was determined for all samples (fig. 8.1 and 8.2 lower graphs).
The d50 values of the samples ground at room temperature increased from 34.5 µm up to
146.6 µm (1x4 bar) and from 9.6 µm to 13.6 µm (3x4 bar), respectively. Particle size of the
cryomilled samples increased as well, from 24.5 µm to 30.7 µm and from 8.3 µm to 9.9 µm.
Jet milling seems to induce changes within the lipid particles which result in particle growth
during storage of the samples. These changes may be caused by high temperatures occurring
at the breakage surfaces as described by Weichert et al. [107]. Glycerol tripalmitate is a highly
crystalline substance normally existing in the stable β-modification. The applied stress and
increased temperatures could probably result in an amorphisation of the particle surfaces or

Lipid Microparticles by Jet Milling Chapter 8
113
even in the formation of polymorphic structures. For glycerol tripalmitate an unstable α-
modification and a metastable β´-modification are described [191,192].
Fig. 8.1 Particle size distribution of lipid microparticles after jet milling at room temperature and 4
bar compared to the results after 3 weeks of storage
0.1 1 10 100 1000 2000
particle Size / µm
0
1
2
3
4
5
6
7
8
9
10
11
12
vo
lum
e/
%
Dynasan 1x4 RT fresh
Dynasan 1x4 RT after 3 weeks
0.1 1 10 100 1000 2000
particle Size / µm
0
1
2
3
4
5
6
7
8
9
10
11
12
vo
lum
e/
%
Dynasan 3x4 RT fresh Dynasan 3x4 after 3 weeks
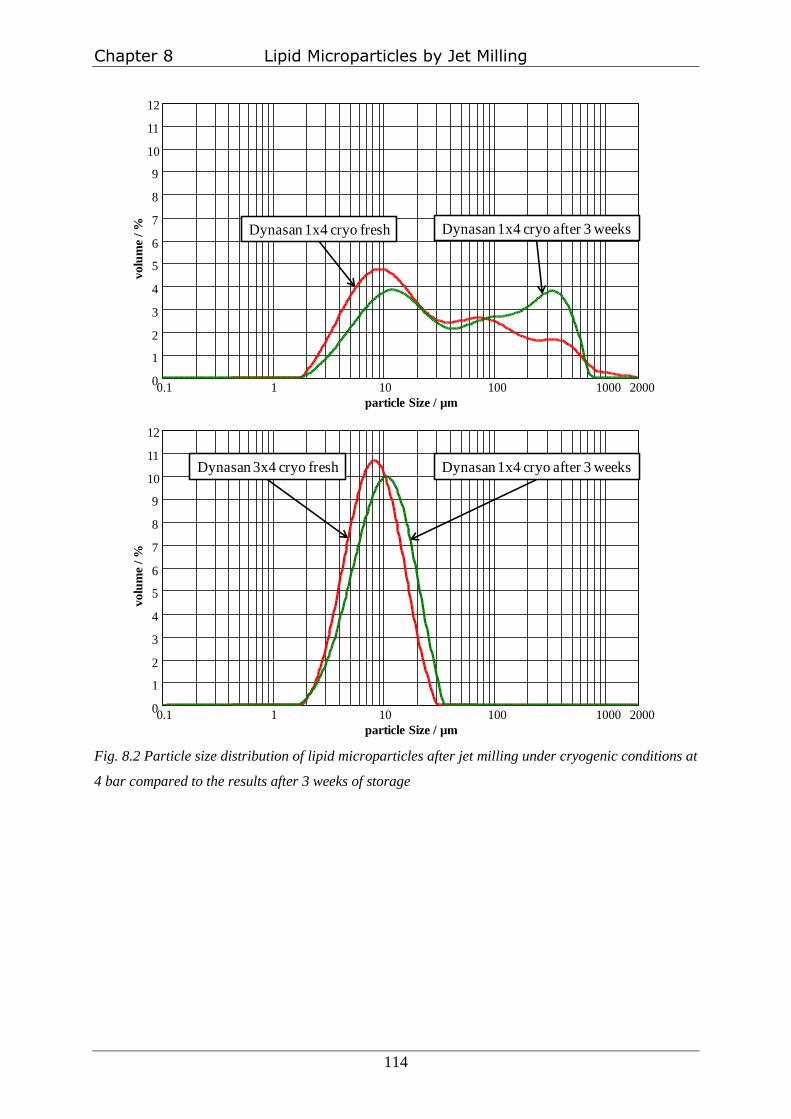
Chapter 8 Lipid Microparticles by Jet Milling
114
Fig. 8.2 Particle size distribution of lipid microparticles after jet milling under cryogenic conditions at
4 bar compared to the results after 3 weeks of storage
0.1 1 10 100 1000 2000
particle Size / µm
0
1
2
3
4
5
6
7
8
9
10
11
12
volu
me
/% Dynasan 1x4 cryo fresh Dynasan 1x4 cryo after 3 weeks
0.1 1 10 100 1000 2000
particle Size / µm
0
1
2
3
4
5
6
7
8
9
10
11
12
vo
lum
e/
%
Dynasan 3x4 cryo fresh Dynasan 1x4 cryo after 3 weeks

Lipid Microparticles by Jet Milling Chapter 8
115
Particle morphology
First scanning electron microscopy was applied to see if the increase in particle size is visible
by this method, too, and if it is possible to determine the reason for this particle growth.
Figures 8.3 and 8.4 show glycerol tripalmitate particles directly after micronization and after
three weeks of storage at room temperature, each in two different magnifications. For
comparison reasons the starting material is visible in the first line.
The size reduction effect of jet milling on the lipid particles is clearly recognizable. The
freshly ground material displays small particles without sharp edges and with a smooth
surface. For the samples milled only once some larger particles were detectable. There were
no obvious differences in morphology between the two different milling gas temperatures.
After three weeks of storage a tremendous change in surface structure appeared. It changed to
very rough and spiky structures, which indicates a crystallization process on the surface of the
particles [185]. The SEM pictures of the three weeks old samples give an impressive insight
into the events responsible for particle growth. Particles were highly agglomerated and
interconnected due to the grown spikes on the surface. When having a closer look, the
changes on the cryomilled particles seemed to be less prominent and the spikes were smaller.

Chapter 8 Lipid Microparticles by Jet Milling
116
bulk
Dynasan 116
1x4 bar
3x4 bar
1x4 bar
3 weeks later
3x4 bar
3 weeks later
Fig. 8.3 SEM picture of glycerol tripalmitate milled at room temperature and 4 bar directly after
micronization and after 3 weeks of storage at room temperature
10 µm
10 µm
10 µm
10 µm
10 µm
1 mm
10 µm
10 µm
10 µm
10 µm

Lipid Microparticles by Jet Milling Chapter 8
117
bulk
Dynasan 116
cryo
1x4 bar
cryo
3x4 bar
cryo
1x4 bar
3 weeks later
cryo
3x4 bar
3 weeks later
Fig. 8.4 SEM picture of glycerol tripalmitate milled at cryogenic conditions and 4 bar directly after
micronization and after 3 weeks of storage at room temperature
10 µm
10 µm
10 µm
10 µm
10 µm10 µm
1 mm
10 µm
10 µm
10 µm

Chapter 8 Lipid Microparticles by Jet Milling
118
Thermal behavior of micronized lipid particles
Thermal analysis is the standard method for investigating lipids. Therefore, DSC
measurements were applied to verify the visible changes within the particle structure and to
detect probable differences between the samples. Figure 8.5 shows the thermogram of the
glycerol tripalmitate bulk material showing one endothermal event with an onset at 62.71°C
and a maximum at 64.79°C, which are typical values for the melting point of this material.
The micronized samples were analyzed by DSC at the same time points as investigated with
the other methods before. For comparison figures 8.6 and 8.7 show thermograms zoomed in
on the area of interest.
Each freshly micronized sample showed an exothermal event in the area between 35 and
50°C. A dependence of the number of milling cycles is clearly visible as with each additional
milling cycle the exothermal event increased. This effect was reduced by applying the cooled
milling gas for the milling process. The detected differences were less prominent, indicating
that alteration of the surface is due to heat generated during the milling process. After three
weeks still some differences were detectable for the room temperature milled samples, but the
curves were much closer to the ―baseline‖ of the bulk material. After three weeks the
cryomilled samples were not any more distinguishable from the bulk material. The energy
input by heat due to particle breakage induces the creation of unordered structures on the
particle surfaces. During storage these activated structures return to the low energy and stable
crystalline state by recrystallization, an exothermic process.

Lipid Microparticles by Jet Milling Chapter 8
119
Fig. 8.5 DSC melting curve of glycerol tripalmitate bulk material
20 40 60 80 100Temperature / C
0
2
4
6
8
10
12H
eat F
low
/ W
/g
0Exo Down
Dynasan 116
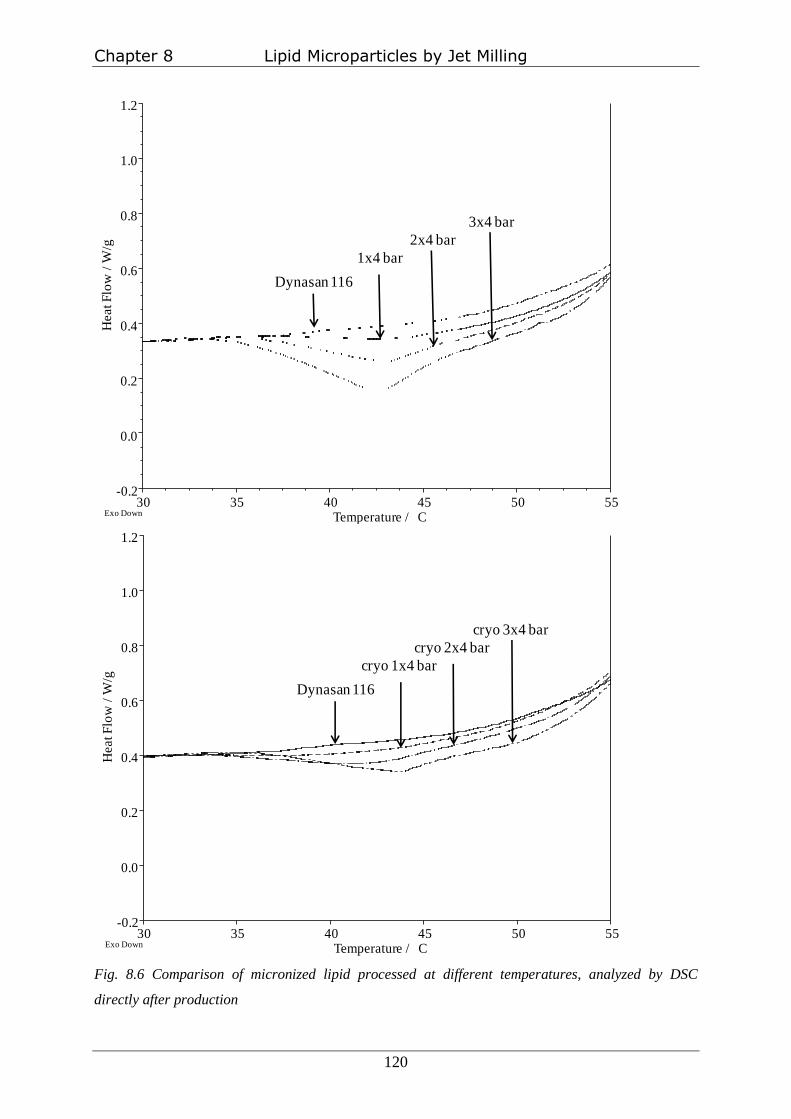
Chapter 8 Lipid Microparticles by Jet Milling
120
Fig. 8.6 Comparison of micronized lipid processed at different temperatures, analyzed by DSC
directly after production
0.0
0.2
0.4
0.6
0.8
1.0
1.2H
eat F
low
/ W
/g
-0.230 35 40 45 50 55
Temperature / CExo Down
Dynasan 116
1x4 bar
2x4 bar
3x4 bar
Dynasan 116
cryo 1x4 bar
cryo 2x4 bar
cryo 3x4 bar
0.0
0.2
0.4
0.6
0.8
1.0
1.2
Heat F
low
/ W
/g
-0.230 35 40 45 50 55
Temperature / CExo Down

Lipid Microparticles by Jet Milling Chapter 8
121
Fig. 8.7 Comparison of micronized dynasan 116 processed at different temperatures and stored for 3
weeks at room temperature, analyzed by DSC
Dynasan 116
1x4 bar
2x4 bar
3x4 bar
0.0
0.2
0.4
0.6
0.8
1.0
1.2H
eat F
low
/ W
/g
-0.230 35 40 45 50 55
Temperature / CExo Down
Dynasan 116
cryo 1x4 bar
cryo 2x4 bar
cryo 3x4 bar
0.2
0.4
0.6
0.8
1.0
1.2
Hea
t F
low
/ W
/g
-0.2
0.0
30 35 40 45 50 55Temperature / °CExo Down
Dynasan 116
cryo 1x4 bar
cryo 2x4 bar
cryo 3x4 bar
0.2
0.4
0.6
0.8
1.0
1.2
Hea
t F
low
/ W
/g
0.2
0.4
0.6
0.8
1.0
1.2
Hea
t F
low
/ W
/g
-0.2
0.0
30 35 40 45 50 55Temperature / °CExo Down
-0.2
0.0
30 35 40 45 50 55Temperature / °CExo Down

Chapter 8 Lipid Microparticles by Jet Milling
122
Summary
The experiments demonstrated that it is possible to obtain microparticles of glycerol
tripalmitate as an example for lipid materials by jet milling. However, only repetitive milling
resulted in a narrow size distribution with most particles below 20 µm. Cryomilling improves
the result significantly. By utilizing lipids as milling samples it was possible to prove surface
activation effects due to the jet milling process. As demonstrated in chapter 3 this process is
not initiated by a heating up of the milling gas, but the changes are caused by heat created by
the impact itself and by the heat occurring during the crack propagation of particle breakage
[107]. This effect can be influenced by reducing the temperature of the milling gas, but cannot
be totally prevented. Unstructured areas with a higher energy level were created on the
particle surface leading to recrystallization processes on the surface of the lipid particles,
which resulted in particle growth during storage.
Jet milling is often indicated for the micronization of heat sensitive substances due to the
cooling effect of the expanding gas stream. Nevertheless, the energy induced by the high
velocity impacts and particle breakage may result in alterations of the substance. This effect
may be also responsible for the observations made for protein grinding described in the
previous chapters.
Lipids seem to be a useful and cheap tool for investigating energetic processes occurring
during jet milling.

Chapter 9
Summary
and
Conclusions

Chapter 9 Summary and Conclusions
124
Summary
The aim of this thesis was to provide more information about the jet milling of proteins, to
identify important parameters and their effect on resulting particle size, chemical stability and
bioactivity of the investigated proteins.
To perform the planned micronization experiments the MC One® of Jetpharma had to be
modified. A cryogenic cooling system had been established facilitating milling gas
temperatures of about -60°C in reproducible quality. To exclude possible effects of air
humidity the whole setup was integrated into a glovebox filled with dry nitrogen. Therefore, it
was possible to process amounts starting from 200 mg with yields of more than 80 % under
constant environmental conditions. This way it was possible to attribute all the observed
effects to controlled parameters (chapter 3).
The micronization of three different model proteins proved the size reduction potential of jet
milling. It was possible to achieve narrow particle size distributions with d90 values below
10 µm for each of the three proteins. Chosen pressure and number of milling cycles had a
significant impact on the milling results. For the first cycle the size distribution of the bulk
material played an important role. Especially for the coarse BSA powder some larger particles
were still present after the first milling cycle. A grinding limit existed for all model proteins at
about 3-4 µm (d90), implicating that additional milling cycles would have no further effect on
the particle size. The effect of the third investigated parameter, the milling gas temperature,
was different for the proteins. No effect was detected for insulin; for lysozyme the particle
size increased slightly under cryogenic conditions, while a clear decrease was detected for
BSA. By applying statistical design it was possible to fit mathematical models to all the three
micronization processes, describing the qualitative and quantitative impact of the parameters
on the resulting particle size. So the prediction of milling results of not tested parameter
combinations within the investigated range was enabled (chapter 4).
It was the second focus of the thesis was to investigate the effect of the jet milling process on
the chemical stability and the bioactivity of proteins. For insulin no chemical changes were
observed. The analysis of secondary and tertiary structures revealed slight changes.
Nevertheless, they seemed to have no effect on the bioactivity investigated, using a
chondrocyte proliferation assay (chapter 5).
After micronization chemically no changes were detected for lysozyme compared to the
unprocessed bulk material. The analysis of the secondary protein structure by CD-
spectroscopy showed no difference either. Regarding the tertiary structure fluorescence

References
125
analysis revealed significant changes. Especially the relative surface hydrophobicity was
affected by a 12-fold increase after three milling cycles at 14 bar. Due to these changes the
bioactivity decreased depending on applied pressure and milling cycles. For three cycles at
14 bar 87 % of the former activity were measured. In particular repeated milling seemed to
have a negative effect. The milling gas temperature had no significant effect. An influence of
increased iron content due to attrition during the milling process was excluded by ICP
measurements. The attempt of reducing the decrease in bioactivity by using crystalline
lysozyme brought no advantage for the process (chapter 6).
For BSA the most prominent effect of the micronization process was the formation of an
insoluble fraction of the protein. Experiments revealed that all the three investigated milling
parameters affected this result. With higher pressure and more milling cycles the insoluble
fraction increased to 14 %. By applying cryogenic conditions the amount had been decreased
to 6-9 %. This indicates that heat creation on the particle surface may play a role in this
process, inducing changes within the particles. Different possible reasons for this
phenomenon were investigated. Covalent protein aggregates due to thiol-disulfide interchange
could be excluded as a reason as well as oxidation processes of this free thiol group. Increased
surface hydrophobicity by rearrangement of fatty acids present at the molecule surface could
be neglected by micronizing fatty acid free BSA. However, changes in relative surface
hydrophobicity were detected by fluorescence analysis. The micronization process resulted in
a significant decrease of this value while the intrinsic fluorescence was not affected. A
correlation to the insoluble BSA fraction was not possible. Attempts to analyse the insoluble
fraction itself brought no results. Nevertheless, beside the cryomilling approach of reducing
this fraction, the co-lyophilization of BSA with PEG showed good results. With increasing
amounts of PEG in the mixture the insoluble fraction decreased. At a BSA PEG ratio of 2:1
no insoluble BSA could be detected anymore. This effect was referred to the separation of the
BSA molecules by PEG, preventing intermolecular reactions, and of the hydrophilic
properties of PEG (chapter 7).
Processing of glycerol tripalmitate revealed that it is possible to micronize even such a soft
material by jet milling. It resulted in d90 values below 20 µm. During storage an increase in
particle size had been observed due to changes in surface structure of the micronized particles.
DSC analysis revealed that the micronization process induces an activation at the surface.
During storage these activated areas recrystallized. It was possible to correlate this effect to
the number of milling cycles and the milling gas temperature. With more milling cycles the

Chapter 9 Summary and Conclusions
126
effect was more prominent, which was significantly reduced by applying cryogenic conditions
(chapter 8).
Conclusion
In conclusion the micronization process of proteins by jet milling was clarified in more detail.
Particle size reduction was possible for all the tested substances, but different effects on
chemical stability and bioactivity were revealed, strongly depending on the investigated
substance. Especially repeated stressing of the materials seemed to have a negative effect and
should be avoided for sensitive substances. Some effects like the formation of insoluble
fractions for BSA or structural changes in glycerol tripalmitate were induced by heat
formation at the breakage surface. In these cases cryomilling had a protective effect and it
may be worth the additional costs. Therefore, for each new substance the milling conditions
should be tested carefully. Application of design of experiments for these investigations
proved to be a useful and cost saving tool.

References
References
128
References
[1] M.P. Mullarney, N. Leyva, Modeling pharmaceutical powder-flow performance using
particle-size distribution data, Pharm. Technol. 33 (2009) 126, 128-130, 132-134.
[2] A. Miranda, M. Millan, I. Carballo, Investigation of the influence of particle size on
the excipient percolation thresholds of HPMC hydrophilic matrix tablets, J. Pharm. Sci. 96
(2007) 2746–2756.
[3] S. Koennings, A. Sapin, T. Blunk, P. Menei, A. Goepferich, Towards controlled
release of BDNF - Manufacturing strategies for protein-loaded lipid implants and
biocompatibility evaluation in the brain, Journal of Controlled Release 119 (2007) 163–
172.
[4] N. Rasenack, B.W. Mueller, Poorly water-soluble drugs for oral delivery - A challenge
for pharmaceutical development. Part II: Micronization technologies and complex
formaton, Pharmazeutische Industrie 67 (2005) 447–451.
[5] S. Koennings, J. Tessmar, T. Blunk, A. Göpferich, Confocal Microscopy for the
Elucidation of Mass Transport Mechanisms Involved in Protein Release from Lipid-based
Matrices, Pharmaceutical Research 24 (2007) 1325–1335.
[6] D.I. Daniher, J. Zhu, Dry powder platform for pulmonary drug delivery, Particuology
6 (2008) 225–238.
[7] G. Walsh, Biopharmaceuticals: Approval trends in 2005, BioPharm International 19
(2006) 58-60, 62, 64, 66, 68.
[8] J. Samuel, Protein drugs come of age, Trends in Biotechnology 20 (2002) 132-132.
[9] P.M. Bummer, S. Koppenol, Chemical and physical considerations in protein and
peptide stability, Drugs and the Pharmaceutical Sciences 99 (2000) 5–69.
[10] W. Wang, Protein aggregation and its inhibition in biopharmaceutics, International
Journal of Pharmaceutics 289 (2005) 1–30.
[11] G. Mustata, S.M. Dinh, Approaches to oral drug delivery for challenging molecules,
Critical Reviews in Therapeutic Drug Carrier Systems 23 (2006) 111–135.
[12] M. Torres-Lugo, N.A. Peppas, Transmucosal delivery systems for calcitonin: a review,
Biomaterials 21 (2000) 1191–1196.
[13] S. White, D.B. Bennett, S. Cheu, P.W. Conley, D.B. Guzek, S. Gray, J. Howard, R.
Malcolmson, J.M. Parker, P. Roberts, N. Sadrzadeh, J.D. Schumacher, S. Seshadri, G.W.
Sluggett, C.L. Stevenson, N.J. Harper, EXUBERA: Pharmaceutical Development of a
Novel Product for Pulmonary Delivery of Insulin, Diabetes Technology & Therapeutics 7
(2005) 896–906.
[14] A.P. Sayani, Y.W. Chien, Systemic delivery of peptides and proteins across absorptive
mucosae, Critical Reviews in Therapeutic Drug Carrier Systems 13 (1996) 85–184.
[15] Y.-C. Lee, P. Simamora, S. Pinsuwan, S.H. Yalkowsky, Review on the systemic
delivery of insulin via the ocular route, International Journal of Pharmaceutics 233 (2002)
1–18.
[16] L. Jin; J. Pei; M. Duan; Y. Zheng, A rectum suppository of protein and its preparation
method and the use, 2006, 2006 33p.
References
129
[17] A.S. Ziegler, E. Schluecker, P. Reichel-Lesnianski, N. Alt, G. Lee, Inactivation effects
on proteins in a needle-free vaccine injector, Engineering in Life Sciences 6 (2006) 384–
393.
[18] J.W. Lee, J.-H. Park, M.R. Prausnitz, Dissolving microneedles for transdermal drug
delivery, Biomaterials 29 (2008) 2113–2124.
[19] W. Wang, Lyophilization and development of solid protein pharmaceuticals,
International Journal of Pharmaceutics 203 (2000) 1–60.
[20] R. Vehring, Pharmaceutical Particle Engineering via Spray Drying, Pharmaceutical
Research 25 (2008) 999–1022.
[21] K. Masters, Spray Drying Handbook. 5th Ed, Longman, New York, 1991.
[22] K.A. Johnson, Preparation of peptide and protein powders for inhalation, Advanced
Drug Delivery Reviews 26 (1997) 3–15.
[23] Y.-F. Maa, S.J. Prestrelski, Biopharmaceutical powders: particle formation and
formulation considerations, Current Pharmaceutical Biotechnology 1 (2000) 283–302.
[24] P. Labrude, M. Rasolomanana, C. Vigneron, C. Thirion, B. Chaillot, Protective effect
of sucrose in spray drying of oxyhemoglobin, Journal of Pharmaceutical Sciences 78
(1989) 223–229.
[25] J. Broadhead, S.K.E. Rouan, I. Hau, C.T. Rhodes, The effect of process and
formulation variables on the properties of spray-dried b-galactosidase, Journal of
Pharmacy and Pharmacology 46 (1994) 458–467.
[26] M. Irngartinger, V. Camuglia, M. Damm, J. Goede, H.W. Frijlink, Pulmonary delivery
of therapeutic peptides via dry powder inhalation: effects of micronization and
manufacturing, European Journal of Pharmaceutics and Biopharmaceutics 58 (2004) 7–14.
[27] H.-K. Chan, Dry Powder Aerosol Delivery Systems: Current and Future Research
Directions, Journal of Aerosol Medicine 19 (2006) 21–27.
[28] S.A. Shoyele, S. Cawthorne, Particle engineering techniques for inhaled
biopharmaceuticals, Advanced Drug Delivery Reviews 58 (2006) 1009–1029.
[29] M. Mumenthaler, C.C. Hsu, R. Pearlman, Feasibility study on spray-drying protein
pharmaceuticals: recombinant human growth hormone and tissue-type plasminogen
activator, Pharmaceutical Research 11 (1994) 12–20.
[30] Y.-H. Liao, M.B. Brown, S.A. Jones, T. Nazir, G.P. Martin, The effects of polyvinyl
alcohol on the in vitro stability and delivery of spray-dried protein particles from
surfactant-free HFA 134a-based pressurised metered dose inhalers, International Journal
of Pharmaceutics 304 (2005) 29–39.
[31] J.D. Andya, Y.-F. Maa, H.R. Costantino, P.-A. Nguyen, N. Dasovich, T.D. Sweeney,
C.C. Hsu, S.J. Shire, The effect of formulation excipients on protein stability and aerosol
performance of spray-dried powders of a recombinant humanized anti-IgE monoclonal
antibody, Pharmaceutical Research 16 (1999) 350–358.
[32] C. Bosquillon, V. Preat, R. Vanbever, Pulmonary delivery of growth hormone using
dry powders and visualization of its local fate in rats, Journal of Controlled Release 96
(2004) 233–244.
[33] M. Adler, M. Unger, G. Lee, Surface composition of spray-dried particles of bovine
serum albumin/trehalose/surfactant, Pharmaceutical Research 17 (2000) 863–870.

References
130
[34] W.R. Gombotz; M.S. Healy; L.R. Brown; H.E. Auer, Process for producing small
particles of biologically active pharmaceuticals, 1990, 1990 28 p.
[35] Z.H. Chang, J.G. Baust, Ultra-rapid freezing by spraying/plunging: pre-cooling in the
cold gaseous layer, Journal of microscopy 161 (1991) 435-444.
[36] Y.-F. Maa, M. Ameri, C. Shu, L.G. Payne, D. Chen, Influenza vaccine powder
formulation development: Spray-freeze-drying and stability evaluation, Journal of
Pharmaceutical Sciences 93 (2004) 1912–1923.
[37] Y.-F. Maa, P.-A. Nguyen, T. Sweeney, S.J. Shire, C.C. Hsu, Protein inhalation
powders: spray drying vs spray freeze drying, Pharmaceutical Research 16 (1999) 249–
254.
[38] H.R. Costantino, L. Firouzabadian, K. Hogeland, C. Wu, C. Beganski, K.G.
Carrasquillo, M. Cordova, K. Griebenow, S.E. Zale, M.A. Tracy, Protein spray-freeze
drying. Effect of atomization conditions on particle size and stability, Pharmaceutical
Research 17 (2000) 1374–1383.
[39] S.D. Webb, S.L. Golledge, J.L. Cleland, J.F. Carpenter, T.W. Randolph, Surface
adsorption of recombinant human interferon-g in lyophilized and spray-lyophilized
formulations, Journal of Pharmaceutical Sciences 91 (2002) 1474–1487.
[40] Z. Yu, K.P. Johnston, R.O. Williams, Spray freezing into liquid versus spray-freeze
drying: Influence of atomization on protein aggregation and biological activity, European
Journal of Pharmaceutical Sciences 27 (2006) 9–18.
[41] M.C. Heller, J.F. Carpenter, T.W. Randolph, Protein formulation and lyophilization
cycle design: Prevention of damage due to freeze-concentration induced phase separation,
Biotechnology and Bioengineering 63 (1999) 166–174.
[42] T.L. Rogers, A.C. Nelsen, J. Hu, J.N. Brown, M. Sarkari, T.J. Young, K.P. Johnston,
R.O. Williams, A novel particle engineering technology to enhance dissolution of poorly
water soluble drugs: spray-freezing into liquid, European Journal of Pharmaceutics and
Biopharmaceutics 54 (2002) 271–280.
[43] Z. Yu, T.L. Rogers, J. Hu, K.P. Johnston, R.O. Williams, Preparation and
characterization of microparticles containing peptide produced by a novel process: spray
freezing into liquid, European Journal of Pharmaceutics and Biopharmaceutics 54 (2002)
221–228.
[44] Z. Yu, A.S. Garcia, K.P. Johnston, R.O. Williams, III., Spray freezing into liquid
nitrogen for highly stable protein nanostructured microparticles, European Journal of
Pharmaceutics and Biopharmaceutics 58 (2004) 529–537.
[45] J.D. Engstrom, D.T. Simpson, C. Cloonan, E.S. Lai, R.O. Williams, III, G.B. Kitto,
K.P. Johnston, Stable high surface area lactate dehydrogenase particles produced by spray
freezing into liquid nitrogen, European Journal of Pharmaceutics and Biopharmaceutics 65
(2007) 163–174.
[46] G.L. Gilliland, M. Tung, J.E. Ladner, The Biological Macromolecule Crystallization
Database: crystallization procedures and strategies, Acta Cryst (2002) 916–920.
[47] S.K. Basu, C.P. Govardhan, C.W. Jung, A.L. Margolin, Protein crystals for the
delivery of biopharmaceuticals, Expert Opinion on Biological Therapy 4 (2004) 301–317.
[48] B. Shenoy, Y. Wang, W. Shan, A.L. Margolin, Stability of crystalline proteins,
Biotechnology and Bioengineering 73 (2001) 358–369.
References
131
[49] A.A. Elkordy, R.T. Forbes, B.W. Barry, Integrity of crystalline lysozyme exceeds that
of a spray-dried form, International Journal of Pharmaceutics 247 (2002) 79–90.
[50] I. Pasquali, R. Bettini, F. Giordano, Solid-state chemistry and particle engineering
with supercritical fluids in pharmaceutics, European Journal of Pharmaceutical Sciences
27 (2006) 299–310.
[51] A. Jen, H.P. Merkle, Diamonds in the rough: protein crystals from a formulation
perspective, Pharmaceutical Research 18 (2001) 1483–1488.
[52] M.-J. Lee, J.-H. Kwon, J.-S. Shin, C.-W. Kim, Microcrystallization of a-lactalbumin,
Journal of Crystal Growth 282 (2005) 434–437.
[53] M.X. Yang, B. Shenoy, M. Disttler, R. Patel, M. McGrath, S. Pechenov, A.L.
Margolin, Crystalline monoclonal antibodies for subcutaneous delivery, Proceedings of
the National Academy of Sciences of the United States of America 100 (2003) 6934–
6939.
[54] P. Reichert; P.C. Weber; R.F. Choudrie; B.O. Stuart; T. Nagabhushan; A. Ganguly,
Crystalline interferon alpha for pulmonary delivery, 1995 424085100, 1995 5 p.
[55] J.F. Brennecke, C.A. Eckert, Phase equilibria for supercritical fluid process design,
AIChE Journal 35 (1989) 1409–1427.
[56] Y. Liu, W. Lin, S. Bai, Z. Wang, Supercritical fluid extraction technology and its
application in tobacco industry, Huagong Shikan 22 (2008) 56–60.
[57] R.L. Mendes, Supercritical fluid extraction of active compounds from algae,
Supercritical Fluid Extraction of Nutraceuticals and Bioactive Compounds (2008) 189–
213.
[58] D.-R. Wu, L. Leith, The impact of chiral supercritical fluid chromatography in drug
discovery, American Pharmaceutical Review 10 (2007) 84–87.
[59] P. Chattopadhyay, B.Y. Shekunov, D. Yim, D. Cipolla, B. Boyd, S. Farr, Production
of solid lipid nanoparticle suspensions using supercritical fluid extraction of emulsions
(SFEE) for pulmonary delivery using the AERx system, Advanced Drug Delivery
Reviews 59 (2007) 444–453.
[60] M. Habulin, M. Primozic, Z. Knez, Supercritical fluids as solvents for enzymatic
reactions, Acta Chimica Slovenica 54 (2007) 667–677.
[61] H. Okamoto, K. Danjo, Application of supercritical fluid to preparation of powders of
high-molecular weight drugs for inhalation, Advanced Drug Delivery Reviews 60 (2008)
433–446.
[62] P. York, Strategies for particle design using supercritical fluid technologies,
Pharmaceutical Science & Technology Today 2 (1999) 430–440.
[63] A. Tandya, F. Dehghani, N.R. Foster, Micronization of cyclosporine using dense gas
techniques, Journal of Supercritical Fluids 37 (2006) 272–278.
[64] P.G. Debenedetti; G.B. Lim; R.K. Prud'homme, Formation of protein microparticles
by antisolvent precipitation, 1992, 1992 11 p.
[65] G. Muhrer, M. Mazzotti, Precipitation of Lysozyme Nanoparticles from Dimethyl
Sulfoxide Using Carbon Dioxide as Antisolvent, Biotechnology Progress 19 (2003) 549–
556.
References
132
[66] R. Thiering, F. Dehghani, A. Dillow, N.R. Foster, The influence of operating
conditions on the dense gas precipitation of model proteins, Journal of Chemical
Technology & Biotechnology 75 (2000) 29–41.
[67] S.-D. Yeo, P.G. Debenedetti, S.Y. Patro, T.M. Przybycien, Secondary Structure
Characterization of Microparticulate Insulin Powders, Journal of Pharmaceutical Sciences
83 (1994) 1651–1656.
[68] S.D. Yeo, G.B. Lim, P.G. Debenedetti, H. Bernstein, Formation of microparticulate
protein powders using a supercritical fluid antisolvent, Biotechnology and Bioengineering
41 (1993) 341–346.
[69] R.T. Bustami, H.-K. Chan, F. Dehghani, N.R. Foster, Generation of microparticles of
proteins for aerosol delivery using high pressure modified carbon dioxide, Pharmaceutical
Research 17 (2000) 1360–1366.
[70] J.Y.H. Blue, Successful lyophilization development of protein therapeutics, Am.
Pharm. Rev. 12 (2009) 90–96.
[71] J.F. Carpenter, B.S. Chang, T.W. Randolph, Physical damage to proteins during
freezing, drying, and rehydration, Biotechnol.: Pharm. Aspects 2 (2004) 423–442.
[72] P. Matejtschuk, Lyophilization of proteins, Methods Mol. Biol. (Totowa, NJ, U. S.)
368 (2007) 59–72.
[73] J. Zhang, F. Huang, K. Wang, Lyophilization and development of protein
pharmaceuticals, Zhongguo Yaoye 15 (2006) 25–27.
[74] I.G.M.N. Roy, Freeze-drying of proteins: some emerging concerns, Biotechnol. Appl.
Biochem. 39 (2004) 165–177.
[75] S.L. Nail, S. Jiang, S. Chongprasert, S.A. Knopp, Fundamentals of freeze-drying,
Pharm. Biotechnol. 14 (2002) 281–360.
[76] L.A. Gatlin, T. Auffret, E.Y. Shalaev, S.M. Speaker, D.L. Teagarden, Freeze-drying
concepts: the basics, Drugs and the Pharmaceutical Sciences 175 (2008) 177–195.
[77] T. Morita, Y. Horikiri, H. Yamahara, T. Suzuki, H. Yoshino, Formation and isolation
of spherical fine protein microparticles through lyophilization of protein-poly(ethylene
glycol) aqueous mixture, Pharmaceutical Research 17 (2000) 1367–1373.
[78] I.J. Castellanos, G. Cruz, R. Crespo, K. Griebenow, Encapsulation-induced
aggregation and loss in activity of g-chymotrypsin and their prevention, Journal of
Controlled Release 81 (2002) 307–319.
[79] S. Koennings, E. Garcion, N. Faisant, P. Menei, J.P. Benoit, A. Goepferich, In vitro
investigation of lipid implants as a controlled release system for interleukin-18,
International Journal of Pharmaceutics 314 (2006) 145–152.
[80] W. Yuan, F. Wu, Y. Geng, S. Xu, T. Jin, Preparation of dextran glassy particles
through freezing-induced phase separation, International Journal of Pharmaceutics 339
(2007) 76–83.
[81] R.M. Platz; A. Ip; C.L. Whitham, Process for preparing micronized polypeptide drugs,
1993 424489000, 1993 5 p Cont.-in-part of U.S. Ser. No. 823,218, abandoned.
[82] E. Phillips, E. Allsopp, T. Christensen, M. Fitzgerald, L. Zhao, Size reduction of
peptides and proteins by jet-milling, Respiratory Drug Delivery VI: Biological,
Pharmaceutical, Clinical and Regulatory Issues Relating to Optimized Drug Delivery by
References
133
Aerosol, the International Symposium, 6th, Hilton Head, S. C., May 3-7, 1998 (1998)
161–168.
[83] W. Schlocker, S. Gschliesser, A. Bernkop-Schnuerch, Evaluation of the potential of
air jet milling of solid protein-poly(acrylate) complexes for microparticle preparation,
European Journal of Pharmaceutics and Biopharmaceutics 62 (2006) 260–266.
[84] K.G.E. Backstrom; C.M.O. Dahlback; P. Edman; A.C.B. Johansson, Therapeutic
preparation for inhalation, 1996 514004000, 1996 16 p, Cont.-in-part of U.S. 5,518,998.
[85] S. Kobayashi, S. Kondo, K. Juni, Pulmonary delivery of salmon calcitonin dry
powders containing absorption enhancers in rats, Pharmaceutical Research 13 (1996) 80–
83.
[86] Z. Herceg, V. Lelas, G. Kresic, Influence of tribomechanical micronization on the
physical and functional properties of whey proteins, International Journal of Dairy
Technology 58 (2005) 225–232.
[87] Z. Herceg, V. Lelas, M. Skreblin, Influence of tribomechanical micronisation on the
rheological properties of whey proteins, Food Technology and Biotechnology 40 (2002)
145–155.
[88] Lizio R, Damm M, Sarlikiotis A W, Bauer H H, Lehr C M, Low-temperature
micronization of a peptide drug in fluid propellant: case study cetrorelix, AAPS
PharmSciTech 2 (2001) E12.
[89] S. Schultz, G. Wagner, K. Urban, J. Ulrich, High-pressure homogenization as a
process for emulsion formation, Chemical Engineering & Technology 27 (2004) 361–368.
[90] T. Shah, D. Patel, J. Hirani, A.F. Amin, Nanosuspensions as a drug delivery system: a
comprehensive review, Drug Delivery Technology 7 (2007) 42, 44, 46, 48-50, 52-53.
[91] J. Hou, S.-w. Zhou, New research on development of solid lipid nanoparticles, Journal
of Medical Colleges of PLA 22 (2007) 385–390.
[92] A. Maschke, N. Cali, B. Appel, J. Kiermaier, T. Blunk, A. Goepferich, Micronization
of insulin by high pressure homogenization, Pharmaceutical Research 23 (2006) 2220–
2229.
[93] M.H. Prior, H. Prem, M.J. Rhodes, Principles of powder technology. Size Reduction,
Wiley, Chichester, 1993.
[94] T. Onishi; S. Mitsumura; Y. Tsuji, Jet mill and manufacture of electrophotographic
toner using the same, 1997, 1997 31 p.
[95] K. Brodka-Pfeiffer, H. Haeusler, P. Grass, P. Langguth, Air jet milling with
homogeneous premixes of fenoterol hydrobromide and glucose for the application in dry
powder inhalers, Pharmazeutische Industrie 67 (2005) 713–719.
[96] K. Marquardt, Untersuchungen zum Zerkleinerungsverhalten kristalliner Stoffe in
einer Spiralstrahlmühle. Dissertation, Würzburg, 2004.
[97] R. Skelton, A.N. Khayyat, R.G. Temple, Fluid energy milling. An investigation of
micronizer performance, Fine Particles Processing 1 (1980) 113–125.
[98] H. Kuerten, H. Rumpf, Zerkleinerungsuntersuchungen mit tribolumineszierenden
Stoffen, Chemie-Ing.-Techn. 38 (1966) 331–342.
[99] H. Rumpf, Versuche zur Bestimmung der Teilchenbewegung in Gasstrahlen und des
Beanspruchungsmechanismus in Strahlmühlen, Chemie-Ing.-Techn. 32 (1960) 335–342.
References
134
[100] G. Abramovich, The Theory of turbulent Jets, M.I.T. Press, Cambridge, 1963.
[101] H. Rumpf, Strain theory of impact comminution, Chemie Ingenieur Technik 31 (1959)
323–337.
[102] H. Rumpf, Prinzipien der Prallzerkleinerung und ihre Anwendung bei der
Strahlmahlung, Chemie-Ing.-Techn. 32 (1960) 129–135.
[103] W. Bohl, Technische Strömungslehre, Vogel Verlag, Würzburg, 1994.
[104] M. Benz, H. Herold, B. Ulfik, Performance of a fluidized bed jet mill as a function of
operating parameters, International Journal of Mineral Processing 44-45 (1996) 507–519.
[105] K. Nielsen, T. Malvik, Grindability enhancement by blast-induced microcracks,
Powder Technology 105 (1999) 52–56.
[106] K. Schoenert, K. Steier, Die Grenzen der Zerkleinerung bei kleinen Korngrößen,
Chemie-Ing.-Techn. 43 (1971) 773–777.
[107] R. Weichert, K. Schoenert, Temperature at the point of fracture, Chemie Ingenieur
Technik 48 (1976) 543–544.
[108] H. Rumpf, Physical Aspects of Comminution and New Formulation of a Law of
Comminution, Powder Technology (1973) 145–159.
[109] K. Schoenert, Advances in comminution fundamentals and impacts on technology,
Aufbereitungs Technik (1960-1989) 32 (1991) 487-90, 492-4.
[110] O. de Vegt, H. Vromans, F. Faassen, K. van der Voort Maarschalk, Milling of Organic
Solids in a Jet Mill. Part 1: Determination of the Selection Function and Related
Mechanical Material Properties, Particle & Particle Systems Characterization 22 (2005)
133–140.
[111] H.A. Lieberman, L. Lachman, J.B. Schwartz, Pharmaceutical Dosage Forms: Tablets,
Vol. 2, Marcel Dekker, New York/Basel, 1990.
[112] M. Zogg, Einführung in die Mechanische Verfahrenstechnik, B.G. Teubner, Stuttgart,
1993.
[113] M. Sokolowski, A new idea of a general law of comminution and establishing energy
indices, Aufbereitungs-Technik 36 (1995) 107-10, 112-16.
[114] H.T. Ozkahraman, A meaningful expression between bond work index, grindability
index, and friability value, Minerals Engineering 18 (2005) 1057–1059.
[115] L. Vogel, W. Peukert, Breakage behaviour of different materials-construction of a
mastercurve for the breakage probability, Powder Technology 129 (2003) 101–110.
[116] O. de Vegt, H. Vromans, F. Faassen, K. van der Voort Maarschalk, Milling of Organic
Solids in a Jet Mill. Part 2: Checking the Validity of the Predicted Rate of Breakage
Function, Particle & Particle Systems Characterization 22 (2005) 261–267.
[117] P.B. Rajendran Nair, Breakage parameters and the operating variables of a circular
fluid energy mill: Part I. Breakage distribution parameter, Powder Technology 106 (1999)
45–53.
[118] P.B. Rajendran Nair, Breakage parameters and the operating variables of a circular
fluid energy mill: Part II. Breakage rate parameter, Powder Technology 106 (1999) 54–61.
[119] H. Berthiaux, J. Dodds, A new estimation technique for the determination of breakage
and selection parameters in batch grinding, Powder Technology 94 (1997) 173–179.

References
135
[120] H.R. Costantino, R. Langer, A.M. Klibanov, Solid-Phase Aggregation of Proteins
under Pharmaceutically Relevant Conditions, Journal of Pharmaceutical Sciences 83
(1994) 1662–1669.
[121] Y.F. Maa, P.A. Nguyen, J.D. Andya, N. Dasovich, T.D. Sweeney, S.J. Shire, C.C.
Hsu, Effect of spray drying and subsequent processing conditions on residual moisture
content and physical/biochemical stability of protein inhalation powders, Pharmaceutical
Research 15 (1998) 768–775.
[122] B. Cervelle, F. Cesbron, J. Berthou, P. Jolles, Morphology and optical properties of
tetragonal and orthorhombic hen lysozyme crystals, Acta Crystallographica, Section A:
Crystal Physics, Diffraction, Theoretical and General Crystallography 30A (1974) 645–
648.
[123] D. Eyrich, F. Brandl, B. Appel, H. Wiese, G. Maier, M. Wenzel, R. Staudenmaier, A.
Goepferich, T. Blunk, Long-term stable fibrin gels for cartilage engineering, Biomaterials
28 (2006) 55–65.
[124] Y.J. Kim, R.L.Y. Sah, J.Y.H. Doong, A.J. Grodzinsky, Fluorometric assay of DNA in
cartilage explants using Hoechst 33258, Analytical Biochemistry 174 (1988) 168–176.
[125] D. Shugar, The measurement of lysozyme activity and the ultra-violet inactivation of
lysozyme, Biochim Biophys Acta 8 (1952) 302–309.
[126] J.M.(.). Walker, The Protein Protocols Handbook, 2nd Edition, Humana Press Inc.,
Totowa, NJ, 1996.
[127] J.K.F. Noel, M.J. Hunter, Bovine Mercaptalbumin and Non-mercaptalbumin
Monomers. Interconversions and Structural Differences, J. Biol. Chem. 247 (1972) 7391–
7406.
[128] G. Bohm, R. Muhr, R. Jaenicke, Quantitative analysis of protein far UV circular
dichroism spectra by neural networks, Protein Eng 5 (1992) 191–195.
[129] V. Lechevalier, T. Croguennec, S. Pezennec, C. Guerin-Dubiard, M. Pasco, F. Nau,
Ovalbumin, Ovotransferrin, Lysozyme: Three Model Proteins for Structural Modifications
at the Air-Water Interface, Journal of Agricultural and Food Chemistry 51 (2003) 6354–
6361.
[130] J.D. Meyer, M.C. Manning, J.F. Carpenter, Effects of potassium bromide disk
formation on the infrared spectra of dried model proteins, Journal of Pharmaceutical
Sciences 93 (2004) 496–506.
[131] S. Krimm, J. Bandekar, Vibrational spectroscopy and conformation of peptides,
polypeptides, and proteins, Advances in Protein Chemistry 38 (1986) 181–364.
[132] T.P. Shakhtshneider, F. Danede, F. Capet, J.F. Willart, M. Descamps, S.A. Myz, E.V.
Boldyreva, V.V. Boldyrev, Grinding of drugs with pharmaceutical excipients at cryogenic
temperatures. Part I. Cryogenic grinding of piroxicam-polyvinylpyrrolidone mixtures,
Journal of Thermal Analysis and Calorimetry 89 (2007) 699–707.
[133] C.T. Murthy, S. Bhattacharya, Cryogenic grinding of black pepper, Journal of Food
Engineering 85 (2007) 18–28.
[134] S. Li, S. Ge, Z. Huang, Q. Wang, H. Zhao, H. Pan, Cryogenic grinding technology for
traditional Chinese herbal medicine, Cryogenics 31 (1991) 136–137.
[135] S.B. Liang, D.P. Hu, C. Zhu, A.B. Yu, Production of fine polymer powder under
cryogenic conditions, Chemical Engineering & Technology 25 (2002) 401–405.

References
136
[136] S.B. Liang, Y.C. Hao, A novel cryogenic grinding system for recycling scrap tire
peels, Advanced Powder Technology 11 (2000) 187–197.
[137] T. Vu-Khanh, Z. Yu, Mechanisms of brittle-ductile transition in toughened
thermoplastics, Theoretical and Applied Fracture Mechanics 26 (1997) 177–183.
[138] C. Butcher, Cryogenic grinding: An independent voice, Chemical Engineer 713 (2000)
19–21.
[139] S.P. Schwendeman, J.H. Lee, R.K. Gupta, H.R. Costantino, G.R. Siber, R. Langer,
Inhibition of moisture-induced aggregation of tetanus toxoid by protecting thiol groups,
Proceedings of the International Symposium on Controlled Release of Bioactive Materials
21ST (1994) 54–55.
[140] H.R. Costantino, R. Langer, A.M. Klibanov, Moisture-induced aggregation of
lyophilized insulin, Pharmaceutical Research 11 (1994) 21–29.
[141] E. Johansson, N. Kettaneh-Wold, C. Wikstrom, S. Wold, L. Ericksson, Design of
Experiments - Principles and Application, Umetrics Acedamy, Umea, 2000.
[142] J. Dong, C.-F. Mandenius, M. Luebberstedt, T. Urbaniak, A.K.N. Nuessler, D.
Knobeloch, J.C. Gerlach, K. Zeilinger, Evaluation and optimization of hepatocyte culture
media factors by design of experiments (DoE) methodology, Cytotechnology 57 (2008)
251–261.
[143] Joelsson Daniel, Moravec Phil, Troutman Matthew, Pigeon Joseph, DePhillips Pete,
Optimizing ELISAs for precision and robustness using laboratory automation and
statistical design of experiments, J Immunol Methods 337 (2008) 35-41.
[144] D. Horvath, R. Noorani, M. Mendelson, Improvement of surface roughness on ABS
400 polymer materials using design of experiments (DOE), Materials Science Forum 561-
565 (2007) 2389–2392.
[145] M. Castagne, Y. Bentolila, F. Chaudoye, A. Halle, F. Nicolas, D. Sinoquet,
Comparison of engine calibration methods based on design of experiments (DoE), Oil &
Gas Science and Technology 63 (2008) 563–582.
[146] International Conference on Harmonisation, Q1D Bracketing and Matrixing Designs
for Stability Testing of New Drug Substances and Products, 2002.
[147] O. Vegt, H. Vromans, W. Pries, K. van der Voort Maarschalk, The effect of crystal
imperfections on particle fracture behavior, International Journal of Pharmaceutics 317
(2006) 47–53.
[148] W. Peukert, Material properties in fine grinding, International Journal of Mineral
Processing 74 (2004) S3-S17.
[149] M. Wilczek, J. Bertling, D. Hnitemann, Optimised technologies for cryogenic
grinding, International Journal of Mineral Processing 2004 (2004) 425–434.
[150] R. Thibert, M. Akbarieh, R. Tawashi, Morphic features variation of solid particles
after size reduction: sonification compared to jet mill grinding, International Journal of
Pharmaceutics 47 (1988) 171–177.
[151] K. Brodka-Pfeiffer, H. Haeusler, P. Grass, P. Langguth, Conditioning Following
Powder Micronization: Influence on Particle Growth of Salbutamol Sulfate, Drug Dev.
Ind. Pharm. 29 (2003) 1077–1084.
[152] G. Walsh, Biopharmaceutical benchmarks 2006, Nature Biotechnology 24 (2006)
769–776.

References
137
[153] J. Zheng, X. Yue, Z. Dai, Y. Wang, S. Liu, X. Yan, Novel iron–polysaccharide
multilayered microcapsules for controlled insulin release, Acta Biomaterialia 5 (2009)
1499–1507.
[154] B. Singh, N. Chauhan, Modification of psyllium polysaccharides for use in oral insulin
delivery, Food Hydrocolloids 23 (2009) 928–935.
[155] R. Diamond et al., Molecular Structures in Biology, Oxford University Press, Oxford,
1993.
[156] G.K. Iwamoto, R.A. van Wagenen, J.D. Andrade, Insulin adsorption: intrinsic tyrosine
interfacial fluorescence, Journal of Colloid and Interface Science 86 (1982) 581–585.
[157] A. Malzert, F. Boury, D. Renard, P. Robert, L. Lavenant, J.P. Benoit, J.E. Proust,
Spectroscopic studies on poly(ethylene glycol)–lysozyme interactions, International
Journal of Pharmaceutics 260 (2003) 175–186.
[158] Q. Zhong, M. Jin, M. Davidson, S. Zivanovic, Sustained release of lysozyme from
zein microcapsules produced by a supercritical anti-solvent process, Food Chemistry 115
(2009) 697–700.
[159] P. Jollès, Jollès J., What´s new in lysozyme research?, Molecular and Cellular
Biochemistry 63 (1984) 165–189.
[160] C.C.F. Blake, D.F. Koenig, G.A. Mair, A.C.T. North, D.C. Phillips, V.R. Sarma,
Structure of Hen Egg-White Lysozyme: A Three-dimensional Fourier Synthesis at 2 Å
Resolution, Nature 206 (1965) 757–761.
[161] D.C. Phillips, The Three-dimensional Structure of an Enzyme Molecule, Scientific
American 215 (1966) 79–90.
[162] W. Zhao, R. Yang, R. Lu, Y. Tang, W. Zhang, Investigation of the Mechanisms of
Pulsed Electric Fields on Inactivation of Enzyme: Lysozyme, Journal of Agricultural and
Food Chemistry 55 (2007) 9850–9858.
[163] J.R. Lakowicz, Principles of Fluorescence Spectroscopy, Plenum Press, New York,
1983.
[164] H. Sellak, E. Franzini, J. Hakim, C. Pasquier, Mechanism of lysozyme inactivation
and degradation by iron, Archives of Biochemistry and Biophysics 299 (1992) 172–178.
[165] H.R. Costantino, L. Shieha, A.M. Klibanov, R. Langer, Heterogeneity of serum
albumin samples with respect to solid-state aggregation via thiol-disulfide interchange —
Implications for sustained release from polymers, Journal of Controlled Release 44 (1997)
255–261.
[166] K. Hirayama, S. Akashi, M. Furuya, K. Fukuhara, Rapid confirmation and revision of
the primary structure of bovine serum albumin by ESIMS and Frit-FAB LC/MS, Biochem
Biophys Res Commun. 173 (1990) 639–646.
[167] K. Murayama, M. Tomida, Heat-Induced Secondary Structure and Conformation
Change of Bovine Serum Albumin Investigated by Fourier Transform Infrared
Spectroscopy, Biochemistry 43 (2004) 11526–11532.
[168] T.J. Peters, Serum albumin, Advances in Protein Chemistry 37 (1985) 161–245.
[169] W.R. Liu, R. Langer, A.M. Klibanov, Moisture-induced aggregation of lyophilized
proteins in the solid state, Biotechnology and Bioengineering 37 (1991) 177–184.
[170] T.P. King, On the Sulfhydryl Group of Human Plasma Albumin, J. Biol. Chem. 236
(1961) PC5.

References
138
[171] L.O. Andersson, The heterogeneity of bovine serum albumin, Biochim Biophys Acta
117 (1966) 115–133.
[172] R.F. Chen, Removal of Fatty Acids from Serum Albumin by Charcoal Treatment, J.
Biol. Chem. 242 (1967) 173–181.
[173] F. Soetewey, M. Rosseneu-Motreff, R. Lamote, H. Peeters, Size and Shape
Determination of Native and Defatted Bovine Serum Albumin Monomers: II. Influence of
the Fatty Acid Content on the Conformation of Bovine Serum Albumin Monomers, J
Biochem 71 (1972) 705–710.
[174] A.F. Habeeb, Immunochemistry of bovine serum albumin, Advances in experimental
medcine and biology 98 (1978) 101–117.
[175] H.R. Costantino, K.G. Carrasquillo, R.A. Cordero, M. Mumenthaler, C.C. Hsu, K.
Griebenow, Effect of excipients on the stability and structure of lyophilized recombinant
human growth hormone, Journal of Pharmaceutical Sciences 87 (1998) 1412–1420.
[176] V.R. Sinha, A. Trehan, Biodegradable microspheres for protein delivery, Journal of
Controlled Release 90 (2003) 261–280.
[177] S. Koennings, A. Goepferich, Lipospheres as delivery systems for peptides and
proteins, Lipospheres in Drug Targets and Delivery (2005) 67–86.
[178] A. Goepferich, R. Langer, Modeling of polymer erosion in three dimensions:
rotationally symmetric devices, AIChE Journal 41 (1995) 2292–2299.
[179] J.M. Anderson, M.S. Shive, Biodegradation and biocompatibility of PLA and PLGA
microspheres, Advanced Drug Delivery Reviews 28 (1997) 5–24.
[180] B. Ronneberger, T. Kissel, J.M. Anderson, Biocompatibility of ABA triblock
copolymer microparticles consisting of poly(L-lactic-co-glycolic-acid) A-blocks attached
to central poly(oxyethylene) B-blocks in rats after intramuscular injection, European
Journal of Pharmaceutics and Biopharmaceutics 43 (1997) 19–28.
[181] A. Brunner, K. Mader, A. Goepferich, The chemical microenvironment inside
biodegradable microspheres during erosion, Proceedings of the International Symposium
on Controlled Release of Bioactive Materials 25th (1998) 154–155.
[182] M. Morlock, H. Koll, G. Winter, T. Kissel, Microencapsulation of rh-erythropoietin,
using biodegradable poly(D, L-lactide-co-glycolide). Protein stability and the effects of
stabilizing excipients, European Journal of Pharmaceutics and Biopharmaceutics 43
(1997) 29–36.
[183] A. Lucke, J. Kiermaier, A. Gopferich, Peptide acylation by poly(a-hydroxy esters),
Pharmaceutical Research 19 (2002) 175–181.
[184] C. Guse, S. Koennings, A. Maschke, M. Hacker, C. Becker, S. Schreiner, T. Blunk, T.
Spruss, A. Goepferich, Biocompatibility and erosion behavior of implants made of
triglycerides and blends with cholesterol and phospholipids, International Journal of
Pharmaceutics 314 (2006) 153–160.
[185] A. Maschke, C. Becker, D. Eyrich, J. Kiermaier, T. Blunk, A. Goepferich,
Development of a spray congealing process for the preparation of insulin-loaded lipid
microparticles and characterization thereof, European Journal of Pharmaceutics and
Biopharmaceutics 65 (2007) 175–187.
[186] H. Reithmeier, J. Herrmann, A. Goepferich, Development and characterization of lipid
microparticles as a drug carrier for somatostatin, International Journal of Pharmaceutics
218 (2001) 133–143.
References
139
[187] H. Reithmeier, A. Goepferich, J. Herrmann, Preparation and characterization of lipid
microparticles containing thymocartin, an immunomodulating peptide, Proceedings of the
International Symposium on Controlled Release of Bioactive Materials 26th (1999) 681–
682.
[188] W. Vogelhuber, E. Magni, M. Mouro, T. Spruss, C. Guse, A. Gazzaniga, A.
Goepferich, Monolithic triglyceride matrixes: A controlled-release system for proteins,
Pharmaceutical Development and Technology 8 (2003) 71–79.
[189] R. Cortesi, E. Esposito, G. Luca, C. Nastruzzi, Production of lipospheres as carriers
for bioactive compounds, Biomaterials 23 (2002) 2283–2294.
[190] T. Eldem, P. Speiser, A. Hincal, Optimization of Spray-Dried and -Congealed Lipid
Micropellets and Characterization of Their Surface Morphology by Scanning Electron
Microscopy, Pharmaceutical Research 8 (1991) 47–54.
[191] B. Heurtault, P. Saulnier, B. Pech, J.-E. Proust, J.-P. Benoit, Physico-chemical
stability of colloidal lipid particles, Biomaterials 24 (2003) 4283–4300.
[192] H. Bunjes, K. Westesen, M.H.J. Koch, Crystallization tendency and polymorphic
transitions in triglyceride nanoparticles, International Journal of Pharmaceutics 129 (1996)
159–173.
[193] J.T. Luxon, D.J. Donald, R. Summitt, Effect of particle size and shape on the infrared
absorption spectra of barium titanate and strontium titanate powders, Journal of Applied
Physics 41 (1970) 2303-2307.


Appendices
141
Appendices

Appendices
142
Abbreviations
ANOVA analysis of variances
ANS 8-anilino-1-naphtalenesolfonic acid
BSA bovine serum albumin
CD circular dichroism
CCF face centered central composite design
Detapac dieethylenetriamine-pentacetic acid
DMEM Dulbecco's Modified Eagle's Medium
DMSO dimethylsulfoxide
DoE Design of Experiments
DSC differential scanning calorimetry
DTNB 5,5´-dithiobis(2-nitrobenzoic acid), Ellman´s reagent
FBS fetal bovine serum
FDA Food and Drug Administration
GSH l-glutathione
hGH human growth hormone
ICH International Conference on Harmonisation of Technical Requirements
for Registration of Pharmaceuticals for Human Use
ICP-OES inductively coupled plasma – optical emission spectroscopy
IGF insulin-like growth factor
MALDI-ToF matrix-assisted laser desorption/ionization time of flight mass
spectrometer
PEG polyethylene glycol
PLGA poly(lactic-co-glycolic acid)
PSH protein surface hydrophobicity
Appendices
143
PTFE polytetrafluoroethylene
RH relative humidity
RSH relative surface hydrophobicity
SCF super critical fluid
SDS sodium dodecyl sulfate
SEM scanning electron microscope
SFD spray freeze drying
SFL spray freezing into liquid
SH sulfhydryl
TFA trifluoroacetic acid

Appendices
144

Appendices
145
Additional data for the experimental design
In this section the statistical data for all responses of the experimental design are given. The
summary list for the statistical evaluation of the models, the ANOVA lists for the evaluation
of the responses as well as the coefficient lists for the determination of the significance of the
investigated factors and interactions thereof. All statistical data was evaluated at a confidence
level of 0.95.
Particle size (d90-value) for insulin (chapter 4)
d90 Coeff. SC Std. Err. P Conf. int(±)
Constant 0.70807 0.08918 4.06164e-006 0.1943
Pre -0.08506 0.01011 2.23664e-006 0.02203
Cyc -0.05011 0.01412 0.004 0.03076
Temp 0.00853 0.0138 0.54814 0.03006
Pre*Pre 0.0765 0.01687 0.00068 0.03675
Cyc*Cyc 0.00652 0.01491 0.66972 0.03248
Temp*Temp -0.15922 0.11353 0.18613 0.24736
Pre*Cyc -0.01062 0.01239 0.40824 0.027
Pre*Temp -0.00054 0.01756 0.97596 0.03826
Cyc*Temp -0.02281 0.01677 0.1986 0.03653
Table 1 coefficient list (significant factors printed in bold)
d90 Coeff. SC Std. Err. P Conf. int(±)
Constant 0.58792 0.01058 1.36293e-021 0.02222
Pre -0.07906 0.00965 1.75528e-007 0.02028
Cyc -0.06434 0.00965 2.9787e-006 0.02028
Pre*Pre 0.08917 0.01432 7.10362e-006 0.03009
Table 2 coefficient list after exclusion of insignificant factors
d90 DF SS MS (variance) F p SD
Total 22 9.10276 0.41376
Constant 1 8.91457 8.91457
Total Corrected 21 0.18819 0.00896 0.09467
Regression 3 0.16806 0.05602 50.0803 0.000 0.23668
Residual 18 0.02013 0.00112 0.03345
Lack of Fit 14 0.01422 0.00102 0.68664 0.732 0.03187
(Model Error)
Pure Error 4 0.00592 0.00148 0.03846
(Replicate Error)
Table 3 Anova list
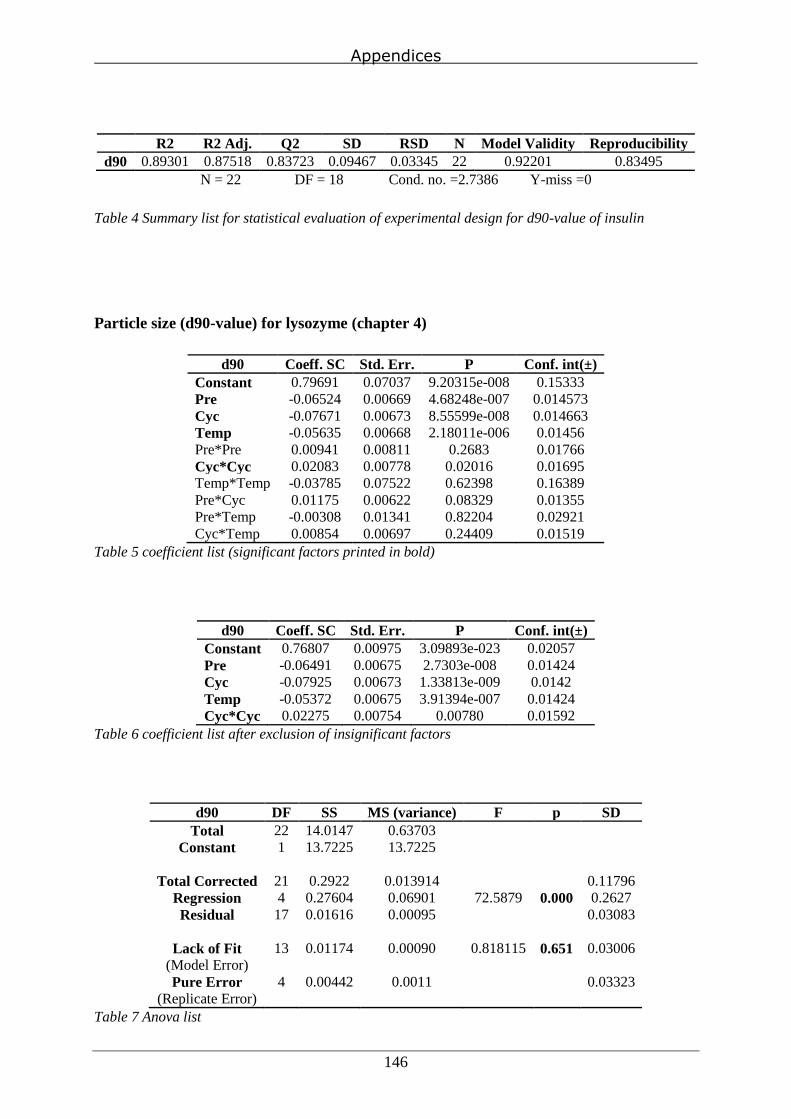
Appendices
146
R2 R2 Adj. Q2 SD RSD N Model Validity Reproducibility
d90 0.89301 0.87518 0.83723 0.09467 0.03345 22 0.92201 0.83495
N = 22 DF = 18 Cond. no. =2.7386 Y-miss =0
Table 4 Summary list for statistical evaluation of experimental design for d90-value of insulin
Particle size (d90-value) for lysozyme (chapter 4)
d90 Coeff. SC Std. Err. P Conf. int(±)
Constant 0.79691 0.07037 9.20315e-008 0.15333
Pre -0.06524 0.00669 4.68248e-007 0.014573
Cyc -0.07671 0.00673 8.55599e-008 0.014663
Temp -0.05635 0.00668 2.18011e-006 0.01456
Pre*Pre 0.00941 0.00811 0.2683 0.01766
Cyc*Cyc 0.02083 0.00778 0.02016 0.01695
Temp*Temp -0.03785 0.07522 0.62398 0.16389
Pre*Cyc 0.01175 0.00622 0.08329 0.01355
Pre*Temp -0.00308 0.01341 0.82204 0.02921
Cyc*Temp 0.00854 0.00697 0.24409 0.01519
Table 5 coefficient list (significant factors printed in bold)
d90 Coeff. SC Std. Err. P Conf. int(±)
Constant 0.76807 0.00975 3.09893e-023 0.02057
Pre -0.06491 0.00675 2.7303e-008 0.01424
Cyc -0.07925 0.00673 1.33813e-009 0.0142
Temp -0.05372 0.00675 3.91394e-007 0.01424
Cyc*Cyc 0.02275 0.00754 0.00780 0.01592
Table 6 coefficient list after exclusion of insignificant factors
d90 DF SS MS (variance) F p SD
Total 22 14.0147 0.63703
Constant 1 13.7225 13.7225
Total Corrected 21 0.2922 0.013914 0.11796
Regression 4 0.27604 0.06901 72.5879 0.000 0.2627
Residual 17 0.01616 0.00095 0.03083
Lack of Fit 13 0.01174 0.00090 0.818115 0.651 0.03006
(Model Error)
Pure Error 4 0.00442 0.0011 0.03323
(Replicate Error)
Table 7 Anova list

Appendices
147
R2 R2 Adj. Q2 SD RSD N Model Validity Reproducibility
d90 0.944689 0.93167 0.90294 0.11796 0.03083 22 0.89271 0.92064
N = 22 DF = 17 Cond. no. =2.6934 Y-miss =0
Table 8 Summary list for statistical evaluation of experimental design for d90-value of lysozyme
Particle size (d90-value) for BSA (chapter 4)
d90 Coeff. SC Std. Err. P Conf. int(±)
Constant 1.12121 0.08118 9.9557e-009 0.17688
pre -0.10374 0.01024 3.11504e-007 0.02231
cyc -0.11162 0.01035 1.57715e-007 0.02256
temp 0.02207 0.01028 0.05293 0.0224
pre*pre 0.05093 0.01658 0.00969 0.03613
cyc*cyc 0.0397 0.01577 0.02708 0.03437
temp*temp -0.27678 0.10727 0.02409 0.23373
pre*cyc 0.04152 0.01263 0.0065 0.02752
pre*temp -0.09533 0.02283 0.00129 0.04974
cyc*temp -0.00388 0.01186 0.74906 0.02584
Table 9 coefficient list (significant factors printed in bold)
d90 Coeff. SC Std. Err. P Conf. int(±)
Constant 1.11603 0.07684 2.05311e-009 0.166
pre -0.10375 0.00988 1.0209e-007 0.02135
cyc -0.11185 0.00997 4.66039e-008 0.02154
temp 0.02166 0.00985 0.04652 0.02127
pre*pre 0.05044 0.01594 0.00745 0.03443
cyc*cyc 0.03988 0.01521 0.02114 0.03287
temp*temp -0.26976 0.10144 0.01965 0.21914
pre*cyc 0.04175 0.01217 0.00448 0.0263
pre*temp -0.09409 0.02173 0.00082 0.04693
Table 10 coefficient list after exclusion of insignificant factors

Appendices
148
d90 DF SS MS (variance) F p SD
Total 22 20.6863 0.94029
Constant 1 20.3153 20.3153
Total Corrected 21 0.37095 0.01766 0.13291
Regression 8 0.35581 0.04448 38.1953 0.000 0.2109
Residual 13 0.01514 0.001164 0.03412
Lack of Fit 9 0.00508 0.00056 0.22447 0.971 0.02376
(Model Error)
Pure Error 4 0.01006 0.00251 0.05015
(Replicate Error)
Table 11 Anova list
R2 R2 Adj. Q2 SD RSD N Model Validity Reproducibility
d90 0.95919 0.93408 0.90856 0.13291 0.03412 22 0.99255 0.85765
N = 22 DF = 13 Cond. no. =26.8749 Y-miss =0
Table 12 Summary list for statistical evaluation of experimental design for d90-value of BSA
Bioactivity of lysozyme (chapter 6)
Activity Coeff. SC Std. Err. P Conf. int(±)
Constant 89.1616 3.12135 2.10399e-012 6.8008
Pre -1.29778 0.29666 0.0009 0.64637
Cyc -3.00796 0.29849 3.29486e-007 0.65034
Temp 0.74775 0.29633 0.02674 0.64565
Pre*Pre 0.20269 0.35951 0.58328 0.78331
Cyc*Cyc 0.28067 0.34513 0.43193 0.75197
Temp*Temp 2.53408 3.33625 0.46218 7.26903
Pre*Cyc -0.11668 0.27579 0.67973 0.6009
Pre*Temp -0.68397 0.59462 0.27245 1.29557
Cyc*Temp 0.53595 0.30919 0.10862 0.67366
Table 13 coefficient list (significant factors printed in bold)
Activity Coeff. SC Std. Err. P Conf. int(±)
Constant 92,0864 0,37561 3,58467e-033 0,78914
Pre -1,27052 0,38561 0,00403 0,81013
Cyc -2,99871 0,38448 3,51184e-007 0,80776
Temp 0,68222 0,38563 0,09382 0,81019
Table 14 coefficient list after exclusion of insignificant factors (significant factors printed in bold)
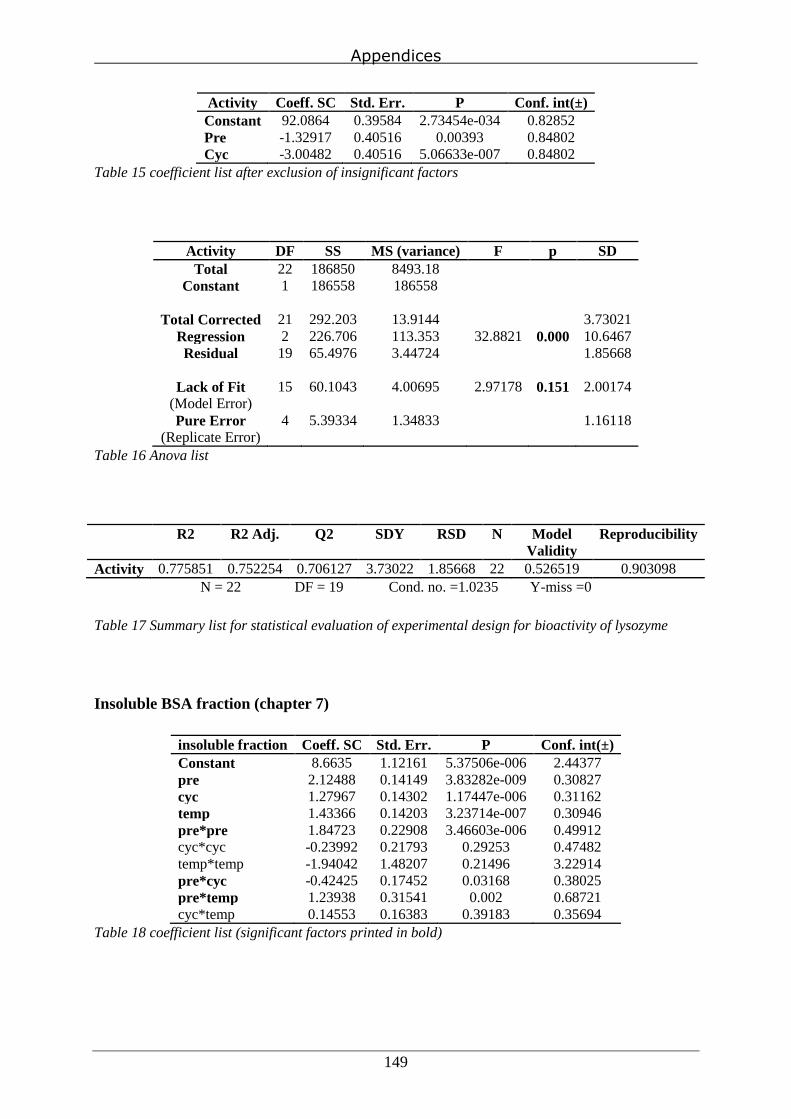
Appendices
149
Activity Coeff. SC Std. Err. P Conf. int(±)
Constant 92.0864 0.39584 2.73454e-034 0.82852
Pre -1.32917 0.40516 0.00393 0.84802
Cyc -3.00482 0.40516 5.06633e-007 0.84802
Table 15 coefficient list after exclusion of insignificant factors
Activity DF SS MS (variance) F p SD
Total 22 186850 8493.18
Constant 1 186558 186558
Total Corrected 21 292.203 13.9144 3.73021
Regression 2 226.706 113.353 32.8821 0.000 10.6467
Residual 19 65.4976 3.44724 1.85668
Lack of Fit 15 60.1043 4.00695 2.97178 0.151 2.00174
(Model Error)
Pure Error 4 5.39334 1.34833 1.16118
(Replicate Error)
Table 16 Anova list
R2 R2 Adj. Q2 SDY RSD N Model
Validity
Reproducibility
Activity 0.775851 0.752254 0.706127 3.73022 1.85668 22 0.526519 0.903098
N = 22 DF = 19 Cond. no. =1.0235 Y-miss =0
Table 17 Summary list for statistical evaluation of experimental design for bioactivity of lysozyme
Insoluble BSA fraction (chapter 7)
insoluble fraction Coeff. SC Std. Err. P Conf. int(±)
Constant 8.6635 1.12161 5.37506e-006 2.44377
pre 2.12488 0.14149 3.83282e-009 0.30827
cyc 1.27967 0.14302 1.17447e-006 0.31162
temp 1.43366 0.14203 3.23714e-007 0.30946
pre*pre 1.84723 0.22908 3.46603e-006 0.49912
cyc*cyc -0.23992 0.21793 0.29253 0.47482
temp*temp -1.94042 1.48207 0.21496 3.22914
pre*cyc -0.42425 0.17452 0.03168 0.38025
pre*temp 1.23938 0.31541 0.002 0.68721
cyc*temp 0.14553 0.16383 0.39183 0.35694
Table 18 coefficient list (significant factors printed in bold)

Appendices
150
insoluble fraction Coeff. SC Std. Err. P Conf. int(±)
Constant 7.12295 0.16027 2.43886e-017 0.34161
pre 2.12998 0.14661 3.04458e-010 0.31248
cyc 1.25493 0.14618 3.57311e-007 0.31157
temp 1.33229 0.12294 1.71859e-008 0.26204
pre*pre 1.70266 0.21743 1.1192e-006 0.46344
pre*cyc -0.46773 0.17903 0.0196 0.38158
pre*temp 1.59827 0.16392 6.96364e-008 0.34939
Table 19 coefficient list after exclusion of insignificant factors
insoluble fraction DF SS MS (variance) F p SD
Total 22 1550 70.4545
Constant 1 1411.2 1411.2
Total Corrected 21 138.798 6.60942 2.57088
Regression 6 134.952 22.492 87.7324 0.000 4.74258
Residual 15 3.84557 0.256371 0.50633
Lack of Fit 11 3.01519 0.27411 1.3204 0.426 0.52355
(Model Error)
Pure Error 4 0.83038 0.2076 0.45563
(Replicate Error)
Table 20 Anova list
R2 R2
Adj.
Q2 SDY RSD N Model
Validity
Reproducibility
insoluble
fraction
0.97229 0.96121 0.92265 2.57088 0.50633 22 0.78636 0.96859
N = 22 DF = 15 Cond. no. =2.7534 Y-miss =0
Table 21 Summary list for statistical evaluation of experimental design for insoluble fraction of BSA
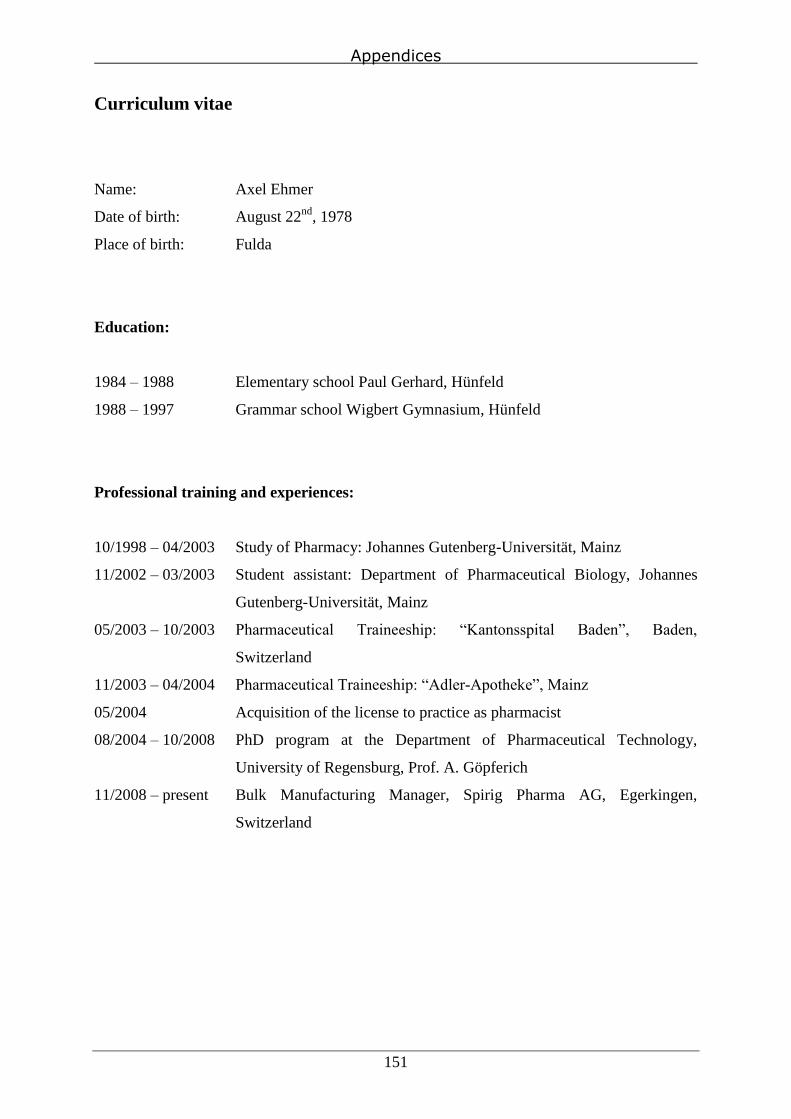
Appendices
151
Curriculum vitae
Name: Axel Ehmer
Date of birth: August 22nd
, 1978
Place of birth: Fulda
Education:
1984 – 1988 Elementary school Paul Gerhard, Hünfeld
1988 – 1997 Grammar school Wigbert Gymnasium, Hünfeld
Professional training and experiences:
10/1998 – 04/2003 Study of Pharmacy: Johannes Gutenberg-Universität, Mainz
11/2002 – 03/2003 Student assistant: Department of Pharmaceutical Biology, Johannes
Gutenberg-Universität, Mainz
05/2003 – 10/2003 Pharmaceutical Traineeship: ―Kantonsspital Baden‖, Baden,
Switzerland
11/2003 – 04/2004 Pharmaceutical Traineeship: ―Adler-Apotheke‖, Mainz
05/2004 Acquisition of the license to practice as pharmacist
08/2004 – 10/2008 PhD program at the Department of Pharmaceutical Technology,
University of Regensburg, Prof. A. Göpferich
11/2008 – present Bulk Manufacturing Manager, Spirig Pharma AG, Egerkingen,
Switzerland
Appendices
152
List of Publications
Publications:
A. Ehmer, C. Becker, D. Eyrich, A. Zaky, J. Teßmar, T. Blunk, A. Göpferich: Protein
jet milling. to be submitted
Conference Abstracts:
2003
A. Ehmer, M. Lutters, P. Vonbach, A. Dubied: Optimierung der pharmazeutischen
Betreuung durch verbesserte Arzneimittelinformation für den Pflegedienst. GSASA,
St. Gallen
(poster presenation)
2006
A. Ehmer, S. Kolb, J. Teßmar, T. Blunk, A. Göpferich: Micronization of Proteins by
Jet Milling. CRS German Chapter, Jena
(poster presentation)
A. Ehmer, A. Zaky, D. Eyrich, J. Teßmar, T. Blunk, A. Göpferich: Micronization of
Insulin by Jet Milling. DPhG Jahrestagung - Joint Meeting, Marburg
(poster presentation)
C. Becker, A. Ehmer, A. Maschke, A. Meindorfer, D. Ausbacher, J. Teßmar, T. Blunk,
A. Göpferich: Influence of Micronisation of Proteins on the Properties of Lipid
Microparticles for Controlled Release. DPhG Joint Meeting, Marburg
(poster presentation)

Appendices
153
2007
A. Ehmer, S. Kolb, C. Becker, J. Teßmar, A. Göpferich: Cryogenic Grinding by Jet
Milling: A Promising Option for the Micronization of Proteins?. 2nd European
Congress on Life Science Process Technology, Nuremberg
(poster presentation)
A. Ehmer, C. Becker, C. Popp, A. Zaky, J. Teßmar, T. Blunk, A. Göpferich: Impact of
Jet Milling on Stability and Bioactivity of Proteins in Solid State. AAPS Annual
Meeting, San Diego, The AAPS Journal Vol. 9, No. S2, Abstract T2350
(poster presentation)
A. Ehmer, C. Becker, J. Teßmar, T. Blunk, A. Göpferich: Parameters Influencing the
Micronization of Proteins Investigated by Using Statistical Experimental Design.
DPhG-Jahrestagung, Erlangen
(oral presentation)
2008
A. Ehmer, T. Blunk, J. Teßmar, A. Göpferich: Jet Milling of BSA: Stabilization by
Low Temperature or Addition of Polyethylene Glycol. 6th World Meeting on
Pharmaceutics Biopharmaceutics and Pharmaceutical Technology, Barcelona
(poster presentation)
2009
A. Zaky, A. Elbakry, A. Ehmer, M. Breunig, A. Göpferich: Protein Release
Mechanism from Triglyceride Microspheres. DPhG-Jahrestagung, Jena
(poster presentation)

Appendices
154
Danksagung
Zum Schluss möchte ich mich bei allen bedanken, die zum Gelingen dieser Arbeit
beigetragen haben
Herrn Prof. Göpferich danke ich sehr für die Überlassung des interessanten Themas und die
Betreuung der Arbeit. Die konstruktiven Anregungen während zahlreicher Meetings waren
sehr hilfreich und motivierend. Besonders danke ich für die zahlreichen Gelegenheiten meine
Ergebnisse auf nationalen und internationalen Konferenzen präsentiert haben zu dürfen.
Der Forschungsvereinigung der Arzneimittel-Hersteller e.V. (FAH) für die Finanzierung der
Arbeit während der ersten 2 Jahre im Rahmen des Projektes „Mikronisierung von Proteinen
und Verarbeitung zu Arzneiformen―.
Bei Dr. Jörg Teßmar für sein immer offenes Ohr, seine fachlichen Ratschläge, für die
Einführung der Superbowl Herrenabende und sein Einsatz für den gesamten Lehrstuhl
beruflich und privat.
Dr. Torsten Blunk für seinen fachlichen Rat und seine Fähigkeit immer etwas Positives in
Forschungsergebnissen zu finden
Bei Dr. Eduard Hochmuth für die Durchführung der MALDI Messungen.
Allen Mitstreitern beim jährlichen Jedermannzehnkampf.
Dr. Barbara Weiser für fachkompetente Gespräche (vor allem in Statistikfragen) und die
Aufnahme von Fritzi.
Dr. Daniela Tausendpfund, Dr. Stephanie Könnings, Dr. Sigrid Grundsteiner und Dr.
Christian Guse für die freundschaftliche Aufnahme in den Lehrstuhl und gemeinsame
Freizeitgestaltung.
Dr. Stefan Rothschenk für 10 freundschaftliche gemeinsame Jahre an der Uni.
Appendices
155
Cornelia Rose und Anna Hezinger für die Unterstützung bei den ICP-Messungen und
zusammen mit Annina Seitz für das Fortführen der Bergfesttradition.
Allen TA`s für ihre Unterstützung und die Aufrechterhaltung des Lehrstuhls, besonders
Angelika Beriè für die langen Sitzungen am Elektronenmikroskop.
Stefan Kolb für seine Hilfe bei der Optimierung der Luftstrahlmühle und allen anderen
technischen Problemen.
Ferdinand Brandl und dem ganzen bits&bites Team für die freundschaftliche Unterstützung
und Zusammenarbeit.
Julia Baumer, Petra Bauer-Kreisel und Alaa Zaky für ihre Hilfe bei den Zellkulturversuchen.
Allen regelmäßigen Kaffeeraumbesuchern für die vielen sinnvollen und sinnlosen Gespräche
und den wechselnden Motivationsbeauftragten für ihren wichtigen Beitrag zur positiven
Lehrstuhlstimmung.
Ali Rhamouni und Claudia Popp für ihre Hilfe bei den Mikronisierungsversuchen.
Christian Becker für die angenehme Zusammenarbeit auf dem FAH Projekt.
Frau Lydia Frommer und Liane Öttl für die kompetente und freundliche Organisation des
Lehrstuhls.
Hildegard Schardt für das geduldige Korrekturlesen der Arbeit.
Allen die ich vergessen habe.
Besonders danke ich meiner Familie für ihre Geduld und Unterstützung.

Appendices
156
“He, who breaks a thing to find out what it is, has left the path of wisdom.”
Lord of the Rings by J.R.R. Tolkien