
MONITORING OF THE SLURRY WALL CAPSULE …€¦ · Poster Session C: Remediation Technologies and...
8
Poster Session C: Remediation Technologies and Concepts MONITORING OF THE SLURRY WALL CAPSULE HAMBURG EIDELSTEDT - EXAMINATION OF WATER BALANCE Thomas Haupt , Volker Sokollek Behörde für Umwelt und Gesundheit, Amt für Umweltschutz, Altlastensanierung, Billstrasse 84, D-20539 Hamburg, Germany ℡ 0049 40 428 45 3593 0049 40 428 45 3572 [email protected] Introduction At present, the quaternary aquifer in Hamburg Eidelstedt is contaminated and is affecting the surrounding areas. It lies uncovered beneath a 8.3 hectare industrial and waste disposal site (see Fig. 1). To isolate this area from its surroundings, a slurry trench wall of 1180 m was constructed around this area at the instance of the Free and Hanseatic City of Hamburg, Department of Environment and Health. Fig. 1: Aerial map of the “Industriegebiet Eidelstedt“ with slurry wall outline 1
-
Upload
phungkhanh -
Category
Documents
-
view
218 -
download
0
Transcript of MONITORING OF THE SLURRY WALL CAPSULE …€¦ · Poster Session C: Remediation Technologies and...
Poster Session C: Remediation Technologies and Concepts MONITORING OF THE SLURRY WALL CAPSULE HAMBURG EIDELSTEDT - EXAMINATION OF WATER BALANCE Thomas Haupt, Volker Sokollek Behörde für Umwelt und Gesundheit, Amt für Umweltschutz, Altlastensanierung, Billstrasse 84, D-20539 Hamburg, Germany ℡ 0049 40 428 45 3593
0049 40 428 45 3572 [email protected]
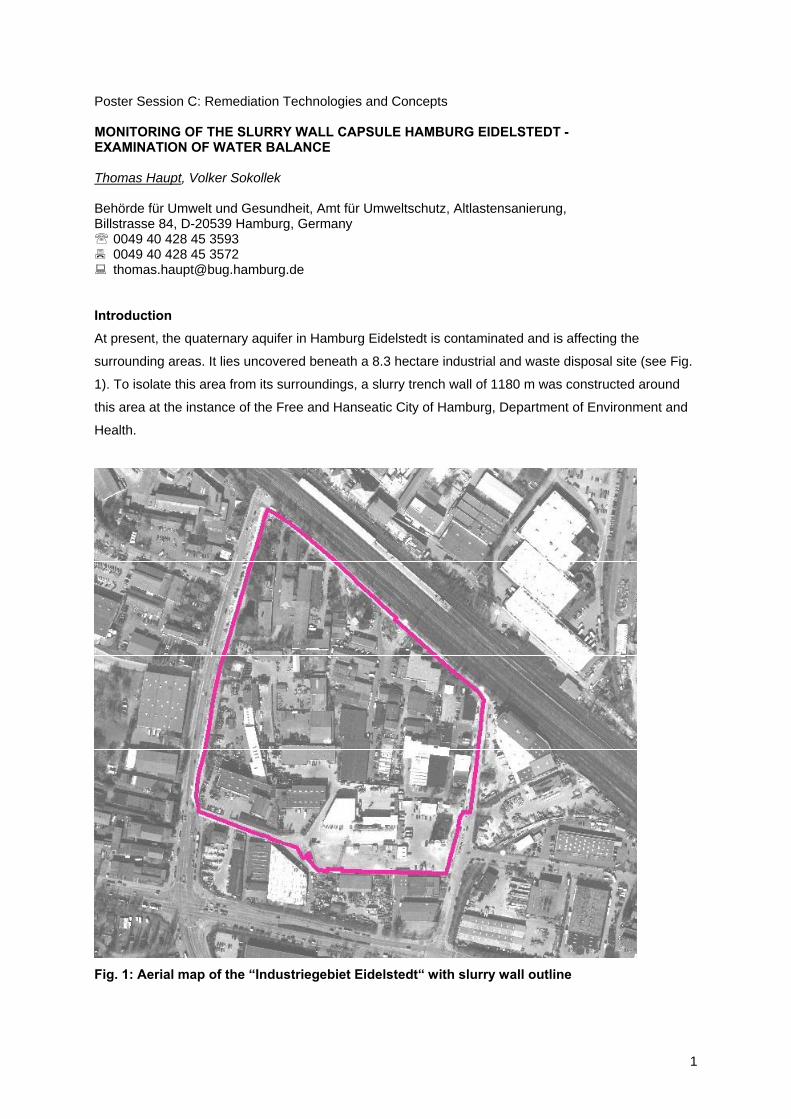
Introduction At present, the quaternary aquifer in Hamburg Eidelstedt is contaminated and is affecting the
surrounding areas. It lies uncovered beneath a 8.3 hectare industrial and waste disposal site (see Fig.
1). To isolate this area from its surroundings, a slurry trench wall of 1180 m was constructed around
this area at the instance of the Free and Hanseatic City of Hamburg, Department of Environment and
Health.
Fig. 1: Aerial map of the “Industriegebiet Eidelstedt“ with slurry wall outline
1
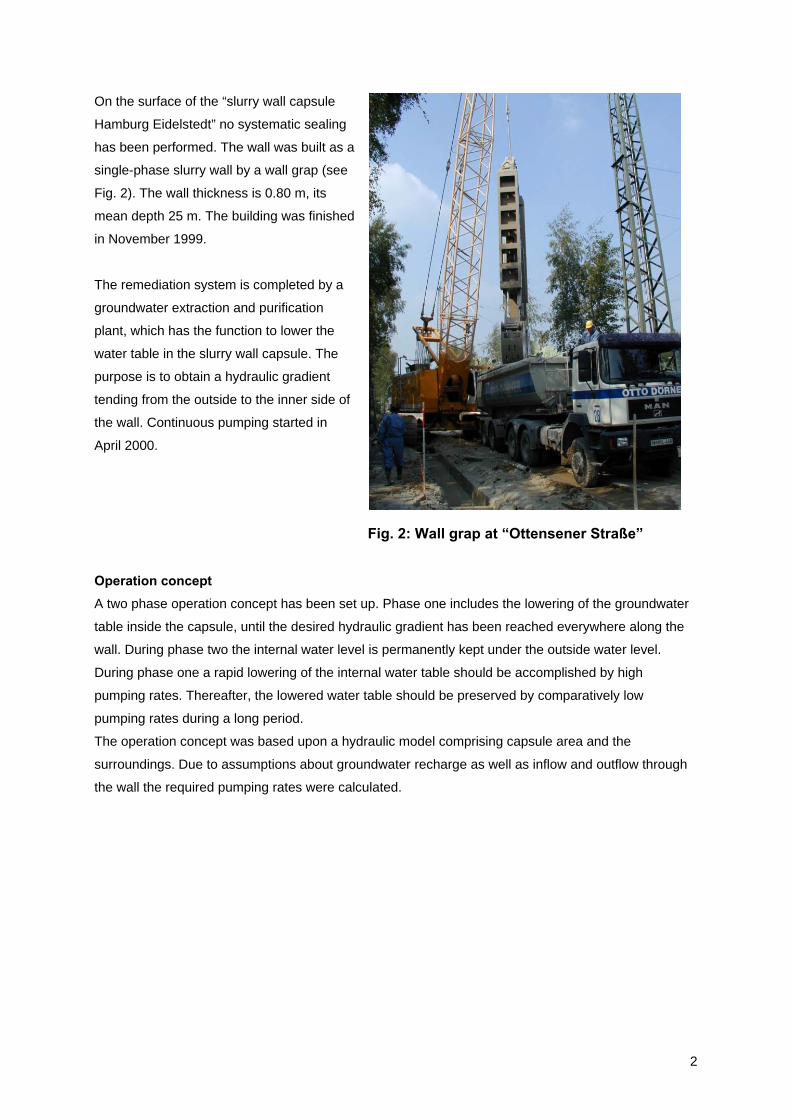
On the surface of the “slurry wall capsule
Hamburg Eidelstedt” no systematic sealing
has been performed. The wall was built as a
single-phase slurry wall by a wall grap (see
Fig. 2). The wall thickness is 0.80 m, its
mean depth 25 m. The building was finished
in November 1999.
The remediation system is completed by a
groundwater extraction and purification
plant, which has the function to lower the
water table in the slurry wall capsule. The
purpose is to obtain a hydraulic gradient
tending from the outside to the inner side of
the wall. Continuous pumping started in
April 2000.
Fig. 2: Wall grap at “Ottensener Straße”
Operation concept A two phase operation concept has been set up. Phase one includes the lowering of the groundwater
table inside the capsule, until the desired hydraulic gradient has been reached everywhere along the
wall. During phase two the internal water level is permanently kept under the outside water level.
During phase one a rapid lowering of the internal water table should be accomplished by high
pumping rates. Thereafter, the lowered water table should be preserved by comparatively low
pumping rates during a long period.
The operation concept was based upon a hydraulic model comprising capsule area and the
surroundings. Due to assumptions about groundwater recharge as well as inflow and outflow through
the wall the required pumping rates were calculated.
2
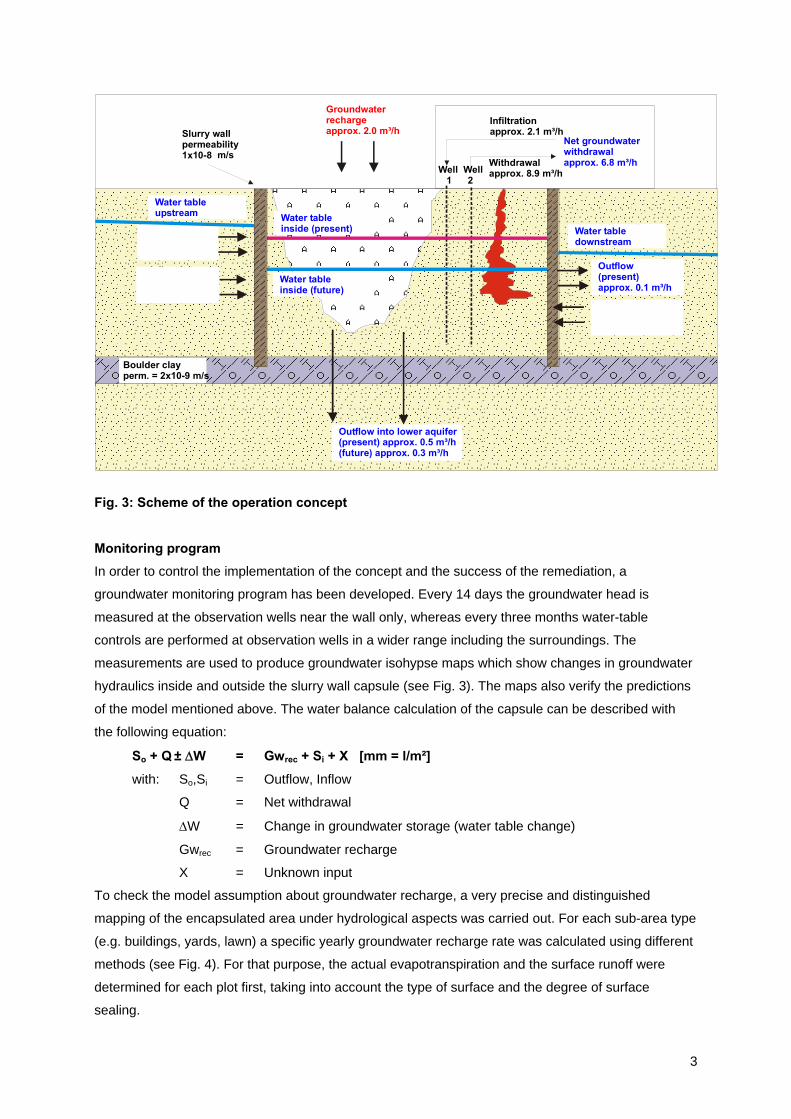
Slurry wallpermeability1x10-8 m/s
Well Well 1 2
Net groundwater withdrawalapprox. 6.8 m³/h
Groundwaterrechargeapprox. 2.0 m³/h
Inflow(present)approx. 0.1 m³/h
Inflow(future)approx. 0.5 m³/h
Inflow(future)approx. 0.3 m³/h
Withdrawalapprox. 8.9 m³/h
Infiltrationapprox. 2.1 m³/h
Boulder clayperm. = 2x10⁻⁹ m/s
Outflow into lower aquifer(present) approx. 0.5 m³/h(future) approx. 0.3 m³/h
Outflow(present)approx. 0.1 m³/h
Water table upstream
Water table inside (future)
Water tableinside (present) Water table
downstream
Fig. 3: Scheme of the operation concept
Monitoring program In order to control the implementation of the concept and the success of the remediation, a
groundwater monitoring program has been developed. Every 14 days the groundwater head is
measured at the observation wells near the wall only, whereas every three months water-table
controls are performed at observation wells in a wider range including the surroundings. The
measurements are used to produce groundwater isohypse maps which show changes in groundwater
hydraulics inside and outside the slurry wall capsule (see Fig. 3). The maps also verify the predictions
of the model mentioned above. The water balance calculation of the capsule can be described with
the following equation:
So + Q ± ΔW = Gwrec + Si + X [mm = l/m²]
with: So,Si = Outflow, Inflow
Q = Net withdrawal
ΔW = Change in groundwater storage (water table change)
Gwrec = Groundwater recharge
X = Unknown input
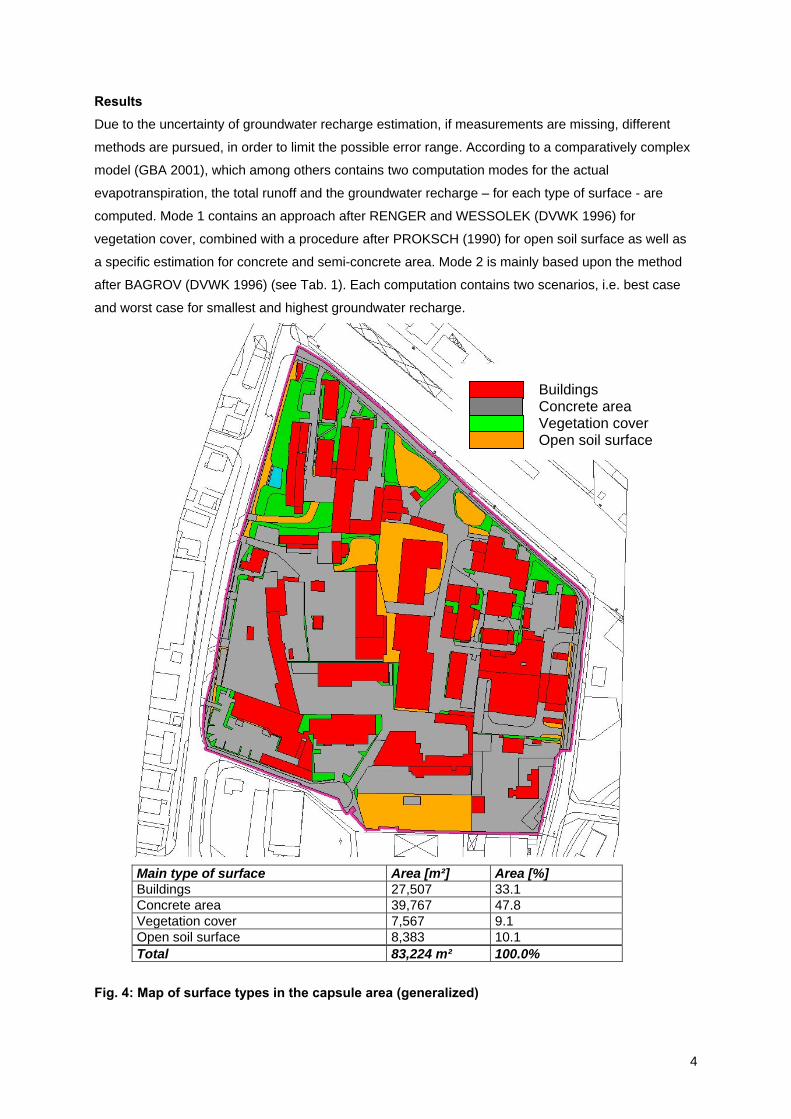
To check the model assumption about groundwater recharge, a very precise and distinguished
mapping of the encapsulated area under hydrological aspects was carried out. For each sub-area type
(e.g. buildings, yards, lawn) a specific yearly groundwater recharge rate was calculated using different
methods (see Fig. 4). For that purpose, the actual evapotranspiration and the surface runoff were
determined for each plot first, taking into account the type of surface and the degree of surface
sealing.
3
Results Due to the uncertainty of groundwater recharge estimation, if measurements are missing, different
methods are pursued, in order to limit the possible error range. According to a comparatively complex
model (GBA 2001), which among others contains two computation modes for the actual
evapotranspiration, the total runoff and the groundwater recharge – for each type of surface - are
computed. Mode 1 contains an approach after RENGER and WESSOLEK (DVWK 1996) for
vegetation cover, combined with a procedure after PROKSCH (1990) for open soil surface as well as
a specific estimation for concrete and semi-concrete area. Mode 2 is mainly based upon the method
after BAGROV (DVWK 1996) (see Tab. 1). Each computation contains two scenarios, i.e. best case
and worst case for smallest and highest groundwater recharge.
Buildings Concrete area Vegetation cover Open soil surface
Main type of surface Area [m²] Area [%] Buildings 27,507 33.1 Concrete area 39,767 47.8 Vegetation cover 7,567 9.1 Open soil surface 8,383 10.1 Total 83,224 m² 100.0%
Fig. 4: Map of surface types in the capsule area (generalized)
4
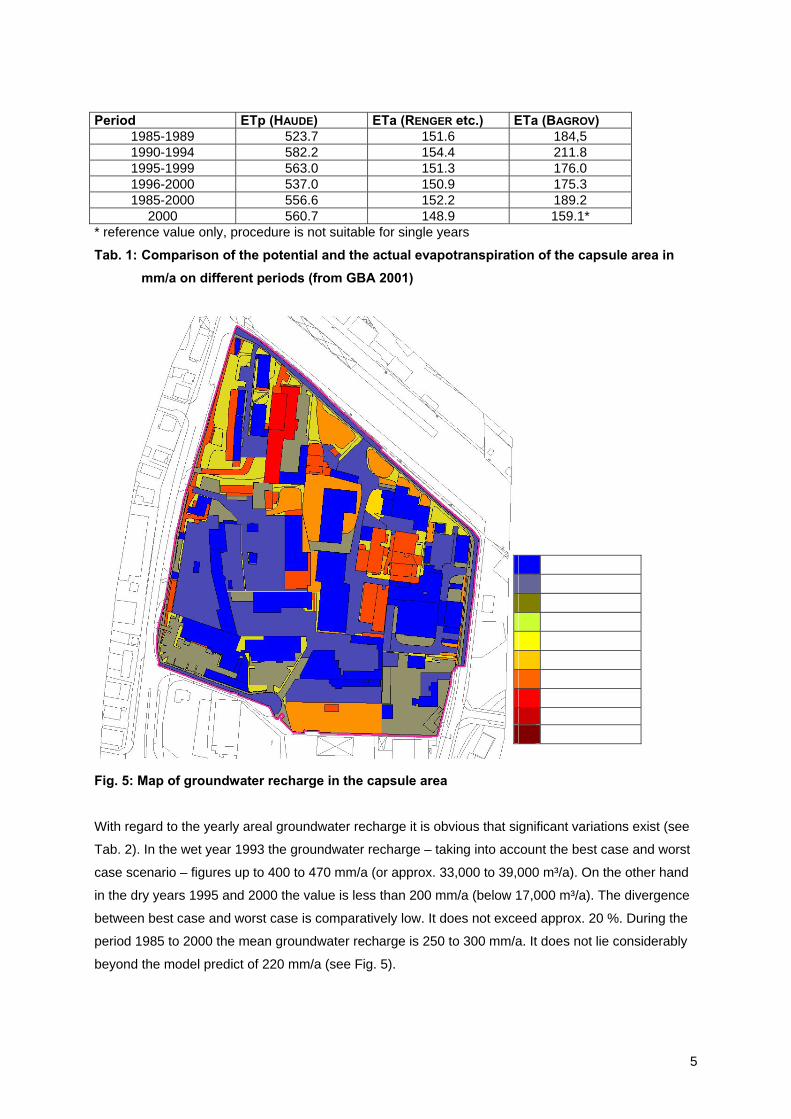
Period ETp (HAUDE) ETa (RENGER etc.) ETa (BAGROV)
1985-1989 523.7 151.6 184,5 1990-1994 582.2 154.4 211.8 1995-1999 563.0 151.3 176.0 1996-2000 537.0 150.9 175.3 1985-2000 556.6 152.2 189.2
2000 560.7 148.9 159.1* * reference value only, procedure is not suitable for single years
Tab. 1: Comparison of the potential and the actual evapotranspiration of the capsule area in mm/a on different periods (from GBA 2001)
< 100 mm/a 100 - 200 200 - 300 300 - 400 400 - 500 500 - 600 600 - 700 700 - 900 900 – 1,100 > 1,100 mm/a Groundwater recharge
Fig. 5: Map of groundwater recharge in the capsule area
With regard to the yearly areal groundwater recharge it is obvious that significant variations exist (see
Tab. 2). In the wet year 1993 the groundwater recharge – taking into account the best case and worst
case scenario – figures up to 400 to 470 mm/a (or approx. 33,000 to 39,000 m³/a). On the other hand
in the dry years 1995 and 2000 the value is less than 200 mm/a (below 17,000 m³/a). The divergence
between best case and worst case is comparatively low. It does not exceed approx. 20 %. During the
period 1985 to 2000 the mean groundwater recharge is 250 to 300 mm/a. It does not lie considerably
beyond the model predict of 220 mm/a (see Fig. 5).
5
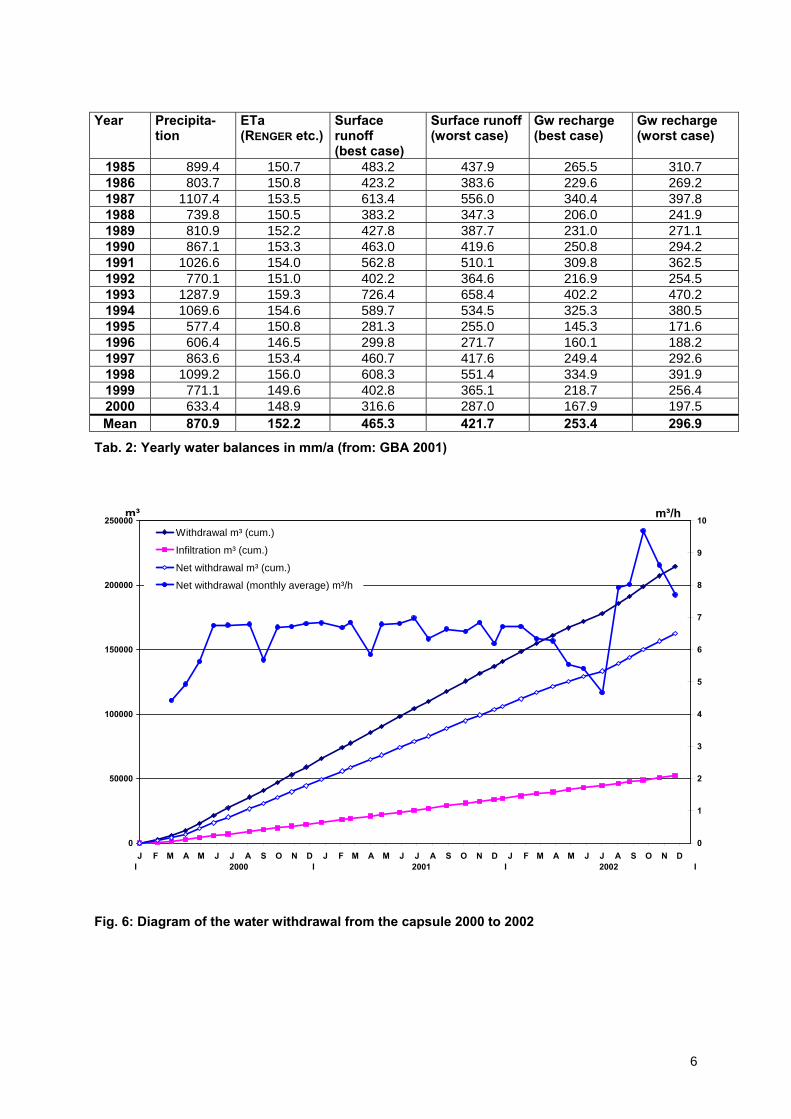
Tab. 2: Yearly water balances in mm/a (from: GBA 2001)
Year Precipita-tion
ETa (RENGER etc.)
Surface runoff (best case)
Surface runoff(worst case)
Gw recharge (best case)
Gw recharge (worst case)
1985 899.4 150.7 483.2 437.9 265.5 310.7 1986 803.7 150.8 423.2 383.6 229.6 269.2 1987 1107.4 153.5 613.4 556.0 340.4 397.8 1988 739.8 150.5 383.2 347.3 206.0 241.9 1989 810.9 152.2 427.8 387.7 231.0 271.1 1990 867.1 153.3 463.0 419.6 250.8 294.2 1991 1026.6 154.0 562.8 510.1 309.8 362.5 1992 770.1 151.0 402.2 364.6 216.9 254.5 1993 1287.9 159.3 726.4 658.4 402.2 470.2 1994 1069.6 154.6 589.7 534.5 325.3 380.5 1995 577.4 150.8 281.3 255.0 145.3 171.6 1996 606.4 146.5 299.8 271.7 160.1 188.2 1997 863.6 153.4 460.7 417.6 249.4 292.6 1998 1099.2 156.0 608.3 551.4 334.9 391.9 1999 771.1 149.6 402.8 365.1 218.7 256.4 2000 633.4 148.9 316.6 287.0 167.9 197.5 Mean 870.9 152.2 465.3 421.7 253.4 296.9
ig. 6: Diagram of the water withdrawal from the capsule 2000 to 2002
0
50000
100000
150000
200000
250000
J F M A M J J A S O N D J F M A M J J A S O N D J F M A M J J A S O N D0
1
2
3
4
5
6
7
8
9
10Withdrawal m³ (cum.)
Infiltration m³ (cum.)
Net withdrawal m³ (cum.)
Net withdrawal (monthly average) m³/h
m³/hm³
Ι 2000 Ι 2001 Ι 2002 Ι
F
6
10
11
12
13
14
15
16
J F M A M J J A S O N D J F M A M J J A S O N D J F M A M J J A S O N D
Ground-water head
Predicted groundwater headin the capsule area
Ι 2000 Ι 2001 Ι 2002 Ι
Observed groundwater head,downstream the capsule (observation well 8271)
Observed groundwater head,in the capsule area(observation well 5471)
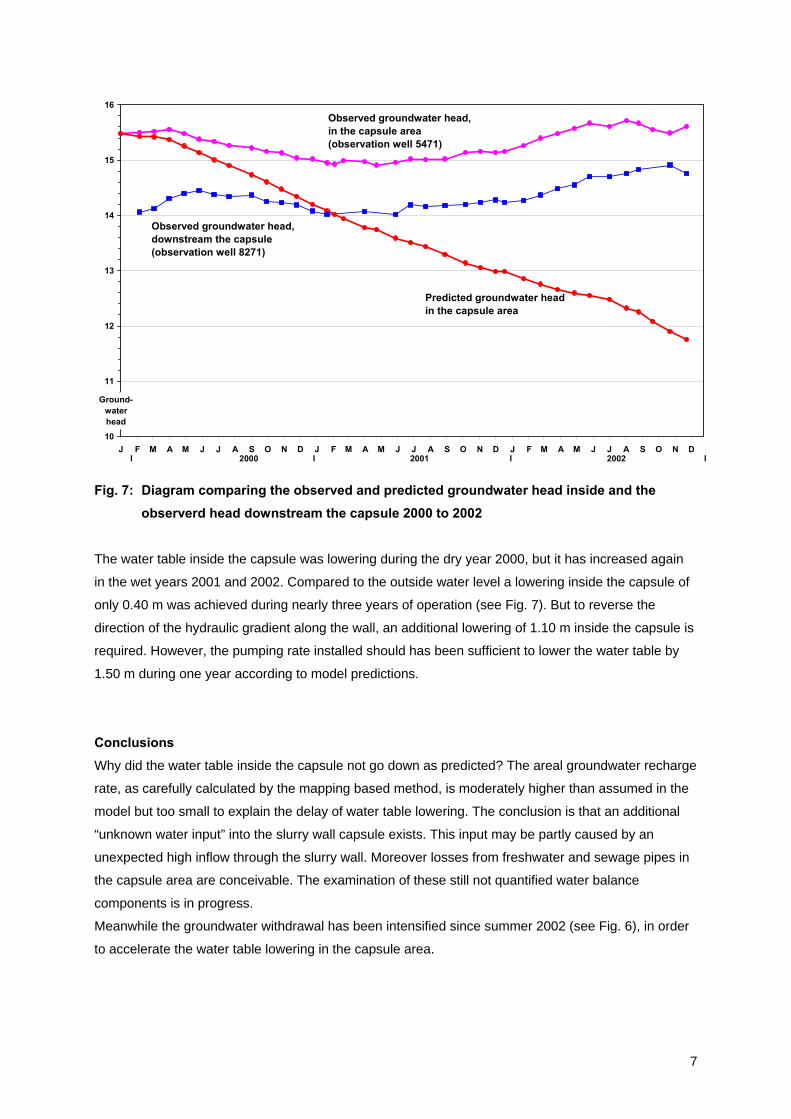
Fig. 7: Diagram comparing the observed and predicted groundwater head inside and the observerd head downstream the capsule 2000 to 2002
The water table inside the capsule was lowering during the dry year 2000, but it has increased again
in the wet years 2001 and 2002. Compared to the outside water level a lowering inside the capsule of
only 0.40 m was achieved during nearly three years of operation (see Fig. 7). But to reverse the
direction of the hydraulic gradient along the wall, an additional lowering of 1.10 m inside the capsule is
required. However, the pumping rate installed should has been sufficient to lower the water table by
1.50 m during one year according to model predictions.
Conclusions Why did the water table inside the capsule not go down as predicted? The areal groundwater recharge
rate, as carefully calculated by the mapping based method, is moderately higher than assumed in the
model but too small to explain the delay of water table lowering. The conclusion is that an additional
“unknown water input” into the slurry wall capsule exists. This input may be partly caused by an
unexpected high inflow through the slurry wall. Moreover losses from freshwater and sewage pipes in
the capsule area are conceivable. The examination of these still not quantified water balance
components is in progress.
Meanwhile the groundwater withdrawal has been intensified since summer 2002 (see Fig. 6), in order
to accelerate the water table lowering in the capsule area.
7
References
DVWK: Ermittlung der Verdunstung von Land- und Wasserflächen, DVWK-Merkblätter 238/1996.
GBA, Geographiebüro Augustin: Ermittlung der Grundwasserneubildung im Bereich der
Grundwasserkapsel Ottensener Straße im Industriegebiet Hamburg-Eidelstedt, Mai 2001.
GEOLOGISCHES LANDESAMT HAMBURG: Grundwassermodell Eidelstedt, 1991 – 1999.
HAUPT, Thomas & SOKOLLEK, Volker: Überwachung der Dichtwandkapsel Hamburg-Eidelstedt –
Bilanzierung des Wasserhaushalts, Mitteilungen des Instituts für Grundbau und Bodenmechanik
Technische Universität Braunschweig, Heft Nr. 69, 2002, pp 289 – 302.
PROKSCH, Walter: Lysimeterauswertungen zur flächendifferenzierten Ermittlung mittlerer
Grundwasserneubildungsraten, Besondere Mitteilungen zum Deutschen Gewässerkundlichen
Jahrbuch Nr. 55, Koblenz 1990.
8
![Entwicklung von flüssig-flüssig Slurry-Systemen für ... · Tabelle 2.1: Vergleich von heterogener und homogener Katalyse [25] Heterogen Katalyse Homogene Katalyse Effektivität](https://static.fdokument.com/doc/165x107/5e1a406c19f08502d45d3a43/entwicklung-von-flssig-flssig-slurry-systemen-fr-tabelle-21-vergleich.jpg)


![Capsule & Powder Technology] - Bickel & Wolf HOeFLIGER/1 Modu-C_d.pdf · Capsule & Powder Technology] - Optionale Tara/Brutto-Waage für die Stichproben - Modu-C kontrolle oder 100%-Qualitätskontrolle.](https://static.fdokument.com/doc/165x107/5e1c6045626e4d6d4779fb2b/capsule-powder-technology-bickel-hoefliger1-modu-cdpdf-capsule.jpg)