
Monte Carlo computer simulations and electron microscopy ...
11
Monte Carlo computer simulations and electron microscopy of colloidal cluster formation via emulsion droplet evaporation Ingmar Schwarz, Andrea Fortini, Claudia Simone Wagner, Alexander Wittemann, and Matthias Schmidt Citation: J. Chem. Phys. 135, 244501 (2011); doi: 10.1063/1.3672106 View online: http://dx.doi.org/10.1063/1.3672106 View Table of Contents: http://jcp.aip.org/resource/1/JCPSA6/v135/i24 Published by the American Institute of Physics. Related Articles Inhomogeneous fluids of colloidal hard dumbbells: Fundamental measure theory and Monte Carlo simulations J. Chem. Phys. 135, 234510 (2011) Kinetics of phase separation and coarsening in dilute surfactant pentaethylene glycol monododecyl ether solutions J. Chem. Phys. 135, 234503 (2011) Transient cage formation around hot gold colloids dispersed in polymer solutions J. Chem. Phys. 135, 224905 (2011) Dynamics of colloidal particles in ice J. Chem. Phys. 135, 224706 (2011) Effect of shell thickness on two-photon absorption and refraction of colloidal CdSe/CdS core/shell nanocrystals Appl. Phys. Lett. 99, 231903 (2011) Additional information on J. Chem. Phys. Journal Homepage: http://jcp.aip.org/ Journal Information: http://jcp.aip.org/about/about_the_journal Top downloads: http://jcp.aip.org/features/most_downloaded Information for Authors: http://jcp.aip.org/authors
Transcript of Monte Carlo computer simulations and electron microscopy ...

Monte Carlo computer simulations and electron microscopy ofcolloidal cluster formation via emulsion droplet evaporationIngmar Schwarz, Andrea Fortini, Claudia Simone Wagner, Alexander Wittemann, and Matthias Schmidt Citation: J. Chem. Phys. 135, 244501 (2011); doi: 10.1063/1.3672106 View online: http://dx.doi.org/10.1063/1.3672106 View Table of Contents: http://jcp.aip.org/resource/1/JCPSA6/v135/i24 Published by the American Institute of Physics. Related ArticlesInhomogeneous fluids of colloidal hard dumbbells: Fundamental measure theory and Monte Carlo simulations J. Chem. Phys. 135, 234510 (2011) Kinetics of phase separation and coarsening in dilute surfactant pentaethylene glycol monododecyl ethersolutions J. Chem. Phys. 135, 234503 (2011) Transient cage formation around hot gold colloids dispersed in polymer solutions J. Chem. Phys. 135, 224905 (2011) Dynamics of colloidal particles in ice J. Chem. Phys. 135, 224706 (2011) Effect of shell thickness on two-photon absorption and refraction of colloidal CdSe/CdS core/shell nanocrystals Appl. Phys. Lett. 99, 231903 (2011) Additional information on J. Chem. Phys.Journal Homepage: http://jcp.aip.org/ Journal Information: http://jcp.aip.org/about/about_the_journal Top downloads: http://jcp.aip.org/features/most_downloaded Information for Authors: http://jcp.aip.org/authors

THE JOURNAL OF CHEMICAL PHYSICS 135, 244501 (2011)
Monte Carlo computer simulations and electron microscopy of colloidalcluster formation via emulsion droplet evaporation
Ingmar Schwarz,1 Andrea Fortini,1 Claudia Simone Wagner,2 Alexander Wittemann,2
and Matthias Schmidt1,a)
1Theoretische Physik II, Physikalisches Institut, Universität Bayreuth, Universitätsstraße 30, D-95440Bayreuth, Germany2Physikalische Chemie I, Universität Bayreuth, Universitätsstraße 30, D-95440 Bayreuth, Germany
(Received 23 June 2011; accepted 4 December 2011; published online 23 December 2011)
We consider a theoretical model for a binary mixture of colloidal particles and spherical emulsiondroplets. The hard sphere colloids interact via additional short-ranged attraction and long-rangedrepulsion. The droplet-colloid interaction is an attractive well at the droplet surface, which inducesthe Pickering effect. The droplet-droplet interaction is a hard-core interaction. The droplets shrinkin time, which models the evaporation of the dispersed (oil) phase, and we use Monte Carlo sim-ulations for the dynamics. In the experiments, polystyrene particles were assembled using toluenedroplets as templates. The arrangement of the particles on the surface of the droplets was analyzedwith cryogenic field emission scanning electron microscopy. Before evaporation of the oil, the parti-cle distribution on the droplet surface was found to be disordered in experiments, and the simulationsreproduce this effect. After complete evaporation, ordered colloidal clusters are formed that are sta-ble against thermal fluctuations. Both in the simulations and with field emission scanning electronmicroscopy, we find stable packings that range from doublets, triplets, and tetrahedra to complexpolyhedra of colloids. The simulated cluster structures and size distribution agree well with the ex-perimental results. We also simulate hierarchical assembly in a mixture of tetrahedral clusters anddroplets, and find supercluster structures with morphologies that are more complex than those ofclusters of single particles. © 2011 American Institute of Physics. [doi:10.1063/1.3672106]
I. INTRODUCTION
Systems of colloidal particles that interact with pair po-tentials that feature short-ranged attraction have been exten-sively studied in the literature. The typical bulk phase dia-gram shows a characteristic gas-liquid phase transition thatcan become metastable with respect to freezing for suffi-ciently short range of attraction.1–4 While the addition of ashort-ranged soft repulsion is known to change the phasediagram5, 6 only quantitatively, a repulsion with a range largerthan that of the attraction can have a dramatic effect on thetopology of the phase diagram.7 Moreover, both in experi-ments and in dynamical simulations the equilibrium phasediagram for systems with competing interactions is oftenovershadowed by non-equilibrium phenomena such as vitri-fication, gelation, and cluster formation.8–12 Typically, pairpotentials with a short-ranged attraction show spontaneousclustering of particles at sufficiently low temperatures. Thegeometric structure of clusters of particles has been studiedtheoretically, e.g., for the Lennard-Jones potential,13, 14 hardspheres,15 and hard spheres that additionally interact with ashort-ranged attraction.16 The structures obtained using theMorse potential were analyzed by Doye, Wales, and Berry17
and by Taffs et al.18 and compared to those from the Asakura-Oosawa potential.19, 20 Stable clusters of colloids are interest-ing because they can be viewed as colloidal molecules21, 22
a)Electronic mail: [email protected].
that can potentially be used as building blocks for the fabri-cation of novel materials. The size and geometric structure ofcolloidal clusters, however, are not easily controllable in ex-periments. Several different methods that offer control of theclustering process have been proposed. Jiang and Granick23
prepared clusters using Janus colloidal particles, i.e., sphericalparticles that possess oppositely charged hemispheres. Clus-ter of particles with larger numbers of patches have also beenstudied.24–26 Erb et al.27 succeeded in preparing clusters ofmagnetic particles.
One particularly promising approach, based on theevaporation of the dispersed phase in an emulsion, wasdeveloped28 by Velev, Furusawa, and Nagayama.29, 30 Herecolloidal particles adsorb at the interface between dispersedand continuous phase in order to minimize the interfacial freeenergy (Pickering effect).31 During evaporation the particlesare pushed together by capillary forces and subsequently heldtogether by van der Waals interactions. Manoharan, Elsesser,and Pine32 prepared micron-sized clusters using this tech-nique with polystyrene microspheres that were 844 nm indiameter. The authors found clusters of particles with pack-ings that minimize the second moment of the mass distribu-tion. The emulsion method is versatile and was subsequentlyused to obtain clusters of particles 220 nm in diameter,33 ofpatchy particles,34, 35 and of bidisperse colloids.36 Shear wasused by Zerrouki et al.37 to produce monodispersed droplets.A similar technique is based on aerosol droplets38 instead ofoil droplets.
0021-9606/2011/135(24)/244501/10/$30.00 © 2011 American Institute of Physics135, 244501-1

244501-2 Schwarz et al. J. Chem. Phys. 135, 244501 (2011)
Similar in spirit to the emulsion evaporation technique,an alternative miniemulsion technique39, 40 was recently de-veloped. Here, a miniemulsion is prepared from a standardemulsion by ultrasonication. The sound waves produce anemulsion of small droplets in a process of fission and fusion.The average size of the droplets can be tuned in the range of360 nm to 1800 nm.41 Small colloidal particles can then beused in solution with the small monodispersed droplets of theminiemulsion to obtain clusters40 that have diameters muchsmaller than 1 μm. Although these clusters can consist ofmany constituent colloidal spheres, they remain small enoughto reside in the colloidal domain,42 i.e., Brownian motion ther-malizes such systems. Therefore hierarchical self-assemblycomes within reach.
In contrast to the large body of experimental work and theclosely related theoretical efforts to understand the resultingcluster structures and their symmetries, little theoretical workhas been done to describe the process of cluster formation.Roman, Schmidt, and Löwen43 proposed a model for a disper-sion of hard spheres and emulsion droplets, but these authorsdid not investigate cluster formation. Lauga and Brenner44
modeled and simulated the evaporation-driven assembly ofcolloidal particles. They considered individual droplets withvarying numbers of adsorbed particles and calculated the(non-spherical, in general) shape of the oil-water interface bythe requirement of minimal surface free energy. They consid-ered different values of the contact angle and reported goodagreement with experimental findings. Very recently, Maniet al.45 studied the stability of larger colloidosome-like shellsof particles, albeit without modeling the assembly process.
In this paper we present a basic model to describe theprocess of cluster assembly through emulsion droplet evap-oration. We use Monte Carlo computer simulations to studythe cluster formation of colloids with competing short-rangedattraction and long-ranged repulsion interactions. Differentlyfrom Lauga and Brenner44 we also simulate the dynamicalcapture of the colloidal particles onto droplet surfaces andstudied not only the cluster structures but also analyzes thehistograms of the cluster size distribution. We complementthese calculations with experiments of polystyrene particlesin an oil-in-water emulsion. We use cryogenic field emissionscanning electron microscopy (cryo-FESEM) and field emis-sion scanning electron microscopy (FESEM) to investigatethe intermediate and final stages of cluster formation, respec-tively. The cryo-FESEM micrographs show the distributionof small particles on a droplet surface. We find the simulationresults to be in good agreement with the experimental resultsfor both intermediate and final cluster structures. We also findgood quantitative agreement between experimental and simu-lation results for the cluster size distribution. Having demon-strated the validity of our model, we study the possibility ofhierarchical self-assembly, by carrying out simulations of amixture of thermal tetrahedral clusters and emulsion droplets.We obtain clusters of clusters (superclusters) with structuresthat differ from the clusters made of single particles.
The paper is organized as follows. In Sec. II A we givethe details of the pair interactions. In Secs. II B and II C wepresent simulation and experimental details, respectively. InSec. III A, we describe the results for the dynamics of cluster
formation. In Sec. III B, we show the results for the clusterstructures and for the histograms of the size distributions. InSec. III C, we present the results for the superclusters. Finalremarks and conclusions are given in Sec. IV.
II. MODEL AND METHODS
A. Definition of the pair interactions
We study a binary mixture of Nc colloidal particles withhard-sphere diameter σ c and Nd droplets of diameter σ d.The total interaction energy U is the sum of colloid-colloid,droplet-droplet, and colloid-droplet interactions,
U =Nc∑i<j
φcc(|ri − rj |) +Nd∑i<j
φdd (|Ri − Rj |)
+Nc∑i
Nd∑j
φcd (|ri − Rj |), (1)
where ri is the center-of-mass position of colloid i, Rj is thecenter-of-mass position of droplet j, φcc is the colloid-colloidpair interaction, φcd is the colloid-droplet pair interaction, andφdd is the droplet-droplet pair interaction.
We consider two different types of colloid-colloid inter-actions. The first is the sum of the short-ranged attractiveAsakura-Oosawa potential UAO(r) and the long-ranged repul-sive Yukawa potential UY(r), i.e.,
φcc(r) ={
∞ r < σc
UY(r) + UAO(r) otherwise,(2)
with β = 1/kBT, where kB is the Boltzmann constant and T isthe temperature. Here the Yukawa potential is defined by
UY(r) = εYσc
e−κ(r−σc)
r, (3)
and the Asakura-Oosawa potential19, 20 is
UAO(r) ={
−εAOf (r) σc < r < σc(1 + q)
0 otherwise,(4)
with f (r) =[1 − 3r
2(1+q)σc+ r3
2(1+q)3σ 3c
]. The parameter εAO
controls the strength of attraction, while εY controls thestrength of the repulsion. The range of the interactions arecontrolled by the parameter q for the AO potential and byκ for the Yukawa interaction. We refer to the combined in-teraction (2) as the Asakura-Oosawa-Yukawa (AOY) poten-tial. Although both the AO and Yukawa potentials have veryspecific physical interpretations, we use them in this papermerely as generic models for a steep short-range attractionand a long-range repulsion, respectively. The AO potential de-scribes the depletion attraction between colloidal particles dueto the presence of non-adsorbing polymers with radius of gy-ration σ cq/2. In the limit of small q Eq. (4) is exact and f(r) isrelated to the free volume gained by the polymers when twocolloids are close to each other.4 The Yukawa potential de-scribes the interaction between two charged particles screenedby a medium with inverse Debye length κ . As shown inFig. 1(a), for a typical set of parameters (justified below) that
244501-3 Cluster formation via emulsion droplets J. Chem. Phys. 135, 244501 (2011)
(a) (b)
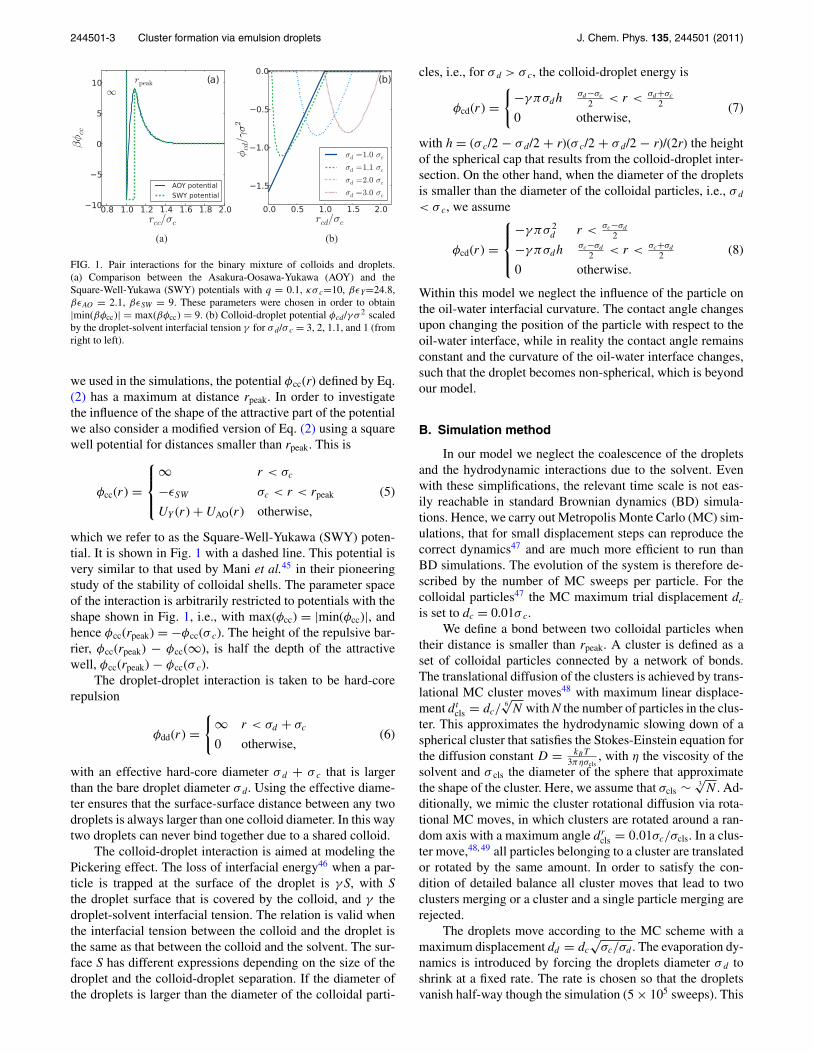
FIG. 1. Pair interactions for the binary mixture of colloids and droplets.(a) Comparison between the Asakura-Oosawa-Yukawa (AOY) and theSquare-Well-Yukawa (SWY) potentials with q = 0.1, κσ c=10, βεY=24.8,βεAO = 2.1, βεSW = 9. These parameters were chosen in order to obtain|min(βφcc)| = max(βφcc) = 9. (b) Colloid-droplet potential φcd/γ σ 2 scaledby the droplet-solvent interfacial tension γ for σ d/σ c = 3, 2, 1.1, and 1 (fromright to left).
we used in the simulations, the potential φcc(r) defined by Eq.(2) has a maximum at distance rpeak. In order to investigatethe influence of the shape of the attractive part of the potentialwe also consider a modified version of Eq. (2) using a squarewell potential for distances smaller than rpeak. This is
φcc(r) =
⎧⎪⎨⎪⎩
∞ r < σc
−εSW σc < r < rpeak
UY (r) + UAO(r) otherwise,
(5)
which we refer to as the Square-Well-Yukawa (SWY) poten-tial. It is shown in Fig. 1 with a dashed line. This potential isvery similar to that used by Mani et al.45 in their pioneeringstudy of the stability of colloidal shells. The parameter spaceof the interaction is arbitrarily restricted to potentials with theshape shown in Fig. 1, i.e., with max(φcc) = |min(φcc)|, andhence φcc(rpeak) = −φcc(σ c). The height of the repulsive bar-rier, φcc(rpeak) − φcc(∞), is half the depth of the attractivewell, φcc(rpeak) − φcc(σ c).
The droplet-droplet interaction is taken to be hard-corerepulsion
φdd(r) ={
∞ r < σd + σc
0 otherwise,(6)
with an effective hard-core diameter σ d + σ c that is largerthan the bare droplet diameter σ d. Using the effective diame-ter ensures that the surface-surface distance between any twodroplets is always larger than one colloid diameter. In this waytwo droplets can never bind together due to a shared colloid.
The colloid-droplet interaction is aimed at modeling thePickering effect. The loss of interfacial energy46 when a par-ticle is trapped at the surface of the droplet is γ S, with Sthe droplet surface that is covered by the colloid, and γ thedroplet-solvent interfacial tension. The relation is valid whenthe interfacial tension between the colloid and the droplet isthe same as that between the colloid and the solvent. The sur-face S has different expressions depending on the size of thedroplet and the colloid-droplet separation. If the diameter ofthe droplets is larger than the diameter of the colloidal parti-
cles, i.e., for σ d > σ c, the colloid-droplet energy is
φcd(r) ={
−γπσdhσd−σc
2 < r < σd+σc
2
0 otherwise,(7)
with h = (σ c/2 − σ d/2 + r)(σ c/2 + σ d/2 − r)/(2r) the heightof the spherical cap that results from the colloid-droplet inter-section. On the other hand, when the diameter of the dropletsis smaller than the diameter of the colloidal particles, i.e., σ d
< σ c, we assume
φcd(r) =
⎧⎪⎨⎪⎩
−γπσ 2d r < σc−σd
2
−γπσdhσc−σd
2 < r < σc+σd
2
0 otherwise.
(8)
Within this model we neglect the influence of the particle onthe oil-water interfacial curvature. The contact angle changesupon changing the position of the particle with respect to theoil-water interface, while in reality the contact angle remainsconstant and the curvature of the oil-water interface changes,such that the droplet becomes non-spherical, which is beyondour model.
B. Simulation method
In our model we neglect the coalescence of the dropletsand the hydrodynamic interactions due to the solvent. Evenwith these simplifications, the relevant time scale is not eas-ily reachable in standard Brownian dynamics (BD) simula-tions. Hence, we carry out Metropolis Monte Carlo (MC) sim-ulations, that for small displacement steps can reproduce thecorrect dynamics47 and are much more efficient to run thanBD simulations. The evolution of the system is therefore de-scribed by the number of MC sweeps per particle. For thecolloidal particles47 the MC maximum trial displacement dc
is set to dc = 0.01σ c.We define a bond between two colloidal particles when
their distance is smaller than rpeak. A cluster is defined as aset of colloidal particles connected by a network of bonds.The translational diffusion of the clusters is achieved by trans-lational MC cluster moves48 with maximum linear displace-ment dt
cls = dc/6√
N with N the number of particles in the clus-ter. This approximates the hydrodynamic slowing down of aspherical cluster that satisfies the Stokes-Einstein equation forthe diffusion constant D = kBT
3πησcls, with η the viscosity of the
solvent and σ cls the diameter of the sphere that approximatethe shape of the cluster. Here, we assume that σcls ∼ 3
√N . Ad-
ditionally, we mimic the cluster rotational diffusion via rota-tional MC moves, in which clusters are rotated around a ran-dom axis with a maximum angle dr
cls = 0.01σc/σcls. In a clus-ter move,48, 49 all particles belonging to a cluster are translatedor rotated by the same amount. In order to satisfy the con-dition of detailed balance all cluster moves that lead to twoclusters merging or a cluster and a single particle merging arerejected.
The droplets move according to the MC scheme with amaximum displacement dd = dc
√σc/σd . The evaporation dy-
namics is introduced by forcing the droplets diameter σ d toshrink at a fixed rate. The rate is chosen so that the dropletsvanish half-way though the simulation (5 × 10⁵ sweeps). This

244501-4 Schwarz et al. J. Chem. Phys. 135, 244501 (2011)
leaves another 5 × 10⁵ sweeps to investigate the stability ofthe clusters against thermal fluctuations. Here the timescalesare chosen for practical reasons. In the experiments stabilitycan be relevant on the time scales of years, while the clustersexperiments last typically tens of minutes. Hence, our simula-tion do not address the true long-time behavior of the system.
We restrict ourselves to symmetric potentials withmax(βφcc) = |min(βφcc)|. In particular, we investigate thecase max(βφcc) = 9 as shown in Fig. 1 (q = 0.1, κσ c = 10and rc = 2.5 σ c). The height of the repulsive barrier is 9 kBT,a value big enough to hinder spontaneous clustering, whilethe depth of the attractive well is 18 kBT, so that in practice aparticle cannot escape by thermal fluctuations. For these pa-rameters we find that the maximum of the potential is at rpeak
= 1.0845σ c. For each parameter set we run eight independentMC simulations with Nc = 500 colloidal particles with pack-ing fraction ηc = 0.0034, and 0.01. The droplets packing frac-tion is fixed at ηd = 0.1. Simulations have been performed forinitial droplet sizes σ d(0) = 2, 4, 6, and 8σ c. Each simulationconsisted of 106 MC sweeps. In every sweep all particles areattempted to be moved on average once. The droplets and theparticles are initialized randomly in the cubic simulation box,with the constraints that all colloids are outside of the dropletsand that the minimum distance between colloidal particles islarger than rpeak. Hence, we start in a state without clusters.We characterize the cluster structure by the bond-number nb,corresponding to the number of pairwise bonds in a cluster.The number of bonds is also an estimate of the total energy ofthe cluster; a higher number of bonds corresponds to a greaterattractive energy.
C. Experimental methods
1. Cluster preparation
The colloidal particles are positively charged and nar-rowly dispersed polystyrene spheres with 154 nm diameter. Adetailed description of the preparation of the constituent par-ticles and their assembly into clusters is given in Ref. 39. Inparticular, in these experiments, the particles were added bothvia the water and via the oil phase. For the present studies theclusters were prepared in a slightly modified fashion. Briefly,53 mg polystyrene particles suspended in 3 ml of toluene and73 μl dodecane (to suppress Ostwald ripening) were emul-sified with 27 ml of an aqueous solution of Pluronic R© F-68(1 wt. %) using an ultrasonic homogenizer (Sonoplus HD3200, Bandelin). Evaporation of the dispersed toluene phaseunder reduced pressure (50 mbar, 40 ◦C) initiated the assem-bly of the particles into clusters.
2. Electron microscopy of droplet and assemblymorphology
The emulsion droplets bearing polystyrene particles attheir surface were examined on a cryogenic field emis-sion scanning electron microscope (Ultra Plus, Zeiss). Spec-imen preparation was accomplished by sandwiching 4 μlof the emulsion in between two aluminum platelets (3 mm× 0.5 mm, 0.15/0.15 mm, Engineering Office M. Wohlwend).The carrier assembly was plunged into a high-pressure-
freezing machine (EM HPM100, Leica) and was vitrified at2000 bar within 20 ms. This helped sealing the sandwich sothat nucleation of ice crystals and specimen damage were sup-pressed. In a cryo preparation chamber (EM MED020 FF, Le-ica) the sample was freeze-fractured, lightly etched for 60 s at−112 ◦C, and sputtered with platinum in an amount equiva-lent to a 4 nm thick coating. The specimen was transferred bya cryo shuttle (EM VCT 100, Leica) to the cold stage of themicroscope. Micrographs were recorded digitally at a temper-ature of −160 ◦C, with an aperture of 10 μm and a voltage of1.0 kV. The morphologies of the colloidal assemblies were an-alyzed by FESEM on a Zeiss LEO 1530 Gemini microscopeequipped with a field emission cathode operating at 3 kV. Aminute amount of the cluster suspension (10−5 wt. %) wasplaced onto a silicon wafer (CrysTec) and dried under am-bient conditions. The specimen was coated with a platinumlayer of 1.3 nm thickness using a sputter coater (Cressington208HR) to make the specimen conductive.
III. RESULTS
A. Dynamics of cluster formation
Figure 2 shows simulation snapshots at four differentstages of the simulation. The initial configuration of the sim-ulation (Fig. 2(a)) is a binary mixture of non-overlappingspheres. The large (pink) spheres represent the droplets, whilethe small (blue) spheres represent single colloidal particles.After 3.6 × 10⁵ MC sweeps (Fig. 2(b)) particles are trappedat the surface of a droplet (red). Figure 2(c)) shows the con-figuration after 5 × 10⁵ sweeps, just after the droplets havevanished completely. Figure 2(d)) shows the configuration atthe end of the simulation after 106 sweeps. All clusters thatare formed due to the droplets are still present in the sys-
FIG. 2. Snapshots of the binary mixture of colloids and droplets at colloidpacking fraction ηc = 0.0034 and SWY potential. Results are shown at dif-ferent stages of the simulation. (a) Initial configuration, (b) after 3.6 × 10⁵,(c) after 5 × 10⁵, and (d) after 106 MC sweeps. Droplets are shown as pinkspheres, single colloidal particles are depicted as blue spheres, green is usedfor particles belonging to spontaneously formed clusters. Colloidal particlestrapped at the surface of a droplet or in a droplet-induced cluster are shownin red.

244501-5 Cluster formation via emulsion droplets J. Chem. Phys. 135, 244501 (2011)
FIG. 3. Colloidal particles trapped at the surface of an emulsion droplet ob-tained with a Cryo-FESEM micrograph of a toluene-in-water emulsion sta-bilized by crosslinked polystyrene particles. Inset: Simulation snapshot of asingle droplet and colloidal particles trapped at its surface obtained after 3 ×10⁵ MC sweeps.
tem demonstrating the stability of the clusters against thermalfluctuations. Few doublets (green) have also formed sponta-neously. As a check we simulated the structure of the pure col-loidal fluid without droplets. We find that the structure of thesingle component fluid is largely composed of single particleswith only 1% of particles belonging to doublets. Larger clus-ters are not formed during the span of our simulations. Thiscan be explained easily by the following argument. The min-imum distance between colloidal particles is at the beginningof the simulation larger than rpeak. In order to form a bond,the colloidal particles have to overcome the repulsive energybarrier (9kBT) of the colloid-colloid interaction. The proba-bility to overcome thermally this barrier is very small, and inorder to form larger clusters the particles have to be forcedbeyond the repulsive barrier. Hence, in the restricted time in-terval that is accessible in the simulations, the colloidal fluidis (quasi-)stable. However, for longer times further clusteringmight occur (see discussion in Sec. II B).
In the binary mixture, a clustering mechanism is providedby the shrinking droplets. The formation of small clusters im-plies that only a limited number of particles are bound ontothe droplets. The small size of our particle makes them idealfor the self-assembly of small clusters that are well suited asbuilding blocks for subsequent self-assembly, but preventedus to follow the assembly process in experiments in real spacesuch as Manoharan, Elsesser, and Pine.32 Therefore, we stud-ied their distribution in the experimental emulsions with cryo-FESEM. The micrographs (Fig. 3) indicate a random distri-bution of the positions of the particles at the droplet surface.The void in the center presents the imprint of the frozen dis-persed phase, i.e., a single micron-sized toluene droplet. Thepolystyrene particles left in the cavity after sublimation oftoluene are randomly distributed at the former droplet sur-face. Because toluene is a good solvent for polystyrene, theparticles are significantly swollen at the droplet interface asexpressed by a larger diameter. This agrees with the fact thatthe micrograph indicates that the polystyrene particles preferthe dispersed toluene phase. The position distribution of the
particles on the droplet surface in simulations (Fig. 2(b) andinset of Fig. 3) is in good agreement with the experiment andindicates that the particles can freely diffuse on the surface ofthe droplets.
In simulations, we consider the case that the particle sur-face has no preference of whether it wets oil or water. Hence,the contact angle at a (planar) oil-water interface is 90◦ be-cause of the assumption that the colloid-solvent interfacialtension is equal to the colloid-droplet interfacial tension – seethe discussion above Eq. (7) . Despite the difference in contactangle between simulation and experiments we do not expectthe contact angle to affect the final results.44
The liquid structure can be further characterized in com-puter simulations. We calculated the colloid-droplet radialdistribution functions, gcd(r), and the colloid-colloid radialdistribution functions, gcc(r), at different stages of the sim-ulations. Since the droplet diameter σ d changes continuouslyduring the simulation the resulting transient structures cap-tured by the distribution functions are not at equilibrium.Figure 4 shows gcd(r) and gcc(r) at different stages. For thecolloid-colloid correlation function we plot both the results ofthe SWY (blue full line) and AOY potentials (yellow dashedline). In particular, Fig. 4(a) shows the correlation functionsafter 105 MC sweeps. The colloid-droplet radial distributionfunction gcd(r) has a small peak at r � 3.1 σ c correspondingto the instantaneous droplet radius σ d(t)/2. The peak is due tocolloidal particles trapped at the droplet surface. At the sametime the colloid-colloid radial distribution functions gcc(r) areapparently flat outside of the core region. In fact, the radialdistribution function is decaying in a way consistent with theBoltzmann factor g(r) = e−βφcc(r) as expected for an equilib-rium low density gas. Figure 4(b) shows the correlation func-tions after 3 × 10⁵ MC sweeps. The cross pair correlationfunction gcd(r) shows that the droplets have shrunk to a ra-dius σ d(t)/2 � 1.45 σ c, while gcc(r) has developed structureat intermediate distances. These results can be explained byparticles trapped at the surface of the droplets and interactingwith each other via the long-ranged colloid-colloid repulsion.After 3.6 × 10⁵ MC sweeps (Fig. 4(c)) the droplet radius hasbecome smaller than σ c. The strong peak at r = σ c indicatesthat a large number of bonds between colloidal particles haveformed for both the AOY and SWY potentials. Finally, after5 × 105 MC sweeps (Fig. 4(d)) a dramatic change of gcd(r)is observed, which is due to droplets having a diameter σ d(t)= 0, and diffusing freely. We show the left panel of Fig. 4(d)for completeness, but stress that it does not correspond to anyphysical situation. On the other hand, gcc(r) shows that strongpeaks have formed also at distances larger than σ c, indicatingthe presence of small clusters. The time evolution of gcc(r)for the two potentials is very similar. Most notably the finalconfigurations differ due to different final cluster structures.
B. Cluster structure and size distribution
An overview of the different cluster structures foundat the end of the simulation runs and in the experiment ispresented in Figs. 5 and 6. In particular, Fig. 5 shows thesimulation structures obtained at colloid packing fraction ηc

244501-6 Schwarz et al. J. Chem. Phys. 135, 244501 (2011)
FIG. 4. Colloid-droplet (left) and colloid-colloid (right) radial distributionfunctions, gcd(r) and gcc(r), respectively, as a function of the scaled dis-tance r/σ c at colloid packing fraction ηc = 0.0034. We plot gcc(r) for theSWY (blue full line) and the AOY (yellow dashed line) potentials. Resultsare shown at different stages of the computer simulation: (a) after 105, (b)after 3 × 10⁵, (c) after 3.6 × 10⁵, and (d) after 5 × 10⁵ MC sweeps.
= 0.0034 for the SWY potential and σ d(0) = 8 σ c. We findclusters with sizes between nc = 2 (doublets not shown) andnc = 9, with nc the number of particles belonging to a cluster.
In particular, we find that for nc ≤ 7 the clusters have thesame structures as Lennard-Jones clusters.13 We find tripletsfor nc = 3 (Fig. 5(a)), tetrahedra for nc = 4 (Fig. 5(b)), trian-gular dipyramids for nc = 5 (Fig. 5(c)), octahedrons for nc = 6(Fig. 5(d)), and pentagonal dipyramids for nc = 7 (Fig. 5(e)).For large number of particles we find the snub disphenoid fornc = 8 (Fig. 5(f)) and triaugmented triangular prism for nc = 9(Fig. 5(g), with two different orientations). In computer simu-lations clusters with particle numbers nc ≥ 10 are obtained at
FIG. 5. Cluster structures found in simulations (left) for SWY potential,σ d(0) = 8σ c, ηc = 0.0034 and micrographs from FESEM (right). The scale-bars indicate 200 nm. The wireframe in the simulation structures connectsthe particles centers in order to visualize the geometric arrangement.
higher packing fractions. The additional structures obtainedat colloid packing fraction ηc = 0.01 are shown in Fig. 6. Thesquare dipyramid is found for nc = 5 (Fig. 5(a)) Also, forthe clusters with nc = 10 ( gyroelongated square dipyramidin Fig. 6(b)) and nc = 12 (icosahedron in Fig. 6(d)) we findgood agreement with experiments. The cluster with nc = 11(icosahedron minus one, Fig. 6(c)) was, on the other hand,not found in experiments. As this structure is identical to theicosahedron except for one missing particle, it can easily bemissed in the experimental FESEM micrographs.
These structures are also in good agreement with thoseobserved in previous experiments.32, 40 As noted by Manoha-ran, Elsesser, and Pine,32 clusters containing nc = 8 (snub
FIG. 6. Same as Fig. 5, but for ηc = 0.01. Only additional structures notfound at ηc = 0.0034 are shown.

244501-7 Cluster formation via emulsion droplets J. Chem. Phys. 135, 244501 (2011)
FIG. 7. Distribution of the number of clusters, Nnc , as a function of the number of particles in the cluster, nc, found in computer simulations (SWY, ηc
= 0.0034). For clarity, the nc = 1 bar is omitted. Shown are result for different initial droplet sizes: (a) σ d(0)/σ c = 2. (b) σ d(0)/σ c = 4. (c) σ d(0)/σ c = 6.(d) σ d(0)/σ c = 8.
disphenoid), nc = 9 (triaugmented triangular prism), and nc
= 10 (gyroelongated square dipyramid) particles are mem-bers of a set of convex polyhedra.50
Larger cluster structures can be obtained not only by in-creasing the colloid packing fraction but also by increasingthe starting droplet size, as demonstrated by the histogramsof the number of clusters Nnc
, with nc the number of col-loidal particles forming the cluster. Figure 7 shows the clusterdistribution for varying starting droplet sizes 2 < σ d(0)/σ c
< 8. From Figs. 7(a) to 7(d) the distribution becomes broaderfor larger droplet diameters σ d(0), while at the same time theyield of smaller clusters decreases. The presence of a greaternumber of large clusters at larger droplet diameters can beexplained by the larger surface available to capture colloidalparticles in the initial stages of the simulation. Likewise, theprobability to capture a small number of colloidal particlesdecreases with increasing droplet surface, which leads to adecrease in the yield of small clusters.
The comparison with experiments can be made morequantitative by comparing the experimentally40 measuredweight fraction of the clusters with the total number of par-ticles, ncNnc
, belonging to a cluster with nc colloids. In orderto compare the two quantities we normalize the experimentalresults with the weight fraction of single particles and the sim-ulation results by the number of single particles N1. In the firstexperiments by Wagner et al., the particles were dispersed inthe oil phase. In subsequent work Wagner et al.,40 experimen-tally compared this situation with that of adding particles viathe water phase. They found that the same cluster structuresresult and that the cluster size distributions are also similar.In the present paper, for consistency, in Fig. 8 we comparethe simulation results to experiments where the particles wereadded via the water phase. We keep, as an additional data set,the size distributions that were obtained by adding particlesvia the oil phase. Figure 8 shows the two experimental resultstogether with the simulation results for the SWY potential,σ d(0)/σ c = 4, and ηc = 0.0034 corresponding to a percentageof particles per oil of 3.4%. As the degree of polydispersityof our emulsions is low,40 we do not expect it to have a sig-nificant effect on the experimental size distribution, and thecomparison to the (monodispersed) simulation results is vi-able. Zerrouki et al.,37 at 5% in weight of silica microparticlesper volume of oil, found a fraction with respect to singletsof 0.75, 0.7 and 0.47 for doublets, triplets, and quadruplets,
respectively. Although these are higher yields than what wefound in our simulations and experiments, their experimentalparameters differ significantly from ours, so that no conclu-sion about the relative performance of both methods can bedrawn.
In simulations, we find that clusters with the same num-ber of constituent particles can still have a variety of differ-ent structures (isomers). Instead of distinguishing between allpossible isomers we classify clusters based on their number ofbonds. The bond-number nb is defined as the total number ofbonds in a cluster and, although unable to distinguish betweenall possible isomers, gives an indication of the compactness ofthe cluster; for a given value of nc a smaller number of bondsindicates a more open structure as compared to a cluster withmore bonds.
Figure 9(a) shows a stacked histogram of the number ofclusters with a specific bond-number (SWY potential, σ d(0)= 8σ c, ηc = 0.0034). The total height of the columns indi-cates the number of cluster Nnc
with nc particles. Each baris divided in differently colored regions with a relative sizeproportional to the number of clusters with nb bonds. Each
FIG. 8. Comparison between the number of particles ncNnc /N1 belongingto a cluster of size nc found in simulations and the weight fraction of par-ticles as a function of nc measured in experiments (see Figures 4 and 6 ofRef. 40). The simulation results are for starting droplet size σ d/σ c = 4, andηc = 0.0034. In the experiments the amount of building blocks added viathe water or oil phase was 108 mg. For both simulation and experiments thepercentage of particles per oil was 3.4%.

244501-8 Schwarz et al. J. Chem. Phys. 135, 244501 (2011)
FIG. 9. Number of cluster N with nc colloidal particles (σ d(0) = 8 σ c andηc = 0.0034). The total height of the columns indicates the number of clusterNnc with nc particles. Each bar is divided in differently colored regions witha relative size proportional to the number of clusters with nb bonds. The nu-merical label indicate the bond-number for the region. For clarity, the nc = 1bar is omitted. (a) Results for the SWY potential. Shown are also the namesof the most relevant structures. (b) Results for the AOY potential.
region is labeled with the actual bond-number. For nc = 2,3, only one type of cluster is found with nb = 1, 3, respec-tively. Clearly, these bond-numbers correspond to doubletsand triplets, respectively. For nc = 4, two different structuresare found, a small fraction of clusters with an open struc-ture with only four bonds, and a structure with six bonds,corresponding to the tetrahedron shown in Fig. 5(b). For in-creasing number of constituent particles the number of iso-mers increases. Figure 9(b)) shows the stacked histogram ofthe number of clusters with a specific bond-number for theAOY potential (σ d(0) = 8σ c, ηc = 0.0034). Strikingly, theAOY potential produces a larger number of different iso-mers than the SWY potential. In particular, the AOY poten-tial has isomers with smaller bond-numbers compared to theSWY potential. We interpret the more open structures thatwe find for the AOY potential as a direct result of its steepattraction and the resulting slow equilibration of the clustergeometry.
C. Hierarchical assembly: Superclusters
In order to investigate the possibility of hierarchical as-sembly of colloidal particles using the droplet-evaporationtechnique we carried out computer simulations of a mixturesof tetrahedral clusters and emulsion droplets. Hence, we pre-pared an initial configuration of the simulation consisting ofclusters with tetrahedral symmetry (Fig. 5(b)). No single par-ticles or other than tetrahedral cluster structures were present.
The tetrahedral clusters are thermal in the sense thatthe particles forming the clusters are kept together solely bythe short-ranged attraction and can in principle dissolve, i.e.,bonds can break on a long time scale by thermal activation.In experiments, bond breaking is even more unlikely becauseclusters are held together by van der Waals interactions, whichare much stronger than the attraction used in our model. Nev-ertheless, structures that require bond-breaking in order toform are easily recognized.
Figure 10 shows the structures obtained in the simula-tions (SWY potential, σ d = 9σ c, ηc = 0.1). In particular,Figs. 10(a) and 10(b) show two structures consisting of
FIG. 10. Supercluster structures (SWY potential, σ d(0) = 9σ c, ηc = 0.1).Particles with the same color belong to the same initial tetrahedral buildingblock. (a) Octahedral dipyramid, (b) truncated hexagonal layers, (c) super-cluster composed of three tetrahedra, and (d) supertetrahedron.
two tetrahedral building blocks. The octahedral dipyramid(Fig. 10(a)) is formed by two tetrahedra rotated by 30◦ againsteach other and with two faces touching. Figure 10(b) showstwo truncated hexagonal layers. This cluster formation is pos-sible only because one of the initial tetrahedral clusters hasdissolved. This structure is therefore not accessible experi-mentally when non-thermal clusters are used. Figure 10(c)shows superclusters of three tetrahedra, while Fig. 10(d)shows a supertetrahedron, i.e., a cluster formed by four tetra-hedra arranged a tetrahedral geometry.
IV. SUMMARY AND CONCLUSIONS
We investigated cluster formation via emulsion dropletevaporation with computer simulations and experiments. Weused Metropolis Monte Carlo simulations to model the pro-cess of cluster formation in a binary mixture of colloidal par-ticles and emulsion droplets. The colloidal particles interactvia both a short-ranged attraction and a long-ranged repul-sion, while the second component that represents the emul-sion droplets interacts only with an attractive well with thecolloids. This potential well has a minimum at the dropletsurface in order to induce the Pickering effect. The droplet-droplet interaction is a hard-core interaction with a hard-sphere diameter chosen so that the droplets cannot merge. Thedroplets shrink at a fixed rate, in order to model experimentalconditions of droplet evaporation.
We also performed experiments on polystyrene spheres154 nm in diameter in a toluene-water emulsion. The emul-sion was vitrified and analyzed with cryo-FESEM, before theevaporation process. The micrographs indicated a random dis-tribution of the positions of the particles that are trapped atthe droplet surface. These results can be surprising becausecharged particles act as electric dipoles when trapped ontodroplets due to the effect that the part of their surface exposedto the nonpolar solvent (toluene) cannot sustain its charge.The resulting long-ranged dipolar repulsions may result inregular spatially separated arrangements of the particles atthe interface.51, 52 For micron-sized particles this is supportedby optical micrographs that indicate polyhedral arrangementswhen a small number of particles are bound onto an emul-sion droplet.53 A different scenario can be expected for oursubmicron-sized particles because their higher diffusivity caninterfere with repulsive interactions, and suppress regularorientation. Interestingly, an earlier study of droplets stabi-lized by a large number of submicron-sized colloids couldeven demonstrate that the particles are not necessarily kept
244501-9 Cluster formation via emulsion droplets J. Chem. Phys. 135, 244501 (2011)
separated from each other and can form close-packed islandsor even a monolayer.54
Computer simulation snapshots and radial distributionfunctions were used to analyze the dynamics of cluster forma-tion in computer simulation. In agreement with experimen-tal results we find that in our model the particles can freelydiffuse on the surface of the droplet before the evaporatingdroplets force particle agglomeration into clusters. The degreeof ordering of the particles on the droplet surface dependson the range of the repulsive interaction, (Debye screeninglength) that in our model is of the order of two particle diam-eters. Choosing a longer range for the repulsion could lead toordered distribution of particles on the surface of the droplets.Furthermore the strength of dipolar interactions, neglected inour present model, could be relevant.
After the complete evaporation of the droplets we findstable clusters that range from sphere doublets to complexpolyhedra. The structures and size distributions found in sim-ulations matched those found in experiments. Histogramsshow that larger clusters can be obtained by increasing theinitial size of the droplets or by increasing the density ofcolloidal particles at the expense of a smaller yield forsmaller clusters in accordance with the results of Wagneret al.40
The bond number was used to distinguish different struc-tures with the same number of constituent particles. We foundthat although the AOY potential gives the same clusters andsize distributions as the SWY potential, the AOY interactionresults in a larger number of possible structures than the SWYinteraction. In particular, the AOY potential gives structureswith a smaller number of bonds, i.e., with more open struc-ture. This is intuitively reasonable, since the steep attractivepart of the AOY potential results in a difficult equilibrationof the geometric structure of the clusters. Although these po-tentials do not model quantitatively our experimental system,this study can give an indication of what type of interactionsone should use in order to change the cluster morphology tomore open (softer) clusters.
Our simple model reproduces the experimental results ac-curately despite a lack of realistic energy or time scales. It istherefore sensible to assume that the model captures the es-sential physics of the assembly process and that more com-plex assembly processes can be studied with a certain confi-dence. Hence, the model can be useful to guide experimentalwork. As an example we applied the theoretical model to afluid mixture of tetrahedra clusters and droplets. The com-puter simulations show that the assembly process via emul-sion droplet evaporation can lead to stable superclusters withtwo, three, and four tetrahedral building blocks. These novelstructures are not found in the assembly of single nanoparti-cles and could represent a step in the direction of novel andcomplex mesoscale materials.
We neglected in our theoretical model the formation ofdipole moments for particles trapped at the droplet surface.Including dipolar interactions and increasing the range of therepulsion both constitute interesting steps beyond the cur-rent work. Furthermore, using our present model for study-ing gelation, as was recently reported in colloidal dispersionswith a small immiscible liquid,55 could be interesting.
ACKNOWLEDGMENTS
We thank Douglas J. Ashton and Helmut R. Brand foruseful discussions. We thank Beate Förster and Martina Hei-der, Bayreuth Institute of Macromolecular Research, for tak-ing cryo-FESEM images. I.S. acknowledges the Elite Net-work of Bavaria for support in the frame of the Elite StudyProgram “Macromolecular Science.” We acknowledge theDeutsche Forschungsgemeinschaft (DFG) for financial sup-port via SFB840/A3.
1H. N. W. Lekkerkerker, W. C. K. Poon, P. N. Pusey, A. Stroobants, andP. B. Warren, Europhys. Lett. 20, 559 (1992).
2S. M. Ilett, A. Orrock, W. C. K. Poon, and P. N. Pusey, Phys. Rev. E 51,1344 (1994).
3M. Schmidt, H. Löwen, J. M. Brader, and R. Evans, Phys. Rev. Lett. 85,1934 (2000).
4M. Dijkstra, J. M. Brader, and R. Evans, J. Phys.: Condens. Matter 11,10079 (1999).
5A. Fortini, M. Dijkstra, and R. Tuinier, J. Phys.: Condens. Matter 17, 7783(2005).
6D. Pini, A. Parola, and L. Reatto, J. Phys: Condens. Matter 18, S2305(2006).
7A. de Candia, E. D. Gado, A. Fierro, N. Sator, M. Tarzia, and A. Coniglio,Phys. Rev. E 74, 010403 (2006).
8F. Sciortino, P. Tartaglia, and E. Zaccarelli, J. Phys. Chem. B 109, 21942(2005).
9S. Mossa, F. Sciortino, P. Tartaglia, and E. Zaccarelli, Langmuir 20, 10756(2004).
10A. I. Campbell, V. J. Anderson, J. S. van Duijneveldt, and P. Bartlett, Phys.Rev. Lett. 94, 208301 (2005).
11A. Coniglio, L. de Arcangelis, A. de Candia, E. D. Gado, A. Fierro, andN. Sator, J. Phys: Condens. Matter 18, S2383 (2006).
12A. J. Archer and N. B. Wilding, Phys. Rev. E 76, 031501 (2007).13M. Hoare and P. Pal, Adv. Phys. 20, 161 (1971).14J. Taffs, A. Malins, and S. R. Williams, J. Chem. Phys. 133, 244901 (2010).15N. Sloane, R. Hardin, T. Duff, and J. Conway, Discrete Comput. Geom. 14,
237 (1995).16N. Arkus, V. N. Manoharan, and M. P. Brenner, Phys. Rev. Lett. 103,
118303 (2009).17J. P. K. Doye, D. J. Wales, and R. S. Berry, J. Chem. Phys. 103, 4234
(1995).18J. Taffs, A. Malins, S. R. Williams, and C. P. Royall, J. Phys.: Condens.
Matter 22, 104119 (2010).19S. Asakura and F. J. Oosawa, Chem. Phys. 22, 1255 (1954).20A. Vrij, Pure Appl. Chem. 48, 471 (1976).21A. van Blaaderen, Science 301, 470 (2003).22E. Duguet, A. Desert, A. Perro, and S. Ravaine, Chem. Soc. Rev. 40, 941
(2011).23S. Jiang and S. Granick, J. Chem. Phys. 127, 161102 (2007).24Z. Zhang and S. Glotzer, Nano Lett. 4, 1407 (2004).25A. W. Wilber, J. P. K. Doye, A. A. Louis, E. G. Noya, M. A. Miller, and
P. Wong, J. Chem. Phys. 127, 085106 (2007).26A. W. Wilber, J. P. K. Doye, and A. A. Louis, J. Chem. Phys 131, 175101
(2009).27R. M. Erb, H. S. Son, B. Samanta, V. M. Rotello, and B. B. Yellen, Nature
(London) 457, 999 (2009).28O. Velev and K. Nagayama, Langmuir 13, 1856 (1997).29O. Velev, K. Furusawa, and K. Nagayama, Langmuir 12, 2385 (1996).30O. Velev, K. Furusawa, and K. Nagayama, Langmuir 12, 2374 (1996).31B. Binks and T. Horozov, Colloidal Particles at Liquid Interfaces
(Cambridge University Press, Cambridge, England, 2006).32V. Manoharan, M. Elsesser, and D. Pine, Science 301, 483 (2003).33Y. Cho, G. Yi, S. Kim, D. Pine, and S. Yang, Chem. Mater. 17, 5006 (2005).34Y.-S. Cho, G.-R. Yi, S.-H. Kim, S.-J. Jeon, M. T. Elsesser, H. K. Yu,
S.-M. Yang, and D. J. Pine, Chem. Mater. 19, 3183 (2007).35S.-H. Kim, G.-R. Yi, K. H. Kim, and S.-M. Yang, Langmuir 24, 2365
(2008).36Y. Cho, G. Yi, J. Lim, S. Kim, V. Manoharan, D. Pine, and S. Yang, J. Am.
Chem. Soc. 127, 15968 (2005).37D. Zerrouki, B. Rotenberg, S. Abramson, J. Baudry, C. Goubault, F. Leal-
Calderon, D. Pine, and M. Bibette, Langmuir 22, 57 (2006).

244501-10 Schwarz et al. J. Chem. Phys. 135, 244501 (2011)
38Y.-S. Cho, G.-R. Yi, Y. S. Chung, S. B. Park, and S.-M. Yang, Langmuir23, 12079 (2007).
39C. S. Wagner, Y. Lu, and A. Wittemann, Langmuir 24, 12126 (2008).40C. S. Wagner, B. Fischer, M. May, and A. Wittemann, Colloid Polym. Sci.
288, 487 (2010).41K. Landfester, Macromol. Symp. 150, 171 (2000).42M. Hoffmann, C. S. Wagner, L. Harnau, and A. Wittemann, ACS Nano 3,
3326 (2009).43F. L. Roman, M. Schmidt, and H. Löwen, Phys. Rev. E 61, 5445 (2000).44E. Lauga and M. P. Brenner, Phys. Rev. Lett. 93, 238301 (2004).45E. Mani, E. Sanz, P. G. Bolhuis, and W. K. Kegel, J. Phys. Chem. C 114,
7780 (2010).46P. Pieranski, Phys. Rev. Lett. 45, 569 (1980).
47E. Sanz and D. J. Marenduzzo, Chem. Phys. 132, 194102 (2010).48D. Wu, D. Chandler, and B. Smit, J. Phys. Chem. 96, 4077 (1992).49D. Frenkel and B. Smit, Understanding Molecular Simulation: From Algo-
rithms to Applications ( Academic, London, 2002).50N. Johnson, Can. J. Math. 18, 169 (1966).51M. G. Nikolaides, A. Bausch, M. F. Hsu, A. D. Dinsmore, M. P. Brenner,
C. Gay, and D. A. Weitz, Nature (London) 420, 299 (2002).52T. S. Horozov, R. Aveyard, J. H. Clint, and B. P. Binks, Langmuir 19, 2822
(2003).53V. N. Manoharan, Thin Solid State Commun. 139, 557 (2006).54B. P. Binks and M. Kirkland, Phys. Chem. Chem. Phys. 4, 3727
(2002).55E. Koos and N. Willenbacher, Science 331, 897 (2011).


![arXiv:cond-mat/0312540v1 [cond-mat.str-el] 19 Dec 2003 · DOS density of states e-e electron-electron e-h electron-hole e-p electron-phonon FFLO Fulde-Ferrell-Larkin-Ovchinnikov FL](https://static.fdokument.com/doc/165x107/5fb0cfa47969fe5d983eb8d6/arxivcond-mat0312540v1-cond-matstr-el-19-dec-2003-dos-density-of-states-e-e.jpg)