Nuclear shell effects in neutron-rich nuclei around N=20 and N=32,34
139
Nuclear shell effects in neutron-rich nuclei around N = 20 and N = 32,34 Inaugural-Dissertation zur Erlangung des Doktorgrades der Mathematisch-Naturwissenschaftlichen Fakultät der Universität zu Köln vorgelegt von Michael Seidlitz aus Hachenburg Köln – 2012
Transcript of Nuclear shell effects in neutron-rich nuclei around N=20 and N=32,34

Nuclear shell effects
in neutron-rich nuclei
around N=20 and N=32,34
I n a u g u r a l - D i s s e r t a t i o n
zur Erlangung des Doktorgradesder Mathematisch-Naturwissenschaftlichen Fakultät
der Universität zu Köln
vorgelegt von
Michael Seidlitzaus Hachenburg
Köln – 2012

Berichterstatter: Prof. Dr. P. ReiterProf. Dr. A. Zilges
Tag der mündlichen Prüfung: 04.12.2012

The works of the LORD are great,sought out of all them that havepleasure therein.
THE HOLY BIBLE, Psalm 111:2

v
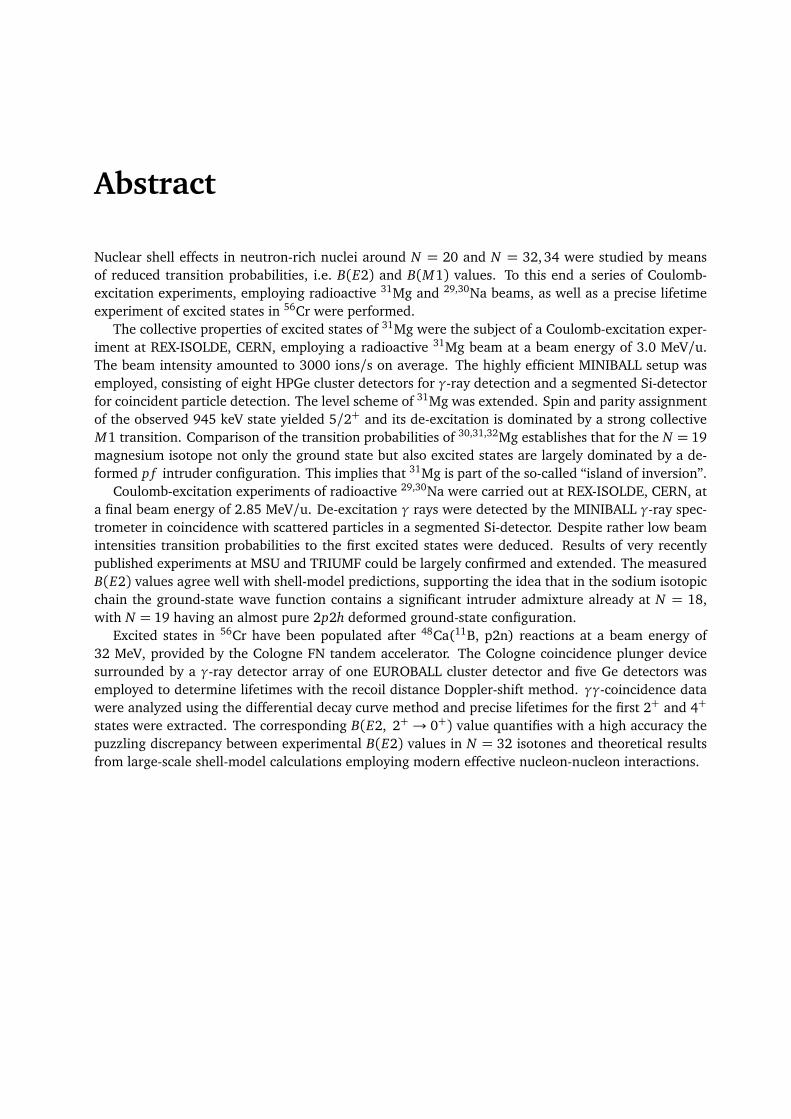
Abstract
Nuclear shell effects in neutron-rich nuclei around N = 20 and N = 32, 34 were studied by meansof reduced transition probabilities, i.e. B(E2) and B(M1) values. To this end a series of Coulomb-excitation experiments, employing radioactive 31Mg and 29,30Na beams, as well as a precise lifetimeexperiment of excited states in 56Cr were performed.
The collective properties of excited states of 31Mg were the subject of a Coulomb-excitation exper-iment at REX-ISOLDE, CERN, employing a radioactive 31Mg beam at a beam energy of 3.0 MeV/u.The beam intensity amounted to 3000 ions/s on average. The highly efficient MINIBALL setup wasemployed, consisting of eight HPGe cluster detectors for γ-ray detection and a segmented Si-detectorfor coincident particle detection. The level scheme of 31Mg was extended. Spin and parity assignmentof the observed 945 keV state yielded 5/2+ and its de-excitation is dominated by a strong collectiveM1 transition. Comparison of the transition probabilities of 30,31,32Mg establishes that for the N = 19magnesium isotope not only the ground state but also excited states are largely dominated by a de-formed p f intruder configuration. This implies that 31Mg is part of the so-called “island of inversion”.
Coulomb-excitation experiments of radioactive 29,30Na were carried out at REX-ISOLDE, CERN, ata final beam energy of 2.85 MeV/u. De-excitation γ rays were detected by the MINIBALL γ-ray spec-trometer in coincidence with scattered particles in a segmented Si-detector. Despite rather low beamintensities transition probabilities to the first excited states were deduced. Results of very recentlypublished experiments at MSU and TRIUMF could be largely confirmed and extended. The measuredB(E2) values agree well with shell-model predictions, supporting the idea that in the sodium isotopicchain the ground-state wave function contains a significant intruder admixture already at N = 18,with N = 19 having an almost pure 2p2h deformed ground-state configuration.
Excited states in 56Cr have been populated after 48Ca(11B, p2n) reactions at a beam energy of32 MeV, provided by the Cologne FN tandem accelerator. The Cologne coincidence plunger devicesurrounded by a γ-ray detector array of one EUROBALL cluster detector and five Ge detectors wasemployed to determine lifetimes with the recoil distance Doppler-shift method. γγ-coincidence datawere analyzed using the differential decay curve method and precise lifetimes for the first 2+ and 4+
states were extracted. The corresponding B(E2, 2+ → 0+) value quantifies with a high accuracy thepuzzling discrepancy between experimental B(E2) values in N = 32 isotones and theoretical resultsfrom large-scale shell-model calculations employing modern effective nucleon-nucleon interactions.


vii
Kurzzusammenfassung
Effekte in der Schalenstruktur neutronenreicher Kerne um N = 20 and N = 32,34 wurden anhandder reduzierten Übergangswahrscheinlichkeiten, d.h. ihrer B(E2)- und B(M1)-Werte, untersucht.Dafür wurden eine Reihe von Coulombanregungsexperimenten mit radioaktiven 31Mg- und 29,30Na-Strahlen, sowie eine hochgenaue Lebensdauermessung angeregter Kernzustände in 56Cr durchge-führt.
Die Untersuchung kollektiver Eigenschaften angeregter Kernzustände in 31Mg waren Bestandteileines Experiments zur Coulombanregung von instabilen 31Mg-Ionen an REX-ISOLDE, CERN, bei einerStrahlenergie von 3.0 MeV/u. Die Strahlintensität betrug durchschnittlich rund 3000 ions/s. Die Mes-sung wurde am hocheffizienten MINIBALL-Aufbau durchgeführt, bestehend aus acht HPGe Cluster-Detektoren zum Nachweis von γ-Quanten und einem segmentierten Si-Zähler zur Detektion koinzi-denter Teilchen. Das Termschema von 31Mg konnte somit erweitert werden. Einem beobachtetenZustand bei 945 keV konnten die Spin- und Paritätswerte 5/2+ zugewiesen werden. Der Zerfalldieses angeregten Zustands wird durch einen stark kollektiven M1-Übergang dominiert. Der Ver-gleich der Übergangswahrscheinlichkeiten in den Kernen 30,31,32Mg belegt, dass im Magnesium-Isotopmit N = 19 nicht nur der Grundzustand, sondern auch angeregte Zustände weitestgehend von de-formierten p f -Intruderkonfigurationen beherrscht werden. Damit ist 31Mg Teil der so genannten„Island of Inversion“.
Experimente zur Coulombanregung von radioaktiven 29,30Na-Ionen in inverser Kinematik wurdenan REX-ISOLDE, CERN, bei einer Strahlenergie von 2.85 MeV/u durchgeführt. γ-Strahlung aus derAbregung angeregter Kernzustände wurde vom MINIBALL-Spektrometer in Koinzidenz mit gestreutenTeilchen in einem segmentierten Si-Detektor nachgewiesen. Trotz recht geringer Strahlintensitätenkonnten die Übergangswahrscheinlichkeiten zu den ersten angeregten Zuständen bestimmt werden.Ergebnisse erst kürzlich veröffentlichter Experimente an MSU und TRIUMF konnten weitestgehendbestätigt, teilweise sogar noch erweitert werden. Die gemessenen B(E2)-Werte stimmen gut mitden Vorhersagen aus dem Schalenmodell überein. Dies unterstützt die Vorstellung, dass in der Iso-topenkette von Na die Wellenfunktion des Grundzustands bereits bei N = 18 einen signifikantenIntruder-Anteil besitzt. Für N = 19 ergibt sich eine fast reine, deformierte 2p2h-Konfiguration imGrundzustand.
Angeregte Kernzustände in 56Cr wurden durch die Reaktion 48Ca(11B, p2n) bei einer Strahlen-ergie von 32 MeV am Kölner FN Tandembeschleuniger bevölkert. Der Kölner Koinzidenz-plunger ermöglichte die Bestimmung von Lebensdauern mithilfe der so genannten „recoil distanceDoppler-shift“ (RDDS) Methode. Emittierte γ-Quanten wurden mit einer Anordnung von einemEUROBALL-Cluster-Detektor und fünf weiteren Ge-Detektoren nachgewiesen. Die aufgenommenenγγ-Koinzidenzen wurden anhand der so genannten „differential decay curve“ (DDC) Methode aus-gewertet. Präzise Lebensdauern des jeweils ersten angeregten 2+ und 4+ Zustands konnten so bes-timmt werden. Der entsprechende B(E2, 2+ → 0+) Wert zeigt mit hoher Präzision die bislang un-gelöste Diskrepanz zwischen den experimentell bestimmten B(E2) Werten der N = 32 Isotone undtheoretischen Vorhersagen aktueller Schalenmodellrechnungen auf, trotz Einbeziehung eines größt-möglichen Modellraums und modernen effektiven Wechselwirkungen zwischen den einzelnen Nuk-leonen.


CONTENTS ix
Contents
Abstract v
Kurzzusammenfassung vii
1 Nuclear structure 11.1 The nuclear shell model . . . . . . . . . . . . . . . . . . . . . . . . . . . . . . . . . . . . . . . . 11.2 The nuclear mean field . . . . . . . . . . . . . . . . . . . . . . . . . . . . . . . . . . . . . . . . . 31.3 Residual interaction . . . . . . . . . . . . . . . . . . . . . . . . . . . . . . . . . . . . . . . . . . . 31.4 Experimental observables . . . . . . . . . . . . . . . . . . . . . . . . . . . . . . . . . . . . . . . 4
1.4.1 Nuclear masses and binding energies . . . . . . . . . . . . . . . . . . . . . . . . . . . 41.4.2 Two-neutron separation energies . . . . . . . . . . . . . . . . . . . . . . . . . . . . . . 51.4.3 Ground-state nuclear moments . . . . . . . . . . . . . . . . . . . . . . . . . . . . . . . 51.4.4 The E(2+) and B(E2, 0+→2+) strength . . . . . . . . . . . . . . . . . . . . . . . . . . 6
I Mapping the border of the “Island of Inversion” – Coulomb excitationof exotic Na and Mg isotopes with MINIBALL at REX-ISOLDE 9
2 Motivation and physics case 112.1 Vanishing of the N = 20 shell gap – the island of inversion . . . . . . . . . . . . . . . . . . . 112.2 The neutron-rich Mg isotopes . . . . . . . . . . . . . . . . . . . . . . . . . . . . . . . . . . . . . 122.3 The neutron-rich Na isotopes . . . . . . . . . . . . . . . . . . . . . . . . . . . . . . . . . . . . . 15
3 The experimental setup and technique 213.1 Introduction . . . . . . . . . . . . . . . . . . . . . . . . . . . . . . . . . . . . . . . . . . . . . . . 213.2 The ISOLDE facility . . . . . . . . . . . . . . . . . . . . . . . . . . . . . . . . . . . . . . . . . . . 22
3.2.1 Production of radioactive isotopes . . . . . . . . . . . . . . . . . . . . . . . . . . . . . 223.2.2 Ion sources . . . . . . . . . . . . . . . . . . . . . . . . . . . . . . . . . . . . . . . . . . . 243.2.3 Mass separation . . . . . . . . . . . . . . . . . . . . . . . . . . . . . . . . . . . . . . . . 25
3.3 REX-ISOLDE . . . . . . . . . . . . . . . . . . . . . . . . . . . . . . . . . . . . . . . . . . . . . . . 263.3.1 Charge breeding system . . . . . . . . . . . . . . . . . . . . . . . . . . . . . . . . . . . 263.3.2 The REX-LINAC . . . . . . . . . . . . . . . . . . . . . . . . . . . . . . . . . . . . . . . . . 28
3.4 The MINIBALL setup . . . . . . . . . . . . . . . . . . . . . . . . . . . . . . . . . . . . . . . . . . 293.4.1 The MINIBALL γ-ray spectrometer . . . . . . . . . . . . . . . . . . . . . . . . . . . . . 303.4.2 Particle detectors . . . . . . . . . . . . . . . . . . . . . . . . . . . . . . . . . . . . . . . . 31
3.5 Time structure of the beam at REX-ISOLDE . . . . . . . . . . . . . . . . . . . . . . . . . . . . 333.6 Coulomb excitation . . . . . . . . . . . . . . . . . . . . . . . . . . . . . . . . . . . . . . . . . . . 33
3.6.1 Semi-classical approach . . . . . . . . . . . . . . . . . . . . . . . . . . . . . . . . . . . . 343.6.2 “Safe” Coulomb excitation . . . . . . . . . . . . . . . . . . . . . . . . . . . . . . . . . . 383.6.3 Relative measurement of the transition strength . . . . . . . . . . . . . . . . . . . . . 38

x CONTENTS
4 Data analysis 394.1 Acquisition and processing of the data . . . . . . . . . . . . . . . . . . . . . . . . . . . . . . . 394.2 Detector calibration . . . . . . . . . . . . . . . . . . . . . . . . . . . . . . . . . . . . . . . . . . . 39
4.2.1 Energy calibration of the DSSSD . . . . . . . . . . . . . . . . . . . . . . . . . . . . . . 394.2.2 Energy- and efficiency calibration of the MINIBALL detectors . . . . . . . . . . . . 40
4.3 Doppler correction . . . . . . . . . . . . . . . . . . . . . . . . . . . . . . . . . . . . . . . . . . . 424.4 Kinematic considerations . . . . . . . . . . . . . . . . . . . . . . . . . . . . . . . . . . . . . . . 454.5 Beam composition . . . . . . . . . . . . . . . . . . . . . . . . . . . . . . . . . . . . . . . . . . . 45
4.5.1 Release curve analysis . . . . . . . . . . . . . . . . . . . . . . . . . . . . . . . . . . . . . 464.5.2 β-decay during charge breeding . . . . . . . . . . . . . . . . . . . . . . . . . . . . . . 484.5.3 Measurements with the ionization chamber . . . . . . . . . . . . . . . . . . . . . . . 494.5.4 Measurements with the Bragg detector . . . . . . . . . . . . . . . . . . . . . . . . . . 504.5.5 Measurements with laser ON/OFF . . . . . . . . . . . . . . . . . . . . . . . . . . . . . 504.5.6 Summary of the experimental beam parameters . . . . . . . . . . . . . . . . . . . . . 51
4.6 Particle-γ coincidence . . . . . . . . . . . . . . . . . . . . . . . . . . . . . . . . . . . . . . . . . 53
5 Results 555.1 Coulomb excitation of 31Mg . . . . . . . . . . . . . . . . . . . . . . . . . . . . . . . . . . . . . . 55
5.1.1 Measurement at 3.0 MeV/u on a 4.0 mg/cm2 thick 109Ag target . . . . . . . . . . . 555.1.2 Measurement at 3.0 MeV/u on a 1.9 mg/cm2 thick 109Ag target . . . . . . . . . . . 61
5.2 Coulomb excitation of 29Na . . . . . . . . . . . . . . . . . . . . . . . . . . . . . . . . . . . . . . 635.2.1 Measurement at 2.85 MeV/u on a 4.1 mg/cm2 thick 104Pd target . . . . . . . . . . 63
5.3 Coulomb excitation of 30Na . . . . . . . . . . . . . . . . . . . . . . . . . . . . . . . . . . . . . . 675.3.1 Measurement at 2.85 MeV/u on a 4.0 mg/cm2 thick 120Sn target . . . . . . . . . . 675.3.2 Measurement at 2.85 MeV/u on a 4.1 mg/cm2 thick 104Pd target . . . . . . . . . . 695.3.3 Measurement at 2.83 MeV/u on a 3.6 mg/cm2 thick 104Pd target . . . . . . . . . . 73
6 Discussion and Summary 756.1 Discussion . . . . . . . . . . . . . . . . . . . . . . . . . . . . . . . . . . . . . . . . . . . . . . . . 756.2 Summary . . . . . . . . . . . . . . . . . . . . . . . . . . . . . . . . . . . . . . . . . . . . . . . . . 78
7 Outlook 797.1 The HIE-ISOLDE project . . . . . . . . . . . . . . . . . . . . . . . . . . . . . . . . . . . . . . . . 797.2 Coulomb excitation of 32,33Mg . . . . . . . . . . . . . . . . . . . . . . . . . . . . . . . . . . . . 79
II Investigating the subshell closure at N=32 – Lifetime measurementsin the neutron-rich isotope 56Cr with the Cologne plunger 83
8 Motivation and physics case 858.1 Evolution of a neutron shell gap at N= 32,34 . . . . . . . . . . . . . . . . . . . . . . . . . . . 858.2 The neutron-rich Ca, Ti, and Cr isotopes . . . . . . . . . . . . . . . . . . . . . . . . . . . . . . 86
9 The experimental setup and technique 919.1 Beam production . . . . . . . . . . . . . . . . . . . . . . . . . . . . . . . . . . . . . . . . . . . . 919.2 The Cologne FN tandem Van de Graaff accelerator . . . . . . . . . . . . . . . . . . . . . . . . 919.3 The Cologne plunger setup . . . . . . . . . . . . . . . . . . . . . . . . . . . . . . . . . . . . . . 92
9.3.1 The Cologne plunger device . . . . . . . . . . . . . . . . . . . . . . . . . . . . . . . . . 929.3.2 γ-ray detector setup . . . . . . . . . . . . . . . . . . . . . . . . . . . . . . . . . . . . . . 93
9.4 Lifetime measurements with a plunger . . . . . . . . . . . . . . . . . . . . . . . . . . . . . . . 949.4.1 The recoil distance Doppler-shift method . . . . . . . . . . . . . . . . . . . . . . . . . 94

CONTENTS xi
9.4.2 γγ-coincidences and the differential decay curve method . . . . . . . . . . . . . . . 95
10 Data analysis 9710.1 Acquisition and processing of the measured data . . . . . . . . . . . . . . . . . . . . . . . . . 9710.2 Calibration measurements . . . . . . . . . . . . . . . . . . . . . . . . . . . . . . . . . . . . . . . 97
10.2.1 Energy calibration of the HPGe detectors . . . . . . . . . . . . . . . . . . . . . . . . . 9710.2.2 Efficiency calibration of the HPGe detectors . . . . . . . . . . . . . . . . . . . . . . . 9810.2.3 Time gate for γγ-coincidences . . . . . . . . . . . . . . . . . . . . . . . . . . . . . . . . 98
10.3 Distance calibration of the plunger foils . . . . . . . . . . . . . . . . . . . . . . . . . . . . . . 9910.4 Yield normalization . . . . . . . . . . . . . . . . . . . . . . . . . . . . . . . . . . . . . . . . . . . 9910.5 Recoil velocity . . . . . . . . . . . . . . . . . . . . . . . . . . . . . . . . . . . . . . . . . . . . . . 100
11 Results 10311.1 Lifetime of the 2+ state . . . . . . . . . . . . . . . . . . . . . . . . . . . . . . . . . . . . . . . . 10411.2 Lifetime of the 4+ state . . . . . . . . . . . . . . . . . . . . . . . . . . . . . . . . . . . . . . . . 105
12 Discussion and Summary 11112.1 Shell-model theory and discussion . . . . . . . . . . . . . . . . . . . . . . . . . . . . . . . . . . 11112.2 Summary . . . . . . . . . . . . . . . . . . . . . . . . . . . . . . . . . . . . . . . . . . . . . . . . . 112
Bibliography 115
Acknowledgments 123
Erklärung 125
Curriculum vitae 127


1.1. THE NUCLEAR SHELL MODEL 1
Chapter 1
Nuclear structure
1.1 The nuclear shell model
Already during the early 1930s detailed stud-ies of atomic nuclei revealed special numbers ofprotons and neutrons, that lead to a stabiliza-tion of the corresponding nuclei in the isotopicor isotonic chains [1]. Only the first numbers2, 8, and 20 could be explained by a simplemodel of non-interacting nucleons, moving in-dependently in an average potential well. Anappropriate explanation for the higher numbersfailed. The first explanation of all of these socalled “magic numbers” 2, 8, 20, 28, 50, 82, and126 was given by Haxel, Jensen, Suess, and in-dependently by Goeppert-Mayer in 1949, whichproposed a strong spin-orbit component of thenucleon-nucleon interaction [2,3]. Every level issplit into two orbits with total angular momentaj = `± s (see Figure 1.1). By this method, nu-clear properties on many nuclei reachable at thattime, e.g. spins, parities, magnetic moments,and β-decay systematics, could be explained andthe model became known as the “nuclear shellmodel”.
Even today, more than 60 years later, shellstructure is one of the most important frame-works for understanding nuclear structure andthe properties of atomic nuclei. Special inter-est has been focused on the evolution of nuclearproperties along isotopic or isotonic chains inthe vicinity of the magic numbers. It was be-lieved that these magic numbers would be per-manent and valid for all nuclei. During thelast three decades both experimental and theo-retical findings indicated that the known magicnumbers are subject to the proton-to-neutron ra-tio and not universal. Especially for exotic nu-clei with large N/Z ratios far from stability newshell closures are expected. Such a new magic
1s1/2 (2)1s
1p
1g
3s
1h
3p
2f
2s
1f
2p
2d
1d
1p3/2 (4)
1p1/2 (2)
1d5/2 (6)
2p3/2 (4)
1g9/2 (10)
2p1/2 (2)
1f5/2 (6)
1f7/2 (8)
2s1/2 (2)
3s1/2 (2)2d3/2 (4)
1i13/2 (14)
1g7/2 (8)
1h9/2 (10)2f7/2 (8)
2f5/2 (6)3p3/2 (4)
2
8
20
28
50
1h11/2 (12)
1d3/2 (4)
VHO VWS
2d5/2 (6)
VWS,SO
3p1/2 (2)
1i126
82
n = 5
n = 4
n = 3
n = 2
n = 1
n = 0
(c)(b)(a)
Figure 1.1: Single particle states in the nuclear shellmodel. (a) Non-interacting nucleons in the potentialwell of a harmonic oscillator. (b) Breakup of the `-degeneracy using a Woods-Saxon potential. (c) Dueto the spin-orbit coupling orbits are split into j = `±s and the magic numbers can be reproduced. Thefigure was adapted from [4].
number was proposed at N = 16 for some nu-clei between Z = 8 (oxygen) and Z = 14 (sili-

2 CHAPTER 1. NUCLEAR STRUCTURE
Figure 1.2: The chart of nuclides. Black boxes indicate stable nuclides, whereas the known unstable isotopes arecolored in yellow. The region colored in green indicates all nuclides, that are believed to exist but have not beenobserved yet (“terra incognita”). Blue boxes mark the isotopes that may be produced by nucleosynthesis in ther-process. The classical magic numbers are denoted by dashed lines, even though they might change for exoticnuclei (adapted from [10]).
con) [5–7] and confirmed in a series of experi-ments and most recently by Kanungo et al., thatrevealed the doubly magic character of 24O [8].
The evolution of nuclear shells for very ex-otic nuclei is important for the understandingof astrophysical processes. Most elements heav-ier than Fe are produced in very rapid or evenexplosive scenarios (e.g. supernovae) by neu-tron captures and subsequent β-decays. Forhigh neutron densities nn > 1020 cm−3 nu-cleosynthesis of very neutron-rich takes placevia the so-called r-process [9]. A sequence offast neutron captures generates isotopes withhigh N/Z-ratios far from stability (see Fig. 1.2).Depending on the nuclear structure of the iso-topes involved in the process, the resulting abun-dances will show a certain structure. In factthe solar r-abundance of nuclei is mainly dom-inated by decay products of the so-called “wait-ing point” nuclei at the neutron shell closuresat N = 50,82, 126 (see Fig. 1.3). The rela-tively long lifetimes of these nuclei delay theprogression of the r-process. Recent experiments
with the N = 82, 126 waiting point nuclei haveshown that changes in the shell structure – such
1.00
80
Mass number A
log
εε εε
100 120 140 160 180 200
0.00
-1.00
-2.00
-3.00
SS s-Process
SS r-Process
Se Sr
Te
Xe Ba
Eu
Os
Pt
Au
Pb
Figure 1.3: Abundances of nuclides in the solar sys-tem, depending on their synthesis mechanism: s- andr-process. The peak-like structure in the r-abundanceis caused by the “waiting point” nuclei at the neu-tron shell closures. Some elements corresponding tothe approximate mass numbers are noted (adaptedfrom [11]).
1.3. RESIDUAL INTERACTION 3
as shell quenching – affect the r-abundances inthat region significantly [12–14].
The shell-model modifications and the occur-rence of new magic numbers are traced back tothe residual nucleon-nucleon interaction.
1.2 The nuclear mean field
The atomic nucleus is a complex system of Astrongly interacting quantum particles. Shell-model calculations, using accurate two-bodyand three-body interactions by QCD or ab ini-tio approaches, have been performed for lightnuclei with 2 ≤ A ≤ 16 to study their structureand reactions. Due to the enormous computingpower that would be required to study heaviernuclei truncations and approximative solutionshave to be used in order to reduce the computedmodel space.
The Hamiltonian for A interacting nucleonscan be written as a sum over the kinetic en-ergy terms Ti and the two-body nucleon-nucleon(NN) interaction Vi j . Based on the superpo-sition of all NN interactions the last term canbe approximated by an effective average single-particle potential U(~r):
H =A∑
i=1
Ti +∑
i< j
Vi j
=A∑
i=1
(Ti + U(~ri)) +
∑
i< j
Vi j −A∑
i=1
U(~ri)
= H0+HR.
H0 describes an ensemble of A independent par-ticles moving in an average single-particle po-tential U(~r) generated by the nucleons them-selves. HR corresponds to the residual interac-tion between the so-called valence nucleons out-side a closed shell (“inert core”). In the vicinityof the valley of stability HR can be neglected byan appropriate choice of H0 and the propertiesof atomic nuclei can be described well by H0.
1.3 Residual interaction
To study the residual NN interaction, the corre-sponding Hamiltonian can be decomposed sub-
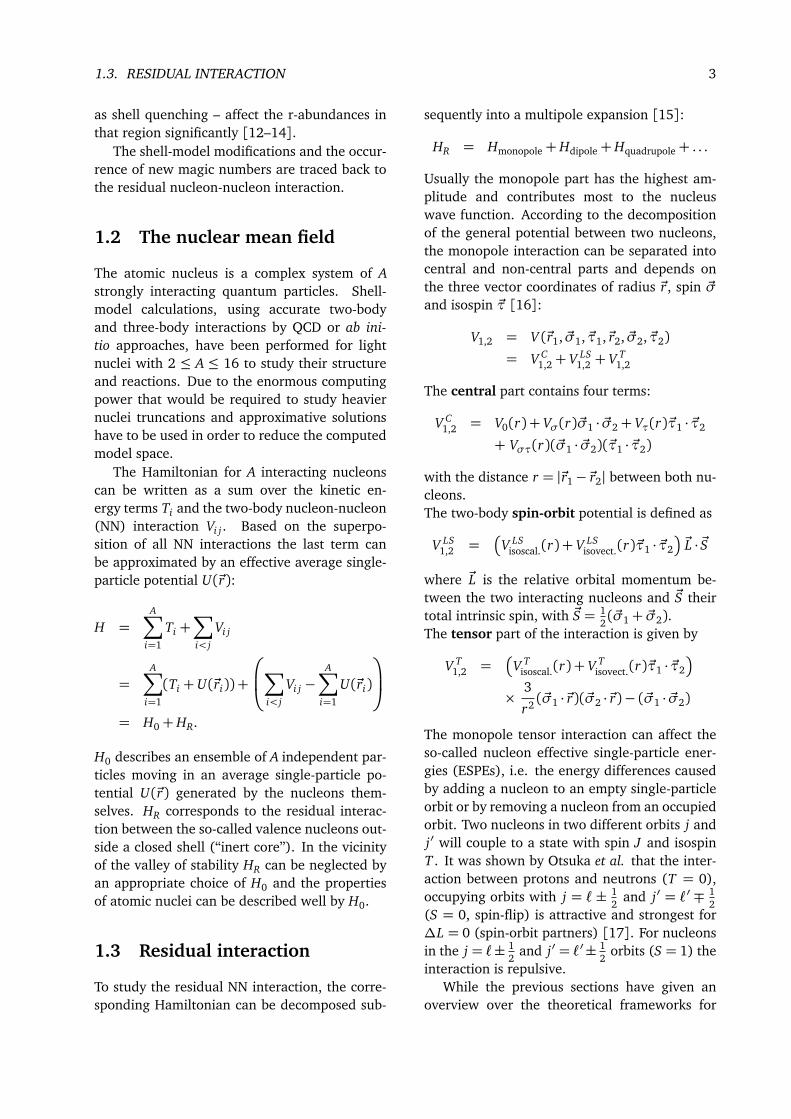
sequently into a multipole expansion [15]:
HR = Hmonopole+Hdipole+Hquadrupole+ . . .
Usually the monopole part has the highest am-plitude and contributes most to the nucleuswave function. According to the decompositionof the general potential between two nucleons,the monopole interaction can be separated intocentral and non-central parts and depends onthe three vector coordinates of radius ~r, spin ~σand isospin ~τ [16]:
V1,2 = V (~r1, ~σ1, ~τ1,~r2, ~σ2, ~τ2)
= V C1,2+ V LS
1,2 + V T1,2
The central part contains four terms:
V C1,2 = V0(r) + Vσ(r)~σ1 · ~σ2+ Vτ(r)~τ1 · ~τ2
+ Vστ(r)(~σ1 · ~σ2)(~τ1 · ~τ2)
with the distance r = |~r1−~r2| between both nu-cleons.The two-body spin-orbit potential is defined as
V LS1,2 =
V LSisoscal.(r) + V LS
isovect.(r)~τ1 · ~τ2
~L ·~S
where ~L is the relative orbital momentum be-tween the two interacting nucleons and ~S theirtotal intrinsic spin, with ~S = 1
2(~σ1+ ~σ2).
The tensor part of the interaction is given by
V T1,2 =
V Tisoscal.(r) + V T
isovect.(r)~τ1 · ~τ2
×3
r2 (~σ1 ·~r)(~σ2 ·~r)− (~σ1 · ~σ2)
The monopole tensor interaction can affect theso-called nucleon effective single-particle ener-gies (ESPEs), i.e. the energy differences causedby adding a nucleon to an empty single-particleorbit or by removing a nucleon from an occupiedorbit. Two nucleons in two different orbits j andj′ will couple to a state with spin J and isospinT . It was shown by Otsuka et al. that the inter-action between protons and neutrons (T = 0),occupying orbits with j = `± 1
2and j′ = `′ ∓ 1
2(S = 0, spin-flip) is attractive and strongest for∆L = 0 (spin-orbit partners) [17]. For nucleonsin the j = `± 1
2and j′ = `′± 1
2orbits (S = 1) the
interaction is repulsive.While the previous sections have given an
overview over the theoretical frameworks for

4 CHAPTER 1. NUCLEAR STRUCTURE
20 40 60 80 100 120 140
Proton number Z
-20
-15
-10
-5
0
5
10
Mexp -
ML
DM
[M
eV
]
20 40 60 80 100 120 140
Neutron number N
-20
-15
-10
-5
0
5
10
Mexp -
ML
DM
[M
eV
]
Z = 8 Z = 20 Z = 28 Z = 50 Z = 82
N = 8 N = 20 N = 28 N = 50 N = 82 N = 126
(a)
(b)
Figure 1.4: Deviations of the measured nuclear masses from the calculated masses of the liquid drop model(LDM, Weizsäcker mass formula) as a function of (a) proton number Z and (b) neutron number N , respec-tively. Due to the enhanced binding of the nuclear system near closed shells the mass is lowered for manyisotones/isotopes (connected by solid lines). The conventional magic numbers are indicated by dashed lines.Experimental masses were taken from [18].
understanding nuclear shell structure, the fol-lowing sections will focus on the experimentalobservables which can provide information onnuclear shell structure and the location of shellclosures across the nuclear landscape.
1.4 Experimental observables
As previously discussed the energy gap betweennuclear orbits and the location of nuclear shellclosures is not static but is subject of the proton-to-neutron ratio. To probe nuclear structuremodels and theory it is necessary to have un-ambiguous experimental observables for the lo-cation of shell and subshell closures. Thereforeexperimental analysis has been focused on theevolution of specific quantities across isotopic or
isotonic chains, which will be discussed in thefollowing paragraphs.
1.4.1 Nuclear masses and binding ener-gies
Nuclear masses and binding energies provide afundamental testing ground for the study of nu-clear structure and shell closures. Due to theenhanced binding of the nucleons near closedshells, the mass of the nuclear system is conse-quently lowered. In Figure 1.4 the mass differ-ence between the measured mass and the cal-culated mass from the liquid drop model (LDM,Weizsäcker mass formula) is shown as a functionof Z and N , respectively. The biggest deviationscan be observed for nuclei near the magic num-bers, for which the measured masses are sig-

1.4. EXPERIMENTAL OBSERVABLES 5
16 18 20 22 24 26 28 30 32 34
Neutron number N
10
20
30
S2n
[
MeV
]
TitaniumScandiumCalciumPotassiumArgonChlorine
Figure 1.5: Trends of the two-neutron separationenergies across the isotopic chains of Cl, Ar, K, Ca,Sc, and Ti. The dramatic drop in S2n for N ≥ 20and N ≥ 28 can be seen for most elements, indicat-ing shell closures at N = 20, 28. Values were takenfrom [18].
nificantly lower than the ones calculated usingthe liquid drop model, indicating the underlyingshell structure of the atomic nucleus.
1.4.2 Two-neutron separation energies
The trend of the two-neutron separation ener-gies S2n across isotopic chains provide a funda-mental indication for completely filled neutronshells. It can be calculated out of the binding en-ergies using S2n = BE(A, Z)−BE(A−2, Z). Neu-trons in a (nearly) closed neutron shell are morestrongly bound and more energy is needed toremove them out of the nuclear medium. Neu-trons populating orbits outside closed shells areless bound and therefore S2n drops dramaticallyat the shell closures (see Figure 1.5).
1.4.3 Ground-state nuclear moments
The nuclear electrical quadrupole momentQ depends on the nuclear charge distribution.Thus it is sensitive to the nuclear shape. Nu-clei near closed shells are expected to be spher-ical. Therefore their ground-state quadrupolemoments should be small. Midshell nuclei maybe axially deformed, having a large magnitudequadrupole moment. For pure single-particleconfigurations it can be shown that a particleoutside a closed shell causes an oblate mass dis-tribution (Q < 0), whereas a hole correspondsto a prolate mass distribution (Q > 0) [4]. Thus,
20 30 40 50 60 70
Proton number Z
-5
0
5
10
Q / Z
R02
16 20 28 50
Figure 1.6: Experimental deduced nuclear ground-state electrical quadrupole moments for odd-evennuclei as a function of Z for 12 < Z < 74. To give ameasure of the nuclear deformation independent ofthe size of the nucleus, the quantity Q/ZR2
0 was cho-sen. At closed shells Q always changes its sign froma prolate to an oblate deformation, as indicated byarrows. The solid line was drawn to guide the eye.Data taken from [19].
the quadrupole moment changes its sign at theshell closures, as it can be seen in Figure 1.6.The evolution of the ground-state nuclear mo-ments provide an indication of changes in thenuclear structure, especially of shell closures.
The nuclear magnetic dipole moment µ fora state with spin I is given by µ = gI IµN ,where gI is called the “gyromagnetic ratio”, andµN is the nuclear magneton. Due to its ori-gin in the motion of the (charged) protons ontheir orbits and the spin of the nucleons, giv-ing rise to an orbital and an intrinsic magneticfield, respectively, the magnetic moment is asensitive probe to the wave function of a nu-clear state. Within the shell-model picture themagnetic moments of odd-A nuclei near closedshells are affected by the unpaired valence nu-cleon. The magnetic moments of the nucleus’states can therefore be calculated using the freenucleon magnetic moments for protons and neu-trons µπ = +2.793 µN and µν = −1.913 µN ,respectively. This approximation works well formost of the light isotopes. In heavier nuclei themagnetic moment is influenced by the presenceof the other nucleons, and “effective” g-factorshave to be used as well as further correction fac-tors in the calculations [20]. Measurements ofthe g-factors in isotopic/isotonic chains allows

6 CHAPTER 1. NUCLEAR STRUCTURE
12 14 16 18 20
Neutron number N
3.4
3.6
3.8
4.0
4.2
ma
gn
. m
om
en
t µ
exp. datanormal sdintruder sd-pfmixed (50% intruder)
Al isotopes
Figure 1.7: Experimental magnetic moments forodd-A aluminum isotopes as a function of N, com-pared to different shell-model calculations in the sd-pf space, assuming a “normal” ground state, an “in-truder” ground state or a “mixed” ground state for33Al. More detailed information is given in the text.All data taken from [22].
to investigate small changes in the nuclear struc-ture with changing N/Z ratio. In Figure 1.7 theexperimentally deduced nuclear ground-statemagnetic moments for odd-A aluminum isotopesare compared to different shell-model calcula-tions. The magnetic moment of 25,27,31Al can bewell described by a “normal” ground-state con-figuration with consecutively filled neutron or-bits in the sd-shell [21]. The more neutron-rich33Al should be in line with these results, due toits magicity N = 20. However, it turns out thatthe deduced g-factor is significantly lower thanthe assumption of a pure sd-shell configuration.This leads to the conclusion that, due to the van-ishing of the N = 20 shell closure for neutron-rich nuclei, 33Al must contain a contribution ofalmost 25% from neutron excitations into the pf-shell, so called 2p2h intruder configurations, inthe ground-state wave function [22].
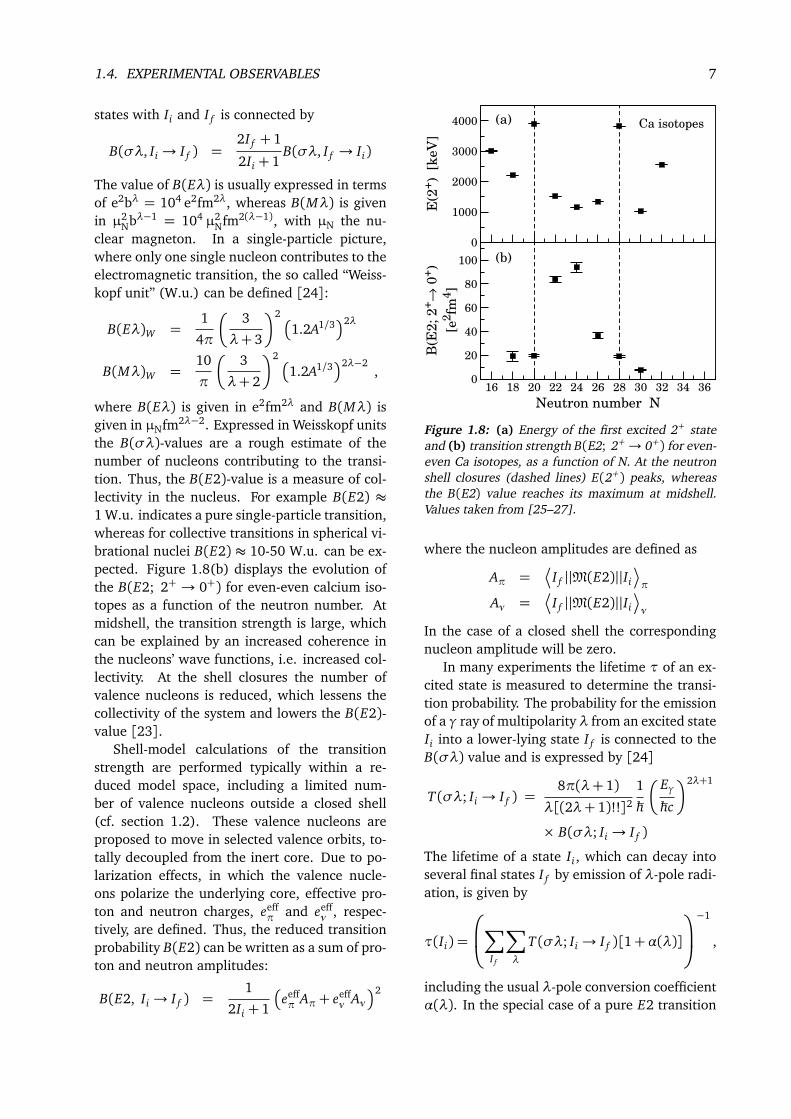
1.4.4 The E(2+) and B(E2, 0+→ 2+)strength
Not only the ground-state properties are usefulindicators for the evolution of nuclear structure,but also excited nuclear states can be used to re-veal the underlying shell structure. As seen inthe previous section, quadrupole collectivity isa very sensitive quantity to probe nucleon shellclosures. The energy of the first excited 2+ state,
E(2+), and the reduced transition probability ofthe transition between the first excited 2+ stateand the 0+ ground state, B(E2; 2+ → 0+), arethe most common measures for quadrupole col-lectivity in even-even nuclei, even far from sta-bility.
The first excited 2+ state in even-even nu-clei is formed by a two quasi-particle excita-tion, i.e. by the breaking of a nucleon-nucleonpair and excitation of one nucleon to the nexthigher orbit. For magic nuclei the energyneeded to excite nucleons across the shell gapis large, thus the energy of the first excited 2+
state is large. For mid-shell nuclei the leveldensity of possible excitations is much higher.Due to the mixing of the N levels φ1, . . . ,φNthe state with the most coherent wave func-tion ψI=
1pN
φ1+ · · ·+φN
is lowered in en-ergy [23]. Thus, lowering of the E(2+) is anindication for increasing coherence in the wavefunction, which in turn is the microscopic basisfor increased collectivity in the structure [23].In Figure 1.8(a) the energy of the first 2+ state ofeven-even calcium isotopes is plotted as a func-tion of N, showing the characteristic peak-likestructure at the shell closures N = 20, 28 and amore constant trend in between.
Due to the pairing interaction the groundstate in even-even nuclei is always 0+. Thus,the first excited 2+ state can only decay by elec-tric quadrupole radiation, i.e. an E2 transition tothe ground state. In general, the transition prob-ability of an (electric or magnetic) transition ofmultipolarity λ is given by
B(σλ, Ii → I f ) =1
2Ii + 1
¬
ψ f ||M(σλ)||ψi
2
with the total angular momentum I of the ini-tial state
ψi
and the final state
ψ f
, re-
spectively [24].¬
ψ f ||M(σλ)||ψi
is the re-duced transition matrix element with the elec-tromagnetic multipole operator M(σλ), whichcan have either an electric (σ = E) or a mag-netic (σ = M) character. The transition matrixelement M(σλ) of an electromagnetic decay ofan excited state is the same transition matrix el-ement as of the excitation process with the sameσλ character. Therefore the transition strengthof the excitation and de-excitation between two
1.4. EXPERIMENTAL OBSERVABLES 7
states with Ii and I f is connected by
B(σλ, Ii → I f ) =2I f + 1
2Ii + 1B(σλ, I f → Ii)
The value of B(Eλ) is usually expressed in termsof e2bλ = 104 e2fm2λ, whereas B(Mλ) is givenin µ2
Nbλ−1 = 104 µ2Nfm2(λ−1), with µN the nu-
clear magneton. In a single-particle picture,where only one single nucleon contributes to theelectromagnetic transition, the so called “Weiss-kopf unit” (W.u.) can be defined [24]:
B(Eλ)W =1
4π
3
λ+ 3
2
1.2A1/32λ
B(Mλ)W =10
π
3
λ+ 2
2
1.2A1/32λ−2
,
where B(Eλ) is given in e2fm2λ and B(Mλ) isgiven in µNfm2λ−2. Expressed in Weisskopf unitsthe B(σλ)-values are a rough estimate of thenumber of nucleons contributing to the transi-tion. Thus, the B(E2)-value is a measure of col-lectivity in the nucleus. For example B(E2) ≈1 W.u. indicates a pure single-particle transition,whereas for collective transitions in spherical vi-brational nuclei B(E2) ≈ 10-50 W.u. can be ex-pected. Figure 1.8(b) displays the evolution ofthe B(E2; 2+ → 0+) for even-even calcium iso-topes as a function of the neutron number. Atmidshell, the transition strength is large, whichcan be explained by an increased coherence inthe nucleons’ wave functions, i.e. increased col-lectivity. At the shell closures the number ofvalence nucleons is reduced, which lessens thecollectivity of the system and lowers the B(E2)-value [23].
Shell-model calculations of the transitionstrength are performed typically within a re-duced model space, including a limited num-ber of valence nucleons outside a closed shell(cf. section 1.2). These valence nucleons areproposed to move in selected valence orbits, to-tally decoupled from the inert core. Due to po-larization effects, in which the valence nucle-ons polarize the underlying core, effective pro-ton and neutron charges, eeff
π and eeffν , respec-
tively, are defined. Thus, the reduced transitionprobability B(E2) can be written as a sum of pro-ton and neutron amplitudes:
B(E2, Ii → I f ) =1
2Ii + 1
eeffπ Aπ+ eeff
ν Aν2
0
1000
2000
3000
4000
E(2
+)
[k
eV
]
16 18 20 22 24 26 28 30 32 34 36
Neutron number N
0
20
40
60
80
100
B(E
2; 2
+→
0+)
[e2fm
4]
Ca isotopes(a)
(b)
Figure 1.8: (a) Energy of the first excited 2+ stateand (b) transition strength B(E2; 2+→ 0+) for even-even Ca isotopes, as a function of N. At the neutronshell closures (dashed lines) E(2+) peaks, whereasthe B(E2) value reaches its maximum at midshell.Values taken from [25–27].
where the nucleon amplitudes are defined as
Aπ =¬
I f ||M(E2)||Ii
π
Aν =¬
I f ||M(E2)||Ii
ν
In the case of a closed shell the correspondingnucleon amplitude will be zero.
In many experiments the lifetime τ of an ex-cited state is measured to determine the transi-tion probability. The probability for the emissionof a γ ray of multipolarity λ from an excited stateIi into a lower-lying state I f is connected to theB(σλ) value and is expressed by [24]
T (σλ; Ii → I f ) =8π(λ+ 1)
λ[(2λ+ 1)!!]21
ħh
Eγħhc
2λ+1
× B(σλ; Ii → I f )
The lifetime of a state Ii , which can decay intoseveral final states I f by emission of λ-pole radi-ation, is given by
τ(Ii) =
∑
I f
∑
λ
T (σλ; Ii → I f )[1+α(λ)]
−1
,
including the usual λ-pole conversion coefficientα(λ). In the special case of a pure E2 transition

8 CHAPTER 1. NUCLEAR STRUCTURE
from the first excited 2+ state to the 0+ groundstate, the lifetime of the 2+ state is
τ(2+) =8.16× 10⁻¹⁴
[1+α(E2)] E5γ B(E2;2+→ 0+)
[s]
where Eγ is given in MeV, and the B(E2) in unitsof e2b2.

Part I
Mapping the borderof the “Island of Inversion” –
Coulomb excitationof exotic Na and Mg isotopes
with MINIBALL at REX-ISOLDE
9


2.1. VANISHING OF THE N = 20 SHELL GAP – THE ISLAND OF INVERSION 11
Chapter 2
Motivation and physics case
Shell structure is one of the most importantframeworks for understanding nuclear structureand the properties of atomic nuclei. Contrary tothe opinion some years ago that magic numbersare permanent and valid for all nuclei, recentexperimental and theoretical findings indicatethat magic numbers are subject to the proton-to-neutron ratio. Thus, well-known shell closuresvanish and new magic numbers are revealedwhen going to more exotic nuclei far from thevalley of stability.
2.1 Vanishing of the N = 20 shellgap – the island of inversion
A first indication for such a vanishing of a shellclosure was found in early mass measurementsfor 31,32Na at ISOLDE (CERN), which found de-viations from the expected binding energies fora closed shell at N = 20 [28]. Campi et al. sug-gested a deformed ground state for these nu-clei [29]. Further evidence for this interpreta-tion was provided by studies of mean square nu-clear charge radii [30] and β-decay spectra ofthe neutron-rich sodium isotopes around N =20 [31, 32]. Later shell-model calculations byWarburton et al. [33] assumed that the 1 f7/2 or-bital becomes lower in energy, reducing the sdshell gap and an anomalous inverted level struc-ture was proposed, which is based on 2-particle2-hole (2p2h) neutron cross shell configurationsin the ground state. Recent shell-model calcula-tions trace this phenomenon back to the resid-ual nucleon-nucleon interaction [5–7, 34]. Themonopole term of the strongly attractive ten-sor interaction between protons and neutrons isstrongest for S = 0 (spin-flip), ∆L = 0 (spin-
orbit partner) and T = 0 (isospin-flip) [17](cf. Sec. 1.3). In the case of silicon, protons inthe πd5/2 orbital strongly interact with neutronsin νd3/2. Moreover the monopole interactionV T=0
d5/2d3/2is the most attractive in the sd shell [5].
As pointed out by Sorlin et al. the V T=0d5/2 f7/2
proton-neutron interaction is weaker firstly dueto the different angular momenta of proton andneutron (∆L = 1), i.e. due to the weaker over-lap of their wave functions. Secondly the in-teraction contains a repulsive tensor force dueto the spin alignment (S = 1) [16]. Thus, theνd3/2 orbital becomes lower in energy with re-spect to the ν f7/2 orbital, resulting in the clas-sical magic number N = 20. By removing pro-tons from the πd5/2 orbital the V T=0
d5/2d3/2residual
interaction decreases due to the missing S = 0partner protons and the νd3/2 orbital is shifted
8 12 16 20N
-20
-10
0
ES
PE
[M
eV
]
8 12 16 20Z
(a) (b)pf shell
pf shell
0d5/2
0d5/2
1s1/2
1s1/2
0d3/2
0d3/2
20
1616
Figure 2.1: Calculated effective single particle ener-gies (ESPE) of neutrons (a) in the Z=8 isotopic chainof oxygen and (b) in the N=20 isotonic chain with8<Z<20. Explanation is given in the text. The figurewas adapted from Ref. [7].

12 CHAPTER 2. MOTIVATION AND PHYSICS CASE
to higher energies. The energy gap to the p fshell becomes smaller, causing a new (sub)shellclosure at N = 16, as shown in Figure 2.1.
The neutron-rich isotopes of Ne, Na and Mgare located at this transition from a shell clo-sure at N = 20 to a shell closure at N = 16.Compared to 34Si the shell gap between the neu-tron d3/2 and the p f orbitals is reduced by about1 MeV for the Mg isotone and about 2 MeV forthe Ne isotone [35]. Thus, excitation of 2p2hintruder configurations of sd and p f orbits is in-creased for the neutron-rich Ne, Na and Mg iso-topes. The intruder configurations gain correla-tion energy, i.e. deformation energy, comprisingproton-neutron and neutron-neutron monopoleand quadrupole terms [36]. If this gain of cor-relation energy largely compensates the loss ofenergy promoting two neutrons from the d5/2orbital across the N = 20 shell gap to a p forbital (2Egap), the ground-state wave functioncontains a dominant 2p2h admixture. Thus, nor-mal (0ħhω) and intruder (2ħhω) configurationsare inverted in those nuclei, triggering the name“island of inversion”. Moreover, due to defor-mation of the ground state, nuclei which residein the region of the island of inversion, showlargely collective behavior, e.g. reduced E(2+)and increased B(E2, 0+ → 2+) values for even-even isotopes. Besides the shell-model calcu-lations the low-lying 2+1 states and increasedB(E2) values were reproduced also by the quasi-particle random-phase approximation [37] andconfiguration mixing with angular-momentumprojection [38, 39]. Mean-field calculations re-sult in a spherical shape for the ground stateof 32Mg [40, 41]. However, it is calculated tobe very soft against quadrupole deformation.Investigations in the following nuclei evincethat 29,30,32Ne [42–44], 30,31Na [45, 46] and31−34,36Mg [47–53] are part of the island of in-version (see Figure 2.2).
Many efforts have been made in experimen-tal and theoretical studies to understand the co-existence of normal 0ħhω and intruder 1ħhω and2ħhω configurations at low energies for differentisotopes in the region of the island of inversion.However, the driving mechanisms are not fullyunderstood yet and the predictive power of mosttheories is not good enough to provide reliableinformation on the low-energy structure and ex-
F
Na
Ne
Mg
Si
Al
P
− sd
16 20 inversionisland of
Z
N
− pf − mixed sd−pf
Figure 2.2: Location of the “island of inversion” in-side the chart of nuclides, summarizing recent ex-perimental results [22, 42–63]. Nuclides colored inblue show normal sd shell structure, whereas nu-clides found to have a pf intruder ground state aremarked in red. Yellow boxes indicate transitional nu-clei with a mixed sd-pf configuration in the groundstate.
perimental observables for many nuclei in thisregion. Especially for nuclei with odd N and/orodd Z detailed theoretical information is rare,although these nuclei are a much more sensitiveprobe for the competing structure of 0ħhω, 1ħhωand 2ħhω configurations at low energies. Thus,the experiments presented in this work will fo-cus on the study of collective properties and thelow-energy structure of the neutron-rich odd-mass magnesium isotope 31Mg and the neigh-boring odd-Z sodium isotopes 29,30Na.
2.2 The neutron-rich Mg isotopes
Shortly after the first observation of the anoma-lous behavior of the neutron-rich sodium iso-topes around N = 20 [28, 30], experimentalstudies focused on the neighboring magnesiumisotopes. β-decay studies of neutron-rich 32Nanuclei found a low-lying 2+ state in 32Mg [31].Its low excitation energy of only 886 keV pointedto a largely deformed nucleus. Early mass mea-surements of 31,32Mg supported this suggestion,finding the neutrons in the νd3/2 orbital tobe less bound than expected for a nucleus atthe N = 20 shell closure [64, 65]. During thelast two decades different experimental meth-ods were employed to study the structure of theneutron-rich Mg isotopes at the region of the is-land of inversion in detail.
As stated in the first chapter, the energy of

2.2. THE NEUTRON-RICH MG ISOTOPES 13
the first excited 2+ state and the reduced tran-sition probability B(E2, 0+ → 2+) are the mostaccessible observables to study the properties ofexcited states in exotic even-even nuclei. There-fore the quadrupole collectivity of the N = 20nucleus 32Mg was determined by Motobayashiet al., employing for the first time the method ofintermediate-energy Coulomb excitation to nu-clei far from stability [50]. The experimentyielded B(E2, 0+ → 2+) = 454(78) e2fm4,corresponding to a large quadrupole deforma-tion of the ground state with β2 = 0.522(41),caused by the highly deformed p f intruder state.These values were confirmed by a series of in-dependent Coulomb-excitation experiments andinelastic scattering experiments [51,52,66–68].The most recent of these Coulomb-excitation ex-periments was performed at REX-ISOLDE, prov-ing the deformed sd-p f intruder configurationdominating the ground state of 32Mg [68]. Incontrast Coulomb-excitation experiments in theN = 18 isotope 30Mg [59, 66] revealed an exci-tation strength of B(E2) = 280(20) e2fm4 forthe 2+ state at 1483 keV, which is consistentwith a spherical 0ħhω ground-state configura-tion. An excited 0+2 state in 30Mg was identifiedat an excitation energy of 1789 keV by measur-ing its E0 ground-state decay 0+2 → 0+gs [69].The configuration of this state was found to bedominated by a deformed 2ħhω intruder config-uration of two neutrons excited across the sd-p f shell gap. Recently a similar shape coex-istence was observed in 32Mg, employing the30Mg(t,p)32Mg 2n-transfer reaction in inversekinematics at REX-ISOLDE [70]. Beside the de-formed 0+gs the first excited 0+2 was identified at1058 keV, supporting the idea of an inversionof normal and intruder configurations for nu-clei residing inside the island of inversion. Fur-ther investigations in the even more neutron-rich nuclei 34,36Mg found low-lying 2+1 states at657(7) keV [51, 52, 71] and 660(6) keV [53],respectively, pointing to well deformed nu-clei. For 34Mg this was supported by severalintermediate-energy Coulomb-excitation experi-ments, yielding a large quadrupole collectivity ofB(E2, 0+→ 2+) = 570(100) e2fm4 [51,52,66],which corresponds to a deformation parameterβ2 = 0.58(6).
All these findings are summarized in Fig-
0
1000
2000
3000
E(2
+)
[k
eV
]
8 10 12 14 16 18 20 22 24
Neutron number N
0
200
400
600
B(E
2;
0+
→ 2
+)
exp.
AMPGCMMCSMUSD
[e2fm
4]
Mg isotopes
(a)
(b)
Figure 2.3: (a) Energies of the first excited 2+
states and (b) their B(E2) values for even-even Mgisotopes. While for N ≤ 18 the experimental val-ues [72] are well reproduced by USD shell-model cal-culations [73], large deviations are found for N≥ 20.This can be explained by dominant 2p2h configura-tions in the ground state of 32,34,36Mg, which weretaken into account in MCSM [35] and AMPGCM [38]calculations.
ure 2.3, showing the energies of the first excited2+ states and their B(E2) values for even-evenMg isotopes. For Z ≤ 18 the experimental val-ues [72] are well reproduced by shell-model cal-culations using the usual sd shell-model space ofthe USD interaction [73]. For N ≥ 20 the valuescan no longer be reproduced by the USD inter-action. A dominant mixing of intruder config-urations, exciting neutrons across the N = 20shell gap, has to be taken into account, whichwas performed in the framework of Monte-Carlo shell model (MCSM) calculations [35] andbeyond-mean-field calculations [38].
The measurement of low-lying 2+1 states andlarge B(E2, 0+ → 2+1 ) values in even-even nu-clei residing inside the island of inversion hasmeanwhile established the picture of highly de-formed intruder ground states. However, the de-tails of the underlying single-particle structurecan be preferentially addressed by studying nu-clei with odd neutron or proton number. A rele-vant case is given by the N = 19 nucleus 31Mg,which is located at the boundary of the island
14 CHAPTER 2. MOTIVATION AND PHYSICS CASE
Jπ Ex [keV] Qs / Q [efm2] B(E2) [e2fm4] µ [µN] B(M1) [µ2N]
1/2+ 0 — — -0.98 —3/2+ 101 -17 / 84 106 +0.56 0.065/2+ 988 -17 / 59 127 -0.30 0.387/2+ 1236 -25 / 75 151 +0.94 0.04
Table 2.1: Predicted energies, electromagnetic moments, and reduced transition probabilities of the positive-parity yrast states in 31Mg, calculated by shell-model calculations in the sd-pf model space [48].
of inversion. Early β-decay studies of 31,32Nadetermined a 3/2+ ground state for 31Mg dueto the measured log f t value [74]. Thus, theground-state wave function was assumed to bedominated by a normal sd shell configuration,placing 31Mg outside of the island of inversion.In a recent hyperfine structure and β-NMR mea-surement by Neyens et al. the spin and nuclearmoment of the ground state in 31Mg were mea-
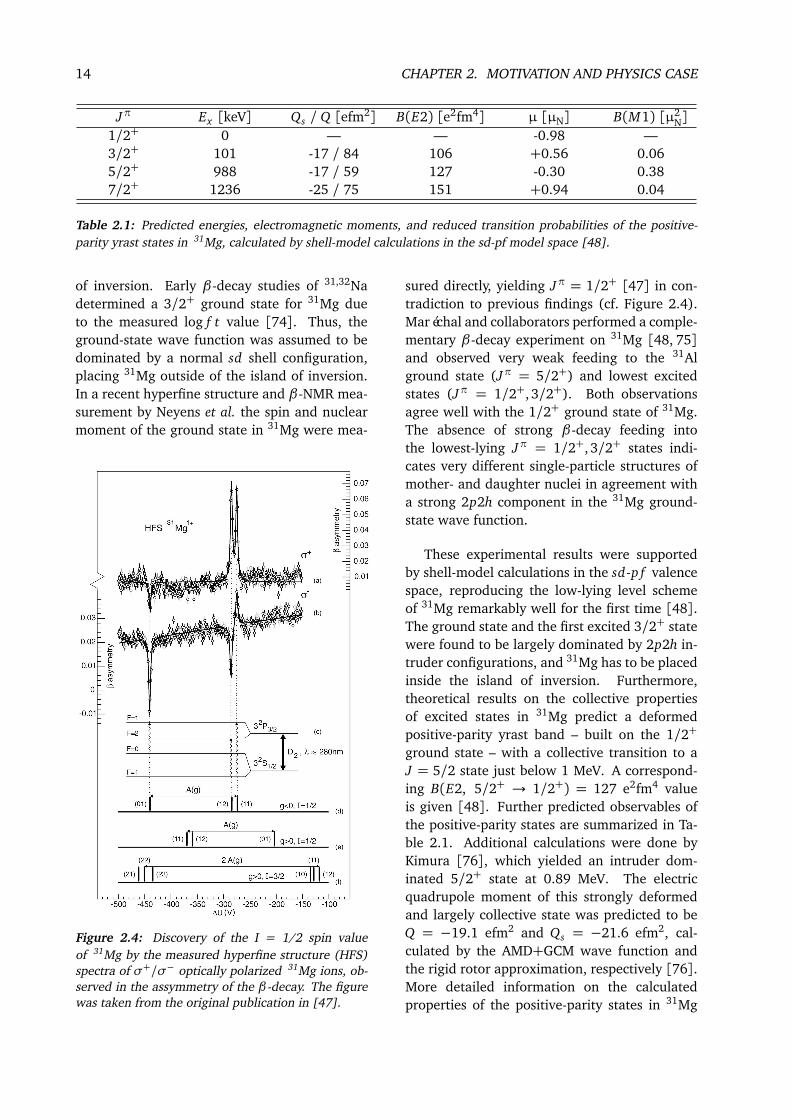
Figure 2.4: Discovery of the I = 1/2 spin valueof 31Mg by the measured hyperfine structure (HFS)spectra of σ+/σ− optically polarized 31Mg ions, ob-served in the assymmetry of the β-decay. The figurewas taken from the original publication in [47].
sured directly, yielding Jπ = 1/2+ [47] in con-tradiction to previous findings (cf. Figure 2.4).Maréchal and collaborators performed a comple-mentary β-decay experiment on 31Mg [48, 75]and observed very weak feeding to the 31Alground state (Jπ = 5/2+) and lowest excitedstates (Jπ = 1/2+, 3/2+). Both observationsagree well with the 1/2+ ground state of 31Mg.The absence of strong β-decay feeding intothe lowest-lying Jπ = 1/2+, 3/2+ states indi-cates very different single-particle structures ofmother- and daughter nuclei in agreement witha strong 2p2h component in the 31Mg ground-state wave function.
These experimental results were supportedby shell-model calculations in the sd-p f valencespace, reproducing the low-lying level schemeof 31Mg remarkably well for the first time [48].The ground state and the first excited 3/2+ statewere found to be largely dominated by 2p2h in-truder configurations, and 31Mg has to be placedinside the island of inversion. Furthermore,theoretical results on the collective propertiesof excited states in 31Mg predict a deformedpositive-parity yrast band – built on the 1/2+
ground state – with a collective transition to aJ = 5/2 state just below 1 MeV. A correspond-ing B(E2, 5/2+ → 1/2+) = 127 e2fm4 valueis given [48]. Further predicted observables ofthe positive-parity states are summarized in Ta-ble 2.1. Additional calculations were done byKimura [76], which yielded an intruder dom-inated 5/2+ state at 0.89 MeV. The electricquadrupole moment of this strongly deformedand largely collective state was predicted to beQ = −19.1 efm2 and Qs = −21.6 efm2, cal-culated by the AMD+GCM wave function andthe rigid rotor approximation, respectively [76].More detailed information on the calculatedproperties of the positive-parity states in 31Mg

2.3. THE NEUTRON-RICH NA ISOTOPES 15
Jπ Ex [MeV] Q [efm2] Qs [efm2] 0p1h [%] 2p3h [%]1/2+1 0.0 — — 0 933/2+1 0.14 -18.9 -17.1 25 613/2+2 0.81 8.2 7.4 68 205/2+1 0.89 -19.1 -21.6 21 637/2+1 1.39 -23.2 -22.55/2+2 1.85 4.8 -2.7 67 117/2+2 2.23 -2.4 -5.39/2+1 2.93 -17.2 -19.5
Table 2.2: Predicted energies, configuration mixings, and electric quadrupole moments of the positive-paritystates in 31Mg, calculated by the AMD+GCM wave function (Q) and the rigid rotor approximation (Qs) [76].
1/2
3/2
3/2
3/2 673 keV
221 keV
Mg31
5/2
461 keV
1029 keV
1390 keV
1155 keV
945 keV
2015 keV
16(3) ns
10.5(8) ns
133(8) ps
0 keV
50 keV(+)
(−)
17
93
keV
92
9 k
eV
80
8 k
eV
89
4 k
eV
69
3 k
eV
67
3 k
eV
62
3 k
eV
45
3 k
eV
24
0 k
eV
22
1 k
eV
17
1 k
eV
50
keV
+
+
+(1/2:7/2 )
+
+
−(5/2:7/2 ),(11/2 )
−(1/2:7/2 )
−(7/2 )
Figure 2.5: Levelscheme of 31Mg up to 2 MeV, de-duced from β-decay, fast timing βγγ measurements,and proton-knockout reactions [72,77,78].
by AMD-GCM calculations can be found in Ta-ble 2.2.
So far detailed structure information on thelow-lying levels of 31Mg have been provided byβ-decay, fast timing βγγ measurements [77],and proton-knockout reactions [78], the latterones allowing for determination of transitionsstrengths and spin and parity assignments of thefirst excited levels, respectively. Three promisingcandidates for a strongly deformed and largelycollective 5/2+ state remain between 900 keVand 1400 keV [72, 77, 78], but spin and parityassignments are not available from β-decay ex-periments (cf. Figure 2.5). The unknown 5/2+
state and the predicted collective properties ofthe first excited positive-parity states in 31Mgmotivated a first Coulomb-excitation experimentwith a 31Mg beam in inverse kinematics at REX-ISOLDE, CERN, performed by the MINBALL col-laboration. The intruder configurations also athigher excitation energy are the subject of thisinvestigation to clarify the placement of 31Mg in-side the island of inversion. Reduced transitionprobabilities, i.e. B(E2) and B(M1) values, willbe presented and compared to recent theoreticalresults in this work.
2.3 The neutron-rich Na isotopes
Besides the exotic magnesium isotopes aroundN = 20 neutron-rich sodium isotopes played themost important role in the discovery and under-standing of the island of inversion. The first in-dication for a vanishing N = 20 shell gap wasfound in early mass measurements for 26−32Naat ISOLDE (CERN) [28]. The observed excess

16 CHAPTER 2. MOTIVATION AND PHYSICS CASE
3/2
5/25/2
3/2
(1/2 )
(7/2 )
(9/2 )
3/2
7/2
9/2
6
2
5
1
(1 )
USD
5/2+
+
+
63
0+
+
SDPF−MExp.USD
+
+
+
1728
2288
2192
3/2+
1/2+
9/2+
7/2+
+
+
+
1+
+3
2+
4+
1+
−
4−
3−
−
−
3+
2+
1+
3+
4+
3+
0+
2+
2+
1+
2+
1+
3+
0
55+
1131
1255
1932
2118+
2+
2827Na Na
3
Exp. SDPF−M
1p1h
0p0h
Figure 2.6: Comparison of the energy levels of 27,28Na, deduced by experiment (middle) and by shell-modelcalculations using the USD (left) and SDPF-M interactions (right). The E2 excitation strengths from the groundstate are indicated by the width of the arrows. The figure was adapted from Refs. [54,57].
in the two-neutron separation energy pointed tothe onset of deformation (at N = 20) in theground state of exotic Na isotopes. Thus, 31,32Nawere proposed to have an intruder-dominatedground state. Later this was confirmed by dif-ferent experimental findings, e.g. the ground-state spin J = 3/2 as well as a significantlyreduced magnetic moment [80] and enhancedquadrupole collectivity [46,56,79] of 31Na.
For the N = 16 and N = 17 isotopes 27,28Nalevel schemes were investigated mainly by β-decay experiments [57, 81] and a recent fu-sion experiment employing both radioactive 14Cbeams and targets [82]. The ground-state spinof 28Na was measured to be Jπ = 1+ by laserspectroscopy [30] and deduced log f t values ofthe 28Ne β-decay [57]. The results agree wellwith shell-model calculations in the sd modelspace using the USD interaction [54], whichshow energetically very close lying states. Anormal shell-model configuration is assumed forthe low-lying 1+1 , 2+1 , 3+1 , and 4+1 states, wherea neutron in the νd3/2 orbital couples weaklywith a proton in the πd3/2 or πd3/2 orbital.
Thus B(E2) values from the ground state to theother low-lying states are expected to be small.Utsuno et al. predicted transition strengths of19 e2fm4 and 27 e2fm4 for the excitation fromthe ground state into the 2+1 and 3+1 states, re-spectively [54]. For the excitation of one neu-tron from the ν1s1/2 orbital into the ν0d3/2 or-bital MCSM calculations with the SDPF-M inter-action yielded B(E2, 1+1 → 2+2 ) = 69 e2fm4 andB(E2, 1+1 → 3+2 ) = 47 e2fm4. An indicationfor the latter ones was observed in a Coulomb-excitation experiment at MSU [56]. Withinthe energy resolution of the NaI detector arrayused one γ ray was observed at 1.24 MeV withB(E2)↑= 54(26) e2fm4 which is quite close tothe predictions.
The nuclear masses and two-neutron sepa-ration energies of the N = 18, 19 sodium iso-topes 29,30Na did not show any major deviationscompared to predicted values from standardshell-model calculations in the sd shell [28].However, measurements of the magnetic dipolemoments and electric quadrupole moments re-vealed significant deviations from the USD
2.3. THE NEUTRON-RICH NA ISOTOPES 17
(3 )
1
2
1
1
2
5
6
5/2
3/2
3/2
1/2
9/2
7/2
5/2
3/2
5/2
3/2
(5/2 )
1+
2+
3+
0+
4+
(2 )+
+
+151
424
516
+0
+926
2
3+
+
+4
1+
2+
0+
1+
2+
3+
3+
+2114
4+
0+
4+
2+
1+
3
4−
−
−
−
−
3+
2+
USD Exp. SDPF−MUSD
5/2+
3/2+
1/2+
9/2+
+
+
+
+
+
+
+
SDPF−M
72
0+
+
1249+
+1588
Exp.
29Na
30Na
2p2h2p2h
0p0h
1p1h
K=1K=2
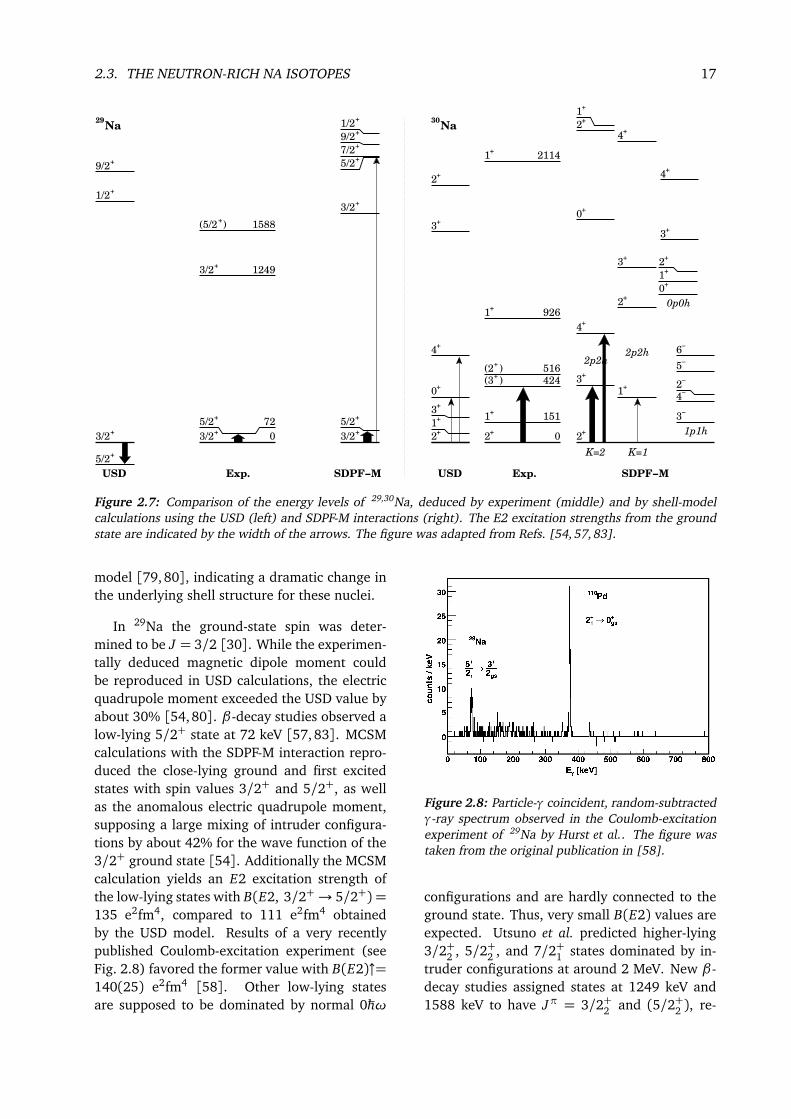
Figure 2.7: Comparison of the energy levels of 29,30Na, deduced by experiment (middle) and by shell-modelcalculations using the USD (left) and SDPF-M interactions (right). The E2 excitation strengths from the groundstate are indicated by the width of the arrows. The figure was adapted from Refs. [54,57,83].
model [79, 80], indicating a dramatic change inthe underlying shell structure for these nuclei.
In 29Na the ground-state spin was deter-mined to be J = 3/2 [30]. While the experimen-tally deduced magnetic dipole moment couldbe reproduced in USD calculations, the electricquadrupole moment exceeded the USD value byabout 30% [54,80]. β-decay studies observed alow-lying 5/2+ state at 72 keV [57, 83]. MCSMcalculations with the SDPF-M interaction repro-duced the close-lying ground and first excitedstates with spin values 3/2+ and 5/2+, as wellas the anomalous electric quadrupole moment,supposing a large mixing of intruder configura-tions by about 42% for the wave function of the3/2+ ground state [54]. Additionally the MCSMcalculation yields an E2 excitation strength ofthe low-lying states with B(E2, 3/2+→ 5/2+) =135 e2fm4, compared to 111 e2fm4 obtainedby the USD model. Results of a very recentlypublished Coulomb-excitation experiment (seeFig. 2.8) favored the former value with B(E2)↑=140(25) e2fm4 [58]. Other low-lying statesare supposed to be dominated by normal 0ħhω
Figure 2.8: Particle-γ coincident, random-subtractedγ-ray spectrum observed in the Coulomb-excitationexperiment of 29Na by Hurst et al.. The figure wastaken from the original publication in [58].
configurations and are hardly connected to theground state. Thus, very small B(E2) values areexpected. Utsuno et al. predicted higher-lying3/2+2 , 5/2+2 , and 7/2+1 states dominated by in-truder configurations at around 2 MeV. New β-decay studies assigned states at 1249 keV and1588 keV to have Jπ = 3/2+2 and (5/2+2 ), re-
18 CHAPTER 2. MOTIVATION AND PHYSICS CASE
spectively [83]. Additional MCSM calculationsobtained 65% and 77% 2p2h admixture for the3/2+2 state and 5/2+2 state, respectively [83].Due to the large intruder mixing in the groundstate these states are supposed to have a no-ticeable overlap with the ground state in theirwave functions. Thus the related B(E2) val-ues are sensitive probes related to the intrudercontent and the N = 20 shell gap. A value ofB(E2, 3/2+gs→ 7/2+2 ) = 57 e2fm4 is given exem-plarily [54], awaiting experimental verification.
The magnetic dipole moment of 30Na wasexperimentally deduced by Keim et al. to be2.069(2) µ2
N, which is significantly lower thanthe predicted value from USD model calcula-tions, yielding µ = 2.687 µ2
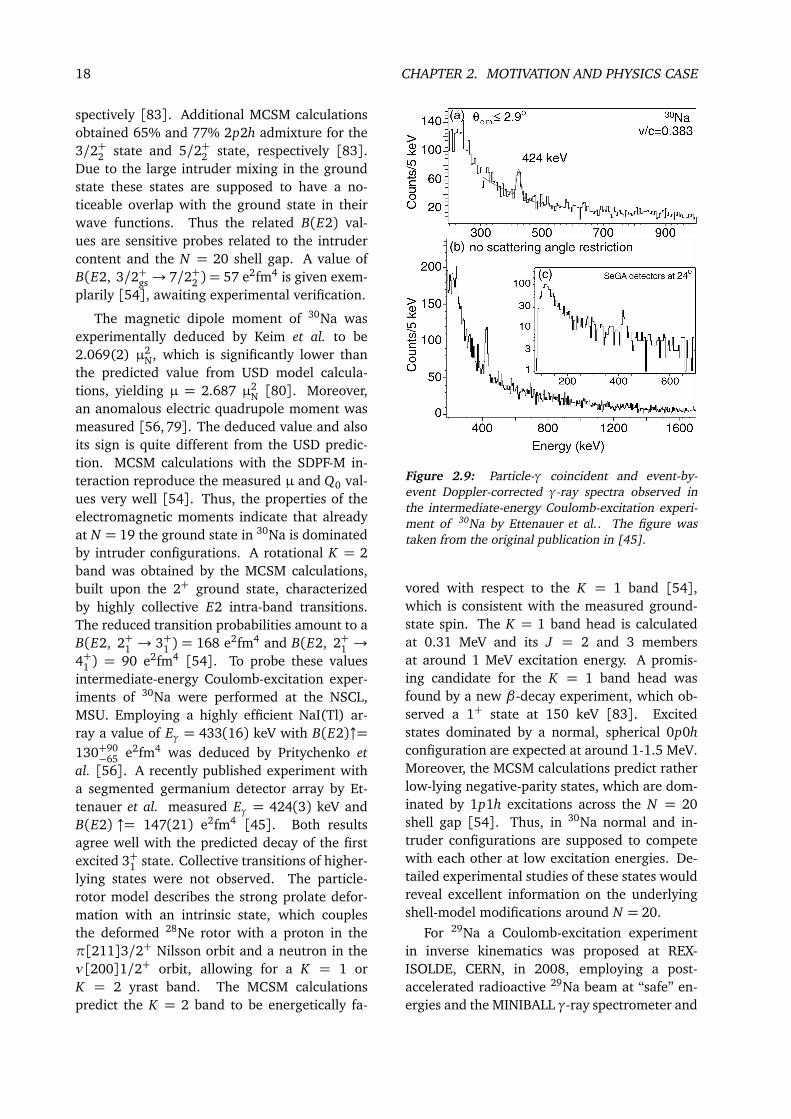
N [80]. Moreover,an anomalous electric quadrupole moment wasmeasured [56, 79]. The deduced value and alsoits sign is quite different from the USD predic-tion. MCSM calculations with the SDPF-M in-teraction reproduce the measured µ and Q0 val-ues very well [54]. Thus, the properties of theelectromagnetic moments indicate that alreadyat N = 19 the ground state in 30Na is dominatedby intruder configurations. A rotational K = 2band was obtained by the MCSM calculations,built upon the 2+ ground state, characterizedby highly collective E2 intra-band transitions.The reduced transition probabilities amount to aB(E2, 2+1 → 3+1 ) = 168 e2fm4 and B(E2, 2+1 →4+1 ) = 90 e2fm4 [54]. To probe these valuesintermediate-energy Coulomb-excitation exper-iments of 30Na were performed at the NSCL,MSU. Employing a highly efficient NaI(Tl) ar-ray a value of Eγ = 433(16) keV with B(E2)↑=130+90
−65 e2fm4 was deduced by Pritychenko etal. [56]. A recently published experiment witha segmented germanium detector array by Et-tenauer et al. measured Eγ = 424(3) keV andB(E2) ↑= 147(21) e2fm4 [45]. Both resultsagree well with the predicted decay of the firstexcited 3+1 state. Collective transitions of higher-lying states were not observed. The particle-rotor model describes the strong prolate defor-mation with an intrinsic state, which couplesthe deformed 28Ne rotor with a proton in theπ[211]3/2+ Nilsson orbit and a neutron in theν[200]1/2+ orbit, allowing for a K = 1 orK = 2 yrast band. The MCSM calculationspredict the K = 2 band to be energetically fa-
Figure 2.9: Particle-γ coincident and event-by-event Doppler-corrected γ-ray spectra observed inthe intermediate-energy Coulomb-excitation experi-ment of 30Na by Ettenauer et al.. The figure wastaken from the original publication in [45].
vored with respect to the K = 1 band [54],which is consistent with the measured ground-state spin. The K = 1 band head is calculatedat 0.31 MeV and its J = 2 and 3 membersat around 1 MeV excitation energy. A promis-ing candidate for the K = 1 band head wasfound by a new β-decay experiment, which ob-served a 1+ state at 150 keV [83]. Excitedstates dominated by a normal, spherical 0p0hconfiguration are expected at around 1-1.5 MeV.Moreover, the MCSM calculations predict ratherlow-lying negative-parity states, which are dom-inated by 1p1h excitations across the N = 20shell gap [54]. Thus, in 30Na normal and in-truder configurations are supposed to competewith each other at low excitation energies. De-tailed experimental studies of these states wouldreveal excellent information on the underlyingshell-model modifications around N = 20.
For 29Na a Coulomb-excitation experimentin inverse kinematics was proposed at REX-ISOLDE, CERN, in 2008, employing a post-accelerated radioactive 29Na beam at “safe” en-ergies and the MINIBALL γ-ray spectrometer and

2.3. THE NEUTRON-RICH NA ISOTOPES 19
particle detector setup, to probe the predictedcollective properties of the first excited 5/2+1state and of the unknown higher-lying 3/2+2 ,5/2+2 , and 7/2+1 states. A few months afterthe proposal was accepted, Hurst and collabo-rators published the results of their Coulomb-excitation experiment which was performed atTRIUMF [58]. However, compared to their ex-periment the experiment with MINIBALL at REX-ISOLDE would gain from the much more intenseradioactive ion beam of about 1×10⁴ ions/s anda slightly higher beam energy. Thus, the newexperiment intended to measure the much lessintense transitions of the proposed higher-lying3/2+2 , 5/2+2 , and 7/2+1 states, even with the pre-dicted moderately large B(E2) values. A con-firmation of those values by experiment wouldestablish the onset of significant intruder mixingin the ground-state wave function of the sodiumisotopes already at N = 18.
The unknown higher-lying states of the K = 2and K = 1 bands in 30Na and their predicted col-lective properties motivated a precise Coulomb-excitation experiment with a 30Na beam in in-verse kinematics at REX-ISOLDE, CERN. Com-pared to the very recent measurements, per-formed at NSCL, MSU [45, 56], the new exper-iment with the MINIBALL setup would provide(i) the high energy resolution of the MINIBALLHPGe detectors, (ii) the enlarged energy rangefor γ-ray detection, which goes down to a lowerthreshold of 50 keV, (iii) the high efficiency ofthe 8 triple cluster detectors of MINIBALL and(iv) the advantage of much lower backgroundat energies below 250 keV in an ISOL beamexperiment compared to measurements utiliz-ing the in-flight production technique. The in-truder configurations also at higher excitationenergy are the subject of this investigation to ob-tain new information about the underlying shellstructure and the evolution of the shell gaps farfrom stability.
In this work reduced transition probabilities,i.e. B(E2) and B(M1) values, of 29,30Na will bepresented and compared to recent theoreticalpredictions.

20 CHAPTER 2. MOTIVATION AND PHYSICS CASE

3.1. INTRODUCTION 21
Chapter 3
The experimental setup and technique
3.1 Introduction
A total number of about 3000 different nuclideshave been experimentally observed so far, ofwhich less than 10% are stable (cf. Fig. 1.2).All other nuclides are radioactive and an over-whelming part of it needed to be produced bynuclear reactions, to be studied in experiments.During the last decades special interest in nu-clear physics has focused on the properties of ra-dioactive nuclei with extreme N/Z ratios far offstability. Production cross sections and result-ing yields for these nuclei are small comparedto the large amount of possible background re-actions, often orders of magnitude more numer-ous. Thus, experimental techniques have to bevery selective and efficient, to provide a pureand intense radioactive ion beam beam. Themain task is the transport of the beam of inter-est, away from its place of production to a spe-cific scientific setup, to eliminate the primary re-action background. Furthermore, in the courseof transport, selective methods (e.g. mass sep-aration) can suppress contaminants. Generally,the following experimental conditions should bemet by any radioactive ion beam (RIB) facility:(i) The radioactive ions should be produced ina sufficient rate. (ii) The extraction techniquehas to be selective to the ions’ A and Z . (iii) Themethod for extraction and preparation of the ra-dioactive ions has to be fast, to produce RIBs ofvery short-lived isotopes. (iv) All stages of theRIB preparation have to be highly efficient.
Two different types of RIB facilities ful-fill these requirements: The “In-Flightseparation” (IF) facilities such as theFRS@GSI, BigRIPS@RIKEN, NSCL@MSU,and LISE@GANIL. The “Isotope Separation On-
Line” (ISOL) facilities such as ISOLDE@CERN,ISAC@TRIUMF, and SPIRAL@GANIL.
The IF method uses an intermediate energyor relativistic heavy ion beam (typically several100 MeV/u up to 4.5 GeV/u), impinging on alow-mass primary production target (e.g. 9Be).Reaction products are emitted in forward direc-tion with energies of still a few 100 MeV/u. Iso-topes of interest are selected and identified witha fragment separator, consisting of electromag-netic field combinations, a degrader, scintilla-tors, and ionization chambers [84,85]. With thisfast technique, isotopes with lifetimes down tothe sub-microsecond range can be investigated.
The basic principles of the ISOL method andthe feasibility of the separation of short-livedradioactive nuclei were first demonstrated byO. Kofoed-Hansen and K.O. Nielsen already in1951 [86]. The “classic” ISOL facility consistsof a thick, heavy target, which is irradiated witha high-energetic ion beam, typically protons atseveral 100 MeV, or neutrons. By heating thetarget to temperatures up to 2500C, the ra-dioactive nuclei can diffuse out of the target ma-terial and into an ion source. After ionization
ISAC
CARIBU
HRIBF
SPIRAL
ISOLDE
EXCYT SPES
DRIBS LISE
FRS
NDNSL
NSCL
ACCULINA
BigRIPS TRIAC
ISOL facilities In-Flight facilities
IGISOL
Figure 3.1: Overview of the current and upcomingradioactive ion beam facilities in the world.

22 CHAPTER 3. THE EXPERIMENTAL SETUP AND TECHNIQUE
Figure 3.2: The schematic layout of the ISOLDE facility at CERN is shown. 1.4 GeV protons from the PS Boosterare delivered to one of the primary target stations, coupled to two different mass separators (GPS and HRS).Post-acceleration up to 3.0 MeV/u of the RIB is possible by the REX-ISOLDE setup. Picture taken from [92].
the isotopes of interest are accelerated and massseparated [87]. Due to the long time needed toget the radioactive nuclei out of the target ma-terial, the number of nuclei is reduced to thosewith typically T1/2 ≥ 10 ms. However, the beamquality (i.e. emittance, size of the beam spot) ofthe RIB is generally better for the ISOL method,than for the IF method.
The Coulomb-excitation experiments pre-sented in this work, have been performed at theISOLDE facility at CERN, making use of the Ra-dioactive beam EXperiment (REX-ISOLDE) [88],providing post-accelerated neutron-rich Na, Mg,and Al beams with a maximum energy of ap-proximately 3.0 MeV/u. In the following sec-tions the ISOLDE facility and the experimentalsetup will be discussed in detail.
3.2 The ISOLDE facility
The ISOLDE facility at CERN started operation in1967. The first “driver” accelerator was CERN’ssynchro-cyclotron (SC), providing a 600 MeVproton beam with up to 4 µA intensity [89].In 1992 ISOLDE was integrated into CERN’s ac-
celerator complex, making use of 1.0-1.4 GeVproton pulses, delivered by the Proton Synchro-ton Booster (PSB) with an averaged maximumintensity of 2 µA. ISOLDE is a world leadingISOL facility, providing isotopically pure radioac-tive ion beams of more than 70 elements (with2≤Z≤92) and more than 700 isotopes with in-tensities ranging from 10−1 to 1012 ions/s [90,91]. Besides low-energy physics (e.g. mass spec-troscopy, laser spectroscopy, solid state and bio-physics) radioactive ions can be post-acceleratedup to 3.0 MeV/u by the REX-ISOLDE accelerator,to study nuclear properties in nuclear reactions.A schematic layout of the present ISOLDE facil-ity can be found in Figure 3.2.
3.2.1 Production of radioactive isotopes
ISOLDE’s driver accelerator is the CERN PSBooster (PSB), providing 1.4 GeV protons witha maximum intensity of 3.2× 10¹³ p/pulse. Thepulses were spaced in time by integer multiplesof 1.2 s, at an average of 2.4 s. Thus, the av-erage proton beam intensity is up to 2 µA atthe ISOLDE target station. ISOLDE provides

3.2. THE ISOLDE FACILITY 23
Figure 3.3: Chart of nuclei produced at ISOLDE. The color code illustrates the yield of the radioactive nucleiprovided for experiments (adapted from [92]).
two target stations, each of them coupled toa mass separator (cf. Section 3.2.3). Differenttargets and target materials have been devel-oped to allow the production of a large vari-ety of high-intensity radioactive ion beams (seeFig. 3.3). The standard ISOLDE target, as seenin Fig. 3.4(a), consists of a tantalum cylinder,20 cm long and 2 cm in diameter, connectedto the ion source by a thin tube, the so-calledtransfer line. The tantalum cylinder contains2-200 g/cm2 of either refractory metal pow-ders, metals or carbides at temperatures of up to2400C (Fig. 3.4(b)), or molten metals kept attemperatures between 700C and 1400C [95].Impinging the high-energy proton beam fromthe PSB directly on the heavy target, exotic ionsare generated by fragmentation, spallation andfission reactions. While proton-rich isotopes areespecially produced by fragmentation of the tar-get nuclei, neutron-rich isotopes are well pro-duced by spallation or fission of neutron-richheavy nuclei. For some isotopes higher beampurity can be achieved, doing neutron inducedfission (generally of a U target), rather than pro-ton induced fission. For this purpose the proton
beam is directed on a heavy metal rod (e.g. Ta,W), the so-called proton-to-neutron converter,placed next to the fission target. Low-energyspallation neutrons are emitted at large angles,inducing fission reactions in the ISOL target.
The produced radionuclides have to be re-leased out of the target material and transportedto the ion source quickly. Therefore the targetand transfer line are electrically heated to hightemperatures, to assure fast diffusion and effu-sion processes of the exotic atoms. Molten metaltargets show a slow release of the produced iso-topes, typically in the range of several 10 s. Re-lease times of metals or carbides at 2000C aremuch faster, in the order of a second or even less.Figure 3.4(c) shows a Monte-Carlo simulation ofthe path of one single atom from production torelease inside the ISOLDE target. Detailed in-formation on the production and release of ra-dioactive nuclei in ISOL targets can be foundin [95,96].
The short-lived radioactive Na and Mg beamsdescribed in this work, were produced by bom-barding a 50 g/cm2 UCx target directly with1.4 GeV protons from the CERN PS Booster. Typ-

24 CHAPTER 3. THE EXPERIMENTAL SETUP AND TECHNIQUE
Figure 3.4: (a) Standard ISOLDE target unit, con-taining an UCx target and a surface ion source.(b) About 120 individual UCx pills are used in anISOLDE target, each with 3.5 g/cm3 density, grainsizes of 3-50 µm, and high porosity for improvedrelease properties. (c) Monte-Carlo simulation ofthe path of one single atom from production to re-lease inside the ISOLDE target. Pictures adaptedfrom [93,94].
ical release times of Na and Mg isotopes areabout 200 ms and 190 ms, respectively [97,98].
3.2.2 Ion sources
To assure the production of intense and pure ra-dioactive ion beams, the combination of targetand ion source should be able to produce ionbeams which preferably should contain only iso-topes from one chemical element. At ISOLDEthree different types of ion sources are currently
atom ion(+)
vacuum
< 5−6 eVenergy
ionization
work function
Fermi energy
hot metal surface
ground state
continuum
ground state
Figure 3.5: Schematic drawing of the principles ofpositive surface ionization (adapted from [96]).
in operation: surface ion sources, plasma ionsources, and laser ion sources. The first and thelast one have been used in this work and willtherefore be discussed in more detail in the fol-lowing paragraphs.
Surface ion source
The most simple setup for ionizing atoms is thesurface ion source. It consists only of a metaltube, the so-called “line”, which can be heatedup to 2400C, just hot enough to desorb theatoms of interest thermally. Usually the lineis made out of tantalum, tungsten or rhenium,which have a high work function φ. If an atomwith a low ionization potential Wi hits the hotsurface of the line, the atom can get ionizedupon desorption by giving a valence electron tothe metal (see Fig. 3.5). The probability for thepositive surface ionization of an element X canbe derived by the so-called Saha-Langmuir equa-tion (from [99]):
αs =X (+)
X (0)=
2J++ 1
2J0+ 1exp
φ −Wi
kB T
Here T is the temperature of the ionizer, and J+and J0 are the (electronic) angular momenta ofthe ionic and atomic ground state of X , respec-tively (e.g. for alkalis J0 = 1/2 for the 2S1/2atomic ground state and J+ = 0 for the 1S0 ionicground state). For most elements (φ −Wi) isnegative, even with very noble metal ionizers.Thus, the ionization efficiency can be enhancedby increasing the temperature of the line. Fig-ure 3.6 shows the ionization potentials of el-

3.2. THE ISOLDE FACILITY 25
10 11 12 13 14 15 16 17 18 Proton number Z
0
5
10
15
20
25 W
i [
eV
]
Ionization potentials Ne
Na
Mg
Al
Si
P
S
Cl
Ar
Figure 3.6: Ionization potentials Wi of elements with10≤Z≤18. Wi ist lowest for Na and Al, explainingtheir enhanced efficiency for surface ionization. Theionization potential of Mg is almost 30% higher com-pared to Al, illustrating the need for resonant laserionization in the Mg experiment.
ements with 10≤Z≤18. It illustrates the en-hanced efficiency for surface ionization of Naand Al due to their low ionization potential, asit was observed and used in the present experi-ments.
Laser ion source
As shown in Figure 3.6, most chemical ele-ments have relatively high ionization potentials>6.5 eV. Thus, these elements can either notbe surface ionized or not in a sufficient amount.Another powerful, element selective ionizationtechnique is the Resonance Ionization Laser IonSource (RILIS) [100]. It utilizes the elementspecific atomic excitation energies of the isotopeof interest. The excitation of the atom is inducedby intense, pulsed laser light, which is tuned inresonance to strong atomic transitions. Therebyionization is achieved in two or three succeed-ing excitation steps. Other chemical elementsare hardly ionized, because the laser light is outof resonance to their atomic transitions. Dur-ing the time between two laser pulses, typicallyabout 100 µs, the atoms have to be stored, to al-low multi-step excitation and a maximum over-lap of the atoms and the laser beam during theionization process. Therefore the ions have toeffuse through a thin, hot tube, referred to as“hot cavity” or “line”. At ISOLDE the RILIS pro-vides ionization schemes of more than 30 dif-
3s2 1S0 Mg
3s 3p 1P1
3s 4d 1D2
285,2 nm
552,8 nm
510,6 nm 578,2 nm
Figure 3.7: RILIS three-step ionization scheme of Mg(adapted from [91]).
ferent chemical elements, which are currentlyavailable [91]. For the preparation of the 31Mgion beam, used in this work, a three-step laserionization scheme was employed, which is pre-sented in Figure 3.7. The quoted ionization effi-ciency was up to 9.8% [91].
3.2.3 Mass separation
After ionization the 1+ ions are extracted fromthe ion source by applying a voltage of up to60 kV, and are guided to the mass separator.Each of the ISOLDE target stations is coupledto one of the ISOLDE mass separators, eitherto the General Purpose Separator (GPS) or tothe High Resolution Separator (HRS), sketchedin Figure 3.8. Both magnetic mass separatorsfeed the radioactive beams into a common beamdistribution system, to which almost all of theISOLDE experiments are connected.
GPS
HRS
Figure 3.8: Schematic picture of the ISOLDE massseparators: the General Purpose Separator (GPS)and the High Resolution Separator (HRS). Addi-tional information is given in the text (adapted fromRef. [101]).

26 CHAPTER 3. THE EXPERIMENTAL SETUP AND TECHNIQUE
General Purpose Separator (GPS)
The General Purpose Separator (GPS) consists ofa 70 double focussing magnet. Its mass resolv-ing power is specified as M/∆M = 2400 [102].A special arrangement of movable, cylinder-shaped electrostatic deflectors, the so-calledswitchyard, enables the GPS to select and deliversimultaneously three different beams within acertain mass range into three different beamlines (i.e. central mass, low mass and high massbeam line). The designed mass range of thelow and high mass beams is ±15% of the cen-tral mass. Thus, up to three different experi-ments can be operated simultaneously on onemass separator. The GPS was used for the exper-iment on 30Na in 2011, presented in this work.
High Resolution Separator (HRS)
ISOLDE’s second mass separator has been con-structed as a High Resolution Separator (HRS).It is built up of a two stage magnetic analysis,consisting of a 90 and a 60 magnet. Higherorder image aberrations could be corrected byspecial electrostatic multipole elements, i.e. 32-poles in octopole configuration as well as poleface windings in the magnet in hexapole con-figuration. A mass resolving power of typicallyM/∆M = 5000 is achieved in normal operation.In high resolution mode a value even of up toM/∆M = 11000 is possible [102]. The HRSwas used for most experiments described in thiswork.
3.3 REX-ISOLDE
Low-energy physics with short-lived radioac-tive nuclei has been the main field of activ-ity in the ISOLDE collaboration for more than30 years. To study the properties of radioac-tive nuclei by reactions at moderate beam ener-gies, e.g. Coulomb excitation and transfer reac-tions, the Radioactive beam EXperiment (REX)at ISOLDE was proposed in 1994 [103]. Oper-ational in 2001 [104], REX-ISOLDE was origi-nally designed for post-acceleration of neutron-rich light isotopes (e.g. Li, Na, K). So far morethan 90 different radioactive isotopes, rang-ing from the light 8Li up to the heavy 224Rn,
REX-LINAC
MINIBALL
REXTRAP
REXEBIS
12 m
1+ ions
at ≤ 60 keV
from ISOLDE
q+ ions
at ≤ 3.0 MeV/u
to experiment
Figure 3.9: Schematic diagram and picture of theREX-ISOLDE setup. Additional information is givenin the text (adapted from [101]).
have been efficiently post-accelerated and stud-ied with the REX-ISOLDE setup at beam energiesup to 3.0 MeV/u [91].
The complex REX-ISOLDE setup is shown inFigure 3.9. Singly charged radioactive ions com-ing from ISOLDE are first cooled and bunchedin a Penning trap (REXTRAP) before they arecharge bred to higher charge states, using anelectron beam ion source (REXEBIS). The ionswith A/q<4.5 are post-accelerated in a compactlinear accelerator (REX-LINAC) up to 3.0 MeV/uand delivered to the experimental area [88].
3.3.1 Charge breeding system
To post-accelerate singly charged ions to beamenergies of up to several MeV/u, very extensive,large-scale acceleration structures are required.Thus, the production of highly charged ions isabsolutely necessary, to ensure the installationof a compact, efficient and cost-effective exper-imental setup [88, 103]. In principle there aretwo different ways for effective charge breed-ing [105], either with an Electron Cyclotron Res-onance Ion Source (ECRIS) using a continuousion beam [106], or with an Electron Beam IonSource (EBIS) using a bunched ion beam [107].At REX-ISOLDE the latter one has been installedsuccessfully, receiving its bunched beam by acylindrical Penning trap (REXTRAP). The totaltransmission rate of the charge breeding systemof REX is typically 10-15% for light ions andabout 5% for ions with A> 150.
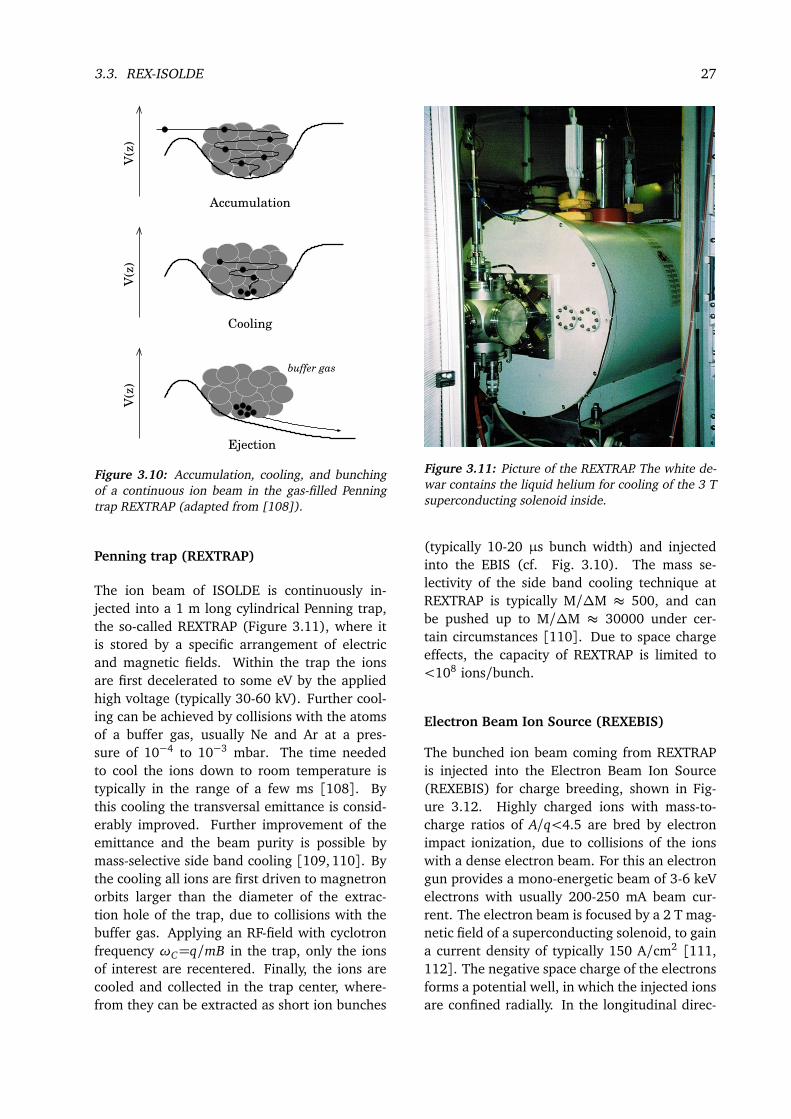
3.3. REX-ISOLDE 27
Accumulation
Cooling
Ejection
V(z)
V(z)
V(z)
buffer gas
Figure 3.10: Accumulation, cooling, and bunchingof a continuous ion beam in the gas-filled Penningtrap REXTRAP (adapted from [108]).
Penning trap (REXTRAP)
The ion beam of ISOLDE is continuously in-jected into a 1 m long cylindrical Penning trap,the so-called REXTRAP (Figure 3.11), where itis stored by a specific arrangement of electricand magnetic fields. Within the trap the ionsare first decelerated to some eV by the appliedhigh voltage (typically 30-60 kV). Further cool-ing can be achieved by collisions with the atomsof a buffer gas, usually Ne and Ar at a pres-sure of 10−4 to 10−3 mbar. The time neededto cool the ions down to room temperature istypically in the range of a few ms [108]. Bythis cooling the transversal emittance is consid-erably improved. Further improvement of theemittance and the beam purity is possible bymass-selective side band cooling [109, 110]. Bythe cooling all ions are first driven to magnetronorbits larger than the diameter of the extrac-tion hole of the trap, due to collisions with thebuffer gas. Applying an RF-field with cyclotronfrequency ωC=q/mB in the trap, only the ionsof interest are recentered. Finally, the ions arecooled and collected in the trap center, where-from they can be extracted as short ion bunches
Figure 3.11: Picture of the REXTRAP. The white de-war contains the liquid helium for cooling of the 3 Tsuperconducting solenoid inside.
(typically 10-20 µs bunch width) and injectedinto the EBIS (cf. Fig. 3.10). The mass se-lectivity of the side band cooling technique atREXTRAP is typically M/∆M ≈ 500, and canbe pushed up to M/∆M ≈ 30000 under cer-tain circumstances [110]. Due to space chargeeffects, the capacity of REXTRAP is limited to<108 ions/bunch.
Electron Beam Ion Source (REXEBIS)
The bunched ion beam coming from REXTRAPis injected into the Electron Beam Ion Source(REXEBIS) for charge breeding, shown in Fig-ure 3.12. Highly charged ions with mass-to-charge ratios of A/q<4.5 are bred by electronimpact ionization, due to collisions of the ionswith a dense electron beam. For this an electrongun provides a mono-energetic beam of 3-6 keVelectrons with usually 200-250 mA beam cur-rent. The electron beam is focused by a 2 T mag-netic field of a superconducting solenoid, to gaina current density of typically 150 A/cm2 [111,112]. The negative space charge of the electronsforms a potential well, in which the injected ionsare confined radially. In the longitudinal direc-
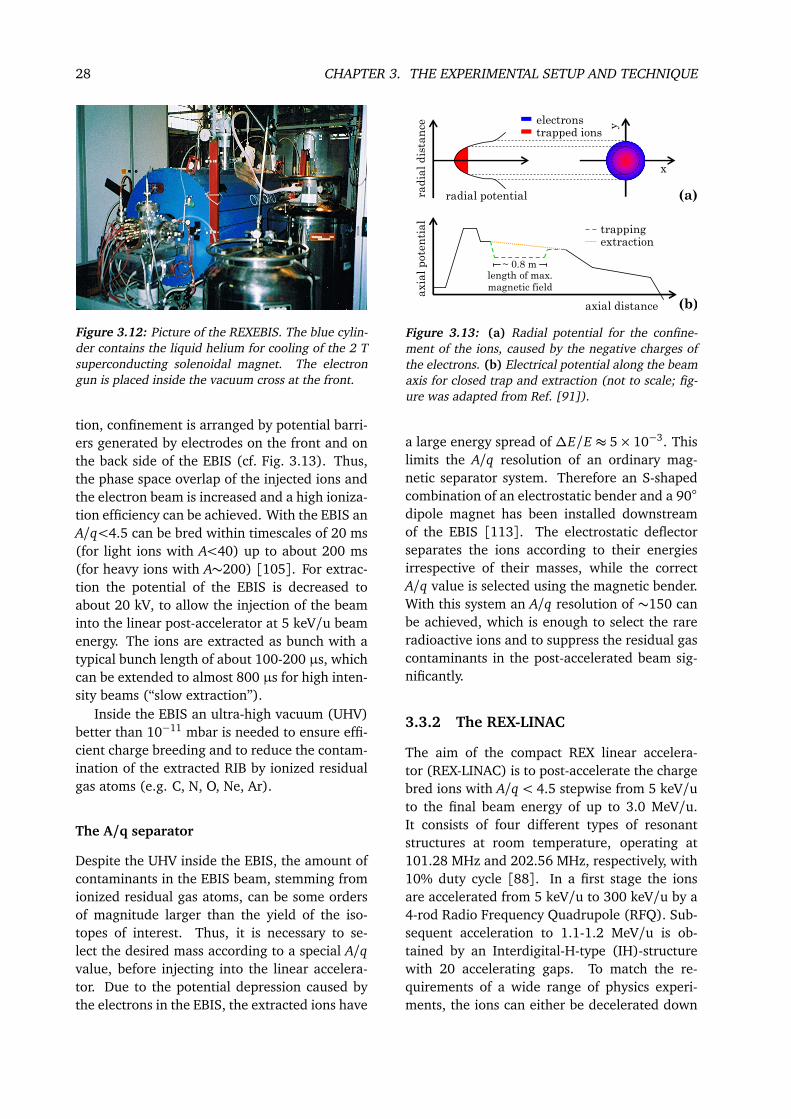
28 CHAPTER 3. THE EXPERIMENTAL SETUP AND TECHNIQUE
Figure 3.12: Picture of the REXEBIS. The blue cylin-der contains the liquid helium for cooling of the 2 Tsuperconducting solenoidal magnet. The electrongun is placed inside the vacuum cross at the front.
tion, confinement is arranged by potential barri-ers generated by electrodes on the front and onthe back side of the EBIS (cf. Fig. 3.13). Thus,the phase space overlap of the injected ions andthe electron beam is increased and a high ioniza-tion efficiency can be achieved. With the EBIS anA/q<4.5 can be bred within timescales of 20 ms(for light ions with A<40) up to about 200 ms(for heavy ions with A∼200) [105]. For extrac-tion the potential of the EBIS is decreased toabout 20 kV, to allow the injection of the beaminto the linear post-accelerator at 5 keV/u beamenergy. The ions are extracted as bunch with atypical bunch length of about 100-200 µs, whichcan be extended to almost 800 µs for high inten-sity beams (“slow extraction”).
Inside the EBIS an ultra-high vacuum (UHV)better than 10−11 mbar is needed to ensure effi-cient charge breeding and to reduce the contam-ination of the extracted RIB by ionized residualgas atoms (e.g. C, N, O, Ne, Ar).
The A/q separator
Despite the UHV inside the EBIS, the amount ofcontaminants in the EBIS beam, stemming fromionized residual gas atoms, can be some ordersof magnitude larger than the yield of the iso-topes of interest. Thus, it is necessary to se-lect the desired mass according to a special A/qvalue, before injecting into the linear accelera-tor. Due to the potential depression caused bythe electrons in the EBIS, the extracted ions have
~ 0.8 m
trapping extraction
length of max.
magnetic field
axial distance (b)
axia
l p
ote
nti
al
(a)rad
ial
dis
tan
ce
y
x
electrons trapped ions
radial potential
Figure 3.13: (a) Radial potential for the confine-ment of the ions, caused by the negative charges ofthe electrons. (b) Electrical potential along the beamaxis for closed trap and extraction (not to scale; fig-ure was adapted from Ref. [91]).
a large energy spread of ∆E/E ≈ 5× 10⁻³. Thislimits the A/q resolution of an ordinary mag-netic separator system. Therefore an S-shapedcombination of an electrostatic bender and a 90
dipole magnet has been installed downstreamof the EBIS [113]. The electrostatic deflectorseparates the ions according to their energiesirrespective of their masses, while the correctA/q value is selected using the magnetic bender.With this system an A/q resolution of ∼150 canbe achieved, which is enough to select the rareradioactive ions and to suppress the residual gascontaminants in the post-accelerated beam sig-nificantly.
3.3.2 The REX-LINAC
The aim of the compact REX linear accelera-tor (REX-LINAC) is to post-accelerate the chargebred ions with A/q < 4.5 stepwise from 5 keV/uto the final beam energy of up to 3.0 MeV/u.It consists of four different types of resonantstructures at room temperature, operating at101.28 MHz and 202.56 MHz, respectively, with10% duty cycle [88]. In a first stage the ionsare accelerated from 5 keV/u to 300 keV/u by a4-rod Radio Frequency Quadrupole (RFQ). Sub-sequent acceleration to 1.1-1.2 MeV/u is ob-tained by an Interdigital-H-type (IH)-structurewith 20 accelerating gaps. To match the re-quirements of a wide range of physics experi-ments, the ions can either be decelerated down

3.4. THE MINIBALL SETUP 29
(a)
1 m
RFQ IH-structure 7-gap 9-gap
5 keV/u
from EBIS
300 keV/u 1.1-1.2 MeV/u 0.8-2.2 MeV/u 2.5-3.0 MeV/u
to MINIBALL
(c)
(b)
tran
spar
ent m
odel
Figure 3.14: (a) Picture of the linear accelerator of REX-ISOLDE in operation (in 2007). The direction of thebeam is from the top right to the bottom left. (b) Layout of the REX-LINAC [91] and (c) of its RF acceleratingstructures (all opened for test/maintenance purposes). Further information is given in the text.
to 0.8 MeV/u or accelerated up to 2.25 MeV/uin three 7-gap resonators. In the final acceler-ation stage a 9-gap IH-structure provides beamenergies of 2.55-3.0 MeV/u. The typical energyspread after the 9-gap amounts to 0.7% [91].The experiments on neutron-rich Mg and Na iso-topes, presented in this work, were performed atbeam energies of 3.0 MeV/u and 2.85 MeV/u,respectively. A 65 bending magnet directsthe post-accelerated ion beam to the MINIBALLsetup.
Since 2009/2010 the REX-LINAC is housedin a concrete bunker to shield the experi-ments against the high X-ray background frombremsstrahlung, caused by accelerated electronsin the RF-resonating structures.
3.4 The MINIBALL setup
To study the nuclear properties of the post-accelerated radioactive ions after Coulomb ex-citation or transfer reactions, a very efficientspectrometer for emitted γ rays and particlesis necessary. For γ-ray detection the highlyefficient MINIBALL spectrometer was devel-oped [114]. In coincidence with particles, de-tected in Si detectors, advanced Doppler correc-tion for rare radioactive ion beams with beamvelocities of β = 0.08 can be realized as wellas an excellent background suppression. Forthe study of transfer reactions the so-called T-
REX setup was designed recently [115]. Forexperiments using projectile Coulomb excita-tion the MINIBALL array is combined with aCD-shaped double-sided silicon strip detector(DSSSD) [116] for scattered particles in forwarddirection, as shown in Figure 3.17. Two ad-ditional particle detectors can be used down-stream after the scattering chamber to monitorthe position of the beam and the beam compo-sition, respectively. A position-sensitive parallel-plate avalanche counter (PPAC), can be placedright into the beam axis 1.2 m behind the targetfor measurement of the beam profile in x andy direction [117]. Permanent monitoring of thebeam composition in mass A and charge Z is al-lowed either by a ∆E-E telescope, consisting ofa gas cell and a silicon detector, or by a Braggionization chamber [118], mounted close to thebeam dump position.
target
DSSSD
γ
REX−ISOLDERIB from
θγ(optionally) chamber
ionization
MINIBALL
PPAC
−spectrometer
Figure 3.17: Schematic view of the experimentalMINIBALL setup for Coulomb-excitation experimentsat REX-ISOLDE. Further information on the detectorsystems is given in the text.

30 CHAPTER 3. THE EXPERIMENTAL SETUP AND TECHNIQUE
RIB
from REX-ISOLDE
MINIBALL
γ-spectrometer
scattering chamber
beam dump and
ionization chamber
PPAC
Figure 3.15: Picture of the MINIBALL setup in 2010. The radioactive ion beam delivered by REX-ISOLDE is com-ing from the bottom right, hitting the secondary target right in the middle of the MINIBALL γ-ray spectrometer.Downstream of the scattering chamber additional detector systems are installed to monitor the position of thebeam and its composition.
3.4.1 The MINIBALL γ-ray spectrometer
In the first REX-ISOLDE proposal a newly de-veloped γ-ray spectrometer was already in-tended [103], to study de-excitation γ rays fol-lowing the induced nuclear processes. Severaltechnical demands have to be met by this de-tector array: (i) Due to the low beam intensi-ties the reactions to be observed are very rare.Thus, the spectrometer has to be highly efficient.(ii) The isotopes of interest are radioactive, cre-ating a large amount of background radiation.Therefore high-resolution detectors are needed,to improve the peak-to-total. (iii) Scattering nu-clei will recoil at velocities of almost 8% of thespeed of light, causing significant Doppler shiftsand broadening. Therefore a high granularity isabsolutely necessary, to reduce the opening an-gle of the detector in a compact configuration.
As a result the high-resolution and highly ef-ficient MINIBALL γ-ray spectrometer was devel-oped [114]. It consists of eight triple clusterdetectors, mounted on movable arms (“MINI-BALL frame”) around the target chamber to al-low a compact geometry. Each cryostat con-
tains three individually encapsulated six-foldsegmented high-purity germanium crystals (seeFigure 3.16). The hexagonal shaped crystalshave a length of 78 mm and a diameter of70 mm. The total number of 8× 3× 6= 144 in-dividual segment signals plus the signals fromthe 24 central electrodes, referred to as “cores”,are processed using digital electronics (“DigitalGamma Finder” DGF, XIA electronics), enablingcount rates of up to 20 kHz per detector. Withclose distances between target and Ge-detectorsof almost 12 cm, the array covers a solid an-gle of about 60% of 4π. The photopeak ef-ficiency of MINIBALL at 1.3 MeV is 8% aftercluster addback. The detectors and the “cold”preamlifier FETs are operated near the tempera-ture of liquid nitrogen (about 80-100 K), givingrise to an average energy resolution of 2.3 keVat Eγ = 1.33 MeV. The azimuthal electrical seg-mentation of the detector increases the granu-larity and ensures a proper Doppler correctionfor in-flight γ-ray emission at β ∼ 8% even atthe very close distances between target and de-tector. Further improvement of the position res-olution can be achieved by Pulse Shape Analysis

3.4. THE MINIBALL SETUP 31
LN2 dewar
preamplifiers (a)
three six-fold
segmented
HPGe detectors
capsule lid
with signal
feedtroughs
six-fold
segmented
Ge crystal
aluminum
can
(b)
Figure 3.16: (a) Picture of a MINIBALL triple cryostat, containing three segmented high-purity germaniumdetectors, mounted in the MINIBALL frame. (b) Layout of the six-fold segmented encapsulated MINIBALL HPGedetector (adapted from [114]).
(PSA) [114]. Combining the information of thetime-dependent charge collection at the centralelectrode and at the segments, the interactionpoint of the γ ray can be reconstructed in ra-dial and azimuthal direction. Thus, a positionresolution of about 5 mm can be achieved. Thisfeature of PSA was not used in the present work.
3.4.2 Particle detectors
Double-sided Silicon Strip Detector (DSSSD)
To ensure a proper Doppler correction for in-flight γ-ray emission at v/c ∼ 8%, the angularinformation of the γ ray provided by MINIBALL,has to be combined with the direction and veloc-ity of the scattered beam particle that was de-tected in coincidence. Therefore the scatteredbeam and recoiling target nuclei are detected bya CD-shaped double sided silicon strip detector(DSSSD), consisting of four identical quadrantswith thicknesses between 35 and 500 µm [116].As shown in Figure 3.18, each quadrant com-prises 16 annular strips at 2 mm pitch at thefront side and 24 radial strips at 3.5 pitch at theback side for identification and reconstruction ofthe trajectories of the scattered nuclei. The in-ner radius of the active area is 9 mm, the outerradius is 40.9 mm. Thus, the total area of theCD detector is 50 cm2, of which approximately93% is active. The distance between the scat-tering target and the DSSSD is typically about
30 mm. This corresponds to a forward angle be-tween 16.8 and 53.7 in the laboratory system,which is covered by the CD detector.
DSSSD
(a)
target wheel,
secondary target
DSSSD - back side DSSSD - front side (b) (c)
θ ϕ
Figure 3.18: (a) Four quadrants of the double-sidedsilicon strip detector, mounted on the holder insidethe scattering chamber. (b) Front view of the detec-tor, showing the 16 annular segments to obtain the θangle of the scattered particle. (c) Back view of theCD with the mounting frame and the central hole forthe beam. The 4×24 radial segments for detection ofthe φ angle can be seen.

32 CHAPTER 3. THE EXPERIMENTAL SETUP AND TECHNIQUE
Figure 3.19: Schematic view of the parallel plateavalanche counter (PPAC), used at REX-ISOLDE(adapted from [117]).
Parallel Plate Avalanche Counter (PPAC)
A position-sensitive parallel-plate avalanchecounter (PPAC), can be placed right into thebeam axis 1.2 m behind the target for measure-ment of the beam profile in x and y direction(cf. Figure 3.15) [117]. It consists of a cen-tral anode foil and two segmented cathode foils,mounted inside a gas volume with a thickness of17 mm and a diameter of 40 mm. Both cath-ode foils are segmented into 25 strips at 1.6 mmpitch, to allow a position-sensitive readout of theparticle flux in x and y direction, respectively.Figure 3.19 shows a schematic view of the PPACdesign. A constant gas flow of CF4 at a pressureof typically ∼10 mbar enables counting rates ofup to 109 ions/s for all heavy ion beams with aproton number Z ≥ 2.
Bragg detector
Close to the beam dump position a Bragg ion-ization chamber can be mounted, to allow apermanent monitoring of the beam composi-tion in mass A and charge Z [118]. The de-tector consists of a gas volume with a lengthof 70 mm and an aperture of 30 mm, filledwith tetrafluoromethane (CF4) at a pressure oftypically 420 mbar. A homogeneous electrical
Figure 3.20: Schematic view of the Bragg ioniza-tion chamber. Calculated field gradients are drawn,demonstrating the homogeneity of the electrical fieldinside the detector (adapted from [118]).
field can be applied along the gas volume on20 electrodes, each separated by 3 mm, as it isshown in Figure 3.20. The incoming ions loosetheir energy in the gas, following the charac-teristic dE/d x curve derived by the Bethe for-mula [119]. Due to the applied longitudinal ho-mogeneous electrical field the generated chargesdrift with a constant velocity towards the anode.From the time evolution of the anode pulse themass A and charge Z of the incoming particle canbe derived. The Bragg detector was used suc-cessfully in the Coulomb-excitation experimentof 31Mg, presented in this work.
Ionization chamber
Another possibility to monitor continuously thecomposition of the RIB delivered by REX-ISOLDE, is the installation of a ∆E-Eres detec-tor, the so-called “ionization chamber”. It con-sists of a gas-filled ionization chamber with CF4at a pressure of 300-450 mbar, generating a Zdependent energy loss signal, coupled to a sili-con detector for the measurement of the resid-ual energy Eres. Assuming that all ions have thesame energy per nucleon, the mass A can be de-rived from Eres. An adjustable collimator is putin front of the entrance windows of the ioniza-tion chamber to attenuate the beam to preventpile-up.

3.6. COULOMB EXCITATION 33
3.5 Time structure of the beam atREX-ISOLDE
The radioactive ion beam provided by REX-ISOLDE is not a continuous flux of particles, butit is delivered in short particle bunches with acharacteristic time structure. It is caused by thetime-dependent yield of the ions of interest dueto their release and radioactive decay and bythe duty cycles of the charge breeding and ac-celerating systems, as mentioned in the previ-ous sections (see Figure 3.21). Experiments canbenefit from this feature by efficient backgroundsuppression and thus increasing the peak-to-background ratio. To synchronize the data ac-quisition at the MINIBALL setup with the pro-duction and acceleration of the radioactive ions,different time signals are available at ISOLDE.
The first periodic time signal is the time pulseat the beginning of each supercycle of the PSBooster. Its periodicity is n × 1.2 s, with n thetotal number of proton pulses in the supercycle.This time signal can be used in experiments withlaser ion sources, to drive a shutter which peri-odically blocks the laser light towards the ioniza-tion tube. From these so-called Laser ON/OFFmeasurements the amount of beam contami-nants can be derived, as it is shown in sec-tion 4.5.5.
Immediately before a proton beam from thePSB impinges on the ISOLDE target, the T1 sig-nal is generated. Since the radionuclides areonly produced at the time of the proton beamimpact, the amount of short-lived species de-tected by the MINIBALL particle detectors willdecrease with increasing time difference be-tween T1 and the detection time. Thus, the anal-ysis of such isotopes is typically restricted to timedifferences of a few half-lives with respect to theT1 signal, to suppress long-lived or stable con-taminants substantially.
An additional time signal is related to the in-jection of the charge bred ions from the EBISinto the REX-LINAC. On the one hand it is usedas a hardware trigger to synchronize the acceler-ator with the incoming particle bunches. On theother hand it is used to trigger a 1 ms time gatein the data acquisition of MINIBALL, referred toas “On Beam” window. Due to the typical bunchlength of the ion beam of 150 µs, all particles
Figure 3.21: Schematic view of the time structureof REX-ISOLDE, using the example of a short-livedlight ion beam (adapted from [88]). More detailedinformation is given in the entire text of this chapter.
arrive at the MINIBALL target within 150 µs af-ter the EBIS signal. For longer time differencesonly background should be detected. Thereforethe analysis of the nuclear reaction events couldbe limited to ∆tEBIS ≤ 150 µs for backgroundsuppression.
3.6 Coulomb excitation
In general, the reduced transition probabilityB(E2) can be determined by different experi-mental methods. One common possibility, whichwas already mentioned on page 7, is to mea-sure the lifetime of the excited nuclear state viathe recoil distance Doppler-shift (RDDS) or the

34 CHAPTER 3. THE EXPERIMENTAL SETUP AND TECHNIQUE
Doppler-shift attenuation method (DSAM). Theformer method was used to study the proper-ties of 56Cr, which will be discussed in the sec-ond part of this work. For rare exotic nucleifar off stability, usually the Coulomb-excitationtechnique in inverse kinematics is applied to de-termine the B(E2) value. For pure Coulomb in-teraction between the projectile and target nu-clei, the excitation can be expressed by the sameelectromagnetic transition matrix elements char-acterizing the de-excitation of the states that areinvolved. Thus, measurements of the Coulomb-excitation cross sections allows a detailed studyof the nuclear structure of the low-lying nuclearstates.
The following sections will give an overviewof the underlying theory in a semi-classical ap-proach, which is commonly used in coupled-channel codes for the calculation of the theo-retical Coulomb-excitation cross sections (e.g.CLX [120, 121], GOSIA [122, 123]). A moredetailed description can be found in Alder etal. [124, 125], where also the fully quantum-mechanical approach is given.
3.6.1 Semi-classical approach
Elastic and inelastic scattering
In the semi-classical approach of the Coulombexcitation it is assumed, that the particles fol-low classical Rutherford trajectories during thescattering process, as indicated in Picture 3.22.The excitation process itself is treated quantum-mechanically. Thus the Coulomb-excitationcross section is given by
dσ
dΩ
CE=
dσ
dΩ
ruthPi→ f
where
dσdΩ
ruthis the classical Rutherford cross
section. Pi→ f is the quantum-mechanical proba-bility of the excitation from an initial state |i⟩ toa final state | f ⟩ in a collision in which the parti-cle is scattered into the solid angle element dΩ.The Rutherford cross section of elastic scatteringcan be written classically as
dσ
dΩ
ruth=
a0
2
2
sin4
θCM
2
−1
.
θCM is the scattering angle in the center-of-masssystem and 2a0 = dmin is the distance of closest
θmin cmd ( ) *
*θ
V(r(t)) t t
Z ,Ap p
Z ,A
CM
Figure 3.22: Schematic diagram of the Coulomb-excitation process of a projectile nucleus (Zp,Ap),scattering inelastically on a target nucleus (Zt ,At), inthe center-of-mass system.
approach between the projectile and target nu-clei in a scattering process with impact parame-ter b = 0. a0 can be expressed in terms of theproton numbers Zp and Zt for projectile and tar-get nuclei, respectively, the reduced mass m andthe velocity β = v/c:
a0 =1
2
ZpZt e2
ECM=
ZpZt e2
mc2β2
≈ 0.71999
1+Ap
At
ZpZt
Ep[fm].
To ensure the validity of the semi-classical de-scription, the size of the scattering nuclei, takenas a wave packet with the de Broglie wavelengthλ, has to be small compared to the dimensionsof the classical orbit. Since such a wave packetwill move along the classical trajectory, the semi-classical approach is justified. Therefore the so-called Sommerfeld parameter
η =a0
λ= α
ZpZt
β
is introduced, where α= 1/137 is the fine struc-ture constant. For the semi-classical approachthe condition
η 1
has to be fulfilled. Moreover, in heavy ion colli-sions well below the Coulomb barrier it guaran-tees that the distance of closest approach is large

3.6. COULOMB EXCITATION 35
compared to the dimensions of the nuclei, pre-venting the nuclei to come into reach of the nu-clear interaction or even penetrate the Coulombbarrier. In the present work the Sommerfeld pa-rameters were η ≈ 52 for a 31Mg beam onto a109Ag target at a beam energy of 3.0 MeV/u andη≈ 48 for a 29,30Na beam onto a 104Pd target ata beam energy of 2.85 MeV/u, respectively.
First-order perturbation theory
Due to the movement of the projectile the elec-tromagnetic field between the incoming projec-tile and the target nucleus will change in timeand can be described by a time-dependent in-teraction potential V (~r(t)). If the interaction isweak, the excitation amplitude for an excitationfrom a state |i⟩ to a state | f ⟩ can be approxi-mated by first-order perturbation theory [124]:
ai→ f =1
iħh
∫ ∞
−∞e
iħh∆Ei f t f |V (~r(t))|i
d t
where∆Ei f is the energy difference between theinvolved states. The probability for Coulomb ex-citation is given by
Pi→ f =
ai→ f
2.
The differential and absolute excitation crosssections are derived by a multipole expansionof the interaction potential V (~r(t)). It con-tains both electric and magnetic parts. Thus,the Coulomb excitation of the projectile nucleus1
can be caused either by the electric or the mag-netic field of the target nucleus. Both excitationmechanisms can be treated separately. For themultipole expansion of the electrostatic part ofV (~r(t)) the excitation probability is
aEλi→ f =
4πZt e
iħh
∑
λµ
¬
Iimi|M(Eλ,µ)|I f m f
¶∗
2λ+ 1SEλµ
The factor SEλµ contains the time integral alongthe classical trajectory of the scattered parti-cle and depends on the parameters of the scat-tering process. In contrast the matrix element
1The target excitation can be explained in an completelyanalog way. Only the expressions for projectile and targethave to be interchanged: Zp Zt , . . .
¬
Iimi|M(Eλ,µ)|I f m f
depends only on the nu-clear properties of the scattered particle. For theabsolute excitation cross section of the multipoleorder λ it follows:
σEλ =
Zt e
ħhv
2
a−2λ+20 B(Eλ; Ii → I f ) fEλ(ξ) ,
where
fEλ(ξ) =
∫ θmax
θmin
d fEλ(θ ,ξ)dΩ
dΩ
is the integrated non-relativistic Coulomb-excitation function over the range of the solidangle, that is covered by θmin and θmax of theparticle detector (in the CM system). The so-called adiabaticity parameter ξwill be explainedat the end of this section.
The total cross section for magnetic excita-tion of multipole order λ can be derived in ananalog way:
σMλ =
Zt e
ħhc
2
a−2λ+20 B(Mλ; Ii → I f ) fMλ(ξ) .
Compared to the cross section of electric excita-tion of the same multipole order, magnetic exci-tation is suppressed by a factor of (v/c)2 = β2.For the typical beam energies of ≤3.0 MeV/uat REX-ISOLDE the maximum velocity of the in-coming particle is β ≈ 0.08. Thus, electric exci-tations will dominate in the Coulomb-excitationexperiments presented in this work.
In an inelastic scattering process, the collisiontime τcoll = a0/v has to be of the same order ofmagnitude, or even shorter than the time of theinternal motion of the nucleus τnucl = ħh/∆Ei f ,to excite a final state | f ⟩ from a state |i⟩. Theadiabaticity parameter ξ is given by the ratioof both times:
ξ =τcoll
τnucl=
a0∆Ei f
ħhv
=Z1Z2e2c
ħh
1
β f−
1
βi
!≤ 1
where βi and β f is the velocity of the incomingnucleus before and after the Coulomb-excitationprocess, respectively [125]. If the velocity ofthe projectile is too slow, i.e. the collision timeis comparatively long, the nucleus can follow

36 CHAPTER 3. THE EXPERIMENTAL SETUP AND TECHNIQUE
Figure 3.23: Logarithmic plotting of the integratednon-relativistic Coulomb-excitation function fπλ(ξ)for (a) electric transitions (λ = 1,2,3,4) and for(b) magnetic transitions (λ= 1,2) [125].
the perturbation caused by V (~r(t)) adiabaticallyand thus, no excitation will occur. As shown inFigure 3.23, the Coulomb-excitation functionsfπλ(ξ) decrease exponentially with increasingadiabaticity ξ. Therefore the excitation prob-ability is reduced significantly for slow impactvelocities or high excitation energies. In exper-iments with low-energy Coulomb excitation atbeam energies of a only few MeV/u, as describedin the present work, the possible excitation ener-gies are limited to typically 1-2 MeV by the adi-abatic cutoff.
The excitation probability is not only affectedby the adiabaticity of the transition of orderπλ from a state |i⟩ to | f ⟩, but also by the so-called excitation strength parameter χ. Fol-lowing [125] it is defined as
χ(Eλ)i→ f =
p16πZt e
ħhv
(λ− 1)!(2λ+ 1)!!
¬
I f ||M(Eλ)||Ii
aλ0p
2Ii + 1
for electric excitations. An analog expression isfound for magnetic excitations:
χ(Mλ)i→ f =
p16πZt e
ħhc
(λ− 1)!(2λ+ 1)!!
¬
I f ||M(Mλ)||Ii
aλ0p
2Ii + 1
The excitation strength can be interpreted as thepossible total angular momentum λħh which canbe transferred in a head-on collision of the two
i
z
i
z
ff
(a) (b)
Figure 3.24: (a) Schematic diagram of one-stepCoulomb excitation from a state |i⟩ to states |z⟩,| f ⟩.(b) Possible multi-step excitations to the final states,including some virtual excitations and de-excitations.
nuclei. An estimation is given by
χ(πλ)i→ f ≈
V (λ)(a0)τcoll
ħh
where Vλ(a0) is the interaction potential ofmultipole order λ between projectile and tar-get at half the distance of closest approach a0,which is proportional to a−(λ+1)
0 . In experimentswith beam energies below the Coulomb barrier,excitation strengths of χ(E2) ≤ 10 are possi-ble for electric quadrupole transitions. Due tothese rather large excitation strengths multi-stepCoulomb excitations are possible (see Fig. 3.24).A sufficient condition for the applicability offirst-order perturbation theory in the Coulombexcitation is, that all possible excitation proba-bilities are small. Obviously this is no longer thecase for multi-step Coulomb excitation. Thus,perturbation expansion of higher order has to beconsidered.
Higher-order perturbation theory
Assuming an excitation from a state |i⟩ to a state| f ⟩ via intermediate states |z⟩, the total excita-tion amplitude is given to second order by [125]
ai→ f = a(1)i→ f +∑
za(2)i→z→ f
where the first term is the excitation amplitudeof first order and the second term a(2)i→z→ f is de-fined as
a(2)i→z→ f =1
iħh
∫ ∞
−∞e
iħh∆Ez f t f |V (~r(t))|z
d t
×1
iħh
∫ ∞
−∞e
iħh∆Eiz t ⟨z|V (~r(t))|i⟩ d t
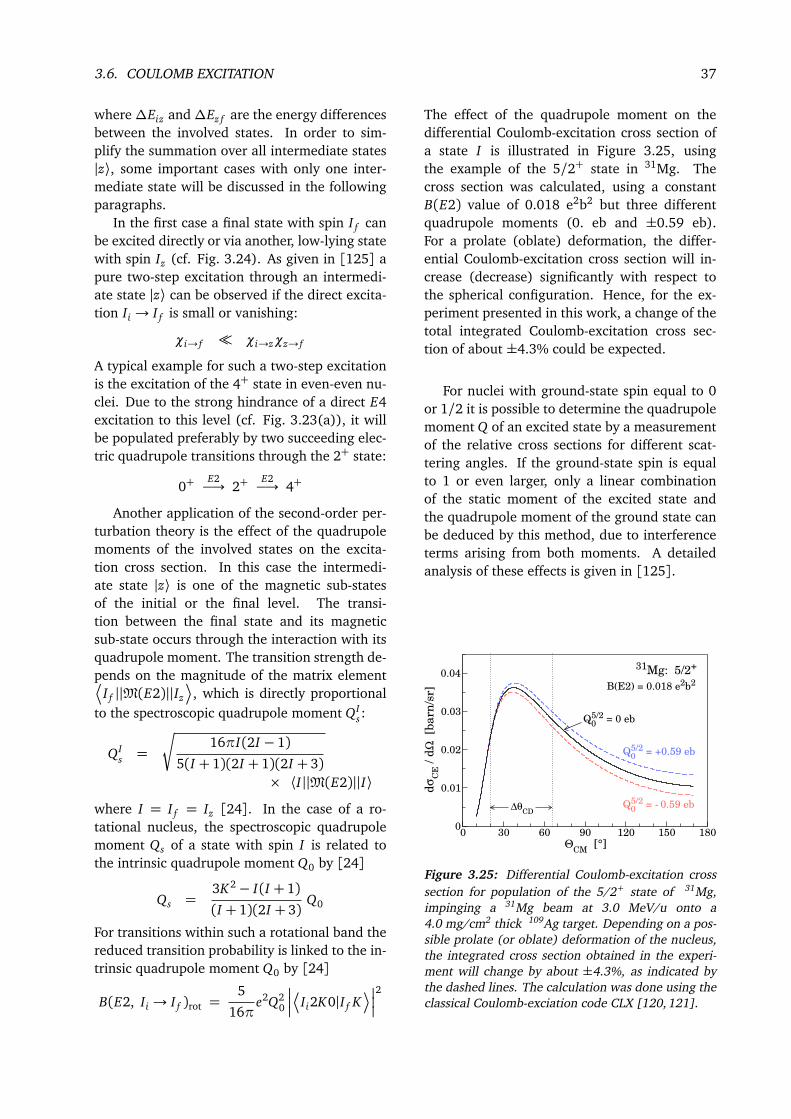
3.6. COULOMB EXCITATION 37
where∆Eiz and∆Ez f are the energy differencesbetween the involved states. In order to sim-plify the summation over all intermediate states|z⟩, some important cases with only one inter-mediate state will be discussed in the followingparagraphs.
In the first case a final state with spin I f canbe excited directly or via another, low-lying statewith spin Iz (cf. Fig. 3.24). As given in [125] apure two-step excitation through an intermedi-ate state |z⟩ can be observed if the direct excita-tion Ii → I f is small or vanishing:
χi→ f χi→zχz→ f
A typical example for such a two-step excitationis the excitation of the 4+ state in even-even nu-clei. Due to the strong hindrance of a direct E4excitation to this level (cf. Fig. 3.23(a)), it willbe populated preferably by two succeeding elec-tric quadrupole transitions through the 2+ state:
0+E2−→ 2+
E2−→ 4+
Another application of the second-order per-turbation theory is the effect of the quadrupolemoments of the involved states on the excita-tion cross section. In this case the intermedi-ate state |z⟩ is one of the magnetic sub-statesof the initial or the final level. The transi-tion between the final state and its magneticsub-state occurs through the interaction with itsquadrupole moment. The transition strength de-pends on the magnitude of the matrix element¬
I f ||M(E2)||Iz
, which is directly proportionalto the spectroscopic quadrupole moment QI
s:
QIs =
r
16πI(2I − 1)5(I + 1)(2I + 1)(2I + 3)
× ⟨I ||M(E2)||I⟩
where I = I f = Iz [24]. In the case of a ro-tational nucleus, the spectroscopic quadrupolemoment Qs of a state with spin I is related tothe intrinsic quadrupole moment Q0 by [24]
Qs =3K2− I(I + 1)(I + 1)(2I + 3)
Q0
For transitions within such a rotational band thereduced transition probability is linked to the in-trinsic quadrupole moment Q0 by [24]
B(E2, Ii → I f )rot =5
16πe2Q2
0
¬
Ii2K0|I f K
2
The effect of the quadrupole moment on thedifferential Coulomb-excitation cross section ofa state I is illustrated in Figure 3.25, usingthe example of the 5/2+ state in 31Mg. Thecross section was calculated, using a constantB(E2) value of 0.018 e2b2 but three differentquadrupole moments (0. eb and ±0.59 eb).For a prolate (oblate) deformation, the differ-ential Coulomb-excitation cross section will in-crease (decrease) significantly with respect tothe spherical configuration. Hence, for the ex-periment presented in this work, a change of thetotal integrated Coulomb-excitation cross sec-tion of about ±4.3% could be expected.
For nuclei with ground-state spin equal to 0or 1/2 it is possible to determine the quadrupolemoment Q of an excited state by a measurementof the relative cross sections for different scat-tering angles. If the ground-state spin is equalto 1 or even larger, only a linear combinationof the static moment of the excited state andthe quadrupole moment of the ground state canbe deduced by this method, due to interferenceterms arising from both moments. A detailedanalysis of these effects is given in [125].
0 30 60 90 120 150 180Θ
CM [°]
0
0.01
0.02
0.03
0.04
dσ
CE / d
Ω [b
arn
/sr]
Q05/2 = - 0.59 eb
Q05/2 = +0.59 eb
Q05/2 = 0 eb
31Mg: 5/2+
∆θCD
B(E2) = 0.018 e2b2
Figure 3.25: Differential Coulomb-excitation crosssection for population of the 5/2+ state of 31Mg,impinging a 31Mg beam at 3.0 MeV/u onto a4.0 mg/cm2 thick 109Ag target. Depending on a pos-sible prolate (or oblate) deformation of the nucleus,the integrated cross section obtained in the experi-ment will change by about ±4.3%, as indicated bythe dashed lines. The calculation was done using theclassical Coulomb-exciation code CLX [120,121].

38 CHAPTER 3. THE EXPERIMENTAL SETUP AND TECHNIQUE
3.6.2 “Safe” Coulomb excitation
In a scattering process the minimum distancedmin(θCM) between the incoming projectile andthe target nucleus depends on the scattering an-gle θCM (cf. Fig. 3.22). As long as the strong in-teraction is negligible, the semi-classical theoryof Coulomb excitation gives
dmin(θCM) = a0
1+
1
sin4
θCM
2
.
To fulfill the basic idea of Coulomb excitation,the interaction between the colliding nuclei hasto be purely electromagnetic. To ensure the neg-ligibility of any contribution from the nuclearinteraction to the excitation process, the mini-mum distance between projectile and target in ahead-on collision has to exceed the sum of bothnuclear radii Rp and Rt , plus an additional safedistance ∆s:
2a0 > Rp + Rt +∆s
Cline et al. found that for a safe distance of∆s = 5 fm and Ri = 1.25A1/3
i the contributionof the nuclear interaction to the total excita-tion cross section is less than 0.1% [126]. Thiscondition corresponds to beam energies below4.5 MeV/u for heavy ions (e.g. 208Pb) decreas-ing to less than 4.1 MeV/u for light ions (e.g.40Ar). If the beam energy exceeds these “safe”bombarding energies, Coulomb-nuclear interfer-ence effects can be minimized by a restriction ofthe scattering angle to forward angles well be-low the grazing angle. Thus, classical trajecto-ries can be chosen where the distance of closestapproach exceeds the safe distance mentionedabove [126].
3.6.3 Relative measurement of the tran-sition strength
In a Coulomb-excitation experiment the numberof inelastically scattered projectile and target nu-clei is a direct measure of the excitation proba-bility between states |i⟩ and | f ⟩ in the respectivenuclei. This number can be determined exper-imentally by the detection of the de-exciting γrays of the transition | f ⟩ → | f ′⟩. For projectile
excitation the number of detected γ rays is
Nγ,proj( f → f ′) = εγ,proj b f→ f ′σproj( f )ρdt NA
AtI ,
where εγ,proj is the absolute detection efficiencyof the γ rays, b f→ f ′ is the branching ratio ofthe transition, σproj( f ) is the absolute Coulomb-excitation cross section of the state | f ⟩ and I isthe beam intensity. The number of scatteringcenters in the target is expressed in terms of thetarget thickness ρdt in mg/cm2, the mass At ofthe target nuclei and Avogadro’s constant NA.
In experiments with radioactive ion beamsthe beam intensity is normally not well knownor has a rather large uncertainty. Therefore,the absolute Coulomb-excitation cross section istypically measured in relation to another, well-known excitation cross section, e.g. the excita-tion of the target nuclei. Analog to the num-ber of detected γ rays of the projectile men-tioned above, the number of γ rays, de-excitinga state |f⟩ of the Coulomb-excited target nucleus,is given by
Nγ,target(f→ f′) = εγ,target bf→f′σtarget(f)ρdt NA
AtI .
The ratio of projectile and target excitation is in-dependent of the physical properties of the beamand the target (e.g. intensity, thickness, mass):
Nγ,proj( f → f ′)
Nγ,target(f→ f′)=
εγ,proj
εγ,target
b f→ f ′
bf→f′
σproj( f )
σtarget(f)
Thus, the unknown Coulomb-excitation crosssection of a state | f ⟩ of the (radioactive) projec-tile can be derived from the ratios of the num-bers of detected γ rays, the detection efficienciesand the branching ratios, and of the well knowntarget excitation cross section, which can be cal-culated with coupled-channel codes like CLX orGOSIA.

4.2. DETECTOR CALIBRATION 39
Chapter 4
Data analysis
Modern experiments in nuclear and particlephysics record all the relevant information on anevent-by-event basis. To characterize a physicalevent in an experiment, all information on en-ergy, position and time of different sub-events iscollected by the complex detector system of var-ious particle- and γ-ray detectors, described inthe last chapter. The information of the differentdetectors then has to be re-combined to the orig-inal event, for example a particle-γ coincidence.This process is referred to as “event-building”.Thus, the raw data have to be preprocessed ef-ficiently, before the experimental data can beanalyzed in detail. The following sections willtherefore concentrate on the sorting of the data(Sec. 4.1) as well as careful calibration of thedetector systems (Sec. 4.2 and 4.3). Due to thelow beam intensities of radioactive beams, back-ground suppression is crucial in the advancedanalysis. A detailed investigation of the beamcomposition and the application of reasonableenergy and time gates will be presented in Sec-tions 4.5 and 4.6.
4.1 Acquisition and processing ofthe data
The data acquisition system MARaBOOU [127]of MINIBALL is based on the GSI front-end sys-tem MBS [128] combined with the ROOT frame-work developed at CERN [129] for the back-end visualization. Recorded list mode data are(pre-)processed, using C/C++ based codes, andstored in the efficient, user-optimized ROOT for-mat. In principle three different steps are imple-mented in the sorting routines:
1. All particle events in the DSSSD are cali-
brated and correlated to the correspondingtime stamps. The registered γ-ray events arecalibrated. Coincident events in neighbor-ing segments are expected to belong to a sin-gle, Compton-scattered γ ray and are addedup (“add-back routine”). The segment withthe highest detected energy deposition is as-sumed to be the point of interaction for thisγ-ray event.
2. All γ-ray events within a time window of typi-cally 4-6 µs with respect to a detected particleare correlated to this particle. This informa-tion on particle-γ coincidence is stored in aROOT tree.
3. User-defined time gates are set, according toprompt and random particle-γ coincidences.Random coincidences are expected to con-tain mostly background radiation. The infor-mation on each particle is stored in a spe-cial ROOT tree with a parameter, indicatingwhether this particle is in prompt or randomcoincidence to a γ ray.
4.2 Detector calibration
4.2.1 Energy calibration of the DSSSD
Calibration of all 160 individual segments of theDSSSD was done with an α-source, containing148Gd, 239Pu, 241Am, and 244Cm. Thus, theenergies of the α particles used for calibrationwere 3.183 MeV, 5.157 MeV, 5.486 MeV, and5.805 MeV. In Figure 4.1 an α-calibration spec-trum is shown, using the example of a single ringof the first quadrant.
The relevant energy range of the scatteredparticles detected in the present experiments isabout 20-70 MeV. Due to the extrapolation of
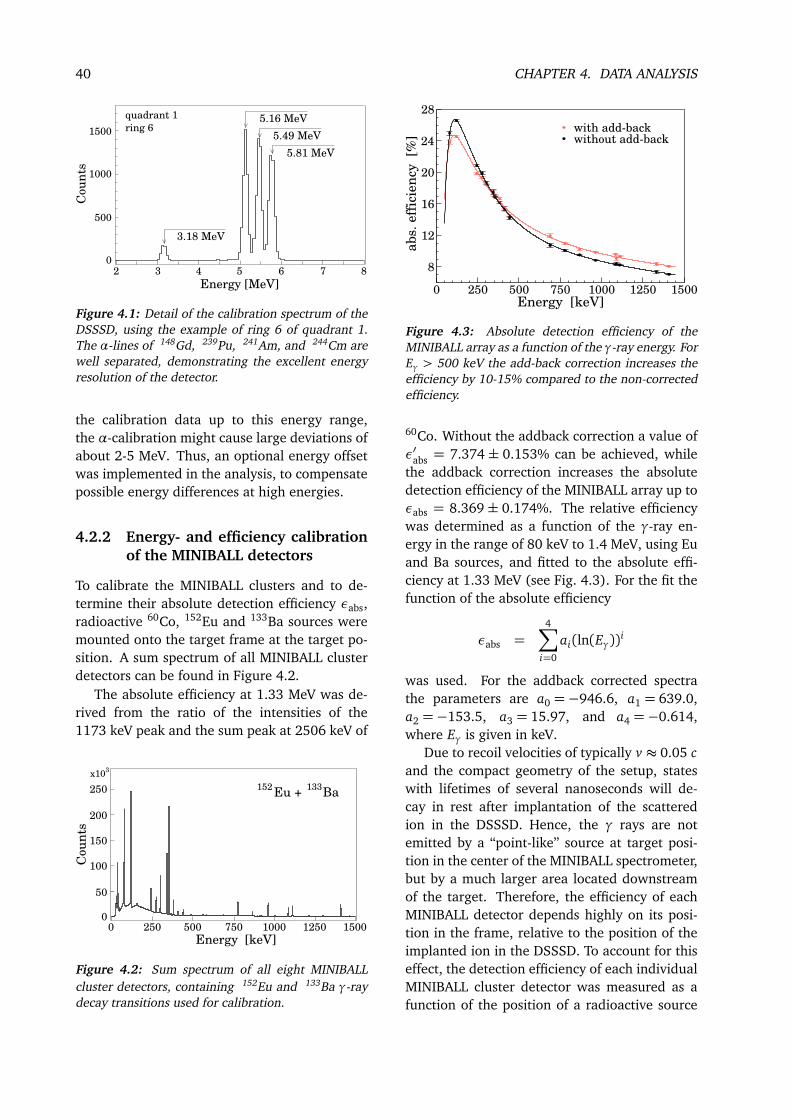
40 CHAPTER 4. DATA ANALYSIS
5 6 7 84320
500
1000
1500
Cou
nts
3.18 MeV
5.16 MeV
5.49 MeV
5.81 MeV
Energy [MeV]
quadrant 1
ring 6
Figure 4.1: Detail of the calibration spectrum of theDSSSD, using the example of ring 6 of quadrant 1.The α-lines of 148Gd, 239Pu, 241Am, and 244Cm arewell separated, demonstrating the excellent energyresolution of the detector.
the calibration data up to this energy range,the α-calibration might cause large deviations ofabout 2-5 MeV. Thus, an optional energy offsetwas implemented in the analysis, to compensatepossible energy differences at high energies.
4.2.2 Energy- and efficiency calibrationof the MINIBALL detectors
To calibrate the MINIBALL clusters and to de-termine their absolute detection efficiency εabs,radioactive 60Co, 152Eu and 133Ba sources weremounted onto the target frame at the target po-sition. A sum spectrum of all MINIBALL clusterdetectors can be found in Figure 4.2.
The absolute efficiency at 1.33 MeV was de-rived from the ratio of the intensities of the1173 keV peak and the sum peak at 2506 keV of
152Eu + Ba
133
250 500 750 10000 1250 15000
50
100
150
200
250
Energy [keV]
Cou
nts
x103
Figure 4.2: Sum spectrum of all eight MINIBALLcluster detectors, containing 152Eu and 133Ba γ-raydecay transitions used for calibration.
0 250 500 750 1000 1250 1500Energy [keV]
8
12
16
20
24
28
abs.
eff
icie
ncy
[%
]
with add-backwithout add-back
Figure 4.3: Absolute detection efficiency of theMINIBALL array as a function of the γ-ray energy. ForEγ > 500 keV the add-back correction increases theefficiency by 10-15% compared to the non-correctedefficiency.
60Co. Without the addback correction a value ofε′abs = 7.374 ± 0.153% can be achieved, whilethe addback correction increases the absolutedetection efficiency of the MINIBALL array up toεabs = 8.369 ± 0.174%. The relative efficiencywas determined as a function of the γ-ray en-ergy in the range of 80 keV to 1.4 MeV, using Euand Ba sources, and fitted to the absolute effi-ciency at 1.33 MeV (see Fig. 4.3). For the fit thefunction of the absolute efficiency
εabs =4∑
i=0
ai(ln(Eγ))i
was used. For the addback corrected spectrathe parameters are a0 =−946.6, a1 = 639.0,a2 =−153.5, a3 = 15.97, and a4 =−0.614,where Eγ is given in keV.
Due to recoil velocities of typically v ≈ 0.05 cand the compact geometry of the setup, stateswith lifetimes of several nanoseconds will de-cay in rest after implantation of the scatteredion in the DSSSD. Hence, the γ rays are notemitted by a “point-like” source at target posi-tion in the center of the MINIBALL spectrometer,but by a much larger area located downstreamof the target. Therefore, the efficiency of eachMINIBALL detector depends highly on its posi-tion in the frame, relative to the position of theimplanted ion in the DSSSD. To account for thiseffect, the detection efficiency of each individualMINIBALL cluster detector was measured as afunction of the position of a radioactive source

4.2. DETECTOR CALIBRATION 41
0
2
4
6
8
0
2
4
6
8
abso
lute
eff
icie
ncy
[%
]
0 500 1000
0
2
4
6
8
0 500 1000 1500
Energy [keV]
0
2
4
6
8
φcl
= 296°
φcl
Eu source
positions
on CD-
detector
φcl
= 58°
φcl
= 237°
φcl
= 305°
φcl
= 48°
φcl
= 220°
φcl
= 139°
Figure 4.4: Energy-dependent detection efficiency of 7 individual MINIBALL cluster detectors in add-back mode,depending on the position of a 152Eu source. The source was mounted in front of the DSSSD at eight differentpositions (see color code). MINIBALL detectors are labeled by their φcl angle, as they are mounted in the frame.The left column shows detectors placed in forward direction, whereas the right column shows detectors placedin backward direction.

42 CHAPTER 4. DATA ANALYSIS
in front of the DSSSD. Therefore the “active”parts of the DSSSD, i.e. the silicon wafers andits mounting PCBs, were replaced by a specialplastic disc for safer handling. An 152Eu sourcewas mounted on the disc at eight different posi-tions, corresponding to the center of the inner-most and outermost rings of each quadrant ofthe DSSSD, as displayed in the bottom left partof Fig. 4.4.
The spectra show a significantly increased ef-ficiency of the cluster detectors in forward di-rection for γ-ray sources in the nearby quadrantof the DSSSD. For example the absolute detec-tion efficiency of a 500 keV γ ray is a factor of2 higher for the detector in forward direction(φ = 296), compared to the one in backwarddirection (φ = 305), if the source is placed atthe outermost position of the top left CD quad-rant (see first row of Fig. 4.4). In a first approxi-mation the evolution of the efficiency of a back-ward cluster detector, depending on the position~rsource of the source, can be described by the sim-ple variation of the distance between source anddetector:
ε(~rsource) = ε0
|~r0−~rdet||~rsource−~rdet|
2
,
where ε0 is the efficiency at a reference point~r0. For detectors in forward direction the ex-planation of the observed efficiencies is muchmore complex, due to additional material in theline of sight between source and detector. Theamount of this material, e.g. the silicon wafers,PCBs, copper cables, and the massive aluminummounting frame of the DSSSD, depends highlyon the position. Furthermore it attenuates espe-cially low-energy γ radiation. Thus, in forwarddirection the efficiency at around 100-200 keV islower than in backward direction for distances,that exceed the distance between the center ofthe DSSSD and the cluster detector (cf. Fig. 4.4).
4.3 Doppler correction
If a γ ray is emitted in-flight (β > 0), the de-tected energy Eγ,lab is Doppler shifted:
Eγ,lab =
p
(1− β2)1− β cosθγ
Eγ,0 ,
Figure 4.5: Definition of the three angles θcl, φcl andαcl, which indicate the exact position of each individ-ual MINIBALL cluster detector. The scattering targetis in the center.
where Eγ,0 is the original energy of the γ ray inthe rest frame of the emitting nucleus and θγ isthe angle between the de-exciting nucleus andthe γ ray. To determine θγ, the exact positioncoordinates of both, the detected γ ray and theemitting nucleus have to be known. If the nu-cleus is detected in the DSSSD with position co-ordinates (θpart,φpart) and the γ ray is detectedin a MINIBALL detector with (θγ,lab,φγ,lab), theangle is given by
cosθγ = sinθpart sinθγ,lab cos(φpart−φγ,lab)
+ cosθpart cosθγ,lab
All eight MINIBALL cluster detectors weremounted on movable arms around the scatter-ing chamber (“MINIBALL frame”) and could berotated in three angular directions: θcl, φcl andαcl, as indicated in Figure 4.5. For Doppler cor-rection, all angles of the cluster detectors hadto be known exactly. Due to the constructionof the MINIBALL frame and the mounting de-vices of the cluster detectors in the frame, onlyφcl can be read at the frame with an appro-priate accuracy. To determine θcl and αcl anangle-calibration measurement was performed,using Doppler-shifted γ rays after the pick-up re-actions d(22Ne,23Ne)p and d(22Ne,23Na)n (seeFig. 4.6). A stable 22Ne beam with an energy of2.2 MeV/u was impinged on a typically 100 µmthick deuterated polyethylene target. Due to themaximum scattering angle of 4.3 of the ejectile,the angle of the emitted γ ray could be approxi-mated by θγ = θγ,lab.

4.3. DOPPLER CORRECTION 43
0
5000
10000
15000
20000
25000C
ou
nts
250 500 750 1000 1250 1500
Energy [keV]
0
5000
10000
15000
20000
25000
Cou
nts
d(22Ne,23Na)n d(22Ne,23Ne)p
w/o Doppler corr.
with Doppler corr.
(a)
d(22Ne, X) Y
(b)
Figure 4.6: Sum spectrum of all MINIBALL cluster detectors containing γ-ray transitions of the d(22Ne,23Ne)pand d(22Ne,23Na)n reactions. The spectrum in (a) is not Doppler corrected. Various narrow background decaytransitions can be observed as well as broad bumps at around 440 keV and 1020 keV. (b) In the Doppler-correctedspectrum the prompt γ-ray transitions of both reaction channels, emitted in-flight, are clearly visible.
The neutron pick-up reaction populated thefirst excited 1/2+ state in 23Ne at an energyof 1016.95(9) keV, which has a lifetime of178(10) ps [130]. The de-excitation γ ray wasemitted in-flight, hence it was Doppler shiftedand could be used for angular calibration. To de-termine the optimum angular parameter set of
200 220 240 260 280 300α
cl [°]
10
15
20
FW
HM
[k
eV
]
Figure 4.7: Evolution of the line width (FWHM) ofthe 1017 keV transition of 23Ne as a function of theangle αcl for one MINIBALL cluster detector. The op-timum position was found to be 252(2). Detailedinformation is given in the text.
each individual MINIBALL cluster detector, theangles θcl, φcl and αcl were varied recursively tooptimize the peak position and to minimize theline width of the Doppler-corrected γ-ray tran-sition. Figure 4.7 shows the evolution of theline width (FWHM) of the 1017 keV transitionfor different angles αcl, which were assumed inthe analysis for the positioning of one MINIBALLcluster detector. This implies an imaginary ro-tation of the detector between 200 and 300
around its axis of symmetry. The angle with theminimum line width indicates the optimum posi-tioning parameter of the cluster detector, in thiscase αcl = 252(2).
Figure 4.8 demonstrates the improvement ofthe energy resolution after Doppler correction,including the segment information of the MINI-BALL detectors. Due to the close geometry of theMINIBALL clusters, the opening angle of a sin-gle detector is quite large, approximately 30.Due to the six-fold segmentation of the detec-tors, the position resolution of the interaction isincreased, giving rise to a much narrower open-ing angle for the γ-ray detection (<15). Thus,Doppler correction on the segment level givesan optimized energy resolution for the 1017 keV

44 CHAPTER 4. DATA ANALYSIS
960 1000 1040 1080Energy [keV]
2000
4000
6000
8000
10000
Cou
nts
FWHM [keV]
segment level: 12.2
core level: 19.1
d(22Ne,23Ne)p
Figure 4.8: Detail of the γ-ray spectrum of theneutron pick-up reaction at different stages of theDoppler correction. The uncorrected spectrum isplotted in black (solid line). Applying Doppler cor-rection on the core level (dashed line, blue), the1017 keV transition becomes visible. Includingthe segment information of the MINIBALL detectors(red), the resolution is further improved.
transition of about 12 keV, which could be fur-ther improved by the use of pulse shape analysis(not implemented in this work).
To get a proper Doppler correction it is nec-essary to determine the precise angles of the dif-ferent segments of the CD detector as well as allcluster angles. θCD could be calculated out of thedimensions of the detector and the distance be-tween target and detector, which amounted toabout 30.0 ± 0.5 mm. Thus, θCD covered typi-cally the laboratory angle from 16.7 to 53.7.To determine the exact azimuth angle φCD, the
0 10 20 30 40 50 60∆φ
CD [°]
20
25
30
35
40
45
FW
HM
[k
eV
]
31Mg: 895 keV
Figure 4.9: Evolution of the line width (FWHM) ofthe 895 keV transition of 31Mg as a function of theangular offset ∆φCD. The optimum value was foundto be 32(5). For detailed information see text.
895 keV transition of the Coulomb excitation of31Mg was used. As a first estimate it was as-sumed that the first strip of the first quadrantof the DSSSD was pointing upwards (φCD =0). Now the evolution of the line width ofthe Doppler-corrected transition was studied asa function of an angular offset∆φCD in the anal-ysis, implying an imaginary rotation of the par-
0
10
20
30
0
10
20
30
0
10
20
30
Cou
nts
/ 4
keV
0
10
20
30
700 800 900 1000 1100
Energy [keV]
0
10
20
30
∆φCD
= 10°
∆φCD
= 20°
∆φCD
= 30°
∆φCD
= 40°
∆φCD
= 50°
Figure 4.10: γ-ray spectra of the 895 keV transitionof 31Mg for five different angular offsets ∆φCD be-tween 10 and 50, implying an imaginary rotationof the DSSSD around its axis of symmetry.

4.5. BEAM COMPOSITION 45
0 30 60 90 120 150 180θ
lab [°]
0
10
20
30
40
50
60
70E
pa
rt
[MeV
]29Na29Al104Pd
∆θCD
Figure 4.11: Calculated energy of 29Na, 29Al andrecoiling 104Pd nuclei as a function of the scatteringangle, for scattering of an A=29 beam with an energyof 2.85 MeV/u on a 4.1 mg/cm2 thick 104Pd target.The spacial dimensions of the beam were neglectedin the calculation. The dotted vertical lines indicatethe angular range covered by the DSSSD.
ticle detector between 0 and 60. Again theangle with the minimum line width indicatesthe optimum angular parameter of the detector,here yielding ∆φCD = 32(5) (cf. Fig. 4.9 and4.10).
4.4 Kinematic considerations
A correct Doppler correction depends largelyupon the identification of the scattered projectileand target nuclei in the DSSSD. Necessary infor-mation can be obtained from the kinematics ofthe scattering process. Measuring the correla-tion of particle energy and scattering angle, dif-ferent beam components can be identified andpartially separated, as well as the recoiling tar-get nuclei.
As an example the scattering of 29Na and29Al nuclei with an energy of 2.85 MeV/u on a4.1 mg/cm2 thick 104Pd target was calculated.Figure 4.11 shows the calculated energy afterthe target as a function of the scattering an-gle. Due to the Z-dependent energy loss in-side the target, the energy of the sodium nucleishould be slightly higher (approx. 6 MeV) thanthe energy of the isobaric aluminum nuclei atthe entrance of the particle detector. The mea-sured spectrum of the particle energy versus thescattering angle (see Fig. 4.12) showed the ex-pected characteristics. The energy of the ions
[°]CD
θ
20 25 30 35 40 45 50 55
[M
eV
]p
art
E
0
20
40
60
80
100
120
0
40
80
120
160
200
Na29
Al29
Pd104
contaminants
with A > 50
Figure 4.12: Measured particle energy at the CD de-tector as a function of the scattering angle θCD forscattering of the A=29 beam on a 4.1 mg/cm2 thick104Pd target. 29Na and 29Al can be identified andpartially separated. For the analysis of Coulomb-excitation events, the indicated particle gate wasused, to select A=29 nuclei only.
detected in the DSSSD was slightly lower thanproposed by the calculations, which was due todisregarded energy straggling and angular strag-gling, as well as the spatial dimensions of thebeam spot. Moreover, these properties lower theresolution, making it impossible to separate the29Na and 29Al ions completely, especially for thehigher scattering angles. Thus, the analysis ofthe Coulomb-excitation data was done applyinga particle gate, which covered all possible iso-bars (Na, Mg, Al, and Si), as indicated in Fig-ure 4.12.
4.5 Beam composition
In Coulomb-excitation experiments with ra-dioactive ion beams possible beam contamina-tions have to be carefully investigated, becauseall beam components contribute to Coulomb ex-citation of the target material, which is used fornormalization. For the extraction of the tran-sition probabilities it was mandatory to moni-tor and to determine the exact beam composi-tion during the experiment. Different sourcesof beam contamination were identified: Iso-baric contaminants occur by β-decay of the ra-dioactive nuclei during accumulation and chargebreeding at REX-ISOLDE. Isobaric contaminants,directly produced in the primary ISOLDE tar-get, were surface ionized due to the high tem-

46 CHAPTER 4. DATA ANALYSIS
Element λ−1r [ms] λ−1
f [ms] λ−1s [ms] α
Mg 66 190 860 0.98Al (100) (500) 22000 (0.5)
Table 4.1: Release parameters of magnesium and aluminum for a standard ISOLDE UCx target with W ionizer ata temperature of about 2000C/2200C, as given in Ref. [96,98]. For a definition of the parameters see the text.
perature of the hot cavity and were not sepa-rated completely in the HRS due to the smallmass differences. An additional beam compo-nent in the Coulomb-excitation experiment of31Mg stemmed from residual argon gas in theREX-Trap and EBIS. After charge breeding, the38Ar11+ had almost the same A/q ratio and wasaccelerated together with the 31Mg9+ ions.
The beam composition was carefully mon-itored during the experiment using differenttechniques, which will be discussed in detail inthe following sections.
4.5.1 Release curve analysis
Due to the pulsed proton beam impinging ontothe primary ISOLDE target and due to the ra-dioactive decay of the nuclei of interest, the in-tensity of the radioactive ion beam at the MINI-BALL setup had a characteristic time-dependentshape, as already mentioned in Section 3.5. Ingeneral the release curve of an element can bedescribed with an empirical formula, includingfour element-specific parameters [131]:
P(t,λr ,λ f ,λs,α) =1
Norm.
1− e−λr t
×
αeλ f t + (1−α)e−λs t
The release process starts with a sharp rise of in-tensity (λr), followed by a steep fall with a fastand a slow component, characterized by the pa-rameters λ f and λs, respectively. The relativeintensity of the fast component is given by theparameter α. As mentioned in Section 3.2.1 al-kali metals and alkaline earths (e.g. Na, Mg,. . . )are released very fast after proton beam im-pact [97, 98]. In contrast, the release of alu-minum is dominated by the slow componentof the fall time [98]. The corresponding re-lease parameters for magnesium and aluminumare given in Table 4.1 as an example. Pleasenote that the release parameters can vary signifi-
cantly due to the chosen macroscopic and micro-scopic target and ion source characteristics (e.g.temperature, material, “grain size”). For exoticisotopes the release function is superimposed by
1000
10000co
un
ts /
20
ms
100
1000
10000
cou
nts
/ 2
0 m
s
0 500 1000 1500 2000 2500
tpart
- tproton
[ms]
100
1000
10000
cou
nts
/ 2
8.5
ms
29Na
30Na
31Mg
T1/2
= 44.9(12) ms
T1/2
= 48(2) ms
T1/2
= 232(15) ms
τexp
= 49.5(5) ms
τexp
= 54.1(8) ms
τexp
= 176.1(15) ms
(a)
(b)
(c)
Figure 4.13: Time-dependent intensity of the RIBwith respect to the last proton beam impact ontothe ISOLDE target for the 29,30Na and 31Mg runs.The experimentally deduced release curves for theisotopes are indicated in red.

4.5. BEAM COMPOSITION 47
the radioactive decay of the nuclei with decayconstant λd :
P ′(t) = e−λd t P(t,λr ,λ f ,λs,α)
To determine the beam composition in the MINI-BALL experiments and to optimize the back-ground suppression in the analysis, the pulseshape of the radioactive ion beam delivered byREX-ISOLDE was studied. Therefore the num-ber of scattered beam particles detected in theDSSSD was measured as a function of the timeinterval since the last proton impact on the pri-mary ISOLDE target. The binning of the mea-surement was given by the repetition rate ofthe charge breeding system of REX-ISOLDE. Fig-ure 4.13 shows the time-dependent intensity ofthe radioactive ion beam with respect to the lastproton beam impact onto the ISOLDE target for29,30Na and 31Mg, taken during the Coulomb-excitation runs at REX-ISOLDE in 2007 (c) and2009 (a-b). Both, sodium and magnesium ionswere released very fast out of the primary target.Thus, the post-accelerated beams had their max-imum intensity 60-80 ms after the proton beamimpact, as it was expected. The decrease of in-tensity was dominated by the fast component ofthe fall and the radioactive decay of the isotopeof interest and could be described by an expo-nential function:
P ′(t) ≈ Ce−(λ f +λd )t = Ce−t/τ , for t > 1/λr
The experimentally deduced release constantsτexp are summarized in Table 4.2 and comparedto the expected values τref by superimposing λ fand λd . The values are in reasonable agreement.Due to their fast release out of the primary tar-get and their short lifetimes, the main intensityof 29,30Na and 31Mg was delivered within sev-eral 100 ms after the proton impact (cf. Fig-ure 4.13). Thus, long-lived and stable contami-
Isotope τexp [ms] τref [ms]29Na 49.5(5) 48.9(14)30Na 54.1(8) 51.4(23)31Mg 176.1(15) 121.2(41)
Table 4.2: The experimentally deduced release con-stants τexp, compared to the expected values τref for29,30Na and 31Mg by superimposing λ f and λd .
nants dominated the beam composition for mostof the time, producing a large amount of back-ground. To reduce this background and to im-prove the relative intensity of the isotope of in-terest, the analysis had to be restricted to rea-sonable time differences ∆t = tpart − tproton. Anappropriate time gate had to be found, to accu-mulate as much intensity of the relevant isotopesas well as to guarantee an optimum backgroundsuppression. Therefore Figure 4.14 shows thetime-dependent evolution of the relative inten-sity of 29,30Na and 31Mg with respect to the in-tegrated intensity of the beam and to the totallydelivered intensity of the isotope. As expected,a saturation of the relative amount of these iso-topes accumulated at the MINIBALL setup wasfound a few 100 milliseconds after the protonpulse. 99% of the total intensity of the isotope
0
50
100
0
50
100
rela
tive i
nte
nsi
ty
[%]
0 250 500 750 1000
tpart
- tproton
[ms]
0
50
100
I(Z,A)
(t) / I(Z,A),tot
(I(Z,A)
(t) + I(Z+1,A)
(t)) / Itot
(t)
(a)
(b)
(c)
29Na
30Na
31Mg
Figure 4.14: Relative intensity of 29,30Na and 31Mgwith respect to the integrated intensity of the beam(black) and to the totally delivered intensity of theisotope (red) as a function of the time difference tothe proton beam impact. Radioactive decay duringcharge breeding is not taken into account.
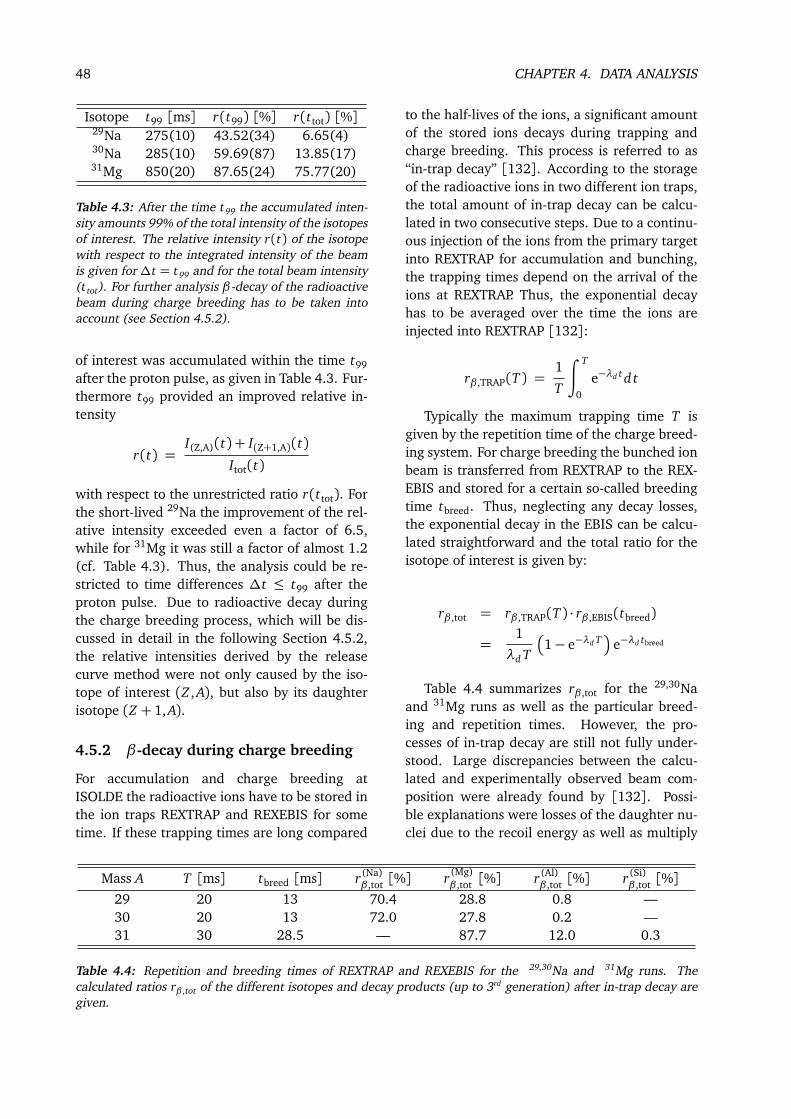
48 CHAPTER 4. DATA ANALYSIS
Isotope t99 [ms] r(t99) [%] r(ttot) [%]29Na 275(10) 43.52(34) 6.65(4)30Na 285(10) 59.69(87) 13.85(17)31Mg 850(20) 87.65(24) 75.77(20)
Table 4.3: After the time t99 the accumulated inten-sity amounts 99% of the total intensity of the isotopesof interest. The relative intensity r(t) of the isotopewith respect to the integrated intensity of the beamis given for ∆t = t99 and for the total beam intensity(ttot). For further analysis β-decay of the radioactivebeam during charge breeding has to be taken intoaccount (see Section 4.5.2).
of interest was accumulated within the time t99after the proton pulse, as given in Table 4.3. Fur-thermore t99 provided an improved relative in-tensity
r(t) =I(Z,A)(t) + I(Z+1,A)(t)
Itot(t)
with respect to the unrestricted ratio r(ttot). Forthe short-lived 29Na the improvement of the rel-ative intensity exceeded even a factor of 6.5,while for 31Mg it was still a factor of almost 1.2(cf. Table 4.3). Thus, the analysis could be re-stricted to time differences ∆t ≤ t99 after theproton pulse. Due to radioactive decay duringthe charge breeding process, which will be dis-cussed in detail in the following Section 4.5.2,the relative intensities derived by the releasecurve method were not only caused by the iso-tope of interest (Z , A), but also by its daughterisotope (Z + 1, A).
4.5.2 β-decay during charge breeding
For accumulation and charge breeding atISOLDE the radioactive ions have to be stored inthe ion traps REXTRAP and REXEBIS for sometime. If these trapping times are long compared
to the half-lives of the ions, a significant amountof the stored ions decays during trapping andcharge breeding. This process is referred to as“in-trap decay” [132]. According to the storageof the radioactive ions in two different ion traps,the total amount of in-trap decay can be calcu-lated in two consecutive steps. Due to a continu-ous injection of the ions from the primary targetinto REXTRAP for accumulation and bunching,the trapping times depend on the arrival of theions at REXTRAP. Thus, the exponential decayhas to be averaged over the time the ions areinjected into REXTRAP [132]:
rβ ,TRAP(T ) =1
T
∫ T
0
e−λd t d t
Typically the maximum trapping time T isgiven by the repetition time of the charge breed-ing system. For charge breeding the bunched ionbeam is transferred from REXTRAP to the REX-EBIS and stored for a certain so-called breedingtime tbreed. Thus, neglecting any decay losses,the exponential decay in the EBIS can be calcu-lated straightforward and the total ratio for theisotope of interest is given by:
rβ ,tot = rβ ,TRAP(T ) · rβ ,EBIS(tbreed)
=1
λd T
1− e−λd T
e−λd tbreed
Table 4.4 summarizes rβ ,tot for the 29,30Naand 31Mg runs as well as the particular breed-ing and repetition times. However, the pro-cesses of in-trap decay are still not fully under-stood. Large discrepancies between the calcu-lated and experimentally observed beam com-position were already found by [132]. Possi-ble explanations were losses of the daughter nu-clei due to the recoil energy as well as multiply
Mass A T [ms] tbreed [ms] r(Na)β ,tot [%] r(Mg)
β ,tot [%] r(Al)β ,tot [%] r(Si)
β ,tot [%]29 20 13 70.4 28.8 0.8 —30 20 13 72.0 27.8 0.2 —31 30 28.5 — 87.7 12.0 0.3
Table 4.4: Repetition and breeding times of REXTRAP and REXEBIS for the 29,30Na and 31Mg runs. Thecalculated ratios rβ ,tot of the different isotopes and decay products (up to 3rd generation) after in-trap decay aregiven.

4.5. BEAM COMPOSITION 49
charged (n+, n ≥ 2) ions after β-decay, induc-ing insufficient cooling in REXTRAP and thus apoor injection into the EBIS, differences in thecharge state distributions of mother and daugh-ter nuclei after charge breeding, or collisions ofthe recoiling daughter nuclei with the installa-tions inside the trap, e.g. with inner walls andelectrodes. [132].
4.5.3 Measurements with the ionizationchamber
For a more direct investigation of the beamcomposition at MINIBALL, a ∆Egas-Eres detec-tor was installed at the beam dump position.Furthermore the ionization chamber allowed fora continuous monitoring of the beam composi-tion during the experiments with the radioac-
tive sodium beams. Figure 4.15 shows ∆Egas-Eres spectra, taken during the 29,30Na beam timeswithout a scattering target in place. Due tothe good resolution of both, the gas detector(∆Egas) and the silicon detector (Eres), the dif-ferent isobars at A = 29,30 could be well sep-arated and identified. Heavier contaminants inthe beam could be identified as stable isotopes(e.g. 58,60Ni, 83,86Kr), partially stemming fromresidual gas in the EBIS, matching almost thesame A/q ratio of 4.143 and 4.286 for the A= 29and A = 30 beams, respectively. The excellentbackground suppression by applying the timegate ∆t = t99, discussed in Section 4.5.1, isdemonstrated. Due to their high ionization po-tential of 7.61 eV, magnesium isotopes will notbe ionized by a surface ion source. Thus, anymagnesium isotopes detected at the MINIBALL
[a.u.]res
E500 1000 1500 2000 2500
[a
.u.]
ga
sE
∆
0
500
1000
1500
2000
2500
3000w/o time gate
A = 29
stable isotopes
from EBIS
Kr,...)83
Ni, 58
(e.g.
Na29
(a)
[a.u.]res
E500 1000 1500 2000 2500
0
500
1000
1500
2000
2500
3000
0
40
80
120
160
200with time gate
99t = t∆
A = 29
stable isotopes
from EBIS
Kr,...)83
Ni, 58
(e.g.
Na29
(b)
[a.u.]res
E500 1000 1500 2000 2500
[a
.u.]
ga
sE
∆
0
500
1000
1500
2000
2500
3000w/o time gate
A = 30
stable isotopes
from EBIS
Kr,...)86
Ni, 60
(e.g.
Na30
(c)
[a.u.]res
E500 1000 1500 2000 2500
0
500
1000
1500
2000
2500
3000
0
100
200
300
400with time gate
99t = t∆
A = 30
stable isotopes
from EBIS
Kr,...)86
Ni, 60
(e.g.
Na30
(d)
Figure 4.15: ∆Egas-Eres spectra of the beam composition, taken with the ionization chamber during the 29Na(top) and 30Na beam times (bottom). The A=29,30 isobars are well separated and can be clearly identified.Some heavier stable contaminants are observable, e.g. 58,60Ni and 83,86Kr, partially from residual gas. While forthe spectra (a,c) no time gate is applied, the spectra (b,d) contain only those ions, which arrive at the ionizationwithin ∆t = t99. The suppression of the stable and long-lived components is well demonstrated.
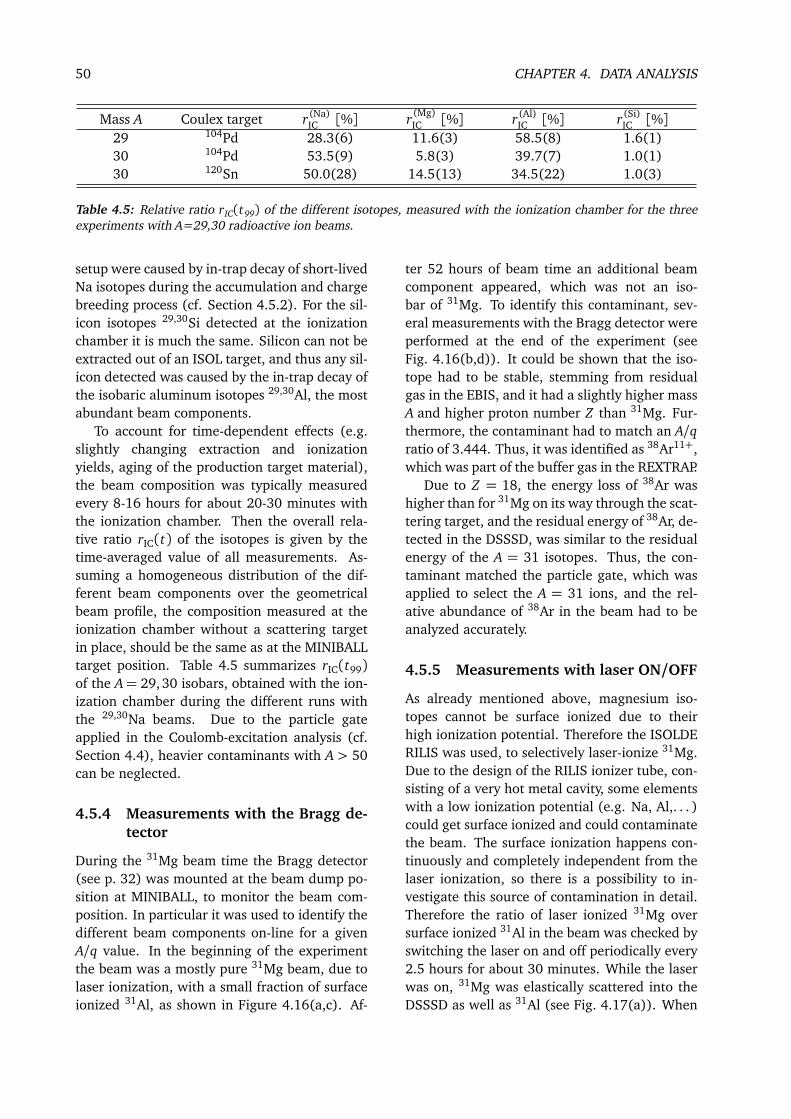
50 CHAPTER 4. DATA ANALYSIS
Mass A Coulex target r(Na)IC [%] r(Mg)
IC [%] r(Al)IC [%] r(Si)
IC [%]29 104Pd 28.3(6) 11.6(3) 58.5(8) 1.6(1)30 104Pd 53.5(9) 5.8(3) 39.7(7) 1.0(1)30 120Sn 50.0(28) 14.5(13) 34.5(22) 1.0(3)
Table 4.5: Relative ratio rIC(t99) of the different isotopes, measured with the ionization chamber for the threeexperiments with A=29,30 radioactive ion beams.
setup were caused by in-trap decay of short-livedNa isotopes during the accumulation and chargebreeding process (cf. Section 4.5.2). For the sil-icon isotopes 29,30Si detected at the ionizationchamber it is much the same. Silicon can not beextracted out of an ISOL target, and thus any sil-icon detected was caused by the in-trap decay ofthe isobaric aluminum isotopes 29,30Al, the mostabundant beam components.
To account for time-dependent effects (e.g.slightly changing extraction and ionizationyields, aging of the production target material),the beam composition was typically measuredevery 8-16 hours for about 20-30 minutes withthe ionization chamber. Then the overall rela-tive ratio rIC(t) of the isotopes is given by thetime-averaged value of all measurements. As-suming a homogeneous distribution of the dif-ferent beam components over the geometricalbeam profile, the composition measured at theionization chamber without a scattering targetin place, should be the same as at the MINIBALLtarget position. Table 4.5 summarizes rIC(t99)of the A= 29, 30 isobars, obtained with the ion-ization chamber during the different runs withthe 29,30Na beams. Due to the particle gateapplied in the Coulomb-excitation analysis (cf.Section 4.4), heavier contaminants with A > 50can be neglected.
4.5.4 Measurements with the Bragg de-tector
During the 31Mg beam time the Bragg detector(see p. 32) was mounted at the beam dump po-sition at MINIBALL, to monitor the beam com-position. In particular it was used to identify thedifferent beam components on-line for a givenA/q value. In the beginning of the experimentthe beam was a mostly pure 31Mg beam, due tolaser ionization, with a small fraction of surfaceionized 31Al, as shown in Figure 4.16(a,c). Af-
ter 52 hours of beam time an additional beamcomponent appeared, which was not an iso-bar of 31Mg. To identify this contaminant, sev-eral measurements with the Bragg detector wereperformed at the end of the experiment (seeFig. 4.16(b,d)). It could be shown that the iso-tope had to be stable, stemming from residualgas in the EBIS, and it had a slightly higher massA and higher proton number Z than 31Mg. Fur-thermore, the contaminant had to match an A/qratio of 3.444. Thus, it was identified as 38Ar11+,which was part of the buffer gas in the REXTRAP.
Due to Z = 18, the energy loss of 38Ar washigher than for 31Mg on its way through the scat-tering target, and the residual energy of 38Ar, de-tected in the DSSSD, was similar to the residualenergy of the A = 31 isotopes. Thus, the con-taminant matched the particle gate, which wasapplied to select the A = 31 ions, and the rel-ative abundance of 38Ar in the beam had to beanalyzed accurately.
4.5.5 Measurements with laser ON/OFF
As already mentioned above, magnesium iso-topes cannot be surface ionized due to theirhigh ionization potential. Therefore the ISOLDERILIS was used, to selectively laser-ionize 31Mg.Due to the design of the RILIS ionizer tube, con-sisting of a very hot metal cavity, some elementswith a low ionization potential (e.g. Na, Al,. . . )could get surface ionized and could contaminatethe beam. The surface ionization happens con-tinuously and completely independent from thelaser ionization, so there is a possibility to in-vestigate this source of contamination in detail.Therefore the ratio of laser ionized 31Mg oversurface ionized 31Al in the beam was checked byswitching the laser on and off periodically every2.5 hours for about 30 minutes. While the laserwas on, 31Mg was elastically scattered into theDSSSD as well as 31Al (see Fig. 4.17(a)). When

4.5. BEAM COMPOSITION 51
60 55 50 45 40
ele
men
t Z
[a
.u.]
10
9
8
7
6
5
4 beginning of experiment
laser ON
(a)
Mg31
Al31
mass A [a.u.]60 55 50 45 40
ele
men
t Z
[a
.u.]
10
9
8
7
6
5
4 beginning of experiment
laser OFF
(c)
Al31
60 55 50 45 4010
9
8
7
6
5
4
5
10
15
20
25
30end of experiment
laser ON
(b)
Ar38
Al31
Mg31
mass A [a.u.]60 55 50 45 40
10
9
8
7
6
5
4
0
5
10
15
20
25
30end of experiment
laser OFF
(d)
Ar38
Al31
Figure 4.16: Spectra taken with the Bragg detector at the beginning (left) and at the end (right) of the 31Mgbeam time, respectively. Z rises from the top to the bottom, A lowers from left to the right. To be sure to have amostly pure, laser ionized 31Mg beam, spectra were taken with laser on (top) and laser off (bottom). 31Al and38Ar can be identified as contaminants (see text).
the laser light was blocked, only the surface ion-ized contaminant was detected (Fig. 4.17(b)).Again, β-decay during charge breeding has tobe taken into account. The fraction rlaser oflaser-ionized magnesium ions and their daugh-ter products in the beam was calculated out ofthe intensities Ion with laser on and Ioff withlaser off as
rlaser =Ion− Ioff
Ion.
Hence, the surface ionized fraction of thebeam was given by rsurface = 1 − rlaser. To
achieve the exact beam composition, the differ-ent scattering cross sections σMg
ruth = 30.0 mb,σAl
ruth = 31.0 mb, and σArruth = 55.6 mb had to be
taken into account. The results, obtained for thedifferent parts of the experiment on 31Mg, aresummarized in Table 4.6.
4.5.6 Summary of the experimentalbeam parameters
In Table 4.7 the most important beam pa-rameters of the 29,30Na and 31Mg beam timesat REX-ISOLDE are summarized. The beam
target thickness rMg+Allaser [%] rAl+Si
surface [%] rArEBIS [%] amount of statistics
109Ag 1.9 mg/cm2 91.1(9) 8.9(9) — 14.0%109Ag 4.0 mg/cm2 93.4(3) 6.6(3) — 34.5%109Ag 4.0 mg/cm2 87.5(4) 6.2(6)∗ 6.3(6)∗ 51.5%
Table 4.6: Beam compositions of the A=31 beam, deduced by the laser ON/OFF measurements for the twodifferent enriched 109Ag targets. To get the average beam composition, the different parts of the experiment haveto be weighted according to their accumulated amount of statistics. To calculate the relative amount of 38Ar itwas assumed, that the ratio of laser ionized and surface ionized ions was constant in time (marked with ∗).

52 CHAPTER 4. DATA ANALYSIS
] o [CD
θ20 25 30 35 40 45 50
[M
eV
]p
art
E
0
20
40
60
80
100
120
laser ON
(a)
] o [CD
θ20 25 30 35 40 45 50
0
20
40
60
80
100
120
0
20
40
60
80
100
120
laser OFF
(b)
Figure 4.17: Energy of elastically scattered 31Mg, 31Al and 38Ar ions in the DSSSD, depending on the scatteringangle θCD, measured during the laser ON/OFF runs. An adequate particle gate was applied, to select beam-likeparticles only. Furthermore the time gate∆t = t99 was selected again. In (a) the laser was on, while for spectrum(b) the laser light was blocked by a shutter.
intensities were derived by the use of theCoulomb-excitation events of the target nuclei,detected with the MINIBALL detectors in coinci-dence with a scattered beam-like particle in theDSSSD. Thus, the beam intensity Ibeam of the nu-cleus of interest is given by
Ibeam =Nγ · rtotal
σCE ·εMB ·Ntarget · T,
where Nγ is the number of detected γ rays fol-lowing Coulomb excitation of the target nuclei,rtotal is the relative ratio of the nucleus of intereston the total beam intensity, σCE is the Coulomb-excitation cross section of the target nuclei, εMBis the energy dependent efficiency of the MINI-BALL array, Ntarget is the number of target nu-
clei, and T is the duration of the measurement.The individual beam composition for each ex-periment was derived by the different experi-mental methods discussed in the last section, i.e.by release curve analysis, measurement with theionization chamber or with laser ON/OFF. Forthe final beam composition the average of the in-dividual beam compositions was calculated, tak-ing into account the β-decay.
All beam components Coulomb excite thetarget material, which is used for normaliza-tion. Thus, this effect has to be taken intoaccount carefully. Isobaric contaminants withhigher Z lose more energy inside the target andhave a larger distance of closest approach, com-pared to the isotopes of interest. Therefore, the
nucleus of interest 29Na 30Na 31MgA/q ratio 4.143 4.286 4.286 3.444 3.444beam energy [MeV/u] 2.85 2.85 2.85 3.0 3.0beam intensity [ions/s] 2700(100) 750(250) 550(60) 3500(200) 2600(150)beam time [hours] 63.7 46.4 37.8 29.0 58.0target nucleus 104Pd 120Sn 104Pd 109Ag 109Agtarget thickness [mg/cm2] 2.2+1.9 4.0 2.2+1.9 1.9 4.0beam composition [%] Na 29.5(7) 46.5(29) 48.2(12) — —
Mg 12.1(3) 15.5(13) 11.2(4) 78.4(10) 77.9(6)Al 57.7(9) 37.4(24) 40.0(13) 20.8(10) 18.1(9)Si 0.7(1) 0.6(3) 0.6(1) 0.8(2) 0.5(2)Ar — — — — 3.5(7)
Table 4.7: Summary of the most important beam parameters of the different beam times, using 29,30Na and31Mg beams at REX-ISOLDE.

4.6. PARTICLE-γ COINCIDENCE 53
Coulomb-excitation cross sections for target ex-citation are slightly lower for the contaminant,than the one of the desired isotope. In the caseof 31Mg and its contaminant 31Al, impingingonto a 4.0 mg/cm2 thick 109Ag target, the differ-ence in the cross section is about 2.5% at a beamenergy of 3.0 MeV/u. The heavier contaminant38Ar has a target excitation cross section, whichis increased by about 25% with respect to thatof 31Mg, due to its higher mass and thereforehigher beam energy. Thus, the final beam com-positions have to be normalized by the dedicatedtarget excitation cross sections.
4.6 Particle-γ coincidence
In experiments using radioactive ion beams, γ-ray spectroscopy often suffers from the massiveamount of background radiation, caused by theradioactive decay of the beam particles, whichcovers the very rare events of interest almostcompletely. Thus, in the Coulomb-excitation ex-periments described in the present work, dig-itized data were recorded using particle-γ co-incidences. To select the prompt Coulomb-excitation events and to suppress random coin-cidences from room background, i.e. β-decayand bremsstrahlung, a restrictive time window
[ns]part tγt2000 1000 0 1000 2000
[k
eV
]γ
E
0
200
400
600
800
1000
0
4
8
12
16
20
pro
mp
t co
inci
den
ces
ran
dom
coin
cid
en
ces
pt∆ rt∆
Figure 4.18: Detected γ-ray energy as a functionof the time difference between the detected parti-cle and the coincident γ ray, measured during the30Na experiment. Background radiation is character-ized by continuous, horizontal lines. The time gatesfor prompt (∆tp) and random (∆t r) coincidencesare given exemplarily for the first quadrant of theDSSSD.
with a width of typically ∆tp = 120 ns up to250 ns between the particle and the γ ray wasapplied in the offline analysis, as shown in Fig-ure 4.18. For γ-ray energies below 150 keV thecoincidence window was chosen slightly broaderand shifted to later times, to account for thewalk effect. To minimize statistical fluctuations,background radiation was analyzed using a longtime window of typically ∆tr = 10 × ∆tp. Asshown in Figure 4.19(a-c), the prompt Coulomb-excitation spectrum for further analysis is par-
0
20
40
60
0
20
40
60
cou
nts
/ 2
keV
0 200 400 600 800 1000Energy [keV]
0
20
40
60
(a)
(b)
(c)
30Na 104Pd
( x 0.1)
∆tr: background
∆tp: prompt
∆tp - 0.1 ∆tr: prompt,
background subtracted
104P
d
30N
a
Figure 4.19: Non-Doppler-corrected γ-ray spectrafor the different coincidence gates, taken during the30Na experiment. (a) The spectrum contains randomcoincidences (∆t r), i.e. only background radiation,which is dominated by the bremsstrahlung comingfrom the 9-gap resonator. (b) Applying the prompttime gate ∆tp, Coulomb-excitation events can be ob-served besides the background. (c) After backgroundsubtraction the prompt spectrum is particularly cleanof any background transitions.

54 CHAPTER 4. DATA ANALYSIS
ticularly clean of any background transitions af-ter background subtraction. All observed γ-raytransitions are due to Coulomb excitation of ei-ther beam or target nuclei.

5.1. COULOMB EXCITATION OF 31MG 55
Chapter 5
Results
The results of all different Coulomb-excitationexperiments of radioactive 29,30Na and 31Mgbeams with MINIBALL at REX-ISOLDE, CERN,will be presented in this chapter. Observed γ-raytransitions were allocated in the level schemes ofthe nuclei. Reduced transition probabilities weredetermined for the different nuclei, using thecoupled-channel codes GOSIA [122, 123] andCLX [120,121]. In the case of 31Mg assignmentsof spin and parity of the levels participating intransitions could be facilitated by the calculatedtransition strengths.
5.1 Coulomb excitation of 31Mg
To determine transition strengths of the neutron-rich odd-mass magnesium isotopes 29,31Mg aCoulomb-excitation experiment was proposedemploying the MINIBALL setup at REX-ISOLDE.A first experiment on 31Mg in 2006 found a hintfor a prominent transition at 895 keV [133]. Itstransition strength could not be deduced due toseveral technical problems.
Therefore, another Coulomb-excitation ex-periment of 31Mg was scheduled and carried outat REX-ISOLDE. The radioactive 31Mg beam wasdelivered with a final energy of 3.0 MeV/u andan average intensity of around 3×10³ ions/sonto the secondary target. During the experi-ment two enriched 109Ag targets were used withthicknesses of 1.9 mg/cm2 and 4.0 mg/cm2, re-spectively, to maximize the yield. The beamon target time added up to about 29 hoursfor the 1.9 mg/cm2 target and 58 hours forthe 4.0 mg/cm2 target. Due to the fast re-lease and the short half-life of 31Mg (T1/2 =232(15) ms [72]) the analysis was restricted tothe first 850 ms after each proton impact at the
primary ISOLDE target (cf. Sec. 4.5.1). More in-formation on the experimental details and thebeam compositions can be found in the previouschapter in Table 4.7.
5.1.1 Measurement at 3.0 MeV/u on a4.0 mg/cm2 thick 109Ag target
Coulomb-excitation data analysis commencedby identifying and selecting scattered 31Mgions, which were identified by the CD detector(DSSSD). As shown in Section 4.4, the kine-matics of the scattered beam or target nuclei isclearly separated by the measured correlation ofparticle energy and scattering angle. Despite in-creased straggling in the thick target, these char-acteristics could be clearly observed for the 31Mgbeam, incident on the 4.0 mg/cm2 thick 109Agtarget at a beam energy of 3.0 MeV/u, as shown
[°]CD
θ
20 25 30 35 40 45 50
[M
eV
]p
art
E
0
20
40
60
80
100
0
5
10
15
20
25
30
Mg31
Figure 5.1: Particle energy versus scattering angle,measured in the DSSSD for the 31Mg beam, incidenton the 4.0 mg/cm2 thick 109Ag target at a beam en-ergy of 3.0 MeV/u. Only those events are plotted,which coincide with at least one prompt γ-ray eventdetected at MINIBALL. The broadened energy distri-bution of the beam-like particles is mainly caused bystraggling in the thick target.

56 CHAPTER 5. RESULTS
0
100
200
300
Cou
nts
/ 4
keV
0 200 400
Energy [keV]
0
100
200
300
Cou
nts
/ 4
keV
600 800 1000 1200
x 1
0
DC for 109Ag
DC for 31Mg
background subtr.
background subtr.
41
5 k
eV
(1
09A
g)
31
1 k
eV
(1
09A
g)
89
5 k
eV
(3
1M
g)
50
keV
(3
1M
g)
50
keV
(3
1M
g)
72
4 k
eV
(3
1M
g)
67
3 k
eV
(3
1M
g)
62
3 k
eV
(3
1M
g)
17
1 k
eV
(3
1M
g)
22
1 k
eV
(3
1M
g)
Figure 5.2: Doppler-corrected (DC) and background-subtracted γ-ray spectra in coincidence with scattered beamparticles. Several γ-ray transitions from the Coulomb excitation of projectile and target nuclei were detected. Forγ-ray energies above 550 keV the scale was zoomed in by a factor of 10 for visibility reasons. Further informationis given in the text.
in Figure 5.1. A particle gate was applied, toselect the scattered 31Mg ions. Using the po-sition and energy information of the scatteredparticle, a proper Doppler correction of the co-incident γ rays was performed for the detected31Mg projectile and the corresponding recoiling109Ag target nucleus, respectively. Prompt γ-rayevents were corrected for random backgroundcoincidences, as described in Section 4.6. Theresulting γ-ray spectra are shown in Figure 5.2.
Analysis of the γ-ray spectra
Applying Doppler correction for scattered 109Agtarget nuclei, strong γ-ray transitions are ob-served in the background-subtracted γ-ray spec-tra at 311 keV and 415 keV, depopulatingCoulomb-excited states in 109Ag [134]. Dopplercorrection for beam-like particles gives rise totwo transitions at 50 keV and 895 keV, alreadyobserved in β-decay studies of 31,32Na [74,135]and assigned to the transitions of a known ex-cited state at 945 keV in 31Mg. The small
Doppler-broadening of the 50 keV transitionin the spectrum corrected for 31Mg is due tothe long half-life of 16(3) ns [74]. The timeof flight between target and CD-detector isonly 1.7-3.2 ns, thus these γ rays were emit-ted at rest after implantation in the detector.There is evidence for some more transitions de-exciting states in 31Mg. Despite high back-ground radiation, coming from bremsstrahlung,there is clear indication for two transitions at171 keV and 221 keV, which are assigned totransitions of a known excited 3/2(−) state at221 keV [74, 77, 78, 135]. Two more transi-tions at 623 keV and 673 keV were already es-tablished by the β-decay studies as depopulat-ing transitions of an excited state at 673 keVinto the 3/2+ state at 50 keV and the groundstate, respectively. The transition at 724 keVwas observed for the first time in this work.To identify this γ-ray transition unambiguouslyand to place it into the level scheme, informa-tion on coincident transitions has been evalu-ated. Multiple γ-ray events, that are in prompt

5.1. COULOMB EXCITATION OF 31MG 57
0
1
2
3
4
Cou
nts
/ 4
keV
0 200 400 600 800 1000Energy [keV]
0
1
2
3
4
Cou
nts
/ 4
keV
Gate 895 keV
Gate 724 keV
50 k
eV
221 k
eV
50 k
eV
171 k
eV
(a)
(b)
Figure 5.3: Prompt γ-ray coincidences in theCoulomb-excitation spectrum of 31Mg, (a) for the895 keV transition and (b) for the 724 keV transi-tion, respectively. Coincident γ rays can be observedat 50 keV, 171 keV and 221 keV. Doppler correctionwas done for the detected 31Mg nucleus.
coincidence with a detected beam particle, havebeen sorted into a γγ-matrix. The known coin-cident transitions at 895 keV and 50 keV froma 5/2+→3/2+→1/2+ cascade are confirmed bycoincidence relations, as shown in Figure 5.3(a).Despite low statistics of 2-3 counts on a meanbackground of about 0.02 count/keV, which isin good agreement with the MINIBALL γ-rayefficiency of ∼10%, the cut spectrum on the724 keV transition shows clear evidence for co-incident γ rays at 50 keV, 171 keV and 221 keV(see Figure 5.3(b)). These transition energiesare all known to belong to the low-energy levelscheme of 31Mg [74, 135]. The new 724 keVtransition can be inserted clearly into the levelscheme of 31Mg as de-exciting transition of the945 keV state, feeding a known 3/2(−) stateat 221 keV [77, 78]. The direct decay of the945 keV state into the ground state was notobserved. A summary of the observed transi-tions and relative intensities can be found in Fig-ure 5.4.
The shape of the 895 keV line in the mea-sured γ-ray spectrum does not follow a simpleGauss distribution, but has a slightly broaderbase (see Figure 5.5). This characteristic can
1/2
3/2
3/2
3/2
5/2
50 keV
945 keV
673 keV
221 keV
0 keV
Mg31
+
+
(−)
+
+
Figure 5.4: Measured γ-ray energies and relative in-tensities of the transitions observed in the Coulomb-excitation experiment of 31Mg. The spin and parityassignments of the states will be discussed later inthe text.
be explained by the fact that the lifetime of the945 keV state is of the same order of magnitudethan the time of flight of the excited nucleusthrough the target. If the Coulomb-excitation re-action takes place towards the end of the target,almost all excited nuclei will de-excite in-flightafter the target. The detected energies ECD ofthe nuclei in the CD detector correspond directly
800 900 1000Energy [keV]
0
5
10
15
20
25
Cou
nts
/ 4
keV
βCD
< β*
βCD
= β*
χ2 = 0.509
Figure 5.5: Shape of the 895 keV line of 31Mg, in-dicating a lifetime of the level of the same order ofmagnitude than the time of flight through the tar-get. The peak is fitted with contributions from the31Mg decaying after the target (βCD = β∗) and dur-ing slowing down inside the target (βCD < β
∗).

58 CHAPTER 5. RESULTS
to the velocities β∗ of the nuclei at the momentof de-excitation. These events are Doppler cor-rected properly, resulting in a narrow contribu-tion to the peak. If the nuclei get Coulomb ex-cited right in the beginning or in the middle ofthe target, de-excitation may occur even duringthe slowing down process in the target. In thepresent case the maximum energy loss in thetarget after the reaction is about 40.3 MeV fora scattering process with θ = 53.7 at the begin-ning of the target. Thus, the detected particleenergies ECD might be significantly lower, yield-ing slower velocities βCD < β
∗, than at the mo-ment the γ ray was emitted. For these eventsthe Doppler correction fails, leading to a slightshift of the detected energies to higher or lowervalues, depending whether the γ rays were emit-ted in forward or backward direction. Figure 5.6shows the distribution of the Doppler-corrected895 keV γ rays detected in forward (θγCM
< 90)and in backward direction (θγCM
> 90), respec-tively. The maximum time of flight through thetarget is about 0.45 ps. Thus, the ratio of the in-tensities of the narrow and broad contributionsgives an estimation of the lifetime of the levelat 945 keV, which yields only a few tenths of apicosecond.
800 900 1000Energy [keV]
0
4
8
12
Cou
nts
/ 4
keV
θγCM< 90
o
θγCM> 90
o
Figure 5.6: Distribution of the Doppler-correctedγ rays at 895 keV, detected in forward direction(θγCM
< 90) and in backward direction (θγCM> 90),
respectively. The asymmetry of the 895 keV line, i.e.the shift to higher/lower energies, depending on thedetection angle is due to γ-ray emission during slow-ing down in the target and hence, an overestimationof the Doppler correction.
Reduced transition probabilities
The measured de-excitation yields of the γ-raytransitions in 31Mg were used to determine theexperimental Coulomb-excitation cross sections,which depend on the unknown reduced tran-sition probabilities. These cross sections werenormalized to the well-known cross sections forexciting the 3/2− and 5/2− states in the 109Agtarget, as shown in Section 3.6.3. According toSection 4.5.6, each isotope in the beam has a dif-ferent cross section for excitation of the targetnuclei. Therefore, the de-excitation yields of theγ-ray transitions in 109Ag were corrected withthe deduced effective beam composition, yield-ing a 31Mg fraction of 77.4% for the excitationof the 3/2− state and 77.7% for the excitationof the 5/2− state. The fit of the experimentaldata was performed using the coupled-channelsCoulomb-excitation code GOSIA [122]. Theelectromagnetic transition matrix elements werefitted using a least squares fit. The calculationtook into account: the energy loss of the pro-jectile in the target material, the angular distri-bution of the emitted γ ray, internal conversioncoefficients, the position and efficiency of eachMINIBALL cluster detector, and an integrationover the scattering angle range of ΘCM = 21.4-67.0, which is covered by the CD detector.
Due to the unknown spin and parity values ofexcited states in 31Mg, different scenarios for thespin and parity of the 945 keV state and differentexcitation modes were assumed:
(i) The 945 keV state has a spin and parity of5/2+ or 7/2+. Excitation takes place by apure 2-step excitation, i.e. via M1 or E2excitation 1/2+g.s.→3/2+ and a subsequentE2 excitation 3/2+→(5/2+, 7/2+).
(ii) The 945 keV state has a spin and parity of1/2− or 3/2− and is excited via an E1 exci-tation from the ground state.
(iii) The 945 keV state has a spin and parity of5/2− or 7/2− and is excited via an E3 exci-tation from the ground state.
(iv) The 945 keV state has a spin and parity of3/2+ and is excited via an E2 excitationfrom the ground state.
(v) The 945 keV state has a spin and parity of

5.1. COULOMB EXCITATION OF 31MG 59
0
1
2
3
4
B(π
λ,
Ji
J
f) /
RU
L
3/2
+ (5/2
+ ,7/2
+ ) (E
2)
3/2
+ (5/2
+ ,7/2
+ ) (E
2)
1/2
+ (5/2
- ,7/2
- ) (E
3)
(i) (ii) (iii) (iv) (v)scenario
5/2
+ 3
/2- (E
1)
1/2
+ 3
/2+
(M1)
1/2
+ 3
/2+
(E2)
1/2
+ 1
/2- (E
1)
1/2
+ 3
/2- (E
1)
3/2
- 3
/2+
(E1)
3/2
- 3
/2- (M
1)
1/2
+ 3
/2+
(E2)
1/2
+ 5
/2+
(E2)
5/2
+ 3
/2+
(E2)
1/2
+ 5
/2+
(E2)
5/2
+ 3
/2+
(M1)
Figure 5.7: Calculated transition strengths of the Coulomb-excited 31Mg. Due to the unknown spin and parityvalue of the 945 keV state different scenarios were tested to reproduce the measured Coulomb-excitation crosssection. All values are given in terms of the recommended upper limits (RUL) for transition strengths [136],i.e. transitions with values > 1 can be excluded (shaded interval). The only scenario giving reasonable valuesis a direct E2 excitation from the 1/2+ ground state into a 5/2+ state at 945 keV, followed by a strong M1de-excitation into the 3/2+ state at 50 keV. Detailed information is given in the text.
5/2+ and is excited via a direct E2 excita-tion from the ground state.
To limit the model space of the Coulomb-excitation calculation a truncated level schemeof 31Mg was used at this point, containing thefollowing states and connecting transitions thatare relevant for excitation of the 945 keV state:the 1/2+ ground state, the 3/2+ state at 50 keV,and the 945 keV state. Other levels contributeless than 10% to the excitation schemes andwere neglected.
First, a possible 2-step excitation into the945 keV state via the two consecutive tran-sitions with 50 keV and 895 keV, respec-tively: 1/2+g.s.→3/2+→(5/2+, 7/2+) is clearlyexcluded. The known B(M1, 3/2+→ 1/2+g.s.) =0.0190(37) µ2
N value [72] for the M1 excita-tion implies a M1 Coulomb-excitation cross sec-tion of 0.05 mb for the 50 keV state. Con-sequently the next excitation to the 945 keVstate, even with an E2 matrix element far be-yond the recommended upper limit (RUL) of100 W.u. for E2 strengths [136], would yield
a nanobarn cross section, which is orders ofmagnitude less than the measured value ofaround 130 mb. Therefore the M1 contribu-tion to the excitation is negligible. A largeE2 component of B(E2, 1/2+ → 3/2+) =460 e2fm4 was assumed for the first exci-tation step, which is comparable to the E2strength of the collective 0+ → 2+ transi-tion in 32Mg. In order to reproduce the mea-sured γ-ray yields, the second excitation into the945 keV state would have to have an excitationstrength of B(E2, 3/2+ → 7/2+) ≈ 2300 e2fm4
which is again significantly higher than the RULfor E2 strengths (cf. Fig. reftrans-prob-calc).Consequently scenario (i), a 2-step excitationprocess, can only play a negligible role in excit-ing the 945 keV state. Thus, the main contribu-tion of the excitation comes from direct excita-tion from the 1/2+ ground state into the 945 keVstate.
In the case of a 1-step excitation via E1the 945 keV level would have negative par-ity and the spin would be limited to 1/2 or3/2. For the assumption of a 1/2− state at

60 CHAPTER 5. RESULTS
945 keV GOSIA calculated excitation probabili-ties of 0.466 e2fm2, which exceeds the RUL of0.1 W.u. for E1 transitions [136] by more thana factor 7. For a 3/2− state GOSIA calculated areduced excitation probability of B(E1, 1/2+→3/2−2 ) = 0.224 e2fm2. For de-excitation intothe 3/2+ state at 50 keV the calculation yieldedB(E1) = 3.3 W.u. and B(M1) = 71.3 W.u. forde-excitation into the 3/2(−) state at 221 keV,respectively. All these values are significantlyhigher than the recommended upper limits ofeach transition and scenario (ii) can be ex-cluded. Also an excitation via E3 to a 5/2− or7/2− state would yield a similar disproportion-ally huge value of B(E3)↑> 40000 e2fm6, whichexceeds the RUL by at least a factor of 4. Thus,a negative parity state, i.e. scenario (iii), can beexcluded.
The remaining possibilities to get consistentvalues for the excitation of the 945 keV state arethe scenarios (iv) and (v). Hence, the 945 keVstate has to be a 3/2+ or a 5/2+ state and thepopulation has to proceed via a direct (1-step)E2 excitation from the ground state. Now thefull known level scheme of 31Mg up to 1 MeVand all known and newly observed transitionswere taken into account for the calculation, withadopted B(E1), B(E2), and B(M1) values for thestates up to 500 keV [72, 77]. Predicted spec-troscopic quadrupole moments Qs and their re-duced matrix elements for the 3/2+ and 5/2+
states [48, 76], so-called re-orientation matrixelements, were included into the calculation, us-ing
QαIs = −
È
16πI(2I − 1)5(I + 1)(2I + 1)(2I + 3)
× MαI ,αI(E2),
where MαI ,αI(E2) = −
αI ||M(E2)||α′ I ′
is thereduced matrix element [24].
For the assumption of a 3/2+ state at 945 keVthe reduced transition probability was calcu-lated to be B(E2, 1/2+ → 3/2+) = 198 e2fm4.De-excitation was investigated using the mea-sured branching ratios of 74(12)% for the895 keV transition, 24(7)% for the 724 keVtransition, and an upper limit of <2.6(8)% forthe unobserved direct transition to the groundstate. De-excitation of a 3/2+ state at 945 keV
0.1 1
B(M1) [µN2]
0
100
200
300
400
500
B(E
2)
[e
2fm
4]
5.86
5.88
5.90
5.92
5.94
χ2
Figure 5.8: Calculated, total χ2 as a function of theB(E2) and B(M1) values of the 895 keV transition,de-excitating the 945 keV state in 31Mg. A minimumwas found at B(M1) = 0.18(5) µ2
N. The χ2 dependsweakly on the B(E2) for a given B(M1) value. Moreinformation is given in the text.
would have to proceed via E2+M1 transitions tothe ground state and the 3/2+ state at 50 keV,respectively. The investigated branching ra-tios yield a ground-state transition via M1+E2with a reduced transition probability that is hin-dered by a factor of about 10−4 compared tothe 895 keV transition. This is very unlikelydue to the similar 2p3h configuration of theground state and the first 3/2+ excited state at50 keV [48]. Thus, scenario (iv), i.e. a 3/2+
state at 945 keV can be rejected.
The only remaining possibility is that the945 keV is a 5/2+ state, i.e. scenario (v). Theanalysis yielded a reduced transition probabilityof B(E2)↑ = 182± 17 (stat.) + 9
−13 (syst.) e2fm4.The error bar is dominated by the statistical er-ror on the number of counts in the observed γ-ray transitions. The systematic error includesmainly the uncertainty on the beam composi-tion, as well as the uncertainties on the B(E2)values of the 109Ag target excitation. Investi-gating de-exciting transitions, a pure E2 transi-tion to the 50 keV state would imply an unrea-sonably high B(E2) value of about 2700 e2fm4,which is in fact about 4.7×RUL, to reproducethe measured intensities. Thus, de-excitation tothe 50 keV state proceeds via a strong M1 tran-sition. The magnitude of the M1 strength de-pends mostly on the multipole mixing ratio δof the transition and its absolute E2 strength.To fix these parameters, the excitation and de-excitation process was calculated for differentB(E2) and B(M1) values of the 895 keV tran-

5.1. COULOMB EXCITATION OF 31MG 61
sition. Figure 5.8 shows the magnitude of theresulting total χ2, depending on the E2 and M1strengths. The χ2 contains mostly the devia-tion of the calculated and measured γ-ray yields,as well as of known branching ratios, lifetimes,and transition strengths. Obviously the χ2 de-pends weakly on the B(E2) for a given B(M1)value. Thus, the absolute E2 strength has tobe determined by another technique, for exam-ple a measurement of the multipole mixing ra-tio δ via the angular distribution of the emit-ted γ rays. For the M1 strength of the 895 keVtransition the calculated χ2 has its minimumat B(M1, 5/2+ → 3/2+) = 0.18(5) µ2
N. Theadditional de-excitation to the 3/2(−) state at221 keV had to proceed via an E1 transitionwith B(E1) = 12(4)× 10−4 e2fm2. A brief sum-mary of the transition strengths calculated forthe different scenarios of the spin and parity ofthe 945 keV state is given in Figure 5.7.
The deduced transition strengths can be usedto calculate the lifetimes of the populated states.For the 945 keV state GOSIA gives an averagelifetime of τ5/2+ = 0.32(9) ps, assuming an E2strength of 60 e2fm4 for the 895 keV transition,which is of the same order as the E2 strengthof the ground-state transition. This result agreeswell with the lifetime, which was estimated us-ing the observed line shape of the 895 keV tran-sition (cf. pages 57f).
For the 673 keV state, which is a 3/2+2state with a 0p1h configuration [78], the anal-ysis yielded a reduced transition probability ofB(E2, 1/2+ → 3/2+2 ) = 21(8) e2fm4. Assum-ing purely E2 de-excitation from this state aswell, the calculation gives B(E2) = 11(5) e2fm4
and B(E2) = 24(12) e2fm4 for the 673 keV and623 keV transitions, respectively. For the lifetimeof this state GOSIA gives τ3/2+2
= 80(30) ps. TheB(E2) value of the 50 keV transition could not bedetermined due to feeding and a complex, non-uniform efficiency for these 50 keV γ rays in theMINIBALL detectors, as stated in Section 4.2.2.
All reduced transition probabilities that werededuced in this experiment are presented in Fig-ure 5.9. For the first time a clear spin and par-ity assignment was done for the 945 keV state.This 5/2+ state is part of a strong collectiveKπ = 1/2+ band in 31Mg.
0.0
19(4
) M
1
221 keV
50 keV
0 keV
673 keV
945 keV
3/2
1/2+
+
3/2(−)
3/2+
5/2+
Mg31
182(2
0)
E2
12(4
) E
1
21(8
) E
2
24(1
2)
E2
0.9
(1)
E1
4.6
(5)
E1
0.1
8(5
) M
1
11(5
) E
2
Figure 5.9: Measured reduced transition probabili-ties for 31Mg. B(E2) values are given in e2fm4, B(E1)in 10-4 e2fm2, and B(M1) in µ2
N. Transition probabil-ities for the shaded transitions of the levels below500 keV are taken from [72,77].
5.1.2 Measurement at 3.0 MeV/u on a1.9 mg/cm2 thick 109Ag target
Another part of the Coulomb-excitation experi-ment on 31Mg with MINIBALL at REX-ISOLDEwas performed with a 1.9 mg/cm2 thick 109Agtarget. The intensity of the post-accelerated ionbeam was 3500(200) ions/s at an energy of3.0 MeV/u. Scattered 31Mg ions were identi-fied and selected by means of the measured cor-relation of particle energy and scattering anglein the CD detector (DSSSD), as shown in Fig-ure 5.10. Due to the thinner target, comparedto the measurement presented in the last sec-tion, straggling is reduced significantly. A parti-cle gate was applied, to select the scattered 31Mgions (cf. Section 4.4). Using the position andenergy information of the scattered particles,Doppler correction of the coincident γ rays wasperformed, either in the rest frame of the pro-jectile or the target nuclei. Additionally promptγ-ray events were corrected for random back-ground coincidences. The resulting γ-ray spec-tra are shown in Figure 5.11. Despite low statis-tics some de-excitation γ rays are observed in the

62 CHAPTER 5. RESULTS
0
20
40
60
Cou
nts
/ 4
keV
0 200 400
Energy [keV]
0
20
40
60
Cou
nts
/ 4
keV
600 800 1000 1200
x 1
0
DC for 109Ag
DC for 31Mg
background subtr.
background subtr.
41
5 k
eV
(1
09A
g)
31
1 k
eV
(1
09A
g)
89
5 k
eV
(3
1M
g)
50
keV
(3
1M
g)
50
keV
(3
1M
g)
Figure 5.11: Doppler-corrected (DC) and background-subtracted γ-ray spectra in coincidence with scatteredbeam particles. γ-ray transitions from the Coulomb excitation of projectile and target nuclei were observed. Forγ-ray energies above 550 keV the scale was zoomed in by a factor of 10 for visibility reasons. Further informationis given in the text.
[°]CD
θ
20 25 30 35 40 45 50
[M
eV
]p
art
E
0
20
40
60
80
100
0
2
4
6
8
10
Mg31
Ag109
Figure 5.10: Particle energy versus scattering angle,measured in the DSSSD for the 31Mg beam, incidenton the 1.9 mg/cm2 thick 109Ag target at a beam en-ergy of 3.0 MeV/u. Only those events are plotted,which coincide with at least one prompt γ-ray eventdetected at MINIBALL. Compared to Fig. 5.1 strag-gling is reduced significantly due to the thinner tar-get. Thus, also some scattered target nuclei can beobserved at energies below 20 MeV.
background-subtracted and Doppler-correctedspectra for both, Coulomb-excited projectile and
target nuclei. For 109Ag the well known tran-sitions at 311 keV and 415 keV are identified,depopulating Coulomb-excited 3/2− and 5/2−
states, respectively [134]. Applying Doppler cor-rection for scattered 31Mg nuclei, the two transi-tions at 50 keV and 895 keV are visible, whichare assigned to the known transitions of the945 keV state in 31Mg [74,135]. Also the newlyobserved 724 keV transition (cf. p.56) can befound, even though there is poor statistics ofonly 5.6(2.4) counts.
Reduced transition probabilities
The measured intensities of the γ-ray transi-tions depopulating Coulomb-excited states inthe 109Ag target and 31Mg projectile nuclei, re-spectively, were used to determine the excitationstrength of the 945 keV state of 31Mg. DeducedCoulomb-excitation cross sections were normal-ized to the well-known cross sections for excit-ing the 311 keV and 415 keV states in the 109Agtarget nuclei. Spin and parity assignments for

5.2. COULOMB EXCITATION OF 29NA 63
the different states of 31Mg, which could be de-duced in the detailed analysis of the experimentwith the 4.0 mg/cm2 thick 109Ag target, weretaken into account. Finally the GOSIA calcula-tions yielded a reduced transition probability ofB(E2)↑ = 138± 42 (stat.)± 21 (syst.) e2fm4 forthe excitation of the 5/2+ state in 31Mg. Theobtained value agrees well with the transitionstrength of B(E2) = 182(20) e2fm4 deducedwith the thicker target.
5.2 Coulomb excitation of 29Na
After the successful experiment on neutron-rich31Mg, another Coulomb-excitation experimentwas proposed with the MINIBALL setup at REX-ISOLDE to study the N = 19 isotone of 31Mg,which is 30Na, as well as the N = 18 sodiumisotope 29Na. The aim was to determine theirreduced transition probabilities.
The Coulomb-excitation experiment of 29Nawas carried out at REX-ISOLDE at a final beamenergy of 2.85 MeV/u. Due to the very shorthalf-life of 44.1(9) ms [137] special attentionhad to be paid on the optimization of the work-ing cycle of the REX-ISOLDE charge breedingsystem in order to minimize losses caused byin-trap decay. Therefore the charge breedingand repetition times were set to 13 ms and20 ms, respectively. The fast release of thesodium ions out of the primary target enablesthe use of a very restrictive time gate of only275(10) ms after the proton impact on the pri-mary target in the off-line analysis. Thus, theaverage relative amount of 29Na in the post-accelerated radioactive ion beam was increasedto 29.5(7)%, which is equivalent to an abso-lute value of 2700(100) ions/s at the MINIBALLscattering target. To maximize the yield of theCoulomb-excitation reaction, the scattering tar-get consisted of a stack of two 104Pd targets withthicknesses of 1.9 mg/cm2 and 2.2 mg/cm2, re-spectively. The beam on target time added upto almost 64 hours. For γ-ray detection sevenMINIBALL triple cluster detectors were avail-able. More information on the experimental de-tails and the beam composition can be found inChapter 4.5.
[°]CD
θ
20 25 30 35 40 45 50 55
[M
eV
]p
art
E
0
20
40
60
80
100
0
4
8
12
16
20
Na29
Figure 5.12: Particle energy versus scattering angle,measured in the CD detector for the A=29 beam, in-cident on the 4.1 mg/cm2 thick 104Pd target at abeam energy of 2.85 MeV/u. Due to the distinctive,Z-dependent energy loss in the target 29Na and 29Alcan be identified and partially separated. Only thoseevents are plotted, which coincide with at least oneprompt γ-ray event detected at MINIBALL.
5.2.1 Measurement at 2.85 MeV/u on a4.1 mg/cm2 thick 104Pd target
Scattered 29Na ions were selected by a particlegate on the measured correlation of particle en-ergy and scattering angle in the CD-detector, ac-cording to Section 4.4. As shown in Figure 5.12the isobars 29Na and 29Al can be well identifiedand partially separated due to their distinctiveenergy losses in the target. Nevertheless theparticle gate includes all A = 29 nuclei. Us-ing the position and energy information of thescattered particle, a proper Doppler correctionof the coincident γ rays was performed for thedetected A = 29 projectile and the correspond-ing recoiling 104Pd target nucleus, respectively.The resulting prompt, background-subtracted γ-ray spectra are shown in Figure 5.13.
Analysis of the γ-ray spectra
De-excitation γ rays of excited states of both pro-jectile and target nuclei were observed in thespectra, shown in Figure 5.13. The well-known2+ → 0+ transition in 104Pd at 555.8 keV [138]was the strongest γ-ray transition in the prompt,background-subtracted spectrum. Due to theslow velocities of the scattered target nuclei(β ≈ 0), which were mostly stopped in the tar-get, no Doppler correction was necessary. Addi-tionally at 767.8 keV the de-exciting transition of

64 CHAPTER 5. RESULTS
0
200
400
600
Cou
nts
/ 2
keV
0 200 400 600 800 1000
Energy [keV]
0
50
100
150
Cou
nts
/ 2
keV
DC for 104Pd
DC for 29Na
background subtr.
background subtr.
55
6 k
eV
(1
04P
d)
72
keV
(2
9N
a)
72
keV
(2
9N
a)
Figure 5.13: Doppler-corrected (DC) and background-subtracted γ-ray spectra in coincidence with beam par-ticles. γ-ray transitions from the Coulomb excitation of projectile and target nuclei were detected. Furtherinformation is given in the text.
0 50 100 150 200 250 300Energy [keV]
0
50
100
150
200
250
Cou
nts
/ 2
keV
prompt, DC for 29Na
random, DC for 29Na
Figure 5.14: Prompt Coulomb-excitation spectrumof 29Na, compared to the random background X-rayradiation, both including Doppler correction for thescattered projectile. The excess of prompt 72 keV γrays is clearly visible.
the 4+ state to the 2+ state [138] was observed,even though it contained only 5(2) counts.
Prior to the Coulomb-excitation experimenton the neutron-rich Na isotopes an experimenton 200Po was performed at the MINIBALL setup.Therefore in the analysis of the γ-ray spectra
special attention had to be paid to the back-ground radiation, coming from the long-liveddecay products of 200Po. Strong X-ray radiationfollowing β-decay of 200Pb and 200Tl matchedthe γ-ray energy of a known transition in 29Naat 72 keV [81]. Thus, careful investigation ofthe low-energy spectra of prompt (Coulomb ex-citation) and random (background) γ-ray eventswas mandatory (see Figure 5.14). It was possi-ble to determine the γ-ray yield of the 72 keVtransition, depopulating the Coulomb-excitedproposed 5/2+ state in 29Na with reasonable ac-curacy.
A detailed analysis of the line-shape of the72 keV transition similar to the analysis of theline shape of the 895 keV transition in 31Mg(cf. Fig. 5.5,5.6) revealed information on thelifetime of the 72 keV state in 29Na. The prompt,Doppler-corrected and background-subtractedγ-ray events were plotted depending on theangle θγCM
between scattered nucleus and γ
ray. The resulting spectrum for backward an-gles (θγCM
> 90) is shown in Figure 5.15.Whereas the 31Mg spectrum for this angular
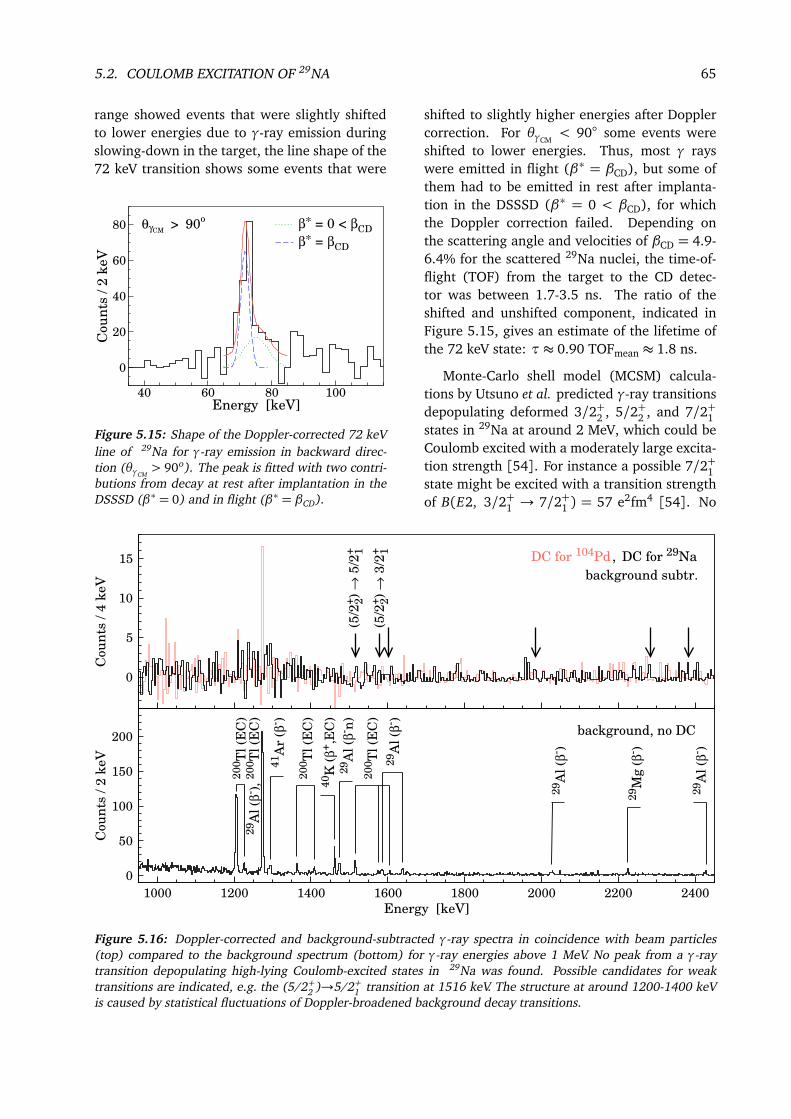
5.2. COULOMB EXCITATION OF 29NA 65
range showed events that were slightly shiftedto lower energies due to γ-ray emission duringslowing-down in the target, the line shape of the72 keV transition shows some events that were
40 60 80 100Energy [keV]
0
20
40
60
80
Cou
nts
/ 2
keV
β* = 0 < βCD
β* = βCD
θγCM> 90
o
Figure 5.15: Shape of the Doppler-corrected 72 keVline of 29Na for γ-ray emission in backward direc-tion (θγCM
> 90o). The peak is fitted with two contri-butions from decay at rest after implantation in theDSSSD (β∗ = 0) and in flight (β∗ = βCD).
shifted to slightly higher energies after Dopplercorrection. For θγCM
< 90 some events wereshifted to lower energies. Thus, most γ rayswere emitted in flight (β∗ = βCD), but some ofthem had to be emitted in rest after implanta-tion in the DSSSD (β∗ = 0 < βCD), for whichthe Doppler correction failed. Depending onthe scattering angle and velocities of βCD = 4.9-6.4% for the scattered 29Na nuclei, the time-of-flight (TOF) from the target to the CD detec-tor was between 1.7-3.5 ns. The ratio of theshifted and unshifted component, indicated inFigure 5.15, gives an estimate of the lifetime ofthe 72 keV state: τ≈ 0.90 TOFmean ≈ 1.8 ns.
Monte-Carlo shell model (MCSM) calcula-tions by Utsuno et al. predicted γ-ray transitionsdepopulating deformed 3/2+2 , 5/2+2 , and 7/2+1states in 29Na at around 2 MeV, which could beCoulomb excited with a moderately large excita-tion strength [54]. For instance a possible 7/2+1state might be excited with a transition strengthof B(E2, 3/2+1 → 7/2+1 ) = 57 e2fm4 [54]. No
0
5
10
15
Cou
nts
/ 4
keV
1000 1200 1400 1600 1800 2000 2200 2400
Energy [keV]
0
50
100
150
200
Cou
nts
/ 2
keV
, DC for 29Na
background, no DC
41A
r (β
- )
background subtr.
20
0T
l (E
C)
29A
l (β
- n)
29A
l (β
- ),
20
0T
l (E
C)
40K
(β
+,E
C)
20
0T
l (E
C)
29A
l (β
- )
20
0T
l (E
C)
29A
l (β
- )
29M
g (
β- )
29A
l (β
- )DC for 104Pd
(5/2
+ 2)
→ 5
/2+ 1
(5/2
+ 2)
→ 3
/2+ 1
Figure 5.16: Doppler-corrected and background-subtracted γ-ray spectra in coincidence with beam particles(top) compared to the background spectrum (bottom) for γ-ray energies above 1 MeV. No peak from a γ-raytransition depopulating high-lying Coulomb-excited states in 29Na was found. Possible candidates for weaktransitions are indicated, e.g. the (5/2+
2 )→5/2+1 transition at 1516 keV. The structure at around 1200-1400 keV
is caused by statistical fluctuations of Doppler-broadened background decay transitions.

66 CHAPTER 5. RESULTS
clear experimental sign was found for such tran-sitions due to the low beam intensity of about3500 ions/s, which was more than three timesless than expected from known ISOLDE yields.Possible candidates for weak transitions werefound at several energies in the range of 1500-2400 keV, as indicated in Figure 5.16. Themost promising one at 1518(4) keV was alreadyknown from β-decay studies as depopulatingtransition of a (5/2+) state at 1588 keV [81].
Reduced transition probabilities
Following the method presented in 3.6.3 theunknown reduced transition probabilities of ex-cited states of 29Na were determined usingthe relative de-excitation γ-ray yields between29Na and the Coulomb-excited, well known 2+
state of 104Pd. The de-excitation yield of the555.8 keV transition of 104Pd was corrected withthe deduced effective beam composition, includ-ing the different Coulomb-excitation cross sec-tions of the isobars for excitation of the targetmaterial, yielding a 29Na fraction of 32.2(10)%for the excitation of the 2+ state. To fitthe electromagnetic transition matrix elementsto the experimental data the coupled-channelsCoulomb-excitation codes CLX and GOSIA wereused. The calculations were performed integrat-ing over the scattering angle range of ΘCM =20.9-66.2, which is covered by the CD detector,and the energy loss of the projectile in the tar-get material. Corrections of the measured γ-rayyields for angular distribution effects and inter-nal conversion were taken into account as wellas position and efficiency of the MINIBALL clus-ter detectors.
The spin and parity of the 72 keV state weredetermined to be Jπ = 5/2+ [83] in agreementwith MCSM calculations which favor a 5/2+
above the 3/2+ ground state [54]. The spectro-scopic quadrupole moment of the ground statewas measured by β-NMR spectroscopy, yield-ing a value of Q3/2+ = +0.086(3) eb [80].This quadrupole moment was included inthe calculation as diagonal matrix element
3/2+||E2||3/2+
= 0.121(4) eb. For the 72 keVstate the diagonal matrix element was assumedto be
5/2+||E2||5/2+
= 0.039(3) eb withina rotational model with K = 3/2.
Including this information the GOSIA calcu-lation yielded a reduced transition probability ofB(E2, 3/2+ → 5/2+) = 150(20) e2fm4 for theCoulomb excitation of the 5/2+ state at 72 keV.The quoted error is dominated by the statisti-cal error of almost 10% for the measured γ-ray yield, but also includes a 6% error for thecorrection for the X-ray radiation backgroundand a 5% error for unobserved feeding fromhigher-lying excited states. Uncertainties of thebeam composition and target excitation wereincluded with 3% and 2%, respectively. Thecode CLX yields a consistent value of B(E2) ↑= 159(21) e2fm4 to reproduce the measuredCoulomb-excitation cross section of 212(28) mbfor the 5/2+ state. The obtained values agreevery well with the transition strength of B(E2)↑= 140(26) e2fm4, which was published by Hurstet al. [58].
De-excitation of the 72 keV state had to pro-ceed via a strong M1 transition, to reproduce theestimated lifetime of less than 2 ns, describedabove. The GOSIA calculation yielded a lowerlimit of B(M1, 5/2+→ 3/2+)> 0.06 µ2
N for theM1 strength. Using the equation
δ2 =3
100
Eγħhc
2 B(E2, Ji → J f )
B(M1, Ji → J f ),
given in [24], where Eγ is given in MeV andthe reduced transition probabilities are given inunits of e2b2 for E2 and µ2
N for M1, this corre-sponds to a multipole mixing ratio |δ|< 0.025.
From Figure 5.16 an upper limit can becalculated for the excitation of the 1588 keVstate, known from β-decay studies [81, 83].The spin and parity of this state are assignedto 1/2+, 3/2+, or 5/2+ due to the measuredlog f t = 4.64 value in combination with the3/2+ ground state of 29Ne [83, 137]. How-ever, the calculated excitation strength differedonly marginally (∼5%) on the spin value ofthe 1588 keV state, yielding B(E2, 3/2+ →(5/2+2 )) = 70(40) e2fm4. For the proposed 7/2+
state [54], as well as for any other higher-lyingexcited state in 29Na, only an upper limit couldbe given for the reduced transition probability.Therefore a detection limit of 2.5 counts wasassumed for a transition on an average back-ground of almost 0.1 counts/keV, measured inthis experiment with the MINIBALL setup in the

5.3. COULOMB EXCITATION OF 30NA 67
1600 1800 2000 2200 2400Energy [keV]
0
50
100
150
200
250
B(E
2,
3/2
+
7
/2+)
[e
2fm
4]
Detection limit
for possible 7/2+ state
above 1600 keV
Figure 5.17: Calculated upper limit for the excita-tion strength of a possible 3/2+→7/2+ transition in29Na between 1600 keV and 2450 keV (solid line)in the present experiment in order to reproduce themeasured γ-ray yields. Detailed information is givenin the text.
energy range between 1600 keV and 2500 keV.It was assumed that the 7/2+ state had to de-cay to the 5/2+ state with a branching ratio ofalmost 100%. Any other branching, e.g. the di-rect decay into the ground state, was neglected.To reproduce the measured γ-ray yields the E2excitation strength of the 3/2+ → 7/2+ transi-tion has to be smaller than the upper limit in-dicated by the solid line in Figure 5.17. Thus,a transition to a 7/2+ state below 1900 keVwould have to have a B(E2) value similar to oreven smaller than the predicted 57 e2fm4 [54],whereas a higher-lying 7/2+ state with such amoderately large value could not be detected atall in the present experiment. A 7/2+ state ataround 2300 keV would need to be connectedto the ground state with B(E2)↑ ≈ 230 e2fm4,to be detected with 2.5 counts.
It was possible to deduce the transitionstrength of the 5/2+→ 3/2+ transition in agree-ment with the value published after proposalsubmission by Hurst et al. [58]. For transitionprobabilities of higher-lying deformed states theresults achieved were not conclusive.
5.3 Coulomb excitation of 30Na
In addition to the of 29Na experiment, anotherCoulomb-excitation experiment on the neigh-boring N = 19 isotope 30Na was carried out, us-ing the MINIBALL setup at REX-ISOLDE, to fur-
ther study the expected transition from spher-ical sd-shell to deformed sd-pf-shell configura-tions at the island of inversion.
To achieve this a radioactive 30Na beam wasaccelerated by the REX-LINAC up to a final en-ergy of 2.85 MeV/u. The fraction of 30Na inthe radioactive A = 30 beam was determinedto be almost 14%, but the ratio could be in-creased up to almost 50% in the analysis by ap-plying a 285 ms wide time gate on the releasecurve (cf. Section 4.5). The average Na inten-sity was about 550-750 ions/s. The experimentwas split into two separate parts with a break oftwo days in between due to another MINIBALLexperiment on 200Po. Two different scatteringtargets were employed, consisting of enriched120Sn and 104Pd with thicknesses of 4.0 mg/cm2
and 4.1 mg/cm2, respectively. The 104Pd tar-get was a stack of two targets (2.2 mg/cm2
and 1.9 mg/cm2) and was already used duringthe 29Na experiment. The beam on target timeadded up to about 46 hours for the 120Sn targetand almost 38 hours for the 104Pd target. Forγ-ray detection seven MINIBALL triple clusterdetectors were mounted on the support framearound the scattering chamber.
5.3.1 Measurement at 2.85 MeV/u on a4.0 mg/cm2 thick 120Sn target
A 30Na beam with an energy of 2.85 MeV/uwas incident on a 4.0 mg/cm2 thick enriched120Sn target. Scattered 30Na nuclei were se-lected by means of the measured correlation be-tween scattering angle θCD and energy depositedin the CD detector as shown in Figure 5.18. Ap-parent deviations in the detected particle ener-gies are due to insufficient calibration data forthe detector in this experiment. Neverthelessit was possible, to perform a sufficient Dopplercorrection of the coincident γ-ray events, us-ing the energy and position information of thescattered particles and γ rays. The resultingbackground-subtracted γ-ray spectra are shownin Figure 5.19, one of them with a Doppler cor-rection in the rest frame of the detected projec-tile, the other one with a Doppler correction inthe rest frame of the target nucleus.

68 CHAPTER 5. RESULTS
0
10
20
Cou
nts
/ 4
keV
0 200 400 600 800 1000 1200
Energy [keV]
0
20
40
Cou
nts
/ 4
keV
DC for 120Sn
DC for 30Na
background subtr.
background subtr.
42
4 k
eV
(3
0N
a)
(12
0S
n)
11
71
keV
Figure 5.19: Doppler-corrected (DC) and background-subtracted γ-ray spectra in coincidence with scatteredbeam particles. Prompt γ-ray transitions from the Coulomb excitation of both projectile ( 30Na) and target( 120Sn) nuclei were detected. Events with 511 keV coming from background radiation were suppressed in thespectra. Further information is given in the text.
[°]CD
θ
20 25 30 35 40 45 50 55
[M
eV
]p
art
E
0
20
40
60
80
100
0
2
4
6
8
Na30
Figure 5.18: Particle energy versus scattering angle,measured in the CD detector for the A=30 beam, in-cident on the 4.0 mg/cm2 thick 120Sn target at abeam energy of 2.85 MeV/u. Only those events areplotted, which coincide with at least one prompt γ-ray event detected at MINIBALL. Apparent deviationsin the detected particle energies for scattering anglesaround 25o and 40o are due to insufficient calibrationdata for the detector in this experiment.
Analysis of the γ-ray spectra
The background-subtracted γ-ray spectra takenduring the experiment contain de-excitation
events of excited states of both, projectile andtarget nuclei. Applying Doppler correction forscattered 120Sn nuclei, a weak γ-ray transitionof the well-known 2+1 → 0+gs transition was ob-served at 1171 keV [139] with a total inten-sity of 12.3(34) counts. Doppler correction forscattered A = 30 projectiles revealed a strongγ-ray transition at 424 keV, which was alreadyobserved by Ettenauer et al. [45] and assignedto the ground-state transition of an excited (3+)state in 30Na at 424 keV. De-exciting transi-tions of low-lying excited 1+ states, which wereknown from β-decay studies of 30Ne [83], werenot observed in this Coulomb-excitation exper-iment. An accumulation of γ-ray events ataround 924 keV could be interpreted as a pos-sible candidate for the proposed (4+) state in30Na. Its identification and placement in thelevel scheme will be presented later on in theanalysis of the experiment using the palladiumtarget (see Section 5.3.2).
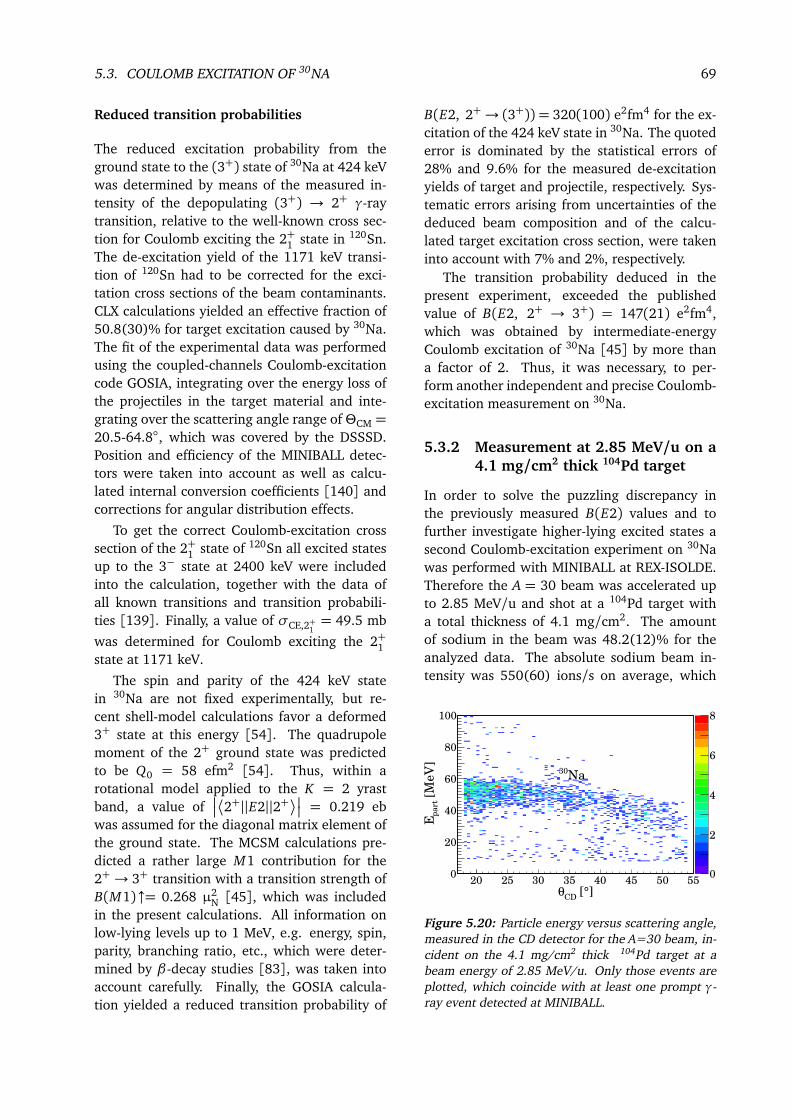
5.3. COULOMB EXCITATION OF 30NA 69
Reduced transition probabilities
The reduced excitation probability from theground state to the (3+) state of 30Na at 424 keVwas determined by means of the measured in-tensity of the depopulating (3+) → 2+ γ-raytransition, relative to the well-known cross sec-tion for Coulomb exciting the 2+1 state in 120Sn.The de-excitation yield of the 1171 keV transi-tion of 120Sn had to be corrected for the exci-tation cross sections of the beam contaminants.CLX calculations yielded an effective fraction of50.8(30)% for target excitation caused by 30Na.The fit of the experimental data was performedusing the coupled-channels Coulomb-excitationcode GOSIA, integrating over the energy loss ofthe projectiles in the target material and inte-grating over the scattering angle range ofΘCM =20.5-64.8, which was covered by the DSSSD.Position and efficiency of the MINIBALL detec-tors were taken into account as well as calcu-lated internal conversion coefficients [140] andcorrections for angular distribution effects.
To get the correct Coulomb-excitation crosssection of the 2+1 state of 120Sn all excited statesup to the 3− state at 2400 keV were includedinto the calculation, together with the data ofall known transitions and transition probabili-ties [139]. Finally, a value of σCE,2+1
= 49.5 mb
was determined for Coulomb exciting the 2+1state at 1171 keV.
The spin and parity of the 424 keV statein 30Na are not fixed experimentally, but re-cent shell-model calculations favor a deformed3+ state at this energy [54]. The quadrupolemoment of the 2+ ground state was predictedto be Q0 = 58 efm2 [54]. Thus, within arotational model applied to the K = 2 yrastband, a value of
2+||E2||2+
= 0.219 ebwas assumed for the diagonal matrix element ofthe ground state. The MCSM calculations pre-dicted a rather large M1 contribution for the2+ → 3+ transition with a transition strength ofB(M1)↑= 0.268 µ2
N [45], which was includedin the present calculations. All information onlow-lying levels up to 1 MeV, e.g. energy, spin,parity, branching ratio, etc., which were deter-mined by β-decay studies [83], was taken intoaccount carefully. Finally, the GOSIA calcula-tion yielded a reduced transition probability of
B(E2, 2+→ (3+)) = 320(100) e2fm4 for the ex-citation of the 424 keV state in 30Na. The quotederror is dominated by the statistical errors of28% and 9.6% for the measured de-excitationyields of target and projectile, respectively. Sys-tematic errors arising from uncertainties of thededuced beam composition and of the calcu-lated target excitation cross section, were takeninto account with 7% and 2%, respectively.
The transition probability deduced in thepresent experiment, exceeded the publishedvalue of B(E2, 2+ → 3+) = 147(21) e2fm4,which was obtained by intermediate-energyCoulomb excitation of 30Na [45] by more thana factor of 2. Thus, it was necessary, to per-form another independent and precise Coulomb-excitation measurement on 30Na.
5.3.2 Measurement at 2.85 MeV/u on a4.1 mg/cm2 thick 104Pd target
In order to solve the puzzling discrepancy inthe previously measured B(E2) values and tofurther investigate higher-lying excited states asecond Coulomb-excitation experiment on 30Nawas performed with MINIBALL at REX-ISOLDE.Therefore the A = 30 beam was accelerated upto 2.85 MeV/u and shot at a 104Pd target witha total thickness of 4.1 mg/cm2. The amountof sodium in the beam was 48.2(12)% for theanalyzed data. The absolute sodium beam in-tensity was 550(60) ions/s on average, which
[°]CD
θ
20 25 30 35 40 45 50 55
[M
eV
]p
art
E
0
20
40
60
80
100
0
2
4
6
8
Na30
Figure 5.20: Particle energy versus scattering angle,measured in the CD detector for the A=30 beam, in-cident on the 4.1 mg/cm2 thick 104Pd target at abeam energy of 2.85 MeV/u. Only those events areplotted, which coincide with at least one prompt γ-ray event detected at MINIBALL.

70 CHAPTER 5. RESULTS
0
20
40
60
Cou
nts
/ 4
keV
0 200 400 600 800 1000 1200
Energy [keV]
0
10
20
30
Cou
nts
/ 4
keV
DC for 104Pd
DC for 30Na
background subtr.
background subtr.
42
4 k
eV
(3
0N
a)
55
6 k
eV
(1
04P
d)
Figure 5.21: Doppler-corrected (DC) and background-subtracted γ-ray spectra in coincidence with scatteredbeam particles. Prompt γ-ray transitions from the Coulomb excitation of both projectile ( 30Na) and target( 104Pd) nuclei were detected. Events with 511 keV coming from background radiation were suppressed in thespectra. Further information is given in the text.
was more than five times less than originallyexpected. More information on the experimen-tal details and the beam composition is given inChapter 4.5.
Scattered 30Na ions were identified and se-lected by means of the measured correlation be-tween scattering angle θCD and particle energyin the CD detector, as shown in Figure 5.20.Using the position information of the scatteredparticle and the coincident γ ray, which wereprovided by the segmentation of the DSSSD andthe MINIBALL detectors, respectively, a properDoppler correction of the emitted γ rays was per-formed. For the projectile Doppler correction isessential due to the relatively high recoil veloc-ities β > 5%, whereas the scattered target nu-clei can be assumed to be almost at rest dueto the low momentum transfer and high stop-ping power. According to section 4.6 a timegate was applied on prompt particle-γ coinci-dences, to suppress random background eventseffectively. The resulting Doppler-corrected andbackground-subtracted γ-ray spectra for both
kinematics of projectile and target nuclei areshown in Figure 5.21.
Analysis of the γ-ray spectra
Performing the Doppler correction according tothe kinematics of scattered target nuclei, theprominent transition in the resulting γ-ray spec-trum at 555.8 keV is the well-known 2+ →0+ transition in 104Pd [138]. Doppler correc-tion for beam-like nuclei gives rise to a strongtransition at 424 keV, which was already ob-served in previous Coulomb-excitation experi-ments of 30Na [45]. This transition was as-signed to the de-excitation of an excited (3+)state in 30Na to the 2+ ground-state. De-excitingtransitions of low-lying excited 1+ states, knownfrom a β-decay experiment of 30Ne [83], werenot observed. Nevertheless, an accumulationof γ-ray events at around 924 keV was found,which could be a possible candidate for the de-excitation of a proposed (4+) state in 30Na. Allthese findings are in agreement with the results

5.3. COULOMB EXCITATION OF 30NA 71
0 200 400 600 800 1000 1200
Energy [keV]
0
20
40
60
Cou
nts
/ 4
keV
92
5 k
eV
(3
0N
a)
DC for 30Na
background subtr.
sum of Sn and Pd data
42
4 k
eV
(3
0N
a)
55
6 k
eV
(1
04P
d)
50
1 k
eV
(3
0N
a)
Figure 5.22: Sum spectrum of the Coulomb-excitation experiments on 30Na, using the data sets taken withthe 120Sn target and the 104Pd target, background subtracted and Doppler corrected for 30Na. In addition tothe known 424 keV transition there is evidence for two weak transitions at 501 keV and 925 keV, depopulatingan excited state at 925 keV. These findings were confirmed by coincidence relations (see below). Events with511 keV coming from background radiation were suppressed.
from the Coulomb-excitation experiment on a120Sn target, which was already presented in theprevious section of this work.
In order to facilitate observation and identi-fication of weak γ-ray transitions in 30Na, datasets taken with both targets, i.e. 120Sn and104Pd, were summed. The resulting γ-ray spec-trum is shown in Figure 5.22. It revealed a newγ-ray transition at 925 keV, which could be as-signed to a proposed 4+ state in 30Na, as wellas a possible branching to the (3+) state with atransition energy of 501 keV. To identify thesetransitions unambiguously and to allocate themin the level scheme of 30Na, experimental datawere sorted into a prompt particle-γγ coinci-dence matrix. This technique was already es-tablished successfully in the analysis of the 31MgCoulomb-excitation experiment (cf. Sec. 5.1.1).A coincidence gate was set on the (3+) → 2+
transition at 424 keV to investigate γ-ray tran-sitions feeding the (3+) state. MCSM calcula-tions predicted a strong 4+→ 3+ transition withB(M1, 4+ → 3+) = 0.43 µ2
N [45]. With thehigh γ-ray efficiency of the MINIBALL array averification of this prediction should be feasibleby the measured coincidence relations. The cutspectrum on the 424 keV transition showed γ-ray events at 501(5) keV, which were coincident
with the (3+)→ 2+ transition in 30Na, as shownin Figure 5.23. This would be perfectly in linewith the results deduced from the γ-ray singlesspectra in Figure 5.22, which favored an excitedstate at 925 keV with about 67% γ-ray decaybranching to the 2+ ground state and about 33%branching to the (3+) state at 424 keV. This
0 200 400 600 800 1000Energy [keV]
0
1
2
3
Cou
nts
/ 4
keV
Gate 424 keV
50
1 k
eV
Figure 5.23: Prompt particle-γγ coincidence spec-trum of the Coulomb excitation of 30Na, gated on the424 keV transition. Coincident γ-ray transitions wereobserved at 501(5) keV, feeding the 424 keV state.Doppler correction was performed for the detected30Na nucleus. γ rays with a detected energy between508 keV and 514 keV were excluded from the anal-ysis, to eliminate possible random coincidences with511 keV γ rays.

72 CHAPTER 5. RESULTS
state at 925 keV is a possible candidate for theproposed 4+ state in 30Na [54]. Moreover itis thought to form a doublet with an 1+2 stateat 924(2) keV, which was observed by β-decaystudies [83]. The known decay branches of the1+2 state were not observed in this experiment.
Reduced transition probabilities
The measured intensities of the γ-ray transi-tions depopulating Coulomb-excited states inthe 104Pd target and 30Na projectile nuclei,were used to determine the dedicated Coulomb-excitation cross sections. The Coulomb-excitation cross sections depend on the un-known reduced transition probabilities, whichare of further interest. Therefore, the deducedcross sections of excited state in 30Na are nor-malized to the well-known cross section for ex-citing the 2+ state in 104Pd, as shown in Sec-tion 3.6.3 and all the experiments previously dis-cussed. The de-excitation yield of the 555.8 keVtransition was corrected for the effective beamcomposition (cf. Sect. 4.5.6), yielding a fractionof 52.6(14)% on average for 30Na exciting the2+ state in 104Pd. The fit of the experimentaldata was performed using the coupled-channelsCoulomb-excitation code GOSIA [122,123]. Thecalculation took into account position and ef-ficiency of each individual MINIBALL detector,angular distribution effects of the emitted γ rayas well as internal conversion coefficients. Inte-gration limits of the calculation were given bythe scattering angle range of ΘCM = 20.5-66.4,which was covered by the DSSSD, and the en-ergy loss of the projectile in the target.
For the calculation of the Coulomb-excitationcross section of the 2+1 state of 104Pd all ex-cited states up to the 4+2 state at 2082 keVwere included into the calculation, together withthe data of all known transitions and transi-tion probabilities [138]. To complete the datasets for the Coulomb-excitation calculations of30Na, all information available on experimen-tally known low-lying excited states and elec-tromagnetic transitions as well as on predictedquadrupole moments, transition probabilitiesand spin assignments, was taken into account.The spin and parity of the 424 keV state wereassumed to be 3+ [45, 54]. Furthermore, shell-
0 keV
Na
151 keV
424 keV
926 keV
925 keV
516 keV
2+
1
(3 )+
+(2 )
+
30
125(4
5)
E2
< 6
5 E
2
< 2
5 E
2
70(2
5)
E2
0.0
27(1
4)
M1, 6
5 E
2
1+
(4 )+
230(4
1)
E2
164(2
9)
E2
Figure 5.24: Measured reduced transition probabil-ities for 30Na. B(E2) values are given in e2fm4 andB(M1) in µ2
N. The dotted transitions de-exciting the1+ states had not been observed in the present ex-periment and were taken from [83]. Thus, for thosestates only an upper limit of the excitation strengthcould be given. For detailed information see text.
model calculations favored a deformed 4+ stateat around 800 keV [54], which could be as-signed to the newly observed 925 keV state. Forthe diagonal matrix elements of the 2+ groundstate and the 4+ state values of
2+||E2||2+
=0.219 eb and
4+||E2||4+
= 0.112 eb, respec-tively, were assumed within a rotational modelapplied to the K = 2 yrast band [54]. Accordingto MCSM calculations de-excitation of the 3+ isexpected to proceed via a strong M1 contribu-tion with B(M1)↓= 0.191 µ2
N [45], which wasincluded in the present calculations. Additionalinformation on low-lying 1+ and (2+) levels upto 1 MeV, e.g. level energies, transition energies,branching ratios, etc., which were determinedby β-decay studies [83], was taken into accountcarefully. The unknown electromagnetic transi-tion matrix elements were fitted by the GOSIAcalculation using a least squares fit.
For the excitation of the 424 keV state in30Na the GOSIA calculation yielded an excitationstrength of B(E2, 2+→ (3+)) = 230(41) e2fm4.The possible (4+) state at 925 keV was popu-lated by the Coulomb excitation with a value

5.3. COULOMB EXCITATION OF 30NA 73
of B(E2, 2+ → (4+)) = 125(45) e2fm4. De-excitation had to proceed via an E2 transitionto the ground state, competing with a mixedE2+M1 transition to the (3+) state. To re-produce the measured branching ratios the M1component of the (4+)→ (3+) transition had tobe much smaller than the value of 0.43 µ2
N, de-duced from MCSM calculations [45]. Assuminga moderate E2 strength of B(E2) = 80 e2fm4
for the 501 keV transition, the GOSIA calcula-tion yielded an M1 strength of B(M1, (4+) →(3+)) = 0.027(14) µ2
N. All quoted errors aremainly dominated by the statistical errors ofthe measured de-excitation yields of the rele-vant projectile and target excitations, respec-tively. Systematic errors arising from uncertain-ties of the deduced beam composition and of thecalculated target excitation cross section, wereminor and were taken into account with 3% and2%, respectively.
In β-decay experiments low-lying 1+ stateswere observed at 151 keV and 924(2) keV [83].De-excitation γ rays of these 1+ states were notobserved in the present Coulomb-excitation ex-periment. Thus, only an upper limit of the re-duced transition probabilities could be deduced.The GOSIA calculations yielded B(E2)) ↑<25 e2fm4 and B(E2))↑< 70 e2fm4 for excitingthe 1+1 and 1+2 state, respectively.
All reduced transition probabilities, mea-sured in this experiment are presented in Fig-ure 5.24. For the first time a possible 4+ statewas observed at 925 keV.
The analysis of the previous experiment us-ing the 120Sn target yielded comparable re-sults. In that experiment the (4+) state wasexcited with B(E2) = 96(50) e2fm4. A dis-crepancy between the B(E2) values of the424 keV transition obtained in “safe” Coulomb-excitation experiments and those, obtained inintermediate-energy Coulomb-excitation exper-iments [45,49], is observed.
5.3.3 Measurement at 2.83 MeV/u on a3.6 mg/cm2 thick 104Pd target
In 2010 and 2011 further Coulomb-excitationexperiments with 30Na were scheduled at REX-ISOLDE, to confirm the results achieved in theprevious experiments. A new 3.60(25) mg/cm2
0 200 400 600 800 1000Energy [keV]
0
1
2
Cou
nts
/ 4
keV
DC for 30Na
no background subtr.
Figure 5.25: Prompt Coulomb-excitation spectrumof 30Na, taken during the run in 2010. Doppler cor-rection was performed for scattered 30Na ions. Noγ ray depopulating the 424 keV state was observedduring 3 hours of beam time.
thick 104Pd target was produced to replace thestack of the two medium-sized 104Pd targets pre-viously used, and thus to reduce uncertainties onthe composition and thickness of the target. Un-fortunately the experiments in 2010 and 2011suffered from very low 30Na beam intensities ofless than 140 ions/s and about 60 ions/s at theMINIBALL setup, respectively. Thus, both exper-iments were stopped after some hours of mea-surement. Figure 5.25 shows the final Coulomb-excitation spectrum of the experiment scheduledin 2010.

74 CHAPTER 5. RESULTS

6.1. DISCUSSION 75
Chapter 6
Discussion and Summary
6.1 Discussion
31Mg
The measured level scheme and reduced tran-sition probabilities of 31Mg are compared to re-sults from recently published shell-model calcu-lations [48] and AMD+GCM calculations [76].Both publications predicted a 5/2+ state at988 keV [48] and 0.89 MeV [76], respec-tively, which is in very good agreement with thepresent results for the 945 keV state in this work,as shown in Fig. 6.1. Additionally, the 673 keVstate is confirmed as 3/2+2 state and the head ofthe Kπ = 3/2+ band with a dominant spherical0p1h configuration [76,78]. A reduced couplingto the deformed 2p3h ground-state configura-tion is in very good agreement with a less col-lective transition with B(E2, 1/2+ → 3/2+2 ) =21(8) e2fm4 observed in this experiment.
1/2
3/2
5/2
3/2
−
0
101
270
988
140
5/2
720
480
3/2
1390
3/2
890
7/2 1236
1
1
+
++0
+
945+
3/2+
673
221
50
(−)
+
SDPF−NR* Exp. AMD+GCM
1/21/2+
13/23/2
+
3/2
5/2+
−
3/2+2
2
−
+
5/21
7/21
+
1310
810
0
−
Figure 6.1: Level scheme of 31Mg, as it was ex-tracted from the Coulomb-excitation data (middle),compared to recently published shell-model calcula-tions [48] (left) and AMD+GCM calculations [76](right). Excitation energies are given in keV.
The measured properties of the 945 keV stateagree well with the predicted 5/2+ state of thepositive-parity yrast band in 31Mg. The 5/2+
state has a strong coupling to the deformedground state with B(E2, 1/2+ → 5/2+) =182(20) e2fm4 due to its predicted dominant2p3h intruder configuration. Combined withthe 1/2+ ground state and the first excited3/2+ state at 50 keV these states form a pos-itive parity yrast band with K = 1/2. More-over, intra-band decay proceeds by almost pureM1 transitions. Measured transition strengthsof B(M1, 5/2+ → 3/2+) = 0.18(5) µ2
N, de-duced in the present work, and B(M1, 3/2+ →1/2+) = 0.019(4) µ2
N [72] agree well with shell-model calculations done by Maréchal [48], thatyield B(M1, 5/2+ → 3/2+) = 0.38 µ2
N andB(M1, 3/2+ → 1/2+) = 0.06 µ2
N, respectively(see Table 6.1). For E2 transitions the shell-model calculations do not reproduce the mea-sured values. With B(E2, 5/2+ → 1/2+) =127 e2fm4 [48] it is in fact a factor of 2 biggerthan the result of the present measurement, thatgives B(E2) = 61(7) e2fm4.
The rigid rotor approximation allows anothercomparison with theory [76]. This is done byassuming a purely rotational K = 1/2 band in31Mg, given by the sequence 1/2+−3/2+−5/2+.For transitions within such a rotational band thereduced transition probability is linked to the in-trinsic quadrupole moment Q0 by [24]
B(E2, Ii → I f )rot =5
16πe2Q2
0
¬
Ii2K0|I f K
2.
For the 5/2+ → 1/2+ transition we getB(E2)rot = 69 e2fm4 and B(E2)rot = 114 e2fm4,calculated with predicted quadrupole momentsfrom shell-model and rigid-rotor approximation

76 CHAPTER 6. DISCUSSION AND SUMMARY
Ii → I f B(E2)exp B(E2)SM B(E2)rot B(M1)exp B(M1)SM
5/2+→ 1/2+ 61(7) 127a 69a / 114b — —5/2+→ 3/2+ 20a / 32b 0.18(5) 0.38a
3/2+→ 1/2+ 106a 140a / 145b 0.019(4)c 0.06a
Table 6.1: Reduced transition probabilities of the positive-parity K=1/2 yrast band in 31Mg, compared to recenttheoretical predictions. B(E2) values are given in e2fm4, B(M1) in µ2
N. For more details see text. a from Ref. [48].b from Ref. [76]. c from Ref. [72].
calculations, respectively [48, 76]. The resultfrom shell-model calculations is in reasonableagreement with the experimental result (see Ta-ble 6.1), whereas the rigid rotor approximationyields a transition strength that is too high by afactor of more than 1.8.
The deduced excitation probabilityB(E2, 1/2+ → 5/2+) = 182(20) e2fm4 of31Mg can be compared to the 0+ → 2+ E2strengths in the neighboring even-even mag-nesium isotopes 30,32Mg. To avoid the effectof the different spin values for the initial(ground) states, the reduced transition matrixelements M(E2) will be compared instead.For 32Mg the experimental results, i.e. B(E2)values, were discussed by [51], includingpossible feeding contributions. An E2 matrixelement of M(E2, 0+ → 2+) = 0.210(13) ebis reported without a correction for feed-ing, and M(E2) = 0.182(13) eb includes acorrection for feeding from a higher-lyingstate [51], which is consistent with [66]. Thenew M(E2, 1/2+ → 5/2+) = 0.191(11) ebvalue of 31Mg compares well with the feedingcorrected M(E2, 0+ → 2+) = 0.182(13) ebof 32Mg [51], and exceeds the measuredM(E2, 0+ → 2+) = 0.155(10) eb of 30Mg [59].This result establishes that deformed p f in-truder configurations exist for the ground andlow-lying states of magnesium isotopes alreadyat N = 19, including a sequence of collectiverotational states.
29Na
The measured reduced transition probabilitiesof the N = 18 nucleus 29Na are comparedto very recently published experimental val-ues [58] and MCSM predictions [54]. Thetransition strength of the 5/2+1 → 3/2+ tran-sition at 72 keV deduced in this work yielded
B(E2, 3/2+ → 5/2+1 ) = 150(20) e2fm4. Thisvalue is in good agreement with the value ofB(E2) ↑= 140(25) e2fm4 published by Hurstand collaborators [58] a few months after theproposal for the present experiment was ac-cepted. Recent shell-model calculations usingthe USD interaction and the SDPF-M interactionpredict an excitation strength of 111 e2fm4 and135 e2fm4, respectively, for the 5/2+1 state [54].Thus, the experimental results are consistentwith the predictions by the MCSM calculationsusing the SDPF-M interaction, which yielded amixing of intruder configurations by 42% and32% for the wave function of the 3/2+ groundstate and the first excited 5/2+1 state, respec-tively [54, 83], confirming the onset of largeintruder admixtures in the ground-state wavefunction already for the N = 18 isotope 29Na.
Moreover, the present measurement indicatesthat the 3/2+ ground state and the 5/2+1 state at72 keV are connected by a dominant M1 tran-sition with B(M1, 5/2+1 → 3/2+) > 0.06 µ2
N,i.e. multipole mixing ratio |δ|< 0.025. Within asimple rotational model the measured transitionstrengths yielded Q0 = 0.542(36) eb for the in-trinsic electric quadrupole moment of 29Na, as-suming a prolate deformation. The quadrupoledeformation parameter is given to first orderby [24]
β2 =
p5π
3
1
ZR20
Q0 ,
yielding β2 = 0.48(3). However, this simplemodel overestimates the quadrupole deforma-tion of 29Na due to the different static and dy-namic nuclear properties, arising from differ-ences in the underlying single-particle configu-rations of the ground and first excited states. Anearlier, precise β-NMR measurement pointed toslightly less deformation: Q0 = 0.430(15) eband β2 = 0.38(2) [80].
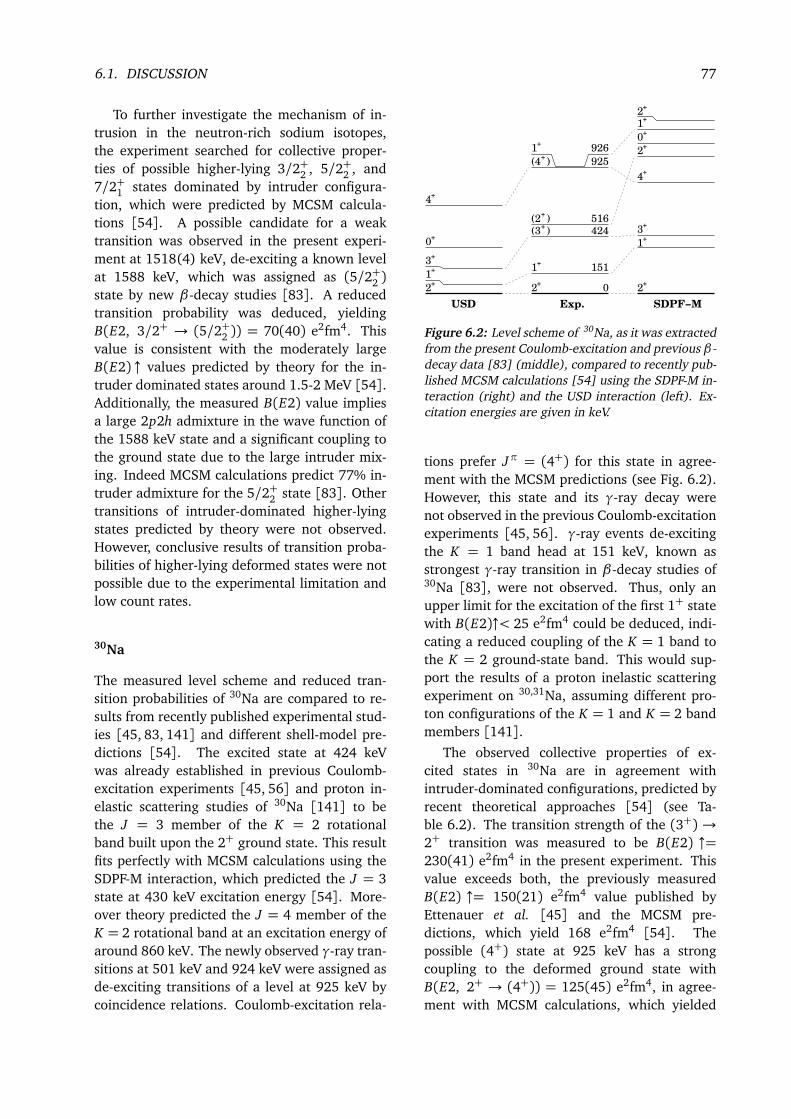
6.1. DISCUSSION 77
To further investigate the mechanism of in-trusion in the neutron-rich sodium isotopes,the experiment searched for collective proper-ties of possible higher-lying 3/2+2 , 5/2+2 , and7/2+1 states dominated by intruder configura-tion, which were predicted by MCSM calcula-tions [54]. A possible candidate for a weaktransition was observed in the present experi-ment at 1518(4) keV, de-exciting a known levelat 1588 keV, which was assigned as (5/2+2 )state by new β-decay studies [83]. A reducedtransition probability was deduced, yieldingB(E2, 3/2+ → (5/2+2 )) = 70(40) e2fm4. Thisvalue is consistent with the moderately largeB(E2) ↑ values predicted by theory for the in-truder dominated states around 1.5-2 MeV [54].Additionally, the measured B(E2) value impliesa large 2p2h admixture in the wave function ofthe 1588 keV state and a significant coupling tothe ground state due to the large intruder mix-ing. Indeed MCSM calculations predict 77% in-truder admixture for the 5/2+2 state [83]. Othertransitions of intruder-dominated higher-lyingstates predicted by theory were not observed.However, conclusive results of transition proba-bilities of higher-lying deformed states were notpossible due to the experimental limitation andlow count rates.
30Na
The measured level scheme and reduced tran-sition probabilities of 30Na are compared to re-sults from recently published experimental stud-ies [45, 83, 141] and different shell-model pre-dictions [54]. The excited state at 424 keVwas already established in previous Coulomb-excitation experiments [45, 56] and proton in-elastic scattering studies of 30Na [141] to bethe J = 3 member of the K = 2 rotationalband built upon the 2+ ground state. This resultfits perfectly with MCSM calculations using theSDPF-M interaction, which predicted the J = 3state at 430 keV excitation energy [54]. More-over theory predicted the J = 4 member of theK = 2 rotational band at an excitation energy ofaround 860 keV. The newly observed γ-ray tran-sitions at 501 keV and 924 keV were assigned asde-exciting transitions of a level at 925 keV bycoincidence relations. Coulomb-excitation rela-
(4 )
(3 )
1
2
1
Exp.
1+
+
(2 )+
+
+151
424
516
925
926+
2
+1
3+
++
1+
2+
0
2+
+
+4
2+
3+
0+
4+
0
USD SDPF−M
Figure 6.2: Level scheme of 30Na, as it was extractedfrom the present Coulomb-excitation and previous β-decay data [83] (middle), compared to recently pub-lished MCSM calculations [54] using the SDPF-M in-teraction (right) and the USD interaction (left). Ex-citation energies are given in keV.
tions prefer Jπ = (4+) for this state in agree-ment with the MCSM predictions (see Fig. 6.2).However, this state and its γ-ray decay werenot observed in the previous Coulomb-excitationexperiments [45, 56]. γ-ray events de-excitingthe K = 1 band head at 151 keV, known asstrongest γ-ray transition in β-decay studies of30Na [83], were not observed. Thus, only anupper limit for the excitation of the first 1+ statewith B(E2)↑< 25 e2fm4 could be deduced, indi-cating a reduced coupling of the K = 1 band tothe K = 2 ground-state band. This would sup-port the results of a proton inelastic scatteringexperiment on 30,31Na, assuming different pro-ton configurations of the K = 1 and K = 2 bandmembers [141].
The observed collective properties of ex-cited states in 30Na are in agreement withintruder-dominated configurations, predicted byrecent theoretical approaches [54] (see Ta-ble 6.2). The transition strength of the (3+) →2+ transition was measured to be B(E2) ↑=230(41) e2fm4 in the present experiment. Thisvalue exceeds both, the previously measuredB(E2) ↑= 150(21) e2fm4 value published byEttenauer et al. [45] and the MCSM pre-dictions, which yield 168 e2fm4 [54]. Thepossible (4+) state at 925 keV has a strongcoupling to the deformed ground state withB(E2, 2+ → (4+)) = 125(45) e2fm4, in agree-ment with MCSM calculations, which yielded
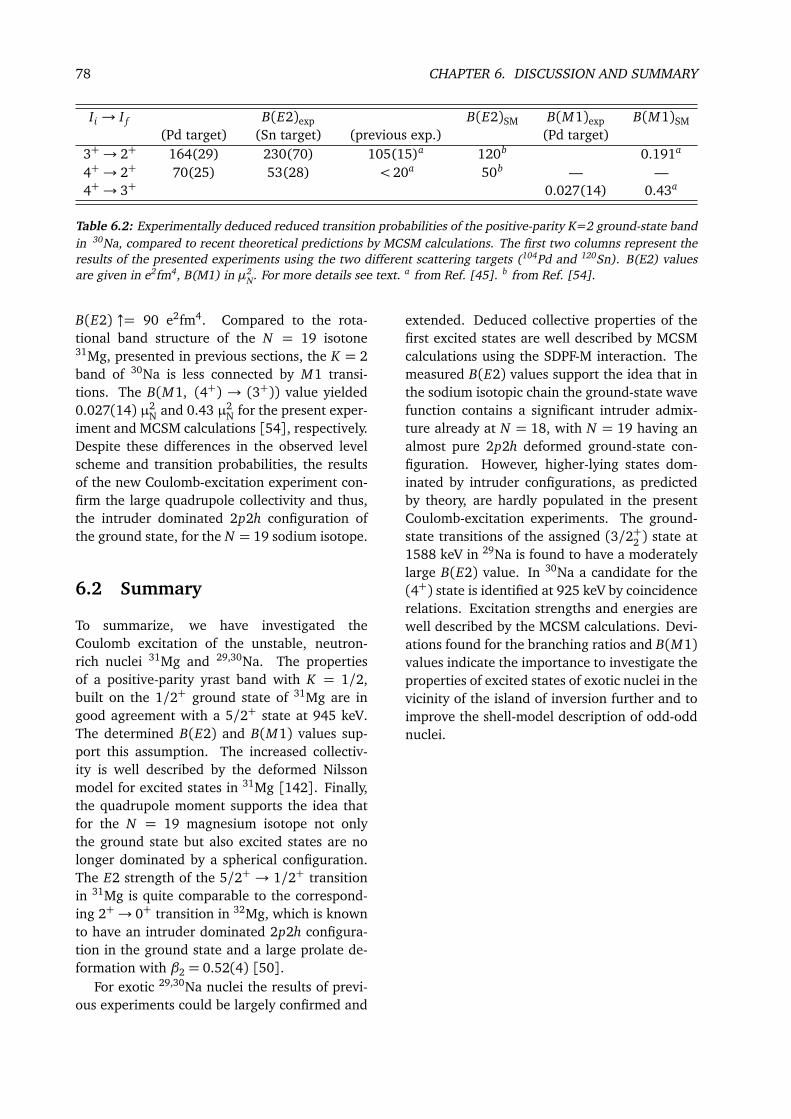
78 CHAPTER 6. DISCUSSION AND SUMMARY
Ii → I f B(E2)exp B(E2)SM B(M1)exp B(M1)SM(Pd target) (Sn target) (previous exp.) (Pd target)
3+→ 2+ 164(29) 230(70) 105(15)a 120b 0.191a
4+→ 2+ 70(25) 53(28) < 20a 50b — —4+→ 3+ 0.027(14) 0.43a
Table 6.2: Experimentally deduced reduced transition probabilities of the positive-parity K=2 ground-state bandin 30Na, compared to recent theoretical predictions by MCSM calculations. The first two columns represent theresults of the presented experiments using the two different scattering targets (104Pd and 120Sn). B(E2) valuesare given in e2fm4, B(M1) in µ2
N. For more details see text. a from Ref. [45]. b from Ref. [54].
B(E2) ↑= 90 e2fm4. Compared to the rota-tional band structure of the N = 19 isotone31Mg, presented in previous sections, the K = 2band of 30Na is less connected by M1 transi-tions. The B(M1, (4+) → (3+)) value yielded0.027(14) µ2
N and 0.43 µ2N for the present exper-
iment and MCSM calculations [54], respectively.Despite these differences in the observed levelscheme and transition probabilities, the resultsof the new Coulomb-excitation experiment con-firm the large quadrupole collectivity and thus,the intruder dominated 2p2h configuration ofthe ground state, for the N = 19 sodium isotope.
6.2 Summary
To summarize, we have investigated theCoulomb excitation of the unstable, neutron-rich nuclei 31Mg and 29,30Na. The propertiesof a positive-parity yrast band with K = 1/2,built on the 1/2+ ground state of 31Mg are ingood agreement with a 5/2+ state at 945 keV.The determined B(E2) and B(M1) values sup-port this assumption. The increased collectiv-ity is well described by the deformed Nilssonmodel for excited states in 31Mg [142]. Finally,the quadrupole moment supports the idea thatfor the N = 19 magnesium isotope not onlythe ground state but also excited states are nolonger dominated by a spherical configuration.The E2 strength of the 5/2+ → 1/2+ transitionin 31Mg is quite comparable to the correspond-ing 2+→ 0+ transition in 32Mg, which is knownto have an intruder dominated 2p2h configura-tion in the ground state and a large prolate de-formation with β2 = 0.52(4) [50].
For exotic 29,30Na nuclei the results of previ-ous experiments could be largely confirmed and
extended. Deduced collective properties of thefirst excited states are well described by MCSMcalculations using the SDPF-M interaction. Themeasured B(E2) values support the idea that inthe sodium isotopic chain the ground-state wavefunction contains a significant intruder admix-ture already at N = 18, with N = 19 having analmost pure 2p2h deformed ground-state con-figuration. However, higher-lying states dom-inated by intruder configurations, as predictedby theory, are hardly populated in the presentCoulomb-excitation experiments. The ground-state transitions of the assigned (3/2+2 ) state at1588 keV in 29Na is found to have a moderatelylarge B(E2) value. In 30Na a candidate for the(4+) state is identified at 925 keV by coincidencerelations. Excitation strengths and energies arewell described by the MCSM calculations. Devi-ations found for the branching ratios and B(M1)values indicate the importance to investigate theproperties of excited states of exotic nuclei in thevicinity of the island of inversion further and toimprove the shell-model description of odd-oddnuclei.

7.2. COULOMB EXCITATION OF 32,33MG 79
Chapter 7
Outlook
7.1 The HIE-ISOLDE project
During the last decade the REX-ISOLDE facilitymade it possible to perform intensive studies ona wide range of exotic nuclei in low-energy nu-clear physics experiments, using e.g. Coulombexcitation, inelastic scattering, transfer and fu-sion reactions. To expand the physics programto nuclei even further from the valley of stabil-ity, reaction cross sections and beam intensitiesneed to be increased. Therefore the “High Inten-sity and Energy ISOLDE” (HIE-ISOLDE) projectwas launched [143]. It is a major upgrade of theexisting ISOLDE facility.
In a first stage the normal-conducting REX-Linac will be complemented by several super-conducting cavities to increase the energy ofthe re-accelerated radioactive ion beam up to5.5 MeV/u (cf. Figure 7.1). A later stagewill boost the available beam energy up to10 MeV/u. Additional improvements in thepreparation and quality of the beam are in-tended. Furthermore ISOLDE will benefit fromthe increased proton beam intensity of the CERNinjector chain, i.e. the new LINAC4 and up-graded PS Booster, delivering up to 6 µA to theISOLDE target stations [143]. Therefore high-power targets and adequate ionization sourceshave to be developed. The increase in protoncurrent will result in about three times higheryields for the radioactive ion production. Tocope with this increased ion beam intensity, fur-ther upgrades of the charge breeding system,i.e. REXTRAP and REXEBIS, are necessary on thelow-energy side of REX-ISOLDE.
The first stage of the HIE-ISOLDE upgrade,i.e. the energy upgrade to 5.5 MeV/u, is plannedto become operational in 2014/2015. The fullenergy of 10 MeV/u as well as the increased in-
tensity of the radioactive ISOLDE beams shouldbe available as of 2016 and 2017, respec-tively [145,146].
7.2 Coulomb excitation of exotic32,33Mg at 5.5 MeV/u withMINIBALL at HIE-ISOLDE
Despite extensive studies the nucleus 32Mg andthe island of inversion [33] remains at the cen-ter of numerous ongoing experimental and the-oretical efforts focusing on the evolution of shellstructure far from the valley of stability. In 32Mgonly for the 2+1 and 4+1 excited states are quan-tum numbers firmly established. Recently thefirst excited 0+2 state of 32Mg was measured em-ploying the 30Mg(t,p)2n-transfer reaction in in-verse kinematics at ISOLDE [70]. A second ex-cited 2+2 state is predicted to exist on the sec-ond excited 0+2 state in 32Mg. Employing thehigher beam intensities and higher beam ener-gies of HIE-ISOLDE will allow observation ofthese states, which are dominated by 0p0h con-figurations [147]. Moreover, future multipleCoulomb excitation can elucidate the collectiv-ity of the 4+1 and the high beam energy will alsoallow detecting the 3−1 state, giving access to thesize of the νd3/2-ν f7/2 shell gap, if the state is ofsingle-particle character. However, a collectiveexcitation built on the highly deformed groundstate would be of even higher relevance.
An even more intriguing case is given atthe moment for the neighboring 33Mg isotope.New measurements of ground-state propertiesof 33Mg at ISOLDE unambiguously determinedthe spin I = 3/2 and a negative g factorg =−0.4971(1) [148]. The quest for the parity

80 CHAPTER 7. OUTLOOK
Figure 7.1: Planned layout of the new HIE-ISOLDE facility at CERN. The final stage of the superconducting accel-erator has been plotted, providing post-accelerated RIBs with an energy of up to 10 MeV/u (adapted from [144]).
of the ground state and the underlying single-particle configuration is described in Ref. [149].Excitation spectra and neutron single-particleconfigurations of 33Mg were investigated by us-ing antisymmetrized molecular dynamics com-bined with the generator coordinate method(AMD+GCM) [150]. The results show that33Mg has a strongly deformed 3/2− ground statewith a 3p2h configuration. The excitation spec-tra are qualitatively understood in terms of theNilsson model and the calculation has shownthe coexistence of different intruder configura-tions within small excitation energy. The nor-mal 1p0h configuration is located at a higher ex-citation energy of 2.1 MeV. Due to the large
Ji J f B(E2, Ji → J f ) [e2fm4]3/2−1 5/2−1 2823/2−1 7/2−1 1545/2−1 7/2−1 1475/2−1 9/2−1 1947/2−1 9/2−1 92
Table 7.1: Calculated E2 transition probabilities forthe ground-state band in 33Mg. Values are takenfrom Ref. [150].
deformation the intra-band E2 transitions arelarge for the ground-state band. The calcu-lated values are summarized in Table 7.1. Themeasurement of the B(E2, 3/2−1 → 5/2−1 ) andB(E2, 5/2−1 → 7/2−1 ) values should be feasi-ble due to the high intrinsic quadrupole mo-ment of the intruder state. Moreover, a multi-ple Coulomb-excitation experiment with a post-accelerated 33Mg HIE-ISOLDE beam would pref-erentially populate the 5/2− and 7/2− levelsfrom the 3/2− ground state [149, 150]. Suchan experiment would thus confirm the proposedspin and parity values for these levels.
Therefore, future Coulomb-excitation exper-iments of 32,33Mg are proposed, using the HIE-ISOLDE facility coupled with the highly efficientMINIBALL array.
Experimental setup and count rate estimate
The experimental instrument used with HIE-ISOLDE will be the MINIBALL array for in-beamγ-ray spectroscopy. In addition to the MINI-BALL array the charged particle detectors of theT-REX configuration will be employed consist-ing of a CD-type double-sided silicon strip de-tector (DSSSD) and segmented Si barrel detec-

7.2. COULOMB EXCITATION OF 32,33MG 81
3/2
−
−
AMD+GCM
3/2
7/2
0
600
3/2+
1/2+
5/2−
1100
1200
1300
2p1h
3p2h
3p2h
3p2h
4p3h
B(E2 ) = 282 e fm2 4
0
Exp.
−
4845/2
546−
(1/2 )+
(3/2 )+
(7/2 )−
705
1243
33Mg
Figure 7.2: Experimentally deduced level scheme of33Mg (left) and results from an AMG+GCM calcula-tion (right). The figure was adapted from [149,150].
tors [151]. The detector thickness of 500 µm al-lows stopping completely the scattered ions. Thehigh segmentation of the detectors allows for akinematic reconstruction of the events and cov-ers an angular range from 15 to 77. A solidangle coverage of 30% is used for the count rateestimate [151].
The proposed MINIBALL experiments withunstable beams of 32,33Mg isotopes at HIE-ISOLDE are from the ISOLDE point of viewcomparable with previous experiments employ-ing 30,31,32Mg beams. The ISOLDE yield valuesfor Mg isotopes are 3 × 10⁴ ions/µC for 32Mgand 3 × 10³ ions/µC for 33Mg [98]. However,the yields available at HIE-ISOLDE should beslightly higher than the quoted value due to re-cent improvements in the RILIS laser technique.
The accelerator efficiency for the complete HIE-ISOLDE chain from REXTRAP to the MINIBALLtarget was estimated conservatively to be 5%.A beam intensity of 32Mg and 33Mg at the sec-ondary target inside the MINBALL of I(32Mg) =2000 ions/s and only I(33Mg) = 200 ions/s canbe expected with an average PSB proton beamcurrent of 1.4 µA.
Coulomb excitation will be done at “safe” en-ergies of 5.5 MeV/u below the Coulomb barrierof a 196Pt target. A distance of closest approachof 52.0 fm is calculated for the incoming 33Mgions hitting the 196Pt target nuclei with an en-ergy of 5.5 MeV/u at an angle of 77 in the lab-oratory. According to the work of Cline [126]the “safe” Coulomb-excitation criterion requiresdistances of d > Rp + Rt + 5 fm = 16.2 fm. Thetarget thickness can be chosen very thick with7.5 mg/cm2 at this high beam energy. Neverthe-less the energy differences between the kineticenergy of scattered beam and target nuclei al-lows for a clear separation between the scatter-ing partners in the particle detectors. The mostrelevant improvements of the proposed mea-surements with respect to the previous result ob-tained for 33Mg at MSU [49] are: (i) the highenergy resolution of the MINIBALL HPGe detec-tors, (ii) the enlarged energy range for γ-ray de-tection, which goes down in a reliable and con-trolled way to a lower threshold of 50 keV andthe (iii) good γ-ray efficiency of the eight triplecluster detectors of MINIBALL.
The cross sections for the excitation of theseveral states in 32,33Mg were calculated withthe Coulomb-excitation code CLX. A beam en-
IISOLDE IMB transition B(E2)↑ σCE Iγ,MBIsotope [ions/µC] [ions/s] energy [e2fm4] [mb] [cts/h]
32Mg 3× 10⁴ 2× 10³ 0+1 → 2+1 , 885 keV 454 110 152+1 → 4+1 , 1436 keV 288a 50 0.50+1 → 2+2 , 2550 keV 45b 1 0.10+1 → 3−1 , 2858 keV 2500b 4 0.25c
33Mg 3× 10³ 2× 10² 5/2−1 → 3/2−1 , 485 keV 282d 795 1.67/2−1 → 3/2−1 , 1243 keV 154d 350 0.27/2−1 → 5/2−1 , 758 keV 147d 0.25
Table 7.2: Rate estimates for the proposed Coulomb-excitation experiments on 32,33Mg at HIE-ISOLDE. For moreinformation see text. a Taken from Ref. [147]. b Estimated excitation strength. c Count rate of the de-exciting3–
1→2+1 transition. d Taken from Ref. [150].
82 CHAPTER 7. OUTLOOK
ergy value of 5.5 MeV/u was used. The crosssection for projectile excitation was integratedfor particle detection in the solid angle range inthe CM-system of θCM = 25-115. These anglesare covered by the particle detectors in the labo-ratory frame by θlab = 15-77. For γ-ray detec-tion the measured energy dependent γ-ray effi-ciency was included. Effects of the γ-ray angulardistribution were neglected in the estimate. Astarget material 196Pt was used with a thicknessof 7.5 mg/cm2.
For 32Mg the B(E2) value for the 0+1 →2+1 transition was taken from experiment [72].CHFB+LQRPA calculations give a value of288 e2fm4 for the excitation strength of the nextexcitation step to the 4+1 state [147]. The ex-citation to a possible 3− state at an energy of2858 keV was assumed to occur with a strengthof about 5 W.u.. Additional excitation to adistorted rotational band built on the excited0+2 state in 32Mg was taken into account withB(E2, 0+1 → 2+2 ) = 45 e2fm4, i.e. an order ofmagnitude less than the excitation of the de-formed first 2+1 state. For the calculation ofthe Coulomb-excitation cross sections of 33Mgthe calculated excitation strengths given in Ta-ble 7.1 were used in combination with the ex-perimentally deduced level scheme presented inRef. [149]. Due to the deduced branching of theγ-ray decay of the 7/2− state, both decay tran-sitions to the 3/2− and 5/2− state, respectively,need to be observed.
The estimated count rates for Coulomb-excitation experiments, employing radioactive32,33Mg beams at HIE-ISOLDE, are summarizedin Table 7.2.

Part II
Investigating thesubshell closure at N=32
Lifetime measurementsin the neutron-rich isotope 56Cr
with the Cologne plunger
83


8.1. EVOLUTION OF A NEUTRON SHELL GAP AT N = 32,34 85
Chapter 8
Motivation and physics case
8.1 Evolution of a neutron shellgap at N=32,34
A large number of recent experimental stud-ies evinced changes in the shell structure forneutron-rich nuclei along the N = 8, 20, 28,and 40 isotonic sequences. These changes canbe explained in terms of the monopole part ofthe nucleon-nucleon (NN) residual interaction.Schematically this is due to the (σσ)(ττ) partof the NN interaction, which is strongest in theS = 0 (spin-flip), ∆L = 0 (spin-orbit partners)and T = 0 (proton-neutron) channel of thetwo-body interaction (cf. Sec. 1.3). Monopoleshifts of neutron single-particle orbits are causedby the missing S = 0 proton partners at largeneutron excess, and new shell gaps are gener-ated. For the sd shell this was first discussedby [5, 6] and for the p f shell by [6, 152, 153].Moreover, for heavier nuclei and increasing spin-orbit splitting near stability the tensor part ofthe NN interaction creates likewise a strongmonopole interaction between S = 0, ∆L = 1and T = 0 orbits of adjacent harmonic oscillatorshells [34,154,155].
In the p f shell above the doubly magic 48Caevolution of shell-model characteristics is drivenby the strong, attractive monopole part of theNN interaction between the proton π1 f7/2 or-bital and the neutron ν1 f5/2 orbital. For Niisotopes the π1 f7/2 is filled completely. Thus,the ν1 f5/2 orbital is lowered between the νp3/2and νp1/2 orbits, opening the classical N = 40shell gap between the ν1p1/2 and ν1g9/2 or-bitals for Ni isotopes. Calculations show thatwhen removing protons from the π1 f7/2 orbitalthe residual interaction is weakened due to themissing S = 0 partner protons and the ν1 f5/2
orbital is rapidly shifted to higher energies, rel-ative to the ν1p1/2 and ν1p3/2 single-particlestates. In the Ca isotopes the proton π f7/2 or-bit is empty. Between the N = 29 isotones 49Caand 57Ni this shift in energy amounts to almost3 MeV [156]. Thus, the N = 40 shell gap closesand new sub-shell gaps are predicted at neu-tron numbers N = 32,34 between the νp3/2 andνp1/2 and the νp1/2 and ν f5/2 orbits [157] forthe neutron-rich Ca, Ti and Cr isotopes, as illus-trated in Figure 8.1. Moreover, the N = 32 shellgap results from the large spin-orbit splitting be-tween the ν1p1/2 and ν1p3/2 orbitals [158].
Effective interactions such as KB3G [159]and GXPF1 [160] with empirically tunedmonopoles mimic this NN interaction, which apriori is not well accounted for in G-matrix-based realistic two-body matrix elements. Thefull p f shell-model calculation using the effec-
28 32 360
1
2
3
4
5
6
ES
PE
(j)
- E
SP
E(p
3/2
) [
MeV
]
28 32 36
Neutron number N28 32 36
KB3GGXPF1GXPF1A
Ca Ti Cr
f5/2
f5/2
p1/2
p1/2
Figure 8.1: Effective single-particle energies (ESPE)of the neutron p1/2 (black) and f5/2 (gray) orbitalsrelative to the energy of the p3/2 orbital as a functionof N for even-even Ca, Ti, and Cr isotopes, calculatedby the three effective interactions KB3G, GXPF1, andGXPF1A. See text for definition of the acronyms. Thefigure was adapted from Ref. [158].

86 CHAPTER 8. MOTIVATION AND PHYSICS CASE
0
1
2
3
4
5
exp. data
KB3G
KB3G*
GXPF1
GXPF1A
Kaneko
CO2
0
4
8
12
16
20
0
1
2
Ex(2
+)
[MeV
]
0
5
10
15
20
B(E
2, 2
+→
0+)
[W
.u.]
20 24 28 32 36
Neutron number N
0
1
2
20 24 28 32 36
Neutron number N
0
8
16
24
32
Ca Ca
Ti Ti
Cr Cr
Figure 8.2: Comparison between recent shell-model calculations and experimental results in even-even Ca-, Ti-and Cr isotopes for E(2+
1 ) energies and B(E2, 2+→0+) values for neutron numbers between N = 20 and N = 38.See text for definition of the acronyms.
tive interaction GXPF1 shows a sub-shell gap atN = 34 for Cr and Ti isotopes. The newer in-teraction, GXPF1A [158], predicts a less pro-nounced N = 34 gap and reproduces well theknown 2+ excitation energies. To complete thelist of interactions in this model space we refer asCO2 to a Vlow-k interaction with the emphasis ona good description of nuclei beyond 48Ca [161],which predicts an even larger, N = 34, gap. Re-cently, a new interaction, called LNPS, has beendeveloped to study Cr and Fe isotopes aroundN = 40 [162]. It predicts a new “island ofinversion” with strong quadrupole correlationsin Cr and Fe for N ≥ 38. Similar conclusionswere drawn from shell-model results for Cr iso-topes employing a pairing-plus-multipole inter-action [163]. Therefore the Cr isotopes with
N ≥ 28 are a good testing ground to study therapid shape evolution from a near-spherical tothe well deformed region close to N = 40.
8.2 The neutron-rich Ca, Ti, andCr isotopes
Intensive efforts were undertaken to verify thetheoretical findings and predictions for the lightrare neutron-rich isotopes in the p f shell. Whilethere is no spectroscopic information availableon 54Ca, the less neutron rich N = 34 isotoneshave been explored to probe the subshell clo-sure at N = 34. The monopole driven evolutionof shell-model characteristics concurs for theneutron-rich chromium nuclei halfway between

8.2. THE NEUTRON-RICH CA, TI, AND CR ISOTOPES 87
the Ca and Ni isotopes. The status of the variouspredictions for E(2+1 ) and B(E2, 2+ → 0+) vs.experiment is summarized in Figure 8.2 for theCa, Ti and Cr isotopic chains.
In the Ca isotopes beyond N = 28 an in-creased neutron gap at N = 32 can be de-duced from the E(2+1 ) energy. However, con-clusions on an N = 34 sub-shell are basedon extrapolations [164, 165]. Detailed inves-tigations of neutron-rich even-even Ti and Crisotopes were performed recently with varioustechniques, e.g. β-decay studies [166, 167],fusion evaporation reactions [168], Coulombexcitation [169, 170], or deep inelastic reac-tions [166, 171]. The sub-shell closure at neu-tron number N = 32 for 54Ti and 56Cr was foundto be apparent in both nuclei from the maximumin E(2+1 ) at N = 32.
A crucial test for a sub-shell closure is pro-vided by the B(E2, 2+ → 0+) values whichare less affected than E(2+) by pairing in theground state. Therefore Coulomb-excitationexperiments with secondary beams after frag-mentation reactions were performed for theN = 32,34 nuclei in the Ti and Cr isotopes. Thechain of 52,54,56Ti nuclei was studied by Dincaet al. with intermediate-energy Coulomb excita-tion at MSU and established a minimum in theB(E2, 2+ → 0+) value for 54Ti [169]. The firstexcited 2+ states in 54,56,58Cr were populated byCoulomb excitation at relativistic energies andγ rays were measured using the RISING setupat GSI [170] (see Fig. 8.3). For 56Cr and 58Crthe B(E2, 2+ → 0+) values were determined as8.7(3.0) W.u. and 14.8(4.2) W.u., respectively.These results are consistent with an enhancedenergy of the first 2+1 state and a local reductionof the collectivity at N = 32 in the Ca, Ti and Crisotopes. The sub-shell gap is most pronouncedfor 52Ca and decreased 2+ energies are found in54Ti and 56Cr. For the heavier isotones 58Fe and60Ni neither the 2+ energies nor the B(E2) val-ues indicate a N = 32 sub-p f -shell gap in agree-ment with theoretical predictions.
The different shell-model approaches are inline with the trend in the E(2+1 ) excitation en-ergies. But surprisingly the staggering of theB(E2, 2+ → 0+) values with a local minimumalong the isotope chains at N = 32 is not re-produced, as shown in Figure 8.2. The theoret-
Figure 8.3: Doppler-corrected coincidence γ-rayspectra for 54,56,58Cr obtained in a Coulomb-excitation experiment at relativistic energies per-formed by Bürger and collaborators at GSI. The fig-ure was taken from the original work in Ref. [170].
ical B(E2) values for the Ti and Cr isotopes arevirtually unchanged and follow a more or lessconstant trend from N = 30 to 34. The exper-imental B(E2) value of 56Cr lies clearly belowthe shell-model predictions by about two stan-dard deviations. The uncertainty of the value,however, does not allow to establish the discrep-ancy in absolute value and staggering trend withan accuracy similar to the observation in Ti iso-topes.
To resolve the puzzling discrepancies be-tween the measured and calculated B(E2) val-ues at N = 32 two different theoretical ap-proaches suggested the following solutions. Firstof all shell-model calculations with the GXPF1and KBG3 interaction were performed witheffective charges that include a polarizationisovector charge [172], referred to as KB3G*in Figure 8.2. The resulting larger neutron ef-fective charge enhances the contribution of the
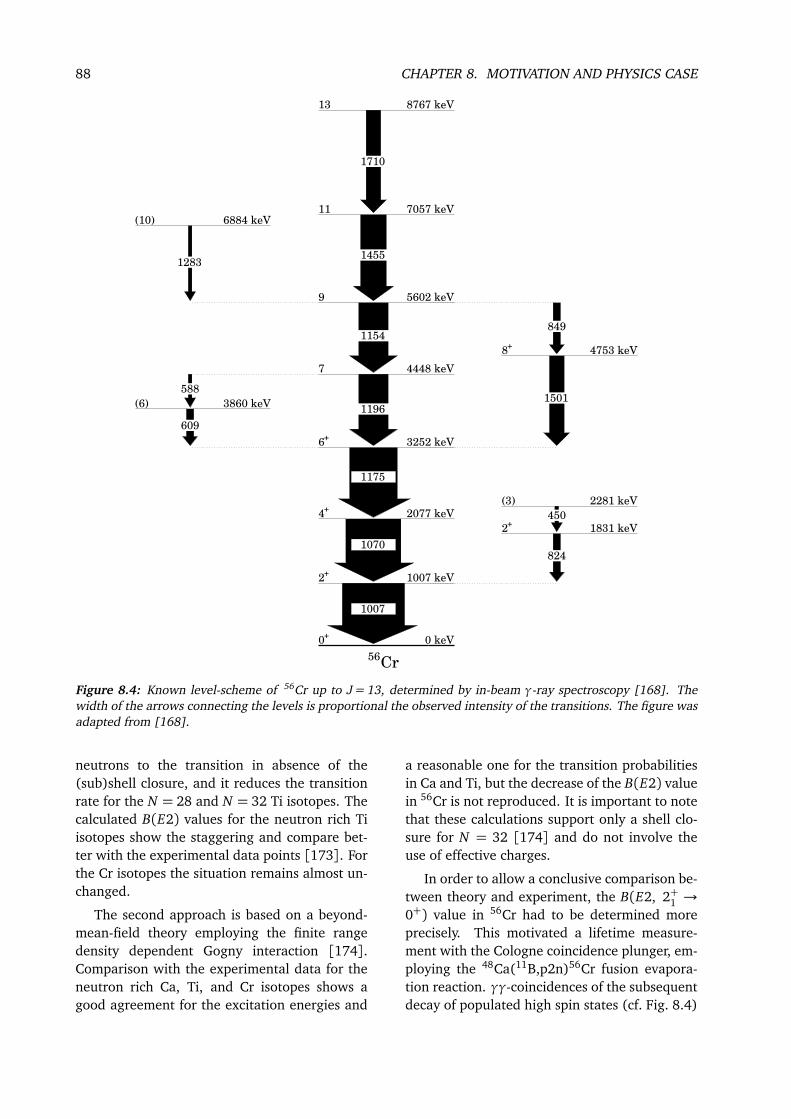
88 CHAPTER 8. MOTIVATION AND PHYSICS CASE
1007
1070
1175
824
450
1501
8491154
1196
1455
1710
1283
588
609
0 keV
1007 keV
2077 keV
1831 keV
2281 keV
3252 keV
4448 keV
5602 keV
4753 keV
3860 keV
6884 keV7057 keV
8767 keV
0
2
4
6
7
9
8
2
(3)
(10)
(6)
11
13
+
+
+
+
+
+
56Cr
Figure 8.4: Known level-scheme of 56Cr up to J = 13, determined by in-beam γ-ray spectroscopy [168]. Thewidth of the arrows connecting the levels is proportional the observed intensity of the transitions. The figure wasadapted from [168].
neutrons to the transition in absence of the(sub)shell closure, and it reduces the transitionrate for the N = 28 and N = 32 Ti isotopes. Thecalculated B(E2) values for the neutron rich Tiisotopes show the staggering and compare bet-ter with the experimental data points [173]. Forthe Cr isotopes the situation remains almost un-changed.
The second approach is based on a beyond-mean-field theory employing the finite rangedensity dependent Gogny interaction [174].Comparison with the experimental data for theneutron rich Ca, Ti, and Cr isotopes shows agood agreement for the excitation energies and
a reasonable one for the transition probabilitiesin Ca and Ti, but the decrease of the B(E2) valuein 56Cr is not reproduced. It is important to notethat these calculations support only a shell clo-sure for N = 32 [174] and do not involve theuse of effective charges.
In order to allow a conclusive comparison be-tween theory and experiment, the B(E2, 2+1 →0+) value in 56Cr had to be determined moreprecisely. This motivated a lifetime measure-ment with the Cologne coincidence plunger, em-ploying the 48Ca(11B,p2n)56Cr fusion evapora-tion reaction. γγ-coincidences of the subsequentdecay of populated high spin states (cf. Fig. 8.4)

8.2. THE NEUTRON-RICH CA, TI, AND CR ISOTOPES 89
are observed in this recoil distance Doppler-shift(RDDS) measurement and are analyzed by thedifferential decay curve method (DDCM). In thiswork, level lifetimes and transition probabilitiesof the first excited states of 56Cr will be pre-sented and compared to recent theoretical pre-dictions.

90 CHAPTER 8. MOTIVATION AND PHYSICS CASE

9.2. THE COLOGNE FN TANDEM VAN DE GRAAFF ACCELERATOR 91
Chapter 9
The experimental setup and technique
In order to allow a conclusive comparison be-tween the theory, presented in the last chapter,and experiment, the B(E2, 2+1 → 0+) value in56Cr was determined very precisely by a life-time measurement. The experiment was per-formed at the FN tandem accelerator of theUniversity of Cologne combining the Cologneplunger device with a setup of one EUROBALLCluster Ge-detector and 5 single Ge-detectors fora γγ-coincidence recoil distance measurement.Excited states in 56Cr were populated by the48Ca(11B,p2n)56Cr reaction using an 11B beamwith an energy of 32 MeV. An overview of thesetup used and the most important experimentaldetails will be given in the following sections.
9.1 Beam production
Preparation of intense (stable) heavy ion beamsstarts with the ionization of neutral atoms in anion source. In general there are two differenttypes of ion sources, either producing positivelyor negatively charged ions. Positively chargedions, even at high charge states, can be pro-duced by a large variety of ion sources, for ex-ample by plasma driven ion sources, such as aPenning ion gauge (PIG) or a vacuum arc ionsource (VARIS/MEVVA), and ion sources of theelectron cyclotron resonance (ECR) or electronbeam (EBIS/EBIT) type. To provide negativelycharged ions for an FN tandem accelerator, as inthe present experiment, a sputter ion source isthe most common and most versatile techniqueamong the RF charge exchange ion source.
The 11B beam used in this experiment wasprovided by the Cologne sputter ion source. Thesputter ion source uses cesium vapor from areservoir of cesium, heated up to approximately
90C. The neutral Cs-atoms are thermally ion-ized on a tantalum ionizer, heated up to about1000C. Applying a voltage of some kV the pos-itively charged Cs+ ions are accelerated towardsthe sputtering target serving as cathode. In theexperiment presented in this work, the cathodewas made of boron. The cathode is cooled,hence it is covered by a thin layer of condensedCs-atoms. The accelerated Cs-ions bombard thecathode, sputtering atoms from the cathode. Bypassing through the thin cesium coating on thecathode’s surface some of the sputtered atomsgain an electron. These negatively charged ionscan be extracted out of the ion source and ac-celerated towards the FN tandem accelerator byapplying a voltage of some 10 kV.
9.2 The Cologne FN tandem Vande Graaff accelerator
The negatively charged ion beam provided bythe sputter ion source is accelerated to its finalbeam energy by the Cologne FN tandem Van deGraaff accelerator. It is an electrostatic linear ac-celerator operating since 1968. The basic prin-ciple of the accelerator is quite simple. A cen-tral metal electrode, the so-called “terminal”, ischarged to a high positive potential U of up toalmost 11 MV. Originally the charging was doneusing a rubber belt, which was replaced in 2004by a modern, inductive pelletron chain system.To isolate the highly charged electrodes of theaccelerator and to prevent sparking, the FN tan-dem accelerator is housed in a large steel vessel,13 m long and 3.66 m in diameter, which is filledwith an insulating gas mixture of 20% SF6 and80% N2 at about 12 bar (see Figure 9.1). Neg-

92 CHAPTER 9. THE EXPERIMENTAL SETUP AND TECHNIQUE
Figure 9.1: The Cologne FN tandem Van de Graaff accelerator, which accelerated the 11B beam up to an energy of32 MeV for the lifetime measurement of 56Cr. The large yellow pressure tank houses the electrostatic acceleratingstructures.
atively charged ions of charge state 1− are ac-celerated inside an evacuated beamline towardsthe terminal, gaining kinetic energy E1 = eU . In-side the terminal the ion beam passes through athin carbon foil (“stripper foil”) with a thicknessof typically some µg/cm2, which strips electronsfrom the ions, leaving it positively charged withcharge state q+. The stripping efficiency typi-cally exceeds 90%. The positively charged ionbeam is accelerated away from the high positivepotential at the terminal, gaining the kinetic en-ergy E2 = qU . Thus, the final energy of the ionbeam is Ebeam = (q+1)U . Due to the populationof different charge states by the stripping pro-cess, ions with different kinetic energy exit theaccelerator. Therefore the ions are bent by a 90
analyzing magnet, to select a charge state, andthus, to specify the beam energy.
In the experiment presented in this work, a56Cr beam was accelerated to a final beam en-ergy of 32 MeV, giving the maximum amount ofabout 2.6% for the 48Ca(11B,p2n)56Cr reactionrelative to the 1020 mb total reaction cross sec-tion (calculated using PACE [175]). The chargestate used was 4+, giving rise to an average 11Bbeam intensity of about 2.5 pnA, which was pro-vided for the plunger experiment.
9.3 The Cologne plunger setup
The accelerated 11B beam was directed to theplunger setup, located at the beamline “R15”.The Cologne plunger setup was designed toallow sensitive γγ-coincidence recoil distancemeasurements even of weakly populated re-action channels. It combined the advancedCologne plunger device with a set of large vol-ume HPGe detectors in close geometry locatedaround the target chamber. A schematic layoutof the setup is shown in Figure 9.2.
9.3.1 The Cologne plunger device
The Cologne plunger apparatus was specially de-signed to allow for RDDS lifetime measurementsof highest precision in the picosecond range.
The principal components of a plunger arethe target and stopper foils and the electroniccontrol system for precise adjustment of the dis-tance between target and stopper. To ensurea well-defined target-to-stopper distance, bothfoils have to be planar and parallel. Thereforethe foils are carefully stretched on conical targetholders, which can be positioned by three mi-crometer screws. A picture of both foils mounted

9.3. THE COLOGNE PLUNGER SETUP 93
θ
foil foil
Au197
11B
Ca
209
target
beam
5 HPGe−detectors
stopper
stopper
plunger
target chamber
Bi
48
beam
Ge−detectorCluster
EUROBALL
Figure 9.2: Schematic layout of the experimen-tal setup (not to scale). The Cologne coincidenceplunger device was located between five single Ge-detectors located at backward positions and anEUROBALL cluster detector at 0o forward position.
on their holders inside the plunger device isshown in Fig. 9.3. The distance between thefoils is varied by a piezoelectric linear motor, theso-called inchworm. Using the inchworm motor,the distance between the foils can be roughly ad-justed up to 10 mm with a global accuracy of0.5 µm. For fine-tuning an additional piezoelec-tric crystal is mounted between the inchwormmotor and the target holder, which is capable toregulate small changes in the target-to-stopperdistance up to 30 µm. The relative distance be-tween target and stopper foil is measured by twodifferent systems. An optical metering system iscoupled to the inchworm motor. To account forany changes in the distance, e.g. caused by theadditional piezoelectric crystal, an independentinductive measuring system has been installed,a so-called TESA sensor.
Due to energy deposition in the target foils bythe beam, the assembly of the plunger is subjectto thermal expansion. Thus, the plunger appa-ratus used was equipped with a feedback systemfor compensation of slow changes in the target-to-stopper distance [176]. The isolated targetand stopper foils form a parallel plate capacitor.Applying a well-defined electrical signal, the dis-tance between the foils can be monitored contin-uously by means of the measured capacitance.If the capacitance, i.e. the target-to-stopper dis-tance, exceeds a specified threshold, this is com-pensated automatically by the piezoelectric crys-tal. Thus, the accuracy of the relative distances
target foil stopper foil
Figure 9.3: Picture of the centerpiece of the plungerdevice, opened for maintenance, showing the targetand stopper foils mounted on their conical holders.
were measured to be better than 2-3% in the rel-evant range of the target and stopper foils, e.g.0.04 µm at a distance of 1.51 µm.
In the present experiment data were taken at12 different target-to-stopper distances rangingfrom 0.5 µm to 80 µm. The target consisted of a0.5 mg/cm2 thick layer of enriched 48Ca whichis sandwiched by two gold foils of 2.0 mg/cm2
and 40 µg/cm2 thickness, respectively. The re-coiling nuclei left the target with approximately1% of the speed of light and were stopped ina 2.15 mg/cm2 Au foil. The 11B beam passingboth foils was stopped in a 1-2 mm thick 209Bisheet.
9.3.2 γ-ray detector setup
The γ rays emitted by the fusion evaporationproducts were measured with one EUROBALLCluster Ge-detector [177], containing 7 encap-sulated HPGe crystals, which was positioned ata close distance of 8.5 cm between target andfront side of the central Ge detector. This closedistance was chosen to improve the efficiency.The original design distance between target andfront side of central Ge detector for EUROBALLcluster detectors was 44.5 cm. Thus, the sixcrystals surrounding the central detector did notpoint towards the target exactly and determina-tion of the mean γ-ray detection angle is not triv-ial. In this experiment the seven Ge capsules in-side the EUROBALL Cluster detectors were usedas seven individual detectors, arranged in for-ward angles of 0 and 27.4, respectively. In

94 CHAPTER 9. THE EXPERIMENTAL SETUP AND TECHNIQUE
Figure 9.4: Picture of the Cologne plunger device,surrounded by five single Ge-detectors at backwardangle and one EUROBALL cluster positioned at 0o
for γ-ray detection. To reduce background contribu-tions in the X-ray region the detectors were shieldedby Cu, Cd, and Pb sheets. During experiment theEUROBALL cluster is positioned as close as possibleto the plunger device (distance < 5 mm).
addition, 5 single Ge-detectors were arrangedin one ring at backward angle with a centralangle at 142.5 with respect to the beam axis.To reduce background contributions in the X-ray region and to suppress summing the ClusterGe-detectors were shielded by copper and leadsheets of 1 mm thickness each. The backwardGe detectors were equipped individually with asmall stack of 1 mm copper and 0.5 mm cad-mium shielding. The total γ-ray efficiency ofthe setup was determined to be about 1.8% at1.3 MeV (cf. Section 10.2.2).
During the experiment presented in this workdata were recorded in γγ-coincidence mode andwritten to disc in listmode format.
9.4 Lifetime measurements witha plunger
To measure lifetimes of excited nuclear states inthe range of about 1 ps up to several hundredpicoseconds, the plunger technique is a power-ful tool. Its basic principle is the applicationof two separate foils at variable distance, em-ploying the recoil distance Doppler-shift (RDDS)method. Performing γγ-coincidence measure-ments with a plunger device, the differential de-cay curve method (DDCM) [178, 179] has be-
come the well-established analysis technique toextract the lifetime of a nuclear state out ofthe RDDS data. Both techniques were used inthe present experiment and will be explained inmore detail in the following sections.
9.4.1 The recoil distance Doppler-shiftmethod
As already stated above a plunger employs therecoil distance Doppler-shift (RDDS) method. Inprinciple a plunger is made up of two foils – atarget foil and a stopper foil – mounted parallelto each other. The distance d between both foilscan be varied precisely in the micrometer to mil-limeter range. In the target foil highly excitednuclei are produced by fusion-evaporation reac-tions. Due to the momentum transfer, the nucleirecoil out of the thin target foil towards the sec-ond foil (“stopper”), where they are stopped af-ter the flight path d. Recoiling nuclei may emitde-excitation γ rays either in flight in the vac-uum between both foils or at rest after implan-tation in the stopper foil. If de-excitation occursin flight, the emitted γ ray will be detected witha certain Doppler shift, depending on the veloc-ity β of the recoiling nucleus and the detectionangle θγ:
E′γ =
p
(1− β2)1− β cosθγ
Eγ,0 ,
where Eγ,0 is the γ-ray energy emitted in rest.Therefore in the γ-ray spectrum a Doppler-shifted component of the original transition canbe observed at E′γ additionally to the original γ-ray energy Eγ,0 (see Figure 9.5).
Normally the line width of the Doppler-shifted component is clearly broadened com-pared to the general detector resolution of thetransition with Eγ. This is mainly caused by therelatively large opening angles of the HPGe de-tectors mounted in close geometry and the dis-tribution of the recoil velocities around a meanvalue ⟨v⟩. This distribution can be explained bydifferent energy loss in the target, dependingwhether the reaction takes place at the begin-ning of the target or at the end. For the presentexperiment the recoil velocity of 56Cr was calcu-lated to be ⟨v⟩ ≈ 0.011± 0.003 c using the LISE

9.4. LIFETIME MEASUREMENTS WITH A PLUNGER 95
θ2
θv
foilstopper
θ
1
2
1
−detector
foiltarget
d
γ γ
γ E’γ
γ
γ
,0E
θ1E’ ( )
beam
−detectorγ
cou
nts
Energy
v = 02
Figure 9.5: Schematic drawing of the RDDS method.Excited nuclei produced in the target recoil out of thetarget foil. De-excitation may occur in flight or at restin the stopper foil. Depending on the detection an-gle, an additional, Doppler-shifted component of thetransition can be observed in the spectrum at loweror higher energies.
code [180, 181]. Experimental verification willbe given in Section 10.5.
The ratio of the shifted and unshifted compo-nent depends on the distance between the twofoils, which is directly correlated to the time offlight of the nucleus between the foils, and thelifetime of the nuclear state. Thus, it is possi-ble to extract the lifetime of an excited nuclearlevel by a detailed analysis of the evolution ofthe intensities of both components with varyingdistance d. A well-established tool for the anal-ysis of those data is the differential decay curvemethod (cf. Section 9.4.2).
For lifetimes in the order of 1 ps or even lessthe effect of the Doppler-shift attenuation occur-ring during slowing down in the stopper has tobe taken into account carefully. This effect is dis-cussed in [182] in detail. It turns out that forτ > 3 ps Doppler-shift attenuation effects can besafely neglected.
9.4.2 γγ-coincidences and the differen-tial decay curve method
The Cologne plunger apparatus is especially ad-vantageous for γγ-coincidence recoil distancemeasurements in combination with the differ-ential decay curve method (DDCM) [178, 179]which was employed for the data analysis. In
the following paragraphs a brief summary ofthe method and its necessary equations will begiven. Further details are given in the publica-tions of Dewald et al. and Böhm et al., whichwere quoted above.
In general the lifetime τ of an excited nu-clear state can be deduced from the decay func-tion. However, the decay function of a state de-pends on the time characteristics and intensitiesof all feeding transitions. Figure 9.6 shows aschematic drawing of a decay scheme with i thelevel of interest. Its lifetime is τi and it is depop-ulated by the transition A to a state j. Higher-lying states f are feeding into level i, where di-rectly feeding transitions are labeled with B, andindirectly feeding transitions are labeled with C.The time derivative of the population ni(t) ofthe level i is given by
d
d tni(t) = −λini(t) +
∑
f
b f iλ f n f (t) ,
where λi, f is the decay constant and b f i thebranching ratio of the transition f → i. Aftera certain time t the number of decays N f i(t)(Ni j(t)), which can be observed as feeding (de-populating) transitions of the level i, are givenby the integrals
N f i(t) =
∫ ∞
t
λ f n f (t′)d t ′
Ni j(t) =
∫ ∞
t
λini(t′)d t ′ .
A
B
iτ
j
fC
i
Figure 9.6: Schematic decay scheme with i the levelof interest. More information is given in the text.

96 CHAPTER 9. THE EXPERIMENTAL SETUP AND TECHNIQUE
Thus, introducing the branching ratio bi j of thedepopulating transition i→ j, the lifetime of thelevel of interest can be determined by the fol-lowing equation:
τi(t) =−Ni j(t) + bi j
∑
f b f iN f i(t)dd t
Ni j(t).
The quantities N f i(t) and Ni j(t) are propor-tional to the intensities of the non-Doppler-shifted γ-ray transitions feeding and depopulat-ing the state i after implantation in the stopperfoil. These numbers can be deduced from theRDDS data for each measured target-to-stopperdistance d, i.e. for each flight time t = d/v.For a measurement in singles mode the propor-tionality constant depends on the detection ef-ficiency and angular distribution effects of thedetector at its position. The calculation of thetime derivative of Ni j(t) is achieved by fittinga continuous sequence of second or third orderpolynomials to the data points and differentiat-ing the fit function. Since the lifetimes τ arecalculated for every flight time t one obtains afunction τ(t) or τ(d) i.e., the so-called τ curvewhich is expected to be a constant. Deviationsfrom a constant behavior indicate the presenceof systematic errors.
The most important disadvantage in theDDCM analysis of RDDS data taken in singlesmode, is the imperative to measure the intensi-ties of all directly feeding transitions very pre-cisely. It may happen that weak feeding tran-sitions are superimposed by stronger transitionsor can not be detected at all, yielding an incor-rect lifetime value.
These inaccurate feeding issues (e.g. the un-observed “sidefeeding”) can be improved consid-erably by a γγ-coincidence measurement. In thefollowing we will use the notation X , Y for asequence of coincident transitions X and Y :
X , Y ≡ fX−→ i
Y−→ j
In RDDS measurements usually Doppler-shiftedand unshifted components of a γ-ray transitionare observed. The different components will beindicated by the subscripts S and U, respectively.Thus, a cascade of two coinciding RDDS eventscan be decomposed by
X , Y =
XS , YS
+
XS , YU
+
XU , YU
.
The case
XU , YS
is not possible, because a nu-cleus which is at rest for the emission of X cannot emit the subsequent γ ray Y in flight.
Using this nomenclature for γγ-coincidencesand the definitions given in Figure 9.6 the equa-tion for the lifetime τ, which was already de-rived for a measurement using singles dataabove, can be rewritten as
τi(t) =
CS , AU
(t)−α
CS , BU
(t)dd t
CS , AS
(t),
where α includes the branching ratio of a se-quence of a directly feeding transition B anda directly depopulating transition A, indepen-dently from the time of flight t:
α =C , AC , B
=
CS , A
CS , B =
CS , AU
+
CS , AS
CS , BU
+
CS , BS
Thus, applying the coincidence condition on adirectly feeding transition B and applying a gateon its Doppler-shifted component, the lifetimeτi of the state of interest can be calculated, using
τi(t) =
BS , AU
(t)dd t
BS , AS
(t)=
IU(t)dd t
IS(t),
with IS and IU the measured intensities of thecoincident depopulating transition A and itsshifted and unshifted components, respectively.
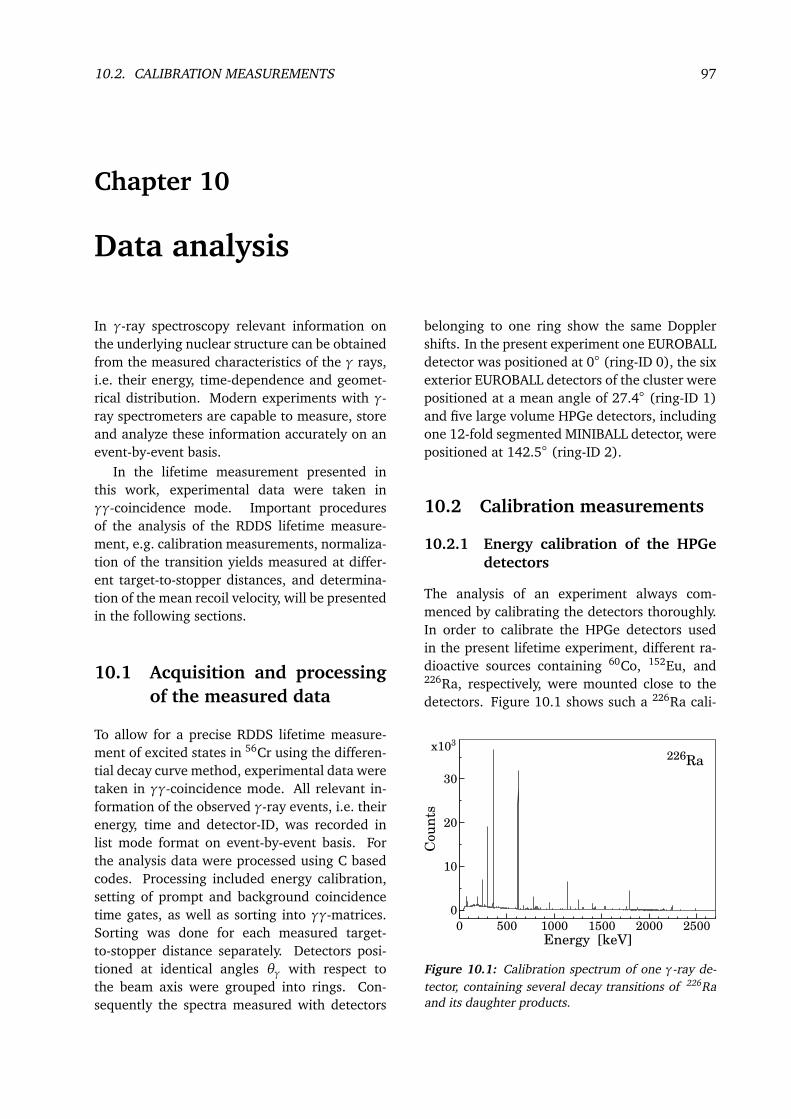
10.2. CALIBRATION MEASUREMENTS 97
Chapter 10
Data analysis
In γ-ray spectroscopy relevant information onthe underlying nuclear structure can be obtainedfrom the measured characteristics of the γ rays,i.e. their energy, time-dependence and geomet-rical distribution. Modern experiments with γ-ray spectrometers are capable to measure, storeand analyze these information accurately on anevent-by-event basis.
In the lifetime measurement presented inthis work, experimental data were taken inγγ-coincidence mode. Important proceduresof the analysis of the RDDS lifetime measure-ment, e.g. calibration measurements, normaliza-tion of the transition yields measured at differ-ent target-to-stopper distances, and determina-tion of the mean recoil velocity, will be presentedin the following sections.
10.1 Acquisition and processingof the measured data
To allow for a precise RDDS lifetime measure-ment of excited states in 56Cr using the differen-tial decay curve method, experimental data weretaken in γγ-coincidence mode. All relevant in-formation of the observed γ-ray events, i.e. theirenergy, time and detector-ID, was recorded inlist mode format on event-by-event basis. Forthe analysis data were processed using C basedcodes. Processing included energy calibration,setting of prompt and background coincidencetime gates, as well as sorting into γγ-matrices.Sorting was done for each measured target-to-stopper distance separately. Detectors posi-tioned at identical angles θγ with respect tothe beam axis were grouped into rings. Con-sequently the spectra measured with detectors
belonging to one ring show the same Dopplershifts. In the present experiment one EUROBALLdetector was positioned at 0 (ring-ID 0), the sixexterior EUROBALL detectors of the cluster werepositioned at a mean angle of 27.4 (ring-ID 1)and five large volume HPGe detectors, includingone 12-fold segmented MINIBALL detector, werepositioned at 142.5 (ring-ID 2).
10.2 Calibration measurements
10.2.1 Energy calibration of the HPGedetectors
The analysis of an experiment always com-menced by calibrating the detectors thoroughly.In order to calibrate the HPGe detectors usedin the present lifetime experiment, different ra-dioactive sources containing 60Co, 152Eu, and226Ra, respectively, were mounted close to thedetectors. Figure 10.1 shows such a 226Ra cali-
0 500 1000 1500 2000 2500Energy [keV]
0
10
20
30
Cou
nts
x103
226Ra
Figure 10.1: Calibration spectrum of one γ-ray de-tector, containing several decay transitions of 226Raand its daughter products.

98 CHAPTER 10. DATA ANALYSIS
2000
4000
6000
Cou
nts
260 280 300 320 340 360 380Energy [keV]
1000
2000
3000
4000
Cou
nts
t = 3 h
t = 0 h
ge2
Figure 10.2: Low-energy part of the spectrum with adominant Coulomb-excitation transition of 197Au at279 keV in the beginning of the experiment (lowerpart) and after 3 hours of beam time (upper part) forone EUROBALL detector. Due to instabilities in theanalog amplifier electronics the gain of this particulardetector was shifted by almost 3%.
bration spectrum for one of the EUROBALL de-tectors.
During the experiment, the gain of some am-plifiers showed a long-term shift due to insta-bilities in the analog amplifier electronics of thedetectors (cf. Fig. 10.2). A first-order approx-imation of these shifts yielded a linear func-tion, fitted to the relative positions of two time-independent γ-ray transitions in the spectrum.The transitions must have a stopped compo-nent only, e.g. from Coulomb excitation, ra-dioactive decay, nuclear isomerism, etc. Inthe present case the 191.44 keV transition, de-exciting a well-known Coulomb-excited 3/2+2state in 197Au, and the 1460.82 keV transition ofthe 40K decay from background radiation wereused to fit the linear polynomial for each detec-tor in each experimental run.
10.2.2 Efficiency calibration of theHPGe detectors
To determine the absolute detection efficiencyεabs of the germanium detectors, a 226Ra sourcewas mounted at target position on the supportframe of the stopper target. Its activity was
θγ εabs [%] comments0 0.20 EUROBALL detector
27.4 0.16
EUROBALL detectors
0.160.170.150.170.17
142.5 0.130.140.150.10 12-fold segmented
MINIBALL detector0.15
total 1.85
Table 10.1: Absolute detection efficiencies εabs of theindividual germanium detectors used in the setup forthe 1238 keV transition of the 226Ra decay.
98.7 kBq. The major γ-ray transition energiesand absolute γ-ray emission intensities of 226Raand its daughter products were taken from thework of Morel et al. [183]. Including dead timeinformation of the detectors, it was possible todetermine the absolute detection efficiency ofeach individual γ-ray detector used in the setup(cf. Table 10.1). Thus, the total γ-ray detectionefficiency of the detector setup is about 1.8% at1.3 MeV.
10.2.3 Time gate for γγ-coincidences
To select real γγ-coincidences and to suppressrandom background events a restrictive coin-cidence gate had to be applied. Therefore, aγγ time-difference spectrum was generated foreach of the 66 possible combinations of two Gedetectors. A prompt coincidence gate ∆tp wasapplied with a width of typically 40-60 ns, asshown in Figure 10.3 using the example of γγ-coincidences in a detector combination of oneEUROBALL detector (ge2) and one detector po-sitioned at backward angle (ge11). To accountfor random background coincidences two back-ground gates ∆tr were applied. The total widthof the background gates was identical to thewidth of the prompt coincidence gate.

10.4. YIELD NORMALIZATION 99
-200 -100 0 100 200
γγ time difference [ns]
10
100
1000
Cou
nts
∆tr
ge2 - ge11
∆tr
∆tp
Figure 10.3: Exemplary γγ time-difference spec-trum for a detector combination of one EUROBALLdetector (ge2) and one backward detector (ge11).A prompt coincidence gate ∆tp was applied with awidth of typically 40-60 ns. Random backgroundcoincidences were taken into account using back-ground gates ∆tr.
10.3 Distance calibration of theplunger foils
As mentioned in the last chapter, the mea-surement systems for the distance between theplunger foils, i.e. the optical system at the inch-worm motor and the TESA sensor, are limited torelative distance measurements. To gain an ab-solute value of the distance between target andstopper foil, a calibration measurement withoutbeam had to be performed. Therefore, the targetis placed at a series of different target-to-stopperdistances using the inchworm motor. For eachtarget-to-stopper distance the measured value ofthe TESA sensor is related to the voltage outputof the capacitive measuring system (cf. 9.3.1).During the calibration measurement the addi-tional piezoelectric crystal of the feedback sys-tem for compensation of slow changes in thetarget-to-stopper distance was deactivated.
Figure 10.4 shows the distance calibration ofthe plunger setup used. At a measured (rel-ative) distance of -1.51 µm the foils had con-tact, defining the zero point of the absolute dis-tance. A series of continuously differentiablepolynomials of third order were fitted to the datapoints. Thus, the voltage output continuouslymonitored during the experiment, could be con-verted into absolute target-to-stopper distances.Figure 10.5 shows the same data points as in
0 50 100 150 200 250 300Distance [µm]
0
1
2
3
4
5
6
7
Volt
age [V
]
Figure 10.4: Distance calibration measurement ofthe plunger setup used. The voltage output of thecapacitive measuring system is plotted as a functionof the relative distance measured by the TESA sensor.More information is given in the text.
0.25 0.50 0.75 1.00 1.25 1.501/Voltage [1/V]
0
50
100
150
200
250
300D
ista
nce
[µ
m]
0.2 0.3 0.4
0
10
20
30
Figure 10.5: Same as in Fig. 10.4, but with the dis-tance values of the TESA sensor plotted as a functionof the reciprocal voltage output. For distances below10 µm the fit is almost linear, just as for a parallelplate condenser.
Fig. 10.4, but with the distance values of theTESA sensor plotted as a function of the recip-rocal voltage output. For distances below 10 µmthe fit is almost linear. Thus, to first order thesetup of the two foils is well described by a par-allel plate condenser. Small deviations were dueto minor unevenness of the target and stopperfoils.
10.4 Yield normalization
In general the lifetime of an excited nuclearstate is determined by a measurement of its de-cay function. In an RDDS measurement all in-
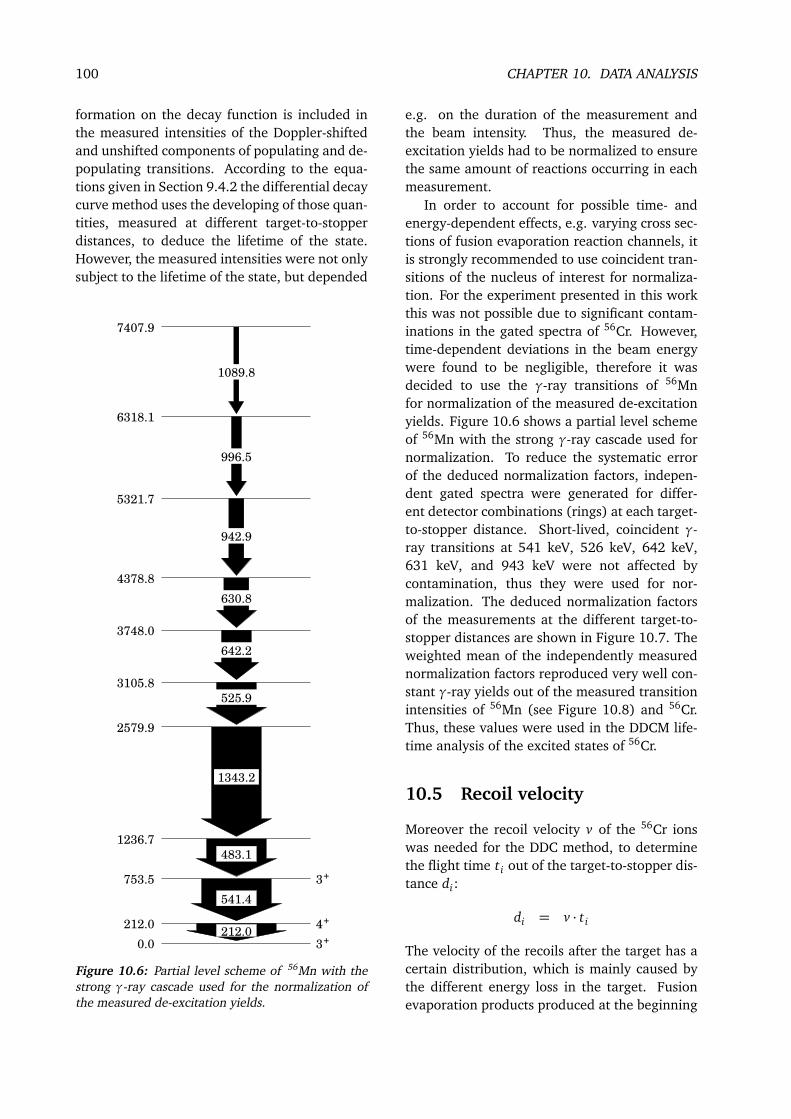
100 CHAPTER 10. DATA ANALYSIS
formation on the decay function is included inthe measured intensities of the Doppler-shiftedand unshifted components of populating and de-populating transitions. According to the equa-tions given in Section 9.4.2 the differential decaycurve method uses the developing of those quan-tities, measured at different target-to-stopperdistances, to deduce the lifetime of the state.However, the measured intensities were not onlysubject to the lifetime of the state, but depended
212.0
753.5
1236.7
2579.9
3105.8
3748.0
4378.8
5321.7
6318.1
7407.9
4
3
30.0
+
+
+
541.4
212.0
483.1
1343.2
525.9
642.2
630.8
942.9
996.5
1089.8
Figure 10.6: Partial level scheme of 56Mn with thestrong γ-ray cascade used for the normalization ofthe measured de-excitation yields.
e.g. on the duration of the measurement andthe beam intensity. Thus, the measured de-excitation yields had to be normalized to ensurethe same amount of reactions occurring in eachmeasurement.
In order to account for possible time- andenergy-dependent effects, e.g. varying cross sec-tions of fusion evaporation reaction channels, itis strongly recommended to use coincident tran-sitions of the nucleus of interest for normaliza-tion. For the experiment presented in this workthis was not possible due to significant contam-inations in the gated spectra of 56Cr. However,time-dependent deviations in the beam energywere found to be negligible, therefore it wasdecided to use the γ-ray transitions of 56Mnfor normalization of the measured de-excitationyields. Figure 10.6 shows a partial level schemeof 56Mn with the strong γ-ray cascade used fornormalization. To reduce the systematic errorof the deduced normalization factors, indepen-dent gated spectra were generated for differ-ent detector combinations (rings) at each target-to-stopper distance. Short-lived, coincident γ-ray transitions at 541 keV, 526 keV, 642 keV,631 keV, and 943 keV were not affected bycontamination, thus they were used for nor-malization. The deduced normalization factorsof the measurements at the different target-to-stopper distances are shown in Figure 10.7. Theweighted mean of the independently measurednormalization factors reproduced very well con-stant γ-ray yields out of the measured transitionintensities of 56Mn (see Figure 10.8) and 56Cr.Thus, these values were used in the DDCM life-time analysis of the excited states of 56Cr.
10.5 Recoil velocity
Moreover the recoil velocity v of the 56Cr ionswas needed for the DDC method, to determinethe flight time t i out of the target-to-stopper dis-tance di:
di = v · t i
The velocity of the recoils after the target has acertain distribution, which is mainly caused bythe different energy loss in the target. Fusionevaporation products produced at the beginning

10.5. RECOIL VELOCITY 101
1 10 100
Distance [µm]
1.0
1.5
2.0
2.5
3.0N
orm
. fa
ctor
Figure 10.7: Deduced normalization factors for each target-to-stopper distance and for different coincident γ-raytransitions in 56Mn (colored lines). Obviously the lines follow a very similar pattern. The black circles plus errorbars mark the weighted mean values of those independently measured normalization factors, which were furtherused in the analysis.
of the target loose more energy than those ionsproduced at the end of the target. The meanrecoil velocity was accurately determined via themeasured Doppler shift of the γ-ray transitionsemitted in flight at a certain detection angle θγ,using
v
c=
1
cosθγ
E(sh)γ
E(us)γ
− 1
!
,
where E(us)γ is the original transition energy and
E(sh)γ is the Doppler-shifted transition energy.
Due to the geometry of the setup used, the detec-tion angles of two detector groups were known.The central EUROBALL detector was positionedat 0, while all HPGe-detectors positioned at
backward angles yielded 142.5. The mean de-tection angle of the detector ring formed by thesix exterior EUROBALL detectors depended onthe distance between target chamber and clus-ter, thus it was not used in this part of the anal-ysis. The Doppler shift of the different tran-sitions was determined for various target-to-stopper distances by fitting the peak positionsof shifted and unshifted component. Table 10.2shows the mean values of the measured transi-tion energies and the resulting recoil velocity.Finally the experimental data yielded a valueof v/c = 1.006(9)% for the mean recoil veloc-ity of 56Cr ions after the target. This agreedvery well with the calculated recoil velocity ofv/c = 1.1(3) using the LISE code [180,181].
E(us)γ [keV] E(sh)
γ [keV] v/c [%]θγ = 0 1006.47(3) 1017.20(19) 1.066(19)
1069.42(14) 1079.52(12) 0.944(17)1175.53(40) 1185.85(67) 0.878(67)
mean 0.994(13)θγ = 142.5 1006.74(4) 998.95(9) 0.975(13)
1069.74(6) 1060.93(16) 1.038(20)1174.94(12) 1164.54(19) 1.116(24)
mean 1.022(14)total mean 1.006(9)
Table 10.2: Mean values of the measured Doppler-shifted and unshifted transition energies and the resultingrecoil velocity v/c of 56Cr for different detectors positioned at forward and backward angle.

102 CHAPTER 10. DATA ANALYSIS
5000
10000
15000
20000
Norm
. in
ten
sity
10000
20000
30000
40000
Norm
. in
ten
sity
1 10 100
Distance [µm]
10000
20000
30000
Norm
. in
ten
sity
Gate 541 keV
Gate 526 keV
Gate 642 keV
526 keV (1)
642 keV (1)
526 keV (2)
642 keV (2)
642 keV (1)
642 keV (2)
631 keV (1)
943 keV (1)
631 keV (2)
943 keV (2)
631 keV (1)
631 keV (2)
943 keV (1)
943 keV (2)
Figure 10.8: Normalized γ-ray intensities of coincident transitions in 56Mn. The detectors used for the cut-spectra and yield measurements are indicated by their ring-ID (in brackets). The dotted line is the average value.Thus, the weighted mean of the independently measured normalization factors reproduces very well constantγ-ray yields for all target-to-stopper distances. More information is given in the text.
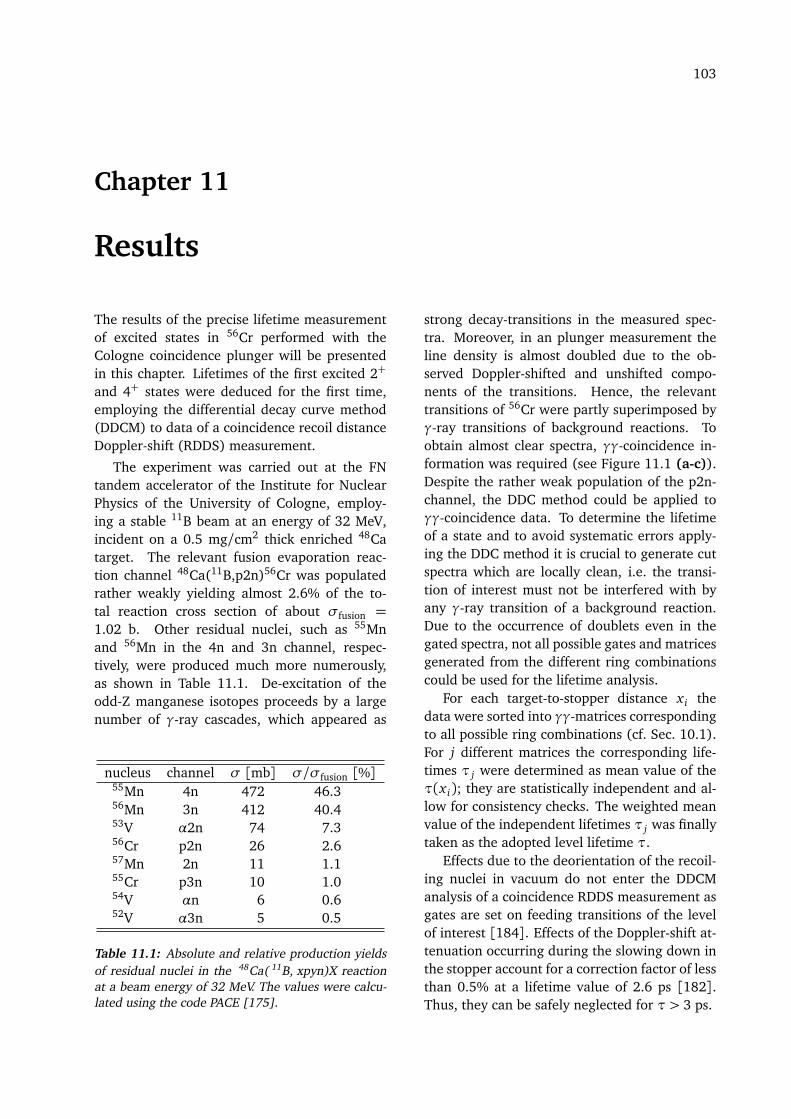
103
Chapter 11
Results
The results of the precise lifetime measurementof excited states in 56Cr performed with theCologne coincidence plunger will be presentedin this chapter. Lifetimes of the first excited 2+
and 4+ states were deduced for the first time,employing the differential decay curve method(DDCM) to data of a coincidence recoil distanceDoppler-shift (RDDS) measurement.
The experiment was carried out at the FNtandem accelerator of the Institute for NuclearPhysics of the University of Cologne, employ-ing a stable 11B beam at an energy of 32 MeV,incident on a 0.5 mg/cm2 thick enriched 48Catarget. The relevant fusion evaporation reac-tion channel 48Ca(11B,p2n)56Cr was populatedrather weakly yielding almost 2.6% of the to-tal reaction cross section of about σfusion =1.02 b. Other residual nuclei, such as 55Mnand 56Mn in the 4n and 3n channel, respec-tively, were produced much more numerously,as shown in Table 11.1. De-excitation of theodd-Z manganese isotopes proceeds by a largenumber of γ-ray cascades, which appeared as
nucleus channel σ [mb] σ/σfusion [%]55Mn 4n 472 46.356Mn 3n 412 40.453V α2n 74 7.356Cr p2n 26 2.657Mn 2n 11 1.155Cr p3n 10 1.054V αn 6 0.652V α3n 5 0.5
Table 11.1: Absolute and relative production yieldsof residual nuclei in the 48Ca( 11B, xpyn)X reactionat a beam energy of 32 MeV. The values were calcu-lated using the code PACE [175].
strong decay-transitions in the measured spec-tra. Moreover, in an plunger measurement theline density is almost doubled due to the ob-served Doppler-shifted and unshifted compo-nents of the transitions. Hence, the relevanttransitions of 56Cr were partly superimposed byγ-ray transitions of background reactions. Toobtain almost clear spectra, γγ-coincidence in-formation was required (see Figure 11.1 (a-c)).Despite the rather weak population of the p2n-channel, the DDC method could be applied toγγ-coincidence data. To determine the lifetimeof a state and to avoid systematic errors apply-ing the DDC method it is crucial to generate cutspectra which are locally clean, i.e. the transi-tion of interest must not be interfered with byany γ-ray transition of a background reaction.Due to the occurrence of doublets even in thegated spectra, not all possible gates and matricesgenerated from the different ring combinationscould be used for the lifetime analysis.
For each target-to-stopper distance x i thedata were sorted into γγ-matrices correspondingto all possible ring combinations (cf. Sec. 10.1).For j different matrices the corresponding life-times τ j were determined as mean value of theτ(x i); they are statistically independent and al-low for consistency checks. The weighted meanvalue of the independent lifetimes τ j was finallytaken as the adopted level lifetime τ.
Effects due to the deorientation of the recoil-ing nuclei in vacuum do not enter the DDCManalysis of a coincidence RDDS measurement asgates are set on feeding transitions of the levelof interest [184]. Effects of the Doppler-shift at-tenuation occurring during the slowing down inthe stopper account for a correction factor of lessthan 0.5% at a lifetime value of 2.6 ps [182].Thus, they can be safely neglected for τ > 3 ps.

104 CHAPTER 11. RESULTS
50000
100000
150000
200000
Cou
nts
/ 0
.5 k
eV
50000
100000
150000
200000
Cou
nts
/ 0
.5 k
eV
800 1000 1200 1400 1600
Energy [keV]
0
200
400
600
800
Cou
nts
/ 0
.5 k
eV
All γ-events
All prompt γγ-coincidences
gate on 4+→ 2+ (sh)
θγ = 142.5° (2 of 5 detectors)
6+
→ 4
+
2+
→ 0
+
(a) 21µm
(b) 21µm
(c) 21µm
θγ = 142.5°
θγ = 142.5°
w/o energy gate
Prompt γγ-coincidences
w/o energy / time gates
9 →
7
7 →
6+
11
→ 9
8+
→ 6
+
9 →
8+
13
→ 1
1
*
*
*
*
*
*
*
**
**
Figure 11.1: γ-ray spectra obtained during the lifetime measurement of 56Cr at a target-to-stopper distance of21 µm. (a) All γ-ray events (singles) detected in two of the five Ge detectors at backward angle. (b) Promptcoincidence spectrum of γ rays emitted in backward direction, which were coincident to a γ-ray detected in theEUROBALL detectors at forward angle. Energies of Doppler-shifted transitions in 56Cr are indicated by arrows.Transitions of other residual nuclei: • 56Mn, ∗ 55Mn, 53V. (c) Same as (b) but with a coincidence gate appliedon the Doppler-shifted component of the 4 +→2 + transition at 1070 keV in 56Cr. γ rays emitted in flight, de-exciting known states up to J = 13, can be observed in an almost clean spectrum. For the 2 +→0 + transitionboth the Doppler-shifted and the unshifted component were detected.
11.1 Lifetime of the 2+ state
DDCM lifetime analysis always commenced byselecting appropriate γγ-coincidence gates toobtain the intensities Ish and Ius as a functionof the target-to-stopper distance. For the life-time analysis of the 2+ state various gated spec-tra were carefully investigated for contaminat-ing transitions, interfering with the Doppler-shifted and unshifted components of the depop-ulating 2+ → 0+ transition at 1007 keV. Cutspectra of most detectors showed a transition at1015 keV coming from Coulomb excitation of
27Al in random coincidence. Therefore cut spec-tra measured with the EUROBALL detectors atforward angles could not be used in the lifetimeanalysis of the 2+ state due to the interferenceof the 27Al γ-ray transition with the Doppler-shifted 2+ → 0+ transition. The analysis wasrestricted to cut spectra obtained with the Ge de-tectors at backward angles. Fig. 11.2 illustratesthe line shape analysis of the 2+ → 0+ transi-tion at 1007 keV in 56Cr and shows examples ofgated spectra for different target-to-stopper dis-tances.
Three different types of coincidence gates

11.2. LIFETIME OF THE 4+ STATE 105
0
400
800
Cou
nts
/ 0
.5 k
eV
0
400
800
1200
Cou
nts
/ 0
.5 k
eV
0
400
800
Cou
nts
/ 0
.5 k
eV
980 990 1000 1010 1020 1030
Energy [keV]
0
400
800
Cou
nts
/ 0
.5 k
eV
(a)
(b)
(c)
(d)
0.5 µm
7.5 µm
21 µm
60 µm
56Cr
2+→ 0+
Figure 11.2: (a)-(d) Gated spectra for the 2+ → 0+
transition at 1007 keV in 56Cr at the indicated dis-tances from the five Ge detectors at backward an-gles. The gate was set on the shifted component ofthe 4+ → 2+ transition in 56Cr, measured in the sixEUROBALL Ge detectors at forward angles.
were used in the lifetime analysis of the 2+
state, which will be discussed in the following.First of all a coincidence gate was applied onthe Doppler-shifted component of the directlyfeeding transition, i.e. the 4+ → 2+ transitionat 1070 keV. The intensities of the Doppler-
shifted (Ish) and unshifted (Ius) components ofthe coincident depopulating 2+ → 0+ transi-tion were determined in the corresponding cutspectra. The lifetime of the 2+ state was de-duced by the evolution of the measured inten-sities as a function of target-to-stopper distanceaccording to the formulas given in Section 9.4.2,using the program “Napatau” [185]. The fi-nal τ curve is shown in Figure 11.3, yieldingτ(2+) = 5.49(15) ps.
Secondly the lifetime of the 2+ was derivedby gating on the Doppler-shifted component ofthe 6+ → 4+ transition at 1175 keV, indirectlyfeeding the 2+ state via the 4+ → 2+ transi-tion. The intensities of the Doppler-shifted andunshifted components of both the directly feed-ing 4+ → 2+ transition and the depopulating2+ → 0+ transition had to be determined in thecut spectra. Following the analysis given in Sec-tion 9.4.2 the lifetime of the 2+ level was mea-sured as τ(2+) = 5.48(50) ps (see Figure 11.4).
Another possibility to deduce the lifetime us-ing the DDC method is to gate on the unshiftedcomponent of the depopulating 1007 keV tran-sition and to analyze the evolution of Ish andIus of the directly feeding 4+ → 2+ transition at1070 keV in the cut spectra (so-called “gate frombelow”). The corresponding τ curve is shownin Figure 11.5, yielding a consistent value ofτ(2+) = 5.49(12) ps for the lifetime of the 2+
state in 56Cr.The weighted mean value of the three
independently determined lifetimes was fi-nally taken as the adopted level lifetimeτ(2+)mean = 5.49(14) ps.
11.2 Lifetime of the 4+ state
γγ-coincidence gates for the lifetime analysis ofthe 4+ state in 56Cr were much less affected byinterfering background transitions than for the2+ state. Thus, all possible gates and ring com-binations could be used in the analysis. The cor-responding τ curves are given in Fig. 11.6-11.12together with the quantities which were used tocalculate the τ(x) values.
Gating on the Doppler-shifted component ofthe directly feeding 6+ → 4+ transition at1175 keV yielded lifetime values of 2.81(23) ps

106 CHAPTER 11. RESULTS
level gate type gated transition θγ [] τ [ps]2+ direct 4+→ 2+ (sh) 142.5 5.49(15)
indirect 6+→ 4+ (sh) 142.5 5.48(50)below 2+→ 0+ (us) 142.5 5.49(12)
weighted mean 5.49(14)
4+ direct 6+→ 4+ (sh) 27.4 2.81(23)direct 6+→ 4+ (sh) 142.5 3.11(19)
indirect 7→ 6+ (sh) 27.4 4.2(15)indirect 7→ 6+ (sh) 142.5 2.89(81)indirect 8+→ 6+ (sh) 142.5 3.78(54)below 4+→ 2+ (us) 27.4 3.39(19)below 4+→ 2+ (us) 142.5 3.18(15)
weighted mean 3.15(11)
Table 11.2: Deduced lifetimes of the 2+ and 4+ state of 56Cr, employing the DDC method on γγ-coincidence dataobtained with different coincidence gates. Gates on the Doppler-shifted component of the (in)directly feedingtransitions are labeled “(in)direct”, while gates on the unshifted component of the depopulating transition arenamed “below”. More information is given in the text.
and 3.11(19) ps, measured at forward and back-ward angles, respectively, while τ = 4.2(15) psand 2.89(81) ps were obtained applying a coin-cidence gate on the indirectly feeding 7 → 6+
transition at 1196 keV. Another coincidencegate on the Doppler-shifted component of the in-directly feeding 8+→ 6+ transition at 1501 keVprovided a lifetime value of 3.78(54)ps. By ap-plying a gate on the unshifted component of thedepopulating 1070 keV transition consistent τvalues of 3.39(19) ps and 3.18(15) ps were mea-sured at forward and backward angles, respec-tively.
All lifetime values deduced from the presentdata are summarized in Table 11.2. Theweighted mean value of all independently de-termined lifetimes of the 4+ state was fi-nally taken as the adopted level lifetimeτ(4+)mean = 3.15(11) ps.
4.5
5.0
5.5
6.0
6.5
τ [ps]
5000
10000
15000
Ish [counts]
110
100
dis
tan
ce [µ
m]
1000
3000
5000
Ius [counts]2
+(a
)
(b)
(c)
1007 k
eV
gate
on
1070 k
eV
(sh
)
τ =
5.4
9(1
5)
ps
θ =
142.5
°
Figu
re11
.3:
(a)
Life
tim
eva
luesτ
asa
func
tion
ofta
rget
-to-
stop
per
dist
ance
for
the
the
2+→
0+
tran
-si
tion
at10
07ke
Vin
56C
r,de
term
ined
byus
ing
aco
inci
denc
ega
teon
the
Dop
pler
-shi
fted
com
pone
ntof
the
dire
ctly
feed
ing
tran
siti
onat
1070
keV.
The
in-
tens
ity
curv
esof
(b)
the
Dop
pler
-shi
fted
and
(c)
the
unsh
ifte
dco
mpo
nent
sm
easu
red
atba
ckw
ard
angl
esar
eal
sosh
own.

11.2. LIFETIME OF THE 4+ STATE 107
3.0
4.0
5.0
6.0
7.0
8.0
9.0
τ [ps]
500
1000
1500
2000
2500
Ish [counts]
110
100
dis
tan
ce [µ
m]
0
500
1000
1500
Ius [counts]2
+(a
)
(b)
(c)
1007 k
eV
gate
on
1175 k
eV
(sh
)
τ =
5.4
8(5
0)
ps
θ =
142.5
°
Figu
re11
.4:
(a)
Life
tim
eva
luesτ
asa
func
tion
ofta
rget
-to-
stop
per
dist
ance
for
the
the
2+→
0+
tran
-si
tion
at10
07ke
Vin
56C
r,de
term
ined
byus
ing
aco
-in
cide
nce
gate
onth
eD
oppl
er-s
hift
edco
mpo
nent
ofth
ein
dire
ctly
feed
ing
tran
siti
onat
1175
keV.
The
in-
tens
ity
curv
esof
(b)
the
Dop
pler
-shi
fted
and
(c)
the
unsh
ifte
dco
mpo
nent
sm
easu
red
atba
ckw
ard
angl
esar
eal
sosh
own.
4.5
5.0
5.5
6.0
6.5
τ [ps]
4000
8000
12000
16000
Ish [counts]
110
100
dis
tan
ce [µ
m]
0
2000
4000
6000
Ius [counts]
2+
(a)
(b)
(c)
1007 k
eV
gate
on
1007 k
eV
(u
s)
τ =
5.4
9(1
2)
ps
θ =
142.5
°
Figu
re11
.5:
(a)
Life
tim
eva
luesτ
asa
func
tion
ofta
rget
-to-
stop
per
dist
ance
for
the
the
2+→
0+
tran
-si
tion
at10
07ke
Vin
56C
r,de
term
ined
byus
ing
aco
inci
denc
ega
teon
the
unsh
ifte
dco
mpo
nent
ofth
ede
popu
lati
ngtr
ansi
tion
at10
07ke
V.Th
ein
tens
ity
curv
esof
(b)
the
Dop
pler
-shi
fted
and
(c)
the
un-
shif
ted
com
pone
nts
mea
sure
dat
back
war
dan
gles
are
also
show
n.
1.0
2.0
3.0
4.0
τ [ps]
4000
6000
8000
10000
Ish [counts]
110
100
dis
tan
ce [µ
m]
0
500
1000
1500
2000
Ius [counts]
4+
(a)
(b)
(c)
1070 k
eV
gate
on
1175 k
eV
(sh
)
τ =
2.8
1(2
3)
ps
θ =
27.4
°
Figu
re11
.6:
(a)
Life
tim
eva
luesτ
asa
func
tion
ofta
rget
-to-
stop
per
dist
ance
for
the
the
4+→
2+
tran
-si
tion
at10
70ke
Vin
56C
r,de
term
ined
byus
ing
aco
inci
denc
ega
teon
the
Dop
pler
-shi
fted
com
pone
ntof
the
dire
ctly
feed
ing
tran
siti
onat
1175
keV.
The
in-
tens
ity
curv
esof
(b)
the
Dop
pler
-shi
fted
and
(c)
the
unsh
ifte
dco
mpo
nent
sm
easu
red
atfo
rwar
dan
gles
are
also
show
n.

108 CHAPTER 11. RESULTS
1.0
2.0
3.0
4.0
5.0
τ [ps]
4000
6000
8000
Ish [counts]
110
100
dis
tan
ce
[µm
]
0
1000
2000
Ius [counts]4
+(a
)
(b)
(c)
10
70
keV
ga
te o
n 1
17
5 k
eV
(sh
)
τ =
3.1
1(1
9)
ps
θ =
14
2.5
°
Figu
re11
.7:
(a)
Life
tim
eva
luesτ
asa
func
tion
ofta
rget
-to-
stop
per
dist
ance
for
the
the
4+→
2+
tran
-si
tion
at10
70ke
Vin
56C
r,de
term
ined
byus
ing
aco
inci
denc
ega
teon
the
Dop
pler
-shi
fted
com
pone
ntof
the
dire
ctly
feed
ing
tran
siti
onat
1175
keV.
The
in-
tens
ity
curv
esof
(b)
the
Dop
pler
-shi
fted
and
(c)
the
unsh
ifte
dco
mpo
nent
sm
easu
red
atba
ckw
ard
angl
esar
eal
sosh
own.
0.0
4.0
8.0
12.0
τ [ps]
1000
2000
3000
Ish [counts]
110
100
dis
tan
ce [µ
m]
0
250
500
750
Ius [counts]
4+
(a)
(b)
(c)
1070 k
eV
gate
on
1196 k
eV
(sh
)
τ =
4.2
(15)
ps
θ =
27.4
°
Figu
re11
.8:
(a)
Life
tim
eva
luesτ
asa
func
tion
ofta
rget
-to-
stop
per
dist
ance
for
the
the
4+→
2+
tran
-si
tion
at10
70ke
Vin
56C
r,de
term
ined
byus
ing
aco
-in
cide
nce
gate
onth
eD
oppl
er-s
hift
edco
mpo
nent
ofth
ein
dire
ctly
feed
ing
tran
siti
onat
1196
keV.
The
in-
tens
ity
curv
esof
(b)
the
Dop
pler
-shi
fted
and
(c)
the
unsh
ifte
dco
mpo
nent
sm
easu
red
atfo
rwar
dan
gles
are
also
show
n.
-4.0
0.0
4.0
8.0
τ [ps]
1000
1500
2000
2500
Ish [counts]
110
100
dis
tan
ce [µ
m]
0
200
400
600
800
Ius [counts]
4+
(a)
(b)
(c)
1070 k
eV
gate
on
1196 k
eV
(sh
)
τ =
2.8
9(8
1)
ps
θ =
142.5
°
Figu
re11
.9:
(a)
Life
tim
eva
luesτ
asa
func
tion
ofta
rget
-to-
stop
per
dist
ance
for
the
the
4+→
2+
tran
-si
tion
at10
70ke
Vin
56C
r,de
term
ined
byus
ing
aco
-in
cide
nce
gate
onth
eD
oppl
er-s
hift
edco
mpo
nent
ofth
ein
dire
ctly
feed
ing
tran
siti
onat
1196
keV.
The
in-
tens
ity
curv
esof
(b)
the
Dop
pler
-shi
fted
and
(c)
the
unsh
ifte
dco
mpo
nent
sm
easu
red
atba
ckw
ard
angl
esar
eal
sosh
own.

11.2. LIFETIME OF THE 4+ STATE 109
1.0
2.0
3.0
4.0
5.0
6.0
τ [ps]
1000
1500
2000
2500
Ish [counts]
110
100
dis
tan
ce [µ
m]
0
200
400
600
800
Ius [counts]4
+(a
)
(b)
(c)
1070 k
eV
gate
on
1501 k
eV
(sh
)
τ =
3.7
8(5
4)
ps
θ =
142.5
°
Figu
re11
.10:
(a)
Life
tim
eva
luesτ
asa
func
tion
ofta
rget
-to-
stop
per
dist
ance
for
the
the
4+→
2+
tran
-si
tion
at10
70ke
Vin
56C
r,de
term
ined
byus
ing
aco
-in
cide
nce
gate
onth
eD
oppl
er-s
hift
edco
mpo
nent
ofth
ein
dire
ctly
feed
ing
tran
siti
onat
1501
keV.
The
in-
tens
ity
curv
esof
(b)
the
Dop
pler
-shi
fted
and
(c)
the
unsh
ifte
dco
mpo
nent
sm
easu
red
atba
ckw
ard
angl
esar
eal
sosh
own.
2.5
3.0
3.5
4.0
4.5
τ [ps]
2000
4000
6000
Ish [counts]
110
100
dis
tan
ce [µ
m]
1000
2000
3000
Ius [counts]
4+
(a)
(b)
(c)
1070 k
eV
gate
on
1070 k
eV
(u
s)
τ =
3.3
9(1
9)
ps
θ =
27.4
°
Figu
re11
.11:
(a)
Life
tim
eva
luesτ
asa
func
tion
ofta
rget
-to-
stop
per
dist
ance
for
the
the
4+→
2+
tran
-si
tion
at10
70ke
Vin
56C
r,de
term
ined
byus
ing
aco
inci
denc
ega
teon
the
unsh
ifte
dco
mpo
nent
ofth
ede
popu
lati
ngtr
ansi
tion
at10
70ke
V.Th
ein
tens
ity
curv
esof
(b)
the
Dop
pler
-shi
fted
and
(c)
the
un-
shif
ted
com
pone
nts
mea
sure
dat
forw
ard
angl
esar
eal
sosh
own.
2.0
2.5
3.0
3.5
4.0
τ [ps]
2000
4000
6000
Ish [counts]
110
100
dis
tan
ce [µ
m]
500
1000
1500
2000
Ius [counts]
4+
(a)
(b)
(c)
1070 k
eV
gate
on
1070 k
eV
(u
s)
τ =
3.1
8(1
5)
ps
θ =
142.5
°
Figu
re11
.12:
(a)
Life
tim
eva
luesτ
asa
func
tion
ofta
rget
-to-
stop
per
dist
ance
for
the
the
4+→
2+
tran
-si
tion
at10
70ke
Vin
56C
r,de
term
ined
byus
ing
aco
inci
denc
ega
teon
the
unsh
ifte
dco
mpo
nent
ofth
ede
popu
lati
ngtr
ansi
tion
at10
70ke
V.Th
ein
tens
ity
curv
esof
(b)
the
Dop
pler
-shi
fted
and
(c)
the
un-
shif
ted
com
pone
nts
mea
sure
dat
back
war
dan
gles
are
also
show
n.

110 CHAPTER 11. RESULTS
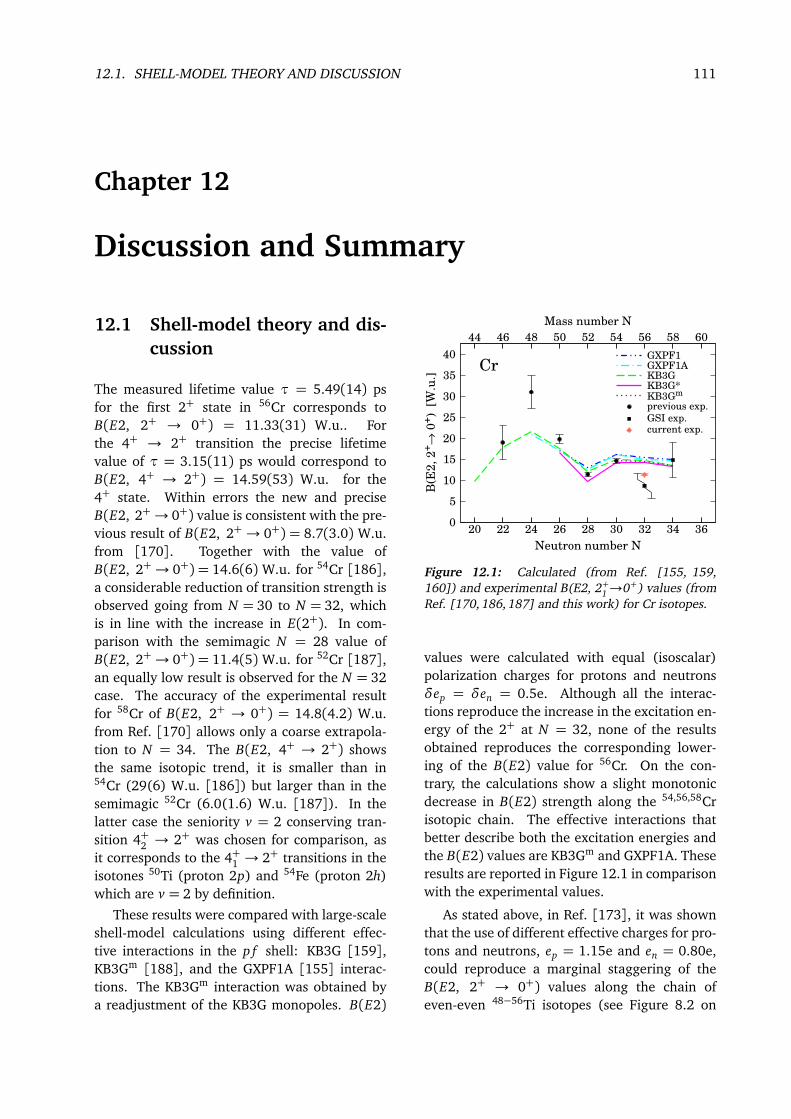
12.1. SHELL-MODEL THEORY AND DISCUSSION 111
Chapter 12
Discussion and Summary
12.1 Shell-model theory and dis-cussion
The measured lifetime value τ = 5.49(14) psfor the first 2+ state in 56Cr corresponds toB(E2, 2+ → 0+) = 11.33(31) W.u.. Forthe 4+ → 2+ transition the precise lifetimevalue of τ = 3.15(11) ps would correspond toB(E2, 4+ → 2+) = 14.59(53) W.u. for the4+ state. Within errors the new and preciseB(E2, 2+→ 0+) value is consistent with the pre-vious result of B(E2, 2+ → 0+) = 8.7(3.0) W.u.from [170]. Together with the value ofB(E2, 2+→ 0+) = 14.6(6) W.u. for 54Cr [186],a considerable reduction of transition strength isobserved going from N = 30 to N = 32, whichis in line with the increase in E(2+). In com-parison with the semimagic N = 28 value ofB(E2, 2+→ 0+) = 11.4(5) W.u. for 52Cr [187],an equally low result is observed for the N = 32case. The accuracy of the experimental resultfor 58Cr of B(E2, 2+ → 0+) = 14.8(4.2) W.u.from Ref. [170] allows only a coarse extrapola-tion to N = 34. The B(E2, 4+ → 2+) showsthe same isotopic trend, it is smaller than in54Cr (29(6) W.u. [186]) but larger than in thesemimagic 52Cr (6.0(1.6) W.u. [187]). In thelatter case the seniority v = 2 conserving tran-sition 4+2 → 2+ was chosen for comparison, asit corresponds to the 4+1 → 2+ transitions in theisotones 50Ti (proton 2p) and 54Fe (proton 2h)which are v = 2 by definition.
These results were compared with large-scaleshell-model calculations using different effec-tive interactions in the p f shell: KB3G [159],KB3Gm [188], and the GXPF1A [155] interac-tions. The KB3Gm interaction was obtained bya readjustment of the KB3G monopoles. B(E2)
20 22 24 26 28 30 32 34 36
Neutron number N
0
5
10
15
20
25
30
35
40
B(E
2, 2
+→
0+)
[W
.u.]
44 46 48 50 52 54 56 58 60
Mass number N
GXPF1GXPF1AKB3GKB3G*KB3Gm
previous exp.
GSI exp.current exp.
Cr
Figure 12.1: Calculated (from Ref. [155, 159,160]) and experimental B(E2, 2+
1→0+) values (fromRef. [170,186,187] and this work) for Cr isotopes.
values were calculated with equal (isoscalar)polarization charges for protons and neutronsδep = δen = 0.5e. Although all the interac-tions reproduce the increase in the excitation en-ergy of the 2+ at N = 32, none of the resultsobtained reproduces the corresponding lower-ing of the B(E2) value for 56Cr. On the con-trary, the calculations show a slight monotonicdecrease in B(E2) strength along the 54,56,58Crisotopic chain. The effective interactions thatbetter describe both the excitation energies andthe B(E2) values are KB3Gm and GXPF1A. Theseresults are reported in Figure 12.1 in comparisonwith the experimental values.
As stated above, in Ref. [173], it was shownthat the use of different effective charges for pro-tons and neutrons, ep = 1.15e and en = 0.80e,could reproduce a marginal staggering of theB(E2, 2+ → 0+) values along the chain ofeven-even 48−56Ti isotopes (see Figure 8.2 on

112 CHAPTER 12. DISCUSSION AND SUMMARY
Spin I exp. GXPF1A KB3G KB3Gm GXPF1A* KB3G* KB3Gm*54Cr 2+ 14.6(6) [186] 16.4 15.1 14.8 15.7 14.8 14.6
4+ 29(6) [186] 21.5 19.0 18.5 20.5 18.2 17.656Cr 2+ 11.33(31) 15.2 14.7 14.4 14.5 15.2 14.6
4+ 14.59(53) 19.5 20.4 18.7 19.2 20.8 18.66+ 14.0 19.0
58Cr 2+ 14.8(4.2) [170] 15.1 13.4 13.6 14.9 13.9 13.74+ 18.1 15.0 14.7 16.9 15.3 14.7
Table 12.1: Experimental and calculated B(E2, I→ I-2) values (in W.u.) for 54,56,58Cr. Shell-model calculationswith a different set of effective polarization charges (ep = 1.15e, en = 0.8e) are designated by a superscriptedasterisk.
page 86). These effective charges, deduced fromthe T = 1/2 mirror nuclei of mass A= 51 [172],result from an additional isovector polarizationcharge. In fact, the trend of the B(E2) valuesin the Ti chain is correct, but the calculated val-ues are still far from the experimental ones. Re-cently, it was shown that these effective chargesdo not reproduce the B(E2) values measuredin the neutron-rich nuclei 50Ca and 51Sc [27].For this work the B(E2) values were computedfor the Cr isotopes using these effective chargeswith the different effective interactions. The re-sults are listed in Table 12.1 and denoted bya superscript asterisk. In all cases, the B(E2)strengths remain almost unchanged; the differ-ences amount to just a fraction of a W.u.. It isonly with the GXPF1A interaction that the useof these effective charges gives a slight, relativereduction of the B(E2) in 56Cr with respect to54,58Cr but remaining still far from the experi-ment.
A dedicated shell-model study of neutron-rich Cr nuclei was performed recently by Kanekoet al. in the f pg model space [163]. This va-lence space comprises the full p f active pro-ton orbitals and the νp3/2, ν f5/2, νp1/2, andν g9/2 neutron orbitals. The schematic pairing-plus-multipole interaction was developed to re-produce the available data in neutron-rich Crisotopes. For calculation of the B(E2) values,standard polarization charges δep = δen = 0.5ewere used. Although a small relative decreasein the transition strength is obtained at N = 32,these calculations do not reproduce the experi-mental energies and B(E2) of 56,58Cr. IncreasingB(E2) values are predicted for heavier Cr nucleiuntil a drastic drop at N = 46.
The recently developed LNPS interaction de-scribes with good accuracy the level schemes ofCr and Fe isotopes around N = 40 [162]. Ithas been applied with success to the descrip-tion of recent data on lifetimes in heavy Fe iso-topes [189]. The model space includes the fullf p orbitals for protons and the νp3/2, ν f5/2,νp1/2, ν g9/2, and νd5/2 shells for neutrons. Thisnew effective interaction accounts for the devel-opment of strong quadrupole correlations thatdrive the Cr and Fe isotopes to large deforma-tion towards N = 40. The adopted 48Ca core inthese calculations – as well as in those of Kanekoet al. [163] – prevents the excitation of neutronsfrom the ν f7/2 shell. While this is sensible forheavy Cr isotopes around N = 40, its influencein the description of the spectroscopy of lighterisotopes increases with decreasing neutron num-ber, in particular, for 56Cr.
The evolution of the 4+ → 2+ transitionstrength from N = 28 to N = 32 shows the ex-pected increase for N = 30 owing to senioritymixing by proton-neutron interaction, followedby an unexpected decrease for N = 32. Thiscorroborates the B(E2, 2+ → 0+) trend and islikewise not borne out by the shell-model results(see Table 12.1).
12.2 Summary
In summary, the decrease in B(E2) values forboth the 2+ and 4+, states in 56Cr, and there-fore their staggering from N = 28 to N = 32, isnow firmly established by several standard de-viations. This and the corresponding oppositetrend in Ex(2+) are consistent with the obser-

12.2. SUMMARY 113
vation in Ti isotopes (see Figure 8.2) and inopen-shell nuclei with the Grodzins-Raman sys-tematics [25, 190]. Despite the large differencein Ex(2+), the B(E2) values in Ti and the mid-proton-shell Cr isotopes are almost identical forN = 28 and N = 30. The staggering amplitudesas defined by
Ast = B(E2)N=30−B(E2)N=28+ B(E2)N=32
2
agree in both chains within experimental uncer-tainties, namely, Ast(Ti) = 4.2(11) W.u. andAst(Cr) = 3.8(6)W.u.. The available shell-modelapproaches using various interactions and/or ef-fective charges account for the global trend ofEx(2+) and B(E2) but fail to reproduce the lo-cal staggering, which, on the other hand, in-dicates an N = 32 subshell. The theoreticalB(E2) values in the Ca, Ti and Cr isotopic chainsbeyond N = 28 show a smooth and unstruc-tured trend (see Figures 8.2 and 12.1). Fromthis evidence one may conclude that the rea-son for the failure of the theoretical approacheslies in the neutron channel and is caused byeither T = 1 monopoles or an imbalance inthe pairing and quadrupole part of the neutron-neutron two-body matrix elements. In the for-mer case, from the disappearance of the stag-gering in the Fe isotopes it can be concludedthat T = 1 monopoles involving ν f5/2 orbit needretuning, as this changes position dramaticallyfrom Z = 20 to Z = 28 owing to the fillingof the π f7/2 shell. Core excitations of protonsacross the Z = 20 gap are unlikely to cause theobserved effect beyond the Ca isotopes. The in-crease in the transition probabilities for heavierCr isotopes predicted by the recent theoreticalworks will have to wait for the measurement oftransition probabilities by means of radioactivebeams.

114 CHAPTER 12. DISCUSSION AND SUMMARY

BIBLIOGRAPHY 115
Bibliography
[1] W.M. Elsasser, J. Phys. Radium 5, 635-639 (1934).
[2] O. Haxel, J.H.D. Jensen, and H.E. Suess, Phys. Rev.75, 1766 (1949).
[3] M. Goeppert-Mayer, Phys. Rev. 75, 1969-1970(1949).
[4] K.L.G. Heyde, “The Nuclear Shell Model”,Springer-Verlag, Berlin Heidelberg (1990).
[5] T. Otsuka, R. Fujimoto, Y. Utsuno, B.A. Brown,M. Honma, and T. Mizusaki, Phys. Rev. Lett. 87,082502 (2001).
[6] T. Otsuka, Y. Utsuno, R. Fujimoto, B.A. Brown,M. Honma, and T. Mizusaki, Eur. Phys. J. A 13,69-74 (2002).
[7] T. Otsuka, Y. Utsuno, R. Fujimoto, B.A. Brown,M. Honma, and T. Mizusaki, Eur. Phys. J. A 15,151-155 (2002).
[8] R. Kanungo, C. Nociforo, A. Prochazka,T. Aumann, D. Boutin, D. Cortina-Gil, B. Davids,M. Diakaki, F. Farinon, H. Geissel, R. Gernhäuser,J. Gerl, R. Janik, B. Jonson, B. Kindler,R. Knöbel, R. Krücken, M. Lantz, H. Lenske,Y. Litvinov, B. Lommel, K. Mahata, P. Maierbeck,A. Musumarra, T. Nilsson, T. Otsuka, C. Perro,C. Scheidenberger, B. Sitar, P. Strmen, B. Sun,I. Szarka, I. Tanihata, Y. Utsuno, H. Weick, andM. Winkler, Phys. Rev. Lett. 102, 152501 (2009).
[9] K.-L. Kratz, J.-P. Bitouzet, F.-K. Thielemann,P. Möller, and B. Pfeiffer, Astrophys. J 403,216-238 (1993).
[10] P. Cottle, Nature (London) 465, 430-431 (2010).
[11] C. Sneden and J.J. Cowan, Science 299, 70-75(2003).
[12] T. Kautzsch, W.B. Walters, M. Hannawald,K.-L. Kratz, V.I. Mishin, V.N. Fedoseyev, W. Böhmer,Y. Jading, P. Van Duppen, B. Pfeiffer, A. Wöhr,P. Möller, I. Klökl, V. Sebastian, U. Köster,M. Koizumi, J. Lettry, and H.L. Ravn, Eur. Phys.J. A 9, 201-206 (2000).
[13] I. Dillmann, K.-L. Kratz, A. Wöhr, O. Arndt,B.A. Brown, P. Hoff, M. Hjorth-Jensen, U. Köster,A.N. Ostrowski, B. Pfeiffer, D. Seweryniak,J. Shergur, and W.B. Walters, Phys. Rev. Lett. 91,162503 (2003).
[14] B. Pfeiffer, K.-L. Kratz, and F.-K. Thielemann, Z.Phys. A 357, 235-238 (1997).
[15] M. Moinester, J.P. Schiffer, and W.P. Alford, Phys.Rev. 179, 984-995 (1969).
[16] O. Sorlin and M.-G. Porquet, Prog. Part. Nucl.Phys. 61, 602-673 (2008).
[17] T. Otsuka, M. Honma, and D. Abe, Nucl. Phys. A788, 3c-11c (2007).
[18] G. Audi, A.H. Wapstra, and C. Thibault, Nucl.Phys. A 729, 337-676 (2003).
[19] N.J. Stone, At. Data Nucl. Data Tables 90, 75-176(2005).
[20] B.A. Brown and B.H. Wildenthal, Nucl. Phys. A474, 290-306 (1987).
[21] D. Borremans, S. Teughels, N.A. Smirnova,D.L. Balabanski, N. Coulier, J.-M. Daugas,F. de Oliveira Santos, G. Georgiev, M. Lewitowicz,I. Matea, Yu.E. Penionzhkevich, W.-D. Schmidt-Ott, Yu. Sobolev, M. Stanoiu, K. Vyvey, andG. Neyens, Phys. Lett. B 537, 45-50 (2002).
[22] P. Himpe, G. Neyens, D.L. Balabanski, G. Bélier,D. Borremans, J.M. Daugas, F. de OliveiraSantos, M. De Rydt, K. Flanagan, G. Georgiev,M. Kowalska, S. Mallion, I. Matea, P. Morel,Yu.E. Penionzhkevich, N.A. Smirnova, C. Stodel,K. Turzó, N. Vermeulen, and D. Yordanov, Phys.Lett. B 643, 257-262 (2006).
[23] R.F. Casten, “Nuclear Structure from a SimplePerspective”, Oxford University Press, New YorkOxford (1990).
[24] W.D. Hamilton, “The Electromagnetic Interactionin Nuclear Spectroscopy”, North-Holland Publish-ing Company, Amsterdam Oxford (1975).
[25] S. Raman, C.W. Nestor, Jr., and P. Tikkanen, At.Data Nucl. Data Tables 78, 1-128 (2001).
[26] P. Doornenbal, P. Reiter, H. Grawe, T. Otsuka,A. Al-Khatib, A. Banu, T. Beck, F. Becker,P. Bednarczyk, G. Benzoni, A. Bracco, A. Bürger,L. Caceres, F. Camera, S. Chmel, F.C.L. Crespi,H. Geissel, J. Gerl, M. Górska, J. Grebosz,H. Hübel, M. Kavatsyuk, O. Kavatsyuk,M. Kmiecik, I. Kojouharov, N. Kurz, R. Lozeva,A. Maj, S. Mandal, W. Meczynski, B. Million,Zs. Podolyák, A. Richard, N. Saito, T. Saito,H. Schaffner, M. Seidlitz, T. Striepling, Y. Utsuno,J. Walker, N. Warr, H. Weick, O. Wieland,M. Winkler, and H.J. Wollersheim, Phys. Lett. B647, 237-242 (2007).
[27] J.J. Valiente-Dobón, D. Mengoni, A. Gadea,E. Farnea, S.M. Lenzi, S. Lunardi, A. Dewald,Th. Pissulla, S. Szilner, R. Broda, F. Recchia,A. Algora, L. Angus, D. Bazzacco, G. Benzoni,P.G. Bizzeti, A.M. Bizzeti-Sona, P. Boutachkov,L. Corradi, F. Crespi, G. de Angelis, E. Fioretto,A. Görgen, A. Gorska, A. Gottardo, E. Grodner,B. Guiot, A. Howard, W. Królas, S. Leoni, P. Mason,
116 BIBLIOGRAPHY
R. Menegazzo, D. Montanari, G. Montagnoli,D.R. Napoli, A. Obertelli, T. Pawłat, G. Pollarolo,B. Rubio, E. Sahin, F. Scarlassara, R. Silvestri,A.M. Stefanini, J.F. Smith, D. Steppenbeck,C.A. Ur, P.T. Wady, J. Wrzesinski, E. Maglione,and I. Hamamoto, Phys. Rev. Lett. 102, 242502(2009).
[28] C. Thibault, R. Klapisch, C. Rigaud,A.M. Poskanzer, R. Prieels, L. Lessard, andW. Reisdorf, Phys. Rev. C 12, 644-657 (1975).
[29] X. Campi, H. Flocard, A.K. Kerman, and S. Koonin,Nucl. Phys. A 251, 193-205 (1975).
[30] G. Huber, F. Touchard, S. Büttgenbach,C. Thibault, R. Klapisch, H.T. Duong, S. Liberman,J. Pinard, J.L. Vialle, P. Juncar, and P. Jacquinot,Phys. Rev. C 18, 2342-2354 (1978).
[31] C. Détraz, D. Guillemaud, G. Huber, R. Klapisch,M. Langevin, F. Naulin, C. Thibault, L.C. Carraz,and F. Touchard, Phys. Rev. C 19, 164-176 (1979).
[32] D. Guillemaud-Mueller, C. Détraz, M. Langevin,F. Naulin, M. de Saint-Simon, C. Thibault,F. Touchard, and M. Epherre, Nucl. Phys. A 426,37-76 (1984).
[33] E.K. Warburton, J.A. Becker, and B.A. Brown,Phys. Rev. C 41, 1147-1166 (1990).
[34] T. Otsuka, T. Suzuki, R. Fujimoto, H. Grawe,Y. Akaishi, Phys. Rev. Lett 95, 232502 (2005).
[35] Y. Utsuno, T. Otsuka, T. Mizusaki, and M. Honma,Phys. Rev. C 60, 054315 (1999).
[36] K. Heyde and J.L. Wood, J. Phys. G 17, 135-143(1991).
[37] M. Yamagami and N. Van Giai, Phys. Rev. C 69,034301 (2004).
[38] R. Rodríguez-Guzmán, J.L. Egido, andL.M. Robledo, Nucl. Phys. A 709, 201-235(2002).
[39] S. Péru, M. Girod, and J.F. Berger, Eur. Phys. J. A9, 35-47 (2000).
[40] J. Terasaki, H. Flocard, P.-H. Heenen, andP. Bonche, Nucl. Phys. A 621, 706-718 (1997).
[41] P.-G. Reinhard, D.J. Dean, W. Nazarewicz,J. Dobaczewski, J.A. Maruhn, and M.R. Strayer,Phys. Rev. C 60, 014316 (1999).
[42] P. Fallon, E. Rodriguez-Vieitez, D. Bazin,C.M. Campbell, J.M. Cook, R.M. Clark,D.C. Dinca, A. Gade, T. Glasmacher, I.-Y. Lee,A.O. Macchiavelli, W.F. Mueller, S.G. Prussin,M. Wiedeking, and K. Yoneda, J. Phys.: Conf. Ser.49, 165-169 (2006).
[43] Y. Yanagisawa, M. Notani, H. Sakurai, M. Kunibu,H. Akiyoshi, N. Aoi, H. Baba, K. Demichi,N. Fukuda, H. Hasegawa, Y. Higurashi,M. Ishihara, N. Iwasa, H. Iwasaki, T. Gomi,S. Kanno, M. Kurokawa, Y.U. Matsuyama,S. Michimasa, T. Minemura, T. Mizoi,T. Nakamura, A. Saito, M. Serata, S. Shimoura,T. Sugimoto, E. Takeshita, S. Takeuchi, K. Ue,K. Yamada, K. Yoneda, and T. Motobayashi, Phys.Lett. B 566, 84-89 (2003).
[44] P. Doornenbal, H. Scheit, N. Aoi, S. Takeuchi,K. Li, E. Takeshita, H. Wang, H. Baba, S. Deguchi,N. Fukuda, H. Geissel, R. Gernhäuser, J. Gibelin,I. Hachiuma, Y. Hara, C. Hinke, N. Inabe,K. Itahashi, S. Itoh, D. Kameda, S. Kanno,Y. Kawada, N. Kobayashi, Y. Kondo, R. Krücken,T. Kubo, T. Kuboki, K. Kusaka, M. Lantz,S. Michimasa, T. Motobayashi, T. Nakamura,T. Nakao, K. Namihira, S. Nishimura, T. Ohnishi,M. Ohtake, N.A. Orr, H. Otsu, K. Ozeki, Y. Satou,S. Shimoura, T. Sumikama, M. Takechi, H. Takeda,K.N. Tanaka, K. Tanaka, Y. Togano, M. Winkler,Y. Yanagisawa, K. Yoneda, A. Yoshida, K. Yoshida,and H. Sakurai, Phys. Rev. Lett. 103, 032501(2009).
[45] S. Ettenauer, H. Zwahlen, P. Adrich, D. Bazin,C.M. Campbell, J.M. Cook, A.D. Davies,D.-C. Dinca, A. Gade, T. Glasmacher, J.-L. Lecouey,W.F. Mueller, T. Otsuka, R.R. Reynolds, L.A. Riley,J.R. Terry, Y. Utsuno, and K. Yoneda, Phys. Rev. C78, 017302 (2008).
[46] B.V. Pritychenko, T. Glasmacher, B.A. Brown,P.D. Cottle, R.W. Ibbotson, K.W. Kemper, L.A. Riley,and H. Scheit, Phys. Rev. C 63, 011305(R) (2000).
[47] G. Neyens, M. Kowalska, D. Yordanov, K. Blaum,P. Himpe, P. Lievens, S. Mallion, R. Neugart,N. Vermeulen, Y. Utsuno, and T. Otsuka, Phys. Rev.Lett. 94, 022501 (2005).
[48] F. Maréchal, D.L. Balabanski, D. Borremans,J.-M. Daugas, F. de Oliveira Santos, P. Dessagne,G. Georgiev, J. Giovinazzo, S. Grévy, P. Himpe,C. Jollet, I. Matea, G. Neyens, F. Perrot, E. Poirier,O. Roig, M. Stanoiu, C. Stodel, J.-C. Thomas,K. Turzó, D. Yordanov, E. Caurier, F. Nowacki, andA. Poves, Phys. Rev. C 72, 044314 (2005).
[49] B.V. Pritychenko, T. Glasmacher, P.D. Cottle,R.W. Ibbotson, K.W. Kemper, L.A. Riley,A. Sakharuk, H. Scheit, M. Steiner, andV. Zelevinsky, Phys. Rev. C 65, 061304(R) (2002).
[50] T. Motobayashi, Y. Ikeda, K. Ieki, M. Inoue,N. Iwasa, T. Kikuchi, M. Kurokawa, S. Moriya,S. Ogawa, H. Murakami, S. Shimoura,Y. Yanagisawa, T. Nakamura, Y. Watanabe,M. Ishihara, T. Teranishi, H. Okuno, andR.F. Casten, Phys. Lett. B 346, 9-14 (1995).
[51] J.A. Church, C.M. Campbell, D.-C. Dinca,J. Enders, A. Gade, T. Glasmacher, Z. Hu,R.V.F. Janssens, W.F. Mueller, H. Olliver, B.C. Perry,L.A. Riley, and K.L. Yurkewicz, Phys. Rev. C 72,054320 (2005).
[52] H. Iwasaki, T. Motobayashi, H. Sakurai, K. Yoneda,T. Gomi, N. Aoi, N. Fukuda, Z. Fülöp, U. Futakami,Z. Gacsi, Y. Higurashi, N. Imai, N. Iwasa, T. Kubo,M. Kunibu, M. Kurokawa, Z. Liu, T. Minemura,A. Saito, M. Serata, S. Shimoura, S. Takeuchi,Y.X. Watanabe, K. Yamada, Y. Yanagisawa, andM. Ishihara, Phys. Lett. B 522, 227-232 (2001).
[53] A. Gade, P. Adrich, D. Bazin, M.D. Bowen,B.A. Brown, C.M. Campbell, J.M. Cook,S. Ettenauer, T. Glasmacher, K.W. Kemper,

BIBLIOGRAPHY 117
S. McDaniel, A. Obertelli, T. Otsuka, A. Ratkiewicz,K. Siwek, J.R. Terry, J.A. Tostevin, Y. Utsuno, andD. Weisshaar, Phys. Rev. Lett. 99, 072502 (2007).
[54] Y. Utsuno, T. Otsuka, T. Glasmacher, T. Mizusaki,and M. Honma, Phys. Rev. C 70, 044307 (2004).
[55] H. Iwasaki, T. Motobayashi, H. Sakurai, K. Yoneda,T. Gomi, N. Aoi, N. Fukuda, Z. Fülöp, U. Futakami,Z. Gacsic, Y. Higurashi, N. Imai, N. Iwasa, T. Kubo,M. Kunibu, M. Kurokawa, Z. Liu, T. Minemura,A. Saito, M. Serata, S. Shimoura, S. Takeuchi,Y.X. Watanabe, K. Yamada, Y. Yanagisawa, andM. Ishihara, Phys. Lett. B 620, 118-124 (2005).
[56] B.V. Pritychenko, T. Glasmacher, P.D. Cottle,R.W. Ibbotson, K.W. Kemper, K.L. Miller, L.A. Riley,and H. Scheit, Phys. Rev. C 66, 024325 (2002).
[57] V. Tripathi, S.L. Tabor, C.R. Hoffman,M. Wiedeking, A. Volya, P.F. Mantica, A.D. Davies,S.N. Liddick, W.F. Mueller, A. Stolz, B.E. Tomlin,T. Otsuka, and Y. Utsuno, Phys. Rev. C 73, 054303(2006).
[58] A.M. Hurst, C.Y. Wu, J.A. Becker, M.A. Stoyer,C.J. Pearson, G. Hackman, M.A. Schumaker,C.E. Svensson, R.A.E. Austin, G.C. Ball,D. Bandyopadhyay, C.J. Barton, A.J. Boston,H.C. Boston, R. Churchman, D. Cline,S.J. Colosimo, D.S. Cross, G. Demand,M. Djongolov, T.E. Drake, P.E. Garrett, C. Gray-Jones, K.L. Green, A.N. Grint, A.B. Hayes,K.G. Leach, W.D. Kulp, G. Lee, S. Lloyd,R. Maharaj, J.-P. Martin, B.A. Millar, S. Mythili,L. Nelson, P.J. Nolan, D.C. Oxley, E. Padilla-Rodal, A.A. Phillips, M. Porter-Peden, S.V. Rigby,F. Sarazin, C.S. Sumithrarachchi, S. Triambak,P.M. Walker, S.J. Williams, J. Wong, and J.L. Wood,Phys. Lett. B 674, 168-171 (2009).
[59] O. Niedermaier, H. Scheit, V. Bildstein, H. Boie,J. Fitting, R. von Hahn, F. Köck, M. Lauer,U.K. Pal, H. Podlech, R. Repnow, D. Schwalm,C. Alvarez, F. Ames, G. Bollen, S. Emhofer,D. Habs, O. Kester, R. Lutter, K. Rudolph,M. Pasini, P.G. Thirolf, B.H. Wolf, J. Eberth,G. Gersch, H. Hess, P. Reiter, O. Thelen, N. Warr,D. Weisshaar, F. Aksouh, P. Van den Bergh, P. VanDuppen, M. Huyse, O. Ivanov, P. Mayet, J. Vande Walle, J. Äystö, P.A. Butler, J. Cederkäll,P. Delahaye, H.O.U. Fynbo, L.M. Fraile, O. Forstner,S. Franchoo, U. Köster, T. Nilsson, M. Oinonen,T. Sieber, F. Wenander, M. Pantea, A. Richter,G. Schrieder, H. Simon, T. Behrens, R. Gernhäuser,T. Kröll, R. Krücken, M. Münch, T. Davinson,J. Gerl, G. Huber, A. Hurst, J. Iwanicki, B. Jonson,P. Lieb, L. Liljeby, A. Schempp, A. Scherillo,P. Schmidt, and G. Walter, Phys. Rev. Lett. 94,172501 (2005).
[60] D. Kameda, H. Ueno, K. Asahi, M. Takemura,A. Yoshimi, T. Haseyama, M. Uchida, K. Shimada,D. Nagae, G. Kijima, T. Arai, K. Takase, S. Suda,T. Inoue, J. Murata, H. Kawamura, Y. Kobayashi,H. Watanabe, and M. Ishihara, Phys. Lett. B 647,93-97 (2007).
[61] V. Tripathi, S.L. Tabor, P.F. Mantica, Y. Utsuno,P. Bender, J. Cook, C.R. Hoffman, S. Lee, T. Otsuka,J. Pereira, M. Perry, K. Pepper, J.S. Pinter, J. Stoker,A. Volya, and D. Weisshaar, Phys. Rev. Lett. 101,142504 (2008).
[62] P. Himpe, G. Neyens, D.L. Balabanski,G. Bélier, J.M. Daugas, F. de Oliveira Santos,M. De Rydt, K.T. Flanagan, I. Matea, P. Morel,Y.E. Penionzhkevich, L. Perrot, N.A. Smirnova,C. Stodel, J.C. Thomas, N. Vermeulen,D.T. Yordanov, Y. Utsuno, and T. Otsuka,Phys. Lett. B 658, 203-208 (2008).
[63] B.V. Pritychenko, T. Glasmacher, B.A. Brown,P.D. Cottle, R.W. Ibbotson, K.W. Kemper, andH. Scheit, Phys. Rev. C 63, 047308 (2001).
[64] C. Détraz, M. Langevin, D. Guillemaud,M. Epherre, G. Audi, C. Thibault, and F. Touchard,Nucl. Phys. A 394, 378-386 (1983).
[65] N.A. Orr, W. Mittig, L.K. Fifield, M. Lewitowicz,E. Plagnol, Y. Schutz, Z.W. Long, L. Bianchi,A. Gillibert, A.V. Belozyorov, S.M. Lukyanov,Y.E. Penionzhkevich, A.C.C. Villari, A. Cunsolo,A. Foti, G. Audi, C. Stephan, and L. Tassan-Got,Phys. Lett. B 258, 29-34 (1991).
[66] B.V. Pritychenko, T. Glasmacher, P.D. Cottle,M. Fauerbach, R.W. Ibbotson, K.W. Kemper,V. Maddalena, A. Navin, R. Ronningen,A. Sakharuk, H. Scheit, and V.G. Zelevinsky,Phys. Lett. B 461, 322-328 (1999).
[67] V. Chisté, A. Gillibert, A. Lépine-Szily,N. Alamanos, F. Auger, J. Barrette, F. Braga,M.D. Cortina-Gil, Z. Dlouhy, V. Lapoux,M. Lewitowicz, R. Lichtenthäler, R. LiguoriNeto, S.M. Lukyanov, M. MacCormick,F. Marie, W. Mittig, F. de Oliveira Santos,N.A. Orr, A.N. Ostrowski, S. Ottini, A. Pakou,Y.E. Penionzhkevich, P. Roussel-Chomaz, J.L. Sida,Phys. Lett. B 514, 233-239 (2001).
[68] O.T. Niedermaier, Doctoral Dissertation “Low-Energy Coulomb Excitation of the Neutron-RichMg Isotopes 30Mg and 32Mg”, University ofHeidelberg (2005).
[69] W. Schwerdtfeger, P.G. Thirolf, K. Wimmer,D. Habs, H. Mach, T.R. Rodriguez, V. Bildstein,J.L. Egido, L.M. Fraile, R. Gernhäuser,R. Hertenberger, K. Heyde, P. Hoff, H. Hübel,U. Köster, T. Kröll, R. Krücken, R. Lutter,T. Morgan, and P. Ring, Phys. Rev. Lett. 103,012501 (2009).
[70] K. Wimmer, T. Kröll, R. Krücken, V. Bildstein,R. Gernhäuser, B. Bastin, N. Bree, J. Diriken,P. Van Duppen, M. Huyse, N. Patronis,P. Vermaelen, D. Voulot, J. Van de Walle,F. Wenander, L.M. Fraile, R. Chapman,B. Hadinia, R. Orlandi, J.F. Smith, R. Lutter,P.G. Thirolf, M. Labiche, A. Blazhev, M. Kalkühler,P. Reiter, M. Seidlitz, N. Warr, A.O. Macchiavelli,H.B. Jeppesen, E. Fiori, G. Georgiev, G. Schrieder,S. Das Gupta, G. Lo Bianco, S. Nardelli,J. Butterworth, J. Johansen, and K. Riisager, Phys.

118 BIBLIOGRAPHY
Rev. Lett. 105, 252501 (2010).
[71] K. Yoneda, H. Sakurai, T. Gomi, T. Motobayashi,N. Aoi, N. Fukuda, U. Futukami, Z. Gacsi,Y. Higurashi, N. Imai, N. Iwasa, H. Iwasaki,T. Kubo, M. Kunibu, M. Kurokawa, Z. Liu,T. Minemura, A. Saito, M. Serata, S. Shimoura,S. Takeuchi, Y.X. Watanabe, K. Yamada,Y. Yanagisawa, K. Yogo, A. Yoshida, andM. Ishihara, Phys. Lett. B 499, 233-237 (2001).
[72] URL http://www.nndc.bnl.gov/ensdf/.[73] B.H. Wildenthal, Prog. Part. Nucl. Phys. 11, 5-51
(1984).
[74] G. Klotz, P. Baumann, M. Bounajma, A. Huck,A. Knipper, G. Walter, G. Marguier, C. Richard-Serre, A. Poves, and J. Retamosa, Phys. Rev. C 47,2502-2516 (1993).
[75] F. Maréchal, D.L. Balabanski, D. Borremans,J.-M. Daugas, F. de Oliveira Santos, P. Dessagne,G. Georgiev, J. Giovinazzo, S. Grévy, P. Himpe,C. Jollet, I. Matea, G. Neyens, F. Perrot, E. Poirier,O. Roig, M. Stanoiu, C. Stodel, J.-C. Thomas,K. Turzó, D. Yordanov, E. Caurier, F. Nowacki, andA. Poves, Phys. Rev. C 76, 059902(E) (2007).
[76] M. Kimura, Phys. Rev. C 75, 041302 (2007).
[77] H. Mach, L.M. Fraile, O. Tengblad, R. Boutami,C. Jollet, W.A. Płóciennik, D.T. Yordanov,M. Stanoiu, M.J.G. Borge, P.A. Butler, J. Cederkäll,P. Dessagne, B. Fogelberg, H. Fynbo, P. Hoff,A. Jokinen, A. Korgul, U. Köster, W. Kurcewicz,F. Maréchal, T. Motobayashi, J. Mrazek, G. Neyens,T. Nilsson, S. Pedersen, A. Poves, B. Rubio, andE. Ruchowska, Eur. Phys. J. A 25, 105-109 (2005).
[78] D. Miller, P. Adrich, B.A. Brown, V. Moeller,A. Ratkiewicz, W. Rother, K. Starosta,J.A. Tostevin, C. Vaman, and P. Voss, Phys.Rev. C 79, 054306 (2009).
[79] M. Keim, in “Proceeding of the InternationalConference on Exotic Nuclei and Atomic Masses(ENAM98)”, AIP Conf. Proc. No. 455, 50 (1998).
[80] M. Keim, U. Georg, A. Klein, R. Neugart,M. Neuroth, S. Wilbert, P. Lievens, L. Vermeeren,and B.A. Brown, Eur. Phys. J. A 8, 31-40 (2000).
[81] V. Tripathi, S.L. Tabor, P.F. Mantica, C.R. Hoffman,M. Wiedeking, A.D. Davies, S.N. Liddick,W.F. Mueller, T. Otsuka, A. Stolz, B.E. Tomlin,Y. Utsuno, and A. Volya, Phys. Rev. Lett. 94,162501 (2005).
[82] M.W. Cooper, S.L. Tabor, T. Baldwin,D.B. Campbell, C. Chandler, C.R. Hoffman,K.W. Kemper, J. Pavan, A. Pipidis, M.A. Riley,and M. Wiedeking, Phys. Rev. C 65, 051302(R)(2002).
[83] V. Tripathi, S.L. Tabor, P.F. Mantica, Y. Utsuno,P. Bender, J. Cook, C.R. Hoffman, Sangjin Lee,T. Otsuka, J. Pereira, M. Perry, K. Pepper,J.S. Pinter, J. Stoker, A. Volya, and D. Weisshaar,Phys. Rev. C 76, 021301(R) (2007).
[84] G. Münzenberg, Nucl. Instrum. Methods B70,265-275 (1992).
[85] H. Geissel, P. Armbruster, K.H. Behr, A. Brünle,K. Burkard, M. Chen, H. Folger, B. Franczak,H. Keller, O. Klepper, B. Langenbeck, F. Nickel,E. Pfeng, M. Pfützner, E. Roeckel, K. Rykaczewski,I. Schall, D. Schardt, C. Scheidenberger,K.-H. Schmidt, A. Schröter, T. Schwab,K. Sümmerer, M. Weber, G. Münzenberg,T. Brohm, H.-G. Clerc, M. Fauerbach,J.-J. Gaimard, A. Grewe, E. Hanelt, B. Knödler,M. Steiner, B. Voss, J. Weckenmann, C. Ziegler,A. Magel, H. Wollnik, J.P. Dufour, Y. Fujita,D.J. Vieira, and B. Sherrill, Nucl. Instrum.Methods B 70, 286-297 (1992).
[86] O. Kofoed-Hansen and K.O. Nielsen, Phys. Rev. 82,96-97 (1951).
[87] M. Lindroos, Conference Proceedings of EPAC2004, 45-49 (2004).
[88] D. Habs, O. Kester, T. Sieber, H. Bongers,S. Emhofer, P. Reiter, P.G. Thirolf, G. Bollen,J. Aystö, O. Forstner, H. Ravn, T. Nilsson,M. Oinonen, H. Simon, J. Cederkall, F. Ames,P. Schmidt, G. Huber, L. Liljeby, O. Skeppstedt,K.G. Rensfelt, F. Wenander, B. Jonson, G. Nyman,R. von Hahn H. Podlech, R. Repnow, C. Gund,D. Schwalm, A. Schempp, K.-U. Kühnel, C. Welsch,U. Ratzinger, G. Walter, A. Huck, K. Kruglov,M. Huyse, P. Van den Bergh, P. Van Duppen,L. Weissman, A.C. Shotter, A.N. Ostrowski,T. Davinson, P.J. Woods, J. Cub, A. Richter,and G. Schrieder, Hyperfine Interact. 129, 43-66(2000).
[89] P. Gregers Hansen, History of CERN 3, 327-413(1996).
[90] C. Lefevre, ISOLDE brochure (English version),unpublished (2010).
[91] URL http://isolde.web.cern.ch/ISOLDE/.[92] P. Van Duppen and K. Riisager, J. Phys. G: Nucl.
Part. Phys. 38, 024005 (2011).
[93] A. Gottberg, A. Andrighetto, P. Bricault,E. Cottereau, P. Delahaye, H. Franberg,F. Gramegna, I. Günther-Leopold, C. Jost, C. Lau,R. Luis, N. Lecesne, T. Marchi, M.G. St.-Laurant,M. Cheikh Mhamed, V. Panteleev, B. Roussiere,D. Scarpa, T. Stora, D. Stracener, and L. Tecchio,Conference Poster at ARIS 2011, unpublished(2011).
[94] B. Mustapha and J.A. Nolen, Nucl. Instrum.Methods B 204, 286-292 (2003).
[95] U. Köster, Radiochim. Acta 89, 749-756 (2001).
[96] U. Köster, Doctoral Dissertation “Ausbeutenund Spektroskopie radioaktiver Isotope beiLOHENGRIN und ISOLDE”, TU Munich (2000).
[97] A.H.M. Evensen, R. Catherall, P. Drumm, P. VanDuppen, O.C. Jonsson, E. Kugler, J. Lettry,O. Tengblad, V. Tikhonov, and H.L. Ravn, Nucl.Instrum. Methods B 126, 160-165 (1997).
[98] U. Köster, V.N. Fedoseyev, A.N. Andreyev,U.C. Bergmann, R. Catherall, J. Cederkäll,M. Dietrich, H. De Witte, D.V. Fedorov,

BIBLIOGRAPHY 119
L. Fraile, S. Franchoo, H. Fynbo, U. Georg,T. Giles, M. Gorska, M. Hannawald, M. Huyse,A. Joinet, O.C. Jonsson, K.L. Kratz, K. Kruglov,Ch. Lau, J. Lettry, V.I. Mishin, M. Oinonen,K. Partes, K. Peräjärvi, B. Pfeiffer, H.L. Ravn,M.D. Seliverstov, P. Thirolf, K. Van de Vel, P. VanDuppen, J. Van Roosbroeck, and L. Weissman,Nucl. Instrum. Methods B 204, 347-352 (2003).
[99] M.J. Dresser, J. Appl. Phys. 39, 338-339 (1968).
[100] V.I. Mishin, V.N. Fedoseyev, H.J. Kluge,V.S. Letokhov, H.L. Ravn, F. Scheerer, Y. Shirakabe,S. Sundell, and O. Tengblad, Nucl. Instrum.Methods B 73, 550-560 (1993).
[101] URL http://www.scholarpedia.org/article/The_ISOLDE_facility/.
[102] E. Kugler, Hyperfine Interact. 129, 23-42 (2000).
[103] D. Habs, G. Correia, A. Jokinen, J. Lettry,M. Lindroos, E. Kugler, H. Raimbault-Hartmann,H.L. Ravn, O. Tengblad, P. Van Duppen,B. Jonson, P.G. Hansen, L. Liljeby, K.G. Rensfelt,R. Wyss, M. Grieser, T. Härtlein, R. von Hahn,C.M. Kleffner, P. Reiter, R. Repnow, D. Schwalm,P. Thirolf, H. Deitinghoff, A. Schempp, H. Backe,G. Bollen, G. Huber, K.L. Kratz, J. Kluge,U. Ratzinger, E. Nolte, J. de Boer, K.P. Lieb,M. Schumacher, G. Schrieder, P. Butler, P. Nolan,D. Warner, B. Gelletly, P. Baumann, Ph. Dessagne,A. Huck, A. Knipper, Ch. Miehé, G. Walter,G. Marguier, C. Richard-Serre, B. Visentin,J. Faure, E.D. Donets, E. Beebe, M. Huyse,D. Forkel, G. Sletten, and B. Herskind, Proposalto the ISOLDE Committee, CERN/ISC 94-25ISC/P68, unpublished (1994).
[104] O. Kester, T. Sieber, S. Emhofer, F. Ames,K. Reisinger, P. Reiter, P.G. Thirolf, R. Lutter,D. Habs, B.H. Wolf, G. Huber, P. Schmidt,A.N. Ostrowski, R. von Hahn, R. Repnow,J. Fitting, M. Lauer, H. Scheit, D. Schwalm,H. Podlech, A. Schempp, U. Ratzinger, O. Forstner,F. Wenander, J. Cederkäll, T. Nilsson, M. Lindroos,H. Fynbo, S. Franchoo, U. Bergmann, M. Oinonen,J. Äystö, P. Van den Bergh, P. Van Duppen,M. Huyse, N. Warr, D. Weisshaar, J. Eberth,B. Jonson, G. Nyman, M. Pantea, H. Simon,G. Schrieder, A. Richter, O. Tengblad, T. Davinson,P.J. Woods, G. Bollen, L. Weissmann, L. Liljeby,and K.-G. Rensfelt, Nucl. Instrum. Methods B 204,20-30 (2003).
[105] F. Wenander, J. Inst. 5, C10004 (2010).
[106] R. Geller, Annu. Rev. Nucl. Sci. 40, 15-44 (1990).
[107] E.D. Donets, Rev. Sci. Instrum. 69, 614-619(1998).
[108] P. Schmidt, F. Ames, G. Bollen, O. Forstner,G. Huber, M. Oinonen, and J. Zimmer, Nucl. Phys.A 701, 550-556 (2002).
[109] F. Ames, G. Bollen, P. Delahaye, O. Forstner,G. Huber, O. Kester, K. Reisinger, and P. Schmidt,Nucl. Instrum. Methods A 538, 17-32 (2005).
[110] A. Gustafsson, A. Herlert, and F. Wenander, Nucl.
Instrum. Methods A 626-627, 8-15 (2011).
[111] F. Wenander, B. Jonson, L. Liljeby, and G. Nyman,CERN-OPEN-2000-320, unpublished (2000).
[112] F. Wenander, Nucl. Phys. A 701, 528-536 (2002).
[113] R. Rao, O. Kester, T. Sieber, D. Habs, andK. Rudolph, Nucl. Instrum. Methods A 427,170-176 (1999).
[114] J. Eberth, G. Pascovici, H.G. Thomas, N. Warr,D. Weißhaar, D. Habs, P. Reiter, P. Thirolf,D. Schwalm, C. Gund, H. Scheit, M. Lauer,P. Van Duppen, S. Franchoo, M. Huyse,R.M. Lieder, W. Gast, J. Gerl, and K.P. Lieb,Prog. Part. Nucl. Phys. 46, 389-398 (2001).
[115] V. Bildstein, R. Gernhäuser, Th. Kröll, R. Krücken,R. Raabe, and P. Van Duppen, Prog. Part. Nucl.Phys. 59, 386-388 (2007).
[116] A.N. Ostrowski, S. Cherubini, T. Davinson,D. Groombridge, A.M. Laird, A. Musumarra,A. Ninane, A. di Pietro, A.C. Shotter, andP.J. Woods, Nucl. Instrum. Methods A 480,448-455 (2002).
[117] J. Cub, C. Gund, D. Pansegrau, G. Schrieder, andH. Stelzer, Nucl. Instrum. Methods A 453, 522-524(2000).
[118] W. Weinzierl, Diploma Thesis “Isobarentrennungmit einer Braggkammer bei REX-ISOLDE”, TUMunich (2006).
[119] H. Bethe, Ann. Phys. (Leipzig) 397, 325-400(1930).
[120] H. Ower, Doctoral Dissertation “High Spin Statesof 232Th, 234U and 236U”, J.W. Goethe-University ofFrankfurt a.M., unpublished (1980).
[121] H. Ower, J. Gerl, and H. Scheit, “Multiple CoulombExcitation Program CLX”, computer code.
[122] T. Czosnyka, D. Cline and C.Y. Wu, Bull. Am. Phys.Soc. 28, 745 (1983).
[123] T. Czosnyka, D. Cline and C.Y. Wu, Internallaboratory report UR/NSRL 308/1986, Universityof Rochester, unpublished (1986).
[124] K. Alder, A. Bohr, T. Huus, B. Mottelson, andA. Winther, Rev. Mod. Phys. 28, 432-542 (1956).
[125] K. Alder and A. Winther, “ElectromagneticExcitation – Theorie of Coulomb Excitation withHeavy Ions”, North-Holland Publishing Company,Amsterdam Oxford (1975).
[126] D. Cline, Ann. Rev. Nucl. Part. Sci. 36, 683-716(1986).
[127] R. Lutter, O. Schaile, K. Schöffel, K. Steinberger,and C. Broude, “MARaBOOU – MBS andROOT Based Online/Offline Utility”, URLwww.bl.physik.uni-muenchen.de/marabou/html/.
[128] H.G. Essel and N. Kurz, “GSI Multi-BranchSystem”, URL http://www-wnt.gsi.de/daq/.
[129] R. Brun and F. Rademakers, “ROOT – A DataAnalysis Framework”, URL http://root.cern.ch/.
[130] R.B. Firestone, Nucl. Data. Sheets 108, 1-78(2008).
[131] J. Lettry, R. Catherall, P. Drumm, P. Van

120 BIBLIOGRAPHY
Duppen, A.H.M. Evensen, G.J. Focker, A. Jokinen,O.C. Jonsson, E. Kugler, and H. Ravn, Nucl.Instrum. Methods B 126, 130-134 (1997).
[132] J. Van de Walle, V. Bildstein, N. Bree, J. Cederkäll,P. Delahaye, J. Diriken, A. Ekström, V.N. Fedosseev,R. Gernhäuser, A. Gustafsson, A. Herlert,M. Huyse, O. Ivanov, T. Kröll, R. Krücken,B. Marsh, N. Partronis, P. Van Duppen, D. Voulot,N. Warr, F. Wenander, K. Wimmer, and S.M. Lenzi,Eur. Phys. J. A 42, 401-406 (2009).
[133] M. Kalkühler, Thesis submitted as part of the FirstState Examination “γ-Spektroskopie von 31Mgin inverser Kinematik”, University of Cologne(2008).
[134] J. Blachot, Nucl. Data Sheets 107, 355-506(2006).
[135] C.M. Mattoon, F. Sarazin, G. Hackman,E.S. Cunningham, R.A.E. Austin, G.C. Ball,R.S. Chakrawarthy, P. Finlay, P.E. Garrett,G.F. Grinyer, B. Hyland, K.A. Koopmans,J.R. Leslie, A.A. Phillips, M.A. Schumaker,H.C. Scraggs, J. Schwarzenberg, M.B. Smith,C.E. Svensson, J.C. Waddington, P.M. Walker,B. Washbrook, and E. Zganjar, Phys. Rev. C 75,017302 (2007).
[136] P.M. Endt, At. Data Nucl. Data Tables 55, 171-197(1993).
[137] M. Shamsuzzoha Basunia, Nucl. Data Sheets 113,909-972 (2012).
[138] J. Blachot, Nucl. Data Sheets 108, 2035-2172(2007).
[139] K. Kitao, Y. Tendow, and A. Hashizume, Nucl. DataSheets 96, 241-390 (2002).
[140] URL http://bricc.anu.edu.au/.[141] Z. Elekes, Z. Dombrádi, A. Saito, N. Aoi, H. Baba,
K. Demichi, Z. Fülöp, J. Gibelin, T. Gomi,H. Hasegawa, N. Imai, M. Ishihara, H. Iwasaki,S. Kanno, S. Kawai, T. Kishida, T. Kubo, K. Kurita,Y. Matsuyama, S. Michimasa, T. Minemura,T. Motobayashi, M. Notani, T. Ohnishi, H.J. Ong,S. Ota, A. Ozawa, H.K. Sakai, H. Sakurai,S. Shimoura, E. Takeshita, S. Takeuchi, M. Tamaki,Y. Togano, K. Yamada, Y. Yanagisawa, andK. Yoneda, Phys. Rev. C 73, 044314 (2006).
[142] I. Hamamoto, Phys. Rev. C 76, 054319 (2007).
[143] A. Herlert and Y. Kadi, J. Phys.: Conf. Ser. 312,052010 (2011).
[144] URL http://hie-isolde.web.cern.ch/hie-isolde/.[145] E. Siesling, Report at the 3rd HIE-ISOLDE Man-
agement meeting, CERN, unpublished (2012).
[146] Y. Kadi, Report at the 3rd HIE-ISOLDE Manage-ment meeting, CERN, unpublished (2012).
[147] N. Hinohara, K. Sato, K. Yoshida, T. Nakatsukasa,M. Matsuo, and K. Matsuyanagi, Phys. Rev. C 84,061302(R) (2011).
[148] D.T. Yordanov, M. Kowalska, K. Blaum,M. De Rydt, K.T. Flanagan, P. Lievens, R. Neugart,G. Neyens, and H.H. Stroke, Phys. Rev. Lett. 99,
212501 (2007).
[149] G. Neyens, Phys. Rev. C 84, 064310 (2011).
[150] M. Kimura, arXiv:1105.3281v1.
[151] V. Bildstein, R. Gernhäuser, T. Kröll, R. Krücken,K. Wimmer, P. Van Duppen, M. Huyse, N. Patronis,and R. Raabe, Eur. Phys. J. A 48, 85 (2012).
[152] H. Grawe, Acta Phys. Pol. B 34, 2267-2276(2003).
[153] J.I. Prisciandaro, P.F. Mantica, B.A. Brown,D.W. Anthony, M.W. Cooper, A. Garcia,D.E. Groh, A. Komives, W. Kumarasiri,P.A. Lofy, A.M. Oros-Peusquens, S.L. Tabor,and M. Wiedeking, Phys. Lett. B 510, 17-23(2001).
[154] H. Grawe, Lect. Notes Phys. 651, 33-75 (2004).
[155] T. Otsuka, T. Suzuki, R. Fujimoto, D. Abe,H. Grawe, Y. Akaishi, Acta Phys. Pol. B 36,1213-1220 (2005).
[156] S.N. Liddick, P.F. Mantica, R.V.F. Janssens,R. Broda, B.A. Brown, M.P. Carpenter, B. Fornal,M. Honma, T. Mizusaki, A.C. Morton, W.F. Mueller,T. Otsuka, J. Pavan, A. Stolz, S.L. Tabor,B.E. Tomlin, and M. Wiedeking, Phys. Rev. Lett.92, 072501 (2004).
[157] H. Grawe, K. Langanke, and G. Martínez-Pinedo,Rep. Prog. Phys. 70, 1525-1582 (2007).
[158] M. Honma, T. Otsuka, B.A. Brown, andT. Mizusaki, Eur. Phys. J. A 25, 499-502 (2005).
[159] E. Caurier, F. Nowacki, and A. Poves, Eur. Phys. J.A 15, 145-150 (2002).
[160] M. Honma, T. Otsuka, B.A. Brown, andT. Mizusaki, Phys. Rev. C 69, 034335 (2004).
[161] L. Coraggio, A. Covello, A. Gargano, and N. Itaco,Phys. Rev. C 80, 044311 (2009).
[162] S.M. Lenzi, F. Nowacki, A. Poves, and K. Sieja,Phys. Rev. C 82, 054301 (2010).
[163] K. Kaneko, Y. Sun, M. Hasegawa, and T. Mizusaki,Phys. Rev. C 78, 064312 (2008).
[164] A. Gade, R.V.F Janssens, D. Bazin, R. Broda,B.A. Brown, C.M. Campbell, M.P. Carpenter,J.M. Cook, A.N. Deacon, D.-C. Dinca, B. Fornal,S.J. Freeman, T. Glasmacher, P.G. Hansen, B.P. Kay,P.F. Mantica, W.F. Mueller, J.R. Terry, J.A. Tostevin,and S. Zhu, Phys. Rev. C 74, 021302(R) (2006).
[165] M. Rejmund, S. Bhattacharyya, A. Navin,W. Mittig, L. Gaudefroy, M. Gelin, G. Mukherjee,F. Rejmund, P. Roussel-Chormaz, and C. Theisen,Phys. Rev. C 76, 021304(R) (2007).
[166] R.V.F. Janssens, B. Fornal, P.F. Mantica, B.A. Brown,R. Broda, P. Bhattacharyya, M.P. Carpenter,M. Cinausero, P.J. Daly, A.D. Davies,T. Glasmacher, Z.W. Grabowski, D.E. Groh,M. Honma, F.G. Kondev, W. Królas, T. Lauritsen,S.N. Liddick, S. Lunardi, N. Marginean,T. Mizusaki, D.J. Morrissey, A.C. Morton,W.F. Mueller, T. Otsuka, T. Pawlat, D. Seweryniak,H. Schatz, A. Stolz, S.L. Tabor, C.A. Ur, G. Viesti,I. Wiedenhöfer, and J. Wrzesinski, Phys. Lett. B

BIBLIOGRAPHY 121
546, 55-62 (2002).
[167] P.F. Mantica, A.C. Morton, B.A. Brown,A.D. Davies, T. Glasmacher, D.E. Groh,S.N. Liddick, D.J. Morrissey, W.F. Mueller,H. Schatz, A. Stolz, S.L. Tabor, M. Honma,M. Horoi, and T. Otsuka, Phys. Rev. C 67, 014311(2003).
[168] D.E. Appelbe, C.J. Barton, M.H. Muikku,J. Simpson, D.D. Warner, C.W. Beausang,M.A. Caprio, J.R. Cooper, J.R. Novak, N.V. Zamfir,R.A.E. Austin, J.A. Cameron, C. Malcolmson,J.C. Waddington, and F.R. Xu, Phys. Rev. C 67,034309 (2003).
[169] D.-C. Dinca, R.V.F. Janssens, A. Gade, D. Bazin,R. Broda, B.A. Brown, C.M. Campbell,M.P. Carpenter, P. Chowdhury, J.M. Cook,A.N. Deacon, B. Fornal, S.J. Freeman,T. Glasmacher, M. Honma, F.G. Kondev,J.-L. Lecouey, S.N. Liddick, P.F. Mantica,W.F. Mueller, H. Olliver, T. Otsuka, J.R. Terry,B.E. Tomlin, and K. Yoneda, Phys. Rev. C 71,041302(R) (2005).
[170] A. Bürger, T.R. Saito, H. Grawe, H. Hübel,P. Reiter, J. Gerl, M. Górska, H.J. Wollersheim,A. Al-Khatib, A. Banu, T. Beck, F. Becker,P. Bednarczyk, G. Benzoni, A. Bracco, S. Brambilla,P. Bringel, F. Camera, E. Clément, P. Doornenbal,H. Geissel, A. Görgen, J. Grebosz, G. Hammond,M. Hellström, M. Honma, M. Kavatsyuk,M. Kmiecik, I. Kojouharov, W. Korten, N. Kurz,R. Lozeva, A. Maj, S. Mandal, B. Million,S. Muralithar, A. Neußer, F. Nowacki, T. Otsuka,Z. Podolyák, N. Saito, A.K. Singh, H. Weick,C. Wheldon, O. Wieland, and M. Winkler, Phys.Lett. B 622, 29-34 (2005).
[171] B. Fornal, S. Zhu, R.V.F. Janssens, M. Honma,R. Broda, P.F. Mantica, B.A. Brown, M.P. Carpenter,P.J. Daly, S.J. Freeman, Z.W. Grabowski,N.J. Hammond, F.G. Kondev, W. Królas,T. Lauritsen, S.N. Liddick, C.J. Lister, E.F. Moore,T. Otsuka, T. Pawlat, D. Seweryniak, B.E. Tomlin,and J. Wrzesinski, Phys. Rev C 70, 064304(2004).
[172] R. du Rietz, J. Ekman, D. Rudolph, C. Fahlander,A. Dewald, O. Möller, B. Saha, M. Axiotis,M.A. Bentley, C. Chandler, G. de Angelis, F. DellaVedova, A. Gadea, G. Hammond, S.M. Lenzi,N. Marginean, D.R. Napoli, M. Nespolo, C. Rusu,and D. Tonev, Phys. Rev. Lett. 93, 222501 (2004).
[173] A. Poves, F. Nowacki, and E. Caurier, Phys. Rev. C72, 047302 (2005).
[174] T.R. Rodriguez and J.L. Egido, Phys. Rev. Lett. 99,062501 (2005).
[175] A. Gavron, Phys. Rev. C 21, 230-236 (1980).
[176] A. Dewald, in “Proceedings: The ’98 Seminar onNuclear Physics with Radioactive Ion Beam andHigh Spin Nuclear Structure, Lanzhou, China”,Atomic Energy Press, Beijing (1999).
[177] J. Eberth, H.G. Thomas, P. Von Brentano,R.M. Lieder, H.M. Jäger, H. Kämmerfing, M. Berst,
D. Gutknecht, and R. Henck, Nucl. Instrum.Methods A 369, 135-140 (1996).
[178] A. Dewald, S. Harissopulos, and P. von Brentano,Z. Phys. A 334, 163-175 (1989).
[179] G. Böhm, A. Dewald, P. Petkov, and P. vonBrentano, Nucl. Instrum. Methods A 329, 248-261(1993).
[180] D. Bazin, O. Tarasov, M. Lewitowicz, and O. Sorlin,Nucl. Instrum. Methods A 482, 307-327 (2002).
[181] O. Tarasov and D. Bazin, Nucl. Phys. A 746,411-414 (2004).
[182] B. Saha, A. Dewald, O. Möller, R. Peusquens,K. Jessen, A. Fitzler, T. Klug, D. Tonev, P. vonBrentano, J. Jolie, B.J.P. Gall, and P. Petkov, Phys.Rev. C 70, 034313 (2004).
[183] J. Morel, S. Sepman, M. Rasko, E. Terechtchenko,and J.U. Delgado, Appl. Radiat. Isotopes 60,341-346 (2004).
[184] P. Petkov, Nucl. Instrum. Methods A 349, 289-291(1994).
[185] B. Saha, “Napatau – or Tk-Lifetime-Analysis”,Institut für Kernphysik der Universität zu Köln, un-published (2003).
[186] J. Huo and S. Huo, Nucl. Data Sheets 107,1393-1530 (2006).
[187] J. Huo, S. Huo, and C. Ma, Nucl. Data Sheets 108,773-882 (2007).
[188] E. Caurier and F. Nowacki, (to be published)private communication (2006).
[189] W. Rother, A. Dewald, H. Iwasaki, S.M. Lenzi,K. Starosta, D. Bazin, T. Baugher, B.A. Brown,H.L. Crawford, C. Fransen, A. Gade, T.N. Ginter,T. Glasmacher, G.F. Grinyer, M. Hackstein, G. Ilie,J. Jolie, S. McDaniel, D. Miller, P. Petkov,T. Pissulla, A. Ratkiewicz, C.A. Ur, P. Voss,K.A. Walsh, D. Weisshaar, and K.O. Zell, Phys. Rev.Lett. 106, 022502 (2011).
[190] L. Grodzins, Phys. Lett. 2, 88-91 (1962).


Acknowledgments
My gratitude goes to many people, who gave support to this thesis and made it a success:
my supervisor Prof. P. Reiter for giving me the great opportunity to work in this exciting field of nu-clear structure physics. Many results of this work originate from fruitful discussions with him and hiscolleagues;
Dr. O. Möller, Dr. D. Mücher, and Dr. J. Van de Walle for their effort and patience to explain all thesteps of careful data analysis;
Dr. F. Wenander, D. Voulot and E. Piselli – representative for the REX-ISOLDE collaboration – for thechallenging preparation of the radioactive ion beams and its operation day and night;
L. Steinert, O. Rudolph, and U. Werner for operating the Cologne tandem accelerator;
Dr. N. Warr, Dr. J. Pakarinen, Dr. C. Fransen, Dr. T. Davinson, R. Lutter, Dr. H. Hess, and Dr. H. DeWitte, preparing the experimental setups at CERN and Cologne;
Dr. K.O. Zell, as well as the personnel of the target labs of the TU Munich and GSI, for the preparationof the targets;
Dr. A. Blazhev, Dr. V. Bildstein, N. Bree, Dr. B. Bruyneel, S. Christen, Dr. E. Clément, Dr. D.D. DiJulio,Dr. J. Diriken, Dr. A. Ekstrøm, F. Finke, Dr. L.P. Gaffney, Dr. K. Geibel, A. Holler, Dr. G. Ilie,N. Kesteloot, Dr. T. Kotthaus, Prof. T. Kröll, Dr. P. Kudejová, Dr. B. Melon, Dr. J.-M. Régis, Dr. B. Saha,Dr. M. Scheck, B. Siebeck, Dr. I. Stefanescu, J. Taprogge, Dr. A. Wendt, Dr. A. Wiens, Dr. K. Wimmer,and Dr. K. Wrzosek-Lipska for taking shifts during the different experiments at CERN and Cologne;
Prof. H. Grawe and Prof. S.M. Lenzi performing shell model calculations included in this work;
Prof. P.A. Butler, Prof. J. Cederkäll, Dr. A. Dewald, Prof. L.M. Fraile, Prof. R. Gernhäuser, Prof. M. Huyse,Prof. J. Jolie, Prof. R. Krücken, Prof. P. Van Duppen, and Prof. P. von Brentano for their critical questionsand conductive input to the publications, which are part of this thesis;
all present and former colleagues of the working group of Prof. P. Reiter and all members of the Institutefor Nuclear Physics of the University of Cologne: Thank you for being such good colleagues.
Special thanks go to my wife Marijke and my family, giving support in all my studies, especially duringthe last months of my work on this doctoral thesis. I know that these have been stressful and busytimes for you. I love you.
This work has been supported by the German BMBF under contracts 06K-167, 06KY205I, 05P09PKCI5,and 05P12PKFNE, by the EUROpean Nuclear Structure Integrated Infrastructure Initiative (EURONS,RII3-CT-2004-506065), and by the European Nuclear Science and Applications Research (ENSAR)under project number 262010.


Erklärung
Ich versichere, dass ich die von mir vorgelegte Dissertation selbstständig angefertigt, die benutztenQuellen und Hilfsmittel vollständig angegeben und die Stellen der Arbeit – einschließlich Tabellen,Karten und Abbildungen –, die anderen Werken im Wortlaut oder dem Sinn nach entnommen sind, injedem Einzelfall als Entlehnung kenntlich gemacht habe; dass diese Dissertation noch keiner anderenFakultät oder Universität zur Prüfung vorgelegen hat; dass sie – abgesehen von unten angegebenenTeilpublikationen – noch nicht veröffentlicht worden ist sowie, dass ich eine solche Veröffentlichungvor Abschluss des Promotionsverfahrens nicht vornehmen werde. Die Bestimmungen dieser Promo-tionsordnung sind mir bekannt. Die von mir vorgelegte Dissertation ist von Prof. Dr. P. Reiter betreutworden.
Köln, 29.10.2012 Michael Seidlitz
Teilpublikationen:
M. Seidlitz, D. Mücher, P. Reiter, V. Bildstein, A. Blazhev, N. Bree, B. Bruyneel, J. Cederkäll, E. Clément,T. Davinson, P. Van Duppen, A. Ekstrøm, F. Finke, L.M. Fraile, K. Geibel, R. Gernhäuser, H. Hess,A. Holler, M. Huyse, O. Ivanov, J. Jolie, M. Kalkühler, T. Kotthaus, R. Krücken, R. Lutter, E. Piselli,H. Scheit, I. Stefanescu, J. Van de Walle, D. Voulot, N. Warr, F. Wenander, and A. WiensCoulomb excitation of 31MgPhysics Letters B 700, 181-186 (2011).
M. Seidlitz, P. Reiter, A. Dewald, O. Möller, B. Bruyneel, S. Christen, F. Finke, C. Fransen, M. Górska,H. Grawe, A. Holler, G. Ilie, T. Kotthaus, P. Kudejová, S.M. Lenzi, S. Mandal, B. Melon, D. Mücher,J.-M. Régis, B. Saha, P. von Brentano, A. Wiens, and K.O. ZellPrecision lifetime measurements of the first 2+ and 4+ states in 56Cr at the N= 32 subshell closurePhysical Review C 84, 034318 (2011).


Curriculum vitae
Personalia
Name: Michael Seidlitz
Geburtsdatum: 8. Dezember 1982
Geburtsort: Hachenburg
Eltern: Klaus SeidlitzMargit Seidlitz, geb. Siegmund
Familienstand: verheiratet
Staatsangehörigkeit: Deutsch
Schulausbildung
08/1989 – 07/1993 Grundschule Wolfsteinschule, Bad Marienberg08/1993 – 07/1996 Privates Gymnasium Marienstatt08/1996 – 06/2002 Städtisches Hölderlin-Gymnasium, Köln
Abschluss mit Abitur
Hochschulstudium
10/2001 – 09/2002 Vorlesungen und Übungen zu Physik I + IIim Rahmen der Teilnahme am Projekt „Schüler an der Universität“ derHochbegabtenstiftung der Kreissparkasse Köln und der Universität zu Köln
10/2002 Immatrikulation an der Universität zu Kölnim Diplomstudiengang Physik
04/2005 Abschluss des Vordiploms im Fach Physik10/2008 Verleihung des Diploms im Fach Physik
Thema der Diplomarbeit: „Coulomb-Anregung von instabilen, ungeradenMg-Isotopen“
seit 11/2008 Promotionsstudium am Institut für Kernphysik der Universität zu Köln
Arbeitsverhältnisse
01/2005 – 10/2008 Studentische Hilfskraftam Institut für Kernphysik der Universität zu Köln
seit 11/2008 Wissenschaftlicher Mitarbeiteram Institut für Kernphysik der Universität zu Köln