Optical magnetic resonance tomography and laser ... · Laser spectroscopy of cesium atoms trapped...
115
Aus dem Departement f¨ ur Physik Universit¨ at Freiburg (Schweiz) Optical magnetic resonance tomography and Laser spectroscopy of cesium atoms trapped in solid helium Inaugural-Dissertation zur Erlangung der W¨ urde eines Doctor rerum naturalium der Mathematisch-Naturwissenschaftlichen Fakult¨ at der Universit¨ at Freiburg in der Schweiz vorgelegt von Daniel Nettels aus M¨ unster (Deutschland) Nummer der Dissertation: Paulusdruckerei Freiburg 2003
-
Upload
nguyenkhanh -
Category
Documents
-
view
231 -
download
0
Transcript of Optical magnetic resonance tomography and laser ... · Laser spectroscopy of cesium atoms trapped...
Aus dem Departement fur Physik
Universitat Freiburg (Schweiz)
Optical magnetic resonance tomography
and
Laser spectroscopy of cesium atoms trapped in solid
helium
Inaugural-Dissertation
zur Erlangung der Wurde einesDoctor rerum naturalium
der Mathematisch-Naturwissenschaftlichen Fakultatder Universitat Freiburg in der Schweiz
vorgelegt von
Daniel Nettels
aus Munster (Deutschland)
Nummer der Dissertation:
Paulusdruckerei Freiburg
2003
Abstract
The present thesis has resulted from my research work carried out at the University of Bonn
and at the University of Fribourg. The thesis can be roughly divided into two distinct parts,
which reflect the research carried out in both places. In Bonn I worked on optical magnetic
resonance tomography of atoms in the gas phase, while all of my time in Fribourg was devoted
to study specific problems of foreign atoms trapped in solid helium crystals. The results are
given in terms of five publications (two published, 2 accepted for publication and one in the
process of being submitted).
The magnetic resonance tomography discussed in the first part is a novel technique, which
allowed us the two-dimensional imaging of the motion of spin-polarized alkali atoms in a buffer
gas using magnetic resonance spectroscopy combined with optical preparation and optical read-
out. I have applied this novel technique to study the diffusion of cesium atoms in a gas of
neon atoms, and to determine the diffusion coefficient D0 of that motion to be 0.20(1) cm2/s in
standard conditions.
The second and main part of this work presents research on the optical and magneto-optical
properties of cesium atoms trapped in solid 4He. The experiments were performed either in
the hexagonal close-packed (hcp) or in the body-centered cubic (bcc) phase of solid helium.
The matrix-isolated cesium atoms reside in bubble-like cavities, which have a spherical shape,
when the atom is in its radially symmetric 6S1/2 ground state. The spherical symmetry and the
purely none-magnetic properties of helium make that extremely long electron spin relaxation
times (≈ 1s) of the cesium atoms can be observed in the isotropic bcc phase. On the other hand,
magnetic resonance lines measured in the hcp phase are significantly broader (by three orders of
magnitude) and show a complex substructure due to a small deformation of the bubble shape.
There was a long standing mystery in the literature regarding the fluorescence of alkali
atoms in condensed helium: while the heavy alkalis Cs and Rb emitted fluorescence light, no
fluorescence could be detected from the lighter alkali atoms, and it was commonly accepted that
the emission is quenched by the formation of exciplex molecules, i.e., bound states of excited
alkali atoms and one or several helium atoms. It was also believed that such exciplexes would
not exist for cesium. In the present work the research was extended to the investigation of the
atomic D2-excitation and to a detailed study of the subconsequent deexcitation of the 6P3/2
state. No direct D2 emission had been observed in the past. Only a weak D1 emission following
the D2 excitation was detected indicating the existence a quenching channel to the 6P1/2 state.
By extending the wavelength range of our detection system two new, broad and intense emission
lines were discovered at 7130 cm−1 and 10520 cm−1. The energetically higher emission line was
recently also observed in a cold helium gas environment and in liquid helium by a group at Kyoto
University. The origin of this line could be attributed to the decay of Cs∗He2 exciplexes, where
the electronic state of this complex is denoted as AΠ3/2 in molecular spectroscopic notation.
The second line could not be observed in He gas nor in liquid He and may occur in a solid
helium environment only. In order to assign the new lines to specific exciplex structures we have
performed model calculation of the emission spectra of decaying Cs∗Hen exciplexes using semi-
empirical Cs-He pair potentials. By comparison with the experimental data it could be confirmed
that the first emission line corresponds indeed to the decay of Cs∗He2. The energetically lower
second line originates from a different exciplex. Our calculations suggest that the corresponding
structure consist of an excited cesium atom of dumbbell-like shaped electronic configuration
with a ring of n helium atoms bound around its waist. The exact number n of bound helium
atoms could not definitely assigned, because of a lacking precision of the calculation. However,
Cs∗He6 seems to be the most probable candidate with our present knowledge. Cs∗Hen exciplexes
with n > 2 were not observed previously, thus seemingly confirming statements found in the
literature that these complexes are not stable. Finally, a third, very faint emission line was
discovered at 10160 cm−1, which could be attributed to the decay of Cs∗He2 from the electronic
AΠ1/2 state. This line was observed following D1-excitation.
Another part of the present work is the study of multi-photon processes in the magnetic
resonance spectra in the ground state of cesium atoms trapped in solid helium. The experimental
technique used in these experiments as in the tomography experiments is optically-detected
magnetic resonance. In this technique resonant circularly polarized laser light is used both to
spin polarize the sample and to detect magnetic resonance transitions. Multi-photon transitions,
i.e. processes in which several radio-frequency photons are absorbed simultaneously in the
magnetic resonance transition, were in the focus of interest. These processes become observable
when the magnetic sublevels are split by the quadratic Zeeman effect. The long relaxation
times of spin coherences of Cs in solid He allowed us to spectrally resolve such transitions
in fields as low as 1 mT. We have observed all allowed multi-photon transitions up to the
∆M = 8 transition in the F = 4-state. Multi-photon transitions can find applications in
magnetometry, in the suppression of systematic effects in edm experiments and may further allow
one to study relaxation phenomena in doped He crystals. The demonstration of this latter feature
is still hindered by inhomogeneous line broadening. We compare our experimental spectra with
theoretical spectra obtained from numerical solutions of the Liouville equation including optical
pumping and the interaction with the static and oscillating fields. The experimental spectra
are very well described when allowing in the calculations for a magnetic field inhomogeneity of
2 · 10−5.We have also performed a theoretical study of the influence of stochastic perturbations of
given multipole orders on the various multi-photon coherences. Algebraic and numerical results
for perturbations of both dipolar and quadrupolar symmetry were obtained, which may in future
help to identify the mechanism governing spin relaxation in helium crystals.
The original idea behind the study of alkali doped helium crystals, pursued in our group
since almost a decade, is to design a novel technique to search for a permanent electric dipole
moment (edm) of cesium. The existence of such an edm would be a direct proof of a violation of
time reversal symmetry (T-violation) in an atomic system. Edm experiments search for a linear
Stark shift of a very narrow magnetic resonance line. The necessary experimental conditions of
long spin relaxation times and the possibility to apply high electric fields are both fulfilled by
atoms trapped in helium crystals. A setup for performing magnetic resonance experiments in
the presence of strong electric fields is shortly presented in the work. Electric fields up to 30
kV/cm could be applied in our samples. Because of technical problems Stark effect studies has
not led to conclusive results yet.
Zusammenfassung
Die vorliegende Arbeit enthalt die Ergebnisse meiner Forschungsarbeit an der Universitat
Bonn und an der Universitat Fribourg (Schweiz). Sie beinhaltend zwei Teile, entsprechend
den unterschiedlichen Themen, die ich an diesen Orten behandelt habe. In Bonn arbeitete
ich an optischer Magnetresonanztomographie von Atomen in der Gasphase, wahrend ich mich
in Fribourg der Untersuchung von in festen Heliumkristallen eingeschlossenen Fremdatomen
widmete. Die Resultate sind in Form von funf Veroffentlichungen dargestellt: zwei publizierte,
zwei zur Publikation akzeptierte und ein im Prozess der Einreichung befindlicher Artikel.
Bei der im ersten Teil behandelten optischen Magnetresonanztomographie handelt es sich um
eine neuartige Technik, die die zweidimensionale Bildgebung der Bewegung spin-polarisierter Al-
kaliatome erlaubt. Sie unterscheidet sich von konventioneller Magnetresonanztomographie durch
ihre optische Praparation und ihren optischen Nachweis von Spinpolarisation. Wir haben diese
Technik angewandt, um Diffusionsprozesse von Casiumatomen in Neongas zu studieren, dabei
bestimmten wir die Diffusionskonstante dieses Systems zu 0.20(1) cm2/s unter Standardbedin-
gungen.
Der zweite Teil und zugleich Hauptteil dieser Arbeit befasst sich mit den optischen und
magneto-optischen Eigenschaften von in festem He4 eingeschlossenen Casiumatomen. Die Ex-
perimente wurden in der kubisch-raumzentrierten (bcc) oder in der hexagonal-dichtgepackten
(hcp) Phase von festem Helium durchgefuhrt. Matrixisolierte Casiumatome befinden sich in
einer blasen-ahnlichen Kavitat spharischer Form, wenn sich das Atom in seinem radial sym-
metrischen 6S1/2-Grundzustand befindet. Die spharische Symmetrie und die ganzlich unmag-
netischen Eigenschaften von Helium erklaren die ungewohnlich langen Spinrelaxationszeiten
(≈ 1s), die in der bcc Phase beobachtet wurden. Im Gegensatz dazu sind in der hcp Phase
gemessenen Magnetresonanzlinien signifikant breiter (um drei Grossenordnungen) und sie zeigen
eine komplexe Unterstruktur bedingt durch eine kleine Deformation der Blasenform.
Ein in der Literatur viel diskutiertes Problem ist die Fluoreszenz von Alkaliatomen in kon-
densiertem Helium: Wahrend die schweren Alkalis Rb und Cs Fluoreszenz emittieren, konnte
keine Fluoreszenz von den leichteren Alkalis beobachtet werden. Es wurde allgemein angenom-
men, dass die Emission beeintrachtigt ist durch die Bildung von Exciplex-Molekulen, d.h. von
gebundenen Zustanden angeregter Alkaliatome mit einem oder mehreren Heliumatomen. Weiter
wurde angenommen, dass fur Helium solche Exciplexe nicht existieren. In dieser Arbeit haben
wir unsere Forschung auf die Untersuchung von atomarer D2-Anregung und der genauen Anal-
yse der darauf folgenden Abregung des 6P3/2-Zustands ausgeweitet. Direkte D2-Emission war
bisher nicht beobachtet worden. Man detektierte lediglich eine schwache D1-Emission nach er-
folgter D2-Anregung, welche auf einen Zerfallskanal zum 6P1/2-Zustand hinweist. Durch die
Ausweitung des Wellenlangenbereichs unseres Detektionssystems konnten wir nun zwei neue,
breite Linien starker Intensitat bei 7130 cm−1 und 10520 cm−1 nachweisen. Die energetisch
hoher liegende Linie war kurzlich auch in kaltem Heliumdampf und in flussigem He II von
einer in Kyoto ansassigen Forschungsgruppe beobachtet worden. Der Ursprung dieser Linie liess
sich dem Zerfall von Cs(AΠ3/2)He2-Exciplexen zuordnen. Die zweite Linie war vorher nicht
beobachtet worden und ist moglicherweise nur in festen Helium nachzuweisen. Um die neuen
Linien zuordnen zu konnen, fuhrten wir Modellrechnungen der Emissionsspektren von zerfallen-
den Cs∗Hen-Exciplexen durch. Durch Vergleich mit den experimentellen Daten bestatigte sich
die Zuordnung der Cs∗He2-Linie. Die energetisch niedriger liegende Linie ist durch den Zer-
fall eines anderen Exciplexes verursacht. Unsere Berechnungen legen nahe, dass es sich bei der
Struktur um ein angeregtes Casiumatom mit hantelformiger Elektronenkonfiguration handelt,
um dessen Taille sich ein Ring von n Heliumatomen befindet. Die genaue Zahl der n gebun-
denen Heliumatome liess sich aufgrund mangelnder Modellgenauigkeit bisher nicht bestimmen.
Jedoch scheint Cs∗He6 der wahrscheinlichste Kandidat zu sein. Cs∗Hen-Exciplexe mit n > 2
waren zuvor nicht beobachtet worden. Dies schien die in der Literatur zu findenden Aussagen
zu bestatigen, dass solche Komplexe nicht stabil seien.
Schliesslich konnten wir nach D1-Anregung eine dritte, sehr schwache Linie bei 10160 cm−1
nachweisen, welche sich dem Zerfall von Cs(AΠ1/2)He2 zuordnen lasst.
Ein weiteres Thema der vorliegenden Arbeit ist die Untersuchung von Multi-Photonen-
Prozessen in den Zeeman-Struktur des Grundzustandes von Casium in festem Helium. Die
benutzte experimentelle Technik ist, wie im Tomographie-Experiment, die optisch-detektierte
Magnetresonanz (ODMR). In dieser wird zirkular polarisiertes Laserlicht sowohl zur Praparation
von Spinpolarisation als auch zum Nachweis von Magnetresonanzubergangen benutzt. Die be-
trachteten Multi-Photonen-Ubergange sind Prozesse, in denen mehrere Photonen gleichzeitig
bei Magnetresonanzubergangen beteiligt sind. Sie werden nachweisbar, wenn die magnetischen
Unterzustande durch den quadratischen Zeeman-Effekt aufgespalten sind. Die langen Spin-
relaxationszeiten von Cs in festem Helium erlauben uns, diese Ubergange auch bei kleinen
magnetischen Feldern (1 mT) auflosen zu konnen. Wir beobachteten alle erlaubten Multi-
Photonen-Ubergange bis zum 8-Photonenubergang im F = 4 Hyperfeinmultiplet. Multi-
Photonen-Ubergange konnen in der Magnetometrie, in der Unterdruckung systematischer Ef-
fekte in EDM-Experimenten Anwendung finden und sie mogen daruberhinaus zur Identifikation
von Relaxationsprozessen in dotierten Heliumkristallen dienen. Die Demonstration des letzteren
ist jedoch zur Zeit noch durch inhomogene Linienverbreitungen verhindert. Wir verglichen
unsere experimentellen Spektren mit theoretischen, die wir aus der numerischen Losung der
Liouville-Gleichung unter Berucksichtigung des optischen Pumpens und der Wechselwirkung
mit dem statischen und dem oszillierenden Feld erhalten haben. Die experimentellen Daten
sind sehr gut wiedergegeben, wenn magnetische Feldinhomogenitaten von 2 · 10−5 angenom-
men werden. Zusatzlich haben wir theoretische Studien des Einflusses stochastischer Storungen
definierter Multipolordnung auf die Multi-Photon-Koharenzen durchgefuhrt. Es wurden alge-
braische sowie numerische Resultate fur dipolare und quadrupolare Storungen erzielt, welche in
Zukunft helfen konnen, den Spinrelaxationsmechanismus in Heliumkristallen zu identifizieren.
Das ursprungliche und weiterhin verfolgte Ziel des Heliumexperiments ist der Nachweis eines
permanenten elektrischen Dipolmoments (EDM) von Casium. Dieser Nachweis ware ein direk-
ter Beleg fur Zeitumkehrverletzung in einem atomaren System. EDM-Experimente suchen nach
einer linearen Stark-Verschiebung schmalbandiger Magnetresonanzlinien. Die notwendige ex-
perimentelle Voraussetzung langer Spinrelaxationszeiten sowie die Moglichkeit hohe elektrische
Felder anlegen zu konnen, sind in unserem Experiment gegeben. Es wird kurz ein Aufbau zur
Durchfuhrung von Magnetresonanzexperimenten bei gleichzeitig angelegten hohen elektrischen
Feldern demonstriert. Elektrische Felder von bis zu 30 kV/cm konnten bisher angelegt werden.
Technische Probleme verhinderten jedoch bisher aussagekratige Stark-Effekt-Messungen.
Contents
Preface 1
I Optical magnetic resonance tomography 3
1 Diffusion of Cs atoms in Ne buffer gas measured by optical magnetic resonance
tomography 5
1.1 Introduction . . . . . . . . . . . . . . . . . . . . . . . . . . . . . . . . . . . . . . . 5
1.2 Experiment . . . . . . . . . . . . . . . . . . . . . . . . . . . . . . . . . . . . . . . 6
1.3 Discussion . . . . . . . . . . . . . . . . . . . . . . . . . . . . . . . . . . . . . . . . 8
1.4 Conclusion and outlook . . . . . . . . . . . . . . . . . . . . . . . . . . . . . . . . 11
II Laser spectroscopy of cesium atoms trapped in solid helium 15
2 Introduction 17
2.1 Historical overview . . . . . . . . . . . . . . . . . . . . . . . . . . . . . . . . . . . 17
2.2 Solid He4 . . . . . . . . . . . . . . . . . . . . . . . . . . . . . . . . . . . . . . . . 18
2.2.1 Phase diagram of 4He . . . . . . . . . . . . . . . . . . . . . . . . . . . . . 18
2.2.2 Structure of the bcc and hcp phases . . . . . . . . . . . . . . . . . . . . . 18
2.2.3 He-He interaction . . . . . . . . . . . . . . . . . . . . . . . . . . . . . . . . 19
2.2.4 Optical properties . . . . . . . . . . . . . . . . . . . . . . . . . . . . . . . 19
2.3 Setup and implantation technique . . . . . . . . . . . . . . . . . . . . . . . . . . . 20
2.4 The optical properties of Cs atoms in solid helium: The spherical bubble model . 21
2.5 Optical Pumping . . . . . . . . . . . . . . . . . . . . . . . . . . . . . . . . . . . . 23
2.6 Optically detected magnetic resonance (ODMR) . . . . . . . . . . . . . . . . . . 24
3 Observation of apple- and dumbbell-shaped Cs∗Hen exciplexes in solid He4 29
3.1 Introduction . . . . . . . . . . . . . . . . . . . . . . . . . . . . . . . . . . . . . . . 29
3.2 Theoretical calculation of the emission spectra . . . . . . . . . . . . . . . . . . . 31
3.2.1 Cs∗-Hen exciplex potentials . . . . . . . . . . . . . . . . . . . . . . . . . . 31
3.2.2 Vibrational structure of the Cs∗Hen exciplexes . . . . . . . . . . . . . . . 35
3.2.3 The emission spectra . . . . . . . . . . . . . . . . . . . . . . . . . . . . . . 37
3.3 Experiment . . . . . . . . . . . . . . . . . . . . . . . . . . . . . . . . . . . . . . . 38
3.3.1 Experimental setup . . . . . . . . . . . . . . . . . . . . . . . . . . . . . . . 38
3.3.2 Observed emission spectra . . . . . . . . . . . . . . . . . . . . . . . . . . . 39
v
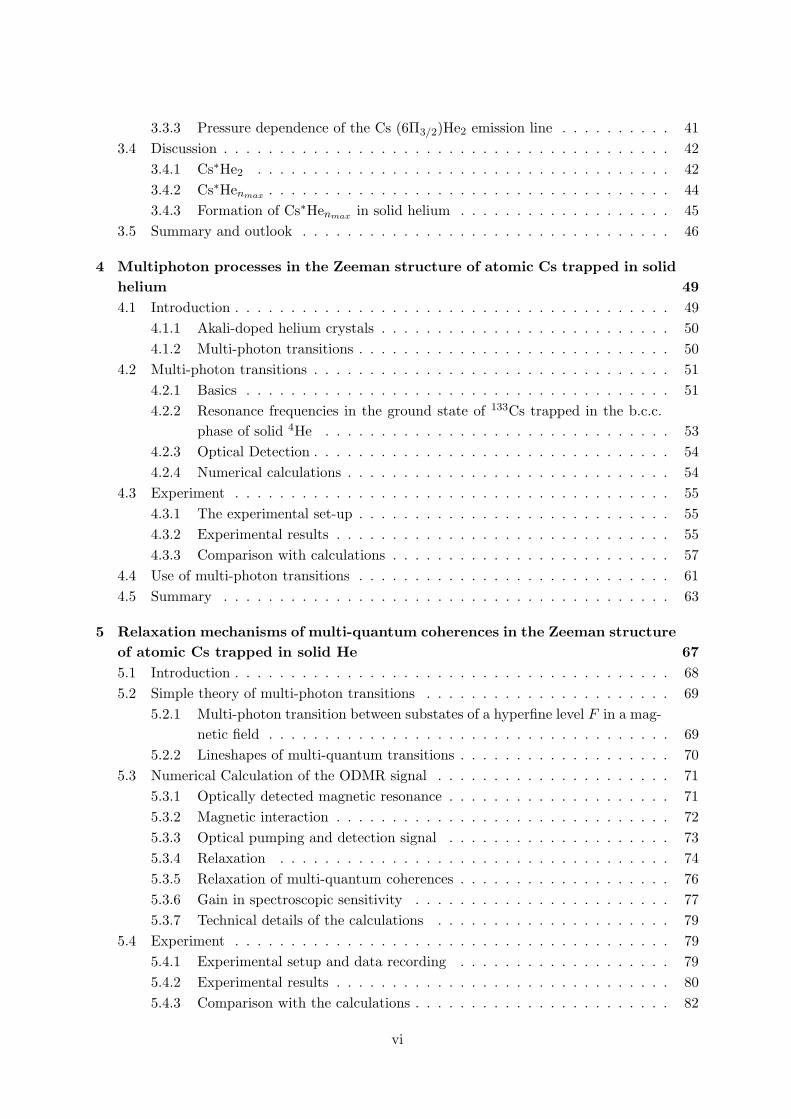
3.3.3 Pressure dependence of the Cs (6Π3/2)He2 emission line . . . . . . . . . . 41
3.4 Discussion . . . . . . . . . . . . . . . . . . . . . . . . . . . . . . . . . . . . . . . . 42
3.4.1 Cs∗He2 . . . . . . . . . . . . . . . . . . . . . . . . . . . . . . . . . . . . . 42
3.4.2 Cs∗Henmax . . . . . . . . . . . . . . . . . . . . . . . . . . . . . . . . . . . . 44
3.4.3 Formation of Cs∗Henmax in solid helium . . . . . . . . . . . . . . . . . . . 45
3.5 Summary and outlook . . . . . . . . . . . . . . . . . . . . . . . . . . . . . . . . . 46
4 Multiphoton processes in the Zeeman structure of atomic Cs trapped in solid
helium 49
4.1 Introduction . . . . . . . . . . . . . . . . . . . . . . . . . . . . . . . . . . . . . . . 49
4.1.1 Akali-doped helium crystals . . . . . . . . . . . . . . . . . . . . . . . . . . 50
4.1.2 Multi-photon transitions . . . . . . . . . . . . . . . . . . . . . . . . . . . . 50
4.2 Multi-photon transitions . . . . . . . . . . . . . . . . . . . . . . . . . . . . . . . . 51
4.2.1 Basics . . . . . . . . . . . . . . . . . . . . . . . . . . . . . . . . . . . . . . 51
4.2.2 Resonance frequencies in the ground state of 133Cs trapped in the b.c.c.
phase of solid 4He . . . . . . . . . . . . . . . . . . . . . . . . . . . . . . . 53
4.2.3 Optical Detection . . . . . . . . . . . . . . . . . . . . . . . . . . . . . . . . 54
4.2.4 Numerical calculations . . . . . . . . . . . . . . . . . . . . . . . . . . . . . 54
4.3 Experiment . . . . . . . . . . . . . . . . . . . . . . . . . . . . . . . . . . . . . . . 55
4.3.1 The experimental set-up . . . . . . . . . . . . . . . . . . . . . . . . . . . . 55
4.3.2 Experimental results . . . . . . . . . . . . . . . . . . . . . . . . . . . . . . 55
4.3.3 Comparison with calculations . . . . . . . . . . . . . . . . . . . . . . . . . 57
4.4 Use of multi-photon transitions . . . . . . . . . . . . . . . . . . . . . . . . . . . . 61
4.5 Summary . . . . . . . . . . . . . . . . . . . . . . . . . . . . . . . . . . . . . . . . 63
5 Relaxation mechanisms of multi-quantum coherences in the Zeeman structure
of atomic Cs trapped in solid He 67
5.1 Introduction . . . . . . . . . . . . . . . . . . . . . . . . . . . . . . . . . . . . . . . 68
5.2 Simple theory of multi-photon transitions . . . . . . . . . . . . . . . . . . . . . . 69
5.2.1 Multi-photon transition between substates of a hyperfine level F in a mag-
netic field . . . . . . . . . . . . . . . . . . . . . . . . . . . . . . . . . . . . 69
5.2.2 Lineshapes of multi-quantum transitions . . . . . . . . . . . . . . . . . . . 70
5.3 Numerical Calculation of the ODMR signal . . . . . . . . . . . . . . . . . . . . . 71
5.3.1 Optically detected magnetic resonance . . . . . . . . . . . . . . . . . . . . 71
5.3.2 Magnetic interaction . . . . . . . . . . . . . . . . . . . . . . . . . . . . . . 72
5.3.3 Optical pumping and detection signal . . . . . . . . . . . . . . . . . . . . 73
5.3.4 Relaxation . . . . . . . . . . . . . . . . . . . . . . . . . . . . . . . . . . . 74
5.3.5 Relaxation of multi-quantum coherences . . . . . . . . . . . . . . . . . . . 76
5.3.6 Gain in spectroscopic sensitivity . . . . . . . . . . . . . . . . . . . . . . . 77
5.3.7 Technical details of the calculations . . . . . . . . . . . . . . . . . . . . . 79
5.4 Experiment . . . . . . . . . . . . . . . . . . . . . . . . . . . . . . . . . . . . . . . 79
5.4.1 Experimental setup and data recording . . . . . . . . . . . . . . . . . . . 79
5.4.2 Experimental results . . . . . . . . . . . . . . . . . . . . . . . . . . . . . . 80
5.4.3 Comparison with the calculations . . . . . . . . . . . . . . . . . . . . . . . 82
vi

5.5 Effect of intrinsic multipole relaxations on the multi-photon spectra . . . . . . . 85
5.6 Summary and outlook . . . . . . . . . . . . . . . . . . . . . . . . . . . . . . . . . 86
5.7 Appendix: Ground state master equation for optical pumping . . . . . . . . . . . 89
6 Magnetic and electric properties of alkali atoms in solid helium 93
6.1 Introduction . . . . . . . . . . . . . . . . . . . . . . . . . . . . . . . . . . . . . . . 93
6.2 Setup . . . . . . . . . . . . . . . . . . . . . . . . . . . . . . . . . . . . . . . . . . 94
6.3 The phase stabilized magnetometer . . . . . . . . . . . . . . . . . . . . . . . . . . 95
Danksagung 99
Curriculum vitae 101
vii

viii
Preface
This thesis is based on research carried out at the Institut fur Angewandte Physik der Univer-sitat Bonn, Germany and at the Departement fur Physik der Universitat Freiburg, Switzerland.It is divided into two parts: The first part is devoted to the motion of alkali vapor atoms stud-ied by optical magnetic resonance tomography. This research was a continuation of my diplomathesis, during which Guido Hinz and myself built up an experimental apparatus for optical mag-netic resonance tomography. In the first year of my PhD student time Dominik Giel and myselfthen studied diffusion processes of spin polarized cesium atoms in Neon buffer gas by means ofthis novel technique. The one and only chapter of this part consists of an article presenting theresults of our work.
The second and main part of this thesis deals with laser spectroscopy of cesium atoms trappedin solid helium. An introducing chapter is followed by four chapters, which present some of ourresearch on this topic. These four chapters consist of independent articles written during thisthesis. Consequently, each chapter can be read as an independent text, which includes anintroduction, a description of the experiment, results, a discussion and the references of thearticle.
The articles included in this thesis are:
1. D. Giel, G.Hinz, D. Nettels, and A. Weis. Diffusion of Cs atoms in Ne buffer gas measuredby optical magnetic resonance tomography. Opt. Express, 6(13):251, 2000.
2. D. Nettels, R. Muller-Siebert, X. Huang, S. Ulzega, and A. Weis. Magnetic and electricproperties of alkali atoms in solid helium. Physica B, 329:406, 2003.
3. D. Nettels, R. Muller-Siebert, Simone Ulzega, and Antoine Weis. Multiphoton processesin the Zeeman structure of atomic Cs trapped in solid helium. (Accepted for publicationby Appl. Phys. B.)
4. D. Nettels, R. Muller-Siebert, and Antoine Weis. Relaxation mechanisms of multi-quantum coherences in the Zeeman structure of atomic Cs trapped in solid He. (Invitedpaper. Accepted for publication by Appl. Phys. B.)
5. D. Nettels, A. Hofer, P. Moroshkin, R. Muller-Siebert, Simone Ulzega, and Antoine Weis.Observation of apple- and dumbbell-shaped Cs∗Hen exciplexes in solid He4. (To besubmitted.)
1

2
Part I
Optical magnetic resonancetomography
3

Chapter 1
Diffusion of Cs atoms in Ne buffergas measured by optical magneticresonance tomography
D. Giel,2 G. Hinz,2 D. Nettels,1,2 and A. Weis1,2 1Institut de Physique, Universite de Fribourg,
Chemin de Musee 3, CH–1700 Fribourg, Switzerland2Institut fur Angewandte Physik, Universitat Bonn, Wegelerstr. 8, D–53115 Bonn, Germany
published in Opt. Express 6 (13), 251 (2000)
Abstract: Optical magnetic resonance tomography uses optical pumping and theparamagnetic Faraday effect to image spin density distributions in optically thinmedia. In this paper we present an apparatus that allows to measure the distributionof spin-polarized Cs atoms, which we applied to study the diffusion of Cs in Ne buffergas by time-resolved 2D-mapping of the evolution of an initial inhomogeneous spindistribution. The diffusion constant D0 for Cs in a Ne buffer gas of 1013 mbar isdetermined as 0.20(1) cm2/s.
1.1 Introduction
Nuclear magnetic resonance tomography is a well-known technique that allows the mapping ofspin-densities, relaxation times and flow velocities in dense media by measuring the precessionfrequencies of nuclear magnetic moments in inhomogeneous magnetic fields. It is best known forits spectacular success in medical science. Optical Magnetic Resonance Tomography (OMRT) isa related technique which detects the precessing electronic magnetic moments of paramagneticatoms manipulated through the interaction with light [1, 3, 4]. Besides producing a macroscopicpolarization by optical pumping, light is also used to monitor the precession of the electronspins. In this work we have applied OMRT to study the diffusional motion of spin-polarizedcesium atoms in neon buffer gas. In contrast to conventional techniques where low temperaturesand/or high magnetic fields are needed to produce (small) population differences of the nuclearmagnetic sublevels, optical pumping of cesium vapor with resonant laser radiation may yieldpopulation inversions close to 100%. Moreover, the precessing magnetization is detected via the
5
6 Chapter 1: Diffusion of Cs atoms in Ne buffer gas . . .
polarimeter
mag. shielding(µ-metal)
aperture(s)
pin-hole
polarizer
z
x
probe laser (D )2
pump laser (D )1
photodiode
CCD-camera
chopper
dichroicatomic vaporlaser lock
Cs celldata acquisition
anamorphicprisms
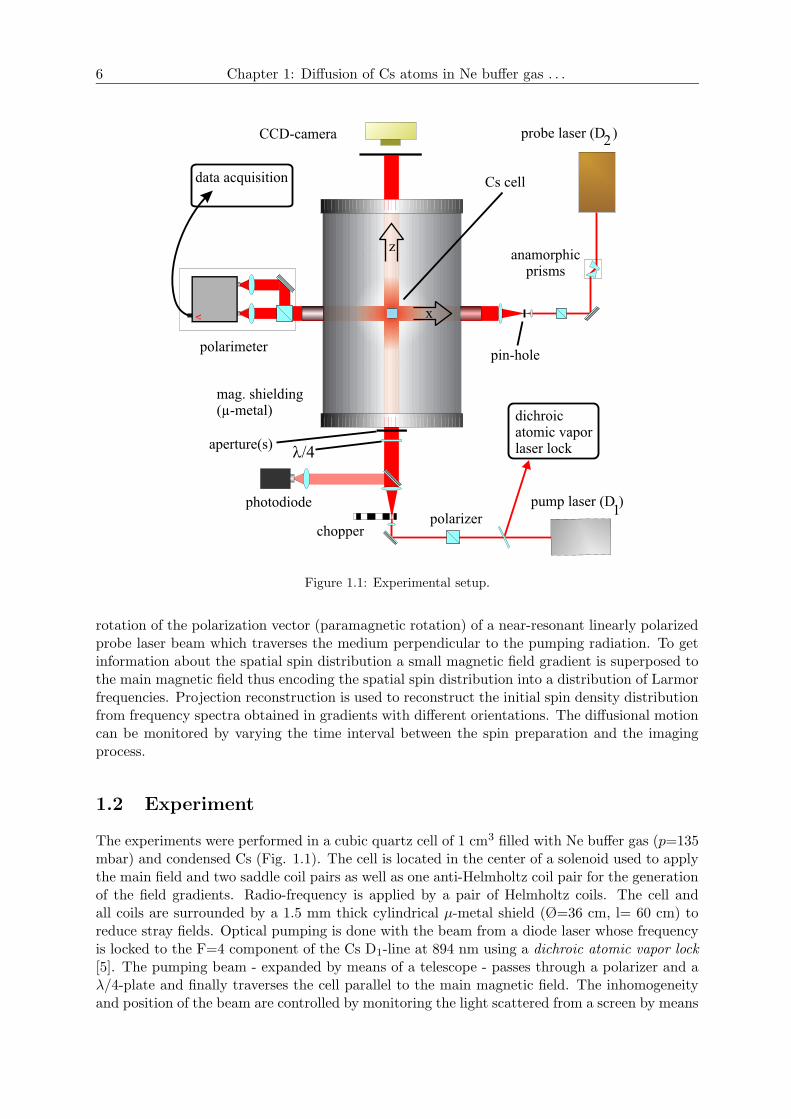
Figure 1.1: Experimental setup.
rotation of the polarization vector (paramagnetic rotation) of a near-resonant linearly polarizedprobe laser beam which traverses the medium perpendicular to the pumping radiation. To getinformation about the spatial spin distribution a small magnetic field gradient is superposed tothe main magnetic field thus encoding the spatial spin distribution into a distribution of Larmorfrequencies. Projection reconstruction is used to reconstruct the initial spin density distributionfrom frequency spectra obtained in gradients with different orientations. The diffusional motioncan be monitored by varying the time interval between the spin preparation and the imagingprocess.
1.2 Experiment
The experiments were performed in a cubic quartz cell of 1 cm3 filled with Ne buffer gas (p=135mbar) and condensed Cs (Fig. 1.1). The cell is located in the center of a solenoid used to applythe main field and two saddle coil pairs as well as one anti-Helmholtz coil pair for the generationof the field gradients. Radio-frequency is applied by a pair of Helmholtz coils. The cell andall coils are surrounded by a 1.5 mm thick cylindrical µ-metal shield (Ø=36 cm, l= 60 cm) toreduce stray fields. Optical pumping is done with the beam from a diode laser whose frequencyis locked to the F=4 component of the Cs D1-line at 894 nm using a dichroic atomic vapor lock[5]. The pumping beam - expanded by means of a telescope - passes through a polarizer and aλ/4-plate and finally traverses the cell parallel to the main magnetic field. The inhomogeneityand position of the beam are controlled by monitoring the light scattered from a screen by means
1.2 7
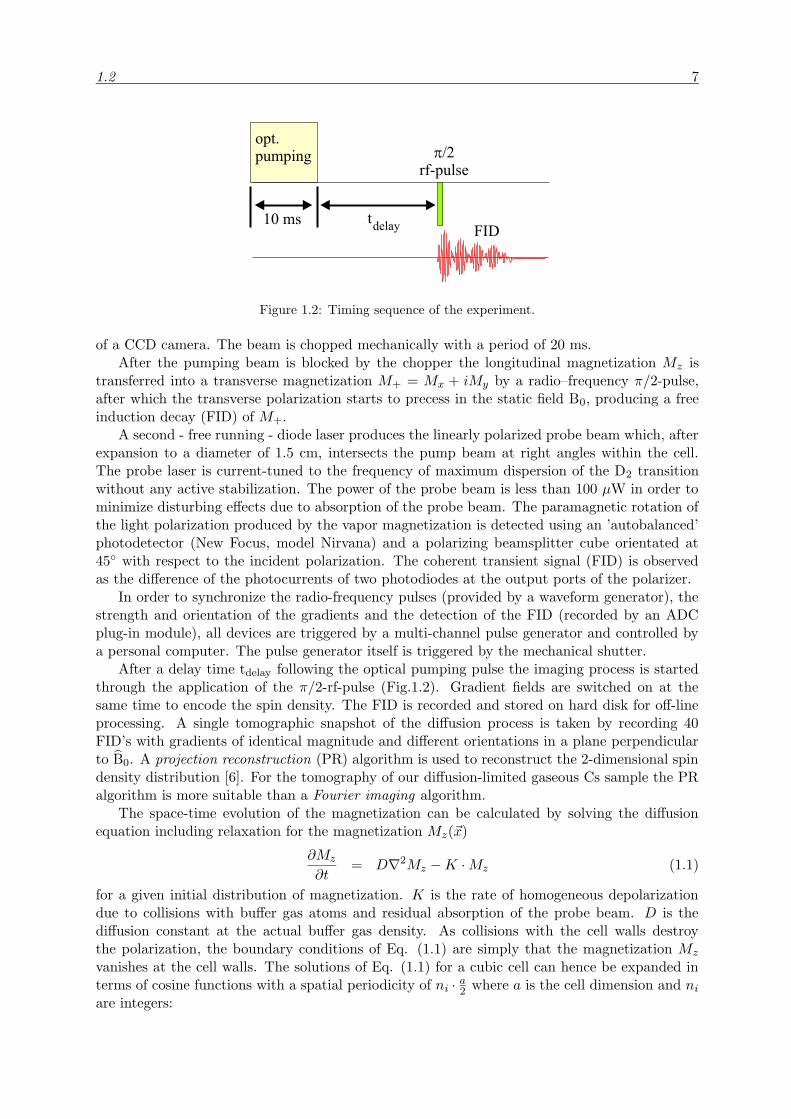
Figure 1.2: Timing sequence of the experiment.
of a CCD camera. The beam is chopped mechanically with a period of 20 ms.After the pumping beam is blocked by the chopper the longitudinal magnetization Mz is
transferred into a transverse magnetization M+ = Mx + iMy by a radio–frequency π/2-pulse,after which the transverse polarization starts to precess in the static field B0, producing a freeinduction decay (FID) of M+.
A second - free running - diode laser produces the linearly polarized probe beam which, afterexpansion to a diameter of 1.5 cm, intersects the pump beam at right angles within the cell.The probe laser is current-tuned to the frequency of maximum dispersion of the D2 transitionwithout any active stabilization. The power of the probe beam is less than 100 µW in order tominimize disturbing effects due to absorption of the probe beam. The paramagnetic rotation ofthe light polarization produced by the vapor magnetization is detected using an ’autobalanced’photodetector (New Focus, model Nirvana) and a polarizing beamsplitter cube orientated at45 with respect to the incident polarization. The coherent transient signal (FID) is observedas the difference of the photocurrents of two photodiodes at the output ports of the polarizer.
In order to synchronize the radio-frequency pulses (provided by a waveform generator), thestrength and orientation of the gradients and the detection of the FID (recorded by an ADCplug-in module), all devices are triggered by a multi-channel pulse generator and controlled bya personal computer. The pulse generator itself is triggered by the mechanical shutter.
After a delay time tdelay following the optical pumping pulse the imaging process is startedthrough the application of the π/2-rf-pulse (Fig.1.2). Gradient fields are switched on at thesame time to encode the spin density. The FID is recorded and stored on hard disk for off-lineprocessing. A single tomographic snapshot of the diffusion process is taken by recording 40FID’s with gradients of identical magnitude and different orientations in a plane perpendicularto B0. A projection reconstruction (PR) algorithm is used to reconstruct the 2-dimensional spindensity distribution [6]. For the tomography of our diffusion-limited gaseous Cs sample the PRalgorithm is more suitable than a Fourier imaging algorithm.
The space-time evolution of the magnetization can be calculated by solving the diffusionequation including relaxation for the magnetization Mz(~x)
∂Mz
∂t= D∇2Mz −K ·Mz (1.1)
for a given initial distribution of magnetization. K is the rate of homogeneous depolarizationdue to collisions with buffer gas atoms and residual absorption of the probe beam. D is thediffusion constant at the actual buffer gas density. As collisions with the cell walls destroythe polarization, the boundary conditions of Eq. (1.1) are simply that the magnetization Mz
vanishes at the cell walls. The solutions of Eq. (1.1) for a cubic cell can hence be expanded interms of cosine functions with a spatial periodicity of ni · a2 where a is the cell dimension and ni
are integers:
8 Chapter 1: Diffusion of Cs atoms in Ne buffer gas . . .
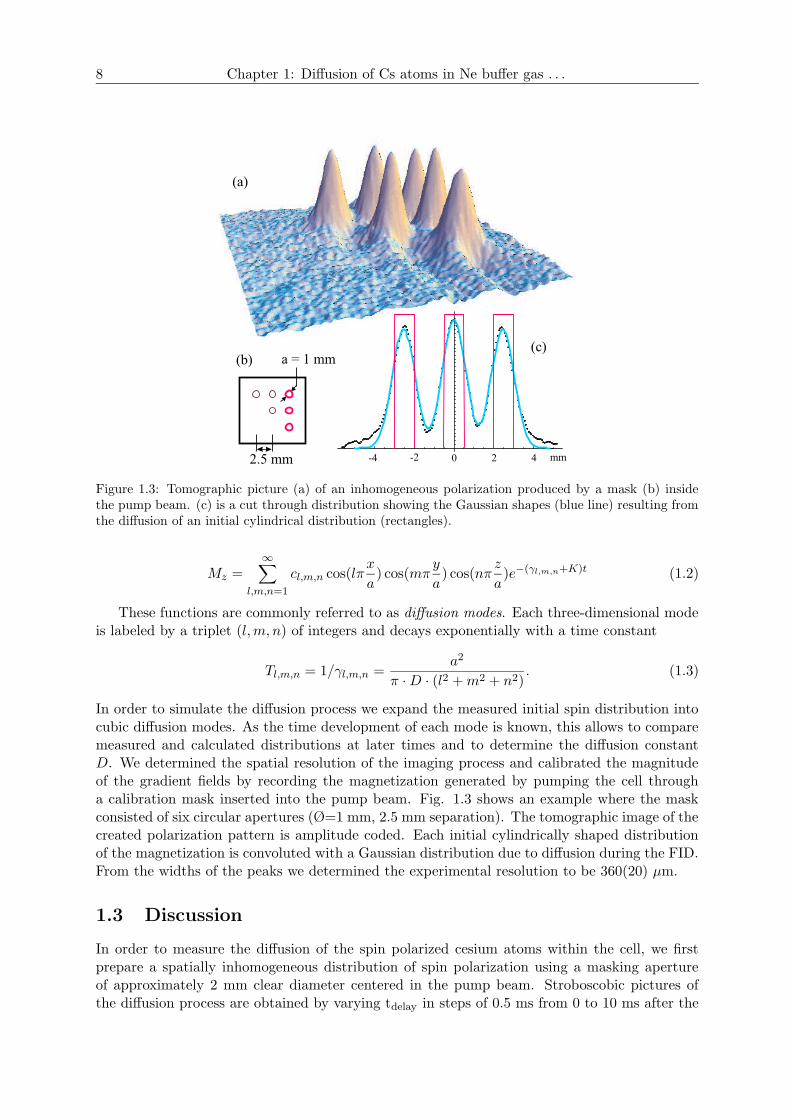
Figure 1.3: Tomographic picture (a) of an inhomogeneous polarization produced by a mask (b) insidethe pump beam. (c) is a cut through distribution showing the Gaussian shapes (blue line) resulting fromthe diffusion of an initial cylindrical distribution (rectangles).
Mz =∞∑
l,m,n=1
cl,m,n cos(lπx
a) cos(mπ
y
a) cos(nπ
z
a)e−(γl,m,n+K)t (1.2)
These functions are commonly referred to as diffusion modes. Each three-dimensional modeis labeled by a triplet (l,m, n) of integers and decays exponentially with a time constant
Tl,m,n = 1/γl,m,n =a2
π ·D · (l2 +m2 + n2). (1.3)
In order to simulate the diffusion process we expand the measured initial spin distribution intocubic diffusion modes. As the time development of each mode is known, this allows to comparemeasured and calculated distributions at later times and to determine the diffusion constantD. We determined the spatial resolution of the imaging process and calibrated the magnitudeof the gradient fields by recording the magnetization generated by pumping the cell througha calibration mask inserted into the pump beam. Fig. 1.3 shows an example where the maskconsisted of six circular apertures (Ø=1 mm, 2.5 mm separation). The tomographic image of thecreated polarization pattern is amplitude coded. Each initial cylindrically shaped distributionof the magnetization is convoluted with a Gaussian distribution due to diffusion during the FID.From the widths of the peaks we determined the experimental resolution to be 360(20) µm.
1.3 Discussion
In order to measure the diffusion of the spin polarized cesium atoms within the cell, we firstprepare a spatially inhomogeneous distribution of spin polarization using a masking apertureof approximately 2 mm clear diameter centered in the pump beam. Stroboscobic pictures ofthe diffusion process are obtained by varying tdelay in steps of 0.5 ms from 0 to 10 ms after the
1.3 9
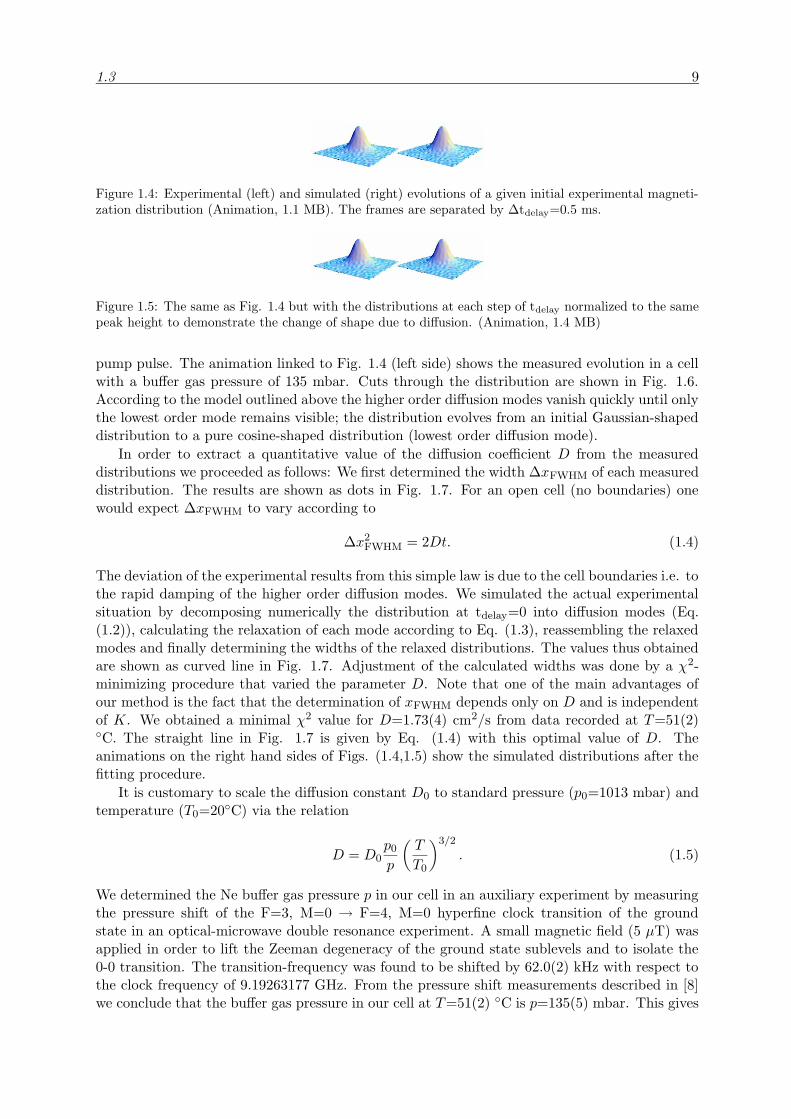
Figure 1.4: Experimental (left) and simulated (right) evolutions of a given initial experimental magneti-zation distribution (Animation, 1.1 MB). The frames are separated by ∆tdelay=0.5 ms.
Figure 1.5: The same as Fig. 1.4 but with the distributions at each step of tdelay normalized to the samepeak height to demonstrate the change of shape due to diffusion. (Animation, 1.4 MB)
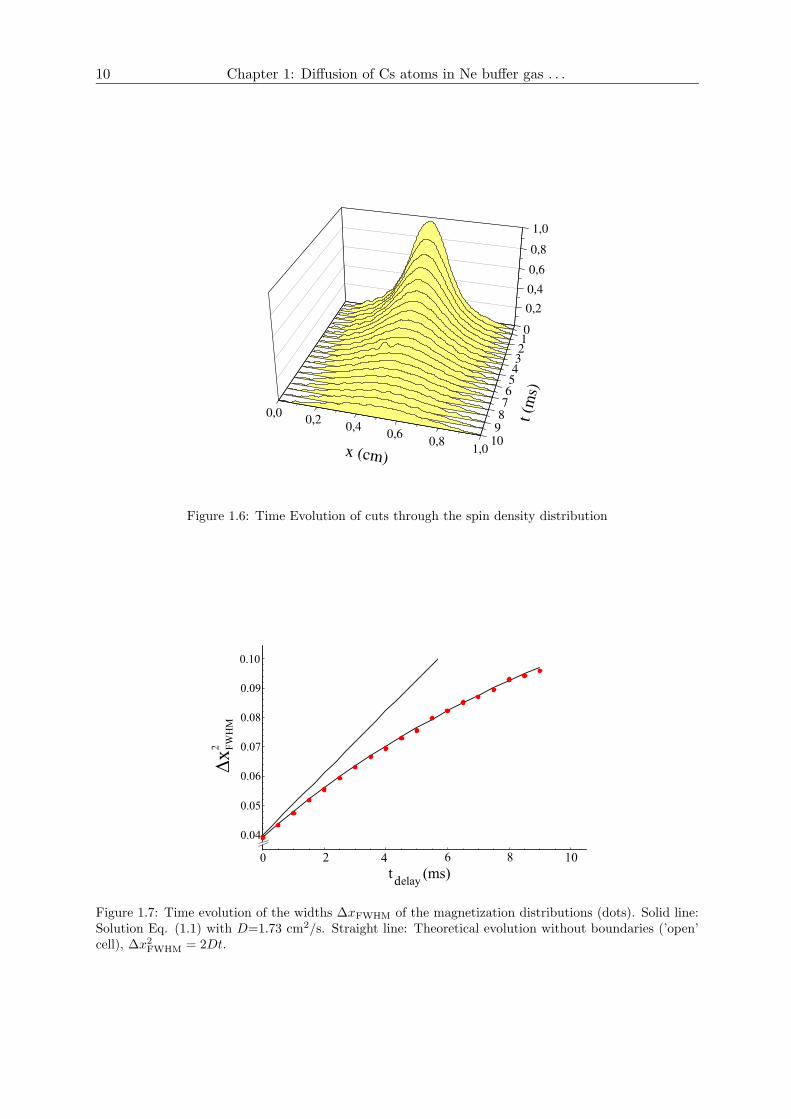
pump pulse. The animation linked to Fig. 1.4 (left side) shows the measured evolution in a cellwith a buffer gas pressure of 135 mbar. Cuts through the distribution are shown in Fig. 1.6.According to the model outlined above the higher order diffusion modes vanish quickly until onlythe lowest order mode remains visible; the distribution evolves from an initial Gaussian-shapeddistribution to a pure cosine-shaped distribution (lowest order diffusion mode).
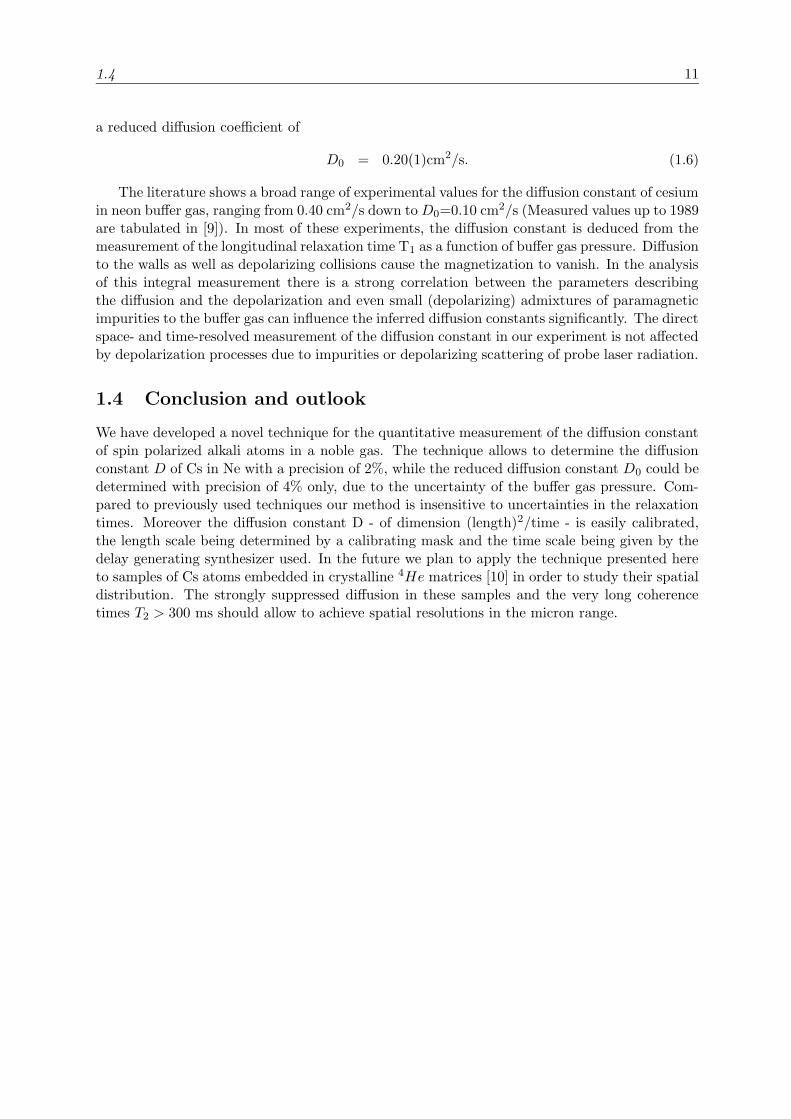
In order to extract a quantitative value of the diffusion coefficient D from the measureddistributions we proceeded as follows: We first determined the width ∆xFWHM of each measureddistribution. The results are shown as dots in Fig. 1.7. For an open cell (no boundaries) onewould expect ∆xFWHM to vary according to
∆x2FWHM = 2Dt. (1.4)
The deviation of the experimental results from this simple law is due to the cell boundaries i.e. tothe rapid damping of the higher order diffusion modes. We simulated the actual experimentalsituation by decomposing numerically the distribution at tdelay=0 into diffusion modes (Eq.(1.2)), calculating the relaxation of each mode according to Eq. (1.3), reassembling the relaxedmodes and finally determining the widths of the relaxed distributions. The values thus obtainedare shown as curved line in Fig. 1.7. Adjustment of the calculated widths was done by a χ2-minimizing procedure that varied the parameter D. Note that one of the main advantages ofour method is the fact that the determination of xFWHM depends only on D and is independentof K. We obtained a minimal χ2 value for D=1.73(4) cm2/s from data recorded at T=51(2)C. The straight line in Fig. 1.7 is given by Eq. (1.4) with this optimal value of D. Theanimations on the right hand sides of Figs. (1.4,1.5) show the simulated distributions after thefitting procedure.
It is customary to scale the diffusion constant D0 to standard pressure (p0=1013 mbar) andtemperature (T0=20C) via the relation
D = D0p0p
(T
T0
)3/2
. (1.5)
We determined the Ne buffer gas pressure p in our cell in an auxiliary experiment by measuringthe pressure shift of the F=3, M=0 → F=4, M=0 hyperfine clock transition of the groundstate in an optical-microwave double resonance experiment. A small magnetic field (5 µT) wasapplied in order to lift the Zeeman degeneracy of the ground state sublevels and to isolate the0-0 transition. The transition-frequency was found to be shifted by 62.0(2) kHz with respect tothe clock frequency of 9.19263177 GHz. From the pressure shift measurements described in [8]we conclude that the buffer gas pressure in our cell at T=51(2) C is p=135(5) mbar. This gives
10 Chapter 1: Diffusion of Cs atoms in Ne buffer gas . . .
0,0 0,2 0,4 0,6 0,8 1,0
0,2 0,4
0,6
0,8
1,0
0 1 2 3 4
5 6
7 8
9 10
x (cm)
t (m
s)
Figure 1.6: Time Evolution of cuts through the spin density distribution
Figure 1.7: Time evolution of the widths ∆xFWHM of the magnetization distributions (dots). Solid line:Solution Eq. (1.1) with D=1.73 cm2/s. Straight line: Theoretical evolution without boundaries (’open’cell), ∆x2
FWHM = 2Dt.
1.4 11
a reduced diffusion coefficient of
D0 = 0.20(1)cm2/s. (1.6)
The literature shows a broad range of experimental values for the diffusion constant of cesiumin neon buffer gas, ranging from 0.40 cm2/s down toD0=0.10 cm2/s (Measured values up to 1989are tabulated in [9]). In most of these experiments, the diffusion constant is deduced from themeasurement of the longitudinal relaxation time T1 as a function of buffer gas pressure. Diffusionto the walls as well as depolarizing collisions cause the magnetization to vanish. In the analysisof this integral measurement there is a strong correlation between the parameters describingthe diffusion and the depolarization and even small (depolarizing) admixtures of paramagneticimpurities to the buffer gas can influence the inferred diffusion constants significantly. The directspace- and time-resolved measurement of the diffusion constant in our experiment is not affectedby depolarization processes due to impurities or depolarizing scattering of probe laser radiation.
1.4 Conclusion and outlook
We have developed a novel technique for the quantitative measurement of the diffusion constantof spin polarized alkali atoms in a noble gas. The technique allows to determine the diffusionconstant D of Cs in Ne with a precision of 2%, while the reduced diffusion constant D0 could bedetermined with precision of 4% only, due to the uncertainty of the buffer gas pressure. Com-pared to previously used techniques our method is insensitive to uncertainties in the relaxationtimes. Moreover the diffusion constant D - of dimension (length)2/time - is easily calibrated,the length scale being determined by a calibrating mask and the time scale being given by thedelay generating synthesizer used. In the future we plan to apply the technique presented hereto samples of Cs atoms embedded in crystalline 4He matrices [10] in order to study their spatialdistribution. The strongly suppressed diffusion in these samples and the very long coherencetimes T2 > 300 ms should allow to achieve spatial resolutions in the micron range.

12 Chapter 1: Diffusion of Cs atoms in Ne buffer gas . . .
1.4 13
References
[1] D. Nettels, “Optische Magnetresonanztomographie an spinpolarisiertem Casiumdampf,”Dipl. thesis Univ. Bonn (unpublished)(1998).
[2] D. Giel, “Darstellung der Diffusion atomarer Spinpolarisation mit optischer Magnetreso-nanztomographie,” Dipl. thesis Univ. Bonn (unpublished)(2000).
[3] J. Skalla, G.Wackerle, M. Mehring and A. Pines, “Optical magnetic resonance imaging ofvapor in low magnetic fields,” Phys. Lett. A 226, 69-74 (1997).
[4] K. Ishikawa et al., “Optical magnetic resonance imaging of laser-polarized Cs atoms,” J.Opt. Soc Am. Bull. 16, 31-37 (1999).
[5] K. L. Corwin, Z. T. Lu, C. F. Hand, R. J. Epstein and C. E. Wieman, “Frequency-stabilizeddiode laser with Zeeman shift in an atomic vapor,” Appl. Opt. 37, 3295 (1998).
[6] P. T. Callaghan, Principles of Nuclear Magnetic Resonance Microscopy (Oxford UniversityPress, Oxford, 1991).
[7] A. Corney, Atomic and Laser Spectroscopy (Oxford University Press, Oxford, 1977).
[8] N. Beverini, F. Strumia and G. Rovera, “Buffer gas pressure shift in the mF=0→mF=0ground state hyperfine line in Cs,” Opt. Commun. 37,6, 394 (1981).
[9] J. Vanier, C. Audoin, The Quantum Physics of Atomic Frequency Standards (Bristol,Hilger, 1989).
[10] S. I. Karnorsky and A. Weis, “Optical and magneto–optical spectroscopy of point defectsin condensed helium,” Advances in Atomic, Molecular and Optical Physics, 38, 87 (1998).

Part II
Laser spectroscopy of cesium atomstrapped in solid helium
15

Chapter 2
Introduction
2.1 Historical overview
In 1991 S. Kanorsky and A. Weis proposed to search for a permanent electric dipole moment(edm) of atoms by using a sample of matrix-isolated paramagnetic atoms in superfluid helium.Because of the purely diamagnetic nature of helium, long electronic spin relaxation times ofthe sample atoms were expected. It was further known that condensed helium has an electricbreak-down voltage exceeding 100 kV/cm. These two characteristic properties were believed toallow for a competitive sensitivity compared to existing edm-experiments [1, 2]. In the followingyear first studies were made with Ba, Au and Cu atoms in superfluid helium by the group of A.Weis at the Max-Planck-Institut fur Quantenoptik (MPQ) in the labatory of T. W. Hansch [1].The atoms were sputtered by means of laser ablation from a solid target and detected by theirlaser-induced fluorescence. The pressure shift and broadening of the excitation and emissionlines of barium in liquid helium were measured and quantitatively interpreted in the frame ofthe so-called spherical bubble model [3].
In 1993 atoms were implanted for the first time into solid helium by using the same laser-ablation technique [4, 5]. In the following years it was demonstrated that cesium atoms trappedin the bcc phase of solid helium can effectively be spin-polarized by means of optical pumping.Very long longitudinal spin relaxation times of 1 s were observed [6]. After the reduction ofmagnetic field inhomogeneities at the sample location magnetic resonance lines of less than20 Hz width were obtained, allowing for a magnetometric sensitivity of 2.6 pT/
√Hz [7]. With
these promising first results important steps toward an edm experiment were achieved.
In parallel it was realized that, besides the long-term objective of measuring an edm, heliumcrytals doped with foreign atoms were a unique system opening a research field for its own.Changes of various atomic properties induced by the weak electromagnetic interaction with thesurrounding helium were observed and asked for explanations. Especially the different atomicproperties measured in the bcc phase and in the hcp phase are until today in the main focusof interest. Such differences can be observed on optical [8], hyperfine [9] as well as in groundstate Zeeman transitions [10]. Furthermore the optical pumping process for producing the spinpolarization was studied in detail [11]
An important step towards an edm experiment was the simultaneous detection of Rb andCs, which demonstrated the useability of rubidium as a co-magnetometer in edm experiments[12].
In the last five years our work concentrated on improving the magnetometric sensitivity andthe general stability of the experimental setup. The detection system was renewed. An activetemperature stabilization was installed. A suitable non-magnetic sealing technique, allowing theleakproof flanging of windows onto the helium crystal containing pressure cell was developed.
17
18 Chapter 2: Introduction
1.4 1.5 1.6 1.7 1.8
T (K)
26
27
28
29
30
31
p(b
a r)
h.c.p.
He IIb .c
.c.
0 1 2.17 3 15
f.c.c.
h.c.p.
b.c.c.
He II
He I
p(b
ar)
T (K)
25,3
50
1000
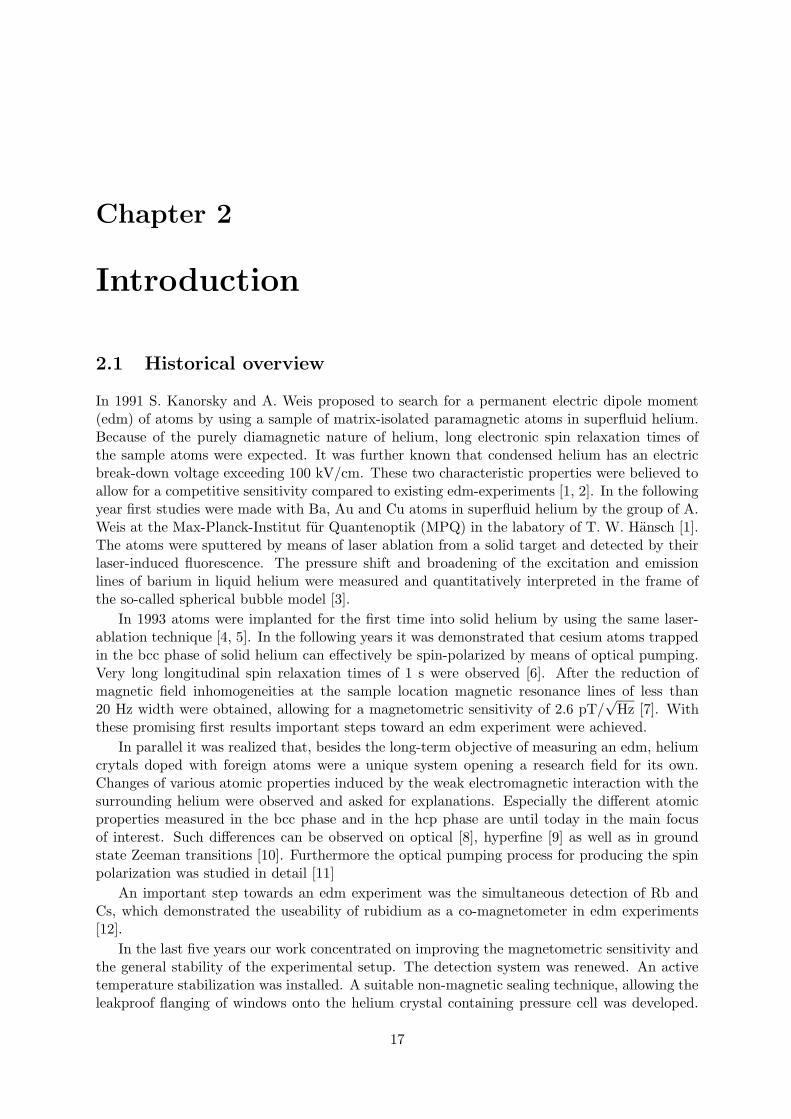
Figure 2.1: Phase diagrams of 4He. The right diagram represents the p-T region relevant for the experi-ment.
Magnetic field shields as well as superconductive magnetic field coils operating in persistingmode were constructed. Most of these and other improvements are described in [13]. Also asetup for applying strong electric fields inside the pressure cell was developed [9, 13, 14], whichallows us the application of up to 30 kV/cm.
2.2 Solid He4
2.2.1 Phase diagram of 4He
Fig. 2.1 shows the phase diagram of condensed helium. At saturated vapor pressure (svp) liquidhelium remains superfluid down to the lowest temperatures. This unique feature is due to theweakness of the interatomic van der Waals attraction, which is comparable to the zero-pointenergy of the helium atoms. Owing to its light mass, helium has a large thermal de Brogliewavelength λT = (h2/2πmkT ) at low temperatures (λT = 8 A at 1.6 K). Thus helium atomscan be localized well enough for forming a solid under pressure only.
Above 25 bar the (p -T )-diagram is dominated by a solid hexagonal close-packed (hcp) phase.Starting from 1000 bar there exists a face-centered cubic (fcc) phase. Between T = 1.45 -1.78 Kand p = 26 -30 bar exists a small island in the phase diagram, where 4He crystalize in body-centered cubic (bcc) phase. One distinguishes two liquid phases: the normal fluid component(He I) and the superfluid component (He II). The p -T region relevant for this experiment isshown in the right part of Fig. 2.1.
2.2.2 Structure of the bcc and hcp phases
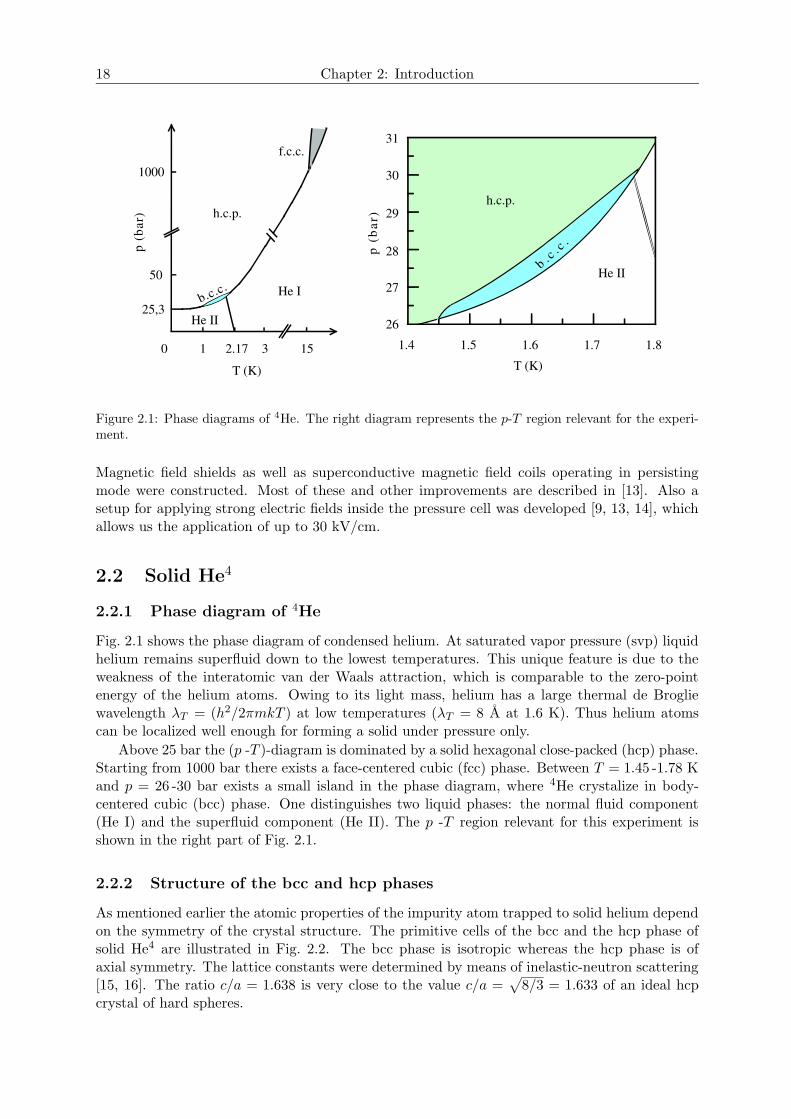
As mentioned earlier the atomic properties of the impurity atom trapped to solid helium dependon the symmetry of the crystal structure. The primitive cells of the bcc and the hcp phase ofsolid He4 are illustrated in Fig. 2.2. The bcc phase is isotropic whereas the hcp phase is ofaxial symmetry. The lattice constants were determined by means of inelastic-neutron scattering[15, 16]. The ratio c/a = 1.638 is very close to the value c/a =
√8/3 = 1.633 of an ideal hcp
crystal of hard spheres.
2.2 19
a c
a
a b
Figure 2.2: a Primitive cell of the bcc structure. The measured lattice constant is a = 4.12 A [15],(T = 1.7 K, p = 28.4 bar). b Primitive cell of the hcp structure. The measured lattice constant area = 3.67 A and c = 6.01 A [16, 15], (T = 1 K, p = 26 bar).
2.2.3 He-He interaction
The interaction between two noble gas atoms can be modelled by a Lenard-Jones potential(Fig. 2.3):
V (r) = 4ε
[(σ
r
)12
−(σ
r
)6]
(2.1)
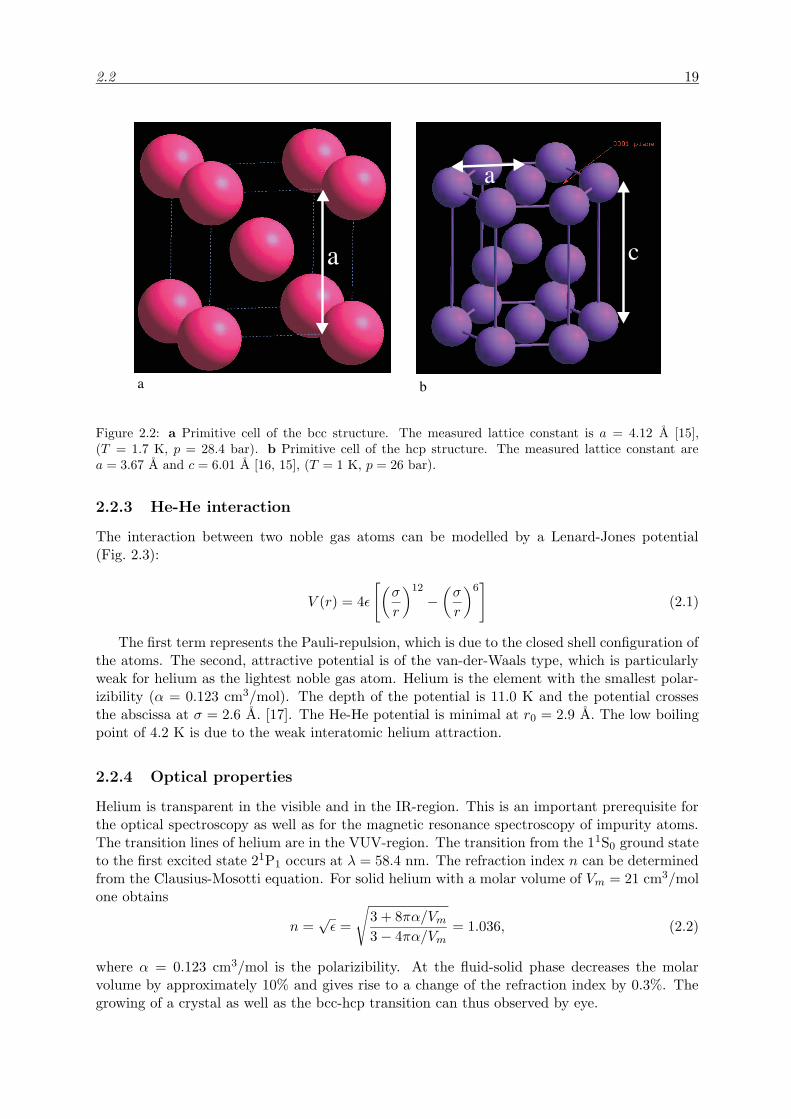
The first term represents the Pauli-repulsion, which is due to the closed shell configuration ofthe atoms. The second, attractive potential is of the van-der-Waals type, which is particularlyweak for helium as the lightest noble gas atom. Helium is the element with the smallest polar-izibility (α = 0.123 cm3/mol). The depth of the potential is 11.0 K and the potential crossesthe abscissa at σ = 2.6 A. [17]. The He-He potential is minimal at r0 = 2.9 A. The low boilingpoint of 4.2 K is due to the weak interatomic helium attraction.
2.2.4 Optical properties
Helium is transparent in the visible and in the IR-region. This is an important prerequisite forthe optical spectroscopy as well as for the magnetic resonance spectroscopy of impurity atoms.The transition lines of helium are in the VUV-region. The transition from the 11S0 ground stateto the first excited state 21P1 occurs at λ = 58.4 nm. The refraction index n can be determinedfrom the Clausius-Mosotti equation. For solid helium with a molar volume of Vm = 21 cm3/molone obtains
n =√ε =
√3 + 8πα/Vm
3− 4πα/Vm= 1.036, (2.2)
where α = 0.123 cm3/mol is the polarizibility. At the fluid-solid phase decreases the molarvolume by approximately 10% and gives rise to a change of the refraction index by 0.3%. Thegrowing of a crystal as well as the bcc-hcp transition can thus observed by eye.
pfisterr
Unterstreichen
20 Chapter 2: Introduction
1 2 3 4 5 6 7 8r HÞL-15
-10
-5
0
5
10
15
VHKL
Figure 2.3: Lenard-Jones potential for He-He interaction. The depth of the potential minimum atr0 = 2.9 A is 11 K.
The axial symmetry of the hcp phase induces optical birefringence. the difference betweenthe ordinary and the extraordinary refraction indices is ∆n = |ne−no| = 2.6·10−6 at λ = 633nm[18].
2.3 Setup and implantation technique
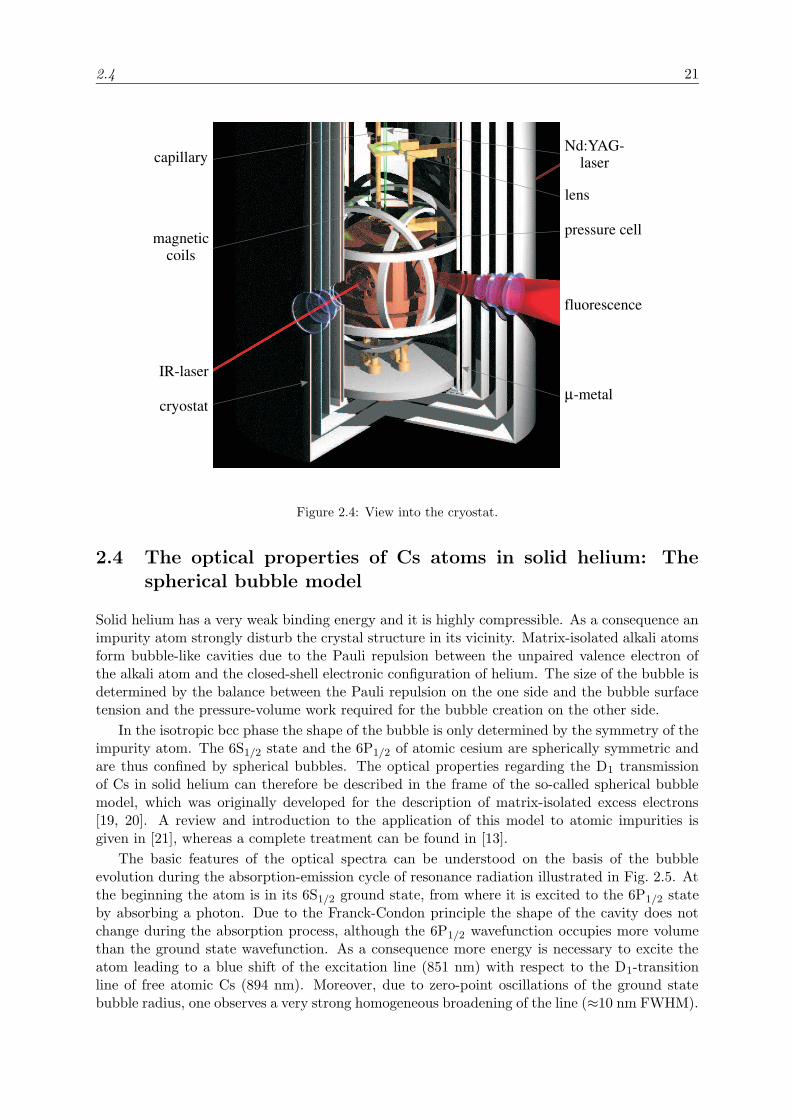
The experiments are performed in a cubic pressure cell made from copper which is immersedinto the helium bath of an optical cryostat Fig. 2.4. Temperatures down to 1.4 K are reachedby pumping on the he gas over the helium bath. The cryostat has optical access from threeorthogonal directions. The pressure cell has a volume of 150 cm3. Its five quartz windows arefitted by sealing rings made from ultra-pure aluminium onto the cell.
A crystal is grown by supplying pressurized helium gas from an external pressure reservoir.A Cs metal target is situated at the bottom, inside the pressure cell. Helium atoms are sputteredfrom the target by means of frequency doubled Nd:YAG laser pulses (532 nm, ∼ 20 mJ), whichare focussed by a height-adjustable lens (f = 10 mm) onto the Cs target. At the same time thehelium crystal melts locally and the cesium atoms diffuse into the molten region. By rising thelens the atoms can be brought to the center of the pressure cell. The crystal freezes again afterthe Nd:YAG laser is switched off. The sample region contains approximately 108 -109 atoms percubic centimeter. After the implantation process further low intensity pulses are applied everyten seconds. Their purpose is to dissociate Cs clusters, which form on a time scale of 10-100 s[8].
The atomic sample is irradiated by a resonant infrared laser beam. The induced fluorescenceis collimated by a lens before it exits the cryostat.
Three pair of Helmholtz coils (outside the pressure cell) allow the applications of magneticfields, whereas another set of three coil pairs inside the pressure cell allow the application ofrf-fields.
The two magnetic shields shown in Fig 2.4 have been replaced in the mean time by a threelayer shield surrounding the whole cryostat. Details of the setup are given in [13].
2.4 21
µ-metal
pressure cell
fluorescence
IR-laser
Nd:YAG-laser
magneticcoils
cryostat
lens
capillary
Figure 2.4: View into the cryostat.
2.4 The optical properties of Cs atoms in solid helium: Thespherical bubble model
Solid helium has a very weak binding energy and it is highly compressible. As a consequence animpurity atom strongly disturb the crystal structure in its vicinity. Matrix-isolated alkali atomsform bubble-like cavities due to the Pauli repulsion between the unpaired valence electron ofthe alkali atom and the closed-shell electronic configuration of helium. The size of the bubble isdetermined by the balance between the Pauli repulsion on the one side and the bubble surfacetension and the pressure-volume work required for the bubble creation on the other side.
In the isotropic bcc phase the shape of the bubble is only determined by the symmetry of theimpurity atom. The 6S1/2 state and the 6P1/2 of atomic cesium are spherically symmetric andare thus confined by spherical bubbles. The optical properties regarding the D1 transmissionof Cs in solid helium can therefore be described in the frame of the so-called spherical bubblemodel, which was originally developed for the description of matrix-isolated excess electrons[19, 20]. A review and introduction to the application of this model to atomic impurities isgiven in [21], whereas a complete treatment can be found in [13].
The basic features of the optical spectra can be understood on the basis of the bubbleevolution during the absorption-emission cycle of resonance radiation illustrated in Fig. 2.5. Atthe beginning the atom is in its 6S1/2 ground state, from where it is excited to the 6P1/2 stateby absorbing a photon. Due to the Franck-Condon principle the shape of the cavity does notchange during the absorption process, although the 6P1/2 wavefunction occupies more volumethan the ground state wavefunction. As a consequence more energy is necessary to excite theatom leading to a blue shift of the excitation line (851 nm) with respect to the D1-transitionline of free atomic Cs (894 nm). Moreover, due to zero-point oscillations of the ground statebubble radius, one observes a very strong homogeneous broadening of the line (≈10 nm FWHM).
22 Chapter 2: Introduction
HeHe
10 s-12
10 s-12
6S 1/2
(3) emission: 10 s-13
-8CsCs
1/26S
6P 1/2
(1) excitation: 10 s-13
R 0
6P 1/2
(2) bubble relaxation
(4) bubble relaxation
life time: 10 s
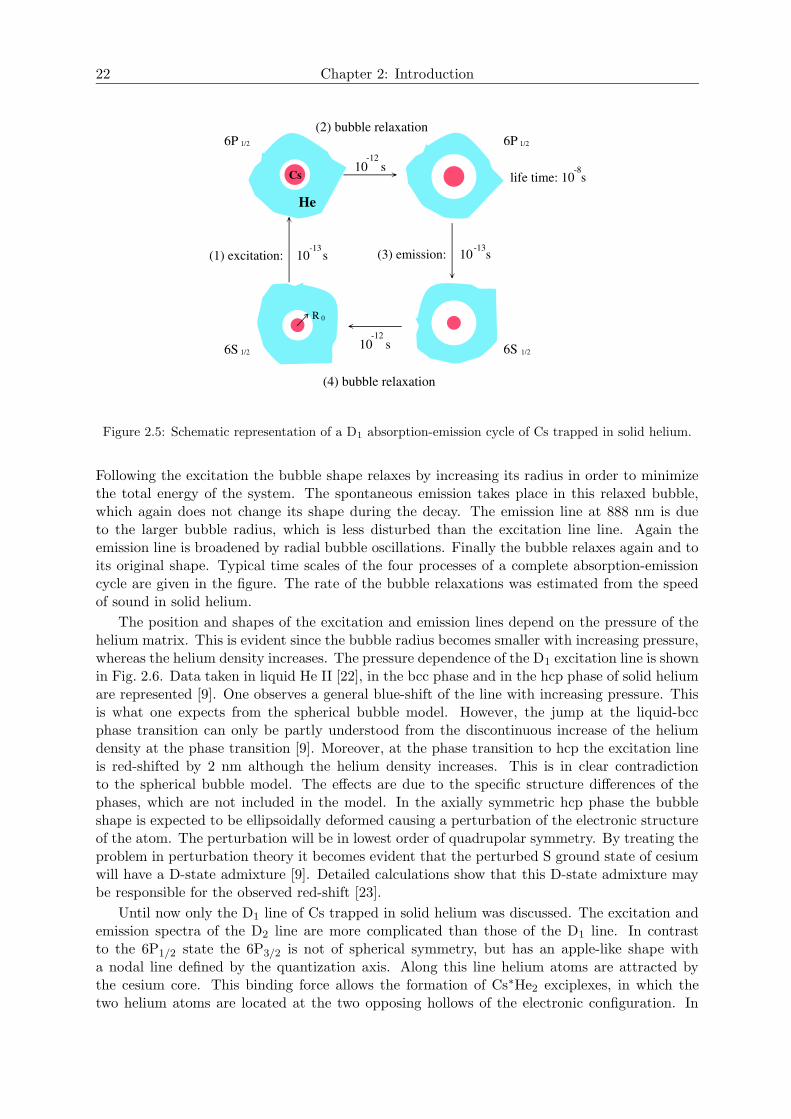
Figure 2.5: Schematic representation of a D1 absorption-emission cycle of Cs trapped in solid helium.
Following the excitation the bubble shape relaxes by increasing its radius in order to minimizethe total energy of the system. The spontaneous emission takes place in this relaxed bubble,which again does not change its shape during the decay. The emission line at 888 nm is dueto the larger bubble radius, which is less disturbed than the excitation line line. Again theemission line is broadened by radial bubble oscillations. Finally the bubble relaxes again and toits original shape. Typical time scales of the four processes of a complete absorption-emissioncycle are given in the figure. The rate of the bubble relaxations was estimated from the speedof sound in solid helium.
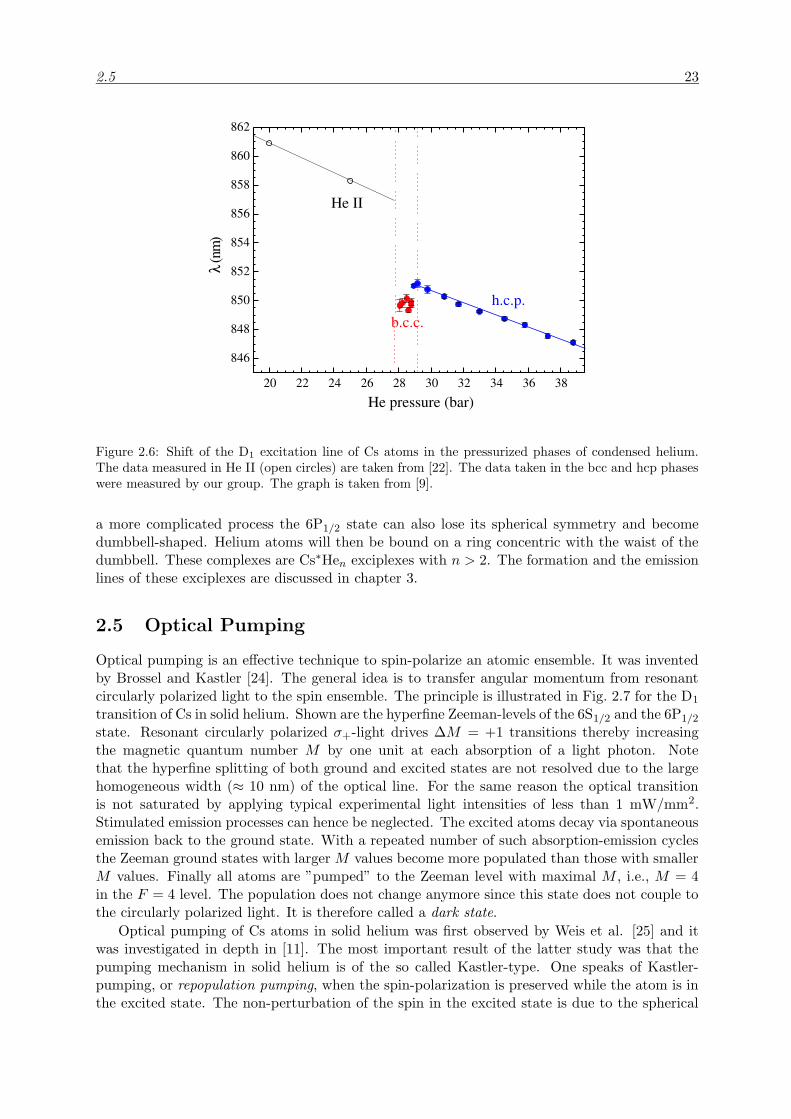
The position and shapes of the excitation and emission lines depend on the pressure of thehelium matrix. This is evident since the bubble radius becomes smaller with increasing pressure,whereas the helium density increases. The pressure dependence of the D1 excitation line is shownin Fig. 2.6. Data taken in liquid He II [22], in the bcc phase and in the hcp phase of solid heliumare represented [9]. One observes a general blue-shift of the line with increasing pressure. Thisis what one expects from the spherical bubble model. However, the jump at the liquid-bccphase transition can only be partly understood from the discontinuous increase of the heliumdensity at the phase transition [9]. Moreover, at the phase transition to hcp the excitation lineis red-shifted by 2 nm although the helium density increases. This is in clear contradictionto the spherical bubble model. The effects are due to the specific structure differences of thephases, which are not included in the model. In the axially symmetric hcp phase the bubbleshape is expected to be ellipsoidally deformed causing a perturbation of the electronic structureof the atom. The perturbation will be in lowest order of quadrupolar symmetry. By treating theproblem in perturbation theory it becomes evident that the perturbed S ground state of cesiumwill have a D-state admixture [9]. Detailed calculations show that this D-state admixture maybe responsible for the observed red-shift [23].
Until now only the D1 line of Cs trapped in solid helium was discussed. The excitation andemission spectra of the D2 line are more complicated than those of the D1 line. In contrastto the 6P1/2 state the 6P3/2 is not of spherical symmetry, but has an apple-like shape witha nodal line defined by the quantization axis. Along this line helium atoms are attracted bythe cesium core. This binding force allows the formation of Cs∗He2 exciplexes, in which thetwo helium atoms are located at the two opposing hollows of the electronic configuration. In
2.5 23
20 22 24 26 28 30 32 34 36 38
846
848
850
852
854
856
858
860
862
He II
b.c.c.h.c.p.
λ(n
m)
He pressure (bar)
Figure 2.6: Shift of the D1 excitation line of Cs atoms in the pressurized phases of condensed helium.The data measured in He II (open circles) are taken from [22]. The data taken in the bcc and hcp phaseswere measured by our group. The graph is taken from [9].
a more complicated process the 6P1/2 state can also lose its spherical symmetry and becomedumbbell-shaped. Helium atoms will then be bound on a ring concentric with the waist of thedumbbell. These complexes are Cs∗Hen exciplexes with n > 2. The formation and the emissionlines of these exciplexes are discussed in chapter 3.
2.5 Optical Pumping
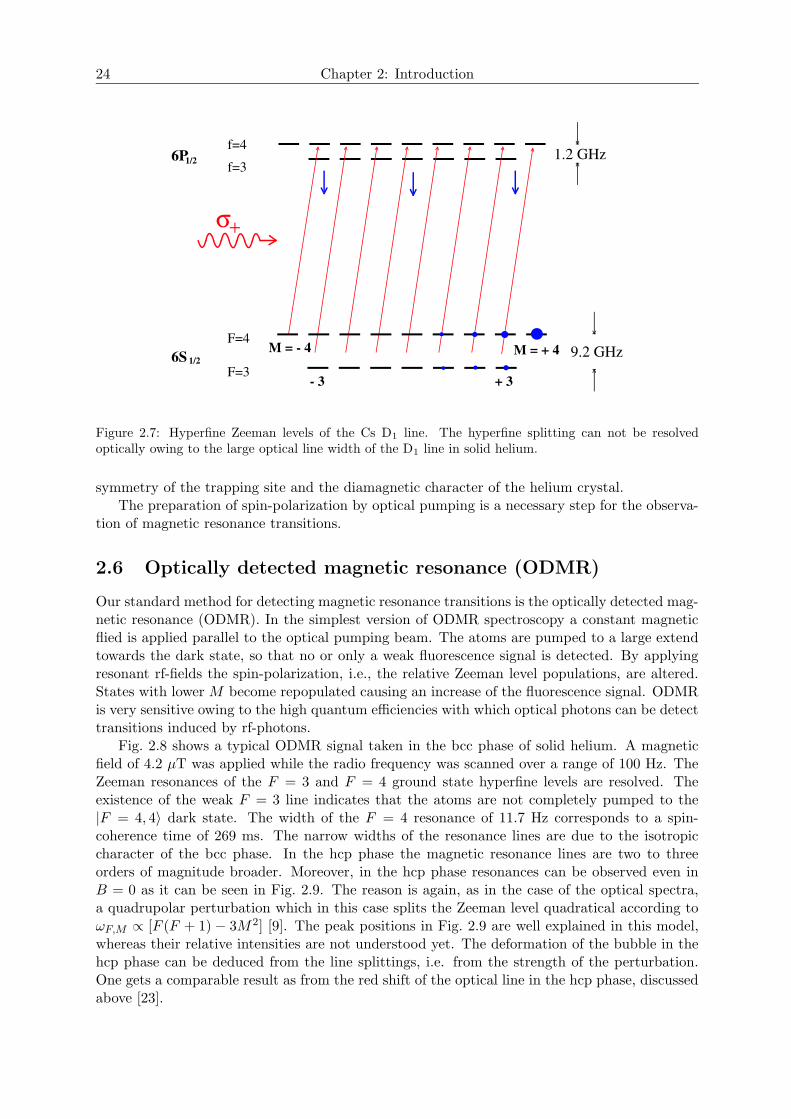
Optical pumping is an effective technique to spin-polarize an atomic ensemble. It was inventedby Brossel and Kastler [24]. The general idea is to transfer angular momentum from resonantcircularly polarized light to the spin ensemble. The principle is illustrated in Fig. 2.7 for the D1
transition of Cs in solid helium. Shown are the hyperfine Zeeman-levels of the 6S1/2 and the 6P1/2
state. Resonant circularly polarized σ+-light drives ∆M = +1 transitions thereby increasingthe magnetic quantum number M by one unit at each absorption of a light photon. Notethat the hyperfine splitting of both ground and excited states are not resolved due to the largehomogeneous width (≈ 10 nm) of the optical line. For the same reason the optical transitionis not saturated by applying typical experimental light intensities of less than 1 mW/mm2.Stimulated emission processes can hence be neglected. The excited atoms decay via spontaneousemission back to the ground state. With a repeated number of such absorption-emission cyclesthe Zeeman ground states with largerM values become more populated than those with smallerM values. Finally all atoms are ”pumped” to the Zeeman level with maximal M , i.e., M = 4in the F = 4 level. The population does not change anymore since this state does not couple tothe circularly polarized light. It is therefore called a dark state.
Optical pumping of Cs atoms in solid helium was first observed by Weis et al. [25] and itwas investigated in depth in [11]. The most important result of the latter study was that thepumping mechanism in solid helium is of the so called Kastler-type. One speaks of Kastler-pumping, or repopulation pumping, when the spin-polarization is preserved while the atom is inthe excited state. The non-perturbation of the spin in the excited state is due to the spherical
24 Chapter 2: Introduction
σ+
f=3
+ 3- 3
6P1/2
6S 1/29.2 GHz
1.2 GHz
M = - 4 M = + 4
f=4
F=4
F=3
Figure 2.7: Hyperfine Zeeman levels of the Cs D1 line. The hyperfine splitting can not be resolvedoptically owing to the large optical line width of the D1 line in solid helium.
symmetry of the trapping site and the diamagnetic character of the helium crystal.The preparation of spin-polarization by optical pumping is a necessary step for the observa-
tion of magnetic resonance transitions.
2.6 Optically detected magnetic resonance (ODMR)
Our standard method for detecting magnetic resonance transitions is the optically detected mag-netic resonance (ODMR). In the simplest version of ODMR spectroscopy a constant magneticflied is applied parallel to the optical pumping beam. The atoms are pumped to a large extendtowards the dark state, so that no or only a weak fluorescence signal is detected. By applyingresonant rf-fields the spin-polarization, i.e., the relative Zeeman level populations, are altered.States with lower M become repopulated causing an increase of the fluorescence signal. ODMRis very sensitive owing to the high quantum efficiencies with which optical photons can be detecttransitions induced by rf-photons.
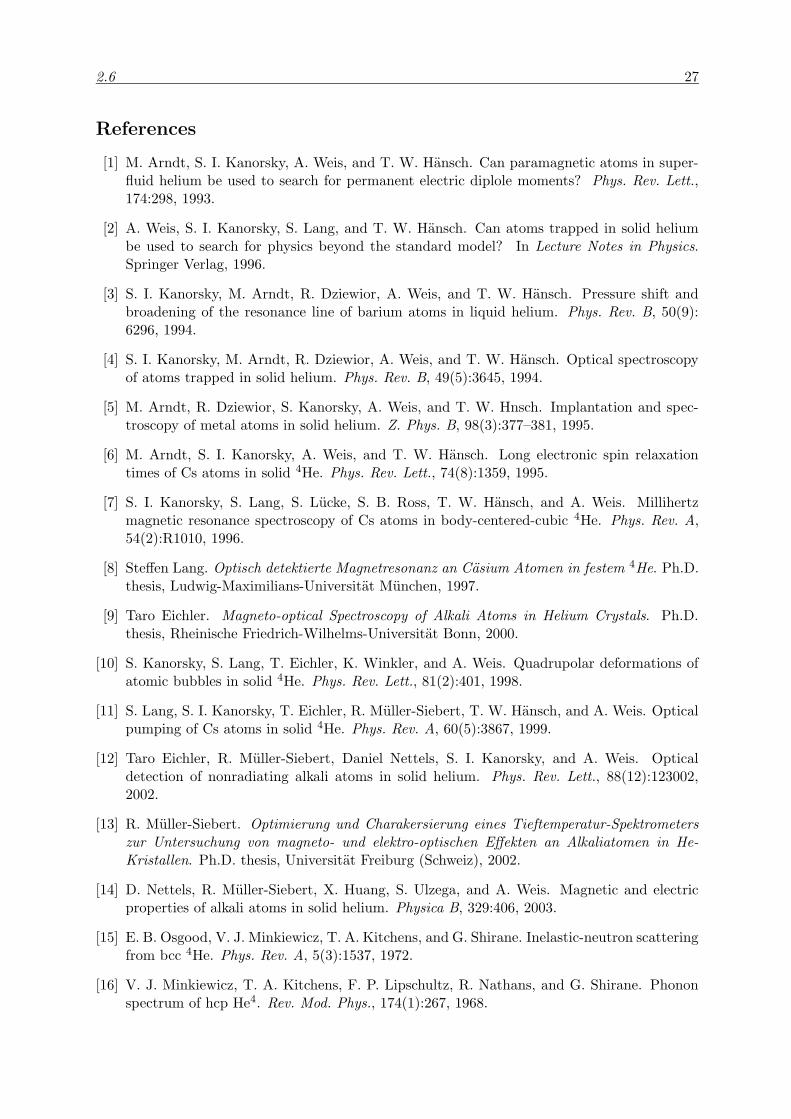
Fig. 2.8 shows a typical ODMR signal taken in the bcc phase of solid helium. A magneticfield of 4.2 µT was applied while the radio frequency was scanned over a range of 100 Hz. TheZeeman resonances of the F = 3 and F = 4 ground state hyperfine levels are resolved. Theexistence of the weak F = 3 line indicates that the atoms are not completely pumped to the|F = 4, 4〉 dark state. The width of the F = 4 resonance of 11.7 Hz corresponds to a spin-coherence time of 269 ms. The narrow widths of the resonance lines are due to the isotropiccharacter of the bcc phase. In the hcp phase the magnetic resonance lines are two to threeorders of magnitude broader. Moreover, in the hcp phase resonances can be observed even inB = 0 as it can be seen in Fig. 2.9. The reason is again, as in the case of the optical spectra,a quadrupolar perturbation which in this case splits the Zeeman level quadratical according toωF,M ∝ [F (F + 1) − 3M 2] [9]. The peak positions in Fig. 2.9 are well explained in this model,whereas their relative intensities are not understood yet. The deformation of the bubble in thehcp phase can be deduced from the line splittings, i.e. from the strength of the perturbation.One gets a comparable result as from the red shift of the optical line in the hcp phase, discussedabove [23].
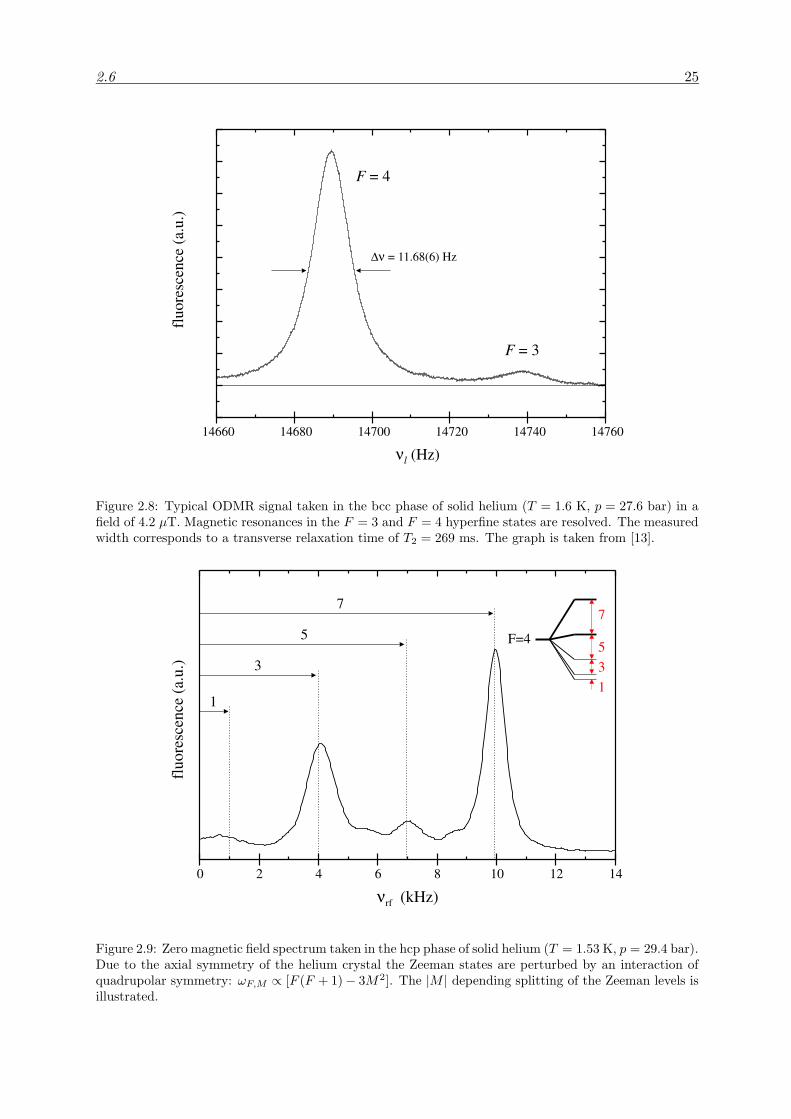
2.6 25
14660 14680 14700 14720 14740 14760
νl (Hz)
fluo
resc
ence
(a.u
.)F = 4
F = 3
∆ν = 11.68(6) Hz
Figure 2.8: Typical ODMR signal taken in the bcc phase of solid helium (T = 1.6 K, p = 27.6 bar) in afield of 4.2 µT. Magnetic resonances in the F = 3 and F = 4 hyperfine states are resolved. The measuredwidth corresponds to a transverse relaxation time of T2 = 269 ms. The graph is taken from [13].
7
31
5F=4
0 2 4 6 8 10 12 14
(kHz)νrf
7
5
3
1
fluo
resc
ence
(a.u
.)
Figure 2.9: Zero magnetic field spectrum taken in the hcp phase of solid helium (T = 1.53 K, p = 29.4 bar).Due to the axial symmetry of the helium crystal the Zeeman states are perturbed by an interaction ofquadrupolar symmetry: ωF,M ∝ [F (F + 1)− 3M2]. The |M | depending splitting of the Zeeman levels isillustrated.

26 Chapter 2: Introduction
2.6 27
References
[1] M. Arndt, S. I. Kanorsky, A. Weis, and T. W. Hansch. Can paramagnetic atoms in super-fluid helium be used to search for permanent electric diplole moments? Phys. Rev. Lett.,174:298, 1993.
[2] A. Weis, S. I. Kanorsky, S. Lang, and T. W. Hansch. Can atoms trapped in solid heliumbe used to search for physics beyond the standard model? In Lecture Notes in Physics.Springer Verlag, 1996.
[3] S. I. Kanorsky, M. Arndt, R. Dziewior, A. Weis, and T. W. Hansch. Pressure shift andbroadening of the resonance line of barium atoms in liquid helium. Phys. Rev. B, 50(9):6296, 1994.
[4] S. I. Kanorsky, M. Arndt, R. Dziewior, A. Weis, and T. W. Hansch. Optical spectroscopyof atoms trapped in solid helium. Phys. Rev. B, 49(5):3645, 1994.
[5] M. Arndt, R. Dziewior, S. Kanorsky, A. Weis, and T. W. Hnsch. Implantation and spec-troscopy of metal atoms in solid helium. Z. Phys. B, 98(3):377–381, 1995.
[6] M. Arndt, S. I. Kanorsky, A. Weis, and T. W. Hansch. Long electronic spin relaxationtimes of Cs atoms in solid 4He. Phys. Rev. Lett., 74(8):1359, 1995.
[7] S. I. Kanorsky, S. Lang, S. Lucke, S. B. Ross, T. W. Hansch, and A. Weis. Millihertzmagnetic resonance spectroscopy of Cs atoms in body-centered-cubic 4He. Phys. Rev. A,54(2):R1010, 1996.
[8] Steffen Lang. Optisch detektierte Magnetresonanz an Casium Atomen in festem 4He. Ph.D.thesis, Ludwig-Maximilians-Universitat Munchen, 1997.
[9] Taro Eichler. Magneto-optical Spectroscopy of Alkali Atoms in Helium Crystals. Ph.D.thesis, Rheinische Friedrich-Wilhelms-Universitat Bonn, 2000.
[10] S. Kanorsky, S. Lang, T. Eichler, K. Winkler, and A. Weis. Quadrupolar deformations ofatomic bubbles in solid 4He. Phys. Rev. Lett., 81(2):401, 1998.
[11] S. Lang, S. I. Kanorsky, T. Eichler, R. Muller-Siebert, T. W. Hansch, and A. Weis. Opticalpumping of Cs atoms in solid 4He. Phys. Rev. A, 60(5):3867, 1999.
[12] Taro Eichler, R. Muller-Siebert, Daniel Nettels, S. I. Kanorsky, and A. Weis. Opticaldetection of nonradiating alkali atoms in solid helium. Phys. Rev. Lett., 88(12):123002,2002.
[13] R. Muller-Siebert. Optimierung und Charakersierung eines Tieftemperatur-Spektrometerszur Untersuchung von magneto- und elektro-optischen Effekten an Alkaliatomen in He-Kristallen. Ph.D. thesis, Universitat Freiburg (Schweiz), 2002.
[14] D. Nettels, R. Muller-Siebert, X. Huang, S. Ulzega, and A. Weis. Magnetic and electricproperties of alkali atoms in solid helium. Physica B, 329:406, 2003.
[15] E. B. Osgood, V. J. Minkiewicz, T. A. Kitchens, and G. Shirane. Inelastic-neutron scatteringfrom bcc 4He. Phys. Rev. A, 5(3):1537, 1972.
[16] V. J. Minkiewicz, T. A. Kitchens, F. P. Lipschultz, R. Nathans, and G. Shirane. Phononspectrum of hcp He4. Rev. Mod. Phys., 174(1):267, 1968.
28 Chapter 2: Introduction
[17] Henry R. Glyde. Excitations in liquid and solid helium. Clarendon Press - Oxford, 1994.
[18] R. H. Crepeau, O. Heybey, D. M. Lee, and Stanley A. Strauss. Sound propagation in hcpsolid helium crystals of known orientation. Phys. Rev. A, 3(3):1162, 1971.
[19] Joshua Jortner, Neil R. Kestner, A. Rice, and M. H. Cohen. Study of properties of anexcess electron in liquid helium. i. the nature of the electron-helium interactions. J. Chem.Phys., 43(8):2614, 1965.
[20] Kazuo Hiroike, Neil R. Kestner, Stuart A. Rice, and Joshua Jortner. Study of propertiesof an excess electron in liquid helium. ii. a refined description of configuration changes inthe liquid. J. Chem. Phys., 43(8):2625, 1965.
[21] Serguei Kanorsky and Antoine Weis. Atoms in nano-cavities. In Quantum optics of confinedsystems. Kluwer Academic Publishers, 1995.
[22] T. Kinoshita, K. Fukuda, Y. Takahashi, and T. Yabuzaki. Optical properties of impurityatoms in pressurized superfluid helium. Z. Phys. B, 98:387, 1995.
[23] A. Weis. (private comunication).
[24] J. Brossel and A. Kastler. La detection de la resonance magnetique des niveaux excites -l’effet de depolarisation des radiations de resonance optique et de fluorescence. C. R. Acad.Sci., 229(23):1213–1215, 1949.
[25] A. Weis, S. I. Kanorsky, M. Arndt, and T. W. Hansch. Spin physics in solid helium:experimental results and applications. Z. Phys. B, 98(3):359, 1995.
Chapter 3
Observation of apple- anddumbbell-shaped Cs∗Hen exciplexesin solid He4
D. Nettels, A. Hofer, P. Moroshkin, R. Muller-Siebert, S. Ulzega , and A.Weis
Departement de Physique, Universite de Fribourg, Chemin du Musee 3, 1700 Fribourg,Switzerland
to be submitted
Abstract: We report the observation of several new spectral features in the fluo-rescence of cesium atoms implanted in the hcp phase of solid helium (T = 1.5 K,p = 31.6 bar) following laser excitation to the 62P states. Based on calculationsof the emission spectra by using semiempirical Cs-He potential curves the newlydiscovered lines could be assigned to the decay of specific Cs∗Hen exciplexes. Anintense line at 10520 cm−1 following D2 excitation, is attributed to Cs(AΠ3/2)He2exciplexes, while a weaker emission at 10160 cm−1 following D1 excitation is identi-fied to originate from Cs(AΠ1/2)He2. The most intense peak, observed at 7130 cm−1
following D2 excitation, could not clearly be assigned. It originates from the decayof a Cs∗Hen exciplex with a well defined number n of helium helium atoms bound asa ring around the Cs atom. The calculations suggest Cs(AΠ1/2)He6 to be the mostprobable candidate. The observations contradict the commonly accepted belief thatCs∗Hen exciplexes with n > 2 do not exist.
3.1 Introduction
Alkali atoms and helium atoms strongly repel each other by virtue of the Pauli principle. How-ever, alkali atoms excited to the lowest lying P states can exert an attractive potential on heliumatoms and lead to bound states (Cs∗Hen), known as exciplexes. In 1995 the formation of such
29
30 Chapter 3: Observation of apple- and dumbbell-shaped Cs∗Hen exciplexes in solid He4
exciplexes was considered by Dupont-Roc [1] and Karnorsky et al. [2] as an explanation for thequenching of atomic fluorescence from light alkali atoms (Na, Li) embedded in solid or liquidHe4. In the meantime (light and heavy) alkali-helium exciplexes have been observed in differentenvironments, such as liquid helium and cold helium gas [3, 4], as well as on the surface ofhelium nanodroplets [5, 6, 7, 8]. Here we present the first observations of such exciplexes in asolid helium matrix.
The alkali-helium interaction at short interatomic distances is dominated by the sphericallysymmetric Pauli repulsion between the valence electron of the S ground state alkali atom andthe closed electronic shell of the helium atom. If in contrast the alkali atom is in an excited Pstate helium atoms can be attracted, if they approach along a nodal lines or a nodal plane ofthe electronic configuration. As Dupont-Roc has first pointed out the strength of the spin-orbitinteraction in the P state plays a key role in this process. If it is weak compared to the Cs-Heinteraction, as in the case of sodium it can be neglected and the possible electronic configurationsare the well known Px,y,z orbitals. Helium atoms are attracted along their nodal planes and andcan be bound as a a ring around the waist of these orbitals. If on the other hand the spin-orbitinteraction is strong, as for cesium, one has to consider the electron distributions of the L-S-coupled P1/2 and P3/2 states. The P1/2 states are spherical, while the P3/2 states have eitherapple-like (for mj = ±1/2) or dumbbell-like (for mj = ±3/2) shapes with a corresponding nodalline or nodal plane. Dupont-Roc concluded that only the P3/2 state of cesium can bind heliumatoms and that their maximal number nmax is restricted to two atoms, each being bound to oneof the two opposing hollows of the apple like shape. This was supported by recent experimentalevidence from a Japanese group [3], which observed Cs∗He1 and Cs∗He2 exciplexes from cesiumin a cold helium gas and found no evidence for exciplex states with n > 2. However, the simpletheory neglects that the shape of the electronic configuration changes adiabatically as heliumatoms approach. As we will discuss below the spherical P1/2 state changes to an apple like formif one helium atom has enough energy to overcome an initially repulsive potential barrier. TheCs∗He1 state then allows the binding of a second helium atom, which is attracted without barrierresulting in a Cs∗He2 complex. In the P3/2 state the formation of the corresponding complex canbe formed without having to overcome a potential barrier. If a further third atom overcomesa corresponding barrier the electronic configuration switches from apple-like to dumbbell-likeshape and the binding of even more helium atoms becomes possible, up to a maximal numbernmax of helium atoms, determined by the interatomic repulsion of the helium atoms located ona ring. All these processes have been observed experimentally in alkali atom, which are lighterthan cesium The maximal number of helium atoms was found to be nmax = 4 for K∗Hen [9],and nmax = 6 for Rb∗Hen [4]: However, as mentioned already, for Cs∗Hen only n = 1, 2 wasobserved. Very detailed experimental and theoretical studies of the formation of rubidium andcesium exciplexes were recently published by the Kyoto group[3, 4]. In particular the authorsdiscuss, based on dynamical and energetic considerations, why the formation of higher orderCs∗Hen might be suppressed. They regard the formation of exciplexes as a sequential process,where one helium atom per time is bound to the complex, and show that already the formationof Cs∗He3 exciplexes is strongly suppressed.
The detection of exciplexes is usually performed by monitoring their emission spectrum afteroptical excitation. The emission line is red-shifted with respect to the excitation profile, andthe shift increases with the number n of of bound helium atoms. A different detection has beenused in [9], where K∗Hen molecules, detached from the surface of helium clusters were detectedby means of mass-spectroscopy.
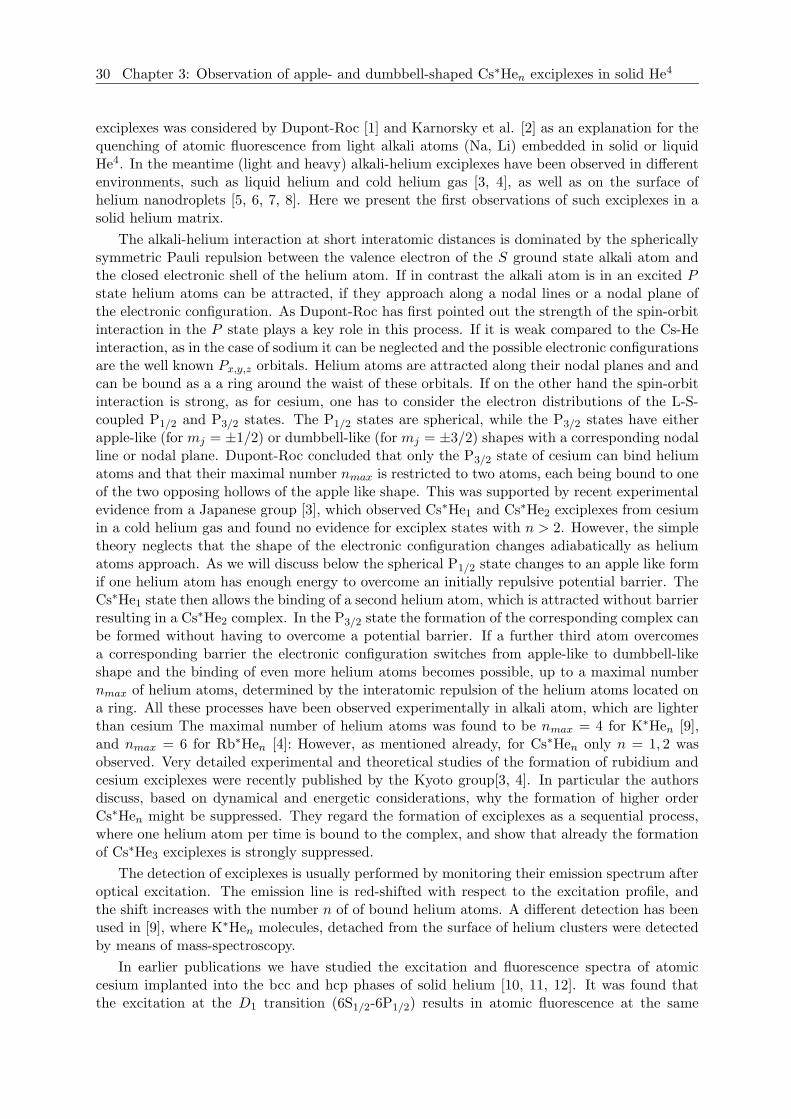
In earlier publications we have studied the excitation and fluorescence spectra of atomiccesium implanted into the bcc and hcp phases of solid helium [10, 11, 12]. It was found thatthe excitation at the D1 transition (6S1/2-6P1/2) results in atomic fluorescence at the same
3.2 31
2 3 4 5 6r HÞL
-5
0
5
10
15
20
VH
e-H
e@rDHcm
-1 L
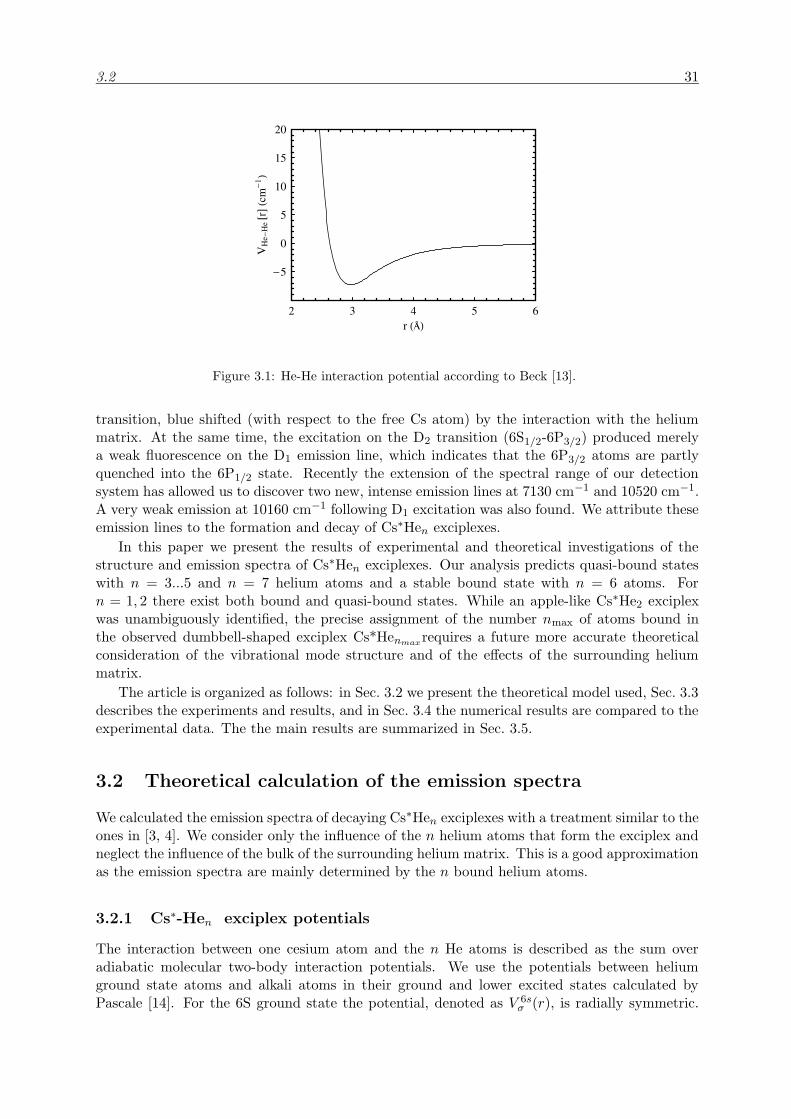
Figure 3.1: He-He interaction potential according to Beck [13].
transition, blue shifted (with respect to the free Cs atom) by the interaction with the heliummatrix. At the same time, the excitation on the D2 transition (6S1/2-6P3/2) produced merelya weak fluorescence on the D1 emission line, which indicates that the 6P3/2 atoms are partlyquenched into the 6P1/2 state. Recently the extension of the spectral range of our detectionsystem has allowed us to discover two new, intense emission lines at 7130 cm−1 and 10520 cm−1.A very weak emission at 10160 cm−1 following D1 excitation was also found. We attribute theseemission lines to the formation and decay of Cs∗Hen exciplexes.
In this paper we present the results of experimental and theoretical investigations of thestructure and emission spectra of Cs∗Hen exciplexes. Our analysis predicts quasi-bound stateswith n = 3...5 and n = 7 helium atoms and a stable bound state with n = 6 atoms. Forn = 1, 2 there exist both bound and quasi-bound states. While an apple-like Cs∗He2 exciplexwas unambiguously identified, the precise assignment of the number nmax of atoms bound inthe observed dumbbell-shaped exciplex Cs*Henmaxrequires a future more accurate theoreticalconsideration of the vibrational mode structure and of the effects of the surrounding heliummatrix.
The article is organized as follows: in Sec. 3.2 we present the theoretical model used, Sec. 3.3describes the experiments and results, and in Sec. 3.4 the numerical results are compared to theexperimental data. The the main results are summarized in Sec. 3.5.
3.2 Theoretical calculation of the emission spectra
We calculated the emission spectra of decaying Cs∗Hen exciplexes with a treatment similar to theones in [3, 4]. We consider only the influence of the n helium atoms that form the exciplex andneglect the influence of the bulk of the surrounding helium matrix. This is a good approximationas the emission spectra are mainly determined by the n bound helium atoms.
3.2.1 Cs∗-Hen exciplex potentials
The interaction between one cesium atom and the n He atoms is described as the sum overadiabatic molecular two-body interaction potentials. We use the potentials between heliumground state atoms and alkali atoms in their ground and lower excited states calculated byPascale [14]. For the 6S ground state the potential, denoted as V 6s
σ (r), is radially symmetric.
32 Chapter 3: Observation of apple- and dumbbell-shaped Cs∗Hen exciplexes in solid He4
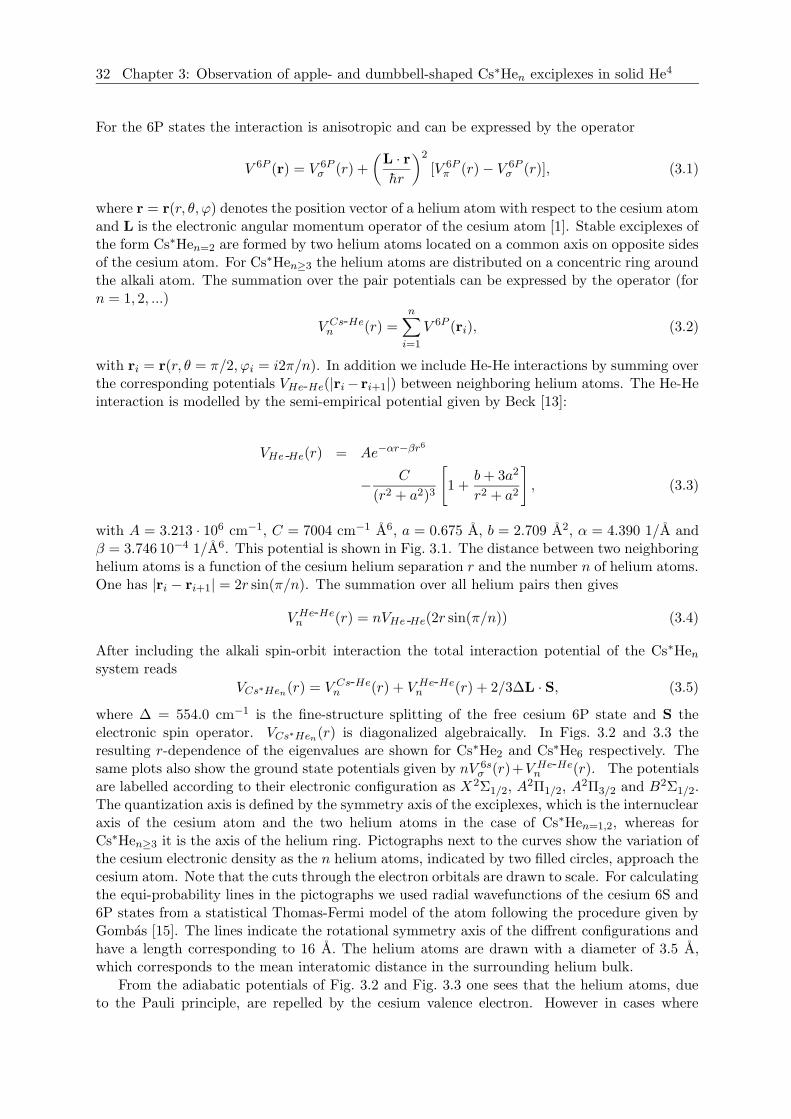
For the 6P states the interaction is anisotropic and can be expressed by the operator
V 6P (r) = V 6Pσ (r) +
(L · rhr
)2
[V 6Pπ (r)− V 6P
σ (r)], (3.1)
where r = r(r, θ, ϕ) denotes the position vector of a helium atom with respect to the cesium atomand L is the electronic angular momentum operator of the cesium atom [1]. Stable exciplexes ofthe form Cs∗Hen=2 are formed by two helium atoms located on a common axis on opposite sidesof the cesium atom. For Cs∗Hen≥3 the helium atoms are distributed on a concentric ring aroundthe alkali atom. The summation over the pair potentials can be expressed by the operator (forn = 1, 2, ...)
V Cs-Hen (r) =
n∑
i=1
V 6P (ri), (3.2)
with ri = r(r, θ = π/2, ϕi = i2π/n). In addition we include He-He interactions by summing overthe corresponding potentials VHe-He(|ri− ri+1|) between neighboring helium atoms. The He-Heinteraction is modelled by the semi-empirical potential given by Beck [13]:
VHe -He(r) = Ae−αr−βr6
− C
(r2 + a2)3
[1 +
b+ 3a2
r2 + a2
], (3.3)
with A = 3.213 · 106 cm−1, C = 7004 cm−1 A6, a = 0.675 A, b = 2.709 A2, α = 4.390 1/A andβ = 3.746 10−4 1/A6. This potential is shown in Fig. 3.1. The distance between two neighboringhelium atoms is a function of the cesium helium separation r and the number n of helium atoms.One has |ri − ri+1| = 2r sin(π/n). The summation over all helium pairs then gives
V He-Hen (r) = nVHe -He(2r sin(π/n)) (3.4)
After including the alkali spin-orbit interaction the total interaction potential of the Cs∗Hensystem reads
VCs∗Hen(r) = V Cs-He
n (r) + V He-Hen (r) + 2/3∆L · S, (3.5)
where ∆ = 554.0 cm−1 is the fine-structure splitting of the free cesium 6P state and S theelectronic spin operator. VCs∗Hen
(r) is diagonalized algebraically. In Figs. 3.2 and 3.3 theresulting r-dependence of the eigenvalues are shown for Cs∗He2 and Cs∗He6 respectively. Thesame plots also show the ground state potentials given by nV 6s
σ (r)+V He-Hen (r). The potentials
are labelled according to their electronic configuration as X2Σ1/2, A2Π1/2, A
2Π3/2 and B2Σ1/2.The quantization axis is defined by the symmetry axis of the exciplexes, which is the internuclearaxis of the cesium atom and the two helium atoms in the case of Cs∗Hen=1,2, whereas forCs∗Hen≥3 it is the axis of the helium ring. Pictographs next to the curves show the variation ofthe cesium electronic density as the n helium atoms, indicated by two filled circles, approach thecesium atom. Note that the cuts through the electron orbitals are drawn to scale. For calculatingthe equi-probability lines in the pictographs we used radial wavefunctions of the cesium 6S and6P states from a statistical Thomas-Fermi model of the atom following the procedure given byGombas [15]. The lines indicate the rotational symmetry axis of the diffrent configurations andhave a length corresponding to 16 A. The helium atoms are drawn with a diameter of 3.5 A,which corresponds to the mean interatomic distance in the surrounding helium bulk.
From the adiabatic potentials of Fig. 3.2 and Fig. 3.3 one sees that the helium atoms, dueto the Pauli principle, are repelled by the cesium valence electron. However in cases where
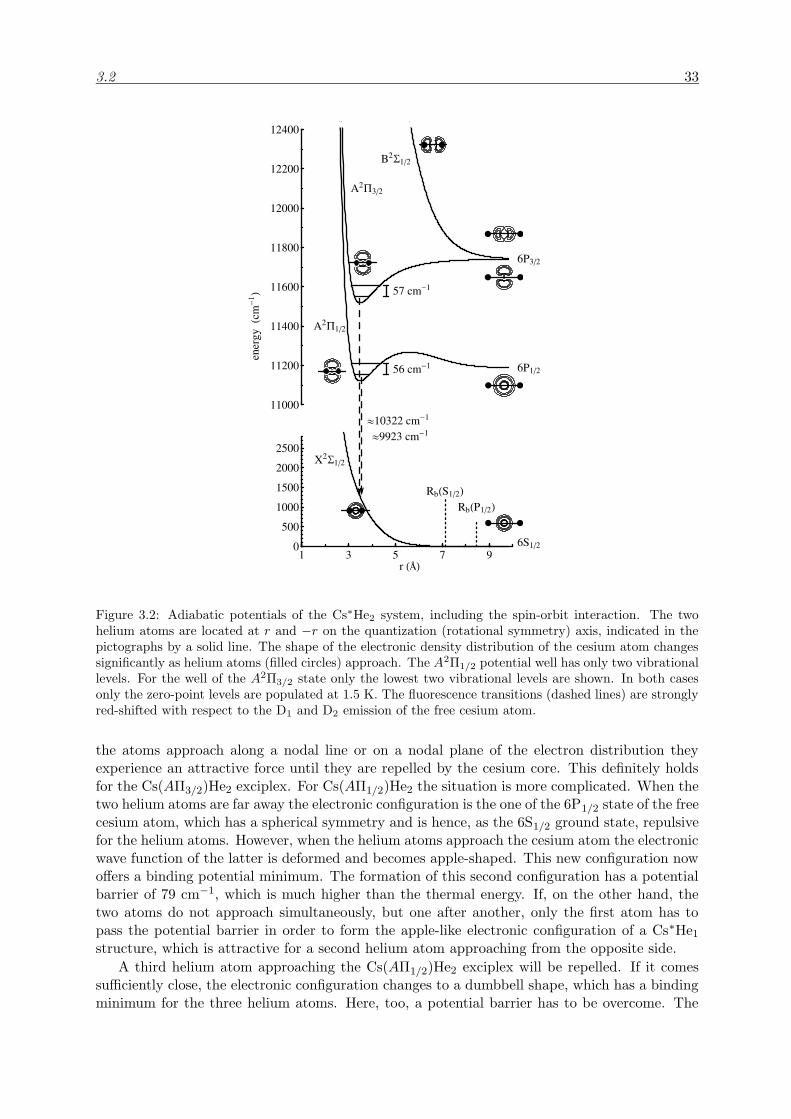
3.2 33
11000
11200
11400
11600
11800
12000
12200
12400
0
500
1000
1500
2000
2500
1 3 5 7 9
6P12
6P32
6S12
ener
gyHcm-
1 L
r HÞL
X2S12
A2P12
A2P32B2S12
57 cm-1
56 cm-1
RbHS12LRbHP12L
»10322 cm-1
»9923 cm-1
Figure 3.2: Adiabatic potentials of the Cs∗He2 system, including the spin-orbit interaction. The twohelium atoms are located at r and −r on the quantization (rotational symmetry) axis, indicated in thepictographs by a solid line. The shape of the electronic density distribution of the cesium atom changessignificantly as helium atoms (filled circles) approach. The A2Π1/2 potential well has only two vibrationallevels. For the well of the A2Π3/2 state only the lowest two vibrational levels are shown. In both casesonly the zero-point levels are populated at 1.5 K. The fluorescence transitions (dashed lines) are stronglyred-shifted with respect to the D1 and D2 emission of the free cesium atom.
the atoms approach along a nodal line or on a nodal plane of the electron distribution theyexperience an attractive force until they are repelled by the cesium core. This definitely holdsfor the Cs(AΠ3/2)He2 exciplex. For Cs(AΠ1/2)He2 the situation is more complicated. When thetwo helium atoms are far away the electronic configuration is the one of the 6P1/2 state of the freecesium atom, which has a spherical symmetry and is hence, as the 6S1/2 ground state, repulsivefor the helium atoms. However, when the helium atoms approach the cesium atom the electronicwave function of the latter is deformed and becomes apple-shaped. This new configuration nowoffers a binding potential minimum. The formation of this second configuration has a potentialbarrier of 79 cm−1, which is much higher than the thermal energy. If, on the other hand, thetwo atoms do not approach simultaneously, but one after another, only the first atom has topass the potential barrier in order to form the apple-like electronic configuration of a Cs∗He1structure, which is attractive for a second helium atom approaching from the opposite side.
A third helium atom approaching the Cs(AΠ1/2)He2 exciplex will be repelled. If it comessufficiently close, the electronic configuration changes to a dumbbell shape, which has a bindingminimum for the three helium atoms. Here, too, a potential barrier has to be overcome. The
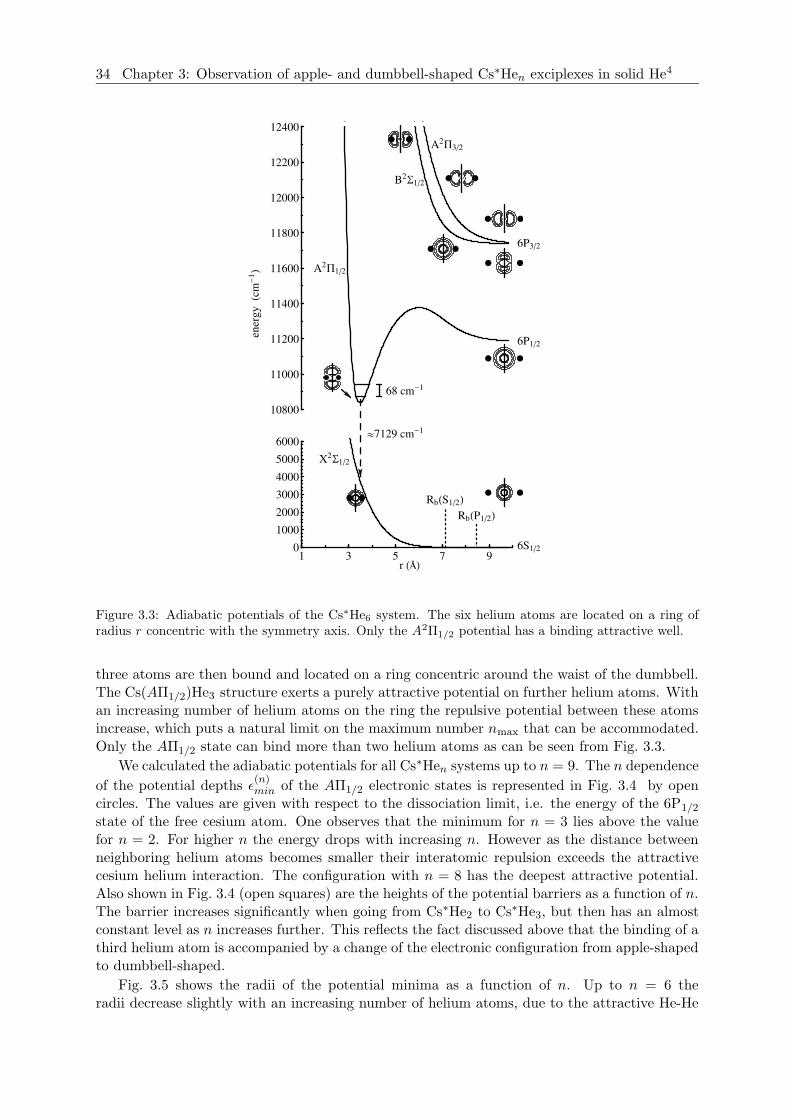
34 Chapter 3: Observation of apple- and dumbbell-shaped Cs∗Hen exciplexes in solid He4
10800
11000
11200
11400
11600
11800
12000
12200
12400
0
1000
2000
3000
4000
5000
6000
1 3 5 7 9
6P12
6P32
6S12
ener
gyHcm-
1 L
r HÞL
X2S12
A2P12
A2P32B2S12
68 cm-1
RbHS12LRbHP12L
»7129 cm-1
Figure 3.3: Adiabatic potentials of the Cs∗He6 system. The six helium atoms are located on a ring ofradius r concentric with the symmetry axis. Only the A2Π1/2 potential has a binding attractive well.
three atoms are then bound and located on a ring concentric around the waist of the dumbbell.The Cs(AΠ1/2)He3 structure exerts a purely attractive potential on further helium atoms. Withan increasing number of helium atoms on the ring the repulsive potential between these atomsincrease, which puts a natural limit on the maximum number nmax that can be accommodated.Only the AΠ1/2 state can bind more than two helium atoms as can be seen from Fig. 3.3.
We calculated the adiabatic potentials for all Cs∗Hen systems up to n = 9. The n dependence
of the potential depths ε(n)min of the AΠ1/2 electronic states is represented in Fig. 3.4 by open
circles. The values are given with respect to the dissociation limit, i.e. the energy of the 6P1/2
state of the free cesium atom. One observes that the minimum for n = 3 lies above the valuefor n = 2. For higher n the energy drops with increasing n. However as the distance betweenneighboring helium atoms becomes smaller their interatomic repulsion exceeds the attractivecesium helium interaction. The configuration with n = 8 has the deepest attractive potential.Also shown in Fig. 3.4 (open squares) are the heights of the potential barriers as a function of n.The barrier increases significantly when going from Cs∗He2 to Cs∗He3, but then has an almostconstant level as n increases further. This reflects the fact discussed above that the binding of athird helium atom is accompanied by a change of the electronic configuration from apple-shapedto dumbbell-shaped.
Fig. 3.5 shows the radii of the potential minima as a function of n. Up to n = 6 theradii decrease slightly with an increasing number of helium atoms, due to the attractive He-He
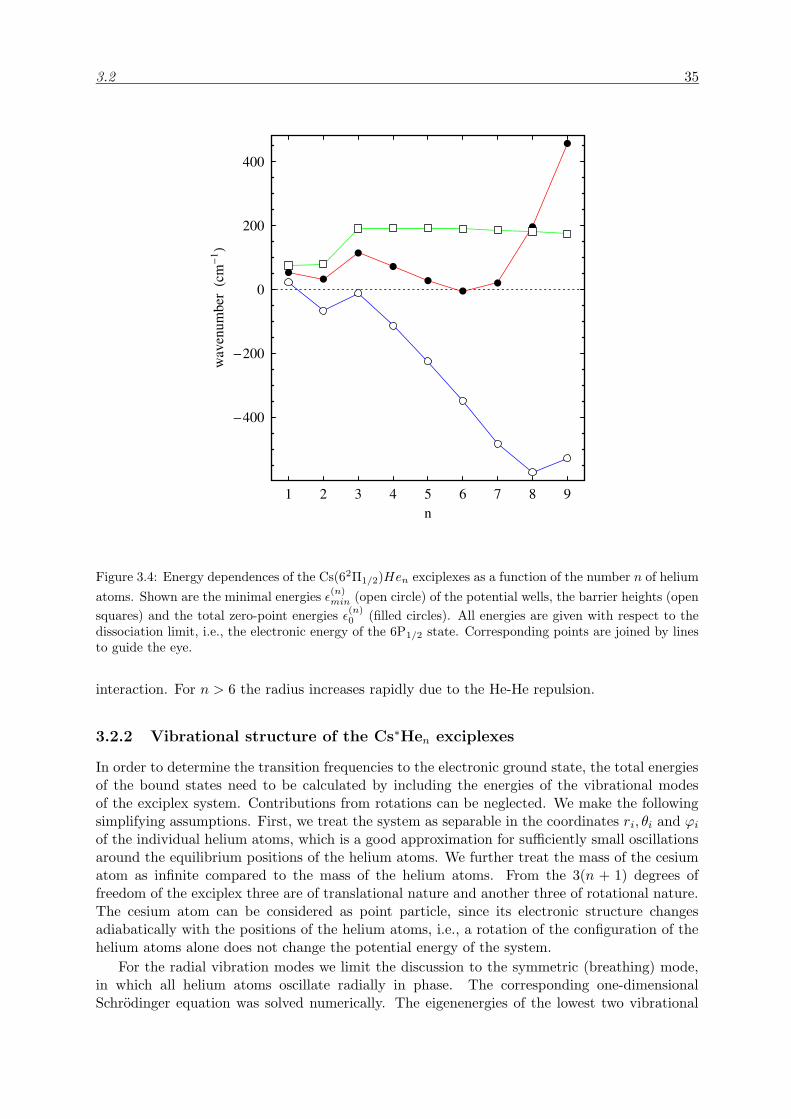
3.2 35
1 2 3 4 5 6 7 8 9n
-400
-200
0
200
400
wav
enum
ber
Hcm-1 L
Figure 3.4: Energy dependences of the Cs(62Π1/2)Hen exciplexes as a function of the number n of helium
atoms. Shown are the minimal energies ε(n)min (open circle) of the potential wells, the barrier heights (open
squares) and the total zero-point energies ε(n)0 (filled circles). All energies are given with respect to the
dissociation limit, i.e., the electronic energy of the 6P1/2 state. Corresponding points are joined by linesto guide the eye.
interaction. For n > 6 the radius increases rapidly due to the He-He repulsion.
3.2.2 Vibrational structure of the Cs∗Hen exciplexes
In order to determine the transition frequencies to the electronic ground state, the total energiesof the bound states need to be calculated by including the energies of the vibrational modesof the exciplex system. Contributions from rotations can be neglected. We make the followingsimplifying assumptions. First, we treat the system as separable in the coordinates ri, θi and ϕi
of the individual helium atoms, which is a good approximation for sufficiently small oscillationsaround the equilibrium positions of the helium atoms. We further treat the mass of the cesiumatom as infinite compared to the mass of the helium atoms. From the 3(n + 1) degrees offreedom of the exciplex three are of translational nature and another three of rotational nature.The cesium atom can be considered as point particle, since its electronic structure changesadiabatically with the positions of the helium atoms, i.e., a rotation of the configuration of thehelium atoms alone does not change the potential energy of the system.
For the radial vibration modes we limit the discussion to the symmetric (breathing) mode,in which all helium atoms oscillate radially in phase. The corresponding one-dimensionalSchrodinger equation was solved numerically. The eigenenergies of the lowest two vibrational
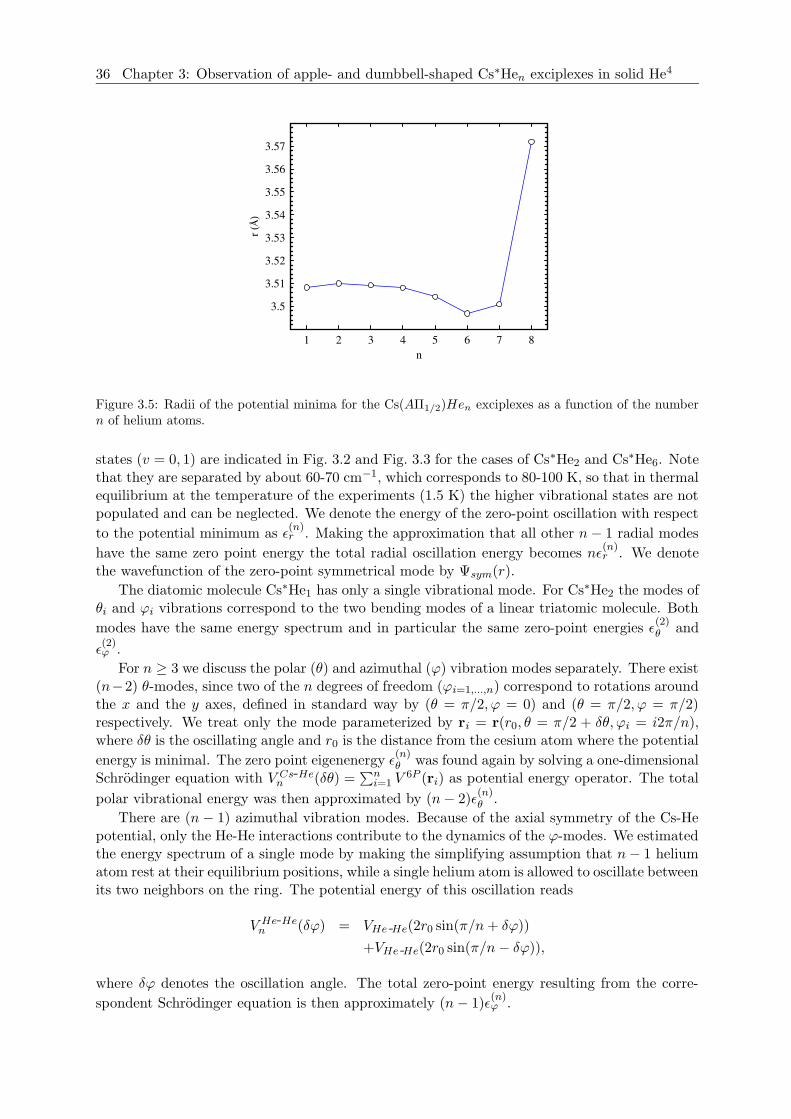
36 Chapter 3: Observation of apple- and dumbbell-shaped Cs∗Hen exciplexes in solid He4
1 2 3 4 5 6 7 8n
3.5
3.51
3.52
3.53
3.54
3.55
3.56
3.57
rHÞL
Figure 3.5: Radii of the potential minima for the Cs(AΠ1/2)Hen exciplexes as a function of the numbern of helium atoms.
states (v = 0, 1) are indicated in Fig. 3.2 and Fig. 3.3 for the cases of Cs∗He2 and Cs∗He6. Notethat they are separated by about 60-70 cm−1, which corresponds to 80-100 K, so that in thermalequilibrium at the temperature of the experiments (1.5 K) the higher vibrational states are notpopulated and can be neglected. We denote the energy of the zero-point oscillation with respect
to the potential minimum as ε(n)r . Making the approximation that all other n− 1 radial modes
have the same zero point energy the total radial oscillation energy becomes nε(n)r . We denote
the wavefunction of the zero-point symmetrical mode by Ψsym(r).
The diatomic molecule Cs∗He1 has only a single vibrational mode. For Cs∗He2 the modes ofθi and ϕi vibrations correspond to the two bending modes of a linear triatomic molecule. Both
modes have the same energy spectrum and in particular the same zero-point energies ε(2)θ and
ε(2)ϕ .
For n ≥ 3 we discuss the polar (θ) and azimuthal (ϕ) vibration modes separately. There exist(n−2) θ-modes, since two of the n degrees of freedom (ϕi=1,...,n) correspond to rotations aroundthe x and the y axes, defined in standard way by (θ = π/2, ϕ = 0) and (θ = π/2, ϕ = π/2)respectively. We treat only the mode parameterized by ri = r(r0, θ = π/2 + δθ, ϕi = i2π/n),where δθ is the oscillating angle and r0 is the distance from the cesium atom where the potential
energy is minimal. The zero point eigenenergy ε(n)θ was found again by solving a one-dimensional
Schrodinger equation with V Cs-Hen (δθ) =
∑ni=1 V
6P (ri) as potential energy operator. The total
polar vibrational energy was then approximated by (n− 2)ε(n)θ .
There are (n − 1) azimuthal vibration modes. Because of the axial symmetry of the Cs-Hepotential, only the He-He interactions contribute to the dynamics of the ϕ-modes. We estimatedthe energy spectrum of a single mode by making the simplifying assumption that n− 1 heliumatom rest at their equilibrium positions, while a single helium atom is allowed to oscillate betweenits two neighbors on the ring. The potential energy of this oscillation reads
V He-Hen (δϕ) = VHe -He(2r0 sin(π/n+ δϕ))
+VHe -He(2r0 sin(π/n− δϕ)),
where δϕ denotes the oscillation angle. The total zero-point energy resulting from the corre-
spondent Schrodinger equation is then approximately (n− 1)ε(n)ϕ .

3.3 37
The overall zero-point energy, which takes all vibrational modes into account, is finally givenby
ε(n)0 = nε(n)r + (n− 1)ε(n)ϕ + (n− 2)ε
(n)θ . (3.6)
The total vibrational energy ε(n)0 is represented as a function of n in Fig. 3.4 as filled circles
and has a local minimum for n = 2. After the strong increase between n = 2 and n = 3 thezero-point energy drops slightly until a global minimum is reached for n = 6. For larger n thezero point energy of the azimuthal modes increases rapidly.
The results presented here are preliminary. The zero-point energy of the angular vibrationalmodes leads to centrifugal forces, which were not taken into account in our simplified treatment.This effect will enlarge the radius of the helium ring. However (quasi) bound states will exist onlyas long as the radius is smaller then the radius of the potential barrier of the radial potentials.The calculations indicate that exciplexes with n ≥ 8, for which the estimated total zero-pointenergy exceeds the barrier energy, are unstable (Fig. 3.4). Cs(AΠ1/2)He7 seems to be the largestpossible quasi-bound exciplex. Only the energy for n = 6 lies 6 cm−1 below the dissociationlimit and is hence stable.
The energetic structure of Cs∗Hen exciplexes is quite different from Rb∗Hen exciplexes. forwhich the zero-point energies for n = 1 to nmax = 7 are well below the dissociation limit [4].This is a consequence of the smaller spin-orbit splitting (∆ = 237.6 cm−1) of rubidium comparedto cesium (∆ = 554.0 cm−1). As for cesium the rubidium exciplex with n = 6 has a minimalenergy, but the energy for the n = 3 exciplex is in the case of rubidium smaller than for n = 2.The minimal energy for n = 6 is the key theoretical argument that no rubidium exciplexes withn > 6 were observed [4]. All intermediate states (n = 1...5) have been observed as transients inthe formation of Rb∗He6.
The zero-point energies of the Cs(AΠ3/2)Hen=1,2 exciplexes are −80 cm−1 and −139 cm−1
respectively, and hence well below the dissociation limit. The exciplexes Cs(AΠ3/2)He1,Cs(AΠ3/2)He2 and Cs(AΠ1/2)He1 are the only ones previously observed.
3.2.3 The emission spectra
Emission spectra I(ν) are calculated in the Franck-Condon approximation by
I(ν) ∝ ν3|∫
Ψ(r, ν)Ψsym(r)dr|2, (3.7)
where ν is the transition frequency and Ψ(r, ν) is the wave function of the Cs∗Hen config-uration in the electronic ground state XΣ1/2. The integrals over the angular variables do notinfluence the shape of the emission lines, because of the radial symmetry of Ψ(r, ν). As men-tioned above we consider only the wave function of the breathing mode oscillation of the exciplexand assume that the other radial vibration modes have similar wave functions as Ψsym(r).
Fig. 3.6 shows the calculated emission lines of the Cs(AΠ1/2)Hen exciplexes for n = 1to n = 7 and of the Cs(AΠ3/2)Hen exciplexes for n = 1 and 2. Only transitions from thevibrational ground states are considered. The red shift of the lines with increasing n is mainlydue to the increasing repulsive energy of the ground state potential nV 6s
σ (r) + V He-Hen (r), while
the corresponding broadening is due to the increase of the slope of this potential. The integralintensity of the lines drops with decreasing frequency ν, because of the ν3-dependence in 3.7. Theasymmetry of the peaks originates from the asymmetric shape of the excited state wavefunctionΨsym(r) and from the curvature of the ground state potential.
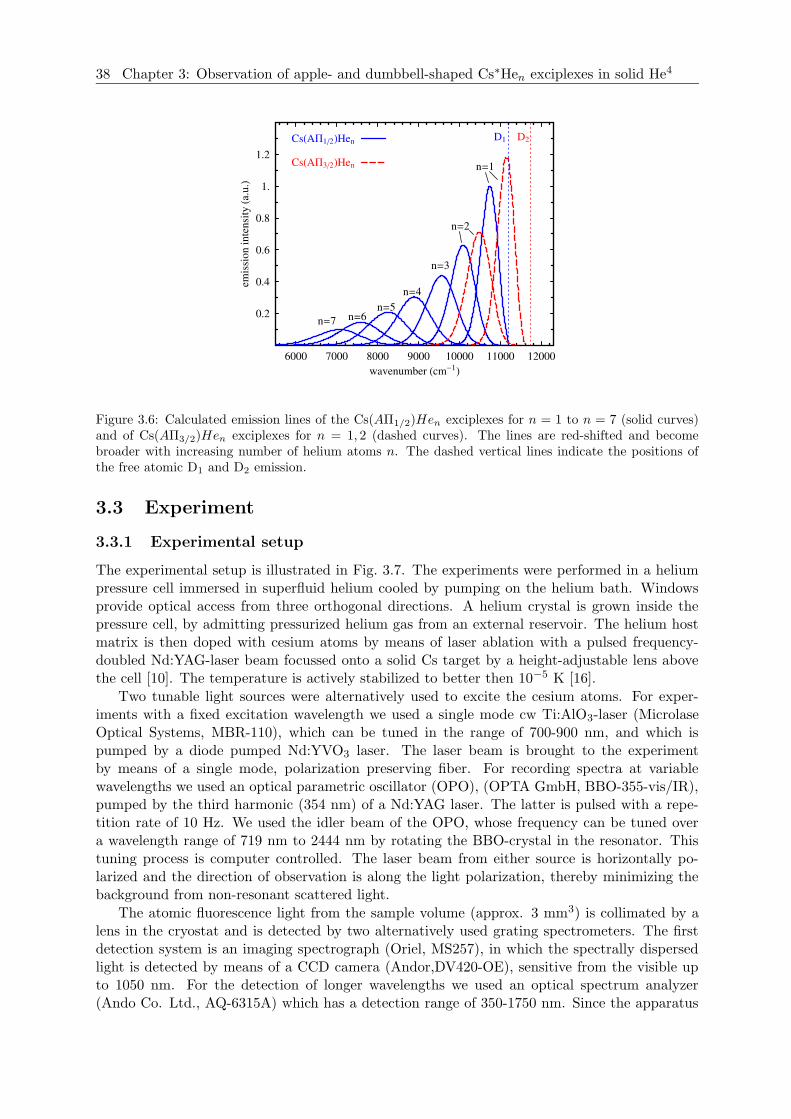
38 Chapter 3: Observation of apple- and dumbbell-shaped Cs∗Hen exciplexes in solid He4
6000 7000 8000 9000 10000 11000 12000wavenumber Hcm-1L
0.2
0.4
0.6
0.8
1.
1.2
emis
sion
inte
nsity
Ha.u.L
n=1
n=2
n=3
n=4n=5
n=6n=7
D1 D2CsHAP12LHen
CsHAP32LHen
Figure 3.6: Calculated emission lines of the Cs(AΠ1/2)Hen exciplexes for n = 1 to n = 7 (solid curves)and of Cs(AΠ3/2)Hen exciplexes for n = 1, 2 (dashed curves). The lines are red-shifted and becomebroader with increasing number of helium atoms n. The dashed vertical lines indicate the positions ofthe free atomic D1 and D2 emission.
3.3 Experiment
3.3.1 Experimental setup
The experimental setup is illustrated in Fig. 3.7. The experiments were performed in a heliumpressure cell immersed in superfluid helium cooled by pumping on the helium bath. Windowsprovide optical access from three orthogonal directions. A helium crystal is grown inside thepressure cell, by admitting pressurized helium gas from an external reservoir. The helium hostmatrix is then doped with cesium atoms by means of laser ablation with a pulsed frequency-doubled Nd:YAG-laser beam focussed onto a solid Cs target by a height-adjustable lens abovethe cell [10]. The temperature is actively stabilized to better then 10−5 K [16].
Two tunable light sources were alternatively used to excite the cesium atoms. For exper-iments with a fixed excitation wavelength we used a single mode cw Ti:AlO3-laser (MicrolaseOptical Systems, MBR-110), which can be tuned in the range of 700-900 nm, and which ispumped by a diode pumped Nd:YVO3 laser. The laser beam is brought to the experimentby means of a single mode, polarization preserving fiber. For recording spectra at variablewavelengths we used an optical parametric oscillator (OPO), (OPTA GmbH, BBO-355-vis/IR),pumped by the third harmonic (354 nm) of a Nd:YAG laser. The latter is pulsed with a repe-tition rate of 10 Hz. We used the idler beam of the OPO, whose frequency can be tuned overa wavelength range of 719 nm to 2444 nm by rotating the BBO-crystal in the resonator. Thistuning process is computer controlled. The laser beam from either source is horizontally po-larized and the direction of observation is along the light polarization, thereby minimizing thebackground from non-resonant scattered light.
The atomic fluorescence light from the sample volume (approx. 3 mm3) is collimated by alens in the cryostat and is detected by two alternatively used grating spectrometers. The firstdetection system is an imaging spectrograph (Oriel, MS257), in which the spectrally dispersedlight is detected by means of a CCD camera (Andor,DV420-OE), sensitive from the visible upto 1050 nm. For the detection of longer wavelengths we used an optical spectrum analyzer(Ando Co. Ltd., AQ-6315A) which has a detection range of 350-1750 nm. Since the apparatus
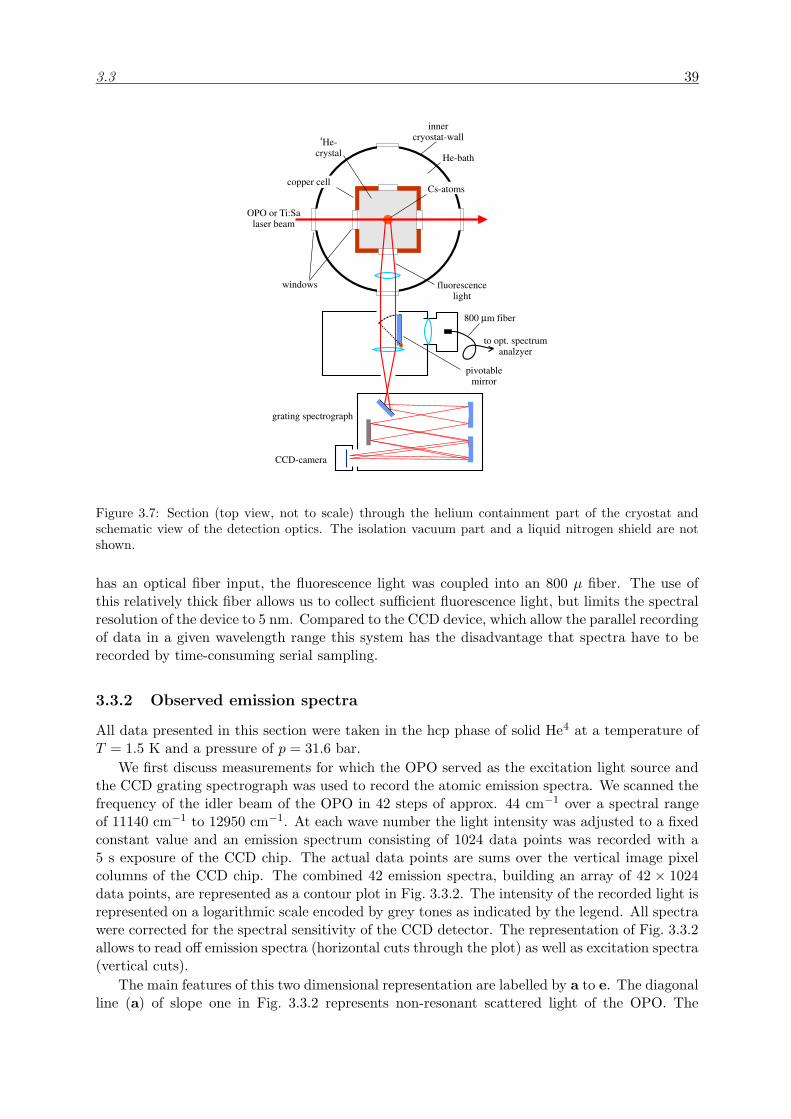
3.3 39
copper cell
innercryostat-wall
Cs-atoms
windows fluorescencelight
800 m fiberµ
4He-crystal He-bath
grating spectrograph
CCD-camera
to opt. spectrumanalzyer
pivotablemirror
OPO or Ti:Salaser beam
Figure 3.7: Section (top view, not to scale) through the helium containment part of the cryostat andschematic view of the detection optics. The isolation vacuum part and a liquid nitrogen shield are notshown.
has an optical fiber input, the fluorescence light was coupled into an 800 µ fiber. The use ofthis relatively thick fiber allows us to collect sufficient fluorescence light, but limits the spectralresolution of the device to 5 nm. Compared to the CCD device, which allow the parallel recordingof data in a given wavelength range this system has the disadvantage that spectra have to berecorded by time-consuming serial sampling.
3.3.2 Observed emission spectra
All data presented in this section were taken in the hcp phase of solid He4 at a temperature ofT = 1.5 K and a pressure of p = 31.6 bar.
We first discuss measurements for which the OPO served as the excitation light source andthe CCD grating spectrograph was used to record the atomic emission spectra. We scanned thefrequency of the idler beam of the OPO in 42 steps of approx. 44 cm−1 over a spectral rangeof 11140 cm−1 to 12950 cm−1. At each wave number the light intensity was adjusted to a fixedconstant value and an emission spectrum consisting of 1024 data points was recorded with a5 s exposure of the CCD chip. The actual data points are sums over the vertical image pixelcolumns of the CCD chip. The combined 42 emission spectra, building an array of 42 × 1024data points, are represented as a contour plot in Fig. 3.3.2. The intensity of the recorded light isrepresented on a logarithmic scale encoded by grey tones as indicated by the legend. All spectrawere corrected for the spectral sensitivity of the CCD detector. The representation of Fig. 3.3.2allows to read off emission spectra (horizontal cuts through the plot) as well as excitation spectra(vertical cuts).
The main features of this two dimensional representation are labelled by a to e. The diagonalline (a) of slope one in Fig. 3.3.2 represents non-resonant scattered light of the OPO. The
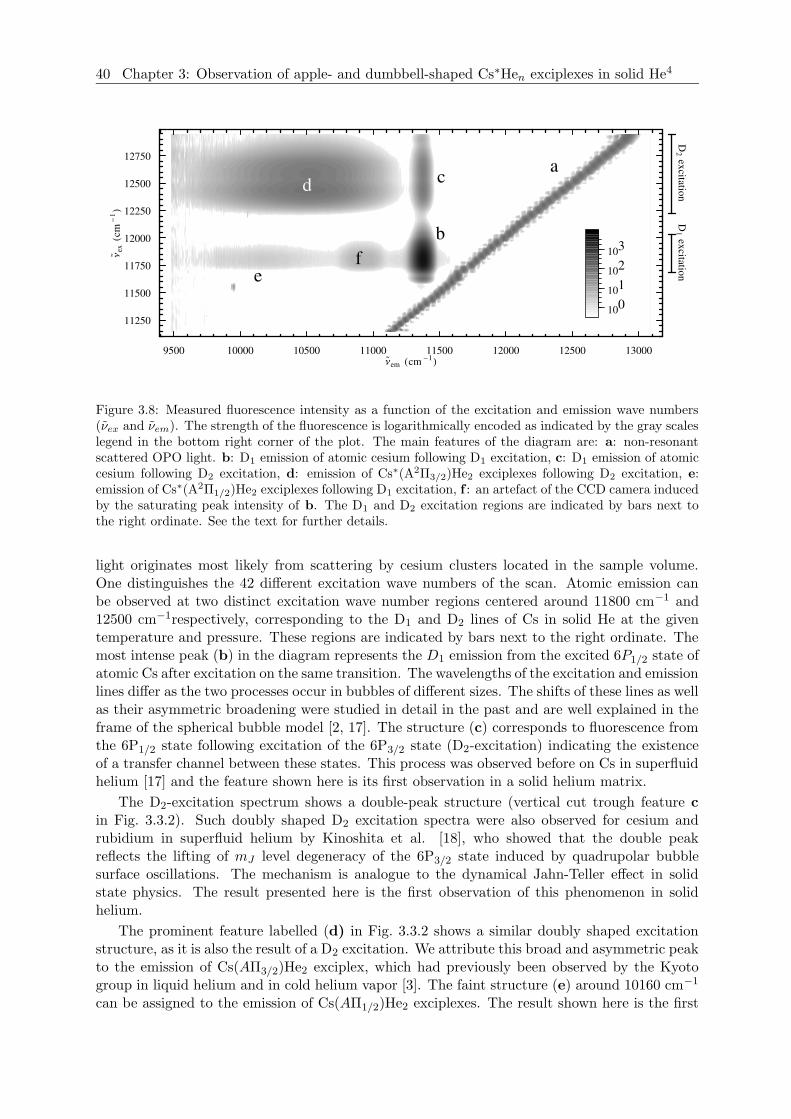
40 Chapter 3: Observation of apple- and dumbbell-shaped Cs∗Hen exciplexes in solid He4
a
b
cd
ef
100101102103
9500 10000 10500 11000 11500 12000 12500 13000Ν
em Hcm -1L11250
11500
11750
12000
12250
12500
12750
Ν exHcm-
1L
D1
excitationD
2excitation
Figure 3.8: Measured fluorescence intensity as a function of the excitation and emission wave numbers(νex and νem). The strength of the fluorescence is logarithmically encoded as indicated by the gray scaleslegend in the bottom right corner of the plot. The main features of the diagram are: a: non-resonantscattered OPO light. b: D1 emission of atomic cesium following D1 excitation, c: D1 emission of atomiccesium following D2 excitation, d: emission of Cs∗(A2Π3/2)He2 exciplexes following D2 excitation, e:emission of Cs∗(A2Π1/2)He2 exciplexes following D1 excitation, f : an artefact of the CCD camera inducedby the saturating peak intensity of b. The D1 and D2 excitation regions are indicated by bars next tothe right ordinate. See the text for further details.
light originates most likely from scattering by cesium clusters located in the sample volume.One distinguishes the 42 different excitation wave numbers of the scan. Atomic emission canbe observed at two distinct excitation wave number regions centered around 11800 cm−1 and12500 cm−1respectively, corresponding to the D1 and D2 lines of Cs in solid He at the giventemperature and pressure. These regions are indicated by bars next to the right ordinate. Themost intense peak (b) in the diagram represents the D1 emission from the excited 6P1/2 state ofatomic Cs after excitation on the same transition. The wavelengths of the excitation and emissionlines differ as the two processes occur in bubbles of different sizes. The shifts of these lines as wellas their asymmetric broadening were studied in detail in the past and are well explained in theframe of the spherical bubble model [2, 17]. The structure (c) corresponds to fluorescence fromthe 6P1/2 state following excitation of the 6P3/2 state (D2-excitation) indicating the existenceof a transfer channel between these states. This process was observed before on Cs in superfluidhelium [17] and the feature shown here is its first observation in a solid helium matrix.
The D2-excitation spectrum shows a double-peak structure (vertical cut trough feature cin Fig. 3.3.2). Such doubly shaped D2 excitation spectra were also observed for cesium andrubidium in superfluid helium by Kinoshita et al. [18], who showed that the double peakreflects the lifting of mJ level degeneracy of the 6P3/2 state induced by quadrupolar bubblesurface oscillations. The mechanism is analogue to the dynamical Jahn-Teller effect in solidstate physics. The result presented here is the first observation of this phenomenon in solidhelium.
The prominent feature labelled (d) in Fig. 3.3.2 shows a similar doubly shaped excitationstructure, as it is also the result of a D2 excitation. We attribute this broad and asymmetric peakto the emission of Cs(AΠ3/2)He2 exciplex, which had previously been observed by the Kyotogroup in liquid helium and in cold helium vapor [3]. The faint structure (e) around 10160 cm−1
can be assigned to the emission of Cs(AΠ1/2)He2 exciplexes. The result shown here is the first
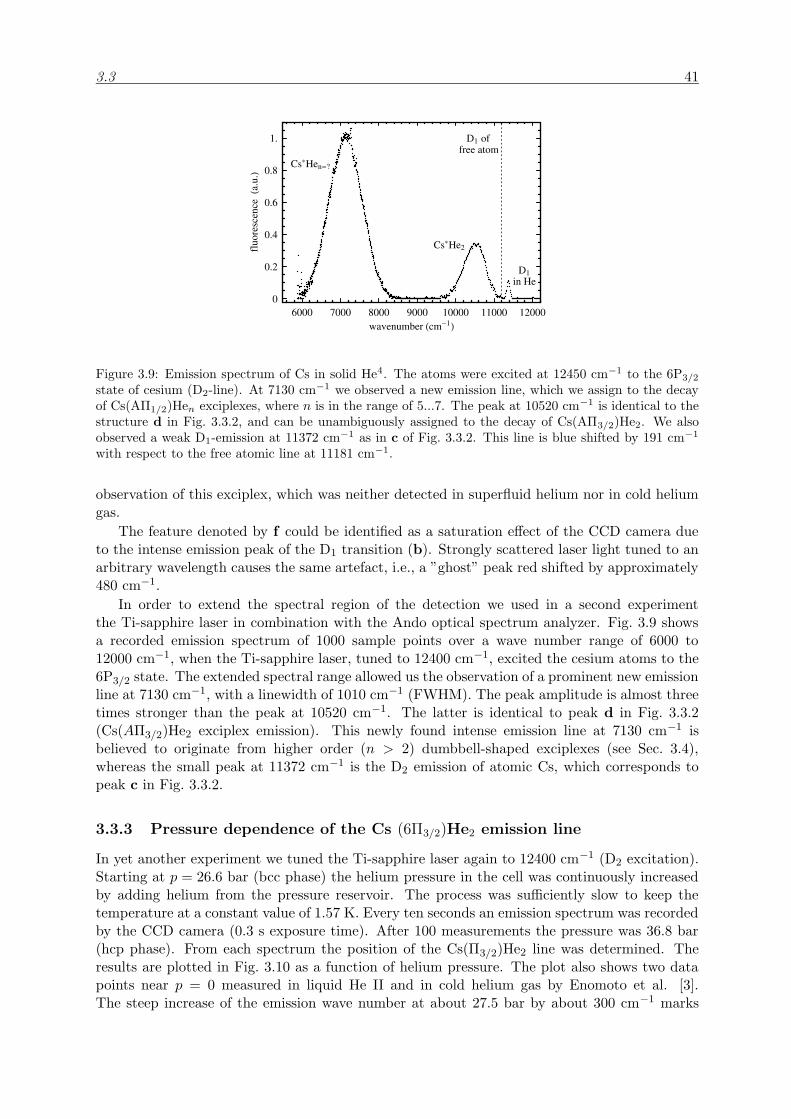
3.3 41
6000 7000 8000 9000 10000 11000 12000wavenumber Hcm-1L
0
0.2
0.4
0.6
0.8
1.
fluo
resc
ence
Ha.u.LCs*He2
D1in He
Cs*Hen=?
D1 offree atom
Figure 3.9: Emission spectrum of Cs in solid He4. The atoms were excited at 12450 cm−1 to the 6P3/2
state of cesium (D2-line). At 7130 cm−1 we observed a new emission line, which we assign to the decay
of Cs(AΠ1/2)Hen exciplexes, where n is in the range of 5...7. The peak at 10520 cm−1 is identical to thestructure d in Fig. 3.3.2, and can be unambiguously assigned to the decay of Cs(AΠ3/2)He2. We alsoobserved a weak D1-emission at 11372 cm
−1 as in c of Fig. 3.3.2. This line is blue shifted by 191 cm−1
with respect to the free atomic line at 11181 cm−1.
observation of this exciplex, which was neither detected in superfluid helium nor in cold heliumgas.
The feature denoted by f could be identified as a saturation effect of the CCD camera dueto the intense emission peak of the D1 transition (b). Strongly scattered laser light tuned to anarbitrary wavelength causes the same artefact, i.e., a ”ghost” peak red shifted by approximately480 cm−1.
In order to extend the spectral region of the detection we used in a second experimentthe Ti-sapphire laser in combination with the Ando optical spectrum analyzer. Fig. 3.9 showsa recorded emission spectrum of 1000 sample points over a wave number range of 6000 to12000 cm−1, when the Ti-sapphire laser, tuned to 12400 cm−1, excited the cesium atoms to the6P3/2 state. The extended spectral range allowed us the observation of a prominent new emissionline at 7130 cm−1, with a linewidth of 1010 cm−1 (FWHM). The peak amplitude is almost threetimes stronger than the peak at 10520 cm−1. The latter is identical to peak d in Fig. 3.3.2(Cs(AΠ3/2)He2 exciplex emission). This newly found intense emission line at 7130 cm−1 isbelieved to originate from higher order (n > 2) dumbbell-shaped exciplexes (see Sec. 3.4),whereas the small peak at 11372 cm−1 is the D2 emission of atomic Cs, which corresponds topeak c in Fig. 3.3.2.
3.3.3 Pressure dependence of the Cs (6Π3/2)He2 emission line
In yet another experiment we tuned the Ti-sapphire laser again to 12400 cm−1 (D2 excitation).Starting at p = 26.6 bar (bcc phase) the helium pressure in the cell was continuously increasedby adding helium from the pressure reservoir. The process was sufficiently slow to keep thetemperature at a constant value of 1.57 K. Every ten seconds an emission spectrum was recordedby the CCD camera (0.3 s exposure time). After 100 measurements the pressure was 36.8 bar(hcp phase). From each spectrum the position of the Cs(Π3/2)He2 line was determined. Theresults are plotted in Fig. 3.10 as a function of helium pressure. The plot also shows two datapoints near p = 0 measured in liquid He II and in cold helium gas by Enomoto et al. [3].The steep increase of the emission wave number at about 27.5 bar by about 300 cm−1 marks
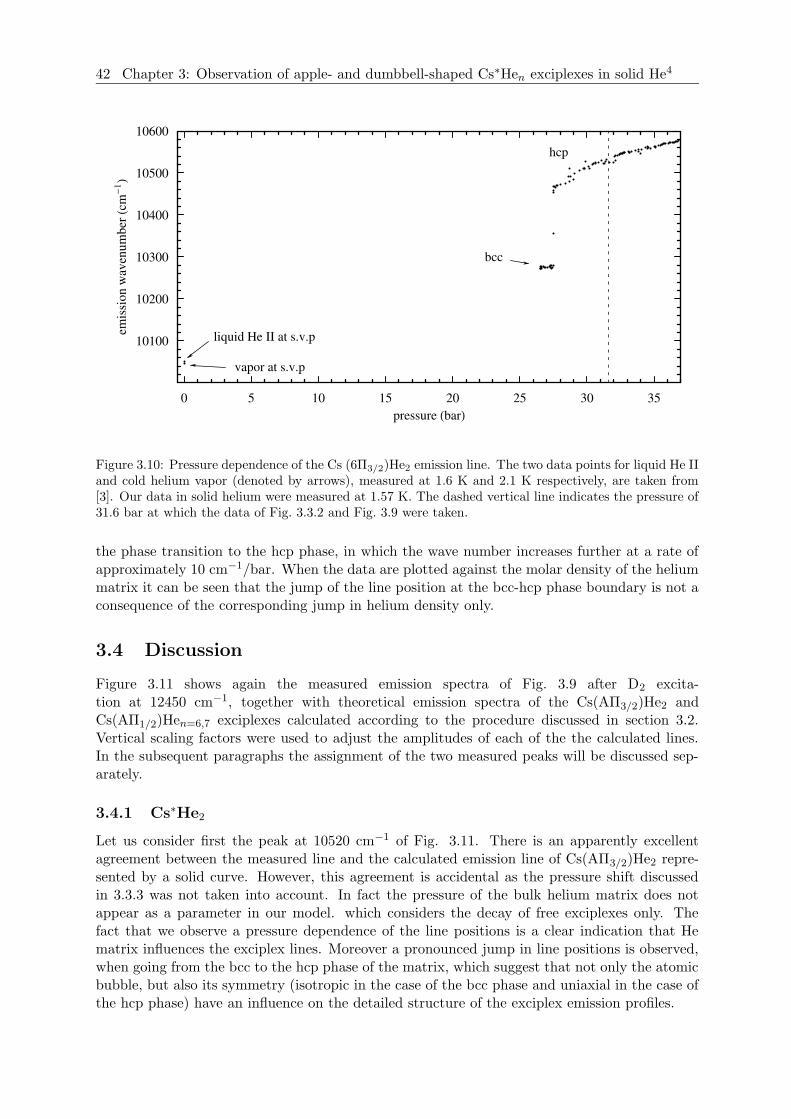
42 Chapter 3: Observation of apple- and dumbbell-shaped Cs∗Hen exciplexes in solid He4
0 5 10 15 20 25 30 35pressure HbarL
10100
10200
10300
10400
10500
10600em
issi
onw
aven
umbe
rHcm-1 L
vapor at s.v.p
hcp
bcc
liquid He II at s.v.p
Figure 3.10: Pressure dependence of the Cs (6Π3/2)He2 emission line. The two data points for liquid He IIand cold helium vapor (denoted by arrows), measured at 1.6 K and 2.1 K respectively, are taken from[3]. Our data in solid helium were measured at 1.57 K. The dashed vertical line indicates the pressure of31.6 bar at which the data of Fig. 3.3.2 and Fig. 3.9 were taken.
the phase transition to the hcp phase, in which the wave number increases further at a rate ofapproximately 10 cm−1/bar. When the data are plotted against the molar density of the heliummatrix it can be seen that the jump of the line position at the bcc-hcp phase boundary is not aconsequence of the corresponding jump in helium density only.
3.4 Discussion
Figure 3.11 shows again the measured emission spectra of Fig. 3.9 after D2 excita-tion at 12450 cm−1, together with theoretical emission spectra of the Cs(AΠ3/2)He2 andCs(AΠ1/2)Hen=6,7 exciplexes calculated according to the procedure discussed in section 3.2.Vertical scaling factors were used to adjust the amplitudes of each of the the calculated lines.In the subsequent paragraphs the assignment of the two measured peaks will be discussed sep-arately.
3.4.1 Cs∗He2
Let us consider first the peak at 10520 cm−1 of Fig. 3.11. There is an apparently excellentagreement between the measured line and the calculated emission line of Cs(AΠ3/2)He2 repre-sented by a solid curve. However, this agreement is accidental as the pressure shift discussedin 3.3.3 was not taken into account. In fact the pressure of the bulk helium matrix does notappear as a parameter in our model. which considers the decay of free exciplexes only. Thefact that we observe a pressure dependence of the line positions is a clear indication that Hematrix influences the exciplex lines. Moreover a pronounced jump in line positions is observed,when going from the bcc to the hcp phase of the matrix, which suggest that not only the atomicbubble, but also its symmetry (isotropic in the case of the bcc phase and uniaxial in the case ofthe hcp phase) have an influence on the detailed structure of the exciplex emission profiles.
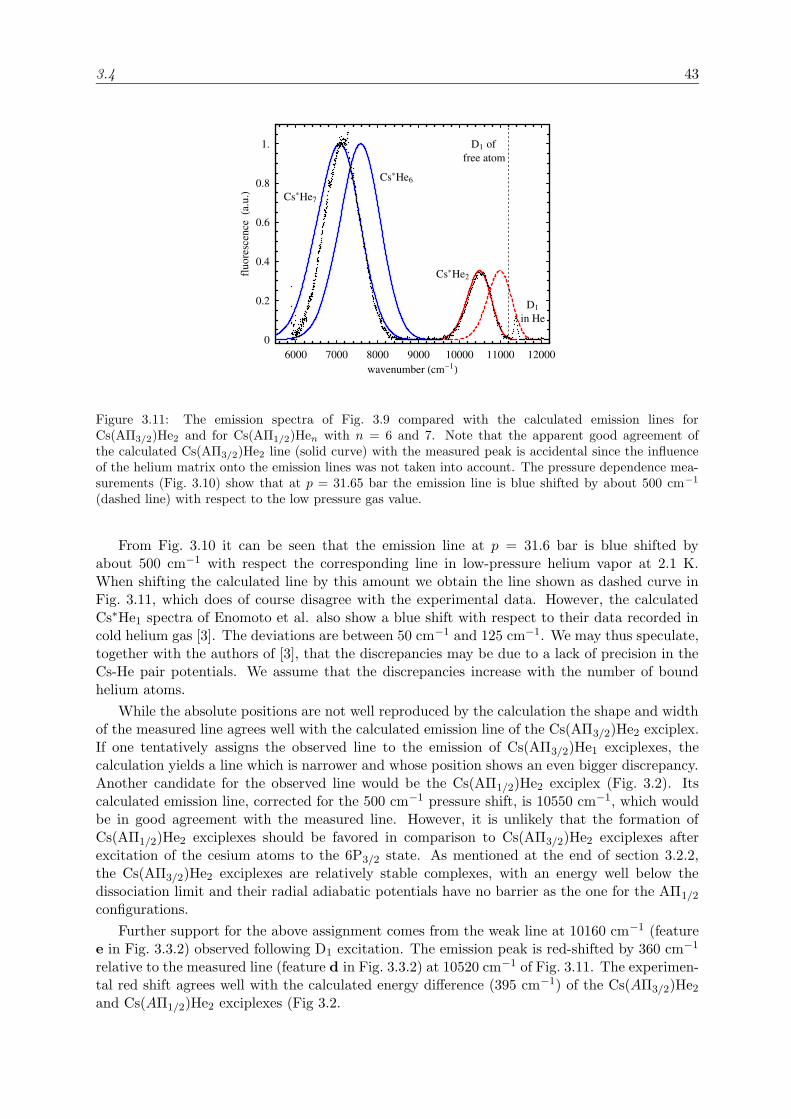
3.4 43
6000 7000 8000 9000 10000 11000 12000wavenumber Hcm-1L
0
0.2
0.4
0.6
0.8
1.
fluo
resc
ence
Ha.u.LCs*He2
D1in He
Cs*He6
Cs*He7
D1 offree atom
Figure 3.11: The emission spectra of Fig. 3.9 compared with the calculated emission lines forCs(AΠ3/2)He2 and for Cs(AΠ1/2)Hen with n = 6 and 7. Note that the apparent good agreement ofthe calculated Cs(AΠ3/2)He2 line (solid curve) with the measured peak is accidental since the influenceof the helium matrix onto the emission lines was not taken into account. The pressure dependence mea-surements (Fig. 3.10) show that at p = 31.65 bar the emission line is blue shifted by about 500 cm−1
(dashed line) with respect to the low pressure gas value.
From Fig. 3.10 it can be seen that the emission line at p = 31.6 bar is blue shifted byabout 500 cm−1 with respect the corresponding line in low-pressure helium vapor at 2.1 K.When shifting the calculated line by this amount we obtain the line shown as dashed curve inFig. 3.11, which does of course disagree with the experimental data. However, the calculatedCs∗He1 spectra of Enomoto et al. also show a blue shift with respect to their data recorded incold helium gas [3]. The deviations are between 50 cm−1 and 125 cm−1. We may thus speculate,together with the authors of [3], that the discrepancies may be due to a lack of precision in theCs-He pair potentials. We assume that the discrepancies increase with the number of boundhelium atoms.
While the absolute positions are not well reproduced by the calculation the shape and widthof the measured line agrees well with the calculated emission line of the Cs(AΠ3/2)He2 exciplex.If one tentatively assigns the observed line to the emission of Cs(AΠ3/2)He1 exciplexes, thecalculation yields a line which is narrower and whose position shows an even bigger discrepancy.Another candidate for the observed line would be the Cs(AΠ1/2)He2 exciplex (Fig. 3.2). Itscalculated emission line, corrected for the 500 cm−1 pressure shift, is 10550 cm−1, which wouldbe in good agreement with the measured line. However, it is unlikely that the formation ofCs(AΠ1/2)He2 exciplexes should be favored in comparison to Cs(AΠ3/2)He2 exciplexes afterexcitation of the cesium atoms to the 6P3/2 state. As mentioned at the end of section 3.2.2,the Cs(AΠ3/2)He2 exciplexes are relatively stable complexes, with an energy well below thedissociation limit and their radial adiabatic potentials have no barrier as the one for the AΠ1/2
configurations.
Further support for the above assignment comes from the weak line at 10160 cm−1 (featuree in Fig. 3.3.2) observed following D1 excitation. The emission peak is red-shifted by 360 cm−1
relative to the measured line (feature d in Fig. 3.3.2) at 10520 cm−1 of Fig. 3.11. The experimen-tal red shift agrees well with the calculated energy difference (395 cm−1) of the Cs(AΠ3/2)He2and Cs(AΠ1/2)He2 exciplexes (Fig 3.2.
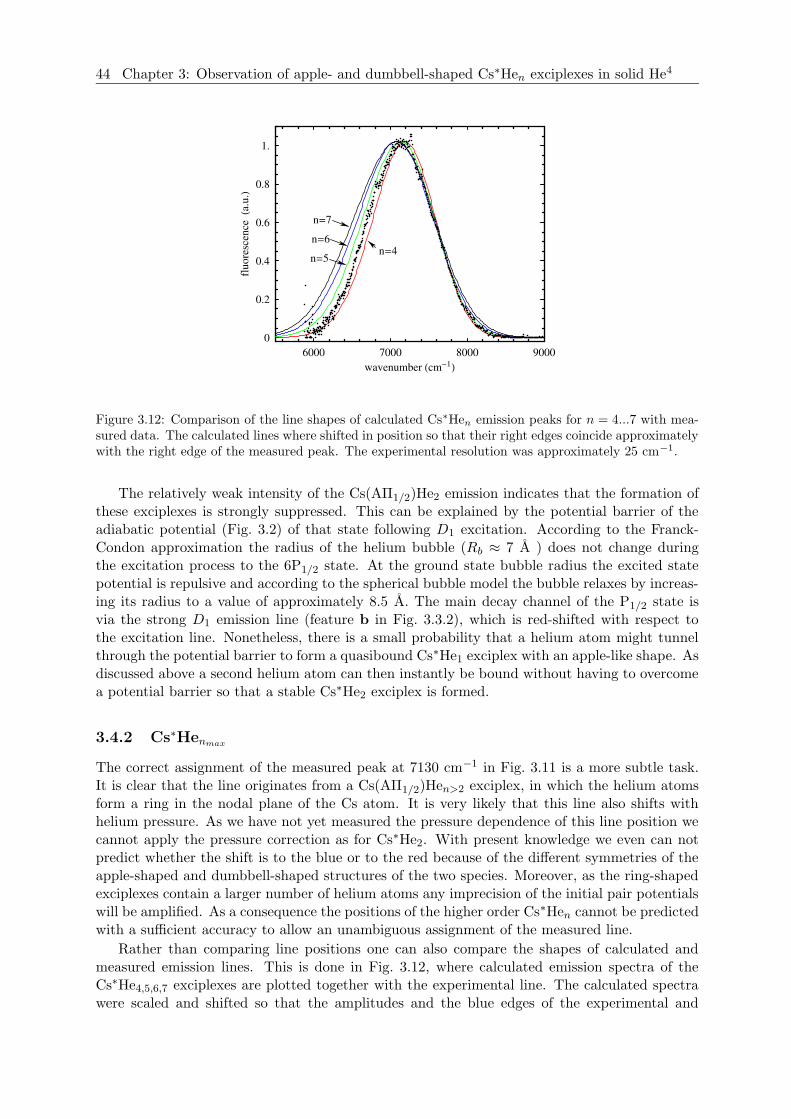
44 Chapter 3: Observation of apple- and dumbbell-shaped Cs∗Hen exciplexes in solid He4
6000 7000 8000 9000wavenumber Hcm-1L
0
0.2
0.4
0.6
0.8
1.
fluo
resc
ence
Ha.u.Ln=4
n=5
n=6
n=7
Figure 3.12: Comparison of the line shapes of calculated Cs∗Hen emission peaks for n = 4...7 with mea-sured data. The calculated lines where shifted in position so that their right edges coincide approximatelywith the right edge of the measured peak. The experimental resolution was approximately 25 cm−1.
The relatively weak intensity of the Cs(AΠ1/2)He2 emission indicates that the formation ofthese exciplexes is strongly suppressed. This can be explained by the potential barrier of theadiabatic potential (Fig. 3.2) of that state following D1 excitation. According to the Franck-Condon approximation the radius of the helium bubble (Rb ≈ 7 A ) does not change duringthe excitation process to the 6P1/2 state. At the ground state bubble radius the excited statepotential is repulsive and according to the spherical bubble model the bubble relaxes by increas-ing its radius to a value of approximately 8.5 A. The main decay channel of the P1/2 state isvia the strong D1 emission line (feature b in Fig. 3.3.2), which is red-shifted with respect tothe excitation line. Nonetheless, there is a small probability that a helium atom might tunnelthrough the potential barrier to form a quasibound Cs∗He1 exciplex with an apple-like shape. Asdiscussed above a second helium atom can then instantly be bound without having to overcomea potential barrier so that a stable Cs∗He2 exciplex is formed.
3.4.2 Cs∗Henmax
The correct assignment of the measured peak at 7130 cm−1 in Fig. 3.11 is a more subtle task.It is clear that the line originates from a Cs(AΠ1/2)Hen>2 exciplex, in which the helium atomsform a ring in the nodal plane of the Cs atom. It is very likely that this line also shifts withhelium pressure. As we have not yet measured the pressure dependence of this line position wecannot apply the pressure correction as for Cs∗He2. With present knowledge we even can notpredict whether the shift is to the blue or to the red because of the different symmetries of theapple-shaped and dumbbell-shaped structures of the two species. Moreover, as the ring-shapedexciplexes contain a larger number of helium atoms any imprecision of the initial pair potentialswill be amplified. As a consequence the positions of the higher order Cs∗Hen cannot be predictedwith a sufficient accuracy to allow an unambiguous assignment of the measured line.
Rather than comparing line positions one can also compare the shapes of calculated andmeasured emission lines. This is done in Fig. 3.12, where calculated emission spectra of theCs∗He4,5,6,7 exciplexes are plotted together with the experimental line. The calculated spectrawere scaled and shifted so that the amplitudes and the blue edges of the experimental and
3.5 45
theoretical spectra coincide. One observes that the experimental spectrum lies in between thecalculated peaks for n = 4 and n = 5, whereas the peaks for n = 6 and n = 7 are definitelybroader. However, the widths of the calculated lines are is very sensitive to the slope of theXΣ1/2 ground state potential, so that a lack of precision of the latter will make the assignmentof the measured line ambiguous.
An important conclusion can nonetheless be drawn from this comparison. The overall goodagreement between calculated and measured lineshapes indicates that the line at 7130 cm−1
originates from the decay of an exciplex with a specific number n of bound helium atoms and thatit is not a superposition of lines from exciplexes with different values of n. Such superpositionswere observed in the case of Rb∗Hen exciplexes in cold He4 vapor [4]. When decreasing thetemperature from 100 K down to 2 K Rb-He exciplexes of increasing n up to nmax = 6 wereobserved and identified by these authors. From 100 K down to 40 K mainly Rb∗He1 was observed,whereas below 5 K only the emission of Rb∗He6 was detectable. At intermediate temperaturesthe spectral signal was a superposition of the emission of several neighboring orders, a feature,which allowed the unambiguous assignment of n by simple counting.
The theoretical considerations of Sec. 3.2.2 suggest that the observed peak at 7130 cm−1
originates from decaying Cs∗He6 complexes, as these exciplexes only were found to be stable.The equilibrium radius of the helium ring in that case is approximately 3.5 A, and the interatomicHe-He interaction was found to be attractive at this radius. Rubidium can bind nmax = 6 heliumatoms on a ring of radius 3.25 A [4], and there is no reason to assume that cesium should bindonly n = 4 or 5 atoms.
However regarding the uncertainties of our calculated spectra no final answer can be givenwhich Cs∗Hen exciplex was observed at 7130 cm−1. Our best guess is Cs∗He6 at the time being.
3.4.3 Formation of Cs∗Henmaxin solid helium
Cs∗Hen exciplexes with n > 2 have not been observed previously, neither in cold helium vapornor in liquid helium at saturated vapor pressure. Hirano et al. discuss on the basis of Cs∗He2-Hepotential energy surfaces that there is no stable Cs∗He3 configuration. They therfore concludethat exciplexes with more than nmax = 2 do not exist, since they regard the formation of exci-plexes as a sequential process (Cs∗ →Cs∗He1 → ... →Cs∗Henmax). However, our experimentalresults show unambiguously that in the hcp phase of solid helium Cs(AΠ1/2)Hen exciplexes withn > 2 are formed, when the atoms are excited to the 6P3/2 state of cesium. From the relativeintegrated observed line intensities (divided by the ν3 dependence of the transition probabilities)one can conclude that this complex has even the highest steady-state population.
The details of the formation process are not yet understood, considering that the exciplexevolves asymptotically to the P1/2 state as r → ∞ of the free Cs atom, while its formationprceeds via excitation of the P3/2 state. The mechanism of the transfer channel from the AΠ3/2
electronic state to the AΠ1/2 state is not clear. We can however speculate that due to the solidstate density of the surrounding helium, which is many orders of magnitude larger than in Hevapor experiments so that the formation does not proceed via sequential capturing of heliumatoms.
We can nonetheless ascertain that the formation is such that the Cs(AΠ1/2)Henmaxstructure
is formed so rapidly that there is no measurable population in any of the transient intermediateconfigurations with 3 < n < nmax.
46 Chapter 3: Observation of apple- and dumbbell-shaped Cs∗Hen exciplexes in solid He4
3.5 Summary and outlook
We have performed a study of laser induced fluorecence of cesium atoms trapped in the hcpphase of a helium crystal. The spectral range of both absorption and emission wavelengthswas significantly enlarged with respect to previous studies. In addition to the well-studiedfluorescence following D1 excitation we observed a number of new spectral features. We haveobserved for the first time a weak emission on the D1 transition following excitation on the D2
line. As observed before in superfluid helium the corresponding absorption line has a double-peaked structure, due to the dynamic Jahn-Teller effect. In addition we have observed threespectral features, which are broader and partly more intense than the pure atomic lines. Webelieve that these lines are formed by the emission from two types of specific Cs∗Hen exciplexstructures, viz. an apple-shaped complex with two helium atoms bound to the Cs atom and adumbbell-shaped complex, in which a ring of helium atoms is bound to the nodal plane of the Cswave function. These assigments are supported by model calculations, which allow us to obtainthe corresponding emission spectra. In the case of the ring structure the number of boundatoms cannot be determined unambiguously, but the calculations suggest n = 6 as the mostlikely number of bound atoms. The theoretical treatment is approximative in the sense that itconsiders only the bound atoms, while neglecting the effect of nearby atoms of the surroundinghelium matrix. The matrix affects both the line positions and widths, as evidenced by theexperimental observation of a pressure dependence of these two parameters. Ongoing work issupposed to shine more light on this problem, by including spherical and deformed bubbles intothe calculation.
On the experimental side we are currently setting up a spectrometer, which extends thepreviously accessible spectral range towards the red with an improved resolution, so that we canperform a pressure dependent study of the ring-shaped exciplexes.
AcknowledgmentsWe like to thank J. Pascale for sending us his numerical Cs-He pair potentials. This work wassupported by a grant of the Schweizerischer Nationalfonds.
3.5 47
References
[1] J. Dupont-Roc. Excited p-state of alkali atoms in liquid helium. Z. Phys. B: Condens.Matter, 98(3):383–386, 1995.
[2] S. Kanorsky, A. Weis, M. Arndt, R. Dziewior, and T. W. Hnsch. Pressure shift of atomicresonance lines in liquid and solid helium. Z. Phys. B, 98(3):371–376, 1995.
[3] K. Enomoto, K. Hirano, M. Kumakura, Y. Takahashi, and T. Yabuzaki. Emission spectraof cs-he excimers in cold helium gas. Phys. Rev. A, 66(4):042505, 2002.
[4] K. Hirano, K. Enomoto, M. Kumakura, Y. Takahashi, and T. Yabuzaki. Emission spectraof rb∗hen exciplexes in a cold 4he gas. Phys. Rev. A, 68(1):012722, 2003.
[5] F. Stienkemeier, J. Higgins, C. Callegari, S. I. Kanorsky, W. E. Ernst, and G. Scoles.Spectroscopy of alkali atoms (Li, Na, K) attached to large helium clusters. Z. Phys. D, 38(3):253–263, 1996.
[6] J. Reho, J. Higgins, C. Callegari, K. K. Lehmann, and G. Scoles. Alkali-helium exciplexformation on the surface of helium nanodroplets. I. dispersed emission spectroscopy. J.Chem. Phys., 113(21):9686–9693, 2000.
[7] J. Reho, J. Higgins, K. K. Lehmann, and G. Scoles. Alkali-helium exciplex formation onthe surface of helium nanodroplets. II. a time-resolved study. J. Chem. Phys., 113(21):9694–9701, 2000.
[8] F. R. Bruhl, R. A. Trasca, and W. E. Ernst. Rb-He exciplex formation on helium nan-odroplets. J. Chem. Phys., 115(22):10220–10224, 2000.
[9] F. Stienkemeier C.P. Schulz, P. Claas. Formation of K∗He exciplexes on the surface ofhelium nanodroplets studied in real time. Phys. Rev. Lett., 87(15):153401, 2001.
[10] S. I. Kanorsky, M. Arndt, R. Dziewior, A. Weis, and T. W. Hansch. Optical spectroscopyof atoms trapped in solid helium. Phys. Rev. B, 49(5):3645, 1994.
[11] Taro Eichler. Magneto-optical Spectroscopy of Alkali Atoms in Helium Crystals. Ph.D.thesis, Rheinische Friedrich-Wilhelms-Universitat Bonn, 2000.
[12] R. Muller-Siebert. Optimierung und Charakersierung eines Tieftemperatur-Spektrometerszur Untersuchung von magneto- und elektro-optischen Effekten an Alkaliatomen in He-Kristallen. Ph.D. thesis, Universitat Freiburg (Schweiz), 2002.
[13] D. E. Beck. A new interatomic potential function for helium. Molecular Physics, 14(4):311,1968.
[14] J. Pascale. Use of l-dependent pseudopotential in the study of alkali-metal-atom-He systems.the adiabatic molecular potential. Phys. Rev. A, 28(2):632, 1983.
[15] Paul Gombas. Pseudopotentiale. Springer-Verlag - Wien - New York, 1967.
[16] R. Muller-Siebert, D. Nettels, and Antoine Weis. To be submitted.
[17] T. Kinoshita, K. Fukuda, Y. Takahashi, and T. Yabuzaki. Optical properties of alkali-metalatoms in pressurized liquid helium. Phys. Rev. A, 52(4):2707, 1995.

48 Chapter 3: Observation of apple- and dumbbell-shaped Cs∗Hen exciplexes in solid He4
[18] T. Kinoshita, K. Fukuda, and T. Yabuzaki. Doubly shaped D2 excitation spectra of Cs andRb atoms in superfluid helium due to a quadrupole bubble surface oscillation. Phys. Rev.B, 54(9):6600–6607, 1996.
Chapter 4
Multiphoton processes in theZeeman structure of atomic Cstrapped in solid helium
D. Nettels, R. Muller-Siebert, S. Ulzega , and A.Weis
Departement de Physique, Universite de Fribourg, Chemin du Musee 3, 1700 Fribourg,Switzerland
accepted for publication by Appl. Phys. B
Abstract: We report on magnetic resonance experiments with optical detectionperformed on cesium atoms trapped in a crystalline 4He matrix. Multi-photon tran-sitions, i.e. processes in which several radio-frequency photons are absorbed simul-taneously in a given hyperfine Zeeman multiplet of the ground state were the centraltopic of these studies. The long relaxation times of spin coherences of Cs in solid Heallow to spectrally resolve such transitions in fields as low as 1 mT. We have observedall allowed multi-photon transitions up to the ∆M = 8 transition in the F = 4-state.We compare the experimental spectra with theoretical spectra obtained from numer-ical solutions of the Liouville equation including optical pumping and the interactionwith the static and oscillating fields. Multi-photon transitions may fiend applicationin magnetometry, suppress systematic effects in edm experiments and may allow thestudy of relaxation phenomena in doped He crystals. The demonstration of thesefeatures is still hindered by inhomogeneous line broadening.
4.1 Introduction
Since the pioneering work of Kastler and Brosssel in 1949 [1] double resonance experiments,which combine magnetic resonance spectroscopy with resonant optical preparation and detectionhave found a large range of applications, to mention only optically pumped magnetometers
49
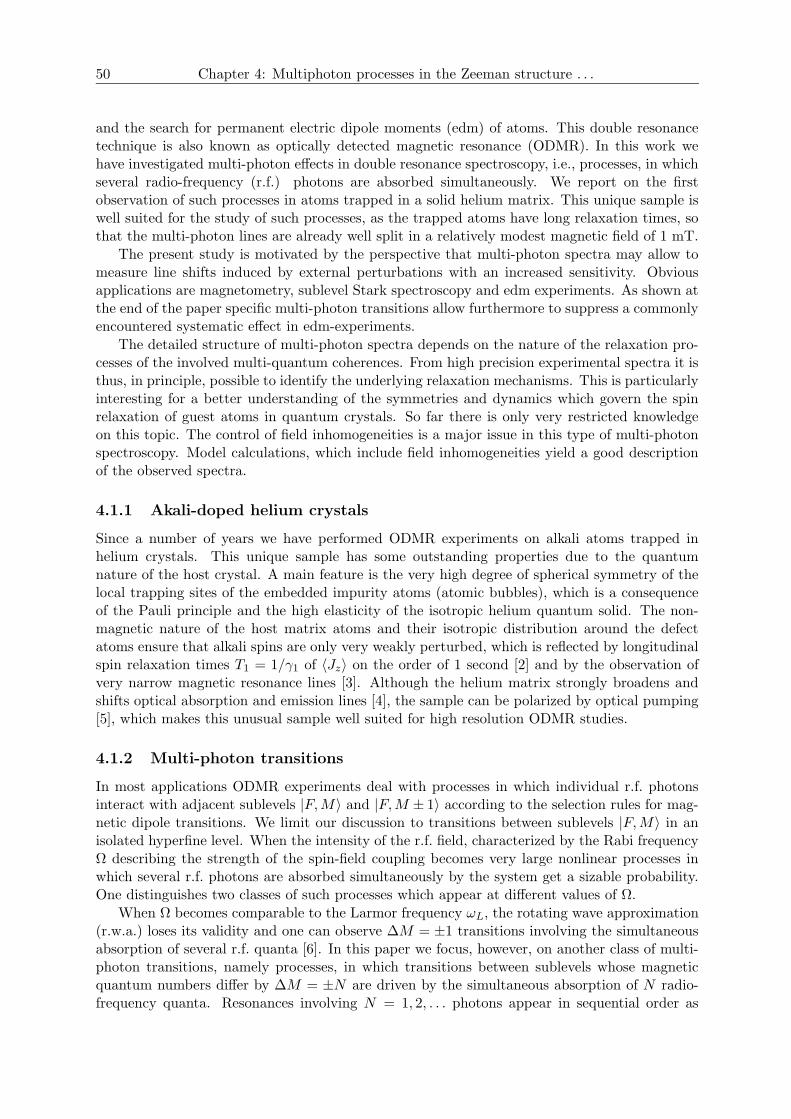
50 Chapter 4: Multiphoton processes in the Zeeman structure . . .
and the search for permanent electric dipole moments (edm) of atoms. This double resonancetechnique is also known as optically detected magnetic resonance (ODMR). In this work wehave investigated multi-photon effects in double resonance spectroscopy, i.e., processes, in whichseveral radio-frequency (r.f.) photons are absorbed simultaneously. We report on the firstobservation of such processes in atoms trapped in a solid helium matrix. This unique sample iswell suited for the study of such processes, as the trapped atoms have long relaxation times, sothat the multi-photon lines are already well split in a relatively modest magnetic field of 1 mT.
The present study is motivated by the perspective that multi-photon spectra may allow tomeasure line shifts induced by external perturbations with an increased sensitivity. Obviousapplications are magnetometry, sublevel Stark spectroscopy and edm experiments. As shown atthe end of the paper specific multi-photon transitions allow furthermore to suppress a commonlyencountered systematic effect in edm-experiments.
The detailed structure of multi-photon spectra depends on the nature of the relaxation pro-cesses of the involved multi-quantum coherences. From high precision experimental spectra it isthus, in principle, possible to identify the underlying relaxation mechanisms. This is particularlyinteresting for a better understanding of the symmetries and dynamics which govern the spinrelaxation of guest atoms in quantum crystals. So far there is only very restricted knowledgeon this topic. The control of field inhomogeneities is a major issue in this type of multi-photonspectroscopy. Model calculations, which include field inhomogeneities yield a good descriptionof the observed spectra.
4.1.1 Akali-doped helium crystals
Since a number of years we have performed ODMR experiments on alkali atoms trapped inhelium crystals. This unique sample has some outstanding properties due to the quantumnature of the host crystal. A main feature is the very high degree of spherical symmetry of thelocal trapping sites of the embedded impurity atoms (atomic bubbles), which is a consequenceof the Pauli principle and the high elasticity of the isotropic helium quantum solid. The non-magnetic nature of the host matrix atoms and their isotropic distribution around the defectatoms ensure that alkali spins are only very weakly perturbed, which is reflected by longitudinalspin relaxation times T1 = 1/γ1 of 〈Jz〉 on the order of 1 second [2] and by the observation ofvery narrow magnetic resonance lines [3]. Although the helium matrix strongly broadens andshifts optical absorption and emission lines [4], the sample can be polarized by optical pumping[5], which makes this unusual sample well suited for high resolution ODMR studies.
4.1.2 Multi-photon transitions
In most applications ODMR experiments deal with processes in which individual r.f. photonsinteract with adjacent sublevels |F,M〉 and |F,M ± 1〉 according to the selection rules for mag-netic dipole transitions. We limit our discussion to transitions between sublevels |F,M〉 in anisolated hyperfine level. When the intensity of the r.f. field, characterized by the Rabi frequencyΩ describing the strength of the spin-field coupling becomes very large nonlinear processes inwhich several r.f. photons are absorbed simultaneously by the system get a sizable probability.One distinguishes two classes of such processes which appear at different values of Ω.
When Ω becomes comparable to the Larmor frequency ωL, the rotating wave approximation(r.w.a.) loses its validity and one can observe ∆M = ±1 transitions involving the simultaneousabsorption of several r.f. quanta [6]. In this paper we focus, however, on another class of multi-photon transitions, namely processes, in which transitions between sublevels whose magneticquantum numbers differ by ∆M = ±N are driven by the simultaneous absorption of N radio-frequency quanta. Resonances involving N = 1, 2, . . . photons appear in sequential order as
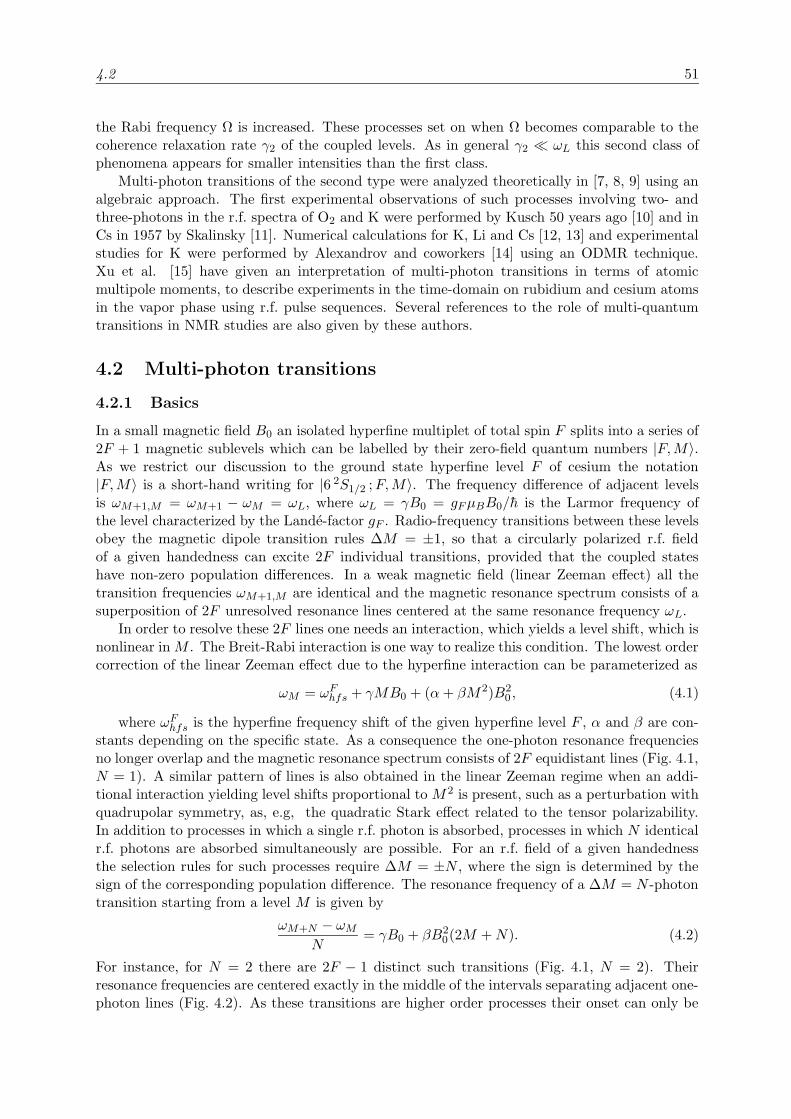
4.2 51
the Rabi frequency Ω is increased. These processes set on when Ω becomes comparable to thecoherence relaxation rate γ2 of the coupled levels. As in general γ2 ¿ ωL this second class ofphenomena appears for smaller intensities than the first class.
Multi-photon transitions of the second type were analyzed theoretically in [7, 8, 9] using analgebraic approach. The first experimental observations of such processes involving two- andthree-photons in the r.f. spectra of O2 and K were performed by Kusch 50 years ago [10] and inCs in 1957 by Skalinsky [11]. Numerical calculations for K, Li and Cs [12, 13] and experimentalstudies for K were performed by Alexandrov and coworkers [14] using an ODMR technique.Xu et al. [15] have given an interpretation of multi-photon transitions in terms of atomicmultipole moments, to describe experiments in the time-domain on rubidium and cesium atomsin the vapor phase using r.f. pulse sequences. Several references to the role of multi-quantumtransitions in NMR studies are also given by these authors.
4.2 Multi-photon transitions
4.2.1 Basics
In a small magnetic field B0 an isolated hyperfine multiplet of total spin F splits into a series of2F + 1 magnetic sublevels which can be labelled by their zero-field quantum numbers |F,M〉.As we restrict our discussion to the ground state hyperfine level F of cesium the notation|F,M〉 is a short-hand writing for |6 2S1/2 ;F,M〉. The frequency difference of adjacent levelsis ωM+1,M = ωM+1 − ωM = ωL, where ωL = γB0 = gFµBB0/h is the Larmor frequency ofthe level characterized by the Lande-factor gF . Radio-frequency transitions between these levelsobey the magnetic dipole transition rules ∆M = ±1, so that a circularly polarized r.f. fieldof a given handedness can excite 2F individual transitions, provided that the coupled stateshave non-zero population differences. In a weak magnetic field (linear Zeeman effect) all thetransition frequencies ωM+1,M are identical and the magnetic resonance spectrum consists of asuperposition of 2F unresolved resonance lines centered at the same resonance frequency ωL.
In order to resolve these 2F lines one needs an interaction, which yields a level shift, which isnonlinear inM . The Breit-Rabi interaction is one way to realize this condition. The lowest ordercorrection of the linear Zeeman effect due to the hyperfine interaction can be parameterized as
ωM = ωFhfs + γMB0 + (α+ βM2)B2
0 , (4.1)
where ωFhfs is the hyperfine frequency shift of the given hyperfine level F , α and β are con-
stants depending on the specific state. As a consequence the one-photon resonance frequenciesno longer overlap and the magnetic resonance spectrum consists of 2F equidistant lines (Fig. 4.1,N = 1). A similar pattern of lines is also obtained in the linear Zeeman regime when an addi-tional interaction yielding level shifts proportional to M 2 is present, such as a perturbation withquadrupolar symmetry, as, e.g, the quadratic Stark effect related to the tensor polarizability.In addition to processes in which a single r.f. photon is absorbed, processes in which N identicalr.f. photons are absorbed simultaneously are possible. For an r.f. field of a given handednessthe selection rules for such processes require ∆M = ±N , where the sign is determined by thesign of the corresponding population difference. The resonance frequency of a ∆M = N -photontransition starting from a level M is given by
ωM+N − ωM
N= γB0 + βB2
0(2M +N). (4.2)
For instance, for N = 2 there are 2F − 1 distinct such transitions (Fig. 4.1, N = 2). Theirresonance frequencies are centered exactly in the middle of the intervals separating adjacent one-photon lines (Fig. 4.2). As these transitions are higher order processes their onset can only be
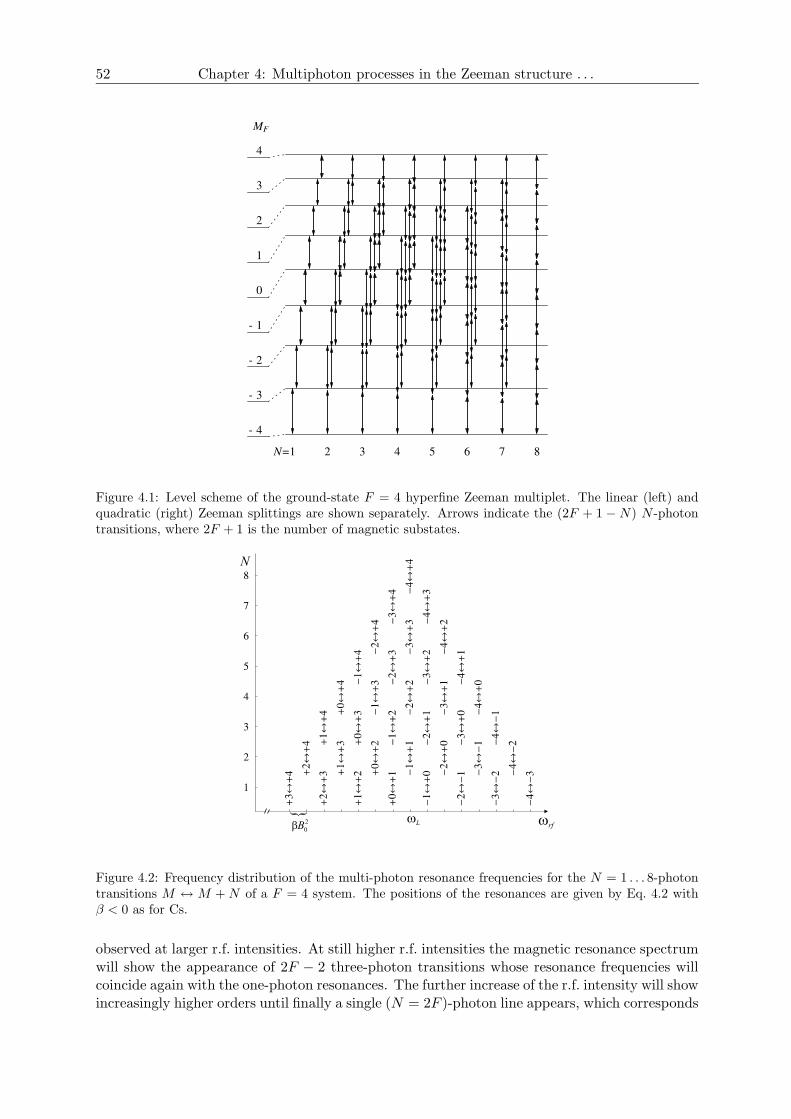
52 Chapter 4: Multiphoton processes in the Zeeman structure . . .
- 4
- 3
- 2
- 1
0
1
2
3
4
MF
N=1 2 3 4 5 6 7 8
Figure 4.1: Level scheme of the ground-state F = 4 hyperfine Zeeman multiplet. The linear (left) andquadratic (right) Zeeman splittings are shown separately. Arrows indicate the (2F + 1 − N) N -photontransitions, where 2F + 1 is the number of magnetic substates.
wL2
0Bb
N
wrf
Figure 4.2: Frequency distribution of the multi-photon resonance frequencies for the N = 1 . . . 8-photontransitions M ↔ M +N of a F = 4 system. The positions of the resonances are given by Eq. 4.2 withβ < 0 as for Cs.
observed at larger r.f. intensities. At still higher r.f. intensities the magnetic resonance spectrumwill show the appearance of 2F − 2 three-photon transitions whose resonance frequencies willcoincide again with the one-photon resonances. The further increase of the r.f. intensity will showincreasingly higher orders until finally a single (N = 2F )-photon line appears, which corresponds
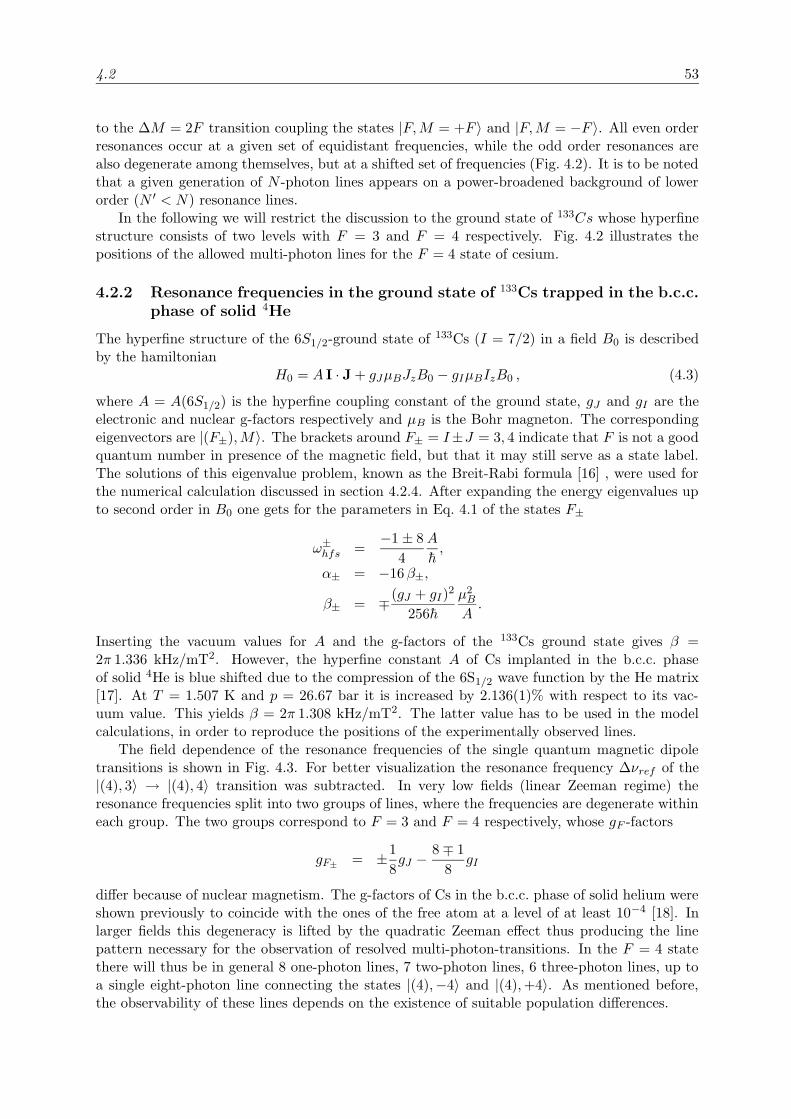
4.2 53
to the ∆M = 2F transition coupling the states |F,M = +F 〉 and |F,M = −F 〉. All even orderresonances occur at a given set of equidistant frequencies, while the odd order resonances arealso degenerate among themselves, but at a shifted set of frequencies (Fig. 4.2). It is to be notedthat a given generation of N -photon lines appears on a power-broadened background of lowerorder (N ′ < N) resonance lines.
In the following we will restrict the discussion to the ground state of 133Cs whose hyperfinestructure consists of two levels with F = 3 and F = 4 respectively. Fig. 4.2 illustrates thepositions of the allowed multi-photon lines for the F = 4 state of cesium.
4.2.2 Resonance frequencies in the ground state of 133Cs trapped in the b.c.c.phase of solid 4He
The hyperfine structure of the 6S1/2-ground state of 133Cs (I = 7/2) in a field B0 is describedby the hamiltonian
H0 = A I · J+ gJµBJzB0 − gIµBIzB0 , (4.3)
where A = A(6S1/2) is the hyperfine coupling constant of the ground state, gJ and gI are theelectronic and nuclear g-factors respectively and µB is the Bohr magneton. The correspondingeigenvectors are |(F±),M〉. The brackets around F± = I±J = 3, 4 indicate that F is not a goodquantum number in presence of the magnetic field, but that it may still serve as a state label.The solutions of this eigenvalue problem, known as the Breit-Rabi formula [16] , were used forthe numerical calculation discussed in section 4.2.4. After expanding the energy eigenvalues upto second order in B0 one gets for the parameters in Eq. 4.1 of the states F±
ω±hfs =−1± 8
4
A
h,
α± = −16β±,
β± = ∓(gJ + gI)2
256h
µ2BA.
Inserting the vacuum values for A and the g-factors of the 133Cs ground state gives β =2π 1.336 kHz/mT2. However, the hyperfine constant A of Cs implanted in the b.c.c. phaseof solid 4He is blue shifted due to the compression of the 6S1/2 wave function by the He matrix[17]. At T = 1.507 K and p = 26.67 bar it is increased by 2.136(1)% with respect to its vac-uum value. This yields β = 2π 1.308 kHz/mT2. The latter value has to be used in the modelcalculations, in order to reproduce the positions of the experimentally observed lines.
The field dependence of the resonance frequencies of the single quantum magnetic dipoletransitions is shown in Fig. 4.3. For better visualization the resonance frequency ∆νref of the|(4), 3〉 → |(4), 4〉 transition was subtracted. In very low fields (linear Zeeman regime) theresonance frequencies split into two groups of lines, where the frequencies are degenerate withineach group. The two groups correspond to F = 3 and F = 4 respectively, whose gF -factors
gF± = ±1
8gJ −
8∓ 1
8gI
differ because of nuclear magnetism. The g-factors of Cs in the b.c.c. phase of solid helium wereshown previously to coincide with the ones of the free atom at a level of at least 10−4 [18]. Inlarger fields this degeneracy is lifted by the quadratic Zeeman effect thus producing the linepattern necessary for the observation of resolved multi-photon-transitions. In the F = 4 statethere will thus be in general 8 one-photon lines, 7 two-photon lines, 6 three-photon lines, up toa single eight-photon line connecting the states |(4),−4〉 and |(4),+4〉. As mentioned before,the observability of these lines depends on the existence of suitable population differences.
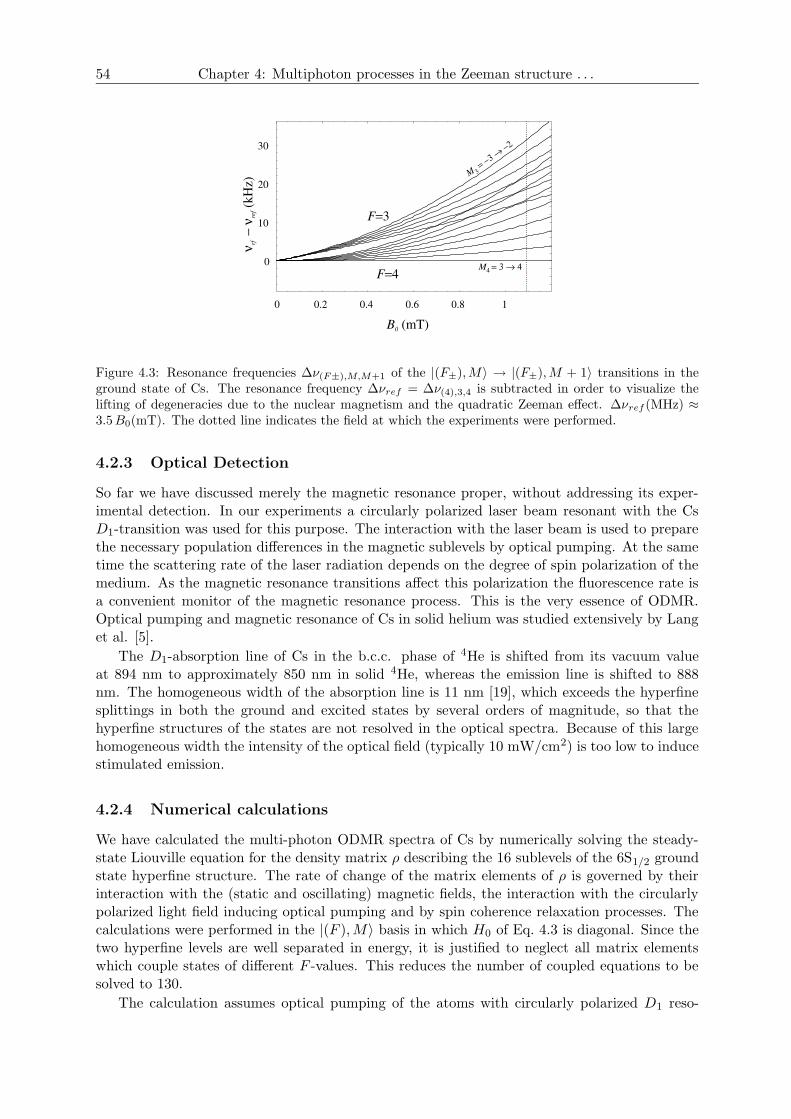
54 Chapter 4: Multiphoton processes in the Zeeman structure . . .
B0 (mT)
ν−
νrf
ref(k
Hz)
F=3
F=4
0.2 0.4 0.6 0.8 1
0
0
10
20
30
M 3= −3 →
−2
M4 = 3 → 4
Figure 4.3: Resonance frequencies ∆ν(F±),M,M+1 of the |(F±),M〉 → |(F±),M + 1〉 transitions in theground state of Cs. The resonance frequency ∆νref = ∆ν(4),3,4 is subtracted in order to visualize thelifting of degeneracies due to the nuclear magnetism and the quadratic Zeeman effect. ∆νref (MHz) ≈3.5B0(mT). The dotted line indicates the field at which the experiments were performed.
4.2.3 Optical Detection
So far we have discussed merely the magnetic resonance proper, without addressing its exper-imental detection. In our experiments a circularly polarized laser beam resonant with the CsD1-transition was used for this purpose. The interaction with the laser beam is used to preparethe necessary population differences in the magnetic sublevels by optical pumping. At the sametime the scattering rate of the laser radiation depends on the degree of spin polarization of themedium. As the magnetic resonance transitions affect this polarization the fluorescence rate isa convenient monitor of the magnetic resonance process. This is the very essence of ODMR.Optical pumping and magnetic resonance of Cs in solid helium was studied extensively by Langet al. [5].
The D1-absorption line of Cs in the b.c.c. phase of 4He is shifted from its vacuum valueat 894 nm to approximately 850 nm in solid 4He, whereas the emission line is shifted to 888nm. The homogeneous width of the absorption line is 11 nm [19], which exceeds the hyperfinesplittings in both the ground and excited states by several orders of magnitude, so that thehyperfine structures of the states are not resolved in the optical spectra. Because of this largehomogeneous width the intensity of the optical field (typically 10 mW/cm2) is too low to inducestimulated emission.
4.2.4 Numerical calculations
We have calculated the multi-photon ODMR spectra of Cs by numerically solving the steady-state Liouville equation for the density matrix ρ describing the 16 sublevels of the 6S1/2 groundstate hyperfine structure. The rate of change of the matrix elements of ρ is governed by theirinteraction with the (static and oscillating) magnetic fields, the interaction with the circularlypolarized light field inducing optical pumping and by spin coherence relaxation processes. Thecalculations were performed in the |(F ),M〉 basis in which H0 of Eq. 4.3 is diagonal. Since thetwo hyperfine levels are well separated in energy, it is justified to neglect all matrix elementswhich couple states of different F -values. This reduces the number of coupled equations to besolved to 130.
The calculation assumes optical pumping of the atoms with circularly polarized D1 reso-
4.3 55
nance radiation in a longitudinal external magnetic field B0. Since the pumping process isnon-saturating the excited state coherences and populations can be eliminated adiabatically.The optical pumping mechanism is parameterized by the pump rate γp defined in [5]. Theradio-frequency field, linearly polarized perpendicular to B0, is assumed to interact with theground state magnetic moments in the rotating wave approximation. Our calculation is similarto the treatment given before by Pazgalev and Alexandrov [13]. However we have corrected fortheir simplifying assumption that the Rabi frequencies of the magnetic dipole transitions areindependent of the magnetic quantum numbers M . Here we have used relative r.f. transitionamplitudes as given by Racah algebra. In the calculations we have furthermore assumed that theground state populations relax with a common rate γ1 towards a thermal equilibrium distribu-tion determined by the Boltzmann factor exp(−h∆νhfs/kBT ) ≈ 0.75, where ∆νhfs ≈ 9.39MHzis the hyperfine splitting in the ground state of Cs in b.c.c. He, and T ≈ 1.5 K typically. Themathematical treatment of the optical pumping process is such that the perturbation of thecoherences due to the interaction with the light field is properly taken into account. Details ofthese calculations will be published elsewhere [20].
The numerical steady-state solutions of the Liouville equations then yield the populationspF,M of the 16 ground state sublevels and the fluorescence signal can be obtained by calculatingthe absorption of circularly polarized light by this population distribution.
4.3 Experiment
4.3.1 The experimental set-up
The experimental set-up (Fig. 4.4) is similar to the one described in [5]. The experiments wereperformed in a helium pressure cell immersed in superfluid helium cooled by pumping on thehelium bath. Five quartz windows, flanged onto the cell using aluminum sealing rings, provideoptical access from three orthogonal directions. A helium crystal is grown inside the pressurecell, by admitting pressurized helium gas from an external reservoir. The helium host matrixis then doped with cesium atoms by means of laser ablation with a pulsed frequency-doubledNd:YAG-laser beam focussed onto a solid Cs target by a height-adjustable lens above the cell.The bath and cell temperatures are measured by germanium resistors located inside and outsideof the pressure cell. A novel feature of the setup is an active temperature stabilization of the Hecrystal by a feed-back loop that regulates the pump speed via a motor-driven valve. A stabilityon the order of 10−5 K over intervals of 100 seconds could be realized in this way [21].
The cesium atoms are excited on the D1 transition (6S1/2 → 6P1/2) at 850 nm with a beamfrom a temperature and current stabilized single-mode extended cavity diode laser. The absorp-tion is monitored by detecting fluorescence light at 888 nm using a cooled, biased avalanche-photodiode. An interference filter (FWHM of 9 nm) suppresses scattered laser light by fourorders of magnitude. The pressure cell is surrounded by three orthogonal pairs of Helmholtzcoils to apply the static magnetic field and to compensate residual fields. Another set of threeHelmholtz coils inside the pressure cell is used to apply the r.f. fields. Three layers of µ-metalsurround the cryostat and suppress laboratory magnetic fields by more than three orders ofmagnitude.
4.3.2 Experimental results
Data were taken in the body-centered cubic (b.c.c.) phase of solid 4He at a temperature of 1.507K and a pressure of 26.67 bar in a field B0 of 1.0947 mT.
Magnetic resonance spectra were recorded by detecting fluorescence while scanning the fre-quency of the r.f. field over the multiphoton resonances of the F = 3 and F = 4 multiplets.
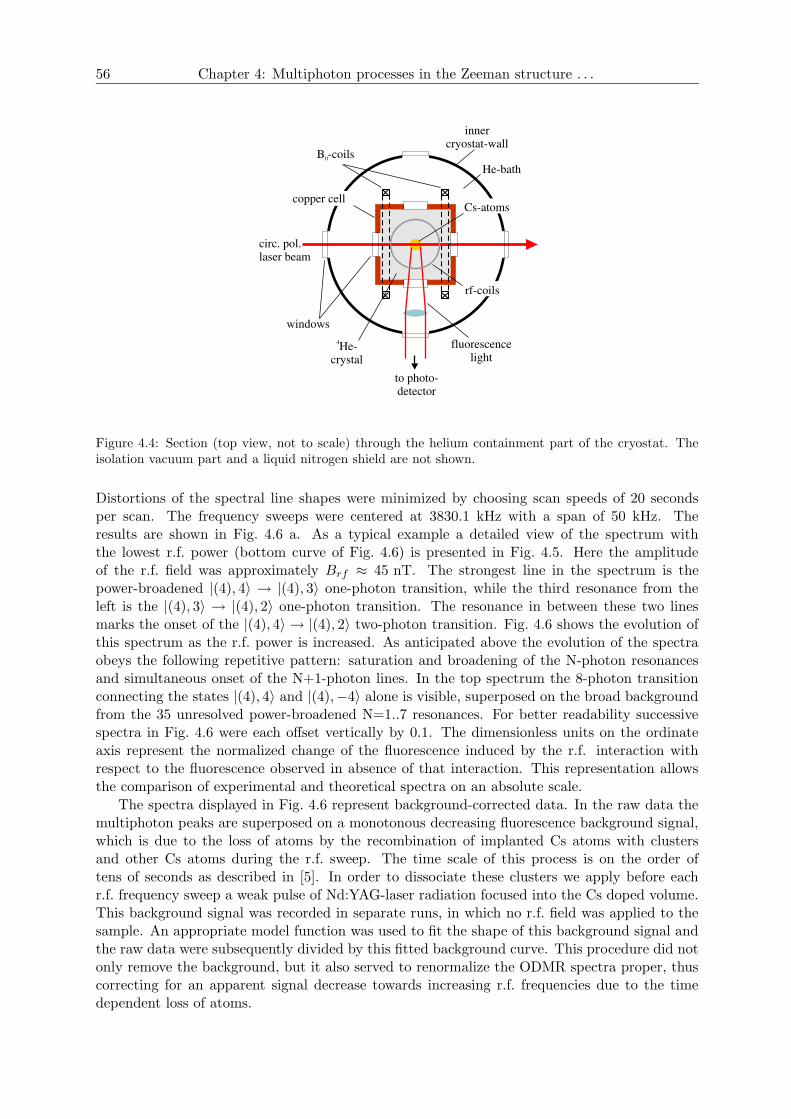
56 Chapter 4: Multiphoton processes in the Zeeman structure . . .
B -coils0
copper cell
rf-coils
innercryostat-wall
circ. pol.laser beam
Cs-atoms
windows
fluorescencelight
to photo-detector
4He-crystal
He-bath
Figure 4.4: Section (top view, not to scale) through the helium containment part of the cryostat. Theisolation vacuum part and a liquid nitrogen shield are not shown.
Distortions of the spectral line shapes were minimized by choosing scan speeds of 20 secondsper scan. The frequency sweeps were centered at 3830.1 kHz with a span of 50 kHz. Theresults are shown in Fig. 4.6 a. As a typical example a detailed view of the spectrum withthe lowest r.f. power (bottom curve of Fig. 4.6) is presented in Fig. 4.5. Here the amplitudeof the r.f. field was approximately Brf ≈ 45 nT. The strongest line in the spectrum is thepower-broadened |(4), 4〉 → |(4), 3〉 one-photon transition, while the third resonance from theleft is the |(4), 3〉 → |(4), 2〉 one-photon transition. The resonance in between these two linesmarks the onset of the |(4), 4〉 → |(4), 2〉 two-photon transition. Fig. 4.6 shows the evolution ofthis spectrum as the r.f. power is increased. As anticipated above the evolution of the spectraobeys the following repetitive pattern: saturation and broadening of the N-photon resonancesand simultaneous onset of the N+1-photon lines. In the top spectrum the 8-photon transitionconnecting the states |(4), 4〉 and |(4),−4〉 alone is visible, superposed on the broad backgroundfrom the 35 unresolved power-broadened N=1..7 resonances. For better readability successivespectra in Fig. 4.6 were each offset vertically by 0.1. The dimensionless units on the ordinateaxis represent the normalized change of the fluorescence induced by the r.f. interaction withrespect to the fluorescence observed in absence of that interaction. This representation allowsthe comparison of experimental and theoretical spectra on an absolute scale.
The spectra displayed in Fig. 4.6 represent background-corrected data. In the raw data themultiphoton peaks are superposed on a monotonous decreasing fluorescence background signal,which is due to the loss of atoms by the recombination of implanted Cs atoms with clustersand other Cs atoms during the r.f. sweep. The time scale of this process is on the order oftens of seconds as described in [5]. In order to dissociate these clusters we apply before eachr.f. frequency sweep a weak pulse of Nd:YAG-laser radiation focused into the Cs doped volume.This background signal was recorded in separate runs, in which no r.f. field was applied to thesample. An appropriate model function was used to fit the shape of this background signal andthe raw data were subsequently divided by this fitted background curve. This procedure did notonly remove the background, but it also served to renormalize the ODMR spectra proper, thuscorrecting for an apparent signal decrease towards increasing r.f. frequencies due to the timedependent loss of atoms.
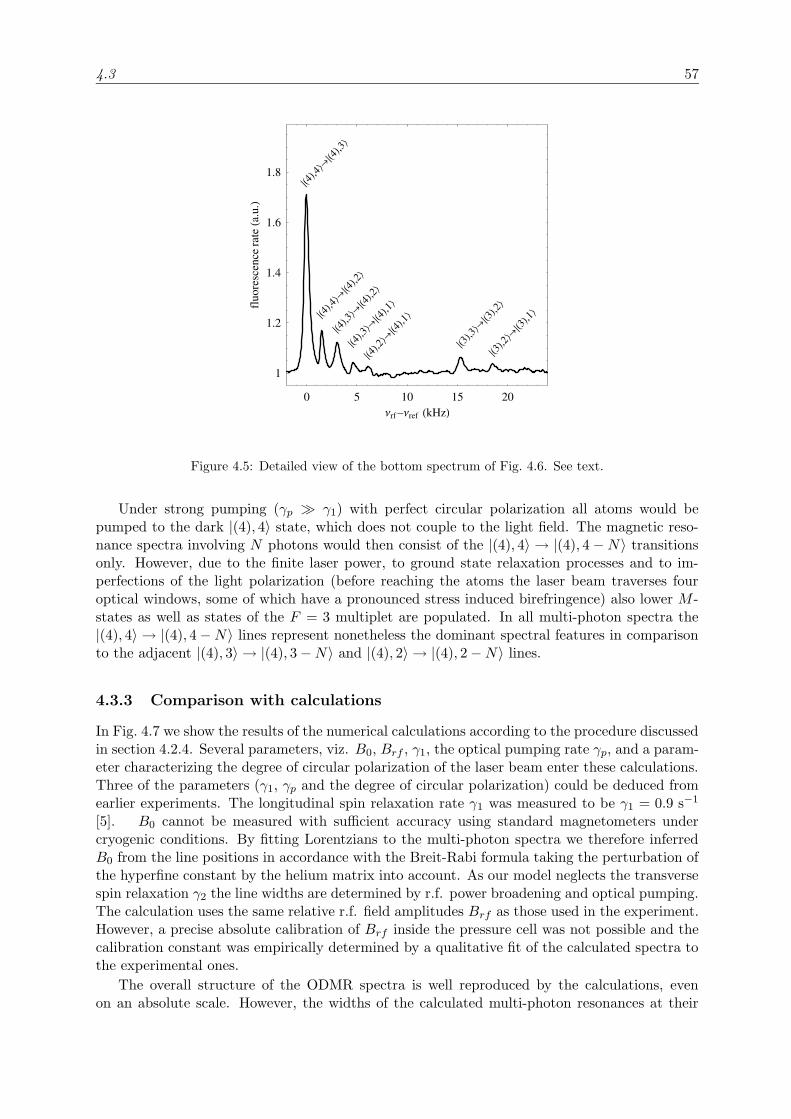
4.3 57
0 5 10 15 20Νrf –Νref HkHzL
1
1.2
1.4
1.6
1.8
fluo
resc
ence
rate
Ha.u.LÈH4L,4\®ÈH4L,3\
ÈH4L,4\®ÈH4L,2\ÈH4L,3\®ÈH4L,2\
ÈH4L,3\®ÈH4L,1\ÈH4L,2\®ÈH4L,1\
ÈH3L,3\®ÈH3L,2\ÈH3L,2\®ÈH3L,1\
Figure 4.5: Detailed view of the bottom spectrum of Fig. 4.6. See text.
Under strong pumping (γp À γ1) with perfect circular polarization all atoms would bepumped to the dark |(4), 4〉 state, which does not couple to the light field. The magnetic reso-nance spectra involving N photons would then consist of the |(4), 4〉 → |(4), 4−N〉 transitionsonly. However, due to the finite laser power, to ground state relaxation processes and to im-perfections of the light polarization (before reaching the atoms the laser beam traverses fouroptical windows, some of which have a pronounced stress induced birefringence) also lower M -states as well as states of the F = 3 multiplet are populated. In all multi-photon spectra the|(4), 4〉 → |(4), 4−N〉 lines represent nonetheless the dominant spectral features in comparisonto the adjacent |(4), 3〉 → |(4), 3−N〉 and |(4), 2〉 → |(4), 2−N〉 lines.
4.3.3 Comparison with calculations
In Fig. 4.7 we show the results of the numerical calculations according to the procedure discussedin section 4.2.4. Several parameters, viz. B0, Brf , γ1, the optical pumping rate γp, and a param-eter characterizing the degree of circular polarization of the laser beam enter these calculations.Three of the parameters (γ1, γp and the degree of circular polarization) could be deduced fromearlier experiments. The longitudinal spin relaxation rate γ1 was measured to be γ1 = 0.9 s−1
[5]. B0 cannot be measured with sufficient accuracy using standard magnetometers undercryogenic conditions. By fitting Lorentzians to the multi-photon spectra we therefore inferredB0 from the line positions in accordance with the Breit-Rabi formula taking the perturbation ofthe hyperfine constant by the helium matrix into account. As our model neglects the transversespin relaxation γ2 the line widths are determined by r.f. power broadening and optical pumping.The calculation uses the same relative r.f. field amplitudes Brf as those used in the experiment.However, a precise absolute calibration of Brf inside the pressure cell was not possible and thecalibration constant was empirically determined by a qualitative fit of the calculated spectra tothe experimental ones.
The overall structure of the ODMR spectra is well reproduced by the calculations, evenon an absolute scale. However, the widths of the calculated multi-photon resonances at their
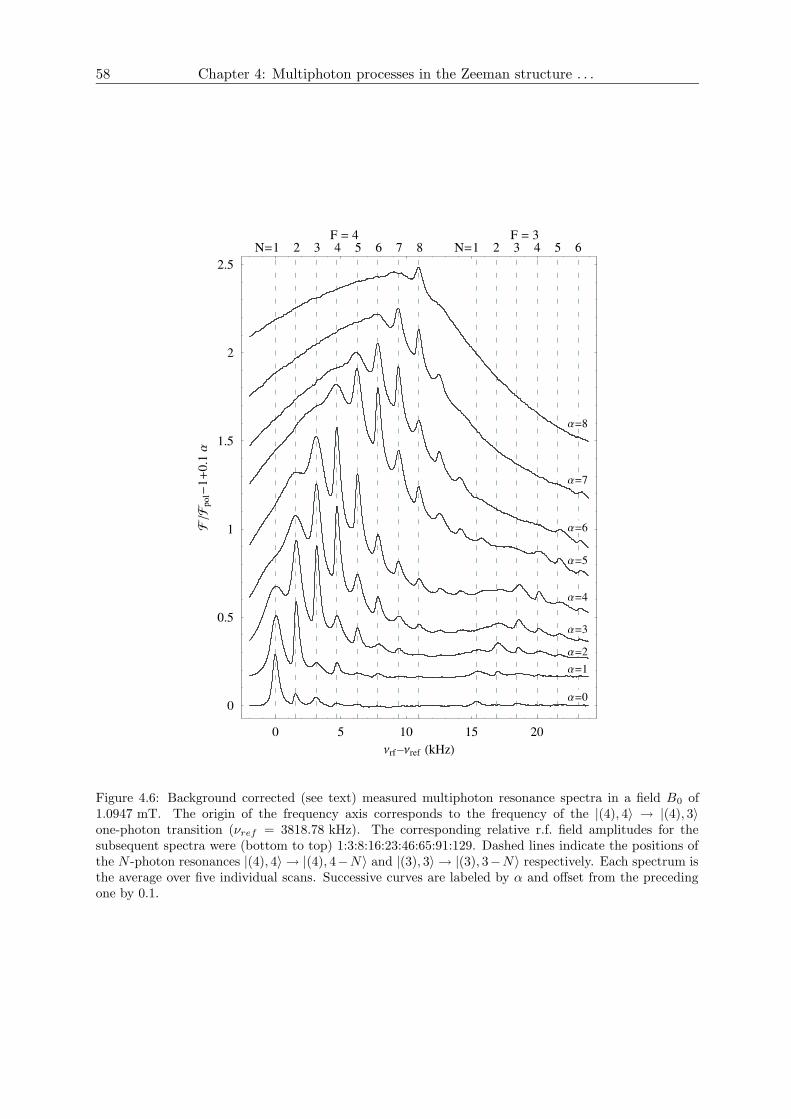
58 Chapter 4: Multiphoton processes in the Zeeman structure . . .
Figure 4.6: Background corrected (see text) measured multiphoton resonance spectra in a field B0 of1.0947 mT. The origin of the frequency axis corresponds to the frequency of the |(4), 4〉 → |(4), 3〉one-photon transition (νref = 3818.78 kHz). The corresponding relative r.f. field amplitudes for thesubsequent spectra were (bottom to top) 1:3:8:16:23:46:65:91:129. Dashed lines indicate the positions ofthe N -photon resonances |(4), 4〉 → |(4), 4−N〉 and |(3), 3〉 → |(3), 3−N〉 respectively. Each spectrum isthe average over five individual scans. Successive curves are labeled by α and offset from the precedingone by 0.1.
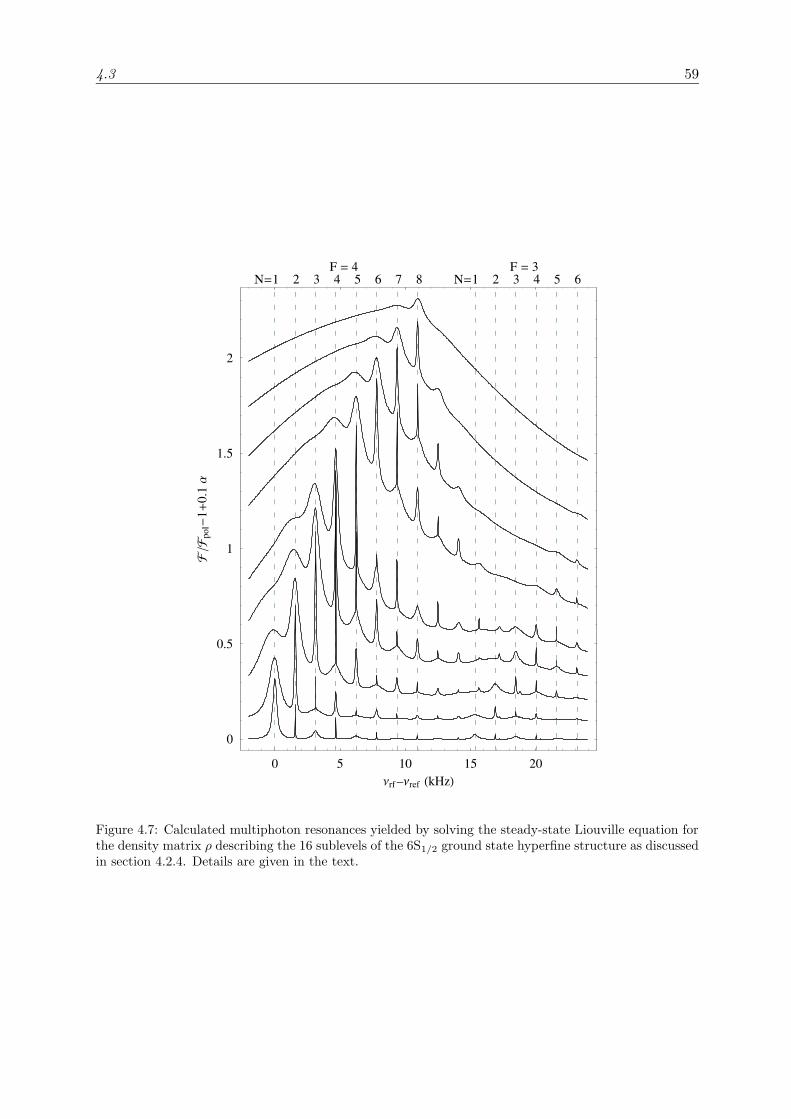
4.3 59
Figure 4.7: Calculated multiphoton resonances yielded by solving the steady-state Liouville equation forthe density matrix ρ describing the 16 sublevels of the 6S1/2 ground state hyperfine structure as discussedin section 4.2.4. Details are given in the text.
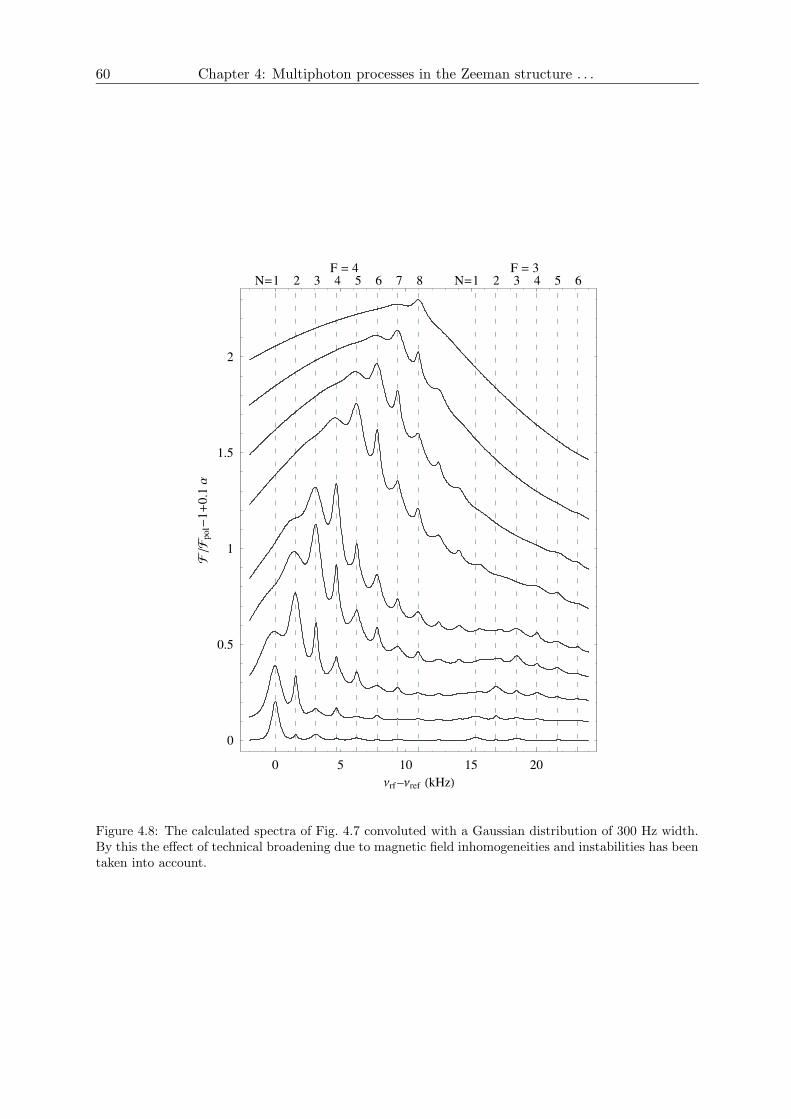
60 Chapter 4: Multiphoton processes in the Zeeman structure . . .
Figure 4.8: The calculated spectra of Fig. 4.7 convoluted with a Gaussian distribution of 300 Hz width.By this the effect of technical broadening due to magnetic field inhomogeneities and instabilities has beentaken into account.
4.4 61
onset (no r.f. power broadening) are much smaller than the corresponding experimental widths.The model calculation has no further free parameter, which can be used for a better matchingof the experimental and theoretical spectra. We note nonetheless that lines, whose widthsare predominantly determined by r.f. power broadening, such as the 8 photon-line on the topspectrum or the 7-photon lines on the second spectrum are well reproduced by the calculation.
The experimental linewidths are determined by several mechanisms, such as the finite sweeptime, field inhomogeneities and field fluctuations. The sweep rate of the radio frequency scanshould be sufficiently low in order to assure that the level populations at all times are as closeas possible to their equilibrium distribution. However, the drop of the atomic signal mentionedabove puts some constraints on acceptable scan speeds, and a scan duration of 20 s was chosen asa trade-off between these conditions. The finite scan time does not only cause a line-broadeningbut also a sweep-direction dependent asymmetry of the line shapes, faintly visible in Fig. 4.5.
The recording of stable and narrow multi-photon spectra puts severe constraint on the homo-geneity of the magnetic field B0. In very slow scans over a single resonance we observed minimallinewidths of approximately 300 Hz. These can be explained by a field inhomogeneity ∆B0/B0
over the sample volume on the order of 10−4. Although model calculations of the field distribu-tion produced by the Helmoltz coils used predict a relative homogeneity of better than 10−6 overthe sample volume – yielding minimal linewidths of 4 Hz – this homogeneity may be reduceddue to distortions induced by distant ferromagnetic components and/or superconducting indiumsealing rings.
Besides field inhomogeneities field fluctuations can also contribute to the linewidth andrequire a current stability of better than 10−4. Although we used superconducting wires forthe Helmholtz coils that generated the B0 field, the coils were connected to a stabilized currentsource during the experiments. In future experiments we plan to use superconducting coilswith a self-sustained supercurrent. The superswitch for this application is currently underconstruction. With this improvement contributions to the resonance linewidths from currentnoise and instabilities will be significantly reduced.
In order to take the effects from inhomogeneities and field fluctuations into account , we haveconvoluted the theoretical spectra of Fig. 4.7 with a Gaussian distribution of field values with awidth of 86 nT, corresponding to a frequency distribution of 300 Hz. The resulting spectra areshown in Fig. 4.8. This last series of spectra gives a satisfactory description of the experimentaldata.
4.4 Use of multi-photon transitions
One of the key motivations for the present study is the perspective that multi-photon linesmight lead to an increased magnetometric sensitivity in ODMR spectroscopy. On one hand thelinewidth of an N -photon resonance is N -times smaller than the linewidth of a single photontransition provided the corresponding coherences relax at the same rate. However, as the detailsof the relaxation mechanisms are not yet known, no quantitative theoretical prediction can bemade at this point. From an experimental point of view no statement about improved sensitivitycan be made yet because of the present problems with abnormal linewidths.
Once the technical problems are overcome the spectra are expected to reveal their intrinsiclinewidths. Their description will then require the inclusion of realistic relaxation mechanisms inthe calculations. In its simplest version the relaxation of the spin coherences could be modelled asisotropic, and can be described by a single transverse relaxation rate γ2. However, very little isknown so far about the mechanisms governing the longitudinal and transverse spin relaxation ofcesium in b.c.c. He. It has been speculated [22] that a coupling of the atomic spins to quadrupolarbubble shape oscillations might be responsible for the long, but nonetheless finite longitudinal
62 Chapter 4: Multiphoton processes in the Zeeman structure . . .
relaxation times [5]. However, no proof of that assumption has been given so far. A morerealistic relaxation model would have to include anisotropic relaxation processes as the one justmentioned using the approach developed, e.g., by Happer [23, 24]. Multi-photon processes, inwhich coherences of different orders, i.e. transverse atomic multipole moments of different rankscan be spectrally isolated may prove to be a powerful tool for testing different relaxation models,once the technical difficulties are overcome. This may open the way to a deeper understandingof the mechanisms and the symmetries governing the interaction of alkali spins with the heliummatrix. Efforts towards improving the measurements and towards extending the calculationsby comparing different relaxation models is currently in progress and will be the subject of aforthcoming publication [20].
Another interesting aspect of the use of particular multi-photon transitions concerns theexperimental search for permanent electric dipole moments (EDM) in atoms. An EDM violatesthe discrete symmetries of parity and time reversal. The experimental signature of an EDM is ashift of a magnetic resonance transition proportional to the strength of an external static electricfield. The techniques used in various ongoing experiments are variants of magnetic resonancespectroscopy, and the sensitivity of a given experiment to EDMs can be expressed in terms ofits magnetometric sensitivity [25]. Besides the expected statistical advantage of multi-photontransitions some specific transitions may also be very useful for the suppression of a serioussystematic effect in EDM experiments.
The resonance energy of a one-photon transition |F,M〉 → |F,M − 1〉 of an atom exposedto parallel/antiparallel magnetic and electric fields B, E± is given by
hω±M = gFµB B0 + gF d E± + 3α2 E2± (2M − 1]) ,
where α2 is the electric tensor polarizability, which characterizes the second order Stark splittingof the hyperfine states |F,M〉 via
∆E(FM) = α2E2±[3M2 − F (F + 1)
](4.4)
The EDM d is experimentally determined by comparing the resonance frequencies ω±M inelectric fields E± of opposite polarities
h∆ωM = h(ω+M − ω−M )
= gFd(E+ − E−) + 3α2 (2M − 1)(E2+ − E2−
).
In a perfect experiment the reversal is perfect, i.e. E+ = −E− and
h∆ωM = 2gFd |E| .In practice, however, the field reversal may not be perfect. If we parameterize the imperfectionas E± = ±|E|+∆E , the resonance shift becomes
h∆ωM = 2gFd|E|+ 12α2|E|∆E(2M − 1).
However, this systematic effect connected with imperfect field reversals does not arise inmulti-photon transitions coupling the states |F,M〉 and |F,−M〉. From the quadratic M -dependence of the tensor Stark shift (Eq. 4.4) one sees that the latter does not influence theresonance frequencies, so that the systematic effect discussed above becomes obsolete. In theCs F = 4 state the |F,M = 4〉 → |F,M = −4〉 transition thus combines an anticipated highsensitivity with the independence of systematic quadratic Stark shifts.
We stress that the outlined features of multi-photon spectroscopy are not specifically con-nected with the sample used here, but that they can be applied as well to experiments in vapors,beams or other atomic samples.
4.5 63
4.5 Summary
We have shown that transitions involving the simultaneous absorption of multiple r.f. photonscan be observed in cesium atoms implanted in solid helium and that the spectra are well repro-duced by a theoretical model taking field inhomogeneities and fluctuations into account.
Multi-photon spectra may be well suited to shine more light on the mechanisms governingthe relaxation of spin coherences of alkalis in condensed helium matrices. We have also outlinedthe possible statistical and systematic advantages for using multi-photon transitions in EDM-experiments.
AcknowledgmentsThis work was supported by a grant of the Schweizerischer Nationalfonds.

64 Chapter 4: Multiphoton processes in the Zeeman structure . . .
4.5 65
References
[1] J. Brossel and A. Kastler. La detection de la resonance magnetique des niveaux excites -l’effet de depolarisation des radiations de resonance optique et de fluorescence. C. R. Acad.Sci., 229(23):1213–1215, 1949.
[2] M. Arndt, S. I. Kanorsky, A. Weis, and T. W. Hansch. Long electronic spin relaxationtimes of Cs atoms in solid 4He. Phys. Rev. Lett., 74(8):1359, 1995.
[3] S. I. Kanorsky, S. Lang, S. Lucke, S. B. Ross, T. W. Hansch, and A. Weis. Millihertzmagnetic resonance spectroscopy of Cs atoms in body-centered-cubic 4He. Phys. Rev. A,54(2):R1010, 1996.
[4] S. I. Kanorsky, M. Arndt, R. Dziewior, A. Weis, and T. W. Hansch. Optical spectroscopyof atoms trapped in solid helium. Phys. Rev. B, 49(5):3645, 1994.
[5] S. Lang, S. I. Kanorsky, T. Eichler, R. Muller-Siebert, T. W. Hansch, and A. Weis. Opticalpumping of Cs atoms in solid 4He. Phys. Rev. A, 60(5):3867, 1999.
[6] J. M. Winter. Etude theorique et experimentale des transitions a plusieurs quanta entre lessous-niveaux Zeeman d’un atome. Ann. Phys. (Paris), 1959.
[7] M. N. Hack. Multiple quantum transitions of a system of coupled angular momenta. Rev.Mod. Phys., 104(12):1, 1956.
[8] H. Salwen. Resonance transitions in molecular beam experiments. I. general theory oftransitions in a rotating magnetic field. Rev. Mod. Phys., 99(4):1274–1286, 1955.
[9] J. Hermann and S. Swain. Resoncance lineshapes in multi-level atomic systems. J. Phys.B, 10(10):1815–1833, 1977.
[10] P. Kusch. Some observations of double-quantum and triple-quatum transitions. Rev. Mod.Phys., 93(5):1022–1025, 1954.
[11] T. Skalinsy. Orientation optique des atomes dans la vapeur saturante de caesium. C. R.Acad. Sci., 245(22):1908–1911, 1957.
[12] A. S. Pazgalev and E. B. Alexandrov. Exact solution of the problem of resonance in amultilevel system in a rotating electromagnetic field. Optics and Spectroscopy, 80(4):473–478, 1996.
[13] A. S. Pazgalev and E. B. Alexandrov. Exact solution of the problem of multi-quantumresonances in Zeeman structure of 133Cs and 6Li atoms. Optics and Spectroscopy, 86(1):6–10, 1999.
[14] A. S. Pazgalev, E. B. Alexandrov, and J. L. Rasson. Observation of four-quantum resonancein the Zeeman structure of the ground-state of 39K. Optics and Spectroscopy, 82(1):10–15,1997.
[15] J. D. Xu, G. Wackerle, and M. Mehring. Multiple-quantum spin coherences in the groundstate of alkali atomic vapor. Phys. Rev. A, 55(1):206–213, 1997.
[16] G. Breit and I.I. Rabi. Rev. Mod. Phys., 38:2082, 1931.
66 Chapter 4: Multiphoton processes in the Zeeman structure . . .
[17] S. Lang, S. I. Kanorsky, M. Arndt, S. B. Ross, T. W. Hansch, and A. Weis. The hyperfinestructure of Cs atoms in the b.c.c. phase of solid 4He. Europhysics Letters, 30(4):233, 1995.
[18] Taro Eichler, R. Muller-Siebert, Daniel Nettels, S. I. Kanorsky, and A. Weis. Opticaldetection of nonradiating alkali atoms in solid helium. Phys. Rev. Lett., 88(12):123002,2002.
[19] Taro Eichler. Magneto-optical Spectroscopy of Alkali Atoms in Helium Crystals. Ph.D.thesis, Rheinische Friedrich-Wilhelms-Universitat Bonn, 2000.
[20] D. Nettels, R. Muller-Siebert, and Antoine Weis. Relaxation mechanisms of multi-quantumcoherences in the Zeeman structure of atomic Cs trapped in solid He. Invited paper,accepted for publication in Appl. Phys. B.
[21] R. Muller-Siebert, D. Nettels, and Antoine Weis. To be submitted.
[22] Serguei Kanorsky and Antoine Weis. Optical and magneto-optical spectroscopy of pointdefects in condensed helium. In Advances in Atomic, Molecular, and Optical Physics,volume 38, pages 87–119. Academic Press, 1997.
[23] William Happer. Multipole relaxation times of a weak perturbing spin system. Phys. Rev.B, 1(5):2203–2207, 1970.
[24] William Happer. Optical pumping. 44(2):169–249, 1972.
[25] Antoine Weis. In Electron Theory and Quantum Electrodynamics: 100 years later. PlenumPress, New York, 1997.
Chapter 5
Relaxation mechanisms ofmulti-quantum coherences in theZeeman structure of atomic Cstrapped in solid He
D. Nettels, R. Muller-Siebert, and A.Weis
Departement de Physique, Universite de Fribourg, Chemin du Musee 3, 1700 Fribourg,Switzerland
accepted for publication by Appl. Phys. B(invited paper)
Abstract: We have extended our previous work on near-degenerate magnetic res-onance transitions in alkali ground states involving the simultaneous absorption ofmultiple radio-frequency quanta. New experimental results with an improved spec-tral resolution were obtained with cesium atoms trapped in the cubic phase of ahelium crystal. The main objective of the paper is a theoretical study of the influ-ence of stochastic perturbations of given multipole orders on the various multi-photoncoherences. Algebraic and numerical results for perturbations of both dipolar andquadrupolar symmetry are presented. The present experimental resolution does notyet allow us to distinguish between these two most likely relaxation mechanisms.Nonetheless, the experimental spectra are very well described when allowing in thecalculations for a magnetic field inhomogeneity of 2 · 10−5.
PACS 76.70.Hb; 32.80.Wr; 32.30.Dx; 32.60.+i
67

68 Chapter 5: Relaxation mechanisms of multi-quantum coherences . . .
5.1 Introduction
In a recent paper we reported on the observation of magnetic resonance transitions involvingthe simultaneous absorption of N radio frequency (r.f.) photons between Zeeman split hyper-fine sublevels |F,M〉 and |F,M + N〉 in the 6S1/2 ground state of Cs implanted in the body-centered cubic (b.c.c.) phase of solid He4 [1]. Such transitions are of multiple interest regardingapplications and fundamental investigations. Under the simplest model assumption that allmulti-quantum coherences have the same relaxation rate, one expects the N -photon transitionsto have a resonance linewidth which is N -times smaller than the width of usual one-photontransition. Therefore multi-photon transitions have the potential to increase the spectroscopicsensitivity in magnetic resonance experiments. We showed furthermore [1] that some specifictransitions allow to suppress a serious systematic effect connected with quadratic Stark shiftsin experiments searching for permanent electric dipole moments. Finally we suggested [1] thatmultiphoton spectra might be a useful tool for the better understanding of the mechanisms,which govern the relaxation of the ground state spin polarization of the cesium atoms due totheir interactions with lattice vibrations of the surrounding He matrix.
The theoretical investigation of the influence of different relaxation processes on the multi-photon spectra and the comparison with improved experimental data are the main topic of thepresent paper. In our previous work [1] only relaxation based on optical pumping was takeninto account, similar to the calculations of Pazgalev and Alexandrov [2]. In this work we havesignificantly extended the treatment of the relaxation processes using generalized ground statemaster equations describing the evolution of the atomic ground state populations and coherencesin the density matrix formalism under the influence of static and oscillating magnetic fields,optical pumping and various relaxation processes.
The optical absorption and emission lines of Cesium atoms embedded in the body-centeredcubic (b.c.c.) phase of solid He4 are strongly broadened and shifted by the helium matrix [3].As a consequence of the very high degree of spherical symmetry of the local trapping sites of theimpurity atoms (atomic bubbles) the sample can nonetheless be efficiently polarized by opticalpumping [4]. The non-magnetic nature of the host matrix atoms and their isotropic distributionaround the defect atoms ensure that the alkali spins are only very weakly perturbed, whichis reflected by longitudinal spin relaxation times T1 = 1/γ1 of 〈Jz〉 on the order of 1 second[5] and by very narrow magnetic resonance lines [6]. For a static distribution of the heliumatoms around the cesium atoms one would expect quasi-infinite relaxation times. The verylong, but nonetheless finite longitudinal and transverse spin coherence times are most probablydue to fluctuations of the bubble interface boundary. So far no detailed investigations of themechanisms by which such fluctuations couple to the Cs spins were performed. In the presentpaper we calculate the effect of dipolar and quadrupolar shape oscillations on the relaxation ofmulti-photon coherences and show explicitly that these spectra have the potential to discriminatebetween the two processes.
Our previously measured magnetic resonance lines were strongly broadened due to magneticfield inhomogeneities and current instabilities. This broadening severely hinders the study of theintrinsic relaxation mechanisms. In the meantime we have improved the experimental apparatusby suppressing some of these technical noise sources. We present new experimental data showingan increased spectroscopic resolution. As before the measurements were done using the techniqueof optically detected magnetic resonance (ODMR), in which resonant optical interactions areused both to build up spin polarization in the sample and to detect radio-frequency inducedtransitions between the magnetic sublevels via their effect on the optical properties of the alkalisample. Unfortunately the observed widths of the experimental spectra are still inhomogeneouslybroadened and do not yet allow to draw a conclusion regarding the actual relaxation mechanism.
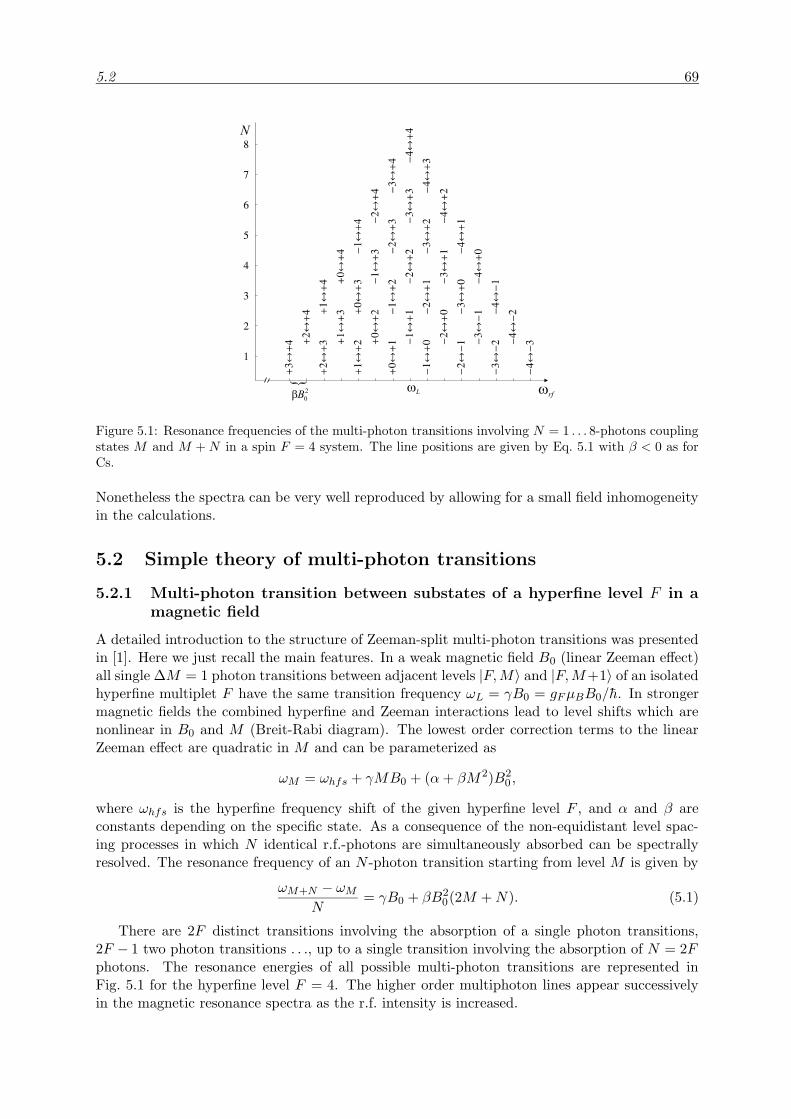
5.2 69
wL2
0Bb
N
wrf
Figure 5.1: Resonance frequencies of the multi-photon transitions involving N = 1 . . . 8-photons couplingstates M and M +N in a spin F = 4 system. The line positions are given by Eq. 5.1 with β < 0 as forCs.
Nonetheless the spectra can be very well reproduced by allowing for a small field inhomogeneityin the calculations.
5.2 Simple theory of multi-photon transitions
5.2.1 Multi-photon transition between substates of a hyperfine level F in amagnetic field
A detailed introduction to the structure of Zeeman-split multi-photon transitions was presentedin [1]. Here we just recall the main features. In a weak magnetic field B0 (linear Zeeman effect)all single ∆M = 1 photon transitions between adjacent levels |F,M〉 and |F,M+1〉 of an isolatedhyperfine multiplet F have the same transition frequency ωL = γB0 = gFµBB0/h. In strongermagnetic fields the combined hyperfine and Zeeman interactions lead to level shifts which arenonlinear in B0 and M (Breit-Rabi diagram). The lowest order correction terms to the linearZeeman effect are quadratic in M and can be parameterized as
ωM = ωhfs + γMB0 + (α+ βM2)B20 ,
where ωhfs is the hyperfine frequency shift of the given hyperfine level F , and α and β areconstants depending on the specific state. As a consequence of the non-equidistant level spac-ing processes in which N identical r.f.-photons are simultaneously absorbed can be spectrallyresolved. The resonance frequency of an N -photon transition starting from level M is given by
ωM+N − ωM
N= γB0 + βB2
0(2M +N). (5.1)
There are 2F distinct transitions involving the absorption of a single photon transitions,2F − 1 two photon transitions . . ., up to a single transition involving the absorption of N = 2Fphotons. The resonance energies of all possible multi-photon transitions are represented inFig. 5.1 for the hyperfine level F = 4. The higher order multiphoton lines appear successivelyin the magnetic resonance spectra as the r.f. intensity is increased.
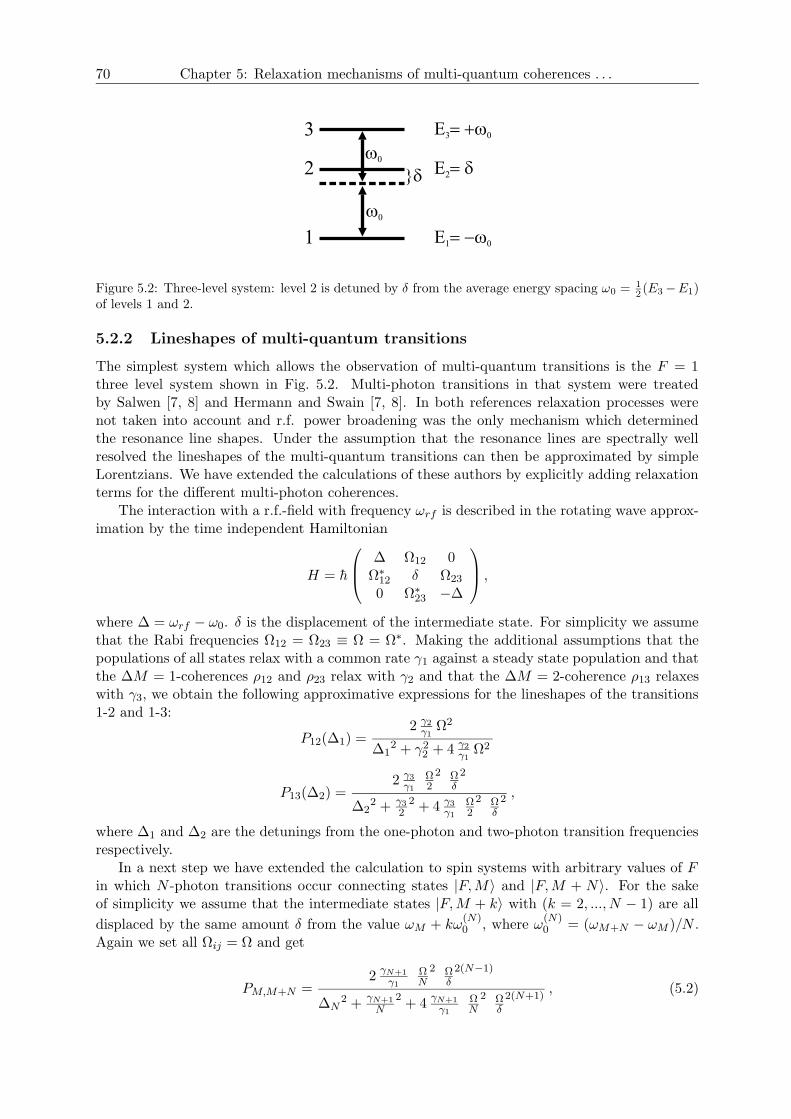
70 Chapter 5: Relaxation mechanisms of multi-quantum coherences . . .
Figure 5.2: Three-level system: level 2 is detuned by δ from the average energy spacing ω0 =12 (E3−E1)
of levels 1 and 2.
5.2.2 Lineshapes of multi-quantum transitions
The simplest system which allows the observation of multi-quantum transitions is the F = 1three level system shown in Fig. 5.2. Multi-photon transitions in that system were treatedby Salwen [7, 8] and Hermann and Swain [7, 8]. In both references relaxation processes werenot taken into account and r.f. power broadening was the only mechanism which determinedthe resonance line shapes. Under the assumption that the resonance lines are spectrally wellresolved the lineshapes of the multi-quantum transitions can then be approximated by simpleLorentzians. We have extended the calculations of these authors by explicitly adding relaxationterms for the different multi-photon coherences.
The interaction with a r.f.-field with frequency ωrf is described in the rotating wave approx-imation by the time independent Hamiltonian
H = h
∆ Ω12 0Ω∗12 δ Ω23
0 Ω∗23 −∆
,
where ∆ = ωrf − ω0. δ is the displacement of the intermediate state. For simplicity we assumethat the Rabi frequencies Ω12 = Ω23 ≡ Ω = Ω∗. Making the additional assumptions that thepopulations of all states relax with a common rate γ1 against a steady state population and thatthe ∆M = 1-coherences ρ12 and ρ23 relax with γ2 and that the ∆M = 2-coherence ρ13 relaxeswith γ3, we obtain the following approximative expressions for the lineshapes of the transitions1-2 and 1-3:
P12(∆1) =2 γ2
γ1Ω2
∆12 + γ22 + 4 γ2
γ1Ω2
P13(∆2) =2 γ3
γ1
Ω2
2 Ωδ
2
∆22 + γ3
22 + 4 γ3
γ1
Ω2
2 Ωδ
2 ,
where ∆1 and ∆2 are the detunings from the one-photon and two-photon transition frequenciesrespectively.
In a next step we have extended the calculation to spin systems with arbitrary values of Fin which N -photon transitions occur connecting states |F,M〉 and |F,M + N〉. For the sakeof simplicity we assume that the intermediate states |F,M + k〉 with (k = 2, ..., N − 1) are all
displaced by the same amount δ from the value ωM + kω(N)0 , where ω
(N)0 = (ωM+N − ωM )/N .
Again we set all Ωij = Ω and get
PM,M+N =2
γN+1
γ1
ΩN
2 Ωδ
2(N−1)
∆N2 +
γN+1
N2+ 4
γN+1
γ1
ΩN
2 Ωδ
2(N+1), (5.2)
5.3 71
where ∆N is the detuning from the N -photon resonance and γN+1 is the relaxation rate of thecoherence between the states |M〉 and |M +N〉.
Although in our experiments the condition (spectral isolation of the N -photon resonancelines) for the validity of Eq. 5.2 is not completely fulfilled, it is nonetheless instructive to usethe simple Lorentzian lineshapes of (5.2) for a first qualitative comparison of the multi-photonlines with the single-photon lines. Our particular interest lies in the possible achievable gain inspectroscopic sensitivity. This sensitivity is determined by the accuracy with which the center ofa given resonance line can be determined experimentally at a given experimental noise level, andis proportional to the steepness of the resonance, i.e., the maximal slope |dP/d∆| of the resonancelineshape P (∆). The steepness is proportional to the ratio RN = P (∆ = 0)/∆ωFWHM of theresonant signal amplitude and its width. For the Lorentzians of Eq. 5.2 the resonant transitionprobability P (0) of an N -photon transition reaches a maximum value of
RmaxN =
1
6√3
N
γN+1(5.3)
at the optimal r.f. amplitude given in terms of the corresponding Rabi frequency by
Ω = Ωopt ≡ δ
(γ1γN+1
2δ2
) 1
2N
, (5.4)
The corresponding transition probabilities PM,M+N (∆N = 0,Ω = Ωopt) are found to have thesame constant value of 1/3 independent of N and the widths of the Lorentzians are found tovary with N as
∆ωFWHM = 2√3γN+1
N,
so that the widths alone determine the N -dependence of the steepness. The validity of the usedapproximations requires that the relaxation rates γi are much smaller than δ. Hence Ω has tobe increased according to Eq. 5.4 in order to observe the higher order multi-photon resonances.The relative change of the sensitivity of an N -photon resonance compared to a single photonresonance is thus given according to (5.3) by
GN ≡Rmax
N
RmaxN=1
=γ2
γN+1N. (5.5)
For the simplest case, treated in our previous paper, in which all multi-photon relaxation ratesγ2, γ3, ..., γN+1 are equal, one thus obtains an increased sensitivity, which is directly proportionalto the number of involved photons. However, in the more realistic case, in which the rates γNdiffer this simple scaling law no longer holds. It is one of the goals of this paper to determine howthe relaxation rates γN of multi-quantum coherences and hence the anticipated improvementof the spectroscopic sensitivity GN depend on the nature and symmetry of different relaxationmechanisms.
5.3 Numerical Calculation of the ODMR signal
5.3.1 Optically detected magnetic resonance
In the experiments the magnetic resonances addressed in the previous paragraph were observedusing a double resonance technique. A circularly polarized laser beam resonant with the Cs D1-transition was used to prepare the necessary population differences in the magnetic sublevelsby optical pumping. As the scattering rate of the laser radiation depends on the degree of spin
72 Chapter 5: Relaxation mechanisms of multi-quantum coherences . . .
polarization of the medium, any change of the latter due to a magnetic resonance transition canbe detected by monitoring the fluorescence light intensity. This technique is known as opticallydetect magnetic resonance (ODMR).
We have calculated the multi-photon ODMR spectra of Cs by numerically solving the steady-state Liouville equation for the density matrix ρ describing the 16 sublevels of the 6S1/2 groundstate hyperfine structure (F = 3, 4). The rate of change ρ of the density matrix is governed bythe interaction with the (static and oscillating) magnetic fields, the optical pumping interactionwith the resonant circularly polarized laser beam and the sublevel population and coherencerelaxation processes:
ρ = (ρ)mag + (ρ)op + (ρ)rel . (5.6)
Steady-state solutions were obtained by setting ρ = 0. In the following we discuss the threeterms of Eq. 5.6 in detail.
5.3.2 Magnetic interaction
The Liouville equation is solved in the |(F±),M〉 basis in which the Hamiltonian
H0 = A I · J+ gJµBJzB0 − gIµBIzB0,
describing the hyperfine and static Zeeman interactions is diagonal. The brackets around F± in|(F±),M〉 indicate that F is not a good quantum number in presence of the magnetic field; F±are merely used as convenient state labels. Since the two hyperfine levels are well separated inenergy, it is justified to neglect all matrix elements of the radio frequency interaction operatorwhich couple states of different F -values. The corresponding coherences in the density matrixρ will also be ignored, so that the density matrix of the ground state has the form
ρ =
(ρF− 00 ρF+
),
where ρF± are sub-matrices restricted to the eigenspaces of F± spanned by the states |(F±),M〉.The interaction operator of the atoms with the r.f.-field B1(t) = B1 cosωt oscillating along thex-direction is
V (t) = (gJµBJxB1 − gIµBIxB1) cosωrf t
= 2V0 cosωrf t. (5.7)
In the rotating field approximation the Liouville equations for ρF− and ρF+are
ih(ρF±)mag = [H±, ρF± ]
with the time-independent Hamiltonian
H± = H0 ∓ hωrfFz + V0,
where all operators are restricted to the corresponding |(F±),M〉 spaces. The different signs infront of the second term reflect the facts that we have chosen ωrf to be positive and that theg-factors of the two hyperfine levels have opposite signs.
5.3 73
5.3.3 Optical pumping and detection signal
A detailed discussion of optical pumping processes of Cs atoms in solid 4He can be foundin [4]. In that paper optical pumping was calculated using rate equations for the ground statepopulations. Here we generalize this approach by the simultaneous treatment of optical pumpingand ground state coherence evolution under the action of the magnetic fields. The destructionof these coherences by the absorptive interaction with the optical radiation then contributesto the broadening of the magnetic resonance lines. In the experiment the laser beam traversesseveral cryostat windows, some of which show stress-induced birefringence. As a consequencethe beam interacting with the sample is not 100% circularly polarized. We take this into accountby allowing the light field E to be elliptically polarized
E =E0√2
(cosωt
sinωt+ ϕ
)=E0√2
(1
ie−iϕ
)e−iωt
2+ c.c.
=1
2Ee−iωt + c.c. , (5.8)
where c.c. denotes the complex conjugate, ω is the light frequency and E0 is the amplitude ofthe electric field. The two components of the vectors correspond to the x- and y-directions,respectively. The degree of circular polarization of this optical field is |cos(ϕ)| and the light is100% left-circularly polarized for ϕ = 0.
The interaction between the radiation field E and the atoms is given by
VAL = −E · d, (5.9)
where d is the electric dipole operator. Because of the large homogeneous linewidth (10 nm)of the D1-transition of Cs in solid He and the relatively low laser intensities used, excitedstate populations and stimulated emission processes can be omitted. As a consequence theatomic evolution under the influence of optical pumping can described by pure ground stateequations only [9]. A further consequence of the large optical linewidth is the fact that all fourhyperfine transitions of the D1-transition are excited simultaneously. We further note that, asshown earlier [3, 4], the creation of spin polarization in Cs trapped in b.c.c. He proceeds viarepopulation pumping in which the spin-polarization in the excited state is preserved during theoptical absorption-emission cycle. We define the operator D = Dge +Deg, with
Deg =−12h
Pe E · dPg and Dge = D†eg ,
where Pg =∑
µ |µ〉〈µ| and Pe =∑
m |m〉〈m| are projection operators onto ground and excitedstates respectively. The sums
∑µ and
∑m extend over all magnetic substates of the 6S1/2
ground state and the 6P1/2 excited state. It is shown in the appendix that the rate of changeof the ground state density matrix elements under the influence of resonant optical pumping isgoverned by
(ρ)op = −2
γ[DgeDeg, ρ]
+3
γ
1∑
q=−1
(C1−q)geDegρDge(C
1q )eg , (5.10)
where C1q =
√4π/3Y1q is the spherical unity operator and γ the homogenous optical linewidth.
The two terms in (5.10) describe depopulation and repopulation pumping respectively. By
74 Chapter 5: Relaxation mechanisms of multi-quantum coherences . . .
applying the Wigner-Eckart theorem to the matrix elements of d one sees that the elements of(5.10) are proportional to the pump rate γp, defined as
γp =E20
h2γ|〈6S1/2‖d‖6P1/2〉|2.
In the experiment fluorescence of the Cs atoms is detected and the fluorescence rate F is (s.appendix) given by
F = F(ρ) = 4
γtr(DegρDge) (5.11)
We note that F is proportional to γp. Alternatively, F can be expressed as
F = Funpol (1− Pz cosϕ) ,
where Pz = 2 〈Jz〉 is the spin polarization and Funpol is the fluorescence rate of the unpolar-
ized atomic ensemble [4] in thermal equilibrium. Optical pumping produces a spin polarizationPmaxz = 2 〈Jz〉max which depends on the light intensity with a corresponding minimum in fluo-
rescence Fpol. The magnetic resonance process alters Pz in a resonant way, which is reflectedby a corresponding resonant change in the fluorescence rate F .
5.3.4 Relaxation
As mentioned in the introduction the electronic spin polarization of alkali atoms embedded in theb.c.c. phase of solid helium reaches values on the order of 1 second. This is a consequence of thespherical symmetry of the local trapping site (spherical bubble) and the non-magnetic propertiesof the host matrix atoms, as helium has neither an electronic nor a nuclear magnetic moment.The most likely mechanism responsible for the perturbation of the alkali spins are helium latticevibrations, and more specifically shape fluctuations of the bubble interface boundary. Theatoms of the first solvation shell undergo oscillations around their equilibrium positions andthe fluctuating shape of the interface (described by the bubble radius R(θ, φ)) formed by theseatoms may be decomposed into spherical harmonics Yk,q as
R(θ, φ, t) = R0 +∑
k,q
ak,q (t)Yk,q(θ, φ) ,
where the coefficients ak,q(t) describe the time dependent fluctuations of a given multipole shape.Without such fluctuations the bubble shape is spherical R(θ, φ, t) = R0 and the alkali groundstate preserves its S-state character. The bubble shape fluctuations deform the electronic wavefunction of the alkali atom, which, in quantum mechanical terms corresponds to an L-mixinginteraction. This admixture of higher orbital momentum states, together with spin-orbit andhyperfine interactions in the cesium atom then constitutes a mechanism by which the heliummatrix atoms can couple to the alkali spins. For a spin perturbing interaction of a definedmultipolarity k the perturbation Hfl(t) between the bubble shape and the alkali spins can thenbe written as [10]
Hfl(t) =k∑
q=−k
(−1)q F k−q(t)T
kq (S, I) , (5.12)
where the T kq (S, I) are spherical tensor operators acting in the combined electronic (S) and
nuclear spin (I) spaces that describe atomic properties. The coefficients F kq (t) are determined
by the amplitudes ak,q(t) of the bubble oscillations and describe the induced fields coupling tothe atom.

5.3 75
The lowest order multipole oscillation is the monopole (or breathing mode) oscillationdescribed by a0,0(t).Because of its scalar nature it will not affect spin coherences nor levelpopulations. However, as shown previously [11], it does affect magnetic hyperfine transitions〈F = 4,M |µ|F = 3,M〉 and hence broadens the corresponding resonance via a modulation ofthe Fermi contact term of the ground state hyperfine interaction. The next multipole oscillationis the dipole oscillation (k = 1). A small (compared to the bubble radius) amplitude dipoledeformation of the bubble is equivalent to an small amplitude displacement of the atom from itsequilibrium position inside a spherical bubble. We will restrict the discussion in the following todipole (k = 1) and quadrupole (k = 2) shape oscillations. The bubble-spin interaction can havean electric and/or a magnetic character. As the atoms have no static electric vector propertythe k = 1 dipole oscillations the perturbation operator in this case will be dominated by thecoupling of induced fluctuating magnetic fields F 1
q (t) ∝ Bq(t) to the atomic magnetic momentT 1q (S, I) ∝ µq = (−gsSq + gIIq)
µB
h . As gI ¿ gS contributions from the nuclear moment will beneglected in the calculations, so that the tensor components T 1
q (S) act in electronic spin spaceonly. In the case of quadrupolar shape oscillations, on the other hand, the second rank tensorsT 2q (S, I) can not couple to the electronic angular momentum, as the Wigner-Eckart theorem
implies that⟨J = 1/2
∥∥T 2∥∥ J = 1/2
⟩= 0 so that the k = 2 interaction operators T 2
q (I) act innuclear spin space only. Here the simplest interaction will be the coupling of fluctuating electricfield gradients, described by F 2
q (t) to the components of the electric quadrupole moment of theCs nucleus, described by T 2
q (I).The ability of Hfl(t) to drive ground state transitions and/or to dephase spin coherences
is determined by the magnitude of the power spectral density J(ω) of the fluctuating fieldcomponents F k
q (t) in the vicinity of the relevant atomic transition frequency. J(ω) can becalculated according to the Wiener-Khinchine theorem as the Fourier cosine transform of theautocorrelation function g(τ) of F k
q (t) [12]. We assume that the fluctuations are isotropic andhave an exponentially decaying autocorrelation function
g(τ) ≡⟨F kq (t)F
kq′(t+ τ)∗
⟩t= δq,q′
(−1)qf22k + 1
e−|τ |/τc ,
where τc is the correlation time and f is the root mean square amplitude of the fluctuation. Thepower spectrum is then proportional to
J(ω) ∝ τc1 + ω2τ2c
.
Under the assumption that in the case under discussion the fluctuations are determined by Helattice vibrations, 1/τc will be on the order of the Debye frequency (1011 s−1) in the b.c.c. phaseof solid helium[13]. In this case ω ¿ 1/τc holds for both hyperfine (GHz) and Zeeman transitions(kHz) in the 6S1/2 ground state. As a consequence J(ω) is approximately constant for all thesetransitions (white noise regime). This assumption is well confirmed by our earlier observationthat the longitudinal electronic spin relaxation rate γ1 has a constant value of approximately1 s−1 for Larmor frequencies ranging from 70 Hz to 4 MHz [5, 14]. The existence of additionalnoise sources,as, e.g. acoustic vibrations with considerably longer correlation times for whichωτc À 1 in the range of investigated frequencies can not be ruled out a priori. As the powerdensity of these fluctuating fields J(ω) → 0 they are not able to drive sublevel transitions(population transfers), but contribute nonetheless to spin dephasing [10]. Because of the abovementioned independence of γ1 on ω the case of ω being comparable to the fluctuation rate 1/τccan be ruled out, so that in the following we will treat the problem for the two extreme casesω ¿ 1/τc and ω À 1/τc only.
In order to obtain an expression for the relaxation term (ρ)rel of the Liouville equation wehave treated the relaxation mechanism as a Markovian process following the methods described,
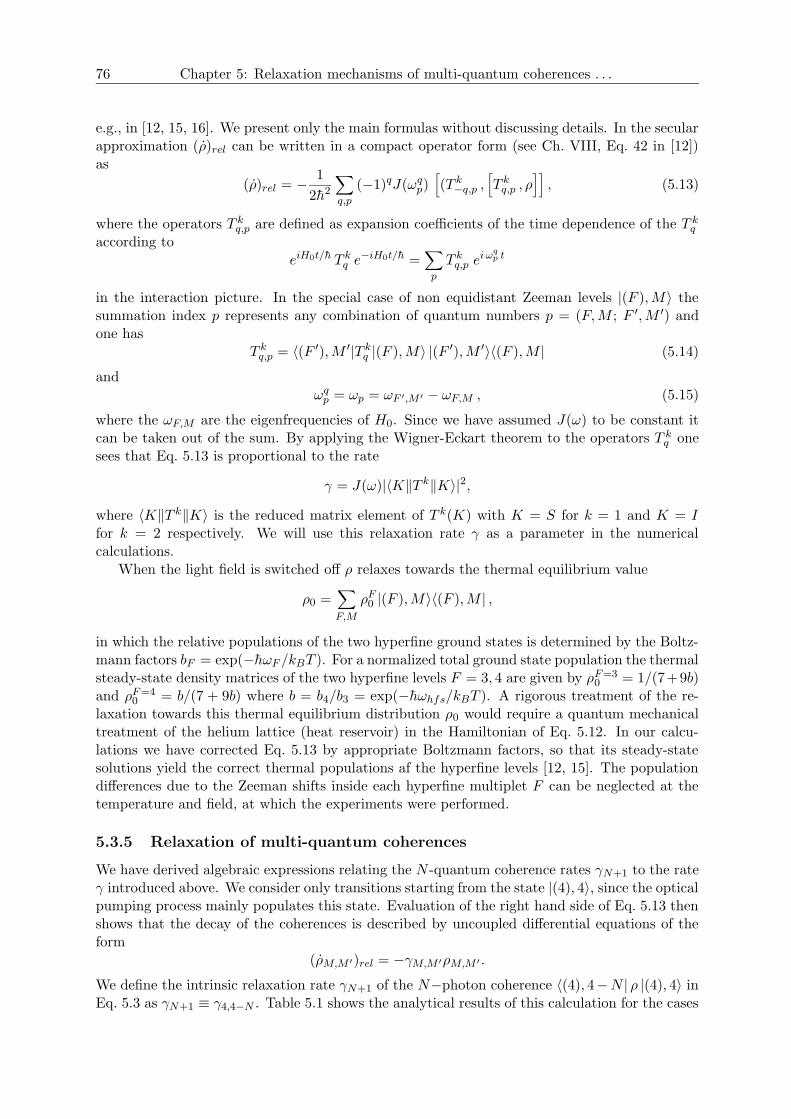
76 Chapter 5: Relaxation mechanisms of multi-quantum coherences . . .
e.g., in [12, 15, 16]. We present only the main formulas without discussing details. In the secularapproximation (ρ)rel can be written in a compact operator form (see Ch. VIII, Eq. 42 in [12])as
(ρ)rel = −1
2h2∑
q,p
(−1)qJ(ωqp)[(T k−q,p ,
[T kq,p , ρ
]], (5.13)
where the operators T kq,p are defined as expansion coefficients of the time dependence of the T k
q
according toeiH0t/h T k
q e−iH0t/h =
∑
p
T kq,p e
i ωqp t
in the interaction picture. In the special case of non equidistant Zeeman levels |(F ),M〉 thesummation index p represents any combination of quantum numbers p = (F,M ; F ′,M ′) andone has
T kq,p = 〈(F ′),M ′|T k
q |(F ),M〉 |(F ′),M ′〉〈(F ),M | (5.14)
andωqp = ωp = ωF ′,M ′ − ωF,M , (5.15)
where the ωF,M are the eigenfrequencies of H0. Since we have assumed J(ω) to be constant itcan be taken out of the sum. By applying the Wigner-Eckart theorem to the operators T k
q onesees that Eq. 5.13 is proportional to the rate
γ = J(ω)|〈K‖T k‖K〉|2,
where 〈K‖T k‖K〉 is the reduced matrix element of T k(K) with K = S for k = 1 and K = Ifor k = 2 respectively. We will use this relaxation rate γ as a parameter in the numericalcalculations.
When the light field is switched off ρ relaxes towards the thermal equilibrium value
ρ0 =∑
F,M
ρF0 |(F ),M〉〈(F ),M | ,
in which the relative populations of the two hyperfine ground states is determined by the Boltz-mann factors bF = exp(−hωF /kBT ). For a normalized total ground state population the thermalsteady-state density matrices of the two hyperfine levels F = 3, 4 are given by ρF=3
0 = 1/(7+9b)and ρF=4
0 = b/(7 + 9b) where b = b4/b3 = exp(−hωhfs/kBT ). A rigorous treatment of the re-laxation towards this thermal equilibrium distribution ρ0 would require a quantum mechanicaltreatment of the helium lattice (heat reservoir) in the Hamiltonian of Eq. 5.12. In our calcu-lations we have corrected Eq. 5.13 by appropriate Boltzmann factors, so that its steady-statesolutions yield the correct thermal populations af the hyperfine levels [12, 15]. The populationdifferences due to the Zeeman shifts inside each hyperfine multiplet F can be neglected at thetemperature and field, at which the experiments were performed.
5.3.5 Relaxation of multi-quantum coherences
We have derived algebraic expressions relating the N -quantum coherence rates γN+1 to the rateγ introduced above. We consider only transitions starting from the state |(4), 4〉, since the opticalpumping process mainly populates this state. Evaluation of the right hand side of Eq. 5.13 thenshows that the decay of the coherences is described by uncoupled differential equations of theform
(ρM,M ′)rel = −γM,M ′ρM,M ′ .
We define the intrinsic relaxation rate γN+1 of the N−photon coherence 〈(4), 4−N | ρ |(4), 4〉 inEq. 5.3 as γN+1 ≡ γ4,4−N . Table 5.1 shows the analytical results of this calculation for the cases
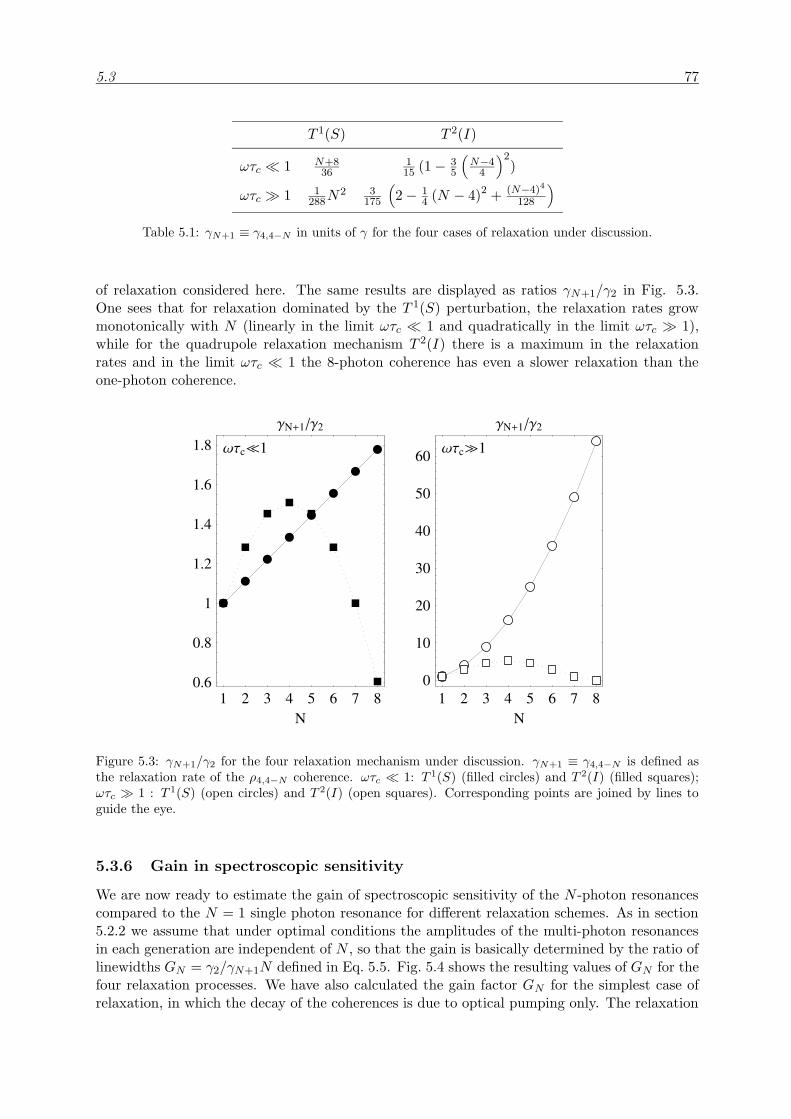
5.3 77
T 1(S) T 2(I)
ωτc ¿ 1 N+836
115 (1− 3
5
(N−44
)2)
ωτc À 1 1288N
2 3175
(2− 1
4 (N − 4)2 + (N−4)4
128
)
Table 5.1: γN+1 ≡ γ4,4−N in units of γ for the four cases of relaxation under discussion.
of relaxation considered here. The same results are displayed as ratios γN+1/γ2 in Fig. 5.3.One sees that for relaxation dominated by the T 1(S) perturbation, the relaxation rates growmonotonically with N (linearly in the limit ωτc ¿ 1 and quadratically in the limit ωτc À 1),while for the quadrupole relaxation mechanism T 2(I) there is a maximum in the relaxationrates and in the limit ωτc ¿ 1 the 8-photon coherence has even a slower relaxation than theone-photon coherence.
1 2 3 4 5 6 7 8N
0.6
0.8
1
1.2
1.4
1.6
1.8ΓN+1Γ2
ΩΤc`1
1 2 3 4 5 6 7 8N
0
10
20
30
40
50
60
ΓN+1Γ2
ΩΤcp1
Figure 5.3: γN+1/γ2 for the four relaxation mechanism under discussion. γN+1 ≡ γ4,4−N is defined asthe relaxation rate of the ρ4,4−N coherence. ωτc ¿ 1: T 1(S) (filled circles) and T 2(I) (filled squares);ωτc À 1 : T 1(S) (open circles) and T 2(I) (open squares). Corresponding points are joined by lines toguide the eye.
5.3.6 Gain in spectroscopic sensitivity
We are now ready to estimate the gain of spectroscopic sensitivity of the N -photon resonancescompared to the N = 1 single photon resonance for different relaxation schemes. As in section5.2.2 we assume that under optimal conditions the amplitudes of the multi-photon resonancesin each generation are independent of N , so that the gain is basically determined by the ratio oflinewidths GN = γ2/γN+1N defined in Eq. 5.5. Fig. 5.4 shows the resulting values of GN for thefour relaxation processes. We have also calculated the gain factor GN for the simplest case ofrelaxation, in which the decay of the coherences is due to optical pumping only. The relaxation
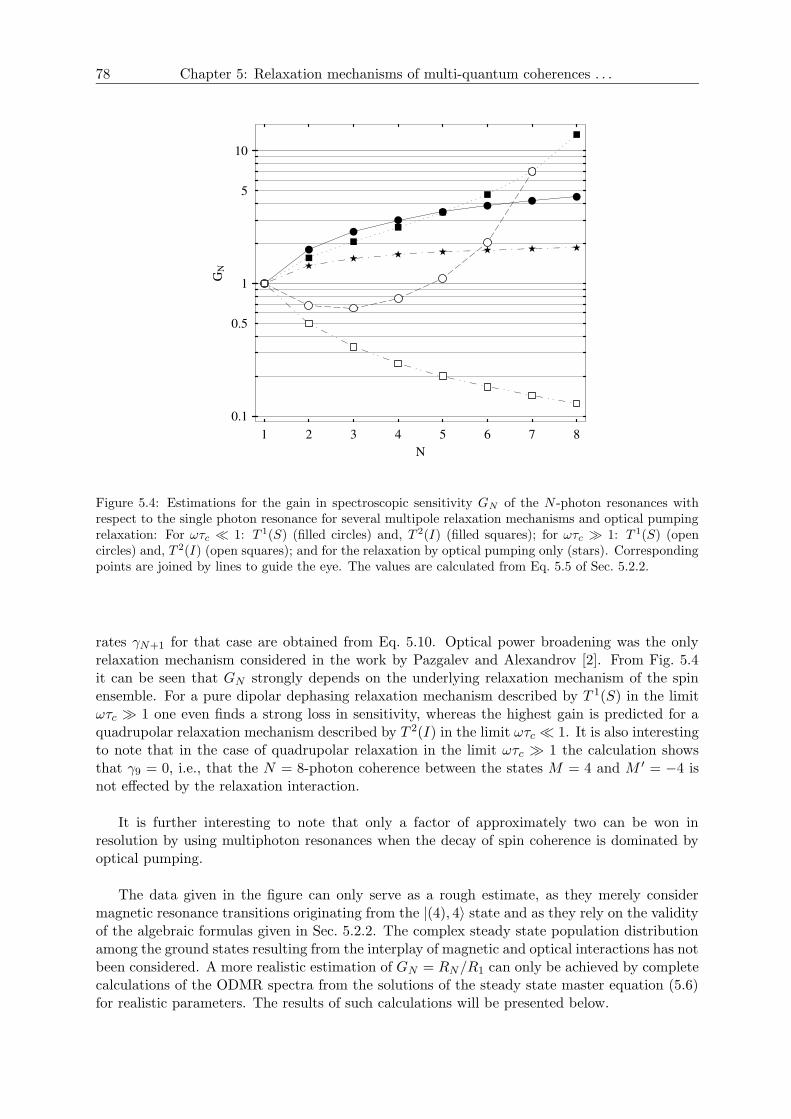
78 Chapter 5: Relaxation mechanisms of multi-quantum coherences . . .
1 2 3 4 5 6 7 8N
0.1
0.5
1
5
10
GN
Figure 5.4: Estimations for the gain in spectroscopic sensitivity GN of the N -photon resonances withrespect to the single photon resonance for several multipole relaxation mechanisms and optical pumpingrelaxation: For ωτc ¿ 1: T 1(S) (filled circles) and, T 2(I) (filled squares); for ωτc À 1: T 1(S) (opencircles) and, T 2(I) (open squares); and for the relaxation by optical pumping only (stars). Correspondingpoints are joined by lines to guide the eye. The values are calculated from Eq. 5.5 of Sec. 5.2.2.
rates γN+1 for that case are obtained from Eq. 5.10. Optical power broadening was the onlyrelaxation mechanism considered in the work by Pazgalev and Alexandrov [2]. From Fig. 5.4it can be seen that GN strongly depends on the underlying relaxation mechanism of the spinensemble. For a pure dipolar dephasing relaxation mechanism described by T 1(S) in the limitωτc À 1 one even finds a strong loss in sensitivity, whereas the highest gain is predicted for aquadrupolar relaxation mechanism described by T 2(I) in the limit ωτc ¿ 1. It is also interestingto note that in the case of quadrupolar relaxation in the limit ωτc À 1 the calculation showsthat γ9 = 0, i.e., that the N = 8-photon coherence between the states M = 4 and M ′ = −4 isnot effected by the relaxation interaction.
It is further interesting to note that only a factor of approximately two can be won inresolution by using multiphoton resonances when the decay of spin coherence is dominated byoptical pumping.
The data given in the figure can only serve as a rough estimate, as they merely considermagnetic resonance transitions originating from the |(4), 4〉 state and as they rely on the validityof the algebraic formulas given in Sec. 5.2.2. The complex steady state population distributionamong the ground states resulting from the interplay of magnetic and optical interactions has notbeen considered. A more realistic estimation of GN = RN/R1 can only be achieved by completecalculations of the ODMR spectra from the solutions of the steady state master equation (5.6)for realistic parameters. The results of such calculations will be presented below.
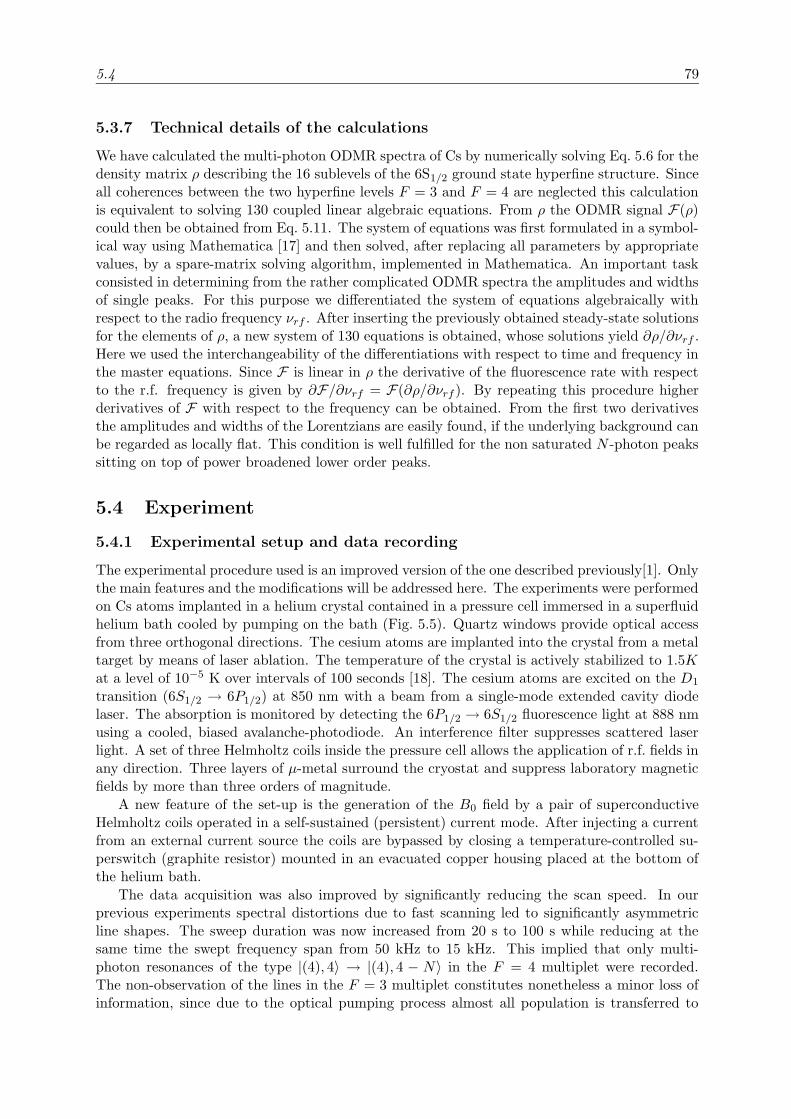
5.4 79
5.3.7 Technical details of the calculations
We have calculated the multi-photon ODMR spectra of Cs by numerically solving Eq. 5.6 for thedensity matrix ρ describing the 16 sublevels of the 6S1/2 ground state hyperfine structure. Sinceall coherences between the two hyperfine levels F = 3 and F = 4 are neglected this calculationis equivalent to solving 130 coupled linear algebraic equations. From ρ the ODMR signal F(ρ)could then be obtained from Eq. 5.11. The system of equations was first formulated in a symbol-ical way using Mathematica [17] and then solved, after replacing all parameters by appropriatevalues, by a spare-matrix solving algorithm, implemented in Mathematica. An important taskconsisted in determining from the rather complicated ODMR spectra the amplitudes and widthsof single peaks. For this purpose we differentiated the system of equations algebraically withrespect to the radio frequency νrf . After inserting the previously obtained steady-state solutionsfor the elements of ρ, a new system of 130 equations is obtained, whose solutions yield ∂ρ/∂νrf .Here we used the interchangeability of the differentiations with respect to time and frequency inthe master equations. Since F is linear in ρ the derivative of the fluorescence rate with respectto the r.f. frequency is given by ∂F/∂νrf = F(∂ρ/∂νrf ). By repeating this procedure higherderivatives of F with respect to the frequency can be obtained. From the first two derivativesthe amplitudes and widths of the Lorentzians are easily found, if the underlying background canbe regarded as locally flat. This condition is well fulfilled for the non saturated N -photon peakssitting on top of power broadened lower order peaks.
5.4 Experiment
5.4.1 Experimental setup and data recording
The experimental procedure used is an improved version of the one described previously[1]. Onlythe main features and the modifications will be addressed here. The experiments were performedon Cs atoms implanted in a helium crystal contained in a pressure cell immersed in a superfluidhelium bath cooled by pumping on the bath (Fig. 5.5). Quartz windows provide optical accessfrom three orthogonal directions. The cesium atoms are implanted into the crystal from a metaltarget by means of laser ablation. The temperature of the crystal is actively stabilized to 1.5Kat a level of 10−5 K over intervals of 100 seconds [18]. The cesium atoms are excited on the D1
transition (6S1/2 → 6P1/2) at 850 nm with a beam from a single-mode extended cavity diodelaser. The absorption is monitored by detecting the 6P1/2 → 6S1/2 fluorescence light at 888 nmusing a cooled, biased avalanche-photodiode. An interference filter suppresses scattered laserlight. A set of three Helmholtz coils inside the pressure cell allows the application of r.f. fields inany direction. Three layers of µ-metal surround the cryostat and suppress laboratory magneticfields by more than three orders of magnitude.
A new feature of the set-up is the generation of the B0 field by a pair of superconductiveHelmholtz coils operated in a self-sustained (persistent) current mode. After injecting a currentfrom an external current source the coils are bypassed by closing a temperature-controlled su-perswitch (graphite resistor) mounted in an evacuated copper housing placed at the bottom ofthe helium bath.
The data acquisition was also improved by significantly reducing the scan speed. In ourprevious experiments spectral distortions due to fast scanning led to significantly asymmetricline shapes. The sweep duration was now increased from 20 s to 100 s while reducing at thesame time the swept frequency span from 50 kHz to 15 kHz. This implied that only multi-photon resonances of the type |(4), 4〉 → |(4), 4 − N〉 in the F = 4 multiplet were recorded.The non-observation of the lines in the F = 3 multiplet constitutes nonetheless a minor loss ofinformation, since due to the optical pumping process almost all population is transferred to
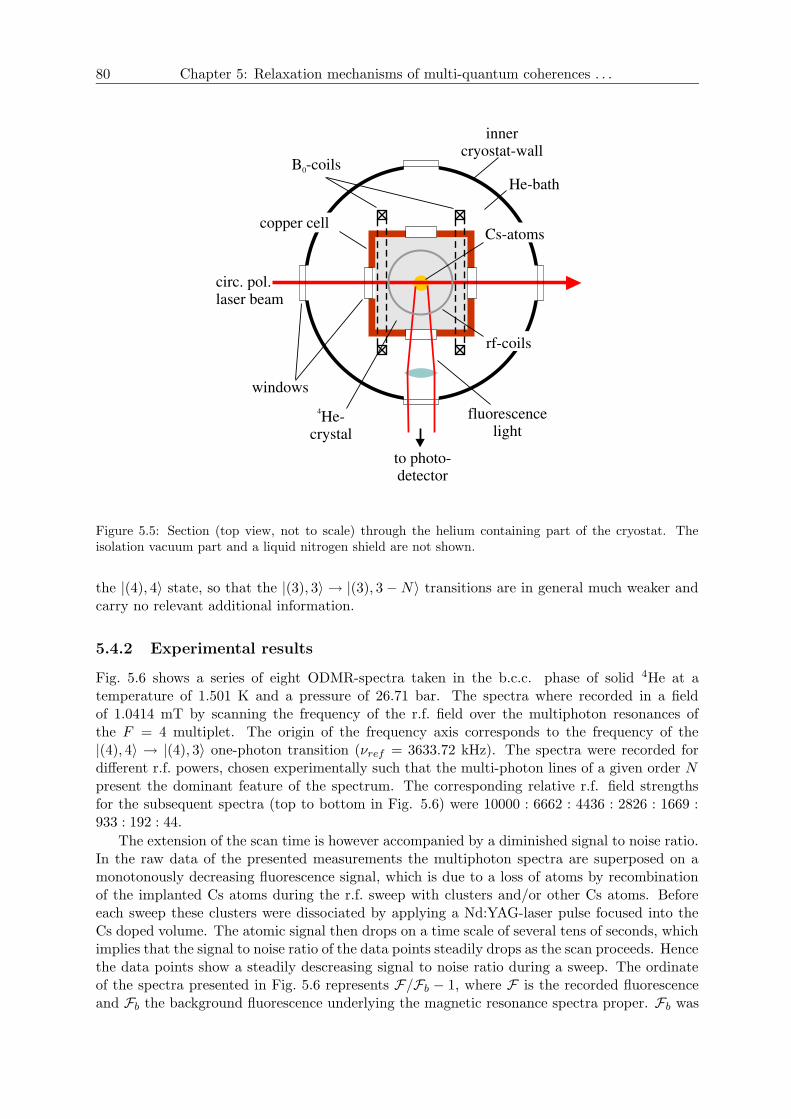
80 Chapter 5: Relaxation mechanisms of multi-quantum coherences . . .
B -coils0
copper cell
rf-coils
innercryostat-wall
circ. pol.laser beam
Cs-atoms
windows
fluorescencelight
to photo-detector
4He-crystal
He-bath
Figure 5.5: Section (top view, not to scale) through the helium containing part of the cryostat. Theisolation vacuum part and a liquid nitrogen shield are not shown.
the |(4), 4〉 state, so that the |(3), 3〉 → |(3), 3−N〉 transitions are in general much weaker andcarry no relevant additional information.
5.4.2 Experimental results
Fig. 5.6 shows a series of eight ODMR-spectra taken in the b.c.c. phase of solid 4He at atemperature of 1.501 K and a pressure of 26.71 bar. The spectra where recorded in a fieldof 1.0414 mT by scanning the frequency of the r.f. field over the multiphoton resonances ofthe F = 4 multiplet. The origin of the frequency axis corresponds to the frequency of the|(4), 4〉 → |(4), 3〉 one-photon transition (νref = 3633.72 kHz). The spectra were recorded fordifferent r.f. powers, chosen experimentally such that the multi-photon lines of a given order Npresent the dominant feature of the spectrum. The corresponding relative r.f. field strengthsfor the subsequent spectra (top to bottom in Fig. 5.6) were 10000 : 6662 : 4436 : 2826 : 1669 :933 : 192 : 44.
The extension of the scan time is however accompanied by a diminished signal to noise ratio.In the raw data of the presented measurements the multiphoton spectra are superposed on amonotonously decreasing fluorescence signal, which is due to a loss of atoms by recombinationof the implanted Cs atoms during the r.f. sweep with clusters and/or other Cs atoms. Beforeeach sweep these clusters were dissociated by applying a Nd:YAG-laser pulse focused into theCs doped volume. The atomic signal then drops on a time scale of several tens of seconds, whichimplies that the signal to noise ratio of the data points steadily drops as the scan proceeds. Hencethe data points show a steadily descreasing signal to noise ratio during a sweep. The ordinateof the spectra presented in Fig. 5.6 represents F/Fb − 1, where F is the recorded fluorescenceand Fb the background fluorescence underlying the magnetic resonance spectra proper. Fb was
5.4 81
-2 0 2 4 6 8 10 12Νrf –Νref HkHzL
0
0.5
1
1.5
2
FF pol-
1
F = 4N= 1 2 3 4 5 6 7 8
Figure 5.6: Background corrected (see the text) measured multiphoton resonance spectra in a field B0 of1.0414 mT. The origin of the frequency axis corresponds to the frequency of the |(4), 4〉 → |(4), 3〉 one-photon transition (νref = 3633.72 kHz). Dashed lines indicate the positions of the N -photon resonances|(4), 4〉 → |(4), 4 −N〉. The r.f. power is increased (ratios given in the text) in each of the eight spectragoing from bottom to top in such a way that the newly appearing N -photon lines show an optimalspectral resolution.
82 Chapter 5: Relaxation mechanisms of multi-quantum coherences . . .
determined by fitting an appropriate function to the time dependent background. In this waythe normalization F/Fb−1 does not only remove the background, but it also corrects for the lossof atoms and hence for the apparent loss of signal amplitude during the scan. The r.f. frequencywas swept from higher to lower frequencies, which explains the larger noise levels at low r.f.frequencies in Fig. 5.6. This procedure of normalizing the signals has the further advantage thatthe experimental signal amplitudes can be compared to the corresponding theoretical spectraon an absolute scale.
5.4.3 Comparison with the calculations
We reproduced the experimental data by calculating the ODMR spectra according to the methodgiven in Sec. 5.3.1. Since the linewidths of the measured resonances were still dominated bythe technical and optical pumping broadening rather than by intrinsic relaxation processes, thelater could be neglected, i.e., we set γ = 0.
Beside Brf which is different for all eight spectra, three common parameters, viz. B0, γp,and the parameter ϕ, characterizing the degree of circular polarization, entered the calculations.By fitting Lorentzians to the measured multi-photon spectra (Fig. 5.6) we inferred B0 from theline positions in accordance with the Breit-Rabi formula taking the perturbation of the hyperfineconstant by the helium matrix into account [1]. A typical value for ϕ of 0.5 rad could be obtainedfrom earlier measurements [14]. From the measured light intensity of 78 mW/cm2 we inferredthe optical pumping rate to be γp ≈ 390 s−1 using again results of recent experiments [4].Fig. 5.7 shows the calculated ODMR spectra. By representing the quantity F/Funpol − 1 thetheoretical results are commensurable with the experimental spectra of Fig. 5.6 on an absolutescale.
Since we do not have a precise calibration of the r.f. field inside the pressure cell, weadjusted Brf for the uppermost curve in Fig. 5.7 so that we achieved optimal consistency withthe corresponding measured spectrum. This was at Brf = 2.57 µT, which is in good agreementwith the value we estimated from the output current of our r.f. generator and the dimensions ofthe r.f. field coils. The other curves were then obtained at lower r.f. fields, with amplitudes inthe same ratios as in the experiment. All other parameters were kept fixed.
The peaks of the calculated spectra whose widths are determined by r.f.-power broadeningreproduce well the overall structure of the experimental data with respect to their relativeheights and shapes, whereas the lesser broadened peaks are too high in amplitude and too smallin width. As we assign this to small magnetic field inhomogeneities in the experiment we takesuch inhomogeneities into account in the calculations by convoluting the theoretical data with aLorentzian distribution of the magnetic fields around the average field value. A FWHM of 70 Hzof the convolution profile (corresponding to a field inhomogeneity of 2 · 10−5) yielded the bestagreement between measurement and theory. Not only is the agreement excellent regarding thedifferent relative heights and widths of the peaks, but the amplitudes of the spectra also coincideon an absolute scale. We stress again that a single set of parameters was used for all spectra. Aresidual small discrepancy of the absolute signals may be assigned to stray fluorescence light ofnon-atomic origin and/or to electronic offsets, which both introduce errors in the normalizationprocedure of the experimental signals. Compared to our previous study [1], now even details ofthe calculated spectra, such as the reduced N = 2-photon peak height in the second (from thebottom) spectrum fit well the experimental data, thus confirming the suitability of our model.
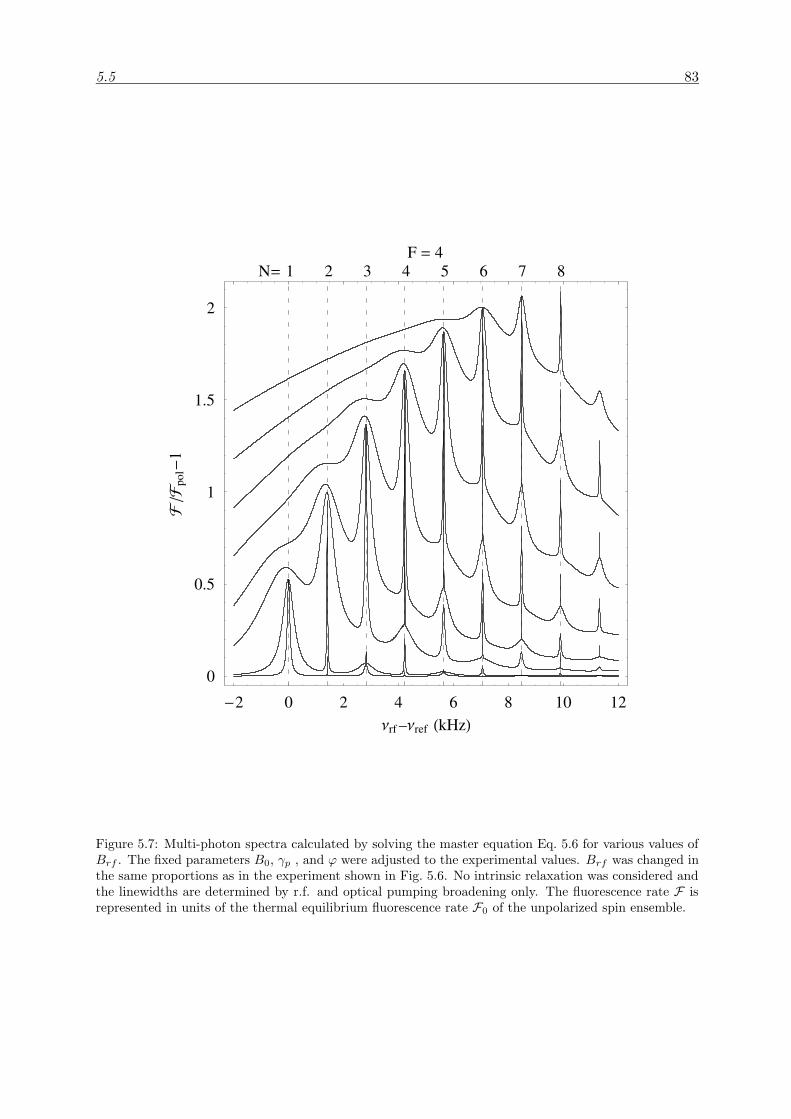
5.5 83
-2 0 2 4 6 8 10 12Νrf –Νref HkHzL
0
0.5
1
1.5
2
FF pol-
1
F = 4N= 1 2 3 4 5 6 7 8
Figure 5.7: Multi-photon spectra calculated by solving the master equation Eq. 5.6 for various values ofBrf . The fixed parameters B0, γp , and ϕ were adjusted to the experimental values. Brf was changed inthe same proportions as in the experiment shown in Fig. 5.6. No intrinsic relaxation was considered andthe linewidths are determined by r.f. and optical pumping broadening only. The fluorescence rate F isrepresented in units of the thermal equilibrium fluorescence rate F0 of the unpolarized spin ensemble.
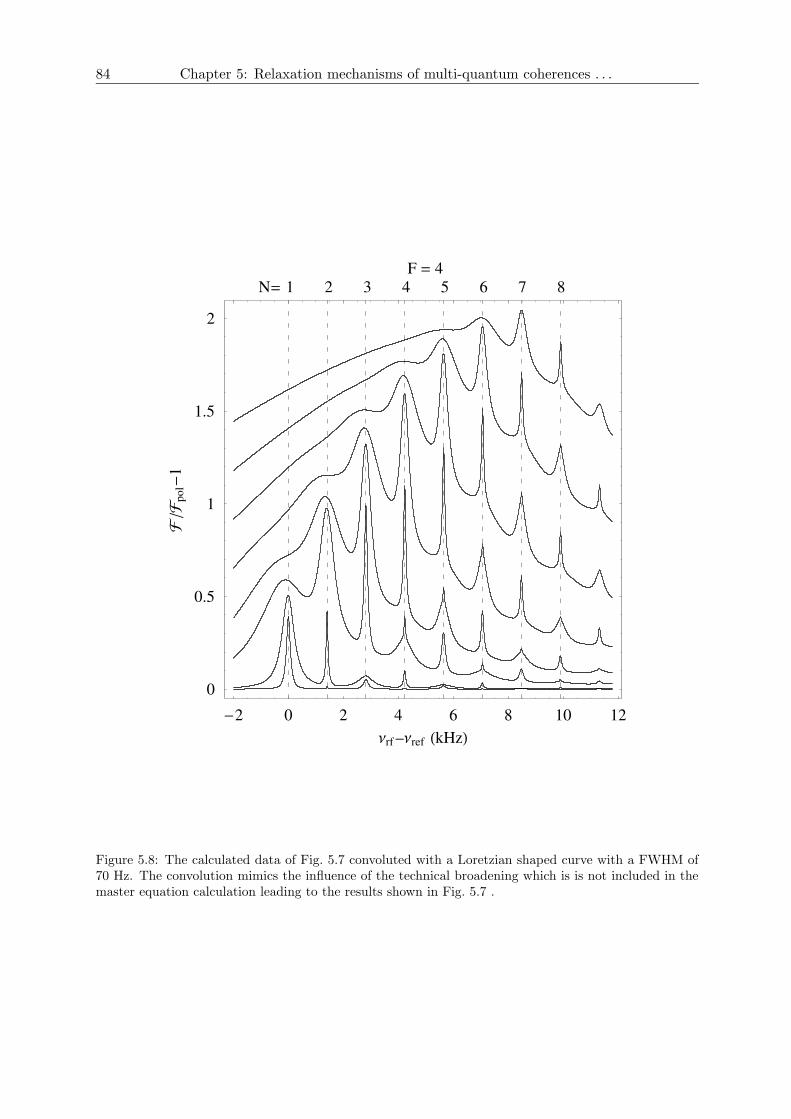
84 Chapter 5: Relaxation mechanisms of multi-quantum coherences . . .
-2 0 2 4 6 8 10 12Νrf –Νref HkHzL
0
0.5
1
1.5
2
FF pol-
1
F = 4N= 1 2 3 4 5 6 7 8
Figure 5.8: The calculated data of Fig. 5.7 convoluted with a Loretzian shaped curve with a FWHM of70 Hz. The convolution mimics the influence of the technical broadening which is is not included in themaster equation calculation leading to the results shown in Fig. 5.7 .
5.5 85
5.5 Effect of intrinsic multipole relaxations on the multi-photonspectra
One of our goals was to extract information about the mechanism which determines the spinrelaxation of Cs atoms in the cubic phase of 4He by comparing experimental multi-photonspectra to theoretical spectra based on different relaxation models. This difficult goal couldnot yet be reached because the experimental line shapes are dominated by an inhomogeneoustechnical broadening, whose origin lies most probably in small (we talk about effects on theorder of ∆B/B ≈ 10−5) residual magnetic field inhomogeneities. In future experiment it shouldbe possible to overcome this problem. In order to demonstrate nonetheless the anticipatedconsequences of different relaxation mechanism we calculated the multiphoton spectra for idealconditions, i.e., for a perfectly homogeneous magnetic field.
We consider the two cases of dipolar and quadrupolar perturbations, described by T 1(S) andT 2(I) respectively, and restrict the discussion to the limit ωτc ¿ 1, for which the fluctuatinginteractions not only lead to transverse spin relaxation, but also to longitudinal relaxation by in-ducing sublevel transitions. In this case the parameter γ, which characterizes the strength of therelaxation mechanism under consideration can be inferred from the experimentally determinedlongitudinal relaxation rate γ1 at which 〈Jz〉 relaxes. In the limit ωτc À 1 only transverse spinrelaxation occurs, and no reasonable quantitative predictions of γ can be made with our presentknowledge. In order to determine γ from the experimental value of γ1 we solved ρ = (ρ)relfor both cases of multipolarity assuming ρ4,4(t=0) = 1 as initial condition for the normalizeddensity matrix. From ρ(t) the temporal evolution of 〈Jz〉 was obtained.
In the case of T 1(S) relaxation we were able to derive the following algebraic function thatdescribes the decay of 〈Jz〉
〈Jz〉(t) =1
62(24e−
4
9γt + 7e−
1
72γt) . (5.16)
The polarization is thus seen to have two decay channels whose rates differ by a factor of 32.Moreover, the slow channel is responsible for the decay of 77% of the initial polarization. Thetime scales in our previous T1 measurements were too small to reveal the presence of two stronglydiffering time scales, and the question arises, which of the two channels should be identifiedwith the measured values of γ1 ≈ 1 s−1. As in the experiments a large amplitude decay of thepolarization was observed it seems natural to identify the experimental γ1 value with 4
9γ, whichyields γ = 2.25 s−1. The second component thus has a decay time of 32 seconds. This relaxationrate is hard to measure as it is comparable to the loss rate of atoms due to recombination asdescribed in Sec. 5.4.2. In the case of T 2(I) relaxation we did not succeed to derive an algebraicfunction describing the decay of 〈Jz〉. However, numerical calculations suggest that 〈Jz〉 has anexponential decay with a single rate, for which comparison with the experimental decay yieldsγ ≈ 88.3 s−1.
These values of γ form the basic input parameters, besides the experimentally determinedparameters B0 and γp, for the theoretical calculations. As already stated several times the exper-imental spectra were limited by technical line broadening. The pump rate γp in the experimentswas chosen in such a way that the broadening due to optical pumping was slightly smaller thanthe technical linewidth of the unsaturated multi-photon resonances. If in future experimentsthe inhomogeneous broadening can be substantially reduced or eliminated, then, of course, theoptimal pump rate for the experiments should be reduced correspondingly. For this reason wedecided to calculate the spectra comparing the influence of the perturbation multipolarity for alight intensity, which is 10 times lower than in the experiments described above. Figs. 5.9 and5.10 show the spectra obtained with γp = 39 s−1 for T 1(S) and T 2(I) relaxation respectively.
86 Chapter 5: Relaxation mechanisms of multi-quantum coherences . . .
The parameter distinguishing the curves in these figures is the r.f. field amplitude Brf . Foreach curve Brf was chosen such as to maximize the spectroscopic resolution of the multi-photongeneration that emerged in that spectrum.
Note that we have also calculated the same spectra as in Figs. 5.9 and 5.10 with γp = 390 s−1,i.e., the pump rate used in the present experiments. As anticipated the resulting resonancesystems look identical for T 1(S) and T 2(I) relaxation, as the widths are dominated by opticalpumping broadening. These spectra are not shown.
We determined the amplitude AN and widths (FWHM) ∆νN of the dominant non-saturatedmulti-photon line in each trace of Figs. 5.9 and 5.10. The dependences of the relative amplitudesAN/AN=1 and relative inverse widths (1/∆νN ) / (1/∆ν1) on the multi-photon orderN are shownin Figs. 5.11 a,b.
In the simplified discussion of magnetic resonance in sections 5.2.2 and 5.3.6 the gain in spec-troscopic sensitivity GN = ∆ν1/∆νN = γN+1/γ2N depended only on the relative line widths.The data in Fig. 5.11 a show the ratios of linewidths from the present complete calculation.Note that the qualitative N -dependence is similar to the one shown in Fig. 5.4 derived from thesimplified treatment, which did not consider the optical pumping process by which coherencesare also destroyed.
The optical pumping process is also responsible that now the amplitudes have a significantN -dependence (Fig. 5.11 b) due to the complex interplay of the production of population differencesby optical pumping and their destruction by saturated lower order multi-photon transitions. Inthe discussion of sections 5.2.2 and 5.3.6 it was assumed that all population was in the |(4), 4〉state, which implied that the amplitudes for optimal sensitivity were found to be N -independent.
As both the amplitudes and the widths of the multi-photon resonances depend on N thegain in spectroscopic resolution has to be calculated according to
GN =AN
∆νN/A1
∆ν1.
The corresponding dependence is shown in Fig. 5.11 c. For the case of the dipolar T 1(S)relaxation the gain grows in a monotonous way to reach a maximum value of approximately8 for the eight-photon transition. It is interesting to note that this factor corresponds to thenaive expectation discussed in the introduction. In the case of quadrupolar T 2(I) relaxation amaximum gain of approx. 5.6 is found for the five-photon process and there is a loss of sensitivityfor higher order processes.
5.6 Summary and outlook
We have performed a theoretical analysis of the influence of stochastic spin perturbing inter-actions of dipolar and quadrupolar symmetry on the spectra of multi-photon transitions in theground state of cesium in solid helium. Algebraic results for the multipole relaxation rates werederived for both cases in the limits ωτc À 1 and ωτc ¿ 1. Numerical results for the multi-photonspectra taking optical pumping, magnetic resonance and relaxation into account were obtained.The results were used to predict the gain in spectroscopic resolution of multi-photon transitionsand yielded a maximum gain factor of 8 for quadrupolar relaxation. Unfortunately the qualityof the present experimental spectra is not sufficient for discriminating between these two mostlikely relaxation mechanisms. However the experimental spectra can be well reproduced by thecalculations taking field inhomogeneities into account. In the future we plan to reduce the mag-netic field inhomogeneities by appropriate shim coils and by replacing recently identified remoteparts of the cryostat which show a residual magnetization.
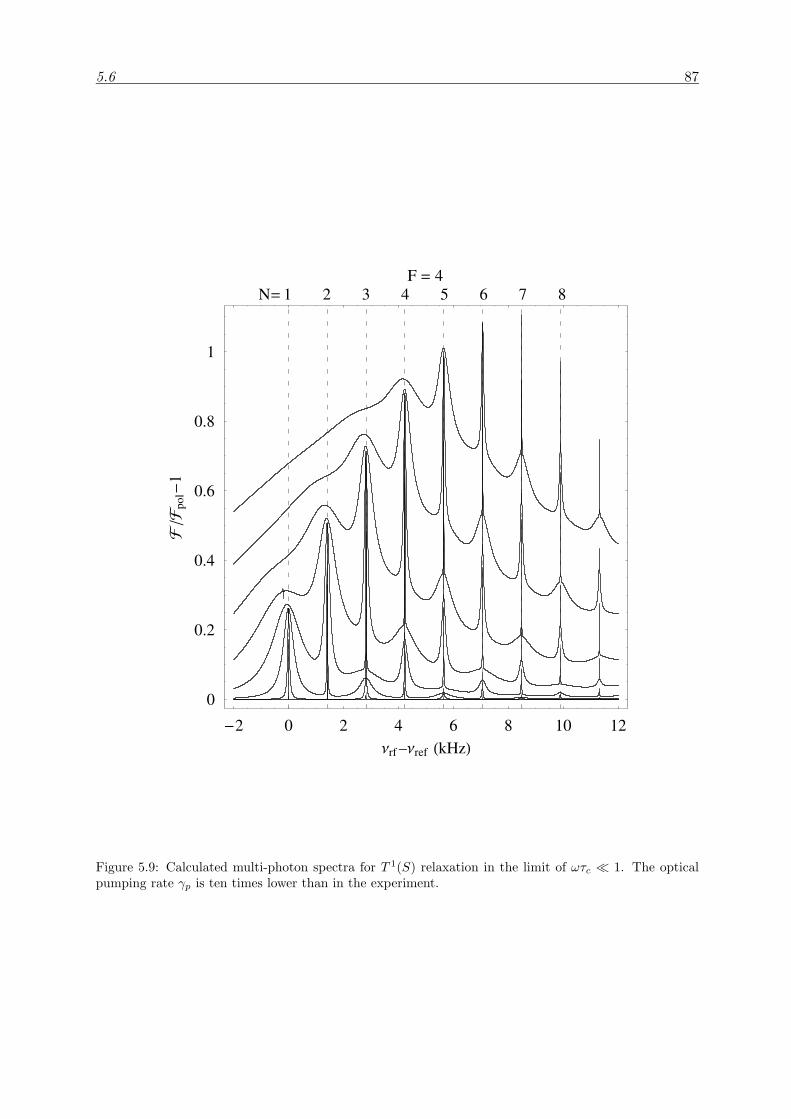
5.6 87
-2 0 2 4 6 8 10 12Νrf –Νref HkHzL
0
0.2
0.4
0.6
0.8
1
FF pol-
1
F = 4N= 1 2 3 4 5 6 7 8
Figure 5.9: Calculated multi-photon spectra for T 1(S) relaxation in the limit of ωτc ¿ 1. The opticalpumping rate γp is ten times lower than in the experiment.
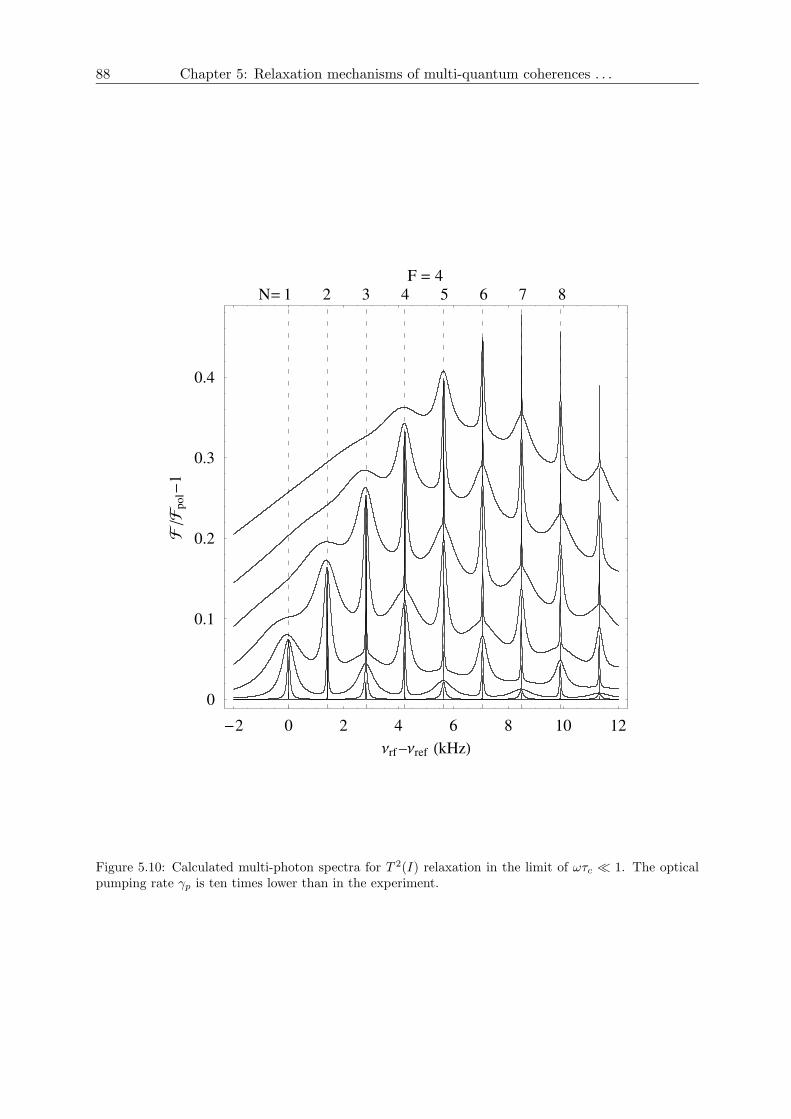
88 Chapter 5: Relaxation mechanisms of multi-quantum coherences . . .
-2 0 2 4 6 8 10 12Νrf –Νref HkHzL
0
0.1
0.2
0.3
0.4
FF pol-
1
F = 4N= 1 2 3 4 5 6 7 8
Figure 5.10: Calculated multi-photon spectra for T 2(I) relaxation in the limit of ωτc ¿ 1. The opticalpumping rate γp is ten times lower than in the experiment.
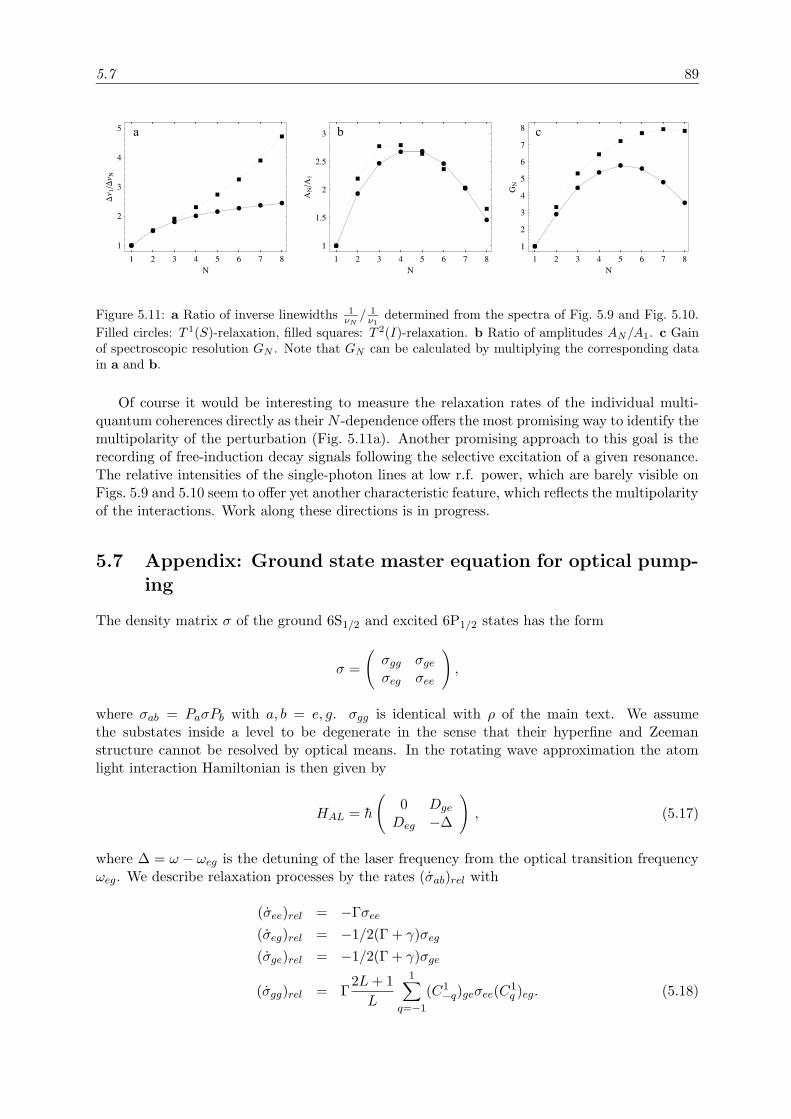
5.7 89
a b c
Figure 5.11: a Ratio of inverse linewidths 1νN
/ 1ν1
determined from the spectra of Fig. 5.9 and Fig. 5.10.
Filled circles: T 1(S)-relaxation, filled squares: T 2(I)-relaxation. b Ratio of amplitudes AN/A1. c Gainof spectroscopic resolution GN . Note that GN can be calculated by multiplying the corresponding datain a and b.
Of course it would be interesting to measure the relaxation rates of the individual multi-quantum coherences directly as their N -dependence offers the most promising way to identify themultipolarity of the perturbation (Fig. 5.11a). Another promising approach to this goal is therecording of free-induction decay signals following the selective excitation of a given resonance.The relative intensities of the single-photon lines at low r.f. power, which are barely visible onFigs. 5.9 and 5.10 seem to offer yet another characteristic feature, which reflects the multipolarityof the interactions. Work along these directions is in progress.
5.7 Appendix: Ground state master equation for optical pump-ing
The density matrix σ of the ground 6S1/2 and excited 6P1/2 states has the form
σ =
(σgg σgeσeg σee
),
where σab = PaσPb with a, b = e, g. σgg is identical with ρ of the main text. We assumethe substates inside a level to be degenerate in the sense that their hyperfine and Zeemanstructure cannot be resolved by optical means. In the rotating wave approximation the atomlight interaction Hamiltonian is then given by
HAL = h
(0 Dge
Deg −∆
), (5.17)
where ∆ = ω − ωeg is the detuning of the laser frequency from the optical transition frequencyωeg. We describe relaxation processes by the rates (σab)rel with
(σee)rel = −Γσee(σeg)rel = −1/2(Γ + γ)σeg
(σge)rel = −1/2(Γ + γ)σge
(σgg)rel = Γ2L+ 1
L
1∑
q=−1
(C1−q)geσee(C
1q )eg. (5.18)
90 Chapter 5: Relaxation mechanisms of multi-quantum coherences . . .
1/Γ is the lifetime of the 6P1/2 level and γ the homogeneous width of the optical transition.L = 1 is the orbital angular momentum of the exited state. Since in this experiment γÀΓ, wewill neglect the Γ/2 terms in the relaxation of the optical coherences.
The Liouville equation for the atom-light interaction is
σ = −i/h[HAL, σ] + (σ)rel . (5.19)
After inserting Eq. 5.17 and Eq. 5.18 into Eq. 5.19 and setting σeg = 0 and σge = 0 (adiabaticelimination) we get for σgg and σee:
σee = DegσggDge2γ
∆2 + (γ/2)2− Γσee (5.20)
σgg = −i(DgeDegσgg∆+ iγ/2
− σggDgeDeg
∆− iγ/2
)
+(σgg)rel . (5.21)
Here we have neglected all terms describing stimulated transitions from the excited state to theground state, which is justified because of the very large homogeneous linewidth (10 nm) andthe modest laser intensities (several 10 mW/cm2) used. Since the lifetime of the excited state(1/Γ ≈ 10−8s) is very short, we further neglect the evolution of σee under the influence of themagnetic fields. In the steady state σ = 0 we can solve Eq. 5.20 for σee and insert the resultinto (σgg)rel of Eq. 5.21. We get
σee =1
Γ
γ
∆2 + (γ/2)2DegσggDge
σgg = −i(DgeDegσgg∆+ iγ/2
− σggDgeDeg
∆− iγ/2
)(5.22)
+3γ
∆2 + (γ/2)2
1∑
q=−1
(C1−q)geDegσggDge(C
1q )eg.
The fluorescence rate F is then calculated to be
F = Γtr(σee) =γ
∆2 + (γ/2)2tr(DegσggDge) . (5.23)
By setting ∆ = 0 in Eq. 5.22 and Eq. 5.23 we get the expressions Eqs. 5.10 and 5.11 of the maintext.
AcknowledgmentsThis work was supported by a grant of the Schweizerischer Nationalfonds.We thank S. Ulzega for helping during the experiment preparation and data taking.
5.7 91
References
[1] D. Nettels, R. Muller-Siebert, Simone Ulzega, and Antoine Weis. Multiphoton processes inthe Zeeman structure of atomic Cs trapped in solid helium. Accepted for publication byAppl. Phys. B.
[2] A. S. Pazgalev and E. B. Alexandrov. Exact solution of the problem of multi-quantumresonances in Zeeman structure of 133Cs and 6Li atoms. Optics and Spectroscopy, 86(1):6–10, 1999.
[3] S. I. Kanorsky, M. Arndt, R. Dziewior, A. Weis, and T. W. Hansch. Optical spectroscopyof atoms trapped in solid helium. Phys. Rev. B, 49(5):3645, 1994.
[4] S. Lang, S. I. Kanorsky, T. Eichler, R. Muller-Siebert, T. W. Hansch, and A. Weis. Opticalpumping of Cs atoms in solid 4He. Phys. Rev. A, 60(5):3867, 1999.
[5] M. Arndt, S. I. Kanorsky, A. Weis, and T. W. Hansch. Long electronic spin relaxationtimes of Cs atoms in solid 4He. Phys. Rev. Lett., 74(8):1359, 1995.
[6] S. I. Kanorsky, S. Lang, S. Lucke, S. B. Ross, T. W. Hansch, and A. Weis. Millihertzmagnetic resonance spectroscopy of Cs atoms in body-centered-cubic 4He. Phys. Rev. A,54(2):R1010, 1996.
[7] H. Salwen. Resonance transitions in molecular beam experiments. I. general theory oftransitions in a rotating magnetic field. Rev. Mod. Phys., 99(4):1274–1286, 1955.
[8] J. Hermann and S. Swain. Resoncance lineshapes in multi-level atomic systems. J. Phys.B, 10(10):1815–1833, 1977.
[9] William Happer. Optical pumping. 44(2):169–249, 1972.
[10] William Happer. Multipole relaxation times of a weak perturbing spin system. Phys. Rev.B, 1(5):2203–2207, 1970.
[11] S. Lang, S. I. Kanorsky, M. Arndt, S. B. Ross, T. W. Hansch, and A. Weis. The hyperfinestructure of Cs atoms in the b.c.c. phase of solid 4He. Europhysics Letters, 30(4):233, 1995.
[12] A. Abragam. The principles of nuclear magnetism. Clarendon Press, Oxford, 1961.
[13] V. J. Minkiewicz, T. A. Kitchens, F. P. Lipschultz, R. Nathans, and G. Shirane. Phononspectrum of hcp He4. Rev. Mod. Phys., 174(1):267, 1968.
[14] Steffen Lang. Optisch detektierte Magnetresonanz an Casium Atomen in festem 4He. Ph.D.thesis, Ludwig-Maximilians-Universitat Munchen, 1997.
[15] Karl Blum. Density matrix theory and application. Plenum Press, New York, second edition,1996.
[16] Mitchel Weissbluth. Photon-Atom Interactions. Academic Press, London, 1989.
[17] Wolfram Research, Inc. Mathematica. Wolfram Research, Inc., Champaign, Illinois, 2002.Version 4.2.1.0.
[18] R. Muller-Siebert, D. Nettels, and Antoine Weis. To be submitted.

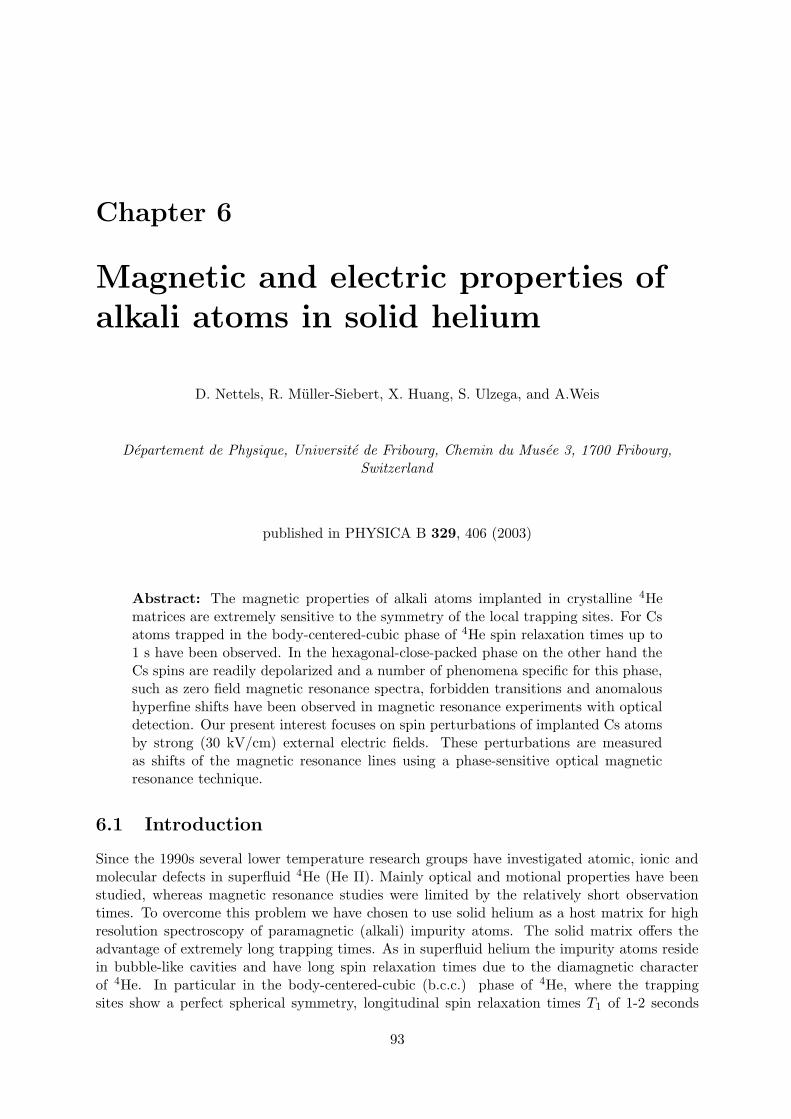
Chapter 6
Magnetic and electric properties ofalkali atoms in solid helium
D. Nettels, R. Muller-Siebert, X. Huang, S. Ulzega, and A.Weis
Departement de Physique, Universite de Fribourg, Chemin du Musee 3, 1700 Fribourg,Switzerland
published in PHYSICA B 329, 406 (2003)
Abstract: The magnetic properties of alkali atoms implanted in crystalline 4Hematrices are extremely sensitive to the symmetry of the local trapping sites. For Csatoms trapped in the body-centered-cubic phase of 4He spin relaxation times up to1 s have been observed. In the hexagonal-close-packed phase on the other hand theCs spins are readily depolarized and a number of phenomena specific for this phase,such as zero field magnetic resonance spectra, forbidden transitions and anomaloushyperfine shifts have been observed in magnetic resonance experiments with opticaldetection. Our present interest focuses on spin perturbations of implanted Cs atomsby strong (30 kV/cm) external electric fields. These perturbations are measuredas shifts of the magnetic resonance lines using a phase-sensitive optical magneticresonance technique.
6.1 Introduction
Since the 1990s several lower temperature research groups have investigated atomic, ionic andmolecular defects in superfluid 4He (He II). Mainly optical and motional properties have beenstudied, whereas magnetic resonance studies were limited by the relatively short observationtimes. To overcome this problem we have chosen to use solid helium as a host matrix for highresolution spectroscopy of paramagnetic (alkali) impurity atoms. The solid matrix offers theadvantage of extremely long trapping times. As in superfluid helium the impurity atoms residein bubble-like cavities and have long spin relaxation times due to the diamagnetic characterof 4He. In particular in the body-centered-cubic (b.c.c.) phase of 4He, where the trappingsites show a perfect spherical symmetry, longitudinal spin relaxation times T1 of 1-2 seconds
93
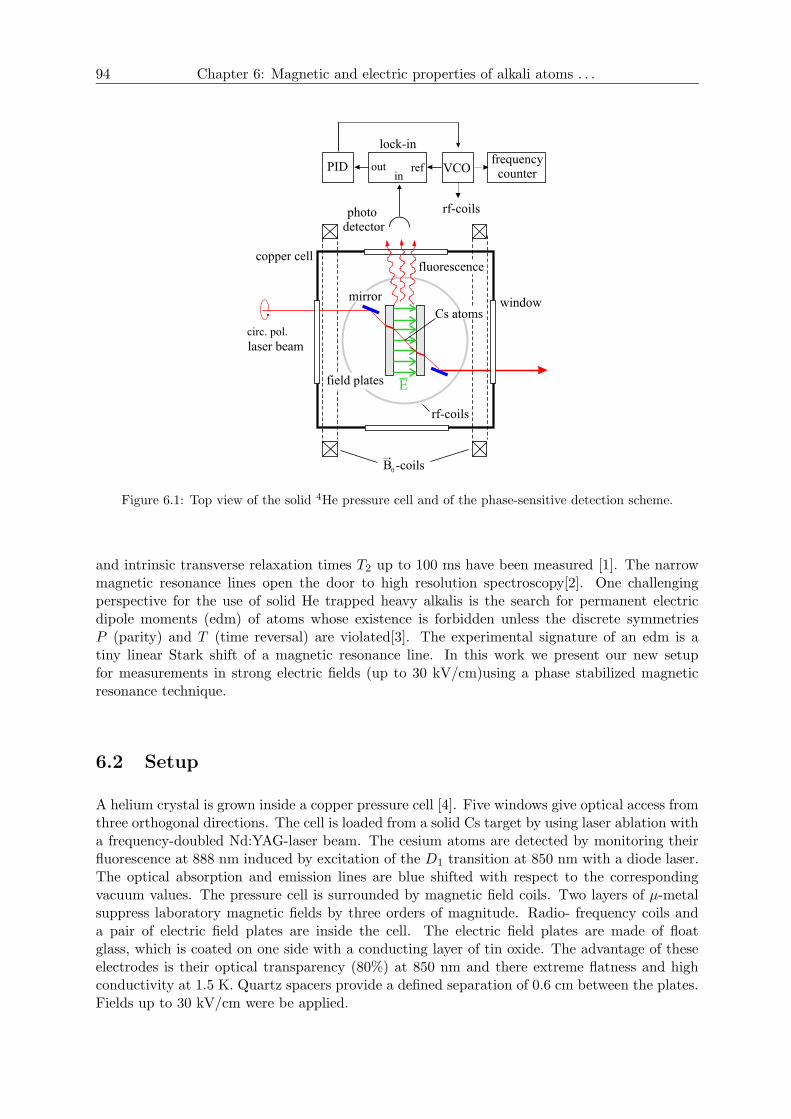
94 Chapter 6: Magnetic and electric properties of alkali atoms . . .
Figure 6.1: Top view of the solid 4He pressure cell and of the phase-sensitive detection scheme.
and intrinsic transverse relaxation times T2 up to 100 ms have been measured [1]. The narrowmagnetic resonance lines open the door to high resolution spectroscopy[2]. One challengingperspective for the use of solid He trapped heavy alkalis is the search for permanent electricdipole moments (edm) of atoms whose existence is forbidden unless the discrete symmetriesP (parity) and T (time reversal) are violated[3]. The experimental signature of an edm is atiny linear Stark shift of a magnetic resonance line. In this work we present our new setupfor measurements in strong electric fields (up to 30 kV/cm)using a phase stabilized magneticresonance technique.
6.2 Setup
A helium crystal is grown inside a copper pressure cell [4]. Five windows give optical access fromthree orthogonal directions. The cell is loaded from a solid Cs target by using laser ablation witha frequency-doubled Nd:YAG-laser beam. The cesium atoms are detected by monitoring theirfluorescence at 888 nm induced by excitation of the D1 transition at 850 nm with a diode laser.The optical absorption and emission lines are blue shifted with respect to the correspondingvacuum values. The pressure cell is surrounded by magnetic field coils. Two layers of µ-metalsuppress laboratory magnetic fields by three orders of magnitude. Radio- frequency coils anda pair of electric field plates are inside the cell. The electric field plates are made of floatglass, which is coated on one side with a conducting layer of tin oxide. The advantage of theseelectrodes is their optical transparency (80%) at 850 nm and there extreme flatness and highconductivity at 1.5 K. Quartz spacers provide a defined separation of 0.6 cm between the plates.Fields up to 30 kV/cm were be applied.
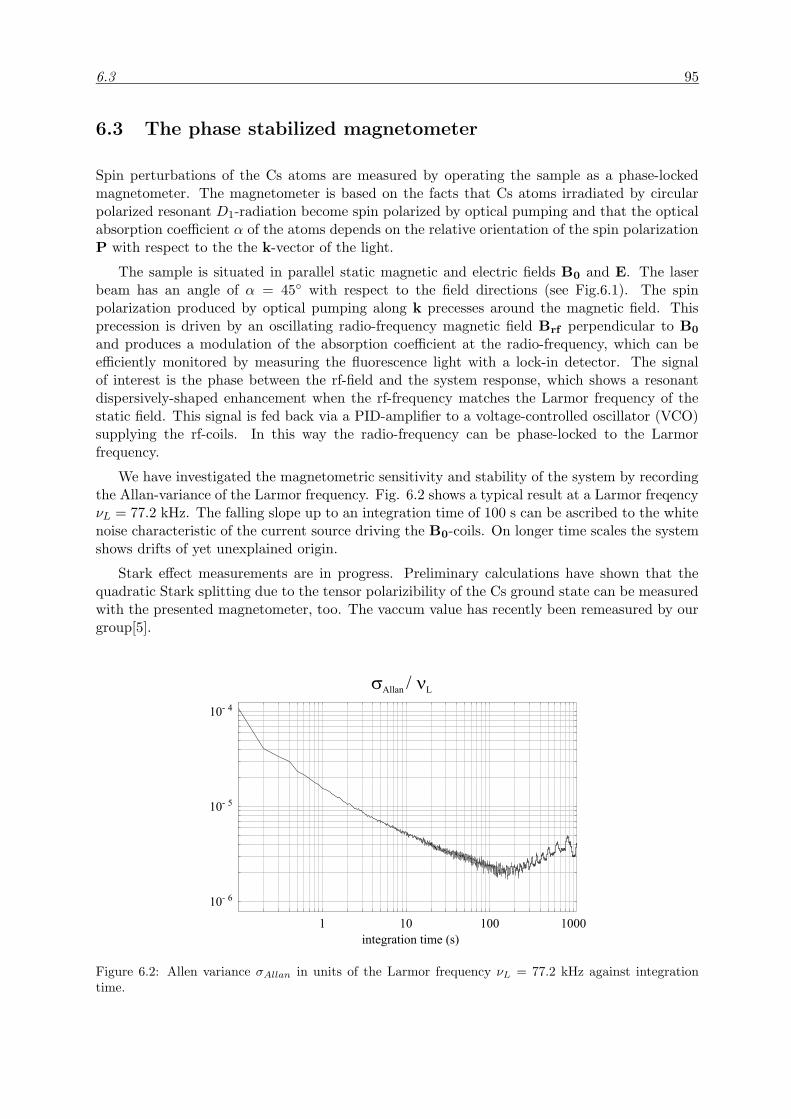
6.3 95
6.3 The phase stabilized magnetometer
Spin perturbations of the Cs atoms are measured by operating the sample as a phase-lockedmagnetometer. The magnetometer is based on the facts that Cs atoms irradiated by circularpolarized resonant D1-radiation become spin polarized by optical pumping and that the opticalabsorption coefficient α of the atoms depends on the relative orientation of the spin polarizationP with respect to the the k-vector of the light.
The sample is situated in parallel static magnetic and electric fields B0 and E. The laserbeam has an angle of α = 45 with respect to the field directions (see Fig.6.1). The spinpolarization produced by optical pumping along k precesses around the magnetic field. Thisprecession is driven by an oscillating radio-frequency magnetic field Brf perpendicular to B0
and produces a modulation of the absorption coefficient at the radio-frequency, which can beefficiently monitored by measuring the fluorescence light with a lock-in detector. The signalof interest is the phase between the rf-field and the system response, which shows a resonantdispersively-shaped enhancement when the rf-frequency matches the Larmor frequency of thestatic field. This signal is fed back via a PID-amplifier to a voltage-controlled oscillator (VCO)supplying the rf-coils. In this way the radio-frequency can be phase-locked to the Larmorfrequency.
We have investigated the magnetometric sensitivity and stability of the system by recordingthe Allan-variance of the Larmor frequency. Fig. 6.2 shows a typical result at a Larmor freqencyνL = 77.2 kHz. The falling slope up to an integration time of 100 s can be ascribed to the whitenoise characteristic of the current source driving the B0-coils. On longer time scales the systemshows drifts of yet unexplained origin.
Stark effect measurements are in progress. Preliminary calculations have shown that thequadratic Stark splitting due to the tensor polarizibility of the Cs ground state can be measuredwith the presented magnetometer, too. The vaccum value has recently been remeasured by ourgroup[5].
Figure 6.2: Allen variance σAllan in units of the Larmor frequency νL = 77.2 kHz against integrationtime.

96 Chapter 6: Magnetic and electric properties of alkali atoms . . .
AcknowledgmentsThis work was supported by a grant of the Schweizerischer Nationalfonds.
6.3 97
References
[1] S. I. Kanorsky, S. Lang, S. Lucke, S. B. Ross, T. W. Hansch, and A. Weis. Millihertzmagnetic resonance spectroscopy of Cs atoms in body-centered-cubic 4He. Phys. Rev. A, 54(2):R1010, 1996.
[2] Taro Eichler, R. Muller-Siebert, Daniel Nettels, S. I. Kanorsky, and A. Weis. Optical detec-tion of nonradiating alkali atoms in solid helium. Phys. Rev. Lett., 88(12):123002, 2002.
[3] E. M. Purcell and N. F. Ramsey. On the possibility of electric dipole moments for elementaryparticles and nuclei. Rev. Mod. Phys., 78:807, 1950.
[4] S. Lang, S. I. Kanorsky, T. Eichler, R. Muller-Siebert, T. W. Hansch, and A. Weis. Opticalpumping of Cs atoms in solid 4He. Phys. Rev. A, 60(5):3867, 1999.
[5] C. Ospelkaus, U. Rasbach, and A. Weis. Measurement of the forbidden tensor polarizabilityof Cs using an all-optical Ramsey resonance technique. Phys. Rev. A, 67:011402, 2003.

Danksagung
Das Helium-Experiment besteht nun seit mehr als zehn Jahren. Der Pioniergeist der An-fangsjahre hat sich gelegt, und der Weg zur Messung eines EDM’s hat sich als als steinig erwiesen.Unser Spezialgebiet lebt aber bekanntlich von je her nicht nur von dieser einen - Nobelpreistrachtigen - Perspektive. Am Wegesrand wachsen reichlich andere exotische Pflanzen, denen wirNamen wie zum Beispiel ”Optischer Blasenzyklus” oder auch ”Nullfeldresonanz” gaben. Frohbin ich, dass auch ich schliesslich meine Pflanzchen gefunden habe. Ich mochte daher all’ denendanken, die zum Gelingen dieser Arbeit beitrugen.
An erster Stelle ist hier Prof. Antoine Weis zu nennen. Tun bin ich in vielerlei Hinsicht zuDank verpflichtet. Er hat es ermoglicht, dass ich etwas herum gekommen bin in der Welt. AmAnfang meiner Doktorarbeit schickte er mich fur ein halbes Jahr nach England zu Professor EdHinds, dem ich an dieser Stelle mitsamt seiner Forschungsgruppe auch meinen Dank aussprechenmochte. Ich war noch nicht aus England zuruck, da hiess es, dass die nachste Station Fribourg sei.Ich freute mich auf dieses neue ”Abenteuer”, welches den Umzug der gesamten Arbeitsgruppevon Bonn in die Schweiz bedeuten sollte. Auch die Konferenzen, die mich bis nach St. Petersburgund Japan fuhrten, sind hier zu nennen.
Vor allem aber mochte ich mich bei Tun dafur bedanken, dass er immer ein guter Chef undLehrer war, der alles zusammenhalt, und mit dem man auch uber ausser-physikalische Dinge gutreden kann. Von seiner vielgelobten Begeisterung fur die Physik habe auch ich mich ansteckenlassen.
Sehr stimulierend waren fur mich ebenso die vielen interessanten Kaffeepausendiskussionen,die wir zusammen mit Robert Wynands fuhrten. Leider war Robert nur kurz bei uns in Fribourgtatig. Ihm und Prof. Jean-Claude Dousse danke ich fur ihr Interesse an meiner Arbeit und dafur,dass sie sich bereit erklarten, die Begutachtung zu ubernehmen.
Mein ganz spezieller Dank gebuhrt naturlich dem Kryo-Team. Die Arbeit am Heliumexper-iment ist nur im Team moglich. Ohne engagierte Mitarbeiter kommt man da nicht weit. Auchbraucht man am Anfang eine gute Einfuhrung in die Handhabung des Kryostaten. Diese habenin meinem Fall Taro Eichler und Reinhard Muller-Siebert besorgt.
Nachdem Taro unsere Gruppe verlassen hatte, war Reinhard der Erfahrenste unter uns.Er hat mit seinem technischen Know-how und seinem unermudlichen Einsatz entscheidend zurVerbesserung der Apparatur beigetragen. Auch fur die vielen fruchtbaren Diskussionen und daskameradschaftliche Verhaltnis mochte ich danken.
Ebenso danke ich allen anderen ehemaligen Kryomitgliedern aus Bonner Zeiten: SergejKarnorsky, Steffen Lang und Karoline Winkler.
Simone Ulzega und Adrian Hofer, in deren Handen zukunftig die Geschicke des Heliumex-perimentes liegen werden, wunsche ich viel Erfolg, und ich danke fur die gute Mitarbeit.
Seit Taros Weggang hat es immer an einem guten Post-Doc im Team gemangelt - bis dannendlich vor einigen Monaten Peter Moroshkin zu uns stiess. Ich danke ihm fur sein reges En-gagement und seine Hilfsbereitschaft. Die fruchtbaren Diskussionen mit ihm haben mir in denletzten Wochen vor der Abgabe dieser Arbeit sehr geholfen.
Weiterhin danke ich allen anderen Mitgliedern der Arbeitsgruppe. Mit Georg Bison undUlrich Rasbach hatte ich eine sehr kameradschaftliche Zusammenarbeit. Beiden danke ich auchfur den vielen gemeinsamen Spass im Labor und privat. Georg danke ich im speziellen fur seinengrenzenlosen Optimismus, der keine unlosbaren Probleme kennt. Auch Stephan Groger mochteich danken. Er ist ein angenehmer Gesprachspartner, und ich wunsche ihm - ebenso wie Georg- viel Erfolg fur die Doktorarbeit.
Mein erster wissenschaftlicher Erfolg war die Optische Magnetresonanztomographie. Ich
99
danke Guido Hinz und Dominik Giel, die meine Mitstreiter waren. Ebenfalls - aus BonnerTagen - danke ich Christian Kurz, Bjorn Heitmann, Frank Rex und Gerhard Zundorf fur dieZusammenarbeit. Und aus Fribourger Zeiten danke ich Patrick Haymoz, Christian Ospelkaus,Silke Ospelkaus-Schwarzer, Philippe Sproll, Stephan Tandler und Xueren Huang.
Von entscheidender Bedeutung fur das Gelingen dieser Arbeit war auch die Kreativitat undder Fleiss unserer hervorragenden Werkstatten. Direkten Kontakt hatte ich vor allem mit ElmarMoser, der in dringenden Fallen immer rasch eine Losung parat hatte - mit Oswald Raetzo, furden immer alles kein Problem, sondern machbar war - mit Jean-Luc Schenker der schnell undzuverlassig unsere elektronischen Wunsche erfullte - und mit Roland Schmid, der wie die anderenviel fur uns gearbeitet hat und dazu immer einen Scherz auf Lager hatte. Diesen und auch denubrigen Werkstattangehorigen mochte ich fur ihre Arbeit danken.
Wie die Werkstatten, so tragt auch die Administration viel zu der allgemein guten Atmo-sphare im Hause bei. Ich danke allen, dass immer alles so reibungslos abgelaufen ist. Meinbesonderer Dank gilt Elisabeth Francois, die uns Doktoranden weitestgehend alle Formalitatenabnimmt. Auch den Werkstatten und der Administration in Bonn am IAP sei gedankt.
Nadia mochte ich fur ihre liebevolle Unterstutzung und Geduld - in turbulenten, angespan-nten und frohlichen Zeiten - ganz besonders herzlich danken!!!
100
Curriculum vitae
Personal details
Family name NettelsFirst name DanielDate of birth August 23, 1971Place of birth Munster, GermanyNationality GermanStatus Single
School
1978 - 1984 Basic education in Papenburg, Germany
1984 - 1985 High School, Stadtisches Gymnasium, Papenburg
1985 - 1991 High School, Kardinal-von-Galen-Gymnasium,Kevelaer, Germany
1991 - 1992 Zivildienst (comunity service), Marienhospital,Bonn, Germany
Studies
1992 - 1998 Studies in Physics,Rheinische Friedrich-Wilhelms-Universitat Bonn, Germany
1998 Diploma work in Atomic Physics:“Optische Magnetresonanztomographiean spinpolarisiertem Casiumdampf”
under the direction of Prof. Dr. Weis
Nov. 1998 - 2000 Graduate student in the research group of Prof. Dr. Weis,Institute for Applied Physics, University of Bonn, Germany
Jun. 1999 Scientific visitor in the research group of Prof. Dr. Ed Hinds,to Nov. 1999 University of Sussex, Brighton, England
since Apr. 2000 Graduate student in the research group of Prof. Dr. Weis,Department of Physics, University of Fribourg, Switzerland
101

102
Publications
1. D. Giel, G.Hinz, D. Nettels, and A. Weis. Diffusion of Cs atoms in Ne buffer gas measuredby optical magnetic resonance tomography. Opt. Express, 6(13):251, 2000.
2. A. Weis, D. Giel, and D. Nettels. Motion of vapor atoms studied by optical magneticresonance tomography. Laser Phys., 11(4):470, 2001.
3. Taro Eichler, R. Muller-Siebert, Daniel Nettels, S. I. Kanorsky, and A. Weis. Opticaldetection of nonradiating alkali atoms in solid helium. Phys. Rev. Lett., 88(12):123002,2002.
4. D. Nettels, R. Muller-Siebert, X. Huang, S. Ulzega, and A. Weis. Magnetic and electricproperties of alkali atoms in solid helium. Physica B, 329:406, 2003.
5. D. Nettels, R. Muller-Siebert, Simone Ulzega, and Antoine Weis. Multiphoton processesin the Zeeman structure of atomic Cs trapped in solid helium. (Accepted for publicationby Appl. Phys. B.)
6. D. Nettels, R. Muller-Siebert, and Antoine Weis. Relaxation mechanisms of multi-quantum coherences in the Zeeman structure of atomic Cs trapped in solid He. (Invitedpaper. Accepted for publication by Appl. Phys. B.)
7. R. Muller-Siebert, D. Nettels, and Antoine Weis. Temperature stabilization of solid heliumcrystals by a double-circuit technique. (To be submitted.)
8. D. Nettels, A. Hofer, P. Moroshkin, R. Muller-Siebert, Simone Ulzega, and Antoine Weis.Observation of apple- and dumbbell-shaped Cs∗Hen exciplexes in solid He4. (To besubmitted.)
Awards
Poster Award: The 23d International Conference on Low Temperature Physics,Hiroshima (Japan), 20.-27. August 2002
Invited paper: D. Nettels, R. Muller-Siebert, and Antoine Weis.Relaxation mechanisms of multi-quantum coherences in the Zeemanstructure of atomic Cs trapped in solid He.(Accepted for publication by Appl. Phys. B.)
103

104