
Pension plans: Risk and governance - Universität Bernboris.unibe.ch/87717/1/16dichter_o.pdfPension...
129
Wirtschafts- und Sozialwissenschaftliche Fakultät Departement Betriebswirtschaft Institut für Finanzmanagement Pension plans: Risk and governance Inaugural dissertation submitted by Oliver Dichter in fulfillment of the requirements for the degree of Doctor rerum oeconomicarum at the Faculty of Business, Economics and Social Sciences of the University of Bern. Submitted by Oliver Dichter from Wangen bei Olten, Solothurn 2016 Original document saved on the web server of the University Library of Bern This work is licensed under a Creative Commons Attribution-Non-Commercial-No derivative works 2.5 Switzerland licence. To see the licence go to http://creativecommons.org/licenses/by-nc-nd/2.5/ch/ or write to Creative Commons, 171 Second Street, Suite 300, San Francisco, California 94105, USA.
Transcript of Pension plans: Risk and governance - Universität Bernboris.unibe.ch/87717/1/16dichter_o.pdfPension...

Wirtschafts- und Sozialwissenschaftliche Fakultät
Departement Betriebswirtschaft
Institut für Finanzmanagement
Pension plans: Risk and governance
Inaugural dissertation submitted by Oliver Dichter in fulfillment of the
requirements for the degree of Doctor rerum oeconomicarum at the Faculty of
Business, Economics and Social Sciences of the University of Bern.
Submitted by
Oliver Dichter
from Wangen bei Olten, Solothurn
2016
Original document saved on the web server of the University Library of Bern
This work is licensed under a
Creative Commons Attribution-Non-Commercial-No derivative works 2.5 Switzerland licence. To see the licence go to
http://creativecommons.org/licenses/by-nc-nd/2.5/ch/ or write to Creative Commons, 171 Second Street, Suite 300, San
Francisco, California 94105, USA.

I
Copyright Notice
This document is licensed under the Creative Commons Attribution-Non-Commercial-
No derivative works 2.5 Switzerland. http://creativecommons.org/licenses/by-nc-nd/2.5/ch/
You are free:
to copy, distribute, display, and perform the work
Under the following conditions:
Attribution. You must give the original author credit.
Non-Commercial. You may not use this work for commercial purposes.
No derivative works. You may not alter, transform, or build upon this work.
For any reuse or distribution, you must take clear to others the license terms of this work.
Any of these conditions can be waived if you get permission from the copyright holder.
Nothing in this license impairs or restricts the author’s moral rights according to Swiss law.
The detailed license agreement can be found at:
http://creativecommons.org/licenses/by-nc-nd/2.5/ch/legalcode.de

II
The faculty accepted this work as dissertation on March 17, 2016 at the request of the three
advisors Prof. Dr. Claudio Loderer, Prof. Dr. Heinz Zimmermann, and Prof. Dr. Alexander
Wagner, without wishing to take a position on the view presented therein.

III
I. Pension Risk and Corporate Investment ......................................................................... 1
1. Introduction ..................................................................................................................... 2
2. Theoretical background .................................................................................................. 5
3. Data ................................................................................................................................. 7
4. Empirical method and variable construction ................................................................ 10
4.1. Measures of pension risk .................................................................................... 10
4.2. Regression model and discussion of the control variables ................................. 12
5. Empirical results ........................................................................................................... 14
5.1. Descriptive sample statistics ............................................................................... 14
5.2. The pension risk sensitivity of investment .......................................................... 16
5.3. Endogeneity ........................................................................................................ 19
5.3.1. Pension freezes and financial distress ................................................................. 20
5.3.2. Unobserved mandatory contributions ................................................................. 22
5.3.3. Unobserved investment opportunities ................................................................. 24
5.4. Reaction of nonpension firms ............................................................................. 26
6. Conclusion .................................................................................................................... 29
Appendix: Tables ............................................................................................................... 30
II. The Duration Gap Matters: How Pension Duration Affects Equity Returns ............ 38
1. Introduction ................................................................................................................... 39
2. Institutional background ............................................................................................... 42
3. Theoretical considerations ............................................................................................ 43
4. Regression specification and variable construction ...................................................... 46
4.1. Regression model ................................................................................................ 46
4.2. Interest rate exposure of the firm ........................................................................ 47
4.3. Systematic interest rate risk of the pension plan – the pension duration gap ..... 48
4.4. Control variables ................................................................................................. 50
5. Data ............................................................................................................................... 51
5.1. Data source .......................................................................................................... 51
5.2. Sample selection ................................................................................................. 52
5.3. Descriptive sample statistics ............................................................................... 53
6. Empirical analysis ......................................................................................................... 55
6.1. Main results ......................................................................................................... 56
6.2. Robustness to the duration assumptions ............................................................. 58
6.3. Robustness to negligibly small pension responsibilities ..................................... 60

IV
6.4. Robustness to financial distress .......................................................................... 61
6.5. Robustness to the sample period ......................................................................... 62
6.6. Out of sample analyses ....................................................................................... 63
7. Conclusion .................................................................................................................... 64
Appendix A: Derivation of the equations in section 3 ...................................................... 65
Appendix B: Tables and figures ........................................................................................ 67
III. How the Chairman’s Personal Preferences Affect Public Pension Risk .................... 76
1. Introduction ................................................................................................................... 77
2. Public pension plans in the U.S. ................................................................................... 82
3. Literature review and empirical predictions ................................................................. 83
3.1. COB age .............................................................................................................. 83
3.2. COB gender ........................................................................................................ 84
3.3. Annuitants ........................................................................................................... 86
3.4. Politicians ............................................................................................................ 87
4. Data and variable construction ...................................................................................... 88
4.1. Sample selection ................................................................................................. 88
4.2. Measuring pension risk ....................................................................................... 89
5. Empirical strategy ......................................................................................................... 94
5.1. Regression model ................................................................................................ 94
5.2. Control variables ................................................................................................. 95
6. Empirical results ........................................................................................................... 97
6.1. Descriptive statistics ........................................................................................... 97
6.2. Main results ......................................................................................................... 99
6.3. Representativeness ............................................................................................ 101
6.4. Causality ........................................................................................................... 102
6.5. Impact of pension governance .......................................................................... 105
7. Conclusion .................................................................................................................. 107
Appendix: Tables ............................................................................................................. 108
References ............................................................................................................................. 117
Selbständigkeitserklärung ................................................................................................... 124
1
I. Pension Risk and Corporate Investment
Oliver Dichter*
October, 2015
This paper studies the relation of systematic pension risk
(pension beta) and corporate investment in a large sample of
U.S. firms. We present evidence of a negative impact of
pension risk on investment, which is consistent with the view
that firms forego valuable investment opportunities because
they fail to notice that systematic pension risk causes an
upward bias in the discount rates they use in capital
budgeting decisions. The pension risk bias in investment is
economically relevant and not limited to financially
constrained firms. The study can be generalized to all firms
that base their investment decisions on a firm-wide discount
rate without noticing the different sources of systematic risk.
Keywords: Defined benefit pension plan; Corporate investment; Capital budgeting; Cost of
capital
JEL codes: G23, G31
*Oliver Dichter (corresponding author, [email protected]), the Institut für Finanzmanagement,
University of Bern. This paper is part of my dissertation with Claudio Loderer, the Institut für
Finanzmanagement, University of Bern and the Swiss Finance Institute. I wish to thank Claudio Loderer, Lukas
Roth, Aleksandar Andonov, and Demian Berchtold for valuable comments. All errors are mine.
2
1. Introduction
The bad news is that standard cost of capital calculations used in corporate finance,
which do not distinguish between the operating asset risk and pension plan risk, can greatly
overestimate the discount rate for net present value analysis of operating projects. […] In
such cases, capital projects with positive net present value could be rejected by management.
– Jin, Merton, and Bodie, Journal of Financial Economics, 2006 –
This paper presents empirical evidence for the distortion of corporate investment
induced by inappropriate factoring in of the risk of defined benefit pension plans. According
to the standard textbook formula, the value of an operating project depends on both its
expected cash flows and its risk, which is reflected in the project’s discount rate (Krüger,
Landier, and Thesmar (2015)). Most firms do not estimate this rate for each project separately
but use the weighted average cost of capital (WACC) as a single, firm-wide discount rate
instead (Bierman (1993) and Graham and Harvey (2001)). According to Jin, Merton, and
Bodie (2006), the WACC of firms that sponsor defined benefit (DB) plans is a biased estimate
of the discount rate for net present value (NPV) analyses of operating projects. By
discounting operating cash flows at the WACC, firms effectively assign their total risk to their
business operations, although part of that risk actually comes from the pension assets and
liabilities (Merton (2006)). Moreover, the standard calculation of the WACC understates the
firm’s leverage ratio because it does not take into account the pension liabilities, which are
off-balance sheet items (Merton (2006)). The cumulative effect of these distortions is that the
WACC generally overestimates the discount rate for operating projects, which could induce
firms to forgo valuable investment opportunities (Jin, Merton, and Bodie (2006) and Merton
(2006)).
3
DB pension plans are the largest off-balance sheet risk of corporate America
(Shivdasani and Stefanescu (2010)). Despite the recent trend to freeze DB plans, the
aggregate value of corporate (DB) pension liabilities reached an all-time high of USD 3.1
trillion in 2012 (Investment Company Institute (2014)). The distortion of corporate
investment by pension risk could hence be substantial.
For the years 2003 to 2012 our analysis covers 1,562 U.S. COMPUSTAT firms that
sponsor a DB pension plan. Our empirical strategy relies on a regression analysis with firm
and year fixed effects. We measure corporate investment by capital expenditures (net of
depreciation) and estimate the pension risk bias in the discount rate as suggested by Jin,
Merton, and Bodie (2006). We predict that investment is decreasing in systematic pension
risk because the discount rate (WACC) increases with pension beta, which reduces the
number of positive NPV projects that the firm effectively invests in. Our empirical evidence
supports this prediction. The distortion of corporate investment because of pension plan risk is
economically large, robust to different empirical specifications, and emerges independently of
plan freezes and financial distress of the plan sponsoring firm. On average, pension firms
forgo valuable investment opportunities.
Our findings are consistent with Krüger, Landier, and Thesmar (2015), who show that
firms underinvest in low risk divisions and overinvest in high risk divisions because they use
a single discount rate that overestimates the systematic risk of low risk segments, while it
underestimates the systematic risk of high risk segments.
Our results could reflect the financing constraints of the sponsoring firm. Rauh (2006)
shows that investment of financially constrained firms declines with mandatory pension
contributions, which are payments to the pension plan that cannot be altered or postponed.
Campbell, Dhaliwal, and Schwartz (2012) explain Rauh’s finding with the effect of
mandatory contributions on the WACC of financially constrained firms. Since our data do not
allow us to control for mandatory pension contributions, the negative relation we observe

4
between pension risk and investment activities could also be caused by the correlation of
pension risk with these contributions. We address this concern by separately estimating the
sensitivity of investment to pension risk for financially constrained as well as financially
unconstrained firms. If our results were explained by unobserved mandatory contributions,
pension risk should only affect the investment of financially constrained firms. Contrary to
that, however, we find that pension risk affects corporate investment regardless of financing
constraints. This indicates that the distortion of investment by pension risk is not driven by the
presence of mandatory contributions.
A further endogeneity concern is the potential correlation between pension risk and
unobserved investment opportunities. Firms with larger pension plans and higher systematic
pension risk are typically older than firms with smaller pension obligations. Older firms might
have fewer investment opportunities (Loderer, Stulz, and Waelchli (2015)). The correlation of
an explanatory variable of investment with unobserved investment opportunities is well-
known in the literature (e.g. Kaplan and Zingales (1997), Kaplan and Zingales (2000),
Erickson and Whited (2000), and Rauh (2006)). To address this concern we match each firm
with a DB plan in our sample to a firm without such a plan. The systematic pension risk is
naturally zero for firms that do not sponsor DB pension plans (Jin, Merton, and Bodie (2006))
and therefore uncorrelated with investment opportunities. The results of this matched-sample
analysis are consistent with our previous findings, which is inconsistent with the claim that
the pension risk sensitivity of investment we observed is the consequence of a correlation of
pension risk with unobserved investment opportunities.
The last section of the paper examines whether nonpension firms seize the investment
opportunities that firms with DB pension plans forgo. Rauh (2006) finds that forgone
investment by financially constrained firms is undertaken by firms that are not financially
constrained. We test this prediction by regressing capital expenditures (net of depreciation) of
nonpension firms on the aggregate pension risk of pension firms in the same Fama French 48

5
industry. We find that the investment of nonpension firms is indeed positively related to
industry pension risk.
We contribute to the investment literature by showing that corporate investment is
distorted by the risk of an important nonoperating activity of listed firms in the U.S. We show
that this distortion is consistent with the effect of pension risk on the standard estimate of
project discount rates (WACC), as described by Jin, Merton, and Bodie (2006). Moreover, we
show that pension risk distorts corporate investment on top of the distortion from mandatory
contributions, as identified by Rauh (2006). Krüger, Landier, and Thesmar (2015) find that
using the WACC as a single discount rate distorts the within firm allocation of resources. We
extend their work by showing that discounting with the WACC distorts the resource
allocation between firms as well. Hence, we believe that the relevance of this paper goes
beyond pension economics. Our findings apply to all firms that base their investment
decisions on a single discount rate without taking into account the different sources of
systematic risk.
The rest of the paper is organized as follows. Section 2 discusses the theoretical
background of the paper. Section 3 describes the data and the sample selection. Section 4
presents our empirical method and the main variables. Section 5 shows the empirical results
and their discussion. Last, section 6 concludes.
2. Theoretical background
There is a substantial strand of literature that studies whether the values of DB pension
assets and liabilities are reflected in the market value of the sponsoring firms. Representative
studies concerning the firm’s equity value include Oldfield (1977), Feldstein and Seligman
(1981), Feldstein and Morck (1983), and Bulow, Morck, and Summers (1987). Carroll and
Niehaus (1998) present similar evidence with respect to the debt market. Jin, Merton, and
6
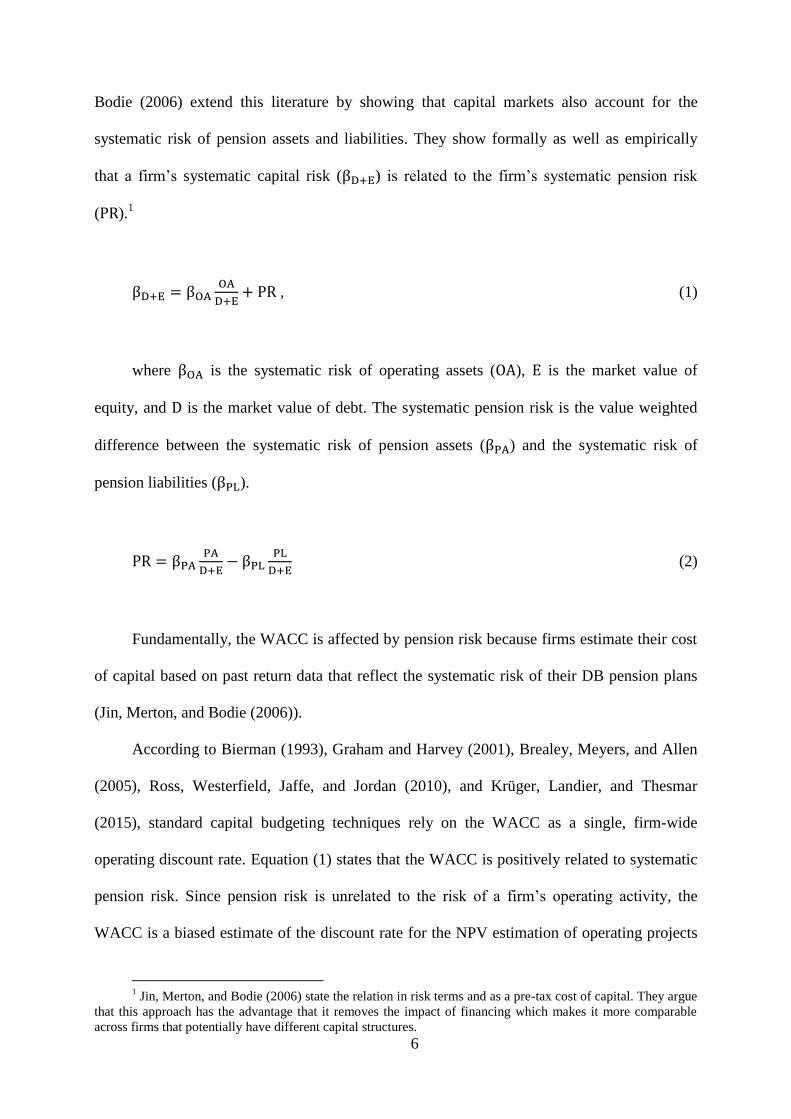
Bodie (2006) extend this literature by showing that capital markets also account for the
systematic risk of pension assets and liabilities. They show formally as well as empirically
that a firm’s systematic capital risk (βD+E) is related to the firm’s systematic pension risk
(PR).1
βD+E = βOAOA
D+E+ PR , (1)
where βOA is the systematic risk of operating assets (OA), E is the market value of
equity, and D is the market value of debt. The systematic pension risk is the value weighted
difference between the systematic risk of pension assets (βPA) and the systematic risk of
pension liabilities (βPL).
PR = βPAPA
D+E− βPL
PL
D+E (2)
Fundamentally, the WACC is affected by pension risk because firms estimate their cost
of capital based on past return data that reflect the systematic risk of their DB pension plans
(Jin, Merton, and Bodie (2006)).
According to Bierman (1993), Graham and Harvey (2001), Brealey, Meyers, and Allen
(2005), Ross, Westerfield, Jaffe, and Jordan (2010), and Krüger, Landier, and Thesmar
(2015), standard capital budgeting techniques rely on the WACC as a single, firm-wide
operating discount rate. Equation (1) states that the WACC is positively related to systematic
pension risk. Since pension risk is unrelated to the risk of a firm’s operating activity, the
WACC is a biased estimate of the discount rate for the NPV estimation of operating projects
1 Jin, Merton, and Bodie (2006) state the relation in risk terms and as a pre-tax cost of capital. They argue
that this approach has the advantage that it removes the impact of financing which makes it more comparable
across firms that potentially have different capital structures.

7
(Jin, Merton, and Bodie (2006)). Following this argument we predict that corporate
investment is negatively related to pension risk as an increase in systematic pension risk (PR)
increases the hurdle rate required for project acceptance, leading the firm to reject valuable
low-risk projects. What follows documents the specification and the results of an empirical
test of this prediction.
3. Data
Firms in the U.S. can choose between two types of retirement saving instruments –
defined contribution (DC) and defined benefit (DB) plans. In a DB plan, the firm guarantees
its employees specific benefits upon retirement. This commitment represents a debt-like
liability of the firm (Jin, Merton, and Bodie (2006)). Since 1974, firms are obligated by the
Employment Retirement Income Security Act (ERISA) to guarantee their pension liability
with assets on a legally segregated account. The difference between pension assets and
pension liabilities determines the funding status of a plan. A funding status of less than zero
represents an underfunding. Whenever a plan is underfunded, the firm must cover for the
deficit by deficit reduction contributions (Rauh (2006)). Until 2006, ERISA required that
firms amortize the underfunding of a DB plan within thirty years (Rauh (2006)). The Pension
Protection Act (PPA) of 2006 reduced this amortization period to seven years (Campbell,
Dhaliwal, and Schwartz (2012)). In addition to the deficit reduction contributions to
underfunded plans, firms are required to cover the plans’ normal cost, which is the present
value of pension benefits accrued during the year (Rauh (2006)). The sum of deficit reduction
contributions and normal cost determines the firm’s mandatory pension contributions.2 When
a firm fails to meet its mandatory contributions, the Pension Benefit Guarantee Corporation
(PBGC) is entitled to recover the outstanding amount by filing a claim against the firm. In a
2 Rauh (2006) and Campbell, Dhaliwal, and Schwartz (2012) provide a detailed discussion on mandatory
pension contributions.

8
bankruptcy case, the PBGC claim has the most senior status (Shivdasani and Stefanescu
(2010)).
The firm’s responsibility in the case of DC plans is fundamentally different. The firm is
simply committed to pay regular and fixed contributions to the employees’ retirement
accounts. Upon retirement, the employees receive whatever amount of money (contributions
plus interest) has accumulated on their behalf. The uncertainty about the level of retirement
benefits is borne entirely by the employees. Besides the regular contributions, the firm faces
no further obligations (Shivdasani and Stefanescu (2010)). Consistent with previous research,
including Rauh (2006), Jin, Merton, and Bodie (2006), and Campbell, Dhaliwal, and
Schwartz (2012), we exclude DC plans from our analysis. Throughout this paper, we
consequently use the terms pension plan and defined benefit pension plan interchangeably.
Our sample of DB pension sponsoring firms builds on data from the COMPUSTAT
North America Pension database and the CRSP/COMPUSTAT Merged file. The
COMPUSTAT North America Pension file contains firm level accounting data on DB
pension plans. Corporate pension accounting in the U.S. is regulated by the Financial
Accounting Standards Board (FASB). Pension assets and liabilities are recorded off-balance
sheet in the footnotes of the 10-K annual statements (Shivdasani and Stefanescu (2010)). The
FASB requires that pension assets be measured by their market value. Moreover, since the
release of FAS 132(R) in 2003, firms are required to disclose pension assets along the
categories equities, bonds, real estate, and other investments. Pension liabilities on the other
hand have to be estimated as the actuarial present value of the promised benefits. However,
the rate at which firms discount the pension benefits has to reflect current interest rate levels
(Jin, Merton, and Bodie (2006) and Carmichael and Graham (2012)). This makes sure that the
actuarial value of pension liabilities is close to their fair, economic value. There are two
common measures of a firm’s pension liability – the Projected Benefit Obligation (PBO) and
the Accumulated Benefit Obligation (ABO). While the ABO only consists of the present
9
value of the benefits that have already been earned by the employees, the PBO additionally
includes the present value of the projected benefits that are attributable to future salary
increases. The general obligation to disclose the ABO ended in 1998, when FAS 132 required
disclosure only in case of severely underfunded plans. Even though Bodie (1990) argues that
the ABO is the most accurate measure of the economic value of the pension liability, the lack
of data after 1998 makes it an unfeasible measure during our observation period. We therefore
quantify the pension liability by the PBO, which is in line with recent studies on corporate
pension plans, including Franzoni and Marín (2006), Campbell, Dhaliwal, and Schwartz
(2010), Campbell, Dhaliwal, and Schwartz (2012), and An, Huang, and Zhang (2013).
We limit our analysis to pension sponsoring firms and firm-years where complete
accounting data are reported (book assets, market value of equity, book value of debt, capital
expenditures, net income, depreciation, pension assets, pension asset classes, PBO, and
pension contributions). Moreover, we exclude foreign firms with American Depository
Receipts (ADRs). Our initial sample consists of 10,100 observations and covers the years
from 2003 to 2012. The sample period starts in 2003 because the information on pension asset
allocations is not available for previous years. This information is essential in our estimation
of the systematic risk of pension assets. We do not exclude financial firms because Krüger,
Landier, and Thesmar (2015) argue that these firms most likely base their investment
decisions on discounted value evaluation techniques as well. Since we normalize our main
variables by beginning-of-year assets, we require information about assets in at least two
consecutive sample years, which reduces our sample size by 330 firm-years to 9,770
observations concerning 1,562 firms.
10
4. Empirical method and variable construction
In section 2, we argue that corporate investment is distorted by pension risk because of
a pension risk bias in the operating discount rate. An empirical test of the relation between
pension risk and investment hence requires that the investment measure reflects decisions that
are presumably made on the basis of criteria such as NPV or internal rate of return (IRR).
According to Bierman (1993), Graham and Harvey (2001), and Krüger, Landier, and Thesmar
(2015), NPV and IRR are predominantly used in decisions about capital expenditures.
Research and development expense (R&D), however, is often set as a fixed fraction of sales
(Anthony and Govindarajan (2007)). Since NPV and IRR are hence less relevant in these
investment decisions, R&D expense should be less sensitive to a bias in the operating
discount rate. Therefore, we primarily measure investment by capital expenditures. In our
main specification, we deduct depreciation expense to focus on decisions that do not reflect
routine replacement activities for which NPV and IRR considerations might also be less
relevant.
4.1. Measures of pension risk
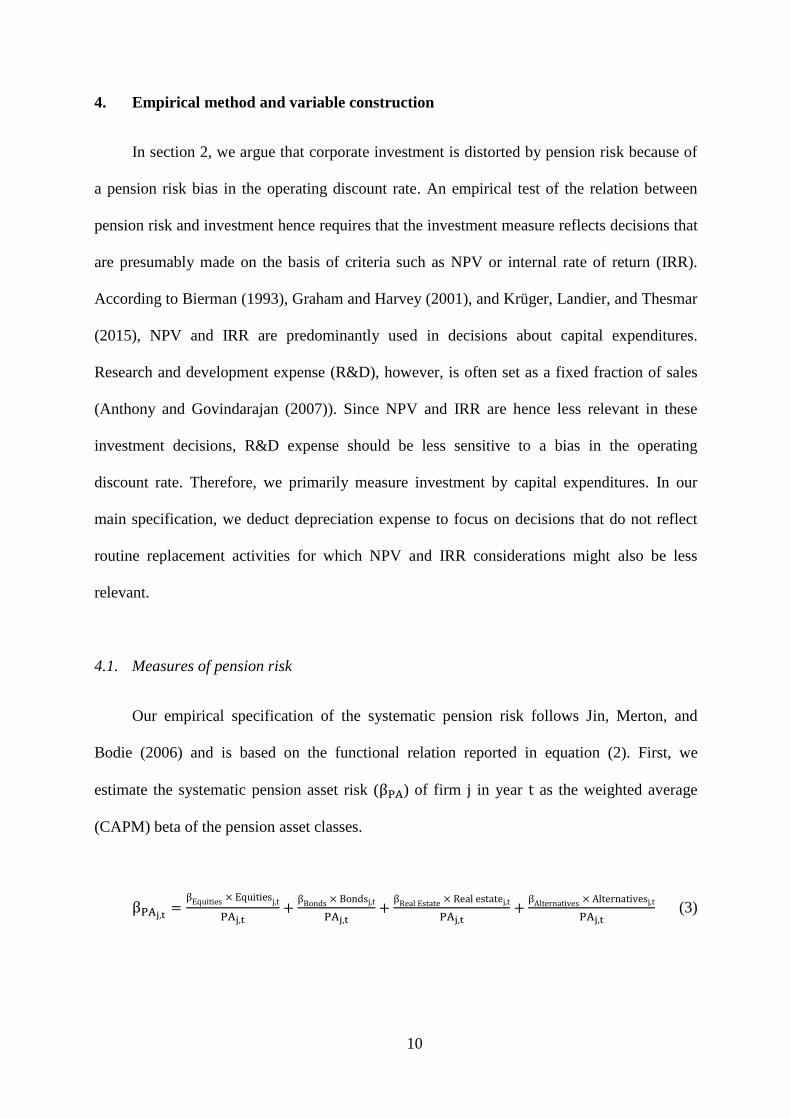
Our empirical specification of the systematic pension risk follows Jin, Merton, and
Bodie (2006) and is based on the functional relation reported in equation (2). First, we
estimate the systematic pension asset risk (βPA) of firm j in year t as the weighted average
(CAPM) beta of the pension asset classes.
βPAj,t=
βEquities × Equitiesj,t
PAj,t+
βBonds × Bondsj,t
PAj,t+
βReal Estate × Real estatej,t
PAj,t+
βAlternatives × Alternativesj,t
PAj,t (3)
11
The weight of each asset class is obtained from the COMPUSTAT North America
Pension database. The betas we assume for equities, fixed income, and real estate are from
Jin, Merton, and Bodie (2006).3 The values are βEquities = 1, βBonds = 0.175, and
βReal estate = 0.15. The asset class alternatives equals the COMPUSTAT category other,
which comprises all assets that are not equity, bond, or real estate investments
(COMPUSTAT (2004)). Since Jin, Merton, and Bodie (2006) do not consider alternative
assets in their study, we rely on the beta of alternatives in Mohan and Zhang (2014). They
argue that investments in alternative assets of DB pension plans predominantly consist of
private equity, venture capital, and commodity investments, which have a beta of 1.2 on
average.4
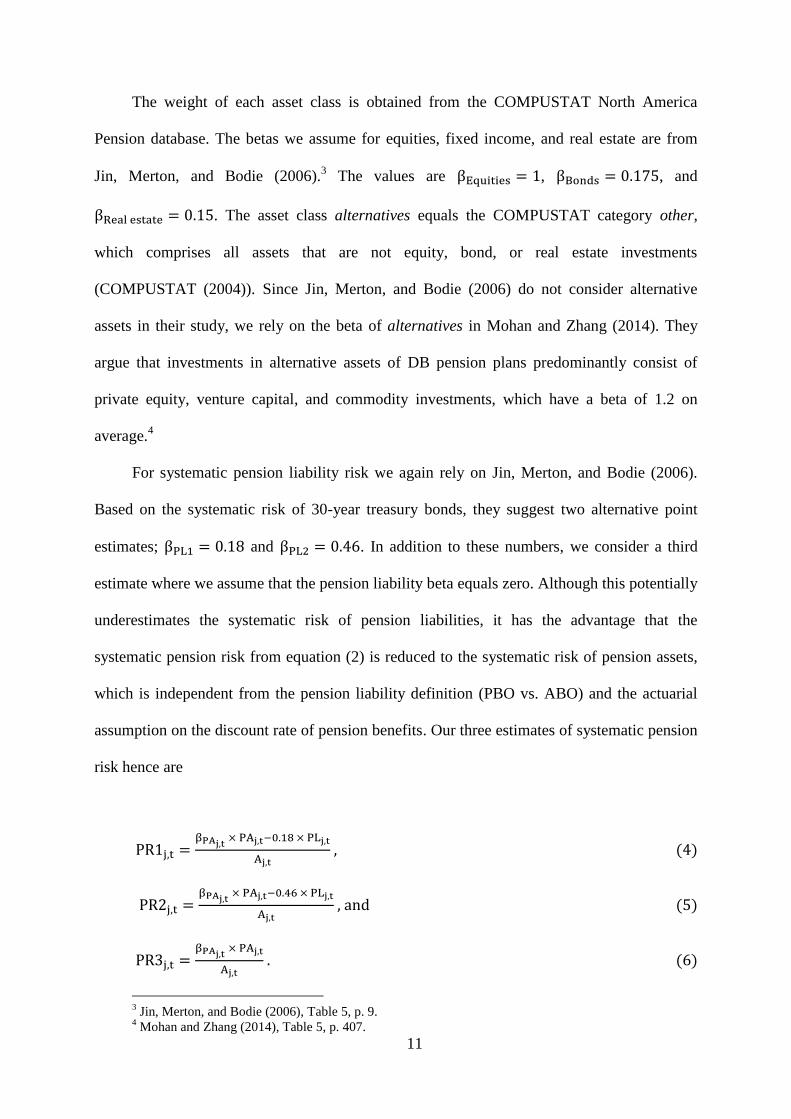
For systematic pension liability risk we again rely on Jin, Merton, and Bodie (2006).
Based on the systematic risk of 30-year treasury bonds, they suggest two alternative point
estimates; βPL1 = 0.18 and βPL2 = 0.46. In addition to these numbers, we consider a third
estimate where we assume that the pension liability beta equals zero. Although this potentially
underestimates the systematic risk of pension liabilities, it has the advantage that the
systematic pension risk from equation (2) is reduced to the systematic risk of pension assets,
which is independent from the pension liability definition (PBO vs. ABO) and the actuarial
assumption on the discount rate of pension benefits. Our three estimates of systematic pension
risk hence are
PR1j,t =βPAj,t
× PAj,t−0.18 × PLj,t
Aj,t , (4)
PR2j,t =βPAj,t
× PAj,t−0.46 × PLj,t
Aj,t , and (5)
PR3j,t =βPAj,t
× PAj,t
Aj,t . (6)
3 Jin, Merton, and Bodie (2006), Table 5, p. 9.
4 Mohan and Zhang (2014), Table 5, p. 407.

12
The variation in these estimates stems from changes in the asset allocation, changes in
the pension funding status, and changes in the size of the pension plan relative to the size of
the sponsoring firm. The assumptions about asset class and liability betas are constant over
time and do not vary between firms. We normalize by book value of firm assets (A) because
Rauh (2006) argues that all variables in the investment regression, which we discuss in the
next section, should be scaled by the same quantity. Since book assets are also the
denominator of Tobin’s Q, Rauh (2006) suggest to scale both pension and firm variables by
the book value of assets.
4.2. Regression model and discussion of the control variables
Following a large body of investment literature, including Fazzari, Hubbard, and Petersen
(1988), Kaplan and Zingales (1997), Kaplan and Zingales (2000), Baker, Stein, and Wurgler
(2003), and Rauh (2006), we examine the pension risk sensitivity of investment in a linear
regression model. The investment of firm j in year t, scaled by beginning-of-year book value
of firm assets, is hence given by
Invj,t = αj + αt + βPRj,t−1 + 𝚪′𝐗𝐣,𝐭 + ϵj,t , (7)
where, αj identifies firm fixed effects, αt represents year fixed effects, 𝐗 is a set of
control variables, 𝚪′ is a vector of coefficients, and ϵ is a stochastic error term. β identifies the
pension risk sensitivity of investment. We expect that the value of β is negative. We consider
the beginning-of-year systematic pension risk (PRj,t−1) because the end-of-year pension risk
cannot yet be reflected in the stock returns that the firm uses to estimate the current year
discount rate.
13
Including year fixed effects allows controlling for macroeconomic effects. Firm fixed
effects control for firm specific differences in investment levels that remain constant over
time. Our continuous control variables include the market-to-book ratio of the beginning-of-
year asset values (average Tobin’s Q), the current year nonpension cash flow (NPC), and the
funding status of the firm’s beginning-of-year pension liability. Q is a standard control for the
firm’s investment opportunities. NPC and funding status are controls for investment
opportunities that are unobserved by Q (Rauh (2006)).
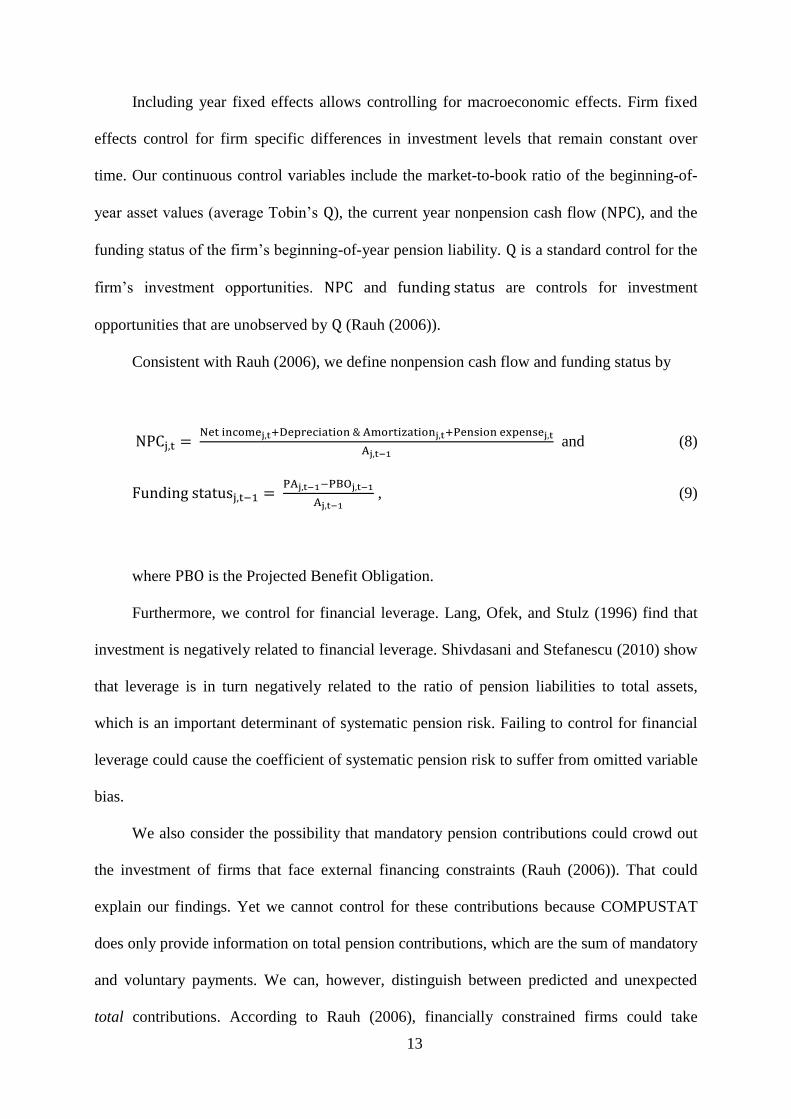
Consistent with Rauh (2006), we define nonpension cash flow and funding status by
NPCj,t = Net incomej,t+Depreciation & Amortizationj,t+Pension expensej,t
Aj,t−1 and (8)
Funding statusj,t−1 = PAj,t−1−PBOj,t−1
Aj,t−1 , (9)
where PBO is the Projected Benefit Obligation.
Furthermore, we control for financial leverage. Lang, Ofek, and Stulz (1996) find that
investment is negatively related to financial leverage. Shivdasani and Stefanescu (2010) show
that leverage is in turn negatively related to the ratio of pension liabilities to total assets,
which is an important determinant of systematic pension risk. Failing to control for financial
leverage could cause the coefficient of systematic pension risk to suffer from omitted variable
bias.
We also consider the possibility that mandatory pension contributions could crowd out
the investment of firms that face external financing constraints (Rauh (2006)). That could
explain our findings. Yet we cannot control for these contributions because COMPUSTAT
does only provide information on total pension contributions, which are the sum of mandatory
and voluntary payments. We can, however, distinguish between predicted and unexpected
total contributions. According to Rauh (2006), financially constrained firms could take

14
measures to secure additional finance for predictable mandatory contributions. If so, the
sensitivity of investment to mandatory contributions should primarily stem from unexpected
mandatory contributions. In analogy to Rauh (2006), we therefore expect that total pension
contributions affect the firms’ willingness to invest mainly via their unexpected rather than
via their expected component. We measure unexpected contributions by the difference
between the pension contributions that the firm effectively pays during a given year and the
amount of contributions it has planned to pay as of the beginning of the fiscal year. Consistent
with the normalization of the other variables in our regression model, we scale unexpected
pension contributions by the beginning-of-year book value of firm assets. We inquire into the
potential distortion of the pension risk sensitivity of investment by unobserved mandatory
contributions in the section (5.3) on endogeneity.
Finally, we control for the natural logarithm of the beginning-of-year book value of
assets (Ln firm size) and the natural logarithm of firm age (Ln firm age) because firms with
large pension plans, and hence large pension risk, are typically larger and older than firms
with small pension plans (Rauh (2006)). Older firms might have fewer investment
opportunities (Loderer, Stulz, and Waelchli (2015)). Detailed definitions of all the variables
are displayed in Table 8 of the appendix.
5. Empirical results
5.1. Descriptive sample statistics
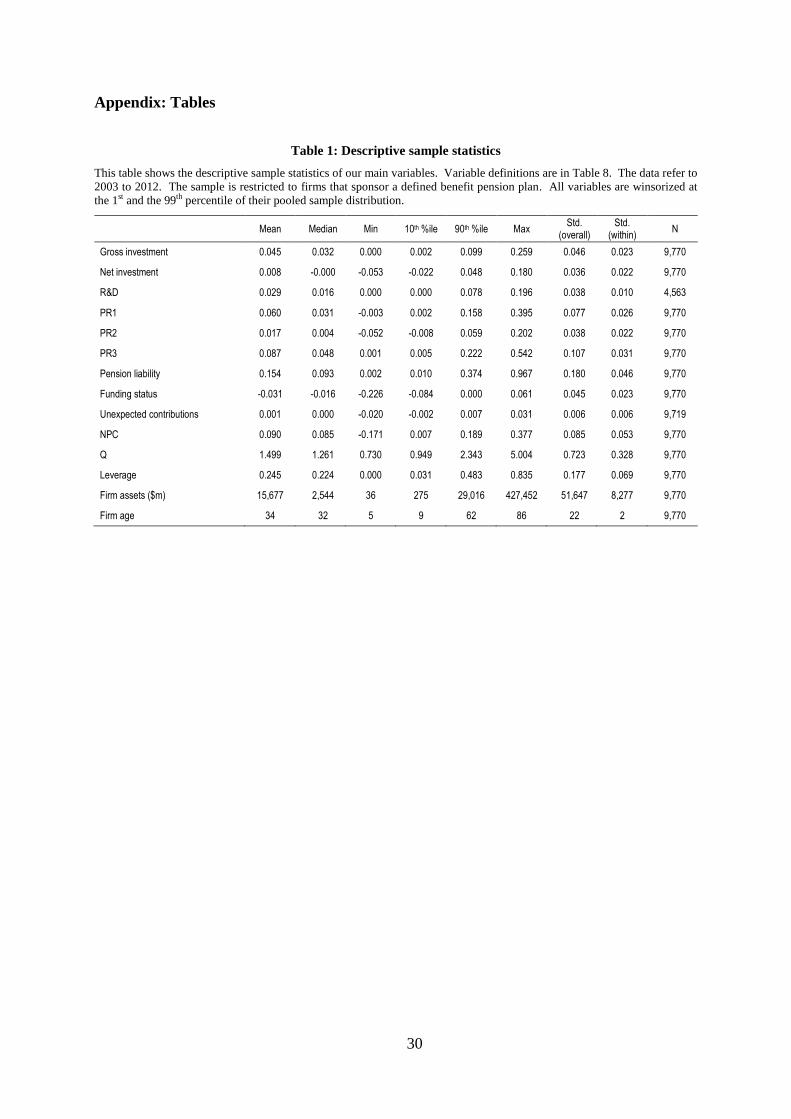
Table 1 shows summary statistics for our sample of pension sponsoring firms from 2003
to 2012. All continuous variables are winsorized at the 1st and the 99
th percent level of their
pooled distribution to eliminate outliers. On average, capital expenditures
(Gross investment) correspond to 4.5 percent of firm assets and capital expenditures minus
depreciation (Net investment) amount to 0.8 percent of assets. The positive mean of net
15
investment indicates that the average firm in our sample is growing (Lang, Ofek, and Stulz
(1996)). The mean aggregate ratio of pension liabilities to firm assets (Pension Liability) is
0.15 which, compared to an average financial leverage ratio (Leverage) of 0.25, illustrates
that pension plans are an important corporate liability. The average funding status of -0.03
indicates that the average firm’s pension liability is underfunded by 3 percent of the firm’s
assets, which corresponds to an average underfunding of pension liabilities by 22 percent. The
mean and the median systematic pension risk are positive for all specifications, which
supports the claim of Jin, Merton, and Bodie (2006) that the systematic pension risk causes
the WACC of the average pension sponsoring firm to exceed the value that would be
appropriate for the firm’s operating business. The mean value of PR1 (0.060) amounts to 9
percent of the average asset beta of U.S. firms, which, according to Damodaran (2015), is
0.67. The 90th
percentile of PR1 (0.158) corresponds to 24 percent of the average asset beta,
which shows that for some firms, the distortion of the discount rate by pension risk could be
substantial.
A large part of the overall variation in our main variables stems from within-firm
variation over time. This is important because, in our main regression model (7), cross-
sectional variation is eliminated by firm fixed effects (Baltagi (2013)). The within-firm
standard deviation of PR1 (0.026) equals one third of the overall standard deviation of PR1
(0.077). In case of PR2 and PR3, the within-firm variation amounts to 58 and 29 percent of
the overall variation, respectively. The within-firm standard deviation of our main investment
variable (Net investment) corresponds to 61 percent of its overall standard deviation. For
R&D, however, the within-firm variation only amounts to 25 percent of the total variation,
which supports the view that R&D expense is stickier than capital expenditures, possibly
because it is set as a fixed fraction of sales.
[insert Table 1 here]

16
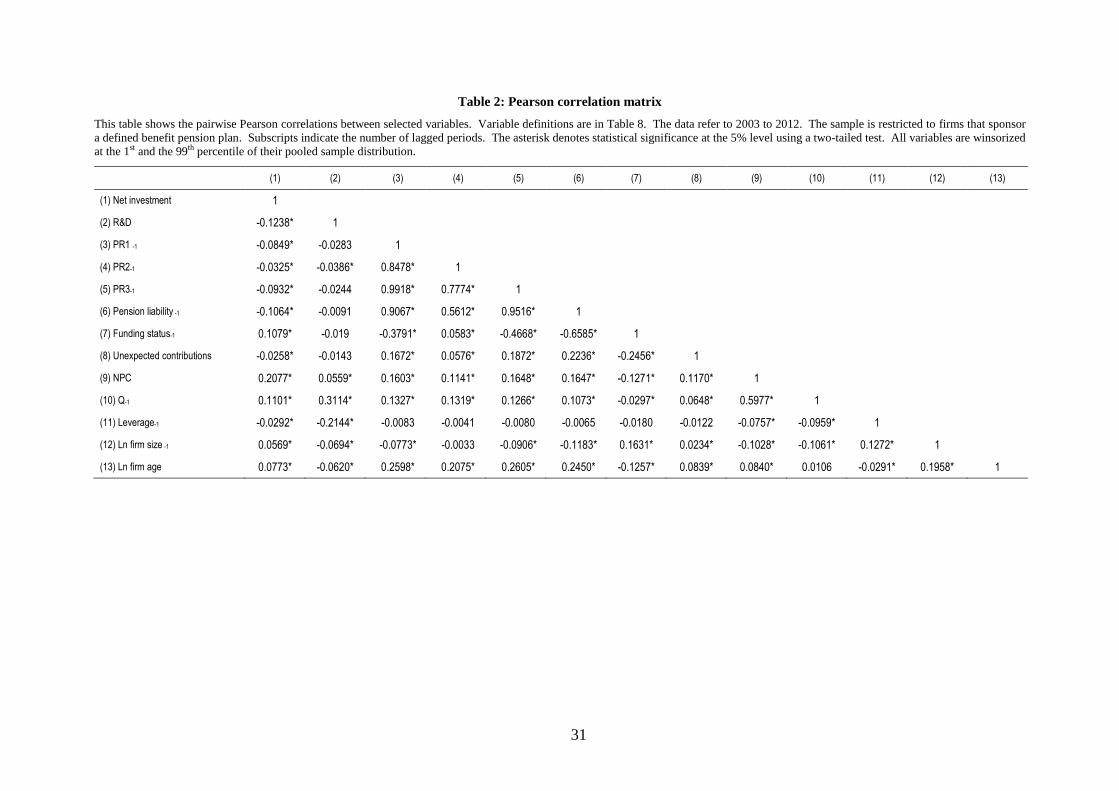
Table 2 reports the pairwise Pearson correlation statistics between selected variables.
The correlation between systematic pension risk and net investment is significantly negative
for all pension risk measures, which represents univariate evidence of the distortion of
corporate investment by DB pension plans. The correlation between net investment and the
ratio of pension liabilities to firm assets is significantly negative as well. This is consistent
with Jin, Merton, and Bodie (2006) and Merton (2006) who argue that pension firms overstate
the discount rate (WACC) for operating projects because the standard calculation of WACC
understates the leverage of these firms. The strong positive correlation between systematic
pension risk and the ratio of pension liabilities to firm assets reflects that systematic pension
risk is related to the size of the pension plan relative to the size of the firm. On average, firms
with larger pension plans have higher pension risk.
R&D expense is negatively correlated with systematic pension risk well. Compared to
net investment, the correlation is however weaker and only significant when we measure
pension risk by PR2.
All our control variables are significantly correlated with net investment. With the sole
exception of leverage, the control variables are also significantly correlated with systematic
pension risk. This supports our approach to study the pension risk sensitivity of corporate
investment in a multivariate regression analysis.
[insert Table 2 here]
5.2. The pension risk sensitivity of investment
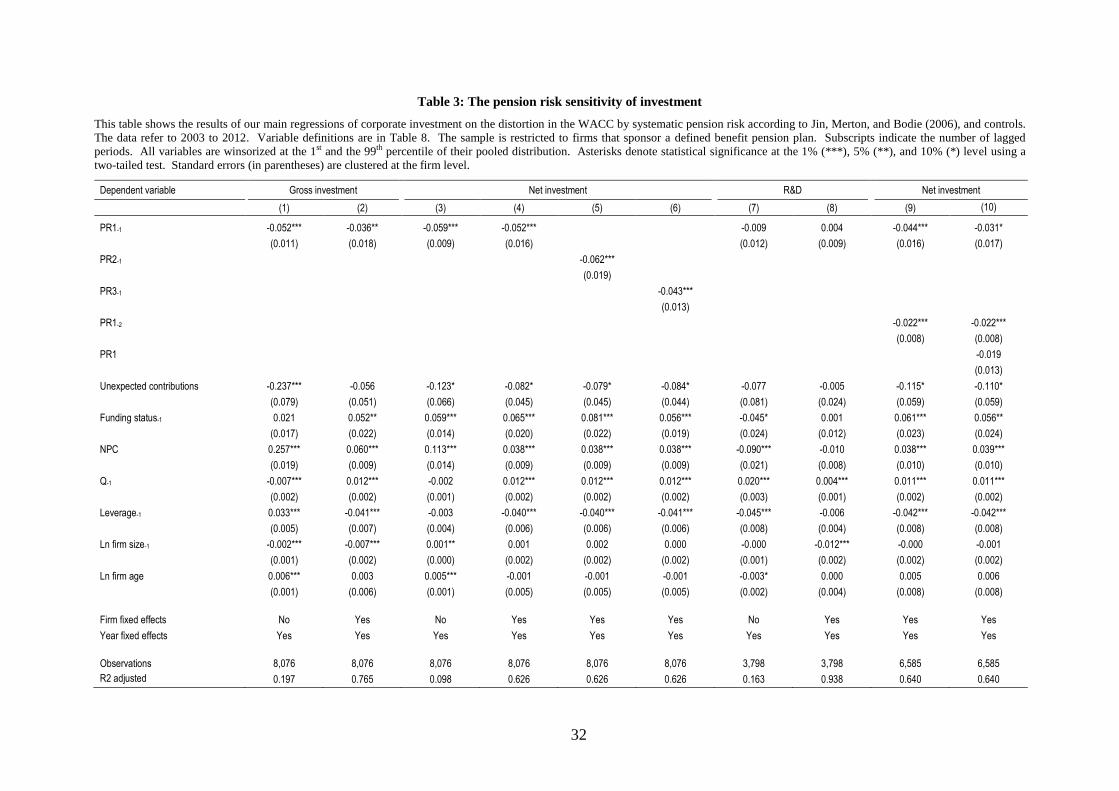
Table 3 studies the relation between corporate investment and systematic pension risk.
The statistical significance of the coefficients is determined based on a two-tailed test with
17
standard errors clustered at the firm level. Column (1) displays the results of a regression of
gross investment (capital expenditures) on systematic pension risk (PR1) and controls,
including year fixed effects. The coefficient on pension risk takes a negative value of -0.052
and is statistically significant at the 1 percent level. This is consistent with the hypothesis that
investment decisions are distorted because firms are discounting expected project cash flows
at a rate that is sensitive to systematic pension risk. Moreover, this result is in line with
Krüger, Landier, and Thesmar (2015), who find that segment investment of conglomerate
firms is distorted because firms fail to adjust the discount rates for the difference in the
systematic risk between their various business segments.
Column (2) shows the results of our regression model (7) that controls also for firm
fixed effects. In this analysis, the coefficient on systematic pension risk is only significant at
the 5 percent level and takes a value of -0.036, which is below the estimate from the
preceding regression. In Columns (3) and (4), we estimate the pension risk sensitivity of net
investment (capital expenditures minus depreciation). Without firm fixed effects, the pension
risk coefficient takes a value of -0.059. Including firm fixed effects slightly changes the
estimate to -0.052. In both regressions, the relation between net investment and pension risk is
statistically significant at the 1 percent level. The comparably stronger pension risk sensitivity
of net investment is in line with our expectation that pension risk primarily affects decisions
on new investment because NPV and IRR evaluation techniques are less frequently used in
pure replacement activities.
The coefficients of the control variables in the regressions that include firm fixed effects
are in line with previous studies regardless of whether investment is measured gross or net of
depreciation. In accordance with Rauh (2006), we find that investment increases with the
pension funding status, the nonpension cash flow, and Tobin’s Q, while it decreases with
18
unexpected pension contributions.5 Moreover, consistent with the findings in Lang, Ofek, and
Stulz (1996), we find that investment is negatively related to leverage. With the exception of
firm size and firm age, all coefficients are significantly different from zero. Firm size is
significantly negatively related to gross investment but unrelated to net investment. The
coefficient on firm age is insignificant and close to zero in magnitude.
Columns (5) and (6) test for the robustness of our results to the assumption concerning
the systematic risk of pension liabilities. We find that net investment is negatively related to
both alternative measures of systematic pension risk – PR2 and PR3. We obtain a similar
result in not tabulated regressions of gross investment.
The distortion of corporate investment by systematic pension risk is also of economic
significance. Based on the coefficients from Column (4), a one standard deviation increase of
pension risk (0.08) decreases net investment by 0.11 standard deviations (1 SD = 0.036). This
represents a decrease in the ratio of capital expenditures to assets by 19 percent. Given the
total asset value of our sample firms of USD 2.3 trillion, this corresponds to an annual USD
amount of 90 billion.
The remainder of Table 3 concerns the causality of the relation between pension risk
and investment. A detailed discussion on endogeneity and further considerations on causality
follow in the remainder of this paper. Columns (7) and (8) test for the pension risk sensitivity
of R&D expense. Unlike capital expenditures, R&D is often set as a fixed fraction of sales
(Anthony and Govindarajan (2007)). Therefore, it should be fairly insensitive to distortions in
the discount rate. Indeed, regardless of whether the regression includes firm fixed effects,
5 In not tabulated regressions, we replace unexpected contributions by the mandatory pension
contribution estimate of Campbell, Dhaliwal and Schwartz (2012). This results in a positive contribution
coefficient, which is inconsistent with Rauh (2006). We also receive positive coefficients for the Campbell et al.
measure when we exactly replicate the regressions in Campbell, Dhaliwal and Schwartz (2012), p. 891, Table 2,
Colum (3) and Column (4) for our sample period. We explain this result in the way that the measure of
Campbell, Dhaliwal and Schwartz (2012) is based on the number of years a firm is allowed to take to eliminate
an underfunding. In 2008, this period changed from 30 to 7 years. The Campbell et al. measure thus potentially
suffers from a structural break within our sample period (2003 – 2012). Replacing unexpected pension
contributions by a simple measure of overall pension contributions has virtually no impact on the coefficient on
systematic pension risk.

19
R&D expense is not significantly related to systematic pension risk (PR1). In not tabulated
regressions, we receive a similar result for PR2 and PR3.
According to Jin, Merton, and Bodie (2006), the WACC is affected by systematic
pension risk because firms estimate their cost of capital based on past return data that reflect
the risk of their DB pension plans. Since firms usually determine the WACC based on more
than one year of past stock return information (Brotherson, Eades, Harris, and Higgins
(2013)), investment decisions should also be sensitive to systematic pension risk measures
lagged by two years. The evidence in Column (9) supports this prediction. We find that net
investment is significantly negative related to both the one-year and the two-year lag of
systematic pension risk. We obtain a similar result when we measure systematic pension risk
by PR2 and PR3, respectively, or when we use gross investment as the dependent variable
(not tabulated). The regression in Column (10) additionally includes the current year
systematic pension risk. In section 4.2, we argue that investment should not be affected by the
current year systematic pension risk because this information is not yet reflected in the stock
returns that the firm uses to estimate the discount rate. Consistent with this reasoning the
coefficient on end-of-year systematic pension risk is not statistically different from zero. In a
not tabulated regression, we receive a similar result for the one year lead systematic pension
risk.
[insert Table 3 here]
5.3. Endogeneity
This section elaborates further on the causality of the relation between pension risk and
investment and discusses potential endogeneity concerns.

20
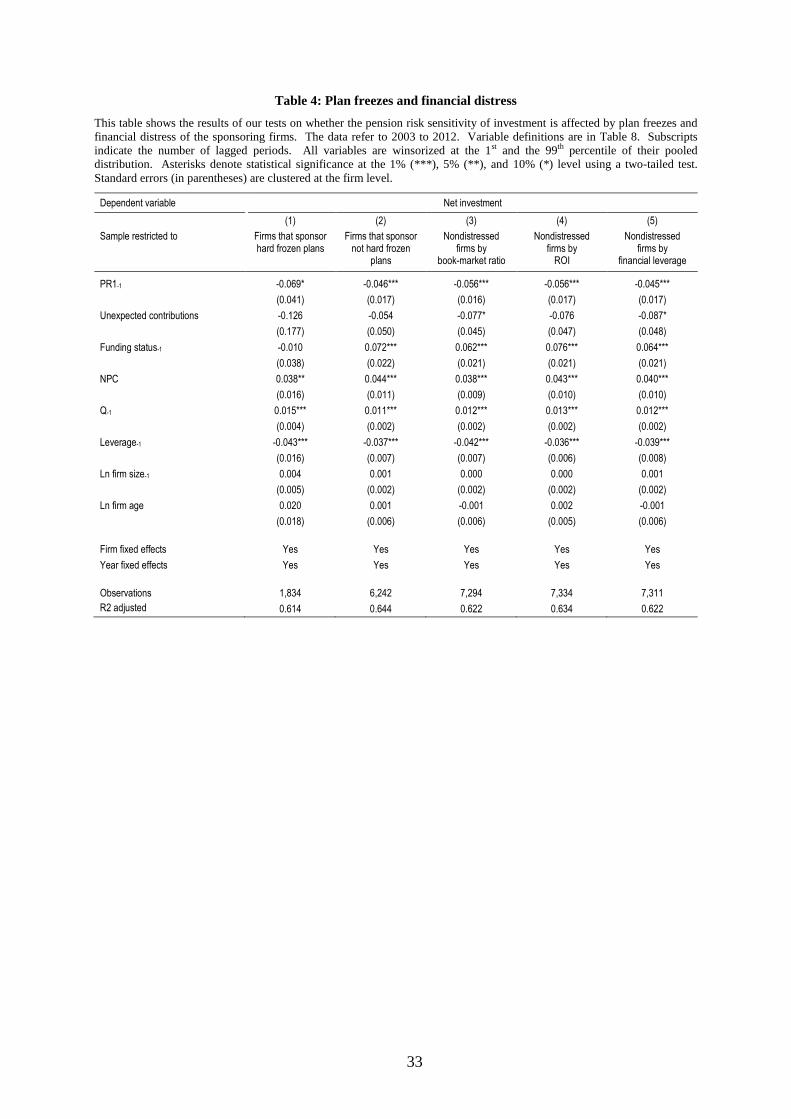
5.3.1. Pension freezes and financial distress
In recent years, many firms have frozen their DB pension plans and replaced new DB
promises by contributions to DC plans, where the uncertainty about future retirement benefits
lies entirely with the employees (Rauh, Stefanescu, and Zeldes (2013)). When a DB plan is
frozen, future accruals are discontinued. The firm’s existing (DB) pension obligations,
however, remain (Shivdasani and Stefanescu (2010)). Since the WACC reflects the risk from
existing pension assets and liabilities (Jin, Merton, and Bodie (2006)), the relation between
pension risk and investment should be robust to pension freezes. We test for this robustness
by separately estimating the pension risk sensitivity of investment of firms with frozen DB
plans and firms with open DB plans. The first two columns of Table 4 present the results.
We identify firms with frozen plans by the reported rate of compensation increase,
which is the firms’ estimate of the increase in the employees' salaries that will affect future
pension plan payments.6 According to FAS 87, a firm is only required to disclose this item if
it sponsors pay-related plans, which are plans where the benefits increase with the salary of
the employees. Since wage related benefit adjustments are explicitly discontinued in (hard)
frozen plans, we conclude that firms that do not report the rate of compensation increase have
frozen their DB plans.7 Based on this identification criterion, we find that the number of firms
with frozen DB plans has steadily increased from 90 in 2003 to 320 in 2012. In an average
year, 25 firms freeze their DB pension plans. However, there is also a small number of 7 firms
per year that unfreeze their DB plans.
We find that the coefficient on PR1 is negative and statistically significant in both
subsamples. In not tabulated regressions, we receive a similar result for gross investment and
our alternative pension risk measures. This shows that the pension risk sensitivity of
6 The reported rate of compensation increase is represented by the COMPUSTAT item pprci.
7 In a soft freeze, it is only future accruals from additional years of service that are discontinued. The
pension obligation is still adjusted for increases in the employees’ salaries (Rauh, Stefanescu, and Zeldes
(2013)).
21
investment is robust to plan freezes. Moreover, it implies that a further increase in the number
of firms with frozen DB plans is unlikely to diminish the economic importance of our finding.
In the second part of Table 4, we test whether our results could be driven by financially
distressed firms. Bodie, Light, Morck, and Taggart (1985), Bodie (1996), and Jin, Merton,
and Bodie (2006) argue that financially distressed pension sponsors face a put option on their
pension liability by the PBGC. In case the plan sponsor goes bankrupt, the PBGC takes over
the pension liabilities. This pension put potentially incentivizes firms in financial distress to
invest the pension assets in securities with higher systematic risk (Jin, Merton, and Bodie
(2006)). According to Hoshi, Kashyap, and Scharfstein (1990), financially distressed firms
have also a tendency to cut investment. The negative relation between pension risk and
investment could hence be driven by financially distressed firms that simultaneously increase
their pension risk and reduce their investment. To address this concern, we repeat our analysis
for nondistressed firms only. Following Jin, Merton, and Bodie (2006), we measure financial
distress based on (1) book to market ratio, (2) return on investment, and (3) financial
leverage.8 Based on each of these criteria, we construct a subsample of firms where
investment decisions are unlikely affected by financial distress. In each year, we exclude the
90th
percentile of firms that appeared the most severe financially distressed the year before. In
Columns (3) to (5) of Table 4, we show the estimates for these subsamples of nondistressed
firms. In all regressions, we estimate a negative and statistically significant coefficient on
systematic pension risk that is close to -0.05 in magnitude, which is comparable to the
pension risk sensitivity of net investment in in the entire sample. We receive a similar result
for gross investment and PR2 and PR3 in not tabulated regressions. This indicates that our
results are not driven by firms in financial distress.
[insert Table 4 here]
8 The definitions are given in Table 8 of the appendix.
22
5.3.2. Unobserved mandatory contributions
Rauh (2006) finds that investment of financially constrained firms declines with
mandatory pension contributions because firms that lack access to external financing
resources face a trade-off between spending a dollar on investment and spending this dollar
on mandatory pension contributions. Campbell, Dhaliwal, and Schwartz (2012) show that
Rauh’s result is explained by the positive impact of mandatory contributions on the WACC of
financially constrained firms. So far, we control for this effect by including unexpected
pension contributions as a control variable. This might however be insufficient to control for
the correlation between mandatory contributions and pension risk. Our finding could hence
still be a consequence of an omitted variable bias. If this was the case, the pension risk
sensitivity of investment could actually reflect the crowding out of investment by mandatory
contributions, as argued by Rauh (2006). It would however also imply that the pension risk
sensitivity of investment is limited to financially constrained firms. Unconstrained firms can
easily replace cash outflows by additional external financing. Their investment activity should
thus be unaffected by mandatory contributions. On the other hand, if the sensitivity of
investment to pension risk is caused by a discount rate bias in the capital budgeting process, it
should affect pension sponsoring firms at large regardless of financing constraints. To
distinguish between these two explanations, we follow Rauh (2006) and repeat our analysis
for different subsamples where we sort the firms along different possible proxies for financing
constraints. Table 5 presents the results. In each panel, the most severe financially constrained
firms constitute the first subsample, partially constrained firms form the second subsample,
and comparably unconstrained firms make up the third subsample. We display the results of
regressions of net investment on PR1 and controls, including year and firm fixed effects. Our
findings remain qualitatively unaffected when we consider regressions of gross investment or
alternatively measure systematic pension risk by PR2 and PR3.
23
Overall, we find that pension risk is negatively related to investment independently of
financing constraints, which is consistent with the existence of a discount rate bias.
Unexpected pension contributions, however, primarily affect the investment of financially
constrained firms, which is in line with the results of Rauh (2006) for mandatory pension
contributions.
The first panel, where we sort firms along their median age, shows a significant
negative impact of pension risk on investment for middle aged and old firms, which are
comparably unconstrained. On the other hand, the coefficient on unexpected pension
contributions is only statistically significant for young firms, where its magnitude (-0.182) is
more twenty times its value in the sample of the oldest firms (-0.009).
Hadlock and Pierce (2010) argue that firm age, together with firm size, is a particularly
good indicator of financing constraints. Hence, they combine the two measures in their size-
age (SA) index, which we use to sort the firms in the second panel.9 We find that investment
decreases with systematic pension risk both for firms with high SA index values (higher
financing constraints) and firms with low SA index values. The coefficient on unexpected
pension contributions is however only statistically significant for firms with high SA index
values. The investment of firms with low SA index values is essentially unaffected by
unexpected pension contributions.
The third panel classifies firms according to their S&P credit rating into firms with no
credit rating, firms with a credit rating that is below investment grade (BBB-), and investment
grade firms. While we find a negative and statistically significant pension risk sensitivity of
investment in all subsamples, the coefficient on unexpected pension contributions is only
statistically significant for firms with no rating.
The fourth panel divides the sample along the median dividend-to-assets ratio. In
analogy to Rauh (2006), the investment of firms with low dividend ratios displays the
9 The detailed SA index calculation is provided in Table 8 of the appendix.
24
strongest sensitivity to unexpected pension contributions, while we observe no significant
relation for high dividend paying firms. On the other hand, investment of high dividend as
well as low dividend firms is significantly negatively affected by systematic pension risk.
Altogether, the results of the analyses in this section represent evidence against an
explanation of the pension risk sensitivity of investment by unobserved mandatory
contributions. On the contrary, they indicate that pension risk affects corporate investment on
top of the distortion from mandatory contributions, as identified by Rauh (2006).
[insert Table 5 here]
5.3.3. Unobserved investment opportunities
A further endogeneity concern is that our results could be caused by the correlation of
systematic pension risk with unobserved investment opportunities of the sponsoring firm. The
correlation of an explanatory variable of investment with unobserved investment
opportunities is a well-known issue in the investment literature. Historically, the problem
primarily concerned the analysis of the cash flow sensitivity of investment (e.g. Kaplan and
Zingales (1997), Kaplan and Zingales (2000), Erickson and Whited (2000), and Rauh (2006)).
The same endogeneity concern applies to our study because firms with higher systematic
pension risk are typically older than firms with small pension plans and these firms might
have fewer investment opportunities (Loderer, Stulz, and Waelchli (2015)). To mitigate the
concern that systematic pension risk is correlated with unobserved investment opportunities,
we match each pension-sponsoring firm to a comparable nonpension firm, i.e., a firm that
does not sponsor a DB pension plan. Our sample of nonpension firms includes all
COMPUSTAT firms that are not listed on the COMPUSTAT North America Pension

25
database. Systematic pension risk is zero for these firms (Jin, Merton, and Bodie (2006)) and
therefore by definition uncorrelated with unobserved investment opportunities. Thus, a
negative and significant coefficient on pension risk in this matched sample is unlikely the
consequence of a correlation of pension risk with unobserved investment opportunities.
We perform a one-to-one matching of pension to nonpension firms based on propensity
scores for each fiscal year, without replacement, using a caliper of 1 percent. Our matching
variables are Tobin’s Q, cash flow, book leverage, book value of assets, firm age, and Fama
French 48 industry membership. We use these criteria because they represent important
determinants of corporate investment and pension firms typically differ from nonpension
firms along these dimensions. Firms that sponsor a DB plan tend to be older and larger than
firms without DB plan (Rauh (2006)). Therefore, they likely have fewer growth opportunities
(Loderer, Stulz, and Waelchli (2015)). Moreover, pension firms are more leveraged and have
higher operating cash flows than nonpension firms (Shivdasani and Stefanescu (2010)).
Finally, due to the historical evolution of pension plans and the emergence of DC plans, firms
that sponsor a DB plan usually belong to more traditional industries. We calculate the
propensity scores based on the method suggested by Abadie and Imbens (2006) and originally
developed by Rosenbaum and Rubin (1983).10
The procedure provides us with a sample of
9,548 observations (4,774 pension firm-years and 4,774 nonpension firm-years).
Table 6 reports the results of the analysis. In Column (1), we regress net investment on an
identifier variable for pension firms (b DBP sponsor), the continuous nonpension variables
from equation (7), and year fixed effects. The coefficient on b DBP sponsor takes a value
of -0.007. This suggests that net investment (relative to assets) of pension firms is on average
approximately 0.7 percentage points lower than net investment of nonpension firms. This
corresponds to 14 percent of the average capital expenditures to assets ratio (0.049) of the
firms in this matched sample.
10
This is implemented in the STATA module psmatch2 of Leuven and Sianesi (2014)
26
In Column (2), we extend the regression by the systematic pension risk (PR1). In this
regression, the coefficient on b DBP sponsor decreases to -0.004. The coefficient on pension
risk is negative and statistically significant. This indicates that a sizable part of the relatively
lower investment of pension firms is explained by systematic pension risk, which is consistent
with the interpretation that pension firms underinvest, on average. In Columns (3) to (5), we
test our original two-way fixed effects specification from equation (7) and estimate the
pension risk sensitivity based on our three pension risk measures (PR1, PR2, and PR3).
Similar to our main analysis in section 5.2, including firm fixed effects allows controlling for
omitted variables that remain constant over time. The pension risk sensitivity of investment is
negative and statistically significant in all estimations. Column (6) shows that pension risk is
also negatively related to gross investment.11
The consistency of these results with our main
findings in section 5.2 alleviates the concern that the pension risk sensitivity of investment is
induced by a negative correlation between pension risk and unobserved investment
opportunities.
[insert Table 6 here]
5.4. Reaction of nonpension firms
As pointed out in the introduction, we finally examine the reaction of firms that do not
sponsor a DB plan (nonpension firms) to the distortion of investment at pension firms. Our
explanation of the pension risk sensitivity of investment implies that pension firms forgo
economically valuable investment opportunities. Rauh (2006) presents evidence that
nonpension firms capture the forgone investment opportunities of financially constrained
11
In not tabulated regressions, we receive a similar result for PR2 and PR3.
27
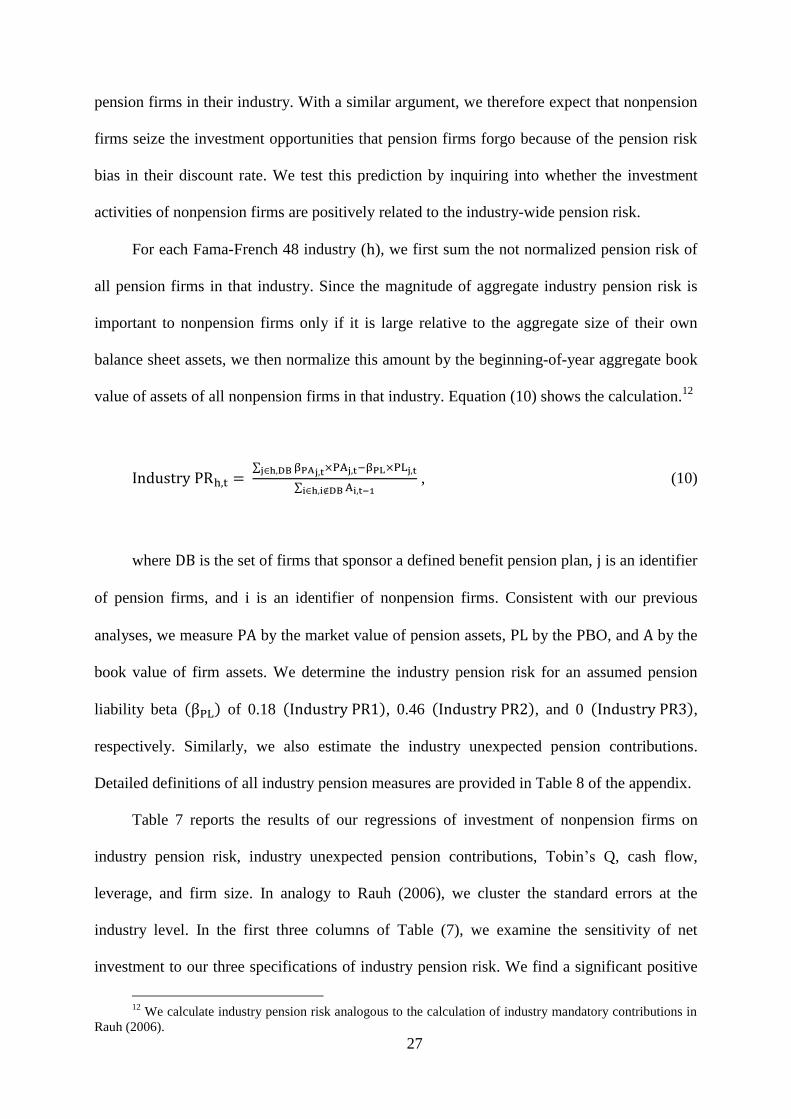
pension firms in their industry. With a similar argument, we therefore expect that nonpension
firms seize the investment opportunities that pension firms forgo because of the pension risk
bias in their discount rate. We test this prediction by inquiring into whether the investment
activities of nonpension firms are positively related to the industry-wide pension risk.
For each Fama-French 48 industry (h), we first sum the not normalized pension risk of
all pension firms in that industry. Since the magnitude of aggregate industry pension risk is
important to nonpension firms only if it is large relative to the aggregate size of their own
balance sheet assets, we then normalize this amount by the beginning-of-year aggregate book
value of assets of all nonpension firms in that industry. Equation (10) shows the calculation.12
Industry PRh,t = ∑ βPAj,t×PAj,t−βPL×PLj,tj∈h,DB
∑ Ai,t−1i∈h,i∉DB , (10)
where DB is the set of firms that sponsor a defined benefit pension plan, j is an identifier
of pension firms, and i is an identifier of nonpension firms. Consistent with our previous
analyses, we measure PA by the market value of pension assets, PL by the PBO, and A by the
book value of firm assets. We determine the industry pension risk for an assumed pension
liability beta (βPL) of 0.18 (Industry PR1), 0.46 (Industry PR2), and 0 (Industry PR3),
respectively. Similarly, we also estimate the industry unexpected pension contributions.
Detailed definitions of all industry pension measures are provided in Table 8 of the appendix.
Table 7 reports the results of our regressions of investment of nonpension firms on
industry pension risk, industry unexpected pension contributions, Tobin’s Q, cash flow,
leverage, and firm size. In analogy to Rauh (2006), we cluster the standard errors at the
industry level. In the first three columns of Table (7), we examine the sensitivity of net
investment to our three specifications of industry pension risk. We find a significant positive
12
We calculate industry pension risk analogous to the calculation of industry mandatory contributions in
Rauh (2006).

28
industry pension risk sensitivity of net investment of nonpension firms in all regressions.
Column (4) shows that gross investment of nonpension firms is significantly positively related
to industry pension risk as well.13
Although it is not statistically significant, the coefficient on
industry unexpected pension contributions is positive. This is consistent with Rauh (2006),
who shows that nonpension firms capture investment that is crowded out by mandatory
pension contributions. With the exception of the natural logarithm of age, which is
significantly negatively related to investment of nonpension firms, the signs and the statistical
significance of the coefficients on the remaining control variables are comparable to the
estimates in or preceding analyses.
We interpret the results from Table (7) as supporting evidence for our explanation of the
pension risk sensitivity of investment with a discount rate bias. It shows that the forgone
valuable investment by firms that use distorted discount rates is undertaken by firms whose
capital budgeting process is not analogously biased.
[insert Table 7 here]
13
In not tabulated regressions, where we estimate the industry pension risk based on PR2 and PR3,
respectively, we receive qualitatively similar results.
29
6. Conclusion
By analyzing a large sample of U.S. firms, we find that corporate investment is
negatively affected by systematic pension risk and that pension firms underinvest, on average.
The effect is economically large and not limited to firms that have not yet frozen their defined
benefit pension plans. Our results are consistent with the interpretation that using the WACC
as a firm-wide discount rate distorts capital budgeting decisions because the standard
calculation of WACC fails to ignore the size and the systematic risk of pension assets and
liabilities, which are both unrelated to a firm’s operating business. Our findings cannot be
explained by financing constraints of the sponsoring firms or the correlation of systematic
pension risk with unobserved investment opportunities. The distortion of investment by
pension risk occurs on top of the effect from mandatory contributions, as identified by Rauh
(2006). The forgone investment by pension firms is partially seized by firms that do not suffer
from a pension risk bias in their capital budgeting process.
We contribute to the investment literature by showing that corporate investment is
distorted by an important nonoperating systematic risk in the computation of discount rates.
Existing research finds that using a single discount rate in the NPV analysis of investment
projects distorts the resource allocation within the firm. We find that it can distort the resource
allocation between firms as well. Hence, we believe that the relevance of this paper goes
beyond pension economics. Our findings apply to all firms that base their investment
decisions on a single discount rate without noticing the different sources of systematic risk.
30
Appendix: Tables
Table 1: Descriptive sample statistics
This table shows the descriptive sample statistics of our main variables. Variable definitions are in Table 8. The data refer to
2003 to 2012. The sample is restricted to firms that sponsor a defined benefit pension plan. All variables are winsorized at
the 1st and the 99th percentile of their pooled sample distribution.
Mean Median Min 10th %ile 90th %ile Max Std.
(overall) Std.
(within) N
Gross investment 0.045 0.032 0.000 0.002 0.099 0.259 0.046 0.023 9,770
Net investment 0.008 -0.000 -0.053 -0.022 0.048 0.180 0.036 0.022 9,770
R&D 0.029 0.016 0.000 0.000 0.078 0.196 0.038 0.010 4,563
PR1 0.060 0.031 -0.003 0.002 0.158 0.395 0.077 0.026 9,770
PR2 0.017 0.004 -0.052 -0.008 0.059 0.202 0.038 0.022 9,770
PR3 0.087 0.048 0.001 0.005 0.222 0.542 0.107 0.031 9,770
Pension liability 0.154 0.093 0.002 0.010 0.374 0.967 0.180 0.046 9,770
Funding status -0.031 -0.016 -0.226 -0.084 0.000 0.061 0.045 0.023 9,770
Unexpected contributions 0.001 0.000 -0.020 -0.002 0.007 0.031 0.006 0.006 9,719
NPC 0.090 0.085 -0.171 0.007 0.189 0.377 0.085 0.053 9,770
Q 1.499 1.261 0.730 0.949 2.343 5.004 0.723 0.328 9,770
Leverage 0.245 0.224 0.000 0.031 0.483 0.835 0.177 0.069 9,770
Firm assets ($m) 15,677 2,544 36 275 29,016 427,452 51,647 8,277 9,770
Firm age 34 32 5 9 62 86 22 2 9,770
31
Table 2: Pearson correlation matrix
This table shows the pairwise Pearson correlations between selected variables. Variable definitions are in Table 8. The data refer to 2003 to 2012. The sample is restricted to firms that sponsor
a defined benefit pension plan. Subscripts indicate the number of lagged periods. The asterisk denotes statistical significance at the 5% level using a two-tailed test. All variables are winsorized
at the 1st and the 99th percentile of their pooled sample distribution.
(1) (2) (3) (4) (5) (6) (7) (8) (9) (10) (11) (12) (13)
(1) Net investment 1
(2) R&D -0.1238* 1
(3) PR1 -1 -0.0849* -0.0283 1
(4) PR2-1 -0.0325* -0.0386* 0.8478* 1
(5) PR3-1 -0.0932* -0.0244 0.9918* 0.7774* 1
(6) Pension liability -1 -0.1064* -0.0091 0.9067* 0.5612* 0.9516* 1
(7) Funding status-1 0.1079* -0.019 -0.3791* 0.0583* -0.4668* -0.6585* 1
(8) Unexpected contributions -0.0258* -0.0143 0.1672* 0.0576* 0.1872* 0.2236* -0.2456* 1
(9) NPC 0.2077* 0.0559* 0.1603* 0.1141* 0.1648* 0.1647* -0.1271* 0.1170* 1
(10) Q-1 0.1101* 0.3114* 0.1327* 0.1319* 0.1266* 0.1073* -0.0297* 0.0648* 0.5977* 1
(11) Leverage-1 -0.0292* -0.2144* -0.0083 -0.0041 -0.0080 -0.0065 -0.0180 -0.0122 -0.0757* -0.0959* 1
(12) Ln firm size -1 0.0569* -0.0694* -0.0773* -0.0033 -0.0906* -0.1183* 0.1631* 0.0234* -0.1028* -0.1061* 0.1272* 1
(13) Ln firm age 0.0773* -0.0620* 0.2598* 0.2075* 0.2605* 0.2450* -0.1257* 0.0839* 0.0840* 0.0106 -0.0291* 0.1958* 1
32
Table 3: The pension risk sensitivity of investment
This table shows the results of our main regressions of corporate investment on the distortion in the WACC by systematic pension risk according to Jin, Merton, and Bodie (2006), and controls.
The data refer to 2003 to 2012. Variable definitions are in Table 8. The sample is restricted to firms that sponsor a defined benefit pension plan. Subscripts indicate the number of lagged
periods. All variables are winsorized at the 1st and the 99th percentile of their pooled distribution. Asterisks denote statistical significance at the 1% (***), 5% (**), and 10% (*) level using a
two-tailed test. Standard errors (in parentheses) are clustered at the firm level.
Dependent variable Gross investment Net investment R&D Net investment
(1) (2) (3) (4) (5) (6) (7) (8) (9) (10)
PR1-1 -0.052*** -0.036** -0.059*** -0.052*** -0.009 0.004 -0.044*** -0.031*
(0.011) (0.018) (0.009) (0.016) (0.012) (0.009) (0.016) (0.017)
PR2-1 -0.062***
(0.019)
PR3-1 -0.043***
(0.013)
PR1-2 -0.022*** -0.022***
(0.008) (0.008)
PR1 -0.019
(0.013)
Unexpected contributions -0.237*** -0.056 -0.123* -0.082* -0.079* -0.084* -0.077 -0.005 -0.115* -0.110*
(0.079) (0.051) (0.066) (0.045) (0.045) (0.044) (0.081) (0.024) (0.059) (0.059)
Funding status-1 0.021 0.052** 0.059*** 0.065*** 0.081*** 0.056*** -0.045* 0.001 0.061*** 0.056**
(0.017) (0.022) (0.014) (0.020) (0.022) (0.019) (0.024) (0.012) (0.023) (0.024)
NPC 0.257*** 0.060*** 0.113*** 0.038*** 0.038*** 0.038*** -0.090*** -0.010 0.038*** 0.039***
(0.019) (0.009) (0.014) (0.009) (0.009) (0.009) (0.021) (0.008) (0.010) (0.010)
Q-1 -0.007*** 0.012*** -0.002 0.012*** 0.012*** 0.012*** 0.020*** 0.004*** 0.011*** 0.011***
(0.002) (0.002) (0.001) (0.002) (0.002) (0.002) (0.003) (0.001) (0.002) (0.002)
Leverage-1 0.033*** -0.041*** -0.003 -0.040*** -0.040*** -0.041*** -0.045*** -0.006 -0.042*** -0.042***
(0.005) (0.007) (0.004) (0.006) (0.006) (0.006) (0.008) (0.004) (0.008) (0.008)
Ln firm size-1 -0.002*** -0.007*** 0.001** 0.001 0.002 0.000 -0.000 -0.012*** -0.000 -0.001
(0.001) (0.002) (0.000) (0.002) (0.002) (0.002) (0.001) (0.002) (0.002) (0.002)
Ln firm age 0.006*** 0.003 0.005*** -0.001 -0.001 -0.001 -0.003* 0.000 0.005 0.006
(0.001) (0.006) (0.001) (0.005) (0.005) (0.005) (0.002) (0.004) (0.008) (0.008)
Firm fixed effects No Yes No Yes Yes Yes No Yes Yes Yes
Year fixed effects Yes Yes Yes Yes Yes Yes Yes Yes Yes Yes
Observations 8,076 8,076 8,076 8,076 8,076 8,076 3,798 3,798 6,585 6,585
R2 adjusted
0.197 0.765 0.098 0.626 0.626 0.626 0.163 0.938 0.640 0.640
33
Table 4: Plan freezes and financial distress
This table shows the results of our tests on whether the pension risk sensitivity of investment is affected by plan freezes and
financial distress of the sponsoring firms. The data refer to 2003 to 2012. Variable definitions are in Table 8. Subscripts
indicate the number of lagged periods. All variables are winsorized at the 1st and the 99th percentile of their pooled
distribution. Asterisks denote statistical significance at the 1% (***), 5% (**), and 10% (*) level using a two-tailed test.
Standard errors (in parentheses) are clustered at the firm level.
Dependent variable Net investment
(1) (2) (3) (4) (5)
Sample restricted to Firms that sponsor hard frozen plans
Firms that sponsor not hard frozen
plans
Nondistressed firms by
book-market ratio
Nondistressed firms by
ROI
Nondistressed firms by
financial leverage
PR1-1 -0.069* -0.046*** -0.056*** -0.056*** -0.045***
(0.041) (0.017) (0.016) (0.017) (0.017)
Unexpected contributions -0.126 -0.054 -0.077* -0.076 -0.087*
(0.177) (0.050) (0.045) (0.047) (0.048)
Funding status-1 -0.010 0.072*** 0.062*** 0.076*** 0.064***
(0.038) (0.022) (0.021) (0.021) (0.021)
NPC 0.038** 0.044*** 0.038*** 0.043*** 0.040***
(0.016) (0.011) (0.009) (0.010) (0.010)
Q-1 0.015*** 0.011*** 0.012*** 0.013*** 0.012***
(0.004) (0.002) (0.002) (0.002) (0.002)
Leverage-1 -0.043*** -0.037*** -0.042*** -0.036*** -0.039***
(0.016) (0.007) (0.007) (0.006) (0.008)
Ln firm size-1 0.004 0.001 0.000 0.000 0.001
(0.005) (0.002) (0.002) (0.002) (0.002)
Ln firm age 0.020 0.001 -0.001 0.002 -0.001
(0.018) (0.006) (0.006) (0.005) (0.006)
Firm fixed effects Yes Yes Yes Yes Yes
Year fixed effects Yes Yes Yes Yes Yes
Observations 1,834 6,242 7,294 7,334 7,311
R2 adjusted
0.614 0.644 0.622 0.634 0.622
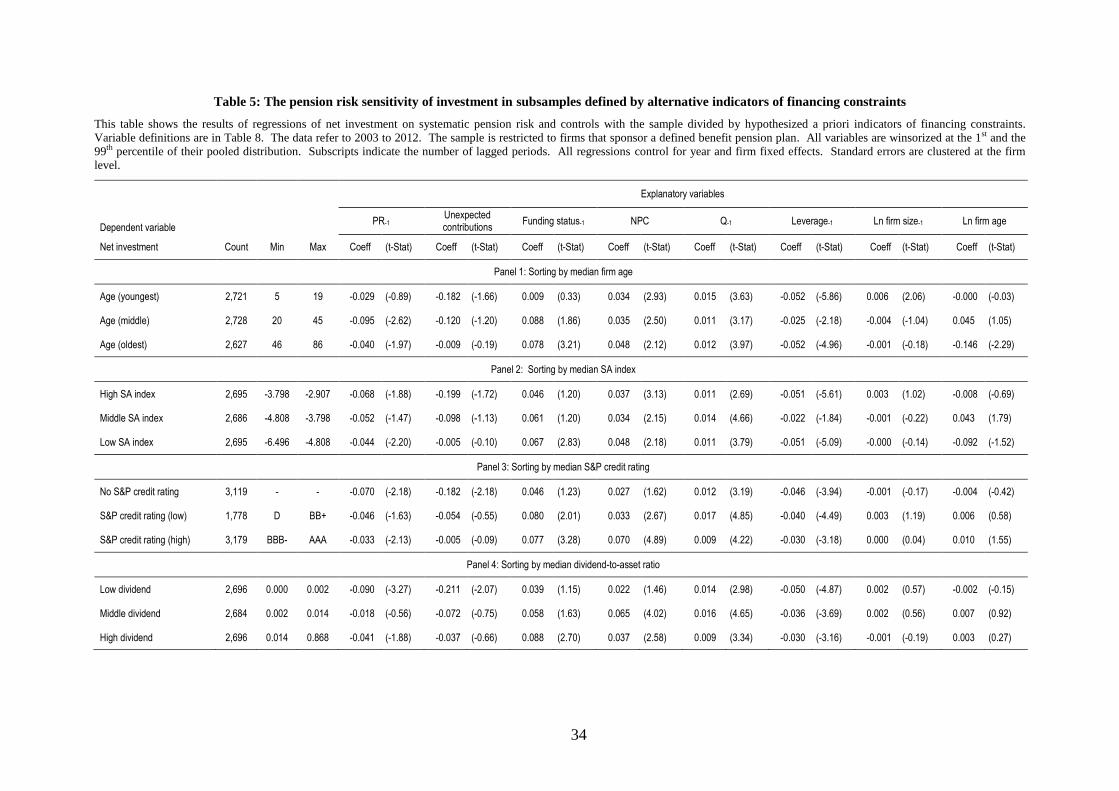
34
Table 5: The pension risk sensitivity of investment in subsamples defined by alternative indicators of financing constraints
This table shows the results of regressions of net investment on systematic pension risk and controls with the sample divided by hypothesized a priori indicators of financing constraints.
Variable definitions are in Table 8. The data refer to 2003 to 2012. The sample is restricted to firms that sponsor a defined benefit pension plan. All variables are winsorized at the 1st and the
99th percentile of their pooled distribution. Subscripts indicate the number of lagged periods. All regressions control for year and firm fixed effects. Standard errors are clustered at the firm
level.
Explanatory variables
Dependent variable PR-1
Unexpected contributions
Funding status-1 NPC Q-1 Leverage-1 Ln firm size-1 Ln firm age
Net investment Count Min Max Coeff (t-Stat) Coeff (t-Stat) Coeff (t-Stat) Coeff (t-Stat) Coeff (t-Stat) Coeff (t-Stat) Coeff (t-Stat) Coeff (t-Stat)
Panel 1: Sorting by median firm age
Age (youngest) 2,721 5 19 -0.029 (-0.89) -0.182 (-1.66) 0.009 (0.33) 0.034 (2.93) 0.015 (3.63) -0.052 (-5.86) 0.006 (2.06) -0.000 (-0.03)
Age (middle) 2,728 20 45 -0.095 (-2.62) -0.120 (-1.20) 0.088 (1.86) 0.035 (2.50) 0.011 (3.17) -0.025 (-2.18) -0.004 (-1.04) 0.045 (1.05)
Age (oldest) 2,627 46 86 -0.040 (-1.97) -0.009 (-0.19) 0.078 (3.21) 0.048 (2.12) 0.012 (3.97) -0.052 (-4.96) -0.001 (-0.18) -0.146 (-2.29)
Panel 2: Sorting by median SA index
High SA index 2,695 -3.798 -2.907 -0.068 (-1.88) -0.199 (-1.72) 0.046 (1.20) 0.037 (3.13) 0.011 (2.69) -0.051 (-5.61) 0.003 (1.02) -0.008 (-0.69)
Middle SA index 2,686 -4.808 -3.798 -0.052 (-1.47) -0.098 (-1.13) 0.061 (1.20) 0.034 (2.15) 0.014 (4.66) -0.022 (-1.84) -0.001 (-0.22) 0.043 (1.79)
Low SA index 2,695 -6.496 -4.808 -0.044 (-2.20) -0.005 (-0.10) 0.067 (2.83) 0.048 (2.18) 0.011 (3.79) -0.051 (-5.09) -0.000 (-0.14) -0.092 (-1.52)
Panel 3: Sorting by median S&P credit rating
No S&P credit rating 3,119 - - -0.070 (-2.18) -0.182 (-2.18) 0.046 (1.23) 0.027 (1.62) 0.012 (3.19) -0.046 (-3.94) -0.001 (-0.17) -0.004 (-0.42)
S&P credit rating (low) 1,778 D BB+ -0.046 (-1.63) -0.054 (-0.55) 0.080 (2.01) 0.033 (2.67) 0.017 (4.85) -0.040 (-4.49) 0.003 (1.19) 0.006 (0.58)
S&P credit rating (high) 3,179 BBB- AAA -0.033 (-2.13) -0.005 (-0.09) 0.077 (3.28) 0.070 (4.89) 0.009 (4.22) -0.030 (-3.18) 0.000 (0.04) 0.010 (1.55)
Panel 4: Sorting by median dividend-to-asset ratio
Low dividend 2,696 0.000 0.002 -0.090 (-3.27) -0.211 (-2.07) 0.039 (1.15) 0.022 (1.46) 0.014 (2.98) -0.050 (-4.87) 0.002 (0.57) -0.002 (-0.15)
Middle dividend 2,684 0.002 0.014 -0.018 (-0.56) -0.072 (-0.75) 0.058 (1.63) 0.065 (4.02) 0.016 (4.65) -0.036 (-3.69) 0.002 (0.56) 0.007 (0.92)
High dividend 2,696 0.014 0.868 -0.041 (-1.88) -0.037 (-0.66) 0.088 (2.70) 0.037 (2.58) 0.009 (3.34) -0.030 (-3.16) -0.001 (-0.19) 0.003 (0.27)
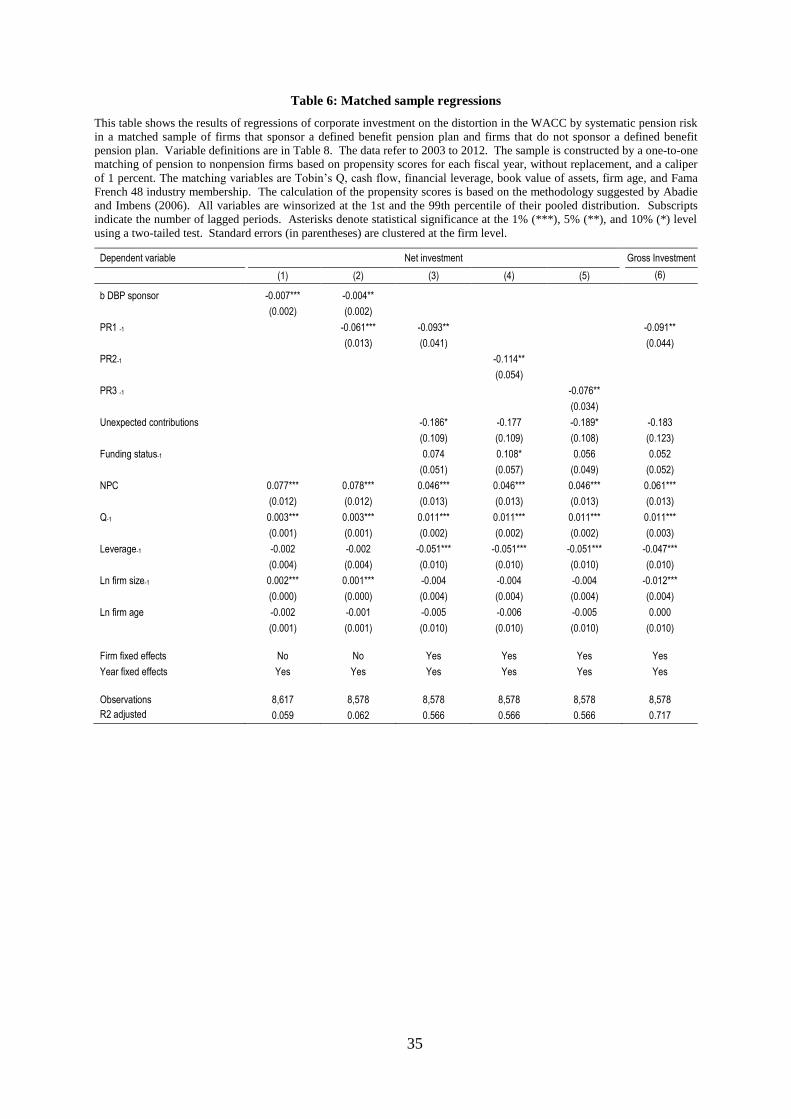
35
Table 6: Matched sample regressions
This table shows the results of regressions of corporate investment on the distortion in the WACC by systematic pension risk
in a matched sample of firms that sponsor a defined benefit pension plan and firms that do not sponsor a defined benefit
pension plan. Variable definitions are in Table 8. The data refer to 2003 to 2012. The sample is constructed by a one-to-one
matching of pension to nonpension firms based on propensity scores for each fiscal year, without replacement, and a caliper
of 1 percent. The matching variables are Tobin’s Q, cash flow, financial leverage, book value of assets, firm age, and Fama
French 48 industry membership. The calculation of the propensity scores is based on the methodology suggested by Abadie
and Imbens (2006). All variables are winsorized at the 1st and the 99th percentile of their pooled distribution. Subscripts
indicate the number of lagged periods. Asterisks denote statistical significance at the 1% (***), 5% (**), and 10% (*) level
using a two-tailed test. Standard errors (in parentheses) are clustered at the firm level.
Dependent variable Net investment Gross Investment
(1) (2) (3) (4) (5) (6)
b DBP sponsor -0.007*** -0.004**
(0.002) (0.002)
PR1 -1 -0.061*** -0.093** -0.091**
(0.013) (0.041) (0.044)
PR2-1 -0.114**
(0.054)
PR3 -1 -0.076**
(0.034)
Unexpected contributions -0.186* -0.177 -0.189* -0.183
(0.109) (0.109) (0.108) (0.123)
Funding status-1 0.074 0.108* 0.056 0.052
(0.051) (0.057) (0.049) (0.052)
NPC 0.077*** 0.078*** 0.046*** 0.046*** 0.046*** 0.061***
(0.012) (0.012) (0.013) (0.013) (0.013) (0.013)
Q-1 0.003*** 0.003*** 0.011*** 0.011*** 0.011*** 0.011***
(0.001) (0.001) (0.002) (0.002) (0.002) (0.003)
Leverage-1 -0.002 -0.002 -0.051*** -0.051*** -0.051*** -0.047***
(0.004) (0.004) (0.010) (0.010) (0.010) (0.010)
Ln firm size-1 0.002*** 0.001*** -0.004 -0.004 -0.004 -0.012***
(0.000) (0.000) (0.004) (0.004) (0.004) (0.004)
Ln firm age -0.002 -0.001 -0.005 -0.006 -0.005 0.000
(0.001) (0.001) (0.010) (0.010) (0.010) (0.010)
Firm fixed effects No No Yes Yes Yes Yes
Year fixed effects Yes Yes Yes Yes Yes Yes
Observations 8,617 8,578 8,578 8,578 8,578 8,578
R2 adjusted
0.059 0.062 0.566 0.566 0.566 0.717
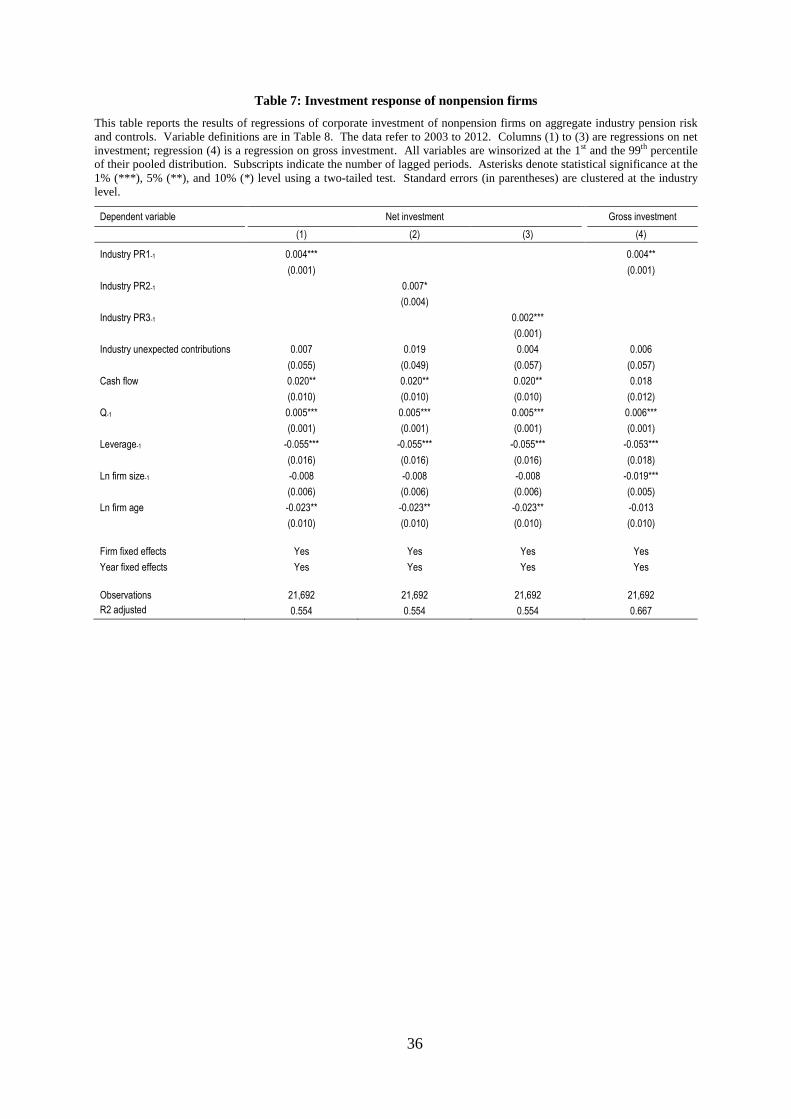
36
Table 7: Investment response of nonpension firms
This table reports the results of regressions of corporate investment of nonpension firms on aggregate industry pension risk
and controls. Variable definitions are in Table 8. The data refer to 2003 to 2012. Columns (1) to (3) are regressions on net
investment; regression (4) is a regression on gross investment. All variables are winsorized at the 1st and the 99th percentile
of their pooled distribution. Subscripts indicate the number of lagged periods. Asterisks denote statistical significance at the
1% (***), 5% (**), and 10% (*) level using a two-tailed test. Standard errors (in parentheses) are clustered at the industry
level.
Dependent variable Net investment Gross investment
(1) (2) (3) (4)
Industry PR1-1 0.004*** 0.004**
(0.001) (0.001)
Industry PR2-1 0.007*
(0.004)
Industry PR3-1 0.002***
(0.001)
Industry unexpected contributions 0.007 0.019 0.004 0.006
(0.055) (0.049) (0.057) (0.057)
Cash flow 0.020** 0.020** 0.020** 0.018
(0.010) (0.010) (0.010) (0.012)
Q-1 0.005*** 0.005*** 0.005*** 0.006***
(0.001) (0.001) (0.001) (0.001)
Leverage-1 -0.055*** -0.055*** -0.055*** -0.053***
(0.016) (0.016) (0.016) (0.018)
Ln firm size-1 -0.008 -0.008 -0.008 -0.019***
(0.006) (0.006) (0.006) (0.005)
Ln firm age -0.023** -0.023** -0.023** -0.013
(0.010) (0.010) (0.010) (0.010)
Firm fixed effects Yes Yes Yes Yes
Year fixed effects Yes Yes Yes Yes
Observations 21,692 21,692 21,692 21,692
R2 adjusted
0.554 0.554 0.554 0.667

37
Table 8: Variable definitions
This table summarizes the variable definitions. The data are from the CRSP/COMPUSTAT Merged database and the
COMPUSTAT North America Pension database. Subscripts indicate the number of lagged periods.
Variable Definition (incl. COMPUSTAT mnemonics)
b DBP sponsor Binary variable that takes a value of one when the firm is listed on the COMPUSTAT North America Pension database in the current year, and zero otherwise.
Net investment Difference of capital expenditures (capx) and depreciation (dp) normalized by beginning-of-year assets (at-1).
Gross investment Capital expenditures (capx) normalized by beginning-of-year assets (at-1).
R&D Research and development expense (xrd) normalized by beginning-of-year assets (at-1).
Pension asset beta Weighted average (CAPM) beta of the firm’s pension assets (pplao + pplau). Asset class weights in percent are equities (pnate), fixed income securities (pnatd), real estate (pnatr), and other assets (pnato). The category other assets contains all residual assets, which are mainly alternative assets.
The assumed asset betas are as follows:
Beta equities = 1 (Jin, Merton, and Bodie (2006))
Beta fixed income securities =0.175 (Jin, Merton, and Bodie (2006))
Beta real estate = 0.15 (Jin, Merton, and Bodie (2006))
Beta other = 1.2 (Mohan and Zhang (2014))
βPA =(1 × pnate + 0.175 × pnatd + 0.15 × pnatr + 1.2 × pnato)/100
pplao + pplau
Pension liability Pension liabilities (pbpro + pbpru) to assets (at).
PR1 Systematic pension risk 1: Pension asset beta (βPA) multiplied by the market value of pension assets (pplao + pplau) minus 0.18 times the PBO (pbpro + pbpru) normalized by assets (at).
PR2 Systematic pension risk 2: Pension asset beta (βPA) multiplied by the market value of pension assets (pplao + pplau) minus 0.46 times the PBO (pbpro + pbpru) normalized by assets (at).
PR3 Systematic pension risk 3: Pension asset beta (βPA) multiplied by the market value of pension assets (pplao + pplau) normalized by assets (at).
Unexpected contributions Difference between effective employer contributions to defined benefit pension plans (pbec) and the beginning-of-year expectation of pension contributions (pbece-1) normalized by beginning-of-year assets (at-1). If the beginning-of-year expectation of pension contributions is missing, it is replaced by the previous year effective contribution (pbec-1).
Funding status Difference between the market value of pension assets (pplao + pplau) and the PBO (pbpro + pbpru) normalized by assets (at).
NPC Nonpension cash flow according to Rauh (2006): Sum of net income (ni), depreciation and amortization (dp), and pension expense (xpr ) normalized by beginning-of-year assets (at-1).
Q Average Tobin’s Q: Market value of equity (csho × prcc_f) plus assets (at) minus the book value of common equity including deferred taxes (ceq + txdb) normalized by assets (at).
Leverage Financial leverage: The ratio of book value of debt (dltt + dlc) to assets (at).
Ln firm size Natural logarithm of assets in million USD (at).
Ln firm age Natural logarithm of the difference between the current fiscal year and the year of birth of the firm. The year of birth is calculated as the first year the firm appears on the CRSP tapes or on the COMPUSTAT files or a link is indicated on the CRSP/COMPUSTAT Merged database.
Book market ratio Book value of equity (at- dltt – dlc) divided by market value of equity (csho × prcc_f).
ROI Return on investment: Net investment (ni) divided by book value of assets (at).
SA Index -0.737 times the natural logarithm of assets (at) plus 0.043 times the squared natural logarithm of assets (at2) minus 0.04 times the firm’s age in years.
Dividend-to-asset ratio Dividends paid (dvc) divided by book value of assets (at).
Cash-to-asset ratio Cash and equivalents (che) divided by book value of assets (at).
Industry PR The sum of the not normalized systematic pension risk of all pension firms in a Fama-French 48 industry divided by the beginning-of-year aggregated assets of nonpension firms in the same industry.
Industry PRh,t = ∑ βPAj,t
× (pplao j,t + pplauj,t) − βPL × (pbproj,t + pbpruj,t)j∈h,DB
∑ ati,t−1i∈h,i∉DB
Industry PR1 assumes a pension liability beta (βPL) of 0.18, Industry PR2 assumes a pension liability beta of 0.46, and Industry PR3 assumes a pension liability beta of 0.
Industry unexpected contributions The sum of the unexpected pension contributions of all pension firms in a Fama-French 48 industry divided by the aggregated assets of nonpension firms in the same industry.
Industry unexpected contributiionsh,t = ∑ (pbecj,t − pbecej,t−1)j∈h,DB
∑ ati,ti∈h,i∉DB
38
II. The Duration Gap Matters: How Pension Duration
Affects Equity Returns
Oliver Dichter*
November, 2015
This paper empirically studies whether equity returns of U.S.
nonfinancial firms reflect the systematic interest rate risk of
the sponsored defined benefit pension plans. It is not obvious
that they should. Pension accounting rules are complex and
pension assets and liabilities are held separately from the
firm’s operating assets. We find that the gap between the
duration of pension assets and pension liabilities affects the
interest rate exposure of the sponsoring firm without bias.
This is consistent with the hypothesis of informationally
efficient capital markets. Our results are robust to a wide
range of assumptions regarding the duration of pension
liabilities and pension asset classes and are not driven by
firms with negligibly small pension plans or firms in financial
distress. Besides, our results are neither caused by the recent
financial crisis nor explained by the subsequent years of
historically low interest rates.
Keywords: Defined benefit pension plan; Interest rates; Exposure; Market efficiency
JEL codes: G12, G14, G23, G32
*Oliver Dichter (corresponding author, [email protected]) is from the Institut für Finanzmanagement,
University of Bern. This paper is part of my dissertation with Claudio Loderer, the Institut für
Finanzmanagement, University of Bern and the Swiss Finance Institute. I wish to thank Claudio Loderer for
valuable comments. All errors are mine.

39
1. Introduction
For many [pension] schemes unhedged interest rate and inflation sensitivity are the
biggest risks they're running within their investment portfolio.
– John Belgrove, senior partner of Aon Hewitt, Professional Pensions, 20 March 2014 –
The sharp fall in interest rates during the period 2008 to 2012 has resulted in a USD 460
billion increase in the liabilities of corporate defined benefit (DB) pension plans in the United
States (Investment Company Institute (2014)). According to J.P. Morgan (2015), the interest
rate risk of DB pension plans ranks among the top ten “striking facts” that firms should
consider by setting their corporate finance strategies for 2015. This paper empirically
examines whether capital markets are aware of the interest rate sensitivity of DB plans by
studying whether the interest rate exposure of the sponsoring firm reflects the duration gap
between the firm’s pension assets and liabilities. It is not obvious that markets process
pension information without bias. Pension assets and liabilities are reported off-balance sheet
and held separately from the firm’s operating assets, which could prevent that capital markets
fully recognize the risk of DB pension plans.
The efficiency of capital markets with respect to pension plan risk is controversially
discussed in the academic literature. While Jin, Merton, and Bodie (2006) find that capital
markets recognize the systematic risk (beta) of pension plans without bias, Franzoni and
Marín (2006) show that equity markets underestimate the financial risk from pension
shortfalls.
Besides its relevance for the hypothesis of efficient capital markets, our research also
contributes to a better understanding of the interest rate exposure of nonfinancial firms. With
the notable exceptions of Sweeney and Warga (1986) and Bartram (2002), most of the
existing research on interest rate exposures concerns financial firms (e.g., Flannery and James
40
(1984), Bae (1990), Madura and Zarruk (1995), and Memmel (2011)). We believe that the
main reason for this limitation lies in the great difficulty to assess the interest rate sensitivity
of the operating activity of nonfinancial firms. Changes in interest rates simultaneously affect
operating cash flows, cost of capital, investment decisions, and the firm’s competitive position
relative to other firms (Bartram (2002)). The joint effect of these channels of influence on
firm value predominantly depends on the specific business model characteristics of the firm
and its competitors (Bartram (2002)). Since these factors are mostly unobservable, an
empirical prediction of the interest rate exposure of nonfinancial firms is quite difficult. Our
paper investigates the interest rate sensitivity of corporate DB pension plans. That sensitivity
is one component of the firm’s overall interest rate exposure that can be measured with
publicly available information.
Based on the considerations about the relation between systematic firm risk and
systematic pension risk in Jin, Merton, and Bodie (2006), we show formally that there should
be a one-to-one relation between the systematic interest rate risk of the pension plan and the
interest rate exposure of the sponsoring firm. We determine the systematic interest rate risk of
pension plans by the difference between the duration of pension assets and the duration of
pension liabilities. Our estimation approach is comparable to the calculation of systematic
pension risk by Jin, Merton, and Bodie (2006). Our measure of the firm’s interest rate
exposure is the sensitivity of stock returns to shifts of the yield curve (i.e., the firm’s equity
duration).
We test our prediction of a one-to-one relation between the firm’s interest rate exposure
and the systematic interest rate risk of its pension plan with a panel of 224 nonfinancial U.S.
COMPUSTAT firms that sponsor DB pension plans. We cover the years from 2003 to 2012
(1,195 firm-years). Our sample excludes firms whose pension plans might hedge their interest
rate risk with derivatives. Unobserved hedging would substantially distort our estimate of the

41
duration gap between pension assets and liabilities. Such distortions would make it difficult to
tell whether deviations from the theoretical relation between the interest rate exposure of the
firm and the systematic interest rate risk of the pension plan stem from market inefficiencies
or simply from measurement error.
In agreement with the hypothesis that capital markets are informationally efficient, we
present evidence that the firm’s interest rate exposure reflects the pension duration gap
without bias. Moreover, we show that this is no different for firms with heavily underfunded
pension plans. Hence, our results are consistent with efficient capital markets but in
contradiction with Franzoni and Marín (2006), who argue that capital markets overvalue the
equity of firms with deficits in their pension funding.
We test the robustness of our results in different ways. We cannot find that the relation
between interest rate exposure and pension duration gap crucially depends on our assumptions
about the duration of pension assets and liabilities. Similarly, we cannot find that our results
are distorted by firms with negligibly small pension plans. Jin, Merton, and Bodie (2006)
expect that pension risk has no first-order impact on equity returns of firms with small
pension responsibilities. Furthermore, the relation between interest rate exposure and pension
duration gap is not driven by firms in financial distress. Possibly, distressed firms
simultaneously reduce their operating interest rate risk and the interest rate risk of their
pension plans. Rauh (2009) shows that distressed firms reduce their pension risk to lower the
expected cost of bankruptcy. Nance, Smith, and Smithson (1993) find that distressed firms
increase risk hedging in general. At last, our results are robust to the financial crisis and the
subsequent period of low interest rates. Bartram (2002) shows that both the direction and the
magnitude of corporate interest rate exposures are sensitive to different periods in time.
Our paper adds to a long tradition of research about the impact of DB pension plans on
the value of the sponsoring firm. Most notably, this includes Oldfield (1977), Feldstein and

42
Seligman (1981), Feldstein and Morck (1983), and Bulow, Morck, and Summers (1987).
Furthermore, we contribute to the existing work of Jin, Merton, and Bodie (2006). They find
that stock returns reflect the systematic risk of DB pension plans. We show that capital
markets also recognize the systematic interest rate risk of DB plans, which represents a
specific risk factor that has not yet been fully understood in the context of nonfinancial firms.
Thus, we also contribute to the comparably scarce literature on interest rate exposures of
nonfinancial firms (e.g., Sweeney and Warga (1986) and Bartram (2002)).
The rest of the paper is organized as follows. Section 2 describes the institutional
background of U.S. corporate pension plans. Section 3 discusses the theoretical relation
between the interest rate exposure of the firm and the systematic interest rate risk of the
pension plan. Section 4 presents our empirical strategy. Section 5 describes the data. Section 6
presents the results and their discussion. Last, section 7 concludes.
2. Institutional background
Firms in the United States can choose between two types of retirement saving
instruments – defined benefit (DB) plans and defined contribution (DC) plans. In a DB plan,
the firm guarantees the employees specific and unconditional benefits upon retirement. This
commitment represents a debt-like liability for the firm (Jin, Merton, and Bodie (2006)).
Since 1974 firms are obligated by the Employment Retirement Income Security Act (ERISA)
to guarantee their pension liabilities with assets in a segregated account. Whenever these
assets are insufficient to cover the liabilities, the pension plan is underfunded, the firm must
cover the deficit with deficit-reducing contributions (Rauh (2006)). Additionally, the firm
must cover the discounted value of the pension benefits that have accrued during the current

43
fiscal year (Rauh (2006)).14
When a firm fails to meet its mandatory contributions, the
Pension Benefit Guarantee Corporation (PBGC) is entitled to recover the outstanding amount
by filing a claim against the firm. In a bankruptcy case, the PBGC claim has the most senior
status (Shivdasani and Stefanescu (2010)).
The firm’s responsibility in the case of DC plans is fundamentally different. When
sponsoring a DC plan, the firm is simply committed to pay regular and fixed contributions to
the employees’ retirement accounts. Upon retirement, the employees receive whatever
amount of money (contributions plus interest) has accumulated on their behalf. The
uncertainty about the level of retirement benefits is borne entirely by the employees. The firm
faces no further obligation besides that of the regular contributions (Shivdasani and
Stefanescu (2010)). Consistent with previous research, including Rauh (2006), Jin, Merton,
and Bodie (2006), Franzoni and Marín (2006), and Campbell, Dhaliwal, and Schwartz (2012),
we exclude DC plans from our analysis. Throughout this paper we consequently use the terms
pension plan and defined benefit pension plan interchangeably.
3. Theoretical considerations
Pension assets and liabilities are recorded off-balance sheet in the footnotes of 10-K
annual statements (Shivdasani and Stefanescu (2010)). Nevertheless, firms are fully
economically responsible for the risk of their pension plans. Firm and pension plan form a
consolidated entity (Jin, Merton, and Bodie (2006)). Accordingly, financial analysts and
rating agencies (e.g., Credit Suisse (2011) and Smyth (2013)) adjust their estimates of firm
value by the values of pension assets and liabilities. There is also a large body of literature
showing that the market value of pension sponsoring firms reflects the values of their pension
assets and liabilities. Representative studies include Oldfield (1977), Feldstein and Seligman
14
Rauh (2006) and Campbell, Dhaliwal, and Schwartz (2012) provide a detailed discussion on mandatory
pension contributions.
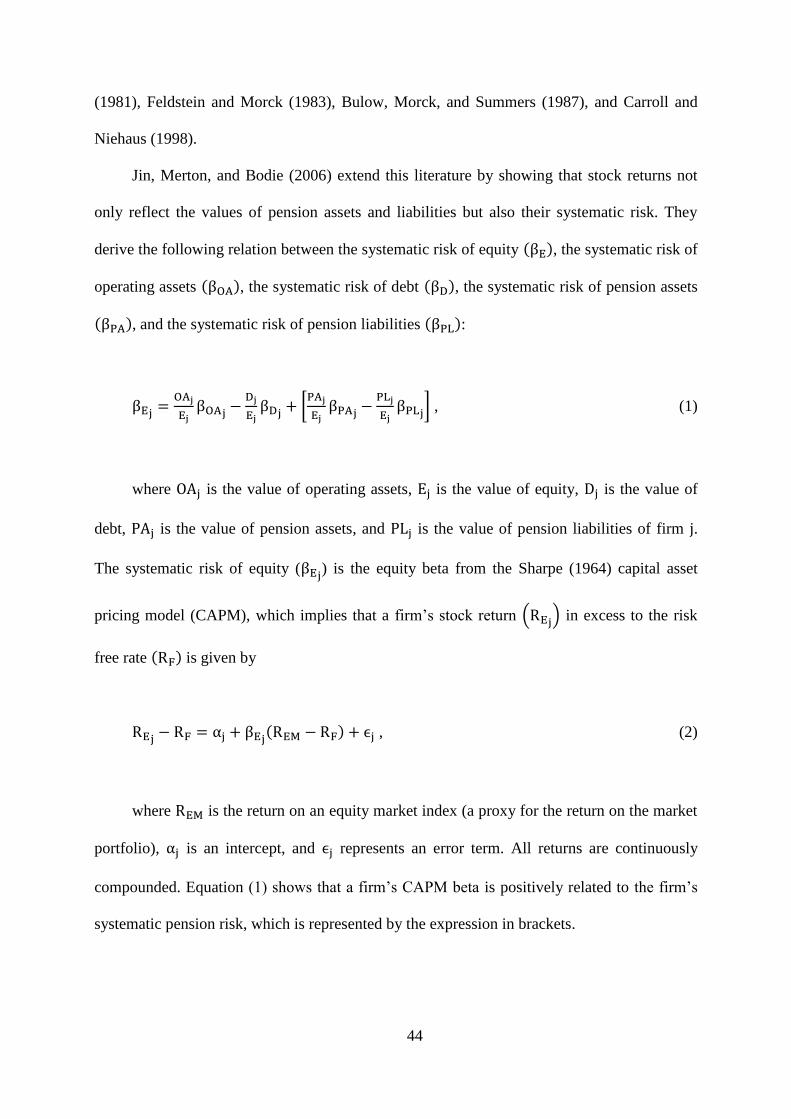
44
(1981), Feldstein and Morck (1983), Bulow, Morck, and Summers (1987), and Carroll and
Niehaus (1998).
Jin, Merton, and Bodie (2006) extend this literature by showing that stock returns not
only reflect the values of pension assets and liabilities but also their systematic risk. They
derive the following relation between the systematic risk of equity (βE), the systematic risk of
operating assets (βOA), the systematic risk of debt (βD), the systematic risk of pension assets
(βPA), and the systematic risk of pension liabilities (βPL):
βEj=
OAj
EjβOAj
−Dj
EjβDj
+ [PAj
EjβPAj
−PLj
EjβPLj
] , (1)
where OAj is the value of operating assets, Ej is the value of equity, Dj is the value of
debt, PAj is the value of pension assets, and PLj is the value of pension liabilities of firm j.
The systematic risk of equity (βEj) is the equity beta from the Sharpe (1964) capital asset
pricing model (CAPM), which implies that a firm’s stock return (REj) in excess to the risk
free rate (RF) is given by
REj− RF = αj + βEj
(REM − RF) + ϵj , (2)
where REM is the return on an equity market index (a proxy for the return on the market
portfolio), αj is an intercept, and ϵj represents an error term. All returns are continuously
compounded. Equation (1) shows that a firm’s CAPM beta is positively related to the firm’s
systematic pension risk, which is represented by the expression in brackets.
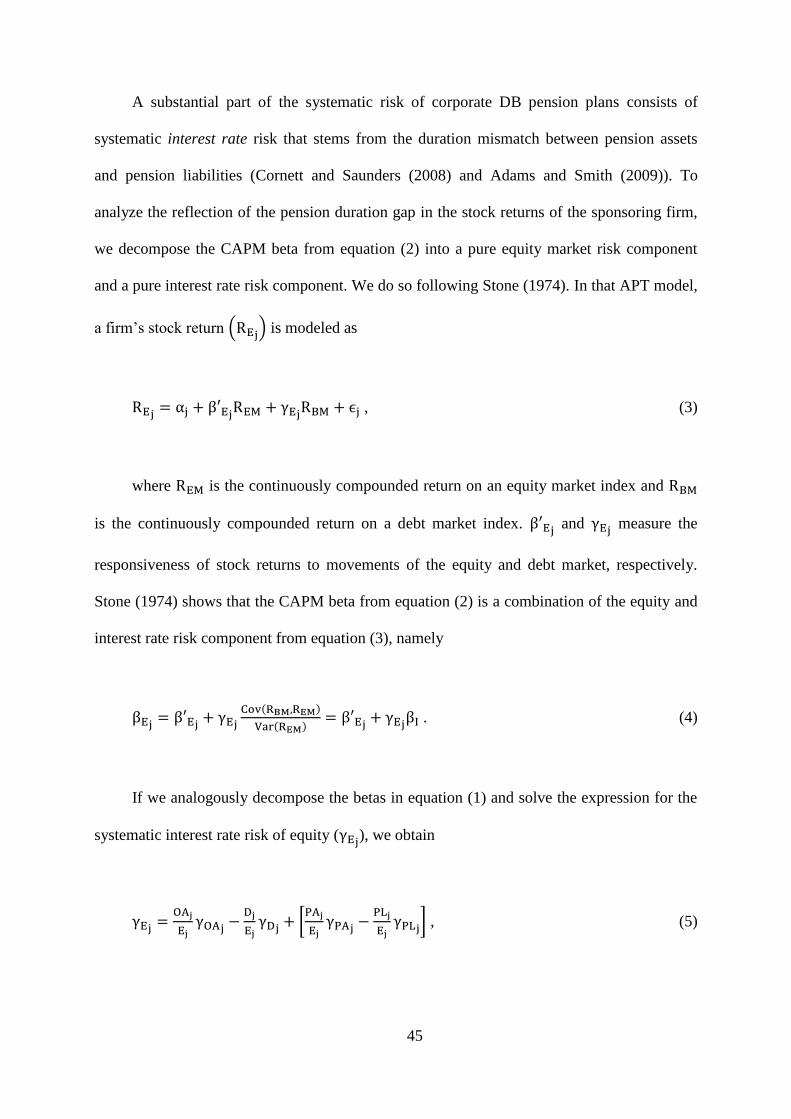
45
A substantial part of the systematic risk of corporate DB pension plans consists of
systematic interest rate risk that stems from the duration mismatch between pension assets
and pension liabilities (Cornett and Saunders (2008) and Adams and Smith (2009)). To
analyze the reflection of the pension duration gap in the stock returns of the sponsoring firm,
we decompose the CAPM beta from equation (2) into a pure equity market risk component
and a pure interest rate risk component. We do so following Stone (1974). In that APT model,
a firm’s stock return (REj) is modeled as
REj= αj + β′Ej
REM + γEjRBM + ϵj , (3)
where REM is the continuously compounded return on an equity market index and RBM
is the continuously compounded return on a debt market index. β′Ej and γEj
measure the
responsiveness of stock returns to movements of the equity and debt market, respectively.
Stone (1974) shows that the CAPM beta from equation (2) is a combination of the equity and
interest rate risk component from equation (3), namely
βEj= β′Ej
+ γEj
Cov(RBM,REM)
Var(REM)= β′Ej
+ γEjβI . (4)
If we analogously decompose the betas in equation (1) and solve the expression for the
systematic interest rate risk of equity (γEj), we obtain
γEj=
OAj
EjγOAj
−Dj
EjγDj
+ [PAj
EjγPAj
−PLj
EjγPLj
] , (5)

46
where γOA is the systematic interest rate risk of operating assets, γD is the systematic
interest rate risk of the firm’s debt, γPA is the systematic interest rate risk of pension assets,
and γPL is the systematic interest rate risk of pension liabilities. We henceforth refer to γE as
the interest rate exposure of the firm, which is consistent with the terminology in Bartram
(2002). The derivation of equation (5) is shown in Appendix A.
Provided that capital markets process the relevant information on systematic interest
rate risk of pension plans without bias, equation (5) implies a one-to-one relation between the
firm’s interest rate exposure (γE) and the systematic interest rate risk of its pension plan
(γPension), namely
γEj= γPensionj
+OAj
EjγOAj
−Dj
EjγDj
, (6)
with
γPensionj=
PAj
EjγPAj
−PLj
EjγPLj
. (7)
In the next section, we discuss our empirical strategy to test whether equation (6) holds
in practice.
4. Regression specification and variable construction
4.1. Regression model
The linearity of equation (6) enables us to test the relation between the firm’s interest
rate exposure (γEj) and the systematic interest rate risk of its pension plan (γPensionj
) with
the linear regression
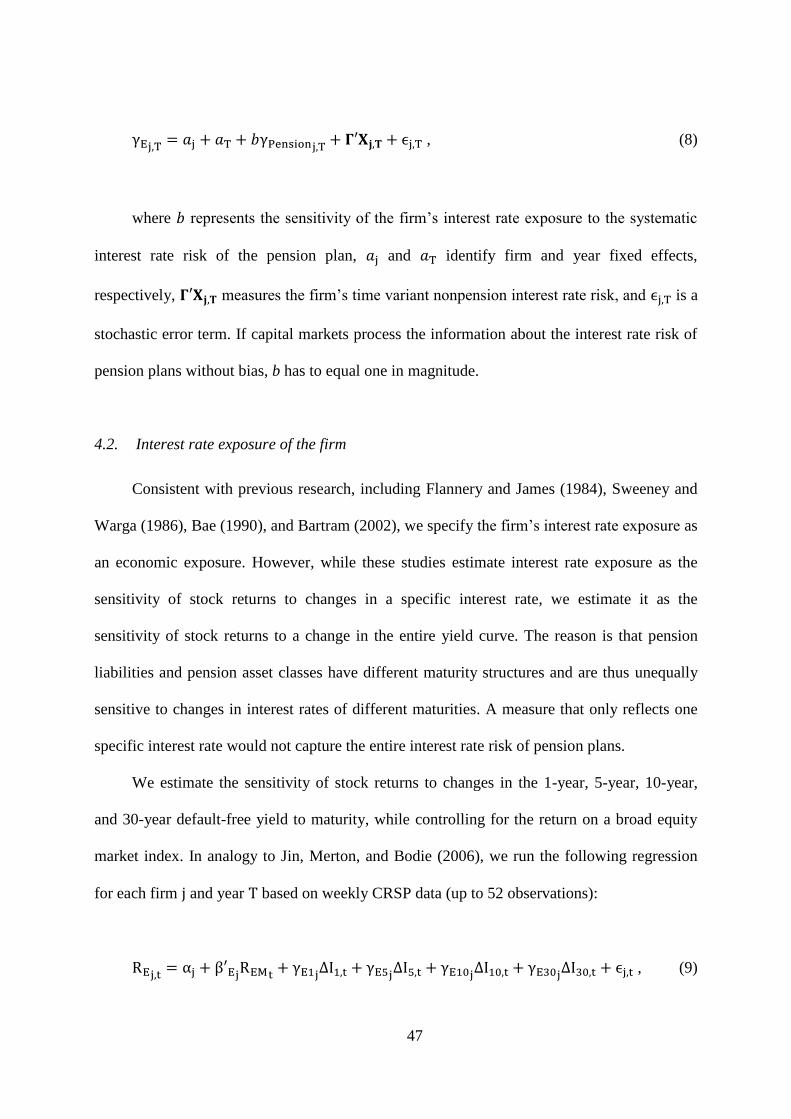
47
γEj,T= 𝑎j + 𝑎T + 𝑏γPensionj,T
+ 𝚪′𝐗𝐣,𝐓 + ϵj,T , (8)
where 𝑏 represents the sensitivity of the firm’s interest rate exposure to the systematic
interest rate risk of the pension plan, 𝑎j and 𝑎T identify firm and year fixed effects,
respectively, 𝚪′𝐗𝐣,𝐓 measures the firm’s time variant nonpension interest rate risk, and ϵj,T is a
stochastic error term. If capital markets process the information about the interest rate risk of
pension plans without bias, b has to equal one in magnitude.
4.2. Interest rate exposure of the firm
Consistent with previous research, including Flannery and James (1984), Sweeney and
Warga (1986), Bae (1990), and Bartram (2002), we specify the firm’s interest rate exposure as
an economic exposure. However, while these studies estimate interest rate exposure as the
sensitivity of stock returns to changes in a specific interest rate, we estimate it as the
sensitivity of stock returns to a change in the entire yield curve. The reason is that pension
liabilities and pension asset classes have different maturity structures and are thus unequally
sensitive to changes in interest rates of different maturities. A measure that only reflects one
specific interest rate would not capture the entire interest rate risk of pension plans.
We estimate the sensitivity of stock returns to changes in the 1-year, 5-year, 10-year,
and 30-year default-free yield to maturity, while controlling for the return on a broad equity
market index. In analogy to Jin, Merton, and Bodie (2006), we run the following regression
for each firm j and year T based on weekly CRSP data (up to 52 observations):
REj,t= αj + β′Ej
REMt+ γE1j
∆I1,t + γE5j∆I5,t + γE10j
∆I10,t + γE30j∆I30,t + ϵj,t , (9)
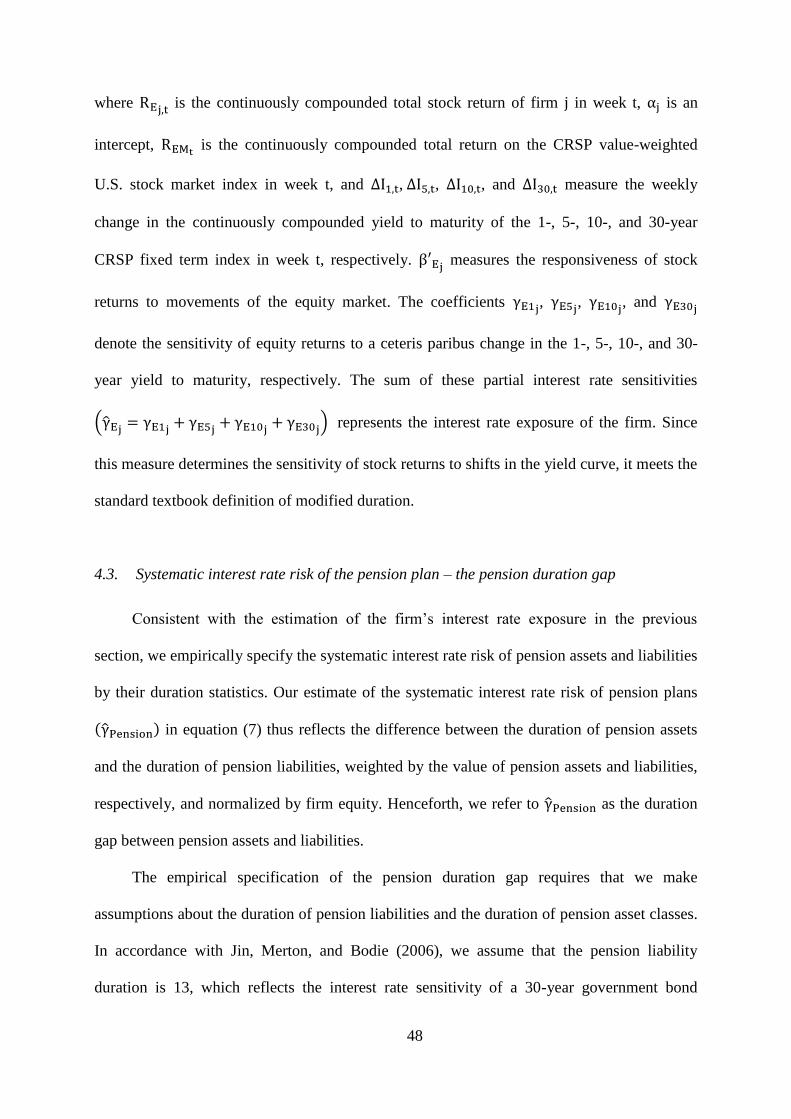
48
where REj,t is the continuously compounded total stock return of firm j in week t, αj is an
intercept, REMt is the continuously compounded total return on the CRSP value-weighted
U.S. stock market index in week t, and ∆I1,t, ∆I5,t, ∆I10,t, and ∆I30,t measure the weekly
change in the continuously compounded yield to maturity of the 1-, 5-, 10-, and 30-year
CRSP fixed term index in week t, respectively. β′Ej measures the responsiveness of stock
returns to movements of the equity market. The coefficients γE1j, γE5j
, γE10j, and γE30j
denote the sensitivity of equity returns to a ceteris paribus change in the 1-, 5-, 10-, and 30-
year yield to maturity, respectively. The sum of these partial interest rate sensitivities
(γ̂Ej= γE1j
+ γE5j+ γE10j
+ γE30j) represents the interest rate exposure of the firm. Since
this measure determines the sensitivity of stock returns to shifts in the yield curve, it meets the
standard textbook definition of modified duration.
4.3. Systematic interest rate risk of the pension plan – the pension duration gap
Consistent with the estimation of the firm’s interest rate exposure in the previous
section, we empirically specify the systematic interest rate risk of pension assets and liabilities
by their duration statistics. Our estimate of the systematic interest rate risk of pension plans
(γ̂Pension) in equation (7) thus reflects the difference between the duration of pension assets
and the duration of pension liabilities, weighted by the value of pension assets and liabilities,
respectively, and normalized by firm equity. Henceforth, we refer to γ̂Pension as the duration
gap between pension assets and liabilities.
The empirical specification of the pension duration gap requires that we make
assumptions about the duration of pension liabilities and the duration of pension asset classes.
In accordance with Jin, Merton, and Bodie (2006), we assume that the pension liability
duration is 13, which reflects the interest rate sensitivity of a 30-year government bond
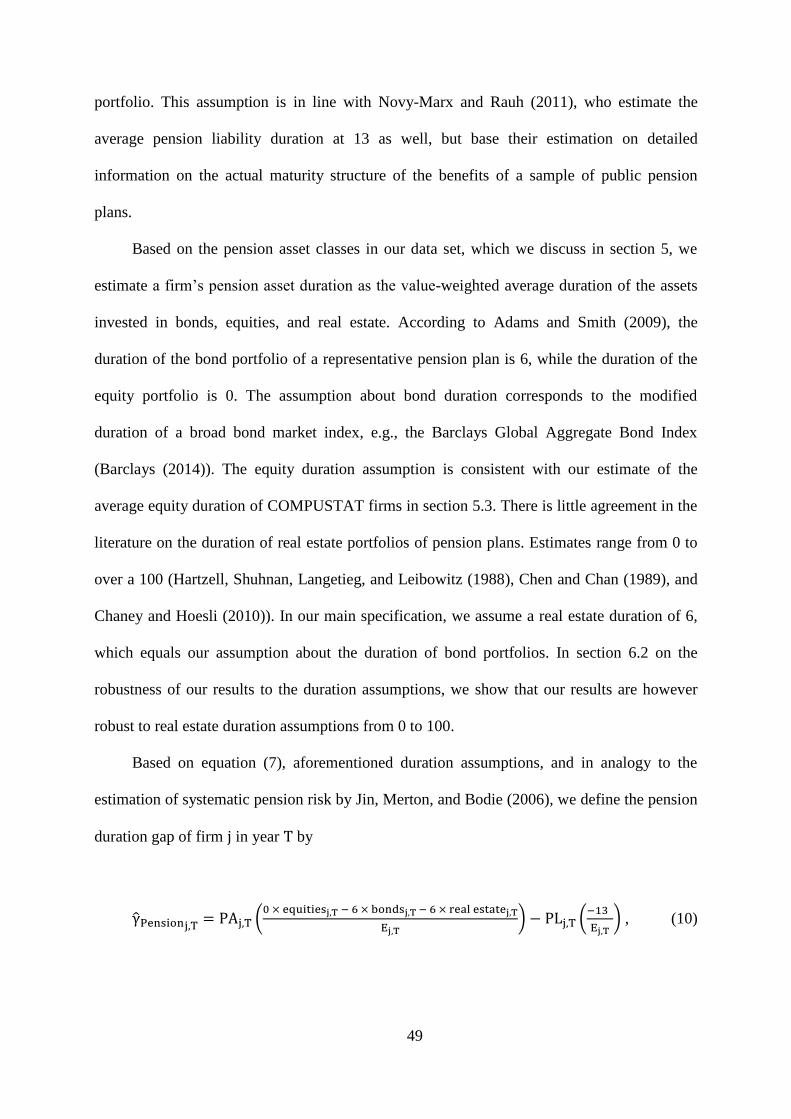
49
portfolio. This assumption is in line with Novy-Marx and Rauh (2011), who estimate the
average pension liability duration at 13 as well, but base their estimation on detailed
information on the actual maturity structure of the benefits of a sample of public pension
plans.
Based on the pension asset classes in our data set, which we discuss in section 5, we
estimate a firm’s pension asset duration as the value-weighted average duration of the assets
invested in bonds, equities, and real estate. According to Adams and Smith (2009), the
duration of the bond portfolio of a representative pension plan is 6, while the duration of the
equity portfolio is 0. The assumption about bond duration corresponds to the modified
duration of a broad bond market index, e.g., the Barclays Global Aggregate Bond Index
(Barclays (2014)). The equity duration assumption is consistent with our estimate of the
average equity duration of COMPUSTAT firms in section 5.3. There is little agreement in the
literature on the duration of real estate portfolios of pension plans. Estimates range from 0 to
over a 100 (Hartzell, Shuhnan, Langetieg, and Leibowitz (1988), Chen and Chan (1989), and
Chaney and Hoesli (2010)). In our main specification, we assume a real estate duration of 6,
which equals our assumption about the duration of bond portfolios. In section 6.2 on the
robustness of our results to the duration assumptions, we show that our results are however
robust to real estate duration assumptions from 0 to 100.
Based on equation (7), aforementioned duration assumptions, and in analogy to the
estimation of systematic pension risk by Jin, Merton, and Bodie (2006), we define the pension
duration gap of firm j in year T by
γ̂Pensionj,T= PAj,T (
0 × equitiesj,T − 6 × bondsj,T − 6 × real estatej,T
Ej,T) − PLj,T (
−13
Ej,T) , (10)

50
where equitiesj,T, bondsj,T , and real estatej,T represent the fraction of pension assets of firm
j that are invested in these asset classes at year T. Ej,T is the current year market value of the
firm’s equity, PAj,T is the market value of pension assets, and PLj,T is the actuarial value of
pension liabilities. The duration statistics (-6 and -13) carry a negative sign because they
represent negative interest rate sensitivities.
Following the terminology in Bartram, Brown, and Conrad (2011), our pension duration
gap measure represents a gross (pre-hedging) exposure of the net pension plan value to
changes in the interest rate. This measure differs across firms and over time because of
differences in asset allocation, in pension funding status, and in size of the pension plan
relative to the equity of the sponsoring firm. The assumptions we made about asset class and
liability duration are constant over time and do not vary between firms.
4.4. Control variables
The control variables in the regression equation (8) should represent the term OA
EγOA −
D
EγD in equation (6), i.e., the fraction of the variation in corporate interest rate exposures that
is caused by the interest rate sensitivity of operating assets and debt. Following the empirical
specification of the test of the relation between systematic firm risk and systematic pension
risk in Jin, Merton, and Bodie (2006), we use a series of proxies.
We proxy the term −D
EγD by the ratio of short-term book value of debt to market value
of equity and the ratio of long-term book value of debt to market value of equity. We expect
that the firm’s interest rate exposure increases with these ratios. This is because the interest
rate sensitivity of debt (γD) is negative and multiplied by minus one in the expression −D
EγD.
Moreover, since long-term debt has a higher duration than short-term debt, we expect that the
coefficient on long-term debt to equity exceeds the coefficient on short-term debt to equity.

51
As for the interest rate risk of the operating business (OA
EγOA), Bartram (2002) argues
that changes in interest rates simultaneously affect operating cash flows, cost of capital,
investment decisions, and the competitive position of the firm relative to other firms. We
proxy for these effects by controlling for the cash flow to assets ratio and the natural
logarithm of the book value of assets (Firm size). Our reasoning is that interest rate
exposures are significantly related to cash flows (Bartram (2002)) and that firm size could
serve as a very general proxy for a firm’s business model and competitive position.
Finally, our regression model (8) includes firm fixed effects, year fixed effects, and the
one-year lag of interest rate exposure. Firm fixed effects control for firm specific differences
in interest rate exposures that remain constant over time, e.g., industry effects. Year fixed
effects allow controlling for macroeconomic effects that affect all firms in a similar way. The
one-year lag of interest rate exposure controls for firm specific trends and shifts in interest
rate exposures. All variable definitions are in Table 9 of Appendix B.
5. Data
5.1. Data source
Our sample builds on data from the COMPUSTAT North American Pension database,
the COMPUSTAT/CRSP Merged database, the CRSP daily fixed term index files, and the
CRSP daily stock files. The COMPUSTAT database contains firm level reporting data based
on 10-K annual statements.
The FASB requires that pension assets be measured by their market value, while
pension liabilities have to be estimated as the actuarial present value of the promised benefits.
The rate at which firms discount their pension liabilities has to reflect current interest rate
levels (Jin, Merton, and Bodie (2006) and Carmichael and Graham (2012)). There are two
common definitions of a firm’s pension liability – the Projected Benefit Obligation (PBO) and
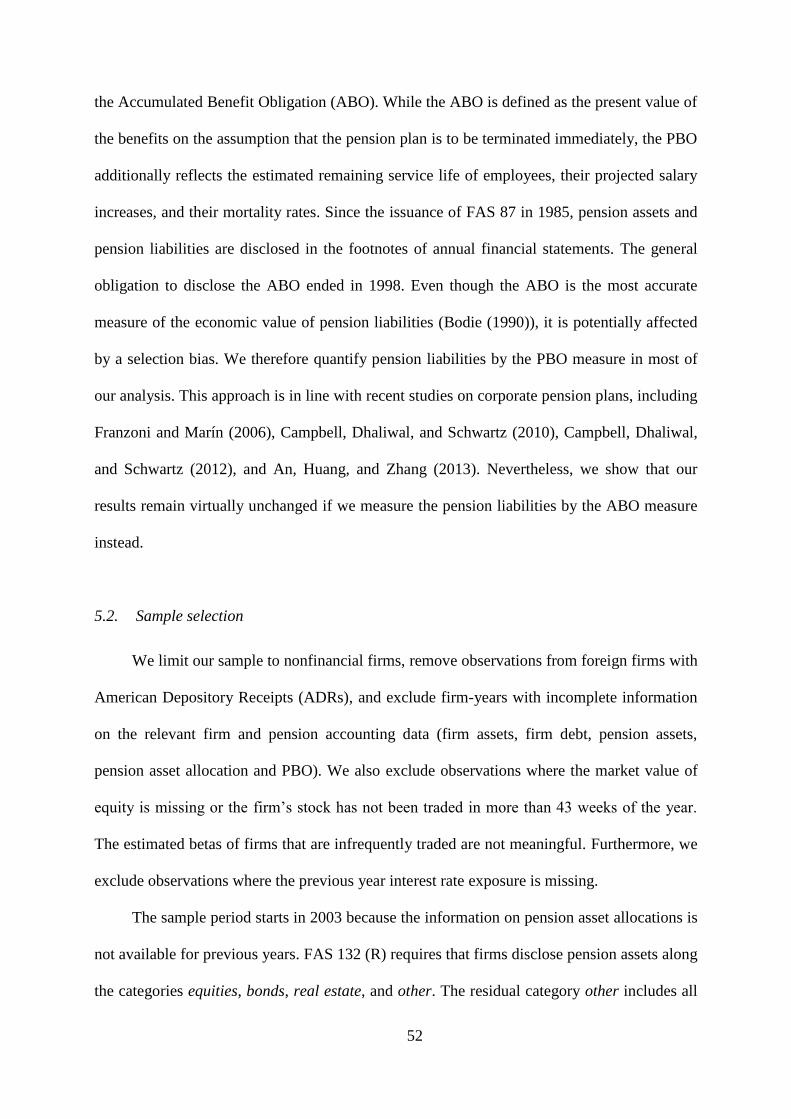
52
the Accumulated Benefit Obligation (ABO). While the ABO is defined as the present value of
the benefits on the assumption that the pension plan is to be terminated immediately, the PBO
additionally reflects the estimated remaining service life of employees, their projected salary
increases, and their mortality rates. Since the issuance of FAS 87 in 1985, pension assets and
pension liabilities are disclosed in the footnotes of annual financial statements. The general
obligation to disclose the ABO ended in 1998. Even though the ABO is the most accurate
measure of the economic value of pension liabilities (Bodie (1990)), it is potentially affected
by a selection bias. We therefore quantify pension liabilities by the PBO measure in most of
our analysis. This approach is in line with recent studies on corporate pension plans, including
Franzoni and Marín (2006), Campbell, Dhaliwal, and Schwartz (2010), Campbell, Dhaliwal,
and Schwartz (2012), and An, Huang, and Zhang (2013). Nevertheless, we show that our
results remain virtually unchanged if we measure the pension liabilities by the ABO measure
instead.
5.2. Sample selection
We limit our sample to nonfinancial firms, remove observations from foreign firms with
American Depository Receipts (ADRs), and exclude firm-years with incomplete information
on the relevant firm and pension accounting data (firm assets, firm debt, pension assets,
pension asset allocation and PBO). We also exclude observations where the market value of
equity is missing or the firm’s stock has not been traded in more than 43 weeks of the year.
The estimated betas of firms that are infrequently traded are not meaningful. Furthermore, we
exclude observations where the previous year interest rate exposure is missing.
The sample period starts in 2003 because the information on pension asset allocations is
not available for previous years. FAS 132 (R) requires that firms disclose pension assets along
the categories equities, bonds, real estate, and other. The residual category other includes all

53
assets that are not equity, bond, or real estate investments (COMPUSTAT (2004)).
Consequently, this includes derivative positions held for interest rate hedging purposes. We
exclude firms that report a partial allocation of their pension assets to other assets.
Unobserved derivative hedging would make it impossible to determine whether deviations
from the theoretical relation between the pension duration gap and the firm’s interest rate
exposure stem from market inefficiencies or simply from an inability to measure the duration
gap correctly. This leaves us with a sample of 224 firms and 1,195 firm-years.
5.3. Descriptive sample statistics
The first three panels of Table 1 show the summary statistics for our sample of pension
sponsoring firms from 2003 to 2012. All variables are winsorized at the 1st and the 99
th
percent level of their pooled distribution to eliminate outliers. Panel A displays our main
variables. Panel B shows additional pension plan characteristics. Panel C shows the
characteristics of the firms in our sample. In Panel D, we additionally display these firm
characteristics for a broad sample of pension and nonpension COMPUSTAT firms. This
sample consists of both financial and nonfinancial firms that satisfy the nonpension selection
criteria from the previous section.
The median interest rate exposure in our sample is 0.97, which suggests that the equity
value of the average sample firm increases by 1 percent in reaction to an upward shift of the
yield curve by one percentage point. Stated differently, the median equity duration of our
sample firms is approximately -1. The median interest rate exposure of our broad sample of
COMPUSTAT firms (Panel D) is 0.22, which is close to our assumption that the average
duration of a broadly diversified equity portfolio is 0. In section 6.2, we show that our results
are virtually unaffected if we assume that the duration of equity portfolios is -0.22.
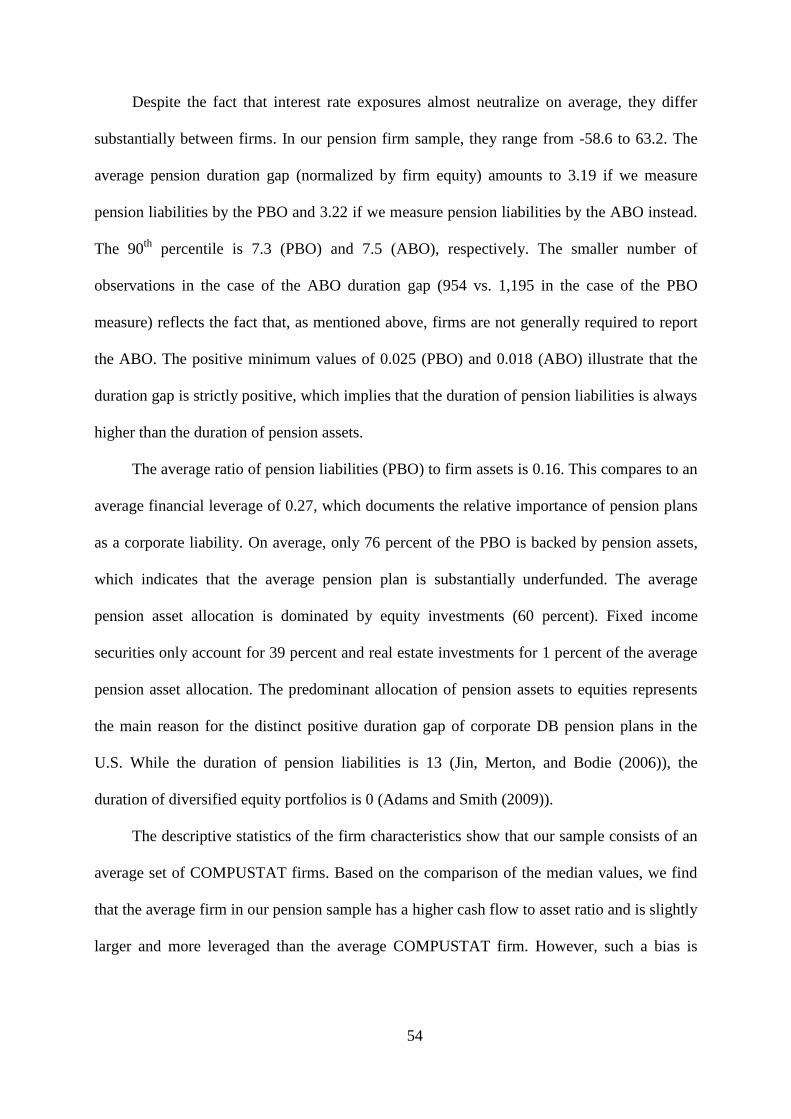
54
Despite the fact that interest rate exposures almost neutralize on average, they differ
substantially between firms. In our pension firm sample, they range from -58.6 to 63.2. The
average pension duration gap (normalized by firm equity) amounts to 3.19 if we measure
pension liabilities by the PBO and 3.22 if we measure pension liabilities by the ABO instead.
The 90th
percentile is 7.3 (PBO) and 7.5 (ABO), respectively. The smaller number of
observations in the case of the ABO duration gap (954 vs. 1,195 in the case of the PBO
measure) reflects the fact that, as mentioned above, firms are not generally required to report
the ABO. The positive minimum values of 0.025 (PBO) and 0.018 (ABO) illustrate that the
duration gap is strictly positive, which implies that the duration of pension liabilities is always
higher than the duration of pension assets.
The average ratio of pension liabilities (PBO) to firm assets is 0.16. This compares to an
average financial leverage of 0.27, which documents the relative importance of pension plans
as a corporate liability. On average, only 76 percent of the PBO is backed by pension assets,
which indicates that the average pension plan is substantially underfunded. The average
pension asset allocation is dominated by equity investments (60 percent). Fixed income
securities only account for 39 percent and real estate investments for 1 percent of the average
pension asset allocation. The predominant allocation of pension assets to equities represents
the main reason for the distinct positive duration gap of corporate DB pension plans in the
U.S. While the duration of pension liabilities is 13 (Jin, Merton, and Bodie (2006)), the
duration of diversified equity portfolios is 0 (Adams and Smith (2009)).
The descriptive statistics of the firm characteristics show that our sample consists of an
average set of COMPUSTAT firms. Based on the comparison of the median values, we find
that the average firm in our pension sample has a higher cash flow to asset ratio and is slightly
larger and more leveraged than the average COMPUSTAT firm. However, such a bias is
55
common in studies on corporate DB pension plans and in line with previous studies (e.g.,
Rauh (2006) and Shivdasani and Stefanescu (2010)).
[insert Table 1 here]
Table 2 reports the pairwise Pearson correlations between selected variables. The
correlation between the pension duration gap and the interest rate exposure is positive,
statistically significant and almost identical for both pension duration gap measures. This
represents first, univariate evidence of the recognition of the pension duration gap by capital
markets. Similarly, the ratios of short-term and long-term debt to equity are significantly
positively correlated with the firm’s interest rate exposure. The control variables for the firm’s
operating interest rate risk are not significantly related to interest rate exposure. They are,
however, significantly correlated with both the PBO and the ABO based duration gap
measure. The high correlation (0.997) between these two measures of the interest rate
sensitivity of pension plans indicates that the pension liability definition might be of little
consequence to our analysis.
[insert Table 2 here]
6. Empirical analysis
In this section, we empirically test whether the relation between interest rate exposure
and pension duration gap, which we have identified under the assumption of efficient capital
markets, also holds in practice.
56
6.1. Main results
In this section, we empirically study the relation between the firm’s interest rate
exposure and the pension duration gap. We run regressions based on different specifications
of equation (8). All regressions are controlled for firm and year fixed effects. The statistical
significance of the coefficients is determined based on a two-tailed test with standard errors
clustered at the firm level. Table 3 displays the results. The p-value at the bottom of the table
refers to a two-tailed Wald test of whether the coefficient on the pension duration gap equals
one.
In the first two columns, we run regression of interest rate exposure on pension duration
gap and our proxies for the interest rate sensitivity of firm debt (short-term and long-term debt
to equity). In these analyses, the variation in a firm’s operating interest rate risk is reflected in
the error term. In the second two columns, we display the results of regressions that include
our entire set of control variables from section 4.4. We measure pension liabilities by the PBO
in Columns (1) and (3) and by the ABO in Columns (2) and (4). For both duration gap
measures, and regardless of whether we include our proxies for the firm’s operating interest
rate risk, the coefficient on pension duration gap is significantly larger than zero and not
statistically different from one. These results support our prediction of a one-to-one relation
between interest rate exposure and pension duration gap and are therefore consistent with the
hypothesis that capital markets are informationally efficient. Considering our control
variables, we find that interest rate exposure is significantly related to cash flows, firm size,
and the one-year lag interest rate exposure. In line with Bartram (2002), who shows that the
statistical relation between interest rate exposure and financial leverage is weak, we can not
57
find that the firm’s interest rate exposure is significantly affected by the short-term and long-
term debt to equity ratio, respectively.15
In Columns (5) and (6), we test for the robustness of our results to the proxies that are
used by Jin, Merton, and Bodie (2006) to control for systematic risk (CAPM beta) of
operating assets. Possibly, these factors might explain the systematic interest rate risk of
operating assets as well. These additional controls include the percentage of industry total
sales that is earned by the firm (Market share), the capital intensiveness of the firm’s
operating business, cash holdings divided by total assets (Cash position), the growth rate of
asset (Growth rate), the ratio of current assets to current liabilities (Liquidity), the ratio of
research and development expense to assets, and the ratio of advertising expense to assets. We
provide detailed definitions of these variables in Table 9 of Appendix B. For both the PBO
and the ABO based duration gap measure, the coefficient is positive and statistically not
different from one. None of the coefficients on the proxies for systematic risk is significantly
different from zero. In our further analyses, we thus rely on our original regression
specification in section 4.
The impact of the pension duration gap on the interest rate exposure of the sponsoring
firm is also of economic significance. Based on the coefficients estimated in Column (3), a
one standard deviation increase in the duration gap (6.0) leads to a rise in the interest rate
exposure (equity duration) of the firm by 7.6 (0.2 standard deviations).
[insert Table 3 here]
In the next step of our analysis, we address the concern of Franzoni and Marín (2006)
that capital markets overvalue the equity of firms with large deficits in their pension funding.
15
If we control for financial leverage instead of short-term and long-term debt to equity, we receive a
similar result (not tabulated).
58
We do so by sorting our sample along the pension funding ratio and repeating our analysis for
different groups of firms whose pension liabilities are the most severely underfunded. The
funding ratio is the ratio of pension assets to PBO. Table 4 reports the results for the PBO
based duration gap measure. Our findings do not change if we alternatively measure pension
liabilities by the ABO (not tabulated). Columns (1) to (4) show the estimates for four
alternative subsamples where we keep 80, 60, 40, and 20 percent of the firms with the most
underfunded pension plans, respectively. In all regressions, the duration gap coefficient is
significantly positive but statistically not different from one. These results indicate that capital
markets are informationally efficient with respect to the systematic interest rate risk of
pension plans regardless of their funding status.
[insert Table 4 here]
6.2. Robustness to the duration assumptions
Figure 1 considers the robustness of our findings to our assumptions about the duration
of pension assets and liabilities. Graph A shows the duration gap coefficient as a function of
the pension liability duration assumption. Graphs B, C, and D display the estimate as a
function of the assumption about the duration of pension assets invested in bonds, equities,
and real estate, respectively. We measure pension liabilities by the PBO. However, the shapes
of the graphs are unaffected if we alternatively measure pension liabilities by the ABO.
For pension liabilities, the literature mentions both longer and shorter duration
assumptions than the 13 we use. Ryan and Fabozzi (2002) and Pennacchi and Rastad (2011)
assume that the duration of state and local pension liabilities is 15. Mercer (2014) estimates
the average duration of corporate pension liability at 17, Jared Gross, a former chief financial
59
economist at the Pension Benefit Guarantee Corporation (PBGC), arrives at an estimate of 12
(Jin, Merton, and Bodie (2006)). Graph A plots the coefficient on the pension duration gap for
an assumed pension liability duration from 10 to 20. A liability duration of 12 is associated
with a duration gap coefficient of 1.41; a duration of 15 yields an estimate of 1.09; and a
liability duration of 17 results in a coefficient of 0.95. None of these values is significantly
different from one.
The impacts of bond, equity, and real estate duration assumptions are comparably small
as well. If we set the bond duration at 18, which implies that pension plans uniquely invest in
bonds with maturities over 20 years (Barclays (2014)), the duration gap coefficient takes a
value of 1.71. If we assume that the entire fixed income portfolio is invested in cash
equivalents (duration of 0), we obtain a point estimate of 1.12. Both estimates are statistically
not different from one.
For equity securities, we test for both positive and negative duration statistics.
Leibowitz (1986) argues that equity durations could also be negative. Graph C plots the
pension duration gap coefficient as a function of equity durations between -20 and 6. We set
the upper level of equity duration at 6 because we believe it is highly unlikely that equity
portfolios have a higher duration than broadly diversified bond portfolios. The lower level
(-18) reflects a reduction of our main equity portfolio duration assumption (0) by one standard
deviation of the equity duration of COMPUSTAT firms in Table 1. The resulting point
estimates range from 0.77 (equity duration of -18) to 1.58 (equity duration of 6). They are
never statistically different from 1. If we assume that the equity duration equals the median
equity duration of our sample of COMPUSTAT firms in Table 1 (-0.22), the coefficient on
the pension duration gap takes a value of 1.27, which is virtually identical to the estimate of
1.28 in Column (1) of Table 3.
60
In section 4.3, we show that the literature mentions duration assumptions for real estate
portfolios between 0 and 100. Though this reflects a considerable uncertainty about the
duration of real estate investments, it does not compromise our analysis as the duration gap
coefficient is virtually insensitive to changes in the assumed real estate duration. The duration
gap coefficient is 1.28 if we assume that real estate has a duration of 0. In comparison, it takes
a value of 1.27 if we set real estate duration to 100. The reason why the duration gap
coefficient is almost insensitive to the assumption about the duration of real estate
investments is that real estate only accounts for a small fraction of the average pension asset
allocation.
Altogether, the results in this section indicate that our findings are robust to the
assumptions about the duration of pension liabilities and pension asset classes.
[insert Figure 1 here]
6.3. Robustness to negligibly small pension responsibilities
For some firms in our sample, the size of the pension plan is small compared to the size
of the sponsoring firm. The pension duration gap might therefore not have a first-order impact
on equity returns of these firms. According to Jin, Merton, and Bodie (2006), these
observations are not likely to add information to the analysis, which could dilute the fit of our
regressions to estimate the true relation between pension duration gap and interest rate
exposure. We address this concern by repeating our analysis for different subsamples of firms
with comparably large pension plans. We measure the size of pension plans by both the ratio
of pension liabilities (PBO) to book value of firm assets and the pension duration gap.

61
Table 5 displays the results. In Columns (1) and (2), we exclude firm-years, where the
ratio of PBO to firm assets is smaller than the 10th
and 20th
percentile of the pooled
distribution, respectively. Similarly, Columns (3) and (4) report the results for a sample of
firm-years where the pension duration gap is larger than in 10 and 20 percent of the
observations, respectively. In all regressions, the coefficient on the pension duration gap
(PBO) is positive and not statistically different from one. We receive a similar result if we
measure pension liabilities by the ABO (not tabulated). We thus conclude that our results are
not distorted by firms with negligibly small pension plans.
[insert Table 5 here]
6.4. Robustness to financial distress
This section considers whether our results could be driven by financial distress of the
pension sponsoring firms. According to Rauh (2009), financially distressed firms try to reduce
the expected cost of bankruptcy by allocating a larger portion of pension assets to bonds,
which implies a reduction of the pension duration gap. Nance, Smith, and Smithson (1993)
find that distressed firms increase their hedging activities in general. The positive relation
between the pension duration gap and the interest rate exposure of the sponsoring firm might
therefore be caused by financially distressed firms that simultaneously reduce the interest rate
risk of their business and their pension plan. We test for this potential bias by examining the
relation between pension duration gap and corporate interest rate exposure for different
subsamples of nondistressed firms only. We use the same indicators of financial distress as
Jin, Merton, and Bodie (2006), namely book to market value, return on investment, and

62
financial leverage.16
In each sample year, we exclude either the decile or the quintile of firms
that appear to be most severely financially distressed the year before. These are the firms with
the highest book to market ratio, the highest financial leverage, and the lowest return on
investment, respectively.17
In total, we consider six different subsamples of non-distressed
firms.
Table 6 presents the results. Columns (1) and (2) sort the firms by their book to market
value, Columns (3) and (4) by return on investment, and Columns (5) and (6) by financial
leverage. In all regressions, the pension duration gap (PBO) coefficient is positive and not
statistically different from one. In not tabulated regressions, we receive a similar result for the
ABO based pension duration gap measure. These results indicate that the relation between
interest rate exposure and duration gap is not caused by financial distress of the sponsoring
firms.
[insert Table 6 here]
6.5. Robustness to the sample period
Our sample period (2003 to 2012) covers a fairly dynamic interest rate environment
characterized by large macroeconomic disturbances, central bank interventions, and a massive
decrease in interest rates. Bartram (2002) finds that the interest rate exposure of nonfinancial
firms differs considerably between different periods in time. This raises the concern that our
results could heavily depend on our observation period. Therefore, we estimate the relation
between duration gap and interest rate exposure for different subperiods of our sample. First,
16
The definitions are given in Table 9 of Appendix B. 17
The value of the 10th
percentile of return on investment is negative in all sample years. The value of the
20th
percentile is negative in the majority of the years.
63
we test whether our results are driven by the recent financial crisis. Second, we compare the
pension duration gap coefficient in high interest rate periods with the estimate in a low
interest rate period. Table 7 displays the estimates of regressions on the PBO based duration
gap measure. However, we receive similar results if we measure pension liabilities by the
ABO (not tabulated).
In Column (1), we exclude the year 2008, when Lehman brothers filed for bankruptcy
and global stock markets collapsed. In Column (2), we further exclude the year 2007, when
the first manifestations of a liquidity crisis took place, and 2009, when the stock market
bottomed out and started to recover. In Columns (3) and (4), we split the sample into years
with comparably high interest rate levels (2004, 2005, 2006, 2007, and 2008) and years with
comparably low interest rate levels (2003, 2009, 2010, 2011, and 2012). In all regressions, we
find a positive pension duration gap coefficient that is not statistically different from one. This
indicates that our findings are persistent over time and do not depend on a specific
macroeconomic environment.
[insert Table 7 here]
6.6. Out of sample analyses
In this last section of our paper, we investigate the relation between interest rate
exposure and pension duration gap in two alternative samples of pension sponsoring firms.
Table 8 displays the results. Column (1) considers nonfinancial firms with pension plans that
potentially hedge their interest rate risk with derivatives. As we discuss in section 5.2, these
represent the firms that report a partial allocation of their pension assets to other assets. The
duration gap coefficient in this sample is significantly negative, which conflicts with our
64
prediction that, under the assumption of market efficiency, the estimate should be equal to
one. However, as we argued before, we cannot rule out that this result is due to unobserved
derivative hedging. We therefore believe that this evidence is not sufficient to reject the
hypothesis of efficient capital markets.
Column (2) displays the estimates for financial firms with pension plans that do not
hedge their interest rate risk with derivatives. Although the coefficient on pension duration
gap is negative, it is not significantly different from one. This is because the standard error is
approximately six times as large as in our main sample of nonfinancial pension sponsoring
firms. Thus, we cannot reject the market efficiency hypothesis based on this sample either.
[insert Table 8 here]
7. Conclusion
This paper examines whether the interest rate exposure of nonfinancial firms is related
to the systematic interest rate risk of their pension plans, and whether the relation is one-to-
one. The interest rate sensitivity of DB pension plans is among the biggest nonoperating risks
of corporate America. Based on publicly available information and controlling for other
factors that potentially affect interest rate exposures, we find that equity returns reflect the
duration gap between pension assets and liabilities without bias – even in cases where
previous research has questioned market efficiency. Our finding is economically important
and robust to the assumptions about the duration of pension assets and liabilities. Moreover,
our analysis is not distorted by negligibly small pension plans, financial distress of the
sponsoring firms, or changes in the macroeconomic environment.

65
This paper contributes to the ongoing discussion about the efficiency of capital markets
with respect to information about DB pension plans. We extend this literature to systematic
interest rate risk, which represents a risk factor that has not yet been fully understood in its
impact on nonfinancial firms. Therefore, we also contribute to the comparatively limited
literature on the interest rate exposure of nonfinancial firms.
Since our data do not provide us with information on derivative hedging in corporate
DB pension plans, we limit our main analysis to firms whose pension plans do not invest in
derivative securities at all. Still, we cannot exclude that these firms hedge the interest rate risk
of their pension plans on their own accounts. However, even if this was the case, it could not
explain our findings. On the contrary, it would rather weaken the relation between pension
duration gap and interest rate exposure of the firm. Future research might have access to more
comprehensive data on interest rate hedging and might therefore be able to test the relation
between pension duration gap and interest rate exposure of the sponsoring firm in a larger
sample of firms.
Appendix A: Derivation of the equations in section 3
If we decompose βOA, βD, βPA and βPL in analogy to equation (4) into their equity and
their interest rate risk components, we can rewrite equation (1) by
β′Ej
+ γEj∙ βI =
OAj
Ej(β′
OAj+ γOAj
∙ βI) −Dj
Ej(β′
Dj+ γDj
∙ βI)
+ [PAj
Ej(β′
PAj+ γPAj
∙ βI) −PLj
Ej(β′
PLj+ γPLj
∙ βI)] . (A1)

66
Rearranging the expression yields
β′Ej
+ γEj∙ βI =
OAj
Ejβ′
OAj−
Dj
Ejβ′
Dj+ [
PAj
Ejβ′
PAj−
PLj
Ejβ′
PLj]
+OAj
EjγOAj
∙ βI −Dj
EjγDj
∙ βI + [PAj
EjγPAj
∙ βI −PLj
EjγPLj
∙ βI] , (A2)
which we decompose into an interest rate risk part
γEj∙ βI =
OAj
EjγOAj
∙ βI −Dj
EjγDj
∙ βI + [PAj
EjγPAj
∙ βI −PLj
EjγPLj
∙ βI] (A3)
and an equity risk part
β′Ej
=OAj
Ejβ′
OAj−
Dj
Ejβ′
Dj+ [
PAj
Ejβ′
PAj−
PLj
Ejβ′
PLj] . (A4)
If βI ≠ 0, we can divide equation (A3) by βI, which yields an interest rate risk
expression analogous to the expression for systematic risk in equation (1):
γEj=
OAj
EjγOAj
−Dj
EjγDj
+ [PAj
EjγPAj
−PLj
EjγPLj
] (5)
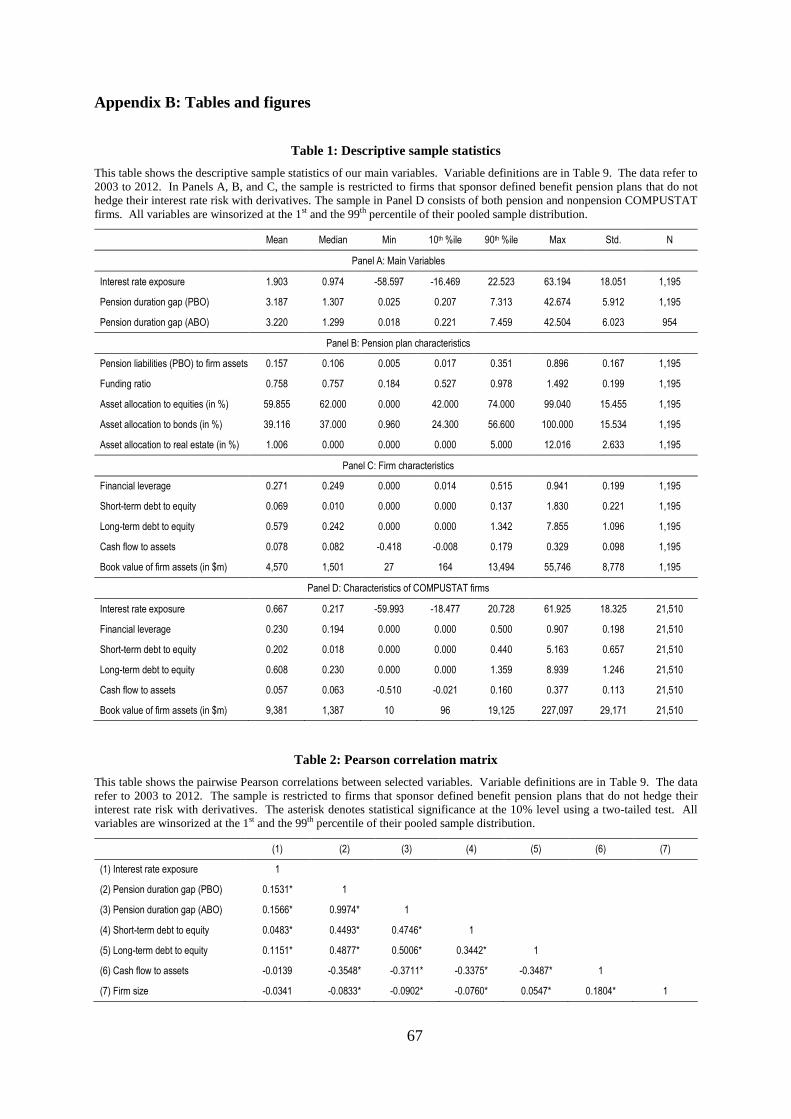
67
Appendix B: Tables and figures
Table 1: Descriptive sample statistics
This table shows the descriptive sample statistics of our main variables. Variable definitions are in Table 9. The data refer to
2003 to 2012. In Panels A, B, and C, the sample is restricted to firms that sponsor defined benefit pension plans that do not
hedge their interest rate risk with derivatives. The sample in Panel D consists of both pension and nonpension COMPUSTAT
firms. All variables are winsorized at the 1st and the 99th percentile of their pooled sample distribution.
Mean Median Min 10th %ile 90th %ile Max Std. N
Panel A: Main Variables
Interest rate exposure 1.903 0.974 -58.597 -16.469 22.523 63.194 18.051 1,195
Pension duration gap (PBO) 3.187 1.307 0.025 0.207 7.313 42.674 5.912 1,195
Pension duration gap (ABO) 3.220 1.299 0.018 0.221 7.459 42.504 6.023 954
Panel B: Pension plan characteristics
Pension liabilities (PBO) to firm assets 0.157 0.106 0.005 0.017 0.351 0.896 0.167 1,195
Funding ratio 0.758 0.757 0.184 0.527 0.978 1.492 0.199 1,195
Asset allocation to equities (in %) 59.855 62.000 0.000 42.000 74.000 99.040 15.455 1,195
Asset allocation to bonds (in %) 39.116 37.000 0.960 24.300 56.600 100.000 15.534 1,195
Asset allocation to real estate (in %) 1.006 0.000 0.000 0.000 5.000 12.016 2.633 1,195
Panel C: Firm characteristics
Financial leverage 0.271 0.249 0.000 0.014 0.515 0.941 0.199 1,195
Short-term debt to equity 0.069 0.010 0.000 0.000 0.137 1.830 0.221 1,195
Long-term debt to equity 0.579 0.242 0.000 0.000 1.342 7.855 1.096 1,195
Cash flow to assets 0.078 0.082 -0.418 -0.008 0.179 0.329 0.098 1,195
Book value of firm assets (in $m) 4,570 1,501 27 164 13,494 55,746 8,778 1,195
Panel D: Characteristics of COMPUSTAT firms
Interest rate exposure 0.667 0.217 -59.993 -18.477 20.728 61.925 18.325 21,510
Financial leverage 0.230 0.194 0.000 0.000 0.500 0.907 0.198 21,510
Short-term debt to equity 0.202 0.018 0.000 0.000 0.440 5.163 0.657 21,510
Long-term debt to equity 0.608 0.230 0.000 0.000 1.359 8.939 1.246 21,510
Cash flow to assets 0.057 0.063 -0.510 -0.021 0.160 0.377 0.113 21,510
Book value of firm assets (in $m) 9,381 1,387 10 96 19,125 227,097 29,171 21,510
Table 2: Pearson correlation matrix
This table shows the pairwise Pearson correlations between selected variables. Variable definitions are in Table 9. The data
refer to 2003 to 2012. The sample is restricted to firms that sponsor defined benefit pension plans that do not hedge their
interest rate risk with derivatives. The asterisk denotes statistical significance at the 10% level using a two-tailed test. All
variables are winsorized at the 1st and the 99th percentile of their pooled sample distribution.
(1) (2) (3) (4) (5) (6) (7)
(1) Interest rate exposure 1
(2) Pension duration gap (PBO) 0.1531* 1
(3) Pension duration gap (ABO) 0.1566* 0.9974* 1
(4) Short-term debt to equity 0.0483* 0.4493* 0.4746* 1
(5) Long-term debt to equity 0.1151* 0.4877* 0.5006* 0.3442* 1
(6) Cash flow to assets -0.0139 -0.3548* -0.3711* -0.3375* -0.3487* 1
(7) Firm size -0.0341 -0.0833* -0.0902* -0.0760* 0.0547* 0.1804* 1
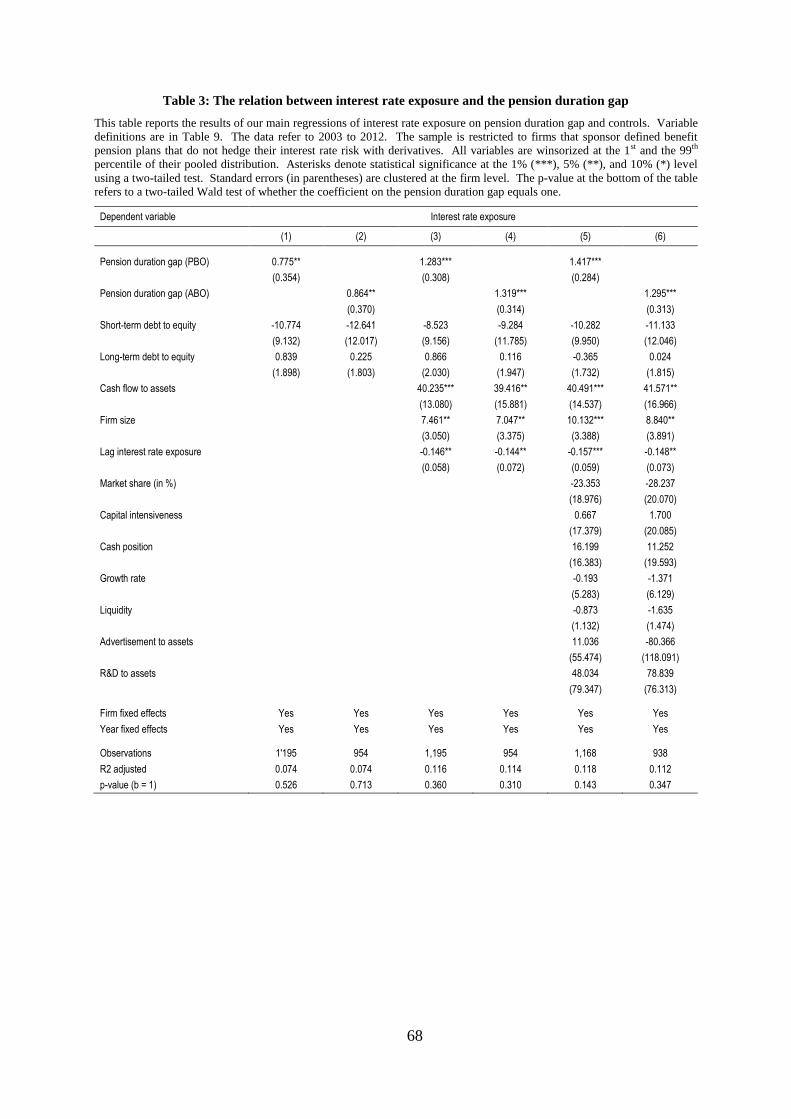
68
Table 3: The relation between interest rate exposure and the pension duration gap
This table reports the results of our main regressions of interest rate exposure on pension duration gap and controls. Variable
definitions are in Table 9. The data refer to 2003 to 2012. The sample is restricted to firms that sponsor defined benefit
pension plans that do not hedge their interest rate risk with derivatives. All variables are winsorized at the 1st and the 99th
percentile of their pooled distribution. Asterisks denote statistical significance at the 1% (***), 5% (**), and 10% (*) level
using a two-tailed test. Standard errors (in parentheses) are clustered at the firm level. The p-value at the bottom of the table
refers to a two-tailed Wald test of whether the coefficient on the pension duration gap equals one.
Dependent variable Interest rate exposure
(1) (2) (3) (4) (5) (6)
Pension duration gap (PBO) 0.775** 1.283*** 1.417***
(0.354) (0.308) (0.284)
Pension duration gap (ABO) 0.864** 1.319*** 1.295***
(0.370) (0.314) (0.313)
Short-term debt to equity -10.774 -12.641 -8.523 -9.284 -10.282 -11.133
(9.132) (12.017) (9.156) (11.785) (9.950) (12.046)
Long-term debt to equity 0.839 0.225 0.866 0.116 -0.365 0.024
(1.898) (1.803) (2.030) (1.947) (1.732) (1.815)
Cash flow to assets 40.235*** 39.416** 40.491*** 41.571**
(13.080) (15.881) (14.537) (16.966)
Firm size 7.461** 7.047** 10.132*** 8.840**
(3.050) (3.375) (3.388) (3.891)
Lag interest rate exposure -0.146** -0.144** -0.157*** -0.148**
(0.058) (0.072) (0.059) (0.073)
Market share (in %) -23.353 -28.237
(18.976) (20.070)
Capital intensiveness 0.667 1.700
(17.379) (20.085)
Cash position 16.199 11.252
(16.383) (19.593)
Growth rate -0.193 -1.371
(5.283) (6.129)
Liquidity -0.873 -1.635
(1.132) (1.474)
Advertisement to assets 11.036 -80.366
(55.474) (118.091)
R&D to assets 48.034 78.839
(79.347) (76.313)
Firm fixed effects Yes Yes Yes Yes Yes Yes
Year fixed effects Yes Yes Yes Yes Yes Yes
Observations 1'195 954 1,195 954 1,168 938
R2 adjusted 0.074 0.074 0.116 0.114 0.118 0.112
p-value (b = 1) 0.526 0.713 0.360 0.310 0.143 0.347
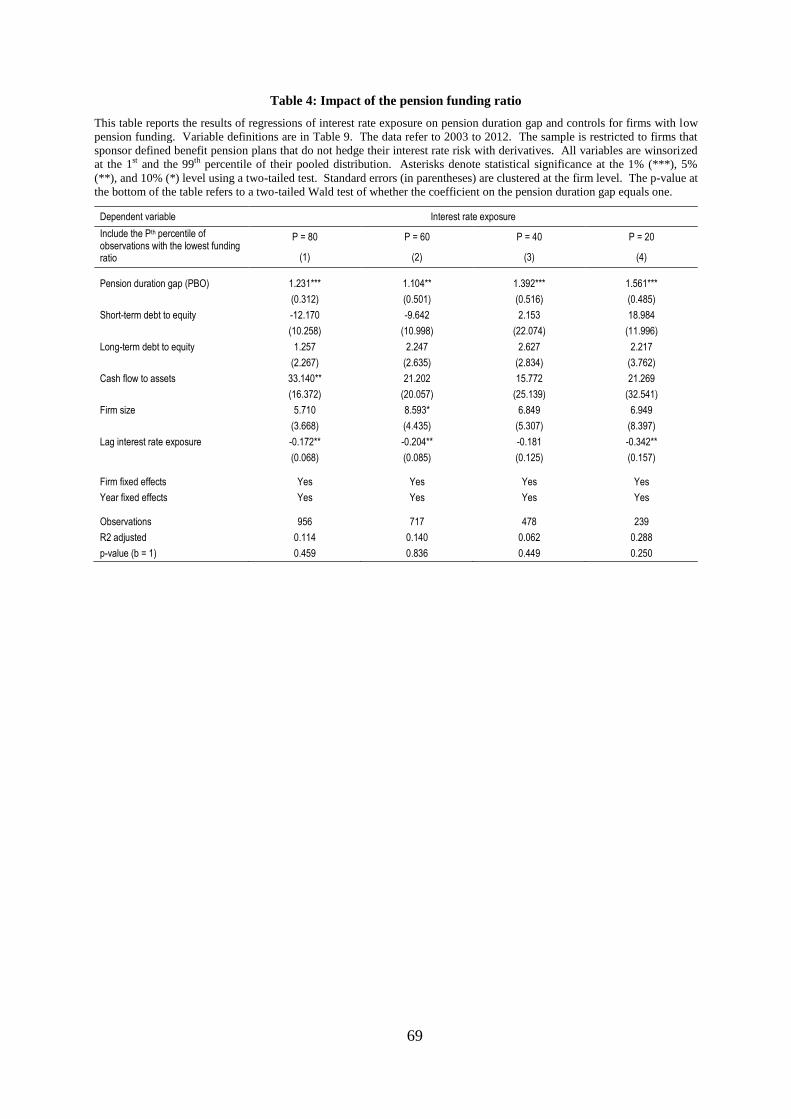
69
Table 4: Impact of the pension funding ratio
This table reports the results of regressions of interest rate exposure on pension duration gap and controls for firms with low
pension funding. Variable definitions are in Table 9. The data refer to 2003 to 2012. The sample is restricted to firms that
sponsor defined benefit pension plans that do not hedge their interest rate risk with derivatives. All variables are winsorized
at the 1st and the 99th percentile of their pooled distribution. Asterisks denote statistical significance at the 1% (***), 5%
(**), and 10% (*) level using a two-tailed test. Standard errors (in parentheses) are clustered at the firm level. The p-value at
the bottom of the table refers to a two-tailed Wald test of whether the coefficient on the pension duration gap equals one.
Dependent variable Interest rate exposure
Include the Pth percentile of observations with the lowest funding ratio
P = 80 P = 60 P = 40 P = 20
(1) (2) (3) (4)
Pension duration gap (PBO) 1.231*** 1.104** 1.392*** 1.561***
(0.312) (0.501) (0.516) (0.485)
Short-term debt to equity -12.170 -9.642 2.153 18.984
(10.258) (10.998) (22.074) (11.996)
Long-term debt to equity 1.257 2.247 2.627 2.217
(2.267) (2.635) (2.834) (3.762)
Cash flow to assets 33.140** 21.202 15.772 21.269
(16.372) (20.057) (25.139) (32.541)
Firm size 5.710 8.593* 6.849 6.949
(3.668) (4.435) (5.307) (8.397)
Lag interest rate exposure -0.172** -0.204** -0.181 -0.342**
(0.068) (0.085) (0.125) (0.157)
Firm fixed effects Yes Yes Yes Yes
Year fixed effects Yes Yes Yes Yes
Observations 956 717 478 239
R2 adjusted 0.114 0.140 0.062 0.288
p-value (b = 1) 0.459 0.836 0.449 0.250
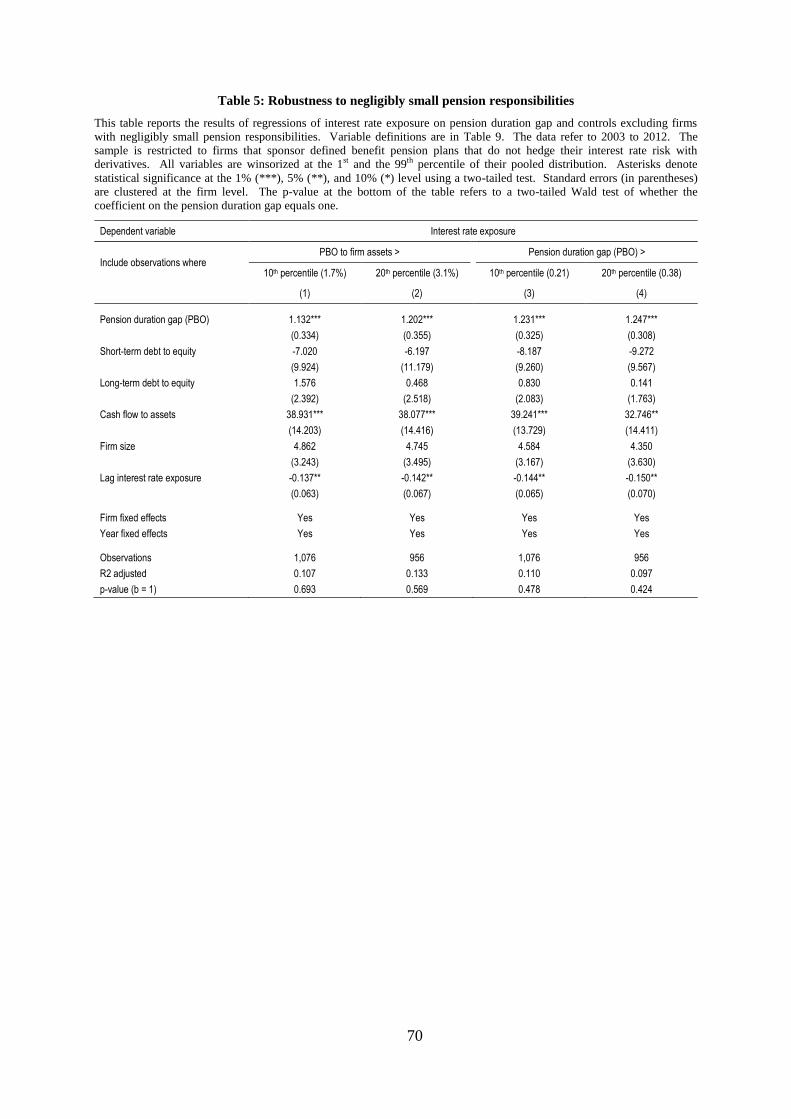
70
Table 5: Robustness to negligibly small pension responsibilities
This table reports the results of regressions of interest rate exposure on pension duration gap and controls excluding firms
with negligibly small pension responsibilities. Variable definitions are in Table 9. The data refer to 2003 to 2012. The
sample is restricted to firms that sponsor defined benefit pension plans that do not hedge their interest rate risk with
derivatives. All variables are winsorized at the 1st and the 99th percentile of their pooled distribution. Asterisks denote
statistical significance at the 1% (***), 5% (**), and 10% (*) level using a two-tailed test. Standard errors (in parentheses)
are clustered at the firm level. The p-value at the bottom of the table refers to a two-tailed Wald test of whether the
coefficient on the pension duration gap equals one.
Dependent variable Interest rate exposure
Include observations where PBO to firm assets > Pension duration gap (PBO) >
10th percentile (1.7%) 20th percentile (3.1%) 10th percentile (0.21) 20th percentile (0.38)
(1) (2) (3) (4)
Pension duration gap (PBO) 1.132*** 1.202*** 1.231*** 1.247***
(0.334) (0.355) (0.325) (0.308)
Short-term debt to equity -7.020 -6.197 -8.187 -9.272
(9.924) (11.179) (9.260) (9.567)
Long-term debt to equity 1.576 0.468 0.830 0.141
(2.392) (2.518) (2.083) (1.763)
Cash flow to assets 38.931*** 38.077*** 39.241*** 32.746**
(14.203) (14.416) (13.729) (14.411)
Firm size 4.862 4.745 4.584 4.350
(3.243) (3.495) (3.167) (3.630)
Lag interest rate exposure -0.137** -0.142** -0.144** -0.150**
(0.063) (0.067) (0.065) (0.070)
Firm fixed effects Yes Yes Yes Yes
Year fixed effects Yes Yes Yes Yes
Observations 1,076 956 1,076 956
R2 adjusted 0.107 0.133 0.110 0.097
p-value (b = 1) 0.693 0.569 0.478 0.424
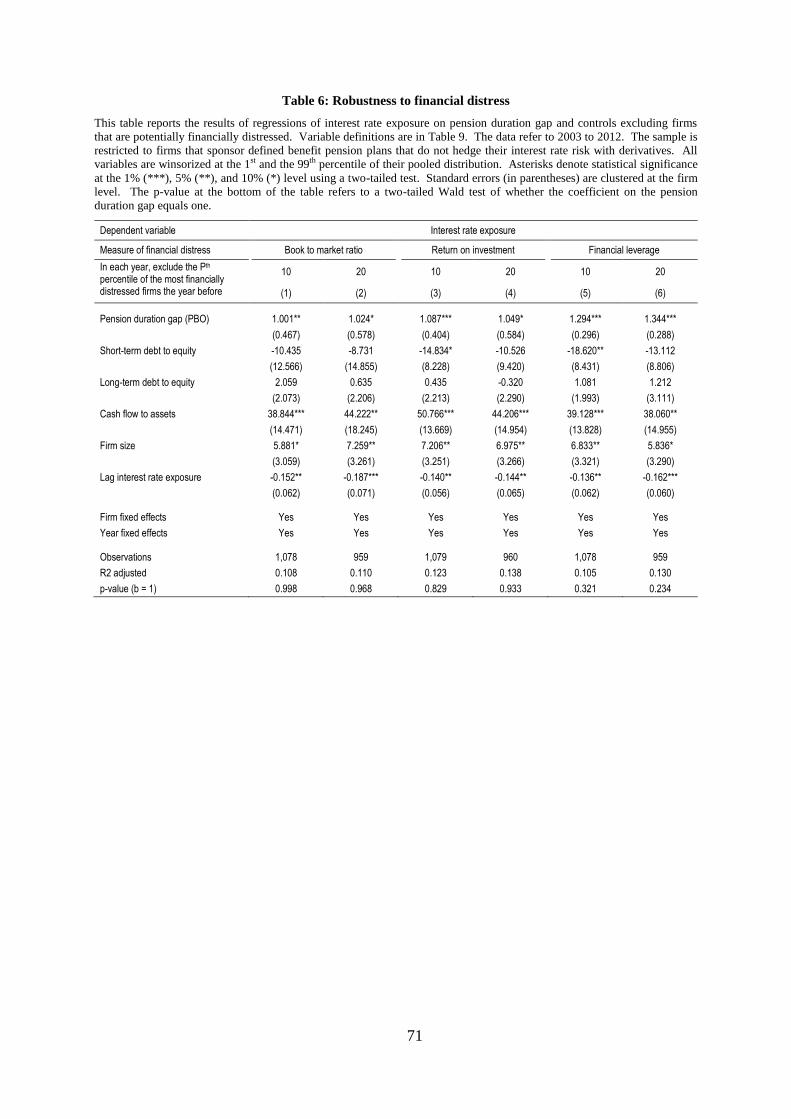
71
Table 6: Robustness to financial distress
This table reports the results of regressions of interest rate exposure on pension duration gap and controls excluding firms
that are potentially financially distressed. Variable definitions are in Table 9. The data refer to 2003 to 2012. The sample is
restricted to firms that sponsor defined benefit pension plans that do not hedge their interest rate risk with derivatives. All
variables are winsorized at the 1st and the 99th percentile of their pooled distribution. Asterisks denote statistical significance
at the 1% (***), 5% (**), and 10% (*) level using a two-tailed test. Standard errors (in parentheses) are clustered at the firm
level. The p-value at the bottom of the table refers to a two-tailed Wald test of whether the coefficient on the pension
duration gap equals one.
Dependent variable Interest rate exposure
Measure of financial distress Book to market ratio Return on investment Financial leverage
In each year, exclude the Pth percentile of the most financially distressed firms the year before
10 20 10 20 10 20
(1) (2) (3) (4) (5) (6)
Pension duration gap (PBO) 1.001** 1.024* 1.087*** 1.049* 1.294*** 1.344***
(0.467) (0.578) (0.404) (0.584) (0.296) (0.288)
Short-term debt to equity -10.435 -8.731 -14.834* -10.526 -18.620** -13.112
(12.566) (14.855) (8.228) (9.420) (8.431) (8.806)
Long-term debt to equity 2.059 0.635 0.435 -0.320 1.081 1.212
(2.073) (2.206) (2.213) (2.290) (1.993) (3.111)
Cash flow to assets 38.844*** 44.222** 50.766*** 44.206*** 39.128*** 38.060**
(14.471) (18.245) (13.669) (14.954) (13.828) (14.955)
Firm size 5.881* 7.259** 7.206** 6.975** 6.833** 5.836*
(3.059) (3.261) (3.251) (3.266) (3.321) (3.290)
Lag interest rate exposure -0.152** -0.187*** -0.140** -0.144** -0.136** -0.162***
(0.062) (0.071) (0.056) (0.065) (0.062) (0.060)
Firm fixed effects Yes Yes Yes Yes Yes Yes
Year fixed effects Yes Yes Yes Yes Yes Yes
Observations 1,078 959 1,079 960 1,078 959
R2 adjusted 0.108 0.110 0.123 0.138 0.105 0.130
p-value (b = 1) 0.998 0.968 0.829 0.933 0.321 0.234
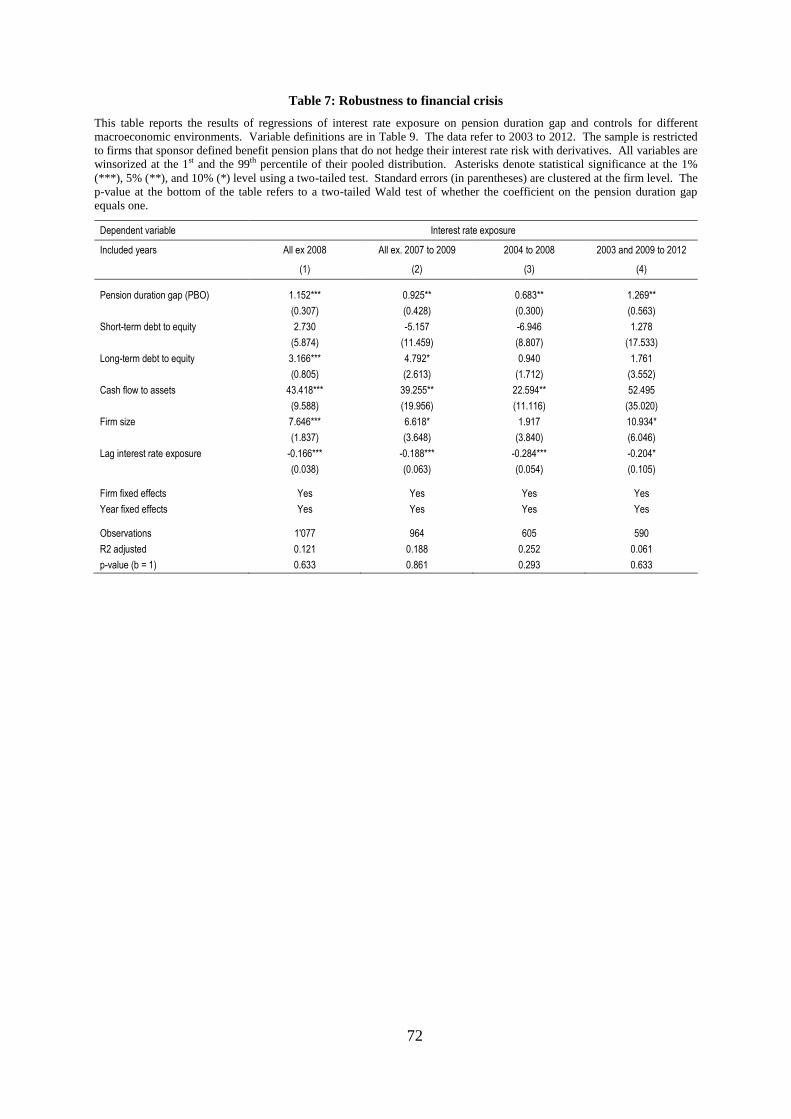
72
Table 7: Robustness to financial crisis
This table reports the results of regressions of interest rate exposure on pension duration gap and controls for different
macroeconomic environments. Variable definitions are in Table 9. The data refer to 2003 to 2012. The sample is restricted
to firms that sponsor defined benefit pension plans that do not hedge their interest rate risk with derivatives. All variables are
winsorized at the 1st and the 99th percentile of their pooled distribution. Asterisks denote statistical significance at the 1%
(***), 5% (**), and 10% (*) level using a two-tailed test. Standard errors (in parentheses) are clustered at the firm level. The
p-value at the bottom of the table refers to a two-tailed Wald test of whether the coefficient on the pension duration gap
equals one.
Dependent variable Interest rate exposure
Included years All ex 2008 All ex. 2007 to 2009 2004 to 2008 2003 and 2009 to 2012
(1) (2) (3) (4)
Pension duration gap (PBO) 1.152*** 0.925** 0.683** 1.269**
(0.307) (0.428) (0.300) (0.563)
Short-term debt to equity 2.730 -5.157 -6.946 1.278
(5.874) (11.459) (8.807) (17.533)
Long-term debt to equity 3.166*** 4.792* 0.940 1.761
(0.805) (2.613) (1.712) (3.552)
Cash flow to assets 43.418*** 39.255** 22.594** 52.495
(9.588) (19.956) (11.116) (35.020)
Firm size 7.646*** 6.618* 1.917 10.934*
(1.837) (3.648) (3.840) (6.046)
Lag interest rate exposure -0.166*** -0.188*** -0.284*** -0.204*
(0.038) (0.063) (0.054) (0.105)
Firm fixed effects Yes Yes Yes Yes
Year fixed effects Yes Yes Yes Yes
Observations 1'077 964 605 590
R2 adjusted 0.121 0.188 0.252 0.061
p-value (b = 1) 0.633 0.861 0.293 0.633
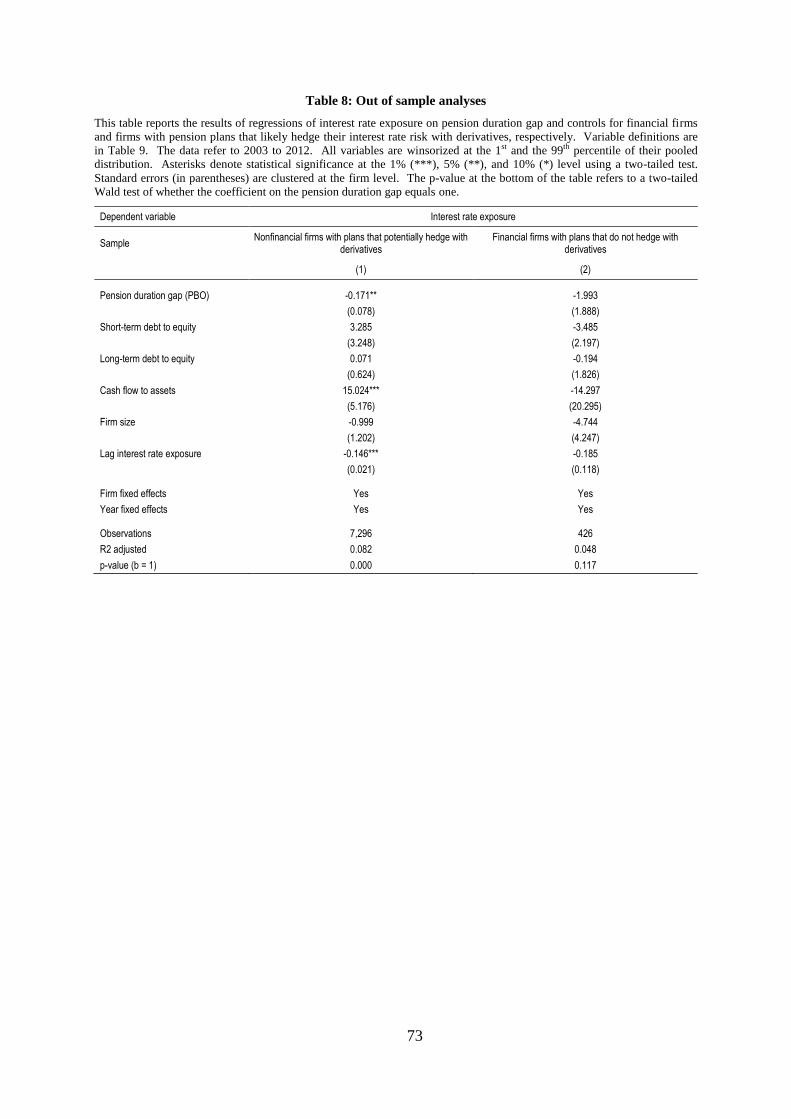
73
Table 8: Out of sample analyses
This table reports the results of regressions of interest rate exposure on pension duration gap and controls for financial firms
and firms with pension plans that likely hedge their interest rate risk with derivatives, respectively. Variable definitions are
in Table 9. The data refer to 2003 to 2012. All variables are winsorized at the 1st and the 99th percentile of their pooled
distribution. Asterisks denote statistical significance at the 1% (***), 5% (**), and 10% (*) level using a two-tailed test.
Standard errors (in parentheses) are clustered at the firm level. The p-value at the bottom of the table refers to a two-tailed
Wald test of whether the coefficient on the pension duration gap equals one.
Dependent variable Interest rate exposure
Sample Nonfinancial firms with plans that potentially hedge with
derivatives Financial firms with plans that do not hedge with
derivatives
(1) (2)
Pension duration gap (PBO) -0.171** -1.993
(0.078) (1.888)
Short-term debt to equity 3.285 -3.485
(3.248) (2.197)
Long-term debt to equity 0.071 -0.194
(0.624) (1.826)
Cash flow to assets 15.024*** -14.297
(5.176) (20.295)
Firm size -0.999 -4.744
(1.202) (4.247)
Lag interest rate exposure -0.146*** -0.185
(0.021) (0.118)
Firm fixed effects Yes Yes
Year fixed effects Yes Yes
Observations 7,296 426
R2 adjusted 0.082 0.048
p-value (b = 1) 0.000 0.117

74
Table 9: Variable definitions
This table summarizes the variable definitions. The data are from the from the COMPUSTAT North American Pension
database, the COMPUSTAT/CRSP Merged database, the CRSP daily fixed term index files, and the CRSP daily stock files.
Variable Calculation (incl. COMPUSTAT mnemonics)
Panel A: Main variables
Interest rate exposure (γ̂E) The interest rate exposure of the firm’s equity is the sum of the partial sensitivities of stock returns to absolute changes in the yield to maturity of the 1-, 5-, 10- and 30-year CRSP fixed term index, while controlling for the return on the CRSP value-weighted total stock market index.
The regression run is: REj,t= αj + β′Ej
∙ REMt+ γE1j
∆I1,t + γE5j∆I5,t + γE10j
∆I10,t + γE30j∆I30,t + ϵj,t
The estimation is made for each firm and year based on weekly CRSP data (up to 52 observations). All returns are continuously compounded. We exclude stocks that have not been traded for more than 43 weeks during a year.
γ̂Ej= γE1j
+ γE5j+ γE10j
+ γE30j
Pension duration gap (γ̂Pension) The pension duration gap is the difference between the duration of pension assets (normalized by the ratio of pension assets to firm equity) and the duration of pension liabilities (normalized by the ratio of pension liabilities to firm equity).
The duration of pension assets is the weighted average duration of pension assets invested in equities (pnate), bonds (pnatd), and real estate (pnatr).
Pension assets are measured by their market value (pplao+pplau). Pension liabilities are primarily measured by the PBO (pbpro + pbpru). In an alternative specification, pension liabilities are measured by the ABO (pbaco + pbacu).
The duration assumptions are:
Duration Pension liabilities = 13
Duration equities = 0
Duration bonds = 6
Duration real estate = 6
Pension duration gap (PBO) = ((0 ∙ pnate − 6 ∙ pnatd − 6 ∙ pnatr)(pplao+pplau)−(−13(pbpro+pbpru))
100(csho ∙ prcc_f))
Pension duration gap (ABO) = ((0 ∙ pnate − 6 ∙ pnatd − 6 ∙ pnatr)(pplao+pplau)−(−13(pbaco +pbacu))
100(csho ∙ prcc_f))
Panel B: Control variables
Short-term debt to equity Book value of short-term debt (dlc) divided by market value of equity (csho x prcc_f).
Long-term debt to equity Book value of long-term debt (dltt) divided by market value of equity (csho x prcc_f).
Cash flow to assets Sum of net income and depreciation and amortization (ni + dp) divided by total assets (at).
Firm size Natural logarithm of total assets (at).
Market share (in %) Sales (sale) divided by total sales of firms in the same Fama-French 48 industry multiplied by hundred.
Capital intensiveness Current assets (act) divided by total assets (at).
Cash position Cash and short-term investments (che) divided by total assets (at).
Growth rate Natural logarithm of total assets divided by lagged total assets (ln(at / att-1)).
Liquidity Current assets (act) divided by current liabilities (lct).
Advertisement to assets Advertising expense (xad) divided by total assets (at). If advertising expense is missing it is set to zero.
R&D to assets Research and development expense (xrd) divided by total assets (at). If research and development expense is missing it is set to zero.
Panel C: Further variables
PBO to firm assets The PBO (pbpro + pbpru) divided by total assets (at).
Funding ratio Pension assets (pplao + pplau) divided by the PBO (pbpro + pbpru).
Book-market ratio Book value of equity (at-dlc-dltt) divided by market value of equity (csho x prcc_f).
Return on investment Net income (ni) divided by total assets (at).
Financial leverage Book value of debt (dltt + dlc) divided by total assets (at).
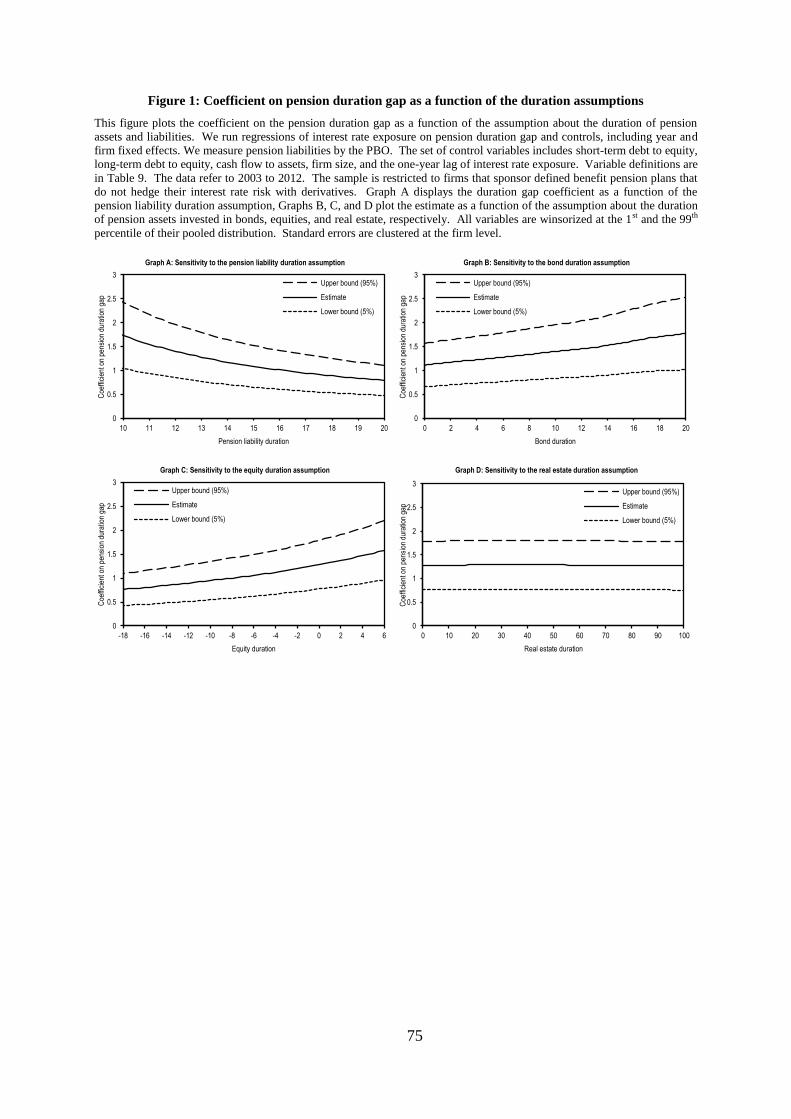
75
Figure 1: Coefficient on pension duration gap as a function of the duration assumptions
This figure plots the coefficient on the pension duration gap as a function of the assumption about the duration of pension
assets and liabilities. We run regressions of interest rate exposure on pension duration gap and controls, including year and
firm fixed effects. We measure pension liabilities by the PBO. The set of control variables includes short-term debt to equity,
long-term debt to equity, cash flow to assets, firm size, and the one-year lag of interest rate exposure. Variable definitions are
in Table 9. The data refer to 2003 to 2012. The sample is restricted to firms that sponsor defined benefit pension plans that
do not hedge their interest rate risk with derivatives. Graph A displays the duration gap coefficient as a function of the
pension liability duration assumption, Graphs B, C, and D plot the estimate as a function of the assumption about the duration
of pension assets invested in bonds, equities, and real estate, respectively. All variables are winsorized at the 1st and the 99th
percentile of their pooled distribution. Standard errors are clustered at the firm level.
0
0.5
1
1.5
2
2.5
3
10 11 12 13 14 15 16 17 18 19 20
Coe
ffici
ent o
n pe
nsio
n du
ratio
n ga
p
Pension liability duration
Graph A: Sensitivity to the pension liability duration assumption
Upper bound (95%)
Estimate
Lower bound (5%)
0
0.5
1
1.5
2
2.5
3
0 2 4 6 8 10 12 14 16 18 20
Coe
ffici
ent o
n pe
nsio
n du
ratio
n ga
p
Bond duration
Graph B: Sensitivity to the bond duration assumption
Upper bound (95%)
Estimate
Lower bound (5%)
0
0.5
1
1.5
2
2.5
3
-18 -16 -14 -12 -10 -8 -6 -4 -2 0 2 4 6
Coe
ffici
ent o
n pe
nsio
n du
ratio
n ga
p
Equity duration
Graph C: Sensitivity to the equity duration assumption
Upper bound (95%)
Estimate
Lower bound (5%)
0
0.5
1
1.5
2
2.5
3
0 10 20 30 40 50 60 70 80 90 100
Coe
ffici
ent o
n pe
nsio
n du
ratio
n ga
p
Real estate duration
Graph D: Sensitivity to the real estate duration assumption
Upper bound (95%)
Estimate
Lower bound (5%)
76
III. How the Chairman’s Personal Preferences Affect
Public Pension Risk
Oliver Dichter*
November, 2015
Based on the analysis of 343 changes of chairpersons in 110
U.S. state and local government pension boards of trustees,
this paper shows that the risk from the mismatch between
pension assets and liabilities reflects the personal risk
preferences of the chairman of the board (COB). We find that
pension risk is negatively affected by an increase in COB
age, and that it is lower if the COB is a woman. We also find
that pension risk is higher if the COB is an annuitant of the
plan, consistent with an incentive of retirees to gamble for
higher benefits. Finally, we observe that the risk of public
pension plans is higher if the COB is an ex officio trustee,
possibly because reporting rules enable politicians to avoid
tax increases or spending cuts by boosting the risk of the
fund’s assets. The current underfunding problems faced by
public pension plans are hence partially a consequence of
past decisions of pension COBs. Our results are robust to
different definitions of pension risk, economically relevant,
and particularly strong for more poorly governed pension
plans. We find no evidence of an endogenous selection of
COBs to pension plans that match their risk preferences.
Keywords: Public pension plans; Asset-liability management; Chairman of the board; Risk
preferences; Governance
JEL codes: G23, G34, J14, J16
*Oliver Dichter (corresponding author, [email protected]), the Institut für Finanzmanagement,
University of Bern. This paper is part of my dissertation with Claudio Loderer, the Institut für
Finanzmanagement, University of Bern and the Swiss Finance Institute. I wish to thank Claudio Loderer for
valuable comments and suggestions. All errors are mine.

77
1. Introduction
Failure to take account of the mismatch between the assets in defined benefit pension
plans (primarily equities) and the liabilities (deferred fixed annuities) has long been a major
unrecognized source of financial instability. The underfunding problems now facing state and
local government pension plans […] are a direct consequence of this conceptual and
practical failure.
– Zivi Bodie (2012), International Journal of Central Banking –
The vast majority of public defined benefit (DB) pension plans in the U.S. are
substantially underfunded. In 2013, the asset value of the 126 largest public DB pension plans
equaled USD 2.86 trillion, while the reported pension liabilities amounted to USD 3.81
trillion (Public Fund Survey (2015)). The economic value of pension obligations was even 15
to 40 percent higher (Novy-Marx and Rauh (2011)). In most states of the U.S., the deficit in
pension funding is larger than the general obligation debt and equals several years of tax
revenues (Novy-Marx and Rauh (2011)). The shortfall in public pension funding has also
been a major contributor to some of the most recent bankruptcies of U.S. cities, including
Detroit (IL), Harrisburg (PA), Mammoth Lakes (CA), Stockton (CA), and Central Falls (RI)
(Spangler (2013)). Unfunded public pension liabilities are thus a huge burden on tax payers.
Moreover, these shortfalls imply that future generations of taxpayers must pay for today’s
pension liabilities, which violates the fundamental principle of public finance that each
generation should pay for the services it consumes (Bader (2015)).
The main cause of the underfunding problems of public pension plans is the historic
mismatch between pension assets and liabilities (Bodie (2012)). According to Pennacchi and
Rastad (2011), this asset-liability mismatch determines the total financial risk of a DB pension
plan. Despite the far-reaching consequences of this risk, we know little about its determinants

78
(Bodie (2012)). Existing research, including Cronqvist, Makhija, and Yonker (2012),
Baxamusa and Jalal (2015), and Cain and McKeon (2015) shows that the risk of listed firms is
explained by the private preferences of corporate executives. This paper investigates if
pension risk is partially explained by the personal preferences of pension executives as well.
We focus on the chairman of the board (COB) because the chairperson represents the pension
executive with the strongest influence on asset-liability decisions. While the chief investment
officer (CIO) is involved in the everyday management of pension assets, the COB is the
president of the board that effectively determines investment allocations, actuarial valuations,
system operations, and often plan benefits (Mitchell (2001)). The pension COB is comparable
to a corporate chairman with his superior access to new information and his substantial
influence on meeting agendas and committee decisions (Parker (1990)).18
To the best of our knowledge, we are the first to inquire into whether the individual
preferences of the COB explain pension risk. Existing empirical studies typically rely on
pension plan or board characteristics to explain risk taking at pension plans but largely ignore
the possible role of individual executives. Pennacchi and Rastad (2011) show that pension
risk increases with the fraction of beneficiaries on the pension board of trustees, possibly
because beneficiaries have an incentive to gamble for higher benefits. Park (2009), Weller and
Wenger (2009), and Mohan and Zhang (2014) present evidence that pension managers tend to
follow trends and peer group norms in their risk taking decisions. There is also a wide
literature on moral hazard of pension managers, which argues that public pension accounting
rules allow managers to manipulate the value of the pension liabilities and the amount of
required pension contributions (e.g., Lucas and Zeldes (2009), Pennacchi and Rastad (2011),
Novy-Marx and Rauh (2011), and Mohan and Zhang (2014)).
Our estimation of the risk from mismatched pension assets and liabilities closely
follows the method suggested by Pennacchi and Rastad (2011). Thus, we define pension risk
18
If not stated differently, masculine pronouns refer to women and men alike.

79
by the volatility of the return difference between pension assets and liabilities. We find that
pension assets are generally poorly matched to pension liabilities. On average, pension risk
therefore even exceeds the volatility of equity market returns. We test whether the personal
risk preferences of COBs affect the risk of the plans they are responsible for based on four
empirical predictions derived from the literature. (1) Pension risk is negatively affected by an
increase in COB age, (2) pension risk is lower if the COB is a woman, (3) pension risk is
higher if the COB is an annuitant (retiree of the plan), and (4) pension risk is higher if the
COB is a politician (ex officio trustee).
According to a substantial body of literature in finance and economics, including
Campbell (2006), Serfling (2014), and Berger, Kick, and Schaeck (2014), risk taking is
decreasing with an individual’s age. We therefore predict that pension risk is negatively
affected by an increase in the COB’s age.
There is also a large literature on gender specific differences in risk attitudes, which
mostly finds that women are intrinsically less risk loving than men (Apicella, Dreber,
Campbell, Gray, Hoffman, and Little (2008), Sapienza, Zingales, and Maestripieri (2009), and
Croson and Gneezy (2009)). Two notable exceptions are Adams and Funk (2012) and Berger,
Kick, and Schaeck (2014), who show that female board members of large, listed firms seek
higher levels of risk than their male counterparts. Adams and Funk (2012) explain this finding
by the personal costs of women who choose a career that eventually leads to a board seat.
Women who decide to bear these costs are less tradition and security oriented than the
average woman in the population (Adams and Funk (2012)). Another study deviating from
the notion that women are universally less risk seeking than men is the survey of Jörg (2005).
It shows that women are only more risk averse than men in investment type decisions but
appear to be more risk loving than men in insurance situations. For public pension plans,
however, we expect that female COBs are less risk loving than their male counterparts. This is
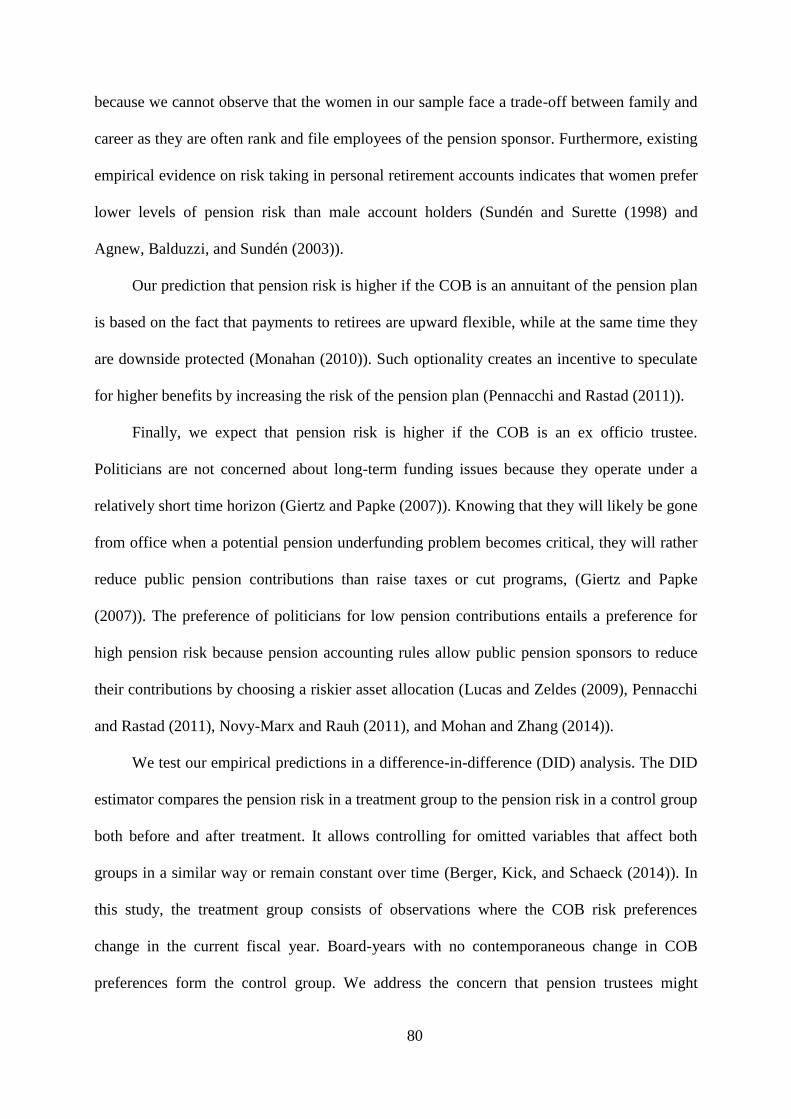
80
because we cannot observe that the women in our sample face a trade-off between family and
career as they are often rank and file employees of the pension sponsor. Furthermore, existing
empirical evidence on risk taking in personal retirement accounts indicates that women prefer
lower levels of pension risk than male account holders (Sundén and Surette (1998) and
Agnew, Balduzzi, and Sundén (2003)).
Our prediction that pension risk is higher if the COB is an annuitant of the pension plan
is based on the fact that payments to retirees are upward flexible, while at the same time they
are downside protected (Monahan (2010)). Such optionality creates an incentive to speculate
for higher benefits by increasing the risk of the pension plan (Pennacchi and Rastad (2011)).
Finally, we expect that pension risk is higher if the COB is an ex officio trustee.
Politicians are not concerned about long-term funding issues because they operate under a
relatively short time horizon (Giertz and Papke (2007)). Knowing that they will likely be gone
from office when a potential pension underfunding problem becomes critical, they will rather
reduce public pension contributions than raise taxes or cut programs, (Giertz and Papke
(2007)). The preference of politicians for low pension contributions entails a preference for
high pension risk because pension accounting rules allow public pension sponsors to reduce
their contributions by choosing a riskier asset allocation (Lucas and Zeldes (2009), Pennacchi
and Rastad (2011), Novy-Marx and Rauh (2011), and Mohan and Zhang (2014)).
We test our empirical predictions in a difference-in-difference (DID) analysis. The DID
estimator compares the pension risk in a treatment group to the pension risk in a control group
both before and after treatment. It allows controlling for omitted variables that affect both
groups in a similar way or remain constant over time (Berger, Kick, and Schaeck (2014)). In
this study, the treatment group consists of observations where the COB risk preferences
change in the current fiscal year. Board-years with no contemporaneous change in COB
preferences form the control group. We address the concern that pension trustees might

81
simultaneously decide on the risk of the pension plan and appoint a COB who matches their
risk preferences by considering a reduced sample of pension plans where COB changes are
exogenous.
We test our empirical predictions with data from the Public Plans Database (PPD) of
the Center for Retirement Research at Boston College (2015), which covers 90 percent of the
pension members and assets of state and local DB plans in the U.S. Our initial sample covers
the years from 2001 to 2013 and consists of 1,310 observations about 110 pension boards of
trustees. We then hand collected information on COBs from over 2,000 public information
sources and personal contacts with the pension plans. We obtained complete COB
information for 1,159 observations of our initial sample (88 percent). This sample covers 343
changes of chairpersons.
Our empirical results are consistent with the hypothesis that pension risk reflects the
personal risk preferences of the COB. Pension risk is negatively affected by an increase in
COB age, lower if the COB is a woman, higher if the COB is an annuitant, and higher if the
COB is an ex officio trustee. We do not find that COBs are appointed by the board of trustees
based on their personal attitude towards pension risk. However, we find evidence that pension
risk is predominantly affected by COB risk preferences if pension governance is weaker. We
consider a plan as more weakly governed if decisions on pension risk are not made by a
separate and professionalized investment board. This finding is consistent with Cronqvist,
Makhija, and Yonker (2012), who shows that CEOs primarily align the risk of the firm with
their personal risk preferences when corporate governance is poor.
Our main contribution is that we are the first to present evidence that the personal risk
preferences of pension COBs are a predictor of public pension plan risk. Since pension risk is
the main driver of today’s substantial funding shortfalls, taxpayers should be wary of who is
in charge of the pension plans in their community.
82
The rest of the paper is organized as follows. In Section 2, we provide an overview of
the public pension system in the U.S. In Section 3, we derive our empirical predictions and
discuss the relevant literature. In Section 4, we describe the sample selection and how we
measure pension risk. In Section 5, we discuss our empirical strategy. In Section 6, we present
the results and their discussion. Last, we conclude in Section 7.
2. Public pension plans in the U.S.
While many firms in the U.S. have moved away from DB plans and opened defined
contribution (DC) retirement schemes such as 401(k) plans instead, the public sector has seen
very limited movement in this direction (Novy-Marx and Rauh (2011)). In 2014, total public
DC assets (USD 533 billion) only amounted to 15 percent of state and local DB assets (USD
3.6 trillion) (Hoops, Stefanescu, and Vidangos (2015)). In a DB plan, the employer guarantees
its employees specific benefits upon their retirement. If pension assets prove to be insufficient
to cover these benefits, the sponsor has to make additional contributions. Therefore, DB plans
represent a financial risk to their sponsors. This risk increases with the mismatch between
pension assets and liabilities (Pennacchi and Rastad (2011)). The sponsor’s responsibility
under DC plans is fundamentally different. It only consists of the sponsor’s commitment to
pay regular and fixed contributions to the employees’ retirement accounts. At retirement, the
employees receive whatever amount of money (contributions plus interest) has accumulated
on their behalf. The uncertainty about the level of retirement benefits lies entirely with the
employees (Shivdasani and Stefanescu (2010)). We therefore exclude these retirement
schemes from our analysis, which is consistent with previous research on public pension risk
(e.g., Pennacchi and Rastad (2011) and Mohan and Zhang (2014)). Throughout this paper, we
consequently use the terms pension plan and defined benefit pension plan interchangeably.

83
3. Literature review and empirical predictions
Recent empirical evidence shows that corporate executives imprint their private risk
preferences on the firms they manage. Cronqvist, Makhija, and Yonker (2012) find that CEOs
align the corporate capital structure with their preference for leverage. Cain and McKeon
(2015) show that firms have a higher equity return volatility if the CEO possesses a private
pilot’s license, which they consider a proxy for personal risk-taking. Baxamusa and Jalal
(2015) find that firms issue more debt and are geographically and operationally less
diversified if the CEO plays a risky sport. Based on this evidence, we expect that pension
COBs align the risk of the plan with their personal attitudes towards risk as well. In our
empirical analysis of the relation between COB risk preferences and pension risk, we test four
predictions that have been suggested by the literature. The following sections discuss these
predictions in detail.
3.1. COB age
A large body of literature identifies a negative relation between individual age and risk
taking. Campbell (2006) finds that older households invest a lower fraction of their total
wealth into equity securities than younger households. Agnew, Balduzzi, and Sundén (2003)
observe a similar pattern in over 7,000 401(k) accounts. In a survey among more than 500
business executives, MacCrimmon and Wehrung (1990) document a negative relation
between executive age and corporate risk taking as well. This is supported by recent empirical
evidence. Serfling (2014) shows that stock return volatility is negatively affected by CEO age
and Berger, Kick, and Schaeck (2014) find that the risk of bank portfolios decreases with the
fraction of older directors on the board.
There are also studies that contradict the view of higher risk aversion among older
executives. Chevalier and Ellison (1999) find that younger mutual fund managers are less risk

84
tolerant than their older colleges because they face a higher probability of being dismissed for
poor performance. Hong, Kubik, and Solomon (2000) show that inexperienced security
analysts are conservative in their forecasts because they are more likely terminated for
inaccurate forecasts that deviate from the consensus estimates than their more experienced
counterparts. We do however not expect career concerns to have a first order impact on the
personal risk preference of pension COBs. First of all, pension COBs are typically much older
than managers and analysts of mutual funds, which makes it less likely that a onetime
negative event destroys their reputation. While the average fund manager in Chevalier and
Ellison (1999) is 44 of age, the mean age of our pension COBs is 57 years. Secondly, we
cannot observe that past performance is of any consequence to pension COB replacements.
Table 1 shows that the probability the COB is replaced after a year of relatively bad
investment performance does not differ from the probability that he is replaced after a year of
good performance. Past performance is also irrelevant for COB replacements if we only
consider the 50 percent youngest or the 25 percent youngest COBs in our sample.19
We
therefore predict that pension risk decreases with COB age.
[insert Table 1 here]
3.2. COB gender
Studies on gender differences in risk attitudes mostly find that women prefer lower
levels of risk than men (Croson and Gneezy (2009)). In their recent analysis of risk taking in
banks, Palvia, Vähämaa, and Vähämaa (2014) document that female CEOs choose less risky
capital structures (higher Tier 1 capital and higher equity capital) than men. Apicella, Dreber,
19
We receive a similar result if we consider three years of past performance instead of one year.

85
Campbell, Gray, Hoffman, and Little (2008) and Sapienza, Zingales, and Maestripieri (2009))
find that risk taking of individuals is increasing in their testosterone level. Dwyer, Gilkeson,
and List (2002) and Jörg (2005) present evidence that the higher risk-aversion of women is
explained by knowledge disparities.
In contradiction to the notion of greater risk aversion among women, Adams and Funk
(2012) and Berger, Kick, and Schaeck (2014) find that female directors of large, listed firms
are more risk loving than male directors because the trade-off between having a family and
choosing a career path that eventually leads to a board seat is more costly for women than for
men. Women who choose career over family are less tradition and security oriented, and
therefore less risk averse than their male counterparts. More risk loving women thus self-
select into the pool of eligible director candidates (Adams and Funk (2012)). In our sample of
public pension COBs, career constraints are however not as evident as they are in case of
directors of large corporations. The typical pension COB is selected from among the members
of the board of trustees, which primarily consists of beneficiaries of the pension plan, which
are often rank and file employees of the pension sponsor (Pennacchi and Rastad (2011)). In
our sample, 72 of 99 female COBs (73 percent) are pension beneficiaries. The trade-off
between family and career is likely small for these women. We thus expect that the selection
bias discussed in Adams and Funk (2012) is not of first order relevance in our analysis.
The second reservation to the notion that women are generally more risk averse than
men is formulated by Jörg (2005). In a large survey of over 2,316 households, she observes
that women are only more risk averse than men in investment type decisions but appear
relatively more risk loving in insurance situations. Decisions on pension risk entail both an
investment and an insurance component. From an investment perspective, higher pension risk
is associated with a higher expected return on pension assets. From an insurance perspective,
reducing pension risk without simultaneously reducing pension benefits requires that the
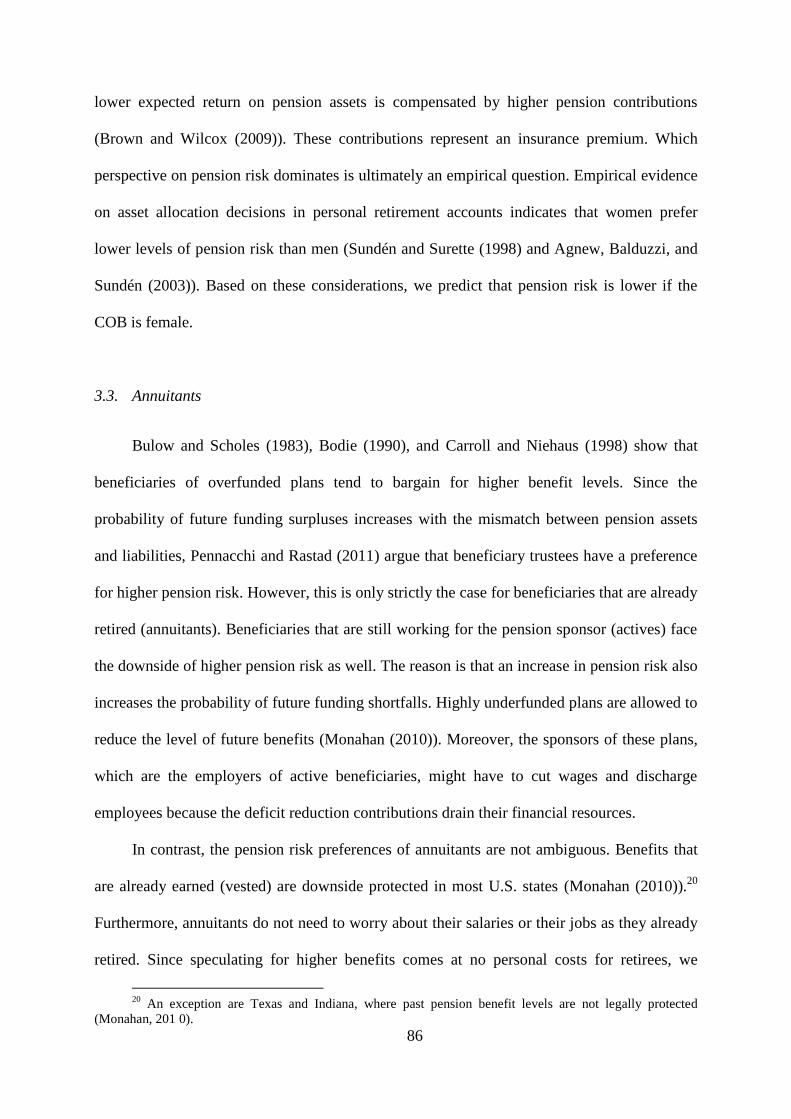
86
lower expected return on pension assets is compensated by higher pension contributions
(Brown and Wilcox (2009)). These contributions represent an insurance premium. Which
perspective on pension risk dominates is ultimately an empirical question. Empirical evidence
on asset allocation decisions in personal retirement accounts indicates that women prefer
lower levels of pension risk than men (Sundén and Surette (1998) and Agnew, Balduzzi, and
Sundén (2003)). Based on these considerations, we predict that pension risk is lower if the
COB is female.
3.3. Annuitants
Bulow and Scholes (1983), Bodie (1990), and Carroll and Niehaus (1998) show that
beneficiaries of overfunded plans tend to bargain for higher benefit levels. Since the
probability of future funding surpluses increases with the mismatch between pension assets
and liabilities, Pennacchi and Rastad (2011) argue that beneficiary trustees have a preference
for higher pension risk. However, this is only strictly the case for beneficiaries that are already
retired (annuitants). Beneficiaries that are still working for the pension sponsor (actives) face
the downside of higher pension risk as well. The reason is that an increase in pension risk also
increases the probability of future funding shortfalls. Highly underfunded plans are allowed to
reduce the level of future benefits (Monahan (2010)). Moreover, the sponsors of these plans,
which are the employers of active beneficiaries, might have to cut wages and discharge
employees because the deficit reduction contributions drain their financial resources.
In contrast, the pension risk preferences of annuitants are not ambiguous. Benefits that
are already earned (vested) are downside protected in most U.S. states (Monahan (2010)).20
Furthermore, annuitants do not need to worry about their salaries or their jobs as they already
retired. Since speculating for higher benefits comes at no personal costs for retirees, we
20
An exception are Texas and Indiana, where past pension benefit levels are not legally protected
(Monahan, 201 0).

87
expect annuitants to have a preference for high pension risk. We thus predict that pension risk
is higher if the COB is an annuitant.
3.4. Politicians
According to the Governmental Accounting Standards Board Statement No. 25 (GASB
25), public pension plans are allowed to discount pension benefits at the expected rate of
return on pension assets. Since this rate reflects the risk of pension assets, higher pension risk
reduces the actuarial value of pension liabilities and improves the pension funding status
(Mohan and Zhang (2014)). Moreover, since the annual required contribution (ARC) of
sponsors of underfunded plans depends on the extent of the underfunding (GASB 25), higher
pension risk also enables a reduction in the ARC. Brown and Wilcox (2009) point out that the
current funding deficits of public pension plans are partially explained by the lack of
contributions due to artificially high discount rates.
Politicians prefer to avoid unpopular decisions in the short-term, such as raising taxes or
cutting social benefits (Giertz and Papke (2007)). Since riskier pension assets help justify a
higher discount rate, which allows lower pension contributions, politicians have a personal
incentive to increase the share of risky assets in the pension asset allocation, which increases
the overall risk of the pension plan. When low contributions and high risk eventually
materialize in underfunded pension liabilities, the politician who is responsible for the
decision will likely be gone from office (Giertz and Papke (2007)). We therefore predict that
pension risk is higher if the COB is an ex officio trustee.

88
4. Data and variable construction
4.1. Sample selection
Our main data source is the Public Plans Database (PPD) of the Center for Retirement
Research at Boston College (2015).21
The PPD contains data from Comprehensive Annual
Financial Reports (CAFRs) of 150 state and local defined benefit pension plans. It covers 90
percent of the pension members and assets of U.S. public DB plans for the years from 2001 to
2013. We aggregate all plans where asset-liability risk decisions are made by the same board
of trustees. This is to avoid double counting certain COB changes that affect several pension
plans at the same time. With the sole exception of North Dakota, all plans that share the same
(investment) board of trustees have also the same asset allocation.22
We then match the
aggregated PPD data with hand collected information on the COB from more than 2,000
public information sources, including CAFRs, CVs, company webpages, newspaper articles,
obituaries, public records databases (intelius.com and dobsearch.com), and social networking
services (linkedin.com and facebook.com). Furthermore, we personally contacted 53 pension
boards where we could not gather all the information from public sources. In total, our data
cover 1,503 observations among 116 pension boards of trustees.
We limit our analysis to observations where complete accounting data are reported
(asset value, asset allocation, liability value, number of beneficiaries, and number of
annuitants). This reduces the number of observations by 112. It has however no effect on the
number of boards in our sample. We further exclude pension plans where the board of trustees
does not have full discretion over asset allocation decisions but receives risk targets by a
separate pension administration board or delegates asset allocation decisions to a separate
21
The data are publicly available at:
http://publicplansdata.org/public-plans-database/download-full-data-set/ 22
In North Dakota, we only use the data for the largest system of the state, the North Dakota Public
Employees Retirement System.

89
investment administration council.23
For these plans, it is unclear which authority is
effectively responsible for asset-liability matching decisions. We do however not exclude
plans where the board of trustees is complemented by a separate pension administration board
if the administration board does not set explicit targets for the risk of plan assets.24
This leaves
us with an initial sample of 1,310 observations among 110 pension boards (142 pension
plans). We have complete COB information in 88 percent of these observations (1,159 board-
years).
4.2. Measuring pension risk
Our estimation of public pension risk closely follows the method suggested by
Pennacchi and Rastad (2011), which defines the risk of plan i in year t as the volatility of the
return difference between pension assets and pension liabilities (tracking error).
Pension riski,t = 100 × √σA2
i,t+ σL
2i,t
− 2ρALi,tσAi,t
σLi,t , (1)
where, σA2
i,t is the variance of the pension asset returns of plan i in year t, σL
2i,t
is the
variance of the relative change in the value of pension liabilities, and ρALi,t is the annual
correlation between pension asset and pension liability returns. We multiply by 100 to obtain
an expression in percentage points.
23
This includes the Alaska Public Employees’ Retirement System and the Alaska Teachers’ Retirement
System for the years 2001 to 2005, the North Dakota Public Employees Retirement System, the Oregon Public
Employees Retirement System, the Employees' Retirement System of Rhode Island, the Rhode Island Municipal
Employees’ Retirement System, the South Carolina Public Employee Benefit Authority, the South Dakota
Retirement System, and the Employees Retirement System of Texas. 24
This includes the State Employees’ Retirement System of Illinois, the Iowa Public Employees
Retirement System, the Massachusetts State Employee Retirement System, the Massachusetts Teachers'
Retirement System, the Minnesota State Retirement System, the Montana Public Employee Retirement
Administration, the Montana Teachers' Retirement System, Nebraska Public Employees Retirement Systems, the
North Dakota Public Employees Retirement System, the West Virginia Public Employees Retirement System,
the West Virginia teachers’ Retirement System, the Wisconsin Retirement System, and the Los Angeles County
Employees Retirement Association.

90
The variance of pension assets is defined by
σA2
i,t= 𝛚′𝐢,𝐭𝛀𝛚𝐢,𝐭 , (2)
where 𝛀 is the variance-covariance matrix of the asset class returns and 𝛚𝐢,𝐭 is the asset
allocation vector of the pension plan i in year t. The PPD data provide us with asset allocation
information along the categories equities, bonds, real estate, short-term securities, and
alternative assets. Following Pennacchi and Rastad (2011), we estimate the variance-
covariance matrix based on monthly time series of asset class returns over our entire
observation period (2001 to 2013). Equity returns are total returns of a composite of U.S. and
international equities. Two thirds of this composite consist of the Vanguard Total Stock
Market Index Fund (Institutional share class). The other third consists of the Vanguard Total
International Stock Index Fund (Investor share class). This weighting corresponds to the
average international diversification of equity securities of pension plans that separately report
their allocations to U.S. and international equities. These plans are approximately half of the
plans in our sample. Our bond composite consists of 90 percent the Merrill Lynch U.S.
Corporate & Government Master Index and 10 percent the Merrill Lynch Global Broad
Market ex US Dollar Index. As in the estimation of equity returns, this weighting reflects the
average international diversification of fixed income investments of the plans in our sample.
Real estate returns are the returns of the Vanguard REIT Index Fund (Investor share class),
and short term security returns are the returns of the Vanguard Short-Term Investment-Grade
Fund (Institutional share class). Finally, the return series for alternative investments reflects
the equally weighted average returns of the Thomson Reuters Core Commodity CRB Total
Return Index, the Thomson Reuters Private Equity Buyout Research Index, and the Thomson
Reuters Venture Capital Research Index. Mohan and Zhang (2014) show that the risk of

91
alternative investments of public pension plans is best approximated by the equally weighted
average risk of commodities, private equity, and venture capital. Some plans report a residual
fraction of assets that is not assigned to any of the above asset classes. Following Pennacchi
and Rastad (2011), we ignore these investments and proportionally increase the weights of the
other asset classes. Since unassigned assets only account for one percent of the average asset
allocation in our sample, the measurement error from this approximation is small. Our
investment return estimates are indeed highly correlated with the actual investment returns
reported by the pension plans. The correlation statistic is 0.92 for the entire sample (1,159
board-years), 0.94 for pension plans that allocate more than 10 percent of their assets to
alternative assets (395 board-years), and 0.88 for plans that report a positive allocation to
other assets (247 board-years).
The economic value of pension liabilities is the present value of expected future benefit
payments. This value is sensitive to both interest rate changes and changes in the growth rate
of government wages (Pennacchi and Rastad (2011)). Interest rates affect the rate at which
pension benefits should be discounted. Changes in the wage growth affect future benefit
payments because pension benefits are defined as a percentage of an employee’s last salary
before retirement. Pennacchi and Rastad (2011) define the economic risk (variance) of
pension liabilities by
σL2
i,t= σLW
2i,t
+ σLB2
i,t+ 2ρWBσLWi,t
σLBi,t , (3)
where σLWi,t measures the volatility of wage increases at plan i in year t, σLBi,t
measures bond return volatility (interest rate risk), and ρWB is the correlation between wage
increases and bond holding period returns over the entire observation period (2001-2013).
Pennacchi and Rastad (2010) show that both wage and interest rate risk of pension liabilities
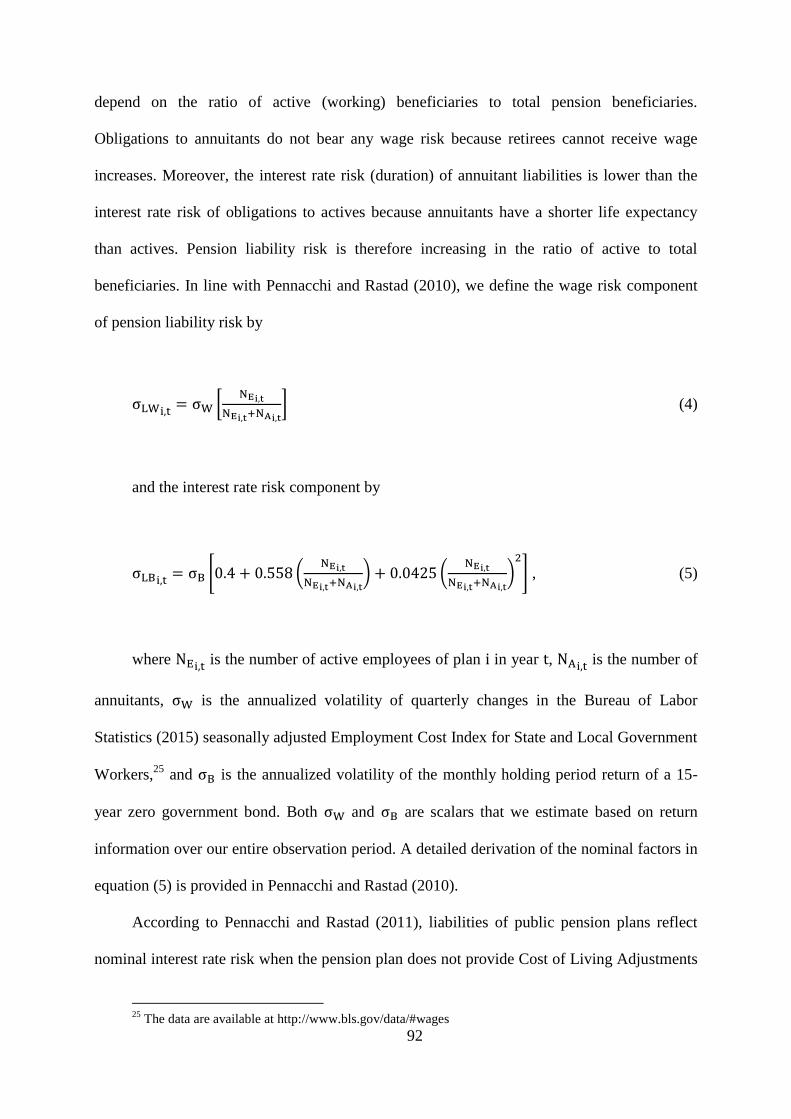
92
depend on the ratio of active (working) beneficiaries to total pension beneficiaries.
Obligations to annuitants do not bear any wage risk because retirees cannot receive wage
increases. Moreover, the interest rate risk (duration) of annuitant liabilities is lower than the
interest rate risk of obligations to actives because annuitants have a shorter life expectancy
than actives. Pension liability risk is therefore increasing in the ratio of active to total
beneficiaries. In line with Pennacchi and Rastad (2010), we define the wage risk component
of pension liability risk by
σLWi,t= σW [
NEi,t
NEi,t+NAi,t
] (4)
and the interest rate risk component by
σLBi,t= σB [0.4 + 0.558 (
NEi,t
NEi,t+NAi,t
) + 0.0425 (NEi,t
NEi,t+NAi,t
)2
] , (5)
where NEi,t is the number of active employees of plan i in year t, NAi,t
is the number of
annuitants, σW is the annualized volatility of quarterly changes in the Bureau of Labor
Statistics (2015) seasonally adjusted Employment Cost Index for State and Local Government
Workers,25
and σB is the annualized volatility of the monthly holding period return of a 15-
year zero government bond. Both σW and σB are scalars that we estimate based on return
information over our entire observation period. A detailed derivation of the nominal factors in
equation (5) is provided in Pennacchi and Rastad (2010).
According to Pennacchi and Rastad (2011), liabilities of public pension plans reflect
nominal interest rate risk when the pension plan does not provide Cost of Living Adjustments
25
The data are available at http://www.bls.gov/data/#wages

93
(COLAs) but reflect real interest rate risk when the plan provides COLAs. Therefore, we
estimate two different versions of the interest rate risk of pension liabilities. The first is based
on the nominal holding period return of a 15-year U.S. government bond from Thomson
Reuters Eikon (USGOV15YZ). The second is based on the holding period return of a 15-year
zero TIPS from Gürkaynak, Sack, and Wright (2008).26
We thus also define two different
estimates of public pension risk. The first (Nominal PR) reflects nominal interest rate risk in
case of all pension plans. Our second pension risk measure (COLA adj PR) measures real
interest rate risk if the pension plan reports that it adjusts pension benefits for changes in the
Consumer Price Index (CPI), and nominal interest rate risk otherwise.
Table 2 displays the correlations and standard deviations of the return series we use to
estimate public pension risk. The reported correlation statistics are consistent with the values
from the return series used by Pennacchi and Rastad (2011). On the one hand, we find that
equities, real estate, and alternative investments are highly correlated. On the other hand, the
correlation of these asset classes with bond returns and wage growth is weak. Most
intuitively, the correlation between bond portfolio returns and 15-year zero bond returns is
high. The only asset class that is substantially correlated with wage increases is short term
securities. During the years 2001 to 2013, 15-year zero bonds had a volatility of 0.151, while
the standard deviation of equity securities was 0.109. This highlights the relative importance
of interest rate risk during our observation period.
[insert Table 2 here]
26
The data are available at http://www.federalreserve.gov/econresdata/feds/2008/index.htm

94
5. Empirical strategy
5.1. Regression model
We assess the impact of COB risk preferences on pension risk in a difference-in-
difference analysis. The DID estimator compares the change in the risk of pension plans in the
current and subsequent fiscal years in which the COB risk preferences have changed
(treatment group) with the contemporaneous change in the risk of pension plans for which the
risk preferences of the COB have not changed (control group). This enables to control for
omitted variables that similarly affect the risk taking of the treated and the untreated group
(Berger, Kick, and Schaeck (2014)). Moreover, it enables to control for unobserved pension
plan characteristics that remain constant over time. We define our main regression equation in
first difference (FD) form by
∆ Pension riski,t = 𝛂t + 𝛃′ ∙ ∆ 𝐂𝐎𝐁 𝐑𝐏i,t + 𝚪′ ∙ ∆ 𝐗𝐂𝐎𝐁i,t+ 𝚼′ ∙ ∆ 𝐗𝐏𝐞𝐧𝐬𝐢𝐨𝐧i,t
+ ϵi,t , (6)
where ∆ Pension riski,t is the change in the risk of the plans managed by board i from
year t − 1 to year t. ∆ 𝐂𝐎𝐁 𝐑𝐏i,t represents a matrix of year-to-year changes in our set of
COB risk preference measures, ∆ 𝐗𝐂𝐎𝐁 is a set of variables that controls for changes in other
COB characteristics, and ∆ 𝐗𝐏𝐞𝐧𝐬𝐢𝐨𝐧 consists of controls for changes in pension plan
characteristics. 𝛃′, 𝚪′, and 𝚼′ are vectors of coefficients, 𝛂t represents year fixed effects, and
ϵi,t is a stochastic error term.
Following our considerations in Section 3, the COB risk preference measures include
changes in COB age (∆ COB age) and gender (∆ COB female), changes in the COB’s status
as an annuitant of the plan (∆ COB annuitant), and changes in whether he is an ex officio
trustee (∆ COB ex officio) or not. We define ∆ COB age as the difference between the age of

95
the new COB and the age of his predecessor in years. ∆ COB female, ∆ COB annuitant, and
∆ COB ex officio represent changes in the respective COB characteristics. All of these
variables take a value of one if the new COB exhibits the characteristic while the predecessor
did not, a value of minus one if the new COB does not exhibit the characteristic while the
predecessor did, and a value of zero otherwise. All COB variables take a value of zero if the
COB does not change. Throughout our analysis, we allocate COB changes to the first fiscal
year when the new COB presides the pension board for at least half of the fiscal year (six
months).
Based on our empirical predictions from Section 3, we expect a negative coefficient on
∆ COB age and ∆ COB female and a positive coefficient on ∆ COB annuitant and
∆ COB ex officio, respectively.
5.2. Control variables
The first variable in our set of COB controls (∆ 𝐗𝐂𝐎𝐁) is a binary variable (New COB)
that identifies board-years where the COB has changed in the current fiscal year. We control
for the COB change per se to distinguish between changes in pension risk that stem from the
COB change alone and effects that reflect changes in COB risk preferences (treatment effect).
Furthermore, we control for the change in a binary variable that indicates whether the COB is
a beneficiary of the plan (∆ COB beneficiary). This is necessary to distinguish between a
general preference of pension beneficiaries for higher pension risk, as suggested by Pennacchi
and Rastad (2011), and our prediction that only annuitants prefer higher levels of pension risk.
Finally, our set of pension plan controls includes the change in a binary variable that indicates
whether the COB is financially literate (∆ Financial literacy). Existing research indicates that
financial literacy matters in portfolio decisions. For instance, poorly educated households
invest less in equity securities and avoid financial strategies for which they feel unqualified

96
(Campbell (2006)). We classify a COB as financially literate when he holds a Master’s degree
or a PhD in economics, finance, or business administration, and/or is a Chartered Financial
Analyst (CFA), a Certified Financial Planner (CFP), a Certified Public Accountant (CPA), or
a Certified Public Financial Advisor (CPFA).27
The first two variables in our set of pension plan controls (∆ 𝐗𝐏𝐞𝐧𝐬𝐢𝐨𝐧) are the change in
the previous year funding ratio (∆ Funding ratio−1) and the change in the previous year
reported investment return (∆ Return−1). Rauh (2009) and Mohan and Zhang (2014) present
evidence that pension risk is correlated with the previous period funding ratio and the
previous period investment return because of either risk management or risk transfer
incentives of pension managers. A risk management view implies that pension risk is
positively affected by both previous year funding ratio and investment return because an
increase in these variables increases the risk carrying capacity of the pension plan (Rauh
(2009)). A risk transfer view on the other hand implies that pension risk is negatively affected
by funding status and past return, respectively. This is because pension managers try to
improve the funding ratio in the short run by raising the expected return on pension assets and
shifting the risk to future tax payers (Mohan and Zhang (2014)). We estimate the funding
ratio as the market value of assets divided by the value of pension liabilities. In line with
Pennacchi and Rastad (2011), we measure pension liabilities by their actuarial value under
GASB standards because pension plans do not report the fair, economic value of their
liabilities.
We also control for changes in the natural logarithm of pension assets (∆ Ln size).
According to Mohan and Zhang (2014), larger pension plans enjoy economies of scale for
transaction fees, which increases their incentive to invest in equity and alternative assets,
which both lead to higher pension risk. Finally, we include year fixed effects to control for
27
For 21 COBs in our main sample, we could not find any information about their education. We assume
that those COBs do not fulfill our criteria of financial literacy. When we alternatively exclude these
observations, our results remain virtually identical.

97
macro-economic effects that affect all pension plans in a similar way. Table 9 of the appendix
provides detailed definitions of all the variables we use in this paper.
6. Empirical results
6.1. Descriptive statistics
Table 3 shows the summary statistics for our sample of public pension plans from 2001
to 2013. All continuous variables are winsorized at the 1st and the 99
th percent level of their
pooled distribution to eliminate outliers. Panel A displays descriptive statistics of selected
pension plan and COB characteristics, Panel B does so for the first differences of our
continuous pension variables, Panel C shows descriptive statistics of the changes in COB
characteristics, and Panel D reports the pairwise Pearson correlation coefficients between
changes in COB characteristics.
The average nominal pension risk (Nominal PR) of the plans in our sample is 14.3
percent; the average COLA adjusted pension risk (COLA adj PR) is 13.4. Pension risk
therefore exceeds the volatility of a broadly diversified equity portfolio (10.9 percent) and
corresponds to the volatility of alternative assets (14.4 percent) in Table 2. Table 3 also shows
that, while the majority of pension assets are invested in equities (56 percent) and alternative
assets (8 percent), only 28 percent of pension assets are allocated to bonds. This predominant
allocation of pension assets to equities and alternatives explains the distinct mismatch
between pension assets and liabilities. As we show in Table 2, both equity returns and returns
on alternative assets are only weakly correlated with wage changes and long-term bond
returns.
Consistent with previous studies of public pension plans, including Pennacchi and
Rastad (2011) and Mohan and Zhang (2014), we observe a pronounced underfunding of
pension obligations. On average, only 77 percent of the actuarial pension liabilities are funded

98
by assets. According to Novy-Marx and Rauh (2011), the funding ratio would be even lower
if pension liabilities were measured by their fair value.
The typical (median) COB age is 56. The probability that the chairperson is a woman,
an annuitant, an ex officio trustee, or a beneficiary, is 22, 12, 22, and 71 percent, respectively.
The probability that he is financially literate is 21 percent. The summary statistics of the 343
COB changes (Panel C) indicate that the average new COB is 2 years younger than his
predecessor. In 166 cases, the new COB is younger than the incumbent chairman. In 143
cases, it is the other way around. The distributions of the first differences in the remaining
measures of COB risk preferences indicate that these changes are fairly symmetrical. 52 out
of 100 changes in COB gender are from man to woman, 38 out of 81 changes of the COB’s
annuitant status are from non-annuitant to annuitant, and 12 out of 28 changes in the
chairman’s ex officio status are from non-ex officio to ex officio. The distributions of the
COB control variables are symmetrical as well. 47 out of 98 changes in the beneficiary status
are from a non-beneficiary to a beneficiary COB. In 56 out of 103 changes in financial
literacy, the new COB is financially educated while the replaced chairman was not.
Panel D shows that changes in COB characteristics, except for changes in COB age, are
not significantly correlated with the decision to replace the COB (New COB). However,
changes in COB characteristics are correlated with each other. Older COBs are more likely
annuitants and beneficiaries but less likely financially educated. Female COBs are less likely
financially literate than men, which is consistent with the findings in Dwyer, Gilkeson, and
List (2002) and Jörg (2005). Female chairpersons are however more likely annuitants, who
are in turn less likely ex officio trustees, more likely beneficiaries, and less likely financially
educated. Finally, ex officio trustees are more likely financially literate.
[insert Table 3 here]

99
6.2. Main results
Table 4 studies the relation between COB risk preferences and the risk of public pension
plans. We run FD regressions based on equation (6). Since we make directional predictions on
the relation between pension risk and our measures of COB risk preferences, we determine
the statistical significance of the respective coefficients based on one-tailed tests. In contrast,
the statistical significance of the coefficients on the control variables is determined with a
two-tailed test. T-statistics are provided in parentheses. We use robust standard errors
clustered at the pension board level.
Column (1) displays the results of an FD regression of nominal pension risk on COB
risk preferences and controls. Column (2) shows the estimates of a similar regression of
COLA adjusted pension risk. In both regressions, the coefficients on ∆ COB age and
∆ COB female are negative, while the coefficients on ∆ COB annuitant and ∆ COB ex officio
are positive. This is in line with our predictions that pension risk is decreasing in COB age,
lower if the COB is a woman, higher if the COB is an annuitant, and higher if the COB is an
ex officio trustee. With the sole exception of the coefficient on ∆ COB ex officio in Column
(2), all coefficients are statistically significant.
The change of the COB per se (New COB) has no impact on public pension risk. The
COB’s beneficiary status has no significant effect on pension risk as well, which supports our
expectation that the pension risk preferences of active beneficiaries are ambiguous. The
financial literacy of the COB has no significant impact on pension risk either.28
We explain
this result by the fact that pension COBs have easy access to advice from investment
professionals. Most public pension plans employ a professional investment consultant (Goyal
and Wahal (2008)). Gaudecker (2015) shows that financial literacy only matters in investment
decisions by individuals who do not seek outside advice.
28
In a not tabulated regression, where we extend our definition of financial literacy to bachelor degrees in
finance, economics, and business administration, we receive a similar result.

100
Furthermore, we find that the change in pension risk is significantly positively related to
both the lagged change in pension funding ratio and the lagged change in investment return.
This supports the risk-management view of Rauh (2009) that pension risk is positively related
to the risk carrying capacity of the plans. It also supports Weller and Wenger (2009) who
show that managers of underfunded pension plans do not systematically chase returns.
Moreover, public pension risk is significantly positively related to pension plan size. This is in
line with Mohan and Zhang (2014), who argue that larger pension plans have higher pension
risk as they benefit from economies of scale for transaction fees, which increases their
incentive to invest in equities and alternative assets.
The impact of COB risk preferences on pension risk is also of economic importance.
Based on the coefficients in Column (1), we find that a one standard deviation increase in
COB age (13 years) results in a reduction of pension risk by 1.42 percent, which equals 0.12
standard deviations of pension risk. A change in COB gender results in a 0.08 standard
deviation change of pension risk, a change in the COB’s annuitant status explains 0.15
standard deviations of pension risk, and a change in the COB’s ex officio status leads to a
change in pension risk by 0.16 standard deviations. In comparison, a one standard deviation
change in funding status explains a 0.20 standard deviation change in pension risk. The
replacement of an old, female, non-ex officio COB by a young, male, ex officio trustee causes
an increase in pension risk by 4.31 percent (0.36 standard deviations of pension risk). To put
this in perspective, in case of California, this would result in an increase of the one year 97.5
percent value at risk of public pension plans by USD 8.5 billion or 7.2 percent of the annual
Californian tax revenue.29
[insert Table 4 here]
29
In 2009, the State of California faced a fair value of pension liabilities of USD 700 billion and achieved
annual tax revenues of USD 117 billion (Novy-Marx and Rauh, 2011).
101
6.3. Representativeness
The median COB turnover in our sample is 3 years. However, there are considerable
differences between boards. While in some plans, the chairman changes every year, he only
changes once during our observation period in other plans. Plans with high COB turnover
hence appear more often in the treatment group than plans where the COB turnover is low. If
the treatment group is repeatedly composed of the same, small number of pension plans, our
findings could thus be non-representative for U.S. public pension plans in general.
We address this concern in Table 5 by repeating the regressions in the previous section
for a restricted sample of pension board-years where the replaced COB served a minimum
term of two years (Columns (1) and (2)). This insures that our analysis is not dominated by
plans with extremely high COB turnover. Consistent with the results in Table 4, we find that
the coefficients on the COB risk preference measures support our predictions. The estimates
on COB age and COB gender remain statistically significant. The coefficient on the COB’s ex
officio status, which is not statistically significant in the COLA adjusted pension risk
regressions in Table 4, is now significantly larger than zero for both pension risk measures.
The coefficient on changes in the COB’s annuitant status is however not statistically
significant anymore. In Columns (3) and (4), we further restrict our sample to board-years
where the replaced COB served a minimum term of three years. With the sole exception of
the coefficient on the COB’s ex officio status, which loses its statistical significance in the
nominal pension risk regression in Column (3), the magnitude and statistical significance of
the estimates remain virtually unchanged.
Based on these results, we conclude that our findings in the previous section are
representative for public pension plans at large.
[insert Table 5 here]

102
6.4. Causality
The main concern regarding our interpretation that personal COB risk preferences affect
pension risk is that the relation between pension risk and COB risk preferences could reflect
the risk preferences of the board of trustees, which usually appoints the COB and formally
decides on the risk of the pension plan. Potentially, the board simultaneously changes the risk
of the plan and appoints a new COB whose preferences match the new risk policy. Table 6
addresses this concern.
In Columns (1) and (2), we extend our set of controls by changes in the discount rate of
pension liabilities (∆ Discount rate), changes in the amortization period for an underfunding
of pension liabilities (∆ Amortization period), and changes in the smoothing period for the
recognition of an investment loss (∆ Smoothing period). Mohan and Zhang (2014) show that
pension risk is increasing in those policy variables. Since changes in risk policies require
board approval, these policy variables reflect the risk preferences of the board of trustees. If
these preferences were driving the results, their inclusion should weaken the relation between
pension risk and our measures of COB risk preferences. Contrary to that, we find that the
coefficients are virtually identical to the estimates in Table 4. None of the coefficients on the
policy variables is statistically significant. However, both the estimate on changes in the
discount rate and the coefficient on changes in the amortization period are positive, which
supports the findings in Mohan and Zhang (2014).
In Columns (3) and (4), we also control for changes in the composition of the board of
trustees. We conduct this analysis in a subsample of state-wide pension plans for which we
have information about changes in the fraction of board seats held by women
(∆ Female seats), annuitants (∆ Annuitant seats), ex officio trustees (∆ Ex officio seats),
and beneficiaries (∆ Beneficiary seats), respectively.30
We cannot control for changes in
30
We like to thank Caroline Ruprecht from the University of Bern for her help in collecting these data.

103
average board member age because we often lack this information. Consistent with our
argumentation about the preferences of individual COBs in Section 3, we expect that boards
with a higher percentage of female board members are more risk averse, while boards with a
higher percentage of annuitant and/or ex officio trustees prefer higher levels of pension risk.
We control for the fraction of beneficiary board seats because Pennacchi and Rastad (2011)
find that pension risk increases with the ratio of beneficiary trustees to total board members.
In this subsample of state-wide plans, we can also control for changes in the S&P state credit
rating (∆ S&P rating), which is a measure of fiscal constraints of the sponsoring state
government (Mohan and Zhang (2014)). According to Mohan and Zhang (2014), government
sponsors that experience tight fiscal constraints have an incentive to increase the risk of
pension assets. Following GASB standards, increasing the risk of pension assets allows
sponsors to justify a higher liability discount rate. Higher discounting reduces the actuarial
value of pension liabilities, improves the funding status, and reduces the annual required
contribution. Higher pension risk hence allows government sponsors to substitute general
obligation debt for pension debt. We measure ∆ S&P rating by the number of notches the
current year rating is higher (positive values) or lower (negative values) than the previous
year rating.
We find that sign, magnitude, and statistical significance of the coefficients on our
measures of COB risk preferences are almost identical to the estimates in Columns (1) and
(2). None of the board composition measures is significantly related to nominal pension risk.
In the regression of COLA adjusted pension risk, we find that the fraction of annuitant
trustees is significantly negatively related to pension risk. We interpret this result as the
reflection of a higher risk aversion of older pension boards. Consistent with the explanation
that fiscally constrained pension sponsors substitute general obligation debt for pension debt,

104
we find a negative relation between S&P rating and pension risk. However, the coefficient on
rating changes is only statistically significant in Column (4).
[insert Table 6 here]
To further mitigate the concern that the relation between pension risk and COB
preferences reflects the risk preferences of the board of trustees, we consider a subsample of
pension plans with ex officio COB. Ex officio chairmen hold their position because they are
elected to a specific public office (e.g., governor, mayor, or superintendent of the school
district). The pension board has no say in their appointment. Therefore, changes in ex officio
COB risk preference cannot be a reflection of changes in the risk preference of the board.
Since ex officio chairpersons are never annuitants but always ex officio trustees, our set of
risk preference measures is reduced to COB age and gender. Similarly, we do not control for
the COB’s beneficiary status because in this subsample there is no within-board variation in
this variable. Columns (1) and (2) of Table 7 report the estimates from regressions of nominal
pension risk and COLA adjusted pension risk, respectively. In line with our previous results,
we find that pension risk decreases with COB age and is lower if the COB is a woman. Both
effects are statistically significant above the 5 percent level. The magnitude of the coefficients
suggests that the reflection of COB preferences in pension risk is more pronounced for plans
where the COB holds his position ex officio than for the average plan in our sample. A one
standard deviation increase in COB age (8.5 years) causes a reduction in pension risk by 3.5
percent (0.30 standard deviations) and the replacement of a male COB by a female
chairperson reduces pension risk by 6.8 percent (0.58 standard deviations). These values are
more than twice the magnitude of the economic effects of COB age and gender in our main
analysis (Table 4). We explain these differences by the fact that in one third of the

105
observations in the ex officio sample, the COB serves as a sole trustee. The personal influence
of sole trustees is likely higher than the influence of chairpersons of large pension boards
because sole trustees do not need their fellow board members to support their decisions. In
Columns (3) and (4), we test this explanation by repeating our regressions for the subsample
of plans where the COB is the sole trustee. In this sample, we find an even stronger economic
effect of COB risk preferences, which supports our contention that the magnitude of the
relation between pension risk and COB risk preferences depends on the personal influence of
the COB. A one standard deviation increase in COB age (8.3 years) reduces pension risk by
0.66 standard deviations and a switch from male to female COB reduces the pension risk by
0.87 standard deviations.
[insert Table 7 here]
The results from Tables 7 and 8 are inconsistent with the hypothesis that COBs are
selected to match the board of trustees’ risk preferences. Moreover, our findings suggest that
individual COB risk preferences have a more pronounced effect on public pension risk when
the COB has a higher influence on asset liability matching decisions. The next section
elaborates further on how our results are affected by the governance structure of the pension
plan.
6.5. Impact of pension governance
Cronqvist, Makhija, and Yonker (2012) show that CEOs primarily imprint their
personal preferences on the managed firm when corporate governance is weak. In this section,
we inquire into whether good pension governance keeps COBs from imprinting their personal
preferences on the plans they are responsible for as well. Table 8 compares the impact of

106
COB risk preferences on pension risk between plans with a single board of trustees and plans
with an (investment) board of trustees that is complemented by a separate pension
administration board. In the first governance model, all decision power lies with the same
board. In the second governance model, asset-liability matching decisions lie with the
investment board, which, however, has to coordinate its decisions with the pension
administration board (Miller and Funston (2014)). The administration board hence serves as
an implicit supervisory unit for pension risk decisions of the investment board. Moreover, the
administration board is responsible for decisions on pension benefit levels. Plans with two
separate boards are also larger and more professionalized (Miller and Funston (2014)). Thus,
we consider plans with a separate investment board as better governed. Consistent with
Cronqvist, Makhija, and Yonker (2012), we expect the risk of these plans to be less affected
by personal preferences of the chairman (of the investment board).
Columns (1) and (2) of Table 8 show the estimates for a sample of pension plans with a
single board of trustees. In both regressions, all coefficients on the COB risk preference
measures are statistically significant and consistent with our empirical predictions. Columns
(3) and (4) show the results for plans with a separate investment board. In the regression of
nominal pension risk, none of the COB risk preference measures is significantly related to
pension risk. In the regression of COLA adjusted pension risk, the coefficient on the COB’s
annuitant status is significantly positive and the estimate on the COB’s ex officio status is
significantly negative. All other coefficients are not significantly different from zero.
Overall, we interpret these results as supporting evidence for the view that pension risk
is predominantly affected by COB preferences when pension governance is weaker.
[insert Table 8 here]

107
7. Conclusion
This paper studies whether the overall risk of public pension plans is affected by the
personal risk preferences of the chairman of the board of trustees. In line with Pennacchi and
Rastad (2011), we define pension risk by the volatility of the difference between pension asset
and pension liability returns. Our empirical analyses of the relation between pension risk and
COB risk preferences are based on four empirical predictions that have been suggested by the
literature. Pension risk is (1) negatively affected by an increase in COB age, (2) lower if the
COB is a woman, (3) higher if the COB is an annuitant, and (4) higher if the COB is a
politician (ex officio trustee).
The evidence we present in this paper supports these predictions. Moreover, we cannot
find that the relation between pension risk and COB risk preferences is explained by an
endogenous appointment of COBs to plans that match their personal preferences. Similarly,
our results are not explained by the risk preferences of the board of trustees. The impact of
COB preferences on pension risk is economically important. Each of our risk preference
measures explains a considerable amount of the variation in pension risk. Consistent with
previous results on the impact of individual manager preferences on corporate risk taking, we
find that the reflection of COB preferences in pension risk is particularly evident among more
weakly governed plans, which are plans not governed by a separate and professionalized
investment board.
Our main contribution is the identification of personal COB risk preferences as a
predictor of the risk from mismatched pension assets and liabilities. Since current funding
problems of state and local government pension plans are mainly the consequence of asset
and liability mismatching, it is in the interest of taxpayers to be wary of who is in charge of
the asset-liability risk decisions in public pension plans.
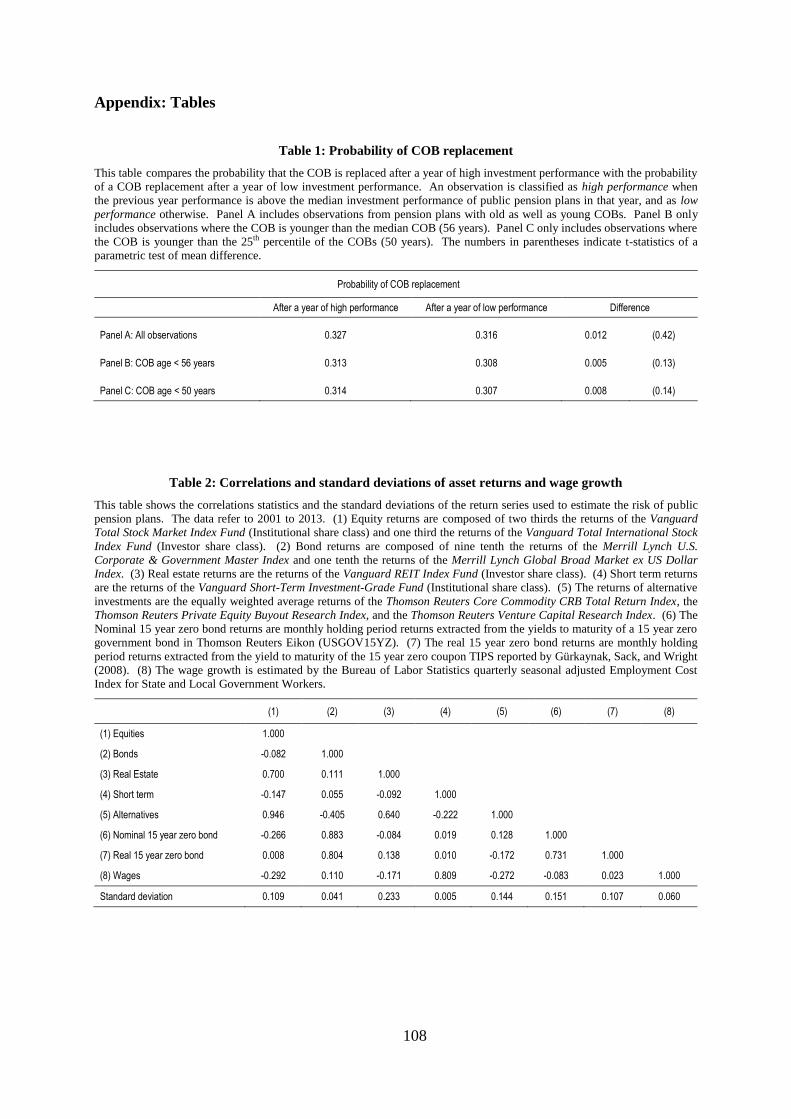
108
Appendix: Tables
Table 1: Probability of COB replacement
This table compares the probability that the COB is replaced after a year of high investment performance with the probability
of a COB replacement after a year of low investment performance. An observation is classified as high performance when
the previous year performance is above the median investment performance of public pension plans in that year, and as low
performance otherwise. Panel A includes observations from pension plans with old as well as young COBs. Panel B only
includes observations where the COB is younger than the median COB (56 years). Panel C only includes observations where
the COB is younger than the 25th percentile of the COBs (50 years). The numbers in parentheses indicate t-statistics of a
parametric test of mean difference.
Probability of COB replacement
After a year of high performance After a year of low performance Difference
Panel A: All observations 0.327 0.316 0.012 (0.42)
Panel B: COB age < 56 years 0.313 0.308 0.005 (0.13)
Panel C: COB age < 50 years 0.314 0.307 0.008 (0.14)
Table 2: Correlations and standard deviations of asset returns and wage growth
This table shows the correlations statistics and the standard deviations of the return series used to estimate the risk of public
pension plans. The data refer to 2001 to 2013. (1) Equity returns are composed of two thirds the returns of the Vanguard
Total Stock Market Index Fund (Institutional share class) and one third the returns of the Vanguard Total International Stock
Index Fund (Investor share class). (2) Bond returns are composed of nine tenth the returns of the Merrill Lynch U.S.
Corporate & Government Master Index and one tenth the returns of the Merrill Lynch Global Broad Market ex US Dollar
Index. (3) Real estate returns are the returns of the Vanguard REIT Index Fund (Investor share class). (4) Short term returns
are the returns of the Vanguard Short-Term Investment-Grade Fund (Institutional share class). (5) The returns of alternative
investments are the equally weighted average returns of the Thomson Reuters Core Commodity CRB Total Return Index, the
Thomson Reuters Private Equity Buyout Research Index, and the Thomson Reuters Venture Capital Research Index. (6) The
Nominal 15 year zero bond returns are monthly holding period returns extracted from the yields to maturity of a 15 year zero
government bond in Thomson Reuters Eikon (USGOV15YZ). (7) The real 15 year zero bond returns are monthly holding
period returns extracted from the yield to maturity of the 15 year zero coupon TIPS reported by Gürkaynak, Sack, and Wright
(2008). (8) The wage growth is estimated by the Bureau of Labor Statistics quarterly seasonal adjusted Employment Cost
Index for State and Local Government Workers.
(1) (2) (3) (4) (5) (6) (7) (8)
(1) Equities 1.000
(2) Bonds -0.082 1.000
(3) Real Estate 0.700 0.111 1.000
(4) Short term -0.147 0.055 -0.092 1.000
(5) Alternatives 0.946 -0.405 0.640 -0.222 1.000
(6) Nominal 15 year zero bond -0.266 0.883 -0.084 0.019 0.128 1.000
(7) Real 15 year zero bond 0.008 0.804 0.138 0.010 -0.172 0.731 1.000
(8) Wages -0.292 0.110 -0.171 0.809 -0.272 -0.083 0.023 1.000
Standard deviation 0.109 0.041 0.233 0.005 0.144 0.151 0.107 0.060
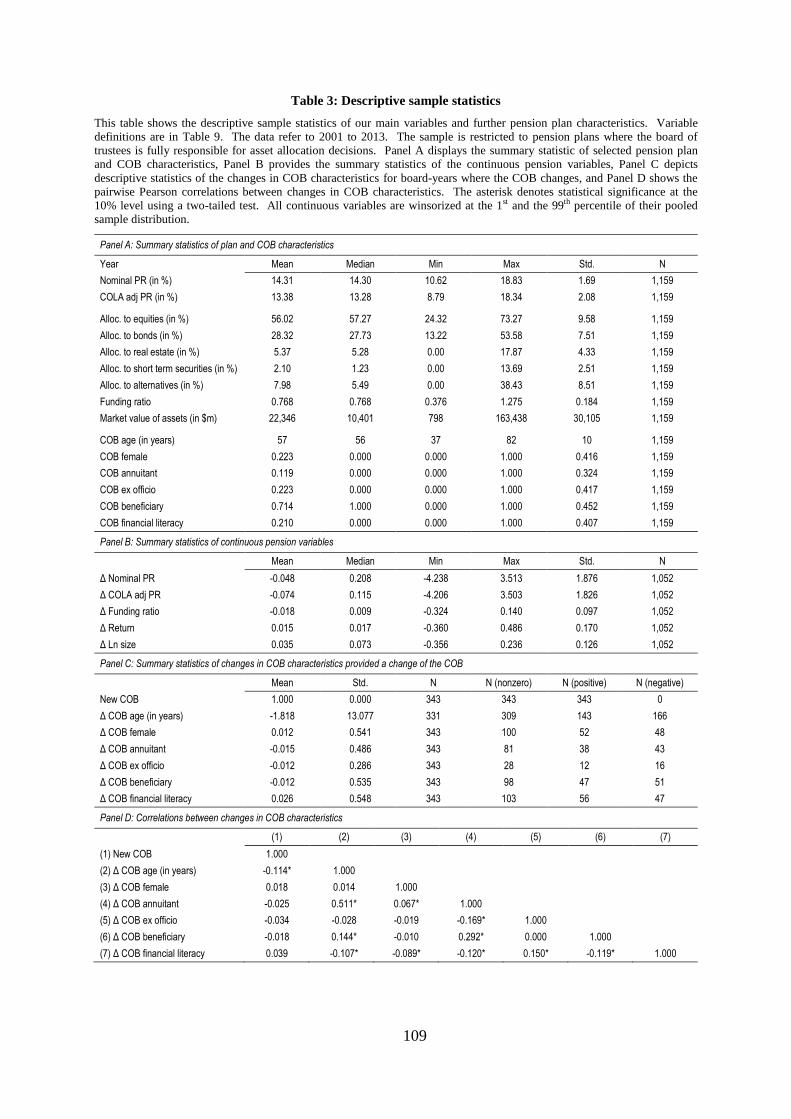
109
Table 3: Descriptive sample statistics
This table shows the descriptive sample statistics of our main variables and further pension plan characteristics. Variable
definitions are in Table 9. The data refer to 2001 to 2013. The sample is restricted to pension plans where the board of
trustees is fully responsible for asset allocation decisions. Panel A displays the summary statistic of selected pension plan
and COB characteristics, Panel B provides the summary statistics of the continuous pension variables, Panel C depicts
descriptive statistics of the changes in COB characteristics for board-years where the COB changes, and Panel D shows the
pairwise Pearson correlations between changes in COB characteristics. The asterisk denotes statistical significance at the
10% level using a two-tailed test. All continuous variables are winsorized at the 1st and the 99th percentile of their pooled
sample distribution.
Panel A: Summary statistics of plan and COB characteristics
Year Mean Median Min Max Std. N
Nominal PR (in %) 14.31 14.30 10.62 18.83 1.69 1,159
COLA adj PR (in %) 13.38 13.28 8.79 18.34 2.08 1,159
Alloc. to equities (in %) 56.02 57.27 24.32 73.27 9.58 1,159
Alloc. to bonds (in %) 28.32 27.73 13.22 53.58 7.51 1,159
Alloc. to real estate (in %) 5.37 5.28 0.00 17.87 4.33 1,159
Alloc. to short term securities (in %) 2.10 1.23 0.00 13.69 2.51 1,159
Alloc. to alternatives (in %) 7.98 5.49 0.00 38.43 8.51 1,159
Funding ratio 0.768 0.768 0.376 1.275 0.184 1,159
Market value of assets (in $m) 22,346 10,401 798 163,438 30,105 1,159
COB age (in years) 57 56 37 82 10 1,159
COB female 0.223 0.000 0.000 1.000 0.416 1,159
COB annuitant 0.119 0.000 0.000 1.000 0.324 1,159
COB ex officio 0.223 0.000 0.000 1.000 0.417 1,159
COB beneficiary 0.714 1.000 0.000 1.000 0.452 1,159
COB financial literacy 0.210 0.000 0.000 1.000 0.407 1,159
Panel B: Summary statistics of continuous pension variables
Mean Median Min Max Std. N
Δ Nominal PR -0.048 0.208 -4.238 3.513 1.876 1,052
Δ COLA adj PR -0.074 0.115 -4.206 3.503 1.826 1,052
Δ Funding ratio -0.018 0.009 -0.324 0.140 0.097 1,052
Δ Return 0.015 0.017 -0.360 0.486 0.170 1,052
Δ Ln size 0.035 0.073 -0.356 0.236 0.126 1,052
Panel C: Summary statistics of changes in COB characteristics provided a change of the COB
Mean Std. N N (nonzero) N (positive) N (negative)
New COB 1.000 0.000 343 343 343 0
Δ COB age (in years) -1.818 13.077 331 309 143 166
Δ COB female 0.012 0.541 343 100 52 48
Δ COB annuitant -0.015 0.486 343 81 38 43
Δ COB ex officio -0.012 0.286 343 28 12 16
Δ COB beneficiary -0.012 0.535 343 98 47 51
Δ COB financial literacy 0.026 0.548 343 103 56 47
Panel D: Correlations between changes in COB characteristics
(1) (2) (3) (4) (5) (6) (7)
(1) New COB 1.000
(2) Δ COB age (in years) -0.114* 1.000
(3) Δ COB female 0.018 0.014 1.000
(4) Δ COB annuitant -0.025 0.511* 0.067* 1.000
(5) Δ COB ex officio -0.034 -0.028 -0.019 -0.169* 1.000
(6) Δ COB beneficiary -0.018 0.144* -0.010 0.292* 0.000 1.000
(7) Δ COB financial literacy 0.039 -0.107* -0.089* -0.120* 0.150* -0.119* 1.000
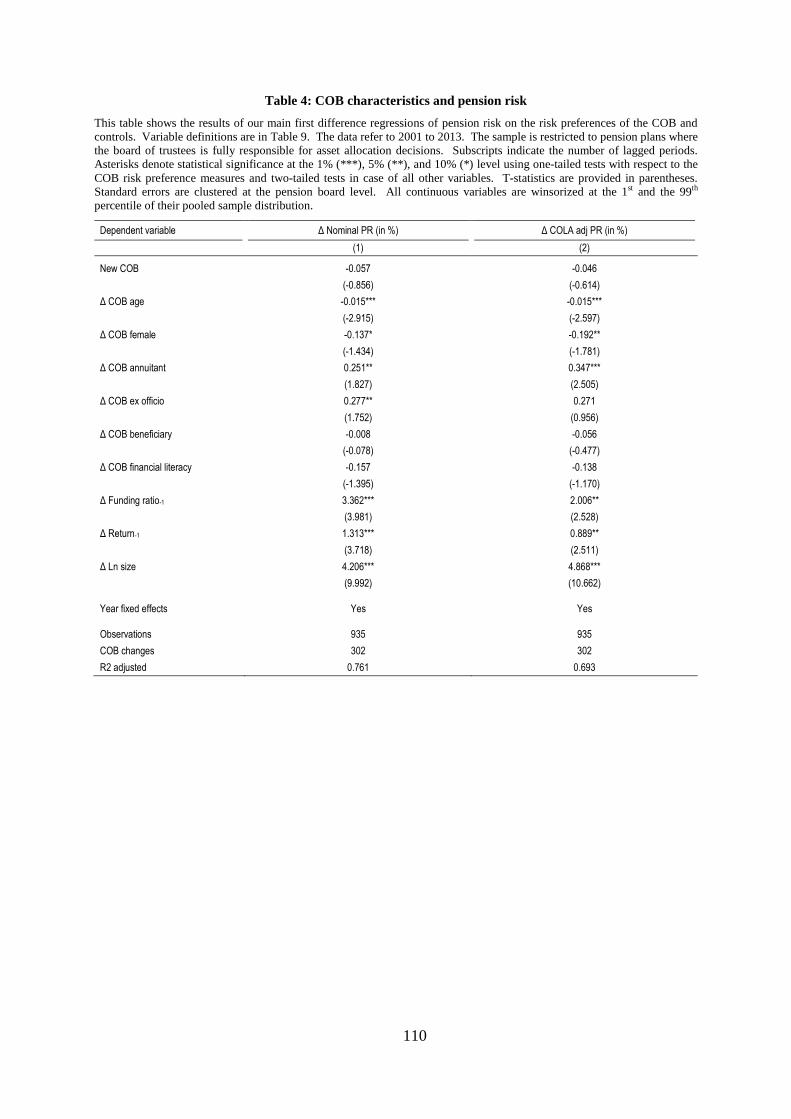
110
Table 4: COB characteristics and pension risk
This table shows the results of our main first difference regressions of pension risk on the risk preferences of the COB and
controls. Variable definitions are in Table 9. The data refer to 2001 to 2013. The sample is restricted to pension plans where
the board of trustees is fully responsible for asset allocation decisions. Subscripts indicate the number of lagged periods.
Asterisks denote statistical significance at the 1% (***), 5% (**), and 10% (*) level using one-tailed tests with respect to the
COB risk preference measures and two-tailed tests in case of all other variables. T-statistics are provided in parentheses.
Standard errors are clustered at the pension board level. All continuous variables are winsorized at the 1st and the 99th
percentile of their pooled sample distribution.
Dependent variable Δ Nominal PR (in %) Δ COLA adj PR (in %)
(1) (2)
New COB -0.057 -0.046
(-0.856) (-0.614)
Δ COB age -0.015*** -0.015***
(-2.915) (-2.597)
Δ COB female -0.137* -0.192**
(-1.434) (-1.781)
Δ COB annuitant 0.251** 0.347***
(1.827) (2.505)
Δ COB ex officio 0.277** 0.271
(1.752) (0.956)
Δ COB beneficiary -0.008 -0.056
(-0.078) (-0.477)
Δ COB financial literacy -0.157 -0.138
(-1.395) (-1.170)
Δ Funding ratio-1 3.362*** 2.006**
(3.981) (2.528)
Δ Return-1 1.313*** 0.889**
(3.718) (2.511)
Δ Ln size 4.206*** 4.868***
(9.992) (10.662)
Year fixed effects Yes Yes
Observations 935 935
COB changes 302 302
R2 adjusted 0.761 0.693

111
Table 5: Representativeness
This table shows the results of first difference regressions of pension risk on the risk preferences of the COB and controls for
a subsample of board-years where the COB does not change or the replaced COB served a minimum term of two and three
years, respectively. Variable definitions are in Table 9. The data refer to 2001 to 2013. The sample is restricted to pension
plans where the board of trustees is fully responsible for asset allocation decisions. Subscripts indicate the number of lagged
periods. Asterisks denote statistical significance at the 1% (***), 5% (**), and 10% (*) level using one-tailed tests with
respect to the COB risk preference measures and two-tailed tests in case of all other variables. T-statistics are provided in
parentheses. Standard errors are clustered at the pension board level. All continuous variables are winsorized at the 1st and
the 99th percentile of their pooled sample distribution.
Sample In case the COB changes, the predecessor served a
minimum term of 2 years
In case the COB changes, the predecessor served a minimum term of 3 years
Dependent variable Δ Nominal PR (in %) Δ COLA adj PR (in %) Δ Nominal PR (in %) Δ COLA adj PR (in %)
(1) (2) (3) (4)
New COB -0.036 -0.027 -0.093 -0.066
(-0.418) (-0.282) (-0.807) (-0.530)
Δ COB age -0.013** -0.014** -0.018** -0.014*
(-1.979) (-1.820) (-2.170) (-1.382)
Δ COB female -0.236** -0.262** -0.387*** -0.301**
(-2.203) (-2.007) (-3.485) (-2.293)
Δ COB annuitant 0.106 0.151 0.171 0.080
(0.601) (0.827) (0.667) (0.313)
Δ COB ex officio 0.320** 0.311** 0.208 0.256*
(2.103) (1.691) (1.262) (1.490)
Δ COB beneficiary 0.037 -0.038 0.003 -0.077
(0.226) (-0.208) (0.014) (-0.338)
Δ COB financial literacy -0.258 -0.254 -0.166 -0.246
(-1.479) (-1.492) (-0.936) (-1.333)
Δ Funding ratio-1 3.515*** 2.190** 3.540*** 2.323**
(3.716) (2.475) (3.480) (2.440)
Δ Return-1 1.285*** 0.819** 1.344*** 0.954**
(3.275) (2.096) (3.117) (2.224)
Δ Ln size 4.318*** 5.003*** 4.067*** 4.783***
(8.764) (8.993) (7.472) (7.658)
Year fixed effects Yes Yes Yes Yes
Observations 820 820 748 748
COB changes 187 187 115 115
R2 adjusted 0.753 0.683 0.757 0.685
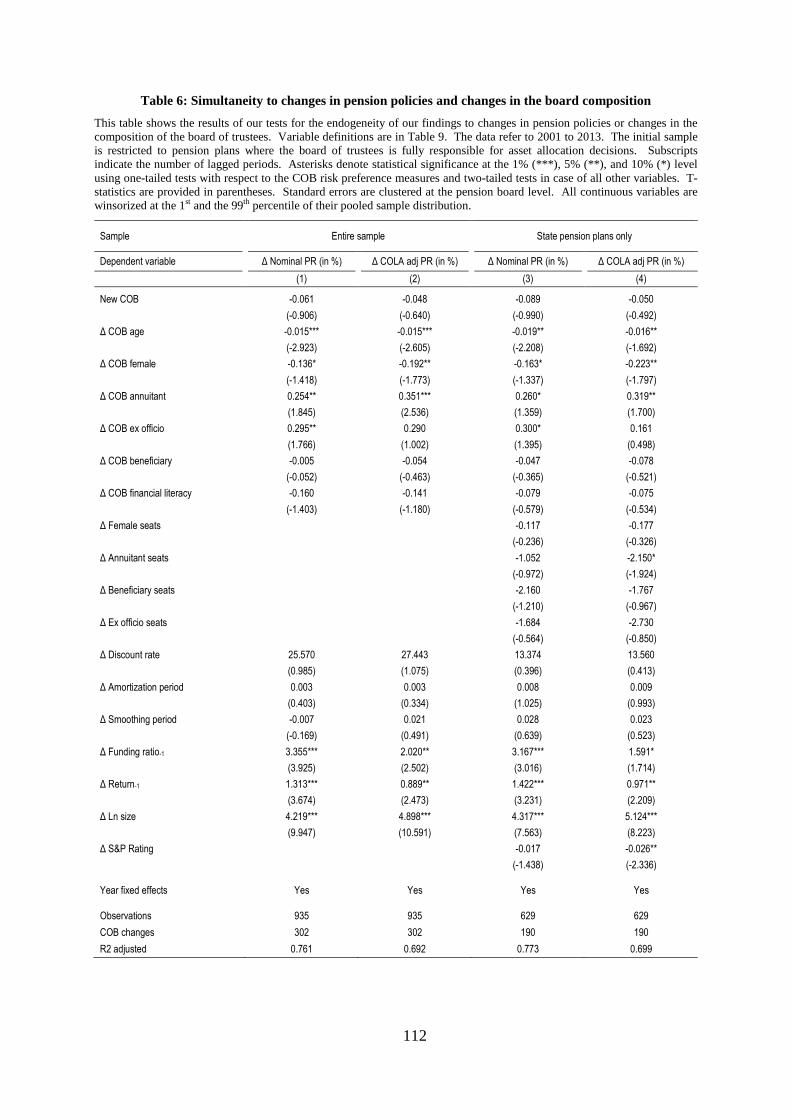
112
Table 6: Simultaneity to changes in pension policies and changes in the board composition
This table shows the results of our tests for the endogeneity of our findings to changes in pension policies or changes in the
composition of the board of trustees. Variable definitions are in Table 9. The data refer to 2001 to 2013. The initial sample
is restricted to pension plans where the board of trustees is fully responsible for asset allocation decisions. Subscripts
indicate the number of lagged periods. Asterisks denote statistical significance at the 1% (***), 5% (**), and 10% (*) level
using one-tailed tests with respect to the COB risk preference measures and two-tailed tests in case of all other variables. T-
statistics are provided in parentheses. Standard errors are clustered at the pension board level. All continuous variables are
winsorized at the 1st and the 99th percentile of their pooled sample distribution.
Sample Entire sample State pension plans only
Dependent variable Δ Nominal PR (in %) Δ COLA adj PR (in %) Δ Nominal PR (in %) Δ COLA adj PR (in %)
(1) (2) (3) (4)
New COB -0.061 -0.048 -0.089 -0.050
(-0.906) (-0.640) (-0.990) (-0.492)
Δ COB age -0.015*** -0.015*** -0.019** -0.016**
(-2.923) (-2.605) (-2.208) (-1.692)
Δ COB female -0.136* -0.192** -0.163* -0.223**
(-1.418) (-1.773) (-1.337) (-1.797)
Δ COB annuitant 0.254** 0.351*** 0.260* 0.319**
(1.845) (2.536) (1.359) (1.700)
Δ COB ex officio 0.295** 0.290 0.300* 0.161
(1.766) (1.002) (1.395) (0.498)
Δ COB beneficiary -0.005 -0.054 -0.047 -0.078
(-0.052) (-0.463) (-0.365) (-0.521)
Δ COB financial literacy -0.160 -0.141 -0.079 -0.075
(-1.403) (-1.180) (-0.579) (-0.534)
Δ Female seats -0.117 -0.177
(-0.236) (-0.326)
Δ Annuitant seats -1.052 -2.150*
(-0.972) (-1.924)
Δ Beneficiary seats -2.160 -1.767
(-1.210) (-0.967)
Δ Ex officio seats -1.684 -2.730
(-0.564) (-0.850)
Δ Discount rate 25.570 27.443 13.374 13.560
(0.985) (1.075) (0.396) (0.413)
Δ Amortization period 0.003 0.003 0.008 0.009
(0.403) (0.334) (1.025) (0.993)
Δ Smoothing period -0.007 0.021 0.028 0.023
(-0.169) (0.491) (0.639) (0.523)
Δ Funding ratio-1 3.355*** 2.020** 3.167*** 1.591*
(3.925) (2.502) (3.016) (1.714)
Δ Return-1 1.313*** 0.889** 1.422*** 0.971**
(3.674) (2.473) (3.231) (2.209)
Δ Ln size 4.219*** 4.898*** 4.317*** 5.124***
(9.947) (10.591) (7.563) (8.223)
Δ S&P Rating -0.017 -0.026**
(-1.438) (-2.336)
Year fixed effects Yes Yes Yes Yes
Observations 935 935 629 629
COB changes 302 302 190 190
R2 adjusted 0.761 0.692 0.773 0.699
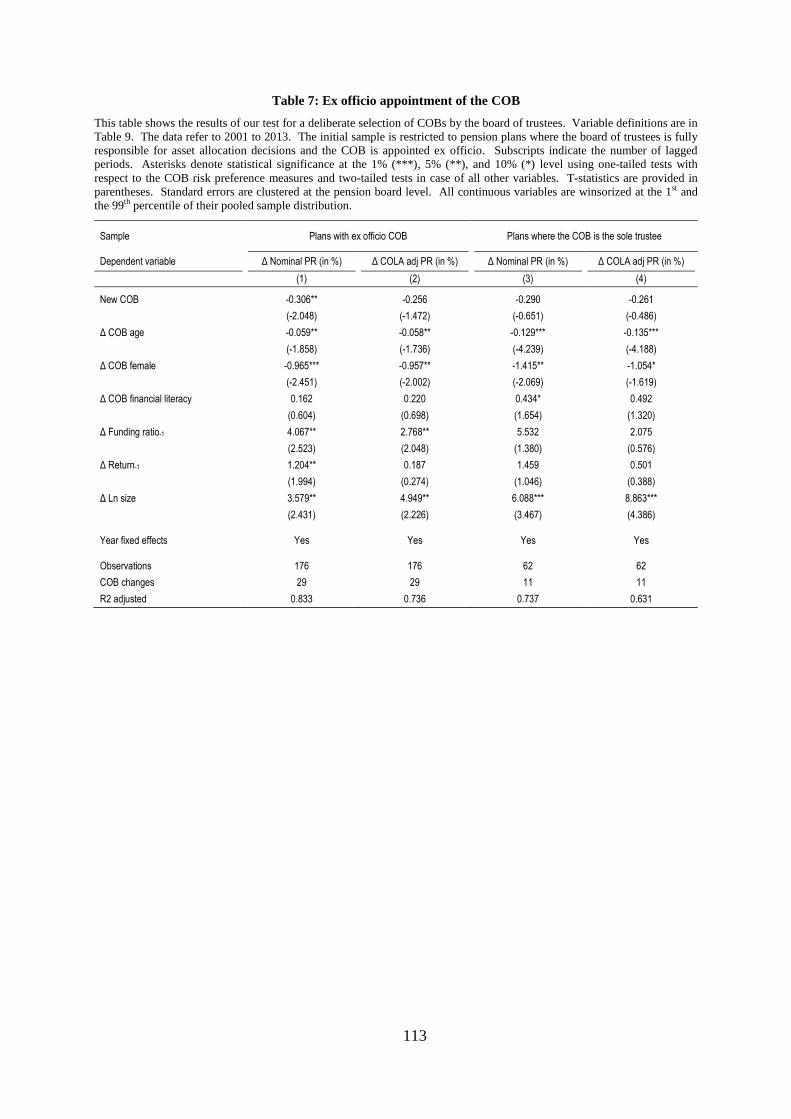
113
Table 7: Ex officio appointment of the COB
This table shows the results of our test for a deliberate selection of COBs by the board of trustees. Variable definitions are in
Table 9. The data refer to 2001 to 2013. The initial sample is restricted to pension plans where the board of trustees is fully
responsible for asset allocation decisions and the COB is appointed ex officio. Subscripts indicate the number of lagged
periods. Asterisks denote statistical significance at the 1% (***), 5% (**), and 10% (*) level using one-tailed tests with
respect to the COB risk preference measures and two-tailed tests in case of all other variables. T-statistics are provided in
parentheses. Standard errors are clustered at the pension board level. All continuous variables are winsorized at the 1st and
the 99th percentile of their pooled sample distribution.
Sample Plans with ex officio COB
Plans where the COB is the sole trustee
Dependent variable Δ Nominal PR (in %) Δ COLA adj PR (in %) Δ Nominal PR (in %) Δ COLA adj PR (in %)
(1) (2) (3) (4)
New COB -0.306** -0.256 -0.290 -0.261
(-2.048) (-1.472) (-0.651) (-0.486)
Δ COB age -0.059** -0.058** -0.129*** -0.135***
(-1.858) (-1.736) (-4.239) (-4.188)
Δ COB female -0.965*** -0.957** -1.415** -1.054*
(-2.451) (-2.002) (-2.069) (-1.619)
Δ COB financial literacy 0.162 0.220 0.434* 0.492
(0.604) (0.698) (1.654) (1.320)
Δ Funding ratio-1 4.067** 2.768** 5.532 2.075
(2.523) (2.048) (1.380) (0.576)
Δ Return-1 1.204** 0.187 1.459 0.501
(1.994) (0.274) (1.046) (0.388)
Δ Ln size 3.579** 4.949** 6.088*** 8.863***
(2.431) (2.226) (3.467) (4.386)
Year fixed effects Yes Yes Yes Yes
Observations 176 176 62 62
COB changes 29 29 11 11
R2 adjusted 0.833 0.736 0.737 0.631
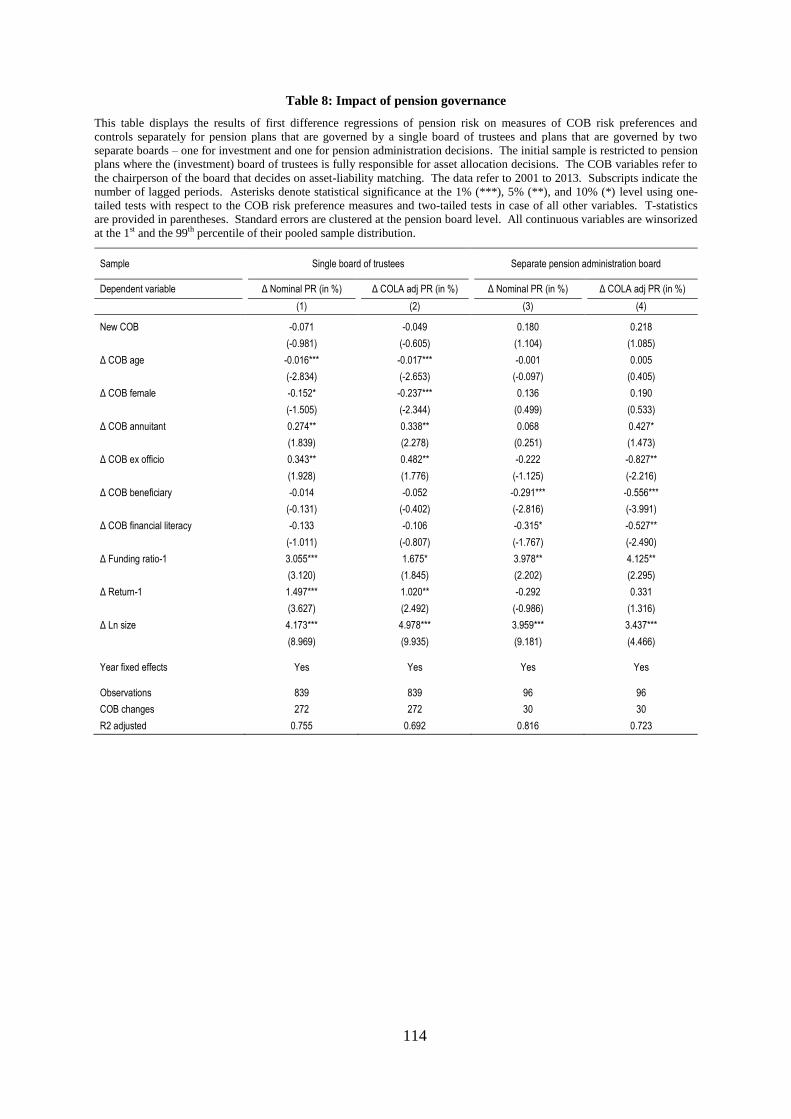
114
Table 8: Impact of pension governance
This table displays the results of first difference regressions of pension risk on measures of COB risk preferences and
controls separately for pension plans that are governed by a single board of trustees and plans that are governed by two
separate boards – one for investment and one for pension administration decisions. The initial sample is restricted to pension
plans where the (investment) board of trustees is fully responsible for asset allocation decisions. The COB variables refer to
the chairperson of the board that decides on asset-liability matching. The data refer to 2001 to 2013. Subscripts indicate the
number of lagged periods. Asterisks denote statistical significance at the 1% (***), 5% (**), and 10% (*) level using one-
tailed tests with respect to the COB risk preference measures and two-tailed tests in case of all other variables. T-statistics
are provided in parentheses. Standard errors are clustered at the pension board level. All continuous variables are winsorized
at the 1st and the 99th percentile of their pooled sample distribution.
Sample Single board of trustees Separate pension administration board
Dependent variable Δ Nominal PR (in %) Δ COLA adj PR (in %) Δ Nominal PR (in %) Δ COLA adj PR (in %)
(1) (2) (3) (4)
New COB -0.071 -0.049 0.180 0.218
(-0.981) (-0.605) (1.104) (1.085)
Δ COB age -0.016*** -0.017*** -0.001 0.005
(-2.834) (-2.653) (-0.097) (0.405)
Δ COB female -0.152* -0.237*** 0.136 0.190
(-1.505) (-2.344) (0.499) (0.533)
Δ COB annuitant 0.274** 0.338** 0.068 0.427*
(1.839) (2.278) (0.251) (1.473)
Δ COB ex officio 0.343** 0.482** -0.222 -0.827**
(1.928) (1.776) (-1.125) (-2.216)
Δ COB beneficiary -0.014 -0.052 -0.291*** -0.556***
(-0.131) (-0.402) (-2.816) (-3.991)
Δ COB financial literacy -0.133 -0.106 -0.315* -0.527**
(-1.011) (-0.807) (-1.767) (-2.490)
Δ Funding ratio-1 3.055*** 1.675* 3.978** 4.125**
(3.120) (1.845) (2.202) (2.295)
Δ Return-1 1.497*** 1.020** -0.292 0.331
(3.627) (2.492) (-0.986) (1.316)
Δ Ln size 4.173*** 4.978*** 3.959*** 3.437***
(8.969) (9.935) (9.181) (4.466)
Year fixed effects Yes Yes Yes Yes
Observations 839 839 96 96
COB changes 272 272 30 30
R2 adjusted 0.755 0.692 0.816 0.723

115
Table 9: Variable definitions
This table summarizes the variable definitions. The first column provides the variable names, the second column displays the
definitions, and the third column shows the source of the data.
Variable Definition Data source
Δ Nominal PR Year-to-year change in the annualized volatility of the monthly difference between pension asset returns and pension liability returns (tracking error). The estimation is made according to Pennacchi and Rastad (2011). The expression is in percentage points. The interest rate risk of pension liabilities reflects nominal interest rate risk. A detailed description is provided in Section 4.2.
Center for Retirement Research at Boston College (2015)31, Thomson Reuters Eikon, Bureau of Labor Statistics32
Δ COLA adj PR Equivalently defined to Δ Nominal PR with the exception that the interest rate risk of pension liabilities reflects real interest rate risk for plans that provide CPI related Cost of Living Adjustments (COLAs) of their pension benefits. A detailed description is provided in Section 4.2.
Center for Retirement Research at Boston College (2015)31, Thomson Reuters Eikon, Gürkaynak, Sack, and Wright (2008)33, Bureau of Labor Statistics32
New COB Binary variable that takes 1 in the first fiscal year when the new COB presides the pension board for at least half of the fiscal year (six month), and 0 otherwise.
Hand collected
Δ COB age Difference in age between the new COB and the predecessor in years. COB age is defined as the difference between the current fiscal year and the year of birth of the COB. The variable is set to 0 if New COB is 0.
Hand collected
Δ COB female Difference in gender between the new COB and the predecessor. The variable takes a value of 1 if the COB changes from a man to a woman, -1 if the COB changes from a woman to a man, and zero otherwise.
Hand collected
Δ COB annuitant Difference in the annuitant status between the new COB and the predecessor. The variable takes a value of 1 if the COB changes from a non-annuitant trustee to an annuitant trustee, -1 if the COB changes from an annuitant trustee to a non-annuitant trustee, and 0 otherwise.
Hand collected
Δ COB ex officio Difference in the ex officio status between the new COB and the predecessor. The variable takes a value of 1 if the COB changes from a non-ex officio trustee to an ex officio trustee, -1 if the COB changes from an ex office trustee to a non-ex officio trustee, and 0 otherwise.
Hand collected
Δ COB beneficiary Difference in the beneficiary status between the new COB and the predecessor. The variable takes a value of 1 if the COB changes from a non-beneficiary to a beneficiary of the plan, -1 if the COB changes from a beneficiary to a non-beneficiary, and 0 otherwise.
Hand collected
Δ COB financial literacy Difference in the financial literacy between the new COB and the predecessor. The variable takes a value of 1 if the COB changes from a not financially literate person to a financially literate person, -1 if the COB changes from a financially literate person to a financially not literate person, and 0 otherwise. A COB is considered financially literate when he holds a Master’s and/or a PhD degree in economics, finance, or business administration, or when he is a Chartered Financial Analyst (CFA), a Certified Financial Planner (CFP), a Certified Public Accountant, or a Certified Public Financial Advisor (CPFA).
For 21 COBs in our sample, we could not find an indication about their education. We assume that those COBs do not fulfill our criteria of financial literacy.
Hand collected
Δ Female seats Year-to-year change in the ratio of female board members to total board members. Hand collected
Δ Annuitant seats Year-to-year change in the ratio of annuitant board members to total board members.
Hand collected
Δ Beneficiary seats Year-to-year change in the ratio of beneficiary board members to total board members.
Hand collected
(continued on next page)
31
The data are available at: http://publicplansdata.org/public-plans-database/download-full-data-set/ 32
The data are available at: http://www.bls.gov/data/#wages 33
The data are available at: http://www.federalreserve.gov/econresdata/feds/2008/index.htm

116
Table 9 (continued)
Variable Definition Data source
Δ Ex officio seats Year-to-year change in the ratio of ex officio board members to total board members.
Hand collected
Δ Funding ratio Year-to-year change in the funding ratio. Funding ratio is defined as the market value of pension assets divided by the actuarial value of pension liabilities following GASB.
Center for Retirement Research at Boston College (2015)34
Δ Return Year-to-year change in the one year investment return. Center for Retirement Research at Boston College (2015)34
Δ Ln size Year-to-year change in the natural logarithm of the market value of assets. Center for Retirement Research at Boston College (2015)34
Δ S&P rating Year-to-year change in the S&P credit rating of the state the pension plan is incorporated in. The change is measured by the number of notches the current year rating is higher (positive values) or lower (negative values) than the previous year rating.
The Pew Charitable Trusts35 and Office of the Chief Financial Officer of the District of Columbia36
Δ Discount rate Year-to-year change in the expected rate of return on pension plan assets, which is equivalent to the discount rate on pension benefits (GASB 25). If the discount rate is reported missing, we assume no change in the discount rate (24 observations).
Center for Retirement Research at Boston College (2015)34
Δ Amortization period Year-to-year change in the number of years the plan is allowed to take for the amortization of an underfunding of pension liabilities. If the amortization period is missing, we assume it does not change (138 observations).
Center for Retirement Research at Boston College (2015)34
Δ Smoothing period Year-to-year change in the smoothing period (in years) for recognizing pension investment losses. If the smoothing period is missing, we assume it does not change (47 observations).
Center for Retirement Research at Boston College (2015)34
34
The data are available at: http://publicplansdata.org/public-plans-database/download-full-data-set/ 35
The data are available at:
http://www.pewtrusts.org/en/research-and-analysis/blogs/stateline/2014/06/09/sp-ratings-2014 36
The data are available at:
http://cfo.dc.gov/sites/default/files/dc/sites/ocfo/publication/attachments/Current%20Historical%20GO-
IT%20Credit%20Ratings_073113.pdf
117
References
Abadie, A., and G. W. Imbens, 2006. Large sample properties of matching estimators for
average treatment effects, Econometrica 74, 235-267.
Adams, J., and D. J. Smith, 2009. Mind the gap: Using derivatives overlays to hedge pension
duration, Financial Analysts Journal 65, 60-67.
Adams, R. B., and P. Funk, 2012. Beyond the glass ceiling: Does gender matter?,
Management Science 58, 219-235.
Agnew, J., P. Balduzzi, and A. Sundén, 2003. Portfolio choice and trading in a large 401(k)
plan, The American Economic Review 93, 193-215.
An, H., Z. Huang, and T. Zhang, 2013. What determines corporate pension fund risk-taking
strategy?, Journal of Banking & Finance 37, 597-613.
Anthony, R. N., and V. Govindarajan, 2007. Management Control Systems, (McGraw-
Hill/Irwin, Boston, MA).
Apicella, C. L., A. Dreber, B. Campbell, P. B. Gray, M. Hoffman, and A. C. Little, 2008.
Testosterone and financial risk preferences, Evolution and Human Behavior 29, 384-390.
Bader, L. N., 2015. How public pension plans can (and why they shouldn't) ignore financial
economics, Financial Analysts Journal 71, 14-16.
Bae, S. C., 1990. Interest rate changes and common stock returns of financial institutions:
Revisited, Journal of Financial Research 13, 71.
Baker, M., J. C. Stein, and J. Wurgler, 2003. When does the market matter? Stock prices and
the investment of equity-dependent firms, Quarterly Journal of Economics 118, 969-1005.
Baltagi, B. H., 2013. Econometric Analysis of Panel Data, (John Wiley & Sons Ltd, Padstow,
Cornwall, Great Britain).
Barclays, 2014. Barclays benchmark index returns, web page.
https://index.barcap.com/Benchmark_Indices/Aggregate/Bond_Indices.
Bartram, S., 2002. The interest rate exposure of nonfinancial corporations, European Finance
Review 6, 101-125.
Bartram, S. M., G. W. Brown, and J. Conrad, 2011. The effects of derivatives on firm risk and
value, Journal of Financial & Quantitative Analysis 46, 967-999.
Baxamusa, M., and A. Jalal, 2015. CEO’s religious affiliation and managerial conservatism,
Financial Management, forthcoming.
Berger, A. N., T. Kick, and K. Schaeck, 2014. Executive board composition and bank risk
taking, Journal of Corporate Finance 28, 48-65.
Bierman, H., Jr., 1993. Capital budgeting in 1992: A survey, Financial Management 22, 24.
118
Bodie, Z., 1990. The ABO, the PBO and pension investment policy, Financial Analysts
Journal 46, 27-34.
Bodie, Z., 1996. What the pension benefit guaranty corporation can learn from the federal
savings and loan insurance corporation, Journal of Financial Services Research 10, 83-100.
Bodie, Z., 2012. Mismatch risk, government guarantees, and financial Instability: The case of
the U.S. pension system, International Journal of Central Banking 8, 273-283.
Bodie, Z., J. O. Light, R. Morck, and R. A. Taggart, Jr., 1985. Corporate pension policy: An
empirical investigation, Financial Analysts Journal 41, 10-16.
Brealey, R., S. Meyers, and F. Allen, 2005. Principles of Corporate Finance, (McGraw-Hill,
New York, NY).
Brotherson, W. T., K. M. Eades, R. S. Harris, and R. C. Higgins, 2013. 'Best practices' in
estimating the cost of capital: An update, Journal of Applied Finance 23, 15-33.
Brown, J. R., and D. W. Wilcox, 2009. Discounting state and local pension liabilities, The
American Economic Review 99, 538-542.
Bulow, J. I., R. Morck, and L. H. Summers, 1987. How Does the Market Value Unfunded
Pension Liabilities? (University of Chicago Press, Chicago and London).
Bulow, J. I., and M. Scholes, 1983. Financial Aspects of the United States Pension System
(University of Chicago Press, Chicago, IL).
Bureau of Labor Statistics, 2015. Employment Cost Index for State and Local Government
Workers (Washington, DC).
Cain, M. D., and S. B. McKeon, 2015. CEO personal risk-taking and corporate policies,
Journal of Financial and Quantitative Analysis, Forthcoming.
Campbell, J. L., D. S. Dhaliwal, and W. C. Schwartz, 2010. Equity valuation effects of the
Pension Protection Act of 2006, Contemporary Accounting Research 27, 469-536.
Campbell, J. L., D. S. Dhaliwal, and W. C. Schwartz, 2012. Financing constraints and the cost
of capital: Evidence from the funding of corporate pension plans, Review of Financial Studies
25, 868-912.
Campbell, J. Y., 2006. Household finance, The Journal of Finance 61, 1553-1604.
Carmichael, D. R., and L. Graham, 2012. Accountants' Handbook, Special Industries and
Special Topics, (John Wiley & Sons, Inc., Hoboken, NJ).
Carroll, T. J., and G. Niehaus, 1998. Pension plan funding and corporate debt ratings, The
Journal of Risk and Insurance 65, 427-443.
Center for Retirement Research at Boston College, 2015. Public Plans Database (Chestnut
Hill, MA).
Chaney, A., and M. Hoesli, 2010. The interest rate sensitivity of real estate, Journal of
Property Research 27, 61-85.
119
Chen, C. R., and A. Chan, 1989. Interest rate sensitivity, asymmetry, and the stock returns of
financial institutions, Financial Review 24, 457-473.
Chevalier, J., and G. Ellison, 1999. Career concerns of mutual fund managers, Quarterly
Journal of Economics 114, 389-432.
COMPUSTAT, 2004. Standard & Poor’s Research Insight North America Data Guide,
(McGraw-Hill, Alton Court, CO).
Cornett, M. M., and A. Saunders, 2008. Financial Institutions Management: A Risk
Management Approach, (Mcgraw-Hill, New York, NY).
Credit Suisse, 2011. The magic of pension accounting, Part V, Credit Suisse Americas/United
States Equity Research Accounting & Tax.
Cronqvist, H., A. K. Makhija, and S. E. Yonker, 2012. Behavioral consistency in corporate
finance: CEO personal and corporate leverage, Journal of Financial Economics 103, 20-40.
Croson, R., and U. Gneezy, 2009. Gender differences in preferences, Journal of Economic
Literature 47, 448-474.
Damodaran, A., 2015. Betas by sector (US), web page.
http://pages.stern.nyu.edu/~adamodar/New_Home_Page/datafile/Betas.html.
Dwyer, P. D., J. H. Gilkeson, and J. A. List, 2002. Gender differences in revealed risk taking:
evidence from mutual fund investors, Economics Letters 76, 151-158.
Erickson, T., and T. M. Whited, 2000. Measurement error and the relationship between
investment and q, Journal of Political Economy 108, 1027-1057.
Fazzari, S. M., R. G. Hubbard, and B. C. Petersen, 1988. Financing constraints and corporate
investment, Brookings Papers on Economic Activity, 141-206.
Feldstein, M., and R. Morck, 1983. Pension Funding Decisions, Interest Rate Assumptions
and Share Prices (University of Chicago Press, Chicago, IL).
Feldstein, M., and S. Seligman, 1981. Pension funding, share prices, and national savings,
Journal of Finance 36, 801-824.
Flannery, M. J., and C. M. James, 1984. The effect of interest rate changes on the common
stock returns of financial institutions, Journal of Finance 39, 1141-1153.
Franzoni, F., and J. M. Marín, 2006. Pension plan funding and stock market efficiency, The
Journal of Finance 61, 921-956.
Gaudecker, H.-M. V., 2015. How does household portfolio diversification vary with financial
literacy and financial advice?, The Journal of Finance 70, 489-507.
Giertz, J. F., and L. E. Papke, 2007. Public pension plans: Myths and realities for state
budgets, National Tax Journal 60, 305-323.
Goyal, A., and S. Wahal, 2008. The selection and termination of investment management
firms by plan sponsors, The Journal of Finance 63, 1805-1847.
120
Graham, J. R., and C. R. Harvey, 2001. The theory and practice of corporate finance:
Evidence from the field, Journal of Financial Economics 60, 187-243.
Gürkaynak, R. S., B. Sack, and J. H. Wright, 2008. The TIPS yield curve and inflation
compensation, Finance and Economics Discussion Series Divisions of Research & Statistics
and Monetary Affairs Federal Reserve Board, Washington, D.C.
Hadlock, C. J., and J. R. Pierce, 2010. New evidence on measuring financial constraints:
Moving beyond the KZ index, Review of Financial Studies 23, 1909-1940.
Hartzell, D., D. G. Shuhnan, T. C. Langetieg, and M. L. Leibowitz, 1988. A look at real estate
duration, Journal of Portfolio Management 15, 16-24.
Hong, H., J. D. Kubik, and A. Solomon, 2000. Security analysts' career concerns and herding
of earnings forecasts, The RAND Journal of Economics 31, 121-144.
Hoops, M., I. Stefanescu, and I. Vidangos, 2015. Defined-contribution pension plans for state
and local government employees in the financial accounts of the United States, FEDS Notes.
Hoshi, T., A. Kashyap, and D. Scharfstein, 1990. The role of banks in reducing the costs of
financial distress in Japan, Journal of Financial Economics 27, 67-88.
Investment Company Institute, 2014. U.S. total retirement market assets, web page.
https://www.ici.org/research/stats.
J.P. Morgan, 2015. Ten “Striking Facts” to guide your corporate finance decisions in 2015,
Corporate Finance Advisory Brief – January 2015.
Jin, L., R. C. Merton, and Z. Bodie, 2006. Do a firm's equity returns reflect the risk of its
pension plan?, Journal of Financial Economics 81, 1-26.
Jörg, P., 2005. Geschlechts- und ausbildungsspezifische Unterschiede im finanziellen
Risikoverhalten, Dissertation an der Wirtschafts- und Sozialwissenschaftlichen Fakultät der
Universität Bern.
Kaplan, S. N., and L. Zingales, 1997. Do investment-cash flow sensitivities provide useful
measures of financing constraints?, The Quarterly Journal of Economics 112, 169-215.
Kaplan, S. N., and L. Zingales, 2000. Investment-cash flow sensitivities are not valid
measures of financing constraints, The Quarterly Journal of Economics 115, 707-712.
Krüger, P., A. Landier, and D. Thesmar, 2015. The WACC fallacy: The real effects of using a
unique discount rate, Journal of Finance 70, 1253-1285.
Lang, L., E. Ofek, and R. Stulz, 1996. Leverage, investment, and firm growth, Journal of
Financial Economics 40, 3-29.
Leibowitz, M. L., 1986. Total portfolio duration: A new perspective on asset allocation,
Financial Analysts Journal 42, 18-77.

121
Leuven, E., and B. Sianesi, 2014. PSMATCH2: Stata module to perform full Mahalanobis
and propensity score matching, common support graphing, and covariate imbalance testing
(Boston College, Department of Economics).
Loderer, C., R. M. Stulz, and U. Waelchli, 2015. Firm rigidities and the decline in growth
opportunities, Working paper (University of Bern, Switzerland).
Lucas, D. J., and S. P. Zeldes, 2009. How should public pension plans invest?, The American
Economic Review 99, 527-532.
MacCrimmon, K. R., and D. A. Wehrung, 1990. Characteristics of risk taking executives,
Management Science 36, 422-435.
Madura, J., and E. R. Zarruk, 1995. Bank exposure to interest rate risk: A global perspective,
Journal of Financial Research 18, 1.
Memmel, C., 2011. Banks’ exposure to interest rate risk, their earnings from term
transformation, and the dynamics of the term structure, Journal of Banking & Finance 35,
282-289.
Mercer, 2014. Mercer pension discount yield curve and index rates in US, web page.
http://www.mercer.com/pensiondiscount.
Merton, R. C., 2006. Allocating shareholder capital to pension plans, Journal of Applied
Corporate Finance 18, 15-24.
Miller, R., and R. Funston, 2014. Public pension governance that works, Funston Advisory
Servicesd LLC.
Mitchell, O. S., 2001. Developments in State and Local Pension Plans (University of
Pennsylvania Press, Philadelphia, PA).
Mohan, N., and T. Zhang, 2014. An analysis of risk-taking behavior for public defined benefit
pension plans, Journal of Banking & Finance 40, 403-419.
Monahan, A. B., 2010. Public pension plan reform: The legal framework, Education Finance
and Policy 5, 617-646.
Nance, D. R., C. W. Smith, and C. W. Smithson, 1993. On the determinants of corporate
hedging, Journal of Finance 48, 267-284.
Novy-Marx, R., and J. Rauh, 2011. Public pension promises: How big are they and what are
they worth?, The Journal of Finance 66, 1211-1249.
Oldfield, G. S., 1977. Financial aspects of the private pension system, Journal of Money,
Credit and Banking 9, 48-54.
Palvia, A., E. Vähämaa, and S. Vähämaa, 2014. Are female CEOs and chairwomen more
conservative and risk averse? Evidence from the banking Industry during the financial crisis,
Journal of Business Ethics, 1-18.

122
Park, Y., 2009. Public pension plan asset allocations, Employee Benefit Research INstitute
Notes.
Parker, H., 1990. The company chairman—His role and responsibilities, Long Range
Planning 23, 35-43.
Pennacchi, G., and M. Rastad, 2010. Portfolio allocation for public pension funds, National
Bureau of Economic Research.
Pennacchi, G., and M. Rastad, 2011. Portfolio allocation for public pension funds, Journal of
Pension Economics and Finance 10, 221-245.
Public Fund Survey, 2015. web page.
http://www.publicfundsurvey.org/publicfundsurvey/summaryoffindings.html.
Rauh, J. D., 2006. Investment and financing constraints: Evidence from the funding of
corporate pension plans, The Journal of Finance 61, 33-71.
Rauh, J. D., 2009. Risk shifting versus risk management: Investment policy in corporate
pension plans, Review of Financial Studies 22, 2687-2733.
Rauh, J. D., I. Stefanescu, and S. P. Zeldes, 2013. Cost shifting and the freezing of corporate
pension plans, FEDS Working Paper No. 2013-82.
Rosenbaum, P. R., and D. B. Rubin, 1983. The central role of the propensity score in
observational studies for causal effects, Biometrika 70, 41-55.
Ross, S., R. Westerfield, J. Jaffe, and B. Jordan, 2010. Corporate Finance, (McGraw-Hill,
New York, NY).
Ryan, R. J., and F. J. Fabozzi, 2002. Rethinking pension liabilities and asset allocation,
Journal of Portfolio Management 28, 7-15.
Sapienza, P., L. Zingales, and D. Maestripieri, 2009. Gender differences in financial risk
aversion and career choices are affected by testosterone, Proceedings of the National
Academy of Sciences 106, 15268-15273.
Serfling, M. A., 2014. CEO age and the riskiness of corporate policies, Journal of Corporate
Finance 25, 251-273.
Sharpe, W. F., 1964. Capital asset prices: A theory of market equilibrium under conditions of
risk, The Journal of Finance 19, 425-442.
Shivdasani, A., and I. Stefanescu, 2010. How do pensions affect corporate capital structure
decisions?, Review of Financial Studies 23, 1287-1323.
Smyth, W., 2013. Moody’s analytical approach to defined benefit pension plans, Moody's
investors services.
Spangler, T., 2013. Detroit not alone under crushing pension obligations, USA TODAY.
http://www.usatoday.com/story/news/nation/2013/07/21/detroit-bankruptcy-pension-
obligation/2573457/.

123
Stone, B. K., 1974. Systematic interest-rate risk in a two-index model of returns, The Journal
of Financial and Quantitative Analysis 9, 709-721.
Sundén, A. E., and B. J. Surette, 1998. Gender differences in the allocation of assets in
retirement savings plans, American Economic Review 88, 207-211.
Sweeney, R. J., and A. D. Warga, 1986. The pricing of interest-rate risk: Evidence from the
stock market, The Journal of Finance 41, 393-410.
Weller, C. E., and J. B. Wenger, 2009. Prudent investors: the asset allocation of public
pension plans, Journal of Pension Economics and Finance 8, 501-525.

124
Selbständigkeitserklärung
„Ich erkläre hiermit, dass ich diese Arbeit selbstständig verfasst und keine anderen als
die angegebenen Quellen benutzt habe. Alle Stellen, die wörtlich oder sinngemäss aus
Quellen entnommen wurden, habe ich als solche gekennzeichnet. Mir ist bekannt, dass
andernfalls der Senat gemäss Artikel 36 Absatz 1 Buchstabe o des Gesetzes vom 5.
September 1996 über die Universität zum Entzug des aufgrund dieser Arbeit verliehenen
Titels berechtigt ist.“
Oliver Dichter
25. Januar 2016


![[DE] GRC Governance, Risk Management & Compliance](https://static.fdokument.com/doc/165x107/54b398f94a795944738b47a2/de-grc-governance-risk-management-compliance.jpg)