Population dynamics and functional traits of annual plants a
220
5 Université Paul Cézanne Aix-Marseille III Universität Regensburg Faculté Sciences et Techniques St Jérôme Fakultät für Biologie und Vorklinische Medizin Institut Méditerranéen d’Ecologie et de Paléoécologie Institut für Botanik N° attribué par la bibliothèque _ _ _ _ _ _ _ _ _ _ THÈSE - DISSERTATION zur Erlangung des Doktorgrades der Naturwissenschaften der Naturwissenschaftlichen Fakultät III - Biologie und Vorklinische Medizin der Universität Regensburg pour obtenir le grade de Docteur de l’Université d’Aix-Marseille III Discipline : Biologie - Ecole doctorale : Sciences de l’Environnement Population dynamics and functional traits of annual plants – a comparative study on how rare and common arable weeds persist in agroecosystems par-von Arne SAATKAMP Borken/Westfalen & Marseille présentée et soutenue publiquement le 14 septembre 2009 vorgelegt am 15. Juli 2009; mündliche Prüfung am 14. September 2009 JURY – PRÜFUNGSAUSSCHUSS : Prof. Dr. Michael THOMM Universität Regensburg Président-Vorsitzender Dr. Jon MARSHALL University of Bristol Rapporteur-Gutachter Prof. Dr. Karl-Georg BERNHARDT Universität Wien Rapporteur-Gutachter Prof. Dr. Christoph OBERPRIELER Universität Regensburg Examinateur-Prüfer Prof. Dr. Erhard STROHM Universität Regensburg Examinateur-Prüfer Prof. Dr. Thierry TATONI Université d’Aix-Marseille III Examinateur-Prüfer Prof. Dr. Thierry DUTOIT* Université d’Avignon Examinateur-Prüfer Dr. Laurence AFFRE* Université d’Aix-Marseille III Examinatrice-Prüferin Prof. Dr. Peter POSCHLOD* Universität Regensburg Examinateur-Prüfer * Codirecteurs-Anleiter der Arbeit
Transcript of Population dynamics and functional traits of annual plants a

5
Université Paul Cézanne Aix-Marseille III Universität Regensburg
Faculté Sciences et Techniques St Jérôme Fakultät für Biologie und Vorklinische Medizin
Institut Méditerranéen d’Ecologie et de Paléoécologie Institut für Botanik
N° attribué par la bibliothèque _ _ _ _ _ _ _ _ _ _
THÈSE - DISSERTATION
zur Erlangung des Doktorgrades der Naturwissenschaften der Naturwissenschaftlichen Fakultät III - Biologie und Vorklinische Medizin der Universität Regensburg
pour obtenir le grade de Docteur de l’Université d’Aix-Marseille III Discipline : Biologie - Ecole doctorale : Sciences de l’Environnement
Population dynamics and functional traits of annual plants –
a comparative study on how rare and common arable weeds persist
in agroecosystems
par-von
Arne SAATKAMP
Borken/Westfalen & Marseille
présentée et soutenue publiquement le 14 septembre 2009
vorgelegt am 15. Juli 2009; mündliche Prüfung am 14. September 2009
JURY – PRÜFUNGSAUSSCHUSS :
Prof. Dr. Michael THOMM Universität Regensburg Président-Vorsitzender Dr. Jon MARSHALL University of Bristol Rapporteur-Gutachter Prof. Dr. Karl-Georg BERNHARDT Universität Wien Rapporteur-Gutachter Prof. Dr. Christoph OBERPRIELER Universität Regensburg Examinateur-Prüfer Prof. Dr. Erhard STROHM Universität Regensburg Examinateur-Prüfer Prof. Dr. Thierry TATONI Université d’Aix-Marseille III Examinateur-Prüfer Prof. Dr. Thierry DUTOIT* Université d’Avignon Examinateur-Prüfer Dr. Laurence AFFRE* Université d’Aix-Marseille III Examinatrice-Prüferin Prof. Dr. Peter POSCHLOD* Universität Regensburg Examinateur-Prüfer
* Codirecteurs-Anleiter der Arbeit

à Nico
für Gerd und Maja

3
5
I
1
2
3
4
C
5
R
GRAPHIC INDEX
I
General introduction
1 Plant diversity in agro-ecosystems influenced by vineyard structure,
landscape class, land use intensity and past cereal cultivation
2 The seed bank longevity index revisited - limited reliability evident from a
burial experiment and database analyses
3 Functional ecology of seed persistence in the soil – insights from
germination experiments and seed traits with cereal weeds
4 Is there an effect of soil seed mortality and seed production on local
population dynamics in annual plants? – the case of rare cereal weeds
5 Comparison of traits between rare and common cereal weeds and
implications for conservation
C
General discussion, conclusions and perspectives
R
References


Index
5
5 5
I
1
2
3
4
C
5
R
INDEX
Graphic Index ............................................................................................................................................... 3
Index .............................................................................................................................................................. 5
Index of tables, figures and boxes ............................................................................................................. 8
Preface ......................................................................................................................................................... 11
Acknowledgements ................................................................................................................................... 13
General introduction ................................................................................................................................. 15
Explanations for coexistence and plant diversity - a mirror of population persistence .......................... 15
Population dynamics in annuals - which traits for local population persistence? ................................... 18
Outline of the thesis .......................................................................................................................................... 21
Theories, concepts and state of knowledge ................................................................................................ 23
Storage effect and bet hedging ........................................................................................................................ 23
Functional traits ................................................................................................................................................. 24
The seed size-seed number trade-off: a central gradient in comparative plant ecology ......................... 25
Germination conditions and germination niche ........................................................................................... 28
Dormancy ........................................................................................................................................................... 29
Soil seed banks ................................................................................................................................................... 30
Mating system and Pollen:Ovule ratio ........................................................................................................... 32
Comparative biology and phylogenetically independent contrasts .......................................................... 33
Study system and site .................................................................................................................................... 36
Cereal weeds, history, evolution ..................................................................................................................... 36
Vegetation types and floristic gradients in arable fields .............................................................................. 37
Traditional Mediterranean cereal cultivation and farm types in the Luberon area ................................. 38
Ecological services of cereal weeds ................................................................................................................. 41
Causes of maintenance or regression ............................................................................................................. 43
Why annual cereal weeds as a study system? ............................................................................................... 45
Study site ............................................................................................................................................................ 45
Transition to chapter 1 .............................................................................................................................. 52
Real world example of diversity at different spatial scales ..................................................................... 52
Chapter 1 ..................................................................................................................................................... 55
Plant diversity in agro-ecosystems influenced by vineyard structure, landscape class, land use
intensity and past cereal cultivation ........................................................................................................... 55
Introduction ....................................................................................................................................................... 55
Methods and study area ................................................................................................................................... 57
Results ................................................................................................................................................................. 62
Discussion .......................................................................................................................................................... 67
Conclusion ......................................................................................................................................................... 70
Transition chapter 1 to 2 ........................................................................................................................... 74
Index
6
From community diversity to the meaning of soil seed bank longevity ............................................... 74
Chapter 2 ..................................................................................................................................................... 77
The seed bank longevity index revisited - limited reliability evident from a burial experiment and
database analyses ........................................................................................................................................... 77
Introduction ....................................................................................................................................................... 77
Materials and Methods ..................................................................................................................................... 81
Results ................................................................................................................................................................. 86
Discussion .......................................................................................................................................................... 89
Conclusion ......................................................................................................................................................... 93
Transition chapter 2 to 3 ........................................................................................................................... 96
From soil seed persistence measures to functional ecology of soil seed banks ..................................... 96
Chapter 3 ..................................................................................................................................................... 97
Functional ecology of seed persistence in the soil – insights from germination experiments and seed
traits with cereal weeds ................................................................................................................................ 97
Introduction ....................................................................................................................................................... 97
Materials and Methods ................................................................................................................................... 101
Results ............................................................................................................................................................... 108
Discussion ........................................................................................................................................................ 121
Conclusion ....................................................................................................................................................... 126
Transition chapter 3 to 4 ......................................................................................................................... 128
From functional ecology of soil seed banks to population persistence ................................................ 128
Chapter 4 ................................................................................................................................................... 131
Is there an effect of soil seed mortality and seed production on local population dynamics in annual
plants? – the case of rare cereal weeds ...................................................................................................... 131
Introduction ..................................................................................................................................................... 131
Materials and Methods ................................................................................................................................... 134
Results ............................................................................................................................................................... 139
Discussion ........................................................................................................................................................ 145
Conclusion ....................................................................................................................................................... 148
Transition chapter 4 to 5 ......................................................................................................................... 152
From population dynamics to rarity and abundance ............................................................................. 152
Chapter 5 ................................................................................................................................................... 155
Comparison of traits between rare and common cereal weeds and implications for conservation 155
Introduction ..................................................................................................................................................... 155
Materials and Methods ................................................................................................................................... 158
Results ............................................................................................................................................................... 163
Discussion ........................................................................................................................................................ 169
General discussion, conclusions and perspectives ............................................................................. 173
General discussion ....................................................................................................................................... 173
Index
7
5 5
I
1
2
3
4
C
5
R
Plant diversity in agro-ecosystems: the main influence of disturbances and the role of spatial
heterogeneity for diversity maintenance ..................................................................................................... 173
Methods and estimates of soil seed bank persistence revisited – which seed bank estimate can predict
local plant diversity and abundance? ........................................................................................................... 175
Function of seed persistence in the soil: how germination and seed traits optimise a plant’s resource
use in disturbance driven ecosystems .......................................................................................................... 177
Traits and local population dynamics in annual plants: can population turnover and extinction
dynamics be predicted? .................................................................................................................................. 181
Traits and their relation to rarity and abundance ....................................................................................... 182
Pollen:ovule ratio and population dynamics .............................................................................................. 185
Dispersal of seeds and population persistence ........................................................................................... 187
Interactions between cereals and annual cereal weeds .............................................................................. 189
General conclusions ..................................................................................................................................... 190
Dispersal traits and a basic consideration of different plant traits ........................................................... 190
Observation influences results: the case of seed burial and germination ................................................ 192
Scaling up from soil seed persistence to population persistence and diversity ..................................... 193
Storage effect explains soil seed bank ecology in agro-ecosystems.......................................................... 193
conservation issues ......................................................................................................................................... 195
Perspectives .................................................................................................................................................. 198
References ................................................................................................................................................. 201
Appendix .................................................................................................................................................. 217
Résumé français ....................................................................................................................................... 218
Deutsche Zusammenfassung ................................................................................................................. 219
Abstract ..................................................................................................................................................... 220

Index
8
INDEX OF TABLES, FIGURES AND BOXES
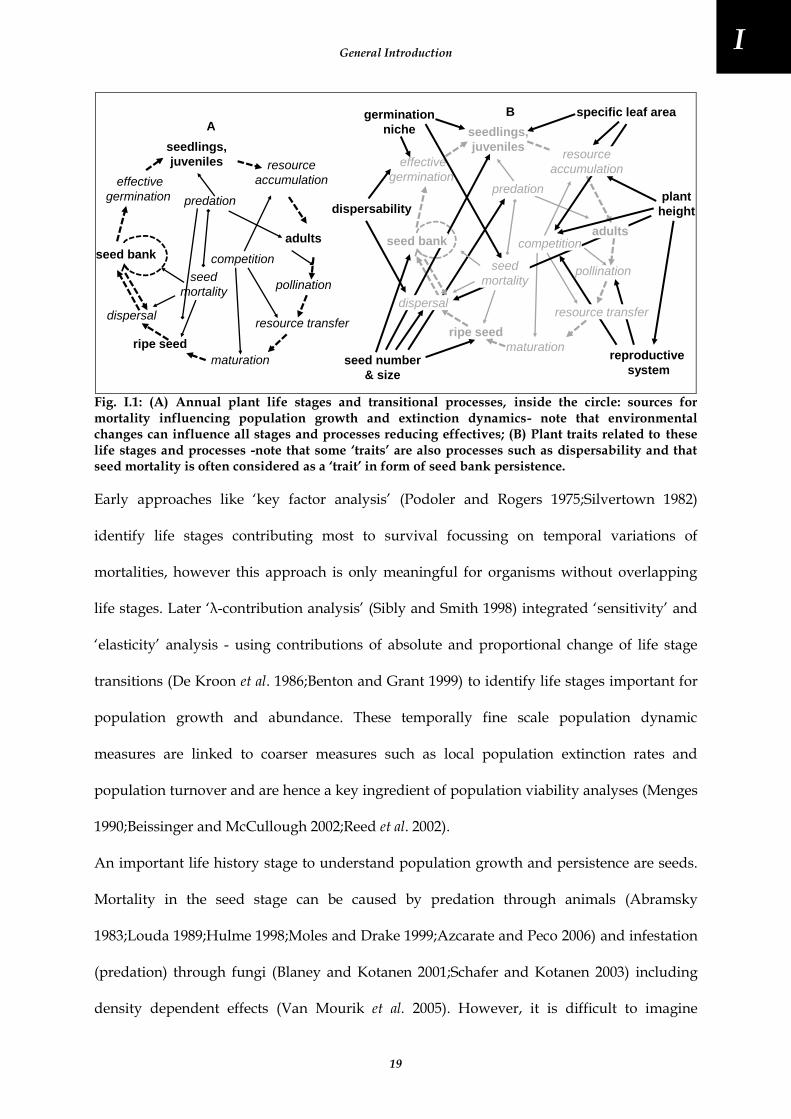
Fig. I.1: (A) Annual plant life stages and transitional processes, inside the circle: sources for mortality influencing population growth and extinction dynamics- note that environmental changes can influence all stages and processes reducing effectives; (B) Plant traits related to these life stages and processes note that some ‘traits’ are also processes such as dispersability and that seed mortality is often considered a ‘trait’ in form of seed bank persistence.............................................................................................................................................................................. 19
Fig. I.2: Schematic view of the storage effect. .................................................................................................................... 24
Fig. I.3: Existing and assumed hypothesis on seed size, seed number and related gradients of processes and traits ................................................................................................................................................................................................. 26
Box 1: Phylogeny and comparative analyses .................................................................................................................... 35
Fig. I.4: Eight years of traditional crop rotation in the Luberon area with five years of Durum wheat and three years of sainfoin as fodder intercrop with disturbance regime as inner circle, black: open bare soil between ploughing and crop germination, dark grey: standing crop, light grey: cut crop, white: wheat stubbles (drawings modified from Jávorka and Csapody 1979; Rothmaler 2000). ........................................................................................ 39
Fig. I.5: Examples of trophic relationships and ecosystem services of cereal weeds, for detailed discussion and bibliographic sources see text. ............................................................................................................................................. 42
Fig. I.6: Regression of two cereal weeds, Adonis flammea and Agrostemma githago in Europe; plain dots are occurrences after 1930, crosses are extinct occurrences; note that for Central and Western Europe regression continued and Agrostemma is now near to extinct in Great Britain, France and Germany (source: Atlas Florae Europaeae). ............................................................................................................................................................................ 43
Fig. I.7: South Eastern France -Région Provence-Alpes-Côte d’Azur- in white, Luberon area marked with a black square and study sites with dots in the shaded relief map. ............................................................................................ 46
Fig. I.8: Monthly rainfall sum (black bars, scale at the left) and mean temperatures per month (grey line, scale at the right) for the study period, rainfall at La Roque d’Antheron, temperature at Manosque (data: www.infoclimat.fr). .............................................................................................................................................................. 47
Box 2: An early description of plant phenology, food webs and plant traits in cereal fields (Pliny) and four classical texts documenting the transport of cereals from Northern Africa to Europe in Roman times (Varro, Livius and Tacitus). .............................................................................................................................................................. 49
Fig. T1.1: Additive partitioning of plant diversity with α-diversity at the plot scale for two pairs of plots, 1 & 2 and 3 & 4, with different overlap and the resulting different β-diversity but similar γ-diversity. ............................ 53
Fig. 1.1: Map of the study area with 1 km grid of the three landscape classes, major villages are marked by white rounds and plots by white squares; dark grey: ‘sand landscape’ class, middle grey ‘marl landscape’ class and light grey ‘limestone landscape’ class, scale is given by the 1 km grid. ........................................................................ 59
Fig. 1.2: The situation of a vineyard with its embankment (grey), vine-rows (black) and the size and position of the three habitat stratified plot types. ................................................................................................................................ 60
Tab. 1.1: Diversity levels, scales and independent factors analysed in this work. ....................................................... 61
Tab. 1.2: Results of the analysis of variance on the species number per plot, factors were habitat type, landscape class and intensity of agriculture. ....................................................................................................................................... 62
Fig. 1.3: Box plot of α-diversity (species richness on 200m²), each box represents 45 samples .................................. 63
Fig. 1.4: Box plot of the interaction of habitat type and intensity of agriculture on the α-diversity, each box represents 15 samples, P-inside field, M-margin, T-embankment, H-intensive, I-intermediate, N-extensive agriculture. ............................................................................................................................................................................. 63
Tab. 1.3: Synthesis of analyses of variance on the vineyard scale absolute and relative β1-diversity; βTM: β-diversity between margin and embankment plots, βMP: β-diversity between margin and inside of vineyards. ..... 64
Fig. 1.5: Box plot of absolute (left) and relative (right) β-diversity, each box represents 15 samples; βTM: β-diversity between margin and inside of vineyards (above), βMP: β-diversity between margin and embankment plots (below). ................................................................................................................................................................................... 64
Tab. 1.4: Synthesis of analyses of variance on the landscape scale of absolute and relative β2-diversity and γ-diversity; βNI: β-diversity between extensive and intermediate vineyards, βIH: β-diversity between intermediate and intensive vineyards. ...................................................................................................................................................... 65
Tab. 1.5: List and status of typical cereal weeds found among 359 species of this study; species of high conservation value are marked in bold; indented: all other species of high conservation value that are not cereal weeds. Status: (1) Roux & Nicolas (2001): 2, threatened; 3, rare; 5, quite rare but not threatened; 6, neither rare nor threatened; (2) Filosa & Verlaque (1997); (3) Jauzein (1995): AC – quite common; AR – quite rare; R – rare; TR – very rare; * special conservation efforts would be beneficial; (4) Montégut (1997). ..................................................... 66

Index
9
5 5
I
1
2
3
4
C
5
R
Fig. 1.6: Number of cereal weed species in the studied plots according to habitat type, intensities of agriculture, landscape class and the former cultivation type; N = 45 for each box, except for vineyards, N= 111 and cereals N= 24. ............................................................................................................................................................................................ 67
Fig. 2.1. Experimental layout: position of blocks, time step replicates (T1-T5) and mesh bags for each species inside blocks. ......................................................................................................................................................................... 82
Fig. 2.2: Percentage survival for five retrieval dates for six representative species. Initial viability in autumn 2005 is presented as 100% to give a scale among species; the survival percentages are relative to this initial viability. Bars are standard errors. ...................................................................................................................................................... 87
Fig. 2.3. Box plots of percentage survival of seeds for 26 species after 2.5 years of burial (five replicates per species), boxes and central bars represent interquartile range and median, dashed lines represent range of sample, dots are outliers. Species are ordered according to their longevity index (LI). Species in bold are those for which at least five records were used for calculation of LI. ............................................................................................ 88
Fig. 2.4. Relation of a species’ reproductive capacity (logarithm of seeds produced per m², Šera and Šery, 2004) and its longevity index (LI, Thompson et al., 1997) based on ≥5 studies per species using seedling emergence from soil seed bank samples; LI is high when many studies classify the species as persistent, and low when there are many transient records, details in the text (R2= 0·10, F1,225=25·23, P < 0·001). .............................................................. 89
Fig. 3.1. Experimental layout: position of blocks, time step replicates (T1-T5) inside blocks and mesh bags for each of 35 species. ........................................................................................................................................................................ 103
Tab. 3.1. Soil seed mortality analysed as dependent variable with block, time of burial and species as independent factors, using Kruskal-Wallis’ test for each factor separately ....................................................................................... 108
Fig. 3.2. Dormancy cycles in three contrasting species (A-C) and mean dormancy cycles of 35 species (D); black: seeds germinating directly after retrieval in 22°/14°C, dark grey: germination in chill phase (4°C), medium grey: germinated seeds after chilling in 4°C in 22°/14°C, light grey: non-germinated but viable seeds ( TZ test) and white: dead seeds. ............................................................................................................................................................... 108
Tab. 3.2. Degree of dormancy (DD) of species and their four letter codes used in the plots and phylogenetic trees; in bold, species which germination patterns are illustrated in figure 3.2 A-C. .......................................................... 110
Fig. 3.3. Box plots of the soil seed mortality of deeply dormant (grey) and little or non-dormant species (white) in five burial periods of six months each; for dormancy definition see text; the only significant difference in a particular burial phase is marked with an asterisk (U-test, p < 0.05, after correction); note that mortality is square root transformed and that squares design mean values, inlay: differences in mean soil seed mortality between the two degrees of dormancy along time. .............................................................................................................................. 111
Fig. 3.4. Soil seed mortality after 2.5 years of burial decreases significantly with the degree of dormancy in simple regression (A, R² = 0.2344, F1,32 = 9.796, p = 0.0037) and using contrasts of mortality and degree of dormancy (B, R² = 0.3135, F1,32 = 14.61, p = 0.0006), numbers in the tree (C) correspond to PICs used in the analysis. Whenever we moved numbers or species codes for legibility, we put them in italic; codes for species names in A and C are in table 3.2. ................................................................................................................................................................................ 112
Fig. 3.5 Soil seed mortality after 2.5 years of burial and seed mass are not significantly related in simple regression (A), but contrasts of mortality and seed mass are (B, R² = 0.2617, F1,33 = 11.7, p = 0.0017), numbers in the tree (C) correspond to PICs used in the analysis. Whenever we moved numbers and species codes for legibility, we put them in italic. .......................................................................................................................................................... 114
Tab. 3.3. Relative germination under diurnally fluctuating temperatures in darkness (RFG) and relative light germination (RLG, under fluctuating temperatures) for 26 species, ordered according to RFG; we excluded nine species with no darkness germination in bold species illustrated in figure 3.6 (see below). .................................... 116
Fig. 3.6: Germination of Papaver argemone (A), Androsace maxima (B) and Asperula arvensis (C) in diurnally fluctuating and constant temperatures in darkness (grey) and in light (white); note that Asperula (C) does not germinate in light. ............................................................................................................................................................... 116
Fig. 3.7. Germination in light (RLG > 0%) and darkness (RLG < 0%) for species with different seed size (A) and number (B) under diurnally fluctuating (black) and constant (grey) temperatures, lines show the significant relationships in weighted regression (black: R2 = 0.14, F1,27=4.49, p = 0.043; grey: R2 = 0.15, F1,27=4.64, p = 0.040); note the back-transformed logarithmic scale for seed mass and seed number. ......................................................... 117
Fig. 3.8. Box plots of the soil seed mortality of species germinating in darkness (grey) and light (white) in five burial periods of 6 months each; inlay: differences in soil seed mortality between light and dark germinating species decline significantly with time; note that mortality is square root transformed and squares design mean values. ................................................................................................................................................................................... 118
Fig. 3.9. Box plots of soil seed mortality of species germinating better under diurnally fluctuating temperatures (grey) than under constant (white) in five burial periods of 6 months each, the significant differences in 2nd and 3rd winter are marked with * (U-test, p < 0.05, after correction for multiple comparisons; tab. 3.4 for details); note that mortality is square root transformed and that squares design mean values, inlay: differences in soil seed

Index
10
mortality between species germinating better under diurnally fluctuating and constant temperatures along time. ............................................................................................................................................................................................... 120
Tab. 3.4. Comparisons of soil seed mortality between species germinating better under diurnally fluctuating or constant temperatures ........................................................................................................................................................ 120
Tab. 4.1. Species studied, their four-letter code, the number of populations (1983-2006) studied per species and phylogenetic relationships. ................................................................................................................................................ 135
Fig. 4.1. Box and whisker plots showing the relationship between the size of a plant population in 1983 and its probability of survival until 2005/2006, population size is on a logarithmic scale. ................................................... 140
Fig. 4.2. Box and whisker plots of relative change of populations Rcp for 2005-2006 and 1983-2006, the thirty species are presented by one box plot per ecological group ordered along gradients (abscissa) of light (6-8), moisture (2-5) and temperature (6-9). .............................................................................................................................. 141
Fig. 4.3. Box and whisker plots of the extinction/colonisation ratio Rext/col for 2005-2006 and 1983-2006 according to a species’ moisture requirement. .................................................................................................................................. 141
Tab. 4.2. Effect of soil seed mortality at different time steps in the burial experiment on long term (1983-2005) extinction/colonisation ratio Rext/new ............................................................................................................................... 142
Fig. 4.4. Effect of seed production and soil seed mortality on extinction/colonisation ratio, lines indicate relations significant in binomial regression (p < 0.05). Whenever we moved species codes for better legibility we put them in italics, codes for species are in table 4.1. ...................................................................................................................... 143
Fig. 4.5. Phylogenetically independent contrasts (PICs) represented as numbers in the tree (left) and in the relation of seed production and of soil seed mortality on extinction/colonisation ratio (Rext/col, right); note that we present here only the regressions that were significant in figure 4.4 and therefore different time steps; the line indicates a significant relation (p < 0.05), species codes in table 4.1. Whenever we moved numbers for better legibility, we put them in italics (right). ........................................................................................................................... 144
Fig. 5.1. Relation between population sizes at different dates, a regression line is drawn when coefficient was significant (straight line p < 0.05; broken line p < 0.1 ). .................................................................................................. 163
Fig. 5.2. Correlates for population size in 1983 for 24 species, the regression line indicates a significant (p < 0.05) relationship. Species codes are in table 4.1. ..................................................................................................................... 164
Fig. 5.3. Population size contrasts (in 1983) and trait contrasts (numbers in plots and tree). The regression lines indicate significant (p < 0.05) relationships. (I): phylogeny used for calculation of PICs. Species codes are in table 4.1. ......................................................................................................................................................................................... 165
Fig. 5.4. Correlates for population size in 2006 for 37 species. The straight regression line indicates a significant (p < 0.05) relationship, the broken line a weakly significant (p < 0.1) relationship. Species codes are in table 4.1. .... 166
Fig. 5.5. Population size contrasts (in 2006) and trait contrasts (numbers in plots and tree). The straight regression lines indicate significant relationships (p < 0.05), the broken line weakly significant relationships (p < 0.1). (I) The phylogeny used for calculation of PICs. Species codes are in table 4.1. ...................................................................... 167
Fig. 5.6. Comparison of regionally rare and common species according to their traits: each dot represents a species pair. Dots are placed according to the values of the rare species on the x-axis and according to the common species on the y-axis, dots on the line indicate no difference between trait values of rare and common species. The phylogeny indicates the species pairs used here. Species codes are in table 4.1. P-values are values from a paired Wilcoxon-test. ............................................................................................................................................. 168
Fig. C.1: Traits and germination ecological characteristics important for soil seed persistence............................... 180
Fig. C.2: Extinction:colonisation rate and pollen:ovule ratio for the studied species (GLM, quasibinomial, T1,29 = -2.66, p = 0.0126); for species codes and details of analysis see chapter 4, methods section, for pollen:ovule ratio methods see chapter 5. ....................................................................................................................................................... 185
Fig. C.3: Size of Agrostemma githago in mm under competition between Durum wheat (Triticum durum) in normal soil conditions (grey boxes) and stony (dotted boxes) soil with 50 Vol % stones in a watered common garden experiment, each box plot represent 5 replicates. ........................................................................................................... 189
Fig. C.4: Storage effect in cereal fields and adaptations of cereal weeds to overcome unfavourable years in the crop rotation. ....................................................................................................................................................................... 194
11
PREFACE
This thesis is part of a series of studies on diversity at the landscape scale, plant communities
and populations in the agricultural landscapes of the Luberon area including recently the
works of Affre, Barroit, Hill, Gerbaud, Roche, Véla, and Le Mire-Pecheux (Dutoit et al.
1999;Barroit et al. 2000;Gerbaud et al. 2001;Dutoit et al. 2001;Roche et al. 2002;Véla 2002;Dutoit
et al. 2003;Affre et al. 2003;Le Mire Pecheux 2004;Gasc 2005;Dutoit et al. 2007).
This work was sustained and funded by the Parc Naturel Régional du Luberon, the
Bayerisch Französische Hochschulzentrum, the Conservatoire Botanique National
Méditerranéen d’Hyères and the Groupement de Développement Agricole du Sud Luberon,
Ansouis. Research work was conducted at the Institut d’Ecologie et de Paléoécologie
(Marseille) and at the Institut für Botanik (Regensburg). Through the first three years of the
thesis the author was working half time as a consultant at ECO-MED (Marseille) involved in
Environmental Impact Assessments and botanical surveys of high plant diversity sites in
South Eastern France and Northern and Central Algeria and in the last year as assistant
teacher at Université Aix-Marseille III.
The different chapters of this thesis are written as independent articles. Chapter 2 has been
accepted in Annals of Botany (2009). The remaining chapters are in preparation for
submission in international scientific journals. Therefore, we had to repeat some aspects in
the ‘Introduction’ and ‘Materials and Methods’ section.
Marseilles, July 2009

13
ACKNOWLEDGEMENTS
Tout d’abord je voudrais remercier Thierry Dutoit (Université d’Avignon), qui, depuis mes premiers pas dans le monde universitaire, m’a toujours soutenu, qui m’a dirigé sur des pistes intéressantes et qui a éveillé mon intérêt pour l’écologie végétale, historique, fondamentale et appliquée -sans oublier de donner de nombreux coups de mains et une formidable introduction aux règles non écrites. Tous ces efforts ont fait naître cette thèse et formé un esprit de chercheur ouvert, merci pour ta confiance. Alsdann geht ein besonderer Dank an Peter Poschlod (Uni Regensburg), der bereit war mitten in einer begonnenen Doktorarbeit einen immer wieder rückfälligen Sonnenflüchtling zu betreuen, der mir die Augen für viel Grundlegendes in der Pflanzenökologie öffnete und mir dann auch ganz praktisch die Möglichkeit gab meinen und seinen Fragen ohne Einschränkung nachzugehen, danke für Dein Vertrauen und Deinen Beistand, und natürlich ein besonderer Dank für die Gastfreundschaft in Regensburg- auch an Marsi & Franzi! Je sais que je dois une part inestimable à Laurence Affre pour ce que j’ai appris pendant la rédaction de cette thèse, mettre toutes ces idées et informations dans le bon ordre, le bon contexte et ne pas perdre de vue une vraie méthodologie scientifique, je te le dois. Merci aussi pour le soutien avec toutes ces petites et grandes questions de tous les jours et pour l’aide avec de nombreuses expérimentations, même inutiles quelquefois. Herzlicher dank geht auch an Ulrich Deil (Uni Freiburg) der den Anfang dieser Arbeit mit betreute und von dessen historisch-geographischem und nicht zu unterschätzendem Weitblick ich als Student, Diplomand und Doktorand immer profitierte, und der mir einen tiefen Einblick in mediterrane Vegetation verschaffte, nicht nur im Maghreb sondern auch „daheim“ in Herbar oder Bibliothek. Je remercie tous les anciens et actuels collègues de l’Institut Méditerranéen d’Ecologie et de Paléoécologie (IMEP), Philip Roche pour son aide précieuse sur l’écologie du paysage et les analyses statistiques, Thierry Tatoni, pour sa bienveillance et la confiance qu’il place en moi en tant qu’enseignant A.T.E.R. ainsi que pour les discussions scientifiques sur les routes du 13, 83 et 84. Un grand merci à Elise Buisson, Errol Vela, Estelle Dumas, Claude Goeury, Brigitte Talon, Mariannick Juin, Maryse Alvitre, Fred Henry, Clémentine Coiffait, Evelyne Franquet, Manuel Lebris, Hélène Folzer, Alain Maasri, Monica Picot pour l’aide dans le dénombrement de graines, l’accès ou la mise à disposition de matériel, l’arrosage … enfin tout ce qui fait marcher la science et ce qui l’anime: les discussions, dialogues, échanges plus ou moins virulents. Der gleiche Dank geht an Inge Lauer, Christine Römermann, Christoph Reisch, ‘Löpp’ Philip Kollmar, ‘Chrilli’ Christine Schneider für die erfolgreiche und sehr angenehme Zeit in Regensburg. I thank the Centre de Coopération Universitaire Franco-Bavarois/Bayerisch-Französische Hoschschul-Zentrum for providing me a mobility grant in 2006/2007. I also thank Pierre Frapa and the Parc Naturel Régional (PNR) du Luberon for funding me for one year of master thesis and three years of doctoral thesis and for providing accommodation on several occasions for the field work. I am also very grateful for the help of Georges Guende (PNR Luberon) who provided very valuable information on the species studied here; I am particularly thankful to Denis Filosa who produced the initial data set, let us use it in this thesis and who accepted to explain me his way to study rare cereal weeds in the field twenty years ago. I thank Myriam Virevaire and the Conservatoire Botanique National Méditerranéen d’Hyères for helpful information on germination and seed material. I also thank Régine Verlaque for a great amount of very interesting information especially on evolution, cultivation and biogeography of rare cereal weeds.

I will never forget the many hands and minds of the GDA Sud Luberon, especially Florence Fraisse for lending me a sewing machine sewing nylon mesh bags, Christine, Fabien and the farmers of the Luberon area to supporting my work institutionally, by letting me see their fields or even explaining me the cultivation practices they are applying or used to apply in former times; a special thank to the family Bremond who accepted the burial experiment on their land, I also thank the GDA for accepting Mariann Kończykowska to work in this structure. Je n’oublierai pas l’aide de Nadia Bertagne, pour le comptage de graines, Errol Véla et Daniel Pavon pour m’avoir donné de bonnes bases, m’avoir formé et réactualiser régulièrement à la botanique méditerranéenne en Provence ou en Afrique du Nord, ainsi que l’a fait Henri Michaud et les « Linnéens » de la Société Linnéenne de Provence. Je dois un grand merci à tous les stagiaires qui m’ont accompagné sur le terrain, aidé à peser des graines, feuilles pour des expérimentations très longues, merci Marianna Kończykowska, David Wedenig, Jérémy André, Romain Sauve, Lara Dixon, Céline Gastaud, Laurie, Anouche (Marseille) et Simone Tausch (Regensburg). Julien Viglione, pour m’avoir permis de gagner ma vie en restant botaniste et pour me faire confiance jusqu’à m’emmener en Algérie. Bruno, Lilian, Renaud et les autres de la bande des singes pour avoir su voler mon temps. Frauke Behrendt, for every now and then coming into my life and lecturing my English. Mille grazie Giacomo di contare semi o di cercare piante, ma d’appertutto per la felicità in tutto questo tempo; Patrick Kuhn, danke für Deine freundschaftliche Hilfe und Gedult überall. und schließlich, Gerd und Maja Saatkamp, meinen Eltern, für Euere uneingeschränkte Unterstützung bei allem was meine Neugier bisher so hervorgebracht hat … Nicolas Crouzet, merci pour ta confiance, ta bienveillance, ta patience, ton soutien.

General Introduction
15
5
I
GENERAL INTRODUCTION
Biological diversity as a result of evolutionary and ecological processes always fascinated
naturalists and lead to central theories in ecology and evolution (Darwin 1859;Janzen
1970;Connell 1978;Hubbell 2001;Mayr 2004). Facing the actual man-made mass extinction of
species i.e. 100-1000 times the geological background rate (Pimm et al. 1995), a deepened
understanding of the processes leading to maintenance of taxa and their populations
through time is now crucial for the preservation of this diversity (Doak et al. 2002).
EXPLANATIONS FOR COEXISTENCE AND PLANT DIVERSITY - A MIRROR OF POPULATION
PERSISTENCE
For plants, early studies on the maintenance of biological diversity stressed the importance
of competition as the main limiting factor for diversity, a process working through
‘competitive exclusion’ and ‘limiting similarity’ (Gause 1934;MacArthur and Levins
1967;Hubbell 2005). It is astonishing that this limit was so long little criticised; even Darwin
(1859) already claimed competition as a motor for the naissance of new species rather than a
limit to its number. The abandonment of a stable and a-spatial view of competition was step-
wise and among the first attempts to reconcile competition with the apparent diversity of
earth’s ecosystems was the consideration of disturbances as diversity maintaining processes,
like in the ‘intermediate disturbance hypothesis’ (Connell 1978). More precise consideration
of the resource usage in ecosystems generated a ‘resource-ratio hypothesis’ suggesting that
as many species as different resources can coexist in a local community (Tilman 1985). Later
the integration of spatiality and dispersal in competition models (Tilman 1994) showed that
competitive exclusion is rather a limited process. Competition has also been shown to be of
different nature according to environment (Ackerly 2004;Liancourt et al. 2005) and its
opposite, i.e. indirect positive interactions have been shown as important in many plant
communities (Michalet et al. 2006). Consequently, competition is far from being the main

General Introduction
16
5
I
limiting factor for diversity even for late successional states (Tilman 1994;Zobel and Pärtel
2008). However, the recent claims of ‘recruitment limitation’ i.e. the unavailability of suitable
patches attributed at least partly to surrounding vegetation (Sanchez and Peco 2007) –in
other words competition– highlights again why plants developed adaptations to detect
temporally and spatially limited gaps with low levels of competition, often via enhanced
germination under diurnally fluctuating temperatures (Thompson et al. 1977). This
adaptation is known as ‘gap detection’. It is thus reasonable to think about different
processes triggering diversity of plant communities at a local level, which are related to
maintenance of plant diversity.
A global historical and biogeographic view of local biodiversity generated a concept that
relates pools of species at different spatial scales (Zobel 1997;Pärtel 2002). This ‘species pool
concept’ emphasises that a regional pool of species limits the possible diversity-environment
relations, and that regional diversity patterns can be explained by evolutionary history of the
region (Pärtel 2002). It has recently been extended for the role of habitat productivity and
plant diversity (Zobel and Pärtel 2008). At the same time this concept explicitly emphasises
on the dispersal limitation of plant communities and the need to take dispersal processes on
a local to regional scale into account in order to explain realistic changes of diversity in local
communities (Zobel et al. 2006). Since the classical works on dispersal limitation by Harper
(Sagar and Harper 1960;Begon et al. 1996), several studies on dispersal limitation showed its
importance for the diversity of real communities (Tilman 1994;Ehrlen and Eriksson
2000;Poschlod and Biewer 2005;Poschlod et al. 2005). Dispersal has effects on both species
richness in communities (Bonn and Poschlod 1998) as well as genetic diversity within species
(Willerding and Poschlod 2002). Hence, dispersal via pollen or seeds are important processes
for the maintenance of diversity at a local level, and traits related to these processes can give
insight into persistence of local populations. Many open questions remain on how diversity

General Introduction
17
5
I
on smaller spatial and temporal scales are related to global processes and the importance of
traits for local population persistence with a comparative approach can yield insights.
A functional trait based approach is a good opportunity to answer such questions (McGill et
al. 2006). A functional trait is any morphological, physiological or ecological trait that can be
triggered by ecosystem properties (response trait) or that has effects on the ecosystem or
population dynamics (effect trait) (Gitay and Noble 1997). Detailed work on evolution of
functional traits as a response to cyclic and a-cyclic disturbances such as herbivory (Diaz et
al. 2007), summer drought (Espigares and Peco 1995), flooding (Stromberg et al. 2008)
illustrate the high importance of specialised structures and finally the many idiosyncratic
responses in vegetation. Dispersal in space (Zobel 1997;Bonn and Poschlod 1998;Zobel et al.
2006), time and regeneration niche (Grubb 1977;Kahmen and Poschlod 2008) have been
identified to explain both, high diversity of at a first view, simple layered homogeneous
ecosystems and unexpected low diversity of others. Reviews on the regeneration niche
(Grubb 1977) and especially on germination ecology (Baskin and Baskin 1998) revealed the
important diversification of regenerative strategies among plants of the same ecosystem.
This trait based-approach opposes to neutral theory (Hubbell 2001) which assumes that
environmental gradients and interspecific differences in traits are without effects on
population dynamics. It proposes that simple time between emergence and extinction of taxa
is sufficient to explain many observed diversity patterns. A major problem of the trait-based
approach is the high number of putative traits and environmental factors to explain
population dynamics (McGill et al. 2006), more rapid insight can thus come from simpler but
complete systems.
In annual plants, there is no resting stage other than seeds. Therefore, temporal variability in
habitat quality cannot be buffered by long living adults and together with other monocarpic
plants, individual fitness (Metcalf et al. 2003), population persistence (Kalisz and McPeek
1993;Menges 2000) and community diversity (Facelli et al. 2005) depend highly on

General Introduction
18
5
I
persistence of seeds. This relative simplicity of annual plants and annual dominated plant
communities make them ideal study models for testing hypotheses on the relative
importance of different life stages for population growth and survival (Harrison and Ray
2002). Additionally, Venable and Brown (1993b) showed, using models on evolutionary
stable strategies on dispersability in space and time, that perennial plants follow similar
models than annuals. The remarkable difference is that the selective pressure on dispersal is
less important for perennials than annuals as they also rely on adult persistence. It is thus
likely that findings concerning the population dynamic function of seed dispersal in space
and time from studies on annuals can successfully be generalised to the remaining plants.
POPULATION DYNAMICS IN ANNUALS - WHICH TRAITS FOR LOCAL POPULATION
PERSISTENCE?
To understand the importance of different factors such as soil seed mortality, competition
and predation for population dynamics of annual plants it is helpful to have a look on the
life cycle of an annual plant (Fig. I.1A). Let us imagine a population of 10 adult annual
plants, each adult producing 200 viable seeds (a realistic value, cf. chapter 2). This results in
2000 individuals in the stage of seeds at the end of the growing season. It is obvious that the
next generation would never consist of 2000 adult plants but rather of a limited number may
be again only 10. There is not one single factor that limits the final number of adults (Fig.
I.1A), mortality in different life stages finally very heavily reduces this number (Symonides
1983;Günter 1997;Silvertown and Charlesworth 2001). However, mortality is not equally
distributed among life stages and has various reasons at the different life stages (Fig. I.1A)
each of these is related to a set of traits (Fig. I.1B).
General Introduction
19
5
I
resource transfer
adults
seed bank
seedlings,
juveniles
dispersal
maturation
ripe seed
resource
accumulation
pollination
effective
germination
competition
seed
mortality
predation
A seedlings,
juveniles
maturation
ripe seed
pollination
effective
germination
seed number
& size
plant
height
specific leaf area
reproductive
system
germination
niche
B
dispersal
adults
resource transfer
seed bank
seed
mortality
competition
predation
resource
accumulation
dispersability
Fig. I.1: (A) Annual plant life stages and transitional processes, inside the circle: sources for mortality influencing population growth and extinction dynamics- note that environmental changes can influence all stages and processes reducing effectives; (B) Plant traits related to these life stages and processes -note that some ‘traits’ are also processes such as dispersability and that seed mortality is often considered as a ‘trait’ in form of seed bank persistence.
Early approaches like ‘key factor analysis’ (Podoler and Rogers 1975;Silvertown 1982)
identify life stages contributing most to survival focussing on temporal variations of
mortalities, however this approach is only meaningful for organisms without overlapping
life stages. Later ‘λ-contribution analysis’ (Sibly and Smith 1998) integrated ‘sensitivity’ and
‘elasticity’ analysis - using contributions of absolute and proportional change of life stage
transitions (De Kroon et al. 1986;Benton and Grant 1999) to identify life stages important for
population growth and abundance. These temporally fine scale population dynamic
measures are linked to coarser measures such as local population extinction rates and
population turnover and are hence a key ingredient of population viability analyses (Menges
1990;Beissinger and McCullough 2002;Reed et al. 2002).
An important life history stage to understand population growth and persistence are seeds.
Mortality in the seed stage can be caused by predation through animals (Abramsky
1983;Louda 1989;Hulme 1998;Moles and Drake 1999;Azcarate and Peco 2006) and infestation
(predation) through fungi (Blaney and Kotanen 2001;Schafer and Kotanen 2003) including
density dependent effects (Van Mourik et al. 2005). However, it is difficult to imagine

General Introduction
20
5
I
competition among resting seeds in the soil. Additionally, there can be losses due to
dispersal into unsuitable habitats although this point is rarely addressed (Günter 1997).
Further on, there can be considerable mortality due to fatal timing of germination at this
stage (Baskin and Baskin 1989;Thompson 2000;Davis and Renner 2007). Traits triggering
differences in mortality among species in this stage include therefore germination niche traits
and seed number and size. At the seedling and juvenile stage, competition becomes
important because of the limited carrying capacity of the habitat, but there is still an
important part of predation in the mortality (Bonfil 1998;Leishman et al. 2000b;Coomes and
Grubb 2003). Traits related to predation such as seed size still explain interspecific
differences in mortality at this stage; but other traits related to competitive ability gain
importance. These traits include again seed size (Coomes and Grubb 2003;Moles et al. 2004),
but also specific leaf area (SLA) (Liancourt et al. 2005) and plant height (Tilman 1988), with
however opposite relations according to environmental constraints (Ackerly 2004;Liancourt
et al. 2005). Comparative analyses of which stage or stage transition are most important in
determining the final number of adult annual plants all point on soil seed mortality and
germination as most important (Symonides 1983;Günter 1997). Differences in fitness can
appear in the reproduction of plants. These differences are bound to different fecundity
among species according to environmental constraints, for example the dependence on
pollinators (Gibson et al. 2006). Whenever seed number or seed size is involved in the
differential performance at a particular stage, the fundamental trade-off between them has to
be considered which suggest that they are equally effective for reproduction (see below for
details, Jakobsson and Eriksson 2000). Finally, genetic diversity and related traits may also
influence on all life stages because of the better performance of e.g. outbreeding
(Charlesworth and Charlesworth 1987), which is an important aspect for perennials whereas
in annuals autogamy is more frequent. All this shows, that there is a potential to deepen
insights into causes for local population extinction rates and population turnover studying

General Introduction
21
5
I
them comparatively in a functional trait-based approach (McGill et al. 2006). Agro-
ecosystems are characterised by a high diversity of annual plants, which enables the study of
many aspects of their life history in relatively short time. In arable fields, there are also many
unpredictable changes and disturbances so it is easier to study changes in population
turnover, extinction rate and their relation to morphologic and life history traits.
OUTLINE OF THE THESIS
The points discussed above show the many open questions on the relation between species
traits and population dynamics and the role of these traits for coexistence in communities.
The main evidence in the field comes either from population ecology of single species or
from comparative trait analyses of whole communities, but both approaches are still little
linked (McGill et al. 2006). We therefore studied explicitly traits related to population ecology
in detail for a set of species –numerous compared to population ecological studies, and
limited for community ecology– to add an intermediate approach. The principal research
questions from a fundamental and applied point of view of this thesis are: (i) What are the
main determinants of annual plant diversity in agro-ecosystems and how is it influenced by
changing land-use? (ii) Is there a consistent relation between soil seed mortality, seed
production and effects in the community? (iii) What are the functional roles of germination
and dormancy characteristics in the soil seed bank of annual plants? What is the role of other
seed traits? (iv) Can differential soil seed mortality explain differences in population
turnover and extinction dynamics among species? Which other traits are related to these
differences? (v) What are the differences between locally abundant and scarce and between
regional widespread and regional rare annual plant species?
We study these questions in five corresponding chapters:

General Introduction
22
5
I
1 – Locating plant diversity in structured habitats – practices, soil types and history drive
vineyard vegetation
2 – Can seed persistence be explained by germination parameters and seed traits? –
Experimental evidence from cereal weeds
3 – The seed bank longevity index revisited - limited reliability evident from a burial
experiment and database analyses
4 – Is there an effect of soil seed mortality and seed production on local population
dynamics in annual plants? – the case of rare cereal weeds
5 – Comparison of traits between rare and common cereal weeds and implications for
conservation
The following paragraphs of the introduction review in more detail scientific background
and concepts of the thesis, and we present here methods and the study system. After each
chapter, we use transition chapters to discuss the results in the frame of the thesis and to
introduce following main chapter. In the conclusion, we replace the findings in a more
general context, combining evidence from the main chapters and the introduction, evaluate
their importance, show the limits and point out important future questions to resolve.

General Introduction
23
5
I
Theories, concepts and state of knowledge
STORAGE EFFECT AND BET HEDGING
Evolutionary models for species in temporally variable habitats predict that germination is
delayed to spread the risk of no reproduction in bad years, a phenomenon called ‘bet
hedging’. The main prediction of bet hedging, i.e. the higher the risk the lower yearly
germination percentages has been elucidated by Venable (2007). Population persistence in
annual plants has also generated concepts to understand coexistence of species which would
exclude each other by competition, leading to the ‘storage effect’ (Chesson and Warner
1981;Warner and Chesson 1985). The storage effect promotes coexistence under three
conditions: (i) the species differ in their responses to temporal changes of the environment,
e.g. germination; (ii) the strength of competition correlates to these changes and (iii) there is a
life stage that buffers population growth and decline, e.g. a persistent soil seed bank
(Chesson and Warner 1981;Warner and Chesson 1985;Levine and Rees 2004;Facelli et al.
2005). Several studies show the applicability of the model (Bonis et al. 1995;Cáceres
1997;Facelli et al. 2005). The first condition (species differ in their responses to temporal
changes) is almost generally the case, with however spatially and temporally varying
degrees. Nevertheless, it seems difficult to examine whether the second condition
(competition correlates to these changes) really is different from the first, e.g. when annuals
do not germinate in reaction to drought, they also will not enter in competition. We thus
have doubts whether it is necessary to keep this condition to explain the diversifying effect,
i.e. maintaining diversity in natural systems. There are simpler approaches to study
population dynamics, which elucidate that only conditions (iii) and (i) may be sufficient for
population persistence (Silvertown 1982;Kalisz and McPeek 1993;Günter 1997;Menges
2000;Adams et al. 2005). In figure 2, we summarise the storage effect that promotes the
coexistence of two species with different responses to temporal changes (‘good’ versus ‘bad’
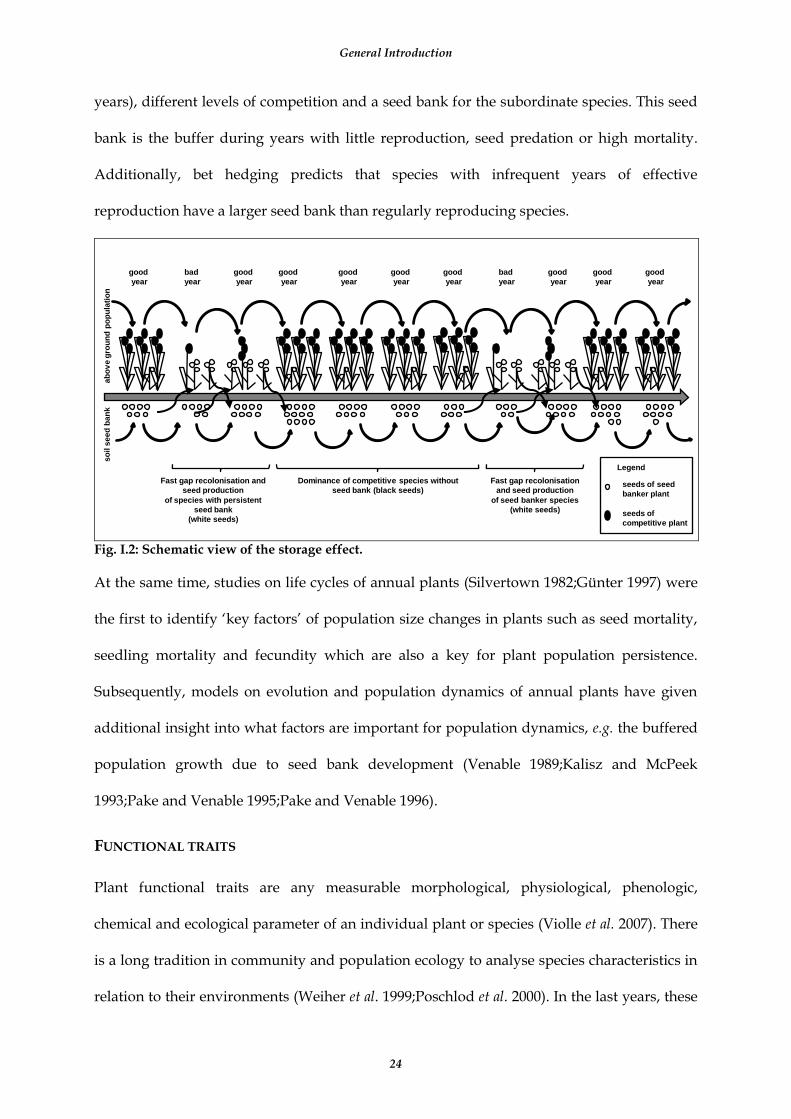
General Introduction
24
5
I
years), different levels of competition and a seed bank for the subordinate species. This seed
bank is the buffer during years with little reproduction, seed predation or high mortality.
Additionally, bet hedging predicts that species with infrequent years of effective
reproduction have a larger seed bank than regularly reproducing species.
bad
year
bad
year
good
year
good
year
good
year
good
year
good
year
good
year
good
year
good
year
good
year
Fast gap recolonisation and
seed production
of species with persistent
seed bank
(white seeds)
Fast gap recolonisation
and seed production
of seed banker species
(white seeds)
Dominance of competitive species without
seed bank (black seeds)
so
il s
ee
d b
an
ka
bo
ve
gro
un
d p
op
ula
tio
n
seeds of seed
banker plant
seeds of
competitive plant
Legend
Fig. I.2: Schematic view of the storage effect.
At the same time, studies on life cycles of annual plants (Silvertown 1982;Günter 1997) were
the first to identify ‘key factors’ of population size changes in plants such as seed mortality,
seedling mortality and fecundity which are also a key for plant population persistence.
Subsequently, models on evolution and population dynamics of annual plants have given
additional insight into what factors are important for population dynamics, e.g. the buffered
population growth due to seed bank development (Venable 1989;Kalisz and McPeek
1993;Pake and Venable 1995;Pake and Venable 1996).
FUNCTIONAL TRAITS
Plant functional traits are any measurable morphological, physiological, phenologic,
chemical and ecological parameter of an individual plant or species (Violle et al. 2007). There
is a long tradition in community and population ecology to analyse species characteristics in
relation to their environments (Weiher et al. 1999;Poschlod et al. 2000). In the last years, these
General Introduction
25
5
I
analyses became more current and explicitly focussed on traits, and definitions have been
refined, and a common methodology has been formed (Weiher et al. 1999;Lavorel and
Garnier 2002;Violle et al. 2007;Kleyer et al. 2008). Violle et al. (2007) clarified the distinction
between traits (e.g. ‘plant height’) and attributes (e.g. ‘smaller than 10 cm’) and Lavorel &
Garnier (2002) between functional response (e.g. tall species increase in the community after
fertilizing’) and functional effect, (e.g. ‘communities with many tall species lead to lower
diurnal temperature fluctuations at the soil surface’). A difference is made between traits that
are easy ‘soft’ or difficult ‘hard’ to measure.
The study of morphological, physiological, phenologic and demographical traits gives
insight how environmental conditions determine species composition. Ecological filters
(Harper 1977) are understood to select taxa with a specific combination of attributes, i.e.
values of a trait, (Lavorel et al. 1997). They can also enhance coexistence in diversifying other
traits (Grime 2006). In fine, the trait based approach aims at predicting species composition
and it can help to recognise extinction threats for species (Thompson 1994;Kahmen
2004;Bekker and Kwak 2005;Smart et al. 2005;Ozinga et al. 2008;Römermann et al. 2008).
Simple single trait analysis connecting directly environmental conditions to functional traits
(Peco et al. 2005) contrast with complex statistics involving classification into a priori
functional groups (Lavorel et al. 1999;Kleyer et al. 2008).
THE SEED SIZE-SEED NUMBER TRADE-OFF: A CENTRAL GRADIENT IN COMPARATIVE PLANT
ECOLOGY
In analysis of functional traits, it is important to consider trade-offs, because they add
constraint to the trait-environment relationship. An ecological and evolutionary trade-off
represents a compromise between two factors that cannot be optimised simultaneously
because of limited resources or time. The most widely acknowledged trade-off in ecology is
the one between number and size of offspring (Fig. I.3). For plants, this means that seed size

General Introduction
26
5
I
and seed production cannot be maximised at a time, and are hence related by a trade-off
(Shipley and Dion 1992;Jakobsson and Eriksson 2000;Turnbull et al. 2000).
biomass invested per seed large seedssmall seeds
number of seeds produced few seedsmany seeds
seedling survival highlow
dispersal in space and time lowhigh
post-dispersal seed predation mammals,birds, ants,
fungi
only fungi?
number of seeds per individual that survive for > one year lowhigh
depth from which a seed can emerge deepshallow
competitivity for light of seedlings strongweak
investment in reppelling seed predators highlow
proportion of survival of a fixed quantity of seeds - equal along seed size-seed number gradient? -
presence of species in established vegetation- equal along seed size-seed number gradient, but with different abundance? -
Fig. I.3: Existing and assumed hypothesis on seed size, seed number and related gradients of processes and traits
This trade-off implies that resources for seed production are limited and that a given
quantity can be invested into either many small seeds or few large ones. It is clear that
whenever other factors (size, survival) are constant, having a higher number of seeds yields
higher chances of establishment and a higher fitness of the mother plant. Seed production
influences seed rain (Jackel and Poschlod 1994), and high seed production enhances
General Introduction
27
5
I
dispersal efficiency (Tackenberg et al. 2003;Poschlod and Biewer 2005;Bruun and Poschlod
2006). It has also been suggested that high seed production increases seed bank persistence
(Thompson 2000) and larger seeds can emerge from deeper burial depth (Grundy et al. 2003)
and that therefore dormancy or the reaction e.g. to light in germination is not equal among
different sized seeds (Milberg et al. 2000;Jurado and Flores 2005). However, after seeds are
dispersed, the seed predation is higher for large seeds and hence a higher investment is done
in repelling substances and structures (Louda 1989). On the other hand, the large range of
seed sizes within communities implies that many small seeds are equally efficient for
reproduction as few large seeds (Leishman et al. 2000b). This should be so even if there might
be some differences in species density that are correlated to seed size (Murray et al. 2005).
There are hence advantages in producing few large seeds. Few large seeds compensate for
their lower number at other life stages, beginning with the seedling (Leishman et al.
2000b;Moles et al. 2004). This includes a higher seedling survival of large seeded species
(Leishman et al. 2000b;Moles et al. 2004), which can be due to a higher survival to partial
damage or higher competitivity of larger seeded species.
In this context, the crucial question is to know at which moment differences in size of seeds
becomes important for function: great differences in seed number between large and small
seeded species exist at dispersal. However, at the end, an equal number of reproductive
adult plants become established. The short discussion above and figure I.3 show that most
mechanisms that compensate larger seeds for their lower number act after germination, at the
seedling stage (McGinley et al. 1987;Louda 1989;Jakobsson and Eriksson 2000;Leishman et al.
2000b;Coomes and Grubb 2003;Moles et al. 2004;Pizo et al. 2006;Bladé and Vallejo 2008).
Consequently, seeds in the seed bank are not equally effective for establishment according to
their size; indeed germinating species in gaps are not necessarily correlated to later
established plants (Hillier et al. 1990). A major question persists therefore if seed bank
General Introduction
28
5
I
persistence estimates based on seedling counts from soil seed samples can give an accurate
perception or if it is biased towards higher soil seed persistence for many small seeds.
GERMINATION CONDITIONS AND GERMINATION NICHE
The timing of germination is crucial for fitness of annual plants: plants germinating early in
season are advantaged over late germinating ones due to intra- and interspecific competition
(Symonides 1983;Coomes and Grubb 2003). However, this holds only when there is a
temporally homogeneous environment and there are for example no drought or frost events
that could damage early germinating plants more than those with germination delayed in
the season, in which case dormancy becomes important (Silvertown 1999). Germination
niche itself can offer several ways how to time and place the germination optimally. Reaction
to diurnally fluctuating temperatures is interpreted as such a gap detection mechanism: in
vegetation gaps temperature fluctuations are higher than in dense vegetation (Thompson et
al. 1977;Grime et al. 1981;Thompson and Grime 1983). Annual and diurnal temperature
fluctuations also decline with burial depth in the soil (Miess 1968). Therefore, enhanced
germination to fluctuating temperatures permits a seed to detect in which depth it is. In
greater depth, secondary dormancy is induced (Benvenuti et al. 2001). The smaller a seed the
shallower the depth from which seedlings can emerge (Grundy et al. 2003). It is thus
important especially for small seeds to detect in which depth they are and this is in
congruence with smaller seeds being more dormant (Jurado and Flores 2005). Another
mechanism that triggers germination is response to light: a light requirement blocks
germination when a seed is buried as light penetrates only very little in the soil (Benvenuti
1995). Therefore this may be, together with primary and secondary dormancy a way to build
up a soil seed bank (Grime et al. 1981;Baskin and Baskin 1989;Milberg et al. 2000). Again
seeds react differently according to their size and smaller seeds are more dependent on light
for germination than large seeds in cold temperate floras (Milberg et al. 2000). For climates

General Introduction
29
5
I
with dry and hot summers, like Mediterranean ecosystems, it has been proposed that there
should even be higher germination in darkness because the soil humidity is higher below
surface (Bell et al. 1995) and it is suggested that in dry environments larger seeds have
advantages (Jurado and Westoby 1992). Studies on the temperature requirements for
germination of Mediterranean annual plant species show that most species germinate at cold
temperatures (Baskin and Baskin 1998). This can be explained by the higher rainfall in winter
(see fig. I.8) and by lower evapo-transpiration and hence a higher fitness for species
germinating in the cold.
DORMANCY
Initially, dormancy was used as a quasi synonym for no germination of resting seeds
(Harper 1977). Now the widely accepted definition of dormancy states is that a seed is
dormant when germination does not occur at optimal (water, light, temperature) conditions
until a specific mechanism (chilling, scarification, after-ripening) breaks dormancy (Baskin
and Baskin 1998). Baskin & Baskin (1998) also differentiate between primary dormancy,
already present in mature seeds and secondary dormancy, acquired by non-dormant seeds
often induced by environmental conditions (e.g. darkness or high temperatures). Many
species show cycling dormancy: they are dormant in one season and non-dormant in
another, optimising the chance of their offspring seed to establish successfully. Primary
dormancy has been classified into several types which also can be combined (Baskin and
Baskin 1998). Most important are (i) physical dormancy where an impermeable seed coat
prevents imbibition (ii) morphological dormancy where an underdeveloped embryo needs
time to fully develop before germination (iii) physiological dormancy where germination is
prevented although seed coats are permeable and an embryo is well developed and
generally a (warm or cold) stratification is needed to break dormancy. The ‘enforced
dormancy’ type of Harper (1977), corresponding to not germinating seeds because

General Introduction
30
5
I
environmental conditions are not favourable is no longer considered as dormancy. Since the
persuasive effort of Baskin & Baskin (1998) and Thompson et al. (2003) it has become clear
that dormancy is only one stage of seeds in the soil and that types of primary dormancy
alone are not sufficient to explain soil seed persistence.
SOIL SEED BANKS
Soil seed banks are the reservoir of viable seeds in a soil or at its surface. The discussion of
population dynamics and models for coexistence points to the central role of soil seed banks
for the understanding of population persistence, especially for annual plants. According to
the time seeds stay viable in the soil, seed banks have been classified into transient (<1 year),
short (> 1 and < 5 years) and long-term persistent (> 5 years) (Thompson et al. 1997). For
temperate floras, Grime & Thompson (1979) used also a species’ germination seasonality
(separating spring and autumn) and the abundance of seeds for persistent seeds. Arable
fields and dry grasslands are probably the most deeply studied vegetation types, including
their seed banks (Poschlod and Jackel 1993;Dutoit and Alard 1995;Thompson et al. 1997). This
has opposite reasons. Arable weeds are studied to predict and control weed emergence (for
example Ball 1992) and only rarely for restoration (Dutoit et al. 2003). Soil seed banks of
calcareous grassland species are studied for the potential to restore species rich communities
with many rare species (van der Valk and Pederson 1989;Dutoit and Alard 1995;Hutchings
and Booth 1996;Bakker et al. 1996b;Poschlod et al. 1998;von Blanckenhagen and Poschlod
2005;Bossuyt and Honnay 2008). For the plants of dry habitats, several works suggest higher
mortality of seeds in moist environments than in their original dry habitat (Ellenberg
1996;Blaney and Kotanen 2001;Schafer and Kotanen 2003;Wagner and Mitschunas 2007). The
importance of disturbances, bare soil and hence soil movement for seed bank formation and
persistence of seed bank forming species has been shown empirically (Peco et al.
1998;Hopfensberger 2007).

General Introduction
31
5
I
The possibilities to obtain a high diversity and abundance of plant species contained in the
soil seed banks has been shown very early by Darwin (1859). Nowadays, this potentiality to
rapidly yield high plant diversity is a cornerstone in restoration of communities (van der
Valk and Pederson 1989;Hutchings and Booth 1996;Bakker et al. 1996b;Schütz 2000;Dutoit et
al. 2003;von Blanckenhagen and Poschlod 2005;Bossuyt and Honnay 2008). Seed mortality in
soil under field conditions is the key factor that most heavily reduces important individual
seed numbers to often only scarce seedlings (Silvertown 1982;Kalisz and McPeek
1993;Günter 1997). From early experiments we know that there can be considerable
differences among species concerning soil seed mortality (Beal 1885;Duvel 1902;Telewski and
Zeevart 2002), but for many especially rare species precise data are still scarce. A
considerable amount of data on natural soil seed banks has accumulated giving insight on
the existence, size and seasonal dynamics of soil seed banks (Thompson and Grime
1979;Poschlod and Jackel 1993;Ortega et al. 1997;Thompson et al. 1997). Soil seed banks
conserve to a certain amount the diversity of a plant community, and therefore can serve as a
means to restore it (van der Valk and Pederson 1989;Hutchings and Booth 1996;Bakker et al.
1996b;Schütz 2000;Dutoit et al. 2003;von Blanckenhagen and Poschlod 2005;Bossuyt and
Honnay 2008). Evidently, this is not true for all species and the effectiveness depends thus
much on the degree of soil seed persistence of the seeds for a given species and on the
proportion of species forming a persistent seed bank. Number of persistent seeds necessarily
decline with time, so restoration is also dependent on the time elapsed since the last seed
input (Waldhart et al. 2001;Dutoit et al. 2003). Finally, the conditions of restoration, notably
the season when the soil is disturbed to promote germination, can drastically decide on
community composition (Lavorel et al. 1994;Ellenberg 1996). Another aspect of soil seed bank
is its role for maintaining genetic diversity. Works on the genetic role of the soil seed bank
show that the genetic diversity in soil seed banks is higher than in the above-ground
population (McGraw 1993;Cabin et al. 1998). Additionally, there is a higher inter-population

General Introduction
32
5
I
genetic diversity in above-ground populations than in the soil seed bank (Cabin et al. 1998).
Moreover, a comparative analysis of many species showed that species forming a persistent
seed bank have a higher evolutionary rate than allied species without persistent soil seed
bank as ageing seeds accumulate mutations (Whittle 2006).
MATING SYSTEM AND POLLEN:OVULE RATIO
Mating system and pollination vectors are related to another set of plant traits that can
trigger genetic diversity and in this way extinction threat of populations. (i) The mating
system leads to levels of in- and outbreeding that result in low or high levels of
heterozygosity respectively (Loveless and Hamrick 1984;Reed et al. 2002). These levels of
heterozygosity in turn are related to high or low levels of local extinction. Mating systems
with limited gene exchange lead also to a lower genetic diversity at the population scale,
because indirectly they reduce effective population size (Silvertown and Charlesworth 2001)
and therefore enhance genetic drift and accumulation of deleterious mutations. However,
there are exceptions to the high extinction risk of limited gene exchange as illustrates the
existence of apomictic and obligate autogamous plants. This decrease in potential to adapt
increases the threat of local extinction (Ellstrand and Elam 1993). These factors can increase
the genetic erosion in plants with already small populations or limited distribution, that have
lowered gene flow compared to common plants (Falk and Holsinger 1991;Cole 2003). (ii) The
pollination vector decides whether there is large scale gene exchange or very limited pollen
transport (Hamrick et al. 1979;Loveless and Hamrick 1984). There are several traits such as
spatial stigmate-anther separation, flower size and the pollen ovule ratio (P/O) that are
related to different pollination vectors and degree of in- and outbreeding (Cruden 1977).
Outcrossing species such as wind pollinated species with high genetic exchange, and a
greater effective population size (Loveless and Hamrick 1984) have a high P/O ratio,
whereas frequently inbreeding species, some of them obligate autogamous, have a low P/O

General Introduction
33
5
I
ratio (Cruden 1977). Inbreeding depression, that is the lower performance of selfed to
outcrossed descendants, is the most important genetic cost of reduced genetic diversity
(Charlesworth and Charlesworth 1987). Gene exchange, as a main determinant of local
genetic diversity, is equally important for plant performance (Ellstrand 1992). Gene exchange
and levels of genetic diversity have also consequences for the survival of entire local
populations (Ellstrand 1992). This shows that beside simple mechanistic performance,
genetic diversity and gene exchange can enhance plant performance at any life stage
(Charlesworth and Charlesworth 1987).
COMPARATIVE BIOLOGY AND PHYLOGENETICALLY INDEPENDENT CONTRASTS
Comparative biology applied to ecological problems is an across species approach which
aims to elucidate the differences in species morphological and life history traits and species
ecological ‘behaviour’, that is, its niche, reaction to environmental factors, population
ecological characteristics and so on. These parameters are then compared for a larger set of
species. With this approach, species are used as independent replicates. However, the use of
species as independent data points is controversial: some species are more related than
others are and measured traits may have evolved only once for a large group of species.
From an evolutionary point of view, these species are not independent realisations: closely
related species often show similar characters and habitats as a consequence of common
ancestry and therefore differences among species are not independent (Harvey and Pagel
1991). For these reasons several approaches take the phylogeny into account while
comparing species (Felsenstein 1985;Harvey and Pagel 1991). Phylogenetically independent
contrasts (PICs; Felsenstein 1985) offer the opportunity to recalculate data in order to retrace
how often they appeared independently in the phylogeny, instead of analysing simply
species as replicates.
General Introduction
34
5
I
However, there are also reasons to analyse comparative data without taking into account
phylogenetic correction and to consider the observed variance to be correlated to ecological
features (Westoby et al. 1995b). Species composition in different communities can be similar
although they originated from different local species pools because species’ traits match the
environmental filters – in this vision, the outcome is strongly dependent on repeated
environmental conditions in other words ecological processes and not evolutionary ones. In
the present thesis, we chose the usage of both approaches giving the opportunity to evaluate
how far observed patterns are correlated to phylogeny and to identify which are only
revealed by the comparison of two closely related species. Phylogenetic explicit analyses
depend on information of phylogenetic relationships among the species studied. We
compiled a tree from recent works on phylogeny of the studied species and families, using
APGII as a backbone (Angiosperm Phylogeny Group 2003). This tree was completely
resolved down to species level for all of the 38 species studied here. Branch lengths can
importantly change the outcome of analysis; this has been explored using three different
trees. We visually examined the branch length of closely related species pairs and distantly
related genera in our data set for three trees were (i) all branch lengths were set to 1; (ii)
branch lengths according to Wikström et al. (2001) and (iii) branch lengths calculated
according to Grafen (1989). Whereas (i) and (ii) gave no realistic branch lengths, whereas
method (iii) retraced very well the many closely related species pairs and longer lengths for
much more distant groups. For this reason, we decided to use Grafen’s (1989) estimation of
branch-length method and not the age estimations of Wikström et al. (2001). We then run
linear regression through the origin as recommended by Garland et al. (1992) and presented
phylogenies in the accompanying figures. We used the comparative method parallel to all
analyses that were not phylogenetically explicit.
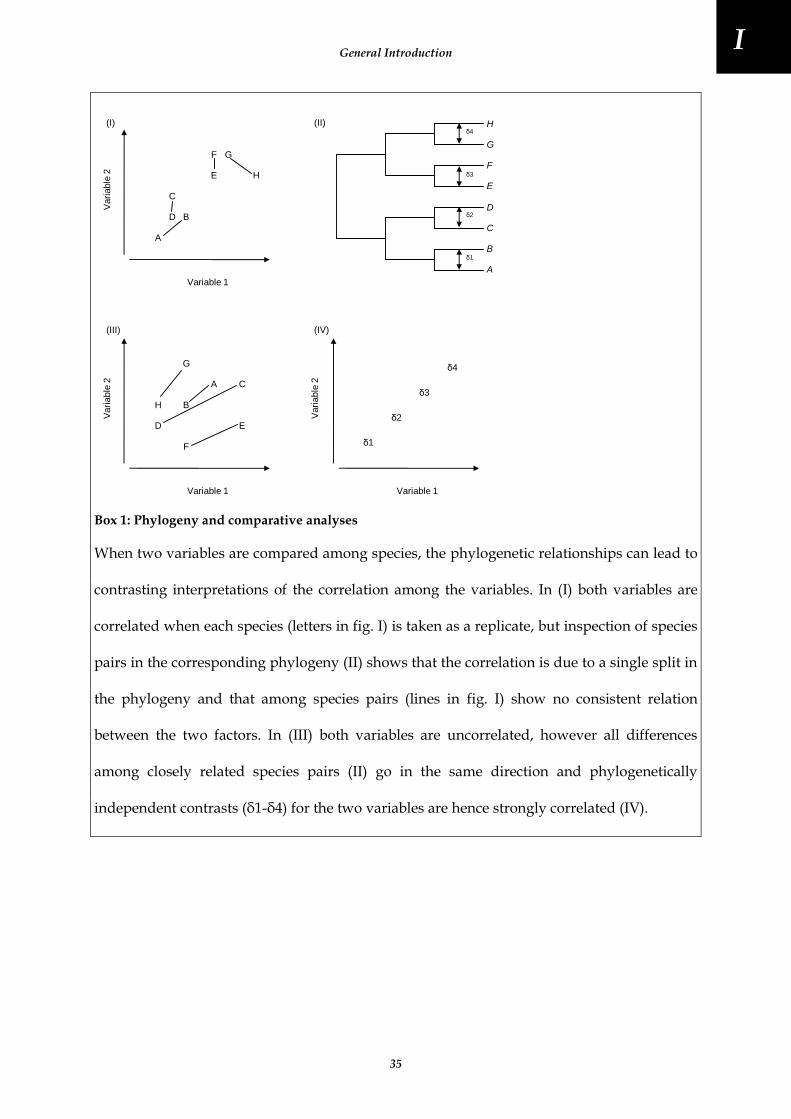
General Introduction
35
5
I
Variable 1
Vari
able
2
δ1
δ2
δ3
δ4
Variable 1
Vari
able
2 A
B
C
D E
F
G
H
Variable 1
Vari
able
2
A
B
C
D
E
F G
H
A
B
C
D
E
F
G
Hδ4
δ3
δ2
δ1
(I)
(III) (IV)
(II)
Box 1: Phylogeny and comparative analyses
When two variables are compared among species, the phylogenetic relationships can lead to
contrasting interpretations of the correlation among the variables. In (I) both variables are
correlated when each species (letters in fig. I) is taken as a replicate, but inspection of species
pairs in the corresponding phylogeny (II) shows that the correlation is due to a single split in
the phylogeny and that among species pairs (lines in fig. I) show no consistent relation
between the two factors. In (III) both variables are uncorrelated, however all differences
among closely related species pairs (II) go in the same direction and phylogenetically
independent contrasts (δ1-δ4) for the two variables are hence strongly correlated (IV).

General Introduction
36
5
I
Study system and site
CEREAL WEEDS, HISTORY, EVOLUTION
Cereal weeds (German ‘Segetalpflanzen’, French ‘messicoles’) are arable weeds that are bound
to cereal cultivation. Ecological reasons for the existence of a special set of plants in cereal
fields are the disturbance characteristics such as timing of ploughing (Schneider et al.
1994;Roche et al. 2002) and reseeding of contaminated seed material known as ‘speirochory’
(Schneider et al. 1994;Jäger 2002). However, the many reasons for their regression highlight
which factors explain their existence in cereal fields, very well documented in the extensive
review of Schneider et al. (1994). There are also historical and biogeographic reasons for the
existence of a particular cereal weed flora (Lososová et al. 2004). Cereal weeds were often
supposed to originate in the same area as cereals themselves (Olivereau 1996) but caryologic
and chorological work on rare arable species (Verlaque and Filosa 1997) showed that the
simplistic opinion that arable weeds are foreign archaeophytes, regressing to their original
distribution area does not hold and that those statements compromise conservation efforts.
Agrostemma githago (Caryophyllaceae) appears in Central Europe very early in Neolithic sites
(Willerding 1986). This species originated probably from Greece or Asia Minor because there
a closely related species, A. gracile, exists in natural habitats such as rocky screes (Tutin et al.
1964). Although cereals are initially collected by hand and toxic seeds of Agrostemma would
have surely been sorted out this species extended rapidly their range with the spread of
agriculture (Willerding 1986). It is possible that it was even cultivated. A related species,
Vaccaria hispanica (Caryophyllaceae) is still cultivated today as a complement to legumes in
forage cultures. Cnicus benedictus (Asteraceae-Cardueae) is another example of a cultivated
plant. From the different species of Valerianella (Caprifoliaceae) only V. locusta is cultivated
today as ‘mâche’ i.e. corn salad. Camelina sativa was cultivated as a source of oil seeds. These
examples show that a part of this flora originated from cultivated species, in some cases from

General Introduction
37
5
I
eastern Mediterranean origin, which subsequently became spontaneous. Another part came
probably from North Africa such as Adonis, Ceratocephala (both Ranunculaceae), Hypecoum,
Roemeria (both Papaveraceae). There are written proves from several Latin authors (see box
2) that North Africa was exporting cereals to Europe in Roman times. That these species
travelled together with cereals and have been re-sown somewhere is very likely in the light
of cereal weed seeds present in today cereal samples from Europe or Northern Africa. Others
have local, North-West Mediterranean origins such as Legousia (Campanulaceae), Anagallis or
Androsace (both Primulaceae). The same or close relatives of the species studied here still
exist on rocky calcareous outcrops or gravels in the wild not far from actual cereal fields
(Molinier 1981;Girerd 1991).
Even in the case of the relatively recent arrival of archaeophyte cereal weed species in
agricultural landscapes of Europe, dating back at least to the Neolithic (Willerding 1986;Bonn
and Poschlod 1998), the rapid local evolutionary processes registered throughout many
organisms (Hairston et al. 2005) makes it evident that local adaptation and hence a form of
specific local genetic diversity is present. The interesting discovery of Verlaque & Filosa
(1997) who found a Provence-specific hexaploid caryotype of Roemeria hybrida is probably
only the tip of the iceberg. A considerable part of original local and regional biodiversity
exists in this group of plants and this cannot be preserved elsewhere or ex situ. The species
analysed in the present work are necessarily a subset of a larger group of plants bound to
cereal fields. We focus here on winter annuals with essentially the same cycle as the
cultivated cereals. Cereal weeds are known to be rather xerophytes with a preference for
soils with a high pebble content (Ellenberg et al. 1992;Ellenberg 1996).
VEGETATION TYPES AND FLORISTIC GRADIENTS IN ARABLE FIELDS
The vegetation of cereal fields has also been studied by phytosociologists for a long time;
they have contributed interesting information on the realised niche, ecological species

General Introduction
38
5
I
groups and floristic vegetation types of annual plants in cereal fields according to soil
parameters and agricultural practices (Braun-Blanquet et al. 1952;Ellenberg 1996). Earlier
(Braun-Blanquet 1939), this approach identified two main gradients in floristic composition
of cereal fields: soil reaction (pH) and time of ploughing. The time and kind of ploughing
opposes the summer cultures grouped together in the ‘Chenopodietea’ to winter cereal fields
‘Secalinetea’ (Braun-Blanquet et al. 1952;Ellenberg 1996). Calcareous bedrock type results in
high soil pH and dry soils, conditions that coincide with a set of species limited to the
‘Caucalidion’ alliance, opposing to acidic soils rarely used for cereal cultivation in Western
Mediterranean with different species (‘Scleranthion’). These works were also the first to
highlight the functional differences between low temperature germinating annuals of winter
cereal fields ‘Secalinetea’ and the high temperature germinating species of summer cultures
‘Chenopodietea’: the key factor that decides which vegetation will establish is not crop type
but time of soil disturbance (Lauer 1953 and Salzmann 1939 cited in Ellenberg 1996).
Additionally species germinating at high temperatures include rapidly growing species,
often with C4-photosynthetic pathways (Larcher 2001, p. 84), with high nutrient
requirements, which become more and more numerous in the European flora. Whereas
species germinating at low temperature grow slowly and are advantaged on oligotrophic
soils with a little competitive environment (Ellenberg 1996).
TRADITIONAL MEDITERRANEAN CEREAL CULTIVATION AND FARM TYPES IN THE
LUBERON AREA
The ecology of cereal weeds is closely bound to the agricultural practices of cereal cultivation
(Schneider et al. 1994). In traditional systems in the Western Mediterranean, cereals are sown
when the field has been prepared by ploughing in September and October just after the first
autumn rains. Over winter, there is no treatment of the fields, in modern more intensive
systems herbicides and chemical fertilizers are applied during autumn or spring. In some

General Introduction
39
5
I
cases, the field is rolled over to break primary shoots of cereals in order to produce several
shoots per individual. In traditional systems, weeds, especially when they become apparent
during flowering, were sometimes pulled out by hand and used as forage. Cereals are
harvested between end of June and July, when they completed ripening and grains became
tough. Cereals are stored dry in the storehouses. In autumn, cereal fields are used as
pastures, Gerbaud et al. (2001) showed that cereal weeds constitute a high quality nutriment
complement for sheep.
There are considerable differences among practices in farms in the Luberon area (see map
below). Gasc (2005) identified three actual types of farms that cultivate cereals: cereal
dominated farms, cereal culture with sheep flock and organic farmers with cereals.
Sainfoin
(Onobrychis viciifolia)
Durum wheat
(Triticum durum)
Durum wheat
(Triticum durum) Durum wheat
(Triticum durum)
Durum wheat
(Triticum durum)
Durum wheat
(Triticum durum)
Sainfoin
(Onobrychis
viciifolia)
Sainfoin
(Onobrychis viciifolia)
1-2 cuts in summer
Ploughing and
seeding in autumn
Harvest in
summer
Harvest in
summer
1
2
3
4
5
6
7
8
v
v
Fig. I.4: Eight years of traditional crop rotation in the Luberon area with five years of Durum wheat and three years of sainfoin as fodder intercrop with disturbance regime as inner circle, black: open bare soil between ploughing and crop germination, dark grey: standing crop, light grey: cut crop, white: wheat stubbles (drawings modified from Jávorka and Csapody 1979;Rothmaler 2000).

General Introduction
40
5
I
In cereal-dominated farms, herbicides are intensively used, seed material is not re-sown but
bought every year and there is only a short fallow period or a rotation with another crop. In
the remaining farms, herbicide use is an exception and rotation alternate one to five years of
cereals with a period of fallow-pasture or legumes. In the Luberon area, the legume phase of
the crop rotation is often three years of Onobrychis viciifolia (Fig. I.4). According to the
farmers experience this reduces considerably the soil seed bank of weedy species. Farm
produced seed material is frequently re-sown, in some cases, especially small farms with
sheep flocks. Weed seeds are even not sorted out before reseeding (Gasc 2005). Jäger (2002)
counted seeds in four replicates of 1 kg seeding material and could identify 43 different
cereal weed species with a mean of over 12000 weed seeds per kg seeding material. We
counted weed seeds from a cereal sample from traditional cereal agriculture in Algeria,
where we identified only eight species and much less seeds per kg cereals (Saatkamp,
unpublished data). This illustrates that ‘speirochory’ i.e. the transport and reseeding of weed
seeds into cereal field is a general and important factor for dispersal of cereal weeds, which
has probably an impact on weed population dynamics. According to Jäger’s (2002) and our
own sample from Algeria there is no strict selection of species with particular seed sizes,
however a tendency to greater plant height. Both wheat samples contain small species
(Aegilops sp., Anagallis arvensis) as well as small seeded species (Papaver rhoeas, Legousia
speculum-veneris, and Silene sp.). In the light of the very simple techniques of some small
farms, the evolution of agricultural practices in the area from first appearance of agriculture
in the Neolithic to today are the mechanisation of working steps, larger cultivated surfaces,
deeper ploughing, watering and different cultivated crops together with probably a shorter
field rotation. For the more intensive farms, synthetic herbicides and fertilizers, high
performance crops and intensive field preparation are in sharp contrast with this traditional
farming. In the study period (1983-2006), there was a shift to more winter wheat cultivation
and abandonment of marginal fields and pastures (Gasc 2005).
General Introduction
41
5
I
ECOLOGICAL SERVICES OF CEREAL WEEDS
Cereal weeds are in a complex web of relations to other organisms in cereal fields, including
pollinators, herbivores, predators and cereals themselves. Figure I.5 resumes some of the
ecological services of cereal weeds for remaining wild life and human usage of agricultural
landscapes (Gerbaud et al. 2001;Marshall et al. 2003;Gibson et al. 2006;Pinke et al. 2008). Plants
developing after harvest and some of those found within cereals are a supply of
complementary nutrients in farms where cereals are cultivated together or for sheep
breeding (Gerbaud et al. 2001). Granivorous birds such as the hunted grey partridge (Perdix
perdix) depend on seeds from wild plants in cereal fields (Marshall et al. 2003). This is
certainly also the case for more heterophagous birds that can also feed on noxious insects
such as the Ortolan bunting (Emberiza hortulana). The recent and general decline of
pollinators (Biesmeijer et al. 2006) with its important economic consequences (Gallai et al.
2009) has various reasons and the quasi-absence of nectar sources for pollinators in
landscapes dominated by intensive agriculture is one reason (Gibson et al. 2006). The decline
of nectar sources has also consequences for the remaining flora (Biesmeijer et al. 2006) and
especially on rare insect-pollinated taxa in cereal fields (Gibson et al. 2006). Presence of
weeds, especially grasses, in cereal fields is also known to increase cereal aphid predating
insects (Sotherton et al. 1989; van Emden 1990 cited in Eliott et al. 1998). Parasitoid wasps (e.g.
Aphidius rhopalosiphi) are the most effective in controlling cereal aphids (e.g. Sitobion avenae)
in cereal fields (Schmidt et al. 2003); these specialised parasitoid wasps develop larger and
thus more effective populations for bio-control when monocot cereal weeds developed prior
to cereals (van Emden 2002). These are just some examples, other beneficial effects of cereal
weeds via other groups of predator insects are also favoured by cereal weeds.

General Introduction
42
5
I
Pollinators:
Apis mellifera
Nectar-rich flowers:
Bifora radians
Seeds of cereal weeds:
Neslia paniculata
Vaccaria hispanica
Post-harvest plants:
Polygonum aviculare
Granivorous birds:
Emberiza hortulana,
Perdix perdix
Sheep
Predator insects:
Aphidius rhopalosiphi
Human nutrition,
economic benefits
Noxious insects
for crops:
Sitobion avenae
+
(honey, pollinated crop plants)
++
+
+ +
+
+ +
-
-
- --
+
+
Fig. I.5: Examples of trophic relationships and ecosystem services of cereal weeds, for detailed discussion and bibliographic sources see text.
The relations of cereal weeds to these organisms show their economic importance but also
the dependence of rare cereal weeds on other plants in these ecosystems e.g. for pollination
(Gibson et al. 2006). It is evident that there can also be severe economic losses due to
infestation of cereal fields by other than the crop plants and pertinent agronomic techniques
evolved to reduce or even exterminate all other plants than crops. A small review in
Ellenberg (1996) already showed that presence of other than crop plants up to 25% of cover is
without major impact on crop yields. Smith et al. (1999) and Marshall (1989) showed that
even the species richer field margins are not important sources of economically detrimental
weeds in cereal fields. There is also sporadic evidence for a direct benefit of some cereal
weeds on the crop yields, such as the positive interaction between Scandix pecten-veneris and
wheat (Dutoit et al. 2001), probably due to allelopathic action of weed born substances on soil
pathogens (Qasem and Foy 2001).
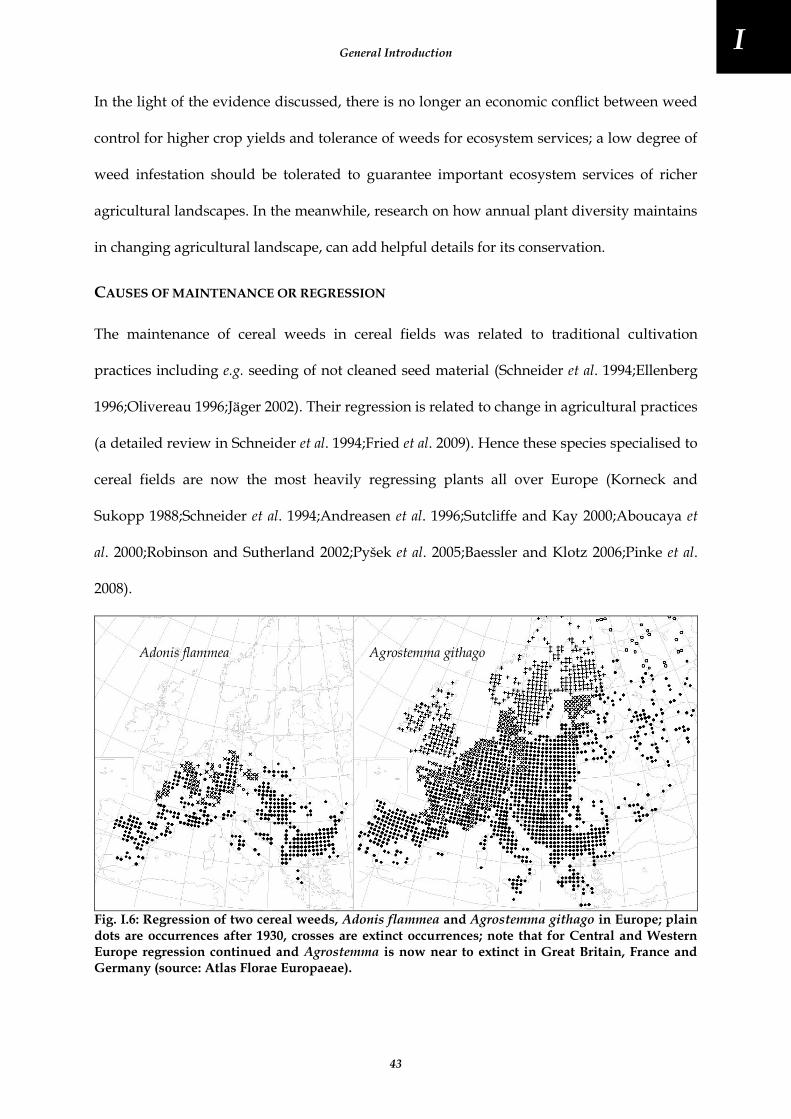
General Introduction
43
5
I
In the light of the evidence discussed, there is no longer an economic conflict between weed
control for higher crop yields and tolerance of weeds for ecosystem services; a low degree of
weed infestation should be tolerated to guarantee important ecosystem services of richer
agricultural landscapes. In the meanwhile, research on how annual plant diversity maintains
in changing agricultural landscape, can add helpful details for its conservation.
CAUSES OF MAINTENANCE OR REGRESSION
The maintenance of cereal weeds in cereal fields was related to traditional cultivation
practices including e.g. seeding of not cleaned seed material (Schneider et al. 1994;Ellenberg
1996;Olivereau 1996;Jäger 2002). Their regression is related to change in agricultural practices
(a detailed review in Schneider et al. 1994;Fried et al. 2009). Hence these species specialised to
cereal fields are now the most heavily regressing plants all over Europe (Korneck and
Sukopp 1988;Schneider et al. 1994;Andreasen et al. 1996;Sutcliffe and Kay 2000;Aboucaya et
al. 2000;Robinson and Sutherland 2002;Pyšek et al. 2005;Baessler and Klotz 2006;Pinke et al.
2008).
Adonis flammea Agrostemma githago
Fig. I.6: Regression of two cereal weeds, Adonis flammea and Agrostemma githago in Europe; plain dots are occurrences after 1930, crosses are extinct occurrences; note that for Central and Western Europe regression continued and Agrostemma is now near to extinct in Great Britain, France and Germany (source: Atlas Florae Europaeae).

General Introduction
44
5
I
Figure I.6 illustrates the early regression (post-1930) of two species in Europe, showing the
important regression in industrialised agro-ecosystems of e.g. Northern France, Netherlands
and Eastern Germany and the preservation in Southern and Eastern Europe. Several
processes have been identified that trigger(ed) the regression of cereal weeds in present day
landscapes and at the same time favoured other often more ruderal species. (i) The use of
herbicides impacts both plant establishment and soil seed banks, favouring resistant lines
(Ball 1992;Schneider et al. 1994;Fried et al. 2009). (ii) Change in characters, identity and
density of crop plants yields a higher competition on weed species (Schneider et al. 1994),
however Roche et al. (2002) clearly showed that higher cereal density favours cereal weeds
with respect to other ruderal plants. (iii) The use of mineral fertilizers instead of organic
manure triggered regression mediated by a changed nutrient status of soils but also less seed
input (Schneider et al. 1994). (iv) Cleaning of seeding material before sowing leads to a lower
seed input and enhanced isolation of populations among different fields (Schneider et al.
1994;Ellenberg 1996;Olivereau 1996;Jäger 2002) (v) change in soil preparation steps,
ploughing depth and changed crop rotation systems. In general, arable weeds are known to
form often long time persistent seed banks, but some cereal weeds like for example
Agrostemma githago lack any dormancy or darkness inhibition of germination and do not
form a persistent soil seed bank (Schneider et al. 1994; this work). In areas with traditional
cereal agriculture, where these species still persist, it could be shown that cereal weed
communities quickly lose the most interesting species after abandonment, and their
regeneration from the soil seed bank is impossible (Jäger 2002;Dutoit et al. 2003). This can at
least partly be explained by the striking differences in the longevity of soil seed banks, but
also by the changes in dispersal processes at the landscape scale (Schneider et al.
1994;Ellenberg 1996;Bonn and Poschlod 1998;Jäger 2002;Dutoit et al. 2003). Because of its high
diversity in rare cereal weeds and the traditional agriculture, the Luberon area is of high
conservation interest on a European scale for these plants (Aboucaya et al. 2000).
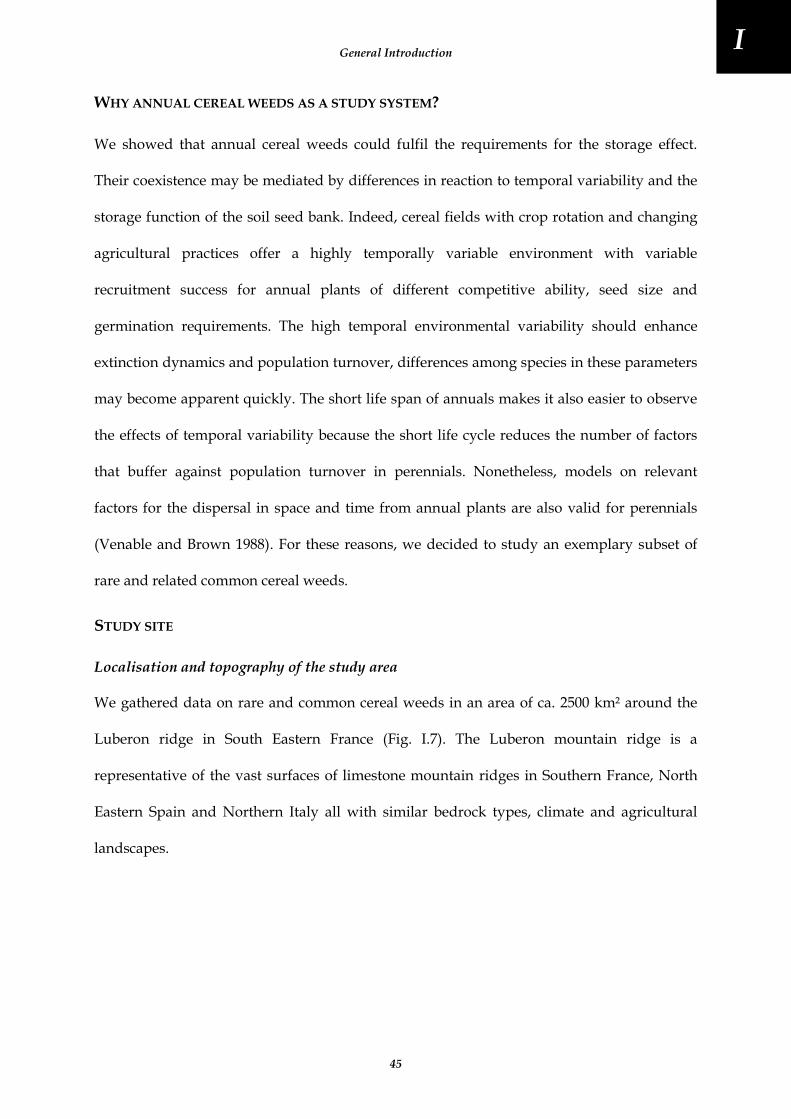
General Introduction
45
5
I
WHY ANNUAL CEREAL WEEDS AS A STUDY SYSTEM?
We showed that annual cereal weeds could fulfil the requirements for the storage effect.
Their coexistence may be mediated by differences in reaction to temporal variability and the
storage function of the soil seed bank. Indeed, cereal fields with crop rotation and changing
agricultural practices offer a highly temporally variable environment with variable
recruitment success for annual plants of different competitive ability, seed size and
germination requirements. The high temporal environmental variability should enhance
extinction dynamics and population turnover, differences among species in these parameters
may become apparent quickly. The short life span of annuals makes it also easier to observe
the effects of temporal variability because the short life cycle reduces the number of factors
that buffer against population turnover in perennials. Nonetheless, models on relevant
factors for the dispersal in space and time from annual plants are also valid for perennials
(Venable and Brown 1988). For these reasons, we decided to study an exemplary subset of
rare and related common cereal weeds.
STUDY SITE
Localisation and topography of the study area
We gathered data on rare and common cereal weeds in an area of ca. 2500 km² around the
Luberon ridge in South Eastern France (Fig. I.7). The Luberon mountain ridge is a
representative of the vast surfaces of limestone mountain ridges in Southern France, North
Eastern Spain and Northern Italy all with similar bedrock types, climate and agricultural
landscapes.
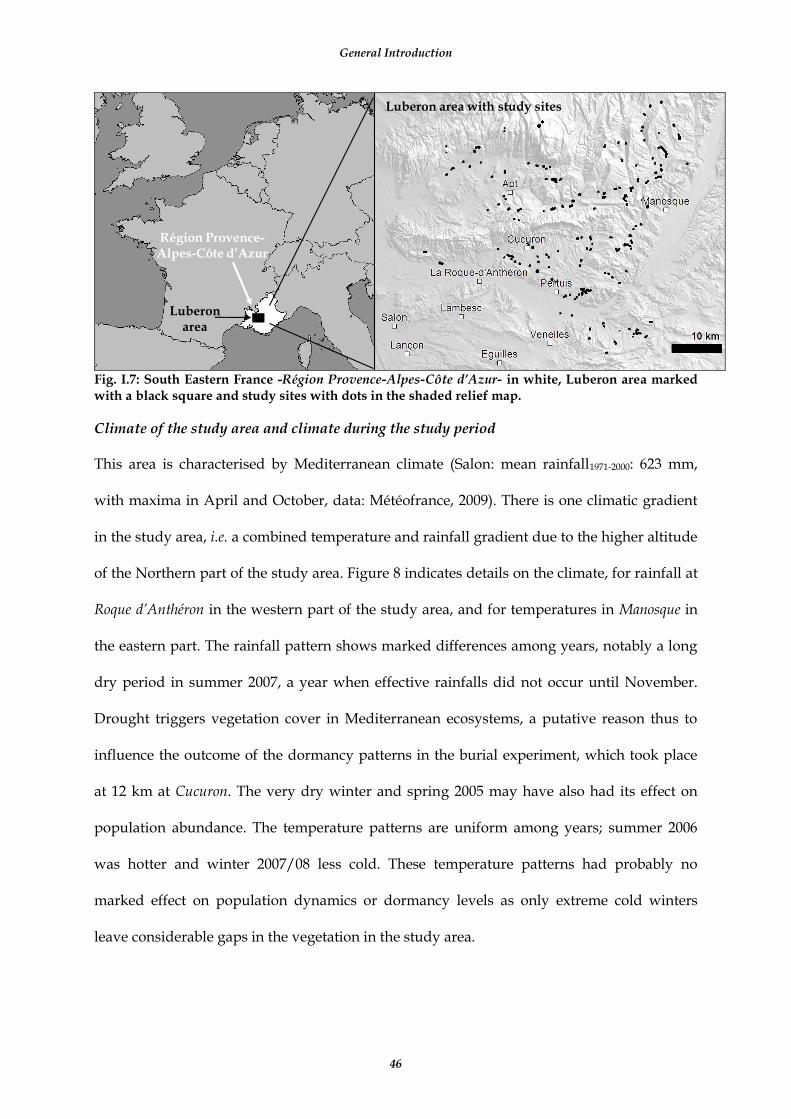
General Introduction
46
5
I
Luberonarea
Région Provence-Alpes-Côte d’Azur
Luberon area with study sites
Fig. I.7: South Eastern France -Région Provence-Alpes-Côte d’Azur- in white, Luberon area marked with a black square and study sites with dots in the shaded relief map.
Climate of the study area and climate during the study period
This area is characterised by Mediterranean climate (Salon: mean rainfall1971-2000: 623 mm,
with maxima in April and October, data: Météofrance, 2009). There is one climatic gradient
in the study area, i.e. a combined temperature and rainfall gradient due to the higher altitude
of the Northern part of the study area. Figure 8 indicates details on the climate, for rainfall at
Roque d’Anthéron in the western part of the study area, and for temperatures in Manosque in
the eastern part. The rainfall pattern shows marked differences among years, notably a long
dry period in summer 2007, a year when effective rainfalls did not occur until November.
Drought triggers vegetation cover in Mediterranean ecosystems, a putative reason thus to
influence the outcome of the dormancy patterns in the burial experiment, which took place
at 12 km at Cucuron. The very dry winter and spring 2005 may have also had its effect on
population abundance. The temperature patterns are uniform among years; summer 2006
was hotter and winter 2007/08 less cold. These temperature patterns had probably no
marked effect on population dynamics or dormancy levels as only extreme cold winters
leave considerable gaps in the vegetation in the study area.
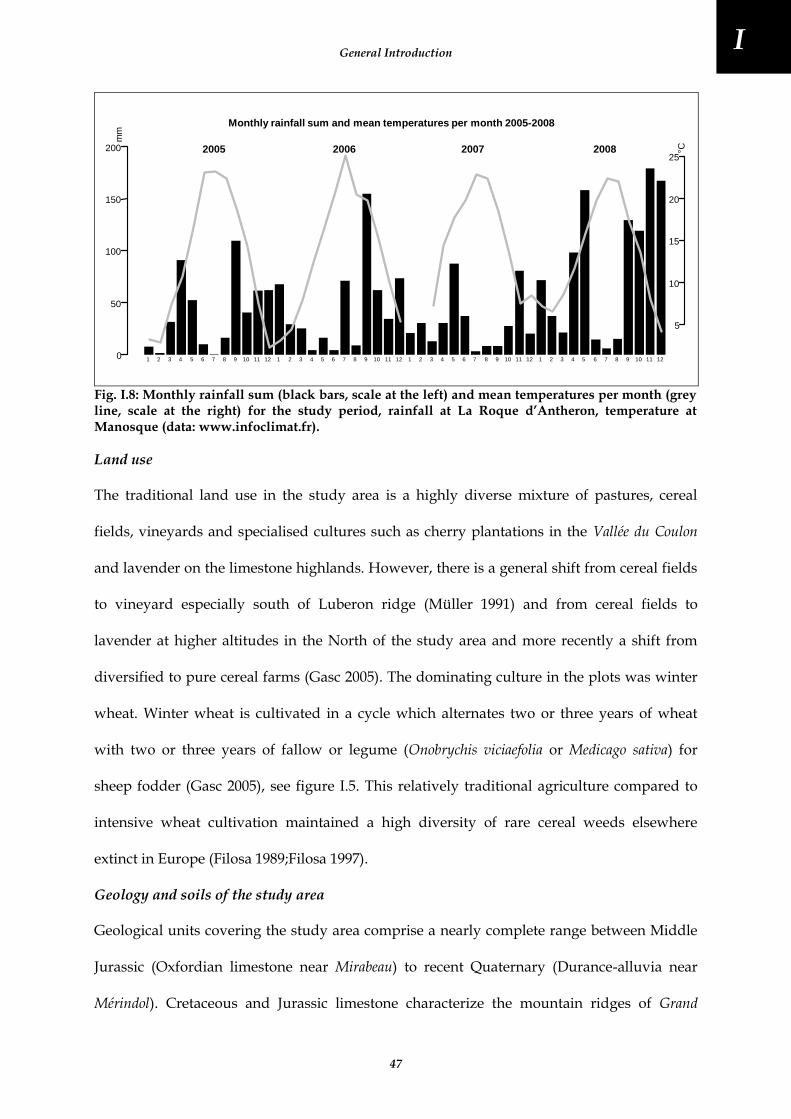
General Introduction
47
5
I
mm
0
50
100
150
200
Monthly rainfall sum and mean temperatures per month 2005-2008
5
10
15
20
25
°C
1 2 3 4 5 6 7 8 9 10 11 12 1 2 3 4 5 6 7 8 9 10 11 12 1 2 3 4 5 6 7 8 9 10 11 12 1 2 3 4 5 6 7 8 9 10 11 12
2005 2006 2007 2008
Fig. I.8: Monthly rainfall sum (black bars, scale at the left) and mean temperatures per month (grey line, scale at the right) for the study period, rainfall at La Roque d’Antheron, temperature at Manosque (data: www.infoclimat.fr).
Land use
The traditional land use in the study area is a highly diverse mixture of pastures, cereal
fields, vineyards and specialised cultures such as cherry plantations in the Vallée du Coulon
and lavender on the limestone highlands. However, there is a general shift from cereal fields
to vineyard especially south of Luberon ridge (Müller 1991) and from cereal fields to
lavender at higher altitudes in the North of the study area and more recently a shift from
diversified to pure cereal farms (Gasc 2005). The dominating culture in the plots was winter
wheat. Winter wheat is cultivated in a cycle which alternates two or three years of wheat
with two or three years of fallow or legume (Onobrychis viciaefolia or Medicago sativa) for
sheep fodder (Gasc 2005), see figure I.5. This relatively traditional agriculture compared to
intensive wheat cultivation maintained a high diversity of rare cereal weeds elsewhere
extinct in Europe (Filosa 1989;Filosa 1997).
Geology and soils of the study area
Geological units covering the study area comprise a nearly complete range between Middle
Jurassic (Oxfordian limestone near Mirabeau) to recent Quaternary (Durance-alluvia near
Mérindol). Cretaceous and Jurassic limestone characterize the mountain ridges of Grand

General Introduction
48
5
I
Luberon, Petit Luberon and the Monts de Vaucluse in the north of the study area. Most of the
agricultural areas are on molasses and sands of the Miocene, sands of the Eocene and marls
and smooth limestone of the Oligocene in the lowland parts and more rarely on Cretaceous
limestone at the slopes of the mountain ridge, for a detailed map of geology in the study
area see Moutier and Balme (1997). Soils that developed on these bedrock types have the
common point of being very stony throughout and having always a very dry phase in
summer when they completely dry out in the relevant layers for annual plants. In a limited
set of parcels on marl bedrock, there can be water saturation in winter, but we had no parcel
with the typical vegetation of winter-inundated fields, which is dominated by Juncus bufonius
and Lythrum hyssopifolium outside the studied parcels.
Overall, gradients of water content, pH and stone content exist inside particular fields and
among fields (Roche et al. 2002). We did not analyse the differences in soil properties in detail
in this thesis because the focus of the thesis is on processes at the population and community
level along time and not among different locations. This bears the risk of not capturing
relevant changes in soil properties along time. We regret not to have the time to bring the
precision needed for questions on changing soil properties; such a work would seriously be
hampered by the lack of old data on soil properties in 1983. We therefore decided to consider
changing properties indirectly through the use of indicator values, a very powerful tool to
detect such changes via vegetation (Diekmann 2003).

General Introduction
49
5
I
‘Frumenta hieme in herba sunt, verno tempore fastigantur in stipulam quae sunt hiberni generis, at milium et panicum in culmum geniculatum et concavum, sesama vero in ferulaceum. omnium satorum fructus aut spicis continetur, ut tritici, hordei, muniturque vallo aristarum contra aves et parvas quadripedes, aut includitur siliquis, ut leguminum, aut vasculis, ut sesamae ac papaveris. milium et panicum tantum pro indiviso et parvis avibus expositum est; indefensum quippe membranis continetur’ (Pliny the Elder, Naturalis Historia, 18.52-53) ‘Cereals are green in winter, in spring they climb into stalks which originated in winter; the millets however, have kneed or curved stems and sesame is quite a creeping herb. All sown crops are -or enclosed in spikes- like those of wheat and barley that are protected by a wall of awns -or they are enclosed in silics- like those of the legumes -or they are enclosed in small cups- like those of sesame and poppy. The millets on the other hand are exposed to the numerous small birds as they lie unprotected in skins.’ ‘igitur quod nunc intra murum fere patres familiae correpserunt relictis falce et aratro et manus movere maluerunt in theatro ac circo, quam in segetibus ac vinetis, ac frumentum locamus qui nobis advehat, qui saturi fiamus ex Africa et Sardinia, et navibus’ (M.T. Varro, Res Rustica, 2.pr.3) As therefore in these days practically all the heads of families have sneaked within the walls, abandoning the sickle and the plough, and would rather busy their hands in the theatre and in the circus than in the grain-fields and the vineyards, we hire a man to bring us from Africa and Sardinia the grain with which to fill our stomachs. ‘frumentique uim ingentem quod ex Africa P. Scipio miserat quaternis aeris populo cum summa fide et gratia diuiserunt’ (T. Livius, Ab urbe condita, 31.4.6-7) They also distributed to the people with strict impartiality and to the general satisfaction a vast quantity of corn which Scipio had sent from Africa. It was sold at four ases the modius. ‘...legati terni in Africam ad Carthaginienses et in Numidiam ad frumentum rogandum, quod in Graeciam portaretur, missi, pro quo pretium solueret populus Romanus’ (T. Livius, Ab urbe condita, 36.3.1-2) ‘(six commissioners) were sent to Africa to procure corn for Greece, the cost to be borne by Rome; three went to Carthage and three to Numidia.’ ‘temperata apud transmarinas provincias frumenti subvectio, et ne censibus negotiatorum naves adscriberentur tributumque pro illis penderent constitutum. Reos ex provincia Africa, qui proconsulare imperium illic habuerant, Sulpicium Camerinum et Pompeium Silvanum absolvit Caesar’ (C. Tacitus, Annales, 13.51-52) ‘In our transmarine provinces the conveyance of corn was rendered less costly, and it was decided that merchant ships should not be assessed with their owner's property, and that no tax should be paid on them. Two men under prosecution from Africa, in which province they had held proconsular authority, Sulpicius Camerinus and Pomponius Silvanus, were acquitted by the emperor’ Box 2: An early description of plant phenology, food webs and plant traits in cereal fields (Pliny) and four classical texts documenting the transport of cereals from Northern Africa to Europe in Roman times (Varro, Livius and Tacitus).

50


52
TRANSITION TO CHAPTER 1
Real world example of diversity at different spatial scales
Spontaneous populations and communities are the basis for understanding and the aim of
prediction of ecology. The study of actual vegetation detects patterns of diversity, abundance
and function, but also temporal changes and realised niches of species. In this approach, data
are gathered on species composition and abundance of local communities complemented by
data on abiotic properties, land use and its history.
Figure T1.1 illustrates how the γ-diversity at a larger spatial scale, exemplified by the species
list of two plots, is subdivided into diversity contributed by α-diversity from two different
plots. In figure T1.1, C marks species that are found in both plots, the species overlap. The
species that are only found in one of two plots is the absolute β-diversity. This β-diversity
can also be calculated among different γ-diversity on a higher spatial scale, leading to
spatially nested components of β-diversity (Crist et al. 2003). Absolute β-diversity is
measured on the same scale as α and γ-diversity, and is most easily obtained as the
difference between γ-diversity and the species overlap: β = γ – C. Absolute β-diversity can be
divided by γ-diversity yielding a relative β-diversity; this is useful when γ-diversity are very
different and one is interested in the relative change not the total number of species added.
These types of diversity measures have fundamental differences: α-diversity and β-diversity
are not correlated and are not driven by similar factors; even relative and absolute β-
diversity are quite different. Diversity at fine scales can have different determinants than
diversity on coarser spatial scales: e.g., factors that increase β-diversity at fine scales can
enhance γ-diversity at a coarser scale. For this reason, an analysis at different spatial scales is
important to understand factors determining plant diversity.
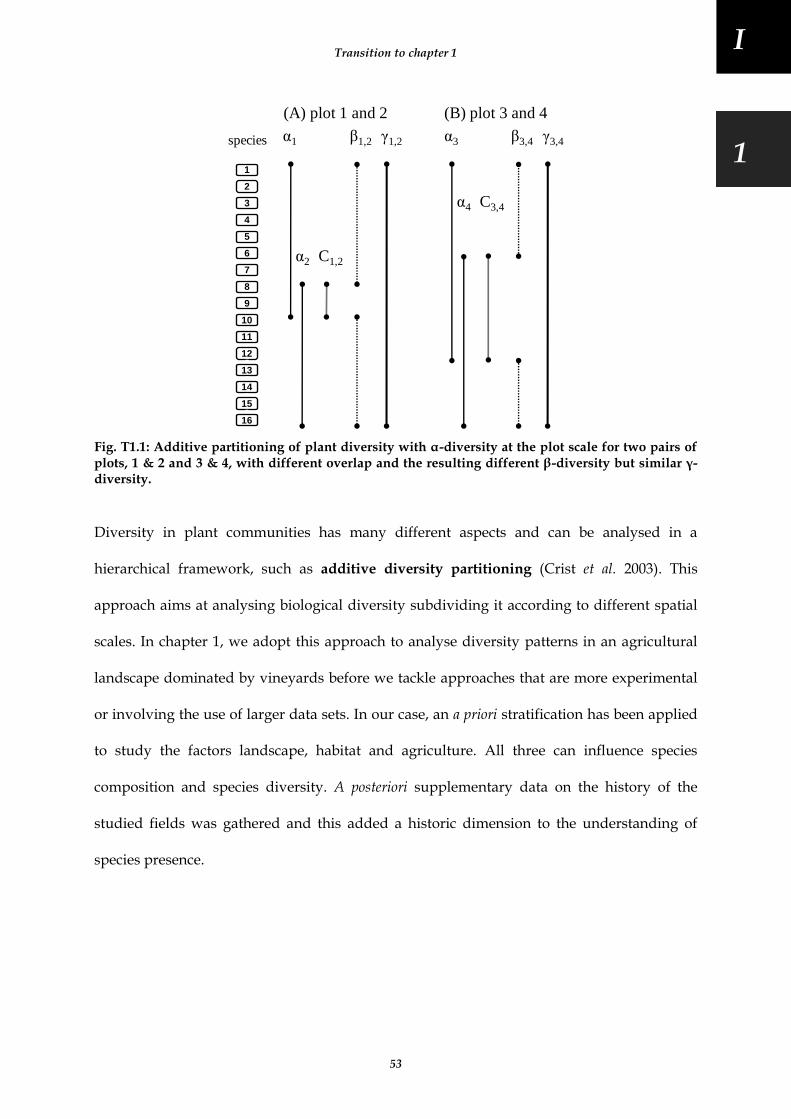
Transition to chapter 1
53
5
I
1 α1 γ1,2β1,2
α2 C1,2
α3 γ3,4β3,4
α4 C3,4
species
1
2
3
4
5
6
7
8
9
10
11
12
13
14
15
16
(A) plot 1 and 2 (B) plot 3 and 4
Fig. T1.1: Additive partitioning of plant diversity with α-diversity at the plot scale for two pairs of plots, 1 & 2 and 3 & 4, with different overlap and the resulting different β-diversity but similar γ-diversity.
Diversity in plant communities has many different aspects and can be analysed in a
hierarchical framework, such as additive diversity partitioning (Crist et al. 2003). This
approach aims at analysing biological diversity subdividing it according to different spatial
scales. In chapter 1, we adopt this approach to analyse diversity patterns in an agricultural
landscape dominated by vineyards before we tackle approaches that are more experimental
or involving the use of larger data sets. In our case, an a priori stratification has been applied
to study the factors landscape, habitat and agriculture. All three can influence species
composition and species diversity. A posteriori supplementary data on the history of the
studied fields was gathered and this added a historic dimension to the understanding of
species presence.

54

Chapter 1 Plant diversity in agro-ecosystems
55
5
1
CHAPTER 1
Plant diversity in agro-ecosystems influenced by vineyard
structure, landscape class, land use intensity and past cereal
cultivation
INTRODUCTION
Plant diversity in agro-ecosystems is in general decline in Europe (Andreasen et al.
1996;Sutcliffe and Kay 2000;Aboucaya et al. 2000;Jauzein 2001;Robinson and Sutherland
2002;Baessler and Klotz 2006). There is now growing concern about this loss of biodiversity,
many specialised species from agro-ecosystems being on regional and national Red Data
Books (Korneck and Sukopp 1988;Roux and Nicolas 2001). In Europe, some specialists, e.g.
cereal weeds are among the most threatened plants on regional scales. In addition to that,
there are also serious concerns due to the functional role of these plants in the agro-
ecosystems and the services they provide for agriculture (Marshall et al. 2003;Pinke et al.
2008). There are indirect services of arable plants by supporting predator populations in
fields (Sotherton 1984;Eliott et al. 1998;van Emden 2002;Schmidt et al. 2003) or on their edges
(Thomas and Marshall 1999;Smith et al. 2008). Decline of arable plants in general also
contribute to the decline of effective pollinator communities with important economic losses
(Biesmeijer et al. 2006;Gallai et al. 2009). The decline of pollinators in turn trigger the decline
of pollinator dependent plants including rare plants (Biesmeijer et al. 2006;Gibson et al. 2006).
It is now clear that at moderate densities within fields and at high densities outside, arable
plants have no important impact on the cultivated crop (Marshall 1989;Ellenberg 1996;Smith
et al. 1999).
Which factors determine plant diversity at different scales in agricultural landscapes is
therefore of prime interest for conservation of plant diversity and maintenance of ecological

Chapter 1 Plant diversity in agro-ecosystems
56
services for agriculture. Reasons for the decline of arable plant diversity are the higher
intensity agriculture, including herbicide use, higher competitiveness of crop plants due to
different crop types, the use of synthetic fertilizers and the consolidation of arable land
(Schneider et al. 1994;Robinson and Sutherland 2002). Moreover, plant diversity in
agricultural systems is also determined by the landscape context, the number and size of
different habitats and diversity of bedrocks and soils. Historical-geographical factors also
determine plant diversity in arable systems (Lososová et al. 2004).
Species diversity can be measured at different scales –from the habitat to regions– and either
as α-diversity, that is species richness, or as β-diversity, i.e. differences in species between
stands at different spatial scales (Crist et al. 2003). The global diversity in a larger area or
region summing up both is termed γ-diversity. This additive framework enables one to
analyse the contribution of α and β-diversity at different spatial scales (Allan 1975;Lande
1996;Crist et al. 2003). This additive diversity partition, permits direct comparisons, whereas
the classical Jaccard’s and Sørensen’s index analyse relative species-turnovers and do not
measure β-diversity on the same scale as species richness.
For pollinators and predator populations, not only the diversity and abundance of arable
plants in the fields themselves are important but also the diversity in crop edges or outside
in adjacent habitats (Steffan-Dewenter et al. 2002;Gabriel and Tscharntke 2007). Therefore, β-
diversity between different habitats has functional importance for biodiversity conservation
and ecosystem services in present day landscapes. However β-diversity in arable systems
with different intensities of agriculture has been analysed only recently, and this has only
been done at the field centred scale, especially for cereal fields (Gabriel et al. 2006;Roschewitz
et al. 2009). Much less is known on the β-diversity of structural elements which are part of the
agro-ecosystem (Thomas and Marshall 1999;von Arx et al. 2002;Dutoit et al. 2007), especially
in crop systems where these elements have a functional role, like in vineyards. Vineyard α-
diversity has thoroughly been analysed by Maillet (1992), but little is known about diversity

Chapter 1 Plant diversity in agro-ecosystems
57
5
1
at different spatial scales and the role of non cultivated habitats such as embankments or the
areas for turning of machines (Dutoit et al. 2007). It can also be asked if in the transition zone
between, cultivated field, field edges and adjacent communities there are new and
characteristic species or not. This has been conceptualised via the distinction of ecotones and
ecoclines, the former without the latter with specialised species in the transition between to
different habitats according to van der Maarel (1990); similar definitions with terms inversed
appeared earlier (Frochot 1987). In the terminology of additive diversity partitioning, these
works compare in detail absolute to relative β-diversity in transition zones between two
habitats and classify transitions according to the amount of absolute β-diversity. However,
these works generally do not consider different spatial scales and they do not consider that
β-diversity in these transition zones can be modified when landscape context or
management change.
The main scope of this study is therefore to know (i) Which factors determine plant α-
diversity in vineyard landscapes? (ii) How do these factors influence β-diversity among
different habitat structures in vineyards, between vineyards and γ-diversity at the landscape
scale? (iii) How recent historical factors such as cereal cultivation influence α-diversity and
finally (iv) Which are plants of high conservation value and do they follow the same trends
of α-diversity that the entire flora follows?
METHODS AND STUDY AREA
Study area
The study has been done in the agricultural landscape south of the Luberon ridge and north
of the Durance river valley in Provence, South Eastern France. This area of about 300 km² is
on molasses and sands of the Miocene, sands of the Eocene and marls and smooth limestone
of the Oligocene (Moutier and Balme 1997). Climate is Mediterranean with mild winters and
summer drought. Forest remnants in the study area are dominated by downy oak (Quercus

Chapter 1 Plant diversity in agro-ecosystems
58
pubescens) on deeper soils and sclerophyllous evergreen Holm oak (Quercus ilex) on shallow
skeletal soils especially on the south-facing slopes of the hills and the Luberon ridge itself.
Initial successional stages after forest destruction include mattorals with kermes oak (Quercus
coccifera), rosemary (Rosmarinus officinalis) and several Cistus species. Some of the species of
initial successional stages and forests occur also in vineyards as a secondary habitat e.g. Rubia
peregrina on the vine-rows and Cistus species on the embankments.
Stratification scheme and plant species survey
We used three main factors, landscape classes, agricultural intensity and habitat type to
stratify plots, and resulting in a balanced sample for each subgroup. To do so, we first
selected at random five areas for three different landscape classes according to a previous
classification based on actual vegetation, geology and relief, which was run in a GIS on a
1km basis. The data sources for this classification include the geological map (Moutier and
Balme 1997), a digital elevation model (DEM) with a 50 m resolution (IGN, Paris) and the
CORINE land-cover map which is based on interpretation of satellite images (DRE-PACA
1999). This classification leads to three classes. The first class consists in a flat unit with
slightly south facing slopes on calcareous molasses between Cucuron, Lourmarin and
Ansouis (fig. 1.1). In these areas, vineyards are the dominating land use type lying mostly on
Miocene molasses as geological unit and we refer to it as limestone landscape. Second, a
landscape class with smooth north-facing slopes on Eocene and Miocene sands,
discontinuous around Pertuis, La Tour d’Aigues and La Bastidonne with vineyards and
cereal fields as co-dominant land use units, which we called sand landscape. Finally a third
class with a complex relief in the northeast around the villages of Grambois, La Bastide des
Jourdans and Mirabeau, has a more balanced land use mixture of forests, vineyards and
cereal fields, predominantly on oligocene marls and limestones, we termed it marl
landscape. We replicated these three landscape classes five times.

Chapter 1 Plant diversity in agro-ecosystems
59
5
1
Fig. 1.1: Map of the study area with 1 km grid of the three landscape classes, major villages are marked by white rounds and plots by white squares; dark grey: ‘sand landscape’ class, middle grey ‘marl landscape’ class and light grey ‘limestone landscape’ class, scale is given by the 1 km grid.
Inside each of these fifteen zones, we selected three vineyards with extensive, intermediate
and intensive agriculture. Intensity of agriculture was studied using three contrasted
neighbouring vineyards that we identified in a previous survey of the entire study area
based on indicators of herbicide use, ploughing frequency and economic value of vineyards
(Saatkamp, unpublished map). We termed the classes ‘H’ for high intensity, ‘I’ for
intermediate, and ‘N’ for extensive vineyards. For each of the resulting 45 individual
vineyards, we studied three different habitat types. Therefore, we selected three very
frequent habitats, which cover important surfaces in the study area. (i) Inside the vineyard
‘P’, where we placed a plot with a size of 10 x 20 m at a fixed 20 m distance from the border,
with always 4 vine-rows and 3 inter-rows. (ii) the border habitat at the endpoints of the vine-
rows where the machines use to turn from one to another vine-row, abbreviated as ‘M’. This
plot had also a size of 200 m² but the shape varied with the possibilities in the field. (iii) The

Chapter 1 Plant diversity in agro-ecosystems
60
adjacent grassy embankment, which is not regularly ploughed or chemically weeded, again a
plot with a size of 200 m², was always maintained, we termed it ‘T’. Most of the embankment
and border plots had 4 m x 50 m. Figure 1.2 resumes a vineyard with the three plot types.
em
bankm
ent plo
t ‘T
’
bord
er plo
t ‘M
’
vine-rows
gra
ss
y
ma
rgin
20 m
10
m
20 m
center
plot ‘P’
and interrows
Fig. 1.2: The situation of a vineyard with its embankment (grey), vine-rows (black) and the size and position of the three habitat stratified plot types.
The resulting 3 x 5 x 3 x 3 =135 plots form the basic dataset used for all analyses. The size of
each individual plot was set to 200m², because we aimed to find high species numbers,
which we think to be more reliable for effects of plant diversity. After noting location (UTM
coordinates) a species list of all vascular plants has been established. We visited plots
between April and June 2004. We sampled all plants which we could not identify directly in
the field and identified it later using Jauzein (1995), this is also the nomenclatural reference,
complemented by Kerguelen (1998).
Documentation of former land-use type
The former cultivated crop for the study has been inferred from the French topographic
maps at 1:25 000 (IGN, Paris) where several land cover types are noted. Vineyards, orchards
and arable fields are differentiated. The most important crops cultivated in former times in
this area are cereals (Müller 1991) and information from local farmers confirmed that all new
vineyards were previously cultivated with cereals. We had however, no precise date of the

Chapter 1 Plant diversity in agro-ecosystems
61
5
1
conversion but we have sure information that in 1986 the date of the revision of maps, all
recent young vineyards were still cereal fields.
In our case, we calculated βTM and βMP at the individual vineyard scale, between
embankment plots (T) and margin (M) of fields as the difference between sum of species of
both, γTM and the species overlap between both CTM. Similarly, we also calculated βMP
between margin plots (M) and inside of vineyard plots (P). We also calculated a β at the
landscape scale between individual vineyards of different intensity that were grouped at one
place as the difference between γ–diversity of two vineyards united and their species overlap
C. We only calculated this β-diversity between extensive and intermediate vineyards, βNZ,
and between intermediate and intensively managed vineyards, βZH. Finally, we analysed α-
diversity and γ–diversity at the plot, vineyard and landscape scale.
Tab. 1.1: Diversity levels, scales and independent factors analysed in this work.
Type Variables Measurement scale Factors analysed
α-diversity α habitats habitat type, intensity of agriculture, landscape class
β1-diversity βTM and βMP vineyards intensity of agriculture, landscape class
β2-diversity βNZ and βZH landscapes landscape class
γ-diversity γNZ and γZH landscapes landscape class
Table 1.1 gives an overview on the diversity levels we analysed. In addition to the absolute
β-diversity, we also measured the relative β-diversity using the percentage β-diversity on the
corresponding γ-diversity, this resembles much classical community composition distances
such as Sørensen’s distance (Lande 1996;Legendre and Legendre 1998;Crist et al. 2003):
% β = 100 · β/γ
Data analysis
α-Diversity has been analysed as species richness per unit area according to three
independent factors, habitat type, intensity of agriculture and landscape class. After testing
the assumptions of normality (Shapiro-Wilk’s test) and equality of variances (F-test) a

Chapter 1 Plant diversity in agro-ecosystems
62
factorial ANOVA (Sokal and Rohlf 1995) has been conducted on the species number per plot
as dependant variable and the three factors with three levels of stratification described
above. In order to detect effects of cultural practices on vegetation differentiation between
margins, borders and fields, or landscape class on differentiation between different
intensities of agriculture, β-diversity has been analysed using ANOVA. For the analysis of
Red List and cereal weed species, we used Kruskal-Wallis rank sum test to account for the
non-normality of these data. Data handling, calculation of diversity measures and all
statistical analyses have been done in the R environment (R Foundation for Statistical
Computing 2008).
RESULTS
The ANOVA on the α-diversity showed that habitat types in vineyards explain most of
species richness, followed by intensity of agriculture and landscape class (Tab. 1.2, fig 1.3).
Furthermore, there is a significant interaction between habitat type and intensity of
agriculture (Tab. 1.2, fig 1.4).
Tab. 1.2: Results of the analysis of variance on the species number per plot, factors were habitat type, landscape class and intensity of agriculture.
Factor Degree of freedom F P
Landscape class 2 5.33 0.0062 **
Intensity of agriculture 2 21.42 <0.0001 ***
Habitat type 2 67.59 <0.0001 ***
Landscape class x Intensity of agriculture 4 0.06 0.9914
Landscape class x Habitat type 4 0.97 0.4232
Intensity of agriculture x Habitat type 4 3.18 0.0162 *
Landscape class x Intensity of agriculture x Habitat type 8 0.77 0.6263
Residuals 108
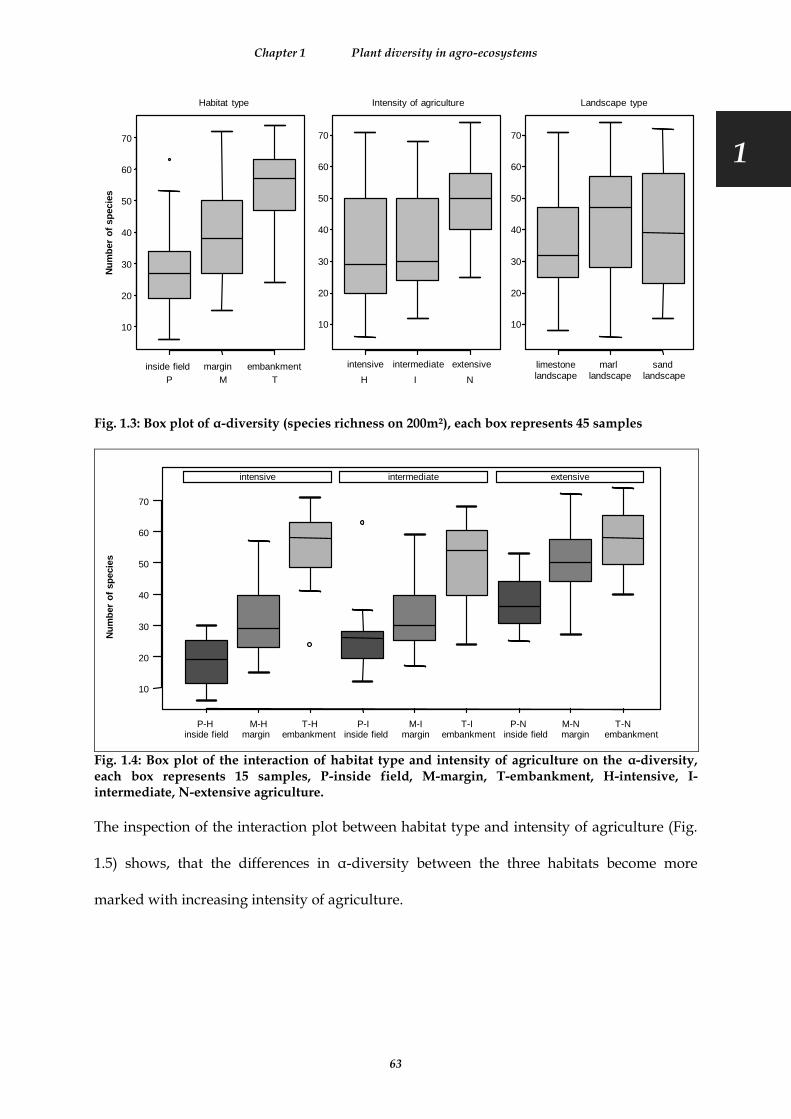
Chapter 1 Plant diversity in agro-ecosystems
63
5
1
inside field margin embankment intensive intermediate extensive limestone
landscape
marl
landscape
sand
landscape
10
20
30
40
50
60
70
10
20
30
40
50
60
70
10
20
30
40
50
60
70
Nu
mb
er
of
sp
ecie
sHabitat type Intensity of agriculture Landscape type
P M T H I N
Fig. 1.3: Box plot of α-diversity (species richness on 200m²), each box represents 45 samples
P-H M-H T-H P-I M-I T-I P-N M-N T-N
10
20
30
40
50
60
70
Nu
mb
er
of
sp
ecie
s
intensive intermediate extensive
inside field margin embankment inside field margin embankment inside field margin embankment
Fig. 1.4: Box plot of the interaction of habitat type and intensity of agriculture on the α-diversity, each box represents 15 samples, P-inside field, M-margin, T-embankment, H-intensive, I-intermediate, N-extensive agriculture.
The inspection of the interaction plot between habitat type and intensity of agriculture (Fig.
1.5) shows, that the differences in α-diversity between the three habitats become more
marked with increasing intensity of agriculture.

Chapter 1 Plant diversity in agro-ecosystems
64
Tab. 1.3: Synthesis of analyses of variance on the vineyard scale absolute and relative β1-diversity; βTM: β-diversity between margin and embankment plots, βMP: β-diversity between margin and inside of vineyards.
Factor Degree of freedom F P
βMP on intensity of agriculture 2 1.42 0.2529
Residuals 42
βMP on landscape class 2 3.99 0.0257 *
Residuals 42
βTM on intensity of agriculture 2 1.75 0.1853
Residuals 42
βTM on landscape 2 5.06 0.0107 *
Residuals 42
%βMP on intensity of agriculture 2 6.50 0.0034 **
Residuals 42
%βMP on landscape class 2 0.29 0.7436
Residuals 42
%βTM on intensity of agriculture 2 2.88 0.0668 ˙
Residuals 42
%βTM on landscape 2 1.19 0.3128
Residuals 42
20
30
40
50
60
70
20
30
40
50
60
70
65
70
75
80
85
90
95
65
70
75
80
85
90
95
20
30
40
50
60
70
20
30
40
50
60
70
55
60
65
70
75
80
85
55
60
65
70
75
80
85
%βMP
intensive interm. extensive limestone marl sandagriculture landscape type
intensive interm. extensive limestone marl sandagriculture landscape type
intensive interm. extensive limestone marl sandagriculture landscape type
intensive interm. extensive limestone marl sandagriculture landscape type
%βMPβMPβMP
%βTM %βTMβTMβTM
Fig. 1.5: Box plot of absolute (left) and relative (right) β-diversity, each box represents 15 samples; βTM: β-diversity between margin and inside of vineyards (above), βMP: β-diversity between margin and embankment plots (below).
The analysis of β-diversity at the vineyard scale (Tab. 1.3, fig. 1.5) reveals that landscape class
had a significant effect on absolute β-diversity for both habitat contrasts, i.e. margin to inside
field plots (βMP) and margin to embankment plots (βTM). Intensity of agriculture had no effect
on absolute β-diversity. However, inspecting the analysis of relative β-diversity shows that
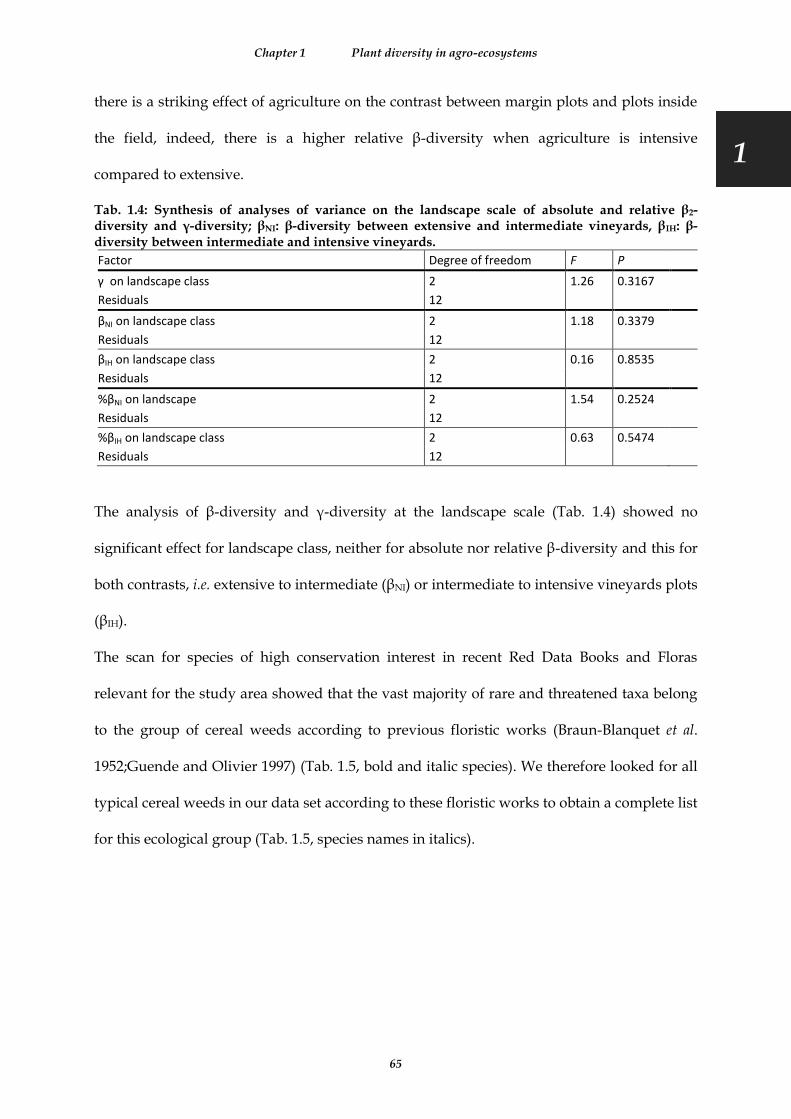
Chapter 1 Plant diversity in agro-ecosystems
65
5
1
there is a striking effect of agriculture on the contrast between margin plots and plots inside
the field, indeed, there is a higher relative β-diversity when agriculture is intensive
compared to extensive.
Tab. 1.4: Synthesis of analyses of variance on the landscape scale of absolute and relative β2-diversity and γ-diversity; βNI: β-diversity between extensive and intermediate vineyards, βIH: β-diversity between intermediate and intensive vineyards.
Factor Degree of freedom F P
γ on landscape class 2 1.26 0.3167
Residuals 12
βNI on landscape class 2 1.18 0.3379
Residuals 12
βIH on landscape class 2 0.16 0.8535
Residuals 12
%βNI on landscape 2 1.54 0.2524
Residuals 12
%βIH on landscape class 2 0.63 0.5474
Residuals 12
The analysis of β-diversity and γ-diversity at the landscape scale (Tab. 1.4) showed no
significant effect for landscape class, neither for absolute nor relative β-diversity and this for
both contrasts, i.e. extensive to intermediate (βNI) or intermediate to intensive vineyards plots
(βIH).
The scan for species of high conservation interest in recent Red Data Books and Floras
relevant for the study area showed that the vast majority of rare and threatened taxa belong
to the group of cereal weeds according to previous floristic works (Braun-Blanquet et al.
1952;Guende and Olivier 1997) (Tab. 1.5, bold and italic species). We therefore looked for all
typical cereal weeds in our data set according to these floristic works to obtain a complete list
for this ecological group (Tab. 1.5, species names in italics).

Chapter 1 Plant diversity in agro-ecosystems
66
Tab. 1.5: List and status of typical cereal weeds found among 359 species of this study; species of high conservation value are marked in bold; indented: all other species of high conservation value that are not cereal weeds. Status: (1) Roux & Nicolas (2001): 2, threatened; 3, rare; 5, quite rare but not threatened; 6, neither rare nor threatened; (2) Filosa & Verlaque (1997); (3) Jauzein (1995): AC – quite common; AR – quite rare; R – rare; TR – very rare; * special conservation efforts would be beneficial; (4) Montégut (1997).
Species Vaucluse (1) Western Provence (2) France (3) France (4) Frequency
Adonis annua 5 threatened R* decreasing 4 Adonis flammea 5 threatened common R* rare 2 Allium rotundum
R*
1
Anthemis altissima
1 Anthemis arvensis
22
Bunias erucago
12 Caucalis platycarpos
less threatened AR decreasing 3
Ceratocephalus falcatus 5 threatened common R very rare 2 Cnicus benedictus 5 threatened AR rare 3 Euphorbia falcata
5
Fumaria parviflora
AC decreasing 3 Galium tricornutum
less threatened AR decreasing 4
Gladiolus italicus
14 Hypecoum pendulum 2 rare & threatened TR*
1
Iberis pinnata
threatened AR
1 Legousia hybrida
threatened AR
3
Lithospermum arvense
10 Medicago coronata 5
TR
1
Orlaya intermedia 3 threatened common R
2 Papaver argemone
threatened common AC decreasing 4
Papaver dubium
14 Papaver hybridum
threatened common AR decreasing 1
Papaver rhoeas
52 Polycnemum majus
1
Ranunculus arvensis
7 Roemeria hybrida 3
TR* rare 2
Salsola kali 5
TR
3 Scandix pecten-veneris
1
Sclerochloa dura
TR*
3 Valerianella coronata
4
Velezia rigida 3
TR* decreasing 1 Vicia narbonensis 3
1
Vicia pannonica
21 Vicia peregrina
AR decreasing 15
Viola arvensis
1
The analysis of the α-diversity of cereal weeds in vineyards using the stratification of plots
and the data on historical land use (Fig. 1.6) shows a higher number of cereal weed species
on the embankment and margins of the vineyards than inside. More cereal weed species
have been found in extensively managed vineyards than in intensive ones. There is a
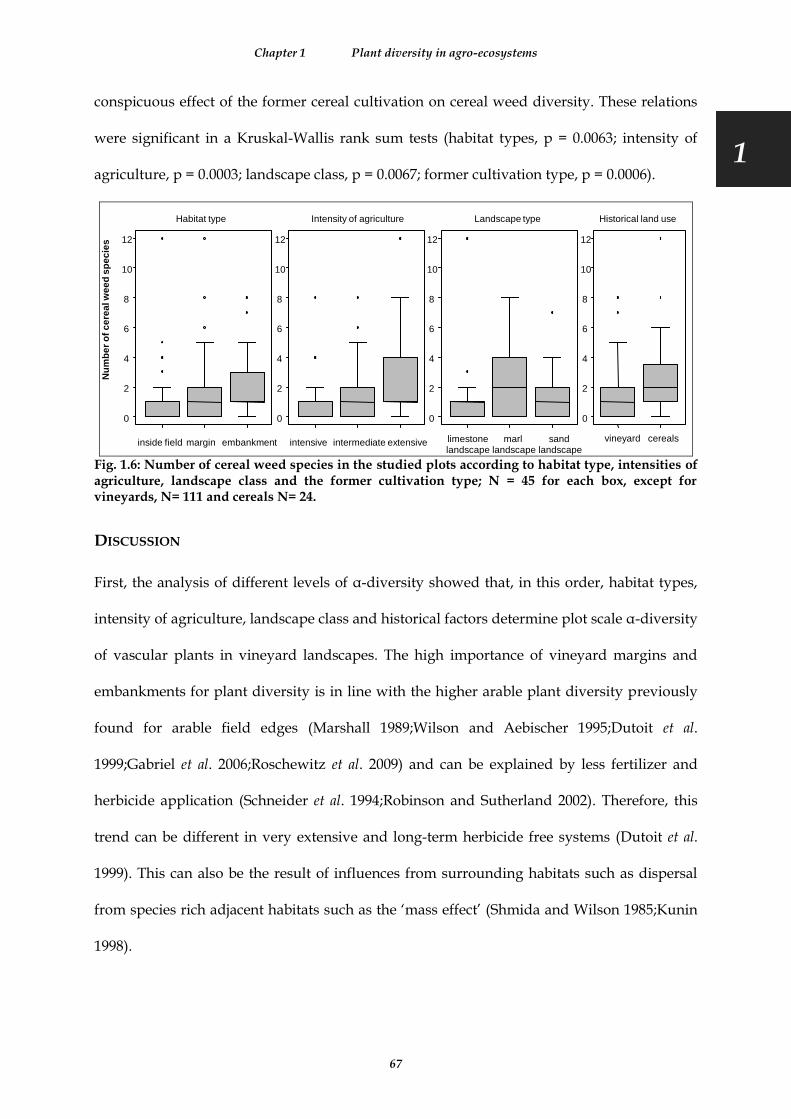
Chapter 1 Plant diversity in agro-ecosystems
67
5
1
conspicuous effect of the former cereal cultivation on cereal weed diversity. These relations
were significant in a Kruskal-Wallis rank sum tests (habitat types, p = 0.0063; intensity of
agriculture, p = 0.0003; landscape class, p = 0.0067; former cultivation type, p = 0.0006).
Nu
mb
er
of
ce
rea
l w
ee
d s
pe
cie
s
inside field margin embankment intensive intermediate extensive limestonelandscape
marllandscape
sandlandscape
Habitat type Intensity of agriculture Landscape type
0
2
4
6
8
10
12
0
2
4
6
8
10
12
0
2
4
6
8
10
12
0
2
4
6
8
10
12
Historical land use
vineyard cereals
Fig. 1.6: Number of cereal weed species in the studied plots according to habitat type, intensities of agriculture, landscape class and the former cultivation type; N = 45 for each box, except for vineyards, N= 111 and cereals N= 24.
DISCUSSION
First, the analysis of different levels of α-diversity showed that, in this order, habitat types,
intensity of agriculture, landscape class and historical factors determine plot scale α-diversity
of vascular plants in vineyard landscapes. The high importance of vineyard margins and
embankments for plant diversity is in line with the higher arable plant diversity previously
found for arable field edges (Marshall 1989;Wilson and Aebischer 1995;Dutoit et al.
1999;Gabriel et al. 2006;Roschewitz et al. 2009) and can be explained by less fertilizer and
herbicide application (Schneider et al. 1994;Robinson and Sutherland 2002). Therefore, this
trend can be different in very extensive and long-term herbicide free systems (Dutoit et al.
1999). This can also be the result of influences from surrounding habitats such as dispersal
from species rich adjacent habitats such as the ‘mass effect’ (Shmida and Wilson 1985;Kunin
1998).
Chapter 1 Plant diversity in agro-ecosystems
68
Second, we observed a decline in α-diversity with increasing intensity of agriculture. This is
an important result from a conservation point of view, because for intensive vineyards in
non-ploughing systems even higher diversity has been predicted previously (Maillet 1992).
However, practices in vineyards changed since that work was published and have become
more diverse. A similar decrease as the one here is documented for α-diversity (and γ-
diversity in small scale studies) between organic and conventional fields (Hald
1999;Hyvönen et al. 2003;Gabriel et al. 2006;Roschewitz et al. 2009). The α-diversity in this
study corresponds to γ-diversity in certain other studies due to the coarse scale we used
here. This decline has similar reasons (i.e. less or no herbicide applications) as the decline
from field edges to centre in the extensive vineyards studied here -an important reason for
species decline in agro-ecosystems (Schneider et al. 1994;Robinson and Sutherland 2002).
There are also differences at the landscape scale. The ‘marl landscape’ with the highest α-
diversity is richer in non-arable land and has a higher and more diverse land use, where
vineyards are little represented. The low diversity ‘limestone landscape’ is completely
dominated by vineyards with a very low part of other habitats. The higher diversity in a
more diverse landscape can be explained by easy dispersal from a huge local species pool
resulting from many different habitats. Maillet (1992) already showed that potentially a large
part of the regional flora can grow in vineyards, hence recruitment limitation may not be the
major determinant. There is considerable evidence now of the importance of species pools
for local species diversity (Zobel 1997;Pärtel 2002;Zobel et al. 2006) and the importance of
dispersal limitation for local diversity (Ehrlen and Eriksson 2000;Coulson et al. 2001;Poschlod
and Biewer 2005;Zobel et al. 2006).
Rare and threatened taxa, future targets for conservation efforts could be revealed by a scan
of our species list using Floras, Red Data Books and floristic works (Girerd 1991;Jauzein
1995;Verlaque and Filosa 1997;Montégut 1997;Roux and Nicolas 2001). This showed that
most species of high conservation value are known to be cereal field specialists, an

Chapter 1 Plant diversity in agro-ecosystems
69
5
1
astonishing result for vineyards. The analysis of their diversity in the same schemes as the
entire flora showed that they are influenced by the same factors as α-diversity of the entire
flora, a finding that is not supported by other works in agro-ecosystems (Roschewitz et al.
2009). The analysis of recent historical factors such as cereal cultivation, complemented the
interpretation of this species group of conservation interest: the highest number of cereal
weeds are found on vineyards with recent cereal cultivation and show the persistence of
these species after land use changes.
The absolute β-diversity among different habitats in vineyards was influenced by landscape
class and intensity of agriculture. The landscape class modified the absolute β-diversity
between the different habitats of field margin and centre and field margin and embankment;
in marl landscape the floristic differences among these habitats are greater than in e.g.
limestone landscapes. There is no effect of landscape class on relative β-diversity; this
indicates that it is due to supplementary species added in one habitat, creating difference by
the higher number of specialist species rather than by sharp differences in composition
without additional species in one of the compared habitats. The importance of dispersal
limitation and species pool concept (Shmida and Wilson 1985;Zobel 1997;Kunin 1998;Pärtel
2002;Zobel et al. 2006) explains how richer structured landscapes can provide more species to
fit into different habitats than monotonous landscapes, as also reported elsewhere
(Roschewitz et al. 2009). This enhances the diversity of the vineyard in general, so the part of
β-diversity on γ-diversity, that is, the relative β-diversity, may not be higher; this is indeed
what we could show here. The change of absolute β-diversity according to the characteristics
of the surrounding landscapes questions the concepts of transition zones between adjacent
communities via the distinction of ecotones and ecoclines. According to the landscape type,
the presence of specialised species in the transition between to different habitats changed
here making the definitions according to van der Maarel (1990) or Frochot (1987) dependent
on characteristics outside the system and not on characteristics of the transition system itself.
Chapter 1 Plant diversity in agro-ecosystems
70
It would be a challenge to follow up more tightly the consistency of these definitions in
landscapes with contrasting diversity.
The relative β-diversity was modified by intensity of agriculture, with a higher relative
difference in intensively managed vineyards than in extensive vineyards. This is the opposite
situation to the effect of landscape class on β-diversity: in intensive vineyards, the floristic
differences between centre, margin and embankment of vineyards are sharp, whereas in
extensive vineyards species of the embankment and margin are also present inside the
vineyard. Similar findings are known from arable fields (Marshall 1989;Wilson and
Aebischer 1995;Gabriel et al. 2006). The analysis of α-diversity discussed above is
complementary for the understanding in this context: intensive fields have much less species
than extensive. This means that only very few specialised species can maintain populations
in the centre of intensive vineyards and therefore this vegetation is quite different from the
surroundings. The low diversity of these fields does not increase the total number of species,
hence we did not observe a difference in absolute β-diversity, similar to studies from arable
fields (Gabriel et al. 2006;Roschewitz et al. 2009). In the light of this findings, it is not
astonishing that the different landscape classes had no effect on higher level β-diversity
contrasting vineyards of different intensity of agriculture, to few species withstand the
intensive treatments and intensive agriculture fails to add relevant plant diversity at higher
scales. Therefore, extensive agriculture can be advised in order to enhance diversity at larger
scales (Gabriel et al. 2006).
CONCLUSION
Considering ecosystem services which depend on a rich flora (Sotherton 1984;Eliott et al.
1998;van Emden 2002;Schmidt et al. 2003;Gibson et al. 2006), it is important to notice that the
enhanced relative β-diversity in intensive systems does not mean more species and hence
has no effect. Extensive systems offer the necessary increased diversity and have also effects

Chapter 1 Plant diversity in agro-ecosystems
71
5
1
beyond the study system itself e.g. by providing pollinators (Gabriel and Tscharntke 2007). It
is also interesting to consider surroundings, it can indeed be argued that the higher diversity
in richly structured landscapes enhances ecosystem services, directly by higher levels in the
field (Sotherton 1984;Eliott et al. 1998;van Emden 2002;Schmidt et al. 2003) or by higher
species richness in surrounding habitats (Thomas and Marshall 1999;Smith et al. 2008). We
could show that α-diversity and absolute β-diversity are higher in some landscape classes. It
is therefore likely that there are differences in levels of services according to landscape
classes. Gibson et al. (2006) showed that these services can have an impact on some rare
species via their pollination mode. Therefore, no doubt remains that from the conservation
point of view the less intense the agriculture is the more diverse the flora is and the better
and longer rare and threatened species are maintained.

72

73

74
TRANSITION CHAPTER 1 TO 2
From community diversity to the meaning of soil seed bank
longevity
The chapter 1 we evaluated the importance of different factors for the outcome of diversity in
plant communities in agro-ecosystems. Different factors constrain diversity, some of them
are anthropogenic like land use – resulting in different habitat structures or in fields of
different intensities -others are of physical geographical origin or related to spatial structure
such as coarse or fine grained habitats in different landscape types. Finally, history of
communities such as past land-use can explain important parts of diversity, such as for
example the presence of threatened and rare species. These target species are at the same
time influenced by actual land use which is in itself directionally changing –from traditional
to industrialised agriculture- but bears also yearly climatic and several year crop cycles
which in contrast create temporally predictable changes.
Annual plants are those plants that cope best with this set of interfering disturbances that can
be temporally predictable or not. A key aspect why annuals persist in these communities is
their persistence in the form of seeds. Therefore, soil seed bank persistence attracted the
interest of naturalists (Darwin 1859) and agronomists (Beal 1885) and later also conservation
biologists (van der Valk and Pederson 1989;Bakker et al. 1996b;Willems and Bik 1998;von
Blanckenhagen and Poschlod 2005;Bossuyt and Honnay 2008) leading to different methods
and measures of soil seed bank persistence. The different methods differ largely in meaning
and quality of data produced (Thompson et al. 1997). Before key aspects of soil seed bank
ecology, such as soil seed bank persistence can be studied, it has to be checked which
methods are sufficiently accurate and unbiased and what should be sampled and defined as
soil seed bank.

Transition 1-2
75
1
2
In chapter 2, we study the accuracy and meaning of the most largely used method, which
uses count and identification of seedlings emerging from soil samples and one widespread
index, the longevity index (L.I.). This chapter contrasts experimental seed decay from
conditions very close to the target community to data from literature coming from seedling
emergence from soil samples. Then we follow up what meaning the seedling emergence
method has. We check for relations between seed persistence gathered by this method and
seed production for a large set of species. Then we discuss this in the light of the seed size
seed number trade-off and its importance for above ground populations.

76

Chapter 2 Seed bank longevity revisited
77
5
2
CHAPTER 2
The seed bank longevity index revisited - limited reliability
evident from a burial experiment and database analyses
(Annals of Botany 104: 715–724, 2009)
INTRODUCTION
Soil seed banks are a key to understanding the dynamics of plant populations, species and
ecosystems (Silvertown 1982;Kalisz 1991;Kalisz and McPeek 1992;Günter 1997;Cabin et al.
1998;Bekker et al. 1998b). Notably, seed persistence in soil has been shown to be an important
correlate of population persistence (Stöcklin and Fischer 1999;Rees and Mills 2002). The
importance of high seed survival in soil seed banks to ensure persistence of local populations
has also been demonstrated in theoretical models (Pake and Venable 1995;Pake and Venable
1996). Species coexistence in communities is enhanced by the ‘storage effect’ of seeds
(Chesson and Warner 1981;Warner and Chesson 1985;Levine and Rees 2004;Facelli et al.
2005). Thus, seed bank attributes such as seed persistence or survival account for a
considerable part of diversity of plant communities via coexistence and may be one of the
traits corresponding to α-niche differentiation (Silvertown et al. 1999;Silvertown et al. 2006).
Additionally, it has been shown that soil seed banks are important for community
composition in open and highly disturbed habitats (Thompson et al. 1997;Hopfensberger
2007) and on a smaller scale for bare soil communities in particular habitats (Peco et al.
1998;Wellstein et al. 2007). This explains the substantial practical use of soil seed banks for
restoration of these communities (van der Valk and Pederson 1989;Bakker et al. 1996b). The
correct identification of transient, short- and long-term persistent species and levels of seed
survival is therefore crucial for the feasibility and success of restoration efforts for plant
communities (Poschlod 1993;Hutchings and Booth 1996;Willems and Bik 1998;Dutoit et al.

Chapter 2 Seed bank longevity revisited
78
2003;von Blanckenhagen and Poschlod 2005) and populations (Adams et al. 2005), and for
understanding the maintenance of rare species in man-made ecosystems. Evidently, the same
is true for more basic questions on vegetation and population dynamics as well as on species
coexistence.
There are various methods to study soil seed bank persistence of seeds, which can be
classified into: (i) direct age determination by C14-dating (McGraw et al. 1991;Moriuchi et al.
2000) (McGraw et al., 1991; Moriuchi et al., 2000); (ii) burial experiments of seeds and
subsequent testing of germinability or viability (Telewski and Zeevart 2002); (iii)
determination of the depth distribution of germinable seeds in the soil (Bekker et al. 1998a);
(iv) determination of soil seed banks along successional seres (Poschlod et al. 1998;Wäldchen
et al. 2005); and (v) comparative analysis of seasonal dynamics of seed rain and seed bank
(Thompson and Grime 1979;Poschlod and Jackel 1993). However, the methods are not
equivalent with respect to quality of results. Whereas methods (i) and (ii) accurately identify
soil seed bank survival, methods (iii) to (v) produce results, which are not accurate for
several reasons. First, they may be affected by seed input – only species, which are frequent
and/or have a high seed production will be found. Second, the results of using depth
distribution will depend on the importance of soil movement and disturbances. Finally,
methods (iii) to (v) are based on the so-called seedling emergence method, where soil
samples are exposed to ‘favourable’ conditions for germination in order to identify and
count seedlings. Since ungerminated but viable seeds are not quantified, levels of dormancy
can influence the results of these methods. For data from the indirect methods (iii to v) based
on seedling emergence we use the term ‘seed bank persistence’ and for direct measures
coming from burial experiments (ii), we use the term ‘soil seed survival’.
Methods that determine seed survival (i and ii) are expensive and time consuming, therefore
Thompson et al. (1998) proposed the calculation of a ‘longevity index’ (LI) which summarises
seed bank persistence and soil seed survival data from different studies (methods ii to v) for

Chapter 2 Seed bank longevity revisited
79
5
2
a species and is measured on a continuous scale. LI is the proportion of the number of
records in a database that report species as having a persistent seed bank relative to all
records, including those classifying the species’ seed bank as transient. LI is now widely used
in fundamental ecological studies when a single continuous value is needed to describe the
soil seed bank type for a given species, e.g. to study ecological correlates of seed bank
persistence at species (Thompson et al. 1998;Hodkinson et al. 1998) and community levels
(Thompson et al. 1998) or even searching trade-offs to other traits (Ozinga et al. 2007).
For several local floras, the use of seedling emergence data to determine soil seed bank
persistence has revealed that persistent seeds tend to be smaller, more compact, dormant
and dependent on light for germination, while transient seeds are larger, often elongated or
bear appendages. (Thompson and Grime 1979;Thompson et al. 1993;Bekker et al. 1998a;Moles
et al. 2000;Cerabolini et al. 2003;Peco et al. 2003;Funes et al. 2007). In contrast no seed size -
seed longevity relation was demonstrated for the Australian flora by Leishman and Westoby
(Leishman and Westoby 1998), who used dormancy patterns to estimate soil seed bank
persistence.
The seedling emergence method to study seed bank persistence, can, even in intensive
studies, fail to pick up species with short dispersal distance, short seed shedding period or
short germination season and with primary dormancy (Thompson and Grime, 1979). Indeed,
Bakker et al. (1996) and Thompson et al. (1997) have already pointed out that rare species can
be absent in seed bank studies even if the species is present in the above ground vegetation
and although its seed bank may be persistent. These aspects raise the question whether seed
bank persistence measured by seed counts from soil seed samples is reliable, and thus
correlated to, independent measures of seed longevity, such as soil seed survival in burial
experiments.
It is widely acknowledged that seed size is related to seed production by a fundamental
trade-off (Shipley and Dion 1992;Jakobsson and Eriksson 2000;Turnbull et al. 2000). High
Chapter 2 Seed bank longevity revisited
80
seed production enhances dispersal efficiency (Tackenberg et al. 2003;Poschlod et al.
2005;Bruun and Poschlod 2006) and it has also been suggested to increase seed bank
persistence (Thompson 2000). Surprisingly, this has never been tested directly and it has not
been asked if the different measures of seed bank persistence all relate to levels of seed
production. This is especially interesting because the trade-off supposes that many small
seeds are equally efficient for reproduction as few large seeds. The latter compensate for
their lower number at other life stages, beginning with the seedling (Leishman et al.
2000b;Moles et al. 2004). In order to understand population dynamics and community
diversity it is important to distinguish between number and survival of seeds, and to know
whether seed bank persistence estimates can be influenced by seed number. Seed production
influences seed rain (Jackel and Poschlod 1994), therefore we can hypothesise that it also
influences seed bank persistence estimates which are based on seedling emergence from soil
samples but not so for soil seed survival.
The understanding of soil seed bank persistence is based primarily on works from arable
fields since they contribute a large part of available data (Thompson et al. 1997). The
difficulty of detecting rare species in seed bank studies using soil samples (Bakker et al.
1996a;Thompson et al. 1997) means that the work of conservation biologists is hampered by
the lack of reliable information on the longevity of seeds for the rarest arable weed species
(Schneider et al. 1994;Wäldchen et al. 2005). Thus, rare arable weeds are ideal candidates to
study the importance of seed counts in soil samples for the estimation of seed bank
persistence together with data on seed survival from burial experiments. For these reasons
and because annuals depend on long-term persistent soil seed banks for their persistence, we
explicitly studied a mixed set of rare and more common annual arable weeds in an
experimental study (Appendix 1) and more generally in a wide set of habitats and species.
Our questions were studied using two different approaches. First, we used an ‘experimental
approach’ (i) to gather reliable data on survival of seed in the soil for a quantified seed

Chapter 2 Seed bank longevity revisited
81
5
2
population. This experiment was complemented by an analysis of seed production and seed
bank persistence from literature for the same species to (ii) answer the question on the
reliability of seed bank persistence estimated by seedling emergence from soil samples in the
light of experimental soil seed survival and to (iii) explore whether experimental soil seed
survival is related to seed production.
In a second ‘data base approach’, we studied further the questions (ii) and (iii) in a more
general way using databases on a wider set of species. This allowed us (iv) to analyse
whether published soil seed survival data from burial experiments show a relation to
literature data on seed production and (v) to determine whether the longevity index based
on published burial experiments and seed production from literature are related.
MATERIALS AND METHODS
(1) Experimental approach
Study system
Annual arable weeds were chosen as the study system because of the well-known
interspecific differences in seed bank persistence and their short life cycle, making them
heavily dependent on mortality in the seed bank. A burial experiment was carried out at
Cucuron (43°46’5’’N, 5°21’2’’E, South Eastern France). The surrounding agricultural
landscape in the Luberon area was chosen as our study region because, here, traditional
agriculture has maintained a high diversity of rare arable weeds that are extinct elsewhere in
Europe. This region is characterised by Mediterranean climate (autumn rain and summer
drought).
Seed material was collected in the study region between June and September 2005. For each
species, ripe seeds were taken from at least ten individuals of a single large population and
mixed. Seed material was stored under dry conditions in paper bags until October 2005,
when we started the burial experiment and the initial viability test. We cannot exclude a loss

Chapter 2 Seed bank longevity revisited
82
of viability or a loss of dormancy due to after-ripening because seeds were not studied
directly after harvesting (Baskin and Baskin 1998). However, this is what normally happens
under Mediterranean climate, where seeds after-ripen in dry summer and germinate in
autumn after the first rains or after ploughing (Baskin and Baskin 1998). Every seed sample
was randomly taken from a single well-mixed seed lot.
Experimental design of the burial experiment
A burial experiment was set up using 38 annual arable weed species (Appendix 1), for which
seed samples were buried for at maximum 2.5 years. Viability was tested every 6 months to
capture the two main germination periods, in autumn and spring. The burial experiment was
done in young fallow land with no disturbance during the time of the experiment. The seed
samples were divided into 30 sub-samples with 25 to 50 seeds for most species (see
Appendix 1). For each species, five samples were assigned at random to each of five retrieval
dates (t1-t5), and five samples were kept for the initial test (t0). The experiment was set up as
a randomised block design with each block containing groups of samples for each of five
time intervals (t1-t5), placed at random in the block (Fig. 2.1).
T 5
T 1
T 3
T 4
T 2
T 4
T 2
T 3
T 1
T 5
T 5
T 4
T 2
T 3
T 1
T 1
T 2
T 5
T 4
T 3
T 5
T 3
T 1
T 4
T 2
Block 1 Block 2 Block 3 Block 4 Block 5
2 m
0.4 m
Detail with mesh bags for 38 species in atime replicate
Fig. 2.1. Experimental layout: position of blocks, time step replicates (T1-T5) and mesh bags for each species inside blocks.
Each of these time step groups contained 38 nylon mesh bags, one for each of the 38 species.
Samples were buried at 10 cm depth. At each retrieval date, one group of 38 mesh bags per
block was removed and studied in the laboratory. Seeds were retrieved twice a year: in
spring (t1, t3, t5) and in autumn (t2, t4); the initial test (t0) was done in autumn 2005. In the

Chapter 2 Seed bank longevity revisited
83
5
2
burial experiment, 39 400 seeds were buried, and an additional 7 880 seeds were tested in the
initial test. In all tests, 9 802 seeds germinated in the three germination test phases (see
below), 16 574 ungerminated seeds were tested after the germination tests for viability using
a tetrazolium test and 20 897 seeds presumably died during burial. The burial experiment
was started in October 2005 and the last tetrazolium tests were finished in September 2008.
Testing experimental seed survival in the burial experiment
Germinability was tested using a sequence of germination conditions standardised for all
seed retrieval dates. After seeds were exhumed, the empty seeds were counted. These were
apparent by their shape or colour or being soft when pressing them with a needle (Ter
Heerdt et al., 1996). Firm seeds were then incubated at 22°C for 14h in light (fluorescent
tubes, ±10 000 lux) and at 14°C for 10h in darkness in a growth chamber on moist filter
paper. After 28 days, seeds were cold stratificated for 6 weeks at 4°C in darkness. Seed
samples were then again subjected to 22°/14°C (14h/10h) for 28 days. Positions of Petri
dishes were randomised in the growth chamber. Seeds were counted as they germinated and
discarded when the tip of radicle emerged.
Seeds that did not germinate were tested for viability with tetrazolium chloride
(International Seed Testing Association 1996). Seeds of Consolida regalis, Legousia hybrida and
Legousia speculum-veneris stained well without previous bisection. Seeds of Papaver rhoeas, P.
argemone, P. hybridum and Roemeria hybrida did not stain in the tetrazolium test. However, the
embryos were firm and white, and thus the seeds were classified as viable. In some cases (e.g.
Adonis annua; morphological dormancy in Ranunculaceae), a very small, underdeveloped
embryo made the use of tetrazolium impossible in the first stages of the experiment. Thus,
we used the highest number of viable seeds (germinable + dormant) detected from a later
seed retrieval date as the initial number of living seeds.

Chapter 2 Seed bank longevity revisited
84
Compiling seed bank persistence estimates from literature: the longevity index
The longevity index for the species in the burial experiment was calculated using literature
data. Thus, we compiled a database using the entries for our species in Thompson et al.
(1997), and results of a survey of the recent literature. Records on seed bank persistence were
classified into one of the following soil seed bank types Thompson et al. (1997):
1 Transient species persist for less than one year
2 Short-term persistent seeds to persist living for more than one but less than five years
after dispersal; and
3 Long-term persistent seeds persist viable in the soil for at least five years.
The longevity index (LI) was calculated for each species (Thompson et al., 1998):
(1) LI = Rsp + Rlp
Rt + Rsp + Rlp
Where LI is the proportion of the number of records (R) classifying a species as short (sp) and
long term persistent (lp) to the sum of all records, including the number of transient records
(Rt) for a given species. Initially we used all types of data. We then wanted to test if data
from seedling emergence from soil samples changed the reliability of LI, so we used only this
data. Due to limited data in the literature on our initial 38 species, we only had LI values for
26 species using all data and for 21 species using only data from seed bank persistence
estimates by seedling emergence from soil samples.
Seed production
Seed production was determined for the 38 species, i.e. mean individual seed production of
10 individuals in the field. Some species had multi-seeded fruits (e.g. Papaver sp. pl.), others
had many fruits per infructescence (e. g. Apiaceae), therefore we counted the number of
fruits or infructescences per individual for these species. Then the number of seeds per fruit
or infructescence was counted in two fruits or infructescences. Seed production per

Chapter 2 Seed bank longevity revisited
85
5
2
individual was calculated as the mean number of seeds per fruit or infructescence multiplied
by the number of fruits or infructescences counted per individual.
(2) Database approach
Data on seed bank studies
A second approach compared seed bank persistence with seed production and completed
our (necessarily) limited data set on arable weeds. Here, we explored a larger database on
seed bank studies (i.e. Thompson et al., 1997), together with another published database on
seed production in the field (Šera and Šery 2004). We extracted all species for which there
were data on both seed bank persistence and on seed production. The database of Thompson
and co-workers (1997) includes a large number of seed bank studies using seedling
emergence from soil seed samples and a relatively small number of burial experiments. Each
record included information on the seed bank type for the species (transient, short or long-
term persistent) according to the key in Thompson et al. (1997). We subdivided the data into
those from seed burial experiments and data from seedling emergence studies. For the latter,
only species with at least five entries were used (Thompson et al., 1998). For burial
experiments, all species were used because seed bank type is more reliable with this method.
LI was calculated for all species in both subsets as explained above.
Data on reproductive capacity
Šera and Šery (2004) measured reproductive capacity by counting seeds per surface of
sampled vegetation and using cover percentages of a species to calculate the potential seed
production of a species at 100% cover; they provide data for 492 species. For 227 of these
species there were seed bank data using the seedling emergence method and 174 species
with data from burial experiments in the database of Thompson et al. (1997). Five of these
species were also used in our own burial experiment.

Chapter 2 Seed bank longevity revisited
86
Statistical analysis
The data were analysed using linear regression to test relationships between continuous
parameters. All analyses were run in R statistical environment (R Foundation for Statistical
Computing 2008).
RESULTS
(1) Experimental approach
Mortality of buried seeds at the end of the experiment ranged from very high, reaching 100
% in some cases, as exemplified by Agrostemma githago, Asperula arvensis and Nigella arvensis
(Fig. 2.2, Appendix 1) to very low (down to 3.5 %) for species such as Androsace maxima,
Bupleurum rotundifolium, Adonis annua and Carthamus lanatus (Fig. 2.2, Appendix 1). Other
species had intermediate mortalities. There were marked differences in the proportion of
surviving seeds and shape of the mortality curve between species. In some cases, final
mortalities were similar but mortality curves were different, compare e.g. Nigella nigellastrum
and N. damascena in figure 2.2.
There was no relation between soil seed mortality in the burial experiment and the longevity
index of the same species (R2= 0.02, F1,25=0.58, p = 0.45; fig. 2.3). When the analysis was
restricted to LI calculated from seedling emergence from soil samples data only, we still
found no relation to experimental soil seed survival (R2= 0.02, F1,20=0.50, p = 0.49). Clearly,
seed mortality under field conditions is not related to seed bank persistence determined
using the seedling emergence method in soil seed samples. Furthermore, there was no
significant relation between individual seed production and experimental seed survival after
2.5 years (R2= 0.01, F1,36=0.46, p = 0.50). This indicates the independence of the two
parameters.

Chapter 2 Seed bank longevity revisited
87
5
2
Nigella nigellastrum
020
40
60
80
100
Turgenia latifolia
020
40
60
80
100
Asperula arvensis
020
40
60
80
100
Nigella damascena
020
40
60
80
100
Autumn
2005
Spring
2006
Autumn
2006
Spring
2007
Autumn
2007
Spring
2008
Androsace maxima0
20
40
60
80
100
Bupleurum rotundifolium
020
40
60
80
100
perc
enta
ge o
f livin
g s
eeds
perc
enta
ge o
f livin
g s
eeds
perc
enta
ge o
f livin
g s
eeds
Autumn
2005
Spring
2006
Autumn
2006
Spring
2007
Autumn
2007
Spring
2008
Autumn
2005
Spring
2006
Autumn
2006
Spring
2007
Autumn
2007
Spring
2008
Autumn
2005
Spring
2006
Autumn
2006
Spring
2007
Autumn
2007
Spring
2008
Autumn
2005
Spring
2006
Autumn
2006
Spring
2007
Autumn
2007
Spring
2008
Autumn
2005
Spring
2006
Autumn
2006
Spring
2007
Autumn
2007
Spring
2008
Fig. 2.2: Percentage survival for five retrieval dates for six representative species. Initial viability in autumn 2005 is presented as 100% to give a scale among species; the survival percentages are relative to this initial viability. Bars are standard errors.
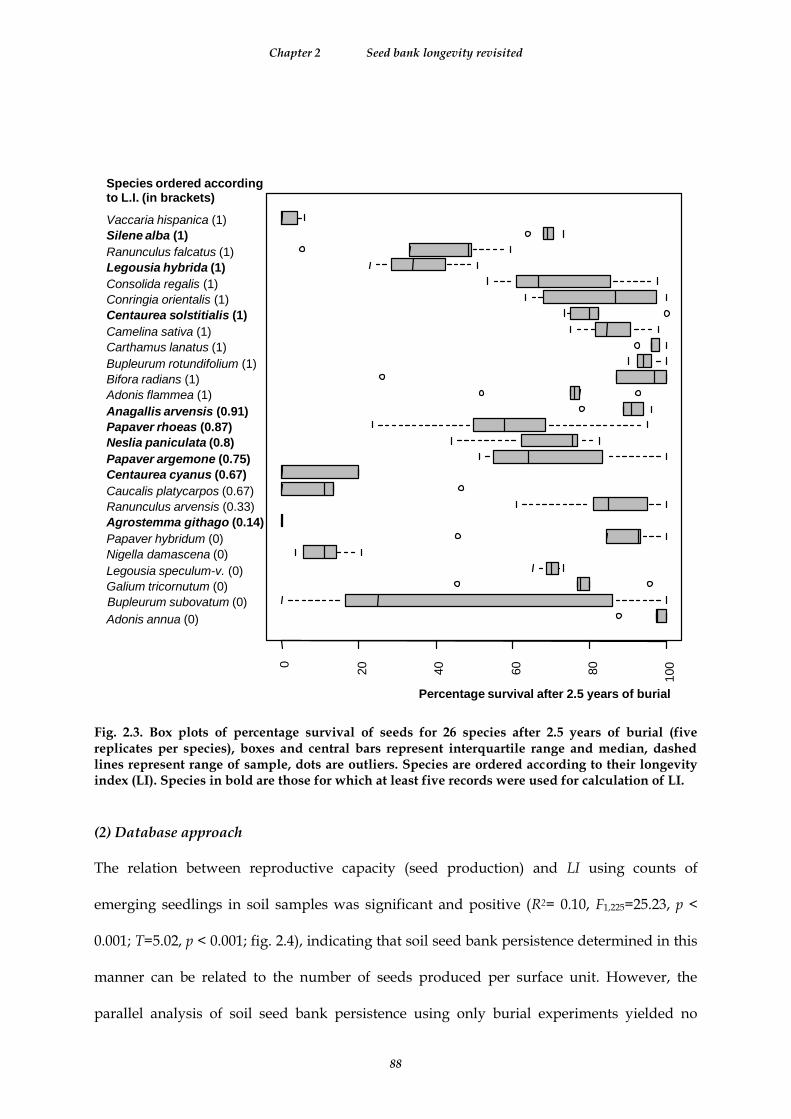
Chapter 2 Seed bank longevity revisited
88
Adonis annua (0)
Bupleurum subovatum (0)
Galium tricornutum (0)
Legousia speculum-v. (0)
Nigella damascena (0)
Papaver hybridum (0)
Agrostemma githago (0.14)
Ranunculus arvensis (0.33)
Caucalis platycarpos (0.67)
Centaurea cyanus (0.67)
Papaver argemone (0.75)
Neslia paniculata (0.8)
Papaver rhoeas (0.87)
Anagallis arvensis (0.91)
Adonis flammea (1)
Bifora radians (1)
Bupleurum rotundifolium (1)
Carthamus lanatus (1)
Camelina sativa (1)
Centaurea solstitialis (1)
Conringia orientalis (1)
Consolida regalis (1)
Legousia hybrida (1)
Ranunculus falcatus (1)
Silene alba (1)
Vaccaria hispanica (1)
Species ordered according to L.I. (in brackets)
Percentage survival after 2.5 years of burial
0
20
40
60
80
100
Fig. 2.3. Box plots of percentage survival of seeds for 26 species after 2.5 years of burial (five replicates per species), boxes and central bars represent interquartile range and median, dashed lines represent range of sample, dots are outliers. Species are ordered according to their longevity index (LI). Species in bold are those for which at least five records were used for calculation of LI.
(2) Database approach
The relation between reproductive capacity (seed production) and LI using counts of
emerging seedlings in soil samples was significant and positive (R2= 0.10, F1,225=25.23, p <
0.001; T=5.02, p < 0.001; fig. 2.4), indicating that soil seed bank persistence determined in this
manner can be related to the number of seeds produced per surface unit. However, the
parallel analysis of soil seed bank persistence using only burial experiments yielded no
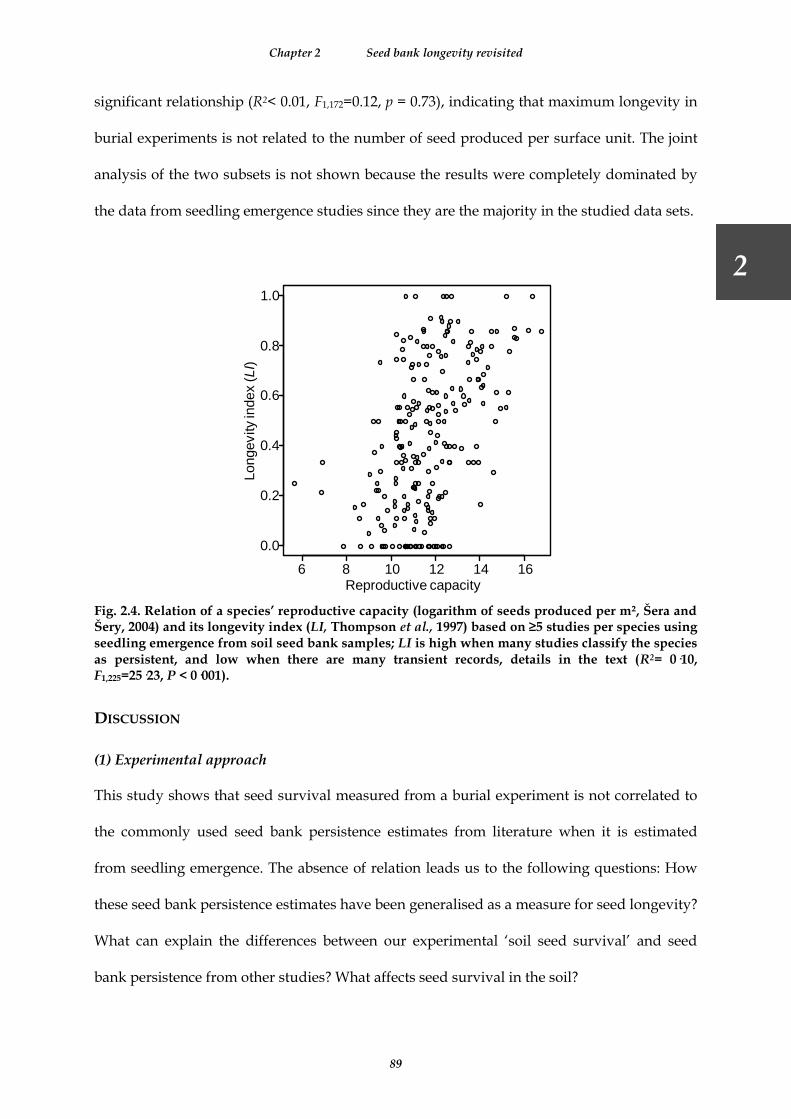
Chapter 2 Seed bank longevity revisited
89
5
2
significant relationship (R2< 0.01, F1,172=0.12, p = 0.73), indicating that maximum longevity in
burial experiments is not related to the number of seed produced per surface unit. The joint
analysis of the two subsets is not shown because the results were completely dominated by
the data from seedling emergence studies since they are the majority in the studied data sets.
6 8 10 12 14 16
0.0
0.2
0.4
0.6
0.8
1.0
Reproductive capacity
Longevity in
dex (
LI)
Fig. 2.4. Relation of a species’ reproductive capacity (logarithm of seeds produced per m², Šera and Šery, 2004) and its longevity index (LI, Thompson et al., 1997) based on ≥5 studies per species using seedling emergence from soil seed bank samples; LI is high when many studies classify the species as persistent, and low when there are many transient records, details in the text (R2= 0·10, F1,225=25·23, P < 0·001).
DISCUSSION
(1) Experimental approach
This study shows that seed survival measured from a burial experiment is not correlated to
the commonly used seed bank persistence estimates from literature when it is estimated
from seedling emergence. The absence of relation leads us to the following questions: How
these seed bank persistence estimates have been generalised as a measure for seed longevity?
What can explain the differences between our experimental ‘soil seed survival’ and seed
bank persistence from other studies? What affects seed survival in the soil?

Chapter 2 Seed bank longevity revisited
90
Bekker et al. (1998a) tested the general validity of seed bank persistence estimates based on
the depth distribution of viable seeds; they detected seeds with the seedling emergence
method. In order to show that their ‘depth derived’ method reflects soil seed longevity, they
used a database without ‘depth derived’ data. However, their database still contained many
entries using the seedling emergence method mixed with entries using seed burial
experiments. The mixture Bekker et al. (1998a) used in their validation database makes it
difficult to know whether the seedling emergence method is related to experimental soil seed
survival, and therefore it is also not clear if data from ‘depth derived’ methods are related to
experimental soil seed bank survival. There is, to our knowledge, no other analysis that
tested the generality of seed bank persistence estimated on seedling emergence from soil
samples in the light of experimental seed survival in soil.
The differences between our ‘soil seed survival’ and ‘seed bank persistence’ estimates based
on seedling emergence from soil samples can be interpreted by methodological differences.
Classically, the seedling emergence method uses 10 plots, each with 10 soil samples of 4 cm
diameter yielding a total sampled surface of just 0.125 m² to represent a community
(Hutchings 1986;Bakker et al. 1996a;Bekker et al. 2005). Thompson and Grime (1979) argued
that species with low seed production are difficult to detect in the soil seed bank even if
seeds are long-lived in the soil. Consequently, there is a strong risk of an erroneous
classification since species present in the vegetation but absent in the seed bank are classified
as transient. Especially rare species or species with low seed production are absent from
samples, although they have long-lived seeds in the soil.
In addition to this, environmental factors acting on soil seed mortality can also explain the
differences between our experimental data and literature data. For example, studies on fungi
indicate that there are differences in soil seed mortality within species related to soil
properties (Blaney and Kotanen 2001;Schafer and Kotanen 2003;Chee-Sanford et al.
2006;Wagner and Mitschunas 2007) but consider also Leishman et al. (2000a). Dry habitat

Chapter 2 Seed bank longevity revisited
91
5
2
species have higher seed mortality under moist than under dry conditions due to pathogenic
fungi attack (Blaney and Kotanen 2001;Schafer and Kotanen 2003). Thus, soil seed survival
varies greatly from one site to another for a given species and differences among sites may
contribute to the differences between our experimental data and the data from the literature.
Moreover, the conditions in our mesh-bags may not reflect conditions in natural seed banks;
this point was addressed by Van Mourik et al. (2005). This might imply that we
overestimated seed depletion, but overall we found rather high survival rates and in
addition, we did not have particularly wet conditions compared to the fields from which the
seeds originated. Furthermore marked differences in seed decay among species appeared in
our burial experiment as exemplified by figure 2.2. This suggests that our experimental seed
survival is realistic and that the seed bank persistence estimates from the literature may
reflect another aspect than only seed survival. According to suggestions of Thompson (e.g.
Thompson and Grime, 1979; Thompson 2000), seed production is a possible candidate to
influence it. However, absence of a significant relationship between seed production and
experimental seed survival in our work suggests that both are independent. We can only
draw limited conclusions with our experimental data because they represent only a single
habitat and a limited number of species.
(2) Database approach
Use of two larger databases on soil seed bank studies and on reproductive capacity from the
literature, including many species from many different habitats, explored whether
reproductive capacity is related to seed bank persistence based on seedling emergence (Fig.
2.4). The regression showed that seed production influences seed bank persistence estimates.
It is not surprising that this relation to reproductive capacity disappears when soil seed
survival from burial experiments is used, a finding confirmed by our experimental data. No
study so far has explored the relation between seed bank persistence and reproductive
capacity. This leads to the conclusion that the seed bank persistence estimates used until now

Chapter 2 Seed bank longevity revisited
92
do not only represent seed longevity but they mix both seed production and soil seed
survival. This has to be considered for all studies using the seedling emergence method
without an estimate of the total initial seed population. Furthermore, this also concerns
studies that directly count seeds in soil samples (e.g. Moriuchi et al. 2000). Here we add
empirical data showing that seed production is an important factor for the formation of a
persistent seed bank (Parker et al. 1989;Simpson 1989;Thompson 2000). Bruun and Poschlod
(2006) showed that seed production is a relevant component of dispersal through space, and
therefore, seed production may also be related to dispersal through time (also see Poschlod et
al. 2005). Our data suggest that seed production and seed mortality are two independent
processes, since there is no relation between experimental seed survival and seed
production. We think both contribute to soil seed bank formation. In contrast to seed
production, seed mass and shape have been frequently used to explain soil seed bank
formation (Bekker et al. 1998a). This should be reconsidered in the light of our findings -
which emphasise the role of seed number- and a fortiori in the light of the seed size-seed
number trade-off (Shipley and Dion 1992;Jakobsson and Eriksson 2000;Turnbull et al. 2000).
The correlation between seed production and persistence reported here suggests that size
and detectability of the soil seed bank of smaller seeds are probably in the same trade-off
with seed size than seed number. This offers a new and parsimonious explanation for the
seed size-seed bank persistence relation (Thompson and Grime 1979;Thompson et al.
1993;Bekker et al. 1998a;Moles et al. 2000;Cerabolini et al. 2003;Peco et al. 2003;Funes et al.
2007). Using the seedling emergence method, seed longevity estimates for smaller seeds (i.e.
more numerous!) are higher without a higher soil seed survival, because mechanisms that
compensate larger seeds for their lower number act after germination, at the seedling stage
(McGinley et al. 1987;Louda 1989;Jakobsson and Eriksson 2000;Leishman et al. 2000b;Coomes
and Grubb 2003;Moles et al. 2004;Pizo et al. 2006;Bladé and Vallejo 2008). This has the
consequence that species with a higher seed bank persistence estimate do not yield higher

Chapter 2 Seed bank longevity revisited
93
5
2
numbers of established plants (Hillier et al. 1990). Seed bank persistence estimates based on
seedling emergence methods are therefore potentially meaningless to explain population
persistence or community diversity.
CONCLUSION
Our results question the use of seed bank persistence estimates based on seedling emergence
in the current literature (Thompson et al. 1998;Bekker et al. 1998b;Ozinga et al. 2007). The
strong relation between seed production and seed bank persistence estimates based on
seedling emergence presented here should encourage us to carefully re-evaluate this
literature. Moreover, we think that a clear distinction between seed quantity related
parameters and seed age related ones could significantly increase our understanding of
mechanisms generating soil seed banks and give new insights to what role seed banks play
in vegetation and population dynamics.
Finally, there is a need to describe the two fundamental characteristics of soil seed banks that
are longevity and abundance in future studies. For longevity, differences in survival of seeds
between species become already apparent after 1.5 years (Fig. 2.2). A longer burial period (>
2.5 years) would confound transient and short-term persistent species because –at least in
our data- both have similar final mortalities (Fig. 2.2) and additionally would greatly limit
available data. Soil seed viability determined after only one year of seed burial does not
discriminate between transient and persistent species. We therefore propose that two
parameters should be used: (i) classes of soil seed abundance, and (ii) mean percentage
survival of seeds after 1.5 years of burial. These two parameters are independent in the
datasets studied here and represent two main factors for the formation of soil seed banks.

Chapter 2 Seed bank longevity revisited
94

95

96
TRANSITION CHAPTER 2 TO 3
From soil seed persistence measures to functional ecology of
soil seed banks
The persistence of seeds in the soil is a very important factor for the persistence of local
populations and the reestablishment of plant communities after disturbances (van der Valk
and Pederson 1989;Kalisz 1991;Kalisz and McPeek 1992;Cabin et al. 1998;Bekker et al.
1998b;Stöcklin and Fischer 1999;Bossuyt and Honnay 2008). Chapter 2 pointed out that the
widely used longevity index is connected to seed production. L.I. may thus bias our
perception of seed decay in the soil suggesting an overly high persistence of seeds of plants
with numerous seeds compared to the low experimental longevity of few large seeds. This
clearly can hamper our knowledge on seed persistence of seeds in the soil and there is a risk
that current knowledge on seed decay is biased by seed number. Notably, the functional
aspects of how seeds persist in the soil and which seed internal factors can limit persistence
must be re-evaluated. However, even without this bias, the functional ecology of soil seed
banks has many gaps of knowledge.
In the chapter 3, we complement therefore the experimental data from chapter 2 with a series
of germination experiments on the same set of species. We also make use of other seed traits
such as seed number and size. In this way, we aim to answer how seed persistence and one
of its main limits -fatal germination at the wrong time or in the wrong depth- can be
triggered by physiological and morphological adaptations of the seed. This gives also
insights which ecological conditions may be the reason for the observed phenomena.

Chapter 3 Functional ecology of soil seed bank persistence
97
3
CHAPTER 3
Functional ecology of seed persistence in the soil – insights
from germination experiments and seed traits with cereal
weeds
INTRODUCTION
Seeds are the fascinating stage in a plant life cycle that permits dispersal in space and time
and originate the regeneration of individuals and populations. Seed persistence, that is seed
dispersal through time, is one of the key aspects for maintaining population persistence and
also for plant diversity in some communities (Chesson and Warner 1981;Kalisz and McPeek
1993;Menges 2000). The germination ecology of seeds and, moreover, the formation of a
persistent soil seed bank has two fundamental evolutionary reasons: (I) delayed germination
or bet hedging of offspring under maternal control to avoid competition and maximise
fitness of the mother plants (Ellner 1986;Silvertown 1999;Venable 2007) and (II) avoid
germination under lethal or unfavourable conditions to maximise offspring fitness, which
results in dormancy and complex reactions to temperature, light, water and other factors to
detect favourable conditions (Baskin and Baskin 1989;Baskin and Baskin 1998;Silvertown
1999). Bet hedging in the form of seed banks and varying germination percentages is an
important pattern in population dynamics of annual plants (Kalisz and McPeek
1993;Venable 2007). Here, germination is the necessary end of a successful dispersal phase
and the link to plant establishment, triggered by conditional germination and dormancy.
However, germination can also be a source of seed mortality as ‘fatal germination’ at the
wrong time or the wrong position in the soil (Benvenuti et al. 2001;Fenner and Thompson
2005;Davis and Renner 2007). Indeed, seed plants developed a wide variety of adaptations to

Chapter 3 Functional ecology of soil seed bank persistence
98
avoid fatal germination especially in seasonal climates, including unexpected abilities to
detect levels of many environmental factors and dormancy (Baskin and Baskin
1998;Benvenuti 2003;Jurado and Flores 2005). Beyond simple detection of environmental
factors, dormancy prevents immediate germination even if temperature, light and water are
at optimum and it makes a specific dormancy breaking mechanism necessary to enable
germination (Baskin and Baskin 1998). Whereas primary dormancy can be short and lost
before a seed enters the soil –with the exception of physical dormancy-, the capacity to
develop secondary dormancy may be a reliable factor for seed bank formation (Baskin and
Baskin 1989). Until now, processes leading to fatal germination have received much less
attention (Fenner and Thompson 2005), some hints however indicate that depth-mediated
fatal germination is often avoided by the means of secondary dormancy (Benvenuti et al.
2001;Davis and Renner 2007). The complex changes in the dormancy state over time make it
necessary to study germination characteristics of species after burial, together with their seed
decay in the soil (Baskin and Baskin 1989;Milberg and Andersson 1998), to test the influence
on soil seed mortality of dormancy, light requirement for germination, reaction to diurnally
fluctuating temperatures (DFT) and seed traits.
Physiological dormancy and cycles of secondary dormancy have been emphasised to be the
main adaptations that permit seed bank formation (Baskin and Baskin 1989). Cycles of
secondary dormancy illustrate how species can time their germination under seasonal
climates (Milberg and Andersson 1997;Baskin and Baskin 1998;Mennan 2003). A shift from
the simple analysis of primary dormant versus non-dormant species to a more
comprehensive analysis integrating at the same time primary and secondary dormancy can
significantly enhance our understanding of interspecific differences in soil seed longevity.
Light diminishes rapidly below soil surface (Benvenuti 1995;Cussans et al. 1996). Therefore, it
has been proposed that species can form persistent seed banks if they require light for
germination (Grime et al. 1981;Baskin and Baskin 1989 and literature cited therein;Milberg et
Chapter 3 Functional ecology of soil seed bank persistence
99
3
al. 2000). A species needing light for germination does not germinate when dispersal takes
place under conditions unfavourable for germination (e.g. drought, high temperatures) and
becomes buried under soil or litter before conditions become favourable. By this means, it
can accumulate in the soil seed bank and germination takes place after disturbance when
species are brought to the soil surface or litter is removed. In parallel with secondary
dormancy, a light requirement can also be acquired by seeds germinating without light
initially (Baskin and Baskin 1989). The light requirement for germination has been related to
seed size, showing that small seeds are more heavily dependent on light for germination
(Grime et al. 1981;Milberg et al. 2000). It can also be hypothesised that larger seeds should
germinate better in darkness (from deeper depth) as predation is high for large seeded
species at the soil surface (Abramsky 1983;Hulme 1998;Moles and Drake 1999) and water and
temperature conditions are better in deeper soil layers in arid climates (Bell et al. 1995).
Diurnally fluctuating temperatures (DFT) are more extreme in large gaps than in small gaps
or under closed vegetation (Bullock 2000). Relative better germination under DFT permits
the detection of disturbances from below the soil surface; a mechanism described as ‘gap
detection’ (Thompson et al. 1977;Grime et al. 1981;Thompson and Grime 1983). Diurnally
fluctuating temperatures also offer a mechanism to detect end of flooding (Schütz 2000). In
greater soil depth, DFT are smaller than at the soil surface (Miess 1968). Thus, DFT may also
permit to detect the position of the seed in the soil profile and hence to be a predictor of soil
seed survival. To our knowledge, the relation of DFT to soil seed survival has not yet been
tested. This is astonishing as DFT are well known to prevent fatal germination under
unfavourable conditions (Bullock 2000).
Benvenuti (2007) showed that in no till systems, and for fallow lands seeds are buried
naturally at different depth according to their sizes, and this may lead to a higher degree of
dormancy and soil seed longevity of small respective to large seeds because small seeds can
only emerge from relatively shallow depths (Bond et al. 1999;Grundy et al. 2003). However,

Chapter 3 Functional ecology of soil seed bank persistence
100
there is also evidence against a strong effect of predation on the size of persistent seeds,
explaining the absence of relation between seed predation and seed size in some cases
(Kollman et al. 1998;Moles and Drake 1999). Large seeds resist better to partial predation
(Leishman et al. 2000b) and have adaptive strategies to avoid predation (Louda 1989;Lokesha
et al. 1992). Both counteract a strong seed size-seed longevity relation. The very small
negative or insignificant effect of seed size on dormancy offers no support to the view that
small seed size enhances seed persistence (Garwood 1989;Rees 1996;Leishman and Westoby
1998;Jurado and Flores 2005). Finally, seed size is related to seed production by a
fundamental trade-off (Jakobsson and Eriksson 2000;Leishman et al. 2000b;Benvenuti et al.
2001). It can therefore be argued that any relation to seed size can also be a relation that
appeared in relation with the higher number of seeds. There is thus a need to show that soil
seed survival is related to seed size, dormancy, light requirement and diurnally fluctuating
temperatures independently from seed number.
Seed traits are phylogenetically conserved (Shipley and Dion 1992). Therefore, it can be
expected that at least some of these relations have a component correlated to phylogeny. In
this case phylogenetically explicit analysis can elucidate to which degree traits are conserved
and relations are correlated to phylogeny (Harvey and Pagel 1991). Nonetheless, caution has
to be paid not to assign overly much variation to phylogeny that can equally well be
explained by ecology (Westoby et al. 1995a;Westoby et al. 1995b). The survival of seeds in the
soil seed bank is often studied on single or two species simultaneously (e.g. Leishman et al.
2000a;Mennan 2003) although comparative studies of a larger part of a flora have turned out
to be particularly informative (Grime et al. 1981;Noronha et al. 1997;Milberg et al.
2000;Thompson et al. 2003). Previous evidence, came from among species comparisons using
compiled data on soil seed persistence without simultaneous comparative studies on the soil
seed survival (Thompson et al. 2003). This can be circumvented by burial experiments that
give sound soil seed mortality data (Baskin and Baskin 2006).

Chapter 3 Functional ecology of soil seed bank persistence
101
3
In annuals the constraints on soil seed persistence are higher than in perennials but in the
same direction (Venable and Brown 1993a). Furthermore, in annuals, adaptations can more
easily be explained because for annuals, there is no competition with the mother plant. This
makes annuals an interesting model to test hypotheses on seed traits and soil seed
persistence.
Using a seed burial experiment and an experiment testing different germination ecological
characteristics, we study the relations between seed traits, germination characteristics and
soil seed survival. We tried to answer the questions: (a) Is light inhibition an important factor
for soil seed persistence? (b) Is a gap-detection mechanism risky for seed persistence? (c) Is
the level of dormancy of buried seeds related to their persistence? (d) Is final soil seed
survival explained by a factor acting equally over time or is this factor more important at a
particular period after burial? (e) Which relations are phylogenetically correlated and to
what degree?
MATERIALS AND METHODS
Study site and species
The study region is the agricultural landscape around the Luberon ridge in South Eastern
France. This region is characterised by Mediterranean climate, with rainfall peaks in October
and April followed by summer drought, and moderate frost occurs during winter (mean
rainfall 1971-2000: 623 mm/ 60 d; Salon). The beginning of vegetation period and cereal
cultivation is in October, resulting in autumn as the main germination season of herbaceous
species (Espigares and Peco 1993;1995;Baskin and Baskin 1998). Rarely, species also
germinate in winter and spring, especially in relation with disturbances (Lavorel et al. 1994).
Traditional agriculture in this area maintained a high diversity of rare arable weeds
elsewhere extinct in Europe (Filosa 1997;Aboucaya et al. 2000).

Chapter 3 Functional ecology of soil seed bank persistence
102
The selection of species focussed on 35 cereal weeds (Tab. 3.2), some regressing in the study
region (Filosa 1985;1989). Seed material was collected in the study region between June and
September 2005 for the burial experiment and between June and September 2006 for the
study on germination characteristics. Ripe seeds were taken from at least ten individuals of
one single large population and mixed before usage. Seed material was stored dry in paper
bags at conditions similar to those in field until burial in October 2005 (or until begin of
germination studies in October 2006). Every seed sample was randomly taken from a single
well-mixed seed lot.
Experimental design of the burial experiment
To test seed viability under field conditions, we set up a burial experiment using 35 of the 38
annual arable weed species. For each species, we buried 25 seed samples, enabling us to
retrieve five replicated samples for five different dates. These five retrieval times are noted t1
to t5. We retrieved and tested seeds for viability every 6 months for 2.5 years. The burial
experiment was done near Cucuron (43°46’5’’N, 5°21’2’’E). Seed retrieval took place twice a
year: in spring (t1, t3, t5) and in autumn (t2, t4), an initial viability test (t0) was run in
autumn 2005. We chose these time steps to capture the two main germination periods in
autumn and spring. The burial experiment was conducted in a fallow land with no
disturbance at the time of the experiment. Collected seed lots were sub-divided in 30 sub-
samples with a fixed number of 10, 25 or 50 seeds per sample. For each species, 25 samples
were assigned at random to one of five burial dates (t1-t5) and one of five experimental
blocks; five samples were kept for the initial test (t0). We set up a randomised block design
with five blocks. Each block contained groups of samples for each of five time steps (t1-t5),
placed at random inside the block (Fig. 3.1). Each of these time step groups contained one
mesh bag for each of 35 species. Seed samples were put in 4 x 4 cm nylon mesh bags and
buried at 10 cm depth. At each retrieval date, all mesh bags of one time step group per block
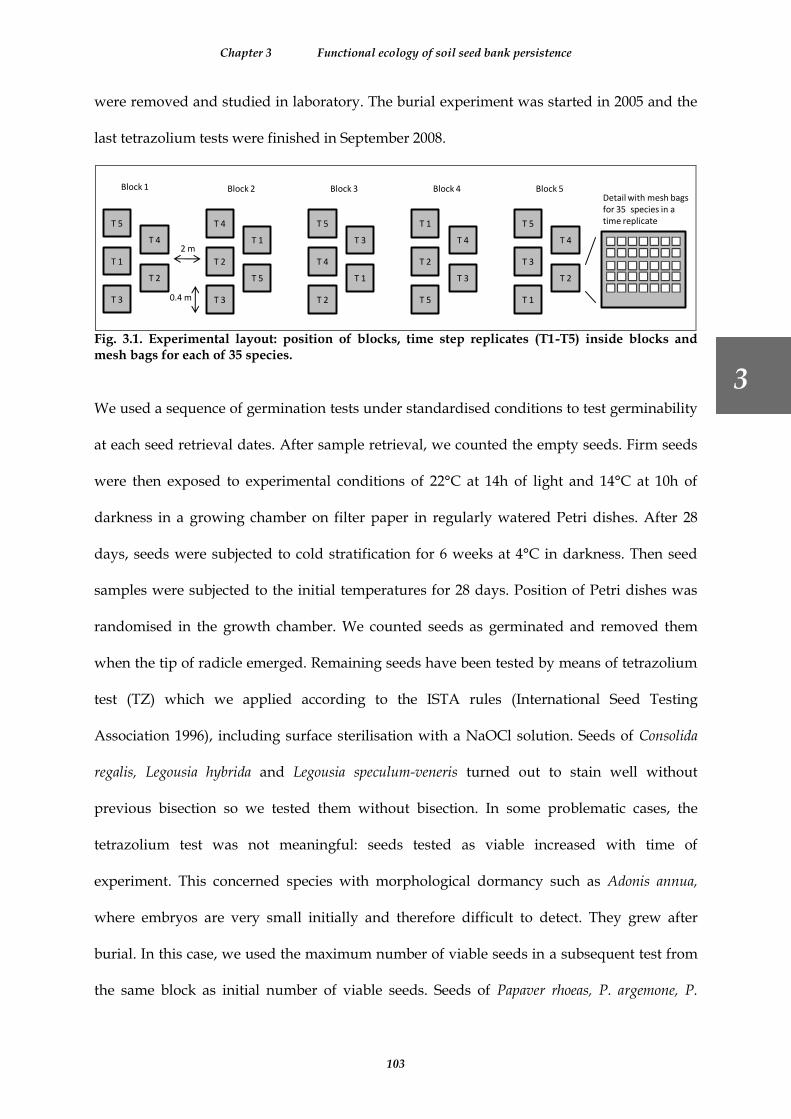
Chapter 3 Functional ecology of soil seed bank persistence
103
3
were removed and studied in laboratory. The burial experiment was started in 2005 and the
last tetrazolium tests were finished in September 2008.
T 5
T 1
T 3
T 4
T 2
T 4
T 2
T 3
T 1
T 5
T 5
T 4
T 2
T 3
T 1
T 1
T 2
T 5
T 4
T 3
T 5
T 3
T 1
T 4
T 2
Block 1 Block 2 Block 3 Block 4 Block 5
2 m
0.4 m
Detail with mesh bags for 35 species in atime replicate
Fig. 3.1. Experimental layout: position of blocks, time step replicates (T1-T5) inside blocks and mesh bags for each of 35 species.
We used a sequence of germination tests under standardised conditions to test germinability
at each seed retrieval dates. After sample retrieval, we counted the empty seeds. Firm seeds
were then exposed to experimental conditions of 22°C at 14h of light and 14°C at 10h of
darkness in a growing chamber on filter paper in regularly watered Petri dishes. After 28
days, seeds were subjected to cold stratification for 6 weeks at 4°C in darkness. Then seed
samples were subjected to the initial temperatures for 28 days. Position of Petri dishes was
randomised in the growth chamber. We counted seeds as germinated and removed them
when the tip of radicle emerged. Remaining seeds have been tested by means of tetrazolium
test (TZ) which we applied according to the ISTA rules (International Seed Testing
Association 1996), including surface sterilisation with a NaOCl solution. Seeds of Consolida
regalis, Legousia hybrida and Legousia speculum-veneris turned out to stain well without
previous bisection so we tested them without bisection. In some problematic cases, the
tetrazolium test was not meaningful: seeds tested as viable increased with time of
experiment. This concerned species with morphological dormancy such as Adonis annua,
where embryos are very small initially and therefore difficult to detect. They grew after
burial. In this case, we used the maximum number of viable seeds in a subsequent test from
the same block as initial number of viable seeds. Seeds of Papaver rhoeas, P. argemone, P.
Chapter 3 Functional ecology of soil seed bank persistence
104
hybridum and Roemeria hybrida did not stain in the initial test. Their seeds have been
examined after removal of teguments and seeds with stiff white embryos were classified as
viable.
At the end, we calculated soil seed survival as the proportion of living seeds at the retrieval
data on the number of viable seeds in the previous test, yielding five independent sets of soil
seed survival data t0-t1, t1-t2, t2-t3, t3-t4 and t4-t5. Additionally, we calculated the soil seed
survival at the end of the experiment (t5) as proportion of viable seeds in the initial test (t0-
t5).
Seed testing conditions in the germination ecological experiments
We then set up a series of experiments to study the effects of temperature, diurnally
fluctuating temperatures (DFT) and light on germination. We did not stratify seeds in cold
prior to these experiments because the Mediterranean species studied here germinate
directly in autumn after a dry summer period (Espigares and Peco 1995;Bell et al. 1995;Baskin
and Baskin 1998;Mennan 2003). Every temperature and light condition was studied using
eight seed replicates for each of 35 species. According to the annual temperature range, we
chose four different temperature conditions with alternating (high and low) temperatures
and one constant temperature of 12°C, all received 14h of light (day) and 10h of darkness
(night) in a growing chamber. The temperature conditions were (day/night °C): 10/2, 16/8,
22/14 and 28/20. Seeds were placed on filter paper in Petri-dishes, controlled and watered
regularly. As soon as radicles emerged, we counted seeds as germinated and removed them.
These temperature regimes correspond to three contrasting situations in the vegetation
period and conditions in early summer/autumn.
Parallel to two temperature conditions, i.e. the 16°C / 8°C daily fluctuating and 12°C
constant conditions, we conducted a darkness experiment. The darkness experiment started
with watering of all prepared samples in complete darkness, without green safety light.
Petri-dishes were then closed with a stretch of Parafilm and all samples placed together in

Chapter 3 Functional ecology of soil seed bank persistence
105
3
specially prepared lightproof boxes. All preparation steps were conducted in complete
darkness and not in safety green light because the latter can induce germination in some
species (Baskin and Baskin 1998). After 10 days, we controlled water content in complete
darkness. Germinations were counted for the first time after four weeks using indirect weak
green light. Within each experimental unit, all samples were placed at random in the
growing chamber or the darkness box.
Relative light germination, index for germination in diurnally fluctuating temperatures and
degree of dormancy
In order to present information from the burial and the germination ecological experiment
we calculated a number of indices. We classified species according to their relative light
germination (RLG) modified from Milberg et al., (2000) extending the scale below zero,
negative values accounting for better germination in darkness:
(1) RLG = Glight – Gdarkness
x 100 Glight + Gdarkness
We calculated RLG as the ratio of the number of seeds germinating in light (Glight) minus the
number of seeds germinating in darkness (Gdarkness) on all seeds germinating in the pair of the
experiment, (Glight +Gdarkness). We used data from the germination ecological experiment
under diurnally fluctuating temperatures of 16°C for 14h and 8°C for 10h. When RLG is
+100%, seeds germinated only in light; at 0% light and darkness germination were equally
important. When RLG is -100% seeds germinated in darkness and never in light.
Similarly, we calculated an index for the relative germination in diurnally fluctuating or
constant temperatures, RFG, being positive when germination percentages are higher under
diurnally fluctuating than at constant temperatures and negative when germination was
higher under constant temperatures relative to diurnally fluctuating (in darkness):
(2) RFG = Gfluctuating – Gconstant
x 100 Gfluctuating + Gconstant
Chapter 3 Functional ecology of soil seed bank persistence
106
Here, we used the difference between the number of germinated seeds in darkness at
diurnally fluctuating temperatures of 16°C (14h) and 8°C (10h), Gfluctuating, and number of
germinated seeds under constant 12°C Gconstant, relative to the sum of seeds germinated in
this two experimental conditions (Gfluctuating + Gconstant) in the germination ecological
experiment. We did not use values measured in light because we think that the most realistic
situation of diurnally fluctuating or constant temperatures is when seeds are buried (in other
words in darkness), whereas when seeds are in light (that is, on the soil surface)
temperatures are always fluctuating daily.
We also ordered species according to their degree of dormancy (DD), we therefore used the
data from the seed burial experiment. In this experiment, we tested all seeds for each seed
retrieval date (t1- t5) and the initial test (t0) under three subsequent conditions (see above) in
a growth chamber and in a final tetrazolium test. We calculated the degree of dormancy
(DD) for each species as following:
(3) DD = meant0-t5 ( Gviable in TZ
) x 100 Ggerminating + Gviable in TZ
We calculated the degree of dormancy as the mean ratio of seed numbers over all retrieval
dates and the initial test. The ratio is the proportion of ungerminated seeds in the three
testing phases detected in the tetrazolium test (Gviable in TZ) respective to all viable seeds, that
is, the sum of germinated (Ggerminating) and ungerminated viable seeds. This value takes 100%
when no seed germinated under the experimental conditions and 0 % when all living seeds
germinated in the testing phase.
Seed traits
We determined seed production for all species sticking to the methodological suggestions in
Poschlod et al. (2000) and Kleyer et al. (2008). Seed production was determined as mean
individual seed production of 10 individuals in the field. For species with capsules or many
seeds per infructescence, we counted the number of capsules or infructescences and sampled

Chapter 3 Functional ecology of soil seed bank persistence
107
3
two of them per individual to count in the laboratory. Seed production per individual was
then calculated as mean seed number per fruit (infructescence) multiplied by the number of
fruits (infructescences) counted per individual.
Statistical analysis and phylogenetically independent contrasts (PICs)
The burial experiment was analysed using a factor by factor non-parametric Kruskal-Wallis
Test because data were non-normal and residuals not uniform and because often a high
number of zero values (Sokal and Rohlf 1995). Relations among the numerous continuous
parameters were analysed using linear regression. We arcsine-transformed DD and log-
transformed seed sizes to meet the normality assumptions of linear regression. For
comparisons of means, we used T-tests for normal data and Mann-Whitney (U) test for non-
normal data. We applied a Wilcoxon-rank sum test and a subsequent correction for multiple
comparisons (Holm 1979) to test at which particular moment of the burial experiment the
difference in soil seed mortality was significant between two groups of high or low DD, high
or low RLG and high or low RFG.
We used phylogenetically independent contrasts (PICs; Felsenstein 1985) to study correlation
of parameters with phylogeny and to complement analyses with species as replicates. We
used the phylogenetically explicit method parallel to all other comparative analyses. We
compiled a phylogeny for our species from recent works on phylogeny of the studied species
and families, using APGII as a backbone (Angiosperm Phylogeny Group 2003). We preferred
Grafen’s (1989) method of branch-length estimation and to age estimations of Wikström et al.
(2001) because in our data set with many closely related species pairs, Wikström-ages gave
no realistic branch lengths. We calculated PICs for seed size, seed number, RLG, RFG, DD
and soil seed survival percentages. We log-transformed seed number and size before
calculating PICs. We then run linear regression through the origin as recommended by
Garland et al. (1992). All analysis where run in R statistical environment (R Foundation for
Statistical Computing 2008).

Chapter 3 Functional ecology of soil seed bank persistence
108
RESULTS
(1) Seed Burial Experiment
The seed burial experiment yielded two types of data: proportions of seeds that died in the
soil that we analysed as soil seed mortality and fractions of living seeds germinating in the
three test phases or remaining ungerminated and then detected in the TZ test (Fig. 3.2).
Tab. 3.1. Soil seed mortality analysed as dependent variable with block, time of burial and species as independent factors, using Kruskal-Wallis’ test for each factor separately
Factor df χ² p-value
block 4 1.815 0.7697 time of burial 4 144.2385 <0.0001 species 34 440.4036 <0.0001
This analysis showed that there was no significant ‘block’ effect on soil seed mortality
overall. Moreover, there were highly significant effects of ‘time of burial’ and highly
significant differences among species in the soil seed mortality.
Secondly, the seed burial experiment yielded a large data set on the germinability of seeds
after different times of burial in the soil and the reaction of seeds to four-week stratification
at 4°C. Figure 3.2 illustrates the dormancy patterns of the different species in the burial
experiment.
AutumnSpring
AutumnSpring
AutumnSpring
Hypecoum pendulum
Perc
enta
ge o
f seeds p
er
fraction
0
20
40
60
80
100
AutumnSpring
AutumnSpring
AutumnSpring
Cnicus benedictus
AutumnSpring
AutumnSpring
AutumnSpring
Garidella nigellastrum
AutumnSpring
AutumnSpring
AutumnSpring
Mean of all species
dead seeds
deeply dormant
after chill
in chill at 4 C
direct germination
A B C D
Fig. 3.2. Dormancy cycles in three contrasting species (A-C) and mean dormancy cycles of 35 species (D); black: seeds germinating directly after retrieval in 22°/14°C, dark grey: germination in chill phase (4°C), medium grey: germinated seeds after chilling in 4°C in 22°/14°C, light grey: non-germinated but viable seeds ( TZ test) and white: dead seeds.

Chapter 3 Functional ecology of soil seed bank persistence
109
3
Figure 3.2D shows the mean proportions of dormant, germinating and dead seeds of all
species per time step, with a marked cycling of dormancy in the experiment and the
importance of autumn respective to spring germination. Figure 3.2D shows that species are
generally non-dormant in autumn, the main germination season, and are dormant in spring.
There is a marked cycling dormancy for many species. However, the proportions of seeds
germinating in the different seed testing phases versus the viable seeds detected only in the
tetrazolium test varied greatly among species.
Dormancy
To order species on a continuous scale of dormancy, we calculated a degree of dormancy
(DD, see methods) which is tabulated for each species in table 3.2.

Chapter 3 Functional ecology of soil seed bank persistence
110
Tab. 3.2. Degree of dormancy (DD) of species and their four letter codes used in the plots and phylogenetic trees; in bold, species which germination patterns are illustrated in figure 3.2 A-C.
Species Family Code DD %
Adonis annua Ranunculaceae Adan 100,0 Adonis flammea Ranunculaceae Adfl 94,9 Agrostemma githago Caryophyllaceae Aggi 0,0 Anagallis arvensis Primulaceae Anar 56,9 Androsace maxima Primulaceae Anma 94,0 Asperula arvensis Rubiaceae Asar 58,7 Bifora radians Apiaceae Bira 94,4 Bifora testiculata Apiaceae Bite 92,7 Bupleurum rotundifolium Apiaceae Buro 40,3 Bupleurum subovatum Apiaceae Busu 82,3 Cartahmus lanatus Asteraceae Cala 85,4 Caucalis platycarpos Apiaceae Capl 99,7 Camelina microcarpa Brassicaceae Casa 59,2 Centaurea cyanus Asteraceae Cecy 29,0 Centaurea cyanus Asteraceae Ceso 13,7 Cnicus benedictus Asteraceae Cnbe 73,2 Conringia orientalis Brassicaceae Coor 77,3 Consolida regalis Ranunculaceae Core 62,5 Galeopsis angustifolia Lamiaceae Gala 88,3 Garidella nigellastrum Ranunculaceae Gani 40,3 Galium tricornutum Rubiaceae Gatr 61,6 Hypecoum pendulum Papaveraceae Hype 73,0 Legousia hybrida Campanulaceae Lehy 32,6 Legousia speculum-veneris Campanulaceae Lesv 62,2 Neslia paniculata Brassicaceae Nepa 97,0 Nigella damascena Ranunculaceae Nida 51,7 Papaver argemone Papaveraceae Paar 92,5 Papaver hybridum Papaveraceae Pahy 75,2 Papaver rhoeas Papaveraceae Parh 68,2 Ranunculus arvensis Ranunculaceae Raar 53,7 Ranunculus falcatus Ranunculaceae Rafa 62,8 Roemeria hybrida Papaveraceae Rohy 83,9 Silene latifolia Caryophyllaceae Sila 13,4 Turgenia latifolia Apiaceae Tula 59,7 Vaccaria hispanica Caryophyllaceae Vahi 8,7
Soil seed mortality and dormancy
We then analysed the relation of a species’ degree of dormancy (DD) together with its soil
seed mortality in two ways. First, we divided species into two subsets tailored by the
median: deeply dormant species (DD > 62.2 percentage, N = 18) and little or non-dormant
species (DD < 62.2 percentage, N = 17). We did five separate plots, corresponding to five
burial times in the soil, i.e. from first burial to first retrieval date (t0-t1), from first to second
retrieval data (t1-t2) and so on, see figure 3.3. Second, we compared the mean soil seed

Chapter 3 Functional ecology of soil seed bank persistence
111
3
mortality for each of these burial time steps among deeply dormant and little or non-
dormant species. Species with deep dormancy had lower soil seed mortality in all phases
and the paired test was highly significant, (see fig. 3.3 for details). We also tested whether the
differences declined with time: but there was no significant effect in a linear regression (inlay
in fig. 3.3).
t0t1 t1t2 t2t3 t3t4 t4t5Winter Winter Winter SummerSummer
N=17 N=17 N=17 N=16 N=17 N=16 N=17 N=16 N=17 N=16
0.0
0.2
0.4
0.6
0.8
1.0
Deeply dormant (grey) and little or non-dormant species (white) in five burial periods
Mo
rtalit
y o
f seeds in
diffe
rent tim
e s
teps (
sqrt
of pro
po
rtio
n)
*
0.10
0.20
0.30
t0t1 t1t2 t2t3 t3t4 t4t5
Δ of means
Fig. 3.3. Box plots of the soil seed mortality of deeply dormant (grey) and little or non-dormant species (white) in five burial periods of six months each; for dormancy definition see text; the only significant difference in a particular burial phase is marked with an asterisk (U-test, p < 0.05, after correction); note that mortality is square root transformed and that squares design mean values, inlay: differences in mean soil seed mortality between the two degrees of dormancy along time.
The mean soil seed mortality of deeply dormant species is significantly lower (one-sided T =
-2.38, p = 0.0376). The pairwise comparisons of soil seed mortality between species with high

Chapter 3 Functional ecology of soil seed bank persistence
112
or low degree of dormancy showed a significant effect after the first six months of burial
(asterisk in fig. 3.3).
In a second approach we analysed the effect of degree of dormancy on the final soil seed
mortality (t0-t5) using linear regression of the mean soil seed mortality at the end of the
burial experiment for a species on the degree of dormancy of the same species (Fig. 3.4A).
This showed the marked effect of dormancy on soil seed mortality.
Raar
Rafa
Adan
Adfl
Gani
Nida
Core
Paar
Pahy
RohyParh
Hype
Casa
Nepa
Coor
Aggi
Vahi
Anar
Anma
Asar
Gatr
Gala
Buro
Busu
Bira
Bite
Tula
Capl
CecyCeso
Cnbe
Cala
Lesv
Lehy
35
36
37
38
3940
41
42
43
44
45
46
47
48
49
50
51
52
53
54
55
56
57
58
59
6061
62
63
64
65
66
67
0.0 0.2 0.4 0.6 0.8 1.0
0.0
0.2
0.4
0.6
0.8
1.0
Degree of dormancy (proportion)
So
il se
ed m
ort
alit
y (pro
po
rtio
n)
AdanAdfl
Aggi
Anar
Anma
Asar
BiraBite
Buro
BusuCala
Capl
Casa
Cecy
Ceso
CnbeCoor
Core
Gala
Gani
Gatr
Hype
Lehy
Lesv
Nepa
Nida
Paar
Pahy
Parh
Raar
Rafa
Rohy
Tula
Vahi
-2 -1 0 1 2
-4
-2
0
2
Degree of dormancy contrasts
So
il se
ed m
ort
alit
y c
ontr
asts
3536
37
38
3940
41
42
43
44
45
46
47
48
49
51
53
55
56
at origin: 57,54,52,50
58
5960
61
62
63
64
65
66
67
A
B
C
Fig. 3.4. Soil seed mortality after 2.5 years of burial decreases significantly with the degree of dormancy in simple regression (A, R² = 0.2344, F1,32 = 9.796, p = 0.0037) and using contrasts of mortality and degree of dormancy (B, R² = 0.3135, F1,32 = 14.61, p = 0.0006), numbers in the tree (C) correspond to PICs used in the analysis. Whenever we moved numbers or species codes for legibility, we put them in italic; codes for species names in A and C are in table 3.2.
Finally, we wanted to know whether phylogenetic constraints had an effect on the outcome
of this relation. Therefore, we calculated phylogenetically independent contrasts (Felsenstein

Chapter 3 Functional ecology of soil seed bank persistence
113
3
1985) for soil seed mortality t0-t5 and for degree of dormancy. The regression through the
origin showed a marked effect of degree of dormancy contrasts on soil seed mortality
contrasts (Fig. 3.4B). Neither degree of dormancy nor soil seed mortality showed important
contrasts in basal splits of the phylogeny; the grouping of the contrasts of the higher nodes at
the origin indicates that most of the differences appear at low phylogenetic level (Fig.
3.4B,C).
We also tried to analyse cycling of dormancy in a similar manner but there were no clear
pattern (data not presented).
Dormancy and seed traits
There was no relation between seed size and dormancy (R² < 0.01, F1,32 = 0.2123, p = 0.648, DD
arcsine-transformed, seed size log-transformed). Nevertheless, there was a significant
relation of seed number per plant and dormancy (R² = 0.1356, F1,32 = 5.022, p = 0.0321). There
was no significant relation between seed number contrasts and dormancy (R² = 0.037, F1,32 =
1.244, p = 0.2731) or seed size contrasts and dormancy (R² = 0.024, F1,32 = 0.803, p = 0.377).
Seed mass, seed number and soil seed mortality
There were no differences among species in their soil seed mortality that were correlated to
their seed mass in a regression of soil seed mortality at the end of the experiment (t0-t5) with
seed mass as the explanatory variable. Figure 3.5A illustrates that there was no significant
relation in this regression (p = 0.1280, F1,33 = 2.437, R² = 0.0688, seed size log-transformed). We
then tested whether these differences were at least apparent in opposing closely related
groups of species and therefore we used a regression of phylogenetically independent
contrasts of soil seed mortality and seed mass. This showed that seed mass contrasts had a
highly significant effect on soil seed mortality contrasts (see fig. 3.5B, F1,33 = 11.7, R² = 0.2617,
p = 0.0017).
We then wanted to know whether the differences in seed size were more marked at
particularly phases of the burial experiments (not illustrated). We subdivided the species in

Chapter 3 Functional ecology of soil seed bank persistence
114
large (N = 17) and small seeds (N = 16) and compared the soil seed mortality of these two
subsets of species in the five burial periods. Regarding only the means of these two groups,
big seeds have a higher seed mortality in four out of five burial time steps (paired, one-sided
T-test, T = 2.3084, p = 0.0411). Testing each individual burial phase yielded no significant
differences after correction for multiple comparisons (p > 0.05, Kruskal-Wallis).
There was no relation between soil seed mortality and seed number (R² < 0.01, F1,32 = 0.0718,
p = 0.7904) even if phylogenetically independent contrasts were applied (R² < 0.01, F1,32 =
0.2739, p = 0.6043).
-4 -2 0 2
-2
-1
0
1
2
3
Seed mass(log) contrasts
So
il se
ed m
ort
alit
y (
t0t5
) co
ntr
asts
36
37
38
39
40
41
42
43
44 45
46
47
48 49
50
51
5253
5455 56
57
58
59
60
61
62
63
64
65
6667
68
69
Raar
Rafa
Adan
Adfl
Gani
Nida
Core
Paar
Pahy
RohyParh
HypeCasa
NepaCoor
Sila
Aggi
Vahi
Anar
Anma
Asar
Gatr
Gala
Buro
Busu
Bira
Bite
Tula
Capl
CecyCeso
Cnbe
Cala
Lesv
Lehy
36
37
38
39
40
41
42
43
44
4546
47
48
49
50
51
52
53
54
55
56
57
58
59
60
61
62
63
64
65
6667
68
69
-1.0 -0.5 0.0 0.5 1.0 1.5
0.0
0.2
0.4
0.6
0.8
1.0
Seed mass (log[mg])
So
il se
ed m
ort
alit
y (
t0t5
)
Adan
Adfl
Aggi
AnarAnma
Asar
Bira
Bite
Buro
Busu
Cala
Capl
Casa
Cecy
Ceso
Cnbe
Coor
Core
Gala
Gani
GatrHype
Lehy
LesvNepa
Nida
Paar
Pahy
Parh
Raar
Rafa
Rohy
Sila
Tula
VahiA
B
C
Fig. 3.5 Soil seed mortality after 2.5 years of burial and seed mass are not significantly related in simple regression (A), but contrasts of mortality and seed mass are (B, R² = 0.2617, F1,33 = 11.7, p = 0.0017), numbers in the tree (C) correspond to PICs used in the analysis. Whenever we moved numbers and species codes for legibility, we put them in italic.

Chapter 3 Functional ecology of soil seed bank persistence
115
3
(2) Germination ecological experiments
In the burial experiment, we showed that most species germinated best directly without
stratification or after warm summer periods in autumn under Mediterranean climate (Fig.
3.2D). This was the reason why we tested seeds directly after harvest and a short dry storage
period without stratification in the germination ecological experiments, because this reflects
best the conditions in the field. We tested the germination of eight samples of 25 to 50 seeds
per species under controlled conditions of light and temperature parallely in five growth
chambers. Most species showed a maximum of germination at low and diurnally fluctuating
temperatures (16/8°C) temperatures, with the only marked exception of Conringia orientalis,
which germinated best under high fluctuating temperatures of 28°/20°C and much less at
16°/8°C. Some species, such as Ranunculus falcatus germinated a little better in the lowest
temperature conditions of 10°/8°C and this was consistent with the frequent germination of
this species in the chilling phase of the germination tests in the burial experiment. Because of
the marked maximum of nearly all species at 16°/8°C, we conducted the experiments on
light/darkness and fluctuating/constant temperatures at this temperature level, this
experimental subset was a 2 x 2 factorial design (see fig. 3.6A-C and tab. 3.3).
Germination under diurnally fluctuating temperatures
In darkness, the majority of species germinated better under diurnally fluctuating
temperatures (N = 3; tab. 3.3). We often found no meaningful differences between constant
and diurnally fluctuating temperatures in light (see for example fig. 3.6). For that reason, we
did not represent the differences between fluctuating and constant temperatures in light and
why we did not used these values later in our analysis.

Chapter 3 Functional ecology of soil seed bank persistence
116
Tab. 3.3. Relative germination under diurnally fluctuating temperatures in darkness (RFG) and relative light germination (RLG, under fluctuating temperatures) for 26 species, ordered according to RFG; we excluded nine species with no darkness germination in bold species illustrated in figure 3.6 (see below).
Species RFG% RLG%
12 C
light
12 C
dark
16 -8 C
light
16 -8 C
dark
0
5
10
15
20Papaver argemone
constant fluctuating
Num
ber
of
germ
inate
dseeds
0
5
10
15
Androsace maxima
12 C
light
12 C
dark
16 -8 C
light
16 -8 C
dark
constant
fluctuating
Num
ber
of
germ
inate
dseeds
0
5
10
15
20 Asperula arvensis
12 C
light
12 C
dark
16 -8 C
light
16 -8 C
dark
constant fluctuating
Num
ber
of
germ
inate
dseeds
A
B
C
Conringia orientalis 100 33,3
Papaver argemone 65 60
Ranunculus arvensis 64 62,5
Centaurea solstitialis 43 95
Bifora radians 35 -31,8
Legousia speculum-veneris 33 75, 6
Roemeria hybrida 33 92,7
Centaurea cyanus 25 3,2
Consolida regalis 25 52,4
Androsace maxima 24 -48,3
Nigella damascena 16 -81,6
Hypecoum pendulum 13 -73,3
Bupleurum rotundifolium 11 3,1
Silene latifolia 1 -1,3
Agrostemma githago 0 -3,1
Vaccaria hispanica -4 -39,7
Papaver rhoeas -7 49,4
Neslia paniculata -8 -89,5
Garidella nigellastrum -18 0
Bifora testiculata -33 -100
Caucalis platycarpos -43 0
Asperula arvensis -59 -100
Legousia hybrida -60 98,8
Ranunculus falcatus -75 93,5
Anagallis arvensis -100 100
Turgenia latifolia -100 100
Fig. 3.6: Germination of Papaver argemone (A), Androsace maxima (B) and Asperula arvensis (C) in diurnally fluctuating and constant temperatures in darkness (grey) and in light (white); note that Asperula (C) does not germinate in light.
Seed traits and germination ecological parameters
Light and darkness germination are related to seed size and number
Figure 3.7A illustrates the relation between light requirement and seed size. In the darkness
experiments, some species did not germinate at all and others only to a very little amount.
Therefore, we weighted the regression by the number of seeds germinated, because we think
that differences involving high numbers of seeds yield more reliable data than with
numbers. Large seeds germinate more easily in darkness than in light, and vice versa (R2 =

Chapter 3 Functional ecology of soil seed bank persistence
117
3
0.14, F1,27 = 4.49, p = 0.043) . This relation is similar under constant temperatures (R2 = 0.15,
F1,27 = 4.64, p = 0.04).
The weighted regression showed no significant relation when seed number is used as an
explanatory variable: figure 3.7B shows species germination as a function of seed number
under diurnally fluctuating (R2 = 0.05, F1,27 = 1.42, p = 0.24), and constant temperatures (R2 =
0.03, F1,27 = 0.85, p = 0.36).
Aggi
Anar
Anma
Asar
Bira
Bite
Buro
Cala
Casa
Cecy
Ceso
Cnbe
Coor
Core
Gatr
Hype
LehyLesv
Nepa
Nida
PaarPahy
Parh
Raar
Rafa
Rohy
Sial
Tula
Vahi
Aggi
Anar
Anma
Asar
Bira
Bite
Buro
Cala
Casa
Cecy
Ceso
Cnbe
Coor
Core
Gatr
Hype
Lehy
Lesv
NepaNida
Paar
Pahy
Parh
Raar
RafaRohy
Sial
Tula
Vahi
0.1 0.32 1 3.16 10 31.62
-100
-50
0
50
100
Seed mass [mg]
RLG
Aggi
Anar
Anma
Asar
Bira
Bite
Buro
Cala
Casa
Cecy
Ceso
Cnbe
Coor
Core
Gatr
Hype
LehyLesv
Nepa
Nida
PaarPahy
Parh
Raar
Rafa
Rohy
Sial
Tula
Vahi
Aggi
Anar
Anma
Asar
Bira
Bite
Buro
Cala
Casa
Cecy
Ceso
Cnbe
Coor
Core
Gatr
Hype
Lehy
Lesv
NepaNida
Paar
Pahy
Parh
Raar
Rafa Rohy
Sial
Tula
Vahi
32 100 316 1000 3162
-100
-50
0
50
100
Seed number per plant
A B
12 C constant
16 C/8 C
RLG
Fig. 3.7. Germination in light (RLG > 0%) and darkness (RLG < 0%) for species with different seed size (A) and number (B) under diurnally fluctuating (black) and constant (grey) temperatures, lines show the significant relationships in weighted regression (black: R2 = 0.14, F1,27=4.49, p = 0.043; grey: R2 = 0.15, F1,27=4.64, p = 0.040); note the back-transformed logarithmic scale for seed mass and seed number.
Diurnally fluctuating temperatures are not related to seed size or number
We then used weighted linear regression to test if seed size or number were related to the
degree to which species reacted on diurnally fluctuating temperatures. Because some species
germinated little or not at all in this experiment, we used the number of all seeds germinated
in this experiment as weights in the regression. In darkness there was no significant relation
between seed mass and relative reaction to diurnally fluctuating temperatures (R2 = 0.06, p =
0.21, F1,25 = 1.609) . This relation is similar in light (R2 = 0.04, p = 0.35, F1,25 = 0.90).

Chapter 3 Functional ecology of soil seed bank persistence
118
Seed number showed no significant effect on relative reaction to diurnally fluctuating
temperatures in the weighted regression neither in light (R2 = 0.02, F1,24 = 0.56, p = 0.46), nor
in darkness (R2 = 0.02, F1,27 = 0.02, p = 0.88).
Combined results of (1) soil seed mortality and (2) germination ecological parameters
Light and darkness germination and soil seed mortality
Moreover, we wanted to know whether there were relations between germination ecological
characteristics and soil seed mortality. We therefore used the data from the germination
ecological experiment to explore differences in soil seed mortality among species.
0.0
0.2
0.4
0.6
0.8
1.0
Species germinating in darkness (grey) and light (white) in five burial periods
Mo
rta
lity
ofse
eds
indiffe
rent
tim
este
ps
(sqrt
ofpro
po
rtio
ns)
0.10
0.15
0.20
t0t1 t1t2 t2t3 t3t4 t4t5
Δ of means
R²=0.95, p<0.01
t0t1 t1t2 t2t3 t3t4 t4t5Winter Winter Winter SummerSummer
N=12 N=17 N=11 N=17 N=11 N=17 N=11 N=17 N=11 N=17
Fig. 3.8. Box plots of the soil seed mortality of species germinating in darkness (grey) and light (white) in five burial periods of 6 months each; inlay: differences in soil seed mortality between light and dark germinating species decline significantly with time; note that mortality is square root transformed and squares designate mean values.
Chapter 3 Functional ecology of soil seed bank persistence
119
3
We subdivided the set of species tested in the germination ecological experiment in species
that germinated better in darkness than in light (N = 12) and species that germinated better
in light than in darkness (N = 17), for this we used the sign of the RLG reported above. The
mean mortality of darkness germinating species at five burial dates is significantly higher
than mean soil seed mortality for species with light requirement for germination (one-sided
T-test, T = 4.21, p = 0.0068). We then tested whether there were significant differences in the
soil seed mortality of the associated species in the five burial periods of six months each (fig.
3.8). There was a highly significant overall difference in the means of darkness germination
species between darkness germinating species and species with a light requirement for
germination (see fig. 3.8). The differences between the two groups declined in a significant
way with time (inlay in fig. 3.8). However, comparing darkness germinators to light
germinators in each single burial period showed no significant difference after correction of
the p-values for multiple comparisons (fig. 3.8).
Reaction to diurnally fluctuating temperatures and soil seed mortality
Finally, we tested whether a species’ reaction to diurnally fluctuating temperatures had an
effect on soil seed mortality. We therefore subdivided the species set in two groups: one with
species germinating much better under diurnally fluctuating temperatures (RFG ≥ 0%, N =
15) and species that germinated better under constant temperatures (RFG < 0 percentage, N
= 11). Using the means of the diurnally fluctuating temperature reactors versus the constant
temperature germinators there was no overall difference (one-sided T-test, T = -1.7, p =
0.9176, see fig. 3.9). We then tested whether there were differences in particular burial
periods by comparing the two groups in each time step and applying a correction for
multiple comparisons. Figure 3.9 and table 3.4 show that there are significant differences in
winter. Species that germinate better under diurnally fluctuating temperature have
significantly lower soil seed mortality in the second and third winter of burial.

Chapter 3 Functional ecology of soil seed bank persistence
120
0.0
0.2
0.4
0.6
0.8
1.0
t0t1 t1t2 t2t3 t3t4 t4t5
Species germinating better with fluctuating (grey) or constant (white) temperatures in five burial periods
Mo
rta
lity o
f se
eds in d
iffe
rent
tim
e s
teps (
sqrt
of pro
po
rtio
ns)
Winter Winter Winter SummerSummer
0.2
0.1
0
t0t1 t1t2 t2t3 t3t4 t4t5
Δ of means
* *
N=15 N=11 N=14 N=11 N=14 N=11 N=14 N=11 N=14 N=11
Fig. 3.9. Box plots of soil seed mortality of species germinating better under diurnally fluctuating temperatures (grey) than under constant (white) in five burial periods of 6 months each, the significant differences in 2nd and 3rd winter are marked with * (U-test, p < 0.05, after correction for multiple comparisons; tab. 3.4 for details); note that mortality is square root transformed and that squares design mean values, inlay: differences in soil seed mortality between species germinating better under diurnally fluctuating and constant temperatures along time.
At the end, we tested if there was an effect of RFG on the final soil seed mortality, using
linear regression, which indicated that there was a marginal significant relationship (R² =
0.08, F1,33 = 2.9, p = 0.0978).
Tab. 3.4. Comparisons of soil seed mortality between species germinating better under diurnally fluctuating or constant temperatures
Time step W p-value corrected p (Holm)
t0t1 78.5 0.8538 1 t1t2 79.5 0.9114 1 t2t3 30 0.01089 0.04356 t3t4 76.5 1 1 t4t5 26 0.004194 0.02097

Chapter 3 Functional ecology of soil seed bank persistence
121
3
We then wanted to know whether there were marked differences among closely related
species, using phylogenetically independent contrasts. The regression of soil seed mortality
contrasts on RFG contrasts showed that there was no such effect (R² = 0.0308, F1,33 = 1.05, p =
0.313, regression forced through origin).
DISCUSSION
Dormancy and soil seed survival - dormancy and seed traits
Dormancy had an important effect on soil seed survival during and at the end of our
experiment (Fig. 3.4 and 3.5). This indicates that species with a higher degree of secondary
dormancy germinate less easily while buried and in this way are less depleted from the soil
seed bank. These findings confirm that dormancy is a very relevant factor for soil seed
survival (Baskin and Baskin 1998;Thompson et al. 2003;Baskin and Baskin 2006). The use of
an experimental data set on soil seed survival rather than data on seed persistence estimated
from the literature and the integration of secondary dormancy may explain why this pattern
is much clearer here than in previous works (Thompson et al. 2003). In deed, we studied soil
seed depletion and degree of dormancy in the same experiment, both on a quantitative scale,
whereas Thompson et al. (2003) studied the qualitative relation between dormancy and soil
seed persistence on a qualitative basis. The fact that dormancy is so closely related to soil
seed survival is clear from an evolutionary point of view: in our experiment dormancy
illustrates the degree to which seeds germinate easily when conditions are optimal (our
standardised testing conditions). This degree of delayed germination is a typical bet hedging
trait that is evolutionarily triggered by the risk in reproductive success for each species
(Venable 2007). Our data confirm that dormancy is the main proximate way how soil seed
persistence is controlled in the long run in buried populations of seeds. This points also to
dormancy as a primary quantitative predictor of soil seed persistence with a sound

Chapter 3 Functional ecology of soil seed bank persistence
122
evolutionary basis, explaining general across species trends and holding true after removal
of phylogenetically correlated variation (Fig. 3.5C).
Dormancy is especially important just after seed burial (Fig. 3.3), because here seeds of some
species, such as Agrostemma githago and Asperula arvensis decrease rapidly to a low level.
Apparently, these species maximise their fitness by immediate germination at the earliest
possible germination period that is consistent with the missing light requirement (tab. 3.3
and discussion below) for these species. Light requirement is therefore a second possibility to
achieve seed survival in burial (Baskin and Baskin 1989;Baskin and Baskin 1998). That
neither seed size nor seed number have a relation to dormancy even when phylogenetically
contrasts are used is astonishing in this context. One can think that larger seeds reduce their
risk by a higher survival to partial predation (Leishman et al. 2000b) and by meaning out
spatial heterogeneity (Fenner and Thompson 2005). Larger seeds should therefore have
lower levels of dormancy. If phylogeny is not accounted for, there is a significant higher
degree of dormancy in species with high seed production. This may be in relation to the fact
that more numerous seeds have always a higher risk of competition due to crowding.
Delaying germination through dormancy is a way to escape this density dependent effect.
The inspection of soil seed mortality at different times after burial (Fig. 3.3) shows the
tendency that soil seed mortality of little dormant species is higher in winter than in summer
(Fig. 3.3), a similar finding to the one reported for diurnally fluctuating temperatures (Fig.
3.9) were it is much clearer and discussed in more detail.
Light requirement, darkness germination, soil seed survival and traits
Our results show clearly that larger seeds are less dependent on light for germination. This is
in congruence with previous findings (Milberg et al. 2000) and the observations that larger
seeds can emerge from deeper soil layers (Bond et al. 1999;Grundy et al. 2003) together with
the fact that light penetrates only extremely little into soil (Benvenuti 1995). We could add to
these findings that larger seeds not only depend less on light, but also that, in our
Chapter 3 Functional ecology of soil seed bank persistence
123
3
experiments (Fig. 3.7A), they show an even higher germination in darkness than small seeds.
Bell et al. (1995) found that some species germinated better in darkness than in light under
the Mediterranean climate of Western Australia. We interpret our findings in a similar way
to Bell et al. (1995), that is, species that can detect favourable moments to germinate, but
which germinate in soil layers were moisture and light conditions are less extreme than at
the surface may have an advantage over light dependent germination under Mediterranean
climate. It has to be noted here, that we conducted our experiments in complete darkness
and that there were not even short light stimuli in our experiment, so our data do not apply
to e.g. shaded environments and more importantly, there is no bias by light stimuli that are
not intended. We discuss later that fluctuating temperatures in darkness are an important
feature to understand germination in darkness.
Species with a light requirement showed a lower soil seed survival in our data set than
species capable of germination in darkness (Fig. 3.8). This is in congruence with the view that
a light requirement can be sufficient to form persistent seed banks even if there is no
dormancy, and vice versa darkness germinators do not form seedbanks (Baskin and Baskin
1989;Baskin and Baskin 2006). The differences in soil seed mortality between light- and
darkness germinators in different times after burial (inlay in fig. 3.8) shows that the
importance of a light requirement decreases with time of burial, this can be so for several
reasons: some dark germinating species disappear completely after short times of burial, as it
is the case with Agrostemma githago. This however cannot explain why the effect lasts so long
and does not completely break down after the first burial phase (Fig. 3.8). Another
explanation is that, once seeds are buried, different mechanisms such as secondary
dormancy or reaction to diurnally fluctuating temperatures, become more important to
control germination than a light requirement. In our data set, Agrostemma githago, Asperula
arvensis and Vaccaria hispanica the most rapidly declining species show no light requirement
for germination. On the other hand, there are some species with better germination in
Chapter 3 Functional ecology of soil seed bank persistence
124
darkness (that are light inhibited!), e.g. Neslia paniculata or Bifora testiculata that have high soil
seed survival; in these cases the degree of dormancy is (not astonishingly) very high showing
the complementary strategies to control germination below ground.
‘Gap detection’, diurnally fluctuating temperatures and soil seed survival – diurnally
fluctuating temperatures and seed traits
The inspection of soil seed mortality at different times after burial (Fig. 3.9) shows that soil
seed mortality of species germinating better without diurnally fluctuating temperatures
(DFT) is higher in winter than in summer (asterisks in fig. 3.9). This is consistent with the
dormancy cycles for nearly all species, which are markedly dormant in spring and less
dormant in autumn (Fig. 3.2). An effect in relation with how we quantified dormancy: we
did not use a particular germination season for the calculation of the DD but averaged over
all available seasons, making our measure relatively independent from degree of cycling
dormancy. While species without gap detection mechanism germinate easily in winter, when
temperatures are relatively constant and buffered by high soil water content and so are
depleted from the soil seed population by fatal germination, species with gap detection
mechanism do not (Fig. 3.9). With increasing depth diurnally temperature fluctuations are
lower (Miess 1968). Our data therefore significantly extend the classical view of the ‘gap
detection’ role of diurnally fluctuating temperatures (Bullock 2000), because DFT can also
prevent germination in situations when seeds are buried too deep to emerge to the soil
surface (Fig. 3.9). Diurnally fluctuating temperatures are therefore a more general feature to
trigger germination, as this suggests also the reaction of e.g. mud flat species to the end of
flooding periods (Schütz 2000). In the context as DFT as a way to detect burial depth, it
would be probable that seed size has a negative effect on the strength of the reaction to DFT.
However, in our results there was no relation between seed size or number and germination
in diurnally fluctuating temperatures. This may indicate on the one hand, that the gap
detection mechanism is equally often evolved in large and small seeded species. On the other
Chapter 3 Functional ecology of soil seed bank persistence
125
3
hand, we may not have measured mortality at the right depth or DFT on the right amplitude
of fluctuations to detect such a relationship. In order to definitely answer the question
whether depth of burial and DFT are related to seed size, more detailed data are needed,
which include different, especially shallower burial depths and different temperature
fluctuation amplitudes (especially smaller amplitudes).
Soil seed survival and traits
We also tested if seed number and seed size were related to soil seed mortality measured in
the burial experiment. There was no strong relationship to seed number. Seed size had an
effect when all burial periods are used but no significant effect on the final soil seed
mortality. In the analysis of phylogenetically independent contrasts, however, there was a
strong negative effect of seed size on soil seed survival, indicating that larger seeds have a
lower soil seed survival when closely related species are compared (Fig. 3.5B). This is the
first test that explicitly uses data from a burial experiment with a defined seed input and
quantitative measures of soil seed survival that shows this relationship. Therefore, this adds
significant data to sustain the seed size-seed persistence relationship reported from a series
of works (Thompson et al. 1993;Bekker et al. 1998a;Moles et al. 2000;Cerabolini et al. 2003;Peco
et al. 2003). However, it is astonishing that there was no clear effect on final soil seed
mortality when PICs were not used. A possible bias in our experiment may be that we used
fixed numbers of seeds for all species and a unique size of mesh bags for burial without
substrate, in this design small seeds are more distant in average than large seeds and
propagation of fungi can be enhanced in more densely packed seeds in mesh bags (Van
Mourik et al. 2005). This bias would lead to higher soil seed mortality in larger seeds due to
fungi attack, one of the most important factors acting in soil seed decay (Schafer and Kotanen
2003;Davis and Renner 2007).
Chapter 3 Functional ecology of soil seed bank persistence
126
CONCLUSION
This work shows that different germination ecological parameters can be used to explain soil
seed mortality; notably diurnally fluctuating temperatures and secondary dormancy have
both to be considered when soil seed survival is analysed from the seed’s perspective. The
previous positions emphasised primary dormancy and light requirement to predict soil seed
survival (Baskin and Baskin 1989;Milberg et al. 2000;Thompson et al. 2003). We also found
similar relations for light requirement, but we could extend the understanding by integrating
explicitly species with pronounced darkness germination. Darkness and light germination
are related to seed size in our data set as in the work of e.g. Milberg et al. (2000). This is
additional support for the view that there is a relationship between seed size and seed
longevity based on selective forces that trigger an earlier depletion of larger seeds in relation
with darkness germination. That may be the explanation why in our data set we found a
seed size-seed survival relation but in the absence of a strong global relation between seed
size and seed survival at the end of our experiment this point has still to be studied.
We also could elucidate that different strategies exist to control germination below ground
that can be complementary in their importance for soil seed mortality as in the case of light
requirement and dormancy. This is important if one wants to predict soil seed mortality
from simple germination and seed traits. Both, information on the dormancy state and the
need of a light requirement are needed to predict whether a species is rapidly declining, that
is forming a transient soil seed bank. This observation has also an importance for
conservation efforts: here it becomes clear which parameters identify high soil seed depletion
and thus more vulnerable species to changes of habitat quality.

127
128
TRANSITION CHAPTER 3 TO 4
From functional ecology of soil seed banks to population
persistence
In chapter 3, we studied how seeds trigger their emergence from the soil seed bank and this
gives insights into how persistence in the soil seed bank is regulated by the timing of
germination. The germination experiments showed that level of dormancy, reaction to
diurnally fluctuating temperatures and reaction to light all showed a direct relation to soil
seed mortality. This re-emphasises the high constraints on the timing of seedling emergence,
corresponding to the low temperatures in Mediterranean type ecosystems because the cold
season is the only season with enough and predictable moisture. Equally, after disturbance
the first germinating seeds have advantages by pre-emption of space and resources as long
as moisture conditions are sufficient. The high dependence of annual species on moisture in
the top soil layers put an important evolutionary constraint – genotypes detecting better this
conditions will have a greater reproductive success. This shows the constrain of the optimal
timing of germination via dormancy, detection of light and diurnally fluctuating
temperatures for seed persistence in the soil.
Soil seed bank persistence was related to population persistence by different authors (Kalisz
and McPeek 1992;Kalisz and McPeek 1993;Pake and Venable 1996;Stöcklin and Fischer
1999;Venable 2007). This has been done by comparing persistence of populations between
many species of different soil seed bank types, which however have been classified using
seedling emergence method (Stöcklin and Fischer 1999). Another approach which points in
this direction comes from studying population dynamics of a single or rather limited set of
species (Kalisz and McPeek 1992;Kalisz and McPeek 1993;Venable 2007) or from modelling
(Venable and Brown 1993a;Pake and Venable 1996). There is hence scarce evidence about this

Transition 3-4
129
3
4
point and comparing a larger set of species with precise data on soil seed bank persistence,
related germination traits and complementary performance traits can be a profitable way to
analyse population dynamics in annuals.
In chapter 4, we study long and short-term population dynamics of annuals in relation to
these traits. There are two aspects of population dynamics: turnover, i.e. the importance of
colonisation and extinction events respective to stable populations and, second, extinction
rate, i.e. the extinction of populations in a given observation frame. Most extinction dynamics
are driven by change of environment. We explicitly place our study in the rapidly changing
environment of arable fields. We study the importance of traits from functional ecology of
soil seed banks. However, there can be many other processes than differences in soil seed
bank parameters that influence population dynamics. Because it is difficult to study all
influences at the same time, we focussed on soil seed mortality as an identified source of
variation among species. In a first step, we did not study other important processes such as
dispersal in space, predation and competition. The disturbance intensity and frequency in
arable fields change with agricultural techniques, which can also modify soil factors such as
nutrient status and soil acidity. We analysed the importance of the change in abiotic factors
for extinction dynamics using indicator values.

130
Chapter 4 Effect of plant traits on local population dynamics
131
4 4
CHAPTER 4
Is there an effect of soil seed mortality and seed production on
local population dynamics in annual plants? – the case of rare
cereal weeds
INTRODUCTION
Annual plants are an important part of plant diversity in habitats with frequent and
unpredictable disturbances, however mechanisms that maintain high diversity are still not
well understood.
First, on the community level, the ‘storage effect’ offers an explanation for coexistence in
habitats where species differ in response to disturbances and levels of competition change
(Chesson and Warner 1981;Warner and Chesson 1985;Levine and Rees 2004;Facelli et al.
2005). Storage effect suggests that a life stage that buffers population growth and decline, e.g.
a persistent soil seed bank, enhances the coexistence of species. Several studies show the
applicability of the storage effect (Bonis et al. 1995;Cáceres 1997;Facelli et al. 2005). In the
same context, plant diversity effects mediated by enhanced local population persistence have
been studied to determine which species are more under risk due to their specific trait
configuration (Fischer and Stöcklin 1997;e.g. Stöcklin and Fischer 1999;Ozinga et al. 2007).
Like storage effect, they all point on the importance of longevity of seeds in the soil. On the
one hand, the formation of a soil seed bank has been related to gap availability or bare soil
cover in vegetation (Peco et al. 1998;Hopfensberger 2007). Arable fields are on the top of this
disturbance and bare soil cover scale. On the other hand, soil moisture varies from year to
year, between and among habitats. Soil moisture was identified as enhancing fungal activity
and thus increasing soil seed mortality for dry habitat species (Blaney and Kotanen
2001;Schafer and Kotanen 2003). However, flooding events can create favourable

Chapter 4 Effect of plant traits on local population dynamics
132
environments for seed bankers (Stromberg et al. 2008) and anoxia in water logged soil
enhances seed longevity in aquatic plants (Baskin and Baskin 1998). Directional changes in
soil humidity can act probably directly on soil seed mortality and in this way influence
extinction of populations for dry habitat species. In a similar way, burial depth and physical
soil factors influence soil seed bank dynamics and mainly determine the fractions of
germinating and dormant seeds (Benvenuti et al. 2001;Benvenuti 2003), triggering in this way
the soil seed mortality of seeds. To compare the rapidity of seed mortality in soil seed banks
among different species, several approaches can be used. The most widespread method is
the use of seedling emergence from soil samples and to classify the species according to their
depth distribution, presence/absence in the surrounding vegetation, seasonality or position
in successional seres (Thompson et al. 1997). A different approach measures directly soil seed
mortality in burial experiments (Telewski and Zeevart 2002). In analysis of large databases,
both approaches are sometimes mixed (Bekker et al. 1998a). We have shown elsewhere, that
seed production influences the classification of seed bank types when it is determined by
seedling emergence and quantified as ‘longevity index’ (Saatkamp et al. 2009). Seed mortality
from burial experiments and seed production are not correlated, showing that soil seed
mortality and seed production are two independent factors for soil seed bank formation (see
also Jakobsson et al. 2006;Saatkamp et al. 2009). Species with high seed mass compensate the
higher seed production of small seeded species by higher survival in the seedling and other
life stages. Hence, many small seeds and few large seeds are equally effective for
regeneration (Leishman et al. 2000b;Moles et al. 2004). For these reasons, we think it is
important to separate clearly between soil seed mortality and seed production (and
correlated measures) when studying the effects of soil seed bank parameters on local
population persistence and dynamics.
Second, on the population level, Poschlod et al. (2000) showed that there are many different
traits or processes contributing to population persistence and they highlighted soil seed

Chapter 4 Effect of plant traits on local population dynamics
133
4 4
persistence. This is especially true for annuals, where there is no other resting stage than the
seed and there is no clonal growth (Menges 2000;Venable 2007). Many works sustain the idea
that soil seed mortality is an important parameter for population size fluctuation in annuals
(Silvertown 1982;Kalisz and McPeek 1993;Schneider et al. 1994;Schmid and Matthies
1994;Günter 1997;Stöcklin and Fischer 1999;Menges 2000;Adams et al. 2005). However most
of these works evaluated the relation on a species level (Silvertown 1982;Kalisz and McPeek
1993;Adams et al. 2005) or used measures of seed persistence confounding soil seed mortality
and seed production (Schneider et al. 1994;Stöcklin and Fischer 1999). High species numbers
make study of several population parameters difficult, so studies including several species
are scarce (Harrison and Ray 2002) whereas comparative population dynamics including a
larger set of species are expected to give new insights (Menges 2000). Furthermore,
regeneration is hampered and plant populations decline when environment changes. Not
only in such a regression context, small populations go extinct easier than large ones
(Matthies et al. 2004). We think similarly that species with high soil seed mortality should go
extinct more easily than species with low soil seed mortality irrespective of seed production
or seed size because of the seed size –seed number trade-off. Detailed works on the latter
show that there is a seed quantity being equally effective for regeneration i.e. corresponding
to some large or to many small seeds (Leishman et al. 2000b;Moles et al. 2004). The buffering
effect soil seed banks against extinction depends thus less on the number of seeds but on
their soil seed mortality. In this respect, it is of high importance not to use seed persistence
estimates based on seedling emergence methods that are biased by seed production.
In cereal fields, population extinctions are mostly due to changing agricultural practices such
as herbicides, fertilizers and high densities of crop plants (Schneider et al. 1994;Fried et al.
2009). Therefore, annual plants in cereal fields give a good opportunity to test effects of
species life history traits and habitat requirements on population dynamics and notably the
respective roles of seed production and proportional soil seed mortality. Because habitat

Chapter 4 Effect of plant traits on local population dynamics
134
requirements such as moisture or nutrient status can also directly influence soil seed
mortality or seed production it should be illustrated if and which directional habitat change
exists in the studied habitat.
In this study, we used data on population fluctuations for 30 cereal weed species together
with experimental soil seed mortality and seed production data to answer (i) whether the
initial size of a population has an impact on population extinction and (ii) how the habitat
requirement of a species is related to population turnover and the extinction/colonisation
ratio. Subsequently, we wanted to know how population turnover and
extinction/colonisation rates are influenced by (iii) soil seed mortality and by (iv) individual
seed production.
MATERIALS AND METHODS
Study site and species
We gathered data on rare and common cereal weeds in an area of ca. 2500 km² around the
Luberon ridge in South Eastern France (see fig. I.7). This area is characterised by
Mediterranean climate (mean rainfall1971-2000: 623 mm, maxima in April and October).
Traditional agriculture in this area maintained a high diversity of rare cereal weeds
elsewhere extinct in Europe (Filosa 1989;Filosa 1997). We surveyed 30 species of rare cereal
weeds (Filosa 1989) which were still present in 2005 (relative to their presence in 1983-1985)
and for which we were able to study more than two populations (see tab. 4.1).

Chapter 4 Effect of plant traits on local population dynamics
135
4 4
Tab. 4.1. Species studied, their four-letter code, the number of populations (1983-2006) studied per species and phylogenetic relationships.
Species Family Code Populations
Raar
Rafa
Adan
Adfl
Nida
Core
Paar
Pahy
RohyParh
HypeCasa
Nepa
MypeCoor
AggiVahi
Anma
Asar
Gatr
Gala
Buro
Bira
Bite
Tula
Capl
CecyCnbe
Lesv
Lehy
Adonis annua Ranunculaceae Adan 30 Adonis flammea Ranunculaceae Adfl 45 Agrostemma githago Caryophyllaceae Aggi 11 Androsace maxima Primulaceae Anma 12 Asperula arvensis Rubiaceae Asar 6 Bifora radians Apiaceae Bira 57 Bifora testiculata Apiaceae Bite 10 Bupleurum rotundifolium Apiaceae Buro 11 Caucalis platycarpos Apiaceae Capl 41 Camelina microcarpa Brassicaceae Casa 17 Centaurea cyanus Asteraceae Cecy 23 Cnicus benedictus Asteraceae Cnbe 28 Conringia orientalis Brassicaceae Coor 20 Consolida regalis Ranunculaceae Core 25 Galeopsis angustifolia Lamiaceae Gala 16 Galium tricornutum Rubiaceae Gatr 52 Hypecoum pendulum Papaveraceae Hype 5 Legousia hybrida Campanulaceae Lehy 29 Legousia speculum-veneris Campanulaceae Lesv 40 Myagrum perfoliatum Brassicaceae Mype 8 Neslia paniculata Brassicaceae Nepa 49 Nigella damascena Ranunculaceae Nida 21 Papaver argemone Papaveraceae Paar 42 Papaver hybridum Papaveraceae Pahy 32 Papaver rhoeas Papaveraceae Parh 83 Ranunculus arvensis Ranunculaceae Raar 64 Ranunculus falcatus Ranunculaceae Rafa 21 Roemeria hybrida Papaveraceae Rohy 17 Turgenia latifolia Apiaceae Tula 35 Vaccaria hispanica Caryophyllaceae Vahi 13
Seed production
Seed production was determined as mean individual seed production of 10 individuals in
the field. Seed production was not calculated for given surface unit (Šera and Šery 2004). For
species with multi-seeded fruits or infructescences, we counted the number of fruits or
infructescences and sampled two of them per individual to count number of seeds per
fruit/infructescence. Seed production per individual was then calculated as mean seed
number per fruit/infructescences multiplied by the number of fruits/infructescences
counted per individual (Kleyer et al. 2008).

Chapter 4 Effect of plant traits on local population dynamics
136
Soil seed mortality
We studied soil seed mortality using a burial experiment presented in more detail in
Saatkamp et al. (submitted). For each of the 30 species studied, we collected seed material
between June and September 2005 in the field. Ripe seeds from at least ten individuals were
mixed and stored dry in paper bags until burial in October 2005. After seed burial, we
retrieved buried seed every six months from October 2005 to April 2008. In an initial test, we
determined the germinable fraction of the seed lots used. Each retrieved seed sample was
tested for viability using first a germination test in a growth chamber and then a tetrazolium
test on all ungerminated seeds (International Seed Testing Association 1996). This burial
experiment yielded mortality percentages for five time steps (t1 to t5). We used soil seed
mortality from the beginning of the experiment (t0) until 6 months (t0t1); until 18 months (t0t3)
until the end of the experiment (32 months, t0t5) and one intermediate period in the middle of
the burial experiment, t2t3, to test for effects on population viability. Here we refer to this as
‘soil seed mortality’.
Population fluctuations
We used a census data set on rare cereal weeds dating from 1983 and 1985 to gather
population sizes and localisations (Filosa 1989). This data set contained 100 cereal fields with
863 populations of 30 rare annual plants. Data from 1983 and 1985 were pooled, we refer to
them as 1983. The locations were dispersed over an area of 2500 km². The populations were
documented by a single visit per year at the flowering to fruiting time of the species before
wheat harvest. We included 20% of cereal fields without any population of the studied
species in 1983. The remaining fields had often populations of several different species. In
2005 and in 2006 we revisited all fields and conducted the census at the same level of
precision as in 1983. Hereafter, we use long time step for the population dynamics between
1983 and 2005 and ‘short time step’ for the population dynamics between 2005 and 2006. We
counted all flowering or fruiting plants of the 30 cereal weeds in the same fields. When the

Chapter 4 Effect of plant traits on local population dynamics
137
4 4
total number of individuals exceeded 50, we estimated the number of individuals. For 338
populations, size has been documented in sufficient detail in the 1983 data set; this enabled
us to study its relation to extinction. In the remaining analyses, we only used
presence/absence data. Evidently, no detection of a population in one single year can be
viewed as above-ground absence but still presence in the soil seed bank, we therefore use the
term ‘new populations’ for those populations that have been found in 2006 not in 2005.
However, for the long time step, it is more realistic to assume that new populations are
effectively colonisations and that disappearances are definitive extinctions. For each species,
we counted population extinctions (Pext), populations found at both dates (Pper) and new
populations (Pnew) on places not inhabited in 1983-1985. We analysed separately the data for
the two observation time steps 1983-2005 and 2005-2006. We calculated two different ratios
to investigate the relationships between population fluctuations and seed traits, (1) a
measure of population turnover, i.e. relative change of populations, Rcp (modified after
Morrison 1997;Morrison 1998) and (2) a measure of regression/progression, i.e. Rext/new the
ratio of extinction to colonisation (Crooks et al. 2001).
(1) Rcp = Pext +Pnew
Pext +Pnew +Pper
(2) Rext/new = Pext
Pnew
Rcp varies between one (only new or extinct populations) and zero, Rext/new is positive. We
omitted species without new populations because this gave undefined values of Rext/new.
Species habitat requirement
To evaluate whether population dynamics were driven by some environmental factors that
enhance soil seed mortality we used indicator values of a species to detect potential
directional changes (Ellenberg et al. 1992). Indicator values are a very sensible way to assess
changes in habitat quality (Diekmann 2003). Ellenberg et al. (1992) provided position of a

Chapter 4 Effect of plant traits on local population dynamics
138
species in gradients of light, temperature, continentality of climate, moisture, soil reaction
and soil fertility. We complemented species missing in (Ellenberg et al. 1992) using the
ecological information from three local floras (Molinier 1981;Girerd 1991;Jauzein 1995).
Statistical analysis
The relation between a species’ position on the gradient and the number of extinct (Pext) or
new (Pnew) populations was analysed using Spearman’s rank correlation coefficient. We run a
logistic regression for the effect of population size in 1983 and persistence until 2005
(Crawley 2000;Harrison and Ray 2002). To give weight to the numerous populations studied
here, we used generalised linear models (GLM) using a binomial response variable, to
investigate ratio data such as relative change of populations, Rcp and extinction/colonisation
ratio Rext/new (Crawley 2000). For Rcp, this led us to use Pext +Pnew and Pext +Pnew +Pper as
binomial denominator. Similarly, we analysed Rext/new with a binomial response variable
contrasting extinct populations (Pext) to colonised (Pnew) populations. The independent
variables studied were mortality percentage data and individual seed production. In all
cases, we square-root transformed mortality data to remove distortion of percentage data
and we used logarithm of seed production to account for left-skewness (Sokal and Rohlf
1995). The use of several data for soil seed mortality leads to a higher false discovery rate, so
we corrected p-values for multiple comparisons (Holm 1979). Generally, we reported the
results of the tests using the intermediate burial period, t2t3 in all analysis using seed
mortality. If significant, we also reported the tests for the other burial periods (t0t1; t0t3 and
t0t5). All analysis where run in R statistical environment (R Foundation for Statistical
Computing 2008).
Phylogenetically explicit analyses
The use of species as independent data points is controversial in ecological literature and
often for comparative analyses between species using some phylogenetic correction
(Felsenstein 1985;Harvey and Pagel 1991). Closely related species often show similar

Chapter 4 Effect of plant traits on local population dynamics
139
4 4
characters and habitats as a consequence of common ancestry and therefore differences
among species are not always independent from a statistical point of view (Harvey and
Pagel 1991). Phylogenetically independent contrasts (PICs; Felsenstein 1985) offer the
opportunity to recalculate data in order to retrace how often they appeared independently in
the phylogeny, instead of analysing simply species as replicates. We compiled a tree from
recent works on phylogeny of the studied species and families, using APGII as a backbone
(Angiosperm Phylogeny Group 2003). We used Grafen’s (1989) estimation of branch-length
method and not age estimations of Wikström et al. (2001) because in our data set with many
closely related species pairs, this gave no realistic age estimations. We calculated PICs for
Rext/new of the two observation time steps, seed production and soil seed mortality. We log10
transformed seed production and square root transformed Rext/new before calculating PICs.
We then run linear regression through the origin as recommended by Garland et al. (1992).
We used the comparative method parallel to all analyses that were not phylogenetically
explicit. There are also reasons to analyse comparative data without taking into account
phylogenetic correction and to consider the variance correlated to ecological features
(Westoby et al. 1995b). We chose the usage of both which gives insight in how far the
relations are correlated to phylogeny or to ecology.
RESULTS
Effect of initial population size on extinction
A logistic regression analysis showed that populations noted small in 1983 went extinct more
easily compared with large ones (Z337 = 3.46, p < 0.001, Fig 4.1).
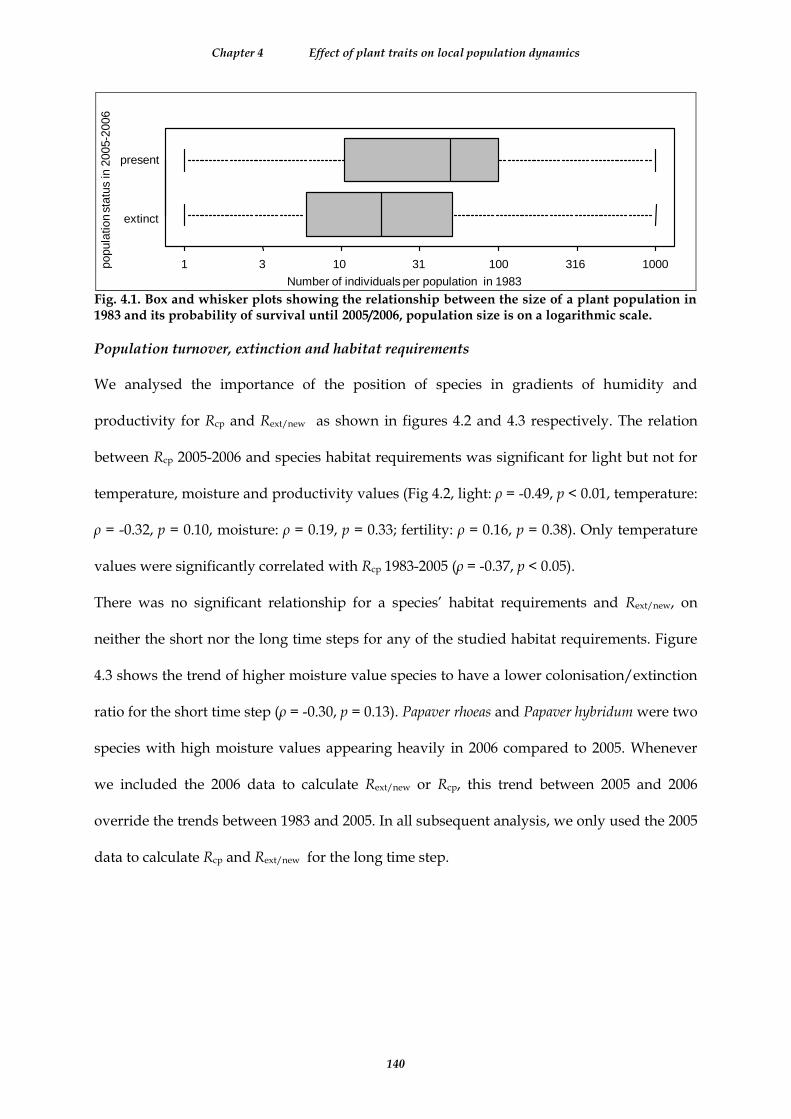
Chapter 4 Effect of plant traits on local population dynamics
140
extinct
present
1 3 10 31 100 316 1000
Number of individuals per population in 1983
popula
tion s
tatu
sin
2005-2
006
Fig. 4.1. Box and whisker plots showing the relationship between the size of a plant population in 1983 and its probability of survival until 2005/2006, population size is on a logarithmic scale.
Population turnover, extinction and habitat requirements
We analysed the importance of the position of species in gradients of humidity and
productivity for Rcp and Rext/new as shown in figures 4.2 and 4.3 respectively. The relation
between Rcp 2005-2006 and species habitat requirements was significant for light but not for
temperature, moisture and productivity values (Fig 4.2, light: ρ = -0.49, p < 0.01, temperature:
ρ = -0.32, p = 0.10, moisture: ρ = 0.19, p = 0.33; fertility: ρ = 0.16, p = 0.38). Only temperature
values were significantly correlated with Rcp 1983-2005 (ρ = -0.37, p < 0.05).
There was no significant relationship for a species’ habitat requirements and Rext/new, on
neither the short nor the long time steps for any of the studied habitat requirements. Figure
4.3 shows the trend of higher moisture value species to have a lower colonisation/extinction
ratio for the short time step (ρ = -0.30, p = 0.13). Papaver rhoeas and Papaver hybridum were two
species with high moisture values appearing heavily in 2006 compared to 2005. Whenever
we included the 2006 data to calculate Rext/new or Rcp, this trend between 2005 and 2006
override the trends between 1983 and 2005. In all subsequent analysis, we only used the 2005
data to calculate Rcp and Rext/new for the long time step.
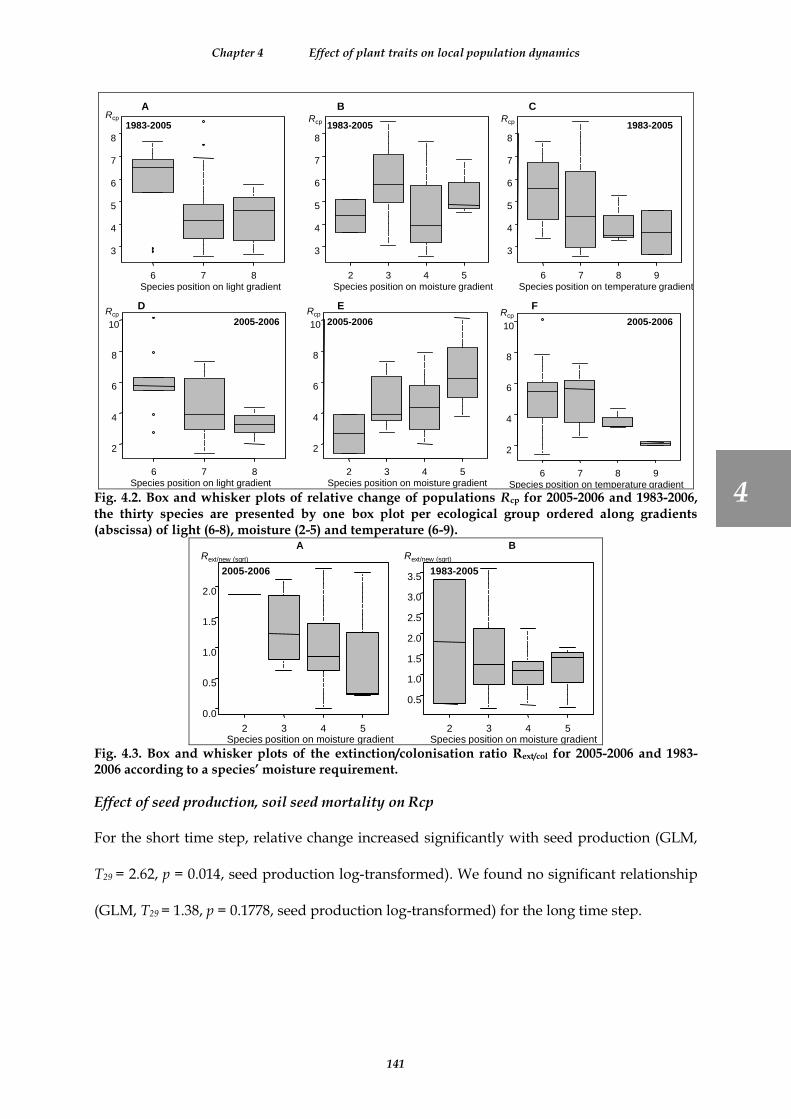
Chapter 4 Effect of plant traits on local population dynamics
141
4 4
6 7 8
3
4
5
6
7
8
1983-2005
Species position on light gradient
Rcp
2 3 4 5
3
4
5
6
7
8
1983-2005
Species position on moisture gradient
Rcp
6 7 8 9
3
4
5
6
7
8
1983-2005
Species position on temperature gradient
Rcp
6 7 8 9
2
4
6
8
10 2005-2006
Species position on temperature gradient
Rcp
2 3 4 5
2
4
6
8
10 2005-2006
Species position on moisture gradient
Rcp
6 7 8
2
4
6
8
10 2005-2006
Species position on light gradient
Rcp
A B C
FED
Fig. 4.2. Box and whisker plots of relative change of populations Rcp for 2005-2006 and 1983-2006, the thirty species are presented by one box plot per ecological group ordered along gradients (abscissa) of light (6-8), moisture (2-5) and temperature (6-9).
2 3 4 5
0.0
0.5
1.0
1.5
2.0
2005-2006
Species position on moisture gradient
Rext/new (sqrt)
2 3 4 5
0.5
1.0
1.5
2.0
2.5
3.0
3.51983-2005
Species position on moisture gradient
Rext/new (sqrt)
A B
Fig. 4.3. Box and whisker plots of the extinction/colonisation ratio Rext/col for 2005-2006 and 1983-2006 according to a species’ moisture requirement.
Effect of seed production, soil seed mortality on Rcp
For the short time step, relative change increased significantly with seed production (GLM,
T29 = 2.62, p = 0.014, seed production log-transformed). We found no significant relationship
(GLM, T29 = 1.38, p = 0.1778, seed production log-transformed) for the long time step.

Chapter 4 Effect of plant traits on local population dynamics
142
Soil seed mortality had no significant effect on Rcp for the short time step (GLM, T28 = 0.21, p
= 0.839, soil seed mortality square root transformed), similarly for the long time step (GLM,
T28 = 1.43, p = 0.1638, soil seed mortality square root transformed).
Effect of seed production on Rext/new
We found a significant negative relation between Rext/new for the short time step and
individual seed production (GLM, T28 = -3.37, p = 0.0023, fig. 4.4). The regression of this
relationship shown in figure 4.3 has an R² of 0.13 (F1,25 =4.622, p = 0.0629, Rext/col square root
transformed, seed production log-transformed, zero values omitted).
We found no significant relation between Rext/new and seed production for the longer time
step 1983 to 2005, neither in GLM (T29 = 1.135, p = 0.266, seed production log-transformed)
nor in linear regression (R² = 0.0954, F1,27 = 2.85, p = 0.1031, Rext/col square-root transformed,
seed production log-transformed, fig. 4.4).
Effect of soil seed mortality on Rext/new
The relation between soil seed mortality and Rext/new for the long time step 1983 to 2005 was
significant in the binomial GLM (1983 to 2005: T28 = 2.133, p = 0.0421, seed mortality square
root transformed). This finding was confirmed by linear regression (R2 = 0.23, F1,26 =8.38, p =
0.0096, Rext/col and seed production square root transformed, fig. 4.4). In this analysis, we
tested four different periods in the burial experiment: t0t1, t0t3, t0t5 and t2t3, all showing a
similar trend (Tab. 4.2).
Tab. 4.2. Effect of soil seed mortality at different time steps in the burial experiment on long term (1983-2005) extinction/colonisation ratio Rext/new
Burial period coefficient R² F1,26 p p-value after Holm’s correction
t0t1 0.84 0.10 3.07 0.091 0.182 t0t3 0.99 0.14 4.29 0.048 0.144 t0t5 0.84 0.10 2.89 0.1 0.182 t2t3 4.53 0.23 7.81 0.009 0.038
We found no significant relation between Rext/new and soil seed mortality for the short time
step neither in GLM (T29 =1.021, p =0.3160, seed mortality square root transformed) nor in
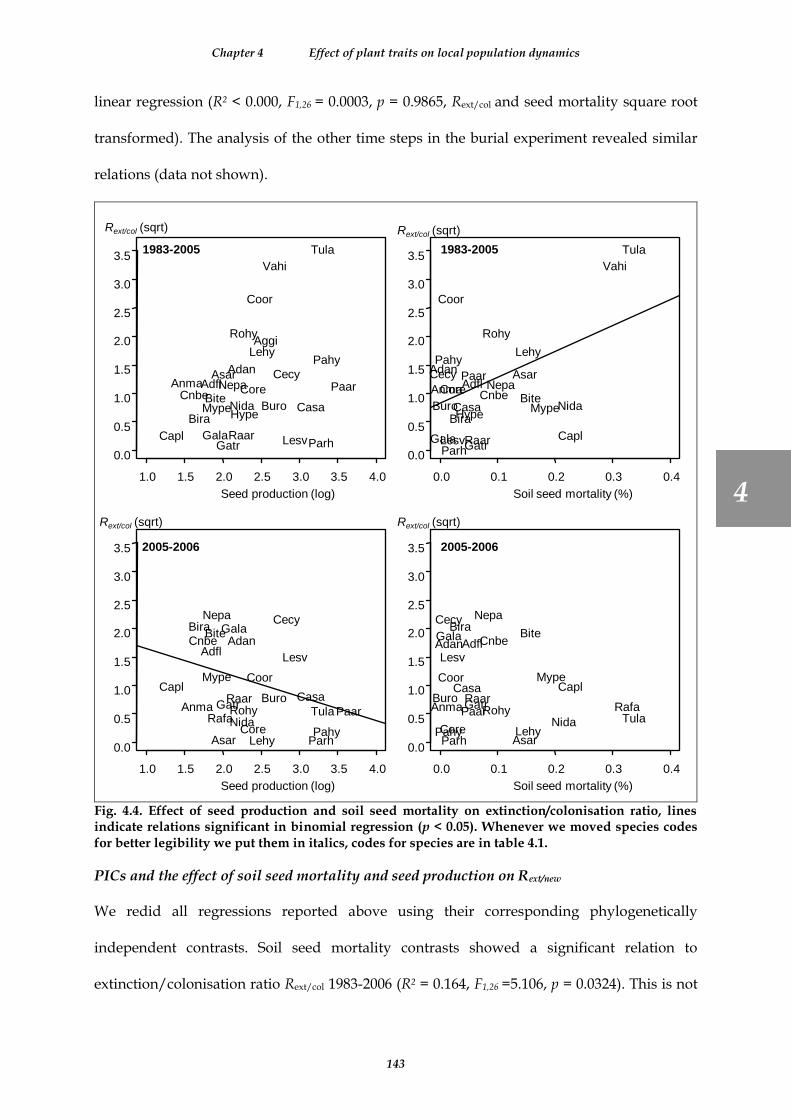
Chapter 4 Effect of plant traits on local population dynamics
143
4 4
linear regression (R² < 0.000, F1,26 = 0.0003, p = 0.9865, Rext/col and seed mortality square root
transformed). The analysis of the other time steps in the burial experiment revealed similar
relations (data not shown).
1.0 1.5 2.0 2.5 3.0 3.5 4.0
0.0
0.5
1.0
1.5
2.0
2.5
3.0
3.51983-2005
Seed production (log)
Rext/col (sqrt)
Adan
Adfl
Aggi
AnmaAsar
Bira
BiteBuro
Capl
Casa
Cecy
Cnbe
Coor
Core
GalaGatr
Hype
Lehy
Lesv
Mype
Nepa
Nida
Paar
Pahy
ParhRaar
Rohy
Tula
Vahi
0.0 0.1 0.2 0.3 0.4
0.0
0.5
1.0
1.5
2.0
2.5
3.0
3.51983-2005
Soil seed mortality (%)
Adan
AdflAnma
Asar
Bira
BiteBuro
Capl
Casa
Cecy
Cnbe
Coor
Core
GalaGatr
Hype
Lehy
Lesv
Mype
Nepa
Nida
Paar
Pahy
ParhRaar
Rohy
Tula
Vahi
1.0 1.5 2.0 2.5 3.0 3.5 4.0
0.0
0.5
1.0
1.5
2.0
2.5
3.0
3.5 2005-2006
Seed production (log)
AdanAdfl
Anma
Asar
BiraBite
BuroCapl
Casa
Cecy
Cnbe
Coor
Core
Gala
Gatr
Lehy
Lesv
Mype
Nepa
NidaPaar
PahyParh
Raar
RafaRohy Tula
0.0 0.1 0.2 0.3 0.4
0.0
0.5
1.0
1.5
2.0
2.5
3.0
3.5 2005-2006
Soil seed mortality (%)
AdanAdfl
Anma
Asar
BiraBite
BuroCaplCasa
Cecy
Cnbe
Coor
Core
Gala
Gatr
Lehy
Lesv
Mype
Nepa
NidaPaar
PahyParh
RaarRafaRohy
Tula
Rext/col (sqrt)
Rext/col (sqrt)Rext/col (sqrt)
Fig. 4.4. Effect of seed production and soil seed mortality on extinction/colonisation ratio, lines indicate relations significant in binomial regression (p < 0.05). Whenever we moved species codes for better legibility we put them in italics, codes for species are in table 4.1.
PICs and the effect of soil seed mortality and seed production on Rext/new
We redid all regressions reported above using their corresponding phylogenetically
independent contrasts. Soil seed mortality contrasts showed a significant relation to
extinction/colonisation ratio Rext/col 1983-2006 (R² = 0.164, F1,26 =5.106, p = 0.0324). This is not
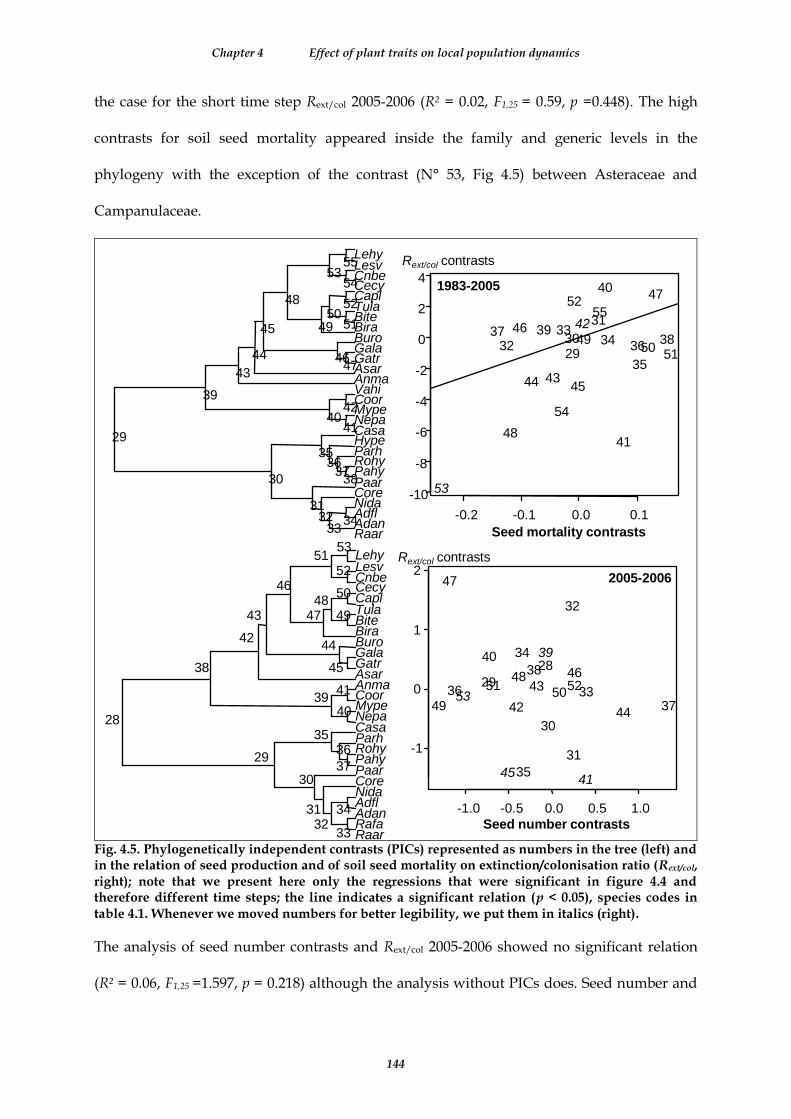
Chapter 4 Effect of plant traits on local population dynamics
144
the case for the short time step Rext/col 2005-2006 (R² = 0.02, F1,25 = 0.59, p =0.448). The high
contrasts for soil seed mortality appeared inside the family and generic levels in the
phylogeny with the exception of the contrast (N° 53, Fig 4.5) between Asteraceae and
Campanulaceae.
RaarAdanAdflNidaCorePaarPahyRohyParhHypeCasaNepaMypeCoorVahiAnmaAsarGatrGalaBuroBiraBiteTulaCaplCecyCnbeLesvLehy
29
30
3132
3334
3536
3738
39
4041
42
43
44
45
4647
48
4950
51
52
5354
55
-0.2 -0.1 0.0 0.1
-10
-8
-6
-4
-2
0
2
4
Seed mortality contrasts
Rext/col contrasts
2930
31
32
3334
35
3637
3839
40
41
42
4344 45
46
47
48
4950
51
52
53
54
55
-1.0 -0.5 0.0 0.5 1.0
-1
0
1
2
Seed number contrasts
28
29
30
31
32
33
34
35
3637
38
3940
41
42
43
44
45
46
47
48
4950
51 5253
RaarRafaAdanAdflNidaCorePaarPahyRohyParhCasaNepaMypeCoorAnmaAsarGatrGalaBuroBiraBiteTulaCaplCecyCnbeLesvLehy
28
29
30
3132
33
34
3536
37
38
3940
41
42
43
44
45
46
4748
49
50
5152
53
2005-2006
1983-2005
Rext/col contrasts
Fig. 4.5. Phylogenetically independent contrasts (PICs) represented as numbers in the tree (left) and in the relation of seed production and of soil seed mortality on extinction/colonisation ratio (Rext/col, right); note that we present here only the regressions that were significant in figure 4.4 and therefore different time steps; the line indicates a significant relation (p < 0.05), species codes in table 4.1. Whenever we moved numbers for better legibility, we put them in italics (right).
The analysis of seed number contrasts and Rext/col 2005-2006 showed no significant relation
(R² = 0.06, F1,25 =1.597, p = 0.218) although the analysis without PICs does. Seed number and

Chapter 4 Effect of plant traits on local population dynamics
145
4 4
contrast had no effect on the Rext/col 1983-2006 long-term extinction/colonisation rate
contrasts (R² = 0.08, F1,27 =2.45, p = 0.129). Interestingly, the most important
extinction/colonisation ratio contrasts for the long time step, 1983-2006, appear at relatively
deep nodes in the phylogeny. The corresponding ratio contrasts for the short time step, 2005-
2006 come from more derived nodes.
DISCUSSION
Population size related extinction and habitat requirements
Our results show that we met the conditions necessary for testing the relationships between
population fluctuations and soil seed mortality and seed production. This includes notably
that smaller populations going extinct more easily than larger ones. This is significant
supplementary evidence for the higher extinction risk of small populations, for which there
is still little empirical evidence (but see e.g. Fischer and Stöcklin 1997;Matthies et al. 2004).
Extinction of the smaller fraction of populations implies that there are processes
compromising reproduction. Reproduction of wild and cultivated plants is impeded by
fragmentation of habitats, lack of pollinators or seed dispersal (Poschlod and Biewer
2005;Biesmeijer et al. 2006;Cousins and Eriksson 2008). These circumstances lead to a decline
on the long run of the cereal weeds studied here and this is in congruence with other recent
findings on cereal weeds in other regions of France (Aboucaya 2000, Fried 2009) and
elsewhere in Europe (Schneider et al., 1994, Andreasen et al., 1996, Sutcliffe and Kay 2000,
Robinson and Sutherland 2002, Pyšek et al., 2005, Baessler and Klotz 2006, Pinke et al. 2008).
Moreover, the regression of these species is a phenomenon observed since the
industrialisation of agriculture after World War II (Aymonin 1962, Schneider et al., 1994,
Robinson and Sutherland 2002). This shows that our study system is a case of regression of
formerly more common species and that the observed processes are general processes for
declining populations.
Chapter 4 Effect of plant traits on local population dynamics
146
A second aspect consists in a lack of a clear long term trend in change of the abiotic
environment as highlighted by the analysis including indicator values (Ellenberg 1996).
There are year-to-year fluctuations in indicator values for moisture and, most probably
triggered by this, nutrients (Ellenberg 1996). Additionally, an analysis within ecological
groups (indicator values) showed that the main outcome is robust to environmental changes
(analysis not presented). They are likely to be connected to climatic fluctuations rather than
to changes in agricultural practices, because the studied fields extend over 2500 km² and
cover a very large range of different types of farms; a synchronous directional change from
one year to another in their agricultural practices can therefore be excluded.
Soil seed mortality and population turnover
Species with higher soil seed mortality in the burial experiment suffer a more rapid
extinction of populations from 1983 to 2005. Lower soil seed bank persistence has been
supposed on several occasions to be related to population extinction threat (Fischer and
Stöcklin 1997;Stöcklin and Fischer 1999;Menges 2000;Poschlod et al. 2000). Studies comparing
several species respective to their soil seed mortality and population fluctuations are scarce.
Stöcklin & Fischer (1999) for example found lower local extinction rates of species with high
seed persistence using fragmented grassland remnants. This work included perennial species
and was conducted in calcareous grasslands. Additionally, the classification of seed
persistence in their work was based on seed presence in soil samples, giving implicitly some
weight to seed production beside soil seed mortality as a factor potentially contributing to
classify a species’ seed bank as persistent (Saatkamp et al., submitted).
The higher extinction rate of species with high soil seed mortality is also in congruence with
the idea that longer soil seed longevity enhances species coexistence, the ‘storage effect’
(Chesson & Warner 1981). In our case, this applies to the coexistence of a species-rich weed
community with cereals, a highly competitive part of the environment. Cereals also fulfil
another condition of the storage effect hypothesis that is different reaction of coexisting

Chapter 4 Effect of plant traits on local population dynamics
147
4 4
species to temporal changes (disturbances). When cereals are sown they germinate instantly,
and cereal seeds have very high soil seed mortality. There are different reactions of cereal
weeds, which can have low (or high) soil seed mortality, delayed (or immediate) germination
and which react to a wide range of different germination cues, some of them related to recent
changes (e.g. Baskin and Baskin 1998, see also Otte 1994).
Seed production and population turnover: the importance of trade-offs
Another important result in this study is clarified that it is seed mortality and not seed
production that importantly influences population turnover in the long run. This is
astonishing at the first sight, because the size of the storage compartment, i.e. the number of
produced seeds, should also count for the effectiveness of the storage effect (Chesson and
Warner 1981, Facelli et al., 2005). To understand this, let us turn back to the reflections of
Moles et al. (2004) on the seed size-seed number trade-off: Moles et al. (2004) showed, why
many small seeds are not more advantageous as few large ones in a comparative study
including many species. They re-emphasized that large seeds compensate for the smaller
number in generating a higher survival of seedlings (Leishman et al. 2000, Jakobsson &
Eriksson 2000), and suggest that there is additional compensation in life stage other than
seedlings. In the light of this, it becomes a both plausible and parsimonious explanation to
say that seed number per se is not so important for the size and effectiveness of the storage
compartment of the soil seed bank. Here, it is proportional soil seed mortality that –
irrespective of the number or size – will affect a proportion of the storage compartment. We
have to re-emphasise that soil seed mortality should be measured on a quantified seed
population in this context and not with methods that could give estimates correlated to seed
production (Saatkamp et al., submitted).
Phylogenetically independent contrasts
The analysis of PICs supports the previous views of a relation between population dynamics
and soil seed mortality on the long run but not for seed production at the short term. The

Chapter 4 Effect of plant traits on local population dynamics
148
analysis of PICs added to this that the studied soil seed mortality is not a phylogenetically
conserved trait. Perhaps the rapid modification of this trait is necessary to react to episodic
changes in disturbance frequencies which otherwise would be fatal. Seed production is a
conserved trait to a degree that it makes it impossible to show with our data that it triggers
extinction/colonisation ratio in the short term independently from phylogeny. This is
nothing new in front of other findings that report seed size as phylogenetically conserved
and the trade-off between both (Shipley and Dion 1992). More interestingly, the
extinction/colonisation ratio for the short time step was less phylogenetically conserved than
the ratio for the long time step. This points to different processes and different traits
(themselves more or less conservative) implicated in the population turnover over the short
and the long term.
CONCLUSION
Our findings imply that there are differential extinction risks among species according to
their soil seed mortality and that soil seed mortality as studied here is not just a workaround
to describe incomplete population surveys. Finally, Venable and Brown (1993, p 47.) already
showed using models that ‘perenniality per se does necessarily change the E[volutionnary]
S[table] S[trategy] dispersibility for escaping crowding or sib interactions’ (our brackets). Soil
seed mortality has therefore a general effect for local persistence of all seed plants.
Consequently they should be more generally be used for extinction risk evaluation. The
above findings underline and precise the importance of soil seed mortality as a parameter for
extinction risk assessment on a species level (Poschlod et al. 2000, Menges 2000). In
population viability analyses, there are still many difficulties bound to the functional roles of
life stage of the seed banks (Poschlod et al. 2000, Menges 2000). For these reasons, soil seed
mortality should be considered more in detail also in population viability analyses for plants
(Menges 1990;Schmid and Matthies 1994;Menges 2000;Harrison and Ray 2002;Brigham and

Chapter 4 Effect of plant traits on local population dynamics
149
4 4
Schwartz 2003). Finally, we suggest giving more attention to soil seed mortality measured
independently from the seed size-number trade-off, to understand the underlying
mechanisms that enhance or reduce diversity not only in annual plant communities.

150

151

152
TRANSITION CHAPTER 4 TO 5
From population dynamics to rarity and abundance
In chapter 4, we evaluated the relationships among a set of traits of two aspects of
population dynamics at two temporal scales. In this approach, we detected an effect of soil
seed mortality on extinction rate over the long term and seed production over the short term,
with only the first being also related when using PICs. This shows that species differing in
their traits also differ in rapidity of population dynamics according to the value by this trait.
In our case, species with high soil seed mortality also have high extinction rates.
Evidently, high extinction rates have also consequences for regional frequency of
populations: species with high extinction rates can be less frequent because many
populations went extinct before the observation date. Rarity at a regional population
frequency scale can thus be related to factors that historically decreased the frequency of a
species. However, geographical distribution is just the first of three main axes of rarity
defined by Rabinowitz (1981); local abundance is the second and niche width is the third
axis. Beside historical factors acting on populations, there can be actual environmental
parameters that limit species, therefore niche width of a species, the third axis of rarity, can
rather be a reason than a dimension of rarity (Gaston 1997). The second axis, local abundance
is also constrained by both environmental limiting factors and traits. The relation of traits
with abundance, such as body size, is very well documented for animals (White et al. 2007).
Much less is known about plant traits and plant abundance, seed size has been evoked as a
putative trait negatively correlated to local abundance, but there is still little evidence on
such a relationship and recent attempts rather refute a general relationship (Murray et al.
2002). However, there have been propositions that mechanistic models involving traits can
predict abundance at the local scale (Shipley et al. 2006). A functional trait approach can give
additional insight what triggers plant rarity at local scales. However, there are still many

Transition 4-5
153
5
4
5
gaps in the understanding of how traits contribute to rarity and local abundance (Murray et
al. 2005).
Additionally, many works focus on very rare and endemic species, so here we focus on the
rare-common contrast but not strictly endemic species, which permits us to have a second
focus on annuals that are little represented among endemic species and hence in previous
work on rarity in plants.
In the chapter 5, we study hence differences between regionally rare and common species
and between locally abundant and scarce species. This corresponds to two axes of rarity. In
this study, we ask if life-history traits such as soil seed survival, dormancy and germination
characteristics are related to these differences. Further on, we also study the pollen:ovule
ratio, a measure that is related to the rate of gene exchange via breeding system (Cruden
1977;Charlesworth and Charlesworth 1987;Reed et al. 2002), and putatively can increase
survival in small populations by increasing connectiveness and effective population size
(Laporte and Charlesworth 2002;Charlesworth 2009).

154

Chapter 5 Comparison of traits between rare and common cereal weeds
155
5
CHAPTER 5
Comparison of traits between rare and common cereal weeds
and implications for conservation
INTRODUCTION
The contrast of rare to common plants is not only one of the main motivations for nature
conservation but also an important source for giving sound advice in this area. Since the key-
stone work of Rabinowitz (1981) it is therefore a research focus in comparative plant ecology
(Hegde and Ellstrand 1999;Lavergne 2003;Farnsworth and Ogurcak 2008;Römermann et al.
2008). Rarity is a complex term covering at least three independent aspects: narrow niche
width, small distribution range and low local abundance (Stebbins 1942;Rabinowitz
1981;Rabinowitz et al. 1986;Hubbell and Foster 1986;Bawa and Ashton 1991). All of range
size, niche width and local abundance potentially contribute to higher extinction threats in
plants and local extinction risk (Harrison and Ray 2002;Reed et al. 2002;Matthies et al. 2004).
However, even if effects and importance are general, possible ecological correlates of these
three aspects of ‘rarity’ are not.
Distribution range, for instance, is obviously a result of very diverse historical and actual
ecological factors and in this light, it seems meaningless to search for a general causal pattern
for its explanation (Fiedler 1986;Hegde and Ellstrand 1999;Gitzendanner and Soltis 2000).
Indeed the reasons are potentially as numerous as plant’s adaptations and histories, even if
in restricted regions with a common set of physical and historical factors the biological
solutions in many rare versus common taxa can be of insightful parallelism (Hubbell and
Foster 1986;Bawa and Ashton 1991;Médail and Verlaque 1997;Lavergne 2003). Distribution
range in itself covers total range size (Gaston 1991), fragmentation (Morgan 1998) and
regional frequency of populations (Hodgson 1986;Eriksson et al. 1995;McCollin et al. 2000).
Chapter 5 Comparison of traits between rare and common cereal weeds
156
Range size has been correlated to genetic diversity at the population level among species
(Hamrick and Godt 1997) implying that larger distribution range with a higher number of
different populations may be reflected in higher local genetic diversity.
Niche width has been supposed to be rather a cause than a type of rarity (Gaston 1997). This
is intuitive given the many ‘rare’ plants on specialised habitats such as coasts or scarce
geological units. This is even more true for the regression from commonness to extreme
rarity of specialised species, e.g. rare weeds from flax (Linum usitatissimum) fields (Schneider
et al. 1994) or inversely the actual ubiquity of formerly exceptional subtropical weeds in corn
or rice fields in northern temperate floras (Jauzein 1995). In our eyes, studying ecological
factors that define a plant’s niche is a powerful way to understand causes of distribution and
abundance. Therefore, comparing rare and common, abundant or scarce species in a
narrowly defined environment is a good opportunity to study plant’s adaptations and
relevant factors in this habitat. This discussion already shows that not all three aspects of
rarity have necessarily a relation to a plant’s biological traits and general relations between
rarity and species’ traits are therefore questioned (Fiedler 1986;Gitzendanner and Soltis
2000). Moreover, it is possible that reasons for rarity are more complex to elucidate than
consequences, since they involve historical factors of the environment. Biological
consequences of rarity or low local abundance are probably more easy to identify, allowing a
plant to survive in small ranges and population sizes (Gaston and Kunin 1997). This has
already been confirmed by Lavergne (2003). There is however strong evidence of a general
relationship between rarity in form of local abundance and genetic diversity at the
population level (Leimu et al. 2006). There are also relations of local abundance to body size
according to allometric relations (White et al. 2007).
For both range size and local abundance, things are complicated by historical factors, leaving
us with actual patterns because of past processes and mechanisms how plants escaped
complete extinction. However, being aware of this dimension enables us to better
Chapter 5 Comparison of traits between rare and common cereal weeds
157
5
understand how plant regression and extinction works and to explain more consistently
actual patterns. Rarity in form of narrow distribution range is one necessary passage in
naissance of many plant species except in some cases of allopatric speciation, where two
common species can generate from one common. It therefore gives insight how plant
diversity is limited or can spread. The patterns observed, especially when not consistent at
different times should also be interpreted in the light of environmental changes to explain
them.
Most works on rarity in plants take a global view on all plants of one or several floras
(Rabinowitz et al. 1986;Hodgson 1986;Hegde and Ellstrand 1999) or focus on endemic and
widespread relatives in a given region (Menges 1991;Lavergne 2003;Farnsworth and
Ogurcak 2008). Only a very few works include annual species (Lavergne 2003) and –to our
knowledge- no work focussed explicitly on annual species in the comparison of rare to
common plants. From a global point of view, this can be deplored for two reasons: (i) the
rapid turnover at both population and range size levels make annuals a more severe test for
hypotheses on rarity and (ii) annuals are model systems where functional relationships of
population dynamics are more easily modelled and understood than for perennials.
Moreover, annuals are underrepresented among narrow ranged (endemic) species (Médail
and Verlaque 1997), probably because a short life cycle prevents relict endemism and
hampers range restriction. In order to test if relations of plant traits to rarity and abundance
hold also for annual plants, we wanted to test relevant quantitative traits for 37 annual plants
including 14 species pairs of rare and common species.
We therefore wanted to know, if: (i) the pollen:ovule ratio is related to local population size
and regional frequency, (ii) seed size has a relation to regional frequency and local
population size, (iii) degree of dormancy and soil seed mortality have a relation to the local
population size and finally if (iv) plant size, specific leaf area (SLA) and leaf dry matter
content (LDMC) can related to local population size or regional frequency.

Chapter 5 Comparison of traits between rare and common cereal weeds
158
MATERIALS AND METHODS
Study site and population data
We gathered data on 37 rare and common cereal weeds species in an area of ca. 2500 km²
around the Luberon ridge in South Eastern France. This area is characterised by
Mediterranean climate (mean rainfall1971-2000: 623 mm, maxima in April and October).
Traditional agriculture in this area maintained a high diversity of rare cereal weeds
elsewhere extinct in Europe (Filosa 1989;Filosa 1997). We used a survey from 1983 (Filosa
1985;Filosa 1989) for which we re-evaluated population size for the same species, giving us
population sizes on two different dates separated by 22 years. We revisited all populations
in 2005 and 2006, so we had also data on a short time step. The initial data set included
mostly rare species, in our later survey, we complemented it with closely related common
species; see appendix 1 for a detailed list of species. In our survey, we counted population
size when there were less than 50 individuals, above, we visually estimated total population
size using density of population and total area covered by the population. This results in
three data sets of population sizes in 1983, 2005 and 2006 with 24 species in the old survey
and 37 species in the recent survey. We used log-transformed data on the mean population
size in 1983 and 2006 for these species and classified species into rare and common according
to regional frequency of population, i.e. the number of populations documented in our
survey.
Traits
Specific leaf area (SLA) and leaf dry matter content (LDMC)
Leaf material was collected in the field from living individuals at the start of flowering (April
to June) using only green, intact and undamaged leaves. For each species, five individual
plants (A, B, C, D, and E) were chosen at random. For each individual, two leaves were
collected, one more basal and one more apical leaf. Position of leaves was noted on a small

Chapter 5 Comparison of traits between rare and common cereal weeds
159
5
piece of paper placed together with each individual leaf (e.g. A1 – basal leaf, A2 – cauline
leaf of individual A). We did not remove petioles. Leaves were transported in sealed plastic
bags with a small amount of additional water to prevent desiccation. Leaves were stored in
sealed plastic bags in a fridge at 4°C, and processed within 24h after collection. Prior to
measurements, soil remnants were removed, wet leaves were rubbed dry with cotton tissue
and we re-hydrated leaves using deionised water according to the recommendations in
Garnier et al. (2001). This ensured that we measured leaf fresh mass and leaf area only on
living and fully turgid leaves. Leaves were then placed individually in tagged paper bags
and dried at 50°C under circulating air until weight constancy. Weight was measured using a
fine balance (± 0.001 mg). We used scanned images along with reference surfaces of known
size to detect leaf area using the lafore software package (Lehsten 2005). Leaf size was
expressed in mm². Specific leaf area was calculated for each single leaf as the ratio of fresh
leave area on leaf dry mass and expressed in mm² · mg-1. Leaf dry matter content was
calculated as the dry leaf mass on fresh leaf mass and noted in mg· g-1.
Pollen Ovule ratio
In spring and summer 2006, we collected three stamens per flower for each of five randomly
chosen individuals per species. We only used closed but near to flowering buds. We stored
the three stamens for each bud dry together in Eppendorf tubes. At sampling, we also kept
the remaining flower and stored it in 70 % alcohol plastic tubes for counting total number of
stamens and ovules. Once all species sampled, we dissolved stamen tissue using 550 µl of
sulphuric acid per tube for 24-48h. After that, we crushed remaining tissues with a small
glass pestle, added 1650 µl of water with 2% triton tenside, and mixed it with the pestle. We
then centrifuged for 5 minutes, decanted the superfluous liquid and added 1000 µl of alcohol
(95 %), and mixed again. We centrifuged again for 5 min, removed liquid, and evaporated to
obtain dry pollen samples. We then added 40 µl of a 30 % sucrose/20 % glycerol solution

Chapter 5 Comparison of traits between rare and common cereal weeds
160
(‘counting solution’) and sonicated. We counted pollen grains under microscope using a 1 µl
hematocytometer and ovules under a binocular lens. The number of pollen grains for one
stamen was then calculated as follows: number of pollen grains in 1 µl x 40 µl of counting
solution, divided by three. We then calculated pollen:ovule ratio (P/O) as the number of
pollen grains for one stamen x number of stamens per flower, divided by the total number of
ovules. When needed, P/O ratios were log10-transformed to meet the normality assumption.
Seed mass, seed number and plant size
We measured seed weight for three samples of 10 seeds for each species; seeds were
collected from at least ten individual plants. Seed production was determined for all 37
species, i.e. mean individual seed production of 10 individuals in the field. Some species had
multi-seeded fruits (e.g. Papaver sp. pl.), other had many fruits per infructescence (e. g.
Apiaceae), we counted the number of fruits or infructescences per individual for these
species. Than we sampled two fruits or infructescences per individual and counted number
of seeds per fruit or infructescence. Seed production per individual was then calculated as
mean number of seeds per fruit or infructescence multiplied by the number of fruits or
infructescences counted per individual. Plant size was measured as height in mm in the field
for 25 random individuals from one population per species at time of fruit set.
Degree of dormancy and soil seed survival
We conducted a burial experiment and subsequent germination and tetrazolium test for the
38 species. This experiment is described in detail in Saatkamp et al. (2009). This experiment
was a randomised block design with species grouped into time steps and the latter into
blocks. At six months intervals for 2 ½ years we retrieved seed samples for each species from
burial and exposed them to standardised germination conditions; ungerminated seeds at the
end of these germination tests were tested for viability using tetrazolium (International Seed
Testing Association 1996). For each species, we determined soil seed survival as the
Chapter 5 Comparison of traits between rare and common cereal weeds
161
5
proportion of living seeds after 1 ½ years of burial out of the number of living seeds in the
seed lot before burial, we chose 1 ½ years because differences among species were most
marked at this date. Degree of dormancy was determined as the proportion of ungerminated
but living seeds (i.e. number of seeds tested using tetrazolium) out of the number of all living
seeds retrieved at a date; we averaged this value for the five retrieval dates together with the
initial test; this gave quantitative values of the proportion of germinating seeds, which we
preferred over a qualitative classification into dormancy types.
Data analysis
Phylogenetically independent contrasts
We took phylogeny into account in our analysis using phylogenetically independent
contrasts (PICs) in the sense of Felsenstein (1985). These are differences in character
(phenotypic) values between phylogenetic sister groups. They are calculated starting from
species values down to deeper nodes of the phylogenetic tree. PICs were computed using the
algorithm pic() in the ape software-package (Paradis et al. 2006) for R (R Foundation for
Statistical Computing 2008). In the case of seed number, population size and pollen/ovule
ratio that were left-skewed, data were log-transformed prior to PIC calculation. We
calculated internal node averages and divergences incorporating branch lengths according to
Felsenstein (1985). These difference data have an arbitrary sign and an inherent mean of zero,
therefore regression analysis of independent contrasts was forced through the origin
(Garland et al. 1992).
Construction of phylogeny
We constructed a hypothesis on phylogenetic relationships including all species using
published trees from the literature. A ‘supertree’ hypothesis was constructed using APGII
(Angiosperm Phylogeny Group 2003) and Phylomatic (Webb and Donoghue 2005) with
branch length estimates taken from Wikström et al. (2001) using the bladj-algorithm (Webb et

Chapter 5 Comparison of traits between rare and common cereal weeds
162
al. 2006). Polytomies among basal angiosperms in this tree where completely resolved using
APGII (Angiosperm Phylogeny Group 2003), Soltis et al. (2000) and Jansen et al.
(2006a;2006b). For derived taxa, we resolved polytomies using recent molecular phylogenies
from recent works (see below). In the case of species pairs belonging to the same genus, a
sister group relationship was inferred. Genus names and phylogenetic relationships are
somewhat contradictory where genera turned out to be paraphyletic in recent phylogenetic
works as in the case of Centaurea (Cnicus benedictus inside Centaurea) and Papaver (Roemeria
hybrida forms a clade with Papaver argemone and P. hybridum; P. rhoeas is sister to this clade).
We detailed the phylogenetic relationships according to recent molecular works for Apiaceae
(Downie et al. 2000a;Downie et al. 2000b), Asteraceae (Garcia-Jacas et al. 2000;Susanna et al.
2006), Caryophyllaceae (Fior et al. 2006), Brassicaceae (Al Shebhaz et al. 2006;Beilstein et al.
2006;Warwick et al. 2006), Papaveraceae (Hoot et al. 1997;Soltis et al. 2005;Carolan et al. 2006)
and Ranunculaceae (Jensen et al. 1995;Paun et al. 2005). We compared three different ways to
obtain branch lengths for this phylogeny: all branch length set to one; second, branch length
according to Wikström et al. (2001) adjusted using the phylocom/bladj algorithm (Webb et al.
2006) and third group-size estimated branch lengths using the algorithm proposed by Grafen
(1989). We chose the method according to Grafen (1989), because it was the only that showed
relatively short and meaningful branch length for the many species pairs relative to deeper
branches in the phylogeny. Missing data complicate analyses of PICs, we removed missing
taxa using the drop.tip()-algorithm in the ape software package (Paradis et al. 2006).
Statistical analysis
We chose species in this comparative work based on their preference for the target
community of winter cereal fields (Secalinion, Braun-Blanquet 1939) and the definition of
Jauzein (1997) and Guende & Olivier (1997). We included whenever possible two close sister
species within a genus or a family and this across the whole system of recent angiosperms.

Chapter 5 Comparison of traits between rare and common cereal weeds
163
5
The choice of species used in the two cases when the species pairs are not the closest possible
relative in our data-set was made to maximize differences in regional frequency of
populations. The data were analysed using linear regression of population sizes at two dates
on continuous trait values using species as replicates. In parallel, we did linear regression
through the origin for the same parameters using phylogenetically independent contrasts
(see above). We also compared the species pairs of rare and common species according to the
regional frequency of populations using a paired Wilcoxon-test. All analyses where run in R
statistical environment (R Development Core Team 2008).
RESULTS
1.2 1.4 1.6 1.8 2.0 2.2 2.4
1.0
1.5
2.0
2.5
3.0
Population size 1983
Popula
tion s
ize 2
005
R² = 0.18; F1,27 = 5.74; p = 0.0238
1.2 1.4 1.6 1.8 2.0 2.2
1.0
1.5
2.0
2.5
3.0
Population size 1983
Po
pu
latio
n s
ize
20
06
R² = 0.1; F1,27 = 3; p = 0.0949
1 2 3 4 5 6 7
1
2
3
4
5
6
7
Population size 2006
Po
pu
latio
n s
ize
20
05
R² = 0.25; F1,52 = 17.49; p = 0.0001
A B C
Fig. 5.1. Relation between population sizes at different dates, a regression line is drawn when coefficient was significant (straight line p < 0.05; broken line p < 0.1 ).
First, we found a clear relation of mean population sizes among different dates, with tight
relations among subsequent years and less close relations for the 22 year time step (Fig. 5.1).
The regression shows a positive overall linear relationship between population sizes in 1983
and population sizes in 2005 and 2006. However, some points below the regression line
indicate clearly smaller population sizes in 2005/2006 than in 1983.
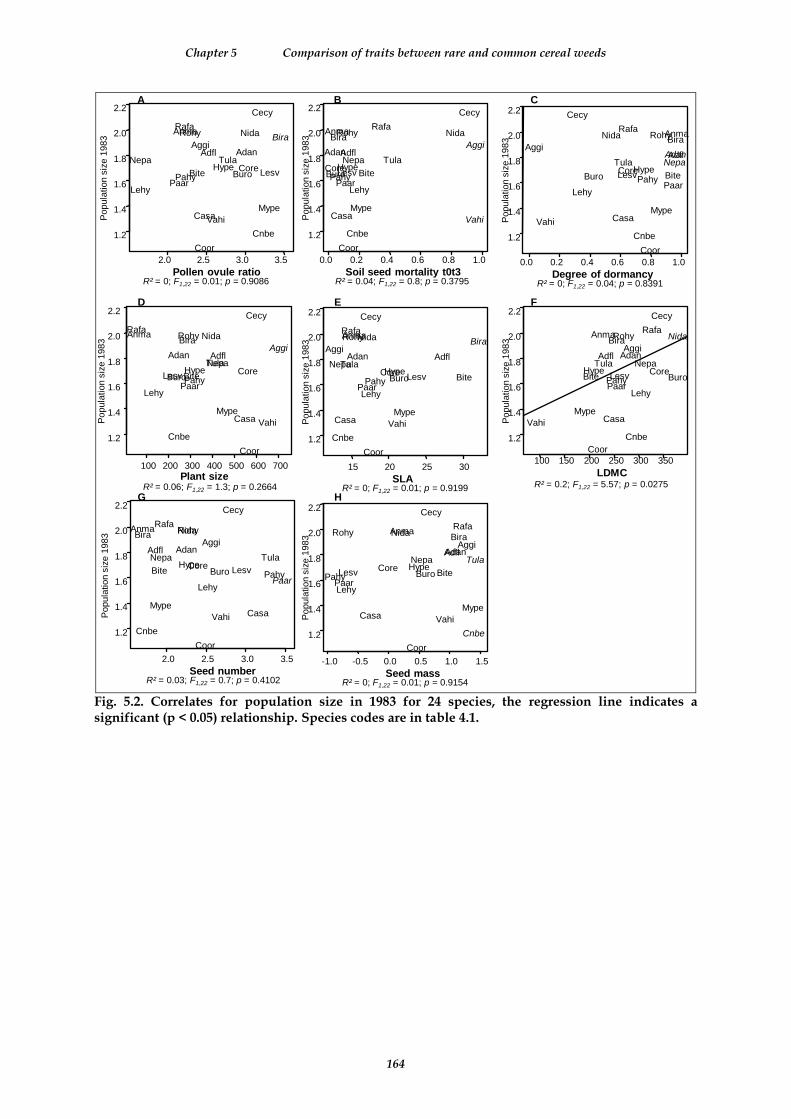
Chapter 5 Comparison of traits between rare and common cereal weeds
164
2.0 2.5 3.0 3.5
1.2
1.4
1.6
1.8
2.0
2.2
Pollen ovule ratio
Popula
tion s
ize 1
983
AdanAdflAggi
AnmaBira
Bite Buro
Casa
Cecy
Cnbe
Coor
CoreHype
Lehy
Lesv
Mype
Nepa
Nida
PaarPahy
RafaRohy
Tula
Vahi
0.0 0.2 0.4 0.6 0.8 1.0
1.2
1.4
1.6
1.8
2.0
2.2
Soil seed mortality t0t3
Popula
tion s
ize 1
983
AdanAdflAggi
AnmaBira
BiteBuro
Casa
Cecy
Cnbe
Coor
CoreHype
Lehy
Lesv
Mype
Nepa
Nida
PaarPahy
RafaRohy
Tula
Vahi
0.0 0.2 0.4 0.6 0.8 1.0
1.2
1.4
1.6
1.8
2.0
2.2
Degree of dormancy
Popula
tion s
ize 1
983
AdanAdflAggi
AnmaBira
BiteBuro
Casa
Cecy
Cnbe
Coor
CoreHype
Lehy
Lesv
Mype
Nepa
Nida
PaarPahy
RafaRohy
Tula
Vahi
100 200 300 400 500 600 700
1.2
1.4
1.6
1.8
2.0
2.2
Plant size
Popula
tion s
ize 1
983
Adan AdflAggi
AnmaBira
BiteBuro
Casa
Cecy
Cnbe
Coor
CoreHype
Lehy
Lesv
Mype
Nepa
Nida
PaarPahy
RafaRohy
Tula
Vahi
R² = 0.06; F1,22 = 1.3; p = 0.2664
15 20 25 30
1.2
1.4
1.6
1.8
2.0
2.2
SLA
Popula
tion s
ize 1
983
Adan AdflAggi
AnmaBira
BiteBuro
Casa
Cecy
Cnbe
Coor
CoreHype
Lehy
Lesv
Mype
Nepa
Nida
PaarPahy
RafaRohy
Tula
Vahi
2.0 2.5 3.0 3.5
1.2
1.4
1.6
1.8
2.0
2.2
Seed number
Popula
tion s
ize 1
983
AdanAdflAggi
AnmaBira
Bite Buro
Casa
Cecy
Cnbe
Coor
CoreHype
Lehy
Lesv
Mype
Nepa
Nida
PaarPahy
RafaRohy
Tula
Vahi
-1.0 -0.5 0.0 0.5 1.0 1.5
1.2
1.4
1.6
1.8
2.0
2.2
Seed mass
Popula
tion s
ize 1
983
AdanAdflAggi
AnmaBira
BiteBuro
Casa
Cecy
Cnbe
Coor
Core Hype
Lehy
Lesv
Mype
Nepa
Nida
PaarPahy
RafaRohy
Tula
Vahi
R² = 0; F1,22 = 0.01; p = 0.9086 R² = 0.04; F1,22 = 0.8; p = 0.3795 R² = 0; F1,22 = 0.04; p = 0.8391
R² = 0; F1,22 = 0.01; p = 0.9199
R² = 0.03; F1,22 = 0.7; p = 0.4102 R² = 0; F1,22 = 0.01; p = 0.9154
100 150 200 250 300 350
1.2
1.4
1.6
1.8
2.0
2.2
LDMC
Popula
tion s
ize 1
983
AdanAdflAggi
AnmaBira
Bite Buro
Casa
Cecy
Cnbe
Coor
CoreHype
Lehy
Lesv
Mype
Nepa
Nida
PaarPahy
RafaRohy
Tula
Vahi
R² = 0.2; F1,22 = 5.57; p = 0.0275
A CB
D FE
G H
Fig. 5.2. Correlates for population size in 1983 for 24 species, the regression line indicates a significant (p < 0.05) relationship. Species codes are in table 4.1.

Chapter 5 Comparison of traits between rare and common cereal weeds
165
5
RafaAdanAdflNidaCorePaarPahyRohyHypeCasaNepaMypeCoorAggiVahiAnmaBuroBiraBiteTulaCecyCnbeLesvLehy
25
26
27
2829
30
31
3233
34
3536
37
38
39
40
41
4243
44
45
46
47
-1 0 1 2
-1
0
1
2
3
Soil seed mortality contrastsP
opula
tion s
ize 1
983 c
ontr
asts
25 2627
28
29
30 31
32
3334
35
36
37
38
39
4041
42
43
44
45
46
47
R² = 0.29; F1,22 = 9.08; p = 0.0064
-40 -20 0 20 40
-1
0
1
2
3
SLA contrasts
Popula
tion s
ize 1
983 c
ontr
asts
252627
28
29
30 31
32
3334
35
36
37
38
39
4041
42
43
44
45
46
47
R² = 0; F1,22 = 0.02; p = 0.8979
-200 0 200 400 600
-1
0
1
2
3
LDMC contrastsP
opula
tion s
ize 1
983 c
ontr
asts
25 2627
28
29
3031
32
3334
35
36
37
38
39
4041
42
43
44
45
46
47
R² = 0.31; F1,22 = 9.68; p = 0.0051
-3 -2 -1 0 1 2 3 4
-1
0
1
2
3
Seed mass contrasts
Popula
tion s
ize 1
983 c
ontr
asts
25 2627
28
29
3031
32
3334
35
36
37
38
39
4041
42
43
44
45
46
47
R² = 0; F1,22 = 0.02; p = 0.8781
-4 -2 0 2 4
-1
0
1
2
3
Seed number contrasts
Popula
tion s
ize 1
983 c
ontr
asts
252627
28
29
3031
32
3334
35
36
37
38
39
4041
42
43
44
45
46
47
R² = 0; F1,22 = 0.02; p = 0.8985
-500 0 500 1000
-1
0
1
2
3
Plant size contrasts
Popula
tion s
ize 1
983 c
ontr
asts
25 2627
28
29
30 31
32
3334
35
36
37
38
39
4041
42
43
44
45
46
47
R² = 0.08; F1,22 = 1.85; p = 0.1871
-2 0 2 4 6
-1
0
1
2
3
Pollen ovule ratio contrasts
Po
pu
latio
n s
ize
19
83
co
ntr
asts
252627
28
29
3031
32
3334
35
36
37
38
39
4041
42
43
44
45
46
47
R² = 0; F1,22 = 0.06; p = 0.8057
-1.5 -1.0 -0.5 0.0 0.5 1.0
-1
0
1
2
3
Dormancy contrasts
Popula
tion s
ize 1
983 c
ontr
asts
252627
28
29
3031
32
3334
35
36
37
38
39
4041
42
43
44
45
46
47
R² = 0.03; F1,22 = 0.79; p = 0.3824
A CB
D FE
G
I
H
Fig. 5.3. Population size contrasts (in 1983) and trait contrasts (numbers in plots and tree). The regression lines indicate significant (p < 0.05) relationships. (I): phylogeny used for calculation of PICs. Species codes are in table 4.1.
Second, we found a number of significant relations between species traits, trait PICs and
population size in 1983 as well as in 2006 (Figs. 5.2, 5.3, 5.4 & 5.5). However, it was not the
same traits that showed a significant relation to population size at the different dates. In
1983, using no phylogenetic correction, leaf dry matter content (LDMC) was positively
correlated to population size (fig. 5.2). When we considered phylogeny, again LDMC
contrasts were related to population sizes (fig. 5.3). Additionally, soil seed mortality

Chapter 5 Comparison of traits between rare and common cereal weeds
166
contrasts were positively related to population size contrasts, in other words, when
comparing related species or taxa, the one with high soil seed mortality has often larger
population sizes in 1983 (fig. 5.3).
-1.0 -0.5 0.0 0.5 1.0 1.5
0
1
2
3
4
Seed mass
Popula
tion s
ize 2
006
AdanAdfl
Aggi
Anar
Anma
AsarBira
Bite
Buro
Busu
Cala
CaplCasa
CecyCeso
Cnbe
Coor
CoreGala
Gani Gatr
HypeLehyLesv
Mype
Nepa
Nida
Paar
Pahy
Parh
Raar
RafaRaru
Rohy
Sial
Tula
Vahi
R² = 0; F1,35 = 0.08; p = 0.7856
1.5 2.0 2.5 3.0 3.5
0
1
2
3
4
Seed number
Popula
tion s
ize 2
006
AdanAdfl
Aggi
Anar
Anma
AsarBira
Bite
Buro
Busu
Cala
CaplCasa
CecyCeso
Cnbe
Coor
CoreGala
GaniGatr
HypeLehy
Lesv
Mype
Nepa
Nida
Paar
Pahy
Parh
Raar
Rafa Raru
Rohy
Sial
Tula
Vahi
R² = 0; F1,35 = 0.05; p = 0.8198
200 400 600 800
0
1
2
3
4
Plant size
Popula
tion s
ize 2
006
Adan Adfl
Aggi
Anar
Anma
AsarBira
Bite
Buro
Busu
Cala
CaplCasa
CecyCeso
Cnbe
Coor
CoreGala
Gani Gatr
HypeLehy
Lesv
Mype
Nepa
Nida
Paar
Pahy
Parh
Raar
RafaRaru
Rohy
Sial
Tula
Vahi
R² = 0; F1,35 = 0.05; p = 0.8315
200 400 600 800
0
1
2
3
4
LDMC
Popula
tion s
ize 2
006
AdanAdfl
Aggi
Anar
Anma
AsarBira
Bite
Buro
Busu
Cala
CaplCasa
CecyCeso
Cnbe
Coor
CoreGala
GaniGatr
HypeLehy
Lesv
Mype
Nepa
Nida
Paar
Pahy
Parh
Raar
RafaRaru
Rohy
Sial
Tula
Vahi
R² = 0.01; F1,35 = 0.46; p = 0.5027
0.0 0.2 0.4 0.6 0.8 1.0
0
1
2
3
4
t0t3
Popula
tion s
ize 2
006
AdanAdfl
Aggi
Anar
Anma
AsarBira
Bite
Buro
Busu
Cala
CaplCasa
CecyCeso
Cnbe
Coor
CoreGala
GaniGatr
HypeLehy
Lesv
Mype
Nepa
Nida
Paar
Pahy
Parh
Raar
Rafa Raru
Rohy
Sial
Tula
Vahi
R² = 0; F1,35 = 0.14; p = 0.7146
0.0 0.2 0.4 0.6 0.8 1.0
0
1
2
3
4
Dormancy
Popula
tion s
ize 2
006
AdanAdfl
Aggi
Anar
Anma
AsarBira
Bite
Buro
Busu
Cala
CaplCasa
CecyCeso
Cnbe
Coor
CoreGala
Gani Gatr
HypeLehy
Lesv
Mype
Nepa
Nida
Paar
Pahy
Parh
Raar
RafaRaru
Rohy
Sial
Tula
Vahi
R² = 0.03; F1,35 = 1.12; p = 0.2966
10 15 20 25 30
0
1
2
3
4
SLA
Popula
tion s
ize 2
006
Adan Adfl
Aggi
Anar
Anma
AsarBira
Bite
Buro
Busu
Cala
CaplCasa
CecyCeso
Cnbe
Coor
CoreGala
GaniGatr
HypeLehy
Lesv
Mype
Nepa
Nida
Paar
Pahy
Parh
Raar
Rafa Raru
Rohy
Sial
Tula
Vahi
R² = 0.09; F1,35 = 3.53; p = 0.0686
1.5 2.0 2.5 3.0 3.5
0
1
2
3
4
Pollen ovule ratio
Popula
tion s
ize 2
006
AdanAdfl
Aggi
Anar
Anma
AsarBira
Bite
Buro
Busu
Cala
CaplCasa
CecyCeso
Cnbe
Coor
CoreGala
GaniGatr
HypeLehy
Lesv
Mype
Nepa
Nida
Paar
Pahy
Parh
Raar
RafaRaru
Rohy
Sial
Tula
Vahi
R² = 0.13; F1,35 = 5.41; p = 0.026
A CB
D FE
G H
Fig. 5.4. Correlates for population size in 2006 for 37 species. The straight regression line indicates a significant (p < 0.05) relationship, the broken line a weakly significant (p < 0.1) relationship. Species codes are in table 4.1.
For the population sizes in 2006 using no correction, we found a significant positive effect of
Pollen/Ovule (P/O) ratio on population size. Specific leaf area showed a marginally
significant effect, with high SLA-species having larger population sizes (fig. 5.4).

Chapter 5 Comparison of traits between rare and common cereal weeds
167
5
-2 0 2 4 6 8-5
0
5
10
Seed number contrasts
Popula
tion s
ize 2
006 c
ontr
asts
383940
41
42
43
4445
46
47
48
49
505152
53 54
5556
57
58
59
60
61
62
63
64
65
66
67
6869
70 71
72
73
-4 -2 0 2-5
0
5
10
Seed mass contrasts
Popula
tion s
ize 2
006 c
ontr
asts
38 3940
41
42
43
4445
46
47
48
49
505152
5354
5556
57
58
59
60
61
62
63
64
65
66
67
6869
7071
72
73
-2000 -1000 0 1000-5
0
5
10
Plant size contrasts
Popula
tion s
ize 2
006 c
ontr
asts
383940
41
42
43
4445
46
47
48
49
505152
53 54
5556
57
58
59
60
61
62
63
64
65
66
67
6869
70 71
72
73
-40 -20 0 20 40 60 80-5
0
5
10
SLA contrasts
Popula
tion s
ize 2
006 c
ontr
asts
383940
41
42
43
4445
46
47
48
49
505152
5354
5556
57
58
59
60
61
62
63
64
65
66
67
6869
7071
72
73
-1500 -1000 -500 0 500-5
0
5
10
LDMC contrasts
Popula
tion s
ize 2
006 c
ontr
asts
383940
41
42
43
4445
46
47
48
49
50 5152
5354
55 56
57
58
59
60
61
62
63
64
65
66
67
6869
70 71
72
73
-2 0 2 4 6-5
0
5
10
Pollen ovule ratio contrasts
Popula
tion s
ize 2
006 c
ontr
asts
383940
41
42
43
4445
46
47
48
49
505152
53 54
5556
57
58
59
60
61
62
63
64
65
66
67
6869
7071
72
73
-3 -2 -1 0 1 2 3 4-5
0
5
10
Soil seed mortality contrasts
Popula
tion s
ize 2
006 c
ontr
asts
383940
41
42
43
4445
46
47
48
49
505152
53 54
5556
57
58
59
60
61
62
63
64
65
66
67
6869
70 71
72
73
-2 -1 0 1-5
0
5
10
Dormancy contrasts
Popula
tion s
ize 2
006 c
ontr
asts
383940
41
42
43
4445
46
47
48
49
505152
5354
55 56
57
58
59
60
61
62
63
64
65
66
67
6869
70 71
72
73
R² = 0.11; F1,35 = 4.41; p = 0.0431 R² = 0.05; F1,35 = 2.01; p = 0.1655
R² = 0.11; F1,35 = 4.3; p = 0.0454 R² = 0.27; F1,35 = 13.05; p = 0.0009 R² = 0.08; F1,35 = 3.02; p = 0.0913
R² = 0.18; F1,35 = 7.45; p = 0.0098 R² = 0; F1,35 = 0.02; p = 0.9026 R² = 0.3; F1,35 = 15.21; p = 0.0004
RaarRafaAdanAdflGaniNidaCorePaarPahyRohyParhHypeCasaNepaMypeRaruCoorSialAggiVahiAnarAnmaAsarGatrGalaBuroBusuBiraBiteTulaCaplCecyCesoCnbeCalaLesvLehy
38
39
4041
4243
44
45
4647
4849
50
5152
5354
55
5657
58
59
60
6162
63
6465
6667
68
6970
7172
73
A CB
D FE
G
I
H
Fig. 5.5. Population size contrasts (in 2006) and trait contrasts (numbers in plots and tree). The straight regression lines indicate significant relationships (p < 0.05), the broken line weakly significant relationships (p < 0.1). (I) The phylogeny used for calculation of PICs. Species codes are in table 4.1.
This picture changed when phylogeny was taken into account (fig. 5.5). Again, P/O ratio
contrasts were significantly related to population size contrasts, with an even slightly
stronger relationship, indicating that among closely related taxa, the one with the higher
P/O ratio has the higher population size (fig. 5.5). SLA contrasts showed a stronger effect on
population size contrasts than without phylogenetic correction (fig 5.4 and 5.5). In addition
to this, degree of dormancy contrasts were negatively correlated to population size contrasts;

Chapter 5 Comparison of traits between rare and common cereal weeds
168
this indicates that among two taxa, the one with low germinating fractions has very
generally the smaller population size in 2006 (fig. 5.5). Using PICs, plant size and seed
number were both positively related to population size (fig. 5.5). Finally leaf dry matter
content showed a marginally negative effect on population size contrasts for 2006 (fig. 5.5),
the inverse of the relation for 2005 (fig. 5.3).
RaarRafaAdanAdflGaniNidaPaarRohyCasaNepaRaruCoorSialAggiAnarAnmaAsarGatrBuroBusuBiraBiteTulaCaplCesoCnbeLesvLehy
0 5 10 15 20 25 30 35
Seed mass of rare speciesp = 0.3575
1.5 2.0 2.5 3.0 3.5
Seed number of rare speciesp = 0.3258
200 250 300 350 400
LDMC of rare speciesp = 0.2166
15 20 25 30
SLA of rare speciesp = 0.0166
200 400 600 800
Plant size of rare speciesp = 0.058
0.0 0.2 0.4 0.6 0.8 1.0
Degree of dormancy of rare speciesp = 0.8552
0.0 0.2 0.4 0.6 0.8 1.0
Soil seed mortality of rare speciesp = 0.4263
1.5 2.0 2.5 3.0 3.5
0
5
10
15
20
25
30
35
1.5
2.0
2.5
3.0
3.5
200
250
300
350
400
15
20
25
30
200
400
600
800
0.0
0.2
0.4
0.6
0.8
1.0
0.0
0.2
0.4
0.6
0.8
1.0
1.5
2.0
2.5
3.0
3.5
P/O ratio for rare species (log)
Seed m
ass o
f com
mon s
pecie
s
Seed n
um
ber
of
com
mon s
pecie
s
LD
MC
of com
mon s
pecie
s
SLA
of
com
mon s
pecie
s
Pla
nt siz
e o
f com
mon s
pecie
s
De
gre
e o
f dorm
ancy
of
com
mon s
pecie
s
Soil s
eed m
ort
ality
of
com
mon s
pecie
s
P/O
ratio for
com
mon s
pecie
s (
log)
p = 0.583
Fig. 5.6. Comparison of regionally rare and common species according to their traits: each dot represents a species pair. Dots are placed according to the values of the rare species on the x-axis and according to the common species on the y-axis, dots on the line indicate no difference between trait values of rare and common species. The phylogeny indicates the species pairs used here. Species codes are in table 4.1. P-values are values from a paired Wilcoxon-test.
Chapter 5 Comparison of traits between rare and common cereal weeds
169
5
For the second measure of rarity, the frequency of populations per species in our study area
shows that rare and common annual species differ in their SLA and marginally in their size
(fig. 5.6). Common species have a higher SLA than their rarer relatives and common species
are also larger in size (fig. 5.6).
DISCUSSION
The first feature of our work shows, that there are no consistent relationships among years
between resource capture or resource conservation traits, such as SLA and LDMC, and
population size. Astonishingly, there were no relationships at all between seed size or
number and population size or regional abundance. Also for the pollen ovule ratio, there
were inconsistencies among years. The interpretation of these results can therefore not been
disconnected from directional changes in the environment of the cereal fields. Previous
works on breeding system and P/O ratio suggested that this trait may be related to the
ability of a species to withstand changing environmental conditions (Lavergne 2003).
Pollen:ovule ratio is related to a plant’s breeding system, with low P/O for inbreeders and
high P/O for outbreeders (Cruden 1976;Cruden 1977). Furthermore, inbreeders are known to
have lower genetic diversity and levels of heterozygosity than outbreeders (Hamrick and
Godt 1997). Therefore, it is possible that species with low pollen:ovule ratio are
disadvantaged due to less exchanges of genetic information. In a severely changing
environment, this can lead to larger population sizes for high P/O species and smaller sizes
for low P/O species, because outbreeders adapt more quickly than inbreeders do.
Additionally, low P/O species can eventually persist in smaller populations without being
pollen limited and hence continue to form seeds, even if the environment is suboptimal
whereas high P/O species disappear completely or show higher fluctuations, due to the
pollen triggered seed set (Leimu et al. 2006). There is however, a problem with this
interpretation as it fails to explain why there are still species with low P/O and why this is
Chapter 5 Comparison of traits between rare and common cereal weeds
170
not already the case in the earlier survey of 1983. It is possible that these species had a high
gene exchange among populations via seed dispersal in former times, in relation with their
higher seed production due to self-compatibility, and that nowadays there are small relictual
populations persisting for inbreeding species. These populations bear however, a very high
extinction risk because they are relatively small and show high levels of inbreeding.
Second, both dates together indicate that smaller populations show a higher degree of
dormancy and longer soil seed viability than larger populations, in other words an important
long-lived soil seed bank. It can be argued that for species with long-lived seed bank, each
year only parts of the seeds germinate and thus total population size is underestimated by
surveys. Long-lived seed banks or low germination fractions are life history traits that buffer
against failure in reproduction in annual plants by bet hedging (Venable 2007). A possible
interpretation of the data would be that a long-lived soil seed bank enables species to persist
even in small populations because effective population size from a genetic (Silvertown and
Charlesworth 2001) and life history (Kalisz 1991;Kalisz and McPeek 1992) point of view is
higher in seed bankers than in species with short lived soil seed bank. However, it is now
clear that there are considerable genetic (McGraw 1993;Cabin et al. 1998;Hock et al. 2008) and
functional (Kalisz 1991;Kalisz and McPeek 1992) differences between above ground and
below ground populations.
Third, the results of plant size and specific leaf area (SLA) are consistent between the
population sizes in 2006 and regional frequency of populations, in both cases, common
species or species with higher number of population at a regional level are taller and have a
higher SLA. SLA is linked to rapid growth and nutrient uptake can potentially be relevant
(Weiher et al. 1999;Garnier et al. 2001). This indicates that species with rapid growth, fast
resource acquisition and big final size have advantages for both, building up larger
populations, disperse, and establish better at a regional level. It is interesting to note here
that this is not the case in the 1983 data set, which -in contrast to 2006- showed a higher leaf

Chapter 5 Comparison of traits between rare and common cereal weeds
171
5
dry matter content (LDMC) for species with larger populations and no relation to plant size
or SLA. This data can be interpreted as a shift from resource conserving plants being
advantaged in the environment of the 1980ies, and this due to dryer climate, less competitive
environment and less fertilizer, all three factors changed over time for the studied ecosystem
in the study area (Gasc 2005;Fried et al. 2009). The differences at the regional scale can
probably be interpreted in a similar manner even if they act at different temporal and
geographical scales. Here, we studied indeed a set of species that were notoriously common
at the beginning of the 20th century and that is now becoming increasingly rare. Herbicide
use, changed ploughing techniques and the use of fertilizer are implicated in these changes.
This makes the surrounding vegetation and especially the standing crop more competitive
and favours plants with rapid nutrient uptake (Bischoff and Mahn 2000;Fried et al. 2009).
In the light of the important changes over time among annual plants, it has to be emphasised
that most of the traits that can be related to local population size or regional frequency of
populations are not general predictors or correlates of population size, but merely indicators
to what limits the studied set of species in the actual landscape. In the light of the data
advanced here, the survival of seeds in the soil seed bank and degree of dormancy may be
excepted: both buffer against the fatality of exceptional years and small population sizes and
may by this promote persistence in small populations.
The relations we document here have an importance to actual conservation of rare annual
plants in the North West Mediterranean. If rare annuals have to be preserved, the nutrient
status of the growing places, in our case cereal fields, have to be kept low at least
somewhere, in order not to disadvantage small plants with slow nutrient uptake. We can
exclude a decline in pollinators and hence pollen mediated reproductive failure as a major
source for the loss of species and populations (Biesmeijer et al. 2006). Because, at the time
scale studied for our study region, outbreeding species, with a high P/O ratio show actually
the larger population sizes. It is rather inbreeding species that face a major actual extinction

Chapter 5 Comparison of traits between rare and common cereal weeds
172
risk. This is in contradiction to claims of a general pollinator mediated plant regression in
other parts of Europe (Biesmeijer et al. 2006). Here we also add significant data to support the
idea that changing nutrient status of the environment –eutrophication– is also a cause for
plant rarity in Mediterranean Europe, for which this general trend in remaining Europe was
often excluded.
Beyond these geographically more restricted conclusions of conservation interest, our
findings suggest that for a vast majority of functional traits relations to ‘rarity’ are not
general but bound to a temporal context. Soil seed bank is a promising research area to
explain some of the contrasts in population sizes among species.

General discussion, conclusions and perspectives
173
5
C
GENERAL DISCUSSION, CONCLUSIONS AND PERSPECTIVES
In the general discussion, we resume and evaluate the main insights from each chapter and
relate them to the theoretical context given in the general introduction. Later we try to point
on the limits of our research. In the general conclusions, we discuss some more basic
questions appearing in the thesis. Finally, we give perspectives which questions can
complete our approach and how future research can successfully answer them.
General discussion
PLANT DIVERSITY IN AGRO-ECOSYSTEMS: THE MAIN INFLUENCE OF DISTURBANCES AND
THE ROLE OF SPATIAL HETEROGENEITY FOR DIVERSITY MAINTENANCE
The analysis of diversity in an agro-ecosystem in the first chapter showed that habitat types,
intensity of agriculture and historical factors all had an important influence on plant
diversity in agro-ecosystems. Because habitat types depend only on differences in land-use
and are only little different in their soil conditions the largest part of biodiversity in these
agricultural landscapes is determined by human disturbances. This result has been shown by
a number of works on herbicide use and plant diversity (Schneider et al. 1994;Robinson and
Sutherland 2002), organic farming and plant diversity (Hald 1999;Hyvönen et al. 2003;Gabriel
et al. 2006;Roschewitz et al. 2009) and agricultural practices in vineyards (Maillet 1992). There
are however new insights coming from chapter 1. For instance, the different habitat types
have only rarely been taken into account for a landscape scale analysis of plant diversity
(von Arx et al. 2002) and, to our knowledge, this has not yet been done for vineyards. The
differences in α-diversity among habitats showed that field margins and embankments play
a major role for maintaining plant diversity in vineyards and that this is especially true for
plants of high conservation interest. Similar findings come from works on intensive arable
fields (Marshall 1989;Wilson and Aebischer 1995;Gabriel et al. 2006;Roschewitz et al. 2009)

General discussion, conclusions and perspectives
174
and this view lead to programs which specially aim on the maintaining of plant and animal
diversity in field margins by reducing herbicide use and crop density (Thomas and Marshall
1999;Moonen and Marshall 2001;Smith et al. 2008). For vineyards, our data indicate however,
that embankments, i.e. the surfaces that are never ploughed, bear by far the most important
remnants of plant diversity. There are several reasons why previous works do not point on
non-ploughed surfaces for maintaining of plant diversity in agricultural landscapes. (i) These
embankments do not necessarily exist in intensive arable land, where they are much smaller
and often bear woody vegetation like hedges in Central and North Western Europe. (ii)
Mediterranean type climate implies severe summer drought with nearly complete drying of
above ground biomass. Drought as a cycling disturbance enhances especially diversity of
annual plants and can give similar niches as in arable land itself. This is not the case for moist
climate field embankments. Evidently, diversity in field embankments in vineyards or arable
land depends also on their management.
The higher diversity on embankments are interpreted to influence adjacent habitats such as
field margins to have a higher diversity due to dispersal and establishment of sink
populations a concept termed ‘mass effect’ (Shmida and Wilson 1985;Kunin 1998). However,
embankments not only increase diversity in adjacent habitats by the establishment of a high
number of sink populations. The higher diversity of embankments so close to the other
habitats can also increase the possible species pool, which provides more species to fit into
the niches available in field margins and centres -a diversifying effect termed ‘species pool
concept’ (Zobel 1997;Pärtel 2002;Zobel et al. 2006). The higher number of different species in
more diverse landscapes that are dispersed into a particular habitat can also explain the
higher absolute β-diversity in landscapes with many different habitats. Both aspects -the
gradient from embankment to field centre and the increased diversity in diversified
landscape- show that plant diversity including target species for conservation cannot be
explained independently from the spatial surroundings. Surroundings can play a crucial role

General discussion, conclusions and perspectives
175
5
C
by constantly dispersing seeds into the studied habitats, and its opposite, dispersal
limitation, is known to be one of the most severe limits to plant diversity (Ehrlen and
Eriksson 2000;Coulson et al. 2001;Poschlod and Biewer 2005;Zobel et al. 2006).
In the introduction we presented the principles of ‘storage effect’ which explains the
coexistence of dominant and subordinate species via temporal heterogeneity in habitat
quality, correlated competition and the buffering effect of persistent soil seed banks. In the
light of the high importance of dispersal from species rich surroundings, we can now better
understand how diversity maintains. In addition to the seed bank, surrounding habitats that
have not the same disturbance regimes than the target community can provide seeds to fill
up vacant niches when conditions become suboptimal in the target community. For arable
fields the work of Dutoit et al. (2003) showed indeed that after long non-crop rotation in
arable field the return of the typical plant community is hampered. However, this is a
transitional condition in the light of the high number of arable plant seeds in seeding
material from traditional systems (Jäger 2002). This gives insights into how plant diversity
can best be maintained in agro-ecosystems: not to long crop rotations and increasing of
dispersal mechanisms, like e.g. the use of not cleaned seeding material. Not surprisingly, the
most threatened arable weeds are those that do not have a persistent soil seed banks and that
relay on seed dispersal by uncleaned seed material to maintain in agricultural landscapes
(Schneider et al. 1994).
METHODS AND ESTIMATES OF SOIL SEED BANK PERSISTENCE REVISITED – WHICH SEED
BANK ESTIMATE CAN PREDICT LOCAL PLANT DIVERSITY AND ABUNDANCE?
In the second chapter, we use seed survival measured from a burial experiment and show
that it is not correlated to the commonly used seed bank persistence estimates from literature
when these are estimated from seedling emergence. This let us ask what quality of data the
methods for the study of soil seed banks give and how soil seed bank persistence estimates
General discussion, conclusions and perspectives
176
have been validated in the past. We had a closer look on the work of Bekker et al. (1998a),
who tested the general validity of seed bank persistence estimates based on the depth
distribution of viable seeds. We realised that the data mixture that Bekker et al. (1998a) used
in their validation database makes it difficult to know whether the seedling emergence
method is related to experimental soil seed survival. Our analyses do not support a close
general relationship of the both. We then asked what could influence the seedling emergence
method to yield different data than burial experiments. One putative candidate to bias
seedling emergence is seed production, which is already known to be strongly related to
dispersal in space (Tackenberg et al. 2003;Poschlod and Biewer 2005;Poschlod et al. 2005). In a
subsequent analysis of data from a literature survey, we therefore tested whether seed
production was correlated to soil seed bank estimates. Using the data of Šera and Šery (2004)
and Thompson et al. (1997), we could demonstrate that there was a clear and significant
relationship indicating that higher seed production is related to higher soil seed bank
persistence estimates. Seed production is caught in a fundamental trade-off with seed size
(Shipley and Dion 1992;Jakobsson and Eriksson 2000;Turnbull et al. 2000). The processes that
compensate larger seeds for their smaller number, such as seedling mortality, act after
germination (McGinley et al. 1987;Louda 1989;Jakobsson and Eriksson 2000;Leishman et al.
2000b;Coomes and Grubb 2003;Moles et al. 2004;Pizo et al. 2006;Bladé and Vallejo 2008). We
therefore think that the classical soil seed bank persistence estimates are not useful when one
wants to predict diversity or population persistence. This finding is confirmed by field
observations showing that the emergent seedling composition in gaps is quite different from
what finally establishes in the gaps (Hillier et al. 1990). This results also question the
existence of a positive relation between seed size and seed longevity which have been shown
using soil seed bank estimates coming from the seedling emergence method (Thompson et al.
1993;Bekker et al. 1998a;Moles et al. 2000;Cerabolini et al. 2003;Peco et al. 2003). In short, high
seed number enhances the probability that one viable seed will survive until formation of a
General discussion, conclusions and perspectives
177
5
C
gap or sampling by an ecologist, but this will not mean that the resulting seedling will grow
to an adult plant under natural conditions. The probability to reach adult age for one
seedling is much higher in large seeded species. There are different numbers of seeds in the
soil seed sample according to differences in abundance and seed production, which itself is
connected to seed size by a trade-off. However, both -many small and few large seeds- will
result in equal numbers of adults or equal chance to establish in the gap. This gives insights
how to scale abundance in the seed bank in order to give sound predictions about diversity
and abundance in the resulting vegetation. Seed size may here be a potential scaling factor:
multiplied by the seed number it yields the relative investment of plants for the given
sample. This should be explored in future works.
Probably, seed size may be near to neutral for the ‘storage effect’. From an evolutionary point
of view, one can imagine many other processes that trigger soil seed persistence. According
to the storage effect, this can also include the adult plant niche, because this may decide
whether immediate or delayed germination yields the highest fitness. Evidently, the timing
of germination can change as a function of environmental conditions. These germination
cues may be one path to a deepened understanding what decides on the longevity of seeds in
the soil - a point that we explored in chapter 3.
FUNCTION OF SEED PERSISTENCE IN THE SOIL: HOW GERMINATION AND SEED TRAITS
OPTIMISE A PLANT’S RESOURCE USE IN DISTURBANCE DRIVEN ECOSYSTEMS
Dormancy had an important positive effect on soil seed survival in our experiment. This
finding confirms that dormancy is an important adaptation to achieve soil seed survival in
the soil (Baskin and Baskin 1998;Thompson et al. 2003;Baskin and Baskin 2006). Inhibition of
germination after burial can also be regulated by a light requirement for germination; a light
requirement that is known to be negatively related to seed size (Milberg et al. 2000). The light
requirement for germination could be confirmed for small seeds and it could be

General discussion, conclusions and perspectives
178
complemented by a darkness requirement for large seeds. The latter is a reasonable
expectation because larger seeds can emerge from deeper soil layers (Bond et al. 1999;Grundy
et al. 2003) and because light penetrates only extremely little into soil (Benvenuti 1995).
Under Mediterranean climate, it has been shown by Bell et al. (1995) that some species
germinated better in darkness than in light. The argumentation behind this is that species
germinate in soil layers were moisture and light conditions are moderated compared to the
soil surface. Species germinating in darkness may therefore have an advantage over light
dependent germination under Mediterranean climate. We also confirm with experimental
data that a light requirement enhances soil seed persistence with a clear decline of its
importance from the moment seeds entered into the soil. This confirms experimentally what
has been argued earlier on smaller experimental basis (Baskin and Baskin 1998;Thompson et
al. 2003;Baskin and Baskin 2006). This factor may sustain a negative seed size-seed longevity
relationship independently from the seed size-seed number trade-off.
The long survival of seeds in the soil may be connected to mechanisms that detect favourable
conditions for establishment and that trigger germination below the surface. We
demonstrated that ‘gap detection’, i.e. reaction to diurnally fluctuating temperatures (DFT) is
one mechanism to enhance soil seed persistence after one and a half year of burial and -in
our Mediterranean example- especially for the winter burial periods. To our knowledge, a
relationship between soil seed survival and DFT has not been reported previously. Diurnally
temperature fluctuations (DFT) are lower with increasing soil depth (Miess 1968). Therefore,
an effect on soil seed persistence can also be an adaptation to detect depth of burial and to
avoid fatal germination in deeper soil layers. This extends the classical view of the ‘gap
detection’ mechanism of DFT, which is restricted to the detection of above ground gaps in
the vegetation. The reaction to DFT had a seasonal component: soil seed mortality is higher
in winter than in summer for species that germinate better without DFT. If DFT is a way to
detect burial depth, one could suggest a relation to seed size, which could have a negative

General discussion, conclusions and perspectives
179
5
C
effect on the strength of the reaction to DFT. In our data set, we could not show such a
relation, which indicates, that the gap detection mechanism evolved equally often evolved in
large than in small seeded species. However, data is scarce and this point would better be
addressed with a burial experiment especially designed to detect the importance of burial
depth, DFT and seed size.
We also confirmed in an analysis of phylogenetically independent contrasts, that seed size
was negatively related to soil seed survival. This is the first test showing this relationship
only with experimental data. This is thus important independent evidence to sustain the seed
size-seed persistence relationship (Thompson et al. 1993;Bekker et al. 1998a;Moles et al.
2000;Cerabolini et al. 2003;Peco et al. 2003). However, we want to highlight that there was no
strong relation of soil seed mortality without the use of PICs. One interpretation would be
that the possibility of detection is enhanced using close relatives. This ignores however, that
seed sizes even in this experiment vary over several orders of magnitude. However, we
could not find any threshold value, i.e. no value beyond which all species have persistent or
transient seeds. An alternative explanation would be to admit a bias in the burial experiment
that is related to seed size: e.g., we used fixed numbers of seeds for all species and a unique
size of mesh bags for burial without substrate. In such a design, small seeds are more distant
on average than large seeds and propagation of fungi can be enhanced in the more densely
packed mesh bags for large seeds (Van Mourik et al. 2005). This leads to higher soil seed
mortality in larger seeds due to fungi promoting seed decay in the soil (Schafer and Kotanen
2003;Davis and Renner 2007). Finally, this illustrates how difficult it is to escape the seed
number –seed size trade-off even under experimental conditions of a seed burial experiment
and that the relation of seed size to soil seed mortality remains unresolved. Future works
should explore different seed sizes and buried seed densities to account for density
dependent effects and to give a definitive test of the relation.

General discussion, conclusions and perspectives
180
so
il s
ee
d b
an
ka
bo
ve
gro
un
d p
op
ula
tio
n
seeds of high
soil seed survival
seeds of low soil
seed survival
Legend
2 8Year 1 3 4 5 6 7 10 119
decreased germination:
detection of high vegetation
cover through light and diurnally
fluctuating temperatures
increased germination:
detection of gaps by
light and diurnally
fluctuating temperatures
high degree of dormancy and
detection mechanisms
maintain seeds ungerminated
Fig. C.1: Traits and germination ecological characteristics important for soil seed persistence.
Figure C.1 summarises the different ways in which soil seed persistence can be controlled by
adaptations in germination ecology. DFT and a light requirement permit the detection of
disturbances and gaps and hence trigger germination (fig. C.1). On the other hand,
dormancy, DFT and light requirement also permit seeds to stay ungerminated while
conditions for establishment are unfavourable (fig. C.1). The complexity of these adaptations
shows how crucial timing of germination is for the individual fitness. According to storage
effect, these adaptations can avoid competition as a limiting factor for individual fitness.
Seed size has been supposed to be correlated to competitive ability in seedlings: larger seeds
can manage to establish in denser vegetation, with a litter cover, in later successional states
or in more shaded habitats (Hodkinson et al. 1998). The advantage of adaptations that detect
the best moment to germinate becomes clear in the light of storage effect. They permit to
detect favourable periods (fig. C.1) and limit the decrease of the soil seed population in
unfavourable years (fig. C.1). Moreover, it can be argued that adaptations that detect
favourable conditions for germination and establishment enhance the storage effect. This
would mean that these traits promote coexistence and diversity in plant communities where
General discussion, conclusions and perspectives
181
5
C
annual plants are common, favourable years are unpredictable and disturbances are
frequent.
TRAITS AND LOCAL POPULATION DYNAMICS IN ANNUAL PLANTS: CAN POPULATION
TURNOVER AND EXTINCTION DYNAMICS BE PREDICTED?
In chapter 4, we show that a part of the studied species is regressing and notably that the
smaller the size of their population the higher the extinction risk during the observation
period 1983-2005. However, there was no clear trend in light conditions, moisture content,
soil pH and soil nutriment status during the study period. We concluded that the reasons for
regression must be elsewhere than in changes of habitat quality in these factors. Indeed, the
major reason for regression is herbicide use, and its increase is possible during the study
period. Furthermore, change in timing of disturbances such as a shift towards more summer
crops can influence the studied species. This would lead to a flora richer in summer
germinating species (‘Chenopodietea’, see introduction), but we could not observe this in the
field. Finally, the disruption of dispersal processes can be an important source for the
disappearance of local populations (Poschlod et al. 1998;Poschlod and Biewer 2005;Poschlod
et al. 2005;Ozinga et al. 2008).
We then analysed functional plant traits and their relation to population dynamics and
found that only soil seed mortality showed a significant relationship to rate of local
population extinction. This is in congruence with previous suggestions and findings
(Stöcklin and Fischer 1999;Menges 2000;Poschlod et al. 2000). Why do plants with rapid soil
seed decay suffer from more rapid local extinction? One answer may come from the storage
effect: when there is no buffer, competition with a temporally dominant other vegetation will
make disappear subordinate species. There is no doubt that this is the case in the study area
because Dutoit et al. (2003) could show that many species disappear after only 10 years of
fallow land. Several years of fallow land are no exception in traditional cereal cultivation
General discussion, conclusions and perspectives
182
(Ellenberg 1996;Dutoit et al. 2003;Gasc 2005). Evidently, one has to answer the question how
these species maintained so long time without soil seed bank in the studied system. We think
that alternative dispersal processes, nowadays disrupted, such as transport with seeding
material and sheep dispersed cereal weeds in former times. This is confirmed by the high
number of non cereal seeds transported with cereal seeding material (Schneider et al.
1994;Jäger 2002) and the comparatively low number of species that are dispersed by sheep
dispersal for the same set of species in the same study area (Jäger 2002).
It is astonishing in this context that other traits did not have a major influence. According to
the storage effect, species with a high competitive ability should more easily be able to
withstand unfavourable years without seed bank. We were not able to show that larger
plants or plants with a high SLA have populations that persist better, so we think that most
is explained by adaptations on the seed and germination level.
TRAITS AND THEIR RELATION TO RARITY AND ABUNDANCE
Today’s plant diversity, abundance and distribution cannot be understood without
knowledge on the history of study area and the plants themselves. What is true for evolution
of floras on continental scales involving geological times is also true for the diversity of
individual fields and the cultivation practices only some years ago as we could illustrate this
in chapter 1 for the cereal weeds that were marker species for former cereal cultivation in
vineyards.
In chapter 5, we study the relationships of plant traits to two different axes of rarity: local
abundance and regional frequency of populations (Rabinowitz 1981;Rabinowitz et al. 1986).
We study essentially the same traits as in chapter 4, but we aim now to relate them to rarity
and abundance at a given date without considering the temporal changes. A striking result
of this analysis is, that there are only very few traits that are consistent among different
years.
General discussion, conclusions and perspectives
183
5
C
One of the traits that were consistently related through time was the smaller population size
across different dates for species with high degree of dormancy and high soil seed viability.
This is an important result from fundamental point of view, because long-lived seed banks
or low germination fractions are life history traits that buffer against failure in reproduction
in annual plants by bet hedging (Venable 2007). This is also in line with the predictions of
storage effect, meaning that a considerable part of plant diversity can be maintained in
unpredictable environments by species that form a persistent seed bank. Their small
population sizes also have only little effect on neighbouring plants via competition because
of their low abundance. For conservation efforts, this means that a diversified disturbance
regime with unpredictable disturbances can enhance local plant diversity in ecosystems with
a characteristic dominance of annual or short-lived plants.
A second complementary explanation for the smaller population sizes of species with long
lived seeds in the soil is the increase in effective population size both by higher gene pool
(Silvertown and Charlesworth 2001) and buffering life history stages (Kalisz 1991;Kalisz and
McPeek 1992). In other words, the soil seed bank extends the above ground population and
provides thus supplementary genetic diversity and this enhances local population
performance. It is therefore interesting to pursue the researches on the genetics comparing
above and below ground populations, an aspect which is still little explored (McGraw
1993;Cabin et al. 1998;Hock et al. 2008).
Our study provides the first account for a relation between soil seed bank persistence and
local population size using comparative species data. It would now be interesting to explore
this relationship notably for annual plants in other regions, such as rare and common steppe
and desert annuals or for other growth forms such as perennial herbs or woody species,
which could elucidate which functional role the soil seed bank plays for their population
structure.

General discussion, conclusions and perspectives
184
Astonishingly, seed size or number had no effect on rarity or abundance and this is in
contrast to the body size-abundance relationship (White et al. 2007) and the seed number-
seed size trade-off (Shipley and Dion 1992;Jakobsson and Eriksson 2000;Turnbull et al. 2000).
Both point to more individuals for smaller than for large seeds. The absence of a relation can
have two reasons. First, we did not study population sizes on fixed surfaces so density
dependent effects leading to fewer individuals for large plants could not be elucidated.
Second, the processes that compensate by disadvantaging small seeds for their higher
number are very effective and lead really to equal numbers of adult individuals (Leishman et
al. 2000b;Moles et al. 2004). This confirms the difficulties to demonstrate body size-abundance
allometries for plants (White et al. 2007).
There were conspicuous differences among years for the resource capture and resource
conservation traits, such as SLA and LDMC (Garnier et al. 1997;Kazakou et al. 2006). These
differences indicated larger populations for high SLA species in 2006 and larger populations
for high LDMC species for 1983-85, in other words opposite resource use strategies were
performing in these two dates. Again, this result is only clear in front of a background data
of changing environment. Our interpretation is hampered by the lack of such a data set. We
had no data on nutrient status in 1983-85 and it was not possible to gather data for 2006. The
analysis of Ellenberg indicator values along time in chapter 4 provides a clear signal for
higher water and nutrient status in 2006 compared to 2005 and 1983-85 and this is in line
with the findings of other works. (Gasc 2005;Fried et al. 2009). Therefore, the change in these
two parameters will be a plausible explanation for the observed relationship between leaf
traits and abundance. This temporally invertible relation between leaf traits and abundance
illustrates why they are not generally relied to abundance: the environmental conditions
determine completely the sense of the relationship. On the other hand, they are good
predictors of reaction to changing environmental conditions. Indeed, in the global change of
climate with altered precipitations, LDMC and SLA are putative traits that can predict future
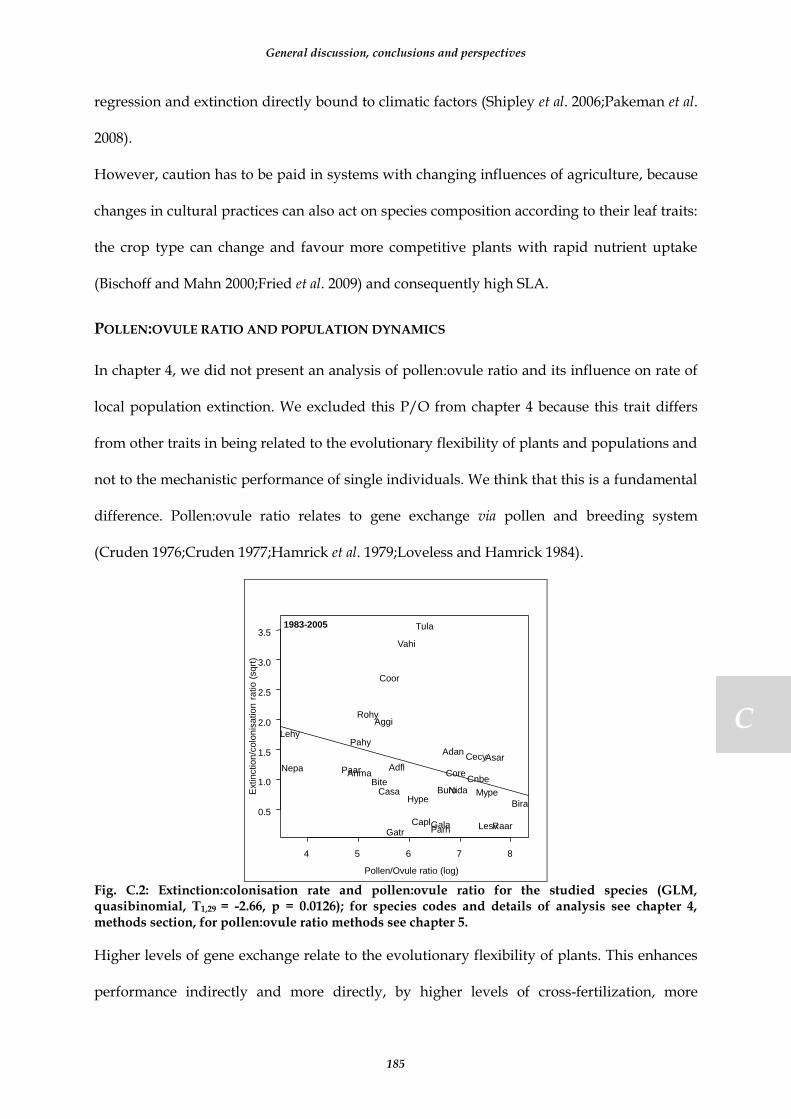
General discussion, conclusions and perspectives
185
5
C
regression and extinction directly bound to climatic factors (Shipley et al. 2006;Pakeman et al.
2008).
However, caution has to be paid in systems with changing influences of agriculture, because
changes in cultural practices can also act on species composition according to their leaf traits:
the crop type can change and favour more competitive plants with rapid nutrient uptake
(Bischoff and Mahn 2000;Fried et al. 2009) and consequently high SLA.
POLLEN:OVULE RATIO AND POPULATION DYNAMICS
In chapter 4, we did not present an analysis of pollen:ovule ratio and its influence on rate of
local population extinction. We excluded this P/O from chapter 4 because this trait differs
from other traits in being related to the evolutionary flexibility of plants and populations and
not to the mechanistic performance of single individuals. We think that this is a fundamental
difference. Pollen:ovule ratio relates to gene exchange via pollen and breeding system
(Cruden 1976;Cruden 1977;Hamrick et al. 1979;Loveless and Hamrick 1984).
4 5 6 7 8
0.5
1.0
1.5
2.0
2.5
3.0
3.51983-2005
Pollen/Ovule ratio (log)
Extinction/c
olo
nis
ation r
atio (
sqrt
)
Adan
Adfl
Aggi
Anma
Asar
Bira
BiteBuro
Capl
Casa
Cecy
Cnbe
Coor
Core
GalaGatr
Hype
Lehy
Lesv
Mype
Nepa
Nida
Paar
Pahy
Parh Raar
Rohy
Tula
Vahi
Fig. C.2: Extinction:colonisation rate and pollen:ovule ratio for the studied species (GLM, quasibinomial, T1,29 = -2.66, p = 0.0126); for species codes and details of analysis see chapter 4, methods section, for pollen:ovule ratio methods see chapter 5.
Higher levels of gene exchange relate to the evolutionary flexibility of plants. This enhances
performance indirectly and more directly, by higher levels of cross-fertilization, more

General discussion, conclusions and perspectives
186
connected population structure and can have effects in this way on population dynamics.
The opposite, low levels of gene exchange via pollen can lead to inbreeding depression, i.e.
the reduced performance of selfed to outcrossed descendants. Figure C.2 shows that species
with high pollen:ovule ratio have lower local extinction rates than species with low
pollen:ovule ratio. What is the relation of P/O to extinction? It has been shown that P/O is
closely correlated to the breeding system and the pollen vector of plants (Cruden 1977). The
breeding system influences levels of genetic diversity in plants and among plants and it has
also consequences on the genetic diversity within populations and genetic structure within
and among populations, because it influences the extent of gene exchange among plants
(Loveless and Hamrick 1984;Reed et al. 2002). Pollen dispersal vectors also have an influence
on the importance and the distance of gene exchange (Loveless and Hamrick 1984;Reed et al.
2002). Higher gene exchange and a larger effective population size can be related to a high
P/O (Silvertown and Charlesworth 2001), with anemophileous species having very high
gene exchange and very large populations (extending to large geographic areas) and obligate
autogamous species or apomictic species with no or very limited gene exchange. For the
latter, the population definition based on gene exchange is probably not applicable. In the
light of this, it can be argued that species with a low P/O go more easily extinct because of
limited gene exchange and decreased genetic diversity making them more vulnerable to
environmental and biotic changes. An alternative way to exchange genetic information via
pollen among populations is the dispersal of seeds. For our study system, important seed
dispersal processes break down recently (Gasc 2005). It becomes therefore plausible that
previously widespread plants, which rely more on seed dispersal for gene exchange than on
pollen, become more now easily extinct. Why gene exchange by pollen plays such a crucial
role? Several observations on herbicide resistance in Amaranthus and Chenopodium illustrate
that species with an important long-distance pollen dispersal in these two anemophileous
genera have advantages in the severely changing environments with very effective

General discussion, conclusions and perspectives
187
5
C
herbicides (Bettini et al. 1987;Darmency and Gasquez 1990;Culpepper et al. 2006). In these
two species, herbicide resistances spread rapidly. They are indeed the only species that
manage to grow in the most industrialised arable fields of Europe and North America due to
the spread of genetically transmitted herbicide resistance to a trazine for Chenopodium in the
1980s and for glyphosate in Amaranthus since 2000.
This shows the high importance of dispersal via pollen or seeds for the maintenance of local
populations. Our findings together with Biesmeijer (2006), point on a general shift of the
flora due to the breakdown of dispersal processes. Here, we only observe tendencies in the
local extinction of some species. We think that this may be only the beginning of a process
that may lead in future to complete disappearance of entire floristic groups with e.g. seed
dispersal relying on disappearing agricultural practices or pollen dispersal by disappearing
pollinators. A special attention should therefore be paid to maintain dispersal processes and
dispersal vectors, when the conservation of ‘nature’, ‘biodiversity’ or a complete set of
‘ecosystem services’ is the aim.
DISPERSAL OF SEEDS AND POPULATION PERSISTENCE
Seed dispersal in space has not yet been considered in detail in this thesis. However, we
mentioned it in the chapters 1, 2, 4, 5 and the introduction, where we discussed that seed
dispersal in space has an impact on diversity and population maintenance. Our results
suggest, especially for species with limited pollen transport and short-lived seeds in the soil,
that the disruption of spatial dispersal of seeds may be responsible for the strong recent
decline of these species. The lack of seed dispersal processes in cereal fields has been shown
to be the reason for the regional extinction of rare cereal weeds (Schneider et al. 1994).
Schneider et al. (1994) showed that the cleaning of seeding material is responsible for the
disappearance of species that do not form persistent soil seed banks such as Agrostemma
githago or Asperula arvensis. They also discuss several aspects of new dispersal mechanisms

General discussion, conclusions and perspectives
188
by harvesting machines that can favour other species, especially grasses with small seeds.
The replacement of organic by mineral fertilizer constitutes another reason for the decrease
in seed dispersal processes at the farm or landscape scale, because dung is very rich in viable
diaspores (Bonn and Poschlod 1998). Finally, the work of Jäger (2002) showed that some
species with seeds bearing appendages, such as Caucalis platycarpos, can also be transported
exozoochorously by sheep. The decline of itinerant sheep flocks in the study region can
therefore accentuate the decline of these species. However, according to Jäger (2002) this
concerns only very few species. Jäger (2002) also showed the very high importance of
uncleaned seeding material that can transport several 10 000s of seeds for each hectare of
seeded cereals and he also showed that this concerns species with a high variability in plant
heights and seed sizes. Complementing this work, Gasc (2005) studied in detail the use of
uncleaned seeding material in the Luberon area. He could show that uncleaned seeding
material is most likely to occur in small farms with cereals being most often cultivated as a
fodder crop for sheep, a situation where herbicides are rarely used and conditions are thus
optimal for the maintenance of a rich cereal weed flora. Other dispersal vectors such as ants
and small mammals have been considered by Gerbaud and Dutoit (2002) but they seem to
play only a minor role compared to other ecosystems. In chapter 1, we showed that seed
dispersal processes are important to explain the diversity of arable field species at a vineyard
and landscape scale and we suggest according to Dutoit et al. (2003) that they are crucial for
the recolonisation after longer crop abandonment. Moreover, in chapter 4, we suggested also
that the disruption of dispersal processes is probably an important source for the
disappearance of local populations in line with previous findings (Poschlod et al.
1998;Poschlod and Biewer 2005;Poschlod et al. 2005;Ozinga et al. 2008). In conclusion, seed
dispersal through uncleaned seed material is crucial for the maintenance in the field for the
most endangered cereal weeds with limited soil seed survival.
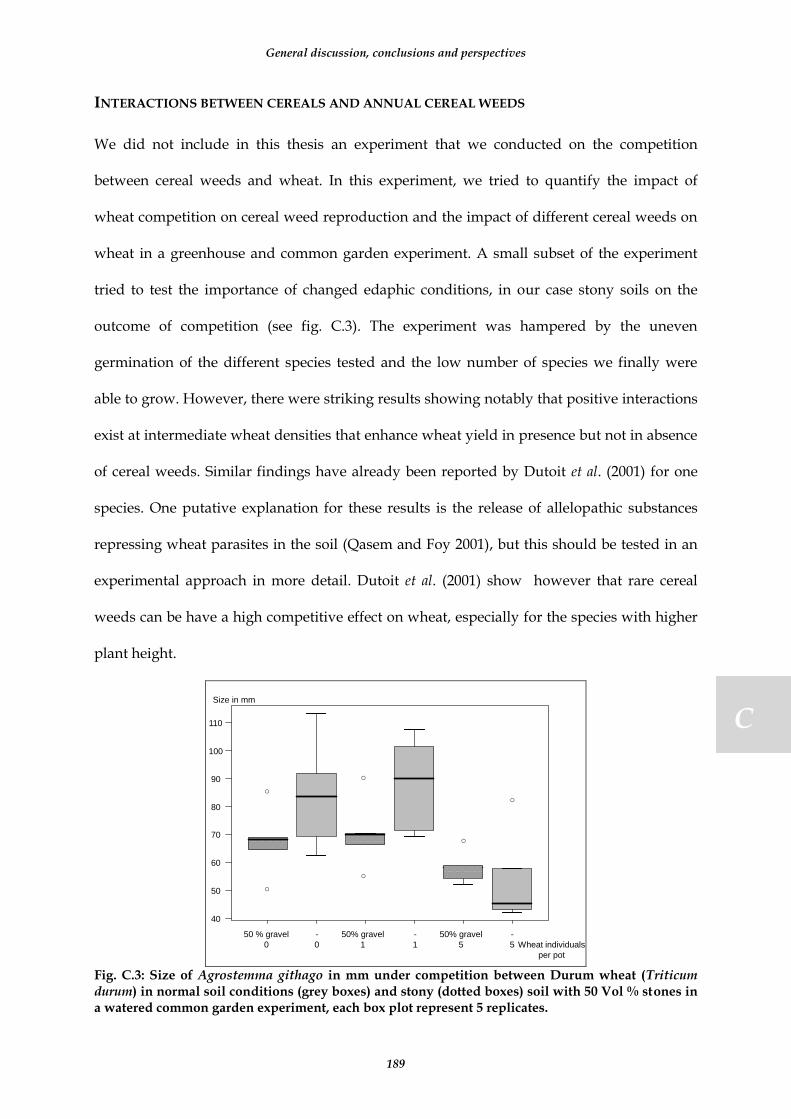
General discussion, conclusions and perspectives
189
5
C
INTERACTIONS BETWEEN CEREALS AND ANNUAL CEREAL WEEDS
We did not include in this thesis an experiment that we conducted on the competition
between cereal weeds and wheat. In this experiment, we tried to quantify the impact of
wheat competition on cereal weed reproduction and the impact of different cereal weeds on
wheat in a greenhouse and common garden experiment. A small subset of the experiment
tried to test the importance of changed edaphic conditions, in our case stony soils on the
outcome of competition (see fig. C.3). The experiment was hampered by the uneven
germination of the different species tested and the low number of species we finally were
able to grow. However, there were striking results showing notably that positive interactions
exist at intermediate wheat densities that enhance wheat yield in presence but not in absence
of cereal weeds. Similar findings have already been reported by Dutoit et al. (2001) for one
species. One putative explanation for these results is the release of allelopathic substances
repressing wheat parasites in the soil (Qasem and Foy 2001), but this should be tested in an
experimental approach in more detail. Dutoit et al. (2001) show however that rare cereal
weeds can be have a high competitive effect on wheat, especially for the species with higher
plant height.
o
o
o
o
o
o
50 % gravel
0
-
0
50% gravel
1
-
1
50% gravel
5
-
5
40
50
60
70
80
90
100
110
Wheat individuals
per pot
Size in mm
Fig. C.3: Size of Agrostemma githago in mm under competition between Durum wheat (Triticum durum) in normal soil conditions (grey boxes) and stony (dotted boxes) soil with 50 Vol % stones in a watered common garden experiment, each box plot represent 5 replicates.

General discussion, conclusions and perspectives
190
Figure C.3 shows one important competitive effect of wheat on cereal weeds: there is a
proper decrease in the performance of cereal weeds under strong densities. In the same way,
this experience also showed that the decrease due to competition with the cultivated crop is
only important in the stone free soil, i.e. under good soil nutrient and moisture conditions.
High densities of the cultivated crop have, however, only limited effect on the performance
of cereal weeds when the amount of fine soil is reduced by the presence of many stones in
the soil. This moderates the findings of Roche et al. (2002) who showed that rare cereal weeds
perform relatively better than ubiquitous weeds under high wheat density. First, they
reported ‘relatively’ that is the absolute abundance of rare cereal weeds was smaller under
high density than under low and it is only the part of rare cereal weeds on all weeds that
increased. Second, they worked on a large field data set giving a mean view, this
corresponds probably better to the ‘no stone’ condition in our experience, which diminished
by half the performance of Agrostemma githago compared to the best condition. In conclusion,
the competition of high-density cultivated crop can severely decrease rare cereal weed
performance, a point of view that is shared by Schneider et al. (1994). In unproductive
environments, such as very stony soil, this is not an issue; here the low performance
decreases only by less than 20%. Therefore, the competitive effect may be important only on
small spatial scales, on the best parts of a particular field, whereas the stony parts of the field,
and this is a widespread situation in our study area, are not concerned.
General conclusions
DISPERSAL TRAITS AND A BASIC CONSIDERATION OF DIFFERENT PLANT TRAITS
The discussion of both the influence of pollen:ovule ratio and the survival of seeds in the soil
showed that these traits had no direct function in the performance of plants. They modified
the evolutionary flexibility of plants by enhancing gene exchange via pollen or via seeds
General discussion, conclusions and perspectives
191
5
C
among populations but also among individuals of the same population (Jain 1976). In this
way, they increase the effective population size and the diversity in terms of individual
genetic diversity or genetic diversity at a population level (Silvertown and Charlesworth
2001). The importance of genetic diversity for population survival is evident. However, the
examples of herbicide resistance showed that even singular genetic information could have
an enormous impact on population growth and size. When comparing performance traits
such as SLA, plant height or even seed size and number to dispersal traits on their generality
to predict extinction or population sizes, dispersal traits have a much larger explanatory
power because they consider evolutionary flexibility and not only mechanistic reaction.
This is a fundamental difference between performance and dispersal traits and emphasises
the importance of evolutionary sound interpretations in ecology. Without taking into
account the possible effects of evolution, any prediction in biology will remain very limited.
Evolution constantly changes biotic conditions and environmental changes constantly the
abiotic conditions. In both cases, there is no return to exactly the same conditions, which
makes ecology necessarily a historical discipline. This is confirmed by the fact that evolution
acts on sufficiently small temporal scales, as illustrated by the examples on herbicide
resistance and ‘rapid evolution’ (Hairston et al. 2005).
Our data highlight dispersal traits as a reliable indicator for ecological parameters such as
population persistence and local abundance. This underlines the importance of creation,
spread and function of biological information, which does not follow mathematical rules, but
is rather characterised by uniqueness. Many biological innovations are unpredictable;
functional trait and phylogenetically explicit analyses try to sieve out the predictable or
repeated part of evolutionary history (Harvey et al. 1995;Westoby et al. 1995a;Westoby et al.
1995b). However, these works systematically disregard the uniqueness of biological
innovations as insignificant and only focus on general rules. At the long sight, these
General discussion, conclusions and perspectives
192
approaches risk to withdraw from ecology its independence towards other, notably physical,
sciences where information cannot change the behaviour of the system (Mayr 2004).
OBSERVATION INFLUENCES RESULTS: THE CASE OF SEED BURIAL AND GERMINATION
When analysing the burial experiment in chapter 3 and in the general discussion above, we
suggested that large seeds become more crowded in the mesh bags we used. The higher
available biomass and lower distance between each seed can enhance propagation of fungi
and in this way lead to a lower soil seed survival of these seeds compared to smaller seeds or
to situation outside the experiment. This is one example where the experiment itself modifies
the relation between seed size and seed survival and is a possible experimental bias we did
not expect. Similarly, we studied germination in complete darkness, that is, we prepared
Petri dishes with seeds and filter paper in them in light and started the darkness experiment
by watering them in complete darkness and closing the Petri dishes with Parafilm in order to
minimize water losses. These dishes have only been controlled once, after four week of
exposition to the different temperature regimes tested. Even the small amount of safety
green light which we while counting the seedlings later is known to enhance germination for
some species (Baskin and Baskin 1998), which would overly alter the outcome in a
comparative work among species. In this case, we had to make a choice between observing
these seedlings at this moment (altering the experimental conditions) or not observing,
lacking probably important data.
These two examples show that experimental data have always limited value for the
prediction in real world situations and that in some cases it is even impossible to gather data
without changing important conditions of the system under study. The observation of
spontaneous systems in the field can thus still yield data with a different quality than field or
laboratory experiments and can still add significant complementary evidence on the function
of ecological systems, e.g. soil seed banks and seedling emergence.

General discussion, conclusions and perspectives
193
5
C
SCALING UP FROM SOIL SEED PERSISTENCE TO POPULATION PERSISTENCE AND DIVERSITY
In chapters 2 to 5, we could illustrate the importance of soil seed persistence for population
persistence. The burial experiment and the analyses of germination tests in chapter 3
showed, that this factor acts on a smaller number of individuals than the entire population,
on a faster time scale than population extinction and on a smaller spatial scale than
population persistence. However, this factor had a clear influence to processes at the next
higher, population dynamic scale. That this factor is not very tightly related is evident as
population persistence involves any individual at one place, also standing vegetation and
migrants and it is related by dispersal two other populations and can be influenced by them
and therefore may act on longer time scales than seed persistence. On the next higher scale,
population persistence is linked to community diversity by persistence of species in situ but
also by dispersal to locally adjacent communities. This shows that diversity at local
community and regional scales cannot be disconnected from processes at the single stage
and population scale. There is a shift of importance of different factors according to scale.
Some traits such as dormancy or soil seed survival, which are important on a local scale, are
less important on the regional scale.
STORAGE EFFECT EXPLAINS SOIL SEED BANK ECOLOGY IN AGRO-ECOSYSTEMS
Storage effect explains how coexistence of a subordinate species is possible in the presence of
a superior competitor. The model predicts that a life stage that buffers against reproductive
failure, such as soil seed bank can promote coexistence when there are unpredictable
environmental changes with correlated changes of competitive intensity. Is this model is
applicable in arable land? In arable land under cereal cultivation, there is competition of
cereals that diminishes reproductive success of cereal weed species. However, cereal weeds
perform relatively better in dense cereals as standing crop than in other cultures or mixtures

General discussion, conclusions and perspectives
194
with non cereal weeds (Dutoit et al. 1999;Roche et al. 2002), but this is relative abundance, the
absolute abundance follows the opposite trend.
One of the main competitive adversaries of cereal weeds in arable land, are other plants in
the crop rotation, in our case legumes that are planted as intercrop every 3-5 years. In this
time, most cereal weeds do not or only little reproduce and disappear sometimes completely
from the above ground vegetation.
Additionally, the high interannual rainfall variability leads consequently to low
predictability of favourable years (see introduction and fig. C.4).
bad
year
bad
year
good
year
good
year
good
year
good
year
good
year
good
year
good
year
good
year
good
year
Fast gap recolonisation
and seed production
of subordinate
Fast gap recolonisation
and seed production
of subordinate
Dominance of competitive species
without seed bankso
il s
eed
ban
kab
ov
e g
rou
nd
po
pu
lati
on
seeds of subordinate
plant with persistent
soil seed bank
seeds of competitive
plant
without seed bank
Legend
1-2 cuts in
summer
Ploughing and
seeding in
autumn
Harvest in
summer
Harvest in
summer
v
v
mm
0
50
100
150
200 Monthly rainfall sum per month 2005-2008
1 2 3 4 5 6 7 8 9 101112 1 2 3 4 5 6 7 8 9 101112 1 2 3 4 5 6 7 8 9 101112 1 2 3 4 5 6 7 8 9 101112
unpredictable rainfall variability
unpredictable disturbances and correlated competition of the
biotic environment
Subordinate species with seed bank detect years with good reproduction oppurtunity by reaction to light and diurnally fluctuating temperatures ; the same processes maintain a higher soil seed bank through unfavourable years and avoid fatal germination
Coexistance and diversity of annuals; Population persistence
Fig. C.4: Storage effect in cereal fields and adaptations of cereal weeds to overcome unfavourable years in the crop rotation.
This is correlated to year-to-year fluctuations in cereal yield and one can imagine that the
competitive strength of cereals towards cereals weeds goes in the same direction.
Competition has been shown to be less important in constrained, especially dry
environments (Michalet et al. 2006) and we showed that there are (i) many positive
General discussion, conclusions and perspectives
195
5
C
interactions between cereal weeds and wheat and (ii) limited interactions in stony soils, with
a much better performance of the cereal weed in stony compared to normal conditions when
density is high (Fig. C.3). Therefore, one may think that dry years represent years with a
better reproduction of cereal weeds because competition is less heavy, a hypothesis worth to
be tested under field conditions. In addition, it is well known that the fields with the richest
cereal weed flora are on very dry, stony fields at the margin of economic equitability.The
importance of unpredictable disturbances for community diversity together with the intense
human land use and climatic instability may also be an explanation why there are so many
annual plants in the European Mediterranean climate zone. In European Mediterranean
climate zone, annual plants are much more important in number of species compared to the
other Mediterranean zones where rainfall is higher, more predictable and intense human
disturbances are of much younger date (Hobbs and Huenneke 1992).
CONSERVATION ISSUES
There was a clear recent decline of species with short-lived soil seed bank in the last two
decades in the study area. Visibly, species with short-lived seeds in the soil are more
threatened than species with a persistent seed bank. This complements the findings of Dutoit
et al. (2003) who showed that most species cannot recover from the seed bank after long
abandonment and thus restoration in this way is impossible. We therefore suggest for
conservation of these species to pay particular attention not to abandon fields longer than 2
years or to cultivate other crops than winter cereals for more than 2 years. Evidently, for the
shortest-lived species, this is still too long and alternative conservation strategies, such as
uncleaned seeding material discussed below, should be used.
The correlation of pollen:ovule ratio with extinction rate at the long time scale (fig. C.2)
showed the importance of exchange of genetic diversity and pollen dispersal processes for
the maintenance of populations. Equally, the data on the local abundance presented in

General discussion, conclusions and perspectives
196
chapter 5 shows that species with small populations have low P/O and probably low gene
exchange via pollen. This permits to identify low P/O species as particularly threatened with
extinction in the studied context.
The paragraph on dispersal of seeds in space showed that for an identified set of species,
those with low soil seed survival and limited pollen exchange, the reseeding with uncleaned
seed material is essential for their conservation in the field. This is crucial for species such as
Agrostemma githago, Vaccaria hispanica and Asperula arvensis (Schneider et al. 1994) for all of
which we could show very low seed survival in the soil in chapter 2. However, the use of
uncleaned seeding material should also generally favour the maintenance of rare cereal
weeds, because even if there are surviving seeds in the soil survival is very variable among
species, with the most interesting species declining fast and only a very limited set of species
can re-establish after abandonment from the soil seed bank under field conditions (Dutoit et
al. 2003). The high diversity and abundance of rare cereal weeds in uncleaned seeding
material found by Jäger (2002) is a promising path to restore high diversity and populations
of rare species.
The discussion of the storage effect and the adaptations of species to detect favourable years
illustrated in chapter 3 show that inter-annual variability plays a role to promote the
diversity of annual cereal weeds. This inter-annual variability of favourable years for cereal
weeds is enhanced in Mediterranean system by the occurrence of dry years. Low moisture
conditions of dry years, similarly to the competition experiment with stony soil, can promote
coexistence and hence reproduction the subordinate species (Cáceres 1997;Facelli et al.
2005;Sears and Chesson 2007). We therefore suggest the following scheme for cereal fields: in
good years, cereal growth is optimal and rare cereal weed reproduction hampered, in dry
years, cereals are less performing and cereal weeds can reproduce. Nevertheless, this effect
can also be triggered by years with suboptimal agricultural practices such as low density
seeding, bad cereal seed material, accidents in the soil preparation etc. This re-emphasises

General discussion, conclusions and perspectives
197
5
C
that the very standardised and homogenised disturbances in industrialised agriculture are
not compatible with the maintenance of a rich weed flora, a finding that is confirmed by the
observation that in some well-organised organic cereal fields there are no rare cereal weeds.
Finally, there are details in the soil preparation for cereal fields that can increase the
occurrences of rare cereal weeds such as autumn ploughing and seeding (Schneider et al.
1994;Roche et al. 2002). We could confirm in chapter 3 that most of the studied species
germinate directly, without stratification at low temperatures a situation that occurs in
autumn after the first rainfalls at cold temperatures and is typical for the germination
conditions of Mediterranean annuals and rare cereal weeds (Baskin and Baskin 1998;Baskin
and Baskin 2006). For the conservation of a typical cereal weed flora ploughing and seeding
in the cold part of the year should therefore be followed. However, there are exceptions to
this, one of the rarest cereal weeds in our study area, Conringia orientalis, only germinated
under high temperatures. A set of cereal weeds, such as Ranunculus falcatus, Consolida regalis
and Bupleurum rotundifolium germinate best at very cold temperatures (< 10°C) and after
retrieval from burial germinate not immediately but in the chilling phase at 4°C. The latter
pattern is conspicuous in the Mediterranean rare cereal weeds Hypecoum pendulum, Garidella
nigellastrum and Papaver hybridum. We have no precise information of when these species
germinate in the field, and it would be particularly interesting to know if they germinate
only late after ploughing in autumn or if ploughing at very low temperatures is mandatory.
In conclusion, precise management suggestions can be given on the grounds of the data
presented in this thesis and previous work on rare cereal fields. The discussion on ploughing
dates and cold germination of rare cereal weeds, the dispersal processes and soil seed
survival showed also that there are big differences among species. On the grounds of the
presented data and data from literature, we should synthesise the data in order to classify
species in highly and low vulnerable and different management groups.

General discussion, conclusions and perspectives
198
Perspectives
Seed banks are known to form a considerable genetic reservoir for local populations. In fact,
from a population genetic point of view, seed banks of species with persistent seeds are more
diverse and less geographically differentiated than above ground populations (Cabin et al.
1998;Hock et al. 2008). It is also clear that seed banks have an important role for population
genetics, as they enhance the stability of local populations with respect to environmental
hazards (Venable 1989;Venable 2007), but also when competing with other plants for
regeneration niches (Chesson and Warner 1981;Warner and Chesson 1985;Facelli et al. 2005).
The role of this reservoir of seeds has been only little studied from a functional and genetic
point of view. In future work it would be interesting to answer questions such as: (i) What is
the germination niche of the seed bank population compared to a one year seed generation?
– We expect that the regeneration niche is much larger with respect to general gradients
important to germination. Reasons are the higher number of genotypes in the seed bank; the
higher number of different seed generations with a particular dormancy state for each one; a
general effect of after-ripening and stratification in the soil leading to a broader germination
niche. (ii) What is the genetic differentiation of seeds along gradients of germination
conditions (temperature, light, fluctuations) compared to one single year of seed
generations? – We expect that there is a genetic differentiation of seeds germinating under
different germination conditions, and that there is a higher among germination conditions
than within experimental germination conditions. We expect also that for a set of regional
populations genetic differentiation is high when comparing different population inside the
same germination conditions.
A second aspect, is the re-interpretation of diversity of annual plants in the light of
predictability of climate. This has not yet been explored in more detail, there is still only little
evidence how annual plant diversity is distributed around the globe, and relatively simple

General discussion, conclusions and perspectives
199
5
C
biogeographic analyses can enhance the understanding of the relations between annual plant
diversity and climatic predictability.
Third, all the long of the chapters 2 to 5, we refer to storage effect as a model to better
understand adaptations at the seed bank and germination level (see also fig C.4). In the
chapter 3 on functional ecology, we demonstrated adaptations in germination and seed traits
that optimise establishment in temporally variable habitats. Additionally, in chapter 2 on the
measure of soil seed bank persistence, we point out that the seed size–seed number trade-off
has a major influence on how we perceive soil seed bank composition and abundance and
that our previous perception is not necessarily useful for prediction of successful
establishment. These two points can have effects on the strength of the storage effect. A good
detection of opportunities for reproduction enhances the longevity of soil seed bank and can
enhance the coexistence of species. How can we measure the importance of these detection
mechanisms for coexistence? In experimental communities, do species without detection
mechanisms coexist for shorter time than species with?
A second issue is the spatiality of storage effect. This aspect has recently been addressed and
the model has been extended (Sears and Chesson 2007). It would now be interesting to test
hypothesis to evaluate the spatial aspects on more natural systems.
The importance of different adaptations for coexistence and diversity exemplified by light
requirement for germination, gap detection mechanism and dormancy has also
consequences for conservation: species that bear these adaptations and ecosystems that are
characterised by many of such species diversity can best be maintained by unpredictable
conditions and disturbances and not by exclusion of disturbances. For practical conservation,
there are hence questions such as: Can disturbances that destroy above ground populations
enhance long-term population persistence? Are there differences in genetic diversity
between populations in high compared to low disturbance frequency or high and low
predictability of favourable years? Obviously, frequent disturbances and unpredictability of

General discussion, conclusions and perspectives
200
favourable years are only important for diversity of a part of flora and cannot enhance
diversity e.g. for long-lived perennial or woody plants. However, these plants also contribute
to local plant diversity. In a first step, it would therefore be interesting to know how
disturbances vary spatially and how diversity at different scales of long-lived compared to
short lived plants can be related to spatially heterogeneous disturbances.
From a conservation point of view, several aspects need to be checked in order to give
consistent suggestions for management. A first aspect is the germination in the field and the
timing of ploughing. A detailed field work should figure out at which moment seedlings
emerge after ploughing and if there is a direct relation between temperature at ploughing
date and germinating species. It should be cleared if there can be delayed germination of
species that need cold stratification or very cold temperatures for germination. Second, the
importance of environmental conditions, such as dry habitats, dry years, heterogeneous or
low cereal density and stony soils are suggested on several occasions to be of high
conservation interest. Future studies should estimate if these conditions are sufficient. This is
an opportunity to run an experimental field work that quantifies the importance of habitat
conditions on rare cereal weed reproduction. Such a detailed experimental work on
temporally changing habitat conditions could also more formally test the theoretical
expectations of the storage effect and enhance very generally our understanding how rare
annual plant diversity can persist.
References
201
5
R
REFERENCES
1. Aboucaya,A., Jauzein,P., Vinciguerra,L. & Virevaire,M. (2000) Plan National d'Action pour la conservation des plantes messicoles.
2. Abramsky,Z. (1983) Experiments on Seed Predation by Rodents and Ants in the Israeli Desert. Oecologia, 57, 328-332.
3. Ackerly,D.D. (2004) Adaptation, niche conservatims and convergence: comparative studies of leaf evolution in the California chaparral. American Naturalist, 163, 654-671.
4. Adams,V.M., Marsh,D.M. & Knox,J.S. (2005) Importance of the seed bank for population viability and population monitoring in a threatened wetland herb. Biological Conservation, 124, 425-436.
5. Affre,L., Dutoit,T., Jäger,M. & Garraud,L. (2003) Écologie de la reproduction et de la dispersion, et structure génétique chez les espèces messicoles : propositions de gestion dans le Parc naturel régional du Luberon. Les Actes du BRG, 4, 405-428.
6. Al Shebhaz,I.A., Beilstein,M.A. & Kellogg,E.A. (2006) Systematics and phylogeny of the Brassicaceae (Cruciferae): An overview. Plant Systematics and Evolution, 259, 89-200.
7. Allan,D. (1975) Components of diversity. Oecologia, 18, 359-367. 8. Andreasen,C., Stryhn,H. & Streibig,J. (1996) Decline of the flora in Danish arable fields. Journal of
Applied Ecology, 33, 619-626. 9. Angiosperm Phylogeny Group (2003) An update of the Angiosperm Phylogeny Group classification
for the orders and families of flowering plants: APG II. Botanical Journal of the Linnean Society, 141, 399-496.
10. Azcarate,F.M. & Peco,B. (2006) Effects of seed predation by ants on Mediterranean grassland related to seed size. Journal of Vegetation Science, 17, 353-360.
11. Baessler,C. & Klotz,S. (2006) Effects of changes in agricultural land-use on landscape structure and arable weed vegetation over the last 50 years. Agriculture Ecosystems & Environment, 115, 43-50.
12. Bakker,J.P., Bakker,E.S., Rosen,E., Verweij,G.L. & Bekker,R.M. (1996a) Soil seed bank composition along a gradient from dry alvar grassland to Juniperus shrubland. Journal of Vegetation Science, 7, 165-176.
13. Bakker,J.P., Poschlod,P., Strykstra,R.J., Bekker,R.M. & Thompson,K. (1996b) Seed banks and seed dispersal: important topics in restoration ecology. Acta Botanica Neerlandica, 45, 461-490.
14. Ball,D.A. (1992) Weed seedbank response to tillage, herbicides and crop rotation sequence. Weed Science, 40, 654-659.
15. Barroit,A., Gerbaud,E., Affre,L. & Raquet,V. (2000) Stratégies de reproduction et de dispersion des graines chez les espèces messicoles: implications pour leur conservation dans le Parc naturel régional du Luberon. Courrier Scientifique du Parc Naturel Régional du Luberon, 4, 128-142.
16. Baskin,C.C. & Baskin,J.M. (1998) Seeds: ecology, biogeography and evolution of dormancy and
germination. Academic Press, San Diego. 17. Baskin,C.C. & Baskin,J.M. (2006) The natural history of soil seed banks of arable land. Weed Science,
54, 549-557. 18. Baskin,J.M. & Baskin,C.C. (1989) Physiology of dormancy and germination in relation to seed
bank ecology. Ecology of soil seed banks (Leck, M. A., Parker, V. T., and Simpson, R. L.), pp. 53-68. London Academic Press, London.
19. Bawa,K.S. & Ashton,P.S. (1991) Conservation of rare trees in tropical rain forests: a genetic perspective. Genetics and Conservation of Rare Plants (Falk, D. A. and Holsinger, K. E.), University Press, Oxford.
20. Beal,W.J. (1885) The viability of seeds. Proceedings of the Society for the Promotion of Agricultural Science, 5, 44-46.
21. Begon,M., Harper,J.L. & Townsend,C.R. (1996) Ecology: individuals, populations and communities. Blackwell Science, London.
22. Beilstein,M.A., Al Shebhaz,I.A. & Kellogg,E.A. (2006) Brassicaceae phylogeny and trichome evolution. American Journal of Botany, 93, 607-619.
23. Beissinger,S. & McCullough,D.R. (2002) Population Viability Analysis. Chicago University Press, Chicago.
References
202
24. Bekker,R.M., Bakker,E.S. & Thompson,K. (2005) Seed Longevity. The LEDA traitbase collecting and measuring standards (Knevel, I. C., Bekker, R. M., Kunzmann, D., Stadler, M., and Thompson, K.), pp. 104-111. LEDA Traitbase project, Groningen.
25. Bekker,R.M., Bakker,J.P., Grandin,U., Kalamees,R., Milberg,P., Poschlod,P., Thompson,K. & Willems,J.H. (1998a) Seed size, shape and vertical distribution in the soil: indicators of seed longevity. Functional Ecology, 12, 834-842.
26. Bekker,R.M. & Kwak,M.M. (2005) Life history traits as predictors of plant rarity, with a particular reference to hemiparasitic Orobanchaceae. Folia Geobotanica, 40, 231-242.
27. Bekker,R.M., Schaminee,J.H.J., Bakker,J.P. & Thompson,K. (1998b) Seed bank characteristics of Dutch plant communities. Acta Botanica Neerlandica, 47, 15-26.
28. Bell,D.T., Rokish,D.P., McChesney,C.J. & Plummer,J.A. (1995) Effects of temperature, light and giberellic acid on the germination of seeds of 43 species native to Western Australia. Journal of Vegetation Science, 6, 797-806.
29. Benton,T.G. & Grant,A. (1999) Elasticity analysis as an important tool in evolutionary and population ecology. Trends in Ecology & Evolution, 14, 467-471.
30. Benvenuti,S. (1995) Soil light penetration and dormancy of jimsonweed (Datura stramonium) seeds. Weed Science, 43, 389-393.
31. Benvenuti,S. (2003) Soil texture involvement in germination and emergence of buried weed seeds. Agronomy Journal, 95, 191-198.
32. Benvenuti,S. (2007) Natural weed seed burial: effect of soil texture, rain and seed characteristics. Seed Science Research, 17, 211-219.
33. Benvenuti,S., Macchia,M. & Miele,S. (2001) Quantitative analysis of emergence of seedlings from buried weed seeds with increasing soil depth. Weed Science, 49, 528-535.
34. Bettini,P., McNally,S., Sevignac,M., Darmency,H., Gasquez,J. & Dron,M. (1987) Atrazine resistance in Chenopodium album. Plant Physiology, 84, 1442-1446.
35. Biesmeijer,J.C., Roberts,S.P.M., Reemer,M., Ohlemuller,R., Edwards,M., Peeters,T., Schaffers,A.P., Potts,S.G., Kleukers,R., Thomas,C.D., Settele,J. & Kunin,W.E. (2006) Parallel declines in pollinators and insect-pollinated plants in Britain and the Netherlands. Science, 313, 351-354.
36. Bischoff,A. & Mahn,E.G. (2000) The effects of nitrogen and diaspore availability on the regeneration of weed communities following extensification. Agriculture Ecosystems & Environment, 77, 237-246.
37. Bladé,C. & Vallejo,V.R. (2008) Seed mass effects on performance of Pinus halepensis Mill. seedlings after fire. Forest Ecology and Management, 255, 2362-2372.
38. Blaney,C.S. & Kotanen,P.M. (2001) Effects of fungal pathogens on seeds of native and exotic plants: a test using congeneric pairs. Journal of Applied Ecology, 38, 1104-1113.
39. Bond,W.J., Honig,M. & Maze,K.E. (1999) Seed size and seedling emergence: an allometric relationship and some ecological implications. Oecologia, 120, 132-136.
40. Bonfil,C. (1998) The effects of seed size, cotyledon reserves, and herbivory on seedling survival and growth in Quercus rugosa and Q. laurina (Fagaceae). American Journal of Botany, 85, 79-87.
41. Bonis,A., Lepart,J. & Grillas,P. (1995) Seed bank dynamics and coexistence of annual macrophytes in a temporaryand variable habitat. Oikos, 74, 81-92.
42. Bonn,S. & Poschlod,P. (1998) Ausbreitungsbiologie der Blütenpflanzen Mitteleuropas. Quelle & Meyer, Wiesbaden.
43. Bossuyt,B. & Honnay,O. (2008) Can the seed bank be used for ecological restoration? An overview of seed bank characteristics in European communities. Journal of Vegetation Science, 19, 875-884.
44. Braun-Blanquet,J. (1939) Aperçu des groupements végétaux du Bas Languedoc. S.I.G.M.A.Communications, 9.
45. Braun-Blanquet,J., Roussine,N., Nègre,R. & Emberger,L. (1952) Les groupements végétaux de la France Méditerranéenne. CNRS, Paris.
46. Brigham,C.A. & Schwartz,M.W. (2003) Population viability in plants. Ecological Studies, 165, 1-392.
47. Bruun,H.H. & Poschlod,P. (2006) Why are small seeds dispersed through animal guts: large numbers or seed size per se? Oikos, 113, 402-411.
48. Bullock,J.M. (2000) Gaps and seedling colonization. The ecology of regeneration in plant communities (Fenner, M.), pp. 375-395. CABI, Wallingford.
References
203
5
R
49. Cabin,R.J., Mitchell,R.J. & Marshall,D.L. (1998) Do surface plant and soil seed bank populations differ genetically? A multipopulation study of the desert mustard Lesquerella fendleri (Brassicaceae). American Journal of Botany, 85, 1098-1109.
50. Cáceres,C.E. (1997) Temporal variation, dormancy, and coexistence: a field test of the storage effect. Proceedings of the National Academy of Sciences, 94, 9171-9175.
51. Carolan,J.C., Hook,I.L.I., Chase,M.W., Kadereit,J.W. & Hodkinson,T.R. (2006) Phylogenetics of Papaver and related genera based on DNA sequences from ITS nuclear ribosomal DNA and plastid trnL intron and trnL-F intergenic spacers. Annals of Botany, 98, 155.
52. Cerabolini,B., Ceriani,R.M., Caccianiga,M., Andreis,R.D. & Raimondi,B. (2003) Seed size, shape and persistence in soil: a test on Italian flora from Alps to Mediterranean coasts. Seed Science Research, 13, 75-85.
53. Charlesworth,B. (2009) Effective population size and patterns of molecular evolution and variation. Nature Reviews Genetics, 10, 195-205.
54. Charlesworth,D. & Charlesworth,B. (1987) Inbreeding depression and its evolutionary consequences. Annual Reviews of Ecology and Systematics, 18, 237-268.
55. Chee-Sanford,J.C., Williams,M.M., Davis,A.S. & Sims,G.K. (2006) Do microorganisms influence seed-bank dynamics? Weed Science, 54, 575-587.
56. Chesson,P.L. & Warner,R.R. (1981) Environmental variability promotes coexistence in lottery competitive systems. American Naturalist, 117, 923-943.
57. Cole,C.T. (2003) Genetic variation in rare and common plants. Annual Reviews of Ecology and Systematics, 34, 213-237.
58. Connell,J.H. (1978) Diversity in tropical rain forests and coral reefs. Science, 199, 1302-1310. 59. Coomes,D.A. & Grubb,P.J. (2003) Colonization, tolerance, competition and seed-size variation within
functional groups. Trends in Ecology & Evolution, 18, 283-291. 60. Coulson,S.J., Bullock,J.M., Stevenson,M.J. & Pywell,R.F. (2001) Colonization of grassland by sown
species: dispersal versus microsite limitation in responses to management. Journal of Applied Ecology, 38, 204-216.
61. Cousins,S.A.O. & Eriksson,O. (2008) After the hotspots are gone: Land use history and grassland plant species diversity in a strongly transformed agricultural landscape. Applied Vegetation Science, 11, 365-374.
62. Crawley,M.J. (2000) Statistics - and introduction using R. Wiley, Chichester. 63. Crist,T.O., Veech,J.A., Gering,J.C. & Summerville,K.S. (2003) Partitioning species diversity across
landscapes and regions: a hierarchical analysis of and -diversity. American Naturalist, 162, 734-735.
64. Crooks,K.R., Suarez,A.V., Bolger,D.T. & Soulé,M.E. (2001) Extinction and colonization of birds on habitat islands. Conservation Biology, 15, 159-172.
65. Cruden,R.W. (1976) Intraspecific variation in pollen-ovule ratios and nectar Secretion - preliminary evidence of ecotypic adaptation. Annals of the Missouri Botanical Garden, 63, 277-289.
66. Cruden,R.W. (1977) Pollen-ovule ratios - conservative indicator of breeding systems in flowering plants. Evolution, 31, 32-46.
67. Culpepper,A.S., Grey,A.L., Vencill,W.K., Kichler,J.M., Webster,T.M., Brown,S.M., York,A.C. & Hanna,W.W. (2006) Glyphosate-resistant Palmer amaranth (Amaranthus palmeri) confirmed in Georgia. Weed Science, 54, 620-626.
68. Cussans,G.W., Raudonius,S., Brain,P. & Cumberworth,S. (1996) Effects of depth of seed burial and soil aggregate size on seedling emergence of Alopecurus myosuroides, Galium aparine, Stellaria media and wheat. Weed Research, 36, 133-141.
69. Darmency,H. & Gasquez,J. (1990) Appearance and spread of triazine resistance in common lambsquarters (Chenopodium album). Weed Technology, 4, 173-177.
70. Darwin,C. (1859) On the origin of species by means of natural selection, or preservation of favored races in the struggle for life. Murray.
71. Davis,A.S. & Renner,K.A. (2007) Influence of seed depth and pathogens on fatal germination of velvetleaf (Abutilon theophrasti) and giant foxtail (Setaria faberi). Weed Science, 55, 30-35.
72. De Kroon,H., Plaisier,A., van Groenendael,J.M. & Caswell,H. (1986) Elasticity: the relative contribution of demographic parameters to population growth rate. Ecology, 67, 1427-1431.

References
204
73. Diaz,S., Lavorel,S., McIntyre,S., Falczuk,V., Casanoves,F., Milchunas,D.G., Skarpe,C., Rusch,G., Sternberg,M., Noy-Meir,I., Landsberg,J., Zhang,W., Clark,H. & Campbell,B.D. (2007) Plant trait responses to grazing - a global synthesis. Global Change Biology, 13, 313-341.
74. Diekmann,M. (2003) Species indicator values as an important tool in applied plant ecology - a review. Basic and Applied Ecology, 4, 493-506.
75. Doak,D.F., Thomson,D.M. & Jules,E.S. (2002) PVA for plants: understanding the demographic consequences of seed banks for population health. Population Viability Analysis (Beissinger, S. and McCullough, D. R.), pp. 312-337. University of Chicago Press, Chicago.
76. Downie,S.R., Katz-Downie,D.S. & Watson,M.F. (2000a) A phylogeny of the flowering plant family Apiaceae based on chloroplast rpl16 and rpoC1 sequences: Towards a suprageneric classification of subfamily Apioideae. American Journal of Botany, 87, 273-292.
77. Downie,S.R., Watson,M.F., Spalik,K. & Katz-Downie,D.S. (2000b) Molecular systematics of Old World Apioideae (Apiaceae): Relationships among some members of tribe Peucedaneae sensu lato, the placement of several island-endemic species, and resolution within the apioid superclade. Canadian Journal of Botany, 78, 506-528.
78. DRE-PACA (1999) Occupation du sol PACA (CORINE land cover) 1999, version 1. DRE-PACA, Marseille-Aix-en-Provence.
79. Dutoit,T. & Alard,D. (1995) Permanent seed banks in chalk grassland under various management regimes: their role in the restoration of species-rich plant communities. Biodiversity and Conservation, 4, 939-950.
80. Dutoit,T., Buisson,E., Gerbaud,E., Roche,P. & Tatoni,T. (2007) The status of transition zones between cultivated fields and their boundaries: ecotones, ecoclines or edge effects? Acta Oecologica, 31, 127-136.
81. Dutoit,T., Gerbaud,E., Buisson,E. & Roche,P. (2003) Dynamics of a weed community in a cereal field created after ploughing a seminatural meadow: Role of the permanent seed bank. Ecoscience, 10, 225-235.
82. Dutoit,T., Gerbaud,E. & Ourcival,J.M. (1999) Field boundary effects on soil seed banks and weed vegetation distribution in an arable field without weed control (Vaucluse, France). Agronomy for Sustainable Development, 19, 579-590.
83. Dutoit,T., Gerbaud,E., Ourcival,J.M., Roux,M. & Alard,D. (2001) Prospective research on the duality between morphological traits and plant competitive capacity: the case of weed species and wheat. Comptes Rendues de l'Académie des Sciences séries B, 324, 261-272.
84. Duvel,J.W.T. (1902) Seeds buried in soil. Science, 17, 872-873. 85. Ehrlen,J. & Eriksson,O. (2000) Dispersal limitation and patch occupancy in forest herbs. Ecology, 81,
1667-1674. 86. Eliott,N.C., Kieckhefer,R.W., Lee,J.H. & French,B.W. (1998) Influence of within-field and
landscape factors on aphid predator populations in wheat. Landscape Ecology, 14, 239-252. 87. Ellenberg,H. (1996) Vegetation Mitteleuropas mit den Alpen. Ulmer, Stuttgart. 88. Ellenberg,H., Weber,H.E., Düll,R., Wirth,V., Werner,W. & Paulissen,D. (1992) Zeigerwerte von
Pflanzen in Mitteleuropa. Scripta Geobotanica, 18, 1-258. 89. Ellner,S. (1986) Germination dimorphisms and parent offspring conflict in seed-germination. Journal
of Theoretical Biology, 123, 173-185. 90. Ellstrand,N.C. (1992) Gene flow by pollen: implications for plant conservation genetics. Oikos, 63, 77-
86. 91. Ellstrand,N.C. & Elam,D.R. (1993) Population genetic consequences of small population size:
implications for plant conservation. Annual Reviews of Ecology and Systematics, 24, 217-243. 92. Eriksson,A., Eriksson,O. & Berglund,H. (1995) Species abundance patterns of plants in Swedish
seminatural pastures. Ecography, 18, 310-317. 93. Espigares,T. & Peco,B. (1993) Mediterranean annual pasture dynamics: the role of germination.
Journal of Vegetation Science, 4, 189-194. 94. Espigares,T. & Peco,B. (1995) Mediterranean annual pasture dynamics - impact of autumn drought.
Journal of Ecology, 83, 135-142. 95. Facelli,J.M., Chesson,P.L. & Barnes,N. (2005) Differences in seed biology of annual plants in arid
lands : a key ingredient of the storage effect. Ecology, 86, 2998-3006.
References
205
5
R
96. Falk,D.A. & Holsinger,K.E. (1991) Genetics and conservation of rare plants. Oxford University Press, Oxford.
97. Farnsworth,E.J. & Ogurcak,D.E. (2008) Functional groups of rare plants differ in levels of imperilment. American Journal of Botany, 95, 943-953.
98. Felsenstein,J. (1985) Phylogenies and the comparative method. American Naturalist, 125, 1-15. 99. Fenner,M. & Thompson,K. (2005) The ecology of seeds. Cambridge University Press, Cambridge. 100. Fiedler,P.L. (1986) Concepts of rarity in vascular plant species, with special reference to the genus
Calochortus Pursh (Liliaceae). Taxon, 35, 502-518. 101. Filosa,D. (1985) Situation de quelques espèces végétales messicoles en Haute-Provence occidentale.
Bulletin de la Société Botanique du Centre-Ouest, 16, 61-79. 102. Filosa,D. (1989) Les plantes messicoles dans le Parc Naturel Régional du Luberon et contrées
limitrophes. Conservatoire Botanique National Méditerranéen. 103. Filosa,D. (1997) La régression des messicoles dans le Sud-Est de la France. Faut-il sauver les
mauvaises herbes? (Dalmas, H.), pp. 67-74. Conservatoire Botanique National Alpin, Gap-Charance.
104. Fior,S., Karis,P.O., Casazza,G., Minuto,L. & Sala,F. (2006) Molecular phylogeny of the Caryophyllaceae (Caryophyllales) inferred from chloroplast matK and nuclear rDNA ITS sequences. American Journal of Botany, 93, 399-411.
105. Fischer,M. & Stöcklin,J. (1997) Local extinction of plants in remnants of extensively used calcareous grasslands 1950-1985. Conservation Biology, 11, 727-737.
106. Fried,G., Petit,S., Dessaint,F. & Reboud,X. (2009) Arable weed decline in Northern France: Crop edges as refugia for weed conservation? Biological Conservation, 142, 238-243.
107. Frochot,B. (1987) Synergism in bird communities: a method to measure edge effect. Acta Oecologica, 8, 253-258.
108. Funes,G., Basconcelo,S., Díaz,S. & Cabido,M. (2007) Seed size and shape are good predictors of seed persistence in soil in temperate mountain grasslands of Argentina. Seed Science Research, 9, 341-345.
109. Gabriel,D., Roschewitz,I., Tscharntke,T. & Thies,C. (2006) Beta diversity at different spatial scales: plant communities in organic and conventional agriculture. Ecological Applications, 16, 2011-2021.
110. Gabriel,D. & Tscharntke,T. (2007) Insect pollinated plants benefit from organic farming. Agriculture Ecosystems & Environment, 118, 43-48.
111. Gallai,N., Salles,J.M., Settele,J. & Vaissière,B.E. (2009) Economic valuation of the vulnerability of world agriculture confronted with pollinator decline. Ecological Economics, 68, 810-821.
112. Garcia-Jacas,N., Susanna,A., Mozaffarian,V. & Ilarslan,R. (2000) The natural delimitation of Centaurea (Asteraceae: Cardueae): ITS sequence analysis of the Centaurea jacea group. Plant Systematics and Evolution, 223, 185-199.
113. Garland,T., Harvey,P.H. & Ives,A.R. (1992) Procedures for the analysis of comparative data using phylogenetically independent contrasts. Systematic Biology, 41, 18-32.
114. Garnier,E., Cordonnier,P., Guillerm,J.-L. & Sonié,L. (1997) Specific leaf area and leaf nitrogen concentration in annual and perennial grass species growing in Mediterranean old-fields. Oecologia, 111, 490-498.
115. Garnier,E., Shipley,B., Roumet,C. & Laurent,G. (2001) A standardized protocol for the determination of specific leaf area and leaf dry matter content. Functional Ecology, 15, 688-695.
116. Garwood,N.C. (1989) Tropical soil seed bank: a review. Ecology of soil seed banks (Leck, M. A., Parker, V. T., and Simpson, R. L.), pp. 149-209. London Academic Press, London.
117. Gasc,D. (2005) Concilier biodiversité et pratiques agricoles - usage de semences fermières et plantes messicoles en Luberon. Master thesis, INRA Avignon.
118. Gaston,K.J. (1991) How large is species geographical range ? Oikos, 61, 434-438. 119. Gaston,K.J. (1997) What is rarity ? The biology of rarity: causes and consequences of rare-common
differences (Kunin, W. E. and Gaston, K. J.), Chapman & Hall, London. 120. Gaston,K.J. & Kunin,W.E. (1997) Rare-common differences: an overview. The biology of rarity:
causes and consequences of rare-common differences (Kunin, W. E. and Gaston, K. J.), Chapman & Hall, London.
121. Gause,I. (1934) The Struggle for Existence. Williams & Wilkins, Baltimore, MD.

References
206
122. Gerbaud,E. & Dutoit,T. (2002) Rôles de la pluie de graines, du stock semencier et de la zoochorie dans la distribution des adventices des grandes cultures (Vaucluse, France). Ecologie, 32.
123. Gerbaud,E., Dutoit,T., Barroit,A. & Toussaint,B. (2001) Teneurs en minéraux des fourrages de chaume et de leurs adventices: l'exemple d'une exploitation agricole du sud-est de la France (Vaucluse). Animal Research, 50, 495-505.
124. Gibson,R.H., Nelson,I.L., Hopkins,G.W., Hamlett,B.J. & Memmott,J. (2006) Pollinator webs, plant communities and the conservation of rare plants: arable weeds as a case study. Journal of Applied Ecology, 43, 246-257.
125. Girerd,B. (1991) La Flore du départment du Vaucluse - Nouvel inventaire. Barthélémy, Avignon. 126. Gitay,H. & Noble,I.R. (1997) What are functional types and how should we seek them? (Smith,
T. H., Shugart, H. H., and Woodward, F. I.), pp. 3-19. Cambridge University Press, Cambridge.
127. Gitzendanner,M.A. & Soltis,P.S. (2000) Patterns of genetic variation in rare and widespread plant congeners. American Journal of Botany, 87, 783-792.
128. Grafen,A. (1989) The phylogenetic regression. Philosophical Transactions of the Royal Society Series B, 326, 119-157.
129. Grime,J.P. (2006) Trait convergence and trait divergence in herbaceous plant communities: Mechanisms and consequences. Journal of Vegetation Science, 17, 255-260.
130. Grime,J.P., Mason,G., Curtis,A.V., Rodman,J., Band,S.R., Mowforth,M.A.G., Neal,A.M. & Shaw,S. (1981) A comparative study of germination characteristics in a local flora. Journal of Ecology, 69, 1017-1059.
131. Grubb,P.J. (1977) Maintenance of Species-Richness in Plant Communities - Importance of Regeneration Niche. Biological Reviews of the Cambridge Philosophical Society, 52, 107-145.
132. Grundy,A.C., Mead,A. & Burston,S. (2003) Modelling the emergence response of weed seeds to burial depth: interactions with seed density, weight and shape. Journal of Applied Ecology, 40, 757-770.
133. Guende,G. & Olivier,L. (1997) Les mesures de sauvegarde et de gestion des plantes messicoles du Parc naturel régional du Luberon. Faut-il sauver les mauvaises herbes? (Dalmas, H.), pp. 179-188. Conservatoire Botanique National Alpin, Gap-Charance.
134. Günter,G. (1997) Populationsbiologie seltener Segetalarten. Scripta Geobotanica, 22, 1-220. 135. Hairston,N.G., Ellner,S.P., Geber,M.A., Yoshida,T. & Fox,J.A. (2005) Rapid evolution and the
convergence of ecological and evolutionary time. Ecology Letters, 8, 1114-1127. 136. Hald,A.B. (1999) Weed vegetation (wild flora) of long established organic versus conventional cereal
fields in Denmark. Annals of Applied Biology, 134, 307-314. 137. Hamrick,J.L. & Godt,M.J.W. (1997) Allozyme diversity in cultivated crops. Crop Science, 37, 26-30. 138. Hamrick,J.L., Linhart,Y.B. & Mitton,J.B. (1979) Relationships between life history characteristics
and electrophoretically detectable genetic variation in plants. Annual Reviews of Ecology and Systematics, 10, 173-200.
139. Harper,J.L. (1977) Population biology of plants. Academic Press, London. 140. Harrison,S. & Ray,C. (2002) Plant population viability and metapopulation-level processes.
Population Viability Analysis (Beissinger, S. and McCullough, D. R.), pp. 109-122. University of Chicago Press, Chicago.
141. Harvey,P.H. & Pagel,M.D. (1991) The comparative method in evolutionary biology. Oxford University Press, Oxford.
142. Harvey,P.H., Read,A.F. & Nee,S. (1995) Why ecologist need to be phylogenetically challenged. Journal of Ecology, 83, 535-536.
143. Hegde,S.G. & Ellstrand,N.C. (1999) Life history differences between rare and common flowering plant species of California and the British Isles. International Journal of Plant Sciences, 160, 1083-1091.
144. Hillier,S.H., Walton,D.H.W. & Wells,D.A. (1990) Calcareous grasslands: ecology and management. Bluntisham Books, Huntingdon.
145. Hobbs,R.J. & Huenneke,L.F. (1992) Disturbance, diversity and invasion: implication for conservation. Conservation Biology, 6, 324-337.
146. Hock,Z., Szövényi,P., Schneller,J.J., Tóth,Z. & Urmi,E. (2008) Bryophyte diaspore bank: a genetic memory? genetic structure and genetic diversity of surface populations and diaspore bank in the liverwort Mannia fragrans (Aytoniaceae). American Journal of Botany, 95, 542-548.

References
207
5
R
147. Hodgson,J.G. (1986) Commonness and Rarity in Plants with Special Reference to the Sheffield Flora .1. the Identity, Distribution and Habitat Characteristics of the Common and Rare Species. Biological Conservation, 36, 199-252.
148. Hodkinson,D.J., Askew,A.P., Thompson,K., Hodgson,J.G., Bakker,J.P. & Bekker,R.M. (1998) Ecological correlates of seed size in the British flora. Functional Ecology, 12, 762-766.
149. Holm,S. (1979) A simple sequentially rejective multiple test procedure. Scandinvavian Journal of Statistics, 6, 65-70.
150. Hoot,S.B., Kadereit,J.W., Blattner,F.R., Jork,K.B., Schwarzbach,A.E. & Crane,P.R. (1997) Data congruence and phylogeny of the Papaveraceae s.l. based on four data sets: atpB and rbcL sequences, trnK restriction sites, and morphological charcters. Systematic Biology, 22, 575-590.
151. Hopfensberger,K. (2007) A review of similarity between seed bank and standing vegetation across ecosystems. Oikos, 116, 1438-1448.
152. Hubbell,S.P. (2001) The Unified Neutral Theory of Biodiversity and Biogeography. Princeton University Press, Princeton.
153. Hubbell,S.P. (2005) Neutral theory in community ecology and the hypothesis of functional equivalence. Functional Ecology, 19, 166-172.
154. Hubbell,S.P. & Foster,R.B. (1986) Commonness and rarity in a neotropical forest: implications for tropical tree conservation. Conservation biology: the Science of Scarcity and Diversity (Soule, M. E.), pp. 205-231. Sinauer, Sunderland.
155. Hulme,P.E. (1998) Post-dispersal seed predation and seed bank persistence. Seed Science Research, 8, 513-519.
156. Hutchings,M.J. (1986) Plant population biology. Methods in plant ecology (Moore, P. D. and Chapman, S. B.), pp. 377-435. Blackwell, Oxford.
157. Hutchings,M.J. & Booth,K.D. (1996) Studies of the feasibilityof re-creating chalk grassland vegetation on ex-arable land. I.The potential roles of the seed bank and the seed rain. Journal of Applied Ecology, 33, 1182-1190.
158. Hyvönen,T., Ketoja,E., Salonen,J., Jalli,H. & Tianinen,J. (2003) Weed species diversity and community composition in cropping of spring cereals. Agriculture Ecosystems & Environment, 97, 131-149.
159. International Seed Testing Association,I.S.T.A. (1996) International rules for seed testing. Seed Science and Technology, 24.
160. Jackel,A.K. & Poschlod,P. (1994) Diaspore production and the influence of the size of diaspore traps on the quantitative result of seasonal diaspore rain in two calcareous grassland sites. Berichte des Institutes für Landschafts- und Pflanzenökologie der Universität Hohenheim, 3, 123-132.
161. Jäger,M. (2002) The relevance of grazing sheep and harvested seeds for the dispersal of segetal species – a case study from south-eastern France. Master thesis, University of Marburg.
162. Jain,S.K. (1976) The evolution of inbreeding in plants. Annual Reviews of Ecology and Systematics, 7, 469-495.
163. Jakobsson,A. & Eriksson,O. (2000) A comparative study of seed number, seed size, seedling size and recruitment in grassland plants. Oikos, 88, 494-502.
164. Jakobsson,A., Eriksson,O. & Bruun,H.H. (2006) Local seed rain and seed bank in a species-rich grassland: effects of plant abundance and seed size. Canadian Journal of Botany, 84, 1870-1881.
165. Jansen,R.K., Cai,Z., Hansen,D., Dastidar,S., Peñaflor,C., Timme,R., Hansen,K., Haberle,R.C., Chumley,T.W., Guisinger-Bellian,M.M., Daniell,H., Lee,S.B., Raubeson,L.A., Peery,R., Depamphilis,C.W., Leebens-Mack,J., McNeal,J.R., Boore,J. & Kuehl,J.V. (2006a) Phylogeny of angiosperms based on whole chloroplast sequences. Botany 2006 - Looking to the Future - Conserving the Past (Botanical Society of America), pp. 227-228.
166. Jansen,R.K., Kaittanis,C., Lee,S.B., Saski,C., Tomkins,J., Alverson,A.J. & Daniell,H. (2006b) Phylogenetic analysis of Vitis (Vitaceae) based on complete chloroplast genome sequences: Effect of taxon sampling and phylogenetic methods on resolving relationships among rosids. BMC Evolutionary Biology, 6, ?
167. Janzen,D.H. (1970) Herbivores and the number of tree species in tropical forests. The American Naturalist, 104, 501-528.
168. Jauzein,P. (1995) Flore des champs cultivés. INRA, Paris. 169. Jauzein,P. (1997) La notion de messicole : tentative de définition et de classification. Monde des
Plantes, 458, 19-23.

References
208
170. Jauzein,P. (2001) L'appauvrissement floristique des champs cultivés. Dossier de l'environnement de l'INRA, 21, 65-78.
171. Jávorka,S. & Csapody,V. (1979) Iconographia florae partis austro-orientalis Europaeae centralis. Fischer, Stuttgart.
172. Jensen,U., Hook,I.L.I., Johansson,J. & Kosuge,K. (1995) Systematics and phylogeny of the Ranunculaceae - a revised family concept on the basis of morphological data. Systematics and Evolution of the Ranunculiflorae (Jensen, U. and Kadereit, J. W.), pp. 273-280. Springer, Vienna.
173. Jurado,E. & Flores,J. (2005) Is seed dormancy under environmental control or bound to plant traits? Journal of Vegetation Science, 16, 559-564.
174. Jurado,E. & Westoby,M. (1992) Seedling Growth in Relation to Seed Size Among Species of Arid Australia. Journal of Ecology, 80, 407-416.
175. Kahmen,S. (2004) Plant trait responses to grassland management and succession. Dissertationes Botanicae, 382, 1-122.
176. Kahmen,S. & Poschlod,P. (2008) Does germination success differ wit respect to seed mass and germination season? Annals of Botany, 101, 541-548.
177. Kalisz,S. (1991) Experimental determination of seed bank age structure in the winter annual Collinsia verna. Ecology, 72, 575-585.
178. Kalisz,S. & McPeek,M.A. (1992) The demography of an age-structured annual: resampled projection matrices, elasticity analyses and seed bank effects. Ecology, 73, 1082-1093.
179. Kalisz,S. & McPeek,M.A. (1993) Extinction dynamics, population growth and seed banks. An example using an age-structured annual. Oecologia, 95, 314-320.
180. Kazakou,E., Vile,D., Shipley,B., Gallet,C. & Garnier,E. (2006) Co-variations in litter decomposition, leaf traits and plant growth in species from a Mediterranean old-field succession. Functional Ecology, 20, 21-30.
181. Kerguelen,M. (1998) Index Synonymique de la Flore de France. INRA Dijon. 182. Kleyer,M., Bekker,R.M., Knevel,I.C., Bakker,J.P., Thompson,K., Sonnenschein,M., Poschlod,P.,
van Groenendael,J.M., Klimes,L., Klimesova,J., Klotz,S., Rusch,G.M., Hermy,M., Adriaens,D., Boedeltje,G., Bossuyt,B., Dannemann,A., Endels,P., Gotzenberger,L., Hodgson,J.G., Jackel,A.K., Kuhn,I., Kunzmann,D., Ozinga,W.A., Romermann,C., Stadler,M., Schlegelmilch,J., Steendam,H.J., Tackenberg,O., Wilmann,B., Cornelissen,J.H.C., Eriksson,O., Garnier,E. & Peco,B. (2008) The LEDA Traitbase: a database of life-history traits of the Northwest European flora. Journal of Ecology, 96, 1266-1274.
183. Kollman,J., Coomes,D.A. & White,S.M. (1998) Consistencies in post-dispersal seed predation of temperate fleshy-fruited species among seasons, years and sites. Functional Ecology, 12, 683-690.
184. Korneck,D. & Sukopp,H. (1988) Rote Liste der in der BRD ausgestorbenen, verschollenen und
gefähreten Farn- und Blütenpflanzen und ihre Auswertung für den Arten- und Biotoschutz. Bundesforschungsanstalt für Naturschutz und Landschaftspflege, Bonn-Bad Godesberg.
185. Kunin,W.E. (1998) Biodiversity at the edge: a test of the importance of spatial "mass effect" in the Rothamsted Park Grass experiments. Proceedings of the National Academy of Sciences, 95, 207-212.
186. Lande,R. (1996) Statistics and partitioning of species diversity and similarity among multiple communities. Oikos, 76, 5-13.
187. Laporte,V. & Charlesworth,B. (2002) Effective population size and population subdivision in demographically structured populations. Genetics, 162, 501-519.
188. Larcher,W. (2001) Ökophysiologie der Pflanzen - Leben, Leistung und Streßbewältigung der Pflanzen in ihrer Umwelt. Ulmer, Stuttgart.
189. Lavergne,S. (2003) Les espèces végétales rares ont-elles des caractéristiques écologiques et biologiques qui leur sont propres? PhD Thesis thesis, ENSAM, Montpellier.
190. Lavorel,S. & Garnier,E. (2002) Predicting changes in community composition and ecosystem functioning from plant traits – revisiting the Holy Grail. Functional Ecology, 16, 545-556.
191. Lavorel,S., Lepart,J., Debussche,M., Lebreton,J.D. & Beffy,J.L. (1994) Small scale disturbances
and the maintenance of species diversity in Mediterranean old fields. Oikos, 70, 455-473.

References
209
5
R
192. Lavorel,S., McIntyre,S. & Grigullis,K. (1999) Plant response to disturbance in a Mediterranean grassland: How many functional groups? Journal of Vegetation Science, 10, 661-672.
193. Lavorel,S., McIntyre,S., Landsberg,J. & Forbes,T.D.A. (1997) Plant Functional Classifications: from general groups to specific groups based on response to disturbance. Trends in Ecology & Evolution, 12, 474-478.
194. Le Mire Pecheux,L. (2004) LandBioDiv : un nouveau modèle de prédiction spatialisée de la diversité et de la composition spécifique au niveau du paysage - Exemple d'application en région méditerranéenne (France). Université Aix-Marseille III.
195. Legendre,P. & Legendre,L. (1998) Numerical Ecology. 196. Lehsten,V. (2005) Functional analysis and the modelling of vegetation. PhD Thesis thesis,
Universität Oldenburg. 197. Leimu,R., Mutikainen,P., Koricheva,J. & Fischer,M. (2006) How general are positive relationships
between plant population size, fitness and genetic variation? Journal of Ecology, 94, 942-952. 198. Leishman,M.R., Masters,G.J., Clarke,I.P. & Brown,V.K. (2000a) Seed bank dynamics: the role of
fungal pathogens and climate change. Functional Ecology, 14, 293-299. 199. Leishman,M.R. & Westoby,M. (1998) Seed size and shape are not related to persistence in soil in
Australia in the same way as in Britain. Functional Ecology, 12, 480-485. 200. Leishman,M.R., Wright,I.J., Moles,A.T. & Westoby,M. (2000b) The evolutionary ecology of
seed size. Seeds - the ecology of regeneration in plant communities (Fenner, M.), CABI, Wallingford.
201. Levine,J.M. & Rees,M. (2004) Effects of temporal variability on rare plant persistence in annual systems. The American Naturalist, 164, 350-363.
202. Liancourt,P., Callaway,R.M. & Michalet,R. (2005) Stress tolerance and competitive response ability determine the outcome of biotic interactions. Ecology, 86, 1611-1618.
203. Lokesha,R., Hegde,S.G., Shaanker,R.U. & Ganeshaiah,K.N. (1992) Dispersal mode as a selective force in shaping the chemical composition of seeds. American Naturalist, 140, 520-525.
204. Lososová,Z., Chytrý,M., Cimalová,S., Kropác,Z., Otýpková,Z., Pyšek,P. & Tichý,L. (2004) Weed vegetation of arable land in Central Europe: Gradients of diversity and species composition. Journal of Vegetation Science, 15, 415-422.
205. Louda,S.M. (1989) Predation in the dynamics of seed regeneration. Ecology of soil seed banks (Leck, M. A., Parker, V. T., and Simpson, R. L.), pp. 25-51. London Academic Press, London.
206. Loveless,M.D. & Hamrick,J.L. (1984) Ecological determinants of genetic structure in plant populations. Annual Reviews of Ecology and Systematics, 15, 65-95.
207. MacArthur,R.H. & Levins,R. (1967) The limiting similarity, convergence and divergence of coexisting species. The American Naturalist, 101, 377-385.
208. Maillet,J. (1992) Constitution et dynamique des communautés de mauvaises herbes des vignes de France et des rizières de Camargue. PhD thesis, Université de Montpellier II.
209. Marshall,E.J.P., Brown,V.K., Boatman,N.D., Lutman,P.J.W., Squire,G.R. & Ward,L.K. (2003) The role of weeds in supporting biological diversity within crop fields. Weed Research, 43, 77-89.
210. Marshall,J. (1989) Distribution patterns of plants associated with arable field edges. Journal of Applied Ecology, 26, 247-257.
211. Matthies,D., Bräuer,I., Maibom,W. & Tscharntke,T. (2004) Population size and the risk of local extinction: empirical evidence from rare plants. Oikos, 105, 481-488.
212. Mayr,E. (2004) What makes biology unique? Considerations on the autonomy of a scientific discipline. Cambridge University Press.
213. McCollin,D., Moore,L. & Sparks,T. (2000) The flora of a cultural landscape: environmental determinants of change revealed using archival sources. Biological Conservation, 92, 249-263.
214. McGill,B.J., Enquist,B.J., Weiher,E. & Westoby,M. (2006) Rebuilding community ecology from functional traits. Trends in Ecology & Evolution, 21, 178-185.
215. McGinley,M.A., Temme,D.H. & Geber,M.A. (1987) Parental investment in offspring in variable environments: theoretical and empirical considerations. The American Naturalist, 130, 370-398.
216. McGraw,J.B. (1993) Ecological genetic variation in seed banks. 4. Differentiation of extant and seed bank derived populations of Eriophorum vaginatum. Arctic and Alpine Research, 25, 45-49.
217. McGraw,J.B., Vavrek,M.C. & Bennington,C.C. (1991) Ecological genetic variation in seed banks. I. Establishment of a time-transect. Journal of Ecology, 79, 617-626.

References
210
218. Médail,F. & Verlaque,R. (1997) Ecological characteristics and rarity of endemic plants from southeast France and Corsica: implications for biodiversity conservation. Biological Conservation, 80, 269-281.
219. Menges,E.S. (1990) Population viability analysis for an endangered plant. Conservation Biology, 4, 52-62.
220. Menges,E.S. (1991) Seed germination percentage increases with population size in a fragmented prairie species. Conservation Biology, 5, 158-164.
221. Menges,E.S. (2000) Population viability analyses in plants: challenges and opportunities. Trends in Ecology & Evolution, 15, 51-56.
222. Mennan,H. (2003) The effects of depth and duration of burial on seasonal germination, dormancy and viability of Galium aparine and Bifora radians seeds. Journal of Agronomy and Crop Science, 189, 304-309.
223. Metcalf,J.C., Rose,K.E. & Rees,M. (2003) Evolutionary demography of monocarpic perennials. Trends in Ecology & Evolution, 18, 471-480.
224. Michalet,R., Brooker,R.W., Cavieres,L.A., Kikvidze,Z., Lortie,C.J., Pugnaire,F.I., Valiente-Banuet,A. & Callaway,R.M. (2006) Do biotic interactions shape both sides of the humped-back model of species richness in plant communities? Ecology Letters, 9, 767-773.
225. Miess,M. (1968) Vergleichende Darstellung von meteorologischen Meßergebnissen und Wärmehaushaltsuntersuchungen an drei unterschiedlichen Standorten in Norddeutschland. Thesis thesis, Universität Hannover.
226. Milberg,P. & Andersson,L. (1997) Seasonal variation in dormancy and light sensitivity in buried seeds of eight annual weed species. Canadian Journal of Botany, 75, 1998-2004.
227. Milberg,P. & Andersson,L. (1998) Does cold stratification level out differences in seed germinability between populations? Plant Ecology, 134, 225-234.
228. Milberg,P., Andersson,L. & Thompson,K. (2000) Large-seeded species are less dependent on light for germination than small-seeded ones. Seed Science Research, 10, 99-104.
229. Moles,A.T. & Drake,D.R. (1999) Post-dispersal seed predation on large-seeded species in the New Zealand flora. New Zealand Journal of Botany, 37, 679-685.
230. Moles,A.T., Falster,D.S., Leishman,M.R. & Westoby,M. (2004) Small-seeded species produce more seeds per square metre of canopy per year, but not per individual per lifetime. Journal of Ecology, 92, 384-396.
231. Moles,A.T., Hodson,D.W. & Webb,C.J. (2000) Seed size and persistence in the soil in the New Zealand flora. Oikos, 89, 679-685.
232. Molinier,R. (1981) Catalogue des plantes vasculaires des Bouches-du-Rhône. Muséum d'Histoire Naturelle Marseille, Marseille.
233. Montégut,J. (1997) Evolution et régression des mauvaises herbes. Faut-il sauver les mauvaises herbes ? (Dalmas, H.), pp. 11-32. Conservatoire botanique de Gap-Charance, Gap.
234. Moonen,A.C. & Marshall,E.J.P. (2001) The influence of sown margin strips, management and boundary structure on herbaceous field margin vegetation in two neighbouring farms in southern England. Agriculture Ecosystems & Environment, 86, 187-202.
235. Morgan,J.W. (1998) Effects of population size on seed production and germinability in an endangered, fragmented grassland plant. Conservation Biology, 13, 266-273.
236. Moriuchi,K.S., Venable,D.L., Pake,C.E. & Lange,T. (2000) Direct measurement of the seed bank age structure of a Sonoran Desert annual plant. Ecology, 81, 1133-1138.
237. Morrison,L.W. (1997) The insular biogeography of small Bahamian cays. Journal of Ecology, 85, 441-454.
238. Morrison,L.W. (1998) The spatiotemporal dynamics of insular ant metapopulations. Ecology, 79, 1135-1146.
239. Moutier,L. & Balme,C. (1997) Carte géologique du Parc Naturel Régional du Luberon. BRGM. 240. Müller,K.J. (1991) Die Provence - Aspekte kulturlandschaftlicher Veränderungen. Beiträge und
Materialien zur regionalen Geographie, 5, 1-279. 241. Murray,B.R., Leishman,M.R., Kelaher,B., Hose,G.C. & Figueira,W.F. (2005) A meta-analysis of
the interspecific relationship between seed size and plant abundance within local communities. Oikos, 110, 191-194.

References
211
5
R
242. Murray,B.R., Thrall,P.H., Gill,A.M. & Nicotra,A.B. (2002) How plant life-history and ecological traits relate to species rarity and commonnes at varying spatial scales. Austral Ecology, 27, 291-310.
243. Noronha,A., Andersson,L. & Milberg,P. (1997) Rate of change in dormancy level and light requirement in weed seeds during stratification. Annals of Botany, 80, 795-801.
244. Olivereau,F. (1996) Les plantes messicoles des plaines françaises. Courrier de l'Environnement de l'INRA, 28, 5-18.
245. Ortega,M., Levassor,C. & Peco,B. (1997) Seasonal dynamics of Mediterranean pasture seed banks along environmental gradients. Journal of Biogeography, 24, 177-195.
246. Ozinga,W.A., Hennekens,S.M., Schaminee,J.H.J., Smits,N.A.C., Bekker,R.M., Romermann,C., Klimes,L., Bakker,J.P. & van Groenendael,J.M. (2007) Local above-ground persistence of vascular plants: Life-history trade-offs and environmental constraints. Journal of Vegetation Science, 18, 489-497.
247. Ozinga,W.A., Römermann,C., Bekker,R.M., Prinzig,A., Tamis,W.L.M., Schaminée,J.H.J., Hennekens,S.M., Thompson,K., Poschlod,P., Kleyer,M., Bakker,J.P. & van Groenendael,J.M. (2008) Dispersal failure contributes to plant losses in NW Europe. Ecology Letters, 11, 1-9.
248. Pake,C.E. & Venable,D.L. (1995) Is coexistence of Sonoran desert annuals mediated by temporal variability in reproductive success? Ecology, 76, 246-261.
249. Pake,C.E. & Venable,D.L. (1996) Seed banks in desert annuals: implications for persistence and coexistence in variable environments. Ecology, 77, 1427-1436.
250. Pakeman,R.J., Garnier,E., Lavorel,S., Ansquer,P., Castro,H., Cruz,P., Dolezal,J., Eriksson,O., Freitas,H., Golodets,C., Kigel,J., Kleyer,M., Leps,J., Meier,T., Papadimitriou,M., Papanastasis,V.P., Quested,H., Quetier,F., Rusch,G., Sternberg,M., Theau,J.P., Thebault,A. & Vile,D. (2008) Impact of abundance weighting on the response of seed traits to climate and land use. Journal of Ecology, 96, 355-366.
251. Paradis,E., Strimmer,K., Claude,J., Jobb,G., Opgen-Rhein,R., Dutheil,J., Noel,Y., Bolker,B., Lemon,J., Durand,B. & Nylander,J. (2006) The ape Package: Analyses of Phylogenetics and Evolution Version 1.8-5.
252. Parker,V.T., Simpson,R.L. & Leck,M.A. (1989) Pattern and process in the dynamics of seed banks. Ecology of soil seed banks (Leck, M. A., Parker, V. T., and Simpson, R. L.), pp. 367-384. London Academic Press, London.
253. Pärtel,M. (2002) Local plant diversity patterns and evolutionary history at the regional scale. Ecology, 83, 2361-2366.
254. Paun,O., Lehnebach,C., Johansson,J.T., LOckhart,P. & Hörandl,E. (2005) Phylogenetic relationships and biogeography of Ranunculus and allied genera (Ranunculaceae) in the Mediterranean region and the European Alpine system. Taxon, 54, 911-930.
255. Peco,B., de Pablos,I., Traba,J. & Levassor,C. (2005) The effect of grazing and abandonment on species composition and functional traits: The case of Dehesa grasslands. Basic and Applied Ecology, 6, 175-183.
256. Peco,B., Ortega,M. & Levassor,C. (1998) Similarity between seed bank and vegetation in Mediterranean grasslands: a predictive model. Journal of Vegetation Science, 9, 815-828.
257. Peco,B., Traba,J., Levassor,C., Sanchez,A.M. & Azcarate,F.M. (2003) Seed size and shape and persistence in dry Mediterranean grass and scrublands. Seed Science Research, 13, 87-95.
258. Pimm,S.L., Russell,G.J., Gittleman,J.L. & Brooks,T.M. (1995) The future of biodiversity. Science, 269, 347-350.
259. Pinke,G., Pál,R., Királ,G. & Mesterházy,A. (2008) Conservational importance of the arable weed vegetation on extensively managed fields in western Hungary. Journal of Plant Diseases and Protection, 21, 447-452.
260. Pizo,M.A., von Allmen,C. & Morellato,L.P.C. (2006) Seed size variation in the palm Euterpe edulis and the effects of seed predators on germination and seedling survival. Acta Oecologica, 29, 311-315.
261. Podoler,H. & Rogers,D.J. (1975) A new method for the identification of key factors from life-table data. Journal of Animal Ecology, 44, 85-114.
References
212
262. Poschlod,P. (1993) Die Dauerhaftigkeit von generativen Diasporenbanken in Böden am Beispiel von Kalkmagerrasenpflanzen und deren Bedeutung für den botanischen Arten- und Biotopschutz. Verhandlungen der Gesellschaft für Ökologie, 22, 229-240.
263. Poschlod,P. & Biewer,H. (2005) Diaspore and gap availability are limiting species richness in wet meadows. Folia Geobotanica, 40, 13-34.
264. Poschlod,P. & Jackel,A.K. (1993) Untersuchungen zur Dynamik von generativen Diasporenbanken von Samenpflanzen in Kalkmagerrasen. I. Jahreszeitliche Dynamik des Diasporenregens und der Diasporenbank auf zwei Kalkmagerrasenstandorten der Schwäbischen Alb. Flora, 188, 49-71.
265. Poschlod,P., Kiefer,S., Tränkle,U., Fischer,S.F. & Bonn,S. (1998) Plant species richness in calcareous grasslands as affected by dispersability in space and time. Applied Vegetation Science, 1, 75-90.
266. Poschlod,P., Kleyer,M. & Tackenberg,O. (2000) Databases on life history traits as a tool for risk assessment in plant species. Zeitschrift für Ökologie und Naturschutz, 9, 3-18.
267. Poschlod,P., Tackenberg,O. & Bonn,S. (2005) Plant dispersal potential and its relation to species frequency and coexistence. Vegetation Ecology (van der Maarel, E.), pp. 147-171. Blackwell, Oxford.
268. Pyšek,P., Jarošik,V., Kropác,Z., Chytrý,M., Wild,J. & Tichý,L. (2005) Effects of abiotic factors on species richness and cover in Central European weed communities. Agriculture Ecosystems & Environment, 109, 1-8.
269. Qasem,J.R. & Foy,C.L. (2001) Weed allelopathy, its ecological impacts and future prospects: a review. Journal of Crop Production, 4, 43-119.
270. R Foundation for Statistical Computing (2008) R: A language and environment for statistical computing. Vienna.
271. Rabinowitz,D. (1981) Seven forms of rarity. The biological aspects of rare plants conservation (Cairns, S. and Dillon, T.), pp. 205-218. Wiley, New York.
272. Rabinowitz,D., Cairns,S. & Dillon,T. (1986) Seven forms of rarity and their frequency in the flora of the British Isles. Conservation biology: the Science of Scarcity and Diversity (Soule, M. E.), pp. 182-204. Sinauer, Sunderland.
273. Reed,J.M., Mills,L.S., Dunning,J.B., Menges,E.S., McKelvey,K.S., Frye,R., Beissinger,S.R., Anstett,M.C. & Miller,P. (2002) Emerging issues in population viability analysis. Conservation Biology, 16, 7-19.
274. Rees,M. (1996) Evolutionary ecology of seed dormancy and seed size. Philosophical Transactions of the Royal Society Series B, 351, 1299-1308.
275. Rees,M. & Mills,L.S. (2002) Emerging issues in population viability analysis. Conservation Biology, 16, 7-19.
276. Robinson,R.A. & Sutherland,W.J. (2002) Post-war changes in arable farming and biodiversity in Great Britain. Journal of Applied Ecology, 39, 157-176.
277. Roche,P., Hill,B. & Mahieu,P. (2002) Suivie scientifique de l'opération locale agriculture-environnement – « Protection in situ des agrosystèmes à messicoles ». IMEP, Université d'Aix-Marseille III.
278. Römermann,C., Tackenberg,O., Jackel,A.K. & Poschlod,P. (2008) Eutrophication and fragmentation are related to species' rate of decline but not to species rarity: results from a functional approach. Biodviersity and Conservation, 17, 591-604.
279. Roschewitz,I., Gabriel,D., Tscharntke,T. & Thies,C. (2009) The effect of landscape complexity on arable weed species diversity in organic and conventional farming. Journal of Applied Ecology, in press.
280. Rothmaler,W. (2000) Exkursionsflora von Deutschland - Gefäßpflanzen: Atlasband. Spektrum, Heidelberg.
281. Roux,J.-P. & Nicolas,I. (2001) Catalogue de la flore rare et menacée en région P.A.C.A. Conservatoire Botanique Méditerranéen de Porquerolles.
282. Saatkamp,A., Affre,L., Dutoit,T. & Poschlod,P. (2009) What tell us seed counts in soil samples about seed persistence? - evidence from a burial experiment with rare arable weeds. Annals of Botany, (online early).
283. Sagar,G.R. & Harper,J.L. (1960) Factors affecting germination and early establishment of plantains (Plantago lanceolata, P. media and P. major). The biology of weeds (Harper, J. L.), pp. 236-245. Blackwell, Oxford.

References
213
5
R
284. Sanchez,A.M. & Peco,B. (2007) Lack of recruitment in Lavandula stoechas subsp pedunculata: a case of safe-site limitation. Acta Oecologica, 31, 32-39.
285. Schafer,M. & Kotanen,P.M. (2003) The influence of soil moisture on losses of buried seeds to fungi. Acta Oecologica, 24, 255-263.
286. Schmid,B. & Matthies,D. (1994) Seltenheit und Gefährdung - Populationsbiologische Grundlagen des Artenschutzes. Naturwissenschaften, 81, 283-292.
287. Schmidt,M.H., Lauer,A., Purtauf,T., Thies,C., Schaefer,M. & Tscharntke,T. (2003) Relative importance of predators and parasitoids for cereal aphid control. Philosophical Transactions of the Royal Society Series B, 270, 1905-1909.
288. Schneider,C., Sukopp,U. & Sukopp,H. (1994) Biologisch-ökologische Grundlagen des Schutzes gefährdeter Segetalpflanzen. Bundesamt für Naturschutz, Bonn-Bad Godesberg.
289. Schütz,W. (2000) The importance of seed regeneration strategies for the persistence of species in the changing landscape of Central Europe. Zeitschrift für Ökologie und Naturschutz, 9, 73-83.
290. Sears,A.W.S. & Chesson,P. (2007) New methods for quantifying the spatial storage effect: an illustration with desert annuals. Ecology, 88, 2240-2247.
291. Šera,B. & Šery,M. (2004) Relation between number and weight of diaspores and reproductive strategies of herbaceous plants. Folia Geobotanica, 39, 27-42.
292. Shipley,B. & Dion,J. (1992) The Allometry of Seed Production in Herbaceous Angiosperms. American Naturalist, 139, 467-483.
293. Shipley,B., Vile,D. & Garnier,E. (2006) From plant traits to plant communities a statistical mechanistic apporach to biodiversity. Science, 314, 812-814.
294. Shmida,A. & Wilson,M.V. (1985) Biological determinants of species diversity. Journal of Biogeography, 12, 1-20.
295. Sibly,R.M. & Smith,R.H. (1998) Identifying key factors using -contribution analysis. Journal of Animal Ecology, 67, 17-24.
296. Silvertown,J. (1982) Introduction to plant population ecology. Longman, London. 297. Silvertown,J. (1999) Seed ecology, dormancy and germination: a modern synthesis from Baskin and
Baskin. American Journal of Botany, 86, 903-905. 298. Silvertown,J. & Charlesworth,D. (2001) Introduction to plant population biology. Blackwell. 299. Silvertown,J., Dodd,M.E., Gowing,D.J.G. & Mountford,J.O. (1999) Hydrologically defined niches
reveal a basis for species richness in plant communities. Nature, 400, 61-63. 300. Silvertown,J., McConway,K., Gowing,D., Dodd,M., Fay,M.F., Joseph,J.A. & Dolphin,K. (2006)
Absence of phylogenetic signal in the niche structure of meadow plant communities. Proceedings of the Royal Society B - Biological Sciences, 273, 39-44.
301. Simpson,R.L. (1989) Seed banks: general concepts and methodological issues. Ecology of soil seed banks (Leck, M. A., Parker, V. T., and Simpson, R. L.), pp. 3-8. London Academic Press, London.
302. Smart,S.M., Bunce,R.G.H., Marrs,R., Le Duc,M., Firbank,L.G., Maskell,L.C., Scott,W.A., Thompson,K. & Walker,K.J. (2005) Large-scale changes in the abundance of common higher plant species across Britain between 1978, 1990 and 1998 as a consequence of human activity: Test of hypothesized changes in trait representation. Biological Conservation, 124, 355-371.
303. Smith,H., Firbank,L.G. & Macdonald,D.W. (1999) Uncropped edges of arable fields managed for biodiversity do not increase weed occurrence in adjacent crops. Biological Conservation, 89, 107-111.
304. Smith,J., Potts,S.G., Woodcock,B.A. & Eggleton,P. (2008) Can arable field margins be managed to
enhance their biodiversity, conservation and functional value for soil macrofauna? Journal of Applied Ecology, 45, 269-278.
305. Sokal,R.S. & Rohlf,F.J. (1995) Biometry. Freeman, New York. 306. Soltis,D.E., Mort,M.E., Soltis,P.S., Albach,D.C., Zanis,M., Savolainen,V., Hahn,W.H., Hoot,S.B.,
Fay,M.F., Axtell,M., Swensen,S.M., Price,L.M., Kress,W.J., Nixon,K.C. & Farris,J.S. (2000) Angiosperm phylogeny inferred from 18S rDNA, rbcL, and atpB sequences. Botanical Journal of the Linnean Society, 133, 381-461.
307. Soltis,D.E., Soltis,P.S., Endress,P.K. & Chase,M.W. (2005) Phylogeny and Evolution of Angiosperms. Sinauer, Sunderland.
308. Sotherton,N.W. (1984) The distribution and abundance of predatory arthropods overwintering in farmland. Annals of Applied Biology, 105, 423-429.

References
214
309. Stebbins,G.L.J. (1942) The genetic approach to the problems of rare and endemic species. Madroño, 6, 241-272.
310. Steffan-Dewenter,I., Münzenberg,U., Bürger,C., Thies,C. & Tscharntke,T. (2002) Scale-dependent effects of landscape context on three pollinator guilds. Ecology, 83, 1421-1432.
311. Stöcklin,J. & Fischer,M. (1999) Plants with longer-lived seeds have lower local extinction rates in grassland remnants 1950-1985. Oecologia, 120, 539-543.
312. Stromberg,J.C., Boudell,J.A. & Hazelton,A.F. (2008) Differences in seed mass between hydric and xeric plants influence seed bank dynamics in a dryland riparian ecosystem. Functional Ecology, 22, 205-212.
313. Susanna,A., Garcia-Jacas,N., Hidalgo,O., Vilatersana,R. & Garnatje,T. (2006) The Cardueae (Compositae) revisited: Insights from ITS, trnL-trnF, and matK nuclear and chloroplast DNA analysis. Annals of the Missouri Botanical Garden, 93, 150-171.
314. Sutcliffe,O. & Kay,Q. (2000) Changes in the arable flora of central southern England since the 1960s. Biological Conservation, 93, 1-8.
315. Symonides,E. (1983) Population size regulation as a result of intrapopulation interactions. I. The effect of density on the survival and development of individuals of Erophila verna (L.). Ekologia Polska, 31, 839-881.
316. Tackenberg,O., Poschlod,P. & Bonn,S. (2003) Assessment of wind dispersal potential in plant species. Ecological Monographs, 73, 191-205.
317. Telewski,F.W. & Zeevart,J.A.D. (2002) The 120-yr period for Dr Beal's seed viability experiment. American Journal of Botany, 89, 1285-1288.
318. Thomas,C.F.G. & Marshall,E.J.P. (1999) Arthropod abundance and diversity in differently vegetated margins of arable fields. Agriculture Ecosystems & Environment, 72, 131-144.
319. Thompson,K. (1994) Predicting the fate of temperate species in response to human disturbance and global change. Biodiversity, temperate ecosystems, and global change (Boyle, T. J. B. and Boyle, C. E. B.), pp. 61-76. Springer, Heidelberg.
320. Thompson,K. (2000) The functional ecology of seed banks. Seeds (Fenner, M.), pp. 215-235. CABI, Wallingford.
321. Thompson,K., Bakker,J.P. & Bekker,R.M. (1997) The soil seed banks of North West Europe. Cambridge University Press, Cambridge.
322. Thompson,K., Bakker,J.P. & Bekker,R.M. (1998) Ecological correlates of seed persistence in the soil in the NW European flora. Journal of Ecology, 86, 163-170.
323. Thompson,K., Band,S.R. & Hodgson,J.G. (1993) Seed size and shape predict persistence in soil. Functional Ecology, 7, 236-241.
324. Thompson,K., Ceriani,R.M., Bakker,J.P. & Bekker,R.M. (2003) Are seed dormancy and persistence
in soil related? Seed Science Research, 13, 97-100. 325. Thompson,K. & Grime,J.P. (1979) Seasonal variation in the seed banks of herbaceous species in ten
contrasting habitats. Journal of Ecology, 67, 893-921. 326. Thompson,K. & Grime,J.P. (1983) A comparative study of germination responses to diurnally
fluctuating temperatures. Journal of Applied Ecology, 20, 141-156. 327. Thompson,K., Grime,J.P. & Mason,G. (1977) Seed germination in response to diurnal fluctuations
of temperature. Nature, 267, 147-149. 328. Tilman,D. (1985) The resource-ratio hypothesis of plant succession. American Naturalist, 125, 827-
852. 329. Tilman,D. (1988) Plant strategies and the dynamics and structure of plant communities. Princeton
University Press, Princeton. 330. Tilman,D. (1994) Competition and biodiversity in spatially structured habitats. Ecology, 75, 2-16. 331. Turnbull,L.A., Crawley,M.J. & Rees,M. (2000) Are plant populations seed-limited? A review of seed
sowing experiments. Oikos, 88, 225-238. 332. Tutin,T.G., Heywood,V.H., Valentine,D.H., Walters,S.M. & Webb,D.A. (1964) Flora Europaea.
Cambridge University Press, Cambridge. 333. van der Maarel,E. (1990) Ecotones and ecoclines are different. Journal of Vegetation Science, 1, 135-
138. 334. van der Valk,A.G. & Pederson,R.L. (1989) Seed banks and the management and restoration of
natural vegetation. Ecology of soil seed banks (Leck, M. A., Parker, V. T., and Simpson, R. L.), pp. 329-346. London Academic Press, London.

References
215
5
R
335. van Emden,H.F. (2002) Conservation biological control: from theory to practice. 1st International Symposium on Biological Control of Arthropods Hawaii 14-18 January 2002 pp. 199-208.
336. Van Mourik,T.A., Stomph,T.J. & Murdoch,A.J. (2005) Why high seed densities within buried mesh bags may overestimate depletion rates of soil seed banks. Journal of Applied Ecology, 42, 299-305.
337. Véla,E. (2002) Biodiversité des milieux ouverts en région méditerranéenne - le cas de la végétation des pelouses sèches du Luberon (Provence Calcaire). Université Aix-Marseille III.
338. Venable,D.L. (1989) Modelling the evolutionary ecology of soil seed banks. Ecology of soil seed banks (Leck, M. A., Parker, V. T., and Simpson, R. L.), pp. 67-87. London Academic Press, London.
339. Venable,D.L. (2007) Bet hedging in a guild of desert annuals. Ecology, 88, 1086-1090. 340. Venable,D.L. & Brown,J.S. (1988) The selective interaction of dispersal, dormancy and seed size as
adaptations for reducing risks in variable environments. The American Naturalist, 131, 360-384.
341. Venable,D.L. & Brown,J.S. (1993a) The population-dynamic functions of seed dispersal. Vegetatio, 108, 31-55.
342. Venable,D.L. & Brown,J.S. (1993b) The selective interaction of dispersal, dormancy and seed size as adaptations for reducing risks in variable environments. The American Naturalist, 131, 360-384.
343. Verlaque,R. & Filosa,D. (1997) Caryologie et biogéographie des messicoles menacées du sud-est de la France. Faut-il sauver les mauvaises herbes ? (Dalmas, H.), pp. 105-125. Conservatoire botanique de Gap-Charance, Gap.
344. Violle,C., Navas,M.L., Vile,D., Kazakou,E., Fortunel,C., Hummel,I. & Garnier,E. (2007) Let the concept of trait be functional! Oikos, 116, 882-892.
345. von Arx,G., Bosshard,A. & Dietz,H. (2002) Land-use intensity and border structures as
determinants of vegetation diversity in an agricultural area. Bulletin of the Geobotanical Institute ETH, 68, 3-15.
346. von Blanckenhagen,B. & Poschlod,P. (2005) Restoration of calcareous grasslands: the role of the soil seed bank and seed dispersal for recolonisation processes. Biotechnol.Agron.Soc.Environ., 9, 143-149.
347. Wagner,M. & Mitschunas,N. (2007) Fungal effects on seed bank persistence and potential applications in weed biocoontrol a review. Basic and Applied Ecology, 9, 191-203.
348. Wäldchen,J., Pusch,J. & Luthardt,V. (2005) Zur Diasporen-Keimfähigkeit von Segetalpflanzen - Unteruchungen in Nord-Thüringen. Beiträge zur Forstwirtschaft und Landschaftsökologie, 38, 145-156.
349. Waldhart, Fuhr-Bossdorf,K. & Otte,A. (2001) The significance of the seed bank as a potential for the reestablishment of arable-land vegetation in a marginal cultivated landscape. Web Ecology, 2, 83-87.
350. Warner,R.R. & Chesson,P.L. (1985) Coexistence mediated by the recruitment fluctuations: a field guide to the storage effect. The American Naturalist, 125, 769-787.
351. Warwick,S.I., Sauders,C.A. & Al Shebhaz,I.A. (2006) Molecular phylogeny, morphology and cytological diversity of Sisymbrium (Brassicaceae). Plant Genome Biodiversity and Evolution Volume 1, Part C. Phanerogams (Angiosperm-Dicotyledons) (Sharma, A. K. and Sharma, A.), pp. 218-250. Science Publishers, Enfield.
352. Webb,C.J., Ackerly,D.D. & Kembel,S.W. (2006) Phylocom: software for the analysis of community phylogenetic structure and character evolution, Version 3.40.
353. Webb,C.J. & Donoghue,M. (2005) Phylomatic, a database for applied phylogenetics. 354. Weiher,E., van der Werf,A., Thompson,K., Roderick,M., Garnier,E. & Eriksson,O. (1999)
Challenging Theophrastus: A common core list of plant traits for functional ecology. Journal of Vegetation Science, 10, 609-620.
355. Wellstein,C., Otte,A. & Waldhardt,R. (2007) Seed bank diversity in mesic grasslands in relation to vegetation type, management and site conditions. Journal of Vegetation Science, 18, 153-162.
356. Westoby,M., Leishman,M.R. & Lord,J. (1995a) Further remarks on phylogenetic correction. Journal of Ecology, 83, 727-729.

References
216
357. Westoby,M., Leishman,M.R. & Lord,J.M. (1995b) On misinterpreting the 'phylogenetic correction'. Journal of Ecology, 83, 531-534.
358. White,E.P., Ernest,S.K.M., Kerkhoff,A.J. & Enquist,B.J. (2007) Relationships between body size and abundance in ecology. Trends in Ecology & Evolution, 22, 323-330.
359. Whittle,C.A. (2006) The influence of environmental factors, the pollen:ovule ratio and seedbank persistence on molecular evolutionary rates in plants. Journal of EvolutionaryBiology, 19, 302-308.
360. Wikström,N., Savolainen,V. & Chase,M.W. (2001) Evolution of the angiosperms: calibrating the family tree. Proceedings of the Royal Society B - Biological Sciences, 268, 2211-2220.
361. Willems,J.H. & Bik,L.P.M. (1998) Restoration of high species density in calcareous grassland: the role of seed rain and soil seed bank. Applied Vegetation Science, 1, 91-100.
362. Willerding,C. & Poschlod,P. (2002) Does seed dispersal by sheep affect the population genetic structure of the calcareous grassland species Bromus erectus? Biological Conservation, 104, 329-337.
363. Willerding,U. (1986) Zur Geschichte der Unkräuter Mitteleuropas. Neumünster. 364. Wilson,P.J. & Aebischer,N.J. (1995) The distribution of dicytoledonous weeds in relation to distance
from the field edge. Journal of Applied Ecology, 32, 295-310. 365. Zobel,M. (1997) The relative role of species pools in determining plant species richness. An alternative
explanation of species coexistence? Trends in Ecology & Evolution, 12, 266-269. 366. Zobel,M., Opik,M., Moora,M. & Pärtel,M. (2006) Biodiversity and ecosystem functioning: It is time
for dispersal experiments. Journal of Vegetation Science, 17, 543-547. 367. Zobel,M. & Pärtel,M. (2008) What determines the relationship between plant diversity and habitat
productivity? Global Ecology and Biogeography, 17, 679-684.

217
APPENDIX

218
RESUME FRANÇAIS
Dynamique des populations et traits fonctionnels des plantes annuelles - une étude comparative sur la persistance des adventices rares et communes dans les agro-écosystèmes L’industrialisation continue de l’agriculture est responsable d’importants changements de composition et d’un appauvrissement des cortèges de plantes vasculaires dans les agro-écosystèmes Européens. Cependant, les fragments d’espaces agricoles encore exploités par une agriculture plus traditionnelle conservent de nombreuses espèces végétales annuelles des cultures de céréales –les messicoles– notamment dans le Sud Est de la France. Leur conservation in situ est difficile en raison du manque d’informations sur les caractéristiques biologiques qui déterminent leur rareté et la régression de leurs populations. Des données sur la longévité de leurs semences – un facteur primordial pour la dynamique des populations de plantes annuelles- peut aider à hiérarchiser les efforts de conservation. L’objectif principal de cette thèse est donc d’étudier la persistance des populations à long terme, l’abondance et la rareté des messicoles en relation avec leurs traits d’histoire de vie, leurs traits physiologiques et traits de graines afin d’identifier les espèces les plus menacées. Nous prenons comme modèle les espèces annuelles en raison de la simplicité et de la rapidité de leur cycle de vie et les champs cultivés comme modèle pour leurs changements d’usages rapides et intenses dans le temps et l’espace. Premièrement, nous analysons les diversités α et β à différentes échelles dans un paysage viticole du Luberon en utilisant le concept du partage additif de diversité. Nous avons identifié le type d’habitat, l’intensité des pratiques, le type de paysage et le passé cultural comme patrons de la diversité végétale et du maintien des espèces à fort enjeu de conservation. Comme la majorité des espèces cibles sont habituellement liées aux champs de céréales, nous avons limité par la suite cette étude aux messicoles. Deuxièmement, en raison de l’importance de la longévité des semences dans le sol pour expliquer la dynamique des populations, nous avons conduit une expérience d’enfouissement des graines pour étudier la survie et les degrés de dormance des espèces. D’importantes différences avec les données auparavant connues sur ces espèces nous ont motivé de réévaluer les méthodes actuelles de l’étude des banques de graines dans le sol. La méthode de l’émergence des plantules et l’indice de longévité qui en dérive se révélaient en effet corrélé à la production de graines et non pas à la survie des graines dans le sol. Troisièmement, nous analysons à nouveau la survie des graines dans le sol grâce aux données sur la germination. La survie des graines se révèle déterminée par une germination dépendante de lumière ou de températures fluctuantes au cours de la journée ainsi que des niveaux de dormance et de taille des graines. Ces mécanismes expliquent comment les graines peuvent se maintenir viables dans le sol. La régression entre 1983 - 2005/2006 et la dynamique de populations ont été corrélées à la survie des graines dans le sol, au niveau de dormance, à la dépendance de lumière et de températures fluctuantes pour la germination, à la surface spécifique et la teneur en masse sèche des feuilles ainsi qu’au ratio pollen/ovule (P/O). Ces analyses ont été complétées par l’utilisation de contrastes phylogénétiquement indépendants. Il en découle que la survie des graines est un facteur majeur pour l’extinction sur une période de vingt années et que cela ne peut pas être expliqué par des changements édaphiques directionnels, car ils ne sont pas détectables pour le niveau trophique, l’acidité du sol ou l’humidité. Finalement, nous analysons deux aspects de la rareté des espèces végétales –l’abondance locale et la fréquence régionale des populations- et leur relations avec les traits biologiques et d’histoire de vie. Nous mettons en évidence que peu de relations sont identiques à différentes dates à l’exception de la survie des semences dans le sol. Cependant, les analyses de la régression et de la rareté soulignent toutes les deux le rôle important du P/O –traceur des échanges génétiques via le pollen- pour la rareté et la régression des espèces messicoles. En conclusion, les espèces à forte mortalité séminale dans le sol et à P/O faible sont les plus menacées de disparition locale et devront être ciblées prioritairement pour la conservation. L’écologie de la germination et de la survie de graines dans le sol indiquent que la variabilité temporelle mésologique et des années défavorables peuvent augmenter la diversité des messicoles au travers de l’effet de stockage. Néanmoins, des différences fortes existent entre espèces. Pour les espèces les plus menacées un maintien de l’utilisation de semences fermières non triées semble nécessaire pour leur maintien à long terme dans les agro-écosystèmes. Mots clés: banque de semences du sol – messicole – dispersion en espace – agriculture – mauvaises herbes des champs de céréales – germination – détection de niches – fluctuations de température journalières – diversité – méditerranéen.

219
DEUTSCHE ZUSAMMENFASSUNG
Populationsdynamik und funktionelle Merkmale von einjährigen Pflanzen- eine vergleichende Studie zur Populationspersistenz von seltenen und häufigen Segetalpflanzen in Agroökosystemen
Die Industrialisierung der Landwirtschaft führt zu kontinuierlichen Veränderungen in der floristischen Diversität und Zusammensetzung Europäischer Agroökosysteme. Im Südosten Frankreichs erhalten die Reste traditioneller Landwirtschaft viele der sehr selten gewordenen Segetalarten, obwohl auch hier ein starker Rückgang zu beobachten ist. Für den Schutz dieser Arten mangelt es an detailliertem Wissen über die biologischen Gründe für die großen Unterschiede in Populationspersistenz, Abundanz und Seltenheit dieser Arten. Daten zur Langlebigkeit der Diasporen im Boden –ein wichtiger Faktor für die Populationsdynamik einjähriger Pflanzen- kann helfen Schutzbemühungen sinnvoll zu orientieren. Gegenstand dieser Dissertation ist es daher die Bezüge von langzeitlicher Populationsdynamik, Abundanz und Seltenheit zu Lebenszyklus-, Samen- und physiologischen Charakterzügen dieser Arten zu untersuchen, auch um Unterschiede in der Gefährdung der Arten herauszustellen. Wir untersuchten explizit einjährige Pflanzen wegen ihres Einfachheit und schnellen Reaktion auf Veränderungen und Agroökosysteme wegen deren starken und schnellen Veränderungen. Zuerst untersuchten wir α- und β-Diversität auf verschiedenen räumlichen Skalen in einer Weinbaulandschaft und konnten Habitattypen, Landbauintensität, Landschaftstyp und frühere Bewirtschaftung als wichtige Einflussfaktoren für pflanzliche Diversität und das Vorkommen von Zielarten herausstellen. Da nahezu alle für den Naturschutz bedeutsamen Pflanzen der Segetalflora angehören, beschlossen wir im Weiteren nur seltene und nah verwandte häufige Segetalarten zu betrachten. Die Bodensamenbank ist eine wichtige Phase im Lebenszyklus einjähriger Pflanzen. Daher untersuchten wir gezielt die Samenmortalität und Dormanz an 38 Arten in einem vergleichenden Vergrabungsexperiment. Die auffälligen Unterschiede zu anderen Studien ermutigte uns bisherige Methoden neu zu evaluieren. Dies zeigte, dass das Schätzwerte der Langlebigkeit in der Bodensamenbank die auf der Sämlingsauflaufmethode und dem davon abgeleiteten Langelbigkeitsindex beruhen mit der Samenproduktion aber nicht mit der Samenmortalität im Boden zu korrelieren sind. Die Samenmortalität im Boden wurde danach zusammen mit Daten zur Keimungsökologie untersucht. Lichtkeimung, Dormanz, Reaktion auf täglich fluktuierende Temperaturen und Samengröße hatten alle einen Einfluss auf die Samensterblichleit im Boden. Diese Faktoren erklären wie langlebige Samen Keimung im Boden steuern können. In einem weiteren Ansatz verglichen wir Daten zur Samenmortalität, Dormanz, Samengröße, und -produktion, spezifischer Blattfläche, Blatttrockenmassengehalt und dem Pollen/Ovulen-Verhältnis mit lokalem Populationserlöschen und Populationsturnover zwischen 1983 und 2005/2006. Dazu nutzten wir auch phylogenetisch unabhängige Kontraste. Samenmortalität im Boden stellte sich als einer der wichtigen Faktoren für lokales Aussterben auf lange Sicht heraus, dies konnte nicht mit gerichteten Veränderungen in edaphischen Faktoren erklärt werden. Zuletzt untersuchten wir zwei Aspekte der Seltenheit, lokale Abundanz und regionale Frequenz von Populationen und deren Bezüge zu funktionellen und Lebenszyklusmerkmalen. Nur wenige Bezüge waren unabhängig vom Beobachtungszeitpunkt, darunter Samenmortalität im Boden, ein Faktor möglicherweise durch effektive Populationsgröße wirkt. Beides, der Rückgang und sowie die Seltenheit von Populationen zeigten enge Korrelation zum P/O-Verhältnis, der als ein Indikator des Genaustausches über Pollen gelten kann. Zusammenfassend kann gesagt werden, dass Arten mit hoher Bodensamenmortalität und niedrigem P/O-Verhältnis besonders gefährdet sind und bei Naturschutzmaßnahmen besonders berücksichtigt werden sollten. Keimungsökologie und Bodensamenbankexperiment zeigten zudem, dass zeitliche Variabilität und „schlechte“ Jahre zur Diversität von Segetalpflanzen durch die Wirkung des „storage effects“ beitragen können. Es gab allerdings große zwischenartliche Unterschiede. Um viele der stark zurückgehenden Arten dauerhaft im Freiland erhalten zu können ist die Nutzung von ungesäubertem Saatgut unumgänglich. Schlüsselwörter: Bodensamenbank – Segetalpflanzen – zeitliche Samenausbreitung – Landwirtschaft – Getreideunkräuter – Keimung – gap detection – im Tagesrythmus schwankende Temperaturen – Vielfalt – Mediterran.
220
ABSTRACT
The continuing industrialisation of agriculture leads to important changes in composition and decrease of plant diversity in European agro-ecosystems. Remnants of traditional agriculture conserved many but declining rare cereal weeds in South Eastern France. Conservation efforts for them are hampered by the little evidence on which differences in their biology are related to population persistence, abundance and rarity among species. Data on longevity of seeds in the soil, an important factor for annual plant population dynamics, can help to prioritise conservation efforts. The main aim of the present thesis was therefore to study the relations between long-term population persistence, abundance and rarity together with life history, physiologic and seed traits in order to identify species most at risk. We studied annual plants -simple and rapidly reacting- in arable fields -an environment with rapid and drastic changes. First, we analysed plant α- and β-diversity in vineyards at different spatial scales, using additive diversity partitioning. We identified habitat types, intensity of agriculture, landscape type and land use history as main determinants for plant diversity and maintenance of species of conservation interest. Nearly all target species are known to be cereal weeds; we therefore restricted the study on rare and common relatives of annual cereal weeds for the remainder of the study. Soil seed banks are known to be an important life stage in annual plants for population dynamics. Therefore, we did a comparative seed burial experiment with 38 species to study soil seed survival and levels of dormancy. The striking differences with previous data motivated us to re-evaluated current methods. This showed that the soil seed bank persistence estimates from seedling emergence method and derived seed longevity index (L.I.) are correlated to seed production but not to soil seed mortality. Third, we re-analysed soil seed survival with data from germination experiments. Light requirement, degree of dormancy, reaction to diurnally fluctuating temperatures and seed size were related to survival of seeds in the soil giving insights into how long-lived species can stay ungerminated while buried. Fourth, we compared data on soil seed survival, degree of dormancy, seed size and number, specific leaf area, leaf dry matter content and pollen:ovule ratio (P/O) to data on local population extinction and turnover from 1983 to 2005 and 2006, in an approach using phylogenetically independent contrasts (PICs). This revealed that soil seed survival was a major correlate of extinction on the long time step and that this could not be explained by directional changes in edaphic factors. Finally, we studied two axes of rarity, local population size and regional frequency of populations and their relation to biological and life history traits. This yielded few results consistent among different dates. An exception was soil seed survival; probably in relation with increased effective population size. Both analyses -on rarity and on regression- emphasised also the role of P/O –a monitor for gene exchange via pollen- for rarity and regression of annual cereal weeds. In conclusion, species with high soil seed mortality and low P/O are most at risk of local extinction and should be considered in conservation efforts. The germination ecology together with the soil seed survival indicated that temporal variability and unfavourable years can trigger annual cereal weed diversity through storage effect. However, there are striking differences between species. For the most regressing species seed dispersal via uncleaned seed material is necessary to conserve them at the long run in rapidly changing agro-ecosystems. Keywords: soil seed bank – segetal – dispersal in time – agriculture – cereal weeds – germination – gap detection – diurnally fluctuating temperatures – diversity –Mediterranean.