Qi Sun · 2016-06-16 · those parties, the ChinaJapan ... below than the optimal level (Dahl et...
42
econstor www.econstor.eu Der Open-Access-Publikationsserver der ZBW – Leibniz-Informationszentrum Wirtschaft The Open Access Publication Server of the ZBW – Leibniz Information Centre for Economics Standard-Nutzungsbedingungen: Die Dokumente auf EconStor dürfen zu eigenen wissenschaftlichen Zwecken und zum Privatgebrauch gespeichert und kopiert werden. Sie dürfen die Dokumente nicht für öffentliche oder kommerzielle Zwecke vervielfältigen, öffentlich ausstellen, öffentlich zugänglich machen, vertreiben oder anderweitig nutzen. Sofern die Verfasser die Dokumente unter Open-Content-Lizenzen (insbesondere CC-Lizenzen) zur Verfügung gestellt haben sollten, gelten abweichend von diesen Nutzungsbedingungen die in der dort genannten Lizenz gewährten Nutzungsrechte. Terms of use: Documents in EconStor may be saved and copied for your personal and scholarly purposes. You are not to copy documents for public or commercial purposes, to exhibit the documents publicly, to make them publicly available on the internet, or to distribute or otherwise use the documents in public. If the documents have been made available under an Open Content Licence (especially Creative Commons Licences), you may exercise further usage rights as specified in the indicated licence. zbw Leibniz-Informationszentrum Wirtschaft Leibniz Information Centre for Economics Liu, Hong; Sun, Qi; Zhao, Zhong Working Paper Social learning and health insurance enrollment: Evidence from China's New Cooperative Medical Scheme Discussion Paper Series, Forschungsinstitut zur Zukunft der Arbeit, No. 7251 Provided in Cooperation with: Institute for the Study of Labor (IZA) Suggested Citation: Liu, Hong; Sun, Qi; Zhao, Zhong (2013) : Social learning and health insurance enrollment: Evidence from China's New Cooperative Medical Scheme, Discussion Paper Series, Forschungsinstitut zur Zukunft der Arbeit, No. 7251 This Version is available at: http://hdl.handle.net/10419/71635
Transcript of Qi Sun · 2016-06-16 · those parties, the ChinaJapan ... below than the optimal level (Dahl et...
econstor www.econstor.eu
Der Open-Access-Publikationsserver der ZBW – Leibniz-Informationszentrum WirtschaftThe Open Access Publication Server of the ZBW – Leibniz Information Centre for Economics
Standard-Nutzungsbedingungen:
Die Dokumente auf EconStor dürfen zu eigenen wissenschaftlichenZwecken und zum Privatgebrauch gespeichert und kopiert werden.
Sie dürfen die Dokumente nicht für öffentliche oder kommerzielleZwecke vervielfältigen, öffentlich ausstellen, öffentlich zugänglichmachen, vertreiben oder anderweitig nutzen.
Sofern die Verfasser die Dokumente unter Open-Content-Lizenzen(insbesondere CC-Lizenzen) zur Verfügung gestellt haben sollten,gelten abweichend von diesen Nutzungsbedingungen die in der dortgenannten Lizenz gewährten Nutzungsrechte.
Terms of use:
Documents in EconStor may be saved and copied for yourpersonal and scholarly purposes.
You are not to copy documents for public or commercialpurposes, to exhibit the documents publicly, to make thempublicly available on the internet, or to distribute or otherwiseuse the documents in public.
If the documents have been made available under an OpenContent Licence (especially Creative Commons Licences), youmay exercise further usage rights as specified in the indicatedlicence.
zbw Leibniz-Informationszentrum WirtschaftLeibniz Information Centre for Economics
Liu, Hong; Sun, Qi; Zhao, Zhong
Working Paper
Social learning and health insurance enrollment:Evidence from China's New Cooperative MedicalScheme
Discussion Paper Series, Forschungsinstitut zur Zukunft der Arbeit, No. 7251
Provided in Cooperation with:Institute for the Study of Labor (IZA)
Suggested Citation: Liu, Hong; Sun, Qi; Zhao, Zhong (2013) : Social learning and healthinsurance enrollment: Evidence from China's New Cooperative Medical Scheme, DiscussionPaper Series, Forschungsinstitut zur Zukunft der Arbeit, No. 7251
This Version is available at:http://hdl.handle.net/10419/71635
DI
SC
US
SI
ON
P
AP
ER
S
ER
IE
S
Forschungsinstitut zur Zukunft der ArbeitInstitute for the Study of Labor
Social Learning and Health Insurance Enrollment:Evidence from China’s New Cooperative Medical Scheme
IZA DP No. 7251
February 2013
Hong LiuQi SunZhong Zhao
Social Learning and Health Insurance Enrollment: Evidence from China’s New Cooperative Medical Scheme
Hong Liu Central University of Finance and Economics
Qi Sun
Shanghai University of Finance and Economics
Zhong Zhao Renmin University of China
and IZA
Discussion Paper No. 7251 February 2013
IZA
P.O. Box 7240 53072 Bonn
Germany
Phone: +49-228-3894-0 Fax: +49-228-3894-180
E-mail: [email protected]
Any opinions expressed here are those of the author(s) and not those of IZA. Research published in this series may include views on policy, but the institute itself takes no institutional policy positions. The IZA research network is committed to the IZA Guiding Principles of Research Integrity. The Institute for the Study of Labor (IZA) in Bonn is a local and virtual international research center and a place of communication between science, politics and business. IZA is an independent nonprofit organization supported by Deutsche Post Foundation. The center is associated with the University of Bonn and offers a stimulating research environment through its international network, workshops and conferences, data service, project support, research visits and doctoral program. IZA engages in (i) original and internationally competitive research in all fields of labor economics, (ii) development of policy concepts, and (iii) dissemination of research results and concepts to the interested public. IZA Discussion Papers often represent preliminary work and are circulated to encourage discussion. Citation of such a paper should account for its provisional character. A revised version may be available directly from the author.
IZA Discussion Paper No. 7251 February 2013
ABSTRACT
Social Learning and Health Insurance Enrollment: Evidence from China’s New Cooperative Medical Scheme*
This paper examines the role of social learning in household enrollment decisions for the New Cooperative Medical Scheme in rural China by estimating a static game with incomplete information. Using a rich dataset from the China Health and Nutrition Survey, we find that the social network effects in the enrollment decision are large and significant. Furthermore, we use temporal and spatial proximity among household heads and obtain the result that the primary mechanism for the social network effects is social learning. Our findings indicate that a 10-percentage-point increase in the enrollment rate in a village increases one’s take-up probability by 5 percentage points. We also find that the importance of social learning decreases significantly with the development of alternative information channels. Finally, the evidence suggests that healthier, wealthier, relatively well-educated older male household heads with Han nationality tend to be opinion leaders. JEL Classification: I1, G22 Keywords: rural China, health insurance, social learning, social effect Corresponding author: Qi Sun Shanghai University of Finance and Economics 777 Guoding Road Shanghai China E-mail: [email protected]
* We would like to thank seminar participants at Renmin University of China, Peking University, the University of Canberra, and 4th CIER/IZA Annual Workshop on Research in Labor Economics for helpful comments. This research uses data from the China Health and Nutrition Survey (CHNS). We thank the National Institute of Nutrition and Food Safety, China Center for Disease Control and Prevention; the Carolina Population Center, University of North Carolina at Chapel Hill; the National Institutes of Health (NIH; R01-HD30880, DK056350, and R01-HD38700); and the Fogarty International Center, NIH, for financial support for the CHNS data collection and analysis files since 1989. We thank those parties, the China-Japan Friendship Hospital, and the Ministry of Health for support for CHNS2009 and future surveys.
2
1. Introduction
One of the main obstacles to social program take-up is a lack of information
about the program (Currie, 2006; Craig, 1991). For instance, Aizer (2007) finds that
information costs are an important contributor to the low take-up rate in the Medicaid
program in the United States. This problem could be more serious in developing
countries, as the official information transmission channels are typically inadequate.
However, such informational barriers could be reduced if information were
transmitted through social learning and peer interaction.
The main objective of this paper is to quantify the importance of social learning
in household health insurance enrollment decisions, exploiting the unique opportunity
of the recent establishment and expansion of the New Cooperative Medical Scheme
(NCMS) in rural China since 2003. The NCMS is a voluntary public health insurance
program to provide health care coverage for the rural population and is one of the
pillars of China’s social security system.
In the context of the NCMS, social learning may play a significant role in
enrollment decisions and it is worth investigating for four reasons. First, as the NCMS
is implemented in rural China, issues related to information barriers could be more
serious because of the low education level of the rural population1, a poor official
information sharing scheme and less transparent government policies.
Second, the operation of the insurance market in general is still new and complex
for most households in rural China. Information on the procedures, payoffs and costs
associated with the NCMS per se is limited because it is a newly established program.
Although local government officials have exerted considerable efforts such as an
intensive advertising campaign and door-to-door appeals (Wu et al., 2006; You and
Kobayashi, 2009) to convey information to rural households, the details of the NCMS
program are still difficult for rural households to understand. For example, Pan et al.
(2009) find that approximately 78 percent of survey respondents were unfamiliar with
1 The overall education level of the Chinese rural population is quite low, with an average of 6.4 years of schooling based on CHNS data.
3
the detailed NCMS regulations implemented in their counties.
Third, some studies find that when the NCMS was introduced, people had low
levels of trust in local governments and were skeptical about the promised benefits of
the NCMS, as the local governments had consistently imposed a number of taxes and
fees on them but misused those funds in the past (Yip and Hsiao, 2009; Yi et al.,
2011). Rural residents’ distrust of government, combined with their low education
levels and the complexity of the NCMS program, may substantially reduce the
effectiveness of the official information campaign, and increase information barriers.
Finally, during the implementation phase of the NCMS, the social norms
regarding and perceptions of the program were still being formed. Households in rural
China typically live in close-knit villages, where they can effectively communicate
with others. An individual villager can learn additional useful information from the
behavior of his co-villagers, who might have better knowledge of or experience with
health insurance, through word-of-mouth communication or observational learning.
Therefore, social interactions and information exchanges among peers could have a
long-term equilibrium effect on the take-up rate of the NCMS, which may be above or
below than the optimal level (Dahl et al., 2012).
Relative to a growing body of literature studying different aspects of public
insurance programs in China, such as design and implementation (Mao, 2005; Brown
et al., 2009), and impact evaluation (Yip et al., 2008; Wagstaff et al., 2009, Lei and
Lin, 2009), our study contributes to the literature by investigating the determinants of
NCMS participation, with a particular focus on the role of social learning at the
village level. Specifically, we aim to examine whether an individual’s decision to
enroll in the NCMS is affected by the decisions of his co-villagers, using data from
the three most recent waves, 2004, 2006 and 2009, of the China Heath and Nutrition
Survey (CHNS).
Our paper also contributes to the growing body of empirical literature on the
importance of social learning in numerous contexts (Manski, 2000), such as health
insurance plan decisions (Sorenson, 2006), group lending (Li et al., 2012), retirement
savings decisions (Duflo and Saez, 2002; 2003), welfare participation (Bertrand et al.,
4
2000; Dahl et al., 2012), and stock market participation (Hong et al., 2005). Our work
is distinct from those listed above in the sense that during our 5-year data period, the
NCMS passed through different stages, from inception to expansion and to full
coverage, which allows us to investigate the peer effects during different stages of the
program.
Our empirical strategy also differs from the current practice in the literature. It is
well known that the effect of social interactions is difficult to identify due to the
mixture of endogenous peer decisions, simultaneous causality among peers,
unobserved common factors within the peer group and the endogenous selection of
peer group members (Manski, 1993; 2000). The existing literature generally adopts
one of three approaches to overcome the identification problems. One is to use
instrumental variables (e.g., Duflo and Saez, 2002; Chen et al., 2010) to account for
the endogeneity of peers’ decision. The second approach is to focus on a certain
subsample and impose certain assumptions regarding the pattern of social interactions
to overcome the simultaneity problem. For example, Sorensen (2006) studies peer
effects on the health plan choices of newly hired employees by assuming that their
choices are influenced by the existing employees, but not vice versa. The third
approach is to study the problem using a randomized experiment (e.g., Duflo and Saez,
2003; Cai et al., 2009).
In this paper, we adopt a different approach to identify the peer effect using
observational data. We model the NCMS participation process as a static game with
incomplete information, in which households make NCMS enrollment decisions
based on their own household-level characteristics (some of which are not observed
by other villagers), village-level characteristics, and the enrollment decisions of other
households in the same village. There are several reasons that this model is applicable
to a social learning context. First, other households’ enrollment decisions may reveal
useful information about an NCMS plan that a particular household does not have.
Second, the benefits that a particular household can obtain from the NCMS crucially
depend on the overall enrollment rate. Third, rural residents may also have a desire to
conform to the behavior of other households in the village (Banerjee, 1992).
5
Therefore, other households’ enrollment decisions may have a significant influence
on an individual household, and households may make enrollment decisions
strategically. However, each household may possess some private information about
their own benefits and costs associated with enrollment. Therefore, we assume that
households in each village participate in an incomplete information game.
The structure and role of the village in rural Chinese life make the village a
natural peer group (we will discuss this further in Section 2), which helps to avoid the
issue of endogenous group membership. We follow Bajari et al. (2010) and apply a
two-step approach to account for the endogeneity of observed peer enrollment
decisions. In addition, due to the panel nature and the richness of the dataset, we can
further distinguish the effect of social learning from common unobservable factors
through different model specifications.
We find that a 10-percentage-point increase in the enrollment rate of other
households in the same village increases one’s own take-up probability by 5
percentage points. We use temporal and spatial proximity among household heads to
further ascertain that the most likely mechanism for the peer effect described above in
NCMS enrollment decisions is information transmission via social learning. We also
find that the importance of social learning decreases significantly with the
development of alternative information channels. Our results also suggest that
healthier, wealthier, relatively well-educated, and older male household heads with
Han nationality tend to be opinion leaders. Finally, low income families and families
living in relatively poor villages are influenced by social effects to a greater extent.
The remainder of the paper is organized as follows. Section 2 briefly describes
the institutional background of the NCMS in China. Section 3 outlines our
econometric model and the estimation strategy. Section 4 describes the data and main
variables. Section 5 presents our empirical findings, and Section 6 concludes.
2. Background
Prior to the economic reforms of the late 1970s, a village-based rural health
6
insurance system, known as the Cooperative Medical Scheme (CMS), covered 90
percent of Chinese rural residents and was their primary channel for accessing basic
health services (Feng et al., 1995; Liu, 2004b; You and Kobayashi, 2009). Along with
the transition from the collective commune system to the “household responsibility
system” beginning in 1978, the CMS collapsed in most rural areas because it lost its
main financial support from the collective commune welfare fund. The health
insurance coverage rate dropped dramatically from 90% in 1980 to 5% in 1985 (Liu
and Cao, 1992). Since then, most rural residents have remained uninsured. According
to the China National Health Service Survey, over 87 percent of the 0.9 billion rural
residents did not have any health insurance in 1998 (Liu, 2004a), and the uninsured
rate was still nearly 80 percent in 2003.
To improve health care access for rural residents, the Chinese government began
to implement a nationwide project known as the New Cooperative Medical Scheme
(NCMS) in rural China in 2003. It was first implemented in 304 pilot rural counties,
was expanded to 1451 counties (approximately 50 percent of all rural counties) in
2006, and to nearly all rural counties (approximately 95 percent) by 2008. This
program covered 835.6 million rural residents in 2010, or nearly two-thirds of the
Chinese population.
According to the broad guidelines issued by the central government, the NCMS
is a voluntary public insurance program operated at the county level. The NCMS
seeks to provide low-cost basic health care services, including inpatient, catastrophic,
and some types of outpatient care, for the entire rural population. To reduce the
adverse selection associated with the voluntary nature of the NCMS, participation in
the NCMS is determined at the household level.2
The details of the NCMS plans are complicated and vary across counties. For
example, the funding for the NCMS comes from three main sources, including
subsidies from the central government, from local (mainly provincial) governments,
and individual contributions. The shares of contributions from different sources differ
2 Despite this requirement, some local governments also allow for enrollment at the individual level in practice, to achieve high levels of enrollment.
7
and change over time. The NCMS plans in all counties cover inpatient care, but differ
in their coverage for outpatient services. Most counties cover outpatient services
through a household account (approximately 65%) or on a pooled basis
(approximately 7%). The rest cover only outpatient services for catastrophic diseases
(approximately 11%), or do not cover outpatient services at all (approximately 17%)
(Lei and Lin, 2009; You and Kobayashi, 2009; Wagstaff et al., 2009). The enrollees
can only visit certain approved facilities to be eligible for reimbursement, and can be
reimbursed immediately or later on at a health facility or other agency, depending on
local policies. The reimbursement rates, deductibles and ceilings also vary across
facility types. These complicated regulations inevitably generate considerable
information costs and barriers for rural households.
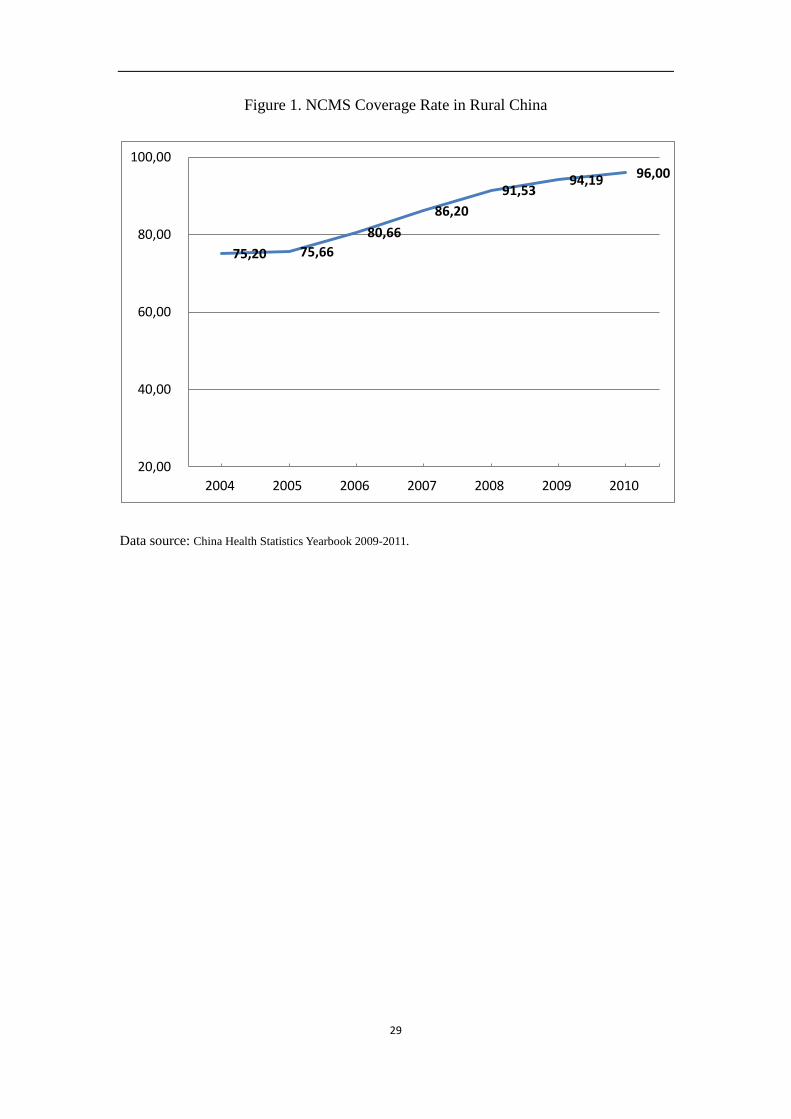
Figure 1 shows the NCMS participation rate in rural China from 2004 to 2010,
based on official national statistics. Surprisingly, the take-up rate of the NCMS was
approximately 75 percent during the initial stage in 2004, increased steadily to 81
percent in 2006, and reached 96% in 2010. Compared to many voluntary social
programs in other countries, such as the Medicaid program in the United States, the
high take-up rate of the NCMS is an achievement in itself.3
[Insert Figure 1]
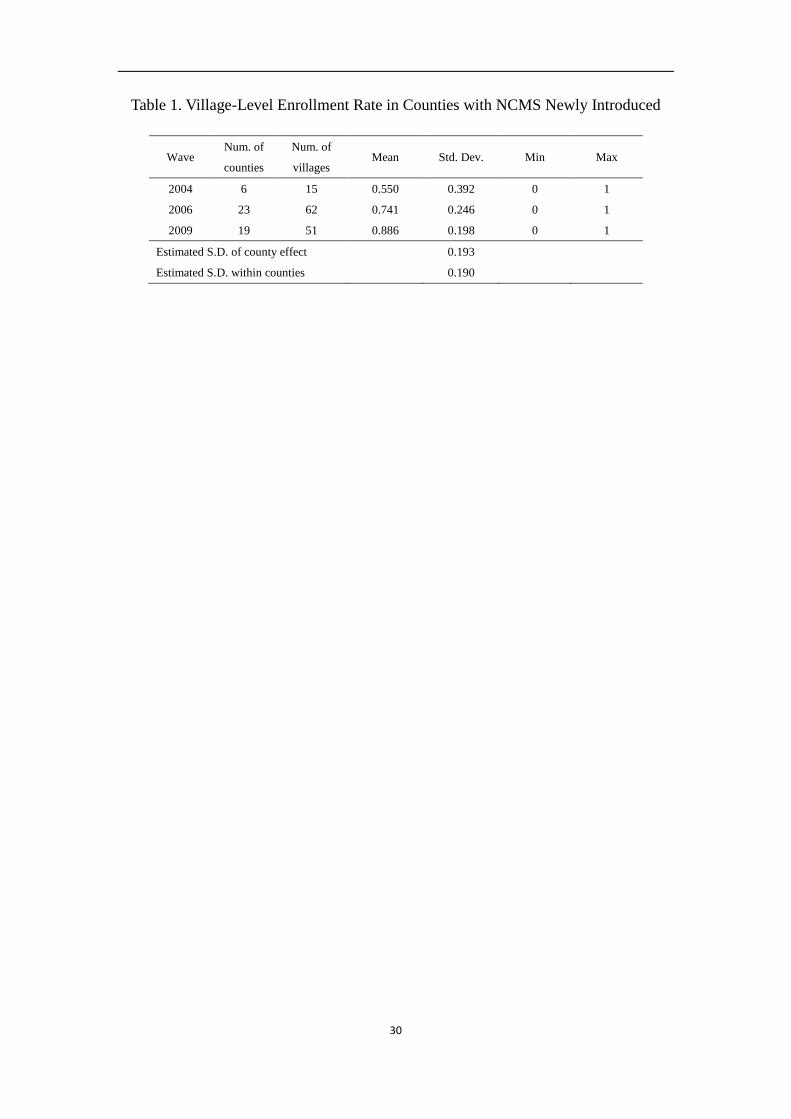
Such high levels of participation may be the result of the relatively generous
government subsidies for the NCMS and the household-based enrollment requirement
(Wagstaff et al., 2007). However, as shown in Table 1, the village-level enrollment
rates varied considerably, ranging from zero enrollment to full enrollment,4 within
the NCMS counties when the NCMS was newly introduced in each wave. The
estimated standard deviation within counties is approximately 0.19, similar to the
estimated standard deviation across counties, which cannot be explained by common
NCMS policies at the county level. Therefore, it is important to understand the
3 According to the studies summarized in Sommers et al. (2012), the estimated adult take-up rates in Medicaid range from 32.3% to 81.3%. 4 In our sample, each wave has a village with zero enrollment and a village with full enrollment.
8
mechanism underlying the NCMS take-up decision and investigate what explains the
high overall take-up rate and different take-up rates at the village level, which may
have important implications for other social programs in China and in other countries
in general.
[Insert Table 1]
Given the experiences of other developing and developed countries, a lack of
information is an important barrier to participation in social programs (Moffitt, 1983;
Currie, 2006), as learning about a program, its eligibility requirements and how to
apply is costly and time-consuming (Kleven and Kopczuk, 2011). In this paper, we
consider the possibility that NCMS participation is influenced by peer-group effects,
which have been shown to be an important information transmission channel for
individual decisions on program participation (Sorenson, 2006; Duflo and Saez, 2002;
Bertrand et al., 2000; Dahl et al., 2012; Li et al., 2012).
Following the empirical literature on social learning in the context of rural
societies (Foster and Rosenzweig, 1995; Munshi, 2004), we define rural villages as
peer groups, as each village in China is a closely-knit, long established social group
(Chen et al., 2010; Brown et al., 2011). A typical village in China consists of 50 to
100 families and approximately 500 individuals, who belong to perhaps 7 to 10 clans.
Most villagers live within walking distance of one another, and usually know each
other well, due to the low population mobility resulting from the restrictions imposed
by the household registration system (Hukou) and close local ties spanning
generations. Mangyo and Park (2011) also show that geographic reference groups are
more salient for rural residents than urban residents in China. Therefore, presumably,
rural residents in the same village may learn much of the information on application
procedures, reimbursement hassles, choice and the quality of the facilities from each
other through formal or casual/word-of-mouth communications or by observational
learning.
9
3. Econometric Specification
To estimate the strength of this social learning effect, we follow Sorenson (2006),
and assume that exogenous peer effects (Manski, 1993; 2000) are not applicable in
health insurance settings, as it is unlikely that the characteristics of co-villagers
directly affect individuals’ insurance take-up behavior. Nevertheless, as Manski (1993)
states, there are three endogeneity issues that may bias the estimation: simultaneous
causality, common unobservables, and endogenous selection into peer groups. In our
empirical analysis, the issue of selection into peer groups is not a concern, as villages
are naturally occurring peer groups as described in section 2, and migration into or out
of a village is restricted by the Hukou system. Due to the restrictions of the Hukou
system, it is impossible for rural residents to move to other villages to obtain NCMS
benefits. We need to address the problem of common unobservables and separate the
effect of social learning from the impact of common unobservables. For example, as
another channel of information transmission, an unobserved local official information
campaign may cause rural households in a village to make similar enrollment
decisions. The positive correlation between an individual’s decision and co-villagers’
decisions could simply reflect unobserved, county-specific common NCMS policies,
shared characteristics of health resources, correlated preferences, etc., instead of
informational spillovers. Therefore, we model the NCMS participation process as a
static game with incomplete information and control for unobserved common factors
in several ways. In this section, we specify the econometric model, discuss
identification conditions and present the estimation methods.
3.1. Model
In rural China, households from the same village are eligible for the same NCMS
plan and the enrollment is at the household level in the sense that each household can
choose to have either all or none of its household members participate. We index a
village by g where a particular NCMS plan is implemented, and a household that is
10
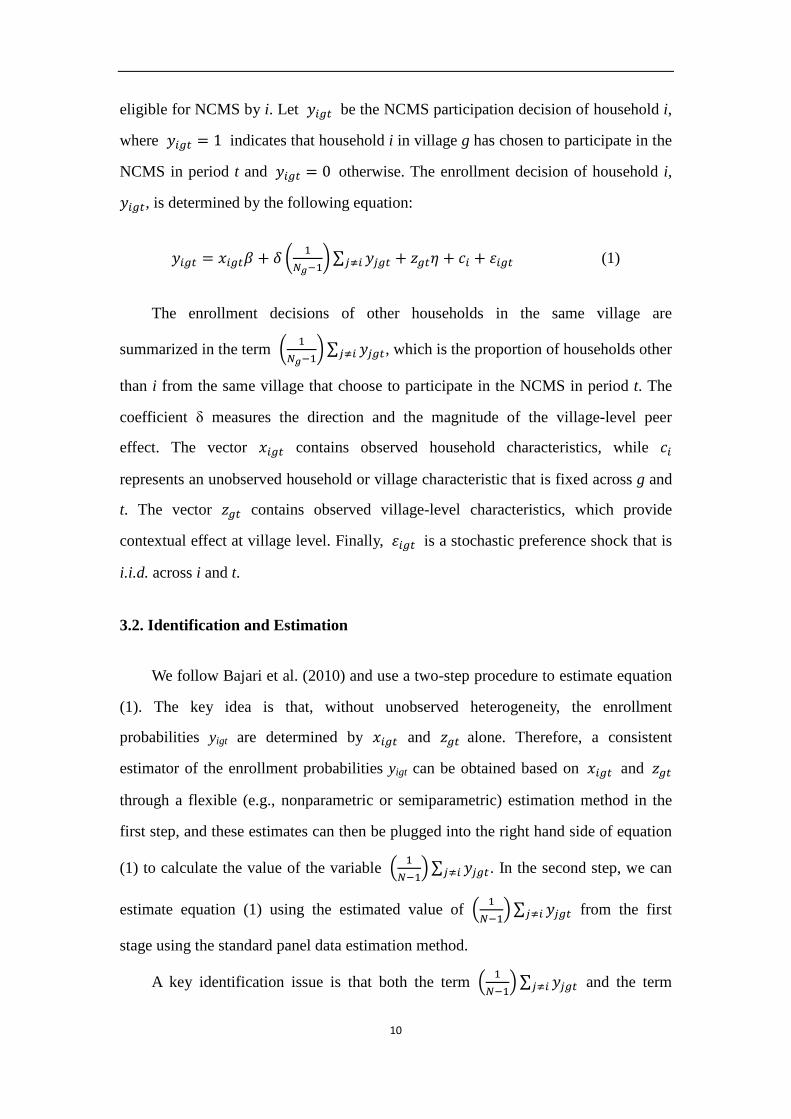
eligible for NCMS by i. Let 𝑦𝑖𝑖𝑖 be the NCMS participation decision of household i,
where 𝑦𝑖𝑖𝑖 = 1 indicates that household i in village g has chosen to participate in the
NCMS in period t and 𝑦𝑖𝑖𝑖 = 0 otherwise. The enrollment decision of household i,
𝑦𝑖𝑖𝑖, is determined by the following equation:
𝑦𝑖𝑖𝑖 = 𝑥𝑖𝑖𝑖𝛽 + 𝛿 � 1𝑁𝑔−1
�∑ 𝑦𝑗𝑖𝑖𝑗≠𝑖 + 𝑧𝑖𝑖𝜂 + 𝑐𝑖 + 𝜀𝑖𝑖𝑖 (1)
The enrollment decisions of other households in the same village are
summarized in the term � 1𝑁𝑔−1
�∑ 𝑦𝑗𝑖𝑖𝑗≠𝑖 , which is the proportion of households other
than i from the same village that choose to participate in the NCMS in period t. The
coefficient δ measures the direction and the magnitude of the village-level peer
effect. The vector 𝑥𝑖𝑖𝑖 contains observed household characteristics, while 𝑐𝑖
represents an unobserved household or village characteristic that is fixed across g and
t. The vector 𝑧𝑖𝑖 contains observed village-level characteristics, which provide
contextual effect at village level. Finally, 𝜀𝑖𝑖𝑖 is a stochastic preference shock that is
i.i.d. across i and t.
3.2. Identification and Estimation
We follow Bajari et al. (2010) and use a two-step procedure to estimate equation
(1). The key idea is that, without unobserved heterogeneity, the enrollment
probabilities yigt are determined by 𝑥𝑖𝑖𝑖 and 𝑧𝑖𝑖 alone. Therefore, a consistent
estimator of the enrollment probabilities yigt can be obtained based on 𝑥𝑖𝑖𝑖 and 𝑧𝑖𝑖
through a flexible (e.g., nonparametric or semiparametric) estimation method in the
first step, and these estimates can then be plugged into the right hand side of equation
(1) to calculate the value of the variable � 1𝑁−1
�∑ 𝑦𝑗𝑖𝑖𝑗≠𝑖 . In the second step, we can
estimate equation (1) using the estimated value of � 1𝑁−1
�∑ 𝑦𝑗𝑖𝑖𝑗≠𝑖 from the first
stage using the standard panel data estimation method.
A key identification issue is that both the term � 1𝑁−1
�∑ 𝑦𝑗𝑖𝑖𝑗≠𝑖 and the term
11
𝑥𝑖𝑖𝑖𝛽 depend on the observed household characteristics 𝑥𝑖𝑖𝑖 . This will cause a
collinearity problem in the second step when we separately estimate β and δ .
Therefore, the above two-step procedure requires the appropriate exclusion conditions
to achieve identification (Bajari et al., 2010). In general, we need covariates that
directly influence the decision of a particular household but do not directly influence
other households. In this study, these covariates include variables that indicate the
health status of the household, i.e., an indicator of whether the household head has
chronic diseases and the number of household members with chronic diseases. This
assumption implies that the NCMS enrollment decision of household i is only directly
determined by the health status of its own members but is not directly affected by the
health status of other households –i in the same village. The health status of other
households –i only affect household i’s decision indirectly through peer effects.
Therefore, if the health status of other households –i are excluded from the term
𝑥𝑖𝑖𝑖𝛽, in both stages of estimation, this collinearity problem can be solved.
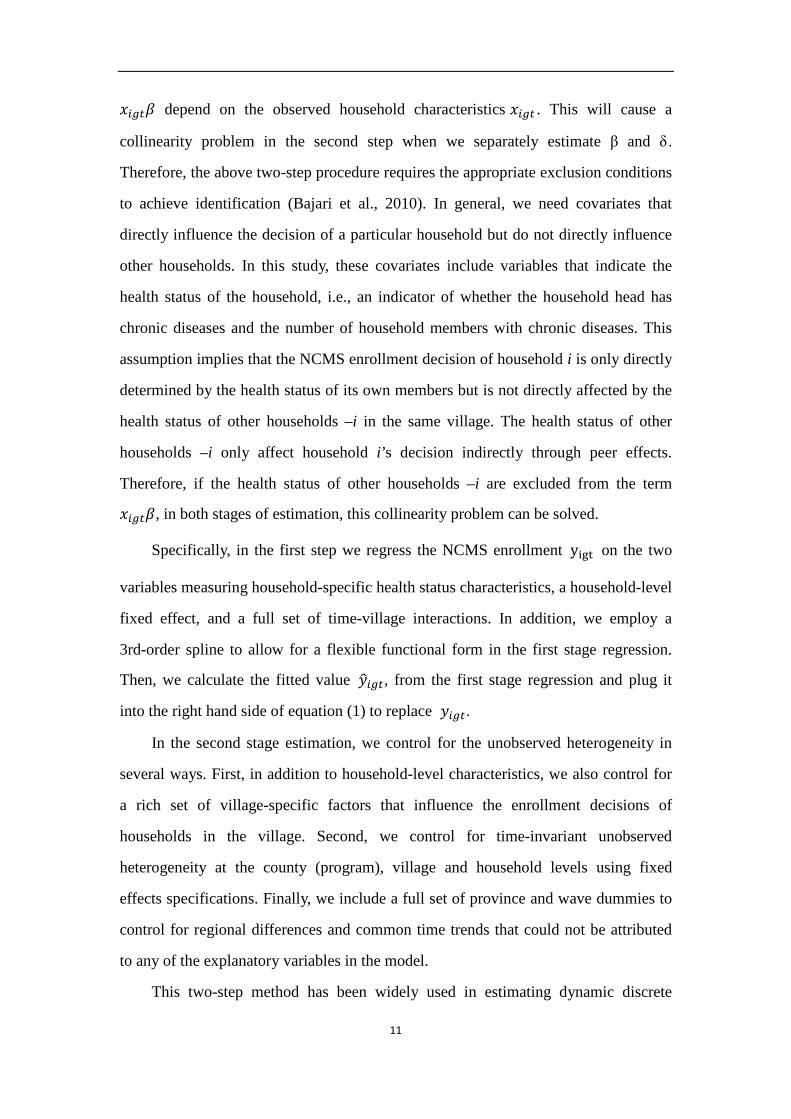
Specifically, in the first step we regress the NCMS enrollment yigt on the two
variables measuring household-specific health status characteristics, a household-level
fixed effect, and a full set of time-village interactions. In addition, we employ a
3rd-order spline to allow for a flexible functional form in the first stage regression.
Then, we calculate the fitted value 𝑦�𝑖𝑖𝑖, from the first stage regression and plug it
into the right hand side of equation (1) to replace 𝑦𝑖𝑖𝑖.
In the second stage estimation, we control for the unobserved heterogeneity in
several ways. First, in addition to household-level characteristics, we also control for
a rich set of village-specific factors that influence the enrollment decisions of
households in the village. Second, we control for time-invariant unobserved
heterogeneity at the county (program), village and household levels using fixed
effects specifications. Finally, we include a full set of province and wave dummies to
control for regional differences and common time trends that could not be attributed
to any of the explanatory variables in the model.
This two-step method has been widely used in estimating dynamic discrete
12
industrial organization games (e.g., Aguirrehabiria and Mira, 2007; Bajari et al., 2007;
Berry et al., 2007), and our model is a special case of such dynamic games with a zero
discount rate.
4. Data and Variables
4.1. Data
Our data come from the China Health and Nutrition Survey (CHNS), conducted
by the Carolina Population Center at the University of North Carolina Chapel Hill and
the National Institute of Nutrition and Food Safety of the Chinese Center for Disease
Control and Prevention. The CHNS is an ongoing longitudinal survey with eight
waves of data in 1989, 1991, 1993, 1997, 2000, 2004, 2006, and 2009. It contains rich
information on individual, household and community (or village in rural areas)
characteristics, allowing researchers to study social and economic changes in China
and their effects on the economic, demographic, health and nutritional status of the
population.
The CHNS data cover nine of China’s 31 provinces, including Guangxi, Guizhou,
Heilongjiang, Henan, Hubei, Hunan, Jiangsu, Liaoning, and Shandong, which differ
considerably in geography, economic development, public resources, and public
health conditions. These sample provinces host approximately 45 percent of China’s
total population. The CHNS uses a multistage, random cluster-sampling approach to
construct the sample. In each sample province, counties were initially stratified into
low, middle, and high income groups, and four counties were then randomly selected
based on a weighted sampling scheme. The provincial capital and a low-income city
are selected when feasible. Villages and townships were selected randomly within the
counties, and urban and suburban neighborhoods within the cities. In 2004-2009,
there were approximately 218 primary sampling units, consisting of 36 urban
neighborhoods, 37 suburban neighborhoods, 37 town neighborhoods5 and 108 rural
5 CHNS 2004 has only 35 town neighborhoods.
13
villages, which are all entities legally identified by the National Bureau of Statistics of
China, referred to as “communities” in the CHNS. In this paper, as we only use the
rural sample, we use “communities” and “villages” interchangeably.
In this study, we use the last three waves of CHNS data (2004, 2006, 2009) and
focus on rural residents in rural areas,6 including approximately 3000 households
each wave. For the purposes of this study, our sample is further restricted to
households living in counties where the NCMS has been introduced. Although the
CHNS has no survey questions directly related to NCMS status at the county level,
the confidential community surveys collected information from the community head
or community health workers and asked whether there was a Cooperative Medical
Scheme in this community and if so for how long. As the NCMS was implemented in
rural areas beginning in 2003, those villages where it was implemented in 2003 or
later are considered NCMS villages. According to the government guideline that the
NCMS should be managed at the county level, we classify a county with any village
implementing the NCMS program as a NCMS county. Furthermore, based on the
same survey questions, we can also determine when the NCMS was introduced in the
county, that is, before 2004, between the 2004 and 2006 waves, or between the 2006
and 2009 waves.
In addition, we exclude approximately 9 percent of sample observations with
missing values for health facility information at the community level and
approximately 1 percent of sample households missing data on important
demographic or socio-economic characteristics. The final study sample consists of
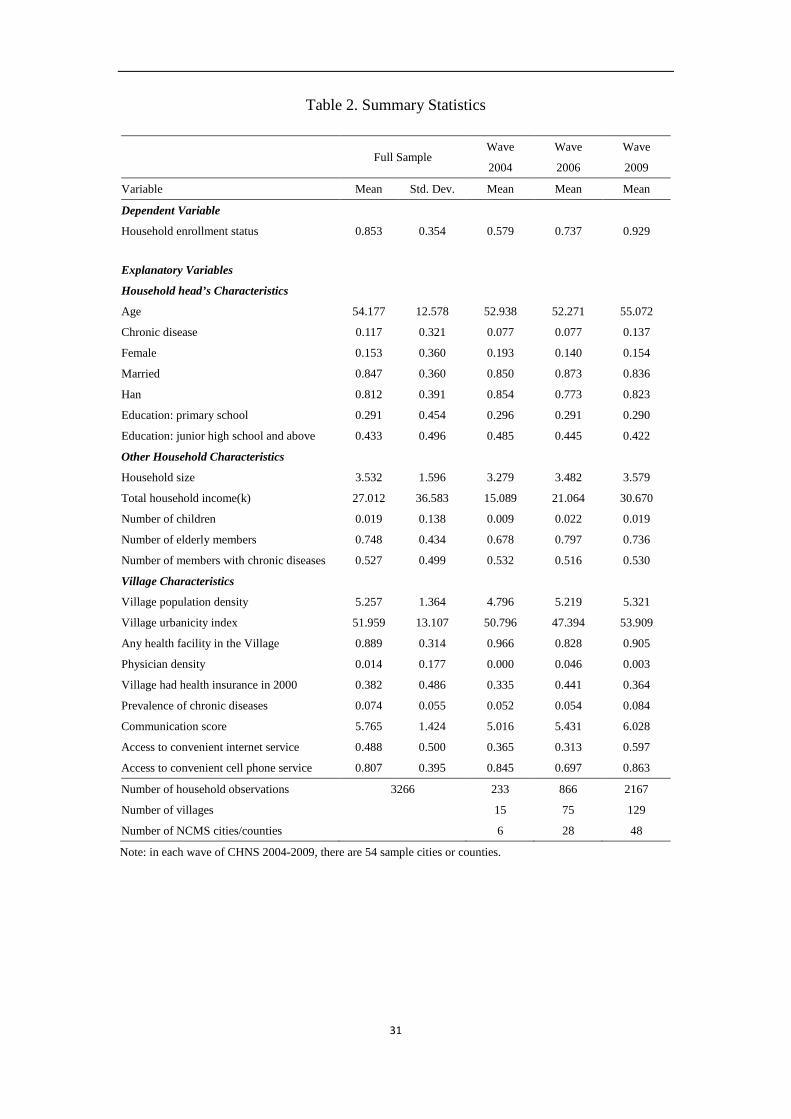
3,266 households, including 233 in 2004, 866 in 2006, and 2,167 in 2009. Table 2
presents the main variables and summary statistics.
[Insert Table 2]
6 According to the administrative definition in China, city neighborhoods and county towns are regarded as urban areas, while suburban and rural villages are treated as rural areas.
14
4.2 Variables
The dependent variable is a dichotomous measure indicating household
participation in NCMS. In the 2004 and 2006 waves, the CHNS asked each
respondent whether he/she had cooperative medical insurance, but made no
distinction between old and new schemes. In the 2009 wave, respondents were asked
specifically about enrollment status in the NCMS. As the study sample is restricted to
counties where the NCMS has been implemented, it is reasonable to consider the
CMS enrollees in the NCMS counties as NCMS participants in the 2004 and 2006
waves. We use the household head’s participation status as the primary measure of
household enrollment. It is coded 1 if the household head is enrolled in NCMS and 0
otherwise. Using this measure, we find that 58% of the households in 2004, 74% in
2006, and 93% in 2009 selected to participate in the NCMS.7
In the empirical model, we also control for the demographic and economic
characteristics of the household and village characteristics. Individual- and
household-level variables include age, gender, nationality, marital status, the presence
of chronic disease (hypertension, diabetes, heart disease, stroke, and asthma), and
education level (illiterate, primary school, junior high school and above) of the
household head, household size, total household income (in 2009 Chinese RMB ), the
number of children under age 18, the number of elderly family members over 60, and
the number of family members with chronic diseases. Village-level variables include
village population density, presence of a health facility, physician density, presence of
health insurance in 2000, prevalence of major chronic diseases, and the community
urbanicity index developed by Jones-Smith and Popkin (2010), which reflects the
levels of development and urbanization.
7 These coverage rates based on our sample are slightly lower than national statistics. It is probably because our sample size is much smaller, especially in wave 2004. And our calculations are at household level, whilst national statistics are based on individual data.
15
5. Results
5.1. Baseline Effect of Social Learning on NCMS Enrollment
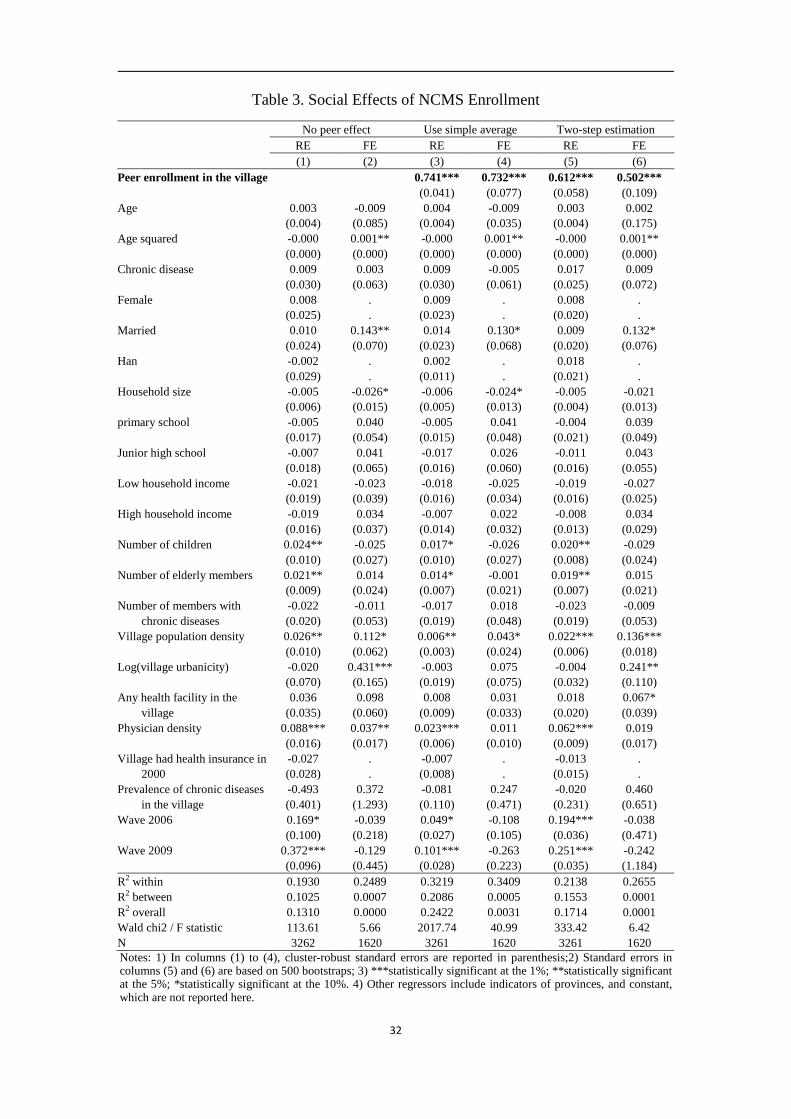
Table 3 presents our baseline results using the two-step approach. We omit the
results from first stage and only report the second-stage results. We have two
specifications for the second stage estimation: random effects (RE) and fixed effects
(FE) models. For comparison, we also conduct RE and FE estimations without peer
effects and using the simple average enrollment in the village to replace the estimates
from the first-stage as the key independent variable.
[Insert Table 3]
As shown in columns (3) and (4), we find that the co-villagers’ enrollment
decisions have had a significant effect on an individual household’s take-up
probability. However, the coefficients (0.73-0.74) based on the reduced form
regressions tend to overestimate the actual magnitude of social effects because they
fail to address the endogeneity problem caused by simultaneous causality and
correlated unobservables (Manski, 1993). After eliminating the endogeneity bias
using the two-step approach in columns (5) and (6), we still find a significant positive
social effect, but the estimates are much smaller, approximately two-thirds the size of
the reduced form estimates. Both the RE and FE estimates show statistical
significance at the 1 percent level. The FE estimate is smaller than the RE estimate,
but the magnitude, 0.50, is still economically large, suggesting that a
10-percentage-point increase in the enrollment rate of other households in the same
village increases a household’s take-up probability by 5 percent.
To place the importance of this social effect in the proper perspective, we can
compare our main estimate in column (6) to the impact of price on health insurance
demand. Unfortunately, we cannot obtain price elasticity estimates for the NCMS
because of the lack of data on premiums, and few studies estimate the price elasticity
of health insurance demand in China. The literature indicates that the price elasticity
16
of demand for non-group health insurance in the US ranges from -0.3 to -0.87 (Gruber
and Poterba, 1994; Marquis and Long, 1995; Congressional Budget Office, 2005;
Krueger and Kuziemko, 2011). Therefore, 10-percentage-point increase in the
proportion of peer enrollment in this study has the same influence on individual
enrollment probability as 6-16 percent decrease in insurance premiums in the US
individual health insurance market.
Another way to understand the magnitudes of estimated social effects is to
compare them to peer effects in other contexts. The study most similar to ours is
Sorensen (2006), which examines individuals’ choices of employer-sponsored health
plans in California. He finds that the estimates for social effects are approximately
1.4-2.1, three to four times ours. However, in contrast to our study, Sorensen (2006)
estimates discrete choice models, and his estimates suggest that 10-percentage-point
increase in the share of a particular health plan in the department increases the
probability that an employee will select this plan by 14-21 percent. In another study of
the Chinese context, Chen et al. (2010) find that if the migration rate of the
co-villagers increases by 10 percentage points, this will increase an individual’s
migration probability by 7.27 percent in rural China, which is slightly larger than our
estimate.
5.2. Non-Linearity of Social Effect on NCMS Enrollment
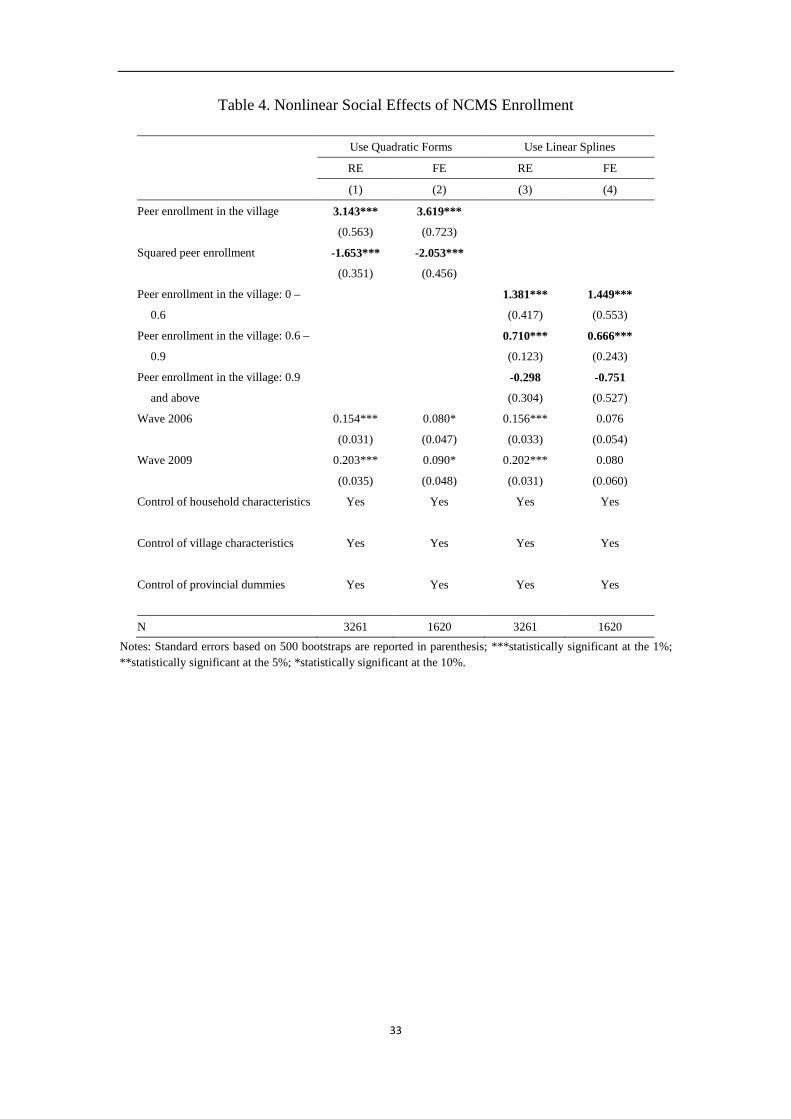
In Table 4, we test for the presence of non-monotonic pattern of social effects in
NCMS enrollment in two alternative ways. First, we add a quadratic term for peer
enrollment in columns (1) and (2) and find that it is highly significant and negative,
implying a concave pattern of social effects. The estimated turning point is 0.88,
above the 60th percentile of the estimated peer enrollment, but very close to the
extreme value.
[Insert Table 4]
To avoid erroneously accepting the hypothesis of an inverse U-shaped
17
relationship, we also conduct linear spline regressions with two discontinuity points,
0.6 and 0.9, corresponding to the 20th and 70th percentiles of peer enrollment.
Consistent with the results from the quadratic specification, the results in columns (3)
and (4) show that the social effect is approximately 1.5 in villages with peer
enrollment rates below 60 percent, decreases to 0.7 when the peer enrollment rate is
between 60 and 90 percent, and becomes statistically indistinguishable from 0 when
the peer enrollment rate exceeds 90 percent. The concavity may suggest that at an
early stage, information is more valuable and the villagers are more susceptible to
peer influence. At a later stage, as the information diffuses, it becomes less useful
because the peer-affected villagers were already in the program.
5.3. Social Effect Mechanism
In the subsection, we investigate whether the mechanism underlying the peer
effects on NCMS enrollment is social learning or is driven by common unobservables.
Social learning refers to any mechanism through which rural residents obtain helpful
insurance information from their co-villagers to make enrollment decisions (Banerjee,
1992; Cai et al., 2009).
The theory of social interactions predicts that social learning is more important in
the demand for complex or unfamiliar products. In other words, if the peer effect
captures information sharing, it should have a greater impact on individual enrollment
decision in villages that receive relatively less health insurance information. We test
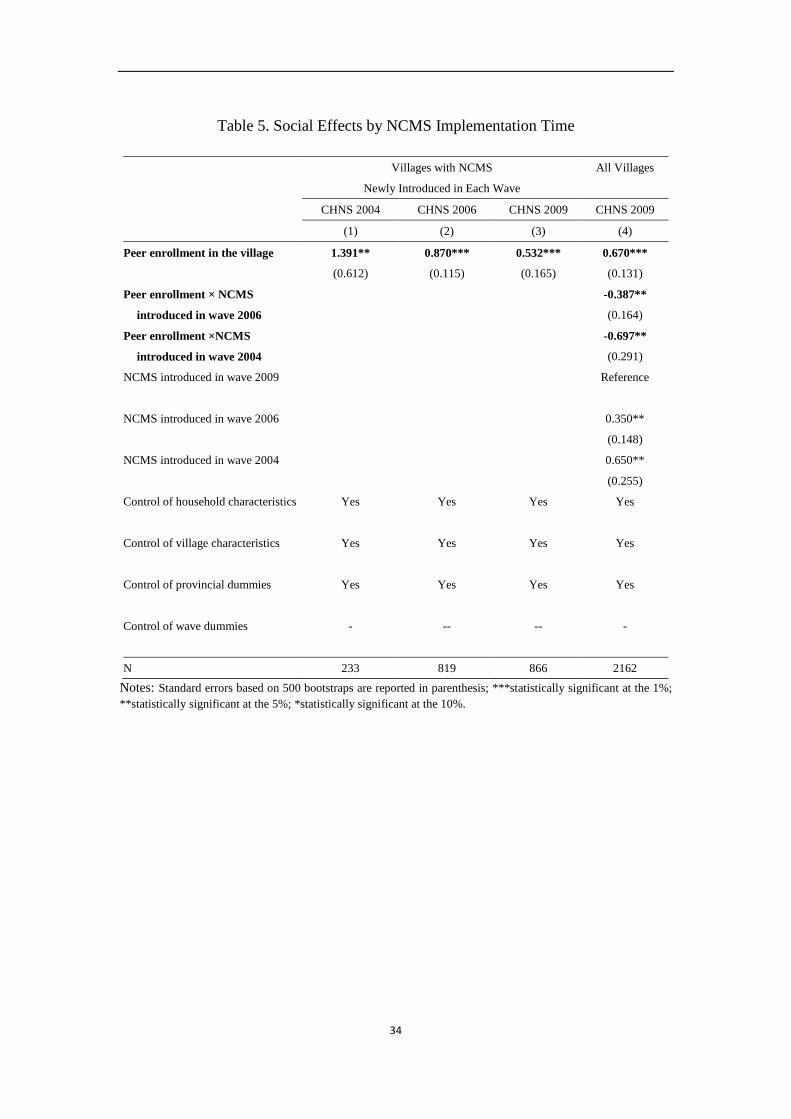
this proposition with three specifications. According to the implementation timing of
the NCMS, we classify the sample counties into three groups: the NCMS programs
introduced in the 2004, 2006 and 2009 waves. In the first specification, we estimate
the social effects for only those counties where the NCMS newly established in each
wave. As shown in columns (1) to (3) of Table 5, all of the social effects are
significant in each wave. Peer enrollment has the highest impact in the NCMS pilot
counties in the 2004 wave, when the NCMS was new to all rural residents. However,
this peer effect is less than half as influential in newly added NCMS counties in the
18
2009 wave, when individuals had already learned more about the NCMS from pilot
counties before it was implemented in their own counties.
In the second specification, we examine the different sizes of the social effects in
counties that had the NCMS for different lengths of time. Using CHNS 2009, we
include interaction terms between peer enrollment and NCMS duration. The results in
column (4) of Table 5 show that social effects are larger in villages where the NCMS
was implemented more recently, while social effects decrease significantly in the
amount of time since the NCMS was implemented. These findings provide evidence
that social learning plays a more important role when people are unfamiliar with the
NCMS.
[Insert Table 5]
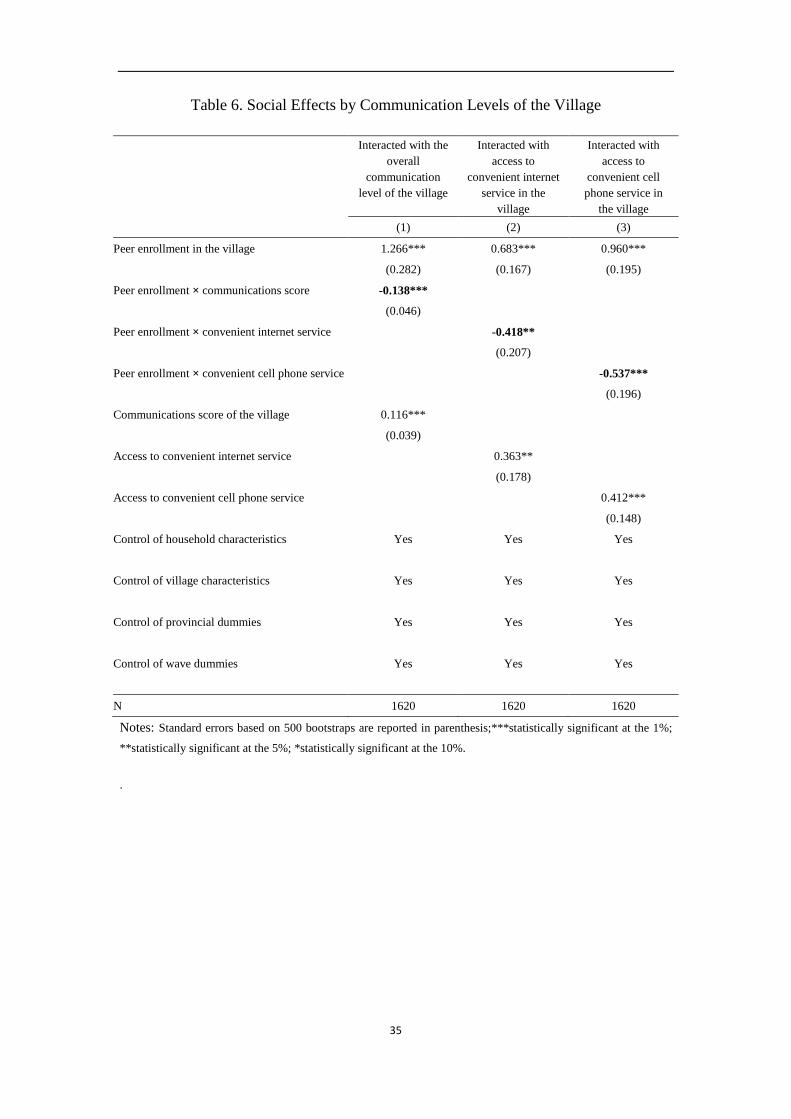
Modern information and communication technologies may provide alternative
channels for information dissemination besides peer interaction and reduce the
strength of social learning within the village (Bikhchandani et al., 1998; Chen et al.,
2010). In the third specification, we include interactions between peer enrollment and
the development of information technology in each village, measured by overall
communication scores constructed by Jones-Smith and Popkin (2012)8, and two
binary variables indicating access to convenient internet and cell phone service in the
village. As shown in Table 6, the interaction terms are negative and statistically
significant. These estimates suggest that individuals are influenced less by
co-villagers when they have more convenient access to modern communication
systems, i.e., alternative informational channels, which is fully consistent with the
social-learning hypothesis.
[Insert Table 6]
8 The communication score is one of the 12 components of the urbanicity scale developed by Jones-Smith and
Popkin (2012), based on CHNS data. They use 7 variables to operationalize the characteristics of the
communication system in each community, including the availability (within community boundaries) of a cinema,
newspaper, postal service, and telephone service and percent of households with a computer, the percent of
households with a television, and the percent of households with a cell phone.
19
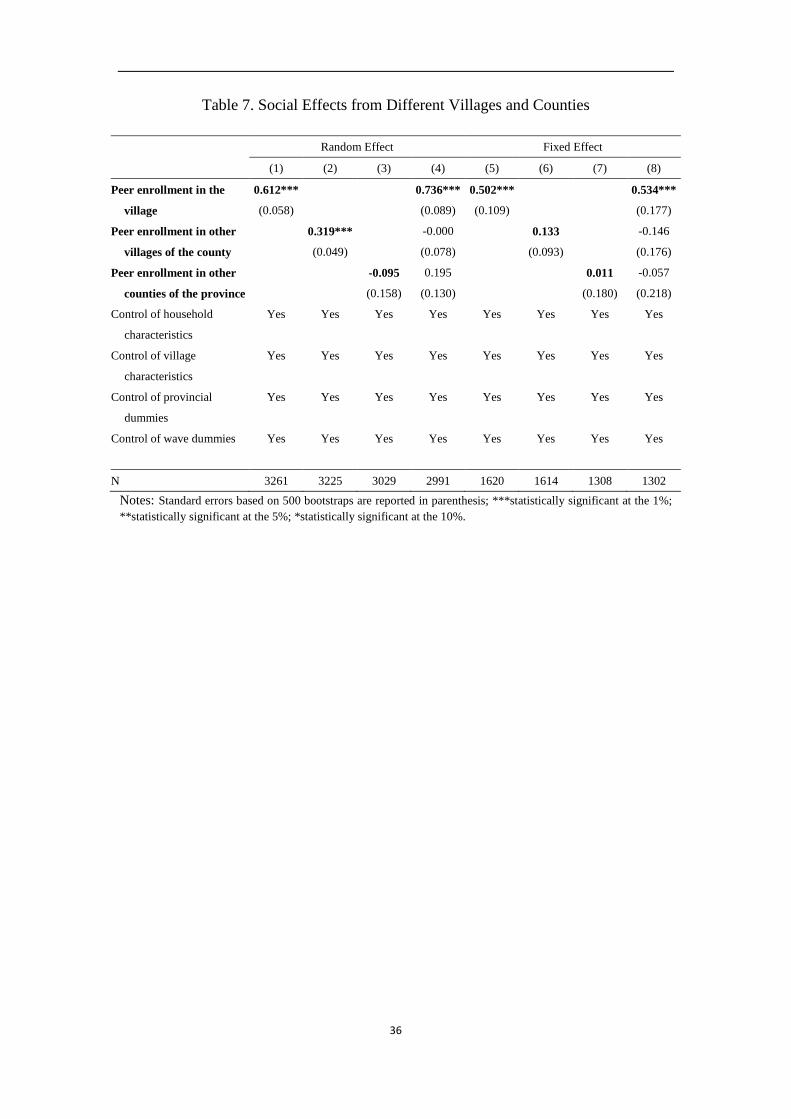
The theory of social interactions also implies that the strength of the social effect
should be greater for household pairs with spatial proximity (Munshi and Myaux,
2006; Bertrand et al., 2000), so that information can be transmitted through formal or
casual/word-of-mouth communications. Each village in China is a closely-knit,
long-established social network, and individuals usually tend to have more social
interactions with others within the village than across villages. In Table 7, we
separately estimate the social effects from peers in the same village, in other villages
of the same county, and in other counties of the same province. The results show that
the estimated social effects decline in spatial distance, implying that households are
influenced more by their peers living in the same village than by others living in
different villages or counties. This suggests that the estimated peer effects are most
likely to capture the role of social learning, and not the effect of the common
unobservables at the county level; otherwise, we should at least observe significant
social effects from peers in other villages of the same county, as they share similar
unobserved NCMS policy characteristics.
[Insert Table 7]
The similarity of households’ enrollment decisions may also be driven by
village-level common unobservables. Although we control for village-specific
observable and time-invariant unobservable characteristics in the second-stage FE
estimation, there is still a concern that time-varying, unobserved heterogeneity is
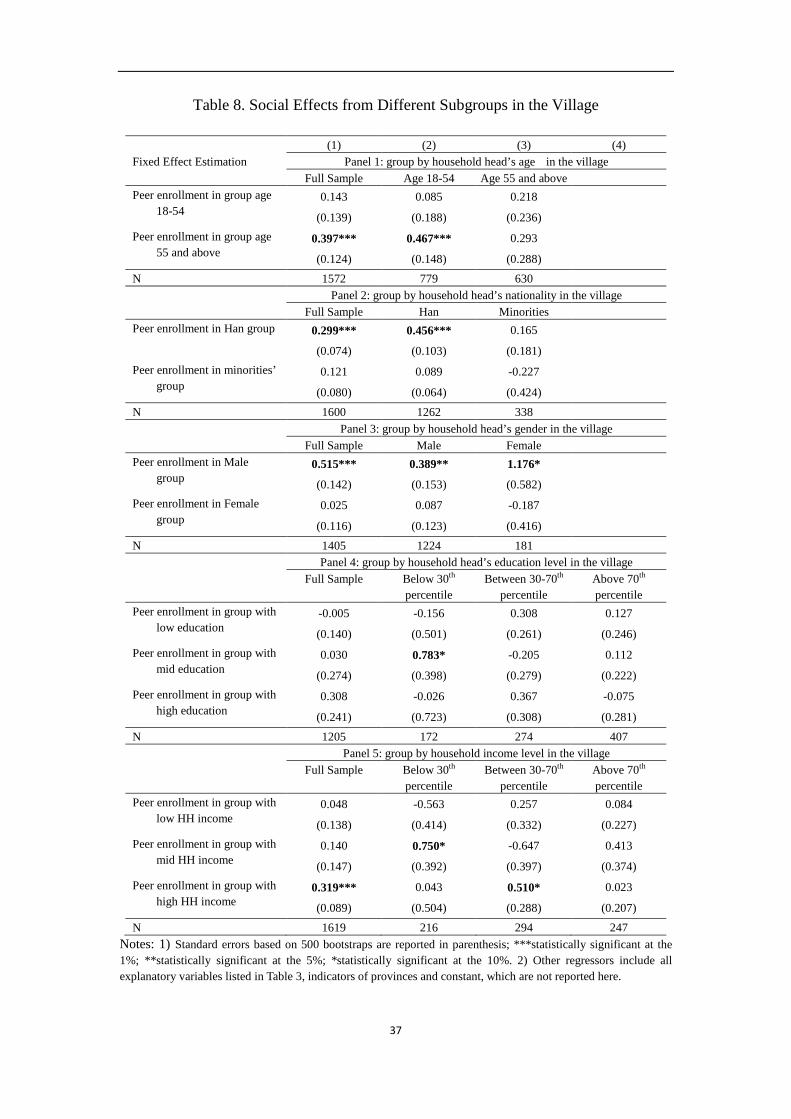
responsible for our findings, e.g., a local official information campaign. In Table 8, we
divide households into different subgroups within villages according to their
observable demographic and socioeconomic characteristics and estimate the different
social effects among subgroups. This analysis can help us separate the effect of social
learning from the influence of village-level common unobservables (Duflo and Saez,
2002; Munshi and Myaux, 2006) and capture the pattern of social learning. Based on
the conjecture that individuals may be more likely to interact with co-villagers who
share common observable characteristics, we should observe stronger social effects
20
within subgroups than across subgroups in the village (Sorensen, 2006; Duflo and
Saez, 2002). If individuals’ enrollment decisions are impacted by their observations of
others’ behavior, there may be opinion leaders in rural villages who appear to have
expertise and the ability to make informed NCMS enrollment decisions
(Bikhchandani et al., 1998). This analysis can determine the observable characteristics
associated with occupying a leadership role.
[Insert Table 8]
Table 8 presents the estimated social effects from co-villagers within subgroups
for households in the full sample and in each subgroup. We find significant symmetric
and asymmetric social effects. The former is consistent with our prior conjecture,
showing that the enrollment behavior of male (or Han) household heads is
significantly affected by other male (or Han) household heads, but not by female (or
minority) heads. Similar to Chen et al. (2010), we also find that younger heads (age
18-55) are significantly affected by those aged 55 and above, and female heads are
significantly influenced by male heads; whereas the reverse effects are close to zero
and within-group effects for these households are nearly absent. These findings imply
that, on average, the behaviors of the older, male heads with Han nationality have the
strongest effect on rural residents in the village.
Moreover, the results in panel 4 indicate that household heads with a low
education level (below the 30th percentile in the village) are significantly affected by
the behavior of household heads with a medium education level (between the 30th and
70th percentiles in the village). Similarly, panel 5 of Table 8 shows that households
with low (middle) income levels respond significantly to the enrollment rate of
households with middle (high) incomes in the same village. We find no significant
within-income-group or within-education-group effects. These findings are consistent
with the theory of social learning. Households with low socioeconomic status may
find the decisions of co-villagers with middle socioeconomic status more informative,
21
due to their lack of relevant knowledge and their limited access to information
resources. However, they are not significantly affected by those with high
socioeconomic status in the village, partly because they lack common backgrounds
and have fewer social interactions.
Overall, the results in Table 8 imply that wealthier, relatively well-educated,
older, male household heads with Han nationality tend to be opinion leaders in NCMS
enrollment in rural villages. Moreover, we do not find the presence of both
within-subgroup effects and cross-subgroup effects in any regression specification in
Table 8. This clear pattern provides supporting evidence that the social effect
mechanisms is social learning rather than common unobservables at the village level.
5.4. Policy Implications of Social Effect on NCMS Enrollment
Social effects have important policy implications for the long run success of the
NCMS. First, they can alleviate issue of adverse selection in NCMS participation. To
illustrate this empirically, in column (1) of Table 9 we first add interactions between
the social effects and indicators of the health status of household head and household
members. The results indicate that social effects are stronger for households without
chronic diseases than for those with chronic diseases. Moreover, when we estimate
social effects for subgroups with or without chronic disease, we also find that both
healthy and unhealthy households are significantly influenced by the average
enrollment of their healthy co-villagers. This finding suggests that enrolling healthier
households is important for the sustainability of the NCMS, not only because of its
direct effect on risk pooling, but also because of its indirect effect through social
influence.
[Insert Table 9]
Designed to reduce the poverty associated with poor health, the NCMS is more
meaningful for poor households. With less relevant knowledge and limited
information access, poor households are more likely to face information barriers in
22
their enrollment decisions. The study of social effects helps us to better understand
how individuals with different backgrounds obtain information through social
learning, especially for the poor. In Table 8, we have already shown that poor
households are significantly influenced by the behaviors of more affluent co-villagers.
Furthermore, in Table 10 we include interactions between the peer effects and
indicators for income groups and indicators for the community urbanicity index in the
regressions. The urbanicity index reflects development on a wide range of village
aspects, including infrastructure, education, and medical services. Households living
in villages with higher urbanicity index scores may enjoy better resources in terms of
education, information, and other aspects of acquiring necessary information about
the NCMS. As expected, the results show that social effect is more influential for
households with low household income and those living in relatively less developed
villages. The significant negative coefficients on the low household income and low
community urbanicity indicators suggest that without the role of social effects,
households that are poor or from poor villages may have low NCMS participation
rates.
[Insert Table 10]
6. Conclusions
In this paper, we investigate the importance of social learning in household
NCMS enrollment decisions in rural China by modeling households’ enrollment
decisions as a static incomplete information game. In our model, households make
their enrollment decisions based on their characteristics, village characteristics, and
other households’ enrollment decisions. We find that the NCMS enrollment
probability of an individual household would increase by 5 percentage points if the
enrollment rate of other households in the same village were to increase by 10
percentage points. From a policy perspective, such peer effects are equivalent to a
social multiplier effect of 1.9 at the village level, based on the computation method
23
proposed by Glaeser (2003).
We discuss and clarify how the identification problems can be resolved or
overcome in this analysis to establish a causal relationship between social effects and
household enrollment behavior.
First, we employ the two-step approach proposed by Bajari et al. (2010), together
with household-level fixed effects, to control for the endogeneity of the village-level
peer enrollment rate. This estimation strategy draws on the growing literature on
estimating static discrete-choice games in industrial organization in which one agent’s
payoff is affected by other agents’ decisions.
Second, using the rich information in our dataset, we conduct several
specification tests to show that the mechanism for social effects in NCMS enrollment
is primarily social learning. Specifically, we show that the role of social effects was
more salient when individuals were unfamiliar with NCMS, and their influence
increased with close geographical proximity, which is fully consistent with the theory
of social learning (Sorensen, 2006; Munshi and Myaux, 2006). Moreover, we also
find that the importance of social learning from co-villagers decreases significantly
with the development of alternative information channels.
Third, we add to the literature by providing empirical evidence for asymmetric
peer effects in the setting of health insurance enrollment. We find that healthier, older,
Han, male household heads with higher education and income levels tend to be
opinion leaders, especially for households with low socioeconomic status. This is
consistent with the empirical finding of Nair et al. (2010) that research-active
physicians significantly influence the behavior of other physicians but not vice versa.
Thus, our results suggest that targeting opinion leaders in rural villages with an
information campaign may have economically significant social multiplier effects on
social programs.
Fourth, our evidence also suggests that low income families and families living
in relatively poor villages were more influenced by social learning, which may have
important implications for the evaluation of social programs.
Finally, our data allow us to investigate peer effects at different stages of a
24
program: from inception, to expansion, and to full coverage. We find that the
importance of the peer effects varies with the evolution of the program.
References
Aguirregabiria, V., Mira, P., 2007. Sequential estimation of dynamic discrete games.
Econometrica 75(1), 1–53.
Aizer, A., 2007. Public health insurance, program take-up, and child health. Review of
Economics and Statistics 89(3), 400–415.
Bajari, P., Benkard, L., Levin, J. 2007. Estimating dynamic models of imperfect
competition. Econometrica 75(5), 1331–1370.
Bajari, P., Hong, H., Krainer, J., Nekipelov, D. 2010. Estimating static models of
strategic interactions. Journal of Business and Economic Statistics 28(4),
469–482.
Banerjee, A. 1992. A simple model of herd behavior. Quarterly Journal of Economics
107(3), 797–817.
Berry, S., Pakes, A., Ostrovsky, M. 2007. Simple estimators for the parameters of
dynamic games, with entry/exit examples. RAND Journal of Economics 38(2),
373–399.
Bertrand, M., Luttmer E., Mullainathan, S. 2000. Network effects and welfare
cultures. Quarterly Journal of Economics 115(3), 1019–1055.
Bikhchandani, S., Hirshleifer, D., Welch, I. 1998. Learning from the behavior of
others: conformity, fads, and informational cascades. The Journal of Economic
Perspectives 12(3), 151–170.
Brown, P., Bulte, E., Zhang, X. 2011. Positional spending and status seeking in rural
China. Journal of Development Economics 96(1), 139–149.
Brown, P., de Brauw, A., Du, Y. 2009. Understanding variation in the design of
China's New Cooperative Medical System. The China Quarterly 198, 304–329.
Cai, H., Chen, Y., Fang, H. 2009. Observational learning: evidence from a randomized
natural field experiment. American Economic Review 99(3), 864–882
25
Chen, Y., Jin, G., Yue, Y. 2010. Peer migration in China. NBER Working Paper No.
15671.
Congressional Budget Office, 2005. The price sensitivity of demand for nongroup
health insurance. Available at:
http://www.cbo.gov/ftpdocs/66xx/doc6620/08-24-HealthInsurance.pdf.
Craig, P. 1991. Costs and benefits: a review of research on take-up of Income-Related
benefits. Journal of Social Policy 20(4), 537–565.
Currie, J. 2006. The take-up of social benefits. In: Auerbach, A., Card D., Quigley, J.
(Eds). Public Policy and the Income Distribution. New York: USA, 80-149.
Dahl, G., Loken, K., Mogstad, M., 2012. Peer effects in program participation. NBER
Working Paper No. 18198.
Duflo, E., Saez, E. 2002. Participation and investment decisions in a retirement plan:
the influence of colleagues’ choices. Journal of Public Economics 85(1),
121–148.
Duflo, E., Saez, E. 2003. The role of information and social interactions in retirement
plan decisions: evidence from a randomized experiment. Quarterly Journal of
Economics 118(3), 815–842.
Feng, X., Tang, S., Bloom, G., Segall, M., Gu, X. 1995. Cooperative medical schemes
in contemporary rural China. Social Science and Medicine 41(8), 1111–1118.
Foster, A., Rosenzweig, M. 1995. Learning by doing and learning from others: human
capital and technical change in agriculture. Journal of Political Economy 103(6),
1176–1209.
Glaeser, E., Sacerdore, B., Scheinkman, J. 2003. The social multiplier. Journal of the
European Economic Association 1(2-3): 345–353.
Gruber, J., Poterba. J. 1994. Tax incentives and the decision to purchase health
insurance: evidence from the self-employed. Quarterly Journal of Economics
109(3), 701–733.
Hong, H., Kubik, J., Stein, J. 2005. Social interaction and stock‐market participation.
Journal of Finance 59(1), 137–163.
Jones-Smith, J., Popkin, B. 2010. Understanding community context and adult health
26
changes in China: development of an urbanicity scale. Social Science and
Medicine 71(8), 1436–1446.
Kleven, H., Kopczuk, W. 2011. Transfer program complexity and the take-up of
social benefits. American Economic Journal: Economic Policy 3(1): 54–90.
Krueger, A., Kuziemko, I. 2011. The demand for health insurance among uninsured
Americans: results of a survey experiment and implications for policy. NBER
Working Paper No. 16978.
Lei, X., Lin, W. 2009. The new cooperative medical scheme in rural China: does more
coverage mean more service and better health? Health Economics 18(S2),
S25–S46.
Li, S., Liu, Y., Deninger, K. 2012. How important are endogenous peer effects in
group lending? Estimating a static game of incomplete information. Journal of
Applied Econometrics, forthcoming.
Liu, Y. 2004a. China’s public health-care system: facing the challenges. Bulletin of
the World Health Organization 82(7), 532–538.
Liu, Y. 2004b. Development of the rural health insurance system in China. Health
Policy and Planning 19(3), 159–165.
Liu, Y., Rao, K., Hsiao, W. 2003. Medical expenditure and rural impoverishment in
China. Journal of Health, Population and Nutrition 21(3), 213–222.
Mangyo, E., Park, A. 2011. Relative deprivation and health: which reference groups
matter? Journal of Human Resources 46(3): 459–481.
Manski, C. 1993. Identification of endogenous social effects: the reflection problem.
Review of Economic Studies 60(3), 531–542.
Manski, C. 2000. Economic analysis of social interactions. Journal of Economic
Perspectives 14(3), 115–136.
Mao, Z. 2005. Pilot program of NCMS in China: System design and progress. World
Bank Report on China Rural Health Study
http://siteresources.worldbank.org/INTEAPREGTOPHEANUT/Resources/5027
34-1129734318233/NCMS-report-revisedversion.pdf.
Marquis, M., Long. S. 1995. Worker demand for health insurance in the nongroup
27
market. Journal of Health Economics 14(1), 47–63.
Moffitt, R. 1983. An economic model of welfare stigma. American Economic Review
75(5), 1023–1035.
Munshi, K. 2004. Social learning in a heterogeneous population: technology diffusion
in the Indian Green Revolution. Journal of Development Economics 73(1),
185–213.
Munshi, K., Myaux, J. 2006. Social norms and the fertility transition. Journal of
Development Economics 80(1), 1–38.
Nair H, Manchanda P, Bhatia T. 2010. Asymmetric social interactions in physician
prescription behavior: the role of opinion leaders. Journal of Marketing Research
47(5), 883–895.
Pan, X., Zhang, Y., Xu, L., Huang, J., Zhao, Q. 2009. An analysis of farmers'
perception of the new cooperative medical system in Liaoning Province, China.
BMC Health Service Research 9:230.
Sommers, B., Kronick, R., Finegold, K., Po, R., Schwartz, K., Glied, S. 2012.
Understanding participation rates in Medicaid: implications for the affordable
care act. ASPE ISSUE BRIEF, Department of Health and Human Services of the
United States.
Sorensen, A. 2006. Social learning and health plan choice. RAND Journal of
Economics 37(4), 929–945.
Wagstaff, A., Lindelow, M., Gao, J., Xu, L., Qian, J. 2007. Extending health insurance
to the rural population: an impact evaluation of China’s New Cooperative
Medical Scheme. World Bank Policy Research Working Paper.
Wagstaff, A., Lindelow, M., Jun, G., Ling, X., Qian, J. 2009. Extending health
insurance to the rural population: an impact evaluation of China's new
cooperative medical scheme. Journal of Health Economics 28(1), 1–19.
Wu, M., Zhang, Z., He, M., Ruan, Y., Lv, C., Tao, L., Miao, M., 2006. Qualitative
study on the implementation and determinants of the New Cooperative Medical
System in rural China. Study Report from WB/MOH NCMS Study.
Yi, H., Zhang, L., Luo, R., Liu, C., Scott, R. 2011. A survey on farmer's understanding
28
of and benefits from New Cooperative Medical Scheme. Population Journal
1(185), 47–53.
Yip, W., Hsiao, W. 2009. China’s health care reform: a tentative assessment. China
Economic Review 20(4), 613–619.
Yip, W., Wang, H., Hsiao,W. 2008. The impact of rural mutual health care on access
to care: evaluation of a social experiment in rural China. Working Paper, Harvard
University.
You, X., Kobayashi, Y. 2009. The new cooperative medical scheme in China. Health
Policy 91(1), 1–9.
29
Figure 1. NCMS Coverage Rate in Rural China
Data source: China Health Statistics Yearbook 2009-2011.
75,20 75,66 80,66
86,20 91,53
94,19 96,00
20,00
40,00
60,00
80,00
100,00
2004 2005 2006 2007 2008 2009 2010
30
Table 1. Village-Level Enrollment Rate in Counties with NCMS Newly Introduced
Wave Num. of
counties
Num. of
villages Mean Std. Dev. Min Max
2004 6 15 0.550 0.392 0 1
2006 23 62 0.741 0.246 0 1
2009 19 51 0.886 0.198 0 1
Estimated S.D. of county effect
0.193
Estimated S.D. within counties
0.190
31
Table 2. Summary Statistics
Full Sample
Wave
2004
Wave
2006
Wave
2009
Variable Mean Std. Dev. Mean Mean Mean
Dependent Variable
Household enrollment status 0.853 0.354 0.579 0.737 0.929
Explanatory Variables
Household head’s Characteristics
Age 54.177 12.578 52.938 52.271 55.072
Chronic disease 0.117 0.321 0.077 0.077 0.137
Female 0.153 0.360 0.193 0.140 0.154
Married 0.847 0.360 0.850 0.873 0.836
Han 0.812 0.391 0.854 0.773 0.823
Education: primary school 0.291 0.454 0.296 0.291 0.290
Education: junior high school and above 0.433 0.496 0.485 0.445 0.422
Other Household Characteristics
Household size 3.532 1.596 3.279 3.482 3.579
Total household income(k) 27.012 36.583 15.089 21.064 30.670
Number of children 0.019 0.138 0.009 0.022 0.019
Number of elderly members 0.748 0.434 0.678 0.797 0.736
Number of members with chronic diseases 0.527 0.499 0.532 0.516 0.530
Village Characteristics
Village population density 5.257 1.364 4.796 5.219 5.321
Village urbanicity index 51.959 13.107 50.796 47.394 53.909
Any health facility in the Village 0.889 0.314 0.966 0.828 0.905
Physician density 0.014 0.177 0.000 0.046 0.003
Village had health insurance in 2000 0.382 0.486 0.335 0.441 0.364
Prevalence of chronic diseases 0.074 0.055 0.052 0.054 0.084
Communication score 5.765 1.424 5.016 5.431 6.028
Access to convenient internet service 0.488 0.500 0.365 0.313 0.597
Access to convenient cell phone service 0.807 0.395 0.845 0.697 0.863
Number of household observations 3266 233 866 2167
Number of villages 15 75 129
Number of NCMS cities/counties 6 28 48
Note: in each wave of CHNS 2004-2009, there are 54 sample cities or counties.
32
Table 3. Social Effects of NCMS Enrollment
No peer effect Use simple average Two-step estimation RE FE RE FE RE FE (1) (2) (3) (4) (5) (6) Peer enrollment in the village 0.741*** 0.732*** 0.612*** 0.502***
(0.041) (0.077) (0.058) (0.109) Age 0.003 -0.009 0.004 -0.009 0.003 0.002 (0.004) (0.085) (0.004) (0.035) (0.004) (0.175) Age squared -0.000 0.001** -0.000 0.001** -0.000 0.001** (0.000) (0.000) (0.000) (0.000) (0.000) (0.000) Chronic disease 0.009 0.003 0.009 -0.005 0.017 0.009 (0.030) (0.063) (0.030) (0.061) (0.025) (0.072) Female 0.008 . 0.009 . 0.008 . (0.025) . (0.023) . (0.020) . Married 0.010 0.143** 0.014 0.130* 0.009 0.132* (0.024) (0.070) (0.023) (0.068) (0.020) (0.076) Han -0.002 . 0.002 . 0.018 . (0.029) . (0.011) . (0.021) . Household size -0.005 -0.026* -0.006 -0.024* -0.005 -0.021 (0.006) (0.015) (0.005) (0.013) (0.004) (0.013) primary school -0.005 0.040 -0.005 0.041 -0.004 0.039 (0.017) (0.054) (0.015) (0.048) (0.021) (0.049) Junior high school -0.007 0.041 -0.017 0.026 -0.011 0.043 (0.018) (0.065) (0.016) (0.060) (0.016) (0.055) Low household income -0.021 -0.023 -0.018 -0.025 -0.019 -0.027 (0.019) (0.039) (0.016) (0.034) (0.016) (0.025) High household income -0.019 0.034 -0.007 0.022 -0.008 0.034 (0.016) (0.037) (0.014) (0.032) (0.013) (0.029) Number of children 0.024** -0.025 0.017* -0.026 0.020** -0.029 (0.010) (0.027) (0.010) (0.027) (0.008) (0.024) Number of elderly members 0.021** 0.014 0.014* -0.001 0.019** 0.015 (0.009) (0.024) (0.007) (0.021) (0.007) (0.021) Number of members with
chronic diseases -0.022 -0.011 -0.017 0.018 -0.023 -0.009 (0.020) (0.053) (0.019) (0.048) (0.019) (0.053)
Village population density 0.026** 0.112* 0.006** 0.043* 0.022*** 0.136*** (0.010) (0.062) (0.003) (0.024) (0.006) (0.018) Log(village urbanicity) -0.020 0.431*** -0.003 0.075 -0.004 0.241** (0.070) (0.165) (0.019) (0.075) (0.032) (0.110) Any health facility in the
village 0.036 0.098 0.008 0.031 0.018 0.067*
(0.035) (0.060) (0.009) (0.033) (0.020) (0.039) Physician density 0.088*** 0.037** 0.023*** 0.011 0.062*** 0.019 (0.016) (0.017) (0.006) (0.010) (0.009) (0.017) Village had health insurance in
2000 -0.027 . -0.007 . -0.013 . (0.028) . (0.008) . (0.015) .
Prevalence of chronic diseases in the village
-0.493 0.372 -0.081 0.247 -0.020 0.460 (0.401) (1.293) (0.110) (0.471) (0.231) (0.651)
Wave 2006 0.169* -0.039 0.049* -0.108 0.194*** -0.038 (0.100) (0.218) (0.027) (0.105) (0.036) (0.471) Wave 2009 0.372*** -0.129 0.101*** -0.263 0.251*** -0.242 (0.096) (0.445) (0.028) (0.223) (0.035) (1.184) R2 within 0.1930 0.2489 0.3219 0.3409 0.2138 0.2655 R2 between 0.1025 0.0007 0.2086 0.0005 0.1553 0.0001 R2 overall 0.1310 0.0000 0.2422 0.0031 0.1714 0.0001 Wald chi2 / F statistic 113.61 5.66 2017.74 40.99 333.42 6.42 N 3262 1620 3261 1620 3261 1620 Notes: 1) In columns (1) to (4), cluster-robust standard errors are reported in parenthesis;2) Standard errors in columns (5) and (6) are based on 500 bootstraps; 3) ***statistically significant at the 1%; **statistically significant at the 5%; *statistically significant at the 10%. 4) Other regressors include indicators of provinces, and constant, which are not reported here.
33
Table 4. Nonlinear Social Effects of NCMS Enrollment
Use Quadratic Forms Use Linear Splines
RE FE RE FE
(1) (2) (3) (4)
Peer enrollment in the village 3.143*** 3.619***
(0.563) (0.723)
Squared peer enrollment -1.653*** -2.053***
(0.351) (0.456)
Peer enrollment in the village: 0 –
0.6
1.381*** 1.449***
(0.417) (0.553)
Peer enrollment in the village: 0.6 –
0.9
0.710*** 0.666***
(0.123) (0.243)
Peer enrollment in the village: 0.9
and above
-0.298 -0.751
(0.304) (0.527)
Wave 2006 0.154*** 0.080* 0.156*** 0.076
(0.031) (0.047) (0.033) (0.054)
Wave 2009 0.203*** 0.090* 0.202*** 0.080
(0.035) (0.048) (0.031) (0.060)
Control of household characteristics Yes Yes Yes Yes
Control of village characteristics Yes Yes Yes Yes
Control of provincial dummies Yes Yes Yes Yes
N 3261 1620 3261 1620 Notes: Standard errors based on 500 bootstraps are reported in parenthesis; ***statistically significant at the 1%; **statistically significant at the 5%; *statistically significant at the 10%.
34
Table 5. Social Effects by NCMS Implementation Time
Villages with NCMS
Newly Introduced in Each Wave
All Villages
CHNS 2004 CHNS 2006 CHNS 2009 CHNS 2009
(1) (2) (3) (4)
Peer enrollment in the village 1.391** 0.870*** 0.532*** 0.670***
(0.612) (0.115) (0.165) (0.131)
Peer enrollment × NCMS
introduced in wave 2006
-0.387**
(0.164)
Peer enrollment ×NCMS
introduced in wave 2004
-0.697**
(0.291)
NCMS introduced in wave 2009 Reference
NCMS introduced in wave 2006 0.350**
(0.148)
NCMS introduced in wave 2004 0.650**
(0.255)
Control of household characteristics Yes Yes Yes Yes
Control of village characteristics Yes Yes Yes Yes
Control of provincial dummies
Yes Yes Yes Yes
Control of wave dummies - -- -- -
N 233 819 866 2162
Notes: Standard errors based on 500 bootstraps are reported in parenthesis; ***statistically significant at the 1%; **statistically significant at the 5%; *statistically significant at the 10%.
35
Table 6. Social Effects by Communication Levels of the Village
Interacted with the overall
communication level of the village
Interacted with access to
convenient internet service in the
village
Interacted with access to
convenient cell phone service in
the village (1) (2) (3)
Peer enrollment in the village 1.266*** 0.683*** 0.960***
(0.282) (0.167) (0.195)
Peer enrollment × communications score -0.138***
(0.046)
Peer enrollment × convenient internet service -0.418**
(0.207)
Peer enrollment × convenient cell phone service -0.537***
(0.196)
Communications score of the village 0.116***
(0.039)
Access to convenient internet service 0.363**
(0.178)
Access to convenient cell phone service 0.412***
(0.148)
Control of household characteristics Yes Yes Yes
Control of village characteristics Yes Yes Yes
Control of provincial dummies Yes Yes Yes
Control of wave dummies Yes Yes Yes
N 1620 1620 1620
Notes: Standard errors based on 500 bootstraps are reported in parenthesis;***statistically significant at the 1%;
**statistically significant at the 5%; *statistically significant at the 10%. .
36
Table 7. Social Effects from Different Villages and Counties
Random Effect Fixed Effect
(1) (2) (3) (4) (5) (6) (7) (8)
Peer enrollment in the
village
0.612*** 0.736*** 0.502*** 0.534***
(0.058) (0.089) (0.109) (0.177)
Peer enrollment in other
villages of the county
0.319*** -0.000 0.133 -0.146
(0.049) (0.078) (0.093) (0.176)
Peer enrollment in other
counties of the province
-0.095 0.195 0.011 -0.057
(0.158) (0.130) (0.180) (0.218)
Control of household
characteristics
Yes Yes Yes Yes Yes Yes Yes Yes
Control of village
characteristics
Yes Yes Yes Yes Yes Yes Yes Yes
Control of provincial
dummies
Yes Yes Yes Yes Yes Yes Yes Yes
Control of wave dummies Yes Yes Yes Yes Yes Yes Yes Yes
N 3261 3225 3029 2991 1620 1614 1308 1302 Notes: Standard errors based on 500 bootstraps are reported in parenthesis; ***statistically significant at the 1%; **statistically significant at the 5%; *statistically significant at the 10%.
37
Table 8. Social Effects from Different Subgroups in the Village
(1) (2) (3) (4) Fixed Effect Estimation Panel 1: group by household head’s age in the village Full Sample Age 18-54 Age 55 and above Peer enrollment in group age
18-54 0.143 0.085 0.218
(0.139) (0.188) (0.236)
Peer enrollment in group age 55 and above
0.397*** 0.467*** 0.293
(0.124) (0.148) (0.288)
N 1572 779 630 Panel 2: group by household head’s nationality in the village Full Sample Han Minorities Peer enrollment in Han group 0.299*** 0.456*** 0.165
(0.074) (0.103) (0.181)
Peer enrollment in minorities’ group
0.121 0.089 -0.227
(0.080) (0.064) (0.424)
N 1600 1262 338 Panel 3: group by household head’s gender in the village Full Sample Male Female Peer enrollment in Male
group 0.515*** 0.389** 1.176*
(0.142) (0.153) (0.582)
Peer enrollment in Female group
0.025 0.087 -0.187
(0.116) (0.123) (0.416)
N 1405 1224 181 Panel 4: group by household head’s education level in the village Full Sample Below 30th
percentile Between 30-70th
percentile Above 70th percentile
Peer enrollment in group with low education
-0.005 -0.156 0.308 0.127
(0.140) (0.501) (0.261) (0.246) Peer enrollment in group with
mid education 0.030 0.783* -0.205 0.112
(0.274) (0.398) (0.279) (0.222) Peer enrollment in group with
high education 0.308 -0.026 0.367 -0.075
(0.241) (0.723) (0.308) (0.281) N 1205 172 274 407 Panel 5: group by household income level in the village Full Sample Below 30th
percentile Between 30-70th
percentile Above 70th percentile
Peer enrollment in group with low HH income
0.048 -0.563 0.257 0.084
(0.138) (0.414) (0.332) (0.227) Peer enrollment in group with
mid HH income 0.140 0.750* -0.647 0.413
(0.147) (0.392) (0.397) (0.374) Peer enrollment in group with
high HH income 0.319*** 0.043 0.510* 0.023
(0.089) (0.504) (0.288) (0.207) N 1619 216 294 247
Notes: 1) Standard errors based on 500 bootstraps are reported in parenthesis; ***statistically significant at the 1%; **statistically significant at the 5%; *statistically significant at the 10%. 2) Other regressors include all explanatory variables listed in Table 3, indicators of provinces and constant, which are not reported here.
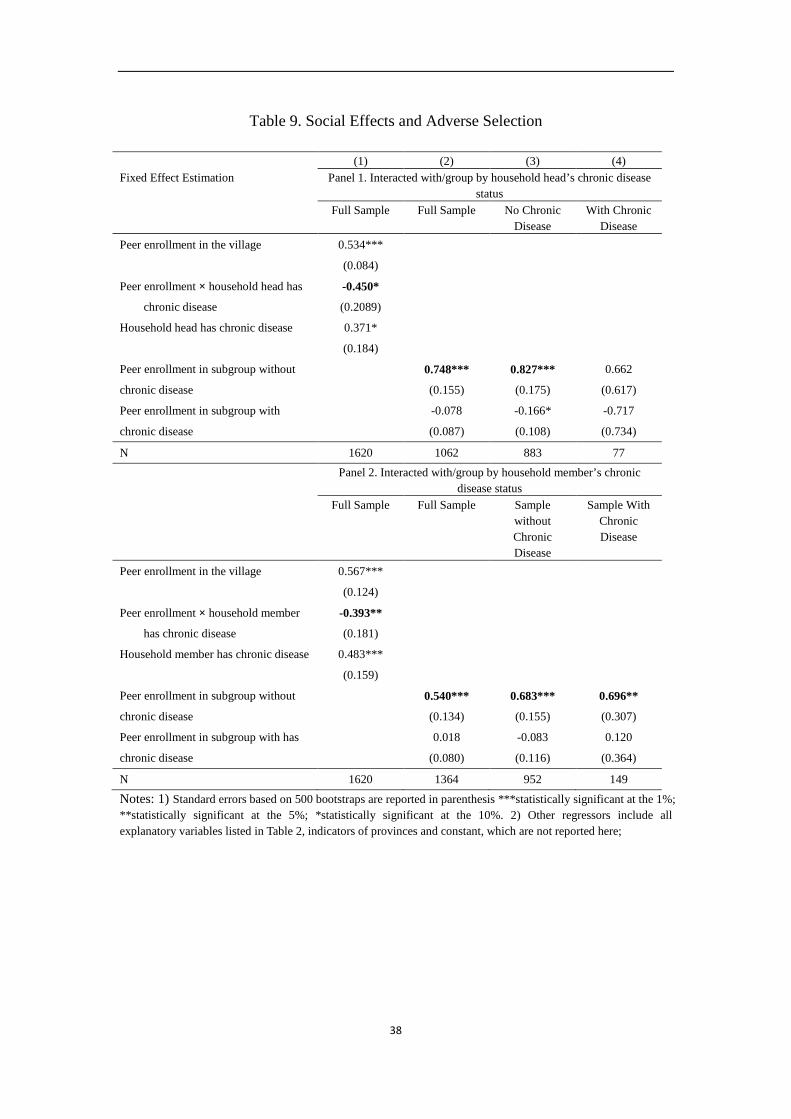
38
Table 9. Social Effects and Adverse Selection
(1) (2) (3) (4) Fixed Effect Estimation Panel 1. Interacted with/group by household head’s chronic disease
status Full Sample Full Sample No Chronic
Disease With Chronic
Disease Peer enrollment in the village 0.534***
(0.084)
Peer enrollment × household head has
chronic disease
-0.450*
(0.2089)
Household head has chronic disease 0.371*
(0.184)
Peer enrollment in subgroup without
chronic disease
0.748*** 0.827*** 0.662
(0.155) (0.175) (0.617)
Peer enrollment in subgroup with
chronic disease
-0.078 -0.166* -0.717
(0.087) (0.108) (0.734)
N 1620 1062 883 77 Panel 2. Interacted with/group by household member’s chronic
disease status Full Sample Full Sample Sample
without Chronic Disease
Sample With Chronic Disease
Peer enrollment in the village 0.567***
(0.124)
Peer enrollment × household member
has chronic disease
-0.393**
(0.181)
Household member has chronic disease 0.483***
(0.159)
Peer enrollment in subgroup without
chronic disease
0.540*** 0.683*** 0.696**
(0.134) (0.155) (0.307)
Peer enrollment in subgroup with has
chronic disease
0.018 -0.083 0.120
(0.080) (0.116) (0.364)
N 1620 1364 952 149
Notes: 1) Standard errors based on 500 bootstraps are reported in parenthesis ***statistically significant at the 1%; **statistically significant at the 5%; *statistically significant at the 10%. 2) Other regressors include all explanatory variables listed in Table 2, indicators of provinces and constant, which are not reported here;
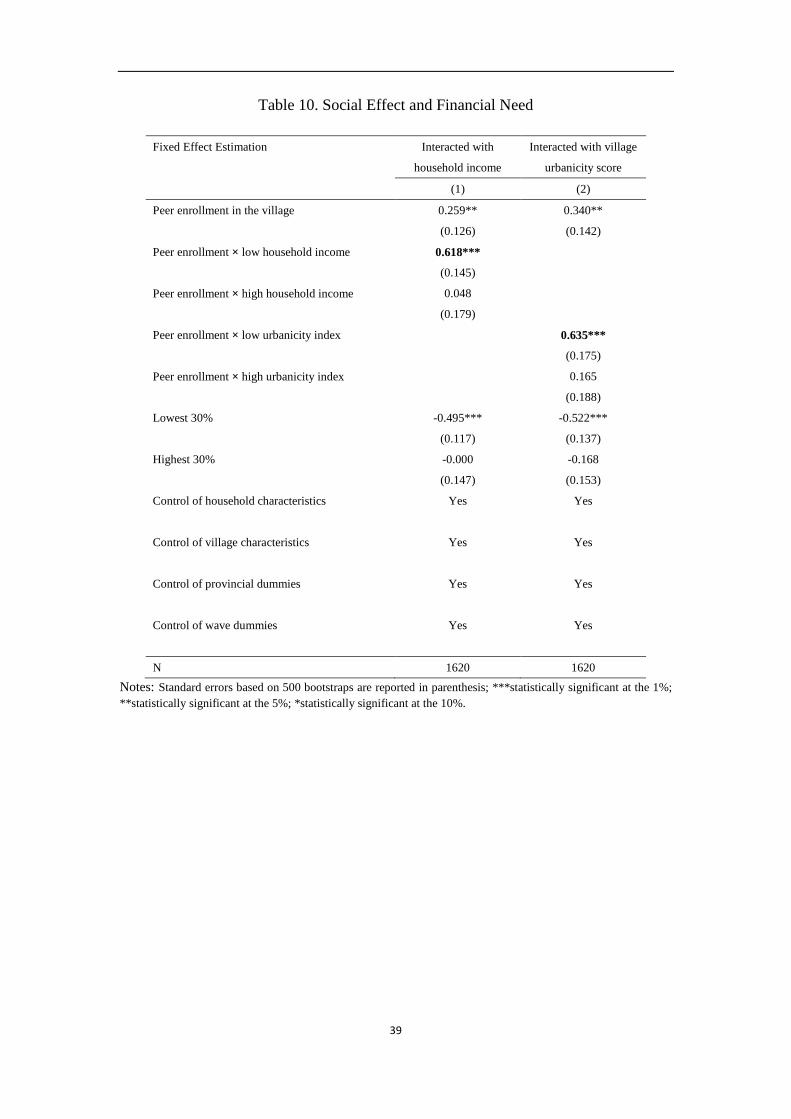
39
Table 10. Social Effect and Financial Need
Fixed Effect Estimation Interacted with
household income
Interacted with village
urbanicity score
(1) (2)
Peer enrollment in the village 0.259** 0.340**
(0.126) (0.142)
Peer enrollment × low household income 0.618***
(0.145)
Peer enrollment × high household income 0.048
(0.179)
Peer enrollment × low urbanicity index 0.635***
(0.175)
Peer enrollment × high urbanicity index 0.165
(0.188)
Lowest 30% -0.495*** -0.522***
(0.117) (0.137)
Highest 30% -0.000 -0.168
(0.147) (0.153)
Control of household characteristics Yes Yes
Control of village characteristics Yes Yes
Control of provincial dummies Yes Yes
Control of wave dummies Yes Yes
N 1620 1620
Notes: Standard errors based on 500 bootstraps are reported in parenthesis; ***statistically significant at the 1%; **statistically significant at the 5%; *statistically significant at the 10%.