Regulation of IGF-1 bioactivity by dietary hormones · Deutsches Institut für Ernährungsforschung...
96
Deutsches Institut für Ernährungsforschung Abteilung klinische Ernährung Regulation of IGF-1 bioactivity by dietary hormones “Impact of glucagon and insulin-induced hypoglycemia” Dissertation Zur Erlangung des akademischen Grades doctor rerum naturalium (Dr. rer. nat) In der Wissenschaftsdizplin klinische Ernährung einngereicht an der Mathematisch-Naturwissenschaftlichen Fakultät der Universität Potsdam Von Zeinab Sarem Geboren am 16.09.1982 in Lattakia, Syrien Potsdam, 2015
Transcript of Regulation of IGF-1 bioactivity by dietary hormones · Deutsches Institut für Ernährungsforschung...

Deutsches Institut für Ernährungsforschung
Abteilung klinische Ernährung
Regulation of IGF-1 bioactivity by dietary hormones
“Impact of glucagon and insulin-induced hypoglycemia”
Dissertation Zur Erlangung des akademischen Grades
doctor rerum naturalium (Dr. rer. nat)
In der Wissenschaftsdizplin klinische Ernährung
einngereicht an der Mathematisch-Naturwissenschaftlichen Fakultät
der Universität Potsdam
Von Zeinab Sarem Geboren am 16.09.1982 in Lattakia, Syrien
Potsdam, 2015


Gutachter Prof. Dr. Florian F. Schweigert Prof. Dr. med. Andreas F.H. Pfeiffer Published online at the Institutional Repository of the University of Potsdam: URN urn:nbn:de:kobv:517-opus4-82198 http://nbn-resolving.de/urn:nbn:de:kobv:517-opus4-82198

Contents
Summary I
Zusammenfassung II
List of figures IV
List of tables V
Abbreviations VI
1. Introduction 1
1.1 Growth hormone 1
1.1.1 Growth hormone structure 1
1.1.2 Biological regulation of growth hormone 2
1.1.3 Growth hormone functions 4
1.1.4 Growth hormone disorders 5
1.1.4.1 Growth hormone deficiency 5
1.1.4.2 Acromegaly 5
1.2 Insulin-like growth factor (IGF) system 5
1.2.1 Ligands 6
1.2.1.1 IGF-2 6
1.2.1.2 IGF-2 6
1.2.2 IGF receptors 7
1.2.3 Insulin like growth factor binding protein (IGFBP) family 8
1.2.3.1 IGFBP-1 8
1.2.3.2 IGFBP-2 9
1.2.3.3 IGFBP-3 9
1.2.3.4 IGFBP-4 9
1.2.3.5 IGFBP-5 10
1.2.3.6 IGFBP-6 10
1.2.3.7 IGFBP-7 10
1.2.4 IGF-1 bioactivity 11
1.2.5 IGF-1 signaling 11

1.2.6 IGF-1 concentration 14
1.3 GH/IGF-1 axis and disease 14
1.4 IGf-1 and nutrition 15
2. Aim of study 16
2.1 Glucagon study 16
2.2 Insulin-induced hypoglycemia study 17
3. Materials and methods 19
3.1 Materials 19
3.1.1 Laboratory materials and equipment 19
3.1.2 Chemicals, reagents and buffers 20
3.1.3 Buffers 21
3.1.3.1 Cell culture solutions 21
3.1.3.2 Kinase receptor activation assay solutions 21
3.1.3.3 Western blot solutions 23
3.1.4 Kits 25
3.1.5 Primers 26
3.1.6 Antibodies 26
3.1.7 Cell lines 26
3.2 Methods 27
3.2.1 In vivo 27
3.2.1.1 Study protocol 27
3.2.1.2 Study participants 27
3.2.1.3 Study design 27
3.2.1.4 Hormone assays 28
3.2.2 In vitro 29
3.2.2.1 Kinase receptor activation assay 29
3.2.2.1.1 Cell culture 30
3.2.2.1.1.1 Thawing of the cells 30
3.2.2.1.1.2 Freezing of the cells 30
3.2.2.1.1.3 Cultivation of the cells 30
3.2.2.1.2 Assay performance 31
3.2.2.2 Western blot 33

3.2.2.3 Gene expression 34
3.2.2.3.1 RNA extraction 34
3.2.2.3.2 cDNA synthesis 34
3.2.2.3.3 Real-time reverse transcriptase polymerase chain
reaction (RT–PCR) 35
3.2.3 Statistical analyses 36
4. Results 37
4.1 Glucagon administration study 37
4.1.1 In vivo study 37
4.1.2 In vitro study 45
4.1.2.1 Impact of glucagon, IGFBP-1, IGFBP-2 and IGFBP-3 on
autophosphorylation of IGF1R 45
4.1.2.2 Impact of glucagon on IGF-1 system gene expression and Akt
phosphorylation in mouse primary hepatocytes 48
4.2 Insulin-induced hypoglycemia study 51
4.2.1 In vivo study 51
4.2.2 In vitro study 56
5. Discussion 58
5.1 Glucagon administration study 58
5.2 Insulin-induced hypoglycemia study 62
6. Conclusion 64
Acknowledgement I
List of publications and conferences II
Thesis declaration IV
I
Summary
The relationship between nutrition and the development of chronic diseases including metabolic
syndrome, diabetes mellitus, cancer and cardiovascular disease has been well studied. On the
other hand, changes in the GH-IGF-1 axis in association with nutrition-related diseases have been
reported. The interplay between GH, total IGF-1 and different inhibitory and stimulatory kinds of
IGF-1 binding proteins (IGFBPs) results in IGF-1 bioactivity, the ability of IGF-1 to induce
phosphorylation of its receptor and consequently its signaling. Moreover, IGF-1 bioactivity is
sufficient to reflect any change in the GH-IGF-1 system. Accumulating evidence suggests that
both of high protein diet, characterized by increased glucagon secretion, and insulin-induced
hypoglycemia increase mortality rate and the mechanisms are unclear. However both of
glucagon and insulin-induced hypoglycemia are potent stimuli of GH secretion. The aim of the
current study was to identify the impact of glucagon and insulin-induced hypoglycemia on IGF-1
bioactivity as possible mechanisms. In a double-blind placebo-controlled study, glucagon was
intramuscularly administrated in 13 type 1 diabetic patients (6 males /7 females; [BMI]: 24.8 ±
0.95 kg/m2), 11 obese subjects (OP; 5/ 6; 34.4 ± 1.7 kg/m2), and 13 healthy lean participants (LP;
6/ 7; 21.7 ± 0.6 kg/m2), whereas 12 obese subjects (OP; 6/ 6; 34.4 ± 1.7 kg/m2), and 13 healthy
lean participants (LP; 6/ 7; 21.7 ± 0.6 kg/m2) performed insulin tolerance test in another double-
blind placebo-controlled study and changes in GH, total IGF-1, IGF binding proteins (IGFBPs) and
IGF-1 bioactivity, measured by the cell-based KIRA method, were investigated. In addition, the
interaction between the metabolic hormones (glucagon and insulin) and the GH-IGF-1 system on
the transcriptional level was studied using mouse primary hepatocytes. In this thesis, glucagon
decreased IGF-1 bioactivity in humans independently of endogenous insulin levels, most likely
through modulation of IGFBP-1 and-2 levels. The glucagon-induced reduction in IGF-1 bioactivity
may represent a novel mechanism underlying the impact of glucagon on GH secretion and may
explain the negative effect of high protein diet related to increased cardiovascular risk and
mortality rate. In addition, insulin-induced hypoglycemia was correlated with a decrease in IGF-
1 bioactivity through up-regulation of IGFBP-2. These results may refer to a possible and poorly
explored mechanism explaining the strong association between hypoglycemia and increased
cardiovascular mortality among diabetic patients.

II
Zusammenfassung
Der Zusammenhang zwischen Ernährung und der Entwicklung von chronischen Krankenheiten
wie metabolischem Syndrom, Diabetes mellitus, Krebs und kardiovaskulären Erkrankungen
wurde untersucht. Veränderungen der GH-IGF-1 Achse in Verbindung mit ernährungsbedingten
Erkrankungen wurden früher beschrieben. Das Wechselspiel zwischen GH, gesamt IGF-1 und
verschiedenen hemmenden und stimulierenden IGF-1 bindenden Proteinen (IGFBPs) bestimmt
die IGF-1 Bioaktivität, die als die Fähigkeit von IGF-1 die Phosphorylierung von seinem Rezeptor
und folglich seinem Signalsweg zu induzieren, identifiziert ist. Deshalb reicht die Messung der
IGF-1 Bioaktivität aus, um Änderungen des GH-IGF-1 Systems darzustellen. Studien deuten
darauf hin, dass proteinreiche Diät, gekennzeichnet durch erhöhte Glukagonsekretion, und
Insulin-induzierte Hypoglykämie die Sterblichkeit erhöhen, und die Mechanismen sind unklar.
Sowohl Glukagon als auch Insulin-induzierte Hypoglykämie stimulieren die GH Sekretion. Das Ziel
der vorliegenden Studie war, die Wirkung von Glucagon und Insulin-induzierter Hypoglykämie
auf die IGF-1 -Bioaktivität als mögliche Mechanismen zu characterizieren. In einer doppelblinden,
Placebo-kontrollierten Studie wurde Glukagon intramuskulär 13 Patienten mit T1DM (6 Männer
/ 7 Frauen; [ BMI ] : 24,8 ± 0,95 kg / m2) , 11 übergewichtigen Teilnehmern (OP ; 5/6 ; 34,4 ± 1,7
kg / m2) und 13 gesunden schlanken Teilnehmern (LP ; 6/7 ; 21,7 ± 0,6 kg / m2) administriert.
Zwölf übergewichtige Teilnehmer (OP ; 6/6 ; 34,4 ± 1,7 kg / m2) und 13 gesunde schlanke
Teilnehmer (LP ; 6/7 ; 21,7 ± 0,6 kg / m2) führten Insulintoleranztests in einer weiteren
doppelblinden, Plazebo- kontrollierten Studie durch. Änderungen des GH, gesamt-IGF-1, der IGF-
bindenden Proteinen ( IGFBPs ) und der IGF-1-Bioaktivität wurden durch das zellbasierte KIRA-
Verfahren gemessen. Außerdem wurde die Wechselwirkung zwischen den metabolischen
Hormonen (Glucagon und Insulin) und GH-IGF-1-System auf der Transkriptionsebene mit
primären Maus-Hepatozyten untersucht. In dieser Arbeit verringerte Glukagon die IGF-1-
Bioaktivität bei den Menschen unabhängig von körpereigenen Insulinspiegeln,
höchstwahrscheinlich durch Modulation des IGFBP-1 und -2. Die Glukagon-induzierte Reduktion
der IGF-1-Bioaktivität stellt einen neuen Mechanismus der Wirkung von Glucagon auf die GH-
Sekretion dar und kann als mögliche Erklärung für die negativen Auswirkungen der
proteinreichen Diät im Zusammenhang auf das erhöhte kardiovaskuläre Risiko und die Mortalität
vorgeschlagen werden.

III
Zusätzlich wurde die Insulin-induzierten Hypoglykämie eine Abnahme der IGF-1-Bioaktivität
durch Hochregulierung von IGFBP-2 zugeordnet. Diese Ergebnisse können auf mögliche und
wenig erforschte Mechanismen zur Erläuterung der starken Assoziation zwischen Hypoglykämie
und erhöhter kardiovaskulärer Mortalität bei diabetischen Patienten beziehen .

IV
List of figures
Figure 1 Growth hormone structure 2
Figure 2 IGF-1 signaling pathway 12
Figure 3 Mean (±SEM) changes in IGF-1 bioactivity and growth
hormone (GH) concentrations after the administration of
glucagon administration in lean and obese participants and
type 1 diabetic patients. 41
Figure 4 No change in total IGF-1 or IGFBP-3 concentration was
observed after glucagon administration in lean, obese
participants and patients with diabetes mellitus. 42
Figure 5 Mean (±SEM) changes in IGFBP-1 and IGFBP-2 after the
administration of glucagon in lean, obese and type 1 diabetic
participants. 44
Figure 6 No direct effect observed of glucagon on IGF-1 bioactivity46
Figure 7 Dose-dependent effect of IGFBP-1, IGFBP-2 and IGFBP-3 on
IGF-1 bioactivity. 47
Figure 8. Changes of IGF-1, IGFBP-3, IGFBP-1 and IGFBP-2 mRNA
expression and Akt phosphorylation after stimulation of
mouse primary hepatocytes with GH, glucagon or both of
them in mouse primary hepatocytes. 50
Figure 9 Mean (±SEM) changes in insulin, glucose, IGFBP-1 and
IGFBP-2 concentrations after applying of insulin tolerance
test in lean and obese participants. 54
Figure 10 Mean (±SEM) changes in IGF-1 bioactivity, total IGF-1, IGFBP-
3 and GH concentrations after applying of insulin tolerance
test lean and obese participants. 55
Figure 11 Changes of IGF-1, IGFBP-3, IGFBP-1 and IGFBP-2 mRNA expression in mouse primary hepatocytes after treatment with insulin in the presence or absence of GH. 57
V
List of tables
Table 1 Baseline Characteristics of Obese, Type 1 Diabetic Patients and lean participants. 28
Table 2 Preparation of RT Master Mix for one reaction. 35
Table 3 Preparation of 10X Power SYBR Green Master Mix for one reaction. 35 Table 4 Time courses of IGF-1 bioactivity, GH, IGFBP-1 and IGFBP-2 in lean
participants, type 1 diabetic patients and obese participants. 39
Table 5 Time courses of glucose, insulin, IGFBP-1, IGFBP-2, IGF-1
bioactivity, total IGF-1, IGFBP-3 and GH after applying of insulin tolerance test in obese participants and lean participants. 53

VI
Abbreviation
GH Growth hormone
IGF-1 Insulin like growth factor 1
IGF-2 Insulin like growth factor 2
kDa Kilodalton
GHRH Growth hormone releasing hormone
SST Somatostatin
GHRHR Growth hormone releasing hormone
receptor
cAMP Cyclic adenosine monophosphate
CREB cAMP response element binding protein
DAG Diacylglycerol
IT3 inositol triphosphate
GHS-R1a Growth Hormone Secretagogue Receptor
type 1a
GRF Growth hormone releasing factor
GHR Growth hormone receptor
JAK2 Janus- family Tyrosine Kinase 2
MAPK Mitogen-activated protein kinase
IRS1 Insulin Receptor Substrate 1
PI3K phosphatidylinositol -3- phosphate Kinase
SH2 Src homology 2
STAT Signal transducer and activator of
transcription

VII
SOCS Supressor of cytokine signaling
SHP1 SH2-containing protein tyrosine
phosphatase-1
GHD Growth hormone deficiency
LDL Low density lipoprotein
IGF1R Insulin like growth factor type 1 receptor
IGF2R Insulin like growth factor type 2 receptor
IGFBPs IGF binding proteins
AD Alzheimer,s disease
IR Insulin receptor
pIGFBP-1 Highly phosphorylated IGFBP-1
LPIGFBP-1 Low phosphorylated IGFBP-1
npIGFBP-1 Non phosphorylated IGFBP-1
ALS Acid-labile subunit
RXR Retinoid X receptor
PAPP-A Preganancy-associated plasma protein
PIP2 phosphotidylinositol (4, 5) diphosphate
PIP3 phosphotidylinositol (3,4,5) triphosphate
PDK1 phosphoinositide-dependent protein
kinase-1
mTORC2 mammalian tor of rapamycin complex 2
FOXO1 Forkhead box O1
PEPECK phoenolpyruvate carboxykinase
G6pase glucose 6 phosphatase
FOXO3 Forkhead box O3
VIII
Bad Bcl-2-antagonist of cell death
Bax B cell lymphoma-associated protein X
TSC1 tuberous sclerosis complex 1
TSC2 tuberous sclerosis complex 2
Rheb Ras homolog enriched in brain
Raptor regulatory associated protein of mTOR
P70S6K1 P70 ribosomal protein S6 kinase 1
4E-BP1 Eukaryotic initiation factor 4E binding
protein 1
EIF-4E eukaryotic translation initiation factor 4E
Grb2 growth factor receptor-bound protein 2
GEF guanine nucleotide exchange factor
MEK mitogen-activated protein kinase
ERK extracellular signal regulated kinase
MDM2 Mouse double minute 2 homolog
TNF Tumor necrosis factor alpha
SOCS3 Supressor of cytokine signaling 3
GSK3 Glycogen synthase kinase 3
MuRF1 muscle RING finger-1
Nrf2 nuclear factor (erythroid-derived 2)-like 2
GCLC Glutamate-cysteine ligase catalytic subunit
NQO1 NAD(P)H dehydrogenase (quinone) 1
HMOX1 Heme oxygenase (decycling) 1
HOMA-IR Homeostatic model assessment of insulin
resistance
ELISA Enzyme-linked immunoassay
IX
RIA Radioimmunoassay
DMSO Dimethyl-sulfoxide
FCS Fetal calf serum
HSA Human serum albumin
BSA Bovine serum albumin
HEK Human embryonic kidney
KIRA Kinase receptor activation assay
RT Room temperature
KRB Krebs ringer buffer
TBST Tris-buffered saline-Tween
SDS-PAGE sodium dodecyl sulfate- Polyacrylamide
gel electrophoresis
SDS sodium dodecyl sulfate
APS Ammonium persulfate
TEMED N, N, N', N'-tetramethylethylenediamine
qRT-PCR quantitative real time-Polymerase
chain reaction


1
1. Introduction
During evolution, our endocrine system has been developed, starting in insects with a
kind of peptides called insulin-like peptides secreted from the brain and mediated various
functions like growth, carbohydrate metabolism, fertility and life span. In mammals, this
system is divided into two functional-separated complementary networks, growth
hormone (GH) and insulin, which are responsible for growth and glucose homeostasis,
respectively. Insulin-like growth factor proteins (IGF-1 and IGF-2 prenatally and IGF-1
postnatally), that are considered as downstream products of GH signaling and involved in
glucose homeostasis, seem to be conserved in mammals linking the functions of GH and
insulin together and mediating growth, reproduction and glucose metabolism. GH/IGF-1
axis and its involvement in many important physiological pathways will be discussed in
details in the following sections.
1.1 Growth hormone
1.1.1 Growth hormone structure
Translation of hGH (human Growth Hormone) gene that is found in the q22-24 region of
the chromosom 17 results in a 22 KDa polypeptide consisting of about 191 amino acids.
hGH protein forms a three-dimensional four-helix complex in an up-up-down-down
behavior with connecting loops between helices 1 & 2 and helices 3 & 4 that are longer
than one between helices 2 & 3. Two disulfide bridges are responsible for this complex
stabilization. One bridge connects C53 belonging the large crossover loop between helix
1 and helix 2 to C165 from helix 4, the other disulfide bridge connects C182 to C189
belonging to the helix 4 and the C-terminal small loop respectively (1).

2
Figure 1: Growth hormone structure (2)
1.1.2 Biological regulation of growth hormone
GH secretion from cells called somatrophs, located in the anterior pituitary, is regulated by
several different stimuli like gonadotropin-releasing hormone, corticotropin-releasing
hormone, dopamine, ghrelin and thyrotropin-releasing hormone (3). The main regulator of
its secretion is the interplay between growth hormone releasing hormone (GHRH) or
somatocrinin and growth hormone inhibiting hormone or somatostatin (SST.) GHRH is
mainly secreted in the arcuate nucleus, whereas SST is expressed in the periventricular
nucleus of the hypothalamus (4;5). GHRH binds to GHRHR, a member of G-protein-coupled
receptors and induces GH secretion through two different mechanisms. The first one is
cyclic adenosine monophosphate (cAMP)-dependent pathway including GHRHR-binding
and changes in its conformation, activation of -subunit of the G-protein complex and
stimulation of adenylyl cyclase leading to an increase in intracellular (cAMP). cAMP binds
and activates the regulatory subunits of protein kinase A resulting in its translocation to the
nucleus and phosphorylation and activation of cAMP response element binding protein
(CREB) which enhances GH transcription by binding to the cAMP response element in the

3
promoter of GH gene. The other mechanism is phospholipase C-dependent which starts
with GHRH-mediated simulation of phospholipase C through complex of heterotrimeric
G-proteins and induction of diacylglycerol (DAG) and inositol triphosphate (IP3) which
increase release of (intracellular calcium) Ca+2 from the endoplasmic reticulum resulting in
increased secretion of GH. Conversely, somatostatin inhibits GH secretion via activation of
tyrosine phosphatase that mediates the inhibition of the above mentioned calcium
channels and adenylyl cyclase activity (6). The balance of these stimulating and inhibiting
peptides which determines GH release is affected by other metabolic factors and hormones
such as ghrelin, a gastric peptide secreted upon energy restriction. It induces GH release
through its binding to the growth Hormone Secretagogue Receptor type 1a (GHS-R1a) by
two mechanisms, one is by regulating GHRH and SST in hypothalamus and the other is by
acting as a SST antagonist at the pituitary level (7;8). In opposite to ghrelin, leptin, a
hormone secreted from white adipose tissues upon satiety and its blood levels correlate
with body fat mass, modulates GH secretion through a direct regulation of growth
hormone-releasing factor (GRF), somatostatin and alpha-melanocyte-stimulating hormone
(9;10). Blood GH concentration is also influenced by various other nutritional, physiological
and metabolic conditions such as gender. To date, it is known that increased androgen
secretion during puberty as well as administration of either oestrogen or testosterone
enhance plasma GH concentration (11;12). Age affects also GH secretion and it has been
indicated that every decade of adult life is associated with a 14% decrease in GH secretion,
following a peak during puberty. The change in blood GH level is not noticed only during
the life but also during a day and the GH peak occurs about an hour after sleep during the
slow wave sleep (13). Physical exercise as well as fasting and some amino acids such as
leucine and arginine have stimulatory effects on GH (14-16). Conversely, glucose and fatty
acids have inhibitory effects (17;18) . In addition to the previous factors, the circulating
GH and its second mediator, IGF-1, can cross the brain-blood barrier, where they play an
important role in regulating GH by a negative feedback mechanism on hypothalamus and
pituitary (19;20).

4
1.1.3 Growth hormone functions
GH exerts its biological effects by binding to the extracellular domain of its receptor. The
first step of GH signaling pathway occurs when a single active GH binds to two GH receptor
(GHR) molecules inducing dimerization of the receptor. The dimerization of GHR leads to
tyrosyl phosphorylation and activation of both GHR and GHR-associated JAK2 (Janus- family
Tyrosine Kinase 2). These molecular events activate many effective downstream molecules
such as MAPK (Mitogen-Activated Protein Kinases), IRS1 (Insulin Receptor Substrate 1),
PI3K (phosphatidylinositol -3- phosphate Kinase), DAG, Protein kinase C and Ca+2 which are
responsible for various GH functions like proliferation, enzymatic and transcriptional
actions and involved in growth and metabolism (21). In addition to the above mentioned
signaling pathway, the activation of JAK2 creates binding sites for the Src homology 2 (SH2)
domains of the STAT (Signal Transducer and Activator of Transcription) proteins 1, 3, 5A
and 5B resulting in their dimerization, nuclear localization and binding to specific regulatory
sequences and increasing the rate of transcription of various genes as IGF-1 gene (22).
Moreover, a family of cytokine-inducible genes called SOCS (Supressor of Cytokine
Signaling) and SHP1 (SH2-containing Protein Tyrosine Phosphatase-1) regulates GHR/JAK2
signaling through inhibition of JAK2 kinase activity and de-phosphorylation of nuclear STAT
proteins respectively. The biological effects of GH result either from the direct binding of
GH to its receptor or from its stimulation of IGF-1 secretion from the liver and other tissues.
To these in growth and metabolism-involved effects belong all of lipolysis, proliferation and
differentiation of chondrocytes, proliferation and differentiation of myoblasts, amino acid
uptake, protein synthesis, triglyceride breakdown and insulin secretion.

5
1.1.4 Growth hormone disorders
1.1.4.1 Growth hormone deficiency
Growth hormone deficiency is identified as a failure of pituitary gland to produce enough
amounts of growth hormone, due a partial or a complete lack of growth hormone
production and is characterized by decreased both of body size and length. It can be
congenital due to mutations of genetics or can be an acquired condition caused by many
reasons such as brain infections or injury, brain tumors, decreased oxygen at birth or
abnormalities of growth hormone receptors. Children with growth hormone deficiency
may grow normally until the second or third year then start to grow slowly less than two
inches per year in comparison with the normal children who grow at least two inches per
year. Other children with growth hormone deficiency may grow slowly immediately after
birth. They show also excess fat storage in the face and abdomen, as well as a low blood
glucose concentration and a delayed puberty. Adults with GHD (Growth Hormone
Deficiency) have increased body fat, decreased muscle and bone mass, impaired
temperature regulation, depression, poor sleep and increased LDL-(low density
lipoprotein) cholesterol.
1.1.4.2 Acromegaly
Acromegaly is a chronic condition caused by tumor-induced excess secretion of growth
hormone. It must be differed between gigantism (excess growth hormone in prepubertal
children) and acromegaly in adults. The most common symptoms of acromegaly are
enlargement of hands and feet, swelling of soft tissues, excessive sweating, headaches
and visual problems.
1.2 Insulin-like growth factor (IGF) system
IGF system consists of two ligands (IGF-1, IGF-2) which bind mainly to two cell-surface
receptors, type 1 IGF receptor and type 2 IGF receptor (IGF1R, IGF2R), seven IGF binding
proteins (IGFBPs) as well as IGFBP proteases.

6
1.2.1 Ligands
IGF-1 and IGF-2 are single-chain proteins consisting of 70 (IGF-1) and 67 (IGF-2) amino
acids. Human IGF-1 and human IGF-2 share 62% of the sequences of each other (23).
Despite this sequence similarity, IGF-1 and IGF-2 activate different signaling. It has been
reported that mice with disturbance of IGF-1 or IGF-2 do not have the same birth weight
as the wild-type mice (24). However, IGF-2 is not able to prevent the mental and growth
retardation in patients with IGF-1 deficiency.
1.2.1.1 IGF-2
IGF-2 gene belongs to the imprinted genes, expressed in a parent-of-origin-specific
manner and located on chromosome 11p15.5 (25). Some studies referred to the role of
IGF-2 in fertility by increasing proliferation of granulosa cells and synthesis of estradiol
and progesterone (26;27). Other studies found that activation of IGF-2 signaling
contributes to treatment of diseases such as alzheimer,s disease (AD) via enhancement
of neurogenesis (28). However, although it is expressed in humans in different tissues
throughout the life but it plays a more essential role in embryogenesis and fetal
development (29). Therefore, IGF-2 is believed to be a fetal growth regulator promoting
growth during gestation and regulating the size and exchange capacity of the placenta in
all vertebrate species, comparable with IGF-1 which is considered to be an adult growth
factor (30). Despite some reports referred that liver IGF-2 production is not influenced by
GH in postnatal stage (31), others showed that liver IGF-2 production in teleost fishes is
regulated, in addition to GH, by insulin and cortisol (32) and affected by fasting-refeeding
state (33). However, how its secretion is regulated remains unknown.
1.2.1.2 IGF-1
IGF-1 is a 7.5 kDa 70-amino acid single-chain polypeptide with 49% sequence homology
to insulin. At the beginning, it was called “somatomedin” and then subsequently
identified as insulin-like growth factor 1, organized with three disulfide bridges that

7
facilitate its binding to its receptor. It is synthesized as an endocrine hormone mainly in
the liver under the stimulation of GH and secreted in bloodstream, where it acts as a
feedback regulator of GH secretion on the hypothalamus and pituitary gland levels (31).
It differs from other hormones that it is also secreted in many extrahepatic tissues where
it exerts its autocrine/paracrine effects. IGF-1 is produced from IGF-1 gene which consists
of more than 6 exons and located in the chromosome 12 in humans and in chromosome
10 in mice (34).
1.2.2 IGF receptors
They form a family of transmembrane proteins that bind IGF-1, IGF-2 or both of them and
consist of IGF1R, IGF2R and insulin receptor (IR). These tyrosine kinase receptors consist
of two extracellular -subunits which bind IGF and two -subunits which have
intracellular tyrosine kinase domain and linking together with disulfide bridges. The
presence of a binding site for ATP in these receptors is responsible for their
autophosphorylation after their binding to the corresponding ligands, induction of
various intracellular signaling and phosphorylation of other cellular molecules.
Overexpression of IGF1R is associated with more cell proliferation and carcinogenesis,
while its depletion increases the resistance to oncogenic transformation (35;36). Because
of its expression on many tumor cell types and its ability to decrease apoptosis and
increase cell survival, it was an important target for tumor treatment (37). Using IGF1R
antisense ribonucleic acid, dominant-negative truncated IGF1R or IGF1R neutralizing
antibodies demonstrated the positive effects of IGF signaling inhibition on tumorigenesis
(38-40). In addition, its critical role in inducing epithelial cell proliferation of mammary
glands during pregnancy and lactation has been reported. IGF1R is the most important
member of this family with a molecular weight of 320 kDa, 60% sequence homology of IR
and a higher affinity to IGF-1 compared with IR. Because of the sequence similarity of IGF-
1 and insulin and IGF1R and IR and the 100-fach less affinity of IGF-1 to IR, IGF-1 binding
to a IGF1R-insulin receptor combination has been demonstrated. Moreover, IGF2R binds
IGF-2 only and despite it mediates no intracellular signaling, it usually works as a clearance
receptor preventing IGF-2 signaling.

8
1.2.3 Insulin-like growth factor binding protein (IGFBP) family
IGFBP family comprises 7 binding proteins (IGFBP-1 to IGFBP-7) that share similar
structures and variable but high affinity to IGF-1 resulting in modulation of IGF-1
actions. All IGFBPs have a common conserved domain consisting of the N-terminus, IGF
binding protein domain, and the C-terminus, thyroglobulin type-1 repeat, while the mid-
region differs among them depending on the presence of proteolysis, phosphorylation
and glycosylation sites. In addition to functioning as carrier proteins, prolonging the
half-life time of IGFs, and preventing their binding to IGF receptors, they can act as
modulators of different physiological processes, independent of IGFs (41). 80 % of the
IGFs circulate in the blood forming a complex of 150 kDa consisting of one molecule of
IGF-1 or IGF-2, a 85 kDa acid-labile subunit (ALS) and IGFBP-3, 20-25 % of the IGFs are
bound to the other IGFBPs forming a complex of 50 kDa, while less than 1 % of IGFs are
found in free form of 7.5 kDa (42).
1.2.3.1 IGFBP-1
IGFBP-1 is found in the liver, ovary, the amniotic fluid and the plasma. It is a 25 kDa
protein and subject to serine phosphorylation at three different phosphorylation sites.
Depending on the degree of phosphorylation, it is found in three isomers (highly
phosphorylated IGFBP-1, pIGFBP-1, less phosphorylated IGFBP-1, Lp IGFBP-1 and non-
phosphorylated IGFBP-1, np-IGFBP-1). Under normal physiological situations, IGFBP-1 is
found circulating in the phosphorylated form that is able to bind IGF-1 and modulate its
activity. It is regulated by a variety of stimuli like glucagon, exercise, thyroid hormones,
growth hormone and glucocorticoids (43-46). However, the main regulator of IGFBP-1 is
insulin that inhibits IGFBP-1 synthesis and secretion from the liver. Circulating IGFBP-1
level is considered as an important predictor of insulin secretion and its decrease refers
to hyperinsulinaemia or to long-term type 2 diabetes mellitus (47;48), whereas a high
serum level of IGFBP-1 is associated with insulin resistance (49).

9
1.2.3.2 IGFBP-2
IGFBP-2 with a molecular weight of 36 kDa is the second most abundant circulating
IGFBP after IGFBP-3. It exerts a higher binding affinity to IGF-2 than IGF-1 (42). Both
stimulatory and inhibitory effects of IGFBP-2 on IGF-1 actions and positive and negative
regulation of IGFBP-2 of tumor growth have been described, depending on tissue type
and physiological conditions (41;50-52). Increased serum concentration of IGFBP-2 has
been reported in non-islet cell tumor hypoglycemia and diabetes mellitus (53).
1.2.3.3 IGFBP-3
It is the major circulating binding protein for IGFs, binds 80-90% of all IGF-1 found in the
blood. It is a 24-45 kDa glycoprotein secreted systematically from the liver and locally
from other normal and cancer cell types. It exists in a 140-150 kDa ternary complex with
IGF-1 or IGF-2 and with a 85 kDa glycoprotein, acid labile subunit (ALS). This complex is
not able to pass the capillary barrier and its formation is inhibited by
glycosaminoglycans. Growth hormone deficiency decreases blood IGFBP-3
concentration, while it increases in patients with acromegaly. In addition to its IGF-1-
dependent effects, its direct modulation of cell growth and survival has been
demonstrated. Interacting with nuclear elements like retinoid X receptor (RXR) and
cellular proteins like Alzheimer's survival protein, humanin, inducing apoptotic protein
Bax and increasing cell sensitivity to ionising radiation through IGFBP-3 have been
reported as possible mechanisms for IGFBP-3 - cell growth interaction (54;55). However,
down-regulated expression of IGFBP-3 has been observed in many tumor cells and
considered as a powerful diagnostic biomarker of cancer development (56).
1.2.3.4 IGFBP-4
Existing in two forms, non-glycosylated (24 kDa) and N-glycosylated (28 kDa), IGFBP-4 is
the smallest IGF-binding protein. It binds IGF-1 and IGF-2 with the same affinity without
any influence of the glycosylation state. It is secreted from the liver and other different
cell types and tissues like adrenals and testis. However, it secretion is affected by

10
different nutritional and hormonal factors like caloric intake, vitamin D and para thyroid
hormones and its ability to bind IGFs is regulated by its proteolysis trough different
proteases like preganancy-associated plasma protein (PAPP-A) (57;58). In addition to its
inhibition of IGF-1 pathway, IGF-independent actions of IGFBP-4 like stimulation of
cardiomyocyte differentiation have been reported (59). Moreover, a tissue-dependent
positive and negative association between IGFBP-4 expression and tumor growth has
been suggested (60;61).
1.2.3.5 IGFBP-5
It is with a molecular weight of 29 kDa located like IGFBP-2 in chromosome 2. It is
expressed in many prostate cell models and cell types like human fibroblasts, ovarian
granulose cells and chondrocytes. It shows a low but similar binding affinity to IGF-1 and
IGF-2 (62). In addition to the various reports indicating the inhibitory effect of IGFBP-5
on the actions of IGF-1, IGFBP-5 has been found to stimulate IGF-1 signaling in prostatic
disease (62).
1.2.3.6 IGFBP-6
A 32 kDa protein found preferentially in cerebrorospinal fluid with a higher affinity to
IGF-2 over IGF-1. It is found in O-glycosylated form that is required for its secretion,
stability and translocation, but not for its binding to IGFs and inhibition of their actions.
Its association with the development of diseases like type 1 diabetes mellitus has been
reported (63).
1.2.3.7 IGFBP-7
It differs from the other six IGFBPs that it lacks the C-terminus and has a low affinity to
IGFs but a high affinity to insulin. A lower IGFBP-7 expression has been observed in
different cancer types like breast, prostate and colorectal cancer compared with normal
cells. However, it seems to function as a powerful tumor suppressor (64;65).
11
1.2.4 IGF-1 bioactivity
In order to measure total circulating IGF-1, many immunoassays like ELISA, RIA ...have
been developed. IGFBPs form complexes with IGFs, dissociate from them very slowly
and give false results in these assays, therefore, techniques like acid-dependent size
exclusion chromatography, extraction with solid-phase and acid-ethanol extraction have
been used. Despite of the above mentioned extraction procedures, the remaining
IGFBPs may still interfere with the used assay. Nevertheless, to measure IGF-1 efficiency
with the presence of IGFBPs, various methods have been evaluated, including
measurement of IGF-1-induced sulfate incorporation, DNA synthesis, RNA synthesis,
protein synthesis and glucose uptake. Recently, an assay called kinase receptor
activation assay (KIRA) that takes in consideration the inhibitory and stimulatory effects
of IGFBPs on IGF-1 signaling, has been widely used (66;67).
1.2.5 IGF-1 signaling
Binding of IGF-1 to the extracellular -subunit of its receptor, IR or IGF1R/IR leads to a
conformational change in the receptor structure and to autophosphorylation of tyrosine
residues in the intracellular -subunit of this receptor. IRS1 binds to the phosphorylated
receptor and the resultant activated IRS1 serves as a binding and activating site for the
PI3kinase which phosphorylates phosphatidylinositol (4, 5) diphosphate (PIP2), a
component of the cell membrane that is integrated into the two lipid layers of the cell
membrane, and forms phosphatidylinositol (3,4,5) triphosphate (PIP3) which can also
bind and activate AKT kinase or protein B kinase. Activation of protein kinase B demands
its phosphorylation on threonine 308 by phosphoinositide-dependent protein kinase-1
(PDK1) as well as its phosphorylation on serine 473 by mammalian target of rapamycin
complex 2 (mTORC2) (68;69)
12
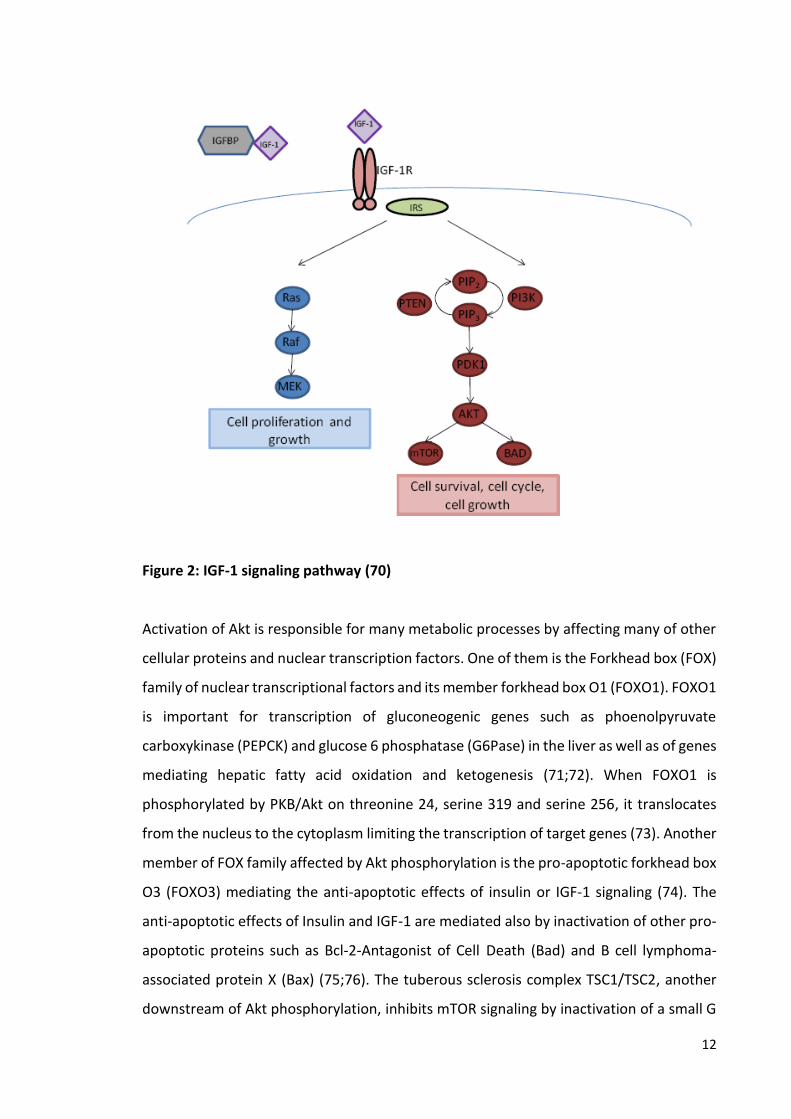
Figure 2: IGF-1 signaling pathway (70)
Activation of Akt is responsible for many metabolic processes by affecting many of other
cellular proteins and nuclear transcription factors. One of them is the Forkhead box (FOX)
family of nuclear transcriptional factors and its member forkhead box O1 (FOXO1). FOXO1
is important for transcription of gluconeogenic genes such as phoenolpyruvate
carboxykinase (PEPCK) and glucose 6 phosphatase (G6Pase) in the liver as well as of genes
mediating hepatic fatty acid oxidation and ketogenesis (71;72). When FOXO1 is
phosphorylated by PKB/Akt on threonine 24, serine 319 and serine 256, it translocates
from the nucleus to the cytoplasm limiting the transcription of target genes (73). Another
member of FOX family affected by Akt phosphorylation is the pro-apoptotic forkhead box
O3 (FOXO3) mediating the anti-apoptotic effects of insulin or IGF-1 signaling (74). The
anti-apoptotic effects of Insulin and IGF-1 are mediated also by inactivation of other pro-
apoptotic proteins such as Bcl-2-Antagonist of Cell Death (Bad) and B cell lymphoma-
associated protein X (Bax) (75;76). The tuberous sclerosis complex TSC1/TSC2, another
downstream of Akt phosphorylation, inhibits mTOR signaling by inactivation of a small G
13
protein called Ras homolog enriched in brain (Rheb). Mutations in the tumor suppressor
genes TSC1 and TSC2 cause a human syndrome known as tuberous sclerosis complex
syndrome and characterized by a development of harmatomas, skin rashes and mental
retardation (77). Phosphorylation of Akt phosphorylates TSC2, a GTPase activating
protein and a component of TSC1/TSC2 complex, and re-destributes this complex from
the cell membrane to the cytosol dissociating the interaction between TSC2 and Rheb and
leading to more accumulation of the active form of Rheb and to more activation of mTOR
signaling (78).
There are two complexes of mTOR, one is called mTORC1 which consists of mTOR,
regulatory associated protein of mTOR (Raptor), mammalian LST8/G-protein β-subunit
like protein (mLST8/GβL) and is inhibited by rapamycin. Its activation is mediated by Akt
signaling through inactivation of TSC1/TSC2 complex. The most important downstream
targets of mTORC1 are P70 ribosomal protein S6 kinase 1 (p70S6K1) which activates S6
Ribosomal protein and stimulates protein synthesis and the eukaryotic initiation factor
4E binding protein 1(4E-BP1) which after its phosphorylation by mTORC1 releases
eukaryotic translation initiation factor 4E (eIF4E) allowing it to bind to mRNA and promote
protein synthesis. mTORC1 is considered to be a nutrient, energy and redox sensor. The
presence of growth hormones activates mTORc1 via Akt signaling and low levels of ATP
under conditions of starvation reduce mTORC1 via AMPK-dependent activation of TSC2.
IGF-1 is known to induce differentiation and proliferation and this effect is mediated by
binding the small adaptor protein called growth factor receptor-bound protein 2 (Grb2)
to the IRS proteins via SH2 domain. Activated Grb2 binds to the guanine nucleotide
exchange factor (GEF) called SOS via SH3 domain which promotes the phosphorylation of
Ras. The phosphorylation of Ras enables its recruitment to the plasma membrane where
it activates a small G protein P21 Ras which binds and activates the serine/threonine
kinase Raf. Activation of its downstream effectors as mitogen-activated kinase (MEKs)
and extracellular signal regulated kinases (ERKs) leads to the translocation of ERK in the
nucleus and phosphorylation of different transcription factors which are involved in
differentiation and proliferation processes. Another pathway which is involved in IGF-1
effects is the apoptosis signaling. Studies have mentioned that IGF-1 through PI3kinase
pathway increases P53 degradation and decrease P53 protein levels by induction of
phosphorylated Mouse double minute 2 homolog (MDM2), an ubiquitin ligase, which

14
binds to P53 and inhibits its DNA binding decreasing the transcription of apoptosis-
mediated genes (79).
1.2.6 IGF-1 concentration
The normal range for growth hormone is 1-9 ng/ml. However, a lower as well as a higher
value may be normal because GH is secreted in pulses. IGF-1 level is used as a screening
test for growth hormone diseases such as growth hormone deficiency, dwarfism,
acromegaly and gigantism. IGF-1 concentration in the blood ranges between 10 and 1000
ng/ml and it is changed by age, gender, pubertal stage and nutritional state (80).
1.3 GH/IGF-1 axis and diseases
Aging is characterized by loss of muscle mass and impairment of its function increasing
the risk for falls and fractures (81;82). Decreased GHR and IGF-1 mRNA and protein and
increased tumor necrosis factor alpha (TNF and suppressor of cytokine signaling 3 (SOC-
S3) mRNA in skeletal muscle biopsies from older male compared with younger ones
suggest the role of GH/IGF-1 signaling in this disorder (83). Through mTOR and Glycogen
synthase kinase 3 (GSK3) and forkhead transcription factors, downstream effectors of Akt
signaling, and reduction of E3 ubiquitin ligases, atrogin-1 and muscle RING finger-1
(MuRF1), IGF-1 induces protein synthesis and myocyte proliferation and increases muscle
growth (84;85). Thus, decreased GH-dependent IGF-1 in parallel with aging could be
responsible for the age-related muscle mass wasting.
IGF-1 is involved in bone generation and mineralization through activation of osteoblast
proliferation and modulation of phosphate and 25-hydroxyvitamin D3 re-absorption at
the kidney level (86). Furthermore, GHR- and IGF-1-knockout mice show skeletal
malformation, decreased mineralization and increased apoptosis which are reversed by
administration of IGF-1 (86), therefore, decreased level of plasma IGF-1 contributes to the
pathogenesis of osteoporosis. There is also an increased incidence about the relationship
between low IGF-1 levels and increased cardiovascular mortality and heart failure (87).
Many mechanisms are expected to mediate the positive effect of high IGF-1 levels as an
increase in the expression of Mouse double minute 2 homolog (MDM2) and the resulting
15
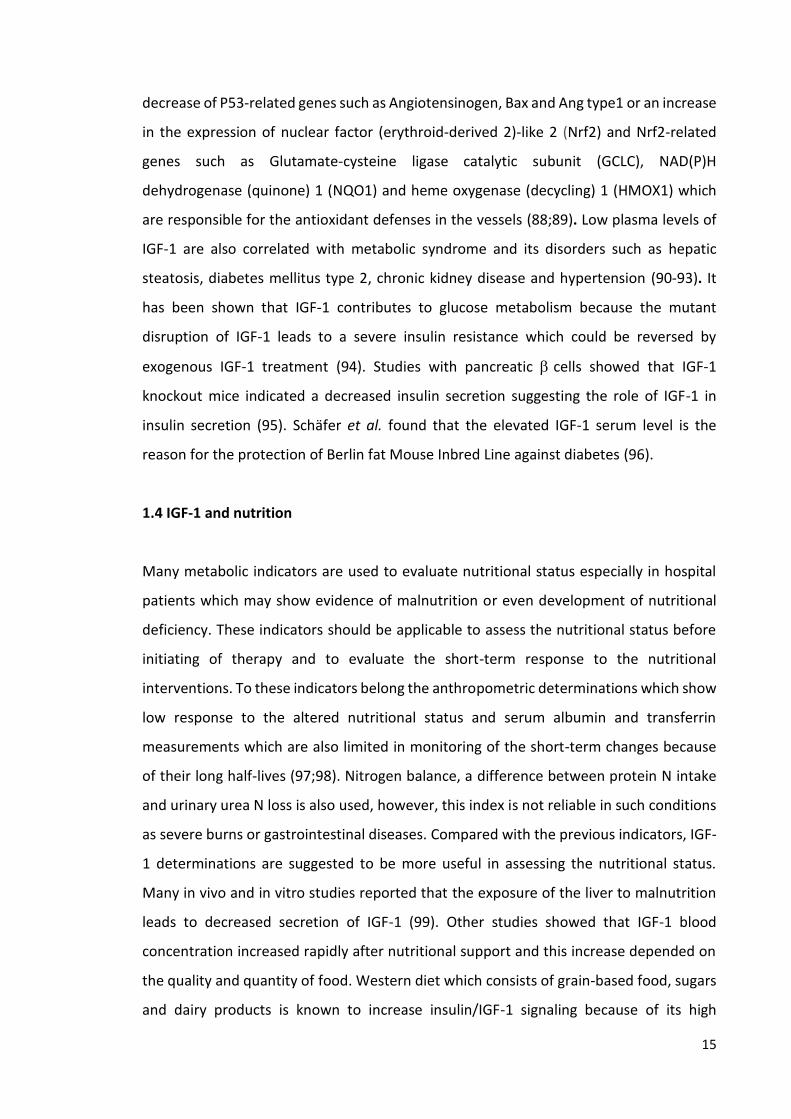
decrease of P53-related genes such as Angiotensinogen, Bax and Ang type1 or an increase
in the expression of nuclear factor (erythroid-derived 2)-like 2 (Nrf2) and Nrf2-related
genes such as Glutamate-cysteine ligase catalytic subunit (GCLC), NAD(P)H
dehydrogenase (quinone) 1 (NQO1) and heme oxygenase (decycling) 1 (HMOX1) which
are responsible for the antioxidant defenses in the vessels (88;89). Low plasma levels of
IGF-1 are also correlated with metabolic syndrome and its disorders such as hepatic
steatosis, diabetes mellitus type 2, chronic kidney disease and hypertension (90-93). It
has been shown that IGF-1 contributes to glucose metabolism because the mutant
disruption of IGF-1 leads to a severe insulin resistance which could be reversed by
exogenous IGF-1 treatment (94). Studies with pancreatic cells showed that IGF-1
knockout mice indicated a decreased insulin secretion suggesting the role of IGF-1 in
insulin secretion (95). Schäfer et al. found that the elevated IGF-1 serum level is the
reason for the protection of Berlin fat Mouse Inbred Line against diabetes (96).
1.4 IGF-1 and nutrition
Many metabolic indicators are used to evaluate nutritional status especially in hospital
patients which may show evidence of malnutrition or even development of nutritional
deficiency. These indicators should be applicable to assess the nutritional status before
initiating of therapy and to evaluate the short-term response to the nutritional
interventions. To these indicators belong the anthropometric determinations which show
low response to the altered nutritional status and serum albumin and transferrin
measurements which are also limited in monitoring of the short-term changes because
of their long half-lives (97;98). Nitrogen balance, a difference between protein N intake
and urinary urea N loss is also used, however, this index is not reliable in such conditions
as severe burns or gastrointestinal diseases. Compared with the previous indicators, IGF-
1 determinations are suggested to be more useful in assessing the nutritional status.
Many in vivo and in vitro studies reported that the exposure of the liver to malnutrition
leads to decreased secretion of IGF-1 (99). Other studies showed that IGF-1 blood
concentration increased rapidly after nutritional support and this increase depended on
the quality and quantity of food. Western diet which consists of grain-based food, sugars
and dairy products is known to increase insulin/IGF-1 signaling because of its high

16
glycemic index and insulinotropic dairy (100). In contrast, dietary restriction and
paleolithic diet which excludes the previous products decreases IGF-1. Some studies
referred that the acute postprandial hyperinsulinemia following the increased intake of
refined carbohydrates and the resulting changes in IGF-1 system is the main reason for
the increased growth in groups such as Eskimo (101).
2. Aim of study
The aim of this work focuses on studying the response of GH/IGF-1 axis to glucagon
administration and insulin-induced hypoglycemia and identifying the impact of this
response on IGF-1 bioactivity, measured by cell-based KIRA assay.
2.1. Glucagon administration study
Among various medical procedures known to validate growth hormone (GH) deficiency in
humans, the glucagon stimulation test (GST) is used (102-105). However, the mechanisms
underlying glucagon-induced GH release are not fully understood.
GH regulates insulin-like growth factor 1 (IGF-1) secretion and circulating IGF-1 loop acts
as a feedback mechanism at the pituitary gland level to increase GH (103). To date, the
interplay between GH, IGF-1 and IGF-binding proteins determines IGF-1 bioactivity, the
ability of IGF-1 to induce its signaling. Thus, IGF-1 bioactivity is sufficient to reflect any
variety in GH/IGF-1 system (106;107).
The impact of insulin on GH/IGF-1 axis has been well studied. Insulin-induced stimulation
of GH receptor expression, -down-regulation of IGFBP-1, -up-regulation of IGFBP-2 and -
decrease in IGF-1 bioactivity have been reported (108-111). Nevertheless, there is no
information about the interference of glucagon, as a counter-regulatory hormone of
insulin, with GH/IGF-1 axis. In the current study, the aim was to investigate whether
glucagon modulates IGF1 bioactivity and to determine how this change accounts later for
GH stimulation.
Although the positive effects of high protein diet, characterized with increased glucagon
secretion on weight control have been suggested, the increased incidence of
cardiovascular disease related to the consumption of this diet has been demonstrated

17
(112-115). However, the effect of glucagon on IGF-1 bioactivity regarding induced
cardiovascular disease is missed.
2.2 Insulin-induced hypoglycemia study
The interplay between insulin and GH/IGF-1 system has been well studied. To date, insulin
is known to induce GH receptor expression, to down-regulate IGFBP-1 and to up-regulate
IGFBP-2 (108-111). To be able to study IGF-1 bioactivity, as an index of free IGF-1, we have
to take in consideration the inhibitory and stimulatory effects of IGF-binding proteins
(106;107). The previous data from our lab showed that insulin administration during
hyperinsulinemic-euglycemic clamp decreases IGF-1 bioactivity through up-regulation of
IGFBP-2 (108). Blood glucose level during this clamp is held constant by glucose infusion
with a certain concentration. However, some in vivo and in vitro investigations revealed
that glucose inhibits GH release, interferes with GH/IGF-1 system and controls GHR
expression and GH-induced IGF-1 expression (116;117). Moreover, oral glucose tolerance
test, a test used to validate the presence of acromegaly and excess GH release, depends on
the principle that GH secretion counter-regulates hypoglycemia (118). On the other hand,
insulin tolerance test (ITT) is a medical procedure performed to assess the good function
of the hypothalamo-pituitary-adrenal axis. Insulin injection during this test is able to induce
in addition to hypoglycemia, GH release and the mechanism is unclear. Therefore, the
current study is aimed to analyze dynamics of changes in secretion of GH/IGF-1 system
members during applying of insulin tolerance test in humans and to verify if insulin-induced
IGF-1 bioactivity response is preserved in hypoglycemic condition. In addition diabetes
mellitus and its complication including cardiovascular disease (CVD) are responsible for
more than million deaths worldwide every year. Insulin-treated diabetic patients who
experience frequent severe hypoglycemia, as a result of intensive glucose control, show
increased rate of mortality and the causes are unclear (119-121). However, changes in
GH/IGF-1 axis related to the development of cardiovascular disease and increased death
have been suggested. Moreover, IGF-1 bioactivity, as a crosstalk between GH, IGF-1 and
IGF-binding proteins (IGFBPs), is considered as a survival predictor in humans (122;123).
The current study is aimed to investigate GH/IGF-1 system response to insulin induced
18
hypoglycemia and its impact on IGF-1 bioactivity as a possible link between hypoglycemia
and increased mortality.
19
3. Materials and methods
3.1. Materials
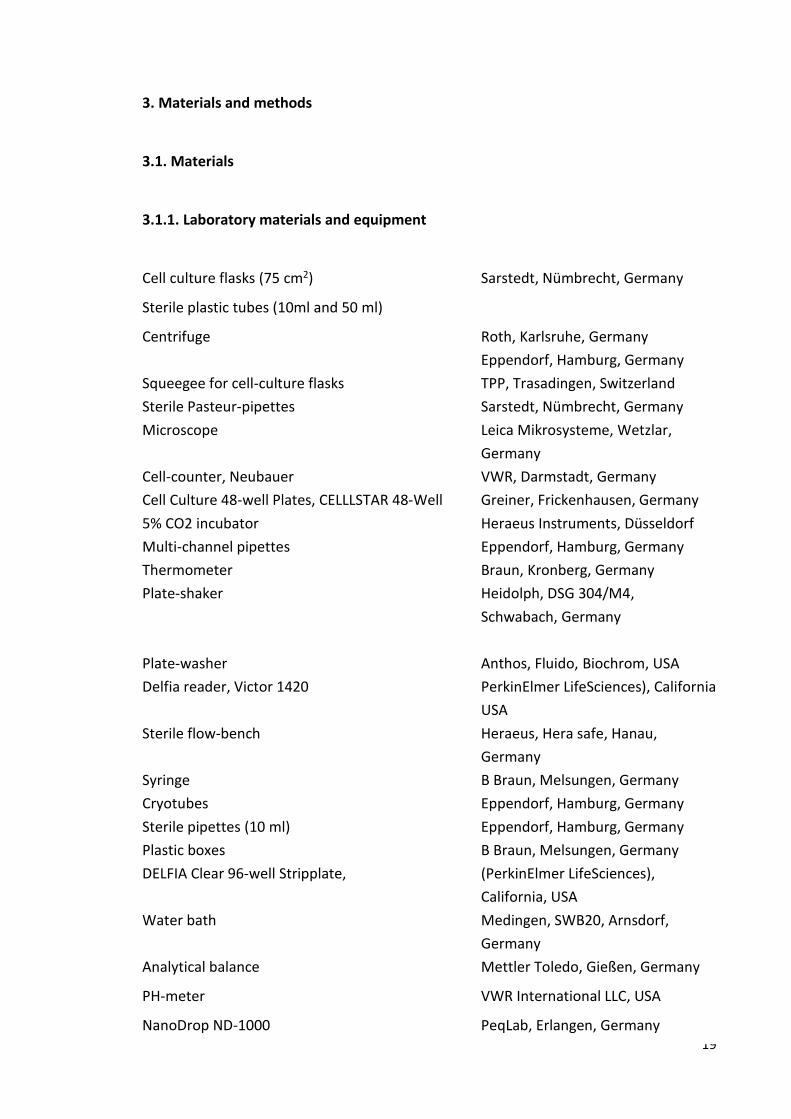
3.1.1. Laboratory materials and equipment
Cell culture flasks (75 cm2) Sarstedt, Nümbrecht, Germany
Sterile plastic tubes (10ml and 50 ml)
Centrifuge Roth, Karlsruhe, Germany
Eppendorf, Hamburg, Germany
Squeegee for cell-culture flasks TPP, Trasadingen, Switzerland
Sterile Pasteur-pipettes Sarstedt, Nümbrecht, Germany
Microscope Leica Mikrosysteme, Wetzlar,
Germany
Cell-counter, Neubauer VWR, Darmstadt, Germany
Cell Culture 48-well Plates, CELLLSTAR 48-Well Greiner, Frickenhausen, Germany
5% CO2 incubator Heraeus Instruments, Düsseldorf
Multi-channel pipettes Eppendorf, Hamburg, Germany
Thermometer Braun, Kronberg, Germany
Plate-shaker Heidolph, DSG 304/M4,
Schwabach, Germany
Plate-washer Anthos, Fluido, Biochrom, USA
Delfia reader, Victor 1420 PerkinElmer LifeSciences), California
USA
Sterile flow-bench Heraeus, Hera safe, Hanau,
Germany
Syringe B Braun, Melsungen, Germany
Cryotubes Eppendorf, Hamburg, Germany
Sterile pipettes (10 ml) Eppendorf, Hamburg, Germany
Plastic boxes B Braun, Melsungen, Germany
DELFIA Clear 96-well Stripplate, (PerkinElmer LifeSciences),
California, USA
Water bath Medingen, SWB20, Arnsdorf,
Germany
Analytical balance Mettler Toledo, Gießen, Germany
PH-meter VWR International LLC, USA
NanoDrop ND-1000 PeqLab, Erlangen, Germany

20
384-Well Mutliply® -PCR Plate Sarstedt, Nümbrecht, Germany
3.1.2. Chemicals, reagents and buffers
Dimethyl-sulfoxide (DMSO) Sigma, Munic, Germany
Dulbeccos Modified Eagle´s Medium, DMEM (with L-glutamine and 3,7g/l NaHCO3 and
1g/l glucose) Biochrom, Berlin, Germany
Geneticin (G 418), Biochrom, Berlin, Germany
Hygromycin (20 ml, 50 mg/ml Gibco, Life Technologies,
Darmstadt, Gemany
Penicillin/Streptomycin (100 ml,– 10000 ug/ml Biochrom, Berlin, Germany
Fetal calf serum (FCS) Biochrom, Berlin, Germany
Human serum albumin (HAS) MP BioMedicals, Eschwege,
Germany
Human serum albumin
Hepes 50mM Sigma, Munic, Germany
NaCl Merck, Darmstadt, Germany
Na4P2O2,10H2O ICN-Biomedicals
NaF Merck, Darmstadt, Germany
KCL Merck, Darmstadt, Germany
NaHCO3 Merck, Darmstadt, Germany
KH2PO3 Merck, Darmstadt, Germany
Mg2SO4.7H2O Merck, Darmstadt, Germany
99% Glycerol Sigma, Munic, Germany
NP-40 (IGEPAL-ca 630 Bie og Berntsen
MgCL2.6H2O Merck, Darmstadt, Germany
CaCl2.2H2O Merck, Darmstadt, Germany
Tween Merck, Darmstadt, Germany
Complete, EDTA-free Protease Inhibitor Cocktail Roche scientific, Basel, Switzerland
Bovine serum albumin (BSA) Sigma, Munic, Germany
Substrate reagent pack R&D system, Pennsylvania, USA
Stop Solution 2N Sulfuric Acid R&D system, Pennsylvania, USA

21
IGF- I, WHO,02/254 (10µg), NIBSC, London, UK
Sodium orthovanadate Sigma, Munic, Germany
PBS buffer (10x) Merck, Darmstadt, Germany
Power SYBR green PCR master mix Fisher scientific Applied
Biosystems, schwerte, Germany
Proteases and phosphatases inhibitors Roche scientific, Basel, Switzerland
Acetic acid
TrisHCL Roth, Karlsruhe, Germany
Sodium deoxycholate Sigma, Munic, Germany
EDTA Roth, Karlsruhe, Germany
SDS Roth, Karlsruhe, Germany
Glycerol Roth, Karlsruhe, Germany
‐Mercaptoethanol Roth, Karlsruhe, Germany]
Bromphenolblue Sigma, Seelze, Germany
Glycine Roth, Karlsruhe, Germany
Methanol Roth, Karlsruhe, Germany
3.1.3. Buffers
3.1.3.1 Cell culture solutions
10% FCS-DMEM
500 ml DMEM
50 ml FCS
2.5 ml penicillin/ streptomycin (1mg/ml)
2.5 ml hygromycin
250µl Geneticin
Storage at 4 C0
3.1.3.2 Kinase receptor activation assay solutions
1M, MgCl2,6H2O+CaCl2,2H2O (10 ml)
22
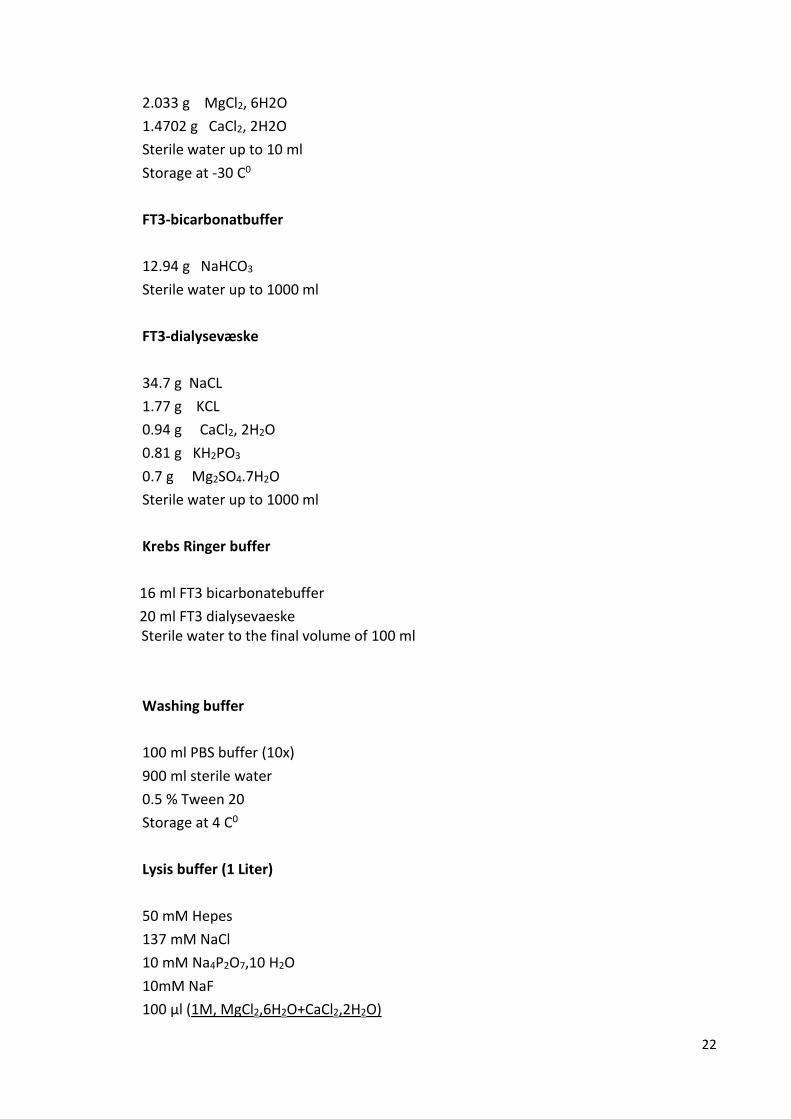
2.033 g MgCl2, 6H2O
1.4702 g CaCl2, 2H2O
Sterile water up to 10 ml
Storage at -30 C0
FT3-bicarbonatbuffer
12.94 g NaHCO3
Sterile water up to 1000 ml
FT3-dialysevæske
34.7 g NaCL
1.77 g KCL
0.94 g CaCl2, 2H2O
0.81 g KH2PO3
0.7 g Mg2SO4.7H2O
Sterile water up to 1000 ml
Krebs Ringer buffer
16 ml FT3 bicarbonatebuffer
20 ml FT3 dialysevaeske Sterile water to the final volume of 100 ml
Washing buffer
100 ml PBS buffer (10x)
900 ml sterile water
0.5 % Tween 20
Storage at 4 C0
Lysis buffer (1 Liter)
50 mM Hepes
137 mM NaCl
10 mM Na4P2O7,10 H2O
10mM NaF
100 µl (1M, MgCl2,6H2O+CaCl2,2H2O)

23
900 µl Sterile water
PH adjusted to 7.4
10 ml NP-40
90 ml glycerol 99%
Storage at 4 C0
Activated orthovanedate pH 10.0
200 mM solution of sodium orthovanadate is adjusted to pH 10.0 using either 1N NaOH or 1N HCL. After that it is boiled until its color disappears (approximately 10 minutes) and then it is cooled to room temperature. These steps are repeated until the solution becomes without any color and the pH stabilizes at 10.0.
Storage as aliquots at – 20C 0
IGF-1 stock solutions
10 µg dissolved in 1ml acetic acid (0.2 M) containing 0.2 % HSA= (10 µg/ml)
Stock solutions of 400 µl with 1.25 mg/L are prepared and distributed in tubes of 40 µl
Storage at – 30C 0
Detection antibody buffer:
500 ml PBS buffer (1X)
0.2% BSA (1g in 500 ml 1x PBS)
0.5% Tween 20
Storage at 4 C0
3.1.3.3 Western blot solutions
RIPA Puffer
10 mM TrisHCl pH 7.2
150 mM NaCl
5 mM EDTA
1% Triton X-100
1% sodium deoxycholate
0.1% sodium dodecyl sulfate (SDS)
5x Laemmli Buffer
1 M Tris‐HCl, pH 6,8, 6,26 % (v/v)
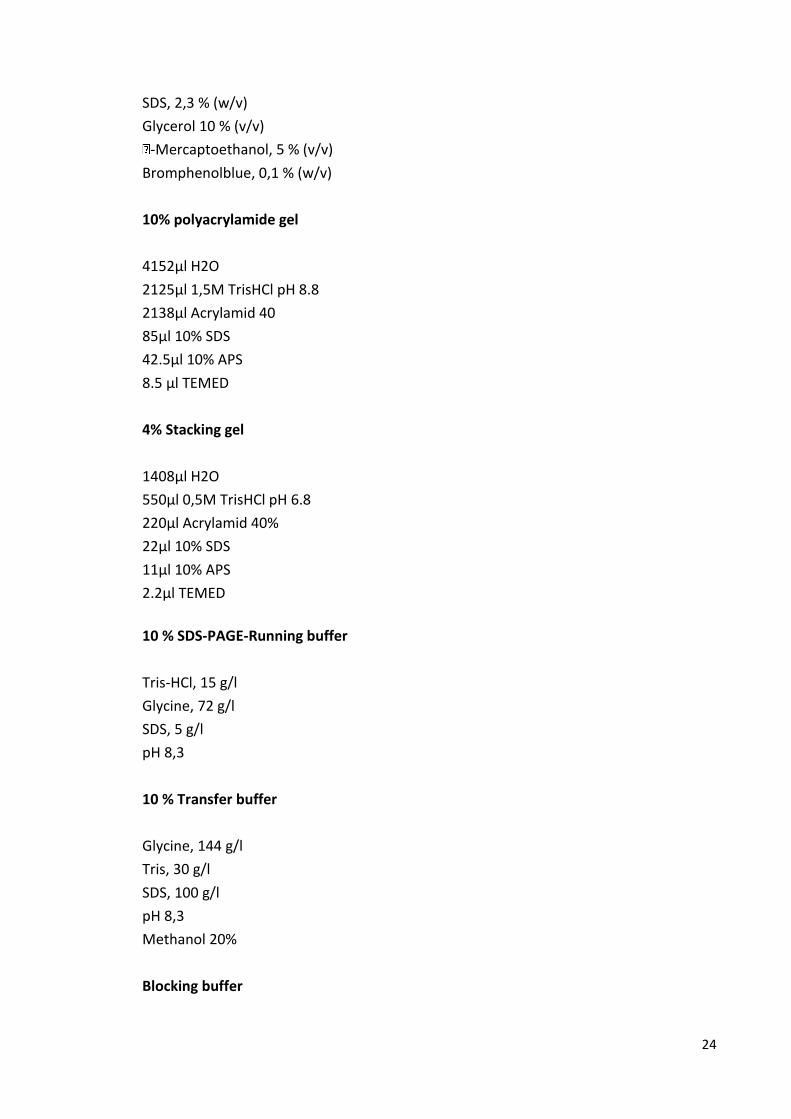
24
SDS, 2,3 % (w/v)
Glycerol 10 % (v/v)
‐Mercaptoethanol, 5 % (v/v)
Bromphenolblue, 0,1 % (w/v)
10% polyacrylamide gel
4152µl H2O
2125µl 1,5M TrisHCl pH 8.8
2138µl Acrylamid 40
85µl 10% SDS
42.5µl 10% APS
8.5 µl TEMED
4% Stacking gel
1408µl H2O
550µl 0,5M TrisHCl pH 6.8
220µl Acrylamid 40%
22µl 10% SDS
11µl 10% APS
2.2µl TEMED
10 % SDS‐PAGE‐Running buffer
Tris‐HCl, 15 g/l
Glycine, 72 g/l
SDS, 5 g/l
pH 8,3
10 % Transfer buffer
Glycine, 144 g/l
Tris, 30 g/l
SDS, 100 g/l
pH 8,3
Methanol 20%
Blocking buffer

25
Non-fat dried milk, 5 g
1 % PBS, 1 l
Washing buffer
Non-fat dried milk, 5 g
1 % PBS, 1 l
Tween 20, 1 ml
PBST
Tween 20, 100 µl
1 % PBS, 100 ml
Restore™ Western Blot Stripping Buffer VWR International GmbH,
Darmstadt, Germany
3.1.4. Kits
GlucaGen Novo Nordisk Pharma Inc,
Mainz, Germany
Glucometer Biosen 5130, EKF-diagnostic Magdeburg, Germany
Insulin Elisa Kit Mercodia, Uppsala, Sweden
Glucagon RIA kit DPC Biermann, Bad
Nauheim, Germany
Automated chemiluminescent immunometric assay Immunodiagnostic systems
GmbH, Frankfurt, Germany
IGFBP-1 ELISA kit DSL Deutschland GmbH,
Sinsheim, Germany
IGFBP-2 ELISA kit DSL Deutschland GmbH
Human phospho-IGF1 receptor capture antibody Kit R&D system
Rneasy Mini Kit Qiagen, Hilden, Germany
RNase-Free DNase Set Qiagen, Hilden, Germany
cDNA Synthese Kit mit Rnase inhibitor Fisher scientific Applied
Biosystems, Schwerte,
Germany
PCA protein assay kit VWR Intrenational GmbH
Darmstadt, Germany

26
3.1.5. Primers (Invitrogen, Darmstadt, Germany)
Mouse HPRT 5′-CAGTCCCAGCGTCGTGATTA-3′ 5′-AGCAAGTCTTTCAGTCCTGTC-3
Mouse IGF-1 5′-TTCACACCTCTTCTACCTGGCG-3′
5′-CGAACTGAAGAGCATCCACCA-3′
Mouse IGFBP-1 5′-CATTCTTGTTGCA-3′ 5′-ACCTCAAGAAA-3′ Mouse IGFBP-2 5′-TCTCCTGCTGCTGC-3′ 5′-GGCGCGGGTACCTGTGAAAA-3′ Mouse IGFBP-3 5′-AATGGCCGGCGGGTTCTGC-3′ 5′-TTCTGGGTGTCTGTGTTT-3′ 3.1.6. Antibodies
Monoclonal anti Phospho-Akt (Ser473) Cell Signalling Technology
Frankfurt, Germany
Monoclonal anti Akt Cell Signaling Technology
Frankfurt, Germany
3.1.7. Cell lines
Human embryonic kidney (HEK) cells that expressed the human IGF-1R was provided by
Prof. J. Frystyk from institute of Clinical Medicine, Aarhus University, Denmark.
Mouse primary hepatocytes that were isolated by Stefanie Lieske from institute of
nutritional science in Potsdam University
27
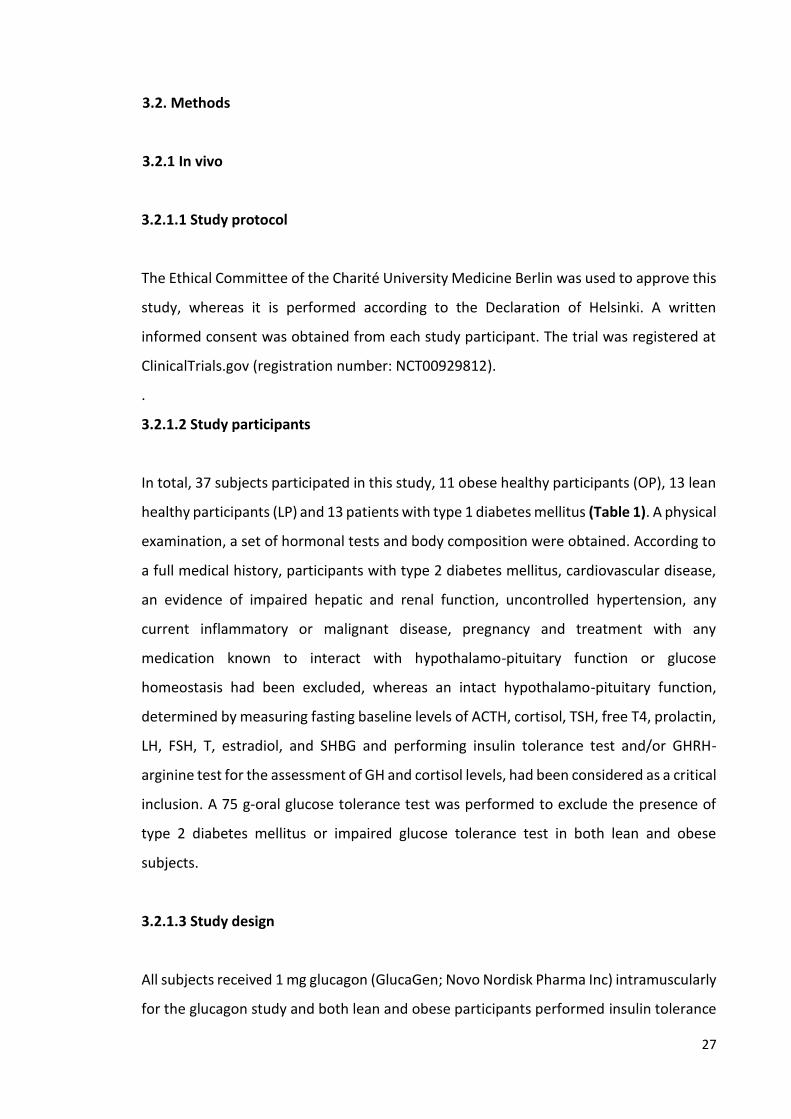
3.2. Methods
3.2.1 In vivo
3.2.1.1 Study protocol
The Ethical Committee of the Charité University Medicine Berlin was used to approve this
study, whereas it is performed according to the Declaration of Helsinki. A written
informed consent was obtained from each study participant. The trial was registered at
ClinicalTrials.gov (registration number: NCT00929812).
.
3.2.1.2 Study participants
In total, 37 subjects participated in this study, 11 obese healthy participants (OP), 13 lean
healthy participants (LP) and 13 patients with type 1 diabetes mellitus (Table 1). A physical
examination, a set of hormonal tests and body composition were obtained. According to
a full medical history, participants with type 2 diabetes mellitus, cardiovascular disease,
an evidence of impaired hepatic and renal function, uncontrolled hypertension, any
current inflammatory or malignant disease, pregnancy and treatment with any
medication known to interact with hypothalamo-pituitary function or glucose
homeostasis had been excluded, whereas an intact hypothalamo-pituitary function,
determined by measuring fasting baseline levels of ACTH, cortisol, TSH, free T4, prolactin,
LH, FSH, T, estradiol, and SHBG and performing insulin tolerance test and/or GHRH-
arginine test for the assessment of GH and cortisol levels, had been considered as a critical
inclusion. A 75 g-oral glucose tolerance test was performed to exclude the presence of
type 2 diabetes mellitus or impaired glucose tolerance test in both lean and obese
subjects.
3.2.1.3 Study design
All subjects received 1 mg glucagon (GlucaGen; Novo Nordisk Pharma Inc) intramuscularly
for the glucagon study and both lean and obese participants performed insulin tolerance
28
tests for the insulin-induced hypoglycemia study. Serum samples were obtained at
different time points and were kept frozen by -80 C0 until analyzed. Type 1 diabetic
patients received the last dose of long-acting insulin in the evening before glucagon
injection.
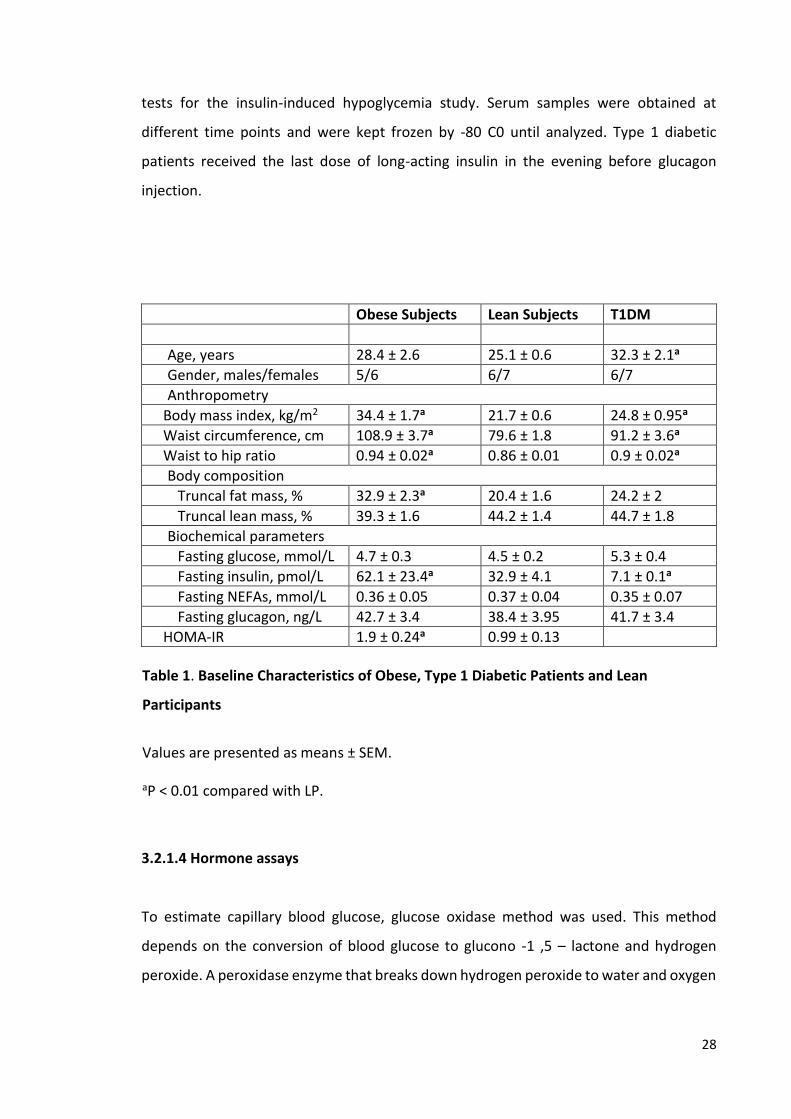
Obese Subjects Lean Subjects T1DM
Age, years 28.4 ± 2.6 25.1 ± 0.6 32.3 ± 2.1a
Gender, males/females 5/6 6/7 6/7
Anthropometry
Body mass index, kg/m2 34.4 ± 1.7a 21.7 ± 0.6 24.8 ± 0.95a
Waist circumference, cm 108.9 ± 3.7a 79.6 ± 1.8 91.2 ± 3.6a
Waist to hip ratio 0.94 ± 0.02a 0.86 ± 0.01 0.9 ± 0.02a
Body composition
Truncal fat mass, % 32.9 ± 2.3a 20.4 ± 1.6 24.2 ± 2
Truncal lean mass, % 39.3 ± 1.6 44.2 ± 1.4 44.7 ± 1.8
Biochemical parameters
Fasting glucose, mmol/L 4.7 ± 0.3 4.5 ± 0.2 5.3 ± 0.4
Fasting insulin, pmol/L 62.1 ± 23.4a 32.9 ± 4.1 7.1 ± 0.1a
Fasting NEFAs, mmol/L 0.36 ± 0.05 0.37 ± 0.04 0.35 ± 0.07
Fasting glucagon, ng/L 42.7 ± 3.4 38.4 ± 3.95 41.7 ± 3.4
HOMA-IR 1.9 ± 0.24a 0.99 ± 0.13
Table 1. Baseline Characteristics of Obese, Type 1 Diabetic Patients and Lean
Participants
Values are presented as means ± SEM.
aP < 0.01 compared with LP.
3.2.1.4 Hormone assays
To estimate capillary blood glucose, glucose oxidase method was used. This method
depends on the conversion of blood glucose to glucono -1 ,5 – lactone and hydrogen
peroxide. A peroxidase enzyme that breaks down hydrogen peroxide to water and oxygen

29
is used forming with an oxygen acceptor like ortho toluidine coloured compounds that
can be measured by colorimetric assays.
Serum insulin concentration was assessed by normal ElISA kit with inter- and intraassay
coefficients of variation (CV) 3.6% and 4%, respectively.
Plasma glucagon concentration was measured by radioimmunoassay (RIA) using a
constant concentration of radioactive I125-labeled glucagon as a tracer that compete with
unlabeled plasma glucagon on the limited binding sites of glucagon antibody raised in
rabbit. Setting up a standard curve using certain dilutions of unlabeled glucagon enables
to determine glucagon level in unknown samples with intra- and interassay CV were
4.8%and 8.6% respectively.
According to the manufacturer,s protocol of commercially available automated
chemiluminescent immunometric assay, serum IGF-1 was measured in one run by its
acidic separation from its binding proteins, neutralizing and adding of excess IGF-2 that
occupies binding sits of IGFBPs and prevents their binding to IGF-1. Free IGF-1 then was
assessed using streptavidin coated magnetic particle, acridinium labeled anti-IGF-1
monoclonal antibody and biotin conjugated anti-IGF-1 monoclonal antibody. Using the
same above mentioned chemiluminescent immunometric principle, serum HGH and
IGFBP-3 levels were quantified in one run.
IGFBP-1 and IGFBP-2 were measured in one run and duplicate using ELISA kits.
Serum bioactive IGF-1 was measured using Kinase receptor activation assay described
below.
3.2.2. In Vitro
3.2.2.1 Kinase Receptor Activation Assay (KIRA)
IGF-1 is found in human serum binding to different kinds of stimulatory and inhibitory
IGFBPs. Free IGF-1 binds to IGF-1R leading to IGF1R phosphorylation on tyrosine
residues. KIRA assay depends on stimulation of cells that have been transfected with
human IGF-1R with serum and collecting both phosphorylated and un-phosphorylated
IGF-1R using anti IGF-1R capture antibody. Anti-phospho-tyrosine antibody conjugated
with horseradish peroxidase and a suitable substrate is used to detect the

30
phosphorylated IGF-1R induced by bioactive IGF-1.
3.2.2.1.1. Cell culture
3.2.2.1.1.1. Thawing of the cells
HEK cells that are stably transfected with the human IGF-1R were a gift from Prof. J.
Frystyk, institute of Clinical Medicine, Aarhus University, Denmark. Cryotube with HEK
cells was transferred from liquid nitrogen to a 37C0 hot water bath for 2 minutes. The
outside of the cryotube was sterilized with 70% ethanol and the cells were transferred to
50ml-tube of 20 ml 10% FCS-DMEM and centrifuged at 850 g for 7 minutes to remove
DMSO. Supernatant was discarded and 40 ml 10%FCS-DMEM were added and mixed
using a sterile pipette. Cell suspension was transferred to and was incubated in 5% CO2
incubator.
3.2.2.1.1.2 Freezing of the cells
In contrast to the thawing, freezing process should be slow to prevent crystal growth in
the cells. The cells were removed carefully from the bottom of the culture flask and
transferred to 50 ml-tube. They were centrifuged at 22 Co and 800 g for 7-8 minutes and
the supernatant was discarded. 8 ml of freezing solution (10% DMSO+ 90% FCS) was
added to the cells and the re-suspended cells were distributed to 8 sterile cryotubes. The
cells were kept at the beginning at -80 C0, hereafter they were transferred to another
container with liquid nitrogen.
3.2.2.1.1.3 Cultivation of the cells
After thawing, cells were grown in 40 ml 10% FCS-DMEM in 75 cm2-cell culture flasks, in
a humidified atmosphere with 5 % CO2 at 37 °C. HEK cells grow adherent to the ground
of the flask. Every three days the medium was thrown away and the cells were
supplemented with fresh 10% FCS-DMEM medium. When the cells reached 80%
confluent, they were passaged by removing 30 ml of the medium and harvesting the cells

31
from the bottom of the flask in the remaining 10 ml medium using a scarper. Cells then
were centrifuged at 22 C0 and 800 g for 7-8 minutes, supernatant was removed again and
10 ml of 10% FCS-DMEM medium was added. Cells were counted and needed amount of
cells were seeded in 75 cm2-cell culture flasks.
3.2.2.1.2 Assay performance
Measuring IGF-1 bioactivity using KIRA assay takes 4 days
KIRA, day 1
The cell culture flask was taken from the incubator and the cells were controlled under
the microscope. The cells were then removed gently with the Squeegee and transferred
to a 50 ml tube and centrifuged at 22 C0 and 800 g for 7-8 minutes. Supernatant was
discarded and 10 ml of DMEM with 10% FCS was added. From this cell suspension, a
dilution of 10 µl cell suspension and 990 µl DMEM medium or 100 µl cell suspension and
900 µl DMEM medium depending on the cell number expected, was made. Cells were
counted. According to the cell density, a 800,000 cells /ml-cell suspension was made and
500 µl from this cell suspension was put in every well in a 48-well plate with mixing the
cell suspension between every row or between each refilling of the syringe. The plate was
incubated at 37 C0, 5% CO2 for the next day and a new passage was started using 2-3 ml
of the cell dilution (depending on the cell density) with 38ml serum-DMEM medium in a
75-cell culture flask and incubated at 37 C0, 5% CO2 for the next week.
KIRA, day 2
All cell media were discarded from the 48-well plate and 500 µl serum-free medium with
0.1 % (human serum albumin) HSA was added to every well and incubated at 37 C0, 5%
CO2 for the next day. phospho IGF1R antibody was diluted (40µl in 10 ml 1x PBS) to get
at the end a concentration of 5.76 µg/ml and the Delfia plate was coated with the diluted
phospho IGF1 R antibody (100 µl/well) and incubated at 4 C0 for the next day.
KIRA, day 3

32
All samples measured in KIRA assay were human serum samples. While serum samples
were thawed slowly on ice, blocking buffer was prepared using 18 ml 1xPBS + 2ml HSA
(20%) and 200 µl of this blocking buffer was added to every well. The Delfia plate was then
incubated at RT for at least 1 hour. KRB (krebs ring buffer) buffer was made, covered with
a film and gased with 5% CO2 for 8 minutes. Finally, 200 µl HSA were added to 100 ml KRB
to serve as a protein carrier for IGF-1 later. To 50 ml lysis buffer, 1 EDTA-free tablet+ 2 ml
activated orthovanadate solution were added and put on the ice until used. To create IGF-
1 standard curve, we had to generate serial dilutions of known concentrations IGF-1 in KRB
buffer, including 0, 1, 2, 4, 8 g/L and incubate them in a box with 37 C0 water. After
thawing of serum samples, they were diluted (1:100) in KRB buffer and incubated with
IGF-1 standards in the same box of hot water. At the same time the 48-well plate with HEK
cells were put in another box filled with 45 C0 hot water for at least 15 minutes. The media
was removed from the 48-well cell plate, two wells at the same time and 500 µl from
standards or samples were added and again in two wells at the same time. For every two
wells together it took 30 seconds for medium removing and sample filling.
After exactly 16 minutes the stimulation of the cells was stopped by removing the
standards or samples and adding 200 µl above described lysis buffer to every well. This
should be done also in duplicates and in 30 seconds for every two wells together. The 48-
well cell plate with lysis buffer was then incubated for at least one hour on the plate shaker
at 4 C0. During this hour, 300 µl fetal calf serum (FCS) was added to the rest of lysis buffer
and kept at 4 C0 until used. The coated and blocked 96-well delfia plate was washed with
the washing buffer. From each well of the 48-well cell plate, 75 µl cell lysate as well as 25
µl (Lysis buffer with FCS) were added to a well of the 96-well Delfia plate, this should be
done also in duplicate to get at the end Quadruplicate. At the end the 96-well Delfia plate
was incubated overnight on plate shaker at 4 C0 in the cold room for the next day.
KIRA, day 4
The plate was washed with the washing buffer and 100 µl from 1:360 in 1x PBS diluted
anti-phospho tyrosine-HRP capture antibody was added to every well and left on the
plate shaker at room temperature for two hours. 5ml of both Reagent A and B from the
33
substrate reagent pack were mixed and 100µl of this mixture were added to each well
and incubated 10 minutes at RT. The reaction was stopped using 50 µl/ well of the stop
solution and the signal was read using Delfia reader, Victor 1420.
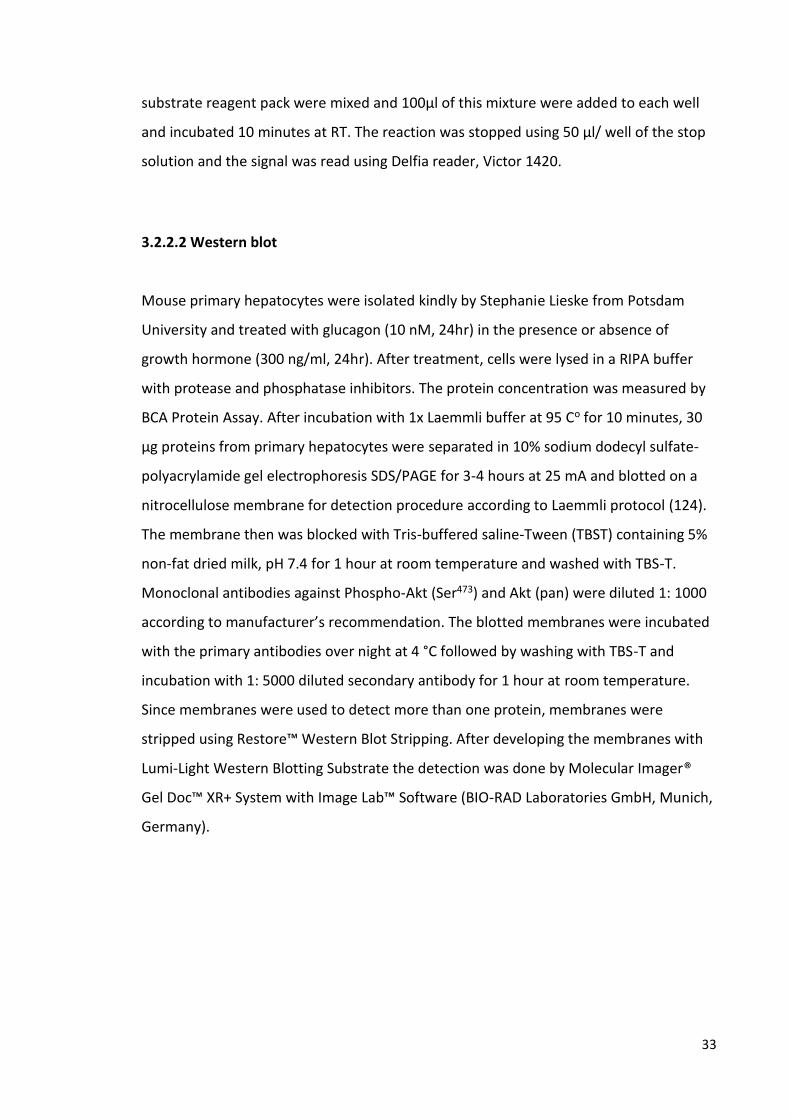
3.2.2.2 Western blot
Mouse primary hepatocytes were isolated kindly by Stephanie Lieske from Potsdam
University and treated with glucagon (10 nM, 24hr) in the presence or absence of
growth hormone (300 ng/ml, 24hr). After treatment, cells were lysed in a RIPA buffer
with protease and phosphatase inhibitors. The protein concentration was measured by
BCA Protein Assay. After incubation with 1x Laemmli buffer at 95 Co for 10 minutes, 30
µg proteins from primary hepatocytes were separated in 10% sodium dodecyl sulfate-
polyacrylamide gel electrophoresis SDS/PAGE for 3-4 hours at 25 mA and blotted on a
nitrocellulose membrane for detection procedure according to Laemmli protocol (124).
The membrane then was blocked with Tris-buffered saline-Tween (TBST) containing 5%
non-fat dried milk, pH 7.4 for 1 hour at room temperature and washed with TBS-T.
Monoclonal antibodies against Phospho-Akt (Ser473) and Akt (pan) were diluted 1: 1000
according to manufacturer’s recommendation. The blotted membranes were incubated
with the primary antibodies over night at 4 °C followed by washing with TBS-T and
incubation with 1: 5000 diluted secondary antibody for 1 hour at room temperature.
Since membranes were used to detect more than one protein, membranes were
stripped using Restore™ Western Blot Stripping. After developing the membranes with
Lumi-Light Western Blotting Substrate the detection was done by Molecular Imager®
Gel Doc™ XR+ System with Image Lab™ Software (BIO-RAD Laboratories GmbH, Munich,
Germany).

34
3.2.2.3. Gene expression
3.2.2.3.1 Isolation and treatment of mouse primary hepatocytes
Mouse primary hepatocytes were isolated by Stephanie Lieske as described previously
(125) and then incubated with glucagon (10 nM, 5hr) in the presence or absence of
growth hormone (300 ng/ml, 24hr). In a subsequent experiment different concentrations
of glucagon (0.1, 1, 10, 100 nM) were used to evaluate glucagon-mediated dose-
dependent effect on the transcription of IGF-1 system members. All stimulations were
performed in four independent experiments done in duplicate. Glucagon-mediated dose-
dependent effect experiment was performed in three independent experiments done in
three technical repeats.
3.2.2.3.2 RNA extraction
Total RNA was extracted from stimulated mouse primary hepatocytes using the
manufacturer instructions of the RNeasy Mini Kit. Cells were lysed and homogenized using
a guanidine-thiocyanate-containing buffer, which ensures inactivation of RNases. The
binding of intact RNAs to a silica gel membrane of spin columns was performed after
adding of ethanol, whereas the contaminants were removed by different wash steps.
Finally, RNAs were eluted in water, collected and quantified by measuring the absorbance
at 260 nm using NanoDrop® ND-1000 Spectrophotometer. The ratio of the absorbance at
260 nm and 230 nm was used to qualify the RNAs and to determine the contamination
with proteins or ethanol. The RNA samples were stored at -80Co until cDNA synthesis.
3.2.2.3.3 cDNA synthesis
cDNA synthesis was done following the instructions of the commercial High Capacity
cDNA Reverse Transcription Kit. RT Master Mix was prepared as described in (Table 2)

35
Substance Volume (µl)
10x RT Buffer 2,0
25x dNTP Mix 0,8
10x RT Random Primers 2,0
Reverse Transcriptase 1,0
RNase inhibitor 1,0
RNases and DNases free water 2,3
Total per reaction 10,0
Table 2. Preparation of RT Master Mix for one reaction
1000 ng of the extracted mRNAs were mixed with RT Master Mix and reverse transcribed
in a thermal cycler. Firstly the random primers annealed to the mRNA strand at 25° C for
10min. This step enables the binding of reverse transcriptase and synthesis of a
complement DNA strand to mRNA at 37° C for 120min. the transcription is terminated at
85° C for 5min and hold at 4° C. Synthesized cDNAs were kept at-20° C until use.
3.2.2.3.4 Real-time reverse transcriptase polymerase chain reaction (RT–PCR)
qRT-PCR is a method used worldwide to study the expression of a target gene by
amplification and quantification of a created cDNA of this gene using the following 10X
Power SYBR Green Master Mix.
Substance Volume (µl)
2x MM Buffer 2.5
Primer Forward 0.35
Primer Reverse 0.35
RNase and DNase-free water 0.8
Total volume 4
Table 3. Preparation of 10X Power SYBR Green Master Mix for one reaction
36
In every PCR cycle double DNA strand is denatured and separated into two strands at 95°
C followed by annealing and binding of the primer at 60° C and polymerase-dependent
elongation of every single DNA strand at 70° C. SYBR green dye is known to bind the
double strand DNA emitting fluorescence signal. The cycle with lower fluorescence signal
detected is called threshold cycle Ct and refers to the cycle number at which the
exponential phase of amplification starts, whereas the specificity of this process is
measured by determination of melting curve. The qualification was performed by using
standard dilution series obtained from samples pools and generation of a standard curve
with X-axis representing the quantity and Y-axis indicating Ct values. The analysis was
performed using ViiA7 RUO software for real time PCR system version 1.2 and the
obtained expression was normalized depending on the expression of mouse
hypoxanthine phosphoribosyltransferase 1 (HPRT1) gene as a house keeping gene.
3.2.3 Statistical analyses
Statistical analyses for human study were performed using SPSS 19 (SPSS, Chicago, IL,
USA). All data are expressed as means ± SEM. Baseline characteristics were compared as
previously described (126).
Serial changes in glucose, insulin, glucagon, GH, total IGF-1, IGFBP-3, IGFBP-1, IGFBP-2 and
IGF-1 bioactivity were analyzed using ANOVA for repeated measures. When the ANOVA
was significant, changes were compared to baseline values using Student t-test for paired
analysis in case of normally distributed data. In case of skewed data, the non-parametric
Wilcoxon test was used. All significances were two-sided and p-values were regarded as
statistically significant after correction by Bonferroni for multiple testing. The baseline
value was calculated as the mean of the -30 and 0 min values. AUCs, calculated by the
trapezoid method, were used to compare the time-courses of each parameter.
Data from animal and cell culture studies were derived from at least three independent
experiments, performed in triplicates or in duplicate. Differences between groups were
analyzed for significance using student t-test. Statistical significance was assumed when
p < 0.05.

37
4. Results
4.1 Glucagon administration study
4.1.1 In vivo study
Plasma glucagon increased significantly after intramuscular glucagon administration by
approximately 8-to 9-fold in all study groups with a peak detected after 30 minutes (324.8
± 30.2 ng/L [OP], 355.9 ± 21.7 ng/L [LP] and 340.6 ± 25.6 ng/L [T1DM]) and returned to
baseline levels by 240 minutes. The glucagon AUC240 increased in all study groups (800 ±
71.9 [LP], 921.4 ± 96.4 [T1DM], and 912± 93[OP]; P<.01) and was comparable between
groups (P=0.3-0.4) (126).
In type 1 diabetic patients glucose levels increased maximally after 60 min with slight
decrease towards baseline after 240 min., whereas only slight increase followed by
decrease towards baseline levels was observed in LP and OP as previously described (126).
Plasma insulin concentrations did not change after glucagon or placebo administration in
patients with type 1 diabetes (p=0.2-0.6), whereas plasma insulin levels showed an
increase with a peak after 30 min followed by a decrease towards baseline level after 120
min. in LP and OP (126).
Glucagon induced a significant reduction in serum IGF-1 bioactivity in all study groups
(Table 4) (Fig. 3 A, B, C), whereas no changes in total IGF-1 and IGFBP-3 were detected
(Fig. 4). The glucagon-induced reduction in IGF-1 bioactivity was associated with a
significant increase in GH levels in all study groups (Table 4) (Fig. 3 D, E, F).
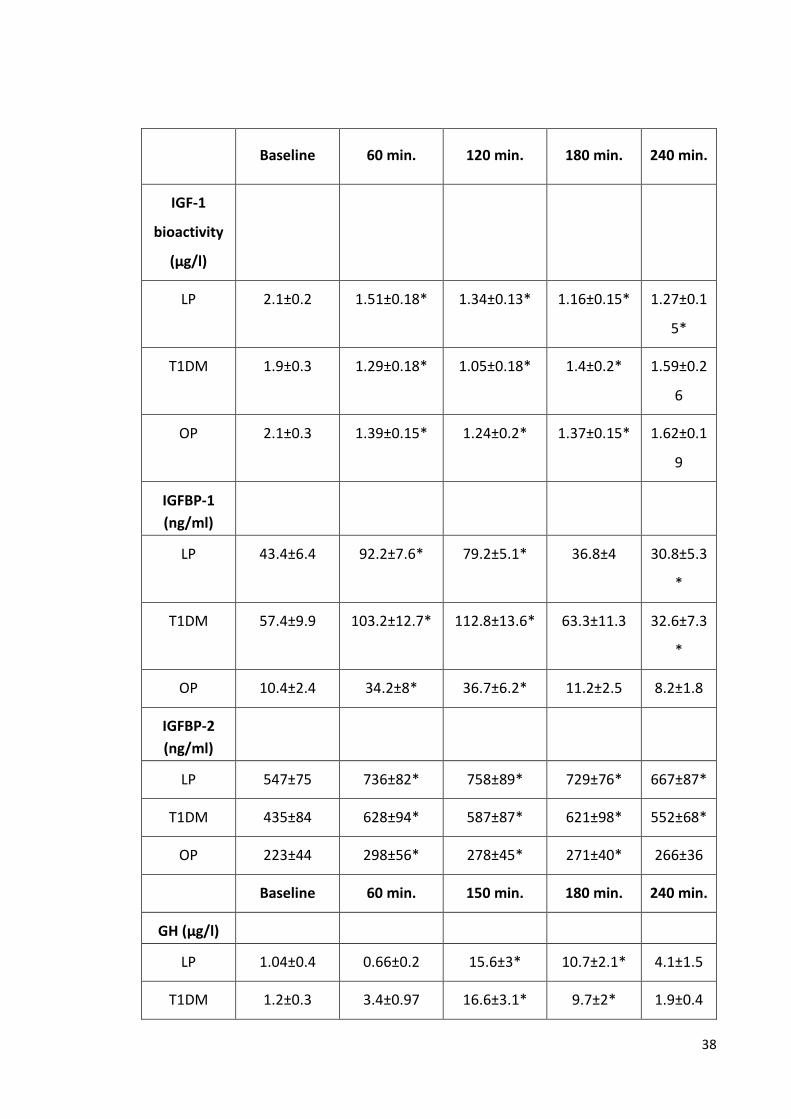
38
Baseline 60 min. 120 min. 180 min. 240 min.
IGF-1
bioactivity
(µg/l)
LP 2.1±0.2 1.51±0.18* 1.34±0.13* 1.16±0.15* 1.27±0.1
5*
T1DM 1.9±0.3 1.29±0.18* 1.05±0.18* 1.4±0.2* 1.59±0.2
6
OP 2.1±0.3 1.39±0.15* 1.24±0.2* 1.37±0.15* 1.62±0.1
9
IGFBP-1
(ng/ml)
LP 43.4±6.4 92.2±7.6* 79.2±5.1* 36.8±4 30.8±5.3
*
T1DM 57.4±9.9 103.2±12.7* 112.8±13.6* 63.3±11.3 32.6±7.3
*
OP 10.4±2.4 34.2±8* 36.7±6.2* 11.2±2.5 8.2±1.8
IGFBP-2
(ng/ml)
LP 547±75 736±82* 758±89* 729±76* 667±87*
T1DM 435±84 628±94* 587±87* 621±98* 552±68*
OP 223±44 298±56* 278±45* 271±40* 266±36
Baseline 60 min. 150 min. 180 min. 240 min.
GH (µg/l)
LP 1.04±0.4 0.66±0.2 15.6±3* 10.7±2.1* 4.1±1.5
T1DM 1.2±0.3 3.4±0.97 16.6±3.1* 9.7±2* 1.9±0.4
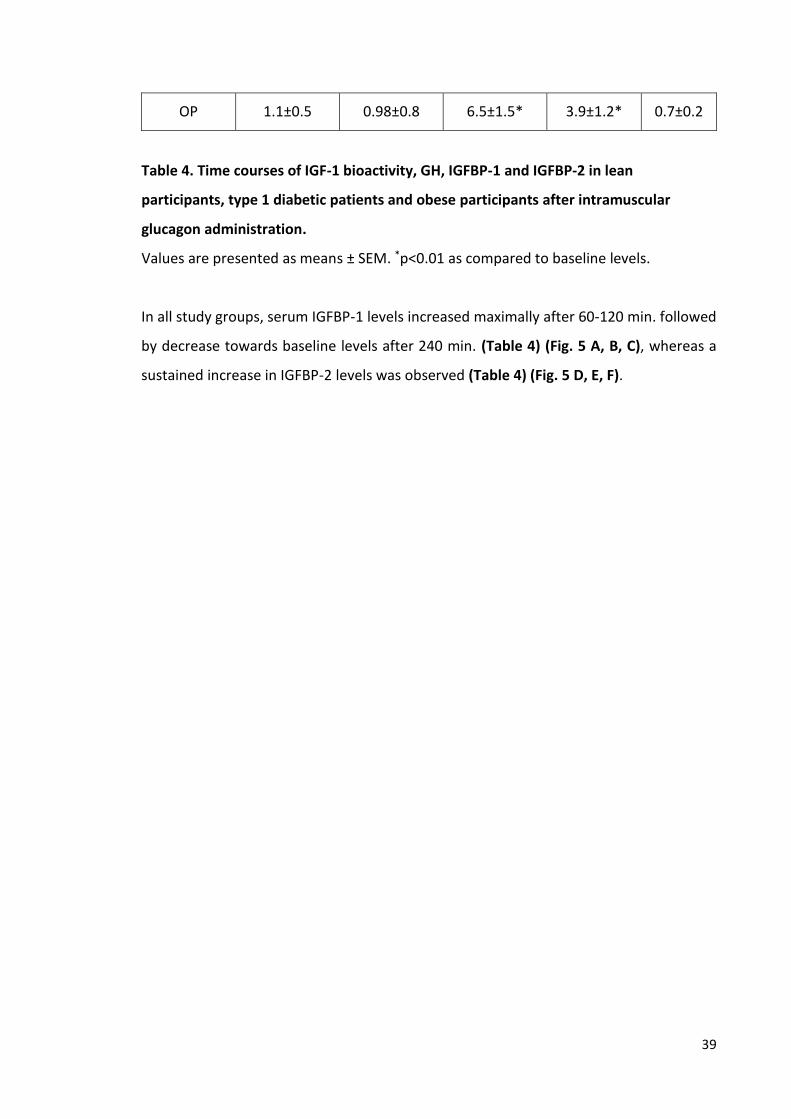
39
OP 1.1±0.5 0.98±0.8 6.5±1.5* 3.9±1.2* 0.7±0.2
Table 4. Time courses of IGF-1 bioactivity, GH, IGFBP-1 and IGFBP-2 in lean
participants, type 1 diabetic patients and obese participants after intramuscular
glucagon administration.
Values are presented as means ± SEM. *p<0.01 as compared to baseline levels.
In all study groups, serum IGFBP-1 levels increased maximally after 60-120 min. followed
by decrease towards baseline levels after 240 min. (Table 4) (Fig. 5 A, B, C), whereas a
sustained increase in IGFBP-2 levels was observed (Table 4) (Fig. 5 D, E, F).

40
Ch
an
ge
s in
IG
F-1
bio
activity (
%)
0
20
40
60
80
100
120
0
20
40
60
80
100
120
Time (minutes)
0 60 120 180 240 300
0
20
40
60
80
100
120
A.
0
5
10
15
20
25
30
Ch
an
ge
s in
GH
co
nce
ntr
atio
ns (
µg
/l)
0
5
10
15
20
25
30
Time (minutes)
0 30 60 90 120 150 180 210 240 270
0
5
10
15
20
25
30
*
**
*
*
*
*
**
***
*
*
*
*
*
*
C.
B.
D.
E.
F.

41
Figure 3. Mean (±SEM) changes in IGF-1 bioactivity after the administration of glucagon in A. 13 lean participants, B. 11 obese participants and C. 13 patients with type 1 diabetes mellitus. (* p < 0.01). Mean (±SEM) changes in growth hormone (GH) concentrations in D. 13 lean participants, E. 11 obese participants and F. 13 patients with type 1 diabetes mellitus. (* p < 0.01). The 0 min value represents the mean of two baseline values (-30 and 0 min). All values are calculated relative to the baseline.

42
A D
B E
C F
Figure 4. No changes in total IGF-1 (A, B, C) or IGFBP-3 (D, E, F) concentration were
observed after glucagon administration in lean, obese participants and patients with
type 1 diabetes mellitus.
Lean Subjects
Time (minutes)
0 60 120 180 240 300
Ch
an
ge
s in
To
tal-
IGF
-1 (
%)
0
50
100
150
200
Obese Subjects
Time (minutes)
0 60 120 180 240 300
Ch
an
ge
s in
To
tal-
IGF
-1 (
%)
0
50
100
150
200
T1DM
Time (minutes)
0 60 120 180 240 300
Ch
an
ge
s in
To
tal-
IGF
-1 (
%)
0
50
100
150
200
Lean Subjects
Time (minutes)
0 60 120 180 240 300
Ch
an
ge
s in
IG
FB
P-3
(%
)
0
50
100
150
200
Obese Subjects
Time (minutes)
0 60 120 180 240 300
Ch
an
ge
s in
IG
FB
P-3
(%
)
0
50
100
150
200
T1DM
Time (minutes)
0 60 120 180 240 300
Ch
an
ge
s in
IG
FB
P-3
(%
)
0
50
100
150
200
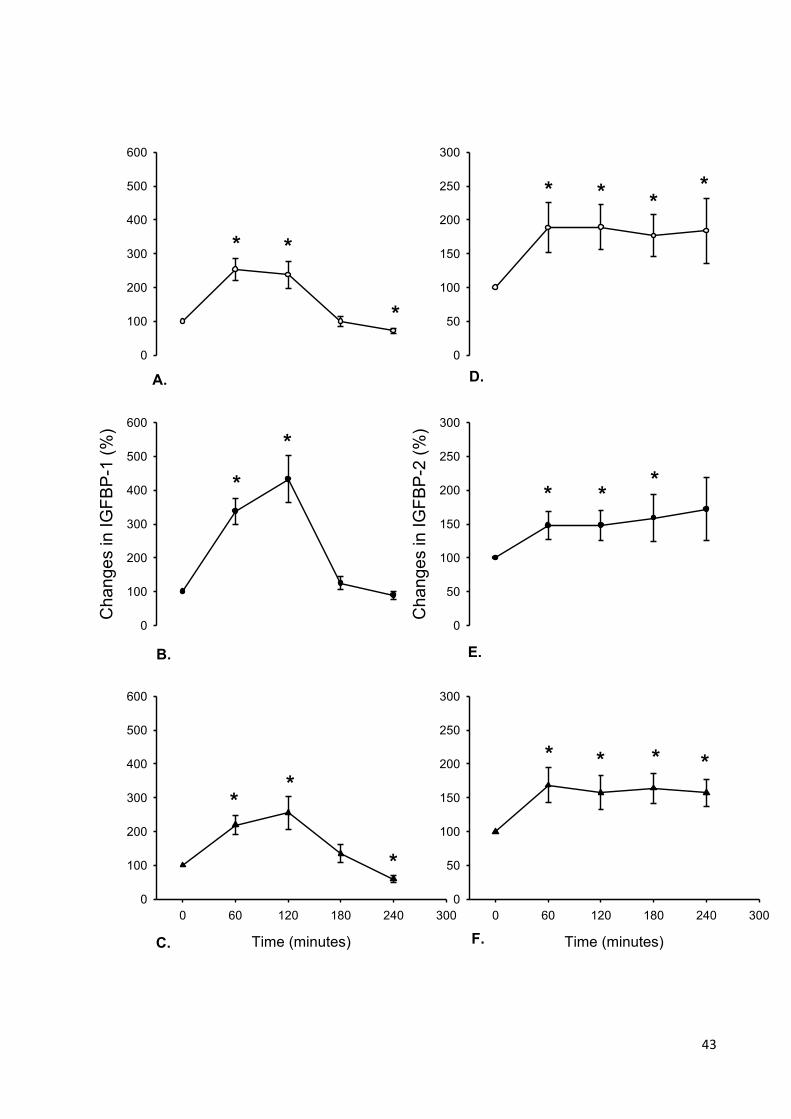
43
0
100
200
300
400
500
600
Ch
an
ge
s in
IG
FB
P-1
(%
)
0
100
200
300
400
500
600
0
50
100
150
200
250
300
Ch
an
ge
s in
IG
FB
P-2
(%
)
0
50
100
150
200
250
300
Time (minutes)
0 60 120 180 240 300
0
100
200
300
400
500
600
Time (minutes)
0 60 120 180 240 300
0
50
100
150
200
250
300
**
*
*
*
**
*
* *
*
**
**
**
* *
A. D.
B.
F.
E.
C.

44
Figure 5. Mean (± SEM) changes in IGF-binding protein-1 (IGFBP-1) after the administration of glucagon in A. 13 lean participants, B. 11 obese participants and C. 13 patients with type 1 diabetes mellitus. (* p < 0.01). Mean (±SEM) changes in IGF-binding protein-2 (IGFBP-2) concentrations in D. 13 lean participants, E. 11 obese participants and F. 13 patients with type 1 diabetes mellitus. (* p < 0.01). The 0 min value represents the mean of two baseline values (-30 and 0 min). All values are calculated relative to the baseline.

45
4.1.2 In vitro study
4.1.2.1 Impact of glucagon, IGFBP-1, IGFBP-2 and IGFBP-3 on auto-phosphorylation of
IGF1R
In order to determine the IGF-1-dependent effects of IGFBPs (IGFBP-1, IGFBP-2 and
IGFBP-3) as well as the direct impact of glucagon on auto-phosphorylation of IGF1R,
human embryonic kidney cells (HEK) were plated in 48-well plate and the KIRA assay was
performed as described above by stimulating the cells with glucagon (10 µM, 100 µM),
IGF-1 (2ng/ml) or IGF1LR3 (2ng/ml), an IGF-1 analogue that binds IGF1R and induces the
same IGF-1 signaling without IGFBPs binding, with or without various concentrations of
IGFBP-1, IGFBP-2 and IGFBP-3. Neither 10 µM nor 100 µM of glucagon induced direct
auto-phosphorylation of IGF1R (Fig. 6). IGFBP-1 at 0.1, 0.2, 1 and 2 nM reduced IGF-1
bioactivity by 85 ± 7, 72 ± 2, 45 ± 7, 23 ± 9 % of IGF-1-treated without IGFBP control
respectively (Fig. 7 A), whereas, the presence of IGFBP-1 did not affect IGF1LR3-induced
phosphorylation of IGF1R (Fig. 7 B). At concentrations of 0.4 nM and 1 nM, IGFBP-3
reduced IGF-1 bioactivity significantly by 72 ± 5 and 46 ± 5% respectively (Fig. 7 E).
However, IGFBP-3 did not show any inhibitory influence on IGF1LR3 signaling (Fig. 7 F).
The inhibitory effect of IGFBP-2 (63 ± 9 and 48 ± 6%) was observed by using concentrations
of 100 and 200 nM respectively (Fig. 7 C) and was diminished by using IGF1LR3 (Fig. 7 D),
suggesting a much less IGF-1-dependent potency compared with IGFBP-1 and IGFBP-3.
0
50
100
150
Control 10 100
IGF
-1 b
ioac
tivit
y (
%)
Glucagon (µM)
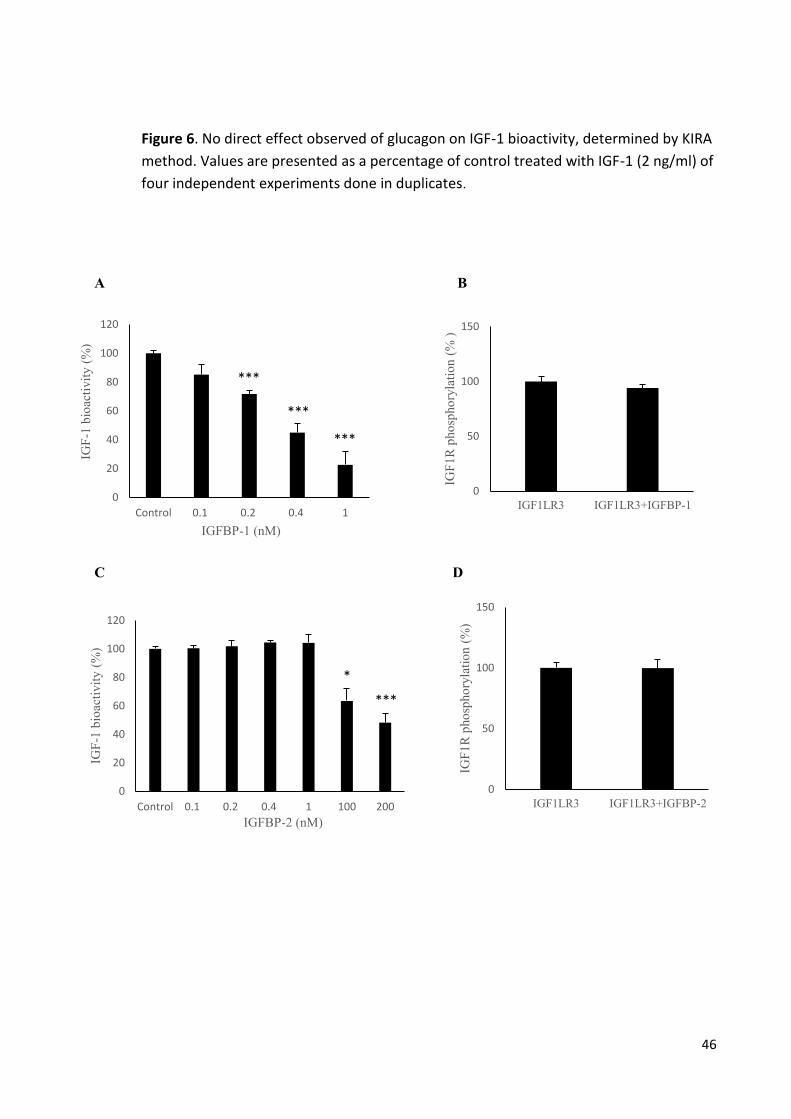
46
Figure 6. No direct effect observed of glucagon on IGF-1 bioactivity, determined by KIRA
method. Values are presented as a percentage of control treated with IGF-1 (2 ng/ml) of
four independent experiments done in duplicates.
A B
C D
0
20
40
60
80
100
120
Control 0.1 0.2 0.4 1 100 200
IGF
-1 b
ioac
tivit
y (
%)
IGFBP-2 (nM)
***
*
0
20
40
60
80
100
120
Control 0.1 0.2 0.4 1
IGF
-1 b
ioac
tivit
y (
%)
IGFBP-1 (nM)
***
***
***
0
50
100
150
IGF1LR3 IGF1LR3+IGFBP-1
IGF
1R
pho
spho
ryla
tio
n (
% )
0
50
100
150
IGF1LR3 IGF1LR3+IGFBP-2
IGF
1R
pho
spho
ryla
tio
n (
%)
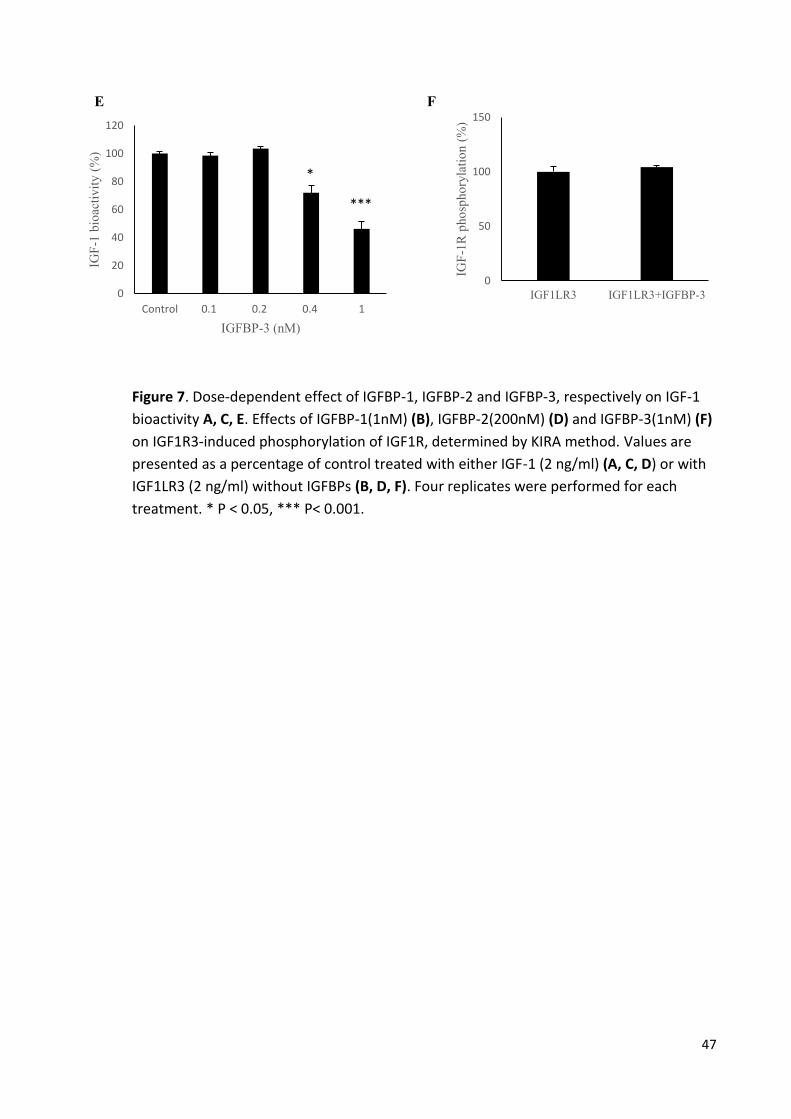
47
E F
Figure 7. Dose-dependent effect of IGFBP-1, IGFBP-2 and IGFBP-3, respectively on IGF-1
bioactivity A, C, E. Effects of IGFBP-1(1nM) (B), IGFBP-2(200nM) (D) and IGFBP-3(1nM) (F)
on IGF1R3-induced phosphorylation of IGF1R, determined by KIRA method. Values are
presented as a percentage of control treated with either IGF-1 (2 ng/ml) (A, C, D) or with
IGF1LR3 (2 ng/ml) without IGFBPs (B, D, F). Four replicates were performed for each
treatment. * P < 0.05, *** P< 0.001.
0
20
40
60
80
100
120
Control 0.1 0.2 0.4 1
IGF
-1 b
ioac
tivit
y (
%)
IGFBP-3 (nM)
*
***
0
50
100
150
IGF1LR3 IGF1LR3+IGFBP-3
IGF
-1R
pho
spho
ryla
tio
n (
%)

48
4.1.2.2 Impact of glucagon on IGF-1 system gene expression and Akt phosphorylation in
mouse primary hepatocytes
The effect of glucagon on gene expression of IGF-1, IGFBP-1, IGFBP-2 and IGFBP-3 was
measured in freshly isolated mouse primary hepatocytes to see whether glucagon
interferes with GH/IGF1-axis on the transcriptional level. Glucagon increased IGF-1 mRNA
and decreased IGFBP-3 mRNA levels in mouse primary hepatocytes in a concentration-
dependent manner (Fig.8 E, F). This effect of glucagon was significant at concentration of
10 nM (Fig.8 E, F). Treatment of mouse primary hepatocytes with 300 ng/ml GH alone for
24 hours significantly increased expression of IGF-1 mRNA to 143% ± 5% of the control
levels, as expected and addition of 10 nM glucagon was able to increase basal and GH-
stimulated IGF-1 mRNA to 156% ± 7% and 208% ± 8% of control levels respectively (Fig. 8
A). GH tended to increase the transcription of IGFBP--3 to 118% ± 13%, although this
increase was not significant (Fig. 8 B). Glucagon (10 nM) decreased basal and GH-
stimulated IGFBP-3 to 49% ± 6% and 50% ± 6% of control levels respectively (Fig. 8 B).
Glucagon tended also to produce higher IGFBP-1 and IGFBP-2 to 121% ± 29% and 111% ±
3%, although these effects were not statistically significant (Fig. 8 C, D). Using western
blot analysis, no phosphorylation of Akt after cell treatment with glucagon, GH or both of
them was detected (Fig. 8 G).

49
A B
C D
E F
0
0,4
0,8
1,2
1,6
2
Control GH Gluc GH+Gluc
IGF
BP
-2 m
RN
A e
xp
ress
ion
0
0,4
0,8
1,2
1,6
2
Control 0.1 nM 1 nM 10 nM 100 nM
IGF
-1 m
RN
A e
xp
ress
ion **
*
0
0,5
1
1,5
2
2,5
Control GH Gluc GH+Gluc
IGF
-1 m
RN
A e
xp
ress
ion
* **
**
*
0
0,4
0,8
1,2
1,6
Control 0.1 nM 1 nM 10 nM 100 nM
IGF
BP
-3 m
RN
A e
xp
ress
ion
*** *
0
0,4
0,8
1,2
1,6
Control GH Gluc GH+Gluc
IGF
BP
-1 m
RN
A e
xp
ress
ion
0
0,4
0,8
1,2
1,6
Control GH Gluc GH+Gluc
IGF
BP
-3 m
RN
A e
xp
ress
ion
** **
*

50
G
Figure 8. Relative changes of IGF-1 (A), IGFBP-3 (B), IGFBP-1 (C) and IGFBP-2 (D) mRNA expression in mouse primary hepatocytes after treatment with GH, glucagon or both of them. Dose-dependent effect of glucagon on IGF-1 and IGFBP-3 mRNA expression respectively (E, F). Akt phosphorylation after stimulation of mouse primary hepatocytes with GH, glucagon or both of them (G). Bars show means ± SEM of four independent experiments done in duplicate (A, B, C, D) or of three independent experiments done in triplicate (E, F). * P < 0.05, ** P< 0.01, *** P< 0.001.
Akt
P-Akt
Control GH Gluc GH + Gluc

51
4.2 Insulin-induced hypoglycemia study
4.2.1 In vivo study
In both study groups, insulin administration induced an increase in plasma insulin with a peak
detected after 15 minutes (509.4 ± 89.3 mU/L [LP] and 1017.1 ± 253.7 mU/L [OP]) and returned
to baseline levels by 120 minutes (Table 5) (Fig. 9 A, B). As expected glucose levels were
decreased significantly after insulin injection in both groups by 15 and 30 minutes followed by
increase towards baseline levels (Table 5) (Fig. 9 C, D). Despite no changes in total IGF-1 and
IGFBP-3 concentrations were observed (Table 5) (Fig. 10 C, D, E, F), insulin induced a significant
reduction in serum IGF-1 bioactivity (Table 5) (Fig. 10 A, B) and a significant increase in growth
hormone levels in both study groups (Table 5) (Fig. 10 G, H).
A significant decrease in serum IGFBP-1 was detected by 15 min. after insulin injection and
followed by increase above the baseline levels by 120 min in both study groups (Table 5) (Fig. 9
E F). A significant increase in IGFBP-2 that returned to the baseline levels by 120 min. was
observed in both study groups (Table 5) (Fig. 9 G, H)

52
Baseline 15 min. 30 min. 45 min. 60 min. 90 min. 120
min.
Glucose
(mmol/L)
LP 4.6 ± 0.14 2.4 ± 0.19* 2.3 ± 0.17* 3.4 ± 0.16* 4.1 ± 0.27 4.2 ± 0.12* 4.5 ±
0.07
OP 4.5 ± 0.11 2.8 ± 0.16* 2.1 ± 0.13* 3.2 ± 0.13* 3.9 ± 0.12* 4.3 ± 0.14 4.5 ±
0.15
Insulin
(mU/L)
LP 51.4 ± 6 509.4 ± 89.3* 222.7 ±
65.5*
75.7 ± 9* 82 ± 17.5 88 ± 16.5 85.3 ±
17.6
OP 81.7 ± 6.6 1017.1 ± 253.7* 283.2 ±
64.2*
110.3 ± 20.6 93.7 ± 15.5 73.8 ± 9.2 88.4 ±
20.7
IGFBP-1
(ng/ml)
LP 43 ± 5.8 35.6 ± 5.1* 35.2 ± 5.4* 32.8 ± 5.2* 29.5 ± 4.6* 32.4 ± 5.4 57.3 ±
7.7
OP 16.5 ± 3.8 8.9 ± 3.5* 8.9 ± 3.2* 8.2 ± 2.8* 7.2 ± 2.3* 14.1 ± 3.6 35.5 ±
7.3*
IGFBP-2
(ng/ml)
LP 647 ± 82.6 790 ± 93.9* 834.5 ±
106.5*
834.2 ±
95.7*
854.2 ± 99.2* 862.5 ±
104.7*
827 ±
94*
OP 324 ± 57 418 ± 67.9* 434.3 ± 69* 427.2 ±
67.1*
415.3 ± 62.8* 420.6 ±
67.4*
409.4 ±
60.9*
B-IGF-1
(µg/L)
LP 2.28 ± 0.28 1.85 ± 0.18 1.76 ± 0.18* 1.69 ±
0.28*
OP 1.84 ± 0.15 1.69 ± 0.12 1.62 ±0.13* 1.44
±0.14*

53
T-IGF-1
(ng/ml)
LP 178.8 ± 9.7 183.5 ± 11.9 170.4 ± 12.6 175.6 ±
8.5
OP 185.2 ± 18.5 180.6 ± 14.8 177.9 ± 15.2 177.5 ±
16.1
IGFBP-3
(ng/ml)
LP 4232.3 ± 149.1 4255.9 ±
139.7
4106.2± 90.3 4469.4 ±
307.8
OP 4410.4 ± 176.9 4504.3 ±
161.4
4389.6 ± 136.6 4375.4 ±
152
GH
(µg/L)
LP 3 ± 1 6 ± 1.5 14.4 ± 2.7* 3.9 ± 1.3
OP 0.9 ± 0.5 0.9 ± 0.4 9.3 ± 2.5* 2.1 ± 0.9
Table 5. Time courses of glucose, insulin, IGFBP-1, IGFBP-2, IGF-1 bioactivity, total IGF-1,
IGFBP-3 and GH after applying of insulin tolerance test in obese and lean participants.
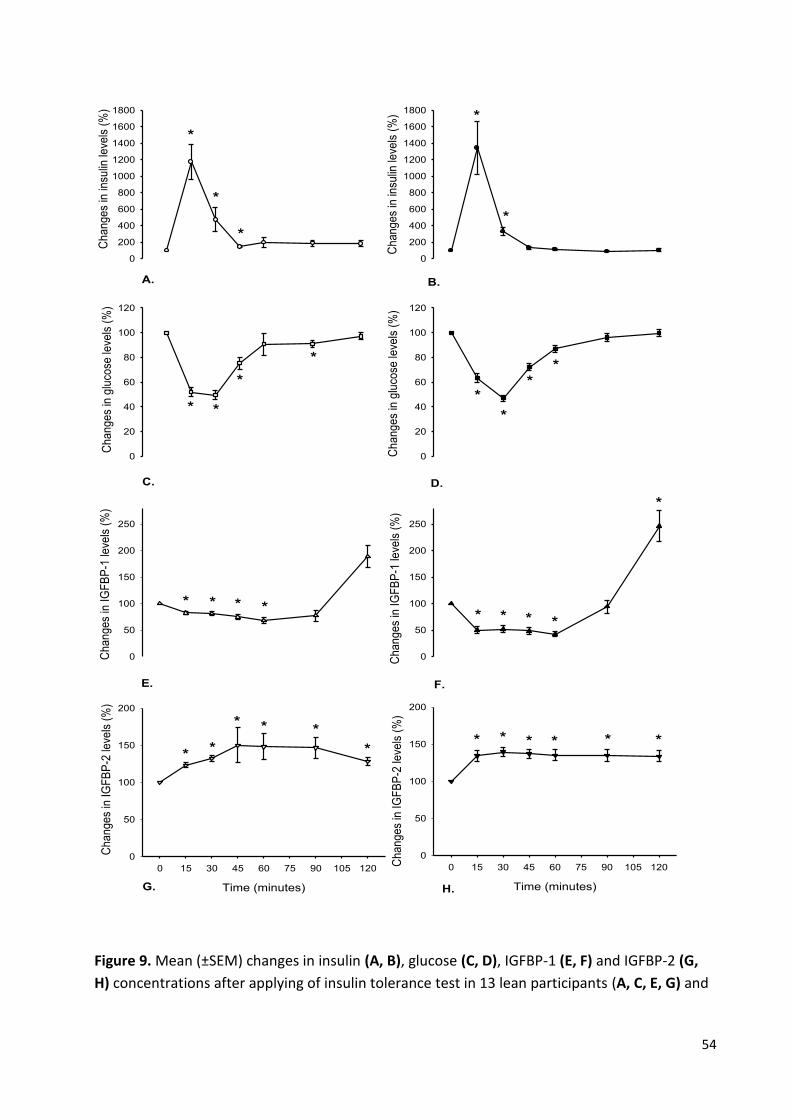
54
Ch
an
ge
s in
insu
lin le
vels
(%
)
0
200
400
600
800
1000
1200
1400
1600
1800
0
20
40
60
80
100
120
0
50
100
150
200
250
A.
0
200
400
600
800
1000
1200
1400
1600
1800
Ch
an
ge
s in
insu
lin le
vels
(%
)
0
20
40
60
80
100
120
0
50
100
150
200
250
*
*
*
*
*
*
*
*
*
*
*
*
* * *
E.
C.
B.
D.
F.
Time (minutes)
0 15 30 45 60 75 90 105 120
0
50
100
150
200
Time (minutes)
0 15 30 45 60 75 90 105 120
0
50
100
150
200
Ch
an
ge
s in
glu
cose
leve
ls (
%)
Ch
an
ge
s in
IG
FB
P-1
leve
ls (
%)
Ch
an
ge
s in
IG
FB
P-2
leve
ls (
%)
Ch
an
ge
s in
IG
FB
P-1
leve
ls (
%)
Ch
an
ge
s in
glu
cose
leve
ls (
%)
Ch
an
ge
s in
IG
FB
P-2
leve
ls (
%)
*
**
* *
* * *
*
**
*
* ** * **
G. H.
*
Figure 9. Mean (±SEM) changes in insulin (A, B), glucose (C, D), IGFBP-1 (E, F) and IGFBP-2 (G,
H) concentrations after applying of insulin tolerance test in 13 lean participants (A, C, E, G) and

55
in 12 obese participants (B, D, F, H). (* p < 0.01). All values are presented compared to the
baseline value.
Time (minutes)
0 60 120
0
5
10
15
20
Time (minutes)
0 60 120
0
5
10
15
20
0
20
40
60
80
100
120
140
Ch
an
ge
s in
IG
F-1
leve
ls (
%)
0
20
40
60
80
100
120
140
0
20
40
60
80
100
120
140
0
20
40
60
80
100
120
140
0
20
40
60
80
100
120
140
0
20
40
60
80
100
120
140
*
* **
*
*
A. B.
C.
F.
D.
E.
Ch
an
ge
s in
IG
F-1
bio
act
ivity
(%
)C
ha
ng
es
in I
GF
BP
-3 le
vels
(%
)
Ch
an
ge
s in
IG
F-1
bio
act
ivity
(%
)C
ha
ng
es
in I
GF
-1 le
vels
(%
)
GH
co
nce
ntr
atio
ns
(µg
/l)
Ch
an
ge
s in
IG
FB
P-3
leve
ls (
%)
GH
co
nce
ntr
atio
ns
(µg
/l)
G. H.
Figure 10. Mean (±SEM) changes in IGF-1 bioactivity (A, B), total IGF-1 (C, D), IGFBP-3 (E, F) and
GH (G, H) concentrations after applying of insulin tolerance test in 13 lean participants (A, C, E,

56
G) and in 12 obese participants (B, D, F, H). (* p < 0.01). All values are presented compared to
the baseline value.
4.2.2 In vitro study
The impact of insulin on IGF-1, IGFBP-1, IGFBP-2 and IGFBP-3 gene expression in mouse primary
hepatocytes
As expected insulin had no direct effect on IGF-1 mRNA expression in mouse primary
hepatocytes, whereas growth hormone significantly induced 4-fold increase in IGF-1 mRNA at a
concentration of 300 ng/ml (Fig. 11 A). Treatment of mouse primary hepatocytes with 100 nM
insulin for 24 hours decreased both of IGFBP-1 mRNA and IGFBP-3 mRNA significantly by
approximately 25% and 21% of the control levels respectively (Fig. 11 B, C). Addition of 300 ng/ml
GH induced more decrease in IGFBP-1 mRNA and attenuated the decrease in IGFBP-3 mRNA
significantly (Fig. 11 B, C). Insulin induced a significant 6-fold increase in IGFBP-2 mRNA (Fig. 11
D). GH tended to attenuate the insulin-induced transcription of IGFBP-2, although this effect was
not statistically significant (Fig. 11 D).

57
A B
C D
Figure 11. Relative changes of IGF-1 (A), IGFBP-3 (B), IGFBP-1 (C) and IGFBP-2 (D) mRNA expression in mouse primary hepatocytes after treatment with insulin in the presence or absence of GH. Bars show means ± SEM of four independent experiments done in duplicate. * P < 0.05, ** P< 0.01, *** P< 0.001.
0
1
2
3
4
5
Control Ins GH+Ins
IGF
-1 m
RN
A e
xp
ress
ion
***
0
2
4
6
8
Control Ins GH+Ins
IGF
BP
-2 m
RN
A e
xp
ress
ion
*
*
0
1
2
Control Ins GH+Ins
IGF
BP
-3 m
RN
A e
xp
ress
ion
* ***
*
0
1
2
Control Ins GH+Ins
IGF
BP
-1 m
RN
A e
xp
ress
ion
*** ***
*

58
5. Discussion
5.1 Glucagon administration study
This study is the first one focusing on the interaction between glucagon and IGF-1 bioactivity as
a possible mechanism for glucagon-induced GH release. Previously published studies postulated
that the glucagon-induced surge in GH secretion might result from the fall in the plasma glucose
concentrations after the initial increase during the test, or through the glucagon-induced
increase in noradrenaline concentrations and its interaction with α-receptors in the pituitary
gland (127). According to this study, glucagon decreases IGF-1 bioactivity suggesting a new
mechanism by which glucagon may impact GH release. It depends on the regulatory feedback
mechanisms of decreased IGF-1 bioactivity on growth hormone gene expression and hormone
release at both of the pituitary gland and the hypothalamus level. This effect was observed in
lean and obese participants and preserved in T1DM patients indicating an insulin-independent
effect.
However, Glucagon is known to be a counter-regulatory hormone of insulin involved in catabolic
pathways associated with increased blood glucose levels such as gluconeogenesis, inhibition of
glycogenesis and lipid storage. IGF-1 has similar effects as insulin in mediating the anabolic
pathways, therefore decreased IGF-1 signaling by glucagon is expected to maintain glucose
homeostasis.
The mechanism underlying glucagon-induced reduction in IGF1 bioactivity
Activation of IGF-1 signaling is determined by the presence and interplay between IGF-binding
proteins such as IGFBP-1, IGFBP-2 and IGFBP-3 and IGF-1. These binding proteins prevent the
IGF-1 from interacting with its receptor (128). Various studies have demonstrated that IGFBPs
levels are regulated by different hormonal, nutritional and biological conditions like exercise,
surgery, pregnancy and age (129-131). Therefore, free or unbound IGF-1 reflects IGF-1
bioactivity, the ability of IGF-1 to induce phosphorylation of its receptor (132). However, my in
vitro experiment showed, in consistence with Firth and Baxter (133) that increased IGFBP-1,
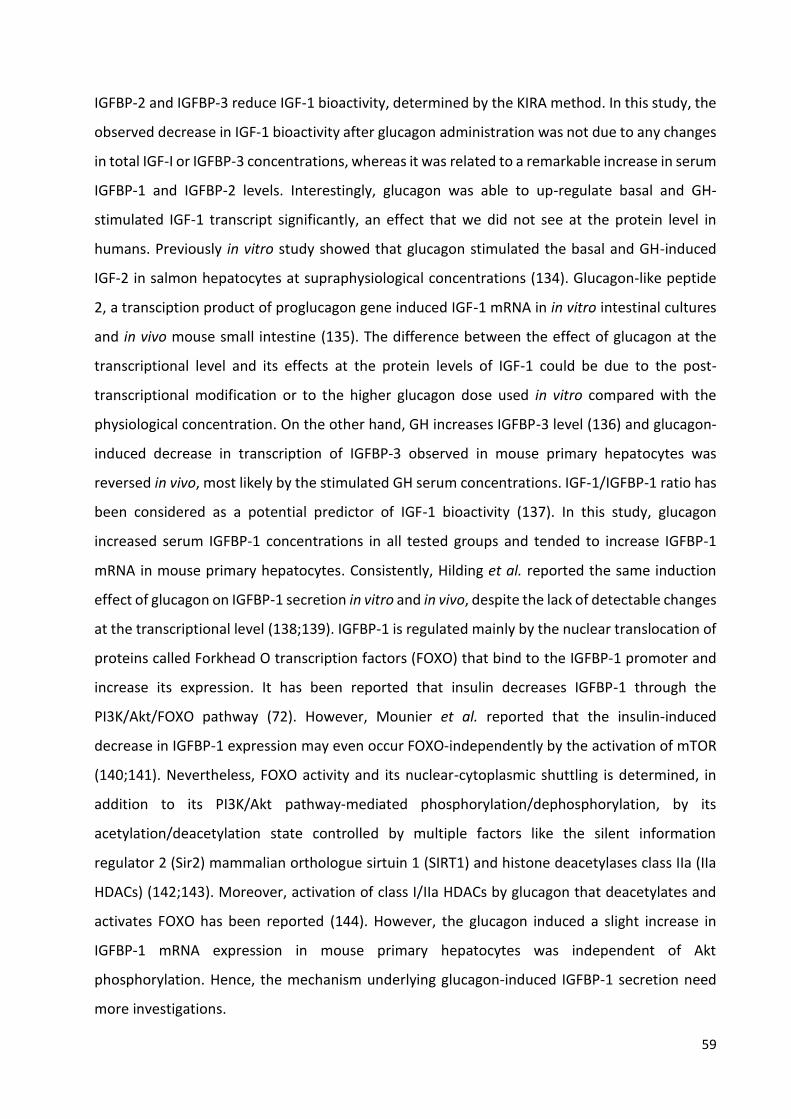
59
IGFBP-2 and IGFBP-3 reduce IGF-1 bioactivity, determined by the KIRA method. In this study, the
observed decrease in IGF-1 bioactivity after glucagon administration was not due to any changes
in total IGF-I or IGFBP-3 concentrations, whereas it was related to a remarkable increase in serum
IGFBP-1 and IGFBP-2 levels. Interestingly, glucagon was able to up-regulate basal and GH-
stimulated IGF-1 transcript significantly, an effect that we did not see at the protein level in
humans. Previously in vitro study showed that glucagon stimulated the basal and GH-induced
IGF-2 in salmon hepatocytes at supraphysiological concentrations (134). Glucagon-like peptide
2, a transciption product of proglucagon gene induced IGF-1 mRNA in in vitro intestinal cultures
and in vivo mouse small intestine (135). The difference between the effect of glucagon at the
transcriptional level and its effects at the protein levels of IGF-1 could be due to the post-
transcriptional modification or to the higher glucagon dose used in vitro compared with the
physiological concentration. On the other hand, GH increases IGFBP-3 level (136) and glucagon-
induced decrease in transcription of IGFBP-3 observed in mouse primary hepatocytes was
reversed in vivo, most likely by the stimulated GH serum concentrations. IGF-1/IGFBP-1 ratio has
been considered as a potential predictor of IGF-1 bioactivity (137). In this study, glucagon
increased serum IGFBP-1 concentrations in all tested groups and tended to increase IGFBP-1
mRNA in mouse primary hepatocytes. Consistently, Hilding et al. reported the same induction
effect of glucagon on IGFBP-1 secretion in vitro and in vivo, despite the lack of detectable changes
at the transcriptional level (138;139). IGFBP-1 is regulated mainly by the nuclear translocation of
proteins called Forkhead O transcription factors (FOXO) that bind to the IGFBP-1 promoter and
increase its expression. It has been reported that insulin decreases IGFBP-1 through the
PI3K/Akt/FOXO pathway (72). However, Mounier et al. reported that the insulin-induced
decrease in IGFBP-1 expression may even occur FOXO-independently by the activation of mTOR
(140;141). Nevertheless, FOXO activity and its nuclear-cytoplasmic shuttling is determined, in
addition to its PI3K/Akt pathway-mediated phosphorylation/dephosphorylation, by its
acetylation/deacetylation state controlled by multiple factors like the silent information
regulator 2 (Sir2) mammalian orthologue sirtuin 1 (SIRT1) and histone deacetylases class IIa (IIa
HDACs) (142;143). Moreover, activation of class I/IIa HDACs by glucagon that deacetylates and
activates FOXO has been reported (144). However, the glucagon induced a slight increase in
IGFBP-1 mRNA expression in mouse primary hepatocytes was independent of Akt
phosphorylation. Hence, the mechanism underlying glucagon-induced IGFBP-1 secretion need
more investigations.

60
IGFBP-2 is another metabolically-regulated modulator of IGF-1 bioactivity (108). Arafat et al.
showed that insulin reduces IGF-1 bioactivity by up-regulation of IGFBP-2 (108). Li et al. reported
that insulin regulates IGFBP-2 expression through PI3K/mTOR pathway (110). In agreement with
this, these results indicate that glucagon increases IGFBP-2 independent of changes in circulating
insulin concentrations. Although I could not detect a statistically significant increase in IGFBP-2
gene expression, levels were numerically higher after glucagon stimulation suggesting an impact
of glucagon on IGFBP-2 expression.
Mothe-Satney et al. found that glucagon increases mTOR phosphorylation on Serine 2448,
whereas it inhibits the phosphorylation of its downstream targets suggesting the involvement of
this phosphorylation site of mTOR in other unknown functions (145). In addition, some studies
suggest that glucagon exerts some of its effects by induction of PI3Kinase pathway (146;147).
Thus, it can be postulated that the glucagon-induced up-regulation of IGFBP-2 secretion is caused
by the glucagon-induced modulation of PI3kinase signaling and the consequent activation of
mTOR, despite more analysis is required.
Although the positive effects of high protein diet on weight control have been previously
suggested, the increased incidence of cardiovascular disease related to the consumption of this
diet has been demonstrated (112-115). However, changes in GH/IGF-1 axis after high protein
diet have been reported (148).
The relationship between GH/IGF-1 axis and mortality has been elucidated. GH deficiency (149),
increased GH in acromegaly (150), increased IGFBP-1 level (151) and IGFBP-2 (152) have been
reported in association with higher mortality rate.
Moreover, the correlation between reduced IGF-1 signaling and the development of diseases
such as metabolic syndrome, hepatic steatosis, diabetes mellitus type 2, chronic kidney disease
and hypertension have been evaluated (90-93). In addition, IGF-1 signaling is involved in the
expression of genes such as Glutamate-cysteine ligase catalytic subunit (GCLC), NAD(P)H
dehydrogenase (quinone) 1 (NQO1) and heme oxygenase (decycling) 1 (HMOX1) which are
responsible for the antioxidant defenses in the vessels (88;89). The present study speculates
that the negative effects of high protein diet, characterized by increased in glucagon secretion,
in association with increased risk of cardiovascular disease and mortality rate, is at least partly
61
due to the ability of glucagon to decrease bioactive IGF-1, a critical protector of cardiovascular
vessels.

62
5.2 Insulin-induced hypoglycaemia study
Accumulating evidence suggests that glucose interferes with GH/IGF-1 system (116;117). In
addition, increased fasting blood glucose levels related to insulin resistance are associated with
increased IGFBP-1, decreased IGFBP-2 and increased IGF-1 bioactivity (108). Despite the above
mentioned data, this study demonstrated herein that the insulin-induced decrease in IGF-1
bioactivity under hypoglycemic condition is very similar to that shown in euglycemic state (108).
Nevertheless, this investigation reveals that the acute changes in blood glucose levels play no
role in insulin-GH/IGF-1 system interaction. This finding is supported by the work of Ma et al.
showing that insulin analogues used to treat type 1 diabetes mellitus have the same impact on
IGF-1 bioactivity compared with human insulin, despite of their different glucose-lowering
abilities (153).
As described before, IGF-1 bioactivity is determined by the interplay between GH, total IGF-1 and
the inhibitory and stimulatory IGF binding proteins. It reflects the active free IGF-1 fraction that
induces IGF-1 signaling. I did not observe any change in total IGF-1 concentrations during insulin-
induced hypoglycemia in all participants which excludes its effect on decreased IGF-1 bioactivity,
a result which was previously obtained under euglycemic condition (108). However, some other
previous studies indicated that hypoglycemia has no influence on IGF-1 secretion patterns
(154;155). Conversely, neonates with hyperinsulinaemic hypoglycemia, a common heterogenous
metabolic abnormality resulting from different genetic mutations of the pancreatic -cells, show
relatively low serum IGF-1 (156). Furthermore, foods with low glycemic load that decreases post-
prandial responses of glucose are correlated with lower IGF-1 concentration (157). The variation
in IGF-1 response between our results and the above mentioned studies could be explained by
the different impact of long-term versus short-term hypoglycemia. Although my in vitro study
showed that insulin decreased IGFBP-3 mRNA in mouse primary hepatocytes and the exposure
to high glucose increased IGFBP-3 mRNA in a porcine PTEC cell line (LLC-PK1 cells) (158), we
demonstrate in this study that IGFBP-3 secretion is not influenced by insulin, regardless of the
glycemic state. Consistently, it is reported that IGFBP-3 levels do not change in response to
glucose loads after applying the oral glucose tolerance tests (159). In addition, the presence of
glucose does not affect the binding between IGF-1 and its most abundant circulating carrier
protein (IGFBP-3), an index for IGF-1 bioactivity (160). Down-regulation of IGFBP-1 by insulin has
63
been evaluated, whereas hypoglycemia-dependent alteration of IGFBP-1 concentration has been
suggested (161). Our data clarify that insulin decreases IGFBP-1 secretion under hypoglycemia.
However, low serum IGFBP-1 levels are considered as a helpful marker to differentiate
hyperinsulinism-induced hypoglycaemia from other hypoglycaemic disorders like
hypopituitarism, fatty acid oxidation and glycogen storage disorders (162).
Treatment of nonislet cell tumor hypoglycaemia decreases serum IGFBP-2 indicating an inverse
correlation with serum glucose (163). In contrast, hyperglycemia is associated with increased
IGFBP-2 production as a result of glucose-enhanced acetylation of histones bound to IGFBP-2
promoter (164). In our study, insulin-induced up-regulation of IGFBP-2 was achieved under
hypoglycemic state as under euglycemic state before. Thus the observed suppression of IGF-1
bioactivity in our investigation is explained as in Arafat et al. (165) by up-regulation of IGFBP-2.
Insulin-induced hypoglycemia is a potent stimulus of GH secretion, although the underlying
mechanism is not fully clear, especially by excluding any change occurred in GHRH and
somatostatin secretion (166;167). Hence, herein this study suggests the hypoglycemia-induced
decrease in IGF-1 bioactivity as a possible mechanism depending on the feedback effect on the
pituitary gland level.
It is known that the occurrence of hypoglycemia, as a result of an intensive glucose control,
increases the cardiovascular risk and the rate of mortality among diabetic patients. Despite
various mechanisms including increased endothelial dysfunction, increased oxidative stress
within mitochondria, induced platelet aggregation and activation of pro-inflammatory
mechanisms have been suggested (168-170), the exact mechanism explaining hypoglycemia-
induced higher death rate remains unclear. How changes in GH/IGF-1 axis and reduced IGF-1
signaling contribute to higher mortality rate have been well discussed in the previous session.
This study showed that insulin-induced hypoglycemia decreases IGF-1 bioactivity in humans by
up-regulation of IGFBP-2 suggesting a new mechanism underlying hypoglycemia-increased
cardiovascular risk and mortality rate.

64
6. Conclusion
This work shows that glucagon is able to suppress bioactive IGF-1 levels independently of
endogenous insulin concentrations. Moreover, it demonstrates that this reduction in IGF-1
bioactivity is caused by up-regulating the secretion of IGF-binding proteins IGFBP-1 and IGFBP-
2. Furthermore, GH hyper-secretion after glucagon injection which is used as a GH stimulation
test to evaluate an intact pituitary gland function or GH deficiency may be caused by a
decreased IGF-1 bioactivity that exerts a feedback mechanism at the pituitary level. In addition,
this study speculates that the negative effect of high protein diet, characterized by increased
glucagon secretion, in association with increased risk of cardiovascular disease and mortality
rate, is at least partly due to the ability of glucagon to reduce bioactive IGF-1, a critical
protector of cardiovascular vessels. However, more analysis regarding the mechanism
underlying glucagon-induced modulation of IGFBPs is required.
Although accumulating evidence suggests that glucose interferes with GH/IGF-1 system, this
study shows, that the insulin-induced decrease in IGF-1 bioactivity under hypoglycemic
condition is very similar to that shown in euglycemic state before. Nevertheless, the current
investigation reveals that the acute changes in blood glucose level play no role in insulin-
GH/IGF-1 system interaction. Moreover, the insulin-induced hypoglycemia decreases IGF-1
bioactivity through up-regulation of IGFBP-2. These results represent a possible and previously
poorly explored mechanism explaining the strong association between hypoglycemia and
increased cardiovascular mortality among diabetic patients.

I
Acknowledgements
I would first like to thank my thesis advisor Dr. Ayman M. Arafat for his excellent and patient
guidance throughout my work. He was always ready for help whenever I needed it.
I am also very thankful to prof. Dr. Andreas Pfeiffer for his consideration, encouragement and
support to make this thesis possible.
Special thanks to Prof. Dr. Florian Schweigert for his supervision in the name of Potsdam-
university.
To the staff of the department of clinical nutrition in German institute for human nutrition,
especially Katrin Sprengel, I am very grateful to give me the opportunity and facilities to do my
practical work in their labs.
I want also to thank both of the Syrian government and the German research foundation (DFG)
for providing the scholarships that allowed me to live and work in Germany as well as the German
institute for human nutrition (DIFE) that provides me the funding to attend many international
conferences and to improve my knowledge.
To my husband, my parents, my brothers and sisters, I appreciate your emotional support.
At last but not at least, I dedicate this thesis to my two lovely boys, Haidrah and Hamzah, who
have given me so much strength and happiness. Without you in my life I could never have
completed this study. I hope that I could have been a good mother for you throughout this
difficult period.

II
List of publications and conferences
Publications
Bumke-Vogt C, Osterhoff MA, Borchert A, Guzman-Perez V, Sarem Z, Birkenfeld AL, Bähr V, Pfeiffer
AF. The flavones apigenin and luteolin induce FOXO1 translocation but inhibit gluconeogenic
and lipogenic gene expression in human cells. PLoS One. 2014 Aug.
Sarem Z, Bumke-Vogt C, Assefa B, Weickert MO, Adamidou A, Bähr V, Frystyk J, Möhlig M, Spranger
J, Lieske S, Birkenfeld AL, Pfeiffer AF and Arafat AM. Exogenous glucagon decreases IGF-I
bioactivity in humans, independently of insulin levels, by modulating its binding proteins.
Submitted.
Conferences
Oral presentation: Glucagon modulates the expression of IGF-1 system members in mouse
primary hepatocytes at 31th international symposium on DNSG 2013 in Dubrovnik, Croatia.
Poster presentation: Glucagon modulates the expresseion of IGF-1 system
members in mouse primary hepatocytes at 10th NuGO week 2013 in Munich, Germany
Poster presentation: Exogenous glucagon decreases IGF-I bioactivity in humans, independently
of insulin levels, by modulating its binding proteins at 50th EASD 2014 in Vienna, Austria.
Poster presenation: Glucagon-IGF-1 bioactivity interaction: a link between high protein diet and
cancer development at 11th NuGO week 2014 in Neapel, Italy.

III
Poster presentation: Glucagon decreases IGF-1 bioactivity in humans: a novel mechanism by
which caloric restriction inhibits cancer development at 58. Symposium der deutschen
Gesellschaft für Endokrinologie (DGE) in Lübeck, Germany.
Poster presentation: Insulin-induced hypoglycemia decreases IGF-I bioactivity in humans: a
missing link to increased mortality in diabetic patients? at ECE 2015 in Dublin, Ireland.

IV
Thesis declaration
Hereby I certify that this thesis is a result of my own research and contains no material that
have been used by another person except where appropriate reference or acknowledgements
have been included.
Date Signature
I
Reference List
1. Chen EY, Liao YC, Smith DH, Barrera-Saldana HA, Gelinas RE, Seeburg PH. The human growth hormone locus: nucleotide sequence, biology, and evolution. Genomics 1989; 4(4):479-497.
2. Walsh G. Biopharmaceutical benchmarks 2006. Nat Biotechnol 2006; 24(7):769-776.
3. Gahete MD, Duran-Prado M, Luque RM et al. Understanding the multifactorial control of growth hormone release by somatotropes: lessons from comparative endocrinology. Ann N Y Acad Sci 2009; 1163:137-153.
4. Lopez M, Nogueiras R, Tena-Sempere M, Dieguez C. Orexins (hypocretins) actions on the GHRH/somatostatin-GH axis. Acta Physiol (Oxf) 2010; 198(3):325-334.
5. Fodor M, Kordon C, Epelbaum J. Anatomy of the hypophysiotropic somatostatinergic and growth hormone-releasing hormone system minireview. Neurochem Res 2006; 31(2):137-143.
6. Florio T, Thellung S, Corsaro A et al. Characterization of the intracellular mechanisms mediating somatostatin and lanreotide inhibition of DNA synthesis and growth hormone release from dispersed human GH-secreting pituitary adenoma cells in vitro. Clin Endocrinol (Oxf) 2003; 59(1):115-128.
7. Maghnie M, Pennati MC, Civardi E et al. GH response to ghrelin in subjects with congenital GH deficiency: evidence that ghrelin action requires hypothalamic-pituitary connections. Eur J Endocrinol 2007; 156(4):449-454.
8. Tannenbaum GS, Epelbaum J, Bowers CY. Interrelationship between the novel peptide ghrelin and somatostatin/growth hormone-releasing hormone in regulation of pulsatile growth hormone secretion. Endocrinology 2003; 144(3):967-974.
9. Saleri R, Giustina A, Tamanini C et al. Leptin stimulates growth hormone secretion via a direct pituitary effect combined with a decreased somatostatin tone in a median eminence-pituitary perifusion study. Neuroendocrinology 2004; 79(4):221-228.
10. Watanobe H, Habu S. Leptin regulates growth hormone-releasing factor, somatostatin, and alpha-melanocyte-stimulating hormone but not neuropeptide Y release in rat hypothalamus in vivo: relation with growth hormone secretion. J Neurosci 2002; 22(14):6265-6271.
11. Liu L, Merriam GR, Sherins RJ. Chronic sex steroid exposure increases mean plasma growth hormone concentration and pulse amplitude in men with isolated hypogonadotropic hypogonadism. J Clin Endocrinol Metab 1987; 64(4):651-656.
12. Massa G, Igout A, Rombauts L, Frankenne F, Vanderschueren-Lodeweyckx M. Effect of oestrogen status on serum levels of growth hormone-binding protein and insulin-like growth factor-I in non-pregnant and pregnant women. Clin Endocrinol (Oxf) 1993; 39(5):569-575.
13. Takahashi Y, Kipnis DM, Daughaday WH. Growth hormone secretion during sleep. J Clin Invest 1968; 47(9):2079-2090.

II
14. Bratusch-Marrain P, Waldhausl W. The influence of amino acids and somatostatin on prolactin and growth hormone release in man. Acta Endocrinol (Copenh) 1979; 90(3):403-408.
15. Hartman ML, Veldhuis JD, Johnson ML et al. Augmented growth hormone (GH) secretory burst frequency and amplitude mediate enhanced GH secretion during a two-day fast in normal men. J Clin Endocrinol Metab 1992; 74(4):757-765.
16. Kjaer M, Bangsbo J, Lortie G, Galbo H. Hormonal response to exercise in humans: influence of hypoxia and physical training. Am J Physiol 1988; 254(2 Pt 2):R197-R203.
17. Imaki T, Shibasaki T, Shizume K et al. The effect of free fatty acids on growth hormone (GH)-releasing hormone-mediated GH secretion in man. J Clin Endocrinol Metab 1985; 60(2):290-293.
18. Masuda A, Shibasaki T, Nakahara M et al. The effect of glucose on growth hormone (GH)-releasing hormone-mediated GH secretion in man. J Clin Endocrinol Metab 1985; 60(3):523-526.
19. Pan W, Yu Y, Cain CM, Nyberg F, Couraud PO, Kastin AJ. Permeation of growth hormone across the blood-brain barrier. Endocrinology 2005; 146(11):4898-4904.
20. Romero CJ, Pine-Twaddell E, Sima DI et al. Insulin-like growth factor 1 mediates negative feedback to somatotroph GH expression via POU1F1/CREB binding protein interactions. Mol Cell Biol 2012; 32(21):4258-4269.
21. Carter-Su C, Schwartz J, Smit LS. Molecular mechanism of growth hormone action. Annu Rev Physiol 1996; 58:187-207.
22. Herrington J, Smit LS, Schwartz J, Carter-Su C. The role of STAT proteins in growth hormone signaling. Oncogene 2000; 19(21):2585-2597.
23. Sara VR, Hall K. Insulin-like growth factors and their binding proteins. Physiol Rev 1990; 70(3):591-614.
24. Baker J, Liu JP, Robertson EJ, Efstratiadis A. Role of insulin-like growth factors in embryonic and postnatal growth. Cell 1993; 75(1):73-82.
25. DeChiara TM, Robertson EJ, Efstratiadis A. Parental imprinting of the mouse insulin-like growth factor II gene. Cell 1991; 64(4):849-859.
26. Spicer LJ, Aad PY. Insulin-like growth factor (IGF) 2 stimulates steroidogenesis and mitosis of bovine granulosa cells through the IGF1 receptor: role of follicle-stimulating hormone and IGF2 receptor. Biol Reprod 2007; 77(1):18-27.
27. Xu YP, Chedrese J, Thacker PA. Effects of GH on IGF-II-induced progesterone accumulation by cultured porcine granulosa cells. Endocrine 1997; 7(2):157-163.
28. Mellott TJ, Pender SM, Burke RM, Langley EA, Blusztajn JK. IGF2 Ameliorates Amyloidosis, Increases Cholinergic Marker Expression and Raises BMP9 and Neurotrophin Levels in the Hippocampus of the APPswePS1dE9 Alzheimer's Disease Model Mice. PLoS One 2014; 9(4):e94287.
29. Constancia M, Hemberger M, Hughes J et al. Placental-specific IGF-II is a major modulator of placental and fetal growth. Nature 2002; 417(6892):945-948.

III
30. Jones JI, Clemmons DR. Insulin-like growth factors and their binding proteins: biological actions. Endocr Rev 1995; 16(1):3-34.
31. Humbel RE. Insulin-like growth factors I and II. Eur J Biochem 1990; 190(3):445-462.
32. Pierce AL, Breves JP, Moriyama S, Hirano T, Grau EG. Differential regulation of Igf1 and Igf2 mRNA levels in tilapia hepatocytes: effects of insulin and cortisol on GH sensitivity. J Endocrinol 2011; 211(2):201-210.
33. Peterson BC, Waldbieser GC. Effects of fasting on IGF-I, IGF-II, and IGF-binding protein mRNA concentrations in channel catfish (Ictalurus punctatus). Domest Anim Endocrinol 2009; 37(2):74-83.
34. Delafontaine P. Insulin-like growth factor I and its binding proteins in the cardiovascular system. Cardiovasc Res 1995; 30(6):825-834.
35. Butler AA, Blakesley VA, Poulaki V, Tsokos M, Wood TL, LeRoith D. Stimulation of tumor growth by recombinant human insulin-like growth factor-I (IGF-I) is dependent on the dose and the level of IGF-I receptor expression. Cancer Res 1998; 58(14):3021-3027.
36. Sell C, Dumenil G, Deveaud C et al. Effect of a null mutation of the insulin-like growth factor I receptor gene on growth and transformation of mouse embryo fibroblasts. Mol Cell Biol 1994; 14(6):3604-3612.
37. Rodriguez-Tarduchy G, Collins MK, Garcia I, Lopez-Rivas A. Insulin-like growth factor-I inhibits apoptosis in IL-3-dependent hemopoietic cells. J Immunol 1992; 149(2):535-540.
38. Burfeind P, Chernicky CL, Rininsland F, Ilan J, Ilan J. Antisense RNA to the type I insulin-like growth factor receptor suppresses tumor growth and prevents invasion by rat prostate cancer cells in vivo. Proc Natl Acad Sci U S A 1996; 93(14):7263-7268.
39. Reiss K, D'Ambrosio C, Tu X, Tu C, Baserga R. Inhibition of tumor growth by a dominant negative mutant of the insulin-like growth factor I receptor with a bystander effect. Clin Cancer Res 1998; 4(11):2647-2655.
40. Wang Y, Hailey J, Williams D et al. Inhibition of insulin-like growth factor-I receptor (IGF-IR) signaling and tumor cell growth by a fully human neutralizing anti-IGF-IR antibody. Mol Cancer Ther 2005; 4(8):1214-1221.
41. Schneider MR, Lahm H, Wu M, Hoeflich A, Wolf E. Transgenic mouse models for studying the functions of insulin-like growth factor-binding proteins. FASEB J 2000; 14(5):629-640.
42. Rajaram S, Baylink DJ, Mohan S. Insulin-like growth factor-binding proteins in serum and other biological fluids: regulation and functions. Endocr Rev 1997; 18(6):801-831.
43. Conover CA, Divertie GD, Lee PD. Cortisol increases plasma insulin-like growth factor binding protein-1 in humans. Acta Endocrinol (Copenh) 1993; 128(2):140-143.
44. Hilding A, Brismar K, Thoren M, Hall K. Glucagon stimulates insulin-like growth factor binding protein-1 secretion in healthy subjects, patients with pituitary insufficiency, and patients with insulin-dependent diabetes mellitus. J Clin Endocrinol Metab 1993; 77(5):1142-1147.
45. Lee PD, Giudice LC, Conover CA, Powell DR. Insulin-like growth factor binding protein-1: recent findings and new directions. Proc Soc Exp Biol Med 1997; 216(3):319-357.

IV
46. Suikkari AM, Sane T, Seppala M, Yki-Jarvinen H, Karonen SL, Koivisto VA. Prolonged exercise increases serum insulin-like growth factor-binding protein concentrations. J Clin Endocrinol Metab 1989; 68(1):141-144.
47. Mogul HR, Marshall M, Frey M et al. Insulin like growth factor-binding protein-1 as a marker for hyperinsulinemia in obese menopausal women. J Clin Endocrinol Metab 1996; 81(12):4492-4495.
48. Petersson U, Ostgren CJ, Brudin L, Brismar K, Nilsson PM. Low levels of insulin-like growth-factor-binding protein-1 (IGFBP-1) are prospectively associated with the incidence of type 2 diabetes and impaired glucose tolerance (IGT): the Soderakra Cardiovascular Risk Factor Study. Diabetes Metab 2009; 35(3):198-205.
49. Maddux BA, Chan A, De Filippis EA, Mandarino LJ, Goldfine ID. IGF-binding protein-1 levels are related to insulin-mediated glucose disposal and are a potential serum marker of insulin resistance. Diabetes Care 2006; 29(7):1535-1537.
50. Hoeflich A, Reisinger R, Lahm H et al. Insulin-like growth factor-binding protein 2 in tumorigenesis: protector or promoter? Cancer Res 2001; 61(24):8601-8610.
51. Jeong EY, Kim S, Jung S et al. Enhancement of IGF-2-induced neurite outgrowth by IGF-binding protein-2 and osteoglycin in SH-SY5Y human neuroblastoma cells. Neurosci Lett 2013; 548:249-254.
52. Wang GK, Hu L, Fuller GN, Zhang W. An interaction between insulin-like growth factor-binding protein 2 (IGFBP2) and integrin alpha5 is essential for IGFBP2-induced cell mobility. J Biol Chem 2006; 281(20):14085-14091.
53. Blum WF, Horn N, Kratzsch J et al. Clinical studies of IGFBP-2 by radioimmunoassay. Growth Regul 1993; 3(1):100-104.
54. Baege AC, Disbrow GL, Schlegel R. IGFBP-3, a marker of cellular senescence, is overexpressed in human papillomavirus-immortalized cervical cells and enhances IGF-1-induced mitogenesis. J Virol 2004; 78(11):5720-5727.
55. Baxter RC. Signalling pathways involved in antiproliferative effects of IGFBP-3: a review. Mol Pathol 2001; 54(3):145-148.
56. Wang Z, Wang Z, Liang Z et al. Expression and clinical significance of IGF-1, IGFBP-3, and IGFBP-7 in serum and lung cancer tissues from patients with non-small cell lung cancer. Onco Targets Ther 2013; 6:1437-1444.
57. Durai R, Davies M, Yang W et al. Biology of insulin-like growth factor binding protein-4 and its role in cancer (review). Int J Oncol 2006; 28(6):1317-1325.
58. Zhou R, Diehl D, Hoeflich A, Lahm H, Wolf E. IGF-binding protein-4: biochemical characteristics and functional consequences. J Endocrinol 2003; 178(2):177-193.
59. Zhu W, Shiojima I, Ito Y et al. IGFBP-4 is an inhibitor of canonical Wnt signalling required for cardiogenesis. Nature 2008; 454(7202):345-349.
60. Mita K, Zhang Z, Ando Y et al. Prognostic significance of insulin-like growth factor binding protein (IGFBP)-4 and IGFBP-5 expression in breast cancer. Jpn J Clin Oncol 2007; 37(8):575-582.
V
61. Ueno K, Hirata H, Majid S, Tabatabai ZL, Hinoda Y, Dahiya R. IGFBP-4 activates the Wnt/beta-catenin signaling pathway and induces M-CAM expression in human renal cell carcinoma. Int J Cancer 2011; 129(10):2360-2369.
62. Degraff DJ, Aguiar AA, Sikes RA. Disease evidence for IGFBP-2 as a key player in prostate cancer progression and development of osteosclerotic lesions. Am J Transl Res 2009; 1(2):115-130.
63. Lu S, Purohit S, Sharma A et al. Serum insulin-like growth factor binding protein 6 (IGFBP6) is increased in patients with type 1 diabetes and its complications. Int J Clin Exp Med 2012; 5(3):229-237.
64. Chen D, Yoo BK, Santhekadur PK et al. Insulin-like growth factor-binding protein-7 functions as a potential tumor suppressor in hepatocellular carcinoma. Clin Cancer Res 2011; 17(21):6693-6701.
65. Evdokimova V, Tognon CE, Benatar T et al. IGFBP7 binds to the IGF-1 receptor and blocks its activation by insulin-like growth factors. Sci Signal 2012; 5(255):ra92.
66. Brugts MP, van den Beld AW, Hofland LJ et al. Low circulating insulin-like growth factor I bioactivity in elderly men is associated with increased mortality. J Clin Endocrinol Metab 2008; 93(7):2515-2522.
67. Brugts MP, Ranke MB, Hofland LJ et al. Normal values of circulating insulin-like growth factor-I bioactivity in the healthy population: comparison with five widely used IGF-I immunoassays. J Clin Endocrinol Metab 2008; 93(7):2539-2545.
68. Alessi DR, James SR, Downes CP et al. Characterization of a 3-phosphoinositide-dependent protein kinase which phosphorylates and activates protein kinase Balpha. Curr Biol 1997; 7(4):261-269.
69. Sarbassov DD, Guertin DA, Ali SM, Sabatini DM. Phosphorylation and regulation of Akt/PKB by the rictor-mTOR complex. Science 2005; 307(5712):1098-1101.
70. Pillai RN, Owonikoko TK. Small cell lung cancer: therapies and targets. Semin Oncol 2014; 41(1):133-142.
71. Wolfrum C, Asilmaz E, Luca E, Friedman JM, Stoffel M. Foxa2 regulates lipid metabolism and ketogenesis in the liver during fasting and in diabetes. Nature 2004; 432(7020):1027-1032.
72. Zhang W, Patil S, Chauhan B et al. FoxO1 regulates multiple metabolic pathways in the liver: effects on gluconeogenic, glycolytic, and lipogenic gene expression. J Biol Chem 2006; 281(15):10105-10117.
73. Brunet A, Kanai F, Stehn J et al. 14-3-3 transits to the nucleus and participates in dynamic nucleocytoplasmic transport. J Cell Biol 2002; 156(5):817-828.
74. Brunet A, Bonni A, Zigmond MJ et al. Akt promotes cell survival by phosphorylating and inhibiting a Forkhead transcription factor. Cell 1999; 96(6):857-868.
75. Datta SR, Dudek H, Tao X et al. Akt phosphorylation of BAD couples survival signals to the cell-intrinsic death machinery. Cell 1997; 91(2):231-241.
76. Gardai SJ, Hildeman DA, Frankel SK et al. Phosphorylation of Bax Ser184 by Akt regulates its activity and apoptosis in neutrophils. J Biol Chem 2004; 279(20):21085-21095.
VI
77. Pan D, Dong J, Zhang Y, Gao X. Tuberous sclerosis complex: from Drosophila to human disease. Trends Cell Biol 2004; 14(2):78-85.
78. Miyazaki M, McCarthy JJ, Esser KA. Insulin like growth factor-1-induced phosphorylation and altered distribution of tuberous sclerosis complex (TSC)1/TSC2 in C2C12 myotubes. FEBS J 2010; 277(9):2180-2191.
79. Ogawara Y, Kishishita S, Obata T et al. Akt enhances Mdm2-mediated ubiquitination and degradation of p53. J Biol Chem 2002; 277(24):21843-21850.
80. Friedrich N, Volzke H, Rosskopf D et al. Reference ranges for serum dehydroepiandrosterone sulfate and testosterone in adult men. J Androl 2008; 29(6):610-617.
81. Ryall JG, Schertzer JD, Lynch GS. Cellular and molecular mechanisms underlying age-related skeletal muscle wasting and weakness. Biogerontology 2008; 9(4):213-228.
82. Szulc P, Beck TJ, Marchand F, Delmas PD. Low skeletal muscle mass is associated with poor structural parameters of bone and impaired balance in elderly men--the MINOS study. J Bone Miner Res 2005; 20(5):721-729.
83. Leger B, Derave W, De BK, Hespel P, Russell AP. Human sarcopenia reveals an increase in SOCS-3 and myostatin and a reduced efficiency of Akt phosphorylation. Rejuvenation Res 2008; 11(1):163-175B.
84. Bodine SC, Stitt TN, Gonzalez M et al. Akt/mTOR pathway is a crucial regulator of skeletal muscle hypertrophy and can prevent muscle atrophy in vivo. Nat Cell Biol 2001; 3(11):1014-1019.
85. Sandri M, Sandri C, Gilbert A et al. Foxo transcription factors induce the atrophy-related ubiquitin ligase atrogin-1 and cause skeletal muscle atrophy. Cell 2004; 117(3):399-412.
86. Giustina A, Mazziotti G, Canalis E. Growth hormone, insulin-like growth factors, and the skeleton. Endocr Rev 2008; 29(5):535-559.
87. Chisalita SI, Dahlstrom U, Arnqvist HJ, Alehagen U. Increased IGF1 levels in relation to heart failure and cardiovascular mortality in an elderly population: impact of ACE inhibitors. Eur J Endocrinol 2011; 165(6):891-898.
88. Bailey-Downs LC, Mitschelen M, Sosnowska D et al. Liver-specific knockdown of IGF-1 decreases vascular oxidative stress resistance by impairing the Nrf2-dependent antioxidant response: a novel model of vascular aging. J Gerontol A Biol Sci Med Sci 2012; 67(4):313-329.
89. Kajstura J, Fiordaliso F, Andreoli AM et al. IGF-1 overexpression inhibits the development of diabetic cardiomyopathy and angiotensin II-mediated oxidative stress. Diabetes 2001; 50(6):1414-1424.
90. Teppala S, Shankar A. Association between serum IGF-1 and diabetes among U.S. adults. Diabetes Care 2010; 33(10):2257-2259.
91. Teppala S, Shankar A, Ducatman A. The association between acculturation and hypertension in a multiethnic sample of US adults. J Am Soc Hypertens 2010; 4(5):236-243.
92. Teppala S, Shankar A, Sabanayagam C. Association between IGF-1 and chronic kidney disease among US adults. Clin Exp Nephrol 2010; 14(5):440-444.

VII
93. Volzke H, Nauck M, Rettig R et al. Association between hepatic steatosis and serum IGF1 and IGFBP-3 levels in a population-based sample. Eur J Endocrinol 2009; 161(5):705-713.
94. Woods KA, Camacho-Hubner C, Bergman RN, Barter D, Clark AJ, Savage MO. Effects of insulin-like growth factor I (IGF-I) therapy on body composition and insulin resistance in IGF-I gene deletion. J Clin Endocrinol Metab 2000; 85(4):1407-1411.
95. Xuan S, Kitamura T, Nakae J et al. Defective insulin secretion in pancreatic beta cells lacking type 1 IGF receptor. J Clin Invest 2002; 110(7):1011-1019.
96. Schafer N, Wagener A, Hantschel C, Mauel S, Gruber AD, Brockmann GA. IGF-I contributes to glucose homeostasis in the Berlin Fat Mouse Inbred line. Growth Factors 2011; 29(6):298-309.
97. Grant JP, Custer PB, Thurlow J. Current techniques of nutritional assessment. Surg Clin North Am 1981; 61(3):437-463.
98. Unterman TG, Vazquez RM, Slas AJ, Martyn PA, Phillips LS. Nutrition and somatomedin. XIII. Usefulness of somatomedin-C in nutritional assessment. Am J Med 1985; 78(2):228-234.
99. Goldstein S, Phillips LS. Nutrition and somatomedin: nutritionally regulated release of somatomedins and somatomedin inhibitors from perfused livers in rats. Metabolism 1989; 38(8):745-752.
100. Melnik BC. Evidence for acne-promoting effects of milk and other insulinotropic dairy products. Nestle Nutr Workshop Ser Pediatr Program 2011; 67:131-145.
101. Schaefer O. Pre- and post-natal growth acceleration and increased sugar consumption in Canadian Eskimos. Can Med Assoc J 1970; 103(10):1059-1068.
102. Leong KS, Walker AB, Martin I, Wile D, Wilding J, MacFarlane IA. An audit of 500 subcutaneous glucagon stimulation tests to assess growth hormone and ACTH secretion in patients with hypothalamic-pituitary disease. Clin Endocrinol (Oxf) 2001; 54(4):463-468.
103. Romero CJ, Pine-Twaddell E, Sima DI et al. Insulin-like growth factor 1 mediates negative feedback to somatotroph GH expression via POU1F1/CREB binding protein interactions. Mol Cell Biol 2012; 32:4258-4269.
104. Secco A, di Iorgi N, Napoli F et al. The glucagon test in the diagnosis of growth hormone deficiency in children with short stature younger than 6 years. The Journal of clinical endocrinology and metabolism 2009; 94:4251-4257.
105. Yuen KC. Glucagon stimulation testing in assessing for adult growth hormone deficiency: current status and future perspectives. ISRN endocrinology 2011; 2011:608056.
106. Varewijck AJ, Lamberts SW, Uitterlinden P, Hofland LJ, Janssen JA. IGF-I bioactivity better reflects growth hormone deficiency than total IGF-I. The Journal of clinical endocrinology and metabolism 2011; 96:2248-2254.
107. Varewijck AJ, Lamberts SW, Neggers SJ, Hofland LJ, Janssen JA. IGF-I bioactivity might reflect different aspects of quality of life than total IGF-I in GH-deficient patients during GH treatment. The Journal of clinical endocrinology and metabolism 2013; 98:761-768.
108. Arafat AM, Weickert MO, Frystyk J et al. The Role of Insulin-Like Growth Factor (IGF) Binding Protein-2 in the Insulin-Mediated Decrease in IGF-I Bioactivity. J Clin Endocrinol Metab 2009.
VIII
109. Leung KC, Doyle N, Ballesteros M, Waters MJ, Ho KK. Insulin regulation of human hepatic growth hormone receptors: divergent effects on biosynthesis and surface translocation. The Journal of clinical endocrinology and metabolism 2000; 85:4712-4720.
110. Li Z, Miard S, Laplante M, Sonenberg N, Picard F. Insulin stimulates IGFBP-2 expression in 3T3-L1 adipocytes through the PI3K/mTOR pathway. Molecular and cellular endocrinology 2012; 358:63-68.
111. Xu J, Ji S, Venable DY, Franklin JL, Messina JL. Prolonged insulin treatment inhibits GH signaling via STAT3 and STAT1. The Journal of endocrinology 2005; 184:481-492.
112. Lagiou P, Sandin S, Weiderpass E et al. Low carbohydrate-high protein diet and mortality in a cohort of Swedish women. J Intern Med 2007; 261(4):366-374.
113. Lagiou P, Sandin S, Lof M, Trichopoulos D, Adami HO, Weiderpass E. Low carbohydrate-high protein diet and incidence of cardiovascular diseases in Swedish women: prospective cohort study. BMJ 2012; 344:e4026.
114. Sjogren P, Becker W, Warensjo E et al. Mediterranean and carbohydrate-restricted diets and mortality among elderly men: a cohort study in Sweden. Am J Clin Nutr 2010; 92(4):967-974.
115. Trichopoulou A, Psaltopoulou T, Orfanos P, Hsieh CC, Trichopoulos D. Low-carbohydrate-high-protein diet and long-term survival in a general population cohort. Eur J Clin Nutr 2007; 61(5):575-581.
116. Ho KY, Veldhuis JD, Johnson ML et al. Fasting enhances growth hormone secretion and amplifies the complex rhythms of growth hormone secretion in man. J Clin Invest 1988; 81(4):968-975.
117. Brameld JM, Gilmour RS, Buttery PJ. Glucose and amino acids interact with hormones to control expression of insulin-like growth factor-I and growth hormone receptor mRNA in cultured pig hepatocytes. J Nutr 1999; 129(7):1298-1306.
118. Arafat AM, Mohlig M, Weickert MO et al. Growth hormone response during oral glucose tolerance test: the impact of assay method on the estimation of reference values in patients with acromegaly and in healthy controls, and the role of gender, age, and body mass index. J Clin Endocrinol Metab 2008; 93(4):1254-1262.
119. Bonds DE, Miller ME, Bergenstal RM et al. The association between symptomatic, severe hypoglycaemia and mortality in type 2 diabetes: retrospective epidemiological analysis of the ACCORD study. BMJ 2010; 340:b4909.
120. Cryer PE. Severe hypoglycemia predicts mortality in diabetes. Diabetes Care 2012; 35(9):1814-1816.
121. Hsu PF, Sung SH, Cheng HM et al. Association of clinical symptomatic hypoglycemia with cardiovascular events and total mortality in type 2 diabetes: a nationwide population-based study. Diabetes Care 2013; 36(4):894-900.
122. Brugts MP, van den Beld AW, Hofland LJ et al. Low circulating insulin-like growth factor I bioactivity in elderly men is associated with increased mortality. J Clin Endocrinol Metab 2008; 93(7):2515-2522.
123. Maggio M, Cattabiani C, Lauretani F et al. Insulin-like growth factor-1 bioactivity plays a prosurvival role in older participants. J Gerontol A Biol Sci Med Sci 2013; 68(11):1342-1350.

IX
124. Laemmli UK. Cleavage of structural proteins during the assembly of the head of bacteriophage T4. Nature 1970; 227(5259):680-685.
125. Docke S, Lock JF, Birkenfeld AL et al. Elevated hepatic chemerin mRNA expression in human non-alcoholic fatty liver disease. Eur J Endocrinol 2013; 169(5):547-557.
126. Arafat AM, Weickert MO, Adamidou A et al. The impact of insulin-independent, glucagon-induced suppression of total ghrelin on satiety in obesity and type 1 diabetes mellitus. J Clin Endocrinol Metab 2013; 98(10):4133-4142.
127. Glynn N, Agha A. Diagnosing growth hormone deficiency in adults. International journal of endocrinology 2012; 2012:972617.
128. Mohan S, Baylink DJ. IGF-binding proteins are multifunctional and act via IGF-dependent and -independent mechanisms. The Journal of endocrinology 2002; 175:19-31.
129. Wakai K, Suzuki K, Ito Y et al. Time spent walking or exercising and blood levels of insulin-like growth factor-I (IGF-I) and IGF-binding protein-3 (IGFBP-3): A large-scale cross-sectional study in the Japan Collaborative Cohort study. Asian Pacific journal of cancer prevention : APJCP 2009; 10 Suppl:23-27.
130. Forbes K, Westwood M. The IGF axis and placental function. a mini review. Horm Res 2008; 69:129-137.
131. Frystyk J. Aging somatotropic axis: mechanisms and implications of insulin-like growth factor-related binding protein adaptation. Endocrinology and metabolism clinics of North America 2005; 34:865-76, viii.
132. Siddals KW, Westwood M, Gibson JM, White A. IGF-binding protein-1 inhibits IGF effects on adipocyte function: implications for insulin-like actions at the adipocyte. The Journal of endocrinology 2002; 174:289-297.
133. Firth SM, Baxter RC. Cellular actions of the insulin-like growth factor binding proteins. Endocr Rev 2002; 23:824-854.
134. Pierce AL, Dickey JT, Felli L, Swanson P, Dickhoff WW. Metabolic hormones regulate basal and growth hormone-dependent igf2 mRNA level in primary cultured coho salmon hepatocytes: effects of insulin, glucagon, dexamethasone, and triiodothyronine. The Journal of endocrinology 2010; 204:331-339.
135. Dube PE, Forse CL, Bahrami J, Brubaker PL. The essential role of insulin-like growth factor-1 in the intestinal tropic effects of glucagon-like peptide-2 in mice. Gastroenterology 2006; 131:589-605.
136. Karila T, Koistinen H, Seppala M, Koistinen R, Seppala T. Growth hormone induced increase in serum IGFBP-3 level is reversed by anabolic steroids in substance abusing power athletes. Clin Endocrinol (Oxf) 1998; 49(4):459-463.
137. Maggio M, Cattabiani C, Lauretani F et al. Insulin-like growth factor-1 bioactivity plays a prosurvival role in older participants. The journals of gerontology Series A, Biological sciences and medical sciences 2013; 68:1342-1350.
X
138. Hilding A, Brismar K, Thoren M, Hall K. Glucagon stimulates insulin-like growth factor binding protein-1 secretion in healthy subjects, patients with pituitary insufficiency, and patients with insulin-dependent diabetes mellitus. J Clin Endocrinol Metab 1993; 77(5):1142-1147.
139. Hilding A, Moller C, Hall KE. Glucagon and GLP-1 stimulate IGFBP-1 secretion in Hep G2 cells without effect on IGFBP-1 mRNA. Growth Horm IGF Res 2002; 12(1):60-68.
140. Brownawell AM, Kops GJ, Macara IG, Burgering BM. Inhibition of nuclear import by protein kinase B (Akt) regulates the subcellular distribution and activity of the forkhead transcription factor AFX. Mol Cell Biol 2001; 21:3534-3546.
141. Mounier C, Dumas V, Posner BI. Regulation of hepatic insulin-like growth factor-binding protein-1 gene expression by insulin: central role for mammalian target of rapamycin independent of forkhead box O proteins. Endocrinology 2006; 147:2383-2391.
142. Schwer B, Verdin E. Conserved metabolic regulatory functions of sirtuins. Cell Metab 2008; 7(2):104-112.
143. von MF, Porstmann T, Gasser E et al. Glucagon-induced acetylation of Foxa2 regulates hepatic lipid metabolism. Cell Metab 2013; 17(3):436-447.
144. Mihaylova MM, Vasquez DS, Ravnskjaer K et al. Class IIa histone deacetylases are hormone-activated regulators of FOXO and mammalian glucose homeostasis. Cell 2011; 145(4):607-621.
145. Mothe-Satney I, Gautier N, Hinault C, Lawrence JC, Jr., Van OE. In rat hepatocytes glucagon increases mammalian target of rapamycin phosphorylation on serine 2448 but antagonizes the phosphorylation of its downstream targets induced by insulin and amino acids. J Biol Chem 2004; 279(41):42628-42637.
146. Gradilone SA, Carreras FI, Lehmann GL, Marinelli RA. Phosphoinositide 3-kinase is involved in the glucagon-induced translocation of aquaporin-8 to hepatocyte plasma membrane. Biology of the cell / under the auspices of the European Cell Biology Organization 2005; 97:831-836.
147. Harney JA, Rodgers RL. Insulin-like stimulation of cardiac fuel metabolism by physiological levels of glucagon: involvement of PI3K but not cAMP. American journal of physiology Endocrinology and metabolism 2008; 295:E155-E161.
148. Levine ME, Suarez JA, Brandhorst S et al. Low protein intake is associated with a major reduction in IGF-1, cancer, and overall mortality in the 65 and younger but not older population. Cell Metab 2014; 19(3):407-417.
149. Rosen T, Bengtsson BA. Premature mortality due to cardiovascular disease in hypopituitarism. Lancet 1990; 336(8710):285-288.
150. Colao A, Marzullo P, Di SC, Lombardi G. Growth hormone and the heart. Clin Endocrinol (Oxf) 2001; 54(2):137-154.
151. Wallander M, Norhammar A, Malmberg K, Ohrvik J, Ryden L, Brismar K. IGF binding protein 1 predicts cardiovascular morbidity and mortality in patients with acute myocardial infarction and type 2 diabetes. Diabetes Care 2007; 30(9):2343-2348.
152. van den Beld AW, Blum WF, Brugts MP, Janssen JA, Grobbee DE, Lamberts SW. High IGFBP2 levels are not only associated with a better metabolic risk profile but also with increased mortality in elderly men. Eur J Endocrinol 2012; 167(1):111-117.

XI
153. Ma Z, Christiansen JS, Laursen T et al. Effects of human insulin and insulin aspart preparations on levels of IGF-I, IGFBPs and IGF bioactivity in patients with type 1 diabetes. BMC Endocr Disord 2014; 14:35.
154. Deichsel K, Hoppen HO, Bruckmaier R, Kolm G, Aurich C. Acute insulin-induced hypoglycaemia does not alter IGF-1 and LH release in cyclic mares. Reprod Domest Anim 2005; 40(2):117-122.
155. Webster JR, Corson ID, Robertson AF, Littlejohn RP, Stuart SK, Suttie JM. Effects of glucose or insulin infusions on growth hormone secretion in male red deer. Gen Comp Endocrinol 1996; 103(3):257-263.
156. Senniappan S, Hussain K. An Evaluation of Growth Hormone and IGF-1 Responses in Neonates with Hyperinsulinaemic Hypoglycaemia. Int J Endocrinol 2013; 2013:638257.
157. Runchey SS, Pollak MN, Valsta LM et al. Glycemic load effect on fasting and post-prandial serum glucose, insulin, IGF-1 and IGFBP-3 in a randomized, controlled feeding study. Eur J Clin Nutr 2012; 66(10):1146-1152.
158. Yoo EG, Lee WJ, Kim JH et al. Insulin-like growth factor-binding protein-3 mediates high glucose-induced apoptosis by increasing oxidative stress in proximal tubular epithelial cells. Endocrinology 2011; 152(8):3135-3142.
159. Bernardi F, Petraglia F, Seppala M et al. GH, IGFBP-1, and IGFBP-3 response to oral glucose tolerance test in perimenopausal women: no influence of body mass index. Maturitas 1999; 33(2):163-169.
160. Mireuta M, Hancock MA, Pollak M. Binding between insulin-like growth factor 1 and insulin-like growth factor-binding protein 3 is not influenced by glucose or 2-deoxy-D-glucose. J Biol Chem 2011; 286(19):16567-16573.
161. Nedic O, Masnikosa R, Lagundzin D. Association between the pattern of IGFBP-1 alteration and the glucose/insulin metabolic control. Exp Clin Endocrinol Diabetes 2011; 119(5):306-313.
162. Levitt Katz LE, Satin-Smith MS, Collett-Solberg P et al. Insulin-like growth factor binding protein-1 levels in the diagnosis of hypoglycemia caused by hyperinsulinism. J Pediatr 1997; 131(2):193-199.
163. Baxter RC, Holman SR, Corbould A, Stranks S, Ho PJ, Braund W. Regulation of the insulin-like growth factors and their binding proteins by glucocorticoid and growth hormone in nonislet cell tumor hypoglycemia. J Clin Endocrinol Metab 1995; 80(9):2700-2708.
164. Biernacka KM, Uzoh CC, Zeng L et al. Hyperglycaemia-induced chemoresistance of prostate cancer cells due to IGFBP2. Endocr Relat Cancer 2013; 20(5):741-751.
165. Arafat AM, Weickert MO, Frystyk J et al. The role of insulin-like growth factor (IGF) binding protein-2 in the insulin-mediated decrease in IGF-I bioactivity. The Journal of clinical endocrinology and metabolism 2009; 94:5093-5101.
166. Kelijman M, Frohman LA. Discordant effects of insulin-hypoglycemia on growth hormone (GH)-releasing hormone-stimulated GH and thyrotropin (TSH)-releasing hormone-stimulated TSH secretion. J Clin Endocrinol Metab 1988; 66(4):872-875.
167. Salvatori R, Serpa MG, Parmigiani G et al. GH response to hypoglycemia and clonidine in the GH-releasing hormone resistance syndrome. J Endocrinol Invest 2006; 29(9):805-808.

XII
168. Gogitidze JN, Hedrington MS, Briscoe VJ, Tate DB, Ertl AC, Davis SN. Effects of acute hypoglycemia on inflammatory and pro-atherothrombotic biomarkers in individuals with type 1 diabetes and healthy individuals. Diabetes Care 2010; 33(7):1529-1535.
169. Trovati M, Anfossi G, Cavalot F et al. Studies on mechanisms involved in hypoglycemia-induced platelet activation. Diabetes 1986; 35(7):818-825.
170. Wang J, Alexanian A, Ying R et al. Acute exposure to low glucose rapidly induces endothelial dysfunction and mitochondrial oxidative stress: role for AMP kinase. Arterioscler Thromb Vasc Biol 2012; 32(3):712-720.


![O Morphological, thermal and bioactivity evaluation of O ... · matrix or coatings of polymer matrix are alternatives to improve these limitations[7]. Calcium phosphate bioceramics](https://static.fdokument.com/doc/165x107/60220a16e4b99421dd6582ff/o-morphological-thermal-and-bioactivity-evaluation-of-o-matrix-or-coatings.jpg)


![Review Modulation of Glucose Transporter Protein by Dietary ......tor and consequently stimulates production of multi-ple inflammatory mediators, including TNF-α and IL-6 [28]. On](https://static.fdokument.com/doc/165x107/611f5ea8af8d03389332ed4b/review-modulation-of-glucose-transporter-protein-by-dietary-tor-and-consequently.jpg)