Report cover form UNH - NH.gov · Retroreflectivity higher than 150 mCd/M2/Lx over a full season is...
114
Final Re p port Prepared by The Advanced Polymer Laboratory, University of New Hampshire, Durham NH for the New Hampshire Department of Transportation, through the U.S. Department of Transportation, Federal Highway Administration Pooled-Fund Project TPF-5(024). P P M M M M A A R R e e t t r r o o - - R R e e f f l l e e c c t t i i v v e e B B e e a a d d s s f f o o r r T T r r a a f f f f i i c c P P a a i i n n t t s s R R e e s s e e a a r r c c h h R R e e c c o o r r d d 288
Transcript of Report cover form UNH - NH.gov · Retroreflectivity higher than 150 mCd/M2/Lx over a full season is...

FFiinnaall RReeppoorrttPrepared by The Advanced Polymer Laboratory, University of New Hampshire, Durham NH for the NewHampshire Department of Transportation, through the U.S. Department of Transportation, Federal HighwayAdministration Pooled-Fund Project TPF-5(024).
PPMMMMAA RReettrroo--RReefflleeccttiivvee BBeeaaddss ffoorr TTrraaffffiicc PPaaiinnttss
RRee sseeaarrcc hh RR eecc oo rrdd
288

1. Report No. FHWA-NH-RD-13739
2. Gov. Acc. No. 3. Recipient's Catalog No.
4. Title and Subtitle
PMMA RETRO-REFLECTIVE BEADS FOR TRAFFIC PAINT
5. Report Date July 28, 2005
6. Performing Organization Code
7. Author(s) Yvon Durant, Ph.D., MBA
8. Performing Organization Report No.
9. Performing Organization Name and Address
University of New Hampshire Advanced Polymer Laboratory
10. Work Unit No. (TRAIS)
Parsons Hall G101
Durham, NH 03824
11. Contract or Grant No. 13739, TPF-5(024)
12. Sponsoring Agency Name and Address NEW HAMPSHIRE DEPARTMENT OF TRANSPORTATION PO BOX 483, 1 HAZEN DRIVE CONCORD, NH 03302-0483
13. Type of Report and Period Covered FINAL REPORT – PHASE II
FALL 2005
See acknowledgement for listing of other contributing states. 14. Sponsoring Agency Code
15. Supplementary Notes In cooperation with the U.S. DEPARTMENT OF TRANSPORTATION, FEDERAL HIGHWAY ADMINISTRATION
16. Abstract This cooperative research program studied the potential of polymethymethacrylate (PMMA) beads to act as a substitute for glass beads when their surface chemistry is modified to react (crosslink) with the binder chemistry. The field testing of these beads was carried in two separate years, with 3 sites during a first year and a single site during a second year. The project was successful in achieving its goal of developing a novel type of traffic coating with improved wear performance. More specifically, it completed the development of a process and recipe to effectively modify the surface of PMMA beads in order to obtain chemical crosslinking of the beads with a paint binder containing acetoacetate function. It also completed the evaluation of these novel beads in reference to conventional traffic coating under accelerated conditions, after several attempts, and yielded clear evidence that the novel traffic coating has significantly higher wear resistance over conventional coatings. Application of the novel coatings was similar to the conventional system, and requires very limited equipment modification. Additionally, several complementary protocol and observational techniques have been developed during this project.
17. Key Words Retroreflectivity, glass beads, polymethylmethacrylate bead, binder bead
crosslinking, accelerated wear, PMMA
18. Distribution Statement
NO RESTRICTIONS. THIS DOCUMENT IS AVAILABLE TO THE PUBLIC THROUGH THE NATIONAL TECHNICAL INFORMATION SERVICE, SPRINGFIELD, VIRGINIA, 22161
19. Security Classif. (of this report) UNCLASSIFIED
20. Security Class. (of this page)
UNCLASSIFIED
21. No. of Pages
114
22. Price

Acknowledgement Prepared in cooperation with the U.S. Department of Transportation, Federal Highway Administration Pooled-Fund Program Project TPF-5(024). The project was sponsored by the States of Colorado, Connecticut, Florida, Indiana, Maine, Maryland, New Hampshire, New Jersey and Vermont. Disclaimer The contents of this report reflect the views of the authors who are responsible for the facts and the accuracy of the data presented herein. The contents do not necessarily reflect the official views or policies of the Sponsoring States or the Federal Highway Administration at the time of publication. This report does not constitute a standard, specification, or regulation.

4
Report prepared for State of New Hampshire, Department of Transportation Bureau of Materials and Research P.O. Box 483, Stickney Ave. Concord, NH 03302-0483 Under Contract # TPF-5(024) statewide 13739 Award date: 12/19/01 Final report July 28th, 2005 Prepared by Dr. Yvon G. Durant Advanced Polymer Laboratory University of New Hampshire Parsons Hall G101, Durham NH 03824 Tel : 603 862 1703, Fax : 603 862 4892 Email : [email protected]

5
Introduction.................................................................................................................................... 6 Abbreviations ................................................................................................................................ 7 Bead synthesis ............................................................................................................................. 8 Traffic coating performance monitoring .................................................................................... 9
University of New Hampshire site.......................................................................................... 9 Lincoln site .............................................................................................................................. 10 Field results of year 2 Application report in Epping .......................................................... 17
Pre Application equipment modifications ............................................................................ 17 Application............................................................................................................................ 18 Sample layout........................................................................................................................ 19 Monitoring and results .......................................................................................................... 20
Added discoveries ...................................................................................................................... 23 Application and measurement protocol .............................................................................. 23 Winter measurements opportunities ................................................................................... 24 Image analysis ........................................................................................................................ 25 Weathering of samples.......................................................................................................... 28 Initial retroreflectivity issues.................................................................................................. 29
Conclusion................................................................................................................................... 30 Appendix 1 - Epping raw data .................................................................................................. 31 Appendix 2 Report #1,2,3+4,5 ................................................................................................. 33

6
Introduction This project dealt with a specific aspect of traffic paint, the improvement of retro-reflective bead retention. More specifically we studied the potential of polymethymethacrylate (PMMA) beads to act as a substitute for glass beads when their surface chemistry is modified to react (crosslink) with the binder chemistry. This project thus is a building block toward an ultimate goal of developing traffic paints with longer durability and sustained retroreflectivity. Within the scientific and technical scope of this project, performance at the time of application, whether initially high or low, is of minimal concern and focus and emphasis is on sustained performance. Retroreflectivity higher than 150 mCd/M2/Lx over a full season is generally considered desirable but does not constitute the objective of this project. This project involved two major phases: a laboratory development phase, where modified polymeric beads were produced, and a field test phase including limited comparison with conventional products. The development of the beads has been covered in previous interim reports and only a final outcome of this research is presented in this final report. The field testing of these beads was carried in two separate years, with 3 sites during a first year and a single site during a second year. The general results of year one are condensed here, and the comprehensive details of the field test of year two are described. Finally several complementary protocol and observational techniques have been developed during this project. Due to their intrinsic value to all readers involved in various aspects of traffic coating, these findings are presented here.
7
Abbreviations AADT: annual average daily traffic AIBN :Azo-bis-isobutyronitril ATR-FTIR : Attenuated total reflectance Fourier transform infrared DOTxx : lot/sample number generated in the laboratory of the University of New Hampshire EGDMA: ethylene glycoldimethylmethacrylate H2O : water HD21A : commercial name of a specific binder produced by the Rohm and Haas company HW : High Wear (wheel path) LTL2000 : commercial named of the retroreflectivity meter used in this study LW : Low Wear (out of traffic lane) MG : Modified Glass MMA : Methylmethacrylate NH3.H20 : Amonia PMMA: Polymethymethacrylate RG : Regular Glass RR: Retroreflectivity SDS : Sodium Dodecyl Sulfate VBC:Vinyl benzylchloride
8
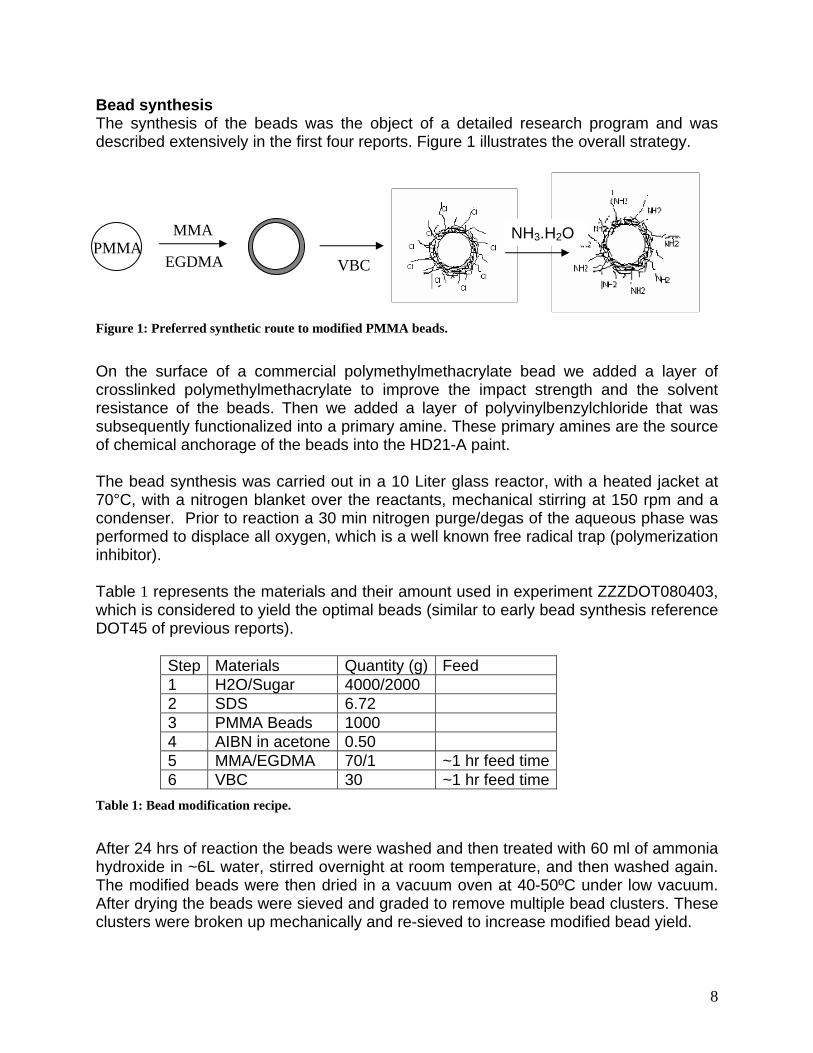
Bead synthesis The synthesis of the beads was the object of a detailed research program and was described extensively in the first four reports. Figure 1 illustrates the overall strategy.
Figure 1: Preferred synthetic route to modified PMMA beads.
On the surface of a commercial polymethylmethacrylate bead we added a layer of crosslinked polymethylmethacrylate to improve the impact strength and the solvent resistance of the beads. Then we added a layer of polyvinylbenzylchloride that was subsequently functionalized into a primary amine. These primary amines are the source of chemical anchorage of the beads into the HD21-A paint. The bead synthesis was carried out in a 10 Liter glass reactor, with a heated jacket at 70°C, with a nitrogen blanket over the reactants, mechanical stirring at 150 rpm and a condenser. Prior to reaction a 30 min nitrogen purge/degas of the aqueous phase was performed to displace all oxygen, which is a well known free radical trap (polymerization inhibitor). Table 1 represents the materials and their amount used in experiment ZZZDOT080403, which is considered to yield the optimal beads (similar to early bead synthesis reference DOT45 of previous reports).
Step Materials Quantity (g) Feed 1 H2O/Sugar 4000/2000 2 SDS 6.72 3 PMMA Beads 1000 4 AIBN in acetone 0.50 5 MMA/EGDMA 70/1 ~1 hr feed time6 VBC 30 ~1 hr feed time
Table 1: Bead modification recipe.
After 24 hrs of reaction the beads were washed and then treated with 60 ml of ammonia hydroxide in ~6L water, stirred overnight at room temperature, and then washed again. The modified beads were then dried in a vacuum oven at 40-50ºC under low vacuum. After drying the beads were sieved and graded to remove multiple bead clusters. These clusters were broken up mechanically and re-sieved to increase modified bead yield.
EGDMA NH3.H2O
PMMA VBC
MMA
9
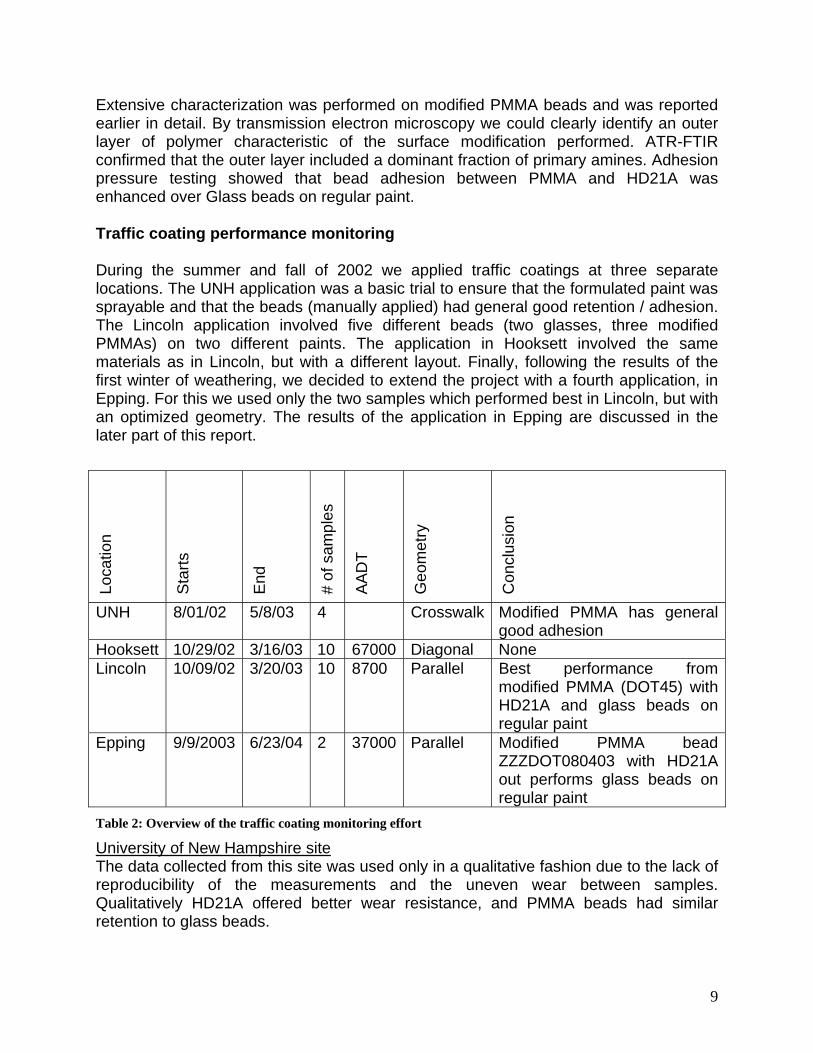
Extensive characterization was performed on modified PMMA beads and was reported earlier in detail. By transmission electron microscopy we could clearly identify an outer layer of polymer characteristic of the surface modification performed. ATR-FTIR confirmed that the outer layer included a dominant fraction of primary amines. Adhesion pressure testing showed that bead adhesion between PMMA and HD21A was enhanced over Glass beads on regular paint. Traffic coating performance monitoring During the summer and fall of 2002 we applied traffic coatings at three separate locations. The UNH application was a basic trial to ensure that the formulated paint was sprayable and that the beads (manually applied) had general good retention / adhesion. The Lincoln application involved five different beads (two glasses, three modified PMMAs) on two different paints. The application in Hooksett involved the same materials as in Lincoln, but with a different layout. Finally, following the results of the first winter of weathering, we decided to extend the project with a fourth application, in Epping. For this we used only the two samples which performed best in Lincoln, but with an optimized geometry. The results of the application in Epping are discussed in the later part of this report.
Table 2: Overview of the traffic coating monitoring effort
University of New Hampshire site The data collected from this site was used only in a qualitative fashion due to the lack of reproducibility of the measurements and the uneven wear between samples. Qualitatively HD21A offered better wear resistance, and PMMA beads had similar retention to glass beads.
Loca
tion
Sta
rts
End
# of
sam
ples
AAD
T
Geo
met
ry
Con
clus
ion
UNH 8/01/02 5/8/03 4 Crosswalk Modified PMMA has general good adhesion
Hooksett 10/29/02 3/16/03 10 67000 Diagonal None Lincoln 10/09/02 3/20/03 10 8700 Parallel Best performance from
modified PMMA (DOT45) with HD21A and glass beads on regular paint
Epping 9/9/2003 6/23/04 2 37000 Parallel Modified PMMA bead ZZZDOT080403 with HD21A out performs glass beads on regular paint

10
The following two images of Figure 2 offer a contrast between the aspect of the coatings after application in August 2002 and on May 8th, 2003.
Figure 2: Traffic paint at the Durham test site. Left on August 2002. Right on May 8th, 2003.
Hooksett site
Application in Hooksett (traffic toll on I93 North bound – most right lane) was delayed until late in the season due to road bridge repairs in the vicinity of the toll plaza. Rapidly, when winter did set, we discovered that most of the site was continuously covered with snow or melted snow, so that no measurement was possible until early spring. Finally, due to the extreme wear encountered at this location, no measurements were deemed of value, as Figure 3 illustrates.
Figure 3: Traffic paint at the Hooksett test site. Left on October 29th 2002. Right on March 16th, 2003.
Lincoln site This site proved to be very valuable. It has harsh winter conditions, with intensive plowing, salting and sanding but limited traffic. We collected data effectively for two months after the paint was applied in October (under conditions within existing approved procedures), and then had to halt until spring due to continuous coverage of snow, salt and sand through the winter. In the spring we found the samples seriously degraded with essentially no beads remaining and very little paint left at the surface of the asphalt as illustrated by Figure 4.

11
While not part of this study, the experience in both Lincoln and Hooksett raises an interesting question. Is it possible that the paint was considered to have dried adequately for normal use, but that there was insufficient time and/or warm weather to permit the complete cohalescence and cure of the binder that is essential for the paint to become tough enough to resist plow damage? If so, the window for applying paint may end earlier in the season than has been generally assumed. This may not be a question of bead retention, but of binder retention. This warrants further study.
Figure 4: Traffic paint at the Lincoln test site. Left on October 9th 2002. Right on March 20th, 2003.
Table 3: description of beads applied in Lincoln
Bead identification RG Regular Glass MG Modified Glass for enhanced adhesion on HD21A DOT58 PMMA bead with 50% VBC in shell DOT59 PMMA bead with 100% VBC in shell DOT45 PMMA bead with 30% VBC in shell The following two graphs provide the retroreflectivity of all five beads with the two different paints separately.
12
Lincoln - Regular Paint
-
50
100
150
200
250
300
350
0 20 40 60 80 100 120 140 160 180
Days
Ret
rore
flect
ivity
RG
MG
DOT58
DOT59
DOT45
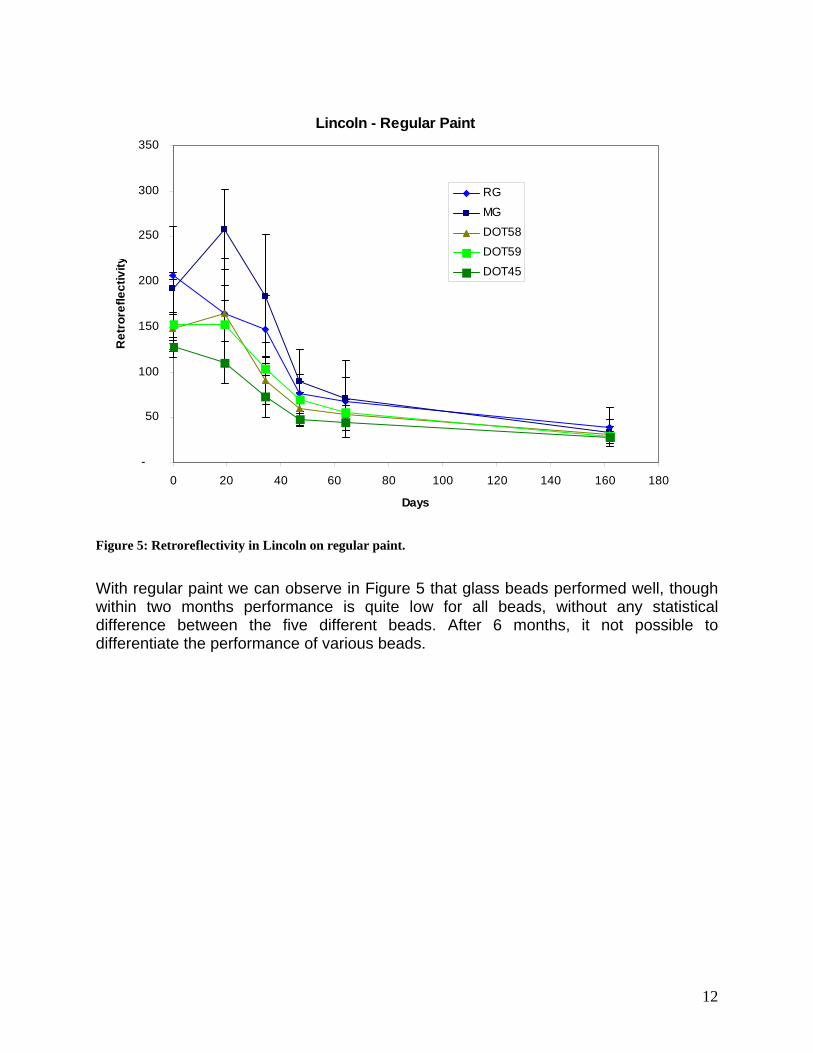
Figure 5: Retroreflectivity in Lincoln on regular paint.
With regular paint we can observe in Figure 5 that glass beads performed well, though within two months performance is quite low for all beads, without any statistical difference between the five different beads. After 6 months, it not possible to differentiate the performance of various beads.
13
Lincoln - HD21A
-
50
100
150
200
250
300
350
0 20 40 60 80 100 120 140 160 180
Days
Ret
rore
flect
ivity
RG
MG
DOT58
DOT59
DOT45
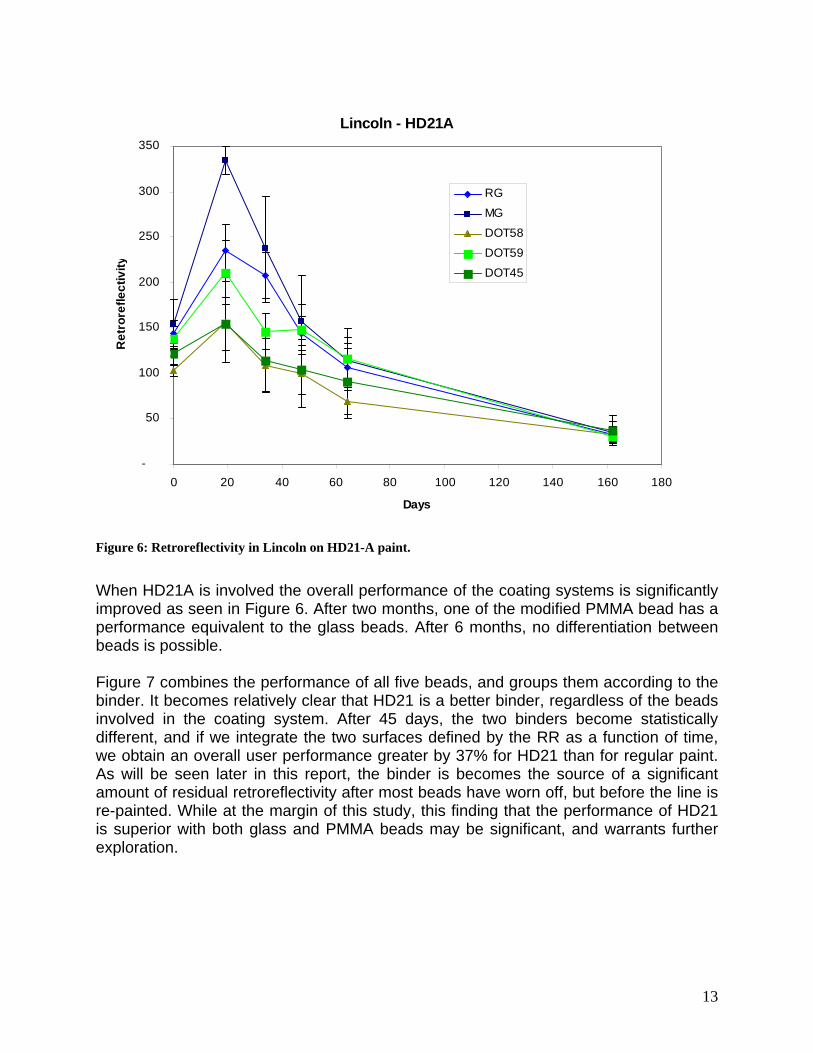
Figure 6: Retroreflectivity in Lincoln on HD21-A paint.
When HD21A is involved the overall performance of the coating systems is significantly improved as seen in Figure 6. After two months, one of the modified PMMA bead has a performance equivalent to the glass beads. After 6 months, no differentiation between beads is possible. Figure 7 combines the performance of all five beads, and groups them according to the binder. It becomes relatively clear that HD21 is a better binder, regardless of the beads involved in the coating system. After 45 days, the two binders become statistically different, and if we integrate the two surfaces defined by the RR as a function of time, we obtain an overall user performance greater by 37% for HD21 than for regular paint. As will be seen later in this report, the binder is becomes the source of a significant amount of residual retroreflectivity after most beads have worn off, but before the line is re-painted. While at the margin of this study, this finding that the performance of HD21 is superior with both glass and PMMA beads may be significant, and warrants further exploration.

14
Lincoln I93- Paint comparison
-
50
100
150
200
250
0 50 100 150
Days
Ret
rore
flect
ivity
Reg. Paint
HD21A
Average of 5 different type of beads
Figure 7: Combined bead performance according to binder.
More relevant to this project is the relative retroreflectivity and the ability of a coating system to maintain this relative performance. The graphs of Figure 8 and Figure 9 present the relative retroreflectivity of the coatings as a function of time for the two different paints. The relative retroreflectivity has been calculated with equation (1):
( )( )asphalt
asphaltt
RRRRRRRR
RRlative−
−=
max
Re Equation (1).
Where RRt is the retroreflectivity at time (date) t in mcd/m2/Lx, RRasphalt the intrinsic retroreflectivity of the asphalt substrate, measured in the vicinity of the test site from the average of 10 readings (25 mcd/m2/Lx in Lincoln, 8.8 mcd/m2/Lx in Epping) and RRmax the observed maximum retroreflectivity of a given sample over the complete life of the coating typically two weeks after application under high wear conditions, and 4 weeks under low wear conditions.
15
Lincoln - Regular Paint
0%
20%
40%
60%
80%
100%
120%
0 20 40 60 80 100 120 140 160 180
Days
Rel
ativ
e R
etro
refle
ctiv
ity
RG
MG
DOT58
DOT59
DOT45
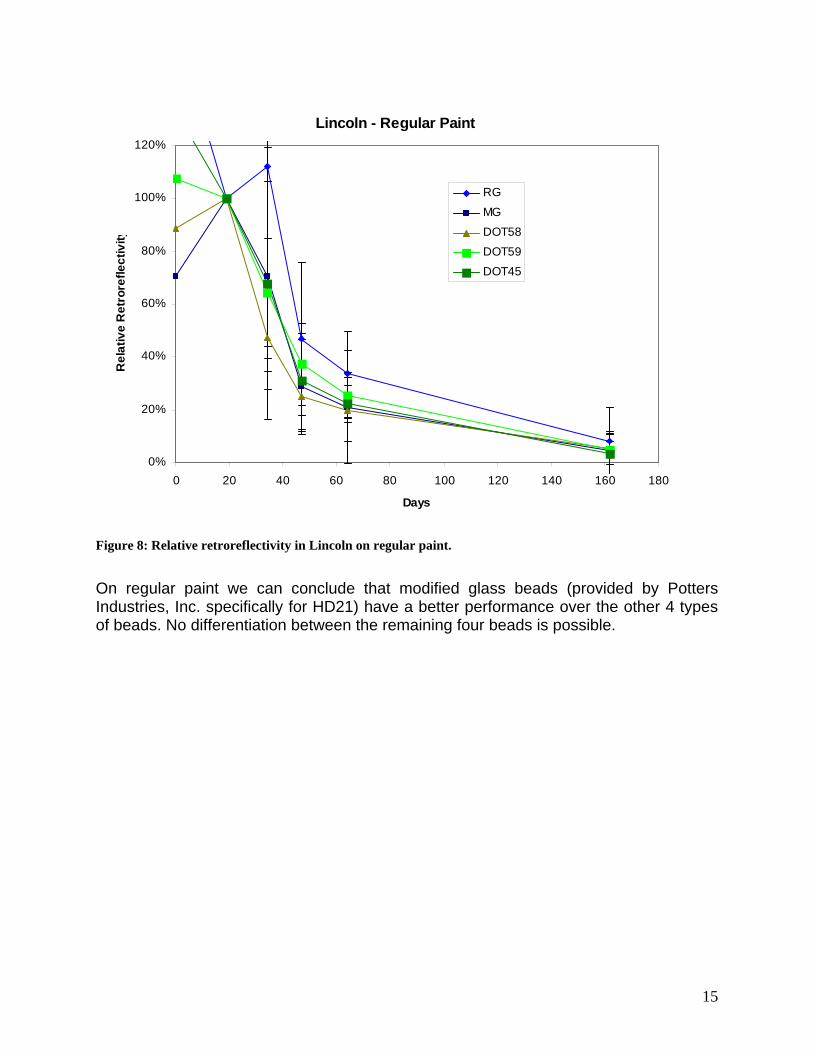
Figure 8: Relative retroreflectivity in Lincoln on regular paint.
On regular paint we can conclude that modified glass beads (provided by Potters Industries, Inc. specifically for HD21) have a better performance over the other 4 types of beads. No differentiation between the remaining four beads is possible.
16
Lincoln - HD21A
0%
20%
40%
60%
80%
100%
120%
0 20 40 60 80 100 120 140 160 180
Days
Rel
ativ
e R
etro
refle
ctiv
ity
RG
MG
DOT58
DOT59
DOT45
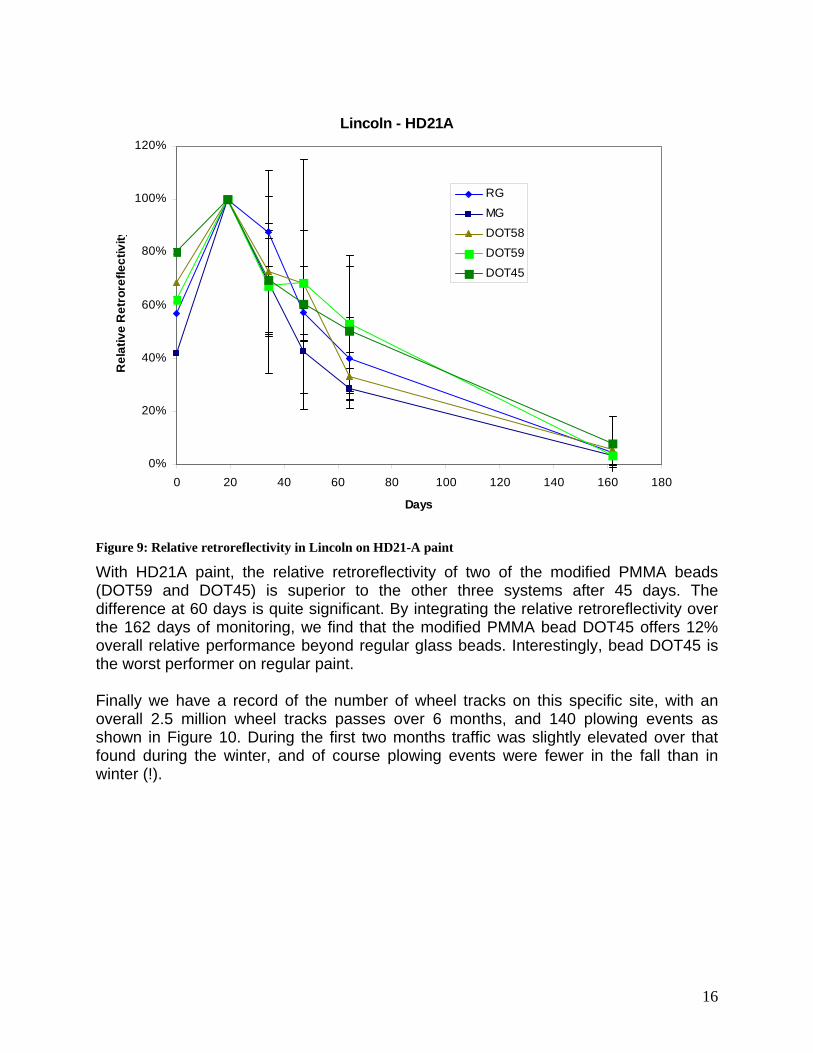
Figure 9: Relative retroreflectivity in Lincoln on HD21-A paint
With HD21A paint, the relative retroreflectivity of two of the modified PMMA beads (DOT59 and DOT45) is superior to the other three systems after 45 days. The difference at 60 days is quite significant. By integrating the relative retroreflectivity over the 162 days of monitoring, we find that the modified PMMA bead DOT45 offers 12% overall relative performance beyond regular glass beads. Interestingly, bead DOT45 is the worst performer on regular paint. Finally we have a record of the number of wheel tracks on this specific site, with an overall 2.5 million wheel tracks passes over 6 months, and 140 plowing events as shown in Figure 10. During the first two months traffic was slightly elevated over that found during the winter, and of course plowing events were fewer in the fall than in winter (!).

17
Traffic and Plowing
0
20
40
60
80
100
120
140
160
0 20 40 60 80 100 120 140 160 180
Day
# of
plo
win
g oc
cure
nces
0
500,000
1,000,000
1,500,000
2,000,000
2,500,000
3,000,000
# of
whe
el tr
ack
Figure 10: Wear generators in Lincoln.
It is valuable to note that coatings outside the wheel paths did not weather as much as coatings in wheel paths due to rolling traffic and this as an undesired effect on the data, both in terms of providing higher average RR and higher standard deviations (12 measurements 4 outside of wheel paths, 8 in wheel paths). Field results of year 2 Application report in Epping
The test site chosen was in Epping on NH Route 101 eastbound at the end of the weighing station. This site has medium traffic volume and mild winter conditions (for New Hampshire). This site has easy access and the weighing station offers a safe parking area.
Pre Application equipment modifications The day prior to the application of our test traffic coatings in Epping modifications were made to the paint sprayer (Lazyliner by Graco). These modifications included the experimentation with different nozzles for paint spraying, a redesigned bead storage hopper and associated connectors, and pre-setting of the flow rates of both the paint and beads. This was done to maximize the probability of proper bead and paint delivery during the actual application at the monitoring site and to yield optimal initial retroreflectivity. During the testing and calibration of the Lazyliner we used unmodified PMMA Beads and paint NH Spec HD21 supplied by Franklin Paint Company based on the HD21A binder of Rohm and Haas.

18
The PMMA beads like all plastics develop static charges and previous applications with the plastic hopper and tube of the Lazyliner proved difficult, due to the beads sticking to the unit. Modification to the Lazyliner was made by the addition of an electrically grounded stainless steel bead hopper and a stainless steel flexible tube connecting the hopper and the bead-gate. The SS hopper was supported on a piece of plywood with plastic quick ties. The metal was grounded by the use of a 12 gauge stranded copper wire and alligator clips as seen in Figure 11. Modification of the bead delivery gate was done to eliminate problems experienced during application at the prior test sites (Lincoln and Hooksett). PMMA beads have a much lower density than glass beads (approximately ½). During application, prevalent winds cause the beads to be blown off target. Cardboard was attached to the bead gate with duct tape as seen in Figure 11 to act as a wind deflector, allowing the beads to fall directly on the paint. The paint and bead delivery was fine tuned to produce an approximate 4” wide strip with sharp edges and uniform coverage. The device was left at the optimal settings for the application on Rt. 101 in Epping, the following day.
Figure 11: Unmodified sprayer with plastic bead hopper (left) and modified sprayer with SS bead hopper and wind deflectors in place.
Application. Application of 2 samples in 2 distinct wear zones was done on September 9th 2003. The modified PMMA beads (ZZZDOT080403) were designed to be applied using an aceto-acetate functional binder such as Rohm and Haas HD-21A. A formulated paint according to NH Spec HD21 was manufactured by Franklin Paint Company (batch # 6311 - stock # 2036-HD21 - manufactured on 8/22/03 with a VOC of 0.78 lbs per gallon). Standard glass beads were applied in the same manner for comparison purposes using the NHDOT standard white traffic paint.
The coatings were applied in 10 distinct sections for each traffic coating system (PMMA-HD21 and Glass–Reg. paint.). Application was done in parallel in the right wheel track of the right lane and in the emergency breakdown lane 12” from the edge
19
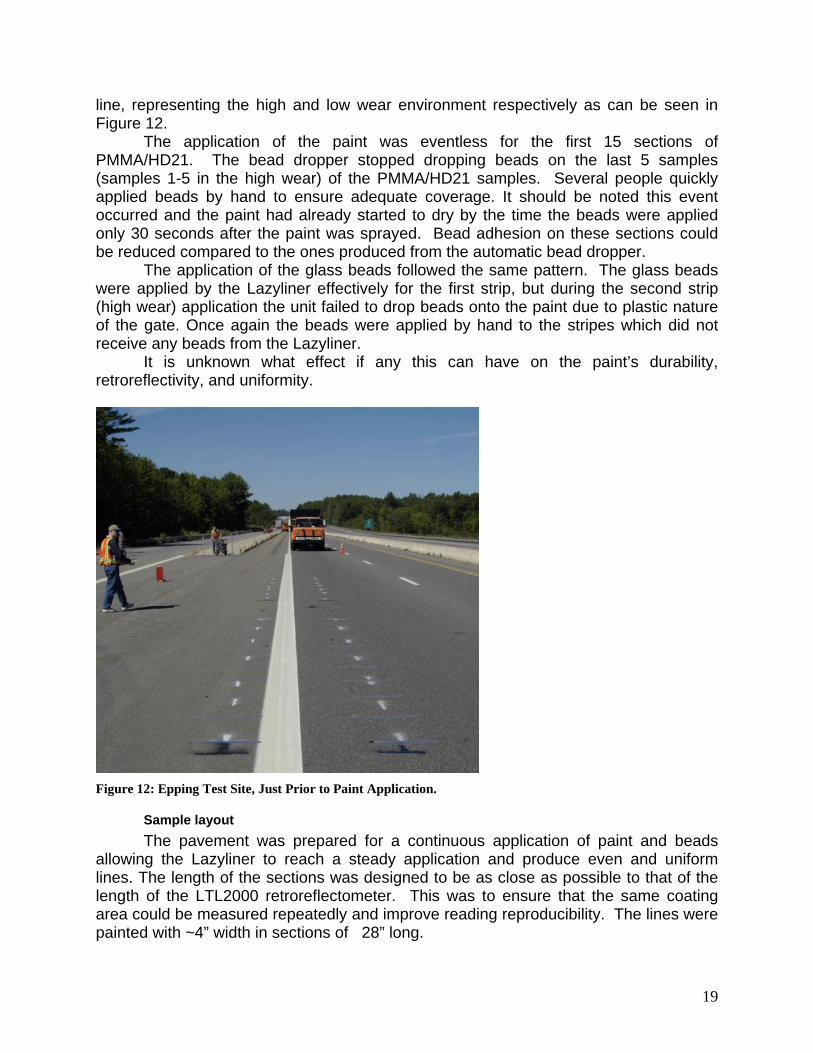
line, representing the high and low wear environment respectively as can be seen in Figure 12.
The application of the paint was eventless for the first 15 sections of PMMA/HD21. The bead dropper stopped dropping beads on the last 5 samples (samples 1-5 in the high wear) of the PMMA/HD21 samples. Several people quickly applied beads by hand to ensure adequate coverage. It should be noted this event occurred and the paint had already started to dry by the time the beads were applied only 30 seconds after the paint was sprayed. Bead adhesion on these sections could be reduced compared to the ones produced from the automatic bead dropper.
The application of the glass beads followed the same pattern. The glass beads were applied by the Lazyliner effectively for the first strip, but during the second strip (high wear) application the unit failed to drop beads onto the paint due to plastic nature of the gate. Once again the beads were applied by hand to the stripes which did not receive any beads from the Lazyliner.
It is unknown what effect if any this can have on the paint’s durability, retroreflectivity, and uniformity.
Figure 12: Epping Test Site, Just Prior to Paint Application.
Sample layout The pavement was prepared for a continuous application of paint and beads allowing the Lazyliner to reach a steady application and produce even and uniform lines. The length of the sections was designed to be as close as possible to that of the length of the LTL2000 retroreflectometer. This was to ensure that the same coating area could be measured repeatedly and improve reading reproducibility. The lines were painted with ~4” width in sections of 28” long.

20
Figure 13 shows the test site just prior to application of the paint. Silver marking paint was used to guide the Lazyliner to follow during the application. The different samples were separated by laying pieces of duct tape down across the path of the line. After the paint was applied the duct tape was removed, leaving even and uniform gaps between each sections.
Figure 13 shows the test site bordering parking lot on-ramp with the sample layout. The sections are numbered 1-20 heading west to east.
Figure 13: Sample layout in Epping.
Monitoring and results Figure 14 and Figure 15 represents the results of the long term monitoring of the performance of the two samples (modified PMMA beads on HD21-A and glass beads on regular latex paint).
traffic
21
Absolute retroreflectivityEpping Rt 101
0
50
100
150
200
250
300
350
400
450
0 50 100 150 200 250 300# Days
Ret
rore
flect
ivity
(mcd
m-2
Lx-
1)
PMMA-HD21 - LW
Glass-Reg.Pt - LW
PMMA-HD21 - HW
Glass-Reg.Pt - HW
not c
lean
ed
clea
ned
not c
lean
ed
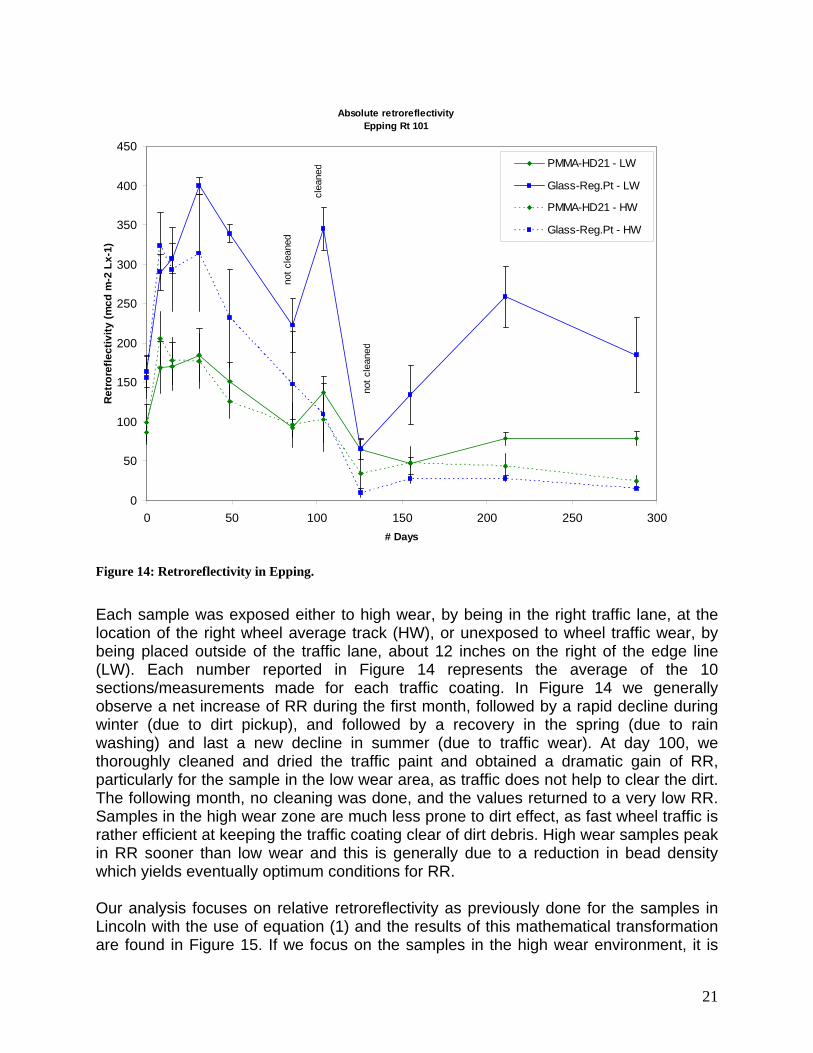
Figure 14: Retroreflectivity in Epping.
Each sample was exposed either to high wear, by being in the right traffic lane, at the location of the right wheel average track (HW), or unexposed to wheel traffic wear, by being placed outside of the traffic lane, about 12 inches on the right of the edge line (LW). Each number reported in Figure 14 represents the average of the 10 sections/measurements made for each traffic coating. In Figure 14 we generally observe a net increase of RR during the first month, followed by a rapid decline during winter (due to dirt pickup), and followed by a recovery in the spring (due to rain washing) and last a new decline in summer (due to traffic wear). At day 100, we thoroughly cleaned and dried the traffic paint and obtained a dramatic gain of RR, particularly for the sample in the low wear area, as traffic does not help to clear the dirt. The following month, no cleaning was done, and the values returned to a very low RR. Samples in the high wear zone are much less prone to dirt effect, as fast wheel traffic is rather efficient at keeping the traffic coating clear of dirt debris. High wear samples peak in RR sooner than low wear and this is generally due to a reduction in bead density which yields eventually optimum conditions for RR. Our analysis focuses on relative retroreflectivity as previously done for the samples in Lincoln with the use of equation (1) and the results of this mathematical transformation are found in Figure 15. If we focus on the samples in the high wear environment, it is

22
clear that past 100 days, the modified PMMA beads on HD-21A provide better performance compared to glass beads on regular paint. When the coatings are cleaned the contrast between the two samples is rather important with a 50% improvement in relative RR over glass beads. In the low wear conditions, the conventional coating has a performance similar to the new coating with an exception around 210 days, where the Spring recovery was very favorable to the conventional system. However at 300 days both systems have the same relative RR. Upon integration of the area defined by time and relative RR we can estimate the relation between low wear and high wear. We found that 300 days of low wear is equivalent to 90 days of high wear. This relation is important as it explains well why the low wear samples have the same relative RR at 300 days, since this was also found to be true under high wear conditions after 90 days. However beyond 100 days, the modified PMMA-HD21A novel coating outperforms the conventional system. Over the 300 days of monitoring we find that the novel system offers 20% higher cumulative relative performance over the conventional system.
Relative retroreflectivityEpping Rt 101
0%
10%
20%
30%
40%
50%
60%
70%
80%
90%
100%
0 30 60 90 120 150 180 210 240 270 300 330# Days
Rel
ativ
e re
tror
efle
ctiv
ity
PMMA-HD21 - LW
Glass-Reg.Pt - LW
PMMA-HD21 - HW
Glass-Reg.Pt - HW
clea
ned
Figure 15: Relative retroreflectivity in Epping.
We used the traffic data collected by the NHDOT to estimate the number of wheel passes that occurred during the monitoring period1. The State reports that at station 147061 an Annual Average Daily Traffic (AADT) of 37000 vehicles. The simple chart of Figure 16 can be used to obtain the conversion of wheel passes as a function of time. 1 http://www.nh.gov/dot/transportationplanning/traffic/trafficweb/reports/nh-101.pdf

23
The basic assumption is that 5% of the traffic is made of large 18 wheel trucks, all traveling in the right lane, and that 80% of the light vehicle traffic occurs in the right lane. This yields an average 1.85 wheel passes in the right lane per vehicle.
Wheel passes per day
-
2,000,000
4,000,000
6,000,000
8,000,000
10,000,000
12,000,000
14,000,000
16,000,000
18,000,000
20,000,000
0 50 100 150 200 250 300
# of days
# of
whe
el p
asse
s
Figure 16: Wear source in Epping By the end of the monitoring period an estimated 20 million wheels had passed over the high wear samples. There is a dramatic difference in the traffic on route 101 in Epping compared to I93 in Lincoln, with a rough ratio of 10 to 1. Added discoveries Application and measurement protocol Following our first three applications during the first year, we came to the conclusion that we had to be able to make measurements under low and high wear conditions and that we had to be able to place the LTL2000 precisely at the same location over an extended period of time. We clearly found a dramatic influence of the original pavement surface on the retroreflectivity. This results in variation of RR for the same traffic coating spaced over a few inches. Consequently to gain any insight in the wear resistance of a new coating system, single measurements are of very limited value. We consequently decided that measurements of 10 samples of the same coating system are necessary. These observations and conclusions led us to the layout used during year 2 at our “Epping RT 101” site. In our view a proper site layout needs the following:

24
• Easy access, constant travel direction and travel speed (avoid intersections, exit / entrance areas, major curves, significant inclines ….)
• The test traffic coating should be in the direction of traffic, not across traffic, so that the full length of the sample receives the same wear exposure.
• The sample should be in the wheel rut (significant depression in the asphalt due to repeated traffic stress. A complementary sample outside of the traffic lane can be very valuable, though not necessary.
• Each sample should be subdivided in length equal to the length of the measuring instrument. This simple step insures precise repositioning of the LTL2000 (or other) over the same section of traffic coating.
With these rather comprehensive layout requirements, we still recorded average standard deviations of 21% over 44 series of 10 measurements, with extreme standard deviations ranging from as little as 3% to as high as 63%. Readers will easily conclude that single (or double or triple) readings of samples across traffic lanes are of limited value. Winter measurements opportunities During the first winter of this project we encountered serious difficulties in measuring retroreflectivity when the pavement is mostly covered with salt and sand residues. Through the course of our second winter we developed a methodology to carry on our measurements following a few days of clear weather. After a number of trials and errors we settled on the following steps:
1. The traffic coating is brushed with a wide broom to remove most of the particulate mater
2. The traffic coating is sprayed with window fluid washer (a mixture of methanol, water, detergent) which does not represent an environmental issue (since vehicles use it freely) from a low pressure portable tank sprayer.
3. The traffic coating is swept again to improve the effectiveness of the washing fluid.
4. The traffic coating is dried with a gas powered leaf blower. 5. The LTL 2000 is calibrated after the instrument was cooled outside for at least
30 minutes 6. The Retroreflectivity of all the traffic coating samples is measured. 7. The reference ceramic sample used for calibrating the LTL 2000 is checked
to insure that no instrumental and temperature drift has occurred. We have tested the impact of temperature on the ability of the LTL2000 to make measurements and found no problems at temperatures as low as 0°F. This verification was done by making measurements of a defined sample at various temperatures. As long as the instrument is thermally equilibrated and a calibration procedure is done, we’ve found the LTL2000 unaffected by low temperature.

25
Image analysis Improvement in digital imaging and in equipment cost has allowed us to acquire a high resolution digital camera (6 Mega pixel Nikon D100 camera). This piece of equipment opened a number of possibilities for traffic paint monitoring. Namely we have developed two protocols, one for luminescence measurement, and one for coating integrity qualification. In each case, a close-up picture of the samples being monitored in Epping was taken using a Kodak grey scale reference such as Figure 17.
Figure 17: Close up picture for luminescence measurement.
The luminance of the samples was recorded by digital photographic means. A digital image was taken with a resolution of 3000x2000 pixels. A fixed grey level standard (KODAK grey scale Q-14, CAT 152 7662) was included in each sample image. Utilizing Adobe Photoshop and using the included grey scale as a standard, the images were converted to the same grey level range. This makes it possible to perform a direct comparison of the grey levels of the samples over time. In this work we are using the term luminescence to refer to the average grey level in the image. In the digital image, each pixel is given a value between 0 (black) and 255 (white). If an image is lighter it has a higher grey level value (i.e. approaching 255) on the luminance scale. The standard deviation is the deviation from this average value on the grey scale histogram provided by the software Photoshop. Figure 18 illustrates the results of such analysis, with the hope to provide an idea of how much more viewing contrast a sample has compared to another. Unfortunately the standard deviation of the luminescence is so large over the 4 samples that it is not possible to produce clear conclusions. Early in the monitoring, the HD-21 paint offers higher white levels. During the winter all samples trend toward grey, which is consistent with “dirt pick up” with the high wear samples being whiter than the low wear. Late in the spring the degradation of the samples is so severe that whiteness drops in the high wear zone, while it keeps rising in the low wear area.

26
Epping Rt 101
120
140
160
180
200
220
240
260
0 50 100 150 200 250 300Days
Lum
ines
cenc
e
PMMA-HD21 - LWGlass-Reg.Pt - LWGlass-Reg.Pt - HWPMMA-HD21 - HW
Figure 18: Luminescence results in Epping
Another imaging technique consists of taking a close up image of the exact same sub section of a sample, covering basically a full 4” * 3” of the coating system, and including only a marginal amount of substrate for spatial orientation. Enlargement of these images to a letter size print allows the qualitative evaluation of the amount of beads left on the coating and the state of degradation of the paint. The amount of original digital data is fairly large, and cannot be reproduced in a report. However, small sections of these images have been assembled in a large matrix in the following figure. A good quality print of this page on glossy paper or enlargement on a computer screen provides a good idea of the rapid erosion of the glass beads on the regular paint samples, and a sustained adhesion of the PMMA beads as the samples are submitted to increasing levels of wear. Large quantities of glass beads are lost almost immediately, while after 20 days essentially no PMMA beads are lost. Between 30 and 90 days we see a degradation of the binder in both samples. By 100 days there are essentially no glass beads left on the surface while most of the PMMA beads are still present. By 200 days, most PMMA beads are gone, and RR is provided essentially by the paint. These observations are very strong evidence that the modified PMMA beads have greater adhesion and retention to the paint based on HD-21A.

27
28
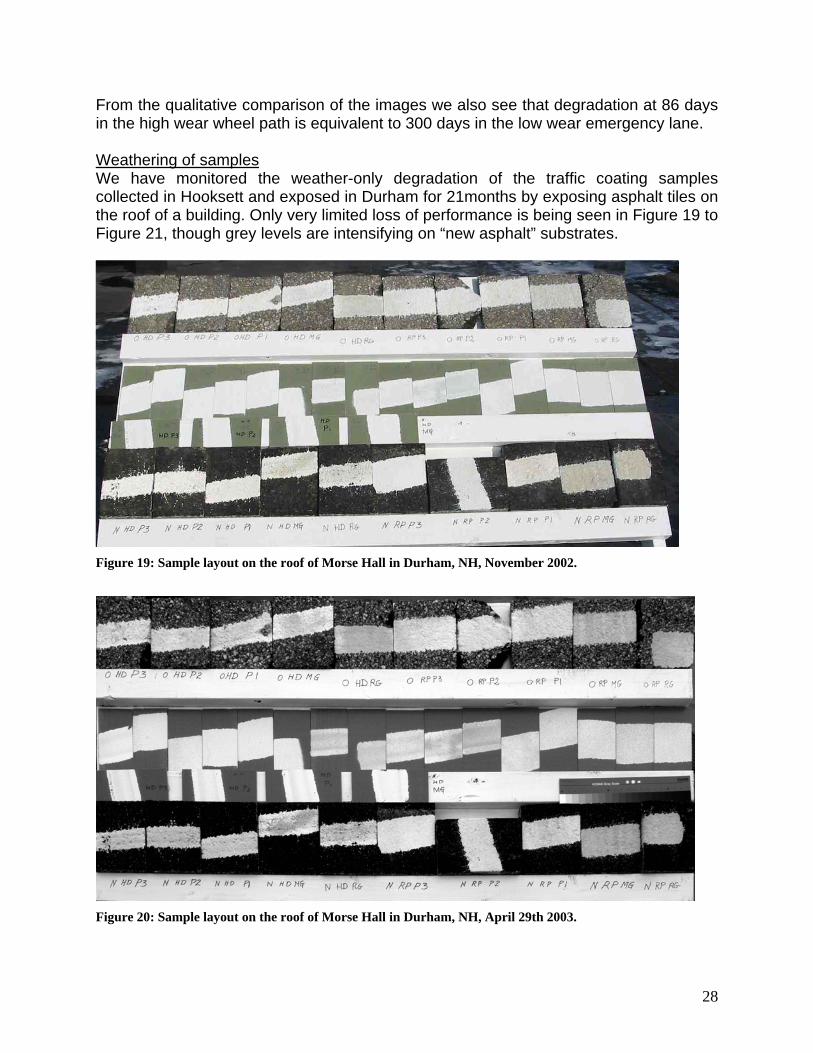
From the qualitative comparison of the images we also see that degradation at 86 days in the high wear wheel path is equivalent to 300 days in the low wear emergency lane. Weathering of samples We have monitored the weather-only degradation of the traffic coating samples collected in Hooksett and exposed in Durham for 21months by exposing asphalt tiles on the roof of a building. Only very limited loss of performance is being seen in Figure 19 to Figure 21, though grey levels are intensifying on “new asphalt” substrates.
Figure 19: Sample layout on the roof of Morse Hall in Durham, NH, November 2002.
Figure 20: Sample layout on the roof of Morse Hall in Durham, NH, April 29th 2003.

29
Figure 21: Sample layout on the roof of Morse Hall in Durham, NH, August 9th 2004.
It is very valuable to observe that several of the samples cracked at the edge of the coatings, more noticeably with HD21A and with new asphalt such as the one of Figure 22. This is most likely due to the strong contrast between the coefficients of thermal expansion of the hot dark asphalt versus the cooler asphalt under the white paint. The repeated cycle of sun/shade leads to this degradation. Upon traffic load such asphalt would lose structural integrity and disperse in small pieces. This would result in the observed “paint holes” found repeatedly on I95 between Boston and Newburyport MA.
Figure 22: Detailed of thermal stress-cracked asphalt.
Initial retroreflectivity issues The focus of this study was on developing beads with potential for higher sustained retention. Thus, the absolute level of initial retroreflectivity was not a major concern here. However, with achievement of a sustained higher level of bead retention, this element becomes a relevant concern. Experience during this project suggests that it should be possible to improve the initial retroreflectivity of PMMA.

30
For example, neither a size nor a size distribution study was carried out, and a single type of rather large PMMA bead was used, yielding consistently lower initial RR than found with glass. A more detailed study of initial retroreflectivity can be carried out by preparing or purchasing PMMA beads in 5 different sizes between 200microns and 1mm with narrow size distribution, and then mixing them in different ratios. This would effectively offer a controlled study of the effect of size and size distribution. This possibility is suggested by the presence of an observed variation in the size distribution of glass beads, despite their nominal description as having a single size. It appeared, based on qualitative observation and without quantification, that narrow size distribution PMMA beads were being evaluated next to broad size distribution glass beads. It is hypothesized that variability in the size distribution of beads results in a higher initial RR reading. This issue warrants further study. Conclusion This cooperative research program was successful in achieving its goal of developing a novel type of traffic coating with improved wear performance. More specifically, it completed the development of a process and recipe to effectively modify the surface of PMMA beads in order to obtain chemical crosslinking of the beads with a paint binder containing acetoacetate function. It also completed the evaluation of these novel beads in reference to conventional traffic coating under accelerated conditions, after several attempts, and yielded clear evidence that the novel traffic coating has significantly higher wear resistance over conventional coatings. Application of the novel coatings was similar to the conventional system, and requires very limited equipment modification. Further optimization of the novel traffic coating, including optimizing initial retroreflectivity, and a detailed cost analysis will be needed before it should be considered as a replacement for the conventional acrylic paint and glass beads system. The observed results also showed that different binders can produce significant variation in retroflectivity after beads have worn off, at which point the only retroreflectivity being obtained is from the binder itself. Given the extent to which lines inevitably are in use long after the enhanced retroreflectivity from beads has disappeared, this warrants further exploration.

31
Appendix 1 - Epping raw data Retroreflectivity data. Low wear Sample Values (mcd m-2 Lx-
1) clean dry
Sample ID 9/9/
2003
9/17
/200
3
9/24
/200
3
10/1
0/20
03
10/2
8/20
03
12/4
/200
3
12/2
2/20
03
1/13
/200
4
2/11
/200
4
4/7/
2004
6/23
/200
4
1 92 181 184 194 164 76 122 63 45 76 81 2 93 182 182 181 152 82 135 71 56 78 79 3 92 166 178 184 149 86 144 39 43 63 65 4 93 170 170 185 146 79 122 60 45 85 85 5 91 150 148 163 132 99 130 71 43 75 75 6 81 130 136 150 124 90 134 52 43 77 75 7 70 119 124 135 116 98 137 62 46 71 70 8 103 161 164 187 157 102 156 76 46 85 81 9 113 190 188 213 164 98 138 74 62 87 85 10 157 236 231 257 204 110 151 83 51 89 95 Average value: 99 169 171 185 151 92 137 65 48 79 79 std dev 24 33 30 34 25 11 11 13 6 8 8 11 206 339 344 417 356 206 336 88 153 288 25112 161 295 317 396 350 225 361 61 132 301 22513 194 321 334 419 357 195 288 62 199 289 22614 169 288 312 400 343 171 342 57 172 272 18915 152 275 298 391 331 217 376 83 141 258 18716 154 266 289 397 324 195 358 75 123 230 15717 159 277 302 405 337 219 362 47 138 295 22118 146 273 293 389 326 275 316 58 82 218 12019 141 291 299 395 333 271 341 73 125 252 16520 159 272 285 387 332 252 369 53 73 181 106Average value: 164 290 307 400 339 223 345 66 134 258 185std dev 21 24 19 11 12 34 27 13 38 39 48 High wear Sample Values (mcd m-2 Lx-
1)
Sample ID 9/9/
2003
9/17
/200
3
9/24
/200
3
10/1
0/20
03
10/2
8/20
03
12/4
/200
3
12/2
2/20
03
1/13
/200
4
2/11
/200
4
4/7/
2004
6/23
/200
4
1 108 237 198 201 142 112 108 30 40 44 24 2 80 214 187 174 127 109 118 41 45 44 21

32
3 66 153 133 125 97 64 75 8 23 28 17 4 67 134 119 125 90 49 55 5 22 23 15 5 79 198 163 149 107 64 70 11 26 27 16 6 114 211 178 162 118 82 85 26 36 35 22 7 80 219 197 208 141 117 129 58 63 52 27 8 86 223 197 209 146 119 129 58 65 60 34 9 92 232 203 210 146 123 133 54 75 54 31 10 97 231 200 208 142 124 127 53 76 73 39 Average value: 87 205 178 177 126 96 103 34 47 44 25 std dev 16 35 30 35 21 29 29 21 21 16 8 11 136 287 243 254 143 66 52 1 21 26 15 12 138 258 214 183 150 52 52 4 19 23 14 13 123 249 195 193 136 56 55 3 23 26 15 14 157 354 316 347 246 123 80 6 23 24 14 15 207 338 323 348 269 176 107 8 27 30 17 16 181 357 330 359 276 180 134 13 32 28 17 17 169 354 331 359 270 182 128 12 33 31 16 18 156 344 327 365 279 204 142 13 31 31 16 19 123 347 324 372 283 234 177 18 31 27 15 20 168 351 326 362 269 200 170 17 34 34 17 Average value: 156 324 293 314 232 147 110 10 27 28 16 std dev 27 42 54 75 62 68 48 6 6 3 1
Luminescence data
Date 9/24
/200
3
10/1
0/20
03
10/2
8/20
03
12/4
/200
3
12/2
2/20
03
4/7/
2004
6/23
/200
4 # of days 15 31 49 86 104 211 288 Luminesence (0-255 scale) PMMA-HD21 - LW 220 211 193 154 183 203 Glass-Reg.Pt - LW 197 201 198 168 135 176 188 Glass-Reg.Pt - HW 199 214 186 221 182 209 196 PMMA-HD21 - HW 214 221 207 216 169 188 172 standard deviation PMMA-HD21 - LW 14.43 13.14 21.17 32.68 15.28 21.86 Glass-Reg.Pt - LW 16.48 16.68 21.07 19.52 28.86 19.55 20.51 Glass-Reg.Pt - HW 12.28 12.92 18.9 13.33 22.69 40.39 44.03 PMMA-HD21 - HW 13.54 15.6 14.93 18.77 35.88 40.58 46.29

33
Appendix 2 Report #1,2,3+4,5

Report prepared for State of New Hampshire, Department of Transportation Bureau of Materials and Research P.O. Box 483, Stickney Ave. Concord, NH 03302-0483 Under Contract # TPF-5(024) statewide 13739 Award date: 12/19/01 First quarterly progress report Arpil 17th, 2002 Prepared by Dr. Yvon G. Durant Dr. Weihong Guo Mr. Timothy McCaffery Advanced Polymer Laboratory University of New Hampshire Parsons Hall G101, Durham NH 03824 Tel : 603 862 1703, Fax : 603 862 3617 Email : [email protected]

Introduction........................................................................................................................... 1 1. Materials selection ........................................................................................................ 2
a. Binder specification and properties............................................................................... 2 b. Original PMMA and glass bead properties................................................................... 4
2. Beads modification strategy.............................................................................................. 7 a. Bead synthesis............................................................................................................... 7 b. Modified bead characterization................................................................................... 10
1. Size ........................................................................................................................ 10 2. Transparency........................................................................................................ 10 3. Crosslinked material content.............................................................................. 11 4 IR test...................................................................................................................... 11 5. Transmission electron microscopy.................................................................... 12
c. Future work ................................................................................................................. 13 3. Application Properties .................................................................................................... 13
a. Wear Testing ............................................................................................................... 13 b. Optical Property Measurement ................................................................................... 14 c. Adhesion Testing ........................................................................................................ 14
Introduction Generally glass retro-reflective beads are used to reflect the light on the highway safety. Glass beads are mechanically projected on the freshly applied paint film to provide the light reflection that is essential for night driving. As illustrated in figure 1, the beads are significantly larger than the thickness of the paint film, which ensures that the beads are raised above the film. The adhesion of the beads to the film is an important issue, and is usually described as bead retention.
Beads
Paint Binder
Light rays entering the beads are retroreflected back to the driver
Figure 1. Retro reflective glass beads at the surface of traffic paints Developments of the modified retroreflctive beads involve several distinct steps: 1) The proper selection of a binder system with propensity to crosslink with the PMMA beads. 2) The chemical modification of the PMMA beads.
Proprietary of the University of New Hampshire 1

3) The testing of the application properties of the beads when combined with the binder. Step one has been completed, step two is 60% completed, step three is in the early stage of development.
1. Materials selection
a. Binder specification and properties The traffic paint, PRIMAL FASTRACK HD-21A, manufactured by ROHM and HASS Company has been identified as a good candidate. It has a solids content of 49.0 % and a viscosity of 38cP, a pH of 10.18. The results are shown in figure 2.
Figure 2. Information of HD21A We performed some �reverse engineering� on HD21A, for the purpose of understanding the reactive chemistry involved in this product. First we performed a literature review of R&H patents (US 5525662) and deducted that an acetoacetate function was likely to be the critical element of this reactive product. We prepare by placing 1ml of the latex on the top in a Petri dish, then drying it into a vacuum oven at 80◦C for 48 hours. This sample was analyzed by Infra Red (IR) spectroscopy (Figure 3). In a second analysis we added 2ml of 1.0 M HCl to 10 ml HD21A latex to separate the latex from the fillers. We washed the deposit with water several times until the pH became stable of 7.54. The deposit was dried in a vacuum oven at 80◦C for 48 hours. IR and thermal gravimetric analysis (TGA) were used to test the deposit. IR is shown in figure 4.
Proprietary of the University of New Hampshire 2
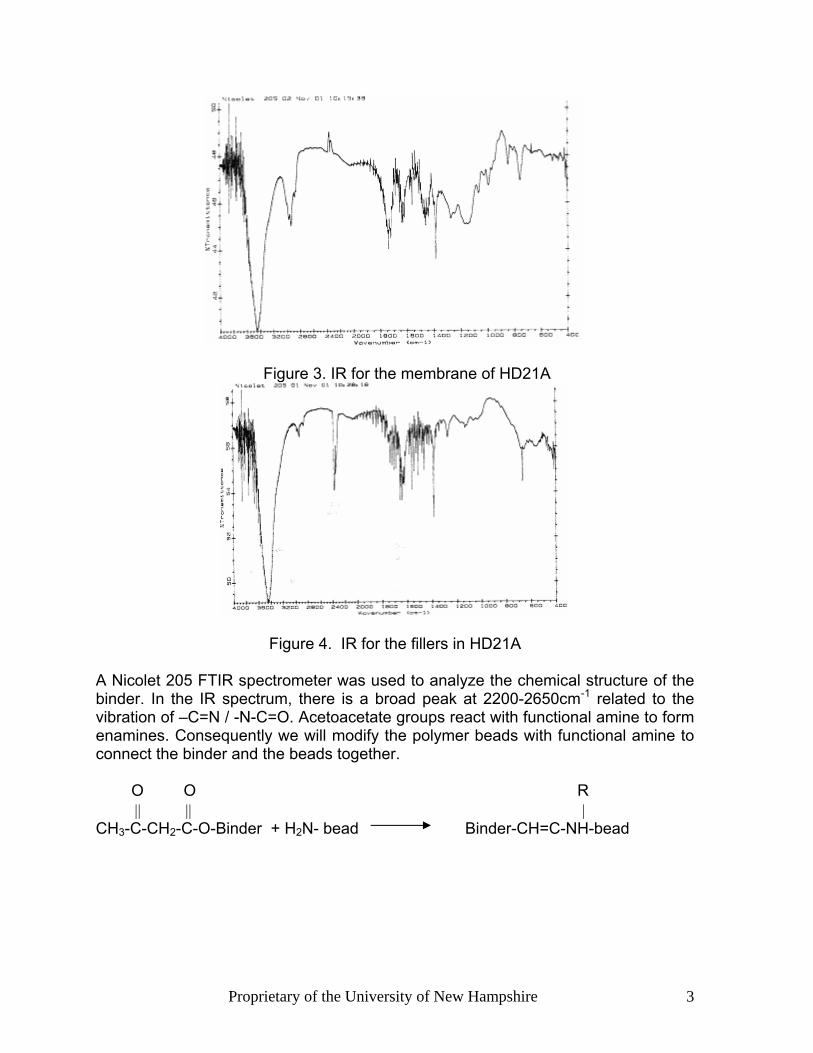
Figure 3. IR for the membrane of HD21A
Figure 4. IR for the fillers in HD21A
A Nicolet 205 FTIR spectrometer was used to analyze the chemical structure of the binder. In the IR spectrum, there is a broad peak at 2200-2650cm-1 related to the vibration of �C=N / -N-C=O. Acetoacetate groups react with functional amine to form enamines. Consequently we will modify the polymer beads with functional amine to connect the binder and the beads together. O O R || || | CH3-C-CH2-C-O-Binder + H2N- bead Binder-CH=C-NH-bead
Proprietary of the University of New Hampshire 3

Figure 5. TGA of HD21A. Left: Dried membrane. Right: Deposit
PERKI ELMER PYRIS1 differential scanning calorimeter was used to analyze the HD21A both the dried membrane and the deposit. The thermal program included a hold for 3.0 min at -50.00°C, followed by a temperature scan from -50°C to 140°C at 20.00°C/min. Illustrated in figure 5, the dried membrane glass transition (Tg) was measured to be 16.394°C, the deposit Tg was 24.422°C.
b. Original PMMA and glass bead properties According to standard specification for glass beads used in traffic paint (AASHTO DESIGNATION), our beads should be transparent, clean, colorless, smooth and spherically shaped, free from milkiness, pits or excessive air bubbles. Additionally they should conform to the following requirements: The beads should have a minimum of 70 percent true sphere, remain free of clusters and lumps and shall flow freely from dispensing equipment. The beads should have a diameter comprised between 0.45 and 0.85mm. After comparing with different kinds of PMMA beads, the �MG102 clear011� �DIAKON� Acrylic bead polymer from INEOS Acrylics was chosen as the original beads. The physical and chemical properties are shown in table 1. Table 1. The physical and chemical properties of MG102 PMMA beads
Proprietary of the University of New Hampshire 4
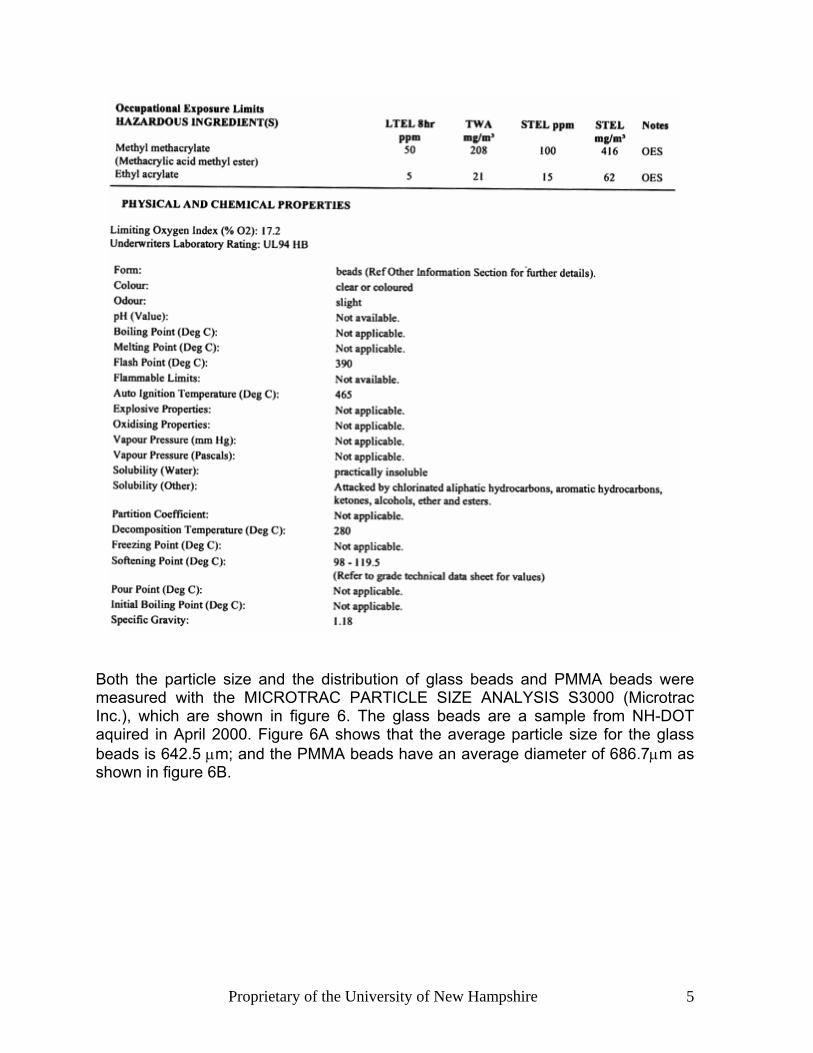
Both the particle size and the distribution of glass beads and PMMA beads were measured with the MICROTRAC PARTICLE SIZE ANALYSIS S3000 (Microtrac Inc.), which are shown in figure 6. The glass beads are a sample from NH-DOT aquired in April 2000. Figure 6A shows that the average particle size for the glass beads is 642.5 µm; and the PMMA beads have an average diameter of 686.7µm as shown in figure 6B.
Proprietary of the University of New Hampshire 5

Figure 6A. The particle size and dispersion of the glass beads
Proprietary of the University of New Hampshire 6

Figure 6B. The particle size and dispersion of the PMMA beads
The transparency of the beads was tested with a UV-visible spectrometer (Cary 400UV) which is shown later with the modified beads.
2. Beads modification strategy Our strategy involves the addition of a crosslinked, functional shell at the surface of the beads.
PMMA
Crosslinked PMMA Grafted functionals(acrylamide+butylacrylate) Figure 7. Illustration of modification strategy (Layers are enlarged).
a. Bead synthesis The modification is carried out in a 1 liter jacketed reactor with mechanical stirring, condenser, nitrogen flow and thermal couple. Different feed strategies, solid content, reactor temperature monomer and density of the continuous aqueous phase were experimented.
Proprietary of the University of New Hampshire 7

From USP5447983, we found the formula: ρB-0.03<ρA<ρB+0.03 where ρA is the specific gravity of the monomer phase, and ρB is the specific gravity of the aqueous phase. Sugar was used to adjust the density of the aqueous phase. The density of PMMA is 1.19g/cm3, which implies ρB-0.03<1.19<ρB+0.03, ρB should in the range of 1.16-1.22, the content of sugar should in the range of 38% to 50%. (Hand Book of Chemistry and Physics P865). Chemical agents related are listed in table 2.
Table 2. Chemical Agents of the reaction Chemical Agents manufacture
Dodecyl sulfate sodium salt (SDS), Acros Na2S2O3.5H2O Acros
PMMA Ineos Acrylics sugar Domino Surgar MMA Acros
EGDMA(ethylene glycol dimethacrylate)
Acros
Benzyl Acrylate Scientific Polymer Products Inc. Na2S2O8 Acros
Methacrylamide(AAM) Acros Methyl acrylate(MA) Acros
1g Dodecyl sulfate sodium salt (SDS), 20mg Na2S2O3.5H2O, together with 200g sugar were solved in 200g water, all these was added in the reactor. After stir was started, 100g PMMA beads was put into reactor. 100g water was used to wash the container and was put into the reactor (40% sugar solution 500g). Started the heat of water bath, setup the temperature at 50°C. Turn on the cool water in the condenser. Other 100g sugar together with 0.2g SDS solved in 100g water, which is called water 2. Put 50g water 2 into a beaker, put in MMA10g, EGDMA 1.1g, (for TEM samples, put in Benzly acrylate 0.5g for the stain.). The mixture was stirred by a magnetic stirrer plate and latex was available, which we called it as monomer 1. 20mg initiator Na2S2O8 was solved in 100g solution 2. After the internal temperature reached 50°C, started the two pumps for monomer 1 and the initiator. In about 1 hour, monomer 1 would be finished. Then started to pump in monomer two, which was 5.5g Methacrylamide and 5g methyl acrylate premixed with 50g solution 2. Another hour was used to pump in monomer two. The pump for the initiator was adjusted to keep the initiator ended 45min after monomer two. All the reaction kept about 3 hours. 30min after the initiator finished, heat was stopped, and stir was continued on. While the reactor cooled to room temperature, stopped stir, put out the beads and the solution. No. 270 USA standard testing sieve was used to separate the beads and the solution. The beads were washed by water for several times, and then beads were dried in an oven at 60°C. The modification experiments of the beads are listed in table3.
Proprietary of the University of New Hampshire 8

Table 3. Modification experiments of the beads No. Water
g PMMA g
SDS g
Na2S2O8 mg
Na2S2O3.5H2Omg
MMA g
EGDMA g
MA g
AAM g
Sugar g
BA g
T °C
result
1 200 200 3 0.3 100 6 6 702 300 100 3
PVA64mg0.6 50 70
3 300 50 0 Pemulen 0.3
0 AIBN 30
25 3 3 75
4 300 50 0 Pemulen 0.3
3 80
5 300 50 0 Pemulen 0.3
0.5 3 80
6 500 100 0 Pemulen 0.3
0 AIBN 60
12 0.75 6 70
7 450 100 0 Pemulen 0.2
20 25 0.1 50
8 500 100 0.8 10 10 20mg 50 509 500 100 0.6 10 10 10mg 90 5010 500 100 1 10 10 10mg 180 5011 500 100 1 10 10 0.11 5.5 150 4512 500 200 1 20 20 0.22 11 150 5013 500 100 1 10 8 10mg 5.5 150 2 5014 500 100 1 10 8
Benzyl A0.5 9.5 1.1 5 5.5 180 50
15 500 100 1 20 16 Benzyl A0.5
9.5 1.1 5 5.5 275 50
16 420 100 1.5 20 16 10 1.1 5 5.5 280 5017 420 100 2.5 20 20 5 1.1 5 5.5 280 50
Proprietary of the University of New Hampshire 9

b. Modified bead characterization
1. Size The Microtrac was used to measure the size of the modified beads and we found the average diameter of the modified beads to be 784.7 µm as shown in figure8.
Figure 8. The particle size and dispersion of modified PMMA beads
2. Transparency A UV-vis spectro photometer (Cary 500) was used to test the transparency of the beads. A rectangular Demountable Cell with one open face was used for the transparency test. The scan was performed from 400nm to 800nm which correspond to the visible light spectra range. The results are shown in figure 9. The modified beads have the highest transparency, and the initial PMMA beads were in the middle, both were better than the glass beads. Repeated the measurement while placing the beads in water, the transparency measured are shown in figure 10. The transparencies of the beads were in the same order but all moved to a lower value.
Proprietary of the University of New Hampshire 10

Modified PMMA DOT011
Unmodified PMMA
Tran
smis
sion
%
Figure 9 Transparency of the modified beads, initial polymer beads abeads from the UV tester.
Tran
smis
sion
%
U
Figure 10 Transparency of the modified beads, initial polymer beglass beads dipped in water.
3. Crosslinked material content The amount of crosslinked material was obtained by solvent extractbeads and initial PMMA beads were placed into filter paper bags. Ea solution of THF was performed for 48 hours. After drying the bags,of the bags were weighted. The gel content of the modified beadsand the unmodified PMMA was 11.1%. Consequently the modifieclearly crosslinked ( on the surface) while the unmodified beads none crosslinker.
4 IR test Modified and unmodified PMMA beads were analyzed by infra red presence of the amine groups. IR spectrums are shown in figure 11at 3600~3300cm-1 and the peak for primary amine at 900~650cm-1 Functional amine are identified to be present in the beads, which is aa successful chemical modification.
Proprietary of the University of New Hampshire
Glass beads
nd the glass
Modified PMMA DOT011
nmodified PMMA
Glass Beads
ads and the
ion. Modified xtraction with the contents was 52.9% d beads are have little to
to assign the . The peaks
can be seen. n element of
11

A
B
Figure 11 IR for A: PMMA Beads B: Modified beads DOT011
5. Transmission electron microscopy Transmission electron microscope (TEM) was per formed to understand the chemical morphology at the surface of the beads. The beads were dispersed in epoxy and microformed to obtain thin sections of the beads. The sections were further stained with Ruthenium. Sections were observed in a JEOL 100S TEM. A small amount (5%) of benzyl acrylate was incorporated in the feed of MMA to bring electronic contrast to the chemically modified phase.
Proprietary of the University of New Hampshire 12

Figure 11. TEM photos of the modified beads DOT014
TEM shows an obviously stained ring around the clearer PMMA. The thickness of the stained layer is 5-8 micrometer.
c. Future work Synthetic work is now focused on the optimization the modification process. We are investigating density adjustments stirring speed and monomer feed.
3. Application Properties
a. Wear Testing Wear resistance of traffic paint will be evaluated by using ASTM standard D 913-88. This standard describes the methods by which the degree of wear can be evaluated either in the field or in the laboratory. The basic principle behind this standard is the comparison of the film with accepted photographic standards. This is accomplished by taking photographs of existing paint stripes on the road. These photographs are evaluated to determine the amount of the paint film remaining intact and the amount of road exposed. The standard D 913-88 indicates that it is possible to discern the percentage of the film that is intact by the naked eye. We are proposing to use computer software to evaluate the photographs and count the pixels of the film (yellow or white) and the pixels of the road (gray or black). This should give us the percentage of film remaining intact by the following equation:
pixels road of # pixelspaint of #pixelspaint of #intact film%
+=
To take the photographs we have acquired a Nikon N 65 single lens reflex (SLR) camera body and a Sigma 28-80 mm lens with a macro setting. The macro setting allows the camera to focus on images as close as 4 to 5 inches away from the end of the lens. Additionally we have acquired a ring flash, which
Proprietary of the University of New Hampshire 13

mounts to the end of the camera lens to illuminate the area close to the lens. The ring flash illuminates a smaller area and is used for close up shots because it eliminates shadows. The other part of the wear testing will be done in the laboratory. These tests consist of conventional wear tests done by allowing a paint film to dry and then running a steel ball over it. The ball oscillates over the film while a weight presses down on the rod to which the ball is attached. The wear depth into the paint film the ball has made is measured as a function of time and the weight placed on the rod. This test gives the wear resistance of the paint film.
b. Optical Property Measurement The optical properties of the traffic paints (retroreflectivity) will be measured by taking pictures of the coatings at night. This will be done by using the headlights of a car to illuminate the road and taking pictures of the paint stripe at the limit of the headlights. Meaning as far as you can see with the headlights on at normal setting. This is to be done by using a spotter scope. The spotter scope is a compact telescope to which it is possible to attach a camera. We have acquired a Celestron C5 spotter scope with a 1250 mm lens. This scope is capable of magnifying a 2 inch stripe of paint to fill the field of view at 150 feet.
c. Adhesion Testing Adhesion testing is being done to determine the adhesive strength of the paint to itself and the paint to the beads. This will indicate if the modification of the beads is successful. The aim is to have the adhesion between the modified beads and the paint be greater than the glass beads and the paint. This testing is being done in the Dynamic Mechanical Analyzer (DMA) (Perkin Elmer Prysis). The basic principle behind the testing is that the paint is placed between two fiberglass polyester resin composite plates and a tensile load is applied to the system.
Proprietary of the University of New Hampshire 14

The figure above illustrates the adhesive strength determination for the paint. This method is possible because the failure occurs within the paint and not at the paint/fiberglass interface.
TRM-001
050000
100000150000200000250000
0 0.5 1 1.5 2 2.5
Strain (m/m)
Stre
ss (N
/m2 )
The curve shown above is for yellow traffic paint obtained from the city of Manchester. The film failed at 230000 N/m2 (33 psi). This is the type of data available from the DMA. The next portion of the adhesive testing is to expand upon this and see how much weaker the paint bead interface is than the paint to its self. The adhesive strength between the paint and the beads is to be tested in the same manner however the beads are super glued to the fiberglass as is shown below.
The interface between the paint and the beads will be the weakest interface and will be the first to break giving the adhesive strength of the paint to the beads. Comparison of the current system of glass beads with the modified beads will indicate how successful the modification process was.
Proprietary of the University of New Hampshire 15
Report prepared for State of New Hampshire, Department of Transportation Bureau of Materials and Research P.O. Box 483, Stickney Ave. Concord, NH 03302-0483 Under Contract # TPF-5(024) statewide 13739 Award date: 12/19/01 Second quarterly progress report July 15th, 2002 Prepared by Dr. Yvon G. Durant Dr. Weihong Guo Mr. Timothy McCaffery Advanced Polymer Laboratory University of New Hampshire Parsons Hall G101, Durham NH 03824 Tel : 603 862 1703, Fax : 603 862 3617 Email : [email protected]
Proprietary of the University of New Hampshire 1

1. Introduction ............................................................................................................................... 2 2. General comments on the project ......................................................................................... 2 3. Bead Modification .................................................................................................................... 3
3.1 Modification process............................................................................................................. 6 3.2 Computational strategies....................................................................................................... 6 3.3 Density adjustments .............................................................................................................. 9 3.4 Stirring speed and monomer feed ....................................................................................... 10 3.5 Initiator amount................................................................................................................... 10 3.6 Crosslink agent.................................................................................................................... 12 3.7 Particle size measurements ................................................................................................. 13 3.8 FTIR analysis ...................................................................................................................... 14
4. Application Properties ........................................................................................................... 16 4.1 Formulation of a paint using the HD21A binder ................................................................ 16 4.2 Wear Testing....................................................................................................................... 17 4.3 Optical Property Measurement ........................................................................................... 18 4.4 Adhesion Testing ................................................................................................................ 18
5. Future plans ............................................................................................................................ 23 1. Introduction This project deals with a specific aspect of traffic paint, the improvement of retro-reflective bead retention. More specifically we are studying the potential of PMMA beads to act as a substitute to glass beads when their surface chemistry is modified to react (crosslink) with the binder chemistry. Ultimately this project seeks to develop traffic paints with sustained retroreflectivity. Initially high or low retroreflectivity are of little concern and interest, as ideally retroreflectivity higher than 150 mCd/M2/Lx over a full season is a appealing goal. The project involves two major phases: a laboratory development phase, where modified beads are being produced, and a field test, where these new products in comparison to conventional products are assessed. Currently this project is into its first phase. The developments of the modified retroreflective beads involve several distinct steps: 1) The proper selection of a binder system with propensity to crosslink with the PMMA beads. 2) The chemical modification of the PMMA beads. 3) The testing of the application properties of the beads when combined with the binder. Step one has been completed, step two is 90% completed, step three is progressing, though major step back have been met so far. 2. General comments on the project A number of useful comments have been made by the readers of the first report, and some answers are provided here for the benefit of all readers.
Proprietary of the University of New Hampshire 2

Bead properties: PMMA has a refractive index of 1.5. Compression strength is typically less than soda-lime glass by an order of magnitude, though this is of minor importance as the substrate holding the beads is typically the weak element of the mechanical system. In most weather condition, mechanical stresses on the beads are transferred to the binder and to the asphalt. The current lot of PMMA bead is extremely clear as reported in the previous report, and is 100% free of air inclusion, and free of “black” beads. Clarity, air inclusion and color is a problem related to glass bead manufacturing technology, and is not encountered in PMMA bead production technology. Our lot of PMMA bead is essentially round, though this has not been quantified. It was reported to us that bead roundness is important. If any of the reader has a reliable source that explain scientifically why this is the case, could that person please pass on this information/document? Our limited understanding of physics, optics and other retroreflective materials does not explain why roundness is important. For the purpose of comparing the performance of PMMA beads with other glass beads, we have acquired a lot of glass beads that are treated to have a primary amine functions on the surface (according to Potter industries) in order to react with the binder in a similar fashion to the PMMA beads. This will allow a better comparison of performance properties for both families of materials. Optical performance measurement: we currently have one of the LTL2000’s of the NH-Dot (on loan) to make standardized 30m geometry measurements. Other optical measurements are being done in parallel for the purpose of qualifying the type of degradation observed with the beads (shaving, discoloration, crushing, wear, shearing, % loss….) We understand that several studies on bead size and size distribution have been done, if readers would be willing to share the result of these quantitative studies, it would be most beneficial to this project. In the mean time we are “matching” bead size to current glass beads used by the NH-DOT. It was reported that surface modification of beads can considerably change the wetting characteristic of bead on the binder. As this is clearly recognized, it is also true that bead “sinking” is not an issue. Sunk beads do no contribute to initial retroreflectivity, but as wear of the surface paint (binder) occur, beads are exposed to offer sustained retroreflectivity. If ALL beads were to sink at application time, then initial retroreflectivity being extremely low would be an issue. We have currently identified a binder from Rohm and Hass, namely HD21-a, and we are still searching for other reactive binders. If readers are aware of alternative products, please let us know. 3. Bead Modification In last quarter report, the chemical properties of the binder, the properties of the original PMMA beads and glass beads, modification strategy were introduced. The
Proprietary of the University of New Hampshire 3

transparencies of different kinds of beads were tested by UV spectrophotometer. IR test confirmed that functional amines are present on the beads. In this progress report we present efforts toward the optimization of the modification process.
Proprietary of the University of New Hampshire 4
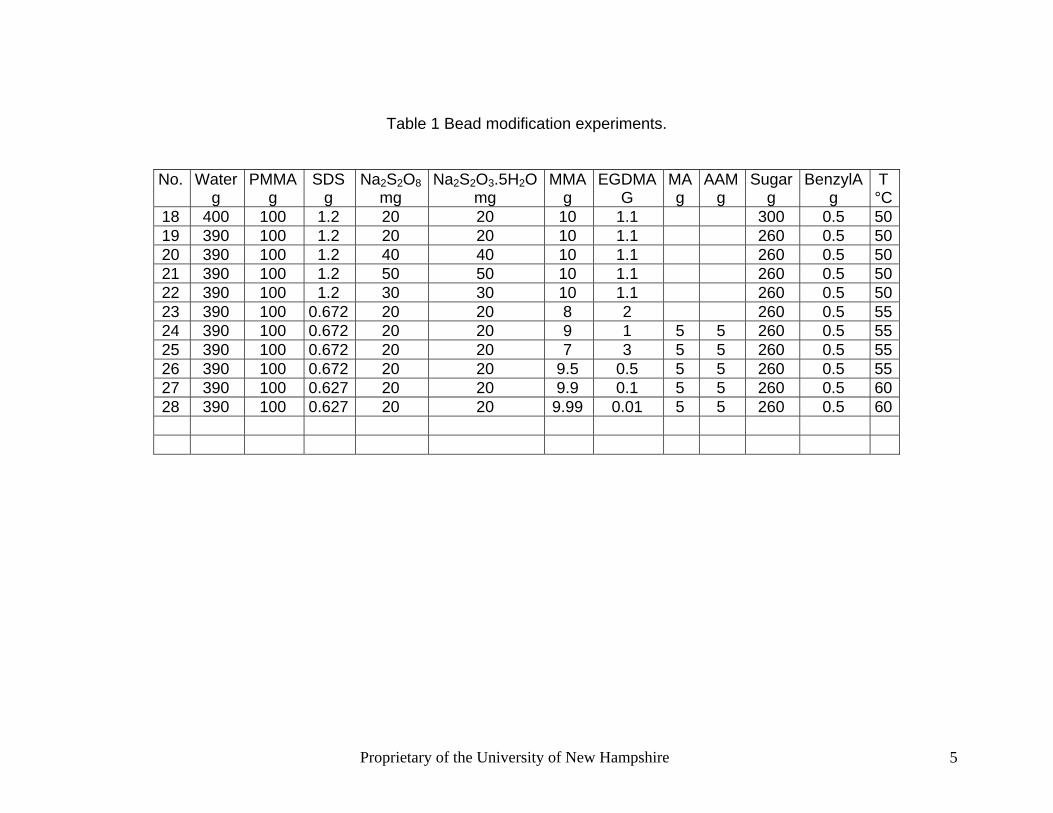
Table 1 Bead modification experiments.
No. Waterg
PMMA g
SDS g
Na2S2O8 mg
Na2S2O3.5H2Omg
MMAg
EGDMAG
MAg
AAMg
Sugarg
BenzylAg
T °C
18 400 100 1.2 20 20 10 1.1 300 0.5 5019 390 100 1.2 20 20 10 1.1 260 0.5 5020 390 100 1.2 40 40 10 1.1 260 0.5 5021 390 100 1.2 50 50 10 1.1 260 0.5 5022 390 100 1.2 30 30 10 1.1 260 0.5 5023 390 100 0.672 20 20 8 2 260 0.5 5524 390 100 0.672 20 20 9 1 5 5 260 0.5 5525 390 100 0.672 20 20 7 3 5 5 260 0.5 5526 390 100 0.672 20 20 9.5 0.5 5 5 260 0.5 5527 390 100 0.627 20 20 9.9 0.1 5 5 260 0.5 6028 390 100 0.627 20 20 9.99 0.01 5 5 260 0.5 60
Proprietary of the University of New Hampshire 5

3.1 Modification process The process of manufacturing the beads is being optimized. The recent series of experiments is listed in table 1. The table contains all the chemicals and their quantities used in the synthesis process. Considerable focus was given to improve the yield in term of individual beads. As a reminder the process involves the suspension of the original PMMA beads in an aqueous solution of water and sucrose. The followings steps were carried out for each reaction. First, dodecyl sulfate sodium salt (SDS), Na2S2O3.5H2O, and sugar were dissolved in water and added to the reactor. Reactor stirring was started, and the unmodified PMMA beads were dropped into reactor. After the reactor temperature was stabilized (between 50 and 60°C depending on the experiment), the two feed pumps were started. The first one contained the monomer solution and the second one, a solution of initiator and sugar. Monomer addition was defined into 2 sequence, one with a composition rich in MMA and EGDMA as crosslinker, while the second sequence contained Methylacrylate (MA) and acrylamid (AAM). The first sequence aimed at creating a shell layer on the PMMA core bead that is particularly strong and resistant to solvent and oils, while the second shell layer provide the network structure of an amine functional water soluble polymer. This final layer is there to react with the binder upon application. This core-shell-shell layering structure of the modified beads is modeled in section 1.1.x. The addition of initiator lasted 40 minutes past the end of the monomer feed sequences, to provide complete polymerization. After polymerization the beads were separated on a sieve from the suspending solution. Yield was defined as the weight of solid modified beads recovered over the initial weight of beads.
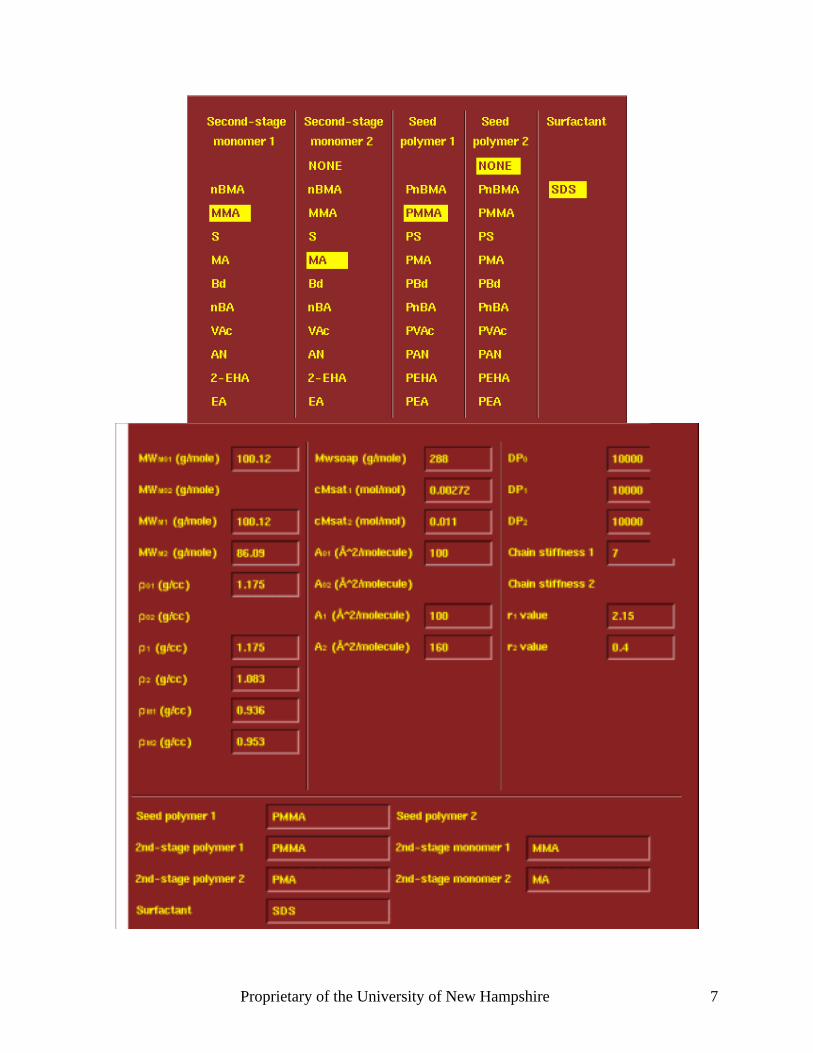
3.2 Computational strategies UNH has developed in the past decade a family of software for the modeling of morphology development in polymeric particles. While the first application of these software is to structured latex synthesis, we have been able to use them for modeling our system. Specifically we used the UNHLATEXTM EQMORPH interactive software for the computational strategies for equilibrium morphology predictions. The PMMA bead was taken as been the seed polymer, and a feed sequence of polymer monomer (MA/MMA) was used to simulate our surface modification. The following 3 figures are representative of the simulation conditions.
Proprietary of the University of New Hampshire 6
Proprietary of the University of New Hampshire 7

The following image is a 2D map of all the possible rearrangement of a second polymer phase (sequence) in yellow with an initial core in black. The most left structure is representative of a core-shell bead, while the bottom right-hand represent an inverted structure in which the second stage polymer has formed inside the initial bead. It is important to understand that all these structure can be created, and are dependent on materials properties and processing conditions.
The software calculated the Gibbs free energy of all these structures, and display them on top of the previous map to create a 2D contour energy map of the following picture.
This energy map is colored from dark brown for the lowest energy state (most favorable) to yellow for the highest energy state (least favorable). We conclude from these simulations that the Core-Shell structure on the top left hand side has the lowest energy, and is the most probable structure to be formed according to our synthesis strategy. This most favorable structure is represented on the lower left side of the figure.
Proprietary of the University of New Hampshire 8
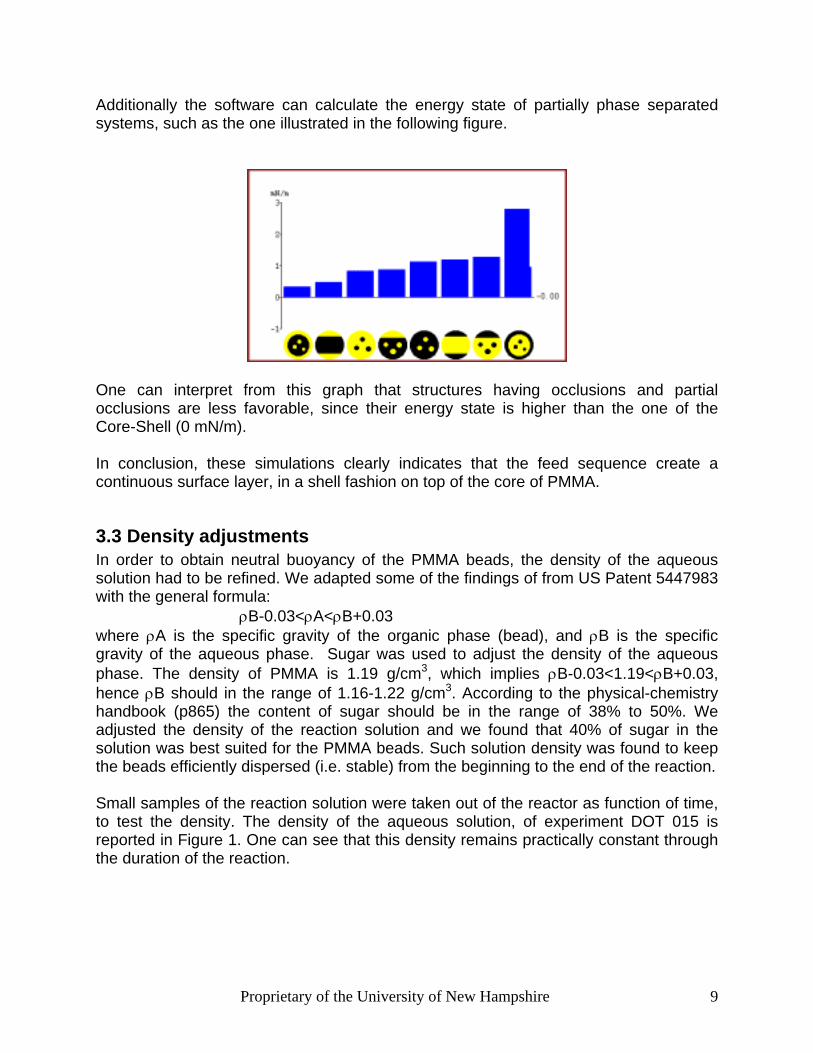
Additionally the software can calculate the energy state of partially phase separated systems, such as the one illustrated in the following figure.
One can interpret from this graph that structures having occlusions and partial occlusions are less favorable, since their energy state is higher than the one of the Core-Shell (0 mN/m). In conclusion, these simulations clearly indicates that the feed sequence create a continuous surface layer, in a shell fashion on top of the core of PMMA.
3.3 Density adjustments In order to obtain neutral buoyancy of the PMMA beads, the density of the aqueous solution had to be refined. We adapted some of the findings of from US Patent 5447983 with the general formula:
ρB-0.03<ρA<ρB+0.03 where ρA is the specific gravity of the organic phase (bead), and ρB is the specific gravity of the aqueous phase. Sugar was used to adjust the density of the aqueous phase. The density of PMMA is 1.19 g/cm3, which implies ρB-0.03<1.19<ρB+0.03, hence ρB should in the range of 1.16-1.22 g/cm3. According to the physical-chemistry handbook (p865) the content of sugar should be in the range of 38% to 50%. We adjusted the density of the reaction solution and we found that 40% of sugar in the solution was best suited for the PMMA beads. Such solution density was found to keep the beads efficiently dispersed (i.e. stable) from the beginning to the end of the reaction. Small samples of the reaction solution were taken out of the reactor as function of time, to test the density. The density of the aqueous solution, of experiment DOT 015 is reported in Figure 1. One can see that this density remains practically constant through the duration of the reaction.
Proprietary of the University of New Hampshire 9
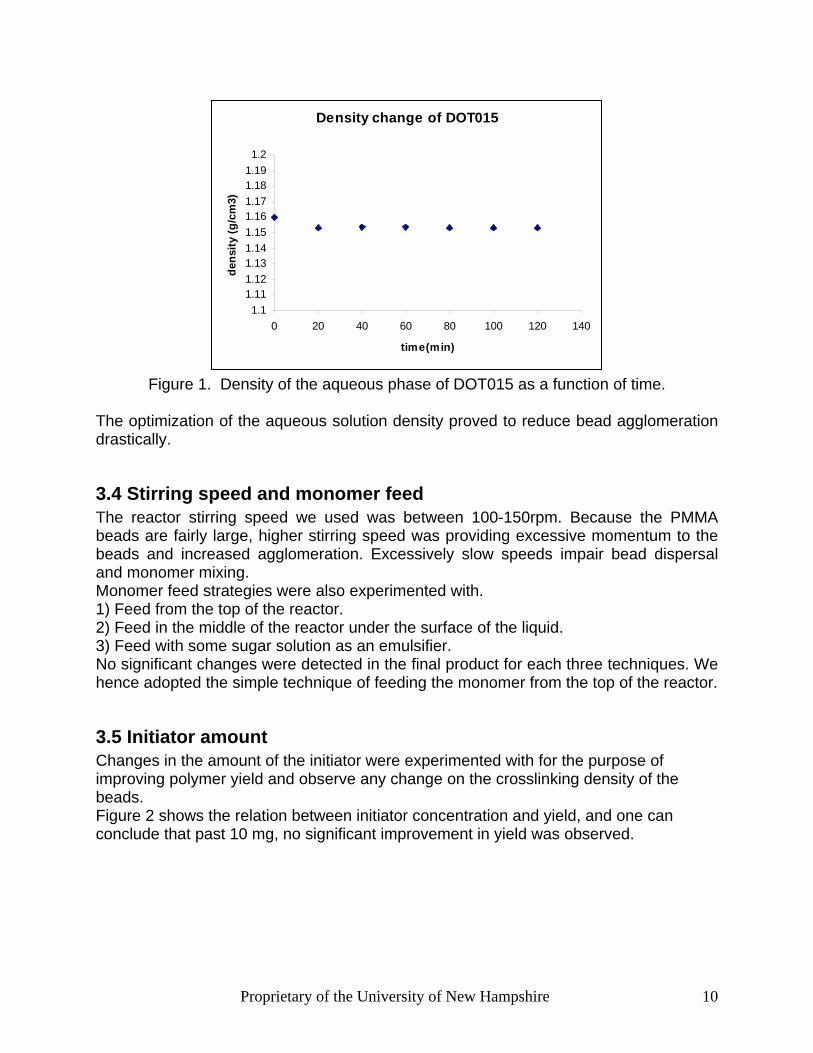
Density change of DOT015
1.11.111.121.131.141.151.161.171.181.191.2
0 20 40 60 80 100 120 140
time(min)
dens
ity (g
/cm
3)
Figure 1. Density of the aqueous phase of DOT015 as a function of time.
The optimization of the aqueous solution density proved to reduce bead agglomeration drastically.
3.4 Stirring speed and monomer feed The reactor stirring speed we used was between 100-150rpm. Because the PMMA beads are fairly large, higher stirring speed was providing excessive momentum to the beads and increased agglomeration. Excessively slow speeds impair bead dispersal and monomer mixing. Monomer feed strategies were also experimented with. 1) Feed from the top of the reactor. 2) Feed in the middle of the reactor under the surface of the liquid. 3) Feed with some sugar solution as an emulsifier. No significant changes were detected in the final product for each three techniques. We hence adopted the simple technique of feeding the monomer from the top of the reactor.
3.5 Initiator amount Changes in the amount of the initiator were experimented with for the purpose of improving polymer yield and observe any change on the crosslinking density of the beads. Figure 2 shows the relation between initiator concentration and yield, and one can conclude that past 10 mg, no significant improvement in yield was observed.
Proprietary of the University of New Hampshire 10

93 92 91
yield (%) 90 89 88 87
0 10 20 30 40 50 60
Amount of Na2S2O8 ( mg )
Figure 2. Relationship between the amount of Na2S2O8 and the yield
Crosslinking density measurements
The crosslink density was estimated by centrifugation extraction. This technique is commonly used to separate crosslinked polymer from linear (non crosslinked) polymer chains. Standard Teflon centrifuge tubes (Oak Ridge centrifuge tube, FEP, 30 ml, 25.5*92 mm) and a Beckman ultracentrifuge were used. First the samples were dried for two days at room temperature under vacuum in large glass pans and a few milligrams of dried polymer were placed in a Teflon centrifuge tube with 30 ml of solvent (Acetone) . The mixture was shake for two days at room temperature on a rotary orbital (shaker) table at 150 rpm to reach equilibrium. The tubes were centrifuged at 10,000 rpm for two hours at room temperature. The supernatant was then removed from the tube by using a syringe. The solid content of the supernatant was then measured by gravimetry. The samples were dried for one day at 70oC and then for 1hour at 80oC under vacuum. Extractions were carried out and the gel fraction was calculated as follows:
100 polymer of mass Total
polymer soluble of mass -polymer of mass Total (%) ⋅=fractionGel
These measurements were done on the various samples corresponding to variations in the concentration of initiator (Na2S2O8). The results are illustrated in Figure 3. While the data shows a significant amount of scattering, the general trend is that the gel content increase with initiator concentration.
Proprietary of the University of New Hampshire 11

0
1
2
3
4
5
6
0 10 20 30 40 50 60
Na2S2O8(mg)
Gel
(%)
Figure 3. Relationship of the amount of Na2S2O8 and the gel fraction.
Results illustrated in Figure 2 and 3 indicate that using large amounts of initiator is not detrimental the properties of the final product.
3.6 Crosslink agent We use different ratio of MMA and EGDMA (crosslink agent). The purpose of EGDMA is to improve the mechanical strength of the surface of the bead, minimize propensity to adsorb solvents and oils, and offer a proper anchoring base for the functional layer. Figure 4 shows that and increase in EGDMA has little effect on yield, as outside of one outlying point (1% EGDMA), all the yields are between 85 and 86.3%. On ther other hand, Figure 5, shows that 5% of EGDMA can increase very significantly the Gel content which is most beneficial to product performance.
84.5
85
85.5
86
86.5
87
87.5
88
88.5
0 10 20 30 4
EGDMA (%)
Yiel
d (%
)
0
Figure 4. Effect of EGDMA content on yield.
Proprietary of the University of New Hampshire 12

0
1
2
3
4
5
6
0 10 20 30 4
EGDMA(%)
Gel
(%)
0
Figure 5. Effect of EGDMA content on Gel content.
3.7 Particle size measurements During surface modification, some of the PMMA beads agglomerate and yield non desirable doublets and triplets (and some time even larger aggregates). Different sieves were used to separate them and quantify the product granulometry. The size of the sieves used were: 1.18mm, 1mm, 850µm and 500µm which means roughly correspond to triplets and larger, doublets, single particles, and super fines. The results for sample DOT027 are presented in Figure 6, in term of percentage of total weight. Because of the overall large amount aggregate, we found that dry ice could be used to separate the aggregated beads (back to singlets) by cooling the beads and fracturing the interconnects.
05
101520253035404550
perc
enta
ge (%
)
0-500 500-850
850-1000
1000-1180
>1180
Size of DOT027
Figure 6. Granulometry of DOT027 in microns
Proprietary of the University of New Hampshire 13

3.8 FTIR analysis We used the capability of Microscope- Fourier Transform Infrared Spectroscopy (µ-FTIR) to analyze three spheres of material. The three beads are labeled DOT016, DOT017, and PMMA. The test were performed by Custom Analytical Services (Londonderry, NH).
DOT16 PMMA
0.5
1.0
1.5
2.0
2.5
3.0
3.5
4.0
4.5
5.0
5.5
6.0
6.5
7.0
7.5
%T
rans
mitt
ance
1000 1500 2000 2500 3000 3500 Wavenumbers (cm-1)
DOT-017
= CH-NH2 -NH2
Figure 7. The micro-FTIR of PMMA, DOT016 and DOT017 beads.
The arrows represent the locations of NH2 peaks. The Bead from DOT016 has the CH-NH2 Amine bond, which masks the Amide bond at 1750 found in the other two samples. Compared with DOT16 and DOT17, DOT16 contains more amine group on the surface.
We used Methacrylamine to react with the HD21A binder. The samples were then dried in an oven at 50°C for 48 hours and put into a vacuum oven at 50°C for 2 hours. Finally the samples were mixed with KBr powder, and A Nicolet 205 FTIR spectrometer was used to analyze the chemical functions. The FTIR plots are shown in Figure 8 for the reaction product and Figure 9 for the neat methacrylamide. The peaks around 2800 are quite similar before and after reaction. As the amine reacted with acetoacetate, the peaks at 3193 and 3387 evolve in to a broad vibration at 3400. These results indicate
Proprietary of the University of New Hampshire 14

that the amine function of methacrylamide reacts properly with the acetoacetate function of HD21a.
Figure 8. FTIR of the reaction product of HD21A and Methacrylamide
Figure 9. FTIR of Methacrylamide
Proprietary of the University of New Hampshire 15

4. Application Properties
4.1 Formulation of a paint using the HD21A binder In order to test some of the mechanical properties of the beads, we need to use a formulated HD12a white paint. Table 2 is the formulation provided by the Rohm and Hass company.
Table 2 Formulations with HD21-A emulsion
We modified this basic formulation with reduce the viscosity to about 800cp (at 5rpm using the S03 spindle by using a Brookfield Model DV-I+ Viscometer). For comparison, the current yellow paint sample from NH DOT has a viscosity of 500cp in the same condition. Our trials evolved into the formulation presented in Table 3.
Table 3. Modified formulation for HD21A white paint. HD21A 94g Tamol 901 1.4g Surfynol 0.56 Octanol 0.4 CaCO3 60 TiO2 10
Proprietary of the University of New Hampshire 16

The previous materials were mixed vigorously with an homogenizer (ultraturax), until a smooth liquid was obtained, then the following liquids were added at slower speed. Methanol 6 Texanol 4.6 Octanol 0.7 This formulated paint will be used in our future mechanical test.
4.2 Wear Testing Wear testing of the traffic paint and beads is being carried out in the laboratory as well as in the field using ASTM D-913-88. This testing utilizes a wear tester at UNH presented in Figure 10.
Figure 10: Wear Tester Developed at UNH Materials Science Department This wear tester oscillates a steel ball over the sample for a predetermined time. The steel ball is connected to a rod that displaces a load cell. The load cell measures the force applied to the sample allowing the calculation of a friction coefficient. This investigation is not interested in the friction coefficient directly but rather the length of time it takes to wear through the film to reach the substrate. The friction coefficient indicates when this has occurred because it changes values from the film to the substrate. Although this test will not simulate the environments the paint experiences in the field, it will give an indication of whether the modifications made to the beads have
Proprietary of the University of New Hampshire 17

increased their wear resistance. Figure 11 shows a sample of traffic paint after the wear test with a magnification of the wear track.
Figure 11: Wear Sample and Magnification of Wear Track The wear track is the groove that the steel ball has worn away. The steel ball was passed over the track 5,000 times on this sample. The film has not completely worn through to the substrate.
4.3 Optical Property Measurement The retroreflectivity of the traffic paints is being measured using a Delta LTL 2000 Reflectometer provided by the NH DOT. The results of the measurements will be compared with pictures taken of the paint strips. This is being done to compare the two methods of optical property measurement.
4.4 Adhesion Testing Testing the adhesive strength between the paint film and the beads has proven to be quite difficult. As a first attempt dynamic mechanical analysis (DMA) was used. This test used fiberglass plates with a strip of paint in the middle. The samples were constructed using paint only with no beads. The first step in the sample preparation procedure was to sand the fiberglass plate using a random orbital sander. This was done in two stages first with 100 grit sandpaper and then with 220 grit sandpaper. This was done to get better adhesion between the paint and plates. After sanding was complete the samples were cut to size and the thickness was measured with a micrometer. Prior to paint application the plates were wiped down with isopropanol to remove all oils from handling with fingers. Several methods of paint application were examined. These included application with a draw bar, airbrush, paint brush and pipette. The draw bar consists of a metal bar with grooves of 250, 500, 750, and 1000 microns milled out of it. The draw bar is used to draw a liquid across a substrate leaving a film the thickness of
Proprietary of the University of New Hampshire 18

the groove used. The draw bar could not be used to produce samples due to its large dimensions even though a mold was fabricated. A small airbrush available at most craft stores was used to replace the draw bar. However the airbrush was found to be inadequate for several reasons. The main reason was because the films painted with it dried too fast to allow correct placement of the second fiberglass plate. Additionally, the paint had to be diluted 50/50 with water to use the airbrush. The airbrush was found to produce uniform films with consistent thickness at 50±10 microns when 6 passes were made. In order to rectify these problems attempts were made to dab the paint on using a sharply tipped paintbrush. This method solved the problems associated with the film drying too fast but other problems arose. These problems consisted of samples with non-uniform thickness and inconsistent geometry. The best method of applying samples was found to apply droplets of paint using a pipette. This method produced samples with circular cross sectional areas. After the paint was applied the second plate was attached to the first at a 90 degree angle. This is shown in Figure 12.
Figure 12: DMA Sample Before and After Test This was done to apply the force to the edges of the fiberglass plates. In theory this would cause the paint film in contact with both plates to be in tension. This should allow for two possible failure modes cohesive failure or adhesive failure. Cohesive failure happens when the paint film fails and is indicated when there is paint remaining on both fiberglass plates. Adhesive failure occurs between the paint and the plate as is shown in the sample presented in Figure 12. When there is paint only on one plate adhesive failure is indicated. Figure 13 shows the sample in the DMA for the test.
Proprietary of the University of New Hampshire 19

Figure 13: Sample in DMA for testing This test had several flaws. The results from these tests were scattered showing no clear trend. This was mainly due to the many possible failure locations and the way in which the forces were applied to the samples. The failure locations were problematic because there was no clear trend for the samples experience adhesive or cohesive failure. Some of the samples indicated that parts of the sample failed adhesively while others failed cohesively. Additionally, due to the range of the machine many samples never failed. The DMA can apply up to 8000mN (0.8N) of force. Additional problems with the test method include the bending of the fiberglass plates. Given the way in which the forces are applied the plates can bend placing the paint film under shear instead of tension. Examples of the results of this test are presented in Figure 14.
Example DMA Test Method Results
0
50000
100000
150000
200000
250000
0 0.2 0.4 0.6 0.8 1 1.2 1.4
Strain (m/m)
Stre
ss (N
/m2)
Figure 14: Some Selected DMA Test Method Results Examination of the results presented above indicates some of the problems associated with the test. The dark blue data set on the left of the figure never failed during the test.
Proprietary of the University of New Hampshire 20
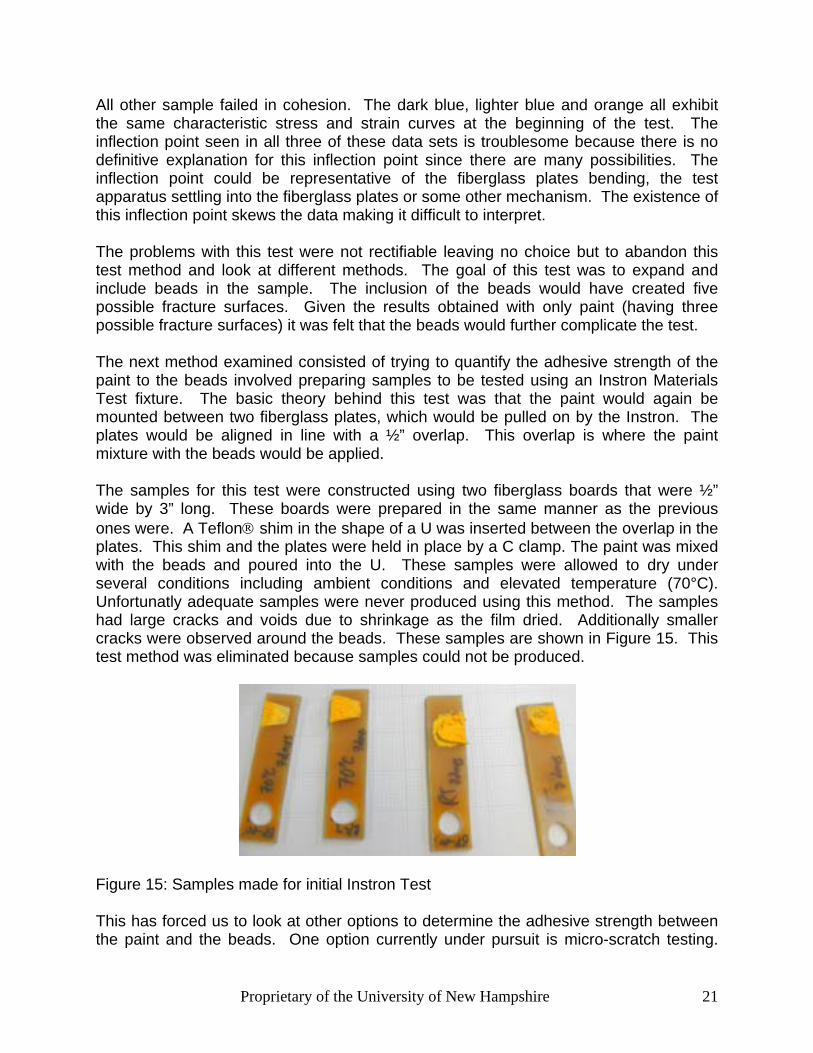
All other sample failed in cohesion. The dark blue, lighter blue and orange all exhibit the same characteristic stress and strain curves at the beginning of the test. The inflection point seen in all three of these data sets is troublesome because there is no definitive explanation for this inflection point since there are many possibilities. The inflection point could be representative of the fiberglass plates bending, the test apparatus settling into the fiberglass plates or some other mechanism. The existence of this inflection point skews the data making it difficult to interpret. The problems with this test were not rectifiable leaving no choice but to abandon this test method and look at different methods. The goal of this test was to expand and include beads in the sample. The inclusion of the beads would have created five possible fracture surfaces. Given the results obtained with only paint (having three possible fracture surfaces) it was felt that the beads would further complicate the test. The next method examined consisted of trying to quantify the adhesive strength of the paint to the beads involved preparing samples to be tested using an Instron Materials Test fixture. The basic theory behind this test was that the paint would again be mounted between two fiberglass plates, which would be pulled on by the Instron. The plates would be aligned in line with a ½” overlap. This overlap is where the paint mixture with the beads would be applied. The samples for this test were constructed using two fiberglass boards that were ½” wide by 3” long. These boards were prepared in the same manner as the previous ones were. A Teflon shim in the shape of a U was inserted between the overlap in the plates. This shim and the plates were held in place by a C clamp. The paint was mixed with the beads and poured into the U. These samples were allowed to dry under several conditions including ambient conditions and elevated temperature (70°C). Unfortunatly adequate samples were never produced using this method. The samples had large cracks and voids due to shrinkage as the film dried. Additionally smaller cracks were observed around the beads. These samples are shown in Figure 15. This test method was eliminated because samples could not be produced.
Figure 15: Samples made for initial Instron Test This has forced us to look at other options to determine the adhesive strength between the paint and the beads. One option currently under pursuit is micro-scratch testing.
Proprietary of the University of New Hampshire 21
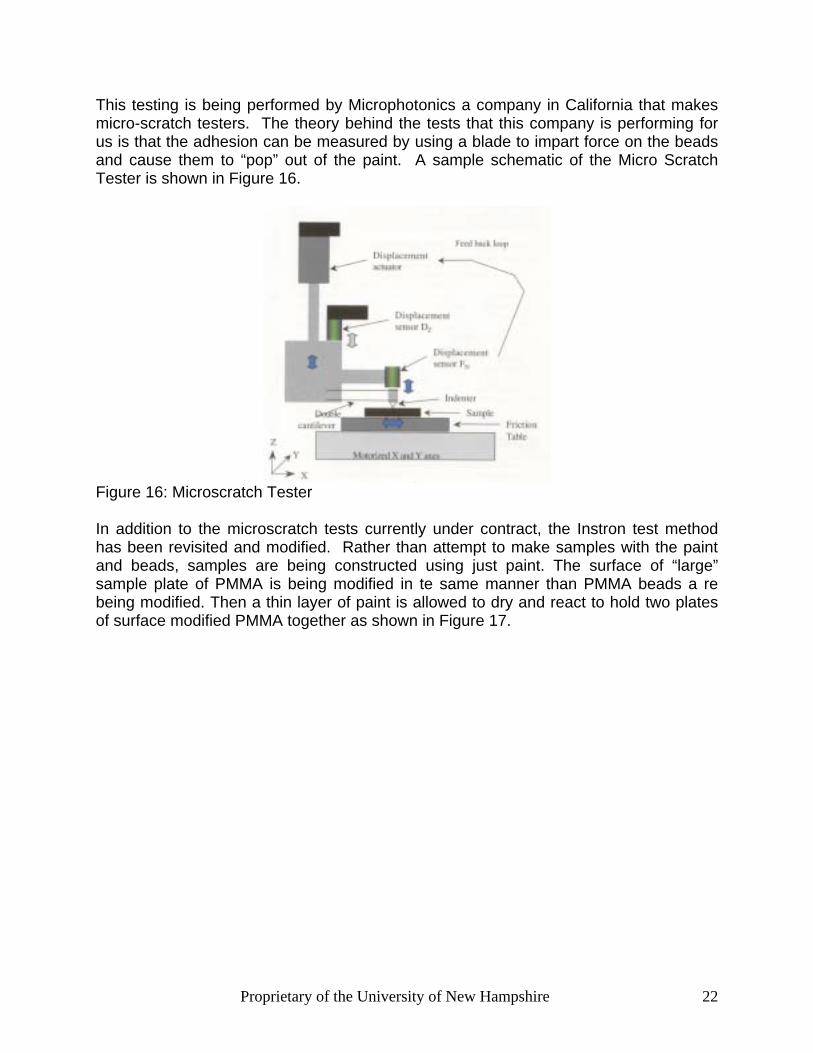
This testing is being performed by Microphotonics a company in California that makes micro-scratch testers. The theory behind the tests that this company is performing for us is that the adhesion can be measured by using a blade to impart force on the beads and cause them to “pop” out of the paint. A sample schematic of the Micro Scratch Tester is shown in Figure 16.
Figure 16: Microscratch Tester In addition to the microscratch tests currently under contract, the Instron test method has been revisited and modified. Rather than attempt to make samples with the paint and beads, samples are being constructed using just paint. The surface of “large” sample plate of PMMA is being modified in te same manner than PMMA beads a re being modified. Then a thin layer of paint is allowed to dry and react to hold two plates of surface modified PMMA together as shown in Figure 17.
Proprietary of the University of New Hampshire 22

Figure 17: Surface modified PMMA plate test method By using the modified plates the problems with paint film application can be eliminated. It is possible to use an Instron to apply force to the PMMA plates and measure the adhesive strength. Comparison of the current system of glass beads with the modified beads will indicate how successful the surface modification process was. 5. Future plans The effort of the coming months will be mostly on the preparation of larger batches of beads for the field test. Some lab developments have been slowed due to problems in the sourcing of PMMA beads. This is currently being resolved and a 50Kg sample is being freighted to UNH. The 10 L mini-pilot reactor will be used to produce these larger batches of modified PMMA beads, as 5-10Lb samples can be prepared in reproducible conditions. Field test will be planned some time in August in cooperation with the NH-DOT. Field application should occur in early October. Mechanical testing of the modification of PMMA will be pursued, with the highest expectation coming from the adhesion strength test between 2 solid plates.
Proprietary of the University of New Hampshire 23

1
Report prepared for State of New Hampshire, Department of Transportation Bureau of Materials and Research P.O. Box 483, Stickney Ave. Concord, NH 03302-0483 Under Contract # TPF-5(024) statewide 13739 Award date: 12/19/01 Third and fourth quarterly progress report December 31th, 2002 Prepared by Dr. Yvon G. Durant Dr. Weihong Guo Advanced Polymer Laboratory University of New Hampshire Parsons Hall G101, Durham NH 03824 Tel : 603 862 1703, Fax : 603 862 4892 Email : [email protected]

2
1. Introduction ......................................................................................................................... 2 2. General comments on the project ................................................................................... 3 3. Bead synthesis ................................................................................................................... 4
3.1. Synthesis strategy. ..................................................................................................... 4 3.2. Recipes for new beads .............................................................................................. 5 3.3. characterization of modified beads .......................................................................... 7
3.3.1. Transmission electron microscopy characterization:.............................................. 7 3.3.2 FTIR analysis. .......................................................................................................... 8 3.3.3 Particle size analysis ................................................................................................ 9 3.3.4. Adhesions pressure testing...................................................................................... 9
4. Paint formulation. ............................................................................................................. 10 5. Field applications ............................................................................................................. 12 6. Performance monitoring ................................................................................................. 21 7. Appendix ........................................................................................................................... 24
7.1 Lincoln raw data......................................................................................................... 24 7.2 Hookset raw data....................................................................................................... 27 7.2 Durham raw data ....................................................................................................... 29 7.3 Relative retroreflectivity in Durham......................................................................... 30
1. Introduction This project deals with a specific aspect of traffic paint, the improvement of retro-reflective bead retention. More specifically we are studying the potential of PMMA beads to act as a substitute for glass beads when their surface chemistry is modified to react (crosslink) with the binder chemistry. This project thus is a building block toward an ultimate goal of developing traffic paints with longer durability and sustained retroreflectivity. Performance at the time of application, whether initially high or low, is of little concern and interest unless it is sustained Retroreflectivity higher than 150 mCd/M2/Lx over a full season is generally considered to be the desired standard. The current project involves two major phases: a laboratory development phase, where modified beads are produced, and a field test phase including limited comparison with conventional products. Currently this project is in its second phase Development of modified retroreflective beads involves several distinct steps: 1) The proper selection of a binder system with propensity to crosslink with the PMMA beads. 2) The chemical modification of commercially available PMMA beads to optimize them for this application. 3) The testing of the application properties of the beads when combined with the binder. Step one and two have been completed, step three is at 90% completion.

3
2. General comments on the project This report consolidates the work of almost two quarters. With the concurrence of NHDOT, we decided to produce a single report for this period because it allows us to present some initial results as well as reporting on what we have been doing. Two added factors came into play. First, the approaching New Hampshire winter required single-minded focus on getting paint applied at our test sites followed by the collection of early test data while weather permitted. Second, we added several items that will increase the project’s long term potential. The next report is scheduled for the end of the first calendar quarter of 2003. We are most pleased to report that this project has made excellent progress. Since July, we have made “large” quantities of beads, prepared a large batch of formulated HD21A paint suitable for this application, applied these products in three locations, and established a routine monitoring protocol. We now are in the phase of continuous monitoring of coating performance, which will contain its own set of issues through the winter. This report provides details on the synthesis of the modified PMMA beads and details of their characterization. NHDOT reporting on the application of the samples comes next, followed by, information on the initial performance of the various coatings through three post-application monitoring visits. We conclude with preliminary and partial interpretation of these results. This information also is available on the project’s UNH website: http://www.unh.edu/apl/RR-traffic-coating.htm Additionally we will update the website directly when new performance results are gathered, in effect making this web site a reporting tool to the various states sponsoring this work so that up-to-date information will be available more frequently. There also will be a final report when performance monitoring is completed after a full seasonal cycle. While this project is focused on assessing the potential of PMMA beads crosslinked with a binder, a number of collateral aspects are arising that are worthy of note. Some examples:
1. Existing measuring devices are not designed for winter operation, probably because paint is applied only when the road temperature is above 40F. However, with increased emphasis on maintaining high levels of retroreflectivity, cold weather states are going to need the capability of taking measurements even atvery low air temperatures.
2. We decided to evaluate the impact of weather, isolating that aspect from road wear. So we applied each of our coatings 1) on new asphalt plates, 2) on three-year old asphalt plates, and 3) on glass-epoxy plates. These have been mounted to maximizize exposure to the elements under optimized conditions. A collateral benefit will be to collect data on paint (weather) aging as well as on bead retention and retroreflectivity.
3. We found relatively little in the literature on methodologies for measuring retroreflectivity over time at frequent intervals. Therefore, we have had to develop protocols for our research that may contribute to this field.
4. We had to develop a laboratory test suitable for measuring adhesion between a bead and the binder, being unable to find one already in use.
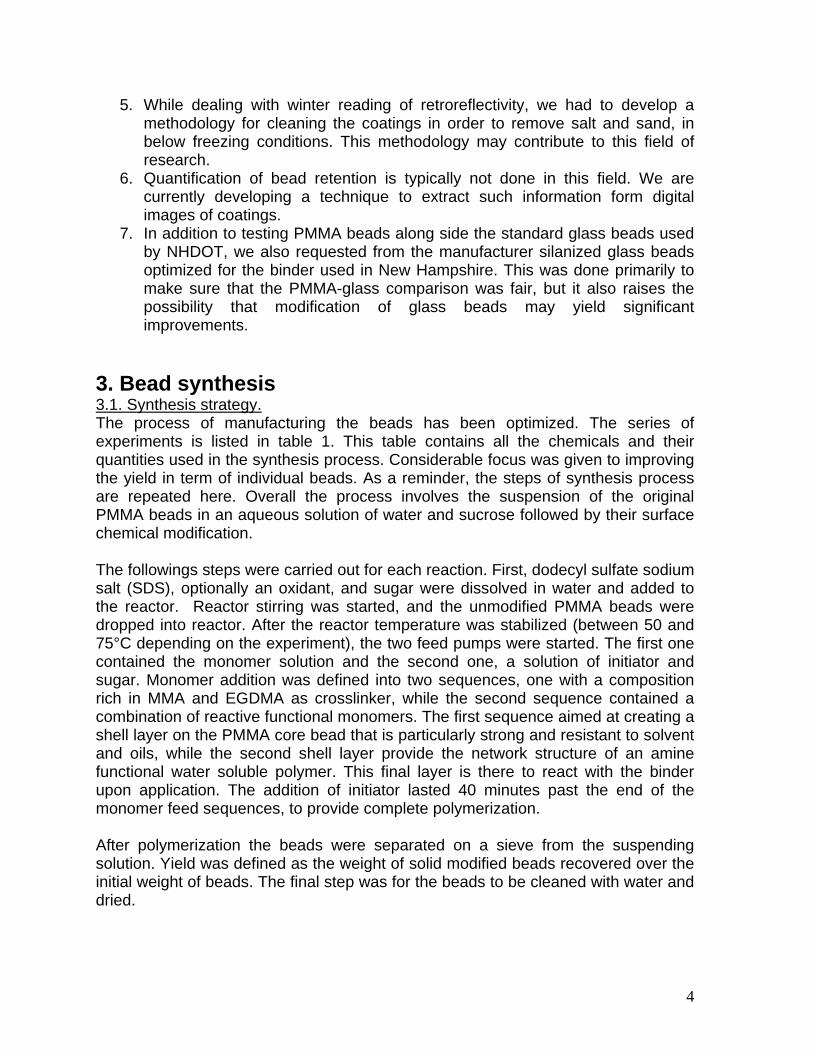
4
5. While dealing with winter reading of retroreflectivity, we had to develop a methodology for cleaning the coatings in order to remove salt and sand, in below freezing conditions. This methodology may contribute to this field of research.
6. Quantification of bead retention is typically not done in this field. We are currently developing a technique to extract such information form digital images of coatings.
7. In addition to testing PMMA beads along side the standard glass beads used by NHDOT, we also requested from the manufacturer silanized glass beads optimized for the binder used in New Hampshire. This was done primarily to make sure that the PMMA-glass comparison was fair, but it also raises the possibility that modification of glass beads may yield significant improvements.
3. Bead synthesis 3.1. Synthesis strategy. The process of manufacturing the beads has been optimized. The series of experiments is listed in table 1. This table contains all the chemicals and their quantities used in the synthesis process. Considerable focus was given to improving the yield in term of individual beads. As a reminder, the steps of synthesis process are repeated here. Overall the process involves the suspension of the original PMMA beads in an aqueous solution of water and sucrose followed by their surface chemical modification. The followings steps were carried out for each reaction. First, dodecyl sulfate sodium salt (SDS), optionally an oxidant, and sugar were dissolved in water and added to the reactor. Reactor stirring was started, and the unmodified PMMA beads were dropped into reactor. After the reactor temperature was stabilized (between 50 and 75°C depending on the experiment), the two feed pumps were started. The first one contained the monomer solution and the second one, a solution of initiator and sugar. Monomer addition was defined into two sequences, one with a composition rich in MMA and EGDMA as crosslinker, while the second sequence contained a combination of reactive functional monomers. The first sequence aimed at creating a shell layer on the PMMA core bead that is particularly strong and resistant to solvent and oils, while the second shell layer provide the network structure of an amine functional water soluble polymer. This final layer is there to react with the binder upon application. The addition of initiator lasted 40 minutes past the end of the monomer feed sequences, to provide complete polymerization. After polymerization the beads were separated on a sieve from the suspending solution. Yield was defined as the weight of solid modified beads recovered over the initial weight of beads. The final step was for the beads to be cleaned with water and dried.

5
3.2. Recipes for new beads We tried different initiator systems under different conditions to try to improve the polymerization yield. The following initiator systems were used (Table 1): Table 1: initiator systems
Sodium persulfate Na2S2O8
Sodium persulfate - Sodium sulfite Na2S2O8-Na2S2O3.5H2O
Hydrogen peroxide H2O2
Hydrogen peroxide - Vitamine C H2O2-Vit C (C6H8O6 - L-ascorbic Acid)
Azo bis-isobutironitril AIBN We also tried different types of monomers containing amine functions, as described in Table 2. Table 2: monomers containing amine functions
AAM Methacrylamide AAM Acrylamide AS 4-amino styrene VBC Vinyl Benzyl Chloride
Most important to note is our most preferred synthetic route. VBC is a relatively inexpensive monomer that can be easily converted into functional amine. First VBC was copolymerized as an outer layer on the bead, then ammonia (NH3.H2O) was added to the bead dispersion. As a consequence the chloride (Cl) group on the P(VBC-co-MMA) chains were substituted with amine (NH2) group, and the primary amine was formed. This is schematically illustrated in Figure 1:
The various systems and concentrations for each experiment are listed in Table 3.
EGDMA NH3.H2O
PMMA VBC
MMA
Figure 1: Preferred synthetic route to modified PMMA beads

6
Table 3: Bead modification experiments
Water PMMA SDS Initiator Vit. C MMA EGDMA MA AAM Sugar=A (g) BzA T No. (g) (g) (g) (mg) (mg) (g) (g) (g) (g)
VBC Sucrose=B (g) (g)
Feed time °C
Yield (g)
Yield (%)
29 400 100 0.672 H2O2 6.7ml 9.9 0.1 5 5 B 260 0 2h 65 102.7 30 400 2 Plates 0.672 H2O2 6.7ml 5 0.05 2.5 2.5 B 260 0.25 50 0.5406 31 200 2 Plates 0.336 H2O2 3.4ml 5 0.5 2.5 B 130 0.25 2h 50 1.164 32 400 100 0.672 H2O2 6.7ml 50 9.5 0.5 5 5 B 260 0.5 2h 65 101 33 400 100 0.672 H2O2 6.7ml 50 9.5 0.5 5 AA 5 B 260 0.5 2h 65 101.3 34 400 100 0.672 AIBN 0.05 9.5 0.5 5 AA 5 0.5 4h 75 35 400 100 0.672 AIBN 0.05 9.9 0.1 5 AA 5 4h 70 109.7 36 400 200 1 AIBN 0.1 19 1 10 AA 10 4h 70 218 37 400 200 1 AIBN 0.1 19 1 10 AA 10 1 4h 70 216.1 38 400 200 1 AIBN 0.1 19 1 10 AA 20 4h 70 213.7/218.2 40 400 200 0.672 AIBN 0.1 19 1 10 AA 10 4h 70 203 41 145 36 0.244 AIBN 0.05 5 AA 5 2h 65 37.8 42 400 200 0.672 AIBN 0.1 19 1 10 AA 10 B 260 4h 70 205.7 43 400 100 0.672 AIBN 0.08 9.5 0.5 5 AS 1 3h 70 102.7 44 400 100 0.672 AIBN 0.05 5 0.1 5 2h 75 105.2 45 400 100 0.672 AIBN 0.05 7 0.1 3 2h 70 102.5 46 400 100 0.672 AIBN 0.05 9 0.1 1 2h 70 101.6 47 400 100 0.672 AIBN 0.05 5 5 2h 70 104.1 48 400 100 0.672 AIBN 0.05 BMA 5 5 106.3 49 400 100 0.672 AIBN 0.05 4.5 0.1 BMA 2h 70 103.3 50 4000 1000 6.72 AIBN 0.5 70 30 2h 75 1065.3 65.30% 51 400 250 1 AIBN 0.125 17.5 0.25 7.5 2h 75 265.8 63.20% 53 400 250 0.672 AIBN 0.125 17.5 7.5 2h 75 261.1 45.60% 54 400 250 0.672 AIBN 0.125 17.5 0.025 7.5 2h 75 265 60% 55 400 250 0.672 AIBN 0.0375 0 0.075 7.5 2h 75 255 66.70% 56 400 250 0.672 AIBN 0.0625 10 7.5 2h 75 260.3 58.90% 57 400 250 0.672 AIBN 0.0175 9.9 0.1 7.5 2h 75 259.9 58 4000 2500 6.72 AIBN 0.15 75 0.75 75 A 2000 3.5h 70-75 59 4000 2500 6.72 AIBN 0.075 0 0.75 75 A 2000 4h 70-75 60 4000 1000 6.72 AIBN 0.03 0 0.3 30 A 2000 3h 70-75 61 4000 1500 6.72 AIBN 0.09 45 0.45 45 3h 70-75 62 4000 1500 6.72 AIBN 0.16 105 1.05 45 A 2000 3h 70-75
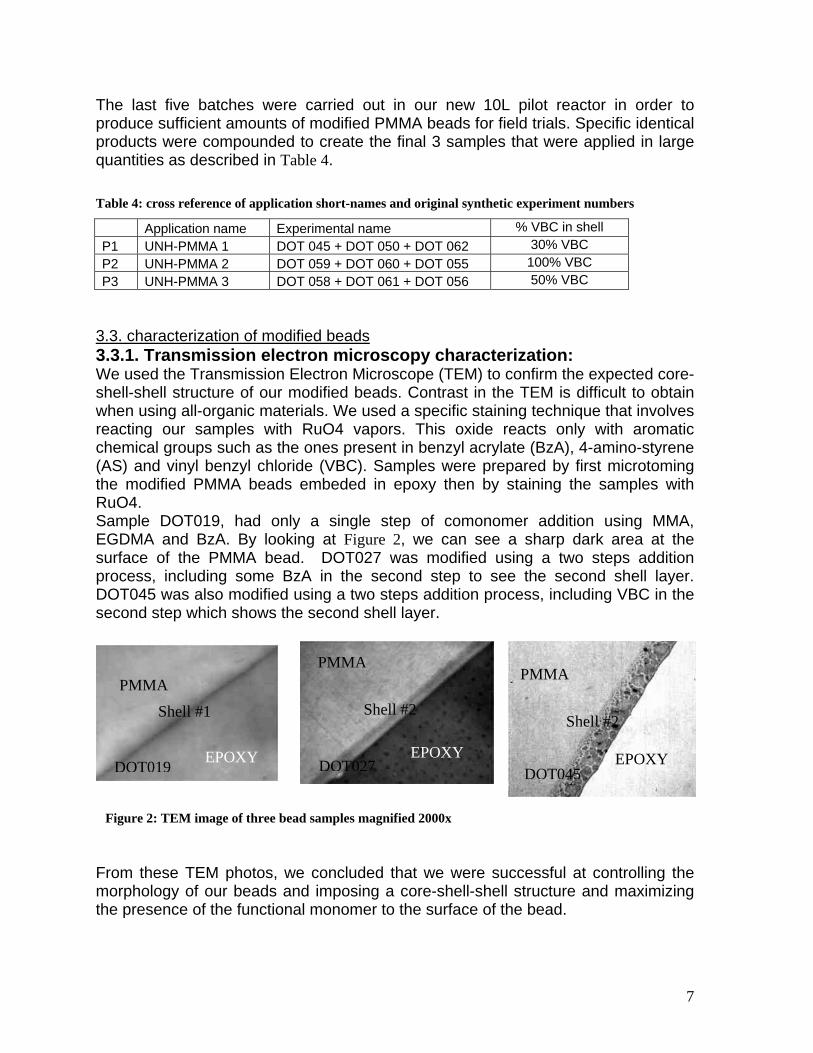
7
The last five batches were carried out in our new 10L pilot reactor in order to produce sufficient amounts of modified PMMA beads for field trials. Specific identical products were compounded to create the final 3 samples that were applied in large quantities as described in Table 4. Table 4: cross reference of application short-names and original synthetic experiment numbers
Application name Experimental name % VBC in shell P1 UNH-PMMA 1 DOT 045 + DOT 050 + DOT 062 30% VBC P2 UNH-PMMA 2 DOT 059 + DOT 060 + DOT 055 100% VBC P3 UNH-PMMA 3 DOT 058 + DOT 061 + DOT 056 50% VBC
3.3. characterization of modified beads 3.3.1. Transmission electron microscopy characterization: We used the Transmission Electron Microscope (TEM) to confirm the expected core-shell-shell structure of our modified beads. Contrast in the TEM is difficult to obtain when using all-organic materials. We used a specific staining technique that involves reacting our samples with RuO4 vapors. This oxide reacts only with aromatic chemical groups such as the ones present in benzyl acrylate (BzA), 4-amino-styrene (AS) and vinyl benzyl chloride (VBC). Samples were prepared by first microtoming the modified PMMA beads embeded in epoxy then by staining the samples with RuO4. Sample DOT019, had only a single step of comonomer addition using MMA, EGDMA and BzA. By looking at Figure 2, we can see a sharp dark area at the surface of the PMMA bead. DOT027 was modified using a two steps addition process, including some BzA in the second step to see the second shell layer. DOT045 was also modified using a two steps addition process, including VBC in the second step which shows the second shell layer.
From these TEM photos, we concluded that we were successful at controlling the morphology of our beads and imposing a core-shell-shell structure and maximizing the presence of the functional monomer to the surface of the bead.
PMMA
EPOXY
Shell #1
PMMA
EPOXY
Shell #2
PMMA
Shell #2
EPOXYDOT019 DOT027 DOT045
Figure 2: TEM image of three bead samples magnified 2000x

8
3.3.2 FTIR analysis. A Thermo Nicollet / Avatar 360 FTIR ESP instrument was used for the surface analysis of modified beads. The results are shown in Figure 3.
Figure 3: FTIR traces of modified beads with ATR probe
This FTIR setup is particularly sensitive to the chemical functions available at the surface of the beads, and is insensitive to the bulk characteristic of the beads. Vibration at three distinct wavenumbers are analyzed and reported in Table 5. At 1730cm-1, the vibration is typical of carbonyls, present in acrylates (PMMA) and acrylamides (AA and AAM). The vibration at 2400 and 2900 cm-1 is typical of =NH present in amine and amides, but with a higher response to amides at 2900cm-1 than for amines. With this information we are able to conclude that the chemical functions that we aim at introducing at the surface of the beads are effectively present. This is valid for both amides and amines. This directly correlates and reinforces the results of the TEM.
DOT035
DOT027
DOT047
PMMA
DOT045

9
Table 5: FITR spectra analysis
Sample Monomer in synthesis
Peak @ 1730
Peak @ 2400
Peak @ 2900
Confirmation of surface function
DOT047 VBC No Yes Yes Amine DOR035 AA Yes Yes Yes Amide DOT027 AAM Yes yes Yes Amide PMMA - Yes No No Acrylate DOT045 VBC No yes Yes Amine
3.3.3 Particle size analysis Particle size was analyzed with our Microtrac particle size analyzer, based on a multi angle light scattering technique. A significant amount of difference was found between the sizes of the samples as reported in Table 6. The average particle size for regular glass beads is 394μm. The amino modified glass beads from Potter are significantly larger at 560μm. The initial PMMA beads are similar in size to the modified glass beads, with a slightly narrower size distribution. Finally all the modified PMMA beads are larger than the initial beads with a significantly narrower size distribution.
Table 6: Bead size and polydispersity
Dn
(µm) Dv
(µm) PDI Regular Glass 309 394 1.28
Modified Glass 480 560 1.17 PMMA 550 596 1.08
DOT036 888 912 1.03 DOT045 417 753 1.81 DOT058 821 847 1.03 DOT059 840 867 1.03
DOT045, DOT058 and DOT059 are the samples used in the field applications for Lincoln and Hookset, while DOT036 was used at UNH.
3.3.4. Adhesions pressure testing After many months of experimental investigation we have finally identified a technique that allows us to properly measure the adhesion strength between bead and paint. This technique measures the force to dislodge a bead from its substrate by “pushing” it at a nearly horizontal angle with a sharp object. These measurements need to be repeated on a significant number of beads in order to be valid, and each force reported represents the average of 10 beads. For proper comparison, the

10
forces then need to be divided by the contact area between the bead and the paint. These results are reported in Table 7. Table 7: Adhesion pressure between beads and paint
Dn
(µm) Dv
(µm) Da
(µm) F
(N) Contact area
(mm^2) Pressure (N/mm^2)
Regular Glass 309 394 367 1.19 0.58 2.1 Modified Glass 480 560 532 2.84 0.84 3.4
PMMA 550 596 500 5.14 0.79 6.5 DOT036 888 912 904 4.66 1.42 3.3
We can read from this table that the adhesion strength of the modified glass is greater than for regular glass. Furthermore, we can read that adhesion strength of PMMA is about twice that of modified glass. Finally we measured that our surface modification in DOT036 actually has weakened the adhesion strength by a factor of two, to a level similar to the modified glass beads. Our success in developing a successful way to test bead adhesion was somewhat offset by the reality that the instrument as yet is not broadly available and is somewhat expensive. Therefore, we had to ship samples to California for testing, with about a 30-day turnaround, and at a relatively high per-sample cost. Even so, our experience in identifying this test, and the initial results shown above, provided important insight into the issue of bead adhesion. They also provided valuable support for the technique we ultimately used to select beads when the approaching winter forced us to choose from among those available. See next paragraph. More important for the longer run, however, the ability to have a laboratory test to measure bead adhesion could be very useful for future research as well as for DOTs. In order to select the best beads for the field applications, we tried to replicate the test qualitatively by estimating the force to detach beads manually, which is particularly empirical and ultimately not reliable, but a reasonable approach to bead selection at this preliminary stage. We used a draw-bar with a make a gap of 250 μm and deposited UNH-HD21A paint on glass fiber - epoxy plate, initially cleaned with methanol and lightly sanded. Then the beads were manually dropped on the wet paint. Relative pull force was estimated 24 hours later. We found the following order of relative adhesion strengths DOT4548>47>46>PMMA>49>44. On a second set of measurements we found that the adhesion strength of the samples followed this order DOT56>45>55>54>PMMA>53. Consequently we chose DOT056, DOT045, and DOT055 as the basic formulas for field application. 4. Paint formulation. We used two paints to test our beads. For reference we used a conventional fast-dry waterborne white from Sherwin-Williams, formulated with the Rohm & Haas FT3427 binder. The second paint was formulated at UNH following essentially a basic

11
formulation from Rohm and Haas for their HD21A binder, and slightly modified from what was reported in the second quarter report, as shown in Table 8.
Table 8: UNH-HD21A formulation
HD21a 1000g Tamol 901 14g Surfynol 5.6g Octanol 4g TiO2 200g CaCO3(Heavy powder) 1300g Methanol 60g Texanol 46g Octanol 7g
The first time this paint was applied was at a test site on the UNH campus, preliminary to testing it on the Interstate test sites. (See section 5.1) The application crew from UNH “ground and roads” services reported a very fast drying time at 75F. When applied on I-93 at about 50F, the drying time was longer than conventional paint (see Table 9). The UNH formulation of HD21a resulted in a viscosity of 680cp (measured at 5rpm with a SO3 spindle using a Brookfield viscometer), which is a match for the viscosity of the Sherwin Williams TM226 setfast white waterborne traffic marking paint (fed.spec.TT-P-1952B). However, during application it was found to be particularly difficult to adjust the spray machine to obtain a uniform paint delivery. Because of these difficulties, we measured the dynamic viscosity of the paints at the NHDOT materials laboratory, using a Rheotech DSR viscometer, with a flat plate configuration, at a 1mm gap at 22C. We obtained the following figures.

12
Dynamic Viscosity
y = 0.0546x-0.6983
y = 0.0466x-0.8688
1.E-04
1.E-03
1.E-02
1.E-01
1.E+00
1.E+01
1.E+02
1.E-04 1.E-03 1.E-02 1.E-01 1.E+00 1.E+01 1.E+02 1.E+03Shear Rate (1/sec)
Visc
oist
y (k
Pa.s
= c
P)
HD21ARWHD21-UNH viscoPower (HD21A)Power (RW)
Vis
cosi
ty m
atch
(UN
H)
App
licat
ion
cond
ition
s (G
raco
)
Figure 4: Dynamic viscosity for the 2 paints used in the field applications
Figure 4 shows that while the viscosities are properly matched at low shear, there is a one order of magnitude difference at high shear rates, which is more representative of the situation in a spray machine. This limited shear thinning of the UNH-HD21A thus seems to have been the source of poor application performance. This formulation issue can be easily remedied by properly controlling the size distribution of the CaC03. While annoying, this application issue should not affect paint performance or bead adhesion significantly.
5. Field applications 5.1. Application at UNH
We decided to test some of the beads and the UNH-HD21A binder at a convenient location before the field applications on I-93 with the state DOT. We selected the crosswalk next to our research building for convenience. The UNH ground and roads crew was most kind in coordinating their application with us and switching paints to facilitate our application. All beads were dropped by hand. Because traffic cannot be completely halted on McDaniel drive, the application was done with a 4 day interval between the south and north side of the street. Regular white paint was used on the south side and UNH-HD21A on the north side.

13
The beads used were: 1) Regular glass beads from NH DOT 2) Amine-Modified glass beads, from POTTER INDUSTRIES, P-40 AC-110-Highway Spheres. 3) Regular PMMA beads unmodified, from INEOS Acrylics. MG102 Clear011 4) Modified PMMA beads DOT036. Beads were applied on the crosswalk between P-Lot and Philbrook hall on McDaniel Drive on 08/01/2002 at 9:00pm. Air temperature was 25C with a Relative Humidity 60% and a wind of 11mph. The paint was a SHERWIN WILLIAMS TM226 SETFAST WHITE WATERBORNE TRAFFIC MARKING PAINT(FED.SPEC.TT-P-1952B) and was applied on the south side (west to east traffic). Beads were applied on the crosswalk between P-Lot and Philbrook hall on McDaniel Drive on 08/05/2002 at 6:00pm. Air temperature was 34C with Relative Humidity 38% and a wind of 13mph. The paint was the UNH-HD21A and was applied on the north side (east to west traffic) The location of the beads is specified in Figure 5.
Figure 5: Bead distribution for UNH test site
The effectiveness of the beads is nicely illustrated with flash photography, as shown in Figure 6.

14
Figure 6: UNH test site after bead application
While interesting, and certainly helpful to us in setting up the I-93 test sites, we are not using data from this location for evaluation purposes. 5.2. Application in Lincoln
Report from Ray Wellman, Research Technician, NHDOT Bureau of Materials & Research Test Application Site 1: I-93 NB, Lincoln, NH (between exit 33 and 34a)
In accordance with the Work plan for the subject study, the first of two field test applications was carried out on 10/09/02 using the ten product combinations as outlined in the plan. The pavement temperature was monitored throughout the application to insure it was within the range of 40ºF and rising. Pavement temperatures were obtained using a Raytek® model Raynger® ST™, non-contact infrared thermometer (Figure 7). The application began at approximately 10:00 a.m. with a pavement temperature of 54ºF. The various product combinations were applied by the NHDOT Bureau of Traffic using a Graco Line Laser/driver (Figure 8). The lines were all laid in a north south direction starting with the left wheel path, center of lane and then right wheel path (Figure 9 and Figure 10). The application began on the north end of the test site going south. The paint was switched from the Department’s standard waterborne binder to Rohm & Haas Formulated HD21A Traffic Paint after the five bead types had been applied with the standard paint. After switching the paint, the application resumed at the south end of the site going north. Figure 12 depicts the location of the various combinations at the test site. The Graco system uses a gravity feed system for bead application. Occasionally, the beads were not applied consistently by the machine. In those instances, the beads were applied by either reversing the machine and allowing the beads to fall from the chute while backing up, or were broadcast by hand over the line. Comments on each particular combination and bead application methods are noted on the spreadsheet accompanying this narrative.
Overall, the application went well and according to plan. There was minor difficulty with the paint switch over. The paint gun and nozzle were replaced and

15
following adjustments of the new nozzle, the application resumed. Retroreflectivity measurements were taken on the lines after the markings had dried. Two sets of values were taken. The first set was taken on the south end of the lines and was taken prior to sweeping excess beads from the lines (Figure 11). The second set of values was taken from the north end of the lines after they were swept off using a push broom. The values have been tabulated and averaged on the accompanying spreadsheet (appendix 7.1). Greg Placy, District One Engineer, pointed out the trend that the highest retroreflectivity readings were all in the left wheel path. Greg felt this could be due to the traffic going by in the open passing lane, blowing excess beads from the lines prior to initial measurements. Painting concluded at approximately 12:15 and retroreflectivity readings were finished at approximately 12:45. The lines will continue to be monitored as coordinated by Yvon Durant, Principle Investigator for the study.
�
Figure 7: Raytex® Thermometer
Figure 8: Graco Line Laser
Figure 9: Beginning of application
�
Figure 10: Continuing of application
Figure 11: Retroreflectivity
measurements

16
Figure 12: Sample layout in Lincoln
1 RP w/RG
3 RP w/P3
4 RP w/P2
5 RP w/P1
10 HD-21 w/RG
9 HD-21 w/MG
8 HD-21 w/P3
7 HD-21 w/P2
6. HD-21 w/P1
I-93 NB Center Line
2 RP w/MG

17
5.3. Application in Hookset Report from Ray Wellman, Research Technician, NHDOT Bureau of Materials & Research Test Application Test Application Site 2: Hooksett Toll Plaza, I-93 NB Lane 1, Hooksett, NH In accordance with the work plan for the subject study, the second of two field test applications was carried out on Tuesday, October 29, 2002. Ten product combinations, as outlined in the plan, were used. Pavement temperatures were monitored throughout the application to insure they were above the minimum specified temperature for application of 40ºF. Pavement temperatures were obtained using a Raytek® model Raynger® ST™, non-contact infrared thermometer. The application began at approximately 10:00 a.m. with a pavement temperature of 50ºF. The various product combinations were applied by the NHDOT Bureau of Traffic using a Graco Line Laser/driver. The lines were all applied southwest to northeast, diagonal to the direction of traffic (Figure 13-a &b). The test site consists of three groups of ten lines, with each combination having one line in each group (three lines per combination). Figure 13 depicts the location of the various combinations at the test site. The Graco system uses a gravity feed system for bead application. Occasionally, the beads were not applied consistently by the machine. Other times the wind greatly affected how the beads were dispersed. The wind, blowing from the north, had a tendency to carry the beads in a southerly direction to the point where, from time to time, few if any beads landed on the line (Figure 13-c). In those instances, the beads were broadcast by hand over the line, or the lack of beads was noted. Pavement temperatures, application times and comments on each particular product combination are noted on the spreadsheet accompanying this narrative. Twenty test plates, measuring approximately 10” x 6”, comprised of pieces of HMA wearing course pavement were placed at the beginning of each line in the first two groups. Ten of these plates were prepared from pavement that had been in service for approximately one month. The other ten plates were from aged pavement that is several years old. The purpose of these plates is to see what effect exposure to only the weather will have on the different combinations. It is intended that the test plates be placed on a roof top for an extended time (a year+), and be monitored to track performance. The test plates can be seen in Figure 13-a and b. The paint was switched from Sherwin Williams TM226 SETFAST White Waterborne Traffic Marking Paint (the Department’s standard waterborne binder) to Rohm & Haas Formulated HD21A Traffic Paint after the five bead types had been applied using the standard paint. There was minor difficulty with the paint switch over. The Rohm & Haas Formulated HD21A Traffic Paint appeared to be more viscous than the standard paint, so the nozzle used for the standard paint would not work for the Rohm & Haas paint. Several nozzles were tried and following adjustments, the application resumed. Retroreflectivity measurements were taken on the lines after the markings had dried. A single set of values was taken from the

18
middle of each line after they were dry and swept off using a push broom. The values have been tabulated and averaged on the accompanying spreadsheet. In addition to the retroreflectivity readings, “No-Pick-Up times” were established on site for each type of paint. The method used was a highly modified version of ASTM D711 – “Standard Test Method for No-Pick-Up Time of Traffic Paint”. The test was conducted using a dual model traffic drying time wheel and ramp as specified in D711 (Figure 13-d). Two No-Pick-Up times were established for each type of paint. Paints were applied over existing lines and to an aluminum sheet (back of an old sign). The wheel was allowed to roll down the ramp and across the line every 30 seconds until no paint was picked up by the wheel. In the standard test, a known mil thickness is applied to a glass plate at a temperature of 73.5+/- 3.5ºF and a relative humidity of 50 +/- 5%. Obviously, the environmental parameters could not be controlled in the field, and the mil thickness was not checked. However, the principal investigator felt the field test would give a good preliminary comparison between the two paints. A more controlled laboratory comparison is planned. Table 9 shows the results of the field tests.
Figure 13: Application images in Hookset
Figure13-c: Wind blew most of these beads South
Figure13-d: ASTM D711No-pick-Up wheel and ramp
Figure13-a: Graco Line Laser Figure13-b: North view of site
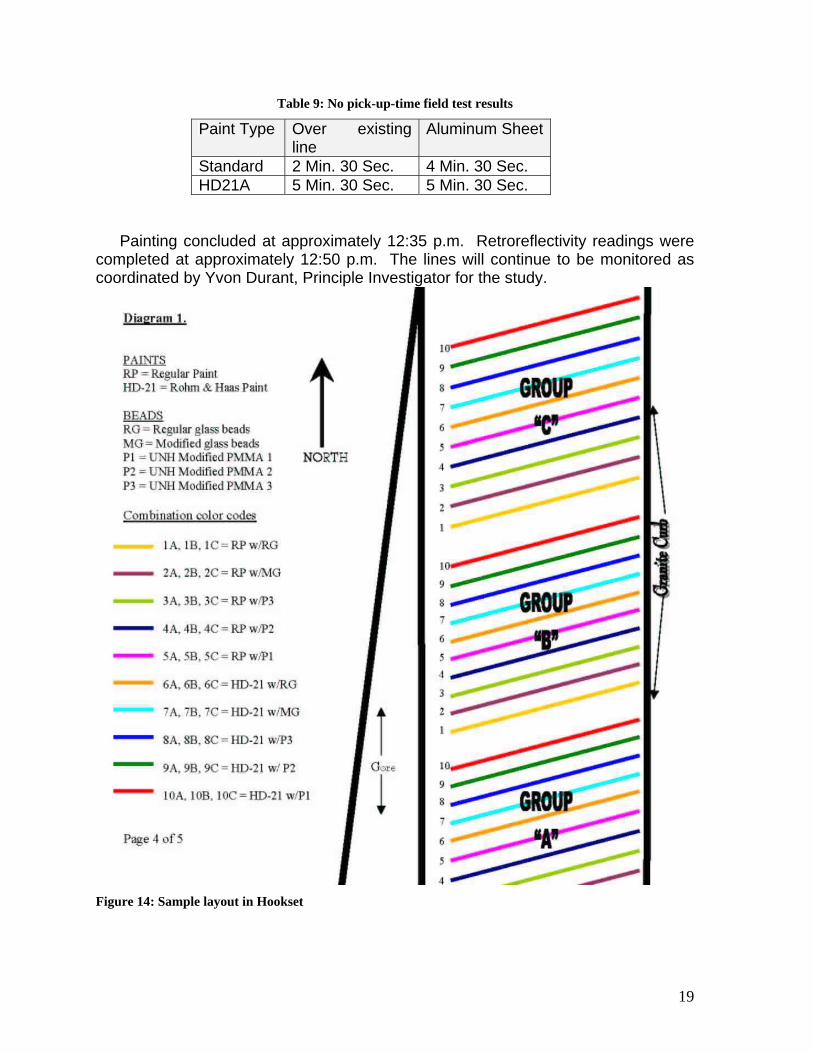
19
Table 9: No pick-up-time field test results
Paint Type Over existing line
Aluminum Sheet
Standard 2 Min. 30 Sec. 4 Min. 30 Sec. HD21A 5 Min. 30 Sec. 5 Min. 30 Sec.
Painting concluded at approximately 12:35 p.m. Retroreflectivity readings were completed at approximately 12:50 p.m. The lines will continue to be monitored as coordinated by Yvon Durant, Principle Investigator for the study.
Figure 14: Sample layout in Hookset

20
From the plates collected in Hookset, we where able to calculate both the thickness of the paint for each sample and the approximate bead density. These numbers are reported in Table 10. Both paints were applied with an average (dry) thickness of 23 mil (576 microns). Bead coverage was more variable and the measurements are most likely non representative of the full samples, because of the collection location.
Table 10: Bead density and paint thickness
Sample bead coverage % Paint thickness (mil)
RW-RG 17% 23
RW-MG 38% 22
RW-DOT 058 50% 22
RW-DOT 059 12% 9
RW-DOT 045 64% 26
HD-RG 52% 22
HD-MG 36% 23
HD- DOT 058 64% 14
HD-DOT 059 61% 25
HD-DOT 045 22% 23
5.4. Weather-Only monitoring from sample Application in Hookset
We took advantage of the paint application at the Hookset test site to also spray the same set of paint-bead combinations on three sets of plates in order to isolate the effects of weather from the effects of road wear. See Section 5.3. All the test plates collected in Hookset have been mounted on a wood frame, shown below (Figure 15). The set of samples was installed December 2nd, exposed to the south at a 45degree angle on the roof of Morse Hall at the University of New Hampshire. These samples will get a maximum exposure to cycles of cold/hot, humid/dry and UV. This control sample may or may not prove significant for this PMMA bead project, but having such a control seemed important to ensure validity of other work. However, we also will monitor the color of the coatings as function of time. Though not really part of the scope of this study, we are curious to see whether there will be a significant level of “graying” coming from the substrate, with a maximum effect on new asphalt substrate and minimum effect on neutral glass/epoxy plates. Color monitoring will be done by digital image analysis using a white reference. This may be significant in suggesting other avenues of inquiry.

21
Figure 15: Sample layout on the roof of Morse Hall in Durham, NH
6. Performance monitoring Following the field applications we rapidly appreciated that the initial retroreflectivity of the samples varied significantly, despite the use of the same application crew and only one coating applicator (Graco Line Laser). In order to minimize the impact of this anomaly, we decided to use multiple measurements of each sample. One can see from the raw data (appendix 7.1 and 7.2) that each sample is measured in 4 separate locations, for each of the three repeated applications. Overall, the retroreflectivity of each sample is read in 12 different locations. Consequently we calculate the % decrease in retro reflectivity (relative retroreflectivity) for each 12 locations, then average them, and report and standard deviation. These results are reported in the following 6 figures. Based on information available in the literature and from NHDOT, the reference for retroreflectivity is the second set of measurements taken after application (2 or 3 weeks after application). The convention of using the second set of measurements allows excess or loosely adhered beads to be dispersed by traffic, thus providing measurements that are relatively comparable from site to site.. Indeed, the distortions caused by excess beads can be quite erratic, including an actual reduction in retroreflectivity when the excess is significant. . Hence, on the following figures the first set of readings represent relative numbers on the day of application, and vary substantially from the level of retroreflectivity found two or three weeks later. All measurements are done with the LTL 2000 on loan from the NHDOT. We do frequent field calibration as the temperature of the instrument decreases in order to
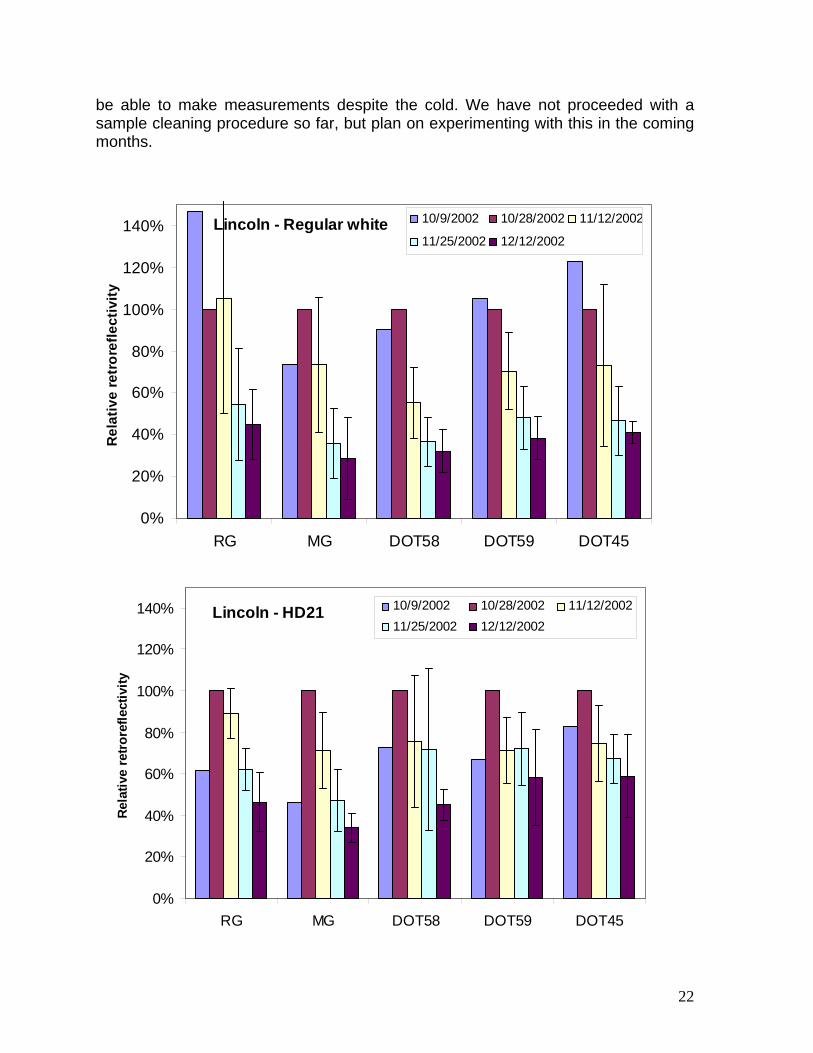
22
be able to make measurements despite the cold. We have not proceeded with a sample cleaning procedure so far, but plan on experimenting with this in the coming months.
Lincoln - Regular white
0%
20%
40%
60%
80%
100%
120%
140%
RG MG DOT58 DOT59 DOT45
Rel
ativ
e re
tror
efle
ctiv
ity
10/9/2002 10/28/2002 11/12/2002
11/25/2002 12/12/2002
Lincoln - HD21
0%
20%
40%
60%
80%
100%
120%
140%
RG MG DOT58 DOT59 DOT45
Rel
ativ
e re
trore
flect
ivity
10/9/2002 10/28/2002 11/12/200211/25/2002 12/12/2002

23
Hookset - Regular white
0%
20%
40%
60%
80%
100%
120%
140%
RG MG DOT58 DOT59 DOT45
Rel
ativ
e re
tror
efle
ctiv
ity
10/29/2002 11/14/200211/25/2002 12/12/2002
Hookset - HD21
0%
20%
40%
60%
80%
100%
120%
140%
RG MG DOT58 DOT59 DOT45
Rel
ativ
e re
trore
flect
ivity
10/29/2002 11/14/200211/25/2002 12/12/2002
The results are reported for both paints separately for convenient comparison. Though this is still very early in the wear cycle of these coatings, we can already report a few preliminary findings.

24
• Relative retroreflectivity improvements in Hookset are on the order of 20%
over standard regular glass beads on regular waterborne paint • Relative retroreflectivity improvements in Lincoln are on the order of 15% • UNH-HD21A paint is clearly outperforming regular paint • In Lincoln and Hoosket DOT59 on HD21 is the combination which is retaining
the highest level of relative retroreflectivity to date • Hookset is offering higher wear conditions than Lincoln
We are strongly encouraged by the early results of this project, and are looking forward to the challenges of monitoring the test areas through the winter. We caution that these are initial results from a limited time period, and should not be taken as anything more than that. We all need to be patient in seeing what emerges as the months pass. While it is much too early to identify specific solutions, the results to date do suggest that significant improvements may be possible. 7. Appendix 7.1 Lincoln raw data Reference Sample Location 10/9/2002 10/28/2002 11/12/2002 11/25/2002 12/12/2002
1 RW-RG A1 203 213 58 55 56 - A2 159 58 58 - A3 157 65 67 - A4 157 67 46 - B1 211 198 158 82 66 - B2 115 67 79 - B3 200 123 134 - B4 173 109 101 - C1 205 86 146 71 58 - C2 164 84 53 - C3 174 79 51 - C4 105 64 44
2 RW-MG A1 259 318 151 99 55 - A2 177 83 58 - A3 168 71 67 - A4 209 85 46 - B1 101 227 247 173 78 - B2 51 45 56 - B3 116 62 56 - B4 103 62 201 - C1 216 229 221 112 58 - C2 260 129 53 - C3 262 83 59 - C4 244 73 61
3 RW-DOT A1 157 150 52 43 31

25
058
- A2 69 51 33 - A3 98 59 42 - A4 104 69 48 - B1 129 164 95 83 76 - B2 104 94 83 - B3 118 70 73 - B4 137 66 62 - C1 161 183 85 38 43 - C2 56 32 46 - C3 62 54 47 - C4 110 59 53
4 RW-
DOT059 A1 162
158 133 97 50 - A2 126 94 46 - A3 151 110 48 - A4 140 74 50 - B1 134 102 79 60 48 - B2 88 54 55 - B3 71 59 53 - B4 72 55 55 - C1 162 200 74 59 60 - C2 97 60 61 - C3 109 53 73 - C4 106 61 67
5 RW-
DOT045 A1 137
80 68 38 39 - A2 81 48 36 - A3 118 65 30 - A4 115 56 34 - B1 134 119 63 61 53 - B2 54 53 51 - B3 75 46 53 - B4 82 47 45 - C1 112 132 62 43 58 - C2 50 40 39 - C3 56 42 47 - C4 57 43 52
6 HD-RG A1 163 262 218 141 141 - A2 189 159 87 - A3 240 151 94 - A4 223 156 117 - B1 131 196 156 107 164 - B2 229 153 80 - B3 197 138 76 - B4 179 152 117 - C1 137 247 228 160 115

26
- C2 186 129 102 - C3 225 112 105 - C4 218 167 85
7 HD-MG A1 168 352 278 211 124 - A2 248 193 80 - A3 259 174 122 - A4 245 220 148 - B1 118 336 113 111 114 - B2 280 88 119 - B3 227 98 103 - B4 127 77 164 - C1 176 316 299 172 99 - C2 278 193 98 - C3 235 188 118 - C4 251 159 78
8 HD-DOT
058 A1 107
164 58 72 85 - A2 74 51 74 - A3 62 43 80 - A4 102 46 74 - B1 94 204 153 102 92 - B2 128 130 71 - B3 135 147 97 - B4 126 127 70 - C1 107 101 123 111 43 - C2 118 116 43 - C3 115 132 41 - C4 111 127 62
9 HD-
DOT059 A1 136
205 145 74 98 - A2 158 132 91 - A3 157 175 103 - A4 138 141 104 - B1 125 172 96 171 151 - B2 151 156 159 - B3 159 131 132 - B4 173 155 154 - C1 155 255 144 169 134 - C2 150 170 130 - C3 155 155 101 - C4 127 150 45
10 HD-
DOT045 A1 137
119 90 94 80 - A2 116 95 114 - A3 112 69 69 - A4 96 86 56 - B1 116 187 161 116 112 - B2 158 149 164

27
- B3 154 134 144 - B4 155 143 102 - C1 111 158 59 93 78 - C2 91 114 59 - C3 80 76 53 - C4 103 76 60
7.2 Hookset raw data
Reference Sample Location 10/29/2002
11/14/02 11/25/2002 12/12/2002 1 RW-RG A1 177 219 148 98
- A2 261 149 118 - A3 275 131 153 - A4 244 156 159 - B1 146 304 140 100 - B2 287 160 190 - B3 286 163 55 - B4 289 65 155 - C1 124 163 92 88 - C2 198 108 81 - C3 241 160 142 - C4 208 96 67
2 RW-MG A1 146 273 127 263 - A2 346 83 242 - A3 357 246 91 - A4 380 183 189 - B1 168 346 53 241 - B2 350 258 279 - B3 351 238 284 - B4 360 195 80 - C1 268 359 206 253 - C2 366 268 197 - C3 388 139 92 - C4 341 134 185
3 RW-DOT
058 A1 129 103 56 76 - A2 102 66 53 - A3 101 68 54 - A4 118 59 58 - B1 120 97 49 52 - B2 121 56 56 - B3 107 62 77 - B4 99 57 58 - C1 146 153 76 106 - C2 151 66 58 - C3 140 86 88 - C4 144 77 92
4 RW-
DOT059 A1 267 89 82 61

28
- A2 128 54 80 - A3 129 83 52 - A4 131 64 88 - B1 159 133 42 64 - B2 140 68 98 - B3 140 77 45 - B4 149 62 86 - C1 172 156 73 87 - C2 156 86 88 - C3 161 58 95 - C4 151 76 123
5 RW-
DOT045 A1 148 92 56 668 - A2 121 73 62 - A3 134 49 78 - A4 126 71 72 - B1 137 121 65 71 - B2 115 54 76 - B3 134 79 72 - B4 100 54 76 - C1 130 134 75 115 - C2 124 67 64 - C3 140 61 52 - C4 144 67 79
6 HD-RG A1 133 262 164 139 - A2 251 94 153 - A3 242 166 153 - A4 250 112 102 - B1 137 184 80 87 - B2 187 81 77 - B3 210 77 78 - B4 123 63 67 - C1 139 276 160 149 - C2 282 189 161 - C3 295 169 151 - C4 287 120 146
7 HD-MG A1 133 210 104 108 - A2 109 133 70 - A3 140 105 47 - A4 272 87 89 - B1 78 70 122 99 - B2 51 76 57 - B3 88 73 49 - B4 154 66 30 - C1 47 147 109 55 - C2 193 31 37 - C3 188 31 32 - C4 41 31 23
8 HD-DOT
058 A1 87 79 62 41 - A2 104 40 60
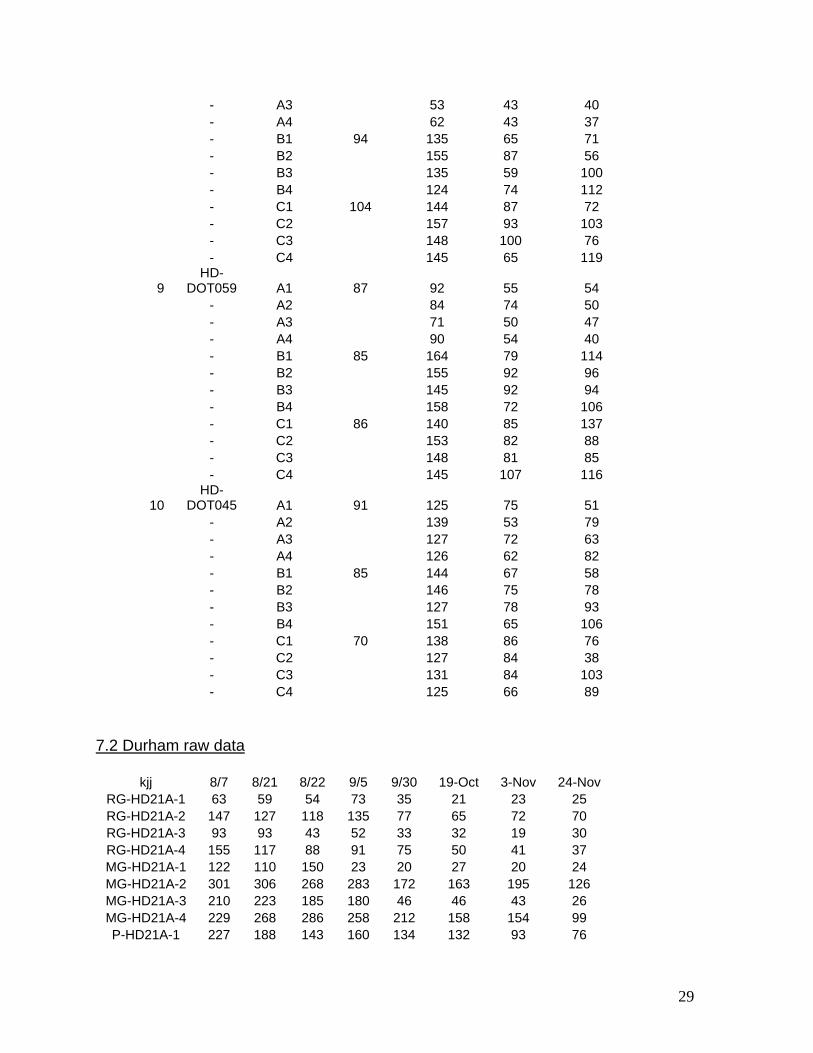
29
- A3 53 43 40 - A4 62 43 37 - B1 94 135 65 71 - B2 155 87 56 - B3 135 59 100 - B4 124 74 112 - C1 104 144 87 72 - C2 157 93 103 - C3 148 100 76 - C4 145 65 119
9 HD-
DOT059 A1 87 92 55 54 - A2 84 74 50 - A3 71 50 47 - A4 90 54 40 - B1 85 164 79 114 - B2 155 92 96 - B3 145 92 94 - B4 158 72 106 - C1 86 140 85 137 - C2 153 82 88 - C3 148 81 85 - C4 145 107 116
10 HD-
DOT045 A1 91 125 75 51 - A2 139 53 79 - A3 127 72 63 - A4 126 62 82 - B1 85 144 67 58 - B2 146 75 78 - B3 127 78 93 - B4 151 65 106 - C1 70 138 86 76 - C2 127 84 38 - C3 131 84 103 - C4 125 66 89
7.2 Durham raw data
kjj 8/7 8/21 8/22 9/5 9/30 19-Oct 3-Nov 24-Nov RG-HD21A-1 63 59 54 73 35 21 23 25 RG-HD21A-2 147 127 118 135 77 65 72 70 RG-HD21A-3 93 93 43 52 33 32 19 30 RG-HD21A-4 155 117 88 91 75 50 41 37 MG-HD21A-1 122 110 150 23 20 27 20 24 MG-HD21A-2 301 306 268 283 172 163 195 126 MG-HD21A-3 210 223 185 180 46 46 43 26 MG-HD21A-4 229 268 286 258 212 158 154 99 P-HD21A-1 227 188 143 160 134 132 93 76

30
P-HD21A-2 206 161 127 153 121 103 115 71 P-HD21A-3 194 179 152 202 120 117 94 88 P-HD21A-4 214 144 75 128 112 111 97 68
MP-HD21A-1 133 103 71 111 82 80 92 54 MP-HD21A-2 110 86 65 97 88 74 78 56 MP-HD21A-3 125 119 103 122 55 60 62 57 MP-HD21A-4 129 128 114 122 81 73 65 49 NB-HD21A-1 26 16 20 23 24 27 19 20 NB-HD21A-2 19 16 19 20 22 23 23 23
RG-WHT-1 279 259 256 250 213 195 190 115 RG-WHT-2 182 250 207 195 141 189 170 119 RG-WHT-3 242 248 212 241 220 191 181 124 RG-WHT-4 255 255 250 222 222 193 199 164 MG-WHT-1 353 353 358 320 287 246 256 200 MG-WHT-2 323 310 315 272 239 220 198 126 MG-WHT-3 78 166 177 181 149 149 123 124 MG-WHT-4 311 161 225 228 192 166 175 156 P-WHT-1 194 169 170 177 123 96 116 78 P-WHT-2 226 184 179 162 127 95 119 86 P-WHT-3 170 161 187 155 130 90 85 92 P-WHT-4 216 187 169 166 141 122 103 85
MP-WHT-1 237 140 154 152 150 109 87 74 MP-WHT-2 112 161 156 157 155 125 65 56 MP-WHT-3 166 149 138 130 122 133 87 67 MP-WHT-4 113 83 79 97 88 83 64 53 NB-WHT-1 26 24 19 23 20 20 18 22 NB-WHT-2 23 19 29 24 26 24 21 24
7.3 Relative retroreflectivity in Durham We are reporting here the results in Durham. These relative retroreflectivity readings are more difficult to interpret, because of the unsuitable design of the sample locations. For example, sample MG on regular paint is partially out of the main traffic. UNH-HD21 is exposed to a higher traffic than the regular paint. When all these “flaws” are accounted for, interpretation is still possible, but always open for controversy. Consequently, we will keep using the Durham site as our “learning” site, but will not report critical conclusions for these readings.

31
Durham - Regular Paint
0%
20%
40%
60%
80%
100%
120%
140%
RG MG PMMA DOT039 No Beads
Rel
ativ
e R
etro
refle
ctiv
ity7-Aug 22-Aug 5-Sep 30-Sep19-Oct 3-Nov 24-Nov
Durham - HD21
0%
20%
40%
60%
80%
100%
120%
140%
RG MG PMMA DOT039 No Beads
Rel
ativ
e R
etro
refle
ctiv
ity
7-Aug 22-Aug 5-Sep 30-Sep19-Oct 3-Nov 24-Nov

1
Report prepared for State of New Hampshire, Department of Transportation Bureau of Materials and Research P.O. Box 483, Stickney Ave. Concord, NH 03302-0483 Under Contract # TPF-5(024) statewide 13739 Award date: 12/19/01 Fifth quarterly progress report May 5th, 2003 Prepared by Dr. Yvon G. Durant Advanced Polymer Laboratory University of New Hampshire Parsons Hall G101, Durham NH 03824 Tel : 603 862 1703, Fax : 603 862 4892 Email : [email protected]

2
1. Introduction ......................................................................................................................... 2 2. General comments on the project ................................................................................... 2 3. Retroreflectivity monitoring............................................................................................... 3 4. Conclusion .......................................................................................................................... 6 5. Appendix ............................................................................................................................. 6
5.1 Lincoln raw data7.2 Hookset raw data ..................................................................... 6 5.3 Relative retroreflectivity in Durham......................................................................... 10
1. Introduction This project deals with a specific aspect of traffic paint, the improvement of retro-reflective bead retention. More specifically we are studying the potential of PMMA beads to act as a substitute for glass beads when their surface chemistry is modified to react (crosslink) with the binder chemistry. This project thus is a building block toward an ultimate goal of developing traffic paints with longer durability and sustained retroreflectivity. Performance at the time of application, whether initially high or low, is of little concern and interest unless it is sustained Retroreflectivity higher than 150 mCd/M2/Lx over a full season is generally considered to be the desired standard. The current project involves two major phases: a laboratory development phase, where modified beads were produced, and a field test phase including limited comparison with conventional products. Currently this project is in its last stage. Development of modified retroreflective beads involves several distinct steps: 1) The proper selection of a binder system with propensity to crosslink with the PMMA beads. 2) The chemical modification of commercially available PMMA beads to optimize them for this application. 3) The testing of the application properties of the beads when combined with the binder. Step one and two have been completed, step three is at 90% completion. 2. General comments on the project Winter has come and is now gone… this winter has been extremely harsh on our test sites. We have found dramatically accelerated wear at all tests sites. During the period of December 12th 2002 and March 20th 2003 we were not able to access our paints. In hookset 1/3 of the test site was under permanent snow cover, and in Lincoln, hardly more than a few days have past without some snow precipitation. We had anticipated to access both site by cleaning the paint strips, but such cleaning procedure, though effective was painstakingly slow. Finally when we accessed the two main test sites, we found dramatic losses of beads and paints. In Lincoln, the NH-DOT recorded 143 snow-plow passes, between late October and mid March !

3
No beads were found, except in areas offering sub-pavement protection (cracks and depressions). Final measurements were done in Lincoln and are reported here. In Hookset, no measurements were deemed of value, as 2/3 of the reading involved measuring the retroreflectivity of bare asphalt. In Durham, a final reading was done, and beads are still to be found on campus. 3. Retroreflectivity monitoring 3.1. Monitoring at UNH
The following two images offer a contrast between the aspect of the coatings after application in August 2002 and on May 8th, 2003.
Traffic paint at the Durham test site. Left on August 2002. Right on May 8th, 2003. We are not using data from this location for evaluation purposes, though this data is provided in appendix. 3.2. Monitoring in Lincoln
Traffic paint at the Lincoln test site. Left on October 9th 2002. Right on March 20th, 2003.

4
The following two graphs provide the relative retroreflectivity of all samples. While these numbers are extremely low, modified PMMA beads DOT45 have weathered marginally better.
Lincoln - Regular white
0%
20%
40%
60%
80%
100%
120%
140%
RG MG DOT58 DOT59 DOT45
Rel
ativ
e re
tror
efle
ctiv
ity
10/9/2002 10/28/2002 11/12/2002
11/25/2002 12/12/2002 3/20/2003
Lincoln - HD21
0%
20%
40%
60%
80%
100%
120%
140%
RG MG DOT58 DOT59 DOT45
Rel
ativ
e re
trore
flect
ivity
10/9/2002 10/28/2002 11/12/200211/25/2002 12/12/2002 3/20/2003

5
It is valuable to note that center lane traffic coatings have not weathered as much as outer lines due to rolling traffic. 3.3. Monitoring in Hookset
Traffic paint at the Hookset test site. Left on October 29th 2002. Right on March 16th, 2003. Due to the extreme wear encountered in Hookset, no measurement were deemed of value. 3.4. Weather-Only monitoring from sample Application in Hookset
We are still monitoring the weather-only degradation of the traffic coatings samples collected in Hookset and exposed in Durham. Only very limited loss of performance is being seen, though grey levels are intensifying on “new aslphat” substrates.
Sample layout on the roof of Morse Hall in Durham, NH, November 2002

6
Sample layout on the roof of Morse Hall in Durham, NH, April 29th 2003
4. Conclusion Indeed the dramatic wear encountered over the winter is very disappointing. As a consequence we are not able to clearly differentiate the potential (or lack thereof) of modified PMMA beads. Very limited indications seem to suggest that they are a match to standard beads, which is certainly not enough to make them economically attractive. We would like to suggest applying a new batch of modified PMMA beads with a different protocol, and focus the retroreflective monitoring to the summer/fall period. 5. Appendix 5.1 Lincoln raw data7.2 Hookset raw data
Ref
eren
ce
Sam
ple
Loca
tion
10/9
/200
2
10/2
8/20
02
11/1
2/20
02
11/2
5/20
02
12/1
2/20
02
3/20
/200
3
1 RW-RG A1 203 213 58 55 56 27 - A2 203 213 159 58 58 30 - A3 203 213 157 65 67 26 - A4 203 213 157 67 46 26 - B1 211 198 158 82 66 84 - B2 211 198 115 67 79 44 - B3 211 198 200 123 134 84 - B4 211 198 173 109 101 45

7
- C1 205 86 146 71 58 27 - C2 205 86 164 84 53 25 - C3 205 86 174 79 51 26 - C4 205 86 105 64 44 25
2 RW-MG A1 259 318 151 99 55 26 - A2 259 318 177 83 58 27 - A3 259 318 168 71 67 27 - A4 259 318 209 85 46 27 - B1 101 227 247 173 78 43 - B2 101 227 51 45 56 42 - B3 101 227 116 62 56 43 - B4 101 227 103 62 201 70 - C1 216 229 221 112 58 22 - C2 216 229 260 129 53 27 - C3 216 229 262 83 59 25 - C4 216 229 244 73 61 30
3 RW-DOT 058 A1 157 150 52 43 31 27 - A2 157 150 69 51 33 29 - A3 157 150 98 59 42 27 - A4 157 150 104 69 48 26 - B1 129 164 95 83 76 43 - B2 129 164 104 94 83 45 - B3 129 164 118 70 73 45 - B4 129 164 137 66 62 37 - C1 161 183 85 38 43 28 - C2 161 183 56 32 46 29 - C3 161 183 62 54 47 25 - C4 161 183 110 59 53 24
4 RW-DOT059 A1 162 158 133 97 50 24 - A2 162 158 126 94 46 26 - A3 162 158 151 110 48 27 - A4 162 158 140 74 50 26 - B1 134 102 79 60 48 31 - B2 134 102 88 54 55 36 - B3 134 102 71 59 53 41 - B4 134 102 72 55 55 34 - C1 162 200 74 59 60 28 - C2 162 200 97 60 61 28 - C3 162 200 109 53 73 25 - C4 162 200 106 61 67 25
5 RW-DOT045 A1 137 80 68 38 39 25

8
- A2 137 80 81 48 36 26 - A3 137 80 118 65 30 26 - A4 137 80 115 56 34 23 - B1 134 119 63 61 53 36 - B2 134 119 54 53 51 37 - B3 134 119 75 46 53 29 - B4 134 119 82 47 45 32 - C1 112 132 62 43 58 27 - C2 112 132 50 40 39 27 - C3 112 132 56 42 47 23 - C4 112 132 57 43 52 26
6 HD-RG A1 163 262 218 141 141 26 - A2 163 262 189 159 87 25 - A3 163 262 240 151 94 25 - A4 163 262 223 156 117 26 - B1 131 196 156 107 164 41 - B2 131 196 229 153 80 39 - B3 131 196 197 138 76 40 - B4 131 196 179 152 117 48 - C1 137 247 228 160 115 28 - C2 137 247 186 129 102 41 - C3 137 247 225 112 105 32 - C4 137 247 218 167 85 30
7 HD-MG A1 168 352 278 211 124 25 - A2 168 352 248 193 80 28 - A3 168 352 259 174 122 27 - A4 168 352 245 220 148 26 - B1 118 336 113 111 114 26 - B2 118 336 280 88 119 60 - B3 118 336 227 98 103 54 - B4 118 336 127 77 164 47 - C1 176 316 299 172 99 32 - C2 176 316 278 193 98 33 - C3 176 316 235 188 118 33 - C4 176 316 251 159 78 32
8 HD-DOT 058 A1 107 164 58 72 85 28 - A2 107 164 74 51 74 26 - A3 107 164 62 43 80 28 - A4 107 164 102 46 74 28 - B1 94 204 153 102 92 36 - B2 94 204 128 130 71 33
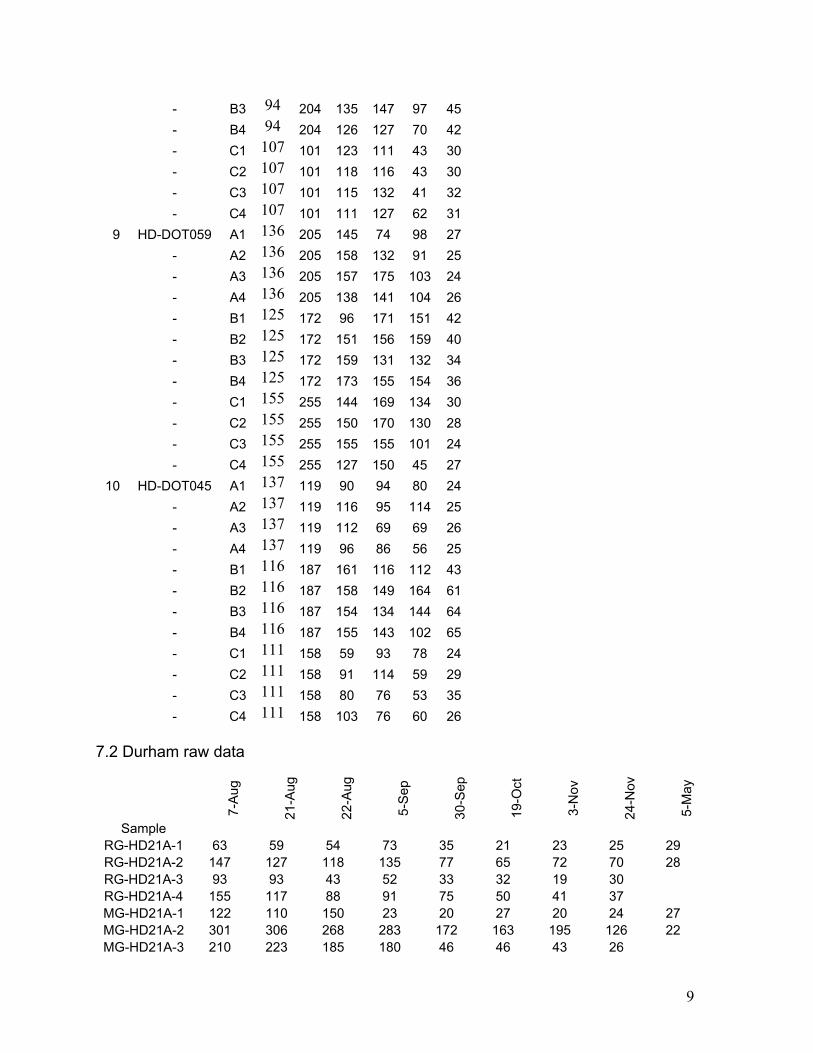
9
- B3 94 204 135 147 97 45 - B4 94 204 126 127 70 42 - C1 107 101 123 111 43 30 - C2 107 101 118 116 43 30 - C3 107 101 115 132 41 32 - C4 107 101 111 127 62 31
9 HD-DOT059 A1 136 205 145 74 98 27 - A2 136 205 158 132 91 25 - A3 136 205 157 175 103 24 - A4 136 205 138 141 104 26 - B1 125 172 96 171 151 42 - B2 125 172 151 156 159 40 - B3 125 172 159 131 132 34 - B4 125 172 173 155 154 36 - C1 155 255 144 169 134 30 - C2 155 255 150 170 130 28 - C3 155 255 155 155 101 24 - C4 155 255 127 150 45 27 10 HD-DOT045 A1 137 119 90 94 80 24 - A2 137 119 116 95 114 25 - A3 137 119 112 69 69 26 - A4 137 119 96 86 56 25 - B1 116 187 161 116 112 43 - B2 116 187 158 149 164 61 - B3 116 187 154 134 144 64 - B4 116 187 155 143 102 65 - C1 111 158 59 93 78 24 - C2 111 158 91 114 59 29 - C3 111 158 80 76 53 35 - C4 111 158 103 76 60 26
7.2 Durham raw data
Sample
7-A
ug
21-A
ug
22-A
ug
5-S
ep
30-S
ep
19-O
ct
3-N
ov
24-N
ov
5-M
ay
RG-HD21A-1 63 59 54 73 35 21 23 25 29 RG-HD21A-2 147 127 118 135 77 65 72 70 28 RG-HD21A-3 93 93 43 52 33 32 19 30 RG-HD21A-4 155 117 88 91 75 50 41 37 MG-HD21A-1 122 110 150 23 20 27 20 24 27 MG-HD21A-2 301 306 268 283 172 163 195 126 22 MG-HD21A-3 210 223 185 180 46 46 43 26
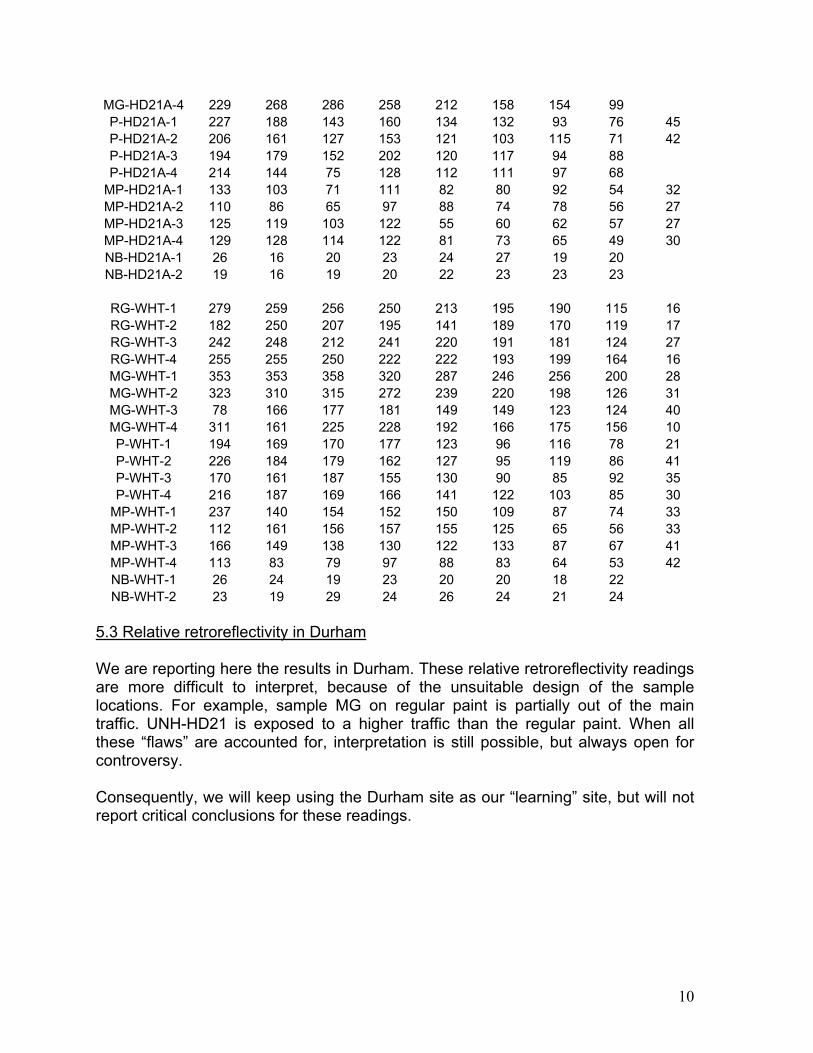
10
MG-HD21A-4 229 268 286 258 212 158 154 99 P-HD21A-1 227 188 143 160 134 132 93 76 45 P-HD21A-2 206 161 127 153 121 103 115 71 42 P-HD21A-3 194 179 152 202 120 117 94 88 P-HD21A-4 214 144 75 128 112 111 97 68
MP-HD21A-1 133 103 71 111 82 80 92 54 32 MP-HD21A-2 110 86 65 97 88 74 78 56 27 MP-HD21A-3 125 119 103 122 55 60 62 57 27 MP-HD21A-4 129 128 114 122 81 73 65 49 30 NB-HD21A-1 26 16 20 23 24 27 19 20 NB-HD21A-2 19 16 19 20 22 23 23 23
RG-WHT-1 279 259 256 250 213 195 190 115 16 RG-WHT-2 182 250 207 195 141 189 170 119 17 RG-WHT-3 242 248 212 241 220 191 181 124 27 RG-WHT-4 255 255 250 222 222 193 199 164 16 MG-WHT-1 353 353 358 320 287 246 256 200 28 MG-WHT-2 323 310 315 272 239 220 198 126 31 MG-WHT-3 78 166 177 181 149 149 123 124 40 MG-WHT-4 311 161 225 228 192 166 175 156 10 P-WHT-1 194 169 170 177 123 96 116 78 21 P-WHT-2 226 184 179 162 127 95 119 86 41 P-WHT-3 170 161 187 155 130 90 85 92 35 P-WHT-4 216 187 169 166 141 122 103 85 30
MP-WHT-1 237 140 154 152 150 109 87 74 33 MP-WHT-2 112 161 156 157 155 125 65 56 33 MP-WHT-3 166 149 138 130 122 133 87 67 41 MP-WHT-4 113 83 79 97 88 83 64 53 42 NB-WHT-1 26 24 19 23 20 20 18 22 NB-WHT-2 23 19 29 24 26 24 21 24
5.3 Relative retroreflectivity in Durham We are reporting here the results in Durham. These relative retroreflectivity readings are more difficult to interpret, because of the unsuitable design of the sample locations. For example, sample MG on regular paint is partially out of the main traffic. UNH-HD21 is exposed to a higher traffic than the regular paint. When all these “flaws” are accounted for, interpretation is still possible, but always open for controversy. Consequently, we will keep using the Durham site as our “learning” site, but will not report critical conclusions for these readings.

11
Durham - Regular Paint
0%
20%
40%
60%
80%
100%
120%
140%
RG MG PMMA DOT039 No Beads
Rel
ativ
e R
etro
refle
ctiv
ity7-Aug 22-Aug 5-Sep 30-Sep19-Oct 3-Nov 24-Nov 5-May
Durham - HD21
0%
20%
40%
60%
80%
100%
120%
140%
RG MG PMMA DOT039 No Beads
Rel
ativ
e R
etro
refle
ctiv
ity
7-Aug 22-Aug 5-Sep 30-Sep19-Oct 3-Nov 24-Nov 5-May