S. Bauerecker, S.M. Sarge and H.K. Cammenga · Van~t Hoff~s law is a considerably simplified...
13
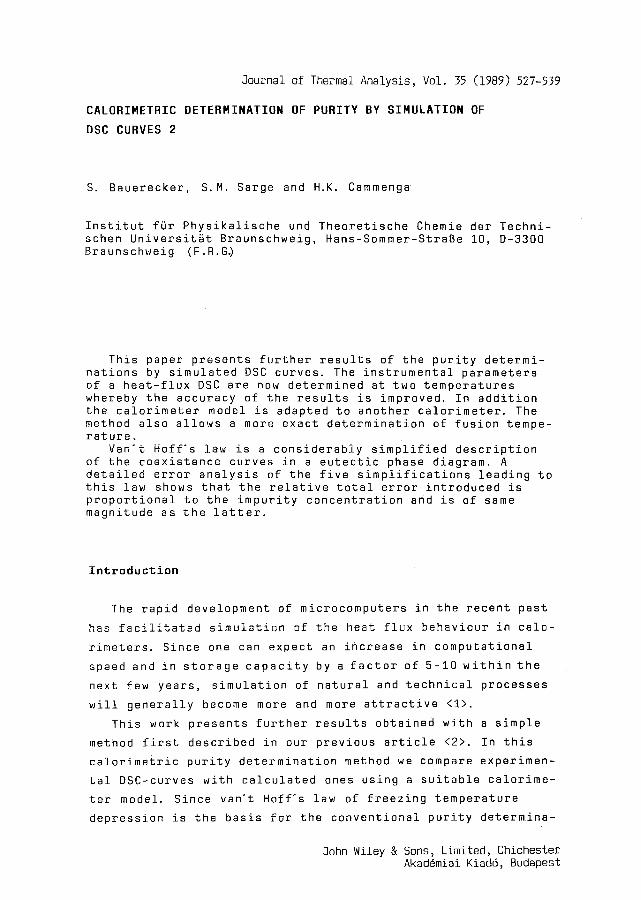
Oournal of Thermal Analysis, Vol. 35 (198~) 527-539 CALORIMETRIC DETERMINATION OF PURITY BY SIMULATION OF DSC CURVES 2 S. Bauerecker, S.M. Sarge and H.K. Cammenga Institut for Physikalische und Theoretische Chemie der Techni- schen Universit~t Braunschweig, Hans-Sommer-StraBe 10, D-3300 Braunschweig (F.R.G~ This paper presents further results of the purity determi- nations by simulated DSC curves. The instrumental parameters of a heat-flux DSC are now determined at two temperatures whereby the accuracy of the results is improved. In addition the calorimeter model is a.dapted to another calorimeter. The method also allows a more exact determination of fusion tempe- rature. Van~t Hoff~s law is a considerably simplified description of the coexistence curves in a eutectic phase diagram. A detailed error analysis of the five simplifications leading to this law shows that the relative total error introduced is proportional to the impurity concentration and is of same magnitude as the latter. Introduction The rapid development of microcomputers in the recent past has facilitated simulation of the heat flux behaviour in calo- rimeters. Since one can expect an increase in computational speed and in storage capacity by a factor of 5-10 within the next few years, simulation of natural and technical processes will generally become more and more attractive <1>. This work presents further results obtained with a simple method first described in our previous article <2>. In this calorimetric purity determination method we compare experimen- tal DSC-curves with calculated ones using a suitable calorime- ter model. Since van~t Hoff~s law of freezing temperature depression is the basis for the conventional purity determina- John Wiley & Sons, Limited, Chichester Akad@miai Kiad6, Budapest
Transcript of S. Bauerecker, S.M. Sarge and H.K. Cammenga · Van~t Hoff~s law is a considerably simplified...
Oournal of Thermal Analysis, Vol. 35 (198~) 527-539
CALORIMETRIC DETERMINATION OF PURITY BY SIMULATION OF
DSC CURVES 2
S. Bauerecker , S.M. Sarge and H.K. Cammenga
Institut for Physikalische und Theoretische Chemie der Techni- schen Universit~t Braunschweig, Hans-Sommer-StraBe 10, D-3300 Braunschweig (F.R.G~
This paper presents further results of the purity determi- nations by simulated DSC curves. The instrumental parameters of a heat-flux DSC are now determined at two temperatures whereby the accuracy of the results is improved. In addition the calorimeter model is a.dapted to another calorimeter. The method also allows a more exact determination of fusion tempe- rature.
Van~t Hoff~s law is a considerably simplified description of the coexistence curves in a eutectic phase diagram. A detailed error analysis of the five simplifications leading to this law shows that the relative total error introduced is proportional to the impurity concentration and is of same magnitude as the latter.
Introduction
The rapid development of microcomputers in the recent past
has facilitated simulation of the heat flux behaviour in calo-
rimeters. Since one can expect an increase in computational
speed and in storage capacity by a factor of 5-10 within the
next few years, simulation of natural and technical processes
will generally become more and more attractive <1>.
This work presents further results obtained with a simple
method first described in our previous article <2>. In this
calorimetric purity determination method we compare experimen-
tal DSC-curves with calculated ones using a suitable calorime-
ter model. Since van~t Hoff~s law of f r e e z i n g t e m p e r a t u r e
depress ion i s the bas is f o r the c o n v e n t i o n a l p u r i t y d e t e r m i n a -
John Wiley & Sons, Limited, Chichester Akad@miai Kiad6, Budapest
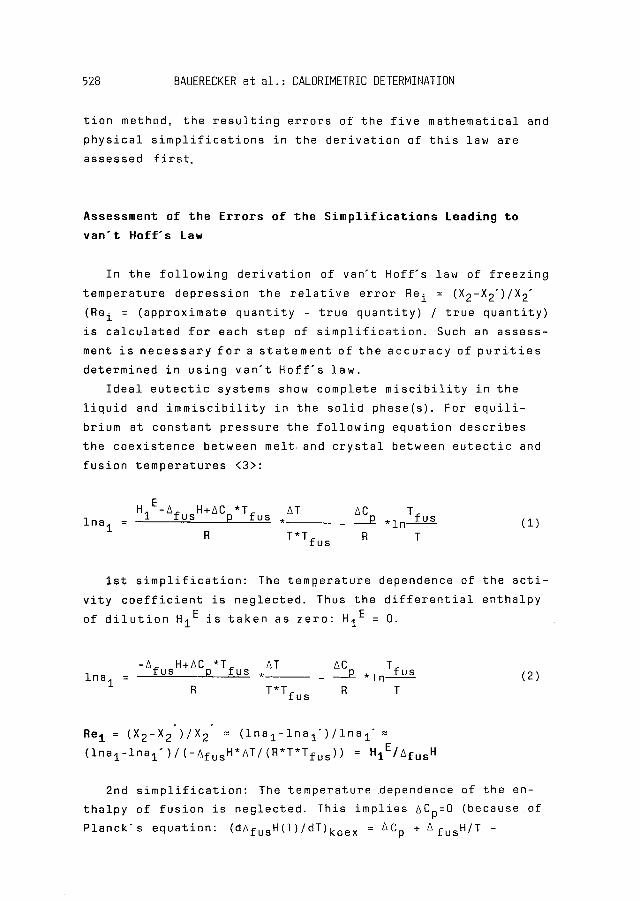
528 BAUERECKER et al.: CALORIMETRIC DETERMINATION
t i o n method, t he r e s u l t i n g e r r o r s of t he f i v e m a t h e m a t i c a l and
p h y s i c a l s i m p l i f i c a t i o n s i n t he d e r i v a t i o n o f t h i s law are
assessed first.
Assessment of the Errors of the Simplifications Leading to
van't Hoff's Law
In the f o l l o w i n g d e r i v a t i o n o f v a n ' t H o f f ' s law o f f r e e z i n g
t e m p e r a t u r e d e p r e s s i o n the r e l a t i v e e r r o r Re i = (X2-X2") /X 2"
(Re i = ( a p p r o x i m a t e q u a n t i t y - t r u e q u a n t i t y ) / t r u e q u a n t i t y )
i s c a l c u l a t e d f o r each s tep of s i m p l i f i c a t i o n . Such an assess -
ment i s n e c e s s a r y f o r a s t a t e m e n t o f t h e a c c u r a c y o f p u r i t i e s
d e t e r m i n e d i n u s i n g v a n ' t H o f f ' s l a w .
I d e a l e u t e c t i c sys tems show comp le te m i s c i b i l i t y i n the
l i q u i d and i m m i s c i b i l i t y i n t he s o l i d phase(s ) . For e q u i l i -
b r i um at c o n s t a n t p r e s s u r e the f o l l o w i n g e q u a t i o n d e s c r i b e s
the c o e x i s t e n c e between me l t , and c r y s t a l between e u t e c t i c and
fusion temperatures <3>:
HIE-AfusH+AC *T AT AC T l n a l = p fus . P * i n fu_~s (1
R T*T fu s R T
1st simplification: The temperature dependence of the acti-
vity coefficient is neglected. Thus the differential enthalpy
of dilution HIE is taken as zero: HIE= O.
l n a l = -A fusH+ACp*Tfus .AT ACp .lnTfus__ (2)
R T * T R T f ua
Re 1 = (X2-X 2 ) / X 2 = ( l n a l - l n a l " ) / l n a l " =
( l n a l - l n a l " ) / ( - A f u e H * A T / ( R * T * T f u s ) ) = H I E / A f u s H
2nd simplification: The temperature dependence of the en-
thalpy of fusion is neglected. This implies ACp=O (because of
Planck's equation: (dAfusH(T)/dT)koex = ACp + A fusH/T -

BAUERECKER et a l . : CALORIMETRIC DETERMINATION 529
A l u s H * ( 5 In V / S T ) p ) .
f l fusH*AT l na I = - (3)
R*T*Tfu s
Re 2 = ( X 2 - X 2 " ) / X 2" = ( l n a l - l n a l " ) / l n a 1" = ACp*AT / (2 *A fusH) =
A C p * R * T f u s 2 / ( 2 * A f u s H 2 ) * X 2
3rd s i m p l i f i c a t i o n : I n s t e a d o f a c t i v i t i e s c o n c e n t r a t i o n s
are used : a l = X l * f l = X1; ( f l := 1) .
AfusH*AT l n ( 1 - X 2 ) = (4)
R*T*Tfu s
Re 3 = ( X 2 - X 2 " ) / X 2" = [ - l n ( 1 - X 2) + l n ( 1 - X 2 " )] /X 2" =
- l n f l / X 2" = - l n f l / X 2 = -C*X 2
4 th s i m p l i f i c a t i o n : The l o g a r i t h m i s a p p r o x i m a t e d :
l n ( 1 - X 2) = -X 2.
AfusH*AT X 2 - (5)
R*T*Tfu s
Re 4 = ( X 2 - X 2 " ) / X 2 " = (X2 -X2+1 /2 *X22 ) /X 2" = 1 / 2 " X 2
5 th s i m p l i f i c a t i o n : The f r e e z i n g t e m p e r a t u r e of t he pure
subs tance Tfu s i s s u b s t i t u t e d f o r t he l o w e r e d f r e e z i n g tempe-
r a t u r e T: T*T fu s = T fus 2.
AfusH*f lT X 2 - ( v a n ' t H o f f ' s law) (6 l
R*T 2 fus
Re 5 = ( X 2 - X 2 " ) / X 2 " = - A T / T f u s = , R * T f u s / A f u s H * X 2
530 8AUERECKER et al.: CALORIMETRIC DETERMINATION
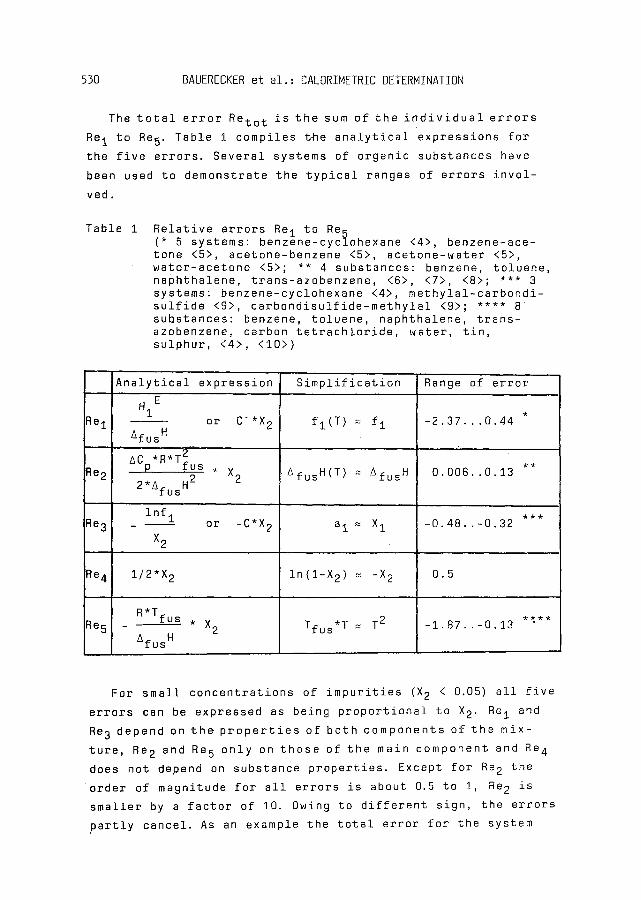
The total error Reto t is the sum of the individual errors
Re I to Re 5. Table 1 compiles the analytical expressions for
the five errors. Several systems of organic substances have
been used to demonstrate the typical ranges of errors invol-
ved.
T a b l e 1 Relative errors Re I to Re 5 (* 5 systems: benzene-cyclohexane <4>, benzene-ace- tone <5>, acetone-benzene <5>, acetone-water <5>, water-acetone <5>; ** 4 substances: benzene, toluene, naphthalene, trans-azobenzene, <6>, <7>, <8>; *** 3 systems: benzene-cyclohexane <4>, methylal-carbondi- sulfide <9>, carbondisulfide-methylal <9>; **** 8 substances: benzene, toluene, naphthalene, trans- azobenzene, carbon tetrachloride, water, tin, sulphur, <4>, <10>)
Re I
Re 2
Re 3
Re 4
Re 5
A n a l y t i c a l e x p r e s s i o n S i m p l i f i c a t i o n Range o f e r r o r
E H 1
or C ' *X 2 &fus H
ACp*R*T~u s * X 2
2 * ~ f u s H2
f l (T) = f l
R*Tfus , X 2
Afus H
~ f u s H ( T ) ~ AfusH
- 2 . 3 7 . . . 0 . 4 4
0 , 0 0 6 . . 0 . 1 3
l n f I * * * _ or -C*X 2 a I ~ X 1 - 0 . 4 8 . . - 0 . 3 2
X 2
1 /2 "X 2 l n ( 1 - X 2 ) ~ -X 2 0 .5
- 1 , 8 7 . . - 0 . 1 3 �9 T f u s * T ~ T 2
For s m a l l c o n c e n t r a t i o n s o f i m p u r i t i e s (X 2 < 0,05) a l l f i v e
e r r o r s can be e x p r e s s e d as be ing p r o p o r t i o n a l t o X 2. Re I and
Re 3 depend on t h e p r o p e r t i e s o f b o t h c o m p o n e n t s o f t h e m i x -
t u r e , Re 2 and Re 5 o n l y on t h o s e o f t h e ma in c o m p o n e n t and Re 4
does not depend on substance properties. Except for Re 2 the
order of magnitude for all errors is about 0.5 to 1, Re 2 is
smaller by a factor of 10. Owing to different sign, the errors
_partly cancel. As an example the total error for the system

BAUERECKER et al. : CALORIMETRIC DETERMINATION 531
b e n z e n e - c y c l o h e x a n e i s R e t o t = ( 0 . 3 2 + 0 , 0 1 - 0 . 4 6 + 0 . 5 0 -
0 . 2 3 ) * X 2 = 0 , 1 4 * X 2.
To c o n t r o l t h e r e s u l t s o b t a i n e d , f o r a l l o f t h e f i v e e s t i -
m a t i o n s b o t h X 2 and X 2" a r e c a l c u l a t e d by t h e e q u a t i o n s (2) t o
(6) r e s p e c t i v e l y (1) t o (5 ) . The l e f t s i d e o f t h e a p p r o x i m a -
t i o n s ( X 2 - X 2 " ) / X 2" i s t h e n c o m p a r e d w i t h t h e a n a l y t i c a l e x -
p r e s s i o n on t h e r i g h t s i d e , w h e r e b y t h e d a t a f o r t h e s y s t e m
b e n z e n e - c y c l o h e x a n e have been used . F o r a l l s i m p l i f i c a t i o n s i n
t h e f i v e a s s e s s m e n t s t h e e r r o r s w e r e l e s s t h a n • I n summa-
r y , t h e f o l l o w i n g s t a t e m e n t can be made:
The amount of the reiative total error involved in van't
Hall's law is approximately of the same size as the impurity
concentration: IRetotl = X 2 .
T h i s a p p l i e s f o r i m p u r i t i e s i n t h e c o n c e n t r a t i o n r a n g e
0 . . . 0 . 0 5 . E x a m p l e : X 2" = 0 , 0 5 , R e t o t = • X 2 = 0 . 0 5 •
0 . 0 0 2 5 .
I n t h e f o l l o w i n g m o d e l c a l c u l a t i o n s t h e d e s c r i p t i o n o f
e u t e c t i c s y s t e m s w i l l be b a s e d on e q u a t i o n ( 4 ) , t h u s i n c o n -
t r a s t t o s t a n d a r d p r o c e d u r e s o f p u r i t y d e t e r m i n a t i o n t h e e r -
r o r s Re 4 and Re 5 a r e a v o i d e d . I t i s h a r d l y p o s s i b l e t o use t h e
more e x a c t e q u a t i o n s ( 1 ) , (2 ) o r ( 3 ) , b e c a u s e i n t h e c a s e o f
t h e i m p u r i t y b e i n g u n k n o w n , n o t h i n g can be s a i d a b o u t t h e
a c t i v i t y c o e f f i c i e n t and t h e e n t h a l p y o f m i x i n g .
Modelling a Heat-flux Calorimeter
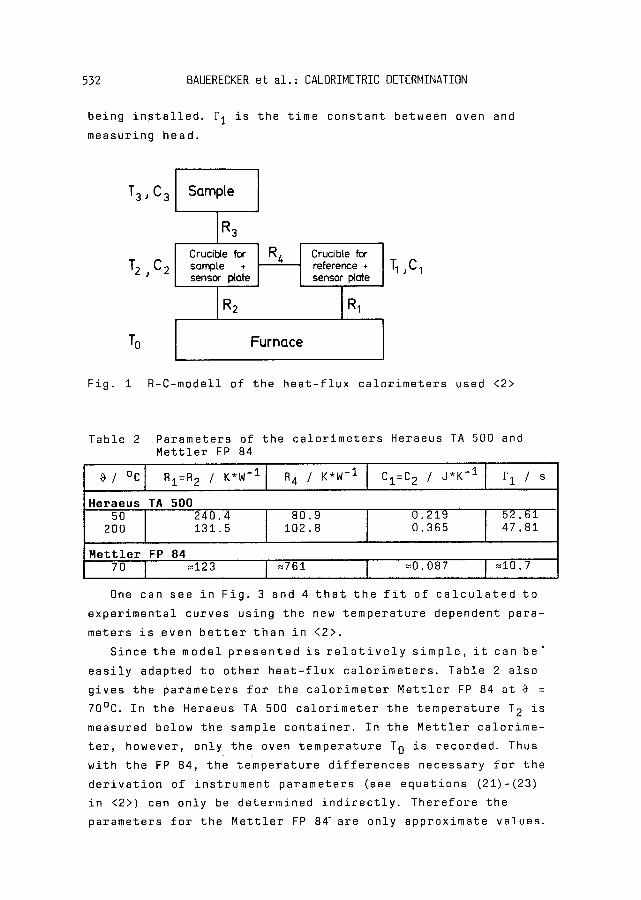
F i g . 1 shows t h e R - C - m o d e l o f a h e a t - f l u x c a l o r i m e t e r
d e v e l o p e d i n <2>, w h i c h i s b a s e d on an a n a l y s i s o f t h e h e a t -
f l u x b e h a v i a u r i n t h e H e r a e u s TA 500 c a l o r i m e t e r ( H e r a e u s
GmbH, H a n a u , F . R . G . )
I n <2> we have d e s c r i b e d how t h e e q u i p m e n t p a r a m e t e r s R1,
R2, R4, C 1 and C 2 can be d e r i v e d f r o m t w o h e a t c a p a c i t y m e a s -
u r e m e n t s . T a b l e 2 l i s t s t h e s e p a r a m e t e r s f o r t h e H e r a e u s TA
500 c a l o r i m e t e r f o r t h e t e m p e r a t u r e s 50 and 200~ The d i f f e -
r e n c e t o t h o s e g i v e n i n <2> a r i s e f r o m a new c a l o r i m e t e r h e a d
532 BAUERECKER et al . : CALORIMETRIC DETERMINATION
being i n s t a l l e d . s i s the time constant between oven and
measuring head.
T3'C3I S~ I
T2 j 02
To I
J R3 Cruci~e for sample , sensor plate
I R4
Furnace
Crucibie for I reference , T 1 , C 1 sensor plete
I F i g . 1 R - C - m o d e l l o f t he h e a t - f l u x c a l o r i m e t e r s used <2>
Tab le 2
/ ~ I
Heraeus TA 500 50 I 240 .4
200 131 .5
Mettler FP 84 70 I =123
P a r a m e t e r s o f t he c a l o r i m e t e r s Heraeus TA 500 and M e t t l e r FP 84
RI=R2 / K'W-1 I R4 / K'W-1 I C1=C2 / J ' K - 1 I s / s _
80 .9 I 0 .219 I 52 ,61 102 .8 0 ,365 47 .81
I =761 I = 0 . 0 8 7 I =10,7
One can see i n F i g . 3 and 4 t h a t t h e f i t o f c a l c u l a t e d t o
e x p e r i m e n t a l c u r v e s us ing t h e new t e m p e r a t u r e dependen t p a r a -
me te rs i s even b e t t e r t h a n i n <2>.
S ince t h e m o d e l p r e s e n t e d i s r e l a t i v e l y s i m p l e , i t can b e '
e a s i l y adap ted t o o t h e r h e a t - f l u x c a l o r i m e t e r s . Tab le 2 a l s o
g i v e s t he p a r a m e t e r s f o r t h e c a l o r i m e t e r M e t t l e r FP 84 a t ~ =
70~ In t he Heraeus TA 500 c a l o r i m e t e r t h e t e m p e r a t u r e T 2 i s
measured be low t he sample c o n t a i n e r . In t h e M e t t l e r c a l o r i m e -
t e r , however , on l y t he oven t e m p e r a t u r e T O i s r e c o r d e d . Thus
w i t h t h e FP 84, t he t e m p e r a t u r e d i f f e r e n c e s n e c e s s a r y f o r t he
d e r i v a t i o n o f i n s t r u m e n t p a r a m e t e r s (see e q u a t i o n s (21 ) - ( 23 )
i n <2>) can o n l y be d e t e r m i n e d i n d i r e c t l y . T h e r e f o r e t he
p a r a m e t e r s f o r t h e M e t t l e r FP 84 ~ are o n l y a p p r o x i m a t e v a l u e s .
BAUERECKER et al.: CALORIMETRIC DETERMINATION 5.3)
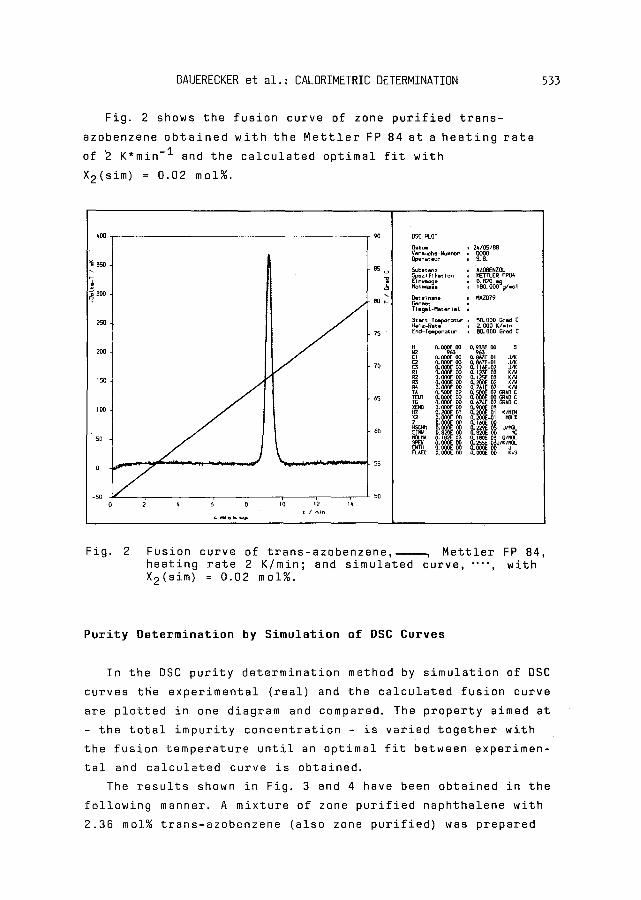
Fig. 2 shows the fusion curve of zone purified trans-
azobenzene obtained with the Mettler FP 84 at a heating rate
of ~ K*min -1 and the calculated optimal fit with
X2(sim) = 0.02 mol%.
400 - 90 DSC-R_OT
�9 Ver ~uohs-Numme~" Oper~eu~ ', s.8.
550 - 85 Subetmnz , AZOBENZOL �9 SpezlFtkstlon , ~TTLER F~4
EInw~e r O.B~O m 9 Molmsz~e ~ 180.000 9~mot
500 Oetet name , MAZ079 - 80 Ger~t
Tto~L -MRteP I I I ',
2 ~ . StaPt- ]Q~ e r i t ~ r i SO. O00 ~'~Id C He1 z.R=mte , 2.000 K/mln
- 75 End-T, ~oenatuP 80,000 Grad C
H O.OC~E O0 @~935E O@ 5 200 N2 963 963
CI o. OOOE ~ O, @6TE~)I J/K C2 O.~OE O0 O, P~TE-OI J/K
70 C3 ~C~OE O00.11~-02 J/K RI O.OOO[ CO O. 123E 05 K/W R2 0.000[ CO O. 125E 05 K/W
150 R3 O.O00E CO O. 200E 02 K/W R4 O.O00E O0 0.761E 05 K/'d TA O.~ 02 0.50~ 02 GRAD C
- 65 TEUT O, 000~. O0 O, O00E ~ GRAD C TG O. OOCE O 0 0 . 674E 02 GRAD C
100 XEND O.~ O0 O.90OE 05 HZ 0.~ Ol O, 20~]E 01 K/M[N X2 O. O0,~ CO O. 20~-01 I~Z
l Z O. O00E O0 O.I~E O0 HSCH~ O. O00E O0 O. 229E 05 J/HOL
60 EINW 0.820E O0 O.820E O0 M[; 0 o MOLMA O. 1 ~ Q 3 0 . ;E~E 05 G/~-
SPEW O.COOE EO 0.255E 03JIK/MOL ENTH 0.O00E CO O. O00E O0 J FLAEC O. 00(~ oo O. O00E O0 K*S
End-Te. ,per 'atur , BO, OOO C.rad C
Fig. 2 Fusion curve of trans-azobenzene, Mettler FP 84, heating rate 2 K/min; and simulated curve, .... , with X2(sim) = 0.02 mol%.
Purity Determination by Simulation of DSC Curves
In the DSC purity determination method by simulation of DSC
curves the experimental (real) and the calculated fusion curve
are plotted in one diagram and compared. The property aimed at
- the total impurity concentration - is varied together with
the fusion temperature until an optimal fit between experimen-
tal and calculated curve is obtained.
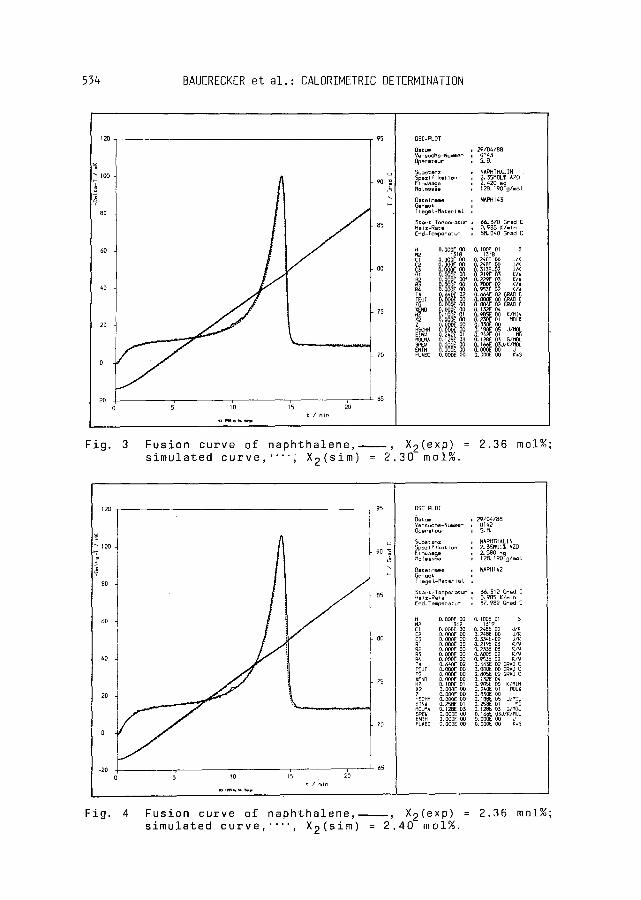
The results shown in Fig. 3 and 4 have been obtained in the
following manner. A mixture of zone purified naphthalene with
2.36 mol% trans-azobenzene (also zone purified) was prepared
534 BAUERECKER et a l . : CALORIMETRIC DETERMINATION
-20) I } 0 ~ ,'0) ,'s ~o
t / mln
u
I RO
DSC-PLOT
Datum 29/04188 Versuchs-Nummer 0143 Operateur 5. B,
Subs~z NA~M4THAL IN 5pezl f I Es~ I on 2. 55MOLl{ AZO Elnwaage 2.400 mg / Molmasse I ~ . 190 9 mol
Oat e I name NAPH ] 43 Ger~t TlQgel-Mat er181
5tart-Temperat~ 66. 370) Grad C Hem z-R~te 0). 985 K/m1 n [nd -Tempera tu r 88.040 Grad C
~2 O, OOOE O0 O. IOOE Ol 5 731B 1318
C1 O.~OD DO 0.24~ {)0 JIK C2 O.OOOE O0 0.248E O0 J/K C3 O. OOOE O0 0. 313E-02 JIK ~1 O. OOOE 00 0.219E 03 K/W R2 O.OOOE 00" 0.22~ 03 K/W 45 O. ~OE O0 O, 780E 02 K/~ R4 D. O00E O0 0), QSSE 02 KIV TA D, 640E 02 O. ~4E 02 ORAD C TEUT D, ~ 00 O. ~ GO GRAD C TO D.O(XO~ 00 O. BO4E 02 GRAD C XENO O. O00E OO O. 152E 04 HZ O. 10)OE DT o. gBSE DO K/M[N X2 O. O00E O0 O, 230E 01 MOL% Z D, OOOE O0 O. D30E DO HSCh~ O. 0~ O0 0. IBBE D5 J/MOL EIN4 0.242E Ol 0.242E O~ MD HOLMA o. IDDE 03 o. 128E 03 G/MOL SPEV O. O00~T DO 0,166E 03J/K/ifOL ENTH O. DOOE DO O. OOOE DO J FLAEC O. OOOE OO O. DOOE DO K*D
F i g . 3 F u s i o n c u r v e o f n a p h t h a l e n e , . , X 2 ( e x p ) : 2 . 3 6 me1%; s i m u l a t e d c u r v e , " " , X 2 ( s i m ) = 2 . 3 0 mol%.
120
B()
60
40
20
0
- 2 0 10
u
90
80
65
15 2'0
DSC-PLOT
O~tum , 29104188 VersL~he-Numm~ 0142 Operateur i S.B.
Substanz , NAPHTHALIN 5pezlfl~atl~n , 2, SSNOL% ^ZO Etnwa~ge 2.580 m 3 Molmasse 12B. 190 9/mol
Oacelname , ~PH I42 Geraec Tle9et-Msteri~k ,
S~art~T~mperatur , 66.312 Grad C Helz_R~te G. gB5 K/mln End-Temperatur , B?.982 Grad C
H D.O~ DO O. IOOE OI 5 N 2 1319 1319 c i D. OOOE O0 0,2#8E DO J/K C2 D. OOOE O0 0.248E DD J/K C3 O. OODE ~ O. 33~E=D2 JIK RI D. OOOE 0.219E D3 KI~ R2 O, OOOE DO 0.255E D3 KIW R3 O. OOOE O0 O. 60DE 02 KI~ 44 O. OOOE O0 O. 953E 02 KIV TA O, 640E 02 0.663D 02 GRAD C TEUT O. OODE O0 O. OOOE DO GRAD C TG O. OODE DO O. BOSE 02 GRAD C XEND O, OODE DO 0.152E O~ HZ O, IODE 01 0. gSDE DO K/MIN x2 O. OOOE DO O. 240E O~ MOLl Z O. OOOE O0 D. BSOE O0 HSCHH O, OOOE O0 O. IBBE 05 J/ffOL EIN~ 0.258E 01 O.~DE 01 MG MOLMA O. 12BE 05 0.1285 D5 GIMOL SPEW O. OOOE DO 0.166E 03JIKIMOL ENTH O. OOOE DO O. DOOE OO J FLAEC O. OOOE DO O, OOOE Do K*D
F i g . 4 F u s i o n c u r v e o f n a p h t h a l e n e , , X 2 ( e x p ) = 2 . 3 6 mol%; s i m u l a t e d c u r v e , ' ' " , X 2 ( s i m ) = 2 . 4 0 mol%.

BAUERECKER et a l . : CALORIMETRIC DETERMINATION 535
as a physical mixture. Even mixing of the components azoben-
zene (red) and naphthalene (white) results in an even colour
distribution in the mixture. To check the homogeneity of the
mixture and the reproducibility of the technique two samples
of 2.420 mg and 2.580 mg mass are weighed into aluminium
crucibles. Fig, 3 and 4 show the fusion curves and their
optimal fit. The impurity concentrations were determined as
2.30 mel% and 2.40 mol%; this corresponds to a deviation of
-3% and +2% respectively.
The column on the right side within the figures contains
all data pertinent to the substance and instrument used in a
specific case.
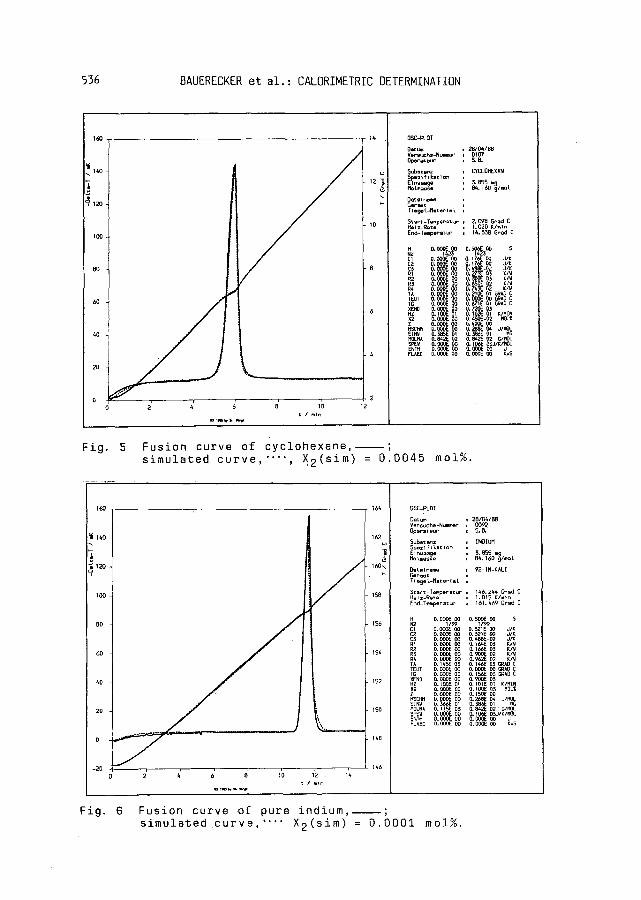
Fig. 5 and 6 demonstrate the applicability of the method
also for small impurity concentrations and for different tem-
perature regions. One recognizes in Fig. 5 that the fit for
cyclohexane with X 2 = 0.0045 mol% at the relatively low tempe-
rature ~fus = 6"71~ is very~reasonable. As shown in Fig. 6
the fit for indium in the falling part of the fusion curve is
not as good. In the increasing part of the curve, however,
which is the one important for the impurity assessment, the
fit is good and the impurity content derived as X2(sim) =
0.0001 mol% is the same as given by the manufacturer.
The experiments shown in Fig. 3 to 6 were performed at the
same heating rate, 1 K*min -1. The figures demonstrate well the
qualitative differences in peak form and peak height with
increasing purity of the main component.
In Table 3 the results of the fits of this and the prece-
Table 3 Compilation of the different fitting results in this paper and <2> together with R 3 and X 2
Substance R 3 / K*W -1 X2(exp) / mol% X2(s im) / mol% I E r r o r
Heraeus TA 500 Naphthalene Naphthalene Naphthalene Naphthalene Indium Cyclohexane
60 80 70 60 90 65
0 .98 5.01 2.36 2,36
< 0.0001 unknown
0.8 -18% 5.4 + 8% 2.30 - 3% 2.40 + 2% 0.0001 > 0% 0.0045
Mettler FP 84 Azobenzene 20 unknown 0.020 I -
536 BAUERECKER et al . : CALORIMETRIC DETERMINATION
[ i~o
60 �9
60 J
40
~o j
ol 0
12
�9 10
1 2
0SC-Pt_0T
O==rl~ , 2B/0z,/BB Ver~uchs-Num~ , 0107
Sub~t ~ z , CYCLOHEXAN Spoz~ f ~ k ~ l O ~ E I nw~ige 3, B55 ~9 Molmaese : 84.160 9/* . : , l
DStelrtBme
[ l e ~ t . ~ e t e r t~k ,
St~r~_Is~Fep~tup ~,09B ~r~ C HQIZ-~tQ : Io020 K/mln [ n d - T ~ a t ~ , 14. 33B Grad C
H ~OECE O0 0,506E OO 5 x2 1423 1425 Cl 0.00(~ co O. 1~'6~ O~ J/K C2 O. C~OE ~ O. t t~E O~ J/K C3 O. EOD~ ~ O. ~BBE-02 J/K nt O.O00E O0 O. 77.73E 05 K/g
R3 0.000E O0 0.6~ 02 K/~ ~4 O.O00E O0 0.743E O2 K/U TA 0 . 0 ( ~ (~ 0.210~ 01 F~R~ C TEUT O. COOE O00 .O [DE O0 C~kD C TG O.O00E ~ 0.671E 01 s C XEN0 O.COOg 00 O.T'Z~ 05 HZ 0.100[ 01 0.102E 1 K/MIN
H~Ch~ O.O00E ~ O. 268E 04 Jfff~ EINW O. $85E OI O.~6E 01 MOLMA 0.8~2E 02 0.8#~2E 02 G/P'~L SPEW 0. O00E O0 O. IO~E OSJIKli~OL ENTH D. O00E O 0 0 . OOCE O0 J FLAEC D. OOO[ Oo O. OC~ ~o ~,S
Fig. 5
Bo i
F u s i o n c u r v e o f c y c l o h e x a n e , - - ; s i m u l a t e d c u r v e , " " , X 2 ( s i m ) = 0 . 0 0 4 5
/
m o l % .
-20 I
16(,
162
160\
IS8
IS6
15(.
152
150
146
DSE-PLOT
Datum 28104/88 Versuchs-Nummer i 0092 Oper~eur ~ 5. B.
Subs~ anz , INDIUM 5pezl f~km~ Ion E I hug:age ~* ~5 mg Motm~ae : B4.160 gl~l
Oet el n~me m 92-1N-KkLI Ger~ T$ egel- t t~ l :sels l ,
StarI-Tampermt~ , 146.2~4 Gr~d C flelz~atm , 1.015 Klm~n End-Temperat~ , 161.469 Grad C
H O. 00Cs 00 O. S00E ~ S
C1 o.(]o(~i ~ o. 3~1E O0 JIK C2 0.00C~ CO 0.321E {X) J/!E C3 O. O00E ~ O. 4BBE-02 J/~( nl 0.0(OE ~ O. ~64E 05 KI~ R2 0. 000[ O0 O. 166E 03 K/'g R3 O. O&DE O0 O. 900E 02 K/~ R4 O. O00E O0 0.962'E 02 Ic/~ ~ i O. 145E 05 O. 146E 05 r.~AO C
U~ O. O00E O0 O. O00E CO GRAO C 0. Q00E 00 0. I~ 03 s C
XEN0 0.(]OOE 00 0,900E 05 HZ O. IOOE 01 O. IOIE OI KIMIN X2 0.C~3~ 00 0. t00s MOL% Z O, O00E 00 O. 150E 00 HSCHM O. OODE O0 O.~SE 04 J/MOL EJNW 0.366E 01 0..3861~ O1 t10Lltk 0. I ~ SE 03 O. B4L~ 02 " G/ffOi. SPEW 0. OOOE O0 O. 106E DSJ/K/tIOL ENTH O. O00E O0 O. COOE O0 J FL~.EC O. O00E CO O. O00E O0 K.S
F i g . 6 F u s i o n c u r v e o f p u r e i n d i u m , ; s i m u l a t e d . c u r v e , " ' " X 2 ( s i m ) = 0 . 0 0 0 1 m o l % .
BAUERECKER et a l . : CALORIMETRIC DETERMINATION 557
ding paper <2> are compiled. The second column contains the
heat resistance R 3 between sample and sample support, which is
not a pure instrument parameter, but depends to some extent on
the substance. For the Heraeus TA 500 calorimeter a mean value
of R 3 = 70 K*W -I is obtained. This value is in good accord
with that determined in <ii> from the slope of the fusion
peaks of several pure reference materiels for temperature and
enthalpy calibration, viz. 80 K*W -i
D e t e r m i n a t i o n of Fusion Tempera tures by S i m u l a t i o n o f DSC
C u r v e s
The extrapolated onset-temperature of a fusion peak is
usually taken as the temperature of fusion. This onset-temper-
ature depends on calorimeter and substance parameters, e.g.
heating rate, sample mass, end purity of the sample. The
influence of these parameters can be easily studied in varying
their magnitude in ~he simulation of DSC curves. Using the set
of parameters given in Fig. 3 (but at X 2 = 0.3 mol%) a varia-
tion in sample mass by a factor of 2 results in a shift of
O.i K for the temperature of fusion. Since in fitting of cal-
culated curves to the experimental DSC curves instrument and
substance parameters are taken into consideration, this method
offers e more'exact determination of fusion temperatures.
Furthermore, comparison of calculated with experimental
DSC-curves gives hints about correc'; function of the calorime-
ter and about the phase transformation (e.g. ideal eutectic
behaviour). Thus it became evident during measurements that
the actual heating rate of the Heraeus TA 500 calorimeter may
differ by • from the set value, (see also the legends in
Fig. 3-6, parameter HZ). These deviations may especially af-
fect those techniques, which depend on the heating rate, ~.g.
measurements of heat capacity or kinetic parameters.

538 BAUERECKER et al. : CALORIMETRIC OETERMINATION
List of Symbols
a i C, C"
1 AfusH R R i Re i T
1 ~ t
X i F 1
a c t i v i t y o f component i c o n s t a n t s hea t c a p a c i t y o f zone i d i f f e r e n c e i n m o l a r hea t c a p a c i t i e s a c t i v i t y c o e f f i c i e n t o f component i d i f f e r e n t i a l e n t h a l p y o f d i l u t i o n mo la r e n t h a l p y o f f u s i o n u n i v e r s a l gas c o n s t a n t hea t r e s i s t a n c e o f pa th i r e l a t i v e e r r o r i a b s o l u t e t e m p e r a t u r e f u s i o n t e m p e r a t u r e o f pure s u b s t a n c e t e m p e r a t u r e d i f f e r e n c e t i m e t e m p e r a t u r e i n degrees c e n t i g r a d e mol f r a c t i o n o f component i t i m e c o n s t a n t between oven and senso r
R e f e r e n c e s
8
9
10
11
K.H. Bohde, Compu te r sys teme - Stand und E n t w i c k l u n g s t e n r denzen, i n : Tegungsband der A r b e i t s t a g u n g Fo rschungsmana- gement i n der P h y s i k 10 der Deutschen P h y s i k a l i s c h e n Ge- s e l l s c h a f t , Bad H o n n e f (1985) S. Sarge, S. Bauerecker, H.K. Cammenga, Calorimetric De- termination of Purity by Simulation of DSC-Curves, Thermo- chim. Acta, 129 (1988) 309-324 G. KortOm, H. Lachmann, EinfOhrung in die chemische Ther- modynamik, Verlag Chemie, Weinheim (1981) 242-245 M.M. Abbott, H.C. van Ness, Thermodynamik, Schaum's Out- line, Mc Graw-Hill, New-York (1976) 255 H.H. MSbius, W. DOrselen, Chemische Thermodynamik, VEB Deutscher Verlag for Grundstoffindustrie, Leipzig ~1973) 98 J. Timmermanns, Physico-Chemical Constants of Pure Organic Compounds, Vol. 2 (1965) 132 J.P. McCullough, H.L. Finke, J.F. Messerly, S.S. Todd, T.C. Kincheloe, G. Waddington, d. Phys. Chem., 61 (1957) 1105-1116 F.-W. Schulze, H.-J. Petrick, H.K. Cammenga, H. Kiinge, Z. Phys. Chem., Frankfurt am Main, 107 (1977) 1-19 I. Prigogine, R. Defay, Chemische Thermodynamik, VEB Deut- scher Verlag for Grundstoffindustrie, Leipzig (1962) 359 Handbook of Chemistry and Physics, 52nd Edition, The Chemical Rubber Co., Cleveland, Ohio (1972) S. Sarge, Dissertation, Technische Universit~t Braun- schweig (1988) 50
BAUERECKER et al.: CALORIMETRIC DETERMINATION 53~
Zusammenfassung
Weitere Ergebnisse zur ~ethode der Reinheitsbestimmung durch simulierte DSC-Kurven werden vorgestellt. Die Ger~tepa- rameter eines W~rme~luSkalorimeters werden for zwei Tempera- turen berechnet, womit genauere Ergebnisse erzielt werden kSnnen. Das Kalorimetermodell wird an ein weiteres W~rmefluS- kalorimeter angepaSt. Die Methode bietet aufgrund der BerSck- sichtigung yon Ger~te- und Substanzeigenschaften auch die MSglichkeit einer genaueren $chmelztemperaturbestimmung.
Weiterhin wird eine Fehlerabsch~tzung zum van't Hof~schen Gesetz durchge~Ohrt, welches eine verein~achte Beschreibung der Koexistenzkurveneines eutektischen Phasensystems und damit der Gefrierpunktserniedrigung darsteiit. Dabei ergibt sich, da5 der relative Gesamtfehler proportional zur Verunreini- gungskonzentration ist und in der gleiohen Gr88enordnung wie diese liegt.
Pe3~Me - Hpe~oTamxe~ ~axbHe~mze pesy~TaTM no onpe~e~eHx~
q~CTOTH C nOMOm~ Mo~e~HMX ~pHB~X ~CK. HHcTpyMenTaX~H~e na-
paMeTp~ ~ ~0E C Ten~os~M n0TO~0U 6H~H onpe~e~eH~ ~pH AByx
Te~nepaTypax, Bc~e~CTB~X qero y~yqmeHa T0~HOCT5 no~yqaeMiAx pe-
3y~bTaTOB. ~0~0~H~Te~H0 K 3TOMy~ ~aHHa~ M0~e&~ Ka~0p~MeTpa
up~0Hoco6~eHa K ~pyroMy Ka~Op~MeTpy. MeT0~ TaI~Ke UO3BOX~eT 50--
~ee TOqHoe o~pe~e~eHze TeMHepaTypH n~aB~eHzH. 3aKoH BaHT-~0~a
3Haq~Te~SH0 yllp0~eHH0 0n~oHBaeT cocy~eCTBOBaHHe KpHBHX Ha ~B--
TeKT~qeOK0~ ~830B0~ ~arpaM~e. ~eTa~HH~ ahab, s o~0K U~TH
y~p0~eHH~ HpHBe& K TOMy~ qT0 38KOH HOK838~ qTO BBe~eHHa~ 0T--
HOO~Te~SHa~ o~a~ 0mH~X8 Hp0~Op~0HS~Ha KoH~eHTpa~H~ HpHMeC~
H ~B~eTC~ TRK0~ Be~HqHH0~ KaK H ca~a KOH~eHTpS~H~.