Sarah M. Kindgen - publications.ub.uni-mainz.de · Sarah M. Kindgen geboren in Mainz Mainz, Juni...
172
Hydrodynamics and Solid Dosage Form Disintegration/Dissolution: Immediate Release Tablets and Novel In Situ Polyelectrolyte Gastroretentive Drug Delivery Systems Dissertation zur Erlangung des Grades ″Doktor der Naturwissenschaften (Dr. rer. nat.)″ im Promotionsfach Pharmazie am Fachbereich Chemie, Pharmazie und Geowissenschaften der Johannes Gutenberg-Universität in Mainz Sarah M. Kindgen geboren in Mainz Mainz, Juni 2015
Transcript of Sarah M. Kindgen - publications.ub.uni-mainz.de · Sarah M. Kindgen geboren in Mainz Mainz, Juni...

Hydrodynamics and Solid Dosage Form
Disintegration/Dissolution:
Immediate Release Tablets and Novel In Situ
Polyelectrolyte Gastroretentive Drug Delivery Systems
Dissertation
zur Erlangung des Grades
″Doktor der Naturwissenschaften (Dr. rer. nat.)″
im Promotionsfach Pharmazie
am Fachbereich Chemie, Pharmazie und Geowissenschaften
der Johannes Gutenberg-Universität
in Mainz
Sarah M. Kindgen
geboren in Mainz
Mainz, Juni 2015

Die vorliegende Arbeit wurde unter der Betreuung von in der
Zeit von Januar 2012 bis Juni 2015 am Institut für Pharmazie und Biochemie-
Therapeutische Lebenswissenschaften der Johannes Gutenberg-Universität Mainz
angefertigt.
Erklärung
Hiermit erkläre ich, dass ich die vorliegende Arbeit selbstständig verfasst und ausschließlich die angegebenen Quellen und Hilfsmittel verwendet habe.
Mainz, 01.06.2015
Sarah Kindgen


Dekan:
1. Berichterstatter:
2. Berichterstatter:
Tag der mündlichen Prüfung: 18.06.2015


Jede Lösung eines Problems ist ein neues Problem.
Johann Wolfgang von Goethe (1749-1832)


i
Zusammenfassung
Der Zerfall fester oraler Darreichungsformen im menschlichen Magen ist ein hoch komplexer
Prozess, der sowohl von den physikochemischen Eigenschaften des Mageninhaltes als auch von
physikalischen Variablen wie Hydrodynamik und mechanischer Beanspruchung abhängig ist. Ein
genaues Verständnis der Rolle von hydrodynamischen Bedingungen und mechanischen
Belastungen während des Zerfalls fester oraler Darreichungsformen kann helfen, die in vitro
Testbedingungen und somit die Vorhersagekraft von in vitro Tests zu verbessern.
Das Ziel dieser Arbeit war es, ein grundlegendes Verständnis des Einflusses von variierenden
hydrodynamischen Bedingungen auf den Zerfall und das Freisetzungsverhalten von festen
Arzneiformen zu erhalten. Zu diesem Zweck wurden zunächst die hydrodynamischen
Bedingungen und Kräfte, die im PhEur/USP Zerfallstester vorherrschen, mittels numerischer
Strömungsmechanik (engl. computational fluid dyanmics, CFD) charakterisiert. Außerdem
wurde ein modifiziertes Zerfallstestgerät entwickelt und die Strömungsverhältnisse darin mittels
CFD simuliert. Dieses modifizierte Gerät wurde in zwei Fallstudien mit schnell freisetzenden
Tabletten (engl. immediate release (IR) tablet) und gastroretentiven Arzneiformen (engl.
gastroretentive drug delivery systems (GRDDS)) eingesetzt.
Durch die Vorgaben des Arzneibuchs folgt die Bewegung des Körbchens des traditionellen
Zerfallstesters einem sinusförmigen Geschwindigkeitsprofil. Daher ändern sich die
hydrodynamischen Bedingung und mechanische Beanspruchungen während des
Bewegungszyklus fortwährend. Die Untersuchungen mittels CFD ergaben, dass die Arzneiform
während der Prüfung einer Bandbreite von Flüssigkeitsgeschwindigkeiten und Scherkräften
ausgesetzt ist. Die hydrodynamischen Bedingungen im traditionellen Testgerät sind somit sehr
variabel und nicht kontrollierbar.
Ein neues, modifiziertes Zerfallstestgerät wurde entwickelt, das auf der computergestützten
numerischen Steuerung (engl. computerized numerical control (CNC)) basiert. Dieses
modifizierte Gerät kann sowohl Bewegungen in alle drei Raumrichtungen als auch radiale
Bewegungen vollziehen. Sowohl einfache als auch komplexe Geschwindigkeitsprofile können
programmiert werden und der Einfluss von Bewegungsgeschwindigkeit und Bewegungsrichtung
auf Zerfall und Freisetzungsverhalten fester oraler Darreichungsformen kann untersucht
werden. Weiterhin wurde ein modifizierter Probenbehälter entwickelt, der zweiseitige
Strömungsbewegung zulässt. Numerische Strömungssimulationen der Flüssigkeitsbewegung
und Kräfte im modifizierten Testgerät haben deutliche Unterschiede zum konventionellen

ii
Tester gezeigt. Durch die CNC Steuerung und die frei wählbare Bewegungsgeschwindigkeit
und -richtung ist es außerdem möglich, die hydrodynamischen Bedingungen zu kontrollieren.
Das modifizierte Gerät wurde eingesetzt, um den Einfluss der Bewegungsgeschwindigkeit des
Probenbehälters auf die Zerfallszeit schnell zerfallender Tabletten zu untersuchen. Es konnten
Einblicke in den Einfluss der Bewegungsgeschwindigkeit, der Viskosität des Mediums und der
Bauart des Probenbehälters auf die Zerfallszeit gewonnen werden. Weiterhin wurde ein
exponentieller Zusammenhang zwischen Zerfallszeit und Bewegungsgeschwindigkeit für den
neuen Probenbehälter etabliert. Dieselben Verhältnismäßigkeiten wurden für den
Zusammenhang zwischen Zerfallszeit und simuliertem Scherstress erhalten.
Weiterhin wurde eine gastroretentive Arzneiform entwickelt. Dabei wurde die Machbarkeit
eines in situ Polyelektrolyt-Komplexes untersucht und erfolgreich umgesetzt. Verschiedene
Komplexe bestehend aus verschiedenen Chitosanen und Carrageenen und unterschiedlichen
Verhältnissen der beiden Polymere wurden hinsichtlich ihres Schwellverhaltens, ihrer
mechanischen Stabilität und ihres in vitro Freisetzungsprofiles des Arzneistoffs untersucht.
Anhand einer optimierten Formulierung wurde der Einfluss von hydrodynamischen
Bedingungen auf das Schwellverhalten und das Freisetzungsprofil des Wirkstoffes durch Einsatz
des modifizierten Zerfallstesters gezeigt. Sowohl das Schwellverhalten der Arzneiform als auch
die Freisetzung des Wirkstoffes waren in hohem Maße abhängig von der
Bewegungsgeschwindigkeit des Probenbehälters.
Abschließend lässt sich zusammenfassen, dass unter Verwendung des modifizierten
Zerfallstestgerätes neue Einblicke in die Rolle von hydrodynamischen Bedingungen bei Zerfalls-
und Freisetzungsprozessen von festen Arzneiformen gewonnen wurden. Unter Auswahl
geeigneter Bedingungen kann mit Hilfe des modifizierten Gerätes die Vorhersagekraft des in
vitro Tests gesteigert werden. Außerdem wurde gezeigt, dass die numerische
Strömungssimulation ein hilfreiches Werkzeug zur Vorhersage von hydrodynamischen
Bedingungen und mechanischen Beanspruchungen in den beiden untersuchten Geräten
darstellt.
iii
Abstract
Solid oral dosage form disintegration in the human stomach is a highly complex process
dependent on physicochemical properties of the stomach contents as well as on physical
variables such as hydrodynamics and mechanical stress. Understanding the role of
hydrodynamics and forces in disintegration of oral solid dosage forms can help to improve in
vitro disintegration testing and the predictive power of the in vitro test.
The aim of this work was to obtain a deep understanding of the influence of changing
hydrodynamic conditions on solid oral dosage form performance. Therefore, the hydrodynamic
conditions and forces present in the compendial PhEur/USP disintegration test device were
characterized using a computational fluid dynamics (CFD) approach. Furthermore, a modified
device was developed and the hydrodynamic conditions present were simulated using CFD. This
modified device was applied in two case studies comprising immediate release (IR) tablets and
gastroretentive drug delivery systems (GRDDS).
Due to the description of movement provided in the PhEur, the movement velocity of the
basket-rack assembly follows a sinusoidal profile. Therefore, hydrodynamic conditions are
changing continually throughout the movement cycle. CFD simulations revealed that the dosage
form is exposed to a wide range of fluid velocities and shear forces during the test. The
hydrodynamic conditions in the compendial device are highly variable and cannot be controlled.
A new, modified disintegration test device based on computerized numerical control (CNC)
technique was developed. The modified device can be moved in all three dimensions and radial
movement is also possible. Simple and complex moving profiles can be developed and the
influence of the hydrodynamic conditions on oral solid dosage form performance can be
evaluated. Furthermore, a modified basket was designed that allows two-sided fluid flow. CFD
simulations of the hydrodynamics and forces in the modified device revealed significant
differences in the fluid flow field and forces when compared to the compendial device. Due to
the CNC technique moving velocity and direction are arbitrary and hydrodynamics become
controllable.
The modified disintegration test device was utilized to examine the influence of moving velocity
on disintegration times of IR tablets. Insights into the influence of moving speed, medium
viscosity and basket design on disintegration times were obtained. An exponential relationship
between moving velocity of the modified basket and disintegration times was established in
simulated gastric fluid. The same relationship was found between the disintegration times and
the CFD predicted average shear stress on the tablet surface.
iv
Furthermore, a GRDDS was developed based on the approach of an in situ polyelectrolyte
complex (PEC). Different complexes composed of different grades of chitosan and carrageenan
and different ratios of those were investigated for their swelling behavior, mechanical stability,
and in vitro drug release. With an optimized formulation the influence of changing
hydrodynamic conditions on the swelling behavior and the drug release profile was
demonstrated using the modified disintegration test device. Both, swelling behavior and drug
release, were largely dependent on the hydrodynamic conditions.
Concluding, it has been shown within this thesis that the application of the modified
disintegration test device allows for detailed insights into the influence of hydrodynamic
conditions on solid oral dosage form disintegration and dissolution. By the application of
appropriate test conditions, the predictive power of in vitro disintegration testing can be
improved using the modified disintegration test device. Furthermore, CFD has proven a
powerful tool to examine the hydrodynamics and forces in the compendial as well as in the
modified disintegration test device.
1
Table of contents
Zusammenfassung……………………………………………………………………………………………………………………….i
Abstract………………………………………………………………………………………………………………………………………ii
Abbreviations .................................................................................................................................. 7
1 Introduction ..................................................................................................................... 9
1.1 Solid oral dosage form disintegration ............................................................................ 10
1.1.1 Factors affecting disintegration ................................................................................. 11
1.1.2 PhEur disintegration testing apparatus ..................................................................... 13
1.2 Physiological considerations for disintegration and dissolution testing ........................ 15
1.2.1 The human stomach .................................................................................................. 15
1.2.2 Gastric contents and volume ..................................................................................... 15
1.2.3 Motility patterns ........................................................................................................ 17
1.2.4 In vivo hydrodynamics and forces ............................................................................. 18
1.2.5 Gastric emptying ........................................................................................................ 19
1.3 Selected biorelevant in vitro models for dissolution testing .......................................... 20
1.3.1 Paddle-bead method ................................................................................................. 20
1.3.2 Rotating beaker ......................................................................................................... 21
1.3.3 Dissolution stress test device .................................................................................... 22
1.3.4 Fed stomach model (FSM) ......................................................................................... 23
1.3.5 Dynamic gastric model (DGM) ................................................................................... 24
1.3.6 Human gastric simulator (HGS) ................................................................................. 25
1.3.7 Artificial digestive system TIM-1 ............................................................................... 26
1.4 Computational fluid dynamics ........................................................................................ 27
1.4.1 Dissolution apparatus ................................................................................................ 28
1.4.2 Stomach ..................................................................................................................... 29
1.5 Gastroretentive drug delivery systems........................................................................... 33

2
1.5.1 Density controlled systems ........................................................................................ 34
1.5.2 Swelling/ expandable systems ................................................................................... 35
1.5.3 Bioadhesive systems .................................................................................................. 36
1.6 Polyelectrolyte complexes .............................................................................................. 36
1.7 The need of a gastroretenive drug delivery system for trospium chloride .................... 37
2 Aims ............................................................................................................................... 39
3 Materials and Methods .................................................................................................. 41
3.1 The modified disintegration test device ......................................................................... 41
3.2 Computational fluid dynamics (CFD) .............................................................................. 42
3.2.1 Governing equations .................................................................................................. 42
3.2.2 Simulations in the PhEur disintegration apparatus ................................................... 44
3.2.2.1 Geometry ........................................................................................................... 44
3.2.2.2 CFD setup........................................................................................................... 45
3.2.2.3 Boundary conditions ......................................................................................... 47
3.2.2.4 Grid settings ...................................................................................................... 47
3.2.3 Validation ................................................................................................................... 47
3.2.4 Simulations in the modified disintegration apparatus .............................................. 47
3.2.4.1 Geometry ........................................................................................................... 47
3.2.4.2 CFD setup........................................................................................................... 48
3.2.4.3 Boundary conditions ......................................................................................... 50
3.2.4.4 Mesh settings .................................................................................................... 50
3.2.5 What if study .............................................................................................................. 50
3.2.6 Media ......................................................................................................................... 50
3.3 Particle image velocimetry ............................................................................................. 53
3.4 Disintegration testing of immediate release tablets ...................................................... 54
3.5 Development and in vitro evaluation of a gastroretentive drug delivery system .......... 55
3.5.1 Materials .................................................................................................................... 55
3.5.1.1 Chitosan ............................................................................................................. 55
3.5.1.2 Carrageenan ...................................................................................................... 56
3
3.5.2 Methods..................................................................................................................... 57
3.5.2.1 Preparation of capsules ..................................................................................... 57
3.5.2.2 FT-IR................................................................................................................... 58
3.5.2.3 Density of the gastroretentive matrix ............................................................... 58
3.5.2.4 Matrix swelling .................................................................................................. 59
3.5.2.5 Effect of hydrodynamics on swelling ................................................................ 59
3.5.2.6 Physicomechanical strength.............................................................................. 60
3.5.2.7 In vitro drug release .......................................................................................... 61
4 Results ............................................................................................................................ 65
4.1 Characterization of the hydrodynamics in the PhEur/USP disintegration test
device .............................................................................................................................. 66
4.1.1 Validation of CFD model using PIV experimental data .............................................. 66
4.1.2 Fluid flow field ........................................................................................................... 68
4.1.3 Effect of viscosity on velocity magnitude .................................................................. 72
4.1.4 Shear rate and viscosity ............................................................................................. 73
4.1.5 Shear stress on tablet surface ................................................................................... 76
4.1.6 Drag force .................................................................................................................. 77
4.1.7 Relative pressure fields .............................................................................................. 79
4.2 Modified disintegration test device ................................................................................ 81
4.3 Characterization of the hydrodynamics in the modified disintegration test
device .............................................................................................................................. 83
4.3.1 Fluid flow field ........................................................................................................... 83
4.3.2 Effect of viscosity on velocity magnitude .................................................................. 86
4.3.3 Shear rate and viscosity ............................................................................................. 87
4.3.4 Shear stress on tablet surface ................................................................................... 89
4.4 What if study .................................................................................................................. 90
4.4.1 Effect of moving speed on velocity magnitude ......................................................... 90
4.4.2 Effect of tablet size on velocity magnitude ............................................................... 93
4
4.4.3 Effect of moving speed and tablet size on average shear stress on the tablet
surface ....................................................................................................................... 95
4.5 Disintegration of immediate release tablets under varying hydrodynamics and
forces .............................................................................................................................. 96
4.6 Development and in vitro characterization of a gastroretentive drug delivery
system ........................................................................................................................... 106
4.6.1 FT-IR measurements ................................................................................................ 106
4.6.2 Density ..................................................................................................................... 107
4.6.3 Matrix swelling ......................................................................................................... 108
4.6.4 Effect of hydrodynamics on degree of swelling....................................................... 112
4.6.5 Physicomechanical strength .................................................................................... 114
4.6.6 In vitro drug release from polyelectrolyte complexes ............................................. 116
4.7 Characterization of the gastroretentive drug delivery system under varying
hydrodynamic conditions ............................................................................................. 119
4.7.1 Swelling behavior ..................................................................................................... 119
4.7.2 Drug release profile ................................................................................................. 120
4.7.3 Correlation between drug release and degree of swelling ..................................... 121
5 Discussion .................................................................................................................... 122
5.1 Development of a modified disintegration test device ................................................ 122
5.2 Comparison of hydrodynamics in the compendial and modified basket design.......... 124
5.3 Comparison of simulated hydrodynamic conditions with literature data .................... 126
5.4 Limitations of computational fluid dynamics (CFD) ...................................................... 133
5.5 Disintegration mechanisms .......................................................................................... 134
5.6 Effect of hydrodynamics on disintegration times of immediate release tablets ......... 135
5.7 Effect of polymer properties and hydrodynamics on in vitro performance the of
gastroretentive drug delivery systems ......................................................................... 137
6 Conclusion and future work ......................................................................................... 141
7 References ................................................................................................................... 143
5
8 Appendix ...................................................................................................................... 152
8.1 Mesh cell information ................................................................................................... 152
8.2 Supporting information on the modified disintegration test device ........................... 153
8.3 Application program of CNC controller ........................................................................ 154
8.4 DoE worksheet .............................................................................................................. 155
8.5 Tablet for in vivo disintegration studies ....................................................................... 156
9 List of related publications .......................................................................................... 158
10 Acknowledgements ..................................................................................................... 159
11 Curriculum vitae .......................................................................................................... 160

6

Abbreviations
7
Abbreviations
ACW antral contraction wave
API active pharmaceutical ingredient
BCS biopharmaceutical classification system
CFD computational fluid dynamics
CNC computerized numerical control
CR controlled release
DGM dynamic gastric model
DoE design of experiments
FaSSGF fasted state simulated gastric fluid
FaSSIF fasted state simulated intestinal fluid
FDA food and drug administration
FeSSGF fed state simulated gastric fluid
FeSSIF fed state simulated intestinal fluid
FSM fed stomach model
GRDDS gastroretentive drug delivery system
HBS hydrodynamically balanced system
HGS human gastric simulator
HPMC hydroxypropyl methylcellulose
IR immediate release
IVIVC in vitro-in vivo-correlation
LDV laser-Doppler velocimetry
MMC migrating motor complex
MR modified release

Abbreviations
8
MRI magnetic resonance imaging
PC polyelectrolyte
PEC polyelectrolyte complex
PhEur European Pharmacopoeia
PIV particle image velocimetry
pLIF planar laser induced fluorescence
SGF simulated gastric fluid
SIF simulated intestinal fluid
USP United States Pharmacopeia

1 Introduction
9
1 Introduction
Solid oral dosage forms, especially tablets, are the most common administration way of drugs.
Various formulations have been developed ranging from straightforward immediate release (IR)
dosage forms to complex modified release (MR) dosage forms. The performance of these
dosage forms in the human stomach is a highly complex process influenced by physiological as
well as physicochemical factors. Currently, the in vitro evaluation of solid oral dosage form
disintegration and dissolution is usually performed in compendial apparatuses. Since their
introduction in the beginning of the 19th century they have become an important quality control
tool in pharmaceutical development. At the time of their development the knowledge about
physiological parameters like gastrointestinal motility or mechanical stresses was very limited.
But, the more we learn about processes in the human stomach due to the development of
modern diagnostic techniques, the more the demand for biorelevant in vitro testing increases.
The present work focuses on the biorelevance of the compendial disintegration test device in
terms of hydrodynamic conditions and mechanical forces. The influence of hydrodynamics on
the disintegration of IR tablets was investigated using a new, modified disintegration test
device. Furthermore, this work describes the development and optimization of a
gastroretentive drug delivery system (GRDDS). The influence of hydrodynamics on the swelling
behavior and the drug release profile of the GRDDS was evaluated. The results of this work help
to understand the influence of hydrodynamic conditions and mechanical forces on
disintegration and dissolution of solid oral dosage forms.
In the following sections of the introduction the mechanism of tablet disintegration and the
influencing factors are discussed. A short summary of the physiological factors of the
gastrointestinal tract which can affect disintegration and dissolution is given. Furthermore,
current compendial and biorelevant in vitro tools to investigate dissolution are presented.
Formulation strategies for GRDDSs are described and the approach of gastroretention via
polyelectrolyte complexes (PEC) is introduced.

1 Introduction
10
1.1 Solid oral dosage form disintegration
Among solid oral dosage forms, tablets are the most popular ones. Tablet dosage forms can be
divided into IR tablets and MR tablets. While IR tablets are supposed to disintegrate in the
stomach rapidly after ingestion, MR tablets are designed to delivery the drug in a controlled
manner. Several mechanisms are known to control the release of the drug: sustained release,
prolonged release, repeated release, and delayed release. With sustained and prolonged
release formulations the drug is released over a prolonged period of time. This is for example
accomplished by the establishment of diffusion barriers. With repeated release formulations
several drug doses are release intermittently. Typical delayed release formulations are enteric
coated dosage forms where the drug release in the stomach is prevented by an enteric coat.
Reaching the intestine, the coat becomes dissolved and disintegration and dissolution will take
place.
After the ingestion of an oral solid dosage form two processes occur that make the drug
available for absorption: disintegration and dissolution (Figure 1). Thereby disintegration is the
process of breaking the dosage form structure into smaller aggregates and particles. Although
disintegration is a prerequisite for rapid drug dissolution from IR dosage forms, complete
disintegration does not mean complete dissolution of the active pharmaceutical ingredient
(API). On the other hand, in the case of MR dosage forms, dissolution occurs without
disintegration but by diffusion and/or erosion. Depending on the desired site of action,
disintegration and dissolution are happening in the stomach or in the intestine.
Figure 1: Disintegration and dissolution process.

1 Introduction
11
1.1.1 Factors affecting disintegration
Factors affecting disintegration can be divided into formulation related factors, physicochemical
characteristics of the immersion fluid, and physical variables the dosage form is exposed to.
Tablet disintegration can be governed by formulation variables such as type, amount, and
properties of disintegrant (Shotton and Leonard, 1976; van Kamp et al., 1983; Colombo et al.,
1984). The mechanisms of action of disintegrants have been investigated early. Several
mechanisms are proposed: swelling, wicking, and repulsive force. Swelling occurs due to
penetration of liquid into the tablet. Thereby, force is exerted on the tablet matrix leading to
disintegration through rupture (Patel and Hopponent, 1966). Wicking is caused by capillary
action upon water penetration into the porous tablet matrix. Thus, the tablet structure is
weakened leading to disintegration (Curlin, 1955). Another proposed disintegration mechanism
is the occurrence of repulsive forces (Guyot-Hermann and Ringard, 1981). It is hypothesized,
that the penetrating water annihilates the hydrogen bonds and van-der-Waals and electrostatic
forces. Repulsive forces, e.g. between starch chains, are generated facilitating disintegration.
For all these proposed mechanisms the penetration of water into the tablet is essential for
action of the disintegrant. How water penetration is influenced by the properties of the fluid is
discussed later in this section.
In the human stomach oral dosage form disintegration can further be influenced by
physicochemical characteristics of the fluid as well as by physical variables such as
hydrodynamics and mechanical stresses. Thereby, the prandial state of the stomach plays an
important role since food ingestion changes gastric contents properties as well as hydrodynamic
conditions.
Several studies examined the effect of food on tablet disintegration in vivo. Kalantzi et al. (2005)
found increased tablet disintegration times in dogs after administration of milk compared to
administration of water. The same observations were made by Abrahamsson et al. (2004)
comparing disintegration times after ingestion of water and nutritional drink. The prolonged
disintegration under fed conditions was attributed to the formation of a protein film around the
tablet.
Other studies investigated the effect of food on tablet disintegration in vitro using viscous
model fluids representing the fed state. Brouwers et al. (2011) immersed the tablet in
nutritional drink and visualized the water mobility by magnetic resonance imaging (MRI). They
explained the delayed tablet disintegration in nutritional drink by reduced water ingress.
Recently, attempts have been made to find a disintegration medium exhibiting the properties of

1 Introduction
12
mashed FDA meal (Radwan et al., 2012). A solution of 1.4 % hydroxypropyl methylcellulose
(HPMC) was found to exhibit similar rheological properties and viscosity. Delayed disintegration
and dissolution in 1.4 % HPMC solution compared to simulated intestinal fluid (SIF) was
measured in vitro. The effect was related to decreased water penetration into the tablet and
reduced water diffusivity.
When exposed to a gastric fluid or a model disintegration test medium, water will penetrate
into the tablet. As described above, water penetration is essential for the action of tablet
disintegrants causing rupture of the tablet. The water penetration rate depends on the
properties of the fluid as well as on the characteristics of the tablet. Water uptake has been
shown to be dependent on the viscosity of the fluid (Anwar et al., 2005; Abrahamsson et al.,
2004; Radwan et al., 2014). Low viscous media can penetrate fast, whereas high viscous media
penetrate slowly. The slow penetration leads to prolonged disintegration times. Abrahamsson
et al. (2004) explained the slow penetration of viscous media by the formation of film around
the tablet that impedes water uptake. A good correlation between media viscosity, water
uptake and disintegration times was established by Radwan et al. (2014).
Water uptake was also found to be dependent on the water diffusivity of the model medium
(Radwan et al., 2013). Reduced water diffusivity decreases the water uptake and delays tablet
disintegration. Water diffusivity decreased with increasing viscosity of sucrose and HPMC
solutions, where the decrease was more pronounced in sucrose solutions indicating an
interaction between the sugars in the sucrose solutions and water. For sucrose solutions a linear
relationship between water diffusivity and inverse viscosity was found, while this correlation
was not linear for HPMC solutions. This indicates that water diffusivity is largely dependent on
the chemical structure of the medium components. Furthermore the water diffusivity was
dependent on the sodium chloride concentration of the solution. A close correlation between
water uptake rates and water diffusivity was observed.
Water uptake is also dependent on the structural properties of the tablet. Functional coatings
for example will swell upon contact with media forming a barrier and thereby slowing liquid
penetration (Radwan et al., 2012). In general, high porosity is associated with fast disintegration
due to fast water absorption. Additionally, the porosity is related to the strength of the tablet
matrix, where high porosity results in low strength. For high porous tablets water absorption
will be fast and therefore fragmentation and rupture will be the driving force of disintegration.
For low porous tablets the water penetration rate will be slow. Thereby, the action of
disintegrants is limited retarding disintegration. It needs to be considered, that different
disintegrants as well as other formulation components have different affinities to water and

1 Introduction
13
may influence the rate of water uptake. Surface erosion from rigid structures is slower
compared to erosion of soft matrices. Surface erosion, rupture, and fragmentation will occur
simultaneously.
Despite these ambiguous investigations, the effect of hydrodynamics on disintegration has been
neglected so far. Only one study (Radwan et al., 2014) mentions the importance of
hydrodynamics for disintegration.
Figure 2 summarizes the factors affecting solid oral dosage form disintegration in the human
stomach and under biorelevant in vitro test conditions.
Figure 2: Factors affecting solid oral dosage form disintegration.
1.1.2 PhEur disintegration testing apparatus
The disintegration testing apparatus proposed by the European Pharmacopoeia (Ph.Eur.,
European Pharmacopoeia, 2014) is depicted in Figure 3. It consists of a basket-rack assembly, a
1 L beaker, a thermostatic water bath and a motor for the up and down movement of the
basket-rack assembly. The assembly comprises a set of six circular arranged open ended glass
tubes that are held in a vertical position by two plates. The bottom of the tubes is limited by a
stainless steel wire mesh with quadratic meshes.
According to the PhEur the basket-rack assembly is moved up and down 29 to 32 times per
minute over a distance of 55±2 mm. Thereby a sinusoidal moving profile is generated. From the
data (30 cycles per minute resulting in a frequency 𝑓 of 0.5 Hz and amplitude of 𝑎= 27.5 mm)
the motion 𝑠 is:
𝑠 = −𝑎 ∗ cos(2𝜋 ∗ 𝑓 ∗ 𝑡) ( 1 )
where 𝑎 is the amplitude, 𝑓 is the frequency and 𝑡 is the time.
1 Introduction
14
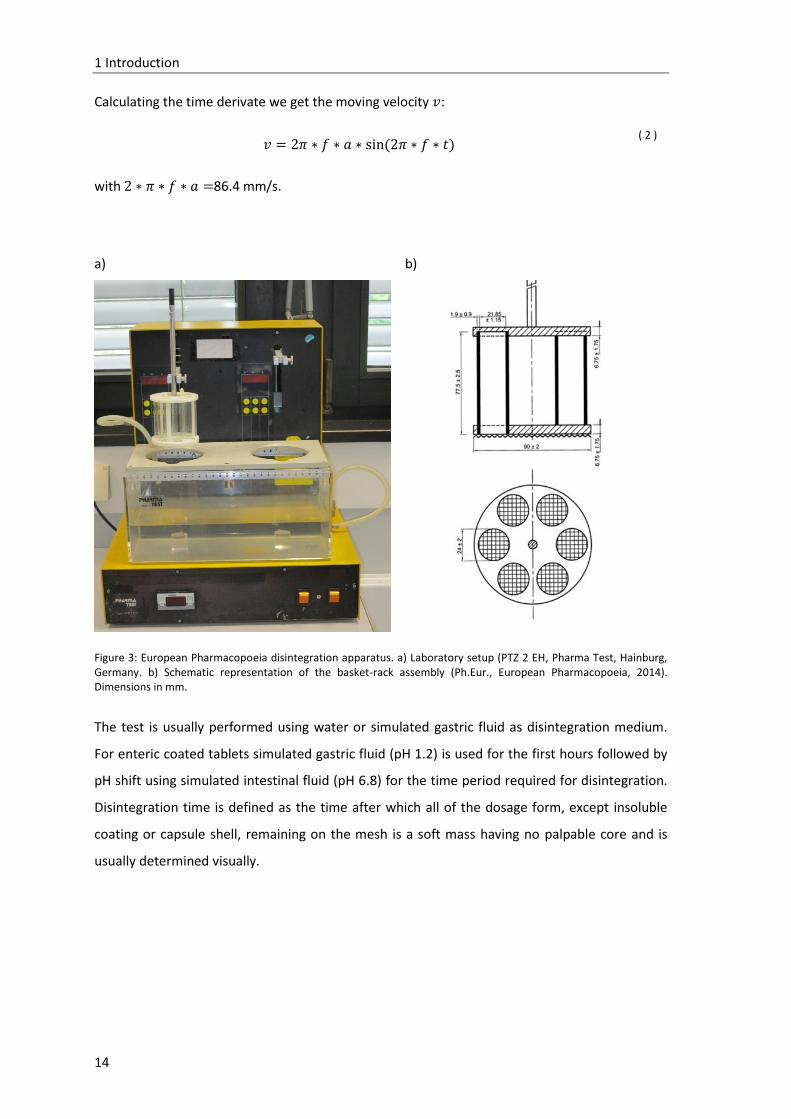
Calculating the time derivate we get the moving velocity 𝑣:
𝑣 = 2𝜋 ∗ 𝑓 ∗ 𝑎 ∗ sin(2𝜋 ∗ 𝑓 ∗ 𝑡) ( 2 )
with 2 ∗ 𝜋 ∗ 𝑓 ∗ 𝑎 =86.4 mm/s.
a) b)
Figure 3: European Pharmacopoeia disintegration apparatus. a) Laboratory setup (PTZ 2 EH, Pharma Test, Hainburg, Germany. b) Schematic representation of the basket-rack assembly (Ph.Eur., European Pharmacopoeia, 2014). Dimensions in mm.
The test is usually performed using water or simulated gastric fluid as disintegration medium.
For enteric coated tablets simulated gastric fluid (pH 1.2) is used for the first hours followed by
pH shift using simulated intestinal fluid (pH 6.8) for the time period required for disintegration.
Disintegration time is defined as the time after which all of the dosage form, except insoluble
coating or capsule shell, remaining on the mesh is a soft mass having no palpable core and is
usually determined visually.
1 Introduction
15
1.2 Physiological considerations for disintegration and
dissolution testing
The human stomach is the starting point of solid oral dosage form disintegration and drug
dissolution. Depending of the site of action, the drug release process is completed in the
stomach or the dosage form is transported to the small and large intestine. To judge the
relevance of in vitro test methods and to understand dosage form performance, profound
knowledge of the in vivo situation is required. Therefore, the following section gives on
overview of the functions of and the conditions in the human stomach available from literature
data.
1.2.1 The human stomach
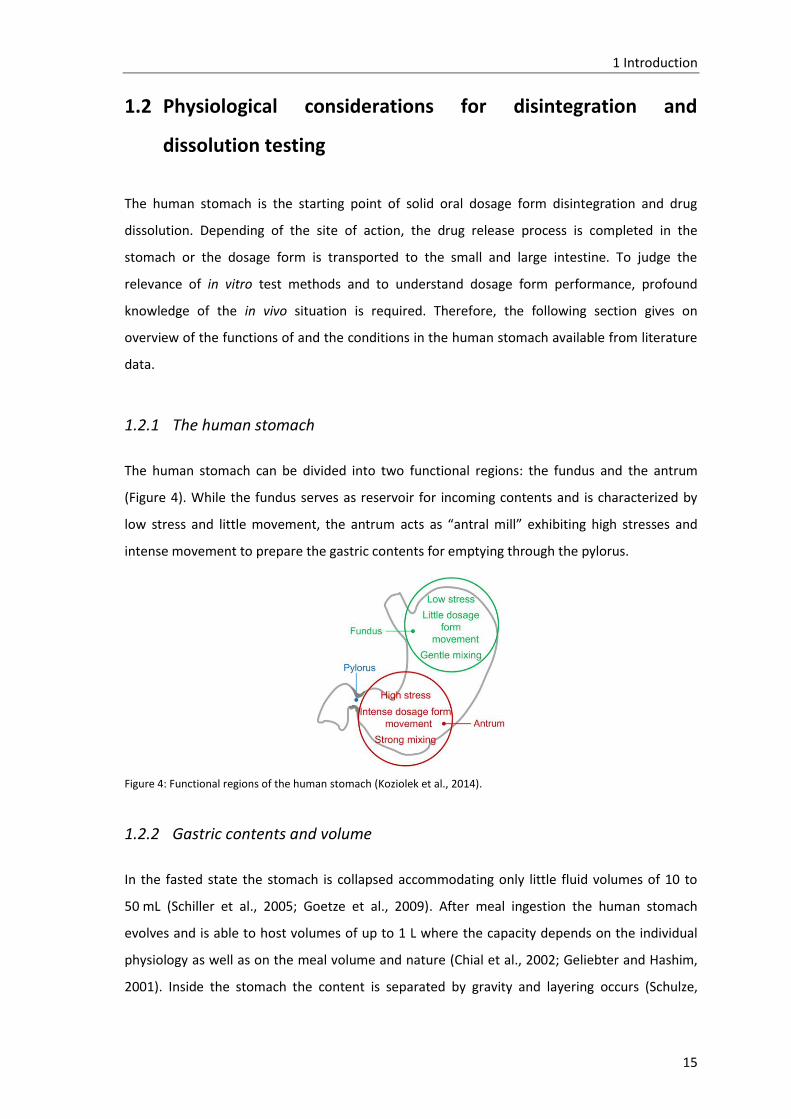
The human stomach can be divided into two functional regions: the fundus and the antrum
(Figure 4). While the fundus serves as reservoir for incoming contents and is characterized by
low stress and little movement, the antrum acts as “antral mill” exhibiting high stresses and
intense movement to prepare the gastric contents for emptying through the pylorus.
Figure 4: Functional regions of the human stomach (Koziolek et al., 2014).
1.2.2 Gastric contents and volume
In the fasted state the stomach is collapsed accommodating only little fluid volumes of 10 to
50 mL (Schiller et al., 2005; Goetze et al., 2009). After meal ingestion the human stomach
evolves and is able to host volumes of up to 1 L where the capacity depends on the individual
physiology as well as on the meal volume and nature (Chial et al., 2002; Geliebter and Hashim,
2001). Inside the stomach the content is separated by gravity and layering occurs (Schulze,

1 Introduction
16
2006). Particles that are heavier than water will sediment to the antrum while fat will float on
top of the contents.
Gastric content is digested by mixing and grinding as well as by the gastric juice. Food intake
stimulates the secretion of gastric juice to rates of 10 to 50 mL/min compared to 1 mL/min in
the unstimulated state (Koziolek et al., 2013). The main components of the gastric juice are
hydrochloric acid, bicarbonate, pepsinogen, gastric lipase, mucins, and bile salts. The pH,
surface tension, osmolality, and the buffer capacity as well as the concentration of the
components are largely dependent of the prandial state (Kalantzi et al., 2006). Table 1
summarizes the physicochemical properties of the gastric contents in the fasted and fed state.
All these parameters need to be considered performing biorelevant in vitro disintegration and
dissolution studies.
Table 1: Physicochemical properties of gastric secretions in the fasted and fed state.
Property Fasted state Fed state Reference
Volume [mL] 10-50 500-1000 Schiller et al., 2005; Goetze et
al., 2009; Chial et al., 2002;
Geliebter and Hashim, 2001
pH 1-2 3-7 Kalantzi et al., 2006
Pepsin [mg/mL] 0.11-0.22 0.26-0.58 Kalantzi et al., 2006
Bile salts [mM] 0.008-0.28 0.06 Armand et al., 1996; Vertzoni et
al., 2005
Buffer capacity [mmolL-1∆pH-1] 7-18 14-28 Kalantzi et al., 2006
Osmolality [mOsm/kg] 98-140 217-559 Kalantzi et al., 2006
Surface tension [mN/m] 41.9-45.7 30-31 Kalantzi et al., 2006
Viscosity [Pa s] n/a 10-2000 Abrahamsson et al., 2005
1 Introduction
17
Several biorelevant model media have been introduced during the last years with some of them
listed in Table 2. Since biorelevant media are of minor relevance for this work they are not
discussed further and the interested reader is referred to corresponding reviews (Klein, 2010;
Kleberg et al., 2010; Reppas and Vertzoni, 2012) and research studies (Anwar et al., 2005;
Radwan et al., 2012; Parojčić et al., 2008).
Table 2: Biorelevant in vitro model media to simulate fasted and fed state physicochemical properties.
Fasted stomach Fed stomach
Fasted state simulated gastric fluid FaSSGF Fed state simulated gastric fluid FeSSGF
Fasted state simulated intestinal fluid FaSSIF Fed state simulated intestinal fluid FeSSIF
Milk
Nutrient drinks (Ensure, EnsurePlus)
1.4 % HPMC solution
1.2.3 Motility patterns
The patterns of gastric motility are highly different in the fasted and fed state. During the fasted
state the interdigestive migrating motor complex (MMC) occurs. This cycle is characterized by 4
phases of different contraction strength and duration (Takahashi, 2012). Phase I, lasting 40-
60 min, is characterized by low contraction frequency and strength. During phase II, which is
similar in length, the frequency and intensity of the contraction waves increases. The following
phase III is short (4-6 min) but powerful. All undigested material is emptied from the stomach,
even large monolithic objects like tablets. During this period highest pressures and forces are
acting on the stomachs content. Phase IV is the transition period between phase III and I, lasting
for 15 to 30 min during which frequency and intensity of the contractions decrease. The
contractions originate in the proximal stomach and propagate towards the pylorus. The cycle is
repeated every 1 to 2 h.
Meal ingestion interrupts the MMC and initiates the fed pattern (digestive motor activity).
Regarding contractile frequency and strength this pattern is comparable to phase II of the MMC.
Thus, forces acting in the fed stomach are lower than in the fasted state and highest forces
occur during phase III of the MMC.
Incoming food is transported to the antrum by slow fundic contractions where it is mixed and
digested by antral contraction waves (ACW). The ACWs originate from the middle of the greater
curvature and travel towards the pylorus with a velocity of about 2 to 3 mm/s and mean
occlusion rate of 40 to 60 % (Marciani et al., 2001c; Kwiatek et al., 2006). The contraction

1 Introduction
18
frequency was found to be 3 contractions/min (Marciani et al., 2001c). Reaching the pylorus,
fluid and small particles up to approximately 2 mm are emptied into the duodenum while
undigested larger particles are retained and digested further. This process is known as gastric
sieving (Schulze, 2006). As the ACW approaches the pylorus the sphincter narrows leading to
the retropulsion of chyme into the corpus. Repeated propulsion and retropulsion causes
grinding and size reduction of the solid contents until they can pass through the pylorus. When
digestion is finished, the stomach returns to the MMC during which indigestible large objects,
like tablets, are emptied.
1.2.4 In vivo hydrodynamics and forces
During gastric mixing and digestion considerable mechanical forces are acting on solid
structures like food particles or dosage forms provoking their disintegration. Thereby, fluid flow
around the objects generates shear forces that contribute to size reduction and breakage. Only
limited information is available in the literature concerning the flow velocity of gastric contents.
Hausken et al. (1992) studied the movement of luminal contents utilizing duplex sonography.
After ingestion of 500 mL meat soup peak velocities of 0.6 m/s were observed. The maximum
velocity during retropulsion was reported to be 0.2 m/s. Using a velocity-sensitive high speed
magnetic resonance imaging technique called echo planar imaging, Boulby et al. (1999)
reported maximum forwarded antral flow velocities of 0.05 m/s, 0.029 m/s, and 0.033 m/s
5 minutes after ingestion of a 5 % glucose solution, 10 % glucose solution, and a nutrient drink,
respectively. Peak velocities associated with the retrolpulsive flow were similar.
The direct measurement of forces on tablets is difficult. The mechanical destructive force in the
gastrointestinal tract was evaluated using a destructive force dependent release system (Kamba
et al., 2000). A marker drug contained in tablets was released only when the force on the
tablets was higher than the predetermined crushing strength. It was reported that the human
stomach has the potential to crush a tablet with a crushing strength of 1.50 N in the fasted state
and 1.89 N in the fed state. Using agar gel beads Marciani et al. (2001a) applied a similar
approach to determine destructive forces. They reported the maximum force exerted by the
antrum to be 0.65 N. Vassallo et al. (1992) utilized a combination of radioscintigraphy,
manometry, and axial force transducer with an inflatable balloon to measure axial forces during
emptying of liquid and solid meals. Cumulated axial forces per unit time are reported
6 N/30 min and 5.5 N/30 min for emptying of liquids and solids, respectively. Laulicht et al.
(2010) reported motive forces experienced by an orally ingested magnetic pill using high-
resolution pill tracking. Highest motive forces were observed during the MMC reaching 0.02481,

1 Introduction
19
0.03014, and 0.01236 N (2481, 3014, and 1236 dynes) in the three dimensions. Average human
gastric emptying forces were insignificantly lower in the fasted state (0.00414 N, 414 dynes)
compared to the fed state (0.00657 N, 657 dynes).
Also, pressure fields in the stomach need to be considered since pressure forces may play a
critical role in disintegration. Manometry has been widely used to investigate antroduodenal
pressures after ingestion of different meals (Indireshkumar et al., 2000; Janssen et al., 2011;
Janssen et al., 2012; Pauwels et al., 2014; Hausken et al., 2002). These studies revealed an
inhomogeneous pressure field with a pressure gradient between the distal antrum and the
proximal duodenum of 80 to 467 Pa (0.6 to 3.5 mm Hg). Fasting intragastric pressures in the
range of 800 to 1733 Pa (4.5 to 10 mm Hg) were reported. Infusion of nutritional drinks
increased the intragastric pressure, but no more than 1067 Pa (6.5 mm Hg).
1.2.5 Gastric emptying
Liquids and small particles are emptied from the stomach through the pylorus. Thereby,
transpyloric flow follows the pattern of antregrade and retrograde fluid movement. Particles,
too large to pass the pyloric sphincter are retained and further processed. It is assumed, that
particles smaller 2 mm can pass the pylorus. However, particles with a density higher than that
of water are retained by the above described process of gastric sieving (Schulze, 2006).
Emptying of large indigestible particles occurs only during phase III of the MMC.
Liquids and solids are emptied with different mechanisms. After ingestion of liquids, they
distribute rapidly throughout the stomach and are emptied immediately following first-order
kinetics (Hellström et al., 2006). In contrast, the emptying pattern of solids is biphasic (Hellström
et al., 2006; Schulze, 2006). After ingestion, a lag phase is observed during which only little
emptying occurs followed by extensive emptying following first-order kinetics. Thereby, particle
size, caloric content, and viscosity have been shown to influence gastric emptying (Marciani et
al., 2001b).

1 Introduction
20
1.3 Selected biorelevant in vitro models for dissolution testing
The USP and PhEur describe different in vitro methods to examine drug dissolution from oral
solid dosage forms. Many years the gold standard for dissolution testing was the paddle
apparatus. However, many studies reported a lack of in vivo-in vitro-correlation (IVIVC). With
todays knowledge about in vivo hydrodynamics and forces we can conclude that this lack of
IVIVC is due to the fact that the standard dissolution test devices are not able to simulate the
complex in vivo conditions appropriately.
In recent years many techniques like magnetic momentum imaging, gamma scintigraphy and
telemetry capsules were developed that could be used to visualize and understand gastric flows
and forces. Due to this new knowledge about the in vivo conditions certain attempts have been
done to develop more biorelevant in vitro models for the investigation of the drug dissolution
from oral solid dosage forms with some of them introduced in this section.
1.3.1 Paddle-bead method (Aoki et al., 1992; Aoki et al., 1993)
Figure 5: Paddle-bead method. a) Matrix tablet, b) beads, c) catheter, d) water bath, e) voltage control unit, f) recorder, g) integrator (Aoki et al., 1993).

1 Introduction
21
To examine the impact of mechanical stress on drug dissolution Aoki et al (1993; 1992)
introduced the paddle-bead method. This apparatus is a modification of the USP paddle
apparatus, where polystyrene beads (diameter 6.35 mm, specific gravity 1.05 g/cm3) are added
to the dissolution medium and dosage form in the vessel (Figure 5). Through the collision
between the beads and the solid oral dosage form mechanical forces are generated. The
number of the beads, the volume of dissolution medium as well as the paddle rotational speed
can be varied to achieve a range of impact forces. The impact force exerted by the beads can be
recorded by the catheter connected to the recorder. It was reported that the in vitro release
was similar to the in vivo release in fasted beagle dogs under the conditions of 25 rpm, 250 mL
of medium and 2500 beads (Aoki et al., 1992; Aoki et al., 1993).
1.3.2 Rotating beaker (Abrahamsson et al., 2005)
Figure 6: Rotating beaker apparatus (Abrahamsson et al., 2005)
The rotating beaker (Figure 6, Abrahamsson et al., 2004) was designed to simulate in vivo
surface shear stresses present in the postprandial stomach. The device is a simple modification
of the USP II apparatus. It consists of a beaker (220 mm diameter) with a tablet fixed centrally
55 mm from the center of the beaker and 40 mm below the free surface. The beaker can be
rotated at a constant rate between 8 and 50 rpm thereby producing a controlled fluid flow
around the tablet and biorelevant Reynolds numbers which are in the range of 0.1 to 30
(Abrahamsson et al., 2005). Fluid flow and surface shear stress in this device were calculated.
The erosion rate of HPMC matrix tablets was investigated under varying operating conditions. A
close relation between experimentally measured erosion rates and predicted shear stress was
demonstrated.
1 Introduction
22
The rotating beaker as well as the paddle-bead apparatus are simple models to investigate the
effect of an individual parameter on drug dissolution. They are not able to predict the
interaction of different parameters like hydrodynamics, mechanical stresses, media volumes
and composition and the dynamic changes.
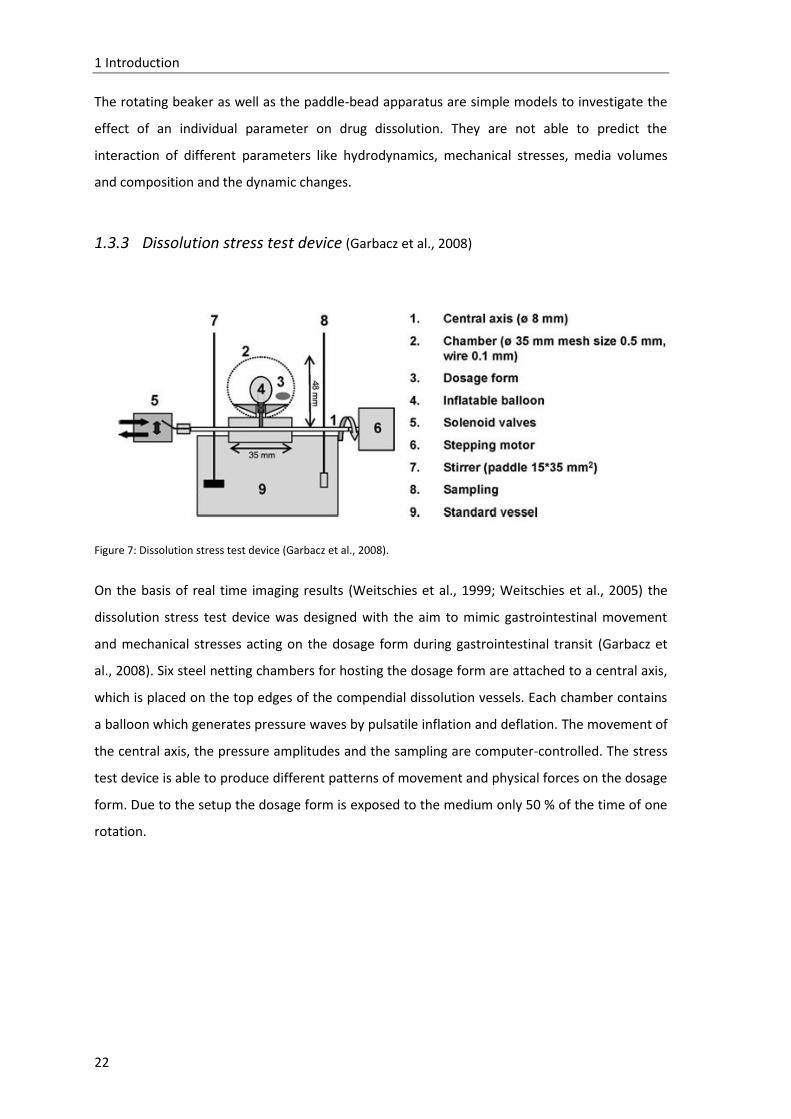
1.3.3 Dissolution stress test device (Garbacz et al., 2008)
Figure 7: Dissolution stress test device (Garbacz et al., 2008).
On the basis of real time imaging results (Weitschies et al., 1999; Weitschies et al., 2005) the
dissolution stress test device was designed with the aim to mimic gastrointestinal movement
and mechanical stresses acting on the dosage form during gastrointestinal transit (Garbacz et
al., 2008). Six steel netting chambers for hosting the dosage form are attached to a central axis,
which is placed on the top edges of the compendial dissolution vessels. Each chamber contains
a balloon which generates pressure waves by pulsatile inflation and deflation. The movement of
the central axis, the pressure amplitudes and the sampling are computer-controlled. The stress
test device is able to produce different patterns of movement and physical forces on the dosage
form. Due to the setup the dosage form is exposed to the medium only 50 % of the time of one
rotation.
1 Introduction
23
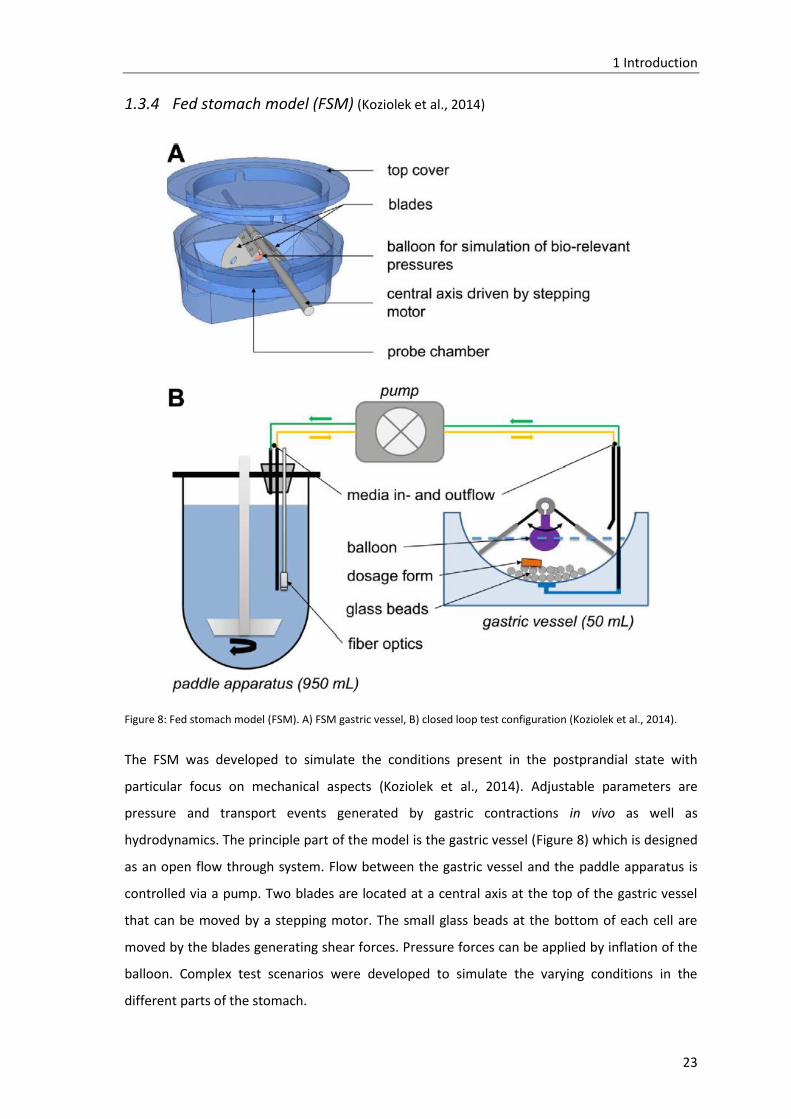
1.3.4 Fed stomach model (FSM) (Koziolek et al., 2014)
Figure 8: Fed stomach model (FSM). A) FSM gastric vessel, B) closed loop test configuration (Koziolek et al., 2014).
The FSM was developed to simulate the conditions present in the postprandial state with
particular focus on mechanical aspects (Koziolek et al., 2014). Adjustable parameters are
pressure and transport events generated by gastric contractions in vivo as well as
hydrodynamics. The principle part of the model is the gastric vessel (Figure 8) which is designed
as an open flow through system. Flow between the gastric vessel and the paddle apparatus is
controlled via a pump. Two blades are located at a central axis at the top of the gastric vessel
that can be moved by a stepping motor. The small glass beads at the bottom of each cell are
moved by the blades generating shear forces. Pressure forces can be applied by inflation of the
balloon. Complex test scenarios were developed to simulate the varying conditions in the
different parts of the stomach.

1 Introduction
24
1.3.5 Dynamic gastric model (DGM) (IFR, Norwich, U.K.))
Figure 9: Schematic presentation of the dynamic gastric model (Wickham and Faulks, 2012).
The DGM was initially developed for the dynamic physicochemical simulation of the intragastric
processing of food. It comprises two parts representing the fundus and antrum, respectively
(Figure 9). In the first part the mixing dynamics, diffusion profiles of acid and enzymes and
emptying cycles of the stomach are simulated. The processed material is transported to the
second part through a unique emptying cycle where higher shear is present forcing the
mechanical breakdown of the contents. The material emptied from the second part can be
further processed within a compartment simulating the small intestine. Originating from food
science the system was recently used to investigate food effect on drug release from matrix
tablets (Chessa et al., 2014).
1 Introduction
25
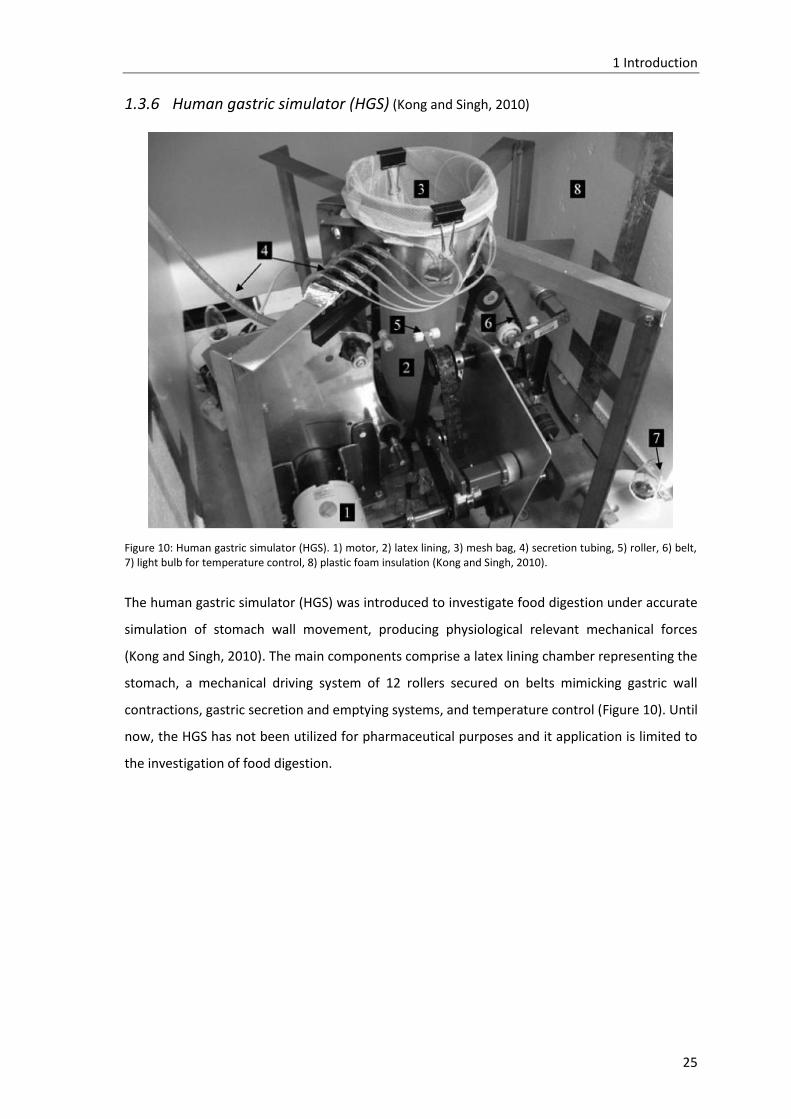
1.3.6 Human gastric simulator (HGS) (Kong and Singh, 2010)
Figure 10: Human gastric simulator (HGS). 1) motor, 2) latex lining, 3) mesh bag, 4) secretion tubing, 5) roller, 6) belt, 7) light bulb for temperature control, 8) plastic foam insulation (Kong and Singh, 2010).
The human gastric simulator (HGS) was introduced to investigate food digestion under accurate
simulation of stomach wall movement, producing physiological relevant mechanical forces
(Kong and Singh, 2010). The main components comprise a latex lining chamber representing the
stomach, a mechanical driving system of 12 rollers secured on belts mimicking gastric wall
contractions, gastric secretion and emptying systems, and temperature control (Figure 10). Until
now, the HGS has not been utilized for pharmaceutical purposes and it application is limited to
the investigation of food digestion.
1 Introduction
26
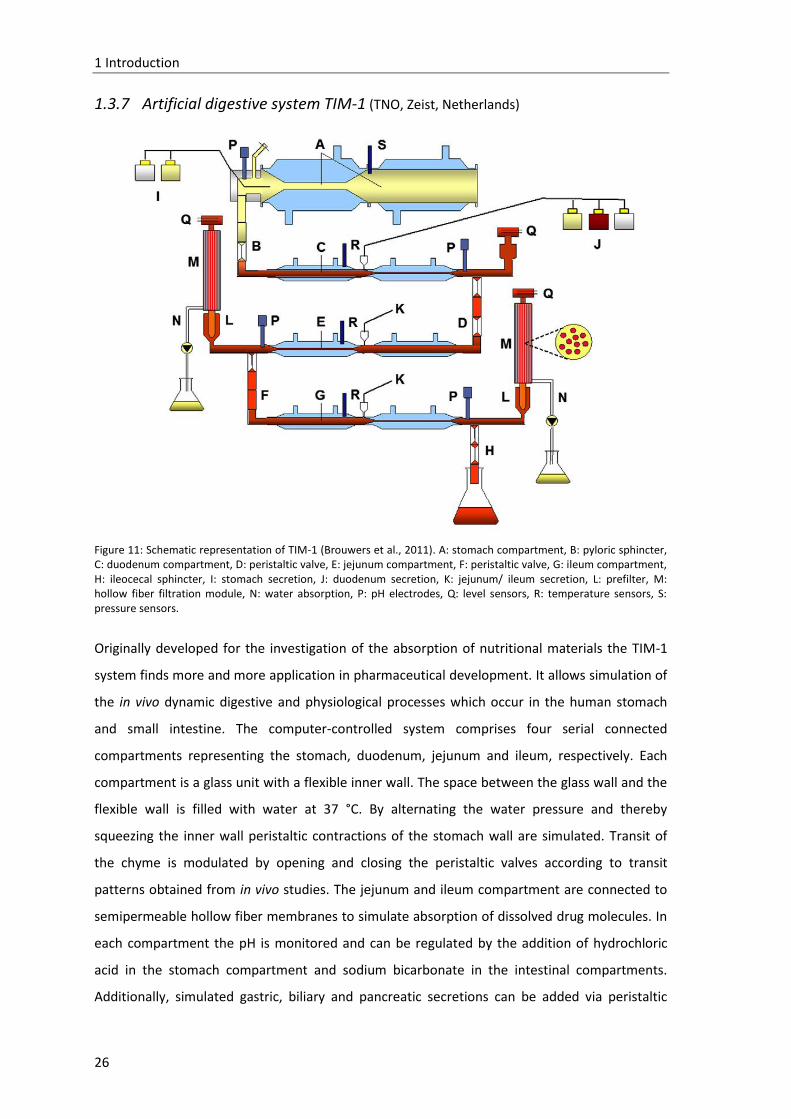
1.3.7 Artificial digestive system TIM-1 (TNO, Zeist, Netherlands)
Figure 11: Schematic representation of TIM-1 (Brouwers et al., 2011). A: stomach compartment, B: pyloric sphincter, C: duodenum compartment, D: peristaltic valve, E: jejunum compartment, F: peristaltic valve, G: ileum compartment, H: ileocecal sphincter, I: stomach secretion, J: duodenum secretion, K: jejunum/ ileum secretion, L: prefilter, M: hollow fiber filtration module, N: water absorption, P: pH electrodes, Q: level sensors, R: temperature sensors, S: pressure sensors.
Originally developed for the investigation of the absorption of nutritional materials the TIM-1
system finds more and more application in pharmaceutical development. It allows simulation of
the in vivo dynamic digestive and physiological processes which occur in the human stomach
and small intestine. The computer-controlled system comprises four serial connected
compartments representing the stomach, duodenum, jejunum and ileum, respectively. Each
compartment is a glass unit with a flexible inner wall. The space between the glass wall and the
flexible wall is filled with water at 37 °C. By alternating the water pressure and thereby
squeezing the inner wall peristaltic contractions of the stomach wall are simulated. Transit of
the chyme is modulated by opening and closing the peristaltic valves according to transit
patterns obtained from in vivo studies. The jejunum and ileum compartment are connected to
semipermeable hollow fiber membranes to simulate absorption of dissolved drug molecules. In
each compartment the pH is monitored and can be regulated by the addition of hydrochloric
acid in the stomach compartment and sodium bicarbonate in the intestinal compartments.
Additionally, simulated gastric, biliary and pancreatic secretions can be added via peristaltic
1 Introduction
27
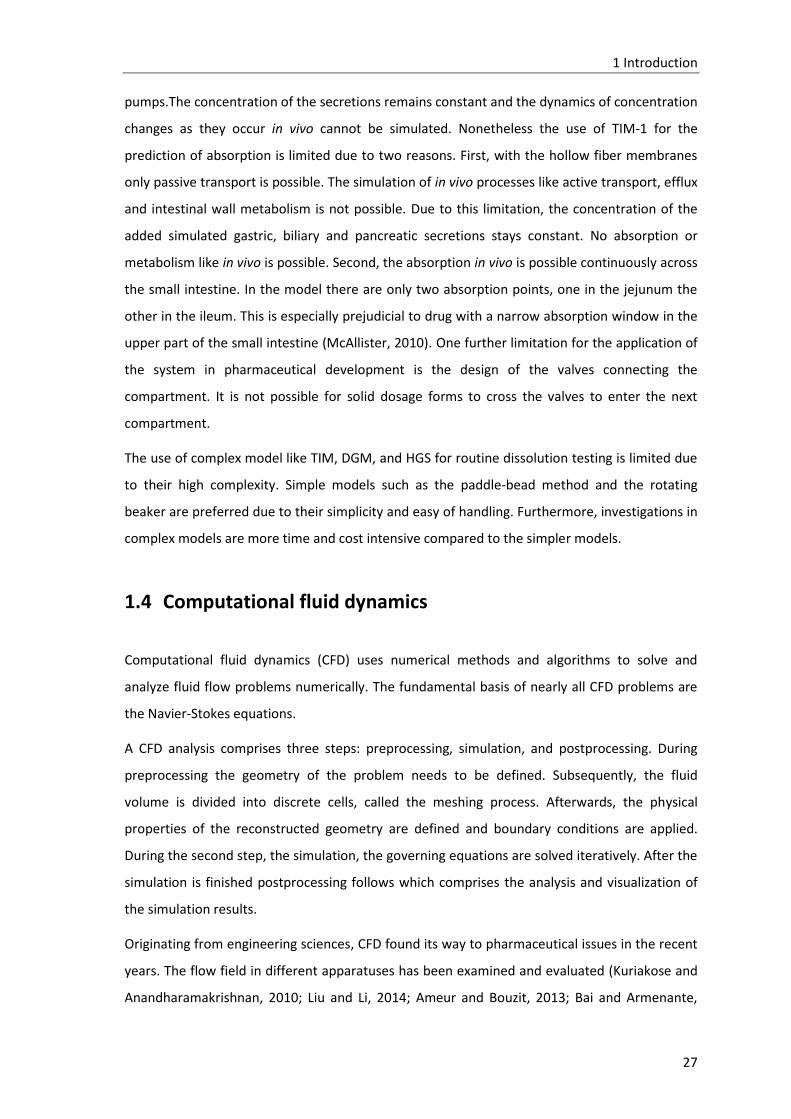
pumps.The concentration of the secretions remains constant and the dynamics of concentration
changes as they occur in vivo cannot be simulated. Nonetheless the use of TIM-1 for the
prediction of absorption is limited due to two reasons. First, with the hollow fiber membranes
only passive transport is possible. The simulation of in vivo processes like active transport, efflux
and intestinal wall metabolism is not possible. Due to this limitation, the concentration of the
added simulated gastric, biliary and pancreatic secretions stays constant. No absorption or
metabolism like in vivo is possible. Second, the absorption in vivo is possible continuously across
the small intestine. In the model there are only two absorption points, one in the jejunum the
other in the ileum. This is especially prejudicial to drug with a narrow absorption window in the
upper part of the small intestine (McAllister, 2010). One further limitation for the application of
the system in pharmaceutical development is the design of the valves connecting the
compartment. It is not possible for solid dosage forms to cross the valves to enter the next
compartment.
The use of complex model like TIM, DGM, and HGS for routine dissolution testing is limited due
to their high complexity. Simple models such as the paddle-bead method and the rotating
beaker are preferred due to their simplicity and easy of handling. Furthermore, investigations in
complex models are more time and cost intensive compared to the simpler models.
1.4 Computational fluid dynamics
Computational fluid dynamics (CFD) uses numerical methods and algorithms to solve and
analyze fluid flow problems numerically. The fundamental basis of nearly all CFD problems are
the Navier-Stokes equations.
A CFD analysis comprises three steps: preprocessing, simulation, and postprocessing. During
preprocessing the geometry of the problem needs to be defined. Subsequently, the fluid
volume is divided into discrete cells, called the meshing process. Afterwards, the physical
properties of the reconstructed geometry are defined and boundary conditions are applied.
During the second step, the simulation, the governing equations are solved iteratively. After the
simulation is finished postprocessing follows which comprises the analysis and visualization of
the simulation results.
Originating from engineering sciences, CFD found its way to pharmaceutical issues in the recent
years. The flow field in different apparatuses has been examined and evaluated (Kuriakose and
Anandharamakrishnan, 2010; Liu and Li, 2014; Ameur and Bouzit, 2013; Bai and Armenante,

1 Introduction
28
2008). CFD was also applied to parts of the human body like the coronary system (Chaichana et
al., 2012; Martorell et al., 2012), the respiratory system (Ides, 2012; Nowak et al., 2003; van
Ertbruggen et al., 2005), the nasal cavity (Di et al., 2013; Wang et al., 2012), and even the
stomach (Ferrua and Singh, 2010; Ferrua et al., 2011; Imai et al., 2013; Kozu et al., 2010; Pal et
al., 2004). The CFD studies on the flow field in the USP dissolution apparatuses and the human
stomach are of considerable importance for the present work and will be described in the
following sections.
1.4.1 Dissolution apparatus
In recent years, CFD was frequently used to examine the hydrodynamics of the USP paddle
dissolution apparatus. The results should help to understand the relations between
hydrodynamics and dissolution and to explain the failures in dissolution testing.
Several studies (Ameur and Bouzit, 2013; Bai and Armenante, 2008; Bai et al., 2007; Bai et al.,
2011; Baxter et al., 2005; Kukura et al., 2004; D’Arcy et al., 2009) have shown that the fluid flow
field in the USP 2 apparatus is highly heterogeneous. Velocity vector magnitude and direction
are strongly variable throughout the vessel (Figure 12 a)). In the region below the impeller,
where the dosage form is typically located, low fluid motion is predicted. Accordingly, the shear
rate is very low in this region (Figure 12 b)).
a) b)
Figure 12: CFD predictions of a) velocity vectors (m/s) and b) strain rate (1/s) on a vertical cross section through the impeller shaft (Bai 2007).
1 Introduction
29
Bai et al. (2011) observed that the flow pattern was nearly independent of the agitation speed.
However, local velocity magnitudes increase with increasing agitation speed whereby the
velocity in the region below the impeller is less affected by changes in agitation speed. Other
studies showed that the hydrodynamics and shear stresses inside the vessel are highly affected
by changes in the geometry or location of the impeller (Bai and Armenante, 2008; Ameur and
Bouzit, 2013). The dissolution profile was shown to be largely affected by the tablet position
due to different shear rates depending on the location (Bai and Armenante, 2009). The results
of this study could explain the variability in dissolution testing.
With the help of laser-Doppler velocimetry (LDV), particle image velocimetry (PIV) and planar
laser induced fluorescence (pLIF) it was proven that CFD models are able to predict the complex
hydrodynamics in the USP apparatus 2 (Bai et al., 2007; Baxter et al., 2005; Kukura et al., 2004).
The above discussed studies show that the CFD approach is capable of predicting complex fluid
flows in pharmaceutical test devices. The predicted results visualized and quantified the
hydrodynamics and shear rates in the USP dissolution apparatus and helped to explain the
problems and variability associated with dissolution testing.
1.4.2 Stomach
The idea to model the fluid flow field in the human stomach originates from food science. The
models were used to gain insights into gastric fluid flow and mixing of food to help to
understand food digestion. However, pharmacists can benefit from the results to get an idea of
dosage form performance in the stomach. Furthermore, the results can aid to formulate
advanced functional dosage forms that are adapted to the gastric environment.
Based on gastric motility patterns and the physicochemical properties of the luminal contents,
CFD can be used to examine gastric mixing and digestion. To analyze gastric mixing and
digestion a model of the human stomach needs to be constructed. Thereby, it is distinguished
between two- and three-dimensional models. Two- dimensional models assume axial symmetry
of the stomach and simplify the geometry to one plane. Since this assumption is difficult to
justify and the reliability of the results gained with two-dimensional models is questionable,
three-dimensional models were developed taking all three dimensions into account. Such
models are capable of reconstruct the shape and dimensions of a human stomach in the three-
dimensional space. All studies use numerical algorithms to rebuild the geometry of the stomach
as a function of time to simulate the propagation of the ACW towards the pylorus.

1 Introduction
30
Initial attempts to numerically model the flow field in the human stomach during digestion were
undertaken by Pal et al. (2004). Based on in vivo magnetic resonance imaging (MRI) data, the
authors constructed a simplified two-dimensional model of the stomach assuming that in
axisymmetric geometries the two-dimensional model has the same behavior as a three-
dimensional model. The propagation of successive ACWs was simulated using numerical
algorithms. The model was used to examine the influence of amplitude and width of the ACW
on gastric flow patterns. Two flow patterns inside the stomach were predicted: retroplusive jet-
like motions with highest fluid velocities reaching 7.5 mm/s and recirculating flow patterns
(eddy structures) between successive ACWs (Figure 13). These predictions are in accordance
with MRI results (Boulby et al., 1999). Strongest fluid motions were predicted in the antrum
indicating that this is the region of intense mixing and particle breakdown. But, since the
stomach is not axisymmetric, the predictions are only of limited value. Furthermore, physical
properties of the gastric juice, like viscosity, were not considered.
Figure 13: Predicted gastric fluid flow velocity vectors (black) at one time instant (modified from Pal et al., 2004). Due to the propagation of the ACW towards the pylorus the geometry of the stomach is changing continuously. Thus, the flow field is time-dependent and the figure shows an instantaneous snapshot. Two distinct flow patterns were predicted: retropulsive jet-like motions and recirculating structures.
Another two-dimensional CFD study was conducted by Kozu et al. (2010), who examined the
influence of fluid viscosity on the flow field. Additionally, attention was paid to fluid shear forces
induced by peristaltic flow. As with Pal et al. (2004), the two main flow structures, retropulsive
jet and eddy structures, were predicted. Highest retopulsive jet velocities reached 12 mm/s
using SGF as model gastric content. The fluid flow velocity in the occluded region was found to
be almost independent of the fluid viscosity but the flow velocity backwards the ACW decreased

1 Introduction
31
with increasing fluid viscosity (Figure 14). Maximum shear rates were predicted in the occluded
region reaching 20 s-1. The shear rate profile was found to be dependent on the fluid viscosity of
the model gastric contents.
Figure 14: a) Schematic diagram of the cross-sectional stomach shape and peristalsis, b) schematic diagram of the computational domain partly deformed by the ACW (t=20 s). The computational domain represents the distal part of the stomach, the antrum. The model was simplified to two dimensions. During the time dependent simulation the ACW propagates from the right to the left hand side. c) Velocity profiles along the center axis for different fluid viscosities ((a) 0.73 mPa s, (b) 1.0 mPa s, (c) 1.9 mPa s, (d) 3.8 mPa s, (e) 12.3 mPa s, (f) 147 mPa s, (g) 4760 mPa s) (Kozu et al., 2010).
The first three-dimensional numerical analysis of fluid flow in the human stomach was reported
by Ferrua et al. (2010; 2011). A highly three-dimensional flow field was predicted with strongest
fluid motions in the lower part of the stomach and slow recirculating flow in the upper part. The
two main flow patterns, retropulsive jet and eddies, that were already predicted using the two-
dimensional models, were also observed with the three-dimensional model (Figure 15). These
flow patterns showed a strong viscosity dependence. Using gastric contents of 1*10-3 Pas (1 cP)
maximum jet velocity is predicted to be 76 mm/s. By increasing the viscosity to 1 Pas (1000 cP)
highest jet velocity increases to 119 mm/s but the jet is restricted to a smaller region. The major
shortcomings of this study are the assumption of a fully filled stomach and a constantly closed
pylorus.

1 Introduction
32
a) b)
Figure 15: Instantaneous streamlines of gastric flow at t=10 s within the middle plane of the three- dimensional model colored by velocity magnitude (cm/s) (Ferrua and Singh, 2010). a) Newtonian fluid of 1*10
-3 Pas (1 cP), b)
Newtonian fluid of 1 Pas (1000 cP). The flow patterns and fluid viscosities show a marked viscosity dependence. By increasing the viscosity retropulsive jet velocities are higher but the jet is restricted to a smaller are compared to lower fluid viscosities.
Recently, Imai et al. (2013) numerically investigated the effects of posture and content volume
on the time-averaged flow field using an anatomical model of the stomach. They choose an
incompressible Newtonian liquid with a viscosity of 1 Pa s. As already observed in the studies
discussed above, a retropulsive jet and recirculating eddies were predicted in the antral region
in the upright position (Figure 16). Highest jet velocity is predicted to be 30 mm/s. In supine and
lateral positions the jet disappears due to the fact that the antrum is not filled with contents.
Only recirculating flow is observed. Regardless of the position, only contents located in the
antral recirculation zone are well mixed.
Figure 16: Instantaneous velocity vectors for upright position for two propagation states of the ACW. A) t= 0, B) t= 1/9T (T= time period) (Imai et al., 2013). Retropulsive flow is observed in the antral lumen narrowed by peristaltic contraction. Large recirculation appears throughout the antrum.

1 Introduction
33
All studies have the occurrence of the retropulsive jet in the antral region and the eddy
structures in the distal region in common. The retropulsive jet velocity and length was found to
be dependent on the viscosity of the model gastric contents. Highest predicted retropulsive
velocities differed strongly in magnitude ranging from 7.5 mm/s predicted by Pal et al. (2004) to
119 mm/s predicted by Ferrrua et al. (2011).
1.5 Gastroretentive drug delivery systems
Gastroretentive drug delivery systems (GRDDS) belong to the group of controlled release (CR)
dosage forms. GRDDS are designed to be retained in the stomach over a prolonged period of
time releasing the drug at a slow and constant rate. Several advantages are accompanied with
the prolonged gastric residence time. The most important is the enhancement of the
bioavailability of drugs with a small absorption window in the upper small intestine. Thereby the
therapeutic efficacy is improved, the necessary dose is reduced, and the dosing interval is
prolonged. Furthermore, GRDDSs are beneficial for locally active drugs like several antibiotics.
Factors affecting the residence time of GRDDSs in the stomach are size and shape of the dosage
form, prandial state of the stomach, gender, age, and posture (Prajapati et al., 2013). The
stability of the GRDDSs against hydrodynamic and mechanical forces is critical for their
efficiency. Insufficient stability will lead to breakage and loss of release control associated with
dose dumping and side effects.
Various approaches and formulations have been investigated since gastroretention has first
been mentioned as promising strategy more than 40 years ago (Singh and Kim, 2000). The most
common approaches include a) floating or low density systems, b) high density systems, c)
swelling or expanding systems, and d) bioadhesive or mucoadhesive systems (Figure 17).
Several reviews concerning the different formulation strategies are published (Streubel et al.,
2006; Singh and Kim, 2000; Prajapati et al., 2013; Lehr, 1994; Klausner et al., 2003; Bardonnet et
al., 2006; Arora et al., 2005). Therefore, the different approaches will be summarized only
briefly within the following sections.
1 Introduction
34
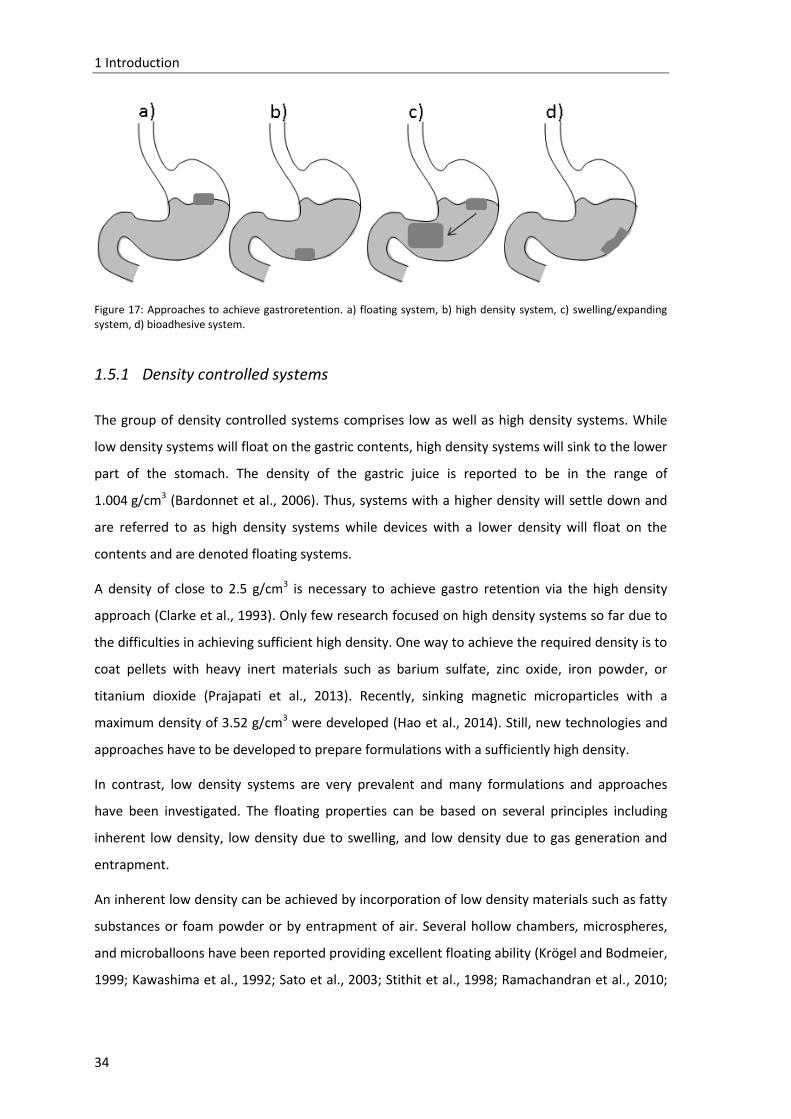
Figure 17: Approaches to achieve gastroretention. a) floating system, b) high density system, c) swelling/expanding system, d) bioadhesive system.
1.5.1 Density controlled systems
The group of density controlled systems comprises low as well as high density systems. While
low density systems will float on the gastric contents, high density systems will sink to the lower
part of the stomach. The density of the gastric juice is reported to be in the range of
1.004 g/cm3 (Bardonnet et al., 2006). Thus, systems with a higher density will settle down and
are referred to as high density systems while devices with a lower density will float on the
contents and are denoted floating systems.
A density of close to 2.5 g/cm3 is necessary to achieve gastro retention via the high density
approach (Clarke et al., 1993). Only few research focused on high density systems so far due to
the difficulties in achieving sufficient high density. One way to achieve the required density is to
coat pellets with heavy inert materials such as barium sulfate, zinc oxide, iron powder, or
titanium dioxide (Prajapati et al., 2013). Recently, sinking magnetic microparticles with a
maximum density of 3.52 g/cm3 were developed (Hao et al., 2014). Still, new technologies and
approaches have to be developed to prepare formulations with a sufficiently high density.
In contrast, low density systems are very prevalent and many formulations and approaches
have been investigated. The floating properties can be based on several principles including
inherent low density, low density due to swelling, and low density due to gas generation and
entrapment.
An inherent low density can be achieved by incorporation of low density materials such as fatty
substances or foam powder or by entrapment of air. Several hollow chambers, microspheres,
and microballoons have been reported providing excellent floating ability (Krögel and Bodmeier,
1999; Kawashima et al., 1992; Sato et al., 2003; Stithit et al., 1998; Ramachandran et al., 2010;

1 Introduction
35
Thanoo et al., 1993). Recently, the incorporation of foam powder was introduced as promising
mechanism to achieve floating drug delivery systems (Streubel et al., 2002, 2003).
Floating can also be achieved by swelling. These so called hydrodynamically balanced systems
(HBS) consist of gel-forming or highly swellable cellulose derivate hydrocolloids (Singh and Kim,
2000). Upon contact with gastric fluids, water is taken up and the polymers swell to several
hundred times of their initial volume. Different polymers have been evaluated for the
applicability in HBSs (Dorozyński et al., 2004; Gerogiannis et al., 1993; Baumgartner et al., 2000).
The performance of the systems was strongly dependent on the type of polymer, the properties
of the polymer, and processing parameters during preparation.
Another principle to provide floating is the generation of carbon dioxide within the device upon
contact with acid fluids. The entrapped carbon dioxide provides the floating ability. An acidic
component is therefore incorporated into the hydrocolloide matrix of the dosage form.
Commonly used compounds are citric acid and sodium bicarbonate (Ingani et al., 1987; Yang
and Fassihi, 1996; Rouge et al., 1998; Ichikawa et al., 1991; Li et al., 2003).
Raft forming systems are another type of GRDDSs based on the mechanism of floating. These
systems contain a gel forming agent (natural or synthetic polymers such as alginic acid, guar
gum, gellan gum, HPMC), effervescent agents and acid neutralizing agents (Mandel et al., 2000;
Prajapati et al., 2013). Upon contact with the gastric content a continuous layer floating on top
of the stomach content is formed due to gelling of the polymer. Carbone dioxide is generated
and entrapped further promoting floating.
The performance of floating drug delivery systems was found to be highly dependent on the
filling state of the stomach. It is recommended to administer floating systems after meal
ingestion (Agyilirah et al., 1991; Timmermans and Moës, 1994). Regarding published scientific
work and output of marketed products floating drug delivery systems are the most important
technology among the gastroretentive drug delivery approaches.
1.5.2 Swelling/ expandable systems
Expandable systems are designed to rapidly increase in size upon contact with the stomachs
content to prevent their emptying through the pylorus (Klausner et al., 2003). Besides the fast
increase in size these systems need to posses sufficient mechanical stability to withstand the
hydrodynamic and mechanical forces present in the human stomach. On the other hand, the
systems need to degrade after a certain period of time to prevent accumulation following
multiple administrations. The large increase in size is reached either by swelling or by unfolding.

1 Introduction
36
Several different shapes and materials were used to prepare unfolding GRDDSs (Cargill et al.,
1989; Fix et al., 1993; Kagan et al., 2006; Klausner et al., 2002; Klausner et al., 2003; Sonobe et
al., 1991; Curatolo et al, 1995). In order to facilitate swallowing the geometrical devices are
folded and placed into capsules. Upon fluid contact the capsule shell dissolves and the device
unfolds. The applicability of the unfolding systems is limited due to difficult and cost intensive
production.
Size increase can also be reached by swelling. GRDDSs based on this principle contain polymeric
hydrogel formers such as polyvinyl pyrrolidone, carbopol, or collagen. Upon contact with fluids
they rapidly swell to a few hundred times of their initial weight. Several promising dosage forms
are described in the literature (Chen et al., 2000; Deshpande et al., 1997; Shalaby and Park,
1990; Gröning et al., 2007).
1.5.3 Bioadhesive systems
Bioadhesive systems contain excipients that mediate adherence to the stomach wall thereby
preventing gastric emptying. Several hydrophilic polymers (e.g. crosslinked polyacrylic acids,
sodium carboxymethylcellulose, sodium alginate, and carrageenan) possess bioadhesive
properties. Several polymers and types of dosage forms have been evaluated for their
applicability for gastroretention via bioadhesion including microspehres (Hejazi and Amiji,
2002), microparticles (Cuña et al., 2001), and minitablets (Schmitz et al., 2005). However, only
few successful approaches are reported. The main challenge designing bioadhesive dosage
forms may be the high turnover rate of the gastric mucus limiting the residence time.
1.6 Polyelectrolyte complexes
Polyelectrolytes (PC) are polymers with functional groups that are charged or become charged
under suitable conditions (Luo and Wang, 2014). Polycations and polyanions can interact with
each other to form a polyelectrolyte complex (PEC). The interactions include electrostatic
attraction, dipole-dipole forces, and hydrogen bonds (Il'ina and Varlamov, 2005). Furthermore
the formation of the PEC is dependent on the degree of ionization of the PECs, their charge
density, their concentration and ratio, and the duration and temperature of formation (Il'ina
and Varlamov, 2005).
Several polyelectrolyte complexes have been evaluated for their potential to serve as controlled
release drug delivery systems (Moustafine et al., 2013; Moustafine et al., 2005a; Moustafine et

1 Introduction
37
al., 2005b; Moustafine et al., 2006; Obeidat et al., 2008; Park et al., 2008; Prado et al., 2008).
Polyelectrolyte complexes are traditionally formed by mixing the solutions of two oppositely
charged polymers. Thereby, a reversible electrostatic interaction between the polyelectrolytes
is formed. Briefly, solutions of the polyelectrolytes are prepared at the pH were they are
soluble. The solutions are mixed whereby the complex is obtained as precipitate that needs to
be dried by lyophilization for several days. The powder complex can then be processed to
receive the desired dosage form, like tablets or capsules.
Due to the complex and time consuming nature of the traditional manufacturing process, the
possibility of an in situ polyelectrolyte complex was investigated (Li et al., 2013b; Tapia et al.,
2002; Tapia et al., 2004).
Polyelectrolye complexes for intragastric delivery are rare (Bani-Jaber et al., 2011; de la Torre et
al., 2005; Gómez-Burgaz et al., 2008; Ngwuluka et al., 2013). However, due to their high ability
to swell and to retard drug dissolution, they are ideal candidates for gastroretentive drug
delivery systems. Therefore, this work describes the preparation and evaluation of an in situ
polyelectrolyte complex for intragastric drug delivery. This approach combines the swelling and
floating principle of gastroretention.
1.7 The need of a gastroretenive drug delivery system for
trospium chloride
Trospium chloride, 3-(2-hydroxy-2,2-diphenylacetoxy)spiro[bicyclo[3.2.1]octane-8,1'-pyrrolidin]-
1'-ium chloride, (Figure 18) is a quaternary amine belonging to the group of muscarinic
antagonist urinary antispasmodics. It is indicated for the treatment of overactive bladder with
symptoms of urgency, frequency, and urges incontinence. Different commercial oral products
are available comprising IR tablets (for example Trospi®, Spasmex®, Spasmolyt®) and CR
capsules (Urivex®).

1 Introduction
38
Figure 18: Structure of trospium chloride.
According to the biopharmaceutical classification system (BCS), which classifies APIs by their
solubility and permeability, trospium chloride is a BCS class III compound characterized by high
water solubility and low permeability. After oral administration the absorption of trospium is
slow and incomplete. The reported mean bioavailability is approximately 10 % (Doroshyenko et
al., 2005). Concomitant food intake further decreases the bioavailability. The low bioavailability
is potentially due to the small absorption window for trospium which is located in the upper
part of the small intestine (Schröder et al., 2004). The drug can only be absorbed when it
reaches this absorption window in dissolved form (Figure 19). A retarded formulation is
therefore not suitable for the delivery since all drug released following the absorption window
cannot be absorbed. A gastroretentive formulation, releasing the drug constantly in the
stomach, is a more promising approach to enhance the low bioavailability.
Figure 19: Drug absorption from a a) controlled release dosage form and b) gastroretentive dosage form.

2 Aims
39
2 Aims
Solid oral dosage form disintegration in the human stomach is a highly complex process
dependent on physicochemical properties of the stomach contents as well as on physical
variables such as hydrodynamics and mechanical stress. The PhEur recommends a simple test
device to evaluate disintegration times in vitro. However, in recent years knowledge about the
in vivo conditions has grown. With this new knowledge the demand for biorelevant in vitro
testing emerged and several biorelevant in vitro dissolution test devices have been introduced
lately. However, disintegration testing has been neglected so far. Understanding the role of
hydrodynamics and forces in disintegration and dissolution of oral solid dosage forms can help
to improve in vitro disintegration testing and the predictive power of the in vitro test.
In this work the hydrodynamic conditions and forces in the compendial PhEur disintegration test
device should be investigated using computational fluid dynamics (CFD). Fluid velocity and shear
stress on tablet surface should be quantified under simulating fasted and fed fluid
characteristics. To validate the computer simulation results experimental particle image
velocimetry (PIV) should be utilized. The predicted results should be compared to literature data
to evaluate the biorelevance of the compendial device.
Moreover, a modified disintegration test device should be constructed to mechanistically
investigate the influence of fluid velocity and pressure forces on disintegration of solid oral
dosage forms. The modified device should allow simple handling to be suitable for routine
testing. In addition, it should be possible to vary moving velocity velocity as well as applied
pressure over a wide range. Furthermore, the modified device should not be limited to vertical
movement like the compendial device but movement in the three-dimensional spece should be
possible. In vitro experiments should be conducted utilizing the modified device to determine
disintegration times of immediate release (IR) tablets. Hydrodynamic conditions and pressure
forces should be varied to simulate both, the fasted and the fed state. The relationship between
model medium, moving velocity, applied pressure, simulated shear stress and disintegration
times should be investigated.
Furterhmore, a gastroretentive drug delivery system should be developed to enhance the low
bioavailability of the BCS III compound trospium chloride. The approach of an in situ
polyelectrolyte complex should be verified. By this means, a strong polymeric network should
form upon contact with the stomach content to swell to a size too large to be emptied from the
stomach. Due to the expected low density of the matrices the systems are furthermore

2 Aims
40
supposed to float on the gastric content. Thereby two mechanisms of gastroretention are
utilized: swelling and floating. The in vitro evaluation of the matrices should comprise the
common techniques to evaluate the density, the degree of swelling, the mechanical stability,
and the drug release.
The resistance of gastroretentive drug delivery systems against hydrodynamic and shear
stresses present in the human stomach is essential for treatment success. Therefore, the degree
of swelling and the drug release should be tested utilizing the new modified disintegration test
device. The results should be compared with those of the classical in vitro tests.
3 Materials and Methods
41
3 Materials and Methods
3.1 The modified disintegration test device
The modification of the compendial PhEur disintegration test device comprised three
alterations:
Movement by a computerized numerical control (CNC)
By this modification the simulation of biorelevant moving velocities and profiles is possible.
While the movement of the basket is restricted to a sinusoidal vertical movement using the
compendial device various movement profiles in all three dimensions can be generated using
the modified device. The movement of the basket is accomplished by a thooted belt CNC drive
(LEZ 1, Isel Germany AG, Eichenzell, Germany) with high-torque stepping motor (MS045HT, Isel
Germany AG, Eichenzell, Germany) and 1:2 gear, that is controlled by a 4- axis stepping motor
controller (CSD 405-IMC, Isel Germany AG, Eichenzell, Germany). The program coding for the
movement of the drive was written in ProNC (Isel Germany AG, Eichenzell, Germany) (see 8.3).
All investigations performed in this work concentrate on the vertical movement of the basket.
Construction of a modified basket with open mesh structure
The advantage of the modified basket is its open design. While the fluid is restricted to the
tubes using the compendial basket, two-sided fluid flow is occurring using the modified basket.
The module consists of three quadratic probe chambers, where the chamber dimensions and
volume are referring to the descriptions of the compendial device given in the PhEur. The front
and back side of the probe chambers is made of wire mesh with a mesh size of 2 mm and
0.5 mm wire diameter (EKA, Bergisch Gladbach, Germany) allowing two-sided fluid flow. All
solid parts are made of polyethylene. Schematic diagrams, pictures and dimensions of the
modified basket are given in the results section (4.2) and in the appendix (8.2). The modified
device can be operated with both basket designs.
Simulation of forces by balloons
The modified basket can further be equipped with balloons to simulate biorelevant pressure
forces on the tablet surface. Therefore, cutaways are milled into the lateral polyethylene
chamber boundaries, in which the balloons can be clamped (picture see results section 4.2).
Inflation and deflation of the balloons is accomplished by the in-house built computerized
pressure-vacuum unit ‘DisPress’ (description see appendix 8.2).

3 Materials and Methods
42
3.2 Computational fluid dynamics (CFD)
Computational fluid dynamics is a powerful tool examine fluid flow phenomenon numerically. In
this work the CAD software SolidWorks (Dassault Systèmes SolidWorks Corporation, Waltham,
Massachusetts, USA) was used for construction of the geometry and for calculating the solution
of the fluid flow problems.
Simulations were performed for the PhEur/USP disintegration test device (3.2.2) and an in-
house built modified test device where the design of the basket was also modified (3.2.4).
3.2.1 Governing equations (from (SolidWorks Flow Simulation 2012 Technical Reference)
SolidWorks flow simulation solves the Navier-Stokes equations to predict the fluid flow field.
Those comprise the conservation of mass, momentum, and energy:
𝜕𝜌
𝜕𝑡+
𝜕
𝜕𝑥𝑖(𝜌𝑢𝑖) = 0
( 3 )
𝜕𝜌𝑢𝑖𝜕𝑡
+𝜕
𝜕𝑥𝑗(𝜌𝑢𝑖𝑢𝑗) +
𝜕𝑝
𝜕𝑥𝑖=
𝜕
𝜕𝑥𝑗(𝜏𝑖𝑗 + 𝜏𝑖𝑗
𝑅) + 𝑆𝑖𝑖 = 1,2,3 ( 4 )
𝜕𝜌𝐻
𝜕𝑡+𝜕𝜌𝑢𝑖𝐻
𝜕𝑥𝑖=
𝜕
𝜕𝑥𝑖(𝑢𝑗(𝜏𝑖𝑗 + 𝜏𝑖𝑗
𝑅) + 𝑞𝑖) +𝜕𝑝
𝜕𝑡− 𝜏𝑖𝑗
𝑅 𝜕𝑢𝑖𝜕𝑥𝑗
+ 𝜌휀 + 𝑆𝑖𝑢𝑖 + 𝑄𝐻 ( 5 )
with 𝐻 = ℎ +𝑢2
2
where 𝑢 is the fluid velocity, 𝜌 is the fluid density, 𝑆𝑖 is a mass-distributed external force per
unit mass due to a porous media resistance (𝑆𝑖𝑝𝑜𝑟𝑜𝑢𝑠
), a buoyancy (𝑆𝑖𝑔𝑟𝑎𝑣𝑖𝑡𝑦
= −𝜌𝑔𝑖, where 𝑔𝑖
is the gravitational acceleration component along the 𝑖-th coordinate direction), and the
coordinate system’s rotation (𝑆𝑖𝑟𝑜𝑡𝑎𝑡𝑖𝑜𝑛), ℎ is the thermal enthalpy, 𝑄𝐻 is a heat source or sink
per unit volume, 𝜏𝑖𝑘 is the viscous shear stress tensor, 𝑞𝑖 is the diffuse heat flux.

3 Materials and Methods
43
To predict turbulent flows, the Favre-averaged Navier-Stokes equations are used. Through this
procedure, extra terms appear in the equations. The shear stress tensor and the Reynolds-stress
tensor are defined as follows:
𝜏𝑖𝑗 = 𝜇 (𝜕𝑢𝑖𝜕𝑥𝑗
+𝜕𝑢𝑗
𝜕𝑥𝑖−2
3𝛿𝑖𝑗
𝜕𝑢𝑘𝜕𝑥𝑘
) ( 6 )
𝜏𝑖𝑗𝑅 = 𝜇𝑡 (
𝜕𝑢𝑖𝜕𝑥𝑗
+𝜕𝑢𝑗
𝜕𝑥𝑖−2
3𝛿𝑖𝑗
𝜕𝑢𝑘𝜕𝑥𝑘
) −2
3𝜌𝑘𝛿𝑖𝑗
( 7 )
with 𝛿𝑖𝑗 the Kronecker delta function, 𝜇 the dynamic viscosity coefficient, 𝜇𝑡 the turbulent eddy
viscosity coefficient and 𝑘 the turbulent kinetic energy. 𝜇𝑡 and 𝑘 are zero for laminar flow.
To calculate turbulent kinetic energy and its dissipation the 𝑘 − 휀 model is employed. In the
frame of this model the turbulent eddy viscosity coefficient is defined as:
𝜇𝑡 = 𝑓𝜇𝐶𝜇𝜌𝑘
2
휀
( 8 )
with 𝑘 the turbulent kinetic energy and 휀 the turbulent dissipation. 𝑓𝜇 is a turbulent viscosity
factor defined by:
𝑓𝜇 = [1 − exp(−0.025𝑅𝑦]2(1 +
20.5
𝑅𝑇)
( 9 )
where 𝑅𝑇 =𝜌𝑘2
𝜇𝜀 and𝑅𝑦 =
𝜌√𝑘𝑦
𝜇.
The following equations are used to describe the turbulent kinetic energy and dissipation:
𝜕𝜌𝑘
𝜕𝑡+
𝜕
𝜕𝑥𝑖(𝜌𝑢𝑖𝑘) =
𝜕
𝜕𝑥𝑖((𝜇 +
𝜇𝑡𝜎𝑘)𝜕𝑘
𝜕𝑥𝑖) + 𝑆𝑘
( 10 )
𝜕𝜌휀
𝜕𝑡+
𝜕
𝜕𝑥𝑖(𝜌𝑢𝑖휀) =
𝜕
𝑥𝑖((𝜇 +
𝜇𝑡𝜎𝜀)𝜕휀
𝜕𝑥𝑖) + 𝑆𝜀
( 11 )

3 Materials and Methods
44
with 𝑆𝑘 = 𝜏𝑖𝑗𝑅 𝜕𝑢𝑖
𝜕𝑥𝑗− 𝜌휀 + 𝜇𝑡𝑃𝐵
( 12 )
and 𝑆𝜀 = 𝐶𝜀1𝜀
𝑘(𝑓1𝜏𝑖𝑗
𝑅 𝜕𝑢𝑖
𝜕𝑥𝑗+ 𝜇𝑡𝐶𝐵𝑃𝐵) − 𝐶𝜀2𝑓2
𝜌𝜀2
𝑘
( 13 )
𝑃𝐵 represents the turbulent generation due to buoyancy forces and is defined as:
𝑃𝐵 = −𝑔𝑖𝜎𝐵
1
𝜌
𝜕𝜌
𝜕𝑥𝑖
( 14 )
where 𝑔𝑖 is the gravitational acceleration in direction 𝑥𝑖, 𝜎𝐵 = 0.9, and 𝐶𝐵=1 when 𝑃𝐵 > 0 and
0 otherwise. 𝑓1 and 𝑓2 are defined as follows:
𝑓1 = 1 + (0.05
𝑓𝜇)
3
, 𝑓2 = 1 − exp(−𝑅𝑇2)
( 15 )
The following constants are defined empirically; 𝐶𝜇 = 0.09, 𝐶𝜀1 = 1.44, 𝐶𝜀2 = 1.92, 𝜎𝜀 = 1.3,
and 𝜎𝑘 = 1.
3.2.2 Simulations in the PhEur disintegration apparatus
3.2.2.1 Geometry
The geometry of the basket-rack assembly with surrounding beaker was reconstructed
according to the depiction and dimensions mentioned in the PhEur (Ph.Eur., European
Pharmacopoeia, 2014; see also Figure 3). The beaker was constructed with 149 mm height and
an inner diameter of 106 mm. Since the requirement for an internal fluid flow analysis is a
closed geometry, the beaker was closed with a lid at the top. The glass tubes are 77.5 mm in
length with an inner diameter of 21.88 mm and a wall thickness of 1.9 mm. Both plates, keeping
the tubes in the vertical position, have a diameter of 90 mm and a thickness of 6.75 mm. The
mesh was constructed with a mesh size of 2 mm and a wire diameter of 0.615 mm. A tablet of
9 mm diameter and 5 mm height was placed in one of the tubes. Simulations were run under
the condition that the tablet is fixed at the wire mesh. Although this assumption does not

3 Materials and Methods
45
necessarily mimic the actual situation in the disintegration tester, it should be preferable due to
the defined position of the tablet when exposed to the hydrodynamic conditions. Figure 20
shows the reconstructed geometry of the PhEur basket-rack assembly.
a) b)
Figure 20: Reconstructed CFD geometry of PhEur basket-rack assembly with surrounding beaker. a) Front view, b) top view.
3.2.2.2 CFD setup
The setup used for this study is summarized in Table 3. The solution of the fluid flow in the
basket-rack assembly requires an internal analysis. Furthermore, the analysis is time dependent
due to the sinusoidal movement profile discussed in 1.1.2 and described by eqn. ( 2 ). Different
model liquids and pasty foods were chosen as model fluids to examine the influence of viscosity
on hydrodynamics. The properties of the fluid are discussed in detail in section 3.2.6. For the
Newtonian fluids the laminar and turbulent flow type was selected. For non-Newtonian fluids
the flow type is set to laminar only by default and cannot be changed. The temperature of the
system was set to 37 °C.
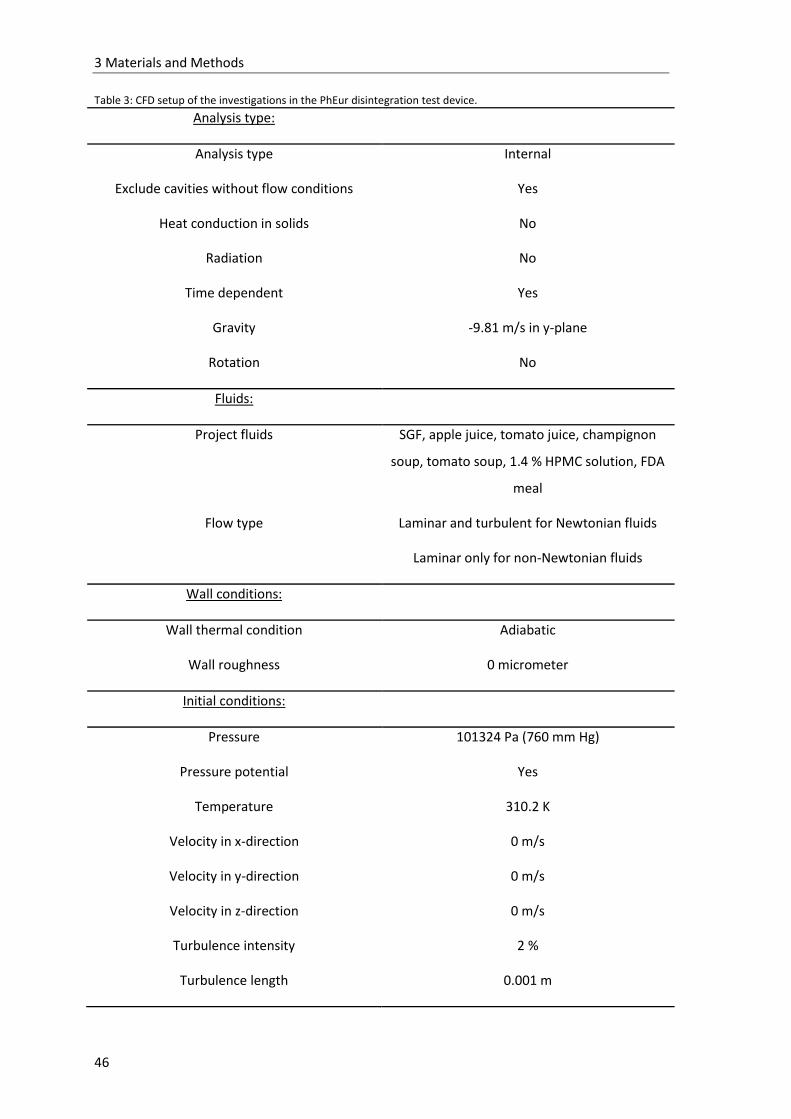
3 Materials and Methods
46
Table 3: CFD setup of the investigations in the PhEur disintegration test device.
Analysis type:
Analysis type Internal
Exclude cavities without flow conditions Yes
Heat conduction in solids No
Radiation No
Time dependent Yes
Gravity -9.81 m/s in y-plane
Rotation No
Fluids:
Project fluids SGF, apple juice, tomato juice, champignon
soup, tomato soup, 1.4 % HPMC solution, FDA
meal
Flow type Laminar and turbulent for Newtonian fluids
Laminar only for non-Newtonian fluids
Wall conditions:
Wall thermal condition Adiabatic
Wall roughness 0 micrometer
Initial conditions:
Pressure 101324 Pa (760 mm Hg)
Pressure potential Yes
Temperature 310.2 K
Velocity in x-direction 0 m/s
Velocity in y-direction 0 m/s
Velocity in z-direction 0 m/s
Turbulence intensity 2 %
Turbulence length 0.001 m

3 Materials and Methods
47
3.2.2.3 Boundary conditions
To solve the governing equations it in necessary to apply boundary conditions to the model. By
default the velocity boundary condition at all solid walls is set to non-slip. Atmospheric pressure
was applied to the top lid of the beaker. The bottom of the beaker was defined as fluid inlet and
outlet for the down and up movement, respectively. The fluid velocity at the inlet and outlet
followed the sinusoidal profile described by eqn. ( 2 ). The fluid flow condition was set to fully
developed. The wall of the beaker was defined as a real wall with no roughness and moved
together with the fluid.
3.2.2.4 Grid settings
To solve the governing equations over the fluid containing domain, the domain must be
separated into small elements, generally known as mesh or grid. The smaller the cell of the grid,
the more accurate the solution. However, with more cells, the computational effort increases
and the more computational power is required. Thus, the level of the grid always is a
compromise of accuracy and calculation time needed.
SolidWorks Flow Simulation possesses an automatic mesh generation tool which applies a
rectangular element mesh to the computational domain to differentiate between solid and fluid
cells. Varying levels, ranging from 1 to 8, can be selected by the user, with 1 being the coarsest
mesh and 8 being the most refined. For the Newtonian fluids, level 8 was applied. Due to
computational limitations, the mesh level was reduced to 5 for the non-Newtonian fluids.
3.2.3 Validation
To validate the CFD results, the predicted data was compared to experimental data obtained
from particle image velocimetry (PIV) (see 3.3). Therefore, the velocity inlet boundary condition
was changed to a constant velocity of 0.06 m/s which is similar to the fluid velocity applied in
the PIV experiment. The model fluid was SGF.
3.2.4 Simulations in the modified disintegration apparatus
3.2.4.1 Geometry
The geometry of the modified basket was reconstructed according to the illustration and
dimensions of the technical drawing (Appendix 8.2). The beaker was constructed with 145 mm
height and an inner diameter of 103 mm. Since the requirement for an internal fluid flow
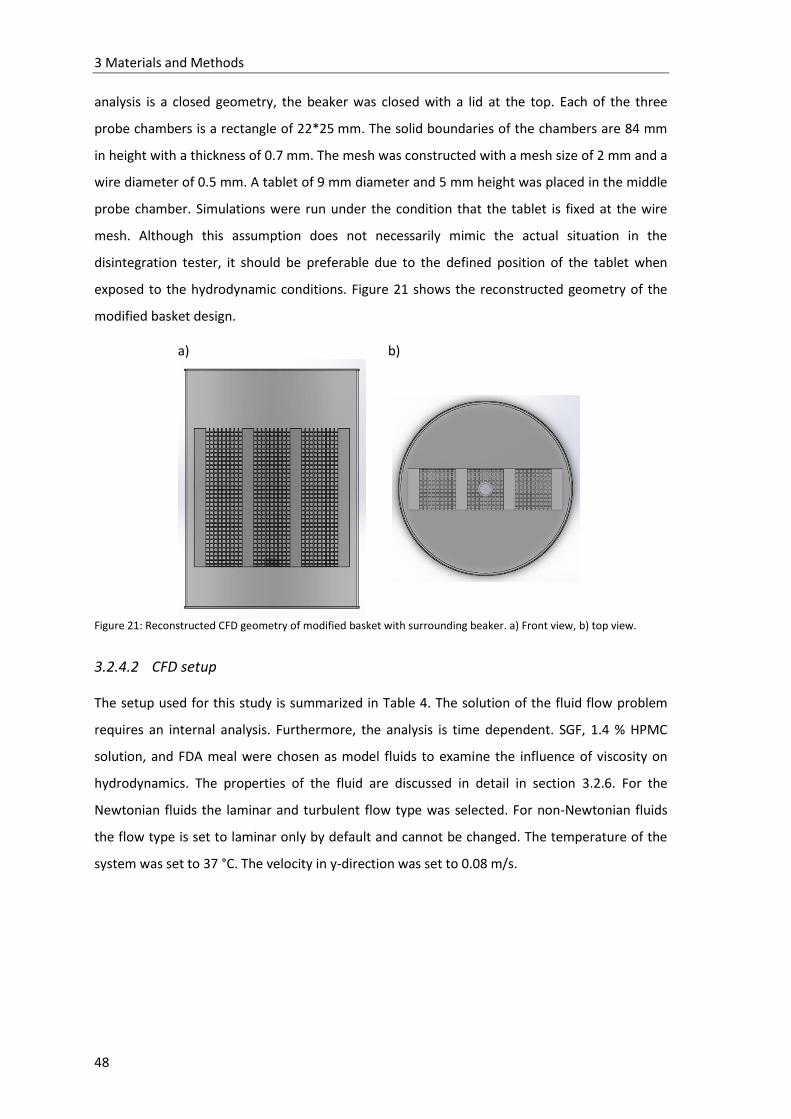
3 Materials and Methods
48
analysis is a closed geometry, the beaker was closed with a lid at the top. Each of the three
probe chambers is a rectangle of 22*25 mm. The solid boundaries of the chambers are 84 mm
in height with a thickness of 0.7 mm. The mesh was constructed with a mesh size of 2 mm and a
wire diameter of 0.5 mm. A tablet of 9 mm diameter and 5 mm height was placed in the middle
probe chamber. Simulations were run under the condition that the tablet is fixed at the wire
mesh. Although this assumption does not necessarily mimic the actual situation in the
disintegration tester, it should be preferable due to the defined position of the tablet when
exposed to the hydrodynamic conditions. Figure 21 shows the reconstructed geometry of the
modified basket design.
a) b)
Figure 21: Reconstructed CFD geometry of modified basket with surrounding beaker. a) Front view, b) top view.
3.2.4.2 CFD setup
The setup used for this study is summarized in Table 4. The solution of the fluid flow problem
requires an internal analysis. Furthermore, the analysis is time dependent. SGF, 1.4 % HPMC
solution, and FDA meal were chosen as model fluids to examine the influence of viscosity on
hydrodynamics. The properties of the fluid are discussed in detail in section 3.2.6. For the
Newtonian fluids the laminar and turbulent flow type was selected. For non-Newtonian fluids
the flow type is set to laminar only by default and cannot be changed. The temperature of the
system was set to 37 °C. The velocity in y-direction was set to 0.08 m/s.

3 Materials and Methods
49
Table 4: CFD setup modified disintegration test device.
Analysis type:
Analysis type Internal
Exclude cavities without flow conditions Yes
Heat conduction in solids No
Radiation No
Time dependent Yes
Gravity -9.81 m/s in y-plane
Rotation No
Fluids:
Project fluids SGF, 1.4 % HPMC solution, FDA meal
Flow type Laminar and turbulent for Newtonian fluids
Laminar only for non-Newtonian fluids
Wall conditions:
Wall thermal condition Adiabatic
Wall roughness 0 micrometer
Initial conditions:
Pressure 101324 Pa (760 mm Hg)
Pressure potential Yes
Temperature 310.2 K
Velocity in x-direction 0 m/s
Velocity in y-direction 0.08 m/s
Velocity in z-direction 0 m/s
Turbulence intensity 2 %
Turbulence length 0.001 m
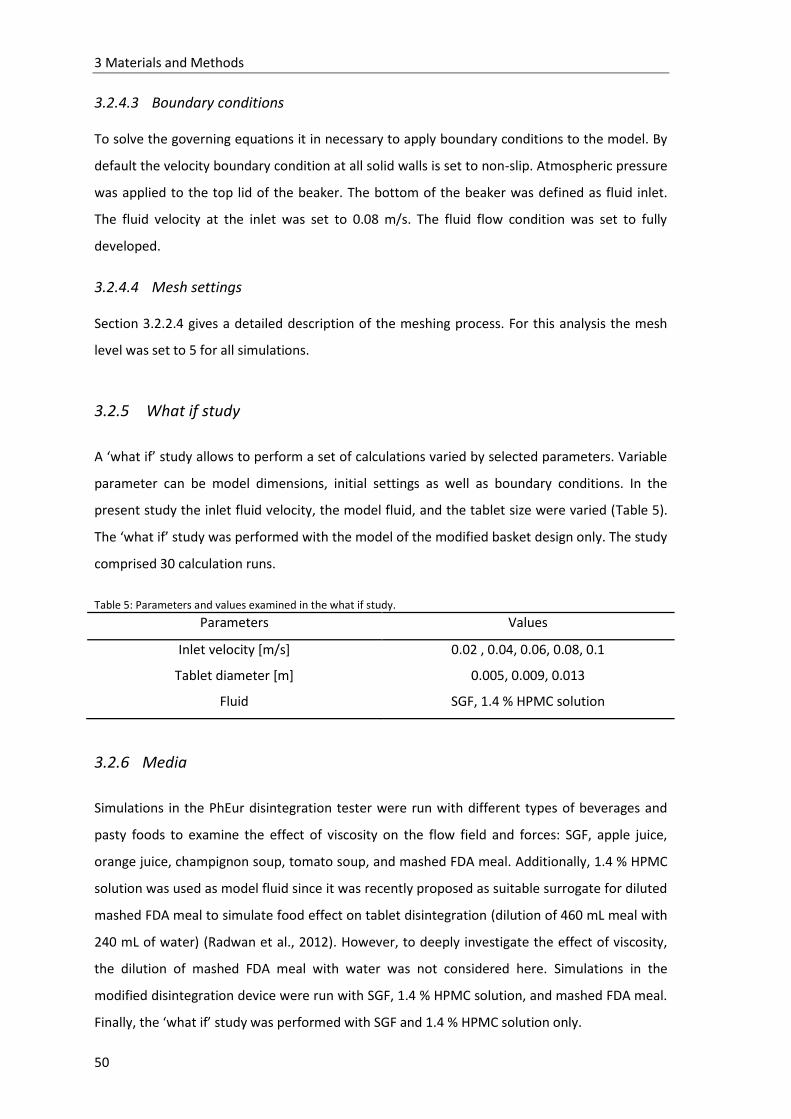
3 Materials and Methods
50
3.2.4.3 Boundary conditions
To solve the governing equations it in necessary to apply boundary conditions to the model. By
default the velocity boundary condition at all solid walls is set to non-slip. Atmospheric pressure
was applied to the top lid of the beaker. The bottom of the beaker was defined as fluid inlet.
The fluid velocity at the inlet was set to 0.08 m/s. The fluid flow condition was set to fully
developed.
3.2.4.4 Mesh settings
Section 3.2.2.4 gives a detailed description of the meshing process. For this analysis the mesh
level was set to 5 for all simulations.
3.2.5 What if study
A ‘what if’ study allows to perform a set of calculations varied by selected parameters. Variable
parameter can be model dimensions, initial settings as well as boundary conditions. In the
present study the inlet fluid velocity, the model fluid, and the tablet size were varied (Table 5).
The ‘what if’ study was performed with the model of the modified basket design only. The study
comprised 30 calculation runs.
Table 5: Parameters and values examined in the what if study.
Parameters Values
Inlet velocity [m/s] 0.02 , 0.04, 0.06, 0.08, 0.1
Tablet diameter [m] 0.005, 0.009, 0.013
Fluid SGF, 1.4 % HPMC solution
3.2.6 Media
Simulations in the PhEur disintegration tester were run with different types of beverages and
pasty foods to examine the effect of viscosity on the flow field and forces: SGF, apple juice,
orange juice, champignon soup, tomato soup, and mashed FDA meal. Additionally, 1.4 % HPMC
solution was used as model fluid since it was recently proposed as suitable surrogate for diluted
mashed FDA meal to simulate food effect on tablet disintegration (dilution of 460 mL meal with
240 mL of water) (Radwan et al., 2012). However, to deeply investigate the effect of viscosity,
the dilution of mashed FDA meal with water was not considered here. Simulations in the
modified disintegration device were run with SGF, 1.4 % HPMC solution, and mashed FDA meal.
Finally, the ‘what if’ study was performed with SGF and 1.4 % HPMC solution only.

3 Materials and Methods
51
Some physicochemical parameters of the fluids are listed in Table 6. Simulated gastric fluid
(SGF), which in terms of viscosity is equal to the simulated intestinal fluid (SIF), apple juice and
orange juice are Newtonian fluids, i. e. their viscosity is not influenced by the shear rate. In
contrast, champignon soup, tomato soup, and mashed FDA meal exhibit non-Newtonian flow
behavior, in which the viscosity decreases with increasing shear rate. This is important to
consider because of the different shear stresses during a cycle of up and down movement due
to the sinusoidal velocity profile.
Table 6: Viscosities and densities of the different model media.
Medium Viscosity [mPa*s] Density [g/L] Flow behavior
SGF 0.817* 0.997* Newtonian
Apple juice 1.062* 1.031* Newtonian
Orange juice 3.367* 1.034* Newtonian
Champignon soup Shear rate-viscosity profile 1.007* non-Newtonian
Tomato soup Shear rate-viscosity profile 1.002* non-Newtonian
Mashed FDA meal Shear rate-viscosity profile 0.992* non-Newtonian
1.4 % HPMC solution Shear rate-viscosity profile 1.031 non-Newtonian
*: from (Radwan et al., 2014)
The rheological profiles of champignon soup, tomato soup, 1.4 % HPMC solution, and mashed
FDA meal (Figure 22) were experimentally measured using a Haake Rheostress 1 viscosimeter
(Thermo Fisher Scientific, Karlsruhe, Germany), operating at room temperature at shear rates in
the range of 0 to 600 s-1. Data from rheological measurements were evaluated using the
attached RheoWin 4 data manager software. The shear stress-viscosity rheograms were loaded
into the fluid characteristics description of the software SolidWorks to account for the non-
Newtonian behavior. The software corrects the inserted values for the 37 °C used in this study
and adjusts the viscosity data for this temperature.
Champignon and tomato soup (Le Gusto, Dr. Lange & Co., GmbH, Düsseldorf, Germany) were
prepared by dissolving the content of the sachets in 500 mL boiling water. The homogenized
FDA meal was prepared of 2 slices of toasted white bread with butter, 2 eggs fried in butter, 2
slices of bacon, 2 ounces of hash browned potatoes and 8 ounces of whole milk and thoroughly
homogenized using an immersion blender. No further dilution with water was performed to
emphasize the effect of viscosity on hydrodynamics. Therefore, the viscosity of the mashed FDA
meal is higher compared to that of champignon soup, tomato soup, and 1.4 % HPMC solution
over the whole range of shear stress. The addition of 240 mL of water as proposed by Radwan
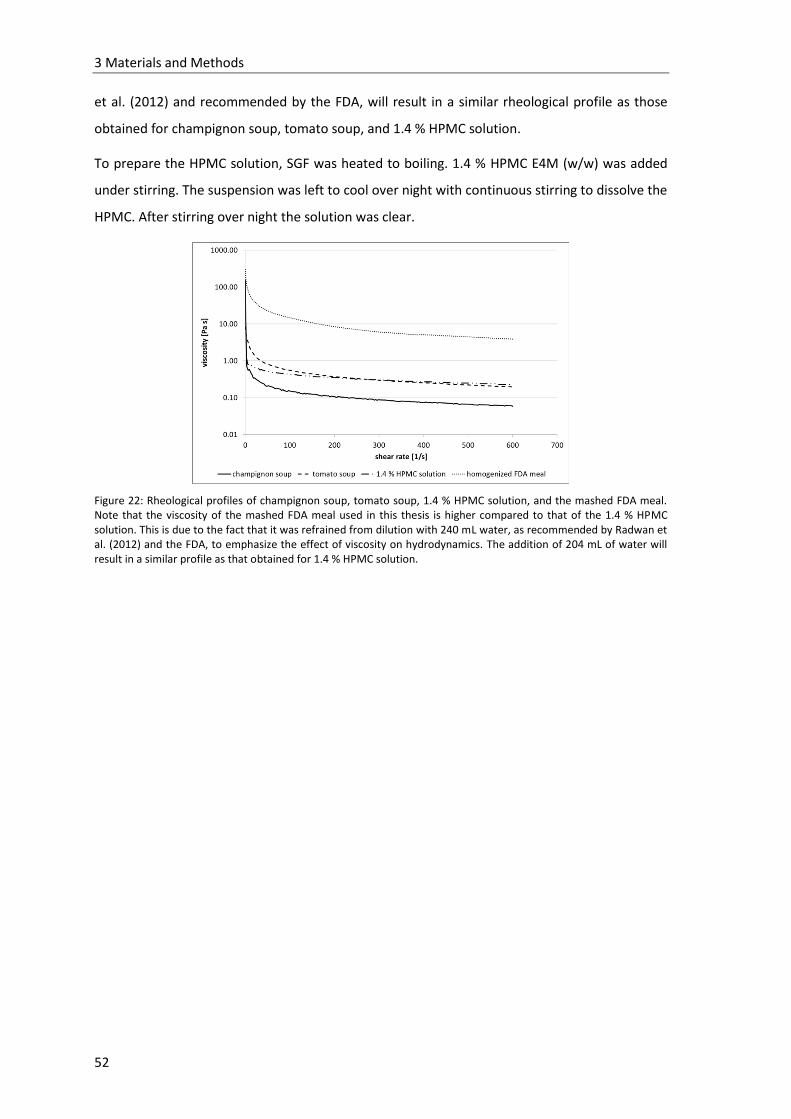
3 Materials and Methods
52
et al. (2012) and recommended by the FDA, will result in a similar rheological profile as those
obtained for champignon soup, tomato soup, and 1.4 % HPMC solution.
To prepare the HPMC solution, SGF was heated to boiling. 1.4 % HPMC E4M (w/w) was added
under stirring. The suspension was left to cool over night with continuous stirring to dissolve the
HPMC. After stirring over night the solution was clear.
Figure 22: Rheological profiles of champignon soup, tomato soup, 1.4 % HPMC solution, and the mashed FDA meal. Note that the viscosity of the mashed FDA meal used in this thesis is higher compared to that of the 1.4 % HPMC solution. This is due to the fact that it was refrained from dilution with 240 mL water, as recommended by Radwan et al. (2012) and the FDA, to emphasize the effect of viscosity on hydrodynamics. The addition of 204 mL of water will result in a similar profile as that obtained for 1.4 % HPMC solution.
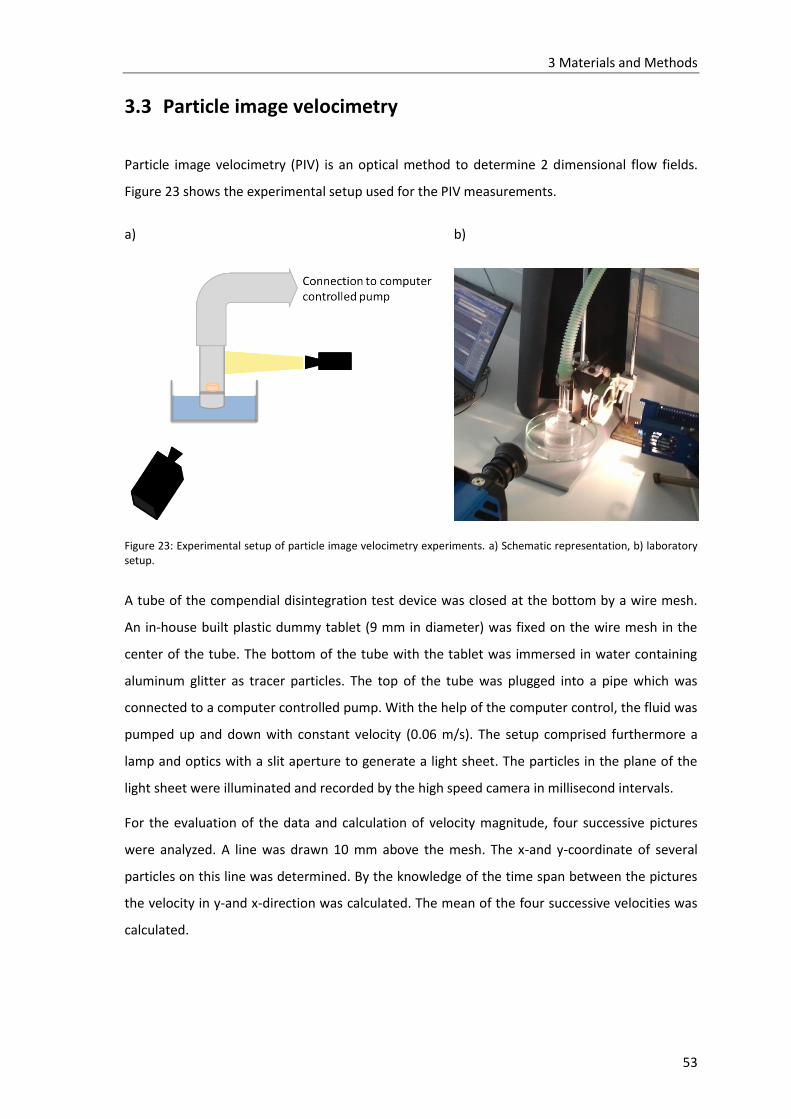
3 Materials and Methods
53
3.3 Particle image velocimetry
Particle image velocimetry (PIV) is an optical method to determine 2 dimensional flow fields.
Figure 23 shows the experimental setup used for the PIV measurements.
a) b)
Figure 23: Experimental setup of particle image velocimetry experiments. a) Schematic representation, b) laboratory setup.
A tube of the compendial disintegration test device was closed at the bottom by a wire mesh.
An in-house built plastic dummy tablet (9 mm in diameter) was fixed on the wire mesh in the
center of the tube. The bottom of the tube with the tablet was immersed in water containing
aluminum glitter as tracer particles. The top of the tube was plugged into a pipe which was
connected to a computer controlled pump. With the help of the computer control, the fluid was
pumped up and down with constant velocity (0.06 m/s). The setup comprised furthermore a
lamp and optics with a slit aperture to generate a light sheet. The particles in the plane of the
light sheet were illuminated and recorded by the high speed camera in millisecond intervals.
For the evaluation of the data and calculation of velocity magnitude, four successive pictures
were analyzed. A line was drawn 10 mm above the mesh. The x-and y-coordinate of several
particles on this line was determined. By the knowledge of the time span between the pictures
the velocity in y-and x-direction was calculated. The mean of the four successive velocities was
calculated.

3 Materials and Methods
54
3.4 Disintegration testing of immediate release tablets
All disintegration studies were performed using the modified disintegration test device
described in 3.1 and 8.2 using 800 mL of medium (SGF or 1.4 % HPMC solution, see 3.2.6). The
compendial as well as the modified basket design were employed. Immediate release (IR)
tablets were manufactured to examine the influence of hydrodynamics and pressure forces on
disintegration time. The composition of the investigated immediate release tablets is given in
Table 7. The powders were mixed thoroughly using a turbula mixer (Willy A. Bachofen AG
Maschinenfabrik, Muttenz, Switzerland) and compressed to 500 mg tablets (diameter 12 mm)
on an eccentric press (Korsch EK0, Korsch AG, Berlin, Germany). The compression force was
adjusted to 1, 2, 3, and 4 t to get batches with different tablet hardness.
Table 7: Composition of immediate release tablets.
Excipient Percentage
Lactose (Pharmatose® DCL 11, DMV international, Veghel, The Netherlands) 93
Polyvinylpyrrolidone K90 (Carl Roth GmbH, Karlsruhe, Germany) 2
Talc (Fagron, Barsbüttel, Germany, Ph Eur quality) 2
Aerosil (Fagron, Barsbüttel, Germany; Ph Eur quality) 2
Magnesium stearate (Caelo, Hilden, Germany; Ph Eur quality) 1
The influence of moving speed along the vertical axis, medium viscosity, and compression force
on disintegration time of IR tablets was investigated. Since the modified disintegration tester
can be operated with both, the compendial and the modified, basket design, the influence of
basket design can also be examined. To investigate the influence of these factors on
disintegration time, a design of experiments (DoE) was created using the software MODDE
(Umetrics, Umea, Sweden). Two separate designs were created for the compendial basket
design and the modified basket design. The factors and their level are summarized in Table 8
and the worksheet is depicted in the appendix 8.4.
Table 8: Settings of the factors used for the DoE.
Parameter Low level High level
Moving speed [mm/s] 40 80
Medium Viscosity [% HPMC] 0 1.4
Compression force [t] Multilevel: 1, 2, 3, 4

3 Materials and Methods
55
For comparison purpose, the disintegration times of commercial available calibrator tablets
mainly composed of lactose (RS tablets, Erweka, Heusenstamm, Germany) were measured
utilizing the modified disintegration test device equipped with the compendial basket and
operating at 40 and 80 mm/s in SGF and 1.4 % HPMC solution.
The programming software ProNC (isel Germany AG, Eichenzell, Germany) was used to write
the application program of the CNC controller (Appendix 8.3). This program controls the vertical
movement of the arm with constant velocity. Disintegration times were investigated at different
moving speeds of 20, 40, 60, 80, and 100 mm/s.
For measurements, investigating the influence of pressure on disintegration time, the modified
basket was equipped with balloons. Inflation and deflation was accomplished by the in-house
built computerized pressure-vacuum unit (8.2). The balloons were inflated to 100 mbar every
10 s.
3.5 Development and in vitro evaluation of a gastroretentive
drug delivery system
3.5.1 Materials
A gastroretentive drug delivery system based on a polyelectrolyte complex should be developed
and evaluated in vitro. Thereby, the polyelectrolyte complex should form in situ, in contrast to
the traditional strategy of forming the complex in solution. Hence, both polyelectrolytes need to
be ionized in the pH range of the stomach. Two natural polyelectrolytes that accomplish this
requirement are chitosan and carrageenan.
3.5.1.1 Chitosan
Chitosan (Figure 24) is a natural polysaccharide composed of repeating glucosamine and N-
acetyl glucosamine units. It is obtained by N-deacetylation of chitin, which is found in the
exoskeleton of crustaceans, insects, and fungi. In acidic medium the amino groups become
protonated resulting in high charge density making it an ideal candidate to form a
polyelectrolyte complex interaction. Due to its good solubility in acidic medium chitosan alone
has limited capability for controlling drug release.

3 Materials and Methods
56
Figure 24: Structural formula of chitosan.
In this study three different types of chitosan were utilized to examine the influence of the
degree of deacetylation and the viscosity on the formation of a polyelectrolyte complex and on
the physicomechanical stability. All types were purchased form Heppe Medical Chitosan (Heppe
Medical Chitosan, Halle, Germany). Table 9 list the specifications of the used types of chitosan
80/1000, 80/500, and 95/500. The first value in the names states the degree of deacetylation
and the second the viscosity.
Table 9: Specifications of chitosan.
95/500 80/500 80/1000
Degree of deacetylation 94.9 % 78 % 79.8 %
Viscosity (1 % in 1% acetic acid, 20 °C) 364 mPa s 710 mPa s 1037 mPa s
pH (10 g/L in 1% acetic acid, 20 °C) 3.0-4.0 3.0-4.0 3.0-4.0
3.5.1.2 Carrageenan
Carrageenan is a natural, sulphated polysaccharide consisting of galactose and 3,6-
anhydrogalactose units. In acidic medium the sulfate groups become deprotonated resulting in
high charge density making it an ideal candidate to form a polyelectrolyte interaction. Two
types of carrageenan, namely iota-carrageenan 379 and lambda-carrageenan 209 (Figure 25),
were utilized in this work. Both were kindly provided by IMCD/ FMC BioPolymer (IMCD
Germany GmbH & Co. KG, Cologne, Germany). Table 10 lists the specifications of the used types
of carrageenan.
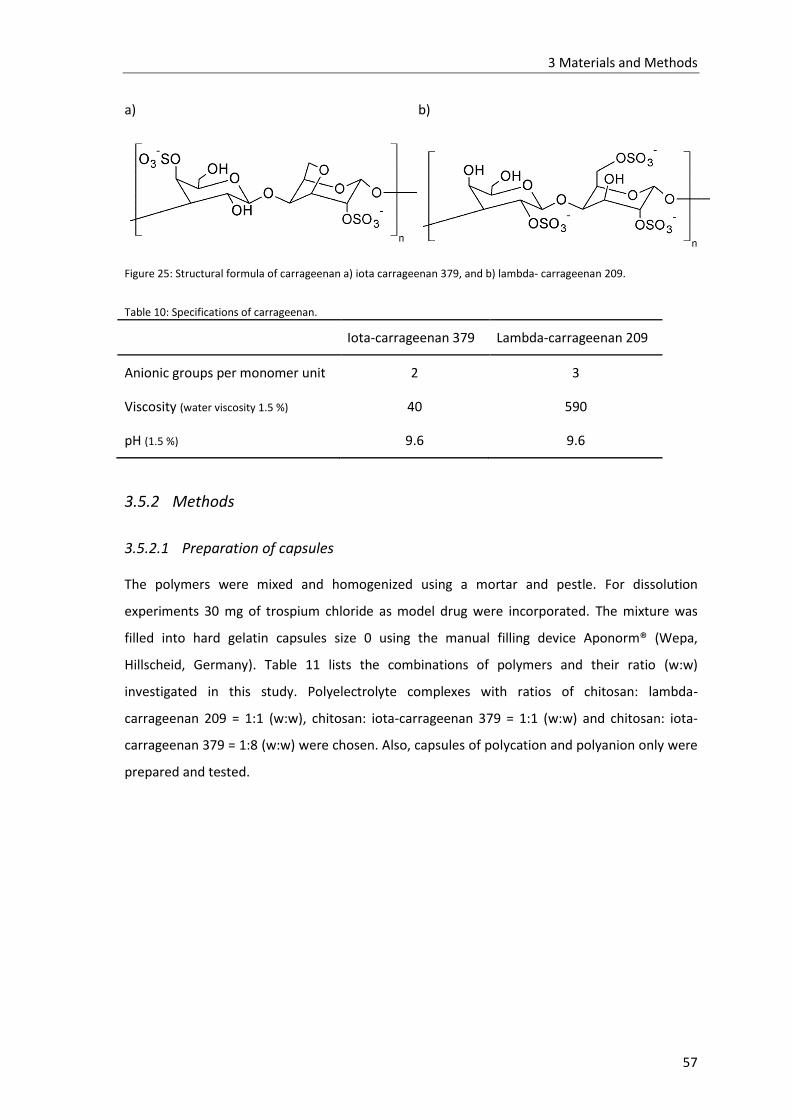
3 Materials and Methods
57
a) b)
Figure 25: Structural formula of carrageenan a) iota carrageenan 379, and b) lambda- carrageenan 209.
Table 10: Specifications of carrageenan.
Iota-carrageenan 379 Lambda-carrageenan 209
Anionic groups per monomer unit 2 3
Viscosity (water viscosity 1.5 %) 40 590
pH (1.5 %) 9.6 9.6
3.5.2 Methods
3.5.2.1 Preparation of capsules
The polymers were mixed and homogenized using a mortar and pestle. For dissolution
experiments 30 mg of trospium chloride as model drug were incorporated. The mixture was
filled into hard gelatin capsules size 0 using the manual filling device Aponorm® (Wepa,
Hillscheid, Germany). Table 11 lists the combinations of polymers and their ratio (w:w)
investigated in this study. Polyelectrolyte complexes with ratios of chitosan: lambda-
carrageenan 209 = 1:1 (w:w), chitosan: iota-carrageenan 379 = 1:1 (w:w) and chitosan: iota-
carrageenan 379 = 1:8 (w:w) were chosen. Also, capsules of polycation and polyanion only were
prepared and tested.

3 Materials and Methods
58
Table 11: Formulations tested in this study
Polymers Ratio (w:w)
80/1000:379 1:8
80/1000:379 1:1
80/1000:209 1:1
80/500:379 1:8
80/500:379 1:1
80/500:209 1:1
95/500:379 1:8
95/500:379 1:1
95/500:209 1:1
379 1
209 1
80/1000 1
80/500 1
95/500 1
3.5.2.2 FT-IR
To confirm the formation of a polyelectrolyte complex FT-IR was utilized. Spectra of chitosan,
carrageenan, and complexes were taken. For the latter the complexes was freeze dried (Christ
Alpha 1-4, Martin Christ GmbH, Osterode, Germany) after 24 h of dissolution testing in SGF.
Spectra were obtained using a FT-IR spectrophotometer (FT-IR 8400S, Shimadzu, Duisburg,
Germany) equipped with an ATR attachment at 4000-750 cm-1.
3.5.2.3 Density of the gastroretentive matrix
The capsules were immersed in SGF maintained at 37 °C and softly agitated in a water bath. At
predetermined time intervals the complexes were removed from the immersion medium and
topically dried by tissue paper. The weight, diameter and length of the complexes were
determined. The complexes were returned to the medium. Volume and density were
calculated. Density measurements were undertaken in triplicate and the mean±SD reported.

3 Materials and Methods
59
3.5.2.4 Matrix swelling
The weighed capsules were placed in a beaker containing 100 mL of SGF or acetate buffer pH
4.5 at 37°C. The beaker was placed in a water bath maintained at 37 °C and softly agitated. At
predetermined time intervals the matrices were removed from the medium, topically dried by
tissue paper, weighed, and returned to the medium.
The degree of swelling 𝑆 was calculated using Eqn. ( 16 ).
𝑆 =𝑚𝑡 −𝑚𝑖
𝑚𝑖∗ 100
( 16 )
where 𝑚𝑡 is the mass at time 𝑡, and 𝑚𝑖 is the initial mass. Matrix swelling for each formulation
was undertaken in triplicate and the mean±SD reported.
3.5.2.5 Effect of hydrodynamics on swelling
To examine the matrices ability to withstand hydrodynamic stress the systems were tested
using the compendial PhEur/USP disintegration tester. All systems were investigated in SGF at
37 °C. Also, capsules containing chitosan only and carrageenan only were tested. Formulations
80/1000:379 1:8 and 80/1000:209 1:1 were additionally investigated in acetate buffer pH 4.5 to
examine the pH dependency of the matrices. All studies were undertaken in triplicate and the
mean±SD reported.
Formulation 80/1000:379 = 1:8 was additionally tested using the modified disintegration test
device (3.1) equipped with the compendial basket to examine the influence of different moving
velocities along the vertical axis on the swelling behavior. The formulation was investigated in
SGF and the device was operated at 40 and 80 mm/s.
The capsules were weighed, placed in the tubes/ probe chambers of the device, and the up and
down movement was started. At predetermined time intervals the complexes were removed,
topically dried by tissue paper, and weighed. The degree of swelling 𝑆 was calculated using Eqn.
( 17 ).
𝑆 =𝑚𝑡 −𝑚𝑖
𝑚𝑖∗ 100 ( 17 )
where 𝑚𝑡 is the mass of the swollen complex at time 𝑡, and 𝑚𝑖 is the initial mass of the
complex.

3 Materials and Methods
60
3.5.2.6 Physicomechanical strength
The ability of the complexes to withstand mechanical stress was tested using a Texture Analyzer
(TA.XTplus, Stable Microsystems, Surrey, UK). Therefore, capsules were placed in a beaker
containing 100 mL of SGF. The beaker was placed in a water bath maintained at 37 °C and softly
agitated. At 2, 4, 6 and 8 h the complexes were removed from the immersion medium and
force-time and force-distance diagrams were recorded using a 12 mm (MH, DE) and a 25 mm
(MR) probe, respectively. Data were recorded and evaluated using the Texture Exponent
software. The settings employed for the study are summarized in Table 12.
Table 12: Parameter settings for texture analyzer study
Parameters MR (%) MH (N/mm2) DE (J)
Pre-test speed 1 mm/s 1 mm/s 1 mm/s
Test speed 0.5 mm/s 0.5 mm/s 0.5 mm/s
Post-test speed 10 mm/s 10 mm/s 10 mm/s
Trigger type Auto Auto Auto
Trigger force 1 g 1 g 1 g
Load cell 5 kg 5 kg 5 kg
Target mode Strain (5%) Distance (5 mm) Distance (5 mm)
Matrix resilience (MR) was calculated from the force-time profile as the ratio between the area
under the curve (AUC) of the peak to baseline after the force is removed (AUC24) and the
baseline to peak before the force removed (AUC12) (Figure 26 a). Matrix hardness (MH) and
deformation energy (DE) were calculated form the force-distance profiles (Figure 26 b). Here,
MH is the gradient between initial and maximal force and DE is the area under the curve (AUC12)
(Bawa et al., 2011; Ngwuluka et al., 2013).

3 Materials and Methods
61
a) b)
Figure 26: Typical a) force-time and b) force-distance profiles for determining matrix resilience (a) and matrix hardness and deformation energy (b).
3.5.2.7 In vitro drug release
In vitro release testing of trospium chloride was performed using USP dissolution apparatus 2
(Sotax AT7, Holm and Halby, Allschwil, Switzerland) connected to an autosampler (Dissoette II,
Hanson research, Chatsworth, CA, USA). 900 mL SGF or acetate buffer pH 4.5 maintained at
37 °C were used. Paddle speed was set to 50 rpm. At predefined time intervals 5 mL samples
were withdrawn and replaced with fresh medium. Samples were analyzed by HPLC. Drug
release studies were undertaken in triplicate within each medium for every formulation and the
mean±SD reported.
Release testing of formulation 80/1000:379 = 1:8 was additionally performed utilizing the
modified disintegration test device (3.1) equipped with the compendial basket operating at 40
and 80 mm/s to examine the influence of hydrodynamics on the drug release profile. 800 mL of
SGF maintained at 37 °C were used. The vertical movement of the modified device was set to 40
and 80 mm/s and the profiles were compared to that obtained using USP apparatus II. Drug
release studies at 80 mm/s were undertaken in triplicate, where one capsule was measured per
trial on three days and the mean±SD is reported. Due to the low SD, drug release studies at 40
mm/s were undertaken in triplicate, where three capsules were measured per trial on one day
and the obtained concentration was divided by three and reported as mean.
3.5.2.7.1 HPLC procedure
Before analyzing by HPLC samples were precipitated with acetonitrile (sample: acetonitrile= 1:2)
and centrifuged at 5 °C and 14000 rpm for 30 min and injected into the HPLC system. Chromatic

3 Materials and Methods
62
conditions are summarized in Table 13. Calibration solutions were prepared in SGF or acetate
buffer, respectively.
Table 13: Chromatographic conditions for the detection of trospium chloride from dissolution samples.
Column LiCroChart 125 x 4 mm, RP-8, Supersphere 60, Merck, Darmstadt, Germany
Mobile phase Acetnonitrile:Phosphate buffer 70:30
Phosphate buffer K2HPO4 x 3 H2O 0.003 M
Phosphoric acid 85 % 1.5 mL
pH adjusted (NaOH) 2.2
temperature ambient
Flow rate 1.2 mL/min
detection UV absorption at 210 nm
Injection volume 20 µL
Running time 5 min
The HPLC method was validated for linearity, precision, accuracy, limit of detection (LOD), and
limit of quantification (LOQ). To confirm linearity standard calibration curves in the range of 0.5
to 30 µg/mL (corresponding to 2 to 140 % of maximum probe concentration) were prepared
and measured each day on three subsequent days. Linear regression analysis of peak area
versus drug concentration curves was performed to calculate the coefficient of correlation (R),
slope and intercept. The data of peak area versus drug concentration were treated by linear
regression analysis. Precision, expressed as % relative standard deviation (RSD), and accuracy,
expressed as % relative error (RE), were investigated for three concentration levels within one
day (intra-day, n=3) as well as on three successive days (inter-day, n=3). LOD and LOQ were
determined based on the standard deviation of the blank and the slope of the calibration curve
according to ( 18 )and ( 19 ) and were 0.045 µg/mL and 0.2 µg/mL, respectively. Results of the
validation procedure are summarized in Table 14.
LOD= 3.3 ∗𝜎
𝑆
( 18 )
LOQ= 10 ∗𝜎
𝑆
( 19 )
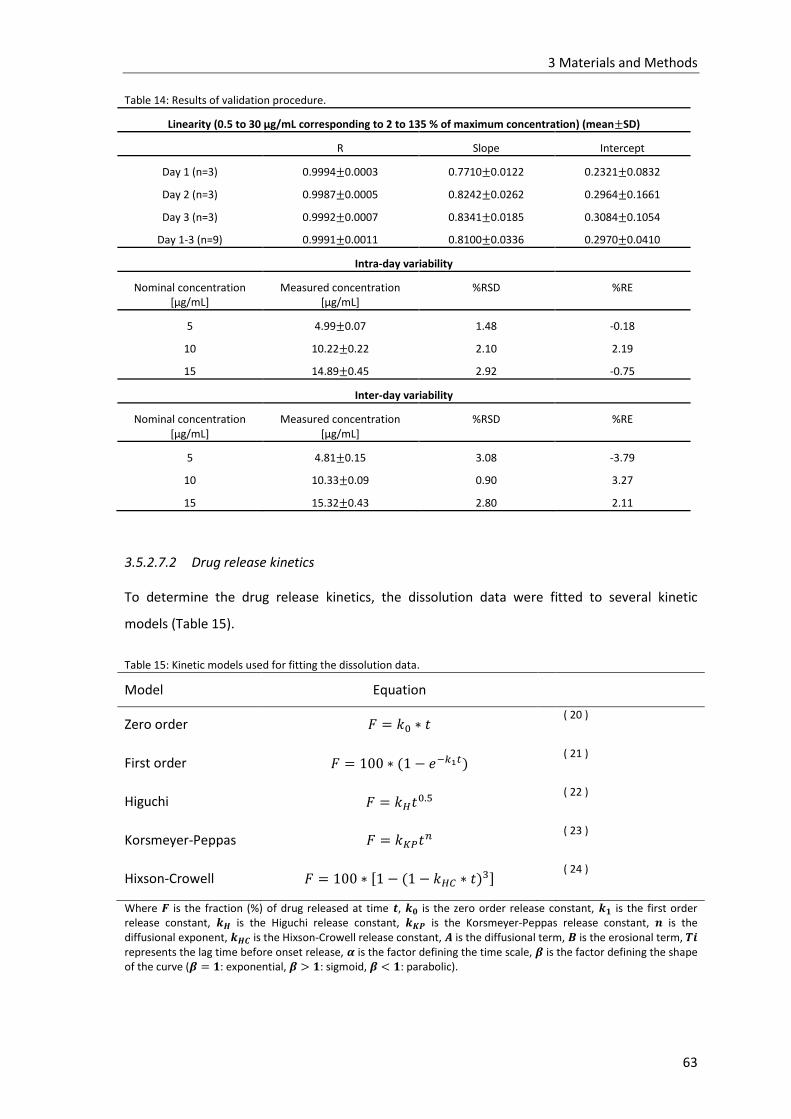
3 Materials and Methods
63
Table 14: Results of validation procedure.
Linearity (0.5 to 30 µg/mL corresponding to 2 to 135 % of maximum concentration) (mean±SD)
R Slope Intercept
Day 1 (n=3) 0.9994±0.0003 0.7710±0.0122 0.2321±0.0832
Day 2 (n=3) 0.9987±0.0005 0.8242±0.0262 0.2964±0.1661
Day 3 (n=3) 0.9992±0.0007 0.8341±0.0185 0.3084±0.1054
Day 1-3 (n=9) 0.9991±0.0011 0.8100±0.0336 0.2970±0.0410
Intra-day variability
Nominal concentration [µg/mL]
Measured concentration [µg/mL]
%RSD %RE
5 4.99±0.07 1.48 -0.18
10 10.22±0.22 2.10 2.19
15 14.89±0.45 2.92 -0.75
Inter-day variability
Nominal concentration [µg/mL]
Measured concentration [µg/mL]
%RSD %RE
5 4.81±0.15 3.08 -3.79
10 10.33±0.09 0.90 3.27
15 15.32±0.43 2.80 2.11
3.5.2.7.2 Drug release kinetics
To determine the drug release kinetics, the dissolution data were fitted to several kinetic
models (Table 15).
Table 15: Kinetic models used for fitting the dissolution data.
Model Equation
Zero order 𝐹 = 𝑘0 ∗ 𝑡 ( 20 )
First order 𝐹 = 100 ∗ (1 − 𝑒−𝑘1𝑡) ( 21 )
Higuchi 𝐹 = 𝑘𝐻𝑡0.5
( 22 )
Korsmeyer-Peppas 𝐹 = 𝑘𝐾𝑃𝑡𝑛
( 23 )
Hixson-Crowell 𝐹 = 100 ∗ [1 − (1 − 𝑘𝐻𝐶 ∗ 𝑡)3]
( 24 )
Where 𝑭 is the fraction (%) of drug released at time 𝒕, 𝒌𝟎 is the zero order release constant, 𝒌𝟏 is the first order release constant, 𝒌𝑯 is the Higuchi release constant, 𝒌𝑲𝑷 is the Korsmeyer-Peppas release constant, 𝒏 is the diffusional exponent, 𝒌𝑯𝑪 is the Hixson-Crowell release constant, 𝑨 is the diffusional term, 𝑩 is the erosional term, 𝑻𝒊 represents the lag time before onset release, 𝜶 is the factor defining the time scale, 𝜷 is the factor defining the shape of the curve (𝜷 = 𝟏: exponential, 𝜷 > 𝟏: sigmoid, 𝜷 < 𝟏: parabolic).

3 Materials and Methods
64
The release exponent 𝑛 derived from fitting to the Korsmeyer-Peppas model is used to analyze
the mechanism of release. For a cylindrical matrix the release mechanism is Fickian diffusion if
𝑛 = 0.45, non-Fickian release or anomalous transport if 0.45 < 𝑛 < 0.89, case II transport or
zero-order release if 𝑛 = 0.89, and super case II transport if 𝑛 > 0.89 (Table 16; Costa and
Sousa, 2001).
Table 16: Interpretation of diffusional exponent.
Release exponent (n) Drug transport mechanism
0.45 Fickian diffusion
0.5<n<0.89 Anomalous transport
0.89 Case-II transport
>0.89 Super case-II transport
To compare the dissolution profiles of the different matrices the similarity factor was calculated
according to eqn. ( 25 ).
𝑓2 = 50 ∗ 𝑙𝑜𝑔 {[1 +1
𝑛∑(𝑅𝑡 − 𝑇𝑡)
2
𝑛
𝑡=1
]
−0.5
∗ 100} ( 25 )
where 𝑅𝑡 and 𝑇𝑡 are the percent drug dissolved at each time point for the reference and the
test formulation, respectively and 𝑛 is the number of time points. According to the guidelines
profiles are denoted similar for 𝑓2 values between 0.5 and 1.
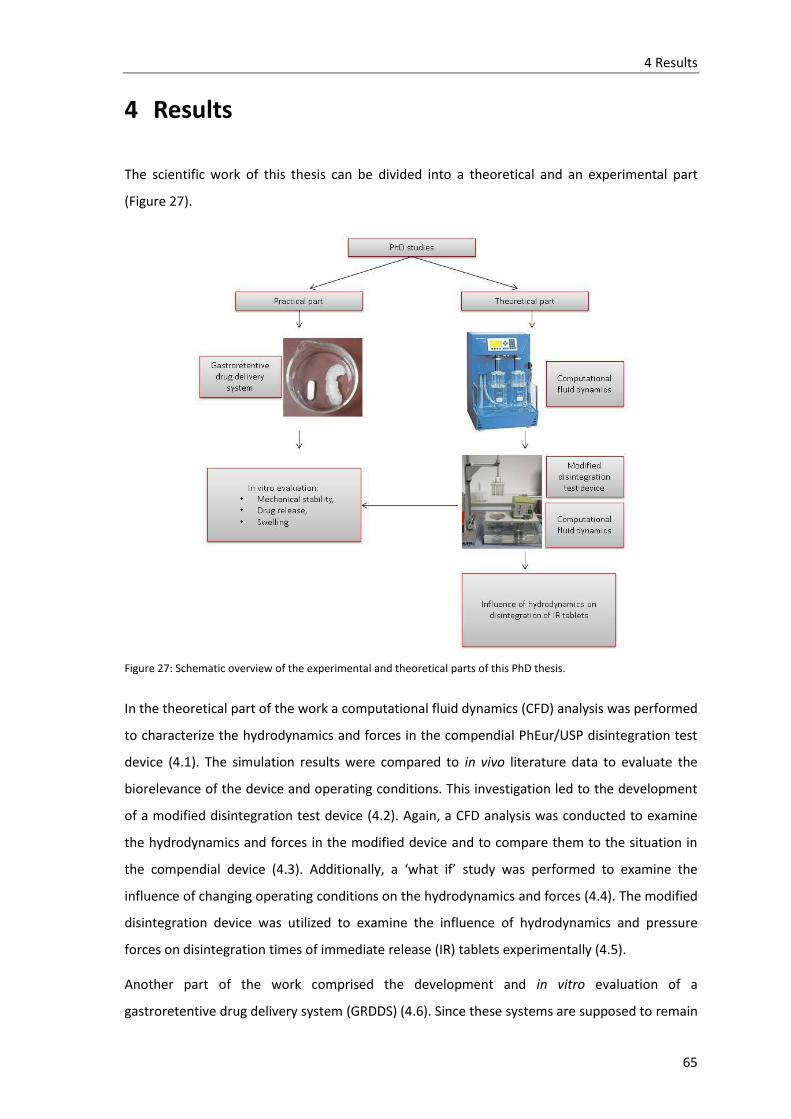
4 Results
65
4 Results
The scientific work of this thesis can be divided into a theoretical and an experimental part
(Figure 27).
Figure 27: Schematic overview of the experimental and theoretical parts of this PhD thesis.
In the theoretical part of the work a computational fluid dynamics (CFD) analysis was performed
to characterize the hydrodynamics and forces in the compendial PhEur/USP disintegration test
device (4.1). The simulation results were compared to in vivo literature data to evaluate the
biorelevance of the device and operating conditions. This investigation led to the development
of a modified disintegration test device (4.2). Again, a CFD analysis was conducted to examine
the hydrodynamics and forces in the modified device and to compare them to the situation in
the compendial device (4.3). Additionally, a ‘what if’ study was performed to examine the
influence of changing operating conditions on the hydrodynamics and forces (4.4). The modified
disintegration device was utilized to examine the influence of hydrodynamics and pressure
forces on disintegration times of immediate release (IR) tablets experimentally (4.5).
Another part of the work comprised the development and in vitro evaluation of a
gastroretentive drug delivery system (GRDDS) (4.6). Since these systems are supposed to remain

4 Results
66
in the stomach for a prolonged period of time, they are exposed to a wide range of
hydrodynamics and forces over time. To guarantee their successful performance it is essential
that they withstand these conditions. Therefore, the influence of changing hydrodynamic
conditions on the swelling behavior and drug release profile was examined using the modified
disintegration test device (4.7).
4.1 Characterization of the hydrodynamics in the PhEur/USP
disintegration test device
Since disintegration of solid oral immediate release (IR) dosage forms is a prerequisite for drug
absorption, disintegration testing is a commonly used tool in pharmaceutical development and
quality control. The PhEur describes a simple device that is moved vertically in a medium
(Ph.Eur., European Pharmacopoeia, 2014; see also chapter 1.1.2). The basis for this test device is
the apparatus for tablet disintegration introduced by Greshberg and Stoll in 1946 (Gershberg
and Stoll, 1946). Since its introduction and following adoption to the pharmacopoeias the
apparatus and operating conditions remained almost unchanged. Due to increasing knowledge
about the in vivo situation in terms of fluid motion and gastric forces it becomes possible to
challenge the biorelevance of the compendial device. In this chapter the results of a CFD study
of the hydrodynamics and forces in the compendial PhEur/USP disintegration test device are
presented. The simulations were performed with several beverages and pasty foods,
representing the fasted and the fed state. Additionally, 1.4 % HPMC solution was used as a
model medium, since it was recently proposed as an in vitro model fluid exhibiting similar
characteristics as mashed diluted FDA meal (460 mL mashed meal + 240 mL water) (Radwan et
al., 2012).
4.1.1 Validation of CFD model using PIV experimental data
Before any investigation it is necessary to prove the capability of the CFD model to predict the
hydrodynamic environment in the disintegration test device. To validate the CFD model a
simulation with constant moving velocity (0.06 m/s) and SGF as fluid was run. The predicted
velocity in vertical direction in the vicinity of the tablet (10 mm above the mesh) was compared
to experimental data from particle image velocimetry (PIV) measurements (Figure 28).
The predicted CFD profiles show good agreement with the experimental PIV velocity profiles, in
both pattern and absolute velocities. There are three data points in the region above the tablet
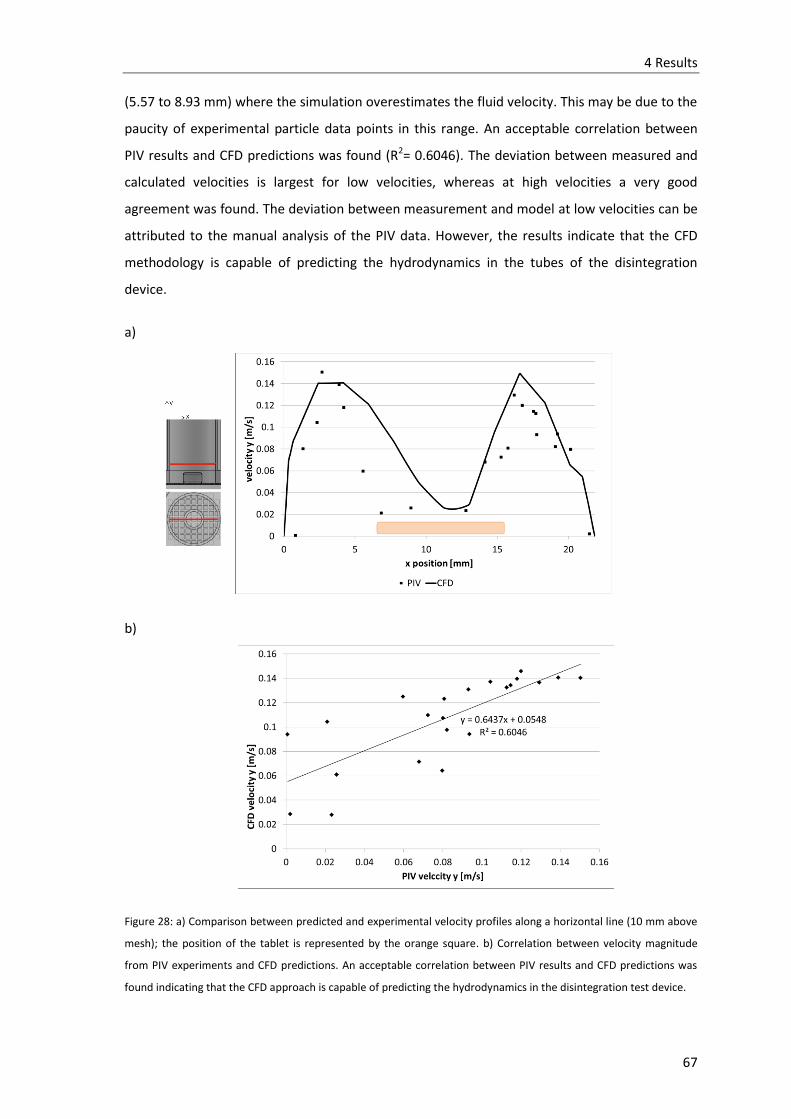
4 Results
67
(5.57 to 8.93 mm) where the simulation overestimates the fluid velocity. This may be due to the
paucity of experimental particle data points in this range. An acceptable correlation between
PIV results and CFD predictions was found (R2= 0.6046). The deviation between measured and
calculated velocities is largest for low velocities, whereas at high velocities a very good
agreement was found. The deviation between measurement and model at low velocities can be
attributed to the manual analysis of the PIV data. However, the results indicate that the CFD
methodology is capable of predicting the hydrodynamics in the tubes of the disintegration
device.
a)
b)
Figure 28: a) Comparison between predicted and experimental velocity profiles along a horizontal line (10 mm above
mesh); the position of the tablet is represented by the orange square. b) Correlation between velocity magnitude
from PIV experiments and CFD predictions. An acceptable correlation between PIV results and CFD predictions was
found indicating that the CFD approach is capable of predicting the hydrodynamics in the disintegration test device.

4 Results
68
4.1.2 Fluid flow field
Hydrodynamic flow inside the tubes of the PhEur/USP disintegration tester is generated by the
vertical up and down movement of the basket-rack assembly. Since the motion follows a
sinusoidal velocity profile described by eqn. ( 2 ), the velocity magnitude and direction is time
dependent and the fluid flow field is continuously changing during the movement cycle
(duration of one down and up movement is 2 s). Figure 29 and Figure 30 show a time sequence
of the CFD predicted velocity contour plots for simulated gastric fluid (SGF) and homogenized
FDA meal, respectively. In the tube which does not contain a tablet (Figure 29 and Figure 30,
right tube), the fluid flow is accelerated by entering the tube for both, SGF and the
homogenized FDA meal. Inside the tube, the non-slip condition comes into effect, which results
in zero velocity at the solid boundary. The fluid velocity is highest in the center of the tube and
lowest at the vicinity of the walls. Nevertheless, there is a distinct difference between
Newtonian versus non-Newtonian media. While the flow field of the non-Newtonian FDA meal
is characterized by a highly ordered motion and a homogeneous velocity distribution, the flow
field and velocity profile of the Newtonian SGF develops more fluctuations and is more
disordered.
Figure 29: Time sequence of CFD predicted velocity contour plots on a vertical cross section for SGF. The tube on the right side does not contain a tablet while the tube on the left side does contain a tablet. The velocity magnitude is color coded (blue: low, red: high). Due to the sinusoidal movement profile the fluid flow field and velocity magnitude are time-dependent. Velocity magnitude accepts positive and negative values due to the change from down to up movement at 1.0s resulting in a reversal of fluid flow along the vertical y-axis.
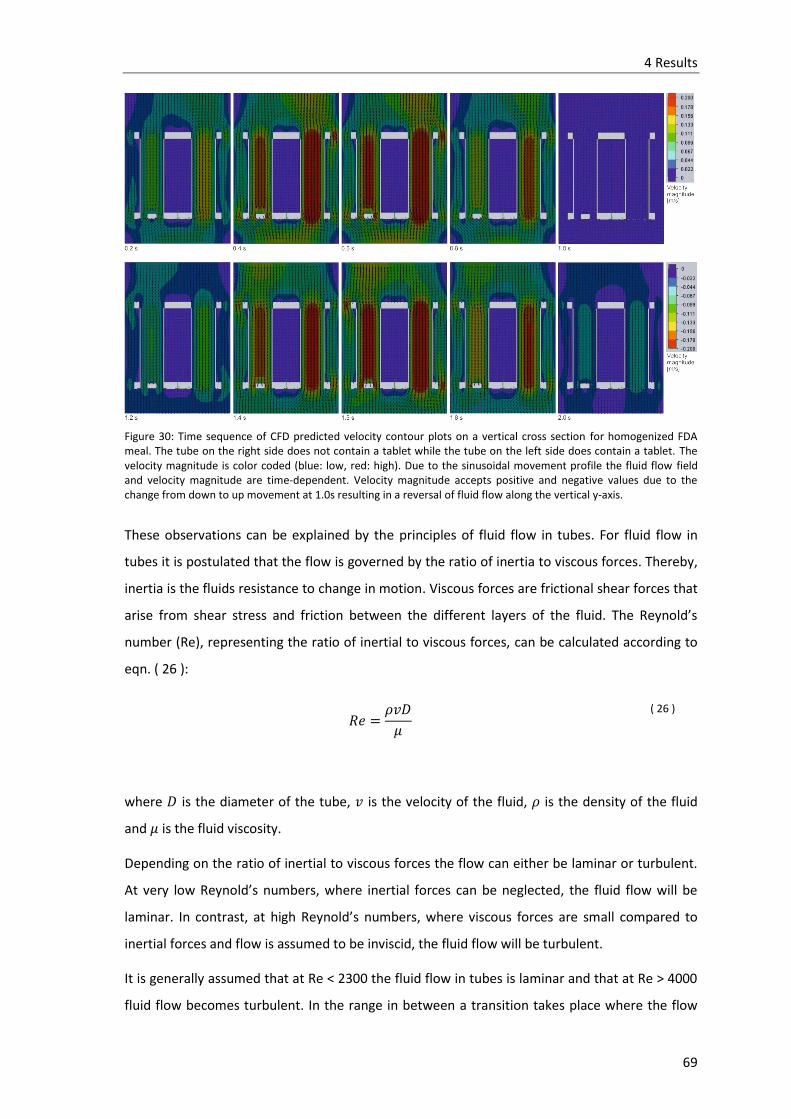
4 Results
69
Figure 30: Time sequence of CFD predicted velocity contour plots on a vertical cross section for homogenized FDA meal. The tube on the right side does not contain a tablet while the tube on the left side does contain a tablet. The velocity magnitude is color coded (blue: low, red: high). Due to the sinusoidal movement profile the fluid flow field and velocity magnitude are time-dependent. Velocity magnitude accepts positive and negative values due to the change from down to up movement at 1.0s resulting in a reversal of fluid flow along the vertical y-axis.
These observations can be explained by the principles of fluid flow in tubes. For fluid flow in
tubes it is postulated that the flow is governed by the ratio of inertia to viscous forces. Thereby,
inertia is the fluids resistance to change in motion. Viscous forces are frictional shear forces that
arise from shear stress and friction between the different layers of the fluid. The Reynold’s
number (Re), representing the ratio of inertial to viscous forces, can be calculated according to
eqn. ( 26 ):
𝑅𝑒 =𝜌𝑣𝐷
𝜇
( 26 )
where 𝐷 is the diameter of the tube, 𝑣 is the velocity of the fluid, 𝜌 is the density of the fluid
and 𝜇 is the fluid viscosity.
Depending on the ratio of inertial to viscous forces the flow can either be laminar or turbulent.
At very low Reynold’s numbers, where inertial forces can be neglected, the fluid flow will be
laminar. In contrast, at high Reynold’s numbers, where viscous forces are small compared to
inertial forces and flow is assumed to be inviscid, the fluid flow will be turbulent.
It is generally assumed that at Re < 2300 the fluid flow in tubes is laminar and that at Re > 4000
fluid flow becomes turbulent. In the range in between a transition takes place where the flow

4 Results
70
fluctuates between laminar and turbulent. Calculations for the Reynold’s number for SGF and
FDA meal using the maximum flow velocity of each fluid at 0.5 s and the averaged viscosity at
30 mm above the mesh at 0.5 s, revealed values of 2731 and 0.3 for SGF and FDA meal,
respectively. These calculations underline the observation of a laminar flow for the
homogenized FDA meal and a transitional flow for SGF in the PhEur/ USP disintegration tester.
The fixed tablet represents an obstacle for the fluid which is forced aside (Figure 29 and Figure
30 left tube). Approaching the tablet, flow is decelerated due to the obstacle, then accelerates
again. Right above or below the tablet, depending on the direction of basket movement, a
sheltered region with negligible fluid flow emerges. This sheltered zone is more pronounced for
the low viscous SGF compared to the high viscous FDA meal. Calculations of the Reynold’s
number around the tablet using the predicted average viscosity and the predicted average
velocity around tablet and the tablet diameter of 9 mm, revealed values of 834 and 0.02 for SGF
and the homogenized FDA meal, respectively. These values indicate different flow patterns
around the tablet for the two fluids. For Reynold’s numbers >100, as in the case of SGF,
frictional forces are negligible and inertial forces are dominant resulting in oscillation of the flow
behind the tablet. This oscillation of flow results in the formation of recirculating flow
structures, so called eddies, in the sheltered region of the tablet. In contrast, at very small
Reynold’s numbers, observed for the homogenized FDA meal, frictional forces overpower
acceleration and no eddy structures are to be expected around the tablet.
The fluid flow velocity is a vector quantity in the three dimensional space specified by the three
components in x-, y-, and z-direction. To illustrate the contribution of each component, a
horizontal cross section was drawn at the middle height of the tablet (plane 1 in Figure 31).
Figure 31 shows the velocity vector (a), as well as the contribution of its components in x-, y-
and z-direction (b, c, d) on this horizontal cross section. The magnitude and direction along
plane 1 are represented by the color code. The depicted fluid flow field is a snapshot at t=0.5 s,
which is the point of maximum moving velocity of the down movement during the movement
cycle. In terms of direction the fluid flow field is similar for all simulated fluids. The vertical y-
component is dominating over the x- and z- component indicated by the high velocity
magnitude values. The x- and z-component represent the horizontal fluid flow. Depending on
the direction of flow, they can accept positive and negative values. Positive values indicate flow
from the left to the right (x-component) and from the back to the front (z-component). Negative
values indicate flow from the right to the left (x-component) and from the front to the back (z-
component).

4 Results
71
Figure 31: CFD predicted contour plots of velocity magnitude on a horizontal cross section at the middle of the tablet (plane 1) for SGF, 1.4 % HPMC solution, and mashed FDA meal at t=0.5 s. a) Magnitude of velocity vector. b) Magnitude of the x-component of the velocity vector. The x-component is directed from the left to the right (see top). Thus, positive values (green to red color) indicate fluid flow from the left to the right and negative values (light green to blue color) indicate fluid flow from the right to the left. c) Magnitude of the y-component of the velocity vector. The y-component is directed upwards and shows only positive values. d) Magnitude of the z-component of the velocity vector. The z-component is directed from the back to the front (see top). Thus, positive values (green to red color) indicate fluid flow from the back to the front and negative values (light green to blue color) indicate fluid flow from the front to the back.
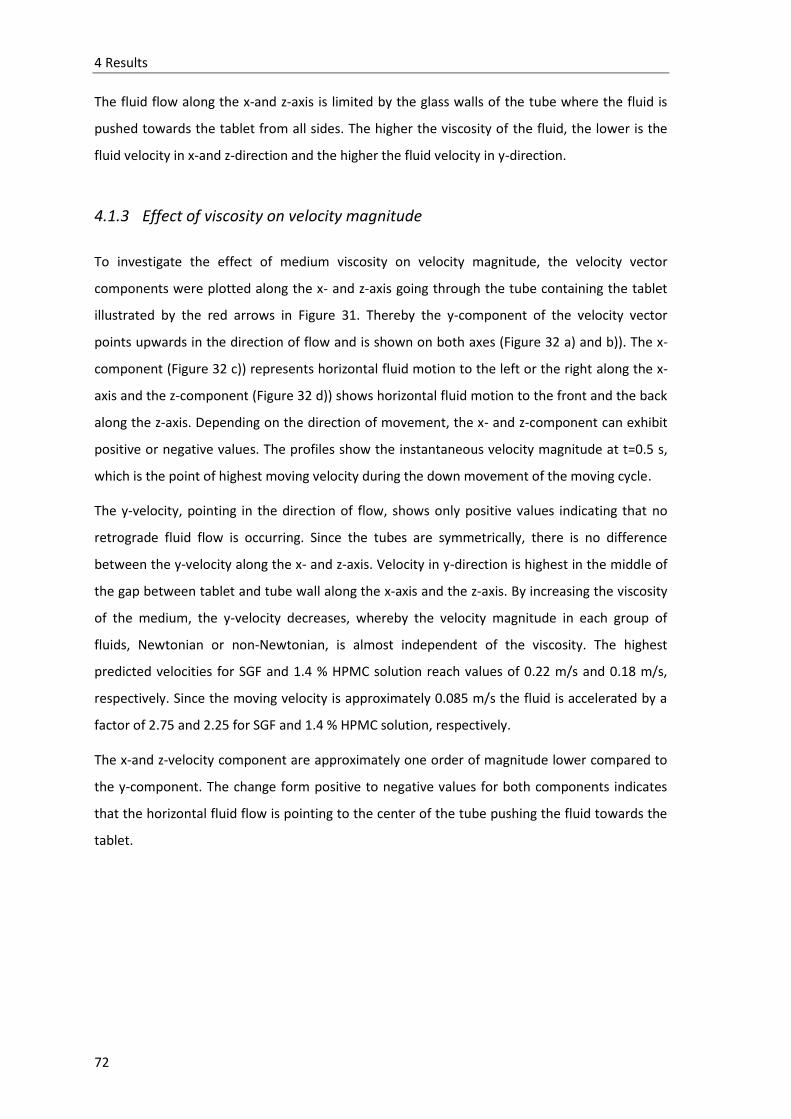
4 Results
72
The fluid flow along the x-and z-axis is limited by the glass walls of the tube where the fluid is
pushed towards the tablet from all sides. The higher the viscosity of the fluid, the lower is the
fluid velocity in x-and z-direction and the higher the fluid velocity in y-direction.
4.1.3 Effect of viscosity on velocity magnitude
To investigate the effect of medium viscosity on velocity magnitude, the velocity vector
components were plotted along the x- and z-axis going through the tube containing the tablet
illustrated by the red arrows in Figure 31. Thereby the y-component of the velocity vector
points upwards in the direction of flow and is shown on both axes (Figure 32 a) and b)). The x-
component (Figure 32 c)) represents horizontal fluid motion to the left or the right along the x-
axis and the z-component (Figure 32 d)) shows horizontal fluid motion to the front and the back
along the z-axis. Depending on the direction of movement, the x- and z-component can exhibit
positive or negative values. The profiles show the instantaneous velocity magnitude at t=0.5 s,
which is the point of highest moving velocity during the down movement of the moving cycle.
The y-velocity, pointing in the direction of flow, shows only positive values indicating that no
retrograde fluid flow is occurring. Since the tubes are symmetrically, there is no difference
between the y-velocity along the x- and z-axis. Velocity in y-direction is highest in the middle of
the gap between tablet and tube wall along the x-axis and the z-axis. By increasing the viscosity
of the medium, the y-velocity decreases, whereby the velocity magnitude in each group of
fluids, Newtonian or non-Newtonian, is almost independent of the viscosity. The highest
predicted velocities for SGF and 1.4 % HPMC solution reach values of 0.22 m/s and 0.18 m/s,
respectively. Since the moving velocity is approximately 0.085 m/s the fluid is accelerated by a
factor of 2.75 and 2.25 for SGF and 1.4 % HPMC solution, respectively.
The x-and z-velocity component are approximately one order of magnitude lower compared to
the y-component. The change form positive to negative values for both components indicates
that the horizontal fluid flow is pointing to the center of the tube pushing the fluid towards the
tablet.
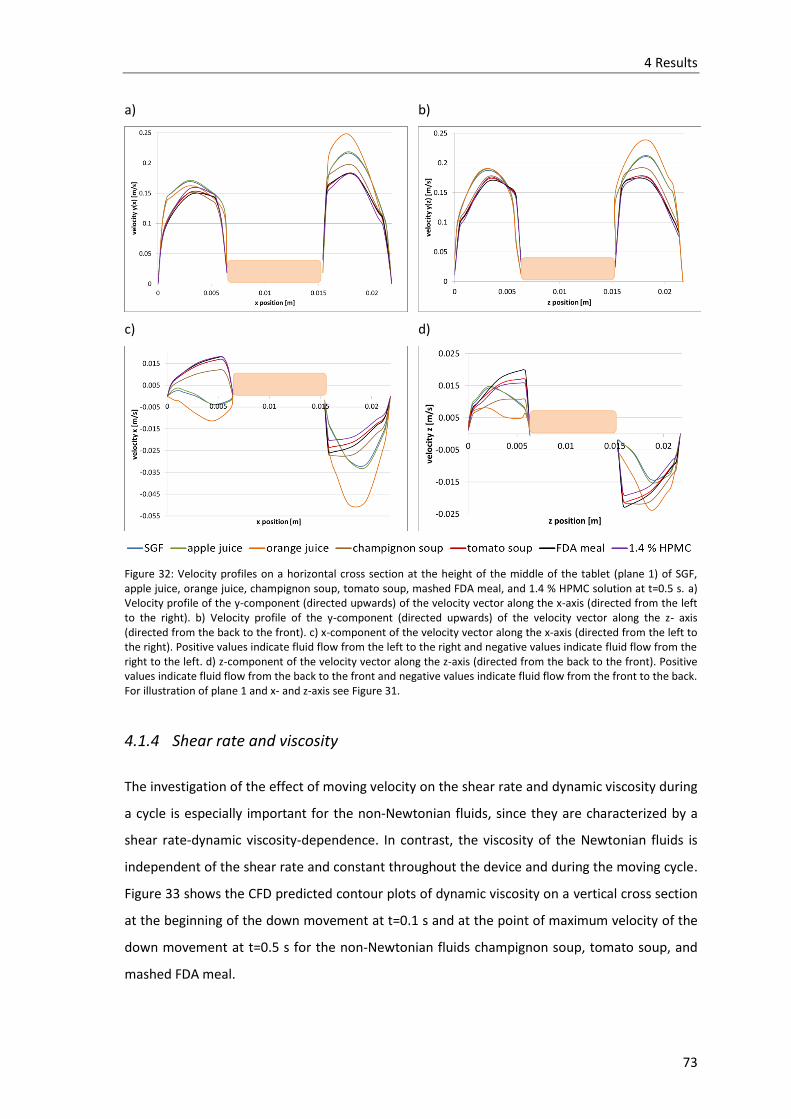
4 Results
73
a) b)
c) d)
Figure 32: Velocity profiles on a horizontal cross section at the height of the middle of the tablet (plane 1) of SGF, apple juice, orange juice, champignon soup, tomato soup, mashed FDA meal, and 1.4 % HPMC solution at t=0.5 s. a) Velocity profile of the y-component (directed upwards) of the velocity vector along the x-axis (directed from the left to the right). b) Velocity profile of the y-component (directed upwards) of the velocity vector along the z- axis (directed from the back to the front). c) x-component of the velocity vector along the x-axis (directed from the left to the right). Positive values indicate fluid flow from the left to the right and negative values indicate fluid flow from the right to the left. d) z-component of the velocity vector along the z-axis (directed from the back to the front). Positive values indicate fluid flow from the back to the front and negative values indicate fluid flow from the front to the back. For illustration of plane 1 and x- and z-axis see Figure 31.
4.1.4 Shear rate and viscosity
The investigation of the effect of moving velocity on the shear rate and dynamic viscosity during
a cycle is especially important for the non-Newtonian fluids, since they are characterized by a
shear rate-dynamic viscosity-dependence. In contrast, the viscosity of the Newtonian fluids is
independent of the shear rate and constant throughout the device and during the moving cycle.
Figure 33 shows the CFD predicted contour plots of dynamic viscosity on a vertical cross section
at the beginning of the down movement at t=0.1 s and at the point of maximum velocity of the
down movement at t=0.5 s for the non-Newtonian fluids champignon soup, tomato soup, and
mashed FDA meal.
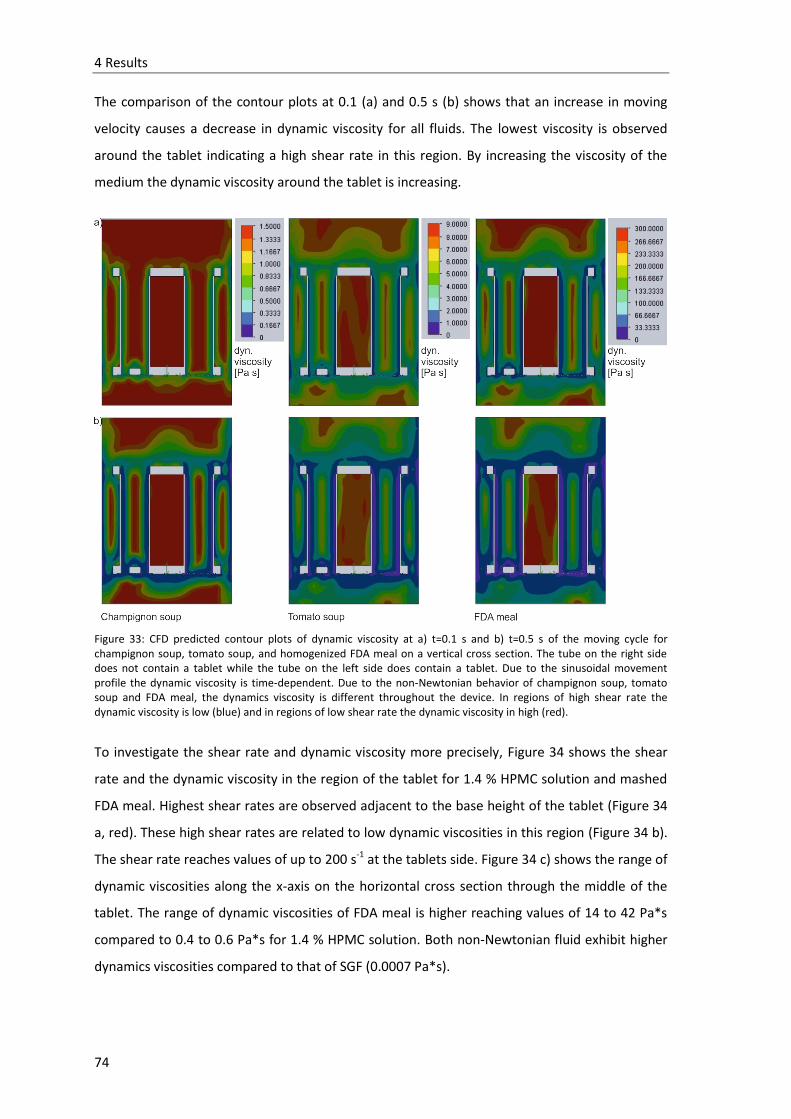
4 Results
74
The comparison of the contour plots at 0.1 (a) and 0.5 s (b) shows that an increase in moving
velocity causes a decrease in dynamic viscosity for all fluids. The lowest viscosity is observed
around the tablet indicating a high shear rate in this region. By increasing the viscosity of the
medium the dynamic viscosity around the tablet is increasing.
Figure 33: CFD predicted contour plots of dynamic viscosity at a) t=0.1 s and b) t=0.5 s of the moving cycle for champignon soup, tomato soup, and homogenized FDA meal on a vertical cross section. The tube on the right side does not contain a tablet while the tube on the left side does contain a tablet. Due to the sinusoidal movement profile the dynamic viscosity is time-dependent. Due to the non-Newtonian behavior of champignon soup, tomato soup and FDA meal, the dynamics viscosity is different throughout the device. In regions of high shear rate the dynamic viscosity is low (blue) and in regions of low shear rate the dynamic viscosity in high (red).
To investigate the shear rate and dynamic viscosity more precisely, Figure 34 shows the shear
rate and the dynamic viscosity in the region of the tablet for 1.4 % HPMC solution and mashed
FDA meal. Highest shear rates are observed adjacent to the base height of the tablet (Figure 34
a, red). These high shear rates are related to low dynamic viscosities in this region (Figure 34 b).
The shear rate reaches values of up to 200 s-1 at the tablets side. Figure 34 c) shows the range of
dynamic viscosities along the x-axis on the horizontal cross section through the middle of the
tablet. The range of dynamic viscosities of FDA meal is higher reaching values of 14 to 42 Pa*s
compared to 0.4 to 0.6 Pa*s for 1.4 % HPMC solution. Both non-Newtonian fluid exhibit higher
dynamics viscosities compared to that of SGF (0.0007 Pa*s).

4 Results
75
Figure 34: CFD predicted contour plot of a) shear rate and b) dynamic viscosity on a vertical cross section through the middle of the basket for 1.4 % HPMC solution and mashed FDA meal at t=0.5 s. c) Range of dynamic viscosity along the red horizontal sketch shown in b) at t=0.5 s for SGF, 1.4 % HPMC solution and mashed FDA meal. The viscosity of non-Newtonian fluids is dependent on the shear rate. High shear stress, occurring especially near the base height indicated by the red color, lowers the viscosity in this region. In c) the viscosity of SGF is shown in blue for comparison purpose.

4 Results
76
4.1.5 Shear stress on tablet surface
The force on an object in a streaming fluid is the sum of the stresses caused by pressure and
shear. While pressure stress acts perpendicular to the surface of the object, shear stress acts
tangential to it. Due to the sinusoidal movement velocity profile the tablet is exposed to
changing shear forces. Figure 35 shows the time sequence of shear stress on the tablet surface
for SGF (a) and FDA meal (b).
Figure 35: Time sequence of CFD predicted shear stress on tablet surface for a) SGF and b) homogenized FDA meal. Due to the sinusoidal movement profile of the device the shear stress is time dependent. From 0 to 1.0 s the basket is moved down and from 1.0 to 2.0 s the basket is moved up. Highest shear stress is observed between 0.4 and 0.6 s or 1.4 and 1.6 s, which is the time of highest moving velocity during down and up movement.
From 0 to 0.5 s the moving velocity of the down movement is increased. This leads to an
increase of shear stress on the tablet surface. From 0.5 to 1.0 s the moving velocity of the down
movement is decreased leading to decreasing surface shear stress. The same observations are
made for the up movement between 1.0 and 2.0 s. For both fluids highest shear stresses are
predicted in the middle of the base height. At the bottom and the top of the tablet lower shear
stresses are predicted. The range of shear stress for SGF is very small extending from 0 to 1 Pa.
For the homogenized FDA meal a high variability of local shear stress over the tablet surface in
the range of 0 to 2000 Pa is predicted.

4 Results
77
The surface shear stress shows marked proportional viscosity dependence as shown in Figure 36
at t=0.5 s. By increasing the fluid viscosity the average surface shear stress increases from values
of 0.50 Pa for SGF to 1442 Pa for the FDA meal.
Figure 36: Average shear stress on the tablet surface as a function of the Reynold’s number at t=0.5 s (point of maximum moving velocity during down movement).
4.1.6 Drag force
All objects positioned in a fluid stream experience a hydrodynamic drag force 𝐹𝐷 acting opposite
to the relative motion of the object. The drag depends on the properties of the fluid as well as
on the size and shape of the tablet:
𝐹𝐷 =1
2𝜌𝑣2𝑐𝐷𝐴
( 27 )
where 𝐹𝐷 is the drag force, 𝜌 is the fluid density, 𝑣 is the fluid velocity, 𝐴 is the area of the tablet
and 𝑐𝐷 is the drag coefficient. 𝑐𝐷 is not a constant but varies with fluid velocity, flow direction,
fluid density, fluid viscosity and object size. For the calculation it makes no difference whether
the tablet moves through the static fluid or whether the fluid moves past a static tablet. In this
simulation 𝐹𝐷 is the force along the vertical y-axis. Due to the change from down to up
movement during the movement cycle, 𝐹𝐷 can accept positive and negative values depending
on the direction of action.
Figure 37 a) shows the drag force as a function of time for the Newtonian fluids. The force
increases to a maximum of 0.0043 to 0.0048 N which is reached at 0.7 s. After this turning point
the force decreases to a minimum value of 0.0013 N. During the whole cycle the force is very
low and directed upwards. A change in the direction of force due to the change of fluid flow

4 Results
78
direction would be expected but as the fluid flow is very sparse right above and below the tablet
for the Newtonian fluids there is no large change in force. For champignon soup the drag force
profile looks similar to those of the low viscous Newtonian fluids with forces in the range of
0.0060 and -0.0009 N. In the last part of the up cycle the force points downwards indicating that
the fluid pushes the tablet towards the wire mesh (Figure 37 b). By further increasing the
viscosity this effect becomes more pronounced and the range between upwards and
downwards directed forces becomes larger. For tomato soup the upwards directed force
increases to a maximum of 0.014 N at 0.6 s followed by a rapid direction change at 1 s. The
maximum downward directed force is reached at 1.6 s and is half the size of the upward
directed (-0.0084 N) (Figure 37 b). For mashed FDA meal the range between upward and
downward force is even larger ranging from 0.2 N to -0.3 N (Figure 37 c).
a) b) c)
Figure 37: Drag force as a function of time. a) Newtonian fluids; b) non-Newtonian fluids champignon soup and tomato soup; c) non-Newtonian homogenized FDA meal. Due to the sinusoidal movement profile of the device the drag force is time dependent. From 0 to 1.0 s the basket is moved down and from 1.0 to 2.0 s the basket is moved up. Due to the reversal of moving direction, the force acting in y-direction (upwards) can accept positive and negative values.
In case the drag force exceeds the weight force, the tablet will be carried with the fluid
experiencing less force. When the tablet is moved with the same velocity as the fluid, no force is
acting on it. The weight force (G) can be calculated according to
𝐺 = 𝑚 ∗ 𝑔 ( 28 )
where 𝑚 is the mass of the tablet and 𝑔 is the gravity acceleration (𝑔 = 9.81𝑚 𝑠2⁄ ). For a
tablet of 500 mg the weight force is 0.005 N. This value is exceeded with all non-Newtonian
fluids indicating that in practice, where the tablet is not fixed at the wire mesh, the tablet would
be carried with the viscous fluids experiencing zero forces.

4 Results
79
4.1.7 Relative pressure fields
Figure 38: CFD predicted contour plots of relative pressure for a) SGF and b) homogenized FDA meal on a vertical cross section at t=0.5 s (down movement) and t=1.5 s (up movement). Due to the sinusoidal moving velocity profile of the device the relative pressure field is time dependent. At 0.5 and 1.5 s maximum moving velocities of down and up movement are reached.
Figure 38 shows the relative pressure inside the basket-rack assembly on a vertical cross section
for SGF and homogenized FDA meal at 0.5 s and 1.5 s which are the time points of maximum
moving velocity during down and up movement, respectively. For both a vertical relative
pressure gradient is predicted. However, the gradient differs in nature and range. For SGF the
relative pressure in the basket-rack assembly is in the range of 267 to -1200 Pa s (2.00 to -
9.00 mmHg) with a vertical gradient for high values at the bottom and low values on top for the
down and up movement (Figure 38 left side). For FDA meal the range is much larger extending
from 27 kPa s to -27 kPa s (200.00 to -200.00 mmHg) showing reverse gradients for up and
down movement (Figure 38 right side). With increasing the viscosity of the fluid the relative
pressure difference inside the tube from the top to the bottom increases. Also, the relative
pressure difference between bottom and top becomes more pronounced with increasing
moving velocity and thus is highest at 0.5 and 1.5 s. As pressure is defined as force over surface
and the surface is the same for both fluids, the large difference must be due to different forces
acting on the surface. Pressure in SGF is generated by the gravitational force which is directed
downwards for both, the up and down movement. Highest pressures are generated at the
bottom of the beaker. In the homogenized FDA meal viscous forces and resistance to flow
dominate over gravitational force. Shear stress and frictional forces are acting in the direction of
movement generating high pressures at the bottom of the vessel for the down movement and
low pressures at the bottom of the vessel for the up movement.
Figure 39 shows a time sequence of the average pressure at the bottom of the tablet for the
Newtonian SGF, apple juice, and orange juice and the non-Newtonian champignon soup,
tomato soup, and mashed FDA meal. The change in relative pressure for the Newtonian fluids is
negligible fluctuating between 71 and -25 Pa s (0.53 and -0.19 mmHg). For the non-Newtonian
fluids strong viscosity dependence is obvious. With increasing viscosity of the medium the

4 Results
80
difference between maximum and minimum relative pressure around the tablet increases
ranging from 0.2 to -0.2, 0.9 to -0.9, and 24 to -25 kPa (1.68 to -1.51, 6.81 to -6.88, and 183 to -
190 mmHg) for champignon soup, tomato soup, and the homogenized FDA meal, respectively.
Figure 39: Relative pressure at the bottom of the tablet as a function of time (0-1 s: down movement; 1-2 s: up movement).

4 Results
81
4.2 Modified disintegration test device
To be able to generate biorelevant hydrodynamics and mechanical forces, the compendial
disintegration test apparatus was modified in terms of moving speed, moving profile and
pressure forces (see materials and methods 3.1). Thereby, it is possible to simulate
physiologically relevant fluid movements and the stomach´s peristaltic contractions. The setup
of the modified device is shown in Figure 40 a) and b). The basket is fixed to a holding device of
the CNC drive, which is connected to the CNC controller. The moving of the basket is realized by
the application of computerized numerical control (CNC). The program coding of the movement
of the CNC drive is written in ProNC (isel Germany AG, Eichenzell, Germany). Although this work
concentrates on the vertical movement of the basket, movement in all three dimensions is
possible. Also, radial movement is possible.
The first step in the modification of the compendial device was the change of the moving profile
and velocity. A major drawback of the compendial device is the restriction of the movement to
the sinusoidal velocity profile (Figure 40 f, blue). Thus, the hydrodynamic conditions and forces
are changing permanently during the moving cycle and the dosage form is exposed to a wide
range of fluid velocities and forces. This limitation can be overcome using the modified device.
In this work the influence of different moving speeds along the vertical axis on disintegration
and dissolution was examined. Thereby, the moving velocity was constant resulting in the
velocity profile exemplary shown in Figure 40 f) for moving velocities of 40 and 80 mm/s. The
moving distance was 55 mm for all investigations. Therefore, the length of one moving cycle is
dependent on the moving velocity. Due to this modification arbitrary moving velocities can be
chosen and the hydrodynamic conditions become controllable.
Additionally, a new modified basket design was built in-house (Figure 40 c). The main difference
to the compendial basket design with glass tubes is the mesh structure of the front and back
side of the probe chamber. With this modification the fluid is no more restricted as in the glass
tubes but two-sided fluid flow is occurring. Although, the three probe chambers of the modified
basket are quadratic, their dimensions and volumes are similar to those of the circular glass
tube of the compendial device. However, the modified device can be operated with both basket
designs. Thus, it is possible to investigate the influence of basket design on disintegration times.
Furthermore, the modified basket can be equipped with balloons to simulate the movement of
the stomach wall by inflation and deflation (Figure 40 d) and e). Inflation and deflation are
regulated by a computerized pressure-vacuum unit (see 8.2) that is controlled by an open-
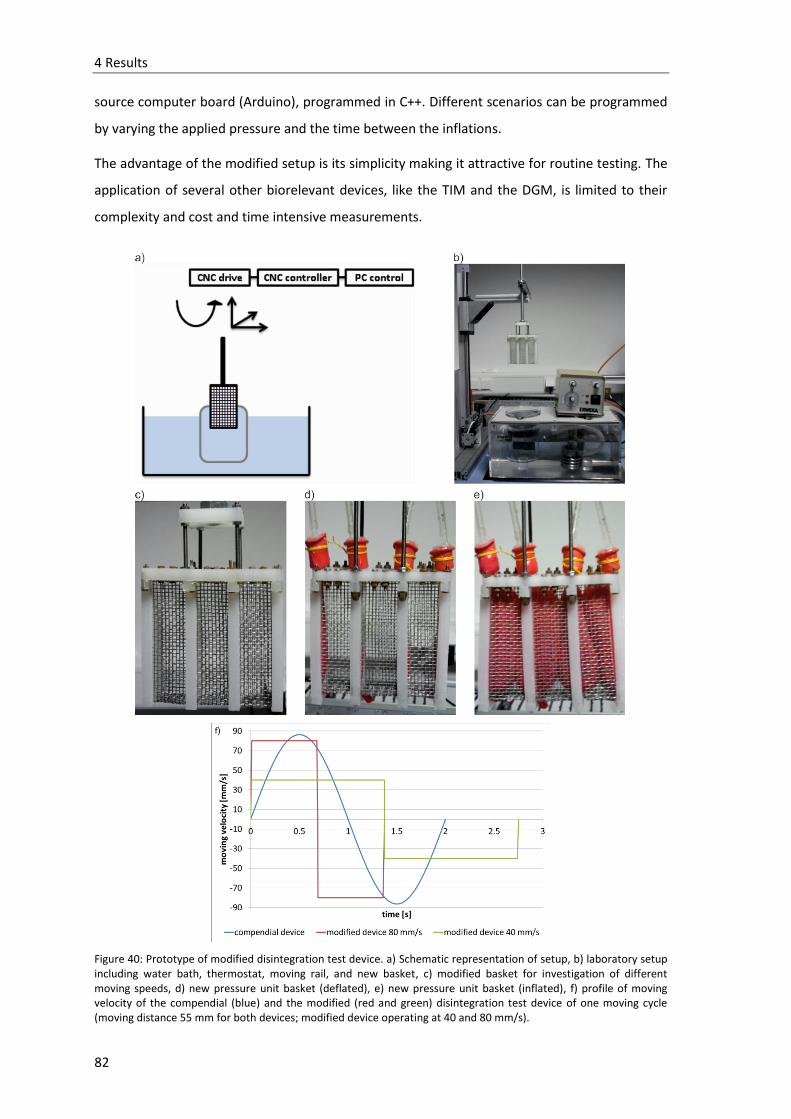
4 Results
82
source computer board (Arduino), programmed in C++. Different scenarios can be programmed
by varying the applied pressure and the time between the inflations.
The advantage of the modified setup is its simplicity making it attractive for routine testing. The
application of several other biorelevant devices, like the TIM and the DGM, is limited to their
complexity and cost and time intensive measurements.
Figure 40: Prototype of modified disintegration test device. a) Schematic representation of setup, b) laboratory setup including water bath, thermostat, moving rail, and new basket, c) modified basket for investigation of different moving speeds, d) new pressure unit basket (deflated), e) new pressure unit basket (inflated), f) profile of moving velocity of the compendial (blue) and the modified (red and green) disintegration test device of one moving cycle (moving distance 55 mm for both devices; modified device operating at 40 and 80 mm/s).
4 Results
83
4.3 Characterization of the hydrodynamics in the modified
disintegration test device
In this chapter the results of a computational fluid dynamics (CFD) analysis of the fluid flow and
forces in the modified disintegration test device and the modified basket design without
balloons are presented. Although vertical, horizontal, and radial movement of the basket are
possible with the modified disintegration test device, the simulations and experiments in this
work concentrated on vertical movement only. Furthermore, simulations and experiments in
this work were performed with constant moving velocity of different magnitude. The
predictions presented in this chapter were calculated for a moving speed of 0.08 m/s. Results of
the ‘what if’ analysis with different moving speeds are presented in 4.4. Since the results for the
up and down movement are similar, only the predictions for the down movement are shown.
4.3.1 Fluid flow field
Figure 41 shows the CFD predicted velocity contour plots for SGF, 1.4 % HPMC, and mashed FDA
meal for the modified disintegration test device with the new basket design without balloons.
Since the modified device is moved with constant moving speed the velocity field and
magnitude are not time dependent as they are for the compendial device. Nevertheless, a short
time span after direction change is required to reach equilibrium conditions. However, as this
time is short compared to the duration of one down movement, only the results at 0.6875 s are
presented (end point of down movement).
The flow field on the vertical cross section through the probe chamber is characterized by
maximum fluid velocity in the center of the probe chamber. Towards the solid boundaries of the
probe chamber the fluid velocity decelerates reaching minimum values at the solid walls. As
already observed for the compendial basket design (Figure 29 and Figure 30) the tablet
represents an obstacle for the fluid forcing it aside. The top face of the tablet is exposed to a
sheltered region with no fluid movement. This sheltered region is more pronounced for the
non-viscous SGF than for the 1.4 % HPMC solution and the mashed FDA meal.

4 Results
84
Figure 41: CFD predicted contour plots of velocity on a vertical cross section through the middle of the basket for SGF, 1.4% HPMC, and mashed FDA meal. The middle chamber contains a tablet. The fluid flow is directed upwards and velocity magnitude is color coded (blue: low velocity, red: high velocity).
The fluid flow velocity is a vector quantity in the three dimensional space specified by the three
components in x-, y-, and z-direction. To illustrate the contribution of each component, a
horizontal cross section was drawn at the middle height of the tablet (plane 1 in Figure 42).
Figure 42 shows the velocity vector (a), as well as the contribution of its components in x-, y-
and z-direction (b, c, d) on this horizontal cross section. The magnitude and direction along
plane 1 are represented by the color code.
Large differences in terms of velocity flied are observed between Newtonian and non-
Newtonian fluids (Figure 42 a). For SGF highest velocity is observed in direct vicinity of the
tablet. In contrast, only little fluid flow is predicted around the tablet for 1.4 % HPMC solution
and mashed FDA meal. For all fluids the vertical y-component of fluid velocity is much higher in
magnitude then the x-and z-component. While for SGF high y-velocities are predicted in direct
vicinity of the tablet, high y-velocities are reached outside the probe chambers for 1.4 % HPMC
solution and mashed FDA meal (Figure 42 c).
The x- and z-component represent the horizontal fluid flow (Figure 42 b) and d). Depending on
the direction of flow, they can accept positive and negative values. Positive values indicate flow
from the left to the right (x-component) and from the back to the front (z-component). Negative
values indicate flow from the right to the left (x-component) and from the front to the back (z-
component). Fluid motion in x-direction is generated by the solid walls of the probe chambers
pushing the fluid towards the tablet. Fluid flow in z-direction is oriented away from the tablet
pushing the fluid through the mesh. The higher the fluid viscosity the lower is the fluid velocity
in x-and z-direction in direct vicinity to the tablet.

4 Results
85
Figure 42: CFD predicted contour plots of velocity magnitude on a horizontal cross section at the middle of the tablet (plane 1) for SGF, 1.4 % HPMC solution, and mashed FDA meal. a) Magnitude of velocity vector. b) Magnitude of the x-component of the velocity vector. The x-component is directed from the left to the right (see top). Thus, positive values (green to red color) indicate fluid flow from the left to the right and negative values (light green to blue color) indicate fluid flow from the right to the left. c) Magnitude of the y-component of the velocity vector. The y-component is directed upwards and shows only positive values. d) Magnitude of the z-component of the velocity vector. The z-component is directed from the back to the front (see top). Thus, positive values (green to red color) indicate fluid flow from the back to the front and negative values (light green to blue color) indicate fluid flow from the front to the back.

4 Results
86
The overall fluid flow field in the beaker is very different from that predicted for the compendial
basket (Figure 31). In the compendial design the fluid is trapped in the solid glass tubes and only
little fluid flow occurs outside the tubes. Thus, the fluid flow is highest inside the tubes of the
compendial basket. Due to the open mesh design of the probe chambers of the new basket
design, two-sided fluid flow becomes possible. The fluid is no more restricted and fluid flow
occurs throughout the beaker.
4.3.2 Effect of viscosity on velocity magnitude
To investigate the effect of medium viscosity on velocity magnitude, the velocity vector
components were plotted along the x- and z-axis going through the chamber containing the
tablet illustrated by the red arrows in Figure 42. Thereby the y-component of the velocity vector
points upwards in the direction of flow and is shown on both axes (Figure 43 a) and b)). The x-
component (Figure 43 c)) represents horizontal fluid motion to the left or the right along the x-
axis and the z-component (Figure 43 d)) shows horizontal fluid motion to the front and the back
along the z-axis. Depending on the direction of movement, the x-and z-component can accept
positive or negative values.
As already observed for the compendial basket design the y-component has the largest
contribution to the velocity vector (compare Figure 32). However, in contrast to the compendial
basket design, two-sided fluid flow is possible. Therefore, the y-velocity component along the x-
axis is not axisymmetrically to the y-velocity component along the z-axis. Furthermore, large
differences for the magnitude are observed between SGF and both non-Newtonian fluids for
the y-velocity along the x-axis (0.08 m/s for SGF and 0.035 m/s for non-Newtonian fluids) and z-
axis (0.12 m/s for SGF and 0.06 m/s for non-Newtonian fluids).
The fluid movement between the solid walls of the probe chambers and the tablet is
represented by the x-component (Figure 43 c)). The x-velocity exhibits positive values by
approaching the tablet and negative values by moving off the tablet towards the wall indicating
that the fluid is pushed towards the tablet. The x-velocity magnitude is higher for SGF compared
to 1.4 % HPMC solution and mashed FDA meal.
Since the probe chamber is limited by the permeable mesh to two sides, fluid motion through
the mesh is possible, which is represented by the z-component. The change from negative to
positive values along the z-axis indicates fluid flow off the tablet through the mesh towards the
beaker walls. The z-component is higher for the non-Newtonian fluids reaching values of
0.05 m/s compared to 0.02 m/s for SGF.
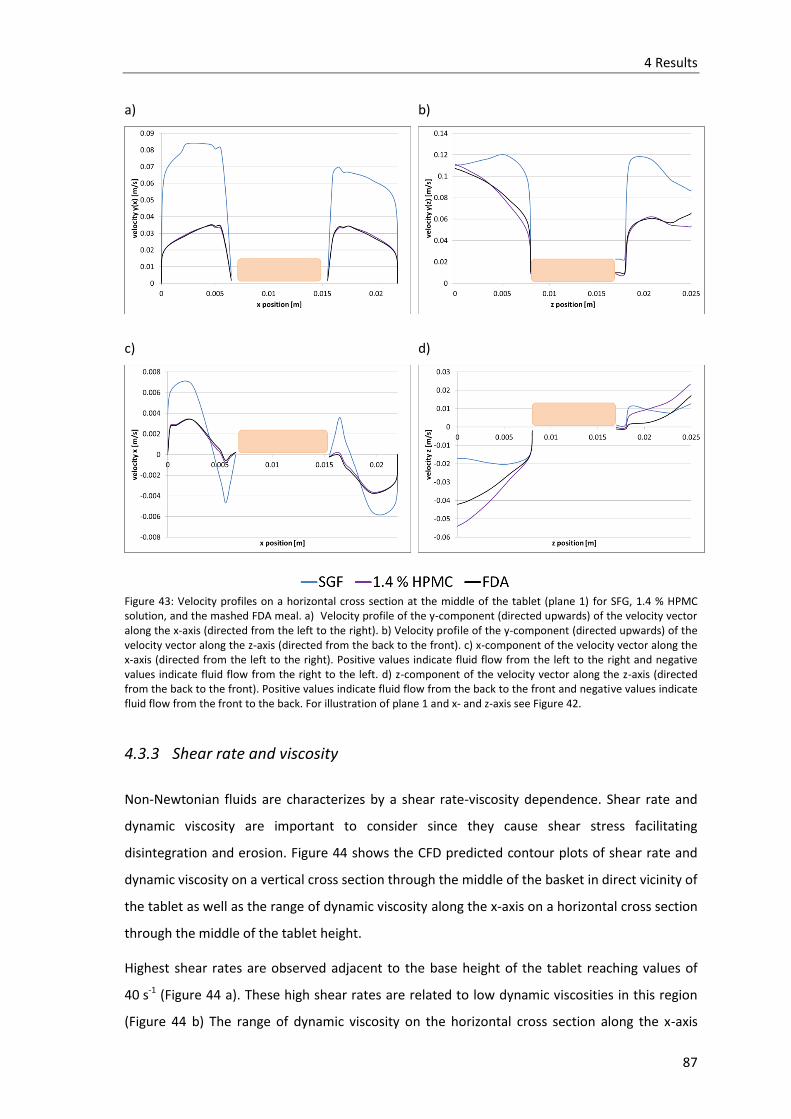
4 Results
87
a) b)
c) d)
Figure 43: Velocity profiles on a horizontal cross section at the middle of the tablet (plane 1) for SFG, 1.4 % HPMC solution, and the mashed FDA meal. a) Velocity profile of the y-component (directed upwards) of the velocity vector along the x-axis (directed from the left to the right). b) Velocity profile of the y-component (directed upwards) of the velocity vector along the z-axis (directed from the back to the front). c) x-component of the velocity vector along the x-axis (directed from the left to the right). Positive values indicate fluid flow from the left to the right and negative values indicate fluid flow from the right to the left. d) z-component of the velocity vector along the z-axis (directed from the back to the front). Positive values indicate fluid flow from the back to the front and negative values indicate fluid flow from the front to the back. For illustration of plane 1 and x- and z-axis see Figure 42.
4.3.3 Shear rate and viscosity
Non-Newtonian fluids are characterizes by a shear rate-viscosity dependence. Shear rate and
dynamic viscosity are important to consider since they cause shear stress facilitating
disintegration and erosion. Figure 44 shows the CFD predicted contour plots of shear rate and
dynamic viscosity on a vertical cross section through the middle of the basket in direct vicinity of
the tablet as well as the range of dynamic viscosity along the x-axis on a horizontal cross section
through the middle of the tablet height.
Highest shear rates are observed adjacent to the base height of the tablet reaching values of
40 s-1 (Figure 44 a). These high shear rates are related to low dynamic viscosities in this region
(Figure 44 b) The range of dynamic viscosity on the horizontal cross section along the x-axis

4 Results
88
expands from 0.6 to 0.8 Pa*s and 27 to 74 Pa*s for 1.4 % HPMC solution and mashed FDA meal,
respectively. Both non-Newtonian fluids exhibit high dynamic viscosities compared to the
viscosity of SGF (0.0007 Pa s) (Figure 44 c). Compared to the shear rates generated in the
compendial basket design at t=0.5 s, shear rates generated in the modified design are lower
(compare Figure 34).
Figure 44: CFD predicted contour plots of a) shear rate and b) dynamic viscosity on a vertical cross section through the middle of the basket for 1.4 % HPMC solution and mashed FDA meal and c) range of dynamic viscosity along the red horizontal sketch shown in b) for SGF, 1.4 % HPMC solution, and mashed FDA meal. The viscosity of non-Newtonian fluids is dependent on the shear rate. High shear stress, occurring especially near the base height indicated by the red color, lowers the viscosity in this region. In c) the viscosity of SGF is shown in blue for comparison purpose.

4 Results
89
4.3.4 Shear stress on tablet surface
Figure 45 shows the local shear stress on the tablet surface (a) and the range of shear stress (b).
For both fluids highest shear stress is predicted in the middle of the base height. At the bottom
and the top of the tablet lower shear stress is predicted. The range of shear stress is very small
extending from 0 to 1 Pa for SGF. By increasing the viscosity of the medium the range of shear
stress as well as the local magnitude increases. While the range of shear stress exceeds from 1
to 50 Pa for 1.4 % HPMC solution, the range for mashed FDA meal is much higher spanning from
61 to 2115 Pa. The average shear stress is also viscosity dependent reaching values of 0.16, 20,
and 1051 Pa for SGF, 1.4 % HPMC solution, and mashed FDA meal, respectively.
Figure 45: Shear stress on tablet surface for SGF, 1.4 % HPMC solution, and mashed FDA meal. a) Local shear stress on tablet surface increases dramatically in the presence of high viscous media. b) Range of local shear stress on tablet surface calculated from the difference between minimum and maximum shear stress. Average shear stress on tablet surface, indicated by the white line, is calculated from local shear stress weighed by area.

4 Results
90
4.4 What if study
In a ‘what if’ analysis the effect of different moving speeds and tablet diameter on
hydrodynamics and forces was investigated for SGF and 1.4 % HPMC solution. The specific
objective of this investigation was to quantify the changes in velocity fields and magnitudes as
well as in average shear stress on tablet surface when the moving speed or tablet size are
altered.
4.4.1 Effect of moving speed on velocity magnitude
Figure 46 and Figure 47 show the velocity components along the x- and z-axis going through the
chamber containing the tablet (illustration of axes see Figure 42) on a horizontal cross section
through the middle of the tablet for SGF and 1.4 % HPMC solution, respectively (tablet diameter
9 mm).Thereby, the y-component of the velocity vector points upwards in the direction of flow
and is shown on both axes (Figure 46 and Figure 47 a) and b). The x-component (Figure 46
Figure 47 c) represents the horizontal fluid motion to the left or the right along the x-axis. The z-
component (Figure 46 and Figure 47 d) represents the horizontal fluid motion to the front and
the back along the z-axis. Depending on the direction of movement, the x- and z-component can
accept positive or negative values.
In both fluids the profiles of the velocity components are similar for all moving speeds but differ
in magnitude. The y-velocity component along the z-and x-axis reaches its maximum in the
middle of the gap between tablet and solid boundary or the mesh boundary of the probe
chamber. However, the y-velocity component along the z-axis is higher than that along the x-
axis. The x-velocity component reaches a maximum positive peak velocity adjacent to the tablet
and a negative peak velocity off the tablet indicating that the fluid is pushed towards the tablet
from both sides. In contrast, the z-velocity component exhibits a negative peak velocity close to
the tablet and a positive peak velocity off the tablet indicating that the fluid is pushed out of the
probe chamber through the mesh towards the beaker wall. Clearly, the y-velocity component is
the dominating one, while the x-component is rather small.

4 Results
91
a) b)
c) d)
Figure 46: Influence of moving velocity (varied form 0.02 to 0.1 m/s) on fluid velocity magnitude on a horizontal cross section at the middle of the tablet (plane 1) for SFG. a) Velocity profile of the y-component (directed upwards) of the velocity vector along the x-axis (directed from the left to the right). b) Velocity profile of the y-component (directed upwards) of the velocity vector along the z-axis (directed from the back to the front). c) x-component of the velocity vector along the x-axis (directed from the left to the right). Positive values indicate fluid flow from the left to the right and negative values indicate fluid flow from the right to the left. d) z-component of the velocity vector along the z-axis (directed from the back to the front). Positive values indicate fluid flow from the back to the front and negative values indicate fluid flow from the front to the back. For illustration of plane 1 and x- and z-axis see Figure 42. Tablet diameter was constant (9 mm).
The influence of moving speed on the magnitude of the velocity components is different for SGF
and 1.4 % HPMC solution. In SGF largest values of y-velocity along the x-axis, y-velocity along
the z-axis, x-velocity, and z-velocity are between 105 %, 150 %, 8 %, and 25 % of moving velocity
for all five different moving speeds. This implies that increasing the moving velocity results in a
proportional increase in the velocity magnitude for each component. In 1.4 % HPMC solution
such proportionality between moving speed and magnitude is not observed. Certainly, higher
moving velocities produce higher velocity magnitudes. But the ratio between moving velocity
and peak velocity becomes higher by increasing the moving velocity. For all moving speed the
magnitude of the y-component along the x-axis and the x-component are higher for SGF than
for 1.4 % HPMC solution. The magnitude of the z-component is lower in SGF compared to 1.4 %
HPMC solution and the magnitude of the y-component along the z-axis is similar for both fluids.

4 Results
92
a) b)
c) d)
Figure 47: Influence of moving velocity (varied form 0.02 to 0.1 m/s) on fluid velocity magnitude on a horizontal cross section at the middle of the tablet (plane 1) for 1.4 % HPMC solution. a) Velocity profile of the y-component (directed upwards) of the velocity vector along the x-axis (directed from the left to the right). b) Velocity profile of the y-component (directed upwards) of the velocity vector along the z-axis (directed from the back to the front). c) x-component of the velocity vector along the x-axis (directed from the left to the right). Positive values indicate fluid flow from the left to the right and negative values indicate fluid flow from the right to the left. d) z-component of the velocity vector along the z-axis (directed from the back to the front). Positive values indicate fluid flow from the back to the front and negative values indicate fluid flow from the front to the back. For illustration of plane 1 and x- and z-axis see Figure 42. Tablet diameter was constant (9 mm).
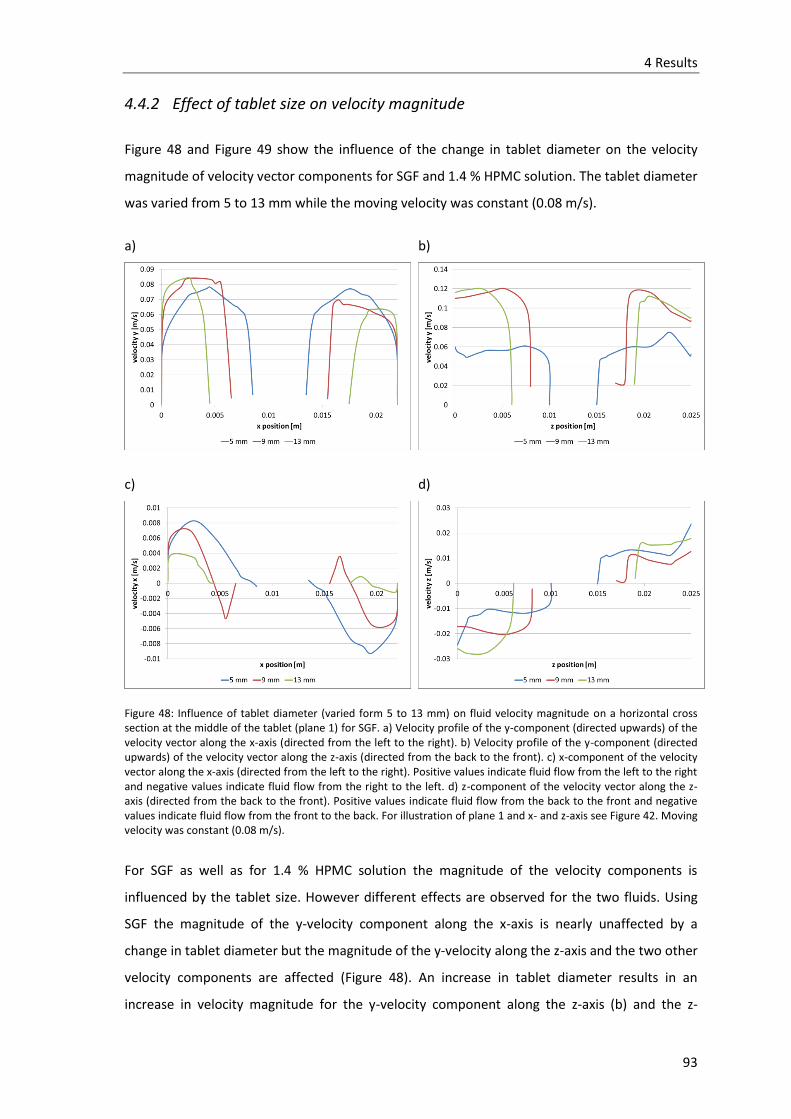
4 Results
93
4.4.2 Effect of tablet size on velocity magnitude
Figure 48 and Figure 49 show the influence of the change in tablet diameter on the velocity
magnitude of velocity vector components for SGF and 1.4 % HPMC solution. The tablet diameter
was varied from 5 to 13 mm while the moving velocity was constant (0.08 m/s).
a) b)
c) d)
Figure 48: Influence of tablet diameter (varied form 5 to 13 mm) on fluid velocity magnitude on a horizontal cross section at the middle of the tablet (plane 1) for SGF. a) Velocity profile of the y-component (directed upwards) of the velocity vector along the x-axis (directed from the left to the right). b) Velocity profile of the y-component (directed upwards) of the velocity vector along the z-axis (directed from the back to the front). c) x-component of the velocity vector along the x-axis (directed from the left to the right). Positive values indicate fluid flow from the left to the right and negative values indicate fluid flow from the right to the left. d) z-component of the velocity vector along the z-axis (directed from the back to the front). Positive values indicate fluid flow from the back to the front and negative values indicate fluid flow from the front to the back. For illustration of plane 1 and x- and z-axis see Figure 42. Moving velocity was constant (0.08 m/s).
For SGF as well as for 1.4 % HPMC solution the magnitude of the velocity components is
influenced by the tablet size. However different effects are observed for the two fluids. Using
SGF the magnitude of the y-velocity component along the x-axis is nearly unaffected by a
change in tablet diameter but the magnitude of the y-velocity along the z-axis and the two other
velocity components are affected (Figure 48). An increase in tablet diameter results in an
increase in velocity magnitude for the y-velocity component along the z-axis (b) and the z-
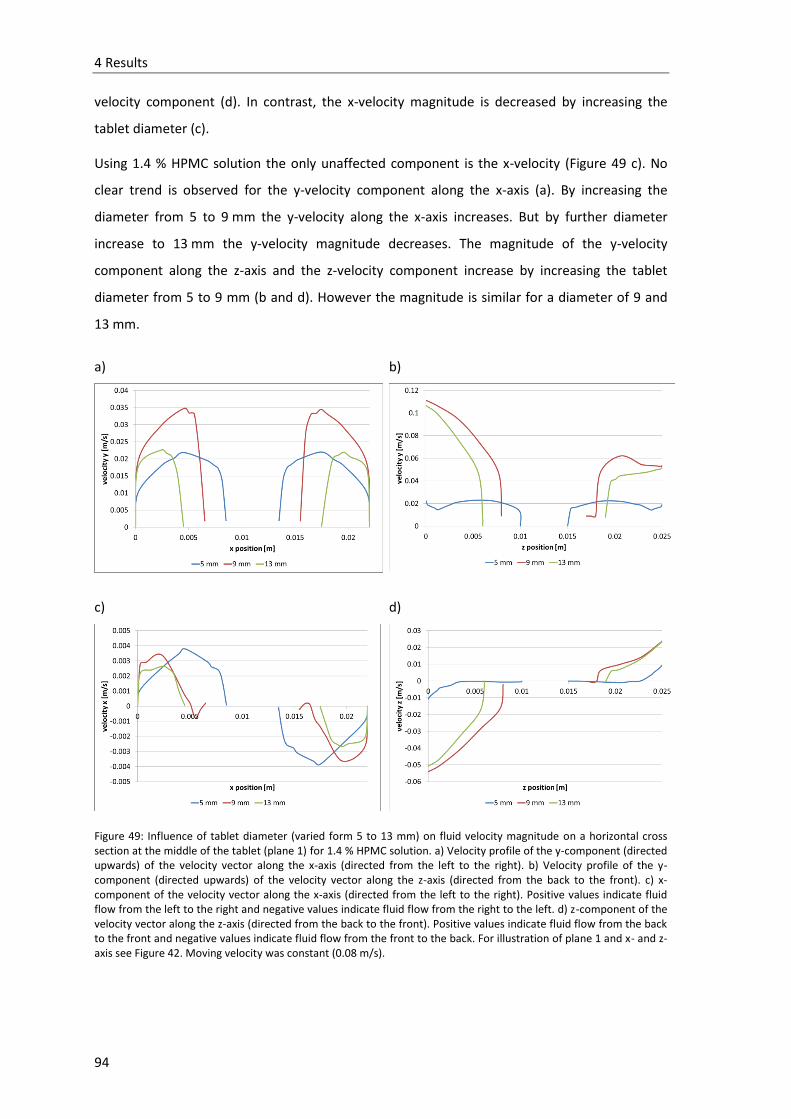
4 Results
94
velocity component (d). In contrast, the x-velocity magnitude is decreased by increasing the
tablet diameter (c).
Using 1.4 % HPMC solution the only unaffected component is the x-velocity (Figure 49 c). No
clear trend is observed for the y-velocity component along the x-axis (a). By increasing the
diameter from 5 to 9 mm the y-velocity along the x-axis increases. But by further diameter
increase to 13 mm the y-velocity magnitude decreases. The magnitude of the y-velocity
component along the z-axis and the z-velocity component increase by increasing the tablet
diameter from 5 to 9 mm (b and d). However the magnitude is similar for a diameter of 9 and
13 mm.
a) b)
c) d)
Figure 49: Influence of tablet diameter (varied form 5 to 13 mm) on fluid velocity magnitude on a horizontal cross section at the middle of the tablet (plane 1) for 1.4 % HPMC solution. a) Velocity profile of the y-component (directed upwards) of the velocity vector along the x-axis (directed from the left to the right). b) Velocity profile of the y-component (directed upwards) of the velocity vector along the z-axis (directed from the back to the front). c) x-component of the velocity vector along the x-axis (directed from the left to the right). Positive values indicate fluid flow from the left to the right and negative values indicate fluid flow from the right to the left. d) z-component of the velocity vector along the z-axis (directed from the back to the front). Positive values indicate fluid flow from the back to the front and negative values indicate fluid flow from the front to the back. For illustration of plane 1 and x- and z-axis see Figure 42. Moving velocity was constant (0.08 m/s).
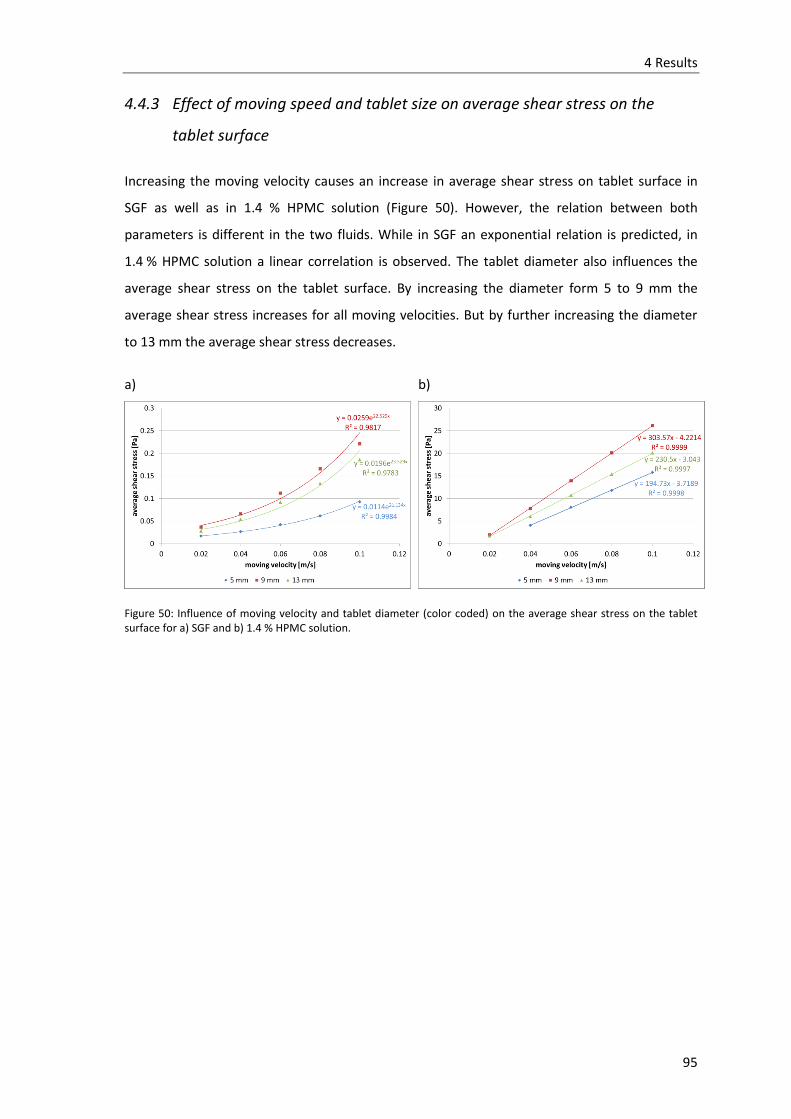
4 Results
95
4.4.3 Effect of moving speed and tablet size on average shear stress on the
tablet surface
Increasing the moving velocity causes an increase in average shear stress on tablet surface in
SGF as well as in 1.4 % HPMC solution (Figure 50). However, the relation between both
parameters is different in the two fluids. While in SGF an exponential relation is predicted, in
1.4 % HPMC solution a linear correlation is observed. The tablet diameter also influences the
average shear stress on the tablet surface. By increasing the diameter form 5 to 9 mm the
average shear stress increases for all moving velocities. But by further increasing the diameter
to 13 mm the average shear stress decreases.
a) b)
Figure 50: Influence of moving velocity and tablet diameter (color coded) on the average shear stress on the tablet surface for a) SGF and b) 1.4 % HPMC solution.
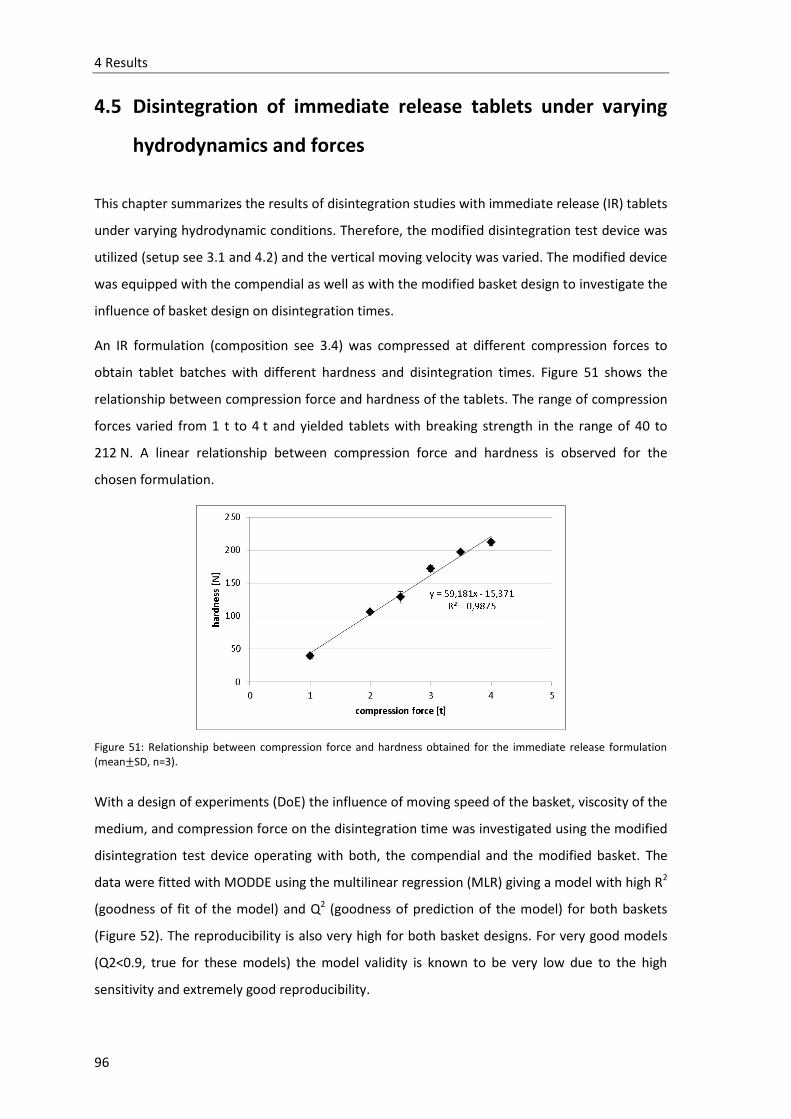
4 Results
96
4.5 Disintegration of immediate release tablets under varying
hydrodynamics and forces
This chapter summarizes the results of disintegration studies with immediate release (IR) tablets
under varying hydrodynamic conditions. Therefore, the modified disintegration test device was
utilized (setup see 3.1 and 4.2) and the vertical moving velocity was varied. The modified device
was equipped with the compendial as well as with the modified basket design to investigate the
influence of basket design on disintegration times.
An IR formulation (composition see 3.4) was compressed at different compression forces to
obtain tablet batches with different hardness and disintegration times. Figure 51 shows the
relationship between compression force and hardness of the tablets. The range of compression
forces varied from 1 t to 4 t and yielded tablets with breaking strength in the range of 40 to
212 N. A linear relationship between compression force and hardness is observed for the
chosen formulation.
Figure 51: Relationship between compression force and hardness obtained for the immediate release formulation (mean±SD, n=3).
With a design of experiments (DoE) the influence of moving speed of the basket, viscosity of the
medium, and compression force on the disintegration time was investigated using the modified
disintegration test device operating with both, the compendial and the modified basket. The
data were fitted with MODDE using the multilinear regression (MLR) giving a model with high R2
(goodness of fit of the model) and Q2 (goodness of prediction of the model) for both baskets
(Figure 52). The reproducibility is also very high for both basket designs. For very good models
(Q2<0.9, true for these models) the model validity is known to be very low due to the high
sensitivity and extremely good reproducibility.

4 Results
97
a)
b)
Figure 52: Summary plot for the response disintegration time for the a) compendial basket design and b) modified basket design. For both basket designs the response disintegration time is excellent fitted (high R
2 of 0.978 and 0.955
for the compendial and modified basket design, green) and predicted (high Q2 of 0.974 and 0.939 for the compendial
and modified basket design, blue) by the model. Model validity (yellow) is low due to the extremely high Q2
values. Reproducibility (cyan) is high for both models (0.99 for both).
The coefficient plot (Figure 53) is used to interpret the model and helps to identify the factors
showing a significant effect on disintegration time. In case the coefficient bar (green) is smaller
than the confidence interval, the influence of the factor is statistically insignificant. For both
basket designs all factors (spe= moving speed, vis= viscosity, and com= compression force)
exhibit a significant influence on disintegration time (p<0.05). For the compendial basket all
interaction effects are significant (p<0.05). For the modified basket design the interaction of
speed and compression force is significant (p<0.05). The interaction effect of viscosity and
compression force is negligible for the modified basket design (p>0.05). The interaction of speed
and viscosity is not significant (p=0.07) but may have a contribution.

4 Results
98
a)
b)
Figure 53: Coefficient plots for the disintegration time. a) Compendial basket, b) modified basket (factor abbreviations: spe= moving speed, vis= medium viscosity, com= compression force). The influence of the factors moving speed, medium viscosity, and compression force on disintegration time was investigated using the modified disintegration test device operating with both, the compendial and the modified basket design. The coefficient plot shows the regression coefficients (green bars) with their confidence intervals. In case the bar is smaller than the confidence interval the factor is not significant.
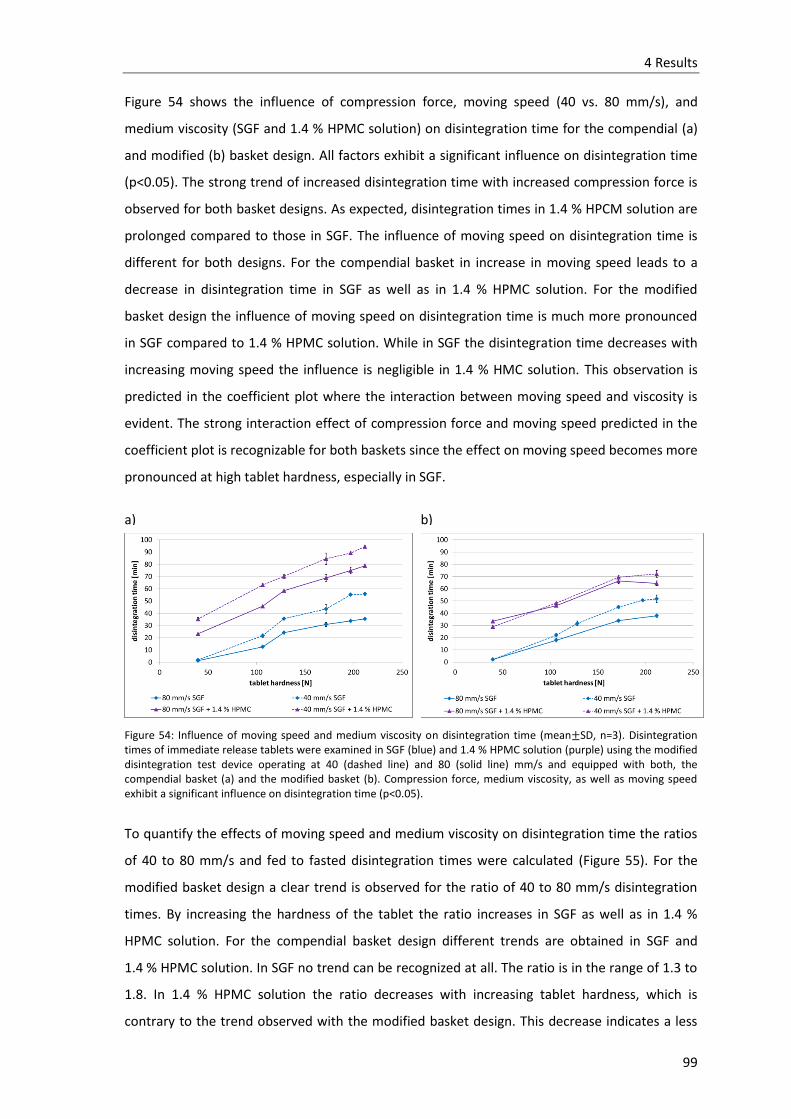
4 Results
99
Figure 54 shows the influence of compression force, moving speed (40 vs. 80 mm/s), and
medium viscosity (SGF and 1.4 % HPMC solution) on disintegration time for the compendial (a)
and modified (b) basket design. All factors exhibit a significant influence on disintegration time
(p<0.05). The strong trend of increased disintegration time with increased compression force is
observed for both basket designs. As expected, disintegration times in 1.4 % HPCM solution are
prolonged compared to those in SGF. The influence of moving speed on disintegration time is
different for both designs. For the compendial basket in increase in moving speed leads to a
decrease in disintegration time in SGF as well as in 1.4 % HPMC solution. For the modified
basket design the influence of moving speed on disintegration time is much more pronounced
in SGF compared to 1.4 % HPMC solution. While in SGF the disintegration time decreases with
increasing moving speed the influence is negligible in 1.4 % HMC solution. This observation is
predicted in the coefficient plot where the interaction between moving speed and viscosity is
evident. The strong interaction effect of compression force and moving speed predicted in the
coefficient plot is recognizable for both baskets since the effect on moving speed becomes more
pronounced at high tablet hardness, especially in SGF.
a) b)
Figure 54: Influence of moving speed and medium viscosity on disintegration time (mean±SD, n=3). Disintegration times of immediate release tablets were examined in SGF (blue) and 1.4 % HPMC solution (purple) using the modified disintegration test device operating at 40 (dashed line) and 80 (solid line) mm/s and equipped with both, the compendial basket (a) and the modified basket (b). Compression force, medium viscosity, as well as moving speed exhibit a significant influence on disintegration time (p<0.05).
To quantify the effects of moving speed and medium viscosity on disintegration time the ratios
of 40 to 80 mm/s and fed to fasted disintegration times were calculated (Figure 55). For the
modified basket design a clear trend is observed for the ratio of 40 to 80 mm/s disintegration
times. By increasing the hardness of the tablet the ratio increases in SGF as well as in 1.4 %
HPMC solution. For the compendial basket design different trends are obtained in SGF and
1.4 % HPMC solution. In SGF no trend can be recognized at all. The ratio is in the range of 1.3 to
1.8. In 1.4 % HPMC solution the ratio decreases with increasing tablet hardness, which is
contrary to the trend observed with the modified basket design. This decrease indicates a less

4 Results
100
pronounced effect of moving speed at higher compression forces in 1.4 % HPMC solution using
the compendial basket. Even though the moving speed is increased by the factor of two, the
ratio of disintegration times is below 2 for all fluid and both basket designs.
a) b)
Figure 55: a) Ratio of disintegration times at 40 and 80 mm/s moving speed for SGF and 1.4 % HPMC solution in the compendial (solid line) and modified basket (dashed line) design and b) ratio of fed to fasted disintegration time for compendial (solid line) and new (dashed line) basket design operating at 40 and 80 mm/s.moving.
For the ratio of fed to fasted disintegration times the trend is consistent for both fluid and
basket designs. By increasing the hardness of the tablet the ratio of fed to fasted disintegration
times decreases. A significant change is present between 40 and 100 N tablet hardness. Minor
changes in the ratio between 100 and 200 N are observed indicating a stabilization for tablets
with high hardness.
Summarizing, Figure 56 shows the 4D response contour plots of disintegration time for the
compendial basket design (a) and the modified basket design (b). Comprising, disintegration
time is increased by increasing compression force or increasing medium viscosity for both
basket designs. A change in moving velocity has different effects for the compendial and the
modified basket. For the compendial basket an increase in moving speed leads to a decrease in
disintegration time over the whole range of tablet hardness. This effect is observed only at high
tablet hardness for the modified basket. At low hardness the effect of moving velocity on
disintegration time is less pronounced. In general, longer disintegration times are observed for
the compendial basket design compared to the modified basket design with the same settings
in 1.4 % HPMC solution. Longest disintegration times of up to 90 min are measured for tablets
with high hardness in 1.4 % HPMC solution and the low moving speed.

4 Results
101
a)
b)
Figure 56: Response contour plot of disintegration time. Results are shown for disintegration studies using the modified disintegration test device equipped with the compendial basket (a) and the modified basket (b). The response contour plot summarizes the influence of the variables viscosity (y-axis; in % HPMC), moving speed (x-axis; in mm/s), and compression force (columns; in tons) on disintegration time (color coded).
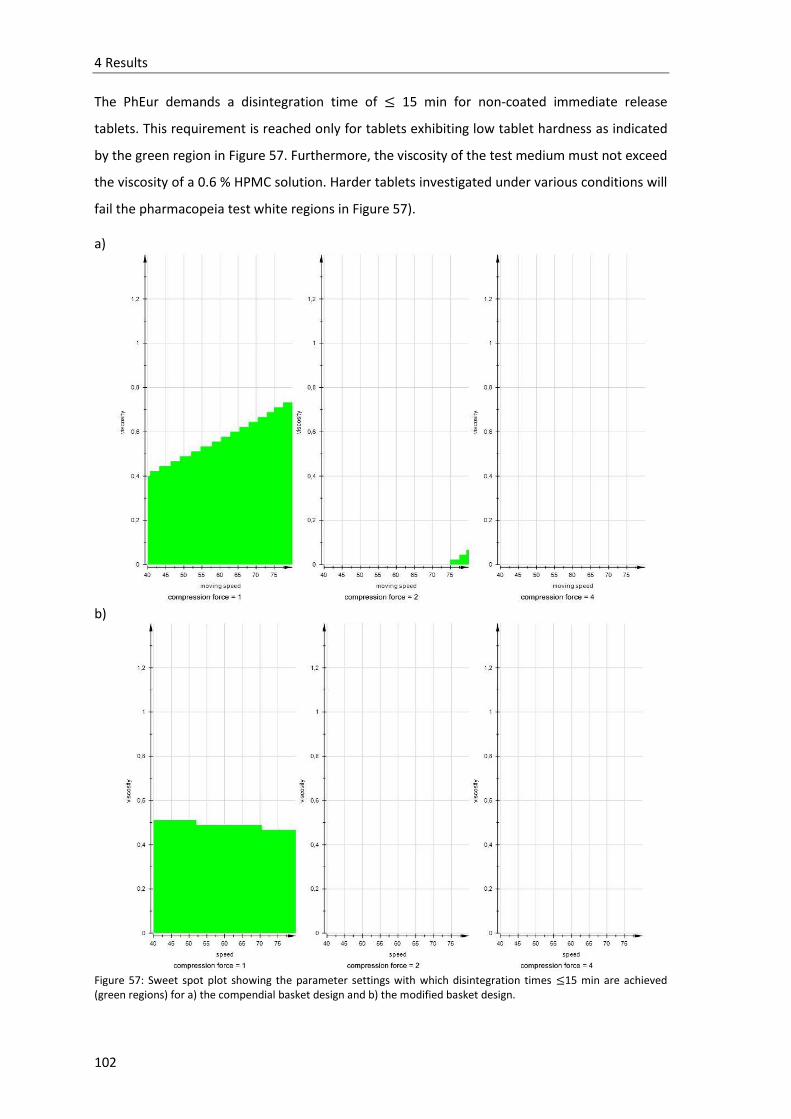
4 Results
102
The PhEur demands a disintegration time of ≤ 15 min for non-coated immediate release
tablets. This requirement is reached only for tablets exhibiting low tablet hardness as indicated
by the green region in Figure 57. Furthermore, the viscosity of the test medium must not exceed
the viscosity of a 0.6 % HPMC solution. Harder tablets investigated under various conditions will
fail the pharmacopeia test white regions in Figure 57).
a)
b)
Figure 57: Sweet spot plot showing the parameter settings with which disintegration times ≤15 min are achieved (green regions) for a) the compendial basket design and b) the modified basket design.
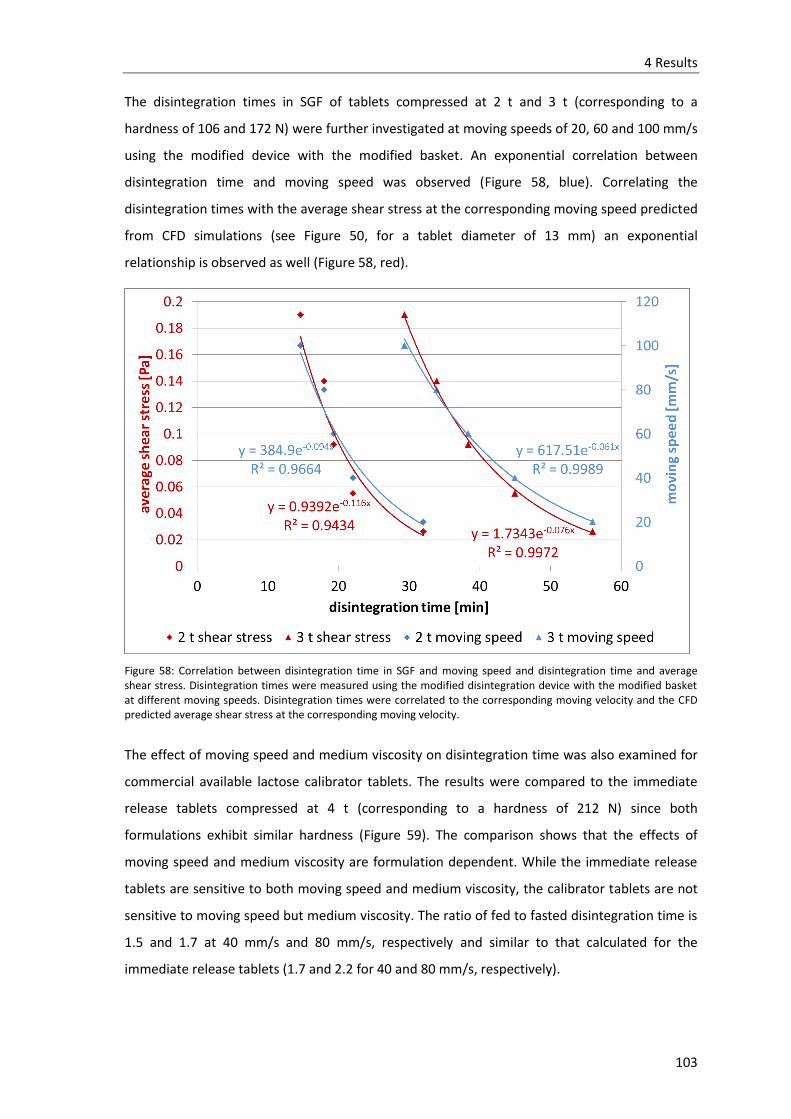
4 Results
103
The disintegration times in SGF of tablets compressed at 2 t and 3 t (corresponding to a
hardness of 106 and 172 N) were further investigated at moving speeds of 20, 60 and 100 mm/s
using the modified device with the modified basket. An exponential correlation between
disintegration time and moving speed was observed (Figure 58, blue). Correlating the
disintegration times with the average shear stress at the corresponding moving speed predicted
from CFD simulations (see Figure 50, for a tablet diameter of 13 mm) an exponential
relationship is observed as well (Figure 58, red).
Figure 58: Correlation between disintegration time in SGF and moving speed and disintegration time and average shear stress. Disintegration times were measured using the modified disintegration device with the modified basket at different moving speeds. Disintegration times were correlated to the corresponding moving velocity and the CFD predicted average shear stress at the corresponding moving velocity.
The effect of moving speed and medium viscosity on disintegration time was also examined for
commercial available lactose calibrator tablets. The results were compared to the immediate
release tablets compressed at 4 t (corresponding to a hardness of 212 N) since both
formulations exhibit similar hardness (Figure 59). The comparison shows that the effects of
moving speed and medium viscosity are formulation dependent. While the immediate release
tablets are sensitive to both moving speed and medium viscosity, the calibrator tablets are not
sensitive to moving speed but medium viscosity. The ratio of fed to fasted disintegration time is
1.5 and 1.7 at 40 mm/s and 80 mm/s, respectively and similar to that calculated for the
immediate release tablets (1.7 and 2.2 for 40 and 80 mm/s, respectively).

4 Results
104
Figure 59: Comparison of the influence of moving speed and medium viscosity on disintegration time between manufactured immediate release tablets (green) and marked calibrator tablets (yellow) (mean±SD, n=3). Disintegration times were measured using the modified disintegration test device with the compendial basket at 40 and 80 mm/s moving velocity in SGF (solid lines) and in 1.4 % HPMC solution (dashed lines).
The influence of applied pressure on disintegration time was investigated using the modified
basket design equipped with the balloons (described in 3.1 and 4.2) to simulate the contraction
of the stomach wall. Tablets compressed at 2 and 4 t (corresponding to a hardness of 106 and
212 N) were investigated. Figure 60 shows the results in SGF and 1.4 % HPMC solution at
moving speeds of 40 mm/s (b) and 80 mm/s (a). In SGF the inflation of the balloons every 10 s
has negligible influence on the disintegration time for both moving speeds. In 1.4 % HPMC
solution the inflation of the balloons results in an increase in disintegration time. It was visually
observed, that the tablet was not touched by the balloon. In contrast, by inflation of the
balloons the tablet was pushed downwards the bottom due to the squeezing out of the fluid
between the balloons and arising downward directed fluid flow. Hence, the observed influence
on disintegration time was not due to applied pressure but to changed hydrodynamic
conditions.
To prove this observation, a small bench was constructed of mesh material and inserted to the
bottom of each probe chamber. Thereby, the tablet cannot escape the impact of the balloons.
As expected, a decrease in disintegration time was measured. With this setup high local force
are acting on the tablet due to the balloons contacting the tablet and pressing it at the mesh.

4 Results
105
a) b)
Figure 60: Influence of applied pressure on disintegration time in SGF and 1.4 % HPMC (mean±SD, n=3). Disintegration times of tablets compressed at 2 and 4 t were investigated using the modified disintegration test device operating at a) 80 mm/s moving speed, and b) 40 mm/s moving speed.
4 Results
106
4.6 Development and in vitro characterization of a
gastroretentive drug delivery system
This chapter describes the development and in vitro characterization of a gastroretentive drug
delivery system (GRDDS). The approach of an in situ polyelectrolyte complex was evaluated for
applicability. The matrices were investigated in terms of complex formation (FT-IR), density,
degree of swelling, mechanical stability, and drug release.
4.6.1 FT-IR measurements
The polyelectrolyte complex is formed by electrostatic interaction between the deprotonated
SO3- groups of carrageenan and the protonated NH3
+ groups of chitosan as soon as they are
exposed to the test medium or the stomach content. This electrostatic interaction was
confirmed by FT-IR spectroscopy. Figure 61 shows exemplarily the obtained FT-IR spectra of
chitosan 80/1000, carrageenan 379, the freeze dried complex, and trospium chloride. The
spectrum of the complex was obtained after 24 h dissolution testing and subsequent freeze
drying of the remaining complex (see material and methods 3.5.2.2). The spectrum of chitosan
exhibits the characteristic bands at 1651 cm-1 and 1589 cm-1 which are assigned to amide I (free
primary amino group) and amide II (acetylated amino group), respectively (Tapia et al., 2004;
Grenha et al., 2010; Araujo et al., 2014). The spectrum of carrageenan shows several
characteristic peaks, of which the one at 1219 cm-1 is of particular interest representing the
sulfate group (Araujo et al., 2014; Grenha et al., 2010). The peaks at 926 cm-1 and 848 cm-1 are
typical for the 3,6-anhydrogalactose unit and the galactose-4-sulfate unit, respectively (Grenha
et al., 2010). The disappearance of the characteristic peaks of the primary amide group of
chitosan at 1651 cm-1 and the sulfate group of carrageenan at 1219 cm-1 in the spectrum of the
freeze dried complex proofs the ionic interaction between the two polymers. Additionally, a
new peak arises at 1512 cm-1 further proofing the interaction. The peaks of the 3,6-
anhydrogalactose unit and the galactose-4-sulfate unit are conserved in the spectrum of the
complex. All three spectra show the characteristic absorption band for the glycosidic link at
1026 cm-1. None of the peaks characteristic for trospium chloride is observed in the freeze dries
complex, indicating that all drug has been released.

4 Results
107
a) b)
c) d)
Figure 61: FT-IR spectra of a) chitosan 80/1000, b) carrageenan 379, c) freeze dried complex, and d) trospium chloride.
4.6.2 Density
The ability of a gastroretentive delivery system to float on the gastric contents is determined by
its density. While systems with a density < 1 g/cm3 are supposed to float, densities of
approximately 2.5 g/cm3 are necessary to sink down to the antrum (Bardonnet et al., 2006). The
calculated densities after immersion in SGF for 0.5 and 8 h are summarized in Table 17.

4 Results
108
Table 17: Densities (mean±SD, n=3) of the complexes after immersion in SGF for 0.5 and 8 h.
Polyelectrolytes Ratio Density [g/cm3] 0.5 h Density [g/cm3] 8 h
80/1000:379 1:8 0.89±0.02 0.75±0.21
80/1000:379 1:1 0.69±0.08 0.71±0.09
80/500:379 1:8 0.90±0.47 0.98±0.08
80/500:379 1:1 0.56±0.11 0.74±0.20
95/500:379 1:8 0.97±0.16 0.90±0.00
95/500:379 1:1 0.83±0.31 0.60±0.05
80/1000:209 1:1 0.53±0.01 0.65±0.10
80/500:209 1:1 0.54±0.20 0.72±0.20
95/500:209 1:1 0.75±0.03 0.60±0.05
When placing the capsules in the beaker immediate floating of all systems was observed. This
observation is proofed by the calculated densities after 0.5 h immersion in SGF which range
from 0.53 to 0.97 g/cm3 indicating the ability of all systems to float on gastric contents
immediately after being exposed to it. Even after 8 h of immersion in SGF, all systems maintain
their floating ability indicated by the densities, which are below 1 g/cm3 for all systems.
Comparing complexes of chitosan and the iota-carrageenan 379 at different ratios (1:1 and 1:8),
the densities are lower when mixing the polymers in the ratio 1:1.
4.6.3 Matrix swelling
Sufficient swelling of the matrix is important to prevent the systems from being emptied from
the stomach. It is generally accepted that objects >15 mm in diameter are retained in the
stomach (Bardonnet et al., 2006).
The maximum degree of swelling for the various formulations is shown in Figure 62. When
testing capsules containing chitosan only, no matrix formation was observed and the chitosan
dissolved immediately after the shell was dissolved due to the protonation of the amino groups.
For capsules containing carrageenan only, matrix formation was observed. The maximum
degree of swelling was low reaching 153 % and 324 % for lambda (209)-and iota (379)-
carrageenan, respectively. Using both oppositely charged polyelectrolytes leads to much higher
degrees of swelling. Highest maximum degrees of swelling in the range of 1554 % and 1718 %
are observed in acetate buffer pH 4.5 for the formulations 80/1000:209 1:1 and 80/1000:379

4 Results
109
1:8, respectively. In general, maximum matrix swelling is higher for formulations containing the
iota-carrageenan 379 as anionic polyelectrolyte compared to the lambda-carrageenan 209.
Figure 62: Maximum degree of swelling (mean±SD, n=3) for all formulations in SGF and for formulations 80/1000:379 1:8 and 80/1000:209 1:1 in acetate buffer pH 4.5 (indicated by A).
The degree of swelling in SGF as a function of time for various formulations containing different
types of chitosan and carrageenan is shown in Figure 63. Capsules prepared form carrageenan
only showed a slight increase in weight after 1h. The matrices composed of the lambda-
carrageenan 209 disintegrated rapidly during 3 h. In contrast, the matrices from the iota-
carrageenan 379 swelled to 324% in the first 4 h of the experiment and maintained this weight
for the last 4 h of the experiment. However, matrices composed of both oppositely charged
polymers swelled to an even greater extent. Furthermore, swelling continued for the whole
duration of the experiment and did not reach equilibrium as observed for the iota-carrageenan
379.
Figure 63 clearly shows that the degree of swelling is strongly dependent on the properties of
the polyelectrolytes as well as on their ratio. All formulations containing chitosan: iota-
carrageenan 379 in the ratio 1:1 show an initial burst in swelling followed by a decrease in
swelling rate (Figure 63 a). When using the polymers in the ratio 1:8 this initial burst is not
observed. Formulation 95/500:379 1:1 shows an extraordinary high initial swelling in the first
30 min followed by a decrease in degree of swelling. After 5 h the degree is slightly rising
reaching a saturation at 6 h for the rest of the experiment. For the two other formulations of
ratio 1:1 (80/1000:379 and 80/500:379) neither decrease nor saturation of swelling is observed.

4 Results
110
Swelling increases continuously during the whole experiment. While formulations 80/1000:379
1:8 and 80/500:379 1:8 exhibit nearly the same swelling behavior, formulation 95/500:379 1:8
shows a much higher degree of swelling.
a)
b)
Figure 63: Degree of swelling (mean±SD, n=3). a) Effect of polymer ratio on degree of swelling in SGF for formulations containing chitosan and iota carrageenan, b) Degree of swelling in SGF for formulations containing chitosan and lambda-carrageenan.

4 Results
111
Comparing the swelling of the matrices containing iota (379)-or lambda (209)-carrageenan, the
degree of swelling is lower for formulations containing the lambda-carrageenan 209. This
difference could be associated to their different amount of charged sulfate groups per
monomer unit, which is higher for the lambda-carrageenan 209 compared to the iota-
carrageenan 379. The amount of charged anionic and cationic groups governs the interaction
between the polymers and the resulting properties of the matrix.
As the pH of the stomach can vary between 1 and 6 during the day, depending on the prandial
state (Kalantzi et al., 2006), the influence of pH on the degree of swelling was examined in SGF
(pH 1.2) and acetate buffer (pH 4.5) (Figure 64). For the formulation 80/1000:379 1:8 no pH
dependence was observed. In contrast, the formulation with the lambda carrageenan
80/1000:209 1:1 shows large pH dependence. In acetate buffer this matrix swelled to a greater
extent reaching 1554 % compared to 866 % in SGF.
Figure 64: Effect of pH of medium on degree of swelling for formulations 80/1000:379 1:8 and 80/1000:209 1:1 (mean±SD, n=3).
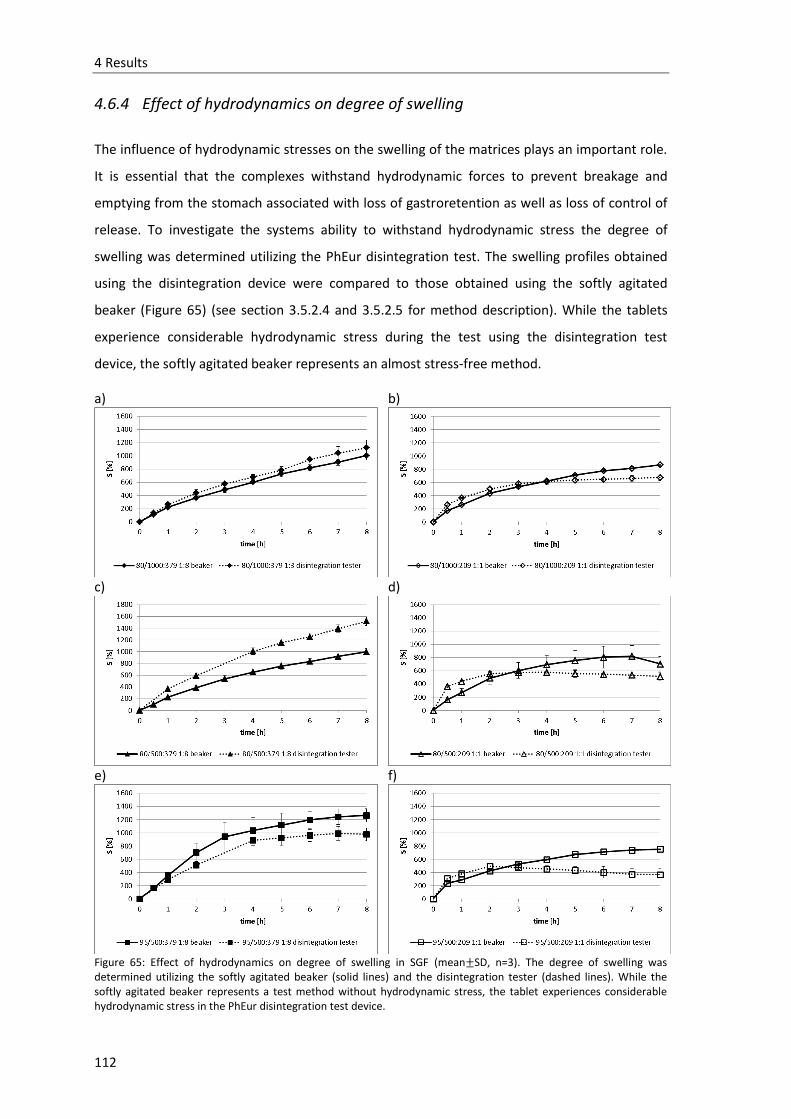
4 Results
112
4.6.4 Effect of hydrodynamics on degree of swelling
The influence of hydrodynamic stresses on the swelling of the matrices plays an important role.
It is essential that the complexes withstand hydrodynamic forces to prevent breakage and
emptying from the stomach associated with loss of gastroretention as well as loss of control of
release. To investigate the systems ability to withstand hydrodynamic stress the degree of
swelling was determined utilizing the PhEur disintegration test. The swelling profiles obtained
using the disintegration device were compared to those obtained using the softly agitated
beaker (Figure 65) (see section 3.5.2.4 and 3.5.2.5 for method description). While the tablets
experience considerable hydrodynamic stress during the test using the disintegration test
device, the softly agitated beaker represents an almost stress-free method.
a) b)
c) d)
e) f)
Figure 65: Effect of hydrodynamics on degree of swelling in SGF (mean±SD, n=3). The degree of swelling was determined utilizing the softly agitated beaker (solid lines) and the disintegration tester (dashed lines). While the softly agitated beaker represents a test method without hydrodynamic stress, the tablet experiences considerable hydrodynamic stress in the PhEur disintegration test device.

4 Results
113
While for formulations 80/1000:379 1:8 and 80/1000:209 1:1 hydrodynamic forces do not
change the ability to swell (Figure 65 a) and b), they play an important role for the other
formulations (Figure 65 c), d), e), f). Whereas the formulation of the iota-carrageenan 379 with
chitosan 80/500 shows increased swelling under higher hydrodynamic forces, the formulation
with chitosan 95/500 shows decreased swelling. The formulations with the lambda-carrageenan
209 exhibit a higher degree of the swelling under higher hydrodynamics during the first three
hours followed by a decrease of swelling indicating erosion of the matrix. While formulation
95/500:379 1:8 shows the highest degree of swelling under low hydrodynamic stress (1263 %),
formulation 80/500:379 1:8 exhibits the highest degree of swelling under high hydrodynamic
stress reaching 1518 %. Formulation 95/500:209 1:1 shows the lowest ability to swell under low
and high hydrodynamic forces.
The pH dependence of the degree of swelling under hydrodynamic stress was examined in SGF
(pH 1.2) and acetate buffer (pH 4.5) (Figure 66). As already observed for the degree of swelling
without hydrodynamic stress, formulations with the lambda-carrageenan 209 exhibit high pH
dependence while formulations with the iota-carrageenan 379 are only slightly influenced by pH
variation. For formulation 80/1000:209 1:1 the degree of swelling dramatically increases with
increasing pH.
Figure 66: Effect of pH of the medium on degree of swelling for formulations 80/1000:379 1:8 and 80/1000:209 1:1 determined utilizing the PhEur disintegration test device (mean±SD, n=3).
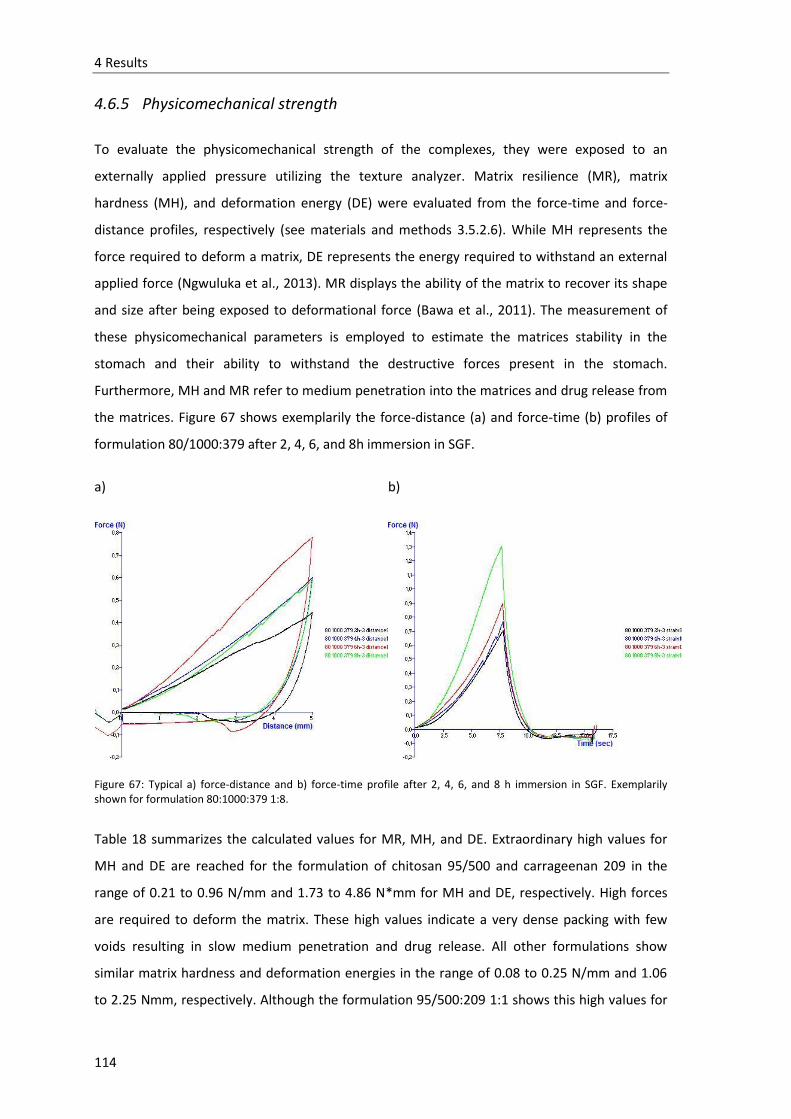
4 Results
114
4.6.5 Physicomechanical strength
To evaluate the physicomechanical strength of the complexes, they were exposed to an
externally applied pressure utilizing the texture analyzer. Matrix resilience (MR), matrix
hardness (MH), and deformation energy (DE) were evaluated from the force-time and force-
distance profiles, respectively (see materials and methods 3.5.2.6). While MH represents the
force required to deform a matrix, DE represents the energy required to withstand an external
applied force (Ngwuluka et al., 2013). MR displays the ability of the matrix to recover its shape
and size after being exposed to deformational force (Bawa et al., 2011). The measurement of
these physicomechanical parameters is employed to estimate the matrices stability in the
stomach and their ability to withstand the destructive forces present in the stomach.
Furthermore, MH and MR refer to medium penetration into the matrices and drug release from
the matrices. Figure 67 shows exemplarily the force-distance (a) and force-time (b) profiles of
formulation 80/1000:379 after 2, 4, 6, and 8h immersion in SGF.
a) b)
Figure 67: Typical a) force-distance and b) force-time profile after 2, 4, 6, and 8 h immersion in SGF. Exemplarily shown for formulation 80:1000:379 1:8.
Table 18 summarizes the calculated values for MR, MH, and DE. Extraordinary high values for
MH and DE are reached for the formulation of chitosan 95/500 and carrageenan 209 in the
range of 0.21 to 0.96 N/mm and 1.73 to 4.86 N*mm for MH and DE, respectively. High forces
are required to deform the matrix. These high values indicate a very dense packing with few
voids resulting in slow medium penetration and drug release. All other formulations show
similar matrix hardness and deformation energies in the range of 0.08 to 0.25 N/mm and 1.06
to 2.25 Nmm, respectively. Although the formulation 95/500:209 1:1 shows this high values for

4 Results
115
MH and DE it exhibits with 10-13 % the lowest values for MR compared to the other
formulations indicating a very poor ability of the matrix to recover its size and dimensions after
exposure to external force. All formulations containing carrageenan 209 as anionic polymer
exhibit lower values of MR compared to those containing carrageenan 379. In general, higher
values of MR are found during the first 4 hours of the experiment. Afterwards the MR starts to
decrease. Formulation 80/500:379 1:8 exhibits the highest MR at 6 hours reaching 27 %.
Table 18: Texture analysis results (mean±SD, n=3). MH was calculated from the force distance profile and represents the force required to deform the matrix. De was also calculated form the force-distance profile and represents the energy required to withstand an external applied force. MR was calculated from the force-time profile and represents the ability of a matrix to recover its shape after being exposed to deformational force.
Formulation t [h] MR [%] MH [N/mm] DE [N*mm]
80/1000:379 1:8 2 17.96±3.33 0.11±0.03 1.60±0.47
4 22.04±3.63 0.10±0.02 1.21±0.22
6 22.04±4.23 0.12±0.03 1.41±0.45
8 20.63±4.56 0.10±0.02 1.28±0.18
80/1000:209 1:1 2 14.00±0.72 0.17±0.04 1.83±0.47
4 16.52±1.87 0.13±0.02 1.18±0.17
6 14.55±1.86 0.18±0.05 1.77±0.63
8 12.82±1.53 0.16±0.08 1.37±0.70
80/500:379 1:8 2 17.15±0.91 0.19±0.05 2.16±0.33
4 26.48±4.26 0.15±0.06 2.24±1.00
6 27.23±0.97 0.15±0.04 1.88±0.54
8 22.98±2.14 0.08±0.04 1.06±0.61
80/500:209 1:1 2 16.09±0.89 0.19±0.06 1.88±0.51
4 18.52±1.75 0.18±0.03 1.59±0.26
6 16.63±1.54 0.24±0.04 2.25±0.53
8 14.39±2.53 0.25±0.08 2.09±0.67
95/500:379 1:8 2 23.49±9.43 0.15±0.03 1.58±0.54
4 24.58±10.77 0.18±0.03 2.25±0.16
6 26.88±4.86 0.14±0.02 1.83±0.50
8 16.40±4.14 0.15±0.02 1.97±0.96
95/500:209 1:1 2 13.39±1.39 0.21±0.08 1.73±0.76
4 11.17±4.01 0.41±0.04 3.30±0.51
6 10.31±1.58 0.96±0.80 4.86±2.59
8 9.76±0.47 0.69±0.29 2.89±0.61
4 Results
116
4.6.6 In vitro drug release from polyelectrolyte complexes
The in vitro release of trospium from various matrices differing in composition and ratio was
investigated in SGF using USP apparatus II operating at 50 rpm (Figure 68). Additionally, release
testing was performed in acetate buffer (pH 4.5) for selected formulations (Figure 69).
As already observed for the degree of swelling, the release of trospium is strongly dependent on
the polymer properties as well as on their mixing ratio (Figure 68). While the release from
formulations of chitosan and iota-carrageenan 379 at the ratio 1:1 follows a 1st order kinetic,
the profiles of formulations at the ratio 1:8 are described by a sigmoidal curve indicating a lag
time before onset of dissolution of the drug (Figure 68 a). Furthermore, release from matrices at
the ratio of 1:1 is incomplete after 24 h reaching approximately 75 %. In contrast, release from
formulations at the ratio 1:8 is complete after 24 h. For comparison purpose the release profile
from a matrix comprised of iota-carrageenan 379 only is also shown. Compared to the profiles
from the polyelectrolyte matrices the release from iota-carrageenan 379 is retarded.
Nevertheless, this matrix is not suitable for gastroretentive drug delivery due to its low swelling
and insufficient stability. Release from matrices containing chitosan only was rapid and
complete release was reached after approximately 4 h (data not shown). The same is true for
matrices of lambda-carrageenan 209.
The release from matrices of chitosan and lambda-carrageenan 209 at the ratio 1:1 is
incomplete after 24 h with only about 60 % trospium released (Figure 68 b). No further release
is observed when measurement is extended to 48 h (data not shown). The release pattern from
matrices of chitosan and lambda-carrageenan 209 is linear up to 10 h followed by a decrease in
release rate.
Table 19 lists the results of the fitting of the dissolution data to different kinetic models. None
of the curves fits to the Higuchi model. As Higuchi describes the drug dissolution as a diffusion
process based on Fick’s law, the low R2 indicate a dissolution process that is not governed by
diffusion. A better fit for most formulations is achieved by using the Hixson-Crowell model,
which can be applied to formulations where drug release is governed by diminishing of the
dosage form surface indicating an erosion controlled release mechanism. To better understand
the release mechanism the dissolution data were fitted to Korsmeyer-Peppas model where the
release exponent 𝑛 indicates the mechanism of drug transport. For all formulations containing
iota-carrageenan 379 𝑛 > 0.89 indicating super case II transport that refers to erosion of the
polymeric chains. Calculated 𝑛 values for all formulations containing lambda-carrageenan 209,
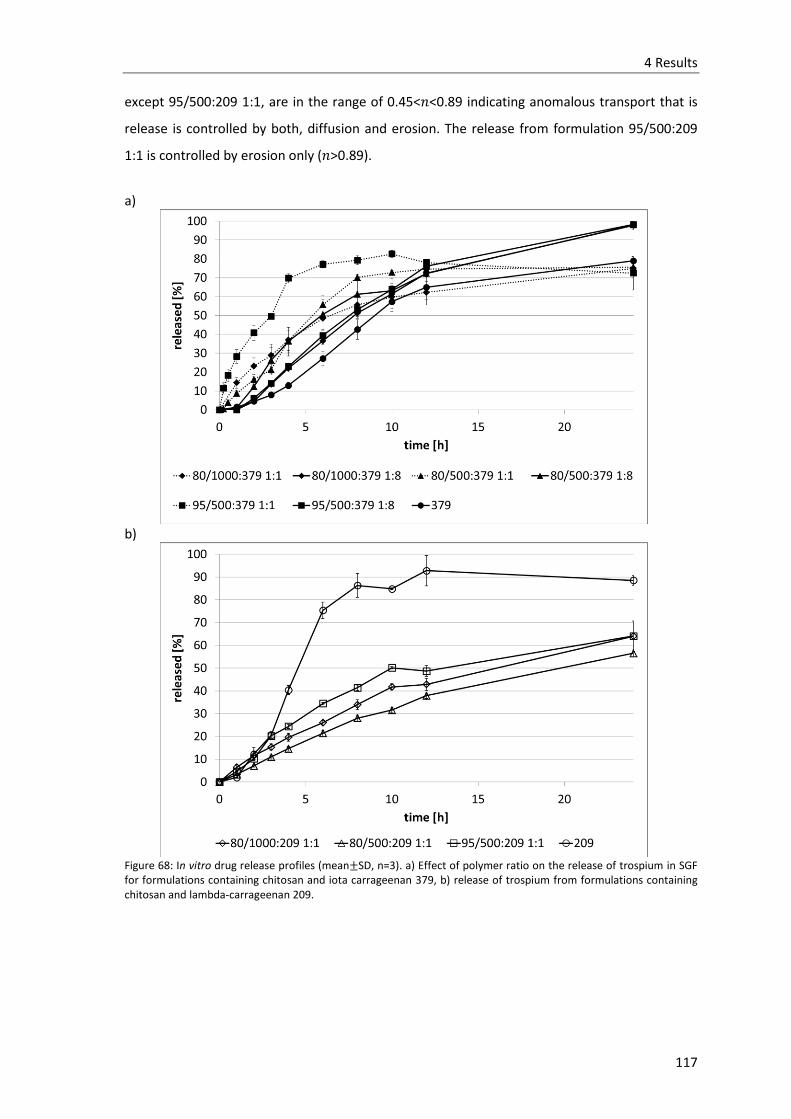
4 Results
117
except 95/500:209 1:1, are in the range of 0.45<𝑛<0.89 indicating anomalous transport that is
release is controlled by both, diffusion and erosion. The release from formulation 95/500:209
1:1 is controlled by erosion only (𝑛>0.89).
a)
b)
Figure 68: In vitro drug release profiles (mean±SD, n=3). a) Effect of polymer ratio on the release of trospium in SGF for formulations containing chitosan and iota carrageenan 379, b) release of trospium from formulations containing chitosan and lambda-carrageenan 209.

4 Results
118
Figure 69: Release of trospium form formulations 80/1000:379 1:8 and 80/1000:209 1:1 in SGF (pH 1.2) and acetate buffer (pH 4.5) (mean±SD, n=3).
Figure 69 shows the effect of dissolution medium pH on release of trospium form two selected
formulations. While for formulation 80/1000:209 1:1 no effect of pH on drug release is observed
(f2= 0.69), the release profiles of formulation 80/1000:379 1:8 are not similar (f2= 0.37). At the
higher pH the release from formulation 80/1000:379 1:8 is retarded compared to the release in
SGF. After a lag time of 2 h the release at pH 4.5 is nearly linear. This observation is contrary to
the results obtained for the pH dependence of the degree of swelling where formulation
80/1000:209 1:1 showed a pH dependency and formulation 80/1000:379 1:8 not.
Table 19: Fitting parameters of drug release data. Formulation zero first Higuchi Korsmeyer-Peppas Hixson-Crowell
K0 R2 K1 R2 KH R2 KKP n R2 KHC R2
80/1000:379 1:8 6.026 0.9785 0.094 0.9150 16.722 0.7794 1.710 1.7071 0.9519 0.027 0.9459
80/500:379 1:8 6.793 0.9338 0.107 0.9728 19.200 0.8843 1.751 2.1331 0.4133 0.030 0.9729
95/500:379 1:8 7.817 0.9362 0.143 0.9352 22.338 0.8473 3.031 1.7294 0.8751 0.038 0.9574
80/1000:209 1:1 4.048 0.9574 0.051 0.9888 11.501 0.9334 6.577 0.7794 0.9919 0.016 0.9818
80/500:209 1:1 3.295 0.9903 0.039 0.9981 9.227 0.8889 4.855 0.7528 0.9584 0.012 0.9973
95/500:209 1:1 4.833 0.9345 0.064 0.9795 13.734 0.9137 5.523 0.9669 0.9219 0.019 0.9703
80/1000:379 1:8 A 3.213 0.9460 0.039 0.9057 8.725 0.7032 0.721 1.6311 0.9758 0.012 0.9209
80/1000:209 1:1 A 4.206 0.9115 0.053 0.9506 12.037 0.9372 7.801 0.7199 0.9685 0.016 0.9405

4 Results
119
4.7 Characterization of the gastroretentive drug delivery system
under varying hydrodynamic conditions
For gastroretentive drug delivery systems it is very important that they withstand the
hydrodynamic and mechanical forces to which they are exposed in the stomach. Thus controlled
drug release is ensured and dose dumping is avoided. Therefore, the influence of different
hydrodynamic conditions on the degree of swelling and drug release profile was examined
utilizing the modified disintegration test device described in 3.1 and 4.2 operating with the
compendial basket design. These investigations were performed with formulation 80/1000:379
1:8. This formulation is regarded as the optimized formulation in terms of degree of swelling,
mechanical stability, and drug rlease based on the results of chapter 4.6.
4.7.1 Swelling behavior
The degree of swelling in SGF was measured using the softly agitated beaker method (3.5.2.4),
the PhEur disintegration test device (3.5.2.5), and the modified disintegration test device
operating at two different speeds (40 and 80 mm/s) and equipped with the compendial basket.
The obtained swelling profiles were compared (Figure 70).
Figure 70: Swelling profiles of optimized gastroretentive formulation 80/1000:379 1:8 in SGF under varying hydrodynamic conditions (mean±SD, n=3). The degree of swelling was investigated using the softly agitated beaker method, the PhEur disintegration test device, and the modified disintegration test device operating at 40 and 80 mm/s.

4 Results
120
The degree of swelling is largely influenced by the hydrodynamic stress. In the softly agitated
beaker the matrices experience nearly no hydrodynamic stress. Operating the modified
disintegration at 80 mm/s the matrices are exposed to harsh hydrodynamic conditions. The
higher the hydrodynamic stress the higher the degree of swelling. The degree of swelling is
about 300 % higher at 80 mm/s compared to the degree of swelling in the softly agitated
beaker.
4.7.2 Drug release profile
The release profiles from the gastroretentive drug delivery system 80/1000:379 = 1:8 under
varying hydrodynamic conditions are shown in Figure 71. The profile obtained using the USP
paddle apparatus (50 rpm) is compared to the profiles obtained using the modified
disintegration test device operating at 40 and 80 mm/s and equipped with the compendial
basket.
Figure 71: Release profiles of trospium in SGF under varying hydrodynamic conditions obtained for the optimized gastroretentive formulation 80/1000:379 1:8 in SGF. Release was tested utilizing the USP paddle apparatus operating at 50 rpm (mean±SD, n=3) and the modified disintegration tester operating at 40 and 80 mm/s (for 80 mm/s mean±SD of three measurements with one capsule per trial is reported. Due to the low SD, three capsules per trial were measured at 40 mm/s and mean is reported).
The different hydrodynamic conditions significantly influence the drug release from the
polyelectrolyte complex (Figure 71). All three release profiles are not similar (f2<50). Using the
paddle apparatus, the system floats on top of the medium and rotates with the fluid. It
experiences nearly no hydrodynamic stress and hence drug release is slow compared to the

4 Results
121
release when tested in the disintegration device under considerable stress. Additionally, the
moving velocity of the device influences drug release from the systems. By increasing the
moving velocity the drug release is faster. At a moving speed of 80 mm/s no lag phase is
observed.
4.7.3 Correlation between drug release and degree of swelling
It is claimed that the degree of swelling determines the rate of drug release from swellable
hydrophilic matrices (Colombo, 1993). This expectation was validated by correlating the degree
of swelling at time t with the drug released at time t at 40 and 80 mm/s (Figure 72). A linear
correlation was obtained for both moving speeds. However, the different slopes of the two
correlations indicate that drug release is not only governed by the swelling. Initially, at low
swelling, a higher percentage of drug is released at 80 mm/s compared to 40 mm/s. At higher
moving speeds surface erosion is higher which might accelerate drug release. Secondly, fluid
flow through the gel layer is higher at 80 mm/s, possibly liberating API from the polymeric
network.
Figure 72: Correlation between drug release and degree of swelling at 40 and 80 mm/s in SGF for formulation 80/1000:379 1:8. Drug release and degree of swelling were measured utilizing the modified disintegration test device operating at 40 and 80 mm/s.

5 Discussion
122
5 Discussion
Understanding the role of hydrodynamics and pressure forces for disintegration/dissolution of
oral solid dosage forms can help to improve disintegration testing and the predictive power of
the in vitro test. This study provides a deep insight into the hydrodynamics and forces in the
PhEur/USP disintegration test device. With an in-house built modified disintegration test device,
the influence of different hydrodynamic conditions on tablet disintegration was investigated.
Furthermore, the influence of hydrodynamic forces on swelling and drug release from
gastroretentive drug delivery systems was evaluated.
5.1 Development of a modified disintegration test device
The modified disintegration test device is derived from the compendial PhEur/USP test device. It
enables the investigation of the influence of hydrodynamic conditions and mechanical stresses
on dosage form disintegration. The alterations made comprised three steps: 1) movement of
the basket by a computer controlled computerized numerical control (CNC), 2) development of
a modified basket design that enables two-sided fluid flow, and 3) simulation of physiologically
relevant pressure forces on the dosage form by inflation and deflation of balloons. The influence
of all factors can be examined separately. The application of computer control and CNC
technology enables to examine the influence moving speed and moving profile on disintegration
times. Simple as well as complex moving profiles can be applied simulating different conditions
in different part of the human stomach. Due to its lateral open mesh structure the modified
basket design allows two-sided fluid flow. Due to the fact that the modified device can be
equipped with both baskets, the compendial and the modified, the influence of the different
designs can be investigated. Forces on the dosage form can be applied by a computer controlled
balloon system. Travelling through the stomach, a solid oral dosage form will be exposed to
different hydrodynamic and mechanical conditions. Entering the fundus, the dosage form will
experience little movement and low stress (Koziolek et al., 2013). The residence in this part of
the stomach can be simulated by low moving speed and sparse or no inflation of the balloons,
by which the pressure conditions can by varied. By settling down to the antrum the
hydrodynamic and mechanical conditions become harsher (Koziolek et al., 2013). This can be
simulated by higher moving speed and more frequent inflation of the balloons. The whole path
through the different parts of the stomach can be simulated by varying hydrodynamic and

5 Discussion
123
mechanical conditions during the test. A later development towards a test device for intestinal
delivery systems is possible.
Investigations in this work were limited to the vertical movement of the basket. However,
horizontal as well as radial movement is possible. The influence of moving direction on
disintegration time remains to be investigated. Especially a unidirectional radial movement is a
promising approach, since turning points can therefore be avoided. These turning points occur
by change in direction when moving the basket vertically or horizontally, but are not likely
observed in vivo.
A pressure unit was constructed to simulate mechanical aspects within the human stomach.
Therefore, balloons were clamped to the solid walls of the modified basket design. By inflation
of the balloons it should be possible to exert mechanical stress on the tablet. The results
showed that this design is not yet suitable to serve its purpose. The balloons did not touch the
tablet which was situated at the bottom of the mesh in the region that was not reached by the
balloons. Furthermore, it can be assumed that the hydrodynamics are changed completely by
inflation of the balloons. They block the fluid’s path and force it aside. Thereby, hydrodynamic
forces on the tablet cannot be well controlled. However, simulation of physiological relevant
pressure forces during in vitro testing is highly important. The importance of gastrointestinal
pressure forces for the release behavior from MR dosage forms has recently been shown
(Garbacz et al., 2008). In this study, the irregular absorption profiles observed for diclofenac
extended release tablets could be predicted using the stress test apparatus designed to
generate physiologically relevant pressure forces.
The modified device was primarily established to investigate the influence of hydrodynamics
and pressure forces on disintegration times of solid oral dosage forms. Such investigations are
of importance for immediate release (IR) as well as for modified release (MR) delivery systems.
IR dosage forms are intended to disintegrate fast after ingestion to achieve an instantaneous
onset of the therapeutic effect. In contrast, MR dosage forms are exposed to the hydrodynamics
and forces present in the GIT for a prolonged period of time and need to withstand them. After
administration of high caloric meals gastric residence times of more than 4 h have been
reported for non-disintegrating tablets and capsules (Weitschies et al., 2010; Weitschies et al.,
2008). The mechanisms of retardation comprise the formation of diffusion barriers, the
modification of the dissolution process of the dosage form, and the controlled erosion of the
matrix. All these mechanisms are supposed to be sensitive to hydrodynamic stress and pressure
forces. The modified disintegration test device may be used to investigate the stability of such
systems against physiological relevant mechanical stresses.
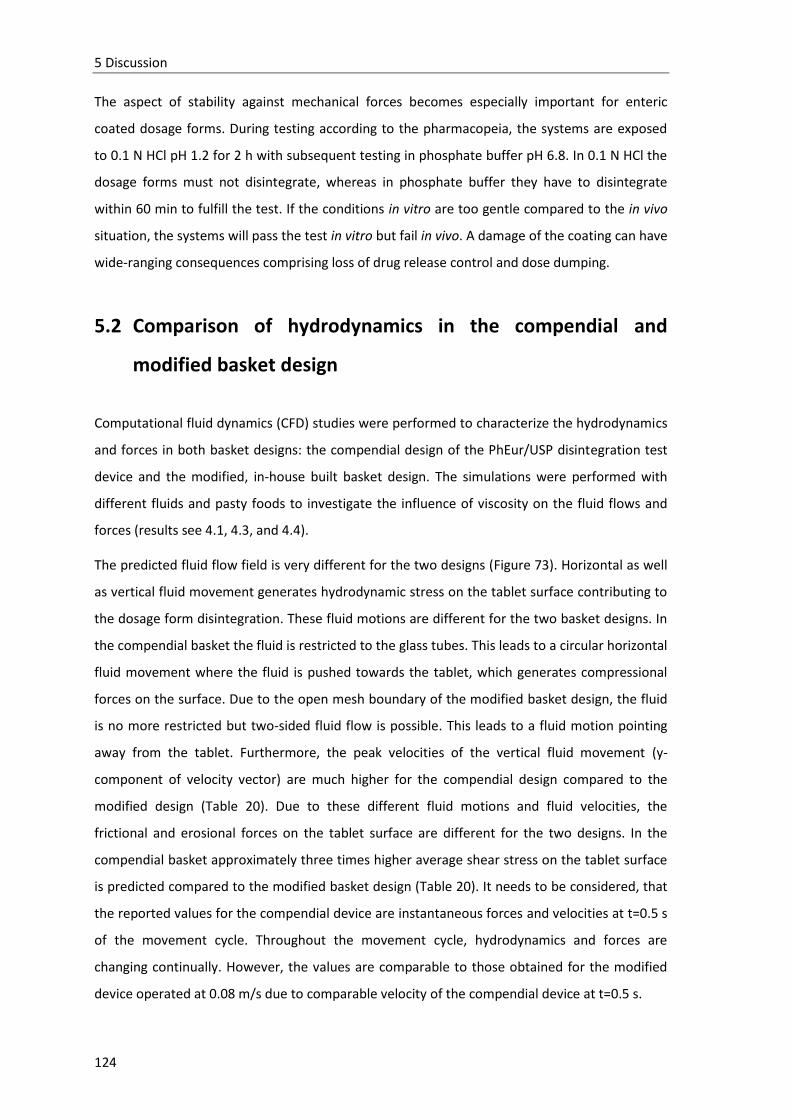
5 Discussion
124
The aspect of stability against mechanical forces becomes especially important for enteric
coated dosage forms. During testing according to the pharmacopeia, the systems are exposed
to 0.1 N HCl pH 1.2 for 2 h with subsequent testing in phosphate buffer pH 6.8. In 0.1 N HCl the
dosage forms must not disintegrate, whereas in phosphate buffer they have to disintegrate
within 60 min to fulfill the test. If the conditions in vitro are too gentle compared to the in vivo
situation, the systems will pass the test in vitro but fail in vivo. A damage of the coating can have
wide-ranging consequences comprising loss of drug release control and dose dumping.
5.2 Comparison of hydrodynamics in the compendial and
modified basket design
Computational fluid dynamics (CFD) studies were performed to characterize the hydrodynamics
and forces in both basket designs: the compendial design of the PhEur/USP disintegration test
device and the modified, in-house built basket design. The simulations were performed with
different fluids and pasty foods to investigate the influence of viscosity on the fluid flows and
forces (results see 4.1, 4.3, and 4.4).
The predicted fluid flow field is very different for the two designs (Figure 73). Horizontal as well
as vertical fluid movement generates hydrodynamic stress on the tablet surface contributing to
the dosage form disintegration. These fluid motions are different for the two basket designs. In
the compendial basket the fluid is restricted to the glass tubes. This leads to a circular horizontal
fluid movement where the fluid is pushed towards the tablet, which generates compressional
forces on the surface. Due to the open mesh boundary of the modified basket design, the fluid
is no more restricted but two-sided fluid flow is possible. This leads to a fluid motion pointing
away from the tablet. Furthermore, the peak velocities of the vertical fluid movement (y-
component of velocity vector) are much higher for the compendial design compared to the
modified design (Table 20). Due to these different fluid motions and fluid velocities, the
frictional and erosional forces on the tablet surface are different for the two designs. In the
compendial basket approximately three times higher average shear stress on the tablet surface
is predicted compared to the modified basket design (Table 20). It needs to be considered, that
the reported values for the compendial device are instantaneous forces and velocities at t=0.5 s
of the movement cycle. Throughout the movement cycle, hydrodynamics and forces are
changing continually. However, the values are comparable to those obtained for the modified
device operated at 0.08 m/s due to comparable velocity of the compendial device at t=0.5 s.
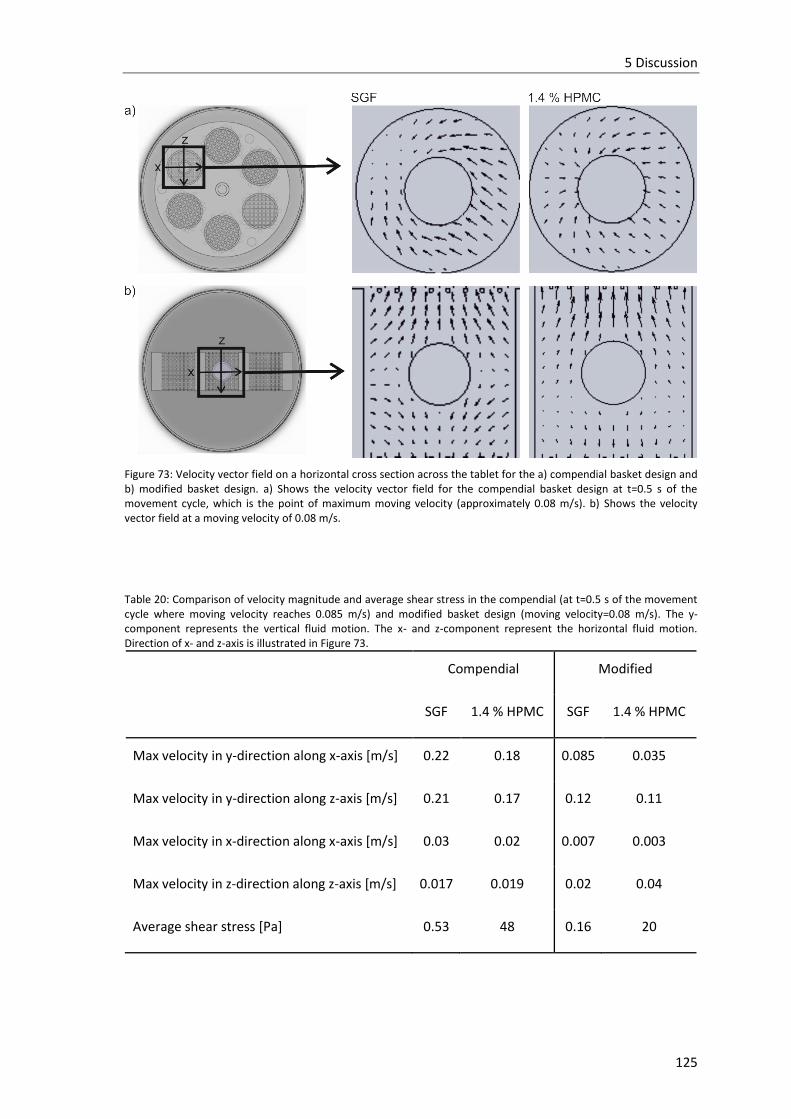
5 Discussion
125
Figure 73: Velocity vector field on a horizontal cross section across the tablet for the a) compendial basket design and b) modified basket design. a) Shows the velocity vector field for the compendial basket design at t=0.5 s of the movement cycle, which is the point of maximum moving velocity (approximately 0.08 m/s). b) Shows the velocity vector field at a moving velocity of 0.08 m/s.
Table 20: Comparison of velocity magnitude and average shear stress in the compendial (at t=0.5 s of the movement cycle where moving velocity reaches 0.085 m/s) and modified basket design (moving velocity=0.08 m/s). The y-component represents the vertical fluid motion. The x- and z-component represent the horizontal fluid motion. Direction of x- and z-axis is illustrated in Figure 73.
Compendial Modified
SGF 1.4 % HPMC SGF 1.4 % HPMC
Max velocity in y-direction along x-axis [m/s] 0.22 0.18 0.085 0.035
Max velocity in y-direction along z-axis [m/s] 0.21 0.17 0.12 0.11
Max velocity in x-direction along x-axis [m/s] 0.03 0.02 0.007 0.003
Max velocity in z-direction along z-axis [m/s] 0.017 0.019 0.02 0.04
Average shear stress [Pa] 0.53 48 0.16 20

5 Discussion
126
5.3 Comparison of simulated hydrodynamic conditions with
literature data
Table 21 gives an overview of the predicted dynamic viscosity, velocity, pressure and forces in
the vicinity of the tablet simulated for the different beverages, viscous meals, and model fluids.
Simulations were performed for the compendial as well as for the modified disintegration test
device (results see 4.1 and 4.3). For the compendial device the inlet velocity was defined to
follow the sinusoidal velocity profile described by eqn. ( 2 ). This equation describes the cycle of
down and up movement with a maximum moving velocity of 0.085 m/s. One cycle last 2 s.
Results discussed in this section are referred to t=0.1 s, which is the beginning of the down
movement, and t=0.5 s, which is the time of maximum moving velocity during the down
movement. Furthermore, these results are compared to the predictions obtained for the
modified disintegration device equipped with the modified basket design and operating at 0.08
m/s. Since the moving speed of the compandial device at t=0.5 s is similar to that of the
modified device operating at 0.08 m/s comparison of results is possible.
The viscosity of the Newtonian fluids is independent on the shear rate and constant throughout
the cycle and device. In contrast, the viscosities of the non-Newtonian fluids are dependent on
the shear rate. The dynamic viscosity of the non-Newtonian fluids in the two devices is not
constant throughout the beaker but dependent on the shear rate generated by the fluid flow
(see Figure 33 and Figure 44). Around the tablet values of 0.18 Pa s for champignon soup up to
27 Pa s for the homogenized FDA meal are predicted for the modified device at t=0.5 s. At this
time of the moving cycle the moving velocity is maximum and shear rates are maximum too.
With increasing shear rate the dynamic viscosity decreases. Thus, dynamic viscosities at t=0.5 s
are the lowest during the movement cycle. Dynamic viscosities at all other time point during the
down movement are expected to be lower due to lower moving velocity and lower shear rates.
The dynamic viscosity of the mashed FDA meal around the tablet predicted for the modified
disintegration test device operating at a moving velocity of 0.08 m/s is even higher reaching
50 Pa s. The dynamic viscosity predicted for the compendial device at t=0.5 s for the model fluid
1.4 % HPMC solution is 0.54 at t=0.5 s, which is similar to that predicted for the modified device
operating at 0.08 m/s (0.69 Pa s). Compared to in vivo results, which are reported in the range
of 0.01 to 0.2 Pa s for the fed stomach (Abrahamsson et al., 2005), the viscosity around the
tablet is too high when using the homogenized FDA meal to simulate the fed state. This may be
due to the fact that either the FDA meal in vivo is diluted due to a secretion of gastric fluids or
that the shear rate in vivo is higher than in the disintegration device. When using 1.4 % HPMC

5 Discussion
127
solution, which is proposed as model medium representing the fed state, values of dynamic
viscosity around the tablet are in the range of those reported in vivo. No information about
fasted state fluid viscosity in vivo is available.
The vertical velocity component (y-component) is higher compared to the horizontal velocity
components (x- and z-component) for both designs (see Figure 31 and Figure 42). For the
compendial basket design highest velocities are reached between the tablet and the tube wall.
Right above and below the tablet, depending on the direction of movement, no fluid movement
is predicted and a sheltered region occurs. During the movement cycle the tablet experiences a
wide range of fluid velocities reaching maximum values of about 0.2 m/s at t=0.5 s. Only small
differences are predicted when comparing the media of different viscosities. However, the
calculated average vertical velocity across the tube diameter at t=0.5 s is smaller (0.06 m/s for
all simulated fluids). For the modified basket design the predicted maximum is 0.12 and
0.11 m/s for SGF and 1.4 % HPMC solution, respectively. Average vertical velocity across the
chamber length for SGF is 0.079 m/s which is higher compared to that predicted for the
compendial design at t=0.5 s. For 1.4 % HPMC solution and the mashed FDA meal the average
vertical velocity across the chamber length is 0.053 m/s which is lower compared to that
predicted for the compendial device at t=0.5 s. Only little is known about the fluid velocities and
flow fields in the human stomach. Using magnetic resonance imaging, Boulby et al. (1999)
reported antral fluid velocities in the range of 0.029 to 0.05 m/s for different nutrient meals.
Earlier, Hausken et al. (1992) measured velocities one order of magnitude higher than those of
Boulby et al. They used duplex sonography to measure the movement of luminal contents after
ingestion of a meat soup and found maximal velocities during retropulsion of 0.2 m/s and peak
velocities of 0.6 m/s. Besides in vivo measurements CFD was used to investigate fluid flow in the
human stomach (Ferrua and Singh, 2010; Ferrua et al., 2011; Kozu et al., 2010; Pal et al., 2004).
In all studies strongest fluid motions were predicted in the lower part of the stomach while only
little fluid motion is predicted in the upper part. These predictions are consistent with
experimental observations (Hausken et al., 1992). The flow field in the antroduodenal region is
characterized by two main flow structures: a jet-like motion and zones of recirculating fluid
(eddies). However, the predicted values for maximum retropulsive jet velocities are not
consistent. Pal et al. reported highest jet velocities of 0.0075 m/s for a liquid with a viscosity of
1 Pa s using a two-dimensional model (Pal et al., 2004). Using a three-dimensional model Ferrua
et al. predicted maximum jet velocities of 0.076 m/s and 0.119 m/s for liquids of a viscosity of
0.001 and 1 Pa s, respectively (Ferrua and Singh, 2010; Ferrua et al., 2011). Our simulated peak
velocities in the modified basket are consistent with the peak jet velocities predicted from the
latter CFD study. Predicted peak velocities in the compendial device are consistent with the

5 Discussion
128
peak velocities reported by (Hausken et al., 1992). Calculated average velocities for both devices
are of the same order of magnitude of the experimental data measured by Boulby et al. Peak
velocities reported by Hausken et al. are highest (0.6 m/s). Such high velocities are neither
reached for the compendial nor for the modified basket design operating at the specified
conditions. A comparison of simulated velocities and in vivo data is hindered by the diverging
results between the two existing in vivo studies which differ approximately by one order of
magnitude (Boulby et al., 1999; Hausken et al., 1992).
The flow pattern around the tablet is characterized by the Reynold’s number (eqn. (24)). For Re
around 100 the flow above the tablet surface opposite to the fluid stream is thought to start to
oscillate back and forward indicating the formation of eddies (recirculating flow strucutres).
Calculations of the Reynold’s number for the flow around the tablet revealed values > 100 for
SGF in the compendial as well as in the modified basket design (834 and 876 for the compendail
and modified device, respectively). Values for 1.4 % HPMC solution and the homogenized FDA
meal are < 100 for both basket designs (1.05 and 0.86 for 1.4 % HPMC solution in the
comependial and modified device, respectively and 0.02 and 0.009 for the mashed FDA meal for
the compendial and modified device, respectively). Reynold’s numbers observed in vivo around
a tablet of a diameter of 1 cm are in the range of 0.01 to 30 (Abrahamsson et al., 2005). Thus,
the values calculated for SGF seem high but currently lack in vivo comparative data.
Nevertheless, the values calculated for the homogenized FDA meal and the 1.4 % HPMC
solution in both in vitro disintegration devices are at the lower end of these determined by in
vivo studies.
For Newtonian fluids the predicted relative pressures at the bottom of the tablet are very small
in the range of 71 to -32 Pa (0.53 to -0.24 mm Hg) for both basket designs. For the non-
Newtonian fluids a strong viscosity dependence of the relative pressure is predicted. Especially
when using the FDA meal the tablet experiences a very large range of relative pressures during
one cycle using the compendial device. Maximal values of 24664 Pa (185 mm Hg) are predicted.
The relative pressure around the tablet is much smaller when using FDA meal in combination
with the modified basket design (5333 Pa, 40 mm Hg. For 1.4 % HPMC solution relative pressure
around the tablet is about one order of magnitude smaller in the modified basket design
compared to the compendial. Different manometric studies detected fasting intragastric
pressures in the range of 600 to 1333 Pa (4.5 to 10 mm Hg) (Desipio et al., 2007; Janssen et al.,
2012; Kwiatek et al., 2009; Pauwels et al., 2014). Several studies (Janssen et al., 2011; Janssen et
al., 2012; Kwiatek et al., 2009; Pauwels et al., 2014) investigated also the influence of infusion
and ingestion of nutritional drinks on intragastric pressure. They found that the postprandial

5 Discussion
129
increase in intragastric pressure is not higher than 867 Pa (6.5 mm Hg). Our simulation results
indicate that when using high viscous mashed FDA meal relative pressure around the tablet is
much higher than those pressures observed in vivo after ingestion of nutritional drinks. When
using soups or 1.4 % HPMC solution the relative pressure is low compared to fed state values in
vivo. For the fasted state, represented by SGF, relative pressures are ten fold lower compared to
in vivo data.
Average shear stress on the tablet surface is smaller in the modified device compared to the
compendial one. However, for both a marked viscosity dependence is observed. Note that for
the predictions it is assumed that the tablet is fixed at the wire mesh contrary to the in vivo
situation where it would be taken with the fluid experiencing less shear stress. In practice the
tablet will be carried with the fluid when the drag force is larger than the weight force. For a
500 mg tablet this is the case for all used non-Newtonian soups and pasty foods. However, it is
not the case for 1.4 % HPMC solution which is proposed as model fluid representing the fed
state. So far, precise in vivo measurements of forces experienced by a tablet are rare.
Furthermore, shear stress, which acts tangential to the tablet surface, needs to be distinguished
from pressure forces, which act perpendicular to the surface of the tablet. While tangential
stress will mainly cause surface erosion, perpendicular forces will more likely be responsible for
rupture and breakage of the tablet. Some approaches have been demonstrated to measure the
different forces in vivo. Vassallo et al. (1992) used a balloon catheter to measure the axial forces
during emptying of liquid and solid meals. The forces experienced by the balloon were reported
to be 6.0 N for emptying of the liquid meal and 22.0 N for the solids. As the balloon is larger
than a conventional pill and additionally tethered, the results cannot easily be transferred to
tablets. Marciani et al. (2001a) used echo-planar imaging to assess antral grinding of a low
viscous and a high viscous liquid meal containing agar gel beads with a range of fracture
strengths. The gel beads accumulated in the antral region where they were exposed to antral
axial forces between 0.53 and 0.78 N. Using a destruction force dependent release system,
Kamba et al. (2000) reported the destructive force to be 1.50 N in the fasted state and 1.89 N in
the fed state. These two measurements represent indirect determination of destructive forces
as they did not measure the force on the dosage forms but observed the breakage visually or
quantified the release of an API, respectively. Laulicht et al. (2010) measured gastric forces on a
gastric pill directly using high-resolution pill tracing. They reported values of average human
gastric emptying force of 414 dynes (0.00414 N) for the fasted state and 657 dynes (0.00657 N)
for the fed state. Much higher forces were observed during the migrating motor complex
(MMC) of the fasted state with highest forces of 2481, 3014, and 1236 dynes (0.02481, 0.03014,

5 Discussion
130
and 0.1236 N). Comparing the simulation results with these data, it is obvious that the forces in
the in vitro disintegration tester are much smaller. For SGF, representing the fasted state test
medium, average shear forces of 0.00010 N and 0.000032 N for the compendial and modified
basket design are predicted, which are about 3 orders of magnitude lower than those observed
during MMC. This large difference could be due to the fact that in vivo hydrodynamic fluid flow
and shear forces are generated by peristaltic contractions of the stomach wall, which are lacking
in vitro. The compendial device is not able to reproduce these forces generated by moving walls
as it consists of static glass tubes. This might be a major limitation of the PhEur/ USP test device
considering the prediction of tablet disintegration in vivo. The same is true for the modified
basket design. But this limitation should be overcome through the usage of the pressure unit. By
inflation of the balloons, the peristaltic contractions of the stomach walls might be simulated.
Predicted average shear stress in the fed state (1.4 % HPMC solution) is of the same order of
magnitude as the values reported by Laulicht et al (2010). Comparison of predicted values with
in vivo data is difficult since the reported values are very inconsistent and largely dependent on
the method used for determination.
In summary, it can be concluded that the compendial device for measuring solid dosage form
disintegration is not optimally designed to reproduce the in vivo situation in terms of relative
pressures and forces. Regarding a comparison of fluid velocities in vitro versus in vivo it turns
out to be limited by the few and diverging in vivo data available. The modified disintegration
test device seems to be able to generate physiologically relevant hydrodynamics by the
selection of appropriate operating conditions. In contrast to the compendial device, that is
limited to the vertical movement following the sinusoidal velocity profile, various moving
profiles can be generated using the modified device (4.2). Thus, a mechanistic investigation of
the influence of fluid velocity and forces on tablet disintegration using the modified device
seems justified.
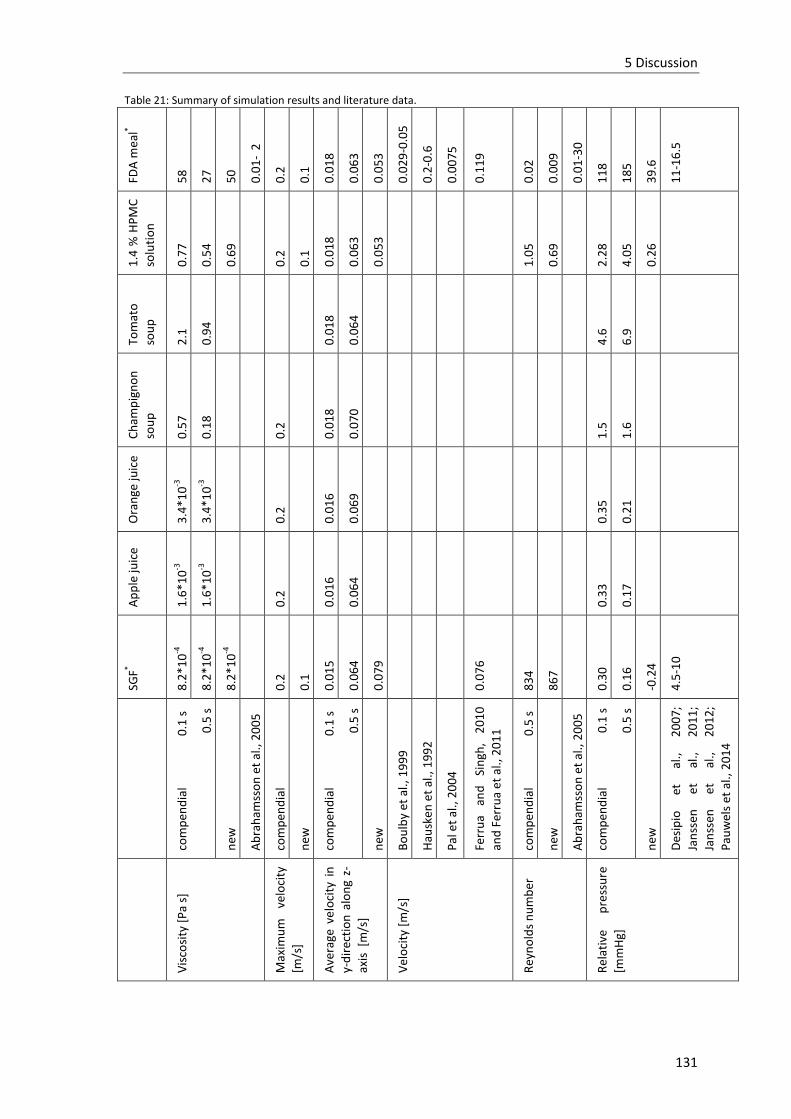
5 Discussion
131
Table 21: Summary of simulation results and literature data.
FDA
mea
l*
58
27
50
0.0
1-
2
0.2
0.1
0.0
18
0.0
63
0.0
53
0.0
29
-0.0
5
0.2
-0.6
0.0
07
5
0.1
19
0.0
2
0.0
09
0.0
1-3
0
11
8
18
5
39
.6
11
-16
.5
1.4
% H
PM
C
solu
tio
n
0.7
7
0.5
4
0.6
9
0.2
0.1
0.0
18
0.0
63
0.0
53
1.0
5
0.6
9
2.2
8
4.0
5
0.2
6
Tom
ato
sou
p
2.1
0.9
4
0.0
18
0.0
64
4.6
6.9
Ch
amp
ign
on
sou
p
0.5
7
0.1
8
0.2
0.0
18
0.0
70
1.5
1.6
Ora
nge
juic
e
3.4
*10
-3
3.4
*10
-3
0.2
0.0
16
0.0
69
0.3
5
0.2
1
Ap
ple
juic
e
1.6
*10
-3
1.6
*10
-3
0.2
0.0
16
0.0
64
0.3
3
0.1
7
SGF*
8.2
*10
-4
8.2
*10
-4
8.2
*10
-4
0.2
0.1
0.0
15
0.0
64
0.0
79
0.0
76
83
4
86
7
0.3
0
0.1
6
-0.2
4
4.5
-10
com
pen
dia
l
0.1
s
0
.5 s
new
Ab
rah
amss
on
et
al.,
20
05
com
pen
dia
l
new
com
pen
dia
l
0.1
s
0
.5 s
new
Bo
ulb
y et
al.,
19
99
Hau
sken
et
al.,
19
92
Pal
et
al.,
20
04
Ferr
ua
and
Si
ngh
, 2
01
0
and
Fer
rua
et a
l., 2
01
1
com
pen
dia
l
0.5
s
new
Ab
rah
amss
on
et
al.,
20
05
com
pen
dia
l
0.1
s
0
.5 s
new
Des
ipio
et
al
.,
20
07
;
Jan
ssen
et
al
.,
20
11
;
Jan
ssen
et
al
.,
20
12
;
Pau
wel
s et
al.,
20
14
Vis
cosi
ty [
Pa
s]
Max
imu
m
velo
city
[m/s
]
Ave
rage
ve
loci
ty i
n
y-d
irec
tio
n a
lon
g z-
axis
[m
/s]
Vel
oci
ty [
m/s
]
Rey
no
lds
nu
mb
er
Rel
ativ
e p
ress
ure
[mm
Hg]

5 Discussion
132
Table 21 continued. FD
A m
eal*
0.2
0 **
0.2
1 **
0.2
1**
22
.0
0.5
3-0
.78
1.8
9
0.0
06
57
0.1
7
0.2
4
0.2
5
*
Sim
ula
tio
ns
wer
e p
erfo
rmed
wit
h S
GF
and
mas
hed
FD
A m
eal a
s m
od
el f
luid
s fo
r th
e fa
sted
an
d f
ed s
tate
. V
alu
es
form
in
viv
o s
tud
ies
liste
d in
th
ese
co
lum
ns
are
give
n f
or
the
fast
ed a
nd
fe
d s
tate
.
** V
alu
es c
alcu
late
d f
rom
Pas
cal u
sin
g th
e ta
ble
t su
rfac
e o
f 0
.00
02
m2 .
***
Larg
e d
iffe
ren
ces
in r
epo
rted
val
ues
co
uld
be
du
e to
dif
fere
nt
mea
sure
men
t te
chn
iqu
es. R
esu
lts
of
Mar
cian
i et
al.
(20
01
a) a
nd
Kam
ba
et a
l. (2
00
0)
are
fro
m
ind
irec
t m
easu
rem
ent
of
gast
roin
test
inal
co
ntr
acti
lity,
mea
sure
d b
y d
estr
uct
ive
forc
e d
ep
end
ent
do
sage
fo
rms.
Re
sult
s o
f V
assa
llo e
t al
. (1
99
2)
rep
rese
nt
the
cum
ula
tive
load
exp
erie
nce
d b
y a
bal
loo
n o
ver
30
min
an
d 2
h d
uri
ng
emp
tyin
g o
f a
liqu
id (
rep
rese
nti
ng
fast
ed s
tate
) an
d s
oli
d (
rep
rese
nti
ng
fed
sta
te)
mea
l.
Lau
lich
t et
al.
(20
10
) re
po
rt t
he
tran
slat
ion
al c
om
po
nen
ts o
f fo
rce
on
a m
agn
etic
pill
. D
iffe
ren
ces
of
rep
ort
ed v
alu
es f
or
the
fast
ed s
tate
co
uld
ad
dit
ion
ally
be
du
e to
mea
sure
men
t d
uri
ng
dif
fere
nt
ph
ase
s o
f th
e m
igra
tin
g m
oto
r co
mp
lex
char
acte
rize
d b
y d
iffe
ren
t co
ntr
acti
le s
tren
gth
s. I
n t
he
fast
ed a
s w
ell
as i
n t
he
fed
sta
te t
he
con
trac
tile
str
engt
h a
nd
th
us
shea
r st
ress
als
o d
epen
ds
on
th
e n
atu
re o
f ga
stri
c co
nte
nts
, wh
ich
was
dif
fere
nt
amo
ng
the
stu
die
s.
1.4
% H
PM
C
solu
tio
n
3.8
*10
-3 *
*
9.6
*10
-3 *
*
0.0
04
**
4.7
*10
-3
1.2
*10
-2
7.9
*10
-3
Tom
ato
sou
p
7.2
*10
-3 **
0.0
12
**
8.2
*10
-3
0.0
14
Ch
amp
ign
on
sou
p
1.6
*10
-3 **
2.6
*10
-3 **
3.2
*10
-3
5.7
*10
-3
Ora
nge
juic
e
3.6
*10
-5 **
2.2
*10
-4 **
2.4
*10
-3
4.3
*10
-3
Ap
ple
juic
e
2.0
*10
-5 *
*
1.3
*10
-4 *
*
2.3
*10
-3
3.9
*10
-3
SGF*
1.7
*10
-5 **
1.0
*10
-4 **
3.2
*10
-5**
6.0
1.5
0.0
04
14
2.3
*10
-3
3.9
*10
-3
3*1
0-3
com
pen
dia
l
0.1
s
0
.5 s
new
Vas
sallo
et
al.,
19
92
***
Mar
cian
i et
al.,
20
01
a**
*
Kam
ba
et a
l., 2
00
0*
**
Lau
lich
t et
al.,
20
10
**
*
com
pen
dia
l
0.1
s
0
.5 s
new
Ave
rage
sh
ear
stre
ss [
N]
Dra
g fo
rce
[N]

5 Discussion
133
5.4 Limitations of computational fluid dynamics (CFD)
With the help of experimental particle image velocimetry (PIV) data it was proofed that the CFD
approach is capable of predicting the hydrodynamics in the disintegration test device (section
4.1.1.) Nevertheless, the model is subjected to a few limitations.
In general, the accuracy of the predictions depends on the number of cells captured by the
mesh. The more refined the mesh, the more accurate the results. However, with more cells of
the mesh, the more computational power is needed to solve the project and the longer the
calculation time. A reasonable compromise between accuracy and calculation time needs to be
defined.
In this work it was assumed that the tablet is fixed on the wire mesh and no movement or
floating occurs. This is contrary to the conditions observed in experiments. Depending on the
moving velocity and medium viscosity, the tablet will be moved with the fluid. Thereby, forces
on the tablet will change.
The process of tablet size reduction during disintegration testing was neglected in this study.
Since a relationship between tablet size and average shear stress on tablet surface was found,
the process of solid mass transfer from the tablet to the test medium needs to be considered.
However, the present study is, to our knowledge, the first investigation of hydrodynamics in the
disintegration device using a CFD approach. Despite the limitations, the results help to
understand the underlying hydrodynamics and shear stress within the compendial and modified
disintegration test device.
5 Discussion
134
5.5 Disintegration mechanisms
Tablet disintegration is a complex process comprising different mechanisms including surface
erosion, fraction, rupture and dissolution of the drug and/or excipients (Figure 74). Solid oral
dosage form disintegration is a result of an interaction of all these mechanisms.
Surface erosion is defined as the skimming of the tablet surface due to detachment of surface
particles by the impinging fluid that causes friction and shear stress. Therefore, surface erosion
is sensitive to hydrodynamic conditions. Surface erosion is the dominant mechanism when the
applied stress is high and the water penetration is slow.
Fraction is the breakage of the tablet into large size particles and occurs when the applied stress
is higher than cohesive forces of the tablet. It is also sensitive to hydrodynamics since they
define the relative pressure field around the tablet and the pressure forces acting on the tablet.
During disintegration testing the texture of the dosage form may change and become softer.
This softening may shift the driving disintegration mechanism towards fragmentation.
The tablet may be reduced in size due to dissolution of the drug or the excipients. This process
is mainly dependent on the dissolution rate and the solubility of the components. But it can also
be influenced by the hydrodynamics by the formation of a boundary layer that limits the
dissolution.
Rupture defines the process of bursting of the tablet due to solvent uptake and the action of the
disintegrant. This mechanism is independent of the hydrodynamic conditions but dependent on
the swelling kinetics, the water uptake rate, and the test medium composition. The effects of
fluid composition and viscosity, water uptake, and water diffusivity on disintegration of solid
oral dosage forms have been investigated previously (Abrahamsson et al., 2004; Anwar et al.,
2005; Radwan et al., 2012; Radwan et al., 2013; Radwan et al., 2014). The results of these
studies are summarized in the introduction (1.1.1).
All these disintegration mechanisms may occur simultaneously. Or, depending on the properties
of the tablet and the fluid characteristics of the disintegration medium, one mechanism may
dominate. A shift from one mechanism to another during disintegration due to changes in the
texture of the tablet is also possible.
The following section concentrates on the discussion of the effect of hydrodynamic forces on
disintegration and helps to understand the observations described in the results part
investigating the influence of hydrodynamics on disintegration time of IR tablets (4.5).

5 Discussion
135
Figure 74: Disintegration mechanisms. Four major mechanism, namely surface erosion, fraction, dissolution of excipient/drug, and rupture, were identified to be responsible for solid oral dosage form disintegration. Among them, rupture is the only one independent of hydrodynamic conditions. It is dependent on swelling, water uptake, and the medium composition. Dissolution of the drug/excipient is both dependent and independent on the hydrodynamics. Dissolution as such is determined by the solubility and the dissolution rate, which are independent on hydrodynamics. Nevertheless, dissolution is dependent on the thickness of the boundary layer, which is dependent on hydrodynamics. Surface erosion and fraction are dependent on the hydrodynamic conditions since they determine shear stress, fluid velocity, drag forces, Reynold’s number, and pressure forces.
5.6 Effect of hydrodynamics on disintegration times of
immediate release tablets
A design of experiments study was performed to investigate the influence of moving velocity,
medium viscosity, and tablet hardness on disintegration of immediate release (IR) tablets. The
compendial as well as the modified basket design were utilized to additionally examine the
influence of different fluid flow fields on disintegration times (results see section 4.5).
It was observed that an increase in tablet hardness results in an increase of disintegration time
(Figure 54). The higher hardness was achieved by applying higher compression force to the
same formulation. Due to the higher compression force the tablets with the higher hardness are
supposed to exhibit a lower porosity compared to the tablet with the lower hardness. Due to
the fewer pores water penetration rate is supposed to be slower leading to the observed delay
in tablet disintegration. Furthermore, the surface erosion form tablet with a more rigid texture
is slower, thus contributing to prolonged disintegration time.

5 Discussion
136
An increase in the medium viscosity leads to an increase in disintegration time (Figure 54).
These observations are consistent with other published work (Radwan et al., 2012; Radwan et
al., 2013; Radwan et al., 2014; Abrahamsson et al., 2004; Anwar et al., 2005) and can be
attributed to the low water diffusivity and slow water penetration in viscous media. The slow
solvent penetration hampers swelling and rupture thereby prolonging disintegration.
In SGF the influence of moving speed on disintegration time is similar for both basket designs
(Figure 54). At low tablet hardness, disintegration is very fast and the influence of moving speed
on disintegration times is minimal. Due to the high porosity of these tablets water penetration is
fast. Therefore, rupture is the driving force of disintegration. The effect of moving velocity on
disintegration time becomes more pronounced with increasing tablet hardness. Higher moving
speeds reduce disintegration times. Due to the higher hardness, the tablets possess fewer
pores. The water penetration rate is slower and the mechanism of disintegration changes from
rupture to surface erosion. The higher the moving speed, the higher the fluid velocity and shear
stress leading to decreased disintegration times. Due to short disintegration times,
fragmentation may play a minor role in SGF. Dissolution of the excipients may also contribute to
disintegration. But since the dissolution is less dependent on the hydrodynamics, the
contribution will be similar for 40 and 80 mm/s and will not explain the different disintegration
times.
In 1.4 % HPMC solution the effect of moving speed on tablet disintegration is different for the
two basket designs (Figure 54). While the moving speed has a significant influence on
disintegration time for the compendial basket, it has only a negligible influence for the modified
basket. This observation is quite surprisingly and must be related to the different design of the
baskets leading to different hydrodynamic conditions and forces. Especially in 1.4 % HPMC
solution, fluid velocities and shear stress are much different for the two basket designs. These
differences observed for 1.4 % HPMC solution might lead to different disintegration
mechanisms in the compendial and modified basket design. It can only be hypothesized, that
due to the different fluid velocities and shear forces in the compendial and the modified basket,
the formation of the boundary layer around the tablet that occurs in viscous media is
influenced. Average shear stress in the compendial basket is much higher compared to the
modified. This high shear stress might hinder the formation of a thick protective boundary layer
in the compendial basket, making the tablet sensitive to changes in hydrodynamics. This
hypothesis is supported by the fact that in SGF, where no film is developed, the influence of
moving speed on disintegration time is similar in both baskets. It can not be clearly recognized

5 Discussion
137
which mechanism is responsible for disintegration in 1.4 % HPMC solution due to the complexity
of interactions.
An exponential correlation between disintegration time and moving speed and between
disintegration time and average shear stress on tablet surface at the corresponding moving
speed was observed in SGF (Figure 58).
No effect of moving velocity on the disintegration times of commercially available calibrator
tablets was observed in SGF as well as in 1.4 % HPMC solution (see Figure 59). Since the
disintegration is independent of the hydrodynamics, rupture and dissolution are the driving
forces of disintegration while the contribution of surface erosion is negligible. Since
disintegration times are short, fragmentation due to softening should not contribute to
disintegration. The observations proof the robustness of the calibrator tablets against changes
in hydrodynamic conditions. The robustness cannot be related to formulation variables since
the exact composition is unknown. However, the main excipient is lactose, which is the same for
the IR tablets that are sensitive to hydrodynamic changes.
Applied mechanical forces may shift the disintegration mechanism towards fragmentation due
to high local forces. The importance of externally applied mechanical forces for accurate
prediction of dissolution from extended release tablet has been demonstrated by Garbacz et al.
(2009; 2014; 2015; 2008; 2010). They developed a biorelevant dissolution test apparatus that is
able to simulate the mechanical forces of the human GIT. They described that the release of the
drug from all investigated formulations was sensitive to mechanical stress. Unfortunately, the
investigation of the influence of physiological relevant pressure forces using the in house-built
pressure unit was not possible in this work due to shortcomings of the construction (Figure 60).
5.7 Effect of polymer properties and hydrodynamics on in vitro
performance the of gastroretentive drug delivery systems
An in situ interpolyelectrolyte gastroretentive drug delivery system was developed. Several
requirements were imposed: fast and high degree of swelling, adequately floating ability,
sufficient stability against hydrodynamic and mechanical stresses and extended drug release
over 24 h. To achieve these targets two polymers were combined to build a polyelectrolyte
matrix upon contact with fluid. The in vitro performance of the systems investigated here is
influenced by a complex interaction of the properties of the polymers, their ratio, pH of the test
medium as well as the hydrodynamic test conditions (see 4.6 and 4.7). However, the

5 Discussion
138
formulation of chitosan 80/1000 (80 % deacetylation, viscosity 1000 mPa*s) and the iota-
carrageenan (379) in the ratio 1:8 (80/1000:379 1:8) is regarded as the optimized formulation
since it shows sufficient pH-independent swelling that is resistant to hydrodynamic stress and
prolonged drug release over a period of 24 h. However, the drug release from this optimized
formulation is very sensitive to changes in hydrodynamic forces (see Figure 71). Gastroretention
of the dosage form and enhancement of bioavailability of the model drug trospium chloride
need to be proofed in an in vivo study.
Several polyelectrolyte complexes have been proposed for gastroretentive and controlled drug
delivery (Bawa et al., 2011; Bani-Jaber et al., 2011; de la Torre et al., 2005; Gómez-Burgaz et al.,
2008; Ngwuluka et al., 2013; Moustafine et al., 2013; Park et al., 2008; Prado et al., 2008).
Traditionally, the complexes are prepared by dissolving the polyelectrolytes separately and
subsequent mixing of the solution. The complexes precipitate and need to be lyophilized before
further processing. Usually, the dried powders are compressed to tablets. This manufacturing
approach is time and cost intensive. This work demonstrated that it is possible to form the
polyelectrolyte complex in situ by appropriate polymer selection.
Upon contact with fluids the polymers become charged and form the polyelectrolyte complex.
Due to the hydrophilic nature of the polymers the polyelectrolyte network starts to swell
forming a gel layer which acts as release controlling barrier. The drug release from hydrophilic
swelling matrices is controlled by dissolution of the drug, diffusion of the drug through the gel
layer, and erosion of the swollen matrix (Colombo, 1993; Maderuelo et al., 2011) (Figure 75).
The effect of several polymer properties and medium characteristics on drug release from
hydrophilic matrix tablets has intensively been studied (Colombo, 1993; Maderuelo et al., 2011,
Conti et al., 2007a, 2007b, Maggi et al., 2002; Siahi et al., 2005; Siahi-Shadbad et al., 2011). The
viscosity of the matrix polymer was found to influence drug dissolution significantly. For HPMC
matrices, for example, drug release from matrices comprised of higher viscosity grade HPMC
was slower compared to the lower viscosity grade HPMC (Nagarwal et al., 2010). Similar results
were obtained for the polyelectrolyte swelling system evaluated in this work (Figure 68, Figure
69). The release from systems containing the higher viscous lambda-carrageenan 209 was
retarded compared to formulations with the low viscous iota-carrageenan 379. It is supposed
that the higher viscosity grade of a polymer can strengthen the gel layer and thereby retard
water penetration. Therefore, less swelling is observed using the high viscous lambda-
carrageenan 209 (Figure 63). A close correlation between water penetration and drug release is
obvious.

5 Discussion
139
Several studies reported the dependence of drug release on the hydrodynamic conditions
present during dissolution testing (Li et al., 2013a; Yang and Fassihi, 1997). Resistance against
hydrodynamic and mechanical stresses is especially important for controlled release dosage
forms. Firstly because they are exposed to gastric forces for several hours experiencing a wide
range of hydrodynamic and mechanical stresses due to different prandial states and moving
patterns of the stomach. And secondly, insufficient stability against stresses will cause loss of
control of drug release and change in release profile showing undesired effects like dose
dumping. Therefore, the influence of moving velocity on the degree of swelling and drug release
from an in situ polyelectrolyte gastroretentive matrix system was investigated to provide
greater insight into the systems ability to withstand physiological relevant hydrodynamic stress
in vivo.
Both were largely dependent on the hydrodynamic conditions (Figure 70, Figure 71). The degree
of swelling increased with rising hydrodynamic stress and drug release was accelerated by
increasing moving speed. Drug release from swellable hydrophilic matrices is reported to be
determined by the degree of swelling and the thickness of the gel layer (Colombo, 1993). By
correlating the released amount of drug with the degree of swelling a linear relationship was
obtained (Figure 72). However, the slopes of the correlations were different at varying
hydrodynamic stress. Therefore, the degree of swelling might not be the only factor
determining drug release. Surface erosion and flow through the polymeric gel layer may also
influence drug release. Figure 75 summarizes the factors affecting drug release from the
swelling gastroretentiv systems and their dependence on hydrodynamics. Shear stress, fluid
velocity and the Reynolds number have large impact on the surface erosion. Therefore, surface
erosion might be higher at rising hydrodynamic stress accelerating drug release. Diffusion of the
drug through the gel layer is dependent on the solubility of the drug as well as on the viscosity
of the polymers. These two parameters are independent of the hydrodynamics. Diffusion is also
controlled by the thickness of the boundary layer, which is dependent on the hydrodynamics. A
thicker boundary layer constitutes a longer diffusion path, thereby decreasing drug release rate.
The boundary layer formed at low hydrodynamic stress might be thicker compared to the one
formed at higher hydrodynamic stress. Additionally, the drug can be released by liberation from
the polymeric network. This process is highly dependent on the hydrodynamic conditions since
higher fluid flow through the polymeric network is present at higher hydrodynamic stress. The
fluid passing through the polymeric network might liberate the drug.
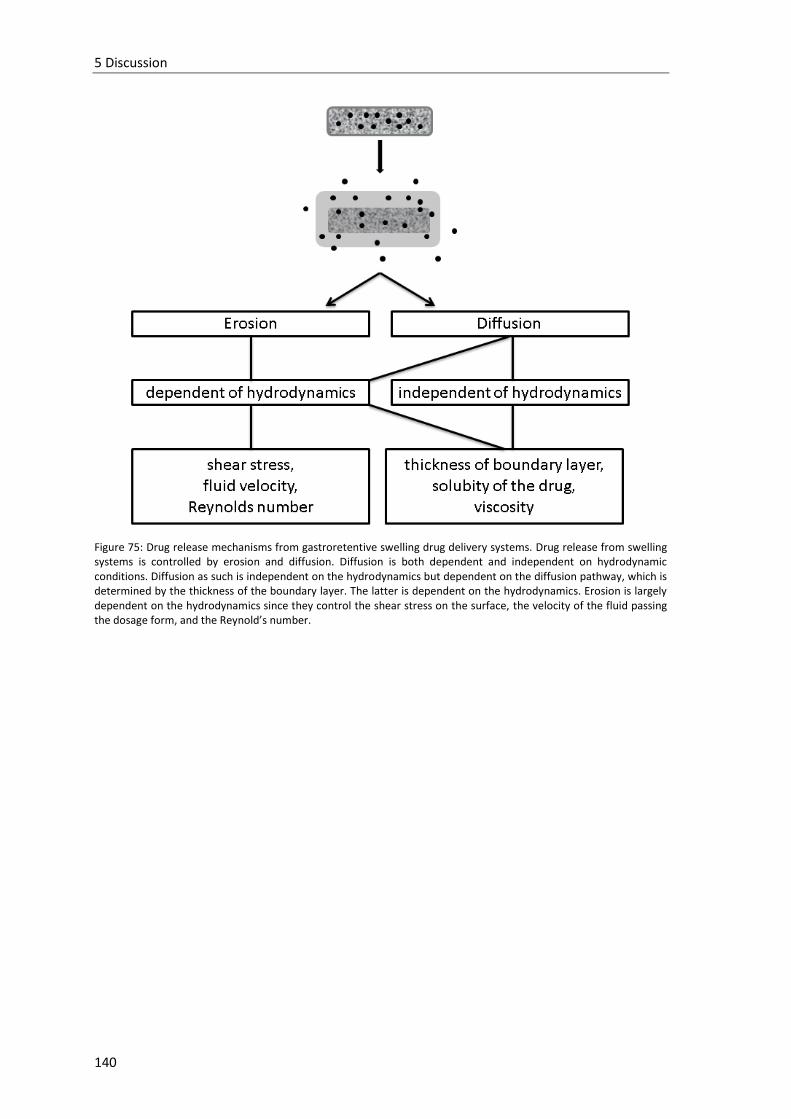
5 Discussion
140
Figure 75: Drug release mechanisms from gastroretentive swelling drug delivery systems. Drug release from swelling systems is controlled by erosion and diffusion. Diffusion is both dependent and independent on hydrodynamic conditions. Diffusion as such is independent on the hydrodynamics but dependent on the diffusion pathway, which is determined by the thickness of the boundary layer. The latter is dependent on the hydrodynamics. Erosion is largely dependent on the hydrodynamics since they control the shear stress on the surface, the velocity of the fluid passing the dosage form, and the Reynold’s number.

6 Conclusion and future work
141
6 Conclusion and future work
For the first time computational fluid dynamics (CFD) was used to characterize the fluid flow
field and forces in the PhEur/USP disintegration test device. The comparison of the predicted
values with in vivo literature data proved difficult as either little is known or the information is
diverging. Nevertheless, the biorelevance of the compendial device is questionable, especially in
terms of fluid velocity and forces on the tablet surface. Furthermore, hydrodynamic conditions
are variable during the movement cycle and not controllable. This observation led to the
development of a modified disintegration test device to examine the relationship between
hydrodynamic flow as well as destructive forces and disintegration times of oral solid dosage
forms. The modifications comprised three steps: 1) change of moving profile and velocity by
application of a computerized numerical control, 2) development of a modified basket allowing
two-sided fluid flow, and 3) possibility to exert mechanical pressure by inflation of balloons.
First experiments showed that hydrodynamic forces may influence the disintegration time of
immediate release tablets as well as controlled release dosage forms. These investigations
contributed to a better understanding of the role of hydrodynamics for oral solid dosage form
disintegration and dissolution. Appropriate test conditions need to be evaluated. In vitro
disintegration and dissolution studies need to be undertaken under physiologically relevant
conditions to strengthen the predictive power of the results. The two case studies with IR and
CR dosage forms showed the importance of hydrodynamics for the evaluation of in vivo
performance. Using the modified test device operated at appropriate conditions the predictive
power of in vitro disintegration testing can be enhanced.
The in house-built pressure basket was designed with the aim to simulate physiologically
relevant mechanical stress on the dosage form surface. However, the constructed unit needs
further development to simulate biorelevant mechanical processes. By inflation of the balloons,
the tablet was pushed towards the bottom and settled. At this position it was not in contact
with the balloons and thus no pressure could be applied to the tablets. Therefore, the pressure
basket needs to be modified. A setup where the tablet is fixed in the tube with the help of a
pouch seems promising.
The investigations described in this work were limited to the vertical movement of the basket.
The influence of horizontal and radial movement on disintegration needs to be investigated.
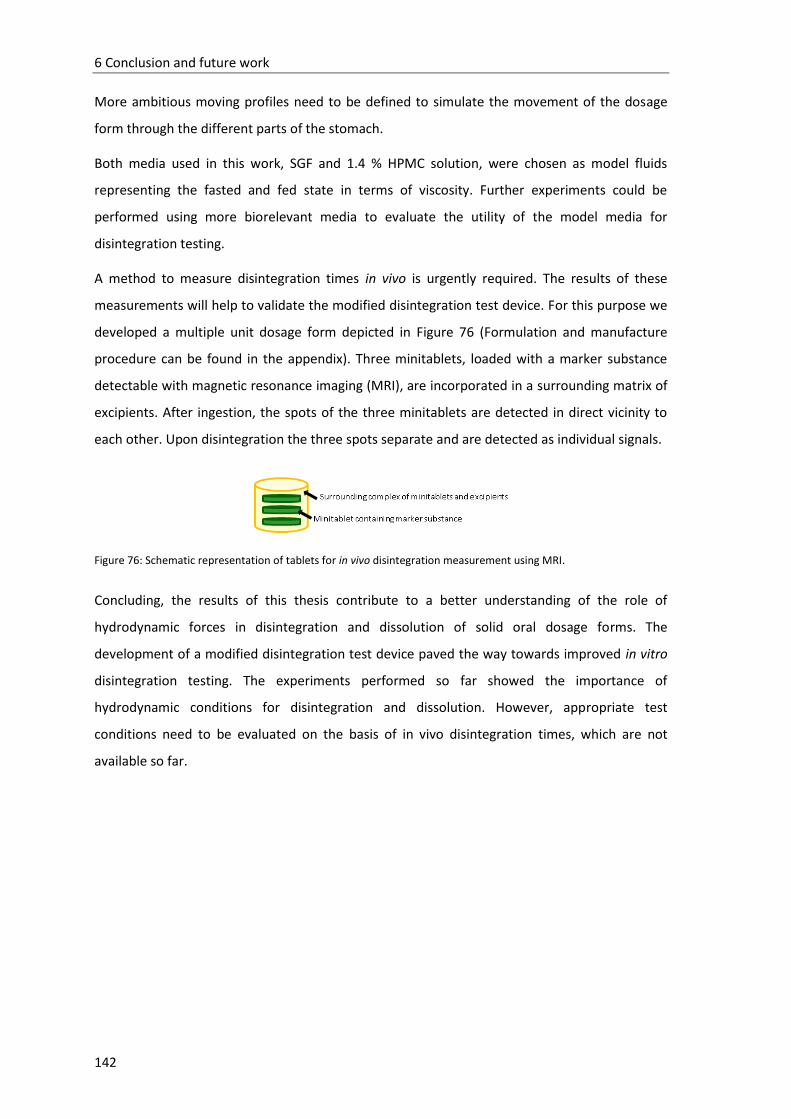
6 Conclusion and future work
142
More ambitious moving profiles need to be defined to simulate the movement of the dosage
form through the different parts of the stomach.
Both media used in this work, SGF and 1.4 % HPMC solution, were chosen as model fluids
representing the fasted and fed state in terms of viscosity. Further experiments could be
performed using more biorelevant media to evaluate the utility of the model media for
disintegration testing.
A method to measure disintegration times in vivo is urgently required. The results of these
measurements will help to validate the modified disintegration test device. For this purpose we
developed a multiple unit dosage form depicted in Figure 76 (Formulation and manufacture
procedure can be found in the appendix). Three minitablets, loaded with a marker substance
detectable with magnetic resonance imaging (MRI), are incorporated in a surrounding matrix of
excipients. After ingestion, the spots of the three minitablets are detected in direct vicinity to
each other. Upon disintegration the three spots separate and are detected as individual signals.
Figure 76: Schematic representation of tablets for in vivo disintegration measurement using MRI.
Concluding, the results of this thesis contribute to a better understanding of the role of
hydrodynamic forces in disintegration and dissolution of solid oral dosage forms. The
development of a modified disintegration test device paved the way towards improved in vitro
disintegration testing. The experiments performed so far showed the importance of
hydrodynamic conditions for disintegration and dissolution. However, appropriate test
conditions need to be evaluated on the basis of in vivo disintegration times, which are not
available so far.

7 References
143
7 References
Abrahamsson, B., Albery, T., Eriksson, A., Gustafsson, I., and Sjöberg, M.: Food effects on tablet disintegration. Eur. J. Pharm. Sci. 22: 165–172, 2004.
Abrahamsson, B., Pal, A., Sjöberg, M., Carlsson, M., Laurell, E., and Brasseur, J. G.: A novel in vitro and numerical analysis of shear-induced drug release from extended-release tablets in the fed stomach. Pharm. Res. 22: 1215–1226, 2005.
Agyilirah, G. A., Green, M., duCret, R., and Banker, G. S.: Evaluation of the gastric retention properties of a cross-linked polymer coated tablet versus those of a non-disintegrating tablet. Int. J. Pharm. 75: 241–247, 1991.
Ameur, H. and Bouzit, M.: 3D hydrodynamics and shear rates' variability in the United States Pharmacopeia Paddle Dissolution Apparatus. Int. J. Pharm. 452: 42–51, 2013.
Anwar, S., Fell, J. T., and Dickinson, P. A.: An investigation of the disintegration of tablets in biorelevant media. Int. J. Pharm. 290: 121–127, 2005.
Aoki, S., Ando, H., Tatsuishi, K., Uesugi, K., and Ozawa, H.: Determination of the mechanical impact force in the in vitro dissolution test and evaluation of the correlation between in vivo and in vitro release. Int. J. Pharm. 95: 67–75, 1993.
Aoki, S., Uesugi, K., Tatsuishi, K., Ozawa, H., and Kayano, M.: Evaluation of the correlation between in vivo and in vitro release of phenylpropanolamine HCl from controlled-release tablets. Int. J. Pharm. 85: 65–73, 1992.
Araujo, J. V., Davidenko, N., Danner, M., Cameron, R. E., and Best, S. M.: Novel porous scaffolds of pH responsive chitosan/carrageenan-based polyelectrolyte complexes for tissue engineering. J. Biomed. Mater. Res. A 102: 4415–4426, 2014.
Armand, M., Borel, P., Pasquier, B., Dubois, C., Senft, M., Andre, M., Peyrot, J., Salducci, J., and Lairon, D.: Physicochemical characteristics of emulsions during fat digestion in human stomach and duodenum. Am. J. Physiol. 271: G172-83, 1996.
Arora, S., Ali, J., Ahuja, A., Khar, R. K., and Baboota, S.: Floating drug delivery systems: a review. AAPS PharmSciTech 6: E372-90, 2005.
Bai, G. and Armenante, P. M.: Velocity Distribution and Shear Rate Variability Resulting from Changes in the Impeller Location in the USP Dissolution Testing Apparatus II. Pharm. Res. 25: 320–336, 2008.
Bai, G. and Armenante, P. M.: Hydrodynamic, mass transfer, and dissolution effects induced by tablet location during dissolution testing. J. Pharm. Sci. 98: 1511–1531, 2009.
Bai, G., Armenante, P. M., Plank, R. V., Gentzler, M., Ford, K., and Harmon, P.: Hydrodynamic investigation of USP dissolution test apparatus II. J. Pharm. Sci. 96: 2327–2349, 2007.
Bai, G., Wang, Y., and Armenante, P. M.: Velocity profiles and shear strain rate variability in the USP Dissolution Testing Apparatus 2 at different impeller agitation speeds. Int. J. Pharm. 403: 1–14, 2011.
Bani-Jaber, A., Al-Aani, L., Alkhatib, H., and Al-Khalidi, B.: Prolonged intragastric drug delivery mediated by Eudragit® E-carrageenan polyelectrolyte matrix tablets. AAPS PharmSciTech 12: 354–361, 2011.
Bardonnet, P. L., Faivre, V., Pugh, W. J., Piffaretti, J. C., and Falson, F.: Gastroretentive dosage forms: overview and special case of Helicobacter pylori. J Control Release 111: 1–18, 2006.
Baumgartner, S., Kristl, J., Vrecer, F., Vodopivec, P., and Zorko, B.: Optimisation of floating matrix tablets and evaluation of their gastric residence time. Int. J. Pharm. 195: 125–135, 2000.
Bawa, P., Pillay, V., Choonara, Y. E., du Toit, Lisa Claire, Ndesendo, Valence Methaius Kessy, and Kumar, P.: A Composite Polyelectrolytic Matrix for Controlled Oral Drug Delivery. AAPS PharmSciTech 12: 227–238, 2011.

7 References
144
Baxter, J. L., Kukura, J., and Muzzio, F. J.: Hydrodynamics-induced variability in the USP apparatus II dissolution test. Int. J. Pharm. 292: 17–28, 2005.
Boulby, P., Moore, R., Gowland, P., and Spiller, R. C.: Fat delays emptying but increases forward and backward antral flow as assessed by flow-sensitive magnetic resonance imaging. Neurogastroenterol. Motil. 11: 27–36, 1999.
Brouwers, J., Anneveld, B., Goudappel, G.-J., Duchateau, G., Annaert, P., Augustijns, P., and Zeijdner, E.: Food-dependent disintegration of immediate release fosamprenavir tablets: in vitro evaluation using magnetic resonance imaging and a dynamic gastrointestinal system. Eur. J. Pharm. Biopharm. 77: 313–319, 2011.
Cargill, R., Engle, K., Gardner, C. R., Porter, P., Sparer, R. V., and Fix, J. A.: Controlled gastric emptying. II. In vitro erosion and gastric residence times of an erodible device in beagle dogs. Pharm. Res. 6: 506–509, 1989.
Chaichana, T., Sun, Z., and Jewkes, J.: Computational Fluid Dynamics Analysis of the Effect of Plaques in the Left Coronary Artery. Comput. Math. Method. M 2012: 1–9, 2012.
Chen, J., Blevins, W. E., Park, H., and Park, K.: Gastric retention properties of superporous hydrogel composites. J Control Release 64: 39–51, 2000.
Chessa, S., Huatan, H., Levina, M., Mehta, R. Y., Ferrizzi, D., and Rajabi-Siahboomi, A. R.: Application of the Dynamic Gastric Model to evaluate the effect of food on the drug release characteristics of a hydrophilic matrix formulation. Int. J. Pharm. 466: 359–367, 2014.
Chial, H. J., Camilleri, C., Delgado-Aros, S., burton, d., Thomforde, G., Ferber, I., and Camilleri, M.: A nutrient drink test to assess maximum tolerated volume and postprandial symptoms: effects of gender, body mass index and age in health. Neurogastroenterol. Motil. 14: 249–253, 2002.
Clarke, G. M., Newton, J. M., and Short, M. D.: Gastrointestinal transit of pellets of differing size and density. Int. J. Pharm. 100: 81–92, 1993.
Colombo, P.: Swelling-controlled release in hydrogel matrices for oral route. Adv. Drug Deliv. Rev. 11: 37–57, 1993.
Colombo, P., Conte, U., Caramella, C., Geddo, M., and La Manna, A.: Disintegrating force as a new formulation parameter. J. Pharm. Sci. 73: 701–705, 1984.
Conti, S., Maggi, L., Segale, L., Ochoa Machiste, E., Conte, U., Grenier, P., and Vergnault, G.: Matrices containing NaCMC and HPMC 1. Dissolution performance characterization. Int. J. Pharm. 333: 136–142, 2007a.
Conti, S., Maggi, L., Segale, L., Ochoa Machiste, E., Conte, U., Grenier, P., and Vergnault, G.: Matrices containing NaCMC and HPMC 2. Swelling and release mechanism study. Int. J. Pharm. 333: 143–151, 2007b.
Cuña, M., Alonso, M. J., and Torres, D.: Preparation and in vivo evaluation of mucoadhesive microparticles containing amoxycillin-resin complexes for drug delivery to the gastric mucosa. Eur. J. Pharm. Biopharm. 51: 199–205, 2001.
Curatolo, W. J., Lo J.: Gastric retention system for controlled drug release, US Patent 5443843. Curlin, L. C.: A note on tablet disintegration with starch. J. Pharm. Sci. 44: 16, 1955. D’Arcy, D. M., Healy, A. M., and Corrigan, O. I.: Towards determining appropriate hydrodynamic
conditions for in vitro in vivo correlations using computational fluid dynamics. Eur. J. Pharm. Sci. 37: 291–299, 2009.
de la Torre, Paloma M, Torrado, G., and Torrado, S.: Poly (acrylic acid) chitosan interpolymer complexes for stomach controlled antibiotic delivery. J. Biomed. Mater. Res. Part B Appl. Biomater. 72: 191–197, 2005.
Deshpande, A. A., Shah, N. H., Rhodes, C. T., and Malick, W.: Development of a novel controlled-release system for gastric retention. Pharm. Res. 14: 815–819, 1997.
Desipio, J., Friedenberg, F. K., Korimilli, A., Richter, J. E., Parkman, H. P., and Fisher, R. S.: High-resolution solid-state manometry of the antropyloroduodenal region. Neurogastroenterol. Motil. 19: 188–195, 2007.
7 References
145
Di, M.-Y., Jiang, Z., Gao, Z.-Q., Li, Z., An, Y.-R., Lv, W., and Secomb, T. W.: Numerical Simulation of Airflow Fields in Two Typical Nasal Structures of Empty Nose Syndrome: A Computational Fluid Dynamics Study. PLoS one 8: e84243, 2013.
Doroshyenko, O., Jetter, A., Odenthal, K. P., and Fuhr, U.: Clinical pharmacokinetics of trospium chloride. Clin. Pharmacokinet. 44: 701–720, 2005.
Dorozyński, P., Jachowicz, R., Kulinowski, P., Kwieciński, S., Szybiński, K., Skórka, T., and Jasiński, A.: The macromolecular polymers for the preparation of hydrodynamically balanced systems--methods of evaluation. Drug. Dev. Ind. Pharm. 30: 947–957, 2004.
Ferrua, M. J., Kong, F., and Singh, R. P.: Computational modeling of gastric digestion and the role of food material properties. Trends Food Sci. Tech. 22: 480–491, 2011.
Ferrua, M. J. and Singh, R. P.: Modeling the Fluid Dynamics in a Human Stomach to Gain Insight of Food Digestion. J. Food Sci. 75: R151, 2010.
Fix, J. A., Cargill, R., and Engle, K.: Controlled gastric emptying. III. Gastric residence time of a nondisintegrating geometric shape in human volunteers. Pharm. Res. 10: 1087–1089, 1993.
Garbacz, G., Golke, B., Wedemeyer, R.-S., Axell, M., Söderlind, E., Abrahamsson, B., and Weitschies, W.: Comparison of dissolution profiles obtained from nifedipine extended release once a day products using different dissolution test apparatuses. Eur. J. Pharm. Sci. 38: 147–155, 2009.
Garbacz, G., Kandzi, A., Koziolek, M., Mazgalski, J., and Weitschies, W.: Release characteristics of quetiapine fumarate extended release tablets under biorelevant stress test conditions. AAPS PharmSciTech 15: 230–236, 2014.
Garbacz, G., Rappen, G.-M., Koziolek, M., and Weitschies, W.: Dissolution of mesalazine modified release tablets under standard and bio-relevant test conditions. J. Pharm. Pharmacol. 67: 199–208, 2015.
Garbacz, G., Wedemeyer, R.-S., Nagel, S., Giessmann, T., Mönnikes, H., Wilson, C. G., Siegmund, W., and Weitschies, W.: Irregular absorption profiles observed from diclofenac extended release tablets can be predicted using a dissolution test apparatus that mimics in vivo physical stresses. Eur. J. Pharm. Biopharm. 70: 421–428, 2008.
Garbacz, G. and Weitschies, W.: Investigation of dissolution behavior of diclofenac sodium extended release formulations under standard and biorelevant test conditions. Drug. Dev. Ind. Pharm. 36: 518–530, 2010.
Geliebter, A. and Hashim, S. A.: Gastric capacity in normal, obese, and bulimic women. Physiol. Behav. 74: 743–746, 2001.
Gerogiannis, V. S., Rekkas, D. M., Dallas, P. P., and Choulis, N. H.: Floating and Swelling Characteristics of Various Excipients Used in Controlled Release Technology. Drug. Dev. Ind. Pharm. 19: 1061–1081, 1993.
Gershberg, S. and Stoll, F. D.: Apparatus, for tablet disintegration, and for shaking-out extractions. J. Pharm. Sci. 35: 284–287, 1946.
Goetze, O., Treier, R., Fox, M., Steingoetter, A., Fried, M., Boesiger, P., and Schwizer, W.: The effect of gastric secretion on gastric physiology and emptying in the fasted and fed state assessed by magnetic resonance imaging. Neurogastroenterol. Motil. 21: 725–e42, 2009.
Gómez-Burgaz, M., García-Ochoa, B., and Torrado-Santiago, S.: Chitosan–carboxymethylcellulose interpolymer complexes for gastric-specific delivery of clarithromycin. Int. J. Pharm. 359: 135–143, 2008.
Grenha, A., Gomes, M. E., Rodrigues, M., Santo, V. E., Mano, J. F., Neves, N. M., and Reis, R. L.: Development of new chitosan/carrageenan nanoparticles for drug delivery applications. J. Biomed. Mater. Res. A 92: 1265–1272, 2010.
Gröning, R., Cloer, C., Georgarakis, M., and Müller, R. S.: Compressed collagen sponges as gastroretentive dosage forms: in vitro and in vivo studies. Eur. J. Pharm. Sci. 30: 1–6, 2007.
Guyot-Hermann, A. M. and Ringard, D. J.: Disintegration Mechanisms of Tablets Containing Starches. Hypothesis About the Particle-Particle Repulsive Force. Drug. Dev. Ind. Pharm. 7: 155–177, 1981.

7 References
146
Hao, S., Wang, Y., and Wang, B.: Sinking-magnetic microparticles prepared by the electrospray method for enhanced gastric antimicrobial delivery. Mol. Pharm. 11: 1640–1650, 2014.
Hausken, T., Mundt, M., and Samsom, M.: Low antroduodenal pressure gradients are responsible for gastric emptying of a low-caloric liquid meal in humans. Neurogastroenterol. Motil. 14: 97–105, 2002.
Hausken, T., Odegaard, S., Matre, K., and Berstad, A.: Antroduodenal motility and movements of luminal contents studied by duplex sonography. Gastroenterology 102: 1583–1590, 1992.
Hejazi, R. and Amiji, M.: Stomach-specific anti-H. pylori therapy. I: Preparation and characterization of tetracyline-loaded chitosan microspheres. Int. J. Pharm. 235: 87–94, 2002.
Hellström, P. M., Grybäck, P., and Jacobsson, H.: The physiology of gastric emptying. Best Pract. Res. Clin. Anaesthesiol. 20: 397–407, 2006.
Ichikawa, M., Watanabe, S., and Miyake, Y.: A new multiple-unit oral floating dosage system. I: Preparation and in vitro evaluation of floating and sustained-release characteristics. J. Pharm. Sci. 80: 1062–1066, 1991.
Ides, K.: Acute effects of intrapulmonary percussive ventilation in COPD patients assessed by using conventional outcome parameters and a novel computational fluid dynamics technique. Int. J. Chron. Obstruct. Pulmon. Dis.: 667, 2012.
Il'ina, A. V. and Varlamov, V. P.: Chitosan-based polyelectrolyte complexes: a review. Appl. Biochem. Micro+ 41: 5–11, 2005.
Imai, Y., Kobayashi, I., Ishida, S., Ishikawa, T., Buist, M., and Yamaguchi, T.: Antral recirculation in the stomach during gastric mixing. AJP: Gastrointestinal and Liver Physiology 304: G536, 2013.
Indireshkumar, K., Brasseur, J. G., Faas, H., Hebbard, G. S., Kunz, P., Dent, J., Feinle, C., Li, M., Boesiger, p., Fried, M., and Schwizer, W.: Relative contributions of "pressure pump" and "peristaltic pump" to gastric emptying. Am. J. Physiol. Gastrointest. Liver Physiol. 278: G604-16, 2000.
Ingani, H., Timmermans, J., and Moes, A.: Conception and in vivo investigation of peroral sustained release floating dosage forms with enhanced gastrointestinal transit. Int. J. Pharm. 35: 157–164, 1987.
Janssen, P., Verschueren, S., Ly, H. G., Vos, R., van Oudenhove, L., and Tack, J.: Intragastric pressure during food intake: a physiological and minimally invasive method to assess gastric accommodation. Neurogastroenterol. Motil. 23: 316-22, e153-4, 2011.
Janssen, P., Verschueren, S., and Tack, J.: Intragastric pressure as a determinant of food intake. Neurogastroenterol. Motil. 24: 612-5, e267-8, 2012.
Kagan, L., Lapidot, N., Afargan, M., Kirmayer, D., Moor, E., Mardor, Y., Friedman, M., and Hoffman, A.: Gastroretentive Accordion Pill: Enhancement of riboflavin bioavailability in humans. J Control Release 113: 208–215, 2006.
Kalantzi, L., Goumas, K., Kalioras, V., Abrahamsson, B., Dressman, J. B., and Reppas, C.: Characterization of the human upper gastrointestinal contents under conditions simulating bioavailability/bioequivalence studies. Pharm. Res. 23: 165–176, 2006.
Kalantzi, L., Polentarutti, B., Albery, T., Laitmer, D., Abrahamsson, B., Dressman, J., and Reppas, C.: The delayed dissolution of paracetamol products in the canine fed stomach can be predicted in vitro but it does not affect the onset of plasma levels. Int. J. Pharm. 296: 87–93, 2005.
Kamba, M., Seta, Y., Kusai, A., Ikeda, M., and Nishimura, K.: A unique dosage form to evaluate the mechanical destructive force in the gastrointestinal tract. Int. J. Pharm. 208: 61–70, 2000.
Kawashima, Y., Niwa, T., Takeuchi, H., Hino, T., and Ito, Y.: Control of prolonged drug release and compression properties of ibuprofen microspheres with acrylic polymer, eudragit RS, by changing their intraparticle porosity [corrected]. Chem. Pharm. Bull. 40: 196–201, 1992.

7 References
147
Klausner, E. A., Lavy, E., Friedman, M., and Hoffman, A.: Expandable gastroretentive dosage forms. J. Control. Release 90: 143–162, 2003.
Klausner, E. A., Lavy, E., Stepensky, D., Friedman, M., and Hoffman, A.: Novel gastroretentive dosage forms: evaluation of gastroretentivity and its effect on riboflavin absorption in dogs. Pharm. Res. 19: 1516–1523, 2002.
Kleberg, K., Jacobsen, J., and Müllertz, A.: Characterising the behaviour of poorly water soluble drugs in the intestine: application of biorelevant media for solubility, dissolution and transport studies. J. Pharm. Pharmacol. 62: 1656–1668, 2010.
Klein, S.: The Use of Biorelevant Dissolution Media to Forecast the In Vivo Performance of a Drug. AAPS J 12: 397–406, 2010.
Kong, F. and Singh, R. P.: A Human Gastric Simulator (HGS) to Study Food Digestion in Human Stomach. J. Food Sci. 75: E627, 2010.
Koziolek, M., Garbacz, G., Neumann, M., and Weitschies, W.: Simulating the postprandial stomach: physiological considerations for dissolution and release testing. Mol. Pharm. 10: 1610–1622, 2013.
Koziolek, M., Görke, K., Neumann, M., Garbacz, G., and Weitschies, W.: Development of a bio-relevant dissolution test device simulating mechanical aspects present in the fed stomach. Eur. J. Pharm. Sci. 57: 250–256, 2014.
Kozu, H., Kobayashi, I., Nakajima, M., Uemura, K., Sato, S., and Ichikawa, S.: Analysis of Flow Phenomena in Gastric Contents Induced by Human Gastric Peristalsis Using CFD. Food Biophys. 5: 330–336, 2010.
Krögel, I. and Bodmeier, R.: Development of a multifunctional matrix drug delivery system surrounded by an impermeable cylinder. J. Control. Release 61: 43–50, 1999.
Kukura, J., Baxter, J., and Muzzio, F.: Shear distribution and variability in the USP Apparatus 2 under turbulent conditions. Int. J. Pharm. 279: 9–17, 2004.
Kuriakose, R. and Anandharamakrishnan, C.: Computational fluid dynamics (CFD) applications in spray drying of food products. Trends Food Sci. Tech. 21: 383–398, 2010.
Kwiatek, M. A., Menne, D., Steingoetter, A., Goetze, O., Forras-Kaufman, Z., Kaufman, E., Fruehauf, H., Boesiger, P., Fried, M., Schwizer, W., and Fox, M. R.: Effect of meal volume and calorie load on postprandial gastric function and emptying: studies under physiological conditions by combined fiber-optic pressure measurement and MRI. Am. J. Physiol. Gastrointest. Liver Physiol. 297: G894-901, 2009.
Kwiatek, M. A., Steingoetter, A., Pal, A., Menne, D., Brasseur, J. G., Hebbard, G. S., Boesiger, P., Thumshirn, M., Fried, M., and Schwizer, W.: Quantification of distal antral contractile motility in healthy human stomach with magnetic resonance imaging. J. Magn. Reson. Imaging 24: 1101–1109, 2006.
Laulicht, B., Tripathi, A., Schlageter, V., Kucera, P., and Mathiowitz, E.: Understanding gastric forces calculated from high-resolution pill tracking. P. Natl. Acad. Sci. U.S.A. 107: 8201–8206, 2010.
Lehr, C. M.: Bioadhesion technologies for the delivery of peptide and protein drugs to the gastrointestinal tract. Crit. Rev. Ther. Drug 11: 119–160, 1994.
Li, L., Wang, L., Shao, Y., Ni, R., Zhang, T., and Mao, S.: Drug release characteristics from chitosan–alginate matrix tablets based on the theory of self-assembled film. Int. J. Pharm. 450: 197–207, 2013a.
Li, L., Wang, L., Shao, Y., Tian, Y., Li, C., Li, Y., and Mao, S.: Elucidation of release characteristics of highly soluble drug trimetazidine hydrochloride from chitosan-carrageenan matrix tablets. J. Pharm. Sci. 102: 2644–2654, 2013b.
Li, S., Lin, S., Daggy, B. P., Mirchandani, H. L., and Chien, Y. W.: Effect of HPMC and Carbopol on the release and floating properties of Gastric Floating Drug Delivery System using factorial design. Int. J. Pharm. 253: 13–22, 2003.

7 References
148
Liu, H. and Li, M.: Two-compartmental population balance modeling of a pulsed spray fluidized bed granulation based on computational fluid dynamics (CFD) analysis. Int. J. Pharm. 475: 256–269, 2014.
Luo, Y. and Wang, Q.: Recent development of chitosan-based polyelectrolyte complexes with natural polysaccharides for drug delivery. Int. J. Biol. Macromol. 64: 353–367, 2014.
Maderuelo, C., Zarzuelo, A., and Lanao, J. M.: Critical factors in the release of drugs from sustained release hydrophilic matrices. J. Control. Release 154: 2–19, 2011.
Maggi, L., Segale, L., Torre, M. L., Ochoa, M. E., and Conte, U.: Dissolution behaviour of hydrophilic matrix tablets containing two different polyethylene oxides (PEOs) for the controlled release of a water-soluble drug. Dimensionality study. Biomaterials 23: 1113–1119, 2002.
Mandel, K. G., Daggy, B. P., Brodie, D. A., and Jacoby, H. I.: Review article: alginate-raft formulations in the treatment of heartburn and acid reflux. Aliment. Pharmacol. Ther. 14: 669–690, 2000.
Marciani, L., Gowland, P. A., Fillery-Travis, A., Manoj, P., Wright, J., Smith, A., Young, P., Moore, R., and Spiller, R. C.: Assessment of antral grinding of a model solid meal with echo-planar imaging. Am. J. Physiol. Gastrointest. Liver Physiol. 280: G844-9, 2001a.
Marciani, L., Gowland, P. A., Spiller, R. C., Manoj, P., Moore, R. J., Young, P., and Fillery-Travis, A. J.: Effect of meal viscosity and nutrients on satiety, intragastric dilution, and emptying assessed by MRI. Am. J. Physiol. Gastrointest. Liver Physiol. 280: G1227-33, 2001b.
Marciani, L., Young, P., Wright, J., Moore, R., Coleman, N., Gowland, P. A., and Spiller, R. C.: Antral motility measurements by magnetic resonance imaging. Neurogastroenterol. Motil. 13: 511–518, 2001c.
Martorell, J., Santomá, P., Molins, J. J., García-Granada, A. A., Bea, J. A., Edelman, E. R., and Balcells, M.: Engineered arterial models to correlate blood flow to tissue biological response. Ann. NY Acad. Sci. 1254: 51–56, 2012.
McAllister, M.: Dynamic dissolution: a step closer to predictive dissolution testing? Mol. Pharm. 7: 1374–1387, 2010.
Moustafine, R. I., Bukhovets, A. V., Sitenkov, A. Y., Kemenova, V. A., Rombaut, P., and Van den Mooter, G: Eudragit E PO as a complementary material for designing oral drug delivery systems with controlled release properties: comparative evaluation of new interpolyelectrolyte complexes with countercharged eudragit L100 copolymers. Mol. Pharm. 10: 2630–2641, 2013.
Moustafine, R. I., Kabanova, T. V., Kemenova, V. A., and Van den Mooter, G: Characteristics of interpolyelectrolyte complexes of Eudragit E100 with Eudragit L100. J. Control. Release 103: 191–198, 2005a.
Moustafine, R. I., Kemenova, V. A., and Van den Mooter, G: Characteristics of interpolyelectrolyte complexes of Eudragit E 100 with sodium alginate. Int. J. Pharm. 294: 113–120, 2005b.
Moustafine, R. I., Zaharov, I. M., and Kemenova, V. A.: Physicochemical characterization and drug release properties of Eudragit E PO/Eudragit L 100-55 interpolyelectrolyte complexes. Eur. J. Pharm. Biopharm. 63: 26–36, 2006.
Nagarwal, R. C., Ridhurkar, D. N., and Pandit, J. K.: In vitro release kinetics and bioavailability of gastroretentive cinnarizine hydrochloride tablet. AAPS PharmSciTech 11: 294–303, 2010.
Ngwuluka, N. C., Choonara, Y. E., Modi, G., du Toit, Lisa C, Kumar, P., Ndesendo, Valence M K, and Pillay, V.: Design of an interpolyelectrolyte gastroretentive matrix for the site-specific zero-order delivery of levodopa in Parkinson's disease. AAPS PharmSciTech 14: 605–619, 2013.
Nowak, N., Kakade, P. P., and Annapragada, A. V.: Computational Fluid Dynamics Simulation of Airflow and Aerosol Deposition in Human Lungs. Ann. Boimed. Eng. 31: 374–390, 2003.
7 References
149
Obeidat, W. M., Abu Znait, Ala'a H, and Sallam, A.-S. A.: Novel combination of anionic and cationic polymethacrylate polymers for sustained release tablet preparation. Drug. Dev. Ind. Pharm. 34: 650–660, 2008.
Pal, A., Indireshkumar, K., Schwizer, W., Abrahamsson, B., Fried, M., and Brasseur, J. G.: Gastric flow and mixing studied using computer simulation. P. Roy. Soc. B-Biol. Sci. 271: 2587–2594, 2004.
Park, S.-H., Chun, M.-K., and Choi, H.-K.: Preparation of an extended-release matrix tablet using chitosan/Carbopol interpolymer complex. Int. J. Pharm. 347: 39–44, 2008.
Parojčić, J., Vasiljević, D., Ibrić, S., and Djurić, Z.: Tablet disintegration and drug dissolution in viscous media: Paracetamol IR tablets. Int. J. Pharm. 355: 93–99, 2008.
Patel, N. R. and Hopponent, R. E.: Mechanism of action of starch as a disintegrating agent in aspirin tablets. J. Pharm. Sci. 55: 1065–1068, 1966.
Pauwels, A., Altan, E., and Tack, J.: The gastric accommodation response to meal intake determines the occurrence of transient lower esophageal sphincter relaxations and reflux events in patients with gastro-esophageal reflux disease. Neurogastroenterol. Motil. 26: 581–588, 2014.
Ph.Eur., European Pharmacopoeia, European Directorate for the Quality of medicines and HealtCare (EDQM), Council of Europe, Strasbourg, France, 2014.
Prado, H. J., Matulewicz, M. C., Bonelli, P., and Cukierman, A. L.: Basic butylated methacrylate copolymer/kappa-carrageenan interpolyelectrolyte complex: preparation, characterization and drug release behaviour. Eur. J. Pharm. Biopharm. 70: 171–178, 2008.
Prajapati, V. D., Jani, G. K., Khutliwala, T. A., and Zala, B. S.: Raft forming system—An upcoming approach of gastroretentive drug delivery system. J. Control. Release 168: 151–165, 2013.
Radwan, A., Amidon, G. L., and Langguth, P.: Mechanistic investigation of food effect on disintegration and dissolution of BCS class III compound solid formulations: the importance of viscosity. Biopharm. Drug. Dispos. 33: 403–416, 2012.
Radwan, A., Ebert, S., Amar, A., Münnemann, K., Wagner, M., Amidon, G. L., and Langguth, P.: Mechanistic understanding of food effects: water diffusivity in gastrointestinal tract is an important parameter for the prediction of disintegration of solid oral dosage forms. Mol. Pharm. 10: 2283–2290, 2013.
Radwan, A., Wagner, M., Amidon, G. L., and Langguth, P.: Bio-predictive tablet disintegration: effect of water diffusivity, fluid flow, food composition and test conditions. Eur. J. Pharm. Sci. 57: 273–279, 2014.
Ramachandran, S., Shaheedha, S. M., Thirumurugan, G., and Dhanaraju, M. D.: Floating controlled drug delivery system of famotidine loaded hollow microspheres (microballoons) in the stomach. Curr. Drug. Deliv. 7: 93–97, 2010.
Reppas, C. and Vertzoni, M.: Biorelevant in-vitro performance testing of orally administered dosage forms. J. Pharm. Pharmacol. 64: 919–930, 2012.
Rouge, N., Cole, E. T., Doelker, E., and Buri, P.: Buoyancy and drug release patterns of floating minitablets containing piretanide and atenolol as model drugs. Pharm. Dev. Technol. 3: 73–84, 1998.
Sato, Y., Kawashima, Y., Takeuchi, H., and Yamamoto, H.: Physicochemical properties to determine the buoyancy of hollow microspheres (microballoons) prepared by the emulsion solvent diffusion method. Eur. J. Pharm. Biopharm. 55: 297–304, 2003.
Schiller, C., Frohlich, C.-P., Giessmann, T., Siegmund, W., Monnikes, H., Hosten, N., and Weitschies, W.: Intestinal fluid volumes and transit of dosage forms as assessed by magnetic resonance imaging. Aliment. Pharmacol. Ther. 22: 971–979, 2005.
Schmitz, T., Leitner, V. M., and Bernkop-Schnürch, A.: Oral heparin delivery: design and in vivo evaluation of a stomach-targeted mucoadhesive delivery system. J. Pharm. Sci. 94: 966–973, 2005.

7 References
150
Schröder, S., Jetter, A., Zaigler, M., Weyhenmeyer, R., Krumbiegel, G., Wächter, W., and Fuhr, U.: Absorption pattern of trospium chloride along the human gastrointestinal tract assessed using local enteral administration. Int. J. Clin. Pharma. Th. 42: 543–549, 2004.
Schulze, K.: Imaging and modelling of digestion in the stomach and the duodenum. Neurogastroenterol. Motil. 18: 172–183, 2006.
Shalaby, W. S. and Park, K.: Biochemical and mechanical characterization of enzyme-digestible hydrogels. Pharm. Res. 7: 816–823, 1990.
Shotton, E. and Leonard, G. S.: Effect of intragranular and extragranular disintegrating agents on particle size of disintegrated tablets. J. Pharm. Sci. 65: 1170–1174, 1976.
Siahi, M. R., Barzegar-Jalali, M., Monajjemzadeh, F., Ghaffari, F., and Azarmi, S.: Design and evaluation of 1- and 3-layer matrices of verapamil hydrochloride for sustaining its release. AAPS PharmSciTech 6: E626-32, 2005.
Siahi-Shadbad, M. R., Asare-Addo, K., Azizian, K., Hassanzadeh, D., and Nokhodchi, A.: Release behaviour of propranolol HCl from hydrophilic matrix tablets containing psyllium powder in combination with hydrophilic polymers. AAPS PharmSciTech 12: 1176–1182, 2011.
Singh, B. N. and Kim, K. H.: Floating drug delivery systems: an approach to oral controlled drug delivery via gastric retention. J. Control. Release 63: 235–259, 2000.
SolidWorks Flow Simulation 2012 Technical Reference. Sonobe, T., Wantanabe, S., Katsuma, M., Takamatsu, N., Konno, Y., Takagi, H.: Gastric retention
device, Eur. Patent 0415671, 1991. Stithit, S., Chen, W., and Price, J. C.: Development and characterization of buoyant theophylline
microspheres with near zero order release kinetics. J. Microencapsul. 15: 725–737, 1998. Streubel, A., Siepmann, J., and Bodmeier, R.: Floating microparticles based on low density foam
powder. Int. J. Pharm. 241: 279–292, 2002. Streubel, A., Siepmann, J., and Bodmeier, R.: Floating matrix tablets based on low density foam
powder: effects of formulation and processing parameters on drug release. Eur. J. Pharm. Sci. 18: 37–45, 2003.
Streubel, A., Siepmann, J., and Bodmeier, R.: Gastroretentive drug delivery systems. Expert Opin. Drug Del. 3: 217–233, 2006.
Takahashi, T.: Mechanism of interdigestive migrating motor complex. J. Neurogastroenterol. Motil. 18: 246–257, 2012.
Tapia, C., Costa, E., Moris, M., Sapag-Hagar, J., Valenzuela, F., and Basualto, C.: Study of the influence of the pH media dissolution, degree of polymerization, and degree of swelling of the polymers on the mechanism of release of diltiazem from matrices based on mixtures of chitosan/alginate. Drug. Dev. Ind. Pharm. 28: 217–224, 2002.
Tapia, C., Escobar, Z., Costa, E., Sapag-Hagar, J., Valenzuela, F., Basualto, C., Gai, M. N., and Yazdani-Pedram, M.: Comparative studies on polyelectrolyte complexes and mixtures of chitosan-alginate and chitosan-carrageenan as prolonged diltiazem clorhydrate release systems. Eur. J. Pharm. Biopharm. 57: 65–75, 2004.
Thanoo, B. C., Sunny, M. C., and Jayakrishnan, A.: Controlled release of oral drugs from cross-linked polyvinyl alcohol microspheres. J. Pharm. Pharmacol. 45: 16–20, 1993.
Timmermans, J. and Moës, A. J.: Factors controlling the buoyancy and gastric retention capabilities of floating matrix capsules: new data for reconsidering the controversy. J. Pharm. Sci. 83: 18–24, 1994.
van Ertbruggen, C., Hirsch, C., and Paiva, M.: Anatomically based three-dimensional model of airways to simulate flow and particle transport using computational fluid dynamics. J. Appl. Physiol. 98: 970–980, 2005.
van Kamp, H. V., Bolhuis, G. K., and Lerk, C. F.: Improvement by super disintegrants of the properties of tablets containing lactose, prepared by wet granulation. Pharmaceutisch weekblad. Scientific edition 5: 165–171, 1983.
Vassallo, M. J., Camilleri, M., Prather, C. M., Hanson, R. B., and Thomforde, G. M.: Measurement of axial forces during emptying from the human stomach. Am. J. Physiol. 263: G230-9, 1992.
7 References
151
Vertzoni, M., Dressman, J., Butler, J., Hempenstall, J., and Reppas, C.: Simulation of fasting gastric conditions and its importance for the in vivo dissolution of lipophilic compounds. Eur. J. Pharm. Biopharm. 60: 413–417, 2005.
Wang, D. Y., Lee, H. P., and Gordon, B. R.: Impacts of Fluid Dynamics Simulation in Study of Nasal Airflow Physiology and Pathophysiology in Realistic Human Three-Dimensional Nose Models. Clin. Exp. Otorhinolar. 5: 181, 2012.
Weitschies, W., Blume, H., and Mönnikes, H.: Magnetic marker monitoring: high resolution real-time tracking of oral solid dosage forms in the gastrointestinal tract. Eur. J. Pharm. Biopharm. 74: 93–101, 2010.
Weitschies, W., Cardini, D., Karaus, M., Trahms, L., and Semmler, W.: Magnetic marker monitoring of esophageal, gastric and duodenal transit of non-disintegrating capsules. Die Pharmazie 54: 426–430, 1999.
Weitschies, W., Friedrich, C., Wedemeyer, R. S., Schmidtmann, M., Kosch, O., Kinzig, M., Trahms, L., Sörgel, F., Siegmund, W., Horkovics-Kovats, S., Schwarz, F., Raneburger, J., and Mönnikes, H.: Bioavailability of amoxicillin and clavulanic acid from extended release tablets depends on intragastric tablet deposition and gastric emptying. Eur. J. Pharm. Biopharm. 70: 641–648, 2008.
Weitschies, W., Kosch, O., Mönnikes, H., and Trahms, L.: Magnetic Marker Monitoring: An application of biomagnetic measurement instrumentation and principles for the determination of the gastrointestinal behavior of magnetically marked solid dosage forms. Adv. Drug Deliv. Rev. 57: 1210–1222, 2005.
Wickham, M. and Faulks, R.: Dynamic Gastric Model. U.S.Patent 8.092.222, 2012. Yang, L. and Fassihi, R.: Zero-order release kinetics from a self-correcting floatable asymmetric
configuration drug delivery system. J. Pharm. Sci. 85: 170–173, 1996. Yang, L. and Fassihi, R.: Examination of drug solubility, polymer types, hydrodynamics and
loading dose on drug release behavior from a triple-layer asymmetric configuration delivery system. Int. J. Pharm. 155: 219–229, 1997.
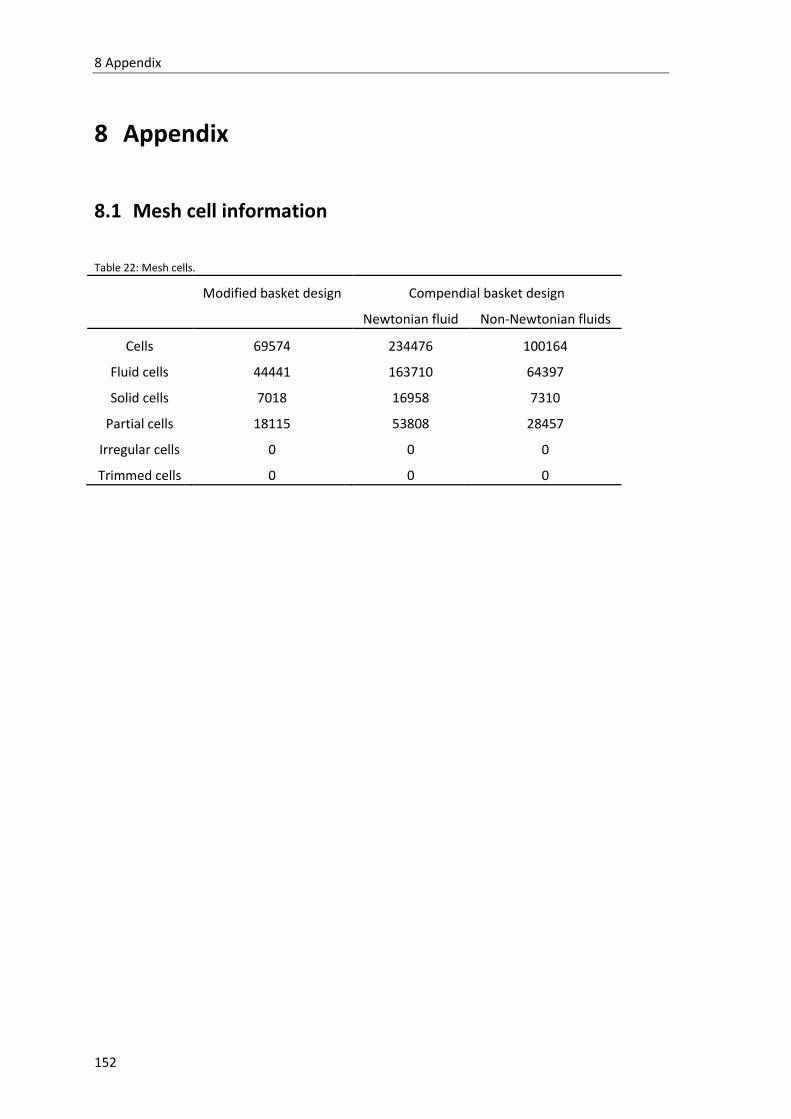
8 Appendix
152
8 Appendix
8.1 Mesh cell information
Table 22: Mesh cells.
Modified basket design Compendial basket design
Newtonian fluid Non-Newtonian fluids
Cells 69574 234476 100164
Fluid cells 44441 163710 64397
Solid cells 7018 16958 7310
Partial cells 18115 53808 28457
Irregular cells 0 0 0
Trimmed cells 0 0 0

8 Appendix
153
8.2 Supporting information on the modified disintegration test
device
Figure 77: Dimensions (cm) of the modified basket.
Figure 78: DisPress unit. The active elements of pressure regulation of the DisPress unit are controlled by a microprocessor (Arduino). Programming was accomplished by numeric parameters.

8 Appendix
154
8.3 Application program of CNC controller
ProgBegin
N01 Type Referenzfaht in allen Achsen…
N02 Ref
MoveAbs X250 F80
R1=Messagebox YESNO „Tablette eingelegt?“
If R1=6
MoveAbs X55 F 80
Endif
Repeat
MoveAbs X55 F80*
MoveAbs X0 F80*
Until E1.4
;
ProgEnd
*: moving speed needs to be specified

8 Appendix
155
8.4 DoE worksheet
Table 23: Design of experiments worksheet for the modified basket design (spe=speed, vis=viscosity, com=compression force).
Exp No Exp Name Run Order Incl/Excl spe vis com
1 N1 4 Incl 40 0 1
17 N17 35 Incl 40 0 1
33 N33 29 Incl 40 0 1
2 N2 44 Incl 80 0 1
18 N18 43 Incl 80 0 1
34 N34 14 Incl 80 0 1
3 N3 17 Incl 40 1.4 1
19 N19 1 Incl 40 1.4 1
35 N35 12 Incl 40 1.4 1
4 N4 46 Incl 80 1.4 1
20 N20 37 Incl 80 1.4 1
36 N36 27 Incl 80 1.4 1
5 N5 19 Incl 40 0 2
21 N21 34 Incl 40 0 2
37 N37 15 Incl 40 0 2
6 N6 22 Incl 80 0 2
22 N22 38 Incl 80 0 2
38 N38 10 Incl 80 0 2
7 N7 2 Incl 40 1.4 2
23 N23 3 Incl 40 1.4 2
39 N39 9 Incl 40 1.4 2
8 N8 11 Incl 80 1.4 2
24 N24 28 Incl 80 1.4 2
40 N40 40 Incl 80 1.4 2
9 N9 5 Incl 40 0 3
25 N25 32 Incl 40 0 3
41 N41 21 Incl 40 0 3
10 N10 13 Incl 80 0 3
26 N26 41 Incl 80 0 3
42 N42 6 Incl 80 0 3
11 N11 7 Incl 40 1.4 3
27 N27 30 Incl 40 1.4 3
43 N43 36 Incl 40 1.4 3
12 N12 20 Incl 80 1.4 3
28 N28 45 Incl 80 1.4 3
44 N44 39 Incl 80 1.4 3
13 N13 47 Incl 40 0 4
29 N29 48 Incl 40 0 4
45 N45 25 Incl 40 0 4
14 N14 23 Incl 80 0 4
30 N30 33 Incl 80 0 4
46 N46 18 Incl 80 0 4
15 N15 31 Incl 40 1.4 4
31 N31 8 Incl 40 1.4 4
47 N47 42 Incl 40 1.4 4
16 N16 16 Incl 80 1.4 4
32 N32 24 Incl 80 1.4 4
48 N48 26 Incl 80 1.4 4
For the compendial basket the design is the same expect that 5 replicates were performed resulting in 96 runs.

8 Appendix
156
8.5 Tablet for in vivo disintegration studies
Formulations:
Markertablets: 50 mg Neusillin
Markersubstance (Magnetic iron for proton MRI, perfluoro-15-crown-5-ether
for fluorine MRI)
Matrixtablets: a) 9,45 g MCC 101
0,5 g Carbopol 971
0,05 g Magnesiumstearate
b) 9,65 g MCC 101
0,35 g Carbopol 971
Preparation:
Markertablets:
50 mg Neusillin are weighed and compressed at 3 kN for 10 s using a hydraulic press. The
markertablets are immersed in the liquid markersubstance overnight. After removing surface
liquid with a tissue paper, the markertablets are coated with 5 % Ethylcellulose in acetone.
Matrixtablets:
The formulation componetns are weighed and homogenized using a motar and pestel. Powder
and markertablets are layered alternating into the die. The mixture is compressed at 5 kN for 10
s using a hydraulic press.
Disintegration time:
Disintegration times were measured in SGF at 37 °C using the compendial disintegration test
device.
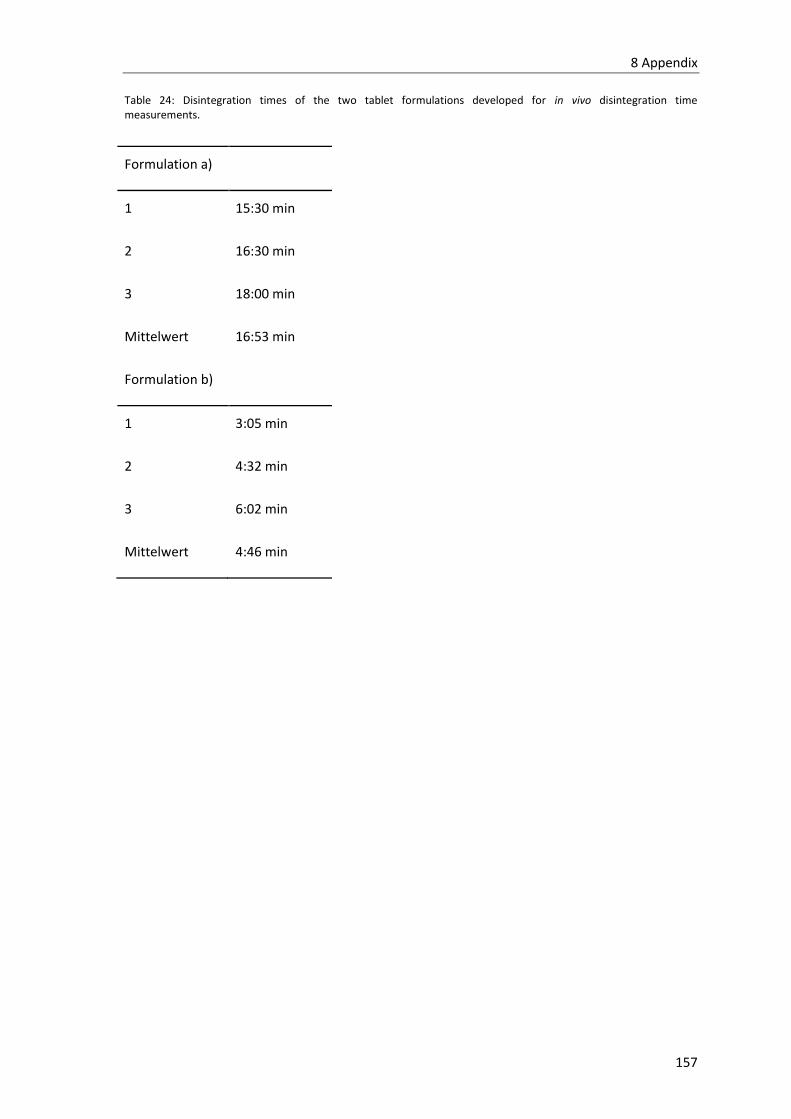
8 Appendix
157
Table 24: Disintegration times of the two tablet formulations developed for in vivo disintegration time measurements.
Formulation a)
1 15:30 min
2 16:30 min
3 18:00 min
Mittelwert 16:53 min
Formulation b)
1 3:05 min
2 4:32 min
3 6:02 min
Mittelwert 4:46 min
9 List of related publications
158
9 List of related publications
Publications:
Kindgen, S., Wachtel H., Abrahamsson B., Langguth P.: Computational Fluid Dynamics
Simulation of Hydrodynamics and Stresses in the PhEur/USP Disintegration Tester Under Fed
and Fasted Fluid Characteristics, J. Pharm. Sci, accepted, 2015.
Kindgen, S., Rach, R., Wachtel, H., Nawroth, T., Langguth, P.: A Modified Disintegration Test
Device- Computational Fluid Dynamics Investigations, in preparation, 2015.
Kindgen, S., Rach, R., Zaheer, K., Nawroth, T., Langguth, P.: Influence of Hydrodynamics on
Tablet Disintegration Investigated using a Modified Disintegration Test Device, in preparation,
2015.
Poster presentations:
S. Kindgen, M. Knoell, U. Schmidt, J. Müller, P. Langguth: Effect of process parameters during
high-shear granulation on the content uniformity of resulting low dose tablets, 8th World
Meeting on Pharmaceutics, Biopharmaceutics and Pharmaceutical Technology, Istanbul, Turkey,
March 2012.
J. Schröder, S. Kindgen, S. Fischer, M. Schuppert, K. Gogoll, P. Langguth, L.M. Schreiber:
Untersuchung des Auflösungsverhaltens von Tabletten mittels 19F-
Magnetresonanzspektroskopie und –tomographie, DGMP Jahrestagung 2012, Jena, Germany,
September 2012.
J. Friedrich, J. Schröder, S. Kindgen, S. Fischer, M. Schuppert, K. Gogoll, P. Langguth, L.M.
Schreiber: Drug dissolution: Investigation of different fluor containing substances using 19F-MRI,
ISMRM, Milano, Italy, May 2014.
S. Kindgen, H. Wachtel, P. Langguth: Hydrodynamics in the PhEur/USP disintegration tester,
Predictive biopharmaceutic methods in drug discovery and oral product development,
workshop, Mainz, Germany, September 2014.
S. Kindgen, H. Wachtel, P. Langguth: Hydrodynamics in the PhEur/USP disintegration tester,
DPhG annual meeting 2014, Frankfurt, Germany, September 2014,

10 Acknowledgements
159
10 Acknowledgements

11 Curriculum vitae
160
11 Curriculum vitae