Schadstoffbildung und Emissionsminimierung bei Kfz Teil I...NOx legislations >2g/kWh Power density...
106
1 Schadstoffbildung und Emissionsminimierung bei Kfz Teil I Theodor Sams WS 2016/17 202011
Transcript of Schadstoffbildung und Emissionsminimierung bei Kfz Teil I...NOx legislations >2g/kWh Power density...

1
Schadstoffbildung und
Emissionsminimierung bei Kfz
Teil I
Theodor Sams
WS 2016/17
202011
2
INHALT
Anthropogene Schadstoffe
Thermodynamik der Verbrennung
Numerische Simulation der Verbrennung
Berechnung der Schadstoffbildung
Analyse charakteristischer Verbrennungen
200056-0
1b
3
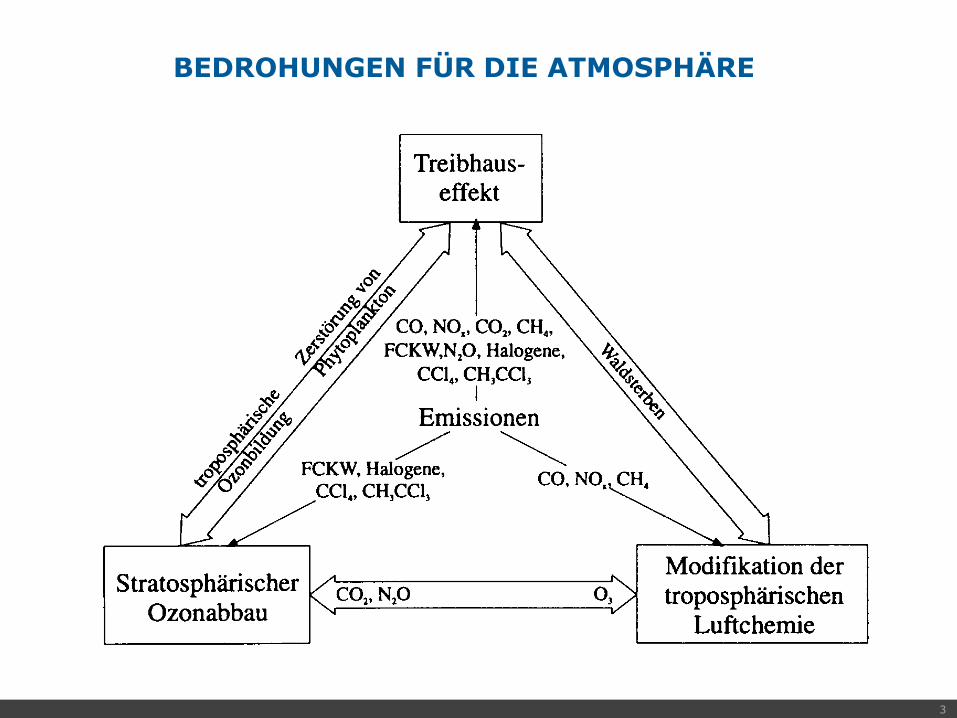
BEDROHUNGEN FÜR DIE ATMOSPHÄRE
200056-0
1b

4
NATÜRLICHE TREIBHAUSEFFEKTE DER ERDE
200056-0
1b
Spurengas atmosphärische Konzentration
(derzeit)
Erderwärmungseffekt
(derzeit)
Wasserdampf (H2O) lokal sehr variabel (2 ppm - 3 %) 20.6 K
Kohlendioxid (CO2) 350 ppm 7.2 K
Ozon, bodennah (O3) 0.03 ppm 2.4 K
Distickstoffoxid (N2O) 0.3 ppm 1.4 K
Methan (CH4) 1.7 ppm 0.8 K
weitere 0.6 K
Summe 33.0 K

5
WÄRMEGLEICHGEWICHT DER ATMOSPHÄRE
200056-0
1b

6
SCHADSTOFFBILDUNG UND EMISSIONSMINIMIERUNG BEI KFZ
CO2-Emissionen
200056-0
1b
Thermodynamik der Verbrennung
7
Electrification
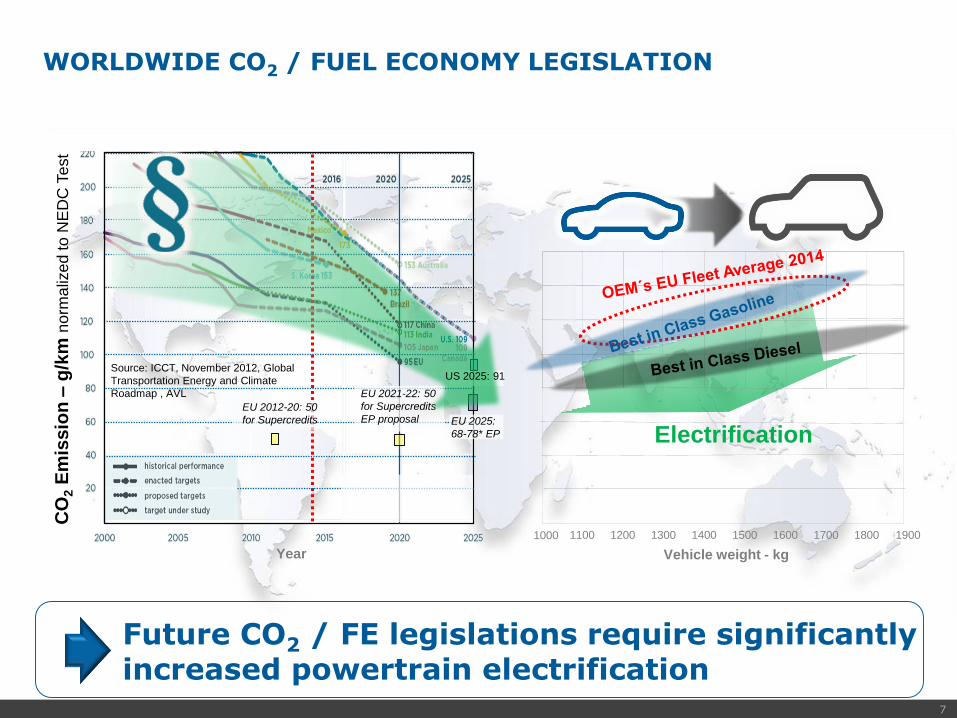
WORLDWIDE CO2 / FUEL ECONOMY LEGISLATIONC
O2
Em
iss
ion
–g
/km
no
rma
lize
dto
NE
DC
Te
st
Source: ICCT, November 2012, Global
Transportation Energy and Climate
Roadmap , AVL EU 2021-22: 50
for Supercredits
EP proposalEU 2012-20: 50
for Supercredits EU 2025:
68-78* EP
1000
US 2025: 91
Year
Future CO2 / FE legislations require significantly increased powertrain electrification
1100 1200 1300 1400 1500 1600 1700 1800 1900
Vehicle weight - kg
8
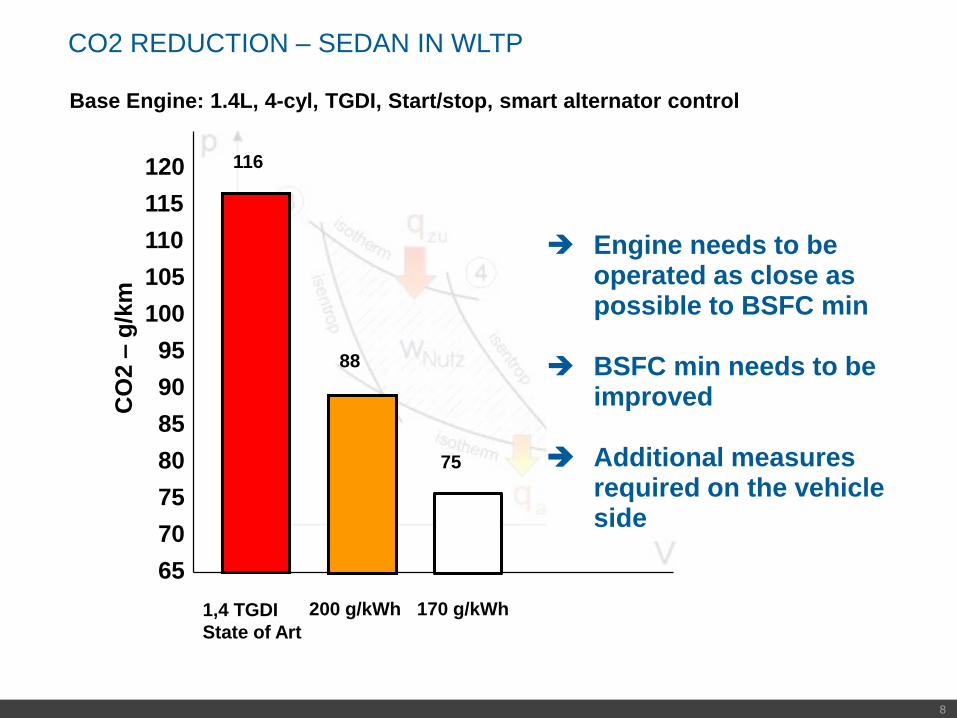
CO2 REDUCTION – SEDAN IN WLTP
Base Engine: 1.4L, 4-cyl, TGDI, Start/stop, smart alternator control
116
CO
2 –
g/k
m
120
115
110
105
100
95
90
85
80
75
70
65
88
75
1,4 TGDI
State of Art
200 g/kWh 170 g/kWh
Engine needs to beoperated as close aspossible to BSFC min
BSFC min needs to beimproved
Additional measuresrequired on the vehicleside
9
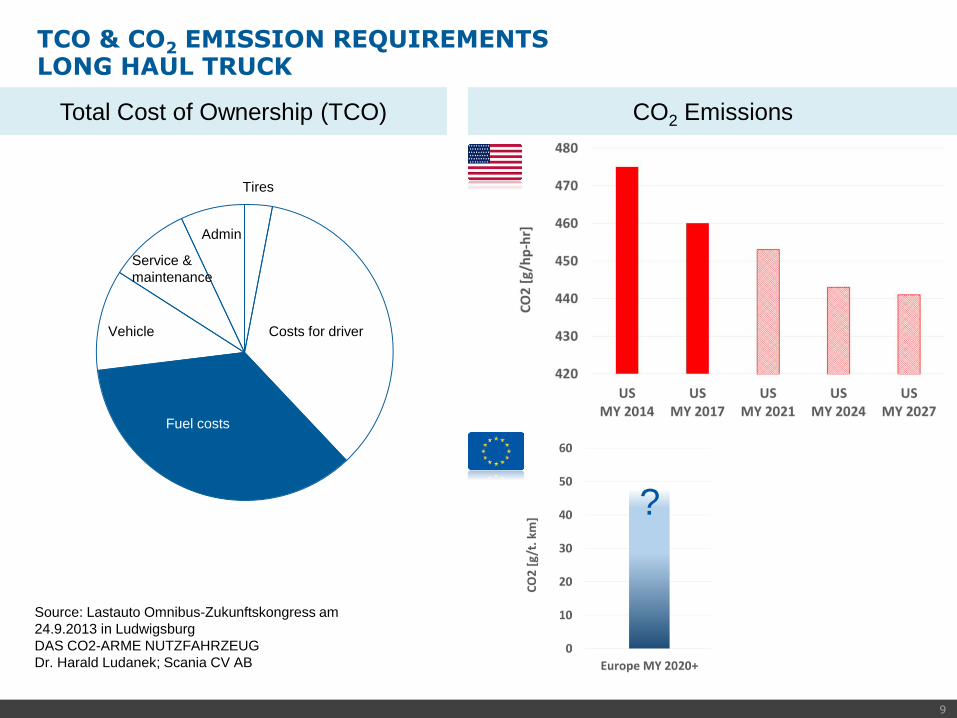
TCO & CO2 EMISSION REQUIREMENTSLONG HAUL TRUCK
Fuel costs
Service &
maintenance
Costs for driver
Fuel costs
Tires
Vehicle
Admin
Source: Lastauto Omnibus-Zukunftskongress am
24.9.2013 in Ludwigsburg
DAS CO2-ARME NUTZFAHRZEUG
Dr. Harald Ludanek; Scania CV AB
?
CO2 EmissionsTotal Cost of Ownership (TCO)
10
SCHADSTOFFBILDUNG UND EMISSIONSMINIMIERUNG BEI KFZ
Motorischer Ansatz zur Verbrauchsreduktion
200056-0
1b

11
WHAT ARE THE DRIVERS FOR THE EFFICIENCY DIFFERENCE BETWEEN DIESEL AND GASOLINE?
Diesel engines have:
Lean combustion
High compression ratio
Stratification
TC
EGR
Gasoline engines today have:
Lambda=1 combustion
Moderate compression ratio
Homogeneous mixture
NA or TC
Three way catalyst
The effects are:
High thermal efficiency
High thermal efficiency
Lower wall heat losses
Torque
NOx reduction
Effects needed:
Combustion with dilution
High expansion ratio
Homogeneous mixture for RDE
NA for response, TC for torque
Conversion of all gaseous emissions
Technology:
Cooled EGR
Miller or articulated crank
Lambda=1
TC + E-SC for torque
Three way catalyst

12
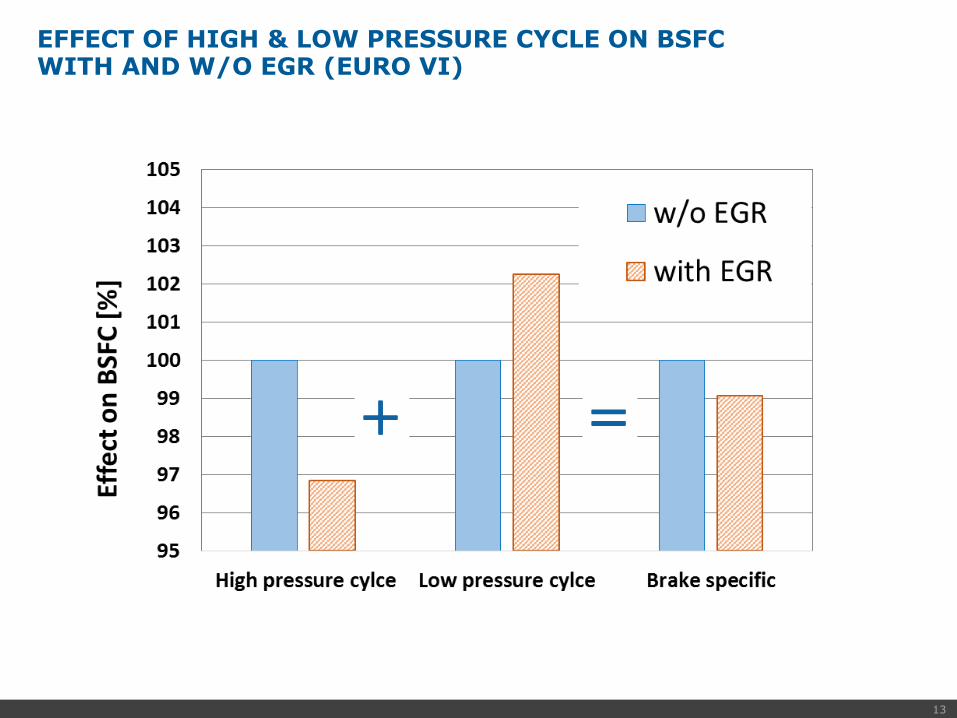
THERMODYNAMIC IMPROVEMENT POTENTIALS
High pressure cycle:
• Cylinder mass
• w/o EGR Excess air ratio
• with EGR Cylinder mass ratio
• Valve timing (Miller, Atkinson)
• Compression ratio
• Combustion process
• Duration of combustion
• Center of combustion (Mass fraction burned 50%)
• Shape of combustion
Low pressure cycle:
• Turbocharging efficiency
• Pressure losses
13
EFFECT OF HIGH & LOW PRESSURE CYCLE ON BSFC WITH AND W/O EGR (EURO VI)
14
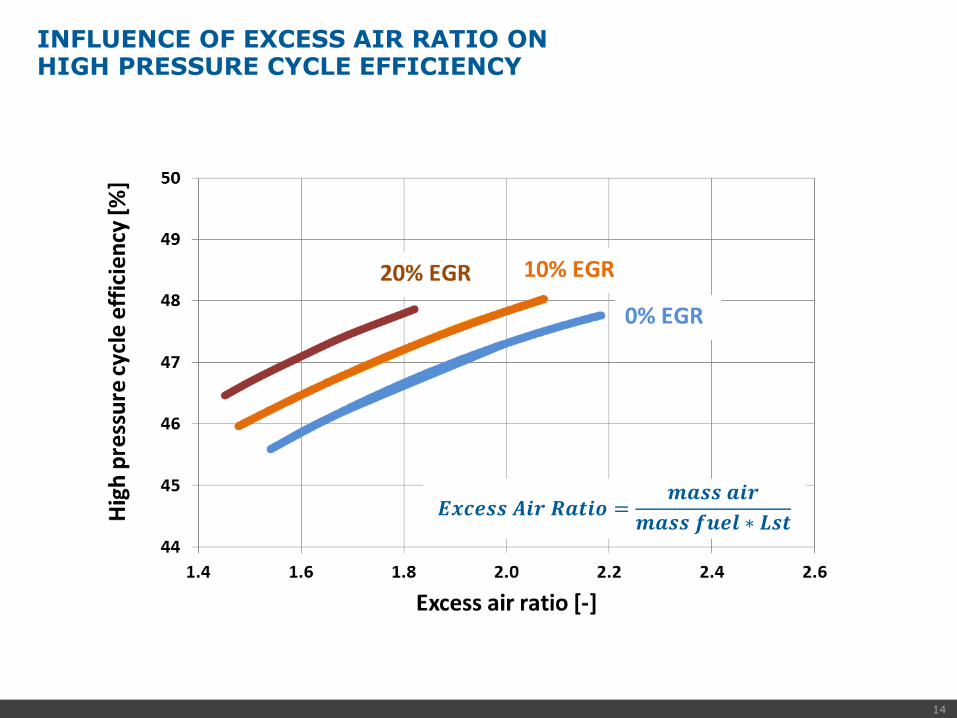
INFLUENCE OF EXCESS AIR RATIO ONHIGH PRESSURE CYCLE EFFICIENCY
𝑬𝒙𝒄𝒆𝒔𝒔 𝑨𝒊𝒓 𝑹𝒂𝒕𝒊𝒐 =𝒎𝒂𝒔𝒔 𝒂𝒊𝒓
𝒎𝒂𝒔𝒔 𝒇𝒖𝒆𝒍 ∗ 𝑳𝒔𝒕
15
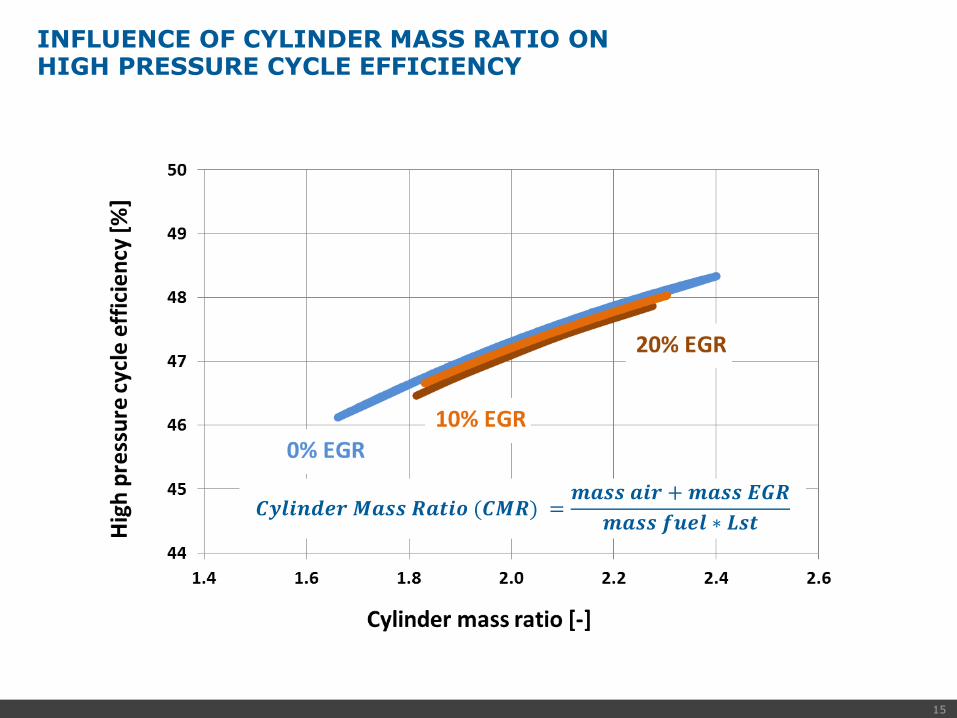
INFLUENCE OF CYLINDER MASS RATIO ON HIGH PRESSURE CYCLE EFFICIENCY
𝑪𝒚𝒍𝒊𝒏𝒅𝒆𝒓 𝑴𝒂𝒔𝒔 𝑹𝒂𝒕𝒊𝒐 (𝑪𝑴𝑹) =𝒎𝒂𝒔𝒔 𝒂𝒊𝒓 +𝒎𝒂𝒔𝒔 𝑬𝑮𝑹
𝒎𝒂𝒔𝒔 𝒇𝒖𝒆𝒍 ∗ 𝑳𝒔𝒕
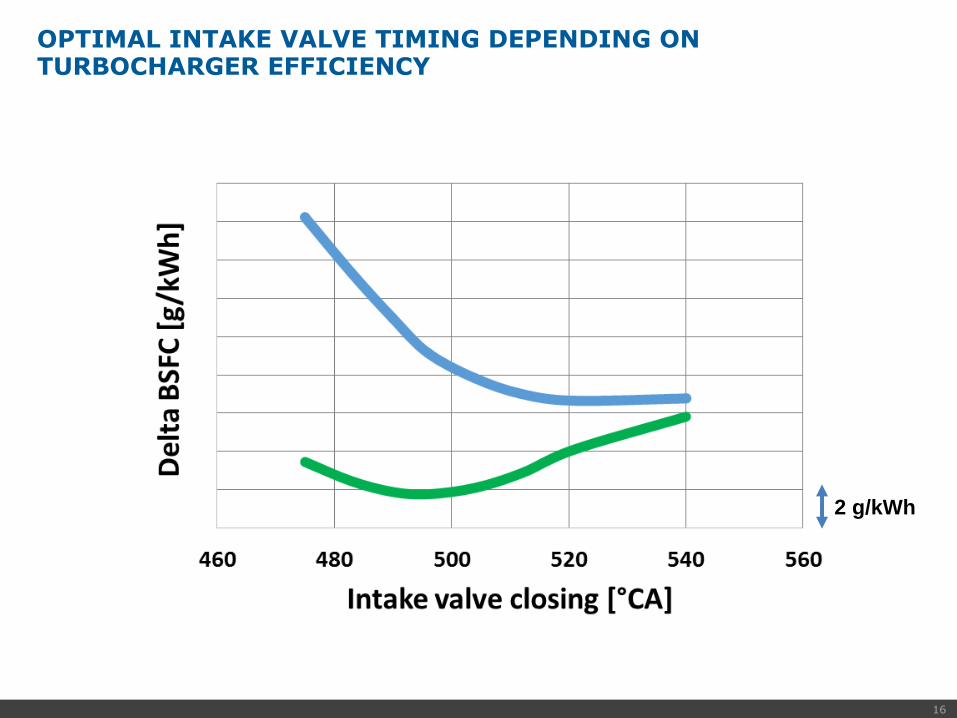
16
OPTIMAL INTAKE VALVE TIMING DEPENDING ON TURBOCHARGER EFFICIENCY
2 g/kWh
17
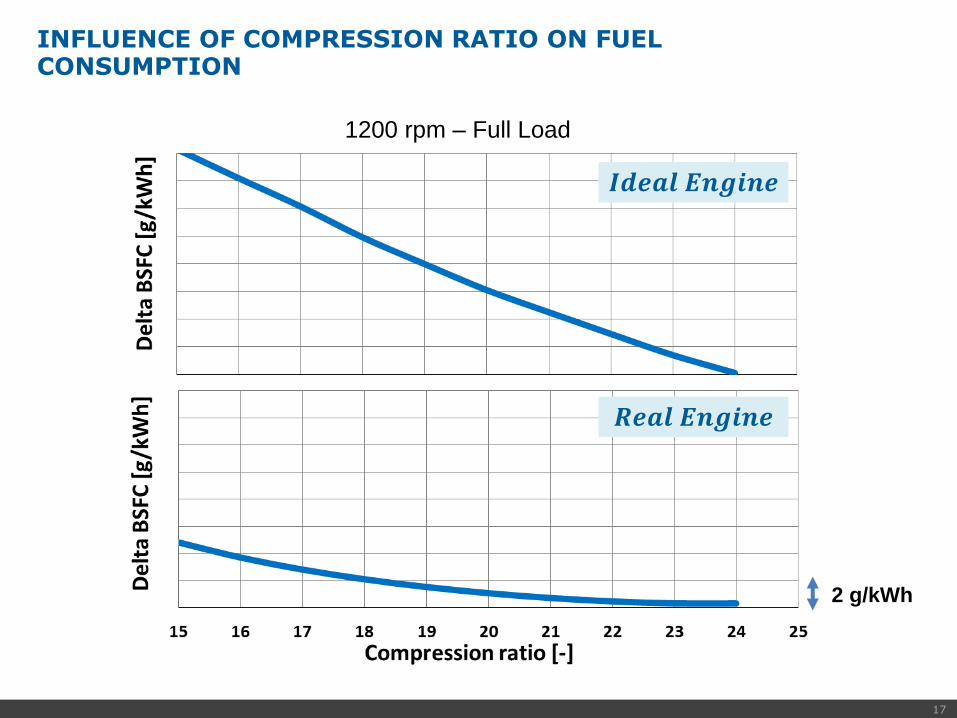
INFLUENCE OF COMPRESSION RATIO ON FUEL CONSUMPTION
1200 rpm – Full Load
2 g/kWh
𝑰𝒅𝒆𝒂𝒍 𝑬𝒏𝒈𝒊𝒏𝒆
𝑹𝒆𝒂𝒍 𝑬𝒏𝒈𝒊𝒏𝒆
18
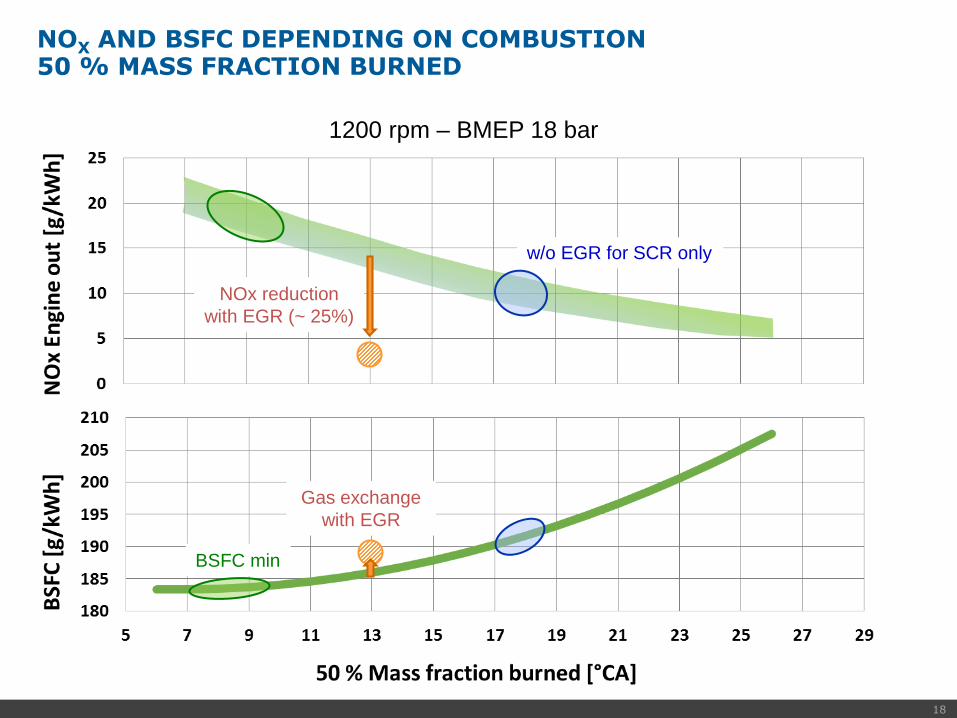
NOX AND BSFC DEPENDING ON COMBUSTION 50 % MASS FRACTION BURNED
BSFC min
w/o EGR for SCR only
NOx reduction
with EGR (~ 25%)
Gas exchange
with EGR
1200 rpm – BMEP 18 bar
19
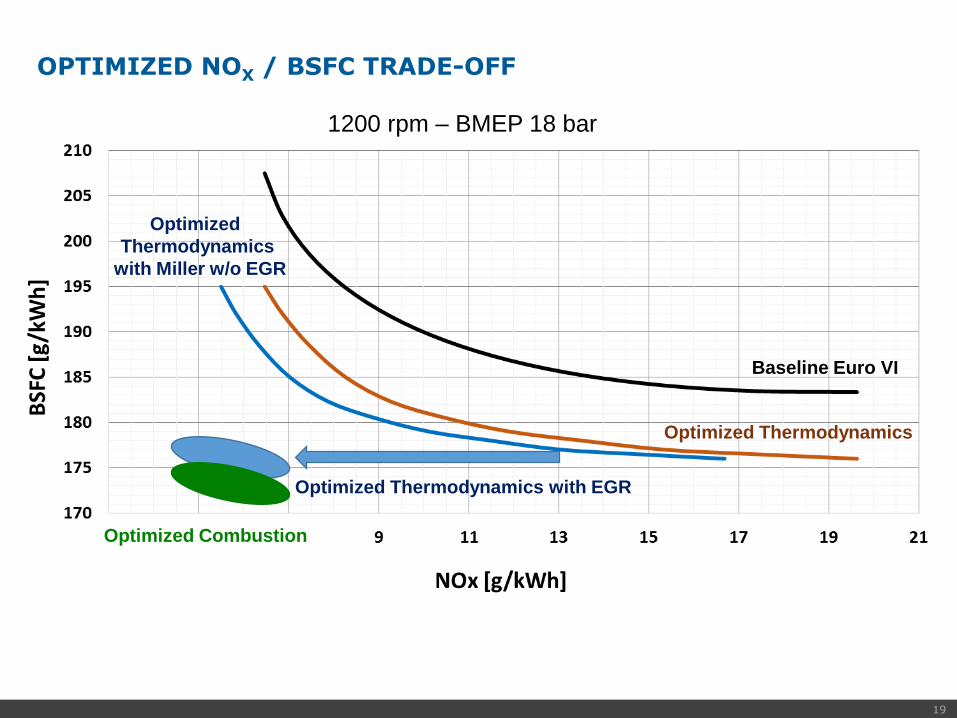
OPTIMIZED NOX / BSFC TRADE-OFF
Baseline Euro VI
Optimized Thermodynamics
Optimized Thermodynamics with EGR
Optimized
Thermodynamics
with Miller w/o EGR
1200 rpm – BMEP 18 bar
Optimized Combustion
20
SCHADSTOFFBILDUNG UND EMISSIONSMINIMIERUNG BEI KFZ
CO2 Minderung durch Elektrifizierung
200056-0
1b

21
DEGREE OF ELECTRIFICATION
Mild Hybrid
Low to mediumvoltage (12 to 120V)
Includes stop-start, regeneration brakingand acceleration assist
Micro Hybrid
Low voltage (12V)Shuts down engine at idle to save fuel
Full Hybrid
High voltage (300V+)
Includes all mildHEV features PLUS EV-mode
Pure EV
High voltage (300V+)BatteryRange extender with combustion engineFuel cell
Plug-In Hybrid (PHEV)
High voltage (300V+)Ability to recharge battery through electrical wall outlet

22
CO2 Emissions - Well to Wheel
Pure Electric Vehicle
ICE DI Gasoline
ICE DI Diesel
ICE DI Gas Full Hybrid
Electric Vehicle withRE
rel. CO2 Emissions [%]
100
50
0
50
100
Tank To Wheel
Well To Tank ? ?
CO2 Reduction by Biofuel
Pure Electric Vehicle
ICE DI Gasoline
ICE DI Diesel
ICE DI Gas Full Hybrid
Electric Vehicle withRE
rel. CO2 Emissions [%]
100
50
0
50
100
Tank To Wheel
Well To Tank ? ?
CO2 Reduction by Biofuel

23
GENERIC MILD HYBRID (48 V) STRATEGY
Downsizing + Downspeeding
bigger VGT
48V Mild Hybrid - BSG
Electric SuperchargerBASE
TARGET

24
OPERATING STRATEGY
100
150
200
250
300
350
400
750 1750 2750 3750 4750
Tor
que
/Nm
Speed /rpm
136 PS
325Nm
25
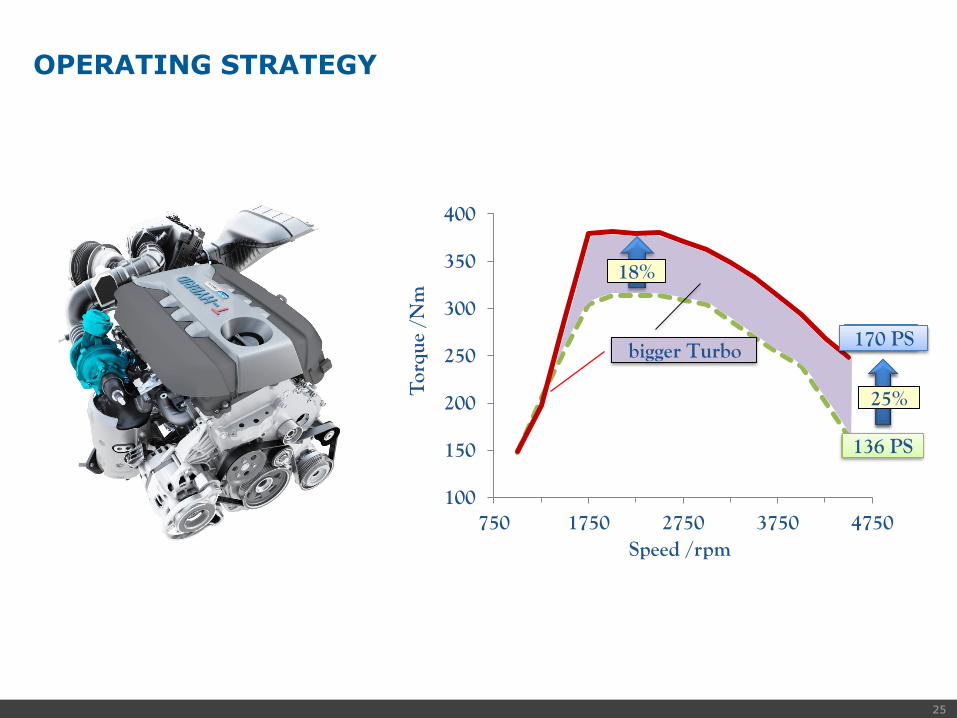
OPERATING STRATEGY
100
150
200
250
300
350
400
750 1750 2750 3750 4750
Tor
que
/Nm
Speed /rpm
12%
25%
170 PS
12%
bigger Turbo
25%
136 PS
170 PS
18%

26
OPERATING STRATEGY
100
150
200
250
300
350
400
750 1750 2750 3750 4750
Tor
que
/Nm
Speed /rpm
12%
40%
12%
40% 48V BSG

27
OPERATING STRATEGY
100
150
200
250
300
350
400
750 1750 2750 3750 4750
Tor
que
/Nm
Speed /rpm
12%
Area of usage
12%
Area of usage
E-Charger
28
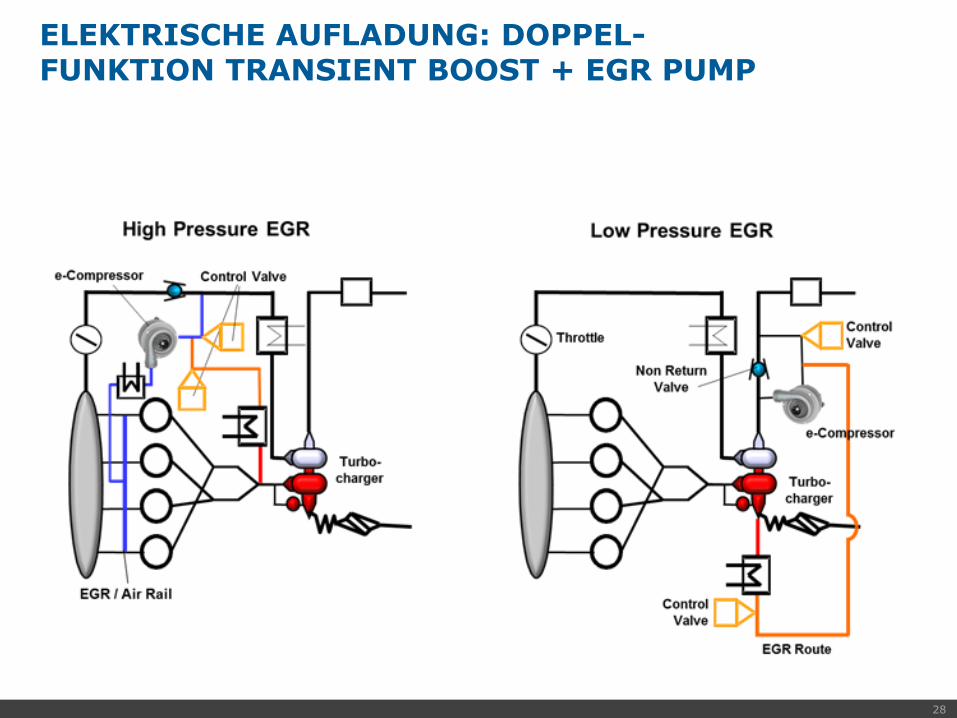
ELEKTRISCHE AUFLADUNG: DOPPEL-FUNKTION TRANSIENT BOOST + EGR PUMP
29
SCHADSTOFFBILDUNG UND EMISSIONSMINIMIERUNG BEI KFZ
CO2 Minderung durch Kraftstoff
200056-0
1b

30
CO2 Emissions - Well to Wheel
Pure Electric Vehicle
ICE DI Gasoline
ICE DI Diesel
ICE DI Gas Full Hybrid
Electric Vehicle withRE
rel. CO2 Emissions [%]
100
50
0
50
100
Tank To Wheel
Well To Tank ? ?
CO2 Reduction by Biofuel
Pure Electric Vehicle
ICE DI Gasoline
ICE DI Diesel
ICE DI Gas Full Hybrid
Electric Vehicle withRE
rel. CO2 Emissions [%]
100
50
0
50
100
Tank To Wheel
Well To Tank ? ?
CO2 Reduction by Biofuel
31
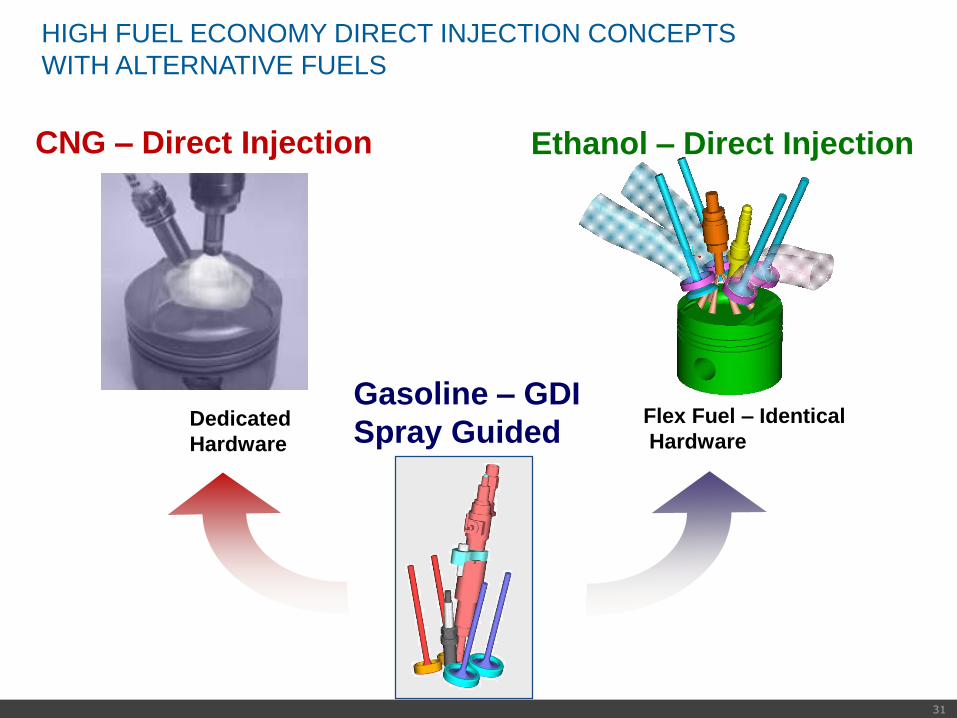
CNG – Direct Injection
Dedicated
Hardware
Ethanol – Direct Injection
Flex Fuel – Identical
Hardware
Gasoline – GDI
Spray Guided
HIGH FUEL ECONOMY DIRECT INJECTION CONCEPTS
WITH ALTERNATIVE FUELS

32
CNG – Direct Injection
• 20% efficiency improvement due to
stratified operation
• Additionally 20% CO2 reduction due
to lower C-content of CH4
• Significantly higher low end torque
compared to manifold injection
• Higher thermodynamic efficiency
due to advantageous fuel properties
• Less enrichment with Turbocharging
• Less NOx with stratified GDI
• E100 - Multiple injection needed to
improve deep temperature cold start
Ethanol – Direct Injection
HIGH FUEL ECONOMY DIRECT INJECTION CONCEPTS
WITH ALTERNATIVE FUELS

33
HD GAS ENGINES MAIN TECHNOLOGY ROUTES FOR
SI Lean burn
Cost effective solution for NOx legislations >2g/kWh
Power density limited by knock / misfire and emissions
Similar thermal loads as Diesel
Need Oxi-Cat and SCR for EU6, US14,T4
High ignition system demands
Require high charging system capabilities
Dual fuel SI Stoichiometric High Pressure DI
Main route for EU6, US EPA14, T4
Cost effective solution Three-Way Catalyst
Improved trans. torque vs. lean burn concept
High thermal loads
Cooled EGR optionally to reduce thermal load & knock sensitivity
Improved trans. torque vs. lean burn concept
Efficiency and power density limited by knock
Reliable technology with limited emission potential
Full load on Diesel possible
Similar thermal loads as Diesel
Limited substitution potential
Challenging in view of emission compliance (CH4)
Need highly efficient MOC +SCR +DPF +Thermal management for EU6, US14,T4
Complex technology withhigh efficiency potential
Limp home on Diesel possible
Efficiency and power density similar to Diesel
Similar thermal loads as Diesel
Need Oxi-cat and SCR +DPF +Thermal management for EU6,US14,T4
Maturity of technology for On-road HD
34
SCHADSTOFFBILDUNG UND EMISSIONSMINIMIERUNG BEI KFZ
CO2 Minderung durch optimierte Fahrweise
200056-0
1b
35
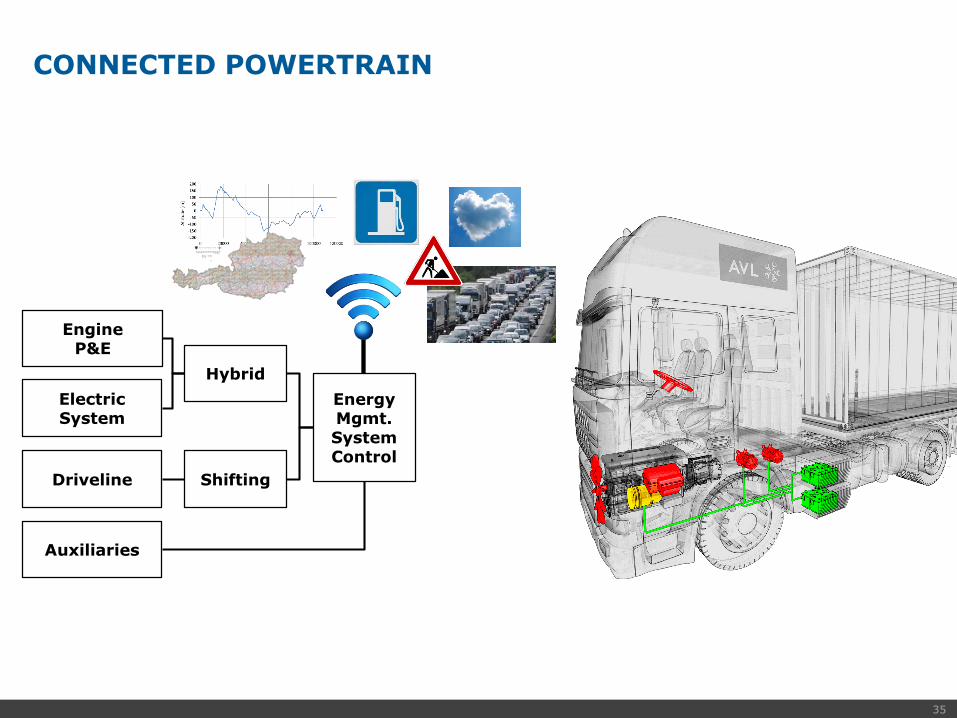
CONNECTED POWERTRAIN
Auxiliaries
EngineP&E
Shifting
Hybrid
EnergyMgmt.SystemControl
Electric System
Driveline

36
COMMERCIAL VEHICLE PREDICTIVE ENERGY MANAGEMENT
VEHICLE ENERGY COORDINATOR
BATTERY
CONTROL
SOC control
SOH control
SOF control
thermal
management
control
etc.
TRANSMISSION
CONTROL
clutch control
gear shift control
oil pump control
retarder control
etc.
COMBUSTION ENGINE
CONTROL
• real time capable vehicle / powertrain model (AVL CRUISE embedded)
• power split: comb. engine - e-motor – battery
• scenario calculator (cost calculator / optimizer)
E-MOTOR
CONTROL
torque control
speed control
thermal manage-
ment
safety monitoring
etc.
HUMAN MACHINE INTERFACE DATA TRANSLATOR
VEHICLE / POWERTRAIN / HYBRID CONTROL
GPS, v2v, i2v, …
Real time P&E control
Adaptive emissions control
Smart Auxiliaries
Vehicle thermal management
WHR control
Engine brake control
OBD
etc.
kW_demand_current
kW_demand_predictedcost / kW
Tasks:
• predictive cruise control
• hybrid system control
• vehicle cooling syst. control
• e-power steering control
• interface to trailer (trailer energy management)
• etc.

37
EMBEDDED CONTROLS
Auxilliaries
Emissions
Shifting
Hybrid
EnergyMgmt.SystemControl
Electric System
Driveline
EmbeddedEnergyMgmt.SystemControl
38
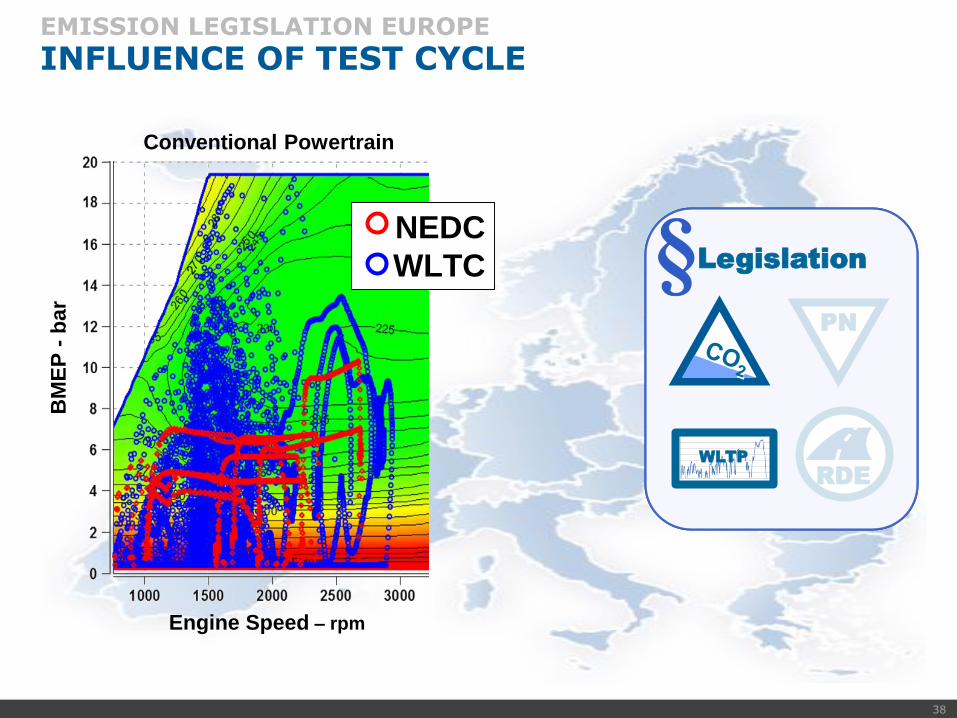
RDE
PN
BM
EP
-b
ar
Conventional Powertrain
Legislation
WLTP
Engine Speed – rpm
NEDC
WLTC
EMISSION LEGISLATION EUROPE
INFLUENCE OF TEST CYCLE

39
0,0
0,1
0,2
0,3
0,4
0,5
0,6
0,7
0,8
0,9
1,0
0 10 20 30 40 50 60 70Cu
mu
lati
ve E
ne
rgy
Co
nsu
mp
tio
n [
-]
Power [kW]
RDE
NEDC
WLTC Passenger Car 1360 kg
New Test Cycles shiftthe ICE operation tohigher load / power
EMISSION LEGISLATION EUROPE
INFLUENCE OF TEST CYCLE

40
0
20
40
60
80
100
CLASSIC EMROAD CLEAR
NOx [mg/km]
0
500
1000
1500
2000
2500
3000
CLASSIC EMROAD CLEAR
CO [mg/km]
0.0E+00
1.2E+12
2.4E+12
3.6E+12
4.8E+12
6.0E+12
7.2E+12
CLASSIC EMROAD CLEAR
PN [#/km]
RDE – Moderate Driver
RDE – Dynamic Driver
RDE Load Spectrum – Moderate vs. Dynamic Driving Style
0 500 1000 1500 2000 2500 3000 3500 4000 4500 5000 5500
Engine Speed - rpm
To
rqu
e
-N
m
0
50
100
150
200
250
300
350
400
RDE Emission Evaluation Moderate vs. Dynamic Driving Style
w/o Tool Tool A Tool B
NOx – mg/km
RDE POSTPROCESSING – SPORTS CAREMISSIONS MODERATE/DYNAMIC

41
DIESEL ENGINE WITH DOC AND SDPF
OPTIMIZATION OF RDE BY CALIBRATION
99%
100%
101%
102%
103%
104%
105%
Conformity Factor (moderate driving) [-]
Fu
el
Co
nsu
mp
tio
n-
%
0.5
42
SCHADSTOFFBILDUNG UND EMISSIONSMINIMIERUNG BEI KFZ
Anthropogene Schadstoffe
NOx
200056-0
1b

43
GLOBALE NOX EMISSION
200056-0
1b
Quelle Natürlich Anthropogen
Waldbrände 0.02 ... 0.07 0.8 ... 3.4
Steppenbrände 0.1 ... 0.2 0.1 ... 0.2
Gewitter 7.5 ... 15 -
NH3 - Oxidation ? 0.2 ... 0.5
N2O - Oxidation 0.6 ... 3 0.2 ... 2
Mikrobielle Bodenprozesse 7 0.5
Technogene Prozesse - 20
Summe 16 ... 25 22 ... 27
Ab
In Mt/a als N

44
HISTORY OF NOX AND PM EMISSION LIMITSEUROPE, US-EPA & CARB
NOx Emissions
PM Emissions
?
optional low NOx emission standards

45
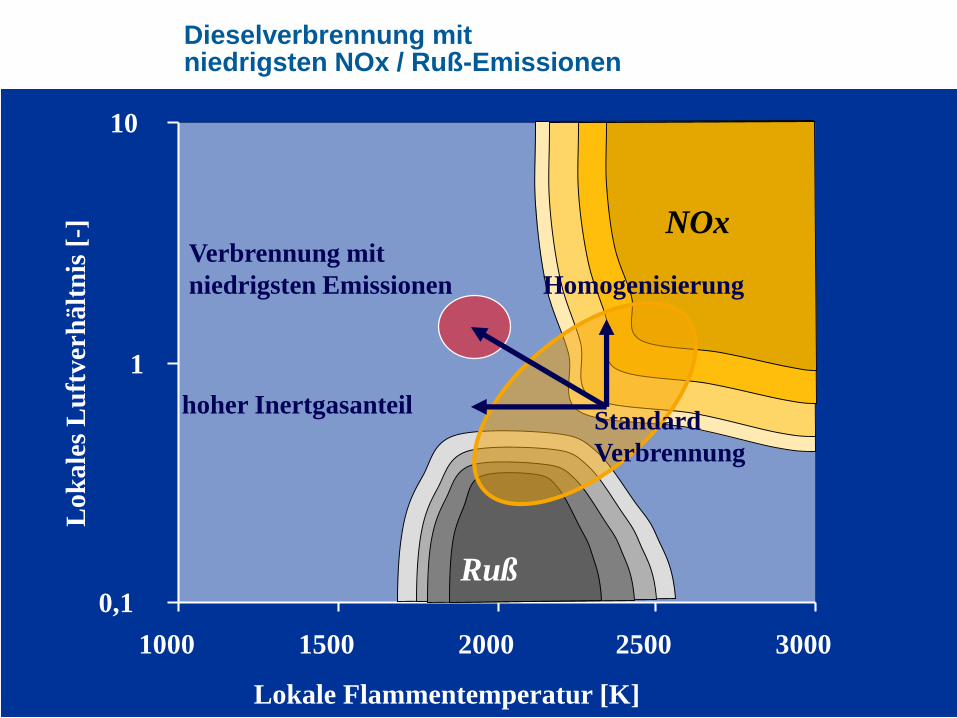
DIESELVERBRENNUNG MITNIEDRIGSTEN NOX / RUß-EMISSIONEN
0,1
1
10
1000 1500 2000 2500 3000
Lokale Flammentemperatur [K]
Lo
kale
s L
uft
verh
ält
nis
[-]
Ruß
NOxVerbrennung mit
niedrigsten Emissionen Homogenisierung
hoher InertgasanteilStandard
Verbrennung

46
Reduced
Temperature
- Charge AirIntercooling
- Retarded Timing
- EGR
- EGR Cooling
- Water Injection(Emulsion)
NOx Emission
- Initially ReducedInjection Rate
Initially
Slow
Combustion
- Elongated Injection Period
- Increased CR
- IncreasedCetane No.
- Reduced Swirl
IMPORTANT PARAMETERS FOR LOW EMISSION DIESEL COMBUSTION

47
NOX-REDUKTION ÜBER O2-KONZENTRATION IM EINLASS
2 l/Cyl; 1900 1/min, 18 bar
0,5 l/Cyl; 2000 1/min, 9 bar
0
1
2
3
4
5
6
7
8
9
12 13 14 15 16 17 18 19 20 21
O2 Intake [ Vol% ]
NO
x [
g/k
Wh
]
PC
Engine
HD Engines
DO2=1,3 %
DNOx=50 %
DO2=1,3 %
DNOx=50 %

48
Air
Exce
ss R
ati
o [
-]
1.0
1.1
1.2
1.4
1.6
2.0
3.0
5.0
10.0
NOx Reduction [-]
105070 30909598 8097
13 14 15 16 17 18 19 20 21Oxygen Intake [Vol%]
Schaubild:
l – AGR-Rate – O2-Konzentration - NOx-Reduktion
EU 6
Area
49
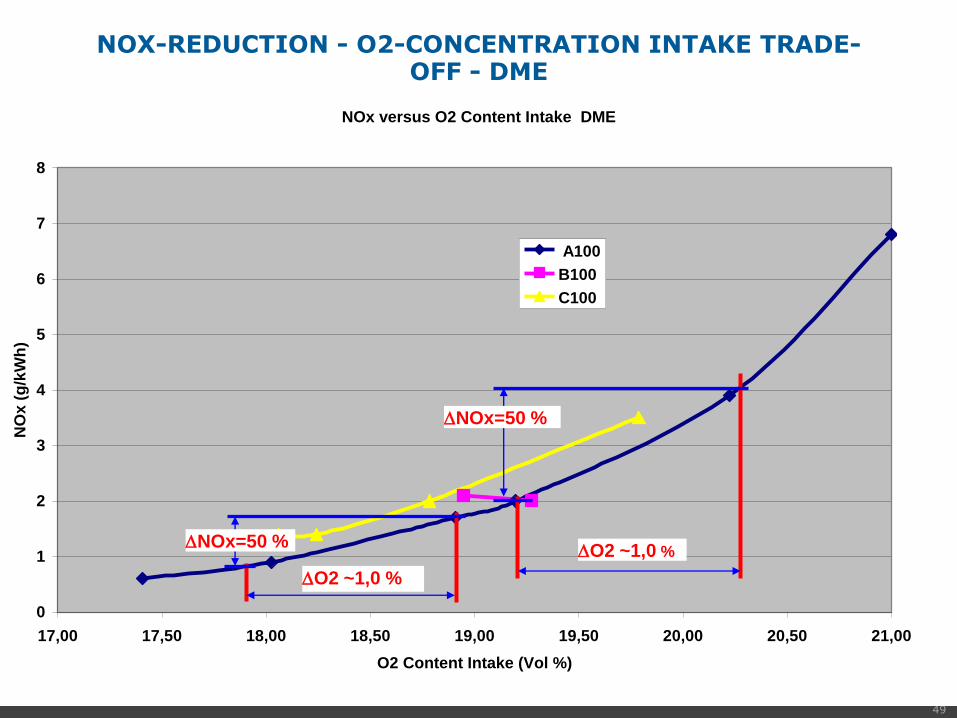
NOx versus O2 Content Intake DME
0
1
2
3
4
5
6
7
8
17,00 17,50 18,00 18,50 19,00 19,50 20,00 20,50 21,00
O2 Content Intake (Vol %)
NO
x (
g/k
Wh
)
A100
B100
C100
NOX-REDUCTION - O2-CONCENTRATION INTAKE TRADE-OFF - DME
DO2 ~1,0 %
DNOx=50 %
DO2 ~1,0 %
DNOx=50 %

50
Air
Exce
ss R
ati
o [
-]
1.0
1.1
1.2
1.4
1.6
2.0
3.0
5.0
10.0
NOx Reduction [-]
5075939799 87
13 14 15 16 17 18 19 20 21Oxygen Intake [Vol%]
l– AGR-Rate – O2-Concentration - NOx-Reduction
DME
EU 6
Area
51
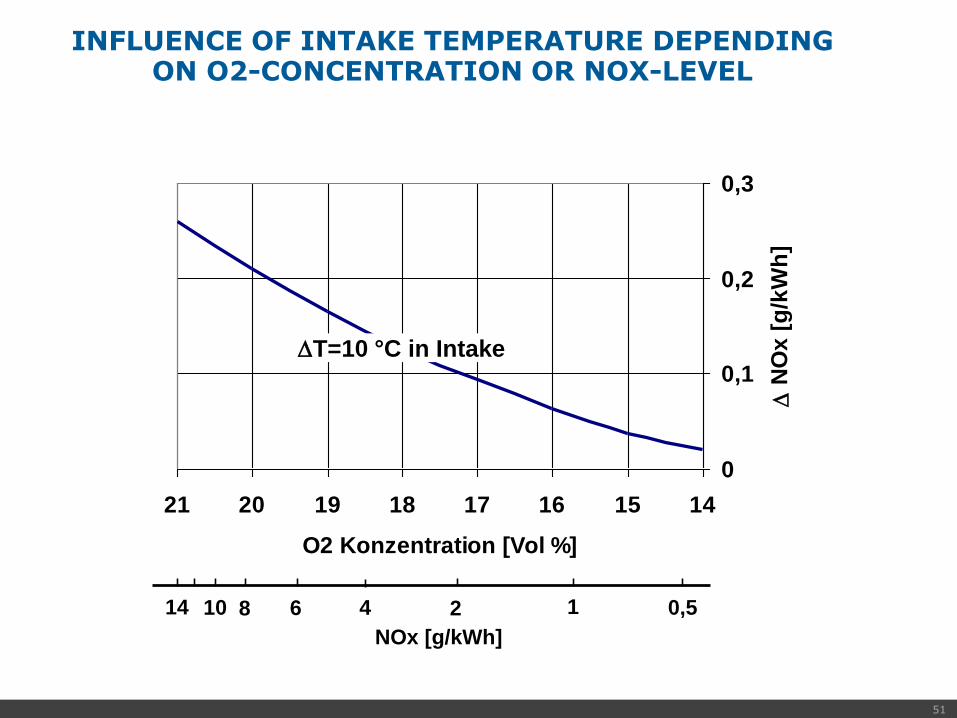
INFLUENCE OF INTAKE TEMPERATURE DEPENDINGON O2-CONCENTRATION OR NOX-LEVEL
NOx [g/kWh]
0
0,1
0,2
0,3
1415161718192021
O2 Konzentration [Vol %]
D N
Ox
[g
/kW
h]
14 10 8 6 4 2 1 0,5
DT=10 °C in Intake
52
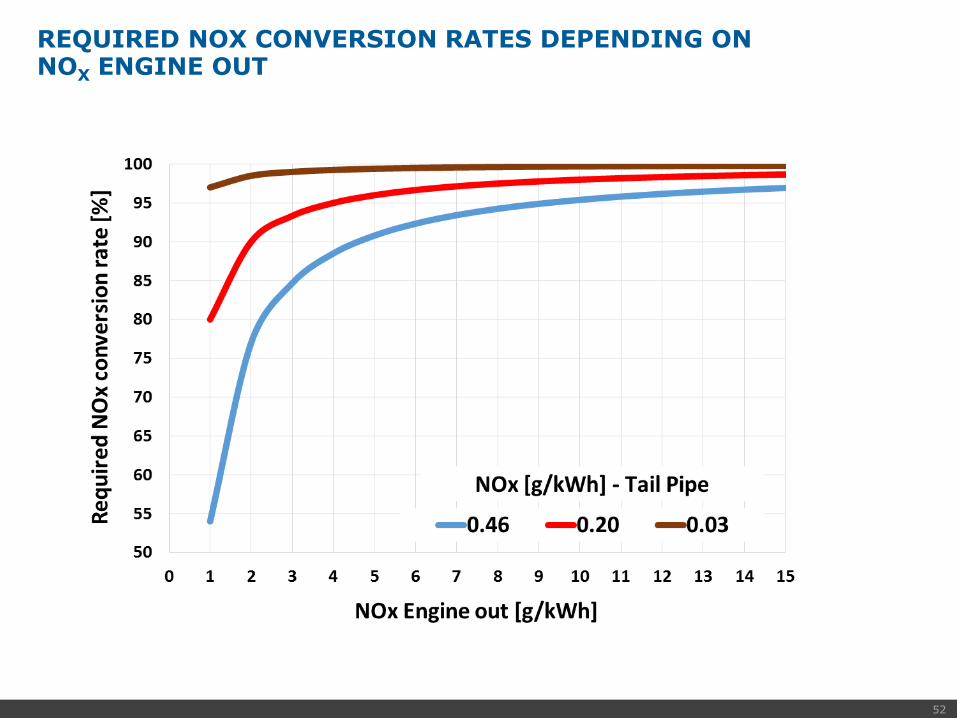
REQUIRED NOX CONVERSION RATES DEPENDING ON NOX ENGINE OUT
53
SCHADSTOFFBILDUNG BEI DER VERBRENNUNG
Anthropogene Schadstoffe
HC
200056-0
1b
54
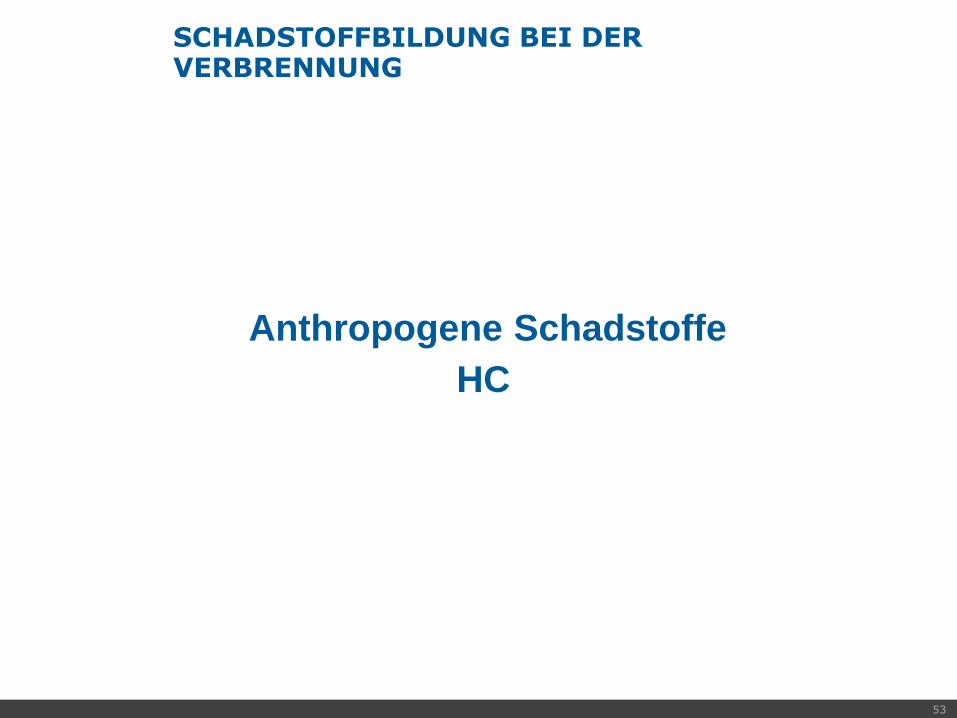
HC ÜBER NOX FÜR CHARAKTERISTISCHE NFZ-LASTPUNKTE
2 l/Cyl HD Engine
0,0
0,1
0,2
0,3
0,4
0,0 1,0 2,0 3,0 4,0
NOx [g/kWh]
HC
[g
/kW
h]
1900 rpm, 18 bar
1500 rpm, 12 bar
1200 rpm, 6 bar
55
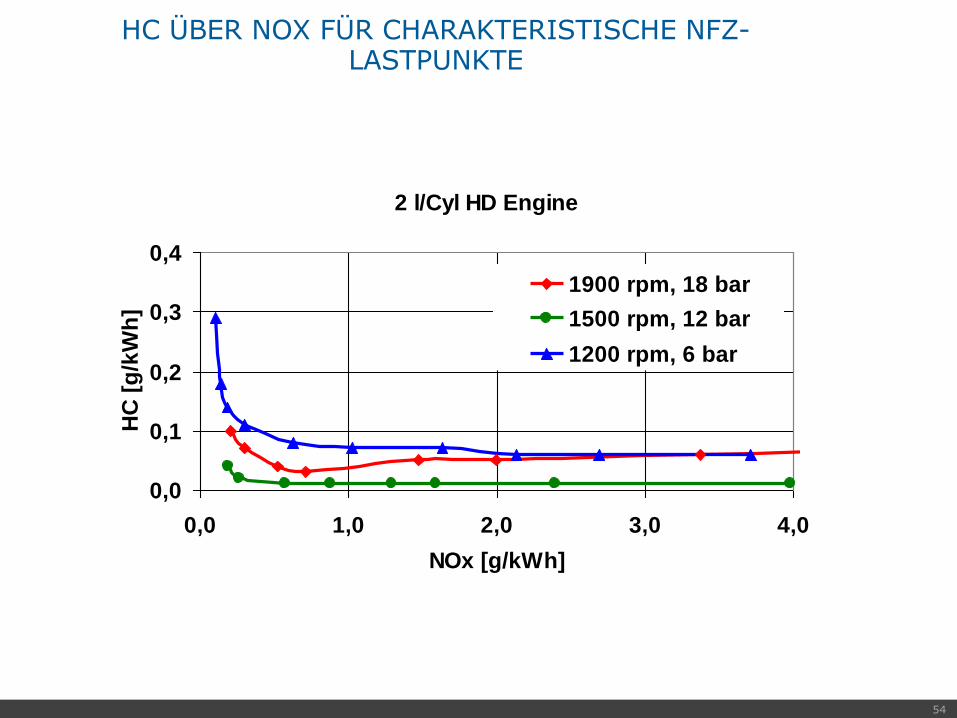
HC ÜBER NOX FÜR CHARAKTERISTISCHE PKW-LASTPUNKTE
0
0,5
1
1,5
2
2,5
3
0 0,5 1 1,5 2
NOx [g/kWh]
HC
[g
/kW
h]
2000 1/min, 9 bar
1500 1/min, 2.5 bar
0,5l/Cyl PC Engine

56
SCHADSTOFFBILDUNG BEI DER VERBRENNUNG
Schwefel
200056-0
1b

57
SCHWEFELGEHALTE IN MASSEPROZENTE
200056-0
1b
Brennstoff Siedetemperatur Schwefelgehalt
Gas, Flüssiggas
CH4 - C4H10
bis 0°C sehr gering
Rohbenzin bis 200°C bis 0.05 %
Mitteldestillate (Kerosin,
Heizöl EL, Diesel
175 - 350 °C 0.2 - 0.8 %
Atmosphärischer Rückstand
schweres Heizöl
> 350°C 1.0 - 3.0 %

58
OXIDATIONSKAT PARTIKELFILTER NOX-SPEICHER-KAT
• Verminderte
Umsetzungsrate für
HC und CO bei
niederen
Temperaturen
• Sulfat-Partikelbildung
• Erhöhte Alterung
• Verminderte
Funktion beim CRT-
Prinzip
• Sulfatbildung, führt
zur Erhöhung der
Partikel trotz des
Filters
• Deaktivierung
• Desulfatisierung
erforderlich
• Sulfatpartikelbildung
• Abgasgeruch (H2S)
S < 50 ppm ? S < 50 ppm ? S < 10 ppm
Schwefel im Dieselkraftstoff – Problemefür die Abgasnachbehandlung
Die wirksame Abgasnachbehandlung benötigt
weitgehend schwefelfreien Kraftstoff
Wirkung des Schwefels auf die Nachbehandlung
90116-2
7
59
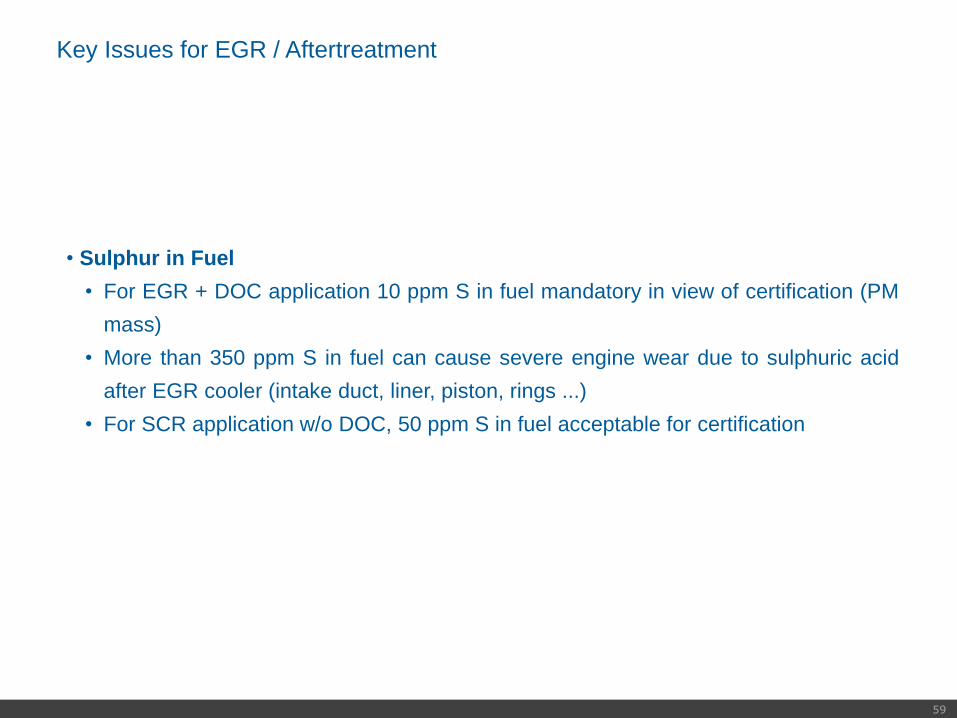
• Sulphur in Fuel
• For EGR + DOC application 10 ppm S in fuel mandatory in view of certification (PM
mass)
• More than 350 ppm S in fuel can cause severe engine wear due to sulphuric acid
after EGR cooler (intake duct, liner, piston, rings ...)
• For SCR application w/o DOC, 50 ppm S in fuel acceptable for certification
Key Issues for EGR / Aftertreatment
60
SCHADSTOFFBILDUNG BEI DER VERBRENNUNG
Partikel, Russ
200056-0
1b

61
ANTHROPOGENOUS PARTICULATE EMISSION
PM 2.5 –Emission Sources in Germany
62
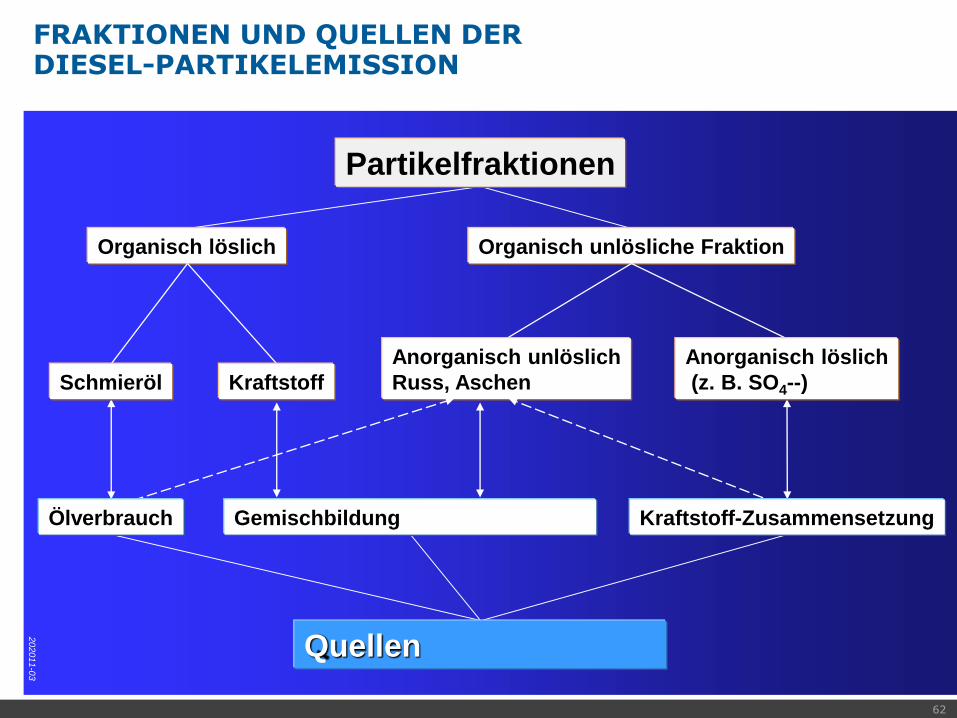
FRAKTIONEN UND QUELLEN DER DIESEL-PARTIKELEMISSION
202011-0
3
Organisch löslich
KraftstoffSchmieröl
Organisch unlösliche Fraktion
Anorganisch löslich
(z. B. SO4--)
Anorganisch unlöslich
Russ, Aschen
GemischbildungÖlverbrauch Kraftstoff-Zusammensetzung
Quellen
Partikelfraktionen
63
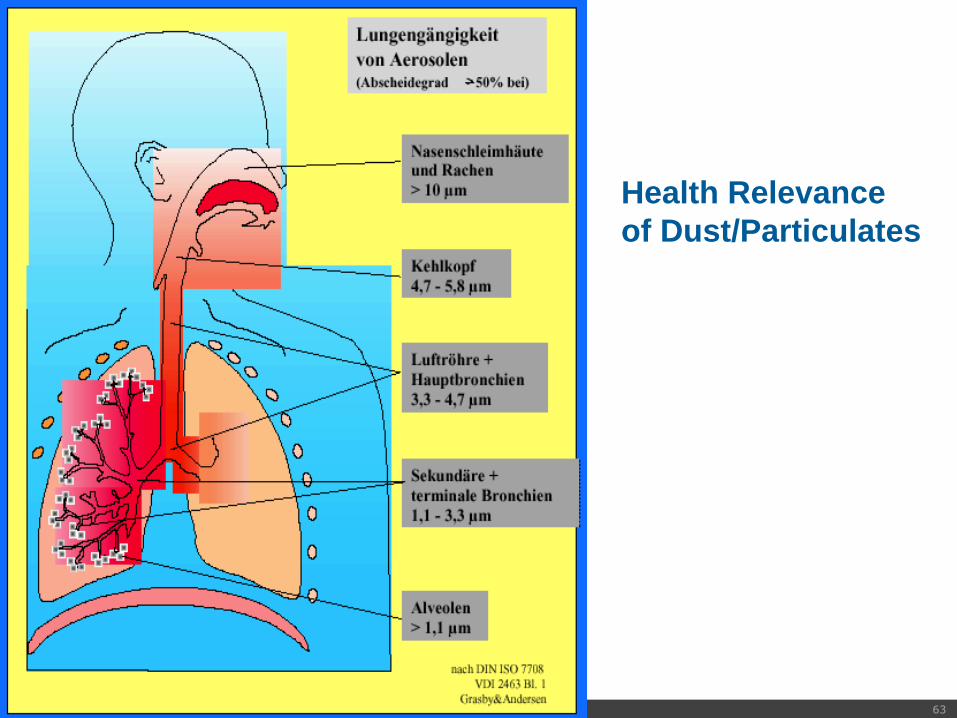
Health
Relevance of
Particulates
Health Relevance
of Dust/Particulates
64
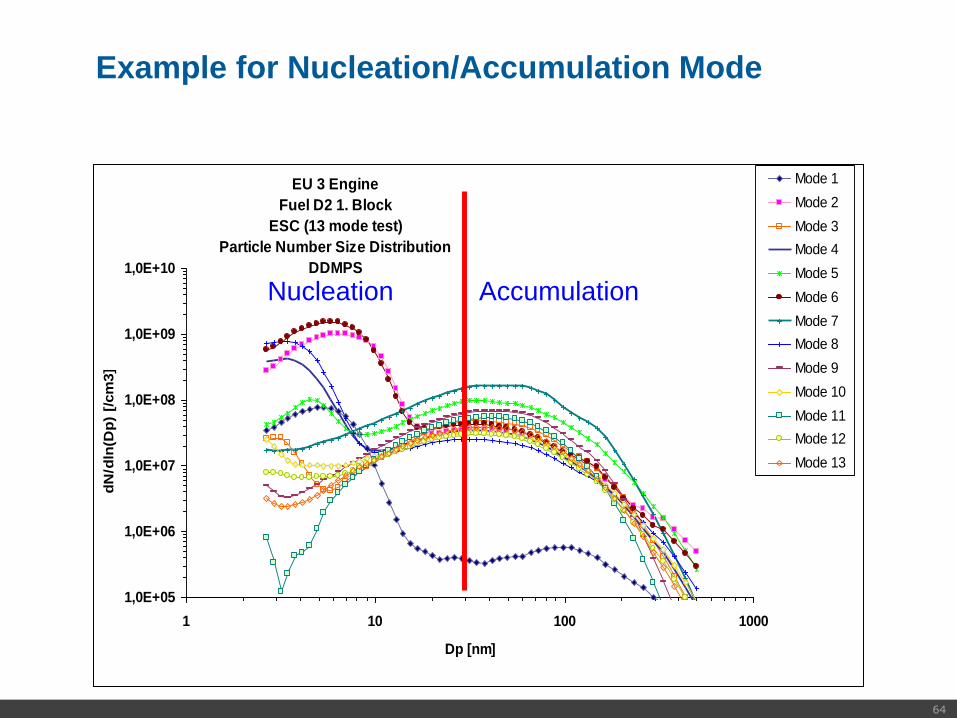
Example for Nucleation/Accumulation Mode
EU 3 Engine
Fuel D2 1. Block
ESC (13 mode test)
Particle Number Size Distribution
DDMPS
1,0E+05
1,0E+06
1,0E+07
1,0E+08
1,0E+09
1,0E+10
1 10 100 1000
Dp [nm]
dN
/dln
(Dp
) [/
cm
3]
Mode 1
Mode 2
Mode 3
Mode 4
Mode 5
Mode 6
Mode 7
Mode 8
Mode 9
Mode 10
Mode 11
Mode 12
Mode 13
Nucleation Accumulation

65
- FuelComposition
- Fuel Sulfur Content
- Good Lube OilConsumption
- Engine Design
Pistons RingsLiners
- Oil Leaks
TurbochargerValve Stem Seals
- Lube Oil Formulation
- Good Atomization
- Reduced Wall Wetting
- Sufficient Air (O2)
- Turbocharging andIntercooling
- Small Nozzle Hole Area
- High Injection Pressure
- Rapid Pressure Drop
- Bowl Shape
- Promoted Post Burning(Swirl, Bowl Shape, Post-Inj.)
- Minimized Dead Volumes
- Fuel Properties (Boiling Range)
Soot Fuel Lube Oil Sulfates + Water
Particulate Emission
IMPORTANT PARAMETERS FOR LOW EMISSION DIESEL COMBUSTION
66
Dieselverbrennung mitniedrigsten NOx / Ruß-Emissionen
0,1
1
10
1000 1500 2000 2500 3000
Lokale Flammentemperatur [K]
Lo
kale
s L
uft
verh
ält
nis
[-]
Ruß
NOxVerbrennung mit
niedrigsten Emissionen Homogenisierung
hoher InertgasanteilStandard
Verbrennung

0
2
4
6
8
10
12
0 5 10 15 20 25 30 35
NOx - g/kg fuel
So
ot -
g/k
g fu
el
SCRE* 0,5L/Cyl Class, 2000rpm, IMEP=13 bar
Combustion – EGR, Railpressure, Boostpressure:
Increasing
EGR-Rate
Increasing
Rail Pressure
Increasing
Boost Pressure
*) SCRE...Single cylinder research engine
Basis

68
2 l/Cyl HD Engine
Rated Power
0,0
0,1
0,2
0,3
0,4
1,5 1,6 1,7 1,8 1,9l - O2/fuel [ - ]
So
ot
[g/k
Wh
]
O2: ~ 17 %, 28 % EGR; 1,2 g/kWh NOx
O2: ~ 19 %, 15 % EGR, 3,5 g/kWh
NOx
2 l/Cyl HD Engine
Rated Power
0,0
0,1
0,2
0,3
0,4
1,5 1,6 1,7 1,8 1,9l - O2/fuel [ - ]
So
ot
[g/k
Wh
]
O2: ~ 17 %, 28 % EGR; 1,2 g/kWh NOx
O2: ~ 19 %, 15 % EGR, 3,5 g/kWh
NOx
RUSS ÜBER LUFTVERHÄLTNIS BEI UNTERSCHIEDLICHER O2
KONZENTRATION
erhöhter Ladedruck
verbesserte
Verbrennung

69
0.001 0.01 0.1 1 10 100
SOOT MASS; PARTICLE MASS [mg/kWh]
1.E+09
1.E+10
1.E+11
1.E+12
1.E+13
1.E+14
1.E+15
PA
RT
ICL
E N
UM
BE
R[1
/kW
h]
PARTICULATE NUMBER MEASUREMENT WITH AVL PARTICLE COUNTER
ESC Euro IV cEGR EO
ESC Euro IV cEGR + POC
WHTC Euro VI cEGR EO
WHTC Euro VI cEGR + DPF empty
WHTC Euro VI cEGR + DPF loaded
6*1011 #/kWh
Euro 6 particle number limit
Euro 6 particle mass limit
70
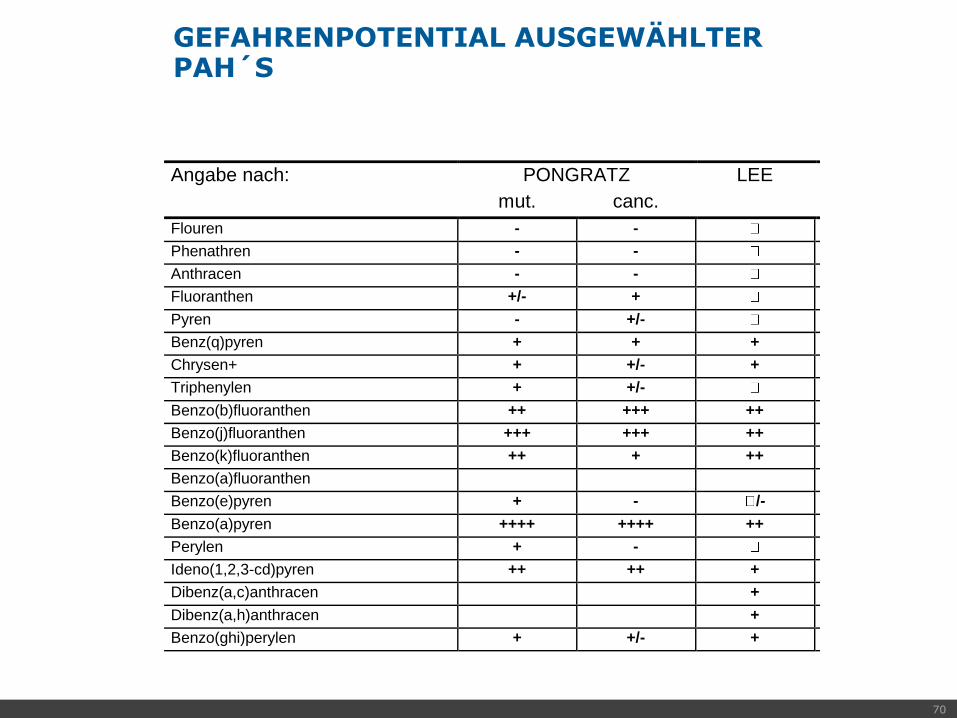
GEFAHRENPOTENTIAL AUSGEWÄHLTER PAH´S
200056-0
1b
Angabe nach: PONGRATZ LEE IRAC EPA
mut. canc.
Flouren - -
Phenathren - -
Anthracen - -
Fluoranthen +/- +
Pyren - +/-
Benz(q)pyren + + +
Chrysen+ + +/- +
Triphenylen + +/-
Benzo(b)fluoranthen ++ +++ ++
Benzo(j)fluoranthen +++ +++ ++
Benzo(k)fluoranthen ++ + ++
Benzo(a)fluoranthen
Benzo(e)pyren + - /-
Benzo(a)pyren ++++ ++++ ++
Perylen + -
Ideno(1,2,3-cd)pyren ++ ++ +
Dibenz(a,c)anthracen +
Dibenz(a,h)anthracen +
Benzo(ghi)perylen + +/- +
Wirkung nach Pongratz:
sehr stark
++++
stark
+++
mäßig
++
schwach
+
keine
-
Canceriogenität im Tierversuch nach
Lee
stark
++
schwach
+
unsicher, aber möglich
/-
nicht nach-
weisbar
IARC: Leitkomponente für die Luftüberwachung in Bezug auf cancerogene Schadstoffe der International Association for
Research on Cancer
EPA: in der von der Environmental Protection Agency herausgegebenen Liste gefährlicher Umweltgifte enthalten

71
STRUKTUR VON BENZO(A)PYREN (BAP) C20H12
200056-0
1b
72
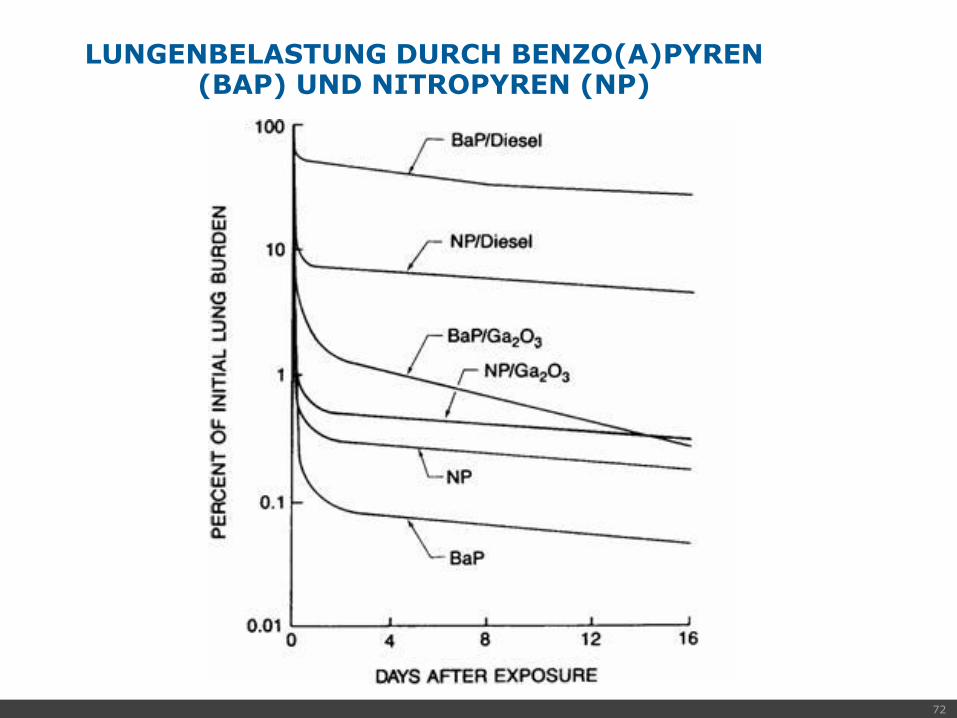
LUNGENBELASTUNG DURCH BENZO(A)PYREN(BAP) UND NITROPYREN (NP)
200056-0
1b

73
SCHADSTOFFBILDUNG UND EMISSIONSMINIMIERUNG BEI KFZ
200056-0
1b
Thermodynamik der Verbrennung

74
BEISPIELE FÜR STANDARDREAKTIONSENTHALPIEN FÜR
T = 298 K
200056-0
1b
Reaktion DH°mR
[KJ/mol]
H2 + 0.5 O2 H2O - 241.835
H2 + CO2 H2O + CO 41.160
0.5 N2 + 1.5 H2 NH3 - 45.901
O2 O + O 498.402
C(graph) + O2 CO2 - 393.533
CO + 0.5 O2 CO2 - 282.995
C6H6 + 7.5 O2 6 CO2 + 3 H2O - 3171.585
N2 + O2 2 NO 180.586
3 H2 + CO H2O + CH4 - 206.183

75
GLEICHGEWICHTSKONSTANTE K FÜR DAS WASSERGASGLEICHGEWICHT
200056-0
1b
Wassergasgleichgewicht
0,0
1,0
2,0
3,0
4,0
5,0
6,0
7,0
8,0
0 500 1000 1500 2000 2500 3000
Temperatur [K]
Gle
ich
ge
wic
hts
ko
ns
tan
te K

76
ZUSAMMENSETZUNG DES TROCKENEN UND
FEUCHTEN VERBRENNUNGSGASES
FÜR MIT C:H = 1:2 UND K = 3.5
200056-0
1b
0 0.5 1 1.5 2 2.5Luftverhältnis l
0
5
10
15
20
25
30
Vol%
H2-tr
H2-f
H2O
CO2-tr
COf
COtr
O2-tr
CO2-f = H2OCO2-f
O2-f
Ru
ßgre
nze
77
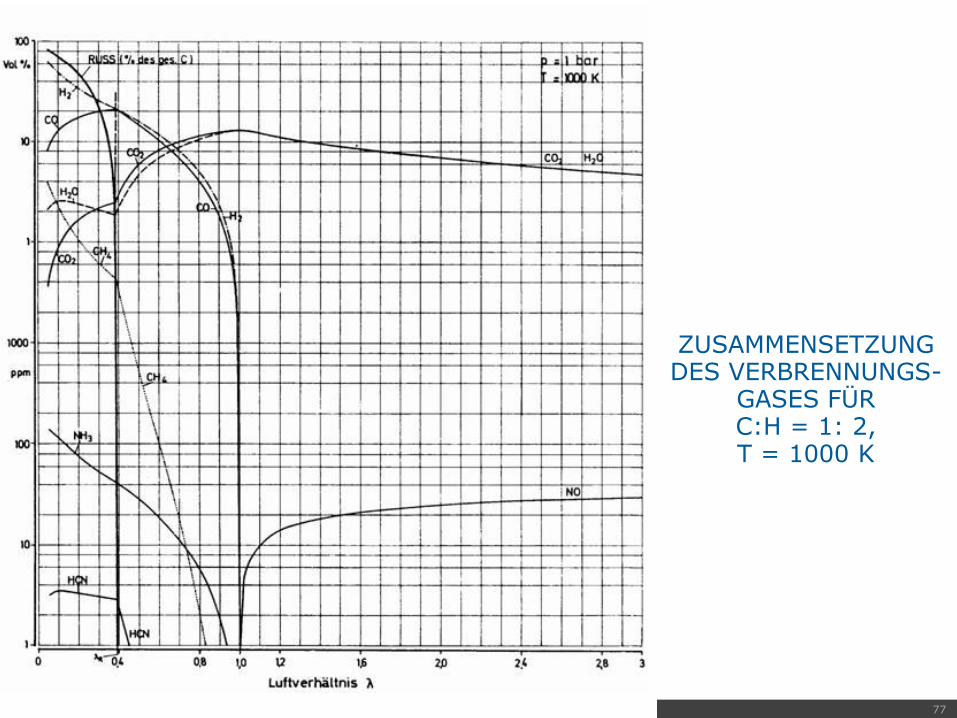
ZUSAMMENSETZUNG DES VERBRENNUNGS-
GASES FÜR C:H = 1: 2, T = 1000 K
200056-0
1b
78
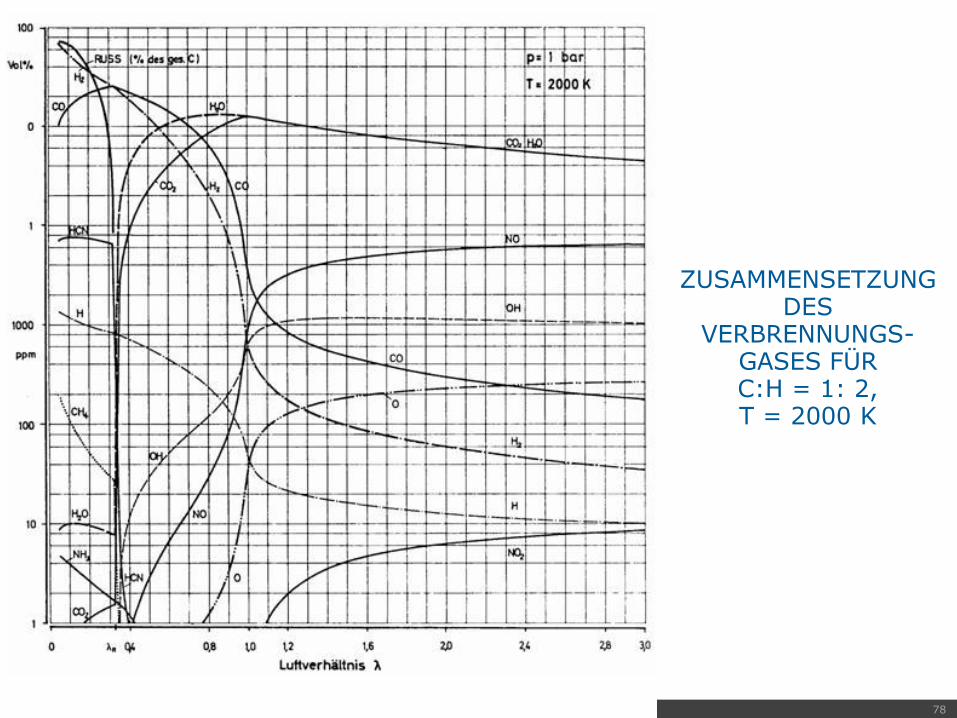
ZUSAMMENSETZUNG DES
VERBRENNUNGS-GASES FÜR C:H = 1: 2, T = 2000 K
200056-0
1b

79
ZEITLICHER KONZENTRATIONSVERLAUF EINER REAKTION 1. ORDNUNG
200056-0
1b

80
ZEITLICHER KONZENTRATIONSVERLAUF EINER REAKTION 2. ORDNUNG
200056-0
1b

81
EXAKTER VERLAUF UND QUASISTATIONARITÄT
200056-0
1b

82
VERGLEICH: PARTIELLES GLEICHGEWICHT –VOLLSTÄNDIGER MECHANISMUS
200056-0
1b

83
REAKTIONSFLUSS-ANALYSE:
STÖCHIOMETRISCHES METHAN-
LUFT-GEMISCH
200056-0
1b

84
200056-0
1b
REAKTIONSFLUSS-ANALYSE – FETTES
METHAN-LUFT-GEMISCH

85
VERGLEICH VON MESSDATEN UND SIMULATION MIT UMFANGREICHEN
REAKTIONSMECHANISMEN
200056-0
1b

86
VERGLEICH MESSDATEN –UMFANGREICHE – REDUZIERTE
MECHANISMEN
200056-0
1b
201030-0
2
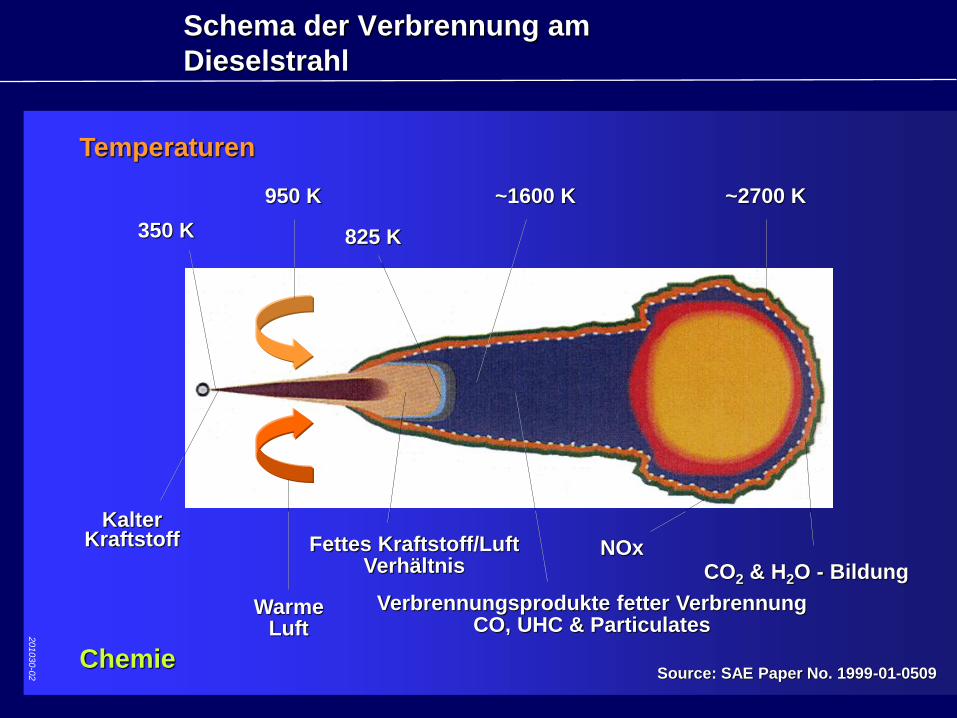
950 K
825 K350 K
~1600 K ~2700 K
KalterKraftstoff
WarmeLuft
Fettes Kraftstoff/LuftVerhältnis
Verbrennungsprodukte fetter VerbrennungCO, UHC & Particulates
NOxCO2 & H2O - Bildung
Temperaturen
ChemieSource: SAE Paper No. 1999-01-0509
Schema der Verbrennung am
Dieselstrahl

AIR
FUEL
INTAKE
PORTS
INJECTION
SYSTEM
COMBUSTION
CHAMBER
AIR/FUEL
MIXING
IGNITION
COMBUSTION
HEAT
RELEASE
EXHAUST
EMISSIONS
Diesel Combustion Process Overview

89
ZEITLICHE FLUKTUATION UND ZEITLICHER MITTELWERT
200056-0
1b
90
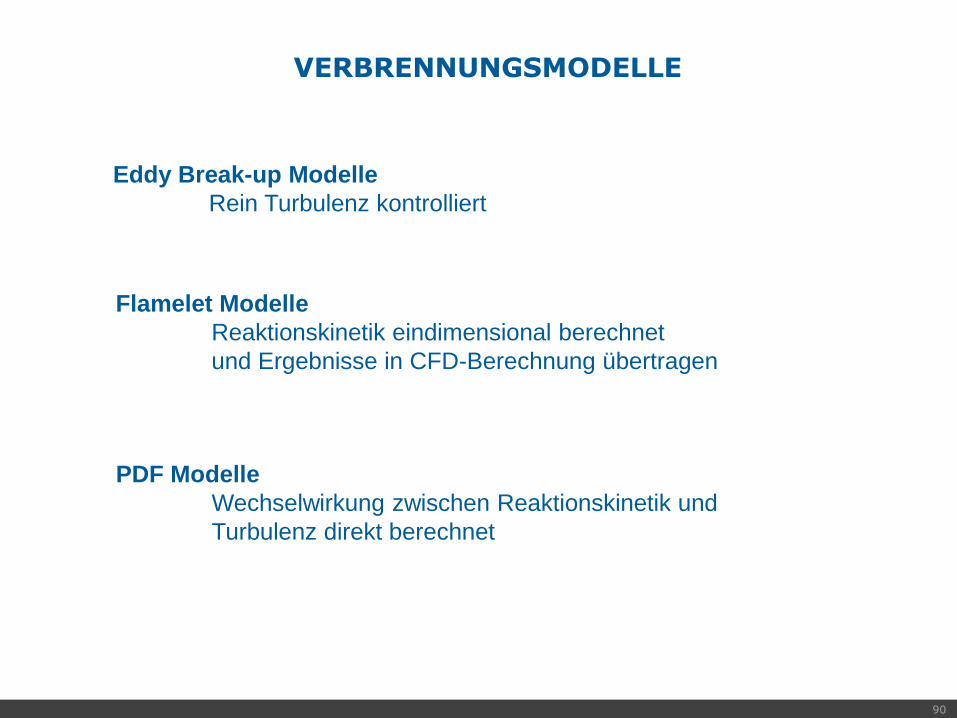
VERBRENNUNGSMODELLE
200056-0
1b
Eddy Break-up Modelle
Rein Turbulenz kontrolliert
Flamelet Modelle
Reaktionskinetik eindimensional berechnet
und Ergebnisse in CFD-Berechnung übertragen
PDF Modelle
Wechselwirkung zwischen Reaktionskinetik und
Turbulenz direkt berechnet

91
VERGLEICH DER BRENNVERLÄUFE DER 3D SIMULATION UND
MOTORPROZESSRECHNUNG
200056-0
1b
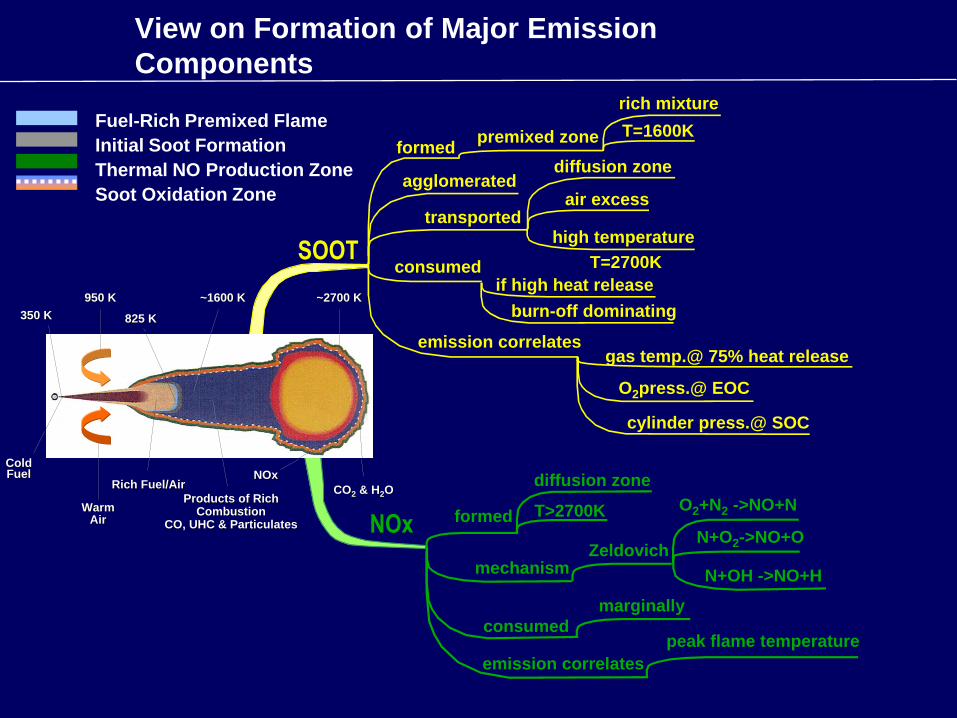
rich mixture
SOOT
formedT=1600K
agglomerated
transported
diffusion zone
air excess
high temperature
T=2700Kconsumedif high heat release
emission correlatesgas temp.@ 75% heat release
O2press.@ EOC
cylinder press.@ SOC
burn-off dominating
premixed zoneFuel-Rich Premixed Flame
Initial Soot Formation
Thermal NO Production Zone
Soot Oxidation Zone
View on Formation of Major Emission
Components
NOx formed
diffusion zone
T>2700K
Zeldovichmechanism
peak flame temperature
emission correlates
consumed
marginally
O2+N2 ->NO+N
N+O2->NO+O
N+OH ->NO+H
950 K950 K
825 K825 K350 K350 K
~1600 K~1600 K ~2700 K~2700 K
ColdColdFuelFuel
WarmWarmAirAir
Rich Fuel/AirRich Fuel/Air
Products of RichProducts of RichCombustionCombustion
CO, UHC & ParticulatesCO, UHC & Particulates
NOxNOx
COCO22 & H & H22OO

93
CO-KONZENTRATION, REAKTIONSKINETISCHE BETRACHTUNG UND
GLEICHGEWICHTSBETRACHTUNG
200056-0
1b

94
CO-KONZENTRATION: EINGEFRORENES GLEICHGEWICHT BEI OT UND BEI AÖ, KINETISCHE
MODELLIERUNG UND MESSWERTE
200056-0
1b

95
BERECHNETE UND GEMESSENE NO –KONZENTRATIONEN IN H2 / LUFT FLAMMEN
200056-0
1b

96
BERECHNETE NO – KONZENTRATIONEN FÜR UNTERSCHIEDLICH KOMPLEXE
REAKTIONSMECHANISMEN
200056-0
1b
97
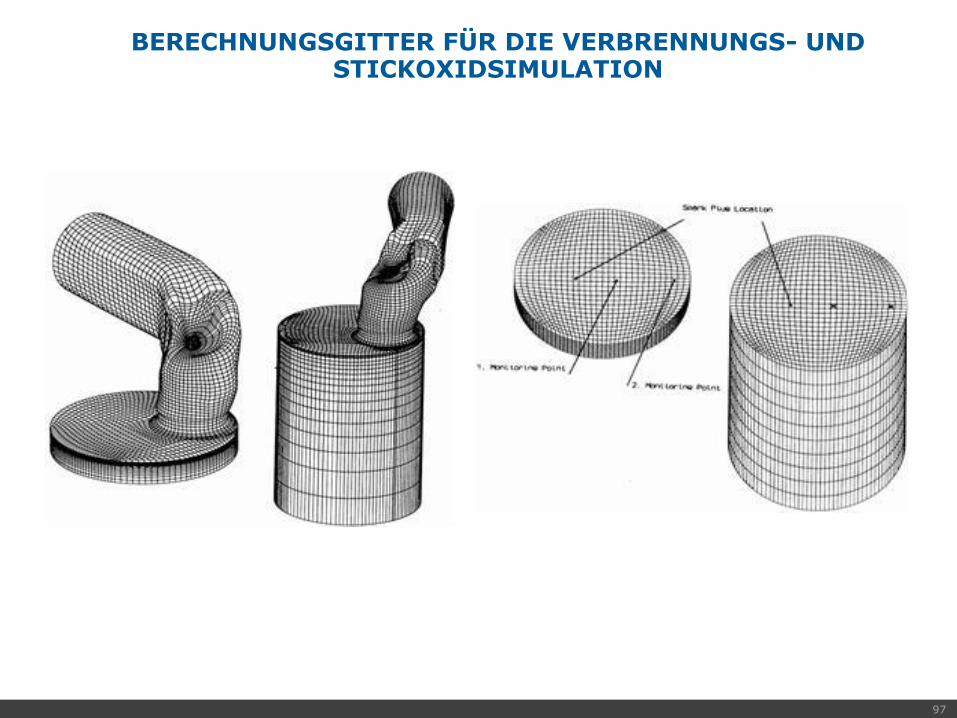
BERECHNUNGSGITTER FÜR DIE VERBRENNUNGS- UND STICKOXIDSIMULATION
200056-0
1b
98
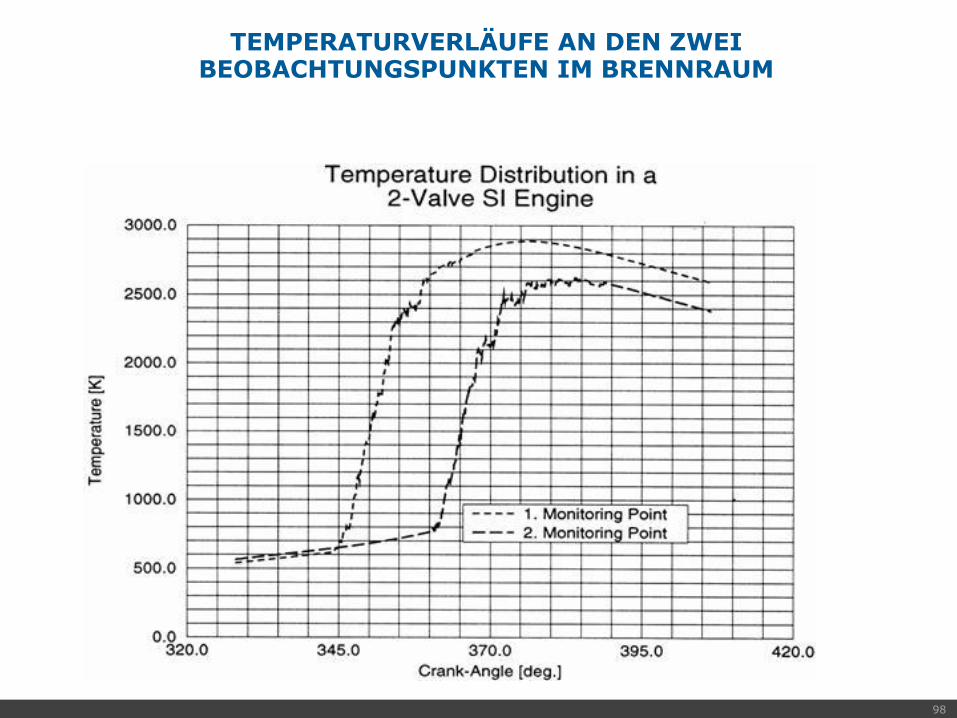
TEMPERATURVERLÄUFE AN DEN ZWEI BEOBACHTUNGSPUNKTEN IM BRENNRAUM
200056-0
1b
99
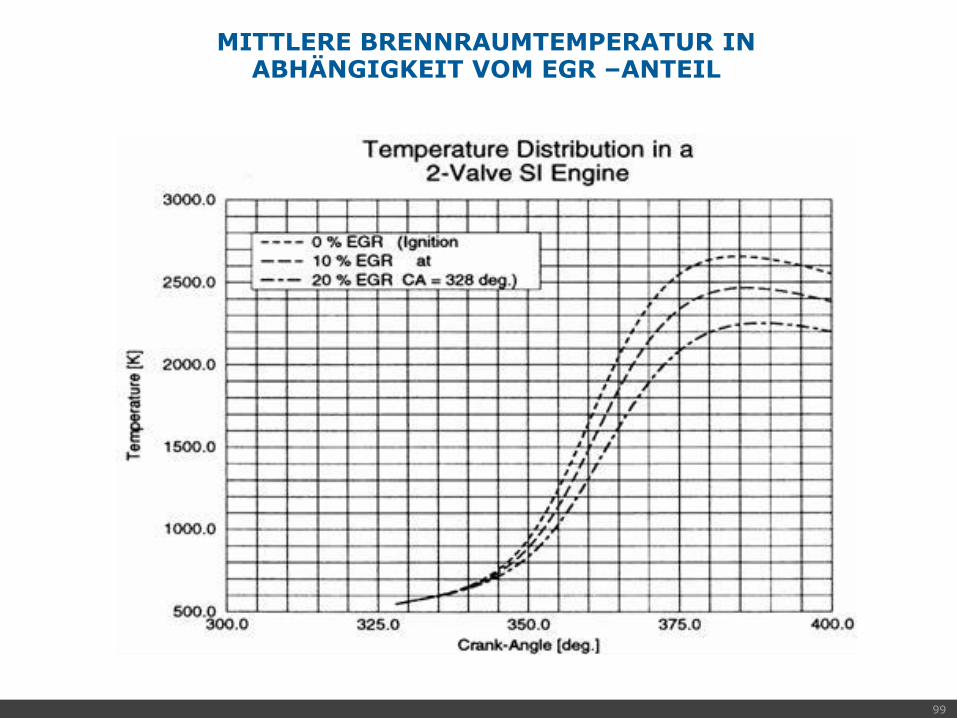
MITTLERE BRENNRAUMTEMPERATUR IN ABHÄNGIGKEIT VOM EGR –ANTEIL
200056-0
1b

100
MASSENANTEIL NO IN ABHÄNGIGKEIT VOM EGR -ANTEIL
200056-0
1b

101
MASSENANTEIL AN NO IN ABHÄNGIGKEIT DES ZÜNDZEITPUNKTES
200056-0
1b

102
RUSSBILDUNGSGRENZEN VERSCHIEDENER ATMOSPHÄRISCHER VORMISCHFLAMMEN
200056-0
1b
Brennstoff chem. Bez. CmHn lR l bei (O/C)krit
Ethan C2H6 0.285 0.47
Propan C3H8 0.300 0.47
n-Pentan C5H12 0.313 0.45
n-Oktan C8H18 0.320 0.45
Ethin C2H2 0.400 0.83
Ethen C2H4 0.330 0.60
Benzol C6H6 0.400 0.57

103
200056-0
1b
SCHEMA DER RUSSBILDUNG IN EINER VORMISCHFLAMME
104
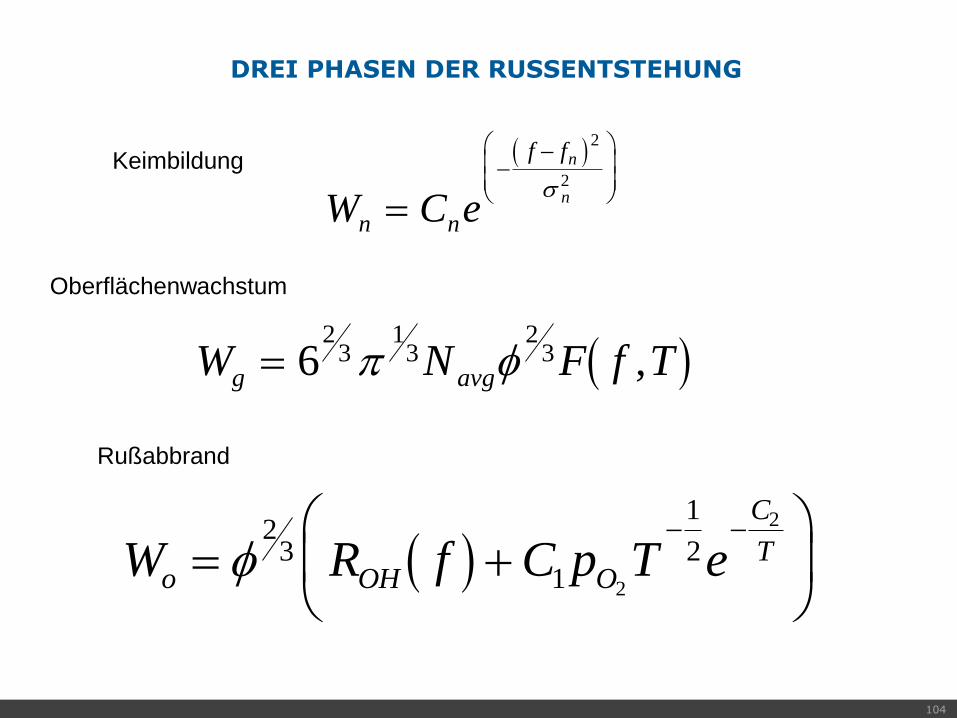
DREI PHASEN DER RUSSENTSTEHUNG
200056-0
1b
W C en n
f fn
n
2
2
W N F f Tg avg 62
31
32
3 ,
W R f C p T eo OH O
C
T
2
31
1
2
2
2
Keimbildung
Oberflächenwachstum
Rußabbrand

105
AUSWIRKUNGEN DER PARTIKELSTRAHLUNG AUF DIE TEMPERATURPROFILE IN EINER LAMINAREN
DIFFUSIONSFLAMME
200056-0
1b
Horizontalschnitt 8 mm über dem Brenneraustritt
0
500
1000
1500
2000
2500
0 0.002 0.004 0.006 0.008 0.01
Abstand vom Flammenkern [m]
TE
MP
ER
AT
UR
[K
]
mit Strahlung
ohne Strahlung
Messdaten

106
200056-0
1b
Horizontalschnitt 25 mm über dem Brennerkante
0
500
1000
1500
2000
2500
0 0.002 0.004 0.006 0.008 0.01
Abstand vom Flammenkern [m]
TE
MP
ER
AT
UR
[K
]
mit Strahlung
ohne Strahlung
Messdaten
AUSWIRKUNGEN DER PARTIKELSTRAHLUNG AUF DIE TEMPERATURPROFILE IN EINER LAMINAREN
DIFFUSIONSFLAMME