Self-assembly behavior in hydrophilic block copolymers · Max-Planck-Institut für Kolloid- und...
176
Max-Planck-Institut für Kolloid- und Grenzflächenforschung Abteilung für Kolloidchemie Self-assembly behavior in hydrophilic block copolymers Dissertation zur Erlangung des akademischen Grades „doctor rerum naturalium“ (Dr. rer. nat) in der Wissenschaftsdisziplin „Polymer- und Kolloidchemie“ eingereicht an der Mathematisch-Naturwissenschaftlichen Fakultät der Universität Potsdam von Clara Valverde Serrano geboren am 02.10.1984 in Murcia (Spanien) Potsdam, Mai 2011
Transcript of Self-assembly behavior in hydrophilic block copolymers · Max-Planck-Institut für Kolloid- und...
Max-Planck-Institut für Kolloid- und Grenzflächenforschung
Abteilung für Kolloidchemie
Self-assembly behavior in hydrophilic
block copolymers
Dissertation
zur Erlangung des akademischen Grades„doctor rerum naturalium“
(Dr. rer. nat)in der Wissenschaftsdisziplin „Polymer- und Kolloidchemie“
eingereicht an derMathematisch-Naturwissenschaftlichen Fakultät
der Universität Potsdam
von
Clara Valverde Serrano
geboren am 02.10.1984 in Murcia (Spanien)
Potsdam, Mai 2011


This work is licensed under a Creative Commons License: Attribution - Noncommercial – No Derivative Works 3.0 Unported To view a copy of this license visit http://creativecommons.org/licenses/by-nc-nd/3.0/ Published online at the Institutional Repository of the University of Potsdam: URL http://opus.kobv.de/ubp/volltexte/2011/5416/ URN urn:nbn:de:kobv:517-opus-54163 http://nbn-resolving.de/urn:nbn:de:kobv:517-opus-54163


Abstract
Abstract
Block copolymers are receiving increasing attention in the literature. Reports on amphiphilic block copolymers have now established the basis of their self assembly behavior: aggregate sizes, morphologies and stability can be explained from the absolute and relative block lengths, the nature of the blocks, the architecture and also solvent selectiveness. In water, self-assembly of amphiphilic block copolymers is assumed to be driven by the hydrophobic. The motivation of this thesis is to study the influence on the self-assembly in water of A-b-B type block copolymers (with A hydrophilic) of the variation of the hydrophilicity of B from non-soluble (hydrophobic) to totally soluble (hydrophilic).
Glucose-modified polybutadiene-block-poly(N-isopropylacrylamide) copolymers were prepared and their self-assembly behavior in water studied. The copolymers formed vesicles with an asymmetric membrane with a glycosylated exterior and poly(N-isopropylacrylamide) on the inside. Above the low critical solution temperature (LCST) of poly(N-isopropylacrylamide), the structure collapsed into micelles with a hydrophobic PNIPAM core and glycosylated exterior. This collapse was found to be reversible. As a result, the structures showed a temperature-dependent interaction with L-lectin proteins and were shown to be able to encapsulate organic molecules.
Several families of double hydrophilic block copolymers (DHBC) were prepared. The blocks of these copolymers were biopolymers or polymer chimeras used in aqueous two-phase partition systems. Copolymers based on dextran and poly(ethylene glycol) blocks were able to form aggregates in water. Dex6500-b-PEG5500 copolymer spontaneously formed vesicles
v
Abstract
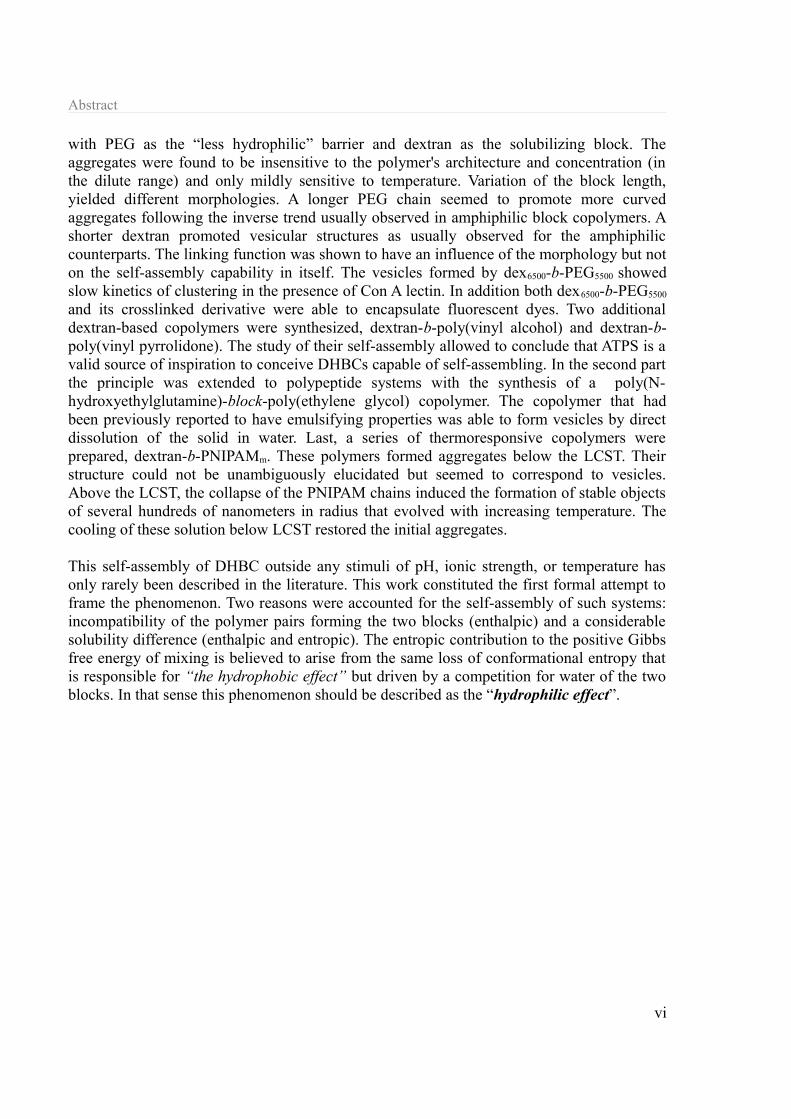
with PEG as the “less hydrophilic” barrier and dextran as the solubilizing block. The aggregates were found to be insensitive to the polymer's architecture and concentration (in the dilute range) and only mildly sensitive to temperature. Variation of the block length, yielded different morphologies. A longer PEG chain seemed to promote more curved aggregates following the inverse trend usually observed in amphiphilic block copolymers. A shorter dextran promoted vesicular structures as usually observed for the amphiphilic counterparts. The linking function was shown to have an influence of the morphology but not on the self-assembly capability in itself. The vesicles formed by dex6500-b-PEG5500 showed slow kinetics of clustering in the presence of Con A lectin. In addition both dex6500-b-PEG5500
and its crosslinked derivative were able to encapsulate fluorescent dyes. Two additional dextran-based copolymers were synthesized, dextran-b-poly(vinyl alcohol) and dextran-b-poly(vinyl pyrrolidone). The study of their self-assembly allowed to conclude that ATPS is a valid source of inspiration to conceive DHBCs capable of self-assembling. In the second part the principle was extended to polypeptide systems with the synthesis of a poly(N-hydroxyethylglutamine)-block-poly(ethylene glycol) copolymer. The copolymer that had been previously reported to have emulsifying properties was able to form vesicles by direct dissolution of the solid in water. Last, a series of thermoresponsive copolymers were prepared, dextran-b-PNIPAMm. These polymers formed aggregates below the LCST. Their structure could not be unambiguously elucidated but seemed to correspond to vesicles. Above the LCST, the collapse of the PNIPAM chains induced the formation of stable objects of several hundreds of nanometers in radius that evolved with increasing temperature. The cooling of these solution below LCST restored the initial aggregates.
This self-assembly of DHBC outside any stimuli of pH, ionic strength, or temperature has only rarely been described in the literature. This work constituted the first formal attempt to frame the phenomenon. Two reasons were accounted for the self-assembly of such systems: incompatibility of the polymer pairs forming the two blocks (enthalpic) and a considerable solubility difference (enthalpic and entropic). The entropic contribution to the positive Gibbs free energy of mixing is believed to arise from the same loss of conformational entropy that is responsible for “the hydrophobic effect” but driven by a competition for water of the two blocks. In that sense this phenomenon should be described as the “hydrophilic effect”.
vi

Table of Contents
Table of Contents
Abstract......................................................................................................................................vTable of Contents.....................................................................................................................viiChapter 1: Introduction..............................................................................................................1Chapter 2: Basic Principles........................................................................................................5
2.1 ATPS and microcompartmentation in cells....................................................................5 2.1.1 Aqueous two phase systems (ATPS)......................................................................5 2.1.2 Microcompartmentation in cells.............................................................................8
2.2 Phase behavior of block copolymers............................................................................10 2.2.1 Phase behavior of block copolymers in bulk........................................................10 2.2.2 Phase behavior of block copolymers in solution..................................................11
2.2.2.a Amphiphilic copolymers in water.................................................................13 2.2.2.b Thermo-responsive block copolymers..........................................................14
2.3 Block copolymer synthesis & other tools of polymer chemistry.................................17 2.3.1 Block copolymers synthesis.................................................................................17
2.3.1.a NCA polymerization.....................................................................................19 2.3.1.b RAFT polymerization...................................................................................20
2.3.2 Other tools of polymer chemistry: efficient linking.............................................22 2.3.2.a Copper(I)-catalyzed alkyne-azide cycloaddition (CuAAC).........................23 2.3.2.b Radical thiol-ene addition.............................................................................26
Chapter 3: Self-assembly of double hydrophilic block copolymers: The hydrophilic effect..............................................................................................................29
3.1 Spontaneous self-assembly of polysaccharide-based block copolymers in water.......32
vii

Table of Contents
3.1.1 Designing DHBCs for self-assembly: incompatibility and solubility difference 32 3.1.2 Polymers syntheses...............................................................................................35
3.1.2.a Dextran-block-poly(ethylene glycol) by CuAAC.........................................35 3.1.2.b Dextran-block-poly(ethylene glycol)-block-dextran....................................39 3.1.2.c Dextran-block-poly(ethylene glycol) by lactone ring opening.....................40
3.1.3 Aggregation behavior in water.............................................................................41 3.1.4 Membrane structure..............................................................................................45
3.1.4.a Preparation of the samples............................................................................46 3.1.4.b Structure of the membrane by Surface Enhanced Raman Spectroscopy......47
3.1.5 Concentration and temperature influence.............................................................51 3.1.5.a Concentration effect on the aggregate's size.................................................52 3.1.5.b Temperature..................................................................................................53
3.1.6 Structural parameters............................................................................................54 3.1.6.a Chain length..................................................................................................54 3.1.6.b Architecture...................................................................................................57 3.1.6.c Linking..........................................................................................................58
3.1.7 Towards biologicals applications..........................................................................61 3.1.7.a Lectin-carbohydrate interaction....................................................................61 3.1.7.b Encapsulation of molecules..........................................................................63
3.1.8 Other polysaccharide-based copolymers..............................................................67 3.1.8.a Synthesis.......................................................................................................67 3.1.8.b Self-assembly behavior in water...................................................................72
3.2 Spontaneous self-assembly of polypeptide-based and polysaccharide hybrid block copolymers..........................................................................................................................74
3.2.1 Spontaneous self-assembly of polypeptide-based block copolymers..................74 3.2.1.a Synthesis.......................................................................................................75 3.2.1.b Self-assembly behavior in water...................................................................76
3.2.2 Spontaneous self-assembly of polysaccharide thermoresponsive block copolymers.....................................................................................................................80
3.2.2.a Synthesis.......................................................................................................80 3.2.2.b Self-assembly behavior at room temperature...............................................81 3.2.2.c Thermoresponsive behavior..........................................................................83
3.3 Summary......................................................................................................................86Chapter 4: Thermoresponsive vesicles with an asymmetric membrane...........................lxxxvii
4.1 Synthesis......................................................................................................................89 4.2 Self-assembly behavior at room temperature...............................................................91 4.3 Thermo-responsive behavior........................................................................................96 4.4 Towards biological applications.................................................................................100
4.4.1 Lectin-carbohydrate recognition........................................................................101 4.4.2 Encapsulation of organic compounds.................................................................106
4.5 Summary....................................................................................................................108Chapter 5: Conclusions and perspectives..............................................................................109 Appendix I.Experimental part....................................................................................................I
A.Experimental procedures...................................................................................................I I.Dextran-block-poly(ethylene glycol) polymers.............................................................I
I.1)Blocks prepapation................................................................................................I
viii
Table of Contents
I.2)Block copolymer synthesis...................................................................................V II.Other dextran-based polymers.................................................................................VII
II.1)Dextran-CTA preparation.................................................................................VII II.2)RAFT polymerization of dextran-based copolymers........................................IX
III.Poly(ethylene glycol)-block-poly(N-hydroxyethyl glutamine)...............................XI III.1)γ-benzyl-glutamate N-carboxyanhydride (BLG NCA)....................................XI III.2)Poly(ethylene glycol)-block-poly(L-benzyl glutamate)...................................XI III.3)Poly(ethylene glycol)-block-poly(N-hydroxyethyl-L-glutamine)...................XI
IV.glycosylated polybutadiene-block-poly(N-isopropyl-acrylamide) polymers.........XII IV.1)CTA synthesis..................................................................................................XII IV.2)PB macronomer synthesis and preparation.....................................................XII IV.3)poly(1,2-butadiene)-block-poly(N-isopropylacrylamide).............................XIII IV.4)Glycosilation 1,2-PB-b-PNIPAM..................................................................XIII
B.Analytical Instrumentation...........................................................................................XIV Appendix II.Supporting experimental data..........................................................................XIX Appendix III.Review on the self-assembly of DHBCs in water.....................................XXVII Appendix IV.Nomenclature............................................................................................XXXIV Appendix V.Selected Analytical Methods...................................................................XXXVIII
A.Light scattering...............................................................................................XXXVIII I.Static light scattering...................................................................................XXXVIII II.Dynamic light scattering....................................................................................XLI
B.Fluorescence correlation spectroscopy...................................................................XLII Appendix VI.Bibliography................................................................................................XLIVDeclaration/Erklärung...........................................................................................................LIIIAcknowledgments...................................................................................................................LV
ix


Introduction
Chapter 1: Introduction
“In order to assemble into vesicular objects, block
copolymers need to have at least two incompatible blocks that have a
different solubility in the liquid where vesicle formation takes place.”
Napoli A., Sebok D., Senti D., and Meier W. [1]
The study of self-assembly involving low molecular weight surfactants into colloidal
structures is now a mature field of supramolecular chemistry. Besides being well-established
in industrial applications, the principles of their self-assembly are now well-understood. The
study of the role of the hydrophilic “head” and the hydrophobic “tail” allows the straight-
forward prediction of the solution behavior and therefore also the design of given surfactants
for a given application. More recently, block copolymers have received increasing attention
due to the fact that their assemblies have potential applications in drug delivery and other
1
Chapter 1
medical applications, imaging and sensing and even catalysis. In the literature, reports on
amphiphilic block copolymers have now established the basis of the self assembly behavior:
aggregate sizes, morphologies, stability can be explained from the absolute and relative block
lengths, the nature of the blocks, architecture and also solvent selectiveness.
In water, self-assembly of amphiphilic block copolymers is assumed to be driven by the
hydrophobic effect, an entropic effect, that promotes the segregation of the hydrophobic
block and water to overcome the loss of conformational entropy. In a classic amphiphilic
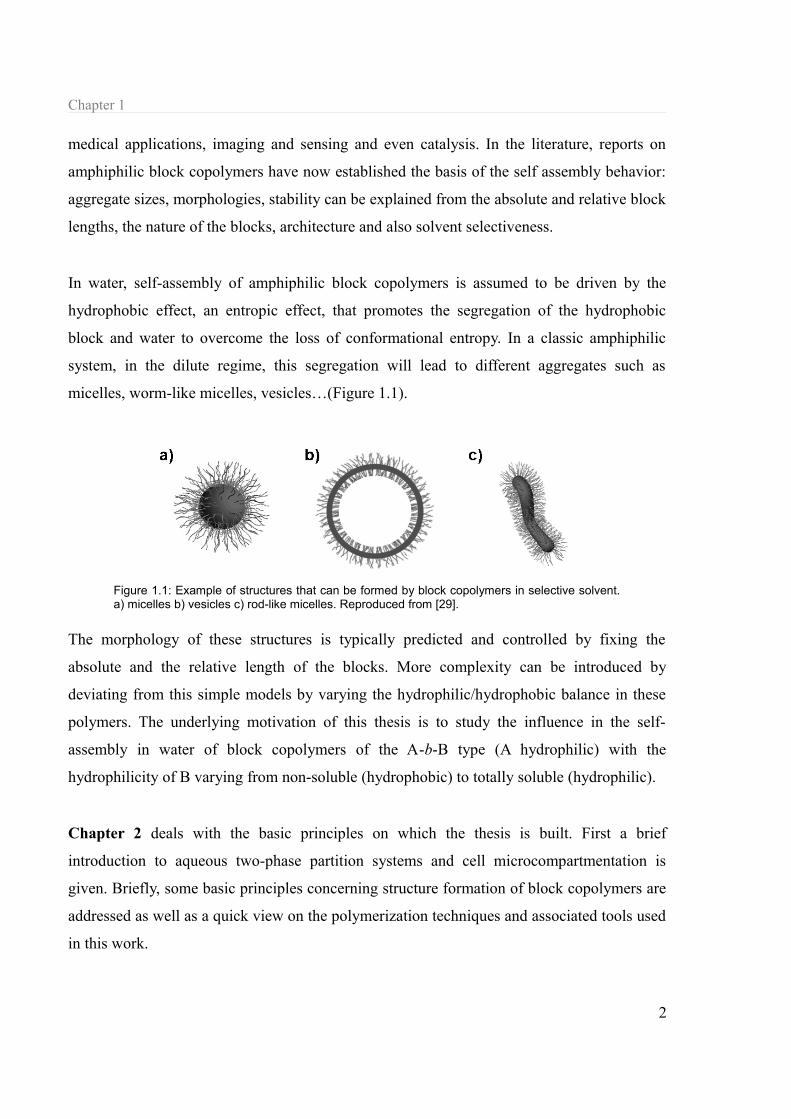
system, in the dilute regime, this segregation will lead to different aggregates such as
micelles, worm-like micelles, vesicles…(Figure 1.1).
The morphology of these structures is typically predicted and controlled by fixing the
absolute and the relative length of the blocks. More complexity can be introduced by
deviating from this simple models by varying the hydrophilic/hydrophobic balance in these
polymers. The underlying motivation of this thesis is to study the influence in the self-
assembly in water of block copolymers of the A-b-B type (A hydrophilic) with the
hydrophilicity of B varying from non-soluble (hydrophobic) to totally soluble (hydrophilic).
Chapter 2 deals with the basic principles on which the thesis is built. First a brief
introduction to aqueous two-phase partition systems and cell microcompartmentation is
given. Briefly, some basic principles concerning structure formation of block copolymers are
addressed as well as a quick view on the polymerization techniques and associated tools used
in this work.
2
Figure 1.1: Example of structures that can be formed by block copolymers in selective solvent. a) micelles b) vesicles c) rod-like micelles. Reproduced from [29].

Introduction
Biomacromolecules crowd the interior and exterior of cells giving raise to a variety of
physico-chemical phenomena that direct a certain number of structural and functional
characteristics of cells including phase separation. This phase separation is analogous to the
aqueous phase separation exploited in aqueous two-phase partition systems (ATPS)
techniques in biological sciences that uses polymer-polymer-water ternary systems. From this
point of view, microcompartmentation and ATPS can be used as inspiration to develop new
block copolymers potentially able to microphase separate in water. Ideal candidates are block
copolymers made of biopolymers or polymer chimeras known to phase separate in ATPS
systems. The covalent link between the two blocks should introduce compatibility, but if the
incompatibility remains high enough and solubility difference is strong, phase separation
could take place leading to the formation of self-assembled aggregates as we know them.
Chapter 3 deals thus with the synthesis, characterization and study of aggregates formed by
double hydrophilic block copolymers (DHBC) engineered to self-assemble outside any
stimuli of pH, ionic strength, or temperature (see Appendix III for a comprehensive review of
literature examples). Several block copolymers systems inspired from ATPS and
microcompartmentation in cells are studied. The introductory paragraph of the chapter
attempts to present the basic thermodynamic background backing the potential microphase
separation of hydrophilic1-hydrophilic2 block copolymers. Both entropic and enthalpic
reasons can be advanced to suggest such behavior in well chosen polymer pairs. The
parameters leading to ΔGm >0 are considered and translated to practical terms first with a
quick study of a poly(ethylene glycol)/dextran/water system and later to the
dextran-block-poly(ethylene glycol) copolymer in water system. A family of dextran-b-PEG
copolymers is thus studied and the characterization of the colloids introduced with a
continuous comparison with the behavior of amphiphilic copolymer systems. Different
conditions of temperature and concentration are tested as well as the variation of structural
parameters known to affect the self-assembly process and phase diagram of copolymers:
block lengths, linking units and architecture. Because dextran is a highly relevant molecule in
the biological context, this system was preliminary tested for its interaction with L-lectin type
of proteins and encapsulation properties. Two additional dextran-based systems were
synthesized, dextran-block-poly(vinyl alcohol) and dextran-block-poly(vinyl pyrrolidone) to
help prove the validity of ATPS as a source of inspiration to engineer such systems. In the
3

Chapter 1
second part of the chapter, a polypeptide system based on poly(N-hydroxyethyl glutamine)
was studied and a thermoresponsive synthetic system based on Poly(N-isopropylacrylamide)
helped extend and complexify this particular self-assembly behavior of double hydrophilic
block copolymers.
In Chapter 4, hydrophilically modified amphiphilic polymers were studied. Inspired by the
glucose-modified polybutadiene-block-poly(ethylene glycol) previously reported,[2]
glucose-modified polybutadiene-block-poly(N-isopropylacrylamide) thermoresponsive
polymers were prepared. Their self-assembly behaviour at room temperature and above the
low critical solution temperature of poly(N-isopropylacrylamide) were studied. Their
temperature-dependent interaction with L-lectin proteins and encapsulation properties were
tested.
4

Basic Principles
Chapter 2: Basic Principles
2.1 ATPS and microcompartmentation in cells
2.1.1 Aqueous two phase systems (ATPS)
ATPS is a liquid-liquid extraction technique. When two polymers or a salt and a polymer are
mixed together at appropriate concentrations and at a particular temperature, phase separation
can occur. Since the bulk of both phases is water, they constitute mild but physico-chemically
differentiated environments where biomaterials can be driven to a preferential phase
according to their characteristics such as isoelectric point, surface hydrophobicity and molar
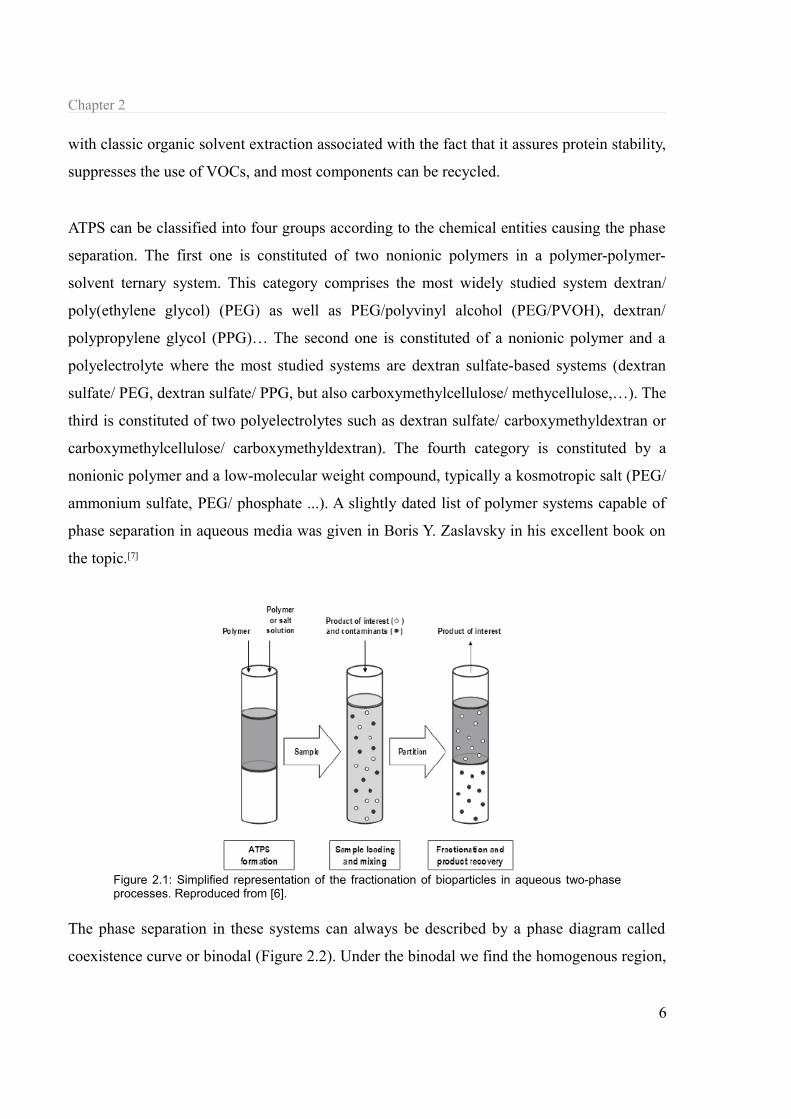
mass (Figure 2.1).[3]-[5] This phenomenon has been exploited for the recovery and partial
purification of biological material including proteins, genetic material, nanoparticles, low
molecular weight molecules, and even cell organelles and cells.[6] Besides the general
advantages associated with liquid-liquid extraction techniques (short phase separation time,
scalability, low-cost…), ATPS techniques show an enhanced attractiveness when compared
5
Chapter 2
with classic organic solvent extraction associated with the fact that it assures protein stability,
suppresses the use of VOCs, and most components can be recycled.
ATPS can be classified into four groups according to the chemical entities causing the phase
separation. The first one is constituted of two nonionic polymers in a polymer-polymer-
solvent ternary system. This category comprises the most widely studied system dextran/
poly(ethylene glycol) (PEG) as well as PEG/polyvinyl alcohol (PEG/PVOH), dextran/
polypropylene glycol (PPG)… The second one is constituted of a nonionic polymer and a
polyelectrolyte where the most studied systems are dextran sulfate-based systems (dextran
sulfate/ PEG, dextran sulfate/ PPG, but also carboxymethylcellulose/ methycellulose,…). The
third is constituted of two polyelectrolytes such as dextran sulfate/ carboxymethyldextran or
carboxymethylcellulose/ carboxymethyldextran). The fourth category is constituted by a
nonionic polymer and a low-molecular weight compound, typically a kosmotropic salt (PEG/
ammonium sulfate, PEG/ phosphate ...). A slightly dated list of polymer systems capable of
phase separation in aqueous media was given in Boris Y. Zaslavsky in his excellent book on
the topic.[7]
The phase separation in these systems can always be described by a phase diagram called
coexistence curve or binodal (Figure 2.2). Under the binodal we find the homogenous region,
6
Figure 2.1: Simplified representation of the fractionation of bioparticles in aqueous two-phase processes. Reproduced from [6].

Basic Principles
and above the binodal the biphasic region.[8] This phase diagram also provides information
such as the composition of the coexisting phases and the tie-line at a given concentration.
Thermodynamically the phase separation in these systems can be easily explained in terms of
Gibbs free energy of mixing (Equation 1).
ΔGm=Δ H m−T Δ Sm>0 (1)
When the gain in entropy of mixing is not large enough to compensate for the repulsive
polymer–polymer interaction enthalpy, the mixing of the two polymers is thermodynamically
unfavorable and phase separation occurs.
The main idea around which Chapter 3 was developed was inspired by the first category of
systems, the phase separation of two non-ionic polymers in water, namely PEG/dextran
systems. Several phase diagrams have been established for this system at different
temperatures and with different molar masses and polydispersities. The general outcome of
them is that phase separation of ternary mixtures can happen with relatively low molecular
mass polymers but also at relatively low concentrations.[9] And although high molecular
masses are often preferred because they sharpen the partition coefficient of the biomolecule
to purify, ATPS remains a source of inspiration for some biological phenomena, such as
7
Figure 2.2: Schematic phase diagram for a general aqueous two-phase system (PEG/electrolyte or PEG/Dextran). The coexistence curve is represented by the full curve, the dashed line represents the tie-line. Reproduced from [8].

Chapter 2
microcompartmentation in cells.
2.1.2 Microcompartmentation in cells
The inside of living cells is a crowded space. The total concentration of macromolecules is
extremely high (10 to 50 wt% depending on the cell type[10]) in both eukaryotic cytoplasm
and prokaryotic cells (Figure 2.3). It is known for example that the concentration of proteins
and RNA in E. Coli is around 300-400 g·L-1 [11] and that red blood cells contain about
350 g·L-1 of hemoglobin alone.[12] This has profound implications on diffusion, reaction rates
and equilibria of interactions involving macromolecules.[10][13] All these implications have
been traditionally attributed to the excluded volume effect by proving that first, diffusion of
both small and macro- molecules are reduced in the cytoplasm by factors up to 10-fold [14][15]
dropping the rate of any diffusion-limited process. Secondly, that it favors the protein’s more
compact conformation i.e. the native biological active one[16][17] enhancing thus the rates of
biochemical reactions when they are not diffusion-limited. And last, that it also promotes
collisions and electrostatic interactions in proteins, affecting the equilibrium of interactions
by two or three orders of magnitude.[11][14]
But excluded volume cannot explain directly the fact that the solvent viscosity of the
cytoplasm is not substantially different from the viscosity of water itself. Ovádi et al.[18]
8
Figure 2.3: Figure 3: The crowded state of the cytoplasm in eukaryotic cells. The sizes, shapes and numbers of macromolecules are approximately correct. Small molecules are not shown. Reproduced from [13]. Originally published in [14].

Basic Principles
suggested that this observation could only be explained if the intracellular medium was
heterogeneous as reported previously by Clegg et al.[19] and Porter et al.[20]: the inside of the
cell is divided into water-rich phases and protein-rich phases. Experimental evidence was
later given[21] that virtually all cytoplasmic proteins have non-diffusive forms, and this could
be explained by highly organized regions inside the cytoplasm. This heterogeneity has since
been linked to a microcompartmentation phenomenon defined as the functional isolation of
molecules to create local composition differences[22] or compartments. This
compartmentation is indeed supposed to facilitate metabolic pathways.[23]
No particular protein is concentrated enough to phase separate with another protein but since
a protein can only occupy the non-excluded volume in the crowded cytoplasm, its effective
concentration is much higher than expected. This effective concentration is similar to the
total polymer concentration used in ATPS and can lead to multiphase separation inside the
cytoplasm.[24] This phase separation is today believed to be responsible for the
microcompartmentation observed in cells.[25]
ATPS has since been used to mimic the dynamic intracellular microcompartmentation.
Long et al.[26] developed a dextran/polyethylene glycol ATPS inside a giant vesicles (GV) as a
primitive cell model (Figure 2.4). It was shown that biological material such as DNA could
indeed be compartmentalized inside these GVs.
9
Figure 2.4: Synthetic cell model developped by Long et al. developed a dextran/polyethylene glycol ATPS inside a giant vesicles (GV) as a primitive cell model. Reproduced from .

Chapter 2
It is not surprising that dextran systems are able to mimic microcompartmentation in
biological media as polysaccharides also contribute to molecular crowding. Outside the cells,
polysaccharides are found in high concentration in the extracellular matrix of tissues such as
collagen[14] and in the glycocalyx on the outer membrane surface of cells.[27]
2.2 Phase behavior of block copolymers
2.2.1 Phase behavior of block copolymers in bulk
Most polymer pairs are incompatible. As a result upon mixing, the enthalpic contribution
(usually positive and decreasing with temperature) to the free energy of mixing of the two
components is greater than the magnitude of the entropic contribution (always negative and
ideally temperature-independent), and the polymers phase separate to minimize the
interaction.[28] In block copolymers of two incompatible blocks ((AB)n type, n=1 for
diblocks, n=2 for triblocks…) linked by covalent bonds, a combination of long-range
repulsive forces (physicochemical incompatibility) and short-range attractive forces (covalent
bonding) manifests. As a consequence the block copolymer in bulk undergoes a microscopic
phase separation to minimize the system’s free energy as demixing is preluded by the
covalent bond. This microscopic phase separation leads to a number of ordered phases in the
nanometric length scale. Common morphologies include hexagonally packed cylinders,
lamellar phases, and bicontinous phases among others (Figure 2.5, right ).[29][30] The phase
behavior of a given copolymer is determined by three experimentally controllable factors: the
overall degree of polymerization N, the architectural constraints (n and the overall volume
fraction f of the block A) and the A-B Flory-Huggins polymer-polymer interaction
paramenter χAB (representing the strength of the repulsive interaction between A and B).[31]
Since the enthalpic and entropic contributions to the free energy are proportional to N -1 and
χ, the product χN dictates the block copolymer phase state. This microphase separation can
thus be represented by phase diagram of χN against f [32] (Figure 2.5, left). Two regimes of
this diagram are usually identified, a weak segregation limit (WSL) for χN ~ 10 where both
10

Basic Principles
blocks are miscible, a strong segregation limit (SSL) for χN ~ 10-100 where the different
ordered phases are stable. Rarely,[33][34] a super strong segregation limit (SSSL) for χN>>100
appears in will each domain of the phase contains purely one of the two blocks and the
interface is strictly the covalent bond.
It should be noted that because χ varies with T-1, it is possible to induce phase transitions
(order-disorder transition ODT, order-order transition OOT) by cooling a polymer melt. In
other words in the diagram, transition between phases for a given f can be achieved by
varying the temperature. In dilute and semi-dilute regimes, i.e. in copolymer- solvent(s)
systems, lyotropic phases can be formed.
2.2.2 Phase behavior of block copolymers in solution
The phase behavior of block copolymers in solution depends not only on the Flory-Huggins
polymer-polymer interaction parameter χAB (considering the simplest AB type copolymer),
but also on the polymer-solvent interaction parameters χAS and χBS[35] and even
concentration.[36] An effective Flory-Huggins interaction parameter can be written from this
11
Figure 2.5: Left: Mean-field phase diagram for conformationally symmetric diblock melts. Right: representation of different ideal block copolymer phases in bulk. BCC (bcc spheres), H (hexagonally packed cylinder), L (lamellae), gyroid (bicontinous gyroid), CPS (closely packed spheres). DIS stands for disordered state. Reproduced from [29] and [30].

Chapter 2
combination (Equation 2).
χeff =φ(χAB+Δ χ)=φ(χAB+∣χAS−χBS∣) (2)
where φ is the volume concentration of the copolymer in the solvent. In the case of a neutral
solvent (good solvent for both A and B), Δ χ→0 and the effective Flory-Huggins
interaction parameter becomes χeff ≈φχAB . Because then χeff N ≈φχAB N , the
addition of a neutral solvent (φ<1) can induce an ODT (Figure 2.6). In other words the
addition of a non-selective solvent can increase compatibility. In practical terms a block
copolymer in a non-selective solvent in the absence of specific interactions adopts a coil
conformation where the monomer subunits are oriented randomly.
By addition of a selective solvent the description is more complex due to the interplay
between φ and Δχ. The solvent swells preferentially a block (e.g. block B) and changes the
volume fraction of the other block (block A) modifying thus the interaction parameter as
follows in equations (3) and (4).
f ≈ f A φ (3)
χeff N≈φ(χ AB+Δχ) N=φ(χ AB+∣χAS−χBS∣) N (4)
12
Figure 2.6: : Schematic phase diagrams for a typical diblock copolymer to show the effects of both neutral and selective solvents. Reproduced from [35].

Basic Principles
So generally, a large Δ χ will raise χeff N from a disordered into an ordered state
(Figure 2.6). Because the volume fraction of A can significantly decrease by addition of a
selective solvent for B, the consequent decrease in f A can cause an OOT as in Hanley’s
work[36] where a polystyrene-block-polyisoprene showed sequential phase changes from from
lamella (L), to perforated layer (PL) to gyroid (G) to cylinder (C) by addition of selective
solvent.
2.2.2.a Amphiphilic copolymers in water
In practice, in colloid chemistry the addition of a selective solvent for one block to a block
copolymer produces aggregates in dilute solution. For example, amphiphilic block
copolymers in water tend to self-assemble into well-defined structures. From the simplest
case of the spherical micelles with a hydrophobic core and a hydrophilic corona to more
complex geometries like vesicles or rod-like micelles (Figure 1.1) they all correspond to
energy minima.
In water, the self-assembly of block copolymers is assumed to be driven by the hydrophobic
effect.[37] In order to minimize the unfavorable interaction of water molecules with the
hydrophobic block, this latter tends to segregate into a solvent-poor phase with the
hydrophilic block forming a corona and promoting solubility.
The observed morphologies of these aggregates depend strongly on the geometry of the
single blocks and can be predicted by the so-called critical packing parameter.[38] This
dimensionless parameter first developed for low-molecular weight surfactants is now
extensively applied for block copolymers (Equation (5)):
ρ= Va0⋅l (5)
13
Chapter 2
where V is the volume occupied by the hydrophobic block, l its length and a0 the area
occupied by the hydrophilic block. ρ< 0.5 favors aggregates with high curvation radii such as
micelles while ρ> 0.5 promotes the formation of less curved bilayer structures such as
vesicles and lamellae. It is common for block copolymers to consider the relative size of the
hydrophilic and hydrophobic blocks to predict the geometry of the aggregates. A decrease in
the hydrophilic block length with respect to the hydrophobic promotes less-curved
aggregates.[39]
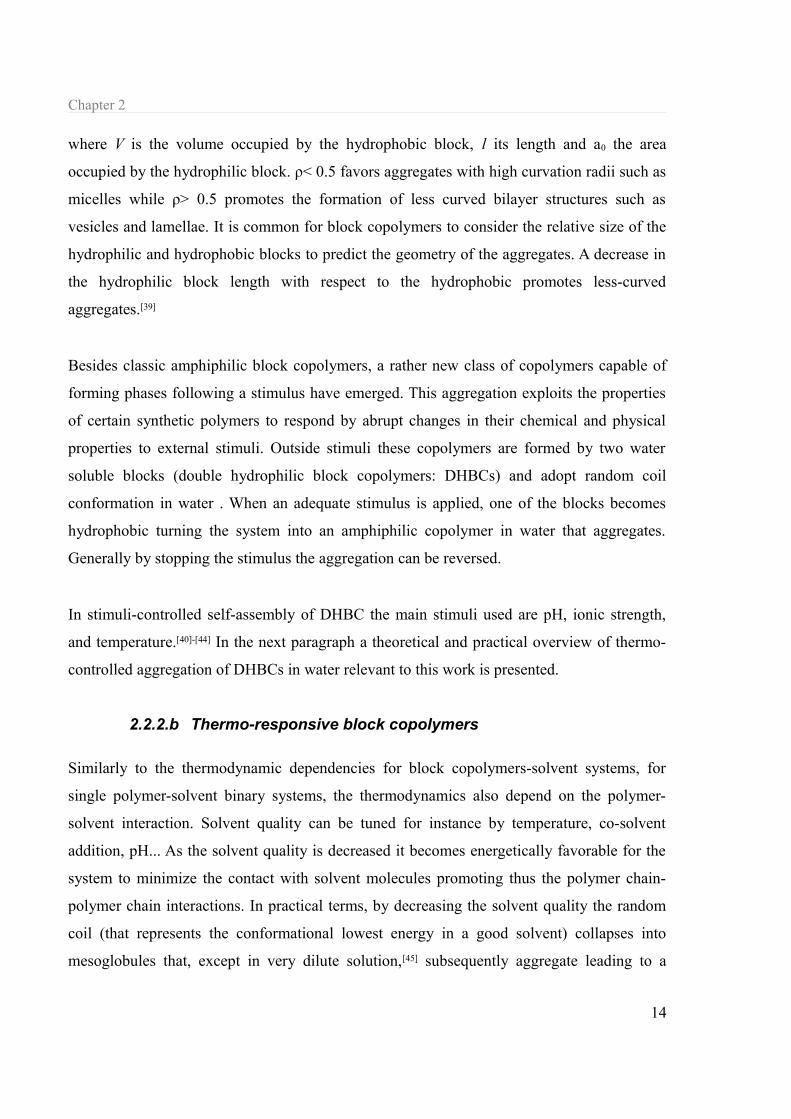
Besides classic amphiphilic block copolymers, a rather new class of copolymers capable of
forming phases following a stimulus have emerged. This aggregation exploits the properties
of certain synthetic polymers to respond by abrupt changes in their chemical and physical
properties to external stimuli. Outside stimuli these copolymers are formed by two water
soluble blocks (double hydrophilic block copolymers: DHBCs) and adopt random coil
conformation in water . When an adequate stimulus is applied, one of the blocks becomes
hydrophobic turning the system into an amphiphilic copolymer in water that aggregates.
Generally by stopping the stimulus the aggregation can be reversed.
In stimuli-controlled self-assembly of DHBC the main stimuli used are pH, ionic strength,
and temperature.[40]-[44] In the next paragraph a theoretical and practical overview of thermo-
controlled aggregation of DHBCs in water relevant to this work is presented.
2.2.2.b Thermo-responsive block copolymers
Similarly to the thermodynamic dependencies for block copolymers-solvent systems, for
single polymer-solvent binary systems, the thermodynamics also depend on the polymer-
solvent interaction. Solvent quality can be tuned for instance by temperature, co-solvent
addition, pH... As the solvent quality is decreased it becomes energetically favorable for the
system to minimize the contact with solvent molecules promoting thus the polymer chain-
polymer chain interactions. In practical terms, by decreasing the solvent quality the random
coil (that represents the conformational lowest energy in a good solvent) collapses into
mesoglobules that, except in very dilute solution,[45] subsequently aggregate leading to a
14
Basic Principles
macroscopic phase separation (precipitation). Inversely, increasing the solvent quality favors
solvent-polymer chains interaction promoting the solubilization of the polymer.
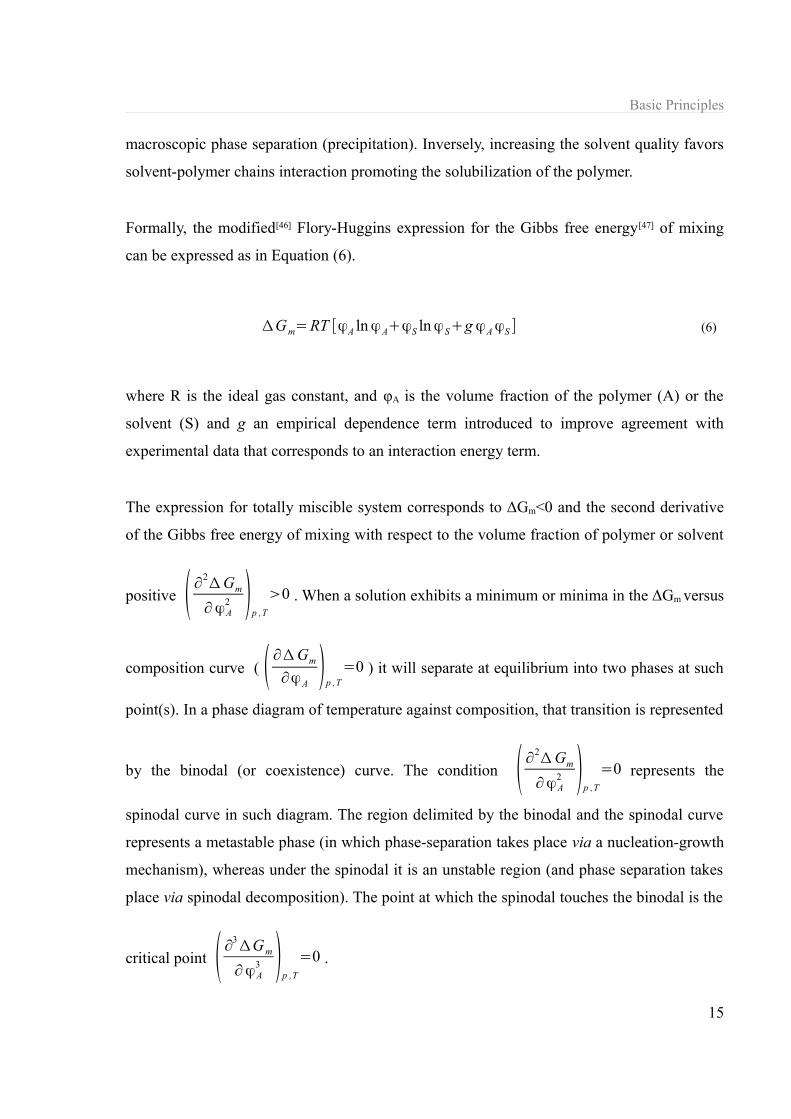
Formally, the modified[46] Flory-Huggins expression for the Gibbs free energy[47] of mixing
can be expressed as in Equation (6).
ΔGm=RT [φA ln φA+φS ln φS+g φA φS ] (6)
where R is the ideal gas constant, and φA is the volume fraction of the polymer (A) or the
solvent (S) and g an empirical dependence term introduced to improve agreement with
experimental data that corresponds to an interaction energy term.
The expression for totally miscible system corresponds to ΔGm<0 and the second derivative
of the Gibbs free energy of mixing with respect to the volume fraction of polymer or solvent
positive (∂2Δ Gm
∂φA2 )p ,T
>0 . When a solution exhibits a minimum or minima in the ΔGm versus
composition curve ( (∂Δ Gm
∂φA )p ,T=0 ) it will separate at equilibrium into two phases at such
point(s). In a phase diagram of temperature against composition, that transition is represented
by the binodal (or coexistence) curve. The condition (∂2Δ Gm
∂φA2 )p ,T
=0 represents the
spinodal curve in such diagram. The region delimited by the binodal and the spinodal curve
represents a metastable phase (in which phase-separation takes place via a nucleation-growth
mechanism), whereas under the spinodal it is an unstable region (and phase separation takes
place via spinodal decomposition). The point at which the spinodal touches the binodal is the
critical point (∂3 ΔGm
∂φA3 )p ,T
=0 .
15

Chapter 2
In practical terms, all polymers exhibit a minimum and a maximum point upon heating or
cooling. This can be represented by a phase diagram (Figure 2.7). The upper critical solution
temperature (UCST) represents the maximum and the lower critical solution temperature
(LCST) the minimum. When the critical temperature UCST or LCST are in the range in
which the solvent is liquid, the polymer is called thermoresponsive because by the
application of a thermal stimulus (heating or cooling) a transition is induced. The most well-
known example of polymer exhibiting a UCST near room temperature and a LCST at higher
temperature is polystyrene in cyclohexane.[48] An exhaustive list of polymers exhibiting
UCST and/or LCST behavior can be found in the literature.[49]
In water, LCST behavior arises from a balance between hydrophilic and hydrophobic
moieties within a repeating unit.[50] The most studied example is poly(N-isopropyl
acrylamide) (PNIPAM) that contains an hydrophobic isopropyl group and hydrophilic
acrylamide backbone whose balance sets the LCST at ~ 32 °C. When this temperature does
not correspond to the critical point but is rather the temperature of the coil-to-globule
16
Figure 2.7: General phase diagram of a polymer in a solvent. The relative position of the LCST and UCST are arbitrary, inversing them would describe the situation of a polymer is not soluble in a solvent in the whole temperature range.
Basic Principles
transition at a given concentration, it is called the cloud point (CP). The CP slightly depends
on the polymer molar mass and can be tuned either by copolymerization of PNIPAM with
other monomers or addition of salts, surfactants…The transition can be monitored by
turbidimetry[51] and shows a relatively large hysteresis upon cooling due to intramolecular
interactions between PNIPAM chains in the collapsed state.
The synthesis of DHBCs (or graft copolymers) with a thermoresponsive block presenting a
LCST allows the access to a new class of “smart” nanomaterials. Upon temperature-induced
collapse of the responsive block, the mesoglobule is stabilized by the other block forming
micelle-like structures. Because this transition is reversible, the micellization is switchable
and presents itself with a great potential for drug delivery and sensing applications.
One of the first and more widely studies examples of thermo-responsive micellization is with
poly(ethylene glycol)-block-poly(propylene glycol) (PEG-b-PPG or PEO-b-PPO) and
poly(ethylene glycol)-block-poly(propylene glycol)-block- poly(ethylene glycol) (PEG-b-
PPG-b-PEG or PEO-b-PPO-b-PEO) commercially known as Pluronics™.[52][53] These
polymers cover critical temperatures from 20 °C to 50 °C depending on the composition.
Other polymers exhibiting a LCST behavior such as PNIPAM,[54] poly(N-vinylcaprolactam
(PNVCL)[55] and poly(2-isopropyl oxazoline) (PIPOX) have been associated to hydrophilic
blocks such as PEO to obtain biocompatible smart materials.
2.3 Block copolymer synthesis & other tools of polymer chemistry
2.3.1 Block copolymers synthesis
The properties of block copolymers in bulk and solution are dramatically dependent on
various parameters such as composition but also architecture, compositional homogeneity,
functionality and molecular polydispersity.[56] The strategies to obtain polymers with such
precision have been regrouped under the label “living/controlled”. “Living” refers to chain
polymerizations from which chain transfer and chain termination are absent (although this
17
Chapter 2
restriction has since been relaxed), in other terms polymerizations that allow block
copolymer synthesis by sequential monomer addition. “Controlled” refers to preparations
methods to afford polymers that are well-defined in terms of topology, terminal functionality,
composition, arrangement of comonomers, with predictable molecular weight as well as
designed polydispersity. Nevertheless “living” polymerizations are not always “controlled”.
Slow initiation and slow exchanges in “living” processes can lead to polymers with
unpredictable molecular weight and high polydispersity index.[57]
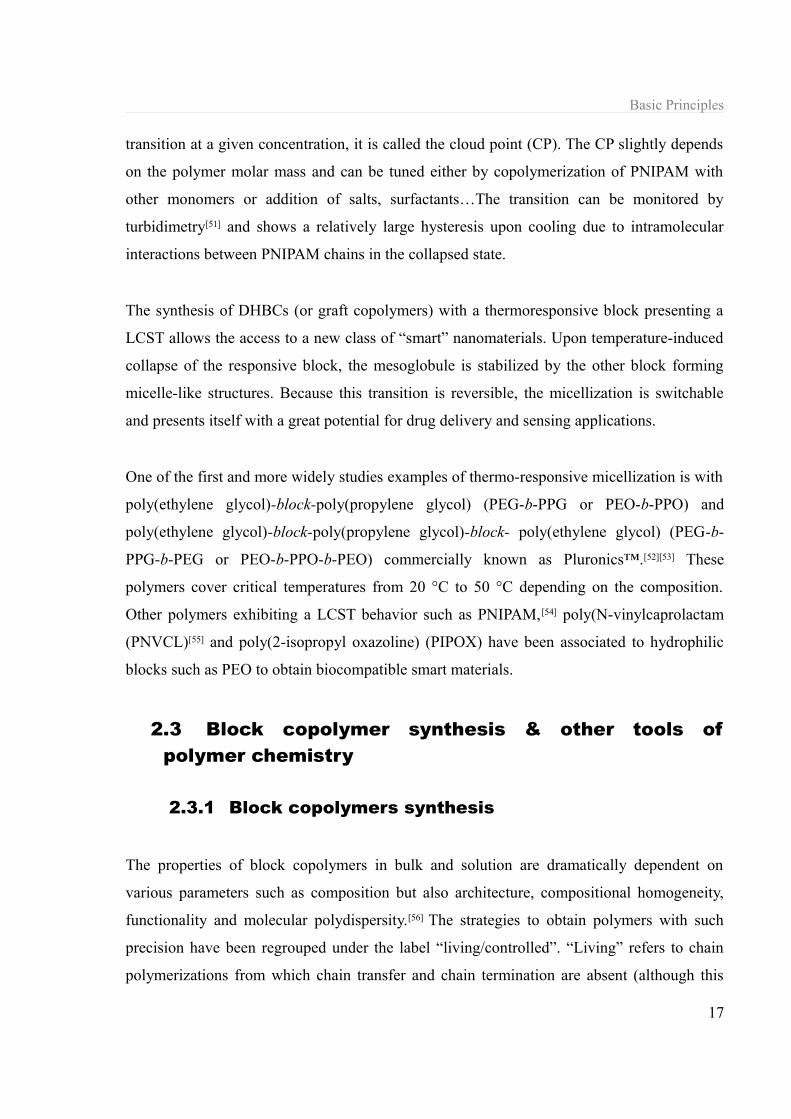
Strategies to obtain block copolymers by “controlled/living” polymerization in the simplest
AB copolymers case include sequential monomer addition (Figure 2.8 (a)) provided that
termination and transfer reactions are negligible, site-transformation technique (Figure 2.8
(b)) that requires the transformation of the propagation site into an initiating site for the
second monomer, dual bifunctional initiation (Figure 2.8 (c)), and polymer-polymer coupling
(Figure 2.8 (d)).
The “controlled/living” methods adapted to those strategies include anionic polymerization in
which the propagating species are anions, cationic polymerization in which the propagating
species are cations, several radical polymerizations (atom transfer radical polymerization
ATRP, Nitroxide-mediated polymerization NMP and Reversible Addition Fragmentation
chain Transfer RAFT) and some ring opening processes. In the next two paragraphs an
overview of the controlled or potentially controlled polymerization techniques used in this
18
Figure 2.8: Synthetic strategies towards AB diblock copolymers. (a) sequential monomer addition, (b) site-transformation technique, (c) by dual initiator and (d) by coupling ω-functional polymers. * refers to active site. Reproduced from [57].

Basic Principles
work, namely NCA polymerization and RAFT polymerization, will be presented.
2.3.1.a NCA polymerization
Polymerization of N-carboxyanhydrides (NCA) is the prefered synthetic pathway for the
obtention of high molecular-weight polypeptides with engineered architecture.[58] These N-
carboxyanhydrides of amino acids can be prepared by cyclisation of N-alkoxycarbonyl-
amino acid halogenides as described by Leuchs,[59] or more commonly by phosgenation of
the aminoacid by phosgene or preferentially triphosgene (Figure 2.9).[60]
Purification of the N-carboxyanhydride from its byproducts and most notably the
aminoacid·HCl salt is a challenge in this synthesis and numerous techniques have been
developed for it.[61][62]
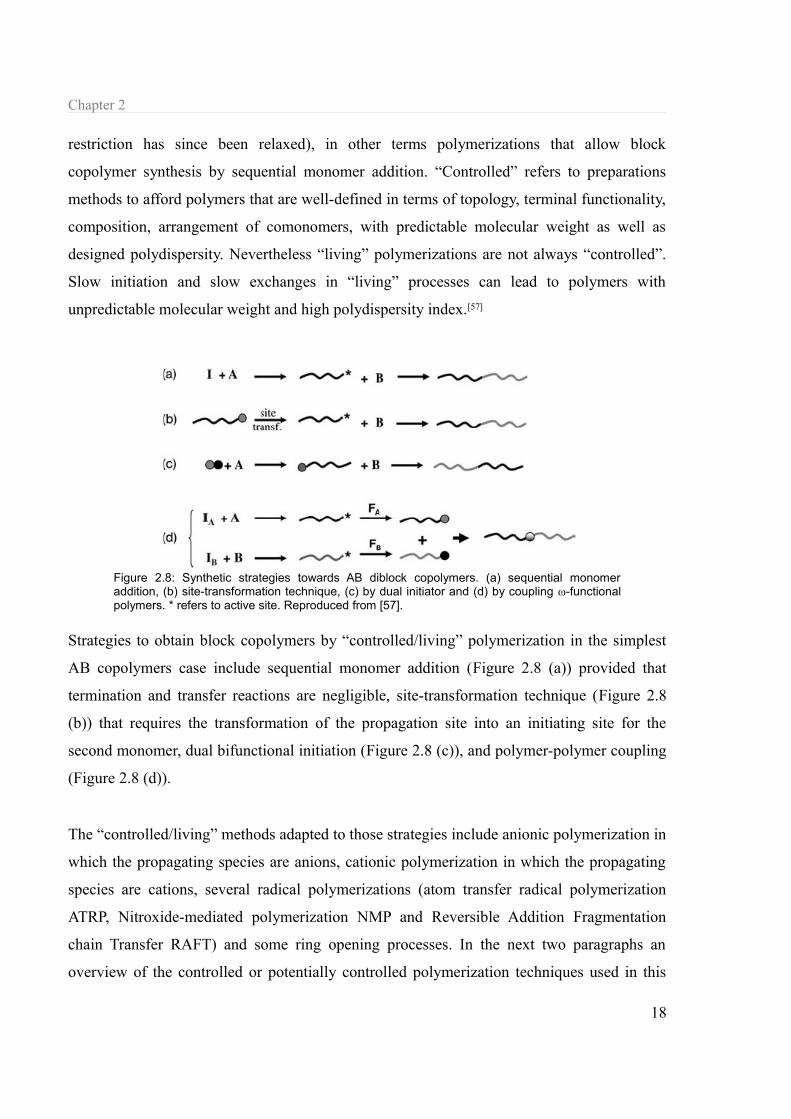
Subsequent polymerization of the monomer has been traditionally achieved by initiation by
primary amines. Under these conditions the polymerization takes place via two different
pathways, the primary amine mechanism (Figure 2.10 (a)) and the activated monomer
mechanism (Figure 2.10.(b)).
The primary amine mechanism is the nucleophilic ring opening chain growth mechanism.
When the polymerization proceeds uniquely via this mechanism, it has “living”
characteristics,[58] but normally this mechanism coexists with the activated monomer one
where the deprotonated NCA can act as an initiator and the polymerization proceeds via step
growth or condensation. Schlaad et al..[63] introduced an ammonium mediated synthesis of
monodisperse polystyrene-polypeptide block copolymers. In this study the use of the amine
ammonium salt as initiator suppressed the activated monomer mechanism by suppressing the
19
Figure 2.9: General NCA synthesis by phosgenation of an aminoacid using triphosgene
Chapter 2
deprotonation of the NCA (Figure 2.11) and seemed to have “living” characteristics.
Deming et al.[64] reported the use of organonickel initiators in the NCA polymerization that
resulted in a side-reaction free process. This polymerization was totally controlled and
allowed the preparation of well-defined homo and block copolymers. Other groups reported
the used of high-vacuum techniques that also resulted in living systems.[65]
2.3.1.b RAFT polymerization
20
Figure 2.10: (a) Primary amine mechanism and (b) activated monomer mechanism in N-carboxyanhydride polymerization.
Figure 2.11: Proposed mechanism for the "ammonium-mediated" ring opening polymerization of NCAs.

Basic Principles
Approximately 50 % of all synthetic polymers are currently obtained via radical
polymerization,[66] because of the large variety of monomers available and the mild
polymerization conditions needed (low temperatures, compatible with some impurities,
water...). In macromolecular science, free radical polymerization is very often unsuitable
because of the unavoidable terminations that lead to ill-defined polymers. A lot of effort has
been put into developing “living/controlled” radical polymerizations techniques. These
techniques, ATRP,[67][68] NMP[69] and RAFT[70][71] are all based on the dynamic equilibrium
between propagating radicals and various dormant species.
In RAFT, reversible chain transfer agents (CTAs) are used (Figure 2.12).
In these polymerizations, the propagating oligomers react with the C=S bond leading to a
transient radical that subsequently undergoes a β-scission (Figure 2.13) generating a R·
radical capable of reinitiating the polymerization. The equilibrium is established by these
successive chain transfer-fragmentation reactions.
The choice of the CTA for a given monomer is very important and determines the degree of
control in the polymerization. The activating substituent Z and the leaving group R have to
be carefully chosen. For example, an increase in the radical intermediate may inhibit the
polymerization. A fast equilibrium relative to the propagation rate must be sought after when
21
Figure 2.12: General structure of the chain transfer agents used in RAFT polymerizations.
Figure 2.13: Chain transfer processes in reversible-addition fragmentation polymerization (a) Transfer to CTA (b) Chain to chain transfer. Reproduced from [40].

Chapter 2
polymers with narrow polydispersity indexes are targeted.
2.3.2 Other tools of polymer chemistry: efficient linking
The design and preparation of more complex and highly functional macromolecular and
polymeric structures have always been a challenge in macromolecular chemistry. With the
quest of better well-defined and complex structure, modular approaches have appeared as the
solution to overcome incompatible chemistries and other synthetic limitations. For instance,
modification of easily accessible and well-defined “polymer precursors” exhibit several
advantages as less synthetic steps, overcoming the use of protecting groups and allowing the
easy tuning of certain properties. These modifications need to respect the “polymer
precursor” architecture and thus classical organic reactions cannot always be used:
byproducts translate into ill-defined polymer structures difficult to characterize and
separate,[72] high temperatures may cause polymer degradation,… In that context, the organic
reactions that Sharpless et al.[73] named “click” have become extremely popular. Pure “click”
reactions are rare. “Click” refers to versatile (orthogonal to other chemistries), efficient (in
high yields), specific (selective) and simple (simple experimental setups, mild reaction
conditions…) reactions. Only a few reactions have gained the “click” label such as Diels-
Alder cycloaddition, copper(I)-catalyzed alkyne-azide cycloaddition,[74] ring-opening
reactions on strained heterocyclic electrophiles such as epoxides,[73]…and more recently
thiol-ene[75]-[77] and thiol-yne[76][78][79] chemistry.
Macromolecular engineering has found in click reactions a versatile tool[72] not only to build
functional structures in one step in a chain- or step-growth polymerization but also to
22
Figure 2.14: Variations on a simple theme: examples of macromolecular architectures recently obtained by click modification of well-defined polystyrene prepared by ATRP. Adapted from [74].

Basic Principles
complement major synthetic polymerization techniques by allowing the chain-end, side-chain
or site specific modification of preformed structures, or even by allowing the linkage of two
separately formed segments[80] (Figure 2.14). Several excellent reviews summarize and
present the use of “click” reactions[72][81][82] and particularly CuAAC[83] and thiol-ene[77]
reactions in materials and polymer science.
Although rarely in the literature these reactions fulfill all the click requirements, they remain
a tool for efficient linking.[84] Two of these reactions were used in this work, Copper(I)-
catalyzed alkyne-azide cycloaddition and thiol-ene radical addition. The next paragraphs aim
at highlighting their principle and their use in polymer chemistry.
2.3.2.a Copper(I)-catalyzed alkyne-azide cycloaddition (CuAAC)
The Azide-Alkyne Huisgen Cycloaddition is a 1,3-dipolar cycloaddition between an azide
and a terminal alkyne to give a 1,2,3-triazole (Scheme 2.1.(a)). First discovered by
Michael[85] in the 19th century, it was later studied in detail by Huisgen[86][87] in the 1960s.
Although orthogonal to other functionalities, the reaction was not regioselective (producing
1,4- and 1,5-substituted triazoles), was slow and required relative high temperatures until in
2002, Meldal et al.[88] reported that the use of catalytic amounts of copper(I) lead to a fast,
efficient and regioselective (1,4-substituted triazole) cycloaddition at room temperature
(Scheme 2.1.(b)).
The complexity of ligand interaction with Cu(I) and particularly that of the alkyne
complexation makes difficult the determination of the detailed structural secrets of the
23
Scheme 2.1: (a) standart Huisgen thermal [3+2] cycloaddition and (b) copper-catalized alkyne-azide cycloaddition (CuAAC).
Chapter 2
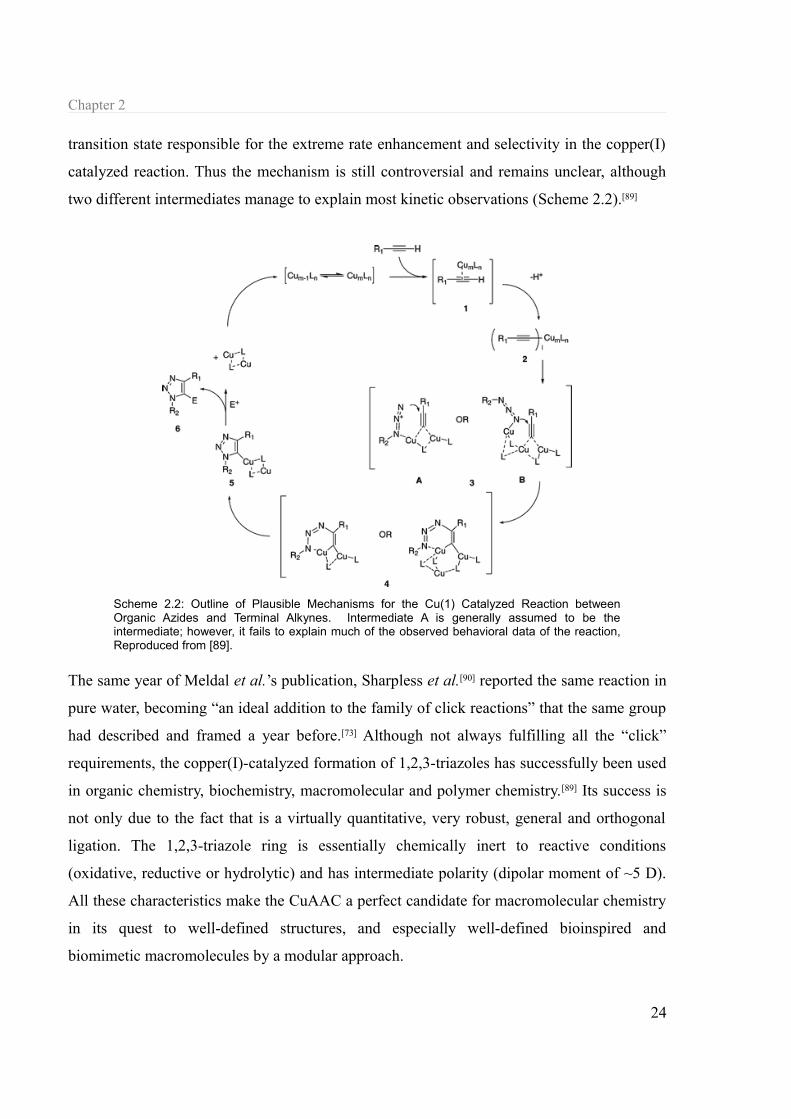
transition state responsible for the extreme rate enhancement and selectivity in the copper(I)
catalyzed reaction. Thus the mechanism is still controversial and remains unclear, although
two different intermediates manage to explain most kinetic observations (Scheme 2.2).[89]
The same year of Meldal et al.’s publication, Sharpless et al.[90] reported the same reaction in
pure water, becoming “an ideal addition to the family of click reactions” that the same group
had described and framed a year before.[73] Although not always fulfilling all the “click”
requirements, the copper(I)-catalyzed formation of 1,2,3-triazoles has successfully been used
in organic chemistry, biochemistry, macromolecular and polymer chemistry.[89] Its success is
not only due to the fact that is a virtually quantitative, very robust, general and orthogonal
ligation. The 1,2,3-triazole ring is essentially chemically inert to reactive conditions
(oxidative, reductive or hydrolytic) and has intermediate polarity (dipolar moment of ~5 D).
All these characteristics make the CuAAC a perfect candidate for macromolecular chemistry
in its quest to well-defined structures, and especially well-defined bioinspired and
biomimetic macromolecules by a modular approach.
24
Scheme 2.2: Outline of Plausible Mechanisms for the Cu(1) Catalyzed Reaction between Organic Azides and Terminal Alkynes. Intermediate A is generally assumed to be the intermediate; however, it fails to explain much of the observed behavioral data of the reaction, Reproduced from [89].

Basic Principles
The choice in this thesis of mainly using the triazole link to build up block copolymer had
many reasons. The first one being the previously cited characteristics of the “click” reaction:
universal, orthogonal to most functionalities and robust. The second one concerns the
similarities with the peptidic bond. In a bioinspired approach, the conjugation of naturally
recurrent polymers such as dextran for potential later biogical applications can be favoured
by the use of biocompatible functionalities that mimic native natural bonds such as the
peptidic bond. The 1,2,3-triazole ring has been shown to be a peptide bond isostere1 [91] and
the functional groups are similar in terms of distance and planarity (Figure 2.15).[92] This
chemistry has been widely applied now in peptidomimetics,[92][93] nucleoside and nucleotide
chemistry,[94] polymer chimeras,[95] and has also led its way into multivalent carbohydrate and
polysaccharide chemistry.[93][96]
CuAAC ligation has been found especially uselful in the ligation of preformed segments.
Naturally recurrent saccharides polymers such as chitin/chitosan, dextran,.. cannot be made
synthetically and are usually obtained from natural sources such as crab shells or in bacteria.
The classic approach for the synthesis of well-defined polymers obtained by controlled
methods such as step-growth polymerization is thus impossible. Selective chemical
modification of functionalities in those polysaccharides allow though to access well-defined
structures[97] constituted of for example, two blocks for which the copolymerization is
impossible such as chitosan and poly(ethylene glycol). In a work by Makuška et al.,[98] the
1 Isosteres are molecules or ions with the same number of atoms and the same number of valence electrons. As a result, they can exhibit similar pharmacokinetic and pharmacodynamic properties.
25
Figure 2.15: Molecular dimensions of the 1,4-disubstituted 1,2,3-triazoles are somewhat similar to amide bonds in terms of distance and planarity. Reproduced from reference [92]
Chapter 2
anomeric end of chitosan was modified by reductive amination with amino propargyl. Azido
terminated poly(ethylene glycol) was then “clicked” onto the polysaccharide to afford a
polysaccharide-block-polyether hybrid with well-defined structure and architecture. Similarly
in a work by Lecommandoux et al.,[99] dextran was modified by reductive amination with
amino propargyl and coupled by CuAAC to a synthetical azido-modified polypeptide,
poly(L-benzyl glutamate) obtained by NCA polymerization (see paragraph 2.3.1.a ).
An implement to the CuAAC reaction as well as other polymer chemistry strategies [100] in the
last years has been the use of the microwave (μW) irradiation. The reaction times can be
decreased from hours to minutes.[101] In polymer chemistry, μW-assisted CuAAC has been
successfully used in the coupling of azido-peptides to dendritic-alkynes[102] with a 96% yield,
far above the 43-56% obtained with normal heating. Similarly, Morvan et al.[103]
demonstrated that μW activation significantly improved the reaction kinetics compared to the
standard conditions.
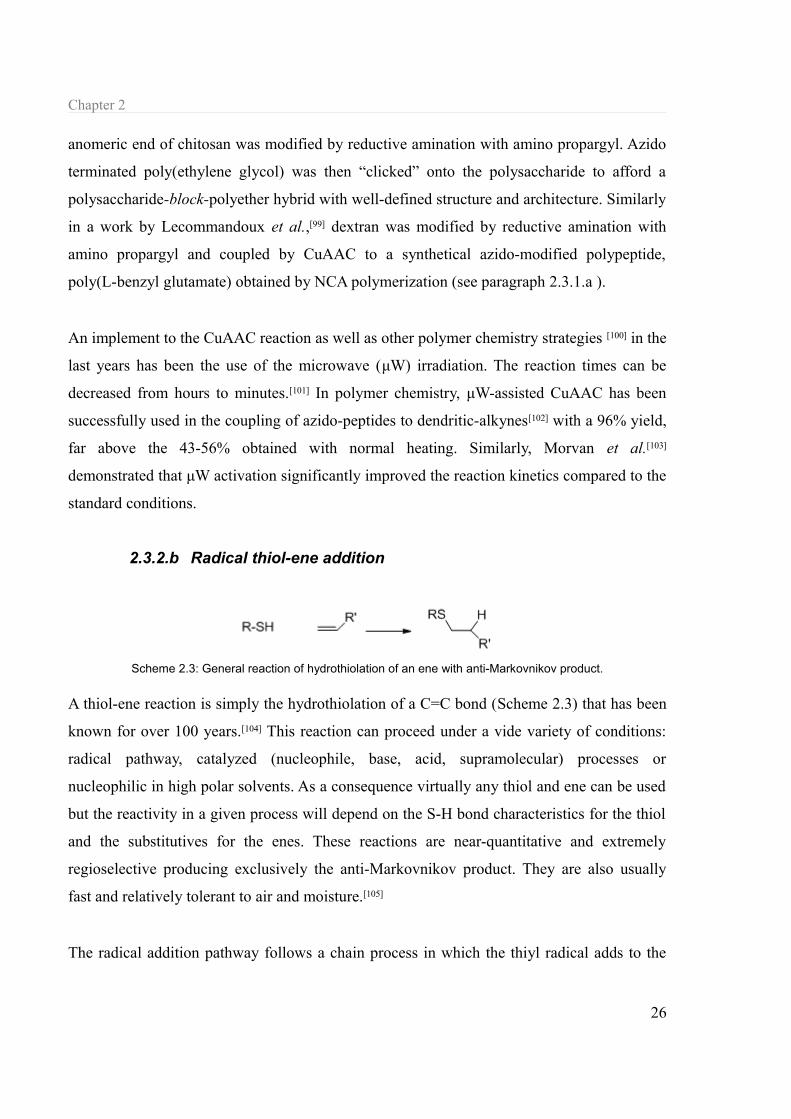
2.3.2.b Radical thiol-ene addition
A thiol-ene reaction is simply the hydrothiolation of a C=C bond (Scheme 2.3) that has been
known for over 100 years.[104] This reaction can proceed under a vide variety of conditions:
radical pathway, catalyzed (nucleophile, base, acid, supramolecular) processes or
nucleophilic in high polar solvents. As a consequence virtually any thiol and ene can be used
but the reactivity in a given process will depend on the S-H bond characteristics for the thiol
and the substitutives for the enes. These reactions are near-quantitative and extremely
regioselective producing exclusively the anti-Markovnikov product. They are also usually
fast and relatively tolerant to air and moisture.[105]
The radical addition pathway follows a chain process in which the thiyl radical adds to the
26
Scheme 2.3: General reaction of hydrothiolation of an ene with anti-Markovnikov product.
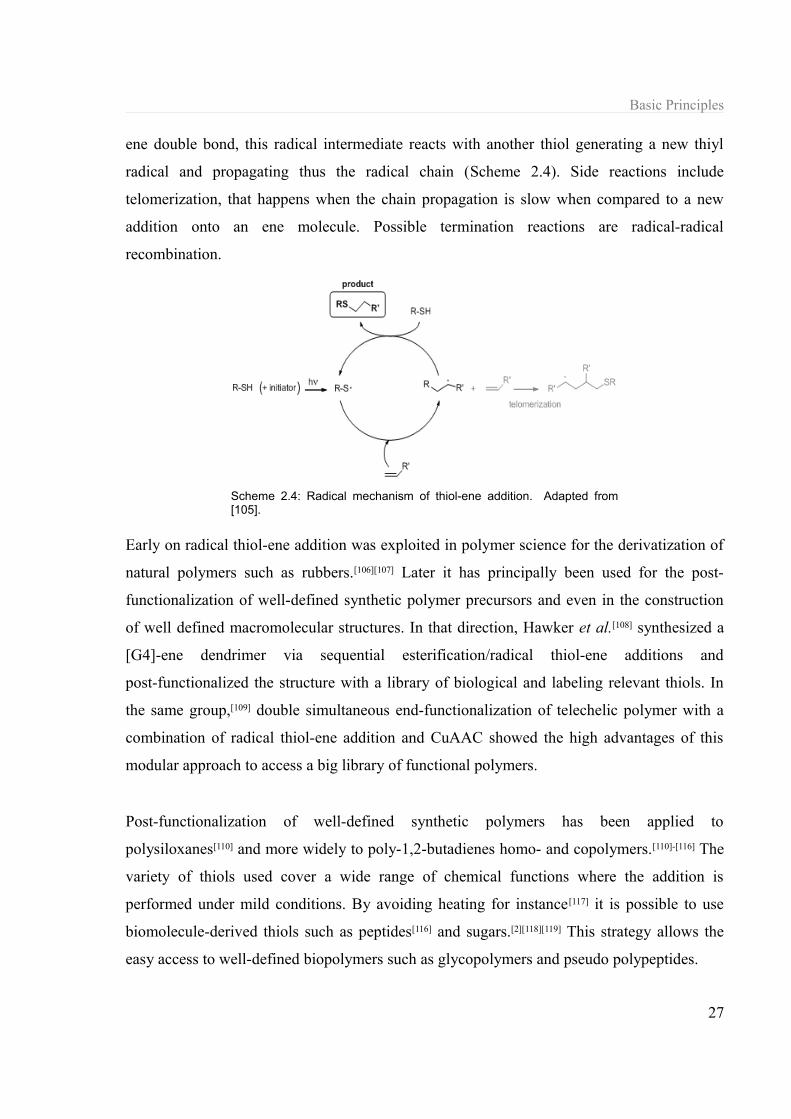
Basic Principles
ene double bond, this radical intermediate reacts with another thiol generating a new thiyl
radical and propagating thus the radical chain (Scheme 2.4). Side reactions include
telomerization, that happens when the chain propagation is slow when compared to a new
addition onto an ene molecule. Possible termination reactions are radical-radical
recombination.
Early on radical thiol-ene addition was exploited in polymer science for the derivatization of
natural polymers such as rubbers.[106][107] Later it has principally been used for the post-
functionalization of well-defined synthetic polymer precursors and even in the construction
of well defined macromolecular structures. In that direction, Hawker et al.[108] synthesized a
[G4]-ene dendrimer via sequential esterification/radical thiol-ene additions and
post-functionalized the structure with a library of biological and labeling relevant thiols. In
the same group,[109] double simultaneous end-functionalization of telechelic polymer with a
combination of radical thiol-ene addition and CuAAC showed the high advantages of this
modular approach to access a big library of functional polymers.
Post-functionalization of well-defined synthetic polymers has been applied to
polysiloxanes[110] and more widely to poly-1,2-butadienes homo- and copolymers.[110]-[116] The
variety of thiols used cover a wide range of chemical functions where the addition is
performed under mild conditions. By avoiding heating for instance[117] it is possible to use
biomolecule-derived thiols such as peptides[116] and sugars.[2][118][119] This strategy allows the
easy access to well-defined biopolymers such as glycopolymers and pseudo polypeptides.
27
Scheme 2.4: Radical mechanism of thiol-ene addition. Adapted from [105].
Chapter 2
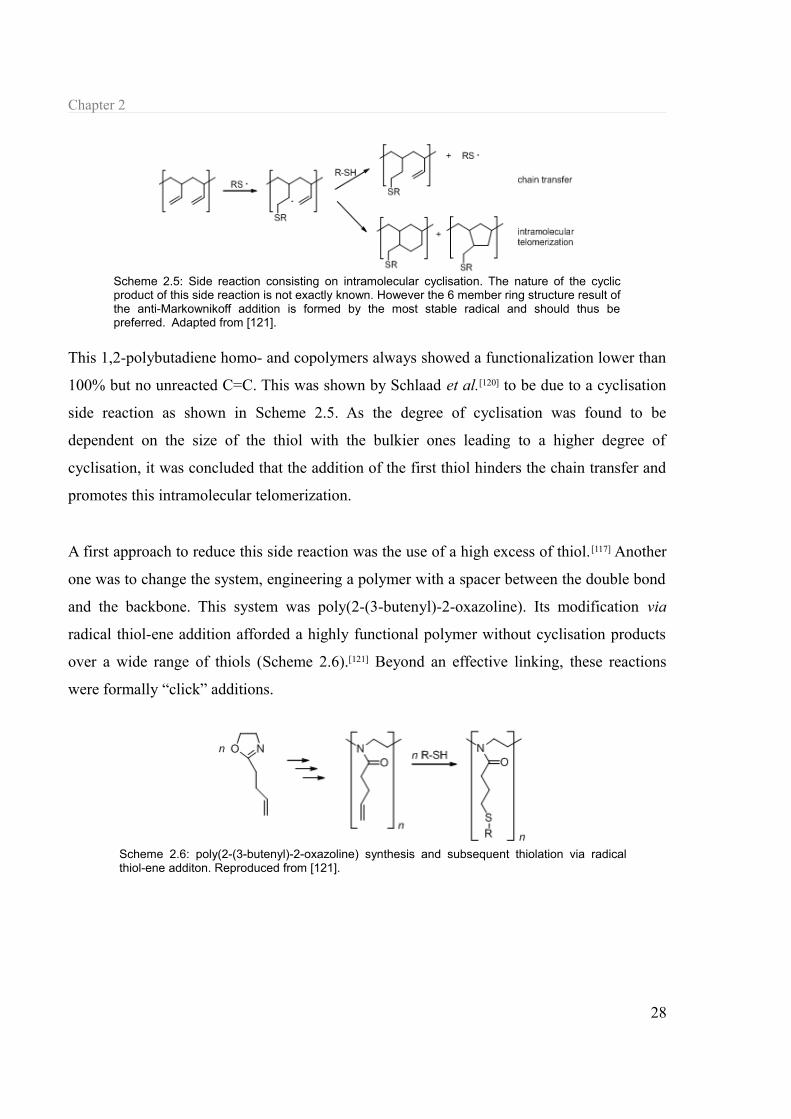
This 1,2-polybutadiene homo- and copolymers always showed a functionalization lower than
100% but no unreacted C=C. This was shown by Schlaad et al.[120] to be due to a cyclisation
side reaction as shown in Scheme 2.5. As the degree of cyclisation was found to be
dependent on the size of the thiol with the bulkier ones leading to a higher degree of
cyclisation, it was concluded that the addition of the first thiol hinders the chain transfer and
promotes this intramolecular telomerization.
A first approach to reduce this side reaction was the use of a high excess of thiol.[117] Another
one was to change the system, engineering a polymer with a spacer between the double bond
and the backbone. This system was poly(2-(3-butenyl)-2-oxazoline). Its modification via
radical thiol-ene addition afforded a highly functional polymer without cyclisation products
over a wide range of thiols (Scheme 2.6).[121] Beyond an effective linking, these reactions
were formally “click” additions.
28
Scheme 2.5: Side reaction consisting on intramolecular cyclisation. The nature of the cyclic product of this side reaction is not exactly known. However the 6 member ring structure result of the anti-Markownikoff addition is formed by the most stable radical and should thus be preferred. Adapted from [121].
Scheme 2.6: poly(2-(3-butenyl)-2-oxazoline) synthesis and subsequent thiolation via radical thiol-ene additon. Reproduced from [121].

Self-assembly of double hydrophilic block copolymers: The hydrophilic effect
Chapter 3: Self-assembly of double hydrophilic block
copolymers: The hydrophilic effect
Since the 1980s ATPS has been used in the biological sciences as a routine extraction
technique. Some attention has been brought to the theory backing such phenomenon[122][123]
but mainly to predict the composition of the phases and the partition coefficients of proteins.
The simplest description states that when the gain in entropy of mixing is not large enough to
compensate for the repulsive polymer–polymer interaction enthalpy, the mixing of the two
polymers is thermodynamically not favorable and phase separation occurs.[124] Just from a
qualitative point of view it seems that phase separation in ATP systems could not purely be
explained by the incompatibility of the polymers (high χAB) as it fails to explain why
29

Chapter 3
relatively low molecular weight polymers mixtures[9] still phase-separate, and experimental
evidence of the magnitude of the incompatibility of the dextran/PEG pair shows that it is not
total.[125]
Two qualitative thermodynamic considerations can be evaluated to explain the phase
separation in ATP systems outside polymer-polymer incompatibility, an enthalpic and an
entropic one, and this discussion can be translated into the feasibility of transposing this
phase separation to the microscale with block copolymers.
Scott[126] and Tompa[127] applied Flory-Huggins solution thermodynamics to the study of
polymer-polymer-solvent (A-B-S) systems assuming that the phase equilibrium only depends
on the polymer-polymer interaction parameter χAB and thus χAS=χBS. This approximation has
found numerous limitations including the direct consequence that the phase separation does
not depend on the nature of the solvent.[128] This limitation can be overcome by relaxing this
restriction and introducing the dependence on |Δχ| as defined by Equation (7).
∣Δ χ∣=∣χAS−χBS∣ (7)
This so called “|Δχ| effect” even allows to predict phase separation in compatible polymer
pairs-solvent ternary systems provided that |Δχ| is big enough.[129]
In block copolymers, the incompatibility of the two segments is at least partially
compensated by the compatibility introduced by the covalent bond between them. Solubility
difference in the Flory Huggins interaction parameter (see paragraph 2.2.2 and Equation
(8))
χeff N≈φ(χ AB+Δχ) N≈φ(χ AB+∣χAS+χ BS∣) N (8)
is often read in terms of “selective solvent |Δχ| ≠ 0” and “common solvent |Δχ| = 0” although
30

Self-assembly of double hydrophilic block copolymers: The hydrophilic effect
this is only an extreme solubility case. If |Δχ| is big enough without one of the polymers
being insoluble provided that χAB remains high enough, then a block copolymer made of two
water-soluble incompatible blocks could phase separate in water i.e. self-assemble in dilute
solution.
In addition, entropic effects should be considered especially when working in water. The
“hydrophobic effect”[37][130] is now widely acknowledged to be the main driving force for self-
assembly of amphiphiles in water. A simple definition of this effect states that over a certain
concentration of amphiphiles (critical aggregate concentration) in water, the non-soluble
segments of the molecule and water segregate to overcome the loss of conformational
entropy of water molecules next to these segments. From that point of view this effect could
be generic and regroup all entropy-driven segregation phenomena, and could in principle not
only be restricted to hydrophobic/amphiphilic molecules. Qualitatively, a block copolymer
made of two water-soluble blocks should possess low free-energy in the random coil
conformational state. But if the polymer is made of blocks presenting high solubility
difference, a segregation could lower even more the system's free energy by freeing the
conformation entropy of the water molecules that were trying to solubilize the “less soluble”
block. This theory supports that to have an entropy-driven segregation, a big solubility
difference is enough provided that the enthalpic contribution to the free energy does not
compensate it.
In this work, a series of block copolymers designed to present incompatibility and high
solubility difference were synthesized and their behavior in water studied. Perfect candidates
were block copolymers based on the ATP systems as they seem to show both high
incompatibility and high solubility difference, and they phase separate under mild conditions
of concentration and temperature. Systems based on biomacromolecules (polysaccharides,
polypeptides) were preferred as there phase separation has been proved in
microcompartimentation in cells and they constitute biologically-relevant systems.
In the first part of this chapter polysaccharide-based polymers are studied. PEG-b-dextran
block copolymers are synthesized and their behavior in aqueous solution is studied. Some
31

Chapter 3
attention is paid to the influence of parameters such as concentration and temperature as well
as some structural parameters on the self-assembly behavior. Other dextran-based
copolymers were briefly studied to test the validity of ATPS as source of inspiration to
engineer DHBCs with self-assembling capabilities.
In a second part, first a polypeptide-based copolymer system is studied to extend the
principle to the main group of biomacromolecules. Secondly, a thermoresponsive
polysaccharide-poly(N-isopropylacrylamide) system is studied and evaluated to increase
complexity in the system and as a hybrid model.
3.1 Spontaneous self-assembly of polysaccharide-based block copolymers in water
3.1.1 Designing DHBCs for self-assembly: incompatibility and solubility difference
PEG/dextran is the most frequently used ATP system certainly due to the low cost of both
polymers. Dextran is a glucan, for instance expressed by bacteria of the species
Leuconostoc spp.. The most common dextran consists of D-glucose units, 95% linked by
α(1→6) bonds with branching formed by α(1→3) and occasionally α(1→4) bonds. Many
aspects of the fine structure of dextran (branching, molecular weight and molecular weight
distribution) depend on the conditions and strain of the bacteria used for expression. [131]
Poly(ethylene glycol) is a synthetic polymer widely used in biological and medical
applications for its non-immunogenicity and biocompatibility. Although often reported as
highly soluble in water,[123] its wide solubility in both water and organic media makes it often
being referred as “amphiphile”. Its solubility in water being complex,[132] PEG also shows a
molar mass dependent LCST behavior.[133]
In our hypothesis of block copolymers microphase separation, both incompatibility of the
polymers and their relative solubility in water are taken into account. To compare the
solubility of both polymers in water, we made a comparison of the hydration of both
32

Self-assembly of double hydrophilic block copolymers: The hydrophilic effect
polymers as reported in literature.
In average, dextran was found to bind 7 water molecules per glycosidic residue for a low
molecular weight polymer but can bind up to 10 water molecules per residue in high
polymers.[134] This is in accordance with the water bounding capabilities of D-glucose that
have been found to be 0.682 g of water per gram.[135] This also reflects the superior hydration
capabilities of dextran compared to other polysaccharides (especially the ones with linking
other than (1→6)) previously reported.[136] In the literature, for the hydration of PEG several
values have been given ranging from 1 to 5,[137]-[140] although 2[141] water molecules per residue
is the commonly acknowledged value. Despite the differences in the values, it seems clear
that PEG binds a substantial lower quantity of water than dextran in solution. So from a
qualitative point of view, these hydration values translate thus into a rather high solubility
difference of the two polymers, and suggests thus that dextran-b-PEG could be a good
candidate for our work.
Incompatibility of two polymers can be evaluated from the thermodynamic parameters as
previously reported[142] but also directly observing a phase separation diagram. A mixture of
the polymers in water undergoes a phase separation when their concentration is above several
weight percent. These phase diagrams can be established by cloud point titration. In these
33
Figure 3.1: Binodal of dextran (Mw 6500 g·mol-1) and PEG (Mw 5500 g·mol-1) in aqueous solution at room. The line is just a guide for the eyes.

Chapter 3
experiments known amounts of a dextran stock solution is titrated with a PEG stock solution
until the solution becomes turbid. By measuring the change in mass after the addition of the
titrant, the quantity of PEG added can be calculated.
In Figure 3.1 the phase diagram of the PEG/dextran polymers used in this study obtained by
cloud point titration at room temperature is shown. When the polymer solution is located
below the binodal the solution is stable and homogeneous and when the solution mixture is
above the binodal it becomes turbid and subsequently separates into two phases (Figure 3.2).
Both homopolymers used in this experiments are characterized by a low-molecular weight
(for dextran Mw ~6500 g·mol-1and for PEG Mw ~5500 g·mol-1). This choice will be discussed
later, but the binodal curve shows phase separation for relatively low weight percentages (eg.
~10/10 wt% dextran/PEG) indicating a negative free energy of mixing above the binodal.
Typical ATP systems are usually performed with at least one of the polymers having a high
molecular weight for several reasons including the fact that higher polymers result in a
sharper separation of biomolecules between the two phases. This is related certainly to the
composition of both phases that varies with temperature and concentration. What seems
surprising is that the binodal in our case seems comparable to a certain extend with binodals
of dextran 500 kDa/PEG 8 kDa,[27] dextran 40 kDa/PEG 3.4 kDa, dextran 70 kDa/ PEG 20
kDa[9]…in terms of position of the curves, so the phase-separation is less molecular-weight
dependent than Scott’s[126] and Tompa’s[127] model could suggest.
Qualitatively, PEG/dextran seems to be a good candidate for our work. Whether the macro
34
Figure 3.2: Cloud point and subsequent macrophase separation.
Self-assembly of double hydrophilic block copolymers: The hydrophilic effect
phase separation in the polymer mixtures can be translated into a microphase separation in
the block copolymer cannot be evaluated directly from the polymer mixture thermodynamic
parameters.
3.1.2 Polymers syntheses
The synthesis of dextran-block-poly(ethylene glycol) cannot be done by sequential
polymerization or other elegant techniques.[143] Dextran being of bacterial origin, it is (at least
currently) impossible to start its polymerization with a poly(ethylene glycol) macroinitiator.
Viceversa dextran being a polyglucan, it is difficult to use it as a macroinitiator in anionic
polymerization to afford a block copolymer. The adopted strategy was therefore polymer-
polymer coupling. This approach has been used before to afford dextran-[99] and other natural
polysaccharide-based [98] block copolymers. Dextran’s anomeric end can be functionalized by
either oxidizing it to a lactone or reducing it by reductive amination.
For getting a high coupling yield, relatively low molecular mass polymers were used, and the
chosen coupling reaction was a well-known one belonging to the “click” family, which is the
microwave-assisted copper(I)-catalyzed alkyne-azide cycloaddition (see paragraph 2.3.2.a ).
The same approach was used to synthesize a triblock dextran-b-PEG-b-dextran. For
comparison, an additional dextran-b-PEG block copolymer with an amide link was prepared
by lactone ring opening.
3.1.2.a Dextran-block-poly(ethylene glycol) by CuAAC
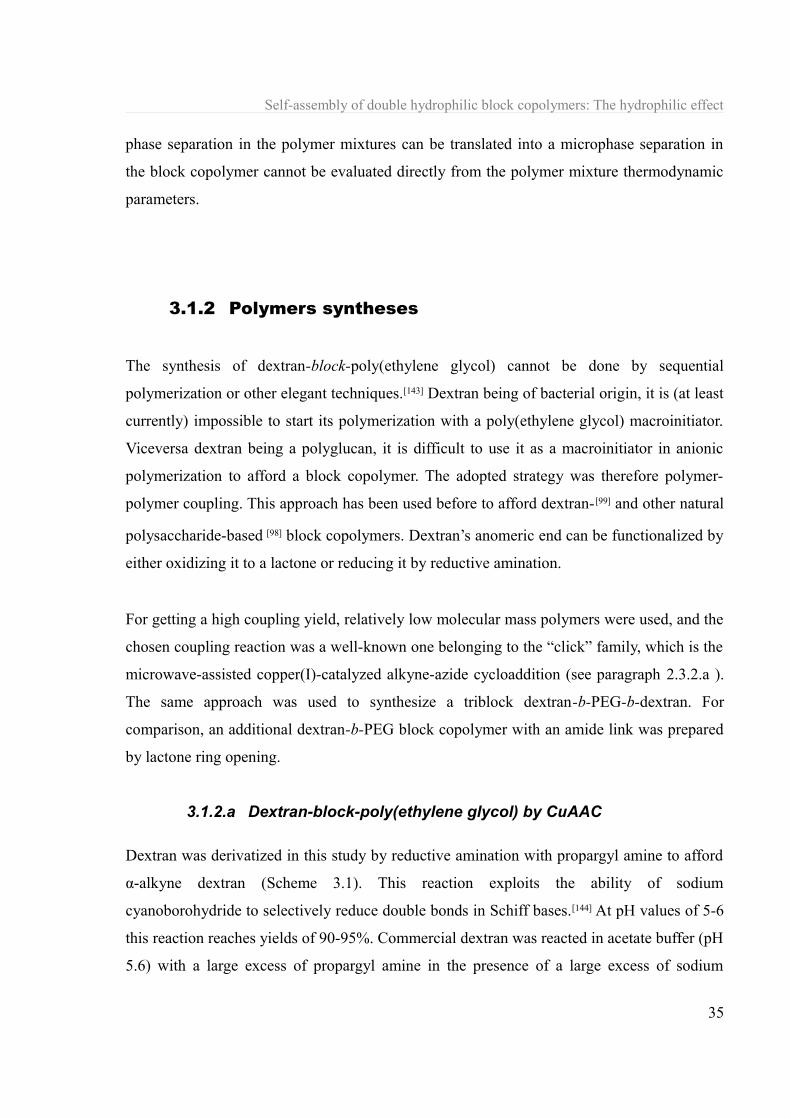
Dextran was derivatized in this study by reductive amination with propargyl amine to afford
α-alkyne dextran (Scheme 3.1). This reaction exploits the ability of sodium
cyanoborohydride to selectively reduce double bonds in Schiff bases.[144] At pH values of 5-6
this reaction reaches yields of 90-95%. Commercial dextran was reacted in acetate buffer (pH
5.6) with a large excess of propargyl amine in the presence of a large excess of sodium
35

Chapter 3
cyanoborohydride (NaCNBH3). Additional excess amounts of NaCNBH3 were added daily as
this compound is water sensitive. The success of the reaction was assessed by the complete
disappearance of the protons of the anomeric end in the 1H NMR spectrum (See Supporting
experimental data).
Commercial methoxy-poly(ethylene glycol) was functionalized in a two step synthesis
(Scheme 3.2). First the ω-hydroxyl was activated by tosylation in dichloromethane with p-
toluenesulfonyl chloride (TsCl), high functionalization (close to quantitative) was assessed by
the disappearance of the OH signal in 1H NMR at 4.57 ppm as well as a ratio close to 1 of the
integrals of the peaks corresponding to the methoxy group and the methyl of the tosyl. This
last ratio also shows the effectiveness of recrystallization from ethanol as a purification
method as an excess of TsCl and triethylamine (TEA) is usually difficult to remove by
reprecipitation with diethyl ether. Secondly the azido group was introduced by nucleophilic
substitution of this α-methoxy-ω-p-toluenesulfonyl-poly(ethylene glycol) with an excess of
sodium azide to afford α-methoxy-ω-azido-poly(ethylene glycol). The completion of the
reaction was assessed by the disappearance of the tosyl group peaks in 1H NMR.
Ultimately, both blocks were coupled under microwave irradiation (~900 W) with CuI/1,8-
Diazabicyclo[5.4.0]undec-7-ene (DBU) as catalyst/ligand system (Scheme 3.3). CuI/DBU as
been shown to induced high yields in 1,2,3-triazole formation not only in organic
chemistry[145] but also in polymer science.[146] For simultaneous solubilization of both blocks
and the catalyst/ligand, a mixture of water and tetrahydrofuran (THF) was used. This
36
Scheme 3.1: Reaction scheme of the reductive amination of dextran with propargyl amine.
Scheme 3.2: Reaction scheme of the two step azidation of methoxypolyethylene glycol.

Self-assembly of double hydrophilic block copolymers: The hydrophilic effect
approach also allowed the easy removal of the copper catalyst: as a large excess of ligand
was used, all the copper ions were complexed, so after the reaction the simple removal of the
THF precipitated the Cu(I)/DBU complex and the free DBU. Although no control of the
Cu(I) content of the sample was performed after the THF removal, the polymer was
additionally purified with activated charcoal.
Four dextran-block-poly(ethylene glycol) were prepared this way with varying block lengths
(Table 3.1).
Table 3.1: List of the synthesized polymers (first column). The second and third column correspond to the commercial starting blocks used. The fourth column corresponds to the block copolymers.
Polymer Dextran Mw (PDI) (1) PEG Mw (PDI) (2) Mw, app (PDI) (3)
dex6500-b-PEG5500 6500 (1.81) 5500 (1.03) 13000 (1.71)
dex6500-b-PEG1900 6500 (1.81) 1900 (1.05) 11400 (1.61)
dex6500-b-PEG13200 6500 (1.81) 13200 (1.08) 20000 (1.85) (*)
dex11000-b-PEG5500 11000 (1.85) 5500 (1.03) 11000 (1.44)
(1) as determined by GPC in DMSO with dextran standard (2) as determined by GPC in NMP with PEG standard (3) as determined by GPC in DMSO with dextran standard (*) contains residual homopolymer
37
Scheme 3.3: Reaction scheme of the coupling of ω-alkyne dextran and α-methoxy-ω-azido-PEG by CuAAC under microwave irradiation.
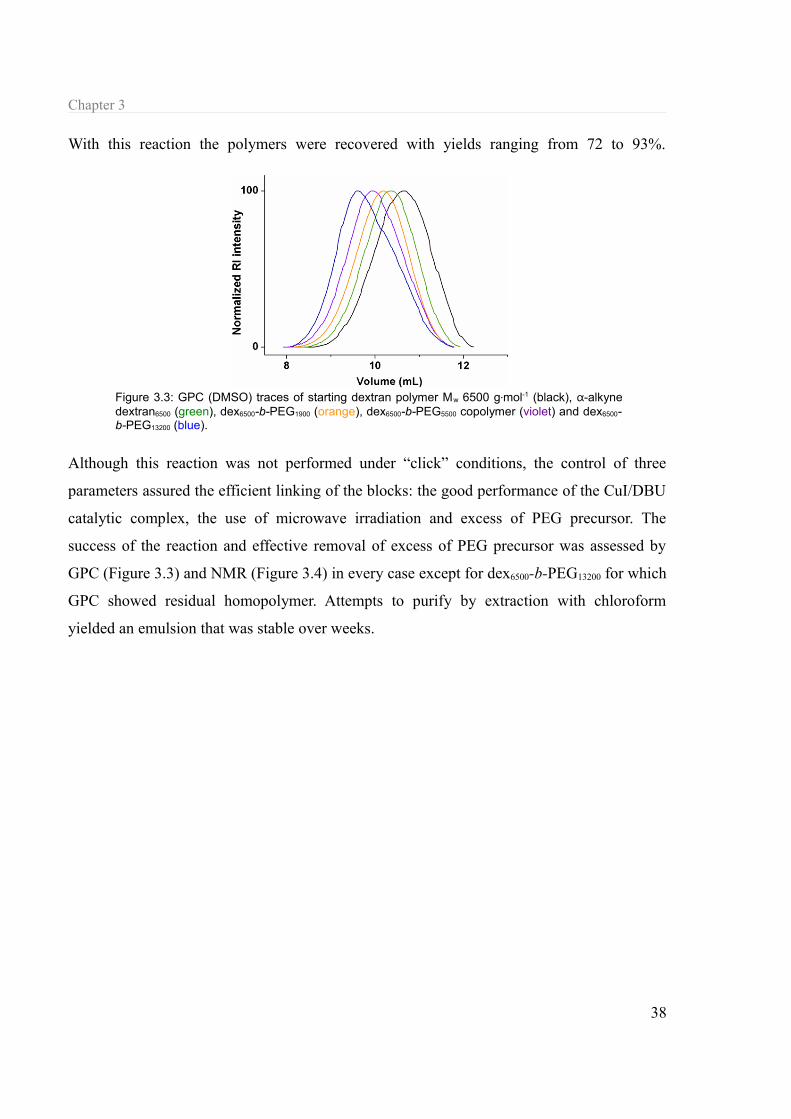
Chapter 3
With this reaction the polymers were recovered with yields ranging from 72 to 93%.
Although this reaction was not performed under “click” conditions, the control of three
parameters assured the efficient linking of the blocks: the good performance of the CuI/DBU
catalytic complex, the use of microwave irradiation and excess of PEG precursor. The
success of the reaction and effective removal of excess of PEG precursor was assessed by
GPC (Figure 3.3) and NMR (Figure 3.4) in every case except for dex6500-b-PEG13200 for which
GPC showed residual homopolymer. Attempts to purify by extraction with chloroform
yielded an emulsion that was stable over weeks.
38
Figure 3.3: GPC (DMSO) traces of starting dextran polymer Mw 6500 g·mol-1 (black), α-alkyne dextran6500 (green), dex6500-b-PEG1900 (orange), dex6500-b-PEG5500 copolymer (violet) and dex6500-b-PEG13200 (blue).

Self-assembly of double hydrophilic block copolymers: The hydrophilic effect
3.1.2.b Dextran-block-poly(ethylene glycol)-block-dextran
In order to investigate the architecture influence on the self-assembly behavior of the
dex-block-PEG copolymer, a triblock dex-b-PEG-b-dex was synthesized. The approach was
the same as for the diblock copolymer, but the polyethylene(glycol) starting polymer was α-
ω-diol and thus the copolymer was synthesized with α,ω-bisazido-poly(ethylene glycol).
The GPC traces (Figure 3.5) show the successful coupling of the copolymer. The low
apparent molecular weight (Table 3.2) could suggest incomplete coupling but the elemental
analysis (EA) of the powder (and compared to the carbon content for the diblock) together
with the single peak in GPC confirm its triblock structure.
Table 3.2: Characteristic of the synthesized dextran-block-poly(ethylene glycol)-block-dextran triblock copolymer and its constituting building blocks.
Polymer Dextran Mw (PDI) (1) PEG Mw (PDI) (2) Mw, app (PDI) (3)
dex6500-b-PEG5100-b-dex6500 6500 (1.81) 5100 (1.03) 12000 (1.62)
(1) as determined by GPC in DMSO with dextran standard (2) as determined by GPC in NMP with PEG standard (3) as determined by GPC in DMSO with dextran standard
39
Figure 3.4: 1H NMR of dex6500-b-PEG5500 in DMSO-d6

Chapter 3
3.1.2.c Dextran-block-poly(ethylene glycol) by lactone ring opening
To study the influence of the 1,2,3-triazole ring on the eventual self-assembly behavior of the
block copolymer, a sample with an amide link was prepared. A starting commercial dextran
was oxidized[147][148] with iodine in the presence of potassium hydroxide (KOH) to produce
α-lactone-dextran (Scheme 3.4). The complete oxidation was assessed by the disappearance
of the anomeric protons in 1H NMR.
The block copolymer was then prepared by the ring opening of the α-lactone-dextran by a
5-fold excess of commercial α-methoxy-ω-amino-poly(ethylene glycol) (Scheme 3.5). After
purification, dextran-block-PEG with an amide link was afforded in good yield (75%). Purity
was assessed by GPC (Figure 3.6). The polymer characteristics are summarized in Table 3.3.
40
Figure 3.5: GPC traces in DMSO of α-alkyne dextran6500 (black) and dex6500-b-PEG5100-block-dex6500 (violet).
Scheme 3.4: Reaction scheme of the oxidation of dextran by potassium hydroxide/iodine.
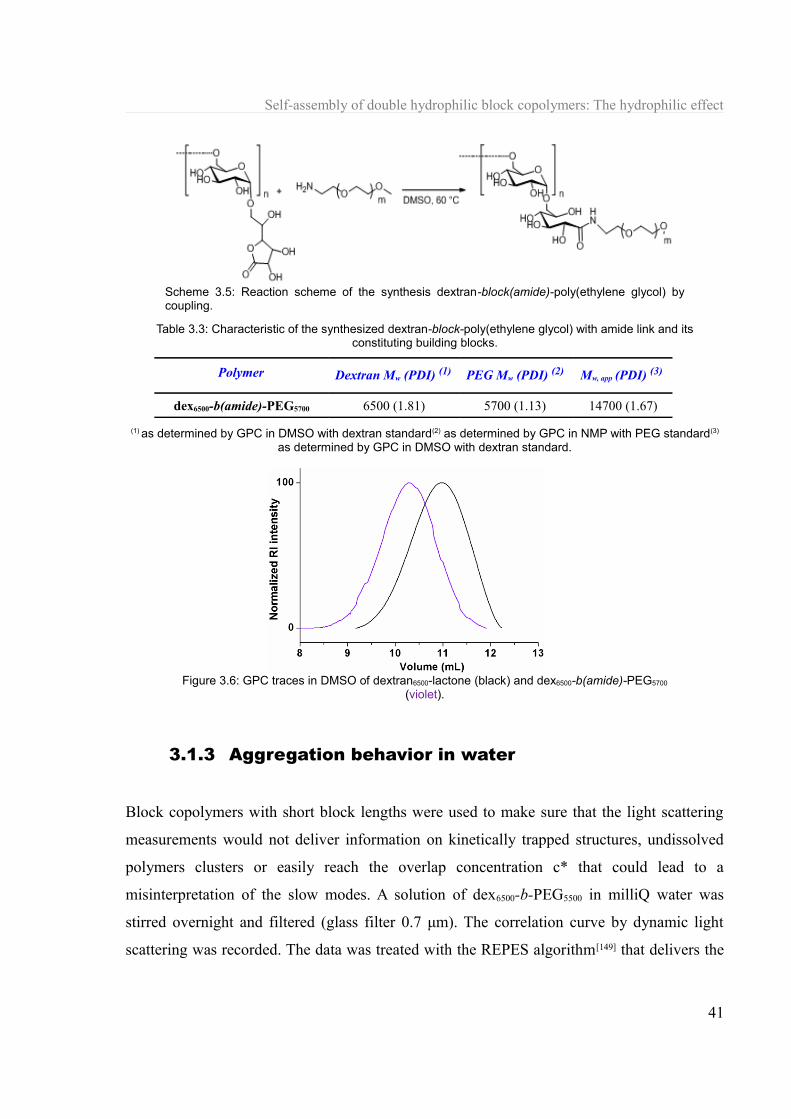
Self-assembly of double hydrophilic block copolymers: The hydrophilic effect
Table 3.3: Characteristic of the synthesized dextran-block-poly(ethylene glycol) with amide link and its constituting building blocks.
Polymer Dextran Mw (PDI) (1) PEG Mw (PDI) (2) Mw, app (PDI) (3)
dex6500-b(amide)-PEG5700 6500 (1.81) 5700 (1.13) 14700 (1.67)
(1) as determined by GPC in DMSO with dextran standard(2) as determined by GPC in NMP with PEG standard(3)
as determined by GPC in DMSO with dextran standard.
3.1.3 Aggregation behavior in water
Block copolymers with short block lengths were used to make sure that the light scattering
measurements would not deliver information on kinetically trapped structures, undissolved
polymers clusters or easily reach the overlap concentration c* that could lead to a
misinterpretation of the slow modes. A solution of dex6500-b-PEG5500 in milliQ water was
stirred overnight and filtered (glass filter 0.7 μm). The correlation curve by dynamic light
scattering was recorded. The data was treated with the REPES algorithm[149] that delivers the
41
Scheme 3.5: Reaction scheme of the synthesis dextran-block(amide)-poly(ethylene glycol) by coupling.
Figure 3.6: GPC traces in DMSO of dextran6500-lactone (black) and dex6500-b(amide)-PEG5700
(violet).

Chapter 3
intensity weighted distribution of hydrodynamic radii similarly to the widely used
CONTIN.150] The following distribution was obtained (Figure 3.7):
This distribution presents three modes. A fast mode of hydrodynamic radius 2 nm that can
only correspond to the single polymer random coil. An intermediate mode of 30 nm that can
correspond to micellar objects and a slow mode corresponding to a hydrodynamic radius of
226 ±41 nm was also present. This same solution was measured over time after 10 and 20
days and only showed a slight variation on the size of the slower and intermediate mode
towards 180 ±16 nm and 16 nm respectively. The solution appeared clear and exhibited thus
prolonged colloidal stability.
In static light scattering experiments, the intesity was acquired for a short time (typically
10 s) to make sure the scattering was mainly due to the slowest mode. A Berry plot was used
to evaluate the static parameters overcoming the angular dependence (Figure 3.8).
42
Figure 3.7: Intensity-weighted distribution of Rh (nm) obtained from a dex6500-b-PEG5500 solution at 10 mg·mL-1 after 3 days stirring (black), 10 days (violet) and 20 days (green) by DLS at 90°.

Self-assembly of double hydrophilic block copolymers: The hydrophilic effect
Mw= 1.21·107 g·mol-1
Rg= 221 nm ± 12%
The gyration radius obtained and the subsequent calculated ρ-ratio of 0.98 suggest a vesicular
structure that could further be confirmed by additional dynamic light scattering experiments
and TEM.
The diffusion extrapolated to 0 concentration against the square wave vector over a wide
angle range was plotted to study the angular dependence (Figure 3.9) of the aggregates. The
plot shows important angular dependence arising from the contribution of the form factor for
43
Figure 3.9: q2-dependence of the apparent diffusion extrapolated at 0 concentration. The red line is the linear fitting at the lowest angles.
Figure 3.8: Berry plot of the SLS data obtained between 40°and 150° at room temperature for dex6500-b-PEG5500 polymer solutions.

Chapter 3
larger particles to the scattering intensity. This dependence is consistent with big spherical
aggregates presenting polydispersity such as vesicles. The polydispersity was already
revealed by the standard deviation from the average hydrodynamic radius 226 ±41 nm. The
functional form of the apparent diffusion coefficient in equation (9) allows to extract the C
coefficient that is calculated from the initial slope of the q2-dependence curve. This C
coefficient characterizes the contribution of the shape fluctuations (softness/polydispersity) to
the relaxation of the correlation function measured in DLS.[151]
Dapp= Dz (1+Cq2 Rg2 ) (9)
Typical values for C[152] include C=0 for hard spheres and C=2 for Gaussian coils. By
considering the gyration radius extracted from static light scattering, the C coefficient could
be evaluated to 0.18. This value characterizes very soft objects and is well above the values
found in other vesicular objects (0.04-0.07).[2] The higher softness in this system compared to
other classical vesicular values seems to translate an additional contribution to the shape
fluctuations that in our case correlates with a highly hydrated membrane composed of
hydrophilic polymers.
The TEM image was acquired from air-dried sample (Figure 3.10). The vesicles appear thus
collapsed but their size seems to be roughly in agreement (R~100 nm) with the gyration
radius of 221 nm. The interactions inside the barrier not being of hydrophobic nature, it is not
surprising that the collapse induces such deformation. In a first approximation, PEG being
less hydrophilic than dextran, we can think of this block copolymer as an amphiphile. It
could then be predicted that the short dextran (Mn 3000 g·mol-1, Mw 6500 g·mol-1) would
prefer low curved structures such as vesicles. Although the membrane thickness could not be
measured from such a micrograph, its structure was elucidated as presented in the next
section.
44
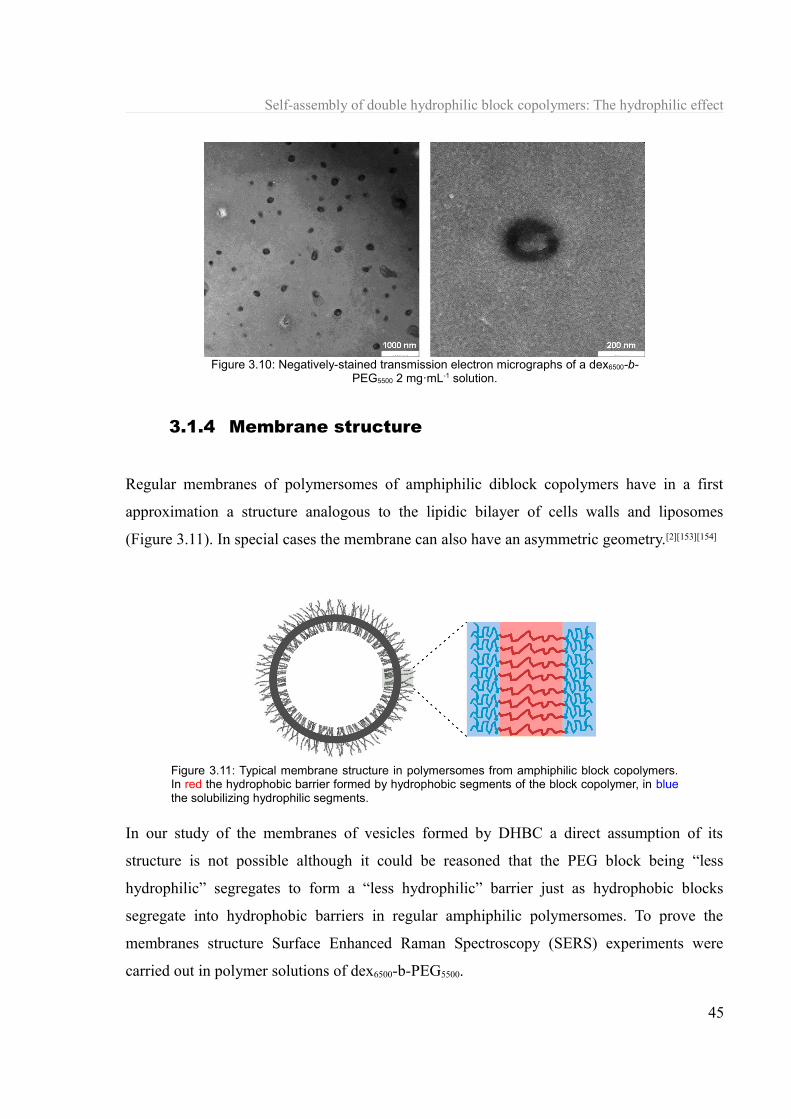
Self-assembly of double hydrophilic block copolymers: The hydrophilic effect
3.1.4 Membrane structure
Regular membranes of polymersomes of amphiphilic diblock copolymers have in a first
approximation a structure analogous to the lipidic bilayer of cells walls and liposomes
(Figure 3.11). In special cases the membrane can also have an asymmetric geometry.[2][153][154]
In our study of the membranes of vesicles formed by DHBC a direct assumption of its
structure is not possible although it could be reasoned that the PEG block being “less
hydrophilic” segregates to form a “less hydrophilic” barrier just as hydrophobic blocks
segregate into hydrophobic barriers in regular amphiphilic polymersomes. To prove the
membranes structure Surface Enhanced Raman Spectroscopy (SERS) experiments were
carried out in polymer solutions of dex6500-b-PEG5500.
45
Figure 3.10: Negatively-stained transmission electron micrographs of a dex6500-b-PEG5500 2 mg·mL-1 solution.
Figure 3.11: Typical membrane structure in polymersomes from amphiphilic block copolymers. In red the hydrophobic barrier formed by hydrophobic segments of the block copolymer, in blue the solubilizing hydrophilic segments.

Chapter 3
3.1.4.a Preparation of the samples
The spontaneous formation of the vesicles by simple dissolution of the polymer in pure water
allowed the development of a preparation method that could elucidate the membrane
structure.
SERS is a technique that results in the enhancement of Raman scattering by molecules
adsorbed on rough metal surfaces.[155] In liquid samples, colloidal metal nanoparticles
(typically Au or Ag) are used as metal surfaces.
The visualization of the external block was carried out as a typical SERS experiment. To a
high concentration solution of dex6500-b-PEG5500 polymer vesicles, a solution of gold
nanoparticles was added. As the membrane has been shown to be little permeable (see
paragraph 3.1.7.b ), it is reasonable that 5-20 nm gold nanoparticles would not diffuse inside
the vesicles (Figure 3.12).
Selective encapsulation of metal nanoparticles inside the vesicles would lead to a selective
adsorption of the internal polymer block to the surface of the nanoparticle, resulting in an
enhancement of the vibration modes of the bonds of that block. This encapsulation could be
achieved by dissolution of the polymer directly in a colloidal gold solution followed by
removal of the non-encapsulated gold by reaction with mercapto-functionalized silica
particles. The strong covalent character of the S-Au bond (bond enthalpy of
418 ± 25 kJ·mol-1[156]) and the excess of sulfur sites[157] could lead first to the complete
removal of external gold. The big size (10 μm) of the silica particles allowed the easy
subsequent removal of the silica-Au particles by simple filtration (Figure 3.13).
46
Figure 3.12: Preparation of the sample for the "visualization" of the external block by SERS. Step 1) is the dissolution of the polymer followed 2) by addition of colloidal gold.
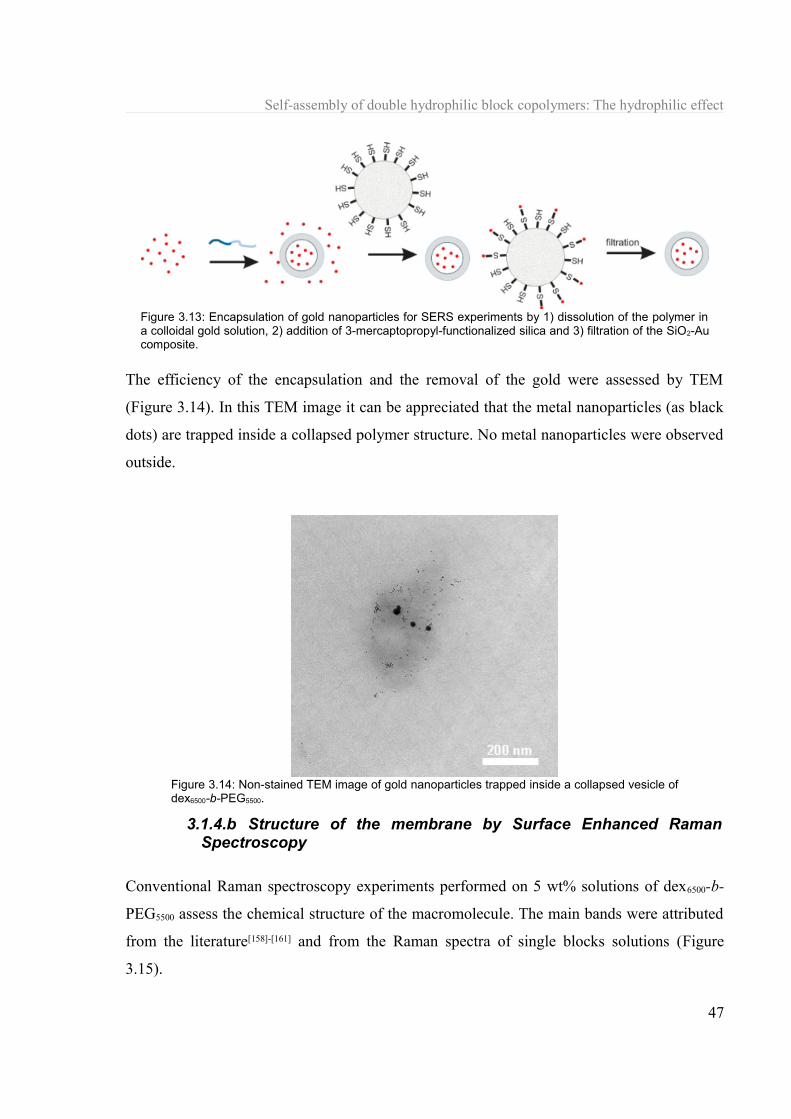
Self-assembly of double hydrophilic block copolymers: The hydrophilic effect
The efficiency of the encapsulation and the removal of the gold were assessed by TEM
(Figure 3.14). In this TEM image it can be appreciated that the metal nanoparticles (as black
dots) are trapped inside a collapsed polymer structure. No metal nanoparticles were observed
outside.
3.1.4.b Structure of the membrane by Surface Enhanced Raman Spectroscopy
Conventional Raman spectroscopy experiments performed on 5 wt% solutions of dex6500-b-
PEG5500 assess the chemical structure of the macromolecule. The main bands were attributed
from the literature[158]-[161] and from the Raman spectra of single blocks solutions (Figure
3.15).
47
Figure 3.13: Encapsulation of gold nanoparticles for SERS experiments by 1) dissolution of the polymer in a colloidal gold solution, 2) addition of 3-mercaptopropyl-functionalized silica and 3) filtration of the SiO2-Au composite.
Figure 3.14: Non-stained TEM image of gold nanoparticles trapped inside a collapsed vesicle of dex6500-b-PEG5500.
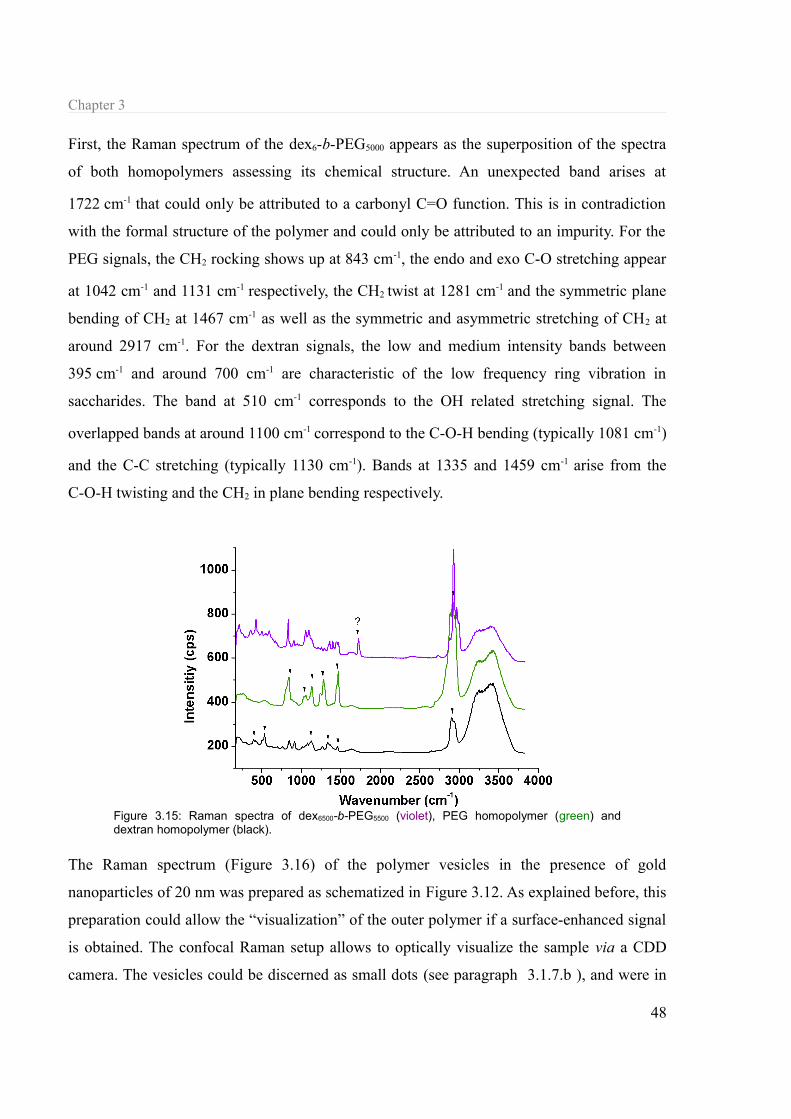
Chapter 3
First, the Raman spectrum of the dex6-b-PEG5000 appears as the superposition of the spectra
of both homopolymers assessing its chemical structure. An unexpected band arises at
1722 cm-1 that could only be attributed to a carbonyl C=O function. This is in contradiction
with the formal structure of the polymer and could only be attributed to an impurity. For the
PEG signals, the CH2 rocking shows up at 843 cm-1, the endo and exo C-O stretching appear
at 1042 cm-1 and 1131 cm-1 respectively, the CH2 twist at 1281 cm-1 and the symmetric plane
bending of CH2 at 1467 cm-1 as well as the symmetric and asymmetric stretching of CH2 at
around 2917 cm-1. For the dextran signals, the low and medium intensity bands between
395 cm-1 and around 700 cm-1 are characteristic of the low frequency ring vibration in
saccharides. The band at 510 cm-1 corresponds to the OH related stretching signal. The
overlapped bands at around 1100 cm-1 correspond to the C-O-H bending (typically 1081 cm-1)
and the C-C stretching (typically 1130 cm-1). Bands at 1335 and 1459 cm-1 arise from the
C-O-H twisting and the CH2 in plane bending respectively.
The Raman spectrum (Figure 3.16) of the polymer vesicles in the presence of gold
nanoparticles of 20 nm was prepared as schematized in Figure 3.12. As explained before, this
preparation could allow the “visualization” of the outer polymer if a surface-enhanced signal
is obtained. The confocal Raman setup allows to optically visualize the sample via a CDD
camera. The vesicles could be discerned as small dots (see paragraph 3.1.7.b ), and were in
48
Figure 3.15: Raman spectra of dex6500-b-PEG5500 (violet), PEG homopolymer (green) and dextran homopolymer (black).

Self-assembly of double hydrophilic block copolymers: The hydrophilic effect
big quantity adsorbed on the glass surface. A careful manipulation could thus allow the
recording of the Raman signal on the vesicle. A surface-enhanced Raman signal was recorded
showing the exaggeration of three bands in the low frequency region and the suppression of
all other bands (except the solvent) especially the ones characteristic of the PEG block. The
three exaggerated bands correspond to wavenumbers 391 cm-1, 511 cm-1 and 630 cm-1. The
bands at 391 cm-1 and 630 cm-1 are characteristic of the low frequency ring vibration in
dextran and 511 cm-1 corresponds to the OH stretching signals. The exaggerated bands in the
SERS correspond thus to vibration modes of the dextran block while the signals belonging to
the PEG block are completely suppressed. This indicates that the dextran block is in contact
with the Au nanoparticles and thus that it is this block that constitutes the vesicles' outer
layer.
Bilayers are the most common membrane structures in polymer vesicles. An outer dextran
layer in a bilayer structure could be rationalized if we consider that PEG is “less hydrophilic”
than dextran, so in a self-assembly process into vesicular structures it would take the place of
the hydrophobic block of a classic amphiphile to form a “less hydrophilic” barrier. A less
common membrane structure is the asymmetric one (see Chapter 4). This structure could
only be attainable if the triazole ring would pack to form a barrier but this option is
geometrically improbable. To confirm the bilayer structure of the membrane, vesicles were
49
Figure 3.16: (Left) Raman (black) and SERS (green) spectrum of of dex6500-b-PEG5500 in water at 5 wt%. The solution for SERS was prepared as explained in Figure 3.12. (Right) Representation of the corresponding vesicles and vesicles/Au to the spectra on the left.

Chapter 3
prepared according to Figure 3.13. A SERS spectrum could be recorded on a vesicle (Figure
3.17). The spectrum shows as in Figure 3.16 the enhancement of three bands corresponding
to vibrations at 391 cm-1, 508 cm-1, 629 cm-1 very similarly to the one with the Au
nanoparticles outside the vesicle. These vibration modes correspond also similarly to the ones
of dextran. Equally, PEG bands are suppressed in the SERS spectrum thus proving that in the
inner compartiment of the vesicle the polymer adsorbed to the metal nanoparticle is dextran.
This confirms the bilayer structure of the membrane that can be schematized as shown in
Figure 3.18. Dex-b-PEG is thus capable of self-assembly in a similar way to amphiphilic
block copolymers in water. The phase separation in the nanoscale is found in the membrane
structure where dextran is preferentially solubilized. Some information concerning the
membrane is missing such as its thickness. Calculations using a hollow sphere model
(Equation (10)) and the bulk polymer density (ρ=1.321 g·cm-1) give d=0.025 nm which is too
small. Possible reasons for the impossibility to apply this model are the deviation from the
perfect spherical geometry for fluctuating objects and the possible high water content in the
membrane that makes the use of the bulk polymer density not adequate.
d =R− 3√ R3− 3M4πρ N A
(10)
50
Figure 3.17: (Left) Raman (black) and SER (violet) spectrum of of dex6500-b-PEG5500 in water at 5 wt%. The solution for SERS was prepared as explained in Figure 3.13. (Right) Representation of the corresponding vesicles and vesicles/Au to the spectra on the left
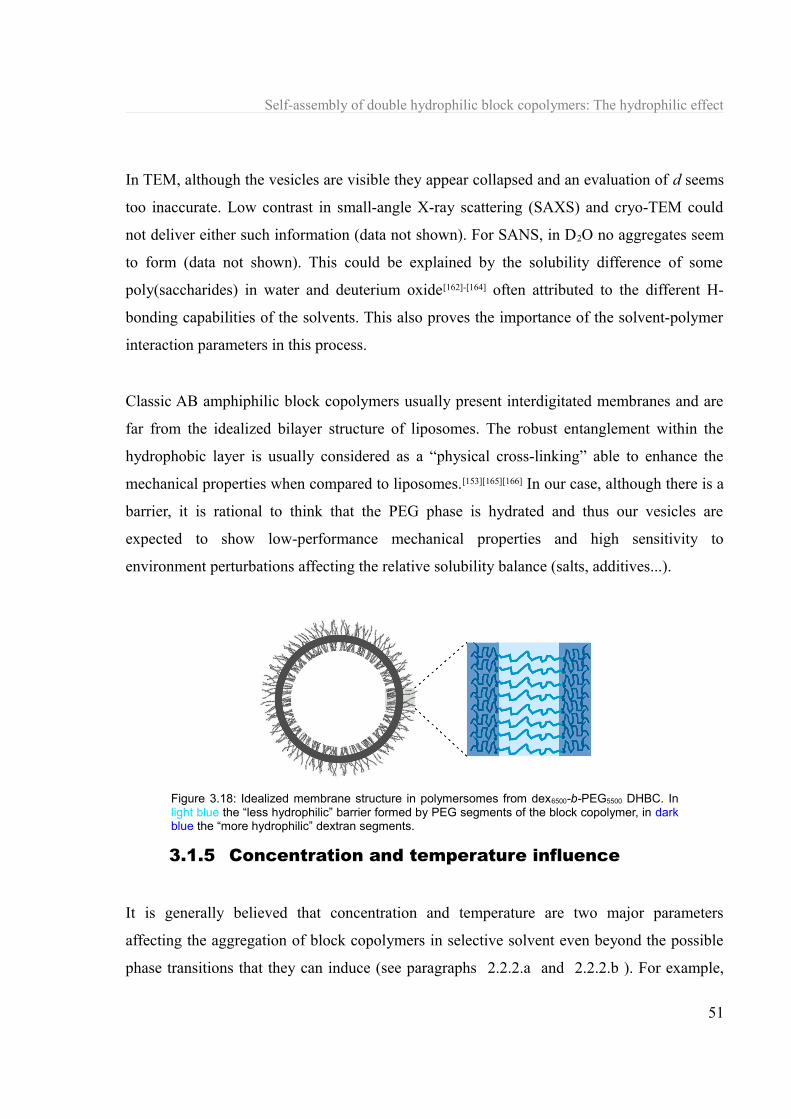
Self-assembly of double hydrophilic block copolymers: The hydrophilic effect
In TEM, although the vesicles are visible they appear collapsed and an evaluation of d seems
too inaccurate. Low contrast in small-angle X-ray scattering (SAXS) and cryo-TEM could
not deliver either such information (data not shown). For SANS, in D2O no aggregates seem
to form (data not shown). This could be explained by the solubility difference of some
poly(saccharides) in water and deuterium oxide[162]-[164] often attributed to the different H-
bonding capabilities of the solvents. This also proves the importance of the solvent-polymer
interaction parameters in this process.
Classic AB amphiphilic block copolymers usually present interdigitated membranes and are
far from the idealized bilayer structure of liposomes. The robust entanglement within the
hydrophobic layer is usually considered as a “physical cross-linking” able to enhance the
mechanical properties when compared to liposomes.[153][165][166] In our case, although there is a
barrier, it is rational to think that the PEG phase is hydrated and thus our vesicles are
expected to show low-performance mechanical properties and high sensitivity to
environment perturbations affecting the relative solubility balance (salts, additives...).
3.1.5 Concentration and temperature influence
It is generally believed that concentration and temperature are two major parameters
affecting the aggregation of block copolymers in selective solvent even beyond the possible
phase transitions that they can induce (see paragraphs 2.2.2.a and 2.2.2.b ). For example,
51
Figure 3.18: Idealized membrane structure in polymersomes from dex6500-b-PEG5500 DHBC. In light blue the “less hydrophilic” barrier formed by PEG segments of the block copolymer, in dark blue the “more hydrophilic” dextran segments.
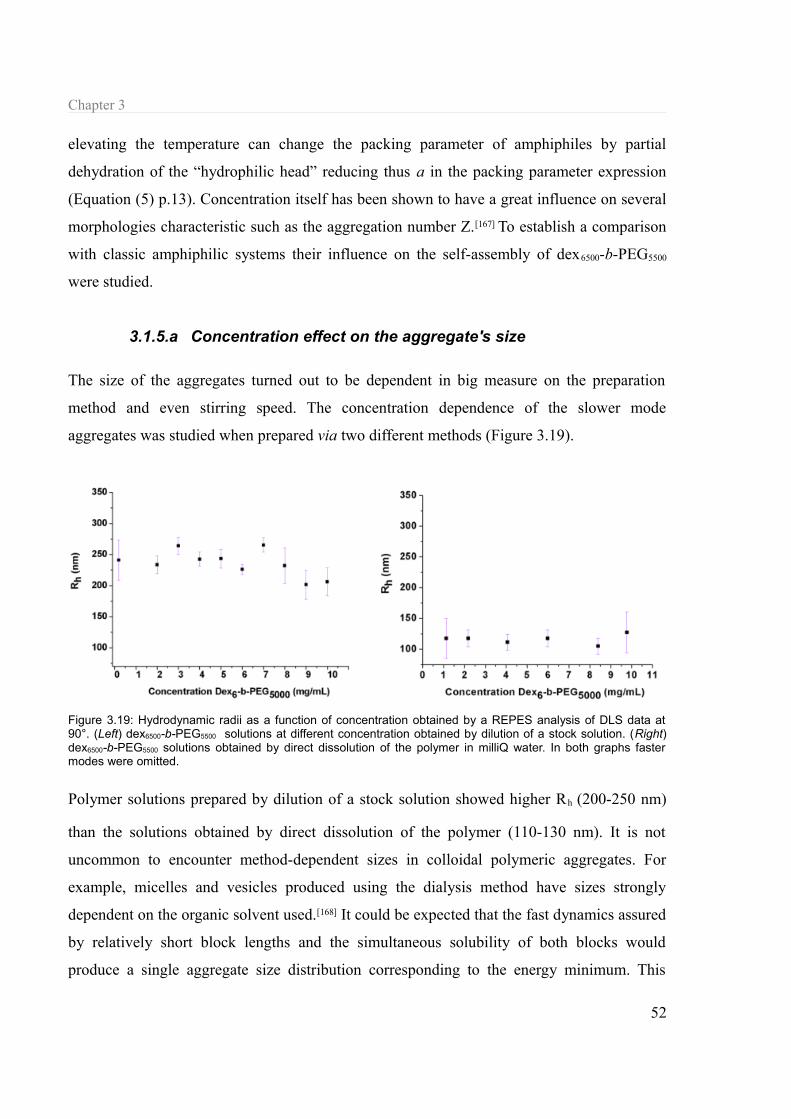
Chapter 3
elevating the temperature can change the packing parameter of amphiphiles by partial
dehydration of the “hydrophilic head” reducing thus a in the packing parameter expression
(Equation (5) p.13). Concentration itself has been shown to have a great influence on several
morphologies characteristic such as the aggregation number Z.[167] To establish a comparison
with classic amphiphilic systems their influence on the self-assembly of dex6500-b-PEG5500
were studied.
3.1.5.a Concentration effect on the aggregate's size
The size of the aggregates turned out to be dependent in big measure on the preparation
method and even stirring speed. The concentration dependence of the slower mode
aggregates was studied when prepared via two different methods (Figure 3.19).
Polymer solutions prepared by dilution of a stock solution showed higher Rh (200-250 nm)
than the solutions obtained by direct dissolution of the polymer (110-130 nm). It is not
uncommon to encounter method-dependent sizes in colloidal polymeric aggregates. For
example, micelles and vesicles produced using the dialysis method have sizes strongly
dependent on the organic solvent used.[168] It could be expected that the fast dynamics assured
by relatively short block lengths and the simultaneous solubility of both blocks would
produce a single aggregate size distribution corresponding to the energy minimum. This
52
Figure 3.19: Hydrodynamic radii as a function of concentration obtained by a REPES analysis of DLS data at 90°. (Left) dex6500-b-PEG5500 solutions at different concentration obtained by dilution of a stock solution. (Right) dex6500-b-PEG5500 solutions obtained by direct dissolution of the polymer in milliQ water. In both graphs faster modes were omitted.

Self-assembly of double hydrophilic block copolymers: The hydrophilic effect
difference confirms that the aggregates seen in DLS are non-equilibrium structures, as the
multimodal distribution already suggested.
Whatever the sample preparation method might be, it seems clear that the aggregates sizes
are not concentration dependent within each preparation. This confirms that the aggregates
formed are not the result of an isodesmic process or specific supramolecular interactions but
rather suggests a cooperative aggregation mechanism.
It should be noted that this concentration independence of the aggregate size is in accordance
with the only other report by Liang et al. on the association of polymers in non-selective
solvent.[169] In this study on the association of PEO44-b-PDMA173 in water, it was found that
the slow mode was concentration independent in a 0.6 mg·mL-1-2 mg·mL-1 range even
though in their case the ρ-ratio of 1.4 indicated an extremely loose aggregate close to a
random coil conformation.
3.1.5.b Temperature
A temperature gradient applied to a 1 mg·mL-1 solution of the polymer revealed that the
aggregate's size is independent of the temperature within the studied range (Figure 3.20).
PEG is a thermoresponsive polymer but its cloud point strongly depends on the molar mass.
PEG of molar mass 5500 g·mol-1 exhibits a cloud point at around 105 °C, so in the studied
53
Figure 3.20: Hydrodynamic radius as a function of the temperature for the aggregates corresponding to the slow mode by DLS 90°.

Chapter 3
range no collapse was expected.
Towards higher temperatures the polydispersity of the aggregate's size decreases. That can be
seen by plotting the standard deviation of the hydrodynamic radius against the temperature
(Figure 3.21). For temperatures of around 17-19 °C the standard deviation is well over
20 nm, for the last temperatures around 57-59 °C this deviation is a little over 5 nm. Even
outside phase transition this variation can be understood in terms of partial dehydration. PEG
being “more hydrophobic” or rather “less hydrophilic” than dextran, it would preferentially
partially loose hydration water molecules upon heating. Actually D-glucose only looses
0.05 g of water per gram of D-glucose from room temperature to 55 °C[135] remaining thus
well hydrated. Its polymer dextran should thus follow the same tendency. So the decrease in
the vesicle's polydispersity in size is mainly due to the partial dehydration of the PEG layer
that rigidifies the vesicle's membrane minimizing the fluctuation of the size.
3.1.6 Structural parameters
3.1.6.a Chain length
Chain length influence on the topology of the aggregates was studied. Three additional
dextran-block-poly(ethylene glycol) copolymers were synthesized (see paragraph 3.1.2.a ),
one with a shorter PEG block (dex6500-b-PEG1900), one with longer dextran block (dex11000-b-
PEG5500) and one with longer PEG block (dex6500-b-PEG13200).
54
Figure 3.21: Standard deviation to the mean value of the hydrodynamic radius for each temperature point.
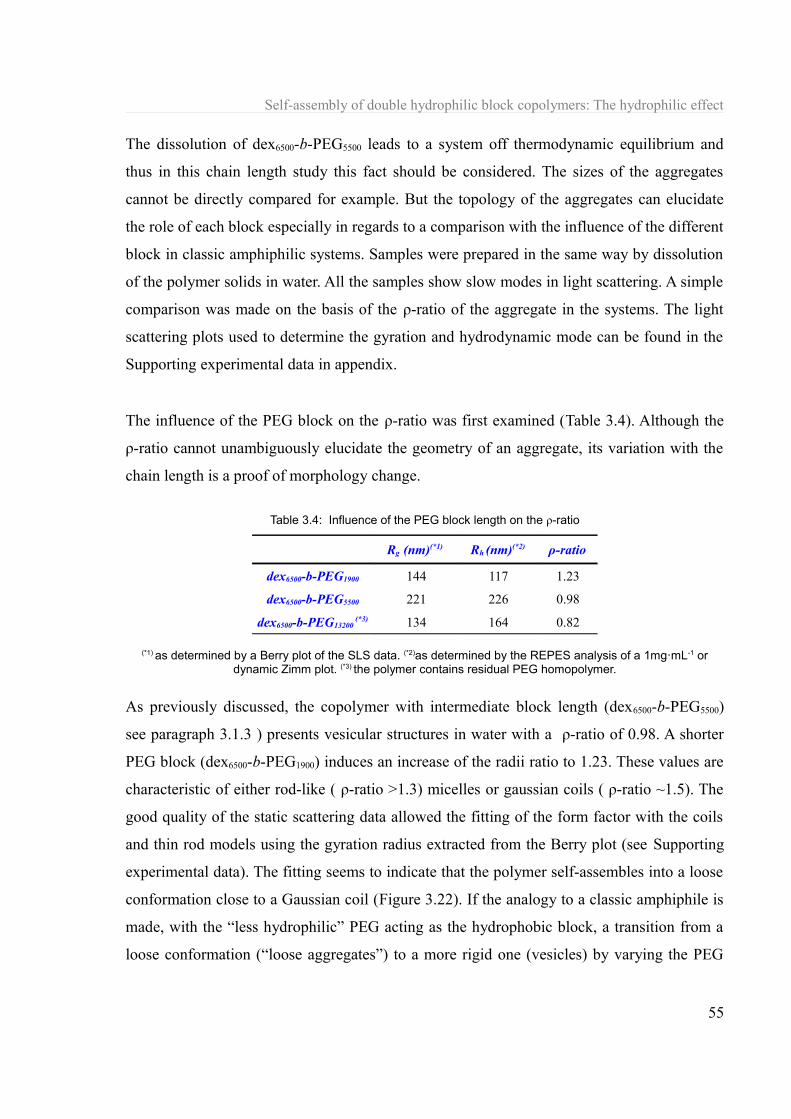
Self-assembly of double hydrophilic block copolymers: The hydrophilic effect
The dissolution of dex6500-b-PEG5500 leads to a system off thermodynamic equilibrium and
thus in this chain length study this fact should be considered. The sizes of the aggregates
cannot be directly compared for example. But the topology of the aggregates can elucidate
the role of each block especially in regards to a comparison with the influence of the different
block in classic amphiphilic systems. Samples were prepared in the same way by dissolution
of the polymer solids in water. All the samples show slow modes in light scattering. A simple
comparison was made on the basis of the ρ-ratio of the aggregate in the systems. The light
scattering plots used to determine the gyration and hydrodynamic mode can be found in the
Supporting experimental data in appendix.
The influence of the PEG block on the ρ-ratio was first examined (Table 3.4). Although the
ρ-ratio cannot unambiguously elucidate the geometry of an aggregate, its variation with the
chain length is a proof of morphology change.
Table 3.4: Influence of the PEG block length on the ρ-ratio
Rg (nm)(*1) Rh (nm)(*2) ρ-ratio
dex6500-b-PEG1900 144 117 1.23
dex6500-b-PEG5500 221 226 0.98
dex6500-b-PEG13200 (*3) 134 164 0.82
(*1) as determined by a Berry plot of the SLS data. (*2)as determined by the REPES analysis of a 1mg·mL-1 or dynamic Zimm plot. (*3) the polymer contains residual PEG homopolymer.
As previously discussed, the copolymer with intermediate block length (dex6500-b-PEG5500)
see paragraph 3.1.3 ) presents vesicular structures in water with a ρ-ratio of 0.98. A shorter
PEG block (dex6500-b-PEG1900) induces an increase of the radii ratio to 1.23. These values are
characteristic of either rod-like ( ρ-ratio >1.3) micelles or gaussian coils ( ρ-ratio ~1.5). The
good quality of the static scattering data allowed the fitting of the form factor with the coils
and thin rod models using the gyration radius extracted from the Berry plot (see Supporting
experimental data). The fitting seems to indicate that the polymer self-assembles into a loose
conformation close to a Gaussian coil (Figure 3.22). If the analogy to a classic amphiphile is
made, with the “less hydrophilic” PEG acting as the hydrophobic block, a transition from a
loose conformation (“loose aggregates”) to a more rigid one (vesicles) by varying the PEG
55
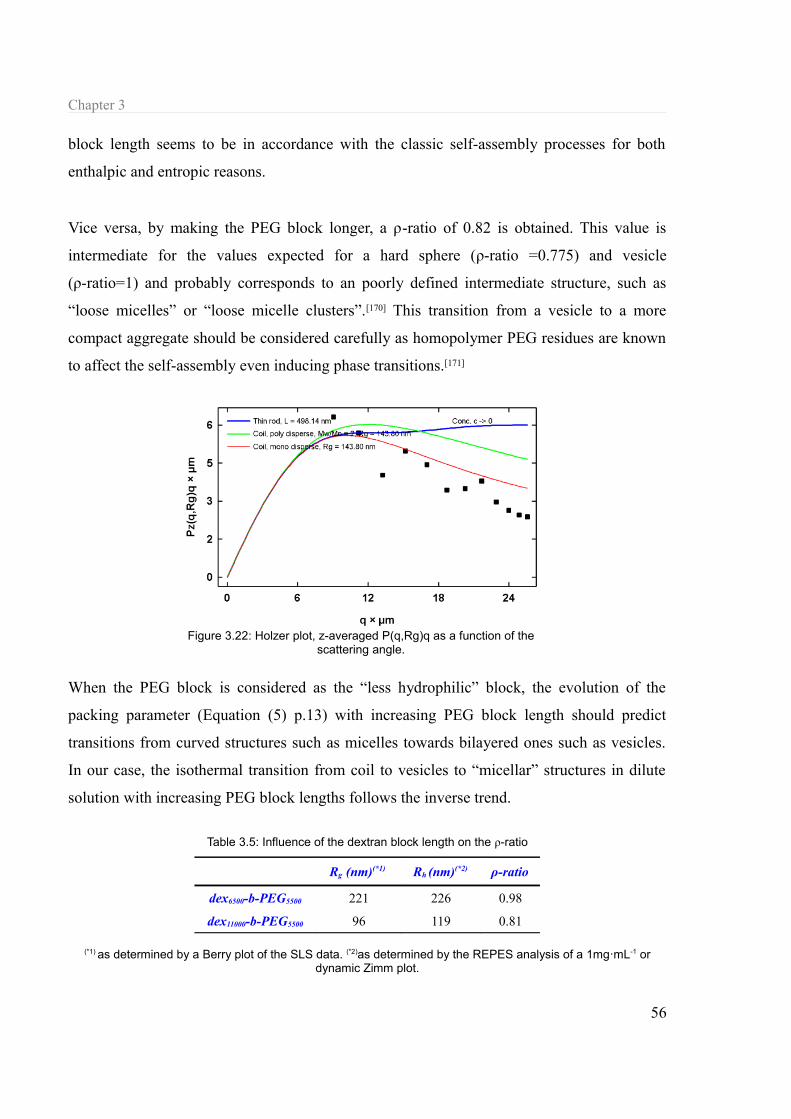
Chapter 3
block length seems to be in accordance with the classic self-assembly processes for both
enthalpic and entropic reasons.
Vice versa, by making the PEG block longer, a ρ-ratio of 0.82 is obtained. This value is
intermediate for the values expected for a hard sphere (ρ-ratio =0.775) and vesicle
(ρ-ratio=1) and probably corresponds to an poorly defined intermediate structure, such as
“loose micelles” or “loose micelle clusters”.[170] This transition from a vesicle to a more
compact aggregate should be considered carefully as homopolymer PEG residues are known
to affect the self-assembly even inducing phase transitions.[171]
When the PEG block is considered as the “less hydrophilic” block, the evolution of the
packing parameter (Equation (5) p.13) with increasing PEG block length should predict
transitions from curved structures such as micelles towards bilayered ones such as vesicles.
In our case, the isothermal transition from coil to vesicles to “micellar” structures in dilute
solution with increasing PEG block lengths follows the inverse trend.
Table 3.5: Influence of the dextran block length on the ρ-ratio
Rg (nm)(*1) Rh (nm)(*2) ρ-ratio
dex6500-b-PEG5500 221 226 0.98
dex11000-b-PEG5500 96 119 0.81
(*1) as determined by a Berry plot of the SLS data. (*2)as determined by the REPES analysis of a 1mg·mL-1 or dynamic Zimm plot.
56
Figure 3.22: Holzer plot, z-averaged P(q,Rg)q as a function of the scattering angle.
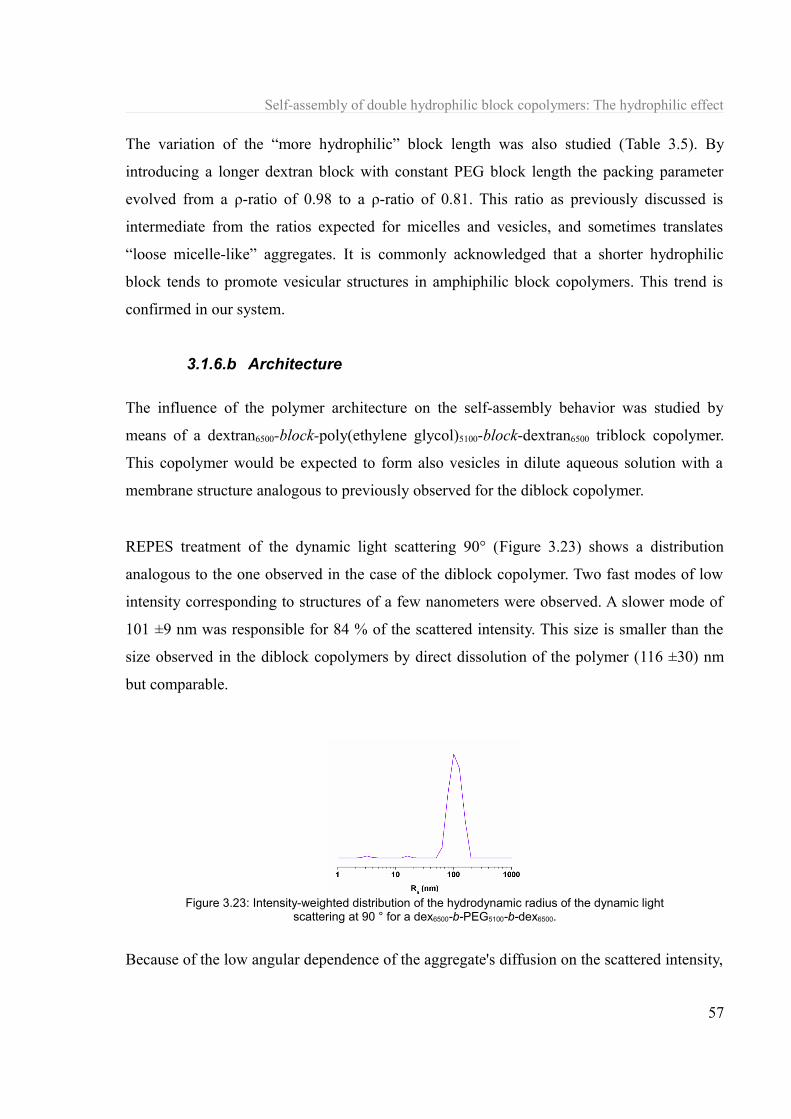
Self-assembly of double hydrophilic block copolymers: The hydrophilic effect
The variation of the “more hydrophilic” block length was also studied (Table 3.5). By
introducing a longer dextran block with constant PEG block length the packing parameter
evolved from a ρ-ratio of 0.98 to a ρ-ratio of 0.81. This ratio as previously discussed is
intermediate from the ratios expected for micelles and vesicles, and sometimes translates
“loose micelle-like” aggregates. It is commonly acknowledged that a shorter hydrophilic
block tends to promote vesicular structures in amphiphilic block copolymers. This trend is
confirmed in our system.
3.1.6.b Architecture
The influence of the polymer architecture on the self-assembly behavior was studied by
means of a dextran6500-block-poly(ethylene glycol)5100-block-dextran6500 triblock copolymer.
This copolymer would be expected to form also vesicles in dilute aqueous solution with a
membrane structure analogous to previously observed for the diblock copolymer.
REPES treatment of the dynamic light scattering 90° (Figure 3.23) shows a distribution
analogous to the one observed in the case of the diblock copolymer. Two fast modes of low
intensity corresponding to structures of a few nanometers were observed. A slower mode of
101 ±9 nm was responsible for 84 % of the scattered intensity. This size is smaller than the
size observed in the diblock copolymers by direct dissolution of the polymer (116 ±30) nm
but comparable.
Because of the low angular dependence of the aggregate's diffusion on the scattered intensity,
57
Figure 3.23: Intensity-weighted distribution of the hydrodynamic radius of the dynamic light scattering at 90 ° for a dex6500-b-PEG5100-b-dex6500.

Chapter 3
the static parameters could be fitted using a Zimm plot (Figure 3.24). The resulting ρ-ratio of
1.08 suggests a vesicular structure. Attempts to visualize any kind of colloidal object by TEM
was unsuccessful.
M(c)= 2,77·105 g·mol-1 ± 10%
Rg= 109 nm ± 4%
It seems though that the vesicular structure is maintained in the triblock copolymer
dex6500-b-PEG5100-b-dex6500. Because poly(ethylene glycol) is the middle block, that would
confirm that this blocks acts as the barrier in the vesicles with dextran as solubilizing block.
3.1.6.c Linking
Another structural parameter studied was the linking function. To reject the possibility that
the aggregates observed in dex-b-PEG copolymers synthesized via CuAAC could result from
specific interactions involving the 1,2,3-triazole group or even from the residual Copper(II)
impurities,[172] the aggregation behavior of a dex6500-b-PEG5700 polymer with amide linking
(see paragraph 3.1.2.c ) was studied.
The REPES analysis of the dynamic light scattering of a 1 mg·mL-1 (prepared by direct
dissolution of the solid) of this polymer (Figure 3.25) reveals an aggregation behavior in
which a very slow mode at around 1000 nm is observed. Taking into account its intensity
with respect to its size, it is clear that it involves a minimal fraction of polymer (if it is not
dust particles) and should not be further considered.
58
Figure 3.24: Zimm plot of the static light scattered data of the triblock copolymer

Self-assembly of double hydrophilic block copolymers: The hydrophilic effect
A slow mode responsible for over 85% of the scattered intensity appears at 120 ±22 nm.
Although this aggregate's size was found to correspond to the aggregates size of 116 ±30 nm
found in this same polymer prepared by CuAAC by direct dissolution of the solid in water,
its size was extremely dependent on the stirring speed.
Interestingly no fast mode was detected, which could mean that fastest modes in the
dex-b(triazole)-PEG were maybe due to unreacted homopolymers, the product of
copper(II)/homopolymer or copper(II)/copolymer interactions, or other product of triazole
interaction.
Mw= 1.45·106 g.mol-1
Rg= 82 nm
A2= 1.20·10-7 dm3·g-2
59
Figure 3.25: REPES algorithm treatment of the dynamic light scattering at 90 ° of a 1 mg·mL -1
solution in water of dex6500-b(amide)-PEG5500
Figure 3.26: Berry plot of the SLS data obtained between 40° and 150° at room temperature for dex6500-b(amide)-PEG5500 polymer solutions.

Chapter 3
Because as previously mentioned, the diffusion mode of the aggregate was found to be
extremely dependent on the stirring speed during the dissolution of the polymer powder, a
simultaneous angular dependent dynamic light scattering and static light scattering
experiment was performed to evaluate the hydrodynamic and the gyration radii respectively.
The Berry plot (Figure 3.26) of the SLS data delivered a gyration radius of 82 nm and the
dynamic Zimm plot of the DLS (Figure 3.27) a hydrodynamic radius of 98 nm. The resulting
ρ-ratio of 0.837 does not correspond unambiguously to either a homogeneous sphere (
ρ-ratio= 0.775) or a hollow sphere model (ρ-ratio=1) and more likely translates a vesicle with
very thick shell or rather a core-shell type of aggregate with low density core.
Dz,0 = 2,51 μm2.s-1 ± 2%
Rh= 98 mn
A possible explanation for the difference in the morphology of the aggregate for this
dex-b(amide)-PEG when compared to dex-b(triazole)-PEG could be given in terms of
packing parameters. Because the block lengths are equal in both polymers, the origin could
reside in the unimer's curvature. If the triazole ring can induce a higher packing parameter,
then the vesicular shape should be preferred. In this case the origin of this difference can be
double: either the triazole ring induces conformational changes in the blocks or the copper
used for the coupling complexes with one or both of the blocks and induces these changes.
Which seems nevertheless confirmed is the fact that the self-assembly in itself is not the
result of complexation or any other specific interaction involving the copper ions or the
triazole. This was further confirmed by other control experiments involving the addition of
60
Figure 3.27: Dynamic Zimm plot of the DLS recorded between 30 ° and 150 °.

Self-assembly of double hydrophilic block copolymers: The hydrophilic effect
copper and other cations (calcium(II)...) to the block copolymer and the single block and
studying the systems by light scattering (data not shown).
3.1.7 Towards biologicals applications
3.1.7.a Lectin-carbohydrate interaction
A colloidal structure with an external layer of saccharides/polysaccharides is a privileged
system on which to study lectin-carbohydrate interaction (see chapter 4.4.1 ). The evolution
of the hydrodynamic radius of the dex6500-b-PEG5500 vesicles in HBS buffer after addition of a
ConA solution was monitored over time at 25 °C (Figure 3.28). The graph shows the slow
evolution of the hydrodynamic radius over time and big particles over a micron where only
detected after a day. Interestingly, even after a week no precipitation was visually observed
although after two days clusters of over 2 μm were detected by DLS.
In the first hours after addition of the ConA solution (Figure 3.29) no apparent evolution of
the hydrodynamic radius is observed. This could be due to the absence of specific
interactions between the vesicles and the proteins. But if there was a ligand-receptor
interaction between glycosydic groups and Con A, it could be that the geometrical
arrangements of the carbohydrate epitopes and the CDRs of the lectins do not allow a
61
Figure 3.28: Monitoring of the evolution of the hydrodynamic radius after addition of ConA
Figure 3.29: Detail of the evolution of the hydrodynamic radius on the first hours after addition of ConA. The green arrow marks the time at which the FCS measurement was carried out.

Chapter 3
multivalent interaction. This was previously reported for vesicles of big size [173] and in
paragraph 4.4.1 .
In order to investigate the interaction in the first hours after the addition of ConA,
fluorescence correlation spectroscopy (FCS) was performed on liquid samples of the vesicles
after addition of fluorescein isothiocyanate (FITC)-labeled ConA (Figure 3.30).
Table 3.6: Data extracted from the analysis in the FCS experiments.
Sample CR (kHz) CPM (kHz) N Fraction 1 Fraction 2
% τD(μs) % τD(μs)
FITC-ConA 17.3 13,3 1.3 96 110 - -
Dex6500-b-PEG5500
+FITC-ConA after 5 min 37.5 0,49 76 80 110 20 10200
Dex6500-b-PEG5500
+FITC-ConA after 2 h 34.2 49,1 0.7 4 110 96 3500
Dex6500-b-PEG5500
+FITC-ConA after 24 h 29.7 1,6 20.5 95 110 5 2700
The normalized autocorrelation curve of the FITC-ConA protein (in black) shows a fast
diffusion that could be fitted to a single population of objects with diffusion time of 110 μs as
previously described (see paragraph 4.4.1 ). By addition of this same quantity of FITC-ConA
62
Figure 3.30: Normalized autocorrelation of fluctuation of the fluorescence intensity and its fittings: in black (violet fitting) FITC-ConA in HBS solution; in green (orange fitting) dex6500-b-PEG5500 with FITC-ConA in HBS solution after 5 min; in red (gray fitting) dex6500-b-PEG5500 with FITC-ConA in HBS solution after 2 h. and in blue (turquoise fitting) dex6500-b-PEG5500 with FITC-ConA in HBS solution after 24 h.
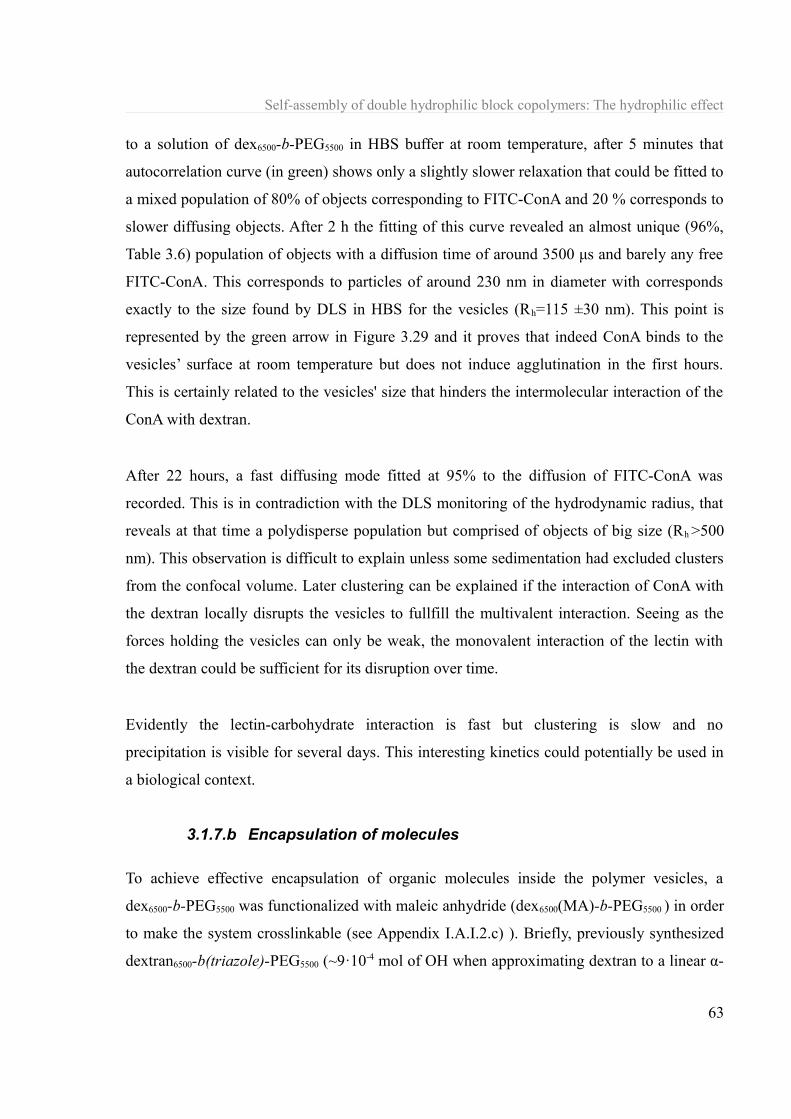
Self-assembly of double hydrophilic block copolymers: The hydrophilic effect
to a solution of dex6500-b-PEG5500 in HBS buffer at room temperature, after 5 minutes that
autocorrelation curve (in green) shows only a slightly slower relaxation that could be fitted to
a mixed population of 80% of objects corresponding to FITC-ConA and 20 % corresponds to
slower diffusing objects. After 2 h the fitting of this curve revealed an almost unique (96%,
Table 3.6) population of objects with a diffusion time of around 3500 μs and barely any free
FITC-ConA. This corresponds to particles of around 230 nm in diameter with corresponds
exactly to the size found by DLS in HBS for the vesicles (Rh=115 ±30 nm). This point is
represented by the green arrow in Figure 3.29 and it proves that indeed ConA binds to the
vesicles’ surface at room temperature but does not induce agglutination in the first hours.
This is certainly related to the vesicles' size that hinders the intermolecular interaction of the
ConA with dextran.
After 22 hours, a fast diffusing mode fitted at 95% to the diffusion of FITC-ConA was
recorded. This is in contradiction with the DLS monitoring of the hydrodynamic radius, that
reveals at that time a polydisperse population but comprised of objects of big size (Rh >500
nm). This observation is difficult to explain unless some sedimentation had excluded clusters
from the confocal volume. Later clustering can be explained if the interaction of ConA with
the dextran locally disrupts the vesicles to fullfill the multivalent interaction. Seeing as the
forces holding the vesicles can only be weak, the monovalent interaction of the lectin with
the dextran could be sufficient for its disruption over time.
Evidently the lectin-carbohydrate interaction is fast but clustering is slow and no
precipitation is visible for several days. This interesting kinetics could potentially be used in
a biological context.
3.1.7.b Encapsulation of molecules
To achieve effective encapsulation of organic molecules inside the polymer vesicles, a
dex6500-b-PEG5500 was functionalized with maleic anhydride (dex6500(MA)-b-PEG5500 ) in order
to make the system crosslinkable (see Appendix I.A.I.2.c) ). Briefly, previously synthesized
dextran6500-b(triazole)-PEG5500 (~9·10-4 mol of OH when approximating dextran to a linear α-
63

Chapter 3
1,6-polyglucan) was dissolved in 0.1 M LiCl/DMF at 60 °C. Triethylamine and 0.2 eq
(to OH) of maleic anhydride were added and the mixture was stirred at 60 °C for 24 h and
subsequently dialyzed against milliQ water. The functionalization could be assessed by 1H
NMR (Figure 3.31) and evaluated at ~ 8% (of the OH functions) by integration of the peaks
at δ ~6.0 ppm and δ =4.7 ppm
The polymer powder could be directly dissolved in milliQ water. Crosslinking was achieved
by exposure of a 1 mg·mL-1 solution to an intense UV irradiation for 10 minutes. The
crosslinking was assessed by comparison on the integral of peaks at δ ~6.0 ppm and δ =4.7
ppm before and after exposure to UV. 33% of the double bonds were found to have reacted.
Dynamic light scattering before (Figure 3.32.a)) and after (Figure 3.32.b)) crosslinking
shows first that the introduction of maleic acid modifies the system only slightly and does not
prevent the self-assembly process, the size increases from 116 ±30 nm to 139±7 nm. The
crosslinking does not significantly affect the size that remains equal within the given error.
The system is thus adapted for the encapsulation of organic molecules.
64
Figure 3.31: 1H NMR dex6500(MA)-b-PEG5500 in DMSO-d6
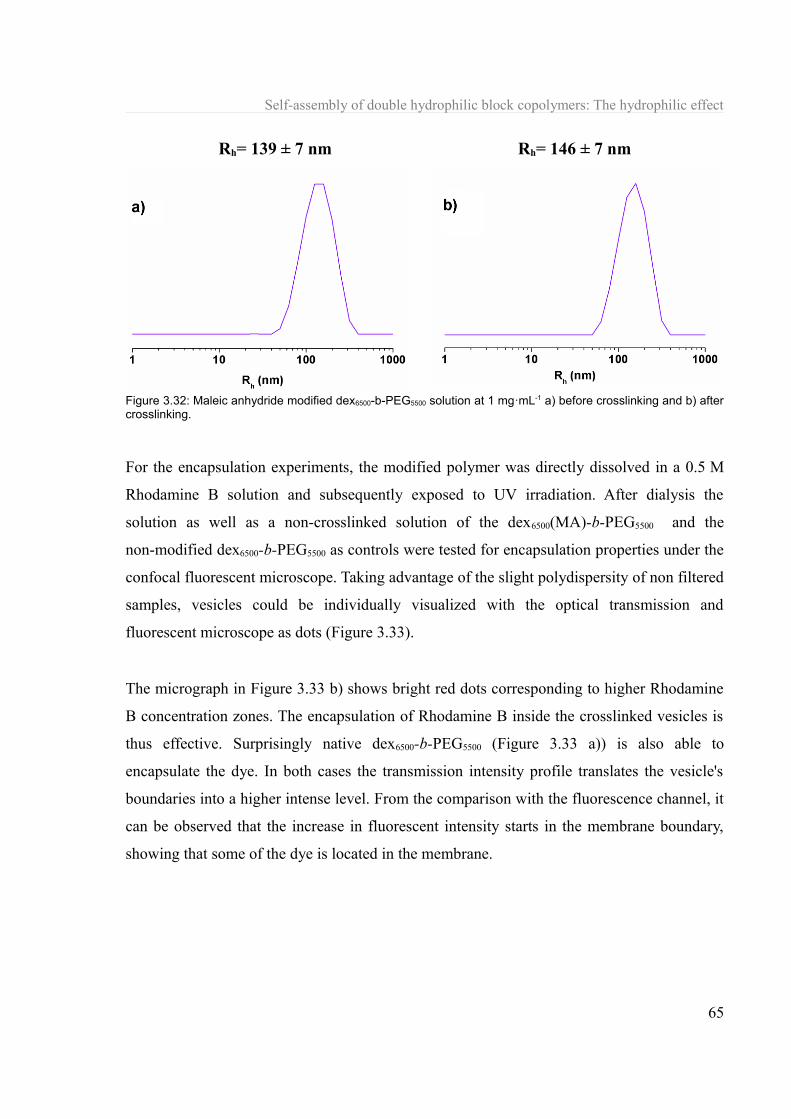
Self-assembly of double hydrophilic block copolymers: The hydrophilic effect
Rh= 139 ± 7 nm Rh= 146 ± 7 nm
For the encapsulation experiments, the modified polymer was directly dissolved in a 0.5 M
Rhodamine B solution and subsequently exposed to UV irradiation. After dialysis the
solution as well as a non-crosslinked solution of the dex6500(MA)-b-PEG5500 and the
non-modified dex6500-b-PEG5500 as controls were tested for encapsulation properties under the
confocal fluorescent microscope. Taking advantage of the slight polydispersity of non filtered
samples, vesicles could be individually visualized with the optical transmission and
fluorescent microscope as dots (Figure 3.33).
The micrograph in Figure 3.33 b) shows bright red dots corresponding to higher Rhodamine
B concentration zones. The encapsulation of Rhodamine B inside the crosslinked vesicles is
thus effective. Surprisingly native dex6500-b-PEG5500 (Figure 3.33 a)) is also able to
encapsulate the dye. In both cases the transmission intensity profile translates the vesicle's
boundaries into a higher intense level. From the comparison with the fluorescence channel, it
can be observed that the increase in fluorescent intensity starts in the membrane boundary,
showing that some of the dye is located in the membrane.
65
Figure 3.32: Maleic anhydride modified dex6500-b-PEG5500 solution at 1 mg·mL-1 a) before crosslinking and b) after crosslinking.
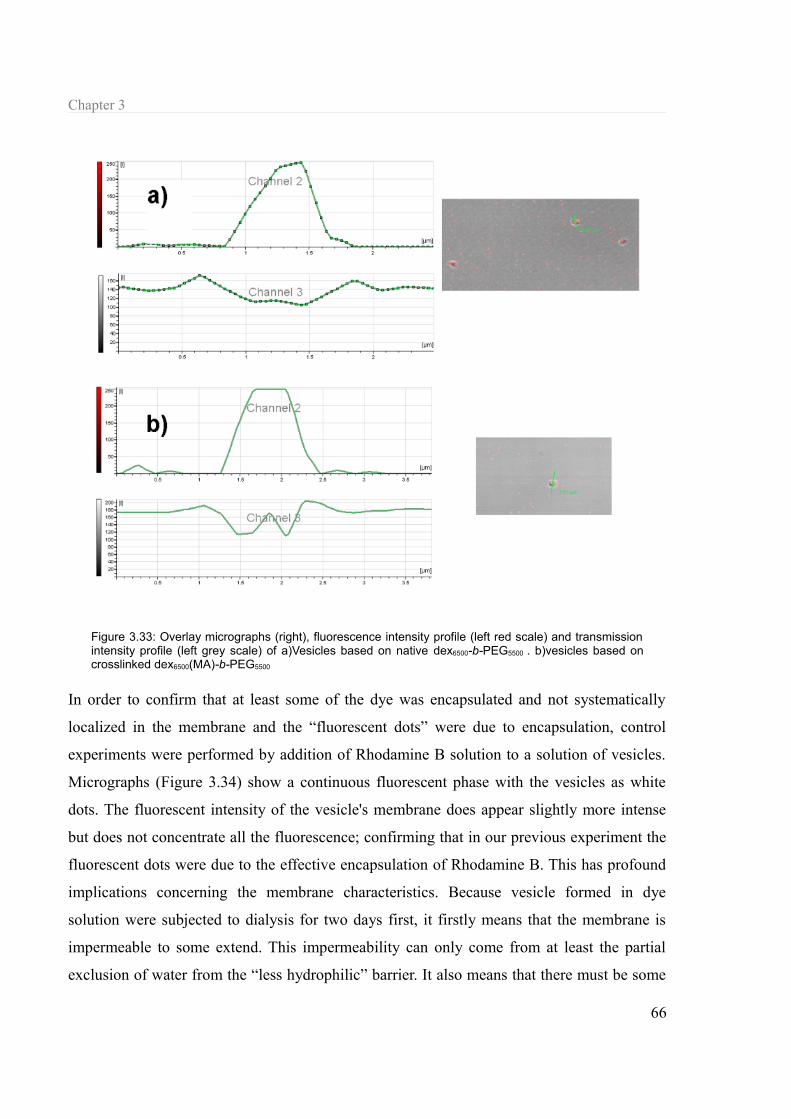
Chapter 3
In order to confirm that at least some of the dye was encapsulated and not systematically
localized in the membrane and the “fluorescent dots” were due to encapsulation, control
experiments were performed by addition of Rhodamine B solution to a solution of vesicles.
Micrographs (Figure 3.34) show a continuous fluorescent phase with the vesicles as white
dots. The fluorescent intensity of the vesicle's membrane does appear slightly more intense
but does not concentrate all the fluorescence; confirming that in our previous experiment the
fluorescent dots were due to the effective encapsulation of Rhodamine B. This has profound
implications concerning the membrane characteristics. Because vesicle formed in dye
solution were subjected to dialysis for two days first, it firstly means that the membrane is
impermeable to some extend. This impermeability can only come from at least the partial
exclusion of water from the “less hydrophilic” barrier. It also means that there must be some
66
Figure 3.33: Overlay micrographs (right), fluorescence intensity profile (left red scale) and transmission intensity profile (left grey scale) of a)Vesicles based on native dex6500-b-PEG5500 . b)vesicles based on crosslinked dex6500(MA)-b-PEG5500

Self-assembly of double hydrophilic block copolymers: The hydrophilic effect
chain-chain interaction between the PEG segments and that the membrane constitutes a real
“barrier”. The double hydrophilic membrane effectively separates two distinct aqueous
phases.
3.1.8 Other polysaccharide-based copolymers
Albertsson[174] published a list of polymer systems capable of phase separation in aqueous
media. Two easily accessible synthetic polymers of the vinyl family appear as capable of
phase separation with dextran, poly(vinyl alcohol) and poly(vinyl pyrrolidone). Poly(vinyl
alcohol) is a polymer of great industrial relevance and is applied in a wide range of fields
such as paper coating, water-soluble packaging, biomedical agents... Poly(vinyl pyrrolidone)
is another synthetic highly hygroscopic polymer with industrial applications as adhesive,
additive, membrane, thickening agent. In order to test our working hypothesis concerning the
validity of ATPS as source of polymer pairs for block copolymer microphase separation,
dextran-block-poly(vinyl alcohol) and dextran-block-poly(vinyl pyrrolidone) were
synthesized. The advantage of working with usual vinyl polymer is that they are easily
accessible via radical controlled polymerizations and well-defined block copolymers should
thus be accessible.
3.1.8.a Synthesis
The synthesis was realized via RAFT polymerization (see paragraph 2.3.1.b ) using a macro-
dextran CTA prepared by CuAAC chemistry (see paragraph 2.3.2.a ). First, an azido
functionalized xanthate CTA (2-azidoethyl-2-((ethoxycarbonothioyl)thio)propanoate) was
67
Figure 3.34: Overlay micrographs of the control experiment performed on preformed vesicles.
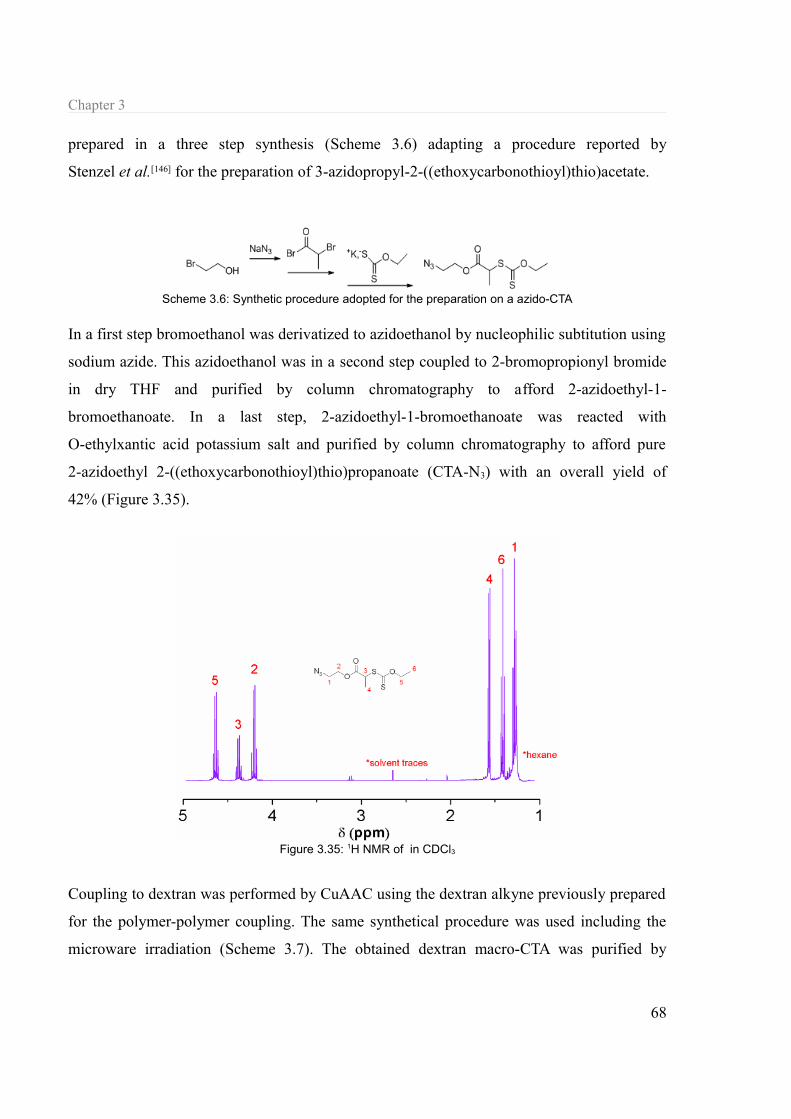
Chapter 3
prepared in a three step synthesis (Scheme 3.6) adapting a procedure reported by
Stenzel et al.[146] for the preparation of 3-azidopropyl-2-((ethoxycarbonothioyl)thio)acetate.
In a first step bromoethanol was derivatized to azidoethanol by nucleophilic subtitution using
sodium azide. This azidoethanol was in a second step coupled to 2-bromopropionyl bromide
in dry THF and purified by column chromatography to afford 2-azidoethyl-1-
bromoethanoate. In a last step, 2-azidoethyl-1-bromoethanoate was reacted with
O-ethylxantic acid potassium salt and purified by column chromatography to afford pure
2-azidoethyl 2-((ethoxycarbonothioyl)thio)propanoate (CTA-N3) with an overall yield of
42% (Figure 3.35).
Coupling to dextran was performed by CuAAC using the dextran alkyne previously prepared
for the polymer-polymer coupling. The same synthetical procedure was used including the
microware irradiation (Scheme 3.7). The obtained dextran macro-CTA was purified by
68
Scheme 3.6: Synthetic procedure adopted for the preparation on a azido-CTA
Figure 3.35: 1H NMR of in CDCl3

Self-assembly of double hydrophilic block copolymers: The hydrophilic effect
dialysis. The yield of the coupling was difficult to evaluate by routine analytical methods.
The only evidence was that in the first attempts to polymerize vinyl monomers using this
macroinitiator, GPC traces of unreacted dextran homopolymer could be seen. After
optimization of the coupling reaction conditions, polymerization yielded a single peak for the
copolymer.
Although xanthate substituents are critical[175] for the control in a Macromolecular design via
interchange of xanthanes (MADIX) polymerization, this dextran macro CTA was a good
starting point as a generic tool for the polymerization of vinyl monomers via RAFT.
As very often when working with polysaccharides-based copolymers the challenge is to find
a suitable solvent or solvent mixture. For dextran, the solubility is usually reduced to DMSO
and water.
With poly(N-vinyl-2-pyrrolidone), the synthesis was performed in DMSO. Although DMSO
in a non-selective solvent for both blocks, the solution was turbid at the end of the reaction. A
69
Scheme 3.7: Microwave assisted CuAAC for the coupling to the N3-CTA to dextran alkyne
Figure 3.36: GPC traces of dextran-CTA (black) and dex-b-PVP6 (violet).

Chapter 3
short block could be thus expected for this copolymer. GPC (Figure 3.36) and 1H NMR
(Figure 3.37) confirmed the structure of the copolymer but by elemental analysis the length
of the PVP block was determined to be only 6 repeating units.
With vinyl acetate monomer the solubility was achieved by a mixture of DMF and DMSO.
Nevertheless at the of the reaction the mixtures were in all cases turbid indicating poor
solubility of the copolymers. It could be thus expected an oligomeric poly(vinyl acetate)
block that was confirmed by 1H NMR (Figure 3.38). Attempts to perform GPC in DMSO
delivered traces with apparent molecular mass lower than the dextran-CTA precursor. It
seems like DMSO being a non-solvent for PVAc, it induces the partial collapse of the coil
70
Figure 3.37: 1H NMR of dex-b-PVP6 in a DMF-d7 and DMSO-d6
mixture
Figure 3.38: 1H NMR of dex-b-PVAc in DMSO-d6.
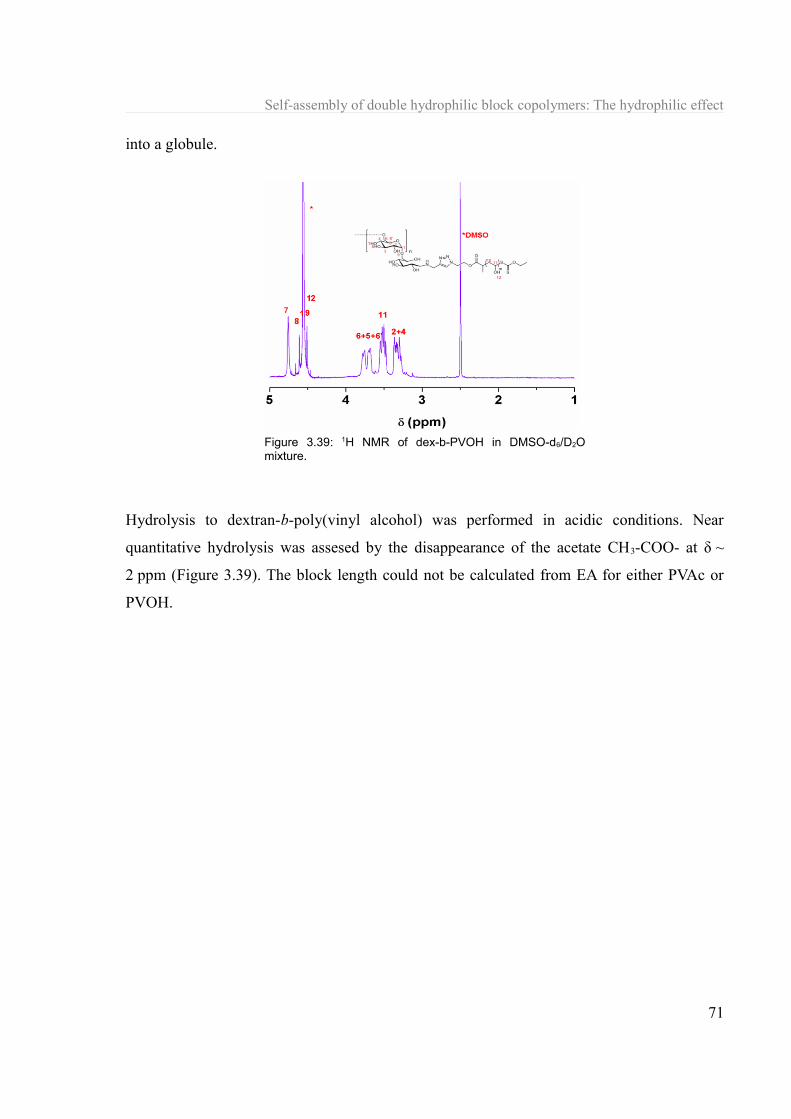
Self-assembly of double hydrophilic block copolymers: The hydrophilic effect
into a globule.
Hydrolysis to dextran-b-poly(vinyl alcohol) was performed in acidic conditions. Near
quantitative hydrolysis was assesed by the disappearance of the acetate CH3-COO- at δ ~
2 ppm (Figure 3.39). The block length could not be calculated from EA for either PVAc or
PVOH.
71
Figure 3.39: 1H NMR of dex-b-PVOH in DMSO-d6/D2O mixture.
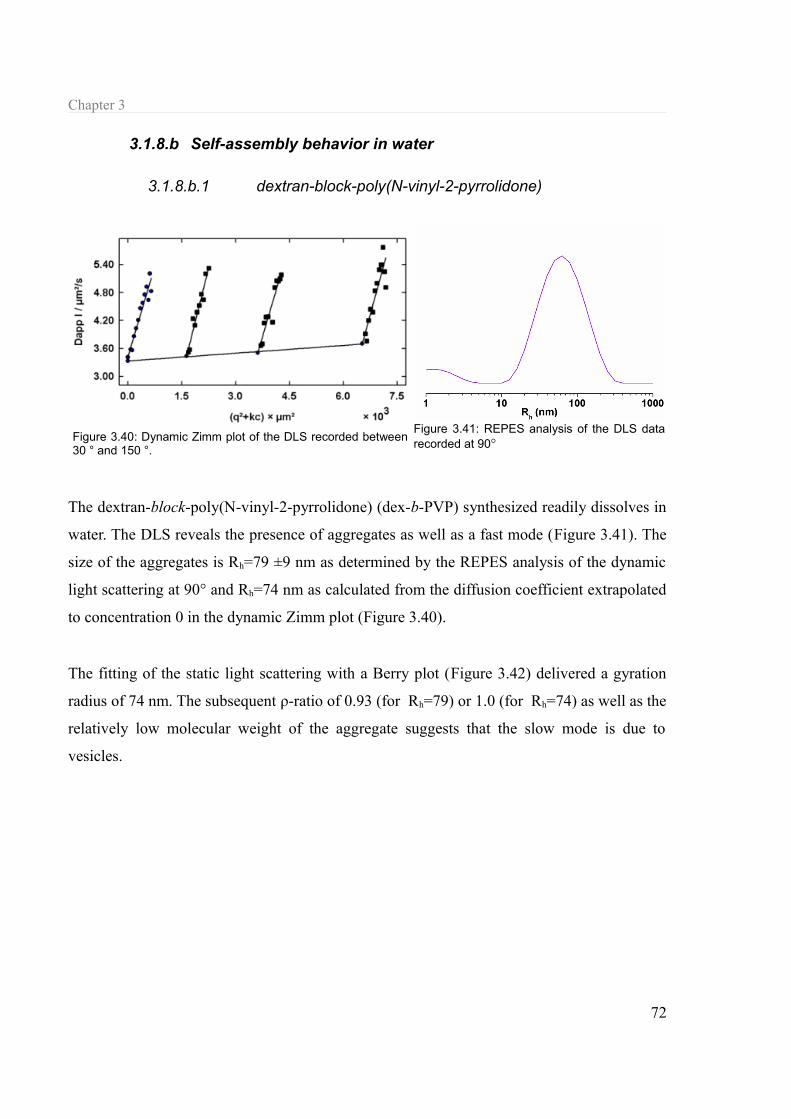
Chapter 3
3.1.8.b Self-assembly behavior in water
3.1.8.b.1 dextran-block-poly(N-vinyl-2-pyrrolidone)
The dextran-block-poly(N-vinyl-2-pyrrolidone) (dex-b-PVP) synthesized readily dissolves in
water. The DLS reveals the presence of aggregates as well as a fast mode (Figure 3.41). The
size of the aggregates is Rh=79 ±9 nm as determined by the REPES analysis of the dynamic
light scattering at 90° and Rh=74 nm as calculated from the diffusion coefficient extrapolated
to concentration 0 in the dynamic Zimm plot (Figure 3.40).
The fitting of the static light scattering with a Berry plot (Figure 3.42) delivered a gyration
radius of 74 nm. The subsequent ρ-ratio of 0.93 (for Rh=79) or 1.0 (for Rh=74) as well as the
relatively low molecular weight of the aggregate suggests that the slow mode is due to
vesicles.
72
Figure 3.40: Dynamic Zimm plot of the DLS recorded between 30 ° and 150 °.
Figure 3.41: REPES analysis of the DLS data recorded at 90°

Self-assembly of double hydrophilic block copolymers: The hydrophilic effect
Mw =4.42·105 g·mol-1
Rg= 74 nm
A2=7.21·10-7 dm3·g-2
3.1.8.b.2 dextran-block-poly(vinylalcohol)
The dextran-block-polyvinylalcohol (dex-b-PVOH) could also be readily dissolved in milliQ
water. The REPES analysis of the dynamic light scattering at 90° shows a main mode at
Rh,app= 123 ±20 nm (Figure 3.43).
In the Berry plot (Figure 3.44) of the static light scattering the Rg= 193 nm found give a
ρ-ratio of 1.56. This value slightly over 1.50 suggests that the aggregate responsible for the
slow mode is close to a coil (theoretical ρ= 1.50). As previously found in the only other
report on self-assembly of non-responsive block copolymers in dilute solution in water,[169]
this polymer self-assembles into a loose conformation close to a Gaussian coil
73
Figure 3.42: Berry plot of the SLS data obtained between 40° and 150° at room temperature for dex6-b-PVP polymer solutions.
Figure 3.43: REPES analysis of the DLS data recorded at 90°.

Chapter 3
Mw =3.20·107 g·mol-1
Rg= 193 nm
A2=3.80·10-8 dm3·g-2
Both polymers directly inspired from ATPS systems seem to form aggregates in dilute
solution. This proves that ATPS systems are an excellent and valid source of inspiration to
engineer such systems. It also strongly suggests that the study of the macrophase separation
in the ATPS systems should be an excellent model for the deep understanding of the
microphase separation in the block copolymers and the detail of their driving forces.
3.2 Spontaneous self-assembly of polypeptide-based and polysaccharide hybrid block copolymers
3.2.1 Spontaneous self-assembly of polypeptide-based block copolymers
De Schryver et al.[176] reported in 1996 the “potential tensioactive properties” of poly(N-(2-
hydroethyl)-L-glutamine)-graft-poly(ethylene glycol) after studying its emulsification
properties with water/octanol mixtures and performing analytical GPC. They postulated
simply that «Since dextran and PHEG are water soluble, but PEG is soluble in water and
organic solvent, one can anticipate that, in aqueous solution, dextran-PEG and PEG-PHEG
act as tensioactive and form aggregates with the "more" hydrophilic polymeric carrier as the
outer shell and the "less" hydrophilic PEG as the core.» This statement was never
74
Figure 3.44: Berry plot of the SLS data obtained between 40° and 150° at room temperature for dex-b-PVOH polymer solutions.

Self-assembly of double hydrophilic block copolymers: The hydrophilic effect
accompanied by a light scattering and never underlined the reasons behind such behavior. In
our study, the development of a peptide-based DHBC capable of microphase separation
seemed thus the perfect target to explore the scope of self-assembly in biological
macromolecules.
3.2.1.a Synthesis
Poly(ethylene glycol)-block-poly(N-(2-hydroethyl)-L-glutamine) was synthesized in a two-
step process. First, Poly(ethylene glycol)-block-poly(benzyl-L-glutamate) was obtained via
NCA polymerization of γ-benzyl-L-glutamate N-carboxyanhydride by initiation with an α-
amino-poly(ethylene glycol). Subsequently, the poly(ethylene glycol)-block-poly(N-(2-
hydroethyl)-L-glutamine) (PEG-b-PHEG) was obtained by aminolysis of this polymer by
aminoethanol in an optimized process published by De Marre.[177] The success of the
aminolysis was confirmed by the total disappearance of the benzyl signals in 1H NMR
(Figure 3.45).
Integration of the peaks of the α-methoxy and the chiral center of the amino acids allows the
determination of the polypeptide chain length m. These results are summarized in Table 3.7.
75
Figure 3.45: Detail of the 1H NMR spectrum of Poly(ethylene glycol)-block-poly(benzyl-L-glutamate) in CDCl3 (black) and Poly(ethylene glycol)-block-poly(N-(2-hydroethyl)-L-glutamine) in DMSO-d6 (violet). The arrows point the shift of the -CH2-C6H5 (~7.3 ppm) and CH2-C6H5 (~5.1 ppm). The star points the solvent signal.
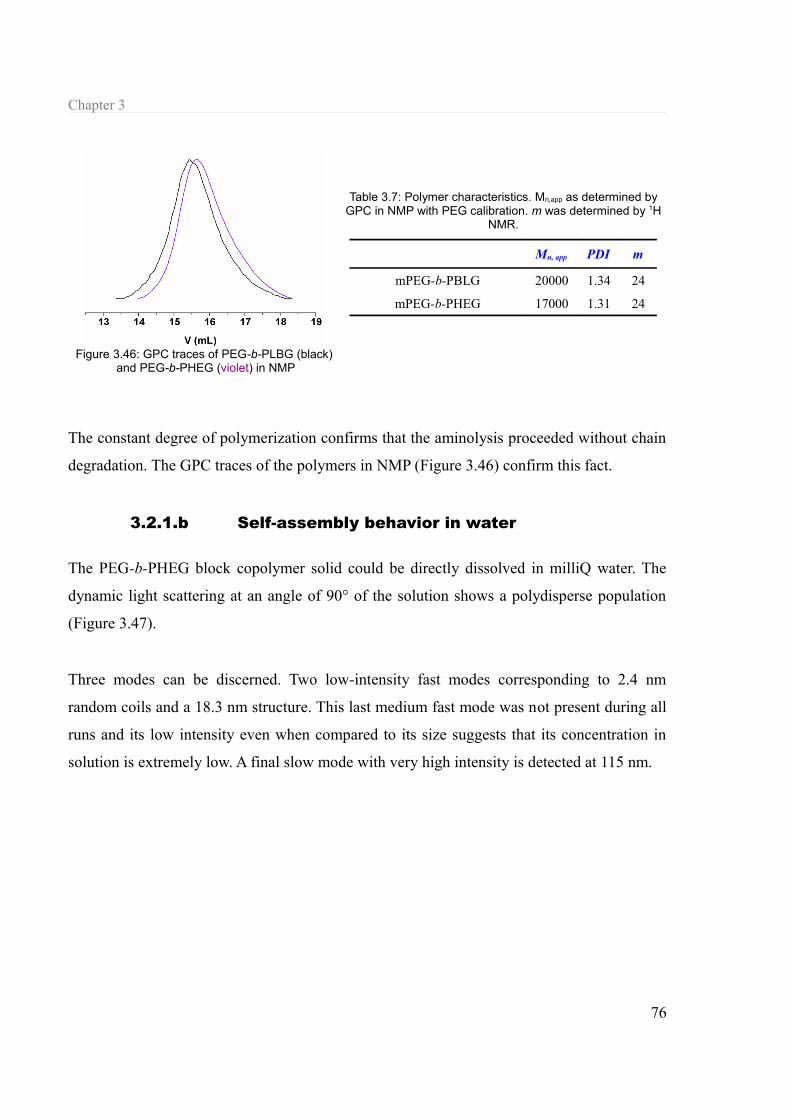
Chapter 3
Table 3.7: Polymer characteristics. Mn,app as determined by GPC in NMP with PEG calibration. m was determined by 1H
NMR.
Mn, app PDI m
mPEG-b-PBLG 20000 1.34 24
mPEG-b-PHEG 17000 1.31 24
The constant degree of polymerization confirms that the aminolysis proceeded without chain
degradation. The GPC traces of the polymers in NMP (Figure 3.46) confirm this fact.
3.2.1.b Self-assembly behavior in water
The PEG-b-PHEG block copolymer solid could be directly dissolved in milliQ water. The
dynamic light scattering at an angle of 90° of the solution shows a polydisperse population
(Figure 3.47).
Three modes can be discerned. Two low-intensity fast modes corresponding to 2.4 nm
random coils and a 18.3 nm structure. This last medium fast mode was not present during all
runs and its low intensity even when compared to its size suggests that its concentration in
solution is extremely low. A final slow mode with very high intensity is detected at 115 nm.
76
Figure 3.46: GPC traces of PEG-b-PLBG (black) and PEG-b-PHEG (violet) in NMP

Self-assembly of double hydrophilic block copolymers: The hydrophilic effect
This slow mode was characterized by a relative small size distribution of ±8 nm for its 115
nm size which suggests a rather well-defined aggregate. The morphology of the aggregate
was further investigated by a combination of static light scattering and negatively stained
TEM. Static light scattering measurements on samples of different concentrations were
performed. The fitting of the statical parameters was difficult and could only be acceptable
with a Berry plot (Figure 3.48). The ρ-ratio calculated from DLS and SLS data is 1.0
suggesting vesicular type of aggregate with thin shell thickness. The molecular weight of the
aggregates is relatively low regarding its size which would be compatible with a vesicular
object.
Mw(q)=1.07·106 g·mol-1
±12%
Rg=117 nm ±4%
To confirm the nature of the aggregates, negatively stained TEM was performed on a
77
Figure 3.48: Berry plot of the static light scattering data on PEG-b-PHEG copolymer in water.
Figure 3.47: Dynamic light scattering at 90 ° of mPEG-b-PHEG block copolymer in water.

Chapter 3
1 mg·mL-1 solution. The samples were air-dried on a copper grid. The micrographs show a
polydisperse population of vesicles (Figure 3.49). The sharp boundaries of the vesicles are
unexpected for aggregates formed by DHBC copolymer. It seems that the vesicles have a
dual distribution, one of size ~250 nm in diameter that could be consistent with the slowest
mode detected by DLS and a population of diameter ~ 1 μm. This mode could not be
detected by DLS as the solutions for those measurements were filtered to avoid saturation of
the detectors by the scattering of dust and big particles. These big aggregates were thus
certainly extruded or filtered in the 0.7 μm glass filter.
The membrane thickness could be measured from those micrographs and has a value of
~ 18 nm. This thickness is consistent with the membrane thickness of other usual polymer
vesicles obtained with amphiphilic polymers.[99] The expected membrane structure is
poly(N-(2-hydroethyl)-L-glutamine) on the outside promoting solubility with a “less
hydrophilic” PEG barrier, similarly to the dex6500-b-PEG5500 vesicles.
The plot of the diffusion vs the scattering vector extrapolated to concentration 0 (Figure 3.50)
shows an important angular dependence which is characteristic of big objects. The C value in
the expression of the apparent diffusion (equation (9) p.44) as the initial slope characterizes
the contribution of the shape fluctuations (softness/polydispersity) to the relaxation and was
78
Figure 3.49: Negatively-stained transmission electron micrographs of a 1mg·mL-1 solution of PEG-b-PHEG

Self-assembly of double hydrophilic block copolymers: The hydrophilic effect
calculated to 0.47 in this case. Because the filtered solution presented a rather monodisperse
population (and the contribution to the diffusion coefficient must be mainly from the slowest
species), this C value was characteristic of extremely soft aggregates.
Last, concentration influence on the slow mode was studied (Figure 3.51). First this sample
preparation delivered aggregates with slightly higher hydrodynamic radius for the same
concentration. The preparation method was the same except for the stirring speed but it
delivered objects with Rh ~ 143 nm instead of 115 nm. This could be because in one or both
cases the vesicles are not in the conformational lowest energy level. Anyway, for objects of
weak curvature it could be imagined that the conformational energy is not so different over a
wide range of sizes.
79
Figure 3.51: Concentration dependence on the aggregates size for PEG-b-PHEG in water.
Figure 3.50: Angular dependence on the diffusion of the slow mode for a 1mg·mL-1 solution in milliQ water

Chapter 3
Secondly, the size of the aggregate seems to change but generally increases with the
concentration of polymer in solution. This behavior is different from the one observed for
dextran-block-poly(ethylene glycol) copolymers and falls within experimental observations
in self-assembly behavior of typical amphiphilic block copolymers in water.
3.2.2 Spontaneous self-assembly of polysaccharide thermoresponsive block copolymers
Poly(N-isopropylacrylamide) (PNIPAM) is a thermoresponsive polymer of LCST around
32 °C (see paragraph 2.2.2.b ) resulting of the balance between the hydrophobicity of the
isopropyl groups and the hydrophilicity of the acryl amide backbone. Because the LCST is so
close to room temperature PNIPAM is considered to be “mildly hydrophobic”.[178] PNIPAM is
also an isomere of poly(leucine) and could be thus be a good canditate in the self-assembly of
DHBC: it is analogous to a biomacromolecule so it could have phase-separation capacity and
because its LCST is close to room temperature it could be “less hydrophilic” enough. With
those qualitative considerations in mind, dextran-block-poly(N-isopropylacrylamide)
copolymers were synthesized and their self-assembly behavior below and above the LCST of
PNIPAM tested.
3.2.2.a Synthesis
80
Figure 3.52: 1H NMR of dex-b-PNIPAM51 in DMSO-d6

Self-assembly of double hydrophilic block copolymers: The hydrophilic effect
Dex-b-PNIPAM was synthesized by RAFT using the previously synthesized dextran macro-
CTA (see the synthesis in paragraph 3.1.8.a and Scheme 3.7). Three different block lengths
were targeted and the obtained block lengths were calculated from the elemental analysis of
the dry polymers powder (Table 3.8). The 1H assessed the chemical structures of the
polymers (Error: Reference source not found).
Table 3.8: Polymers characteristics
Sample Mn, app PDI
dex-b-PNIPAM6 3400 1,89
dex-b-PNIPAM16 3700 1,90
dex-b-PNIPAM51 4915 2,10
GPC traces (Figure 3.53) show the limited growth of one of the polymers. Because it showed
macroscopic thermoresponsive behavior it was nevertheless tested for its self-assembly
behavior.
3.2.2.b Self-assembly behavior at room temperature
The direct dissolution of the polymer solids in water lead to clear solutions that were
analyzed at 25 °C by dynamic light scattering at an angle of 90°. By treatment of the
autocorrelation curve with the algorithm REPES, all three samples present slow modes
indicating that dex-b-PNIPAMm self-assemble in water below LCST (Figure 3.54 and Table
3.9).
The two block copolymers with shorter PNIPAM block present monomodal distribution and
in the block copolymer with longer PNIPAM chain length two modes are detected. As
81
Figure 3.53: GPC traces in DMSO of dextran-CTA (black), dextran-PNIPAM6 (violet), dextran-PNIPAM16 (green) and dextran-PNIPAM51 (orange)

Chapter 3
attempt to elucidate the structure of the aggregates, SLS was performed on the samples as
well as negatively-stained TEM.
Table 3.9: Hydrodynamic radius corresponding of the slowest mode in dex-b-PNIPAMm solution in water at 25 °C
Rh ± ΔRh (nm) Rg (nm) ρ-ratio
dex-b-PNIPAM6 84 ± 9 nm 90 1,07
dex-b-PNIPAM16 97 ± 12 nm 123 1,27
dex-b-PNIPAM51 113 ± 10 nm 135 1,19
The Berry plot static light scattering data (see Supporting experimental data) delivered the
gyration radius that allowed to determine the ρ-ratio (Table 3.9). Although none of the
ρ-ratios correspond to the theoretical values for the well-established models (hard sphere,
vesicle, coils, rods...) the values are close to the value expected for vesicles with infinite shell
(ρ-ratio=1) or gaussian coils (ρ-ratio=1.5).
82
Figure 3.54: Dynamic light scattering at 90 ° of dextran-b-PNIPAMm block copolymer in water a)dex-b-PNIPAM6
b)dex-b-PNIPAM16 c)dex-b-PNIPAM51
Figure 3.55: Negatively-stained transmission electron micrographs of air-dried samples of dextran-b-PNIPAMm
block copolymer in water a)dex-b-PNIPAM6 b)dex-b-PNIPAM16 c)dex-b-PNIPAM51

Self-assembly of double hydrophilic block copolymers: The hydrophilic effect
Negatively-stained TEM micrographs of air-dried samples (Figure 3.55), reveal for all of
them spherical, supposedly vesicular structures. Because this technique is subjected to
numerous artifacts and the ρ-ratio significantly deviate from the models,[179] an unambiguous
attribution could not be made but strongly suggests vesicular structures.
3.2.2.c Thermoresponsive behavior
Typical thermoresponsive DHBC adopt a random coil conformation when no other specific
interactions or responsiveness are present. Upon heating, the thermoresponsive block
collapses (see paragraph 2.2.2.b ) and when the solubilizing blocks manages to stabilize the
structure, micelle-like objects are formed. In our case the temperature phase transition at the
cloud point should be the result from the collapse of the PNIPAM block in the previously
spontaneously formed colloidal aggregates. This transition was monitored by turbidimetry
and DLS.
The turbidimetry profile (Figure 3.56) of 1 mg·mL-1 polymer solutions upon heating show a
transition at 33.2 °C for dex-b-PNIPAM6 and at around 31.7 °C for dex-b-PNIPAM16 and
dex-b-PNIPAM51, close to the typical cloud point (CP) of PNIPAM in water. The shift in
temperature the case of the shorter PNIPAM is common for oligomeric chains and is
attributed to the decrease of entropy of mixing with decreasing molecular weight. [180] Visually
a change from clear transparent solutions at room temperature to opaque white solutions at
40 °C (Figure 3.57) is observed. Importantly, no precipitation is observed even after several
hours at 40 °C showing that the turbidity is not due to precipitation but rather to the probable
83
Figure 3.56: Turbidity profiles of 1 mg·mL-1 solution of polymers in water a) dex-b-PNIPAM6, b) dex-b-PNIPAM16
and c) dex-b-PNIPAM51.

Chapter 3
formation of stable objects of several hundreds of nanometers in diameter.
By DLS the evolution of the hydrodynamic radius upon heating was followed. For the
polymer with shorter PNIPAM (Figure 3.58 a)) an interesting behavior is observed. Below
LCST as expected the object previously studied (see paragraph 3.2.2.b ) of Rh ~ 90 nm was
detected. At the CP determined by turbidimetry of 33.2 °C (Figure 3.56) no apparent change
in the aggregate's size is detected although the transmittance drops to 0%. This suggests that
the aggregate increases in mass without increasing in size for the 33-36 °C temperature
range. By further increasing the temperature, the size rapidly increases but is relatively stable
(low size deviation) for every temperature. For the copolymer with the intermediate PNIPAM
size (Figure 3.57 b)) several size domains upon heating can be described. Below the CP, the
aggregates previously studied are (see paragraph 3.2.2.b ) stable in size. Sharply at the CP
the size triplicates and increases almost linearly with the temperature until around 52 °C.
Above this temperature the size seems to be stable and of about 2 μm which is certainly a
precipipate. As visually seen, at 40 °C, monodisperse objects of Rh ~400 nm are present,
which correlates with the turbidity observed. For the copolymer with the longer PNIPAM
chain the transition appears even more complex (Figure 3.57 c)). As for the other polymers
below the CP the size is stable and even slightly decreases. Upon heating the sizes increases
and reaches a plateau at 38 °C until 46 °C. Upon further heating, the size increases again
until it reaches a second plateau at Rh ~ 300 nm.
The collapse of the PNIPAM chains upon heating is more complex than the model of
micellisation from thermoresponsive copolymers. Within moderate temperatures, the
particles progressively grow reaching stable particle sizes within some temperature ranges.
84
Figure 3.57: Visual appearance of 1 mg·mL-1 solutions of a) dex-b-PNIPAM6, b) dex-b-PNIPAM16 and c) dex-b-PNIPAM51 at room temperature (left) and 40 °C (right).

Self-assembly of double hydrophilic block copolymers: The hydrophilic effect
Because the starting morphology of the aggregates below LCST is difficult to assess with
certainty, the mechanism of collapse remains unclear. The fact that turbidity increases
demonstrates that there is a mass increase. And for a given temperature over the CP the
particles are stable showing that the systems behaves like classic amphiphilic systems with
dextran as stabilizing block.
Upon cooling, the association was found to be reversible (Figure 3.59). The process shows,
in accordance with the reported temperature behavior of PNIPAM, hysteresis by both DLS
and turbidimetry. This hysteresis is caused by the strong chain-chain interactions above the
LCST. Importantly the relaxation of the PNIPAM chains upon cooling leads to an aggregate
in the same order of size (Rh ~90 nm) as the initial system.
85
Figure 3.59: Evolution of the hydrodynamic radius with temperature monitored by DLS at 90 °C treated with REPES algorithm of 1 mg.mL-1 solutions of dex-b-PNIPAM6. In red the heating and
in blue the cooling process.
Figure 3.58: Evolution of the hydrodynamic radius with temperature monitored by DLS at 90 °C treated with REPES algorithm of 1 mg.mL-1 solutions of a) dex-b-PNIPAM6, b) dex-b-PNIPAM16 and c) dex-b-PNIPAM51
Chapter 3
3.3 Summary
In this chapter a family of dextran-block-poly(ethylene glycol) block copolymers were
synthesized. These block copolymers directly inspired from the widely used PEG/dextran
ATPS system were able to form aggregates in water by simply dissolution of the solid.
Dex6500-b-PEG5500 copolymer spontaneously formed vesicles with PEG as the “less
hydrophilic” barrier and dextran as the solubilizing block. The aggregates were found to be
insensitive to the polymer architecture and to the concentration (in the dilute range) and only
mildly sensitive to temperature. Variation of the block length, yielded different morphologies.
A longer PEG chain seemed to promote more curved aggregates following the inverse trend
usually observed in amphiphilic block copolymers. A shorter dextran promoted vesicular
structures as usually observed for the amphiphilic counterparts. The linking function was
shown to have an influence of the morphology but not on the self-assembly capability in
itself. The vesicles formed by dex6500-b-PEG5500 showed slow kinetics of clustering in the
presence of ConA lectin. In addition both dex6500-b-PEG5500 and its crosslinked derivative
were able to encapsulate fluorescent dyes. Two additional dextran-based copolymers were
synthesized, dextran-b-poly(vinyl alcohol) and poly(vinyl pyrrolidone). The study of their
self-assembly allowed to conclude that ATPS is a valid source of inspiration to conceive
DHBCs capable of self-assembling.
In the second part the principle was extended to polypeptide systems with the synthesis of a
poly(N-hydroxyethylglutamine)-block-poly(ethylene glycol) copolymer. The copolymer that
had been previously reported to have emulsifying properties was able to form vesicles by
direct dissolution of the solid in water. Last, a series of thermoresponsive copolymers were
prepared, dextran-block-poly(N-isopropylacrylamide)m. These polymers formed aggregates
below the LCST. Their structure could not be unambiguously elucidated but seemed to
correspond to vesicles. Above the LCST, the collapse of the PNIPAM chains induced the
formation of stable objects of several hundreds of nanometers in radius that evolved with
increasing temperature. The cooling of these solution below LCST restored the initial
aggregates.
86
Thermoresponsive vesicles with an asymmetric membrane
Chapter 4: Thermoresponsive vesicles with an asymmetric
membrane
Biological membranes are highly heterogeneous (lateral heterogeneity) and asymmetric
(transverse asymmetry) structures (Figure 4.1[181]). Lateral heterogeneity arises from
clustering of particular types of proteins or lipids in the plane of the membrane. This
heterogeneity has several potential functions such as the binding of charged macromolecules,
rigidity control as well as lateral compressibility that facilitates membrane fusion,
cytosis...[182] The transverse asymmetry arises from the different lipid and protein composition
of the two monolayers. For example, amine-containing phospholipids (intracellular
communication) are enriched in the inner cytofacial monolayer whereas choline-containing
phospholipids (cell signaling, enzyme activation) and sphingolipids (transmission, cell
recognition) are enriched in the exofacial monolayer. Carbohydrate groups of glycolipids and
glycoproteins are also always found in the exofacial layer where they participate in cell
lxxxvii

Chapter 4
recognition phenomena.[183]
Lipid bilayers and vesicles (liposomes) as cell mimics have shown to be a good architectural
model of cell membranes but most of the time their preparation procedures do not provide
control over lipid compositions between the inner and outer monolayers. Partial asymmetry
can nevertheless be introduced by altering the distribution of specific phospholipids using pH
gradients, osmotic pressure, or molecules that promote lipid redistribution.[184] Polymersomes
made from ABC-type block copolymers have introduced some intrinsic asymmetry to the
biomembrane model associated with the mechanical advantages of polymer structures.[185]
These polymersomes could further be modified by directed insertion of membrane
proteins.[186]
Direct formation of biologically relevant polymersomes with an asymmetric membrane was
recently achieved by Schlaad et al..[2] A polybutadiene-block-poly(ethylene glycol) copolymer
was glycosylated via thiol-ene chemistry (PB(Glc)-b-PEG). The resulting glucose-
functionalized polymer readily formed vesicles by direct dissolution of the polymer solid in
water. The study of the membrane revealed its asymmetric structure with the outside covered
by glucose, the inside by poly(ethylene glycol) and a polybutadiene hydrophobic barrier
(Figure 4.2). This structures proved a good primitive mimic for the asymmetry observed in
cell membrane concerning the glycolipids and glycoproteins that assure cell recognition.
88
Figure 4.1: Schematic three dimensional cross section of a cell membrane. Reproduced from [181]

Thermoresponsive vesicles with an asymmetric membrane
Figure 4.2: Schematic representation of the glycosome with asymmetric membrane obtained by dissolution of PB(Glb)-b-PEO in water. Adapted from [2].
To access the next generation of polymersomes that mimic cell membranes, we designed a
copolymer also based on glycosylated polybutadiene but with a “smart” block. This structure
based on a thermoresponsive block of poly(N-isopropylacrylamide) (PNIPAM) could form
analogous glycosomes to the PB(Glc)-b-PEG ones in water at room temperature. Its behavior
upon the application of a thermal stimulus was studied, and the first experiments to evaluate
its potential applications in biological context are shown.
4.1 Synthesis
Polybutadiene with a high degree of 1,2-substitution (1,2-PB-OH) was prepared by living
anionic polymerization as described previously.[187][188]
The chain transfer agent (CTA) used to couple to PB was synthesized by the coupling of
potassium ethyl xanhogenate to 2-bromo-2-methyl propionic acid adapting a procedure
described by Ladavière[189] for the synthesis of S-benzyl-O-ethyl dithiocarbonate. The CTA
was subsequently coupled to the 1,2-PB-OH polymer by esterification and the resulting
macro-CTA was used for the synthesis of 1,2-PB-b-PNIPAM block copolymers by RAFT. In
initial attempts at monomer concentrations of 25 wt% in dioxane, the irreversicle
precipitation of material during polymerization indicated cross-linking. Very likely double
bonds of the 1,2-PB-OH block polymerized under these conditions. Under more dilute
conditions (5 wt%), no precipitation was observed, indicating that the simple dilution of the
reaction mixture, crosslinking could be effectively avoided. Double bonds of the 1,2-PB-OH
are thus under these condition less reactive than the acryl function of the monomer in both
89

Chapter 4
the initiation and propagation steps (see chapter 2.3.1 ). This way it was possible to afford
1,2-polybutadiene block copolymers via radical polymerization of an acrylamide (Scheme
4.1).
Two PNIPAM block lengths were targeted and their value was determined by 1H NMR. The
GPC showed remaining unreacted 1,2-PB certainly due to the incomplete coupling of the
CTA in the macromononer preparation. This homopolymer was partially removed by
extraction of the mixture in water with hexane. The presence of a small fraction of
homopolymer was not considered a major inconvenient as the target structure was a vesicle
prepared by simple dissolution of the polymer in water, and would thus incorporate the
homopolymer into the membrane.
The 1,2-PB-b-PNIPAM copolymers were further functionalized with sugar moieties via thiol-
ene (see paragraph 2.3.2.b ) chemistry. 1-Thio-β-D-glucose tetraacetate was coupled to the
double bonds of the 1,2-PB block in the block copolymer as previously reported.[118][119] 1.5 eq
of thio-sugar to double bonds were used in THF. UV irradiation was used to produce thiyl
radicals. The sugar moieties were deprotected simply by addition of a 0.5 M NaOH solution
in methanol to a solution of the PB80(GlcAc4)-b-PNIPAMm in chloroform. The complete
deacetylation was assessed by the disappearance of the acetyl group at δ=2.09 ppm in 1H
NMR. The degree of functionalization was determined using the C/S ratio of the elemental
90
Scheme 4.1: Representation of the first synthetics steps. First the coupling of the CTA to afford a 1,2-polybutadiene macro-CTA and the subsequent polymerization under two different concentrations.

Thermoresponsive vesicles with an asymmetric membrane
analysis to calculate the number of sugar moieties per PB unit. The results are summarized in
Table 4.1.
Table 4.1: Characteristics of glycosylated 1,2-PB-b-PNIPAM (f stands for degree of functionalization). Molar masses as calculated from the degree of polymerization determined by 1H NMR
Mn f
PB80(Glc)-b-PNIPAM259 38500 0.26
PB80(Glc)-b-PNIPAM557 76000 0.52
1H NMR shows only residual amounts of non-functionalized 1,2-PB although the degree of
functionalization remains relatively low. This can be explained as it has been observed
before[118][119] by the side reactions upon addition of thiols to 1,2-PB leading to ring structures.
The chemical structure of the polymer is represented in Scheme 4.2.
4.2 Self-assembly behavior at room temperature
Glycosylation of the 1,2-PB block in the block copolymers sets the fraction of hydrophilic
91
Scheme 4.2: Chemical structure of 1-thio-β-D-glucose tetraacetate-functionalized 1,2-PB-b-PNIPAM after deacetylation (x+y=0.51, m=259 or 557).
Scheme 4.3: Chemical structure of PB80(Glc)-b-PNIPAMm. In red the hydrocarbon chain accounting for hydrophobicity in the polymer. In blue, the moeties and block contributing the hydrophilicity of the copolymer.
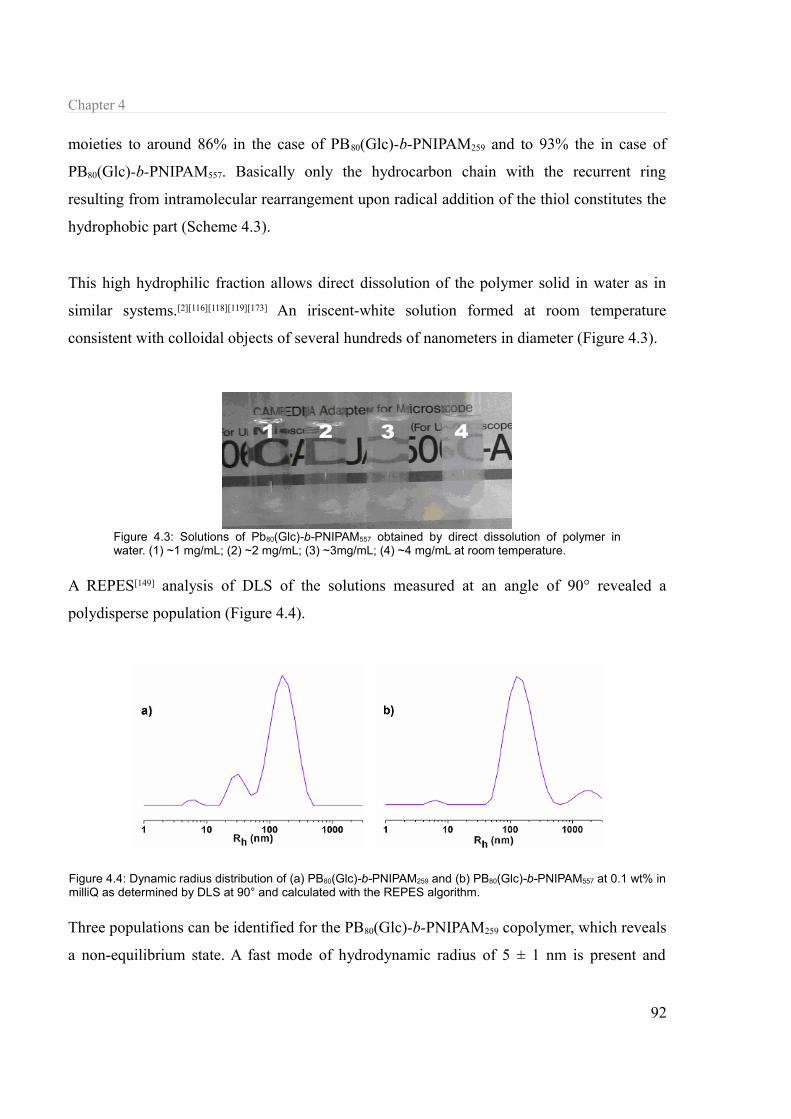
Chapter 4
moieties to around 86% in the case of PB80(Glc)-b-PNIPAM259 and to 93% the in case of
PB80(Glc)-b-PNIPAM557. Basically only the hydrocarbon chain with the recurrent ring
resulting from intramolecular rearrangement upon radical addition of the thiol constitutes the
hydrophobic part (Scheme 4.3).
This high hydrophilic fraction allows direct dissolution of the polymer solid in water as in
similar systems.[2][116][118][119][173] An iriscent-white solution formed at room temperature
consistent with colloidal objects of several hundreds of nanometers in diameter (Figure 4.3).
A REPES[149] analysis of DLS of the solutions measured at an angle of 90° revealed a
polydisperse population (Figure 4.4).
Three populations can be identified for the PB80(Glc)-b-PNIPAM259 copolymer, which reveals
a non-equilibrium state. A fast mode of hydrodynamic radius of 5 ± 1 nm is present and
92
Figure 4.3: Solutions of Pb80(Glc)-b-PNIPAM557 obtained by direct dissolution of polymer in water. (1) ~1 mg/mL; (2) ~2 mg/mL; (3) ~3mg/mL; (4) ~4 mg/mL at room temperature.
Figure 4.4: Dynamic radius distribution of (a) PB80(Glc)-b-PNIPAM259 and (b) PB80(Glc)-b-PNIPAM557 at 0.1 wt% in milliQ as determined by DLS at 90° and calculated with the REPES algorithm.

Thermoresponsive vesicles with an asymmetric membrane
likely corresponds to a polymer random coil or rather an off-equilibrium association of a
finite number of polymer chains. An intermediate mode of Rh= 25 ± 12 nm that could be
identified as micellar objects but whose relative high standard deviation is contradictory with
such a usually well-defined colloidal structure and more likely is an intermediate non-
equilibrium structure between the fastest and the slowest mode. The slowest mode
corresponds to an aggregate of Rh= 148 ± 17 nm. The size of this relatively well defined
structure seems to be similar to the size of the vesicles previously obtained in glycosylated
polybutadiene systems.[118][119]
The copolymer with longer PNIPAM block, PB80(Glc)-b-PNIPAM557, shows two modes. The
fastest one corresponds to an apparent hydrodynamic radius of 7 ± 1 nm and is compatible
with a polymer random coil diffusion or low aggregation intermediate. The slower mode
corresponds to objects with Rh= 134 ± 14 nm. This diffusion is also compatible with the
previously reported glycosylated polybutadiene-based vesicles. A third mode arises at a
hydrodynamic radius in the micrometer order, but as the scattering intensity is strongly
dependent on the radius of the particle and the proportion of big particles is always
exaggerated in CONTIN and REPES analyses, this mode concerns only an extremely low
percentage of particles and is actually probably due to incomplete dissolution of the polymer
or simply dust particles.
A combination of SLS and negative stained TEM was used to elucidate the structure of the
aggregates. In SLS measurements the intensity was acquired for a short time (typically 10 s)
to make sure the scattering was mainly due to the slowest mode. A Berry plot (Figure 4.5)
was used to evaluate the static parameters to overcome the angular dependence in the Zimm
plot as in most spherical aggregates with Rg > 50 nm.[190] For the PB80(Glc)-b-PNIPAM259
copolymer the fitting delivered a gyration radius of 162 nm ± 3%. The combination of this
SLS data with the Rh value delivered by DLS allows evaluating the ρ-ratio (Rg/Rh) to 1.09.
This ratio is consistent with the value theoretically calculated for hollow spheres with a thin
shell (ρ-ratio=1.0),[191] and suggests that the aggregates at Rh=148 nm are vesicles.
Rg=162 nm ± 3%
93

Chapter 4
Mw=3.8·108 g.mol-1 ± 10%
TEM images of a negatively stained air-dried sample of a 1 wt% of PB80(Glc)-b-PNIPAM259
prepared by drop casting delivered further evidence (Figure 4.6). The sample appears
polydisperse, but clearly shows vesicles. Their size is compatible with the aggregate detected
by DLS if we take into account the air-drying process that the TEM grid undergo before
measurement tends to shrink soft matter.
The same SLS/TEM analysis performed on PB80(Glc)-b-PNIPAM557 delivers similar
information (see Supporting experimental data). In this case the analysis was less straight
forward certainly due to the contribution to the scattered intensity of the micrometer sized
94
Figure 4.6: TEM images of a 1 wt% solution of PB80(Glc)-b-PNIPAM259. TEM grid prepared by drop casting and stained with uranyl acetate.
Figure 4.5: Berry plot of the SLS data of PB80(Glc)-b-PNIPAM259
obtained from 40° to 90°.
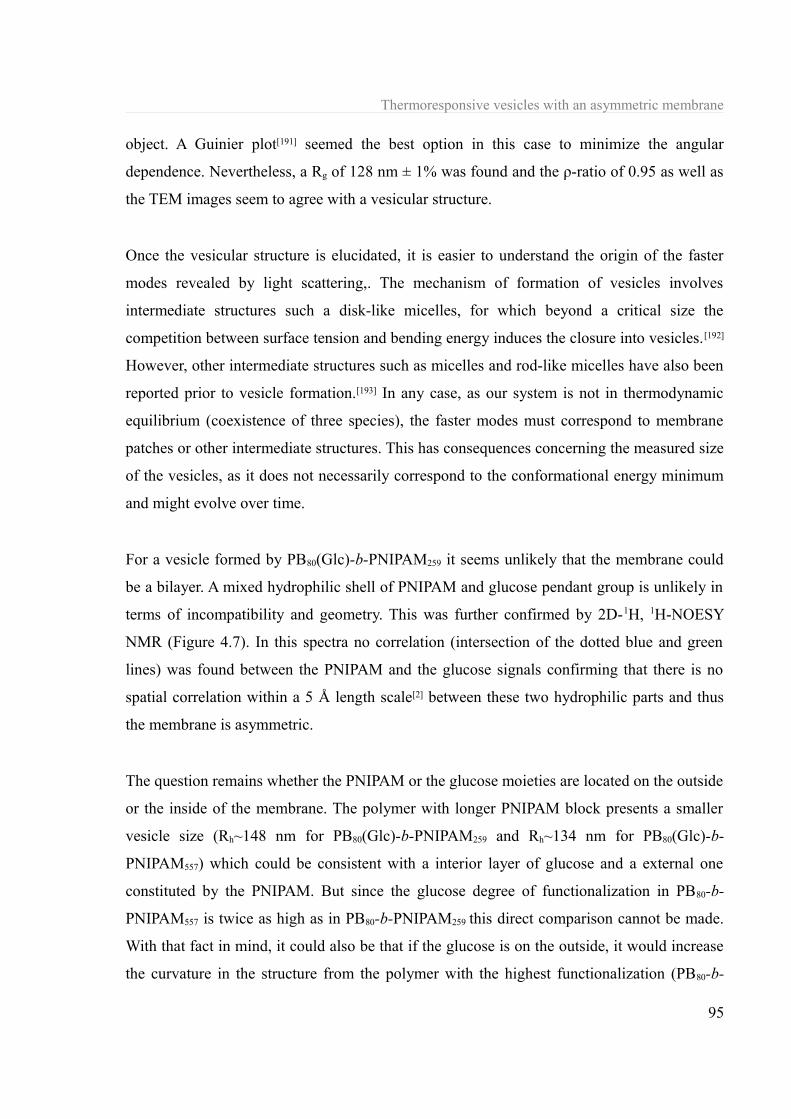
Thermoresponsive vesicles with an asymmetric membrane
object. A Guinier plot[191] seemed the best option in this case to minimize the angular
dependence. Nevertheless, a Rg of 128 nm ± 1% was found and the ρ-ratio of 0.95 as well as
the TEM images seem to agree with a vesicular structure.
Once the vesicular structure is elucidated, it is easier to understand the origin of the faster
modes revealed by light scattering,. The mechanism of formation of vesicles involves
intermediate structures such a disk-like micelles, for which beyond a critical size the
competition between surface tension and bending energy induces the closure into vesicles.[192]
However, other intermediate structures such as micelles and rod-like micelles have also been
reported prior to vesicle formation.[193] In any case, as our system is not in thermodynamic
equilibrium (coexistence of three species), the faster modes must correspond to membrane
patches or other intermediate structures. This has consequences concerning the measured size
of the vesicles, as it does not necessarily correspond to the conformational energy minimum
and might evolve over time.
For a vesicle formed by PB80(Glc)-b-PNIPAM259 it seems unlikely that the membrane could
be a bilayer. A mixed hydrophilic shell of PNIPAM and glucose pendant group is unlikely in
terms of incompatibility and geometry. This was further confirmed by 2D-1H, 1H-NOESY
NMR (Figure 4.7). In this spectra no correlation (intersection of the dotted blue and green
lines) was found between the PNIPAM and the glucose signals confirming that there is no
spatial correlation within a 5 Å length scale[2] between these two hydrophilic parts and thus
the membrane is asymmetric.
The question remains whether the PNIPAM or the glucose moieties are located on the outside
or the inside of the membrane. The polymer with longer PNIPAM block presents a smaller
vesicle size (Rh~148 nm for PB80(Glc)-b-PNIPAM259 and Rh~134 nm for PB80(Glc)-b-
PNIPAM557) which could be consistent with a interior layer of glucose and a external one
constituted by the PNIPAM. But since the glucose degree of functionalization in PB80-b-
PNIPAM557 is twice as high as in PB80-b-PNIPAM259 this direct comparison cannot be made.
With that fact in mind, it could also be that if the glucose is on the outside, it would increase
the curvature in the structure from the polymer with the highest functionalization (PB80-b-
95

Chapter 4
PNIPAM557) when compared to PB80(Glc)-b-PNIPAM259, reducing thus its size. Further
experimental results will be discussed under this perspective later in this report (see
paragraph 4.4.1 ).
4.3 Thermo-responsive behavior
Once the solution behavior at room temperature of PB80(Glc)-b-PNIPAMm copolymers had
been studied and shown the presence of vesicles, its thermo-responsive behavior was tested.
PNIPAM is a thermo-responsive polymer that shows a lower critical solution temperature
(LCST) in water at around 32 °C,[194] close to the human body temperature. For this, and for
its relatively low-cost and biocompatibility, it is of especial interest in systems that target
biological and medical applications. The vesicles formed by PB80(Glc)-b-PNIPAMm in water
are thus expected to be thermo-responsive and undergo a transition at the critical temperature
of PNIPAM.
The turbidity profile of PB80(Glc)-b-PNIPAM259 at 1 mg·mL-1 in water (Figure 4.8) shows a
96
Figure 4.7: 2D-1H, 1H-NOESY NMR spectrum of PB80(Glc)-b-PNIPAM557 at 5 wt% in D2O.

Thermoresponsive vesicles with an asymmetric membrane
LCST transition from around 85% of transmittance to 53%. The polymer does not
precipitate. The LCST calculated at 50% of the decay of the transmittance in the transition
(by derivating the heating curve and identifying the minimum) is 32.6 °C which is in good
agreement with literature values for PNIPAM-based systems.[195]-[197] A similar value of
32.8 °C was found for the PB80(Glc)-b-PNIPAM557 copolymer.
Visually, dilute solution of polymer go from iriscent to white-iriscent (Figure 4.9) with
increasing temperature but no precipitation is observed even over days at 40 °C, meaning that
stable colloidal objects are formed. This is the reason why the transmittance in Figure 4.8
never drops to 0 %. A change to a more intense white is usually consistent with objects of
higher mass. A DLS measurement of these solutions at 25 °C and 40 °C shows that the
transition is towards a very monodisperse objects of smaller size (Figure 4.10).
97
Figure 4.9: Visual aspect of PB80(Glc)-b-PNIPAM259 and PB80(Glc)-b-PNIPAM557 dilute solution (1mg·mL-1) at 25 °C and 40 °C).
Figure 4.8: Turbidity profile of a 1 mg·mL-1 solution of PB80(Glc)-b-PNIPAM259 in water at 1 °C.min-1. Heating curve (red) and cooling curve (blue).

Chapter 4
The increase in opacity can thus be explained in two terms. The first possibility is that several
vesicles collapse into a single micelle accounting thus for the increase in mass revealed by
the turbidity. The second possibility is that a single vesicle collapses into a single micelle.
The collapse of single PNIPAM chains in its coil-to-globule transition makes the
homopolymer loose around 40% of its mass by release of water changing the density from
2.5·10-2 g·cm-3 to 3.4·10-1 g·cm-3.[198] It seems thus rational that this collapse could raise the
optical density of the PNIPAM blocks within the colloidal objects and raise thus the turbidity
of the solution. In addition, the opacity above the LCST of PNIPAM is more pronounced
(Figure 4.9) in the polymer with much longer PNIPAM chain-length (557 repeating units
compared to 259 repeating units) for a comparable colloidal size (41 ± 0 nm for PB 80(Glc)-b-
PNIPAM259 and 52 ± 2 nm for PB80(Glc)-b-PNIPAM557) meaning that collapsed PNIPAM
density within the colloidal objects is greater in PB80(Glc)-b-PNIPAM557 copolymers.
The transition can also be monitored with DLS by monitoring the evolution of the
hydrodynamic radius of the aggregate with temperature (Figure 4.11). Below the cloud point
the Rh seems to slowly decrease certainly due to the deformation cause by the PNIPAM
chains coming close together as a result of dehydration. At a temperature close to the cloud
point determined by turbidity the decrease is sharp, showing that the transition from vesicles
to the object of smaller size is well caused by the PNIPAM collapse and is fast. Above the
LCST, the single species with narrow size distribution are formed.
Even though fitting of the SLS data at 40 °C was not possible, it seems rational that an object
of that size showing colloidal stability formed after the collapse of PNIPAM chains can only
98
Figure 4.10: Hydrodynamic radius distribution below LCST and above the LCST of PB80(Glc)-b-PNIPAM259 as determined by a REPES analysis of the DLS data for a 1mg·mL -1 solution in water.

Thermoresponsive vesicles with an asymmetric membrane
have micellar structure in which the core if formed by these hydrophobic collapsed PNIPAM
chains with a hydrophilic glucose-based corona to assure stability. The geometry of the
micellar structures remains nevertheless unknown. As the fast modes present below LCST
(Figure 4.4) have disappeared above LCST, it seems that the micelles have incorporated the
membrane patches present below the LCST.
Below the LCST, if the PNIPAM is on the outside of the vesicles, it would mean that the
membrane “flips” at the LCST, revealing a very interesting collapse mechanism. If the
PNIPAM is on the inside, the vesicle to micelle transition would take place by progressive
shrinkage of the structure induced by the PNIPAM's collapse.
The reversibility of the vesicle to micelle transition was studied for the three heating/cooling
cycles. The radius of gyration seems to remain invariable within the given error after each
cycle. The hydrodynamic radius also remains constant within the error always slightly above
Rg. This gives in all cases a ρ-ratio from 0.87 to 0.95 that can be assigned to a vesicle with
finite shell thickness. Although no values are exactly the same for two different cycles, there
seem to be no given tendency towards shrinkage or deformation, and the vesicle to micelle
transition seems to be reversible within the three cycles limit.
99
Figure 4.11: Evolution of the hydrodynamic radius with increasing temperature in the PB80(Glc)-b-PNIPAM259 copolymer. The small amplitudes below the LCST were omitted for clarity.
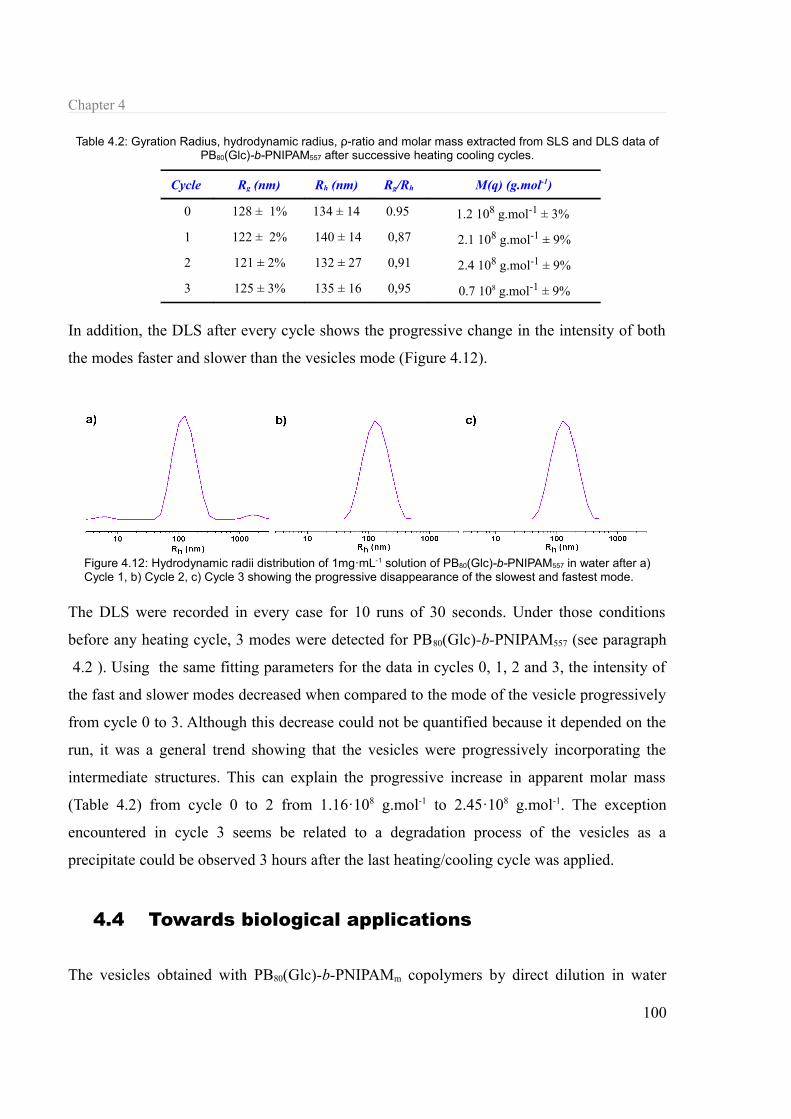
Chapter 4
Table 4.2: Gyration Radius, hydrodynamic radius, ρ-ratio and molar mass extracted from SLS and DLS data of PB80(Glc)-b-PNIPAM557 after successive heating cooling cycles.
Cycle Rg (nm) Rh (nm) Rg/Rh M(q) (g.mol-1)
0 128 ± 1% 134 ± 14 0.95 1.2 108 g.mol-1 ± 3%
1 122 ± 2% 140 ± 14 0,87 2.1 108 g.mol-1 ± 9%
2 121 ± 2% 132 ± 27 0,91 2.4 108 g.mol-1 ± 9%
3 125 ± 3% 135 ± 16 0,95 0.7 108 g.mol-1 ± 9%
In addition, the DLS after every cycle shows the progressive change in the intensity of both
the modes faster and slower than the vesicles mode (Figure 4.12).
The DLS were recorded in every case for 10 runs of 30 seconds. Under those conditions
before any heating cycle, 3 modes were detected for PB80(Glc)-b-PNIPAM557 (see paragraph
4.2 ). Using the same fitting parameters for the data in cycles 0, 1, 2 and 3, the intensity of
the fast and slower modes decreased when compared to the mode of the vesicle progressively
from cycle 0 to 3. Although this decrease could not be quantified because it depended on the
run, it was a general trend showing that the vesicles were progressively incorporating the
intermediate structures. This can explain the progressive increase in apparent molar mass
(Table 4.2) from cycle 0 to 2 from 1.16·108 g.mol-1 to 2.45·108 g.mol-1. The exception
encountered in cycle 3 seems be related to a degradation process of the vesicles as a
precipitate could be observed 3 hours after the last heating/cooling cycle was applied.
4.4 Towards biological applications
The vesicles obtained with PB80(Glc)-b-PNIPAMm copolymers by direct dilution in water
100
Figure 4.12: Hydrodynamic radii distribution of 1mg·mL-1 solution of PB80(Glc)-b-PNIPAM557 in water after a) Cycle 1, b) Cycle 2, c) Cycle 3 showing the progressive disappearance of the slowest and fastest mode.

Thermoresponsive vesicles with an asymmetric membrane
present themselves as privileged systems for biological applications. Not only all their
components are biocompatible, D-glucose is also a biologically relevant molecule. Besides
its value in metabolism, it plays an important role as ligand in host-pathogen interactions,
targeting of proteins within cells and cell-cell interactions with lectin as its receptor.[199] From
that point of view these sugar decorated vesicles are potential multivalent ligands for
proteins. This interaction was studied in paragraph 4.4.1. These vesicles present also a novel
reversible hydrophobic collapse that in addition to its biological value makes it a potential
candidate for thermocontrolled release of hydrophilic drugs. A preliminary study of the
encapsulation capabilities of organic molecules is presented in paragraph 4.4.2.
4.4.1 Lectin-carbohydrate recognition
Lectins are glycan-binding proteins and the study of their interaction with carbohydrates goes
back to the end of the 19th century.[200] Concanavalin A (ConA) from jack bean (Canavalia
ensiformis) is a kind of L-lectin that specifically binds to the monosaccharides glucose and
101
Figure 4.13: Structure of Concanavalin A (ConA), a legume seed lectin. a.1) tertiary structure of the unimer. a.2) This fold consists of a flat six-stranded antiparallel “back” β-sheet (red), a curved seven-stranded “front” β-sheet (green), and a five-stranded “top” sheet (pink) linked by loops of various lengths. b)Tetramer of Con A. Reproduced from [200].

Chapter 4
mannose. These monosaccharide-lectin interactions have low affinity constants Ka in the
range of 103 to 106 M-1.[201] To overcome this weak interaction and fulfill a biological activity,
in nature most ligands (both carbohydrates and glycoconjugates) and lectins are
multivalent.202] For example Con A is at pH 7 a tetramer (Figure 4.11.b)) and presents thus
four carbohydrate-recognition domains (CRDs) composed of antiparallel β-sheets connected
by short loops and β-bends (Figure 4.11.a)).
The presence of multivalent ligands (polysaccharides, glucose functionalized polymers...)
does not only enhance the binding affinity, it also might lead in some cases to the formation
of crosslinked complexes,[202]-[204] depending of the structural arrangement of the carbohydrate
epitopes and the CDRs of the lectins. This crosslinking ultimately leads to clustering and
precipitation.
Previous works with sugar decorated vesicles[173][205][206] have already exploited lectin-
carbohydrate interactions. In our case buffered solutions (HBS, pH 7.4) of polymers were
studied by DLS at an angle of 30°. In that buffer and at that angle the hydrodynamic radii
(Table 4.3) seems to follow the logic of the ones extracted from the DLS in water at 90°
taking into account the angular dependence inherent to objects of such size. The only
difference is the relative size of the object formed by both polymers although that could
easily be due to a higher angular dependence of PB80(Glc)-b-PNIPAM557.
Table 4.3: Hydrodynamic radii (DLS, 30°) of the objects formed in HBS buffer pH 7.4 by PB80(Glc)-b-PNIPAM259
and PB80(Glc)-b-PNIPAM557 at 25 °C and 40 °C.
In HBS buffer pH 7.4 Rh (nm) at 25 °C Rh (nm) at 40 °C
PB80(Glc)-b-PNIPAM259 159 ± 27 45 ± 3
PB80(Glc)-b-PNIPAM557 211 ± 21 52 ± 2
The evolution of the hydrodynamic radius of the vesicles after addition of a ConA solution
was monitored over time at 25 °C (Figure 4.14.a)) and 35 °C (Figure 4.11.a)). At 25 °C very
polydisperse objects with Rh from ~270 to ~460 nm were detected with no apparent evolution
over time in the studied timeframe. Visually no precipitation was observed (Figure 4.14.b)).
The absence of precipitation means that there is no crosslinking. The fluctuations of the
102

Thermoresponsive vesicles with an asymmetric membrane
hydrodynamic radii could indicate short-lived non-specific interactions between the vesicles
and the proteins to form vesicle dimers or even the deformation of the vesicles.
This absence of clear specific interaction could be understood if the glucose is not on the
outside below the LCST as previously discussed (see paragraph 4.2). In that case the
PNIPAM on the outside could be engaged in non-specific short-lived interactions with the
proteins giving raise to the fluctuations of the hydrodynamic radii observed in the sample. No
evolution overtime or precipitation would be expected. But the absence of precipitation is not
a proof of the absence of interaction. The cluster glycosidic effect leading to precipitation is a
particular case of this interaction in which geometrical arrangement of the carbohydrate
epitopes and the CDRs of the lectins allows the creation of 3D crosslinked networks.
To investigate further the interaction between the vesicles and the lectin, fluorescence
correlation spectroscopy (FCS) experiments were carried out with fluorescein isothiocyanate
(FITC)-labeled Concavalin A (FITC-ConA). Briefly, FCS performs a correlation analysis of
fluctuation of the fluorescence intensity. The analysis of the correlation by fitting with the
least squares method gives the average number of fluorescent particles and their diffusion
time (see Appendix V.). When the FITC-ConA is not bound, a single fast diffusion time can
be fitted to the correlation curve. When FITC-ConA binds to the vesicles surface, the
fluorescence correlation can be fitted with a slower diffusion component corresponding to the
“fluorescent vesicles”.
103
Figure 4.14: The evolution of the hydrodynamic radius after addition of Con A at 25 °C of a PB80(Glc)-b-PNIPAM557 b) Visual appearance of the solution at the end of the experiment.
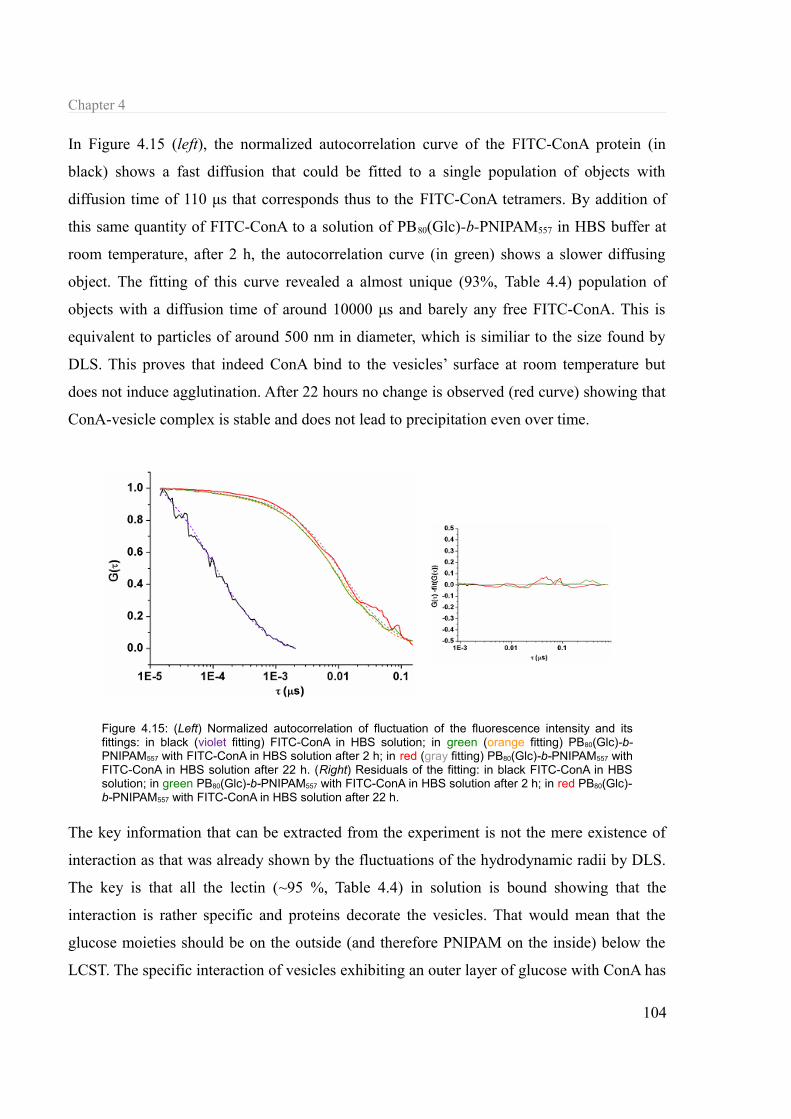
Chapter 4
In Figure 4.15 (left), the normalized autocorrelation curve of the FITC-ConA protein (in
black) shows a fast diffusion that could be fitted to a single population of objects with
diffusion time of 110 μs that corresponds thus to the FITC-ConA tetramers. By addition of
this same quantity of FITC-ConA to a solution of PB80(Glc)-b-PNIPAM557 in HBS buffer at
room temperature, after 2 h, the autocorrelation curve (in green) shows a slower diffusing
object. The fitting of this curve revealed a almost unique (93%, Table 4.4) population of
objects with a diffusion time of around 10000 μs and barely any free FITC-ConA. This is
equivalent to particles of around 500 nm in diameter, which is similiar to the size found by
DLS. This proves that indeed ConA bind to the vesicles’ surface at room temperature but
does not induce agglutination. After 22 hours no change is observed (red curve) showing that
ConA-vesicle complex is stable and does not lead to precipitation even over time.
The key information that can be extracted from the experiment is not the mere existence of
interaction as that was already shown by the fluctuations of the hydrodynamic radii by DLS.
The key is that all the lectin (~95 %, Table 4.4) in solution is bound showing that the
interaction is rather specific and proteins decorate the vesicles. That would mean that the
glucose moieties should be on the outside (and therefore PNIPAM on the inside) below the
LCST. The specific interaction of vesicles exhibiting an outer layer of glucose with ConA has
104
Figure 4.15: (Left) Normalized autocorrelation of fluctuation of the fluorescence intensity and its fittings: in black (violet fitting) FITC-ConA in HBS solution; in green (orange fitting) PB80(Glc)-b-PNIPAM557 with FITC-ConA in HBS solution after 2 h; in red (gray fitting) PB80(Glc)-b-PNIPAM557 with FITC-ConA in HBS solution after 22 h. (Right) Residuals of the fitting: in black FITC-ConA in HBS solution; in green PB80(Glc)-b-PNIPAM557 with FITC-ConA in HBS solution after 2 h; in red PB80(Glc)-b-PNIPAM557 with FITC-ConA in HBS solution after 22 h.

Thermoresponsive vesicles with an asymmetric membrane
already been reported to show interaction without cross-linking.[173] This is presumably due to
the size of the vesicles for which the geometrical arrangements of the carbohydrate epitopes
and the CDRs of the lectins would not allow the creation of cross-linked networks (Figure
4.17.a)).
Table 4.4: Data extracted from the analysis in the FCS experiments.
Sample CR (kHz) CPM (kHz) N Fraction 1 Fraction 2
% τD(μs) % τD(μs)
FITC-ConA 17.3 13.3 1.3 96 110 - -
PB80(Glc)-b-PNIPAM557
+ FITC-ConA after 2h28.5 25.7 1.2 7 110 93 10000
PB80(Glc)-b-PNIPAM557
+ FITC-ConA after 22h 23.5 55.3 0.4 5 110 95 11500
At 35 °C, the addition of ConA to the polymer solution induced the rapid precipitation
(Figure 4.16.b)) of the solution as the monitoring of Rh by DLS over time shows (Figure
4.16.a)). This means that the addition of ConA created a crosslinked 3D network, which
indicates that at least 2 or 3 out of the 4 CDRs were able to interact with two or more
micellar objects. By comparison with the previous experiments it seems that the size of the
smaller micelle size optimizes the geometry for multiple CDRs to interact simultaneously
(Figure 4.17.b)).
A deeper study of the interaction of the vesicles and micelles with lectins could elucidate the
105
Figure 4.16: a) The evolution of the hydrodynamic radius after addition of Con A at 35 °C of a PB80(Glc)-b-PNIPAM557 b) Visual appearance of the solution at the end of the experiment

Chapter 4
number of lectins bounds per vesicle/micelle, however it is beyond the frame of this work to
perform a complete biological evaluation of this system. As a preliminary conclusion, it has
been shown that PB80(Glc)-b-PNIPAMm copolymers exhibit a temperature-dependent
interaction with lectins, a feature that could be exploited in potential biological and especially
medical applications as it is potentially a controlled biological response.
4.4.2 Encapsulation of organic compounds
Research on the delivery of hydrophilic drugs is normally done with systems such as
liposomes i.e. synthetic vesicles made of phospholipids[207] and polyelectrolyte capsules.[208]
where the drug is encapsulated inside in the hollow interior. More recently, in order to take
advantage of the superior mechanical performance of polymer vesicles and the special
features of certain polymers (PEG antiadhesion, thermoresponsiveness...), polymersomes
have gained attention as potential drug carriers.[209]
As mentioned before PB80(Glc)-b-PNIPAMm polymersomes are interesting potential
candidates for such purpose as all their components are biocompatible and the external
glucose layer could be a potential vector. The encapsulation capabilities of such systems were
investigated in water by means of fluorescence microscopy.
Solid polymer was dissolved in a Rhodamine B solution and subsequently dialyzed against
milliQ water. The confocal fluorescence micrographs (Figure 4.18) shows bright red dots
corresponding to higher fluorophore concentration zones that are superimposed onto the
vesicles seen in the transmission optical micrograph. The encapsulation of Rhodamine B
106
Figure 4.17: Schematic representation of the possible structure of the interacting a) vesicles/ConA at 25°C and b)micelles/ConA at 35 °C. In red the tetravalent ConA, in green vesicles and micelles. The relative size of vesicles and micelles is on scale, Con A is not.

Thermoresponsive vesicles with an asymmetric membrane
inside the vesicles is thus effective. From the comparison of the transmission and the
fluorescence intensity profiles, it seems that the fluorophore is inside the cavity and not
located in the membrane.
In order to confirm that the fluorescent dye is not located in the membrane and the
“fluorescent dots” were due to encapsulation, control experiments were performed by
addition of Rhodamine B solution to a solution of preformed vesicles. Micrographs (Figure
4.19) show a continuous fluorescent phase with the vesicles as white dots. The transmission
and fluorescence intensity profiles though suggest a concentration gradient of the fluorescent
dye starting in the membrane's external boundary. This gradient is probably due to the
107
Figure 4.18: Overlay micrographs (right), fluorescence intensity profile (left red scale) and transmission intensity profile (left grey scale) of vesicles formed by PB80(Glc)-b-PNIPAM557 with encapsulated Rhodamine B.
Figure 4.19: Overlay micrographs (right), fluorescence intensity profile (left red scale) and transmission intensity profile (left grey scale) of vesicles formed by PB80(Glc)-b-PNIPAM557 with Rhodamine B in the continuous phase.

Chapter 4
osmotic pressure between the vesicle's cavity and the continuous phase that tends to
equilibrate the fluorophore concentration from the outside to the inside of the vesicle.This
encapsulation behavior suggests thus that these asymmetric vesicles are not good candidates
for the encapsulation of hydrophilic drugs as they tend to concentrate the organic molecules
around the membrane.
4.5 Summary
Figure 4.20 summarizes the structure of the aggregate obtained by direct dissolution of
PB80(Glc)-b-PNIPAMm copolymers in water at room temperature. The aggregate was found
to be a vesicle with asymmetric membrane with an outer glycosylated exterior and PNIPAM
on the inside. Above the LCST of PNIPAM, the structure collapsed into micelles with a
hydrophobic PNIPAM core and glycosylated exterior. This collapse was found to be
reversible at least in the three heating/cooling cycles’ context. As a result, the structures
showed a temperature-dependent interaction with L-lectin proteins and were shown to be
able to encapsulate organic molecules.
108
Figure 4.20: Schematization of the possible temperature-induced collapse of a vesicle into a micellar object. The two insets show the membrane structure of the vesicle, and the internal structure of the micelle. The blue hexagons are represent the D-glucose moieties, the PB segment is red and the PNIPAM chains are green

Conclusions and perspectives
Chapter 5: Conclusions and perspectives
In chapter 3, several DHBC systems were studied in water. They all formed structures as a
consequence of microphase separation. The microphase separation was obviously not driven
by “the hydrophobic effect” as we know it but two other reasons were accounted for it:
incompatibility of the polymer pairs forming the two blocks (enthalpic) and a considerable
solubility difference (enthalpic and entropic). The entropic contribution to this positive Gibbs
free energy of mixing is believed to arise from the same loss of conformational entropy that
is responsible for “the hydrophobic effect”. If the polymer is made of blocks presenting high
block solubility difference, a segregation could lower even more the free energy of the
system by freeing the water molecules that were trying to solubilize the “less soluble” block
(loss of conformational entropy). This theory supports that to have an entropy-driven
segregation, a big solubility difference is enough provided that the enthalpic contribution to
the free energy does not compensate it. In that sense this is a “hydrophilic effect”, a sort of
competition for water. It is to some extend an extension of the notion of “hydrophobic effect”
109

Chapter 5
without the sharp solubility boundary. The notion of hydrophilic effect is an acknowledged
phenomenon in biological sciences[210] that does not have an equivalent in supramolecular
and macromolecular chemistry. For example, in biological sciences, the notion of water
structure near hydrophilic substrates (most notably ions) is often explained in terms of
“hydrophilic effect”. A consequence of this effect in supramolecular chemistry is that phase
separation in water is ubiquitous to biomacromolecules and thus microphase separation and
the subsequent formation of dilute solution phases in water is a principle well beyond
hydrophobicity and amphiphilicity.
Concerning the systems developed in chapter 3, the next foci should concern for instance the
study of the copolymers-water phases in semi-dilute and concentrated solutions. At those
higher concentrations, the enthalpic contribution should rise and mesophases can be
expected.[211] A modelization of these systems could bring detailed information of the driving
forces and open doors towards a formalization of the “hydrophilic effect”.
Chapter 4 studied the self-assembly of a glucose-modified polybutadiene-block-poly(N-
Isopropylacrylamide). The polymer spontaneously formed vesicles by dissolution of the
polymer solid in water. The structures of the micelle should still be further studied to
elucidate their geometry.
110

Experimental part
Appendix I. Experimental part
A. Experimental procedures
I. Dextran-block-poly(ethylene glycol) polymers
I.1)Blocks prepapation
I.1.a) α-alkyne dextrans
1 eq of dextran was dissolved at 2 wt% in acetate buffer (pH=5.5, 50 mM) at 50 °C. 100 eq of propargylamine were added followed by 100 eq of sodium cyanoborohydride (NaCNBH3). The mixture was stirred for 5 days with a daily addition of 100 eq of sodium cyanoborohydride. Purification was achieved by concentrating the solution in the rotatory evaporator and dialyzing against milliQ water (MWCO 1000) for 5 days with daily solvent change. The polymer was recovered by lyophilization.
Block α-alkyne dextran6 α-alkyne dextran11 α-alkyne dextran6(SO3Na)
Quantities1 eq Dextran (g) 10,0 10,0 5,0
100 eq Propargylamine (mL)
9,6 9,3 5,0
100 eq NaCNBH3 (g) 9,5 9,5 4,8
YieldMass recovered (g) 5,8 7,1 3,6
Yield (%) ~58 ~71 ~71
α-alkyne dextran65001H NMR (DMSO-d6, 400 MHz): δ (ppm)= 4.91, 4.83, 4.67, 4.50 (b, 1’+6’), 3.75, 3.64, 3.48 (b, 5+6+3’), 3.36 (bs, 2+4+5), 3.20 (b, 3)
I

Appendix I.
GPC (DMSO, dextran): Mn,app= 5100, PDI=1.66
α-alkyne dextran110001H NMR (DMSO-d6, 400 MHz): δ (ppm)= δ (ppm)= 4.91, 4.83, 4.67, 4.50 (b, 1’+6’), 3.75, 3.64, 3.48 (b, 5+6+3’), 3.36 (bs, 2+4+5), 3.20 (b, 3)GPC (DMSO, dextran): Mn,app=6500 PDI=1.75
I.1.b) α-methoxy-ω-azido-poly(ethylene glycol)
• α-methoxy-ω-p-toluenesulfonyl-poly(ethylene glycol)
1 eq of commercial poly(ethylene glycol) methyl ether (mPEG-OH) was dissolved at 25 wt% in dichloromethane. 7 equivalents of triethylamine (TEA) were added and the mixture was cooled down to 0 °C. Under stirring 5 eq of p-toluenesulfonyl chloride (TsCl) were added and the mixture was stirred for 2 hours at 0 °C and overnight at room temperature.The polymers were purified by precipitation in diethylether and subsequent recrystallization twice from ethanol. The obtained solids were dried at room temperature under vacuum overnight.
Block mPEG13200-OTs mPEG5500- OTs mPEG1900- OTs
Quantities1 eq mPEG-OH (g) 4,0 20,0 20,0
7 eq TEA (mL) 4,0 10,05 eq TsCl (g) 4,0 10,0
YieldMass recovered (g) 3,8 17,2 7,0
Yield (%) ~95 ~86 ~35
mPEG13200-OTs 1H NMR (DMSO-d6, 400 MHz): δ (ppm)= δ (ppm)= 7.78 and 7.48 (4H, A2B2 dd, 5), 4.11 (2H, t, 4), 3.51 (bs, 2+3), 3.24 (3H, s, 1), 2.42 (3H, s, 6)GPC (DMSO, dextran): Mn,app=11200 PDI=1.05
mPEG5500-OTs 1H NMR (DMSO-d6, 400 MHz): δ (ppm)= 7.78 and 7.48
(4H, A2B2 dd, 5), 4.11 (2H, t, 4), 3.51 (bs, 2+3), 3.24 (3H, s, 1), 2.42 (3H, s, 6)GPC (DMSO, PEG): Mn,app=3600 PDI=1.14
II

Experimental part
mPEG1900-OTs 1H NMR (DMSO-d6, 400 MHz): δ (ppm)= 7.78 and 7.48 (4H, A2B2 dd, 5), 4.11 (2H, t, 4), 3.51 (bs, 2+3), 3.24 (3H, s, 1), 2.42 (3H, s, 6)GPC (DMSO, PEG): Mn,app=1400 PDI=1.04
• α-methoxy-ω-azido-poly(ethylene glycol)
p-toluenesulfonyl terminated poly(ethylene glycol) methyl ether polymers were dissolved at 10 wt% in DMF and 10 eq of sodium azide (NaN3) were added. The mixtures were heated at 60 °C under stirring for 3 days. Purification was achieved by removal of the solvent under reduced pressure and redissolving the solid in water for subsequent dialysis against bidistilled water for 4 days with 4 solvent changes. The polymer was recovered as a white solid by freeze-drying.
Block mPEG13200-N3 mPEG5500-N3 mPEG1900-N3
QuantitiesmPEGy-OTs 3,8 10,0 10,0
NaN3(g) 0,2 1,3 3,3Yield
Mass recovered (g) 3,1 9,0 8,7Yield (%) ~81 ~90 ~87
mPEG13200-N3 1H NMR (DMSO-d6, 400 MHz): δ (ppm)= 3.51 (bs, 2+3), 3,37 (s, 4), 3.24 (3H, s, 1)GPC (DMSO, PEG): Mn,app=13200 PDI=1.08
mPEG5500- N3 1H NMR (CDCl3, 400 MHz): δ (ppm)= 3.51 (bs, 2+3), 3,35 (s, 4), 3.25 (3H, s, 1)GPC (DMSO, PEG): Mn,app=5500 PDI=1.03
mPEG1900- N31H NMR (DMSO-d6, 400 MHz): δ (ppm)= 3.51 (bs, 2+3), 3,37 (s, 4), 3.24 (3H, s, 1)GPC (DMSO, PEG): Mn,app=1900 PDI=1.05
I.1.c) α, ω-bisazido-poly(ethylene glycol)
• α, ω-bis-p-toluenesulfonyl -poly(ethylene glycol)
1 eq (10 g)of commercial poly(ethylene glycol) (HO-PEG-OH) Mw 5100 g·mol-1was dissolved at 25 wt% in dichloromethane. 14 eq (4 mL) of triethylamine (TEA) were added and the mixture was cooled down to 0 °C. Under stirring 10 eq (4 g) of p-toluenesulfonyl
III

Appendix I.
chloride (TsCl) were added and the mixture was stirred for 2 hours at 0 °C and overnight at room temperature.The polymers were purified by precipitation in diethylether and subsequent recrystallization twice from ethanol. The obtained solids were dried at room temperature under vacuum overnight. m=10,01 g, Yield~ 99%
TsO-PEG5100-OTs1H NMR (DMSO-d6, 400 MHz): δ (ppm)= 7.79 and 7.48 (4H, A2B2 dd, 4), 4.11 (2H, t, 3), 3.51 (bs, 1+2), 2.42 (3H, s, 5)GPC (DMSO, dextran): Mn= 4800 PDI=1.05
• α, ω-bisazido-poly(ethylene glycol)
1 eq (6,5 g) of bis-p-toluenesulfonyl terminated poly(ethylene glycol) polymer Mw 5000 was dissolved at 10 wt% in DMF and 20 eq (1,7 g) of sodium azide (NaN3) were added. The mixtures were heated at 60 °C under stirring for 3 days. Purification was achieved by removal of the solvent under reduced pressure and redissolving the solid in water for subsequent dialysis against bidistilled water for 4 days with 4 solvent changes. The polymer was recovered as a white solid by freeze-drying. m=5,23 g, yield ~82%.
N3-PEG5100- N31H NMR (DMSO-d6, 400 MHz): δ (ppm)= 3.50 (bs, 2+3), 3,38 (s, 3)GPC (DMSO, dextran): Mn=5100 PDI=1.03
I.1.d) α-lactone-dextran
2 eq of Iodine 1N in water (6,6 mL) were added to 1 eq (5 g) of dextran (Mw 6000) at 10% in water. 8 eq (0.746 g) of KOH in water were added drop by drop under stirring. The mixture was stirred at room temperature overnight and subsequently dialyzed against milliQ water (MWCO 1000) for 3 days with 3 water changes. The solution was then stired with DOWEX 50 (sulfonic acid, H form), filtered and freeze dried. The product was recovered as a slightly yellow powder. m=4,5 g, yield~90%.
α-lactone-dextran65001H NMR (DMSO-d6, 400 MHz): δ (ppm)= 4.91-4.50 (b, 1’+6’), 3.75, 3.64, 3.48 (b, 5+6+3’), 3.36 (bs, 2+4+5), 3.20 (b, 3)GPC (DMSO, dextran): Mn,app=3000 PDI=1.69
IV
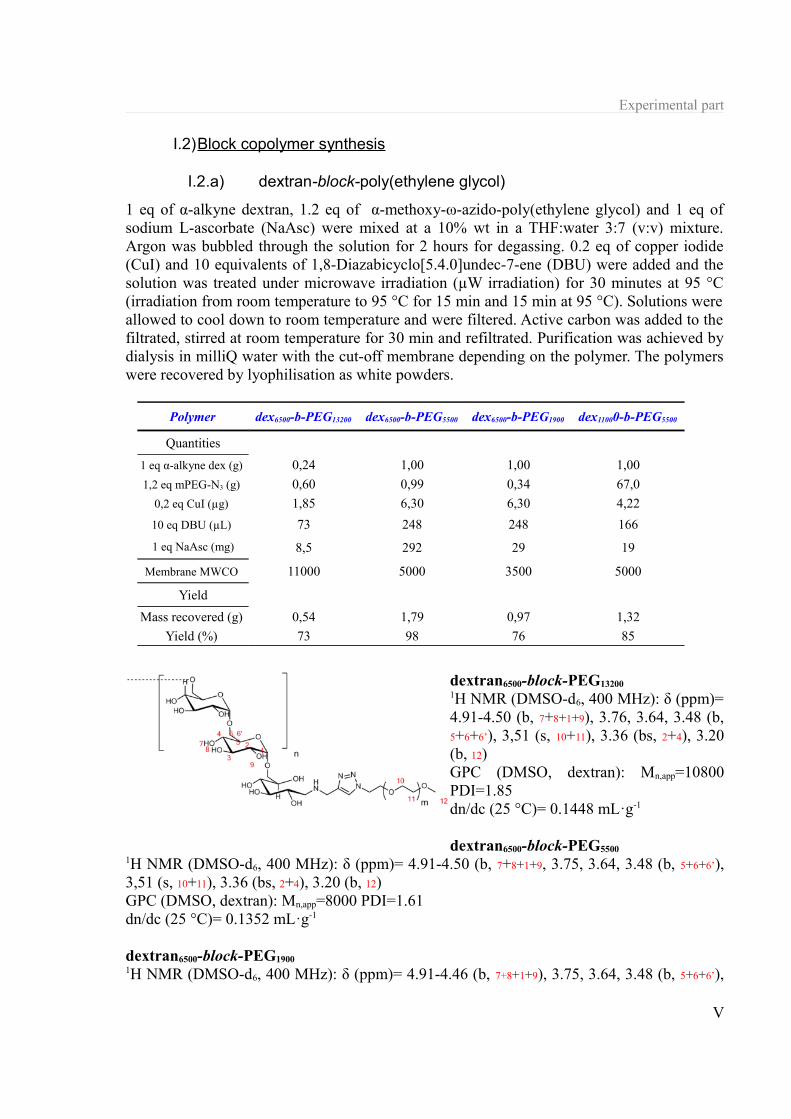
Experimental part
I.2)Block copolymer synthesis
I.2.a) dextran-block-poly(ethylene glycol)
1 eq of α-alkyne dextran, 1.2 eq of α-methoxy-ω-azido-poly(ethylene glycol) and 1 eq of sodium L-ascorbate (NaAsc) were mixed at a 10% wt in a THF:water 3:7 (v:v) mixture. Argon was bubbled through the solution for 2 hours for degassing. 0.2 eq of copper iodide (CuI) and 10 equivalents of 1,8-Diazabicyclo[5.4.0]undec-7-ene (DBU) were added and the solution was treated under microwave irradiation (µW irradiation) for 30 minutes at 95 °C (irradiation from room temperature to 95 °C for 15 min and 15 min at 95 °C). Solutions were allowed to cool down to room temperature and were filtered. Active carbon was added to the filtrated, stirred at room temperature for 30 min and refiltrated. Purification was achieved by dialysis in milliQ water with the cut-off membrane depending on the polymer. The polymers were recovered by lyophilisation as white powders.
Polymer dex6500-b-PEG13200 dex6500-b-PEG5500 dex6500-b-PEG1900 dex11000-b-PEG5500
Quantities1 eq α-alkyne dex (g) 0,24 1,00 1,00 1,001,2 eq mPEG-N3 (g) 0,60 0,99 0,34 67,0
0,2 eq CuI (µg) 1,85 6,30 6,30 4,2210 eq DBU (µL) 73 248 248 1661 eq NaAsc (mg) 8,5 292 29 19
Membrane MWCO 11000 5000 3500 5000
YieldMass recovered (g) 0,54 1,79 0,97 1,32
Yield (%) 73 98 76 85
dextran6500-block-PEG13200 1H NMR (DMSO-d6, 400 MHz): δ (ppm)= 4.91-4.50 (b, 7+8+1+9), 3.76, 3.64, 3.48 (b, 5+6+6’), 3,51 (s, 10+11), 3.36 (bs, 2+4), 3.20 (b, 12)GPC (DMSO, dextran): Mn,app=10800 PDI=1.85dn/dc (25 °C)= 0.1448 mL·g-1
dextran6500-block-PEG5500 1H NMR (DMSO-d6, 400 MHz): δ (ppm)= 4.91-4.50 (b, 7+8+1+9, 3.75, 3.64, 3.48 (b, 5+6+6’), 3,51 (s, 10+11), 3.36 (bs, 2+4), 3.20 (b, 12)GPC (DMSO, dextran): Mn,app=8000 PDI=1.61dn/dc (25 °C)= 0.1352 mL·g-1
dextran6500-block-PEG1900 1H NMR (DMSO-d6, 400 MHz): δ (ppm)= 4.91-4.46 (b, 7+8+1+9), 3.75, 3.64, 3.48 (b, 5+6+6’),
V

Appendix I.
3,51 (s, 10+11), 3.36 (bs, 2+4), 3.20 (b, 12)GPC (DMSO, dextran): Mn,app=7000 PDI=1.61dn/dc (25°C)= 0.0812 mL·g-1
dextran11000-block-PEG5500 1H NMR (DMSO-d6, 400 MHz): δ (ppm)= 4.91-4.46 (b, 1’+6’), 3.75, 3.64, 3.48 (b, 5+6+6’), 3,51 (s, 10+11), 3.36 (bs, 2+4), 3.20 (b, 12)GPC (DMSO, dextran): Mn,app=7600 PDI=1.44dn/dc (25°C)= 0.1365 mL·g-1
I.2.b) dextran-block-poly(ethylene glycol)-block-dextran
2.4 equivalent (0.5 g) of α-alkyne dextran, 1 equivalents (1.44 g) of α,ω-bisazido-poly(ethylene glycol) and 1 eq (35 mg) of sodium L-ascorbate were mixed at a 10% wt in a THF:water 3:7 (v:v) mixture. Argon was bubbled through the solution for 2 hours for degassing and 0.4 eq (7.6 mg) of copper iodide (CuI) and 10 eq (298 µL) of 1,8-Diazabicyclo[5.4.0]undec-7-ene (DBU) were added. The solution was treated under microwave irradiation (µW irradiation) for 30 minutes at 95 °C (irradiation from room temperature to 95 °C for 15 min and 15 min at 95 °C). Solution was allowed to cool down to room temperature and filtered. Active carbon was added to the filtrated, stirred at room temperature for 30 min and refiltrated. Purification was achieved by dialysis in milliQ water MWCO 3500 for 3 days. The polymer was recovered by lyophilisation as white powders.
dextran6500-block-PEG5100-block-dextran65001H NMR (DMSO-d6, 400 MHz): δ (ppm)= 4.91-4.47 (b, 1’+6’), 3.75, 3.64, 3.48 (b, 5+6+6’), 3,51 (s, 10+11), 3.36 (bs, 2+4)GPC (DMSO, dextran): Mn,app=7400 PDI=1.62dn/dc (25°C)= 0.1438 mL·g-1
I.2.c) maleic anhydride-derived dextran-block-poly(ethylene glycol)
75 mg of dextran6500-b-PEG5500 (~9.10-4 mol OH when approximating dextran to a linear α-1,6-polyglucan) was dissolved at 3 wt% in a 0,1M LiCl/DMF at 60 °C and 5µL of TEA were added. 0.2 eq (to OH) of maleic anhydride (18,2mg) were subsequently added and the mixture was stirred at 60 °C for 24 h. The polymer was dialyzed against milliQ water in a MWCO 1000 membrane and freeze-dried. 60 mg of polymer were recovered as a slightly yellow powder.
VI

Experimental part
dextran6(MA)-block-PEG5000 1H NMR (DMSO-d6, 400 MHz): δ (ppm)= 6.01 (s, 13+13'), 4.91-4.50 (b, 7+8+1+9), 3.75, 3.64, 3.48 (b, 5+6+6’), 3.51 (s, 10+11), 3.36 (bs, 5+6+6’), 3.20 (b, 12)
I.2.d) dextran-block-poly(ethylene glycol) (amide link)
1eq (0.84 g) of dextran α-lactone-dextran6 and 5 equivalents of commercial α-methoxy-ω-amino-poly(ethylene glycol) Mw 5000 (3,48 g) were dissolved in DMSO and stirred at 60 °C for 6 days. DMSO was removed by freeze-drying and the polymer redissolved in water and dialysed against milliQ water for 3 days. The polymer was recovered as a white powder (Yield=75%).
dextran6500-block-PEG5700 (amide linkage)1H NMR (DMSO-d6, 400 MHz): δ (ppm)= 4.93-4.52 (b, 7+8+1+9), 3.75, 3.63, 3.48 (b, 5+6+6’), 3.51 (s, 10+11), 3.36 (bs, 5+6+6’), 3.20 (b, 12)GPC (DMSO, dextran): Mn,app=8800 PDI=1.67dn/dc (25°C)= 0.1290 mL·g-1
II. Other dextran-based polymers
II.1) Dextran-CTA preparation
II.1.a) Azido-RAFT agent
The synthetic strategy was adapted from the one reported by Stenzel [146] and coworkers for the synthesis of 3-azidopropyl 2-((ethoxycarbonothioyl)thio)acetate.
• 2-azidoethanol
10 g (5.67 mL, 0.08mol) of 2-bromothanol and 8,45 g (0.13 mol) and sodium azide were mixed together at 10 wt% in a 65:10 (v:v) acetone:water mixture and stirred at 65 °C for two days. The mixture was allowed to cooled down to room temperature and the acetone was removed under reduced pressure. 100 mL of water were added and the mixture was extracted 3 times with diethyl ether. The organic phase was then dried over anhydrous magnesium sulfate and the solvent evaporated under reduced pressure. 5,60g of product were obtained as a yellow liquid (Yield=).
VII

Appendix I.
1H NMR (CDCl3, 400 MHz): δ (ppm)= 3.76 (2H, t, 2), 3.42 (2H, t, 1), 2.46 (1H, s, 3)
• 2-azidoethyl-1-bromoethanoate
5 g (57.2 mmol) of 2-azido-ethanol and TEA dried over CaH2 were mixed in dry THF and cooled down to 0 °C. 9 ml (86.1 mmol) of 2-bromopropionyl bromide in 60 mL of dry THF were added drop by drop under stirring. After the addition was completed, the mixture was allowed to reach room temperature under stirring and reacted an additional hour. The solution was then filtered (removal of TEA·HCl), 20 mL of water were added drop by drop to the filtrated and the allowed to stir for 30 min. The solvent was removed under reduced pressure to dry and the solide redissolve in dichloromethane. The solution was extracted twice with a saturated ammonium chloride solution, twice with distilled water, twice with a 0.1M sodium hydroxide solution and twice with bidistilled water. The organic layer was then dried over anhydrous magnesium sulfate and filtered, and the solution concentrated under reduced pressure. Final purification was achieved by flash column chromatography with a gradient eluent CH2Cl2:MeOH 1:0 to 10:1 (v:v). After removal of the eluents 8,5g of pure product were isolated (Yield=).
1H NMR (CDCl3, 400 MHz): δ (ppm)= 4.41 (1H, q, 3), 4.33 (2H, t, 2), 3.53 (2H, t, 1), 1.84 (3H, d, 4)
• 2-azidoethyl 2-((ethoxycarbonothioyl)thio)propanoate (CTA-N3)
8,5 g (3,83.10-2 mol) of 2-azidoethyl-1-bromoethanoate and 6.14 g (1 eq, 3.83·10-2 mol) of O-ethylxantic acid potassium salt were dissolved in 80 mL of ethanol and stirred at 55 °C for 20 h. 200 mL of water were added and the solution was extracted three times with diethyl ether. The collected organic layers were dried over anhydrous magnesium sulfate, filtered and the product was concentrated under reduced pressure. The product was purified by column chromatography with a gradient eluent hexane:ethyl acetate 19:1 to 9:1 (v:v). 5,1 g of pure product were isolated after removal of the eluents under reduced pressure (Yield=)
1H NMR (CDCl3, 400 MHz): δ (ppm)= 4.65 (2H, q, 5), 4.40 (1H, q, 3), 4.22 (2H, q ), 1.48(3H, d, 4), 1.44 (3H, t, ), 1.29 (2H, t,)
II.1.b) Dextran-CTA
1 equivalent (2 g) of α-alkyne dextran, 2eq (0.175 g, 160 µL) of 2-azidoethyl 2-((ethoxycarbonothioyl)thio)propanoate and 1 eq (587 mg) of sodium L-ascorbate ascorbate were mixed at a 10% wt in a THF:water 3:7 (v:v) mixture. Argon was bubbled through the solution for 2 hours for degassing and 0.2 eq (12.6 mg) of copper iodide (CuI) and 10 eq (497 µL) of 1,8-Diazabicyclo[5.4.0]undec-7-ene (DBU) were added. The solution was treated
VIII

Experimental part
under microwave irradiation (µW irradiation) for 30 minutes at 95 °C (irradiation from room temperature to 95 °C for 15 min and 15 min at 95 °C). Solution was allowed to cool down to room temperature and filtered. Active carbon was added to the filtrated, stirred at room temperature for 30 min and refiltrated. Purification was achieved by dialysis against milliQ water MWCO 1000 for 3 days. The polymer was recovered by lyophilisation as a white powder.
dextran6-CTA 1H NMR (DMSO-d6, 400 MHz): δ (ppm)= GPC (DMSO, dextran): Mn,app=3800 PDI=1.66
II.2) RAFT polymerization of dextran-based copolymers
II.2.a) General procedure
0.5g of dextran6-CTA was suspended in 40 mL of DMF 0.1 eq of Azobisisobutyronitrile (AIBN) was added. Small volumes of dry DMSO were added until the solution became clear (~2 mL). The desired amount of freshly purified (distilled or recrystallized) monomer was added and argon was bubble through the solution for 2 h. The flask was then sealed and heated to 70 °C under stirring for 4 days. The mixture was then concentrated, dialysed against milliQ water and lyophilized. The polymer was obtained as a white powder.
Polymers 1 eq dex-CTA 0.1 eq AIBN Monomer
dextran-b-poly(N-vinylpyrrolidone) N-vinylpyrrolidone dex-b-PVP 0.5 g 1.43 mg 200 eq (1.87 mL)
dextran-b-polyvinyl acetate Vinyl acetate
dex-b-PVAc 0.5 g 1.43 mg 200 eq (1.61 mL)dextran-b-poly(N-isopropylacrylamide) N-isopropylacrylamide
dex6-b-PNIPAM6 0,2 1,08 100 eq (0.75 g)dex6-b-PNIPAM16 0,2 1,08 200 eq (1.50 g)dex6-b-PNIPAM51 0,2 1,08 300 eq (2.26 g)
dextran6500-b-PVP 1H NMR (DMSO-d6+ DMF-d7), 400 MHz):
δ (ppm)= 4.98 (s, 7), 4.87 (s, 8), 4.76 (s, 1), 4.50 (s, 9),, 3.88-3.43 (m, 5+6+6'), 3.29 (m, 2+4), 2.31 (s, 14) 2.09-1.96 (m, 10), 1.68 (b,
IX

Appendix I.
13) *11+12 covered by DMF-d7
GPC (DMSO, dextran): Mn,app=6500 PDI=1.79dn/dc (25°C)= 0.1295 mL·g-1
dextran6500-b-PVAc 1H NMR (DMSO-d6, 400 MHz): δ (ppm)= 4.98 (s, 7), 4.87 (s, 8), 4.76 (s, 1), 4.50 (s, 9),, 3.88-3.43 (m, 5+6+6'), 3.29 (m, 2+4), 2.01-1.95 (m, 12), 1.68 (b, 10) *11 covered by dextran signalsGPC (DMSO, dextran): Mn,app=5200 PDI=1.64
dextran6500-b-PNIPAMm1H NMR (DMSO-d6, 400 MHz): δ (ppm)= 7.68-6.88 (b, 13), 4.91 (s, 7), 4.83 (s, 8), 4.67 (s, 1), 4.48 (s, 9). 3.83 (bs, 13), 3.63-3.43 (m, 5+6+6'), 3.19 (m, 2+4), 1.95 (bs, 11), 1.43 (bs, 10), 1.04 (s, 14+14')
dextran6-b-PNIPAM51: GPC (DMSO, dextran): Mn,app=6700 PDI=1.89dn/dc (25°C)= 0.1494 mL·g-1
dextran6-b-PNIPAM16: GPC (DMSO, dextran): Mn,app=5300 PDI=1.81dn/dc (25°C)= 0.1626 mL·g-1
dextran6-b-PNIPAM6: GPC (DMSO, dextran): Mn,app=4900 PDI=1.79dn/dc (25°C)= 0.1885 mL·g-1
II.2.b) dextran-block-poly(vinyl alcohol)
dextran6-b-PVAc was dissolved at 60 °C in a water/methanol mixture (~5:5 v:v) and 2 mL of HCl 37% percent was added. The solution was stirred for 20 hours and subsequently dialyzed against milliQ water (MWCO 1000)
dextran6500-b-PVOH 1H NMR (DMSO-d6 +D2O, 400 MHz): δ (ppm)= 4.80-4.47 (m, 7+1+9+12), 3.83-3.63 (m, 5+6+6'), 3.57-3.44 (m, 3+11), 3.37-3.22 (2+4)dn/dc (25°C)= 0.1300 mL·g-1
X

Experimental part
III. Poly(ethylene glycol)-block-poly(N-hydroxyethyl glutamine)
III.1) γ-benzyl-glutamate N-carboxyanhydride (BLG NCA)
The synthesis was carried out adapting a procedure previously described by Daly et al.[212] In a typical synthesis L-Glutamic acid γ-benzylester (30 g, 126 mmol) was suspended in dry THF (300 mL) and heated to reflux under argon atmosphere. Triphosgene (13 g, 0.35 eq) was added and the mixture heated to reflux under Argon until a clear solution formed. In case the clear solution did not form after 5 hours, additional 0.5 g of triphosgene were added. The solution was cooled to room temperature under argon and precipitated with “wet” heptane. The solid was filtered out, dissolved in “dry” EtAc and filtered. The filtrate was then concentrated under vacuum at room temperature. The obtained white solid was recrystallized twice from a EtAc/heptane mixture, dried under high vacuum overnight, stored at -5 °C and used within one week. Yield was typically around 50%.
mp: (°C)= 94-971H NMR (CDCl3, 400 MHz): δ (ppm)= 2.20 (m, 2H, 3), 2.60 (t, 2H, 4), 4.37 (t, 1H, 1), 5.14 (s, 2H, 5), 6.50(s, 0.9H, 2), 7.35 (m, 5H, 6)
III.2) Poly(ethylene glycol) -block- poly(L-benzyl glutamate)
2.84 g (10.8 mmol) of γ-benzyl-glutamate N-carboxyanhydride and 0.6 g (0.12 mmol)commercial amino-functionalized poly(ethylene glycol) (Mw=5700 g·mol-1, PDI=1.08) were dissolved at 10 wt% in NMP under argon atmosphere, and stirred in a schlenk flash equipped with an argon balloon at 40 °C for 5 days.The polymer was precipitated with EtAc and purified by reprecipitation from CH2Cl2/EtAc twice
PEG-b-PLBG241H NMR (CDCl3, 400 MHz): δ (ppm)= 8.34 (bs, 4), 7.24 (bs. 9), 5.03 (bs, 8), 3.93 (bs, 5), 3.64 (bs, 2+3), 3.38 (s, 1), 2.61-1.78 (b, 6+7)GPC (NMP, PS): Mn,app=27000, PDI=1.22GPC (NMP, PEG): Mn,app=20000, PDI=1.34
III.3) Poly(ethylene glycol) -block- poly(N-hydroxyethyl-L-glutamine)
2 g of the previously synthesized poly(ethylene glycol)-block-poly(L-benzyl glutamate) were dissolved in 100 mL of DMF. 4.13 g (excess) of 2-hydrohypyridine and 10.41 mL (excess) of 2-aminoethanol. The solution for stirred at room temperature for 4 days. Purification was achieved by dialysis against milliQ water for 4 days with 4 solvent changes. The polymer
XI

Appendix I.
was recovered by lyophilization. M= 1.55 g.
PEG-b-PHEG241H NMR (DMSO-d6, 400 MHz): δ (ppm)= 8,12 (bs, 4), 7,78 (bs, 8), 4.70 (b, 11), 4.12 (b, 5), 3.36 (b, 2+3), 3.23 (s, 1), 3.10 (b, 9+10), 2.24-1.70 (b, 6+7)GPC (NMP, PEG): Mn,app=17000, PDI=1.31dn/dc (25°C)= 0.1545 mL·g-1
IV. glycosylated polybutadiene-block-poly(N-isopropyl-acrylamide) polymers
This synthesis was carried out by Ines Below-Lutz and Niels ten Brummelhuis.
IV.1) CTA synthesis
3.489 g potassium ethyl xanhogenate was dissolved at 10 wt% in ethanol and heated to 55 °C. 3.69 g of 2-bromo-2-methyl propionic acid was added to the solution and the mixture was stirred at 55 °C overnight. 130 mL of water were added to the solution and the resulting mixture was extracted with Et2O three times. The collected organic layers were dried over MgSO4 and filtered. The solvent was removed under reduced pressure and the product was purify by silica column chromatography with a 10:1 (v:v) hexane:ethyl acetate solvent mixture as eluent.
S-Ethoxy(thiocarbonyl)-2-mercapto-2-methylpropanoic acid1H NMR (CHCl3, 400 MHz): δ = 1.20 (t, 3H, 3), 1.44 (s, 6H, 1+1’), 2.48 (q, 2H, 2).
IV.2) PB macronomer synthesis and preparation
IV.2.a) 1,2-polybutadiene synthesis
Monomers and solvents were purified using conventional methods reported elsewhere in the literature.[187][188] All reactions were performed under a dry argon atmosphere. 1,2-PB(OH) was synthesized by anionic polymerization of 1,3-butadiene in tetrahydrofuran (THF) solution at -78 °C using sec-butyllithium (sBuLi) as the initiator. After 1 day, ethylene oxide was added, and the solution was stirred for 3 days at room temperature. The polymer was precipitated into methanol and dried under vacuum.PB80-OHGPC (THF, PB): Mn=43000, PDI=1.0796% 1,2-units
XII
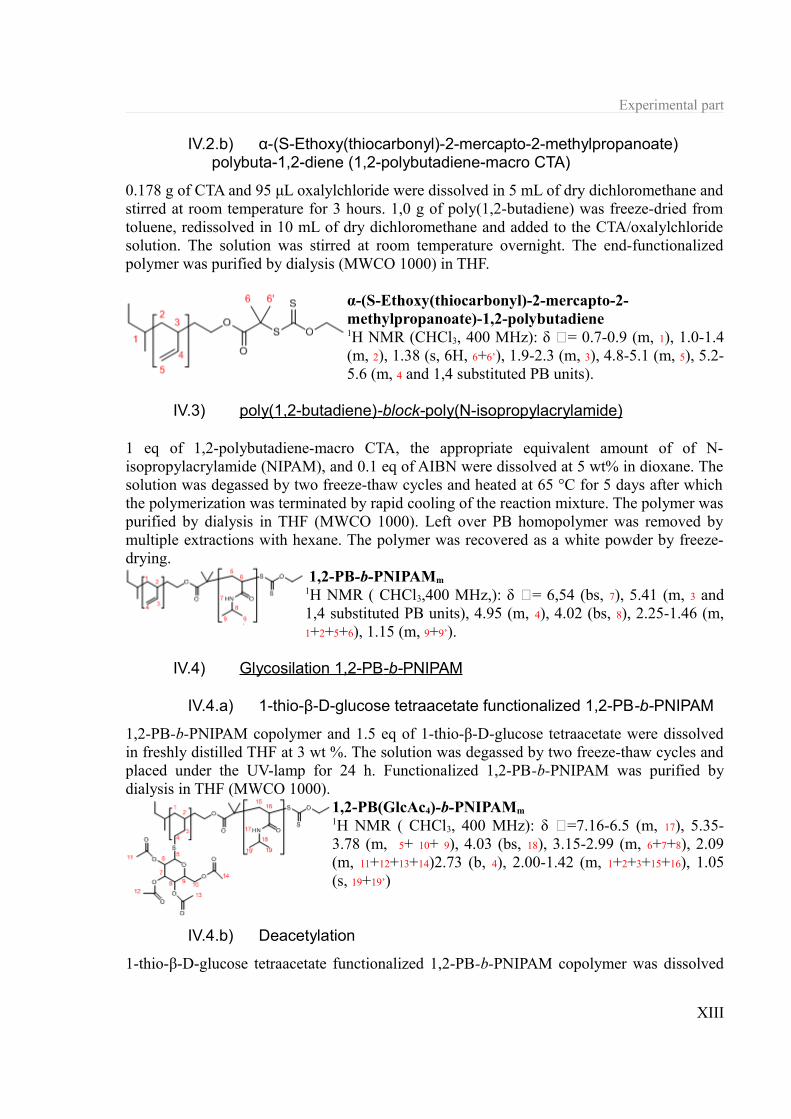
Experimental part
IV.2.b) α-(S-Ethoxy(thiocarbonyl)-2-mercapto-2-methylpropanoate) polybuta-1,2-diene (1,2-polybutadiene-macro CTA)
0.178 g of CTA and 95 μL oxalylchloride were dissolved in 5 mL of dry dichloromethane and stirred at room temperature for 3 hours. 1,0 g of poly(1,2-butadiene) was freeze-dried from toluene, redissolved in 10 mL of dry dichloromethane and added to the CTA/oxalylchloride solution. The solution was stirred at room temperature overnight. The end-functionalized polymer was purified by dialysis (MWCO 1000) in THF.
α-(S-Ethoxy(thiocarbonyl)-2-mercapto-2-methylpropanoate)-1,2-polybutadiene1H NMR (CHCl3, 400 MHz): δ = 0.7-0.9 (m, 1), 1.0-1.4 (m, 2), 1.38 (s, 6H, 6+6’), 1.9-2.3 (m, 3), 4.8-5.1 (m, 5), 5.2-5.6 (m, 4 and 1,4 substituted PB units).
IV.3) poly(1,2-butadiene) -block- poly(N-isopropylacrylamide)
1 eq of 1,2-polybutadiene-macro CTA, the appropriate equivalent amount of of N-isopropylacrylamide (NIPAM), and 0.1 eq of AIBN were dissolved at 5 wt% in dioxane. The solution was degassed by two freeze-thaw cycles and heated at 65 °C for 5 days after which the polymerization was terminated by rapid cooling of the reaction mixture. The polymer was purified by dialysis in THF (MWCO 1000). Left over PB homopolymer was removed by multiple extractions with hexane. The polymer was recovered as a white powder by freeze-drying.
1,2-PB-b-PNIPAMm1H NMR ( CHCl3,400 MHz,): δ = 6,54 (bs, 7), 5.41 (m, 3 and 1,4 substituted PB units), 4.95 (m, 4), 4.02 (bs, 8), 2.25-1.46 (m, 1+2+5+6), 1.15 (m, 9+9’).
IV.4) Glycosilation 1,2-PB -b- PNIPAM
IV.4.a) 1-thio-β-D-glucose tetraacetate functionalized 1,2-PB-b-PNIPAM
1,2-PB-b-PNIPAM copolymer and 1.5 eq of 1-thio-β-D-glucose tetraacetate were dissolved in freshly distilled THF at 3 wt %. The solution was degassed by two freeze-thaw cycles and placed under the UV-lamp for 24 h. Functionalized 1,2-PB-b-PNIPAM was purified by dialysis in THF (MWCO 1000).
1,2-PB(GlcAc4)-b-PNIPAMm1H NMR ( CHCl3, 400 MHz): δ =7.16-6.5 (m, 17), 5.35-3.78 (m, 5+ 10+ 9), 4.03 (bs, 18), 3.15-2.99 (m, 6+7+8), 2.09 (m, 11+12+13+14)2.73 (b, 4), 2.00-1.42 (m, 1+2+3+15+16), 1.05 (s, 19+19’)
IV.4.b) Deacetylation
1-thio-β-D-glucose tetraacetate functionalized 1,2-PB-b-PNIPAM copolymer was dissolved
XIII

Appendix I.
in chloroform (~ 100 mL·g-1 polymer) and a 0.5 M NaOH solution in methanol (10 mL·g-1
polymer) was added. The reaction mixture was stirred at room temperature for 48 hours after which the solvent was removed under reduced pressure and the product was redissolved in water. The pH of the solution was neutralized by addition of small amounts of 1 M HCl solution and the polymer was purified by dialysis in water (MWCO 1000).
1,2-PB(Glc)-b-PNIPAMm1H NMR ( DMSO-d6, 400 MHz): δ = 7.33-7.19 (m, 17), 4.92-3.45 (m, 11+12+13+ 14+ 5+ 10+ 9), 3.85 (bs, 18) 3.15-2.99 (m, 6+7+8), 2.73 (b, 4), 2.00-1.42 (m, 1+2+3+15+16), 1.05 (s, 19+19’)
1,2-PB(Glc)-b-PNIPAM259
dn/dc (25°C)= 0.1570 mL·g-1
1,2-PB(Glc)-b-PNIPAM557
dn/dc (25°C)= 0.1722 mL·g-1
B. Analytical Instrumentation
FT-IR spectra were recorded on a BioRad 6000 FT-IR. Samples were measured in the solid
state using a single reflection diamond ATR.
Elemental analysis (EA) was performed using a Vario EL Elemental Analyzer. The samples
were analyzed for carbon, hydrogen and nitrogen content.
Turbidimetry was conducted on a turbidimetric photometer TP1 (Tepper Analytik,
Wiesbaden) at a wavelength of 599 nm at a rate 1 °C·min-1. Solutions were prepared by
dissolving the polymer powder in milliQ water to afford 1 wt% solutions unless otherwise
stated. Cloud points temperature (CP) were take at the 50% of the transmission drop by
deriving the transmission as a function of temperature curve and identifying the minimum.
Light scattering (LS). Solutions were investigated by light scattering using ALV-7004
Multiple tau digital correlator equipped with CGS-3 Compact Goniometer system, 22 mW
He-Ne laser (wavelength λ = 632.8 nm) and pair of avalanche photodiodes operated in a
XIV

Experimental part
pseudo-cross-correlation mode. Solution were prepared in milliQ water and filtered through
0,45 μm PVDF or 0,7 μm glass serynge filters. For dynamic light scattering (DLS) unless
otherwise stated the measurements were made at a 90° angle and the measured intensity
correlation function g2(t) was analyzed using the algorithm REPES[149] performing the inverse
Laplace transformation according to Equation 11.
g2( t)=1+ ß [∫ A( t)exp(−t /τ)dt ]2=1+ ß [∑i=1
n
Ai exp(−t / τi)]2
(11)
(where t is the delay time of the correlation function and β an instrumental parameter) and
yielding distribution A(τ) of relaxation times τ.The relaxation time τ is related to the diffusion
coefficient D and relaxation (decay) rate Γ by the relation in Equation 12.
Γ= 1τ=Dq2 (12)
where q is the scattering vector defined as q = (4πn/λ)sin(θ/2) where n is the refractive index
of the solvent and θ is the scattering angle. The hydrodynamic radius Rh of the particles can
be calculated from the diffusion coefficient using the Stokes-Einstein equation 13.
D=k BT
6Πη Rh (13)
where T is absolute temperature, η the viscosity of the solvent and kB the Boltzmann
constant. Static light scattering was recorded in the same setup by in the angle range 30°-
150° with 10° steps. Acquisition of the intensity was performed for 10 seconds with 3
consecutive runs for each angle and the intensity corrected with respect to the scattering of
the solvent and toluene bath. Only measurements for which the intensity fluctuation within
the 3 runs was <5% were considered. The data was plotted by means of the software ALVStat
XV
Appendix I.
4.48.
1H Nuclear Magnetic Resonance (NMR) spectra were recorded at room temperature on a
Bruker DPX-400 Spectrometer operating at 400.1 MHz. Calibration was carried out using
signals corresponding to non-deuterated solvent traces (CDCl3: 7.26 ppm; DMSO-d6: 2.50
ppm).
1H-1H 2D NOESY NMR. 2D-NOESY measurements were performed on a Varian VNMRS
600 spectrometer operating at 600 MHz
Density were carried out on a density meter DMA 5000 (Anton Paar, Germany) at 25 °C.
The specific density of the bulk polymer was extrapolated from the density data measured for
a particular solvent and a polymer solution in that solvent of known cocentration.
Confocal laser scanning microcopy (CLSM) of the polymer vesicles were recorded with a
Leica system mounted to a Leica Aristoplan and equipped with a 100xoil immersion
objective with a numerical aperture of 1.4 working on simultaneous transmission and
fluorescence mode.
Fluorescence correlation spectroscopy (FCS) measurements were performed at room
temperature in special chambered quartz glass holders (Lab-Tek; 8-well, NUNC A/S), on a
Zeiss LSM 510-META/Confcor2 laser-scanning microscope equipped with an Argon2-laser
(488 nm) and a 40× water-immersion objective (Zeiss C/Apochromat 40X, NA 1.2), with
pinhole adjusted to 70 µm. Spectra were recorded over 30 s, and each measurement was
repeated 10 times. Excitation power of the Ar laser was PL =15 mW, and the excitation
transmission at 488 nm was 5%. Diffusion times for free dye-labeled protein (FITC-ConA)
was independently determined and fixed in the fitting procedure. The results were presented
as a mean value of three independent measurements. The fluorescence signal was measured
in real time and the autocorrelation function was calculated by a software correlator (LSM
510 META - ConfoCor 2 System). For the fitting of the autocorrelation function according to
XVI

Experimental part
a two component model, the following equation 14 was used:
(14)
Where N is the number of fluorescent particles, S the structural parameter determined to be
5, τD1 the diffusion time of the component 1 in the assay, 1-γ the fraction of particles with
diffusion time τD1, τD2 the diffusion time of component 2 in the assy, γ the fraction of
particles with diffusion time τD2 and f(T) the funtion used for the fitting of the triplet
characteristics τT and % τT of the fluorescent label within the assay. By means of an iterative
least-square method, the values calculated by the algorithm are compared repeatedly to the
experimentally generated autocorrelation curve and approximated until the difference
between the two curves is minimized.
Raman. For Raman spectroscopy, a 532 nm Nd:YAG laser (WITec, Ulm, Germany) beam
was focused down to a micrometer size spot on the sample through a confocal Raman
microscope (CRM300, WITec, Ulm, Germany) equipped with piezo-scanner (P-500, Physik
Instrumente, Karlsruhe, Germany). The spectra were acquired using an air-cooled CCD
detector (DU401-BV, Andor, Belfast, UK) behind a grating (600 g·mm-1) spectrograph
(UHTS 300, WITec, Ulm, Germany). The ScanCtrlSpectroscopyPlus (version 2.02, Witec)
was used for measurement setup and data processing.
Surface-enhanced Raman Spectroscopy (SERS) experiments were carried out in the same
setup as the Raman but an excess of colloidal gold (Sigma-Aldrich) of 20 nm or 5 nm was
added to the samples prior to measurement.
Differential refractrometer NFT-Scanref was used to determine the refractive index increment
dn/dc in a thermostated cell at 25 °C.
XVII
G ' (τ)=1+ 1N [(1−γ)( 1
1+ ττD1
)( 1
1+ τS2 τD1
)(12)+γ( 1
1+ ττD2
)( 1
1+ τS 2 τ D2
)( 12)+ f (T )]

Appendix I.
Transmission electron microscopy (TEM) was performed with a Zeiss EM 912 Omega
microscope operating at 120 kV. Samples were prepared by drop cast on carbon-coated
copper grids. For negatively stained microgrphs, samples prepared by drop casting were
subsenquently treated with a 2% uranyl acetate solution in water, washed with water and
dried.
XVIII

Supporting experimental data
Appendix II. Supporting experimental data
Paragraph 3.1.2.a
Paragraph 3.1.6.a
XIX
Figure II.1: 1H NMR of native dextran (below) and α-alkyne-dextran (above) showing the total disappearance of the anomeric protons.

Appendix II.
• dex6500-b-PEG1900
a) Dynamic light scattering
Rh=117 ±18 nm
b) Static light scattering
Mw= 1,73·107 g·mol-1
Rg= 144 nm
A2=1.08·10-8 mol·dm3·g-2
XX
Figure II.2: Intensity-weighted distribution of the hydrodynamic radius of the DL scattering at 90 ° for a dex6500-b-PEG1900
Figure II.3: Berry plot of the SLS data obtained between 40° and 150° at room temperature for dex6500-b-PEG1900 polymer solutions.

Supporting experimental data
• dex6500-b-PEG13200
a) Dynamic light scattering
Dz(q2)=1.52 μm2.s-1 ±3%
Rh =164 nm
b) Static light scattering
Mw (q2)= 4.20·106 g·mol-1
Rg= 134 nm
A2=4.27·10-9 mol.dm3.g-2
XXI
Figure II.4: Dynamic Zimm plot of the DLS recorded between 30 ° and 150 °.
Figure II.5: Berry plot of the SLS data obtained between 40° and 150° at room temperature for dex6500-b-PEG13200 polymer solutions.
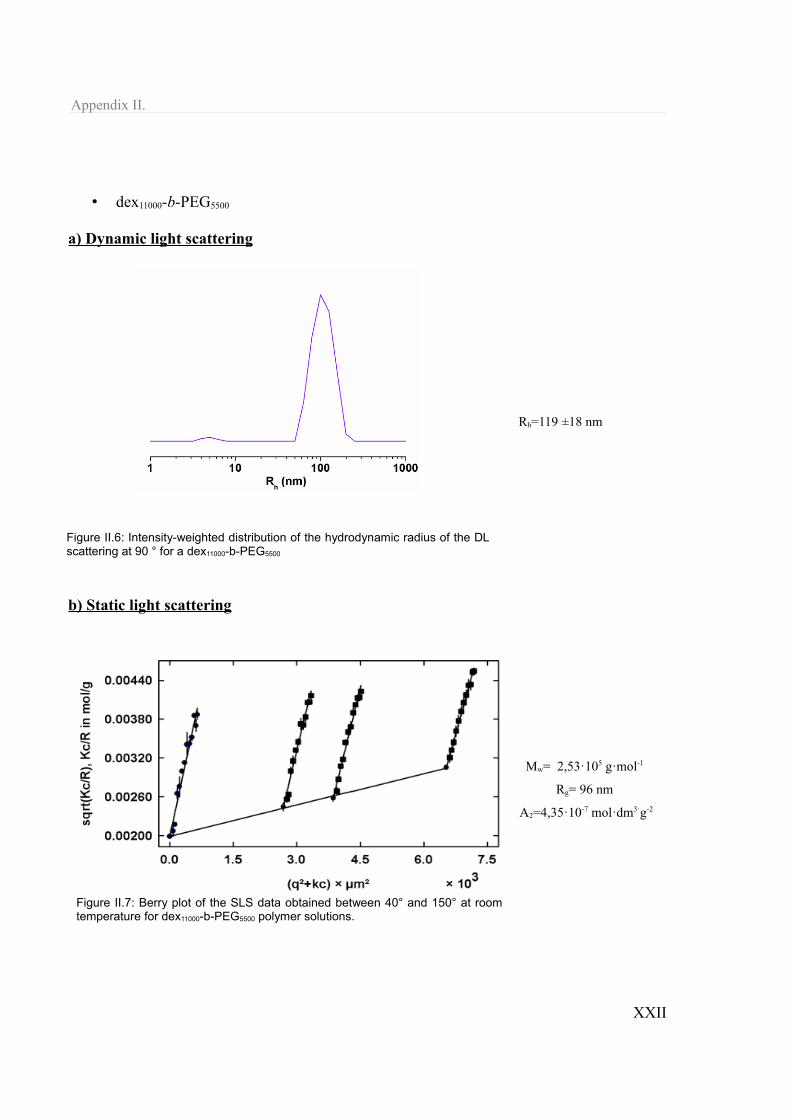
Appendix II.
• dex11000-b-PEG5500
a) Dynamic light scattering
Rh=119 ±18 nm
b) Static light scattering
Mw= 2,53·105 g·mol-1
Rg= 96 nm
A2=4,35·10-7 mol·dm3·g-2
XXII
Figure II.6: Intensity-weighted distribution of the hydrodynamic radius of the DL scattering at 90 ° for a dex11000-b-PEG5500
Figure II.7: Berry plot of the SLS data obtained between 40° and 150° at room temperature for dex11000-b-PEG5500 polymer solutions.

Supporting experimental data
Paragraph 3.2.2.b
• dex-b-PNIPAM6: Static light scattering
Mw= 3,59·106 g·mol-1
Rg= 90 nm
A2=9,26·10-9 mol·dm3·g-2
• dex-b-PNIPAM16: Static light scattering
Mw= 1,94·106 g·mol-1
Rg= 123 nm
A2=8,46·10-8 mol·dm3·g-2
XXIII
Figure II.8: Berry plot of the SLS data obtained between 40° and 150° at room temperature for dex-b-PNIPAM6 polymer solutions.
Figure II.9: Berry plot of the SLS data obtained between 40° and 150° at room temperature for dex-b-PNIPAM16 polymer solutions.
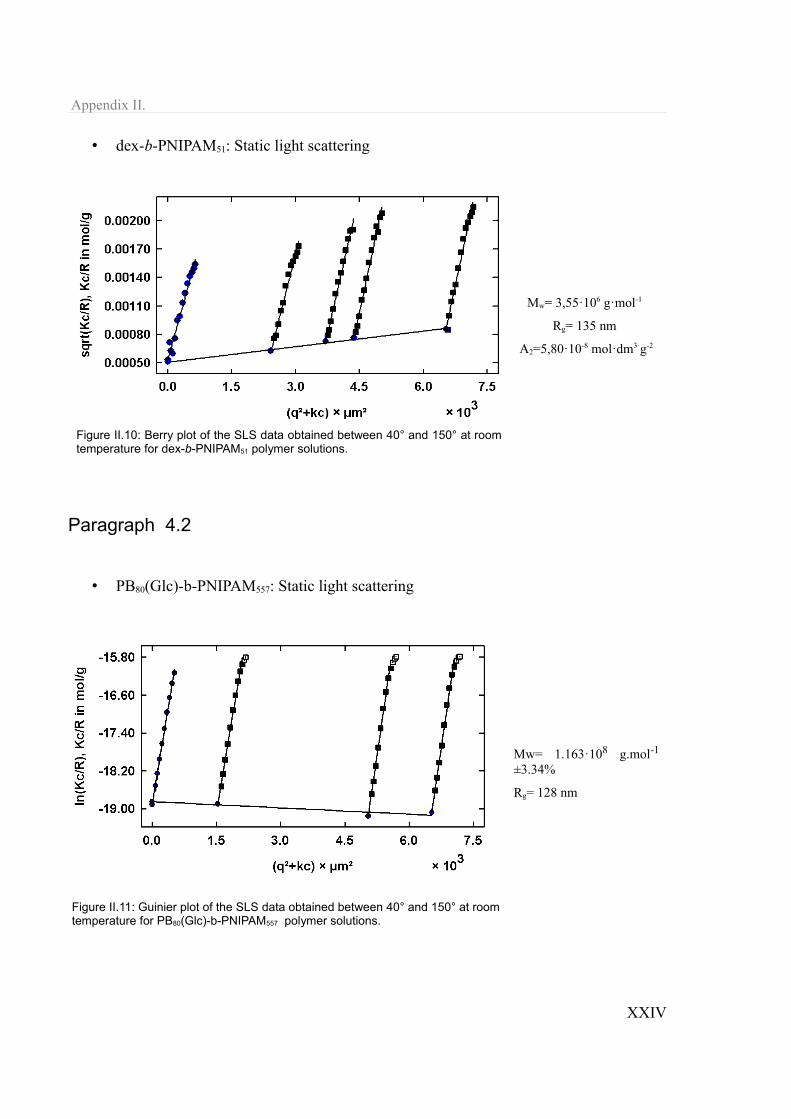
Appendix II.
• dex-b-PNIPAM51: Static light scattering
Mw= 3,55·106 g·mol-1
Rg= 135 nm
A2=5,80·10-8 mol·dm3·g-2
Paragraph 4.2
• PB80(Glc)-b-PNIPAM557: Static light scattering
Mw= 1.163·108 g.mol-1
±3.34%
Rg= 128 nm
XXIV
Figure II.10: Berry plot of the SLS data obtained between 40° and 150° at room temperature for dex-b-PNIPAM51 polymer solutions.
Figure II.11: Guinier plot of the SLS data obtained between 40° and 150° at room temperature for PB80(Glc)-b-PNIPAM557 polymer solutions.

Supporting experimental data
• PB80(Glc)-b-PNIPAM557: TEM
Paragraph 4.4.1
• PB80(Glc)-b-PNIPAM259: Fluorescence correlation spectroscopy
XXV
Figure II.12: TEM images of a 1 wt% solution of PB80(Glc)-b-PNIPAM557. TEM grid prepared by drop casting and stained with uranyl acetate.
Figure II.13: (Left) Normalized autocorrelation of fluctuation of the fluorescence intensity and its fittings: in black (violet fitting) FITC-ConA in HBS solution; in green (orange fitting) PB80(Glc)-b-PNIPAM259 with FITC-ConA in HBS solution after 2 h; in red (gray fitting) PB80(Glc)-b-PNIPAM259 with FITC-ConA in HBS solution after 22 h. (Right) Residuals of the fitting: in green PB80(Glc)-b-PNIPAM259 with FITC-ConA in HBS solution after 2 h; in red PB80(Glc)-b-PNIPAM259 with FITC-ConA in HBS solution after 22 h.

Appendix II.
Table II.1: Data extracted from the analysis in the FCS experiments.
Sample CR (kHz) CPM (kHz) N Fraction 1 Fraction 2
% τD(μs) % τD(μs)
FITC-ConA 17.3 13.3 1.3 96 110 - -
PB80(Glc)-b-PNIPAM259
+ FITC-ConA after 2h30.9 12.1 3 10 110 90 5500
PB80(Glc)-b-PNIPAM259
+ FITC-ConA after 22h 27.5 20.4 1.4 1 110 99 4700
XXVI
Review on the self-assembly of DHBCs in water
Appendix III. Review on the self-assembly of DHBCs in water
The classical view on amphiphilic self-assembly in which a typical surfactant with
hydrophilic head and hydrophobic tails self-assembles above a critical concentration into
well-define monodisperse micelles has long been insufficient to describe the behavior of
more complex systems e.g. copolymers. Although the behavior of an amphiphile block
copolymer constituted of a hydrophobic non-soluble block and a hydrophilic soluble block in
water follows a similar pattern, the wider range of parameters that polymers allow to tune
(chemical composition, block lengths, architecture, specific interactions, polydispersity…)
gives raise to much more complex phenomena. Association of blocks copolymers in non-
selective solvent outside stimulus are included in this list of systems without a low-molecular
weight equivalent and this rare phenomenon lacks of a solid bibliography account that could
give a good general picture of the phenomenon.
The most studied case is the association of PEG-b-PNIPAM or PNIPAM-g-PEG copolymers.
At least six publications report the presence of aggregation below the LCST of
poly(isopropylacrylamide).[54][213]-[217] The explanations for this unexpected large aggregates
vary. Motokawa et al.[214] reported an onset temperature of the decrease in the ratio I1/I3 on the
emission spectra of pyrene in the presence of PEG-b-PNIPAM copolymers at 16 °C to 28 °C
depending on the concentration but always far below the LCST (Figure III.1.a)). The phase
diagram (Figure III.1.b)) of the block copolymer in water could show the existence of two
different transparent sol regions, (I) corresponding to the non solubilization of pyrene in the
XXVII
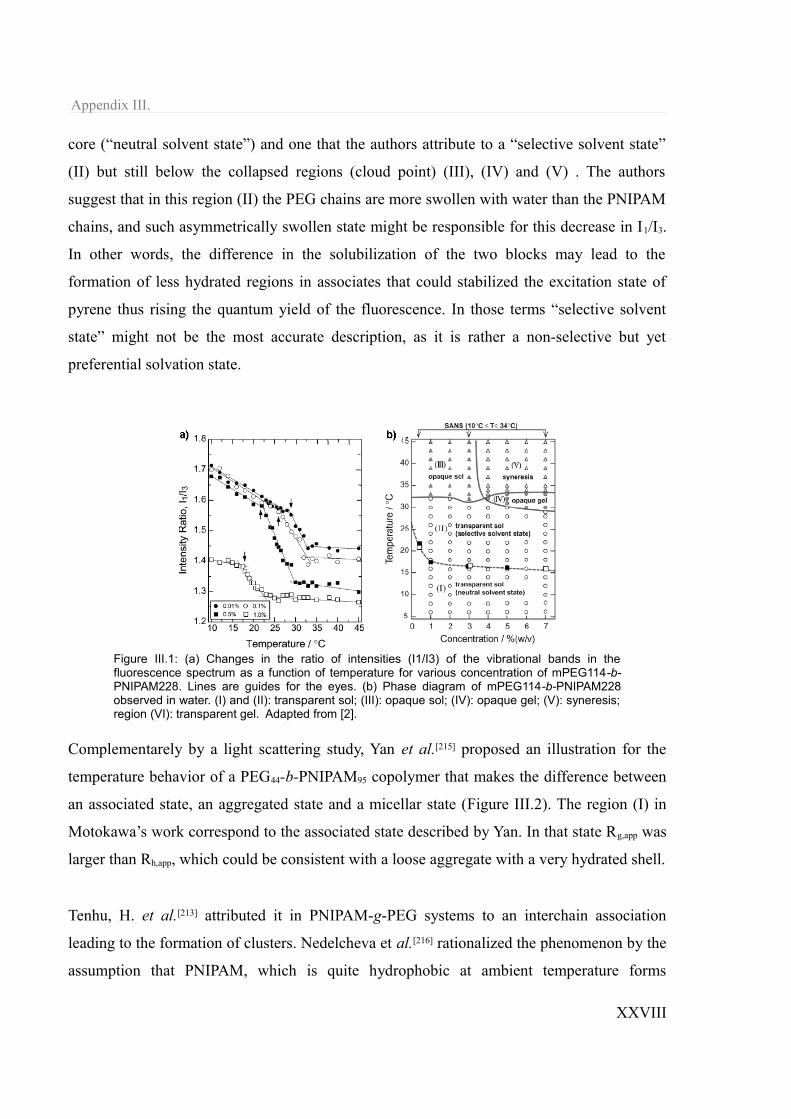
Appendix III.
core (“neutral solvent state”) and one that the authors attribute to a “selective solvent state”
(II) but still below the collapsed regions (cloud point) (III), (IV) and (V) . The authors
suggest that in this region (II) the PEG chains are more swollen with water than the PNIPAM
chains, and such asymmetrically swollen state might be responsible for this decrease in I1/I3.
In other words, the difference in the solubilization of the two blocks may lead to the
formation of less hydrated regions in associates that could stabilized the excitation state of
pyrene thus rising the quantum yield of the fluorescence. In those terms “selective solvent
state” might not be the most accurate description, as it is rather a non-selective but yet
preferential solvation state.
Complementarely by a light scattering study, Yan et al.[215] proposed an illustration for the
temperature behavior of a PEG44-b-PNIPAM95 copolymer that makes the difference between
an associated state, an aggregated state and a micellar state (Figure III.2). The region (I) in
Motokawa’s work correspond to the associated state described by Yan. In that state Rg,app was
larger than Rh,app, which could be consistent with a loose aggregate with a very hydrated shell.
Tenhu, H. et al.[213] attributed it in PNIPAM-g-PEG systems to an interchain association
leading to the formation of clusters. Nedelcheva et al.[216] rationalized the phenomenon by the
assumption that PNIPAM, which is quite hydrophobic at ambient temperature forms
XXVIII
Figure III.1: (a) Changes in the ratio of intensities (I1/I3) of the vibrational bands in the fluorescence spectrum as a function of temperature for various concentration of mPEG114-b-PNIPAM228. Lines are guides for the eyes. (b) Phase diagram of mPEG114-b-PNIPAM228 observed in water. (I) and (II): transparent sol; (III): opaque sol; (IV): opaque gel; (V): syneresis; region (VI): transparent gel. Adapted from [2].
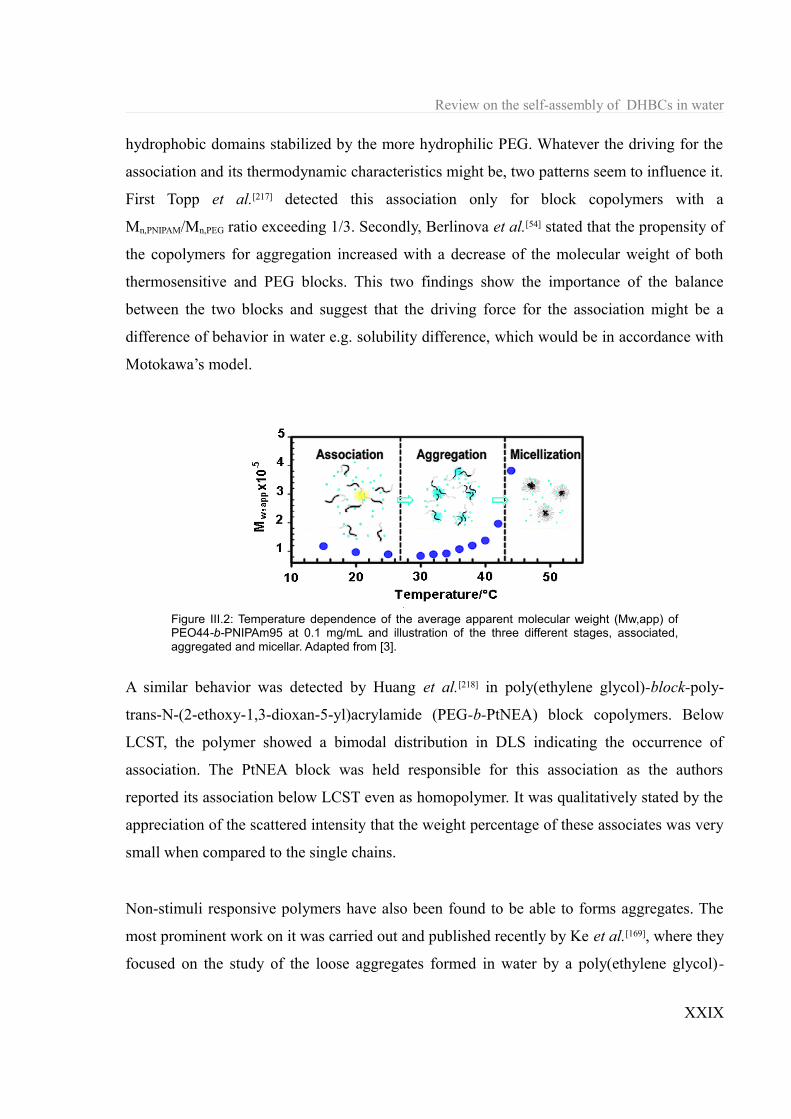
Review on the self-assembly of DHBCs in water
hydrophobic domains stabilized by the more hydrophilic PEG. Whatever the driving for the
association and its thermodynamic characteristics might be, two patterns seem to influence it.
First Topp et al.[217] detected this association only for block copolymers with a
Mn,PNIPAM/Mn,PEG ratio exceeding 1/3. Secondly, Berlinova et al.[54] stated that the propensity of
the copolymers for aggregation increased with a decrease of the molecular weight of both
thermosensitive and PEG blocks. This two findings show the importance of the balance
between the two blocks and suggest that the driving force for the association might be a
difference of behavior in water e.g. solubility difference, which would be in accordance with
Motokawa’s model.
A similar behavior was detected by Huang et al.[218] in poly(ethylene glycol)-block-poly-
trans-N-(2-ethoxy-1,3-dioxan-5-yl)acrylamide (PEG-b-PtNEA) block copolymers. Below
LCST, the polymer showed a bimodal distribution in DLS indicating the occurrence of
association. The PtNEA block was held responsible for this association as the authors
reported its association below LCST even as homopolymer. It was qualitatively stated by the
appreciation of the scattered intensity that the weight percentage of these associates was very
small when compared to the single chains.
Non-stimuli responsive polymers have also been found to be able to forms aggregates. The
most prominent work on it was carried out and published recently by Ke et al.[169], where they
focused on the study of the loose aggregates formed in water by a poly(ethylene glycol)-
XXIX
Figure III.2: Temperature dependence of the average apparent molecular weight (Mw,app) of PEO44-b-PNIPAm95 at 0.1 mg/mL and illustration of the three different stages, associated, aggregated and micellar. Adapted from [3].
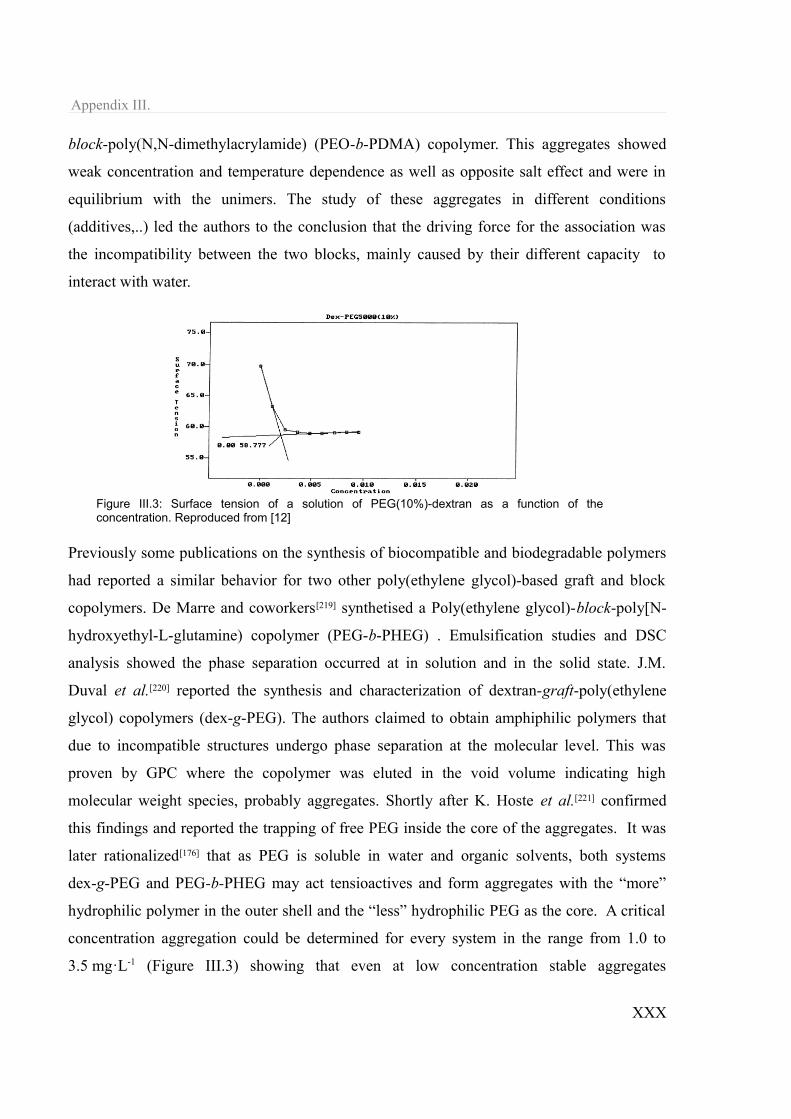
Appendix III.
block-poly(N,N-dimethylacrylamide) (PEO-b-PDMA) copolymer. This aggregates showed
weak concentration and temperature dependence as well as opposite salt effect and were in
equilibrium with the unimers. The study of these aggregates in different conditions
(additives,..) led the authors to the conclusion that the driving force for the association was
the incompatibility between the two blocks, mainly caused by their different capacity to
interact with water.
Previously some publications on the synthesis of biocompatible and biodegradable polymers
had reported a similar behavior for two other poly(ethylene glycol)-based graft and block
copolymers. De Marre and coworkers[219] synthetised a Poly(ethylene glycol)-block-poly[N-
hydroxyethyl-L-glutamine) copolymer (PEG-b-PHEG) . Emulsification studies and DSC
analysis showed the phase separation occurred at in solution and in the solid state. J.M.
Duval et al.[220] reported the synthesis and characterization of dextran-graft-poly(ethylene
glycol) copolymers (dex-g-PEG). The authors claimed to obtain amphiphilic polymers that
due to incompatible structures undergo phase separation at the molecular level. This was
proven by GPC where the copolymer was eluted in the void volume indicating high
molecular weight species, probably aggregates. Shortly after K. Hoste et al.[221] confirmed
this findings and reported the trapping of free PEG inside the core of the aggregates. It was
later rationalized[176] that as PEG is soluble in water and organic solvents, both systems
dex-g-PEG and PEG-b-PHEG may act tensioactives and form aggregates with the “more”
hydrophilic polymer in the outer shell and the “less” hydrophilic PEG as the core. A critical
concentration aggregation could be determined for every system in the range from 1.0 to
3.5 mg·L-1 (Figure III.3) showing that even at low concentration stable aggregates
XXX
Figure III.3: Surface tension of a solution of PEG(10%)-dextran as a function of the concentration. Reproduced from [12]

Review on the self-assembly of DHBCs in water
spontaneously form.
Non-amphiphilic self-assembly has already been studied in semi-dilute/concentrated solution
when referred to liquid crystal phases and water-in-water emulsions of liquid crystals. The
group of Luk[222] first studied a water-in.water emulsion consisting of dispersed droplets of
water-soluble liquid crystal disodium cromoglycate (DSCG) (.Figure III.4.a)) in a continuous
phase of water-soluble polymers (Figure III.4.1)).
Depending on the polymer in the continous phase, the droplets can be spherical and the LC
adopt a radial configuration in which they are aligned perpendicular to the interface (Figure
III.4.b.2)), or be ellipsoidal and the LC adopt a tangential configuration in which they align
parallel to the interface (Figure III.4.b.3)) which suggests a direct interaction between the
polymer’s functional groups and the LC molecules. The same group later reported [223] the
nonamphipilic assembly in water of the so-called chromonic liquid crystal phases. These
water-soluble aromatic molecules self-assemble above 11 wt% in thread-like structures rather
than molecular stacks (as the usual amphiphilic LC) and are very sensitive to small variations
in the structural details. Interestingly, the mixing of these molecules with slightly different
structure in water can result in a macro-phase separation, each phase solvating one type of
LC molecule. This thermodynamic incompatibility is surprising but supports the model of
threads of molecules acting as a pair of incompatible polymers.
XXXI
Figure III.4: a) Disodium cromoglycate (DSCG) b.1) Model of emulsions of water-solvated liquid crystal (LC) droplets stabilized from coalescence by the adsorption of polymers in a continuous aqueous medium. Two possible droplet configurations: b.2) radial configuration in b.3) tangential configuration. Reproduced from [13].

Appendix III.
Also in concentrated solution, Taubert et al.[211] reported the mesophases formed by a DHBC
of poly(ethylene glycol)-block-poly(2-methyl oxazoline) (PEG-b-PMOXA) in water. Below
55% wt of polymer the polymer solution is isotropic but above that concentration two
mesophases can be formed (Figure III.5.a)): one presumably hexagonal (H1) and a lamellar
one (Lα). This implies the existence of distinct water domains separated only by hydrophilic
copolymers. The authors explained the phase separation in terms of incompatibility between
the two blocks, that would microphase-separate and give raise two those water-rich domains
(Figure III.5.b)).
The formation of associates, aggregates, and mesophases in non-selective solvent does not
appear exclusively in water. Several examples are available in organic media. The most
prominent and studied ones are the formation of aggregates in toluene of polystyrene-b-
poly(methyl methacrylate) and poly(ethylene glycol)-b-poly(methyl methacrylate)
copolymers. Strategieszielle et al.[224] studied the dynamic of a of polystyrene-b-poly(methyl
methacrylate) (PS-b-PMMA) diblock copolymer in toluene and reported the apparition of a
slow mode above c*. The frequency of this mode was very low and decreased with
increasing copolymer concentration. It was attributed to the formation of aggregates.
Similarly, poly(ethylene glycol)-poly(methyl methacrylate) diblock copolymers
(PEG-b-PMMA).in toluene and other organic solvents have been found to form
aggregates.225][226] Often mistaken by a classic self-assembly in selective solvent,[226] these
polymers show bimodal distribution by dynamic light scattering in toluene. The deviations
XXXII
Figure III.5: a) Phase diagram of PEG-b-PMOXA in water showing three regions. Lα lamellar LM. L1 isotropic. H1 presumably hexagonal. b) Schematic representation of a water-in-water LM where the separation between water layers is due to the phase separation of the block copolymer. Reproduced from [15].

Review on the self-assembly of DHBCs in water
from the hard-sphere model suggested that the aggregates responsible for the slow mode
were not compact but rather loosely packed, globular structures formed by strongly
fluctuating chains.[225]
XXXIII
Appendix IV.
Appendix IV. Nomenclature
ΔGm Gibbs free energy change of mixing
ΔHm Enthalpy of mixing
ΔSm Entropy of mixing
χAB Polymer-Polymer interaction parameter
χAS Polymer-Solvent interaction parameter
χeff Effective interaction parameter
φ Volume concentration
ρ Packing parameter
ρ-ratio Rg/Rh
ATPS Aqueous two-phase system
ATRP Atom transfer radical polymerization
C C-parameter as in Dapp=Dz·(1+C·Rg)
CONTIN Constrained regularization algorithm[150]
CP Cloud point
CRD Carbohydrate-recognition domain
CTA Chain transfer agent
CuAAC Copper-catalyzed azide-alkyne cycloaddition
XXXIV

Nomenclature
DCM Dichloromethane
DHBC Double hydrophilic block copolymer
DMF Dimethylformamide
DMSO Dimethyl sulfoxide
DNA Deoxyribonucleic acid
EA Elemental analysis
f Volume fraction
FCS Fluorescence correlation spectroscopy
FITC Fluorescein isothiocyanate
FITC-ConA Fluorescein isothiocyanate-labeled Concavalin A
Glc D-Glucose
GPC Gel permeation chromatography
GV Giant vesicle
HBS (4-(2-hydroxyethyl)-1-piperazineethanesulfonic acid ) saline buffer
LCST Lower critical solution temperature
MADIX Macromolecular design via interchange of xanthanes
Mn Number average molecular weight
Mw Weight average molecular weight
MWCO Molecular weight cut-off
N Degree of polymerization
NCA N-Carboxyanhydride
NMP N-methylpyrrolidone
NMR Nuclear magnetic resonance spectroscopy
NOESY Nuclear Overhauser Enhancement Spectroscopy
XXXV
Appendix IV.
ODT Order-disorder transition
OOT Order-order transition
P(q) Form Factor
PB Polybutadiene
PEG Poly(ethylene glycol)
PDI Polydispersity index
PNIPAM Poly(N-isopropylacrylamide)
PPG Poly(propylene glycol)
PVAc Poly(vinyl acetate)
PVOH Poly(vinyl alcohol)
PVP Poly(vinyl pyrrolidone)
RAFT Reversible addition-fragmentation chain transfer
REPES Regularized positive exponential sum algorithm[149]
Rg Radius of gyration
Rh Hydrodynamic radius
RNA Ribonucleic acid
RT Room temperature
SANS Small-angle neutron scattering
SAXS Small-angle X-ray scattering
SERS Surface-enhanced Raman spectroscopy
SLS Static light scattering
SSL Strong segregation limit
SSSL Super strong segregation limit
TEA Triethylamine
TEM Transmission electron microscopy
XXXVI

Nomenclature
THF Tetrahydrofuran
p-TsCl para-Toluenesulfonyl chloride
UCST Upper critical solution temperature
UV Ultraviolet
VOC Volatile organic compound
WSL Weak segregation limit
XXXVII

Appendix V.
Appendix V. Selected Analytical Methods
A. Light scattering
The light scattering[191] phenomenon happens when an incident light beam interacts with the
charges constituting a given molecule and remodel the spatial charge distribution. The
molecule acts then as a oscillating dipole and emits in all directions an electromagnetic wave
of same wavelength as the incident one (elastic scattering).
For molecules or particles larger than 20 nm, several oscillating dipoles are created
simultaneously. The interference of the simultaneously emitted scattered waves is
characteristic for the size and shape of the scattering particle.
I. Static light scattering
Static light scattering (SLS) is a technique used to determine the mass, size and shape of
particles. In experiments the intensity I(θ) of the elastically scattered light is measured at
different angles with respect to the incident beam. The ratio of the scattered light intensity
I(θ) over the incident beam intensity I0 is given by equation (15).
I (θ)I 0
=16π2 α2
λ04 r2 (15)
where α is the polarizability of the molecule, λ0 the vacuum wavelength of the incident beam
XXXVIII

Selected Analytical Methods
and r is the distance between the sample and the detector. Debye related the scattered light
intensity to the osmotic pressure by considering that additional scattering results from local
fluctuation of the concentration (equation (16)).
KcR(θ)
= 1RT (∂Π
∂c )T (16)
where R(θ) is the Rayleigh ratio, Π is the osmotic pressure, c is the concentration, R the ideal
gaz constant, T the temperature and K an optical constant given by equation (17).
K= 4 π2
λ04 N A
n02(∂ n
∂c )2
(17)
with n0 the refractive index of the solvent, NA Avogadro's number and n the refractive index
of the sample.
By extending the osmotic module into a power series (equation (18)), equation (16) can be
expressed as equation (19).
(∂Π∂ c )=RT ( 1
M w+2A 2 c+3A3 c+...) (18)
where Mw is the weight-averaged molar molecular mass and Ax virial coefficients.
KcR(θ)
= 1M w
+2A2 c+... (19)
For particles of diameter above λ/20 nm, the interference pattern of intraparticular scattered
light has to be taken into account as the scattering becomes sensitive to the particle's
anisotropy. The dependence is expressed in the Mie theory as the angle dependent form
factor P(q) (equation (20)) and the expression of the Rayleigh ratio is expressed as in
XXXIX

Appendix V.
equation (22).
P (q)=1− 13
⟨ Rg2 ⟩q2+... (20)
with q the module of the scattering vector q⃗ (difference of the scattered and incident wave
vectors)
q=4πλ0
n0 sin( θ2) (21)
KcR(θ)
= 1M w
+ 1P (θ)
+2A 2c= 1M w
(1+q2 ⟨Rg
2 ⟩3 )+2A2 c (22)
Equation (22) is used for data evaluation of the static light scattering in the form of a Zimm
plot. Kc/ΔR(θ) is plotted against q2 +kc (k is an arbitrary constant) for a series of
concentrations and angles. The extrapolation to 0 concentration and 0 q allows the
determination of Mw, A2 and <Rg>. When the scattering intensity does not depend on the
angle linearly for a given concentration, which is the case for particles of diameter over 50
nm, alternative plots can be build. For example, Guinier's approximation plots the logarithm
of the scattered intensity vs. q2 and the Berry plot plots the square root of the scattered
intensity vs. q2.
Static light scattering can also be used to study the morphology of particles via the fitting of
the form factor with known models. Widely used plots are Holtzer's that plots the z-averaged
form factor Pz(u)·q vs q or Kratky's that plots the Pz(u)·q2 vs q and that is typically used to
analyze the conformation of proteins.
XL

Selected Analytical Methods
II. Dynamic light scattering
If static light scattering averages the scattered intensity, dynamic light scattering (DLS)
studies its fluctuations over time. The intensity fluctuates because the change in the
interparticle position as a result of Brownian motion changes the interference pattern.
Correlation of the intensities I at time intervals τ can be expressed by a normalized intensity
autocorrelation function (equation (23)).
g2(q , τ)= ⟨ I (t) I ( t+τ)⟩⟨ I (q , τ)2⟩
(23)
The dynamic structure factor g1(q,τ) can be derived via the Siegert relation (equation (24)).
g1(q ,τ)=√ g2(q , τ)−1 (24)
For diluted monodisperse particle samples with qRg<1, g1(t) can be expressed as a single
exponential (equation (21)).
g1(q ,τ)=exp( Dt q2 τ) (25)
where Dt is the translational diffusion coefficient. For particle with qRg>1 the g1(t) function
has a multiexponential decay and can be expressed as a sum of several single exponentials
weighted by different diffusion coefficients (equation (26)).
g1(q ,τ)=⟨exp (−Γ τ)⟩=∫0
∞
exp(−Γ τ)G(Γ). d Γ (26)
where Г= Dapp(q)·q2. In dilute solution, when the interparticular interactions can be neglected,
XLI

Appendix V.
the hydrodynamic radius of particles can be obtained from the Stokes-Einstein equation
(equation (25)).
Rh=kT
6π η D (27)
Data analysis of the dynamic light scattering can be performed with different mathematical
approaches. The simplest method is the fitting of the first order autocorrelation function
g1(q,τ) with a single exponential decay but it is only valid for monodisperse samples
(situation in equation (21)). Other methods are more sophisticated and adapted to the study of
polydisperse samples. Two examples are the cumulant method where the experimental data
points are fitted to a polynomial series expansions and the nonnegatively least square method
which calculates a histogram of the particle size by minimizing an expression.
A very popular method is the one based on the CONTIN algorithm, that delivers a solution of
the Laplace inverse of g1(q,τ). Similarly to CONTIN, the REPES algorithm also solves the
Laplace inverse of g1(q,τ) but avoids certain artifacts and is therefore more adapted than
CONTIN for the study of polydisperse samples. Both these analyses deliver the intensity-
weighted size distribution of the samples.
B. Fluorescence correlation spectroscopy
Fluorescence correlation spectroscopy[227] (FCS) is a correlation analysis of the fluorescence
intensity fluctuations. Similarly to DLS, the intensity fluctuations are the result of the
Brownian motion of the fluorescent particles, in other words the number of the particles in
the sub-space defined by the optical system is randomly changing around the average
number. Correlation of the intensities I at time intervals τ can be expressed by a normalized
intensity autocorrelation function G(τ) (equation (28)).
G(τ )=⟨δ I (t )δ I (t+τ)⟩
⟨ I ( t)⟩2 =⟨ I (t) I ( t+τ)⟩
⟨ I ( t)⟩2 −1 (28)
XLII

Selected Analytical Methods
where δI(t) is the deviation from the mean intensity.
The analysis of this function gives the average number of fluorescent particles and average
diffusion time, when the particle is passing through the confocal volume. Eventually, both the
concentration and size of the particle are determined. The most common method for the data
analysis is the use of a nonlinear least square algorithm to fit the expression of the
autocorrelation curve expressed without baseline G'(τ).
For a unique monodisperse population G'(τ) has the form expressed in equation (29).
G ' (t)= 1N
1
(1+ tτD)√1+ t
S 2 τD
(29)
where N is the average number of fluorescents present at any given moment in the focal
volume, τD is the average diffusion time of a single fluorescent and S is the structural
parameter of the focal volume.
Multiple monodisperse populations can be simultaneously detected when the autocorrelation
time is fitted with the general form of G'(τ) (equation (30)).
G ' (t)= 1N ∑
i=1
n F i
(1+ tτDi)√1+ t
S 2 τDi
(30)
with Fi the fraction of number of fluorescents of the i-th population (Ni/N).
From the diffusion time τD the diffusion coefficient D can be calculated and this can later be
related to the hydrodynamic radius of the molecule/particle via the Stokes-Einstein (equation
(25)).
XLIII

Appendix VI.
Appendix VI. Bibliography
[1] A. Napoli, D. Sebök, A. Senti, W. Meier, in Block Copolymers in Nanoscience, Wiley-vch Verlag Gmbh & Co. Kgaa, 2008.
[2] H. Schlaad, L. You, R. Sigel, B. Smarsly, M. Heydenreich, A. Mantion, A. Masic, Chemical Communications 2009, 1478-1480.
[3] M. E. Silva, T. T. Franco, Brazilian Journal of Chemical Engineering 2000, 17, 1-17.[4] R. Hatti-Kaul, Molecular Biotechnology 2001, 19, 269-277.[5] R. Hatti-Kaul, in Aqueous Two-Phase Systems: Methods and Protocols, 2000, pp. 1-
10.[6] J. Benavides, O. Aguilar, B. Lapizco-Encinas, M. Rito-Palomares, Chemical
Engineering & Technology 2008, 31, 838-845.[7] B. Y. Zaslavsky, Aqueous Two-Phase Partitioning : Physical Chemistry and
Bioanalytical Applications, C R C Press Llc, 1994.[8] P. G. Mazzola, A. M. Lopes, F. A. Hasmann, A. F. Jozala, T. C. Penna, P. O.
Magalhaes, C. O. Rangel-Yagui, A. Pessoa Jr, Journal of Chemical Technology & Biotechnology 2008, 83, 143-157.
[9] A. D. Diamond, J. T. Hsu, Biotechnology Techniques 1989, 3, 119-124.[10] S. B. Zimmerman, A. P. Minton, Annual Review of Biophysics and Biomolecular
Structure 1993, 22, 27-65.[11] S. B. Zimmerman, S. O. Trach, Journal of Molecular Biology 1991, 222, 599-620.[12] H. M. R. Brij M. Mitruka, Clinical Biochemical and Hematological Reference Values
in Normal Experimental Animals and Normal Humans, Masson Pub. Usa, New York, 1981.
[13] R. J. Ellis, Trends in Biochemical Sciences 2001, 26, 597-604.[14] R. J. Ellis, Current Opinion in Structural Biology 2001, 11, 114-119.[15] D. S. Goodsell, The Machinery of Life, Springer, New York, 1993.[16] K. Sasahara, P. McPhie, A. P. Minton, Journal of Molecular Biology 2003, 326, 1227-
1237.[17] S. L. Flaugh, K. J. Lumb, Biomacromolecules 2001, 2, 538-540.[18] J. Ovádi, V. Saks, Molecular and Cellular Biochemistry 2004, 256-257, 5-12.[19] J. S. Clegg, American Journal of Physiology: Regulatory, Integrative and
Comparative Physiology 1984, 246, R133-151.
XLIV

Bibliography
[20] K. R. Porter, M. C. Beckerle, M. A. McNiven, in Modern Cell Biology, Alan R. Liss Inc., New York, 1983, pp. 259-302.
[21] N. D. Gershon, K. R. Porter, B. L. Trus, Proceedings of the National Academy of Sciences of the United States of America 1985, 82, 5030-5034.
[22] M. Al-Habori, The International Journal of Biochemistry & Cell Biology 1995, 27, 123-132.
[23] M. E. Campanella, H. Chu, P. S. Low, Proceedings of the National Academy of Sciences of the United States of America 2005, 102, 2402-2407.
[24] H. Walter, International Review of Cytology 1999, 192, 331-343.[25] G. J. Pielak, Proceedings of the National Academy of Sciences of the United States of
America 2005, 102, 5901-5902.[26] M. S. Long, C. D. Jones, M. R. Helfrich, L. K. Mangeney-Slavin, C. D. Keating,
Proceedings of the National Academy of Sciences of the United States of America 2005, 102, 5920-5925.
[27] Y. Li, Phase Separation in Giant Vesicles, phD Thesis, Potsdam Universität, 2008.[28] M. Stamm, D. W. Schubert, Annual Review of Materials Science 1995, 25, 325-356.[29] S. Förster, T. Plantenberg, Angewandte Chemie International Edition 2002, 41, 688-
714.[30] M. W. Matsen, F. S. Bates, Macromolecules 1996, 29, 1091-1098.[31] F. S. Bates, G. H. Fredrickson, Annual Review of Physical Chemistry 1990, 41, 525-
557.[32] L. Leibler, Macromolecules 1980, 13, 1602-1617.[33] I. A. Nyrkova, A. R. Khokhlov, M. Doi, Macromolecules 1993, 26, 3601-3610.[34] V. V. Vasilevskaya, L. A. Gusev, A. R. Khokhlov, O. Ikkala, G. ten Brinke,
Macromolecules 2001, 34, 5019-5022.[35] Y. Li, X. Wang, I. C. Sanchez, K. P. Johnston, P. F. Green, The Journal of Physical
Chemistry B 2006, 111, 16-25.[36] J. H. Kenneth, P. L. Timothy, Journal of Polymer Science Part B: Polymer Physics
1998, 36, 3101-3113.[37] C. Tanford, Science 1978, 200, 1012-1018.[38] G. H. Findenegg, Berichte der Bunsengesellschaft für physikalische Chemie 1986, 90,
1241-1242.[39] D. A. Hajduk, M. B. Kossuth, M. A. Hillmyer, F. S. Bates, The Journal of Physical
Chemistry B 1998, 102, 4269-4276.[40] M. Lazzari, G. Liu, S. Lecommandoux, Block Copolymers in Nanoscience, Wiley,
2006.[41] D. Schmaljohann, Advanced Drug Delivery Reviews 2006, 58, 1655-1670.[42] C. de las H. Alarcon, S. Pennadam, C. Alexander, Chemical Society Reviews 2005, 34,
276-285.[43] P. Bawa, V. Pillay, Y. Choonara, L. du Toit, Biomedical materials 2009, 4, 022001.[44] J. Rodríguez-Hernández, F. Chécot, Y. Gnanou, S. Lecommandoux, Progress in
Polymer Science 2005, 30, 691-724.[45] V. Aseyev, S. Hietala, A. Laukkanen, M. Nuopponen, O. Confortini, F. E. Du Prez, H.
Tenhu, Polymer 2005, 46, 7118-7131.[46] R. Koningsveld, L. A. Kleintjens, H. M. Schoffeleers, Pure and Applied Chemistry
1974, 39, 1-35.
XLV

Appendix VI.
[47] S. B. Allin, in Polymer Science and Technology (Ed.: J.R. Fried), American Chemical Society, 2004, p. 809.
[48] S. Saeki, N. Kuwahara, S. Konno, M. Kaneko, Macromolecules 1973, 6, 246-250.[49] C. Wohlfarth, in Polymers, Polymer Solutions, Physical Properties and Their
Relations I:Thermodynamic Properties andPhase Equilibria, Springer-verlag Berlin Heidelberg, 2009.
[50] R. Liu, M. Fraylich, B. Saunders, Colloid & Polymer Science 2009, 287, 627-643.[51] J.-F. Lutz, Ã. Akdemir, A. Hoth, Journal of the American Chemical Society 2006, 128,
13046-13047.[52] M. Almgren, W. Brown, S. Hvidt, Colloid & Polymer Science 1995, 273, 2-15.[53] G. Wanka, H. Hoffmann, W. Ulbricht, Colloid & Polymer Science 1990, 268, 101-
117.[54] I. Berlinova, N. Iliev, P. Vladimirov, C. Novakov, Journal of Polymer Science Part A:
Polymer Chemistry 2007, 45, 4720-4732.[55] M. Prabaharan, J. J. Grailer, D. A. Steeber, S. Gong, Macromolecular Bioscience
2009, 9, 744-753.[56] N. Hadjichristidis, M. Pitsikalis, H. Iatrou, G. Sakellariou, in Controlled and Living
Polymerizations: From Mechanisms to Applications, Wiley-vch Verlag Gmbh & Co. Kgaa, 2010.
[57] C. Tsitsilianis, in Controlled and Living Polymerizations: From Mechanisms to Applications, Wiley-vch Verlag Gmbh & Co. Kgaa, 2010.
[58] N. Hadjichristidis, H. Iatrou, M. Pitsikalis, G. Sakellariou, Chemical Reviews 2009.[59] H. Leuchs, W. Manasse, Berichte der Deutschen Chemischen Gesellschaft 1907, 40,
3235-3249.[60] R. Wilder, S. Mobashery, The Journal of Organic Chemistry 1992, 57, 2755-2756.[61] D. S. Poche, M. J. Moore, J. L. Bowles, Synthetic Communications 1999, 29, 843 -
854.[62] J. R. Kramer, T. J. Deming, Biomacromolecules 2010, 11, 3668-3672.[63] I. Dimitrov, H. Schlaad, Chemical Communications 2003, 2944-2945.[64] T. J. Deming, Nature 1997, 390, 386-389.[65] T. Aliferis, H. Iatrou, N. Hadjichristidis, Biomacromolecules 2004, 5, 1653-1656.[66] K. Matyjaszewski, in Controlled and Living Polymerizations: From Mechanisms to
Applications, Wiley-vch Verlag Gmbh & Co. Kgaa, 2010.[67] J.-S. Wang, K. Matyjaszewski, Journal of the American Chemical Society 1995, 117,
5614-5615.[68] T. E. Patten, K. Matyjaszewski, Advanced Materials 1998, 10, 901-915.[69] R. J. Spontak, S. D. Smith, Journal of Polymer Science Part B: Polymer Physics
2001, 39, 947-955.[70] G. Moad, E. Rizzardo, S. H. Thang, Polymer 2008, 49, 1079-1131.[71] E. Rizzardo, J. Chiefari, R. Mayadunne, G. Moad, S. Thang, Macromolecular
Symposia 2001, 174, 209-212.[72] J.-F. Lutz, H. Schlaad, Polymer 2008, 49, 817-824.[73] C. K. Hartmuth, M. G. Finn, K. B. Sharpless, Angewandte Chemie International
Edition 2001, 40, 2004-2021.[74] J.-F. Lutz, Angewandte Chemie International Edition 2007, 46, 1018-1025.[75] A. Dondoni, Angewandte Chemie International Edition 2008, 47, 8995-8997.
XLVI
Bibliography
[76] C. E. Hoyle, T. Y. Lee, T. Roper, Journal of Polymer Science Part A: Polymer Chemistry 2004, 42, 5301-5338.
[77] C. E. Hoyle, A. B. Lowe, C. N. Bowman, Chemical Society Reviews 2010, 39, 1355-1387.
[78] R. M. Hensarling, V. A. Doughty, J. W. Chan, D. L. Patton, Journal of the American Chemical Society 2009, 131, 14673-14675.
[79] B. D. Fairbanks, T. F. Scott, C. J. Kloxin, K. S. Anseth, C. N. Bowman, Macromolecules 2008, 42, 211-217.
[80] J. A. Opsteen, J. C. M. van Hest, Chemical Communications 2005, 57-59.[81] H. B. Wolfgang, S. Robert, Macromolecular Rapid Communications 2007, 28, 15-54.[82] H. B. Wolfgang, S. Robert, Macromolecular Rapid Communications 2008, 29, 952-
981.[83] M. Morten, Macromolecular Rapid Communications 2008, 29, 1016-1051.[84] C. Barner-Kowollik, F. E. Du Prez, P. Espeel, C. J. Hawker, T. Junkers, H. Schlaad, W.
Van Camp, Angewandte Chemie International Edition 2011, 50, 60-62.[85] M. Arthur, Journal für Praktische Chemie 1893, 48, 94-95.[86] R. Huisgen, Angewandte Chemie International Edition 1963, 2, 633-645.[87] R. Huisgen, Angewandte Chemie International Edition 1963, 2, 565-598.[88] C. W. Tornøe, C. Christensen, M. Meldal, The Journal of Organic Chemistry 2002,
67, 3057-3064.[89] M. Meldal, C. W. Tornøe, Chemical Reviews 2008, 108, 2952-3015.[90] V. R. Vsevolod, G. G. Luke, V. F. Valery, K. B. Sharpless, Angewandte Chemie
International Edition 2002, 41, 2596-2599.[91] V. D. Bock, D. Speijer, H. Hiemstra, J. H. van Maarseveen, Organic & Biomolecular
Chemistry 2007, 5, 971-975.[92] Y. L. Angell, K. Burgess, Chemical Society Reviews 2007, 36, 1674-1689.[93] J. P. Roland, T. S. R. Dirk, M. J. L. Rob, QSAR & Combinatorial Science 2007, 26,
1181-1190.[94] F. Amblard, J. H. Cho, R. F. Schinazi, Chemical Reviews 2009, 109, 4207-4220.[95] B. Le Droumaguet, K. Velonia, Macromolecular Rapid Communications 2008, 29,
1073-1089.[96] S. Dedola, S. A. Nepogodiev, R. A. Field, Organic & Biomolecular Chemistry 2007,
5, 1006-1017.[97] D. B. Aaron, L. K. Kristi, Peptide Science 2009, 94, 128-140.[98] R. Gruškienė, G. Čiuta, R. Makuška, Chemija 2009, 20, 241-249.[99] C. Schatz, S. Louguet, J.-F. Le Meins, S. Lecommandoux, Angewandte Chemie
International Edition 2009, 48, 2572-2575.[100] B. Mareike, G. Nina, R. Helmut, Macromolecular Chemistry and Physics 2008, 209,
25-31.[101] P. Appukkuttan, W. Dehaen, V. V. Fokin, E. Van der Eycken, Organic Letters 2004, 6,
4223-4225.[102] D. T. S. Rijkers, G. W. van Esse, R. Merkx, A. J. Brouwer, H. J. F. Jacobs, R. J.
Pieters, R. M. J. Liskamp, Chemical Communications 2005, 36, 4581-4583.[103] C. Bouillon, A. Meyer, S. Vidal, A. Jochum, Y. Chevolot, J.-P. Cloarec, J.-P. Praly, J.-
J. Vasseur, F. Morvan, The Journal of Organic Chemistry 2006, 71, 4700-4702.[104] T. Posner, Berichte der deutschen chemischen Gesellschaft 1905, 38, 646-657.
XLVII

Appendix VI.
[105] A. B. Lowe, Polymer Chemistry 2010, 1, 17-36.[106] B. Holmberg, Berichte der deutschen chemischen Gesellschaft (A and B Series) 1932,
65, 1349-1354.[107] G. E. Serniuk, F. W. Banes, M. W. Swaney, Journal of the American Chemical Society
1948, 70, 1804-1808.[108] K. L. Killops, L. M. Campos, C. J. Hawker, Journal of the American Chemical
Society 2008, 130, 5062-5064.[109] L. M. Campos, K. L. Killops, R. Sakai, J. M. J. Paulusse, D. Damiron, E.
Drockenmuller, B. W. Messmore, C. J. Hawker, Macromolecules 2008, 41, 7063-7070.[110] L. Herczynska, L. Lestel, S. Boileau, J. Chojnowski, S. Polowinski, European
Polymer Journal 1999, 35, 1115-1122.[111] U. Gorski, E. Klemm, Die Angewandte Makromolekulare Chemie 1995, 224, 125-131.[112] F. Ciardelli, M. Aglietto, E. Passaglia, F. Picchioni, Polymers for Advanced
Technologies 2000, 11, 371-376.[113] F. Romani, E. Passaglia, M. Aglietto, G. Ruggeri, Macromolecular Chemistry and
Physics 1999, 200, 524-530.[114] J. Justynska, Z. Hordyjewicz, H. Schlaad, Macromolecular Symposia 2006, 240, 41-
46.[115] J. Justynska, H. Schlaad, Macromolecular Rapid Communications 2004, 25, 1478-
1481.[116] Y. Geng, D. E. Discher, J. Justynska, H. Schlaad, Angewandte Chemie International
Edition 2006, 45, 7578-7581.[117] N. ten Brummelhuis, C. Diehl, H. Schlaad, Macromolecules 2008, 41, 9946-9947.[118] L. You, H. Schlaad, Journal of the American Chemical Society 2006, 128, 13336-
13337.[119] Z. Hordyjewicz-Baran, L. You, B. Smarsly, R. Sigel, H. Schlaad, Macromolecules
2007, 40, 3901-3903.[120] J. Justynska, Z. Hordyjewicz, H. Schlaad, Polymer 2005, 46, 12057-12064.[121] A. Gress, A. Voelkel, H. Schlaad, Macromolecules 2007, 40, 7928-7933.[122] H. Cabezas, Journal of Chromatography B: Biomedical Sciences and Applications
1996, 680, 3-30.[123] P. A. Pessôa Filho, R. S. Mohamed, Process Biochemistry 2004, 39, 2075-2083.[124] R. J. H. Stenekes, O. Franssen, E. M. G. van Bommel, D. J. A. Crommelin, W. E.
Hennink, International Journal of Pharmaceutics 1999, 183, 29-32.[125] S. Kavlak, H. K. Can, A. Güner, Journal of Applied Polymer Science 2004, 94, 453-
460.[126] R. L. Scott, The Journal of Chemical Physics 1949, 17, 268-279.[127] H. Tompa, Polymer Solutions, Academic Press, New York, 1956.[128] A. E. Nesterov, I. S. Lipatov, Thermodynamics of Polymer Blends, Volume I, Crc Pr
Inc, 1997.[129] A. Robard, D. Patterson, G. Delmas, Macromolecules 1977, 10, 706-708.[130] C. Tanford, The Hydrophobic Effect: Formation of Micelles and Biological
Membranes, John Wiley & Sons, New York, 1973.[131] M. Naessens, A. Cerdobbel, W. Soetaert, E. J. Vandamme, Journal of Chemical
Technology & Biotechnology 2005, 80, 845-860.[132] L. H. Derek, H. Boualem, R. K. Steven, Journal of Polymer Science Part B: Polymer
XLVIII

Bibliography
Physics 2003, 41, 135-138.[133] S. Han, B. Jhun, Archives of Pharmacal Research 1984, 7, 1-9.[134] E. I. Fedin, V. G. Tsitsishvili, V. Y. Grinberg, T. I. Bakari, V. B. Tolstoguzov,
Carbohydrate Research 1975, 39, 193-199.[135] P. Cernoch, H. Schlaad, H. Coelfen, submitted 2011.[136] É. Kalutskaya, Chemistry of Natural Compounds 1990, 26, 621-625-625.[137] K.-J. Liu, J. L. Parsons, Macromolecules 1969, 2, 529-533.[138] V. Mank, I. Solomentseva, A. Baran, O. Kurilenko, Ukrainian Chemistry Journal
1974, 40, 1035.[139] H. Yoshioka, The Journal of Physical Chemistry 1978, 82, 2736-2739.[140] C. Branca, S. Magazù, G. Maisano, F. Migliardo, P. Migliardo, G. Romeo, The
Journal of Physical Chemistry B 2002, 106, 10272-10276.[141] R. Kjellander, E. Florin, Journal of the Chemical Society, Faraday Transactions 1:
Physical Chemistry in Condensed Phases 1981, 77, 2053-2077.[142] K. Serap, C. Hatice Kaplan, G. Ali, Journal of Applied Polymer Science 2004, 94,
453-460.[143] M. Hillmyer, Current Opinion in Solid State and Materials Science 1999, 4, 559-564.[144] R. F. Borch, M. D. Bernstein, H. D. Durst, Journal of the American Chemical Society
1971, 93, 2897-2904.[145] S. L. Ng, P.-Y. Yang, K. Y. T. Chen, R. Srinivasan, S. Q. Yao, Organic &
Biomolecular Chemistry 2008, 6, 844-847.[146] D. Quemener, T. P. Davis, C. Barner-Kowollik, M. H. Stenzel, Chemical
Communications 2006, 5051-5053.[147] T. Zhang, R. E. Marchant, Macromolecules 1994, 27, 7302-7308.[148] O. S. Hernandez, G. M. Soliman, F. M. Winnik, Polymer 2007, 48, 921-930.[149] J. Jakeš, Collection of Czechoslovak Chemical Communications 1995, 60, 1781-1797.[150] S. W. Provencher, Computer Physics Communications 1982, 27, 213-227.[151] R. Sigel, M. Łosik, H. Schlaad, Langmuir 2007, 23, 7196-7199.[152] W. Burchard, M. Schmidt, W. H. Stockmayer, Macromolecules 1980, 13, 1265-1272.[153] Y. Zhang, F. Wu, W. Yuan, T. Jin, Journal of Controlled Release 2010, 147, 413-419.[154] Cheng, T. Hui, Megha undefined London, , and , Erwin, The Journal of Biological
Chemistry 2009, 284, 6079-6092.[155] E. Le Ru, P. Etchegoin, Principles of Surface-Enhanced Raman Spectroscopy and
Related Plasmonic Effects, Elsevier, 2008.[156] D. Lide, CRC Handbook of Chemistry and Physics, 88th Edition (Crc Handbook of
Chemistry and Physics), Crc, 2007.[157] Z. Lu, J. Goebl, J. Ge, Y. Yin, Journal of Materials Chemistry 2009, 19, 4597-4602.[158] R. G. Zhbankov, S. P. Firsov, E. V. Korolik, P. T. Petrov, M. P. Lapkovski, V. M.
Tsarenkov, M. K. Marchewka, H. Ratajczak, Journal of Molecular Structure 2000, 555, 85-96.
[159] H. Matsuura, T. Miyazawa, Journal of Polymer Science Part A-2: Polymer Physics 1969, 7, 1735-1744.
[160] J. L. Koenig, Journal of Polymer Science: Macromolecular Reviews 1972, 6, 59-177.[161] J. L. Koenig, A. C. Angood, Journal of Polymer Science Part A-2: Polymer Physics
1970, 8, 1787-1796.[162] E. Sabadini, T. Cosgrove, F. do C. Egídio, Carbohydrate Research 2006, 341, 270-
XLIX

Appendix VI.
274.[163] L. Whistler Roy, in Carbohydrates in Solution, American Chemical Society, 1973, pp.
242-255.[164] M. R. Gittings, L. Cipelletti, V. Trappe, D. A. Weitz, M. In, C. Marques, The Journal
of Physical Chemistry B 2000, 104, 4381-4386.[165] G. Battaglia, A. J. Ryan, Journal of the American Chemical Society 2005, 127, 8757-
8764.[166] B. M. Discher, Y.-Y. Won, D. S. Ege, J. C. M. Lee, F. S. Bates, D. E. Discher, D. A.
Hammer, Science 1999, 284, 1143-1146.[167] L. J. M. Vagberg, K. A. Cogan, A. P. Gast, Macromolecules 1991, 24, 1670-1677.[168] F. Szoka, D. Papahadjopoulos, Annual Review of Biophysics and Bioengineering
1980, 9, 467-508.[169] F. Ke, X. Mo, R. Yang, Y. Wang, D. Liang, Macromolecules 2009, 42, 5339-5344.[170] W. Zhang, L. Shi, K. Wu, Y. An, Macromolecules 2005, 38, 5743-5747.[171] S. Koizumi, H. Hasegawa, T. Hashimoto, Makromolekulare Chemie. Macromolecular
Symposia 1992, 62, 75-91.[172] G. W. Gokel, K. Arnold, T. Cleary, R. Friese, V. Gatto, D. Goli, Hanlon C. undefined
Kim M. undefined Miller S. undefined Ouchi M. undefined Posey I. undefined Sandler A. undefined Viscariello A. undefined White B. undefined Wolfe J. undefined , and undefined Yoo H.in Phase-Transfer Catalysis, American Chemical Society, 2011, pp. 24-37, .
[173] P. George, A. Cameron, Angewandte Chemie International Edition 2008, 47, 4847-4850.
[174] P.-A. Albertsson, Partition of Cell Particles and Macromolecules, Wiley, New York, 1986.
[175] M. Destarac, D. Taton, S. Z. Zard, T. Saleh, Y. Six, in Advances in Controlled/Living Radical Polymerization, American Chemical Society, 2011, pp. 536-550.
[176] E. H. Schacht, K. Hoste, in Poly(ethylene Glycol) (Ed.: S.Z. J. Milton Harris), American Chemical Society, 1997, pp. 297-315.
[177] A. De Marre, H. Soyez, E. Schacht, J. Pytela, Polymer 1994, 35, 2443-2446.[178] G. Bokias, I. Iliopoulos, D. Hourdet, G. Staikos, Trends in Colloid and Interface
Science XV 2001, 118, 48.[179] H. Friedrich, P. M. Frederik, G. de With, N. A. J. M. Sommerdijk, Angewandte
Chemie International Edition 2010, 49, 7850-7858.[180] Z. Li, Y.-H. Kim, H. Min, C.-K. Han, K. Huh, Macromolecular Research 2010, 18,
618-621-621.[181] NIST Center for Neutron Research, “Cell Membrane,” can be found under
http://www.ncnr.nist.gov/programs/reflect/cnbt/[182] J. Arimatti, Lateral Heterogeneity in Model Membranes - Inducements and Effects,
phD Thesis, University of Helsinki, 2001.[183] R. Garrett, C. Grisham, Biochemistry, Brooks Cole, 1999.[184] J. M. Boon, B. D. Smith, Medicinal Research Reviews 2002, 22, 251-281.[185] R. Stoenescu, W. Meier, Chemical Communications 2002, 3016-3017.[186] R. Stoenescu, A. Graff, W. Meier, Macromolecular Bioscience 2004, 4, 930-935.[187] H. Kukula, H. Schlaad, J. Falkenhagen, R.-P. Krueger, Macromolecules 2002, 35,
7157-7160.
L

Bibliography
[188] H. Schlaad, H. Kukula, J. Rudloff, I. Below, Macromolecules 2001, 34, 4302-4304.[189] C. Ladavière, N. Dörr, J. P. Claverie, Macromolecules 2001, 34, 5370-5372.[190] R. Borsali, R. Pecora, W. Burchard, in Soft Matter Characterization, Springer
Netherlands, 2008, pp. 463-603.[191] W. Schärtl, Light Scattering from Polymer Solutions and Nanoparticle Dispersions,
Springer Laboratory, 2007.[192] M. Antonietti, S. Förster, Advanced Materials 2003, 15, 1323-1333.[193] M. Gradzielski, Current Opinion in Colloid & Interface Science 2003, 8, 337-345.[194] M. Heskins, J. E. Guillet, journal of Macromolecular Science, Part A: Pure and
Applied Chemistry 1968, 2, 1441 - 1455.[195] K. Skrabania, L. Wen, A. Laschewsky, Macromolecular Chemistry and Physics 2008,
209, 1389-1403.[196] D. Roy, J. N. Cambre, B. S. Sumerlin, Chemical Communications 2009, 16, 2106-
2108.[197] L. Guiying, G. Lei, M. Songmei, Journal of Applied Polymer Science 2009, 113,
1364-1368.[198] C. Wu, X. Wang, Physical Review Letters 1998, 80, 4092.[199] S. Elgavish, B. Shaanan, Trends in Biochemical Sciences 1997, 22, 462-467.[200] A. Varki, Essentials of Glycobiology, Cold Spring Harbor Laboratory Press, Cold
Spring Harbor, N.Y., 2009.[201] T. K. Dam, R. Roy, S. K. Das, S. Oscarson, C. F. Brewer, The Journal of Biological
Chemistry 2000, 275, 14223-14230.[202] J. C. Sacchettini, L. G. Baum, C. F. Brewer, Biochemistry 2001, 40, 3009-3015.[203] W. I. Weis, K. Drickamer, Annual Reviews of Biochemistry 1996, 65, 441-473.[204] J. J. Lundquist, E. J. Toone, Chemical Reviews 2002, 102, 555-578.[205] J. Voskuhl, M. C. A. Stuart, B. J. Ravoo, Chemistry – A European Journal 2010, 16,
2790-2796.[206] H.-K. Lee, K. M. Park, Y. J. Jeon, D. Kim, D. H. Oh, H. S. Kim, C. K. Park, K. Kim,
Journal of the American Chemical Society 2005, 127, 5006-5007.[207] V. P. Torchilin, Nature Reviews Drug Discovery 2005, 4, 145-160.[208] B. G. De Geest, N. N. Sanders, G. B. Sukhorukov, J. Demeester, S. C. De Smedt,
Chemical Society Reviews 2007, 36, 636-649.[209] D. E. Discher, F. Ahmed, Annual Review of Biomedical Engineering 2006, 8, 323-341.[210] B. Ratner, Biomaterial Science: An Introduction to Materials in Medecine, Academic
Press, 2004.[211] A. Taubert, E. Furrer, W. Meier, Chemical Communications 2004, 2170-2171.[212] W. H. Daly, D. Poché, Tetrahedron Letters 1988, 29, 5859-5862.[213] A.-L. Kjøniksen, B. Nyström, H. Tenhu, Colloids and Surfaces A: Physicochemical
and Engineering Aspects 2003, 228, 75-83.[214] R. Motokawa, K. Morishita, S. Koizumi, T. Nakahira, M. Annaka, Macromolecules
2005, 38, 5748-5760.[215] J. Yan, W. Ji, E. Chen, Z. Li, D. Liang, Macromolecules 2008, 41, 4908-4913.[216] N. N. Ana, G. V. Nikolay, P. N. Christo, V. B. Iliyana, Journal of Polymer Science
Part A: Polymer Chemistry 2004, 42, 5736-5744.[217] M. D. C. Topp, P. J. Dijkstra, H. Talsma, J. Feijen, Macromolecules 1997, 30, 8518-
8520.
LI

Appendix VI.
[218] X. Huang, F. Du, J. Cheng, Y. Dong, D. Liang, S. Ji, S.-S. Lin, Z. Li, Macromolecules 2009, 42, 783-790.
[219] A. De Marre, K. Hoste, D. Bruneel, E. Schacht, F. De Schryver, Journal of Bioactive and Compatible Polymers 1996, 11, 85-99.
[220] J. Marc Duval, C. Delestre, M.-C. Carré, P. Hubert, E. Dellacherie, Carbohydrate Polymers 1991, 15, 233-242.
[221] K. Hoste, D. Bruneel, A. D. Marre, F. D. Schrijver, E. Schacht, Macromolecular Rapid Communications 1994, 15, 697-704.
[222] K. A. Simon, P. Sejwal, R. B. Gerecht, Y.-Y. Luk, Langmuir 2006, 23, 1453-1458.[223] L. Wu, J. Lal, K. A. Simon, E. A. Burton, Y.-Y. Luk, Journal of the American
Chemical Society 2009, 131, 7430-7443.[224] L. Ould-Kaddour, C. Strazielle, Polymer 1992, 33, 899-908.[225] K. Edelmann, M. Janich, E. Hoinkis, W. Pyckhout-Hintzen, S. Höring,
Macromolecular Chemistry and Physics 2001, 202, 1638-1644.[226] Z. Lei, L. Zhang, Colloids and Surfaces A: Physicochemical and Engineering Aspects
2008, 312, 166-171.[227] E. Haustein, P. Schwille, in Soft Matter Characterization, Springer Netherlands, 2008,
pp. 637-675-675.
LII

Declaration/Erklärung
Declaration/Erklärung
I herewith declare that I have made this existing work single-handedly. I have onlyused the stated utilities and references.
Ich erkläre hiermit, dass ich die vorliegende Dissertation selbst verfasst habe undkeine anderen als die angegebenen Quellen und Hilfsmittel benutzt habe.
Potsdam, Mai 2011
Clara Valverde Serrano
LIII

LIV

Acknowledgments
Acknowledgments
First, I would like to thank Prof. Markus Antonietti for giving me the chance to join his department in 2008 and for contributing to my work with remarkable insight. I would like to equally thank Dr. habil. Helmut Schlaad for welcoming me into his working group and the freedom to play around :).I would like to express my gratitude to Jessica Brandt and Marlies Gräwert and Ines Below-Lutz for the help all along this process...even in ways that go beyond the professional side! This work wouldn't have been possible without your continous help, THANKS.Dr. Mihaela Delcea and Dr. (!) Dorothee Kohler are greatly thanked for help with the confocal fluorescence microscopy. Pascal Tanner and Dr. Cornelia Palivan are kindly acknowledged and thanked for welcoming me in Basel and helping with the fluorescence confocal spectroscopy experiments. Caro Lukas is greatly acknowledged for her help with the nerdy stuff. Thanks also to Dr. Florence Gayet from U Warwick for the GPC in chloroform. Dr. Peter Černoch is dearly thanked for assistance with light scattering measurements and for sharing his wisdom and coconuts. I shall not forget to thank Olaf Niemeyer for some NMR, Irina Shekova for surface tension, Rona Pitschke for TEM, Sylvia Pirok for elemental analysis and Antje Völkel for AUC attempts.
I would like to thank the past and present members of the AG Schlaad for the good moments and the fruitful discussions: Yusuf, Annabelle, Christina, Niels, Ina, Josh, Peter, Ying, Hua, Junpeng, Nora, Kai, Christian, Denis…and especially Flo.
Thanks also to Jens (darling) Paraknowitsch for understanding everything I say no matter how non-politically correct it is and for the hours spent together drinking zumo natural de naranja in “our” bench, or?. Thanks to Vasana Funkatana for being so caring, her unforgettable “cuisine” (balsamic reduction all the way!) and being such a good friend. Thanks also to Magda Titirici for trying her best old-school reverse psychology techniques to motivate me (it did not work :P ) and all the lunch breaks (and brunches, dinners, bike rides, parties…) in the world together.
To the coffee corner crew, to the kicker crew: Pablo, Daniel, Irene, Katja, Jelenita, Shiori, Marina, Maria Luz, Marta, Nico, Tim, Steff, Nina, Stefan, Constanze, Alex, Bettina, David,
LV
Zoe, Alfonso, Filipe, Hiro, Robin, Jéjé, Camillo, Li, Yael, Silke, Nicole, Caro, Cécile, Yuan, Nicola, Micha, Johannes, Dim, Caro, John, Marek, Daniel Pussak, Camillo's electric expresso …and a long etcetera.
To my friends in Berlin for their infinite patience over my “I’m too tired” sentence and for the music-related fun and to the brunch crew (Boitel, Steffan, Jana, ♥Dana ♥, Kazka, Sonne, Asja).
I would like to thank my father, my sister and my mother for their support along the years even when I took decisions that they could not understand. Last I would like to thank my grandmother to whom I would also like to dedicate this work, may all that wax not have burnt in vain. You are a model of intelligence, strength and generosity and I admire and love you dearly for it.
Me gustaría agradecer a mi padre, mi hermana y a mi madre su apoyo a lo largo de los años, incluso cuando he tomado decisiones que no siempre han sido fáciles de entender, os quiero. Y ya por último me gustaría dar la gracias a mi abuela, a quien también quisiera dedicar este trabajo, espero que toda esa cera no se haya quemado en vano. Eres un modelo de inteligencia, fuerza y generosidad, y por ello te quiero y admiro profundamente.
Clara.
LVI