
Silver Mirroring on Silver Gelatin Glass Negatives
94
SILVER MIRRORING ON SILVER GELATIN GLASS NEGATIVES INAUGURAL DISSERTATION zur Erlangung des Würde eines Doktor der Philosophie vorgelegt der Philosophisch-Naturwissenschaftlichen Fakultät der Universität Basel von Giovanna Di Pietro aus Pescara / Italien Basel, 2002
-
Upload
cezar-popescu -
Category
Documents
-
view
234 -
download
2
description
by Giovanna di Pietro, 2002
Transcript of Silver Mirroring on Silver Gelatin Glass Negatives
SILVER MIRRORING
ON SILVER GELATIN GLASS
NEGATIVES
INAUGURAL DISSERTATION
zur
Erlangung des Würde eines Doktor der Philosophie
vorgelegt der
Philosophisch-Naturwissenschaftlichen Fakultät
der Universität Basel
von
Giovanna Di Pietro
aus Pescara / Italien
Basel, 2002
1
ACKNOWLEDGEMENTS
I want to thank my mentor, Rudolf Gschwind, for having supported me in these years with
many useful discussions and my colleague, Frank Ligterink, for many scientific discussions and
for sharing with me his knowledge about mathematical modelling.
I would like to thank the Institute of Physical Chemistry, Department of Chemistry, University
of Basel for financial support and the Head of the Institute, Prof. J.P. Maier, for having accepted
me as Ph.D. student.
I would like also to thank the Netherlands Institute of Cultural Heritage (Instituut Collectie
Nederland), Amsterdam, and particularly Agnes Ballestrem, previously Head of the Scientific
Department and Rick Vos, director of the Institute, for having supported my collaboration with
the Institute.
Also I would like to express my gratitude to all the colleagues and friends of the Chemistry
Department at the University of Basel and of the Scientific Department of the Netherlands
Institute of Cultural Heritage.
Many persons have contributed to this work. I want to thank:
Christian de Capitani and Susanne Th. Schmid of the Microprobe Laboratory, Department of
Geology, University of Basel, Peter Oelhafen of the Department of Physics, University of Basel,
Markus Durrenberg of the Interdivisional Electron Microscopy Laboratory, University of Basel,
H. G. Berke of the Department of Chemistry, University of Zürich, Peter Eglin and Alexandra
Tschakert of the Laboratory of Scientific Photography, University of Basel, Ruth Pfalzberger of
the Department of Chemistry, University of Basel, Peter Hallebeek of XRD Laboratory,
Instituut Collectie Nederland, Sebastian Dobrusskin of the Conservation Program in Bern and
Barbara Spalinger of the Bern State Archive, Dario Meneghetti and Niklaus Landolt of the
Basel State Archive in Basel, Ulla B. Nielsen Kejser of the Danish National Library and Jesper
S. Johnsen of the Danish Film Institute.
2
TABLE OF CONTENTS
Table of contents..................................................................................................................................2
Introduction and structure of the work................................................................................................4
1.0 Phenomenology of silver mirroring ..............................................................................................6
1.1 Photographic documentation.....................................................................................................7
1.2 Examples of silver mirrored glass negatives ............................................................................8
1.2.1 Edge Patterns ......................................................................................................................8
1.2.2 Inner patterns ....................................................................................................................12
1.3 Conclusions..............................................................................................................................17
2.0 The state of the art on the models for silver mirroring formation..............................................19
2.1 Open questions on silver mirroring.........................................................................................22
3.0 Local PHYSICAL-chemical model of silver mirroring formation: improvements to the
oxidation-migration-re-aggregation model .......................................................................................24
3.1 Experimental part ....................................................................................................................25
3.1.1 Chemical composition of silver mirroring ......................................................................25
3.1.2 Size and shape distributions of the silver mirroring particles.........................................31
3.2 Results......................................................................................................................................33
3.2.1 Results on the chemical composition of silver mirroring ...............................................33
3.2.1 Results on the size and shape distribution of the silver mirroring particles...................35
3.3 Discussion................................................................................................................................39
3.3.1 Oxidation ..........................................................................................................................40
3.3.2 Diffusion of silver ions.....................................................................................................43
3.3.3 Reaction with external sulphur compounds ....................................................................44
3.3.4 Growth of silver sulphide particles..................................................................................46
3.4 Conclusions..............................................................................................................................49
4.0 Gas diffusion-reaction models for the formation of silver mirroring edge patterns..................51
4.1 Theory ......................................................................................................................................51
4.1.1 Stacked plate exposure.....................................................................................................52
4.1.2 Single plate exposure .......................................................................................................55
4.2 Experimental part ....................................................................................................................58
4.2.1 Determination of plate distances and edge patterns in an unaltered stack .....................59
4.2.2 Incubation chamber experiments .....................................................................................61
4.2.3 Profile of mass of silver mirroring in the edge pattern ...................................................62
4.3 Results......................................................................................................................................63
4.3.1 Plate distances and edge patterns in an unaltered stack..................................................63
4.3.2 Incubation chamber results ..............................................................................................64

3
4.3.3 Results on profiles of silver mirroring mass ...................................................................66
4.4 Discussion................................................................................................................................68
4.5 Conclusions..............................................................................................................................69
5.0 Notes on the formation of Inner patterns of silver mirroring.....................................................71
5.1 Case study: mirroring stains resembling the creases of glassine sleeves. .............................72
5.2 Experimental part ....................................................................................................................73
5.2.1 Matching of the shape of the silver mirroring stains and of the glassine wrinkles........74
5.2.2 Creasing patterns of stacked glassines.............................................................................74
5.3 Results......................................................................................................................................75
5.3.1 Results of the matching experiment ................................................................................75
5.3.2 Results of the creasing experiment ..................................................................................77
5.4 Discussion................................................................................................................................79
5.5 Conclusions..............................................................................................................................79
6.0 Conclusions..................................................................................................................................81
References ..........................................................................................................................................84
4
INTRODUCTION AND STRUCTURE OF THE WORK
Silver mirroring is a bluish metallic sheen appearing on the surface of silver based photographs
as result of ageing. One of the photographic processes most affected by silver mirroring is that
of silver gelatin glass negatives, the most common photographic negative process between the
1880s and the 1920s when they were slowly replaced by nitrate and acetate negatives.
The present research was initiated by the findings of plates that, beside the usual silver
mirroring along the negative edges, had mirroring stains at the centre of the plate whose shape
matched the creases of the glassine envelope in which the plates were stored. An informal
inquiry among photographic conservators revealed that patterns connected to the enclosure
material are rather common and they are not necessarily related to the poor quality of the
material.
Although silver mirroring has been observed since the early years of silver gelatin photography
and it has been investigated again and again in the course of the XX century, confusion is still
present on its chemical composition, on the compounds responsible for its formation and on the
reasons for the specific patterns.
The aim of this work is to better understand the mechanisms of both local and pattern formation
of silver mirroring in order to set the choice of best suited enclosure materials and storage
conditions on a more rational basis. This work is focused on silver gelatin glass negatives but
the results and models here presented can be easily applied to other photographic processes
exhibiting silver mirroring.
The first chapter is a gallery of possible patterns found on silver gelatin glass negatives. This is
first of all a visual definition of silver mirroring. Moreover, as patterns do not arise by
coincidence but they are the result of simple physical processes, the visual features of silver
mirroring suggest the causes for its formation.
The models about silver mirroring developed in the course of the XX century are reviewed in
the second chapter. The outcome is the definition of the open questions on silver mirroring: the
detailed microscopic processes leading to its local formation on one side and the macroscopic
processes leading to the pattern formation on the other side.
In order to answer the first question new experiments on the chemical composition and the
physical structure of the silver mirroring layer were performed. Based on these results some
improvements to the well-established oxidation-migration-re-aggregation model of local silver
mirroring formation are proposed in the third chapter.
The reasons for the arising of the usual silver mirroring edge patterns are investigated in the
fourth chapter. A mathematical model based on the diffusion and reaction of gases explaining
the formation of both historically and artificially produced edge patterns is presented.

5
The fifth chapter deals with the formation of inner patterns of silver mirroring. In this case, it
was not possible to propose a unique model explaining the formation of the many different inner
patterns that are likely to be found on silver gelatin glass negatives. The case of negatives with
mirroring stains resembling the wrinkles of glassine envelopes is examined in details and a
mechanism of formation is proposed.
Finally, in the conclusions, it is stated which are the contributions of this dissertation to the
development of strategies to prevent or mitigate silver mirroring and which are the questions on
which more research is needed.
6
1.0 PHENOMENOLOGY OF SILVER MIRRORING
Silver gelatin glass negatives, also called gelatin dry plates, were the most common negative
process in the years between the 1880s and the 1920s when they were slowly replaced by nitrate
and acetate negatives. They have glass plates of different dimensions and of thickness of the
order of 1-2 mm as a base. The emulsion, of thickness of the order of 50 micrometers, is applied
on one side of the plate. It is made of gelatin and, in most cases, of silver bromide grains which
turn to metallic silver after chemical development.
Two valuable historical sources on the manufacture of silver gelatin glass plates are the third
volume of the Ausführliches Handbuch der Photographie by J.M.Eder (Eder 1903) and the
fourth volume of the Handbuch der wissenschaftlichen und angewandten Photographie by R.
Jahr (Jahr 1930). These manuals describe how to choose, cut and prepare the glass plates and
how to mix, prepare and apply, both manually and with machines, the emulsion layer.
A review on conservation problems of silver gelatin glass plates can be found in the paper of
Gillet and co-workers (Gillet et al. 1986).
Photographic archives have usually large collections of silver gelatin glass negatives, often
exhibiting silver mirroring degradation. In the following paragraphs many examples,
representative of the variety of its patterns, forms and colours, are presented. These images are
first of all a definition of what silver mirroring is. Moreover the visual features of silver
mirroring suggest the causes for its formation.
The main source of examples was the Cueni study collection, a collection of about 150 glass
plate negatives of the Swiss painter and amateur photographer Adolf Cueni active in the Basel
region in the years 1910s -1920s. The plates, of no commercial value, have been donated from
the Cueni family to the Laboratory of Scientific Photography, University of Basel, in their
original cardboard boxes in the early 1990s and have never been archived. The boxes have the
labels of the photographic industries Agfa in Berlin, Unger und Hoffmann in Dresden, J. Hauff
& Co. in Fuerbach Württemberg and J. Will in Binningen-Basel. The plates have either 9 cm _
12 cm or 13 cm _ 18 cm format.
Few examples were taken from the glass negative collections of the State Archive in Bern and
of the State Archive in Basel.
The plates belonging to the State Archive in Bern (Staatsarchiv des Kantons Bern, Falkenplatz
4, 3012 Bern) are 7 plates of format 13 cm _ 18 cm. They are part of the Schweizerische
Landesausstellung collection, a thematic collection on Swiss landscapes dating back to the
second decade of the XX century. They were stored in glassine envelopes and stacked in
cardboard boxes. The envelopes are probably more recent than the plates because, apart from
being creased, they are in good conditions, not presenting yellowing or brittleness.
7
The negatives belonging to the Negative Collection of State Archive in Basel (Staatsarchiv des
Kantons Basel-Stadt, Martinsgasse 2 Postfach 4001 Basel) were chosen during the survey of a
section of the photographic archive conducted as part of the present research. Most of the plates
were stored vertically in paper envelopes in metal cabinets. Few plates, instead, were not
archived and stored in the original boxes in which they were sold.
Finally few negatives, named Gent plates, were bought on the flea market in Gent, Belgium in
spring 2000. Nor their age neither their history before the acquisition is known.
1.1 PHOTOGRAPHIC DOCUMENTATION
Silver mirroring is visually observed at best under reflected light, that is to say when the angles
between the perpendicular to the photograph surface and on one side the light source and on the
other side the eye are equal. The same condition has to be fulfilled when photographing a
mirrored glass negative.
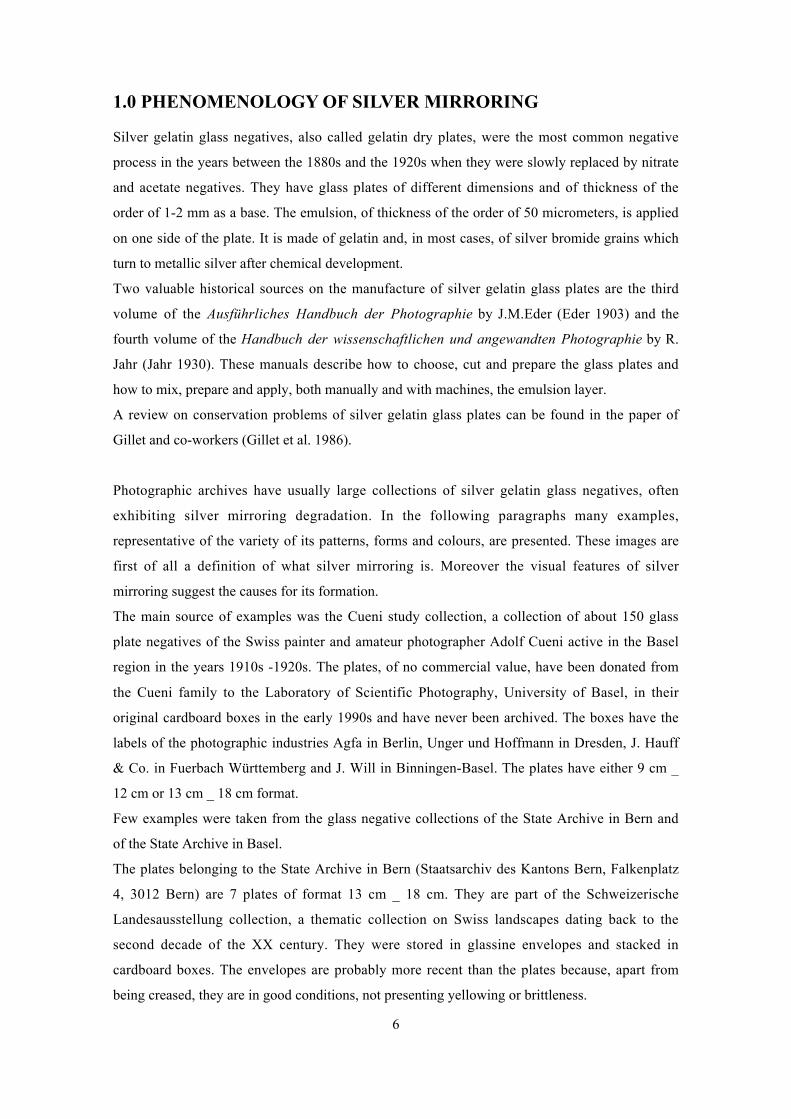
On account of the usual presence of silver mirroring at the four edges of the plate, the proper
illumination geometry has to satisfy the reflected light condition along the four plate edges. For
this purpose a construction holding the light sources, four fluorescent light tubes, along the sides
of a rectangle at a fixed distance over the plate, was built. The plate lies on the table on a black
paper at the centre of the construction and the camera is placed over the light sources (Fig. 1).
Figure 1. Construction made to photograph the silver mirroring present at the glass negative edges underreflected light.
The mutual distance between the light sources can be adjusted to the plate size. The exact
position of the light sources is found placing a small mirror beside a plate side and adjusting the
position of the tube till, looking through the camera, the image of the tube falls in the area of the
mirror closest to the plate side.
In the case silver mirroring is present at the centre of the plate it is possible either to approach
the tubes or to use a single light source. When silver mirroring is present both at the edges and
at the centre of the plate, two photographs have to be taken to fully document the state of the
glass negative.
The plates have been photographed in transmission only in the cases in which it was necessary
8
to document the relation between silver mirroring and image density.
Most of the photographs were taken with a 35-mm colour reversal film for tungsten light
(Kodak Ektachrome 64T) and making use of filters. They have been subsequently digitised with
a scanner based on an eye-like camera produced by JenOptic in Germany.
1.2 EXAMPLES OF SILVER MIRRORED GLASS NEGATIVES
The possible shapes of silver mirroring degradation on silver gelatin glass plates will be divided
in two main groups based on the location of the stain on the negative: edge patterns and inner
patterns.
Edge patterns include all the cases in which the mirroring stain is distributed at the four edges of
the plate. The features of the stain can vary in width, detailed shape, sharpness and colour but it
can always be identified as a stripe all along the plate edges. Edge patterns are the most usual
silver mirroring patterns.
Inner patterns include all the cases in which the silver mirroring stain is located either at the
centre of the negative or, when present at the edges, has a shape not falling under the definition
of edge patterns. Spots, lines, irregular shapes of silver mirroring are categorised as inner
patterns.
For space reasons only a limited number of examples are presented in the printed version of this
work. These and more examples1 can be found at the web address
www.abmt.unibas.ch/~dipietro.
1.2.1 Edge Patterns
Silver mirroring edge patterns are so common on silver gelatin glass negatives that they are
sometimes used to distinguish this photographic process from other types of glass negatives.
Although there is a large variety in their features, they always seem to bear a relation with the
way historical negatives were normally stored, i.e. in stacks.
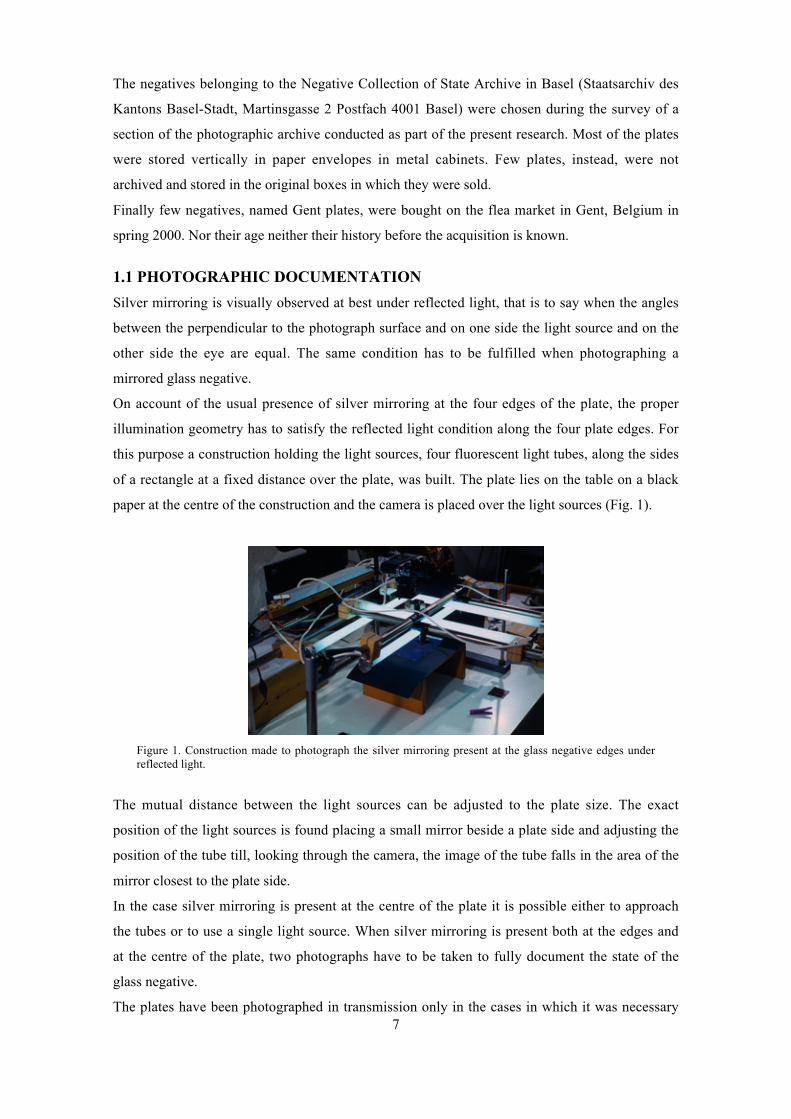
In some cases the mirroring extension is constant all along the four sides but very often it varies
steadily between the centre of the sides and the corners, usually being smaller at the corners
than at the centre of the sides. Among the constant extension cases, examples of both narrow
stain (Fig. 2) and of wide stain partially obscuring the image (Fig. 3) were found. In the most
advanced cases silver mirroring can cover almost the entire plate surface.
1 The digital photographs contained in the web site are protected by copyright. They can not bereproduced without permission of the author.
9
Figure 2. Silver gelatin glass negative. Cuenistudy collection (~1910). The mirroring sheen isnarrow and blunt, just visible at the plate edges.
Figure 3. Silver gelatin glass negative. Cuenistudy collection (~1910). The mirroring stain iswide, partially obscuring the image.
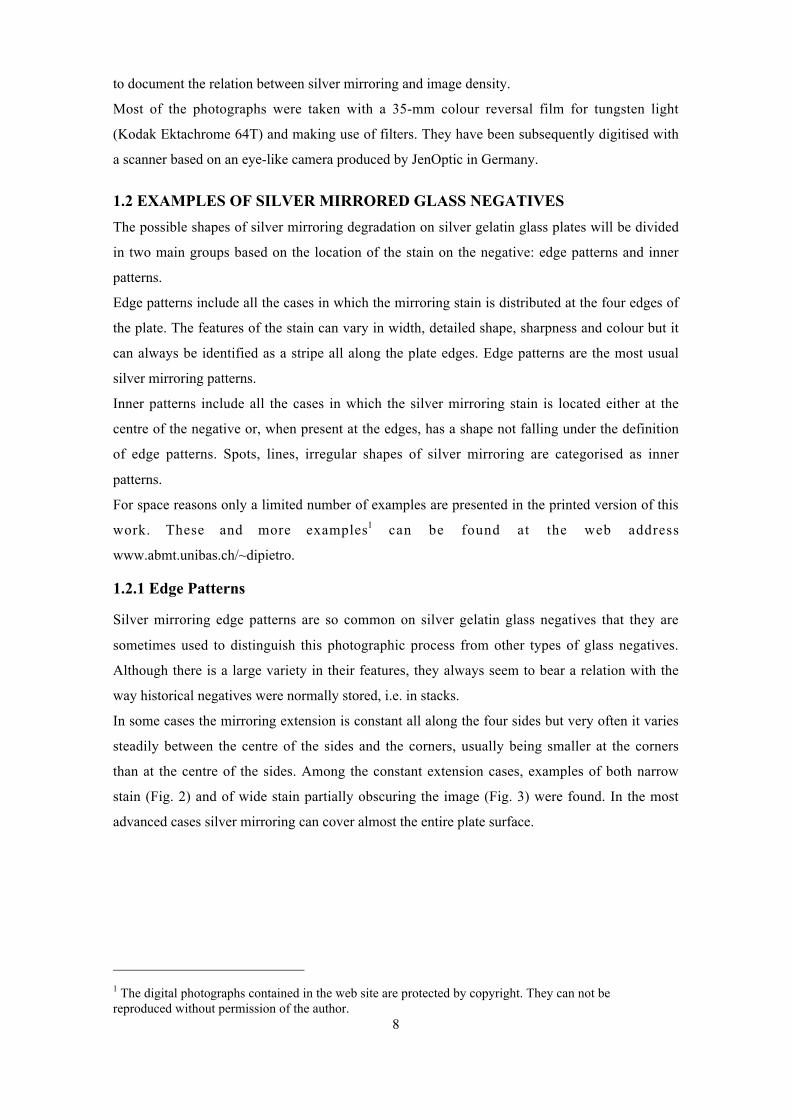
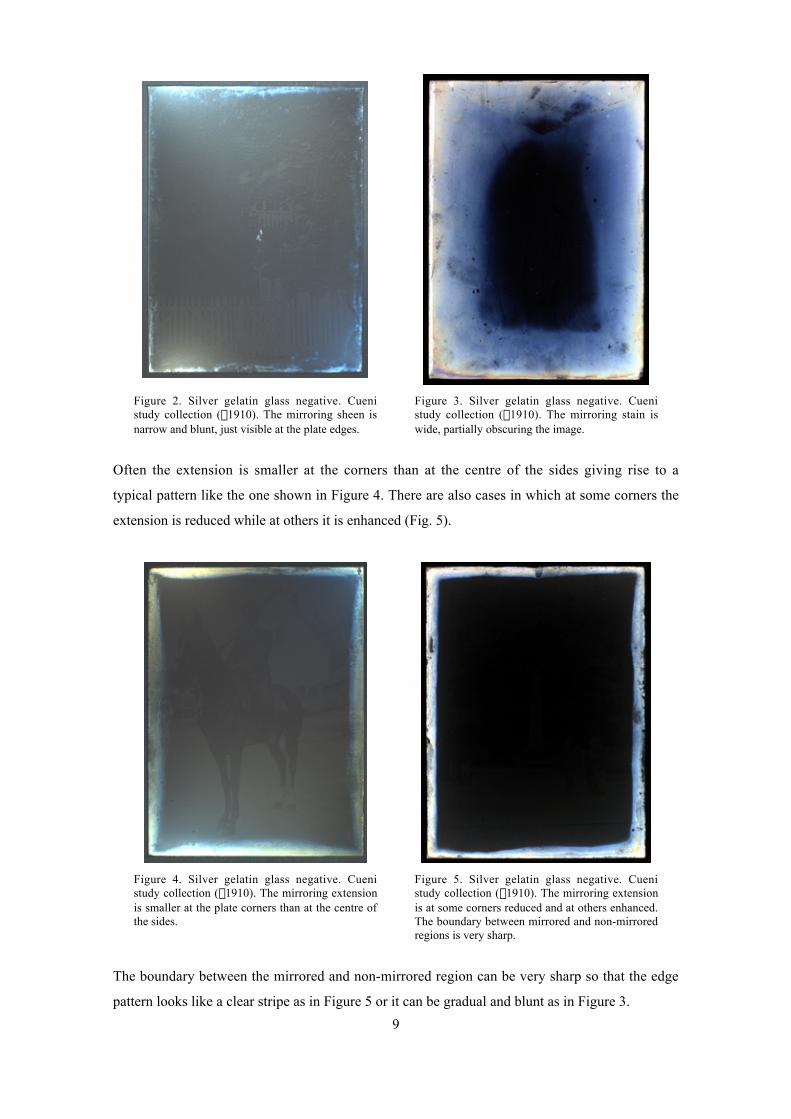
Often the extension is smaller at the corners than at the centre of the sides giving rise to a
typical pattern like the one shown in Figure 4. There are also cases in which at some corners the
extension is reduced while at others it is enhanced (Fig. 5).
Figure 4. Silver gelatin glass negative. Cuenistudy collection (~1910). The mirroring extensionis smaller at the plate corners than at the centre ofthe sides.
Figure 5. Silver gelatin glass negative. Cuenistudy collection (~1910). The mirroring extensionis at some corners reduced and at others enhanced.The boundary between mirrored and non-mirroredregions is very sharp.
The boundary between the mirrored and non-mirrored region can be very sharp so that the edge
pattern looks like a clear stripe as in Figure 5 or it can be gradual and blunt as in Figure 3.
10
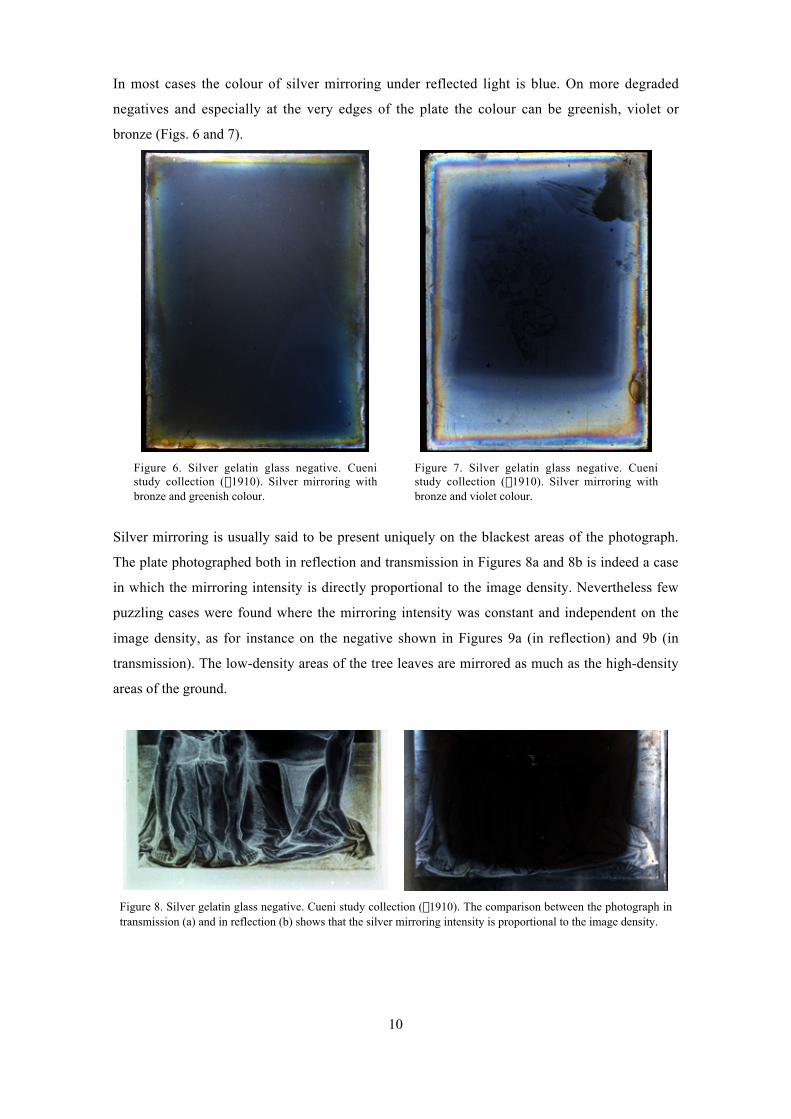
In most cases the colour of silver mirroring under reflected light is blue. On more degraded
negatives and especially at the very edges of the plate the colour can be greenish, violet or
bronze (Figs. 6 and 7).
Figure 6. Silver gelatin glass negative. Cuenistudy collection (~1910). Silver mirroring withbronze and greenish colour.
Figure 7. Silver gelatin glass negative. Cuenistudy collection (~1910). Silver mirroring withbronze and violet colour.
Silver mirroring is usually said to be present uniquely on the blackest areas of the photograph.
The plate photographed both in reflection and transmission in Figures 8a and 8b is indeed a case
in which the mirroring intensity is directly proportional to the image density. Nevertheless few
puzzling cases were found where the mirroring intensity was constant and independent on the
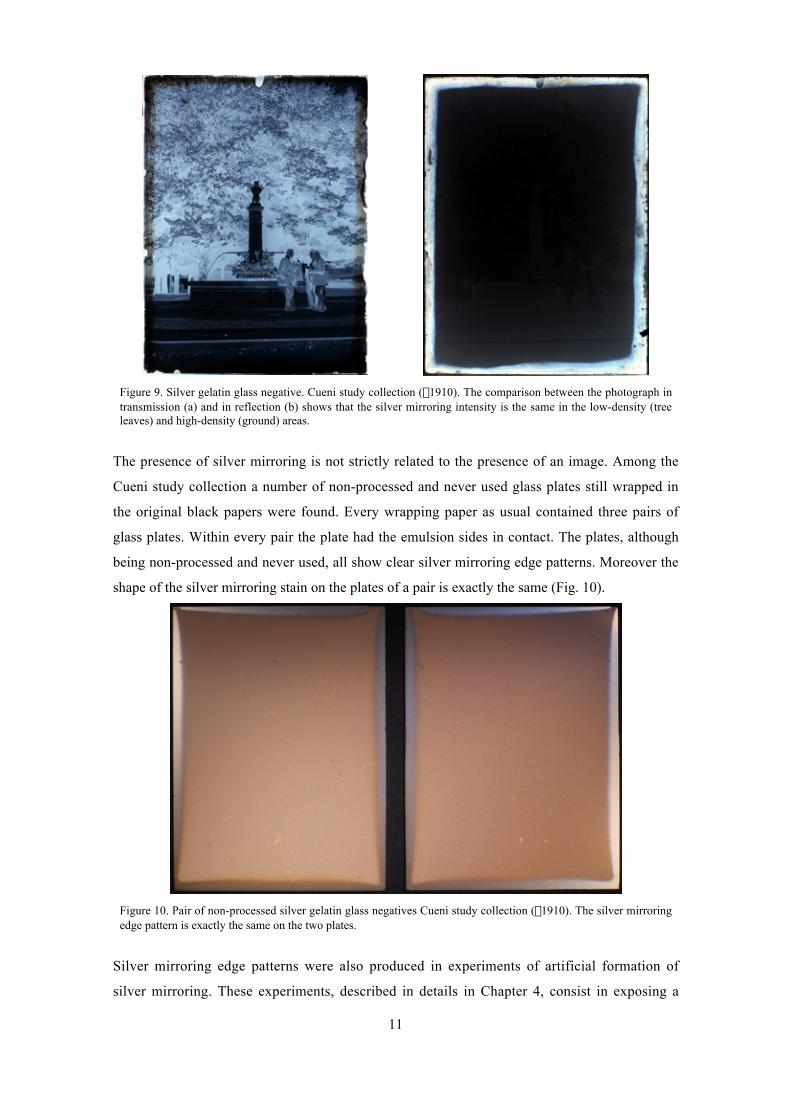
image density, as for instance on the negative shown in Figures 9a (in reflection) and 9b (in
transmission). The low-density areas of the tree leaves are mirrored as much as the high-density
areas of the ground.
Figure 8. Silver gelatin glass negative. Cueni study collection (~1910). The comparison between the photograph intransmission (a) and in reflection (b) shows that the silver mirroring intensity is proportional to the image density.
11
Figure 9. Silver gelatin glass negative. Cueni study collection (~1910). The comparison between the photograph intransmission (a) and in reflection (b) shows that the silver mirroring intensity is the same in the low-density (treeleaves) and high-density (ground) areas.
The presence of silver mirroring is not strictly related to the presence of an image. Among the
Cueni study collection a number of non-processed and never used glass plates still wrapped in
the original black papers were found. Every wrapping paper as usual contained three pairs of
glass plates. Within every pair the plate had the emulsion sides in contact. The plates, although
being non-processed and never used, all show clear silver mirroring edge patterns. Moreover the
shape of the silver mirroring stain on the plates of a pair is exactly the same (Fig. 10).
Figure 10. Pair of non-processed silver gelatin glass negatives Cueni study collection (~1910). The silver mirroringedge pattern is exactly the same on the two plates.
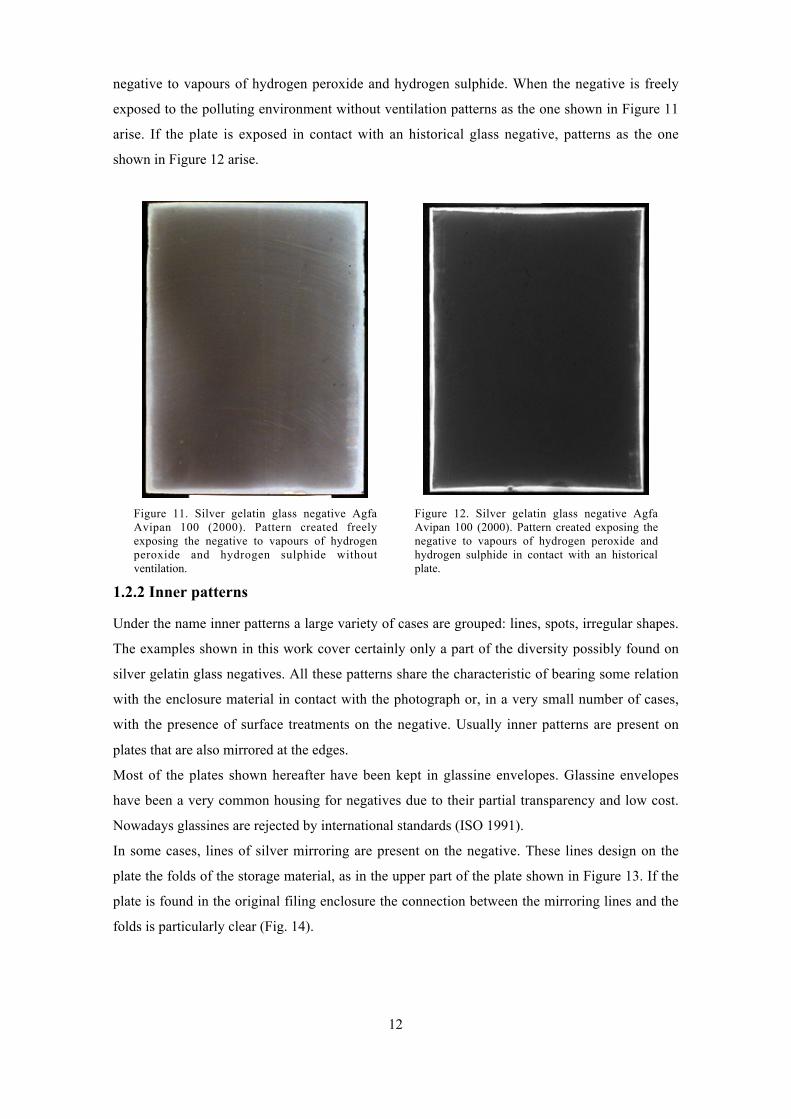
Silver mirroring edge patterns were also produced in experiments of artificial formation of
silver mirroring. These experiments, described in details in Chapter 4, consist in exposing a
12
negative to vapours of hydrogen peroxide and hydrogen sulphide. When the negative is freely
exposed to the polluting environment without ventilation patterns as the one shown in Figure 11
arise. If the plate is exposed in contact with an historical glass negative, patterns as the one
shown in Figure 12 arise.
Figure 11. Silver gelatin glass negative AgfaAvipan 100 (2000). Pattern created freelyexposing the negative to vapours of hydrogenperoxide and hydrogen sulphide withoutventilation.
Figure 12. Silver gelatin glass negative AgfaAvipan 100 (2000). Pattern created exposing thenegative to vapours of hydrogen peroxide andhydrogen sulphide in contact with an historicalplate.
1.2.2 Inner patterns
Under the name inner patterns a large variety of cases are grouped: lines, spots, irregular shapes.
The examples shown in this work cover certainly only a part of the diversity possibly found on
silver gelatin glass negatives. All these patterns share the characteristic of bearing some relation
with the enclosure material in contact with the photograph or, in a very small number of cases,
with the presence of surface treatments on the negative. Usually inner patterns are present on
plates that are also mirrored at the edges.
Most of the plates shown hereafter have been kept in glassine envelopes. Glassine envelopes
have been a very common housing for negatives due to their partial transparency and low cost.
Nowadays glassines are rejected by international standards (ISO 1991).
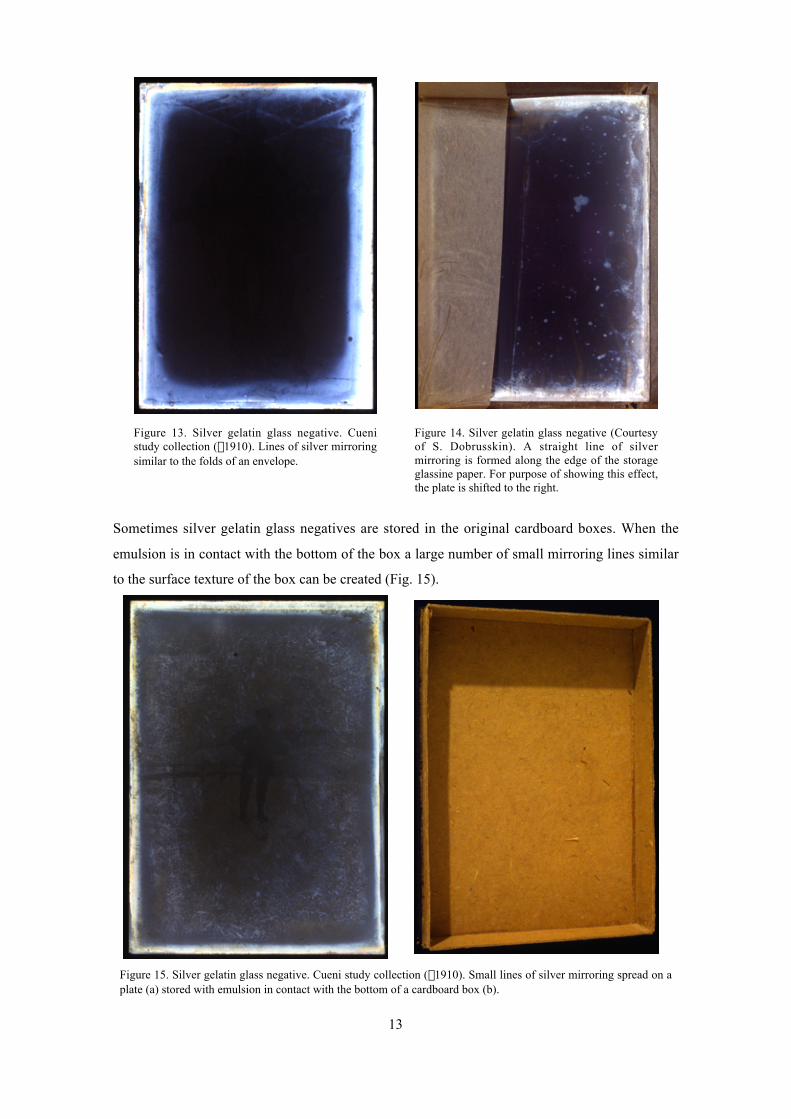
In some cases, lines of silver mirroring are present on the negative. These lines design on the
plate the folds of the storage material, as in the upper part of the plate shown in Figure 13. If the
plate is found in the original filing enclosure the connection between the mirroring lines and the
folds is particularly clear (Fig. 14).
13
Figure 13. Silver gelatin glass negative. Cuenistudy collection (~1910). Lines of silver mirroringsimilar to the folds of an envelope.
Figure 14. Silver gelatin glass negative (Courtesyof S. Dobrusskin). A straight line of silvermirroring is formed along the edge of the storageglassine paper. For purpose of showing this effect,the plate is shifted to the right.
Sometimes silver gelatin glass negatives are stored in the original cardboard boxes. When the
emulsion is in contact with the bottom of the box a large number of small mirroring lines similar
to the surface texture of the box can be created (Fig. 15).
Figure 15. Silver gelatin glass negative. Cueni study collection (~1910). Small lines of silver mirroring spread on aplate (a) stored with emulsion in contact with the bottom of a cardboard box (b).
14
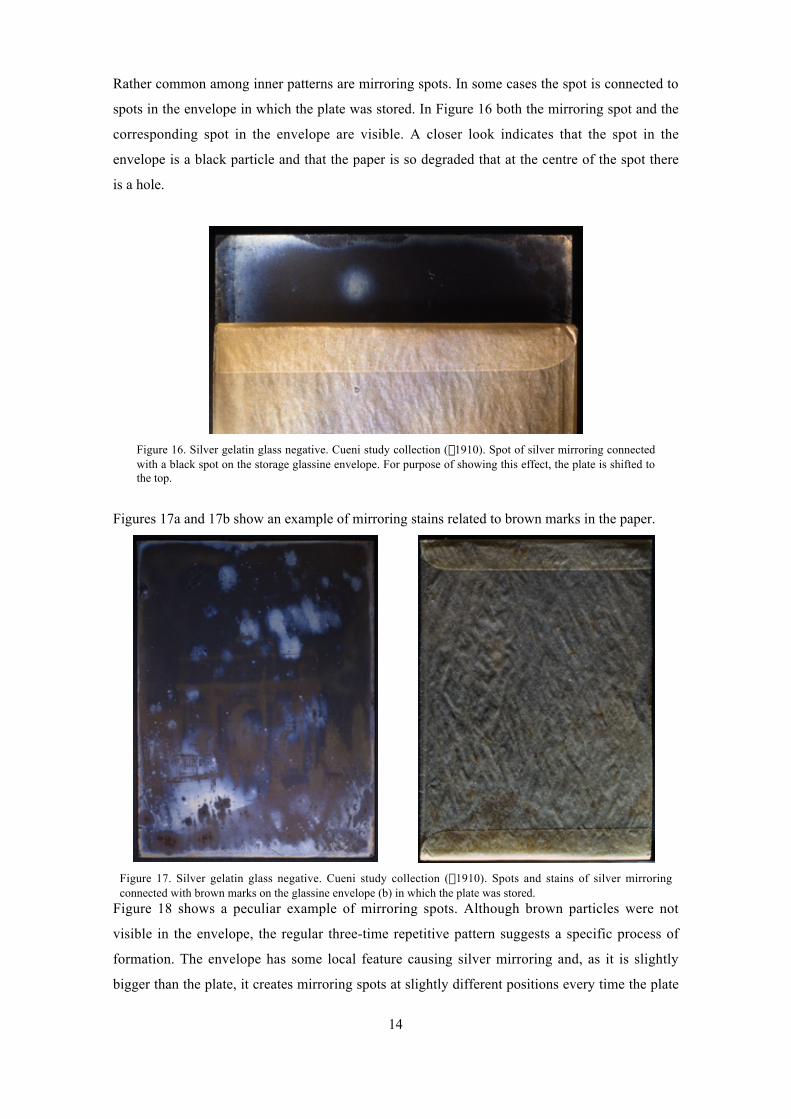
Rather common among inner patterns are mirroring spots. In some cases the spot is connected to
spots in the envelope in which the plate was stored. In Figure 16 both the mirroring spot and the
corresponding spot in the envelope are visible. A closer look indicates that the spot in the
envelope is a black particle and that the paper is so degraded that at the centre of the spot there
is a hole.
Figure 16. Silver gelatin glass negative. Cueni study collection (~1910). Spot of silver mirroring connectedwith a black spot on the storage glassine envelope. For purpose of showing this effect, the plate is shifted tothe top.
Figures 17a and 17b show an example of mirroring stains related to brown marks in the paper.
Figure 17. Silver gelatin glass negative. Cueni study collection (~1910). Spots and stains of silver mirroringconnected with brown marks on the glassine envelope (b) in which the plate was stored.
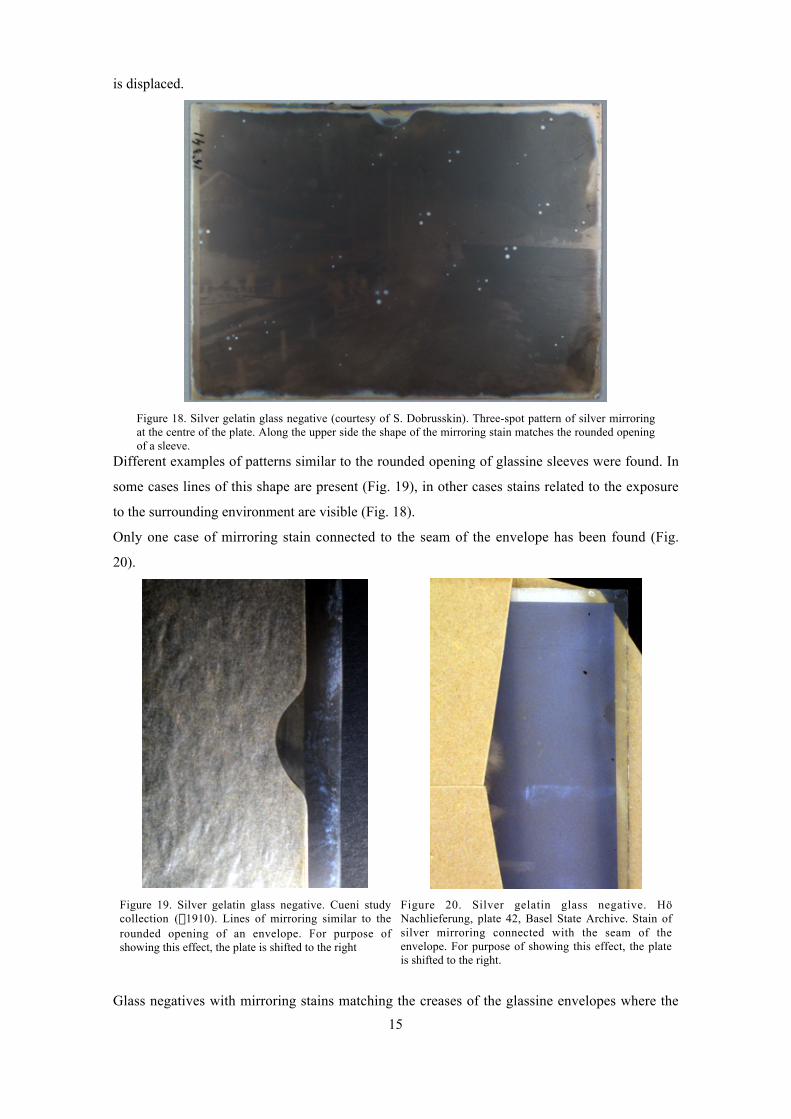
Figure 18 shows a peculiar example of mirroring spots. Although brown particles were not
visible in the envelope, the regular three-time repetitive pattern suggests a specific process of
formation. The envelope has some local feature causing silver mirroring and, as it is slightly
bigger than the plate, it creates mirroring spots at slightly different positions every time the plate
15
is displaced.
Figure 18. Silver gelatin glass negative (courtesy of S. Dobrusskin). Three-spot pattern of silver mirroringat the centre of the plate. Along the upper side the shape of the mirroring stain matches the rounded openingof a sleeve.
Different examples of patterns similar to the rounded opening of glassine sleeves were found. In
some cases lines of this shape are present (Fig. 19), in other cases stains related to the exposure
to the surrounding environment are visible (Fig. 18).
Only one case of mirroring stain connected to the seam of the envelope has been found (Fig.
20).
Figure 19. Silver gelatin glass negative. Cueni studycollection (~1910). Lines of mirroring similar to therounded opening of an envelope. For purpose ofshowing this effect, the plate is shifted to the right
Figure 20. Silver gelatin glass negative. HöNachlieferung, plate 42, Basel State Archive. Stain ofsilver mirroring connected with the seam of theenvelope. For purpose of showing this effect, the plateis shifted to the right.
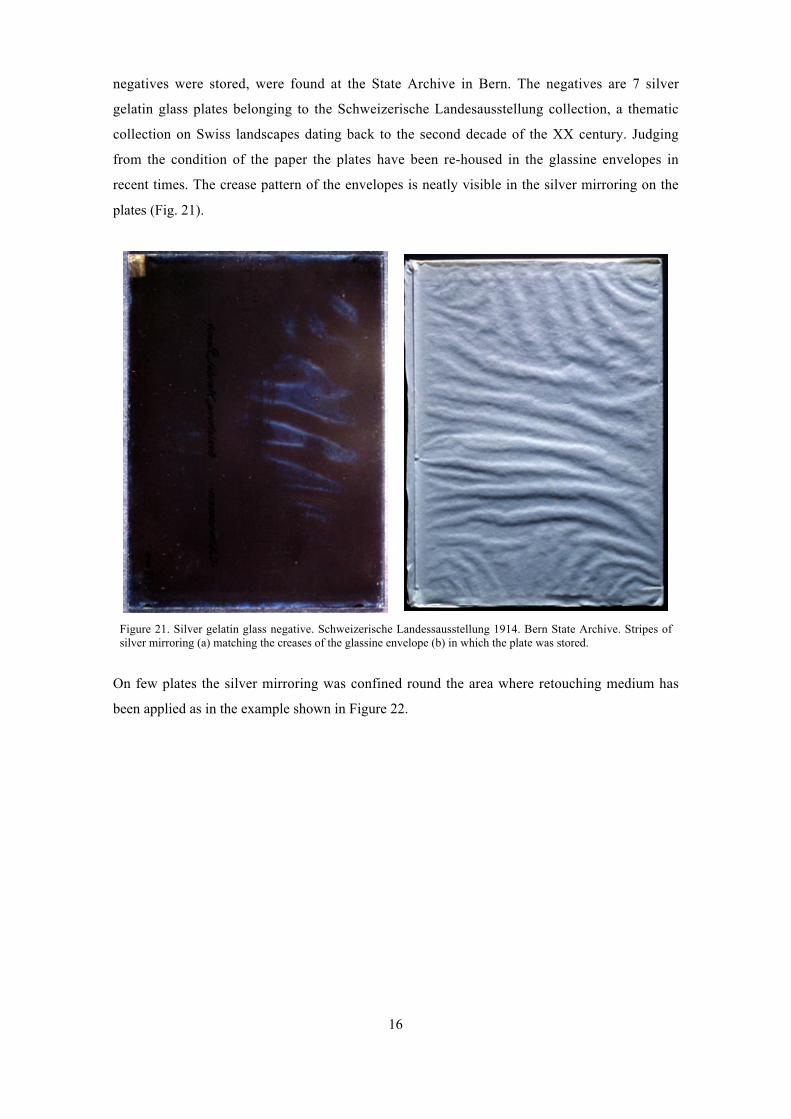
Glass negatives with mirroring stains matching the creases of the glassine envelopes where the
16
negatives were stored, were found at the State Archive in Bern. The negatives are 7 silver
gelatin glass plates belonging to the Schweizerische Landesausstellung collection, a thematic
collection on Swiss landscapes dating back to the second decade of the XX century. Judging
from the condition of the paper the plates have been re-housed in the glassine envelopes in
recent times. The crease pattern of the envelopes is neatly visible in the silver mirroring on the
plates (Fig. 21).
Figure 21. Silver gelatin glass negative. Schweizerische Landessausstellung 1914. Bern State Archive. Stripes ofsilver mirroring (a) matching the creases of the glassine envelope (b) in which the plate was stored.
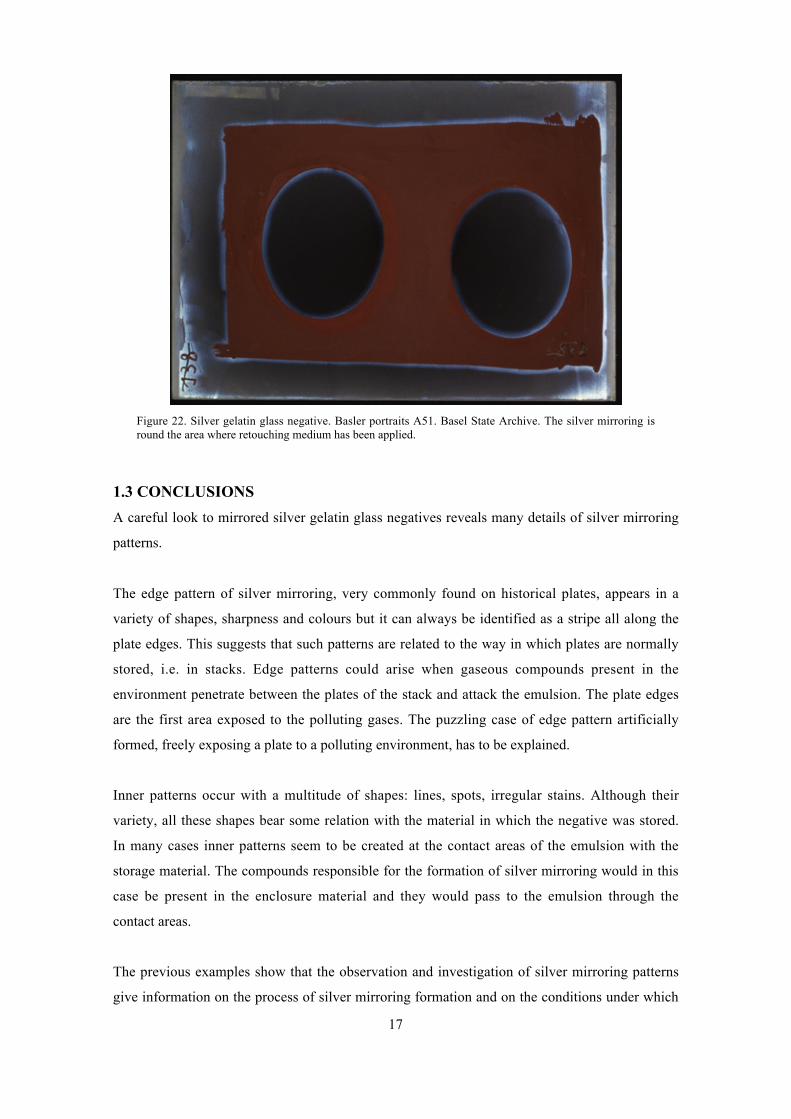
On few plates the silver mirroring was confined round the area where retouching medium has
been applied as in the example shown in Figure 22.
17
Figure 22. Silver gelatin glass negative. Basler portraits A51. Basel State Archive. The silver mirroring isround the area where retouching medium has been applied.
1.3 CONCLUSIONS
A careful look to mirrored silver gelatin glass negatives reveals many details of silver mirroring
patterns.
The edge pattern of silver mirroring, very commonly found on historical plates, appears in a
variety of shapes, sharpness and colours but it can always be identified as a stripe all along the
plate edges. This suggests that such patterns are related to the way in which plates are normally
stored, i.e. in stacks. Edge patterns could arise when gaseous compounds present in the
environment penetrate between the plates of the stack and attack the emulsion. The plate edges
are the first area exposed to the polluting gases. The puzzling case of edge pattern artificially
formed, freely exposing a plate to a polluting environment, has to be explained.
Inner patterns occur with a multitude of shapes: lines, spots, irregular stains. Although their
variety, all these shapes bear some relation with the material in which the negative was stored.
In many cases inner patterns seem to be created at the contact areas of the emulsion with the
storage material. The compounds responsible for the formation of silver mirroring would in this
case be present in the enclosure material and they would pass to the emulsion through the
contact areas.
The previous examples show that the observation and investigation of silver mirroring patterns
give information on the process of silver mirroring formation and on the conditions under which

18
the degradation has taken place. Indeed patterns do not arise by coincidence but are the result of
simple physical processes. The knowledge of these processes is the necessary basis to decide
rationally on the conditions and on the materials best suited to prevent or mitigate silver
mirroring degradation.
19
2.0 THE STATE OF THE ART ON THE MODELS FOR SILVERMIRRORING FORMATION
The majority of the papers on silver mirroring found during the literature search2 performed as
part of the present work is on the chemical nature of silver mirroring, on its mechanism of
formation and on the methods to avoid or remove it. In particular, in the second half of the XX
century, a chemical model, called in this work oxidation-migration-re-aggregation model and
sometimes known as the Hendriks’ model, was developed. This is, in its basic structure, the
present established model for the local formation of silver mirroring.
On the contrary, although the peculiar mirroring patterns attracted the attention of the
photographers since the early times of silver gelatin photography, detailed models for their
formation were never developed.
The first account of silver mirroring on silver gelatin glass negatives is from 1882 (British
Journal of Photography 1982). The author reports that a “peculiar iridescent fringe” is present
“round the margin of the plate” and it is due to a sort of “sulphurisation“. He raises the question
on the mirroring pattern: “why does it affect the edges of the plate only? Or why, rather, does it
always start from the edges?” and he concludes that “the action does not come from contact of
the film with the platebox”.
Later the presence of silver mirroring on uranium toned prints and intensified negatives was
reported (British Journal of Photography 1901). Silver mirroring, called a “metallic sheen” or an
“iridescent stain”, appears in the darkest portions of the photograph in only few weeks time
from the processing date. It is recognised to be a very thin surface film. Two pathways for its
formation are proposed: either it is due to atmospheric hydrogen sulphide (“sulphuretted
hydrogen”) or to the action of the paper under humid conditions. It can be avoided
“collodionising” or waxing the prints.
The ideas on the nature and on the mechanism of formation of silver mirroring do not change
considerably till the 1922. The terms used for silver mirroring show some variations: “a bronzed
or semi-metallic deposit” (British Journal of Photography 1918), “a bloom” (British Journal of
Photography 1920). The mechanism of formation is defined a “slow sulphiding” and therefore
its chemical nature is implicitly stated to be silver sulphide (British Journal of Photography
1918). The use of abrasive paste or of a simple rubber is proposed as removing methods (British
Journal of Photography 1920).
In a paper of the 1922 (British Journal of Photography 1922) a second compound is recognised
2 I would like to acknowledge my debt to Ulla Bøgvad Nielsen Kejser for providing essential material forthis literature review.
20
to play an important role in the formation of silver mirroring, i.e. silver salts left in the emulsion
by incomplete fixing. Silver mirroring would result from the reaction between sulphur
containing compounds and these residual silver salts.
The importance of incomplete fixing is the core idea of the well-known papers published by
Shaw in 1931 (Shaw 1931a, Shaw 1931b), where silver mirroring is called “tarnishing”, in
accordance with the term used for the degradation of silver plates and of daguerreotypes. In
these papers the role played by hydrogen sulphide is denied. Silver mirroring would result from
a not specified attack of the image by the products of decomposition of the “silver-sodium-
halide-thiosulphate complexes”, decomposition triggered by atmospheric CO2.
The research on the nature and on the mechanism of formation of silver mirroring had new
improvements in the 1960s due to the observation that silver mirroring was often associated to
what was felt as a great danger for our heritage, i.e. the appearance of red spots on microfilms
(Henn and Wiest 1963, McCamy and Pope 1965, McCamy et al. 1969).
In 1963 Henn and Wiest proposed a model called in the present work the oxidation-migration-
re-aggregation model. First the image silver particles are oxidised and the resulting silver ions
migrate in the gelatin, then the silver ions are reduced to silver and either they re-aggregate
within the gelatin forming small particles appearing as red spots, or they re-aggregate at the
emulsion top surface forming silver mirroring (Henn and Wiest 1963). The main difference with
the previous ideas is that the silver ions are not believed to be due to careless processing but to
the reaction with external agents like oxidising gases. Peroxides or atmospheric oxygen in
combination with hydrogen sulphide, ammonia and sulphur dioxide were considered to be both
oxidant and reducing compounds. Henn and Wiest showed that the red spots could be
artificially created exposing the microfilms to vapours of hydrogen peroxide. They investigated
making use of Electron Microprobe X-ray analysis the composition of mirrored areas,
concluding that they contained “appreciable but highly variable quantities of silver sulphide”.
The three steps of oxidation, migration and re-aggregation are the basic framework for almost
all the researches on silver mirroring formation published afterwards.
In 1981 Feldman, in a work on discoloration of photographic prints, proposed some changes to
the oxidation-migration-re-aggregation model as expressed by Henn and Wiest. The silver ions
results of the reaction with peroxides could either be reduced to metallic silver by light or they
could react with hydrogen sulphide to give silver sulphide (Feldman 1981). He published the
first transmission electron micrographs of mirrored photographs showing that silver mirroring
consists of a layer of colloidal particles clustered at the emulsion top surface.
A researcher very active in this field was Klaus B. Hendriks of the Public Archives of Canada.
He supported the oxidation-migration-re-aggregation model with transmission electron
micrographs (Hendriks 1989, Hendriks 1991a, Hendriks 1991b). First of all he showed that the
image silver grains in oxidised silver gelatin emulsions are often surrounded by clouds of
21
smaller particles. This confirmed the theory of Torigoe and co-workers asserting that the
consequence of image oxidation is the formation of smaller colloidal particles causing yellow
discoloration to the photograph (Torigoe et al. 1984).
Second, he confirmed the results of Feldman showing that mirrored areas are characterised by
colloidal particles at the emulsion top surface. Hendriks believed that these particles are a proof
of an upward migration of the silver ions. He added that the presence of transfer images in the
baryta layer of deteriorated silver gelatin prints, already noticed by Weyde in the 1950s (Weyde
1955), is a proof of a downward migration of the silver ions3. He thought the silver mirroring
particles to be made of a very thin layer of elementary silver, centred on a silver sulphide
nucleus (Hendriks 1984). He indicated as compounds responsible for silver mirroring:
a) compounds present either in the image layer or in the support as a result of careless
processing;
b) atmospheric gases such as sulphur dioxide, hydrogen sulphide, oxides of nitrogen, peroxides
and ozone;
c) compounds present in the filing enclosures in contact with the photograph.
The images published by Hendriks provide strong evidence that the first step to image
deterioration is the oxidation of the image grains. The image grains lose their integrity and
smaller particles are formed within the emulsion or at the emulsion surface. Nevertheless
Hendriks did not explain why the ions or the colloidal particles would migrate towards the
emulsion surface. Neither he explained why in some cases small particles are formed within the
emulsion, resulting in macroscopic yellowing discoloration, and in other cases the particles are
formed at the emulsion top surface, resulting in silver mirroring.
An attempt to answer these crucial questions and the question of the chemical nature of silver
mirroring was made by Nielsen and Lavedrine (Nielsen and Lavedrine 1993, Nielsen 1993).
They published transmission electron micrographs of historically and artificially mirrored
photographs showing that surface particles were present only in the mirrored regions and that
smaller particles are found underneath the top layer of closely packed mirroring particles. The
concentration and the size of the smaller particles decrease as the distance from the surface
increases. This particle distribution is considered the proof for a migration of silver salts
towards the surface although no driving force for such a migration is given. The close fitting
mosaic of the uppermost particles is indicated as a proof of their gradual growth from smaller
3 “Transfer images” (also called “ghost images”) are silver based images formed spontaneously, duringprocessing, on the baryta layer of prints processed with developing solutions contaminated with fixingsolutions. They were reported the first time by Weyde (1955). They are formed in wet emulsions whenthe fixer dissolves the not-exposed silver halide grains and the resulting silver ions are reduced back tosilver by the developer. The reduction of the silver ions by the developer is normally not possible insolution but it can take place when the ions are attached to particles present in the baryta layer. Thismechanism is at the base of diffusion transfer photographic processes, as in Polaroid photographs.Differences with the mechanism of formation of silver mirroring will be outlined in paragraph 3.3.4 andnote 10 of chapter 3 of the present work.
22
nuclei. They did not define the chemical composition of silver mirroring because only
qualitative SEM-EDX (Scanning Electron Microscope-Energy Dispersive X-rays) analysis was
performed. The analysis detected the presence of both silver and sulphur.
Finally, it is important to discuss a paper of the 1988 which proposes a theory of silver
mirroring formation drastically different from the ideas developed in the XX century.
The theory presented by Barger and Hill (1988) is based on the fact that both surface roughness
measurements and scanning electron micrographs showed that the mirrored areas have a higher
surface roughness in comparison with non-mirrored areas. Moreover their SEM-EDX analysis
detected in the mirrored areas uniquely the presence of silver. These results, combined with the
relevant difference between the reflectance spectrum of mirrored emulsions and of silver
sulphide or of silver films, prompted them to propose a non-chemical mechanism of silver
mirroring formation. The bluish appearance of mirrored photographs would result from a
shrinking of the gelatin around the image particles. Such a rough surface would scatter the light
differently and therefore would acquire a bluish tone.
As far as the patterns of silver mirroring are concerned only scattered observations have been
found in the literature. Most of the observations simply describe the presence of silver mirroring
at the photograph’s edges. It is interesting to quote a short correspondence of the 1926 (Wood
1926) reporting the presence of silver mirroring “round the patches where retouching medium
has been applied”. This phenomenon is the same as the one found on the negative belonging to
Basel State Archive shown in Figure 22 of Chapter 1. Moreover, a contribution on the
permanency of silver gelatin glass plates from the 1933 (Kieser 1933) reports the presence of
silver mirroring stains (“Schleier”) all around the plate edges on non-processed and never used
silver gelatin negatives, as in the negatives belonging to the Cueni Collection shown in Figure
10 of Chapter 1. These examples show that the patterns found in the surveys performed in this
work are not isolated cases, but examples of general phenomena taking place in the first years or
months of the negative life.
The investigation of the active methods to remove silver mirroring is outside the scope of this
work. A recent and valid research that also reviews a large part of the methods available is the
work of Luzeckyi and Brückle (1999).
2.1 OPEN QUESTIONS ON SILVER MIRRORING
The established model for silver mirroring formation among the community of photographic
conservators is the oxidation-migration-re-aggregation model, sometimes referred as Hendriks’
model. The work of Nielsen and Lavedrine has clearly demonstrated that particles are present at
the emulsion top surface only in the visually mirrored areas. This is in contradiction with the
23
gelatine shrinking model of Burger and Hill.
Nevertheless the oxidation-migration-re-aggregation model leaves two main questions to be
answered:
- Which is the chemical composition of silver mirroring and therefore which are the responsible
compounds apart from oxidant compounds?
- Which is the driving force for the formation and /or aggregation of particles at the emulsion
surface and therefore why in certain cases there is the formation of silver mirroring and in others
yellowing discoloration?
A detailed description of the chemical reactions involved and of the driving forces governing
the displacement of the silver ions within the emulsion can fill the gaps of the oxidation-
migration-re-aggregation model, providing the answers to these questions. In the next chapter
new experiments attempting to reach these aims are presented.
The oxidation-migration-re-aggregation model is a local microscopic description of the
formation of silver mirroring. It does not explain the macroscopic formation of the peculiar
silver mirroring patterns. The reasons for the formation of the silver mirroring patterns are the
subject discussed in Chapters 4 and 5 of the present work.
24
3.0 LOCAL PHYSICAL-CHEMICAL MODEL OF SILVERMIRRORING FORMATION: IMPROVEMENTS TO THEOXIDATION-MIGRATION-RE-AGGREGATION MODEL
The oxidation-migration-re-aggregation model does not explain the questions about the
chemical composition of the silver mirroring particles and about the driving force governing the
formation and/or aggregation of particles at the emulsion surface.
These questions are investigated with two sets of experiments.
The first set of experiments consists in spectroscopic investigations of the chemical composition
of the silver mirroring layer. The aim is to determine if the silver mirroring particles are made of
silver or of silver sulphide (Ag2S). In the first case the compounds responsible for silver
mirroring, apart from oxidant compounds, have to be searched among silver reducing
substances (e.g. aldeheydes) while in the second case among sulphur containing substances (e.g.
hydrogen sulphide H2S).
The second set of experiments consists in the investigation of the distribution of the particles’
size and shape within the silver mirroring layer. As shown by Nielsen and Lavedrine (1993)
silver mirroring is formed by a layer of closely packed colloidal particles of dimensions of the
order of hundred nanometres located at the emulsion top surface, underneath which a large
number of smaller particles of dimensions of the order of ten nanometres is found. It is possible
to conceive two pathways for the formation of these particle layers.
The first hypothesis is that small colloidal particles are formed in the emulsion following the
oxidation-reduction mechanism suggested by Torigoe and co-workers (1984), the same
mechanism that governs the yellowing of photographs. A driving force leads the particles to
migrate towards the upper emulsion surface. As the particles can not escape from the emulsion,
their density increases the closer they are to the surface. When they are sufficiently close they
cluster together, giving rise to bigger, ellipsoidal particles. At the very surface of the emulsion
the particle density is at maximum and the particles are almost all clustered.
This scenario predicts that the shape of the particles underneath the main silver mirroring layer
is spherical at great distances from the surface and ellipsoidal the closer the particles are to the
surface. Moreover, to be consistent with the mechanism proposed, it has to be demonstrated that
colloidal particles of dimensions of the order of ten nanometres can move in the gelatin in the
times of formation of silver mirroring (order of months or years) and the force driving this
movement has to be found.
The second hypothesis is that small colloidal particles are formed directly in the upper portion
of the emulsion according to the following mechanism. As a result of the oxidation of the image
grains, silver ions are produced and they diffuse away in all directions driven by the difference
in their concentration between the areas closest to the grains and the areas more removed. When
25
a second compound from the external environment diffuses into the emulsion and reacts with
the silver ions, particles are formed at the emulsion upper surface because this is the first region
where the reactants meet. These particles grow because of further reaction between the silver
ions and the second compound on their surface.
This scenario predicts that the final shape of the particles is spherical because the reaction
among the ions has not a preferential direction. The particles formed at the very surface of the
emulsion are predicted to be relevantly bigger because they are directly exposed to the second
reactant. For consistency reasons it has to be demonstrated that silver ions can actually diffuse
in the gelatin in the times of formation of silver mirroring.
The analysis of the size and shape of the particles underneath the main silver mirroring layer,
combined with calculations on the diffusion of colloidal particles and ions in the gelatin, allows
therefore discerning between the two proposed mechanism of silver mirroring formation.
Based on the results of these two sets of experiments some modifications to the oxidation-
migration-re-aggregation model will be proposed.
3.1 EXPERIMENTAL PART
3.1.1 Chemical composition of silver mirroring
The spectroscopic methods suited to determine the chemical composition of silver mirroring
have to fulfil two requisites.
The first requisite is that they have to distinguish between compounds present in the mirroring
layer, of thickness of the order of hundred nanometres, and compounds present in the emulsion
bulk, of thickness of the order of fifty microns.
The second requisite is that they have to be able to detect silver sulphide. The simple detection
of sulphur is not sufficient to draw conclusions. Indeed, sulphur compounds can arise from the
protein cystine, one of the constituent proteins of the gelatin, and from the not complete removal
of sodium thiosulphate (Na2S2O3), the usual fixing agent. In order to arrive at a conclusion it is
fundamental either to determine the amount of sulphur and silver in the mirroring layer (if the
particles are made of silver sulphide their amount has to be in the ratio 2:1) or to detect the
presence of silver sulphide directly (e.g. detection of silver sulphide crystal structures).
Spectroscopic analyses are based on the detection of the radiation emitted by a sample excited
by an incoming beam. The emitted radiation is characteristic of the elements and in some cases
of the compounds present in the sample.
In spectroscopic equipments samples of mirrored emulsions can be analysed using one of the
following arrangements:
1) emulsion layer perpendicular to the incoming radiation (flat samples),
2) emulsion layer parallel to the incoming radiation (cross-section samples),
3) powder of emulsion scratched off from the mirroring layer (powder samples).
26
The fulfilment of the first requisite depends on both the properties of the incoming radiation
beam and on the arrangement used.
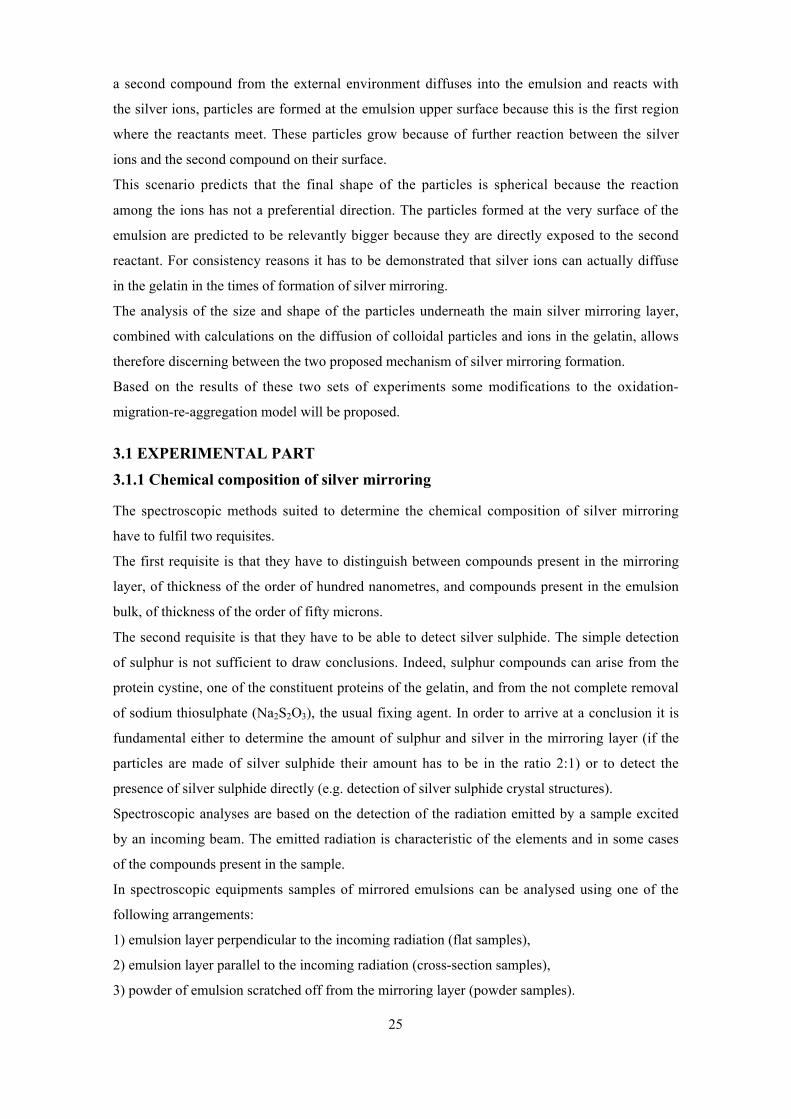
Flat and cross-section sample analyses give reliable results when the penetration depth and area
of the incoming beam are smaller than the silver mirroring thickness respectively (Fig. 1).
Powder sample analyses are in any case reliable but require highly sensitive spectroscopic
techniques due to the small amount of sample analysed.
Figure 1. a) Flat samples: the emulsion layer is perpendicular to the incoming radiation. b) Cross-sectionsamples: the emulsion layer is parallel to the incoming radiation.
It is therefore necessary to preliminary evaluate the penetration depth of the radiation used by
the X-rays techniques available to the author, X-rays and electrons, into photographic
emulsions.
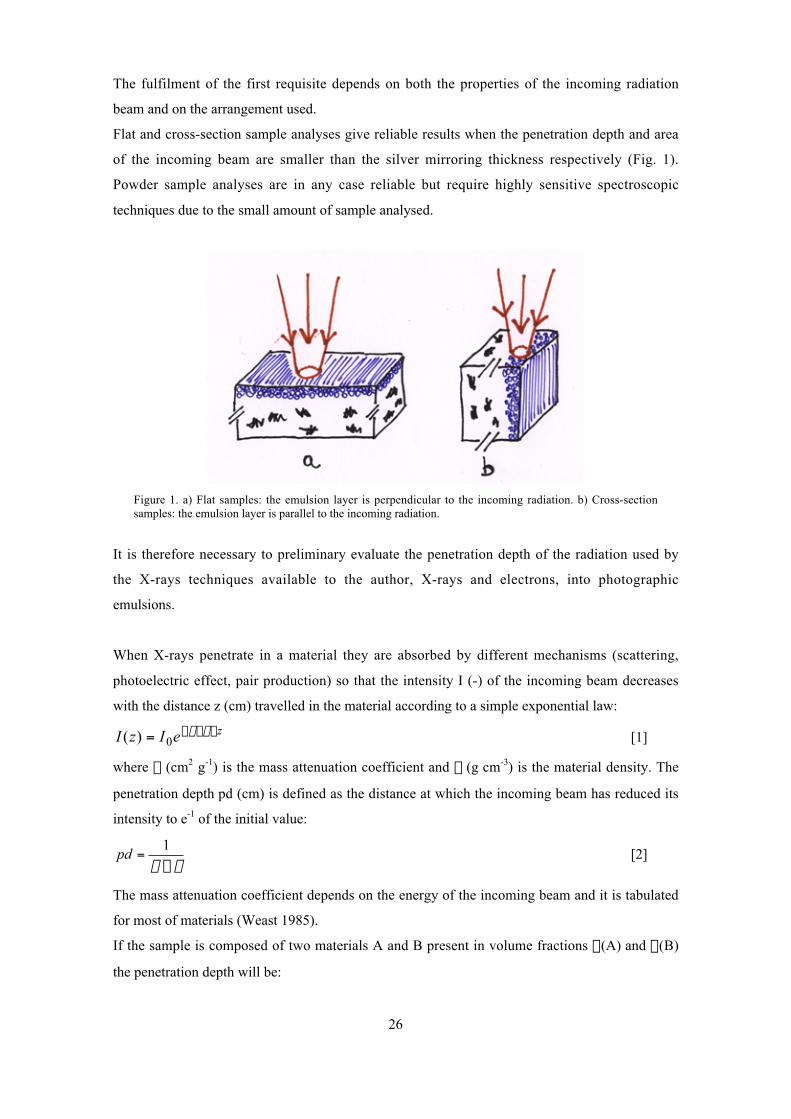
When X-rays penetrate in a material they are absorbed by different mechanisms (scattering,
photoelectric effect, pair production) so that the intensity I (-) of the incoming beam decreases
with the distance z (cm) travelled in the material according to a simple exponential law:
zeIzI ¥¥-= rm0)( [1]
where m (cm2 g-1) is the mass attenuation coefficient and r (g cm-3) is the material density. The
penetration depth pd (cm) is defined as the distance at which the incoming beam has reduced its
intensity to e-1 of the initial value:
pd =¥
1
m r[2]
The mass attenuation coefficient depends on the energy of the incoming beam and it is tabulated
for most of materials (Weast 1985).
If the sample is composed of two materials A and B present in volume fractions j(A) and j(B)
the penetration depth will be:
27
pdA A A B B B
=¥ ¥ + ¥ ¥
1
m r j m r j( ) ( ) ( ) ( ) ( ) ( )[3]
Assuming that an emulsion is made of the 10% (by volume) of silver (m(Ag)=218 cm2 g-1 ,
r(Ag)= 10.5 g cm-3) and of the 90% of gelatin (m(gel)=9.8 cm2 g-1 as for water, r(gel)= 1.29 g
cm-3) the penetration depth calculated for an incoming X-ray beam of 8.041 keV (energy of the
most common X-ray source in X-Ray Diffraction (XRD) instruments) will result of the order of
1 mm. The penetration depth in a mirrored emulsion will be smaller because the emulsion is
covered by a layer of particles. Nevertheless even the penetration depth in pure silver is of the
order of 4 microns, about 20 times bigger than the thickness of silver mirroring. Therefore the
flat sample arrangement is not suited for XRD experiments.
On the other hand X-rays are seldom focused into beams with diameter smaller than few
microns; also the cross-section arrangement is not suited.
When electrons penetrate in a material they loose their energy with different processes
dependent on their energy value.
If their kinetic energies are in the range of keV (kilo electronvolts) the main mechanism is
ionisation or excitation of the atoms present in the material. The amount of energy loss per unit
travelled path is proportional to the electrons density in the material so that materials made of
heavy elements will stop electrons much faster than light elements materials. The electrons
penetration depth is estimated calculating the path travelled by the electrons before they stop.
This is called the CSDA (Continuous Slowing Down Approximation) range and it is tabulated
for most materials4.
For starting electron energies of 20 keV, typical energy of the incoming electrons in a Scanning
Electron Microscope (SEM) X-ray microanalysis apparatus, the penetration depth is about 6 mm
in photographic gelatin and 1.5 mm in silver, in both cases bigger than the thickness of the silver
mirroring layer. Therefore the flat sample arrangement is not suited for SEM experiments.
If the electron kinetic energy is of the order of a few hundreds of electronvolts, the CSDA range
is not valid. Few hundreds of electronvolts is the typical energy of the electrons emitted in X-
rays photoelectron spectroscopy (XPS) equipments. This energy is so small that uniquely the
electrons emitted from atoms distant at maximum 10 nanometres from the sample surface can
escape and be detected (Grunthaner 1987). Therefore the flat sample arrangement can give
reliable results in XPS experiments.
4 The values of the electron rate energy loss and of the CSDA range in different materials and fordifferent starting energies can also be found on a shareware database on the web at the addresshttp://physics.nist.gov/PhysRefData/Star/Text/contents.html.
28
In conclusion the methods fulfilling the first requisite are XRD on powder samples and XPS on
flat samples. Both methods satisfy also the second requisite because XRD detects crystalline
compounds (and therefore directly the presence of silver sulphide) while XPS provides
quantitative results of the sample atomic composition. The results achieved with Scanning
Electron Microscopy (SEM) X-ray Microanalysis and with X-Ray Diffraction on flat samples,
methods often used in the literature to examine silver mirroring, will be shown for comparison.
The combination of these X-rays analyses has been used to determine the chemical composition
of the edge silver mirroring present on four glass negatives belonging to the Cueni study
collection. Three out of the four plates examined (numbers 1, 2, and 4) were processed
negatives while the number 3 was a historical non-processed glass negative. Small, approximate
squared, samples were cut out from the plates with a diamond knife, cutting from the glass side.
Every sample underwent only one type of analysis.
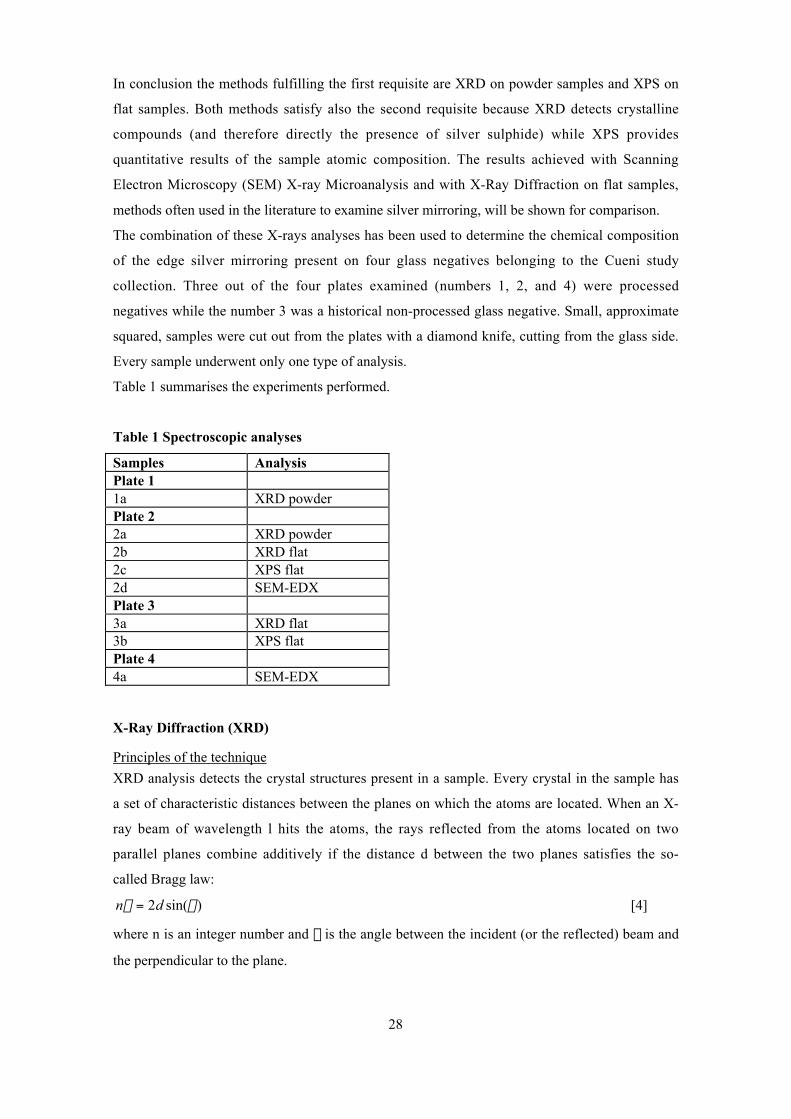
Table 1 summarises the experiments performed.
Table 1 Spectroscopic analyses
Samples AnalysisPlate 11a XRD powderPlate 22a XRD powder2b XRD flat2c XPS flat2d SEM-EDXPlate 33a XRD flat3b XPS flatPlate 44a SEM-EDX
X-Ray Diffraction (XRD)
Principles of the technique
XRD analysis detects the crystal structures present in a sample. Every crystal in the sample has
a set of characteristic distances between the planes on which the atoms are located. When an X-
ray beam of wavelength l hits the atoms, the rays reflected from the atoms located on two
parallel planes combine additively if the distance d between the two planes satisfies the so-
called Bragg law:
n dl q= 2 sin( ) [4]
where n is an integer number and q is the angle between the incident (or the reflected) beam and
the perpendicular to the plane.
29
Changing the angle q the distances between the planes are scanned. Peaks of intensity of the
diffracted radiation are present in correspondence of the distances satisfying the relation [4].
In the case the diffracted radiation is detected with a scintillator, the spectrum is a graph of the
intensity of the diffracted x-rays towards the angle q.
In the case the diffracted radiation is recorded on a photographic film, the spectrum consists of
circles located around the direction of the incoming beam of radii simply related to the
characteristic distances.
Measurements on powder samples
The XRD analysis on powder samples was performed at the XRD facilities of the Instituut
Collectie Nederlands, Amsterdam, under the supervision of Mr. P. Hallebeek. The XRD
instrument is composed of an X-ray generator (Philips PW 1010) using a Cuka X-Ray source at
wavelength l=1.5406 Å and energy E=8.041 keV and of a Debey-Scherrer powder camera with
a double coated CEA Reflex 25 film. The sample, consisting of few powder grains, is fixed on
the tip of a glass fibre with cedar oil and it is continuously rotated during the measuring time
(order of a few hours) to cover all the possible mutual positions between the incoming beam and
the crystal planes within the sample. This instrument is able to detect the crystal composition of
extremely minute amount of sample, of dimension of the order of 0.5 mm2.
The silver mirroring was scratched off the plates with a scalpel under a loupe, with carefull
attention in removing only the mirroring layer and not the underlying emulsion. The total
amount of material was of the order of few powder grains.
Measurements on flat samples
The XRD analysis on flat samples was performed at the XRD facility of the Institut für
Anorganische Chemie, Universität Zürich, under the direction of Prof. H. Berke. The XRD
diffractometer is a Kristalloflex instrument produced by Siemens using a Cuka X-Ray source at
wavelength l=1.5406 Å and energy E=8.041 keV. The diffracted rays are collected with a
scintillator and the relative position of the sample and the detector is changed at steps of
2q=0.05° and with a measuring time of 0.3 s for every step.
The samples have approximate dimensions of 2¥1 cm2 and they are hold flat in aluminium
holders. In order to prevent contributions in the diffracted beam from the side areas not
presenting silver mirroring, these areas were covered with self-adhesive tape.
X-ray Photoemission Spectroscopy (XPS)
Principles of the technique
XPS is a spectroscopic technique based on the measurement of the binding energies (Eb) of the
core electrons of the atoms contained in a material. It is able to detect all the atoms of the
periodic table apart from Hydrogen.
30
The sample is bombarded with monochromatic X-rays of energy EX higher than the core
electrons binding energies; the atoms present in the sample absorb the X-rays and eject their
core electrons with a kinetic energy Ek satisfying the relation:
E E Ek X b= - [5]
Since EX is known and Ek is measured in the experiment, the core electrons binding energies Eb
are calculated and used to identify the atoms.
Shifts in the measured core electron binding energy can be used to determine the molecular
composition of the sample.
XPS is a real surface analysis because only electrons ejected from a distance of maximum 10
nanometres from the sample surface have enough kinetic energy to escape and be detected.
An XPS spectrum is a graph of the number of the emitted electrons against the detected
energies. Peaks are present in correspondence of the binding energies of the core electrons of
the atoms contained in the material. As the area Ai of the peaks is proportional to the amount of
atoms ejecting the electrons, the percentage atomic composition Mi of the sample can be
calculated as follows:
MA
C A
C
ii
i i
i
= ¥
Â
1[6]
where Ci is the photoionization cross-section for the atomic core electron i.
If the sample is not conductive, the ejected electrons can accumulate above the sample surface
and they can shift the position of the peaks eventually making the peak determination
impossible.
Measurements on flat samples
The measurements were performed at the XPS laboratory, Institut für Physik, Universität Basel,
under the direction of prof. P. Oelhafen.
The samples, of dimensions approximately of 1*2 cm, are fixed with metal screws on a metal
holder and inserted in the spectrometer where an air pressure of about 10-9 millibar is reached in
about 10 hours. In spite of the high vacuum attained during the measurement, no damage was
visible on the samples. The samples are then bombarded with X-ray and the spectra recorded in
a few minutes.
Due to high surface charging effects it was possible to record spectra only from the silver
mirroring areas close to the metal screws. In these areas the surface charging was minimised
because the electrons could diffuse to the metal holder and dissipate.
Scanning Electron Microscope (SEM) and X-ray microanalysis
Principle of the technique
A Scanning Electron Microscope (SEM) is a microscope which provides an enhanced image of
the surface of a sample recording the electrons ejected when the sample is bombarded with a
31
primary electron beam. Besides electrons, the sample ejects x-rays which can be used to analyse
its elemental composition. For a description of a SEM apparatus see Lawes (1987).
Here it is important only to recall that the x-rays emitted are due to the inverse photoelectric
effect, i.e. as a result of the electron bombardment, the atoms present in the sample eject their
core electrons, these are replaced by outer electrons with the emission of characteristic X-rays.
The ejected X-rays can be detected either with a Wavelength Dispersive System (WDS) or with
an Energy Dispersive System (EDS). A WDS separates spatially the x-rays based on their
wavelength with the use of diffracting crystals. The amount of x-rays with a definite wavelength
is detected with gas flow proportional detectors. A WDS detects all the elements heavier than
Bore (Z=5). In an EDS system the energy and the amount of the x-rays is measured with solid
state detectors. An EDS can detect all elements heavier than sodium (Z=11).
Normally a SEM-X-rays microanalysis apparatus is provided with 4 WDS systems, each one
able to detect one element per time, and an EDS system. By moving the primary electron beam
on the sample surface and by detecting at any point the emitted x-rays, maps of the distribution
of the elements present in the sample can be built.
Because x-rays are produced also by layers well below the region reached by the incoming
electron beam, X-ray microanalysis is a bulk and not a surface analysis. Moreover the area from
which x-rays are emitted is about 3 times bigger than the electron beam diameter, reducing
drastically the spatial resolution of the elemental maps. Another drawback of this technique is
that 90% of the energy of the incoming electron beam is dissipated in heat within the sample,
which determines heavy alterations in soft samples.
Measurements on flat and cross-section samples
The SEM-X-ray microanalysis experiment was performed at the Microprobe laboratory,
Institute of Mineralogy and Petrography, University of Basel, under the direction of prof. C. de
Capitani. The instrument used is a JEOL 8600 Superprobe, dating to year 1987, provided with 4
WDS spectrometers and an EDX system. The instrument is controlled by a Sun Spark station
with the "VOYAGER III" software.
The electron column was kept at a pressure of 2*10-6 mb; the electron beam, of 10 nA intensity,
was accelerated at a 15 keV voltage. The electron beam diameter was about 1 micron, but the
X-rays arise from a bigger area. In order to avoid surface charging the samples were coated with
carbon. They were fixed on the sample holder with epoxy glue.
3.1.2 Size and shape distributions of the silver mirroring particles
The size and shape distributions of the silver mirroring particles, belonging to the edge
mirroring present on a historical non-processed glass plate, was analysed making use of
Transmission Electron Microscopy (TEM).
The TEM micrographs were later digitised and the digital images were analysed with image
analysis software. The software Mathematica‚ was used in the statistics analysis of the data.
32
Transmission Electron Microscopy (TEM)
Principle of the technique
A Transmission Electron Microscope (TEM) basically consists of an under vacuum column
where electrons, emitted by a heated tungsten filament, are accelerated to a high voltage (200
keV) and then focused by electron lenses (condenser lenses) on the specimen. The specimen is a
thin section of material (thickness of the order of 70 nm) partially absorbing the electrons. The
transmitted beam is then enlarged and focused by electron lenses (imaging system) so that an
enlarged image is formed on the viewing screen, a plate covered with phosphors fluorescing
once hit by electrons. If a permanent image of the sample is wanted, the screen is removed and
the electrons can hit directly a photographic film which is subsequently developed and printed.
For a deeper description of transmission electron microscopy see Hayat (2000).
The electron absorption by the specimen is dependent on the sample thickness and composition
(dense areas absorb more electrons). This determines an amplitude contrast and therefore an
image.
As the electrons have to pass through the sample, the sample has to be 100 nm thick maximum.
Thin slices can be obtained by cutting the sample with an ultramicrotome. Normally a soft
sample cannot be cut straightaway but it has first to be embedded in a harder material. Sample
embedding is crucial factor in transmission electron microscopy.
Measurements
Small portions (dimension 1¥2 mm2) of mirrored emulsion were removed from a historical non-
processed glass negative, after shortly immersing the plate in a solution of water and alcohol
and using blade knife and tweezers under a loupe. The squares were embedded in a harder
material and then cut in the cross-section direction. Three preparation methods were tested.
Simple embedding in epoxy resin.
The sample was laid flat on a drop of epoxy resin, a standard mixture of epoxy embedding
medium, hardener (DDSA and MNA) and accelerator (BDMA) all produced by Fluka. After
removing the water in excess on the emulsion, the sample was covered with a second drop of
resin and inserted in an oven at 60 degrees for about 8 hours. In this preparation water is not
extracted from the sample core but the sample is purely surrounded by a harder medium.
Plastic embedding (Kejser, 1995)
This method is a minor modification of the plastic embedding procedure published by Kejser
(1995). The sample was first cross-linked by immersion for 30-60 minutes at 20º C in a solution
of 1 part of PBS buffer and 1 part of glutaric aldehyde. Then it was rinsed and underwent a
dehydration procedure in alcohol solutions (alcohol concentration increasing from 10% to 90 %)
followed by an embedding procedure as described by Kejser. In the final steps propylenoxid
was substituted with acetone. Finally the sample was polymerised in the oven at 70º C for about
33
8 hours. In this preparation water is extracted from the sample bulk and substituted with the
resin.
No embedding
The third method consisted in directly cutting the sample without any embedding but just fixing
the sample on a sample holder with epoxy glue.
After embedding, slices of thickness 70 nm were cut in the cross-section direction with an ultra
microtome. The slices were transferred on a grid and they were inserted in the microscope
available at the Interdivisional Electron Microscopy Laboratory of the University of Basel (LEO
EM 912) where images with magnification of the order of *10000 were taken. As the negative
is a non-processed plate, long electron exposures have to be avoided in order not to physically
develop the silver bromide grains.
3.2 RESULTS
3.2.1 Results on the chemical composition of silver mirroring
The XRD analysis on powder samples has determined that the silver mirroring scratched off
from plates 1 and 2 is composed at 100% of silver sulphide Ag2S. No other crystalline
compounds were detected.
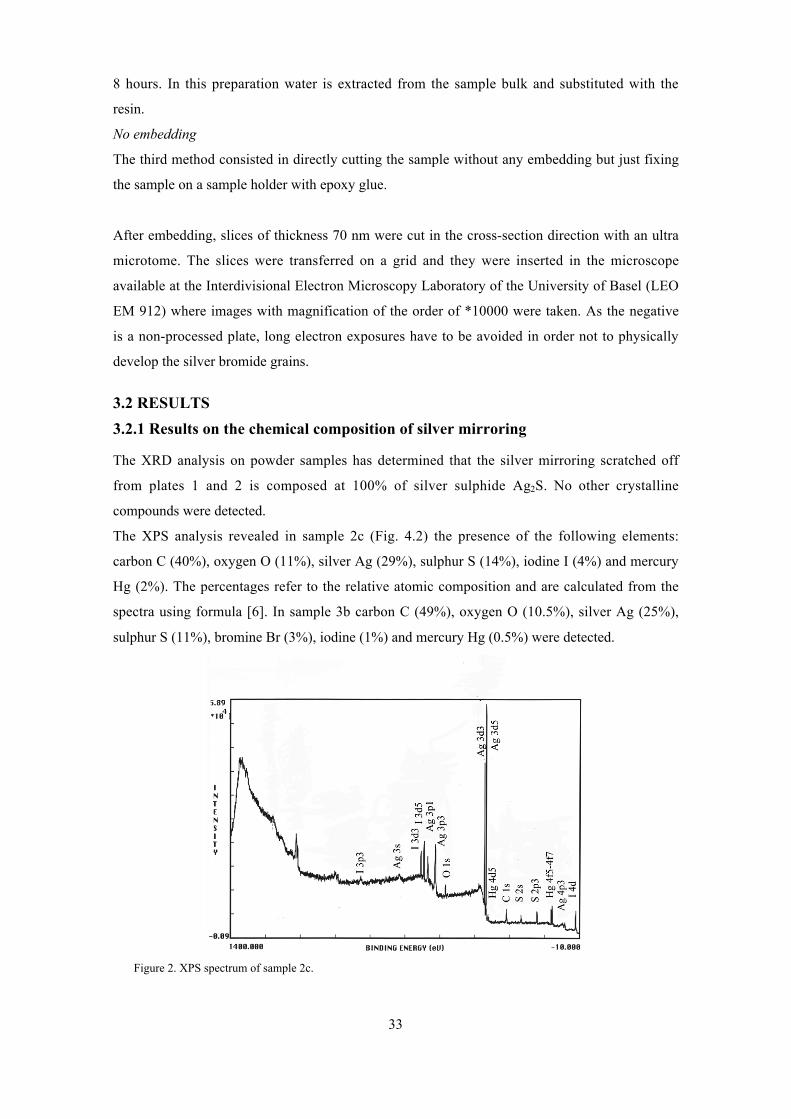
The XPS analysis revealed in sample 2c (Fig. 4.2) the presence of the following elements:
carbon C (40%), oxygen O (11%), silver Ag (29%), sulphur S (14%), iodine I (4%) and mercury
Hg (2%). The percentages refer to the relative atomic composition and are calculated from the
spectra using formula [6]. In sample 3b carbon C (49%), oxygen O (10.5%), silver Ag (25%),
sulphur S (11%), bromine Br (3%), iodine (1%) and mercury Hg (0.5%) were detected.
Figure 2. XPS spectrum of sample 2c.
34
In both samples the main component is carbon, arising from the collagen contained in the
gelatin emulsion. It is followed by silver and sulphur. The ratio between the amount of silver
and the amount of sulphur in the mirrored areas ranges between 2.07 and 2.27, almost
stochiometric for silver sulphide Ag2S. Moreover the S(2p) peak has in both cases a negative
shift (ranging from –4.5 to –6.3 eV) suggesting that sulphur is in the S2- state (Hammond et al.
1975). This indicates that silver sulphide is present in the mirroring areas. The detected amount
of oxygen arises probably from the collagen present in the emulsion; indeed, the absence of the
O(1s) peak at 529 eV excludes the presence of silver oxide AgO or silver dioxide Ag2O. The
presence of bromine in sample 3b is consistent with the fact that plate 3 is a non-processed
negative.
The XRD analysis on flat samples determined uniquely the presence of silver (Ag) crystal
structures in sample 2b. In sample 3a both silver and silver bromide (AgBr) structures were
identified, consistently with the fact that plate 3 is a non-processed negative.
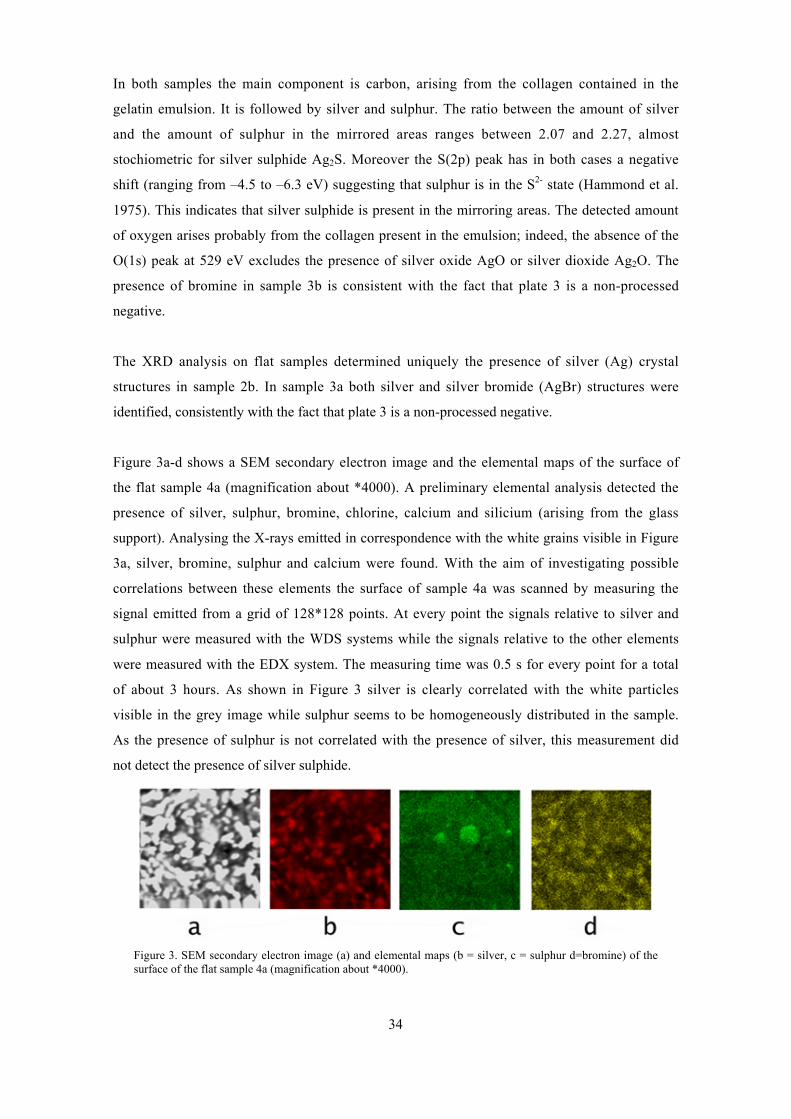
Figure 3a-d shows a SEM secondary electron image and the elemental maps of the surface of
the flat sample 4a (magnification about *4000). A preliminary elemental analysis detected the
presence of silver, sulphur, bromine, chlorine, calcium and silicium (arising from the glass
support). Analysing the X-rays emitted in correspondence with the white grains visible in Figure
3a, silver, bromine, sulphur and calcium were found. With the aim of investigating possible
correlations between these elements the surface of sample 4a was scanned by measuring the
signal emitted from a grid of 128*128 points. At every point the signals relative to silver and
sulphur were measured with the WDS systems while the signals relative to the other elements
were measured with the EDX system. The measuring time was 0.5 s for every point for a total
of about 3 hours. As shown in Figure 3 silver is clearly correlated with the white particles
visible in the grey image while sulphur seems to be homogeneously distributed in the sample.
As the presence of sulphur is not correlated with the presence of silver, this measurement did
not detect the presence of silver sulphide.
Figure 3. SEM secondary electron image (a) and elemental maps (b = silver, c = sulphur d=bromine) of thesurface of the flat sample 4a (magnification about *4000).
35
Also the analysis of the cross-section of sample 2d showed that silver was connected to the
white spots visible in the grey image while sulphur was homogeneously distributed. In
conclusion the X-rays microanalysis maps did not evidence the presence of silver sulphide.
The results obtained with the different spectroscopic techniques are summarised in Table 2.
Table 2 Results of the analysis of the chemical composition of silver mirroring
Sample XRDPowder
XPS XRDFlat
SEM-EDX
1a Ag2S
2a Ag2S2b Ag2c Ag2S
O,C,I,Hg2d Ag,S,Cl,Ca,Si
3a Ag, AgBr3b Ag2S
O,C,Br,I,Hg
4a Ag,S,Br,Cl,Ca,Si
The preliminary analysis of the penetration depth of X-rays and electrons in the emulsion
performed in paragraph 3.1.1 selected as reliable analyses XRD on powder samples and XPS.
Both techniques have determined that silver mirroring is composed of silver sulphide. The
minor presence of other halides like iodine or bromine has been detected by XPS analysis.
XRD on flat samples and SEM-EDX microanalysis, techniques that, although being not reliable
for the determination of the chemical composition of silver mirroring, are often used in the
literature, did not detect the presence of silver sulphide.
3.2.1 Results on the size and shape distribution of the silver mirroring particles
Unfortunately all the three preparation methods created some problems.
The samples prepared with the first method were difficult to cut because of the softness of the
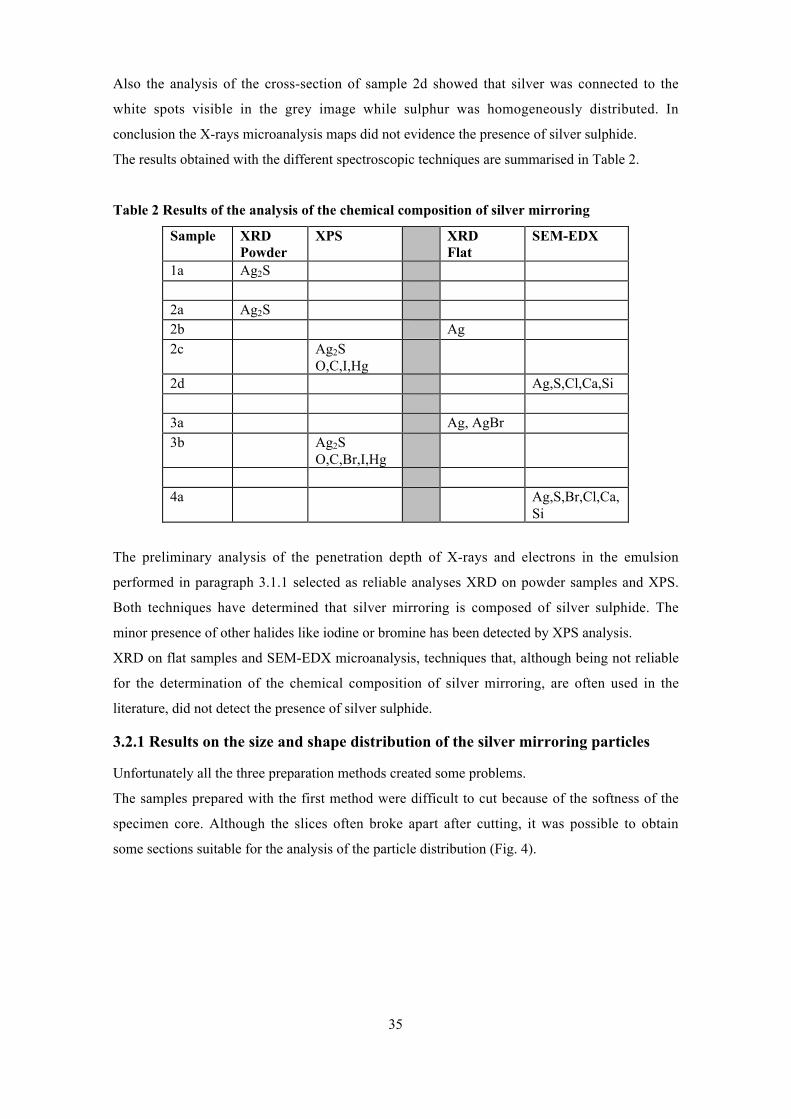
specimen core. Although the slices often broke apart after cutting, it was possible to obtain
some sections suitable for the analysis of the particle distribution (Fig. 4).
36
Figure 4. TEM micrograph of the cross-section of a mirrored area on a non-processed glass negative.
The samples prepared with the second method did not present any problem during cutting but
under microscopic inspection all sections showed folds and voids (Fig. 5) altering the structure
of the mirroring layer. This type of sample alterations is reported also by Kejser (1995). They
probably arise during the preparation procedure and not during cutting.
Figure 5. Alterations on a sample prepared with the plastic embedding method.
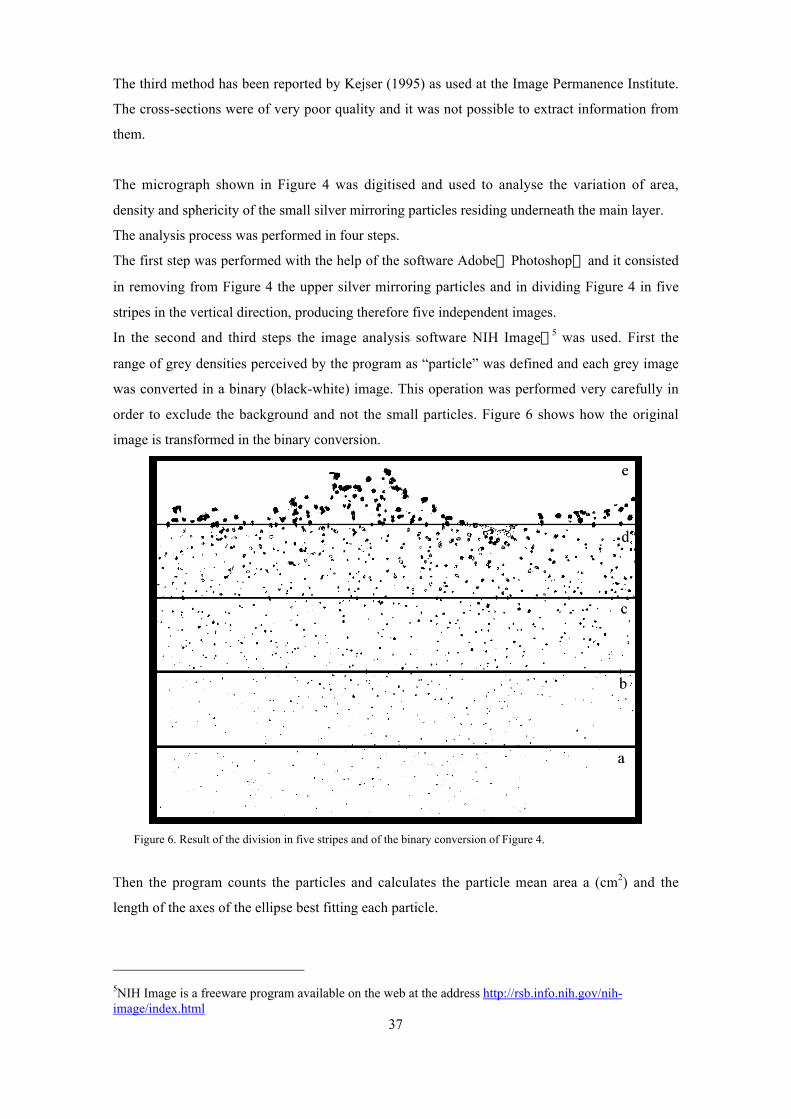
37
The third method has been reported by Kejser (1995) as used at the Image Permanence Institute.
The cross-sections were of very poor quality and it was not possible to extract information from
them.
The micrograph shown in Figure 4 was digitised and used to analyse the variation of area,
density and sphericity of the small silver mirroring particles residing underneath the main layer.
The analysis process was performed in four steps.
The first step was performed with the help of the software Adobe“ Photoshop“ and it consisted
in removing from Figure 4 the upper silver mirroring particles and in dividing Figure 4 in five
stripes in the vertical direction, producing therefore five independent images.
In the second and third steps the image analysis software NIH Image“5 was used. First the
range of grey densities perceived by the program as “particle” was defined and each grey image
was converted in a binary (black-white) image. This operation was performed very carefully in
order to exclude the background and not the small particles. Figure 6 shows how the original
image is transformed in the binary conversion.
Figure 6. Result of the division in five stripes and of the binary conversion of Figure 4.
Then the program counts the particles and calculates the particle mean area a (cm2) and the
length of the axes of the ellipse best fitting each particle.
5NIH Image is a freeware program available on the web at the address http://rsb.info.nih.gov/nih-image/index.html
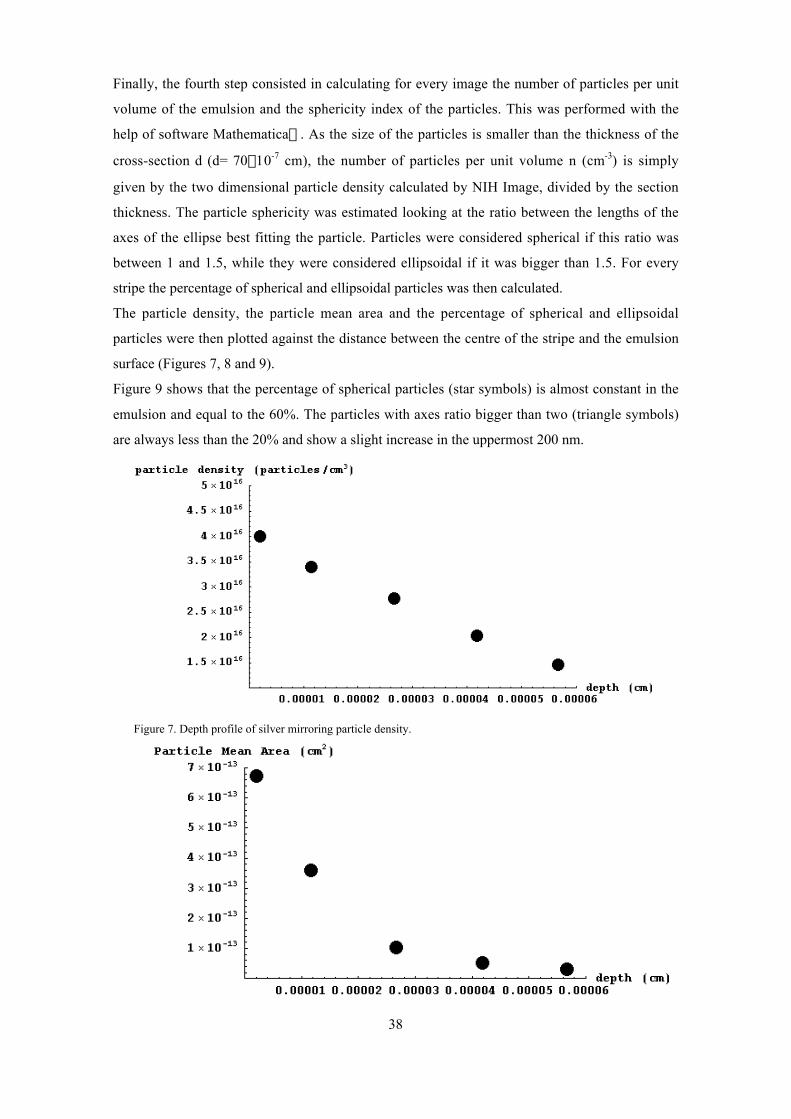
38
Finally, the fourth step consisted in calculating for every image the number of particles per unit
volume of the emulsion and the sphericity index of the particles. This was performed with the
help of software Mathematica“. As the size of the particles is smaller than the thickness of the
cross-section d (d= 70¥10-7 cm), the number of particles per unit volume n (cm-3) is simply
given by the two dimensional particle density calculated by NIH Image, divided by the section
thickness. The particle sphericity was estimated looking at the ratio between the lengths of the
axes of the ellipse best fitting the particle. Particles were considered spherical if this ratio was
between 1 and 1.5, while they were considered ellipsoidal if it was bigger than 1.5. For every
stripe the percentage of spherical and ellipsoidal particles was then calculated.
The particle density, the particle mean area and the percentage of spherical and ellipsoidal
particles were then plotted against the distance between the centre of the stripe and the emulsion
surface (Figures 7, 8 and 9).
Figure 9 shows that the percentage of spherical particles (star symbols) is almost constant in the
emulsion and equal to the 60%. The particles with axes ratio bigger than two (triangle symbols)
are always less than the 20% and show a slight increase in the uppermost 200 nm.
Figure 7. Depth profile of silver mirroring particle density.
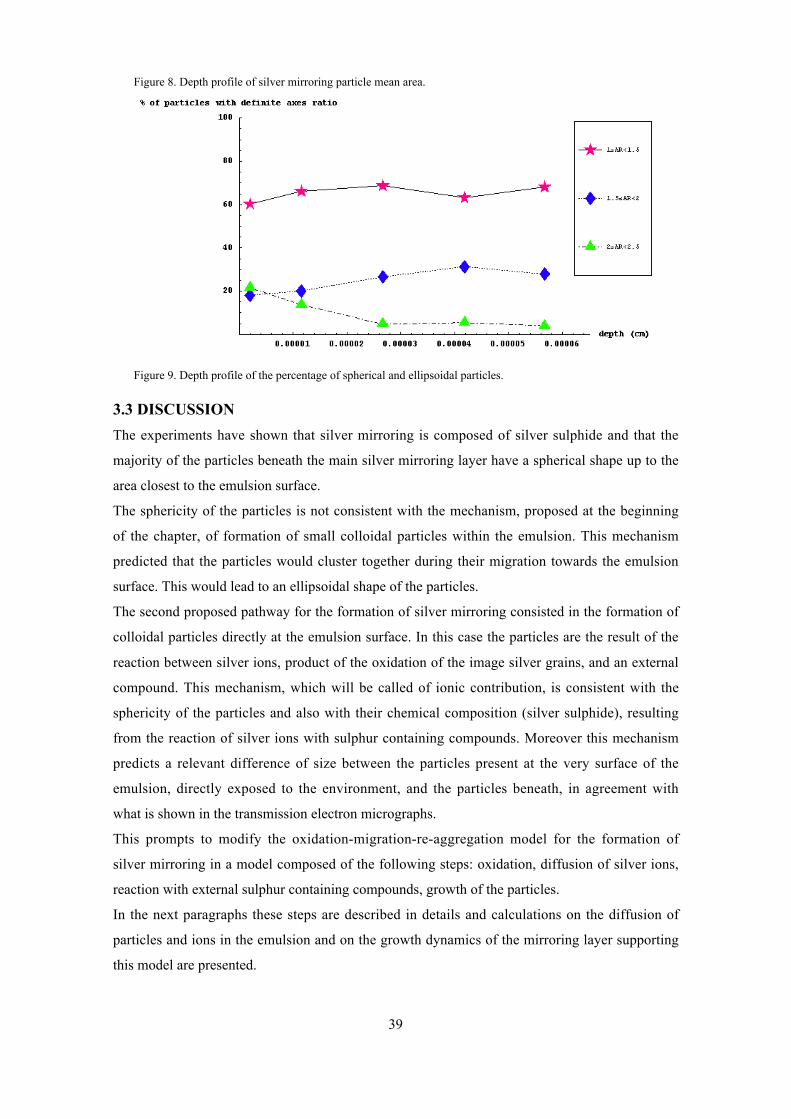
39
Figure 8. Depth profile of silver mirroring particle mean area.
Figure 9. Depth profile of the percentage of spherical and ellipsoidal particles.
3.3 DISCUSSION
The experiments have shown that silver mirroring is composed of silver sulphide and that the
majority of the particles beneath the main silver mirroring layer have a spherical shape up to the
area closest to the emulsion surface.
The sphericity of the particles is not consistent with the mechanism, proposed at the beginning
of the chapter, of formation of small colloidal particles within the emulsion. This mechanism
predicted that the particles would cluster together during their migration towards the emulsion
surface. This would lead to an ellipsoidal shape of the particles.
The second proposed pathway for the formation of silver mirroring consisted in the formation of
colloidal particles directly at the emulsion surface. In this case the particles are the result of the
reaction between silver ions, product of the oxidation of the image silver grains, and an external
compound. This mechanism, which will be called of ionic contribution, is consistent with the
sphericity of the particles and also with their chemical composition (silver sulphide), resulting
from the reaction of silver ions with sulphur containing compounds. Moreover this mechanism
predicts a relevant difference of size between the particles present at the very surface of the
emulsion, directly exposed to the environment, and the particles beneath, in agreement with
what is shown in the transmission electron micrographs.
This prompts to modify the oxidation-migration-re-aggregation model for the formation of
silver mirroring in a model composed of the following steps: oxidation, diffusion of silver ions,
reaction with external sulphur containing compounds, growth of the particles.
In the next paragraphs these steps are described in details and calculations on the diffusion of
particles and ions in the emulsion and on the growth dynamics of the mirroring layer supporting
this model are presented.
40
3.3.1 Oxidation
As proposed since the first formulation of the oxidation-migration-re-aggregation model (Henn
and Wiest 1963) and clearly repeated by Hendriks (1991b) the first step in the formation of
silver mirroring is the oxidation of the image silver grains. Possible oxidant gases are hydrogen
peroxide H2O2, oxygen O2, ozone O3, nitrogen oxide NO or dioxide NO2. Hydrogen peroxide is
assumed to be the most relevant oxidising gas because it is evolved during the degradation of
cellulosic materials (Marraccini 1962, Shafizadeh and Bradbury 1979).
Hydrogen peroxide is first dissolved in the water contained in the emulsion and then reacts with
the silver grains according to:
Ag(s)+1/2H2O2(aq)+H+(aq) F Ag+
(aq)+H2O(l) [7]
The first question is if, in a photographic emulsion, under the conditions normally found in
archives, this reaction occurs spontaneously, that is to say if its electrochemical potential is
positive.
The electrochemical potential of [7] depends on the amount of hydrogen peroxide in water
m(H2O2) (mol L-1) (hydrogen peroxide molality), on the H+ concentration (pH) and on the silver
ions activity a(Ag+(aq)).
The hydrogen peroxide molality is related to the partial pressure of hydrogen peroxide in air p
(atm) through Henry’s law:
m H p= ¥* [8]
where H* (mol L-1 atm-1) is the Henry coefficient, for hydrogen peroxide H*= 1.8¥105 mol L-1
atm-1 (Okita 1983).
For hydrogen peroxide partial pressures typically found in museums, ranging from 1 ppb to 1
ppm therefore from 10-9 atm to 10-6 atm, the hydrogen peroxide molality ranges from 1.8¥10-4
mol L-1 to 1.8¥10-1 mol L-1.
Using these values and repeating the calculations performed by Brandt (1987), the
electrochemical potential of reaction [7] is positive for all silver ions activities ranging from 1 to
10-6 and for all pH from 2 to 11, therefore for almost all conditions of a photographic emulsion6.
The second question is how long it takes to produce a certain number of silver ions. The time
needed to produce a certain amount of silver ions will in general depend on the amount of
hydrogen peroxide available, on the time needed for the hydrogen peroxide to diffuse in the
emulsion (mass transport rate) and on the time needed for the reaction to take place (reaction
rate). While the amount of hydrogen peroxide available and the mass transport rate can be
evaluated from a theoretical standpoint, it is not possible to evaluate the reaction rate. 6 The electrochemical potential of reaction [7] is the difference between the electrochemical potentials ofthe two half-reactions:1) 1/2H2O2+H++e-FH2O
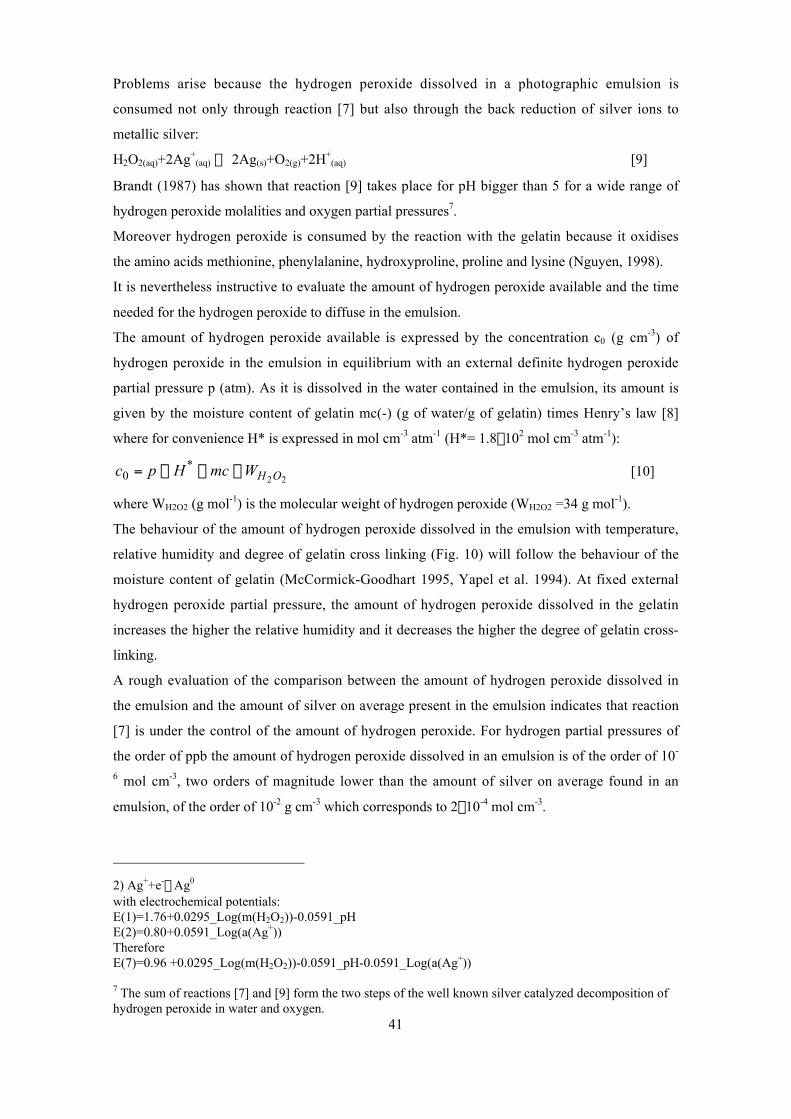
41
Problems arise because the hydrogen peroxide dissolved in a photographic emulsion is
consumed not only through reaction [7] but also through the back reduction of silver ions to
metallic silver:
H2O2(aq)+2Ag+(aq) Æ 2Ag(s)+O2(g)+2H+
(aq) [9]
Brandt (1987) has shown that reaction [9] takes place for pH bigger than 5 for a wide range of
hydrogen peroxide molalities and oxygen partial pressures7.
Moreover hydrogen peroxide is consumed by the reaction with the gelatin because it oxidises
the amino acids methionine, phenylalanine, hydroxyproline, proline and lysine (Nguyen, 1998).
It is nevertheless instructive to evaluate the amount of hydrogen peroxide available and the time
needed for the hydrogen peroxide to diffuse in the emulsion.
The amount of hydrogen peroxide available is expressed by the concentration c0 (g cm-3) of
hydrogen peroxide in the emulsion in equilibrium with an external definite hydrogen peroxide
partial pressure p (atm). As it is dissolved in the water contained in the emulsion, its amount is
given by the moisture content of gelatin mc(-) (g of water/g of gelatin) times Henry’s law [8]
where for convenience H* is expressed in mol cm-3 atm-1 (H*= 1.8¥102 mol cm-3 atm-1):
c p H mc WH O0 2 2= ¥ ¥ ¥* [10]
where WH2O2 (g mol-1) is the molecular weight of hydrogen peroxide (WH2O2 =34 g mol-1).
The behaviour of the amount of hydrogen peroxide dissolved in the emulsion with temperature,
relative humidity and degree of gelatin cross linking (Fig. 10) will follow the behaviour of the
moisture content of gelatin (McCormick-Goodhart 1995, Yapel et al. 1994). At fixed external
hydrogen peroxide partial pressure, the amount of hydrogen peroxide dissolved in the gelatin
increases the higher the relative humidity and it decreases the higher the degree of gelatin cross-
linking.
A rough evaluation of the comparison between the amount of hydrogen peroxide dissolved in
the emulsion and the amount of silver on average present in the emulsion indicates that reaction
[7] is under the control of the amount of hydrogen peroxide. For hydrogen partial pressures of
the order of ppb the amount of hydrogen peroxide dissolved in an emulsion is of the order of 10-
6 mol cm-3, two orders of magnitude lower than the amount of silver on average found in an
emulsion, of the order of 10-2 g cm-3 which corresponds to 2¥10-4 mol cm-3.
2) Ag++e-FAg0
with electrochemical potentials:E(1)=1.76+0.0295_Log(m(H2O2))-0.0591_pHE(2)=0.80+0.0591_Log(a(Ag+))ThereforeE(7)=0.96 +0.0295_Log(m(H2O2))-0.0591_pH-0.0591_Log(a(Ag+))
7 The sum of reactions [7] and [9] form the two steps of the well known silver catalyzed decomposition ofhydrogen peroxide in water and oxygen.

42
Figure 10. Equilibrium hydrogen peroxide concentration in the emulsion against hydrogen peroxide partialpressure in air for different RH, T and degree of gelatin cross linking.
The pure mass transport rate can be predicted with the diffusion theory. It will depend on the
emulsion thickness l (cm) (approx. l=50¥10-4 cm) and on the diffusion constant D (cm2 s-1) of
hydrogen peroxide in the gelatin. Although no data are available in the literature for this
quantity, it can be assumed that it is of the same order of magnitude as the diffusion constant of
water in gelatin, extensively investigated by Yapel and co-workers (1994). They have shown
that the diffusion constant of water in gelatin depends slightly on temperature and moisture
content of gelatin (at T=20 C and RH=50% it is of the order of Dª4¥10-8 cm2 s-1) while it has a
stronger variation with the degree of gelatin cross linking (it is one order of magnitude smaller
in hardened gelatin, Dª4¥10-9 cm2 s-1).
The full solution for the amount of hydrogen peroxide M (g) taken up by the emulsion when the
reaction with the silver grains is neglected, is found applying formula 4.18 in Crank (1975):
M t Mn
D n t
ln
n( ) (
( )exp{
( )})= ¥ -
+
- +•
=
=•Â1
8
2 1
2 1
420
2 2
2
p[11]
where M• (g) is the amount taken up at the equilibrium (M• =V¥c0 , V(cm3) is the emulsion
volume) and l (cm) is the emulsion thickness (l≈5¥10-3 cm).
Figure 11 shows that the theoretical time needed for hydrogen peroxide to diffuse into the
emulsion and reach the equilibrium is of the order of 30 minutes in standard gelatin and of two
hours in hardened gelatin.
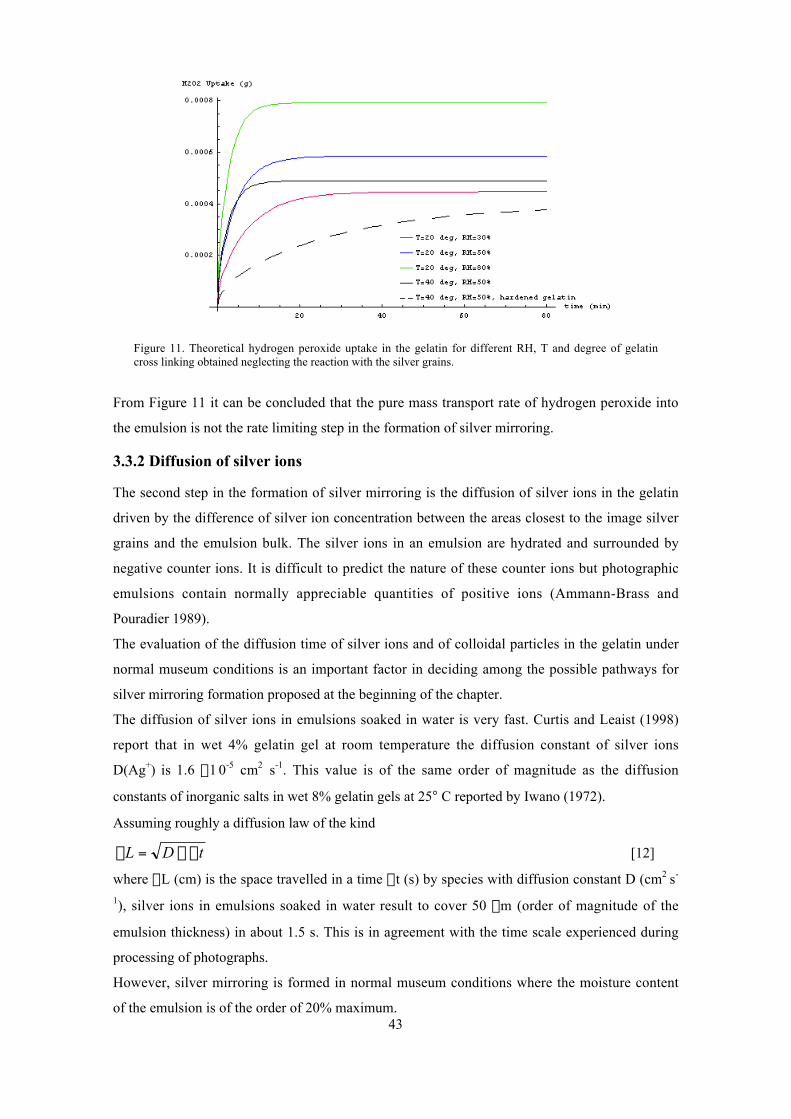
43
Figure 11. Theoretical hydrogen peroxide uptake in the gelatin for different RH, T and degree of gelatincross linking obtained neglecting the reaction with the silver grains.
From Figure 11 it can be concluded that the pure mass transport rate of hydrogen peroxide into
the emulsion is not the rate limiting step in the formation of silver mirroring.
3.3.2 Diffusion of silver ions
The second step in the formation of silver mirroring is the diffusion of silver ions in the gelatin
driven by the difference of silver ion concentration between the areas closest to the image silver
grains and the emulsion bulk. The silver ions in an emulsion are hydrated and surrounded by
negative counter ions. It is difficult to predict the nature of these counter ions but photographic
emulsions contain normally appreciable quantities of positive ions (Ammann-Brass and
Pouradier 1989).
The evaluation of the diffusion time of silver ions and of colloidal particles in the gelatin under
normal museum conditions is an important factor in deciding among the possible pathways for
silver mirroring formation proposed at the beginning of the chapter.
The diffusion of silver ions in emulsions soaked in water is very fast. Curtis and Leaist (1998)
report that in wet 4% gelatin gel at room temperature the diffusion constant of silver ions
D(Ag+) is 1.6 ¥1 0-5 cm2 s-1. This value is of the same order of magnitude as the diffusion
constants of inorganic salts in wet 8% gelatin gels at 25° C reported by Iwano (1972).
Assuming roughly a diffusion law of the kind
D DL D t= ¥ [12]
where DL (cm) is the space travelled in a time Dt (s) by species with diffusion constant D (cm2 s-
1), silver ions in emulsions soaked in water result to cover 50 mm (order of magnitude of the
emulsion thickness) in about 1.5 s. This is in agreement with the time scale experienced during
processing of photographs.
However, silver mirroring is formed in normal museum conditions where the moisture content
of the emulsion is of the order of 20% maximum.
44
Only one study was found about the mobility of silver ions in gelatin films under these
conditions. Tanaka and co-workers (1973) measured the electrical conductivity K (ohm-1 cm-1)
and the silver ions transport number t(-) of gelatin-silver nitrate (AgNO3) films kept at 79% RH
and 25° C. The transport number t is related to the diffusion constant of silver ions through
(Moore 1972, chapter 10 sec. 13):
)()(
2 ++ ¥
¥=Agm
K
F
RTAgD tot t
[13]
where R is the gas constant (R = 8.3143 J K-1 mol-1), T (K) is the absolute temperature, F is the
Faraday constant (F = 96487 C mol-1), Ktot (W-1 cm-1) is the total film conductivity and m(Ag+)
(mol cm-3) is the silver ions molar concentration in the film.
Inserting Tanaka’s data for t, Ktot and m(Ag+) in equation [13], the diffusion constant of silver
ions in gelatin films kept at 79% RH and 25 C results as being of the order of 5¥10-11 cm2 s-1.
Assuming again a diffusion law of the kind [12], the silver ions would now cover 50 mm in
about 6 days. This time is short in comparison with the observed time scale of silver mirroring
formation under normal archive conditions, of the order of months or few years maximum. This
allows concluding that in typical archive conditions silver ions diffuse rather fast in the
emulsion and they can be responsible of the formation of silver mirroring.
No data have been found in the literature about the diffusion constant of colloidal particles in
gelatin. Nevertheless it is possible to estimate it by observing that the image in silver gelatin
printed out papers (POP) dating back to the beginning of the XX century is made of silver
colloidal particles of radius of the same order of magnitude as the particles found beneath the
silver mirroring layer, i.e. of the order of 5 nm (Lavedrine 1991). As these images are still very
sharp, particles of this size do not cover a distance sufficient to have a blurred image (assumed
to be 0.1 mm (=10-2 cm)) in hundred years (≈3_109 s). By applying equation [12] with _L=10-2
cm and _t>3_109 s, the diffusion constant of these particles in gelatin results to be smaller than
3_10-14 cm2 s-1. By applying equation [12] it is possible to conclude that these particles would
need more than 25 years to cover a distance of 50 _m, the typical emulsion thickness, and
therefore they are immobile in the emulsion in the time scale of silver mirroring formation.
This allows concluding that the formation of silver mirroring is due to diffusion of silver ions
and not of colloidal particles in the emulsion.
3.3.3 Reaction with external sulphur compounds
Due to the oxidation of the image grains, silver ions are produced and then they diffuse in all
directions distributing themselves in a short time homogeneously in the emulsion. The next step
in the formation of silver mirroring is the reaction with an external sulphur containing
compound to produce silver sulphide seeds. Among environmental gases the most probable gas
45
is hydrogen sulphide H2S. Typical sources of hydrogen sulphide in archives or museums are
natural fibres, wool, humans and rubbers. Apart from hydrogen sulphide an other possible gas
that react with silver ions to give silver sulphide is carbonyl sulphide (OCS).
To get an insight into the detailed reaction mechanism between hydrogen sulphide and silver
ions, it is useful to look at the studies on the formation of silver sulphide on silver plates,
phenomenon usually called silver tarnishing.
These studies have pointed out that if moisture (Lilienfeld and White 1930, Pope et al. 1968,
Bennett et al. 1969, Graedel et al. 1985, Reagor and Sinclair 1981, Franey et al. 1985, Volpe
and Peterson 1989) or oxidant gases (Volpe and Peterson 1989) are present, the tarnishing rate
increases. In this case the rate limiting step is not the reaction but the time needed for the gas to
reach the plate, the so-called mass transport rate in air (Reagor and Sinclair 1981, Volpe and
Peterson 1989). Moreover it has been observed that silver sulphide growth occurs on silver
sulphide clumps created at the initial exposure (Bennett et al. 1969, Franey et al. 1985). Once
the clumps coalesce in a continuous film, the tarnishing rate is limited by the diffusion of the
silver ions through this film.
Although the increase of the reaction rate in presence of moisture is widely recognised, no
agreement is found on the detailed role of moisture in the reaction. Three possible pathways
involving water are given:
1) Oxidation of H2S by oxygen in water to give sulphur followed by direct reaction of sulphur
with silver (Lilienfeld and White 1930, Volpe and Peterson, 1989);
2) Dissolution of H2S to HS- followed by direct reaction of HS- with silver (Graedel et al. 1985);
3) Absorption of H2S in water and direct dissociative co-ordination of H2S with silver resulting
in the formation of a not specified intermediate. This intermediate reacts with a second silver
atom to give silver sulphide (Graedel et al. 1985).
The previous observations suggest that in silver mirroring the reaction rate between hydrogen
sulphide and silver ions is fast in comparison with the diffusion rates. Indeed, the reaction can
be assumed to take place in a water environment because photographic emulsions contain an
amount of water up to the 20% of their weight. Moreover oxidised emulsions contain hydrogen
peroxide, able to oxidise not only the silver grains but also hydrogen sulphide.
It is possible to envisage the following pathway for the dissolution of hydrogen sulphide in
water followed by the reaction with silver ions :
a) H2SFH++HS-
b) HS-FH++S2-
c) 2Ag++S2-FAg2S
46
Although it has not been possible to calculate the reaction rate, it is important to notice that the
constant of dissociation of a) is ka=([H+]_[HS-])/[H2S]=9.8_10-8 and of b) is kb=([H+]_[S2-
])/[HS-]=1.1_10-12 , therefore hydrogen sulphide is completely dissociated in S2-only for pH
bigger than 12. Nevertheless, as the solubility constant of silver sulphide is very low
(ksp=[Ag+]2_[S2-]=6.89_10-50 ), precipitation of silver sulphide will occur as soon as S2- ions will
be in solution.
Silver sulphide seeds are produced at the emulsion upper surface for three reasons. First of all,
the upper surface is the region where the reactants, -silver ions present in the emulsion and
hydrogen sulphide present in the atmosphere-, first meet. Calculations of the concentration
profiles for a similar problem (ions S2- that penetrate into a gel containing a second reactant Pb++
and form a precipitate at the interface) were performed by Hermans (1947). Second, hydrogen
sulphide is extremely less soluble in water than hydrogen peroxide. The Henry coefficient H* in
[8] for hydrogen sulphide is 9.8¥10-2 mol L-1 atm-1 (Fogg and Gennard 1991), seven orders of
magnitude smaller than the Henry coefficient for hydrogen peroxide. This implies that for
hydrogen sulphide partial pressures typically found in museums, of the order of ppb, the amount
of hydrogen sulphide dissolved in the gelatin is of the order of 10-13 mol cm-3. In this case the
reaction among silver ions and hydrogen sulphide is under the control of the amount of
hydrogen sulphide. This, added to the fact that the rate of reaction is probably faster than the
rate of hydrogen sulphide diffusion into the gelatin, results in a small penetration of hydrogen
sulphide into the emulsion.
3.3.4 Growth of silver sulphide particles
The final step in the formation of silver mirroring is the growth of the silver sulphide particles.
The silver sulphide seeds grow because of the reaction between silver ions and hydrogen
sulphide molecules on them. The reaction has not a preferential direction; therefore the final
shape of the particles is spherical.
The hypothesis that, at first exposure of an oxidised emulsion to hydrogen sulphide, a certain
number of seeds are produced and that further exposure will provoke the growth of the seeds
without increasing of their number is supported in the literature by two different kinds of
studies.
The first kind of studies is concerned with the tarnishing of silver plates. As already reported in
the previous paragraph, Bennet and co-workers (1969) have shown that silver sulphide clumps
on silver plates nucleated on initial exposure to hydrogen sulphide and that further reaction
occurred on the initially formed clumps. Graedel and co-workers (1985) also report the same
dynamics.
The second kind of studies is related to the photographic processes called diffusion transfer
processes (typically used in Polaroid photographs).
47
Diffusion transfer processes consist basically in placing an exposed negative in contact with a
positive paper containing a certain number of colloidal silver sulphide particles and impregnated
with both developer and fixer. The fixer dissolves the non-exposed grains in the negative and
then the silver ions diffuse to the positive. In the positive paper they are reduced by the
developer on the silver sulphide particles.
The function of the silver sulphide particles is to catalyse the reaction between the developer
and the silver ions (James 1939, Eggert 1947, Shuman and James 1971, Levenson and Twist
1973).
Two reasons to explain the catalytic action of colloidal particles were given: a) adsorption of the
developer onto the colloidal particles (Shuman and James 1971), b) stabilisation of a single
silver atom by the electrical conductivity of the colloidal particle (Shuman and James 1971,
Levenson and Twist 1973).
The stabilisation of silver atoms by silver aggregates has also been the object of more recent
studies8 (Plieth 1982, Belloni 1991, Henglein 1993).
Although diffusion transfer processes differ from silver mirroring because the reaction takes
place between silver ions and hydrogen sulphide instead of between silver ions and developer,
colloidal silver sulphide particles could play the same catalytic function9.
The difference of size between the particles at the interface emulsion-air and the particles
underneath can be explained by the following mechanism of growth. The particles at the
interface grow relatively fast because they are directly exposed to the environmental hydrogen
sulphide. The more they grow, the more they fill the emulsion surface hindering the penetration
of the gas into the emulsion. When the surface is completely covered, the amount of hydrogen
sulphide entering the emulsion is zero and the growth of the particles underneath the surface is
blocked.
8It has been shown (for a review see Henglin (1993)) that the electrochemical potential for thereactionAg++e-TAg0
is very low for single ions (-1.8 V) and it increases with the size of the silver aggregates till the valueassumed on the solid metal (+ 0.799 V). For small silver aggregates quantum effects have been taken intoaccount (Belloni et al. 1991) while for aggregates bigger than 1 nm a simple surface energy effectexplains this behaviour (Plieth 1982).
9Diffusion transfer processes have been discovered observing the so called transfer images produced onthe baryta layer of prints processed with developer contaminated with fixer (Weyde 1955). This effect hasbeen compared with silver mirroring arguing that silver mirroring is the result of an upwards migration ofsilver ions while transfer images are the result of a downwards migration (Hendriks 1989). It is importantto point out some relevant differences between the two phenomena: a) transfer images are formed duringprocessing, therefore in wet emulsions while silver mirroring is formed in time in relatively dry emulsions(see the different values for the diffusion constant of silver ions under these conditions); b) transferimages are the result of the reduction of silver ions by the developer while silver mirroring is the result ofthe reaction of silver ions with hydrogen sulphide.
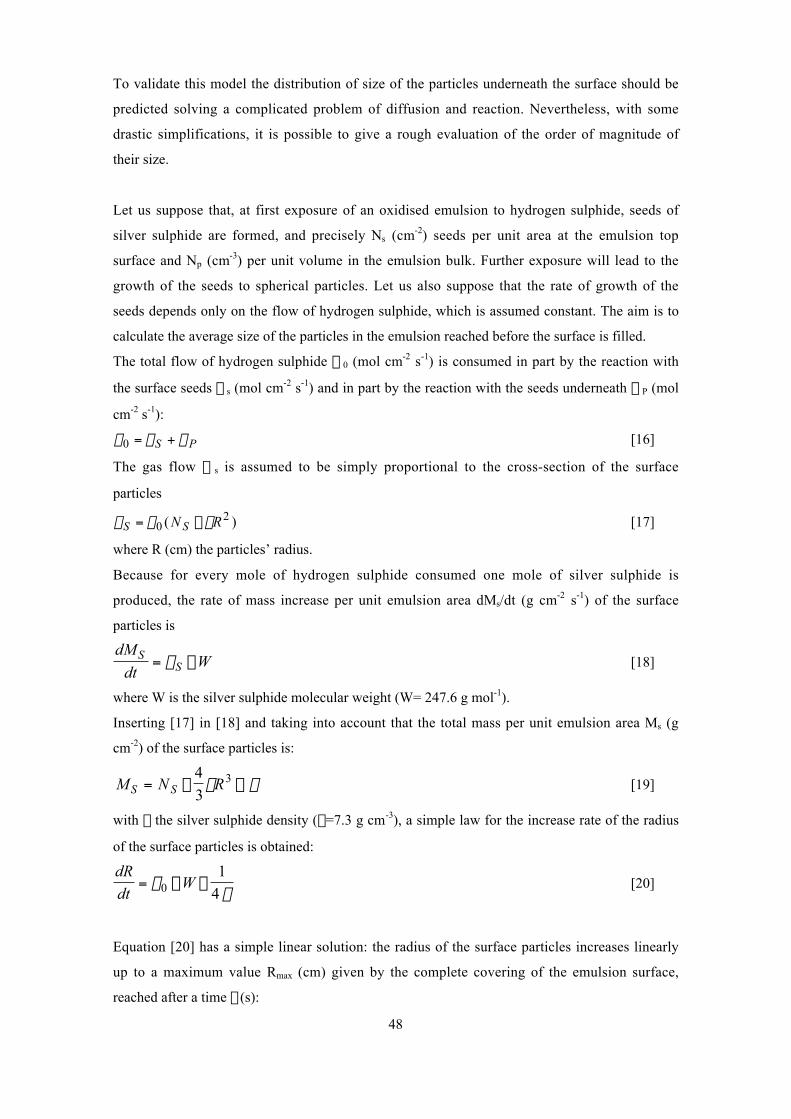
48
To validate this model the distribution of size of the particles underneath the surface should be
predicted solving a complicated problem of diffusion and reaction. Nevertheless, with some
drastic simplifications, it is possible to give a rough evaluation of the order of magnitude of
their size.
Let us suppose that, at first exposure of an oxidised emulsion to hydrogen sulphide, seeds of
silver sulphide are formed, and precisely Ns (cm-2) seeds per unit area at the emulsion top
surface and Np (cm-3) per unit volume in the emulsion bulk. Further exposure will lead to the
growth of the seeds to spherical particles. Let us also suppose that the rate of growth of the
seeds depends only on the flow of hydrogen sulphide, which is assumed constant. The aim is to
calculate the average size of the particles in the emulsion reached before the surface is filled.
The total flow of hydrogen sulphide F0 (mol cm-2 s-1) is consumed in part by the reaction with
the surface seeds Fs (mol cm-2 s-1) and in part by the reaction with the seeds underneath FP (mol
cm-2 s-1):
f f f0 = +S P [16]
The gas flow F s is assumed to be simply proportional to the cross-section of the surface
particles
f f pS SN R= ¥02( ) [17]
where R (cm) the particles’ radius.
Because for every mole of hydrogen sulphide consumed one mole of silver sulphide is
produced, the rate of mass increase per unit emulsion area dMs/dt (g cm-2 s-1) of the surface
particles is
dM
dtWS
S= ¥f [18]
where W is the silver sulphide molecular weight (W= 247.6 g mol-1).
Inserting [17] in [18] and taking into account that the total mass per unit emulsion area Ms (g
cm-2) of the surface particles is:
M N RS S= ¥ ¥4
33p r [19]
with r the silver sulphide density (r=7.3 g cm-3), a simple law for the increase rate of the radius
of the surface particles is obtained:
dR
dtW= ¥ ¥f
r01
4[20]
Equation [20] has a simple linear solution: the radius of the surface particles increases linearly
up to a maximum value Rmax (cm) given by the complete covering of the emulsion surface,
reached after a time t (s):
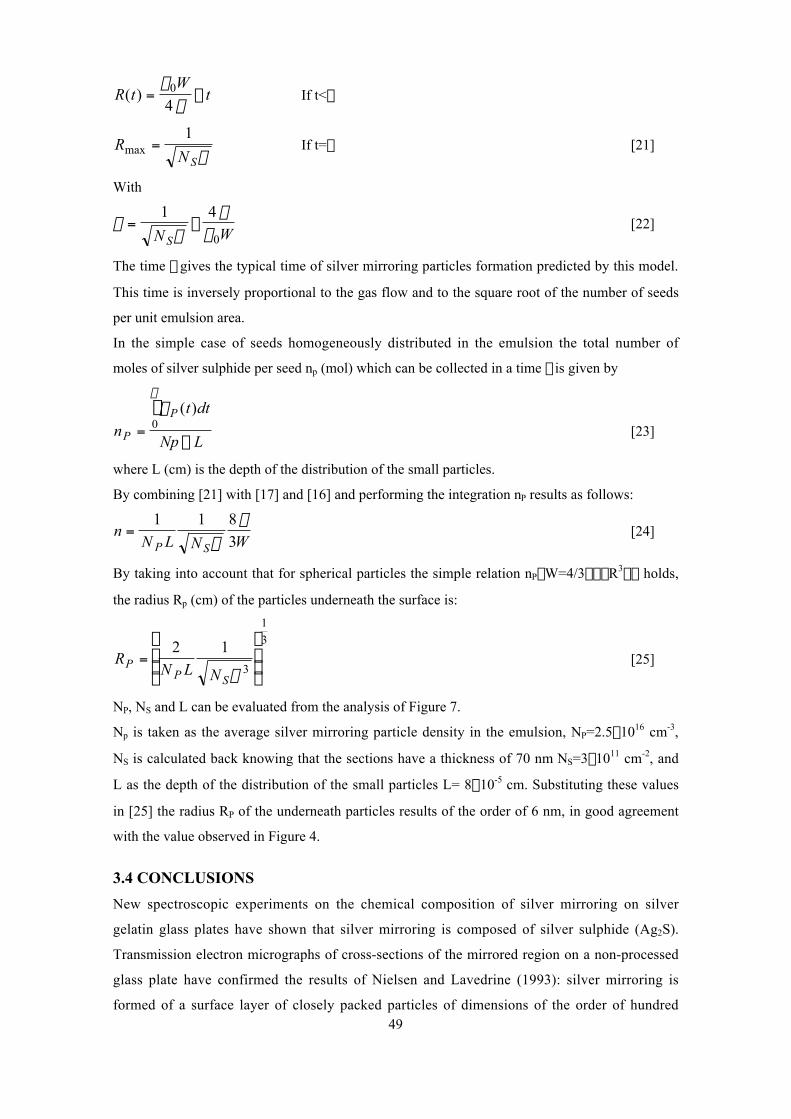
49
R tW
t( ) = ¥f
r0
4If t<t
RN S
max =1
pIf t=t [21]
With
tp
rf
= ¥1 4
0N WS[22]
The time t gives the typical time of silver mirroring particles formation predicted by this model.
This time is inversely proportional to the gas flow and to the square root of the number of seeds
per unit emulsion area.
In the simple case of seeds homogeneously distributed in the emulsion the total number of
moles of silver sulphide per seed np (mol) which can be collected in a time t is given by
n
t dt
Np LP
P
=¥
Ú ft
( )0 [23]
where L (cm) is the depth of the distribution of the small particles.
By combining [21] with [17] and [16] and performing the integration nP results as follows:
nN L N WP S
=1 1 8
3p
r[24]
By taking into account that for spherical particles the simple relation nP¥W=4/3¥p¥R3¥r holds,
the radius Rp (cm) of the particles underneath the surface is:
RN L N
PP S
=Ê
Ë
ÁÁ
ˆ
¯
˜˜
2 13
1
3
p[25]
NP, NS and L can be evaluated from the analysis of Figure 7.
Np is taken as the average silver mirroring particle density in the emulsion, NP=2.5¥1016 cm-3,
NS is calculated back knowing that the sections have a thickness of 70 nm NS=3¥1011 cm-2, and
L as the depth of the distribution of the small particles L= 8¥10-5 cm. Substituting these values
in [25] the radius RP of the underneath particles results of the order of 6 nm, in good agreement
with the value observed in Figure 4.
3.4 CONCLUSIONS
New spectroscopic experiments on the chemical composition of silver mirroring on silver
gelatin glass plates have shown that silver mirroring is composed of silver sulphide (Ag2S).
Transmission electron micrographs of cross-sections of the mirrored region on a non-processed
glass plate have confirmed the results of Nielsen and Lavedrine (1993): silver mirroring is
formed of a surface layer of closely packed particles of dimensions of the order of hundred
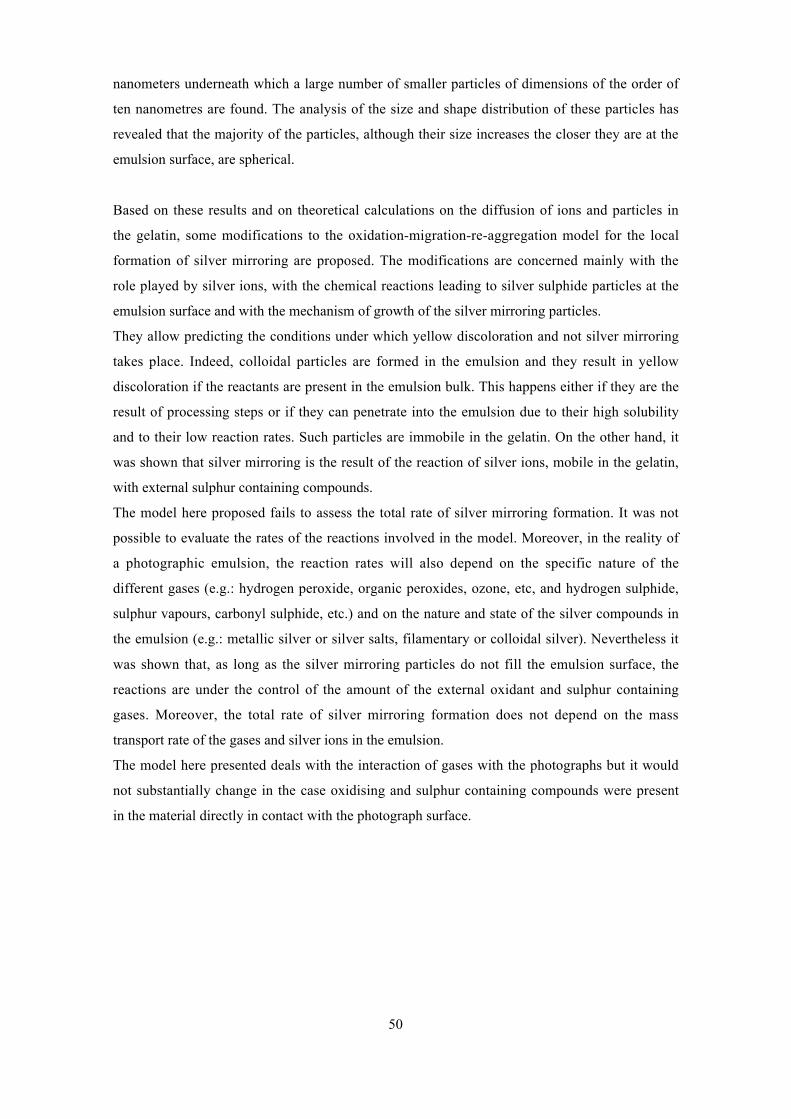
50
nanometers underneath which a large number of smaller particles of dimensions of the order of
ten nanometres are found. The analysis of the size and shape distribution of these particles has
revealed that the majority of the particles, although their size increases the closer they are at the
emulsion surface, are spherical.
Based on these results and on theoretical calculations on the diffusion of ions and particles in
the gelatin, some modifications to the oxidation-migration-re-aggregation model for the local
formation of silver mirroring are proposed. The modifications are concerned mainly with the
role played by silver ions, with the chemical reactions leading to silver sulphide particles at the
emulsion surface and with the mechanism of growth of the silver mirroring particles.
They allow predicting the conditions under which yellow discoloration and not silver mirroring
takes place. Indeed, colloidal particles are formed in the emulsion and they result in yellow
discoloration if the reactants are present in the emulsion bulk. This happens either if they are the
result of processing steps or if they can penetrate into the emulsion due to their high solubility
and to their low reaction rates. Such particles are immobile in the gelatin. On the other hand, it
was shown that silver mirroring is the result of the reaction of silver ions, mobile in the gelatin,
with external sulphur containing compounds.
The model here proposed fails to assess the total rate of silver mirroring formation. It was not
possible to evaluate the rates of the reactions involved in the model. Moreover, in the reality of
a photographic emulsion, the reaction rates will also depend on the specific nature of the
different gases (e.g.: hydrogen peroxide, organic peroxides, ozone, etc, and hydrogen sulphide,
sulphur vapours, carbonyl sulphide, etc.) and on the nature and state of the silver compounds in
the emulsion (e.g.: metallic silver or silver salts, filamentary or colloidal silver). Nevertheless it
was shown that, as long as the silver mirroring particles do not fill the emulsion surface, the
reactions are under the control of the amount of the external oxidant and sulphur containing
gases. Moreover, the total rate of silver mirroring formation does not depend on the mass
transport rate of the gases and silver ions in the emulsion.
The model here presented deals with the interaction of gases with the photographs but it would
not substantially change in the case oxidising and sulphur containing compounds were present
in the material directly in contact with the photograph surface.
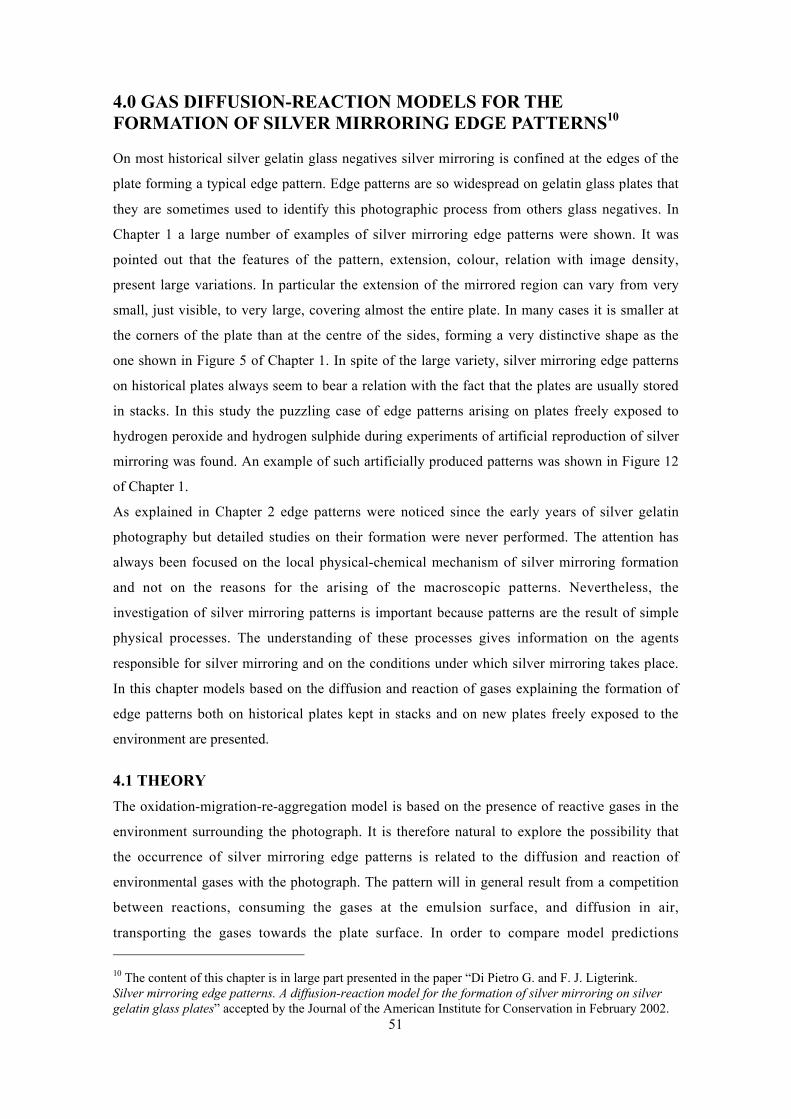
51
4.0 GAS DIFFUSION-REACTION MODELS FOR THEFORMATION OF SILVER MIRRORING EDGE PATTERNS10
On most historical silver gelatin glass negatives silver mirroring is confined at the edges of the
plate forming a typical edge pattern. Edge patterns are so widespread on gelatin glass plates that
they are sometimes used to identify this photographic process from others glass negatives. In
Chapter 1 a large number of examples of silver mirroring edge patterns were shown. It was
pointed out that the features of the pattern, extension, colour, relation with image density,
present large variations. In particular the extension of the mirrored region can vary from very
small, just visible, to very large, covering almost the entire plate. In many cases it is smaller at
the corners of the plate than at the centre of the sides, forming a very distinctive shape as the
one shown in Figure 5 of Chapter 1. In spite of the large variety, silver mirroring edge patterns
on historical plates always seem to bear a relation with the fact that the plates are usually stored
in stacks. In this study the puzzling case of edge patterns arising on plates freely exposed to
hydrogen peroxide and hydrogen sulphide during experiments of artificial reproduction of silver
mirroring was found. An example of such artificially produced patterns was shown in Figure 12
of Chapter 1.
As explained in Chapter 2 edge patterns were noticed since the early years of silver gelatin
photography but detailed studies on their formation were never performed. The attention has
always been focused on the local physical-chemical mechanism of silver mirroring formation
and not on the reasons for the arising of the macroscopic patterns. Nevertheless, the
investigation of silver mirroring patterns is important because patterns are the result of simple
physical processes. The understanding of these processes gives information on the agents
responsible for silver mirroring and on the conditions under which silver mirroring takes place.
In this chapter models based on the diffusion and reaction of gases explaining the formation of
edge patterns both on historical plates kept in stacks and on new plates freely exposed to the
environment are presented.
4.1 THEORY
The oxidation-migration-re-aggregation model is based on the presence of reactive gases in the
environment surrounding the photograph. It is therefore natural to explore the possibility that
the occurrence of silver mirroring edge patterns is related to the diffusion and reaction of
environmental gases with the photograph. The pattern will in general result from a competition
between reactions, consuming the gases at the emulsion surface, and diffusion in air,
transporting the gases towards the plate surface. In order to compare model predictions
10 The content of this chapter is in large part presented in the paper “Di Pietro G. and F. J. Ligterink.Silver mirroring edge patterns. A diffusion-reaction model for the formation of silver mirroring on silvergelatin glass plates” accepted by the Journal of the American Institute for Conservation in February 2002.
52
concerning the shape and the extent of the edge patterns with actually observed patterns both
processes have to be included into a single model.
The theory proposed in Chapter 3 fails to model the local consumption of gases during the
formation of silver mirroring in terms of a single reaction rate. It was shown that the rate of
formation of silver mirroring, and therefore the rate of consumption of gases, depends on the
rate of the reactions involved (between hydrogen peroxide and the silver image grains and
between hydrogen sulphide and the silver ions) and on the growth dynamic of the silver
mirroring particles. Nevertheless it was shown that, as long as the silver mirroring particles do
not fill the emulsion surface, the reactions are under the control of the amount of external
reactive gases. In order to model the reaction process it is currently merely possible to assume
that the rate of local formation of silver mirroring is determined by the consumption of a single
gas and to try to calculate the effects for some simple reaction rate laws. The results will be then
compared with the observations.
Modelling of the gas diffusion process towards the plate is relatively straightforward. The gas
diffusion to the plates is determined by the geometry of the plate in the space, which is the
position and the shape of the plate, by the diffusion coefficient in air for the specific type of gas,
and by the presence of ventilation that gives rise to convective gas streams able to alter the
simple gas diffusion.
The full general equations describing this phenomenon of diffusion and reaction are
complicated to solve. The discussion will be restricted to few simple cases starting from
simplifying assumptions both in terms of geometries and in terms of reaction rate laws.
Two different geometries under which a plate can be exposed to reactive gases will be
discussed: (1) plates kept in stacks and (2) plates freely exposed to the environment.
4.1.1 Stacked plate exposure
Let us consider silver gelatin glass plates kept in a stack, as for example the glass plates
contained in a traditional box. The gases will penetrate from the surrounding air to the space in
between the plates where they will be consumed by the reaction with the silver in the emulsion
layers. The silver mirroring pattern will also in this case be determined by the rate of diffusion
of the gas parallel to the plate surface and by the rate of reaction with the plates. The amount of
gas diffusing parallel to the plates will be proportional to the distance between the plates, the
higher the distance, the higher the amount of gas able to diffuse between the plates. If the
reactivity is high the gas will be consumed as soon as it penetrates between the plates and the
silver mirroring will be confined at the very edge of the plate. If, on the other hand, the
reactivity is low, the diffusion term will prevail on the reaction term and the silver mirroring
will be spread all over the plate.
The simplest mathematical model which can predict an edge pattern assumes that the glass plate
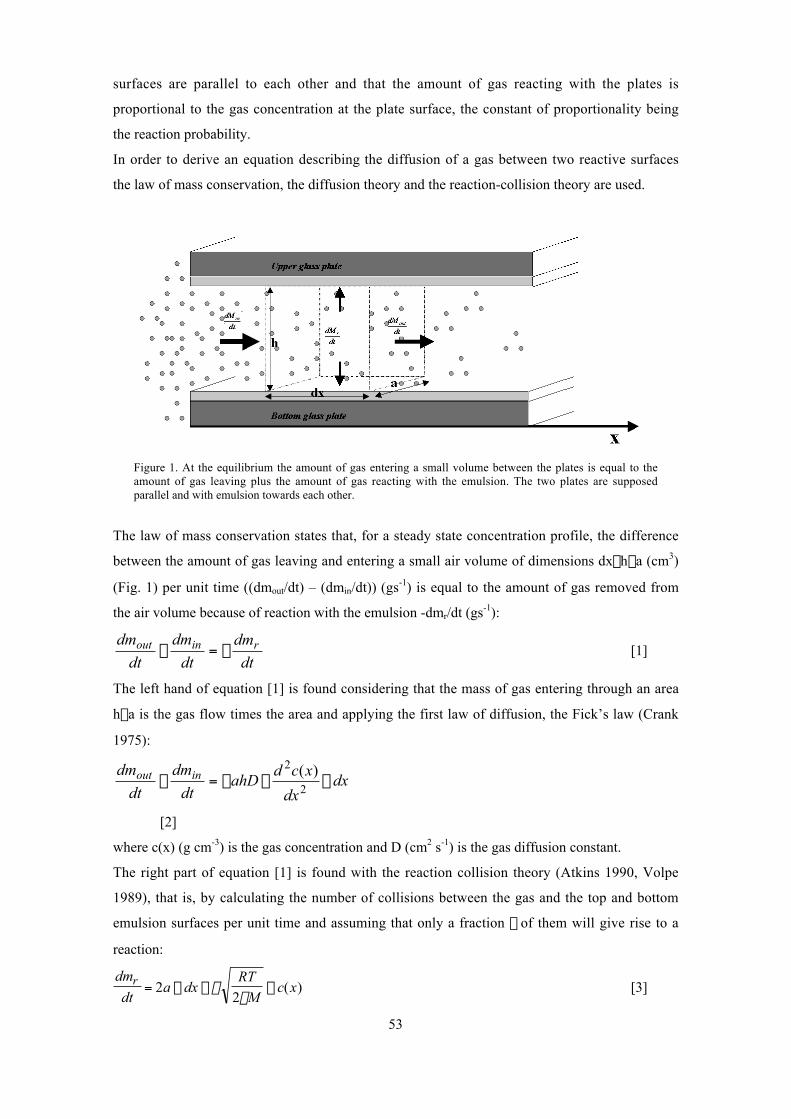
53
surfaces are parallel to each other and that the amount of gas reacting with the plates is
proportional to the gas concentration at the plate surface, the constant of proportionality being
the reaction probability.
In order to derive an equation describing the diffusion of a gas between two reactive surfaces
the law of mass conservation, the diffusion theory and the reaction-collision theory are used.
Figure 1. At the equilibrium the amount of gas entering a small volume between the plates is equal to theamount of gas leaving plus the amount of gas reacting with the emulsion. The two plates are supposedparallel and with emulsion towards each other.
The law of mass conservation states that, for a steady state concentration profile, the difference
between the amount of gas leaving and entering a small air volume of dimensions dx¥h¥a (cm3)
(Fig. 1) per unit time ((dmout/dt) – (dmin/dt)) (gs-1) is equal to the amount of gas removed from
the air volume because of reaction with the emulsion -dmr/dt (gs-1):
dt
dm
dt
dm
dt
dm rinout -=- [1]
The left hand of equation [1] is found considering that the mass of gas entering through an area
h¥a is the gas flow times the area and applying the first law of diffusion, the Fick’s law (Crank
1975):
dxdx
xcdahD
dt
dm
dt
dm inout ¥¥-=-2
2 )(
[2]
where c(x) (g cm-3) is the gas concentration and D (cm2 s-1) is the gas diffusion constant.
The right part of equation [1] is found with the reaction collision theory (Atkins 1990, Volpe
1989), that is, by calculating the number of collisions between the gas and the top and bottom
emulsion surfaces per unit time and assuming that only a fraction g of them will give rise to a
reaction:
dm
dta dx
RT
Mc xr = ¥ ¥ ¥2
2g
p( ) [3]
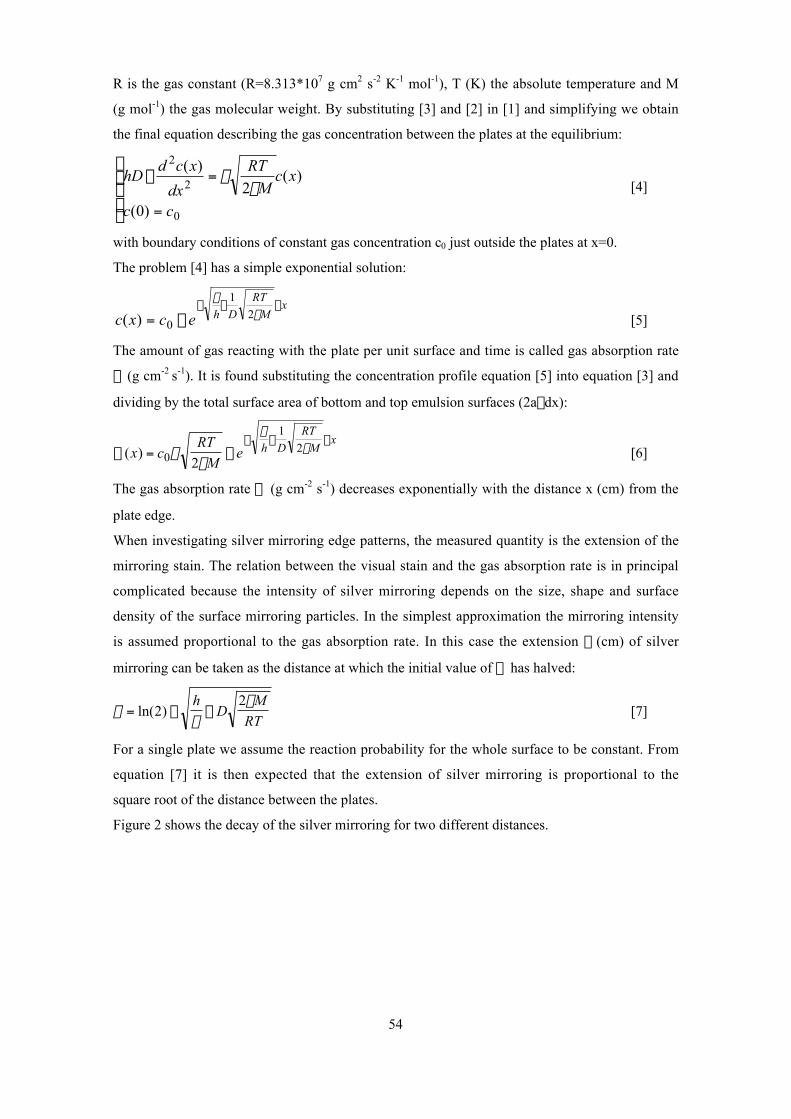
54
R is the gas constant (R=8.313*107 g cm2 s-2 K-1 mol-1), T (K) the absolute temperature and M
(g mol-1) the gas molecular weight. By substituting [3] and [2] in [1] and simplifying we obtain
the final equation describing the gas concentration between the plates at the equilibrium:
ÔÓ
ÔÌ
Ï
=
=¥
0
2
2
)0(
)(2
)(
cc
xcM
RT
dx
xcdhD
pg
[4]
with boundary conditions of constant gas concentration c0 just outside the plates at x=0.
The problem [4] has a simple exponential solution:
xM
RT
Dhecxc¥¥-
¥= pg
2
1
0)( [5]
The amount of gas reacting with the plate per unit surface and time is called gas absorption rate
y (g cm-2 s-1). It is found substituting the concentration profile equation [5] into equation [3] and
dividing by the total surface area of bottom and top emulsion surfaces (2a¥dx):
Y( )x cRT
Me h D
RT
Mx
= ¥- ¥ ¥
0
1
22
gp
gp [6]
The gas absorption rate Y (g cm-2 s-1) decreases exponentially with the distance x (cm) from the
plate edge.
When investigating silver mirroring edge patterns, the measured quantity is the extension of the
mirroring stain. The relation between the visual stain and the gas absorption rate is in principal
complicated because the intensity of silver mirroring depends on the size, shape and surface
density of the surface mirroring particles. In the simplest approximation the mirroring intensity
is assumed proportional to the gas absorption rate. In this case the extension d (cm) of silver
mirroring can be taken as the distance at which the initial value of Y has halved:
dg
p= ¥ ¥ln( )2
2hD
M
RT [7]
For a single plate we assume the reaction probability for the whole surface to be constant. From
equation [7] it is then expected that the extension of silver mirroring is proportional to the
square root of the distance between the plates.
Figure 2 shows the decay of the silver mirroring for two different distances.
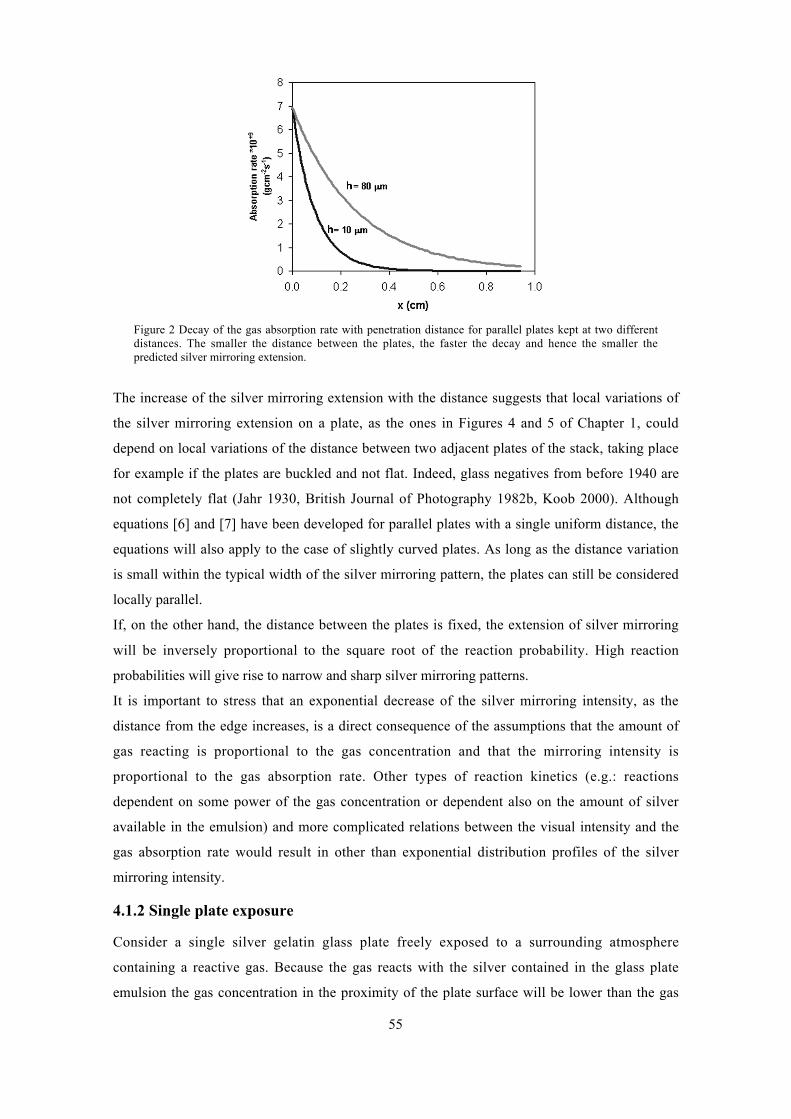
55
Figure 2 Decay of the gas absorption rate with penetration distance for parallel plates kept at two differentdistances. The smaller the distance between the plates, the faster the decay and hence the smaller thepredicted silver mirroring extension.
The increase of the silver mirroring extension with the distance suggests that local variations of
the silver mirroring extension on a plate, as the ones in Figures 4 and 5 of Chapter 1, could
depend on local variations of the distance between two adjacent plates of the stack, taking place
for example if the plates are buckled and not flat. Indeed, glass negatives from before 1940 are
not completely flat (Jahr 1930, British Journal of Photography 1982b, Koob 2000). Although
equations [6] and [7] have been developed for parallel plates with a single uniform distance, the
equations will also apply to the case of slightly curved plates. As long as the distance variation
is small within the typical width of the silver mirroring pattern, the plates can still be considered
locally parallel.
If, on the other hand, the distance between the plates is fixed, the extension of silver mirroring
will be inversely proportional to the square root of the reaction probability. High reaction
probabilities will give rise to narrow and sharp silver mirroring patterns.
It is important to stress that an exponential decrease of the silver mirroring intensity, as the
distance from the edge increases, is a direct consequence of the assumptions that the amount of
gas reacting is proportional to the gas concentration and that the mirroring intensity is
proportional to the gas absorption rate. Other types of reaction kinetics (e.g.: reactions
dependent on some power of the gas concentration or dependent also on the amount of silver
available in the emulsion) and more complicated relations between the visual intensity and the
gas absorption rate would result in other than exponential distribution profiles of the silver
mirroring intensity.
4.1.2 Single plate exposure
Consider a single silver gelatin glass plate freely exposed to a surrounding atmosphere
containing a reactive gas. Because the gas reacts with the silver contained in the glass plate
emulsion the gas concentration in the proximity of the plate surface will be lower than the gas
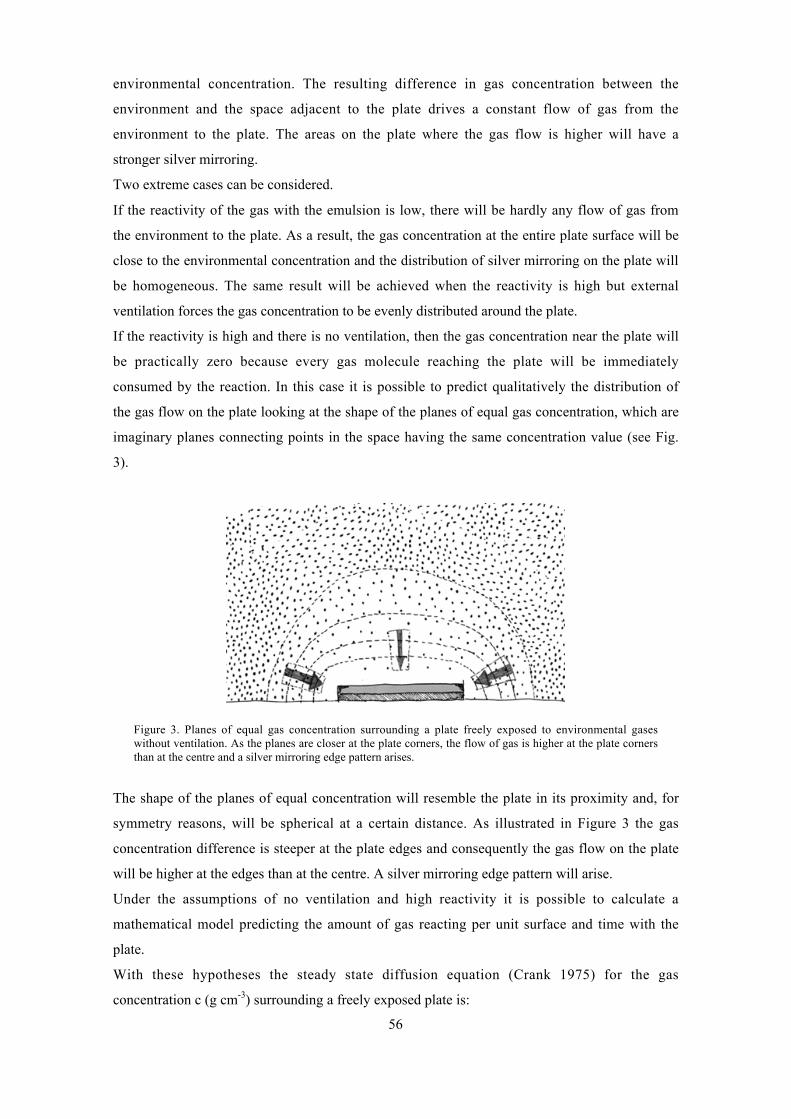
56
environmental concentration. The resulting difference in gas concentration between the
environment and the space adjacent to the plate drives a constant flow of gas from the
environment to the plate. The areas on the plate where the gas flow is higher will have a
stronger silver mirroring.
Two extreme cases can be considered.
If the reactivity of the gas with the emulsion is low, there will be hardly any flow of gas from
the environment to the plate. As a result, the gas concentration at the entire plate surface will be
close to the environmental concentration and the distribution of silver mirroring on the plate will
be homogeneous. The same result will be achieved when the reactivity is high but external
ventilation forces the gas concentration to be evenly distributed around the plate.
If the reactivity is high and there is no ventilation, then the gas concentration near the plate will
be practically zero because every gas molecule reaching the plate will be immediately
consumed by the reaction. In this case it is possible to predict qualitatively the distribution of
the gas flow on the plate looking at the shape of the planes of equal gas concentration, which are
imaginary planes connecting points in the space having the same concentration value (see Fig.
3).
Figure 3. Planes of equal gas concentration surrounding a plate freely exposed to environmental gaseswithout ventilation. As the planes are closer at the plate corners, the flow of gas is higher at the plate cornersthan at the centre and a silver mirroring edge pattern arises.
The shape of the planes of equal concentration will resemble the plate in its proximity and, for
symmetry reasons, will be spherical at a certain distance. As illustrated in Figure 3 the gas
concentration difference is steeper at the plate edges and consequently the gas flow on the plate
will be higher at the edges than at the centre. A silver mirroring edge pattern will arise.
Under the assumptions of no ventilation and high reactivity it is possible to calculate a
mathematical model predicting the amount of gas reacting per unit surface and time with the
plate.
With these hypotheses the steady state diffusion equation (Crank 1975) for the gas
concentration c (g cm-3) surrounding a freely exposed plate is:
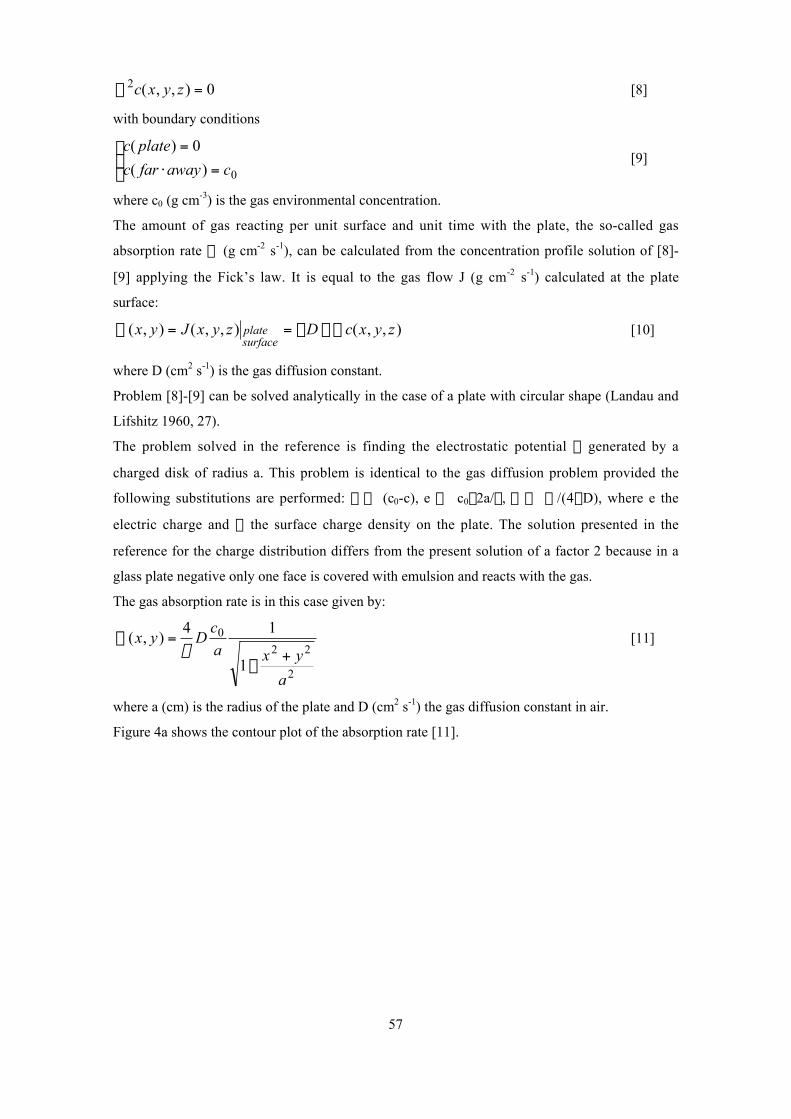
57
— =2 0c x y z( , , ) [8]
with boundary conditions
c plate
c far away c
( )
( )
=
⋅ =
ÏÌÓ
0
0[9]
where c0 (g cm-3) is the gas environmental concentration.
The amount of gas reacting per unit surface and unit time with the plate, the so-called gas
absorption rate Y (g cm-2 s-1), can be calculated from the concentration profile solution of [8]-
[9] applying the Fick’s law. It is equal to the gas flow J (g cm-2 s-1) calculated at the plate
surface:
Y( , ) ( , , ) ( , , )x y J x y z D c x y zplatesurface
= = - ¥ — [10]
where D (cm2 s-1) is the gas diffusion constant.
Problem [8]-[9] can be solved analytically in the case of a plate with circular shape (Landau and
Lifshitz 1960, 27).
The problem solved in the reference is finding the electrostatic potential j generated by a
charged disk of radius a. This problem is identical to the gas diffusion problem provided the
following substitutions are performed: j Æ (c0-c), e Æ c0¥2a/p, s Æ Y/(4pD), where e the
electric charge and s the surface charge density on the plate. The solution presented in the
reference for the charge distribution differs from the present solution of a factor 2 because in a
glass plate negative only one face is covered with emulsion and reacts with the gas.
The gas absorption rate is in this case given by:
Y( , )x y Dc
a x y
a
=
-+
4 1
1
02 2
2
p[11]
where a (cm) is the radius of the plate and D (cm2 s-1) the gas diffusion constant in air.
Figure 4a shows the contour plot of the absorption rate [11].
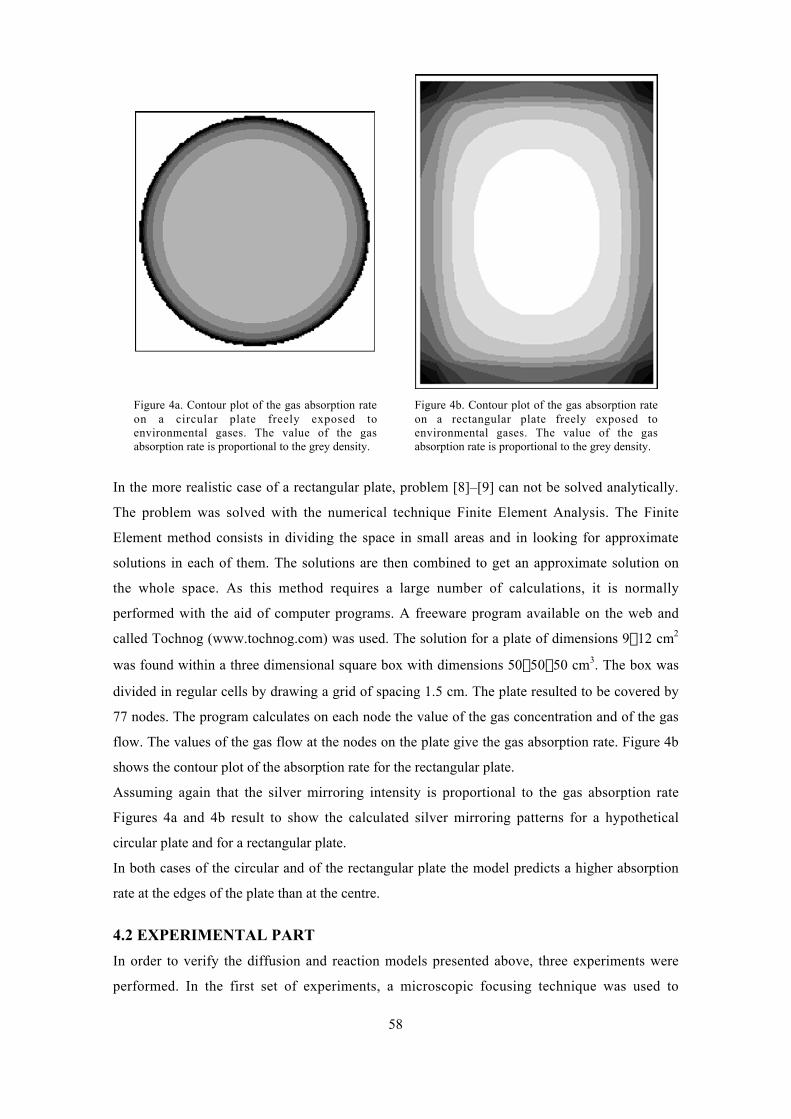
58
Figure 4a. Contour plot of the gas absorption rateon a circular plate freely exposed toenvironmental gases. The value of the gasabsorption rate is proportional to the grey density.
Figure 4b. Contour plot of the gas absorption rateon a rectangular plate freely exposed toenvironmental gases. The value of the gasabsorption rate is proportional to the grey density.
In the more realistic case of a rectangular plate, problem [8]–[9] can not be solved analytically.
The problem was solved with the numerical technique Finite Element Analysis. The Finite
Element method consists in dividing the space in small areas and in looking for approximate
solutions in each of them. The solutions are then combined to get an approximate solution on
the whole space. As this method requires a large number of calculations, it is normally
performed with the aid of computer programs. A freeware program available on the web and
called Tochnog (www.tochnog.com) was used. The solution for a plate of dimensions 9¥12 cm2
was found within a three dimensional square box with dimensions 50¥50¥50 cm3. The box was
divided in regular cells by drawing a grid of spacing 1.5 cm. The plate resulted to be covered by
77 nodes. The program calculates on each node the value of the gas concentration and of the gas
flow. The values of the gas flow at the nodes on the plate give the gas absorption rate. Figure 4b
shows the contour plot of the absorption rate for the rectangular plate.
Assuming again that the silver mirroring intensity is proportional to the gas absorption rate
Figures 4a and 4b result to show the calculated silver mirroring patterns for a hypothetical
circular plate and for a rectangular plate.
In both cases of the circular and of the rectangular plate the model predicts a higher absorption
rate at the edges of the plate than at the centre.
4.2 EXPERIMENTAL PART
In order to verify the diffusion and reaction models presented above, three experiments were
performed. In the first set of experiments, a microscopic focusing technique was used to
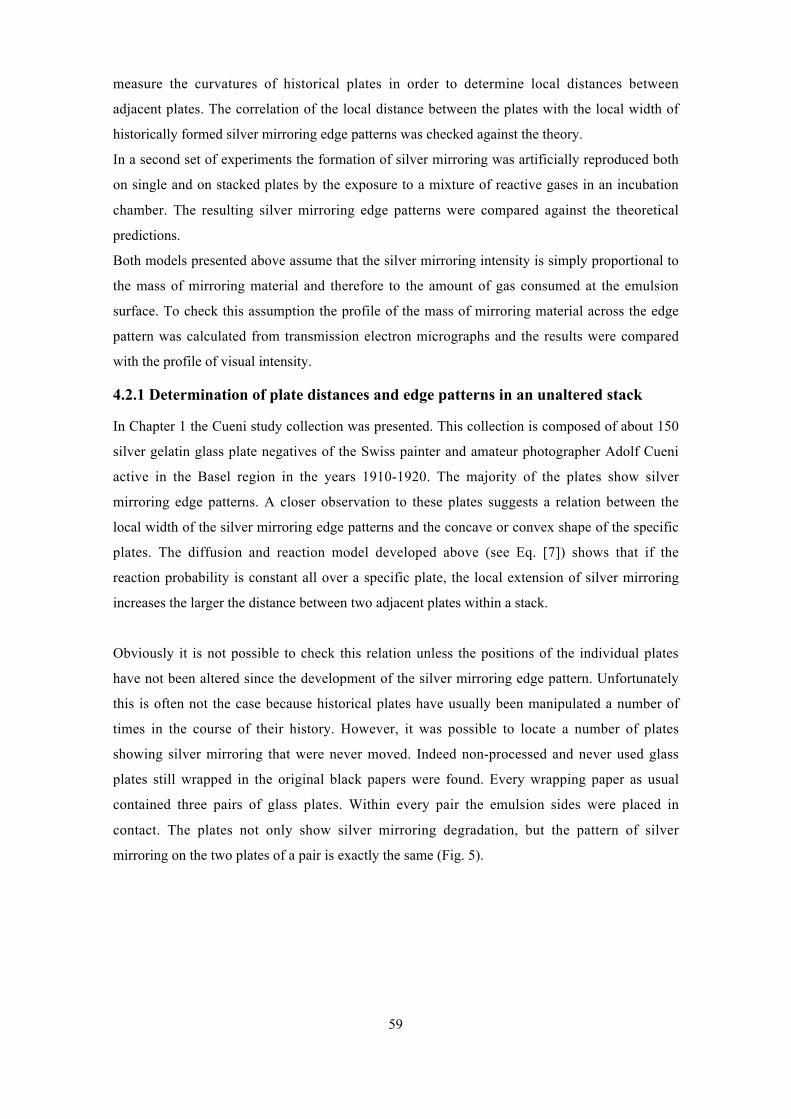
59
measure the curvatures of historical plates in order to determine local distances between
adjacent plates. The correlation of the local distance between the plates with the local width of
historically formed silver mirroring edge patterns was checked against the theory.
In a second set of experiments the formation of silver mirroring was artificially reproduced both
on single and on stacked plates by the exposure to a mixture of reactive gases in an incubation
chamber. The resulting silver mirroring edge patterns were compared against the theoretical
predictions.
Both models presented above assume that the silver mirroring intensity is simply proportional to
the mass of mirroring material and therefore to the amount of gas consumed at the emulsion
surface. To check this assumption the profile of the mass of mirroring material across the edge
pattern was calculated from transmission electron micrographs and the results were compared
with the profile of visual intensity.
4.2.1 Determination of plate distances and edge patterns in an unaltered stack
In Chapter 1 the Cueni study collection was presented. This collection is composed of about 150
silver gelatin glass plate negatives of the Swiss painter and amateur photographer Adolf Cueni
active in the Basel region in the years 1910-1920. The majority of the plates show silver
mirroring edge patterns. A closer observation to these plates suggests a relation between the
local width of the silver mirroring edge patterns and the concave or convex shape of the specific
plates. The diffusion and reaction model developed above (see Eq. [7]) shows that if the
reaction probability is constant all over a specific plate, the local extension of silver mirroring
increases the larger the distance between two adjacent plates within a stack.
Obviously it is not possible to check this relation unless the positions of the individual plates
have not been altered since the development of the silver mirroring edge pattern. Unfortunately
this is often not the case because historical plates have usually been manipulated a number of
times in the course of their history. However, it was possible to locate a number of plates
showing silver mirroring that were never moved. Indeed non-processed and never used glass
plates still wrapped in the original black papers were found. Every wrapping paper as usual
contained three pairs of glass plates. Within every pair the emulsion sides were placed in
contact. The plates not only show silver mirroring degradation, but the pattern of silver
mirroring on the two plates of a pair is exactly the same (Fig. 5).
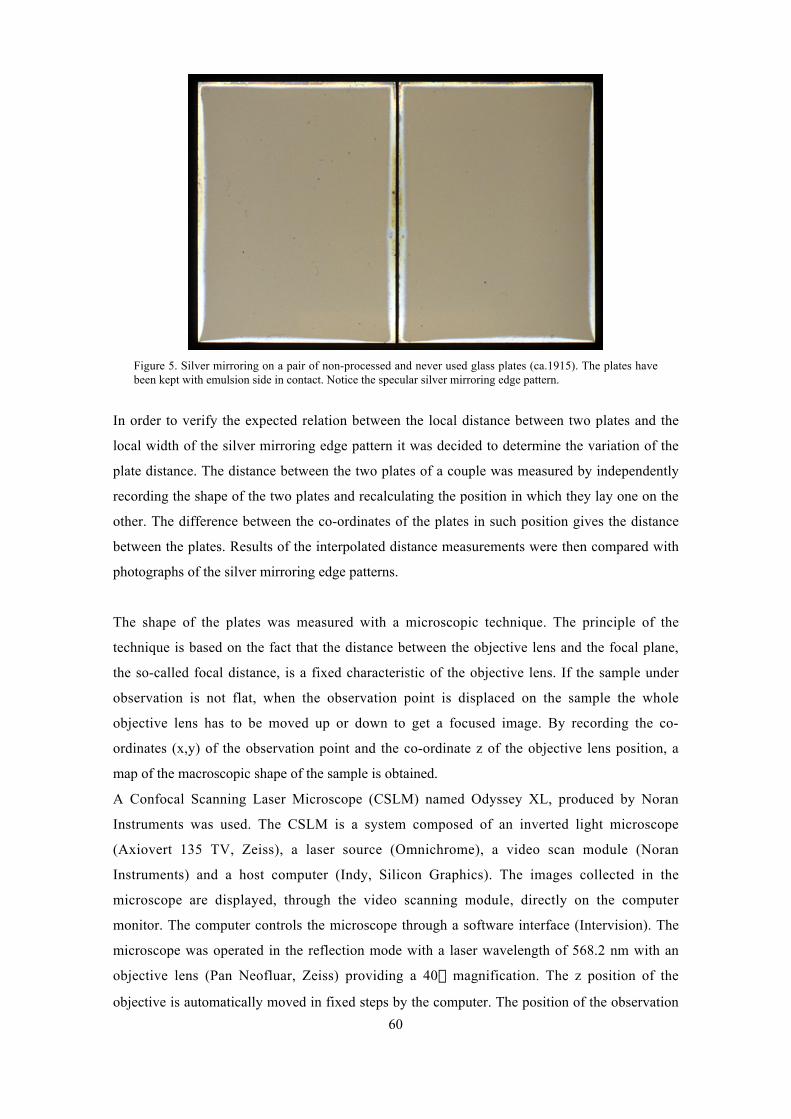
60
Figure 5. Silver mirroring on a pair of non-processed and never used glass plates (ca.1915). The plates havebeen kept with emulsion side in contact. Notice the specular silver mirroring edge pattern.
In order to verify the expected relation between the local distance between two plates and the
local width of the silver mirroring edge pattern it was decided to determine the variation of the
plate distance. The distance between the two plates of a couple was measured by independently
recording the shape of the two plates and recalculating the position in which they lay one on the
other. The difference between the co-ordinates of the plates in such position gives the distance
between the plates. Results of the interpolated distance measurements were then compared with
photographs of the silver mirroring edge patterns.
The shape of the plates was measured with a microscopic technique. The principle of the
technique is based on the fact that the distance between the objective lens and the focal plane,
the so-called focal distance, is a fixed characteristic of the objective lens. If the sample under
observation is not flat, when the observation point is displaced on the sample the whole
objective lens has to be moved up or down to get a focused image. By recording the co-
ordinates (x,y) of the observation point and the co-ordinate z of the objective lens position, a
map of the macroscopic shape of the sample is obtained.
A Confocal Scanning Laser Microscope (CSLM) named Odyssey XL, produced by Noran
Instruments was used. The CSLM is a system composed of an inverted light microscope
(Axiovert 135 TV, Zeiss), a laser source (Omnichrome), a video scan module (Noran
Instruments) and a host computer (Indy, Silicon Graphics). The images collected in the
microscope are displayed, through the video scanning module, directly on the computer
monitor. The computer controls the microscope through a software interface (Intervision). The
microscope was operated in the reflection mode with a laser wavelength of 568.2 nm with an
objective lens (Pan Neofluar, Zeiss) providing a 40¥ magnification. The z position of the
objective is automatically moved in fixed steps by the computer. The position of the observation
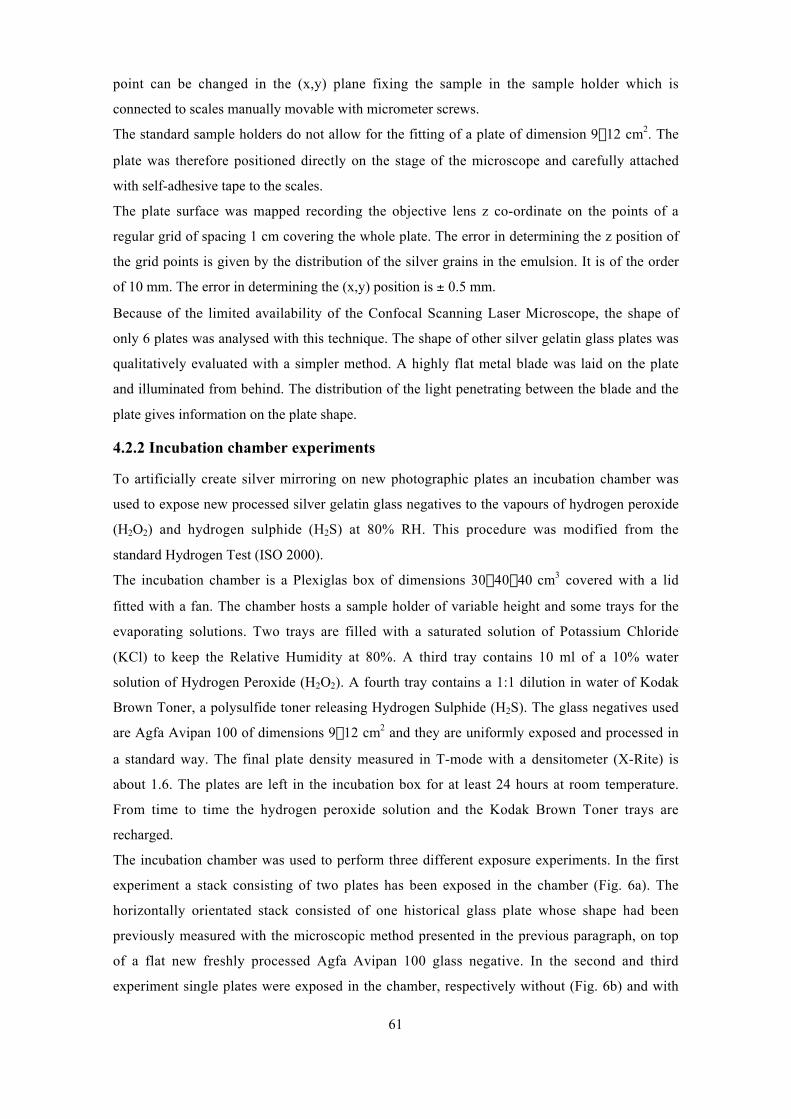
61
point can be changed in the (x,y) plane fixing the sample in the sample holder which is
connected to scales manually movable with micrometer screws.
The standard sample holders do not allow for the fitting of a plate of dimension 9¥12 cm2. The
plate was therefore positioned directly on the stage of the microscope and carefully attached
with self-adhesive tape to the scales.
The plate surface was mapped recording the objective lens z co-ordinate on the points of a
regular grid of spacing 1 cm covering the whole plate. The error in determining the z position of
the grid points is given by the distribution of the silver grains in the emulsion. It is of the order
of 10 mm. The error in determining the (x,y) position is ± 0.5 mm.
Because of the limited availability of the Confocal Scanning Laser Microscope, the shape of
only 6 plates was analysed with this technique. The shape of other silver gelatin glass plates was
qualitatively evaluated with a simpler method. A highly flat metal blade was laid on the plate
and illuminated from behind. The distribution of the light penetrating between the blade and the
plate gives information on the plate shape.
4.2.2 Incubation chamber experiments
To artificially create silver mirroring on new photographic plates an incubation chamber was
used to expose new processed silver gelatin glass negatives to the vapours of hydrogen peroxide
(H2O2) and hydrogen sulphide (H2S) at 80% RH. This procedure was modified from the
standard Hydrogen Test (ISO 2000).
The incubation chamber is a Plexiglas box of dimensions 30¥40¥40 cm3 covered with a lid
fitted with a fan. The chamber hosts a sample holder of variable height and some trays for the
evaporating solutions. Two trays are filled with a saturated solution of Potassium Chloride
(KCl) to keep the Relative Humidity at 80%. A third tray contains 10 ml of a 10% water
solution of Hydrogen Peroxide (H2O2). A fourth tray contains a 1:1 dilution in water of Kodak
Brown Toner, a polysulfide toner releasing Hydrogen Sulphide (H2S). The glass negatives used
are Agfa Avipan 100 of dimensions 9¥12 cm2 and they are uniformly exposed and processed in
a standard way. The final plate density measured in T-mode with a densitometer (X-Rite) is
about 1.6. The plates are left in the incubation box for at least 24 hours at room temperature.
From time to time the hydrogen peroxide solution and the Kodak Brown Toner trays are
recharged.
The incubation chamber was used to perform three different exposure experiments. In the first
experiment a stack consisting of two plates has been exposed in the chamber (Fig. 6a). The
horizontally orientated stack consisted of one historical glass plate whose shape had been
previously measured with the microscopic method presented in the previous paragraph, on top
of a flat new freshly processed Agfa Avipan 100 glass negative. In the second and third
experiment single plates were exposed in the chamber, respectively without (Fig. 6b) and with
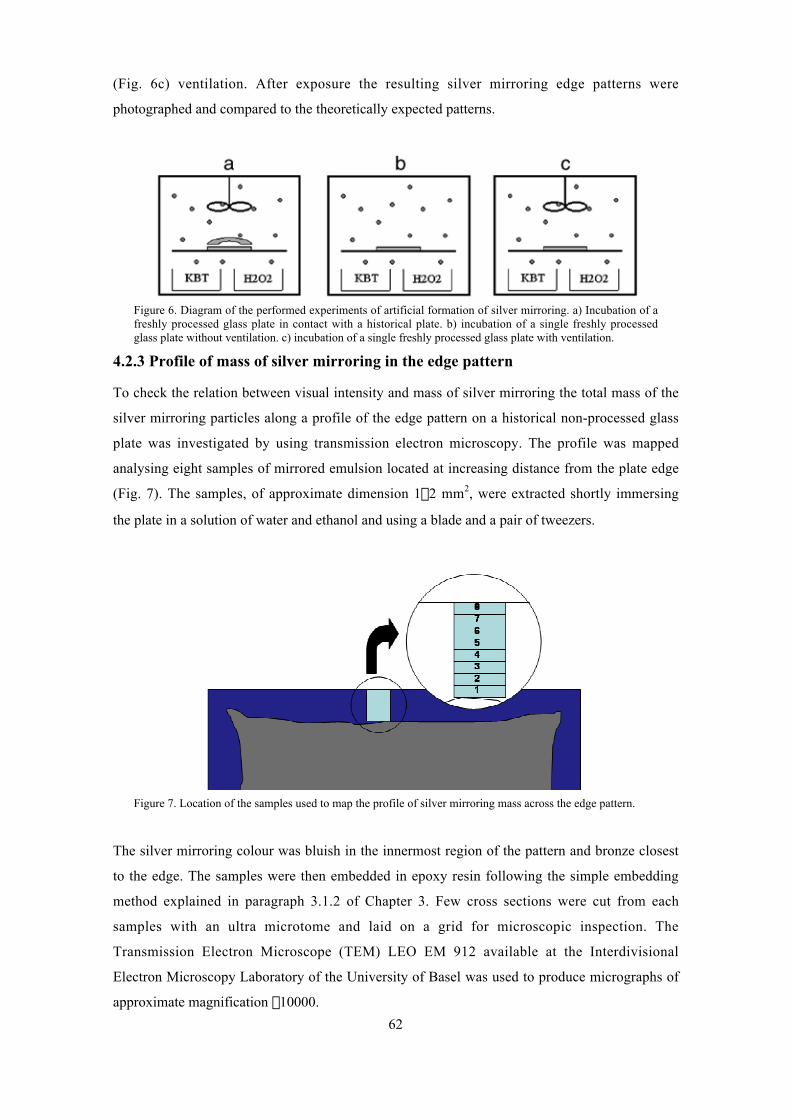
62
(Fig. 6c) ventilation. After exposure the resulting silver mirroring edge patterns were
photographed and compared to the theoretically expected patterns.
Figure 6. Diagram of the performed experiments of artificial formation of silver mirroring. a) Incubation of afreshly processed glass plate in contact with a historical plate. b) incubation of a single freshly processedglass plate without ventilation. c) incubation of a single freshly processed glass plate with ventilation.
4.2.3 Profile of mass of silver mirroring in the edge pattern
To check the relation between visual intensity and mass of silver mirroring the total mass of the
silver mirroring particles along a profile of the edge pattern on a historical non-processed glass
plate was investigated by using transmission electron microscopy. The profile was mapped
analysing eight samples of mirrored emulsion located at increasing distance from the plate edge
(Fig. 7). The samples, of approximate dimension 1¥2 mm2, were extracted shortly immersing
the plate in a solution of water and ethanol and using a blade and a pair of tweezers.
Figure 7. Location of the samples used to map the profile of silver mirroring mass across the edge pattern.
The silver mirroring colour was bluish in the innermost region of the pattern and bronze closest
to the edge. The samples were then embedded in epoxy resin following the simple embedding
method explained in paragraph 3.1.2 of Chapter 3. Few cross sections were cut from each
samples with an ultra microtome and laid on a grid for microscopic inspection. The
Transmission Electron Microscope (TEM) LEO EM 912 available at the Interdivisional
Electron Microscopy Laboratory of the University of Basel was used to produce micrographs of
approximate magnification ¥10000.
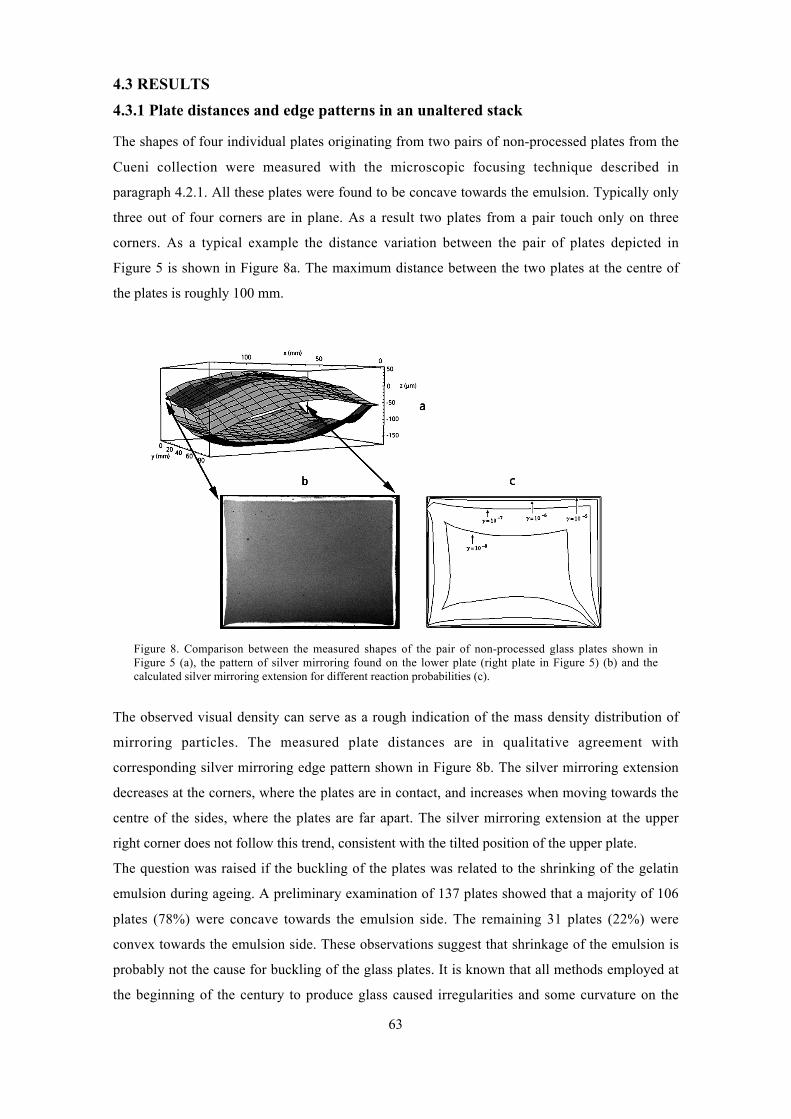
63
4.3 RESULTS
4.3.1 Plate distances and edge patterns in an unaltered stack
The shapes of four individual plates originating from two pairs of non-processed plates from the
Cueni collection were measured with the microscopic focusing technique described in
paragraph 4.2.1. All these plates were found to be concave towards the emulsion. Typically only
three out of four corners are in plane. As a result two plates from a pair touch only on three
corners. As a typical example the distance variation between the pair of plates depicted in
Figure 5 is shown in Figure 8a. The maximum distance between the two plates at the centre of
the plates is roughly 100 mm.
Figure 8. Comparison between the measured shapes of the pair of non-processed glass plates shown inFigure 5 (a), the pattern of silver mirroring found on the lower plate (right plate in Figure 5) (b) and thecalculated silver mirroring extension for different reaction probabilities (c).
The observed visual density can serve as a rough indication of the mass density distribution of
mirroring particles. The measured plate distances are in qualitative agreement with
corresponding silver mirroring edge pattern shown in Figure 8b. The silver mirroring extension
decreases at the corners, where the plates are in contact, and increases when moving towards the
centre of the sides, where the plates are far apart. The silver mirroring extension at the upper
right corner does not follow this trend, consistent with the tilted position of the upper plate.
The question was raised if the buckling of the plates was related to the shrinking of the gelatin
emulsion during ageing. A preliminary examination of 137 plates showed that a majority of 106
plates (78%) were concave towards the emulsion side. The remaining 31 plates (22%) were
convex towards the emulsion side. These observations suggest that shrinkage of the emulsion is
probably not the cause for buckling of the glass plates. It is known that all methods employed at
the beginning of the century to produce glass caused irregularities and some curvature on the
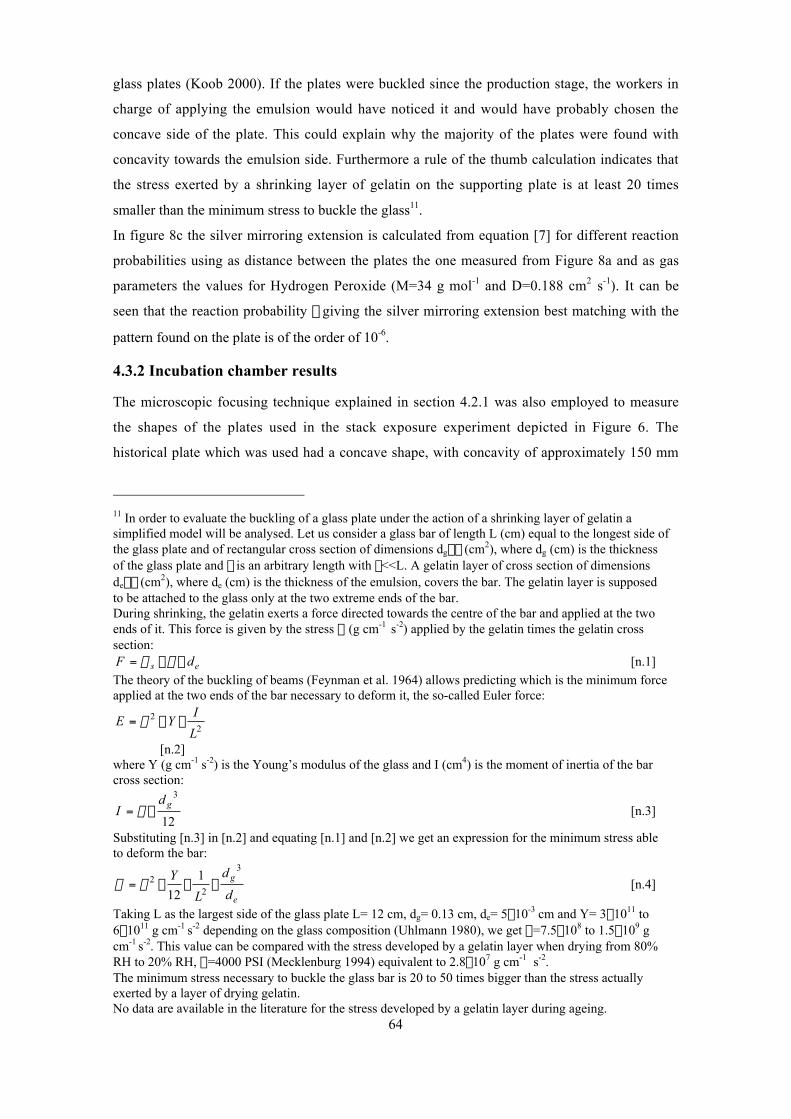
64
glass plates (Koob 2000). If the plates were buckled since the production stage, the workers in
charge of applying the emulsion would have noticed it and would have probably chosen the
concave side of the plate. This could explain why the majority of the plates were found with
concavity towards the emulsion side. Furthermore a rule of the thumb calculation indicates that
the stress exerted by a shrinking layer of gelatin on the supporting plate is at least 20 times
smaller than the minimum stress to buckle the glass11.
In figure 8c the silver mirroring extension is calculated from equation [7] for different reaction
probabilities using as distance between the plates the one measured from Figure 8a and as gas
parameters the values for Hydrogen Peroxide (M=34 g mol-1 and D=0.188 cm2 s-1). It can be
seen that the reaction probability g giving the silver mirroring extension best matching with the
pattern found on the plate is of the order of 10-6.
4.3.2 Incubation chamber results
The microscopic focusing technique explained in section 4.2.1 was also employed to measure
the shapes of the plates used in the stack exposure experiment depicted in Figure 6. The
historical plate which was used had a concave shape, with concavity of approximately 150 mm
11 In order to evaluate the buckling of a glass plate under the action of a shrinking layer of gelatin asimplified model will be analysed. Let us consider a glass bar of length L (cm) equal to the longest side ofthe glass plate and of rectangular cross section of dimensions dg¥d (cm2), where dg (cm) is the thicknessof the glass plate and d is an arbitrary length with d<<L. A gelatin layer of cross section of dimensionsde¥d (cm2), where de (cm) is the thickness of the emulsion, covers the bar. The gelatin layer is supposedto be attached to the glass only at the two extreme ends of the bar.During shrinking, the gelatin exerts a force directed towards the centre of the bar and applied at the twoends of it. This force is given by the stress s (g cm-1 s-2) applied by the gelatin times the gelatin crosssection:
es dF ¥¥= ds [n.1]
The theory of the buckling of beams (Feynman et al. 1964) allows predicting which is the minimum forceapplied at the two ends of the bar necessary to deform it, the so-called Euler force:
22
L
IYE ¥¥= p
[n.2]where Y (g cm-1 s-2) is the Young’s modulus of the glass and I (cm4) is the moment of inertia of the barcross section:
12
3gd
I ¥= d [n.3]
Substituting [n.3] in [n.2] and equating [n.1] and [n.2] we get an expression for the minimum stress ableto deform the bar:
e
g
d
d
L
Y3
22 1
12¥¥¥= ps [n.4]
Taking L as the largest side of the glass plate L= 12 cm, dg= 0.13 cm, de= 5¥10-3 cm and Y= 3¥1011 to6¥1011 g cm-1 s-2 depending on the glass composition (Uhlmann 1980), we get s=7.5¥108 to 1.5¥109 gcm-1 s-2. This value can be compared with the stress developed by a gelatin layer when drying from 80%RH to 20% RH, s=4000 PSI (Mecklenburg 1994) equivalent to 2.8¥107 g cm-1 s-2.The minimum stress necessary to buckle the glass bar is 20 to 50 times bigger than the stress actuallyexerted by a layer of drying gelatin.No data are available in the literature for the stress developed by a gelatin layer during ageing.
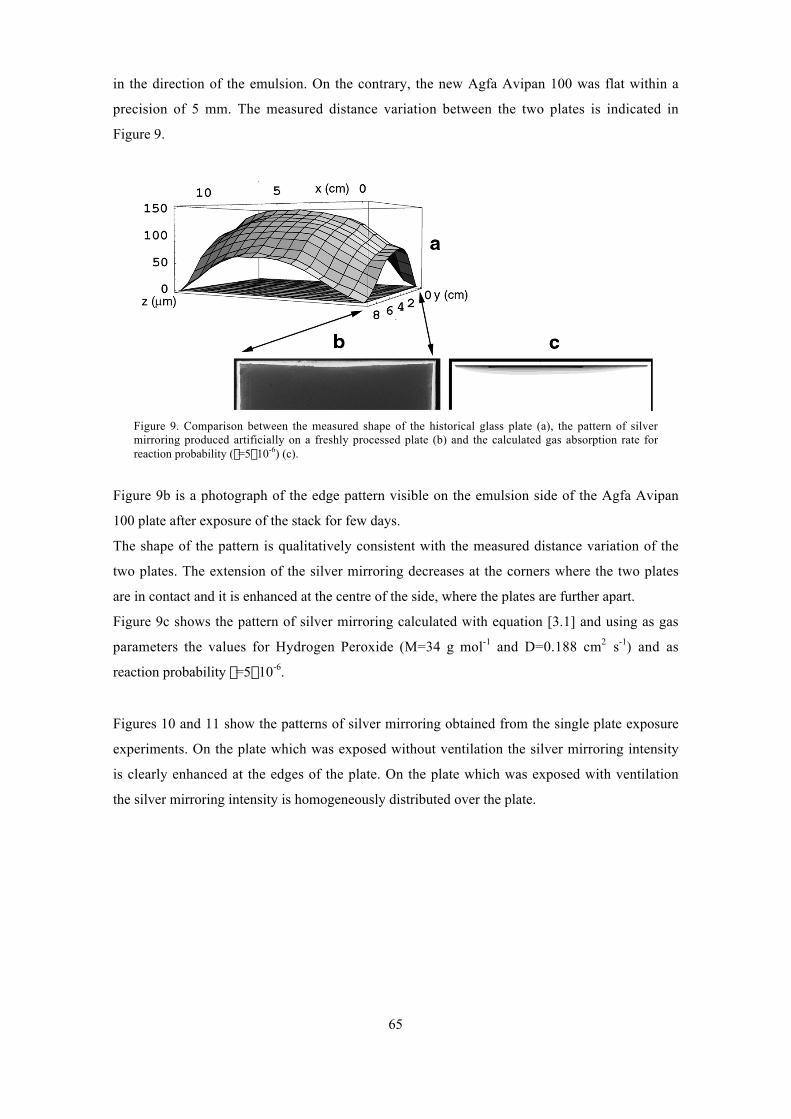
65
in the direction of the emulsion. On the contrary, the new Agfa Avipan 100 was flat within a
precision of 5 mm. The measured distance variation between the two plates is indicated in
Figure 9.
Figure 9. Comparison between the measured shape of the historical glass plate (a), the pattern of silvermirroring produced artificially on a freshly processed plate (b) and the calculated gas absorption rate forreaction probability (g=5¥10-6) (c).
Figure 9b is a photograph of the edge pattern visible on the emulsion side of the Agfa Avipan
100 plate after exposure of the stack for few days.
The shape of the pattern is qualitatively consistent with the measured distance variation of the
two plates. The extension of the silver mirroring decreases at the corners where the two plates
are in contact and it is enhanced at the centre of the side, where the plates are further apart.
Figure 9c shows the pattern of silver mirroring calculated with equation [3.1] and using as gas
parameters the values for Hydrogen Peroxide (M=34 g mol-1 and D=0.188 cm2 s-1) and as
reaction probability g=5¥10-6.
Figures 10 and 11 show the patterns of silver mirroring obtained from the single plate exposure
experiments. On the plate which was exposed without ventilation the silver mirroring intensity
is clearly enhanced at the edges of the plate. On the plate which was exposed with ventilation
the silver mirroring intensity is homogeneously distributed over the plate.
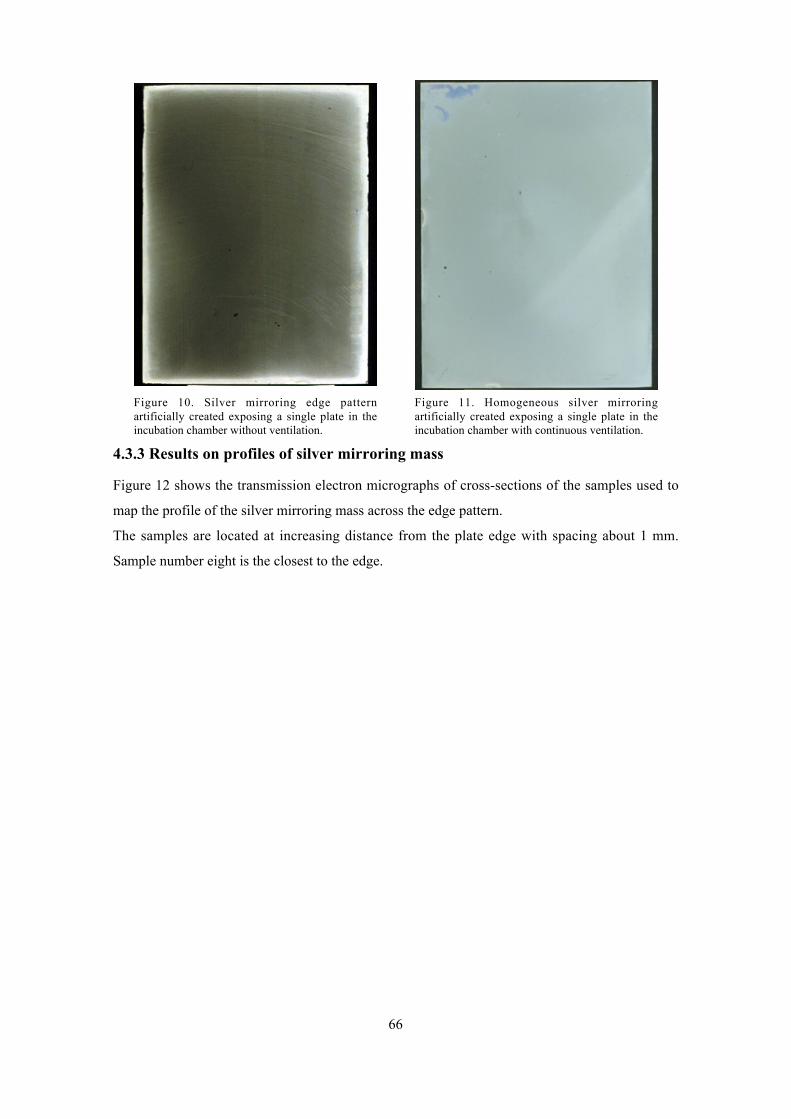
66
Figure 10. Silver mirroring edge patternartificially created exposing a single plate in theincubation chamber without ventilation.
Figure 11. Homogeneous silver mirroringartificially created exposing a single plate in theincubation chamber with continuous ventilation.
4.3.3 Results on profiles of silver mirroring mass
Figure 12 shows the transmission electron micrographs of cross-sections of the samples used to
map the profile of the silver mirroring mass across the edge pattern.
The samples are located at increasing distance from the plate edge with spacing about 1 mm.
Sample number eight is the closest to the edge.
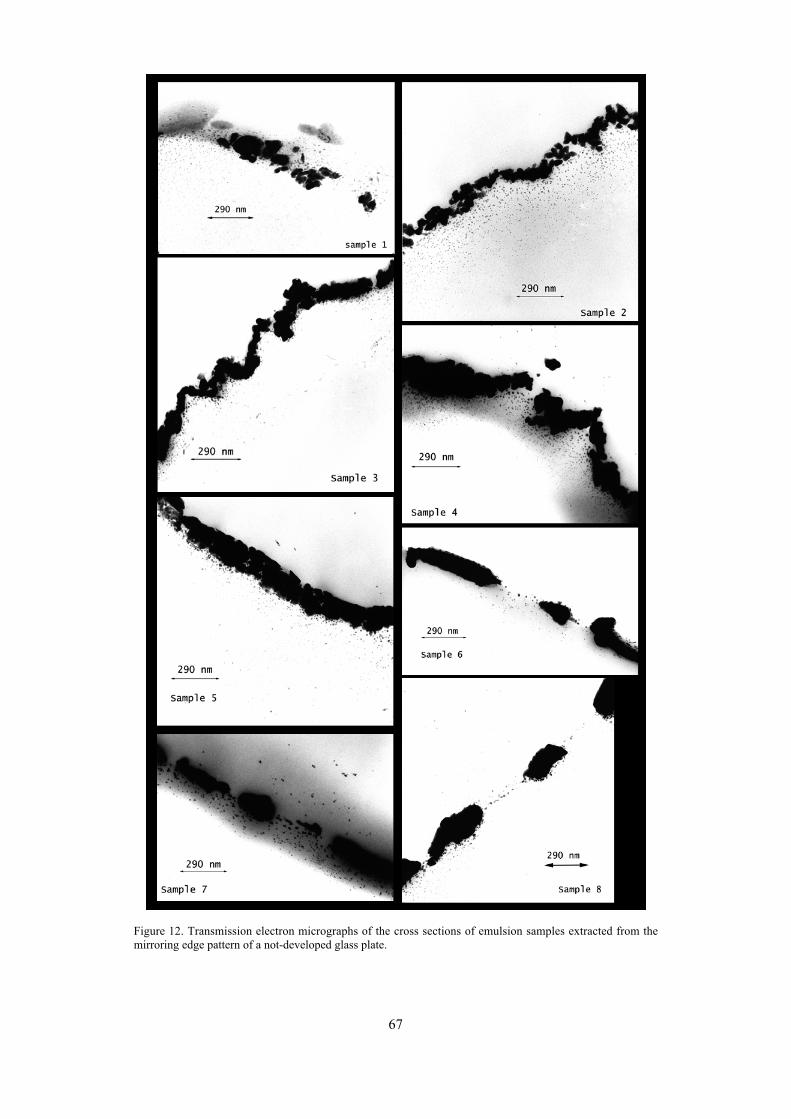
67
Figure 12. Transmission electron micrographs of the cross sections of emulsion samples extracted from themirroring edge pattern of a not-developed glass plate.
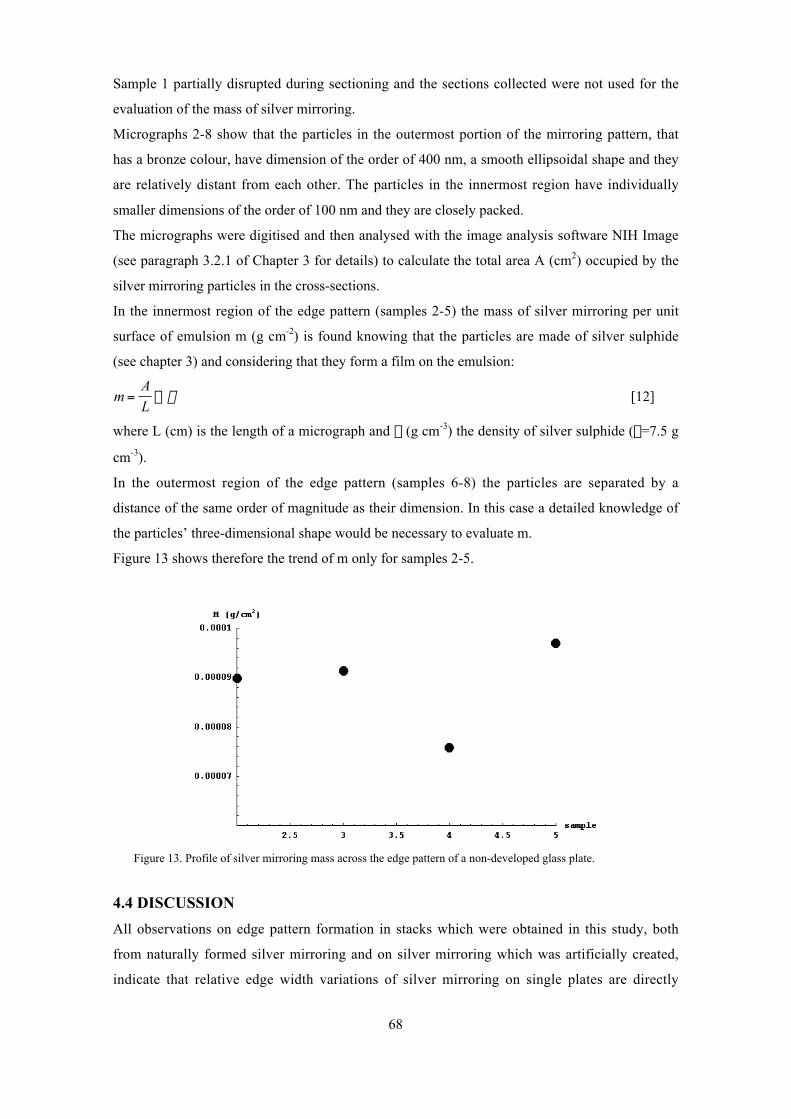
68
Sample 1 partially disrupted during sectioning and the sections collected were not used for the
evaluation of the mass of silver mirroring.
Micrographs 2-8 show that the particles in the outermost portion of the mirroring pattern, that
has a bronze colour, have dimension of the order of 400 nm, a smooth ellipsoidal shape and they
are relatively distant from each other. The particles in the innermost region have individually
smaller dimensions of the order of 100 nm and they are closely packed.
The micrographs were digitised and then analysed with the image analysis software NIH Image
(see paragraph 3.2.1 of Chapter 3 for details) to calculate the total area A (cm2) occupied by the
silver mirroring particles in the cross-sections.
In the innermost region of the edge pattern (samples 2-5) the mass of silver mirroring per unit
surface of emulsion m (g cm-2) is found knowing that the particles are made of silver sulphide
(see chapter 3) and considering that they form a film on the emulsion:
mA
L= ¥ r [12]
where L (cm) is the length of a micrograph and r (g cm-3) the density of silver sulphide (r=7.5 g
cm-3).
In the outermost region of the edge pattern (samples 6-8) the particles are separated by a
distance of the same order of magnitude as their dimension. In this case a detailed knowledge of
the particles’ three-dimensional shape would be necessary to evaluate m.
Figure 13 shows therefore the trend of m only for samples 2-5.
Figure 13. Profile of silver mirroring mass across the edge pattern of a non-developed glass plate.
4.4 DISCUSSION
All observations on edge pattern formation in stacks which were obtained in this study, both
from naturally formed silver mirroring and on silver mirroring which was artificially created,
indicate that relative edge width variations of silver mirroring on single plates are directly
69
related to the local distance between two adjacent plates. This confirms the idea that diffusion
and subsequent reaction of gases drive the formation of silver mirroring.
The pattern calculated from the theoretical gas absorption rate formula is in good agreement
with the patterns found on the real plates. The silver mirroring extension is underestimated at
the plate corners where diffusion takes place simultaneously from two sides, a situation more
complicated than the 1-dimensional model here presented.
A comparison of edge patterns from different plates shows that both artificially created patterns
and naturally formed patterns on non-processed plates are narrower, sharper and more intense
than the naturally formed patterns found on processed plates.
This difference can be explained as a result of different reaction speeds. In case of the
artificially produced patterns the reactivity is comparatively high, owing to the presence of
hydrogen peroxide, a more powerful oxidising gas than the natural organic peroxides released
by cardboard and paper. In case of non-processed plates the reactivity is high compared to
processed plates due to the presence in the emulsion of silver halide crystals instead of metallic
silver.
With the exception of the naturally formed silver mirroring on processed plates the silver
mirroring edge patterns on all other plates show a relatively even distribution of silver mirroring
with a remarkably sharp boundary. This visual observation is in agreement with the mass profile
of silver mirroring calculated across the edge pattern which is approximately constant and does
not show an exponential decrease. This confirms on one side that the distribution of the visual
intensity of silver mirroring provides a good indication of the mass distribution. On the other
side, it confirms the presence of non-exponential mass distribution profiles. It can be concluded
that, for these plates, the amount of gas reacting is not proportional to the gas concentration. The
simple exponential model that was discussed in the theory section can not describe the
phenomenon of a sharp boundary.
The results for the single plates that were freely exposed in the incubation chamber indicate that,
in absence of ventilation, an edge pattern is formed. When the air around a plate is agitated no
such edge pattern is formed. These results shows that a simple diffusion and reaction
mechanism can give rise to edge patterns on photographs freely exposed to the surrounding
atmosphere. As suggested by Nishimura (2000) the same mechanism could play a role in the
edge yellowing of photographs freely exposed to the environment.
4.5 CONCLUSIONS
The formation silver mirroring edge patterns both on single glass negatives and on stacked glass
negatives can be understood as a result of the interaction of external gases with the negatives,

70
and, precisely, of the competition between reactions, consuming the gases at the emulsion
surface and diffusion in air, transporting the gases towards the negative surface. Incubation
chamber experiments show that, in absence of ventilation, edge patterns can also arise on single
glass negatives. For stacked glass negatives the local variations of the inward extension of the
silver mirroring edge pattern are correlated to the distance between the negative and the
neighbour item in the stack. The evaluation of the mass of silver mirroring along a profile of the
edge pattern and the visual characteristics of such patterns indicate that the reaction mechanisms
involved do not obey simple first order reaction kinetics.
71
5.0 NOTES ON THE FORMATION OF INNER PATTERNS OFSILVER MIRRORING12
As shown in the first chapter a number of plates found during the surveys performed as part of
the present work have, along the usual edge pattern of silver mirroring, also peculiar inner
patterns. Inner patterns appear in a wide variety of shapes like lines, spots, irregular stains, but
their shape is often connected with the features of the enclosing material.
The hypothesis that silver mirroring is present at the contact areas of the enclosure with the
emulsion has been explored in a particular example, that is, the case of mirroring stains with
shape similar to the wrinkles of glassine envelopes.
If silver mirroring is present at the contact areas, say at the valleys of the glassine surface, it is
possible to advance the hypothesis that compounds responsible for the local formation of silver
mirroring are present in the glassines. According to the model presented in chapter 3 these
compounds can be oxidising species that convert the image silver grains in silver ions and/or
sulphur containing compounds that react with the silver ions to give silver sulphide. Where
contact with the emulsion is closest they could be transferred from the paper to the photograph,
possibly through direct solution in the emulsion.
It is important to stress that such a mechanism would explain only the formation of a certain
number of inner patterns.
Photographic conservators also report about opposite cases in which contact with the envelope
prevented the formation of silver mirroring. An interesting example appeared on the
Conservation Discussion List about mirroring patterns on cellulose nitrate negatives matching
the topographic features of the watermarks of the buffered PAT (Photographic Activity Test
(ISO 2000)) tested paper envelopes in which the negatives were stored (Shoemaker 1998).
Shoemaker reports that mirroring was present in some negatives where the emulsion was in
contact with the paper and in other negatives it was the other way around. Two hypotheses were
advanced. When mirroring is at the contact areas, the alkaline nature of the paper could have
promoted the reduction of the silver ions and therefore the formation of silver mirroring. In the
other cases, the paper could have neutralized the oxidising gas nitrogen oxide probably given
off by the negative base and could have prevented the formation of silver mirroring (Nishimura
1998).
This example is particularly interesting because it shows that the possible mechanism of
formation depends heavily on the particular case of inner pattern and that the relation between
silver mirroring and contact areas is a key factor to decide on the possible mechanisms.
Moreover, it shows that silver mirroring can be connected with “archival quality” enclosing
12 Part of this chapter was published in the paper “Di Pietro, G. and F. Ligterink. 2000. Bemerkungen zumVerwellen von Pergaminkuverts, Rundbriefe Fotografie 7 (2):13-17.
72
materials.
While it has been possible to propose a unique model explaining the formation of edge patterns
of silver mirroring, for inner patterns it is at the moment merely possible to propose models
valid in a limited number of cases.
5.1 CASE STUDY: MIRRORING STAINS RESEMBLING THE CREASES OFGLASSINE SLEEVES.
In 1998 the conservator in charge of the photographic collection of the State Archive in Bern,
Barbara Spalinger, found in the archive 7 silver gelatin glass negatives which along the common
edge pattern, presented peculiar mirroring stains located in the central portion of the plates. The
plates, of format 13 cm*18 cm, were part of the collection Schweizerische Landesausstellung, a
thematic collection on Swiss landscapes dating to the second decade of the XX century. They
were stored in heavily creased glassine envelopes and they were tightly stacked in boxes.
Judging from the condition of the paper, i.e. absence of yellow discoloration and of brittleness,
the glassine envelopes are more recent than the negatives, but no record was available in the
archive about the date of their replacement.
Glassines are a very common housing for silver gelatin glass plates due to transparency and low
cost. They are generally made from wood pulp, which is mechanically beaten to reduce the fibre
dimensions and to attain a high degree of hydration. Ethylene glycol and other additives are
usually included to increase the translucency and flexibility of the paper. In some cases the pulp
can be chemically cooked with the sulphite process. Although some newly produced glassines
passed the Photographic Activity Test, the use of glassines is rejected by the ISO standard (ISO
1991) because the degenerating paper fibres and the use of additives can cause harm to the
photographs. Moreover, two other characteristics of glassines are of concern to conservators:
their tendency to stick to the emulsion in case of very high humidity (or water damage) and their
easiness to crease under humid conditions.
A close look to the silver mirroring patterns revealed that the shape of the stains resembled
closely the shape of the glassine creases. Figure 1 shows one of these glass negatives.
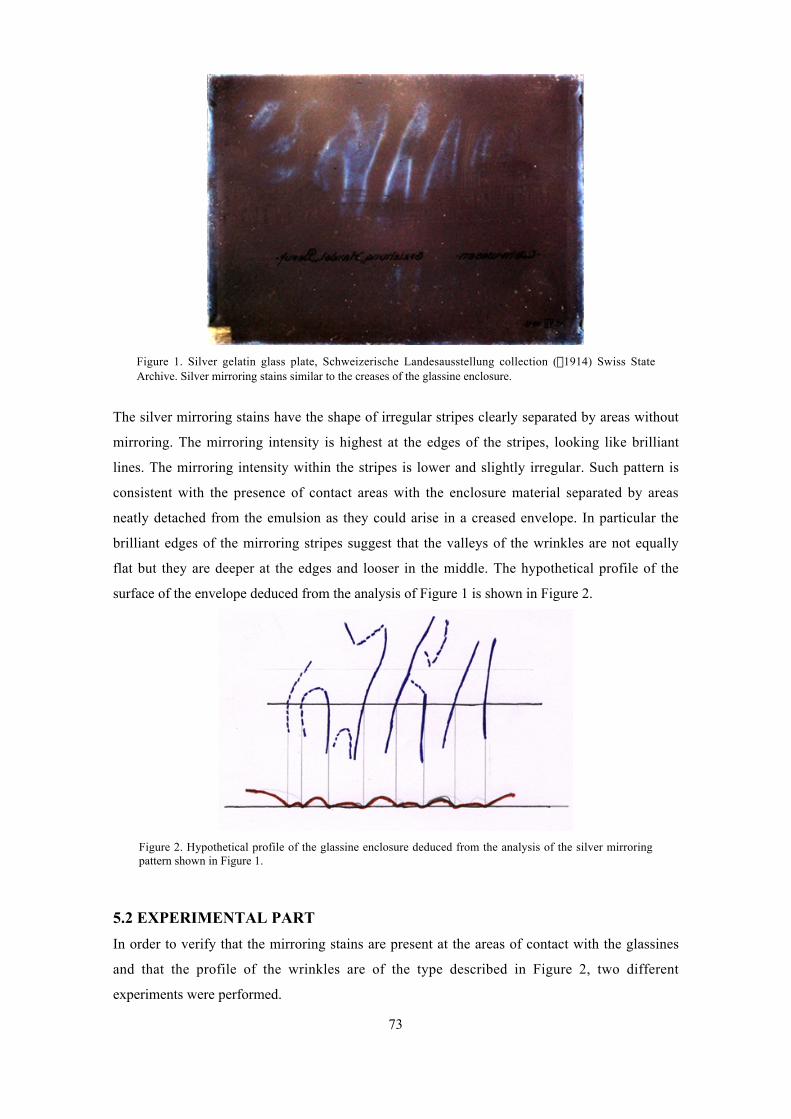
73
Figure 1. Silver gelatin glass plate, Schweizerische Landesausstellung collection (~1914) Swiss StateArchive. Silver mirroring stains similar to the creases of the glassine enclosure.
The silver mirroring stains have the shape of irregular stripes clearly separated by areas without
mirroring. The mirroring intensity is highest at the edges of the stripes, looking like brilliant
lines. The mirroring intensity within the stripes is lower and slightly irregular. Such pattern is
consistent with the presence of contact areas with the enclosure material separated by areas
neatly detached from the emulsion as they could arise in a creased envelope. In particular the
brilliant edges of the mirroring stripes suggest that the valleys of the wrinkles are not equally
flat but they are deeper at the edges and looser in the middle. The hypothetical profile of the
surface of the envelope deduced from the analysis of Figure 1 is shown in Figure 2.
Figure 2. Hypothetical profile of the glassine enclosure deduced from the analysis of the silver mirroringpattern shown in Figure 1.
5.2 EXPERIMENTAL PART
In order to verify that the mirroring stains are present at the areas of contact with the glassines
and that the profile of the wrinkles are of the type described in Figure 2, two different
experiments were performed.
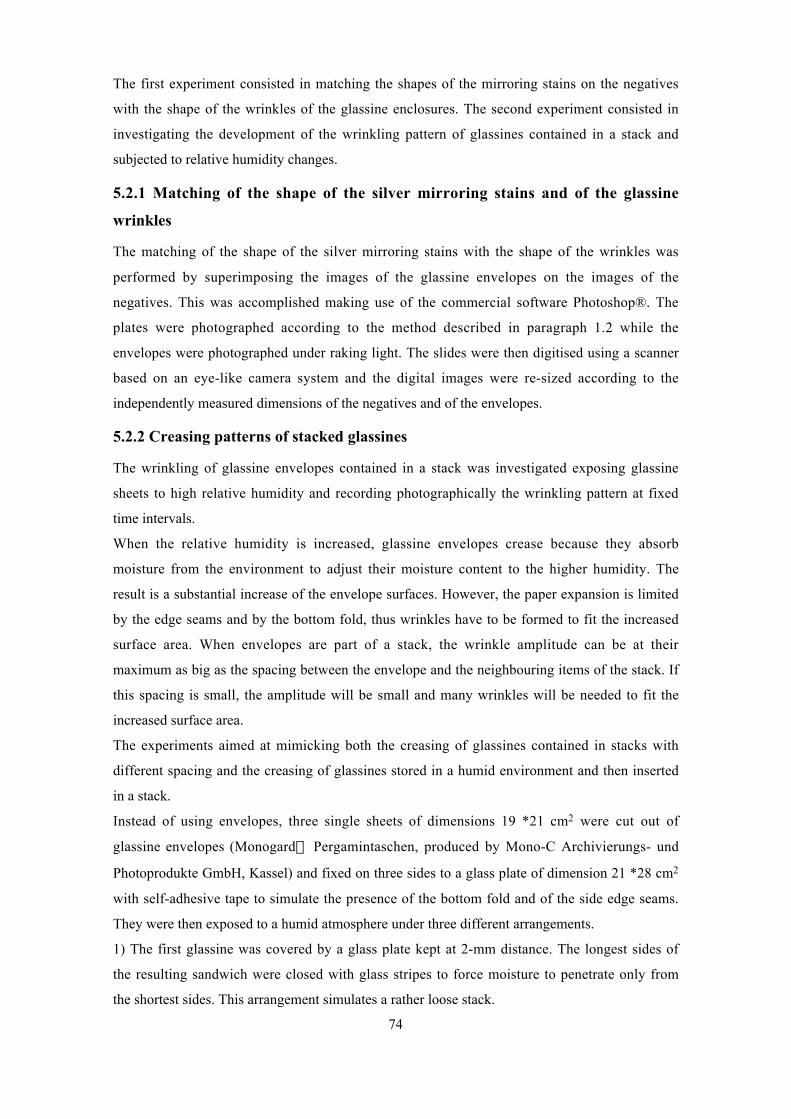
74
The first experiment consisted in matching the shapes of the mirroring stains on the negatives
with the shape of the wrinkles of the glassine enclosures. The second experiment consisted in
investigating the development of the wrinkling pattern of glassines contained in a stack and
subjected to relative humidity changes.
5.2.1 Matching of the shape of the silver mirroring stains and of the glassine
wrinkles
The matching of the shape of the silver mirroring stains with the shape of the wrinkles was
performed by superimposing the images of the glassine envelopes on the images of the
negatives. This was accomplished making use of the commercial software Photoshop®. The
plates were photographed according to the method described in paragraph 1.2 while the
envelopes were photographed under raking light. The slides were then digitised using a scanner
based on an eye-like camera system and the digital images were re-sized according to the
independently measured dimensions of the negatives and of the envelopes.
5.2.2 Creasing patterns of stacked glassines
The wrinkling of glassine envelopes contained in a stack was investigated exposing glassine
sheets to high relative humidity and recording photographically the wrinkling pattern at fixed
time intervals.
When the relative humidity is increased, glassine envelopes crease because they absorb
moisture from the environment to adjust their moisture content to the higher humidity. The
result is a substantial increase of the envelope surfaces. However, the paper expansion is limited
by the edge seams and by the bottom fold, thus wrinkles have to be formed to fit the increased
surface area. When envelopes are part of a stack, the wrinkle amplitude can be at their
maximum as big as the spacing between the envelope and the neighbouring items of the stack. If
this spacing is small, the amplitude will be small and many wrinkles will be needed to fit the
increased surface area.
The experiments aimed at mimicking both the creasing of glassines contained in stacks with
different spacing and the creasing of glassines stored in a humid environment and then inserted
in a stack.
Instead of using envelopes, three single sheets of dimensions 19 *21 cm2 were cut out of
glassine envelopes (Monogard“ Pergamintaschen, produced by Mono-C Archivierungs- und
Photoprodukte GmbH, Kassel) and fixed on three sides to a glass plate of dimension 21 *28 cm2
with self-adhesive tape to simulate the presence of the bottom fold and of the side edge seams.
They were then exposed to a humid atmosphere under three different arrangements.
1) The first glassine was covered by a glass plate kept at 2-mm distance. The longest sides of
the resulting sandwich were closed with glass stripes to force moisture to penetrate only from
the shortest sides. This arrangement simulates a rather loose stack.
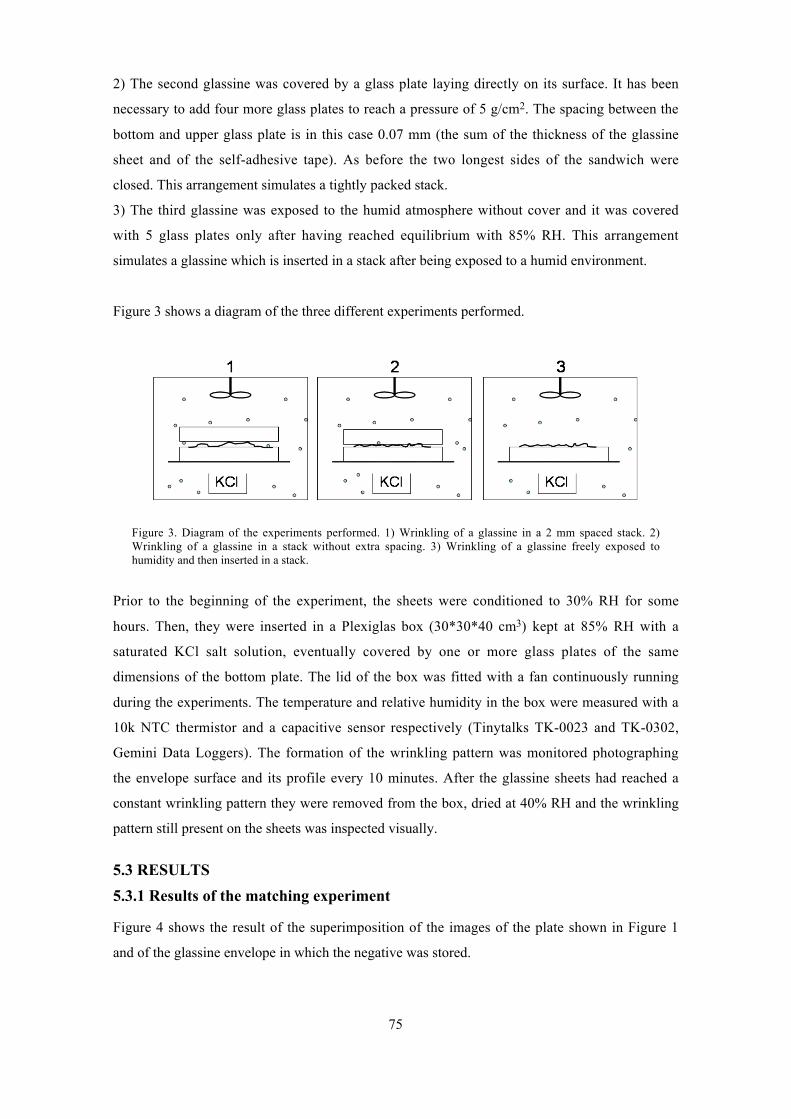
75
2) The second glassine was covered by a glass plate laying directly on its surface. It has been
necessary to add four more glass plates to reach a pressure of 5 g/cm2. The spacing between the
bottom and upper glass plate is in this case 0.07 mm (the sum of the thickness of the glassine
sheet and of the self-adhesive tape). As before the two longest sides of the sandwich were
closed. This arrangement simulates a tightly packed stack.
3) The third glassine was exposed to the humid atmosphere without cover and it was covered
with 5 glass plates only after having reached equilibrium with 85% RH. This arrangement
simulates a glassine which is inserted in a stack after being exposed to a humid environment.
Figure 3 shows a diagram of the three different experiments performed.
Figure 3. Diagram of the experiments performed. 1) Wrinkling of a glassine in a 2 mm spaced stack. 2)Wrinkling of a glassine in a stack without extra spacing. 3) Wrinkling of a glassine freely exposed tohumidity and then inserted in a stack.
Prior to the beginning of the experiment, the sheets were conditioned to 30% RH for some
hours. Then, they were inserted in a Plexiglas box (30*30*40 cm3) kept at 85% RH with a
saturated KCl salt solution, eventually covered by one or more glass plates of the same
dimensions of the bottom plate. The lid of the box was fitted with a fan continuously running
during the experiments. The temperature and relative humidity in the box were measured with a
10k NTC thermistor and a capacitive sensor respectively (Tinytalks TK-0023 and TK-0302,
Gemini Data Loggers). The formation of the wrinkling pattern was monitored photographing
the envelope surface and its profile every 10 minutes. After the glassine sheets had reached a
constant wrinkling pattern they were removed from the box, dried at 40% RH and the wrinkling
pattern still present on the sheets was inspected visually.
5.3 RESULTS
5.3.1 Results of the matching experiment
Figure 4 shows the result of the superimposition of the images of the plate shown in Figure 1
and of the glassine envelope in which the negative was stored.
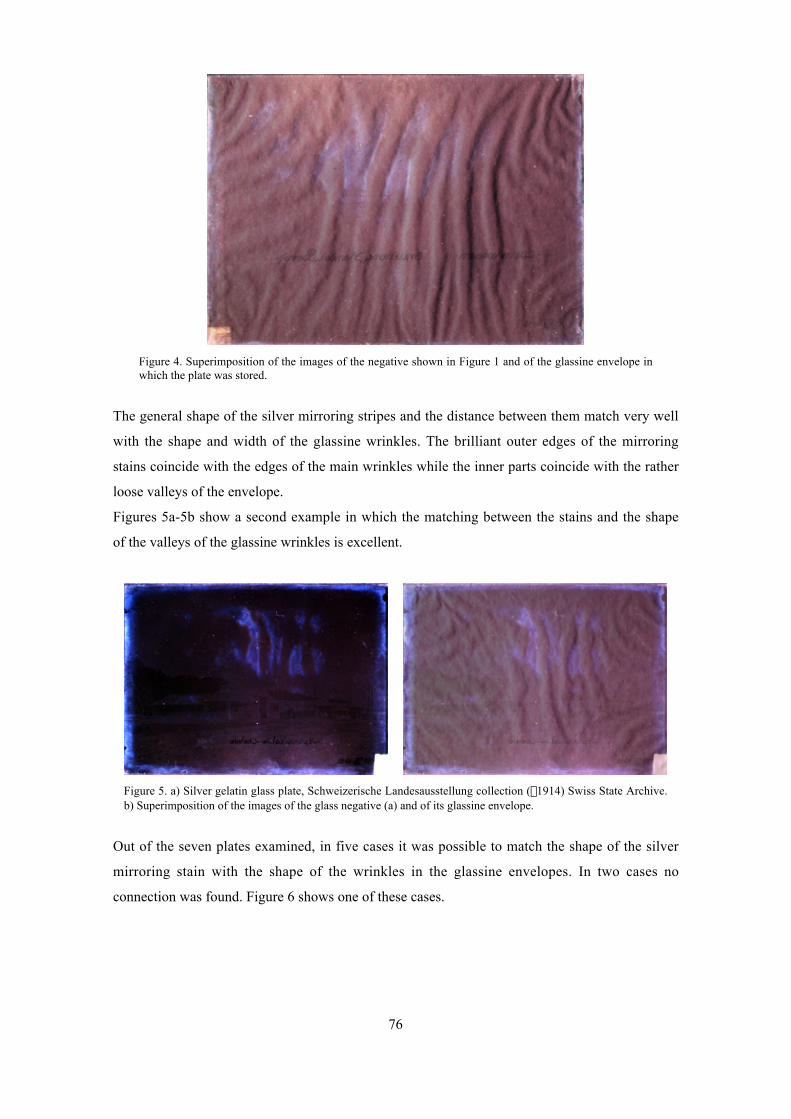
76
Figure 4. Superimposition of the images of the negative shown in Figure 1 and of the glassine envelope inwhich the plate was stored.
The general shape of the silver mirroring stripes and the distance between them match very well
with the shape and width of the glassine wrinkles. The brilliant outer edges of the mirroring
stains coincide with the edges of the main wrinkles while the inner parts coincide with the rather
loose valleys of the envelope.
Figures 5a-5b show a second example in which the matching between the stains and the shape
of the valleys of the glassine wrinkles is excellent.
Figure 5. a) Silver gelatin glass plate, Schweizerische Landesausstellung collection (~1914) Swiss State Archive.b) Superimposition of the images of the glass negative (a) and of its glassine envelope.
Out of the seven plates examined, in five cases it was possible to match the shape of the silver
mirroring stain with the shape of the wrinkles in the glassine envelopes. In two cases no
connection was found. Figure 6 shows one of these cases.

77
Figure 6. a) Silver gelatin glass plate, Schweizerische Landesausstellung collection (~1914) Swiss State Archive.b) The glassine envelope in which the plate a) was stored.
The images of the seven negatives of the Schweizerische Landesasusstelung with their
envelopes are recorded in the CD-rom included in this work.
5.3.2 Results of the creasing experiment
Figures 7a-7d show the development of the wrinkles on the glassine sheet subjected to the first
experiment. The final wrinkles were formed in about 90 minutes and had an average width of 2
cm and a length of 19 cm, equal to the sheet length. The inspection of the sheet profile showed
that the wrinkles had a hill-like profile.
Figure 7. Wrinkle formation on the sheet subjected to experiment 1). a) at the starting of the experiment, b) at t=30 min., c) at t= 60 min, d) at t= 120 min.
Figures 8a-8c show the development of the wrinkles on the glassine subjected to the second
experiment. In spite of the pressure of 5 g/cm2 applied on the sheet, exposure to high RH
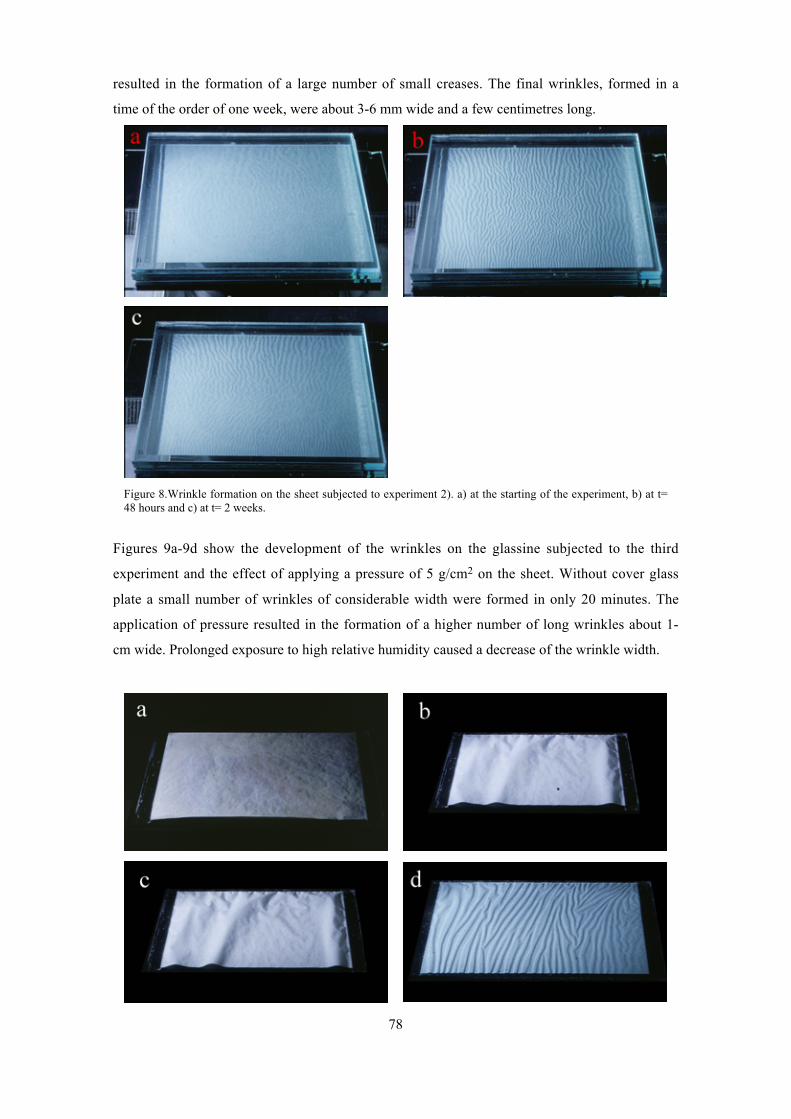
78
resulted in the formation of a large number of small creases. The final wrinkles, formed in a
time of the order of one week, were about 3-6 mm wide and a few centimetres long.
Figure 8.Wrinkle formation on the sheet subjected to experiment 2). a) at the starting of the experiment, b) at t=48 hours and c) at t= 2 weeks.
Figures 9a-9d show the development of the wrinkles on the glassine subjected to the third
experiment and the effect of applying a pressure of 5 g/cm2 on the sheet. Without cover glass
plate a small number of wrinkles of considerable width were formed in only 20 minutes. The
application of pressure resulted in the formation of a higher number of long wrinkles about 1-
cm wide. Prolonged exposure to high relative humidity caused a decrease of the wrinkle width.
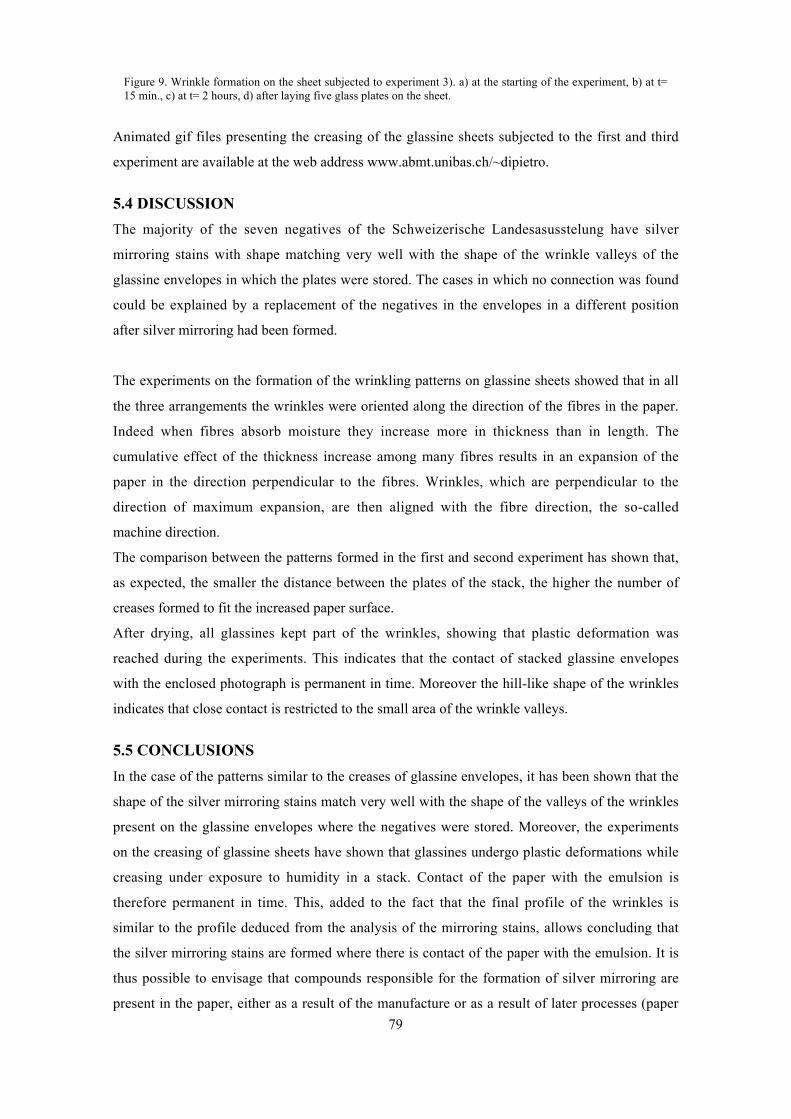
79
Figure 9. Wrinkle formation on the sheet subjected to experiment 3). a) at the starting of the experiment, b) at t=15 min., c) at t= 2 hours, d) after laying five glass plates on the sheet.
Animated gif files presenting the creasing of the glassine sheets subjected to the first and third
experiment are available at the web address www.abmt.unibas.ch/~dipietro.
5.4 DISCUSSION
The majority of the seven negatives of the Schweizerische Landesasusstelung have silver
mirroring stains with shape matching very well with the shape of the wrinkle valleys of the
glassine envelopes in which the plates were stored. The cases in which no connection was found
could be explained by a replacement of the negatives in the envelopes in a different position
after silver mirroring had been formed.
The experiments on the formation of the wrinkling patterns on glassine sheets showed that in all
the three arrangements the wrinkles were oriented along the direction of the fibres in the paper.
Indeed when fibres absorb moisture they increase more in thickness than in length. The
cumulative effect of the thickness increase among many fibres results in an expansion of the
paper in the direction perpendicular to the fibres. Wrinkles, which are perpendicular to the
direction of maximum expansion, are then aligned with the fibre direction, the so-called
machine direction.
The comparison between the patterns formed in the first and second experiment has shown that,
as expected, the smaller the distance between the plates of the stack, the higher the number of
creases formed to fit the increased paper surface.
After drying, all glassines kept part of the wrinkles, showing that plastic deformation was
reached during the experiments. This indicates that the contact of stacked glassine envelopes
with the enclosed photograph is permanent in time. Moreover the hill-like shape of the wrinkles
indicates that close contact is restricted to the small area of the wrinkle valleys.
5.5 CONCLUSIONS
In the case of the patterns similar to the creases of glassine envelopes, it has been shown that the
shape of the silver mirroring stains match very well with the shape of the valleys of the wrinkles
present on the glassine envelopes where the negatives were stored. Moreover, the experiments
on the creasing of glassine sheets have shown that glassines undergo plastic deformations while
creasing under exposure to humidity in a stack. Contact of the paper with the emulsion is
therefore permanent in time. This, added to the fact that the final profile of the wrinkles is
similar to the profile deduced from the analysis of the mirroring stains, allows concluding that
the silver mirroring stains are formed where there is contact of the paper with the emulsion. It is
thus possible to envisage that compounds responsible for the formation of silver mirroring are
present in the paper, either as a result of the manufacture or as a result of later processes (paper
80
degradation or absorption of gases from the surrounding environment). These compounds are
then transferred from the paper to the emulsion where the contact is the closest. The formation
of silver mirroring would then proceed following the model discussed in Chapter 3.
The hypothesis that inner patterns are formed at the contact points of the emulsion with the
enclosure materials can explain also the cases of silver mirroring lines shown in Figures 14 and
19 of Chapter 1. Nevertheless, contrary to the widespread edge patterns, it is not possible to
formulate a unique model explaining the formation of the many inner patterns of silver
mirroring which are likely to be found on silver gelatin glass negatives. The cases of mirroring
spots (Figures 16, 17 and 18 of Chapter 1), mirroring surrounding the areas where retouching
medium was applied (Figure 22 of Chapter 1), have to be individually investigated.
81
6.0 CONCLUSIONS
This work has shown that the silver mirroring often found on silver gelatin glass negatives,
which is microscopically formed of a layer of particles located at the emulsion top surface, is
composed of silver sulphide. The spherical shape and the size of the particles found beneath this
layer, added to theoretical calculations on the diffusion constant of ions and particles in the
gelatin under typical archive conditions, has prompted to propose some modifications to the
local physical-chemical model for silver mirroring formation. According to these modifications,
silver mirroring is the result of the diffusion of silver ions in the emulsion, diffusion driven by
the gradient of silver ion concentration between the areas closest to the oxidised image silver
grains and the emulsion bulk, and of the reaction of these ions with external sulphur containing
compounds, as for example the gas hydrogen sulphide. Particles are formed at the emulsion top
surface because this is the area where the reactants first meet, added to the low solubility of
hydrogen sulphide. The relevant difference of size between the particles found at the very
emulsion surface and the particles beneath is explained by the reduced availability, within the
emulsion, of the external reactant. This is due to the filling up of the surface by the particles
which are directly exposed to the environment.
The investigation of the silver mirroring patterns, subject neglected in the past, has brought
relevant information on the mechanism of silver mirroring formation and has revealed that
patterns are intimately connected with the way in which the negatives are stored.
The usual and widespread edge pattern of silver mirroring on historical silver gelatin glass
negatives, usually stored in stacks, is due to the diffusion and reaction of gases, as for example
hydrogen peroxide and hydrogen sulphide, between the items of the stack. The detailed shape of
the edge pattern is related to the local distance between the negatives in the stack and to the
reaction probability of the gases with the emulsion. It has been shown that the higher is the
distance between the negatives, the bigger is the extension of the silver mirroring edge pattern.
Variations of the edge pattern extension within a negative are therefore due to the buckled shape
of the glass plates.
In the course of the investigation it was found that edge patterns can arise also on negatives
which are freely exposed to the environment. Also in this case the pattern is due to the diffusion
and reaction of gases with the emulsion. It has been shown, by solving a mathematical model of
diffusion and reaction for plates exposed to gases under this arrangement, that, in absence of
ventilation, the amount of gas reacting with the emulsion is higher at the negative edges than at
the negative centre. This phenomenon is similar to the common edge yellowing of displayed
photographic prints.
Silver mirroring is also sometimes present on silver gelatin glass negatives with peculiar inner
patterns. Inner patterns present larger variation than edge patterns and it has not been possible to
82
develop a unique model explaining their formation. Nevertheless, the close observation of the
inner patterns of silver mirroring suggests that their shape is often related to the material directly
in contact with the emulsion. In the case of the negatives belonging to the Schweizerische
Landesausstellung Collection (Bern State Archive) with mirroring stains with shapes resembling
the creases of the glassine envelopes in which they were stored, it has been shown that silver
mirroring is formed at the contact areas of the paper with the emulsion. Glassine papers crease
when exposed to high humidity even if they are subjected to relevant pressure as the pressure
present in a stack of negatives. In this case the glassine envelopes undergo plastic deformations
resulting in a permanent contact of the paper with the emulsion. It has been proposed that
compounds present in the paper and potentially responsible for the formation of silver
mirroring, as peroxides and sulphur containing compounds, can be transferred from the paper to
the emulsion at the contact areas and give rise to silver mirroring according to the local
physical-chemical mechanism proposed above.
Modern photographs with silver based emulsions suffer much less of silver mirroring
degradation than historical photographs. This is due to the higher degree of hardening of
modern emulsions, to the usual presence of protective layers covering the emulsion and to the
better quality of modern storage materials. Another possibility to efficiently prevent the
formation of silver mirroring on modern materials is to convert the image silver grains in more
stable particles, as silver sulphide or gold particles, a process which is called in photography
toning.
Obviously it is not possible to apply these treatments on historical photographs. In this case it is
very important to limit the amount of potentially harmful compounds, as peroxides and sulphur
based compounds, both in the environment and in the material directly in contact with the
emulsion. Nevertheless it is very difficult to assess the maximum allowable level to prevent
silver mirroring degradation. Consider a silver based photograph, for example a silver gelatin
glass plate, exposed to an environment containing a certain amount of oxidising and sulphur
compounds, possibly given off by the degradation of other materials. The rate of silver
mirroring formation will depend on the balance between the rate at which the polluting
compounds are produced (e.g. the degradation rate of cellulosic materials), the rate of diffusion
of these compounds to the photograph and the rate of reaction with the silver in the emulsion. In
this work it has been shown that the diffusion rates, which depend on the particular arrangement
of the photograph in the space, are in many cases relatively easy to be modelled. Screening the
diffusion of external compounds to the photograph is obviously an efficient way to prevent
silver mirroring degradation. The bottleneck in the rate of silver mirroring formation could, on
the other hand, also reside in the rate of production of the pollutants, e.g. in the rate of
degradation of cellulosic materials, or in the rate of reaction with the emulsion. On the one hand
83
the rate of degradation of cellulosic materials is still subject to research, on the other hand this
work, and precisely the improvements to the oxidation-migration-re-aggregation model
proposed in Chapter 3, still fail to predict the rate of local silver mirroring formation. The rates
of the reactions involved in the model were not defined. Nevertheless it was shown that the rates
of diffusion of the external compounds into the emulsion and of the silver ions in the emulsion
are negligible in comparison with the rates of silver mirroring formation reported in the
literature (of the order of months).
Often the question asked by conservators is the effect of relative humidity and temperature
changes on the rate of silver mirroring formation. Based on data found in the literature, it has
been shown that the amount of external pollutants dissolved in the emulsion increases of a
factor 2 when the relative humidity changes from 20% to 80%. The rate of diffusion of these
compounds into the gelatin is expected to show a smaller variation for the same change of
relative humidity. Temperature changes will probably affect the rate of the reactions involved. It
is nevertheless hard to say if changes of this order of magnitude are of any relevance for the
total rate of silver mirroring formation. Indeed, on the one hand, a more precise theoretical and
experimental knowledge of the reactions involved in the mechanism of silver mirroring
formation, in real photographs and not in model systems, is needed, and, on the other hand, also
the rates of pollutant production and of pollutant diffusion have to be evaluated as well.
84
REFERENCES
Adelstein, P.Z. et al. 1997. Moisture relationships of photographic film. Journal of the american
institute of conservation 36:193-206.
Ammann-Brass, H. and J. Pouradier, eds. 1989. Photographic gelatin: proceedings of the fifth
IAG conference, held in Fribourg, September 1988. Fribourg.
Atkins P.W. 1990. Physical chemistry, 4th edition. Oxford: Oxford University Press.
Barger, M. S. and T. T. Hill. 1988. Thiourea and ammonium thiosulfate treatments for the
removal of "silvering" from aged negative materials. Journal of Imaging Technology 14 (2):43-
46.
Belloni, J. et al. 1991. Quantum size effects and photographic development. Journal of imaging
science 35: 68-74.
Bennett, H. E. et al. 1969. Formation and growth of tarnish on evaporated silver films. Journal
of applied physics 40 (8):3351-3360.
Bethe, H. A. 1930. Zur Theorie des Durchgangs schneller Korpuskularstrahlen durch Materie,
Annalen der Physik 5: 325.
Brandt, E. S. 1987. Mechanistic studies of image stability. 3. Oxidation of silver from the
vantage point of corrosion theory. Journal of imaging science 31 (5):199-207.
British Journal of Photography. 1901. The permanency of toned bromide prints. The British
Journal of Photography January 18: 39.
British Journal of Photography. 1918. Degrees of permanence in photographic prints. The
British Journal of Photography February 15: 74-76.
British Journal of Photography. 1920. Bloom on negatives and prints. The British Journal of
Photography July 30: 462.
British Journal of Photography. 1922. Bloom on negatives and prints. The British Journal of
Photography August 25: 502-503.
85
British Journal of Photography. 1982a. The deterioration of gelatin plates. The British Journal
of Photography November 12: 1206.
British Journal of Photography. 1982b. Negatives on uneven glass. The British Journal of
Photography December 24: 1396.
Crank, J. 1975. The mathematics of diffusion. Oxford: Oxford University Press.
Curtis, N. and D. G. Leaist. 1998. Interdiffusion of acqueus silver nitrate and potassium
chromate and the periodic precipitation of silver chromate lisegang bands. Berichte der Bunsen-
Gesellschaft fuer Physikalische Chemie 102 (2): 164-176.
Eder, J. M. 1903. Ausführliches Handbuch der Photographie. Vol. 3, Die Photographie mit
Bromsilber-Gelatine und Chlorsilber-Gelatine. Halle a.S: Knapp.
Eggert, J. 1947. Zur katalytischen Abscheidung von Silber. Helvetica Chimica Acta 30: 2114-
2119.
Feldman, L. H. 1981. Discoloration of black and white photographic prints. Journal of Applied
Photographic Engineering 7 (1):1-9.
Feynman, R. P. et al. 1965. The Feynman lectures on physics, vol. 2, chapter 38. Reading,
Massachusetts: Addison-Wesley.
Fogg, P. G. T. and W. Gennard. 1991. Solubility of gases in liquids. New York: John Wiley &
Sons.
Franey, J. P. et al. 1985. The corrosion of silver by atmospheric sulfurous gases. Corrosion
Science 25(2): 133-143.
Gillet M., et al. 1986. Glass plate negatives, preservation and restoration. Restaurator 7 (2):49-
80.
Graedel, T. E. et al. 1985. On the mechanism of silver and copper sulfidation by atmospheric
H2S and OCS. Corrosion Science 25(12):1163-1180.
86
Grunthaner, F. J. 1987. Fundamentals of X-ray Photoemission Spectroscopy. MRS Bulletin, 12
(6):60-64.
Haist, G. 1979. Modern photographic processing. New York: John Wiley & Sons.
Hammond, J. S. et al. 1975. X-ray photoelectron spectroscopy studies of cadmium-oxygen and
silver-oxygen surfaces. Analytical Chemistry 47:2193-2199.
Hayat, M. Arif. 2000. Principles and techniques of electron microscopy. Cambridge: Cambridge
University Press.
Hendriks, K. B. 1984. The preservation and restoration of photographic materials in archives
and libraries: a RAMP study with guidelines. Paris: Records and Archives Management
Program, UNESCO.
Hendriks, K. B. and L. Ross. 1988. The restoration of discoloured black and white photographic
images in chemical solutions. AIC preprints. American Institute for Conservation 6th Annual
Meeting. New Orleans. Lousiana: AIC. 97-117.
Hendriks, K. B. 1989. The stability and preservation of recorded images. In Imaging processes
and materials, Neblette’s eight edition, ed. J. Sturge et al. New York: Van Nostrand Reinhold.
637-684.
Hendriks, K. B. 1991a. On the mechanism of image silver degradation. In Sauvegarde et
conservation des photographies, dessins, imprimés et manuscrits. Actes des journées
internationales d’études de l’ARSAG, Paris 30 sept.-4 oct. 1991. ARSAG.73-77.
Hendriks, K. B. et al. 1991b. Fundamentals of photograph conservation: a study guide.
Toronto: Lugus publications.
Henglein, A. 1993. Physicochemical properties of small metal particles in solution:
microelectrode reactions, chemisorption, composite metal particles and the atom-to-metal
transition. Journal of Physical Chemistry 97:5457-5471.
Henn, R. W. and D. G. Wiest. 1963. Microscopic spots in processed microfilms: their nature
and prevention. Photographic Science and Engineering 7 (5): 253-261.
87
Hermans, J. J. 1947. Diffusion with discontinuous boundary. Journal of Colloid Science 2:387-
398.
ISO 1991. Photography – Processed photographic materials – Filing enclosure for
storage.10214. Geneva: International Organization for Standardization.
ISO 2000. Imaging materials -- Methods for the evaluation of the effectiveness of chemical
conversion of silver images against oxidation. 18915. Geneva: International Organization for
Standardization.
Iwano, H. 1972. The penetration rate of photographic chemicals into gelatin layers and into
emulsion layers under development. The Journal of Photographic Science, 20:135-142.
James, T. H. 1939. The reduction of silver ions by hydroquinone. The Journal of the American
Chemical Society, 61: 648-652.
James, T. H. 1939. The reduction of silver ions by hydroxylamine. The Journal of the American
Chemical Society, 61: 2379-2383.
Jahr, R. 1930. Handbuch der wissenschaftlichen und angewandten Photographie. Vol. 4, Die
Fabrikation der photographischen Trockenplatten. Wien: Verlag von Julius Springer.
Kejser, U. B. 1995. Examination of photographs with TEM-sample preparation and
interpretation of the image. In Research techniques in photographic conservation, Proceedings
of the Conference held in Copenhagen 14-19 may 1995. Copenhagen: The Royal Danish
Academy of Fine Arts. 41-45.
Kieser, K. 1933. Ein Beitrag zur Haltbarkeit photographischer Trockenplatten. Photographische
Industrie 1933: 276.
Koob, S. 2000. Personal communication. The Corning Museum of Glass, One Museum way,
Corning, NY 14830.
Landau L. D., and E. M. Lifshitz. 1960. Electrodynamics of continuous media. Oxford.
Pergamon Press. Pag.27.
Lavedrine, B. 1991. Les Aristotypes. In Les documents graphiques et photographiques. Paris:
88
Archives Nationales. 149-219.
Lawes, G. 1987. Scanning Electron Microscopy and X-ray Microanalysis. London: John Wiley
& Sons.
Levenson, G. I. P. and P. J. Twist. 1973. The reduction of silver ions on nuclei by
hydroquinone. The Journal of Photographic Science 21: 211-219.
Lilienfeld, S. and C. E. White. 1930. A study on the reaction between hydrogen sulfide and
silver. Journal of the American Chemical Society 52: 885-892.
Luzecky, T. and I. Brückle. 1999. Immediate and long-term effects of the treatment of silver
mirroring on the surface of photographs. Topics in photographic preservation 8:31-43.
Marraccini, L. M. and T. N. Kleinert.1962. Spectrometric estimation of peroxide in cellulosic
materials. Svensk Papperstidning 65 (3):78-80.
McCamy, C. S. and C. I. Pope. 1965. Current research on presrvation and archival records on
silver-gelatin type microfilm in roll form. Journal of research of the National Bureau of
Standards-A. Physics and Chemistry 69A (5):385-395.
McCamy, C. S. et al. 1969. A survey of blemishes on processed microfilms. Journal of research
of the National Bureau of Standards-A. Physics and Chemistry 73A (1):79-84.
McCormick-Goodhart, M. H. 1995. Moisture content isolines and the glass transition of
photographic gelatin: their significance to cold storage and accellerated aging. In Research
techniques in photographic conservation, Proceedings of the Conference held in Copenhagen
14-19 may 1995. Copenhagen: The Royal Danish Academy of Fine Arts. 65-69.
Mecklenburg, M. F. et al. 1994. Investigation into the deterioration of paintings and
photographs using computerized modelling of stress development. Journal of the American
Institute for Conservation 33 (2):153-170.
Moore, W. J. 1972. Physical Chemistry. London: Longman.
Nguyen, T. 1998. Étude des effect de la pollution atmosphérique sur la dégradation de la
gélatine photographique. Thèse pour obtenire le grade de docteur de l’Université de Rouen,
89
Université de Rouen, U.F.R. de Sciences.
Nielsen, U. B. 1993. Silver mirror on photographs. Master thesis. Royal Danish Academy of
Fine Arts, School of Conservation.
Nielsen, U. B. and B. Lavedrine. 1993. Etude du miroir d’argent sur les photographies. In Les
documents graphiques et photographiques. Paris: Archives nationales. 131-143
Nishimura, D. 2000. Personal communication. Image Permanence Institute. Rochester Institute
of Technology, 70 Lomb Memorial Drive, Rochester, NY 14623-5604 USA.
Nishimura, D. 1998. Nitrate negatives. Conservation Discussion List. Issue 16 September 1998.
Okita, T. et al. 1983. Determination of air-water Henry's law constants for low concentration of
hydrogen peroxide and aldehydes. Taiki Osen Gakkaishi 18 (6):491-495.
Plieth, W. J. 1982. Electrochemical properties of small clusters of metal atoms and their role in
surface enhancement raman scattering. Journal of Physical Chemistry 86:3166-3170.
Pope, D. et al. 1968. The tarnishing of Ag at naturally-occuring H2S and SO2 levels. Corrosion
Science 8: 883-887.
Reagor, B. T. and J. D. Sinclair. 1981. Tarnishing of silver by sulfur vapor: film characteristics
and humidity effects. Journal of the Electrochemical Society 128 (3):701-705.
Reilly, J. M. 1986. Care and identification of 19th century photographic prints. Rochester, NY:
Kodak Publication No. G-2S. 39 and 47.
Scheirs, J. et al. 1998. Origin of furanic compounds in thermal degradation of cellulosic
insulating paper. Journal of Applied Polymer Science 69:2541-2547.
Shaw, W. B. 1931a. Permanent bromide prints. The British Journal of Photography October
2:594-595.
Shaw, W. B. 1931b. Permanent bromide prints. The British Journal of Photography November
27:708-710.
90
Shafizadeh, F. and A. G .W. Bradbury. 1979. Thermal degradation of cellulose in air and
nitrogen at low temperature. Journal of Applied Polymer Science 23:1431-1442.
Shoemaker, H. 1998. Nitrate negatives. Conservation Discussion List. Issue 10 September 1998.
Shoemaker, H. 1999. Paper presented at the PMG-AIC Winter Meeting , Boston 12-13 March
1999.
Shuman, D. C. and T. H. James. 1971. Kinetics of physical development. Photographic Science
and Engineering 15:42-47.
Tanaka, T. et al. 1973. Drift motion of silver ions in gelatin films and its implication in the
photolysis of low-pAg emulsions. In Proceedings of the symposiums on photographic
sensitivity held at Gouvill & Caius College and Little Hall, Cambridge, September 1972.
Cambridge: R.J.Cox. 139-147.
Torigoe, M. et al. 1984. A challenge in the preservation of black-and-white photographic
images. Scientific Publication of the Fuji Photo Film Co. Ltd. 39 (29):31-36.
Uhlmann, D. R, eds.1980. Glass: Science and Technology. NewYork. Academic Press.
Vantelon, J. P. and M. L. Bernard.1974. Ètude de la décomposition du peroxide d’hydrogène
par l’argent en réacteur a lit catalytique fixe. Résultats en régime transitoire. Journal de Chimie
Physique 71 (11-12):1423-1428.
Volpe, L. and P. J. Peterson. 1989. The atmospheric sulfidation of silver in a tabular corrosion
reactor. Corrosion Science 29 (10):1179-1196.
Warren, G. W. et al. 1984. Relationships between the Pourbaix Diagram for Ag-S-H2O and
electrochemical oxidation and reduction of Ag2S. Metallurgic Transactions B 15B: 235-242.
Weast, R. C. 1985. CRC Handbook of Chemistry and Physics, 66th ed. Boca Raton, Florida.
CRC Press.
Weyde, E. 1955. Das Copyrapid-Verfahren der AGFA. Mitteilungen aus den
Forschunglaboratorien der Agfa Leverkusen. Münich Band 1: 262-266.

91
Wood, B. 1926. Tarnishing of negatives. The British Journal of Photography November 26:699.
Yapel, R. A. et al. 1994. Mutual and self diffusion of water in gelatin: experimental
measurement and predictive test of volume-free theory. Polymer 35 (11): 2411-2416.
92
Curriculum VitaeGiovanna Di Pietro
Date and place of birth: September 28th 1969 in Pescara, Italy.Country of citizenship: ItalyCivil status: married with Jacopo Pasotti, one daughter, Bianca, born on the 20th of June 2001
Education
- 1998-2002: PhD research at the Laboratory of Image and Media Technologies (previouslyLaboratory of Scientific Photography), University of Basel, under the supervision of PD Dr. R.Gschwind. Research developed in collaboration with the Netherlands Institute of CulturalHeritage (ICN), Amsterdam. Research subject: Silver mirroring on silver gelatin glassnegatives. Foreseen due of dissertation exam: June 2002.Assistant duties: theoretical and practical courses on historical photographic processes(daguerreotypes, salted papers, albumin papers), mathematics course for chemistry students.
- 1989-1994. Department of Physics, University of Milano (Italy). Master thesis on Phaseseparations in colloidal solutions under the supervision of V. Degiorgio and M. Giglio obtainedwith Magna cum Laude.
Working experiences- Since January 1996: collaboration with the Netherlands Institute of Cultural Heritage,Amsterdam as conservation scientist. Research projects:
- 1996: investigation on the use of laser on art objects.- 1997-2002: microclimate effects of backboard protections for canvas paintings.- 1998-2002: silver mirroring on silver gelatin glass plates.- 1999. Browning of paper.
- January-June 1997: project on internet access for small and medium enterprises incollaboration with Hewlett Packard, Bergamo
- April-October 1995: stage at the research and development department of DSM, Maastricht,the Netherlands.
Skills in Conservation
- Preventive conservation: measurement and modelling of heat and humidity exchanges appliedto art objects (painting, paper, photographs); evaluation of pollution measurement and pollutantdiffusion in closed environments.- Photographic conservation: reproduction of historical photographic processes (daguerreotypes,salted papers, albumin papers, cyanotypes); measurement, artificial reproduction and modellingof degradation processes of silver gelatin based photographs, in particular silver gelatin glassnegatives; modelling of reaction and diffusion of pollutants around and within photographicemulsions.- Colour Science: measurement and modelling of colour changes of art objects (fluorescence ofpaper, colour of silver mirroring on photographs).- Active conservation: evaluation of active methods to remove silver mirroring fromphotographs, evaluation of effects of laser use on art objects.- Surveys: surveys of photographic collection in Switzerland and The Netherlands.
93
Languages and computers
- Italian mother tongue, proficient level in English and German, intermediate level in French.- Proficient levels in mathematic and statistical software and in Microsoft Office environment,intermediate level in Linux environment.
Publications
G. Di Pietro and F.J. Ligterink. 2002. Silver mirroring edge patterns. A diffusion-reaction modelfor the formation of silver mirroring on silver gelatin glass plates. Accepted by the Journal ofthe American Institute of Conservation, March 2002.
G. Di Pietro. 2000. Silver mirroring edge pattern: a diffusive model for silver gelatin glassplates. Presentation at 28th annual meeting, Philadelphia PA, June 8-13 2000
J.L. Pedersoli, F.J. Ligterink and G. Di Pietro. 2000. Browning of paper. PapierRestaurierung(IADA Yearbook 2000) 1: 47-54.
G. Di Pietro and F. Ligterink. 2000. Bemerkungen zum Verwellen von Pergaminkuverts.Rundbrief Fotografie 7 (2): 13-17.
G. Di Pietro and F. Ligterink.1999. Silver mirroring: a diffusive model for edge pattern. Posterpresentation at 12th Triennial Meeting of Icom-CC 29 August-3 September 1999, Lion, France.
F. Ligterink and G. Di Pietro. 1999. The effect of the wooden stretcher on the RH response ofbackboard protected canvas paintings. Preprints of the 12th Triennial Meeting of Icom-CC 29August-3 September 1999, Lion, France, ed. James and James: 70-76
G Di Pietro and F. Ligterink. 1999. Gas diffusion related degradation patterns. Presentation atIndoor Air Pollution: detection and prevention, held at the Instituut Collectie Nederland,Amsterdam, 26-27 August 1999.
G. Di Pietro and F. Ligterink. 1999. Prediction of the relative humidity response of backboardprotected canvas paintings. Studies in Conservation 44 (4):269-277.
R. Gschwind and G. Di Pietro. 1998. Metamerism in colour imaging systems and „reverse“colour reproduction. ICPS’98 (The International Committee on the Science of Photography),International Congress on Imaging Science, Antwerp, 7-11 Sept. 1998, Vol. 2, p.11-14.
V. Degiorgio, R. Piazza and G. Di Pietro. 1995. Depletion Interaction and Phase Separation inMixtures of Colloidal Particles and Nonionic Micelles. Proceedings of the ECIS Conference,Barcellona, Spain, September 1995.
R. Piazza and G. Di Pietro.1994. Phase Separation and gel-like structures in mixtures ofcolloids and surfactant. Europhysics Letters 28, 445.


![Gelatin Nanoparticles as Potential Nanocarriers for ... · an attractive biomaterial for nanoparticulate drug delivery systems [73]. 1.5.1. Preparation Techniques Different preparation](https://static.fdokument.com/doc/165x107/5ff7bf7d8a79f723cd3c95a3/gelatin-nanoparticles-as-potential-nanocarriers-for-an-attractive-biomaterial.jpg)