Single Cell Protein (SCP) Production from Date Juice
177
Single Cell Protein (SCP) Production from Date Juice Der Technischen Fakultät der Universität Erlangen-Nürnberg zur Erlangung des Grades DOKTOR-INGENIEUR vorgelegt von Najah Mahdi Mohammed Al-Mhanna, M. Sc. Erlangen-2012
Transcript of Single Cell Protein (SCP) Production from Date Juice

Single Cell Protein (SCP) Production from Date Juice
Der Technischen Fakultät der
Universität Erlangen-Nürnberg
zur Erlangung des Grades
DOKTOR-INGENIEUR
vorgelegt von
Najah Mahdi Mohammed Al-Mhanna, M. Sc.
Erlangen-2012

Single Cell Protein (SCP) Produktion aus Dattelpalmensaft
Der Technischen Fakultät der
Universität Erlangen-Nürnberg
zur Erlangung des Grades
DOKTOR-INGENIEUR
vorgelegt von
Najah Mahdi Mohammed Al-Mhanna, M. Sc.
Erlangen-2012

Als Dissertation genehmigt von
der Technischen Fakultät der
Universität Erlangen-Nünberg
Tag der Einreichung:
Tag der Promotion:
Dekan:
Berichterstatter:
30. März 2011
31. Mai 2011
Prof. Dr.-Ing. Reinhard German
Prof. Dr. rer. nat. Rainer Buchholz
Prof. Dr. rer. nat. Ruth Freitag

,, Science is a light and ignorance is darkness. “ Arabic wisdom
,, Die Wissenschaft ist ein Licht und die Unwissenheit ist eine Dunkelheit.“
Arabische Weisheit

Dedicated to my
Home country
Wife
Children
With my love
Najah

Acknowledgment
Acknowledgment
I wish to express my sincere thank and deep gratitude to
� Prof. Dr. Rainer Buchholz for his supervision and supporting of the work
by giving the possibility to do this work at his chair.
� My respectable second supervisor Dr. Ing. Holger Huebner for his
guidance, discussions and encouragements.
� DAAD, German Academic exchange service, for granting me a scholarship
which enabled me to support my life during this work.
� Cell culture group team, Mrs. Anette Amtmann, Ms. Kenny Zambrano
(M.Sc.), Mr. Christoph Linderberg (Dipl. Ing.), Mr. Mathias Stach (Dipl.
Ing.), Mr. Björn Sommerfeldt (Dipl. Ing.) and Mr. Stefan Popov (M.Sc.)
for their kindly and scientifically cooperation.
� Staff members of institute of bioprocess engineering for the ideal
atmosphere
� My friends out of institute of bioprocess engineering
� My parents for their support and trust
Finally, and from my heart
I would like to express my very deep respect and sincere appreciation to my
wife for spending most of her time to encourage and support me, which was
the successful key of finishing this work.

Acknowledgment
I
Acknowledgment Acknowledgment Acknowledgment List of Contents
List of Contents
Page
List of Contents I
Nomenclature VII
Summary X
Zusammenfassung XII
Chapter One : Introduction 1
1.1 Background 1
1.2 Aims and objectives 3
1.3 Significances 4
Chapter Two : Principles and Literature Survey 5
2.1 Single cell protein definition and uses 5
2.2 Criteria of choosing microorganism for SCP production 5
2.2.1 Growth rate and biomass 5
2.2.2 Stress tolerance to broad range of temperature 6
2.2.3 Stress tolerance to broad range of pH 6
2.2.4 Mutation rate 7
2.2.5 Aeration requirement and energy cost 7
2.2.6 Filamentous growth 8
2.3 Substrate for SCP production 8
2.4 Production of SCP 9
2.4.1 Biomass production 9
2.4.2 Design of process and control 10
2.4.3 SCP production economic aspect 12
2.4.3.1 Parameters affecting economic viability 12
2.4.3.2 Practical aspects of economic viability 13
2.4.3.3 Advantages and constraints of SCP as a market product 14
2.4.4 Process examples 15
2.4.4.1 Production of SCP from carbon dioxide 15
Blue-green bacteria (cyanobacteria) 15
Algae (Chlorophyceae) 16

Acknowledgment
II
Acknowledgment Acknowledgment Acknowledgment List of Contents
List of Contents
Page
2.4.4.2 SCP from carbohydrates 17
Molasses; Whey 17
Sulphite waste liquor; 'Myco-protein' process 18
Starches 19
Cellulosics 19
2.4.4.3 SCP from hydrocarbons and derivatives 20
From n-alkanes 20
From ethanol 20
From methanol 21
2.5 Crabtree effect 21
2.6 Maillard products(MRPs) 22
2.7 Date of palm 24
2.7.1 Introduction 24
2.7.2 Date juice extraction and clarification 27
2.7.3 Industrial usages 28
2.8 Optimization 29
2.8.1 Single-factor optimization 29
2.8.2 Multifactor optimization 30
2.8.2.1. Theoretical or Consultant’s approach. 31
2.8.2.2. Shotgun Approach. 31
2.8.2.3. Single-factor-at-a-time approach. 32
2.8.3 Evolutionary operation (EVOP) 33
2.8.3.1 Simplex EVOP 33
2.8.3.2 Definition of simplex 37
2.8.3.3 Simplexes in various dimensions 38
Zero dimension 38
One dimension 39
Two dimensions 39
Three dimensions 40
Higher dimensions 40

Acknowledgment
III
Acknowledgment Acknowledgment Acknowledgment List of Contents
List of Contents
Page
2.8.3.4 Simplex reflection move 40
2.9 Mathematical model and modelling of fermentation growth 43
2.9.1. Background 43
2.9.2 Structured versus unstructured models 45
2.9.3 Segregated versus un-segregated models 46
2.9.4. General model structure 46
2.9.5 Growth dynamics models of Saccharomyces cerevisiae 47
2.9.5.1 Introduction 47
2.9.5.2 Theoretical concept and modelling 48
Theoretical concept 48
Modelling 49
Model equations 50
Chapter Three : Experimental work 51
Abstract 51
3.1 Growth medium 51
3.1.1 Yeast extract peptone D-Glucose (YEPD) medium 51
3.1.1.1 Medium preparation 51
3.1.2 Complex growth medium 51
3.1.2.1 Medium preparation 52
3.1.3 Date syrup 52
3.2 Units and equipments 53
3.3 Experimental work 54
3.3.1 Cultivation of Saccharomyces cerevisiae in an incubator 54
3.3.2 Batch cultivation of Saccharomyces cerevisiae in a bioreactor 54
3.4 Analysis 55
3.4.1 Date juice sugar identification by using Gas chromatography mass
spectrometry (GcMs)
55
3.4.2 Sugar quantification 57
3.4.2.1 Sugar quantification by using delta pH device 57
Acknowledgment
IV
Acknowledgment Acknowledgment Acknowledgment List of Contents
List of Contents
Page
Theory 57
Procedure 58
Enzyme preparation 59
Date juice sugar determination 59
3.4.2.2 Sugar quantification by using an enzymatic assay 60
Theory 60
Material 61
Procedure 61
Glucose calibration curve preparation 61
Date syrup sample sugar determination 62
3.4.3 Cells number 63
3.4.4 Dry weight 64
3.4.4.1 Heat dryer 64
3.4.4 .2 Freeze dryer 65
3.4.5 Protein determination 65
3.5 Online continuous measurements 68
Chapter Four : Results 70
4.1 Analysis 70
4.1.1 Analysis of sugar content: qualification and quantification of sugar
contents in date juice
70
4.1.1.1 Date juice sugar qualification by using gas chromatography mass
spectrometer
70
4.1.1.2 Quantification of Sugar concentration 78
4.2 Protein Quantification 80
4.3 Biomass 82
4.4 Cells number calibration curve and the necessity of sample diluting 84
4.5 Cultivation of Saccharomyces cerevisiae within incubator 87
4.5.1 YEPD medium 88
4.5.2 Date juice 90
4.6 Cultivation of Saccharomyces cerevisiae in bioreactor 90

Acknowledgment
V
Acknowledgment Acknowledgment Acknowledgment List of Contents
List of Contents
Page
4.6.1 Crabtree effect Observation by using absorption 90
4.6.1.1 in the absence of yeast extract in medium 90
4.6.1.2 in the presence of yeast extract in medium 94
4.6.2 Effect of glutamine on biomass of Saccaromyces serevisiae 95
4.6.3 Lag phase reduction 96
4.6.4 Parameters optimization 98
4.6.4.1 Temperature and pH optimization by using simplex method 98
4.6.4.2. Dissolved oxygen optimization 110
4.6.5 Date juice as substrate 111
Chapter Five : Discussion 114
5.1 Analysis 114
5.1.1 Analysis of sugar content: qualification and quantification of sugar
contents in date juice
114
Date juice sugar identification 114
Quantification of sugar concentration in date juice 115
5.2 Protein quantification 116
5.3 Biomass 117
5.4 Cells number calibration curve and the necessity of sample diluting 117
5.5 Cultivation of Saccharomyces cerevisiae within incubator 118
5.5.1 Cultivation on YEPD medium (Crabtree Efeect and Maillard
Products)
118
5.5.2 Cultivation on date juice 120
5.6 Mathematical model results 123
5.7 Cultivation of Saccharomyces cerevisiae in bioreactor 124
5.7.1 Crabtree effect observation by absorption in the absence and presence
of yeast extract in medium
124
5.7.2 Effect of glutamine on biomass and growth of Saccharomyces
cerevisiae
127
5.7.3 Lag phase reduction 127

Acknowledgment
VI
Acknowledgment Acknowledgment Acknowledgment List of Contents
List of Contents
Page
5.7.4 Parameters optimization 129
5.7.4.1 Temperature and pH optimization by using simplex method 129
5.7.4.2. Dissolved oxygen optimization 131
5.7.5 Date juice as substrate 133
Chapter Six : Conclusions 135
Chapter Seven: Error Analysis 137
References 138
List of figures 148
List of tables 152
Appendix 1: Yeast disruption time 153
Appendix 2: Chromatogram of standard mannose and date juice obtained at
40 split ratio
157
Appendix 3: Online measurement accuracy
158

Chapter One
VII
Nomenclature
Symbol Description
ATP Adenosine triphosphate
BSTFA N,O-bis(trimethylsilyl)trifluoroacetamide
BOD Biological Oxygen Demand
BSA Bovine serum albumin
C Intracellular storage carbohydrate mass fraction
Cm Ccentimeter is a unit length
CO2 Carbon dioxide gas
D Dilution rate hr -1 ( inlet flow rate/ reactor volume)
DNA Deoxyribonucleic acid
FAO Food and Agriculture Organization of the United Nations
g Gram (weight unit)
GC Gas chromatography
H+ Hydrogen ion
(Ki)
saturation constant g/dm3
Kla
Oxygen mass transfer coefficient (h-1)
L stoichiometric coefficient for intracellular storge carbohydrate synthesis and consumption
Mg+2
Magnesium ion
min Minute ( time unit)

Chapter One
VIII
Nomenclature
Symbol Description
ml
Milliliter (unit of volume)
MS Mass spectrometr
NADP+
Nicotinamide adenine dinucleotide phosphate
NaCl
Sodium cloride
NADPH
Is the reduced form of Nicotinamide adenine dinucleotide phosphate
NH4 Ionized ammonia
NO3 Nitrate ion
O2
Oxygen gas
O Oxygen concentration in liquid medium g/dm3
O* Oxygen saturation solubility g/dm3
OH-1
Hydroxide ion
OTR Oxygen transfer rate
P Product (ethanol) mass g
PBS
Phosphate buffer saline
pH Potential for hydrogen ion concentration
Q Stoichiometric coefficient for different substrates
Qo2 Specific oxygen uptake rate
RNA Ribonucleic acid

Chapter One
IX
Nomenclature
Symbol Description
RQ Respiration quotient
Ri Growth rate
r i / ∑ ri . Rates ratio
rpm
Rotation per minute (speed unit)
S Substrate (sugar)
TIC Total ion chromatogram
TMS Trimethylsilylether
u i Enzyme synthesis
v i enzyme activity
v/v Volume ratio
w/w Weight ratio
YE
Yeast extract
YEPD Yeast Extract Peptone D-Glucose growth medium
Yx/s
Biomass yield coefficient
µ Specific growth rate hr -1
µmax Maximum specific growth rate
µg Microgram ( weight unit)
c', o' p',
s',
Is the deferential of C, O, P, S with time

Summary
X
Summary
Single cell protein is a term for the protein that can be used into human foods or mixed
animal feeds. The source of this protein is microorganisms which grow as unicellular rather
than as complex multicellular such as bacteria, yeast, moulds or algae. There are several
carbon sources, which can be used in single cell protein production (SCP). Many processes
have been developed to produce SCP at low cost. However, in all these processes, the type of
substrate has determined design and the cost of the product’s process. Substrates are ranged
from by–products like whey and molasses to a high complicated substrate like cellulose and
passing through the use of hydrocarbons as substrate.
Many countries have an overproduction of dates. For instant, Iraq exports most of his
harvested dates with cheep price. In many cases, there is a waste of this product within
storage. It was reported that annually about 14.3 %( 60.000 tonne) of Iraqi dates is wasted
while about 35.7% (100.000 tonne) is used as animal feed. Therefore, it was intended to
investigate the potential of date juice as a substrate for single cell production.
Simplex method was used to optimize cultivation parameters such as temperature and
pH. Applying this technique was because of the simultaneous effect of the parameters.
Applying factorial design, in existence of such interaction between parameters, requires many
experiments in order to get the optima. In contrast, using simplex method caused a large
reduction in the number of required experiments. The optima of temperature and pH were
found within just 28 runs. Some of these runs were done in order to ensure the result. A wide
range of pH and temperature was investigated. The range of pH was (3.0-7.0) and the range of
temperature was (26.4-32°C) with an interval increment of 0.2 for both variables. Such wide
ranges in the presence of the parameters interaction showed the powerful of using simplex
technique in optimization. Thus optima of temperature and pH were 27.7°C and 4.0
respectively.
In order to find the optima of stirring speed and air flow rate, an idea of studying a
simultaneous effect was raised up. This idea gave the benefit of reduction of the required
experiments number on one hand. On the other hand, it has given the flexibility of either
control the stirring speed or air flow rate for future research application. The simultaneous
effect was assumed to be presented by dissolved oxygen content in the medium as the cells is
affected by oxygen content. The results indicated that oxygen dissolved content of 75%

Summary
XI
saturation was the optima. Before and after this percentage, the biomass was less. Thus before
this percentage, oxygen content possibly is not sufficient. Therefore, oxidative pathway is not
dominated. Moreover, an over oxidation was potentially happened above 75% saturation.
A diauxic behaviour and Crabtree effect were observed by measuring absorption. A
diauxic growth happens when Saccharomyces cerevisiae is growing on two hexoses as
substrates. The same is observed when yeast is fed with hexose due to Crabtree effect of
alcohol by-production. Since Saccharomyces cerevisiae was cultivated on one substrate,
glucose complex medium, diauxic observation by absorption was an indictor for Crabtree
effect. The results demonstrated that diauxic behaviour is dominated at high glucose
concentration i.e. 4g/L. Moreover up to 50mg/L glucose concentration, no Crabtree effect was
observed.
A cybernetic mathematical model was assumed to represent the growth of
Saccharomyces cerevisiae in batch mode. The simulation results were satisfied with the
experimental results. Berkeley Madonna program was used to execute the proposed
mathematical model. A development of the model was done to represent the continuous
mode.
An online measuring method was developed and applied in this work. This technique
facilitated continuously absorption measurements. Therefore, the growth curves and growth
parameters optimization were achieved more accurately and easily.
The obtained optimum operating conditions such as (27.7°C, pH 4.0 and 75%
saturation oxygen dissolved) were used in Saccharomyces cerevisiae cultivation on date juice
medium within bioreactor. The biomass yield per total consumed sugar was 46.7%.
Moreover, the maximum obtained protein content was 48.5% (w/w) of dry yeast biomass.
Therefore, the results indicated that date juice is a potential substrate for SCP production.
Additionally, date juice can be used without additives. However, such cultivation will be on
the expense of time. For instance, a 44% process time reduction was achieved when the date
juice medium was diluted with complex medium of 91% of its constituents. Moreover, these
results suggested that date juice lacks to some essential vitamins, minerals and amino acids,
which are necessary for Saccharomyces cerevisiae growth.

Zusammenfassung
XII
Zusammenfassung Single cell protein ist ein Begriff für das Protein, es in Lebensmitteln oder Tierfutter
verwendet werden können. Die Quelle dieses Proteins sind die Mikroorganismen wie z.B.
Bakterien, Hefen, oder Algen, die als Einzeller wachsen. Es gibt verschiedene
Kohlenstoffquellen, die für die Herstellung von Einzellerprotein (SCP) verwendet werden
können. Viele Prozesse wurden entwickelt, um SCP kostengünstig herzustellen. Bei jedem
dieser Verfahren spielt die Art des Substrats eine wichtige Rolle, so dass von diesen
Substraten das Design und weiterhin die Kosten des produzierten Produktes stark abhängen.
Die Substrate reichen von den Nebenprodukten von anderen Prozessen wie zum Beispiel
Molke und Melasse und komplizierteren Substraten wie zum Beispiel Cellulosen und bis hin
zur Verwendung von Kohlenwasserstoffen.
Viele Länder haben eine Überproduktion an Datteln. Der Irak ist eines davon, der derzeit den
größten Teil der Dattelernte zu geringen Preisen exportiert. In vielen Fällen gibt es eine
Verschwendung schon während der Lagerung. Es wurde berichtet, dass jährlich etwa 14,3%
(60.000t) der irakischen Datteln verschwendet werden. Zusätzlich werden etwa 35,7%
(100.000t) als Tierfutter verwendet. Deshalb ist es Ziel dieser Arbeit, das Potential von
Dattelsaft als Substrat für die Herstellung von Einzellerproteinen zu untersuchen.
Zur Optimierung der Kulturparameter und deren vielfältigen Wechselwirkungen
untereinander, wurde die Simplexmethode hierfür herangezogen. Die Anwendung eines
faktoriellen Designs für die Parameteroptimierung hätte zu viele Versuche erfordert. Im
Gegensatz zu faktoriellen Ansätzen, führt die Simplex-Methode zu einer starken Reduzierung
der Anzahl der benötigen Experimente. Innerhalb von 28 Versuchen wurden die Optima für
Temperatur und pH-Wert gefunden. Ein paar dieser Versuche wurden durchgeführt, um die
Ergebnisse abzusichern und um einen ausreichend breiten Bereich an pH-Werten (pH 3,0 bis
pH 7,0) und Kultivierungstemperaturen (26,4°C bis 32°C) zu untersuchen, wobei das
Optimum bei pH 4,0 und 27,7°C gefunden wurde. Als Intervall wurde für beide Variablen der
Wert 0,2 gewählt. Die Möglichkeit einen so weiten Bereich in kurzer Zeit so fein untersuchen
zu können, unterstreicht noch mal die Mächtigkeit der Simplexmethode.
Weiterhin wurde der Einfluss des gelösten Sauerstoffs untersucht, wobei durch Variation von
Begasungsrate und Rührerdrehzahl verschiedene Regime erzeugt wurden. Die Ergebnisse
zeigten, dass ein gelöster Sauerstoffgehalt (DO) von 75% der Sättigung optimal war. Über
und unter diesem Wert wurde immer weniger Biomasse gebildet. Möglicherweise waren die

Zusammenfassung
XIII
niedrigeren Werte für den Sauerstoffgehalt für den oxidativen Abbau nicht ausreichend, so
dass dieser herunterreguliert wurde. Und bei höheren Sauerstoffgehalten litten die Zellen
offenbar unter oxidativem Stress.
Diauxieartiges Verhalten und der Crabtree-Effekt wurden beobachtet. Diauxie geschieht,
wenn die Hefe Saccharomyces cerevisiae zwei Hexosen als Substrate zur Verfügung hat.
Ähnliches beobachtet man, wenn Hefen mit Hexosen gefüttert werden und aufgrund des
Crabtree-Effektes Alkohol entsteht. Dieser wird wiederum erst dann von den Hefen als
Substart verwertet, wenn die ursprüngliche C-Quelle limitierend geworden ist. Unter diesen
Umständen ist ein diaxieartiges Wachstum ein sicheres Zeichen für den Crabtree-Effekt. Die
Ergebnisse zeigten, dass das diauxieartige Verhalten bei erhöhten Glucosekonzentration (z.B.
4g/L) dominiert. Unter 50mg/L Glucose wurde keine solches Verhalten beobachtet.
Ein kybernetisches mathematisches Modell wurde angenommen, um das Wachstum von
Saccharomyces cerevisiae im Batch-Modus darzustellen. Die Simulationsergebnisse stimmten
mit dem experimentellen Ergebnisse überein. Das Programm „Berkeley Madonna“ wurde hier
verwendet, um das vorgeschlagene mathematische Modell auszuführen. Das Model erlaubt
auch, kontinuierliche Kultivierungen darzustellen.
Eine Online-Analysemethode wurde in dieser Arbeit entwickelt, mit der das Wachstum der
Hefen deutlich einfacher verfolgt werden konnte, was die Optimierung aller Kulturparameter
erleichterte.
Unter optimalen Betriebsbedingungen (27,7°C, pH 4,0 und 75% DO) wurde unter
Verwendung von Dattelpalmenpresssaft im Bioreaktor eine Ausbeute von 46,7% pro
insgesamt verbrauchte Zucker erzielt. Der maximale Proteingehalt wurde 48,5% (w/w) der
Trockenhefe Biomasse. Hieraus lässt sich ableiten, dass Dattelsaft ein potentiales Substrat für
die Herstellung von SCP ist. Es zeigte sich auch ist, dass Dattelsaft ohne Zusatzstoffe
eingesetzt werden kann. Allerdings verlängert sich dadurch die Kultivierungszeit.
Beispielsweise wurde die Prozesszeit um 44% reduziert, wenn konzentriertes
Dattelsaftmedium einem Vollmedium zugegeben wurde. Die Ergebnisse bestätigten, dass
einige wichtige Vitaminen, Mineralstoffen und Aminosäuren für das Wachstum von
Saccharomyces cerevisiae im Dattelsaft fehlen.
Chapter One
1
Introduction Chapter One
1.1 Background
Conventional agriculture may not be able to meet man’s requirements for protein if
one considers the population growth. This problem of low animal protein sources has led to
search for substantial high protein microbial source. Single cell protein production (SCP) was
the choice. Initially, SCP field focused of using various species of yeast. Saccharomyces
cerevisiae, Torula sp. and Candida utilis were the common yeast that used in protein
production. Afterward using bacteria and filamentous fungi became an interest subject. This
field (SCP) refers to the fact that most of the microorganisms used as producers grow as
single rather than as complex multicellular organisms like plants or animals. Food yeast could
provide a substantial contribution to human diet during both world wars [Barnell, H. 1974;
Wiebe, M. 2002].
Many reasons make the microbes prime candidate for SCP production. Some of those
reasons are the high growth rate under optimum conditions and high feed efficiency, which is
expressed as gram protein produced/Kg feed consumed. Moreover, microorganisms are more
easily modified genetically than plants or animals. Furthermore, microorganisms can be
grown in a vast number in relatively small continuous fermentation processes using small land
area and also independent of climate [Riviere, J.1977].
Abundant substrates with low prices were investigated. By-products such as cheese
whey, molasses, starch, methanol, hydrocarbon substrates and spent sulfite liquor were chosen
to sustain a commercial process. Unwanted waste product consumption added a new
economic incentive to SCP production, as the idea of low cost substrates. Using of a waste
product in SCP production has contributed in the preservation of the environment rather than
food production. Carbohydrates can be converted to single cell protein SCP with different
compositions and nutritional values by using a variety of microorganisms. SCP is a protein-
rich ingredient that can be used into human foods or mixed animal feeds [Basil, S. 1979; Jarl,
K. 1969].
High content of nucleic acids causes gout and kidney stones because of ingestion of
purine compounds arising from RNA breakdown. This will lead to increased plasma levels of
uric acid. However, high content of nucleic acids causes no problems to animals since uric
acid can be converted to allantoin, which is readily excreted in urine. Therefore, human intake
of nucleic acid has to be limited to 2g/day. Nucleic acid content of SCP from fungal renders it
as a food factor. Yeast and fugal SCP have been included in animal feeds. Fish has digested
SCP of fungal origin well.

Chapter One
2
Introduction Chapter One
However, treatment of the cells with acid, alkali or enzymes can remove nucleic acids.
Heating fungal biomass to temperature above 68°C for 30-45 minutes will reduce the RNA
content of the cells. This heating method is applied in myco-protein from Fusarium
venenatum [Solomons, G. 1983; Ward, P. 1998].
A variety of SCP processes have been developed with a view to producing food and
feed from alternative or waste carbon sources such as carbohydrates, hydrocarbons and their
derivatives. Technology has ranged from relatively simple open lagoons or solid-substrate
fermentations to large-scale aseptic continuous cultures in fermenter. Various processes have
adopted different fermenter designs with respect to process requirements. The choice of
substrates has determined the design and strategy of SCP processes.
Molasses is a by-product of the sugar manufacturing process. Molasses contents
(sugar, minerals, organic compounds and vitamins) make its valuable substrate in a
fermentation process. Baker’s yeast was the first microorganism to be produced in aerobic
stirred fermentation on molasses. It is still produced today. This yeast seldom been destined as
food, but rather for baking purpose [White, J. 1954; Chen, S. and Chinger, M. 1985].
Starch is very abundant carbohydrate, which can be obtained from rice, maize and
cereals. Starch is a cheap and amenable substrate for SCP production. In tropical countries,
cassava has been proposed as a good source of starch for SCP process [Forage, A. and
Righelato, R. 1979].
The Quorntm myco-protein production process has used wheat-starch, a by-product of the
wheat gluten production and wheat flour production, as the carbon source [Trinci, A. 1994;
Moulin, G. et al 1983].
Whey is a residual liquid obtained after the removal of protein and fat from milk.
Whey can be obtained from either traditionally curdling process in cheese production or
obtained after ultrafiltration procedures for the production of spreading cheeses. Whey has
been presented as an extremely suitable substrate for the production of SCP. Nevertheless,
many problems associated with whey for SCP production because of seasonal supply
variation and its high water content (> 90%) which makes transport prohibitively expensive
[Moulin, G. et al 1983].
Methanol has been used as a substrate for SCP production. ICI process is the most
common processes of producing single cell protein by utilizing methanol as a substrate while
ammonia gas is the nitrogen source. The process applies pressure recycle fermenter by

Chapter One
3
Introduction Chapter One
a combination of an airlift and loop reactor. Yield of the process is 0.5g/g. The process suffers
from the raising of oil price [Faust, U. and Prave, P. 1983].
Cellulose from agriculture can be considered as a potential substrate for SCP
production. However, that will need to break down cellulose into assimilable forms, which
can be taken up in solution by the growing organism. Therefore, ceallulose must be subjected
to pre-treatment in numbers of steps, which include milling and chemical or enzymatic
hydrolysis. The cost of these steps has prevented the generalized production of SCP from
cellulose [Callihan, C. and Clemmer, J. 1979].
Dates are produced in abundance in west and southwest Asia. They are wasted a great
deal annually. Dates contain about 60-70% sugar and are utilizable in much fermentation
media. Date syrup is an attractive by-product from dates. It could be replaced in different food
formulations. Date syrup looks like a darker honey, presenting the same viscosity but having a
very peculiar organoleptic flavour, and contains different minerals and phosphorus. It could
be used as a substrate replacing carbon and mineral sources in single cell protein (the protein
utilizable as food or feed) production. It also contains a substantial level of nutrients that are
required for the growth of microorganisms [Basil, S. 1979; Myhara, R. et al 1999].
The future development of SCP process depends mainly on the type of substrate.
Therefore, a search for cheap and abundant carbon source is the domain concept. Date juice or
date syrup can be a good choice for some countries by regarding date’s overproduction. The
price of dates on the market is depressed (i.e. in Iraq USA$ 0.25-0.9 /1Kg of date) .This range
of price is according to the kinds of dates. Much of the date product is exported. Dates are
rich in carbohydrates but have low protein content. In addition to its contents of easily
extractable sugars such as (glucose, fructose and sucrose), it contains mineral and vitamins.
This will make the dates potential substrate for fermentation process.
1.2 Aims and objectives
The aim of this study is to investigate date juice as a substrate for SCP production.
Saccharomyces cerevisiae, S.c., was chosen as the growing organism. Finding the optimum
operating conditions by applying the simplex method was a target of the study in order to
maximize product yield and protein content of final product. Moreover, to follow the growth
of S.c., a mathematical model is to be assumed, developed, improved and subjected during
this work. Finally, indicating whether the date juice devoid of additives is suitable for SCP
production.

Chapter One
4
Introduction Chapter One
1.3 Significances
Many proteins manufacturing companies have taken a strategic interest in substrate
type. A new substrate, acceptable as raw material for food or feed manufacturing, at low cost
has big importance to industry. Using date juice as a substrate will be an economic aspect at
least for the countries which have overproduction of low price dates. Potentially, it provides
possible improvement and gives a good significance when the results are used for further
investigation in pharmaceutical manufacturing of recombinant protein production.

5
Chapter Two Principles and Literature survey
2.1 Single cell protein definition and uses
Single cell protein (SCP) is the term used to describe microbial cells which are grown
and harvested primarily for use as human or animal feed. Most of the microorganisms which
are used as produces grow as single rather than as complex multicellular organisms. SCP
contains nucleic acids, carbohydrate cell wall material, lipids, minerals and vitamins.
Microbial cells are produced as protein source for food or feed. Some edible eaten foods are
in fact micro-organisms. Good examples for that are blue green algae which were collected
from lakes in Mexico, edible fungi which have been collected from the wild and yeast which
were grown on a large scale in Germany and used as food and feed [Barnell, H.1974; Reed, R.
et al. 1985; Thaysen, A. 1943; Sivasanker, B. 2002]. Many advantages have made
microorganisms as protein source. Microbial cells are rich in protein and they can create
protein from inorganic nitrogen i.e. ammonia. Microorganisms can use alternative carbon
sources i.e. CO2 as by algae. Organic carbon is another carbon source that be used in wide
range like waste products from industries or agriculture. SCP production plants are efficient in
space and microorganisms grow much more rapidly than plants or animals which have given
usage of microbial cells another advantages. But beside these advantages there are some
disadvantages. The leak of sufficient quantities of essential amino acids like methionine in
algal, little taste or smell, digestibility problem of some of microbial cells kinds, adverse
effects in humans, limitation of range of microorganism’s kinds because of pathogenic or
toxicity and the high content of nucleic acid RNA which cause gout [Murray, M. 2004;
Halasz, Anna 2000].
2.2 Criteria of choosing microorganism for SCP production
Many factors have to be considered before using a microorganism for SCP production.
These factors relate to growth of organism because pathogenic or toxic organism will not be
used.
2.2.1 Growth rate and biomass
High growth rate is needed for high output (weight of biomass produced per unit of
time). However, this will give also disadvantage of high RNA content in cell because nucleic
acid content is proportional to the growth rate. The biomass yield coefficient is weight of cells
produced per unit of substrate consumed. High yield coefficient will be a target to give high
6
Chapter Two Principles and Literature survey
output in order to utilize as much as possible of substrate (especially if the substrate is
expensive). The slower the growth rate, which means larger proportion of the total substrate
consumed for maintenance, gives as a result less available substrate for biomass synthesis;
consequently, the substrate yield coefficient is diminished [Waldron, C. and Lacroute, F.1975;
Boehlke, K. and Friesen, J. 1975; Leuenberger, H. 1971].
2.2.2 Stress tolerance to broad range of temperature
When the cells from different organisms are exposed to mild heat shock, they acquire
resistance to subsequent various stresses. That would normally be lethal, a phenomenon called
acquired stress tolerance. Stress tolerance can be induced by various treatments, such as the
heating of cells and the treatment of cells with chemicals. These treatments can also induce
production of a small set of proteins called heat shock protein. A mild heat shock (37 °C, 30
min) induced thermo tolerance and oxidative tolerance in both aerobic and anaerobic cells.
Sensitivity to both heat and oxidative stress was dependent on membrane lipid composition. In
the case of anaerobic cells, the most stress resistant had membranes enriched in saturated fatty
acids, followed in order by cells enriched in oleic and linolenic acids. Aerobic cells with
membranes enriched in palmitoleic and oleic acids showed the highest resistance to stress
under all conditions. The ability of organism to tolerate raised temperature, which can be
happened during exothermic fermentation, would reduce the need for cooling. The ability of
an organism to grow at ambient temperature overcomes the need for cooling or heating. The
broader the temperature range tolerate, the less the need for temperature control [Katsuhiro, T.
et al. 1998; Steels, E. 1994].
2.2.3 Stress tolerance to broad range of pH
A pH of a medium tends to change during fermentation. Most often media are
buffered, and the fermenter is fitted with pH control. However, the ability to tolerate a wide
range of pH can overcome the need to pH control. Fungi, for example, grow at lower pH than
bacteria. Therefore, cultivation can be at very low pH to prevent bacterial growth. That means
than an aseptic process will be less prone to contamination if aseptic procedures fail. In some
circumstances non-sterile processes can be operated, saving sterilisation costs.
Saccharomyces cerevisiae, a model organism in biology, grows better at acidic than at
neutral or alkaline pH. Maintenance of an acidic environment is based primarily on the active
proton extrusion mediated by its plasma membrane H+-ATPase, and this proton gradient is
7
Chapter Two Principles and Literature survey
critical for the uptake of different nutrients, including diverse cations. Therefore, sudden
alkalinization of the environment represents a stress condition for this yeast, and to survive, S.
cerevisiae must detect the change and react to it, triggering an adaptive response. The
response of budding yeast to alkalinization of the environment has been characterized in some
detail in the last few years, in many cases through the study of mutants sensitive to high pH
conditions and/or the definition of the transcriptional adjustments after exposure to alkaline
pH [Serrano, R. et al. 2006].
2.2.4 Mutation rate
Mutant is a strain which exhibits inheritably changed characteristic when a microbial
cell divides, while a mutation is the process giving rise to it. Metabolism of an organism is
controlled by its genome. Microbial products can be quantitatively enhanced by improving
fermenter design and optimal culture conditions. But that needs genetic stability which has
made genetic improvement of the organism fundamental in fermentation technology.The
probability of a mutation occurring may be increased by exposing the culture to a mutagenic
agent such as UV light, ionizing radiation, and various chemicals, for example
nitrosoguanidine, nitrous acid and caffeine. Such an exposure usually involves subjecting the
population to a mutagen dose which results in the death of the vast majority of the cells. The
survivors of the mutagen exposure may then contain some mutants, the vast majority of which
will produce lower levels of the desired product [Walker, J. and Rapley, R. 2000].
Organisms for SCP production require a high degree of genetic stability. In continuous
process, which is often used for SCP production, the long growth period of several weeks can
enhance the mutation. In batch culture there is not enough time for mutation.
2.2.5 Aeration requirement and energy cost
In order to achieve a suitable yield of single cell product (except from algae), a
sufficient aeration with filtered air has to be applied. The running costs are 20% of the total
production costs of SCP. Aeration costs contribute 60% of running costs. Therefore, aeration
costs can be as much as 12% of the production costs of SCP. The lower the aeration costs the
better. Power cost for aeration, fluid handling, and steam for cleaning, recovery, and drying
the product are significant factors in the total energy costs [Porter, R. 1979].

8
Chapter Two Principles and Literature survey
2.2.6 Filamentous growth
In filamentous growth, the high surfaces to volume of a filament will facilitate
transport of nutrients. It might be cheaper to recover filaments from media and have a more
fibrous texture. On other hand, there is difficulty to aerate dense broths of filamentous
organisms. Also wall growth can cause problems such as clogging of pipes and valves. The
growth form of filamentous fungi is more complex. The extension of individual hyphea is
localized at the tip, whereas biomass synthesis supporting that growth may take place
throughout mycelium. Different morphological and physico-vhemical characteristics of fungal
hyphal elements and thereby their tendency to aggregate caused by distinct cultivation
conditions. Large scale industrial fermentations involving filamentous fungi can be only
controlled and operated on the basis of quantitative information [Nail, A. and Gow, M.1994;
Cox, P. et al. 1998].
2.3 Substrate for SCP production
Substrate has to be included all the nutrients required for cell material and energy
production in order to grow a microorganism. There are a wide range of substrates for SCP
production. Carbohydrates, which provide carbon and energy source of different kinds, are the
most common substrate. Molasses (the by-product), starch, whey, hydrocarbons are the most
widespread used substrates for SCP production. Some organisms have additional requirement
for growth factor, such as vitamins. Both photosynthetic and non-photosynthetic
microorganism can be used for SCP production. Nitrogen source can be nitrate, ammonia or
ammonium salt. Carbon: nitrogen ratio in medium should be as much as 10:1 because this
ratio is nearly the same in organism. This ratio differs slightly among organisms. If the ratio is
more than 10:1 the ammonia would be completely used up before all sugar and that leads to
reduce the biomass output and wasting the sugar while at ratio of 1:1 most of ammonia would
not be incorporated into cells and would be wasted.
The cost of substrates used in SCP production may represent 40-75% of total
production cost. Ammonia contributes 5-15% of substrate cost but the major portion is the
carbon source. Atmospheric CO2 is free, but costly energy is needed for agitation to dissolve
it into dense algal cultures. Wastes from industry and agriculture can plentiful and relatively
cheap, but may still represent 20-30% of the total production costs. Solid agricultural wastes,
especially cellulosic ones, need expensive pre-treatment. Industrial wastes can have high
levels of BOD which means they could cause pollution if disposed in water without treatment.

9
Chapter Two Principles and Literature survey
Using them as substrates for SCP production can reduce BOD by as much as 70-80% and so
save on treatment costs. Hydrocarbons and their derivatives can represent from 30-70% of
total production costs. They are derived from oil or natural gas which are non-renewable and
will become increasingly expensive. They also have used as fuels and petrochemicals and
their availability is often influenced by political issues [James, M. et al. 2005; Keshav, T.
1990; Hacking, A. 1986].
2.4 Production of SCP
2.4.1 Biomass production
Yeast and filamentous fungi are heterotrophic organisms. Supply of an organic source
of carbon, nitrogen source, sulfur, phosphorus and other elements is required in order to
produce biomass. The synthesis ATP in hetrotrophic organisms growing on glucose arises
from two connected metabolic pathways. Glycolysis oxidises glucose to pyruvate with a net
ATP yield of 2 mols per mole of glucose consumed. The respiratory pathway, which
consumes pyruvate , yields 38mols of ATP and 6 mols of CO2 through the total oxidation of
glucose with 6mols of O2 ( thus called oxidative pathway) [Peppler, H.1979; Gancedo, C. and
Serrano, R. 1989].
The carbon source and oxygen are required for an oxidative metabolic pattern. Oxygen
contributes as much of 21% of the total air volume, and must be supplied to the culture
through sparging. The dissolved oxygen concentration in a reactor must always remain above
a critical point; otherwise the rate of oxygen consumption becomes dependent on oxygen
concentration [Bailey, J.; Ollis, D. 1986].
At high glucose containing medium, yeast will metabolise the sugar substrate through
oxido-reductive metabolism at a rate of higher than that of the matching oxidative pathway,
even when oxygen is available above the critical point. The resulting ethanol is generally
toxic to competing microbes, but can be withstood by yeast up to concentrations normally
reaching 12% (v/v). Ethanol may subsequently be metabolised aerobically by yeast [Gancedo,
C. and Serrano, R. 1989; Solomons, G. 1985].
Up to half of the carbon source supplied is assimilated to build cell material under
perfect aerobic culture. Thus, the optimum yield is 50% (w/w)(biomass/ intial substrate).
Maintenance and growth of cells will consume the rest as fuel [Oura, E. 1983].
The biomass from yeast fermentation processes is harvested normally by continuous
centrifugation. This process results in biomass concentrations around 30% (w/v). Filamentous

10
Chapter Two Principles and Literature survey
fungi are harvested by filtration. The biomass is then treated for RNA reduction and dried in
steam drums of spray driers. Drying is expensive, but results in stabilized product with shelf
lives of years. This is a key feature in the animal feed and fodder business. A more detailed
revision of the different processes, flow charts and reaction configurations used for
commercial SCP production can be found in other references [Solomons, G. 1985; Ward, P.
1992].
2.4.2 Design of process and control
Under an oxidative metabolic pattern, the control of the carbon source concentrations
and an adequate supply of oxygen for the maintenance of balanced growth is recommended.
This is because of the physiological features of yeast and fungal organisms. Continuous
modifications on process parameters, which influence physiology, over substrate
concentration, should be done as microbial growth is a time dependent process. Therefore, an
adequate technology which maintains appropriate growth conditions for a prolonged period of
time must be implemented specifically for the purpose of obtaining high yield and
productivity values. Batch fermentations are inadequate for the purpose of biomass
production because the conditions in the reaction medium change with time. Fed-batch
fermentations are better suited for the purpose of biomass production, since they involve the
control of the carbon source supply through feeding rates. However, as the biomass
concentration increases, the oxygen demand of the culture reaches a level which cannot be
met in engineering or economic terms. Fed-batch culture is still in use for bakers yeast
production using well established and proven models. However, they have not been favoured
for the production of SCP at a large industrial scale [Peppler, H.1979; Chen, S. and Chinger,
M. 1985; Fiechter, A. 1987].
Continuous addition of fresh medium with the simultaneous harvesting of product has
been implemented successfully in industrial fermentations destined to biomass production.
Chemostat, the most commonly mode, has given a perfectly mixed suspension of biomass into
which medium is fed at a constant rate. In order to keep culture volume constant, the culture is
harvested at the same rate of inlet feed [Fiechter, A. 1975; Cooney, C. 1986]. A steady state
condition is obtained when the rates of incoming and out flowing medium to and from the
reactor are identical. If the conditions are carefully controlled, the process may be maintained
at production settings which are optimal for long periods. Production periods as long as six
weeks have been implemented in many fungal and yeast SCP production processes based on

11
Chapter Two Principles and Literature survey
carbohydrate carbon sources. Running the process for long time is not devoid the risk of
contamination. After a certain number of generations, the appearance of undesirable genetic
variations will be raised [Trinci, A. (1992; Muller, L.1969].
In a chemostat culture the specific growth rate (µ) may be set by the dilution rate (D,
h-1) of the process (D = F/V = flow rate/reactor volume). Substrate and oxygen concentrations
have to be held under steady-state state conditions for any set dilution rate. The continuous
removal of biomass relieves the limitations on oxygen supply that apply for batch and fed-
batch culture systems. The reaction volumes also determine the dimensions of all surrounding
facilities, with important consequences on capital investment. Under chemostat culture, high
yielding (Y = 0.45-0.5) SCP processes have been operated at µ values ranging between 0.2
and 0.3 h-1 in yeast cultures and between 0.15 and 0.2 h-1 in cultures using filamentous fungi
[Solomons, G. 1985; Fiechter, A. 1987; Castrillo, J.1993].
Optimization of oxygen transfer, through the gas-liquid interface has been an
important scientific and technological effort. Massive aeration is not recommended on
economic grounds and on the technical side. The higher the proportion of gas pumped through
the solution, the greater is the partial volume occupied by the gas, and therefore the reactor
volume. Over aeration will cause evaporation and cooling of the medium, which is another
undesired consequence. In addition, a common problem of industrial fermentations is the
profuse appearance of foam on the head space of the reactor, causing reactor pressurization,
spillages and contamination hazard.
Oxygen transfer, substrate and product concentration, the appearance of minimal
amounts of toxic compounds through undesired metabolic processes, which may compromise
the quality of the final product are carried out automatically as a result of a rapid development
in all aspects of control, from sensor design to the computer algorithms which modulate the
control responses. Simplified control devices are preferred due to the price competition of
SCP with plant proteins which leads to take advantage of existing conventional technology
such as oxygen and pH control [Ritzka, A.; Sosnitza, P., 1997; Royce, P. ;1993; Sonnleitner,
B. 1996].
A relationship between proton production and cell growth has been recently
demonstrated during experimental evidence of extracellular medium acidification by cell
cultures. The on-line estimation of biomass and growth-linked product synthesis through pH
control analysis using formal relationships which are applicable for a wide range of organisms
has become possible [Vicente, A. et al. 1998].

12
Chapter Two Principles and Literature survey
In SCP fermentation processes, the oxygen concentration must be above a critical
point. The various control devices used to maintain oxygen levels within the oxidative
physiological range, span from increased agitation and aeration, to more sophisticated control
of carbon source dosage and oxygen gas injection. Specific electrodes placed at different
reactor locations give an account of the levels of dissolved oxygen in the medium [Zhang, X-
C. and Visala, A.1994].
2.4.3 SCP production economic aspect
The need for accurate cost estimations is very relevant, since in the majority of cases
the product is competing against protein sources of plant origin, and the profit margins are
predictably low. In other cases, such as that of Quorn myco-protein process, fungal
proteinis competing against meat as a meat substitute, but an added economic effort is
required to promote the product against such an established competitor, and the added cost
must be compensated for in the production economy. Thus, in all cases, product cost
estimation is a central element in the food and feed market industry. A detailed review of this
subject can be found in references. Details of the following related subjects can be found in
references [Hacking, A. 1986; Kalk, J.; Langlykke, A.1986; Rose, A.1979; Cooney, C. et al.
1980].
2.4.3.1 Parameters affecting economic viability
There are several parameters are used in the estimation of economic viability. Raw
material costs play a big role in the economic estimation. And it is essential of the criteria of
selecting raw material for bioprocess which includes price, a viability, composition, form an
oxidative form of carbon. An example is the termination of many projects of SCP, based on
petroleum products, because of the rising of oil price in 1973.
Manufacturing cost and general expenses contribute in the product cost. The product
cost normally is divided by the annual production in order to estimate product’s unit cost. The
former includes all aspects directly related to production, such as direct operating costs,
labour, supervision and utilities. Empirical formulae which relate the unknown values of some
parameters to other obtainable ones are used in order to build an approximate estimation.
All of the funds required to build start and test the production facility before the
product is put to the market are included. This investment parameter may be further
subdivided into Fixed capital, or capital invested in hardware, land and equipment, and

13
Chapter Two Principles and Literature survey
working capital, which includes inventory of raw materials, products and supplies, receivable
and payable accounts. Profitability is calculated from the return on the investment as a
percentage.
Despite the elaborate skills with which cost estimation may be carried out, it is still
vulnerable to deviations which are sometimes strong, due to the appearance of unaccounted
variables. One such variable of technical nature mentioned already can be the appearance of
highly branched colony mutants in the myco-protein production process. Other very important
variables are more conventional, but they can make or break a business venture, in the same
way as they influence private family economies. Labour costs, fuel prices or interest rates are
but a few variables which can unpredictably change as a consequence of local or global
developments.
2.4.3.2 Practical aspects of economic viability
Besides the largest elements influencing Total Product Cost, there is a myriad of
details which can cut the cost of production. Small though their contribution may seem, the
additive effects of all the adequate measures may represent the difference between favourable
and unfavourable economic balance. Higher process temperatures leading to greater
productivities may result in reduced reactor cooling costs.
Fine adjustment of the aeration levels to values still higher to the critical oxygen
concentration limit, below which the organism no longer supports an oxidative metabolic
pattern, reduces aeration consumption, as well as foaming and evaporation of the medium.
Fine adjustment of the medium required to sustain growth results in savings in some growth
factors, such as vitamins, which are expensive. Cheaper sources of vitamin, where they are
found in impure mixtures (yeast extract, Soya bean extract, etc) often make all the difference
in the cost of the supplement. Many processes sacrifice part of the biomass to make an extract
which is fed back as a source of growth factors.
Care in the choice of the nitrogen source may be relevant. Some sources of nitrogen
(i.e. urea) contain higher amounts of nitrogen per unit weight than ammonium salts. The
savings come through transport costs. Hydrated forms of salts are not recommended for the
same reason. In addition, since urea consumption does not involve proton extrusion [Marx, J.
1989]; savings can also be made in pH adjustment reagents.

14
Chapter Two Principles and Literature survey
2.4.3.3 Advantages and constraints of SCP as a market product
Besides the aspects cited above, the variability in the market price of other products
against which SCP is competing, clearly determines the market price and hence the
profitability.
One direct competitor for SCP in western countries was brewers yeast. Identical in
almost every feature, brewers yeast had a bitter taste which carried through to feed
formulations, as the only differing characteristic from SCP yeast. However, this competitor
was a by-product, the production of which was independent from the market strategy of the
producers. That lead to policies of high turnover, low stock age of the by-product and
consequently low market prices. Another competitor was excess bakers yeast. Thus, yeast and
fungal SCP had to fall in the by-product market.
One common feature of SCP processes was that they often eliminated waste products,
thus covering the function of expensive waste treatment installations. This led to the logic that
the substrate may not only be provided at low prices or free, but received with payments by
SCP producers. In the case of public wastes, an environmental quota could be payed to SCP
producing companies. Such payments would add to those for the final product, with important
repercussions on profitability.
Though these reasonings made some sense, market reality proved to be very different.
Since a profit was expected to materialise from SCP production, the wastes which the process
consumed passed on to become substrates, and little interest was paid on their potential
environmental hazard once consumed. The use of wastes, in addition brought additional
problems in cases where the interest in waste treatment prevailed: The production volumes
were not determined by the market demand of the product, but by the need to eliminate the
waste. In those instances, waste treatment was the product and SCP was a true by-product,
which accumulated until buyers could negotiate bargain sales which liberated stock capacity
for the producer. Processes using whey and sulfite liquor were examples vulnerable to these
constraints
While SCP protein coexisted with its competitors in the 70's and early 80's, mainly due
to the limitations in the availability of brewers yeast, the emergence of cheap protein from
Soya bean and maize in the late 80's and 90's tilted the balance against SCP processes in most
countries. Soya bean protein was available at prices which were 50% lower than SCP, with no
restrictions on dosage due to high nucleic acid content. The incidence of the price of
competitor protein clearly determined the out marketing of SCP.
15
Chapter Two Principles and Literature survey
2.4.4 Process examples
Many processes of SCP production have been developed by utilizing different sources
of carbon. Feed processes have been developed mainly in Europe, Japan and the former
USSR, where feedstuffs are in short supply. Processes have not generally been successful due
to unfavourable economics (rising substrate costs and decreasing cost of Soya). For food, SCP
has been produced on a smaller scale and is mainly limited to yeasts, the use of which in food
has been traditional. The exception is Myco-protein, which is being promoted as a health
food, rich in protein and lacking animal fat, and which can be used as meat substitutes in
high-value vegetarian convenience foods.
2.4.4.1 Production of SCP from carbon dioxide
Blue-green bacteria (cyanobacteria)
Cyanobacteria are organisms with some characteristics of bacteria and some of algae.
They are similar to algae in size and, unlike other bacteria; they contain blue-green and green
pigments and can perform photosynthesis. Therefore, they are also termed blue-green algae.
Blue green algae (cyanobacteria) bacteria are photosynthetic. They can be found as single
cells or groups of cells on water surface. In Asia, Africa, and parts of Central/South America,
naturally occurring green and blue-green algae have been harvested and consumed for their
nutritive properties for centuries. In western cultures, certain blue-green algae (cyanobacteria)
have been an accepted source of food for about 30 yr, in particular Spirulina (Arthrospira)
platensis and Spirulina maxima. In this process, blue-green bacteria (cyanobacteria) of the
genus Spirulina is grown on natural bicarbonate rich ground-water, into which atmospheric
CO2 readily dissolves. A common observation is that blue-green algal dominance of aquatic
communities is greater when water temperatures are warmer. In Lake Mendota, Wis., blue-
green algae are an insignificant component of the phytoplankton in the spring, but become
dominant as the water temperature warms. The product is used as SCP in Mexico. The single
10 hectare (1 ha = l0,000 m2 )open lagoon is about 0.6 m in depth and unmixed. The system
is operated as a batch culture or as a semi-continuous culture. Nitrate is added as a nitrogen
source, and other minerals are present in the water. The long filaments are raked mechanically
from the pond onto screens, where water is drained and either recycled or disposed of. The
biomass is then dewatered by rotary vacuum filtration, dried by vacuum drying, then dried in

16
Chapter Two Principles and Literature survey
a drum drier and ground to a powder. The product contains 56% protein and is sold as food
[Fish,S. and Codd,G.1993; Konopk, A. and Brock, B.1978].
The product is rich in proteins, vitamins, essential amino acids, minerals, and essential
fatty acids. Consumers of blue-green algae report a wide variety of putative effects such as
mental clarity, increased energy, blood and colon cleansing, increased focus, particularly in
children with attention deficit disorder, improved digestion, increased eye health, and
healthier joints, and tissues [Reed, R. et al. 1985; Carmichael, W. and Stukenberg, M. 2006].
Algae (Chlorophyceae)
The chlorophyceae is green algae, distinguished mainly on the basis of ultrastructural
morphology. SCP is produced by using Eukaryotic algae (Chlorophyceae). Several types of
cultivation systems have been considered, depending on the substrate used and whether the
SCP is intended for use as food or feed.
For use as food or feed, algae are grown in pure or mixed culture in a mineral salts
medium containing NH4 or NO3 and supplied with air or gaseous CO2. Open systems have
been developed with organisms growing as continuous cultures in open lagoons or circulation
ditches. The ponds can be lined with clay, concrete, brick or plastic sheeting and are 20-50
Cm in depth. Mixing can be mechanical, using motor driven paddles, or can be manual, and it
is necessary to prevent sedimentation of cells and uneven exposure to sunlight. The organisms
grow as photottrophs using sunlight as an energy source and atmospheric CO2 as carbon
source. Such systems are relatively simple (low-tech) but, as they are open, they are liable to
contamination by wild algae and bacteria. Heterotmphic bacteria can grow in the ponds using
organic materials released into the water by the algal cells.
Development work is being carried out growing algae for feed on municipal effluents
and animal slurries. This is carried out in high-rate algal ponds (shallow aerated lagoons
operated at high dilution rates). Aerobic bacteria oxidise organic materials in the effluents,
producing CO2 which is used by the algae growing as photoautotrophs (using CO2 and
sunlight). The algae in turn produce O2 which further stimulates the aerobic bacteria. Such
systems are able to produce feed on the one hand and to reduce BOD, nitrate and phosphate
(ie pollutants) from effluents on the other hand. In Japan chlorella scp has been produced for
food in continuous aseptic systems in conventional bioreactors. The organisms are grown in
the dark as heterotrophs using sucrose (in the form of molasses) or glucose as carbon and
17
Chapter Two Principles and Literature survey
energy source [Shubert, L.1988; Fabregas,J.and Herrero,C.1985; Ciferri,O.1983; Marx,
J.1989].
2.4.4.2 SCP from carbohydrates
Carbohydrates are renewable source. A carbohydrate is an excellent substrate for SCP
production by heterotrophs. Many forms of carbohydrates can be found such as sugars, starch,
pectin and cellulosic material. Yeasts can utilize variety kinds of sugar. Therefore, it was used
widespread in production of SCP. Each process differs slightly according to the nature of the
substrate and the organism used. Hydrolysis of starch can be carried out by chemical or
enzymatic treatment to produce sugars for a fermentation medium. Cellulosic material is solid
and is normally used in solid-substrate fermentations. Cellulosic materials require hydrolysis
to sugars before they are available for cell uptake and use.
Molasses
Molasses is a by-product of sugar manufacturing process, mostly from beet or cane,
and contains 35-50% sucrose and small quantities of nitrogen. It is used as a fermentation
medium for the production of bakers yeast, ethanol and other products. Baker’s yeast was
produced firstly in aerobic fermentation on molasses. For SCP production, the molasses is
diluted to 44% sucrose, supplemented with phosphate and sterilised by continuous heat
sterilisation. Continuous processes are run in aerated fermentors with ammonia addition,
producing food-grade Candida utilis and Sacchmomyces cerevisiae. Systems operate at
dilution rates 0.2-0.3 h-’ at pH 3.545 at 25-35°C.Yeasts are recovered by centrifugation,
washed, dried by drum or spray drying and packaged. The product contains about 45%
protein and is used as a high protein food supplement, particularly in Taiwan and South
Africa [Oura, E. 1983; Chen, S. and Chinger, M. 1985; Marx, J.1989].
Whey
Whey is the residue drained from the crude in cheese manufacture as a by-product. It
contains about 5% lactose, 0.3% fat, 93% water, 0.6 salts and about 0.7% protein. About half
of the global production is used as a feed supplement but the rest is unused. For SCP
processes the valuable protein from the whey is first recovered by precipitation or
ultrafiltration, and the deproteinised whey used in processes such as described for molasses.
The yeasts used are food-grade organisms capable of using lactose as a carbon source, namely

18
Chapter Two Principles and Literature survey
Saccharomyces lactis, Candida utilis and Kluyumyces (previously Saccharomyces) fragilis.
Feed-grade SCP is often prepared by spray drying the complete fermentation broth. Whey is
produced in very large quantities. But the output of whey is high in the summer and low in
winter which will affect its usage as substrate source [Muller, L.1969; Hacking, A. 1986;
Moebus, O. and Teuber, M. 1983].
Sulphite waste liquor
Sulphite waste liquor is one of the major’s substrates that used in commercial
production. It is a waste product of the sulphite wood pulping process. This process has now
been replaced in many countries. The liquor contains about 20% w/v sugars, in the form of
both hexoses (6carbon sugars) and pentoses (5-carbon sugars), and 6% w/v acetic acid.
Processes have been operated growing Candida utilis for food or feed but the most effective
has produced feed from Paecibmyces azrioti (the Pekilo process). This process was applied in
Finland and was put into operation in 1975. Biomass production was estimated to be around
7000 tons per year in 1983. But this process is not currently in operation [Oura, E.1983;
Morgan, N. et al. 2001; Webb, F.1964].
'Myco-protein' process
The process operating in the UK to produce the QuornTM myco-protein.This process is
currently used glucose obtained from maize as substrate. It has been reported earlier to grow
the filamentous fungus fusarium graminearum on food-grade glucose syrup, produced by the
enzymatic hydrolysis of wheat starch, a by-product of wheat gluten production. The medium
is composed of diluted glucose syrup, ammonia, mineral salts, choline and biotin. Ammonia
gas is added to continuous aseptic systems via the air inlet and serves as a nitrogen source and
to maintain pH at 9.0. The system used to develop the process was an air-lift fermentor of 36
m3 capacity. For full-sale production a pressure-cycle bioreactor of larger volume is used.
This technology was developed for SCP production from methanol and was acquired under
licence for the Myco-protein process. After concentration from the medium, by separation in a
cyclone, the cell suspension is heated to 64°C for about 20 minutes, during which time heat-
stable RNAses degrade cellular RNA, the components of which are released from the cells.
This reduces the RNA content from 10% to 2%. The heating process in addition inactivates
proteases, which makes the produce more stable during storage. Biomass recovery is by
filtration (dewatering) by horizontal belt vacuum filtration. The recovered biomass is usually

19
Chapter Two Principles and Literature survey
blast chilled for storage by deep freezing, although it can be dried for storage [Trinci, A.
1992; Jarl, K. 1969; Steinkraus, K. 1986].
Starches
Effluents from the processing of starchy vegetables such as potatoes, cassava, rice or
corn (maize) have been the substrates for commercially operated SCP processes. The Symba
process was developed in Sweden to produce SCP for animal feed from potato processing
wastes. The Symba process is a two-stage continuous process based on a symbiotic culture of
the yeasts Endomycopsis fibuligena (which is amylolytic but of low value as SCP) and
Candida utilis. The effluent is supplemented with ammonia, sterilised and fed to the first
bioreactor containing E. fibuligera. This organism secretes amylase which hydrolyses the
starch. The broth feeds a second bioreactor inoculated with Candida utilis, which grows faster
and predominates [Oura, E. 1983; Morgan, N. et al. 2001; Jarl, K. 1969].
Cellulosics
Lignocellulosic waste is a renewable source for SCP production.If an economic
process can be found to hydrolyse cellulosic material to its constituent sugars, by chemical
and/or enzymic means, then vast quantities of sugar could be made available for fermentation
processes, including SCP production. Despite long and hard research effort, success has been
limited. However, projects have been developed to enhance protein content of cellulosic
wastes by growing cellulolytic fungi (such as Trichoderma spp) on them in solid-substrate
fermentations (using the technology described for solid starch wastes). In this way the low-
protein substrate (for example wheat straw or rice straw) can be converted into protein-
enriched feed, with a protein content of up of 15%. This can be used as feed for ruminant
animals. However, for high conversion rates, cellulosic material requires expensive physical
or chemical pre-treatment. As yet no large scale commercial processes have been developed.
Processes have been developed in North America to pilot scale growing the bacterium
Cellulomonas or the fungus Trichaderma on pre-treated milled cellulosic material in
conventional fermentors, ie in a liquid medium. However, preparation costs are considerably
higher than with solid-substrate fermentations [Callihan, C. and Clemmer, J.1979; Ferranti,
M. and Fiechter, A.1983].

20
Chapter Two Principles and Literature survey
2.4.4.3 SCP from hydrocarbons and derivatives
Using hydrocarbon as a carbon source for producing SCP is not devoid from
complications because of low solubility of it in water and the requirement for high aeration
rate. Many disadvantages accompany such process such as raising of costs because of high
aeration and cost of cooling, as the oxidation process is exothermic. Toxicity can be obtained
with small traces of alkanes [Faust, U. and Prave, P. 1983].
From n-alkanes
In the former time alkanes were considered as an attractive substrate for SCP
production. Many processes were developed such by British petroleum, in Italy, France and in
the former Soviet Union, where the structural deficit in feed protein was compensated by the
availability of oil. A large number of microorganisms, include yeasts and filamentous fungi,
are able to assimilate n-alkanes and 1-alkenes in liquid culture. Processes have been
developed to production scale growing yeasts, for feed, on purified Cl0 – C23 n-alkanes (such
n-paraffins being liquid at normal ambient temperatures). The process was developed to
production scale with a capacity of 200,000 tonnes per year. This process, developed by
British Petroleum, was one of several in Europe and Japan that, although fully developed, was
never operated commercially. This was due to sharply increased substrate costs in 1973 and
social pressures against the use of petroleum-based substrates (possibly contaminated with
carcinogenic or toxic compounds). However, most of these processes have ceased because of
the suspected helth hazard. Japan was the first country decided to ban any protein from
petrochemicals [Morgan, N. et al. 2001; Riviere, J. 1977; Smith, J. 2004; Pandey, A.2004].
From ethanol
Ethanol based SCP production is suitable source if the SCP intended for human
consumption. SCP production from ethanol has been started by many companies such as
Amoco in USA, Mitsubishi petrochemical co. in Japan, and Exxon-nestle project in
Switzerland.. A few processes operate in the USA using ethanol to produce food-grade
Candida utilis, with capacity of about 7,000 tonnes per year. The technology is similar to that
already described for SCP from sugars. On ethanol, the yield is about 0.65 kg dry wt per kg
ethanol used. But the rising of ethanol price will limit the ethanol based SCP production
[Arora, D. et al. 1991; Smith, J. 2004; Pandey, A.2004].

21
Chapter Two Principles and Literature survey
From methanol
Methanol is petrochemical industry by-product. Methanol has many advantages over
other hydrocarbons in SCP production. Methane and other hydrocarbon are slightly soluble in
water and the rate of utilize them is limited by their mass transfer rate. Methanol demands low
oxygen rate in comparison with methane, which means lowering in cooling cost. Methanol
can be produced by the oxidation of methane. Methane can be chemically oxidised to
methanol relatively cheaply. The heat liberated during such oxidation is higher grade than that
liberated by biological conversion, and is thus easier to recover and use elsewhere. It was
expected that using methanol as a fermentation substrate would, having by-passed the energy-
inefficient methane oxidation step, lead to higher yield and lower the oxygen and cooling
requirement. Methanol has the added advantage of being very much more soluble in water
and easier to handle than methane.
Several processes have been developed to produce feed-grade SCP using methanol as
a substrate. In the late 1960s, Imperial Chemical Industries (ICI) in the UK were interested in
developing an SCP process using abundant and cheap methane from newly developed sources
in the North Sea. In this process an air-lift pressure-cycle bioreactor was chosen. Despite
optimised culture conditions, yield coefficients for methanol were lower than the expected
level of about 0.5. Yields were, in fact, lower than those achieved routinely with the lm3
fermentation system The problem was traced to the cyclical nature of the pressurecycle
system, which, due to introduction of air, ammonia, methanol and other nutrients at single
points, leads to cyclical changes in nutrient concentrations as well as changes in pH,
temperature and hydrostatic pressure. These parameters change in cycles as the medium flows
around the reactor. Such changes do not occur in stirred vessels, accounting for differences in
yield observed in comparison with those in the 1 m3 system [Faust, U.; Prave, P. 1983; David,
P. 1972; Pandey, A. 2004].
2.5 Crabtree effect Crabtree effect describes the phenomenon whereby the respiratory growth of some kinds
of yeast e.g. Saccharomyces serevisiea, is inhibited or repressed. The crabtree effect is not
noticeable in glucose-insensetive yeast (e.g. candida utilis, kluyveromyces marximianus,
Trichosporon cutaneum) or in respiratoty-deficient mutants( e.g. S.cerevisiae ‘petites’).Utilis,
a Crabtree-negative yeast, may limit its glycolytic rate by accumulating interacellular reserve
carbohydrates or the cells may exhibit altered regulation of sugar uptake [Postama, E.1989;
Walker, G. 1998].

22
Chapter Two Principles and Literature survey
Crabtree effect will happen under fully aerobic conditions and in the presence of sugars
as a carbon source. Under aerobic conditions, yeast mitochondria are involved in ATP
synthesis coupled to oxidative phosphorylation. The activities of the citric acid cycle and the
respiratory chain will largely depend on the yeast species and the expression of the Crabtree
effect. This is a phenomenon related that relates glucose concentrations with the particular
catabolic pathway adopted by glucose-sensitive cells, in that even in the presence of oxygen
fermentation predominates over respiration. Catabolite inhibition may result from the
transport of a particular sugar into the cell which causes inhibition of the other sugar transport
systems [De Deken, R. 1966; Mchinnisj, F. and Paigen, K. 1973].
At high glucose concentrations, Saccharomyces cerevisiae produces ethanol aerobically
rather than producing biomass via the tricarboxylic acid. Increasing concentrations of glucose
accelerates glycolysis, the breakdown of glucose, which results in the production of
appreciable amounts of ATP through substrate-level phosphorylation. This reduces the need
of oxidative phosphorylation done by the TCA cycle via the electron transport chain and
therefore decreases oxygen consumption. In S.cerevisiae glucose suppression of respiration in
the Crabtree effect is thought to be due to glucose repressing respiratory enzymes synthesis
and/or inactivating respiratory enzymes and sugar transport activity [Branett, J. and Entain,
K.2005].
The Crabtree effect may also be due to a saturation of limited respiratory capacity of
yeast cells. Thus, glucose-sensitive (Crabtree-positive) yeast like S.cerevisiae may process a
limited oxidative capacity when grown on glucose which leads to an overflow reaction at
pyruvate. When the respiratory capacity is saturated, ethanol is formed [Sonnleitner, B. and
Kappeli, O.1986; Walker, G. 1998].
The Crabtree effect seems to be due to over saturation of the respiratory pathways. The
yeast cannot pass the excess sugar through the main path and simply send it through an
alternate route to ethanol.
2.6 Maillard products(MRPs)
It is the compound that is produced by Maillard reaction. Maillard reaction occurs
between carbonyl group of monosaccharide or polysaccharides and amino groups of amino
acids or protein under heating condition. The product forms complex networks of reactions
products including colored compounds, intermediate-molecular-weight products, or high-

23
Chapter Two Principles and Literature survey
molecular-weight polymers [Ledl, F. and Schleicher, F.1990]. Mechanism of Maillard
formation can be shown in figure 2.1 below [Kato, H. et al. 1987; Szwergold, B. et al. 1990].
Fig. 2.1: Role of dicarbonyl intermediates in oxidative and nonoxidative pathways of the Maillard reactions
The monosaccharide such as Glucose, fructose, and rip, readily react with amino acids,
such as lys.The resulting MRP mixture demonstrated better antioxidant activities than did
unheated sugar and amino acids mixtures.The polysaccharides (i.e. dextran and
galactomannan) could also react with proteins through the MR to form neoglycoproteins. The
neoglycoprotein,(i.e. lysozyme and ovalbumin-galactomannan), have enhanced emulsifying
capacity, antimicrobial, and antioxidantive activities. Neoglycoproteins are not toxic and are
not mutagenic [Ledl, F. and Schleicher, F.1990].
The formation of MRP is subject to many variables, such as reactant substrate source, pH,
temperature, and heating time. MRPs have varied effects. It was shown that a heated glucose-
glycine solution produced a maximum of 97% scavenging capacity of hydroxyl radical, while
the unheated mixture exhibited only 36% inhibition of hydroxyl radical. Heated amino acid
and reducing sugar solution exhibit greater antioxidant activity than unheated mixtures
[Wijewickreme, A. et al. 1997; Yoshimura, Y.; Injima, T. et al. 1997].
It was found that the growth of Aeropyrum pernix was severely inhibited in a medium
containing reducing sugars and tryptone due to the formation of Maillard reaction products.
The rate of the Maillard browning reaction was markedly enhanced under aerobic conditions,

24
Chapter Two Principles and Literature survey
and the addition of Maillard reaction products to the culture medium caused fatal growth
inhibition [Kee Woung Kim and Sun Bok Lee2003].
Ethanol fermentation experiments were carried out in a model system in the presence
and absence of Maillard reaction products. It was investigated that increasing amounts of
Maillard products reduced the formation of ethanol up to 80%. This effect was dependent on
the pH value during the Maillard reaction, reaction time, as well as the carbohydrate and
amino acid component used for the generation of Maillard reaction products. Another
important factor is the pH value during fermentation. The inhibitory effect of Maillard
products was not detectable at a pH of 4 and increased with higher pH-values [Andreas T. et
al. 2004].
Maillard reaction product was found to inhibit growth and alcohol production by
Saccharomyces cerevisiae. Furfural concentrations above 1 mg ml–1 significantly decreased
CO2 evolution by resuspended yeast cells. Important glycolytic enzymes such as hexokinase,
phosphofructokinase, triosephosphate dehydrogenase, aldolase and alcohol dehydrogenase
were assayed in presence of furfural. Dehydrogenases appeared to be the most sensitive
enzymes and are probably responsible for the observed inhibition of alcohol production and
growth [Nirupama, B. et al. 1981].
2.7 Date of palm 2.7.1 Introduction Dates are the fruit of the date palm. They have been used as food of the Middle East
for thousands of years. Dates have been considered one of the most important fruits in the
desert regions. There are about 90 million palm trees all over the world, which yield about
1.25 million tons of dates annually. They are distributed in 22 countries, mostly in the desert
regions of North Africa and South Western Asia [Dowson, V.1962].
Worldwide date production has increased exponentially over the last three decades.
Starting in 1965 at about 1.85 million tons, it reached 2.7 million tons in 1985 and 7.0 million
tons in 2005. Figure 2.2 shows the world wide production of date.
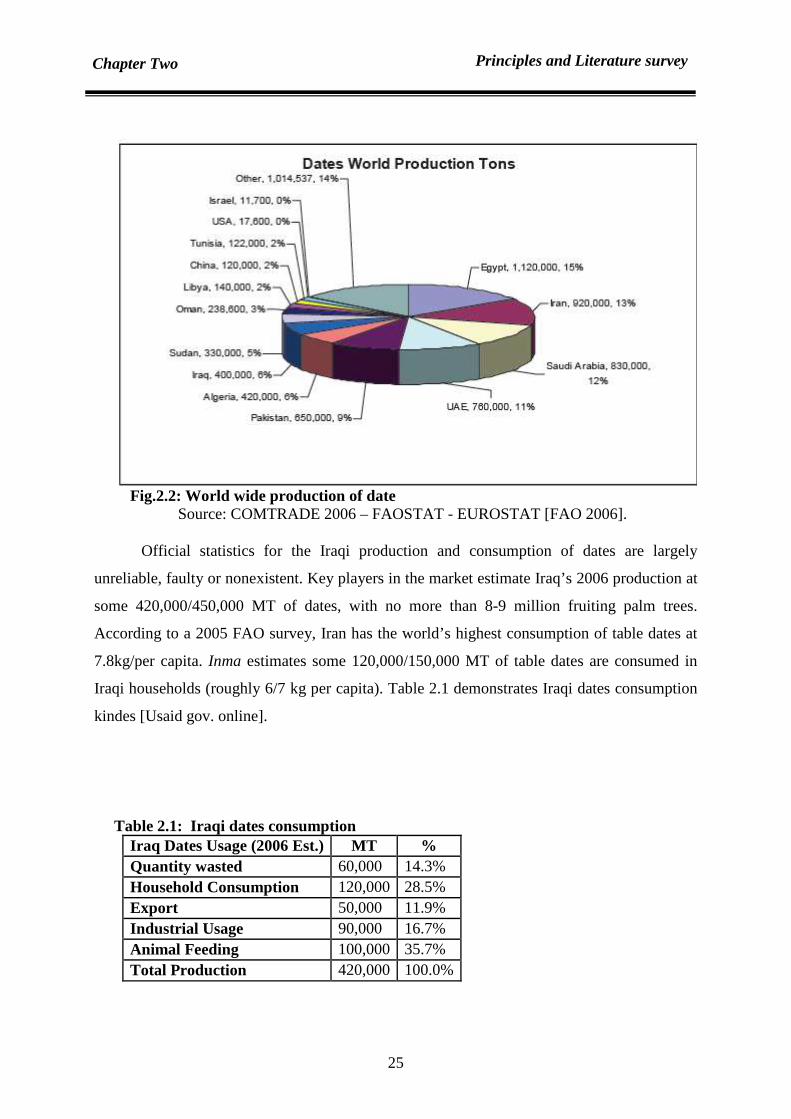
25
Chapter Two Principles and Literature survey
Fig.2.2: World wide production of date Source: COMTRADE 2006 – FAOSTAT - EUROSTAT [FAO 2006].
Official statistics for the Iraqi production and consumption of dates are largely
unreliable, faulty or nonexistent. Key players in the market estimate Iraq’s 2006 production at
some 420,000/450,000 MT of dates, with no more than 8-9 million fruiting palm trees.
According to a 2005 FAO survey, Iran has the world’s highest consumption of table dates at
7.8kg/per capita. Inma estimates some 120,000/150,000 MT of table dates are consumed in
Iraqi households (roughly 6/7 kg per capita). Table 2.1 demonstrates Iraqi dates consumption
kindes [Usaid gov. online].
Table 2.1: Iraqi dates consumption Iraq Dates Usage (2006 Est.) MT % Quantity wasted 60,000 14.3% Household Consumption 120,000 28.5% Export 50,000 11.9% Industrial Usage 90,000 16.7% Animal Feeding 100,000 35.7% Total Production 420,000 100.0%

26
Chapter Two Principles and Literature survey
Evidence from surveys conducted in Iran and the Gulf area indicates that date
consumption is much lower among the new generation. Realistically, per capita consumption
of table dates in Iraq seems to have limited margins of growth, therefore additional production
, due to the introduction of manual pollination and IPM, must be absorbed by either exports or
the industrial segment. Inma believes that there is a potential for expanding date production in
Iraq by 150,000/200,000 MT to satisfy potential growing demand in the industrial segment
(especially for syrup and “syrup extensions” processing line) and for regional export. Table
2.2 shows the quantities of imported date by Europe market.
Due to the fact that many syrup plants are currently idle and because a lack of
manufacturing capacity creates a supply constraint, actually consumption today may be as low
as 30,000 MT [Usaid gov. online].
Table 2.2: Imported dates quantities by Europe market.
Source: COMTRADE 2006 – FAOSTAT – EUROSTAT [FAO 2006].
The production of dates, according to the recent Food and Agriculture Organization of
the United Nations (FAO) statistics in the Arab countries, is about 4332208 metric tons,
which accounts to 71.69% of total the international production. However, the date production
in many Arab countries faces a wide range of problems, including the predominance of low
quality dates and change of the local consumers habits. Thus, the demand for dates has not
been matching the increasing production. The current industries, local market, and export can
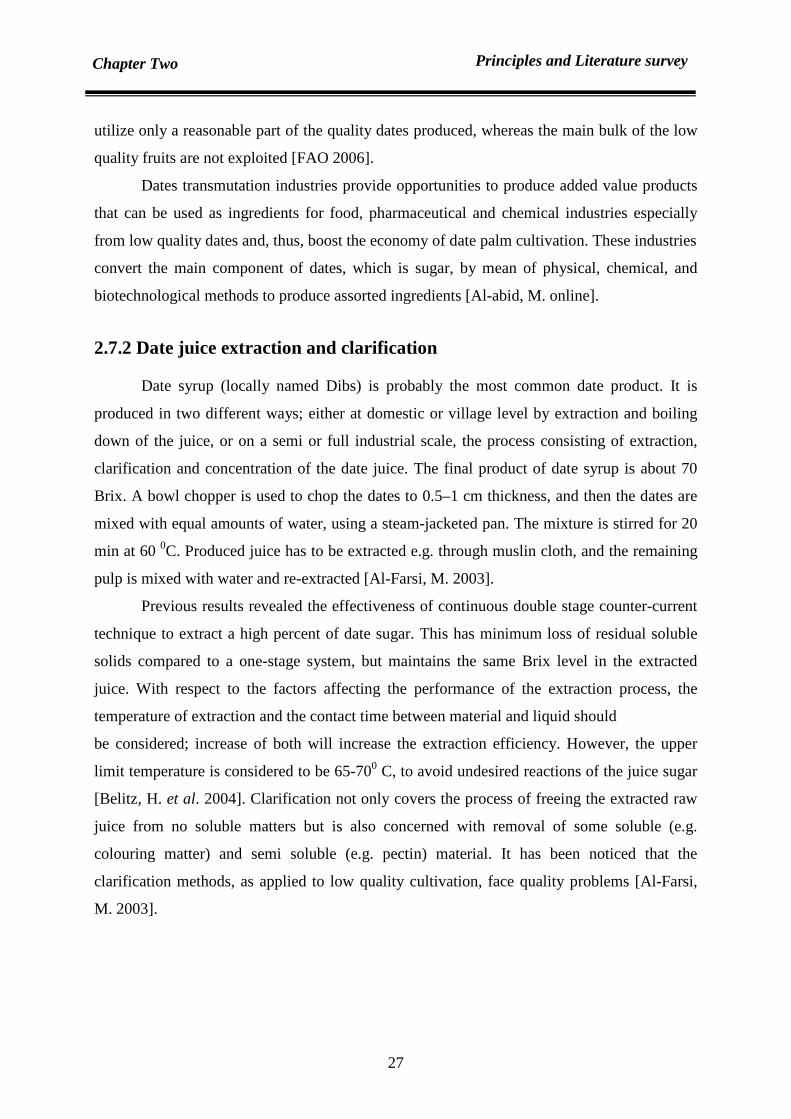
27
Chapter Two Principles and Literature survey
utilize only a reasonable part of the quality dates produced, whereas the main bulk of the low
quality fruits are not exploited [FAO 2006].
Dates transmutation industries provide opportunities to produce added value products
that can be used as ingredients for food, pharmaceutical and chemical industries especially
from low quality dates and, thus, boost the economy of date palm cultivation. These industries
convert the main component of dates, which is sugar, by mean of physical, chemical, and
biotechnological methods to produce assorted ingredients [Al-abid, M. online].
2.7.2 Date juice extraction and clarification
Date syrup (locally named Dibs) is probably the most common date product. It is
produced in two different ways; either at domestic or village level by extraction and boiling
down of the juice, or on a semi or full industrial scale, the process consisting of extraction,
clarification and concentration of the date juice. The final product of date syrup is about 70
Brix. A bowl chopper is used to chop the dates to 0.5–1 cm thickness, and then the dates are
mixed with equal amounts of water, using a steam-jacketed pan. The mixture is stirred for 20
min at 60 0C. Produced juice has to be extracted e.g. through muslin cloth, and the remaining
pulp is mixed with water and re-extracted [Al-Farsi, M. 2003].
Previous results revealed the effectiveness of continuous double stage counter-current
technique to extract a high percent of date sugar. This has minimum loss of residual soluble
solids compared to a one-stage system, but maintains the same Brix level in the extracted
juice. With respect to the factors affecting the performance of the extraction process, the
temperature of extraction and the contact time between material and liquid should
be considered; increase of both will increase the extraction efficiency. However, the upper
limit temperature is considered to be 65-700 C, to avoid undesired reactions of the juice sugar
[Belitz, H. et al. 2004]. Clarification not only covers the process of freeing the extracted raw
juice from no soluble matters but is also concerned with removal of some soluble (e.g.
colouring matter) and semi soluble (e.g. pectin) material. It has been noticed that the
clarification methods, as applied to low quality cultivation, face quality problems [Al-Farsi,
M. 2003].

28
Chapter Two Principles and Literature survey
2.7.3 Industrial usages
Juice of date is one of the richest foodstuffs in neutral compounds such as
momnosaccharides, disaccharide, mineral salts , vitamins and protein content (1.5- 3% w/w)
is low. Dates contain between 60%- 70% by weight of easily extractable sugars,
predominantly glucose and fructose. Table 2.3 represents an overview of varieties of palm
date and syrup constituents from different countries. These substances considered as essential
elements for the growth of microorganisms especially yeast. Date extracts is used in different
industrial process. Utilization of poor quality dates and date by-products has been studied for
bakery and ice-cream, for the production of caramel color, alcohol, vinegar, citric acid,
oxytetracycline, as well as for thermophilic dairy starter and single cell protein preparation
[Mehaia, M. and Cheryan, M. 1991; Basil S. 1979].
Table 2.3: Date palm/ syrup constituents ( [mg/100g] )
Palm Date (Iraq)
Date juice
(Iraq)
Palm Date
(UAE)
Palm Date
Date Syrup
(Libya)
Date Syrup
(Egypt)
Date Syrup
Palm Date
(Kuwait) Na 4.45 12 2.3-5.1 - 70.4 - - 595-673 K 701 858 402-652 - 217 521 - 497.9-
531.8 Ca 58 106.8 43-56 - 37.7 65 - 26-35.4 Mg 54.4 58.1 43.6-
53.3 - - 20 - 22.7-28.4
Fe 150 - 1.38-2.17
- 9.3 2.69 - 0.1
Cu 0.19 - .27-.35 - - - - 0.13-0.18 P 58.52 126 48.8-
68.2 - - 72 - 138.1-
152.3 S 47.4 - - - - - - - Cl 269 - - - - - - -
Thiamine .7 - - - 0.08 - - Riboflavin 0.03 - - - 0.05 - -
Nicotinic acid B3
- - - - - 2.2 -
Protein - 1.3 2.0-2.5 - 1.2 3 - 2.03-2.6 Sugar 60-70 63.6 78-79.39 - 70.81 73 - -
Reducing sugar - - - - 67.01-68.42
- - 87.53-88.02
Mn - - 0.31-0.44
- - - 0.2-0.29
Glucose - - 38.47-40.4
32 33.32 - 26.9-34.5
38.02-38.45
Fructose - - 38.55-39.95
30 30.93 - 29.1-33.2
39.12-39.69
Sucrose - - Detected 1.08-3.97 - - - Fructos:Glucose - - 1:1 0.93:1 0.93:1 - - 1.03:1
Refrence [11] [79] Provided by producing company of used date
juice
[4] [108] [78] [35] [3] [5]

29
Chapter Two Principles and Literature survey
2.8 Optimization
Many of earlier researches were done in order to find optima of a process conditions
by using different approaches such as one variable-at-a time or factorial methods. In any real
process there are upper and lower bound of operating conditions. Normally these boundary
conditions are imposed by physical phenomena. Therefore to optimize a process a
mathematical representation of the objective function has to be written. Then one can use any
of the well known multidimensional optimization methods. These methods are analytical and
make use of the techniques of differential calculus in locating the optimum points [Rao, S.
2009].
2.8.1 Single-factor optimization
One variable- at-a-time method is the traditional approach to optimize single-factor.
In this approach all variables but one are held constant and the variable has to be varied by
equal intervals. The optimum level for this variable is determined. By using this optimum, the
second variable's optimum is found, etc. The algorithm for determining the maximum
required five initial experiments in which the ratio of variable volumes is varied in four
increments to cover the range of interest of the independent variable. These data is examined
to find the maximum rate in the set. Two new experiments should be designed and carried out
at intervals equal to one-half the original interval on either side of the volume ratio
corresponding to the maximum rate. The procedure is repeated until the resolution of the
independent variable is 1/32 of the range. Few required experiments to attain this resolution at
the variable maximum.
This single-factor optimization strategy has several advantages:
1. Only a few experiments are needed to get into the region of the optimum.
2. The density of experiments is greatest in the region of the optimum. Most of the
experiments are carried out in the region of ultimate interest.
3. Those regions that are not of much interest have not been explored unnecessarily. Sparse
information has been obtained in those regions, just enough to know that additional
experiments there are probably not justified.
4. The ruggedness of the system is readily apparent from the well-defined curvature in the
region of the optimum.

30
Chapter Two Principles and Literature survey
This process works if, and only if, there is no interaction between variables. On other
words, this method cannot solve functions having nonlinear interactions among design
variables. Therefore, if there is an interaction between the variables, the one-variable-at-a-
time approach failed to find the true optimum. In order to find the optimum conditions, it
would have been necessary to repeat the one-variable-at-a-time process at each step to verify
that the true optimum was reached. This requires numerous sequential experimental runs, a
time-consuming and ineffective strategy, especially when many variables need to be
optimized. Because of the complexity of microbial metabolism, interaction between the
variables is inevitable, especially when using commercial substrates which are complex
mixture of many nutrients. Therefore, since it is both time- consuming and inefficient, the
one-variable-at-a-time approach is not satisfactory for fermentation development. Fortunately,
there are a number of statistical methods which will find the optimum quickly and efficiently
[Frederick, H. et al. 1991; Deb, K. 2005].
2.8.2 Multifactor optimization
A two-factor response surface - response y1 as a function of factors x1 and x2 can be
shown in figure 2.3. There are three common approaches that are used to optimize multifactor
systems [Frederick, H. et al. 1991]:
Fig. 2.3: A two-factor response surface [Frederick H. et al. 1991].
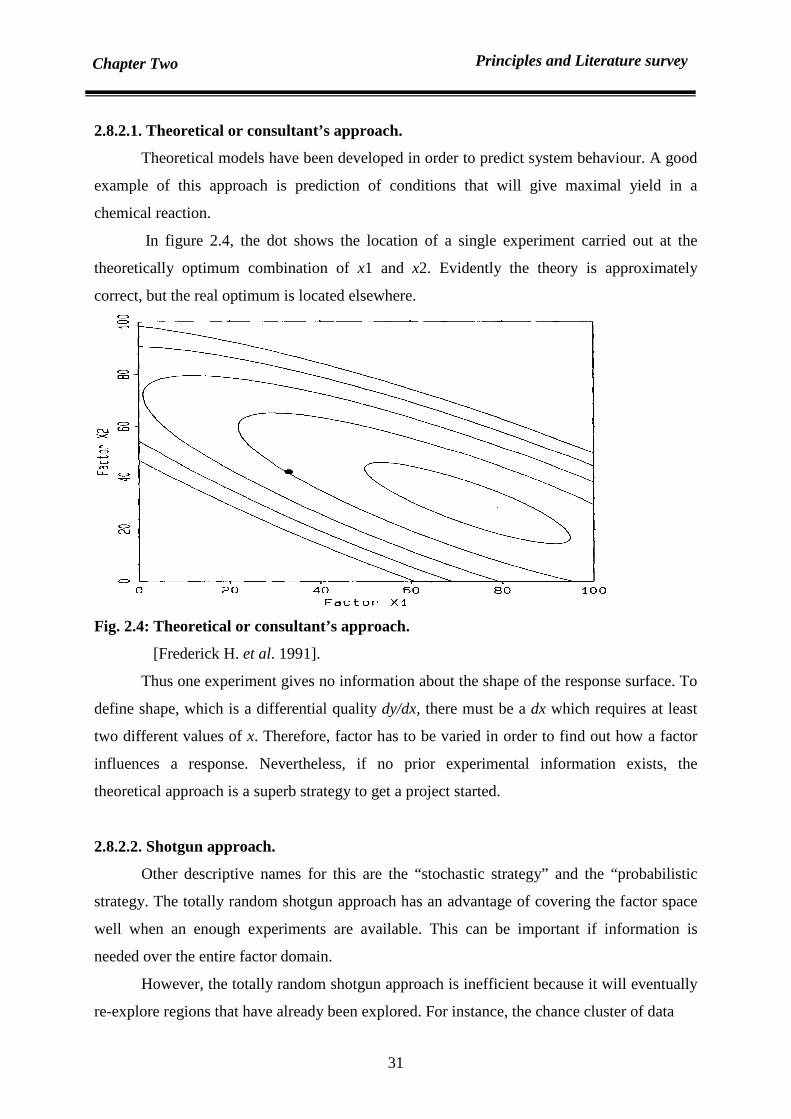
31
Chapter Two Principles and Literature survey
2.8.2.1. Theoretical or consultant’s approach.
Theoretical models have been developed in order to predict system behaviour. A good
example of this approach is prediction of conditions that will give maximal yield in a
chemical reaction.
In figure 2.4, the dot shows the location of a single experiment carried out at the
theoretically optimum combination of x1 and x2. Evidently the theory is approximately
correct, but the real optimum is located elsewhere.
Fig. 2.4: Theoretical or consultant’s approach.
[Frederick H. et al. 1991].
Thus one experiment gives no information about the shape of the response surface. To
define shape, which is a differential quality dy/dx, there must be a dx which requires at least
two different values of x. Therefore, factor has to be varied in order to find out how a factor
influences a response. Nevertheless, if no prior experimental information exists, the
theoretical approach is a superb strategy to get a project started.
2.8.2.2. Shotgun approach.
Other descriptive names for this are the “stochastic strategy” and the “probabilistic
strategy. The totally random shotgun approach has an advantage of covering the factor space
well when an enough experiments are available. This can be important if information is
needed over the entire factor domain.
However, the totally random shotgun approach is inefficient because it will eventually
re-explore regions that have already been explored. For instance, the chance cluster of data

32
Chapter Two Principles and Literature survey
Fig. 2.5: The “shotgun” (or “stochastic” or “probab ilistic”) approach.
[Frederick H. et al. 1991].
points at the bottom left of figure 2.5 is unfortunate. Only one experiment is enough to find
out that the response is undesirable and further investigation is not needed.
Potentially the biggest difficulty with “shotgun” experiments is that the results can be
confusing and hard to interpret. Figure 2.5 demonstrates that at low values of x2, increasing
the value of x1 causes the response to go up. However, at high values of x2 increasing the
value of x1 causes the response to go down. That reveals that the effect of one factor depends
on the level of another factor, an interaction exists between the two factors.
2.8.2.3. The Single-factor-at-a-time approach.
This approach studies the effects of factor on response by holding all other factors
constant in condition of the values of all other factors as shown in figure 2.6. However, it can
be shown in figure 2.5, that the change in the value of one of these other factors will probably
give a different answer because of factor interaction.

33
Chapter Two Principles and Literature survey
Fig. 2.6: Sequential single-factor-at-a-time optimization on a multifactor surface
[Frederick H. et al. 1991].
2.8.3 Evolutionary operation (EVOP)
An alternative to the one-variable-at-a-time approach is the technique of evolutionary
optimization. Evolutionary optimization (EVOP) is a simple optimization technique
developed by Box in 1957. The algorithm requires (2n+1) points, of which 2n are corner of an
N-dimensional hypercube centred on the other point. All (2n+1) function values are compared
and the best point is identified. In the next iteration, another hypercube is formed around this
best point. If at any iteration, an improved point is not found, the size of the hypercube is
reduced. This process continues until the hypercube becomes very small as in figures 2.7 and
2.8 [Deb, K. 2005].
2.8.3.1 Simplex EVOP
In the simplex (EVOP) method, the number of points in the initial simplex is much
less compared to that in the evolutionary optimization method. This reduces the number of
function evaluations required in each iteration. With N variables only (N+1) points are used in
the initial simplex [Deb, K. 2005].
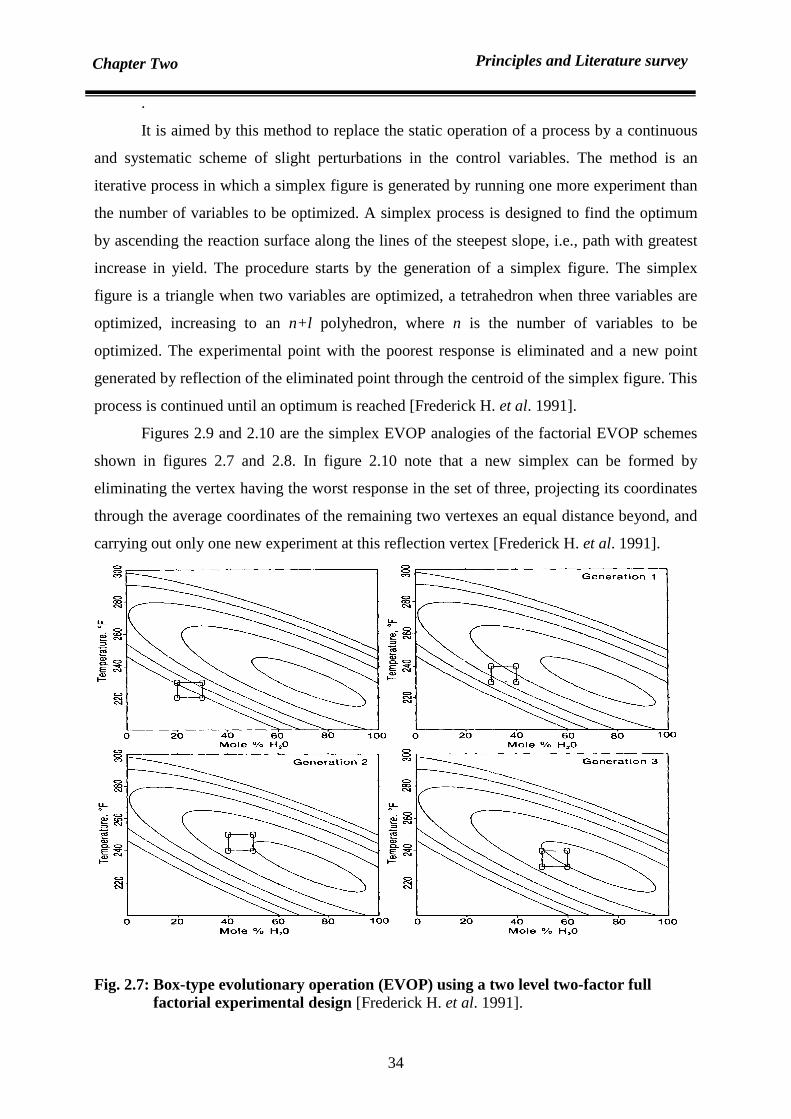
34
Chapter Two Principles and Literature survey
.
It is aimed by this method to replace the static operation of a process by a continuous
and systematic scheme of slight perturbations in the control variables. The method is an
iterative process in which a simplex figure is generated by running one more experiment than
the number of variables to be optimized. A simplex process is designed to find the optimum
by ascending the reaction surface along the lines of the steepest slope, i.e., path with greatest
increase in yield. The procedure starts by the generation of a simplex figure. The simplex
figure is a triangle when two variables are optimized, a tetrahedron when three variables are
optimized, increasing to an n+l polyhedron, where n is the number of variables to be
optimized. The experimental point with the poorest response is eliminated and a new point
generated by reflection of the eliminated point through the centroid of the simplex figure. This
process is continued until an optimum is reached [Frederick H. et al. 1991].
Figures 2.9 and 2.10 are the simplex EVOP analogies of the factorial EVOP schemes
shown in figures 2.7 and 2.8. In figure 2.10 note that a new simplex can be formed by
eliminating the vertex having the worst response in the set of three, projecting its coordinates
through the average coordinates of the remaining two vertexes an equal distance beyond, and
carrying out only one new experiment at this reflection vertex [Frederick H. et al. 1991].
Fig. 2.7: Box-type evolutionary operation (EVOP) using a two level two-factor full factorial experimental design [Frederick H. et al. 1991].

35
Chapter Two Principles and Literature survey
Fig. 2.8: Summary of experiments for Box-type EVOP [Frederick H. et al. 1991].
Fig. 2.9: Simplex EVOP using a two-factor simplex experimental design.
[Frederick H. et al. 1991].

36
Chapter Two Principles and Literature survey
Fig. 2.10: Summary of experiments for simplex EVOP [Frederick H. et al. 1991].
Numerous modifications have been made to the original algorithm of Spendley. One
of the more important modifications was made by Nelder and Mead who modified the method
to allow expansions in directions which are favorable and contractions in directions which are
unfavorable. This modification increased the rate at which the optimum is found [Nelder, J.
and Mead, R.1965].
Simplex EVOP has two major advantages over classical factorial EVOP. First, the
number of experiments in the initial simplex design is only k + 1 instead of 2k in the initial
factorial design. This is to say that the number of experiments in the initial simplex design
increases arithmetically, whereas the number of experiments in the initial factorial design
increases geometrically. The second major advantage the simplex has over classical factorial
EVOP is that the simplex requires only one new experiment to move into an adjacent region
of factor space whereas the factorial design requires (at best) one-half the number of
experiments in the factorial design [Frederick H. et al. 1991].
EVOP has limitations. First, because of its iterative nature, it is a slow process which
can require many steps. Secondly, it provides only limited information about the effects of the
variables. Upon completion of the EVOP process only a limited region of

37
Chapter Two Principles and Literature survey
the reaction surface will have been explored and therefore, minimal information will be
available about the effects of the variables and their interactions. This information is
necessary to determine the ranges within which the variables must be controlled to insure
optimal operation. Further, EVOP approaches the nearest optimum. It is unknown whether
this optimum is a local optimum or the optimum for the entire process. Despite the
limitations, EVOP is an extremely useful optimization technique. EVOP can handle many
variables at the same time, and will always lead to an optimum. Also, because of its iterative
nature, little needs to be known about the system before beginning the process. Most
important, however, is the fact that it can be useful in plant optimization where the cost of
running experiments using conditions that result in low yields or unusable product cannot be
tolerated. In theory, the process improves at each step of the optimization scheme, making it
ideal for a production situation [Carpenter, B. and Sweeny, H. 1965; Umeda T. and Ichikawa,
A.1971; Basel, W. 1965].
2.8.3.2 Definition of a simplex
A k+1 geometric figure in a k-dimensional space is called a simplex. The corners of
this figure are called vertices. A simplex is a geometric figure that has a number of vertexes
equal to one more than the number of dimensions in the factor space. If k is the number of
dimensions in the factor space, then a simplex is defined by k + 1 points in that factor space.
With two variables the first simplex design is based on three trials, for three variables it is
four trials, etc. This number of trials is also the minimum for defining a direction of
improvement. As shown in Figure 2.11, a two-factor simplex is defined by three points. In
two dimensions, a simplex is a triangle [Frederick H. et al. 1991].

38
Chapter Two Principles and Literature survey
Fig. 2.11: A two-factor simplex is represented as a triangle in a two-dimensional plane.
Each vertex (corner) corresponds to a set of experimental conditions.
When using a simplex for the optimization of experimental systems, each vertex
corresponds to a set of experimental conditions. The solid lines drawn between vertexes are
used to visualize the simplex. They have no other function. It is the vertexes only that
determine experimental conditions.
2.8.3.3 Simplexes in various dimensions
As shown in figure 2.12, a simplex can be defined for any number of factors, even for no
factors.
Zero dimension
Simplex is a geometric figure that has a number of vertexes equal to one more than the
number of dimensions in the factor space. Therefore, in zero dimensions the simplex must
have one vertex. The geometric figure that has only one vertex is the single point as shown in
figure 2.12A. However, a zero-dimensional simplex has no degrees of freedom. Thus, it
cannot be made to move because it has no dimensions in which to move. A zero-dimensional
simplex is an admittedly trivial case. [Frederick H. et al. 1991].

39
Chapter Two Principles and Literature survey
Fig. 2.12: Simplexes in (A) zero-dimensional, (B) one-dimensional, (C) two-dimensional,
and (D) three-dimensional factor spaces. Higher dimensional simplexes cannot
be visualized easily [Frederick H. et al. 1991].
One dimension
A simplex in one dimension have two vertexes. The geometric figure that has only two
vertexes is the line segment as shown in figure 2.12B. A line segment can be move in only
one direction, the direction of the single factor. The one-dimensional simplex should have
nonzero length: if the two vertexes coincide, the simplex will degenerate into a single point
and lose its ability to move [Frederick H. et al. 1991].
Two dimensions
A simplex in two dimensions must have three vertexes. It forms a triangle as seen in
figure 2.12C. Two-dimensional simplexes do not have to be equilateral triangles, or isosceles
triangles, or any other special kind of triangle. Two-dimensional simplexes should have some
length and width so they do not degenerate into a one-dimensional line segment or a zero-
dimensional point [Frederick H. et al. 1991].

40
Chapter Two Principles and Literature survey
Three dimensions
A simplex in three dimensions consists of four vertexes. Figure 2.12D shows the
geometric figure of four vertexes as tetrahedron. There are no special symmetry requirements
for three dimensional simplexes. However, they should have some length, width, and depth so
they do not degenerate into a two-dimensional quadrilateral or triangle, or a one-dimensional
line segment, or a zero-dimensional point [Frederick H. et al. 1991].
Higher dimensions
A simplex in four or more dimensions must have five or more vertexes. Such higher
dimensional simplexes are often referred to as “hypertetrahedra” These higher dimensional
simplexes cannot be drawn, but they do exist and their properties are analogous to the
properties of the simplexes that can be visualized [Frederick H. et al. 1991].
2.8.3.4 Simplex reflection move
The points chosen for the initial simplex should not from a zero-volume N-
dimensional hypercube. At each iteration, the worst point in the simplex is found first. Then,
in a new simplex is formed from the old simplex by some fixed rules that steer the search
away from the worst pointing the simplex. The extent of steering depends on the relative
function values of the simplex. Four different situations may arise depending on the function
values such as reflection, expansion and two different contractions.The obtained new point
replaces the worst point in the simplex and the algorithm continues with the new simplex.
Figure 2.13 shows three examples of how a simplex can be moved into an adjacent
area by rejecting one vertex (usually the vertex that gave the worst response) and projecting it
through the average of the remaining vertexes to create one new vertex on the opposite side of
the simplex. This new vertex corresponds to a new set of experimental conditions that can
then be evaluated. In each example shown in figure 2.13 the old, rejected vertex is connected
to the retained vertexes by dashed lines. The vertexes joined by solid lines represent the new
simplex. In figures 2.13B and 2.13C, the small open circle shows the location of the average
of the remaining vertexes. Because zero-dimensional simplexes have no freedom to move,
they are not illustrated in figure 2.13[Frederick H. et al. 1991; Deb, K. 2005].
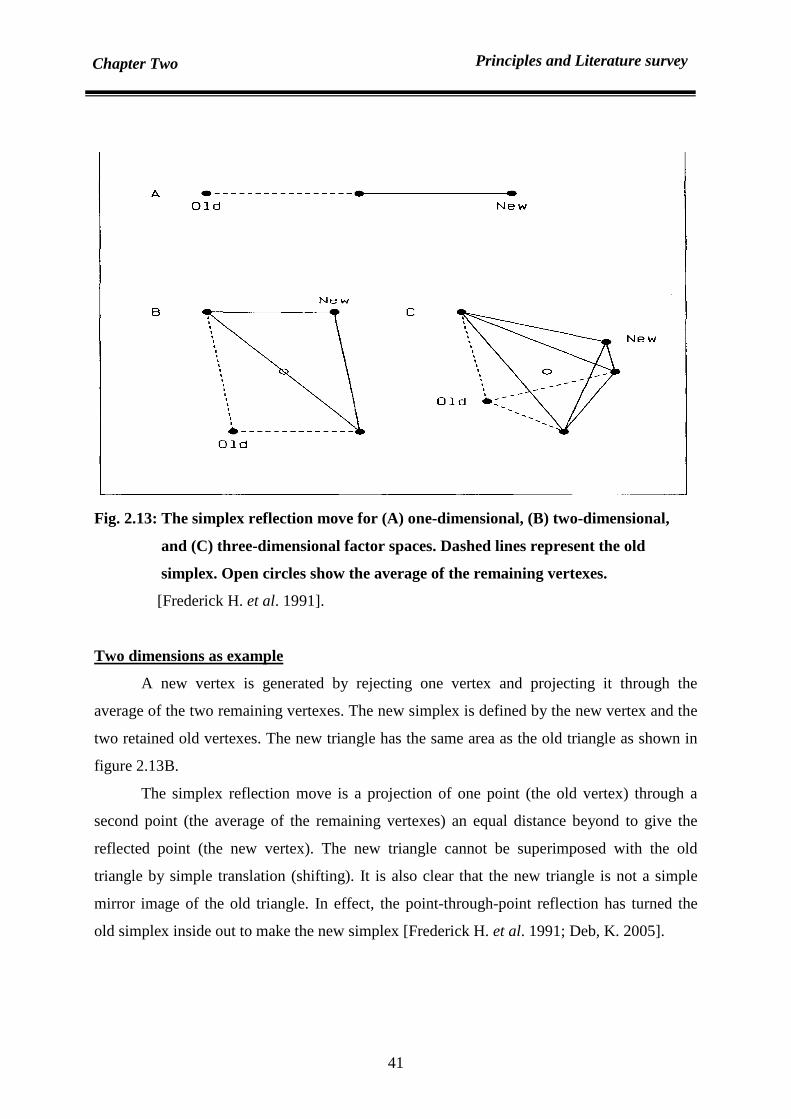
41
Chapter Two Principles and Literature survey
Fig. 2.13: The simplex reflection move for (A) one-dimensional, (B) two-dimensional,
and (C) three-dimensional factor spaces. Dashed lines represent the old
simplex. Open circles show the average of the remaining vertexes.
[Frederick H. et al. 1991].
Two dimensions as example
A new vertex is generated by rejecting one vertex and projecting it through the
average of the two remaining vertexes. The new simplex is defined by the new vertex and the
two retained old vertexes. The new triangle has the same area as the old triangle as shown in
figure 2.13B.
The simplex reflection move is a projection of one point (the old vertex) through a
second point (the average of the remaining vertexes) an equal distance beyond to give the
reflected point (the new vertex). The new triangle cannot be superimposed with the old
triangle by simple translation (shifting). It is also clear that the new triangle is not a simple
mirror image of the old triangle. In effect, the point-through-point reflection has turned the
old simplex inside out to make the new simplex [Frederick H. et al. 1991; Deb, K. 2005].

42
Chapter Two Principles and Literature survey
Return from hyperspace
In order to move through simplex way, three fundamental ideas should be applied:
1. The simplex reflection is that of a point through a point. It is not a mirror-image
reflection across a line (or across a plane, or across a hyperplane). The new vertex
corresponds to a new set of experimental conditions ,what statisticians call a
“treatment” , “treatment combination” , “Factor combination” or “design point”
2. The system under investigation must be evaluated at this set of conditions and a
response must be obtained. Thus experiments are required.
3. The purpose of the simplex is to move rapidly into the region of the optimum. The
simplex can be very effective and efficient for this purpose.
Figure 2.14 outlines the calculations in the Multi Simplex algorithm. For each simplex
the following labels are used: W for the least favourable trial or the trial being rejected, B for
the most favourable trial and Nw for the second least favourable trial (i.e. next-to-the worst)
[Frederick H. et al. 1991].
.
Fig. 2.14: Multi simplex algorithm path.

43
Chapter Two Principles and Literature survey
2.9 Mathematical model and modelling of fermentation growth 2.9.1. Background
A mathematical model is an expression to describe a phenomena or behavior of a
system in mathematical mode i.e. a set of variables and a set of equations that establish
relationships between the variables. It is also to represent essential aspects of an existing
system in usable form. Mathematical modeling is defined as the process of developing a
mathematical model. Mathematical models are used in different fields such as natural
sciences, engineering disciplines and in the social sciences. The main usage of a mathematical
model is either to analyze or to optimize a system and sometimes both of them. There are
many kinds of mathematical models i.e. deterministic, probabilistic, linear, nonlinear, static,
dynamic, lumped parameters, and distributed parameters, structured, unstructured, segregated
and un-segregated [Eykhoff, P.1974].
A main part of the modeling process is the evaluation of accuracy of a given
mathematical model. One needs to start model evaluation by checking fitting of model to
experimental measurements or other empirical data in other word by doing simulation. In
models with parameters, a common approach to test this fit is to split the data into two disjoint
subsets: training data and verification data. The training data are used to estimate the model
parameters. An accurate model will closely match the verification data even though this data
was not used to set the model’s parameters. Mathematical models make it possible to bring
high-speed computers to bear on biology problems. Large scale applications at present are in
the design of drugs and analysis of genome organization [Waterman, M. 1995].
Simple models are often very useful, since they can be used to determine the
numerical values for many important process parameters. The equations of Blackman in 1905
and Monod in 1942 were the first samples of growth models. Their models have represented
growing of microorganisms at limiting substrate condition. Monod kinetics can be used to
determine basic parameter values such as the specific growth rate (µ), saturation constant
(Ks), biomass yield coefficient (Yx/s) and maintenance coefficient (m). This basic kinetic
data can be supplemented by additional kinetic factors, such as oxygen transfer rate (OTR),
carbon dioxide production rate (CPR), respiration quotient (RQ) based on off-gas analysis and
related quantities, such as specific oxygen uptake rate (Qo2), specific carbon dioxide
production rate (Qco2), may also be derived and used to provide a complete kinetic

44
Chapter Two Principles and Literature survey
description. Although a huge number of models have been developed for different
microorganisims, still kinetics of Monod model is the crucial part of them [Dunn, I. et al.
2000].
Mathematical modelling of biochemical networks has been attempted since the 1960s
and, before genomic-scale pathway information became available, they mostly employed
numerical integration of ordinary differential equations for obtaining reaction rates. This kind
of dynamic model allows the prediction of time dependent parameters such as metabolite
concentration and reaction rate [Mariaa; C. et al. 2008].
Understanding the growth kinetics of microbial, animal, or plant cells is important for
the design and operation of fermentation systems employing them. Cell kinetics deals with the
rate of cell growth and how it is affected by various chemical and physical conditions. Many
assumptions have to be made in order to get simple models which are useful for fermenter
design and performance predictions. Various models can be developed based on the
assumptions concerning cell components and population as shown in Figure 2.15.This
systematic framework for viewing cell populations has indicated the way that biochemical
engineers conceive of, mathematically describe, and experimentally characterize systems
involving living cells. The simplest model is the unstructured, distributed model [Fredrickson,
A. et al. 1970; Lee, J. 2002]. Nowadays biological models are classified according to this
framework to either structured or unstructured in one hand and to either segregated or un-
segregated in other hand.
Fig. 2.15: Classifications introduced by A. G. Fredrickson for mathematical representations of cell populations [Lee, J. 2002].

45
Chapter Two Principles and Literature survey
2.9.2 Structured versus unstructured models
Unstructured models take the cell mass as a uniform quantity without internal dynamics.
The reaction rates depend only upon the macroscopic conditions in the liquid phase of the
bioreactor. Therefore, the models only contain kinetics of growth, substrate uptake and
product formation. This is a good approximation if the response time to changes in the
environment of the cell is either negligibly small or very long compared to the duration of the
cultivation process.
Structured model based on the internal state of the cells to designate a formulation in
which cell material is composed of multiple chemical components. Structured kinetic model
will be necessary when a variation in the biomass activity and composition per unit biomass
concentration take place. Structured models recognize the multiplicity of cell components and
their interactions. Many different models have been proposed based on the assumptions made
for cell components and their interactions. Such models are structured on the basis of biomass
components such as concentrations of metabolites, enzymes, DNA and/or RNA. It is not easy
to develop a realistic structured model because of insufficient knowledge of mechanistic cell
metabolism. Parameter estimation may be very difficult, and the application of complex
numerical methods may easily lead to physically meaningless results. Therefore, structured
models are seldom used for design or control [Fredrickson, A. et al. 1970; Harder, A. and
Roels, J. 1982; Lee, J. 2002; Dunn, I. et al. 2000].
The simplest model is the unstructured, un-segregated model which is based on the
following two assumptions:
1. Cells can be represented by a single component, such as cell mass, cell number, or the
concentration of protein, DNA, or RNA. This is true for balanced growth, since a doubling of
cell mass for balanced growth is accompanied by a doubling of all other measurable
properties of the cell population.
2. The population of cellular mass is distributed uniformly throughout the culture. The cell
suspension can be regarded as a homogeneous solution. The heterogeneous nature of cells can
be ignored. The cell concentration can be expressed as dry weight per unit volume.
Besides the assumptions for the cells, the medium is formulated so that only one
component may be limiting the reaction rate. All other components are present at sufficiently
high concentrations, so that minor changes do not significantly affect the reaction rate.
Fermenters are also controlled so that environmental parameters such as pH, temperature, and

46
Chapter Two Principles and Literature survey
dissolved oxygen concentration are maintained at a constant level. For example, description
of cell growth rate based on Monod model is possible. Furthermore, this model can be
modified easily to include such additional effects and the cell kinetics are completely devoid
of any mechanistic interpretation [Lee, J. 2002].
2.9.3 Segregated versus un-segregated models
Un-segregated models treat the culture as a collection of average cells. All cells have the
same characteristics at any given time. Usually unstructured models are un-segregated
models.
Segregated models consider each cell as independent and treat a population as a collection
of such distinct cells. It is also to indicate explicit accounting for the presence of
heterogeneous individuals in a population of cells. These kinds of models describe different
morphological types of cells or ageing and sometimes describe the interactions between
different cells [Fredrickson, A. et al. 1970].
2.9.4. General model structure
Biotechnological processes generally have the following structural elements: liquid
phase, gas phase and the biotic phase. The latter consists of cells or enzymes. All the reactions
catalysed by microorganisms take place in the liquid phase. The structure of a model of a
biotechnological process is shown in figure 2.16.The phases and compartments are coupled
through transport processes i.e., mass transfer gas-liquid, uptake and excretion of products
and trnslocation of metabolites across the mitochondrial membrane [Rizzi, M. et al. 1997].
Taking this biological model as a local micro kinetic model is independent of the type of
reactor and mode of operation.

47
Chapter Two Principles and Literature survey
2.9.5 Growth dynamics models of Saccharomyces cerevisiae
2.9.5.1 Introduction
Modelling has been become a prerequisite for developing of optimization and control
methods. Thus, modelling and simulation are valuable tools in basic biological research by
directing investigators towards a search for quantifiable results.
Saccharomyces cerevisiae has been an important organism in industrial biotechnology
and many valuable pharmaceutical proteins have been expressed in this host113. Many models
of the aerobic batch and continuous growth of the yeast Saccharomyces cerevisiae have
already been published. Most of them are mechanistic, structured models [Dantigny, P. 1995].
In the production of yeast, it is important to maximize both the yield, in comparison
with the substrate conversion (g cells/g sugar), and the volumetric productiveness (g cells/l h).
The influences of variables, such as pH and temperature, can easily be defined. While, yield
and productiveness can largely be affected from the concentration of biomass, sugar, oxygen
and ethanol formation. Therefore, the optimal conditions giving maximum yield and
productiveness change along with time together with the biomass growth. Models have been
made to follow that. Structured unsegregated models are established in order to describe a
growth rate. This will enable the model to provide information about the metabolic routes
prevailing at any moment of the cells colony life and about how the growth is influenced from
Gas Phase
Liquid Phase
Cells
Gas flow rate, Fg Gas fractions; X
Feed rate, Fl
Reactions, Q
Concentrations,C
Mass transfer, G
Fig. 2.16: structure of models for biotechnological processes

48
Chapter Two Principles and Literature survey
operation conditions. Such a model, named cybernetic model, has been proposed for the first
time by Kompala et al. for the diauxic growth of Klebsiella oxytoca [Serio,M. et al. 2001].
They have been termed cybernetic models because of the underlying assumption that
the microorganisms use their cellular regulatory machinery to ‘steer’ themselves toward some
optimal objective [Ramkrishna, D. and Turner, B. 1987].
2.9.5.2 Theoretical concept and modelling
Theoretical concept
Monod model was insufficient to explain real kinetics of growth. But it indicted
important phenomena of diauxic behaviour during growth on multiple substrates. Diauxic
behaviour means that microorganisms prefer to consume one substrate completely before
starting consuming a second substrate when the microoganisms grow in two substrates batch
culture. A short lag phase can be noticed between first and second growth.
Saccharomyces cerevisiae has diauxic behaviour even when it is grown in glucose
limiting aerobic batch culture. During the first fast exponential growth phase, Saccharomyces
cerevisiae consume all available glucose till depletion. A by-product of ethanol is
accumulated within this phase i.e. Crabtree effect. Therefore, organism synthesizes new
enzymes to consume ethanol. This is the why that the organism pass through short lag phase.
A second slow exponential growth begins after this lag phase. Organism will consume ethanol
and build up more biomass [Dantigny, P. 1995]. This diauxic behaviour will not happen if
Saccharomyces cerevisiae is cultivated in continuous mode of low dilution rate i.e. glucose
concentration in reactor less than 50 mg/ L. That means glucose will be consumed only
through oxidative metabolic pathway [Kaspar von Meyenburg 1969]. However, under oxygen
starvation condition, the fermentative metabolic pathway predominates even at low sugar
concentration (Pasteur Effect).
Neither monod model nor unstructured models can predict complicated dynamics, e.g.
diauxic behaviour and especially the intermediate lag phase. A detailed knowledge of
intercellular control mechanisms is necessary to start modelling of growth of Saccharomyces
cerevisiae. This problem was simplified by developing cybernetic model framework. Within
this simplification, the hypothesis of that microorganisms optimize the utilization of available
substrate to maximize their growth rate at all time is established. A modified monod equation
rate is applied for each single growth rate while every growth rate is proportional the

49
Chapter Two Principles and Literature survey
concentration of a key enzyme controlling the single metabolic pathway [Serio,M. et al. 2001;
Ramkrishna, D.; Turner, B. 1987; Kompala, D. and Jones, K. 1999].
Modelling
In this work a developed cybernetic model was proposed. Three major metabolic
pathways were assumed such glucose oxidative, glucose fermentative and ethanol oxidative
as shown in figure 2.17.
Fermentative pathway (r1)
GLUCOSE ETHANOL
Oxidative pathway (r3) Ethanol oxidative pathway (r2)
BIOMASS
Fig. 2.17: Metabolic path way during aerobic cultivation of Saccharomycess cerevisiae
The previous cybernetic models assumed values for enzyme’s synthesis and activity in
order to do simulation. While in this proposed model, a relation between enzyme activity (v i)
and enzyme synthesis (u i) with rate ratio from was assumed. Rate ratio is represent as r i / ∑ ri . .
While enzyme activity (v i) was assumed to be effected by ratio of metabolic rate to maximum
growth rate. Therefore, there is no need to assume or to find values for enzymes through try
and error. Also the equations of rates were devoid from enzyme term. A combination between
yield and stoichiometric coefficients as a one term was done. This unity, which was done by
multiplying them, gives a good fit to the results as will be shown in chapter 4.

50
Chapter Two Principles and Literature survey
Model equations
r1= µ m1*s/ (k1+s) r2= µ m2 *O*p/ ((k2+p)*(ko+O)) r3= µ m3 *O*s/ ((k3+s)*(ko+O)) x = x*r2*v 2*u2/ (y2*Q2) +x*r3*v 3*u3/ (y3*Q3) s'= -x*r1*v 1/(Q1*y 1)-x*r 3*v 3*u3/(Q3*y 3) p' = x*r1*v 1*u1/(Q1*y 1)-x*r 2*v 2*u2/(y2*Q2) v1= r1/0.5 v2= r2/0.5 v3= r3/0.5 u1= r1/( r1+ r2+ r3) u2= r2/( r1+ r2+ r3) u3= r3/( r1+ r2+ r3) o'= (kla*(O*-O))-(x*((Q2*r 2*v 2/y2)+(Q3*v 3*r 3/y3))) c'= (L3*r 3*v 3)-c*L 1*r 1*v 1-c*L 2*r 2*v 2-c*r1*v 1-c*r2*v 2-c*r3*v 3
51
Chapter Three Experimental Work
Abstract
A strain of Saccharomyces cerevisiae (DSM No 70451) was used in all experiments.
Growth mediums, equipments, materials, experimental procedure, analysis methods and
preparing of standard calibration curves are described in this chapter.
3.1 Growth medium
During the experiments, three types of the growth medium were used. The constituents
of these mediums are as below:
3.1.1 Yeast extract peptone D-Glucose (YEPD) medium
This medium was used within the first experiments for cultivation Saccharomyces
cerevisiae in Erlenmeyer flasks in order to follow the growth curve of them. Table 3.1 shows
the constituents of this medium.
Table 3.1: YEPD medium
Nr. Substance Amount g/L
1 Yeast extract 10
2 Peptone 20
3 D-Glucose 20
3.1.1.1 Medium preparation
Yeast extract and peptone were dissolved in bidest water. The glucose was dissolved
separately in order to avoid formation of Maillard products during autoclaving. The pH of the
medium was adjusted according to the experiment condition. Then the two solutions were
autoclaved at 121°C for 15 minutes. After autoclaving the two solutions were mixed within
the safety cabinet to keep the sterile condition of the medium.
3.1.2 Complex growth medium
In order to study the growth kinetics of Saccharomyces cerevisiae, this medium was
used. Simultaneously, this medium was the bases for simplex method optimization and
accuracy determination of the assumed mathematical model as well. Beyond glucose content,
the constituents of this medium were used according to [Von Meyenburg 1969] as shown in
table 3.2.

52
Chapter Three Experimental Work
Table 3.2: Complex growth medium
N0. Substance Amount
1 Glucose 0.05-7g (according to the experiment)
2 (NH4)2SO4 2.5 g
3 KH2PO4 0.5 g
4 MgSO4.7H2O 0.2 g
5 CaCL2.6H2O 0.02 g
6 FeSO4.6H2O 4 mg
7 ZnSO4.7H2O 2 mg
8 CuSO4.5H2O 0.3 mg
9 Pyridoxine 1 mg
10 Thiamine 4.4 mg
11 Calcium pantothenate 0.5 mg
12 myo-Inositol 20 mg
13 D-Biotin 0.03 mg
14 L-Glutamine 0.75 g
15 Yeast extract (Difco) 0.25 g
16 bidest water 1 L
3.1.2.1 Medium preparation
Because of the heat sensibility of many vitamins in this medium, the medium was
sterilized by filtration. The medium was prepared according to the table above by dissolving
all the substances in 10L bidest water. Then the medium was filtered with a cellulose acetate
filter (0.2µm).
3.1.3 Date syrup (juice)
Date syrup was used as an alternative substrate for the cultivation of Saccharomyces
cerevisia. Except the sugar content in date syrup, date syrup was used as one substrate despite
its constituents. During the analysis of date syrup by using gas chromatography and an
enzymatic test, date syrup was consisted of two types of sugars which are monosaccharide
and disaccharide.
A stock solution of date juice was prepared. Bidest water was added to the date juice
until a final concentration of 80g/l was obtained. Then it was filtered in the similar way

53
Chapter Three Experimental Work
mentioned in section (3.1.2.1). This stock solution was diluted in sterile bidest water
according to the demand concentration of sugar. Additives like peptone, yeast extract, mineral
and vitamins were added to diluted date syrup as shown in tables 4.1 and 4.4. This addition
was done in order to study the effects of additives and the suitability of date syrup as a
substrate in comparison with other standard mediums such as YEPD and complex medium.
3.2 Units and equipments
Table 3.3 represents the main units, equipments, and devices that used during this study.
Table 3.3: Experimental units: equipments and devices
Nr. Device description
1 Incubator CO2 incubator type AI 71 from Infors company
2 Bioreactor 1 Litre bioreactor.New Brunswick Scientific Co.,INC.
3 Analytical balance Electronic balance.Kern & Sohn GmbH
4 PH meter PH-meter 766 calimatic. Knick
5 Autoclave Systec Vx-95. Systec GmbH
6 Dryer Heraeus. Kendro Heraeus
7 Dry freeze Chaist & Alpha 1-2
9 Vortex Vortex-genie 2. Scientific industries Inc.
10 Placement micro pipette 10-1000µl . Eppendorf
11 Safety cabinet Herasafe. Heraeus instruments.
12 Spectrophotometer Specord 205. Analytick Jena
13 Centrifuge Centrifuge 5810R. Eppendorf
14 Microscope Model LHS-H100. Nikon
15 Gas chromatography
Mass spectrometer
GcMs 2010. Shimadzu
16 Delta pH device ( CL 10) Cl10 microplus.Eurochem
17 Refrigerator ( 4 0C) Liebherr
18 Freezer (-80 0C) Ultra low temperature freezer. New Brunswick Scientific
19 Syringes Microliter syringes. Hamilton
20 Ultra-sonic Ultrasonic homogenizer. Sonoplus
21 French press High pressure homogenizer. G. Heinemann
22 Turax IKA T-10 Basic Ultra Turrax

54
Chapter Three Experimental Work
3.3 Experimental work
Many varying experiments were done during this work. However, it can be classified in
two major types. The first class was yeast cultivation in an incubator while the second was in
a bioreactor.
3.3.1 Cultivation of Saccharomyces cerevisiae in an incubator
35ml of YEPD medium was put in 300ml Erlenmeyer flask. A small amount of frozen
Saccharomyces cerevisiae culture was thawed. The cell suspension was added to sterile
Erlenmeyer flask. The flask was closed with cotton wool plugs and put in the incubator. The
temperature and the shaking speed were regulated at constant values of 30°C and 120rpm
respectively. By changing growth mediums, the cells were adapted to this new medium. In
this case, three sub cultivations of 1 day each were done according to the above procedure.
3.3.2 Batch cultivation of Saccharomyces cerevisiae in a bioreactor
A 1L stirred tank fermenter was used to achieve cultivation of Saccharomyces
cerevisiae. The pH probe was calibrated with two points of pH 4 and pH 7. After assembling
of fermenter parts, the fermenter was autoclaved at 121°C for 15 minutes. Then the fermenter
was filled with a sterile growth medium of a defined glucose concentration (0.05-7 g/l)
depending on the experiment. The oxygen probe was calibrated with two point’s calibration
by using nitrogen gas and air in order to get 0% and 100 % oxygen content respectively. 30
ml of Saccharomyces cerevisiae adapted pre-culture, which was cultivated in the same way
mentioned in section 3.3.1, was added to the growth medium in the fermenter. The initial
biomass (in terms of absorption) was kept nearly constant at 0.15. The operating conditions
such as temperature, pH and stirring speed were controlled automatically according to each
experiment. Air flow rate was regulated manually at constant value by using a rotameter. This
air passed through a sterile (0.2µm) polytetrafluoroethylene filter before entering the
fermenter. Air flow was running through a distributor loop immerged inside the growth
medium at the bottom of the fermenter. In addition to the six plate’s mixer, the bubbling of air
assisted in mixing of the cell suspension. A control program was used to maintain the
parameters constant. Additionally, the program recorded the values of dissolved oxygen
content, temperature, pH and stirring speed. All these values were shown through a monitor.
In order to maintain a constant temperature, a cooling water system and a heat exchanger
55
Chapter Three Experimental Work
jacket were used. The cooling water was running through a heat exchanger loop inside the
fermenter for cooling while the heat exchanger jacket heated up the fermenter according to
the indicated temperature.
By using 1M NaOH and 10% 0f 85% phosphoric acid, the pH was regulated
automatically. Furthermore, dissolved oxygen content was kept constant by mixing inlet air
with nitrogen. The amount of given nitrogen was regulated automatically by the control
program.
3.4 Analysis
3.4.1 Date juice sugar identification by using gas chromatography mass
spectrometry (GCMS)
Theory
In a chromatography process, mixture of various components enters and the
components are flushed at different rates. These differential rates of migration as the mixture
moves over adsorptive materials provide separation. The smaller the affinity a molecule has,
the shorter the time spent in a column. A stationary and a mobile phase are the main phases in
a gas chromatography. The mobile phase is an inert gas e.g. helium, nitrogen and argon while
the stationary phase is adsorptive materials coated the separation column. Several factors,
such as compound’s volatility and polarity, determine the rate of compound travelling through
the column to reach the detector. Thus, the components in a mixture can be identified by
analyzing the difference in their retention times.
The process starts with liquid sample injection into the separation column of gas
chromatography. The column is placed within an oven. Thus, the sample is vaporized. Inert
gas, e.g. helium carries the compounds through the column to a detector in different times.
The detector signals a chart recorder, which records the response.
A combination of gas chromatography (GC) with mass spectrometry (MS) makes the
analysis more accurate by giving more information about analyses. Moreover, the stream
from GC enters the mass spectrometer to ionize sample molecules. Since the molecules have
different retention time through GC column, mass spectrometry will ionize, accelerate and
deflect them separately. Thus, the molecule is ionized by emitted electrons from a filament.
This filament is inside an ion source of the mass spectrometry. Therefore, the molecule looses
an electron and forming a radical cation.
56
Chapter Three Experimental Work
Furthermore, each molecule is broken as ionized fragments. These fragments are separated
and detected as mass to charge ratio in the spectrometer’s analyzer.
Standard sugars preparation
Standard sugar solutions were prepared separately by dissolving 10mg of each
glucose, fructose, manose and sucrose in 800µl of pyridine. Then these solutions were
subjected to oximation-silylation step, which is described later.
Date juice sample preparation
A small amount of date syrup (20mg) was dried at (55°C, 10mbar and 2hr) by using a
rotational vacuum concentrator (Christ Rvc 2-33IR). The dried date syrup was dissolved in
1000µl pyridine and placed in ultrasonic bath for 5min. In addition, the sample was mixed
well by vortex for 20sec. In order to remove any insoluble materials, the sample was
centrifuged at (12000g, 10min and 20°C). Part of the supernatant, 800µl, was taken for further
oximation and silylation step, which is described below.
Oximation and silylation
hexose’s sugars such as (glucose, fructose and mannose) in standard solutions or
sugars in the date juice sample were oximated. The oximation was achieved by adding 50mg
of O-methyl hydroxylamine-hydrochloride to each 800µl of standard sugar solutions or date
juice solution. Then the solutions were incubated at 95°C for 45min in a heat plate.
Next, 200µl of silylation reagent (N, O-bis(trimethylsilyl)trifluoroacetamide), BSTFA,
were added to each oximated samples. Moreover, the mixture was incubated at 90°C for
30min in a heat plate. Then, the samples were centrifuged at (8.000g, 10min, and 20°C). In
addition, standard sucrose solution was silylated by the same procedure. However, the
incubated time was extended to 60min. Thus, the derivative samples were transferred to
GCMS device in order to be analyzed.
Measurement procedure
One micro litre of derivative sample was injected in GCMS automatically and the
measurement was started at once. Parameters of the GCMS are described below.

57
Chapter Three Experimental Work
GC parameters
Instrument Shimadzu GCMS-QP 2010
Pressure 459kpa
Ionisation energy 70eV
Total flowrate 64.7ml/min
Column flow 0.87ml/min
Linear velocity 59.5cm/sec
Purge flow 3.0ml/min
Split ratio 70.0
Carrier gas Helium
Column oven temperature 80 °C
Injection temperature 250 °C
MS parameters
Ion source temperature 200°C
Interface temperature 280°C
Start time 2min
End time 7.5min
Full scan 45-750amu
3.4.2 Sugar quantification
Two types of analysis were applied in order to quantify sugar contents.
3.4.2.1 Sugar quantification by using delta pH device
Theory
Some enzymatic reactions cause a change in pH of solution. For instance, hexokinase
enzyme can catalyze D-glucose phosphorylation. A co-enzyme like ATP is used in this
reaction in order to give this pH change. That happens as ATP will be converted to ADP and a
H+ will be produced. Mechanism of this reaction is as in figure 3.1

58
Chapter Three Experimental Work
Fig. 3.1: Enzymatic D-glucose phosphorylation reaction
A liberated H+ will be passed to the solution. One can measure this change in pH by
using a sensitive device like CL10. Principally, this device consists of two pH electrodes,
which can detect small pH changes (≥5*10-5). Basically, CL10 device measures the difference
in pH between tow solutions. The difference will be zero before the reaction starts; there is no
sample. Upon adding a sample to one solution, the reaction starts and the pH will be measured
against time until the end point of enzymatic reaction. A kinetic curve of delta pH with time
can be monitored and the corresponded data will be saved. Figure 3.2 demonstrates the
schematic diagram of the parts of CL10 device, i.e. differential pH analyzer.
Procedure
The differential pH device was set at a constant temperature of 37°C, a waiting time of
4 seconds and maximum reaction time (cycle time) of 200 seconds. First run was done for
buffer only in order to see the noise of the device. Then, 10 µl of sample were added to the
mixing chamber of the device manually by using micropipette. After 40 seconds, the
measurement cycle was started and about 315µl of this solution was then automatically
distributed into the tubes leading to electrodes 1 and 2. In order to add a certain amount of
enzyme to the mixing chamber, which include about 775µl remaining solution, 10 µl of
hexokinase enzyme (1U/5µl) were injected by using micropipette. Difference in pH between
the solutions of electrode 1 and electrode 2 was observed for all samples. The time required to
……3.1
[ Mg 2+] + ATP 4-
Hexokinase + ADP 3- + H+ ……..3.1

59
Chapter Three Experimental Work
achieve these reactions was different from one sample to another depending on the glucose
concentration (time is proportional to 1/ [glucose]). This procedure was done in order to make
a calibration curve from different glucose concentrations.
Enzyme preparation
After preparing 1.5ml of solution contains 25 %( v/v) glycerol in bidest water, a
certain amount of enzyme was added to 1ml of this solution. The mixture was mixed well by
a vortex device.
Date juice sugars determination
Date juice was quantified by this method. An additional step of hydrolyses of sucrose
was done in order to convert sucrose to fructose and glucose. Glucose concentration was
measured before and after hydrolyses in order to determine sucrose concentration as below
[Sucrose] = [glucose] Total (after hydrolysis) - [glucose] Initial (before hydrolysis)……. 3.2
Hydrolysis step was done by adding 10µl invertase enzyme (3.2 U/µl) to 1 ml date
juice sample at pH 4.7. The mixture was mixed well in a thermo-mixer at 37°C and 350rpm
for 30 minutes.
Fig. 3.2: Schematic diagram of the Differential pH Analyzer System CL10.
P1 to P5, peristaltic pumps; C, mixing chamber; M, stirring motor;
N, magnetic stirrer; E1 and E2, glass capillary electrodes;
A, differential amplifier [Luzzana, M. et al 1983].
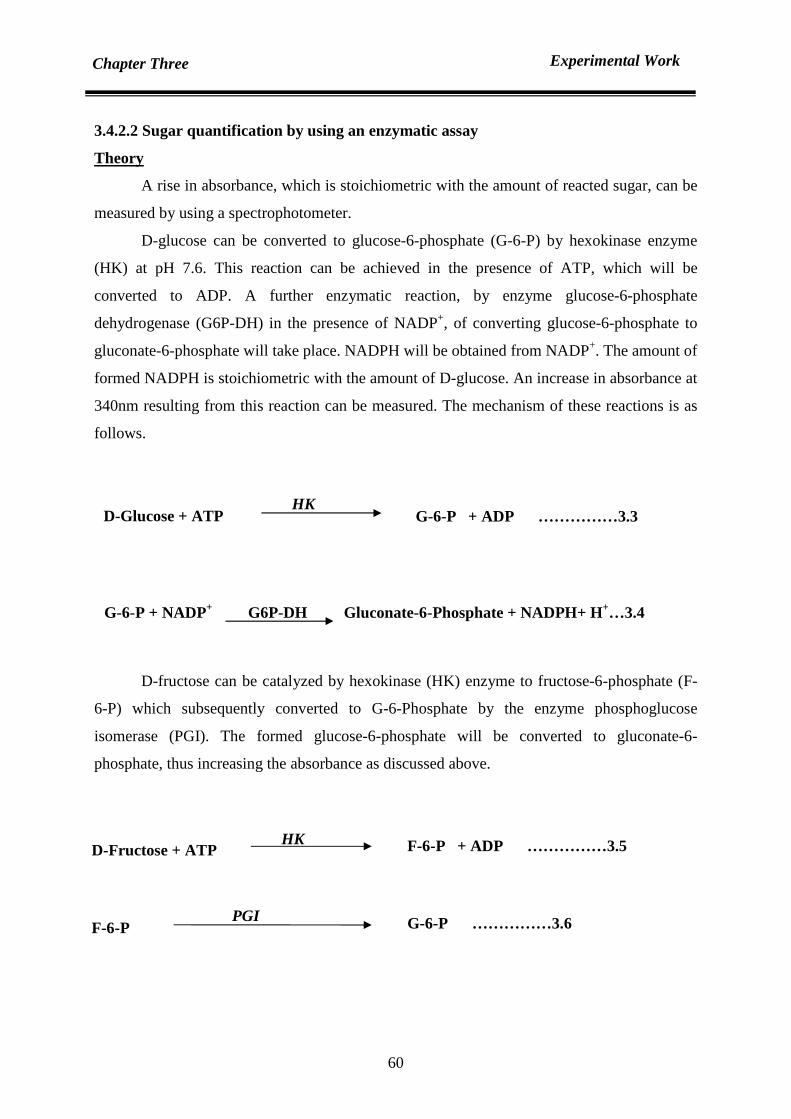
60
Chapter Three Experimental Work
3.4.2.2 Sugar quantification by using an enzymatic assay
Theory
A rise in absorbance, which is stoichiometric with the amount of reacted sugar, can be
measured by using a spectrophotometer.
D-glucose can be converted to glucose-6-phosphate (G-6-P) by hexokinase enzyme
(HK) at pH 7.6. This reaction can be achieved in the presence of ATP, which will be
converted to ADP. A further enzymatic reaction, by enzyme glucose-6-phosphate
dehydrogenase (G6P-DH) in the presence of NADP+, of converting glucose-6-phosphate to
gluconate-6-phosphate will take place. NADPH will be obtained from NADP+. The amount of
formed NADPH is stoichiometric with the amount of D-glucose. An increase in absorbance at
340nm resulting from this reaction can be measured. The mechanism of these reactions is as
follows.
D-fructose can be catalyzed by hexokinase (HK) enzyme to fructose-6-phosphate (F-
6-P) which subsequently converted to G-6-Phosphate by the enzyme phosphoglucose
isomerase (PGI). The formed glucose-6-phosphate will be converted to gluconate-6-
phosphate, thus increasing the absorbance as discussed above.
G-6-P + NADP+ G6P-DH Gluconate-6-Phosphate + NADPH+ H+…3.4
HK D-Fructose + A F-6-P + ADP ……………3.5 HK
D-Fructose + ATP
G-6-P ……………3.6 PGI F-6-P
G-6-P + ADP ……………3.3 HK
D-Glucose + ATP
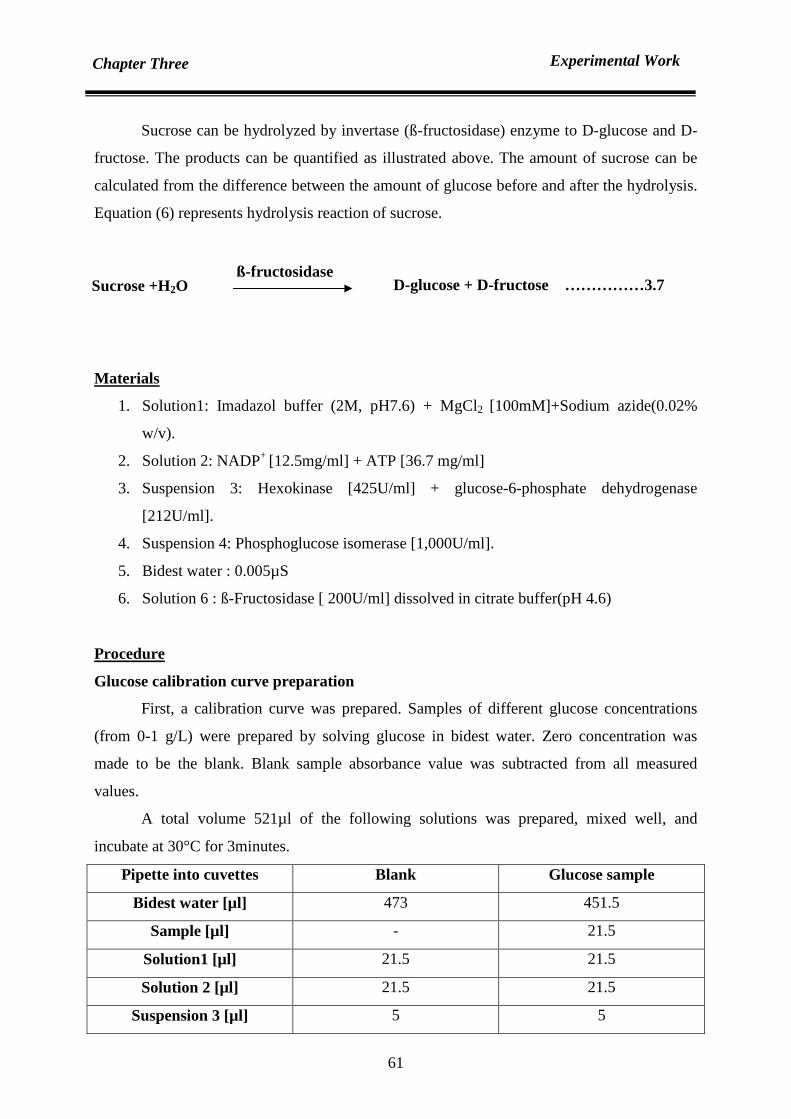
61
Chapter Three Experimental Work
Sucrose can be hydrolyzed by invertase (ß-fructosidase) enzyme to D-glucose and D-
fructose. The products can be quantified as illustrated above. The amount of sucrose can be
calculated from the difference between the amount of glucose before and after the hydrolysis.
Equation (6) represents hydrolysis reaction of sucrose.
Materials
1. Solution1: Imadazol buffer (2M, pH7.6) + MgCl2 [100mM]+Sodium azide(0.02%
w/v).
2. Solution 2: NADP+ [12.5mg/ml] + ATP [36.7 mg/ml]
3. Suspension 3: Hexokinase [425U/ml] + glucose-6-phosphate dehydrogenase
[212U/ml].
4. Suspension 4: Phosphoglucose isomerase [1,000U/ml].
5. Bidest water : 0.005µS
6. Solution 6 : ß-Fructosidase [ 200U/ml] dissolved in citrate buffer(pH 4.6)
Procedure
Glucose calibration curve preparation
First, a calibration curve was prepared. Samples of different glucose concentrations
(from 0-1 g/L) were prepared by solving glucose in bidest water. Zero concentration was
made to be the blank. Blank sample absorbance value was subtracted from all measured
values.
A total volume 521µl of the following solutions was prepared, mixed well, and
incubate at 30°C for 3minutes.
Pipette into cuvettes Blank Glucose sample
Bidest water [µl] 473 451.5
Sample [µl] - 21.5
Solution1 [µl] 21.5 21.5
Solution 2 [µl] 21.5 21.5
Suspension 3 [µl] 5 5
D-glucose + D-fructose ……………3.7 ß-fructosidase
Sucrose +H2O
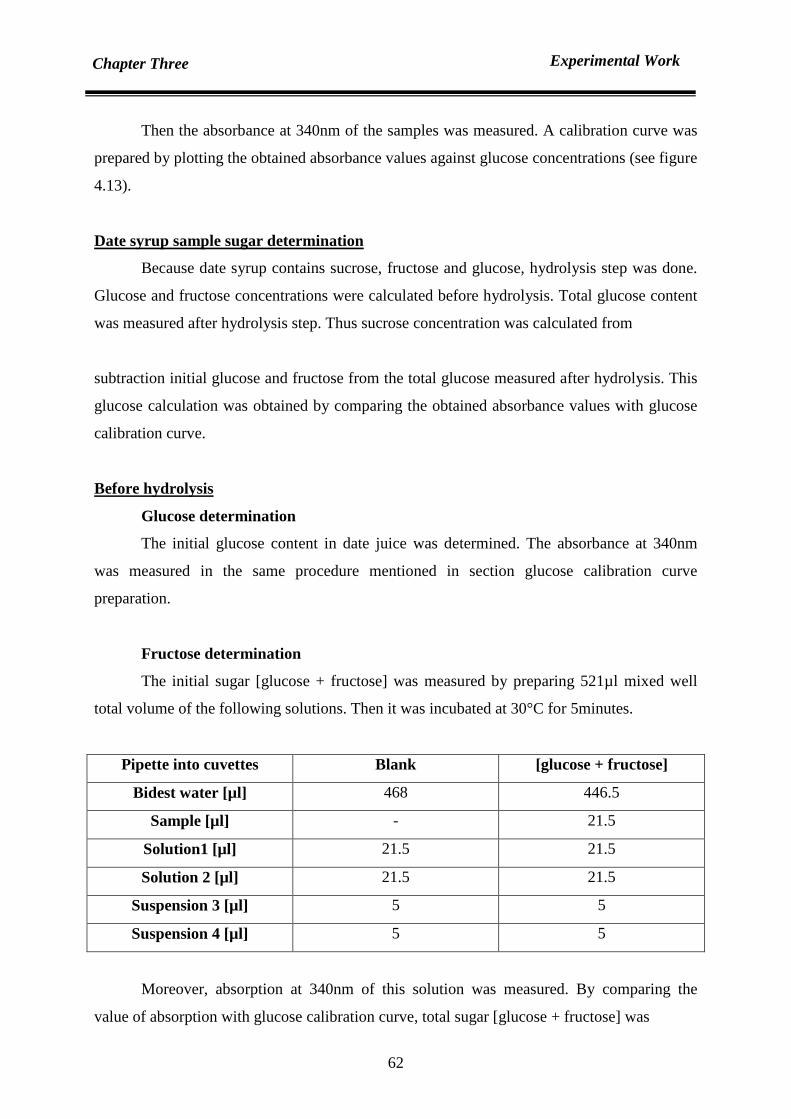
62
Chapter Three Experimental Work
Then the absorbance at 340nm of the samples was measured. A calibration curve was
prepared by plotting the obtained absorbance values against glucose concentrations (see figure
4.13).
Date syrup sample sugar determination
Because date syrup contains sucrose, fructose and glucose, hydrolysis step was done.
Glucose and fructose concentrations were calculated before hydrolysis. Total glucose content
was measured after hydrolysis step. Thus sucrose concentration was calculated from
subtraction initial glucose and fructose from the total glucose measured after hydrolysis. This
glucose calculation was obtained by comparing the obtained absorbance values with glucose
calibration curve.
Before hydrolysis
Glucose determination
The initial glucose content in date juice was determined. The absorbance at 340nm
was measured in the same procedure mentioned in section glucose calibration curve
preparation.
Fructose determination
The initial sugar [glucose + fructose] was measured by preparing 521µl mixed well
total volume of the following solutions. Then it was incubated at 30°C for 5minutes.
Pipette into cuvettes Blank [glucose + fructose]
Bidest water [µl] 468 446.5
Sample [µl] - 21.5
Solution1 [µl] 21.5 21.5
Solution 2 [µl] 21.5 21.5
Suspension 3 [µl] 5 5
Suspension 4 [µl] 5 5
Moreover, absorption at 340nm of this solution was measured. By comparing the
value of absorption with glucose calibration curve, total sugar [glucose + fructose] was

63
Chapter Three Experimental Work
determined. By subtraction initial glucose concentration from this total sugar, fructose
concentration was indicated.
After hydrolysis
Sucrose determination
21.5µl sample was mixed with 43µl of solution 6. Then the mixture was incubated at
37°C for 10minutes. Thus, a 521µl total volume of the following solutions was prepared and
mixed well.
Pipette into cuvettes Blank [Total sugar]
Bidest water [µl] 425 403.5
[Sample +Solution 6] [µl](
after hydrolysis)
- (21.5 + 43)
Solution 6 [µl] 43 -
Solution1 [µl] 21.5 21.5
Solution 2 [µl] 21.5 21.5
Suspension 3 [µl] 5 5
Suspension 4 [µl] 5 5
After 10miutes incubation at 30°C, the absorption at 340nm was measured. The
absorption value demonstrated the entire sugar content in terms of total glucose. Subtraction
the value of calculated initial sugar content [glucose + fructose] from this total sugar content,
sucrose concentration was determined.
3.4.3 Cell number
Theory
Trypan blue is a vital dye. It is used to indicate dead cells, because the chromopore is
negatively charged and does not interact with the cell unless the membrane of the cell is
damaged. Therefore, dead cells take up the blue stain of trypan blue while the viable cells will
exclude the dye. Percentage of viability can be determined by subtracting the dead cells
number from the total cells number. Then division of the result by the total cells number has
to be done.
Viability% = Number of living cells * 100% / Total cells number ……… 3.8
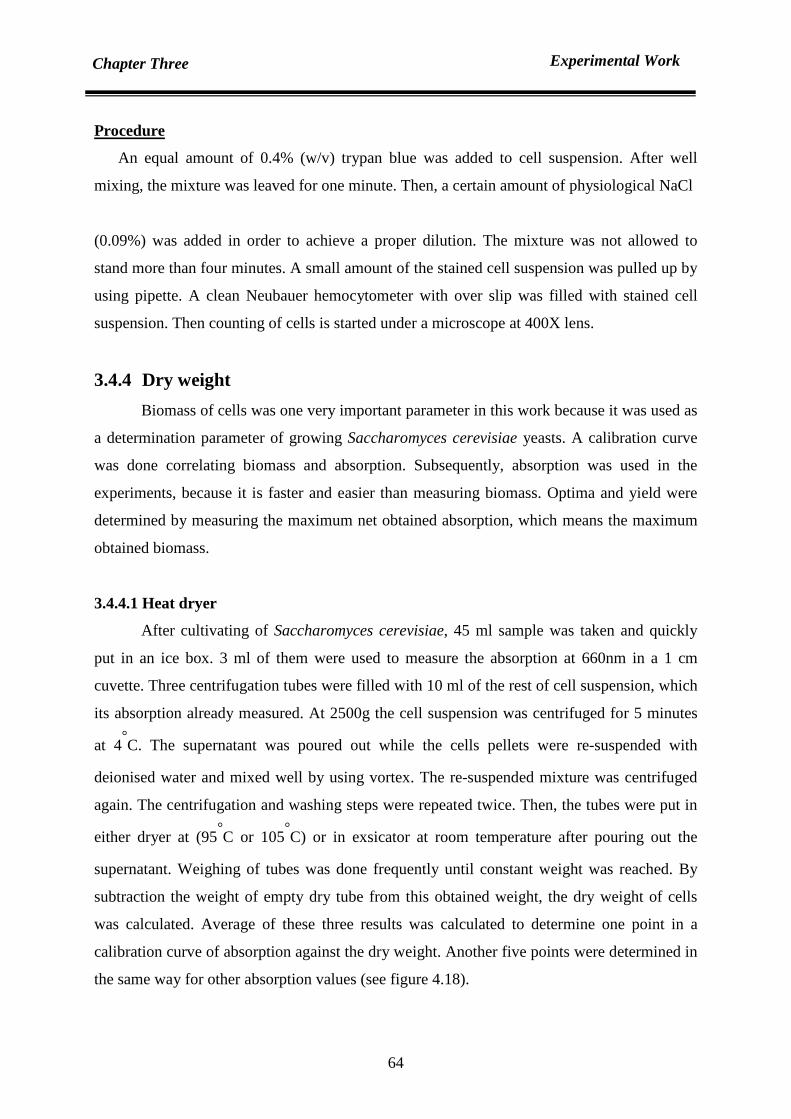
64
Chapter Three Experimental Work
Procedure
An equal amount of 0.4% (w/v) trypan blue was added to cell suspension. After well
mixing, the mixture was leaved for one minute. Then, a certain amount of physiological NaCl
(0.09%) was added in order to achieve a proper dilution. The mixture was not allowed to
stand more than four minutes. A small amount of the stained cell suspension was pulled up by
using pipette. A clean Neubauer hemocytometer with over slip was filled with stained cell
suspension. Then counting of cells is started under a microscope at 400X lens.
3.4.4 Dry weight
Biomass of cells was one very important parameter in this work because it was used as
a determination parameter of growing Saccharomyces cerevisiae yeasts. A calibration curve
was done correlating biomass and absorption. Subsequently, absorption was used in the
experiments, because it is faster and easier than measuring biomass. Optima and yield were
determined by measuring the maximum net obtained absorption, which means the maximum
obtained biomass.
3.4.4.1 Heat dryer
After cultivating of Saccharomyces cerevisiae, 45 ml sample was taken and quickly
put in an ice box. 3 ml of them were used to measure the absorption at 660nm in a 1 cm
cuvette. Three centrifugation tubes were filled with 10 ml of the rest of cell suspension, which
its absorption already measured. At 2500g the cell suspension was centrifuged for 5 minutes
at 4°C. The supernatant was poured out while the cells pellets were re-suspended with
deionised water and mixed well by using vortex. The re-suspended mixture was centrifuged
again. The centrifugation and washing steps were repeated twice. Then, the tubes were put in
either dryer at (95°C or 105
°C) or in exsicator at room temperature after pouring out the
supernatant. Weighing of tubes was done frequently until constant weight was reached. By
subtraction the weight of empty dry tube from this obtained weight, the dry weight of cells
was calculated. Average of these three results was calculated to determine one point in a
calibration curve of absorption against the dry weight. Another five points were determined in
the same way for other absorption values (see figure 4.18).

65
Chapter Three Experimental Work
3.4.4.2 Freeze dryer
Theory
The principle of this method is to convert frozen liquid to vapour without passing
through a liquid phase. This method can be done by using a freeze dryer which operated at
vacuum pressure and sub zero temperature.
Procedure
The procedure is the same of the heat dryer except that the pellet was resuspended again, after
washing step, in 3ml deionised water. Then the suspension was poured in (3*20ml) clean and
dry weighed glass Petri dishes. The Petri dishes were put in a freezer at -20°C for 2 hours.
Subsequently, they were transferred as soon as possible to a freeze dryer at -54 0C for three
days.
3.4.5 Protein determination (Bradford Assay)
The absorbance of a Coomassie Brilliant Blue Dye-G250 at 595nm will change when
it binds with protein. This binding will change the protein from cationic to an ionic state as
shown in equation 3.9. The change in absorbance is proportional to the protein concentration.
Coomassie Brilliant Blue Dye-G250 binds primarily to basic amino acids such as (arginine,
lysine and histidine). Therefore, there is a difference in absorption level of different proteins.
For this reason, a calibration curve by using BSA has to be made.
Procedure
Calibration curve
Different amounts of BSA were dissolved in PBS buffer in order to get a range of
concentrations (2µg-51µg/ml). 800µl of each concentration were mixed well with 200µl of
Coomassie dye in a 1ml cuvette. Then the absorbance of this mixture at 595nm was
H+
Cationic 470nm(red)
Neutral 650nm(green)
Anionic …… 3.9 595nm(blue)
OH-
H+
OH-
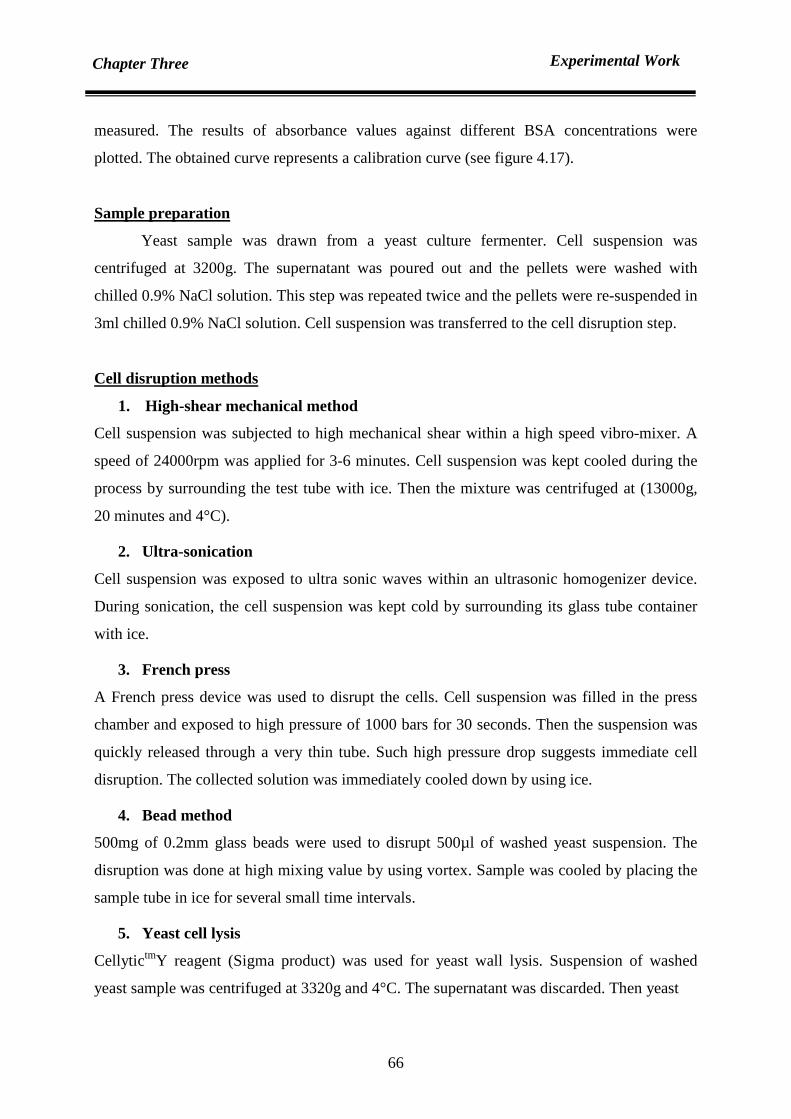
66
Chapter Three Experimental Work
measured. The results of absorbance values against different BSA concentrations were
plotted. The obtained curve represents a calibration curve (see figure 4.17).
Sample preparation
Yeast sample was drawn from a yeast culture fermenter. Cell suspension was
centrifuged at 3200g. The supernatant was poured out and the pellets were washed with
chilled 0.9% NaCl solution. This step was repeated twice and the pellets were re-suspended in
3ml chilled 0.9% NaCl solution. Cell suspension was transferred to the cell disruption step.
Cell disruption methods
1. High-shear mechanical method
Cell suspension was subjected to high mechanical shear within a high speed vibro-mixer. A
speed of 24000rpm was applied for 3-6 minutes. Cell suspension was kept cooled during the
process by surrounding the test tube with ice. Then the mixture was centrifuged at (13000g,
20 minutes and 4°C).
2. Ultra-sonication
Cell suspension was exposed to ultra sonic waves within an ultrasonic homogenizer device.
During sonication, the cell suspension was kept cold by surrounding its glass tube container
with ice.
3. French press
A French press device was used to disrupt the cells. Cell suspension was filled in the press
chamber and exposed to high pressure of 1000 bars for 30 seconds. Then the suspension was
quickly released through a very thin tube. Such high pressure drop suggests immediate cell
disruption. The collected solution was immediately cooled down by using ice.
4. Bead method
500mg of 0.2mm glass beads were used to disrupt 500µl of washed yeast suspension. The
disruption was done at high mixing value by using vortex. Sample was cooled by placing the
sample tube in ice for several small time intervals.
5. Yeast cell lysis
CellytictmY reagent (Sigma product) was used for yeast wall lysis. Suspension of washed
yeast sample was centrifuged at 3320g and 4°C. The supernatant was discarded. Then yeast
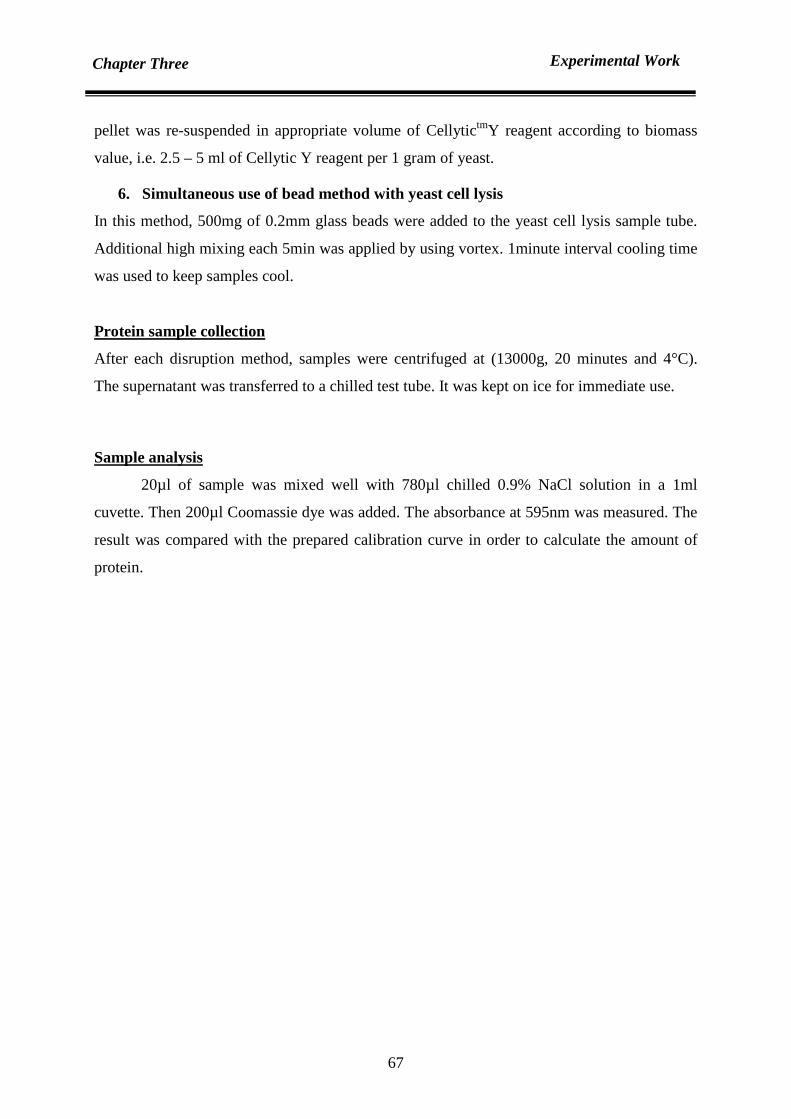
67
Chapter Three Experimental Work
pellet was re-suspended in appropriate volume of Cellytic tmY reagent according to biomass
value, i.e. 2.5 – 5 ml of Cellytic Y reagent per 1 gram of yeast.
6. Simultaneous use of bead method with yeast cell lysis
In this method, 500mg of 0.2mm glass beads were added to the yeast cell lysis sample tube.
Additional high mixing each 5min was applied by using vortex. 1minute interval cooling time
was used to keep samples cool.
Protein sample collection
After each disruption method, samples were centrifuged at (13000g, 20 minutes and 4°C).
The supernatant was transferred to a chilled test tube. It was kept on ice for immediate use.
Sample analysis
20µl of sample was mixed well with 780µl chilled 0.9% NaCl solution in a 1ml
cuvette. Then 200µl Coomassie dye was added. The absorbance at 595nm was measured. The
result was compared with the prepared calibration curve in order to calculate the amount of
protein.

68
Chapter Three Experimental Work
3.5 Online continuous measurements
An own developing measurement technique was used during parameter growth
optimization. Moreover, this technique was applied during S.cerevisiae cultivation. This
method based on measuring absorption in continues mode. Figures 4.32-4.37 and 4.44-4.45
demonstrate the achieved absorption measurements by this method.
Instruments and devices
1. Spectrophotometer
2. Flow through measurements cuvette: Quartz Suprasil cuvette ( Hellma): (V= 400µl)
3. Peristaltic pumps
4. Silicon tubes ((2.6mm inside diameter)
5. Vial (V =20ml)
6. Magnetic bar
7. Magnetic stirrer
8. Computer
9. Waste bottle ( V=2L)
Procedure
Figure 3.3 demonstrates the schematic diagram of the online measurement system.
The process started by filling bioreactor, f, with determined medium. The medium flowed
inside a silicon tube, f1, to the 20ml glass vial by increasing the pressure inside the bioreactor.
This increment in pressure was achieved by reducing the outlet air flow rate at 0.5 L/min sub
of the inlet flow rate. Then the medium poured inside the glass vial to be mixed well by a
stirred magnetic bar. A magnetic stirrer, on which the vial was standing, achieved the stirring
of the magnetic bar at 600rpm. Simultaneously, the medium was circulated within a closed
circle by using a peristaltic pump, f2-f4. This circle started by sucking the medium from the
vial, f2, and pumped it (f2-f3) throw two flows through measurements quartz suprisal
cuvettes, which were held inside a spectrophotometer. The first cuvette was used to trap any
air bubbles while the second cuvette was used to achieve the absorption measurement. Then
the medium was gone back, f4, to the glass vial. This closed circle maintained sample flow
rate at 7ml/42sec. A second peristaltic pump was used to suck the sample from the glass vial,
f5, and pour it again in the bioreactor. This pump achieved sample flow rate at 1ml/5sec.

69
Chapter Three Experimental Work
Thus, the sample was kept at 7ml constant level in on hand. On the other hand, new samples
were obtained in continuous mode. A 2L waste bottle was used in order to avoid any potential
sample overflow, sample floating, and in order to wash the glass vial, silicon tubes and
cuvettes.
A control program was developed to run the spectrophotometer automatically. This
program achieved a continuous measurement each 8 minutes in order to measure significant
change in absorption. It is possible by using this program to run the measurement in
continuous mode even in seconds and for many days. Then the results converted to an excel
sheet in order to plot absorption values against process time.
Fig. 3.3: Schematic diagram of the online measurement system.
F1 to F5, sample flowrate; F6, overflow/ waste flowrate; F1-F6 flow through
silicon tubes (2.6mm inside diameter); F, fermenter; M, mixer; V, valve; Ms,
magnetic stirrer; B, magnetic bar; Gv, 20ml glass vial; P1 and P2, peristaltic pumps;
Sp, spectrophotometer; Qv1 and Qv2, 400µl quartz suprasil cuvettes; S, signal; Pc,
computer; W, 2L waste bottle; Fi, air filter.

Chapter Four Results
70
4.1 Analysis
4.1.1 Analysis of sugar content: qualification and quantification of sugar
contents in date juice
Different methods were used in order to qualify and quantify the sugar contents in the
date juice. Gas chromatography was used to identify the types of sugar while enzymatic
assays were used in quantifying the types of sugar’s concentrations. The enzymatic assay was
used also to prove sugar identity. Additionally, delta pH technique was used to support the
results.
4.1.1.1 Date juice sugar qualification by using gas chromatography mass spectrometer
Standard sugars such as (D-glucose, fructose and sucrose) and date juice sample were
analyzed at the same operating conditions by using GCMS (see section 3.4.1). Figures (4.1a-
c) showed the chromatogram of date juice sample. The results revealed main peaks at
different retention times such as 3.88, 3.905, 3.95, 3.90 and 5.33 minutes. These peaks were
corresponded to others peaks obtained for standard sugars i.e. fructose (fig.4.2), D-glucose
(fig.4.3) and sucrose (fig.4.4). Moreover, figures (4.6b, 4.7b, 4.8b, 4.9b and 4.11)
demonstrated the spectra of date juice, which were matched the spectra of standard sugars as
shown in figures (4.6a, 4.7a, 4.8a, 4.9a and 4.10). Additionally, the chromatogram of blank
sample, pyridine, indicated a small peak at 5.3min retention time as shown in figure 4.5. Thus,
the spectrum of it can be found in figure 4.12.
2.0 3.0 4.0 5.0 6.0 7.0
1.0
2.0
3.0
4.0
(x10,000,000)
TIC
Time [minutes]
A
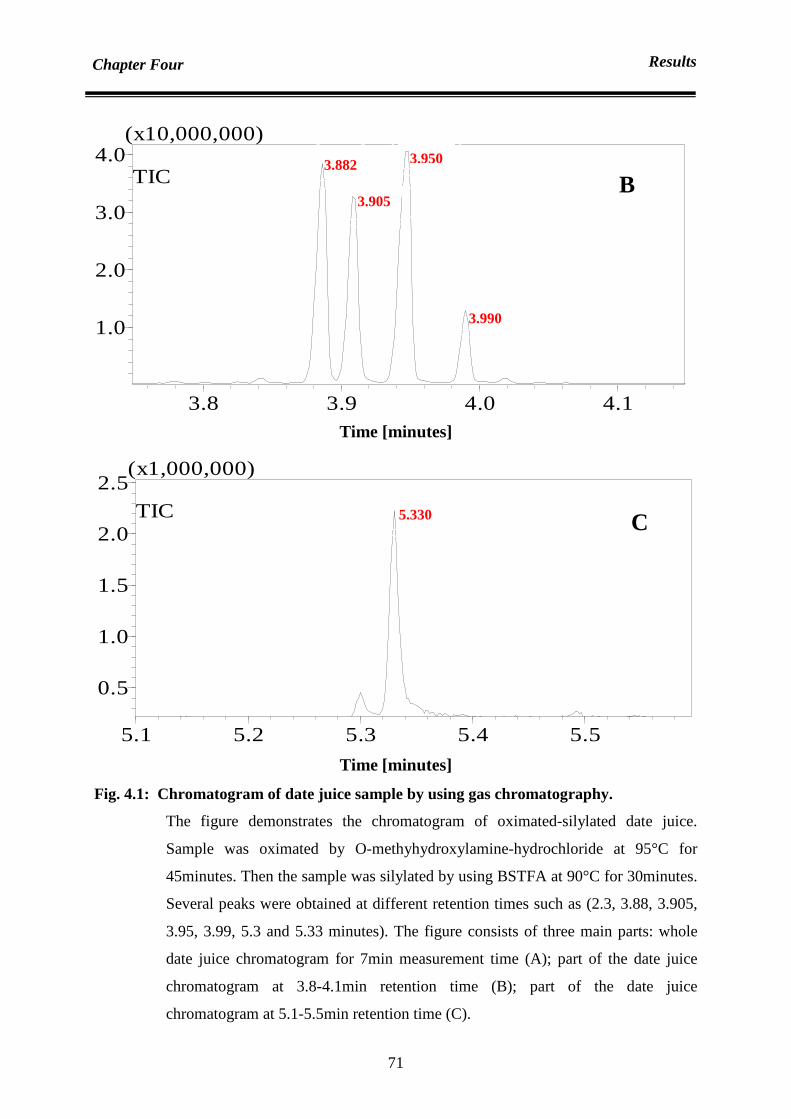
Chapter Four Results
71
3.8 3.9 4.0 4.1
1.0
2.0
3.0
4.0(x10,000,000)
TIC
Time [minutes]
5.1 5.2 5.3 5.4 5.5
0.5
1.0
1.5
2.0
2.5(x1,000,000)
TIC
Time [minutes]
Fig. 4.1: Chromatogram of date juice sample by using gas chromatography.
The figure demonstrates the chromatogram of oximated-silylated date juice.
Sample was oximated by O-methyhydroxylamine-hydrochloride at 95°C for
45minutes. Then the sample was silylated by using BSTFA at 90°C for 30minutes.
Several peaks were obtained at different retention times such as (2.3, 3.88, 3.905,
3.95, 3.99, 5.3 and 5.33 minutes). The figure consists of three main parts: whole
date juice chromatogram for 7min measurement time (A); part of the date juice
chromatogram at 3.8-4.1min retention time (B); part of the date juice
chromatogram at 5.1-5.5min retention time (C).
3.905
3.882 3.950
3.990
B
5.330 C

Chapter Four Results
72
2.0 3.0 4.0 5.0 6.0 7.0
1.0
2.0
3.0
(x10,000,000)
TIC
Time [minutes]
Fig. 4.2: Chromatogram of standard fructose.
Fructose sample was oximated by O-methyhydroxylamine-hydrochloride at 95°C
for 45minutes. Then a silylation step was achieved by adding BSTFA at 90°C for
30minutes. Syn- and anti-forms of fructose were observed at 3.88 and 3.905min
retention times. The figure consists of two parts: whole chromatogram of the
standard fructose for 7min measuring time (A); part of the standard fructose
chromatogram at 3.8-4.0min retention time (B).
3.8 3.9 4.0
1.0
2.0
(x10,000,000)
TIC
3.905
3.882
B
A
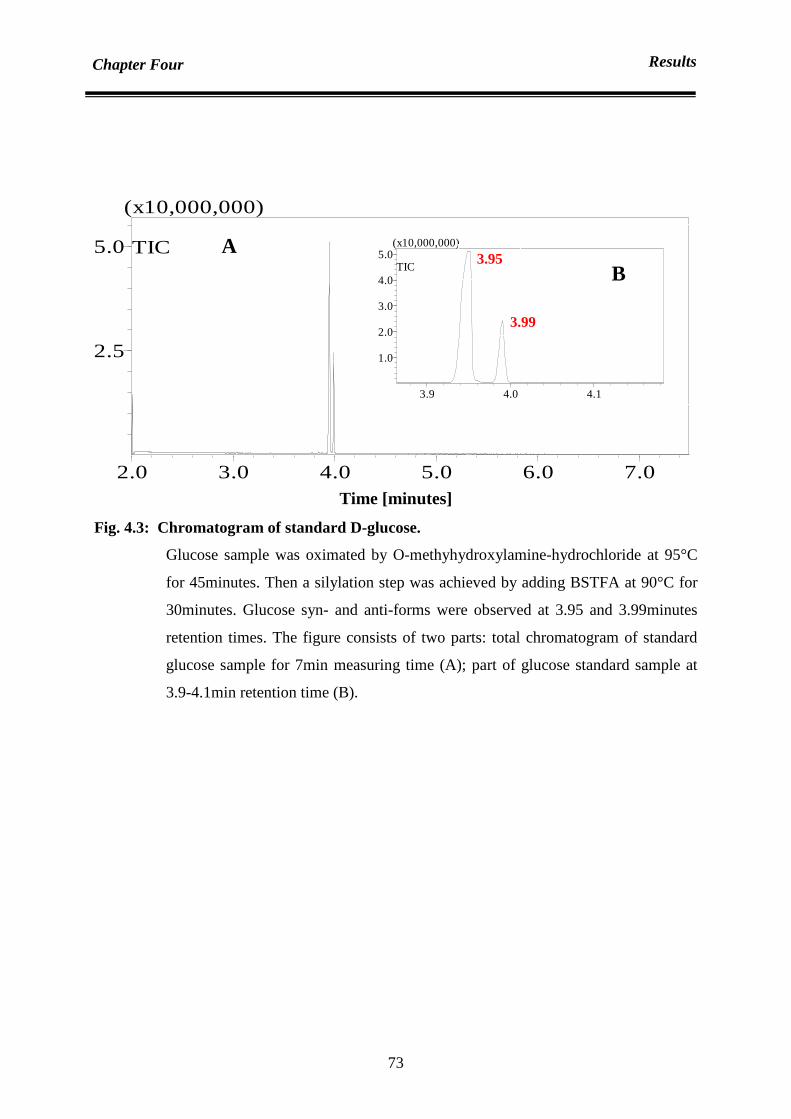
Chapter Four Results
73
Time [minutes]
Fig. 4.3: Chromatogram of standard D-glucose.
Glucose sample was oximated by O-methyhydroxylamine-hydrochloride at 95°C
for 45minutes. Then a silylation step was achieved by adding BSTFA at 90°C for
30minutes. Glucose syn- and anti-forms were observed at 3.95 and 3.99minutes
retention times. The figure consists of two parts: total chromatogram of standard
glucose sample for 7min measuring time (A); part of glucose standard sample at
3.9-4.1min retention time (B).
2.0 3.0 4.0 5.0 6.0 7.0
2.5
5.0
(x10,000,000)
TIC
3.9 4.0 4.1
1.0
2.0
3.0
4.0
5.0(x10,000,000)
TIC
3.99
3.95 A
B

Chapter Four Results
74
Time [minutes]
Fig. 4.4: Chromatogram of standard sucrose.
Sucrose sample was silylated by adding BSTFA at 90°C for 60minutes. The figure
consists of two parts: chromatogram of standard sucrose for 5.1-5.5min retention
time (A); whole chromatogram of standard sucrose for 7min measuring time (B).
Time [minutes]
Fig. 4.5: Chromatogram of blank sample (pyridine).
Pyridine sample was analyzed as blank sample. The figure consists of two parts:
whole chromatogram of blank sample for 7min measuring time (A);
chromatogram of blank sample for 5.1-5.5min retention time (B).
2.0 3.0 4.0 5.0 6.0 7.0
1.0
2.0
3.0
4.0(x10,000,000)
TIC
5.330
5.1 5.2 5.3 5.4 5.5
1.0
2.0
3.0
(x10,000,000)
TIC A B
2.0 3.0 4.0 5.0 6.0 7.0
0.5
1.0
(x10,000,000)
TIC
5.1 5.2 5.3 5.4 5.50.5
1.0
1.5
2.0
(x1,000,000)
TIC
A
B

Chapter Four Results
75
50 100 150 200 250 300 350 400 4500.0
25.0
50.0
75.0
100.0
%
73
103
307217147
11745 277189 219 363172 334262 392 433
50 100 150 200 250 300 350 400 4500.0
25.0
50.0
75.0
100.0
%
73
103
307217
14711745 277189 219 363172 334306262 392 433
447
Fig. 4.6: Mass spectrum at retention time 3.88min.
A. Standard fructose
B. Date juice
50 100 150 200 250 300 350 400 4500.0
25.0
50.0
75.0
100.0
%
73
103
307217147
11745 277219 262 363191 306173 334 432447
403
50 100 150 200 250 300 350 400 4500.0
25.0
50.0
75.0
100.0
%
73
103
307217147
11745 277219 262191 363334306173 431447
401
Fig. 4.7: Mass spectrum at retention time 3.905min.
A. Standard fructose
B. Date juice
A
B
A
B
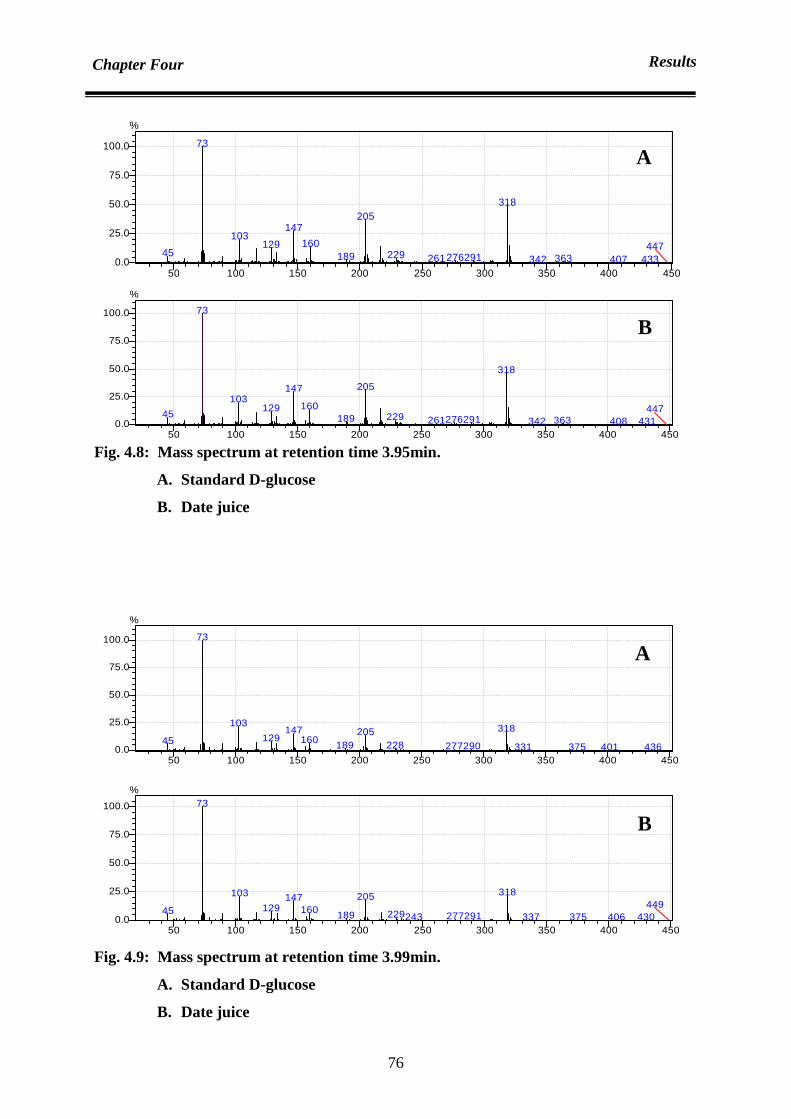
Chapter Four Results
76
50 100 150 200 250 300 350 400 4500.0
25.0
50.0
75.0
100.0
%
73
318205
147103
16012945 229189 291276 363261 342
447433407
50 100 150 200 250 300 350 400 4500.0
25.0
50.0
75.0
100.0
%
73
318
205147103
16012945 229189 291276 363261 342
447431408
Fig. 4.8: Mass spectrum at retention time 3.95min.
A. Standard D-glucose
B. Date juice
50 100 150 200 250 300 350 400 4500.0
25.0
50.0
75.0
100.0
%
73
103 318147 205129 16045 189 228 290277 375331 401 436
50 100 150 200 250 300 350 400 4500.0
25.0
50.0
75.0
100.0
%73
318103 205147129 16045 229189 291277243 375337 406 430
449
Fig. 4.9: Mass spectrum at retention time 3.99min.
A. Standard D-glucose
B. Date juice
A
B
A
B

Chapter Four Results
77
50 100 150 200 250 300 350 400 4500.0
25.0
50.0
75.0
100.0
%
73
360
103 217129 147 271 436169 243 319191 219 43845 377 396
Fig. 4.10: Mass spectrum of standard sucrose at retention time 5.33min.
50 100 150 200 250 300 350 400 4500.0
25.0
50.0
75.0
100.0
%
73
360
103 217147129 27052 243 436169 319191 219 401377
Fig. 4.11: Mass spectrum of date juice sample at retention time 5.33min.
50 100 150 200 250 300 350 400 4500.0
25.0
50.0
75.0
100.0
%
79
52
149
113 167 279207 230 295 314 360 438396334
Fig. 4.12: Mass spectrum of blank sample (pyridine) at retention time 5.3min.

Chapter Four Results
78
4.1.1.2 Quantification of sugar concentration
Sugar concentration in the date juice was determined. Thus, an enzymatic standard
method and delta pH technique were used.
Figure 4.13 represents a calibration curve of obtained absorption against different
standards glucose concentration. This calibration curve was obtained by using materials of an
enzymatic assay, K-SUFRG (Megazyme Company). Reasonable results were obtained for
glucose concentrations (0.05-5mM) by using this test. Thus, the calibration curve was a
straight line in that concentration range. Therefore, sample diluting has to be done for glucose
concentration above 5mM. Moreover, the equation of linear relationship between glucose
concentration and absorption is as below:
[Glucose] [mM ]= [3.9015×××× (Absorption at 340nm) - 0.1263] ×××× [mM]……4.1
The calibration curve was prepared in order to be used in determination of sugar
concentration in the growth medium and in date juice as well.
0
1
2
3
4
5
6
0 0.2 0.4 0.6 0.8 1 1.2 1.4Absorption [ 340nm ]
Glu
cose
[ m
M ]
Fig. 4.13: Calibration curve for glucose concentration in (mM).
Several glucose standards (0.05- 5mM) were analyzed by using
enzymatic kit–assay (K-SUFRG) which was purchased from Megazyme
Company. A calibration curve was obtained by plotting glucose concentrations
against measured absorption at 340nm. The plotted values of absorption were an
average of three measured values with an average standard deviation of ± 0.04.

Chapter Four Results
79
Measuring the changing in pH of the solution during the phosphorylation of glucose
was another developed method of determination of sugar contents in the date juice.
Calibration curve was made by measuring the changing in pH of solution against the
standards samples of different glucose concentrations as can be shown in figure 4.14.
Linearity between changing in pH and glucose concentration was obtained for glucose
concentration (4.2-42mM). Thus, the following equation revealed this linear relationship.
[Glucose] [mM] = [0.7798××××change in pH + 0.3508] ×××× [mM]…… 4.2
0
5
10
15
20
25
30
35
0 10 20 30 40 50│Change in pH │ [ mpH]
Glu
cose
[ m
M]
Fig. 4.14: Calibration curve for glucose concentration in (mM).
Different glucose standards (4.4- 42mM) were analyzed by measuring the change
in pH of the solution during the phosphorylation of glucose. This enzymatic
reaction was achieved by using delta pH device. A calibration curve was obtained
by plotting glucose concentrations against measured change in pH. The plotted
values of changing in pH (mpH) were an average of three absolute measured
values with an average standard deviation of ± 0.008%.

Chapter Four Results
80
4.2 Protein quantification
In order to determine total protein content in growth samples, Bradford’s method of
protein determination was chosen. A scan of absorption against wave length of these mixtures
from 400nm to 800nm was made. Thus, 200µl of Coomassie Brilliant Blue Dye-G250 were
mixed with 800µl of different liquids such as bidest water, 0.9% NaCl solution, PBS of pH
6.3 and PBS of pH 7.4. This scan showed two absorption peaks at 470nm, 650nm and less
absorbance at 595nm as seen in figure 4.15.a. A calibration curve was made as explained in
section 3.4.5.
Fig. 4.15: Wave length scan of absorption of undiluted 200µl Coomassie dye.
A. Coomassie blue dye was blended separately with 800µl 0.9% NaCL, bidest
water, PBS at pH 6.3 and PBS at pH 7.4 solutions.
B. Coomassie dye blue was mixed separately with 800µl 0.9% NaCL, bidest
water, PBS at pH 6.3 and PBS at pH 7.4 solutions, which were containing
51.3µg BSA.
0
0.5
1
1.5
2
2.5
375 450 525 600 675 750
Wave length [nm]
Abs
orpt
ion
valu
es
w ith 0.9% NaCl
with bidest water
with PBS (pH 6.3)
with PBS(pH 7.4)
0
0.5
1
1.5
2
2.5
3
375 450 525 600 675 750
A B
Wave length [nm]

Chapter Four Results
81
Adding protein like BSA for these preparations forming new peak at 595nm as can be
found in figure 4.15.b and figure 4.16.
Different BSA concentrations were used in order to prepare a calibration curve. The
calibration curve was linear in the range of (0-30µg/ml) BSA concentrations as can be shown
in figure 4.17. The relevant equation that represents the relation between BSA concentration
and absorption at 595nm of the calibration curve was as below:
[Protein] [µg/ml] = [0.0271×××× (Absorption at 595nm) + 0.0025] [µg/ml]…..4.3
0
0.5
1
1.5
2
2.5
350 450 550 650 750
Wave length [nm]
Abs
orpt
ion
valu
es
with 0.9% NaCl
with 0.9% NaCl
Fig. 4.16: Effect of adding BSA to absorption of Coomassie dye.
Undiluted 200µl Coomassie blue dye was blended with 800µl of 0.9% NaCl
solution. This final Coomassie blue dye solution had two high peaks of absorption
at 470 and 650nm while it had less absorption at 595nm. Adding of 51.3µg BSA
caused a higher absorption value (peak) at 595nm while the other peaks at 470 and
650nm were decreased dramatically.
Adding 51.3µl BSA

Chapter Four Results
82
0
5
10
15
20
25
30
35
0 0.2 0.4 0.6 0.8 1Absorption [ 595 nm ]
BS
A [
µg/m
l ]
Fig. 4.17: Coomassie blue calibration curve for BSA concentrations [µg/ml].
Different BSA concentrations standards (0- 51µg/ml) were analysed. 20µl BSA
was added to undiluted 200µl Coomassie dye mixed with in 780µl of 0.9% NaCl
solution. A calibration curve was obtained by plotting different BSA
concentrations against measured absorption values at 595nm. The plotted values of
obtained absorption were an average of three absolute measured values with an
average standard deviation of ± 0.01%. The linear relationship was obtained in the
BSA concentration range (0-30µg/ml).
4.3 Biomass
The produced biomass during growing of Saccharomyces cerevisiae is a key
parameter in calculating the yield of SCP production. Therefore, a calibration curve between
biomass and absorption was made in order to estimate the recent biomass at any time during
the growth.
Four different methods such as (freeze dryer, exsiccator, drying at 95°C and at 105°C)
were used in order to get the best calibration curve. The absorption values of Saccharomyces
cerevisiae growth samples at 660nm were plotted against its dry weights. The results of these
methods can be shown in figure 4.18. The best results were obtained by using drying at

Chapter Four Results
83
105°C. A linear calibration curve was achieved in the absorption range (0.58-1.75). This
linear relationship revealed the following equation:
[Dry weight] [mg. 1/ml] = [1.2×××× (Absorption at 660nm) - 0.2891] [mg. 1/ml] …..4.4
0
0.5
1
1.5
2
2.5
3
0.5 0.7 0.9 1.1 1.3 1.5 1.7 1.9
Absorption [660nm]
Dry
wei
ght [
mg
.1/m
l]
freeze dryer95°Cexsiccator105°CLinear (105°C)
Fig. 4.18: Biomass calibration curve for yeast dry weight [mg/ml].
A calibration curve was achieved by plotting measured absorption at 660nm of
Saccharomyces cerevisiae growth samples against its dry weight. The dry weights
were obtained by different methods such as freeze drying, exsiccator, heating at
95°C and at 105°C. The drying step was done after three times of cells washing
with dionised water. The best result was reached by using heating at 105°C. Thus,
the linear regression was observed for absorption value range (0.58-1.75). The
values in this calibration curve were an average of three measured values for each
absorption values and dry weights. The average standard deviation was ±0.02%.

Chapter Four Results
84
4.4 Cells number calibration curve and the necessity of sample diluting
In order to facilitate presenting cell numbers during Saccharomyces cerevisiae growth,
a calibration curve between cell density and absorption was made. Saccharomyces cerevisiae
was cultivated on YEPD and date juice mediums as shown in figures 4.19 & 4.21
respectively. The growth conditions were constant at 25°C, pH 5.5 and 150rpm shaking
speed. The results demonstrate that the calibration curve is linear up to absorption values of
0.86 and 0.6 for Saccharomyces cerevisiae cultivation on YEPD medium and date juice
medium respectively as shown in figures 4.20 and 4.22. Similarly, equations 4.5 and 4.6
demonstrate this linearity for cultivation on YEPD and date juice respectively.
[Cell density] [cells/ml] = [3.107×××× (Absorption at 660nm) - 4.106] [cells/ml] …..4.5
[Cell density] [cells/ml] = [3.107×××× (Absorption at 660nm) + 98287] [cells/ml] …..4.6
Cell density [cells/ml]
0 20x106 40x106 60x106 80x106
Abs
orpt
ion
[660
nm]
0.0
0.2
0.4
0.6
0.8
1.0
1.2
1.4
1.6
Cell density [cells/ml]
Fig. 4.19: Absorption at 660nm against Saccharomyces cerevisiae cell density [cells/ml].
Saccharomyces cerevisiae was grown on YEPD medium at 25°C, pH 5.5 and
150rpm shaking speed. The graph demonstrates the relationship between cell
density and absorption at 660nm, which was linear up to absorption value of 0.86.
The absorption was measured for each sample in triplicate while cell density was
an average value of four values. The plotted values are an average value with a
maximum average standard deviation was ±0.05%.

Chapter Four Results
85
Absorption [660nm]
0.1 0.2 0.3 0.4 0.5 0.6 0.7 0.8 0.9
Cel
l den
sity
[cel
ls/m
l]
0
5x10⁶
10x106
15x106
20x106
25x106
30x106
Cell densityLinear regression
Fig. 4.20: Calibration curve for cell density [cells/ml] against absorption at 660nm.
Absorption values for different cell density samples at 660nm were measured.
These samples were obtained from cultivated Saccharomyces cerevisiae on YEPD
medium at 25°C, pH 5.5 and shaking speed of 150rpm. The plotting of cell density
against absorption gave a linear calibration curve in the range of absorption value
(0.23-0.86). The values of absorption were an average value of triplicate
measurements while cell density was an average value of four values. The
maximum average standard deviation was ±0.03%.
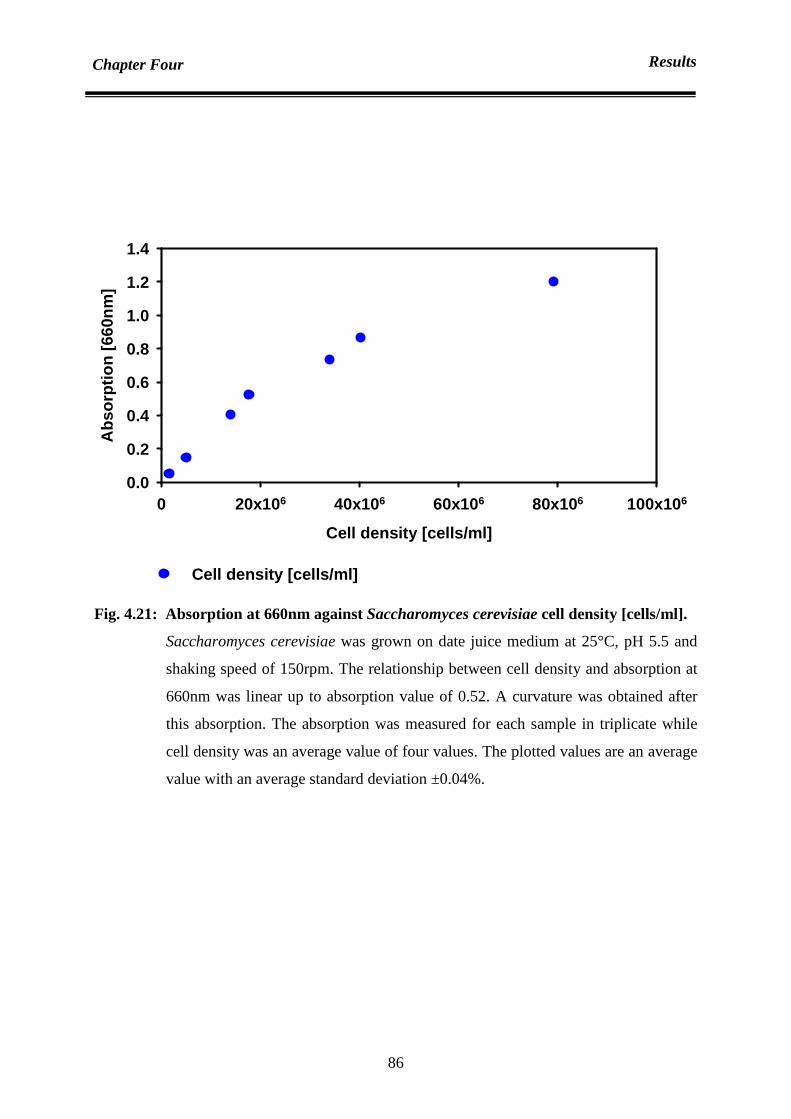
Chapter Four Results
86
Cell density [cells/ml]
0 20x106 40x106 60x106 80x106 100x106
Abs
orpt
ion
[660
nm]
0.0
0.2
0.4
0.6
0.8
1.0
1.2
1.4
Cell density [cells/ml]
Fig. 4.21: Absorption at 660nm against Saccharomyces cerevisiae cell density [cells/ml].
Saccharomyces cerevisiae was grown on date juice medium at 25°C, pH 5.5 and
shaking speed of 150rpm. The relationship between cell density and absorption at
660nm was linear up to absorption value of 0.52. A curvature was obtained after
this absorption. The absorption was measured for each sample in triplicate while
cell density was an average value of four values. The plotted values are an average
value with an average standard deviation ±0.04%.

Chapter Four Results
87
Absorption [660nm]
0.0 0.1 0.2 0.3 0.4 0.5 0.6
Cel
l den
sity
[cel
ls/m
l]
02x106
4x10⁶
6x10⁶
8x10⁶
10x106
12x106
14x106
16x106
18x106
20x106
Cell density [cells/ml]Linear regression
Fig. 4.22: Calibration curve for cell density [cells/ml] against absorption at 660nm.
A calibration curve was achieved by plotting absorption values at 660nm for
different cell density samples. These samples were obtained from cultivated
Saccharomyces cerevisiae on date juice medium at 25°C, pH 5.5 and shaking
speed of 150rpm. In the absorption range (0.05-0.52), a linear relationship was
observed between cell density and absorption. An average value of triplicate
measurements for absorption of each sample were plotted against the average
value of four values of counted cell numbers per ml of the same sample. The
maximum average standard deviation was ±0.035%.
4.5 Cultivation of Saccharomyces cerevisiae within incubator
Saccharomyces cerevisiae was cultivated on YEPD medium in order to observe its
growth behaviour. Then Saccharomyces cerevisiae was grown on date juice medium in
presence and absence of additives in order to estimate the potential of date juice as a substrate
for single cell protein production.

Chapter Four Results
88
4.5.1 YEPD medium
Cultivation of Saccharomyces cerevisiae on YEPD growth medium was done at pH
5.5, temperature of 25°C and 150rpm shaking speed. Here YEPD medium was sterilized as
mentioned in section (3.1.1.1). Absorption was measured during cultivation time. The
absorption values were plotted against time in order to demonstrate yeast growth. The growth
showed two distinct phases with two different maximum specific growth rates (µmax). First
growth phase of Saccharomyces cerevisiae was faster and gave a highest absorption of 4.6
within process time of 13 hours while the second growth phase started after 2hr lag phase.
The maximum obtained absorption was 9.0 at 36 hours of cultivation time as shown in figure
4.23. The maximum specific growth rate of first growth phase was 0.20 hr -1. This value was
determined by plotting exponential function of five points within log phase of the growth
curve as shown in figure 4.24. This function gave the following relationship:
Absorption [-] = 0.1396 e [0.2126 1/hr * time]….. 4.7
Moreover, this equation represents the logarithmic phase of growing. By comparing it
with logarithmic growth equation X= X0 e [µ * time], µ was calculated. Similarly, the maximum
specific growth rate of the second phase was calculated and it was 0.03hr -1.
Another experiment of cultivation of Saccharomyces cerevisiae on autoclaving YEPD
without separating glucose was made as shown in figure 5.1.

Chapter Four Results
89
0
2
4
6
8
10
0 20 40 60 80Time [hours]
Abs
orpt
ion
[660
nm]
Fig. 4.23: Growth curve of cultivated Saccharomyces cerevisiae on YEPD medium.
Saccaromyces serevisiae was grown on YEPD medium in Erlenmeyer flask.
Cultivation conditions were pH 5.5, temperature of 25°C and 150rpm shaking
speed. The first growth phase was faster and has µmax value of 0.20 hr -1and took
13hr. After 2hr lag phase, the second growth phase started for 21hr and has µmax
value of 0.03hr -1. The required time of reaching stationary phase was 36hr while
the total cultivation time was 68.5hr.
0.1
1
10
8 9 10 11 12 13 14Time [hours]
Abs
orpt
ion
[660
nm]
Fig. 4.24: Calculating of maximum specific growth rate µmax. Five points was extracted from logarithmic growth phase of figure 4.23. An
exponential function was plotted within these points. Thus, the maximum specific
growth rate was 0.20hr -1.
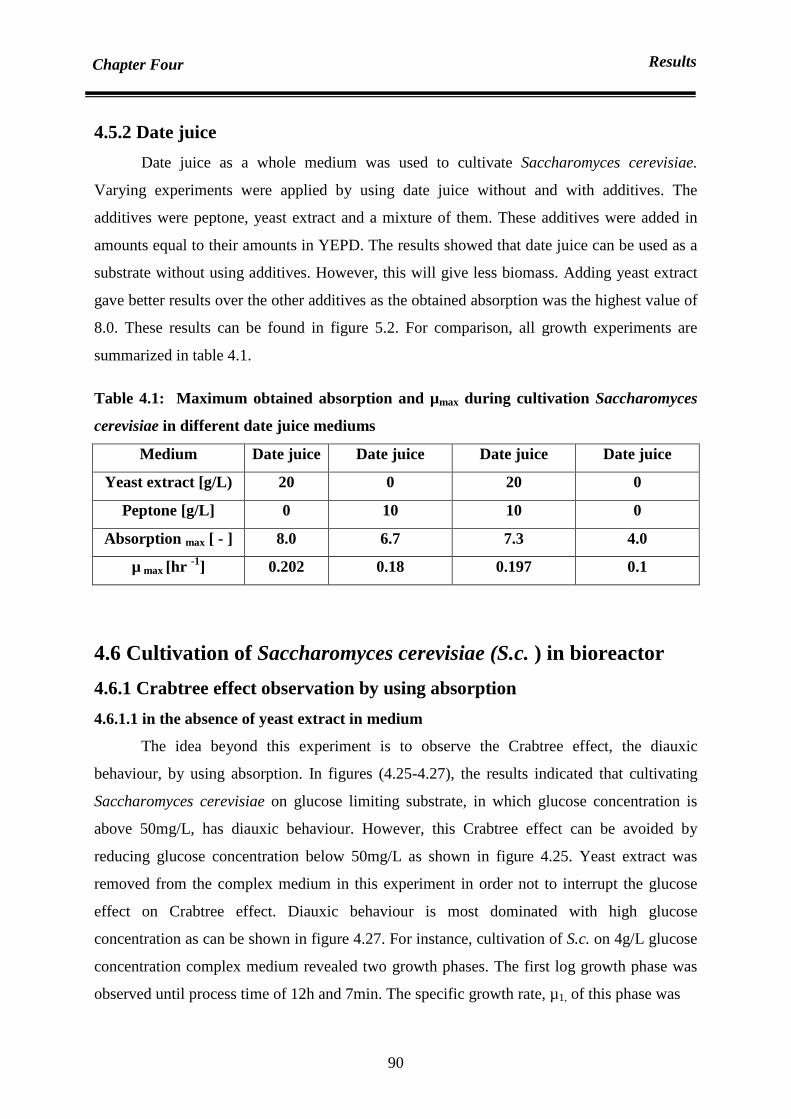
Chapter Four Results
90
4.5.2 Date juice
Date juice as a whole medium was used to cultivate Saccharomyces cerevisiae.
Varying experiments were applied by using date juice without and with additives. The
additives were peptone, yeast extract and a mixture of them. These additives were added in
amounts equal to their amounts in YEPD. The results showed that date juice can be used as a
substrate without using additives. However, this will give less biomass. Adding yeast extract
gave better results over the other additives as the obtained absorption was the highest value of
8.0. These results can be found in figure 5.2. For comparison, all growth experiments are
summarized in table 4.1.
Table 4.1: Maximum obtained absorption and µmax during cultivation Saccharomyces
cerevisiae in different date juice mediums
Medium Date juice Date juice Date juice Date juice
Yeast extract [g/L) 20 0 20 0
Peptone [g/L] 0 10 10 0
Absorption max [ - ] 8.0 6.7 7.3 4.0
µ max [hr -1] 0.202 0.18 0.197 0.1
4.6 Cultivation of Saccharomyces cerevisiae (S.c. ) in bioreactor
4.6.1 Crabtree effect observation by using absorption
4.6.1.1 in the absence of yeast extract in medium
The idea beyond this experiment is to observe the Crabtree effect, the diauxic
behaviour, by using absorption. In figures (4.25-4.27), the results indicated that cultivating
Saccharomyces cerevisiae on glucose limiting substrate, in which glucose concentration is
above 50mg/L, has diauxic behaviour. However, this Crabtree effect can be avoided by
reducing glucose concentration below 50mg/L as shown in figure 4.25. Yeast extract was
removed from the complex medium in this experiment in order not to interrupt the glucose
effect on Crabtree effect. Diauxic behaviour is most dominated with high glucose
concentration as can be shown in figure 4.27. For instance, cultivation of S.c. on 4g/L glucose
concentration complex medium revealed two growth phases. The first log growth phase was
observed until process time of 12h and 7min. The specific growth rate, µ1, of this phase was

Chapter Four Results
91
0.208h-1 while µ2 of the second phase was 0.057h-1. The second phase continued till process
time of 19h and 26min. Similarly, the growth of S.c. on 7g/L glucose concentration complex
medium demonstrated two growth phases. The initial phase ended at process time of 14h and
6min, while the second phase ended at 21h and 40min process time. The specific growth rates
of the first and second phase were 0.245h-1 and 0.048h-1 respectively.
0.15
0.2
0.25
0.3
0.35
0.4
0:00 1:00 2:00 3:00 4:00 5:00 6:00 7:00 8:00
Process Time [ h:mm ]
Abs
orpt
ion
[ 66
0nm
]
0.05g/l glucose
0.1g/l glucose
Fig. 4.25: Cultivation of S.cerevisiae on 0.05 and 0.1g/L glucose complex mediums.
Two complex mediums at different glucose concentrations (0.05 and 0.1g/L) were
used for S. cerevisiae cultivation. Growth conditions were temperature of 30°C,
pH of 5.5, stirring speed of 750rpm and air flow rate of 1.5 L/min. Growth of
S.cerevisiae on 0.05g/L complex medium demonstrated one growth phase. Two
growth phases were observed during S. cerevisiae cultivation on 0.1g/L glucose
complex medium. The first log growth phase was achieved during the first 4 hours
of process time and had (µ1) of 0.14h-1. Then second growth phase was started and
had (µ2) of 0.026h-1. The second phase continued until process time of 5h and
20min.
Ending of the first phase and starting of the second phase
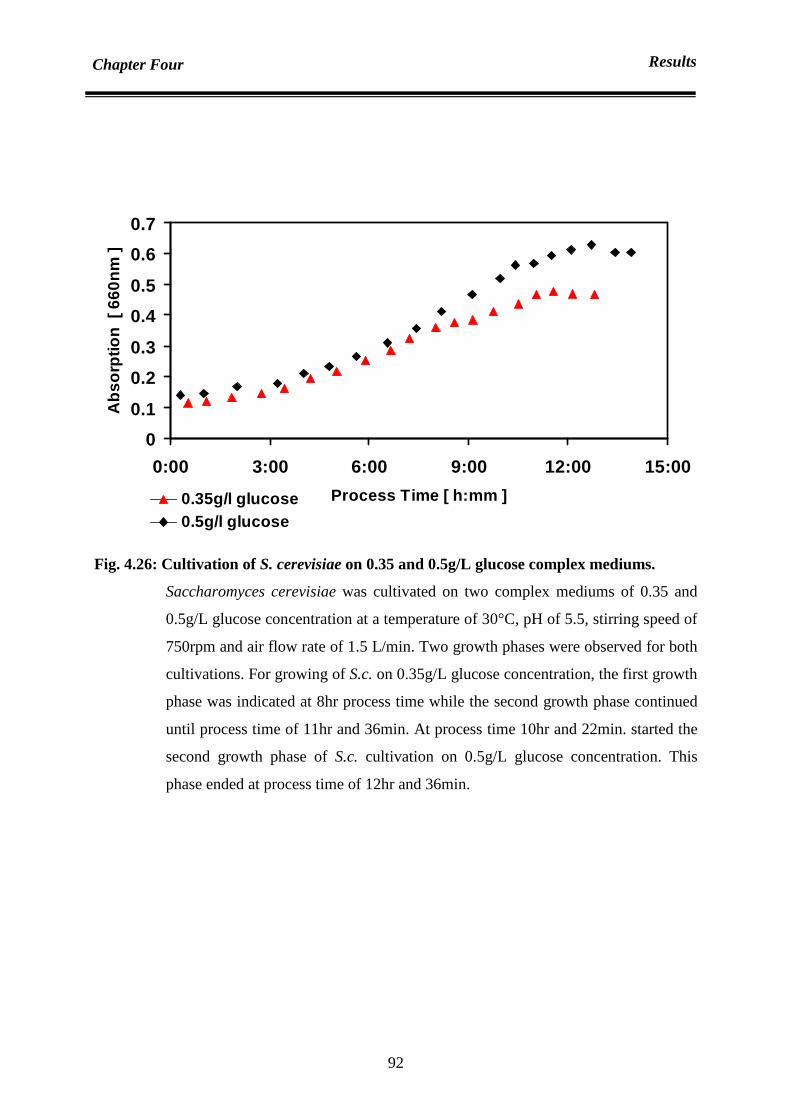
Chapter Four Results
92
0
0.1
0.2
0.3
0.4
0.5
0.6
0.7
0:00 3:00 6:00 9:00 12:00 15:00
Process Time [ h:mm ]
Abs
orpt
ion
[ 66
0nm
]
0.35g/l glucose0.5g/l glucose
Fig. 4.26: Cultivation of S. cerevisiae on 0.35 and 0.5g/L glucose complex mediums.
Saccharomyces cerevisiae was cultivated on two complex mediums of 0.35 and
0.5g/L glucose concentration at a temperature of 30°C, pH of 5.5, stirring speed of
750rpm and air flow rate of 1.5 L/min. Two growth phases were observed for both
cultivations. For growing of S.c. on 0.35g/L glucose concentration, the first growth
phase was indicated at 8hr process time while the second growth phase continued
until process time of 11hr and 36min. At process time 10hr and 22min. started the
second growth phase of S.c. cultivation on 0.5g/L glucose concentration. This
phase ended at process time of 12hr and 36min.
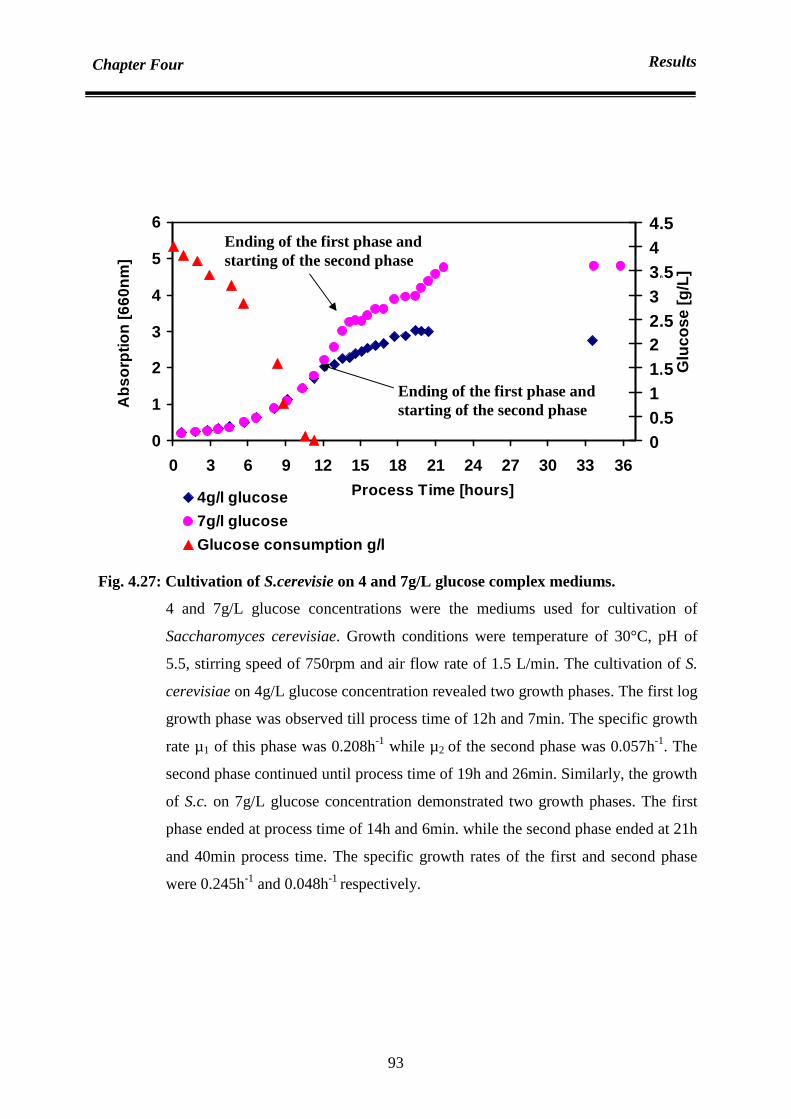
Chapter Four Results
93
0
1
2
3
4
5
6
0 3 6 9 12 15 18 21 24 27 30 33 36
Process Time [hours]
Abs
orpt
ion
[660
nm]
00.511.522.533.544.5
4g/l glucose
7g/l glucose
Glucose consumption g/l
Fig. 4.27: Cultivation of S.cerevisie on 4 and 7g/L glucose complex mediums.
4 and 7g/L glucose concentrations were the mediums used for cultivation of
Saccharomyces cerevisiae. Growth conditions were temperature of 30°C, pH of
5.5, stirring speed of 750rpm and air flow rate of 1.5 L/min. The cultivation of S.
cerevisiae on 4g/L glucose concentration revealed two growth phases. The first log
growth phase was observed till process time of 12h and 7min. The specific growth
rate µ1 of this phase was 0.208h-1 while µ2 of the second phase was 0.057h-1. The
second phase continued until process time of 19h and 26min. Similarly, the growth
of S.c. on 7g/L glucose concentration demonstrated two growth phases. The first
phase ended at process time of 14h and 6min. while the second phase ended at 21h
and 40min process time. The specific growth rates of the first and second phase
were 0.245h-1 and 0.048h-1 respectively.
Ending of the first phase and starting of the second phase
Ending of the first phase and starting of the second phase
Glu
cose
[g/L
]

Chapter Four Results
94
4.6.1.2 in the presence of yeast extract in medium
Using yeast extract in the growth medium had an effect on growth behaviour. The
results showed that diauxic behaviour was disappeared when yeast extract was added to
complex growth medium. The results showed one growth curve as shown in figure 4.28.
0
0.2
0.4
0.6
0.8
1
1.2
1.4
0:00 3:00 6:00 9:00 12:00 15:00 18:00Process Time [ hh:mm ]
Abs
orpt
ion
[ 66
0nm
]
0.5g/l without yeast extract0.5g/l with yeast extract1g/l with yeast extract
Fig. 4.28: Effect of adding yeast extract on the observation of diauxic behaviour.
Adding of 0.25g/L yeast extract to complex medium caused a disappearing of
diauxic behaviour. Thus, one growth phase was observed for cultivation of
Saccharomyces cerevisiae at a temperature of 30°C, pH of 5.5, stirring speed of
750rpm and air flow rate of 1.5 L/min.
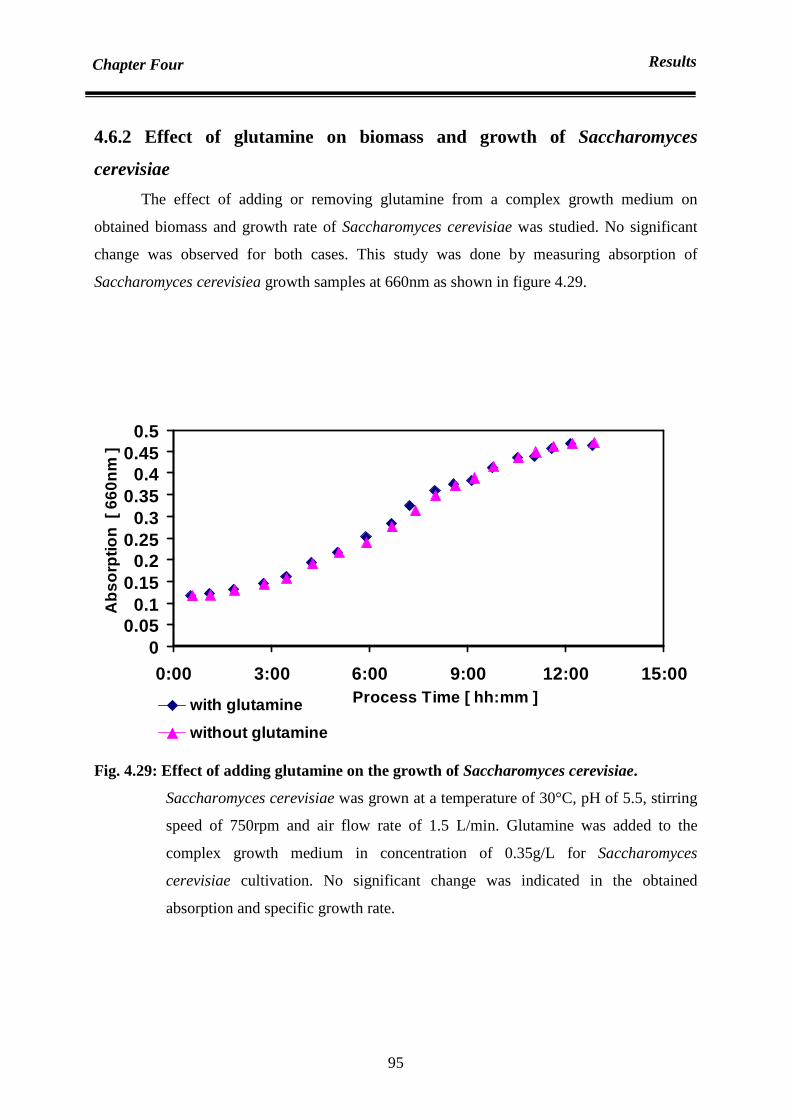
Chapter Four Results
95
4.6.2 Effect of glutamine on biomass and growth of Saccharomyces
cerevisiae
The effect of adding or removing glutamine from a complex growth medium on
obtained biomass and growth rate of Saccharomyces cerevisiae was studied. No significant
change was observed for both cases. This study was done by measuring absorption of
Saccharomyces cerevisiea growth samples at 660nm as shown in figure 4.29.
00.05
0.10.15
0.20.25
0.30.35
0.40.45
0.5
0:00 3:00 6:00 9:00 12:00 15:00Process Time [ hh:mm ]
Abs
orpt
ion
[ 66
0nm
]
with glutamine
without glutamine
Fig. 4.29: Effect of adding glutamine on the growth of Saccharomyces cerevisiae.
Saccharomyces cerevisiae was grown at a temperature of 30°C, pH of 5.5, stirring
speed of 750rpm and air flow rate of 1.5 L/min. Glutamine was added to the
complex growth medium in concentration of 0.35g/L for Saccharomyces
cerevisiae cultivation. No significant change was indicated in the obtained
absorption and specific growth rate.

Chapter Four Results
96
4.6.3 Lag phase reduction
Most of the batch cultivation of Saccharomyces cerevisiae suffers from lag phase.
This experiment was designed in order to decrease lag phase by increasing
inoculum’s size. Figures 4.30&4.31 indicated that increasing inoculum’s size will
reduce the lag phase proportionally. Moreover, a reduction of 2h and 10min lag
phase was achieved by increasing the initial absorption of culture above 0.169 as
shown in figure 4.30.
0.01
0.1
1
10
00:00 03:00 06:00 09:00 12:00 15:00 18:00 21:00 00:00
Process Time [ hh:mm ]
Abs
orpt
ion
[ 66
0nm
]
0.0655 0.094
0.1693 0.4231
0.6517 0.8995
Fig. 4.30: Effect of increasing inoculum’s size in lag phase reduction in semi log graph.
Saccharomyces cerevisiae was grown on 0.5g/L glucose simplex medium at a
temperature of 29.5°C, pH of 5.2 and shaking speed of 120rpm. Different
inoculum’s sizes, in terms of initial absorption at 660nm, were used. Reduction of
2h and 10min lag phase was achieved by increasing the initial absorption of
culture above 0.169.
24:00
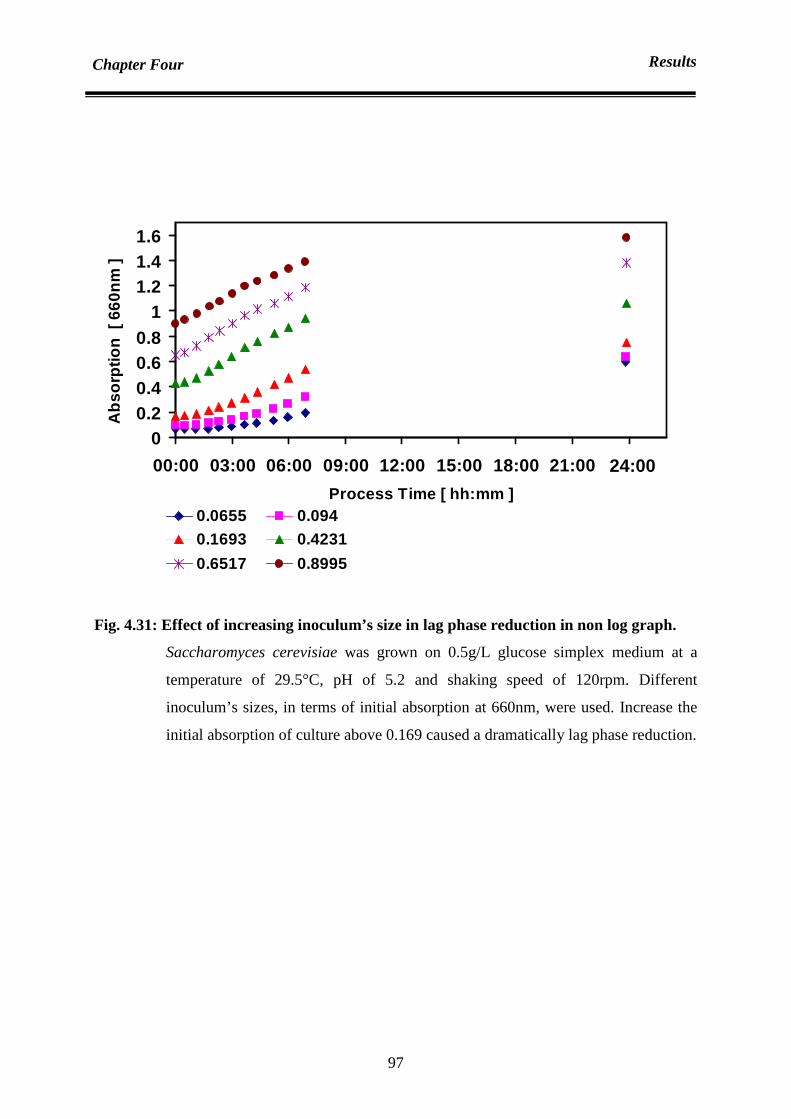
Chapter Four Results
97
00.20.40.60.8
11.21.41.6
00:00 03:00 06:00 09:00 12:00 15:00 18:00 21:00 00:00
Process Time [ hh:mm ]
Abs
orpt
ion
[ 66
0nm
]
0.0655 0.0940.1693 0.4231
0.6517 0.8995
Fig. 4.31: Effect of increasing inoculum’s size in lag phase reduction in non log graph.
Saccharomyces cerevisiae was grown on 0.5g/L glucose simplex medium at a
temperature of 29.5°C, pH of 5.2 and shaking speed of 120rpm. Different
inoculum’s sizes, in terms of initial absorption at 660nm, were used. Increase the
initial absorption of culture above 0.169 caused a dramatically lag phase reduction.
24:00

Chapter Four Results
98
4.6.4 Parameters optimization
4.6.4.1 Temperature and pH optimization by using simplex method
This experiment was done in order to find the optima of temperature and pH during
cultivation of Saccharomyces cerevisiae, by using simplex method. Saccharomyces cerevisiae
was cultivated at different pH and temperatures ranges on limiting glucose complex medium.
The range of pH was (3.0-7.0) while the range of temperature was (26.4-32 0C). Other
parameters such as air flow rate and stirring speed were held constant. Air flow rate was 1.5
L/min while stirring speed was 600rpm within bioreactor of 750ml working volume.
In table 4.2, the results of the starting points and the new vertex can be found. The
obtained results of the whole runs can be found in table 4.3. Optima of temperature of 27.7 0C
and pH of 4.0 were obtained by achieving the higher absorption value of 0.475 as can be
shown in table 4.3 and figures 5.7&5.8. Figures (4.32-4.41) represent the individual results of
table 4.3. The first starting points and its reflection can be shown in figure 4.42 while figure
4.43 demonstrates the whole simplex path way
0
0.05
0.1
0.15
0.2
0.25
0.3
0.35
0.4
00:00 03:00 06:00 09:00 12:00 15:00 18:00 21:00Process Time [ hh:mm ]
Obt
aine
d ne
t abs
orpt
ion
[660
nm]
T 27.3°C_ pH 4.2T 27.3°C_ pH 4.0T 27.3°C _pH 3.8T 27.3°C _pH 3.6
Fig. 4.32: Temperature and pH optimization. Constant growth temperature at 27.3°C.
Saccharomyces cerevisiae was cultivated at constant air flow rate of 1.5 L/L.min,
stirring speed of 600rpm, and 750ml working volume bioreactor. Temperature was
held constant at 27.3°C while pH was changed from 3.6 to 4.2 with constant 0.2
intervals. These experiments are parts of simplex method set of experiments.

Chapter Four Results
99
0
0.1
0.2
0.3
0.4
0.5
00:00 03:00 06:00 09:00 12:00 15:00 18:00 21:00
Process Time [ hh:mm ]
Obt
aine
d ne
t abs
orpt
ion
[660
nm]
T 27.7°C_pH 4.2T 27.7°C_pH 3.8T 27.7°C_ pH 3.6T 27.7°C_ pH 4.0T 27.7°C_ pH 4.5
Fig. 4.33: Temperature and pH optimization. Constant growth temperature at 27.7°C.
Simplex method was applied to optimize temperature and pH of Saccharomyces
cerevisiae cultivation. Other parameters such as temperature at 27.7°C, air flow
rate at 1.5 L/L.min, stirring speed at 600rpm and 750ml working volume
bioreactor were held constant. pH of culture was in the range (3.6-4.5). Optimum
temperature and pH were 27.7°C and 4.0 respectively.

Chapter Four Results
100
00.05
0.10.15
0.20.25
0.30.35
0.40.45
0.5
00:00 03:00 06:00 09:00 12:00 15:00 18:00 21:00Process Time [ hh:mm ]
Obt
aine
d ne
t abs
orpt
ion
[660
nm]
T 28.1°C_pH 4.6T 28.1°C_pH 4.4T 28.1°C_ pH 4.2T 28.1°C _pH 4.0
Fig. 4.34: Temperature and pH optimization. Constant growth temperature at 28.1°C.
The growth conditions of Saccharomyces cerevisiae cultivation was held constant.
Thus, air flow rate was 1.5 L/L.min and stirring speed of 600rpm within 750ml
working volume bioreactor. Temperature was held constant at 28.1°C while pH
was changed from 4.0 to 4.6 with constant 0.2 intervals. These experiments are
parts of simplex method set of experiments.

Chapter Four Results
101
00.05
0.10.15
0.20.25
0.30.35
0.40.45
0.5
00:00 03:00 06:00 09:00 12:00 15:00 18:00 21:00Process Time [ hh:mm ]
Obt
aine
d ne
t abs
orpt
ion
[660
nm]
T 29°C_pH 5.0T 29°C_pH 4.8T 29°C_PH 4.3T 29°C_pH 4.0T 29°C_pH 4.5
Fig. 4.35: Temperature and pH optimization. Constant growth temperature at 29°C.
Different pH values were applied in order to cultivate Saccharomyces cerevisia.
The range of pH value was (4.0-5.0). The growth of Saccharomyces cerevisiae
was achieved at constant air flow rate of 1.5 L/L.min and stirring speed of 600rpm
within 750ml working volume bioreactor. Temperature was held constant at 29°C.
These experiments are parts of simplex method set of experiments.

Chapter Four Results
102
00.05
0.10.15
0.20.25
0.30.35
0.40.45
00:00 03:00 06:00 09:00 12:00 15:00 18:00 21:00
Process Time [ hh:mm ]
Obt
aine
d ne
t abs
orpt
ion
[660
nm]
T 30°C_pH 5.7
T 30°C_pH 5.5
T 30°C_pH 5.3
Fig. 4.36: Temperature and pH optimization. Constant growth temperature at 30°C.
A range of pH (5.3-5.7) was used during Saccharomyces cerevisia cultivation.
Temperature at 30°C, air flow rate at 1.5 L/L.min and stirring speed at 600rpm
within 750ml working volume bioreactor were held constant. These experiments
are parts of simplex method set of experiments.

Chapter Four Results
103
0
0.05
0.1
0.15
0.2
0.25
0.3
0.35
0.4
00:00 03:00 06:00 09:00 12:00 15:00 18:00 21:00
Process Time [ hh:mm ]
Obt
aine
d ne
t abs
orpt
ion
[660
nm]
T26.4°C_pH 4.0
T 29.7°C_pH 3.0
T 28.4°C _pH 4.1
T 28°C_pH 7.0
Fig. 4.37: Temperature and pH optimization. Different temperatures and pH values.
Different pH and temperatures values were applied. Other operating conditions
such as air flow rate at 1.5 L/L.min and stirring speed at 600rpm within 750ml
working volume bioreactor were held constant. These experiments are parts of
simplex method set of experiments.

Chapter Four Results
104
0.2
0.22
0.24
0.26
0.28
0.3
0.32
3.4 3.6 3.8 4 4.2 4.4
pH
Obt
aine
d ne
t ab
sorp
tion
[660
nm
]
Temperature 27.3°C
Fig. 4.38: Obtained net absorption at 27.3°C constant growth temperature.
These results were extracted from simplex method set of experiments table 4.3.
The graph demonstrated the obtained net absorption during Saccharomyces
cerevisiae cultivation at constant air flow rate of 1.5 L/L.min and constant stirring
speed of 600rpm within 750ml working volume bioreactor. Temperature was held
constant at 27.3°C while pH was changed from 3.6 to 4.2 with constant 0.2
intervals. The best result was at pH 3.8.
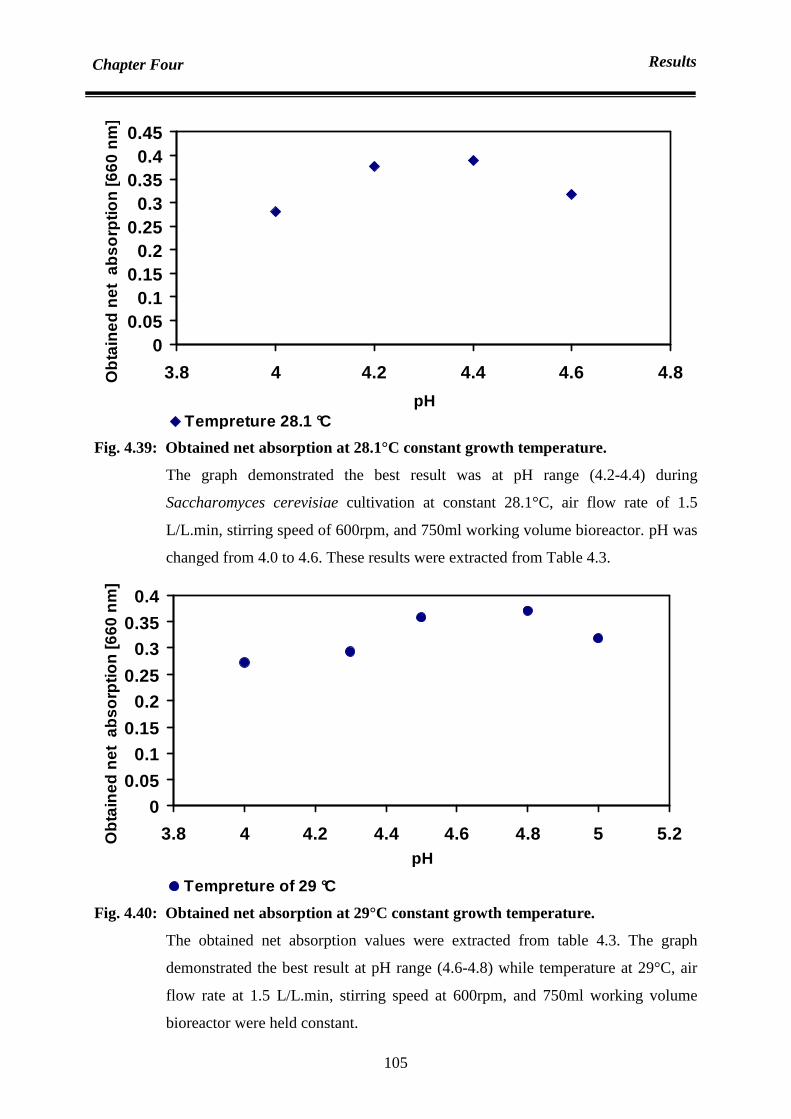
Chapter Four Results
105
00.05
0.10.15
0.20.25
0.30.35
0.40.45
3.8 4 4.2 4.4 4.6 4.8
pH
Obt
aine
d ne
t ab
sorp
tion
[660
nm
]
Tempreture 28.1 °C
Fig. 4.39: Obtained net absorption at 28.1°C constant growth temperature.
The graph demonstrated the best result was at pH range (4.2-4.4) during
Saccharomyces cerevisiae cultivation at constant 28.1°C, air flow rate of 1.5
L/L.min, stirring speed of 600rpm, and 750ml working volume bioreactor. pH was
changed from 4.0 to 4.6. These results were extracted from Table 4.3.
00.05
0.10.15
0.20.25
0.30.35
0.4
3.8 4 4.2 4.4 4.6 4.8 5 5.2pH
Obt
aine
d ne
t ab
sorp
tion
[660
nm
]
Tempreture of 29 °C
Fig. 4.40: Obtained net absorption at 29°C constant growth temperature.
The obtained net absorption values were extracted from table 4.3. The graph
demonstrated the best result at pH range (4.6-4.8) while temperature at 29°C, air
flow rate at 1.5 L/L.min, stirring speed at 600rpm, and 750ml working volume
bioreactor were held constant.

Chapter Four Results
106
0.22
0.24
0.26
0.28
0.3
0.32
0.34
0.36
5.2 5.3 5.4 5.5 5.6 5.7 5.8
pH
Obt
aine
d ne
t ab
sorp
tion
[660
nm
]
Temperature 30°C
Fig. 4.41: Obtained net absorption at 30°C constant growth temperature.
The graph revealed the best result at pH 5.5 during Saccharomyces cerevisiae
cultivation at a constant temperature at 30°C, air flow rate at 1.5 L/L.min, stirring
speed at 600rpm and 750ml working volume bioreactor. pH was changed from
(5.3-5.7) with constant 0.2 intervals. The obtained net absorption values were
extracted from table 4.3.

Chapter Four Results
107
Temperature °C
27 28 29 30 31 32 33
pH
2
3
4
5
6
7
8
1
2
3
4
5
6
7
8
25 27 29 31 33 35
Temperature °C
pH
Start points
New vertex in simplex
Fig. 4.42: First starting points within simplex path way reflection.
This figure demonstrated the first starting points during applying the simplex
method. These points were [(32°C, pH 4.0), (30°C, pH 5.5), (29.7°C, pH 3.0)].
The worse point was at (32°C, pH 4.0). Thus, a reflection point, new vertex 1, at
(27.7°C, pH 4.5) was determined. Similarly, worse point 2 at (29.7°C, pH 3.0) and
new vertex2 at (28°C, pH 7) were indicated. This figure consists of two parts:
A. Obtained net absorption values of the first stating points and the new vertexes.
B. Reflection points; New Vertexes.
First Simplex Second Simplex
Third Simplex
Worse Point 1 New Vertex 1
Worse Point 2
New Vertex 2
0.371 0.238
0.33
0.259
0.162
B
A

Chapter Four Results
108
2.83.33.84.34.85.35.86.36.87.3
26 27 28 29 30 31 32 33
Temperature ( °C )
pH
simplex method way
Fig. 4.43: Simplex method path way
The graph showed all tested points within the simplex method. The optima were at
(27.7°C, pH 4.0). The relevant results of these points can be found in table 4.3.
Table 4.2: Net obtained absorption for the first starting points
T (0C ) pH
Net obtained absorption [660nm]
32 4 0.2378 30 5.5 0.3300
29.7 3 0.2588 27.7 4.5 0.3710 28 7 0.1620
Optima

Chapter Four Results
109
Table 4.3: Results of simplex methods runs
Run
No.
Tempreture
°C pH
Net
Absorption
Yield %
Yx/s
1 27.7 4 0.4747 48
2 27.7 4.5 0.3716 38
3 29 4.5 0.3578 36.8
4 26.4 4 0.2738 28.2
5 27.7 3.5 0.3136 32.3
6 29 5 0.3180 32.7
7 29 4.3 0.2923 30.1
8 28.4 4.1 0.3032 31.2
9 29 4 0.2722 28.1
10 29 4.8 0.3700 38.1
11 27.7 3.8 0.3740 38.5
12 27 4 0.2770 28.5
13 27.3 4.2 0.2540 26.2
14 27.3 4 0.2960 30.5
15 27.7 4.2 0.3960 40.8
16 28.1 4 0.2800 28.9
17 30 5.5 0.3460 35.7
18 30 5.7 0.2600 26.8
19 30 5.3 0.3050 31.5
20 27.3 3.8 0.3117 32.1
21 27.3 3.6 0.2980 30.7
22 29.7 3 0.2588 26.7
23 28 7 0.1620 16.8
24 28.1 4.2 0.3760 38.7
25 28.1 4.4 0.3900 40.2
26 28.1 4.6 0.3100 32
27 27.7 3.6 0.3200 33
28 32 4.0 0.2584 26.7

Chapter Four Results
110
4.6.4.2. Dissolved oxygen optimization
The effect of oxygen on growth of Sacchromyces cerevisiae was studied by observing
the effect of dissolved oxygen on the obtained absorption. The gotten optima of temperature
and pH at 27.7°C and 4.0 respectively were held constant during Sacchromyces cerevisiae
cultivation on complex medium. In these set of experiments, the stirring speed and inlet flow
rate of air was held constant at 600rpm and 1.5 L/min respectively. The bioreactor working
volume was 750ml. The results can be shown in figure 4.44 and table 4.4. The best result was
obtained at 75% oxygen dissolved as 48.5% yield and 0.24h -1 µ were the highest.
0
0.1
0.2
0.3
0.4
0.5
00:00 03:00 06:00 09:00 12:00 15:00 18:00 21:00Process Time [ hh:mm ]
Obt
aine
d ne
t abs
orpt
ion
[660
nm]
30% o2 50% o2 70% o2 80% o2
93% o2 75% o2 65%o2
Fig. 4.44: Dissolved oxygen effect on net obtained absorption.
Growth curves of Sacchromyces cerevisiae cultivation on complex medium of
0.244g/L glucose concentration at different oxygen dissolved concentrations.
Other operating conditions were temperature of 27.7°C, stirring speed of 600rpm,
air flow rate of 1.5 L/min and pH of 4.0. The best result was obtained at 75% of
dissolved oxygen as the highest yield 48.5% and best µ at 0.24h-1 were achieved.

Chapter Four Results
111
Table 4.4: Results of Sc. cultivation at different oxygen dissolved percentages
O2% Absorption [660nm] Yield % (Y x/s)
30% 0.271 28
50% 0.32 33
65% 0.36 37
70% 0.44 45
75% 0.472 48.5
80% 0.42 43
93% 0.36 37
4.6.5 Date juice as substrate
Date juice was used as a substrate for single cell protein production. The obtained
optimum operating conditions, which are mentioned in section 4.7.5, such as (T=27.7°C,
pH=4, air flow rate= 1.5L/L.min and stirring speed of 600rpm) were applied. A complex
medium was blended with date juice as a growth substrate. Thus, Saccharomyces cerevisiae
was grown on date juice medium, which included different amount of supplements as shown
in table 4.5. These supplements are the same of the complex medium except glucose content.
Date juice was blended with different percentages of the whole complex medium constituents.
The whole complex medium means that it contains 100% of its constituents mentioned in
chapter 3 section 3.1.2. The results of obtained net absorption of cultivation Saccharomyces
cerevisiae on date juice medium, which includes a different amount of additives, can be
shown in figure 4.45.

Chapter Four Results
112
Table 4.5: Effect of adding different percentage of complex medium constituents to date
juice mediums on maximum obtained absorption and µmax during cultivation
Saccharomyces cerevisiae.
Medium Date juice Date juice Date juice Date juice Date juice
Percentage of
complex medium
[%]
0 10 10 20 91
Total Yeast
extract [g/L)]
0 0.025 0.25 0.35 0.227
Absorption max [ - ] 0.94 0.96 1.1 1.1 0.96
Process time
[hour]
33.5 31 30 27 18.5
Process time
reduction %
0 7.5 10.5 19.4 45
µ max [hr -1] 0.12 0.13 0.14 0.15 0.199
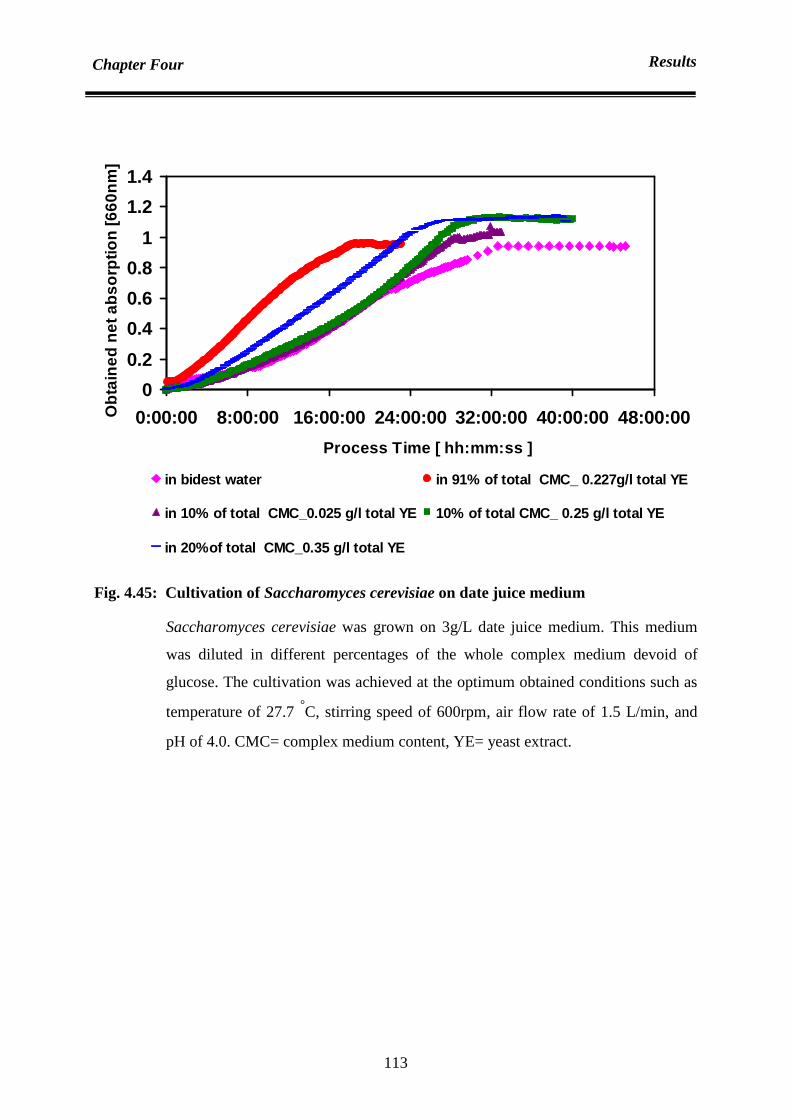
Chapter Four Results
113
0
0.2
0.4
0.6
0.8
1
1.2
1.4
0:00:00 8:00:00 16:00:00 24:00:00 32:00:00 40:00:00 48:00 :00
Process Time [ hh:mm:ss ]
Obt
aine
d ne
t abs
orpt
ion
[660
nm]
in bidest water in 91% of total CMC_ 0.227g/l total YE
in 10% of total CMC_0.025 g/l total YE 10% of total CMC_ 0.25 g/l total YE
in 20%of total CMC_0.35 g/l total YE
Fig. 4.45: Cultivation of Saccharomyces cerevisiae on date juice medium
Saccharomyces cerevisiae was grown on 3g/L date juice medium. This medium
was diluted in different percentages of the whole complex medium devoid of
glucose. The cultivation was achieved at the optimum obtained conditions such as
temperature of 27.7 °C, stirring speed of 600rpm, air flow rate of 1.5 L/min, and
pH of 4.0. CMC= complex medium content, YE= yeast extract.

Chapter Five Discussion
114
5.1 Analysis
5.1.1 Analysis of sugar content: qualification and quantification of sugar
contents in date juice
Date juice sugar identification
Figures 4.1a-c showed the chromatograms of date juice. The retention times of the
main obtained peaks such as (3.88, 3.905, 3.95, 3.90 and 5.33 minutes) were compared with
retention times of the individual standards of fructose (fig.4.2), D-glucose (fig.4.3) and
sucrose (fig.4.4). Since the retention times were great consistent, fructose, glucose and
sucrose were observed in date juice. Furthermore, these results revealed two peaks for each
six carbon sugar while one peak was observed for sucrose. Two new structural isomers, syn
and anti-form, are obtained by the oximation of reduced sugar while none reduced sugar,
disaccharide, has one form [Füzfai, Z. et al. 2008; Sanz, M. et al. 2003]. Moreover, the mass
spectrum of the individual peaks of date juice was similar to the spectra of the analyzed
standard sugars. In addition, characteristic fragments (m/z) were obtained. Thus, a base peak
was obtained at m/z 73. This fragment is a characteristic for silylation and results from the
cleavage of tri-methylsilan group (TMS). Furthermore, fragments at (m/z) (103, 117, 147,
160, 191, 205, 217, 291 and 319) were observed for fructose and glucose as shown in figures
4.6a-b, 4.7a-b, 4.8a-b and 4.9a-b. Others reported that these fragments are characteristic for
glucose and fructose [Shimasaki, C. et al. 1994; Dejongh, D. et al. 1968]. Additionally, a
characteristic fragment for sucrose at (m/z) 361 [Dejongh, D. et al. 1968] was presented at
each spectrum of this sugar as can be found in figures 4.10 and 4.11. The results determined
that glucose and fructose are the main sugars in date juice. They are approximately in equal
amounts while sucrose is a minor sugar. These results are in a good agreement with reported
results and the results of the enzymatic method as well [see next section of sugar
quantification in date juice].
In figure 4.1c, a minor peak at 5.3min was obtained. This peak potentially
demonstrates pyridine, since a similar peak was observed for the blank sample, pyridine, as
shown in figure 4.5. The spectrum of it was suggested, by the GCMS data base library, to be
pyridine. In figure 4.1a, small peak at 2.3min was observed. A similar peak was obtained
during an earlier analysis of date juice at another split ratio, 40. At this spilt ratio, standard
mannose peak was got at 4.25min [see figure a&b in appendix2]. GCMS database suggested
that this peak revealed glycine content in date juice. Moreover, date juice producing company
reported that date juice includes 1.3% protein.

Chapter Five Discussion
115
Quantification of sugar concentration in date juice
Enzymatic Kit -Assay
The results indicated that when the glucose concentration increased from (0.01g/L) to
(0.9g/L), the obtained net absorption at 340nm increased from 0.039 to 1.299 respectively.
The increment in absorption was because of the increasing in the amount of formed NADPH.
The formed NADPH has an absorption value at 340nm. Thus, formed NADPH is
stoichiometric with amount of D-glucose as mentioned in equation 3.4. Therefore, a
correlation between D-glucose and absorption was made. A calibration curve of absorption
against D-glucose concentrations was plotted as shown in figure 4.13. This curve was a
straight line which means that this curve can be used to determine sample’s glucose
concentration.
An enzymatic assay, K-SUFRG, according to Megazyme protocol, indicated that the
concentrations of glucose, fructose and sucrose in 1 gram date juice were 0.2737 g, 0.277g,
0.064g respectively. Therefore, the total invert sugar (glucose + fructose) was 0.5507g while
entire sugar content was 0.615g in 1g date juice. The sample’s glucose concentration was
calculated by comparing the obtained absorption of sample analysis with that of calibration
curve figure 4.13 by applying its linear equation 4.1. The ratio of fructose: glucose was 0.99.
However, this ratio was reported to be 1:1 [Al-Hooti, S. et al. 1997] or 1.03:1 [Al-Hooti, S. et
al. 2002]. That makes the results more reliable.
An additional hydrolyses step was made by ß-fructosidase in order to convert date
juice sucrose to D-glucose and D-fructose. The sucrose concentration was calculated from the
difference between the total sugar concentration after hydrolysis and the initial concentration
of glucose and fructose.
Measuring the change in pH of solution
Using deferential pH sensor device, CL10 device, to determine sugar content of date
juice gave a slightly different result from that obtained by applying K-SUFRG assay. Thus, 1
gram date juice contains 0.5275g total six carbon sugars (glucose + fructose) while it contains
0.068g sucrose. Thus, 0.600g was the whole sugar content in 1g date juice. These values were
obtained by using the prepared calibration curve figure 4.14. The change in pH of solution
was due to the liberated H+ during glucose phosphorylation reaction. This enzymatic reaction
converted the D-glucose to gluconate-6-phosphate while ATP converted to ADP. The
phosphorylation reaction is represented in equations 3.1 and 3.2. Since the date juice contains
Chapter Five Discussion
116
glucose and fructose, it was impossible to measure initial fructose concentration by using
CL10 device. That was because hexsokinase (HK) catalyses phosphorylation of D-glucose
and D-fructose simultaneously according to equations 3.3 & 3.5. Thus, the obtained change in
pH represented the total liberated H+ for both reactions. This amount can be correlated to
entire sugar content (glucose and fructose).
The slightly differences in results by applying both methods mentioned above can be
potentially caused by different applications of each device, e.g. spectrophotometer and
differential pH sensor. Such applications require varying steps. Dilution of samples, noise of
device and even small error in measuring, are the most potential factors that affect the
measurements, i.e. slightly difference measurement values. Moreover, the obtained values of
date juice sugars are in the range mentioned in table 2.3 (see section 2.7.3). Additionally,
slightly higher total sugar content (0.63g in 1g date juice) was determined by the company
which has produced the used date juice. The small difference in total sugar content cannot be
determined as the analysis method of the company is not known.
As a conclusion, both applied methods are in good agreement with the results given in
the above literatures and the results determined by the producing company.
5.2 Protein quantification
In figure 4.15, different absorption values were measured because the medium
contained colour substances e.g. red, green, and blue. Therefore, two absorption peaks at
470nm, 650nm and less absorbance at 595nm, which reference to those colours, were
obtained.
The results in figure 4.16 demonstrated that the absorbance peaks at 470nm and
650nm was disappeared by adding a small amount of BSA e.g. 51.3µg. In contrast, a new
peak at 595nm is formed due to the binding between Coomassie Brilliant Blue Dye-G250 and
protein. This behaviour gets along with equation 3.9 and the theory of changing of protein
state from cationic to an ionic which mentioned in section 3.4.5. The results indicated that all
kinds of liquids can be used in the assay. For sample analysis 0.9% NaCl solution was chosen
to give the same background of electro forces. The reason was that the samples will be
washed with 0.9%NaCl solution in order to omit any interfere effect caused by the cultivation
medium and to avoid cells disruption. Different BSA concentrations were used to prepare
calibration curve. The calibration curve was linear in the range of BSA concentrations up to

Chapter Five Discussion
117
30µg/ml. A correlation between BSA concentrations and absorption was made. A calibration
curve with linearity of 99.97% was obtained as shown in figure 4.17.
Applying disruption methods mentioned in section 3.4.5 revealed that those methods
were not sufficient. High-shear mechanical, ultrasonication, French press and yeast cell lysis
methods failed to remove yeast cell wall. However, beads method caused cell wall removal on
expensive of time and less protein yield. In contrast, using beads method and yeast cell lysis
method simultaneously gave high protein productivity and 100% cell wall removal after
45min [see appendix1].
5.3 Biomass
Biomass or cells mass (g/L) is an important parameter in single cell protein
production. In order to measure this parameter, one needs to make several consequent steps.
Sample has to be withdrawn, centrifuged, washed, dried and finally weighed. Measuring
biomass is not an easy matter and not devoid of error. A calibration curve between biomass
and absorption was made to overcome these difficulties. Absorption can be measured easier
and more accurate. Four different methods such as (freeze dryer, exsiccator, drying at 95°C
and 105°C) were used to get the best calibration curve. The results indicate that drying at
105°C was the best method. Drying at 95°C cannot dry the cells 100% because of the
saturation equilibrium. On the other hand, freeze and exsiccator were not effective methods as
there was water left in the cells. Figure 4.18 represents these results.
5.4 Cells number calibration curve and the necessity of sample diluting
Cells number counting during Saccharomyces cerevisiae growth consumes time on
one hand and has a risk of doing an error, on the other hand. For the same difficulties and
reasons mentioned in section 4.3, the absorption was chosen. Therefore, calibration curve
between absorption and cells number was made. This calibration curve is linear up to
absorption value of 0.8 for cultivation on YEPD medium while the linearity was up to
absorption value of 0.6 for cultivation on date juice medium as shown in figures 4.20 and
4.22. This linearity indicted the need for diluting samples above these critical values of
absorption as the relationship between cells number and absorption tends to be curvature as
shown in figures 4.19 and 4.21. Potentially, that was because of the cells size diversity in
samples. Such difference in cell sizes cause different light scatterings or reflections.

Chapter Five Discussion
118
That is suggested since all conditions of measurement were the same for each sample except
the turbidity, cell density. Thus, a deviation from linearity was obtained. Beer-Lambert law
suggests that the linearity is achieved when the fraction of the light absorbed by each layer of
solution is the same. In other words, every photon must have the same chance of absorption.
According to [Schmauder, H. et al. 1997, Mahesh, S. 2004; Swamy, P. 2009], absorption of
light passing through solution is related to the concentration. Moreover, the absorption
coefficient is constant for lower numbers of microorganisms, but decreases at higher cell
concentrations because of light scattering in the suspension. Therefore, the suspension must
be diluted. In addition, deviation from the Beer-Lambert law occurs due to the asymmetric
distribution of the molecules in the medium, association/ dissociation and other environmental
parameters.
5.5 Cultivation of Saccharomyces cerevisiae within incubator
5.5.1 Cultivation on YEPD medium (Crabtree Efeect and Maillard
Products)
In figure 4.23, growth of Saccharomyces cerevisiae on YEPD medium showed two
growth phases with a short lag phase between them. This growth represents diauxic behaviour
of growing on two substrates. First, Saccharomyces cerevisiae was growing only on glucose
as there were no other carbon sources in the medium. Since glucose concentration was too
high, ethanol was produced as a by-product. This growth was for 13 hours. Then
Saccharomyces cerevisiae started growing on the produced ethanol as a second substrate after
a short lag phase.
During this lag phase, Saccharomyces cerevisiae synthesize the necessary enzymes in
order to consume ethanol. The maximum growth rates were (µ1=0.20h-1 and µ2=0.03h-1) for
yeast growing in devoid of Maillard effect while the maximum growth rates were (µ1=0.207
h-1 and µ2=0.021h -1) for yeast cultivation in presence of the Maillard products. Thus, the
growth on ethanol was slower than on glucose as the relevant specific growth rate was lower
too. These results confirmed with the Crabtree effect phenomenon whereby an over saturation
of respiratory pathways. Therefore, the excess sugar does not pass through the main path but
will be sent to an alternative route of ethanol production [De Deken, R. 1966: Mchinnisj, F.
and Paigen, K. 1973; Branett, J. and Entain,K. 2005; Sonnleitner, B. and Kappeli, O. 1986].
Phenomena of Crabtree effect and diauxic behaviour is discussed in detail (please see section
5.7.1).
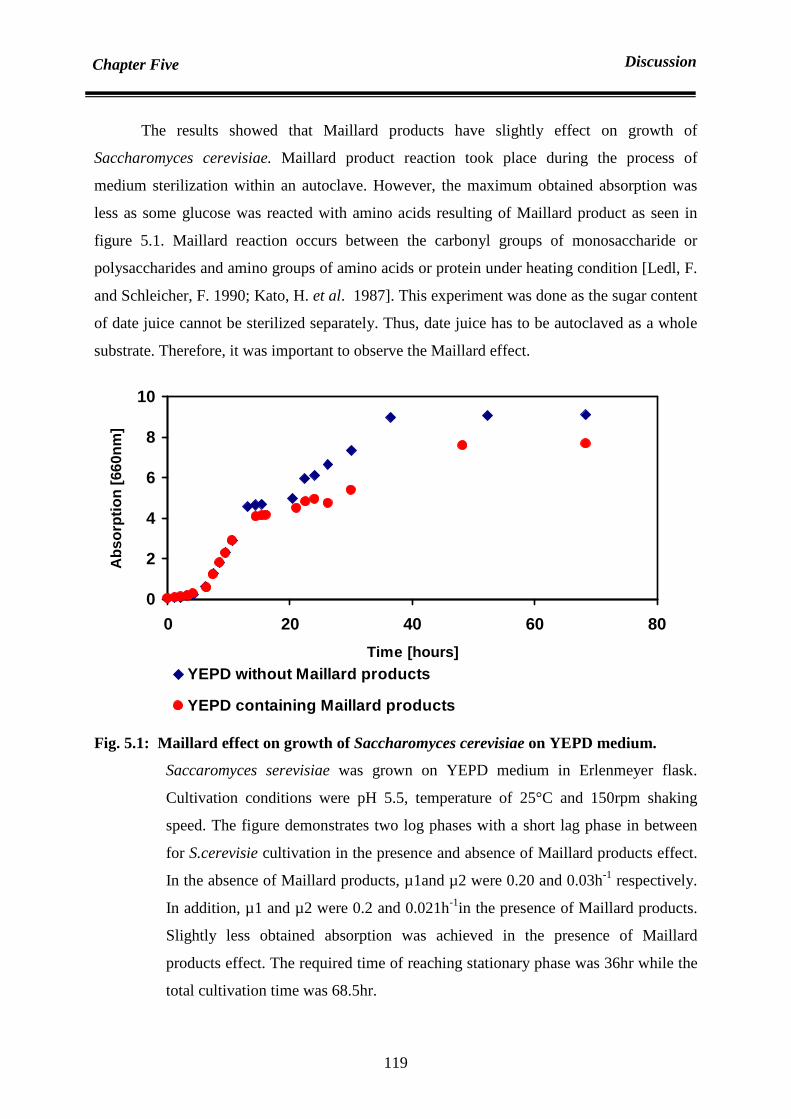
Chapter Five Discussion
119
The results showed that Maillard products have slightly effect on growth of
Saccharomyces cerevisiae. Maillard product reaction took place during the process of
medium sterilization within an autoclave. However, the maximum obtained absorption was
less as some glucose was reacted with amino acids resulting of Maillard product as seen in
figure 5.1. Maillard reaction occurs between the carbonyl groups of monosaccharide or
polysaccharides and amino groups of amino acids or protein under heating condition [Ledl, F.
and Schleicher, F. 1990; Kato, H. et al. 1987]. This experiment was done as the sugar content
of date juice cannot be sterilized separately. Thus, date juice has to be autoclaved as a whole
substrate. Therefore, it was important to observe the Maillard effect.
0
2
4
6
8
10
0 20 40 60 80
Time [hours]
Abs
orpt
ion
[660
nm]
YEPD without Maillard products
YEPD containing Maillard products
Fig. 5.1: Maillard effect on growth of Saccharomyces cerevisiae on YEPD medium.
Saccaromyces serevisiae was grown on YEPD medium in Erlenmeyer flask.
Cultivation conditions were pH 5.5, temperature of 25°C and 150rpm shaking
speed. The figure demonstrates two log phases with a short lag phase in between
for S.cerevisie cultivation in the presence and absence of Maillard products effect.
In the absence of Maillard products, µ1and µ2 were 0.20 and 0.03h-1 respectively.
In addition, µ1 and µ2 were 0.2 and 0.021h-1in the presence of Maillard products.
Slightly less obtained absorption was achieved in the presence of Maillard
products effect. The required time of reaching stationary phase was 36hr while the
total cultivation time was 68.5hr.

Chapter Five Discussion
120
5.5.2 Cultivation on date juice
These results of cultivating Saccharomyces cerevisiae on date juice medium with or
without additives can be found in figure 5.2 and table 4.1. The results demonstrated that date
juice can be used as a substrate without using additives. However, this will give less biomass
and on the expense of time. Adding yeast extract gave better results over the other additives
such as peptone as the obtained absorption was the highest value at 8.0.
A comparison between results of growing Saccharomyces cerevisiae on date juice
with those of cultivation Saccharomyces cerevisiae on YEPD growth medium was made.
Thus, the maximum growth rates for both cases were similar while highest obtained
absorption was less for cultivation on date juice medium. Highest obtained absorption and
maximum growth rate of cultivation Saccharomyces cerevisiae on YEPD were 9.0 and 0.20
respectively. However, growing of Saccharomyces cerevisiae on date juice has greatest
obtained absorption and maximum growth rate of 8.0 and 0.202 respectively as shown in
figure 5.3 and table 5.1.
It was reported that yeast extract includes amino acids, minerals and vitamins.
Additionally, it is uses as a source of nutrients in microbiological media [Vandakova, M. et al.
2004; Grant, C. and Pramer, D. 1962; Chae, H. et al. 2001]. Thus, yeast extract gave better
results than peptone. Moreover, that indicates date juice lacks from some essential amino
acids and vitamins, which are necessary for yeast growing. Therefore, date juice medium has
to be integrated with additives and supplements, in order to get higher absorption i.e. higher
biomass. Others reported that palm date contains many traces of vitamins and minerals. These
constituents are in traces and do not adequate for cultivation as shown in table 2.3. Such result
candidates date juice as a potential substrate for Saccharomyces cerevisiae cultivation.
Table 5.1: Comparison between maximum obtained absorption and µmax during
cultivation Saccharomyces cerevisiae in YEPD and date juice mediums
Medium YEPD Date Juice contains
1% Yeast extract
Absorption 9.0 8.0
µ(hr -1) 0.20 0.202

Chapter Five Discussion
121
0123456789
0 10 20 30 40 50 60 70Time [hours]
Abs
orpt
ion
[660
nm]
Date juice containing yeast extract
Date jice without additives
Date juice containing pepton
Date juice containing pepton and yeast extract
Fig. 5.2: Additives effect on growth of Saccharomyces cerevisiae on date juice medium.
S.serevisiae was grown on date juice medium in Erlenmeyer flask. Cultivation
conditions were pH 5.5, temperature of 25°C and 150rpm shaking speed. The
figure demonstrates the effect of adding additives such as peptone and yeast
extract to date juice medium on S.cerevisiae growth. Sugar concentration in date
juice was 22g/L while the concentration of yeast extract and peptone was 1% and
2% respectively.

Chapter Five Discussion
122
0
2
4
6
8
10
0 20 40 60 80
Time [hours]
Abs
orpt
ion
[660
nm]
YEPD
Date juice containing yeast extract [1g/100ml]
Fig. 5.3: Comparison between Saccharomyces cerevisiae growths on YEPD and date
juice medium.
Saccaromyces cerevisiae was grown on date juice and YEPD mediums in
Erlenmeyer flask. Cultivation conditions were pH 5.5, temperature of 25°C and
150rpm shaking speed. Yeast extract in concentration of 1% was added to date juice
medium. The figure revealed a slightly difference in result for both cases. Obtained
absorption and µ for S. cerevisiae grown on YEPD were 3.0 and 0.21h-1respectively.
However, µ for S. cerevisiae cultivation on date juice with yeast extract additive
were 2.8 and 0.17h-1respectively.

Chapter Five Discussion
123
5.6 Mathematical model results
A cybernetic mathematical model was developed from other previous models in order
to present biomass, glucose consumption and ethanol production during growth of
Saccharomyces cerevisiae. This model is based on hypothesis of a relation between enzyme
activity (vi) and enzyme synthesis (ui) with the rate ratio. Enzyme activity (vi) was assumed to
be effected by the ratio of metabolic rate to maximum growth rate. These assumptions take
over the need of the previous models for values assuming of enzyme activity (vi) and enzyme
synthesis (ui).Therefore, the model’s equations were devoid of enzyme’s term.
The proposed model was used in simulation of real experiments. The simulation
results satisfied with experimental results as shown in figures 5.4 and 5.5. The model can be
used in estimating growth of Saccharomyces cerevisiae for different glucose concentrations.
A developing for this model was made in order to meet the requirements of continuous mode
of cultivation.
Fig. 5.4: Simulation results of proposed mathematical model.
The figure represents result simulation achieved by proposed mathematical model
for Saccaromyces serevisiae cultivation on glucose limiting substrate medium.
S= glucose concentration (g/L), X= biomass (g/L), P= ethanol concentration (g/L).
302520151050
4.5
4
3.5
3
2.5
2
1.5
1
0.5
0
9
8
7
6
5
4
3
2
1
0
TIME
x, p s
p
x
s

Chapter Five Discussion
124
0123456789
10
0.00 5.00 10.00 15.00 20.00
Time [hours]
Con
cent
ratio
n [g
/ L]
Cell mass [g/L]
Glucose [g/L]
Ethanol [g/L]
Fig. 5.5: Results of cultivation Saccharomyces cerevisiae on glucose limiting
medium [ Kasper von Meyenburg 1969].
Saccaromyces serevisiae was grown on 9g/L glucose limiting substrate medium
within 10L bioreactor. Cultivation condition were pH 5.5, temperature at 30°C, air
flow rate at 1-2L/min.L and stirring speed at 750rpm.
5.7 Cultivation of Saccharomyces cerevisiae in bioreactor
5.7.1 Crabtree effect observation by measuring absorption in the absence
and presence of yeast extract in medium
In figures (4.25-4.28), absorption was used as indicator of Crabtree effect and to
observe the diauxic behaviour. By cultivation Saccharomyces cerevisiae on medium of
50mg/L glucose concentration, the absorption was increased exponentially from 0.2 to 0.26
within 4h. The absorption remains constant at this value until process time of 6h. Then the
absorption value started to decrease. That means Saccharomyces cerevisiae entered the
stationary phase and starting consuming storage carbohydrate or lipids as the glucose was
Chapter Five Discussion
125
depleted. A formation of by-product alcohol was not observed. The results show that
increasing glucose concentration from 50mg to 100mg per litre gave two growth phases,
diauxic behaviour. The initial log phase was faster and had a specific growth rate (µ1) of
0.14h-1 while the specific growth rate of the second log phase (µ2) was 0.026h-1. Thus first
growth was exponential with increasing value of absorption from 0.22 to 0.33 during the 4 h
process time. Then the rate of growth became slower but exponential too. The absorption
value increased from 0.33 to 0.35 until process time of five hours as demonstrated in figure
4.25. Increasing glucose contents above 100 mg/L up to 7g/L gave clearly observed diauxic
behaviour as shown in figures 4.26&4.27. Thus, the second growth rate referred to that
Saccharomyces cerevisiae starting consuming a second substrate after glucose depletion as
seen in figure 4.27. Since the medium contained only glucose as a carbon source, the second
substrate was suggested to be a by-product. Ethanol is the solely by-product during
Saccharomyces cerevisiae cultivation. This hypothesis was confirmed by others like
[Sonnleitner et al. 1986; Walker, G. 1998].They emphasized that Crabtree effect is due to a
saturation of limited respiratory capacity of yeast cells. Additionally, at high glucose
concentrations, Saccharomyces serevisiea produces ethanol aerobically rather than producing
biomass via the tricarboxylic acid [Branett, J. et al. 2005].
Moreover, in aerobic batch culture Saccharomyces cervisiae exhibits diauxic
behaviour when it is cultivated on medium contains only glucose as a carbon source [Von
Meyenburg, K. 1969]. Similarly, oxidation predominates and maximum biomass yield when
sugar concentration remains below 50-100mg/L [Serio, M. et al. 2001]. According to
[Furukawa, J. et al 1983], a concentration of glucose at 0.1 g/L is suggested to be the
maximum growth condition for cell growth.
Thus, glucose-sensitive (Crabtree-positive) yeast like Saccharomyces cerevisiae may
process a limited oxidative capacity when grown on glucose, which leads to an overflow
reaction at pyruvate. When the respiratory capacity is saturated, ethanol is formed. After all
carbohydrates had been consumed, Saccharomyces cerevisiae began to consume ethanol after
synthesising the necessary enzymes. Furthermore, these results showed the usefulness of
using absorption for observing Crabtree effect and diauxic behaviour. Using biomass doesn’t
help for such low glucose concentration (100 mg/L) as the obtained biomass for increasing in
absorption value from 0.34 to 0.37 will be the same. Therefore, plotting biomass values
against process time will give only one growth phase.

Chapter Five Discussion
126
Yeast extract was added to the medium in order to state its effect on diauxic growth
observation by using absorption. The results indicated that diauxic behaviour cannot be
observed clearly by absorption when yeast extract is used. Potentially, that was due to the fact
of growth accelerating, which is caused by yeast extract. Yeast extract contains minerals,
vitamins and amino acids, which are the essential nutrients source for growth [Vandakova, M.
et al. 2004; Grant, C. and Pramer, D. 1962; Chae, H et al. 2001]. Thus, the acceleration can be
observed from µ values. Consequently, the µ values were 0.165h-1 and 0.213h-1 for
Saccharomyces cerevisiae growth on 0.5g/L glucose complex medium without and with yeast
extract respectively. Therefore, the transition stage for growing Saccharomyces cerevisiae to
change from glucose to ethanol consumption, stage of synthesizing of necessary enzymes,
was shortened as shown in figure 4.28.
Observations of diauxic growth and Crabtree effect by absorption during growth of
Saccharomyces cerevisiae have many advantages over other methods. For instance,
measuring ethanol concentrations within long process time costs as much money. Principally,
diauxic behaviour can be determined by measuring biomass increment, glucose consumption,
ethanol production or by measuring the increase in absorption. Biomass determination doesn’t
help in diauxic growth observation for low glucose concentration medium. Both ethanol
measurement and biomass determination suffer from accuracy and difficulties as samples
have to be withdrawn, centrifuged and diluted (if necessary). In contrast, there is no need for
centrifugation step in measuring the absorption. However, most of the ethanol measurements
are executed by measuring the increase of absorption during an enzymatic reaction of
producing NADH. Therefore, it is better to use absorption value of sample in observing
diauxic growth instead of using a costly ethanol assay, which is executed by absorption too.
The results showed the diauxic behaviour through measuring of absorption. Diauxic
behaviour is an indicator of Crabtree effect. Diauxic behaviour was shown evidently for
glucose concentration above 50mg/L as shown in figures (4.25-4.27). These results satisfy
with other published results, which have used biomass, glucose and ethanol determination to
determine the diauxic behaiviour [Sonnleitner, B. and Kappeli, O. 1986; Kaspar von
Meyenburg, 1969]. The above results and the literature show clearly that highest yields can be
achieved when the diauxic behaviour is avoided.
Using absorption will reduce the cost of experiments. For instance, at least 15 samples
have to be analyzed during a 15 hours of process time experiment. Making triple samples for

Chapter Five Discussion
127
accuracy will lead to analyze 45 samples for ethanol determination per experiment. This is a
really costly method as ethanol measurement is an expensive enzymatic assay.
5.7.2 Effect of glutamine on biomass and growth of S. cerevisiae
The effect of glutamine on growing of Saccharomyces cerevisiae was studied. The
results indicated that there is no effect of glutamine on either biomass production or
maximum growth rate of growing Saccharomyces cerevisiae on complex medium. There was
no difference between obtained absorption and maximum growth rate in either presence or
absence of glutamine as shown in figure 4.29. That can be revealed clearly by considering the
pathway of glutamine. Glutamine serves as donors of the amino group in other amino acids.
Glutamine is absolutely required as a prominent precursor in several important pathways,
such as the synthesis of asparagine, tryptophane, histidine, arginine, carbamoyl phosphate,
CTP, AMP, GMP, glucosamine, and NAD. Yeast use amino acids as a nitrogen source and
can synthesize most of the amino acids necessary for building its protein [Newsholme, P.
2003; Feldmann, H. 2005].
5.7.3 Lag phase reduction
Lag phase, whereby a change in cell number is negligible, is affected by many factors
such as type and age of the microorganisms, the size of the inoculum and culture conditions.
If a small mount of the cells is inoculated into a large volume, they will have a long lag phase.
For large-scale operation of the cell culture, it is the objective to make this lag phase as short
as possible [Dutta, R. 2008; Walker, G. 1998].
Since the type and the age of Saccharomyces cerevisiae were the same during this
study, the results demonstrate the effect of inoculum’s size on lag phase. The results indicated
that increasing absorption (which is related to inoculum’s size) to 0.169 absorption unit have
reduced lag phase. Thus, a reduction of two hours was achieved. The maximum net obtained
absorption was slightly different for each inoculum’s size up to absorption of 0.65. However,
increasing inoculum’s size above absorption of 0.65 will reduce the net obtained absorption,
which means less obtained biomass as shown in figure 5.6. Therefore, these results indicated
that lag phase reduction saved energy, which was converted in biomass. Figures 4.30 and 4.31
represent these phenomena. That suggests a co-operative effect of the cells in ending lag
phase. Lower inoculum size resulted in an increased growth rate and relatively longer lag.

Chapter Five Discussion
128
Cultures of higher initial population density show shorter lag phases because more cells are
contributing to the extracellular pool of active substance and the critical concentration needed
for growth is attained more rapidly. The active substance has been thought to be carbon
dioxide, a range of low molecular weight metabolic intermediates, specific division-initiating
compound, ‘schizokinen ’, which acts as a specific chelator of ferric ions [Mian, F. et al.
1971; Pamment, N. and Hall, R. 1978].
0
0.1
0.2
0.3
0.4
0.5
0.6
0.7
0.8
0 0.2 0.4 0.6 0.8 1
Initial absorption value of culture[660nm]
Obt
aine
d ne
t abs
orpt
ion
[660
nm]
net obtained absorption
Fig. 5.6: Effect of increasing inoculum’s size on maximum obtained net absorption.
Saccharomyces cerevisiae was grown on 0.5g/L glucose complex medium at a
temperature of 29.5°C, pH of 5.2 and shaking speed of 120rpm. Different
inoculum’s sizes, in terms of initial culture absorption at 660nm, were used.
Maximum obtained net absorption increased directly with inoculum’s size up to
0.65 initial culture absorption. Beyond this point, the maximum obtained net
absorption decreased.

Chapter Five Discussion
129
5.7.4 Parameters optimization
5.7.4.1 Temperature and pH optimization by using simplex method
There are several methods that can be used in parameters optimization. One variable-
at-a time or factorial methods are often used in optimizing temperature and pH of growth
conditions. Many published results have concerned that temperature and pH are independent
of each other. The reason of applying the simplex method in this study is the idea of
interaction existence between these two parameters. Thus, one variable-at-a time doesn’t work
while a factorial method needs numerous of runs. This idea of simultaneously effect of
temperature and pH on growth of Saccharomyces cerevisiae was aimed to be proved. In order
to follow the growth curve, samples from growth culture were withdrawn and the absorptions
of samples were measured. The net obtained absorption was calculated in order to make good
comparison as the absorption can be converted in biomass by correlation calibration curve.
As there were two variables to be studied, the first simplex design was based on three
trails. In other words, running one more experiment than the number of variables to be
optimized. A geometric figure in a 3-dimensional space was made. Start points were chosen
randomly in order to cover a boundary of different range of pH and temperature. The start
points can be shown in figures 4.42a and 4.42b while the obtained net absorption of these
points can be found in table 4.2. From these results, the net obtained absorption at (T= 32 °C
and pH of 4) was the worse. According to simplex reflection move, which is discussed in
chapter 2(section 2.8.3.4), a new point of (T= 27.7 °C and pH of 4.5) was tested. The whole
simplex path way of this work can be shown in figure 4.43.
As the results of most experiments at different pH and temperatures had slightly
difference in the obtained absorption, the idea of simultaneous effect of temperature and pH
can be proved. Such results can be shown in table 4.3 for each group of runs, e.g.{(2,10,11,24
) , (4, 9, 12,16) , (7,14,21,19) , (3,17) , (5, 6, 26) , (13,18, 22 ,28 ) , (15,25 ) or (20,26) }. As
self-evident, pH of any solution changes when its temperature changes. Thus, such change in
pH can happen for the pH inside cells too. Potentially, any deviation in pH from the optimum
will stress the cells, causing more energy consumption and leading to low biomass. Therefore,
temperature and pH has a simultaneous effect on cell growth. The cell can regulate its internal
hydrogen ion concentration on the expense of the maintenance energy [Halasz, Anna 2000].
Moreover, the pH of the external medium potentially affects structure and permeability of cell
membrane.
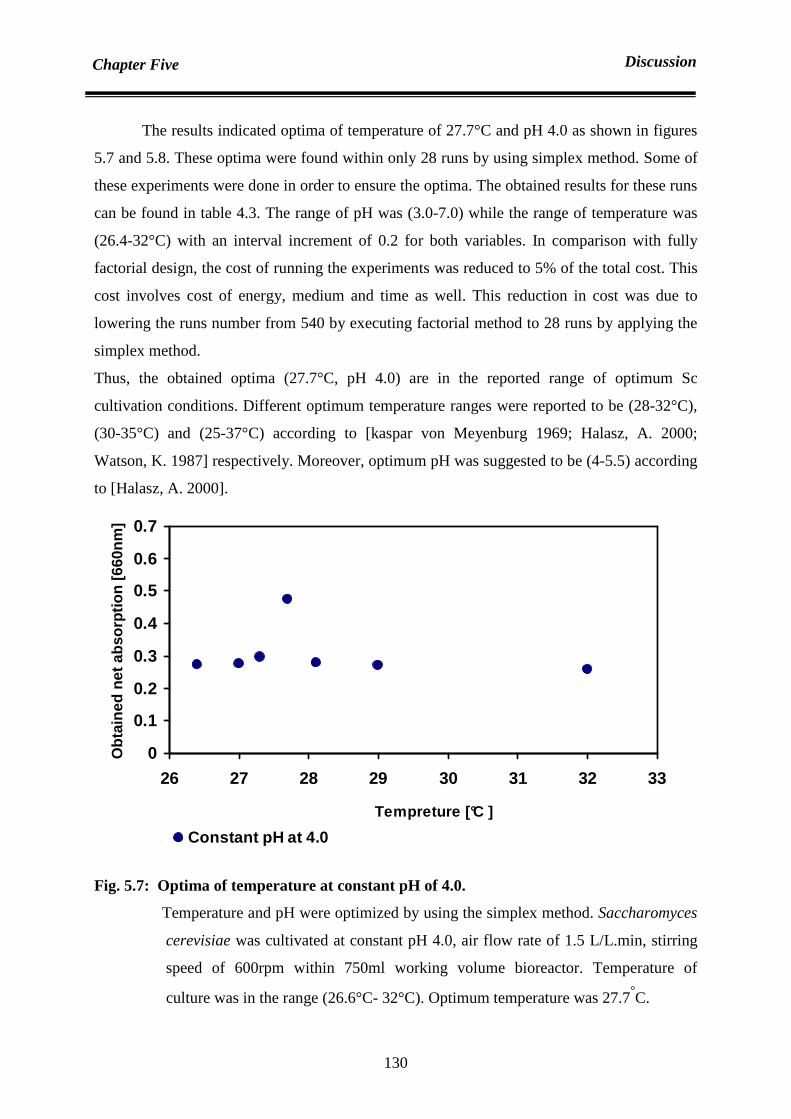
Chapter Five Discussion
130
The results indicated optima of temperature of 27.7°C and pH 4.0 as shown in figures
5.7 and 5.8. These optima were found within only 28 runs by using simplex method. Some of
these experiments were done in order to ensure the optima. The obtained results for these runs
can be found in table 4.3. The range of pH was (3.0-7.0) while the range of temperature was
(26.4-32°C) with an interval increment of 0.2 for both variables. In comparison with fully
factorial design, the cost of running the experiments was reduced to 5% of the total cost. This
cost involves cost of energy, medium and time as well. This reduction in cost was due to
lowering the runs number from 540 by executing factorial method to 28 runs by applying the
simplex method.
Thus, the obtained optima (27.7°C, pH 4.0) are in the reported range of optimum Sc
cultivation conditions. Different optimum temperature ranges were reported to be (28-32°C),
(30-35°C) and (25-37°C) according to [kaspar von Meyenburg 1969; Halasz, A. 2000;
Watson, K. 1987] respectively. Moreover, optimum pH was suggested to be (4-5.5) according
to [Halasz, A. 2000].
0
0.1
0.2
0.3
0.4
0.5
0.6
0.7
26 27 28 29 30 31 32 33
Tempreture [°C ]
Obt
aine
d ne
t abs
orpt
ion
[660
nm]
Constant pH at 4.0
Fig. 5.7: Optima of temperature at constant pH of 4.0.
Temperature and pH were optimized by using the simplex method. Saccharomyces
cerevisiae was cultivated at constant pH 4.0, air flow rate of 1.5 L/L.min, stirring
speed of 600rpm within 750ml working volume bioreactor. Temperature of
culture was in the range (26.6°C- 32°C). Optimum temperature was 27.7°C.

Chapter Five Discussion
131
0.2
0.25
0.3
0.35
0.4
0.45
0.5
0.55
0.6
3.4 3.6 3.8 4 4.2 4.4 4.6 4.8pH
Obt
aine
d ne
t abs
orpt
ion
[660
nm]
Constant temperature at 27.7°C
Fig. 5.8: Optima of pH at constant temperature 27.7°C.
Temperature and pH were optimized by using simplex method. Saccharomyces
cerevisiae was cultivated at constant temperature of 27.7°C, air flow rate of
1.5L/L.min, stirring speed of 600rpm within 750ml working volume bioreactor.
pH of culture was in the range (3.5-4.5). Optimum pH was 4.0.
5.7.4.2. Dissolved oxygen optimization
The significance of this study is to find the optima of required oxygen during yeast
cultivation. Many researches have been done in order to determine these optima by
optimizing either stirring speed or air flow rate. Therefore, an idea of making a simultaneous
effect was raised up. This idea gave the benefit of reduction of the number of required
experiments on one hand. On the other hand, it has given the flexibility of either control the
stirring speed or air flow rate for future research application. The simultaneously effect was
assumed to be presented by the dissolved oxygen content in the medium as the cells growth is
affected by oxygen content directly.
The change in dissolved oxygen content of the medium was controlled within a gas
controller. This controller utilized nitrogen to keep the percentage of oxygen content constant.
In addition to combination effect, the reasons of studying dissolved oxygen percentage instead
of making different air flow rate or different stirring speed are:

Chapter Five Discussion
132
1. Sacchromyces cerevisiae can grow at high stirring speed and at high aeration rate
where there is no medium floating or cell destruction.
2. Both the stirring speed and air flow rate affect the kLa value which means that one
needs to make factorial design experiments to study their simultaneous effect on
growth. However, that requires numerous experiments.
3. The growth of Sacchromyces cerevisiae is effected by dissolved oxygen content of a
medium and not by stirring speed or air flow rate.
The results indicated that the optimum dissolved oxygen percentage was 75%
saturation. At this percentage, higher biomass (in term of absorption) was obtained as shown
in figure 4.44. Similarly, greatest yield 48.5% was achieved as shown in table 4.4. In this
figure, the specific growth rate was 0.24h-1 at 75% dissolved oxygen. This value was the
highest since the obtained specific growth rates at other dissolved oxygen was about 0.2h-1.
Thus, before and after this optimum of oxygen content percentage, the obtained absorptions
were less. Before this percentage, oxygen content can be supposed not to be sufficient.
Therefore, oxidative pathway is not dominated. Similarly, above this percentage of dissolved
oxygen content, the biomass was decreased slightly as shown in figure 5.9 and possibly that
was because of an over oxidation. That agrees with following suggestions.
The carbon source and oxygen are required for an oxidative metabolic pattern. In SCP
fermentation processes, the oxygen concentration must be above a critical point, otherwise the
rate of oxygen consumption becomes dependent on oxygen concentration [Bailey, J. and
Ollis, D. 1986]. At high glucose containing medium, yeast will metabolise the sugar substrate
through oxido-reductive metabolism at a higher rate than that of the matching oxidative
pathway, even when oxygen is available above the critical point [Gancedo, C. and Serrano,
R.1989; Solomons, G. 1985]. In aerobic fermentation aeration and agitation should be
maintained above a critical value to give dissolved oxygen of 40% saturation. It was
suggested that dissolved oxygen values higher than critical do not cause an essential rise in
specific growth rate [Halasz, Anna 2000]. Moreover, [Oura, E. 1983] pointed out that biomass
yield was 52% at a high oxygen level while it decreased to 15% at a low dissolved oxygen.
Additionally, when exceeding a definite upper limit of pO2 in aeration gas, the cell physiology
is changed due to an overoxidation [Halasz, A. 2000].

Chapter Five Discussion
133
0
0.1
0.2
0.3
0.4
0.5
20 40 60 80 100
Dissolved Oxygen %
Obt
aine
d ne
t abs
orpt
ion
[660
nm]
Highest net absorption
Fig. 5.9: Dissolved oxygen effect on maximum obtained net absorption.
Optimization of temperature and pH was achieved by using simplex method.
Saccharomyces cerevisiae was grown on complex medium at constant temperature
of 27.7°C, pH 4.0, air flow rate of 1.5 L/L.min, stirring speed of 600rpm within
750ml working volume bioreactor. The cultivation was achieved on complex
medium at different dissolved oxygen percentage (30- 93%).
5.7.5 Date juice as substrate
The aim of doing this experiment was to determine whether date juice is suitable for
SCP production within a bioreactor. Acomplex medium was used as a source of additives by
blending date juice with it.
In figure 4.45 and in table 4.5 the results showed that the maximum obtained
absorption i.e. obtained biomass was slightly different for each experiment. However, process
time is the longest when additives were not used. Therefore, process time i.e. productivity was
indicated as the comprised parameter. For instance, Saccharomyces cerevisiae cultivation
process time on date juice diluted by bidest water was 33.5 hours. While, blending date juice

Chapter Five Discussion
134
in 10% and 91% of the whole complex medium decreased the cultivation process time to 31.5
and 18.5 hours respectively.
On the other hand, making total yeast extract content of 0.25 g/L, by adding yeast
extract to date juice medium diluted in 10% of the entire complex medium constituents,
decreased process time to 30 hours. Similarly, using date juice medium containing 20% of
whole complex medium constituents with a total amount of yeast extract of 0.35 g/L required
27 hours of process time. On other words, 20% process time reduction was achieved.
However, there is no sense to increase yeast extract in an amount which will be potentially
more than half of produced yeast biomass.
Thus, using defined additives, which are contained in the complex medium, gave
better results than adding yeast extract as the required process time was reduced dramatically.
Moreover, the process time reduction was 44%. Figure 4.45 demonstrates these results. In
addition, the maximum obtained biomass, for Saccharomyces cerevisiae cultivation on date
juice blended with 91% complex medium, was 0.86g. Therefore, the biomass yield per total
consumed sugar was 46.7%. Maintenance and growth of cells will consume the rest as fuel.
Furthermore, measuring the protein content indicated that 48.5% (w/w) of dry yeast biomass
is protein. Other reported that optimum biomass yield of yeast cultivation in perfect condition
is 45-50% [Smith, G. and Johnson, M. 1954; Oura, E. 1983; Waites, M. et al. 2001].
In summary, these results showed that date juice is a potential substrate for SCP
production. Nevertheless, date juice has to be blended with additives in order to get higher
biomass within a shorter time. In other words, date juice lacks to some essential vitamins,
minerals, and amino acids, which are necessary for Saccharomyces cerevisiae growth.
According to table 2.3, date juice contains many vitamins and elements. Therefore, running a
process of biomass production on high date juice concentration will increase them content in
date juice. Thus, that will decrease the required amount of additives.

Conclusion Conclusion
135
Chapter Six Conclusion
6. Conclusions
During single cell protein (SCP) production by using date juice as a substrate, many points
can be observed. These points can be summarized as below:
1. Using absorption as an indicator for cells number estimation requires diluting of
samples. The need for diluting the sample is because of non-linear relationship
between the absorption and cells number. Therefore, a calibration curve between cells
number and absorption was made until absorption value of 0.6. After this value,
absorption behaviour has tended to be curvature.
2. Date juice can be used as a potential substrate for single cell protein production. It is
not necessary to add additives to date juice medium. However, that will be on the
expense of time.
3. Absorption can be used to demonstrate the growth of Saccharomyces serevisiae
instead of biomass. It is complicated to determine biomass during yeast cultivation as
that includes several steps of withdrawing, centrifuging, washing of cells and drying.
Therefore, a calibration curve between absorption and biomass has to be prepared in
order to convert absorption values to biomass.
4. Absorption is a well measured value, by which one can compare the results. The
highest obtained absorption value, the highest biomass is.
5. Single cell protein production research doesn’t need to calculate cells number as the
crucial measured parameters will be either cells mass for biomass or protein content.
6. Calibration curves, especially for analysis, have to be used instead of using standard
protocols. Standard protocols were made according to provider’s instruments, which
can have different specifications from user’s instruments.
7. It was stated in the literatures that Maillard products should be avoided during cells
cultivation. Nevertheless, this effect of Maillard products does not play big role during
yeast cultivation. The results showed that the maximum obtained absorption was 7.6
in the presence of Maillard effect, while the maximum obtained absorption was 9.0 in
the absence of Maillard effect.
8. It is highly recommended from this work to make mathematical model for yeast
cultivation. The assumed mathematical model showed a good estimation for yeast
growth. This estimation can be used to develop an on-line estimation of cultivation
parameters.

Conclusion Conclusion
136
Chapter Six Conclusion
9. Crabtree effect was indicated in the previous literature by measuring glucose and
ethanol concentration through yeast growth. It is possible to indicate Crabtree effect
by using absorption. The results showed the diuxic behaviour through measuring of
absorption. Diuxic behaviour is an indicator of Crabtree effect. Diuxic behaviour was
shown clearly when the glucose concentration increased over 50mg/L. These results
satisfy with other published literatures, which have used glucose and ethanol
concentration in Crabtree effect determination.
10. Glutamine has no effect in biomass of produced yeast. The results showed the same
obtained absorption of 0.469 for both cases of absence and presence of glutamine in
the growth mediums.
11. Lag phase can be reduced by increasing inoculum’s size. Increasing inoculum’s size
until 0.169 absorption unit reduces lag phase directly. However, the increasing of
inoculum’s size has not to be more 0.652 because the maximum obtained biomass will
start to decrease.
12. Simplex method is a better technique over others in cultivation parameter
optimization. Especially, if there is an interaction between parameters. Applying this
technique in this work facilitated finding of optima of temperature and pH within few
experiments.
13. It is not necessary to study mixing and air flow rate as two parameters. One can study
the effect of KLa in terms of dissolved oxygen content in a medium. Optimizing
dissolved oxygen content to obtain maximum biomass gives flexibility either to
control mixing speed or amount of air flow rate.

Chapter One
137
Error Analysis Chapter Seven
7.1 Absorption measurements by regular method and by new developed online method
During this work, measuring absorption of sample by using the spectrophotometer was
suffering from some errors. The error came from pipetting, dilution, yeast settling. Therefore,
a new online measurement method was developed. This online technique gave a big error at
the first day of measurement. This deviation was happened because of air bubbles forming
inside cuvette, which was placed inside the spectrophotometer. Most of these bubbles were
remained at the wall of the cuvette and caused light reflection. In order to solve this problem,
a second cuvette was connected and placed before the measuring cuvette. This new cuvette
achieved trapping air bubbles and preventing forming any bubbles inside the measuring
cuvette. Furthermore, the continuous sample inside the measurement cuvette was uniform and
the measurements were satisfied. This development in measurements gave best results with
maximum standard deviation of 0.003 as shown in appendix 3.
7.2 Using delta pH device
Since this device was used to measure the change in pH during enzymatic sugar
phosphorylation, holding a constant temperature played a role. Putting the device inside an
incubator at a constant temperature made the results more accurate. In addition, the deviation
between measurements was reduced dramatically by adding 150µl used buffer at
99%measuring time. This gave extra washing to the device and did not interfere with the
measurement. Moreover during calibration curve preparation, standard glucose was dissolved
in the experiment medium in order to avoid the noise by giving the same medium electric
background.

138
References
1. Al-Abid, M. (online): Dates Derived Industries. Arab authority for agriculture
investment and development.www.aaaid.org/english/journal_issue2006.
2. Al-Abid, M. R. 2005. Dates Derived Industries: Technologies and Economics.
Ministry of Agriculture and Fisheries. Oman (in Arabic).
3. Al-Farsi, M. (2003):Clarification of date juice. International Journal of Food Science
and Technology. 38: 241–245.
4. Al-Hooti, S.; Sidhu, J.; Qabazard, H. (1997): Physicochemical characterstics of five
date fruit cultivars grown in the UAE. Plant Food for Human Nutrition. 50: 101-113.
5. Al-Hooti, S.; Sidhu, J.; Al-Saqer, J.; Al-Othman, A. (2002): Chemical composition
and quality of date syrup as affected by pectinase/ cellulose enzyme treatment. 79:
215-220.
6. Amoros, A.; Pretel, M.; Almansa, M.; Botella, M. ; Zapata, P.; Serrano, M. (2009):
Antioxidant and Nutritional Properties of Date Fruit from Elche Grove as Affected by
Maturation and Phenotypic Variability of Date Palm. Food Science and Technology
International. 15: 65-72.
7. Andreas Tauer; Sandra Elss; Matthias Frischmann et al(2004): Influence of Thermally
Processed Carbohydrate/Amino Acid Mixtures on the Fermentation by
Saccharomyces cerevisiae . J. Agric. Food Chem. 52 (7).pp 2042–2046.
8. Arora, D.;Mukerji,K.;Marth,E.(1991): Handbook of applied mycology: feed and food.
Vol3,p503.Marcel dekker, Inc. New York.
9. Bailey, J.; Ollis, D. (1986): Biochemical engineering fundamentals.2ndedn. Mac Graw
Hill.
10. Barnell, H.R. (1974): Biology and the food industry. Edward Arlond Ltd, London.
11. Basil S. (1979): Dates as a potential substrate for single cell protein production.
Enzyme and Microbial Technology. Volume 1, Issue 3, 180-182.
12. Basel, W. (1965): Chem. Eng., 72:147.
13. Belitz, H. D.; Grosh, W. ; Schieberle, P. (2004): Food Chemistry. Springer Verlag
Berlin Heidelberg, New York, USA.
14. Boehlke, K.; Friesen, J. (1975): Cellular content of ribonucleic acid and protein in
Saccharomyces cerevisiae as a function of exponential growth rate: calculation of the
apparent peptide chain elongation rate. J. Bacteriol. 121(2): 429-433
15. Branett, J.; Entain,K.(2005): Review a history research on yeast 9: regulation of sugar
metabolism. In Yeast. 22: 835-895.
139
References
16. Callihan, C. D. and Clemmer, J. E. (1979) Biomass from Cellulosic Materials.
Economic Microbiology. Vol. 4. p. 271. Academic Press, London
17. Carpenter, B.; Sweeny, H. (1965): Chem. Eng. 72:117.
18. Carmichael, W.; Stukenberg, M. (2006): Blue-Green Algae
(Cyanobacteria). Encyclopedia of Dietary Supplements. Informa Healthcare.
19. Castrillo, J.(1993) : Patterns of energy metabolism and growth kinetics of
Kluyveromyces marxianus in whey chemostat culture. Appl. Microbiol. Biotecnol. 40
(2-3), 386.
20. Chae, H.; Joo, H.; In, M. (2001): Utilization of brewer's yeast cells for the production
of food-grade yeast extract. Part 1: effects of different enzymatic treatment on solid
and protein recovery and flavour characteristics. Bioresource Technology. 76: 253-
258.
21. Chen, S. L. and Chinger, M. (1985) Production of Baker’s Yeast. In Comprehensive
Biotechnology. Vol. 3. p. 429, Pergamon, Oxford.
22. Ciferri,O.(1983):Spirulina, the Edible Microorganism. Microbiological
reviews.Vol47.pp. 551-578.
23. Cooney, C. (1986): Continuous culture: A tool for research, development and
production. In Perspectives in Biotechnology and Applied Microbiology (D. I. Alanl
and M. Moo-Young Eds.) p. 271. Elsevier Applied Science Publishers.London
24. Cooney, C.;Rha, C.; Tannenbaum, S.(1980): Single-Cell Protein: Engineering,
economics and utilization in foods. Adv. Food Res. 26, 1.
25. Cox, P.; Paul, G.; Thomas, C. (1998): Image analysis of the morphology of
filamentous micro-organisms. Microbiology. 144:817-827.
26. Dantigny, P. (1995): Modelling of the aerobic growth of Saccharomyces cerevisiae on
mixture of glucose and ethanol in continuous culture. Journal of Biotechnology.43:
213-220.
27. David Perlman, D.(1972) : Advances in applied microbiology. Academic press Inc.
New York.
28. Deb, K. (2005): Optimization for engineering: Algorithms and examples. Prentice-
Hall of India. New Delhi.
29. De Deken, R. H. (1966): The Crabtree Effect: a regulatory system in yeast. Journal of
General Microbiology. 44, 149-156.

140
References
30. Dejongh, D. C.; Radford, T.; Haribar, J.D.; Hanessian, S.; Bieber, M.; Dawson, G.;
Sweeley, C.C. (1969): Analysis of trimethylsilyl derivatives of carbohydrates by gas
chromatography and mass spectrometry. Journal of the American chemical society.
91, 7: 1728-1740.
31. De la Broise, D. and Durand, A. (1989): Osmotic, biomass and oxygen effects on the
growth rate of Fusarium oxysporum using a dissolved oxygen-controlled turbidostat.
Biotechnol. Bioeng. 33 (6), 699.
32. Dowson, V.H.W. (1962). Composition and ripening of dates. ln: Dates Handling,
Processing and Packing. F.A.O. publication (72). Rome.
33. Dunn, I.; Heinzle, J. et al.(2000): Biological reaction engineering: dynamic modelling
fundamentals with simulation examples. Wiley-Vch Verlag. Weinheim. Germany.
34. Dutta, R. (2008): Fundamentals of Biochemical Engineering. Springer Berlin.
35. El-Sohaimy S.; Hafez,E. (2010): Biochemical and nutritional characterizations of date
palm fruits. Journal of Applied Sciences Research. 6(8): 1060-1067.
36. Eykhoff, P. (1974): System Identification: Parameter and State Estimation. Wiley &
Sons.
37. Fabregas, J.; Herrero, C. (1985): Marine microalgae as a potential source of single cell
protein (SCP). Applied Microbiology and Biotechnology. 23 : 110-113
38. FAO. [Online]. FAOSTAT(2006). http://faostat.fao.org
39. Faust, U.; Präve, P. (1983): Biomass from Methane and Methanol. In Biotechnology.
Vol. 3, p. 83.
40. Feldmann, H. (2005): Yeast Molecular Biology (A Short Compendium on Basic
Features and Novel Aspects. Adolf-Butenandt-Institute. University of Munich.
Published online. http://biochemie.web.med.uni-muenchen.de/Yeast_Biol.
41. Ferranti, M.;Fiechter, A.(1983): Production and Feeding of Single Cell Protein.
Applied Science Publishers, London and New York.
42. Fiechter, A. (1975): Continuous cultivation of yeasts. In Methods in Cell Biology.
Vol. XI. (Yeast cells) (D. M. Prescott Ed.) pp. 97. Academic Press.
43. Fiechter, A.;Käppeli, O.; Meussdoerffer, F. (1987): Batch and continuous culture. In
The Yeasts 2ndedn. Vol. 2. pp. 99.Academic Press, London.
44. Fish, S.; Codd,G.(1993): Bioactive compound production by thermophilic and
thermotolerant cyanobacteria (blue-green algae).World Journal of Microbiology &
Biotechnology 10, 338-341

141
References
45. Forage, A. J. and Righelato, R. C. (1979) Biomass from Carbohydrates. Economic
Microbiology. Vol. 4 p. 289. Academic Press, London, New York.
46. Frederick H.,Walters et al.( 1991 ): Sequential Simplex Optimization. CRC Press
LLC. Sweden.
47. Fredrickson, A. G.; McGee, R. D., III; Tsuchiya, H.(1970): Mathematical Models in
Fermentation Processes. Adv. Appl. Microbiol. 23: pp 419.
48. Furukawa, K.; Heinzle, E.; Dunn, L. (1983): Influence of oxygen on the growth of
Saccharomyces cerevisiae in continous culture. Biotechnol. Bioeng. 25: 2293- 2317.
49. Füzfai, Z.; Boldizsar, I.; Molnar-Perl, I. (2008): Characteristic fragmentation patterns
of the trimethylsilyl and trimethylsilyl-oxime derivatives of various saccharides as
obtained by gas chromatography coupled to ion-trap mass spectrometry. Journal of
chromatography A. 1177:183-189.
50. Gancedo, C.; Serrano, R. (1989): Energy yielding metabolism. Vol.3.pp 205.
Academic press. New Yourk.
51. Grant, C.; Pramer, D. (1962): Minor element composition of yeast extract. J. Bacteriol.
869-870.
52. Hacking, A. (1986): Economic aspects in biotechnology. Cambridge University press.
Cambridge.
53. Halasz, Anna (2000): Use of yeast biomass in food production. CRC press. Inc.
Florida.
54. Harder, A.; Roels, J. (1982): Application of Simple Structured Models in
Bioengineering,. Adv. Biochem. Eng. 21:56-107.
55. James Monroe Jay;Martin J. Loessner; David A. Golden(2005): Modern food
microbiology. E-book. Springer Science+Business media.Inc.
56. Jarl, K. (1969): Symba yeast process. Food Technol. 23.pp1009.
57. Kalk, J.; Langlykke, A. (1986): Cost Estimation for Biotechnology Projects. In
Manual of Industrial Microbiology and Biotechnology.p. 363. American Society for
Microbiology. Washington.
58. Konopk, A.; Brock, B. (1978): Effect of Temperature on Blue-Green Algae
(Cyanobacteria) in Lake Mendota. Applied and environmental microbiology. Vol. 36,
No. 4. p. 572-576.
59. Jarl, K. (1969): Symba yeast process. Food Technol. 23, 1009

142
References
60. Kaspar von Meyenburg (1969): Katabolit-Repression und der Sprossungszyklus von
Saccharomyces serevisiae. Dissertation. No.4279. Edig.Techn. Hochschule. Zürich.
61. Kato, H.;Cho, R.;Okitani, A.;Hayase,A.(1987): Agrie. Biol. Chem. 51: 683-9.
62. Katsuhiro, T.; Mitsuo, M.; Hitoshi, I. (1998): Stress tolerance of pressure-shocked
Saccharomyces cerevisiae. Biotechnology Letters, Vol. 20, No 12.pp. 1167–1169.
63. Kee Woung Kim; Sun Bok Lee(2003): Inhibitory Effect of Maillard Reaction Products
on Growth of the Aerobic Marine Hyperthermophilic Archaeon Aeropyrum pernix.
Applied and enviromenntal microbiology.Vol.69 (7).pp.4325-4328.
64. Keshav Trehan(1990): Biotechnology. New age international Ltd.New Delhi.
65. Kompala, D.; Jones, K. (1999): Cybernetic model of the growth dynamics od
Saccharomyces cerevisiae in batch and continous cultures. Journal of Biotechnology.
71: 105–131
66. Ledl, F.; Schleicher, F.(1990): New aspects of the Maillard reaction in food and in the
human body. Angewandte Chemie International Edition in English.Vol.29: 565-594
67. Lee, J. (2002): Biochemical engineering. Prentice-Hall.
68. Leuenberger, H. (1971). Cultivation of Saccharomyces cerevisiae in continuous
culture. Arch. Mikrobiol. 79:176-186.
69. Luuzzana, M.; Dossi, G.; Mosca, A.; Granelli, A.; Berger, D.; Rovida, M.; Ripamonti,
M.; Musetti, A.; Rossi-Bernardi, L. (1983): Measurement of glucose in plasma by a
differential pH technique. Clinical Chemistry. 29: No.1: 80-85.
70. Mahesh, S. (2004): Biotechnology-3: Including Molecular Biology Biophysics. New
Age International (P) Limited, Publishers. New Delhi.
71. Mariaa; C.; Grassinia, D.;Vozzib, F.; Vinci, B.; Landic, A.; Ahluwaliaa, A.; Vozzia,
G. (2008): HEMET: Mathematical model of biochemical pathways for simulation and
prediction of HEpatocyte METabolism . Computer methods and programs in
biomedicine. 92:121–134.
72. Marx, J. (1989): A revolution in biotechnology. International council of scientific
union. Cambridge.
73. Matsumura, M.; Umemoto, K. (1982): Application of pure oxygen in a new gas
entraining fermentor. J. Ferment. Technol. 60 (6), 565.
74. Mian, F.; Prokop, A.; Fencl, Z. (1971): Growth and physiology of a yeast cultivated
in batch and continuous culture systems. Folia Microbiologica. 16:249-259.

143
References
75. Mchinnisj, F.; Paigen,K. (1973): Site of catabolite inhibition of carbohydrate
metabolism. Journal of Bacteriology .114, 885-887.
76. Mehaia, M.; Cheryan, M. (1991): Fermentation of date extracts to ethanol and vinegar
in batch and continuous membrane reactors Enzyme Microb. Technol.vol. 13.
77. Moebus, O. ;Teuber, M. (1983):General aspects of production of biomass by yeast
fermentation from whey and permeate. In Production and Feeding of Single Cell
Protein ( M. P. Ferranti and A. Fiechter Eds.) 153. Applied Science London.
78. Mohamed, M.; Ahmed, A. (1981): Libyan Date Syrup (Rub Al-Tamr). Journal of
Food Science. 46: 1162-1166.
79. Monalisa Tade AB: Provider of used date juice. Stockholm.Sweden.
80. Morgan, N.; Higton, G.; Rockey, J. (2001): Microbial biomass production. In
Industrial microbiology: an introduction. Blackwell Science Ltd. France.
81. Moulin, G., Malige, B. and Galzy, P. (1983): Production of yeast from whey. J. Dairy
Sci. 66 (1), 21.
82. Muller, L. (1969): Yeast products from whey. Process Biochem. 4:1, 21.
83. Murray Moo-Young (2004): single cell protein. Concise encyclopedia of bioresource
technology. P 293-305.
84. Myhara, R. M.; Karkalas, J.; Taylor, M. S. (1999): The composition of maturing
Omani dates. Sci. Food Agric. 79, 1345.
85. Nancib, A.; Nancib, N.; Fick, M.; Boudrant, J.; Mezaine, D.; Boubendir, A. (2005):
Join effect of nitrogen sources and B vitamin supplementation of date juice on lactic
acid production by Lactobacillus casei subsp. rhamnosus. Bioresource Technology.
96: 63-67.
86. Nail, A.; Gow, M.(1994): The growing fungus. Chapman and Hall. London.
87. Nelder, J.; Mead, R.(1965): A Simplex Method for Function Minimization. Comput J.
7:308.
88. Newsholme, P.; Procopio, J.; Lima, M.; Curi, R. (2003): Glutamine and glutamate—
their central role in cell metabolism and function. Cell biochemistry and function,Cell
Biochem Funct . 21: 1–9. Published online 1 November 2002 in Wiley InterScience
(www.interscience.wiley.com ). DOI: 10.1002/cbf.1003.
89. Nirupama, B.; Bhatnagar,R.; Viswanathan,L.(1981): Inhibition of glycolysis by
furfural in Saccharomyces cerevisiae. Applied microbiology and
biotechnology.Vol.11.No4.
144
References
90. Oura, E. (1983): Biomass from Carbohydrates. In Biotechnology. Vol. 3.pp. 3. Verlag
Chemie, Weinheim.
91. Pandey, A.(2004) : Concise encyclopedia of bioresource technology. Haworth
press.Binghamton.
92. Pamment, N.; Hall, R. (1978): Absence of External Causes of Lag in Saccharomyces
cerevisiae. Journal of General Microbiology, 105: 297-304.
93. Peppler, H. (1979) : Production of yeast and yeast products. In microbial Technology
2ndedn.Vol.1, pp 157. Academic press.New Yourk.
94. Porter, R. (1979): Microbial processes: promising technologies for developing
countries. National academy of sciences. Washington, D.C.
95. Postama, E. (1989): Enzymic Analysis of the Crabtree Effect in Glucose-Limited
Chemostat Cultures of Saccharomyces cerevisiae. Applied and environmental
microbiology.pp.468-477.
96. Ramkrishna, D.; Turner, B. (1987): Cybernetic modelling of bacterial Cultures at low
growth rates: Mixed-Substrate systems. Biotechnology and bioengineering. 32:46-54.
97. Rao, S. (2009): Engineering optimization: Theory and practice. John Wiley and
Sons.Inc. New Jersey.
98. Reed, R. H.; Warr, S. R. C. et al.(1985): Blue-green algae (cyanobacteria): prospects
and perspectives. Plant and soil. Vol.89: 97-106.
99. Ritzka, A.; Sosnitza, P., (1997): Fermentation monitoring and process control.
Curr.Opin. Biotechnol. 8 (2), 160.
100. Riviere, J. (1977): Industrial applications of microbiology. John Wiley and Sons,
New York, USA.
101. Riviere, J. (1977): Microbial proteins. In Industrial Applications of Microbiology.
Chap. 4, p. 105. Surrey University Press.
102. Rizzi, M.; Baltes, M. et al (1997): In vivo analysis of metabolic dynamics in
Saccharomyces cerevisiae: Mathematical model. Biotechnology and bioengineering.
Vol.55, No.4: 593-608.
103. Rose, A. (1979): Microbial Biomass. Economic Microbiology. Vol. 4 (A.H. Rose
Ed.) Academic Press. London.
104. Royce, P.; (1993): A discussion of recent developments in fermentation monitoring
and control from a practical perspective. Crit. Rev. Biotechnol. 13, 117.
145
References
105. Sanz, M.; Sanz, J.; Martinez-Castro, I.; Diez-Barrio, M. (2003): Gc behaviour of
disaccharide trimethylsilyl oximes. Jornal of chromatographic science. 41:205-208.
106. Serio, M.; Tesser, E.; Santacesaria, E. (2001):A kinetic and mass transfer model to
simulate the growth of baker’s yeast in industrial bioreactors. Chemical engineering
journal.82:247-354.
107. Serrano, R. et al. (2006): Signaling Alkaline pH Stress in the Yeast Saccharomyces
cerevisiae through the Wsc1 Cell Surface Sensor and the Slt2 MAPK Pathway. The
Journal of Biological chemistry. Vol. 281. No. 52, pp. 39785–39795.
108. Shafiei, M.; Karimi, K.; Taherzadeh, M.(2010): Palm Date Fibers: Analysis and
Enzymatic Hydrolysis. International Journal of Molecular Sciences. 11: 4285-4296.
109. Shimasaki, C.; Kanaki, T.; Zakeuchi, S.; Hasegawa, K.; Horita, D.; Tsukurimichi,
E.; Yoshimura, T. (1995): Pyrolysis and mass spectra of trimethylsilyl derivatives of
monosaccharides. Journal of thermal analysis. 44:855-867.
110. Schmauder, H.; Schweizer, M. (1997): Method in Biotechnology. Taylor& Francis
Ltd.UK.
111. Shubert, L. (1988): The use of Spirulina (Cyanophyceae) and Chlorella
(Chlorophyceae) as food sources for animals and humans. In: Progress in Phycological
Research. Vol. 6, p. 286. Round, F.E., Chapman, D.J. eds. Biopress Lts.
112. Sivasanker, B. (2002): Food processing and reservation. Prentice- Hall. New Delhi.
Solomons, G. (1983): Single cell protein. CRC Critical reviews in biotechnology.
1,21. CRC press. Boca Raton, USA.
113. Smith, G. and Johnson, M. (1954): Aeration requirements for the growth of aerobic
microorganisms. Journal of Bacteriology. 68: 346-350.
114. Smith, J. (2004): Biotechnology.Cambridge University press. Cambridge.
115. Solomons, G. (1985): Production of biomass by filamentous fungi. In
comprehensive biotechnology. Vol.3.pp 429. Pergamon. Oxford.
116. Sonnleitner, B.; Kappeli, O. (1986): Growth of Saccharomyces cerevisiae is
controlled by its limited respiratory capacity: formulation and verification of a
hypothesis. Biotechnol. Bioeng. 28:927-937.
117. Sonnleitner, B. (1996): New concepts for quantitative bioprocess research and
development. In Advances in Biochemical Engineering and Biotechnology (T. Sheper
Ed.) Vol. 54, p. 155. Springer-Verlag, Berlin.

146
References
118. Steels, E.; Learmonth , R; Watson ,K.(1994): Stress tolerance and membrane lipid
unsaturation in Saccharomyces cerevisiae grown aerobically or anaerobically.
Microbiology. 140: 569-576.
119. Steinkraus, K.(1986): Microbial biomass protein grown on edible substrates: the
indigenous fermented foods. In Microbial Biomass Protein (M. Moo-Young and K. F.
Gregory Eds.) Section I, p. 33. Elsevier Applied Science, London.
120. Swamy, P. (2009): Laboratory Manual on Biotechnology. Rakesh Kumar Rastogi
for Rastogi Publications. New Delhi.
121. Szwergold, B.; Kappler, F.; Brown, T. (1990): Science. 247, 451-4 (1990).
122. Thaysen, A. C. (1943): Value of microorganisms in nutrition (food yeast).Nature,
161, 406-408.
123. Trinci, A. (1992): Myco-protein: A twenty-year overnight success story. Mycol.
Res. 96 (1) 1.
124. Trinci,A.(1994): Evolution of the Quorn myco-protein fungus Fusarium
graminearum A3/5. Microbiology 140, 2181.
125. Umeda T.; Ichikawa, A. (1971): An approach to the optimal synthesis problem. Ind.
Eng. Chem. Process. 10: 229.
126. Usaid.(online):Inma Agribusiness Program: Iraq – A Strategy for Dates. Report can
be found at the web site of www.usaid.gov.
127. Vandakova, M.; Platkova, Z.; Antosova, M.; Bales, V.; Polakovie, M. (2004):
Optimization of cultivation conditions for production of fructosyltransferase by
Aureobasidium pullulans. Chem.Pap. 58(1): 15-22.
128. Vicente, A. et al. (1998): On-line estimation of biomass through pH control analysis
in aerobic yeast fermentation systems. Biotechnol. Bioeng. 58 (4), 445.
129. Waites, M.; Morgan, N.; Rockey, J. ; Higton, G. (2001):Industrial microbiology: an
introduction. Blackwell Science Ltd.USA
130. Waldron, C.; Lacroute, F.( 1975): Effect of growth rate on the amounts of ribosomal
and transfer ribonucleic acids in yeast.122(3):855-65
131. Walker, G. (1998): Yeast physiology and biotechnology. John Wiley and Sons Ltd.
Engeland Wiebe, M. G. (2002): Myco-protein from Fusarium venenatum: a well-
established product for human consumption. Appl Microbiol Biotechnol 58: 421-427.
132. Walker, J.; Rapley, R. (2000): Molecular biology and biotechnology. Chapter one
(fermentation technology). pp 7-24.Royal Society of chemistry. Cambridge.Uk.

147
References
133. Ward, P. (1992): Biomass production. In Fermentation Biotechnology. Chap.6.
pp.91. John Wiley & Sons, Chichester
134. Ward, P. (1998): Production of food. Patent No.US5739030
135. Waterman, M. (1995): Introduction to computational biology. Chapman Hall.
136. Webb, F. (1964): Biochemical Engineering. D. Van Nostrand Ltd. London.
137. White, J. (1954): Yeast Technology. Chapman & Hall, London.
138. Wijewickreme, A.; Kitts, D.; durance, T. (1997): Reaction conditions influence the
elementary composition and metal chelating affinity of nondialyzable model Maillard
reaction products. J. Agric. Food Chem.45:4577-4583.
139. Yoshimura,Y.; Injima,T. (1997): Antioxidative effect of Maillard reaction products
using glucose-glycine model system. J. Agric. Food Chem.45:4577-4583.
140. Zhang, X-C.; Visala, A. (1994): Functional state modelling and fuzzy control of fed-
batch aerobic baker’s yeast process. J. Biotechnol. 37, 1.
141. Zhang, Z.; Scharer, J.; Moo-young, M. (1997): Mathematical model for aerobic
culture of recombinant yeast. Bioprocess engineering.17:235-240.
148
Chapter One List of Figures
List of Figures
Page
Fig. 2.1: Role of dicarbonyl intermediates in oxidative and nonoxidative pathways of the Maillard reactions
23
Fig. 2.2: World wide production of date 25
Fig. 2.3: A two-factor response surface 30
Fig. 2.4: Theoretical or consultant’s approach 31
Fig. 2.5: The “shotgun” (or “stochastic” or “probabilistic”) approach 32
Fig. 2.6: Sequential single-factor-at-a-time optimization on a multifactor
surface
33
Fig. 2.7: Box-type evolutionary operation (EVOP) using a two level two-factor full factorial experimental design
34
Fig. 2.8: Summary of experiments for Box-type EVOP 35
Fig. 2.9: Simplex EVOP using a two-factor simplex experimental design 35
Fig. 2.10: Summary of experiments for simplex EVOP 36
Fig. 2.11: A two-factor simplex is represented as a triangle in a two-dimensional
plane
38
Fig. 2.12: Simplexes in (A) zero-dimensional, (B) one-dimensional, (C) two-
dimensional, and (D) three-dimensional factor spaces
39
Fig. 2.13: The simplex reflection move for (A) one-dimensional, (B) two-
dimensional, and (C) three-dimensional factor spaces. Dashed lines
represent the old simplex
41
Fig. 2.14: Multi simplex algorithm path 42
Fig. 2.15: Classifications introduced by A. G. Fredrickson for mathematical representations of cell populations
44
Fig. 2.16: structure of models for biotechnological processes
47
Fig. 2.17: Metabolic path way during aerobic cultivation of Saccharomycess
cerevisiae
49
Fig. 3.1: Enzymatic D-glucose phosphorylation reaction 58
Fig. 3.2: Schematic diagram of the Differential pH Analyzer System CL10 59
Fig. 3.3: Schematic diagram of the online measurement system 69
149
Chapter One List of Figures
List of Figures
Page
Fig. 4.1a: Whole date juice chromatogram for 7min measurement time 70
Fig. 4.1b: Part of date juice chromatogram at 3.8-4.1min retention time 71
Fig. 4.1c: Part of date juice chromatogram at 5.1-5.5min retention time 71
Fig. 4.2: Chromatogram of standard fructose 72
Fig. 4.3: Chromatogram of standard D-glucose 73
Fig. 4.4: Chromatogram of standard sucrose 74
Fig. 4.5: Chromatogram of blank sample (pyridine) 74
Fig. 4.6: Mass spectrum at retention time 3.88min:
Standard fructose(A); Date juice (B)
75
Fig. 4.7: Mass spectrum at retention time 3.905min:
Standard fructose(A); Date juice (B)
75
Fig. 4.8: Mass spectrum at retention time 3.95min:
Standard D-glucose(A); Date juice (B)
76
Fig. 4.9: Mass spectrum at retention time 3.99min:
Standard D-glucose(A); Date juice (B)
76
Fig. 4.10: Mass spectrum of standard sucrose at retention time 5.33min 77
Fig. 4.11: Mass spectrum of date juice sample at retention time 5.33min 77
Fig. 4.12: Mass spectrum of blank sample (pyridine) at retention time 5.3min 77
Fig. 4.13: Calibration curve for glucose concentration in (mM) 78
Fig. 4.14: Calibration curve for glucose concentration in (mM) 79
Fig. 4.15: Wave length scan of absorption of undiluted 200µl Coomassie dye 80
Fig. 4.16: Effect of adding BSA to absorption of Coomassie dye 81
Fig. 4.17: Coomassie blue calibration curve for BSA concentrations [µg/ml] 82
Fig. 4.18: Biomass calibration curve for yeast dry weight [mg/ml] 83
Fig. 4.19: Absorption at 660nm against Saccharomyces cerevisiae cell density 84
Fig. 4.20: Calibration curve for cell density [cells/ml] against absorption at
660nm
85
Fig. 4.21: Absorption at 660nm against Saccharomyces cerevisiae cell density
[cells/ml]
86

150
Chapter One List of Figures
List of Figures
Page
Fig. 4.22: Calibration curve for cell density [cells/ml] against absorption at
660nm
87
Fig. 4.23: Growth curve of cultivated Saccharomyces cerevisiae on YEPD
medium
89
Fig. 4.24: Calculating of maximum specific growth rate µmax 89
Fig. 4.25: Cultivation of S.cerevisiae on 0.05 and 0.1g/L glucose complex
mediums
91
Fig. 4.26: Cultivation of S. cerevisiae on 0.35 and 0.5g/L glucose complex
mediums
92
Fig. 4.27: Cultivation of S.cerevisie on 4 and 7g/L glucose complex mediums 93
Fig. 4.28: Effect of adding yeast extract on the observation of diauxic behaviour 94
Fig. 4.29: Effect of adding glutamine on the growth of Saccharomyces cerevisiae 95
Fig. 4.30: Effect of increasing inoculum’s size in lag phase reduction in semi log
graph
96
Fig. 4.31: Effect of increasing inoculum’s size in lag phase reduction in non log
graph
97
Fig. 4.32: Temperature and pH optimization. Constant growth temperature at
27.3°C
98
Fig. 4.33: Temperature and pH optimization. Constant growth temperature at
27.7°C
99
Fig. 4.34: Temperature and pH optimization. Constant growth temperature at
28.1°C
100
Fig. 4.35: Temperature and pH optimization. Constant growth temperature at
29°C
101
Fig. 4.36: Temperature and pH optimization. Constant growth temperature at
30°C
102
Fig. 4.37: Temperature and pH optimization. Different temperatures and pH
values
103
Fig. 4.38: Obtained net absorption at 27.3°C constant growth temperature 104
151
Chapter One List of Figures
List of Figures
Page
Fig. 4.39: Obtained net absorption at 28.1°C constant growth temperature 105
Fig. 4.40: Obtained net absorption at 29°C constant growth temperature 105
Fig. 4.41: Obtained net absorption at 30°C constant growth temperature 106
Fig. 4.42: First starting points within simplex path way reflection:
Obtained net absorption values of the first stating points and the new
Vertexes(A); Reflection points, New Vertexes (B)
107
Fig. 4.43: Simplex method path way 108
Fig. 4.44: Dissolved oxygen effect on net obtained absorption 110
Fig. 4.45: Cultivation of Saccharomyces cerevisiae on date juice medium 113
Fig. 5.1: Maillard effect on growth of Saccharomyces cerevisiae on YEPD
medium
119
Fig. 5.2: Additives effect on growth of Saccharomyces cerevisiae on date juice
medium
121
Fig. 5.3: Comparison between Saccharomyces cerevisiae growths on YEPD and
date juice medium
122
Fig. 5.4: Simulation results of proposed mathematical model 123
Fig. 5.5: Results of cultivation Saccharomyces cerevisiae on glucose limiting
medium
124
Fig. 5.6: Effect of increasing inoculum’s size on maximum obtained net
absorption
128
Fig. 5.7: Optima of temperature at constant pH of 4.0 130
Fig. 5.8: Optima of pH at constant temperature 27.7°C 131
Fig. 5.9: Dissolved oxygen effect on maximum obtained net absorption 133

Acknowledgment
152
List of Tables
List of Tables
Page
Table 2.1: Iraqi dates consumption 25
Table 2.2: Imported dates quantities by Europe market. 26
Table 2.3: Date palm/ syrup constituents ( [mg/100g] ) 28
Table 3.1: YEPD medium 51
Table 3.2: Complex growth medium 52
Table 3.3: Experimental units: equipments and devices 53
Table 4.1: Maximum obtained absorption and µmax during cultivation
Saccharomyces cerevisiae in different date juice mediums
90
Table 4.2: Net obtained absorption for the first starting points 108
Table 4.3: Results of simplex methods runs 109
Table 4.4: Results of Sc. cultivation at different oxygen dissolved percentages 111
Table 4.5: Effect of adding different percentage of complex medium
constituents to date juice mediums on maximum obtained
absorption and µmax during cultivation Saccharomyces cerevisiae.
112
Table 5.1: Comparison between maximum obtained absorption and µmax during
cultivation Saccharomyces cerevisiae in YEPD and date juice
mediums
120

153
Appendix 1: Yeast disruption time
The following photos showed the process time of yeast disruption by using a combined method of celllytic and beads. The yeast wall was removed completely after 45min as shown in photo 5.
Photo 1: Yeast sample before disruption time
Photo 2: Yeast sample after 5min disruption time
Appendix

154
Photo 3: Yeast sample after 15min disruption time
Photo 4: Yeast sample after 30min disruption time
Appendix

155
Photo 5: Yeast sample after 45min disruption time: Photo of 16 quadrates (A); part of 16 quadrates (B).
A
B
Appendix

156
Photo 6: Yeast sample after 55min disruption time
Appendix

157
Appendix 2: Chromatogram of standard mannose and date juice obtained at 40 split ratio
Standard mannose and date juice sugars were oximated by O-methyhydroxylamine-hydrochloride at 95°C for 45minutes. Then a silylation step was achieved by adding BSTFA at 90°C for 30minutes. For mannose, a peak was obtained at 4.25min retention time. Besides the spilt ratio, the operating conditions of the GCMS were the same [section 3.4.1]. However, the spilt ratio was 40 in this analysis. The relevant obtained chromatograms for standard mannose and date juice were as below:
2.5 5.0 7.5 10.0 12.5 15.0
1.0
2.0
3.0
4.0
5.0
6.0
(x10,000,000)TIC
Fig. A: Chromatogram of standard mannose.
2.5 5.0 7.5 10.0 12.5 15.0
1.0
2.0
3.0
4.0
5.0
(x10,000,000)TIC
Fig. B: Chromatogram of date juice.
Appendix

158
Appendix 3: Online measurement accuracy The measurements show maximum standard deviation 0.003. Each point is an average of five measurement points.
Standard deviation
00.050.1
0.150.2
0.250.3
0.350.4
0.45
0:00:00 5:00:00 10:00:00 15:00:00 20:00:00 25:00:00
PROCESS TIME [ hh:mm:ss]
Ob
tain
ed n
et a
bso
rptio
n [6
60n
m]
0
0.002
0.004
0.006
0.008
0.01
T 28.1°C_ pH 4.4
STDV


![Bedienungsanleitung JUICE BOOSTER 2€¦ · Benutzerhandbuch JUICE BOOSTER 2 [EL-JB2] Version 1.07 DE 1 Bedienungsanleitung JUICE BOOSTER 2 VORSICHT Handbuch lesen und aufbewahren!](https://static.fdokument.com/doc/165x107/605cab85ef4262182c30d9cf/bedienungsanleitung-juice-booster-2-benutzerhandbuch-juice-booster-2-el-jb2-version.jpg)