
SOCNET 2018 - Proceedings of the Second International ...
127
Schriften aus der Fakultät Wirtschaftsinformatik und Angewandte Informatik der Otto-Friedrich-Universität Bamberg 26 Kai Fischbach, Udo R. Krieger (eds.) SOCNET 2018 Proceedings of the „Second International Workshop on Modeling, Analysis, and Management of Social Networks and Their Applications“
Transcript of SOCNET 2018 - Proceedings of the Second International ...
Schriften aus der Fakultät Wirtschaftsinformatik und Angewandte Informatik der Otto-Friedrich-Universität Bamberg26
Kai Fischbach, Udo R. Krieger (eds.)
SOCNET 2018Proceedings of the „Second International Workshop on Modeling, Analysis, and Management of Social Networks and Their Applications“

Schriften aus der Fakultät Wirtschaftsinformatik und Angewandte Informatik der Otto-Friedrich-Universität Bamberg
26
Contributions of the Faculty Information Systems and Applied Computer Sciences of the Otto-Friedrich-University Bamberg

Schriften aus der Fakultät Wirtschaftsinformatik und Angewandte Informatik der Otto-Friedrich-Universität Bamberg
Band 26
2018
Contributions of the Faculty Information Systems and Applied Computer Sciences of the Otto-Friedrich-University Bamberg
Kai Fischbach, Udo R. Krieger (eds.)
2018
Proceedings of the “Second International Workshop on Modeling, Analysis, and Management of Social Networks and Their Applications“
SOCNET 2018
Dieses Werk ist als freie Onlineversion über den Hochschulschriften-Server (OPUS; http://www.opus-bayern.de/uni-bamberg/) der Universitätsbibliothek Bamberg er- reichbar. Kopien und Ausdrucke dürfen nur zum privaten und sonstigen eigenen Gebrauch angefertigt werden.
Herstellung und Druck: docupoint, MagdeburgUmschlaggestaltung: University of Bamberg Press, Larissa GüntherUmschlagbild: © Kathrin Eismann
© University of Bamberg Press Bamberg, 2018http://www.uni-bamberg.de/ubp/
ISSN: 1867-7401ISBN: 978-3-86309-545-1 (Druckausgabe) eISBN: 978-3-86309-546-8 (Online-Ausgabe) URN: urn:nbn:de:bvb:473-opus4-510266DOI: http://dx.doi.org/10.20378/irbo-51026
Bibliographische Information der Deutschen NationalbibliothekDie Deutsche Nationalbibliothek verzeichnet diese Publikation in der Deutschen Nationalbibliographie; detaillierte bibliographische Informationen sind im Internet über http://dnb.ddb.de/ abrufbar.
Contents
Organization III
Preface V
Tutorial 1
Network Analysis in Python - A Brief Introduction
Oliver Posegga . . . . . . . . . . . . . . . . . . . . . . . . . . . . . . 3
Invited Talk 7
From the Age of Emperors to the Age of Empathy
Peter A. Gloor . . . . . . . . . . . . . . . . . . . . . . . . . . . . . . 9
Reviewed Papers - SOCNET 2018 11
A Framework for the Analysis of the Impact of the Use of Social Media
by an Organization (FAIUSMO)
Patricia Gouws, Elmarie Kritzinger and Jan Mentz . . . . . . . . . . 13
Bringing Structure to Interfirm Interaction – The Influence Nested For-
mal Organizations on Knowledge Transfer Patterns in Interorga-
nizational Networks
Fabian Reck . . . . . . . . . . . . . . . . . . . . . . . . . . . . . . . 31
Preferential Attachment in Social Media - The Case of Nico Nico Douga
Johannes Putzke, Hideaki Takeda . . . . . . . . . . . . . . . . . . . . 45
Modelling Group Dynamics in Epidemic Opinion Propagation
Dieter Fiems . . . . . . . . . . . . . . . . . . . . . . . . . . . . . . . 55
Towards a DDC-based Topic Network Model of Wikipedia
Tolga Uslu, Alexander Mehler and Andreas Niekler . . . . . . . . . . 67

II International Workshop of MMB 2018
Using Social Network Analysis to Make Sense of Radio Communication
in Emergency Response
Kathrin Eismann, Diana Fischer, Oliver Posegga and Kai Fischbach . . 85
Analyzing the Missing Data of Online Travel Reviews Published in a
Large Virtual Travel Community
Lisa Hepp . . . . . . . . . . . . . . . . . . . . . . . . . . . . . . . . 103
Author Index 113
Organization
Organizing Committee
General Chairs
Kai Fischbach University of Bamberg, Germany
Udo R. Krieger University of Bamberg, Germany
Local Arrangement Co-Chairs
Cornelia Schecher University of Bamberg, Germany
Marcel Großmann University of Bamberg, Germany
Technical Program Committee
Jana Diesner University of Illinois at Urbana-Champaign, USA
Kai Fischbach University of Bamberg, Germany
Peter A. Gloor Sloan School of Management, MIT, USA
Roger Häußling RWTH Aaachen, Germany
Udo R. Krieger University of Bamberg, Germany
Alexander Mehler Goethe-Universität Frankfurt am Main, Germany
Oliver Posegga University of Bamberg, Germany
Christian Stegbauer Goethe-Universität Frankfurt am Main, Germany
Katharina A. Zweig TU Kaiserslautern, Germany

IV International Workshop of MMB 2018
Additional Reviewers
Dieter Fiems Ghent University, Belgium
Diana Fischer University of Bamberg, Germany
Lisa Hepp University of Bamberg, Germany
Preface
In recent years, social networks have produced significant on-line applications
running on top of a modern Internet infrastructure. The associated information
exchange patterns that are caused by the underlying massive human interactions
constitute a major driver of the fast growing Internet traffic observed in the last
decade.
Generally speaking, a social network denotes the social structures emerging
from interactions of human actors among each other and within their organiza-
tions. The modeling, analysis, control, and management of complex social net-
works represent an important area of interdisciplinary research in an advanced
digitalized world. Over the years, scholars in the fields of anthropology, sociology,
psychology, economics, and organizational theory have proposed different meth-
ods to reveal the underlying structures of these complex networks, to analyze their
functioning and to determine the associated network outcomes. For this reason
the practical application of social network analysis constitutes an important and
rapidly growing scientific domain in our interconnected information societies.
The related scientific concepts incorporate a variety of sophisticated techniques
stemming from diverse areas such as computer science, control theory, graph
theory, simulation, visualization, and statistics, among others.
To cover related research issues in the vibrant field of social networks, “The Sec-
ond International Workshop on Modeling, Analysis and Management of Social
Networks and Their Applications” (SOCNET 2018) was organized in cooperation
with representatives of Deutsche Gesellschaft für Netzwerkforschung (German
Association for Network Research, DGNet) and the organizing committee of the
19th International GI/ITG Conference on “Measurement, Modelling and Evalu-
ation of Computing Systems” (MMB 2018). It toke place at Friedrich-Alexander-
Universität Erlangen-Nürnberg, Germany, on February 28, 2018. The workshop
VI International Workshop of MMB 2018
was co-located with MMB 2018 that was held during February 26–28, 2018.
SOCNET 2018 was an interdisciplinary, international event where authors from
Belgium, Japan, South Africa, and Germany presented their new scientific results.
After a careful review process the international program committee of SOCNET
2018 finally selected eight regular papers from different fields such as informa-
tion systems, business administration, computational social science, and com-
puter science. These papers covered important aspects of the modeling, the anal-
ysis, and the application of social networks. The topics ranged from theoretical
oriented studies focusing on the structural inference of topic networks, the mod-
eling of group dynamics, and the analysis of emergency response networks to the
application areas of social networks such as social media used in organizations or
social network applications and their impact on modern information society.
Apart of these contributed papers, the scientific program included the invited
talk “From the Age of Emperors to the Age of Empathy” by Dr. Peter A. Gloor,
Center for Collective Intelligence, Massachusetts Institute of Technology, USA.
The program was complemented by a tutorial “Network Analysis in Python - A
Brief Introduction” offered by Dr. Oliver Posegga, University of Bamberg.
The program of SOCNET 2018 fulfilled its initial objective to reveal the rich
methodological, technical, socio-economic and psychological aspects of social net-
work analysis. As conference chairs, we thank all authors for their submitted pa-
pers and all the speakers, in particular the invited speaker, for their vivid presen-
tations and lively discussions.
We are grateful for the support of all members of the program committee and
thank all external reviewers for their dedicated service and the timely provision of
their reviews.
We express our gratitude to Friedrich-Alexander-Universität Erlangen-Nürnberg
as host of the workshop and the local organizing committees of SOCNET 2018 and
MMB 2018 for their great efforts. We thank Technology Alliance Oberfranken
(TAO) regarding its endorsement. We also acknowledge the support of the Easy-
Chair conference system and express our gratitude to its management team.

SOCNET 2018, February 28, 2018 VII
We are indebted to University of Bamberg Press for an unceasing support of
our publication effort. In particular, we are thankful to Mr. M. Großmann who
prepared the proceedings by his powerful editorial tools.
Finally, we hope that the Proceedings of SOCNET 2018 will strongly stimulate
the readers’ future research on monitoring, modeling, and analysis of social net-
works and encourage their development efforts regarding social network applica-
tions of the next generation.
February 2018
Kai Fischbach
Udo R. Krieger


Tutorial

Network Analysis in Python
A Brief Introduction
Oliver Posegga
University of Bamberg,An der Weberei 5, 96047 Bamberg, Germany
http://www.uni-bamberg.de/sna/
Abstract. This tutorial provides an entry-level introduction to social net-
work analysis using Python and NetworkX. We discuss Python as a
platform for network analysis and provide a systematic overview on the
available libraries that elevate Python to a powerful toolbox for network
research. Further, we introduce the fundamental concepts of network
analysis and visualization, which we illustrate with practical examples
based on a freely available dataset that we analyze with the software in-
troduced in the beginning of the tutorial.
Goals
The goal of this tutorial is to provide a brief but comprehensive introduction to so-
cial network analysis using Python. After attending the tutorial, participants will
be familiar with the basic concepts of network analysis, know how to analyze net-
works from a multi-level multi-theory perspective, understand the fundamentals
of the Python ecosystem and know how to quickly setup their own Python environ-
ment. Further, they will be able to model, analyze, and visualize simple networks
from freely available datasets using contemporary Python libraries.
Requirements
This course is designed to be an entry-level tutorial for individuals interested in
social network analysis and serves as a starting point and overview on the topic.
Participants are not required to be familiar with social network analysis and related
software in general. Previous knowledge, however, will be beneficial to understand
the topics of the tutorial. Participants who are already familiar with social network
SOCNET 2018, February 28, 2018 3
analysis and Python are not the primary target audience of the tutorial, but might
be interested in some of the advanced topics (e.g. interactive network visualization
using Python and d3.js [2]), which are briefly discussed and demonstrated as an
outlook at the end of the tutorial.
Structure and Content
The tutorial covers threemajor topics, i.e. (1) the Python ecosystem, including net-
work analysis and visualization libraries, (2) the fundamentals of network analy-
sis, and (3) the fundamentals of network visualization. The contents discussed for
each topic are briefly outlined in the following.
. Python and Social Network Analysis
There are multiple readily available software solutions that come with many of
the different methods and techniques falling into the domain of social network
analysis, some of which have been around for decades (e.g. UCINET [8], Pajek
[7], Gephi [4]). Recently, however, Python and the ecosystem evolving around it
have gained popularity in the network community. As a programming language,
Python is known for its intuitive syntax, readability, extensibility, versatility, cross-
platform availability, high degree of customizability, and the large community that
has emerged from it. As a platform for social network analysis, it primarily benefits
from the extensive number of libraries and extensions contributed by this commu-
nity, which elevate Python from a simple programming language to a flexible and
powerful ecosystem with a wide range of scientific applications.
Over the course of the tutorial, we provide a brief overview of the various libraries
that are necessary to use Python for social network analysis. For this tutorial, we
use a freely available Python distribution, i.e. Anaconda [1], which provides a com-
prehensive scientific Python environment, including Jupyter [5], a web-based, in-
teractive development environment, formerly known as iPython.
We briefly discuss the scientific Python environment and its setup, before we
demonstrate how Anaconda [1] can be used in conjunction with Docker [3] to pro-
vide a flexible cross-platform environment for network analysis. Further, we pro-
vide an overview of themost commonly used network analysis libraries for Python
and continue the tutorial with a practical introduction to the NetworkX [6] library
using practical examples based on a freely available dataset.
4 International Workshop of MMB 2018
. The Fundamentals of Social Network Analysis
We discuss the basic concepts of network analysis using the previously introduced
dataset based on simple analyses conducted with NetworkX [6]. Over the course of
this introduction, we follow an exploratory analysis pattern [9], which comprises
the following steps: Definition of nodes and edges, manipulation of the network,
computation of network measures, visualization of the network.
In the definition step, we discuss the implicit and explicit assumptions that have
to be made when modeling network structures from different types of network
data.With regard to themanipulation step, we explain several approaches to query-
ing andmanipulating network structures usingNetworkX [6]. After covering those
steps, we proceed with the introduction of well-known network measures along a
multi-level multi-theory framework [10], which systematically captures different
units of analysis, ranging from the level of individual actors to the network level.
Finally, we cover the visualization of networks in general, and in Python in partic-
ular, in a dedicated section of this tutorial.
. The Fundamentals of Network Visualization
One of the profound strengths of network analysis lies within the beauty and in-
tuitive nature of network visualizations. While it has become deceptively easy to
visualize networks using tools like Gephi [4], which provide easy access to a variety
of sophisticated layout algorithms and a plethora of useful visualization features,
creating meaningful visualizations requires a systematic understanding of their
building blocks.
We briefly discuss those building blocks and provide an overview of the most
common layout algorithms used in practice. Using the dataset analyzed in the first
part of this tutorial, we demonstrate how to create simple network visualizations
using NetworkX [6].
The last part of this tutorial is dedicated to the discussion of the interactive vi-
sualization of networks. We demonstrate two approaches to create such visual-
izations: The first approach is based on exporting network data from Python and
importing them into Gephi [4]. The second approach utilizes the d3.js [2] frame-
work in conjunction with Python and NetworkX [6].
SOCNET 2018, February 28, 2018 5
References
1. Anaconda. https://anaconda.org/2. d3js. https://d3js.org/3. Docker. https://www.docker.com/4. Gephi. https://gephi.org/5. Jupyter. http://jupyter.org/6. Networkx. https://networkx.github.io/7. Pajek. http://mrvar.fdv.uni-lj.si/pajek/8. Ucinet. https://sites.google.com/site/ucinetsoftware/home/9. De Nooy, W., Mrvar, A., Batagelj, V.: Exploratory social network analysis with Pajek,vol. 27. Cambridge University Press (2011)
10. Monge, P.R., Contractor, N.S.: Theories of communication networks. Oxford Uni-versity Press, USA (2003)
6 International Workshop of MMB 2018

Invited Talk

From the Age of Emperors to the Age of Empathy
Peter A. Gloor
Massachusetts Institute of TechnologyCenter for Collective Intelligence
5 Cambridge CenterCambridge, MA 02138, USA
[email protected]://cci.mit.edu/pgloor
Abstract
The age of imperial CEOs residing in the corner office is over, Mark Zuckerberg
shares the same open office space with the rest of his Facebook employees. Today’s
Millennials do not want to be led by emperors high on testosterone and authority,
but by leaders high on empathy and compassion.
This talk is based on my new books “SwarmLeadership” and “Sociometrics” .
“SwarmLeadership” introduces a framework based on “social quantum physics”,
which explains how all living beings are connected through empathy in entan-
glement, and learning. To track empathy, entanglement, and learning we have
developed “seven honest signals of collaboration” which can be used to measure
empathy, entanglement, and learning on any level, from the global level on social
media, inside the organization with e-mail, down to face-to-face entanglement us-
ing the body sensors of smartwatches. The talk will present themain concepts and
the underlying algorithms andmodels, documenting them by numerous industry
examples from our own work.
Key words:
Social quantum physics, Entanglement, Empathy, Learning, Collaborative Inno-
vation Networks.
SOCNET 2018, February 28, 2018 9

References:
1. Gloor, P.: Swarm Leadership and the Collective Mind: Using Collaborative In-
novation Networks to Build a Better Business. Emerald Publishing, London,
2017
2. Gloor, P.: Sociometrics and Human Relationships: Analyzing Social Networks
to Manage Brands, Predict Trends, and Improve Organizational Performance.
Emerald Publishing, London 2017
Curriculum Vitae
Peter A. Gloor is a Research Scientist at the Center for Collective Intelligence at
MIT’s Sloan School of Management where he leads a project exploring Collabo-
rative Innovation Networks. He is also Founder and Chief Creative Officer of soft-
ware company galaxyadvisors, a Honorary Professor at University of Cologne, a
lecturer at AaltoUniversity inHelsinki, DistinguishedVisiting Professor at P. Uni-
versidadCatólica deChile, and aHonorary Professor at JilinUniversity, Changchun,
China. Earlier he was a partner with Deloitte and PwC, and a manager at UBS. He
got his Ph.D in computer science from the University of Zurich and was a Post-
Doc at the MIT Lab for Computer Science working on WWW-like systems before
the Web existed.
He is currently focusing on quantum social physics, predicting social behavior
from electronic communication patterns and trying to model collective conscious-
ness and competitive collaboration.
10 International Workshop of MMB 2018

Reviewed Papers
SOCNET 2018

6 Framework for the 6nalysis of the Impact of the Use of
Social Media by an Organization (F6IUSMO)
Patricia Gouws, Elmarie Kritzinger, and Jan Mentz
School of Computing, College of Science, Engineering and Technology,University of South Africa
6bstract. This paper presents a proposed framework for the analysis of
the impact of the use of social media by an organization (FAIUSMO).
A design science research (DSR) approach was used to create aware-
ness of the research problem, propose a solution, create and evaluate
the research artefact (FAIUSMO), and to communicate the first itera-
tion of the framework. The theoretical framework is proposed from the
synthesis of extant literature using dimensional data modelling. The
internal (organization), external (virtual community) and strategic (so-
cial media strategy) perspectives describe the analysis of the impact of
the use. The measures of the use are the identified strategic social me-
dia metrics. The FAIUSMO framework comprises four stages, namely:
process and scope, attribute perspectives (internal, external and strate-
gic), measurement data and processing, and analysis and presentation.
The frameworkmay be used to transform socialmediametrics to strate-
gic insights and social intelligence. The evaluation of the framework is
ongoing.
Key words: organizational social media, social media strategy, virtual
community
Introduction
Social media (SM) refers to a collection of web-enabled applications, used to com-
municate, to collaborate, and to create user-generated content [1]. Examples of
current SM applications include: Facebook, Twitter, Instagram and YouTube. The
background to the research problem is considered in terms of the impact of the
use of SM and the analysis of use of SM by an organization.
SOCNET 2018, February 28, 2018 13
The identified research problem is a lack of a comprehensive and integrated ap-
proach to the analysis of the impact of the use of SMby an organization. This paper
reports on the design, creation and evaluation of a comprehensive and integrated
framework to address the identified research problem.
. 7ackground to Problem
SM is a universal focus of the societal communications [2]. Organizations use SM
for communication. However, SM has changed the ways in which communities
and organizations communicate and interact [3]. The use of SM applications al-
lows for the creation, sharing and exchange of information [1].
SM research is considered in terms of theories, constructs and conceptual frame-
works [3]. The need for research pertaining to the impact of the use of organiza-
tional SM is identified [4]. However, there is a need for conceptual instruments to
guide the approach and structure of SM knowledge [2]. The nature of SM data as
big data from diverse subject matter domains is a focus of the research framework
[2].
The review [3] presents groups of theories used in the formulation of conceptual
frameworks within SM research, namely personal behaviours, social behaviours
andmass communication. From the theories identified, a causal-chain framework
of social media research on the adoption and use of SM is formulated, the at-
tributes of which include [3]: inputs (e.g. social factors),mediators (e.g. platform at-
tributes), moderators (e.g. user characteristics) and outcomes (e.g. organizational
context). Thus, research considers a wider spectrum thanmerely quantitativemea-
surement [5].
From the review presented, research gaps and opportunities were identified [3].
The focus on personal use suggests a gap in the study of SM adoption from an or-
ganization perspective. Organizational use of SM for daily operational and strate-
gic use is limited [3]. It is recommended that the impact of the use of SM be in-
vestigated. The contribution of the impact of the use of SM on the organizational
strategic performance is questioned. From the review [3], four areas for future SM
research are identified, namely: the organizational orientation in the use of SM,
the social power, the cultural diversity of the use of SM, and the impact of the use of
SM. However, balance should be maintained to mitigate the negative impacts (e.g.
14 International Workshop of MMB 2018
distraction, reduced productivity, lack of data control), and infrastructure should
be deployed to manage data [3].
The use of SM creates both positive (communication, collaboration) and nega-
tive (security, risk) effects [3], and thus requires tracking to identify problems and
discover solutions timeously. A better understanding of the use of SM may lead
to an appreciation of the impact of the use of SM [3]. Thus, to understand the use
of SM, some form of measurement of the use of SM is required.
The first gap identified is the analysis of the impact of the use of SM. The sec-
ond gap identified is the analysis of use of SM by an organization. The problem
considered by this research is the analysis of the impact of the use of SM by an
organization. The proposed artefact is a comprehensive framework for a compre-
hensive and integrated approach to the analysis of the impact of the use of SM by
an organization.
. Organization of Paper
This paper presents an introduction (Section 1) and an overview of researchmethod-
ology (Section 2), relevant literature (Section 3), and creation of artefact (Section
4). This paper concludes with recommendations for future research (Section 5 and
6).
Research Methodology
Design science research (DSR) in information systems (IS) research is considered
a collection of techniques for the design and creation of artefacts to address a prob-
lem [6]. The first step of DSR is the awareness of the problem. In this research, a
review of the extant literature leads to the definition of the problem.
The second step of the DSR approach is the proposal of the design criteria for a
solution to address the problem. The Step 1 and Step 2 of the DSR approach are
presented in Section 3.
The third step of the DSR approach is the design and creation of the research
artefact, as a solution to address the problem. In this research, the framework
FAIUSMO is proposed. The Step 3 of the DSR approach is presented in Section
4.
The fourth step is an evaluation of the utility of the research artefact, to deter-
mine the extent to which the artefact addresses the problem, as well as the evalua-
SOCNET 2018, February 28, 2018 15
tion of the design criteria specified. The Step 4 of the DSR approach is introduced
in Section 5.
To address the need of iteration in the DSR approach, it is envisaged that future
research may include multiple iterations of evaluation of utility and quality, where
feedback from an evaluation may be used for the improvement of the FAIUSMO
framework. The final step in the DSR approach requires the communication of
the contribution of the research. Future research opportunities are also recom-
mended.
Literature Overview
SM is the collective name for a number of SM applications. The purpose of use by
an organization will determine the collection of SM applications that may be used
by the organization. Each of the SM applications may be classified according to
purpose. The definition and classification [1] of SM is evolving. Generic guidelines
for the use of SM [1,5,7] are presented in the literature.
To present an awareness of the research problem, the literature is considered in
terms of aspects of the analysis of the impact of the use of SM by an organization.
These aspects include the measurement of the use of SM (Section 3.1). From the
measurement options considered, the internal (organization) (Section 3.2), the ex-
ternal (virtual community) (Section 3.3) and strategic (SM strategy) (Section 3.4)
perspectives are identified. For the strategic perspective, the identification of strate-
gic metrics is required to evaluate the SM strategy.
To ensure that the use of SM is aligned to organizational strategies, SM data
needs to be integrated with organization data (Section 3.5). This leads to the aware-
ness of the identified research problem, namely: the lack of a comprehensive and
integrated approach to the analysis of the impact of the use of SM by an organiza-
tion.
. Measurement of Impact of Use of SM
To analyze the impact of the use of SM, some form of measurement is required.
The measurement of the use of SM is imperative to ensure success [8]. The con-
tribution of SM may be considered in terms of the relevant metrics and methods
[9]. Approaches to SM measurement include an iterative measurement process
[8], a step-by-step SM measurement approach [10], an evaluation framework [11],
16 International Workshop of MMB 2018
and a performance measurement system [9]. This confirms the observation that
an over-arching approach to SM measurement, and thus also analysis, is lacking
[9].
A five-phase SM measurement process includes [8]:
– Concept Phase: During this phase, the goals, objectives and key performance
indicators aligned with objectives are identified. Targets or performance bench-
marks of success are recommended.
– Definition Phase: The social strategy is detailed in terms of indicators that
quantify the reach, the discussion and the outcome.
– Design Phase: The tactics to achieve the SM goals are defined. The data col-
lection methods are identified. Examples of types of SM data sources include:
enterprise listening platforms, text mining partners, platform API tools and
site analytic solutions.
– Deployment Phase: During the phase, data is collected from the SM applica-
tions that are used. The data must be quality assured, validated and aggregated
for meaningful analysis.
– Optimization Phase: The data is analyzed and insights are reported.
However, the use of SM requires long term commitment [8]. Whilst the pro-
posed planning includes the identification of strategic goals, the stakeholders and
the needs of the stakeholders, these aspects are not detailed in the planning of the
use of SM.
To provide more detail, an eight-step SMmeasurement process and a valid met-
rics framework are provided, albeit specifically for the public relations industry
[10]. An Eight-Step SM Measurement Process includes [10]:
– Identification of the strategic goals.
– Prioritization of the stakeholders (internal and external to the organization).
– Identification of the objectives that are aligned to the goals.
– Link key performance indicators (as quantifiable measurements that may be
used to assess strategic success) to objectives.
– Selection of SM applications (tools) and benchmarks.
– Analysis of results with reference to the SM effort and activities.
– Presentation of results.
– Iterative measurement and improvement.
SOCNET 2018, February 28, 2018 17
Despite the increased level of detail presented in the literature, the eight-step ap-
proach has a public relations and marketing focus. Although the stakeholders are
considered in the planning, the attributes of the stakeholders are not included in
the analysis or in the presentation of the results. A more generic focus is required.
An evaluation framework to assess the impact and value of the use of SM is
developed [11]. The evaluation is considered from an internal and external per-
spective and includes the strategic objectives of the organization. The key perfor-
mance indicators (KPIs) are, however, not linked to specific metrics of specific SM
applications.
Performance measurement systems for the measurement of SM is considered
in terms ofmetrics andmethods of measurement [9] and themeasurementmodel
required [12]. Information derived from the large volumes of SM data may con-
tribute to the organizational decision-making processes [12]. Phases in which the
SM information may be used include: planning, performance and action for im-
provement [12]. However, there exists a lack of a comprehensive and integrated
approach to the analysis of the impact of the organizational use of SM.
Themetrics are defined as the indicators that are used to quantify an entity, thus
the SM and related activities [9]. The methods are defined as the approaches used
to calculate the metrics, including the retrieval, collection and storage of the SM
data [9]. This is required to quantify the contribution or impact of use of the SM,
specifically by an organization.
The performance measurement system addresses the data collection and anal-
ysis [9]. Approaches to data collection include: default data collection (e.g. Google
Analytics), manual data collection (e.g. number of likes) and automated data col-
lection (e.g. web-crawling). Approaches to the analysis of SM data include content
and sentiment analysis [9]. Both data collection and data analysis approaches need
to be taken into account during the planning of the measurement of SM.
The planning for the use and measurement of SM considers the internal, ex-
ternal and strategic perspectives of the use of SM. The five-phase process [8], the
eight-step approach [10] and the evaluation framework [11] include the following
aspects in the planning for the use and measurement of the impact of the use of
SM: internal (Section 3.2), external (Section 3.3) and strategic (Section 3.4) per-
spectives.
18 International Workshop of MMB 2018
. Internal Perspective – The Organization
This refers to the organization that uses the SM. Organization SM (OSM) is pre-
sented in the literature [13]. The users within an organization are considered the
internal environmental perspective of use. An organization may use SM to com-
municate internally within the organization and externally to the virtual commu-
nity. SM applications may be used by an organization to enhance the services of
government, includingmarketing, customer care relations and health care [16,17].
SM is used in organisations for specific functions (in order of priority), including
branding, information sharing, public relations, understanding customers, gener-
ation of leads, work collaboration, communication (internal) and support for sales
[18].
A more strategic approach to the use of SM would promote and support the use
of SM by the organization. Factors that could encourage SM use include allocated
budgets and guidelines for the use of SM [19]. Factors to encourage rather than
hinder the use of SM by an organization should be considered. However the anal-
ysis of use of SM by an organization tends to be challenged also by a focus on
personal and individual use rather than an aggregated organizational level of use
[13].
The organization social media (OSM) refers to actors, artefacts and activities,
highlighting the need for more aggregated, organization focused analysis of the
use of SM [13]. The organization type may influence the organizational actors in
the artefacts (SM applications) used. Although organizational use of SM is consid-
ered a domain of IS researchwhere limited research is available, empirical analysis
of the use of SM with an organization may impact the use of SM and address one
or more of the challenges identified in the use of SM by the organization.
. External Perspective - The Virtual 8ommunity
This refers to the users of the SM that are stakeholders in the use of SM, albeit
external to the organization. These users are considered members of the organi-
zation’s virtual community. The virtual community (VC) is external to the orga-
nization. The members of the VC are also stakeholder in the planning of the use
of SM. A VC may be described in terms of VC attributes that include a VC typol-
ogy [14], a life-cycle stage of a VC [20], or the VC type [21]. These VC attributes
may provide dimensions for comparative and deeper analysis of measures of the
SOCNET 2018, February 28, 2018 19
impact of the use of SM. The identified research gap is that the VC attributes of
SM use, although described in the literature, should be included in the analysis
of SM metrics. There is also the option of the comparative analysis of perceived
(theoretical) and actual (empirical) community demographics.
. Strategic Perspective - SM Strategy
Planning prior to the definition of a SM strategy is required. To ensure that the
goals are achieved, required SM tactics are addressed in SM activities. These SM
activities focus on content, community, resources, and support (e.g. skills, equip-
ment, and governance). The recommended strategic objectives may include: to
inspire adoption, to build community and to engage community. A SM strategy
should be aligned to the organizational strategy [27].
A SM strategy ensures that the use of the SM is not merely ad hoc, but that an
integrated use of these SM applications addresses the purpose of use as well as the
strategic goals and objectives of the organization. A SM strategy must be defined
for a given SM perspective, and quantified using strategic targets and benchmarks
of use of SM applications. Each SM application generates its own specific format
application data stream and metrics. However, the integration of these metrics is
required to ensure that synergy of the defined SM strategy. Thus, the on-going
measure and evaluation of the use of SM in terms of identified strategic metrics
must be aligned within the SM strategy.
The limited availability of a comprehensive SM strategy that uses the integrated
SM data to evaluate the strategy against targets is considered a gap. The organi-
zations need to be guided in the formulation of a SM strategy from generic goals
that can be customized according to the specifics of the application.
The SM strategy should also be aligned to the organizational or business strategy
through generic business goals aligned to SM activities [15], and key performance
indicators need to be linked to generic metrics [22].
. 9ata and 9ata Processing Required for 6nalysis of Impact of Use
To address the need for the analysis of the impact of the use of SM by an organiza-
tion, the SM data needs to be integrated with the organizational business data. To
this end, a procedure is required to ensure that intelligence may be derived from
SM data. The synthesis of accessible business intelligence (the process in which
20 International Workshop of MMB 2018
information is derived from organizational data) and SM data is investigated [23].
According to [23], the value of the SM data is attributed to the fact that the users
generate the data. He continues that organizations pursue information to discover
trends that may influence organizational performance [23]. The intention of the
analysis of the SM data, is to go beyond analysis. The focus is the social business
intelligence. Social business intelligence systems are defined as systems that are
developed to derive information from SM data to support decision making [23].
Although business information systems derived the information from internal
business (organizational) data, cognizance is given to the external SM data that
may be included in the business intelligence process.
A procedure was developed to collect, process and analyze SM data for business
intelligence [23]. SM is considered a new data domain, a novel source of useful
data [24]. The integration of SM data frommultiple SM applications is required to
support the comprehensive and integrated analysis of the impact of the use of SM
by an organization.
Organizational or enterprise data is stored in the enterprise data warehouse, and
this data is traditionally analyzed using the technique of online analytical process-
ing (OLAP). However, the enterprise data warehouse may be extended to accom-
modate SM data. Thus, OLAP may also be extended for the analysis of SM data.
Although OLAP technology is considered under-exploited for the analysis of SM
data and is thus under-represented in SM research [24], extensions to data ware-
houses and online analytical processing (OLAP) technology allow for analysis of
emerging novel data domains [24]. The extensions include [24]: a five-layer data
warehouse architecture, reinforcement of OLAP for the analysis of SM data, and
a three-layer Social Business Intelligence (SBI) framework integrates the use of
business intelligence with the analytics of SM. Social OLAP is defined as the use
of OLAP for the multi-dimensional analysis of SM and business data [24].
The external SM data needs to be imported and stored in the organization’s in-
ternal data structures, i.e. the enterprise data warehouse [24]. This allows for the
analysis of the SM data integrated with the business data. The data warehouse that
uses conformed dimensions will ensure that the analysis of impact of the use is
within the defined internal, external and strategic perspectives and aligned to the
organizational data. Thus, the gap is a comprehensive and integrated approach to
the identification and transformation of the externally generated SM data. Within
SOCNET 2018, February 28, 2018 21
the warehouse, this SM data will be integrated with the organizational data to en-
sure that social business intelligence may be gleaned [24].
. Summary of Literature Overview
The following are identified as design criteria for an artefact to address the prob-
lem: process and scope of purpose, perspectives, and the data (SM metrics) pro-
cessing, analysis and presentation required for the analysis. The review of the ex-
tent literature, and thus awareness of the problem, leads to the creation of the
proposed framework (FAIUSMO) to address the identified problem.
9esign and 8reation of Framework
The Framework for the Analysis of the Impact of theUse of SMby anOrganization
(FAIUSMO) is proposed to address the research problem identified. As the body
of SM knowledge evolves, and the SM landscape changes accordingly, the needs
for analysis of the impact of the use of SM by an organization will develop too.
It is envisaged that the FAIUSMO framework will be adapted to accommodate
these changes. The eight-step SMmeasurement process [10] guides the synthesis
of a proposed four-stage framework. The given eight steps are used in themapping
of the proposed four FAIUSMO stages, thus:
– Step 1: The initial purpose of use of SM is defined to address the needs of the
users. The unit of use, strategy and time-frame need to be identified. This is
addressed in Stage 1 of the framework.
– Step 2, Step 3 and Step 4: The internal, external and strategic perspective are
identified. These details are addressed in Stage 2 of the proposed framework.
Stage 2.1 considers the internal, organizational perspective, Stage 2.2 considers
the external, virtual community, perspective, Stage 2.3 considers the strategic
perspective (goals, objectives, key performance indicators and genericmetrics),
Stage 2.4 sets the weights of the strategic goals, and Stage 2.5 defines the strate-
gic target ranges.
– Step 5: The data that will be used in the analysis of use is identified. As the
data resides external to the organization, the data needs to be imported into
the organizational data structure. Only the strategic metrics (i.e. a subset) are
selected for import into the organizational data repository and used in the anal-
ysis. These details are addressed in Stage 3 of the proposed framework.
22 International Workshop of MMB 2018
– Step 6, Step 7 and Step 8: The data that has been imported as strategic metrics
must be processed, analyzed and presented for the identification of information
and trend patterns. These details are presented in Stage 4.
The nine decision points of dimensional data modelling [25,26] guide the devel-
opment of the FAIUSMO framework. In Section 4.9, a detail diagram is presented
in Figure 1.
. Stage : Process and Scope of Purpose
The process to analyze the use of a subset of SM for a given time by an organiza-
tional unit (for this research, a project) for a given purpose requires the definition
of the scope of purpose of use. The definitions of the following entities are re-
quired: Time (to ensure that analysis trends and patterns may be detected and
explored), organizational unit (e.g. a project) (to allow for comparison of use of
SM across multiple units), and strategy (to identify for comparison purposes).
. Stage . : Internal Perspective - Organization
These attributes are considered sufficient to define the internal perspective: orga-
nization (type) (a synthesis of organization types describes an organization), or-
ganizational artefacts (SM applications) (organizational artefacts [13] are included
as per the classification [1]), organizational actors and activities (strategic activities
are included in Stage 2.3).
. Stage . : External Perspective - Virtual 8ommunity
These attributes are considered sufficient to define the external perspective: clas-
sification of virtual community (Classification is defined in terms of profiles [21]),
typology of the virtual community (Typology is defined in terms of purpose, place,
platform, population and profit. Identified benefits of using a typology includes a
classification to understand a virtual community, to contribute to a growing knowl-
edge base of virtual communities and to ensure rigor in the research of virtual
communities [14]), and virtual community life-cycle stage (Identification of the
stage in the life-cycle of a virtual community leads to a better understanding of
the needs of the virtual community, guidance in the inclusion of SM applications,
and conversant creation of the community [20]).
SOCNET 2018, February 28, 2018 23
. Stage . : Strategic Perspective
For the framework, these attributes are considered sufficient to define the strate-
gic perspective: goals (The goals of the social business strategy are generic busi-
ness goals [15]. These are the long term goals), objectives (An objective is consid-
ered more short term. It refers to the SM objectives, the SM strategic theme that
contributes to the social business goals [11,28], though linking the recommended
aligned SM activities), activity (The aligned and generic SM activities are presented
for each of the selected, prioritized goals [15]), key performance indicator (KPIs)
(a goal may have multiple KPIs. An indicator may be linked to multiple goals [15].
Each KPI may be measured by multiple generic metrics [22], and are mapped (in
this research) onto the strategic themes [11]), generic metrics (KPIs are linked to
generic metrics [22]), and SM application metric. Each generic metric defined [22]
may be linked (in this research) to a SMapplicationmetric (A number of such links
may be recommended, however, due to the evolving user needs, these may be de-
fined by users. A SM application metric is required to be linked to each strategic
generic metric, for each of the SM applications used).
Each social business goal [15] is aligned to one or more SM activities. The def-
inition of the KPI (and thus generic metric) [22] is used to derive KPIs from the
descriptions of the SM metrics in this research. It is envisaged that this apparent
link between a social business goal and a generic metric may be utilized in this
research towards the analysis of the use of SM, specifically in the strategic per-
spective. By highlighting the focus of the SM activity, one or more indicators may
be linked to the activity, and thus to the goal.
. Stage . : Strategic Perspective - Goal Weightings
The collection of SM business goals may not all be equally relevant in a SM ap-
plication. The allocated weight may be considered an indication of priority of the
goal within the strategy. These assigned relative weights of the strategic goals may,
however, change. The sum of the goal weights must however be one. These goal
weight values are considered sufficient to analyze the impact of use of SM by or-
ganizations that have varying strategic priorities.
24 International Workshop of MMB 2018
. Stage . : Strategic Target Setting of the Strategic Metrics
The target ranges are defined in terms of minimum and maximum values for
each of the strategic metrics that are included in the strategy. This ensures that
the actual metric values can be compared to strategic values. Strategically, a metric
value must be within range. Action may be deemed necessary when values occur
out of range. These target values are considered sufficient to analyze the use of
SM.
. Stage : 9ata Measures and Processing
The measures to support the analysis of the impact of the use of SM are the actual
SM data values of the identified strategic metrics. This data must be imported and
loaded into the SM data warehouse. The structure of the SM data warehouse is
developed according to the data warehouse architecture of conformed dimensions.
The use of each of the SM applications deployed may be measured in terms of a
range of metrics. Relevant metrics from appropriate data sources are identified.
Each application may have a range of metrics that are generated. Metric values are
quantitative and objectivemeasures, andmay be exported regularly and frequently.
. Stage : 6nalysis and Presentation
For each SM application used, the metric values are considered. These measures
may be analyzed in terms of the attributes that describe the metrics. The analysis
activities (compare, present and identified) must be supported to meet the data
needs of all stakeholders in the use of SM by the organization. The SM metric
values may need to be aggregated for the evaluation of the SM strategy and an in-
tegrated analysis of the strategic use of SM applications. The dimensions (defined
in Stage 2) and the measures (derived from the data in Stage 3) are considered
sufficient to analyze the impact of the strategic use of SM by an organization.
. The F6IUSMO Framework
This completes Step 3 of theDSR approach that is followed. The FAIUSMO frame-
work is defined in terms of the four stages presented above. A comprehensive
diagram of the framework is presented in Figure 1 below.
The building blocks for FAIUSMO are synthesized from extant literature, and
the construction process followed is guided by the nine decision points [25,26].
SOCNET 2018, February 28, 2018 25
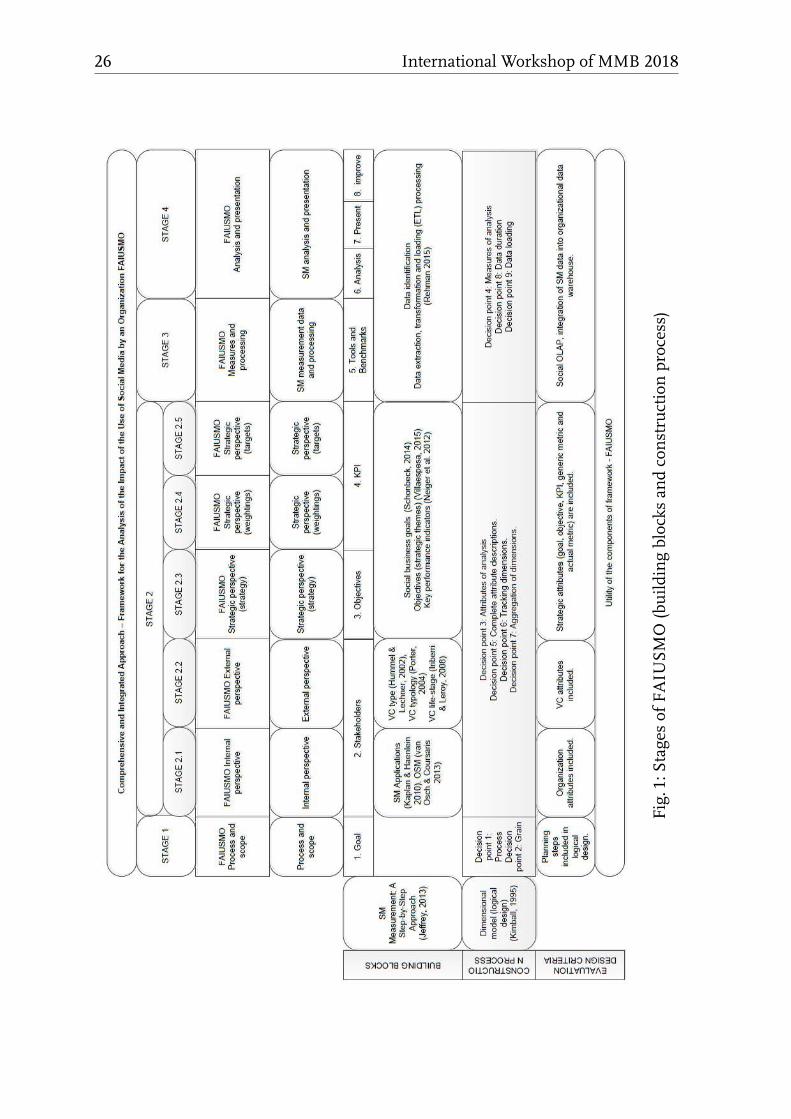
Fig.1:StagesofFAIUSMO(buildingblocksandconstructionprocess)
26 International Workshop of MMB 2018
This initial design and creation of FAIUSMO requires evaluation of utility to en-
sure that the identified research problem has been addressed.
Initial Evaluation
In Step 4 of the DSR approach followed, an initial evaluation of utility of the re-
search artefact is required. An application domain was identified, and participants
from the domain volunteered to participate. The participants completed a ques-
tionnaire that required the evaluation of the utility of each of the stages included
in the FAIUSMO framework, as well as the overall utility. Recommendations and
suggestions will be used to design and create the next iteration of the research
artefact.
Recommendations for Future Research
In Step 5 of the DSR approach follows, the research results are communicated.
The results thus far are presented in this paper. From the study, the following are
recommended as future research:
– The evaluation of FAIUSMO in different application domains. This may iden-
tify additional user needs, and may lead to the discovery of improvements and
enhancements of the framework.
– The development of a more comprehensive (not merely demonstration) proto-
type with actual SM data. This may increase the clarity of concepts.
– The revision of the initial version of the proposed framework. This may require
enhancement and adaptation to include additional SM data, identified environ-
mental and strategic dimensions and strategic measures fact tables, as well as
aggregations for comparative and trend analysis.
8onclusions
The contribution of this research is to address the research problem of a lack of a
comprehensive and integrated approach to the analysis of the impact of the use of
SM by an organization. The purpose of this study was to create awareness of the
research problem. A comprehensive and integrated framework (FAIUSMO) that
includes the internal (organizational), external (virtual community) and strategic
SOCNET 2018, February 28, 2018 27
(strategy) perspectives in the analysis use of SM by an organization, is designed
and created in this research to address the identified research problem. An initial
evaluation of utility was conducted that confirmed the utility of the FAIUSMO
framework.
Subsequent iterations of the DSR approach will lead to refinement and enhance-
ment of the FAIUSMO framework to ensure that the ongoing analysis of the (in-
creasing) impact of the (evolving) use of SM by organizations.
References
1. Kaplan, A.M., Haenlein, M.: Users of the world, unite! The challenges and opportu-nities of Social Media. Bus. Horiz. 53, 59–68 (2010).
2. Lynn, T., Healy, P., Kilroy, S., Hunt, G., van derWerff, L., Venkatagiri, S., Morrison, J.:Towards a general research framework for social media research using big data. In:2015 IEEE International Professional Communication Conference (IPCC). pp. 1–8.IEEE, Limerick, Ireland (2015).
3. Ngai, E.W.T., Tao, S.S.C., Moon, K.K.L.: Social media research: Theories , constructs,and conceptual frameworks. Int. J. Inf. Manage. 35, 33–44 (2015).
4. Shneiderman, B., Preece, J., Pirolli, P.: Realizing the value of social media requiresinnovative computing research. Commun. ACM. 54, 34 (2011).
5. Hanna, R., Rohm, A., Crittenden, V.L.: We’re all connected: The power of the socialmedia ecosystem. Bus. Horiz. 54, 265–273 (2011).
6. Vaishnavi, V., Kuechler, B.: Design Science Research in InformationSystems Overview of Design Science Research, http://desrist.org/design-research-in-information-systems/.
7. Kietzmann, J.H., Hermkens, K., McCarthy, I.P., Silvestre, B.S.: Social media? Getserious! Understanding the functional building blocks of social media. Bus. Horiz.54, 241–251 (2011).
8. Murdough, C.: Social MediaMeasurement: it’s not impossible. J. Interact. Advert. 10,94–99 (2009).
9. Agostino, D., Sidorova, Y.: A performance measurement system to quantify the con-tribution of social media: new requirements for metrics and methods. Meas. Bus.Excell. 20, 38–51 (2016).
10. Jeffrey, A.: Social Media Measurement: A Step - by - Step Approach Using the AMECValid Metrics Framework, www.instituteforpr.org/wp.../Social-Media-Measurement-Paper-Jeffrey-6-4-13.pdf.
11. Villaespesa, E.: An evaluation framework for success: Capture and measure yoursocial-media strategy using the Balanced Scorecard. In: MW2015 Museums and theWeb 2015. , Chicago, USA (2015).
12. Sidorova, Y., Arnaboldi, M., Radaelli, J.: Social media and performancemeasurementsystems: towards a new model? Int. J. Product. Perform. Manag. 65, 139–161 (2016).
28 International Workshop of MMB 2018
13. van Osch, W., Coursaris, C.K.: Organizational Social Media: A ComprehensiveFramework and Research Agenda. In: System Sciences (HICSS), 2013 46th HawaiiInternational Conference on System Sciences. pp. 700–707 (2013).
14. Porter, C.E.: A typology of Virtual Communities: A multi-disciplinary foundation forfuture research. J. Comput. Commun. 10, (2004).
15. Schonbeck, M.: Linking business goals and social media activities - a method forthe utilization of social business, https://dspace.library.uu.nl/handle/1874/296601, (2014).
16. Emamjome, F., Rabaai, A., Gable, G., Bandara, W.: Information Quality in SocialMedia: A Conceptual Model. Proc. Pacific Asia Conf. Inf. Syst. (2013).
17. Emamjome, F., Gable, G., Bandara, W., Rabaai, A.: Understanding the value of socialmedia in organizations. In: Pacific Asia Conference on Information Systems (PACIS)2014 Proceedings (2014).
18. Gordon, J.: The Coming Change in Social Media Business Applications Separat-ing the Biz from the Buzz, http://www.crmxchange.com/uploadedFiles/White_Papers/PDF/SMT_whitepaper_biz.pdf.
19. Linke, A., Zerfass, A.: Future trends in social media use for strategic organisationcommunication: Results of a Delphi study. Public Commun. Rev. 2, 17–29 (2012).
20. Iriberri, A., Leroy, G.: A Life Cycle Perspective on Online Community Success. ACMComput. Surv. 41, 1–29 (2008).
21. Hummel, J., Lechner, U.: Social profiles of virtual communities. Proc. 35th Annu.Hawaii Int. Conf. Syst. Sci. 0, 1–10 (2002).
22. Neiger, B.L., Thackeray, R., Van Wagenen, S.A., Hanson, C.L., West, J.H., Barnes,M.D., Fagen, M.C.: Use of Social Media in Health Promotion: Purposes, Key Perfor-mance Indicators, and EvaluationMetrics. Health Promot. Pract. 13, 159–164 (2012).
23. Heijnen, J.: Social Business Intelligence - how and where firms can use social mediadata for performance measurement, an exploratory study, (2012).
24. Rehman, N.U.: Extending the OLAP Technology for Social Media Analysis, (2015).25. Kimball, R.: The DataWarehouse Toolkit - Practical Techniquess for Building Dimen-
sional Data Warehouses. John Wiley & Sons, Inc (1995).26. Kimball, R., Reeves, L., Ross, M., Thornthwaite, W.: The Data Warehouse Lifecycle
toolkit. Wiley (1998).27. Werder, K., Helms, R.W., Slinger, J.: Social Media for Success: a Strategic Framework.
In: Pacific Asia Conference on Information Systems PACIS 2014. p. Paper 92 (2014).28. Culture24, Villaespesa, E.: Making sense of your social media strategies using
the Culture24 Social Media Evaluation Framework, http://culturehive.co.uk/resources/making-sense-of-your-social-media-strategies.
SOCNET 2018, February 28, 2018 29

Bringing Structure to Inter rm Interaction – The
In uence Nested Formal Organizations on Knowledge
Transfer Patterns in Interorganizational Networks
Fabian Reck
University of Bamberg,Kaerntenstraße 7, 96052 Bamberg, Germany
Abstract. This study examines how managerial interventions impact
structures of knowledge transfer. Thework thereby focuses on one form
of network management, the implementation of nested organizations.
I develop a theoretical framework discerning two forms of nested orga-
nizations, namely platforms and projects, and propose distinct effects
from these forms’ unique features. I test the research hypotheses based
network data from the biggest association of small and medium mu-
nicipal utilities in Germany using exponential random graph models
(ERGM). The results largely support the proposed hypotheses and indi-
cate that platforms induce structural mechanisms of social embedded-
ness whereas projects induce mechanisms of task interdependence.
Key words: Interorganizational Networks, Knowledge Transfer, Network
Management, ERGM
Introduction
Networks such as strategic alliances, regional clusters or industrial associations
bear huge potential to provide firms with opportunities to share costs and risks
of research and development, access complementary assets or profit from knowl-
edge spillover. Hence, especially for small andmediumfirms for which innovation
opportunities may exceed their own resource base, interorganizational networks
represent an important strategic element in innovation management [17].
One essential mechanism through which interorganizational networks increase
member firms’ performance is knowledge transfer. Consequentially, in order for
SOCNET 2018, February 28, 2018 31
interorganizational networks to fulfill their innovation-enhancing effects, high
levels of knowledge mobility – i.e., the “ease with which knowledge is shared,
acquired, and deployed within the network” [10, p. 660] – are indispensable. As
such, establishing, supporting and steering knowledge flows is a key task in net-
workmanagement [10,17]. As such, managerial interventionmechanisms need to
be applied to ensure knowledge “transfer to other points in the network where it
is needed” [10, p. 660]. One type of such interventions is the implementation of
nested formal organizations within the broader scope of interorganizational net-
works. These nested organizations represent subsets of member firms which are
formally constituted by clear membership boundaries and a defined purpose [34].
By establishing such formal structures, network management sets a frame for ar-
ranging encounters and as a consequence channeling knowledge flows between
member firms [9]. Hence, nested formal organizations are likely to represent a
mean to substantially shape the structure of knowledge flows. Thus, they represent
a valuable element in the toolbox of interorganizational network management.
However, up to now little to no research examined managerial interventions in
interorganizational networks, let alone providing empirical evidence on these in-
terventions’ effectiveness [30]. Network management thus represents a clearly un-
derresearched topic that demands for deeper investigation [25]. Accordingly, also
the effects of nested formal organizations on knowledge transfer in interorgani-
zational networks remain somewhat unclear. Within this work, I therefore aim
to explain how the installment of nested organizations within interorganizational
networks shapes the structure of interfirm knowledge transfer. More specifically,
I develop and test a theoretical model outlining the effects of two distinct types of
nested organizations – platforms [1] and projects [36]. In all, this paper sheds light
on the following research question: “How do nested formal organizations impact
structural patterns of knowledge transfer and how do the effects of projects and
platforms differ?”.
Nested Organizations and their E ect on Knowledge Network
Development
Network management which Provan and Kenis [30] describe as monitoring and
controlling member firms’ behaviour and aligning them towards an overarching
network-level goal by definition aims to impact the “natural” endogenous tenden-
32 International Workshop of MMB 2018
cies in a network’s development [33]. Accordingly, initiatives of network manage-
ment represent exogenous interventionist forces that may impact interorganiza-
tional networks directly by establishing new structural logics as well as indirectly
by enforcing, altering or diminishing the causal mechanisms endogenous to the
network [6]. In doing so, network management steers network development to-
wards new structural patterns [13].
By implementing nested organizations in a network of firms, network manage-
mentmay alter a network’s structure substantially. Nested organizations comprise
a certain number of formally associated member firms that group together to ac-
complish a specific goal [34]. In practice, especially two different types of nested
organizations are prevalent: platforms and projects [15]. On the one hand, plat-
forms represent communities of firmswhich collaboratively address a certain field
of business or innovation [1]. On the other hand, projects are temporal forms of
organization with the goal of producing a clearly specified outcome, e.g. the devel-
opment of a new technology or product [34]. Both forms of nested organizations
differ in two dimensions: temporal scope and functional scope. While platforms
combine long-term interaction with a rather broad goal, projects are temporal and
deal with a narrowly specified issue.
These types of nested formal organizations are likely to induce framing mecha-
nisms shaping knowledge network structures. Framing describes the “behaviors
used to arrange and integrate a network structure by facilitating agreement on
participants’ roles, operating rules, and network values.” [23, p. 603]. By establish-
ing nested formal structures, network management sets a task frame respectively
a reference point to which network members can align their efforts [9]. With the
creation of an organization with particular goals, interdependencies are created
leading to a stimulation of knowledge transfer. Hence, network management fa-
cilitates the creation of internal structure in the knowledge network as well as the
positioning of network members within this structure [27]. I argue that based on
the features of the particular task frame that is created by the implementation of
platforms and projects, the corresponding framing mechanisms will differ. As a
consequence, platforms and projects will stimulate different structural tendencies
in the knowledge network which I will outline in the following.
SOCNET 2018, February 28, 2018 33
. Platforms
A platform describes a form of nested formal organizations on which a number
of firms comes together to make sense of a new field of technology respectively
to create new visions and blueprints on how to set up commercial systems that
address future trends in the industry [26]. Hence, their scope is rather targeting
long-term developments in the particular market [1]. Firms that engage in inno-
vation platforms are thus mostly focused on staying in touch with general techno-
logical developments and exchanging experiences with their peers in the industry.
Still, such a platform creates a community of firms that are willing to learn about
new knowledge in the market and enlarge their own knowledge base [22]. The
firms engaging in it thus signal openness to external knowledge and interorgani-
zational knowledge transfer in general. Hence, firms participating in the platform
will probably be more likely to perceive other platform participants as accessible
and willing to share their expertise.
In general, platforms possess a rather large temporal and functional scope. Con-
cerning the former, platforms do not aim to address immediate problems for
which a solution might be developed in the near future, but provide firms with
a forum to discuss macrotrends within the particular industry [1]. Hence, rather
than providing a closed time framewith clear points of beginning and ending, plat-
forms enforce a rather cyclical time frame in which loops of learning and continu-
ous development dominate [2]. Accordingly, the task frame of a platform includes
a rather broad and open temporal scope, without deadlines or time restrictions.
Concerning the latter, platforms also possess a rather broad and open functional
scope. Their goal statement normally is vague so that participating firms jointly
may shape the agenda to issues of interest and topicality [23]. Rather than project-
ing a clear vision of the future, these platforms provide an opportunity for firms
to exchange experiences with other companies that face similar long-term chal-
lenges. Hence, platforms set the frame for firms jointly honing their own base of
expertise and capabilities by the help of their peers [28].
Due to these broad scopes of time and function, I expect structural logics that
depict social coordinationmechanisms to bemore prevalent than structural logics
that might be induced by task characteristics. As the task frame is broad and am-
biguous, there is no clear immediate goal to be achieved. In turn however, firms
participating in a platform commit broadly to an overarching longterm vision [5].
34 International Workshop of MMB 2018
This special context should account for the increased occurrence of a number
of structural logics. First, I propose that firms will be more likely to accept in-
direct reciprocity within the platform. The long-term horizon and commitment
to a broad vision could diminish potential source firms’ need to be incentivized
by counteroffer of relevant and new information as they may rely on generalized
exchange in the platform. Second, firms might be less likely to acquire knowledge
from other firms in the platform based on tendencies of homophily. Whereas in
networks, firms tend to generally find similar others to be more accessible and
their knowledge to be more valuable [24], the context of a platform is likely to re-
duce these tendencies. When two firms similar to each other commit to a nested
organization with a broad overarching vision, they indicate similar preferences
and worldviews thus altering the perception of accessibility. With the lack of a
clear immediate goal, firmsmoreover possess the freedom to explore diverse areas
of knowledge leading to a diminished preference towards similar firms [7]. Third
and finally, transitive triads will be more likely to occur within platforms. All three
logics behind the existence of transitive triads, namely clustering, bypassing and
countering may be stimulated by a platform [21,19]. Clustering will be enhanced
because of the common long-term vision of platformsmembers, bypassing might
be more likely because of the social proximity created by the platform facilitating
the formation of forming ties to third actors, and countering will be induced by
short term self-interest. As a consequence, I propose the following hypotheses:
Hypothesis 1a: Firms in a platform are less likely to form reciprocal knowledge ties
between each other and more likely to form cyclic triads.
Hypothesis 1b: Firms in a platform are less likely to acquire knowledge from similar
others in the platform as well as firms located in close geographic distance.
Hypothesis 1c: Firms in a platform are more likely to form transitive triads.
. Projects
Projects, the second form of formal nested organizations in interorganizational
networks aim at exploring technology fields, identifying market opportunities or
developing new products, processes or businessmodels. Projectmembers thereby
agree to fulfill a specified task in a certain amount of time [12]. Expecting an im-
pact of projects on the likelihood of a knowledge transfer tie existing between two
member firms is reasonable. First, firms engaging in the same project will bemore
SOCNET 2018, February 28, 2018 35
both visible to each other. Moreover, due to a clear collective goal, high levels of ac-
cessibility among project members as well as high motivation to share knowledge
resources are likely [2]. Second, knowledge exchange among project members will
be perceived as especially valuable and profitable due to task interdependencies
and coordination needs [34].
In comparison to platforms, projects are nested organizations with clear tempo-
ral and functional boundaries. They group together firms in aiming to accomplish
a unique, novel and complex task [29]. Though the goal of projects is most often
clearly specified, the operational rules of how to achieve this goal are normally
not [34]. Thereby, instead of pursuing a long-term vision, projects have immedi-
ate task and performance demands [12]. In sum, projects usually demand highly
focused and fast knowledge work with specified goals and finite time horizon but
ambiguity in terms of how to reach them [34]. In other words, interorganizational
projects are the organizational equivalent of a one-night stand [12].
I argue that these features of projects will lead to different effects on knowledge
transfer network structures than it was the case for platforms. Previous research
found that the narrow temporal and functional scopes of projects lead member
firms to predominantly focus on the task at hand. Due to performance and time
pressures, the social system of project members is likely to immediately jump
into a mode of action without first letting firms develop relationships or a com-
mon knowledge base [18,20]. This radical task focus leads to the emergence of
distinct structural logics in the according knowledge exchange network [36]. First,
research on social psychology has shown that in task-oriented contexts, centralized
network structures tend to develop [3,16]. More recent studies support these no-
tions in outlining the importance of lead organizations in providing for fast and
easy communication linkages across interfirm networks [26]. Hence, we predict
a tendency of open triadic structures occurring in project networks [12]. Second,
via task focus, interdependencies in firms’ activities emerge. It is likely that in
a project network, knowledge network structures will reflect such interdependen-
cies in order tominimize coordination failures [11]. As a consequence,firmsmight
tend to not experiment with their partners and exchange knowledge more likely
with similar others. Finally, due to the more transactional character of projects in
comparison to platforms, firmsmight be less likely to rely on generalized exchange
and thus to accept indirect reciprocity.
36 International Workshop of MMB 2018
In sum, I propose the following hypotheses:
Hypothesis 2a: Firms in the same project are more likely to form reciprocal knowledge
ties between each other and less likely to form cyclic triads.
Hypothesis 2b: Firms in the same project are more likely to acquire knowledge from
similar others in the platform.
Hypothesis 2c: Firms in the same project are more likely to form open triads.
Nested Organizations and their E ect on Knowledge Network
Development
In order to test the research hypotheses proposed in this paper, I collected net-
work data from the biggest association of municipal utilities in Germany. The 84
members of this association are local energy providers from all over the country.
The data collection procedure was done via cross-sectional survey. I approached at
least two key informants in all the association’s member firms. Managers respon-
sible for innovation management within their respective firms as well as C-level
executives were contacted. In total, I was able to obtain contact information from
314 potential sources within the 84 member organizations. These were contacted
via e-mail and telephone calls. In all, I received 147 completed questionnaires. The
responses came from 74 of the 84 member organizations resulting in a response
rate of 88.1 percent.
In the questionnaire I asked respondents to indicate ‘flow relations’ between
the organizations [4]. To this end, sociometric techniques were applied [35]. These
comprised a rooster-based approach to obtain data on a focal firm’s knowledge
sources. In addition to the surveys, the association’s central management unit pro-
vided me with access to extensive archival data. I thereby obtained annual reports
of all member firms, the association’s quarterly magazine published to the mem-
ber firms, internal newsletters, and project reports, all adding up to over 1,500
pages of text material. Based on this archival data, I was able to reconstruct the
membership of firms in platforms and projects within the association’s context.
Concerning platforms, the central management unit installed two different long-
term interest groups. The first one is dealing with the issues of digitalization and
digital business models in the energy sector. In this platform 39 of the 84 asso-
ciation members participate. The second one addresses the future of energy pro-
duction. Here, 11 member firms participate. Concerning projects, I identified 18
SOCNET 2018, February 28, 2018 37
projects dealing with concrete tasks such as developing a rollout concept for smart
meter solutions or creating an app for end users to monitor their homes energy
consumption. This final list includes only projects which fell into the three year
before the survey and had at least three firms participating.
In order to test my theoretical arguments with an appropriate statistical model,
I consider each individual tie between two firms in the observed network as a ran-
dom variable. Hence, I linkmy data structure to the p-star (p*) class of Exponential
Random Graphs Models (ERGM) [31]. I follow usual approaches in the specifica-
tion of ERGM in that I include both actor-relation effects and local dependencies
in the estimation model. Concerning actor-relation effects, I used the status (mea-
sured by the firm’s size [14]) and intellectual capital (measured by eight survey
items based on [32] of firms for sender and receiver effects as well as organiza-
tional similarity (measured by size difference), geographical closeness (assigned
if both firms are located in the same region in northern, central or southern Ger-
many) and technology base similarity (measured by Pearson correlations between
both firms’ energy production mix (consisting of coal, nuclear energy, gas and
renewables)) for homophily effects. As local dependencies I included popularity
spread (A-in-S), activity spread (A-out-S), multiple connectivity (A2P-T), path clo-
sure (AT-T), popularity closure (AT-D), activity closure (AT-U) and cyclic closure
(AT-C). For parameter estimation, Markov Chain Monte Carlo Maximum Likeli-
hood simulations techniques were used. The model was estimated for the overall
network, the platform network and the project network.
Results and Conclusion
The results confirm the impact of formal nested organizations on knowledge trans-
fer structures in interorganizational networks. In general interorganizational knowl-
edge networks seem to have a tendency towards reciprocity, status and expertise-
based selection, homophily in terms of organizational similarity and geographi-
cal closeness as well as popularity-based closure (‘Overall Network’ in Fig. 1). In
the platform network, reciprocity, status-based selection, expertise-based selection
and geographic closeness effects are also existent, though the last is clearly lower
than in the overall network. The effect of status similarity, the positive tendency
towards popularity-based closure and the negative tendency for cyclic closure dis-
appear whereas path closure and activity spread become significant (‘PlatformNet-
38 International Workshop of MMB 2018
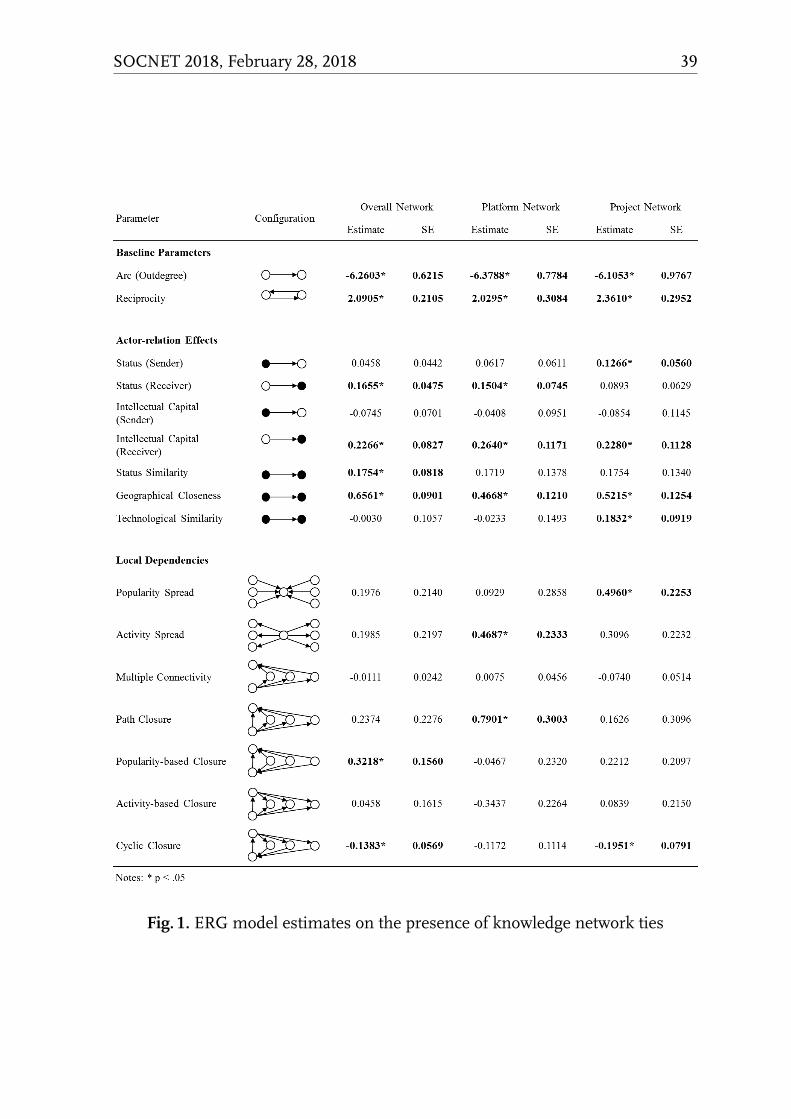
Fig. 1. ERG model estimates on the presence of knowledge network ties
SOCNET 2018, February 28, 2018 39
work’ in Fig. 1). In the project network, reciprocity, expertise-based selection and
geographical closeness effects are similar to the overall network. Cyclic closure be-
comes even less likely, status-based selection, status similarity effects and tenden-
cies towards popularity-based closure disappear. In turn, popularity spread, sender
effects of status and technology similarity effects emerge (‘Project Network’ in Fig.
1).
Partial support for the proposed hypotheses and revealing several additional
structural logics is displayed. H1a proposed that in platforms, indirect reciprocity
is more likely. In the platform network, the estimation score for direct reciprocity
is only slightly lower than in the overall network, the score for cyclic closure is still
negative but insignificant in contrast to the overall network. Hence, adequate sup-
port for this hypothesis can be stated. H1b suggests lowered similarity/proximity
effects. These are clearly evident for size similarity and geographic proximity, but
not for technological similarity. Hence, there is partial support for H1b. As pro-
posed in H1c, transitivity in the form of path closure occurred at a significantly
higher frequency whereas estimation scores for popularity - and activity-based clo-
sure are not significant. Hence, bypassing is a prevalent network dynamic in plat-
forms. Concerning projects, H2a is confirmed in that the probability of indirect
reciprocity is diminished in a task-oriented context whereas estimation scores for
reciprocity are clearly higher than in the overall network. H2b which proposes that
firms participating in the same project are more likely to acquire knowledge from
similar others is partially confirmed in terms of firms in a project being more
likely to acquire knowledge from other firms with a similar technological knowl-
edge base. In contrast, the tendency towards geographic proximity is reduced also
in the project network. Finally, H2c is partially confirmed. On the one hand, pop-
ularity spread is significantly more likely in the context of projects. On the other
hand, there is no significant tendency towards activity spread or multiple connec-
tivity.
With these results, the paper makes some important contributions to different
streams of research. First, this work contributes to previous literature knowledge
transfer networks. In this context, works such as [7] outlined the existence of a
range of theories and causal mechanisms explaining in which structural patterns
knowledge transfer among firms emerges. Furthermore, [19] provided evidence
for the notion that features of the overall context in which firms operate deter-
40 International Workshop of MMB 2018
mine the specific structural logics in place. The results of this paper further ex-
pands these pioneering insights by supporting the notion that a formal context
connecting firms through a certain type of task frame has an impact on the par-
ticular emerging structural logics in the network. Second, the paper adds to re-
search on the management of firm networks. I am able to provide empirical evi-
dence for the actual impact of a concrete type of management measure, namely
the initiation of nested organizations. Thereby, both platforms and projects serve
to foster knowledge transfer in interorganizational networks. Besides these direct
effects, both platforms and project induce indirect effects on knowledge network
structure. More specifically, the broad functional and temporal scope of platforms
induces a long term vision task frame fostering a social MBB structure geared
towards interfirm learning. In contrast, the goal-oriented task frame of projects
rather stimulates structural mechanisms that allow for communication efficiency.
In sum, both forms of nested organizations thus complement each other as they
foster the emergence of fairly different network patterns and characteristics. Fu-
ture research should further specify these differences and validate the findings
across interorganizational networks in different industrial and regional settings.
References
1. Asheim, B.T., Boschma, R., Cooke, P.: Constructing Regional Advantage: PlatformPolicies based on Related Variety and Differentiated Knowledge Bases. Reg. Stud. 45,893–904 (2011)
2. Bakker, R.M.: Taking Stock of Temporary Organizational Forms: A Systematic Reviewand Research Agenda. Int. J. Manage. Rev. 12, 466–486 (2010)
3. Bavelas, A.: Communication Patterns in Task-oriented Groups. J. Acoust. Socie. Amer. 22, 725–730 (1950)
4. Borgatti, S.P., Halgin, D.S.: On Network Theory. Org. Sci. 22, 1168–1181 (2011)5. Cantner, U., Graf, H., Toepfer, S.: Structural Dynamics of Innovation Networks in Ger-man Leading-Edge Clusters. In: DRUID Society Conference 2015, pp. 1–23. DRUID,Copenhagen (2015)
6. Chrisholm, R.F.: DevelopingNetworkOrganizations: Learning fromPractice and The-ory. Addison-Wesley, Reading (1998)
7. Contractor, N.S., Monge, P.R.: Managing Knowledge Networks. Manage. Comm. Q.16, 249–258 (2002)
8. Contractor, N.S., Wasserman, S., Faust, K.: Testing Multitheoretical, Multilevel Hy-potheses about Organizational Networks: An Analytic Framework and Empirical Ex-ample. Acad. Manage. Rev. 31, 681–703 (2006)
SOCNET 2018, February 28, 2018 41
9. Dagnino, G.B., Levanti, G., Mocciaro Li Destri, A.: Structural Dynamics and Inten-tional Governance in Strategic Interorganizational Network Evolution: A MultilevelApproach. Org. Stud. 37, 349–373 (2016)
10. Dhanaraj, C., Parkhe, A.: Orchestrating Innovation Networks. Acad.Manage. Rev. 31,659–669 (2006)
11. Gargiulo, M., Benassi, M.: Trapped in Your Own Net? Network Cohesion, StructuralHoles, and the Adaptation of Social Capital. Org. Sc. 11, 183–196 (2000)
12. Grabher, G.: Temporary Architectures of Learning: Knowledge Governance in ProjectEcologies. Org. Stud. 25, 1491–1514 (2004)
13. Herranz, J.: The Multisectoral Trilemma of Network Management. J. Pub. Adm. Res.Theo. 18, 1–31 (2008)
14. Jensen, M., Roy, A.: Staging Exchange Partner Choices: When Do Status and Repu-tation Matter? Acad. Manage. J. 51, 495–516 (2008)
15. Jha, S.K., Gold, R., Dube, L.: Convergent Innovation Platform to Address ComplexSocial Problems: A Tiered Governance Model. Acad. Manage. Proc. (2016)
16. Leavitt, H.J.: Some Effects of Certain Communication Patterns on Group Perfor-mance. J. Abn. Soc. Psy. 46, 38–50 (1951)
17. Lee, S., Park, G., Yoon, B., Park, J.: Open Innovation in SMEs – An IntermediatedNet-work Model. Res. Pol. 39(2) 290–300 (2010)
18. Lindkvist, L.: Knowledge Communities and Knowledge Collectives: A Typology ofKnowledge Work in Groups. J. Manage. Stud. 42, 1189–1210 (2005)
19. Lomi, A., Pattison, P.: Manufacturing Relations: An Empirical Study of the Organi-zation of Production Across Multiple Networks. Org. Sci. 17, 313–332 (2006)
20. Lundin, R.A., Soederholm, A.: A Theory of the Temporary Organization. Scand. J.Manage. 11, 437–455 (1995)
21. Madhavan, R., Gnyawali, D.R., He, J.: Two’s Company, Three’s a Crowd? Triads inCooperative-competitive Networks. Acad. Manage. J. 47, 918–927 (2004)
22. McCormick, K., Kiss, B.: Learning throughRenovations forUrban Sustainability: TheCase of the Malmö Innovation Platform. Ops. Environ. Sust. 16, 44–50 (2015)
23. McGuire, M.: Managing Networks: Propositions on What Managers Do and WhyThey Do It. Pub. Adm. Rev. 62, 599–609 (2002)
24. McPherson, M., Smith-Lovin, L., Cook, J.M.: Birds of a Feather: Homophily in SocialNetworks. Ann. Rev. Soc. 27, 415–444 (2001)
25. Mueller-Seitz, G.: Leadership in Interorganizational Networks: A Literature Reviewand Suggestions for Future Research. Int. J. Manage. Rev. 14, 428–443 (2012)
26. Moeller, K., Svahn, S.: Managing Strategic Nets: A Capability Perspective. Market.Theo. 3, 209–234 (2003)
27. O’Toole, L.J.: Treating Networks Seriously: Practical and Research-based Agendas inPublic Administration. Pub. Adm. Rev. 57, 45–52 (1997)
28. Patrucco, P.P.: Changing Network Structure in the Organization of Knowledge: TheInnovation Platform in the Evidence of the Automobile System in Turin. Econ. Innov.New Techn. 20, 477–493 (2011)
42 International Workshop of MMB 2018

29. Prencipe, A., Tell, F.: Inter-project Learning: Processes and Outcomes of KnowledgeCodification in Project-based Firms. Res. Pol. 30, 1373–1394 (2001)
30. Provan, K.G., Kenis, P.: Modes of Network Governance: Structure, Management, andEffectiveness. J. Pub. Adm. Res. Theo. 18, 229–252 (2008)
31. Robins, G., Pattison, P., Wang, P.: Closure, Connectivity and Degree Distributions:Exponential Random Graph (p*) Models for Directed Social Networks. Soc. Net. 31,105–117 (2009)
32. Subramaniam, M., Youndt, M.A.: The Influence of Intellectual Capital on the Typesof Innovative Capabilities. Acad. Manage. J. 48, 450–463 (2005)
33. Sydow, J.: Network Development by Means of Network Evaluation? Explorative In-sights from a Case in the Financial Services Industry. Hum. Rel. 57, 201–220 (2004)
34. Sydow, J., Lindkvist, L., DeFillippi, R.: Project-based Organizations, Embeddednessand Repositories of Knowledge. Org. Stud. 25, 1475–1489 (2004)
35. Wasserman, S., Faust, K.: Social Network Analysis: Methods and Applications. Cam-bridge University Press, Cambridge (1994)
36. Windeler, A., Sydow, J.: Project Networks and Changing Industry Practices Collabo-rative Content Production in the German Television Industry. Org. Stud. 22(6), 1035–1060 (2001)
SOCNET 2018, February 28, 2018 43

Preferential Attachment in Social Media
The Case of Nico Nico Douga
Johannes Putzke1 and Hideaki Takeda21 University of Bamberg,
An der Weberei 5, 96047 Bamberg, Germany2 National Institute of Informatics (NII)2-1-2, Hitotsubashi, Chiyoda-ku, Tokyo, 101-8430, Japan
Abstract. In the examination of evolving complex networks, the analysis
of preferential attachment is a core research problem. However, the re-
sults of studies that examine whether preferential attachment operates
in social media networks are conflicting. On the one hand, preferential
attachment generally has been found to be a stable predictor of network
evolution. On the other hand, IS researchers question the applicabil-
ity of the preferential attachment hypothesis to social media networks.
This study shows that preferential attachment also operates on Nico
Nico Douga, a Japanese video sharing service similar to Youtube with
more than 20 million registered users. However, this study also reveals
that the attachment kernel differs substantially from the classically as-
sumed log-linear form, when estimating the kernel with nonparametric
maximum likelihood estimation (PAFit).
Key words: PAFit, preferential attachment, social media, social network
analysis
Introduction
Social media radically have changed the way in which we create and consume con-
tent. During content creation and consumption we are embedded in networks of
peers that leave their digital traces on the social media platforms that we use. Con-
sequently, a number of recent papers applies methods from network science for
the examination of social media, e.g. [1]. In this context, authors particularly tried
SOCNET 2018, February 28, 2018 45
to answer the research question what might be a goodmodel to describe the evolu-
tion of a network. As a general network formation model, preferential attachment
(PA) [2] has been found to be a stable predictor for network evolution. PA means
that newly arriving nodes in a network connect with a higher probability to those
nodes in the network that already have a large number of connections. However,
since recent studies by information systems (IS) scholars [1][3] could not find evi-
dence for PA in social media networks, these scholars question the applicability of
the PA hypothesis to networks in social media. On the other hand, a recent study
about friendship networks on the social media website Flickr [4] provides evidence
for PA in social media networks, but not in the classically assumed log-linear form
of the attachment kernel. Therefore, in this paper we try to shed further light on the
question whether PA operates in social media networks. Particularly, we intend to
examine whether [4]’s findings can be replicated on a data set from the social me-
dia website Nico Nico Douga (NND). NND is a Japanese video sharing platform
similar to Youtube. As of 2014, it has more than 20 million registered users [5].
However, NND has a unique feature that differentiates it from Youtube. In NND,
users can add time-stamped comments to the videos. These comments are then
overlaid to the original video when playing back the video. This commenting fea-
ture made NND famous for a new form of content co-creation. In this form of
content co-creation, song writers and (3D) illustrates collaborate and create music
videos. In doing so, they comment on their videos and (re-) use some content (e.g.
music or graphics) from each other. When creating content and using the con-
tent of other videos, the creators frequently attribute credits to the videos which
they used. In such a way a network of co-creation emerges. We analyze the PA
hypothesis for this evolving co-creation network.
The remainder of this paper will be structured as follows. The next section, Back-
ground, will be structured into two sub-sections. In the first sub-section, we re-
view the related literature about the PA hypothesis. In the second sub-section, we
present [4]’s nonparametric maximum likelihood (ML)-based preferential attach-
ment kernel estimationmethod (PAFit) as well as its application to a Flickr dataset.
In the next section, Replication I, we describe theNND data set used for replicating
the results of [4]’s study, the procedures used in the replication, as well as the com-
parative results of the application of PAFit to our data set (see also [6]). Since we
could replicate [4]’s results with the NND data set, we performed another replica-
46 International Workshop of MMB 2018
tion with a publicly available social media data from the Website Digg.3 This repli-
cation will be presented in the section “Replication II”. Finally, the paper closes
with a short Discussion section.
Background
. The Preferential Attachment Hypothesis
The “preferential attachment hypothesis” has been examined in the literature un-
der various names such as the “Yule distribution/process” [7], the “Mathew effect”
[8], or “cumulative advantage” [9].4 It states that subjects with an attribute X will
acquire new units of this attribute X according to howmany units of this attribute
they already have. In network science, “preferential attachment is generally un-
derstood as a mechanism where newly arriving nodes have a tendency to con-
nect with already-well connected nodes” [12]. Most researchers attribute the name
“preferential attachment hypothesis” to [2] who published a highly influential pa-
per in Science about the subject.5 Considering the vast amount of papers on PA,
it would not be meaningful to provide a complete (interdisciplinary) literature re-
view on this subject at this place.6 Rather, an appropriate literature review focusses
on the groundbreaking works about PA (e.g., [13,14]), as well as on the works of
IS researchers who conducted network studies and pointed out to the (missing)
PA process in the context of social media. Concerning the groundbreaking works
about PA, the reader is referred to the literature reviews in [15] and [16], as well
as the corresponding sections in the work by [4]. Concerning the works by IS re-
searchers, there were some interesting findings concerning PA in social media.
For example, [3] could not find evidence for the PA hypothesis examining data
from 28 online communities. Also [1] do not find evidence for PA examining en-
terprise social media networks such as an online social networking platform. On
3 http://digg.com/, accessed on 02/28/2017.4 For the history of the PA hypothesis see also [10] and [11]. The interested reader isalso referred to a lecture by Aaron Clauset (available at http://tuvalu.santafe.edu/~aaronc/courses/5352/fall2013/csci5352_2013_L13.pdf, accessed on04/12/2017) in which Clauset explains the PA hypothesis and its history in detail.
5 The paper has been cited more than 25,000 times as of a google scholar search on04/17/2017.
6 For example, a google scholar search for the term “preferential attachment” providedmore than 24,000 search results as on 04/17/2017.
SOCNET 2018, February 28, 2018 47
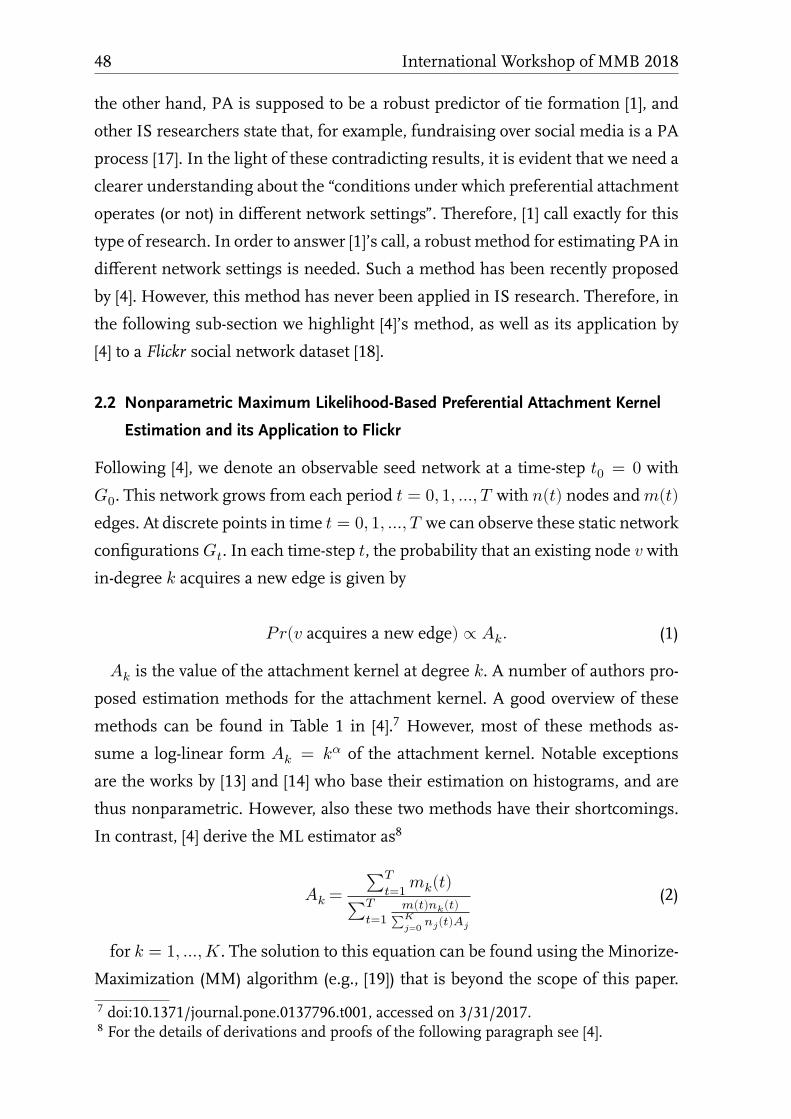
the other hand, PA is supposed to be a robust predictor of tie formation [1], and
other IS researchers state that, for example, fundraising over social media is a PA
process [17]. In the light of these contradicting results, it is evident that we need a
clearer understanding about the “conditions under which preferential attachment
operates (or not) in different network settings”. Therefore, [1] call exactly for this
type of research. In order to answer [1]’s call, a robust method for estimating PA in
different network settings is needed. Such a method has been recently proposed
by [4]. However, this method has never been applied in IS research. Therefore, in
the following sub-section we highlight [4]’s method, as well as its application by
[4] to a Flickr social network dataset [18].
. Nonparametric Maximum Likelihood-Based Preferential Attachment Kernel
Estimation and its Application to Flickr
Following [4], we denote an observable seed network at a time-step �0 = 0 with�0. This network grows from each period � = 0, 1, …, � with �(�) nodes and�(�)edges. At discrete points in time � = 0, 1, …, � we can observe these static networkconfigurations��. In each time-step �, the probability that an existing node � within-degree � acquires a new edge is given by��(� acquires a new edge) ∝ ��. (1)�� is the value of the attachment kernel at degree �. A number of authors pro-posed estimation methods for the attachment kernel. A good overview of these
methods can be found in Table 1 in [4].7 However, most of these methods as-
sume a log-linear form �� = �� of the attachment kernel. Notable exceptionsare the works by [13] and [14] who base their estimation on histograms, and are
thus nonparametric. However, also these two methods have their shortcomings.
In contrast, [4] derive the ML estimator as8
�� = ∑��=1 ��(�)∑��=1 �(�)��(�)∑��=0 ��(�)�� (2)
for � = 1, …, �. The solution to this equation can be found using the Minorize-Maximization (MM) algorithm (e.g., [19]) that is beyond the scope of this paper.
7 doi:10.1371/journal.pone.0137796.t001, accessed on 3/31/2017.8 For the details of derivations and proofs of the following paragraph see [4].
48 International Workshop of MMB 2018
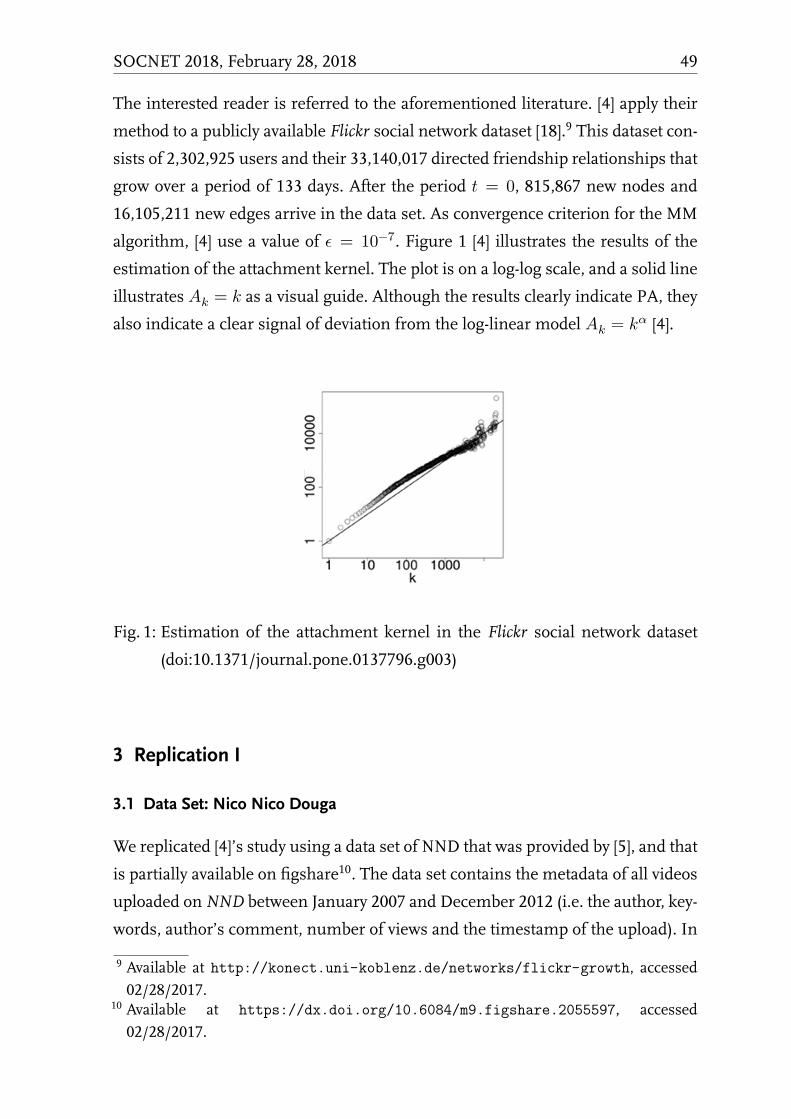
The interested reader is referred to the aforementioned literature. [4] apply their
method to a publicly available Flickr social network dataset [18].9 This dataset con-
sists of 2,302,925 users and their 33,140,017 directed friendship relationships that
grow over a period of 133 days. After the period � = 0, 815,867 new nodes and16,105,211 new edges arrive in the data set. As convergence criterion for the MM
algorithm, [4] use a value of � = 10−7. Figure 1 [4] illustrates the results of theestimation of the attachment kernel. The plot is on a log-log scale, and a solid line
illustrates �� = � as a visual guide. Although the results clearly indicate PA, theyalso indicate a clear signal of deviation from the log-linear model �� = �� [4].
Fig. 1: Estimation of the attachment kernel in the Flickr social network dataset
(doi:10.1371/journal.pone.0137796.g003)
Replication I
. Data Set: Nico Nico Douga
We replicated [4]’s study using a data set of NND that was provided by [5], and that
is partially available on figshare10. The data set contains the metadata of all videos
uploaded onNND between January 2007 and December 2012 (i.e. the author, key-
words, author’s comment, number of views and the timestamp of the upload). In
9 Available at http://konect.uni-koblenz.de/networks/flickr-growth, accessed02/28/2017.
10 Available at https://dx.doi.org/10.6084/m9.figshare.2055597, accessed02/28/2017.
SOCNET 2018, February 28, 2018 49
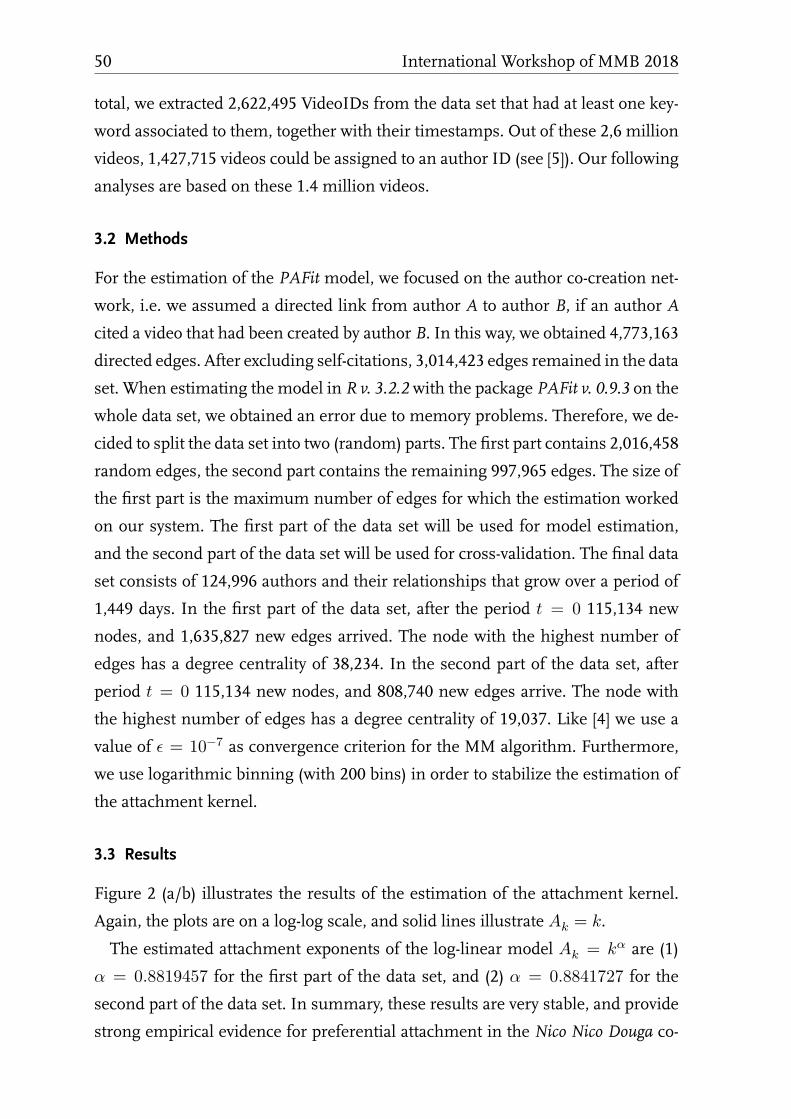
total, we extracted 2,622,495 VideoIDs from the data set that had at least one key-
word associated to them, together with their timestamps. Out of these 2,6 million
videos, 1,427,715 videos could be assigned to an author ID (see [5]). Our following
analyses are based on these 1.4 million videos.
. Methods
For the estimation of the PAFit model, we focused on the author co-creation net-
work, i.e. we assumed a directed link from author A to author B, if an author A
cited a video that had been created by author B. In this way, we obtained 4,773,163
directed edges. After excluding self-citations, 3,014,423 edges remained in the data
set. When estimating the model in R v. 3.2.2 with the package PAFit v. 0.9.3 on the
whole data set, we obtained an error due to memory problems. Therefore, we de-
cided to split the data set into two (random) parts. The first part contains 2,016,458
random edges, the second part contains the remaining 997,965 edges. The size of
the first part is the maximum number of edges for which the estimation worked
on our system. The first part of the data set will be used for model estimation,
and the second part of the data set will be used for cross-validation. The final data
set consists of 124,996 authors and their relationships that grow over a period of
1,449 days. In the first part of the data set, after the period � = 0 115,134 newnodes, and 1,635,827 new edges arrived. The node with the highest number of
edges has a degree centrality of 38,234. In the second part of the data set, after
period � = 0 115,134 new nodes, and 808,740 new edges arrive. The node withthe highest number of edges has a degree centrality of 19,037. Like [4] we use a
value of � = 10−7 as convergence criterion for the MM algorithm. Furthermore,
we use logarithmic binning (with 200 bins) in order to stabilize the estimation of
the attachment kernel.
. Results
Figure 2 (a/b) illustrates the results of the estimation of the attachment kernel.
Again, the plots are on a log-log scale, and solid lines illustrate �� = �.The estimated attachment exponents of the log-linear model �� = �� are (1)� = 0.8819457 for the first part of the data set, and (2) � = 0.8841727 for the
second part of the data set. In summary, these results are very stable, and provide
strong empirical evidence for preferential attachment in the Nico Nico Douga co-
50 International Workshop of MMB 2018
Fig. 2: (a/b).Estimation of the attachment kernel in the NND data set (first part,
second part)
creation network. Nevertheless, like Pham et al. [4] we observe a deviance from
the log-linear functional form of the attachment kernel, particularly in the high
degree region.
Replication II
Since we could replicate [4]’s results with the NND data set, we performed an-
other replication with a publicly available social media data. This data set com-
prises user interactions on the social media websiteDigg between 10/28/2008 and
11/12/2008.11 In the data set, each node reflects a user in the network, and an edge
between user A and user B reflects that user A replied to user B. The data set con-
sists of 30,398 nodes, and 87,627 edges between them. Concerning the evolution of
the network, there was only one edge with a timestamp 10/28/2008 in the dataset.
Therefore, we assumed that the observable seed network at a time-step �0 = 0comprises all edges with a time-stamp ≤ 10/29/2008. During the evolution of the
network, 30,382 new nodes and 59,655 new edges arrived. Since the maximum
degree of the nodes was rather low (243), we did not apply logarithmic binning.
Figure 3 displays the estimation results. The estimated attachment exponent
has a value of � = 0.3958123. Again, the results indicate PA, but also not in log-linear form. The low value of the attachment exponent � is an interesting finding,particularly since the social news website Digg is used for professional as well as
for private use.
11 Available at http://konect.uni-koblenz.de/networks/munmun_digg_reply, ac-cessed 02/28/2017.
SOCNET 2018, February 28, 2018 51
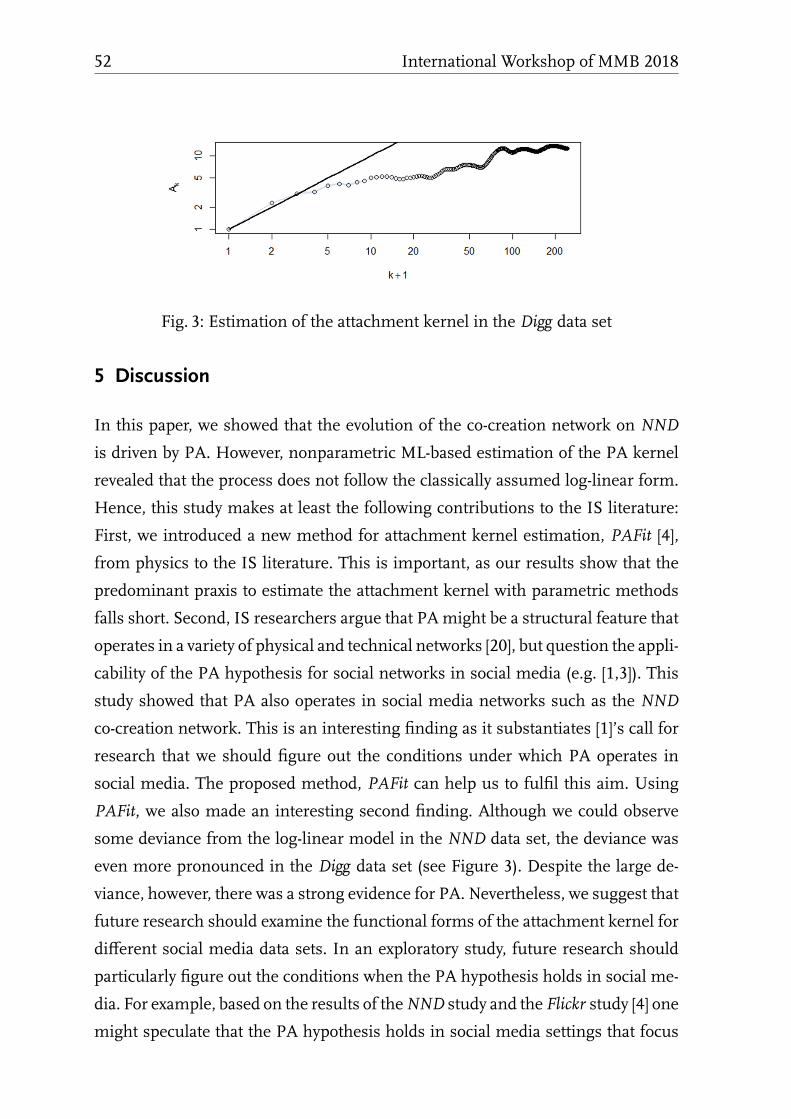
Fig. 3: Estimation of the attachment kernel in the Digg data set
Discussion
In this paper, we showed that the evolution of the co-creation network on NND
is driven by PA. However, nonparametric ML-based estimation of the PA kernel
revealed that the process does not follow the classically assumed log-linear form.
Hence, this study makes at least the following contributions to the IS literature:
First, we introduced a new method for attachment kernel estimation, PAFit [4],
from physics to the IS literature. This is important, as our results show that the
predominant praxis to estimate the attachment kernel with parametric methods
falls short. Second, IS researchers argue that PAmight be a structural feature that
operates in a variety of physical and technical networks [20], but question the appli-
cability of the PA hypothesis for social networks in social media (e.g. [1,3]). This
study showed that PA also operates in social media networks such as the NND
co-creation network. This is an interesting finding as it substantiates [1]’s call for
research that we should figure out the conditions under which PA operates in
social media. The proposed method, PAFit can help us to fulfil this aim. Using
PAFit, we also made an interesting second finding. Although we could observe
some deviance from the log-linear model in the NND data set, the deviance was
even more pronounced in the Digg data set (see Figure 3). Despite the large de-
viance, however, there was a strong evidence for PA. Nevertheless, we suggest that
future research should examine the functional forms of the attachment kernel for
different social media data sets. In an exploratory study, future research should
particularly figure out the conditions when the PA hypothesis holds in social me-
dia. For example, based on the results of theNND study and the Flickr study [4] one
might speculate that the PA hypothesis holds in social media settings that focus
52 International Workshop of MMB 2018
on the creation of artistic goods (such as photos and videos), which people mainly
use during their free time. On the other hand, based on the analyses of technology
related discussion forums [3] and enterprise social media platforms [1] one might
speculate that the PA hypothesis does not hold in social media settings that focus
on increasing productivity (in enterprises). However, these conjectures still have
to be substantiated by examining more social media data sets. We hope that this
study will lie the basis for more work into this direction.
Acknowledgments. Thisworkwas supported by a fellowshipwithin the FITweltweit
programme of the German Academic Exchange Service (DAAD). The authors
thank Remy Cazabet for the provision of the Nico Nico Douga data set.
References
1. Kim, Y., Kane, G.: Online Tie Formation in Enterprise Social Media. In: ICIS 2015Proceedings. (2015)
2. Barabási, A.-L., Albert, R.: Emergence of Scaling in Random Networks. Science 286,509–512 (1999)
3. Johnson, S.L., Faraj, S., Kudaravalli, S.: Emergence of Power Laws in Online Com-munities: The Role of Social Mechanisms and Preferential Attachment. Mis Quart38, 795–808 (2014)
4. Pham, T., Sheridan, P., Shimodaira, H.: PAFit: A Statistical Method for MeasuringPreferential Attachment in Temporal Complex Networks. Plos One 10, 1–18 (2015)
5. Cazabet, R., Takeda, H.: Understandingmassive artistic cooperation: the case of NicoNico Douga. Social Network Analysis and Mining 6, 1–12 (2016)
6. Niederman, F., March, S.: Reflections on Replications. AIS Transactions on Replica-tion 1, paper 7, pp.1–16 (2015)
7. Simon, H.A.: On a class of skew distribution functions. Biometrika 42, 425–440(1955)
8. Merton, R.K.: The Matthew effect in science. Science 159, 56–63 (1968)9. Price, D.d.S.: A general theory of bibliometric and other cumulative advantage pro-cesses. Journal of the American Society for Information Science 27, 292–306 (1976)
10. Newman, M.E.J.: Networks: An Introduction. Oxford University Press Inc., NewYork, United States (2010)
11. Barabási, A.-L.: Network science. Cambridge University Press (2016)12. Kunegis, J., Blattner, M., Moser, C.: Preferential attachment in online networks: Mea-
surement and explanations. In: Proceedings of the 5th Annual ACM Web ScienceConference, pp. 205–214. (2013)
13. Newman, M.E.J.: Clustering and preferential attachment in growing networks. PhysRev E 64, 025102-1–025102-4 (2001)
SOCNET 2018, February 28, 2018 53
14. Jeong, H., Neda, Z., Barabasi, A.L.: Measuring preferential attachment in evolvingnetworks. Europhys Lett 61, 567–572 (2003)
15. Barabasi, A.L.: Scale-Free Networks: A Decade and Beyond. Science 325, 412–413(2009)
16. Hidalgo, C.A.: Disconnected, fragmented, or united? a trans-disciplinary review ofnetwork science. Applied Network Science 1, 6 (2016)
17. Tan, X., Lu, Y., Tan, Y.: An Examination of Social Comparison Triggered by HigherDonation Visibility over Social Media Platforms. In: ICIS 2016 Proceedings. (2016)
18. Mislove, A., Koppula, H.S., Gummadi, K.P., Druschel, P., Bhattacharjee, B.: Growthof the flickr social network. In: Proceedings of the First Workshop on Online SocialNetworks, pp. 25–30. (2008)
19. Hunter, D.R., Lange, K.: A tutorial on MM algorithms. Am Stat 58, 30–37 (2004)20. Faraj, S., Kudaravalli, S., Wasko, M.: Leading Collaboration in Online Communities.
Mis Quart 39, 393–412 (2015)
54 International Workshop of MMB 2018
Modelling Group Dynamics in Epidemic Opinion
Propagation
Dieter Fiems
Ghent University, Department of Telecommunications and Information ProcessingSt-Pietersnieuwstraat 41, 9000 Gent, Belgium
http://telin.ugent.be
Abstract. Motivated by weblogs and discussion forums, epidemic opin-
ion propagation on affiliation networks is investigated. An affiliation
network is a bi-partite graph describing the connections between in-
dividuals and their affiliations. In contrast to epidemics on complex
networks, the epidemic spreading process in the current setting is not
the consequence of pairwise interactions among individuals but of a
group dynamic. We derive a Markov model for the epidemic process
and its fluid limit obtained by sending the population size to infinity
while keeping the number of affiliations constant. This results in a set
of modified SIR-like ordinary differential equations. Different types of
group dynamics are studied numerically and the accuracy of the fluid
limit is verified by simulation.
Introduction
With the emergence of social network services (SNS), the speed and outreach of
information diffusion has reached unprecedented heights. In just over a decade,
SNS’s have attracted millions of users, many of them using these services on a
daily basis [1]. A typical SNS allows users to create a profile and make connec-
tions to other users in the social network. A profile is a unique page where one
can “type oneself into being” [2] and can be public or semi-public. SNS users can
send private messages to their connections, inform their connections when their
profile is updated, or pass on messages received from their connections, etc. Such
functionality greatly facilitates quick dissemination of information.
This paper studies epidemic-like opinion propagation on social networks.While
initial epidemiological models assumed well-mixed populations, it has been in-
SOCNET 2018, February 28, 2018 55
creasingly recognised that topological properties of the network of members of
the population and their connections greatly affect the epidemic spreading pro-
cess [3]. The interplay between topology and dynamics is one of the most pressing
challenges in the development of network science [4] and runs in parallel with
the increased research effort on complex networks [5]. Indeed, the large amount
of scientific effort devoted to this subject [6, 7] has made it evident that dynam-
ical processes (like epidemics) taking place on top of a complex network can be
strongly influenced by the topological features of the network, especially in the
case of scale-free networks, in which the degree distribution (the degree of a node
is the number of nodes it is connected to) follows a power law [8].
In contrast to previous studies on epidemic processes on complex networks,
we adopt the affiliation network (AN) paradigm [9], which was studied for SNSs
in [10] and [11]. An AN describes the connections between individuals and their
affiliations. An affiliation can be a shared interest or personal affinity, a common
collective activity, etc. [12]. The AN is a bi-partite graph of individuals and affil-
iations. Such a graph consists of affiliations and individuals and only intercon-
nections between individuals and affiliations are allowed. As opposed to standard
complex networks, ANs allow for a considerably richer and a more intricate inter-
action between individuals. Whereas interaction between individuals is explicitly
pairwise in complex networks, multiple individuals can interact jointly by sharing
an affiliation in an AN.
The effects of such non-pairwise interaction is the subject of the present study.
Borrowing from epidemiological terminology, it is assumed that the state of any
individual is either susceptible (S), infected (I) or recovered (R). Such epidemi-
ological models are usually referred to as SIR-type models. The SIR model as-
sumes that an individual’s state goes from susceptible to infected to recovered,
an infection being the consequence from contact with infected individuals. This
process can be directly reformulated in terms of the propagation of opinions on
a particular topic: a susceptible individual has yet to form an opinion on a certain
topic, whereas infected or opinionated individuals do have such an opinion and
spread their opinion to other individuals. Finally, individuals loose their interest
in the topic after some time and stop spreading their opinion, which corresponds
to recovery in the epidemiological context [13]. While we retain the classical as-
sumption of Markovian SIRmodels that individuals recover after an exponentially
56 International Workshop of MMB 2018
distributed amount of time, we modify the infection process as to reflect “group
dynamics” associated with affiliations. We adopt the term “group dynamics” as in-
troduced by Lewin [14] as the spreading process is not simply the result of the sum
of individual interactions [15]. In particular, we assume that affiliations infect their
members with a rate which is a generic function of the states of the affiliation’s
members. That is, if an affiliation has �� susceptible and � infected members,
the affiliation’s susceptible members get infected with rate (��, � ), being a
generic function. Obviously, an individual can have multiple affiliations, and it
is assumed that infection by the different affiliations are independent processes,
such that the infection rate of an individual is the sum of the infection rates of this
individual’s affiliations.
The remainder of this paper is organised as follows. The epidemicMarkovmodel
and the notational conventions of the paper are introduced in the next section. The
fluid limit of the Markov model, which is obtained by increasing the population
size while keeping the number of affiliations constant, is discussed in section 3
and numerically investigated in section 4. Finally, conclusions are drawn in sec-
tion 5.
Markovian Epidemic Model
We consider epidemic opinion propagation on ANs. An AN is a bipartite graph,
whose vertices are divided into affiliations and individuals and whose edges con-
nect affiliations with individuals.
Let � be the set of all affiliations and let �̂ = �(�) be the power set of �, thatis �̂ is the set of all subsets of �. Further, let � be the set of individuals. Each
individual can have multiple affiliations, for an individual � ∈ �, let �(�) ∶ � → �̂be the set of this individual’s affiliations. The mapping � induces a partition of�, all individuals having the same affiliations in each subset of the partition. For� ∈ �̂, let � = {� ∈ �, �(�) = �} be the corresponding subset of � and let� = |� | be the number of individuals in this subset. For any set�, |�| denotesits cardinality. We may exclude subsets � with � = 0 from further analysis.
Therefore, let � = {� ∈ �̂ ∶ � > 0}.
SOCNET 2018, February 28, 2018 57
With a slight abuse of notation, for any affiliation � ∈ �, let �� be the set ofindividuals having affiliation �, �� = {� ∈ � ∶ � ∈ �(�)}, and let �� = |��|be the number of individuals in this set. Note that for �1 ≠ �2 the intersection of��1 and��2 may be non-empty as individuals may have affiliations �1 and �2.We adopt a Markovian SIR-type epidemic process. At any time, an individual is
in one out of three possible states: susceptible, infected or recovered. Hence, the
individuals can also be partitioned into susceptible, infected and recovered indi-
viduals. Let �( ), ℐ( ) and ℛ( ) be the sets of susceptible, infected and recoveredindividuals at time , and let� ( ) = |�( ) ∪ � | , � ( ) = |ℐ( ) ∪ � | , � ( ) = |ℛ( ) ∪ � |.Individuals in the same partition � ∈ � are indiscernible. Moreover, affilia-
tions inherit their state from the state of their members. Therefore, the state of
the epidemic process is completely described by the number of susceptible and
infected individuals in the different subsets � ∈ �. Let �( ) = [� ( )] ∈� and�( ) = [� ( )] ∈� be the vectors whose elements represent the number of suscep-tible and infected individuals in the different partitions at time . Here and in the
remainder, we index vectors by the elements of � for ease of presentation. More-over, let �(�, �� ) = � [�( ) = �, �( ) = �], for � = [ ] ∈� and � = [� ] ∈�, suchthat (�, �) ∈ �. Here� denotes the state space of the Markov chain,� = {([ ] ∈�, [� ] ∈�) ∶ , � ∈ , + � ≤ � }.For � ∈ � and given state vectors � and �, let �(�) and ��(�) be the fraction of
susceptible and infected individuals that have affiliation �,��(�) = 1�� ∑∈�,�∈ � , �(�) = 1�� ∑∈�,�∈ .Affiliation � ∈ � infects its susceptible members with a rate �( �(�), ��(�)), �being a generic function. The infection rate experienced by individuals in the sub-
set � ∈ � therefore equals, (�, �) = ∑�∈ �( �(�), ��(�)) .
58 International Workshop of MMB 2018
Let be the recovery rate of the individuals, the Chapman-Kolmogorov equations
are then given by,�� �(�, �� ) = ∑∈� �(� + � , � − � � ) (� + � , � − � )( + 1)+ ∑∈� �(�, � + � � ) (� + 1) − �(�, �� ) ∑∈� ( � + (�, �) ) ,where we set �(�, �� ) = 0 for (�, �) ∉ � to simplify notation. Moreover � is
a vector of zeros apart from the �th element which equals 1. The first term on
the right-hand side of the former expression corresponds to an infection of an
individual in one of the sets � ∈ �. The second term corresponds to having a
recovery in these different sets.
Fluid Limit
Due to the considerable size of the state space �, even for modest population
sizes and a modest number of affiliations, direct computation of either transient
or stationary distributions is quite forbidding. As we are mainly interested in the
dynamics when the population is large, we focus on the fluid limit of the process.
The present study scales the size of the population, while keeping the number of
affiliations constant. Let ℱ be the infinitesimal generator of the Markov process
above, we then have,ℱℎ(�, �) = ∑∈�[ℎ(�−� , �+� ) − ℎ(�, �)] (�, �) + [ℎ(�, �−� ) − ℎ(�, �)] � .We now consider a sequence of Markov chains with generatorsℱ� such that thenumber of individuals is � for the � th Markov chain, thereby equally scaling� for the different sets �; set � = � �→∞ � �−1. We track the fractionsof populations, such that components of the state space �� of the � th Markovchain live on a lattice with step size 1/� , the unit vectors having size 1/� as well.
In contrast, the transition rates increase by � as we translate from population
fractions to population sizes. Setting � ≐ 1/� , we get the following generator:ℱ�−1ℎ(�, �) = �−1 ∑∈�[ℎ(� − �� , � + �� ) − ℎ(�, �)] (�−1�, �−1�)+ �−1 ∑∈�[ℎ(�, � − �� ) − ℎ(�, �)] � .
SOCNET 2018, February 28, 2018 59
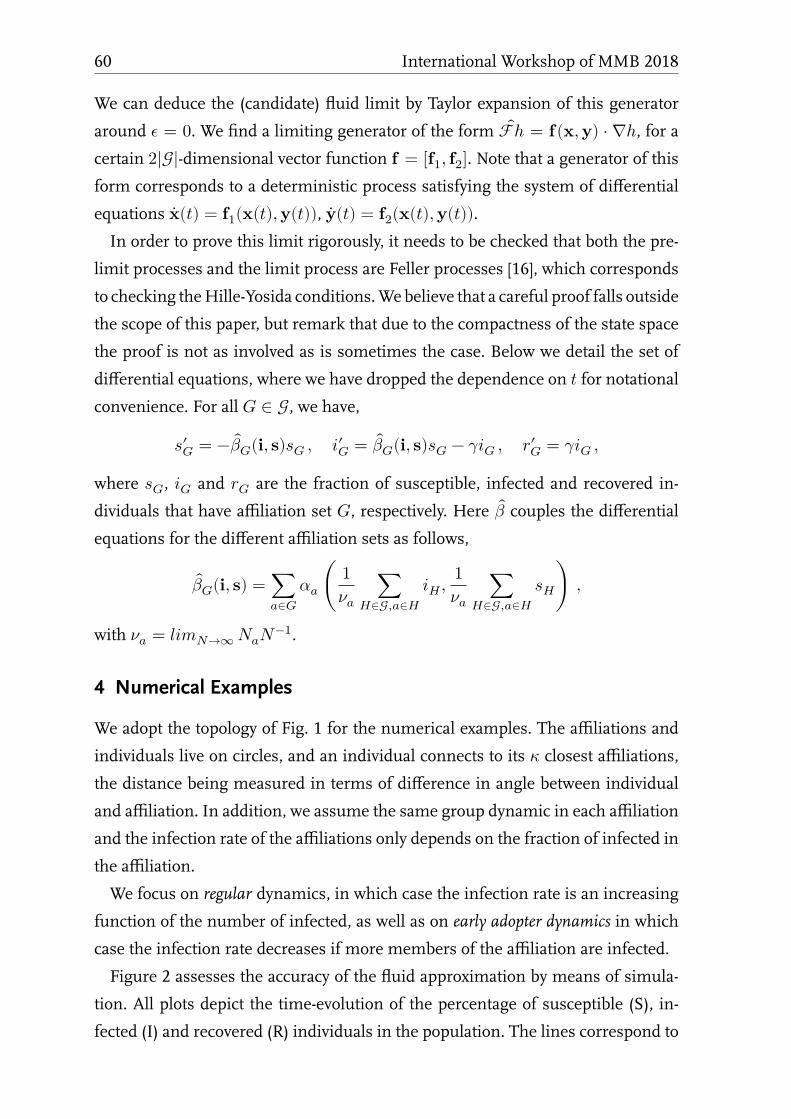
We can deduce the (candidate) fluid limit by Taylor expansion of this generator
around � = 0. We find a limiting generator of the form ̂ℱℎ = �(�, �) ⋅ ∇ℎ, for acertain 2|�|-dimensional vector function � = [�1, �2]. Note that a generator of thisform corresponds to a deterministic process satisfying the system of differential
equations �̇( ) = �1(�( ), �( )), �̇( ) = �2(�( ), �( )).In order to prove this limit rigorously, it needs to be checked that both the pre-
limit processes and the limit process are Feller processes [16], which corresponds
to checking theHille-Yosida conditions.We believe that a careful proof falls outside
the scope of this paper, but remark that due to the compactness of the state space
the proof is not as involved as is sometimes the case. Below we detail the set of
differential equations, where we have dropped the dependence on for notational
convenience. For all � ∈ �, we have,′ = − ̂ (�, �) , �′ = ̂ (�, �) − � , ′ = � ,where , � and are the fraction of susceptible, infected and recovered in-
dividuals that have affiliation set �, respectively. Here ̂ couples the differentialequations for the different affiliation sets as follows,̂ (�, �) = ∑�∈ � ( 1�� ∑∈�,�∈ � , 1�� ∑∈�,�∈ ) ,with �� = � �→∞ ���−1.
Numerical Examples
We adopt the topology of Fig. 1 for the numerical examples. The affiliations and
individuals live on circles, and an individual connects to its � closest affiliations,the distance being measured in terms of difference in angle between individual
and affiliation. In addition, we assume the same group dynamic in each affiliation
and the infection rate of the affiliations only depends on the fraction of infected in
the affiliation.
We focus on regular dynamics, in which case the infection rate is an increasing
function of the number of infected, as well as on early adopter dynamics in which
case the infection rate decreases if more members of the affiliation are infected.
Figure 2 assesses the accuracy of the fluid approximation by means of simula-
tion. All plots depict the time-evolution of the percentage of susceptible (S), in-
fected (I) and recovered (R) individuals in the population. The lines correspond to
60 International Workshop of MMB 2018
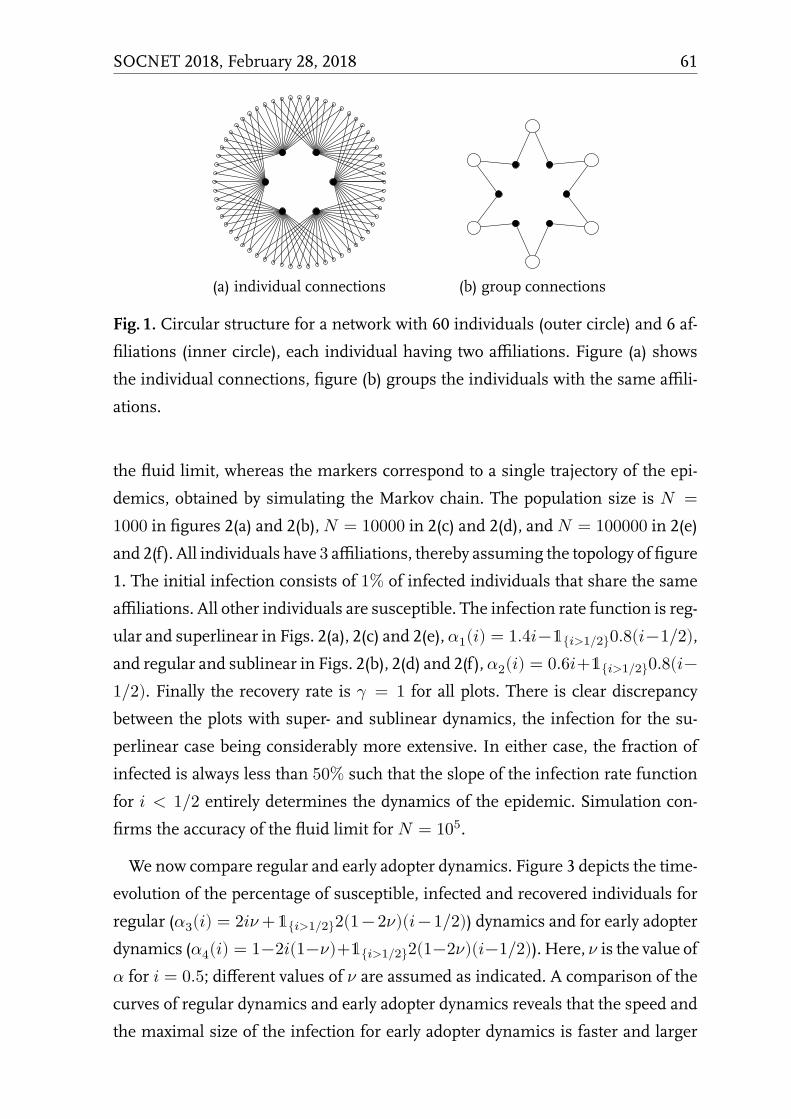
(a) individual connections (b) group connections
Fig. 1. Circular structure for a network with 60 individuals (outer circle) and 6 af-
filiations (inner circle), each individual having two affiliations. Figure (a) shows
the individual connections, figure (b) groups the individuals with the same affili-
ations.
the fluid limit, whereas the markers correspond to a single trajectory of the epi-
demics, obtained by simulating the Markov chain. The population size is � =1000 in figures 2(a) and 2(b),� = 10000 in 2(c) and 2(d), and� = 100000 in 2(e)and 2(f). All individuals have 3 affiliations, thereby assuming the topology of figure1. The initial infection consists of 1% of infected individuals that share the same
affiliations. All other individuals are susceptible. The infection rate function is reg-
ular and superlinear in Figs. 2(a), 2(c) and 2(e), 1(�) = 1.4�−1{�>1/2}0.8(�−1/2),and regular and sublinear in Figs. 2(b), 2(d) and 2(f), 2(�) = 0.6�+1{�>1/2}0.8(�−1/2). Finally the recovery rate is = 1 for all plots. There is clear discrepancybetween the plots with super- and sublinear dynamics, the infection for the su-
perlinear case being considerably more extensive. In either case, the fraction of
infected is always less than 50% such that the slope of the infection rate function
for � � 1/2 entirely determines the dynamics of the epidemic. Simulation con-firms the accuracy of the fluid limit for � = 105.We now compare regular and early adopter dynamics. Figure 3 depicts the time-
evolution of the percentage of susceptible, infected and recovered individuals for
regular ( 3(�) = 2�� +1{�>1/2}2(1 − 2�)(� − 1/2)) dynamics and for early adopterdynamics ( 4(�) = 1−2�(1−�)+1{�>1/2}2(1−2�)(�−1/2)). Here, � is the value offor � = 0.5; different values of � are assumed as indicated. A comparison of the
curves of regular dynamics and early adopter dynamics reveals that the speed and
the maximal size of the infection for early adopter dynamics is faster and larger
SOCNET 2018, February 28, 2018 61
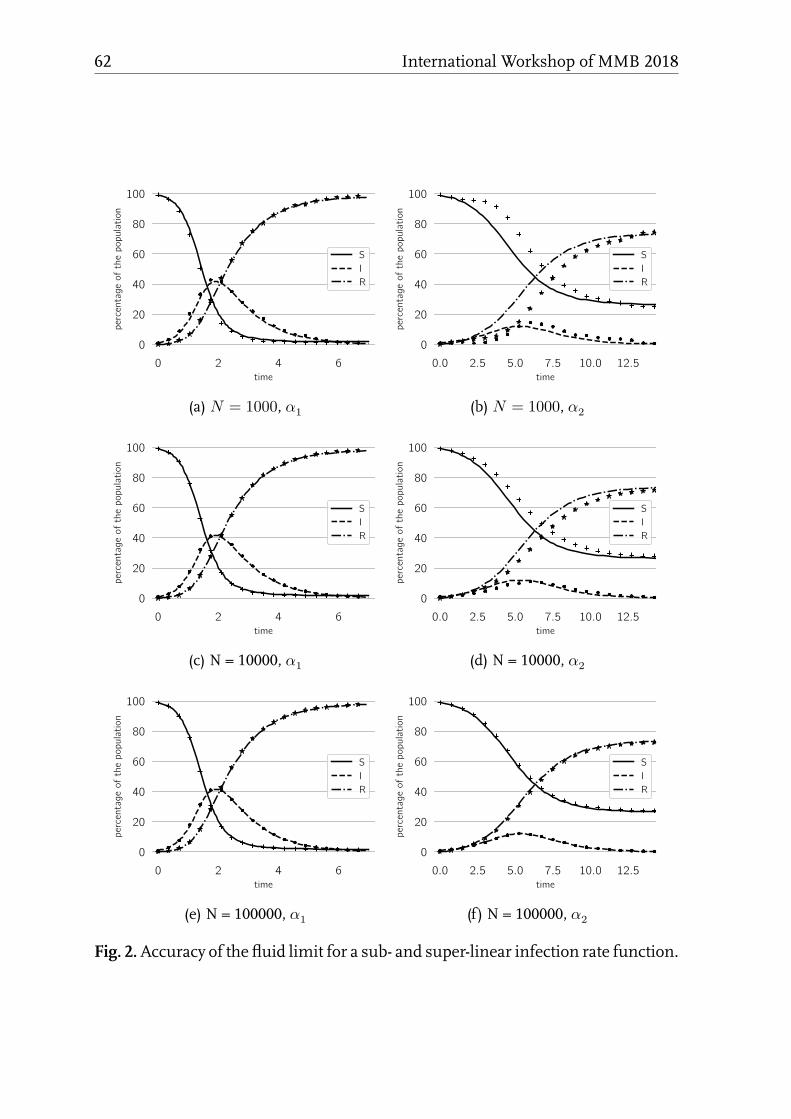
0 2 4 6
time
0
20
40
60
80
100
perc
enta
ge
ofth
epopula
tion
S
I
R
(a) � = 1000, 10.0 2.5 5.0 7.5 10.0 12.5
time
0
20
40
60
80
100
perc
enta
ge
ofth
epopula
tion
S
I
R
(b) � = 1000, 2
0 2 4 6
time
0
20
40
60
80
100
perc
enta
ge
ofth
epopula
tion
S
I
R
(c) N = 10000, 10.0 2.5 5.0 7.5 10.0 12.5
time
0
20
40
60
80
100
perc
enta
ge
ofth
epopula
tion
S
I
R
(d) N = 10000, 2
0 2 4 6
time
0
20
40
60
80
100
perc
enta
ge
ofth
epopula
tion
S
I
R
(e) N = 100000, 10.0 2.5 5.0 7.5 10.0 12.5
time
0
20
40
60
80
100
perc
enta
ge
ofth
epopula
tion
S
I
R
(f) N = 100000, 2Fig. 2.Accuracy of the fluid limit for a sub- and super-linear infection rate function.
62 International Workshop of MMB 2018
0 2 4 6 8 10
time
0
20
40
60
80
100
perc
enta
ge
susc
eptible
ν = 0.3
ν = 0.4
ν = 0.5
ν = 0.6
ν = 0.7
(a) regular, 3, susceptible0 1 2 3 4
time
0
20
40
60
80
100
perc
enta
ge
susc
eptible
ν = 0.3
ν = 0.4
ν = 0.5
ν = 0.6
ν = 0.7
(b) early adopters, 4, susceptible
0 2 4 6 8 10
time
0
10
20
30
40
50
perc
enta
ge
infe
cte
d
ν = 0.3
ν = 0.4
ν = 0.5
ν = 0.6
ν = 0.7
(c) regular, 3, infected0 1 2 3 4
time
0
10
20
30
40
50
perc
enta
ge
infe
cte
d
ν = 0.3
ν = 0.4
ν = 0.5
ν = 0.6
ν = 0.7
(d) early adopters, 4, infected
0 2 4 6 8 10
time
0
20
40
60
80
100
perc
enta
ge
recovere
d
ν = 0.3
ν = 0.4
ν = 0.5
ν = 0.6
ν = 0.7
(e) regular, 3, recovered0 1 2 3 4
time
0
20
40
60
80
100
perc
enta
ge
recovere
d
ν = 0.3
ν = 0.4
ν = 0.5
ν = 0.6
ν = 0.7
(f) early adopters, 4, recoveredFig. 3. Regular dynamics versus early adopter dynamics for different values of �.
SOCNET 2018, February 28, 2018 63
than regular dynamics. This is not unexpected as the infection rate is larger at the
onset of the infection for early adopter dynamics.
Conclusion
We proposed an epidemic process on an affiliation network for modelling group
dynamics for opinion propagation on social networks. Opinions are spread from
one individual to another via shared affiliations: the opinions of the members of
an affiliation determine the spread of the opinions to the (non-infected) mem-
bers of the affiliation. We provided a continuous-time Markov process for SIR-like
propagation, and studied its fluid limit. That is, we scaled the Markov process by
sending number of individuals to infinity while keeping the number of affiliations
constant. By numerical examples, we showed that the fluid limit is accurate when
the number of individuals is sufficiently large, while the nature of the group dy-
namic can seriously affect spreading in the network.
Apart from the SIR epidemic, other epidemic models may apply to rumour
spreading as well. For example, if the SIS model is adopted, individuals alternate
between being susceptible and infected, i.e. between spreading and not spreading
their opinion. In the SEIRmodel, individuals are exposed before they are infected,
which introduces some time during which in individual has adopted the opinion,
but does not yet spread. We aim at developing similar mathematical tools for these
alternative epidemic processes on affiliation networks in the near future.
References
1. D.M. Boyd and N.B. Ellison. Social network sites: definition, history, and scholarship.Journal of Computer-Mediated Communication 13:210-230, 2008.
2. J. Sundén.Material Virtualities. New York: Peter Lang. 2003.3. K. Avrachenkov, K. De Turck, D. Fiems, and B.J. Prabhu. Information disseminationprocesses in directed social networks. InternationalWorkshop onModeling, AnalysisandManagement of Social Networks and their Applications (SOCNET).MMB&DFT2014, Bamberg, Germany, 2014.
4. M.E.J. Newman. Networks: An introduction. Oxford University Press, 2010.5. A.-L. Barabási and E. Bonabeau. Scale-free networks. Scientific American, 288:50-59,2003.
6. S.N. Dorogovtsev, A.V. Goltsev, and J.F.F. Mendes. Critical phenomena in complexnetworks. Reviews of Modern Physics 80: 1275-1335, 2008.
64 International Workshop of MMB 2018
7. A. Barrat,M. Barthélemy, andA. Vespignani.Dynamical processes on complex networks.Cambridge University Press, 2008.
8. A.-L. Barabási, R. Albert, H. Jeong, and G. Bianconi . Power-law distribution of theworld wide web. Science 287:2115a, 2000.
9. S. Lattanzi and D. Sivakumar, Affiliation networks. In: Proceedings of the 41st ACMSymposium on Theory of Computing, pp. 427-434, Maryland, USA, 2009.
10. E. Zheleva, H. Sharara, and L. Getoor. Co-evolution of social and affiliation networks.In: Proceedings of the 15th ACM SIGKDD international conference on Knowledgediscovery and data mining, pp. 1007-1016, Paris, France, 2009.
11. S. Ghosh, S. Saha, S. Srivastava, T. Krueger, N. Ganguly, and A. Mukherjee. Un-derstanding evolution of inter- group relationships using bipartite networks. IEEEJournal on Selected Areas in Communciations 31(9):584-594, 2013.
12. R.L. Breiger. Duality of persons and groups. Social Forces 53(2):181-190, 1974.13. E. De Cuypere, K. De Turck, S. Wittevrongel, D. Fiems. Opinion propagation in
bounded medium-sized populations. Performance Evaluation 99–100:1–15, 2016.14. K. Lewin. Frontiers in Group Dynamics: Concept, Method and Reality in Social Sci-
ence; Social Equilibria and Social Change.Human Relations 1:5–41, 1947.15. D.R. Forsyth. Group Dynamics. 6th ed. Wadsworth Publishing, 2013.16. S. N. Ethier and T. G. Kurtz. Markov processes. John Wiley & Sons, 1986.
SOCNET 2018, February 28, 2018 65

Towards a DDC-based Topic Network Model of Wikipedia
Tolga Uslu1⋆, Alexander Mehler1, Andreas Niekler2, and Daniel Baumartz11Goethe University, TextTechnology Lab,
Robert-Mayer-Straße 10, 60325 Frankfurt am Main, [email protected]
[email protected]://hucompute.org/2Leipzig University, Natural Language Processing Group
Augustusplatz 10, 04109 Leipzig, [email protected]
http://asv.informatik.uni-leipzig.de/
6bstract. This paper presents a network-theoretical approach to mod-
eling the semantics of large text networks. By example of the German
Wikipedia we demonstrate how to estimate the structuring of topics
focused by large corpora of natural language texts. Algorithms of this
sort are needed to implement distributional semantics of textual man-
ifestations in large online social networks. Our algorithm is based on
a comparative study of short text classification starting from two state-
of-the-art approaches: Latent Dirichlet Allocation (LDA) and Neural Network
Language Models (NNLM). We evaluate these models by example of (i)
OAI metadata, (ii) a TREC dataset and (iii) the Google Snippets dataset
to demonstrate their performance. We additionally show that a combi-
nation of both classifiers is better than any of its constitutive models.
Finally, we exemplify our text classifier by plotting the topic structuring
of all articles of the German Wikipedia.
Key words: Topic model, topic networks, short text classification, LDA,
NNLM, SVM
⋆ Financial support by the Bundesministerium für Bildung und Forschung (BMBF) via theCEDIFOR project (https://www.cedifor.de/en/) as being performed by the TTLab atGoethe University Frankfurt (https://hucompute.org/) is gratefully acknowledged.
SOCNET 2018, February 28, 2018 67
Introduction
In this paper, we develop a simple algorithm for modeling the semantics of large
text networks. This is done by example of the German Wikipedia. Our aim is to
model the structure and networking of topics as manifested by large corpora of
natural language texts. Algorithms serving this task are needed to implement a
distributional semantics of textual manifestations in online social networks. One
may want to know, for example, what topics are focused in a certain period of
time in Twitter. Alternatively, onemay want to know which fields of knowledge are
either preferred or underrepresented in media such as Wikipedia or Wiktionary
[20]. In order to answer questions of this sort, it is necessary to determine the topic
distribution of each individual text aggregate of the focused media and to decide
how the resulting distributions are to be networked. This is the task of the present
paper.
Our algorithm for modeling the thematic structure of large text corpora uti-
lizes a well-established topic classification, that is, the Dewey Decimal Classifica-
tion (DDC). More specifically, we build on a comparative study of approaches to
short text classification. Short texts (e.g. tweets) refer to situations in which only
snippets (e.g., metadata, abstracts, summaries or only single sentences such as
titles) are available as input for classification instead of full texts. One example of
this is digital libraries working on OAI (Open Archives Initiative) metadata [28].
It also concerns text mining in online social media by example of chat messages,
news feeds, tweets [24], or turn-taking in online discussions [7]. In all these cases
the central information to be extracted is what the snippets are about in order to
classify them thematically [29], to disambiguate or to classify their constituents [8]
or to enrich them by means of external knowledge resources. The requirement to
handle big data streams is another reason to process snippets instead of full texts
even if being accessible. In each of these cases, classifiers are influenced more by
the sparseness of the lexical content of short text. Therefore, one needs both fast
and accurate classifiers that are expressive enough to overcome the problem of
lexical sparseness.
In this paper, we present a network model of topic structuring that is based
on a comparative study of text snippet classification starting from two state-of-
the-art approaches: Latent Dirichlet Allocation (LDA) and Neural Network Language
Models (NNLM). In the latter case we experiment with fastText [13], which has been
68 International Workshop of MMB 2018
developed to overcome problems of time-consuming deep learners.We test each of
these approaches separately and also test a variant in which fastText is additionally
fed with topics generated by LDA.We have found that both classifiers classify with
similar quality. Feeding fastText with LDA-based topics has not accomplished any
improvements. However, the combination of both classifiers has enabled us to
improve the overall quality of classification.
As a gold standard of topic modeling we use the DDC, which is the most com-
mon thematic classification system in (digital) libraries. One advantage of this ap-
proach is that it provides access to extensive training and test data. In addition
to that we consider two tasks of short text classification in order to enable com-
parisons with state-of-the-art approaches: the first uses the TREC (Text Retrieval
Conference) dataset [26], the second the Google Snippets dataset [21]. As a result
of these evaluations we receive a classifier that allows for determining the topic
distribution of all articles of the German Wikipedia so that we can finally model
the networking of these topics. In this way, we exemplify how to map text corpora
on networks of topics described by them.
The paper is organized as follows: Section 2 discusses related work of text clas-
sification. Section 3 describes the series of topic classifiers with which we exper-
iment in Section 3. In Section 5, the best performer of this evaluation is applied
in order to visualize the thematic structure of Wikipedia. Finally, in Section 6 we
draw a conclusion and give an outlook on future work.
Related Work
Since our paper deals with the DDC-related classification of short texts, we con-
sider two areas of related work: text snippet classification and topic modeling used
for content analysis of online social networks.
By exploring OAI Metadata, [28] present an SVM-based classifier that considers
all three levels of the DDC. A basic restriction of this approach relates to the fact
that it only processes OAI records of a certain minimal length. In contrast to this,
we do not consider such a lower bound so that we face a more realistic scenario
in which the topic of a snippet is highly underrepresented by its vocabulary. Thus,
unlike [28], we consider all 2nd-level DDC categories: in the case of English texts
this 2-level approach even deals with a larger set of target classes than the 3-level
approach of [28] (who are considering only 88 classes in total). Likewise, we aim at
SOCNET 2018, February 28, 2018 69
overcoming problems of computational complexity as exemplified by the approach
of [27]. This research shows that DDC-related text categorization, especially by
example of short texts, has been a desideratum so far.
The classification of text snippets, regardless of the classification scheme, has
made significant progress with the utilization of neural networks for text classi-
fication. [29] show that the projection of similar text snippets onto a matrix can
be a very helpful input to training a convolutional neural network that outper-
forms approaches based on other neural networks [14,16], LDA [21,5] or SVMs [23].
These approaches concentrate on single aspects like syntactic rules, topic model-
ing of text snippets or semantic similarity measurement. Our case study examines
sources of information that have not previously been investigated together in the
context of classifying text snippets. This includes
1. information about -grams,
2. information provided by dataset-external semantic knowledge as given by topic
models derived from general corpora, and
3. information provided by NLP tools about tokens, lemmas and parts of speech.
We integrate these information sources into our model and compare the per-
formance of a neural network and an SVM-based approach as two competing in-
stances of our model.
The usage of topic models and thematic classifications as an input to graph
structures has been explored in different ways. Mostly, the connections in such
graphs are built by topical similarities of the documents [4,17]. In this way, one
can observe, for example, which sources or authors are highly connected in the re-
sulting graph. On the other hand, social networks can be analyzed with respect to
topical preferences manifested by their textual content [19,3,9,25]. Our approach
also adds the network perspective regarding topic distributions. However, we ad-
ditionally explore the networking of topics as a function of the polysemy of the
underlying textual aggregates.
Models of Topic Classification
In this section we describe the models that we used for topic-related text classifi-
cation: based on LDA (Sec. 3.1), on neural networks (Sec. 3.2), on neural networks
fed by LDA-based topics (Sec. 3.3), on neural networks fed by vectors representing
70 International Workshop of MMB 2018
word significance distributions (Sec. 3.4), and based on a combination of a SVM
and a NNLM-based classifier (Sec. 3.5).
. LD6-based classification (SVM-LD6)
Topic models, as the Latent Dirichlet Allocation (LDA) model, utilize large text cor-
pora to infer a latent distribution of words over a given number of topics so that
each document can be described as a mixture of those topics when exploring co-
occurrences of their lexical constituents [2]. The parameters of the LDA model,� (word-topic distribution) and � (document-topic distribution) can be estimatedusing either a variational inference scheme or Gibbs samplers on a training set of
documents [11]. One of the great benefits of topic models is the generalization of
the model. The topic structure of documents which do not belong to the training
set can be inferred using the fixed model parameters even if additional unknown
vocabulary is included. In this way, each document of a corpus can be described
in terms of its topic distribution regarding the parameters of a topic model that
has been generated by means of a reference corpus.
In text classification, a vector space model is often used to derive elementary
features for documents. The famous tf-idf scheme, entropy-based measures or
the pointwise mutual information can be used as alternatives to weight the terms
in the document vectors. In [27], lexical features are weighted using such term
weights. The resulting feature vectors are used to train a Support Vector Machine
(SVM) using a Negative Euclidean Distance Kernel (NDK) on a dataset of 4 000 Ger-
man DDC classified documents. This approach achieves 0.723 in F-score with re-
spect to the dataset.
Our approach uses additional information besides the tf-idf weights including
the extraction of uni-, bi-, and trigrams and the additional use of topics as features
within an SVM-classification scheme. That is, we informationally enrich each doc-
ument in the training set. Unigram stop words are deleted from the set of features
and words of the document collection were stemmed. Since a topic encodes an
associated vocabulary context (e.g., the word-topic distribution), each document
holds general information about other documents containing similar topics. This
information can be useful in classification tasks if we augment the lexical features
with the topic structure for a category. Our hope is to enhance the results of [27]
by the use of such topic model-related features. The here described approach uses
SOCNET 2018, February 28, 2018 71
the LDA model of [2] to infer topics on the dataset.
We considered a novel strategy to augment the lexical features with topic in-
formation. An LDA-model with 100 topics is inferred on “general” language data
and the topic distributions of documents from both, training and test datasets, are
determined with respect to this model.1 This gives us an additional topic distri-
bution on each document in the training and test sets. The language resource to
build our model is based on corpora from the Wortschatz2 project. We chose 3
million sentences from news data which were crawled in 2015 from German and
English websites to build the respective models. We did not use Wikipedia-based
data because of the possible domain similarity to our OAI-datasets in Section 4.
Additionally, we apply the tf-idf weighting scheme to the document term vec-
tors (uni-, bi- and trigrams) in order to reduce the influence of general vocabulary.
Then, we append the topic distribution for a document as a vector of probabilities
to its vector of lexical features. To train the SVM, we used the R-version of lib-
linear with an L2-regularized logistic regression and estimated the C-parameter
heuristically [6,12].
. Neural network-based classification (NN)
For the neural network-based approaches, we started with the simple but very ef-
ficient classifier of [13] called fastText (see Figure 1 for a visual depiction of thismodel in our context). fastText uses a bag-of-words (bow) model and defines theoccurrences of words in a document as input of the neural network. Since the or-
der of words is ignored in the bow-model, fastText uses -grams to capture some
information about the local order. To avoid being forced to use default parame-
ter settings, we have written a parameter analyzer, which searches the parameter
space for better performing settings (according to a hill-climbing algorithm). Since
the input corpora were not preprocessed, we applied various NLP tools to obtain
additional information about tokenization, lemmas and parts of speech. We also
used pretrained word embeddings to initialize the neural network.
1 Our experiments showed that 100 topics provided the best topic solution for the de-scribed experiments in terms of F1 performance of the final classifier. We tested 20,50, 75, 100, 250 and 500 as values for the amount of topics to infer.
2 http://wortschatz.uni-leipzig.de/en/download
72 International Workshop of MMB 2018
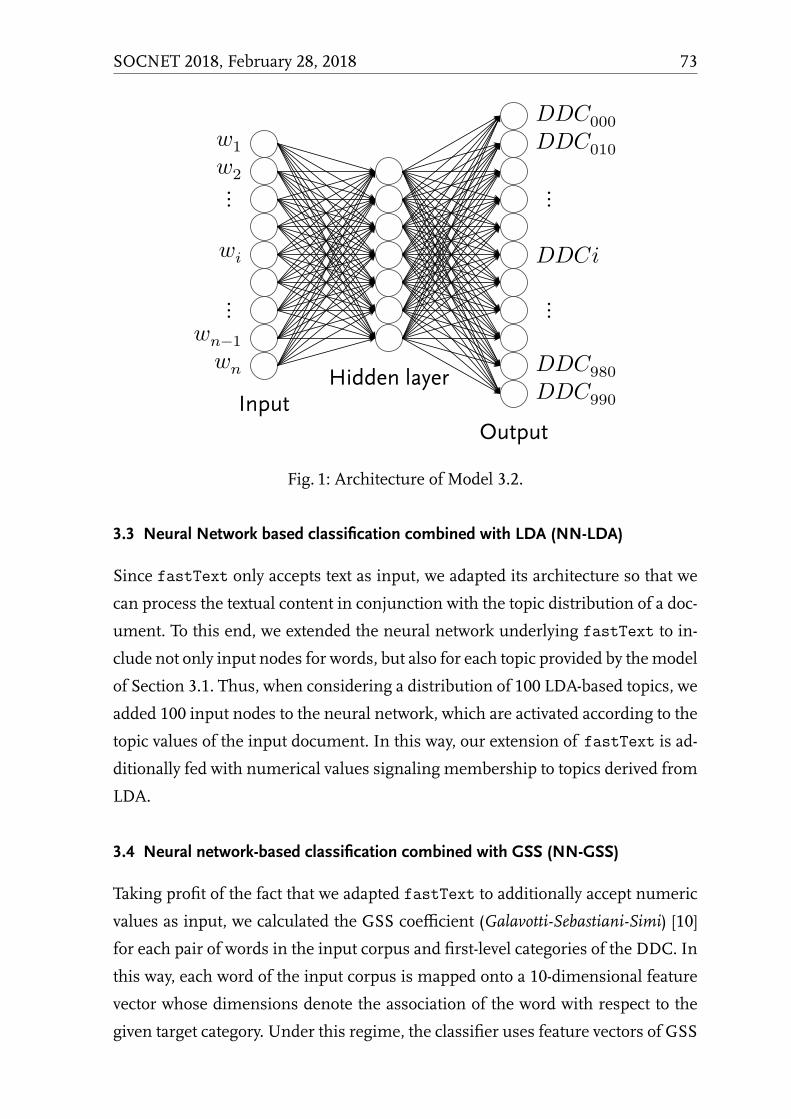
Input
�1�2⋮��⋮��−1�� Hidden layer
Output
000010�980990
⋮⋮
Fig. 1: Architecture of Model 3.2.
. Neural Network based classification combined with LD6 (NN-LD6)
Since fastText only accepts text as input, we adapted its architecture so that wecan process the textual content in conjunction with the topic distribution of a doc-
ument. To this end, we extended the neural network underlying fastText to in-clude not only input nodes for words, but also for each topic provided by themodel
of Section 3.1. Thus, when considering a distribution of 100 LDA-based topics, we
added 100 input nodes to the neural network, which are activated according to the
topic values of the input document. In this way, our extension of fastText is ad-ditionally fed with numerical values signaling membership to topics derived from
LDA.
. Neural network-based classification combined with GSS (NN-GSS)
Taking profit of the fact that we adapted fastText to additionally accept numericvalues as input, we calculated the GSS coefficient (Galavotti-Sebastiani-Simi) [10]
for each pair of words in the input corpus and first-level categories of the DDC. In
this way, each word of the input corpus is mapped onto a 10-dimensional feature
vector whose dimensions denote the association of the word with respect to the
given target category. Under this regime, the classifier uses feature vectors of GSS
SOCNET 2018, February 28, 2018 73
coefficients instead of the words themselves. This results in a neural network with× input nodes, where is the size of the vocabulary of the input corpus and� 10 the number of top-level DDC classes.. Combining both worlds (NN-SVM-LD6)
Bymeans of an error analysis we found that the SVM and the NN-based classifiers
make different errors, although achieving similar classification qualities. There-
fore, we calculated a scoring for each document with respect to each target cate-
gory based on the two best performing classifiers from the SVM- and NN-world,
respectively, and experimented with two methods to combine their scorings:
1. voting for the target class as a function of the maximum score (not to be con-
fused with majority voting) or
2. by means of the average score.
Classification Experiment
We test the models of Section 3 by example of four different data sets. Two of these
samples represent OAI-based datasets (one in German and one in English) which
were used regarding two classification tasks. The first task was to classify the first
level of the DDC (10 classes in the English corpus (EN-10) and 10 classes in the
German corpus (DE-10)). The second task was to classify the first two levels of
the DDC (93 classes in the English corpus (EN-All) and 88 classes in the German
corpus (DE-All)). The German corpus consists of 595 493 records with an average
of 37.24 words per document. The English corpus consists of 1 222 948 records
with an average of 50.69 words per document. Each corpus was randomly divided
into training (70%) and test (30%) sets. In order to ensure comparability with state-
of-the-art systems for classifying text snippets, we also evaluated our models using
the TREC 2003 Question Answering dataset [18] and the Google Snippet dataset
[22] as used in [29].
. Classification
For the SVM-based classification using LDA-features we trained one SVM-model
for each dataset and task. The results are shown in Table 1. The SVM-LDA model
outperforms the models described in [27,28]. Furthermore, it performs as good as
74 International Workshop of MMB 2018
the NN-based model described in [29]. In examining the impact of all features, we
find that the -gram features have an impact similar to features provided by the
topic model. The combination of both feature sets does not improve overall per-
formance. In detail, the classification for the DE-10 dataset results in the following
F1-scores for the different feature configurations: 1. unigrams – 0.786; 2. unigrams
+ topics – 0.805; 3. -grams – 0.814; 4. -grams + topics – 0.815. In general, it can be
shown that using topic model features improves the quality of the classification,
albeit to a limited extent. From a classification point of view, -grams and LDA-
based topics seems to encode related information within the feature space. This
may give rise to future research.
In the case of classifying with neural networks, we carried out a parameter study
to detect optimal parameter settings. To this end, we examined the following pa-
rameters:
– Learning rate (0.025 - 0.1)
– n-grams (1 - 5)
– Dimension (50 - 100)
– Epochs (500 - 10000)
The results are shown in Table 1.
It shows that SVM-LDA performs better than its NN-based counterparts in the
case of the English data sets, while the NN-based (lemma + POS) classifier outper-
forms its competitors in the case of the German data. However, the difference to
SVM-LDA is very small. Additionally feeding the NN with LDA topics (NN-LDA)
performs worse as does NN-GSS (DE-10). Further, lemma-level features perform
very little better than token-level ones (DE-10 and DE-All).
Next, we selected the best classifiers of both areas (SVM and NN) and further
analyzed their classification quality. Although both classifiers perform similarly
(81.4% and 81.6%), they make different mistakes. When always knowing the right
class of a snippet and then selecting the classifier voting for it, we would achieve
an F-score of 89.6% as a kind of an upper bound of an algorithmic combination of
SVM-LDA and NN (lemmas + POS). However, we cannot presuppose this knowl-
edge. Thus, we need to apply one of the combinations of Section 3.5. This produces
an the F-score of 82% in the DE-10 experiment using the method of averaging
scores.
SOCNET 2018, February 28, 2018 75
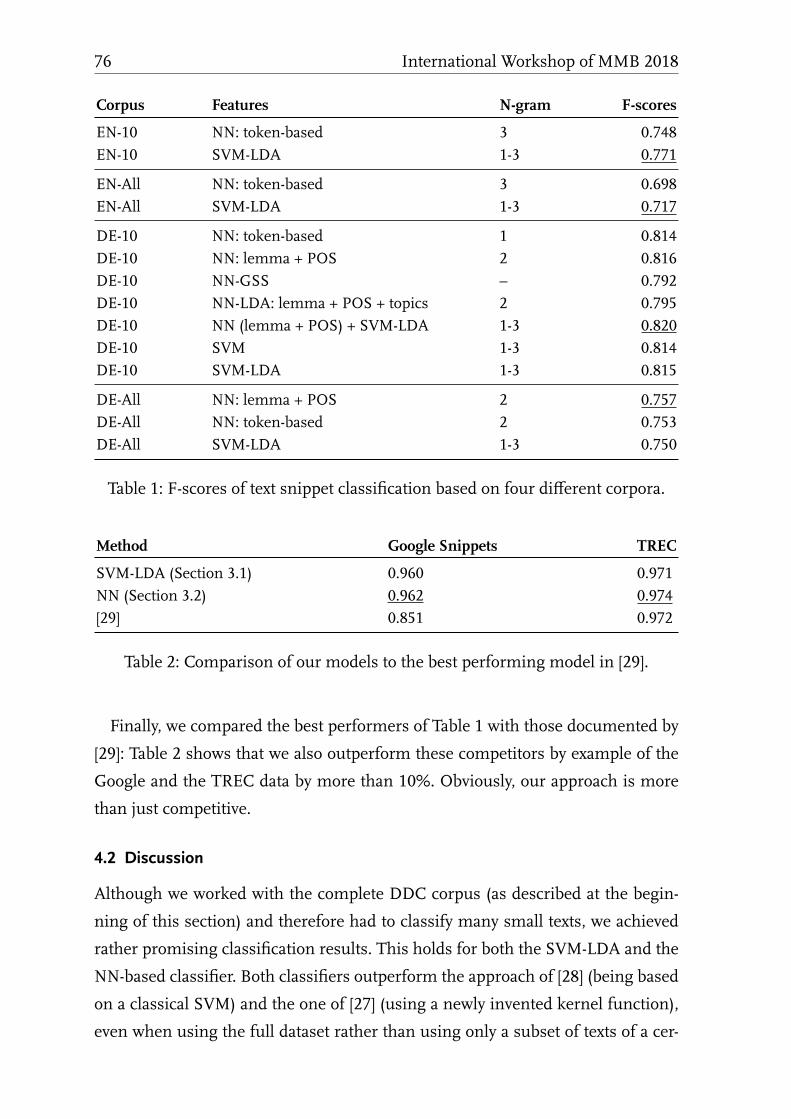
Corpus Features N-gram F-scores
EN-10 NN: token-based 3 0.748EN-10 SVM-LDA 1-3 0.771
EN-All NN: token-based 3 0.698EN-All SVM-LDA 1-3 0.717
DE-10 NN: token-based 1 0.814DE-10 NN: lemma + POS 2 0.816DE-10 NN-GSS – 0.792DE-10 NN-LDA: lemma + POS + topics 2 0.795DE-10 NN (lemma + POS) + SVM-LDA 1-3 0.820DE-10 SVM 1-3 0.814DE-10 SVM-LDA 1-3 0.815
DE-All NN: lemma + POS 2 0.757DE-All NN: token-based 2 0.753DE-All SVM-LDA 1-3 0.750
Table 1: F-scores of text snippet classification based on four different corpora.
Method Google Snippets TREC
SVM-LDA (Section 3.1) 0.960 0.971NN (Section 3.2) 0.962 0.974[29] 0.851 0.972
Table 2: Comparison of our models to the best performing model in [29].
Finally, we compared the best performers of Table 1 with those documented by
[29]: Table 2 shows that we also outperform these competitors by example of the
Google and the TREC data by more than 10%. Obviously, our approach is more
than just competitive.
. Discussion
Although we worked with the complete DDC corpus (as described at the begin-
ning of this section) and therefore had to classify many small texts, we achieved
rather promising classification results. This holds for both the SVM-LDA and the
NN-based classifier. Both classifiers outperform the approach of [28] (being based
on a classical SVM) and the one of [27] (using a newly invented kernel function),
even when using the full dataset rather than using only a subset of texts of a cer-
76 International Workshop of MMB 2018
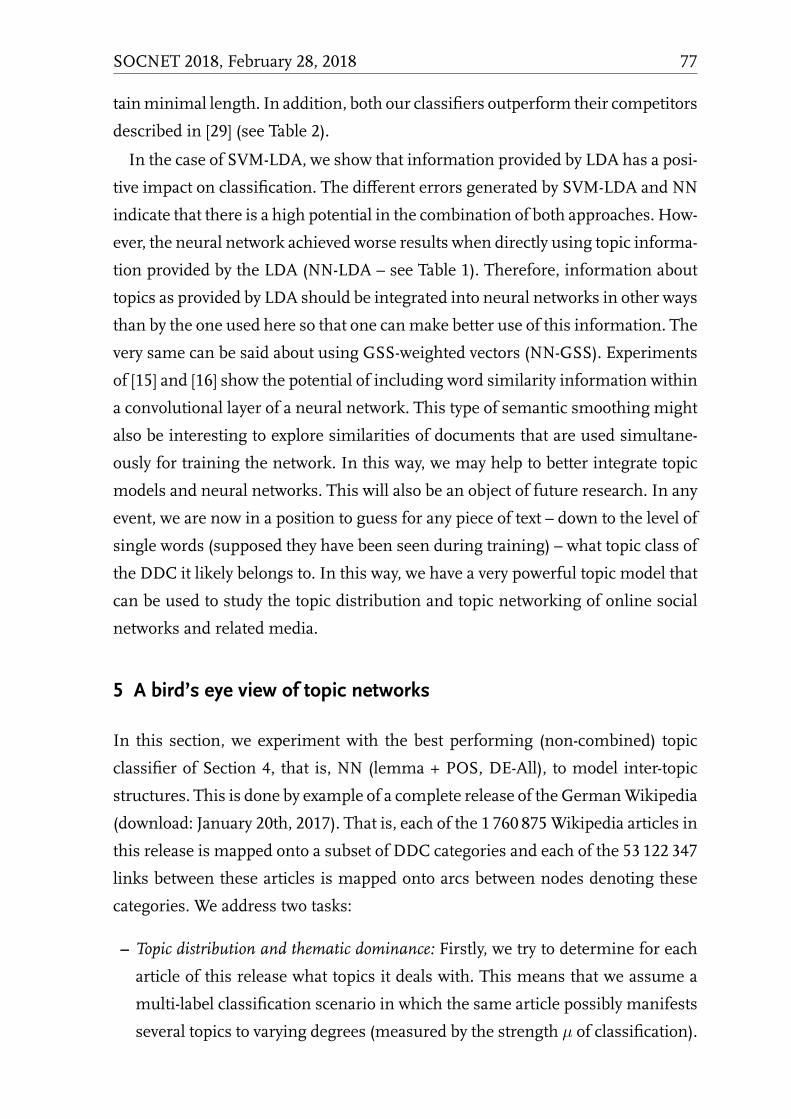
tainminimal length. In addition, both our classifiers outperform their competitors
described in [29] (see Table 2).
In the case of SVM-LDA, we show that information provided by LDA has a posi-
tive impact on classification. The different errors generated by SVM-LDA and NN
indicate that there is a high potential in the combination of both approaches. How-
ever, the neural network achieved worse results when directly using topic informa-
tion provided by the LDA (NN-LDA – see Table 1). Therefore, information about
topics as provided by LDA should be integrated into neural networks in other ways
than by the one used here so that one canmake better use of this information. The
very same can be said about using GSS-weighted vectors (NN-GSS). Experiments
of [15] and [16] show the potential of including word similarity information within
a convolutional layer of a neural network. This type of semantic smoothing might
also be interesting to explore similarities of documents that are used simultane-
ously for training the network. In this way, we may help to better integrate topic
models and neural networks. This will also be an object of future research. In any
event, we are now in a position to guess for any piece of text – down to the level of
single words (supposed they have been seen during training) – what topic class of
the DDC it likely belongs to. In this way, we have a very powerful topic model that
can be used to study the topic distribution and topic networking of online social
networks and related media.
6 bird’s eye view of topic networks
In this section, we experiment with the best performing (non-combined) topic
classifier of Section 4, that is, NN (lemma + POS, DE-All), to model inter-topic
structures. This is done by example of a complete release of the GermanWikipedia
(download: January 20th, 2017). That is, each of the 1 760 875Wikipedia articles in
this release is mapped onto a subset of DDC categories and each of the 53 122 347
links between these articles is mapped onto arcs between nodes denoting these
categories. We address two tasks:
– Topic distribution and thematic dominance: Firstly, we try to determine for each
article of this release what topics it deals with. This means that we assume a
multi-label classification scenario in which the same article possibly manifests
several topics to varying degrees (measured by the strength � of classification).
SOCNET 2018, February 28, 2018 77
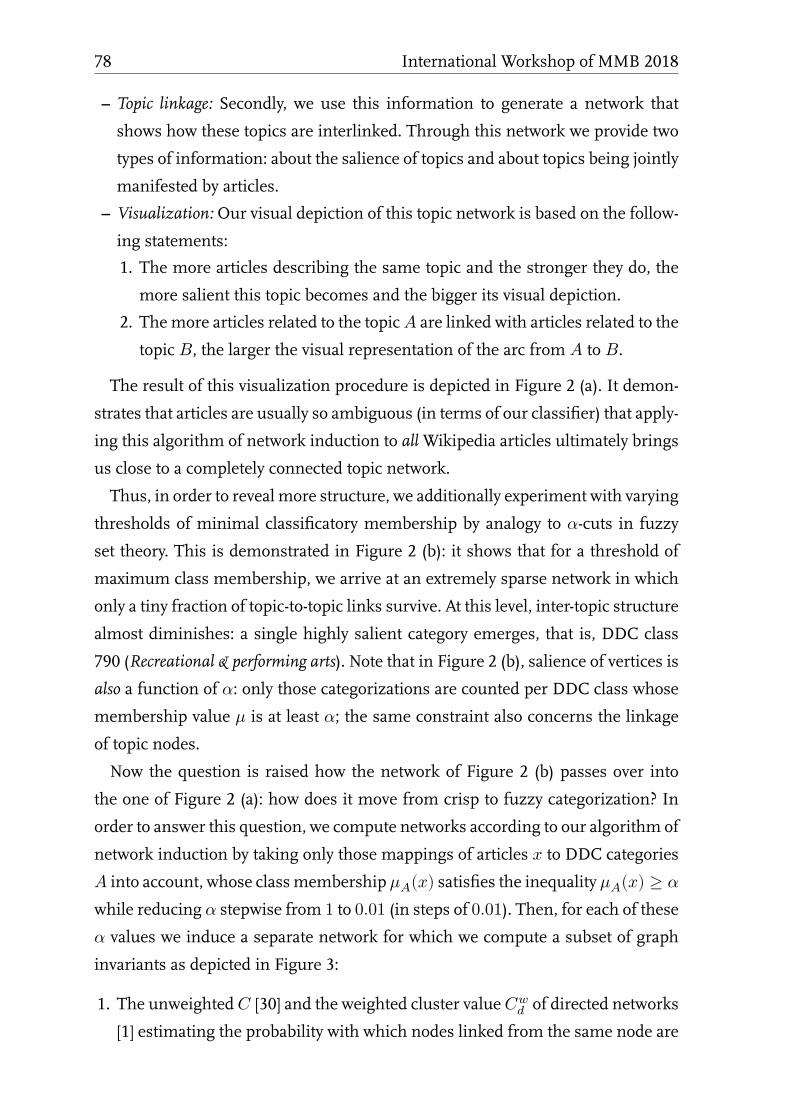
– Topic linkage: Secondly, we use this information to generate a network that
shows how these topics are interlinked. Through this network we provide two
types of information: about the salience of topics and about topics being jointly
manifested by articles.
– Visualization: Our visual depiction of this topic network is based on the follow-
ing statements:
1. The more articles describing the same topic and the stronger they do, the
more salient this topic becomes and the bigger its visual depiction.
2. The more articles related to the topic are linked with articles related to the
topic , the larger the visual representation of the arc from to .
The result of this visualization procedure is depicted in Figure 2 (a). It demon-
strates that articles are usually so ambiguous (in terms of our classifier) that apply-
ing this algorithm of network induction to allWikipedia articles ultimately brings
us close to a completely connected topic network.
Thus, in order to reveal more structure, we additionally experiment with varying
thresholds of minimal classificatory membership by analogy to �-cuts in fuzzyset theory. This is demonstrated in Figure 2 (b): it shows that for a threshold of
maximum class membership, we arrive at an extremely sparse network in which
only a tiny fraction of topic-to-topic links survive. At this level, inter-topic structure
almost diminishes: a single highly salient category emerges, that is, DDC class
790 (Recreational & performing arts). Note that in Figure 2 (b), salience of vertices is
also a function of �: only those categorizations are counted per DDC class whosemembership value � is at least �; the same constraint also concerns the linkageof topic nodes.
Now the question is raised how the network of Figure 2 (b) passes over into
the one of Figure 2 (a): how does it move from crisp to fuzzy categorization? In
order to answer this question, we compute networks according to our algorithm of
network induction by taking only those mappings of articles � to DDC categoriesinto account, whose classmembership ��(�) satisfies the inequality ��(�) ≥ �
while reducing � stepwise from 1 to 0.01 (in steps of 0.01). Then, for each of these� values we induce a separate network for which we compute a subset of graphinvariants as depicted in Figure 3:
1. The unweighted [30] and the weighted cluster value �� of directed networks[1] estimating the probability with which nodes linked from the same node are
78 International Workshop of MMB 2018
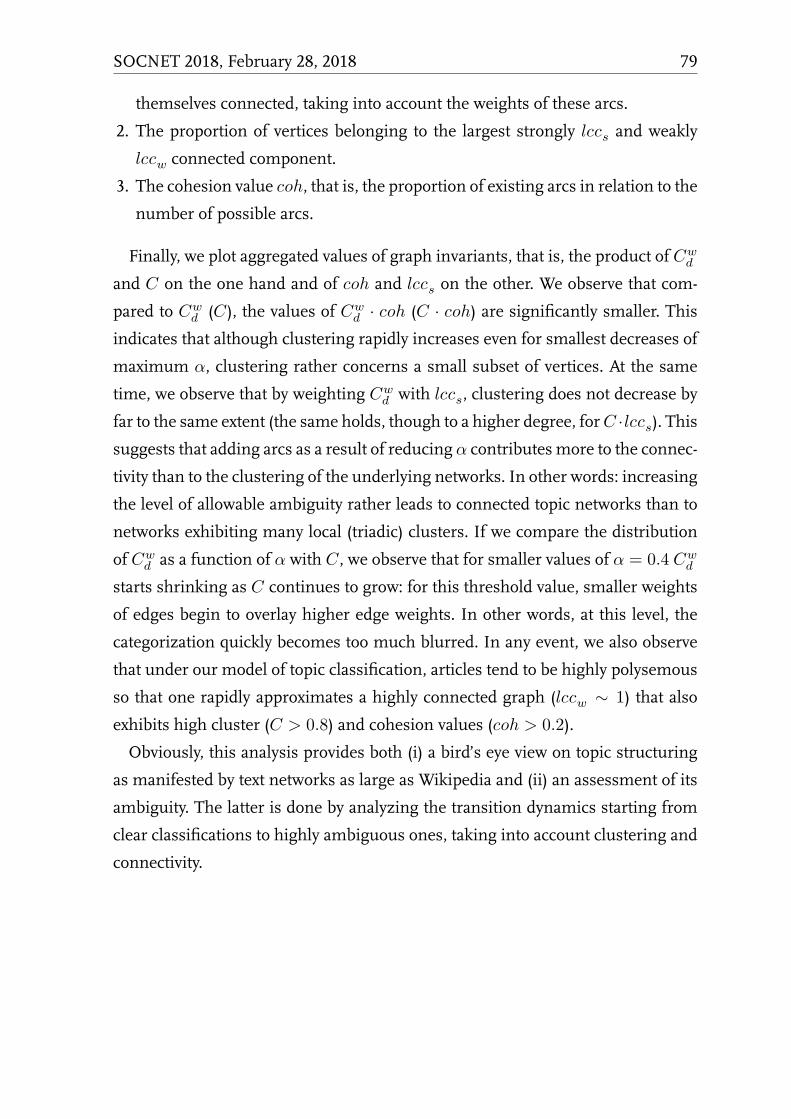
themselves connected, taking into account the weights of these arcs.
2. The proportion of vertices belonging to the largest strongly ��� and weakly��� connected component.3. The cohesion value � ℎ, that is, the proportion of existing arcs in relation to thenumber of possible arcs.
Finally, we plot aggregated values of graph invariants, that is, the product of ��and on the one hand and of � ℎ and ��� on the other. We observe that com-pared to �� ( ), the values of �� ⋅ � ℎ ( ⋅ � ℎ) are significantly smaller. Thisindicates that although clustering rapidly increases even for smallest decreases of
maximum �, clustering rather concerns a small subset of vertices. At the sametime, we observe that by weighting �� with ���, clustering does not decrease byfar to the same extent (the same holds, though to a higher degree, for ⋅ ���). Thissuggests that adding arcs as a result of reducing � contributes more to the connec-tivity than to the clustering of the underlying networks. In other words: increasing
the level of allowable ambiguity rather leads to connected topic networks than to
networks exhibiting many local (triadic) clusters. If we compare the distribution
of �� as a function of � with , we observe that for smaller values of � � 0.4 ��starts shrinking as continues to grow: for this threshold value, smaller weights
of edges begin to overlay higher edge weights. In other words, at this level, the
categorization quickly becomes too much blurred. In any event, we also observe
that under our model of topic classification, articles tend to be highly polysemous
so that one rapidly approximates a highly connected graph ( ��� ∼ 1) that alsoexhibits high cluster ( > 0.8) and cohesion values (� ℎ > 0.2).Obviously, this analysis provides both (i) a bird’s eye view on topic structuring
as manifested by text networks as large as Wikipedia and (ii) an assessment of its
ambiguity. The latter is done by analyzing the transition dynamics starting from
clear classifications to highly ambiguous ones, taking into account clustering and
connectivity.
SOCNET 2018, February 28, 2018 79
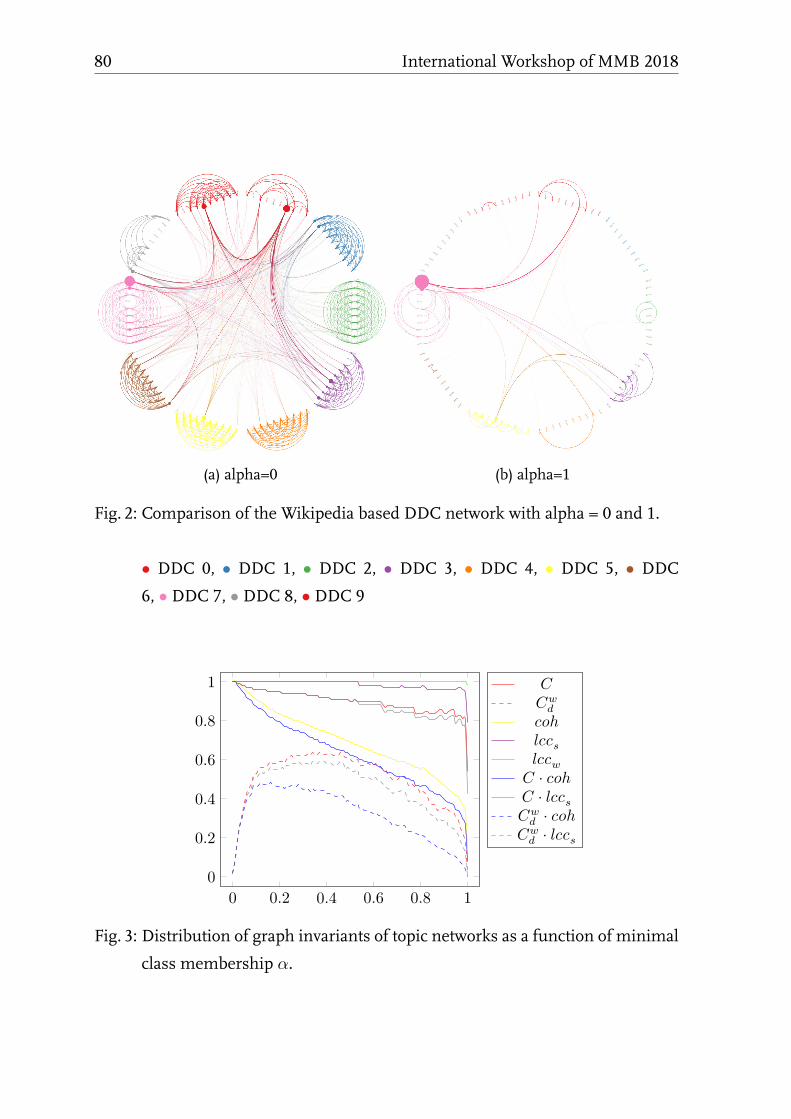
(a) alpha=0 (b) alpha=1
Fig. 2: Comparison of the Wikipedia based DDC network with alpha = 0 and 1.• DDC 0, • DDC 1, • DDC 2, • DDC 3, • DDC 4, • DDC 5, • DDC6, • DDC 7, • DDC 8, • DDC 9
0 0.2 0.4 0.6 0.8 100.20.40.60.81 ��� ℎ������⋅ � ℎ⋅ ����� ⋅ � ℎ�� ⋅ ���
Fig. 3: Distribution of graph invariants of topic networks as a function of minimal
class membership �.
80 International Workshop of MMB 2018
Conclusion
In this paper, we developed a simple algorithm for analyzing and visualizing the
topic structure of large text networks. To this end, we experimented with a series
of classifiers in the context of three evaluation scenarios. This included an SVM-
based classifier exploring topics derived from LDA, a NNLM-based classifier (i.e,
fastText) as well as combinations thereof. Using the best performer of theseexperiments, we have shown how to generate a bird’s eye view of the salience and
linkage of topics as manifested by hundreds of thousands of texts. In this context,
we observed a very high degree of thematic ambiguity, whichmakes it necessary to
search for more precise, less ambiguous classifiers. This will be the task of future
work. Nevertheless, our paper shows a way to automatically visualize the thematic
dynamics of textual aggregates as produced by large online social networks.
References
1. Alain Barrat, Marc Barthélemy, and Alessandro Vespignani. The architecture of com-plex weighted networks. In Guido Caldarelli and Allesandro Vespignani, editors,Large Scale Structure and Dynamics of Complex Networks, pages 67–92. World Scien-tific, New Jersey, 2007.
2. DavidMBlei, Andrew YNg, andMichael I Jordan. Latent dirichlet allocation. Journalof machine Learning research, 3(Jan):993–1022, 2003.
3. Youngchul Cha and Junghoo Cho. Social-network analysis using topic models. InProceedings of the 35th international ACM SIGIR conference on Research and develop-ment in information retrieval, pages 565–574. ACM, 2012.
4. Jonathan Chang and David Blei. Relational topic models for document networks. InArtificial Intelligence and Statistics, pages 81–88, 2009.
5. Mengen Chen, Xiaoming Jin, and Dou Shen. Short text classification improved bylearning multi-granularity topics. In Proceedings of the Twenty-Second InternationalJoint Conference on Artificial Intelligence - Volume Volume Three, IJCAI’11, pages 1776–1781. AAAI Press, 2011.
6. Rong-En Fan, Kai-Wei Chang, Cho-Jui Hsieh, Xiang-Rui Wang, and Chih-Jen Lin.LIBLINEAR: A library for large linear classification. Journal of Machine Learning Re-search, 9:1871–1874, 2008.
7. Eric N Forsythand and Craig HMartell. Lexical and discourse analysis of online chatdialog. In Semantic Computing, 2007. ICSC 2007. International Conference on, pages19–26. IEEE, 2007.
8. Robert Gaizauskas, Emma Barker, Monica Lestari Paramita, and Ahmet Aker. As-signing terms to domains by document classification. In Proceedings of the 4th Inter-national Workshop on Computational Terminology, pages 11–21, 2014.
SOCNET 2018, February 28, 2018 81

9. Brynjar Gretarsson, John O’donovan, Svetlin Bostandjiev, Tobias Höllerer, ArthurAsuncion, David Newman, and Padhraic Smyth. Topicnets: Visual analysis of largetext corpora with topic modeling. ACM Transactions on Intelligent Systems and Tech-nology (TIST), 3(2):23, 2012.
10. Luigi Galavotti and Fabrizio Sebastiani, and Maria Simi. Experiments on the use offeature selection and negative evidence in automated text categorization. Proceedingsof ECDL-00, 4th European Conference on Research and Advanced Technology forDigital Libraries, Lisbon, PT, pages 59–68, 2000.
11. Thomas L Griffiths and Mark Steyvers. Finding scientific topics. Proceedings of theNational academy of Sciences, 101(suppl 1):5228–5235, 2004.
12. Thibault Helleputte. LiblineaR: Linear Predictive Models Based on the LIBLINEARC/C++ Library, 2015. R package version 1.94-2.
13. Armand Joulin, Edouard Grave, Piotr Bojanowski, and Tomas Mikolov. Bag of tricksfor efficient text classification. CoRR, abs/1607.01759, 2016.
14. Nal Kalchbrenner, Edward Grefenstette, and Phil Blunsom. A convolutional neuralnetwork for modelling sentences. arXiv preprint arXiv:1404.2188, 2014.
15. Jonghoon Kim, François Rousseau, and Michalis Vazirgiannis. Convolutional sen-tence kernel from word embeddings for short text categorization. In EMNLP, pages775–780, 2015.
16. Yoon Kim. Convolutional neural networks for sentence classification. arXiv preprintarXiv:1408.5882, 2014.
17. John D. Lafferty and David M. Blei. Correlated topic models. In Advances in neuralinformation processing systems, pages 147–154, 2006.
18. Xin Li and Dan Roth. Learning question classifiers. In Proceedings of the 19th inter-national conference on Computational linguistics-Volume 1, pages 1–7. Association forComputational Linguistics, 2002.
19. Andrew McCallum, Andres Corrada-Emmanuel, and Xuerui Wang. Topic and rolediscovery in social networks. Computer Science Department Faculty Publication Series,page 3, 2005.
20. Alexander Mehler, Rüdiger Gleim, Wahed Hemati, and Tolga Uslu. Skalenfreie on-line soziale Lexika am Beispiel vonWiktionary. In Stefan Engelberg, Henning Lobin,Kathrin Steyer, and Sascha Wolfer, editors, Proceedings of 53rd Annual Conference ofthe Institut für Deutsche Sprache (IDS), March 14-16, Mannheim, Germany, Berlin,2017. De Gruyter.
21. Xuan-Hieu Phan, Le-Minh Nguyen, and Susumu Horiguchi. Learning to classifyshort and sparse text & web with hidden topics from large-scale data collections. InProceedings of the 17th International Conference on World Wide Web, WWW ’08, pages91–100, New York, NY, USA, 2008. ACM.
22. Xuan-Hieu Phan, Le-Minh Nguyen, and Susumu Horiguchi. Learning to classifyshort and sparse text & web with hidden topics from large-scale data collections.In Proceedings of the 17th international conference on World Wide Web, pages 91–100.ACM, 2008.
82 International Workshop of MMB 2018
23. João Silva, Luísa Coheur, Ana CristinaMendes, and AndreasWichert. From symbolicto sub-symbolic information in question classification. Artificial Intelligence Review,35(2):137–154, 2011.
24. Bharath Sriram, Dave Fuhry, Engin Demir, Hakan Ferhatosmanoglu, and MuratDemirbas. Short text classification in twitter to improve information filtering. InProceedings of the 33rd International ACM SIGIR Conference on Research and Develop-ment in Information Retrieval (SIGIR ’10), pages 841–842, New York, NY, USA, 2010.
25. Jie Tang, Jimeng Sun, Chi Wang, and Zi Yang. Social Influence Analysis in Large-scale Networks. In Proceedings of the 15th ACM SIGKDD International Conference onKnowledge Discovery and Data Mining, KDD ’09, pages 807–816, New York, NY, USA,2009. ACM.
26. Ellen M. Voorhees and Dawn M. Tice. Building a question answering test collection.In Proceedings of the 23rd Annual International ACM SIGIR Conference on Researchand Development in Information Retrieval, SIGIR ’00, pages 200–207, New York, NY,USA, 2000. ACM.
27. Tim vor der Brück, Steffen Eger, and Alexander Mehler. Complex decomposition ofthe negative distance kernel. CoRR, abs/1601.00925, 2016.
28. Ulli Waltinger, Alexander Mehler, Mathias Lösch, and Wolfram Horstmann. Hierar-chical classification of oai metadata using the ddc taxonomy. In Raffaella Bernardi,Sally Chambers, Björn Gottfried, Frédérique Segond, and Ilya Zaihrayeu, editors,NLP4DL/AT4DL, volume 6699 of Lecture Notes in Computer Science, pages 29–40.Springer, 2009.
29. Peng Wang, Bo Xu, Jiaming Xu, Guanhua Tian, Cheng-Lin Liu, and Hongwei Hao.Semantic expansion using word embedding clustering and convolutional neural net-work for improving short text classification. Neurocomputing, 174, Part B:806 – 814,2016.
30. Duncan J Watts and Steven H Strogatz. Collective dynamics of ‘small-world’networks. nature, 393(6684):440–442, 1998.
SOCNET 2018, February 28, 2018 83

Using Social Network Analysis to Make Sense of Radio
Communication in Emergency Response
Kathrin Eismann, Diana Fischer, Oliver Posegga, and Kai Fischbach
University of Bamberg,An der Weberei 5, 96047 Bamberg, Germany
http://www.uni-bamberg.de/sna/
Abstract. In the wake of an increasing interest in the communication
networks of emergency responders, radio communication systems have
been recognized as an important source of digital trace data. In this pa-
per, we explore how radio data can be used as part of social network
analysis (SNA). In particular, we investigate how social networks can be
modeled and analyzed based on digital trace data obtained from radio
systems in the emergency response field. We outline SNA challenges
and opportunities based on radio networks, following the work of [9].
Utilizing radio data from a recent emergency response field exercise,
we illustrate an example of a workflow that can be applied for modeling
social networks from emergency responders’ radio communication and
discuss the implications of our findings for the analysis and interpreta-
tion of radio network structures. Hence, this paper is a useful starting
point for future research that applies tools and methods from the SNA
repertoire to radio networks in the context of emergency response and
beyond.
Key words: Social NetworkAnalysis, RadioCommunication,Digital Trace
Data, Emergency Response
SOCNET 2018, February 28, 2018 85
Introduction
Radio communication – that is, telecommunication by means of radio waves [11]1
– has largely disappeared from the public consciousness but remains a common
communication medium in many fields of operation, such as in ground, air, and
water transportation, in businesses with factories and other industrial sites, and
in care facilities.
Naturally, radio data afford opportunities to apply tools and methods from the
repertoire of social network analysis (SNA) to communication networks [1]. While
such research was once rare, new interest in the communication networks of
emergency responders has emerged in recent years [8,12,13,14,19]. Radio is crucial
for emergency responders, especially when other communication infrastructures
are compromised or destroyed by disasters or extreme events [10], and has thus
remained the baseline communication tool of emergency services in many places
[8,14]. Radio interoperability disruptions are still among the most severe commu-
nication problems emergency responders face [7,13,15]. Research also suggests
that studying radio communication provides unique insights into the social struc-
ture of emergency response operations [2,17].
Utilizing radio as a basis for SNA is not without challenges, though. In this
paper, we focus on the modeling and analysis of social networks based on radio
communication as a special case of digital trace data. We outline key issues in
utilizing digital trace data for SNA based on [9] (section 2). We then discuss the
SNA challenges and opportunities for radio networks based on our experiences in
a research project involving three major German relief organizations, and share
our insights from a recent emergency response field exercise (section 3). Finally,
we outline the contributions of our work (section 4).
SNA for Digital Trace Data
Digital trace data are “records of activity (trace data) undertaken through an on-
line information system (thus, digital)” [9]. Unlike traditional network data, which
are produced for research (e.g. from interviews, observations, or archival records
1 In technical terms, radio communication is any transmission, emission, or reception ofsigns, signals, writings, images, sounds, or intelligence of any nature using radio waves(i.e., electromagnetic waves of frequencies arbitrarily lower than 3,000 GHz, transmit-ted in space without artificial guide such as wire) [11].
86 International Workshop of MMB 2018
[16,20]), digital trace data are found. Furthermore, whereas traditional network
data typically describe specific relationships, digital trace data are event-based, and
they are longitudinal records of events instead of cross-sectional network snap-
shots. Digital trace data thus enable scholars to understand the structure and out-
comes of social networks on an unprecedented scale. This type of data does, how-
ever, require scholars to make crucial assumptions regarding the nodes, ties, and
structures they model from it [9].
According to [9], five steps are necessary to construct and analyze social networks
from digital trace data such as radio communication. In the first step, digital trace
data have to be understood and interpreted in alignment with the context and char-
acteristics of the information systems they emerge from. In this context, issues
relating to the reliability of the information systems from which communication
events are to be extracted in the first place, as well as practical usage behaviors devi-
ating from the intended information systems usage, need to be considered. In the
second step, the network elements (i.e., the nodes and links of the network) have
to be modeled from the identified communication events. In particular, digital
trace data typically allow for different ways to handle the multiplexity, intensity,
and directionality of ties. Furthermore, missing ties may be an issue when the
records provided by the information system are incomplete or limited to a partial
representation of the relationships and interactions within the context of a study.
In the third step, the identified network elements have to be aggregated into a
network, which may entail difficulties in the temporal aggregation of nodes and
links. In the fourth step, appropriate network measures that align with both the
intended theoretical construct to be analyzed and the social network at hand have
to be selected. This can be challenging especially if there is mismatch between the
temporal dynamics of constructs and network representation, or if software tools
applied to support computation of measures yield invalid results. Finally, in the
fifth step, the theoretical constructs inferred from the network measures have to
be interpreted and generalized in a valid way, which is important for SNA-based
research in general, but particularly challenging when working with digital trace
data.
In the case of communication networks modeled from radio communication, it
is necessary to initially extract communication events (i.e., instances of radio com-
munication between two or more users of the radio communication system) from
SOCNET 2018, February 28, 2018 87
the electronic records of radio communication. Based on this, unique actors that
constitute the nodes of the communication network have to be identified from the
radio names of users (i.e., the aliases radio users rely on to address their peers).
Furthermore, the trade-offs of considering directed and weighted communica-
tion links between these users as opposed to simple undirected and unweighted
links, as well as the potential consequences of omitting unobserved communica-
tion events have to be discussed. In the next step, several options are available for
the temporal aggregation of these network elements, in particular, aggregation of
communication links over the entire period of observation, over limited periods
using sliding windows, or over fixed periods focusing on specific events. Once a
communication network has been generated from the identified nodes and edges,
it is important to select appropriate network measures. In particular, we discuss
the applicability of standard measures that are often applied to the analysis of dig-
ital trace data. Finally, we turn to the implications of the identified network struc-
tures for the interpretation of the communication network.
Figure 1 provides an overview on the chain of reasoning described by [9], which
covers the major assumptions that have to be made in the process of modeling
networks from digital trace data in general. In addition, the figure includes an
adaption of this concept for radio communication networks in particular, which
we use as an example to discuss the challenges and opportunities involved inmod-
eling and analyzing such networks.
In the following section, we discuss in detail how digital trace data of emer-
gency responders’ radio communication can be utilized for SNA based on findings
from a research project with relief organizations in Germany and insights from
the analysis of empirical radio data obtained from a recent emergency response
field exercise.
Challenges and Opportunities of SNA for Radio Networks in the
Emergency Response Field
. Case Description
We utilize data from a recent emergency response field exercise to illustrate SNA
challenges with respect to radio networks. The exercise scenario was based on a
past crisis event – a flash flooding of a river during a large festival in a medium-
sized city in Germany. In the emergency response exercise, emergency responders
88 International Workshop of MMB 2018
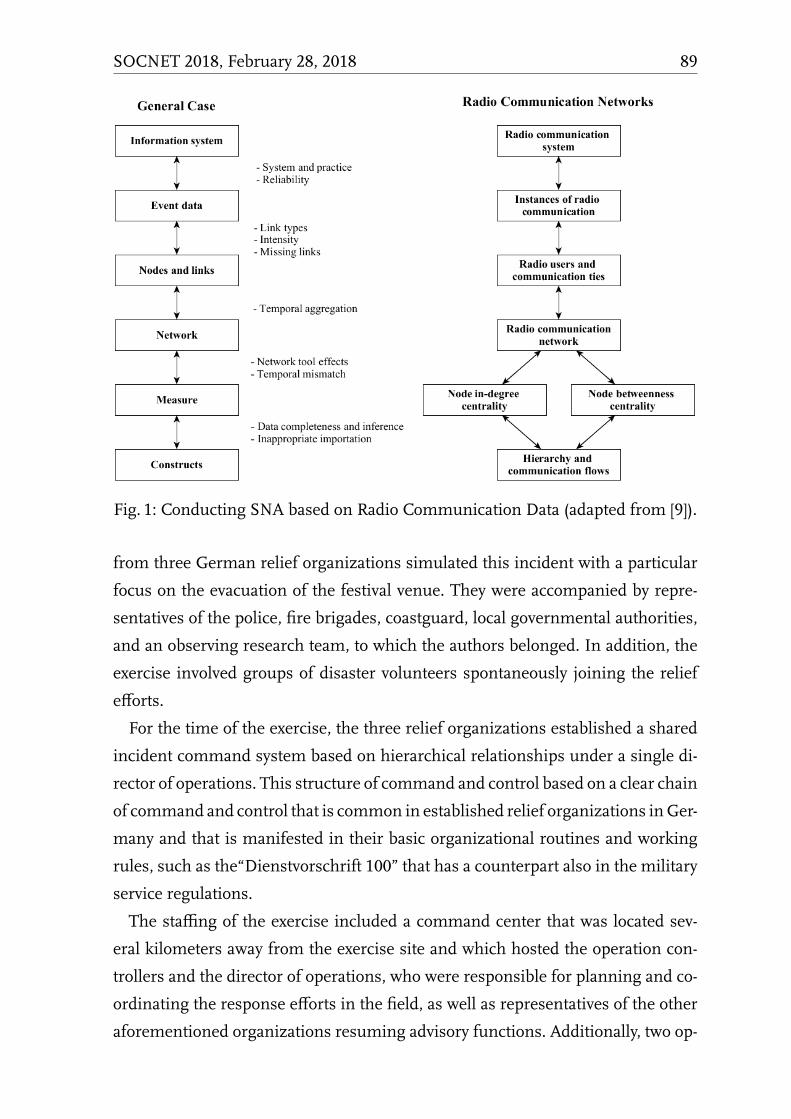
Fig. 1: Conducting SNA based on Radio Communication Data (adapted from [9]).
from three German relief organizations simulated this incident with a particular
focus on the evacuation of the festival venue. They were accompanied by repre-
sentatives of the police, fire brigades, coastguard, local governmental authorities,
and an observing research team, to which the authors belonged. In addition, the
exercise involved groups of disaster volunteers spontaneously joining the relief
efforts.
For the time of the exercise, the three relief organizations established a shared
incident command system based on hierarchical relationships under a single di-
rector of operations. This structure of command and control based on a clear chain
of command and control that is common in established relief organizations inGer-
many and that is manifested in their basic organizational routines and working
rules, such as the“Dienstvorschrift 100” that has a counterpart also in the military
service regulations.
The staffing of the exercise included a command center that was located sev-
eral kilometers away from the exercise site and which hosted the operation con-
trollers and the director of operations, who were responsible for planning and co-
ordinating the response efforts in the field, as well as representatives of the other
aforementioned organizations resuming advisory functions. Additionally, two op-
SOCNET 2018, February 28, 2018 89
erations control groups located inmobile command vehicles nearby the command
center (in the following referred to as “‘mobile command units”) were responsible
for ensuring the radio communication flow and thus served as information hubs
between the operation controllers and the responders in the field. The immediate
area of operations was divided into three sub-areas, each of which was staffed with
a local operation commander and approximately nine additional responders. Ow-
ing to the requirements of the exercise scenario, each response team worked on
similar tasks related to the evacuation of persons and equipment simultaneously.
Observers from other organizations and researchers were admitted to all locations
at any time during the approximately three hours of operation.
Our data consist of personal observations of the operation controllers, mobile
command units, and response operations in the field. Furthermore, we were given
access to a dataset that contains all records of radio communication taking place
during the exercise, including unique identifiers of the communicating individu-
als and the complete audio records of their conversations.2 Hence, we could listen
to the radio communication and observe when and between which radio users the
communication took place in the aftermath of the event.
Below, we describe an exemplary workflow of conducting SNA research based
on digital trace data as were obtained from this exercise.
. Practical SNA Challenges and Opportunities for Radio Networks in the
Emergency Response Field
Extracting communication events from the radio system. Initially, we identified
from the radio system concrete instances of communication among users. These
communication events are the basis for the extraction of network nodes and links
and thus the first step of conducting SNA based on radio data.
In the emergency response field, radio systems that enable at least half-duplex
communication – that is, non-simultaneous two-way communication, such as giv-
ing orders and receiving status updates – are common [3]. Responders taking part
in the field exercise relied on a digital radio system that included an electronic
interface by which the system can be connected to computers, making available
2 Note, however, that recording emergency responders’ radio communication can beproblematic because German relief organizations require permission to do so. For thefield exercise, the local authorities granted us permission to record emergency respon-ders’ radio communication.
90 International Workshop of MMB 2018
electronic records of the communication, which includes detailed metadata, such
as the technical identifiers of sending and receiving radio devices. While those
identifiers are unique and exclusively assigned to specific individuals taking part
in the emergency response field exercise, we had to employ qualitative coding tech-
niques to match those technical identifiers with the corresponding radio names
(used on the organizational level by the participants to address each other). Ac-
cordingly, we transcribed all radio communication records and manually coded
the radio names of the senders and receivers of each radio message (i.e., the tech-
nical identifier and the radio names), the instant of time at which themessage was
sent, and the content of the message. This provides us with the necessary data to
model the nodes of the network (defined by radio names and the corresponding
technical identifiers) and the edges (defined by the recorded radio messages).
Further, based on the transcript of all radio messages, we identified events that
occurred during the emergency response field exercise and which caused an in-
creased amount of observable radio communication. A typical example of a com-
munication event extracted from the digital record of radio communication is
given in table 1 and refers to the launch of unmanned arealial vehicles (drones) to
surveil the field.
Time Sender Receiver Content of communication
10:01 AM Responder 1 Responder 2 We will launch the drones in fiveminutes.
10:05 AM Responder 1 Responder 2 We are launching the drones.
10:14 AM Responder 1 Responder 2 The drones are back on the ground.
10:15 AM Responder 2 Responder 1 Let us know when you are flyingagain.
Table 1: Radio communication example.
We experienced several issues during coding that we suspect are common prob-
lems when dealing with radio systems. The first has to do with radio charts and
radio discipline. Members of relief organizations we talked to often praised radio
for enabling reliable and standardized patterns of communication among respon-
SOCNET 2018, February 28, 2018 91
ders. In particular, this is based on the common practice to prepare radio charts
that define the radio name, operational role, and designated radio contacts of all
users of a radio system prior to the actual emergency operations. This results in
a well structured and hierarchical organizational chart of communication paths
among the responders. Relief professionals we interviewed also expressed their
intent to ensure compliance with radio discipline, meaning the avoidance of un-
necessary calls and calls outside of the predefined routine.
Nevertheless, we witnessed cases in which radio charts were incorrect or incom-
plete, or in which inadequate flows of communication could not be prevented.
During the field exercise, for instance, not all radio names and operational roles
were predefined, which led to some confusion because some responders initially
did not respond to their assigned radio names. Such unexpected patterns of ra-
dio usage can heavily complicate the practical identification of communication
events from radio. This issue is, at least in part, related to the inter-organizational
nature of emergency relief efforts. In this particular case, one of the relief orga-
nizations took the leading role in organizing the exercise. Due to organizational
communication barriers, especially lack of trust and information sharing between
the involved organizations, some members of other involved relief organizations
did not receive all of the information that had been distributed beforehand. Such
barriers, which manifest themselves as gaps in the inter-organizational flow of
information, are a common phenomenon in this context [7,13,15].
Other problems arose from the quality of the available audio records. While com-
mon standards of radio communication (e.g., specifying the radio name of both
senders and receivers at the beginning of a message) facilitate identifying users,
we were not always able to do so because some recorded passages were inaudible.
We were able, however, to identify senders and receivers and the timestamps of
communication by relying on additional information from the electronic interface
of the digital radio system.
Moreover, we noted that records of radio communication are almost necessarily
incomplete. Relief organizations usually intend that all emergency-related com-
munication take place via radio. During the field exercise, however, we could ob-
serve that communication, especially for longer messages, also took place via un-
recorded channels, such as instant messaging, telephone, and face-to-face. Natu-
rally, such communication is not covered by the radio system, which means that
92 International Workshop of MMB 2018
recordsmight include non-random and possibly indiscernible discontinuities in the
communication flow.
Modeling actors and communication ties from event data. The second challenge
we faced was determining network nodes and ties from the event data.While radio
users – as indicated by their radio names – could readily be regarded as nodes of
the communication network, it was less clear when to assume a communication
tie between them.
We discussed the modeling of different types of communication ties and decided
to define a tie as the occurrence of a communication event between any pair of
sender and (potentially multiple) receivers, under the condition that it referred to
the ongoing emergency response operations. In our view, not incorporating addi-
tional information on the content of communication is acceptable in the restricted
case of a simulated event with a narrow focus on the general structure of emer-
gency responders’ operational communications.
Next, we considered the strength and direction of ties. With regard to tie strength,
we believe that dichotomization is mostly uncritical in the given context because
radio communication essentially reproduced the predefined structures of the radio
chart, with repeated communication stressing the role of the known information
hubs in the network. As to the directionality of ties, including the directionality of
the information flow enables insights into the role of specific users in the com-
munication process. This information is relevant to our analysis for two reasons.
First, including the direction of ties allows us to distinguish between simple (one-
directional) commands and information exchanges (reciprocal ties). Second, the
normative structure imposed by the participating organizations and emergency
relief work in general suggests that the network shows strong hierarchical pat-
terns resembling the information flows suggested by the radio charts. Those hier-
archies define directed information flows, which can only be analyzed in directed
radio communication networks. Therefore, we distinguish between the senders
and receivers of messages and model edges as directed ties flowing from the for-
mer to the latter. Note, however, that we regarded receivers’ affirmative responses
to incoming calls – common in radio communications to signal that receivers are
listening or have understood – to be part of the initial call directed towards them,
SOCNET 2018, February 28, 2018 93
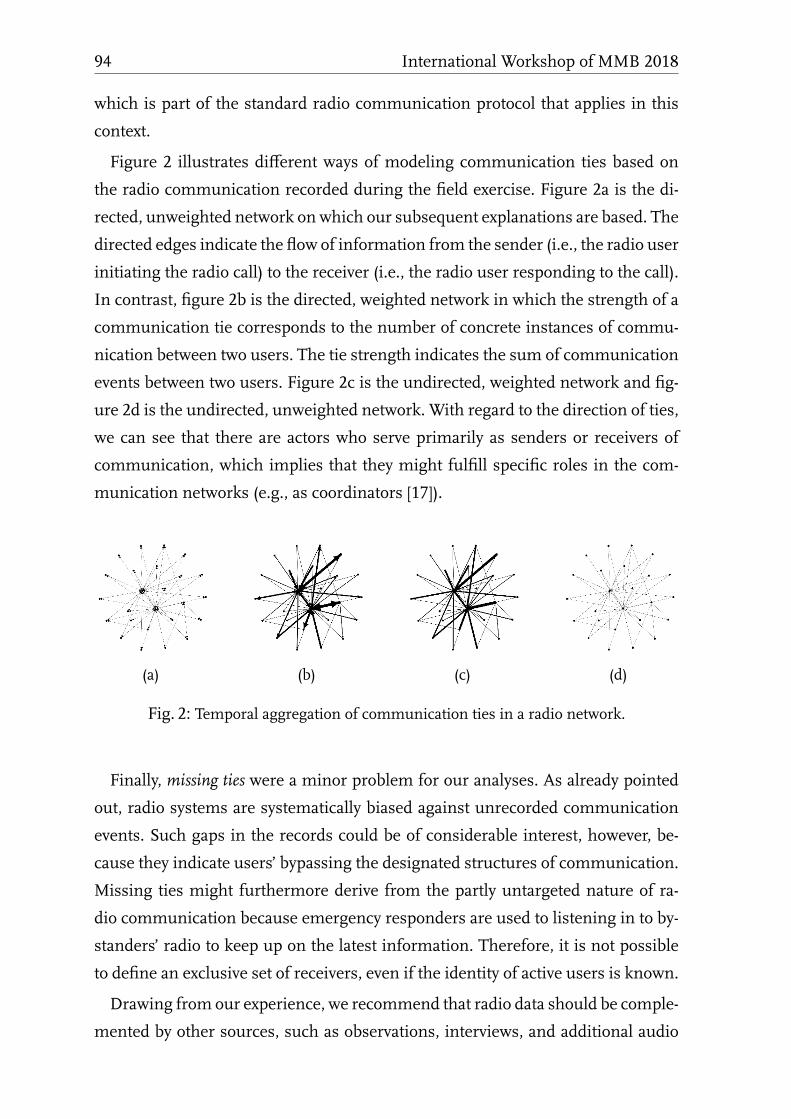
which is part of the standard radio communication protocol that applies in this
context.
Figure 2 illustrates different ways of modeling communication ties based on
the radio communication recorded during the field exercise. Figure 2a is the di-
rected, unweighted network on which our subsequent explanations are based. The
directed edges indicate the flow of information from the sender (i.e., the radio user
initiating the radio call) to the receiver (i.e., the radio user responding to the call).
In contrast, figure 2b is the directed, weighted network in which the strength of a
communication tie corresponds to the number of concrete instances of commu-
nication between two users. The tie strength indicates the sum of communication
events between two users. Figure 2c is the undirected, weighted network and fig-
ure 2d is the undirected, unweighted network. With regard to the direction of ties,
we can see that there are actors who serve primarily as senders or receivers of
communication, which implies that they might fulfill specific roles in the com-
munication networks (e.g., as coordinators [17]).
(a) (b) (c) (d)
Fig. 2: Temporal aggregation of communication ties in a radio network.
Finally, missing ties were a minor problem for our analyses. As already pointed
out, radio systems are systematically biased against unrecorded communication
events. Such gaps in the records could be of considerable interest, however, be-
cause they indicate users’ bypassing the designated structures of communication.
Missing ties might furthermore derive from the partly untargeted nature of ra-
dio communication because emergency responders are used to listening in to by-
standers’ radio to keep up on the latest information. Therefore, it is not possible
to define an exclusive set of receivers, even if the identity of active users is known.
Drawing from our experience, we recommend that radio data should be comple-
mented by other sources, such as observations, interviews, and additional audio
94 International Workshop of MMB 2018
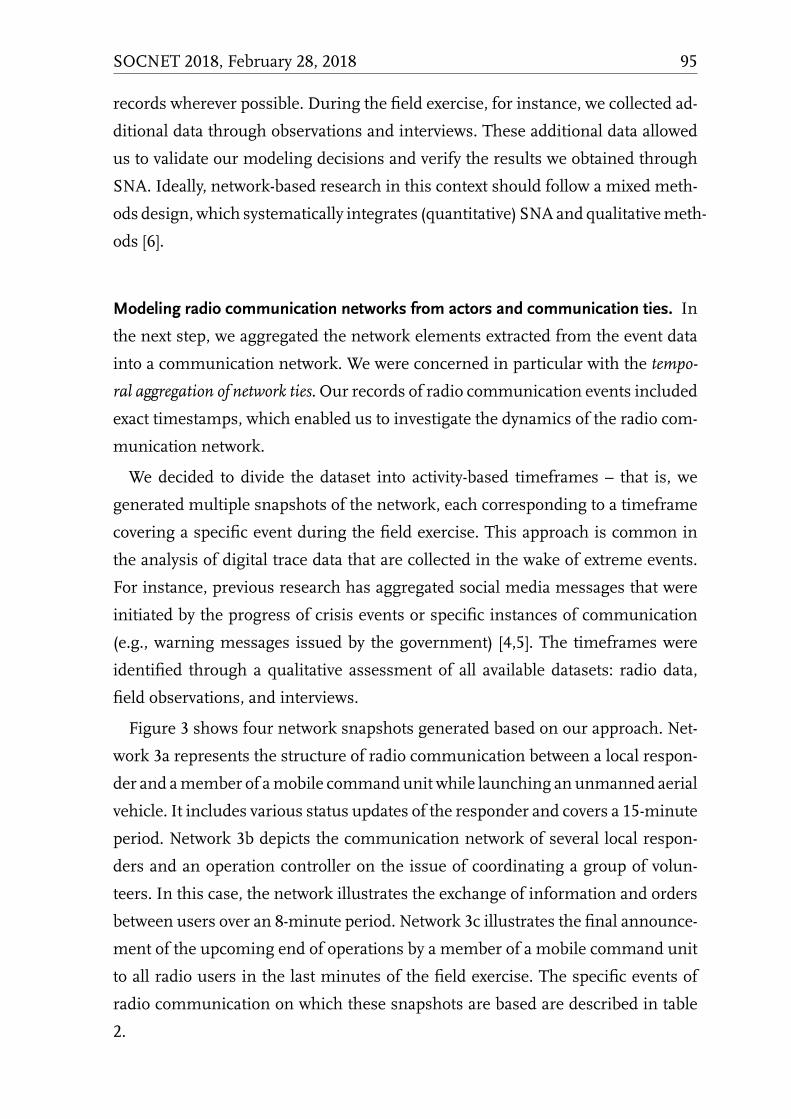
records wherever possible. During the field exercise, for instance, we collected ad-
ditional data through observations and interviews. These additional data allowed
us to validate our modeling decisions and verify the results we obtained through
SNA. Ideally, network-based research in this context should follow a mixed meth-
ods design, which systematically integrates (quantitative) SNA and qualitativemeth-
ods [6].
Modeling radio communication networks from actors and communication ties. In
the next step, we aggregated the network elements extracted from the event data
into a communication network. We were concerned in particular with the tempo-
ral aggregation of network ties. Our records of radio communication events included
exact timestamps, which enabled us to investigate the dynamics of the radio com-
munication network.
We decided to divide the dataset into activity-based timeframes – that is, we
generated multiple snapshots of the network, each corresponding to a timeframe
covering a specific event during the field exercise. This approach is common in
the analysis of digital trace data that are collected in the wake of extreme events.
For instance, previous research has aggregated social media messages that were
initiated by the progress of crisis events or specific instances of communication
(e.g., warning messages issued by the government) [4,5]. The timeframes were
identified through a qualitative assessment of all available datasets: radio data,
field observations, and interviews.
Figure 3 shows four network snapshots generated based on our approach. Net-
work 3a represents the structure of radio communication between a local respon-
der and amember of amobile commandunit while launching an unmanned aerial
vehicle. It includes various status updates of the responder and covers a 15-minute
period. Network 3b depicts the communication network of several local respon-
ders and an operation controller on the issue of coordinating a group of volun-
teers. In this case, the network illustrates the exchange of information and orders
between users over an 8-minute period. Network 3c illustrates the final announce-
ment of the upcoming end of operations by a member of a mobile command unit
to all radio users in the last minutes of the field exercise. The specific events of
radio communication on which these snapshots are based are described in table
2.
SOCNET 2018, February 28, 2018 95
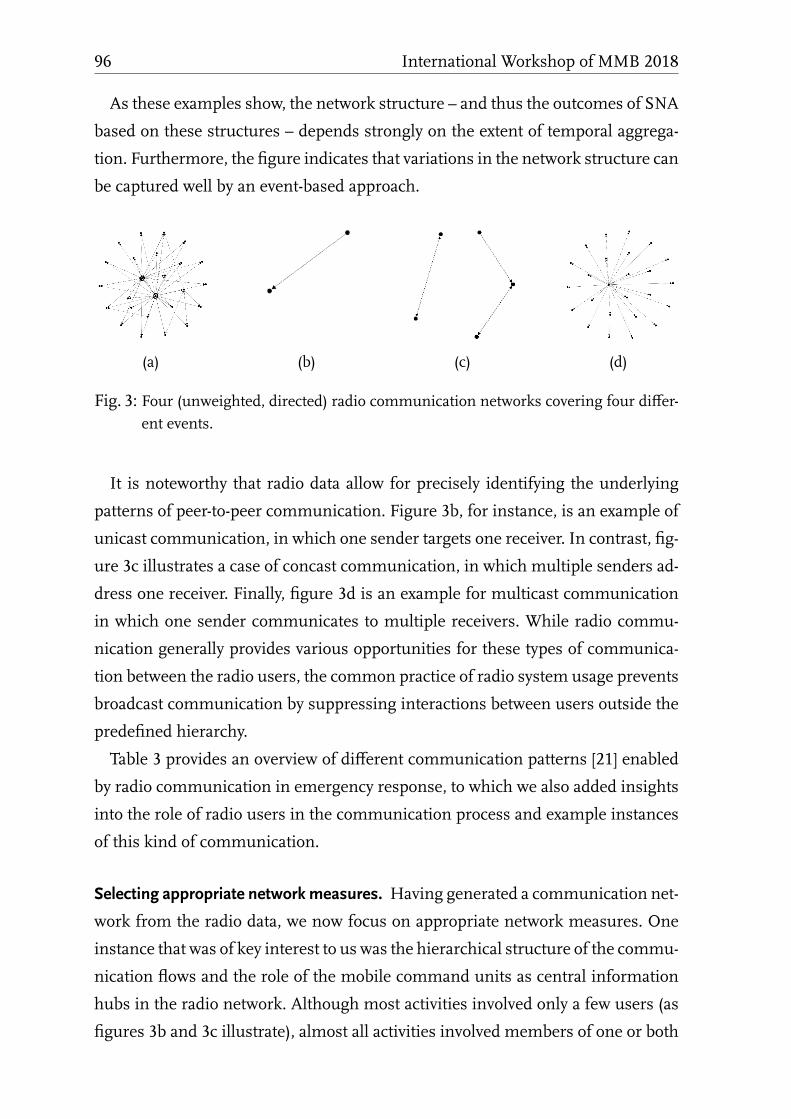
As these examples show, the network structure – and thus the outcomes of SNA
based on these structures – depends strongly on the extent of temporal aggrega-
tion. Furthermore, the figure indicates that variations in the network structure can
be captured well by an event-based approach.
(a) (b) (c) (d)
Fig. 3: Four (unweighted, directed) radio communication networks covering four differ-ent events.
It is noteworthy that radio data allow for precisely identifying the underlying
patterns of peer-to-peer communication. Figure 3b, for instance, is an example of
unicast communication, in which one sender targets one receiver. In contrast, fig-
ure 3c illustrates a case of concast communication, in which multiple senders ad-
dress one receiver. Finally, figure 3d is an example for multicast communication
in which one sender communicates to multiple receivers. While radio commu-
nication generally provides various opportunities for these types of communica-
tion between the radio users, the common practice of radio system usage prevents
broadcast communication by suppressing interactions between users outside the
predefined hierarchy.
Table 3 provides an overview of different communication patterns [21] enabled
by radio communication in emergency response, to which we also added insights
into the role of radio users in the communication process and example instances
of this kind of communication.
Selecting appropriate network measures. Having generated a communication net-
work from the radio data, we now focus on appropriate network measures. One
instance that was of key interest to us was the hierarchical structure of the commu-
nication flows and the role of the mobile command units as central information
hubs in the radio network. Although most activities involved only a few users (as
figures 3b and 3c illustrate), almost all activities involved members of one or both
96 International Workshop of MMB 2018
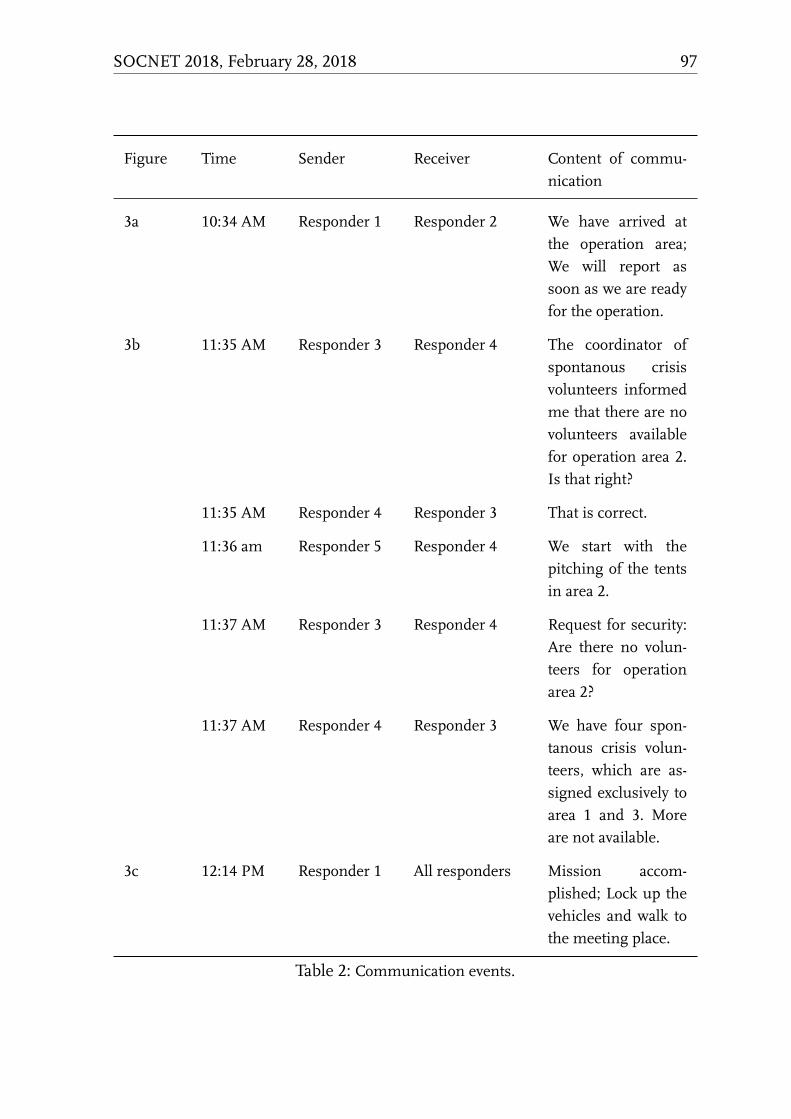
Figure Time Sender Receiver Content of commu-nication
3a 10:34 AM Responder 1 Responder 2 We have arrived atthe operation area;We will report assoon as we are readyfor the operation.
3b 11:35 AM Responder 3 Responder 4 The coordinator ofspontanous crisisvolunteers informedme that there are novolunteers availablefor operation area 2.Is that right?
11:35 AM Responder 4 Responder 3 That is correct.
11:36 am Responder 5 Responder 4 We start with thepitching of the tentsin area 2.
11:37 AM Responder 3 Responder 4 Request for security:Are there no volun-teers for operationarea 2?
11:37 AM Responder 4 Responder 3 We have four spon-tanous crisis volun-teers, which are as-signed exclusively toarea 1 and 3. Moreare not available.
3c 12:14 PM Responder 1 All responders Mission accom-plished; Lock up thevehicles and walk tothe meeting place.
Table 2: Communication events.
SOCNET 2018, February 28, 2018 97
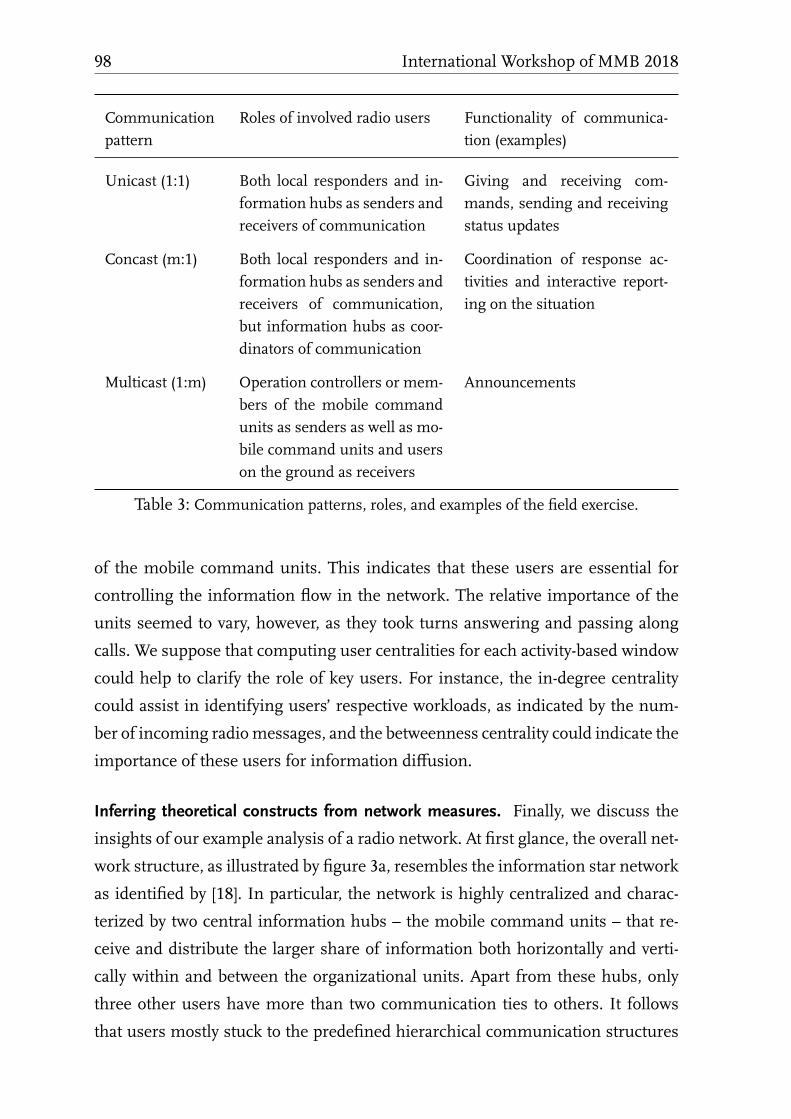
Communicationpattern
Roles of involved radio users Functionality of communica-tion (examples)
Unicast (1:1) Both local responders and in-formation hubs as senders andreceivers of communication
Giving and receiving com-mands, sending and receivingstatus updates
Concast (m:1) Both local responders and in-formation hubs as senders andreceivers of communication,but information hubs as coor-dinators of communication
Coordination of response ac-tivities and interactive report-ing on the situation
Multicast (1:m) Operation controllers or mem-bers of the mobile commandunits as senders as well as mo-bile command units and userson the ground as receivers
Announcements
Table 3: Communication patterns, roles, and examples of the field exercise.
of the mobile command units. This indicates that these users are essential for
controlling the information flow in the network. The relative importance of the
units seemed to vary, however, as they took turns answering and passing along
calls. We suppose that computing user centralities for each activity-based window
could help to clarify the role of key users. For instance, the in-degree centrality
could assist in identifying users’ respective workloads, as indicated by the num-
ber of incoming radiomessages, and the betweenness centrality could indicate the
importance of these users for information diffusion.
Inferring theoretical constructs from network measures. Finally, we discuss the
insights of our example analysis of a radio network. At first glance, the overall net-
work structure, as illustrated by figure 3a, resembles the information star network
as identified by [18]. In particular, the network is highly centralized and charac-
terized by two central information hubs – the mobile command units – that re-
ceive and distribute the larger share of information both horizontally and verti-
cally within and between the organizational units. Apart from these hubs, only
three other users have more than two communication ties to others. It follows
that users mostly stuck to the predefined hierarchical communication structures
98 International Workshop of MMB 2018
as stipulated in the radio chart. This insight is not surprising since it mirrors the
predefined hierarchical structure imposed by the radio chart that also reflects the
hierarchical nature of relief organizations in general.
Considering specific action-based windows instead suggests a more dynamic
view of both network structures and the role of the central users within them.
Contrasting the degree and betweenness centralities within these windows sug-
gests that the two information hubs alternated in their respective workloads and
relevance for ensuring overall communication flow.While this finding is trivial for
the small communication network obtained from the field exercise, such knowl-
edge can be crucial during actual emergency response operations, for instance, to
ensure an efficient flow of information among responders, design robust commu-
nication structures, and prevent information overload of central actors.
Since the field exercise was restricted to a timeframe of only three hours, the
extent of observed network dynamics is, of course, limited. Furthermore, the field
exercise was the result of a long planning process and involved only low degrees of
stress and uncertainty for responders, which is atypical in emergency response op-
erations. Nevertheless, operational tasks were chosen by experienced emergency
managers and judged to be realistic by experts from all three relief organizations
involved. Therefore, our results allow for initial insights into patterns of commu-
nication that might also be observed in a similar way under similar circumstances
in a non-simulated emergency response. More importantly, however, we have de-
scribed an example workflow of how radio data can be utilized for SNA, pointing
to the challenges and opportunities of radio systems and indicating initial oppor-
tunities for future analyses.
Conclusion
Our paper’s purpose was to discuss how SNA can be used to understand radio
communication networks in the context of emergency response. In particular, we
outline the importance of modeling and analyzing radio networks appropriately
based on [9], experiences from a research project in the emergency management
field, and a radio network obtained in an emergency response field exercise. We
document and prototype a workflow that can be utilized for generating and ana-
lyzing emergency responders’ radio communications from an SNA perspective.
SOCNET 2018, February 28, 2018 99
Given the growing interest in emergency response communication in general
[13,14,19], and emergency responders’ radio communication in particular [2,17],
our work is as a starting point for further SNA research based on such data.
References
1. Butts, C.T.: Revisiting the Foundations of Network Analysis. Science 325(5939), 414–416 (2009)
2. Butts, C.T., Miruna, P., Cross, R.B.: Responder Communication Networks in theWorld Trade Center Disaster: Implications for Modeling of Communication withinEmergency Settings. Journal of Mathematical Sociology 31(2), 121–147 (2007)
3. Camp, P.J., Hudson, J.M., Keldorph, R.B., Lewis, S., Mynatt, E.D.: Supporting Com-munication and Collaboration Practices in Safety-Critical Situations. CHI ’00 Ex-tended Abstracts on Human Factors in Computing Systems pp. 249–250 (2000)
4. Chatfield, A.T., Reddick, C.G.: All Hands onDeck to Tweet #Sandy: NetworkedGover-nance of Citizen Coproduction in Turbulent Times. Government Information Quar-terly (2017)
5. Chatfield, A.T., Scholl, H.J.J., Brajawidagda, U.: Tsunami Early Warnings via Twitterin Government: Net-Savvy Citizens’ Co-Production of Time-Critical Public Informa-tion Services. Government Information Quarterly 30(4), 377–386 (2013)
6. Domínguez, S., Hollstein, B.: Mixed Methods Social Networks Research: Design andApplications. Cambridge University Press (2014)
7. Fischer, D., Posegga, O., Fischbach, K.: Communication Barriers in Crisis Manage-ment: A Literature Review. ECIS Proceedings (2016)
8. Houghton, R.J., Baber, C., Richard, M., Stanton, N.A., Salmon, P., Stewart, R.,Walker, G.: Command and Control in Emergency Services Operations: A Social Net-work Analysis. Ergonomics 49(12-13), 1204–1225 (2006)
9. Howison, J., Wiggins, A., Crowston, K.: Validity Issues in the Use of Social NetworkAnalysis with Digital Trace Data. Journal of the Association for Information Systems12(12), 767–797 (2011)
10. International TelecommunicationUnion (ITU): Emergency andDisaster Relief: ITU-R Special Supplement (2006)
11. International Telecommunication Union (ITU): Radio Regulations: Articles (2006)12. Kapucu, N.: Interorganizational Coordination in Dynamic Context: Networks in
Emergency Response Management. Connections 26(2), 33–48 (2005)13. Kapucu, N.: Interagency Communication Networks during Emergencies: Boundary
Spanners in Multiagency Coordination. American Review of Public Administration36(2), 207–225 (2006)
14. Kapucu, N., Arslan, T., Collins, M.: Examining Intergovernmental and Interorgani-zational Response to Catastrophic Disasters: Toward a Network-Centered Approach.Administration & Society 42(2), 222–247 (2010)
100 International Workshop of MMB 2018
15. Manoj, B., Baker, A.: Communication Challenges in Emergency Response. Commu-nications of the ACM 50(3), 51–53 (2007)
16. Marsden, P.V.: NetworkData andMeasurement. Annual Review of Sociology 16, 435–463 (1990)
17. Miruna, P., Butts, C.T.: Emergent Coordination in the World Trade Center Dis-aster. imbs-dev.ss.uci.edu/files/docs/technical/2005/mbs05_03.pdf, ac-cessed 2018-01-07 (2005)
18. Pan, S.L., Pan, G., Leidner, D.E.: Crisis Response Information Networks. Journal ofthe Association for Information Systems 13(1), 31–56 (2012)
19. Uhr, C., Johansson, H., Fredholm, L.: Analysing Emergency Response Systems. Jour-nal of Contingencies and Crisis Management 16(2), 80–90 (2008)
20. Wassermann, S., Faust, K.: Social NetworkAnalysis:Methods andApplications (1994)21. Wittmann, R., Zitterbart, M.: Multicast Communication: Protocols, Programming, &
Applications. Morgan Kaufmann (2000)
SOCNET 2018, February 28, 2018 101

Analyzing the Missing Data of Online Travel Reviews
Published in a Large Virtual Travel Community
Lisa Hepp
University of Bamberg,An der Weberei 5, 96047 Bamberg, Germany
http://www.uni-bamberg.de
Abstract. In the present study, a data set of a virtual travel community
is to be analyzed. The relationship between two variables of the data set
is being examined with a regression model. The network was identified
to contain a lot of missing data and the need to handle the missing data
was presented. The missing data was found to be missing at random.
A plan to handle the missing data in this specific data set by multiple
imputation was developed.
Key words: Missing Data, Social Network Analysis, Multiple Imputation
Introduction
A huge data set of the virtual travel community trip advisor was generated by Ro-
man Tilly [7] . It contains the user generated reviews of many accommodations
worldwide. Using this data, we want to examine the relationship between the rat-
ing given for service and the rating given for check-in. The reviewers are given
the option to rate several aspects of the accommodation such as the service or
the location. Many users choose to only fill in some of these categories and leave
others blank. This leads to a large amount of missing data in the network. Previ-
ous research has shown that simply ignoring missing data when analyzing social
networks can lead to bias and lower the significance of the network analysis dra-
matically and should therefore be avoided [2]. It is therefore the aim of this work to
prepare the given network data to allow further network analysis to be performed.
In order to achieve this, the data was analyzed with a focus on the missing data.
Reasons for the missing data and the missingness mechanism were identified.
SOCNET 2018, February 28, 2018 103
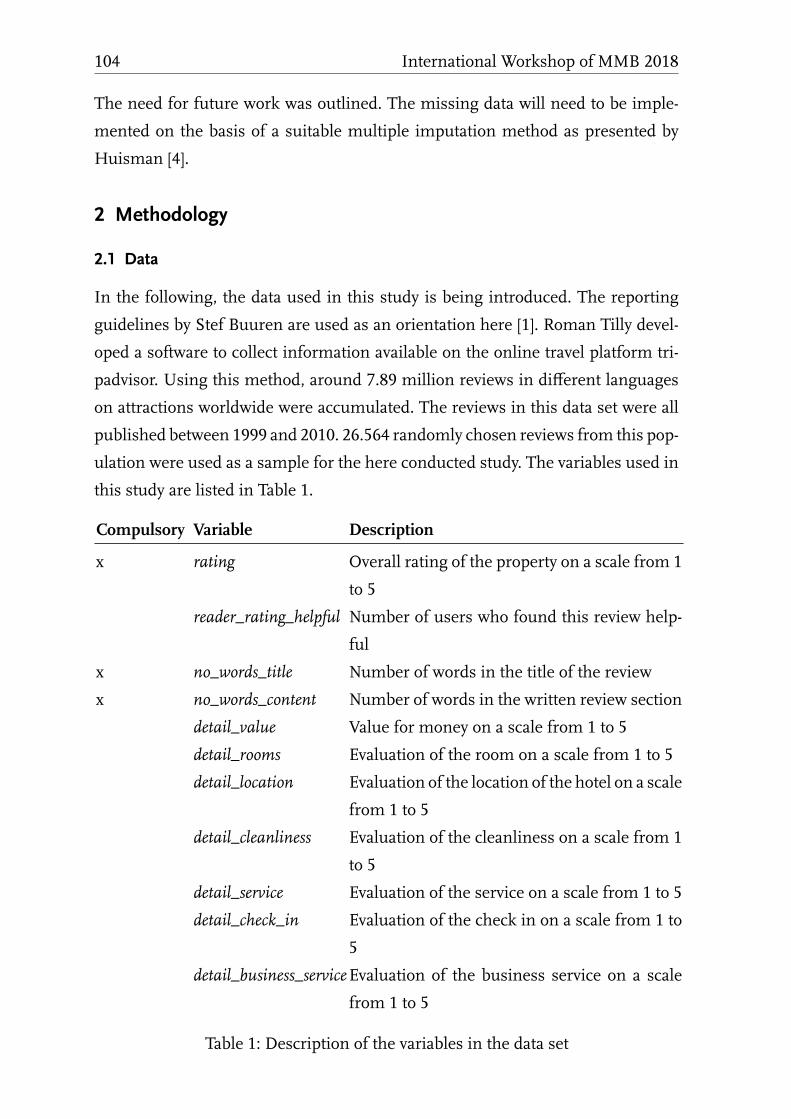
The need for future work was outlined. The missing data will need to be imple-
mented on the basis of a suitable multiple imputation method as presented by
Huisman [4].
Methodology
. Data
In the following, the data used in this study is being introduced. The reporting
guidelines by Stef Buuren are used as an orientation here [1]. Roman Tilly devel-
oped a software to collect information available on the online travel platform tri-
padvisor. Using this method, around 7.89 million reviews in different languages
on attractions worldwide were accumulated. The reviews in this data set were all
published between 1999 and 2010. 26.564 randomly chosen reviews from this pop-
ulation were used as a sample for the here conducted study. The variables used in
this study are listed in Table 1.
Compulsory Variable Description
x rating Overall rating of the property on a scale from 1
to 5
reader_rating_helpful Number of users who found this review help-
ful
x no_words_title Number of words in the title of the review
x no_words_content Number of words in the written review section
detail_value Value for money on a scale from 1 to 5
detail_rooms Evaluation of the room on a scale from 1 to 5
detail_location Evaluation of the location of the hotel on a scale
from 1 to 5
detail_cleanliness Evaluation of the cleanliness on a scale from 1
to 5
detail_service Evaluation of the service on a scale from 1 to 5
detail_check_in Evaluation of the check in on a scale from 1 to
5
detail_business_serviceEvaluation of the business service on a scale
from 1 to 5
Table 1: Description of the variables in the data set
104 International Workshop of MMB 2018
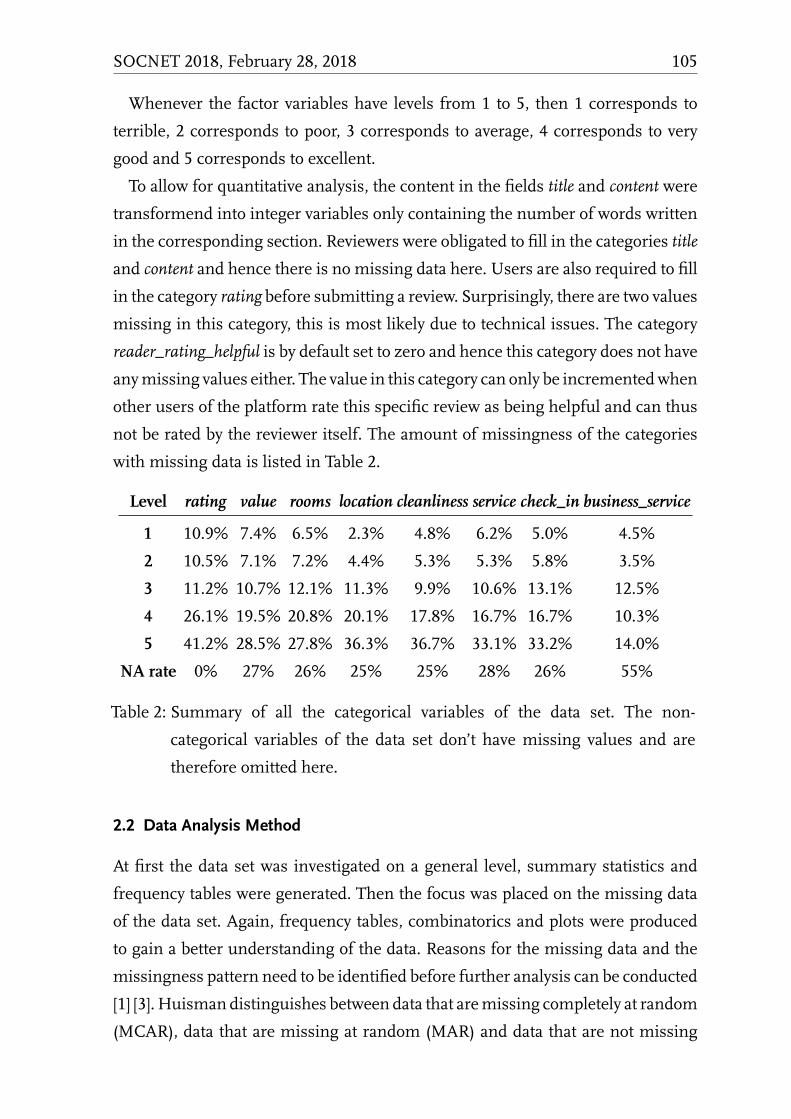
Whenever the factor variables have levels from 1 to 5, then 1 corresponds to
terrible, 2 corresponds to poor, 3 corresponds to average, 4 corresponds to very
good and 5 corresponds to excellent.
To allow for quantitative analysis, the content in the fields title and content were
transformend into integer variables only containing the number of words written
in the corresponding section. Reviewers were obligated to fill in the categories title
and content and hence there is no missing data here. Users are also required to fill
in the category rating before submitting a review. Surprisingly, there are two values
missing in this category, this is most likely due to technical issues. The category
reader_rating_helpful is by default set to zero and hence this category does not have
anymissing values either. The value in this category can only be incrementedwhen
other users of the platform rate this specific review as being helpful and can thus
not be rated by the reviewer itself. The amount of missingness of the categories
with missing data is listed in Table 2.
Level rating value rooms location cleanliness service check_in business_service
1 10.9% 7.4% 6.5% 2.3% 4.8% 6.2% 5.0% 4.5%
2 10.5% 7.1% 7.2% 4.4% 5.3% 5.3% 5.8% 3.5%
3 11.2% 10.7% 12.1% 11.3% 9.9% 10.6% 13.1% 12.5%
4 26.1% 19.5% 20.8% 20.1% 17.8% 16.7% 16.7% 10.3%
5 41.2% 28.5% 27.8% 36.3% 36.7% 33.1% 33.2% 14.0%
NA rate 0% 27% 26% 25% 25% 28% 26% 55%
Table 2: Summary of all the categorical variables of the data set. The non-
categorical variables of the data set don’t have missing values and are
therefore omitted here.
. Data Analysis Method
At first the data set was investigated on a general level, summary statistics and
frequency tables were generated. Then the focus was placed on the missing data
of the data set. Again, frequency tables, combinatorics and plots were produced
to gain a better understanding of the data. Reasons for the missing data and the
missingness pattern need to be identified before further analysis can be conducted
[1] [3]. Huisman distinguishes between data that aremissing completely at random
(MCAR), data that are missing at random (MAR) and data that are not missing
SOCNET 2018, February 28, 2018 105

at random (NMAR) [3]. When an item is missing completely at random, neither
the (unknown) value of the missing item nor the observed items are related to
the missigness of an item. In this case, the observed data is simply a random
subset of the original set of oberservations, since there is no systematic bias. MAR
means that the missingness of an item is not related to its value, but it is related
to some of the observed data in the data set. The systematic bias can, in this case,
be controlled as it is related to known values. The property MNAR describes the
case in which the probability that an item is missing is related to the item’s value.
This mechanism can lead to a large bias and is hard to regulate. To determine the
missingness mechanism in the data set, the following hypothesis is set up:
Hypothesis 1 �0 : The data is missing completely at random.�1 : The data is not missing completely at random.
To test the null hypothesis, Little’s test for MCAR was conducted using the R-
package BaylorEdPsych on the entire data set [5] . The hypothesis is to be rejected
if the corresponding p-value is less than 0.05.
In the next step, a further hypothesis was set up to investigate whether the re-
viewer’s satisfaction of the attraction that is being reviewed and the thoroughness
of the review are dependent.
Hypothesis 2 �0 : The overall rating of a review and the number of missing items in
the review are not related.�1 : The overall rating of a rewiew and the number of missing items in the review are
related.
AChi-Square test of independence was conducted on the value of the categorical
variable rating and the number of missing values in the review to test this null hy-
pothesis. The test was conducted with 26561 degrees of freedom at a significance
level of 0.05.
After investigating the missing data, the complete cases of the data set were
analyzed and summary statistics were computed.
. Setting up the Analysis Model
In order to examine the relationship between the two variables detail_service and
detail_check_in , a regression model is set up. Additionally to the above mentioned
106 International Workshop of MMB 2018
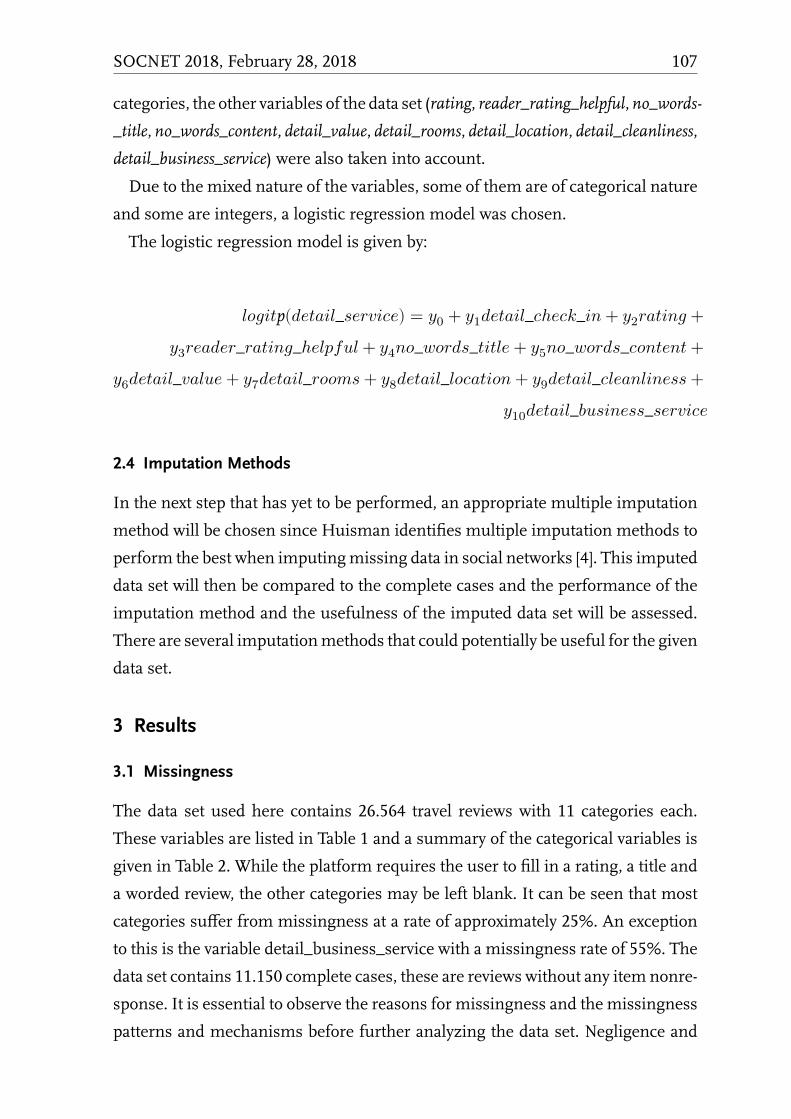
categories, the other variables of the data set (rating, reader_rating_helpful, no_words-
_title, no_words_content, detail_value, detail_rooms, detail_location, detail_cleanliness,
detail_business_service) were also taken into account.
Due to the mixed nature of the variables, some of them are of categorical nature
and some are integers, a logistic regression model was chosen.
The logistic regression model is given by:
� p( � _ � ) � �0 + �1 � _ ℎ _� + �2 � +�3 _ � _ℎ + �4 _ _ � + �5 _ _ +�6 � _ + �7 � _ + �8 � _ � + �9 � _ � +�10 � _ � _ �. Imputation Methods
In the next step that has yet to be performed, an appropriate multiple imputation
method will be chosen since Huisman identifies multiple imputation methods to
perform the best when imputingmissing data in social networks [4]. This imputed
data set will then be compared to the complete cases and the performance of the
imputation method and the usefulness of the imputed data set will be assessed.
There are several imputationmethods that could potentially be useful for the given
data set.
Results
. Missingness
The data set used here contains 26.564 travel reviews with 11 categories each.
These variables are listed in Table 1 and a summary of the categorical variables is
given in Table 2. While the platform requires the user to fill in a rating, a title and
a worded review, the other categories may be left blank. It can be seen that most
categories suffer from missingness at a rate of approximately 25%. An exception
to this is the variable detail_business_service with a missingness rate of 55%. The
data set contains 11.150 complete cases, these are reviews without any item nonre-
sponse. It is essential to observe the reasons for missingness and the missingness
patterns and mechanisms before further analyzing the data set. Negligence and
SOCNET 2018, February 28, 2018 107
ambiguity may have led to missing data here [8]. Moreover, users may have omit-
ted filling in some categories of the review if they felt they were closely related to
another category and they wanted to avoid repetition. An example of such a pair of
variables are detail_service and detail_check_in. The relationship of themissingness
of the two variables is strong. Due to its nature of being a survey whose sample is
chosen by self-selection, we do not have unit nonresponse here and only deal with
item nonresponse. The hypothesis that the data are MCAR was strongly rejected
with a p-value of zero when Little’s test for MCAR was conducted [5] . Therefore,
we assume the data to be MAR.
An interesting observation can be made that shows that there are two kinds of
people writing reviews on this particular platform: Participants who fill in every
single category or only miss out one rating and participants who only fill in the cat-
egories one needs to rate in order to submit a review. In fact, 42,0% are complete
cases, 28,7% are only missing one item per review and 24,5% of the reviews are
missing 7 values. Only 4,8% of the reviews have 2-6 missing items. This raises the
question whether missingness only depends on the personality of the person writ-
ing the review and is independent of the accommodation that is being reviewed. To
check this assumption, I first compared the values of the variable rating from the
complete cases and the reviews with seven missing items (”obligatory data”). At
first sight, the data looks very similar as can be seen in Table 4 and this strengthens
the assumption that missingness is independent of the rating itself. Afterwards,
a Chi-Squared test of independence was conducted to check whether rating and
number ofmissing values per review are independent.With a p-value smaller than
2,2e-16 there is strong evidence that these factors are, in fact, dependent and the
hypothesis was incorrect.
. Logistic Regression Model
The logistic regression model for the dependent variable detail_service can be seen
in the following figure 1.
The model output shows that not only the covariate detail_check_in but also the
covariate rating is highly significant for every value of the categorical variable.
108 International Workshop of MMB 2018
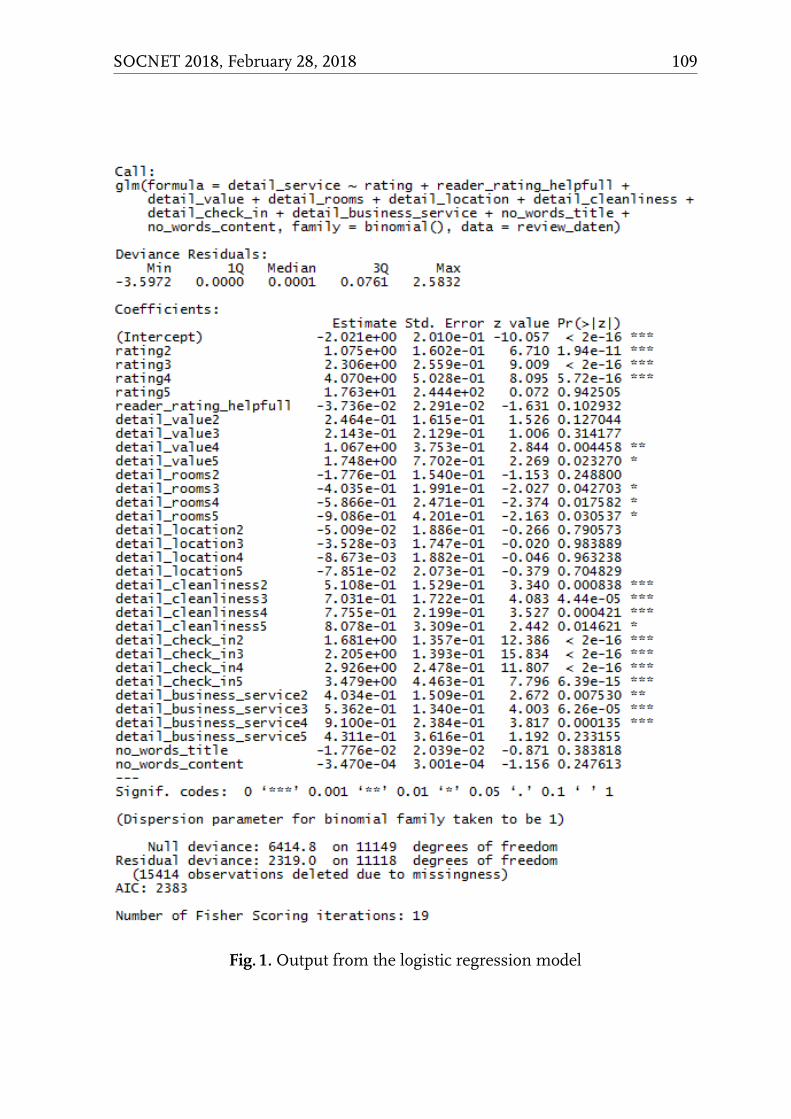
Fig. 1. Output from the logistic regression model
SOCNET 2018, February 28, 2018 109
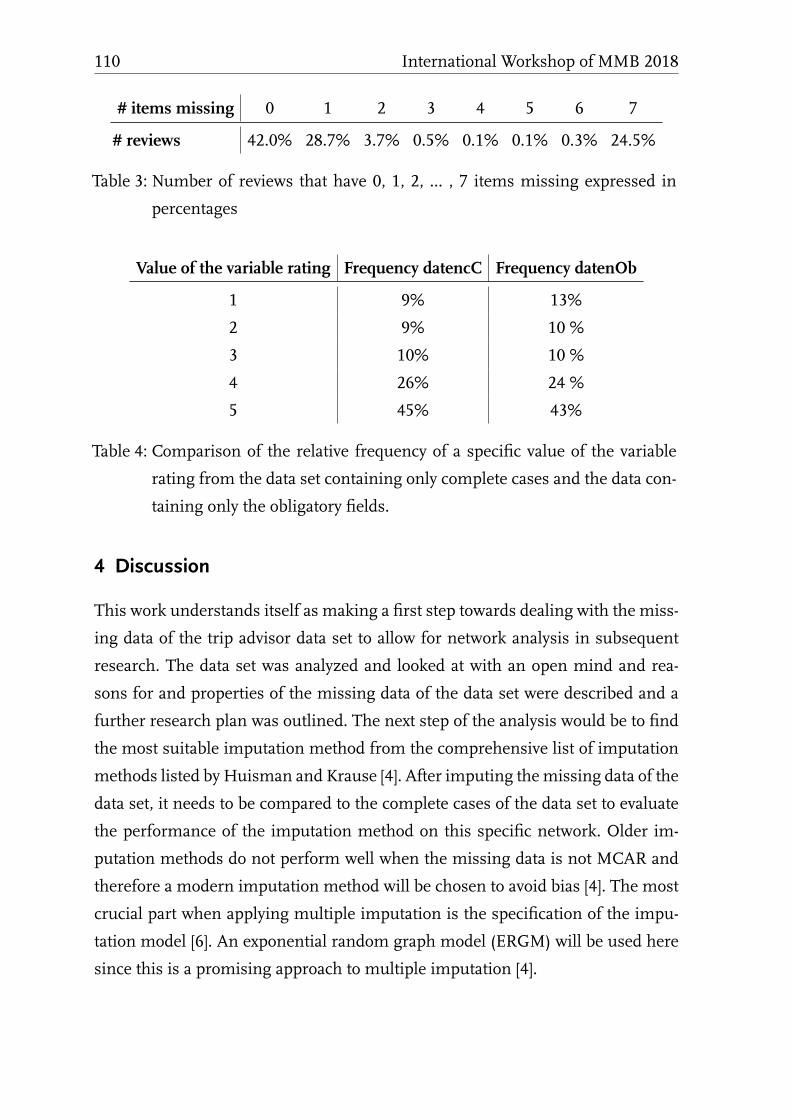
# items missing 0 1 2 3 4 5 6 7
# reviews 42.0% 28.7% 3.7% 0.5% 0.1% 0.1% 0.3% 24.5%
Table 3: Number of reviews that have 0, 1, 2, ... , 7 items missing expressed in
percentages
Value of the variable rating Frequency datencC Frequency datenOb
1 9% 13%
2 9% 10 %
3 10% 10 %
4 26% 24 %
5 45% 43%
Table 4: Comparison of the relative frequency of a specific value of the variable
rating from the data set containing only complete cases and the data con-
taining only the obligatory fields.
Discussion
This work understands itself as making a first step towards dealing with the miss-
ing data of the trip advisor data set to allow for network analysis in subsequent
research. The data set was analyzed and looked at with an open mind and rea-
sons for and properties of the missing data of the data set were described and a
further research plan was outlined. The next step of the analysis would be to find
the most suitable imputation method from the comprehensive list of imputation
methods listed by Huisman and Krause [4]. After imputing themissing data of the
data set, it needs to be compared to the complete cases of the data set to evaluate
the performance of the imputation method on this specific network. Older im-
putation methods do not perform well when the missing data is not MCAR and
therefore a modern imputation method will be chosen to avoid bias [4]. The most
crucial part when applying multiple imputation is the specification of the impu-
tation model [6]. An exponential random graph model (ERGM) will be used here
since this is a promising approach to multiple imputation [4].
110 International Workshop of MMB 2018
References
1. van Buuren, S.: Flexible Imputation of Missing Data. CRC Press (2012), 252–2532. Borgatti, S., Carley, K., Krackhardt, D.: On the Robustness of Centrality Measures Un-der Conditions of Imperfect Data. Social Networks 28(2), 124–136 (2006)3. Huisman,M.: Imputation ofMissingNetworkData: Some Simple Procedures. Journalof Social Structure 10 (2009)4. Huisman, M., Krause, R.: Imputation of missing network data. Encyclopedia of SocialNetwork Analysis and Mining 382–392 Springer New York (2017)5. Little, R.: A test of missing completely at random for multivariate data with missingvalues. Journal of the American Statistical Association 83, 1198 – 1202 (1988)6. Nguyen, C., Carlin, J., Lee, K.: Model checking in multiple imputation: an overviewand case study. Emerging Themes in Epidemiology 14:8 (2017)7. Tilly, R., Fischbach, K., Schoder, D.: Mineable or messy? Assessing the quality ofmacrolevel tourism information derived from social media. Electronic Markets 25(3),227–241 (2015)8. Wang, H., Wang, S.: Mining imcomplete survey data through classification. Knowl-edge and Information Systems 24(2) 221–233 (2010)
SOCNET 2018, February 28, 2018 111


Author Index
Eismann, Kathrin 85
Fiems, Dieter 55
Fischbach, Kai 85
Fischer, Diana 85
Gloor, Peter A. 9
Gouws, Patricia 13
Hepp, Lisa 103
Kritzinger, Elmarie 13
Mehler, Alexander 67
Mentz, Jan 13
Niekler, Andreas 67
Posegga, Oliver 3, 85
Putzke, Johannes 45
Reck, Fabian 31
Takeda, Hideaki 45
Uslu, Tolga 67
eISBN: 978-3-86309-546-8
Modeling, analysis, control, and management of complex social networks repre-sent an important area of interdisciplinary research in an advanced digitalized world. In the last decade social networks have produced significant online appli-cations which are running on top of a modern Internet infrastructure and have been identified as major driver of the fast growing Internet traffic. „The Second International Workshop on Modeling, Analysis and Management of Social Networks and Their Applications“ (SOCNET 2018) held at Friedrich-Alexander-Universität Erlangen-Nürnberg, Germany, on February 28, 2018, co-vered related research issues of social networks in modern information society. The Proceedings of SOCNET 2018 highlight the topics of a tutorial on „Network Analysis in Python“ complementing the workshop program, present an invited talk „From the Age of Emperors to the Age of Empathy“, and summarize the contributions of eight reviewed papers. The covered topics ranged from theore-tical oriented studies focusing on the structural inference of topic networks, the modeling of group dynamics, and the analysis of emergency response networks to the application areas of social networks such as social media used in organi-zations or social network applications and their impact on modern information society. The Proceedings of SOCNET 2018 may stimulate the readers‘ future research on monitoring, modeling, and analysis of social networks and encou-rage their development efforts regarding social network applications of the next generation.