Substitute Natural Gas Production with direct Conversion ... · PDF fileund den Freiraum, der...
148
Substitute Natural Gas Production with direct Conversion of Higher Hydrocarbons Erzeugung von Substitute Natural Gas mit direkter Umsetzung von höheren Kohlenwasserstoffen Der Technischen Fakultät der Universität Erlangen-Nürnberg zur Erlangung des Grades DOKTOR-INGENIEUR vorgelegt von Christoph Baumhakl aus Graz
Transcript of Substitute Natural Gas Production with direct Conversion ... · PDF fileund den Freiraum, der...

Substitute Natural Gas Production with
direct Conversion of Higher Hydrocarbons
Erzeugung von Substitute Natural Gas mit direkter
Umsetzung von höheren Kohlenwasserstoffen
Der Technischen Fakultät der Universität Erlangen-Nürnberg
zur Erlangung des Grades
DOKTOR-INGENIEUR
vorgelegt von
Christoph Baumhakl
aus Graz
Als Dissertation genehmigt von der Technischen Fakultät der
Friedrich-Alexander-Universität Erlangen-Nürnberg
Tag der mündlichen Prüfung: 25.07.2014
Vorsitzende des Promotionsorgans: Prof. Dr.-Ing. habil. Marion Merklein
Gutachter: Prof. Dr.-Ing. Jürgen Karl
Prof. Dr. Wilhelm Schwieger
III
Vorwort/Acknowledgement
Die vorliegende Arbeit entstand im Zuge meiner Tätigkeit als wissenschaftlicher Mitarbeiter am
Institut für Wärmetechnik der Technischen Universität Graz und am Lehrstuhl für
Energieverfahrenstechnik der Friedrich-Alexander-Universität Erlangen-Nürnberg.
Ich möchte an dieser Stelle ganz herzlich Herrn Prof. Jürgen Karl für seine Betreuung und
Unterstützung bei dieser Arbeit bedanken. Im Besonderen aber auch für das optimale Arbeitsumfeld
und den Freiraum, der mir im Rahmen meiner Arbeit geboten wurde und maßgeblich zum Gelingen
beitrug. Besonderer Dank gilt auch Herrn Prof. Wilhelm Schwieger für die Übernahme des
Zweitgutachtens.
Großen Dank schulde ich meinem Mitstreiter im Kampf mit Vergasungsanlagen, Dr. Thomas
Kienberger, für die Einführung in die Vergasung und Methansynthese und die langen Diskussionen.
Meinen ehemaligen Kollegen, Dr. Lorenz Griendl, Dr. Martin Hauth, Bernhard Gatternig und
Dr. Andreas Schweiger danke ich ganz herzlich für ihre Hilfestellung beim Bau und Betrieb von
Versuchsanlagen.
Natürlich danke ich auch allen meinen anderen Kollegen für ihre Hilfe und offenen Ohren und das
freundschaftliche Verhältnis.
So eine Arbeit wäre ohne die Mitarbeit von Studenten im Rahmen von verschiedensten
Abschlussarbeiten nicht durchführbar. Dafür möchte ich ihnen auch ganz herzlich Danke sagen.
Großer Dank gilt natürlich meinen Eltern und meiner Familie, durch deren Motivation und
finanziellen Unterstützung meiner Ausbildung, ich erst so weit kommen konnte um diese
Doktorarbeit zu erstellen.
Dir Katrin gilt mein größter Dank; dass Du mich immer aufgeheitert und auf andere Gedanken
gebracht hast und ich durch Dich immer wieder aufs Neue zu meiner Arbeit motiviert worden bin.
Nürnberg, im April 2014 Christoph Baumhakl
A part of the research leading to these results has received funding from the European Community’s
Research Fund for Coal and Steel (RFCS) under grant agreement n° RFCR-CT-2009-00003.

IV
Abstract
V
Abstract
This thesis gives a contribution to develop a methanation process for production of Substitute
Natural Gas (SNG) in small-scale, decentralized facilities. Smaller plant sizes require a reduction of
the plant complexity. Therefore, a reduced gas cleaning and simplified methanation process is
proposed. A reduced gas cleaning effort results in remaining of certain contaminations in the
synthesis gas. Consequently, the methanation catalyst must be able to deal with these species.
To investigate the influence of contaminations on the methanation, suitable test setups were
constructed to validate these influences experimentally. The tests were performed with artificial,
bottle-mixed synthesis gas as well as with real synthesis gas from allothermal gasification of biomass
and lignite. The gas composition for the tests with bottle-mixed syngas bases mainly on results from
gasification tests.
In a first step, bench-scale methanation tests with clean, bottle-mixed synthesis gas prove the
proposed polytropic fixed bed reactor concept for methanation. Results from long-term tests show a
full-conversion respectively yield down to 230°C without deactivation of the catalyst. Due to the
polytropic operation of the reactor, a temperature peak originates at its inlet. It is assumed that this
temperature peak provides the required heat for conversion of higher hydrocarbons.
The lab-scale tests with contaminated synthesis gas investigate the influence of typical synthesis gas
contaminations such as ethylene, tars and hydrogen sulfide. The tests confirm that higher
hydrocarbons are directly converted within methanation. Conversion tests with ethylene and tars
showed that they fully convert within the first centimeters of the reactor. Main problem thereby is
the coking of the catalyst.
Addition of higher 0.5 vol. % ethylene results in severe coking, whereas only minor coking occurred
by addition of a representative tar mixture with a concentration of 6-12 g/Nm³. The amount of
deposited carbon depends on the reactor temperatures and the water content of the syngas.
A combined conversion of ethylene and tars showed lower coking compared to conversion of
ethylene only. A further lowering as well as prevention of carbon deposition is possible by addition of
traces (< 1 ppm) of hydrogen sulfide.
In the last step, the whole SNG production process, containing gasification, gas cleaning and
methanation is demonstrated in bench-scale. The simplified gas cleaning removes sufficiently dust,
alkalis and sulfur species such as H2S and COS, but has probably weaknesses with organic sulfur.
Therefore, the measured catalyst deactivations are high, which requires further improvements.
Promising is the almost full conversion of tars during methanation with real synthesis gas.

Kurzfassung
VI
Kurzfassung
Diese Arbeit beschäftigt sich mit verschiedenen Aspekten zur Entwicklung eines Prozesses zur
Erzeugung von Substitute Natural Gas (SNG) in kleinen, dezentralen Anlagen. Um auch im kleineren
Leistungsbereich wirtschaftlich sein zu können, muss die Anlagenkomplexität reduziert werden.
Daher wird in dieser Arbeit ein Prozess mit einer reduzierten Gasreinigung und vereinfachter
Methanisierung vorgeschlagen. Durch den reduzierten Gasreinigungsaufwand verbleiben bestimmte
Verunreinigungen im Synthesegas und beeinflussen die Methanisierung.
Zur Untersuchung des Einflusses von Verunreinigungen auf die Methansynthese wurden geeignete
Versuchsanordnungen aufgebaut und die Einflüsse experimentell ermittelt. Dabei sind sowohl
künstliche, flaschengemischte Synthesegase aber auch reale Synthesegase aus der thermischen
Vergasung verwendet worden. Die Gaszusammensetzung bei den Tests mit flaschengemischten
Gasen basiert hauptsächlich auf Ergebnissen aus Vergasungstests.
In einem ersten Schritt bestätigen Tests mit sauberen, flaschengemischten Synthesegasen die
Eignung des vorgeschlagenen polytropen Festbettreaktor Konzepts für die Methanisierung.
Langzeittests zeigen eine Aktivität des gewählten Katalysators bis runter zu 230°C, wobei ein
vollständiger Umsatz ins thermodynamische Gleichgewicht möglich ist. Zeichen für eine
Deaktivierung des Katalysators waren dabei nicht erkennbar. Durch die polytrope Betriebsweise des
Reaktors bildet sich ein Temperaturpeak in der Eintrittszone des Reaktors aus. Es wird vermutet, dass
dieser Temperaturpeak genügend Wärme für den Umsatz von höheren Kohlenwasserstoffe im Zuge
der Methanisierung liefert.
Labortests mit flaschengemischten Synthesegas unter Zugabe verschiedener Verunreinigungen wie
Ethylen, Teere und Schwefelwasserstoff zeigen den Einfluss dieser Komponenten auf die
Methanisierung. Die Ergebnisse bestätigen, dass höhere Kohlenwasserstoff direkt im Zuge der
Methansynthese umgesetzt werden. Untersuchungen des Umsatzes zeigen, dass dies innerhalb der
ersten Zentimeter des Reaktors geschieht. Hauptproblem dabei ist aber die Verkokung des
Katalysators.
Die Zugabe von mehr als 0.5 vol. % Ethylen führt zu starker Verkokung, wohingegen Teere in
Konzentrationen von 6-12 g/Nm³ nur zu geringen Kohlenstoffablagerungen am Katalysator führten.
Die Menge des abgelagerten Kohlestoffs hängt von den Reaktortemperaturen aber auch dem
Wasseranteil des Synthesegases ab.
Ein kombinierter Umsatz von Ethylen und Teeren zeigte, im Vergleich zum Umsatz von Ethylen
alleine, geringere Verkokung. Diese Verkokung lässt sich weiter reduzieren, beziehungsweise
vermeiden, durch die Zugabe von geringen Mengen (< 1 ppm) Schwefelwasserstoff.
Im letzten Teil der Arbeit wurde die gesamte Prozesskette der SNG-Produktion, von der Vergasung,
über die Gasreinigung, bis zur Methanisierung, im Labormaßstab erprobt. Die vereinfachte
Gasreinigung entfernt effektiv Staub, Alkalien und Schwefelverbindungen wie H2S und COS, hat aber
wahrscheinlich Schwächen bei der Abscheidung von organischen Schwefelverbindungen. Das zeigt
sich auch in den noch recht hohen Deaktivierungsraten des Katalysators. Eine weitere Optimierung
der Entschwefelung ist deshalb erforderlich. Vielversprechend ist der fast vollständige Umsatz von
Teere auch in den Tests mit realem Synthesegas.

Content
VII
Content
1. Introduction ......................................................................................................................... 1
1.1. Motivation ............................................................................................................................... 1
1.2. Objectives ................................................................................................................................ 3
2. State-of-the-Art .................................................................................................................... 5
2.1. Reactor concepts for methanation ......................................................................................... 6
2.2. Large SNG plants and projects in operation ............................................................................ 9
2.2.1. Large-scale coal-to-SNG plants ........................................................................................ 9
2.2.2. Biomass-to-SNG projects ............................................................................................... 10
2.2.3. Future large SNG plants and projects ............................................................................ 13
3. Theoretical Background ...................................................................................................... 15
3.1. Gasification ............................................................................................................................ 15
3.1.1. Allothermal gasification with water steam ................................................................... 16
3.1.2. Tar problematic of thermal gasification ........................................................................ 18
3.1.3. Contaminations in the product gas from allothermal gasification ............................... 19
3.2. Hot gas cleaning for sulfur and chlorine removal ................................................................. 21
3.2.1. Adsorptive desulfurization with metal oxides ............................................................... 21
3.2.2. Desulfurization with activated carbons ......................................................................... 23
3.3. Methanation .......................................................................................................................... 24
3.3.1. Thermodynamics ........................................................................................................... 25
3.3.2. Reaction kinetics and mechanisms ............................................................................... 27
3.3.3. Reforming of higher hydrocarbons ............................................................................... 29
3.3.4. Theoretical and practical aspects for the reactor design .............................................. 33
4. Catalyst Deactivation and Carbon Deposition ...................................................................... 35
4.1. Deactivation mechanisms ..................................................................................................... 35
4.2. Carbon deposition ................................................................................................................. 36
4.2.1. Types of carbon deposits and reactions ........................................................................ 36
4.2.2. Thermodynamics of carbon formation ......................................................................... 39
4.2.3. Possibilities for regeneration of carbon deposits .......................................................... 43
4.2.4. Measurement methods for carbon deposition ............................................................. 44
4.3. Poisoning ............................................................................................................................... 49

Content
VIII
4.3.1. Poisoning by sulfur ........................................................................................................ 49
4.3.2. Regeneration of sulfur-poisoned catalysts .................................................................... 50
4.4. Thermal degradation ............................................................................................................. 50
4.5. Evaporation – nickel tetracarbonyl ....................................................................................... 51
5. Bench-Scale Methanation Tests with Clean Syngas – Polytropic Reactor Concept.................. 53
5.1. Experimental setup ............................................................................................................... 53
5.2. Catalysts for methanation ..................................................................................................... 55
5.3. Test procedure ...................................................................................................................... 56
5.4. Methanation tests with different catalysts ........................................................................... 57
5.4.1. Basic performance screening ........................................................................................ 57
5.4.2. Detailed catalyst screening ........................................................................................... 59
5.4.3. Long-term performance of catalysts ............................................................................. 62
5.5. Conclusion bench-scale methanation tests........................................................................... 63
6. Experimental Investigations with Bottle-Mixed Contaminated Syngas – Experimental Setup 65
6.1. Investigation focus and program ........................................................................................... 65
6.1.1. Definition of investigation parameters ......................................................................... 65
6.1.2. Test program and procedure......................................................................................... 67
6.2. Test rig assembly ................................................................................................................... 68
6.2.1. Gas mixing station with tar conditioning unit ............................................................... 68
6.2.2. Methanation reactor test rig ......................................................................................... 71
6.2.3. Gas and tar analysis and measurement techniques ..................................................... 73
7. Experimental Investigations with Bottle-Mixed Contaminated Syngas – Results ................... 81
7.1. Parameter variations with non-contaminated synthesis gas ................................................ 81
7.2. Parameter variations with aliphatic hydrocarbons – Ethylene ............................................. 83
7.2.1. Behavior of carbon on the catalyst ............................................................................... 83
7.2.2. Definition of a critical/acceptable carbon content ....................................................... 86
7.2.3. Influence on ethylene-promoted carbon deposition .................................................... 89
7.3. Parameter variations with representative tar mixtures........................................................ 91
7.4. Reduction of carbon deposition by addition of sulfur species .............................................. 97
7.5. Visual evaluation of carbon deposits .................................................................................. 100
7.6. Summary and conclusion bottle-mixed syngas tests .......................................................... 102

Content
IX
8. Bench-Scale Tests with Real Synthesis Gas Produced in Allothermal Gasification ................. 103
8.1. Investigation focus and program ......................................................................................... 103
8.2. Test rig assembly and setup ................................................................................................ 103
8.2.1. Test rig assembly ......................................................................................................... 103
8.2.2. Test setup and operating conditions ........................................................................... 107
8.3. Results ................................................................................................................................. 110
8.3.1. Gasification .................................................................................................................. 110
8.3.2. Adsorptive hot gas cleaning ........................................................................................ 113
8.3.3. Methanation ................................................................................................................ 114
9. Conclusion ......................................................................................................................... 121
10. References ......................................................................................................................... 124

Content
X

Figures
XI
Figures
Figure 1.1: General process steps for the production of SNG .............................................................. 1
Figure 1.2: Simplified flow sheet for the proposed SNG production process with hot gas cleaning ... 2
Figure 2.1: First patent for a catalytic methanation apparatus from Elworthy, 1905 .......................... 5
Figure 2.2: Different reactor concepts and processes for methanation of synthesis gas .................... 6
Figure 2.3: Simplified flow sheet of the DGC Great Plains synfuels plant ............................................ 9
Figure 2.4: Simplified flow sheet of SNG production in the FICFB gasification plant ......................... 11
Figure 2.5: Conceptual design of the HPR and idea for decentralized SNG production..................... 12
Figure 3.1: Simulation of the influence of σ on the permanent gas composition (dry basis) for allothermal gasification .................................................................................................... 17
Figure 3.2: Typical concentrations of gaseous contaminates from gasification of woody biomass and lignite with the measured contaminates from the lab-scale allothermal gasifier .... 20
Figure 3.3: H2S equilibrium desulfurization concentrations for different sorbents with standard synthesis gas composition with 100 ppm H2S .................................................................. 21
Figure 3.4: Influence of temperature on the equilibrium composition of H2/CO=3 at 1 bar. ............ 25
Figure 3.5: Influence of pressure on the equilibrium composition of an H2/CO=3 at 300°C.............. 26
Figure 3.6: Influence of temperature on the equilibrium composition of the standard synthesis gas composition used and on the chemical efficiency ..................................................... 26
Figure 3.7: Influence of the H2O content on the equilibrium composition of the standard synthesis gas composition used at 250°C and atmospheric pressure .............................. 27
Figure 3.8: Model of the Langmuir-Hinshelwood approach for the methanation reaction ............... 28
Figure 3.9: Model of a combined L-H and E-R approach for the water-gas-shift reaction................. 29
Figure 3.10: Model of the reaction mechanism for the reforming of ethane ...................................... 30
Figure 3.11: Model for hydrocracking of phenanthrene and naphthalene .......................................... 31
Figure 3.12: Reforming of benzene, toluene and naphthalene in model gas over a Ni catalyst .......... 32
Figure 4.1: Forms of carbon deposits on Ni surfaces.......................................................................... 36
Figure 4.2: Reaction paths for formation, gasification and transformation of coke and carbons ..... 37
Figure 4.3: Steps of growth of carbon filaments ................................................................................ 38
Figure 4.4: C-H-O ternary plot with phase equilibrium lines for solid carbon. ................................... 39
Figure 4.5: Rates of formation and hydrogenation of C and C species ........................................... 41
Figure 4.6: Temperature dependency of carbon deposition on Ni, 1-butene propene in hydrogen . 42
Figure 4.7: Typically observed reactor differential pressure trends resulting from coking ............... 44
Figure 4.8: SEM-photos of different carbon deposit forms ................................................................ 45
Figure 4.9: Flow sheet of the TPO setup to determine carbon deposits ............................................ 45
Figure 4.10: Results of TPO analysis of a methanation catalyst without carbon deposits ................... 47
Figure 4.11: Results of TPO analysis of a methanation catalyst with severe carbon deposits ............. 47
Figure 4.12: Displacement of the reactor temperature profile due to selective deactivation ............ 49
Figure 4.13: Equilibrium concentration for Ni(CO)4 for different CO concentrations .......................... 51
Figure 5.1: Simplified flow sheet of the bench-scale methanation test rig ........................................ 53
Figure 5.2: 3D drawing of the tube reactor and sketch with positions of thermocouples................. 54
Figure 5.3: Temperature profiles of the tested catalysts ................................................................... 57

Figures
XII
Figure 5.4: Gas composition measured at various points of the reactor compared to temperature-related equilibrium gas compositions for EVT05 ........................................ 58
Figure 5.5: H2 content in the product gas for different catalysts at varying synthesis gas H2O contents .................................................................................................................... 59
Figure 5.6: H2 content in the product gas in dependency of the reactor outlet temperature and the water content with EVT01 .......................................................................................... 59
Figure 5.7: H2 content in the product gas in dependency of the reactor outlet temperature and the water content with EVT05 .......................................................................................... 60
Figure 5.8: H2 content in the product gas in dependency of the GHSV and the water content with EVT01 ............................................................................................................................. 61
Figure 5.9: H2 content in the product gas in dependency of the GHSV and the water content with EVT05 ............................................................................................................................. 61
Figure 5.10: Reactor temperatures for a long-term test with EVT01 ................................................... 62
Figure 5.11: Gas composition for a long-term test with EVT01 ............................................................ 63
Figure 6.1: Parameters influencing methanation ............................................................................... 66
Figure 6.2: Photo of the test rig for tests with bottle-mixed, contaminated synthesis gases ............ 68
Figure 6.3: Flow sheet of the gas mixing station with tar conditioning unit ...................................... 69
Figure 6.4: User interface of the control system ................................................................................ 71
Figure 6.5: Flow sheet of the methanation reactor test rig ............................................................... 72
Figure 6.6: 3D-drawing of the reactor oven with the reactors ........................................................... 72
Figure 6.7: Flow sheet of gas analyzing unit ....................................................................................... 73
Figure 6.8: UV absorption tar measuring cell ..................................................................................... 77
Figure 6.9: Configuration for SPA sampling ........................................................................................ 79
Figure 7.1: Measured axial temperature profiles over the reactor at different reactor oven temperatures .................................................................................................................... 82
Figure 7.2: Resulting reactor temperatures in dependency of the reactor oven temperatures ........ 82
Figure 7.3: Carbon deposition on the catalyst at 300°C using different C2H4 contents ..................... 84
Figure 7.4: Carbon deposition on the catalyst at 320°C using different C2H4 contents ..................... 84
Figure 7.5: Carbon deposition on the catalyst at 370°C using different C2H4 contents ..................... 85
Figure 7.6: Temperature profiles of a test with high carbon deposition ............................................ 85
Figure 7.7: Differential pressure across the reactor during a test with high carbon deposition ....... 86
Figure 7.8: Relation of differential pressure and the amount of carbon deposited in the reactor .... 87
Figure 7.9: Photographs of catalyst samples with different amounts of deposited carbon .............. 88
Figure 7.10: Specific amounts of catalyst consumption and cost ........................................................ 89
Figure 7.11: Influence of temperature on the amount of deposited carbon ....................................... 90
Figure 7.12: Deposited carbon in dependency of the temperature and the C2H4 content .................. 91
Figure 7.13: Amount of deposited carbon in dependency of the temperature and the H2O content, syngas with standard tar concentration ........................................................................... 92
Figure 7.14: Amount of deposited carbon in dependency of the temperature and the tar concentration .................................................................................................................... 93
Figure 7.15: Tar conversion during a methanation test in dependency of the reactor temperature .. 93
Figure 7.16: Tar conversion during a methanation test with reduced catalyst filling .......................... 94
Figure 7.17: Influence of methanation conditions on the conversion of toluene ................................ 95

Figures
XIII
Figure 7.18: Amount of deposited carbon resulting from methanation with simultaneous addition of C2H4 and tars compared to separate addition .............................................................. 95
Figure 7.19: Measured catalyst degradation from poisoning with H2S for EVT05 .............................. 98
Figure 7.20: Specific catalyst consumption and related catalyst cost due to poisoning with H2S ....... 98
Figure 7.21: Influence of C2H4 and H2S on the amount of deposited carbon ....................................... 99
Figure 7.22: Influence of a C2H4, tars and H2S on the amount of deposited carbon ............................ 99
Figure 7.23: States of polymeric carbon coverage on a catalyst pellet .............................................. 100
Figure 7.24: SEM photos of polymeric carbon deposits on the catalyst resulting from C2H4 ............ 100
Figure 7.25: SEM photos of polymeric carbon filaments resulting from C2H4 .................................... 101
Figure 7.26: SEM photos of polymeric carbon layers resulting from C2H4 ......................................... 101
Figure 8.1: Photo of the bench-scale test rig for SNG production with real synthesis ..................... 104
Figure 8.2: Flow sheet of the indirectly heated, fluidized bed gasifier ............................................ 105
Figure 8.3: Flow sheet of the bench-scale hot gas cleaning and methanation unit ......................... 106
Figure 8.4: Flow sheet of the gas analysis unit for methanation and gasification tests ................... 107
Figure 8.5: Mean dry permanent gas composition from gasification of biomass and lignite .......... 110
Figure 8.6: Mean wet permanent gas composition from gasification of biomass and lignite ......... 111
Figure 8.7: Mean C2-C4 content from gasification of woody biomass and lignite ............................ 111
Figure 8.8: Mean tar concentrations from gasification of woody biomass and lignite .................... 112
Figure 8.9: Mean contaminations from gasification of woody biomass and lignite ........................ 113
Figure 8.10: Comparison of the mean contaminations resulting from gasification of lignite before and after hot gas desulfurization with ZnO .................................................................... 113
Figure 8.11: Trend of the permanent gas composition after methanation ....................................... 114
Figure 8.12: Measured tar concentration after methanation and the related tar conversion .......... 115
Figure 8.13: Trend of the differential pressure across the methanation reactor .............................. 115
Figure 8.14: Measured catalyst carbon contents at different points of the methanation reactor .... 116
Figure 8.15: SEM-photos of polymeric carbon filaments on a catalyst sample taken after longtime real gas tests ................................................................................................................... 117
Figure 8.16: SEM-photos of laminar (graphitic) carbon deposits on a catalyst sample taken after longtime real gas tests .................................................................................................... 117
Figure 8.17: SEM-photo of cracks on a catalyst tab after 200 h runtime with real synthesis gas ...... 117
Figure 8.18: Axial temperature trends in the methanation reactor for different runtimes ............... 118
Figure 8.19: Measured catalyst degradation for tests 1-5.................................................................. 119
Figure 8.20: Measured specific catalyst consumptions for tests 1-5 ................................................. 120
Figure 9.1: Influence of contaminations on the specific amount of catalyst consumption ............. 121
Figure 9.2: Influence of sulfur concentration and ethylene content on catalyst consumption ....... 122

Tables
XIV
Tables
Table 2.1: Typical gas compositions of the FICFB gasifier, operated with wood chips ...................... 10
Table 2.2: Overview of gasification systems proposed for specific SNG projects .............................. 13
Table 3.1: Standard synthesis gas composition for the methanation tests ....................................... 17
Table 3.2: Tar classes according to ECN ............................................................................................. 18
Table 3.3: Overview of commercially available impregnated activated carbons............................... 23
Table 4.1: Overview of mechanisms of catalyst deactivation ............................................................ 35
Table 4.2: Carbon species formed on Ni catalyst ............................................................................... 37
Table 4.3: TPO method for a quantitative and qualitative analysis of carbon deposits .................... 46
Table 5.1: Overview of the catalysts used for the methanation tests ............................................... 55
Table 5.2: Standard reducing procedure ............................................................................................ 56
Table 6.1: Overview of parameters for the methanation tests .......................................................... 67
Table 6.2: Constants for Antoine equations of different tar species ................................................. 70
Table 6.3: Overview of used µ-GC-modules ....................................................................................... 75
Table 6.4: Parameters for the standard µ-GC method ....................................................................... 75
Table 6.5: Overview of the most commonly used detector tubes ..................................................... 78
Table 8.1: Fuel parameters for the used lignite and biomass .......................................................... 108
Table 8.2: Operating parameters for the real gas methanation tests .............................................. 108

Nomenclature
XV
Nomenclature
Abbreviations
BTX Benzene toluene xylene
CHP Combined heat and power
CNG Compressed natural gas
DGC Dakota Gasification Company
DVGW Deutscher Verein des Gas-und Wasserfaches
ECN Energy Research Center of the Netherlands
EDX Energy -dispersive X-ray analysis
E-R Eley-Rideal
EVT Institute for Energy Process Engineering, University Erlangen-Nurenberg
FICFB Fast internal circulating fluidized bed
FID Flame ionization detector
GA Gas analyzer
GC Gas chromatograph
GHSV Gas hourly space velocity
GoBiGas Gothenburg Biomass Gasification
HGR Hot gas recycle
HPR Heatpipe-Reformer
IGCC Integrated gasification combined cycle
IGT Institute of Gas Technology (GTI)
IPA Isopropyl alcohol
LED Light emitting diode
L-H Langmuir-Hinshelwood
LHV Lower heating value
MFC Mass flow controller
NDIR Non-dispersive infrared
PAH Polycyclic aromatic hydrocarbons
PSI Paul-Scherrer-Institute
RFCS Research Fund for Coal and Steel
RME Rapeseed methyl ester
S/C Steam to carbon
SEM Scanning electron microscopy
SNG Substitute natural gas
SPA Solid phase adsorption
SPE Solid phase extraction
TGA Thermo gravimetric analysis
TOF Turnover frequency
TPO Thermo programmed oxidation
TREMP Topsøes recycle methanation process
TU Technical University
TWR Tube wall reactor
UV Ultra violet
WGS Water-gas shift

Nomenclature
XVI
Latin symbols
aCatalyst Active catalyst area
an,Catalyst Normalized active catalyst area
Aλ Absorbance [-]
b Optical path length [m]
c Molar concentration [mol/l]
CC Carbon content [mgCarbon/gCatalyst]
cCat. Specific catalyst costs [€ct/kWhSyngas]
CCat. Catalyst costs [€/kg]
dP Catalyst particle diameter
dR Inner reactor diameter
GHSV Gas hourly space velocity [h-1]
I0 Intensity of the incident light [W/m²]
I1 Intensity of the transmitted light [W/m²]
L Reactor length
LHV Lower heating value [kJ/kg] or [kJ/mol]
mCat. Catalyst mass [g]
ni Mole content
ni Molar flow rate
p Pressure [Pa]
pi Partial pressure [Pa]
PSG Synthesis gas power [kW]
T Temperature [°C]
t Time [h] tOp. Catalyst operation time [h]
VReactor Reactor volume [m³]
VStd Standard volume flow [m³/h]
xH2O,min Minimal required mass of water [kgH2O/kgFuel]
X Conversion [-]
Greek symbols
ΔHR Reaction enthalpy [kJ/mol]
ελ Molar absorption coefficient [l mol-1 m-1]
ηMeth Chemical efficiency for methanation [-]
λ Air ratio [-]
σ Excess steam ratio [-]

Introduction
1
Chapter 1
1. Introduction
1.1. Motivation
The worldwide increasing consumption of energy requires new or improved technologies for
supplying the demand. Besides security of supply and public acceptance, the influence on the
environment and world climate in particular, has become a central issue. Production of Substitute
Natural Gas (SNG) from biomass could be one way of addressing these issues. SNG has several
advantages, such as the high conversion efficiency and the possibility to use the existing gas grid for
distribution and storage. Typically, larger amounts of biomass are available in rural areas with a
relatively low population density and therefore low energy demand. Since biomass has a low energy
density, transportation over long distances is hardly economical and ecologically sustainable. Thus,
the maximum plant size for biomass applications is limited [1]. In addition, direct transportation of
biomass into areas with higher energy needs, such as urban areas, is not convenient. Small-scale,
decentralized production of SNG and feed-in into the gas grid enables indirect transportation of solid
fuels via the gas grid. Additionally, smaller plants facilitate the utilization of waste heat.
Energy production processes are highly influenced by the economies-of-scale principle [2], which
implies that increased plant power significantly reduces production costs. Since plant power for
biomass applications is limited, alternative ways of making them economically viable need to be
found. A simplified downscaling of state-of-the-art, large-scale processes is generally not possible. It
is also necessary to reduce the complexity of plants. Therefore, this thesis proposes a simplified
process for the production of SNG.
Figure 1.1: General process steps for the production of SNG
The production process of SNG typically consists of four essential steps (figure 1.1): synthesis gas
production, gas cleaning, methanation and gas conditioning. Synthesis gas is produced by gasifying a
solid fuel. In the gas cleaning step contaminates such as particles, alkalis or sulfur, are removed prior
to methanation. In the methanation step, the synthesis gas is then catalytically converted to
raw-SNG. Before feed-in into the gas grid or alternative usage, it is necessary to condition the gas,
e.g. by removing CO2 and H2O or by odorization.
Thermalgasification
Gas cleaning MethanationGas
conditioning
Fuel H2O
Heat/O2
H2O/CO2
SNG

Introduction
2
State-of-the-art large-scale plants for SNG production, such as the Dakota Gas synfuels plant [3], put
a lot of effort into removing all impurities from the synthesis gas. This is only feasible by using
cold/wet gas cleaning methods such as Rectisol scrubbing. Operators of the Dakota Gas synfuels
plant described this as the ‘bottleneck’ in SNG production as it is the largest utility consumer in the
plant [3]. The most demonstrated or planned gas cleaning technology for biomass-scale SNG plants is
a combination of tar scrubbing (cold with bio oil) and adsorptive dechlorination and desulfurization
[4]. This is quite complex too and has not reached a commercial state yet.
To achieve a reduction of plant complexity, this thesis proposes the usage of hot gas cleaning
techniques. A reduction of exergetic losses, which are due to the high temperature level of waste
heat, is also advantageous. The main steps in hot synthesis gas cleaning are particle filtration and
different catalytic and adsorptive processes. The bioliq-plant [5] demonstrates such a process. Due to
the tar-free gasification by means of an entrained flow gasifier, tars do not need to be considered in
the gas cleaning process. Other gasification systems do not have this advantage. The SNG production
concept proposed in this thesis is based on indirectly heated fluidized bed gasification. Therefore, the
presence of tars and other higher hydrocarbons is an important issue to consider. The approach of
this thesis is to not remove tars and other hydrocarbons from the synthesis gas. Thus, the
methanation catalyst must be able to deal with these components. For methanation, this thesis
proposes a partially cooled, tubular fixed bed reactor. Due to the polytropic temperature profile
inside the reactor, the temperature peak that occurs at the inlet provides the heat needed for the
conversion of the hydrocarbons.
Figure 1.2 shows a possible option for SNG production by means of hot gas cleaning. After
gasification, a hot gas filter (ceramic or sinter metal) removes particles and ash. If the filter
temperature is sufficiently low (550-350°C), alkalis will condensate on the filter cake. Sulfur and
chlorine components can be adsorbed by means of different adsorptive materials such as zinc oxide
or activated carbons. Afterwards, the still tar-loaded synthesis gas is fed into the methanation
reactor. The central issue of the proposed SNG production concept is how the methanation catalyst
performs with higher hydrocarbons that are present in the synthesis gas.
Figure 1.2: Simplified flow sheet for the proposed SNG production process with hot gas cleaning
The proposed concept was developed on the basis of allothermal biomass gasification, as used in the
Heatpipe-Reformer (HPR) [6], [7] or in the FICFB-gasifier (Güssing) [8], [9]. However, the results of
this thesis do not only apply to allothermal biomass gasification systems. By considering the
boundary conditions, they can be also transferred, or partially transferred, to other concepts of
synthesis gas production.
Gasifier
Steam
Fuel
Heat
Ash
Hot gas filter
Adsorptive gas cleaning
Methanation Gas conditioning
SNG
CO2H2O

Introduction
3
1.2. Objectives
The main objective of this thesis is to gain a better understanding of the methanation process and
the influences of higher hydrocarbons and tars on the methanation catalysts for simplified systems
with hot gas cleaning in particular. The methanation process has been investigated and used for
more than 100 years. However, previous applications, like CO removal from town gas or methanation
of synthesis gas from oxygen-blown gasifiers, had other aspects to consider than the methanation
step of the concept proposed here. Therefore, additional investigations are necessary.
Bench-scale methanation tests with clean, bottle-mixed synthesis gas
In a first step methanation tests with clean, bottle-mixed synthesis gas prove the polytropic reactor
concept for methanation. By screening of different commercial as well as experimental nickel-based
catalysts, an appropriate catalyst was chosen for detailed investigations (chapter 5).
Influence of higher hydrocarbons and syngas contamination
The major part of this work is dedicated to a detailed analysis of the influence of higher
hydrocarbons on methanation. Previous investigations by Kienberger [10] showed that a direct
conversion of hydrocarbons is possible during methanation, but is accompanied by deactivation of
the catalyst and coking. To reduce or prevent such negative effects, a more detailed understanding
of the processes is helpful. Therefore, methanation tests with bottle-mixed synthesis gas with
addition of different hydrocarbons were performed (chapter 7). The evaluation of these tests is
based on measured deactivation rates, amounts of carbon deposited as well as conversion rates. A
first test series investigates the manner of carbon deposition, and, in particular, how runtime and the
amount of deposited carbon correlate. If this correlation is known, the number of long-term tests can
be significantly reduced by substituting them with short-term (e.g. one-day) tests. From the test
results, conclusions can also be drawn about the amount of carbon that is acceptable on the catalyst.
With the information from this first test series, further tests analyze the influence of different
parameters on the amount of deposited carbon. Parameters to vary are the reaction temperature,
the concentration of hydrocarbons in the feed and the amount of water. The permanent gas
composition, derived from allothermal gasification of biomass, was kept constant for all tests. The
results enable the definition of operating limits for methanation with sufficiently low coking and
deactivation of the catalyst, and they also provide options for reducing carbon deposits.
Bench-scale demonstration of the SNG process
The whole SNG production process, consisting of gasification, gas cleaning and methanation, is
demonstrated in a bench-scale (chapter 8). These experimental validations focus on the performance
of the catalyst using real synthesis gas from allothermal gasification. The operating conditions for
these tests are set in accordance with the results of the detailed investigations made with bottle-
mixed synthesis gas. The results provide information about catalyst degradation rates, amounts of
deposited carbon as well as gas composition, including contaminates, at all points of the process.
For all tests it was necessary to develop, design and construct suitable test rigs and setups.
Additionally, methods of analyzing different deposits and contaminations, e.g. coke, sulfur,
hydrocarbons or tars had to be developed or applied.

Introduction
4

State-of-the-Art
5
Chapter 2
2. State-of-the-Art
The production of combustible gases from a solid fuel, mainly coal, has a long tradition. At the
beginning 19th century, the first gas grids were established in several European and North American
cities. The first commercial gas works started its operation in London in 1812 [11]. In the early years
town gas was mainly the product of gasified pyrolysis gases. The invention of the water-gas
generator by Carl Wilhelm Siemens in the middle of the 19th century, allowed the utilization of coke
too. At end of the 19th century, a town gas composition of around 50 vol. % hydrogen, 25 vol. %
methane, 10 vol. % carbon monoxide and various amounts of carbon dioxide, nitrogen, oxygen and
hydrocarbons had become established [12].
In 1897, Bone et al. [13] published first experiments of the formation of methane from carbon and
hydrogen. They reported that, at a temperature of around 1200°C, carbon unites directly with
hydrogen to form methane without formation of other hydrocarbons. In 1902, Sabatier and
Senderens [14] reported the first catalytic methanation. They discovered that a mixture of one part
carbon monoxide and three parts hydrogen undergoes complete conversion into methane and water
when passing reduced nickel at 250°C. The same happened with carbon dioxide and methane at
higher temperatures. Elworthy [15] identified the commercial potential of this discovery and applied
for several patents (figure 2.1) for the technical implementation of methanation.
Figure 2.1: First patent for a catalytic methanation apparatus from Elworthy, 1905 [15]
The commercial exploitation of Elworthy’s inventions failed due to a lack in demand for methane.
Feed-in into existing gas grids would have required replacing or modifying the majority of utilization
devices. Fischer and Tropsch were investigating the methanation of coal-derived synthesis gas when

State-of-the-Art
6
they discovered the formation of long-chain hydrocarbons, the basis for the Fischer-Tropsch process
[16]. Until the early 1960s several investigations into methanation were carried out; however, the
focus of both research and commercial activities remained on the liquefaction of solid fuels.
From the 1960s, many states began to switch from town gas to natural gas. Even in those days there
was already an awareness of the finiteness of oil and natural gas. Furthermore, many countries did
not want to become too dependent on other countries in terms of energy supply and began to
facilitate the utilization of domestic coal and lignite. At that time methanation moved into the focus
of research. The first energy crisis in 1973 also led to the emergence of commercial interests. The
majority of the different methanation concepts have their origins in the 1970s and early 80s.
2.1. Reactor concepts for methanation
Basically, four different concepts have been demonstrated for methanation (figure 2.2): adiabatic
fixed bed reactors, cooled reactors (isothermal reactors), three-phase methanation and fluidized bed
methanation. Kopyscinski et al. [4] and Karl et al. [12] give a detailed review on methanation
concepts and concepts for SNG production.
Figure 2.2: Different reactor concepts and processes for methanation of synthesis gas, according to [12]
3-Phasen-Wirbelschicht
Synthesegas
(CO, H2)
methanreiches Produktgas
Synthesegas/ Produktgas
(gasförmig)
Katalysator-Partikel
(fest)
ca. 70 bar
Zwischenkühlung
inertes Trägeröl
(flüssig)
Trägeröl-
Rezirkulation
Separatordruckaufgeladene Wirbelschicht
Synthesegas
(CO, H2)
methanreiches Produktgas
Synthesegas/ Produktgas
(gasförmig)
Katalysator-Partikel
(fest)
bis ca. 70 bar
Kühlung
adiabate Festbett-
katalysatoren
Synthesegas
(CO, H2)
methanreiches Produktgas
Produktgas-rezirkulation
gestufte Edukt-zugabe
Zwischenkühlung
Zwischenkühlungca. 300-400°C
bis 600°C
gestufte Edukt-zugabe
Beispiel:
Synthane Hot Tube ReactorThermoöl-
Kühlung
Synthesegas
(CO, H2)
methanreiches Produktgas
ca. 400°C
adiabate Festbettreaktoren gekühlte Reaktoren Beispiel:
Synthane Hot Tube Reactor
Beispiel:
Lurgi Methanation
Beispiel:
Thyssen Comflux-Verfahren
Beispiel:
Chem Systems Liquid Phase Methanation
Flüssigphasen-Methanierung Wirbelschicht-Methanierung
adiabatic fixed beds
syngas
recycle compressor
intercooling staged feed injection
staged feed injection
intercooling
raw-SNG
ca. 300-400°C
up to 600-700°C
Adiabatic fixed bed reactors
e.g. Lurgi methanation process
3-Phasen-Wirbelschicht
Synthesegas
(CO, H2)
methanreiches Produktgas
Synthesegas/ Produktgas
(gasförmig)
Katalysator-Partikel
(fest)
ca. 70 bar
Zwischenkühlung
inertes Trägeröl
(flüssig)
Trägeröl-
Rezirkulation
Separatordruckaufgeladene Wirbelschicht
Synthesegas
(CO, H2)
methanreiches Produktgas
Synthesegas/ Produktgas
(gasförmig)
Katalysator-Partikel
(fest)
bis ca. 70 bar
Kühlung
adiabate Festbett-
katalysatoren
Synthesegas
(CO, H2)
methanreiches Produktgas
Produktgas-rezirkulation
gestufte Edukt-zugabe
Zwischenkühlung
Zwischenkühlungca. 300-400°C
bis 600°C
gestufte Edukt-zugabe
Beispiel:
Synthane Hot Tube ReactorThermoöl-
Kühlung
Synthesegas
(CO, H2)
methanreiches Produktgas
ca. 400°C
adiabate Festbettreaktoren gekühlte Reaktoren Beispiel:
Synthane Hot Tube Reactor
Beispiel:
Lurgi Methanation
Beispiel:
Thyssen Comflux-Verfahren
Beispiel:
Chem Systems Liquid Phase Methanation
Flüssigphasen-Methanierung Wirbelschicht-Methanierung
syngas
raw-SNG
heat-transfer-fluid cooling
ca. 400°C
Cooled reactors
e.g. Synthane hot tube reactor
3-Phasen-Wirbelschicht
Synthesegas
(CO, H2)
methanreiches Produktgas
Synthesegas/ Produktgas
(gasförmig)
Katalysator-Partikel
(fest)
ca. 70 bar
Zwischenkühlung
inertes Trägeröl
(flüssig)
Trägeröl-
Rezirkulation
Separatordruckaufgeladene Wirbelschicht
Synthesegas
(CO, H2)
methanreiches Produktgas
Synthesegas/ Produktgas
(gasförmig)
Katalysator-Partikel
(fest)
bis ca. 70 bar
Kühlung
adiabate Festbett-
katalysatoren
Synthesegas
(CO, H2)
methanreiches Produktgas
Produktgas-rezirkulation
gestufte Edukt-zugabe
Zwischenkühlung
Zwischenkühlungca. 300-400°C
bis 600°C
gestufte Edukt-zugabe
Beispiel:
Synthane Hot Tube ReactorThermoöl-
Kühlung
Synthesegas
(CO, H2)
methanreiches Produktgas
ca. 400°C
adiabate Festbettreaktoren gekühlte Reaktoren Beispiel:
Synthane Hot Tube Reactor
Beispiel:
Lurgi Methanation
Beispiel:
Thyssen Comflux-Verfahren
Beispiel:
Chem Systems Liquid Phase Methanation
Flüssigphasen-Methanierung Wirbelschicht-Methanierung
syngas
raw-SNGheat exchanger
separatorreactants(gaseous)
inert fluid(liquid)
catalyst particles (solid)
three-phase fluidized bed
Three-phase methanation
e.g. Chem systems liquid phase methanation
3-Phasen-Wirbelschicht
Synthesegas
(CO, H2)
methanreiches Produktgas
Synthesegas/ Produktgas
(gasförmig)
Katalysator-Partikel
(fest)
ca. 70 bar
Zwischenkühlung
inertes Trägeröl
(flüssig)
Trägeröl-
Rezirkulation
Separatordruckaufgeladene Wirbelschicht
Synthesegas
(CO, H2)
methanreiches Produktgas
Synthesegas/ Produktgas
(gasförmig)
Katalysator-Partikel
(fest)
bis ca. 70 bar
Kühlung
adiabate Festbett-
katalysatoren
Synthesegas
(CO, H2)
methanreiches Produktgas
Produktgas-rezirkulation
gestufte Edukt-zugabe
Zwischenkühlung
Zwischenkühlungca. 300-400°C
bis 600°C
gestufte Edukt-zugabe
Beispiel:
Synthane Hot Tube ReactorThermoöl-
Kühlung
Synthesegas
(CO, H2)
methanreiches Produktgas
ca. 400°C
adiabate Festbettreaktoren gekühlte Reaktoren Beispiel:
Synthane Hot Tube Reactor
Beispiel:
Lurgi Methanation
Beispiel:
Thyssen Comflux-Verfahren
Beispiel:
Chem Systems Liquid Phase Methanation
Flüssigphasen-Methanierung Wirbelschicht-Methanierung
pressurized fluidized bedup to 70 bar
reactants (gaseous)
catalyst particles (solid)
syngas
raw-SNG
cooling
Fluidized bed methanation
e.g. Thyssengas Comflux process

State-of-the-Art
7
Since methanation is highly exothermic, the thermodynamic equilibrium demands low temperatures
and high pressures for a maximum methane yield. In the majority of processes demonstrated, nickel-
based catalysts were used. The main issue with these is the removal of the heat of reaction that is
released, with the aim of achieving the appropriate gas properties and preventing the destruction of
the catalyst.
Methanation with adiabatic fixed bed reactors
Methanation with adiabatic fixed bed reactors is the state-of-the-art concept for the production of
SNG. The common feature of all concepts with adiabatic fixed bed reactors is that they exist of two
to six reactors with intermediate cooling and recycle of the product gas or staged injection of feed.
The methanation concept with probably the highest amount of SNG output to date is the Lurgi
methanation process [17]. It consists of three reactors with intermediate cooling and a recycle of
product gas of around 70-85 % from the outlet of the second stage to the first one. A bypass of the
first reactor enables a staged feed injection of 10-60 % into the second reactor. The outlet gas from
the first reactor has typically a temperature of around 650°C and a CH4 content of 60-70 vol. %. In the
final stage the outlet gas temperature is around 290-400°C and the CH4 content between
85-95 vol. %. BASF is the exclusive supplier of the catalysts (e.g. BASF G1 85) used in the Lurgi
methanation process, which was first demonstrated in two semi-commercial pilot plants in South
Africa (for SASOL) and in the petroleum refinery Schwechat in Austria [18]. The DGC Great Plains
synfuels plant, which was the first – and for a long time only - large-scale commercial SNG plant, is
also based on the Lurgi methanation process [3].
Another important fixed bed methanation process is the Haldor Topsøe TREMP process [19], which is
quite similar to the Lurgi methanation, but tries to minimize the recycle ratio. This is possible due to
the usage of high temperature methanation catalysts (Topsøe MCR), which resist temperatures up to
700°C. The high process temperatures allow the efficient usage of waste heat by production of
superheated steam with typically 540°C at 100 bars. The TREMP process originates from the first
ADAM and EVA project [20]. The idea was to use chemically bound energy for long-distance
transportation of nuclear energy. A high temperature nuclear reactor provides the heat for the
reformation of methane (EVA). The produced syngas can be transported via pipelines to the
methanation plant (ADAM). The methanation plant re-converts the syngas to methane by release of
high temperature process heat. For a high efficiency, high process heat temperatures and therefore a
high temperature methanation process, TREMP, is required. The second-largest SNG plant in the
world, located in Yining in the province of Xinjiang and operated by the Chinese Qinghua Group, uses
the TREMP process for the production of SNG from coal [21]. In addition, several other large-scale
coal-to-SNG projects in China and Korea as well as the largest biomass-to-SNG project (GoBiGas)
intend to use the TREMP technology for methanation [21].
Besides the two most common processes, pilots of several other methanation concepts with fixed
bed reactors have been developed and demonstrated, such as the Conoco/Westfield process [22],
IGT Hygas process [23], RMP process [24], and the HICOM process [4].

State-of-the-Art
8
Methanation with cooled reactors
The main idea of cooled reactor concepts is a reduction of process complexity by reducing the
amount of reactors to, ideally, a single reactor. The challenge for cooled reactor concepts is the
removal of exothermic heat of the methanation process. In fixed bed reactors this heat removal is
limited by the high thermal resistance of the bed. Therefore, classical fixed bed concepts are not
suitable.
One approach is the usage of catalytically coated heat transfer elements, as demonstrated within the
Synthane hot-gas recycle (HGR) and tube-wall reactor (TWR) [25]. The TWR reactor consists of tubes
which are coated with Raney nickel on their inside. A heat transfer fluid removes the heat of reaction
and keeps the reaction temperature below 390°C.
Another idea was to also use the Linde isothermal reactor for methanation [4]. The Linde isothermal
reactor is a fixed bed reactor with a large number of cooling tube bundles in the catalyst bed.
However, there are no reports of its actual use for large-scale methanation.
A newer concept, which might allow nearly isothermal operation, bases on honeycomb catalysts.
Catalytically coated honeycomb carriers are easier to equip with heat transfer elements. Within the
RFCS research project ‘CO2freeSNG’, the usage of honeycomb methanation catalysts has been
investigated [26].
Three-phase methanation
Another option for isothermal methanation is the three-phase, or liquid-phase, reactor, in which a
bubble column-like reactor contains an inert heat transfer fluid and a solid catalyst. The gas passing
through the reactor fluidizes the catalyst, thus creating a three-phase fluidized bed.
Such a concept was demonstrated by Chem Systems [27] within their liquid-phase methanation/shift
process. The operating pressure was up to 70 bars. Mineral oil was used as a heat carrier and nickel
containing balls as a catalyst.
Nowadays, the usage of liquid-phase methanation is investigated for methanation of hydrogen and
carbon dioxide for power-to-gas production [28]. The advantage of the liquid-phase methanation is
the higher degree of flexibility offered during dynamical operation, as the fluid is easier to keep on
temperature.
Fluidized bed methanation
Fluidized bed methanation allows a simpler removal of exothermic heat from the reactor and
therefore a nearly isothermal operation. Furthermore, the catalyst can be replaced or partially
replaced more easily also during operation.
The Bi-Gas project [29] of Bituminous Coal Research Inc. demonstrated the methanation of coal-
derived syngas in a fluidized bed with a diameter of 150 mm and a reaction zone length of 2.4 m.
Around 3 m² of finned cooling tubes, cooled with a heat transfer fluid, remove the heat from the
reactor. The main challenge with fluidized bed methanation is the attrition of the catalyst. Since
according to reports, the number of fine particles increases during operation whereas the number of
coarse particles decreases. Attrition-stable catalysts are required for fluidized-bed methanation.
The largest demonstration plant for fluidized bed methanation was the Comflux process built by
Thyssengas [30]. The pre-commercial plant had a power of up to 20 MWSNG. One special feature of
this plant was the combination of methanation and water-gas shift within the same reactor.
The Paul-Scherrer-Institute (PSI) and partners developed a 1 MWSNG demonstration project for
methanation of biomass-derived synthesis gas at the FICFB gasification plant in Güssing
(chapter 2.2.2) [4].

State-of-the-Art
9
2.2. Large SNG plants and projects in operation
After the energy crises of the 1970s had been overcome, gas prices remained at a level with which
SNG from coal could not compete. Therefore, the majority of SNG research and demonstration
projects were stopped in the 1980s. Bucking this general trend, the DGC Great Plains synfuels plant,
which until 2013 remained the only large-scale SNG plant, started its operation in 1984.
With ever-increasing energy demand of countries like China or India, several new coal-to-SNG plants
are now being planned and constructed; the first large-scale plant in China, in the Inner Mongolia
region started to operate in 2012. In the last few years, with the favoring of renewable sources of
energy in Europe, SNG production from biomass has become an interesting option, as demonstrated
in the 1 MWSNG biomass-to-SNG/CNG project developed by PSI for the Güssing gasification plant. The
largest project currently under commissioning (Jan. 2014) is the GoBiGas project in Goteborg with a
total SNG capacity of 20 MW.
2.2.1. Large-scale coal-to-SNG plants
DGC Great Plains synfuels plant
The Dakota Gasification Company´s (DGC) Great Plains synfuels plant in North Dakota [3] was the
first large-scale commercial plant for the production of SNG from coal. Its 14 Lurgi-Mark-IV gasifiers
convert around 18,000 tons of coal per day. After gasification, around 2/3 of the gas is cooled and
removed from condensed water (figure 2.3). As the condensed process water contains valuable
by-products, separate by-product processing extracts phenol, dephenolized cresylic acid and
ammonium sulfate. The remaining 1/3 of the gas passes a shift conversion unit until it reunites with
the cooled gas stream. A Rectisol scrubber then removes contaminations and CO2 from the syngas.
Since 1999 the compressed CO2 has been fed into a pipeline and transported to oilfields for enhanced
oil recovery. Having passed the Rectisol unit, the cleaned synthesis gas is converted to SNG by a Lurgi
fixed bed methanation process. Before feed-in into the gas grid, water is removed and the dry SNG is
compressed to pipeline pressure. The average amount of SNG produced every day is around
4.33 mil. m³ with a heating value of 36.3 MJ/m³ and a corresponding SNG power of 1.82 GW [31].
To increase the income an ammonia plant was added which uses a slipstream of the synthesis gas. In
2012 the revenue from sales of SNG was $ 252.4 million and of by-and co-products at $ 295.3 million
[31]. The fact, that more than the half of the revenue comes from the selling of by-products, shows
how important the efficient usage of by-products is for large-scale plants.
Figure 2.3: Simplified flow sheet of the DGC Great Plains synfuels plant, adapted from [3]
ASUAir
Ash lock
Lurgi gasifiers
Coal lock
Coal Gas cooling
Shift conversion
Rectisol unit
Fixed bed methanation
Gravity separation
Tar oil By-product processing
Phenol, Cresol, Ammonium sulfate
SNG
CO2 for enhanced oil recoveryN2, Xe,
KrAsh
Steam
Naphta
Condenser
Water
Syngas to ammonia plant
O2

State-of-the-Art
10
Datang Keshiketeng (Hexigten) SNG plant
China`s first SNG plant, the Datang Keshiketeng SNG plant [32], started its operation in September
2012. It is located in Keshiketeng (Hexigten) in the Inner Mongolia region. The first phase has a plant
capacity of 1.33 bn. Nm³ SNG per year (around 1.4-1.6 GWSNG). It is planned to add two plants of the
same size in phases two and three after successful operation of phase one. The gasification
technology is provided by SEDIN (Second Design Institute of Chemical Industry) [33]. The plant uses
an SNG process (fixed bed) from Davy Process Technology with purification and methanation
catalysts from Johnson Matthey.
Yining SNG plant
The second large-scale SNG plant in China, operated by the Chinese Qinghua (Kingho) Group and
located in Yining/Yili in the province of Xinjiang, started its operation in 2013 [21]. Its planned SNG
output of the first phase is around 1.4 bn. Nm³ per year, which is equivalent to an SNG power of
1.5-1.7 GW, depending on the heating value of the gas. The final phase will have an SNG output of
around 5.5 bn. Nm³ per year. The majority of the produced SNG will be fed into a pipeline and
transported to the more densely populated eastern part of China. The plant uses the Haldor Topsøe
TREMP technology for methanation of the coal-derived synthesis gas. SEDIN provides the sixteen
gasifiers [33].
2.2.2. Biomass-to-SNG projects
Güssing/PSI
The fast internally circulating fluidized bed (FICFB) gasifier [34] installed in Güssing, Austria, which
was developed at Vienna University of Technology and constructed by Repotec, has operated
commercially since 2002. The main purpose of the Güssing gasifier is combined heat and power
generation (CHP). The total fuel capacity is 8 MW (wood chips) and the electrical output around
2 MW. The FICFB gasifier consists of two zones, a gasification zone and a combustion zone. In the
combustion zone, bed material (olivine) is heated up by combustion of biomass with air. The hot bed
material circulates to the gasification zone, where it provides the heat for the endothermic
gasification of biomass by means of water steam. This allows the production of synthesis/producer
gas, which contains next-to no nitrogen. Table 2.1 shows the typical gas compositions for the Güssing
gasification plant.
Table 2.1: Typical gas compositions of the FICFB gasifier, operated with wood chips, according to [35]
Permanent gases
H2 CO CO2 CH4 N2 35-45 vol. % 19-23 vol. % 20-25 vol. % 9-11 vol. % ≈1 vol. %
Higher hydrocarbons
C2H4 C2H6 C3H8 BTX Tars 2-3 vol. % ≈0.5 vol. % ≈0.5 vol. % 10 g/Nm³ 1-5 g/Nm³
Contaminations
H2S COS org. S HCl NH3 ≈150 ppm ≈5 ppm ≈37 ppm ≈3 ppm 500-1500 ppm

State-of-the-Art
11
The favorable gas compositions and the high availability were the reasons for demonstrating SNG
production from biomass on a slipstream of the FICFB gasifier. After bench-scale tests, the Paul-
Scherrer-Institute (PSI), in cooperation with Conzepte Technik Umwelt AG (CTU) and Repotec,
developed and constructed the whole process chain for a 1 MWSNG demonstration [36].
After gasification, particles are removed and the gas passes an RME scrubber (figure 2.4). The
majority of the gas goes to a gas engine. A slipstream is further processed for the SNG production.
Before methanation, the gas is compressed and cleaned of H2S. The methanation takes place in a
fluidized bed reactor, adapted from the Comflux process [4]. To meet the specifications for further
applications, NH3, H2O, CO2 and H2 are removed step by step from the raw-SNG.
Figure 2.4: Simplified flow sheet of SNG production in the FICFB gasification plant, adapted from [4]
The main challenge for methanation is the high ethylene concentration in the synthesis gas and the
resulting coking of the catalyst. Kopyscinski [37], [38] reported that the advantage of fluidized bed
methanation is the internal regeneration of the catalyst. Measurements showed strong carbon
exchange processes between gas phase and carbon species on the catalyst surface. The gas
compositions change over the height of the fluidized bed. Therefore the atmosphere of the upper
part of the fluidized bed allows a removal of deposited carbon from the catalyst.
GoBiGas
The largest European biomass-to-SNG project under commissioning (Jan. 2014) is the Gothenburg
Biomass Gasification (GoBiGas) project [39]. It will demonstrate the commercial production of SNG
from biomass with an SNG power of 20 MW. The gasifier used in Gothenburg is based on the FICFB
technology and is being constructed by Metso under a Repotec license. As in the plant in Güssing, the
first gas cleaning steps are the removal of dust trough textile filters and the removal of tars and other
solvable pollutants in an oil scrubber. Before methanation, the gas is compressed and passes a sulfur
removal unit, a water-gas-shift unit and a CO2 removal unit. For methanation, the Haldor Topsøe
TREMP process was chosen. After cooling and drying, the produced SNG is fed into the Swedish gas
grid.
The results of the first GoBiGas project should constitute the basis for a 100 MW follow-up project.
Ash
Filter Fluidized bed methanation
FICFBgasifier
RME
RME scrubber
Bulk H2S removal
Pre-heating
Biomass
Air
Steam Tars/tiophene
Fine H2S removalFlue
gas
NH3/H2O removal
CO2/H2 removal
SNG
CO2
H2Water
To gas engine

State-of-the-Art
12
Heatpipe-Reformer
The Heatpipe-Reformer (HPR) [6], which was developed at the University of Technology Munich
consists of two separated fluidized beds, one for combustion and one for gasification (figure 2.5 a).
The heat required for endothermic gasification is transported from the combustion chamber to the
reformer by means of heat pipes. These are closed tubes, filled with a small amount of sodium or
potassium. Due to the evaporation and condensation of the fluid, high heat fluxes can be achieved.
The reformer is pressurized during operation and uses water steam for fluidization and gasification.
Two prototypes were erected and tested under the European ‘Biomass Heat Pipe Reformer’ project
[40]. Pilot plants with a thermal input of 500 kW were developed by Agnion Energy Inc. in
Pfaffenhofen [7] and by HS Energieanlagen GmbH in Freising (both in Germany). Agnion erected the
first commercial plant with a thermal input of 1.3 MW in Grassau, Germany in 2012. In it, the syngas
produced fuels a gas engine for CHP.
As the gas quality achieved there is similar to that of the Güssing gasifier, the HPR is ideal for
synthesis applications. One of the possible applications of the HPR is the decentralized production of
SNG from biomass [41] (figure 2.5 b), the idea being that of using small-scale units to generate SNG
in rural areas, close to where the biomass resources are. The existing gas infrastructure allows the
transporting of the bio-SNG to areas with a higher demand. The waste heat from the process can be
used in local heat grids. However, small-scale units require lower complexities, as an economical
operation using the demonstrated state-of-the-art process chains for SNG production is not possible.
The European research project ‘CO2freeSNG’ investigated an upscale of the HPR technology for the
production of SNG from coal and lignite [26]. Besides an experimental validation, concept studies for
SNG production in a 50 MW range were developed.
Figure 2.5: a. Conceptual design of the HPR, b. idea for decentralized SNG production, according to [41]
FuelSteamSyngas
Flue gas
Combustion chamber
Reformer
Heat pipes

State-of-the-Art
13
2.2.3. Future large SNG plants and projects
In the last few years, plans for constructing a number of large-scale coal-to-SNG plants have been
announced. SNG from coal is attractive for countries with substantial domestic coal resources but
little natural gas. New projects are therefore mainly being considered in countries that are highly
dependent on imports of natural gas, such as China and South Korea. With the increasing gas prices
from 2000 to 2008, interest for new coal-to-SNG projects also began to grow in the United States.
Some of the projects were already quite specific, until sharply dropping gas prices stopped all
activities. Different press releases also mentioned plans for SNG plants in the Ukraine [42] and
Indonesia [43].
Currently (December 2013), concrete activities for erection of further large-scale coal-to-SNG plants
can be found only in Korea and China [33].
Numerous different technologies are planned or proposed for the different SNG projects. Table 2.2
gives an overview of the different gasification systems proposed for specific SNG projects.
Table 2.2: Overview of gasification systems proposed for specific SNG projects, adapted from [33]
Name Type Project
Siemens [44] entrained flow CPI Yinin (CN), Decatur SNG plant (US) SES U-Gas fluidized bed Jiangxi SNG (CN) [45] CB&I E-Gas entrained flow Posco Gwangyang (KR) GreatPointEnergy Bluegas hydromethanation Wanxiang Turpan (CN) [46] TPRI gasification entrained flow CHNG Xinjiang (CN) SEDIN fixed bed ? Datang Keshiketeng (CN), Yining SNG (CN)
For methanation, mainly systems from Haldor Topsøe, Davy - Johnson Matthey and Foster Wheeler -
Clariant are proposed. All these systems base on fixed bed methanation.
Posco Gwangyang SNG, Korea
The first South Korean large-scale coal-to-SNG plant is currently under construction in Gwangyang.
The start-up is estimated for 2014 and SNG production output is expected to be 500,000 t per year.
This equals an SNG power of around 550-700 MW, depending on the heating value of the SNG. Three
ConocoPhillips (CB&I) E-gas gasifiers (one back up) will produce the synthesis gas. The gas will be
cleaned by means of a Rectisol unit delivered by Linde. The plant will use the Haldor Topsøe TREMP
technology for the methanation of the synthesis gas. [47]
CPI Yinin, China
The China Power Investment Corporation (CPI) is planning to erect a 2 billion Nm³/year
(1.9-2.2 GWSNG) coal-to-SNG plant in Yinin/Yili in Xinjiang province. Siemens will deliver eight Siemens
SGF-500 entrained flow gasifiers with a thermal power of 500 MW each, while Haldor Topsøe will
supply the methanation. [48]
Other Chinese SNG projects
Besides the already constructed Datang and Yining SNG plant and the CPI Yinin plant, six other coal-
to-SNG plants have been approved by the Chinese government [49]. The total SNG capacity of the
approved SNG plants is 37.1 bn. Nm³ per year [49], which is equivalent to an SNG power of around
40-45 GW. However, only little information on the project and construction progress is available.

State-of-the-Art
14

Theoretical Background
15
Chapter 3
3. Theoretical Background
3.1. Gasification
The thermal gasification of a solid feed-stock is the essential step for the production of synthesis gas
and therefore for the production of SNG. After drying and pyrolysis, the products from the pyrolysis
step are gasified at temperatures above 700°C. The solid pyrolysis coke reacts in heterogeneous
gasification reactions (equations 3.1 to 3.5) with the gasification medium to form gaseous
components, whereas the gaseous pyrolysis products react in homogenous reactions (equations 3.6
to 3.10). Although gasification is the term used to describe the third step in the production of gas
from a solid feedstock, also the whole process, including drying and pyrolysis, is referred to as
gasification.
Heterogeneous gasification reactions
3.1
3.2
3.3
3.4
3.5
The heterogeneous combustion reactions (equations 3.1 and 3.2) produce the heat for the
endothermic gasification reactions. The combustion reactions only occur in autothermal gasification
with air or oxygen. The heterogeneous water-gas reaction (equation 3.3) and the Boudouard reaction
(equation 3.4), produce the main synthesis gas components H2 and CO.
Homogeneous gasification reactions
3.6
3.7
3.8
3.9
3.10

Theoretical Background
16
Similar to the heterogeneous reactions, the homogeneous combustion reactions (equations 3.6 to
3.8) only occur in the autothermal gasification process. The CH4 produced in the pyrolysis step, or in
smaller amounts via the hydrothermal gasification reaction (equation 3.5), is converted to H2 and CO
via the methane-reforming reaction (equation 3.10). The CO generated can further react via the
water-gas-shift reaction (equation 3.9) by increasing the H2 content of the synthesis gas.
Only four of the ten gasification equations are independent [1]. Therefore the entire thermodynamic
process can be described by these four equations: the Boudouard reaction, the water-gas-shift
reaction, the methane-reforming reaction, and, in case of gasification with air or oxygen, the
oxidation reaction of CO (equation 3.6).
The thermodynamic equilibrium of the reactions determines the reachable product gas composition
in an ideal case. Usually the residence time in the gasifier is not sufficiently long to reach this
thermodynamic equilibrium. As a result, certain quantities of the pyrolysis products - mainly tars and
CH4 - are present in the product gas.
The theoretically reachable composition of gas depends primarily on reaction temperature and
pressure as well as fuel composition and the gasification medium. According Le Chatelier’s principle
high temperatures favor endothermic reactions, whereas higher pressures favor volume-reducing
reactions. Consequently the amount of H2 and CO increases with an increase in temperature and the
amount of CO2 and CH4 increases with an increase in pressure.
3.1.1. Allothermal gasification with water steam
The allothermal gasification with water steam is an efficient method of producing synthesis gas with
high amounts of H2, which is ideal for methanation. Contrary to gasification with oxygen or air, an
external heat source provides the heat of reaction for the endothermic gasification reactions.
The equation for the general reforming reaction of a hydrocarbon (equation 3.11) enables the
calculation of the amount of stoichiometric molar water needed for the reformation of a fuel.
( ) (
) 3.11
The minimum mass of water xH2O,min required for complete reformation can be calculated according
to equation 3.12. The minimum mass of water for wood pellets, used within this work, with the
molar formula (wet basis) CH1.646O0.722 is xH2O,min=0.199 kgH2O/kgFuel; for the used lignite (RWE Power
split), CH1.341O0.506, it is xH2O,min=0.415 kgH2O/kgFuel.
( )
( ) [
]
3.12
Typically, the gasification is performed at higher amounts of water, as required by the stoichiometry.
The excess steam ratio σ (equation 3.13) can be calculated analogously to the excess air ratio λ.
3.13

Theoretical Background
17
The excess steam ratio allows an adjustment of the H2/CO ratio of the synthesis gas. A high σ leads to
higher amounts of hydrogen in the product gas. Figure 3.1 shows a simulated permanent gas
composition on a dry basis as well as the water content for allothermal gasification of wood pellets
(ENplus-A1) with varying σ. The thermodynamic simulation was performed with Aspen Plus by using
an equilibrium approach with restriction of the CH4 content. According to the thermodynamic
equilibrium only a minor amount of CH4 would be present at typical gasification conditions. A
restriction of the CH4 content to realistic values allows therefore simulations that are more precise.
The main parameters and assumptions for the simulation were a gasification temperature of 800°C, a
pressure of 2 bars and total carbon conversion.
It can be seen that an increase in the amount of water leads to an increase in the H2 and CO2 content
and to a decrease in the CO content, as a result of pushing the shift-reaction (equation 3.9) to the
product side.
Figure 3.1: Simulation of the influence of σ on the permanent gas composition (dry basis) for allothermal
gasification: wood pellets, 800°C, 2 bars, equilibrium with restriction on CH4, Aspen Plus simulation
Such thermodynamic simulations, as well as validations on real gasifiers, provided the basis for the
definition of the standard synthesis gas composition (table 3.1) for the methanation tests within this
thesis.
Table 3.1: Standard synthesis gas composition for the methanation tests
Dry [vol. %] Wet [vol. %]
H2 51.6 31
CO 18.2 10.9
CO2 23.3 14
CH4 6.9 4.1
H2O 40
0.0
0.1
0.2
0.3
0.4
0.5
0.6
2 4 6 8 10
Gas
co
mp
osi
tio
n [
mo
le f
ract
ion
]
Excess steam ratio σ [-]
H2Owet
CO2,dry
COdry
H2,dry
CH4,dry

Theoretical Background
18
3.1.2. Tar problematic of thermal gasification
One product formed during the pyrolysis step is tar, a mixture of numerous organic components. Its
composition strongly dependents on the feedstock and the type of origination. From an operational
point of view tar is defined as a condensable product of organics in the producer gas stream [50]. The
literature proposes numerous classifications for tar; these are usually adapted for a particular
purpose. One of the most common methods is the classification according to ECN [51] (table 3.2),
which focuses on the properties, in particular the detection properties and the condensation
behavior of the tar species. Benzene is no tar species according to the ECN-classification.
Nevertheless, this thesis uses the term ‘tar’ for all hydrocarbons greater than or equal to benzene,
including benzene.
Table 3.2: Tar classes according to ECN [51]
Class Class name Properties Species e.g.
1 GC undetectable
Very heavy tars, gravimetric tar 7-rings and higher
2 Heterocyclic Cyclic hydrocarbons with heteroatoms, water soluble
phenol, cresol, pyridine
3 Light aromatic Compounds that usually do not pose problems regarding condensation or water solubility
xylene, styrene, toluene
4 Light polyaromatic
2/3-ring compounds that condense at intermediate temperatures at higher concentrations
naphthalene, acenaphthene, anthracene
5 Heavy polyaromatic
4-to-6-ring compounds that condense at high temperatures at low concentrations
fluoranthene, pyrene, chrysene
Ideally tar is just an intermediate product, which, in the gasification step, further reacts to
permanent gases. However, since this conversion is not complete, a certain amount of tar remains in
the synthesis gas, the exacts amount primarily depending on the gasification system, the type of fuel
and the reaction conditions.
Milne und Evans [50] classified tars according to their origination into primary, secondary and
tertiary products. The oxygen-rich primary tars, e.g. substituted phenols, are produced during
pyrolysis at 200-500°C. The majority of primary tars with increasing temperature react to permanent
gases, olefins and secondary tars, e.g. xylene, cresol, phenol or toluene. High temperatures
respectively increased reaction severities facilitate the formation of tertiary tars. Typically, tertiary
tars are polycyclic aromatic hydrocarbons (PAHs) without substitutes, like benzene, naphthalene,
anthracene or pyrene. Tertiary tars are formed by recombination of smaller molecular fragments
[52]. Primary and tertiary tars are generally not present at the same time, due to their nature of
formation and destruction. Primary products are destroyed before tertiary products appear. In
general, the total amount of tar significantly decreases with increasing gasification temperature and
reaction time and also the type of tar species changes. Higher temperatures lead to increased
formation of tertiary tars, which are more stable and might be more difficult to crack and remove
than primary or secondary products [50]. The assumption that, at higher temperatures, tars
thermally crack to permanent and other lighter gases is true for primary products. However, this is

Theoretical Background
19
not valid for tertiary tars, which grow in molecular weight with temperature and gas phase resistance
time [50]. Thus, the end-use of the synthesis gas should be considered when choosing the
gasification concept and operating conditions.
Downdraft gasifiers usually have lower concentrations of, what are mainly tertiary tars as the
products have to pass the hot oxidation zone. Contrary to that, producer gas from updraft gasifiers
contains large amounts of primary products. The tar yield of fluidized beds lies between that of
downdraft und updraft gasifiers. Entrained-flow gasifiers can be assumed as being almost tar-free.
Typical tar concentrations for updraft gasifiers are in a range of 20-100 g/Nm³, for downdraft
gasifiers of 0.1-1 g/Nm³ and for fluidized beds in a range of 2-20 g/Nm³ [50].
Methods for qualitative and quantitative tar analysis are presented in the experimental part of this
thesis (chapter 6.2.3).
3.1.3. Contaminations in the product gas from allothermal gasification
Besides tars, several other contaminations are present in the producer gas generated in allothermal
gasification such as particles, alkalis, sulfur and chlorine species and nitrogen containing
contaminations.
Particles and alkalis
The amount of particles in the producer gas is strongly dependent on the type of gasifier that is used.
Typical quantities for the FICFB gasifier in Güssing, as the state-of-the-art representative for
allothermal, fluidized bed gasification, are 30-100 g/Nm³ [35]. In case of fluidized bed gasification,
the particle fraction is a mixture of fuel ash and attrited bed material. Particles can cause plugging of
downstream applications if they remain in the synthesis gas.
Main alkali metals from biomass gasification are sodium (Na) and potassium (K) with a maximum
concentration of a few ppm [53]. Alkalis typically condense at temperatures below 600°C. They are
deposited as a sticky film on metal surfaces and adhere particular matter by forming ash deposits.
These alkali deposits are assumed to be corrosive to metal surfaces [54].
Sulfur
The main sulfur components of the synthesis gas are hydrogen sulfide (H2S) and in general, according
to the thermodynamic equilibrium, with a one to two powers lower amount, the organic species
carbonyl sulfide (COS) and carbon disulfide (CS2). The amount of sulfur in the feedstock is the main
influence for the rate of H2S released to the synthesis gas [55]. Allothermal, fluidized bed gasification
of biomass pellets, which contain relatively small amounts of sulfur, lead to H2S concentrations of
around 15-25 ppm ( [7] and own results), whereas the use of wood chips results in concentrations of
30-150 ppm ( [35] and own results).
Additionally, amounts of other organic sulfur species, like thiols (e.g. ethyl mercaptan), tiophene and
aromatic sulfur species, can be found in producer gas. There is, however, hardly any documented
evidence in the literature of the amount of organic sulfur species present after biomass gasification,
probably due to the complex method of measurement required.
Measurements by Kienberger and Zuber [56] (dotted area in figure 3.2) of producer gas generated
through allothermal water-steam gasification of wood pellets have shown that organic sulfur species

Theoretical Background
20
are in a range of about 10 % (≈1-3 ppm) of H2S. The operating conditions – and reaction temperature,
in particular – are the main factors influencing the concentration of organic sulfur. Higher gasification
temperatures, as a rule, decrease the amount of organic sulfur in the gas [57].
Figure 3.2 shows typical concentrations for sulfur contaminations and other gaseous contaminates in
producer gas from thermal gasification of woody biomass and lignite. Additionally, results of
measurements taken at the lab-scale gasifier that was used for the real gas methanation tests within
this work are depicted.
Sulfur is the main poison for nickel-based methanation catalysts. To guarantee a long operating time
catalyst specifications require a sulfur concentration in a low ppb range (e.g. < 100 ppb).
Chlorine and nitrogen species
Chlorine compounds are present in most biomass feedstocks, but only in a low concentration in
woody biomass. Chlorines usually appear in producer gas in the form of hydrochloric acid (HCl) [35].
In own measurements HCl was not detectable (below the detection limit of 1 ppm) in the raw
synthesis gas. HCl is listed as a catalyst poison for nickel catalysts.
Ammonia (NH3) is the main nitrogen-containing contamination. The amount of NH3 released
primarily depends on the nitrogen content of the fuel as well as the process conditions [35].
According to the thermodynamic equilibrium, higher temperatures and longer resistance times lead
to an increased conversion of NH3 to N2 [58]. Most suppliers of Ni-based methanation catalysts
specify NH3 as catalyst poison, but probably only as a precaution. Ni catalysts are also used to
catalyze NH3 decomposition, although at higher temperatures than in methanation. Own results, as
well as thermodynamic calculations, showed no discernible interaction between Ni and NH3 at
methanation conditions, but ammonia can become a problem for the later usage of the produced
SNG as it is corrosive for downstream applications and, if combusted, increases NOX emissions.
Figure 3.2: Typical concentrations of gaseous contaminates from gasification of woody biomass and lignite
with the measured contaminates from the EVT lab-scale allothermal gasifier
Measured contaminates lab scale gasifier
Woody Biomass Lignite (higher quality)
Co
nce
ntr
atio
n [
pp
m]
or
[g/N
m³]
fo
r B
TX/T
ar
0.1
1
10
100
1000
10000
H2S COS CS2 org. S* HCl NH3 BTX Tar**
*excluding COS and CS2; **Total tar amount including BTX;

Theoretical Background
21
3.2. Hot gas cleaning for sulfur and chlorine removal
The concept proposed in this thesis requires a removal of sulfur contaminations and perhaps a
removal of chlorines too, from the hot synthesis gas. The temperature for this cleaning process has
to be above the condensation temperature of the tars (> 300°C). Therefore, adsorptive hot gas
cleaning is a suitable option.
3.2.1. Adsorptive desulfurization with metal oxides
There are several metal oxides that are capable of adsorbing sulfur compounds from the hot
synthesis gas. Equations 3.14 and 3.15 show the general reactions of the two major sulfur
contaminates in synthesis gas, H2S and COS, with metal oxides. Oxides from the group of transition
metals such as Co, Cu, Fe, Mn, Mo, V, W and Zn have particularly good properties for adsorptive
desulfurization [59]. Furthermore, oxides of Ba, Ca, Ce and Sn also showed to be sufficient for
adsorption of sulfur [59]. The most common sorbents for hot gas applications are ZnO, CuO and CaO.
3.14
3.15
Figure 3.3: H2S equilibrium desulfurization concentrations for different sorbents with standard synthesis gas
composition (table 3.1) with 100 ppm H2S, upper limit with 40 vol. % H2O, lower limit dry, Aspen simulation
Zinc oxide (ZnO)
Zinc oxide is probably the most widespread adsorbent used for removing H2S in hot conditions. ZnO
allows desulfurization to a low ppb-range, but is strongly dependent on the water content of the
synthesis gas. Due to the formation of zinc vapor the operating temperature must not exceed around
700°C [60]. Strong reducing atmospheres additionally reduce this maximum temperature.
0.001
0.01
0.1
1
10
100
200 300 400 500 600 700 800 900
Temperature [°C]
Fe3O4
Ni
MnO
CaO
ZnO
H2S
con
cen
trat
ion
[pp
m]

Theoretical Background
22
Figure 3.3 depicts equilibrium H2S concentrations after desulfurization with different metal oxides
and Ni of the standard synthesis gas (table 3.1) with 100 ppm H2S. The upper limit is calculated for a
synthesis gas containing 40 vol. % H2O, whereas the lower limit is for the dry case. It shows that ZnO
enables a removal to 0.1 ppm H2S at 300°C of the wet standard synthesis gas composition.
The literature reports sulfur capacities of up to 34 wt. % for ZnO based sorbents [61], [59]. Higher
temperatures increase the adsorption capacity for sulfur [61]. Sorbents on ZnO basis are
commercially available, e.g. Clariant/Süd-Chemie ActiSorb S2 (capacity according to supplier of
32 wt. % S [62]) or BASF R5-12 (29 wt. % S [63]).
Own results for desulfurization tests with the ZnO sorbent Clariant-Südchemie ActiSorb S2 show a
sulfur adsorption capacity of around 28 wt. %. These tests were performed with the standard
synthesis gas composition with 40 vol. % H2O with addition of 500 ppm H2S, 25 ppm COS and 16 ppm
CS2 at a adsorption temperature of 250°C. Besides H2S, ActiSorb S2 also showed activity for removal
of COS and CS2. It is not clear if COS directly reacts with ZnO or if it first converts to H2S. Only few
literature sources report a direct reaction according to equation 3.19. Zinc sulfide (ZnS), produced
from adsorption of H2S on ZnO, catalyzes the COS conversion via the hydrogenation reaction. Thus, if
the ZnO bed already contains ZnS, COS can convert to H2S and be subsequently adsorbed [57].
Tests with 99.9 % ZnO powder carried out in the same conditions as the tests with ActiSorb S2, did
not show the removal of COS or CS2, whereas H2S was adsorbed. The ZnO powder reached a sulfur
load of around 9 wt. %.
Copper oxide (CuO)
Copper oxide has excellent thermodynamic properties for the adsorption of H2S. The capacity for
sulfur is lower than that of ZnO, which is way it is mainly used for deep desulfurization. Sulfidation
proceeds according to equation 3.16 and 3.17. [64]
The calculation of the reachable equilibrium concentration of H2S for desulfurization with CuO
showed that concentrations are in a low ppb range. Since this calculation was only possible in inert
gas conditions (H2S in N2), it is not shown in figure 3.3. In reducing synthesis gas conditions, CuO
always reduced to Cu, which has a much lower affinity to sulfur.
The maximum operating temperature proposed for CuO is 750°C [65]. However, since CuO strongly
tends to reduce to metallic copper in reducing atmospheres, the operation temperature is
limited [66]. Pure CuO adsorbents are not normally used for synthesis gas purification. The addition
of other metal oxides can stabilize the CuO and prevent it from reduction. Examples therefore are
copper aluminates (CuAl2O4, CuAlO2) or combinations with iron oxide [64]. Mixed oxides from copper
and manganese, like CuMnO2 and CuMn2O4, are very promising too. Cu-Mn sorbents are already
commercially available, e.g. Clariant/Süd-ChemieActiSorb 310 or FCDS-GS6. FCDS-GS6 allows the
removal of H2S and also of COS and other organic sulfur species up to a temperature of 400°C. Own
results proved the desulfurization ability of synthesis gas containing H2S, COS and CS2. These tests
also showed hydrogenation of COS and CS2 to H2S, despite full sulfidation of the sorbent.
3.16
3.17

Theoretical Background
23
Other metal oxides
Two sorbents for coarse desulfurization are calcium oxide (CaO) and calcium carbonate (CaCO3) or
their naturally occurring forms dolomite and calcite. Due to their thermodynamic properties
calcium-based sorbents are not suitable for desulfurization in a low ppm range (figure 3.3). Common
applications are in-situ desulfurization during gasification [67] or desulfurization in IGCC plants [68].
Manganese oxide (MnO) allows desulfurization up to a temperature of 1000°C even in strongly
reducing atmospheres. Apart from H2S, MnO also adsorbs COS according to equation 3.15 [69].
Iron oxide (Fe3O4) was one of the first materials used for removing sulfur. It is readily available and
therefore cheap and has a high sulfur adsorption capacity. Typical operating temperatures are
between 330-660°C. Fe3O4 is, however, only suitable for a coarse desulfurization (figure 3.3) and can
catalyze unwanted reactions, e.g. Boudouard-reaction. [64]
The literature reports numerous other types of sorbents for desulfurization, such as ceria (CeO2) and
mixtures of cerium with zircon, copper or lanthanum [70] or zinc-ferrite, zinc-titanate [64].
3.2.2. Desulfurization with activated carbons
Adsorption on activated carbons is one of the state-of-the-art methods for fine desulfurization of
biogas. Commercially available activated carbons are made from wood, lignite and hard coal as well
as coconut shells. By applying different impregnations the activity and the sulfur adsorption capacity
can be increased. In addition to the effect of physisorption from pure activated carbon, impregnation
enables adsorption by chemisorption. Typical applications for gas cleaning with activated carbons
operate at ambient or near ambient temperatures. This is due to the decreased adsorption
performance of the activated carbon itself. However, impregnations can overcome this problem.
Table 3.3 gives an overview of commercially available impregnated activated carbons for sulfur
removal. [71]
It can be seen that, contrary to most metal oxide sorbents, activated carbons also allow the removal
of organic sulfur, which makes them an interesting option for the removal of organic sulfur from hot
synthesis gas.
Table 3.3: Overview of commercially available impregnated activated carbons, adapted from [71]
Impregnation Amount Applications Products
Potassium carbonate K2CO3
10-20 wt. % Sour gases (H2S, HCl, HF, SO2, NO2), CS2
Carbotech D47/3-KC10
Iron oxide 10 wt. % H2S, mercaptans, COS -
Potassium iodide KI 1-5 wt. % H2S, PH3, Hg, AsH3, radioactive gases, mercaptans
Norit ROZ 3
Potassium permanganate KMnO4
5 wt. % H2S (without O2), aldehydes -
Potassium hydroxide KOH
10 wt. % Sour gases (H2S, HBr, HCl, HF, SO2, NO2), mercaptans
Donau Carbon Desorex K43Na
Sodium hydroxide NaOH
10 wt. % H2S, mercaptans -

Theoretical Background
24
In the recent years several investigations have addressed the use of activated carbon for hot gas
cleaning applications.
Desulfurization tests [72] with activated carbons with KOH, NaOH, Na2CO3 and KI impregnation
showed no large influence on the adsorption capacity for H2S at room temperature; at higher
temperatures (up to 550°C), however, the adsorption capacity increased significantly. It can be
assumed that carbon binds sulfur physically at lower temperatures (< 130°C), whereas at higher
temperatures, chemisorption is the predominating effect. The measured H2S adsorption capacity of
these activated carbons was between 0.4 and 4 wt. %.
Tests by Sakanishi [73] examined the simultaneous removal of H2S and COS over iron-impregnated
activated carbons. The results showed a higher capacity for COS removal than for H2S, due to the
partial decomposition of COS to CO. These tests also indicate that H2S may be removed mainly
through reaction with metal to produce metal oxide, whereas COS may be preferably adsorbed as
COS itself in the pores and decompose further.
Only few authors reported investigations under realistic synthesis gas conditions. Cal et al. [74]
studied the influence of the different synthesis gas components on hot desulfurization with activated
carbons. CO2 and H2O were favorable for H2S adsorption, whereas CO and H2 showed a contrary
effect.
In summary it can be said that the use of impregnated activated carbons for desulfurization of hot
synthesis gas has so far been investigated insufficiently. However, the results reported show a high
potential, especially for applications for which standard metal oxide sorbents are not suitable, e.g.
the removal of organic sulfur.
3.3. Methanation
The French chemists Sabatier and Senderens discovered the catalytic reaction of hydrogen and
carbon monoxide to methane in 1902 [14]. They reported a complete conversion of three parts H2
and one part CO to CH4 and H2O by reaction over reduced nickel at 250°C.
The methanation reaction (equation 3.18) is highly exothermic and reduces the gas volume by half.
Due to the stoichiometry, the reaction requires an H2/CO ratio of three. When using real synthesis
gas from thermal gasification, the ideal stoichiometric ratio of H2/CO = 3 cannot be expected.
Advantageously, the water-gas-shift reaction (equation 3.19) can adjust the H2/CO ratio. Nickel also
catalyzes the water-gas-shift reaction, which implies that if sufficient H2O or CO2 is available,
synthesis gases with a wide range of H2/CO ratios can be fully converted in the methanation reactor.
O 3.18
3.19
3.20
3.21
Instead of CO and H2, also methanation with CO2 and H2, according to the Sabatier reaction (equation
3.20) is possible. This reaction is a combination of methanation and the water-gas-shift reaction. If
CO and CO2 are present in the synthesis gas, CO2 conversion does not start until almost all CO has
been converted [25].
Another reaction to consider for methanation processes is the Boudouard reaction (equation 3.21).
Depending on the reaction conditions, it can lead to carbon deposition on the catalyst.

Theoretical Background
25
3.3.1. Thermodynamics
The achievable equilibrium product gas composition is, of course, determined by the stoichiometry,
but also by the composition of the inlet gas, the temperature and the pressure. The equilibrium
composition of a gas mixture, resulting from the reactions equilibrium constant K, can be calculated
minimizing the free enthalpy.
The simultaneous equations, necessary for the calculation of the equilibrium gas composition, can be
devised manually (e.g. according to [75]), or by means of thermodynamic calculation software with
already implemented equations (e.g. FactSage, AspenPlus). For the following thermodynamic
calculations, the software AspenPlus was used.
Figure 3.4 shows the influence of the reaction temperature on an ideal stoichiometric H2/CO mixture
of three at atmospheric pressure (1 bar). Due to the exothermic nature of the methanation reaction
higher methane conversions are favored at lower temperatures. This also implies that a cooling of
the reactor is necessary to achieve suitable conversion ratios. For that purpose, state-of-the art
concepts use cooled reactors or more common multiple reactors with intermediate cooling and high
product gas recirculation.
Figure 3.4: Influence of temperature on the equilibrium composition of an H2/CO=3 mixture at 1 bar,
FactSage simulation
Elevated pressure also promotes the conversion of methane, due to the reduction of molar volume
by the methanation reaction (figure 3.5). As the shift reaction is equimolar, reaction pressure does
not influence it. The major influence of pressure is in the range of 1 bar (atmospheric pressure) and
10 bars. An increase in pressure from 1 bar to 5 bars reduces the H2 content in the product gas by
half (from 6 to 3 vol. %) and increases the CH4 content by more than 1.5 vol. %, whereas an increase
from 5 to 20 bars only reduces the H2 content by about 1 vol. % and increases the CH4 content by
0.7 vol. % (figure 3.5). Considering this as well as the greater technical effort for high-pressure
applications, a medium pressure range of up to 5 bars during operation is suggested. A doubling of
the pressure can compensate for a reaction temperature increase of 20°C [10] and is a suitable
method for reaching higher conversions, especially if the temperature of the catalyst is already at the
lower limit for the catalytic activity.
0
0.1
0.2
0.3
0.4
0.5
0.6
0.7
0.8
0 200 400 600 800 1000
Gas
co
mp
osi
tio
n [
mo
le f
ract
ion
]
Reaction temperature [°C]
H2
CO
CH4
H2O
CO2

Theoretical Background
26
Figure 3.5: Influence of pressure on the equilibrium composition of an H2/CO=3 mixture at 300°C, FactSage
Since real synthesis gas mixtures always contain certain amounts of other gaseous components, like
CO2, CH4 and H2O, they also influence the achievable equilibrium composition. Figure 3.6 shows the
equilibrium composition of the standard synthesis gas used and its dependency on the reaction
temperature. An important parameter, especially for feed-in into the gas grid, is the amount of H2
remaining in the raw-SNG as different national regulations and technical requirements restrict the
H2 content permissible in the natural gas grid. To avoid the high technical effort of downstream H2
separation, the operating conditions for methanation should be carefully chosen. Figure 3.6 and
figure 3.7 show the main parameters influencing the reachable equilibrium gas composition. At an
outlet temperature of 250°C and an operating pressure of 5 bars the standard gas composition used
results in an H2 content of 3.3 vol. % in the SNG (after removal of CO2 and H2O).
Figure 3.6: Influence of temperature on the equilibrium composition of the standard synthesis gas
composition used (H2=0.3096, CO=0.1092, CO2=0.1398, CH4=0.0414, H2O=0.4; in mole fraction) and on the
chemical efficiency for methane conversion at atmospheric pressure (1 bar), FactSage simulation
0
0.1
0.2
0.3
0.4
0.5
0.1 1 10 100
Gas
co
mp
osi
tio
n [
mo
le f
ract
ion
]
Reaction pressure [bar]
H2
CO
CH4
H2O
CO2
0
0.1
0.2
0.3
0.4
0.5
0.6
0.7
0.8
0.9
0
0.1
0.2
0.3
0.4
0.5
0.6
0.7
200 300 400 500 600
Ch
em
ical
eff
icie
ncy
ηM
eth
Gas
co
mp
osi
tio
n [
mo
le f
ract
ion
]
Reaction temperature [°C]
H2 CO
CH4
H2O
CO2
ηMeth

Theoretical Background
27
The chemical efficiency (equation 3.22) is the ratio between the chemically bounded energy of the
produced methane stream and the chemically bounded energy of the synthesis gas stream. Since
lower temperatures increase the methane yield, also the chemical efficiency increases with lower
temperatures up to its maximum of 84.5 % for the standard synthesis gas composition.
[ ]
3.22
Figure 3.7: Influence of the H2O content on the equilibrium composition (without carbon forming reactions) of
the standard synthesis gas composition used (H2=0.516, CO=0.182, CO2=0.233, CH4=0.069; dry basis in mole
fraction) at 250°C and atmospheric pressure (1 bar), FactSage simulation
3.3.2. Reaction kinetics and mechanisms
Different group VIII metals are known to catalyze both methanation and the water-gas shift reaction.
An experimental study [76] which sorted the metals according to their activity and selectivity for
methanation found that due to its high activity, relatively high selectivity and reasonable price, nickel
is the favored catalyst for methanation. Typical methanation catalysts have an active compound that
is finely dispersed on a catalyst support with a large surface. The support material also has a
significant influence on the kinetics. Bartholomew, who investigated the influence of different
support materials, reported the highest reaction rate for TiO2, followed by Al2O3 and SiO2 [77].
The structure of the nickel crystals also affects reactivity. Stepped crystal faces, e. g. Ni(211), are
generally more reactive than close-packed faces, e. g. Ni(111) [78]. Additionally, different promoters
like Pt or Ru improve catalytic activity [79].
There is no agreement in the literature about the reaction steps for the methanation reaction of CO.
The most common theory (figure 3.8), which is based on a Langmuir-Hinshelwood (L-H) approach,
uses a stepwise hydrogenation of adsorbed surface carbon [80], [81].
0
0.1
0.2
0.3
0.4
0.5
0.6
0 0.1 0.2 0.3 0.4 0.5 0.6
Dry
gas
co
mp
osi
tio
n [
mo
le f
ract
ion
]
H2O content of synthesis gas [mole fraction]
H2
CO
CH4
CO2
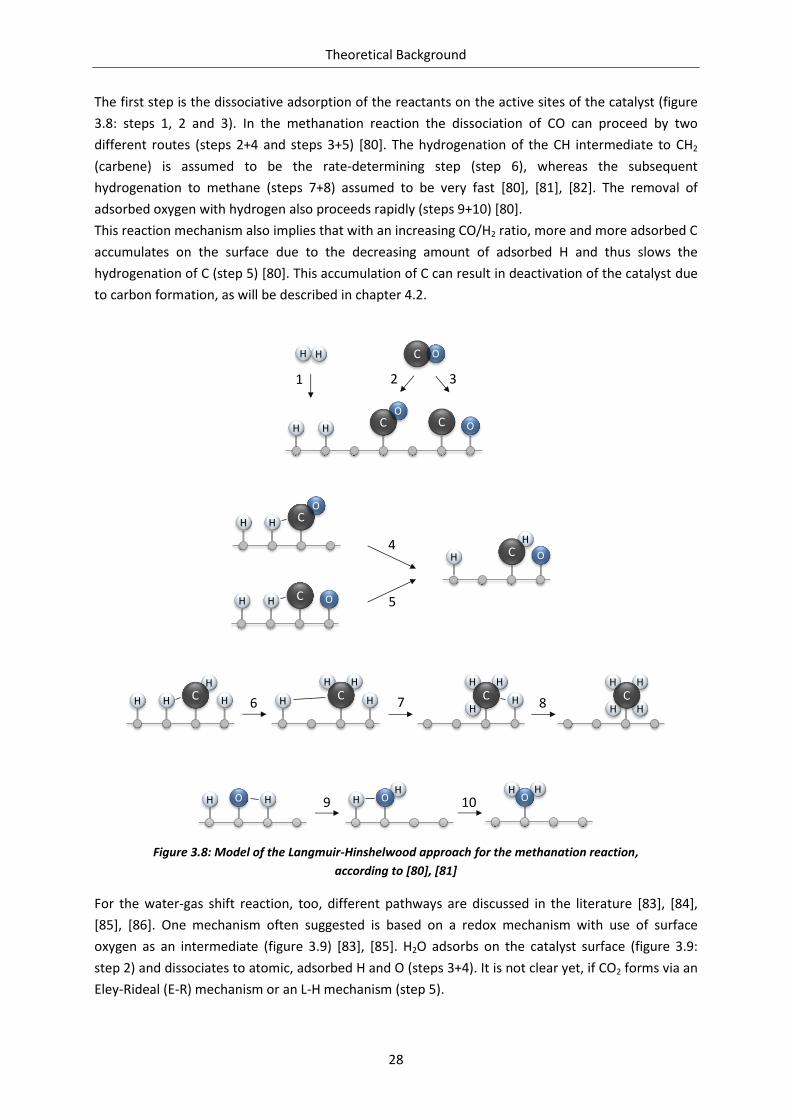
Theoretical Background
28
The first step is the dissociative adsorption of the reactants on the active sites of the catalyst (figure
3.8: steps 1, 2 and 3). In the methanation reaction the dissociation of CO can proceed by two
different routes (steps 2+4 and steps 3+5) [80]. The hydrogenation of the CH intermediate to CH2
(carbene) is assumed to be the rate-determining step (step 6), whereas the subsequent
hydrogenation to methane (steps 7+8) assumed to be very fast [80], [81], [82]. The removal of
adsorbed oxygen with hydrogen also proceeds rapidly (steps 9+10) [80].
This reaction mechanism also implies that with an increasing CO/H2 ratio, more and more adsorbed C
accumulates on the surface due to the decreasing amount of adsorbed H and thus slows the
hydrogenation of C (step 5) [80]. This accumulation of C can result in deactivation of the catalyst due
to carbon formation, as will be described in chapter 4.2.
Figure 3.8: Model of the Langmuir-Hinshelwood approach for the methanation reaction,
according to [80], [81]
For the water-gas shift reaction, too, different pathways are discussed in the literature [83], [84],
[85], [86]. One mechanism often suggested is based on a redox mechanism with use of surface
oxygen as an intermediate (figure 3.9) [83], [85]. H2O adsorbs on the catalyst surface (figure 3.9:
step 2) and dissociates to atomic, adsorbed H and O (steps 3+4). It is not clear yet, if CO2 forms via an
Eley-Rideal (E-R) mechanism or an L-H mechanism (step 5).
OCHH
H H
OC C O
H
H C O
HH
H HC
HHO
H H
OC
H H C O
H
H CH H H H
H HC H
H
H HC
H O H HH
O
1 2 3
4
5
6 7 8
9 10

Theoretical Background
29
Figure 3.9: Model of a combined L-H and E-R approach for the WGS reaction, according to [83], [85]
The ability of nickel to catalyze the water-gas shift reaction allows complete methanation of a wide
range of different gas compositions. Synthesis gases from thermal gasification generally contain a
certain amount of CO2. If there is an insufficient amount CO in the synthesis gas, the reverse water-
gas shift reaction can use CO2 to produce CO. Due to the stronger adsorption of CO molecules than of
CO2 molecules the reaction is kinetically limited and takes places only until almost all CO has been
converted [25], [87].
3.3.3. Reforming of higher hydrocarbons
Reforming of higher hydrocarbons is one of the most widespread chemical processes. The steam
reforming of methane for the production of hydrogen-rich synthesis gas is a particularly important
step in many chemical processes. Usually, steam reforming of natural gas, which is the major steam
reforming application, takes place in tubular reformers filled with catalyst material and at
temperatures of between 400-550°C at the inlet and up to 900°C at the outlet [88].
This work proposes a direct conversion of higher hydrocarbons (tars) on the methanation catalyst.
The strongly exothermic methanation reaction and adequate management of reactor heat create a
temperature peak at the inlet of the reactor, which allows the catalytically supported conversion of
hydrocarbons, as shown by Kienberger [10].
In the literature there is, due to the complexity and variety of hydrocarbon and tar species, no
generally valid model for the reforming reaction to be found.
For the reforming of methane, which is the simplest reforming reaction, Xu and Froment developed
and validated an often-cited model [89]:
1. H2O reacts with the Ni atoms of the catalyst, yielding adsorbed oxygen and gaseous
hydrogen.
2. CH4 adsorbs on Ni atoms of the catalyst and either reacts with the adsorbed oxygen or
dissociate to form chemisorb radicals (CH3, CH2, CH and C).
3. The adsorbed oxygen and the carbon-containing radicals react to form adsorbed CH2O, CHO,
CO and CO2.
4. The hydrogen, carbon monoxide and carbon dioxide formed are directly released into the
gas phase, regarding the adsorption equilibrium.
The overall reaction of H2O with CH4 and H2O with CO is assumed to be the rate-determining
step/reaction within this model.
OC HHO
HHO
OC H
O
OC H O C HO H HOO C H
HHOO COC
1 2
3 4 5
6 7E-R
L-H

Theoretical Background
30
Rostrup-Nielsen proposed a model for the reforming of higher hydrocarbons, based on ethane
reforming [90]. Figure 3.10 shows a simplified version (in which not all reaction steps are shown) of
the model for ethane reforming. In contrast to the model of Xu, water adsorbs on the catalyst
support (figure 3.10: step 1). H2O dissociates on Ni atoms to adsorbed O and gaseous H2 (steps 2 and
3). C2H6 initially adsorbs on a dual site on the surface of the catalyst, involving a dehydrogenation
(step 4) followed by a rupture of the C-C bond to form adsorbed radicals (step 5). Next, the carbon-
containing radicals react with the adsorbed oxygen to form CO and CO2 by releasing gaseous H2
(steps 6, 7 and 8).
It is not clear yet, whether the rupture of the carbon-carbon bond or desorption of the products is
the rate-determining step [90].
Figure 3.10: Model of the reaction mechanism for the reforming of ethane, according to [90]
Korre et al. [91] proposed a model containing four essential steps for the reforming of polycyclic
aromatic hydrocarbons. Figure 3.11 shows one possible path for hydrocracking according to this
model for phenanthrene and naphthalene. In it, the first step is the hydrogenation of the aromatic
compound. The first hydrogenation product of naphthalene is tetrahydronaphthalene, which further
hydrogenates to decahydronaphthalene [92]. The next step is the isomerization of the compound.
One isomerization product of naphthalene is methylindane. The third step is the ring opening, which,
for example for naphthalene, forms butylbenzene. The last dealkylation step gradually reduces the
alkyl groups until, in the case of naphthalene, only benzene remains. [91], [93]
With increasing numbers of aromatic rings, also the number of possible pathways for reforming
increases [91].
HHO
HHO O H H O H H
HH
H
H
H
C
H
H
H
C
H
H
C H
H
C H H
HH
H
H
C H
H
C H H
H
H
C O
OC
OC
C OH H
HH
1
2 3
4
5
6 7
8

Theoretical Background
31
Figure 3.11: Model for hydrocracking of phenanthrene and naphthalene, according to [91] and [93]
Ising detected a relation between the activation energies of typical tar components (benzene,
naphthalene and phenanthrene) and the resonance-energy differences between the aromatic basic
state and the 1,2-hydrogenation. This relation implies that the coordination on the nickel surface is
the rate-determining step. [94]
The conversion rate of higher hydrocarbons on nickel catalysts depends on many different
influencing factors such as the reaction temperature in particular, but also the water content of the
gas, the retention time respectively the flow rate, the gas composition and interactions between
different tar species [52]. It has been reported, that the reforming activity increases with increasing
temperature and with increasing water content of the synthesis gas [95], [96].
Coll et al. investigated the reactivity for the reforming of different tar components and ranked the
compounds accordingly [95]. Benzene showed a higher reactivity than toluene, whereas that of
anthracene was much lower than that of toluene. Pyrene and naphthalene had the lowest reactivity
of the tar species investigated. Tendentially, the reactivity for reforming increases the lower the ring
number of the aromatics is, except for naphthalene.
A study [97] with real tar compositions from thermal biomass gasification also confirms the low
reactivity of naphthalene, but contrary to the investigations of Coll et al., benzene showed a much
lower conversion rate. At 800°C, 97 % of naphthalene and only 86 % of benzene are actually
converted. One reason for this observation could be that benzene was produced as intermediate
from the reforming of other tar species [95], as already presented in the model in figure 3.11. A
second reason could be cross-influences and interaction of different tar components.
Jess [96] reported that in case of a naphthalene-benzene-methane mixture, only naphthalene is
converted up to a temperature of about 750°C. This can be explained by the fact that naphthalene
strongly adsorbs on the catalytic surface and thereby decreases the conversion of benzene and
methane. Methane and benzene adsorb only weakly and therefore do not influence the catalytic
conversion of each other. More detailed information can be found in a summarizing review on
catalytic biomass tar removal by Dayton [98].
Hydrogenation Isomerization Ring Opening Dealkylation

Theoretical Background
32
Low temperature tar reforming and in-situ tar reforming during methanation
Vosecký et al. [99] investigated tar removal by means of steam reforming on a nickel catalyst at a
temperature of 500°C. In tests with a model gas composition containing the permanent gases H2, CO,
CO2, CH4, N2 and the tar components toluene, benzene and naphthalene and H2O, a tar conversion of
80 % at 350°C and 95 % at 500°C was achieved (figure 3.12). Due to the high GHSV (25000-30000 h-1)
used for these tests, a higher conversion would have been possible by operating at a lower GHSV.
Tests carried out with real synthesis gas from thermal biomass gasification confirm this assumption,
as the tar conversion reached > 99 %, also at lower S/C-ratios of 5-6. [99]
Figure 3.12: Reforming of benzene, toluene and naphthalene in model gas containing N2, H2, CO, CO2, CH4
and H2O over a Ni catalyst with an S/C-ratio of 18.1 [99]
Kienberger [10], [100] investigated tar conversion in-situ methanation on a commercial Ni-based
methanation catalyst. In the used polytropic fixed bed reactor concept, which is very similar to the
reactor concept proposed in this work, a temperature peak originates at the inlet zone of the reactor,
which provides enough exothermic heat for the conversion of higher hydrocarbons. In tests with real
synthesis gas from an allothermal biomass gasifier, tar conversion rates of 97.9 % were achieved. The
synthesis gas used, which was produced by the gasifier, mainly contained the permanent gases H2,
CO, CO2, CH4 and N2, had a water content of 35 vol. % and a total tar load (without BTX) of 6 g/Nm³.
In the tests the methanation reactor operated at a GHSV of around 3200 h-1 and an inlet temperature
of 350°C, a peak temperature of around 480°C and an outlet temperature of 275°C. [10]
200 250 300 350 400 450 500
Temperature [°C]
100%
80%
60%
40%
20%
0%
CnH
mco
nve
rsio
n[%
]
Benzene Naphthalene Toluene

Theoretical Background
33
3.3.4. Theoretical and practical aspects for the reactor design
The reaction mechanisms provide a basis for developing models that allow calculating the reaction
rate respectively the rate constant for the reactions taking place in the methanation reactor. By
knowing the reaction properties, the chemical reaction rate and diffusion limitations, a layout model
for the reactor can be developed. Numerous different calculation models can be found in the
literature. Kopyscinski [4] provides a good overview of different kinetic models for methanation and
for the water-gas shift reaction. Since all these models have been developed for a particular catalyst
and for particular operating conditions, it is, in general, not possible to directly transfer them to
other applications.
A practical approach for reactor design is to follow the recommendations for operating conditions
made by the catalyst manufacturer. A commonly used parameter is the gas hourly space velocity
(GHSV) (equation 3.23). It can be used to calculate the reactor volume (VReactor) from a given synthesis
gas volume flow (Vstd). The GHSV for the methanation catalysts used in this work should be below
4000-6000 h-1, depending on the reaction temperatures. Unfavorable operating conditions, e.g. high
water contents or low operating temperatures, can require much lower space velocities respectively
higher retention times.
[ ] 3.23
Besides the GHSV, other parameters also have to be considered in reactor design. Important
parameters to achieve plug-flow conditions are the L/dR-ration (catalyst bed length / reactor
diameter), the dR/dP-ration (reactor diameter / catalyst particle diameter) and the related L/dP-ratio
(catalyst bed length / catalyst particle diameter).
Due to their strong dependency on various operating conditions, such as volume flow or density of
the catalyst bed, there are no generally valid limits for L/dR, dR/dP and L/dP ratios. Different
mathematical approaches, summarized e.g. in [101], [102], [103], allow a validation if plug-flow
conditions can be reached in the reactor.
Typical values for the minimum dR/dP ratio required for minimizing wall effects are in the range of
8-15 [103]. If dR/dP ratios are too high, this has a negative impact on heat removal from the reactor. If
isothermal conditions are required, the dR/dP ratio should be below 5-6.
Typical values for minimum L/dP ratios are in the range of 25-350 [103]. For experimental fixed bed
reactors Mears proposed treating them as plug-flow reactors if the dR/dP ratio is > 10 and the
L/dP-ratio is > 30 [104].

Theoretical Background
34

Catalyst Deactivation and Carbon Deposition
35
Chapter 4
4. Catalyst Deactivation and Carbon Deposition
4.1. Deactivation mechanisms
Catalyst deactivation is one of the major concerns in industrial catalytic processes. While a slow and
controlled loss of activity is common, a rapid and unpredictable deactivation has to be avoided. Fast
deactivation processes are typical symptoms of wrong operating conditions, the presence of
impurities in the gas or improperly designed processes.
The deactivation rate for processes is generally a matter of economy. Whereas large industrial
application can require a catalyst lifetime of several years, small- or medium-scale applications can
also allow a much shorter lifetime, if this helps to reduce process complexity.
Table 4.1 provides an overview of the different catalyst deactivation mechanisms. In methanation
with nickel-based catalysts, poisoning, and fouling due to carbon deposition are the two most
common causes of catalyst deactivation.
Several papers contain a detailed review of catalyst deactivation mechanisms: [105], [88], [106],
[107].
Table 4.1: Overview of mechanisms of catalyst deactivation, according to [105]
Mechanism Type Description
Poisoning Chemical Strong chemisorption of species on catalytic sites, thereby blocking sites for catalytic reaction
Fouling Mechanical Physical deposition of species from fluid phase onto the catalytic surface and in catalyst pores
Thermal degradation Thermal Thermally induced loss of catalytic surface area (sintering)
Vapor formation Chemical Reaction of gas with catalyst phase to produce volatile compounds, e.g. Ni(CO)4
Vapor-solid and solid-solid reactions
Chemical Reaction of fluid, support or promoter with catalytic phase to produce inactive phase
Attrition/Crushing Mechanical Loss of catalytic material due to abrasion or crushing of catalyst particles

Catalyst Deactivation and Carbon Deposition
36
4.2. Carbon deposition
Carbon deposition is one of the major challenges for catalytic methanation of synthesis gas. It occurs
when carbon from the gaseous phase deposits on catalytic surfaces. Carbon deposition can result in
the destruction of the catalyst (figure 4.1), by an increase of the pressure drop across the reactor by
plugging of the reactor voids (a, c) and/or a loss of activity due to blockage of the active sites (a, b).
Due to the high cost of catalyst replacement, it is important to avoid carbon deposition in large-scale
industrial applications.
Figure 4.1: Forms of carbon deposits on Ni surfaces: (a) encapsulating film, (b) plugging of pores, (c) whisker
carbon, adapted from [108], [10] and [109]
According to Bartholomew [105] carbon deposits are distinguished by their origin as either carbon or
coke. Carbon is a product of CO dissociation, while coke is produced by decomposition or
condensation of hydrocarbons on catalyst surfaces. Coke forms vary and range from high-molecular-
weight hydrocarbons, such as condensed polyaromatics, to primary carbons, such as graphite,
depending on their formation and aging conditions. Within this work, the terms coking and carbon
deposition will be used synonymously.
4.2.1. Types of carbon deposits and reactions
As already mentioned in chapter 3.3.2, different studies have shown that the methanation reaction
consists of two main steps, the dissociative adsorption of CO and the hydrogenation of the adsorbed
species [81], [110], [111]. The first step of this reaction is the formation of intermediate carbon,
defined as C, from the dissociation of CO (equation 4.1). In the second step, the intermediate
carbon and the adsorbed oxygen are hydrogenated to CH4 and H2O (equations 4.2 and 4.3).
( ) ( ) 4.1
( ) 4.2
( ) 4.3
A distinction of carbon species found on Ni catalysts can be made according to their reactivity [112],
[113]. Table 4.2 shows the five major carbon species during methanation on Ni catalysts with their
temperature of formation from CO and C2H4 decomposition and their temperature (peak
temperature) with the highest rate for hydrogenation.
Nickel
Carbon(a)
(b)(c)

Catalyst Deactivation and Carbon Deposition
37
Table 4.2: Carbon species formed on Ni catalyst, adapted from [113] and [112]
Carbon species Formation
temperature from CO decomposition
Formation temperature from
C2H4 decomposition
Peak temperature for reaction with H2
C Adsorbed, atomic (surface carbide)
200-400°C 100-330°C
(Peak 220°C) 200°C
C Polymeric, amorphous films or filaments
250-500°C 330-620°C
(Peak 430°C) 400°C
CV Vermicular (polymeric, amorphous) filaments, fibres or whiskers
300-1000°C - 400-600°C
C Nickel carbide 150-250°C 230-330°C
(Peak 270°C) 275°C
CC Graphitic (crystalline) platelets or films
500-550°C - 550-850°C
Adapted from [113], [108], the reaction paths of carbon species listed in table 4.2 are shown in figure
4.2.
Adsorbed carbon C can be formed either by dissociation of CO (figure 4.2 route 1) or by
decomposition/ dehydrogenation of hydrocarbons/CH4 (2), (4). C is the essential intermediate for
the methanation reaction, but also for the formation of solid carbon. The methanation reaction (1-2-
3 and 4-2-3) proceeds quite fast when no diffusion limitations exist [108]. These reaction routes are
the desired ones for methanation of hydrocarbon-loaded synthesis gas. If more C remains on the
surface than is reacted, it can polymerize to less reactive solid C (10).
Figure 4.2: Reaction paths for formation, gasification and transformation of coke and carbons, adapted from
[113] and [108]
CxHy
CO
CxHy
CH4
CH4
C
C Cv
C
Cc
+H2Ovia H2/CO2
+H2
+/- H2
via CHn
-H2
1
2
3
4
5
6 7 8
9
10
1112 13
SolidAdsorbedGaseous
fast reaction
kinetically limited reaction
+H2Ovia H2/CO2
via CHn

Catalyst Deactivation and Carbon Deposition
38
C can be gasified with H2O or hydrogenated with H2 (9), but the reaction speeds are around two
orders of magnitude lower compared to reactions 1-3 [108]. C can further transform to graphitic
carbon Cc (11), especially at higher temperatures which are not typically reached in methanation
processes. Remaining on the catalyst, C can encapsulate the Ni crystallites or lead to blockage of
the pores.
When C dissolves in nickel, it can form vermicular carbon CV. The steps of filament growth can be
seen in figure 4.3. Amorphous, flocculent carbon is assumed to be a precursor for filament formation
(figure 4.3, step 2). The dissolved C diffuses along a thermal gradient (4) resulting from heat
released by the decomposition of CO/hydrocarbons (3), before being deposited. If more carbon
deposits on the particle surface than is removed for forming the filaments, the free particle surface
decreases. As a result, the decomposition of the reactants decreases, the particle temperature drops
and the rate of growth of filaments is slowed down (5) [109]. Filament growth does not necessarily
lead to a loss of catalyst activity, unless they are formed in such great quantities as to cause plugging
of the reactor voids or loss of nickel by removing the carbon fibers during regeneration. In fact,
filaments can even increase the activity of the catalyst by re-dispersion of Ni on the carbon support
[105]. Bartholomew [113] reported that during methanation at 400-500°C, amorphous films as well
as amorphous vermicular carbon were observed. This indicates that there is some overlapping in the
Cβ and CV forms.
Figure 4.3: Steps of growth of carbon filaments, adapted from [109]
At lower temperatures, C can also form nickel carbide C. There is some uncertainty if nickel carbide
is a short-living intermediate in the process of carbon dissolving in nickel as a precursive process for
the formation of CV [114], [115]. Under typical methanation conditions the formation of fixed C is
unlikely as it is not stable at such temperatures [108], [116].
Another route to solid carbon deposits on the surface of the catalyst is the formation of coke from
hydrocarbons (figure 4.2, route 6). Coke originates from condensed/adsorbed higher hydrocarbons
or from polymerization of hydrocarbons and methane intermediates (7 upwards). Coke can
transform into C by dehydrogenation (8) and can be gasified with water to H2 and CO2 before finally
being transformed to CH4 (7 downwards). The reaction rates for the transformation of coke are
assumed to be rather slow compared to the methanation reaction [108], [117].
Coke in the form of soot can also be produced by homogenous reactions from C2-C4 hydrocarbons at
temperatures above 650°C, whereas BTX and higher hydrocarbons need even higher
temperatures [118]. Due to the high temperatures, homogeneous reactions play no role for
carbon/coke formation under methanation conditions.
Support
Ni
Support
NiAmorphouscarbon
Support
Ni
CO / CxHy
C C
1 2
34 5

Catalyst Deactivation and Carbon Deposition
39
4.2.2. Thermodynamics of carbon formation
Equilibrium calculations are useful for estimating the amount of solid carbon deposited in
equilibrium in dependency of pressure and temperature. The calculations are based on the three
independent reactions, methanation (equation 3.18), water-gas shift (equation 3.19) and Boudouard
(equation 3.21). The results of these calculations can be illustrated in a C-H-O ternary diagram (figure
4.4). For each temperature, a phase equilibrium line for solid carbon can be plotted; in equilibrium,
carbon deposition can only occur in the area above the lines. As plotted for lignite and biomass,
carbonaceous fuels are typically deep inside carbon deposition area. The synthesis gas, gained by
gasifying fuel by means of steam (allothermal gasification) or oxygen and steam (autothermal
oxygen-blown gasification), is located much closer to the equilibrium lines, but usually still within in
the carbon deposition zone. Therefore, additional water – the more the lower the temperature – is
needed to prevent carbon deposition in equilibrium. With the lignite used for the real gas
methanation tests the amount of water needed in the synthesis gas to prevent carbon deposition in
equilibrium was about 35 vol. % at 300°C and about 40 vol. % at 250°C.
Figure 4.4: C-H-O ternary plot with phase equilibrium lines for solid carbon at different temperatures at 1 bar
Although ternary plots are useful as a rough guideline for checking whether the process conditions
carry a higher or lower risk of carbon being deposited, they do not allow making precise predictions.
Due to the nature of reaction processes, equilibrium conditions are not always reached. Therefore,
0.0 0.1 0.2 0.3 0.4 0.5 0.6 0.7 0.8 0.9 1.0
0.0
0.1
0.2
0.3
0.4
0.5
0.6
0.7
0.8
0.9
1.00.0
0.1
0.2
0.3
0.4
0.5
0.6
0.7
0.8
0.9
1.0
Hydrogen H Oxygen O
Carbon C
600°C500°C
400°C300°C
200°C
Phase equilibrium lines for solid carbon
Lignite CH0.87O0.27
BiomassCH1.36O0.61
Syngas dry
Syngas with 40 vol. % H2O
H2O

Catalyst Deactivation and Carbon Deposition
40
carbon deposition may not occur although one point, e.g. ‘syngas dry’ in the ternary plot, is clearly
above the boundary line.
In addition, carbon deposition can occur in regions were no carbon was predicted in equilibrium, e.g.
syngas with 40 vol. % water. These kinetic limitations and deviations from the equilibrium are even
higher if the synthesis gas contains other gaseous components, in particular C2-C5 hydrocarbons, BTX
and other higher hydrocarbons [119]. The carbon formation tendency decreases with increasing
saturation of the hydrocarbons: alkynes > alkenes > alkanes [118]. Other kinetic investigations
reported that the amount of carbon formed when using benzene and toluene is several magnitudes
higher than when using CO [118], [120].
The mechanisms how these hydrocarbons promote carbon deposition are not fully clear yet. Gates et
al. [121] suggested that coking from olefins might proceed via olefin polymerization, olefin cyclization
to substituted benzenes, and subsequent formation of polycyclic aromatics from benzene. If
aromatics are present, one step could be the dehydrogenation to olefins. All these steps use
carbonium ions as intermediates and are catalyzed by Brønsted acid sites. The hypothesis of
carbonium ion chemistry would also explain why coke forms faster in the presence of hydrogen
acceptors such as olefins [106].
The main influences on the kinetics of carbon formation, apart from the presence of hydrocarbons in
the feed, are the steam-to-carbon ratio (S/C), the H2/CO ratio, the temperature, the presence of
pollutants in the synthesis gas, and, of course, the catalyst type, its surface structure and the support
material used.
Effects of H2 and H2O on kinetics
Detailed investigations under typical methanation conditions have shown that the rates of carbon
formation decreases with increasing S/C ratios and H2/CO ratios [122]. This is due to the fact that
adsorbed H2O or H2 reacts with adsorbed carbon and coke precursors formed by the dissociation of
CO or by the decomposition of hydrocarbons, and, in doing so, removes it. If sufficient H2 or H2O is
present, the residence time of carbon and coke precursors is too short to allow transformation to
more inactive carbon forms as shown in figure 4.2 [113]. A complete prevention of carbon deposition
only by adjusting the H2 and H2O content is not possible, as other influencing factors also have to be
in appropriate conditions.
Effects of temperature on the kinetics
It is a well-known fact that the temperature has a significant influence on kinetics. Figure 4.5
provides a summary of data on the formation and hydrogenation of atomic carbon Cα and
amorphous carbon Cβ under methanation conditions [113]. It clearly shows that the rate of
hydrogenation of Cα exceeds the rate of formation below 325°C. Therefore, atomic carbon is
removed faster than it is produced and no carbon should be deposited in methanation below 325°C.
However, depending on the methanation concept, temperatures above this point will be reached. If
methanation takes place far below 325°C and hydrocarbons are present in the feed, coke formation
due to condensation of higher hydrocarbons can occur.
Above 325°C, the rate of Cα formation is higher than the rate of hydrogenation, which results in an
accumulation of Cα. If sufficient Cα accumulates, the rate of conversion of Cα to Cβ becomes
significant [113]. Above 425°C, hydrogenation - and therefore the minimization/removal of Cβ - is

Catalyst Deactivation and Carbon Deposition
41
faster than the transformation of Cα to Cβ; however, the formation of filamentous carbon CV also
increases significantly at temperatures above 425°C [123].
Kinetic data such as those shown in figure 4.5 are only valid for a specific catalyst under specific
operating conditions and therefore not directly transferable to other systems. However, the
tendency and general behaviors should be represented anyway.
Figure 4.5: Rates of formation and hydrogenation of C and C species [113]
The temperature dependencies become even more complex if hydrocarbons are present in the
synthesis gas. Different studies have investigated carbon formation from hydrocarbons [118], [119],
[124], [125], [126]. Figure 4.6 shows carbon formation rates in relation to the temperature, for
example, for 1-butene and propene. With increasing temperature, the formation of carbon increases
until it reaches a maximum at 500-550°C. At temperatures above that level, the rate decreases until a
minimum has been reached. This decrease in the reaction rate and resulting apparent negative
activation energy is probably due to the effects caused by the relative magnitude of the activation
energy and the heat of adsorption of reactants. In addition, gasification of carbon and encapsulation
of nickel by carbon may also contribute to the decrease [119].
1 1.5 2 2.5
-2
0
2
4
6
8
10
1 1.5 2 2.5
Rat
e o
f fo
rmat
ion
ln(N
x 1
0³)
Reciprocal Temperature 1/T [10-3 K]
700 600 500 400 300 200 150
Temperature [°C]
C+HCH
C C
C+H CH
CO C+O

Catalyst Deactivation and Carbon Deposition
42
Figure 4.6: Temperature dependency of carbon deposition on Ni; 1-butene=133 kPa in hydrogen=33 kPa
[118]; propene=42.5 kPa in hydrogen=42.5 kPa [119]
The increase of the formation rate at higher temperatures (after the minimum) is caused by
homogenous reactions which lead to the formation of coke (soot) [125]. Due to the high
temperatures, this is not relevant for methanation.
Behaviors similar to those shown in figure 4.6 for 1-butene and propene, have also been obtained for
other hydrocarbons, e.g. C2-C5 [119], C5-C6 and benzene [126].
Effects of catalysts and poisons
Catalyst manufactures put a lot of effort in the development and improvement of catalysts with
enhanced activity, selectivity and durability by adding different promoters or modifying the surface
structure and the catalyst support. Such modifications can also be made to optimize the catalyst’s
resistance to carbon and coke formation. Different studies under methanation conditions found out
that addition of molybdenum weakens, and addition of platinum, iridium, bismuth or copper
improves resistance to carbon formation on a Ni/Al2O3 (SiO2 for copper) [122], [127], [114], [110].
Besides increasing the hydrogenation/gasification rate of carbon and its precursors, promoters can
also reduce the mobility and/or solubility for carbon in Ni [105].
Contaminations/poisons in the synthesis gas can also affect the rate of carbon deposition. For sulfur
(H2S) - one of the major contamination in synthesis gas - negative as well as positive effects on
carbon formation have been reported.
Tests in which H2S was added in concentrations of < 10 ppm to the feed stream have shown that
sulfur enhances the transformation of Cα to less active, polymerized Cβ, either by catalyzing the
transition or by preventing the dissociative adsorption of H2 [128].
On the other hand, it has been demonstrated that coking during steam reforming can be minimized if
traces of sulfur are added to the feed. Sulfur, as one of the strongest poisons for nickel catalysts,
chemisorbs on the nickel surface and deactivates it. But in low concentrations (H2S/H2=0.75 ppm)
700 600 500 400
Temperature T [°C]
1
10
100
0.9 1 1.1 1.2 1.3 1.4 1.5
Rat
e o
f d
ep
osi
tio
n [
µg/
min
cm
²]
Reciprocal Temperature 1/T [10-3 K]
1-Butene
Propene

Catalyst Deactivation and Carbon Deposition
43
some delineated zones, where no sulfur is adsorbed, will remain. If the size of the remaining zones is
in an order of 5 atoms, it will inhibit carbon formation, while enabling the steam reforming
reaction [129]. These investigations have been industrially implemented in the Haldor Topsøe SPARG
process [130], in which a pre-desulfurized catalyst is used for steam reforming.
Effects of the surface structure and the catalyst support have been observed in several studies. It has
been reported that carbon formation occurs at different rates on different Ni-crystal faces [131]. The
formation of carbon is favored on small particles having a high frequency of rough planes [113]. The
catalyst support mainly influences the carbon formation by effecting the hydrogenation of carbon. It
was found that hydrogenation of adsorbed carbon occurred 21 % faster on Ni/TiO2 than on Ni/Al2O3
and 43 % faster than on Ni/SiO2 [132]. Furthermore, also the dissociation of CO to C was found to
occur more rapidly in Ni/TiO2 than in Ni/Al2O3 and Ni/SiO2 [113].
All these complex dependencies of different influences on carbon and coke formation make a
detailed, application-related investigation necessary.
4.2.3. Possibilities for regeneration of carbon deposits
Generally, the two options for removing carbon deposits from Ni catalysts are either
gasification/hydrogenation with H2O/CO2/H2 or oxidation with oxygen or oxygen-containing
compounds [113].
The gasification rate between 500-700°C is slow until encapsulations from the Ni catalyst have been
removed. The rate significantly increases when surface reactions with Ni can occur [118]. Therefore,
partial blockages are easier to regenerate, while the regeneration of encapsulations or plugged pores
is much more difficult and requires harsher regeneration conditions [108]. Hydrogenation with H2 is
also slower than gasification with H2O [118].
As regeneration by gasification/hydrogenation requires high temperatures, it is not practical for most
industrial applications. Regeneration by oxidation is possible at lower temperatures. Studies [133]
have shown that using a mixture of 1-3 % air in N2 or 1-4 % O2 in N2 allows the removal of carbon
deposits from Ni catalysts at 300°C, but also leads to loss of active surface by sintering and loss of
catalyst crystallites due to removal of filamentous carbon. According to the results, it is impractical to
regenerate carbon-fouled catalysts more than 2-3 times [133].
An innovative option for regeneration could be microwave-enhanced regeneration with H2O [134], a
process in which carbon is selectively heated by means of microwaves and gasified with water steam.
Due to the properties of microwaves, carbon heats up much faster than the Ni catalyst. The
challenges with this approach lie in the limitation of the surface temperature to prevent sintering
and in process integration. However, the use of this regeneration technique cannot prevent the loss
of catalyst crystallites as a result of removal of filamentous carbon, either.
Due to all these limitations and challenges, the regeneration of industrial methanation catalysts is
not common. In practice, deactivated methanation catalysts are replaced. Typically, these
replacement periods are in an order of several years for large-scale applications, but can also be
shorter if this is economically advantageous.

Catalyst Deactivation and Carbon Deposition
44
4.2.4. Measurement methods for carbon deposition
Measuring carbon deposits on catalysts is crucial for minimizing carbon deposition during
methanation. An online and in-situ detection method would be the ideal tool for that purpose.
Mueller [135] presented a newly developed in-situ method for detecting coking on single Al2O3
catalysts particles, in which the catalyst particles are electrically contacted and characterized by
impedance spectroscopy. This approach relies on the fact that measured impedance changes with
the amount of coke on the catalyst. Unfortunately, such an application is neither available nor state-
of-the-art.
Within this work, carbon deposits were detected and analyzed using four different methods.
Increase of differential pressure
Strong carbon deposition results in a blockage of the fixed-bed methanation reactor, typically in the
inlet zone. The resulting increase in the differential pressure across the reactor provides an indication
during operation if carbon is being deposited in large amounts. The graph of the differential pressure
also indicates the amount of deposited carbon and the area of the reactor affected by it. Figure 4.7
shows typically observed trends during methanation tests. Strong coking with small axial distribution
within the reactor results in a fast exponential-like increase over the runtime. A slower, steadier
increase indicates more widespread coking with lower deposition rates. This method, however,
detects only severe coking and is therefore only helpful as a shut-off criterion for the reactor.
Figure 4.7: Typically observed reactor differential pressure trends resulting from coking
Visual evaluation of carbon deposits
Visual inspection of a representative sample can provide the first clues as to the amount of carbon
deposited on the catalyst after methanation. By classifying the catalyst particles into different groups
(e.g. no carbon, partially/fully covered with carbon) it is possible to calculate a dimensionless number
for comparison of different samples. This method allows only the detection of visible surface carbon
and is only suitable for a rough estimation.
0
20
40
60
80
100
0 20 40 60 80 100
Re
acto
r d
iffe
rnti
al p
ress
ure
[m
bar
]
Runtime [h]
No or low coking

Catalyst Deactivation and Carbon Deposition
45
Qualitative analysis of carbon deposits by means of scanning electron microscopy (SEM)
Scanning electron microscopy (SEM) is a standard method for analyzing surface characteristics. Thus,
it allows the definition of surface carbon deposits. Figure 4.8 shows the three major forms of carbon
deposits identifiable using SEM: filamentous carbon, carbon films/layers and graphitic platelets.
Figure 4.8: SEM-photos of different carbon deposit forms: a) filamentous, b) film, c) graphitic platelets
A combination with energy dispersive X-ray spectroscopy (EDX) also enables quantitative analysis.
Within this work, a Zeiss Gemini Ultra 55 SEM with EDX detector from the Institute of Particle
Technology of the Friedrich-Alexander-Universität Erlangen-Nürnberg was used for qualitative
analysis of several catalyst samples. It used an accelerating voltage of 20 kV and a secondary electron
(SE) as well as a back-scattered electron (BE) detector for detection.
Temperature-programmed oxidation (TPO)
Temperature-programmed oxidation (TPO) is a common analytical method used for quantifying
different catalyst deposits (e.g. [136], [137], [138], [139]). By heating a sample in an oxidizing
atmosphere the deposits oxidize, which results in the sample losing weight relative to the amount of
oxidized products. Additionally, it is possible to measure the composition of effluent gas after the
TPO. To quantify carbon deposits it is possible to calculate the amount of oxidized carbon from the
CO2 content in the off-gas of the TPO.
To analyze the deposited catalyst samples a Linseis STA PT 1750 thermo-gravimetric analyzer (TGA)
coupled with an ABB Uras 26 continuous non-dispersive infrared sensor (NDIR) photometer and an
ABB O2 analyzer were used. Figure 4.9 depicts the flow sheet for the TPO setup. The TGA is equipped
with a gas box for a controlled dispensing of two different gases (argon and oxygen); it is directly
connected with the TGA cell. The catalyst sample is filled in a slotted ceramic crucible, placed in the
TGA cell. The gas leaves the TGA cell at the top and flows directly through the gas analyzer, which
measures the CO2 and O2 concentration.
Figure 4.9: Flow sheet of the TPO setup to determine carbon deposits
500 nm 500 nm 500 nma) b) c)
Ar
F
MFC Ar: max. 400 ml/min
O2
F
MFC O2: max. 300 ml/min
Gas analyzer O2
Gas analyzer CO2
Thermogravimetric analyzer(TGA)
Filter
Exhaust

Catalyst Deactivation and Carbon Deposition
46
The TPO method used (table 4.3) allows a quantitative as well as qualitative analysis of carbon
deposits on catalysts. In steps 1 and 2 the catalyst sample is heated to 100°C in an argon atmosphere
and is thereby dried – although it is usually already completely dry at that stage and would need no
further drying. Subsequently the catalyst is heated to 700°C at a rate of 3°C/min and a constant flow
of 10 vol. % O2 in Ar (step 3). Argon is used because it has a similar density as CO2; which is why the
two mix easily. This should reduce the influence of buoyancy variations on the balance. In step 4 a
reduction of the heating rate to 2°C/min at temperatures between 700°C and 850°C increases the
precision and lowers the maximum CO2 concentration.
Table 4.3: TPO method for a quantitative and qualitative analysis of carbon deposits
Step Temperature
[°C] Heating rate
[°C/min] Time [min]
Argon [ml/min]
Oxygen [ml/min]
1 100 3 - 380 0
2 100 - 20 380 0
3 700 3 - 380 42
4 850 2 - 380 42
5 850 - 30 380 42
6 20 30 - 100 0
Figure 4.10 shows the results of a TPO analysis of a methanation catalyst used under operating
conditions without carbon deposition. It plots the temperature profile of the TPO method, the mass
change of the sample and the CO2 content formed. The catalyst mass increases in the first
120 minutes due to the oxidation of nickel. For methanation, it is necessary to reduce the fresh
catalyst to metallic nickel since the fresh catalyst mainly contains nickel oxide. To allow easy handling
of the catalyst it is slightly oxidized (only on the surface) after methanation as metallic nickel is not
stable at oxidizing atmospheres. As a result the catalyst sample still consists mainly of nickel rather
than of nickel oxide. After 120 minutes the catalyst is almost completely oxidized and the mass stops
to increase. With increasing temperature graphitic carbon, a component of the catalyst, starts to
oxidize and the mass decreases as a result of the formation of CO2.
It is possible to distinguish carbon species according to their reactivity with oxygen [139]. Reactive
carbon oxidizes mainly below 300°C. Polymeric carbon (Cβ) typically reacts at temperatures between
450 and 600°C. The less reactive graphitic carbon (CC) needs temperatures above 600°C for oxidation.

Catalyst Deactivation and Carbon Deposition
47
Figure 4.10: Results of TPO analysis of a methanation catalyst used under operating conditions without
carbon deposits (reference sample)
Figure 4.11 shows the results of a TPO analysis carried out on a methanation catalyst which
contained the highest amount of deposited carbon encountered in the course of this work. The CO2
trend shows the different types of carbon deposits measureable with the method used. The first
peak (shoulder) at 260°C results from more reactive carbon. The next peak at 350°C cannot be clearly
assigned to any particular carbon species. It can be assumed that it is a type of less reactive
polymeric carbon. This unknown carbon type, as well as reactive carbon, was only measured on
catalysts with severe carbon deposits that were operated with real synthesis gas. Typically, only
polymeric carbon with its peaks at about 530°C and 570°C is measurable. Due to the already high
amount of graphite in the catalyst, it is not possible to use this method for detecting graphitic carbon
deposits. However, graphite is not of particular interest as it only forms in significant amounts at
temperatures higher than the ones used in methanation [113].
Figure 4.11: Results of TPO analysis of a methanation catalyst used under operating conditions with severe
carbon deposits (sample with maximum amount of carbon)
-0.5
0
0.5
1
1.5
2
2.5
3
3.5
4
4.5
-100
0
100
200
300
400
500
600
700
800
900
0 100 200 300 400
CO
2co
nte
nt
[vo
l. %
]
Ch
ange
in m
ass
[mg]
Te
mp
era
ture
[°C
]
Runtime [min]
Temperature profile
CO2 content
Change in mass
Graphitic carbon
-0.5
0
0.5
1
1.5
2
2.5
3
3.5
4
4.5
-100
0
100
200
300
400
500
600
700
800
900
0 100 200 300 400
CO
2co
nte
nt
[vo
l. %
]
Ch
ange
in m
ass
[mg]
Te
mp
era
ture
[°C
]
Runtime [min]
Temperature profile
CO2 content
Change in mass
Polymericcarbon
Graphitic carbon
Reactivecarbon

Catalyst Deactivation and Carbon Deposition
48
Due to the influence of nickel oxidation, it is not possible to use mass change for calculations up to
temperatures of about 500°C. The results gained through mass change and CO2 formation only
coincide in a small temperature range of about 500°C to 600°C. At higher temperatures the results
from mass change measurements are much higher, which is due to reaction/decomposition of other,
unknown catalyst components (e.g. sulfur). Hence, the amount of deposited carbon was calculated
only from the amount of CO2 that had formed.
To calculate the mass of carbon on the catalyst sample, the CO2 profile of the carbon-free reference
sample (figure 4.11) is subtracted from the CO2 profile of the analyzed sample. From the CO2
concentration and the total gas flow the amount of released carbon can be determined, which, when
put in relation to the mass of catalyst allows calculating the specific carbon content of the
catalyst (mgCarbon/gCatalyst).
Error analysis
The lowest carbon content measureable was determined with < 0.1 mgCarbon/gCatalyst. Different
handling and measuring errors may influence the results. Measuring errors may be due to varying gas
supply (volume flow), the gas analyzer (measured concentration) and the manual processing of the
results. Errors of the mass flow controllers result in error rates of < ± 1.3 %, weighing errors in error
rates < ± 0.4 % of the TPO value measured. Gas analyzer errors may lead to deviations of < ± 1.4 % of
the measured value. The main error caused by the GA, the offset error, is compensated for during
the processing of the data. Manual data processing can result in an additional error of < ± 2 %. The
total measuring error of TPO analysis is < ± 5.1 % of the measured value.
However, an even higher error percentage may come from the sample itself and the way it is
handled. For TPO analysis, a sample of 5 g is taken from the total sample amount of typically 30 g.
Coking occurs only on few catalyst pellets, especially at low coking rates. Therefore, variations in the
quantity of coked catalyst pellets that make up a TPO sample lead to variations of the measured
values. However, these variations can be described by means of statistical methods and reduced
through multiple testing. The variations of the measured values of different samples are < 23 % for a
confidence interval of 80 % and < 30 % for a confidence interval of 95 %, the maximum variation
being 48 %. The variation related to a medium value out of 2-4 samples is < 11 % for a confidence
interval of 80 % of the samples and < 25 % for a confidence interval of 95 %. The maximum variation
between these medium values is 36 %. Variations are generally higher in samples with lower carbon
content and lower in samples with higher carbon content.
Based on this statistical error analysis, the overall error of TPO method used in this investigation is
50 % for a measured carbon content below 0.5 mg/g, 25 % for a carbon content between 0.5-4 mg/g
and 20 % for a carbon content > 4 mg/g.
Although, the used TPO analysis is not a precise instrument for quantifying the amount of carbon
deposited on a catalyst, it is nonetheless a useful and valuable tool as this type of investigation does
not require great precision.

Catalyst Deactivation and Carbon Deposition
49
4.3. Poisoning
Poisoning is the loss of catalytic activity due to strong chemisorption of contaminates on active sites
[106]. A poison can affect catalytic activity via different mechanisms [105]:
1. A strongly adsorbed atom of poison physically blocks several adsorption/reaction sites and
topside sites on the metal surface of the catalyst.
2. It modifies the adsorption/dissociation ability of neighboring atoms by virtue of the strong
chemical bond.
3. It can restructure the surface of the catalyst, which can lead to dramatic changes in catalytic
properties.
4. It can block the access of adsorbed reactants to each other.
5. It may lower or prevent the surface diffusion of adsorbed reactants.
The major poisons for Ni catalysts present in synthesis gas from thermal gasification are sulfur and
chlorine components [106]. Besides H2S, as main sulfur component, also COS, CS2, thiophene, thiole
and other organic sulfur species act as catalyst poisons.
4.3.1. Poisoning by sulfur
Due to its high industrial relevance, poisoning by H2S has been well researched, e. g. [140], [141],
[142]. These studies show that H2S adsorbs rapidly, strongly and dissociatively on nickel surfaces and
indicate that the adsorption of both H2 and CO is poisoned by sulfur [105], resulting in a significant
loss of methanation activity, even at low concentrations between 15-100 ppb. In this context it has to
be added that most of these fundamental studies were performed several decades ago and a lot of
progress has been made since then in the development of more sulfur-tolerant catalysts (e.g. [143],
[144]). Typical limits for sulfur contaminations for commercially available Ni-containing methanation
catalysts are in an order of 200 ppb. However, the rate of sulfur poisoning strongly depends on the
operating conditions and the composition of the catalyst. Addition of additives such as Mo and B,
which selectively adsorb sulfur species, significantly increases the sulfur tolerance [105].
Figure 4.12: Displacement of the reactor temperature profile due to selective deactivation at the entrance of
a polytropic cooled fixed bed reactor
200
300
400
500
600
0 0.2 0.4 0.6 0.8 1
Normalized reactor length
Tem
per
atu
re [
°C]
Deactivated reactor area after txh
t0htxh

Catalyst Deactivation and Carbon Deposition
50
Since sulfur is adsorbed very fast and selectively at the entrance of a packed bed [105], it results in
displacement of the exothermic-reaction-related temperature peak due to catalyst deactivation
(figure 4.12).
4.3.2. Regeneration of sulfur-poisoned catalysts
One critical question in the context of poisoning is whether it is reversible or not and if the catalyst
can therefore be re-used after regeneration. From the point of view of thermodynamics, a
regeneration of sulfur by oxidation should be possible [145]. However, due to kinetic limitations
temperatures above 500°C are necessary for oxidation of sulfur [146]. Another aspect to consider is
the formation of nickel sulfates. To prevent the formation of sulfates the temperature should not be
below 500-600°C [145]. Catalysts to which different promoters have been added can require higher
temperatures for a proper regeneration [147]. Higher temperatures can, however, also lead to the
destruction of the catalyst surface.
Different experimental researches have investigated the regeneration of sulfur by means of H2 and
H2O. It has, for example, been reported that a removal of sulfur from unpromoted Ni catalysts with
H2O at temperatures above 600-650°C is possible [147]. The regeneration with H2 is more difficult
because it is slow, even at high temperatures [148]. Several investigations deal with promising
attempts to regenerate sulfur-poisoned reforming catalysts, but due to the high temperatures of
700-900°C, this is not convenient for methanation catalysts (e. g. [149], [150]).
Regeneration of sulfur-poisoned methanation catalysts is complicated and therefore not common.
Even if regeneration were possible, the activity would decrease with every regeneration cycle.
Therefore, all state-of-the-art methanation processes require the removal of sulfur contaminations
to avoid poisoning.
4.4. Thermal degradation
Thermal degradation of the catalyst can result in a loss of catalytic surface due to crystallite growth
and pore collapse, loss of support area due to support collapse and chemical transformation of the
catalytic phases to non-catalytic phases [105]. All thermal degradation and sintering mechanisms
cause a reduction in size of the catalytic surface and of the number of active sites.
Sintering of nickel-containing catalysts is affected by different operating conditions and catalyst
properties. Sintering rates increase exponentially with increasing temperatures [105]. Sintering in O2
is faster than in H2 [105]; H2O also increases the sintering rate [151]. The main influences on the
sintering rate are the type of catalyst support and the promoters used. Generally speaking, Al2O3 is
more stable than SiO2, but also the interactions between the catalyst and its support have to be
considered [105]. This is why the only commercially available methanation catalyst for high-
temperature methanation, Haldor Topsøe’s MCR-2X, which is designed for operating temperatures
of up to 750°C, uses an Al2O3 support. Other methanation catalysts for lower temperatures can also
contain mixtures of different support materials, like MgO and SiO2 for the BASF G1-80 catalyst
(operating temperature < 650°C) [152] and Al2O3 and SiO2 for the Südchemie ActiSorb S7 (operating
temperature < 550°C) [153]. It was found that promoters like potassium and contaminates like sulfur
significantly increase the sintering rate at high pressures. At low pressures no influence of promoters
and contaminates on the sintering rate could be observed [151].
However, for the methanation concepts investigated within this work, sintering and thermal
degradation are insignificant as the maximum methanation temperature is below 550°C.

Catalyst Deactivation and Carbon Deposition
51
4.5. Evaporation – nickel tetracarbonyl
By reaction of gaseous CO with solid Ni (equation 4.4) poisonous, gaseous nickel tetracarbonyl is
formed. Low reaction temperatures and high partial pressure of CO facilitate Ni(CO)4 formation
[105]. Figure 4.13 shows the equilibrium Ni(CO)4 concentration for different concentrations of CO in
synthesis gas. The line for 10.9 vol. % CO represents the CO concentration in the standard synthesis
gas used for the methanation tests.
( ) 4.4
Deactivation due to formation of nickel tetracarbonyl is mainly a problem at the inlet of the
methanation reactor, where the temperature is low enough and the CO partial pressure high enough
to allow this poisonous gas to form [105]. After it has formed, nickel tetracarbonyl is transported
downstream the reactor. If the CO partial pressure is much lower and the temperature is higher,
Ni(CO)4 can react reverse to CO and Ni, which results in Ni deposition downstream in the
methanation reactor.
Apart from the deactivation effect, another important aspect to consider is the fact that Ni(CO)4 is
extremely toxic. The median lethal concentration (LC50) for 30-minute exposure lies around 3 ppm
[154]. Therefore exposure even to low concentrations of Ni(CO)4 has to be avoided.
The most common method of preventing the formation of significant amounts of Ni(CO)4 is to ensure
the inlet temperature of the synthesis gas respectively the inlet catalyst temperature are high
enough. Generally speaking, an inlet temperature of > 250°C is sufficient for the methanation
concept and conditions introduced in this work. Lower temperatures at the reactor outlet are no
problem as the CO concentration is low, too.
Figure 4.13: Equilibrium concentration for Ni(CO)4 for different CO concentrations in dependency of the
temperature, calculated with FactSage
0.001
0.01
0.1
1
10
100
100 150 200 250 300 350 400
Ni(
CO
) 4co
nce
ntr
atio
n [
pp
m]
Ni catalyst temperature [°C]

Catalyst Deactivation and Carbon Deposition
52

Bench-Scale Methanation Tests with Clean Syngas
53
Chapter 5
5. Bench-Scale Methanation Tests with Clean Syngas –
Polytropic Reactor Concept
The main objectives of bench-scale methanation tests are to prove the proposed polytropic reactor
concept for methanation and to screen different methanation catalysts. All tests were performed
with bottle-mixed synthesis gas of the standard gas composition (table 3.1). To conduct the different
tests, a suitable test rig was constructed. Results from these tests are conversions expressed by
achieved gas compositions, and the long-term performance of the catalyst.
5.1. Experimental setup
The test rig (figure 5.1) consists of a gas mixing station for providing artificial, bottle-mixed syngas, a
bench-scale methanation reactor and a gas analysis unit.
Figure 5.1: Simplified flow sheet of the bench-scale methanation test rig
T
PD
Flare
Natural gas
16 thermocouples (side-mounted and center-mounted)
Dif
fern
enti
al p
ress
ure
sen
sor
Methanation reactor
Rea
cto
r co
olin
g
3 z
on
e h
eati
ng
Water saturator
Trace heated
lines (2
00
°C)
H2
F
MFC H2: max. 21 l/min
CO2
F
MFC CO2: max. 15 l/min
CO
F
MFC CO: max. 10 l/min
CH4
F
MFC CH4: max. 1.6 l/min
F
MFC N2: max. 55 l/minN2
L
P
Pressure sensor
Gas analyzer H2, O2
Gas analyzer CO, CO2, CH4 Condenser
unit
Pump unit
Pressurized air
Gas
sam
plin
g o
ver
reac
tor
len
gth
Air (for catalyst oxidation)
WaterDemineralization
Exhaust

Bench-Scale Methanation Tests with Clean Syngas
54
The gas mixing station consists of mass flow controllers and a water saturator. The mass flow
controllers (for H2, CO, CO2, CH4, N2) provide a dry synthesis gas with a total flow rate of 3-50 l/min.
For addition of water the dry syngas flows through a temperature-controlled bubble column filled
with water to be saturated. The water content can be between 0-60 vol. %. An automatic water-
refilling system ensures a constant water level in the bubbler. Overheating of the gas at the outlet
prevents condensation.
An ABB AO2000 system (chapter 6.2.3) analyzes the permanent gas composition. The product gas
leaving the reactor is burned in a natural gas flare.
To allow performing methanation tests, a tube reactor was constructed. For the layout high
representativity for large-scale concepts was a primary consideration. Therefore, and also to allow
the usage of commercial catalysts in their original shape, a certain minimum size was required.
The inner reactor diameter is 27.6 mm to fulfill the requirement of the dR/dP ratio being > 8
(chapter 3.3.4) for catalyst particles with a particle size of 3 mm. The length was set in order to
achieve a catalyst bed height of 600 mm. This results in a reactor (catalyst) volume of 350 cm³.
Figure 5.2: 3D drawing of the tube reactor and sketch with positions of thermocouples and gas sample ports
The reactor is divided into three separate heating and cooling zones with a length of 10, 20 and
30 cm. Electrical heating cords heat the reactor until the methanation releases enough exothermic
heat. Excess heat is removed through controllable air cooling.
Inlet
Outlet
Air cooled mantle
T1: 0 cmT2: 1 cmT3: 2 cmT4: 3 cmT5: 5 cmT6: 7 cm
T7: 10 cm
T8: 15 cm
T9: 25 cm
T10: 35 cm
T11: 45 cm
T12: 57 cm
TM 1-5
G1
G2
G3
G4
G5
DR,i: 27.6mm
VR: 350 cm³

Bench-Scale Methanation Tests with Clean Syngas
55
Numerous thermocouples measure the temperatures at various points of the reactor (figure 5.2),
thus provinding information about variations of the temperature profile. The inlet zone (first 10 cm)
is equipped with more thermocouples due to the higher temperature gradients in this area.
Additionally, a tube for axially displaceable thermocouples is placed in the center of the reactor. Five
modified supports for thermocouples enable additional gas sampling at different points of the
reactor.
A differential pressure sensor between reactor inlet and outlet measures the pressure increases
resulting from blockages caused by catalyst deposits.
The reactor operates at atmospheric pressure although pressurization would be possible, too.
5.2. Catalysts for methanation
For the methanation of hydrogen- and water-rich synthesis gases, several catalysts from commercial
manufacturers seemed promising. For the first screening, five different catalysts (table 5.1) were
chosen. In order to fulfill the non-disclosure agreements with the catalyst manufacturers, it is
necessary to use synonyms for the different catalysts.
Table 5.1: Overview of the catalysts used for the methanation tests
EVT01 EVT02 EVT03 EVT04 EVT05
63 % Ni on SiO2/MgO
56 % Ni on SiO2/Al2O3
Ni-based Ni (> 50 wt. %) Ni (> 50 wt. %) on
Al2O3/SiO2
3 x 3 mm tabs Extrudates,
1.6 mm Extrudates,
1.6 mm 3 x 3 mm tabs 1.9 x 3.5mm tabs
< 650°C < 550°C < 550°C < 500°C < 550°C
Reforming catalyst
Sulfur sorbent Methanation
catalyst Methanation
catalyst Methanation
catalyst
EVT01
EVT01 has a thermal stability up to 650°C and a good resistance to degradation in water steam.
Typical applications are the reforming of natural gas at low steam-to-carbon (S/C) ratios and the pre-
reforming of hydrocarbons from natural gas to naphtha.
EVT02
EVT02 is a sorbent for sulfur removal in hydrocarbon streams. Due to its high nickel content, it is
promising for catalytic methanation. It was already tested at the Institute of Thermal Engineering at
the Graz University of Technology in previous research projects [155]. The operation temperature
should be limited to 550°C.

Bench-Scale Methanation Tests with Clean Syngas
56
EVT03
EVT03 is an experimental catalyst with properties similar to those of EVT02, but was especially
developed and tested for methanation. The operation temperature should be limited to 550°C.
EVT04
EVT04 has similar properties as EVT03, but with addition of promoters to improve the resistance to
coking. It has also been used for the reformation of naphtha with up to 20 vol. % benzene at a
temperature of 500°C.
EVT05
This new semi-commercial experimental catalyst, which was specially developed for methanation,
should provide a higher activity than both EVT03 and EVT04.
5.3. Test procedure
To allow good comparability all the tests were performed according to the same procedure. The
catalyst was filled into the reactor until the first thermocouple (figure 5.2, T1) was slightly covered,
resulting in a catalyst volume of around 350 cm³.
Before the application of synthesis gas it is necessary to reduce the catalyst since the fresh catalyst is
in an oxidized or partially oxidized state. Table 5.2 shows the standard reducing procedure.
The fully reduced catalyst is highly pyrophoric. Therefore, it is necessary to oxidize it before removing
it from the reactor. For mild oxidation, a mixture of 5 % O2 in N2 was used.
Table 5.2: Standard reducing procedure
Step Temperature [°C] Heating rate [°C/h] Time [h] Gas
1 200 100 (2) 100 vol. % N2
2 500 50 (6) 50/50 vol. % H2/N2
3 500 - 3 50/50 vol. % H2/N2
4 350 50 (3) 50/50 vol. % H2/N2
Evaluation
The evaluation of the tests is based on the measured gas composition. The aim was to investigate the
relation between gas compositions measured and gas compositions calculated according to the
thermodynamic equilibrium. The results indicate the activity of the used catalysts. Variable
parameters for these investigations were the GHSV, the synthesis gas water content and the reactor
outlet temperature.
Catalytic activity is generally expressed by the turnover frequency (TOF), which expresses the rate of
formation in relation to the catalyst concentration. In this study catalytic activity was determined by
comparing hydrogen conversion rates respectively the amounts of un-converted hydrogen present,
which corresponds to the methane formation rate. One advantage of this approach lies in the fact
that the hydrogen concentration in the product gas is much lower and more volatile as the methane
concentration and can therefore be measured more accurately. Additionally, hydrogen is a critical

Bench-Scale Methanation Tests with Clean Syngas
57
parameter for a feed-in into the gas grid and therefore important for the evaluation of appropriate
catalysts. All gas compositions given in this work are on a dry basis if not otherwise stated.
Another indicator for catalytic activity is the temperature distribution along the catalyst bed.
Temperature profiles can be useful for comparing the activity of different catalysts. Higher
temperature gradients at the inlet indicate higher catalytic activity. However, heat transfer
properties of the catalyst must be considered too. Temperature profiles are particularly useful for
evaluating the long-term activity of catalysts. If a catalyst is becoming less activate, the temperature
distribution changes and in case of poisoning, a displacement of the temperature peak occurs (figure
4.12). Deactivation of the catalyst leads to a general decrease in temperatures.
5.4. Methanation tests with different catalysts
5.4.1. Basic performance screening
The aim of the basic performance tests was both to evaluate the polytropic reactor concept and to
choose promising catalysts for detailed investigations. The question for the polytropic reactor
concept was if sufficient cooling is feasible. Figure 5.3 shows the axial temperature profiles of the
reactor of the five tested catalyst. The inlet zone (scaled reactor length 0-0.17) was not cooled,
whereas the cooling of the middle and outlet zone was set to reach 265°C at the outlet. As it can be
seen in figure 5.3 the temperature peak occurs at the end of the inlet zone, with peak temperatures
between 490-520°C. The lower peak temperature of EVT03 points to lower activity of this catalyst.
However, since the temperature gradients of the different catalysts are quite similar, and considering
the different catalyst shapes and their effect on heat transfer properties, the temperature profiles
measured do not allow making any reliable assumption about how active the different catalysts are.
Figure 5.3: Temperature profiles of the tested catalysts at a GHSV of 4000h
-1 and an H2O content of 40 vol. %
The temperature distribution in the reactor signifies that the majority of the reaction heat is released
in the inlet zone of the reactor, which caused the high temperature increase. This also indicates a
high conversion rate within this inlet zone. Gas composition measurements taken at various points of
200
250
300
350
400
450
500
550
0.0 0.2 0.4 0.6 0.8 1.0
Tem
pe
ratu
re [
°C]
Scaled reactor length [-]
EVT01EVT02
EVT03
EVT04
EVT05

Bench-Scale Methanation Tests with Clean Syngas
58
the reactor confirm this assumption. Figure 5.4 shows the gas composition at various points of the
reactor compared to the temperature-related equilibrium compositions (dotted lines). The cooling
conditions and the resulting temperature profile were similar to the results shown in figure 5.3. The
CO conversion (XCO) is already 60 % after 0.1 of the scaled reactor length, which corresponds well
with the high amount of released reaction heat. CO conversion and CO2 formation are in equilibrium
after 0.1 of the scaled reactor length. This implies that only the temperature respectively heat
removal from the reactor limits the further reaction of CO and CO2. Contrary to that, H2 and CH4 need
the whole reactor length to reach equilibrium. Therefore those gases are the limiting components
that need to be considered for activity analysis. Tests showed that additional cooling of the inlet zone
leads to reduced conversion, especially of H2. A reduction of the overall reactor temperature also
slows down the kinetics. Strong cooling, or isothermal operation, would therefore significantly
increase the reactor volume needed. This makes the polytropic reactor concept a good alternative to
state-of-the-art concepts as it combines a simple design with lower catalyst volumes.
Figure 5.4: Gas composition measured at various points of the reactor compared to temperature-related
equilibrium gas compositions for EVT05 at a GHSV of 1500 h-1
, 30 vol. % H2O
To get a first impression of the activity of the catalysts, methanation tests performed with a GHSV
high enough to exclude any possibility of the catalyst reaching the equilibrium for H2. Additionally,
the influence of the H2O content of the synthesis gas was analyzed. Figure 5.5 shows the measured
H2 content of the product gas for the different catalysts. The results confirm that no catalyst reached
equilibrium with a GHSV of 4000 h-1 and that the H2O content has a significant effect on
H2 conversion.
In the tests EVT01 performed best, followed by EVT05 and EVT02. The two specially developed
methanation catalysts, EVT03 and EVT04, showed the lowest activity. Due to their good
performance, EVT01 and EVT05 were chosen for detailed investigations. Although the activity of
EVT02 was similar to that of EVT05, it was rejected as it is a commercial sulfur sorbent for which the
catalyst manufacturer cannot guarantee a constant activity across all batches. Considering the first
results and the catalyst specifications, EVT05 looks the most promising: it shows good activity and it
was specially developed with a view to high coking resistance.
0
10
20
30
40
50
60
0 0.2 0.4 0.6 0.8 1
Gas
co
mp
osi
tio
n [
vol.
%]
Scaled reactor length [-]
H2
CH4
CO2
CO

Bench-Scale Methanation Tests with Clean Syngas
59
Figure 5.5: H2 content in the product gas for different catalysts at varying synthesis gas H2O contents
at a GHSV of 4000 h-1
and 265°C reactor outlet temperature
5.4.2. Detailed catalyst screening
In the course of detailed catalyst screening, the performances of EVT01 and EVT05 were analyzed
under typical operating conditions. The parameters used for this purpose are the reactor outlet
temperature (varied between 220-280°C), the H2O content of the synthesis gas (varied between
30-40 vol. %) and the GHSV (varied between 1000-3000 h-1). The results obtained are not only useful
for comparing catalysts, but also show a general behavior of Ni-based methanation catalysts.
Figure 5.6 and figure 5.7 depict the influence of the reactor outlet temperature and the H2O content
of the synthesis gas on the H2 content after methanation. With decreasing temperature, the H2
content reaches a minimum until it starts to rise again. This increase at lower temperatures is due to
the lower catalytic activity and therefore slower kinetics.
Figure 5.6: H2 content in the product gas in dependency of the reactor outlet temperature and the water
content with EVT01 at a GHSV of 1500h-1
0
2
4
6
8
10
12
14
16
18
20
20 25 30 35 40
H2
con
ten
t [
vol.
%]
H2O content [vol. %]
EVT01
EVT02
EVT03
EVT04
EVT05
Equilibrium 265°C
0
1
2
3
4
5
6
7
220 230 240 250 260 270 280
H2
con
ten
t [v
ol.
%]
Reactor outlet temperature [°C]
30% H2O
33% H2O
35% H2O
37% H2O
40% H2O
Equilibrium 30 vol. % H2O
Equilibrium 40 vol. % H2O
30% H2O
33% H2O
35% H2O
37% H2O
40% H2O
5 K

Bench-Scale Methanation Tests with Clean Syngas
60
The achievable H2 minimum depends significantly on the H2O content of the synthesis gas. An
increase of the H2O content shifts the minimum to higher temperatures. This shift also depends on
the type of catalyst that is used. An increase in the H2O content from 30 to 40 vol. %, for example,
causes a shift of the H2 minimum of 5 K for EVT01, whereas for EVT05 the same increase results in a
shift of 25 K.
The H2O content influences the equilibrium composition only slightly. The equilibrium H2 content for
40 vol. % H2O is only 0.5 vol. % higher than for 30 vol. % H2O at 280°C. Since the difference is even
smaller at lower temperatures, the great influence of the H2O content on the H2 conversion must
result from kinetic limitations. Studies of the methanation kinetics show that due to adsorption
effects higher H2O concentrations limit both methanation and the WGS reaction [38], [156], [157].
Kopyscinski [38] reported that the effects of higher H2O concentrations were outbalanced by the
WGS reaction, which leads to higher levels of H2 in the product gas and lower CH4 yields.
Figure 5.7: H2 content in the product gas in dependency of the reactor outlet temperature and the water
content with EVT05 at a GHSV of 1500h-1
0
1
2
3
4
5
6
7
8
220 230 240 250 260 270 280
H2
con
ten
t [v
ol.
%]
Reactor outlet temperature [°C]
30 vol. % H2O
40 vol. % H2O
Equilibrium 30 vol. % H2O
Equilibrium 40 vol. % H2O
25 K

Bench-Scale Methanation Tests with Clean Syngas
61
Figure 5.8 and figure 5.9 show the influence of the GHSV on the H2 content analogous to the previous
diagrams. Since the H2 content at the reactor outlet depends on the reactor outlet temperature
(figure 5.6 and figure 5.7), it was set so as to reach the lowest possible H2 content at each operating
point. The GHSV influences H2 content in a rather linear relationship, whereby the inclination of the
curve rises with increasing H2O content. Higher GHSVs and higher H2O contents result in higher
H2 contents in the product gas.
Figure 5.8: H2 content in the product gas in dependency of the GHSV and the water content with EVT01
The results show that a high H2 conversion requires low GHSVs. To fulfill the requirements for feed-in
into the gas grid, such as the DVGW G260 [158] and G262 [159] regulations, an H2 content in the SNG
below 5 vol. % is required. This means that the H2 content of the raw-SNG, as presented above, must
not exceed around 2.6 vol. % before CO2 removal. This value can only be achieved with low GHSVs,
e.g. 1500 h-1 at 30 vol. % H2O. However, other requirements, which may allow higher H2 contents or
additionally restrict the amount of H2 in SNG, also have to be taken into account.
The comparison of the two catalysts tested shows that EVT05 is more sensitive to higher GHSV and
higher H2O contents.
Figure 5.9: H2 content in the product gas in dependency of the GHSV and the water content with EVT05
0
1
2
3
4
5
6
7
1000 1500 2000 2500 3000
H2
con
ten
t [v
ol.
%]
GHSV [1/h]
30% H2O
33% H2O
35% H2O
37% H2O
40% H2O
290
280
270
260
250
240
220
Ave
rage
eq
uili
bri
um
te
mp
era
ture
[°C
]
30% H2O
33% H2O
35% H2O
37% H2O
40% H2O
0
1
2
3
4
5
6
7
8
9
10
1000 1500 2000 2500 3000
H2
con
ten
t [v
ol.
%]
GHSV [1/h]
320
300
280
260
240
220
Ave
rage
eq
uili
bri
um
tem
pe
ratu
re[°
C]
30 vol. % H2O
40 vol. % H2O

Bench-Scale Methanation Tests with Clean Syngas
62
5.4.3. Long-term performance of catalysts
To prove the long-term performance of the catalysts, several tests over a longer period were
performed. Figure 5.10 shows the temperature trend of a long-term test with EVT01 at a GHSV of
1500 h-1 and with varying H2O contents of 35-40 vol. %. The temperature trends show temperatures
in the inlet respectively main reaction zone, in which a possible deactivation should be recognizable
first. The position of the different temperatures and a drawing of the reactor can be found in figure
5.2.
Figure 5.10: Reactor temperatures for a long-term test with water content between 35-40 vol. % with EVT01,
GHSV 1500h-1
As depicted in figure 5.10, the temperature decreases by around 10°C in the first 80 hours. After that
the overall temperature trend remains constant. The large and fast fluctuations of the trends are due
to short interruptions of the gas supply, unsteady operation of the water saturator and changes of
the H2O content. The decrease of the temperature in the first 80 hours is an indicator for minor
deactivation. However, due to the stabilization of the temperatures in the following period, this
minor deactivation can be accepted. Other tests also confirmed this effect. A possible explanation for
this initial deactivation is minor re-oxidation of the nickel catalyst due to the water contained in the
synthesis gas, which leads to a loss of active surface. After a certain time a state of equilibrium
between the reducing influence of H2 and the oxidizing influence of H2O is reached and deactivation
stops. The temperature profiles and the trend of the gas compositions (figure 5.11) show no
indication of deactivation of the catalyst. The variations of the gas compositions mainly result from
changes in the H2O content.
450
470
490
510
530
550
570
0 100 200 300 400
Tem
pe
ratu
re [
°C]
Runtime [h]
TM2: 5cm
TM3: 8.5cm
T4: 3cm
T7: 10cm

Bench-Scale Methanation Tests with Clean Syngas
63
Figure 5.11: Gas composition for a long-term test with a water content of 35-40 vol. % with EVT01,
a reactor outlet temperature of 240-260°C and a GHSV 1500h-1
5.5. Conclusion bench-scale methanation tests
The results show that the dry raw-SNG mainly contains CH4 and CO2 in about the same quantities as
well as certain amounts of H2 (figure 5.4 or figure 5.11).
The tested catalysts, especially EVT01 and EVT05, have a good activity for methanation under the
test operating conditions. Catalysts EVT01 and EVT05 are active down to around 230°C, but strongly
dependent on the H2O content. Higher amounts of H2O result in a reduction of H2 conversion and a
lower CH4 yield. Low GHSVs are required to reach equilibrium for H2 and CH4 at the reactor outlet.
For high GHSVs and higher H2O contents the highest possible H2 content could be too high to meet
the requirements. This problem, however, can be easily dealt with other technical solutions, e.g. by
having a second reactor with previous water condensation. CO conversion is already in equilibrium
after the gas has passed the first section of the reactor, also at high GHSVs.
Long-term tests showed no indication of deactivation apart from some minor initial deactivation.
The axial temperature profile in the reactor is shaped as desired, with a temperature peak directly
behind the inlet and a long cooling zone. The polytropic reactor concept therefore constitutes a good
alternative to state-of-the-art reactor concepts as it combines a simple design with lower catalyst
volumes.
The tests with clean, bottle-mixed synthesis gas produced no evidence against the concept proposed
in this work. However, to allow studying catalyst behavior under more realistic conditions, testing
also needed to be done using contaminated synthesis gas (chapters 6 to 8).
0
2
4
6
0 100 200 300 400
Runtime [h]
46
48
50
Gas
co
mp
osi
tio
n [
vol.
%]
H2
CH4
CO2

Bench-Scale Methanation Tests with Clean Syngas
64

Methanation Tests with Contaminated Syngas - Setup
65
Chapter 6
6. Experimental Investigations with Bottle-Mixed
Contaminated Syngas – Experimental Setup
The investigations with bottle-mixed contaminated synthesis gas focused on several specific
questions arising from the proposed methanation concept. The goal of the tests was to gain a better
understanding of the methanation process with hydrocarbon-contaminated synthesis gas and the
resulting interactions, in particular the formation of carbon deposits, the influence of operating
conditions on carbon formation and the effects of carbon deposition on methanation. Related to the
problem of carbon deposition is the question whether it is possible to convert higher hydrocarbons
directly during methanation without adversely affecting the methanation process and the catalyst in
particular.
In order to answer these questions, methanation tests with representative artificial synthesis gases
were performed. For this purpose a suitable test rig that allowed the mixing of synthesis gas from
individual gas bottles as well as the addition of different synthesis gas contaminations such as
ethylene, tars and sulfur species was constructed, as well as a reactor test rig to enable conducting a
large number of methanation tests.
6.1. Investigation focus and program
The investigation program addresses several questions concerning the process of methanation with
hydrocarbon-loaded synthesis gas and the resulting problems:
Which contaminates lead to carbon formation on Ni catalysts?
What are these carbon deposits like and how do they behave?
What is the influence of the operating conditions, and especially the temperature, on the
amount of deposited carbon?
Is it possible to convert higher hydrocarbons directly during methanation without any
negative impact on the methanation process and the catalyst in particular?
Is it possible to reduce or prevent carbon formation?
6.1.1. Definition of investigation parameters
Numerous parameters influence the methanation process as well as the performance and lifetime of
the catalysts (figure 6.1). Apart from influencing methanation, many of these parameters also
interact with each other. Due to the limited amount of time and resources available a variation of all
the parameters was not possible; this, however, is not necessary as many parameters are already
fixed by the process concept and only few parameters can be directly defined during methanation.

Methanation Tests with Contaminated Syngas - Setup
66
Since the focus of the investigations was on the influence of synthesis gas contaminations, and
higher hydrocarbons in particular, this is one of the main parameters to vary. Ethylene was chosen as
representative aliphatic hydrocarbon as it is the major C2-C4 hydrocarbon in synthesis gas formed
during gasification; furthermore, it is one of the synthesis gas components that promote carbon
deposition most heavily. Tars were represented by a mixture of benzene, toluene, phenol and
naphthalene, which are the main tar species found in the synthesis gas produced through
allothermal biomass gasification.
The composition of the synthesis gas is mainly defined by the gasification process. Therefore all the
experiments were conducted in accordance with the fixed standard gas composition shown in table
3.1. The layout of the whole process, as well as the reactor type, defines parameters such as the
reaction pressure and the residence time. Pressure influences methanation, and the conversion in
particular. However, as this influence is minor and pressurization significantly increases test rig
complexity, all methanation tests were performed at atmospheric pressure.
Figure 6.1: Parameters influencing methanation
The bench-scale methanation tests with clean synthesis gas (previous chapter) already confirmed the
suitability of the polytropic reactor concept and allowed determining suitable space velocities. The
bench-scale methanation tests and other tests also showed that the main conversion of CO and
higher hydrocarbons occurs within the first few centimeters of the reactor and that, if carbon is
deposited, this always happens directly after the reactor inlet (for fresh catalyst with full activity).
The part after the inlet zone is only necessary for reaching a high methane yield according to the
thermodynamic equilibrium. The bench-scale methanation tests already proved the possibility of full
conversion of synthesis gas. In this chapter the focus of investigations is on the influence of higher
hydrocarbons. For that purpose it is sufficient to consider just the reactor inlet zone, which was done
by downscaling and shortening the reactor, but maintaining the same axial velocities as in the bench-
scale reactor.
Due to its good results during the bench-scale tests and the promising properties, the catalyst EVT05
was chosen for the methanation tests.
Synthesis gas contaminations
Reactor type
Residence time
Permanent gas composition
Reactortemperature
Reactionpressure
Catalyst
Water contentsyngas
MethanationCarbon deposition
ConversionActivity

Methanation Tests with Contaminated Syngas - Setup
67
The amount of water in the syngas is one major factor influencing carbon deposition. For most tests
the water content was set to 40 vol. %, to be outside the thermodynamic equilibrium for carbon
deposition (figure 4.4).
As a result, the only parameter left to vary for methanation was the temperature, which has
significant influence on the reaction kinetics and therefore on the conversion as well as formation of
carbon (chapter 4.2.2). The dew point of tars is the factor limiting the lower temperature, whereas
catalyst properties limit the maximum temperature allowed.
Table 6.1 summarizes the parameters used and their variations for the methanation tests. Unless
otherwise stated, standard conditions were used for the tests, which will be presented in the next
chapter.
Table 6.1: Overview of parameters for the methanation tests
Parameter Variations
Synthesis gas composition H2: 52.6 vol. %, CO: 18.2 vol. %, CO2: 23.3 vol. %; CH4: 6.9 vol. %
Water content 30-40* vol. %
Contaminates C2H4: 0-1 vol. %, Tars: 0-12 g/Nm³, H2S: 0-1 ppm
Reactor temperature oven: 300-550°C, inlet: 280-460°C, peak: 455-530°C
Reactor pressure atmospheric
Catalyst EVT05, Ni-based
Residence time / gas flow 3500 ml/min, axial velocity 0.15 m²/s, GHSV of ≈10000 h-1
*standard conditions
6.1.2. Test program and procedure
The basic idea for the test procedure was to run numerous short-term and long-term methanation
tests with varying operating conditions and varying addition of contaminates. After the tests, the
amount of carbon deposited on the catalyst was analyzed quantitatively by means of the TPO
method. The temperature profiles recorded during the methanation tests also provided an indication
for possible catalyst deactivation.
The tests conducted can be classified in four groups: tests with clean synthesis gas, tests with
ethylene, tests with tars, and tests to reduce deposition of carbon. The tests with clean synthesis gas
were the basis and reference for the further investigations. The tests with ethylene showed the
influence of an aliphatic hydrocarbon on the formation of carbon deposits and analyzed its behavior.
The third series of tests investigated the influence of tars on methanation, while in the last test series
different ways of preventing or minimizing carbon deposition were analyzed.

Methanation Tests with Contaminated Syngas - Setup
68
6.2. Test rig assembly
The test rig (figure 6.2) consists of a gas mixing station with tar conditioning unit (figure 6.3), a
methanation reactor test rig (figure 6.5) and the gas analyzing unit (figure 6.7).
Figure 6.2: Photo of the test rig for tests with bottle-mixed, contaminated synthesis gases
6.2.1. Gas mixing station with tar conditioning unit
The gas mixing station (figure 6.3) consists of mass flow controllers (MFC), a water saturator and tar
saturators to allow conditioning a realistic artificial synthesis gas.
The MFCs provide a dry gas mixture of H2, CO, CO2, CH4 and N2. Additionally, two MFCs allow the
addition of different gaseous contaminates, e.g. C2H4, H2S, COS. The total dry gas flow is in a range of
around 500 to 5500 ml/min, depending on the composition. The dry gas mixture passes a
temperature-controlled bubble column with water in order to saturate the gas stream up to
60 vol. % H2O. An automatic refilling system ensures a constant water level in the bubbler. It consists
of a floating level switch inside a communicating vessel and a liquid mass flow controller for refilling.
If only dry gas is required, a solenoid valve allows bypassing the saturator. Overheating of the
saturated gas as well as heating of all downstream lines prevents condensation.
Gas analyzing unit
Methanation reactor
Gas mixing station with tar saturators

Methanation Tests with Contaminated Syngas - Setup
69
Figure 6.3: Flow sheet of the gas mixing station with tar conditioning unit
Tar saturators
Four independent tar saturators allow the addition of different higher hydrocarbons in gaseous state,
even if they are liquid or solid under ambient conditions. The tar saturators are bubble columns,
similar to the water saturator. MFCs dose carrier gas (8-50 ml/min N2), which passes the bubble
columns containing the liquid tar species.
The bubblers have a high length-to-diameter ratio (length: 400 mm, diameter: 66 mm) to ensure
good saturation. The filling level is at around 250 mm (850 ml); the high volume enables a long
operation without refilling.
The tar saturator is heated and temperature-controlled, because the vapor pressure, which is
relevant for saturation, depends on the temperature. To achieve high isothermality, a thigh-fitted
10 mm aluminum shell surrounds the bubble column, which is made of stainless steel. A heating cord
Demineralization
H2
F
MFC H2: max. 2800 ml/min
CO2
F
MFC CO2: max. 1000 ml/min
CO
F
MFC CO: max. 1000 ml/min
CH4
F
MFC CH4: max. 350 ml/min
F
MFC N2: max. 3500 ml/min
F
MFC N2: max. 350 ml/min
N2
TG1
F
MFC TG1: max. 380 mlN2/min
TG2
F
MFC TG2: max. 1200 mlN2/min
L
F
F
F
F
N2
Tar saturator 1(Benzene)
Tar saturator 2(Phenol)
Tar saturator 3(Naphthalene)
Tar saturator 4(Toluene)
F
Water
Water saturator with automatic refilling
Trace heated lines (200°C)
P
Pressure sensor
Overpressure valve
Outlet / to reactor
Static mixer

Methanation Tests with Contaminated Syngas - Setup
70
wrapped around the aluminum shell heats the whole bubbler. Only the upper part of the column is
outside the shell and additionally heated with a heating sleeve to overheat the saturated stream. The
control system automatically calculates the necessary temperatures from the preset tar
concentrations. To calculate the temperatures (T), the partial pressure (pi) for each tar species is
calculated via the relation of the mole contents (ni) (equation 6.1). The saturation temperature
required is determined by solving Antoine equations (equation 6.2) for the different tar species. The
constants for the Antoine equations are according to Landolt-Börnstein [160]. Table 6.2 shows
Antoine constants for commonly used tar species.
[ ] 6.1
( )
[ ]
6.2
For calculations that are more precise the standard Antoine equation can be extended according to
equation 6.3. The variable χ (equation 6.4) contains the temperature T for which the vapor pressure
should be calculated, the temperature of the lower boundary T0 and the critical temperature TC
(temperature of the upper boundary of the temperature range).
( )
[ ]
6.3
[ ] 6.4
Table 6.2: Constants for Antoine equations of different tar species, according to [160]
Temp. Range [K]
A B C n E F
Benzene 279-376 5.98523 1184.24 -55.623 2.3835 12.283 664.01
Toluene 281-393 6.05043 1327.62 -55.525 2.38083 50.777 -877.95
Phenol 315-351 6.7074 1633.05 -98.55 360-480 6.296 1523.42 -97.75
Naphthalene 300-353 8.70592 2619.91 -52.5 354-420 6.13555 1733.71 -71.291
o-Cresol 245-296 11.9247 3979.5 -0.15 0.43429 463.53 -36925 308-356 4.4627 782.97 -170.05 0.43429 463.53 -36925 356-493 6.1834 1534.54 -96.85 0.43429 463.53 -36925
o-Xylene 248-301 7.5862 2277.61 -0 2.3586 75.45 -880.27 301-445 6.09789 1458.706 -60.109 2.3586 75.45 -880.27
Indene 290-460 6.34410 1749.215 -52.375
Acenaphthene 290-310 4.32951 1266.801 -136.33 335-367 9.20403 3076.294 -56.060 367-415 6.36589 2089.345 -71.070
Acenaphthylene 280-325 9.70593 3781.506 -1.688
Anthracene 299-430 10.5899 4903.3 -1.58 504-615 7.47799 3612.44 44.91

Methanation Tests with Contaminated Syngas - Setup
71
Because already small temperature variations have a great influence on tar concentration and
saturation can only be achieved in theory, it is necessary to additionally measure and monitor the tar
concentration (Micro-GC, FID, SPA-method). Although the deviations from the calculated values are
small, they nevertheless have to be taken into account for precise measurements.
When the tar saturators are not used, a manual cone valve seals the lines. Before leaving the gas
mixing station, the streams pass a static mixer. The standard operating pressure of the test rig is that
of ambient or near ambient conditions (200 mbar overpressure at most). However, the design allows
even higher pressure and all parts are leak-tested to cope with an overpressure of up to 3 bars. For
safety reasons, a mechanical overpressure valve with a release pressure of 6 bars is installed at the
outlet.
More details about the construction and layout of the gas mixing station can be found in [161].
Control system
The whole test rig is monitored and controlled by an industrial control system with hardware by B&R
Automation. A high level of automation, including safety precautions, allows long-term testing
without manual monitoring. Several automatized routines, such as an automatized catalyst reduction
cycle, increase the repeatability of the tests.
Figure 6.4: User interface of the control system
6.2.2. Methanation reactor test rig
The reactor test rig (figure 6.5) is directly attached to the gas mixing station and integrated into its
control system. It consists of a reactor oven for two reactors, the reactors, a gas supply for reducing
the catalyst and a flare.
The methanation reactor is placed in the reactor oven and is directly connected to the outlet of the
gas mixing station. A natural-gas-supported flare burns the gas leaving the reactor. Sample ports at
the in- and outlet enable gas and tar analysis.
The second reactor oven allows simultaneous reduction of the catalyst. By replacing the used reactor
with a freshly reduced one, the time intervals between the methanation tests can be shortened

Methanation Tests with Contaminated Syngas - Setup
72
considerably. If the reduced reactor is not used immediately after reduction, it can be kept heated in
the reduction part by purging it with N2.
Figure 6.5: Flow sheet of the methanation reactor test rig
The reactor oven (figure 6.6) consists of two steel tubes heated with electrical heating cords. The
heating cords are covered with high temperature insulation to reduce heat losses and operate up to
750°C with separate control of each part.
Figure 6.6: 3D-drawing of the reactor oven with the reactors; right side: methanation, left side: reduction
Reactor
The fixed bed reactor represents only the inlet zone of large polytropic reactors. Thus, the L/dR-ratio
is low. The reactor is made from high-temperature-resistant stainless steel (1.4841 or 1.4541) and
has an inner diameter of 22 mm and a useable length of around 140 mm. However, the standard
catalyst filling height is 50-60 mm to ensure the gas is heated sufficiently as it passes the upper part
PD
T
H2
F
MFC H2: max. 2500 ml/min
N2
F
MFC N2: max. 25000 ml/min
Reactor oven
Reactor in methanation
test part
Reactor in reduction part
Dif
fere
nti
al
pre
ssu
re s
enso
r
SPE
Port for SPE-sample
5 thermo-couples
To FID
To gas analyzing
unit
To FID
Trace heated lines
From gas mixing station
Flare
Natural gas
SPE
Port for SPE-sample

Methanation Tests with Contaminated Syngas - Setup
73
of the reactor. Using some inert bed material above the catalyst leads to better heating of the gas
and ensures the formation of a steady plug flow.
To measure the reactor temperatures over the whole length, a 4 x 0.5 mm tube with five axially
moveable thermocouples inside it is placed in the center of the reactor. Compression fittings connect
the reactors with the gas supply unit and the outlet, to allow easy unplugging, replacing and reuse of
the reactor.
6.2.3. Gas and tar analysis and measurement techniques
To enable proper validation of the results, a complex online analysis system (figure 6.7) was set up
allowing the use of a variety of methods. Additionally, different offline measurement methods were
used to support the analytical process. The main parts of the online analysis system are the
permanent gas analyzer (GA), a micro gas chromatograph (µ-GC), a flame ionization detector (FID)
and a UV-adsorptive tar analysis system. The offline methods comprise contamination
measurements with adsorption tubes (Dräger tubes) as well as tar sampling and analysis by means of
the solid-phase adsorption (SPA) method.
Figure 6.7: Flow sheet of gas analyzing unit
H2
CG
UV-adsorptive tar analysis
Ejector pump with flow regulation
Condenser
N2 (zero gas)Pressurized air
Flame ionization detector
Calibration gas (1 vol. % C3H8 in N2)
Pressurized air
Silica gel Activated carbon
Filter (1µm)
Activated carbon (heated, 90°C)
H2, combustion gas
Trace heated lines (200°C)
Micro-GC
Gas analyzer H2, O2
Gas analyzer CO, CO2, CH4
Activated carbon
Condenser unit
Pump unit
Exhaust
He
From reactor
Exhaust
From reactor inlet
From reactor outlet

Methanation Tests with Contaminated Syngas - Setup
74
Permanent gas analyzer (GA)
The GA measures the permanent gas composition (H2, CO, CO2, CH4, O2) either at the reactor inlet or
outlet. Different valves (shown in the flow sheet in figure 6.5) allow switching to the desired
measuring point.
The used ABB AO2000 gas analyzer system [162] consists of a Uras26, Caldos25 and a Magnos206
module as well as a pump and condenser unit.
The Uras26 analyzer is a non-dispersive infrared (NDIR) photometer, which measures the CH4, CO2
and CO content. The measurement range is between 0-60 vol. % for CH4, between 0-100 vol. % for
CO2 and between 0-25 vol. % for CO. It works on the principle that certain gases absorb infrared
radiation in relation to their concentration at a specific wavelength. Non-dispersive means that the
full spectrum of the infrared light source passes the sampling chamber and is filtered just before the
detector. For accurate measuring results it is important to consider that components of the gas
mixture have different absorption wavelengths and therefore do not cross-influences each other.
The Caldos25 analyzer measures the thermal conductivity of gases and, in doing so, the H2 content of
the gas mixture in a range of 0-100 vol. %. The thermal conductivity of a gas mixture depends on the
concentrations of specific gas species present in it. The analyzer module contains a chamber fitted
with thermostatically controlled resistors. The gas to be measured flows via a membrane into the
chamber and cools the resistors. The temperature drop thus created is compensated for by an
increase in electrical current flowing through the resistors. This electrical current relates to the gas
concentration. The thermal conductivity detector has high cross-sensitivity with other gas species.
This influence is computationally corrected via the mainboard by using the gas concentrations
measured in the other detector modules.
The oxygen analyzer Mangos206 uses the paramagnetic behavior of oxygen (oxygen molecules are
attracted by a magnetic field) and the magneto-mechanical measuring principle. The sensor
measures oxygen up to 25 vol. %. Since oxygen is not a synthesis gas component, it is not present in
any of the gas mixtures used in this investigation; however, the sensor allows monitoring of possible
leakages.
The three analyzer modules are mounted inside two 19” housings. One housing contains the
mainboard, where all signals are brought together. The readings are displayed on the user interface
of the GA, but are also integrated into the control system of the test rig via analog signals. This
enables combined recording of test rig data with the related values of gas composition.
As the GA requires dry, dust-free and non-condensing gas, the gas passes a condenser unit, which
cools the gas to around 2°C, before entering the analyzer. Furthermore, an activated carbon filter
removes contaminations, like tars and sulfur species. The typical gas flow through the GA is in a
range of 20-40 l/h.
Micro gas chromatograph (µ-GC)
Gas chromatography is a standard method for qualitative as well as quantitative analysis of gas
mixtures. A µ-GC uses miniaturized components, including an injector, a column and a detector,
inside fully configured modules. This allows faster, quasi-online measuring. The used Agilent 490
µ-GC [163] is a quad-channel version equipped with three different GC modules. Table 6.3 gives an
overview of the GC modules used. The µ-GC has a heated sample line and heated injectors up to
110°C, which also allows measuring the amount of condensing hydrocarbons such as BTX.
Typical runtimes of one sample are between 30 and 180 s (max. 600 s). The µ-GC measures either a
defined number of samples or continuously (e.g. one sample every 120 seconds). The results, i.e. the

Methanation Tests with Contaminated Syngas - Setup
75
concentrations in vol. % or ppm of the different compounds, are automatically displayed in a
spreadsheet.
An internal pump provides the µ-GC with the sample gas, which has to be dry or almost dry
(condensation at ambient temperature is sufficient). Online measurements at the methanation test
rig were therefore taken after the condenser (figure 6.7), although measuring before the condenser
is possible too.
A common method for offline gas analysis is the use of gas sampling bags, which has the advantage
that the gas does not cool down to below-ambient temperature and components such as H2S or BTX
remain in the gas almost completely while the water content is sufficiently low.
Table 6.3: Overview of used µ-GC-modules
Module Column type Column data Detectable species
MS5A 10m Molecular sieve 5Å (zeolite type A) PLOT-column with pre-column PoraBOND Q
L = 10 m, D = 0.25 mm, Tmax = 180°C
H2, O2, N2, CH4, CO, NO, Ar, He, Ne
PPQ 10m PLOT-column with polystyrene-divinylbenzene
L = 10 m, D = 0.25 mm, Tmax = 180°C
C1-C5, CO2, H2S, COS, SO2
5CB 8m WCOT-column with 100% dimethylpolysiloxane
L = 8 m, D = 0.15 mm, Tmax = 180°C
C3-C10, CS2, H2S, other S-compounds
Several GC methods have been developed for analyzing the different compounds and
contaminations of synthesis gas. Due to the large variations in concentrations and to realize low
runtimes no method allows complete analysis of all the species. One method enables measuring
almost all major components (table 6.4): C2-C4 hydrocarbons, BTX and the main sulfur species.
Permanent gases are not measured as they are covered by the GA. The only limitation of this
standard method is the fact that it does not allow separating C2H2 and C2H4.
More details on different methods, the calibration and the application of the used µ-GC can be found
in [164].
Table 6.4: Parameters for the standard µ-GC method for C2-C4 hydrocarbons, sulfur compounds and BTX
Parameters PPQ 10m 5CB 8m
Injector temperature 60°C 80°C
Column temperature 60°C 80°C
Injection time 50 ms 40 ms
Column pressure 200 kPa 350 kPa
Runtime 110 s 110 s
Carrier gas He He
Calibrated components C2H2, C2H4, C2H6, H2S, COS, C3H8, C3H6
H2S, C3H8, C3H6, C4H10, CS2, benzene, toluene, ethylbenzene*, o-,p-xylene*
*Runtime 220 seconds

Methanation Tests with Contaminated Syngas - Setup
76
Flame ionization detector (FID)
A flame ionization detector (FID) measures the concentration of organic compounds in a gas stream.
A compound needs to have C-H or C-C bonds to be measurable with a FID. The gas sample, which is
burnt in a hydrogen flame, contains organic species, which, when burnt, lead to formation of ions.
The ions released during combustion are proportional to the concentrations of organic compounds.
The signal intensity is generally equal to the number of carbon atoms in the molecule. However,
response factors, depending on the device and on the measured species, lead to deviations from this.
The output signal as well as the response factors are always related to a reference gas.
The FID used within this work is an ABB AO MultiFID 14 analyzer [165]. It has a heated sample gas
port and uses C3H8 as reference gas. An air-supplied ejector pump draws the sample gas into the
combustion chamber. Typical sample gas flows are in a range of 35-60 l/h and are set by varying the
air pressure for the ejector pump. H2 is used as combustion gas, and conditioned pressurized air (dry,
hydrocarbon- and dust-free) as combustion air.
Heated pipes connect the FID with the reactor inlet or outlet (figure 6.7), depending on the position
of the 3-port valve. By switching on a bypass, the whole gas stream passes a heated activated carbon
filter prior to passing through the FID. The activated carbon is supposed to remove all tars from the
sample gas without affecting the permanent gas composition. By comparing the original signal with
the signal of the filtered gas sample the total amount of tars present in the sample can be
determined. This differential measurement works well with tar-loaded N2, but is difficult with real
synthesis gas. Apart from tars also CO2 and H2O adsorb on the activated carbon. The resulting
increase in the concentration of FID-detectable gases - mainly CH4 - leads to higher signal readings.
Once the adsorption of H2O and CO2 has reached a state of equilibrium, which is the case after a
certain time, the gas composition of the sample gas is not influenced any more. However,
fluctuations of the gas composition, the limited tar adsorption capacity of activated carbon and the
different magnitudes of CH4 and tars make the measurement inaccurate. A good alternative for dry
gases would be the usage of a tar condenser (e.g. cooled silica wool) instead of a tar adsorber as it
does not influence the gas composition.
Mörsch [166] put a lot of effort in developing a FID-based online tar analyzer, working on a similar
principle as the system described above.
Due to the above-mentioned difficulties, the FID was mainly used for the calibration and monitoring
of the tar saturators and not for online measuring of hydrocarbon conversion. More details on the
operation and calibration of the FID can be found in [167].
Optical tar analysis with UV absorption
Optical methods are promising alternatives for online analysis of tar in different gas mixtures. An
often proposed option is the usage of fluorescence spectroscopy for quantitative and semi-
qualitative analysis of tar produced in biomass gasification [168], [169], [170]. Most aromatic
hydrocarbons show the ability to fluoresce after absorbing of UV radiation; the intensity of the
fluorescence signal corresponding with the concentration of tar molecules.
A measurement setup for fluorescence spectroscopy consists mainly of a heated measurement cell
with optical ports, a UV-light source (laser or LED) and a spectrometer. To measure low tar
concentrations, e.g. after tar reforming, expensive lasers and highly sensitive detectors are required.
An alternative to fluorescence spectroscopy is measuring the amount of absorption, which has the
main advantage that due to the higher signal intensity low-power light sources, such as UV LEDs, and
conventional photodiodes can be used.

Methanation Tests with Contaminated Syngas - Setup
77
The Beer-Lamberts law (equation 6.5) describes the relation of absorbance (A) to the properties of
the light-absorbing material [171]. Absorbance is the logarithmic quotient of the intensity of the
incident light (I0) and the intensity of the transmitted light (I1). It is further described as product of
the molar absorption coefficient (ε), the molar concentration (c) and the optical path length (b). The
Beer-Lamberts law is only valid for low concentrations, which are typical for tars in synthesis gas. The
molar absorption coefficient is an intrinsic property and depends on the species and the wavelength,
e.g. for naphthalene ε286nm = 9300 [l mol-1 cm-1], for toluene ε261nm = 300 [l mol-1 cm-1].
( ) [ ]
6.5
Equation 6.5 shows that the transmitted intensity (I1) depends exponentially on the optical path
length (b). Therefore the simplest way of measuring low concentrations is to increase the length of
the measurement cell. The maximum amount of absorbance of a species can only be reached at a
particular wavelength, e.g. for naphthalene at 286 nm.
The disadvantage of absorption measurements is that if more than one absorptive species is present,
cross-influences reduce accuracy. Systems with multiple light sources of different wavelengths can
reduce or overcome this drawback.
Since in this investigation the focus of the measurement setup was on measuring the conversion of
naphthalene during the methanation process, a 285 nm LED was chosen as a light source. The
detector used was a standard, amplified photodiode for detection of UV and visible light and the
measuring cell (figure 6.8) a steel tube 22 mm in diameter and with an optical length of 300 mm.
Light was coupled-in or out by means of 6 mm silica glass rods, which allowed heating of the cell
while enabling cooling of the electronic parts. The measurement cell can be heated up to 300°C, to
prevent condensation of tars.
Figure 6.8: UV absorption tar measuring cell
The measuring cell can take measurements either at the reactor inlet or outlet. An ejector pump
after the measurement cell with flow regulation ensures the sample is moved continuously through
the cell, the standard flow rate being between 0.1-0.3 l/min. Before they reach the pump, water and
tar are removed by a condenser. To measure the initial intensity of the light the measuring cell is
purged with N2. The control system of the test rig records and processes the amplified signal sent by
the photodiode. The tar concentration is automatically calculated using calibration factors.
UV-LED with mountingPhotodiode with
mounting Glass rod
Heated measuring cell

Methanation Tests with Contaminated Syngas - Setup
78
Detector tubes (Dräger tubes)
One of the classical techniques of fast gas analysis is the use of detector tubes, where a defined
amount of sample gas is pumped through a tube which contains chemicals that react with the
substance to be measured by changing color. Typically, the length of the discoloration represents the
concentration of the measured species. A printed scale allows direct reading of the measured value.
Standard deviations are in a range of ± 5 to 25 % [172]. Condensation of water and interferences with
other species of the sample have to be considered and reduce accuracy. A good method of
preventing condensation and reducing the interference of water is to collect the gas in a gas
sampling bag. If a specific humidity of the gas is needed, the gas bag may be additionally cooled.
Although their precision is lower, detector tubes are a valuable tool for measuring species where no
other technique is available or where the existing techniques do not have the right measuring range,
e.g. H2S < 1 ppm. Table 6.5 gives an overview of the most commonly used detector tubes for
measuring contaminates during this work.
Table 6.5: Overview of the most commonly used detector tubes for measuring contaminates in synthesis gas
Species Tube type Range Interferences
NH3 Gastec Ammonia 3La 2.5-200 ppm CO2 (corr. Factor)
H2S Gastec Hydrogen sulfide 4M 12.5-500 ppm -
H2S Gastec Hydrogen sulfide 4LT 0.1-4 ppm Mercaptans
H2S Dräger Hydrogen sulfide 0.2/b 0.2-6 ppm Mercaptans
HCl Dräger Hydrochloric acid 1/a 1-10 ppm -
HF Gastec Hydrogen fluoride 17 0.25-100 ppm HCl
Tar sampling and analysis according to tar protocol
The European tar-measurement standard CEN/TS 15439 [173], so called ‘tar protocol’, is an attempt
to standardize the different tar and dust analysis methods for biomass gasification; it regulates the
sampling as well as the analyzing process. The sampling is based on collecting dust in a heated filter
and in sampling tars by dissolving them in isopropyl alcohol (IPA). Since the sampling in this study
was done after the particle filter of the gasifier, the filter, as specified by the tar protocol, was not
used. The heated sample port of the gasifier was directly connected to the impinger bottles (figure
8.4) and a membrane pump was used to draw the gas through the washing bottles, the silica gel
adsorber and the gas meter. The gas flow was in a range of 150-250 l/h and sampling durations
between 30 to 180 minutes. A deviation from the standard was that the first impinger bottle was left
empty instead of being filled with IPA. This was necessary due to the high water content of the gas,
which condenses in the first bottle and would overflow it if it had been filled. Additionally, an internal
standard for GC analysis was added to the solvent in the second bottle. All other sampling
procedures were according to the standard CEN/TS 15439 [173].
After combining the different solutions from the washing bottles, a small sample was analyzed with
an Agilent GC 7890A with CP-Sil 8 CB 25 x 0.25 column with retention gap. To improve accuracy, the
phenolic fraction was analyzed using a different method. The major tar species, as presented for
example in figure 8.8, are calibrated by means of different standards.

Methanation Tests with Contaminated Syngas - Setup
79
Solid-phase adsorption (SPA) method
Based on solid-phase extraction (SPE), another common method of tar sampling is to draw a tar-
loaded gas stream through a sorbent cartridge, where the tars are adsorbed before being extracted
and analyzed in a laboratory. Brage [174] first introduced this method of sampling of tars produced in
biomass gasifiers.
The method used in course this work [175] is a modified version of the original method, the two main
differences being the use of an octadecyl-phase (C18) adsorbent in place of an aminopropyl-phase
(NH2) and the use of isopropyl alcohol as the only solvent for extraction. The C18 column showed the
same sampling performance as the NH2 column. Due to lower initial contamination the baseline and
the separation performance of GC analysis were better for samples taken with C18. A comparison of
the extraction performance of different solvents (IPA, acetonitrile, acetone, dichloromethane)
showed no significant benefits of the other solvents compared to IPA. IPA has the advantage of being
easy to handle and of allowing the use of the same GC methods for analyzing the SPA samples and
the tar protocol samples.
Figure 6.9: Configuration for SPA sampling
The small reactor test rig (figure 6.5) as well as the gas cleaning and methanation test rig for real
gases (figure 8.3) are equipped with several sample ports (via septum). Heating the sample ports to
300°C prevents the condensation of tars. The design of the ports ensures that the tip of the
0.9x70 mm needle is directly exposed to the gas stream (figure 6.9). A 100 ml glass syringe draws the
sample over the Chromabond C18ec SPE column within a typical sampling time of 1 minute. To relate
the concentration to standard conditions, it is necessary to know the gas temperature in the syringe.
For that purpose the syringe temperature is either measured or the syringe is kept at a constant
temperature, e.g. by means of a bag filled with an ice-water mixture that is wrapped around the
syringe. After sampling, the column is immediately closed with a silicone plug and stored in the
refrigerator for later analysis.
SPE-column
100 ml syringe
Septum retainer
Gas stream

Methanation Tests with Contaminated Syngas - Setup
80

Methanation Tests with Contaminated Syngas - Results
81
Chapter 7
7. Experimental Investigations with Bottle-Mixed
Contaminated Syngas – Results
This chapter presents the results of the methanation tests carried out with contaminated, bottle-
mixed synthesis gas. First, tests with non-contaminated synthesis gas were performed as a reference
(chapter 7.1), before in further tests, ethylene (chapter 7.2), tar mixtures (chapter 7.3) and hydrogen
sulfide (chapter 7.4) were added to the synthesis gas.
7.1. Parameter variations with non-contaminated synthesis gas
These tests showed the relation of the different temperatures to each other (reactor oven
temperature, inlet temperature and peak temperature) and their distribution in the reactor.
Furthermore, the tests proved that contamination-free synthesis gas does not cause carbon
deposition.
Reactor temperatures
Adequate measuring of the different reactor temperatures is crucial for analyzing and comparing the
results of methanation tests. An error analysis that was carried out shows the influences of errors on
the measurements. Errors may stem from the influence of the protective steel tube, the
thermocouple itself and the evaluation unit. Since in the used setup the temperature in the center of
the reactor is measured via thermocouples fitted inside a steel tube (chapter 6.2.2), thermal
conduction along the tube may influence the measured temperature. A computational analysis
showed that this influence is < ± 1.5°C. The maximum error range of the thermocouples themselves
is < ± 2°C and that of the evaluation unit < ± 1.5°C. Thus, the overall maximum error range in
measuring reactor temperature is < ± 5°C.
Figure 7.1 shows the profiles of the measured reactor temperatures for standard methanation
conditions in dependency of the reactor oven temperature. The reactor temperatures are controlled
and influenced by the reactor oven temperature. Since the lab-scale reactor represents the inlet zone
of the bench-scale reactor the scaled reactor length is related to the length of the bench-scale
reactor.
Figure 7.2 shows the relation of reactor temperatures to the reactor oven temperature. As can be
seen, there is a clear, linear relation between all measurable temperatures. The inlet temperature is
the temperature of the gas directly before contacting the catalyst. The medium inlet zone
temperature is the medium temperature measured within the first centimeter after the inlet. It is the
result of the inlet temperature and the release of exothermic heat of reaction and is important as it

Methanation Tests with Contaminated Syngas - Results
82
influences carbon deposition, which affected this zone most. The peak temperature is the maximum
temperature measured; it is primarily influenced by the heat of reaction, and only secondarily by the
reactor oven temperature. The heat of reaction released decreases with increasing temperature due
to the lower conversion of synthesis gas. Therefore, the lower amount of released heat compensates
for some of the increase in reactor oven temperature.
Figure 7.1: Measured axial temperature profiles over the reactor at different reactor oven temperatures
The further results presented here are mainly based on the reactor oven temperature as this was the
set temperature for all experiments; however, all other temperatures directly relate to it, as shown
in figure 7.2.
Figure 7.2: Resulting reactor temperatures in dependency of the reactor oven temperatures
-0.05 0 0.05 0.1
200
250
300
350
400
450
500
550
-2 -1 0 1 2 3 4 5
Scaled reactor lenght [-]
Re
acto
r te
mp
era
ture
[°C
]
Reactor length [cm]
500°C450°C370°C320°C300°C550°C
Catalyst bed
250
300
350
400
450
500
550
300 350 400 450 500 550
Co
rre
spo
nd
ing
tem
pe
ratu
re [
°C]
Temperature reactor oven [°C]
Peak
Medium inlet zone
Inlet

Methanation Tests with Contaminated Syngas - Results
83
Results of tests with non-contaminated synthesis gas
To prove the influence of synthesis gas without contaminations, several tests were performed under
standard conditions (table 6.1), with reactor oven temperatures between 320-450°C, runtimes
between 2-72 h and a water content between 20-40 vol. %.
In all the tests the measured catalyst carbon content after the test was below the detection limit of
0.1 mgC/gCatalyst in the TPO. Also SEM and EDX analysis did not show evidence for carbon deposits.
Some of the analyzed catalyst pellets showed cracks and minor spallings on their surface. The most
likely explanation for this is the occurrence of thermal stresses resulting from the sudden increase in
heat at the beginning of each test. Due to the exothermic heat released after the introduction of the
syngas, the temperature in the main reaction zone rises sharply within seconds. An increase in the
number of cracks with ongoing runtime was not observed. However, a negative impact of the cracks
on the tests is not assumed and therefore this was not further investigated. For applications on a
larger-scale, slower heating, e.g. by dilution of the synthesis gas, should be considered.
7.2. Parameter variations with aliphatic hydrocarbons – Ethylene
Ethylene is known to be one of the major promoters of carbon deposition. Its concentration in typical
producer gas from thermal gasification is the highest of any C2-C5 species present in it. Unfortunately,
removal of C2H4 from synthesis gas requires some effort and is not possible with the proposed hot
gas cleaning concept.
7.2.1. Behavior of carbon on the catalyst
To allow conducting a large number of experiments it would be helpful to reduce the runtime. To
make this possible it is, however, necessary to know how carbon deposits on the catalyst develops
with time. If the amount of formed carbon correlates with the runtime, extrapolation of short-term
tests could replace, or at least partially replace, long-term tests.
To analyze the behavior of carbon on the catalyst numerous tests were carried out under operating
conditions where coking was expected. Previous tests as well as investigations by the catalyst
manufacturer had shown that the presence of ethylene in amounts as small as > 0.3 vol. % already
promotes carbon formation. Therefore tests with different runtimes were conducted in which
0.5 vol. % and 0.7 vol. % of C2H4 were added to the standard synthesis gas. Additionally, the inlet
temperature was varied (280°C, 300°C, 330°C) in order to investigate the influence of temperature.
After each test run the amount of deposited carbon was determined by means of the TPO method.
Figure 7.3, figure 7.4 and figure 7.5 show the results of these investigations. The results show clearly
that if coking occurs, the amount of deposited carbon increases linearly with the runtime.
Furthermore, it can be seen that the gradients of the graphs increase significantly with higher
C2H4 contents. The temperature has an influence on the gradient as well, as will be discussed in
chapter 7.2.3. The error bars are based on a statistical analysis of errors occurring when using the
TPO method (chapter 4.2.4).

Methanation Tests with Contaminated Syngas - Results
84
Figure 7.3: Carbon deposition on the catalyst at 300°C reactor oven temperature (≈280°C inlet) using different
C2H4 contents and runtimes, GHSV 10000 h-1
Figure 7.4: Carbon deposition on the catalyst at 320°C reactor oven temperature (≈300°C inlet) using different
C2H4 contents and runtimes, GHSV 10000 h-1
Since the methanation conditions are outside the thermodynamic area for carbon deposition, due to
a water content of 40 vol. %, deposition must result from kinetic effects. Carbon deposition caused
by ethylene is, according to figure 4.2, either the result of its decomposition to Cα or its
polymerization to coke. The favored route is not determinable.
Carbon can only accumulate if the kinetics for the formation of carbon is faster than any reactions
removing carbon deposits. The kinetics depends on the operating parameters and catalytic activity.
Since the operating parameters were the same for all runtimes, the kinetics should not be
influenced, either. If, additionally, catalytic activity remains constant, the kinetics can also be
0.5 vol. % C2H4
0.7 vol. % C2H4
Car
bo
nco
nte
nt
[mg C
arb
on/g
Cat
alys
t]
0
2
4
6
8
10
12
14
0 50 100 150 200 250
Runtime [h]
0
2
4
6
8
10
12
14
0 50 100 150 200 250
Runtime [h]
0.5 vol. % C2H4
0.7 vol. % C2H4
Car
bo
nco
nte
nt
[mg C
arb
on/g
Cat
alys
t]

Methanation Tests with Contaminated Syngas - Results
85
assumed to be constant. Therefore the measured linear correlation between amount of deposited
carbon and runtime can also be explained by constant kinetic parameters over the whole runtime.
This further indicates that the amount of deposited carbon does not influence catalytic activity; at
least not with the amounts that had been occurred in course of this work. The temperature profiles
obtained during testing with different runtimes and high coking confirm that the kinetic behavior
during methanation also remain constant (figure 7.6). However, these results do not necessarily
mean that carbon deposition does not influence catalytic activity at all.
Figure 7.5: Carbon deposition on the catalyst at 370°C reactor oven temperature (≈330°C inlet) using different
C2H4 contents and runtimes, GHSV 10000 h-1
Figure 7.6: Temperature profiles of a test with high carbon deposition; reactor oven temperature 370°C,
0.7 vol. % C2H4, runtime 142 h
0
2
4
6
8
10
12
14
0 50 100 150 200 250
Runtime [h]
0.5 vol. % C2H4
0.7 vol. % C2H4
Car
bo
nco
nte
nt
[mg C
arb
on/g
Cat
alys
t]
300
350
400
450
500
0 1 2 3 4 5 6
Re
acto
r te
mp
era
ture
[°C
]
Reactor length [cm]
10 h
140 h
50 h
100 h

Methanation Tests with Contaminated Syngas - Results
86
A more severe problem is the blockage of reactor voids by carbon deposits and the resulting increase
in differential pressure. Blockage due to agglomeration of catalyst pellets and coke occurs directly
after the reactor inlet in the main reaction zone, where most of the conversion happens. Figure 7.7,
for example, shows the differential pressure measured in the experiment above (illustrated in figure
7.6): it increased from around 10 mbars at the beginning to 150 mbars after 140 hours, which was
the upper limit and meant the end of the experiment.
Figure 7.7: Development of differential pressure across the reactor during a test with high carbon deposition;
reactor oven temperature 370°C, 0.7 vol. % C2H4, runtime 142 h
7.2.2. Definition of a critical/acceptable carbon content
The fact that carbon accumulates linearly with time raises the question how much carbon is
acceptable. The critical point is reached when coking leads to blockage of the reactor and
subsequent increase in differential pressure in the reactor. Deactivation of the catalyst by carbon
was not considered for definition of a critical carbon content due to the fact that it was not
noticeable under the conditions applied in this investigation.
Figure 7.8 shows the amount of carbon deposits related to the maximum differential pressure. There
is, of course, a tendency towards higher differential pressures with increased carbon deposition, but
there is no clear connection; some points with similar amounts of carbon have differential pressures
that are 2 to 5 times higher (e.g. 300°C/0.5 vol. %/187 h and 320°C/0.7 vol. %/70 h).
There may be several reasons for this. Besides the amount of carbon, its dispersal also influences
differential pressure. Most of the carbon is usually deposited along the first centimeter of the
catalyst bed, which is between 5.5 to 6 centimeters long. The amount of carbon is determined on the
basis of the total amount of catalyst material; its location and dispersal are not considered. If the
same amount of carbon is deposited in a smaller area, this leads to a greater blockage and thus to a
higher differential pressure than in the case of more widespread coking.

Methanation Tests with Contaminated Syngas - Results
87
If coking is accompanied by catalyst poisoning, this can increase the amount of deposited carbon
before the blocking effect becomes problematic. As already been mentioned, poisoning leads to
deactivation and subsequent continuous shifting of the main reaction and the coking zone, causing
carbon deposition to be more dispersed. In tests with simultaneously poisoning carbon amounts of
15 mg/g and above did not lead to an increase in differential pressure (tests with real synthesis gas,
chapter 8).
When comparing results, such as the amount of deposited carbon, in particular, it is important to
consider the fact that the measured amounts are always a mixture of coked and uncoked catalyst
and that it is therefore important to use the same flows and geometric parameters (same axial
velocity, same L/dR ratio and, ideally, same dR/dP ratio) .
Another factor potentially influencing the relation between differential pressure and the amount of
carbon deposition is the filling procedure used. Variations in reactor bed density and in the flatness
of the surface of the catalyst bed can always occur; to minimize this influence, a standardized filling
procedure was used throughout this investigation.
Figure 7.8: Relation of differential pressure and the amount of carbon deposited in the reactor
Considering all these different issues it becomes clear that it is difficult to define a critical/acceptable
level of carbon content.
Figure 7.9 shows catalyst samples with different amounts of deposited carbon. At low carbon
contents (< 1 mg/g) only few catalyst pellets are partially covered with a thin layer of carbon. Since
the differential pressure is not increased, either, this amount of carbon can be assumed to be
uncritical. Samples with a content of up to 5 mg/g contain a larger number of catalyst pellets with
carbon deposits. They are also mainly partially covered, but have a thicker layer of carbon. These
layers lead to a diameter increase of up to 30 % and agglomerations to an increase in differential
pressure. Although high values were measured too, the average differential pressure lies in the
medium range, where, depending on the application, it is not problematic.
Carbon contents of around 10 mg/g lead to the formation of a large number of coked catalyst pellets.
They appear as both fully and partially covered pellets. The carbon layers are thick, and strong
0
40
80
120
160
200
0 2 4 6 8 10 12 14
Re
acto
r d
iffe
rnti
al p
ress
ure
[m
bar
]
Deposited carbon [mgC/gCatalyst]
Initial pressure320/0.5/70
320/0.5/210
320/0.7/70
320/0.7/142
320/0.7/46
300/0.5/70370/0.5/66
300/0.5/187
370/0.7/70
Temp./C2H4/Runtime [°C/vol.%/h]

Methanation Tests with Contaminated Syngas - Results
88
agglomerations between the coked pellets lead to a high differential pressure across the reactor. A
carbon content above 10 mg/g could be problematic for many applications. Therefore, this work
assumes 10 mgC/gCatalyst to be the maximum carbon content acceptable (the critical catalyst carbon
content). However, it has to be mentioned that this value is based only on the results of the concept
proposed and the catalyst used in this investigation and might not be directly transferable to other
setups and applications.
A carbon content of 15 mg/g leads to the formation of mainly fully covered, agglomerated catalyst
pellets with a thick carbon layer and an increase in the differential pressure to around 20 times the
normal level. Such a high amount of carbon (> 15 mg/g) – which was never found in methanation
tests with bottle-mixed synthesis gas – is probably too much for continued operation of a reactor.
The sample with the almost fully coked catalyst containing 35 mg/g of carbon was taken from the
main reaction zone after a methanation test using real synthesis gas from biomass gasification.
Figure 7.9: Photographs of catalyst samples with different amounts of deposited carbon
If 10 mg/g is considered the maximum carbon content acceptable and the threshold value at which a
catalyst needs to be replaced, and assuming a linear coking rate, it is possible to calculate an
acceptable carbon content for any particular moment of the process. This, in turn, allows short-term
testing, e.g. over 22 hours, to replace long-term tests.
The permissible carbon content is also an important consideration when it comes to making
decisions about the required lifetime of the catalyst and the costs associated with it. Considering the
catalyst as a consumable, as the proposed concept does, means incurring additional costs.
Equation 7.1 allows the calculation of the necessary catalyst runtime tOp. [h] in dependency of
catalyst mass for one replacement mCat.[g], the catalyst costs CCat. [€/kg], the required specific catalyst
costs cCat. [€ct./kWhSyngas] and the synthesis gas power PSG [kW]. The main variable in this equation is
the specific catalyst costs, which represent the additional costs for the production of SNG due to
catalyst replacement. Transforming this equation makes it possible to calculate the specific cost of a
catalyst from a given runtime.
35 mg/g 15 mg/g 10 mg/g
5 mg/g 1 mg/g 0 mg/g

Methanation Tests with Contaminated Syngas - Results
89
[ ] [ ]
[
] [ ] [ ]
7.1
The acceptable carbon content after a certain time CC(t) (equation 7.2) depends on the maximum
carbon content acceptable CCmax [mg/g], the time [h]and the required runtime tOp. [h]. The examples
with values are just intended to show of which orders the values typically are.
( )
[ ] [ ]
[ ] [
]
7.2
Figure 7.10 shows the specific amounts of catalyst consumption and the related specific catalyst
costs in dependency of different maximum carbon contents and the amount of deposited carbon per
hour. The costs are based on catalyst costs of 70 €/kg.
Figure 7.10: Specific amounts of catalyst consumption and cost in dependency of different carbon contents
In summary it can be said that it is quite difficult to define a value for an acceptable amount of
carbon. While carbon contents < 10 µg/gCatalyst·h are low and can be considered as unproblematic for
the proposed applications, contents > 70 µg/gCatalyst·h are considered as too high in terms of catalyst
consumption costs. In figure 7.11 the different carbon contents are rated on a colored scale.
7.2.3. Influence on ethylene-promoted carbon deposition
The main variable influences on ethylene-promoted coking are temperature, water content, and, of
course, the ethylene concentration itself. To ensure that no carbon formation results from the
thermodynamic equilibrium, the water content of the synthesis gas was fixed with 40 vol. % to
ensure being outside of the thermodynamic equilibrium for carbon formation.
0
0.5
1
1.5
2
2.5
3
3.5
0
0.1
0.2
0.3
0.4
0.5
0 50 100 150 200 250
Cat
alys
t co
sts
[€ct
/kW
hSy
nga
s]
Cat
alys
t co
nsu
mp
tio
n [
g/kW
hSy
nga
s]
Carbon content [µg/g·h]
30 mg/gMax. acceptable carbon content
20 mg/g
10 mg/g
5 mg/g

Methanation Tests with Contaminated Syngas - Results
90
Figure 7.11: Influence of temperature on the amount of deposited carbon,
based on a runtime of 22 h, GHSV 10000 h-1
The amount of deposited carbon depends heavily on temperature (figure 7.11 and figure 7.12).
Starting at a reactor inlet temperature of 300°C respectively a peak temperature of 460°C, carbon
formation increases and reaches its maximum at an inlet temperature of 330°C (475°C peak
temperature). Further rises in temperature up to 420°C (515°C peak temperature), however, lead to
a decrease in carbon deposition. There is confirmation of this also in the literature.
Bartholomew [113], for example, reported that the formation of polymeric carbon from ethylene
reaches its maximum at 430°C because the coking rate is a matter of the kinetics between formation
and removal of carbon. Unfortunately, a direct comparison with temperature values found in the
literature is not possible as those values are always based on isothermal conditions and the use of
different catalysts. Furthermore, the high temperature gradients in a polytropic reactor make it very
difficult to define a representative temperature for the kinetics of carbon formation. However, since
this work focuses on application-oriented rather than on fundamental investigations, variation of the
inlet temperature is a very convenient way of controlling temperature as the inlet temperature is
also the one variable parameter in large-scale applications.
Below 300°C inlet temperature the coking rate starts to increase again. This effect, which has not
been reported in the literature so far, might be due to the condensation of ethylene polymerization
products. However, since operation beyond an inlet temperature of 300°C is not intended, this effect
was not considered further in this study.
Figure 7.12 shows all points of the parameter study for ethylene-promoted carbon deposition.
Besides temperature the amount of ethylene present in the synthesis gas has a strong influence on
the amount of deposited carbon. No carbon deposition occurred beyond a C2H4 content of
0.3-0.35 vol. %. This corresponds to the experience of the catalyst manufacturer according to which
ethylene-induced coking starts only at a certain C2H4 level.
C2H4 contents above 0.7 vol. % were not investigated as the amount of carbon at 0.7 vol. % is already
too high for long-term operation of a reactor. High coking also occurred at lower contents of
280 300 320 340 360 380 400 420 440
Car
bo
nco
nte
nt
[µg C
arb
on/g
Cat
alys
t · h
]
0.5 vol. % C2H4
0.7 vol. % C2H4
Reactor inlet temperature [°C]
0
20
40
60
80
100
120
140
160
0
20
40
60
80
100
120
140
160
250 300 350 400 450 500 550
Reactor oven temperature [°C]
Low
Med
ium
Hig
h

Methanation Tests with Contaminated Syngas - Results
91
0.5 vol. %. However, there are certain inlet temperature ‘windows’ – 300°C and above 400°C – at
which the amount of deposited carbon could be low enough to allow longer operation.
In all the tests ethylene was fully converted and no other C2-C4 hydrocarbons were detected at the
outlet of the methanation reactor.
Figure 7.12: Amount of deposited carbon in dependency of the temperature and the C2H4 content,
based on a runtime of 22 h, GHSV 10000 h-1
In summary it can be said that already relatively low amounts of ethylene (> 0.5 vol. %) lead to severe
coking; unfortunately, C2H4 contents in synthesis gas are usually above this level. The formation of
carbon can only be prevented by keeping the ethylene content sufficiently low and ensuring that
methanation happens at a convenient temperature. Otherwise alternatives need to be found that
will help to reduce or prevent coking (chapter 7.4) or will make it possible to regenerate the catalyst.
7.3. Parameter variations with representative tar mixtures
The investigations with tars were performed in the same way as the tests with ethylene. Numerous
short-term tests (22 hours) with varying parameters showed the various influences on catalyst coking
that occurs due to the presence of tars in the synthesis gas. A mixture of four different tar species –
benzene, toluene, phenol and naphthalene – was chosen to represent tar contaminations in
synthesis gas because they constitute the main tar components produced in gasification and because
they represent different properties of tars. These tars, which are also easy to dose, are often referred
to as representative tar species in the literature, e.g. [99], [96], [95], [52].
The standard tar mixture used consisted of 3.5 g/Nm³ of benzene, 1 g/Nm³ of toluene, 1 g/Nm³ of
naphthalene and 0.5 g/Nm³ of phenol, which adds up to 6 g/Nm³ in total. The ratio between the
components remained constant even if a higher total concentration was used. The parameters varied
in these investigations are temperature, the tar concentration and, contrary to the tests with
ethylene, also the water content. Water is one of the main influences on the reforming and
conversion of higher hydrocarbons. An increased water content enhances the reforming of
hydrocarbons and should reduce the propensity for coking.
0
0.1
0.2
0.3
0.4
0.5
0.6
0.7
0.8
0.9
1
250 300 350 400 450 500 550
Reactor inlet temperature [°C]C
2H
4co
nte
nt
[vo
l. %
]
Reactor oven temperature [°C]
280 300 320 340 360 380 400 420 440
60
133 54
26 16
0012
3
3910
20
8989
0 0 0
20 µgC/gCatalyst·h
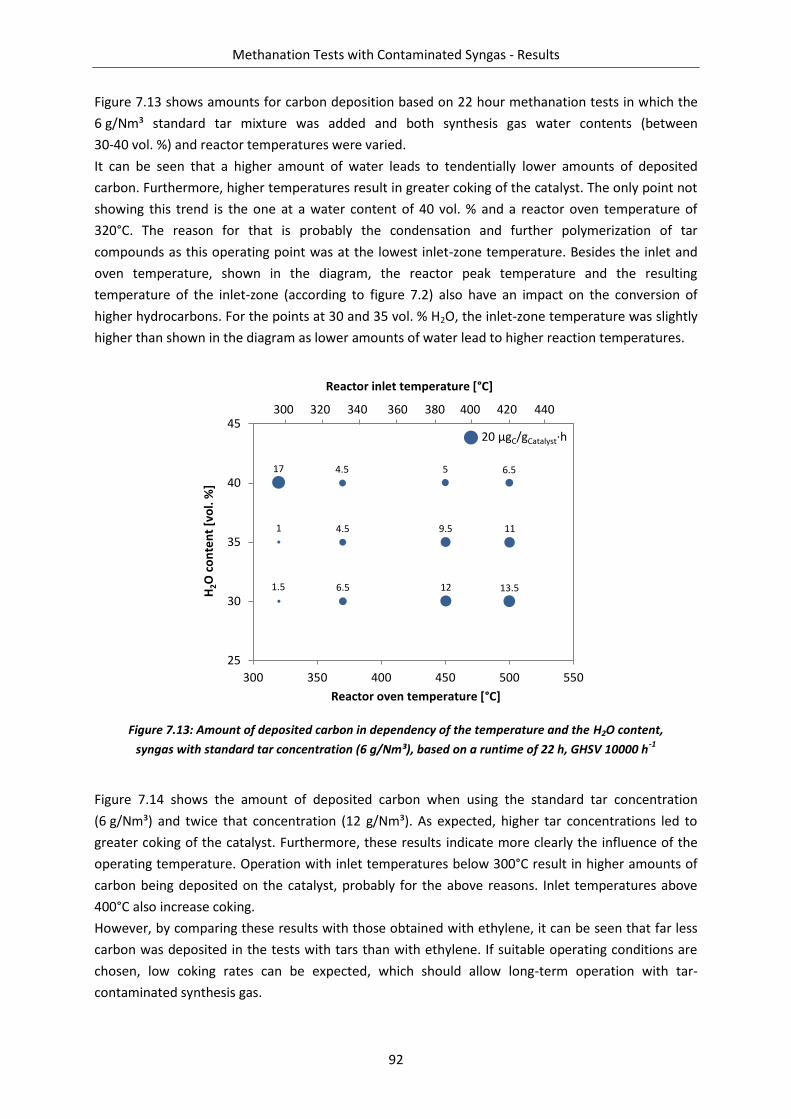
Methanation Tests with Contaminated Syngas - Results
92
Figure 7.13 shows amounts for carbon deposition based on 22 hour methanation tests in which the
6 g/Nm³ standard tar mixture was added and both synthesis gas water contents (between
30-40 vol. %) and reactor temperatures were varied.
It can be seen that a higher amount of water leads to tendentially lower amounts of deposited
carbon. Furthermore, higher temperatures result in greater coking of the catalyst. The only point not
showing this trend is the one at a water content of 40 vol. % and a reactor oven temperature of
320°C. The reason for that is probably the condensation and further polymerization of tar
compounds as this operating point was at the lowest inlet-zone temperature. Besides the inlet and
oven temperature, shown in the diagram, the reactor peak temperature and the resulting
temperature of the inlet-zone (according to figure 7.2) also have an impact on the conversion of
higher hydrocarbons. For the points at 30 and 35 vol. % H2O, the inlet-zone temperature was slightly
higher than shown in the diagram as lower amounts of water lead to higher reaction temperatures.
Figure 7.13: Amount of deposited carbon in dependency of the temperature and the H2O content,
syngas with standard tar concentration (6 g/Nm³), based on a runtime of 22 h, GHSV 10000 h-1
Figure 7.14 shows the amount of deposited carbon when using the standard tar concentration
(6 g/Nm³) and twice that concentration (12 g/Nm³). As expected, higher tar concentrations led to
greater coking of the catalyst. Furthermore, these results indicate more clearly the influence of the
operating temperature. Operation with inlet temperatures below 300°C result in higher amounts of
carbon being deposited on the catalyst, probably for the above reasons. Inlet temperatures above
400°C also increase coking.
However, by comparing these results with those obtained with ethylene, it can be seen that far less
carbon was deposited in the tests with tars than with ethylene. If suitable operating conditions are
chosen, low coking rates can be expected, which should allow long-term operation with tar-
contaminated synthesis gas.
25
30
35
40
45
300 350 400 450 500 550
Reactor inlet temperature [°C]
H2O
co
nte
nt
[vo
l. %
]
Reactor oven temperature [°C]
300 320 340 360 380 400 420 440
17 4.5 5 6.5
1 4.5 9.5 11
1.5 6.5 12 13.5
20 µgC/gCatalyst·h

Methanation Tests with Contaminated Syngas - Results
93
Figure 7.14: Amount of deposited carbon in dependency of the temperature and the tar concentration,
syngas with H2O content of 40 vol. %, based on a runtime of 22 h, GHSV 10000 h-1
What happens with tars during methanation?
As the test have shown, tar contaminations of synthesis gas lead only to minor catalyst coking during
methanation. It is, however, also important to know if tars are really converted during methanation
or if they just pass through the reactor. As can be seen in figure 7.15, which shows tar conversions
for the standard methanation configuration based on tar concentrations measured using the
SPA method, tars were fully converted under typical methanation conditions. Minor amounts of
benzene and toluene were detectable at the reactor outlet only at higher temperatures.
Figure 7.15: Tar conversion during a methanation test with the standard catalyst filling (30g) and standard
tar concentration in dependency of the reactor temperature, GHSV 10000 h-1
0
2
4
6
8
10
12
14
16
300 350 400 450 500 550
Reactor inlet temperature [°C]
Tar
con
cen
trat
ion
[g/
Nm
³]
Reactor oven temperature [°C]
300 320 340 360 380 400 420 440
17 4.5 5 6.5
25 13.5 12.5 24.5
20 µgC/gCatalyst·h
320 370 450 550 700
Reactor oven temperature [°C]
0.90
0.91
0.92
0.93
0.94
0.95
0.96
0.97
0.98
0.99
1.00
450 500 550 600 650
Tar
con
vers
ion
[-]
Reactor peak temperature [°C]
Benzene
Toluene
Naphthalene
Phenol
Total

Methanation Tests with Contaminated Syngas - Results
94
A test with a reduced amount of catalyst and increased tar concentration (figure 7.16) shows the
temperature influence on tar conversion even more clearly. The diagram indicates that the
methanation temperature has only a minor influence on the conversion of tars as the overall
conversion rate is between 96.5-98 % for all tested temperatures. Due to the low amount of catalyst
material used, the total catalyst bed height was only 1.5 cm, which, however, was enough to convert
> 96.5 % of the tars. Therefore these results represent the conversion that took place directly after
the inlet of the reactor.
Figure 7.16: Tar conversion during a methanation test with reduced catalyst filling (9 g) and 10 g/Nm³ of tar,
GHSV 33000 h-1
This high and fast conversion of tars is somehow contrary to what the literature says on tar
reforming. Many authors report that high temperatures – of up to 900°C – are needed for sufficient
conversion of higher hydrocarbons (chapter 3.3.3). Industrial steam reforming applications also
typically operate at outlet temperatures of up to 900°C [88]. Although the majority of the literature
claims that full reforming of tars at typical methanation temperatures is not possible, practice shows
that it is, at least with tars formed under steam gasification conditions.
Previous investigations [176] already analyzed the influence of methanation conditions on the
conversion of higher hydrocarbons (figure 7.17). In three test runs, performed for this study, 3 g/Nm³
of toluene were added to different gas compositions. The maximum temperature was constant in all
three tests. In the first test an H2/H2O mixture was used to represent reforming conditions; in the
second and third test run 6 vol. % and 18 vol. % of CO were added respectively to simulate
methanation conditions. Figure 7.17 clearly shows that the tar conversion rate is much higher when
CO is added rather than a mixture of H2 and H2O is used only. Similar results can be found in
publications by Vosecký [99], however, without any explanation of the reasons for this behavior.
The main difference between the tests with and without CO lies in the amount of reaction partners
that are available. Therefore the additional CO must somehow influence the kinetics of tar
conversion. One hypothesis is that the additional carbon or oxygen enhances the kinetics of tar
conversion, e.g. by faster dehydrogenation. However, which detailed mechanism is really at work
here cannot be clarified by this investigation as this would require additional, more detailed kinetic
studies.
0.90
0.91
0.92
0.93
0.94
0.95
0.96
0.97
0.98
0.99
1.00
450 500 550 600 650
Tar
con
vers
ion
[-]
Reactor peak temperature [°C]
Benzene
Toluene
Naphthalene
Phenol
Total
320 370 450 550 700
Reactor oven temperature [°C]

Methanation Tests with Contaminated Syngas - Results
95
Figure 7.17: Influence of methanation conditions on the conversion of toluene; adapted from [176],
standard reactor setup with EVT01 catalyst, GHSV 10000 h-1
Methanation with simultaneously addition of C2H4 and tars
Since ethylene and tars are both present in gasification-derived synthesis gas, interactions between
them are likely. To prove these interactions methanation tests were carried out in which tars and
ethylene were added simultaneously. Figure 7.18 shows the effects this had on carbon deposition.
The determination of the conversion rate of higher hydrocarbons confirmed previous results, which
had shown that higher hydrocarbons are completely converted under the chosen operating
conditions. However, since the amount of deposited carbon resulting from simultaneous conversion
is not a simple addition of the amounts of separate conversions, an interaction between the different
contaminates is obvious.
Figure 7.18: Amount of deposited carbon resulting from methanation with simultaneous addition of C2H4 and
tars compared to separate addition, based on a runtime of 22 h, GHSV 10000 h-1
0.80
0.85
0.90
0.95
1.00
350 400 450 500 550 600
Tolu
en
e c
on
vers
ion
[-]
Reactor peak temperature [°C]
54/6/4042/18/40
60/0/40
H2/CO/H2O [vol. %]
0
20
40
60
80
100
120
140
160
250 300 350 400 450 500 550
Reactor oven temperature [°C]
0.5 vol. % C2H4
0.7 vol. % C2H4
280 300 320 340 360 380 400 420 440
0.7 vol. % C2H4 + Tar
6 g/Nm³ Tar
0.5 vol. % C2H4+Tar
Reactor inlet temperature [°C]
condensation/polycondensation expected
Car
bo
nco
nte
nt
[µg C
arb
on/g
Cat
alys
t · h
]

Methanation Tests with Contaminated Syngas - Results
96
At lower reactor inlet temperatures (≈330°C) the measured amount of deposited carbon for
coincident conversion of tars and C2H4 was lower than when C2H4 was converted alone. At higher
temperatures the opposite effect occurred.
Raising the C2H4 content from 0.5 to 0.7 vol. % caused the amount of carbon deposited from tars and
C2H4 to rise by the same amount as when C2H4 was converted separately. It therefore seems that the
magnitude of coking is determined mainly by the ethylene content, whereas the trend of increased
coking with higher temperatures results from the influence of tars.
Which mechanism causes these interactions was not investigated in the course of this work. Jess [96]
reported that during conversion of hydrocarbon mixtures some species hinder or reduce the
conversion of others. A similar effect may also reduce or increase the amount of carbon formed
during the conversion of a hydrocarbon mixture and, in doing so, produce the results described
above.
Although simultaneous conversion of C2H4 and tars can be beneficial for lower coking than in
methanation with conversion of C2H4 only, the coking rates obtained are probably still too high for
commercial applications. Further investigations into ways of reducing coking are therefore necessary.

Methanation Tests with Contaminated Syngas - Results
97
7.4. Reduction of carbon deposition by addition of sulfur species
An observation made during bench-scale methanation tests with real synthesis gas led to the
assumption that sulfur somehow influences the formation of carbon on the catalyst. After having
made improvements on the desulfurization unit, severe coking occurred on the catalyst although
methanation tests under similar operating conditions had not shown this problem. Kienberger
et al. [100] reported that no coking occurred during methanation of H2S-loaded synthesis gas
although the syngas contained ethylene and tars in a concentration at which, according to the results
presented earlier in this thesis, carbon deposition was to be expected.
The coke-reducing effect of sulfur during steam reforming is well reported by Rostrup-Nielsen [129].
Sulfur chemisorbs and deactivates the catalyst. At low H2S concentrations delineated active zones
remain, which enable the reforming reaction but inhibit carbon formation reactions (chapter 4.2.2).
The same effect may lead to the coke-reducing behavior of sulfur observed during methanation.
However, despite the fact that sulfur may prevent carbon deposition, it is nevertheless a strong
poison for nickel, which is why even minor amounts of sulfur will deactivate the catalyst. Therefore
the use of sulfur to reduce coking makes only sense if the degree of catalyst degradation due to
sulfur is smaller than the amount of coking or if the gas cleaning effort can be reduced.
Catalyst deactivation by sulfur
To determine catalyst degradation from sulfur, methanation tests with addition of H2S were
performed. Figure 7.19 shows the degree of catalyst deactivation and the amount of adsorbed sulfur
that was measured in these tests. The active catalyst area was determined by measuring the axial
temperature profile along the whole length of the reactor. Due to deactivation the temperature of
the reactor inlet zone decreases (figure 4.12). Therefore, the area beyond the temperature graph
reduces as well with ongoing deactivation. If the temperature graph equals the graph of the inert
temperature, a state of full deactivation has been reached.
The H2S concentration was 14 ppm for the first 52 hours, 130 ppm between hour 53 and 116, and
14 ppm again after that. It can be seen that deactivation at 130 ppm is faster than at 14 ppm, but
that H2S is not adsorbed in the same ratios. This leads to the assumption that the specific amount of
catalyst deactivation, e.g. gCatalyst/gH2S, is also a matter of overall sulfur concentration. Which
mechanism causes these results cannot be clarified. One possible explanation is that the diffusional
restrictions inside the catalyst pellets slow down the adsorption rate [177] so that at higher
concentrations sulfur adsorbs in greater amounts on the surface of the catalyst pellets and thus does
not deactivate the inner part of the catalyst. The results also indicate that the deactivation rate
decreases with high amounts of sulfur and high deactivation of the catalyst. This may be due to sulfur
adsorption being spread more widely across the reactor, which leads to a smaller temperature
decrease. However, this effect will not be pursued any further as such high degrees of catalyst
deactivation are not suitable for methanation anyway.

Methanation Tests with Contaminated Syngas - Results
98
Figure 7.19: Measured catalyst degradation from poisoning with H2S (14 and 130 ppm) for EVT05
From the measured deactivation rates it is possible to calculate the specific amount of catalyst
consumption and, consequently, the specific catalyst cost, which is the additional cost of catalyst
replacement due to deactivation of the catalyst. Figure 7.20 shows the amount of catalyst
consumption and the specific cost of catalyst degradation based on the results from methanation
tests with poisoning with 14 ppm H2S. Due to the above-mentioned influence of the sulfur
concentration on the deactivation rate, the values may differ somewhat for lower H2S
concentrations. However, the magnitude of catalyst consumption should be represented well.
Figure 7.20: Specific catalyst consumption and related specific catalyst cost due to poisoning with H2S,
determined with 14 ppm H2S for EVT05; estimated catalyst cost of 70 €/kg
If the H2S concentration is low, the resulting catalyst consumption and cost might well be in an
acceptable range for medium and small-scale applications. If the H2S concentration in the feed is
0.5 ppm, the deactivation of the catalyst results in a catalyst consumption in a range of
0.015-0.02 g/kWhSyngas.
0
0.2
0.4
0.6
0.8
1
1.2
1.4
1.6
0.0
0.1
0.2
0.3
0.4
0.5
0.6
0.7
0.8
0.9
1.0
0 50 100 150 200
Ad
sorb
ed
H2S
[g]
No
rmal
ize
d a
ctiv
e c
atal
yst
are
a [-
]
Runtime [h]
130 ppm 14 ppm 14 ppm H2S
0.0
0.5
1.0
1.5
2.0
2.5
0
0.1
0.2
0.3
0.4
0 1 2 3 4 5 6 7 8 9 10
Cat
alys
t co
sts
[ct/
kWh
Syn
gas]
Cat
alys
t co
nsu
mp
tio
n [
g/kW
hSy
nga
s]
H2S concentration [ppm]

Methanation Tests with Contaminated Syngas - Results
99
Influence of sulfur on carbon deposition
To investigate the influence of sulfur in the feed, the same procedure as in the methanation tests
with C2H4 and tars was applied; additionally, however, 0.25 to 1 ppm of H2S was added to the
synthesis gas. The tests were performed at a reactor oven temperature of 370°C, where the highest
coking had occurred during the tests with C2H4. This operating point was therefore of particular
interest concerning the impact of sulfur. As can be seen in figure 7.21, which shows the effects of
adding C2H4 and H2S, the addition of as little as 0.25 ppm of H2S already leads to a significant
reduction in the amount of deposited carbon, and even with 1 vol. % of C2H4 almost-carbon-free
methanation was possible by addition of 1 ppm of H2S.
Figure 7.21: Influence of C2H4 and H2S on the amount of deposited carbon at 370°C reactor oven temperature,
based on a runtime of 22 h, GHSV 10000 h-1
Since C2H4 and tars are normally present simultaneously in gasification-derived synthesis gas, the
influence the addition of H2S has on such gas compositions was also investigated. For that purpose
the standard tar mixture with a total of 6 g/Nm³ of tar was added, along with C2H4, to the syngas.
Figure 7.22: Influence of a C2H4, tars and H2S on the amount of deposited carbon at 370°C reactor oven
temperature, based on a runtime of 22 h, GHSV 10000 h-1
0.2
0.4
0.6
0.8
1.0
1.2
-0.2 0 0.2 0.4 0.6 0.8 1 1.2
C2H
4co
nte
nt
[vo
l. %
]
H2S concentration [ppm]
605 3.5
133
17 8.5 9
2.5
20 µgC/gCatalyst·h
0.2
0.4
0.6
0.8
1.0
1.2
-0.2 0 0.2 0.4 0.6 0.8 1 1.2
C2H
4co
nte
nt
[vo
l. %
]
H2S concentration [ppm]
19
99 62
29 8
506 187 61
C2H4 + 6 g/Nm³ Tar 20 µgC/gCatalyst·h

Methanation Tests with Contaminated Syngas - Results
100
Figure 7.22 shows the measured carbon contents for methanation tests with different C2H4 and H2S
concentrations. These results also confirm the coking-reducing property of sulfur. However,
compared to the results with C2H4/H2S only (figure 7.21), this effect is less strong. At a C2H4 content
of 0.7 vol. %, 6 g/Nm³ tars and an H2S concentration of 0.5 ppm the carbon deposition was 8 µg/g·h,
which could be sufficiently low to allow long-term operation.
To also prove the influence of H2S over a longer runtime, long-term tests were performed as well. In
one such test with 0.7 vol. % of C2H4, 6 g/Nm³ of tar and addition of 0.5 ppm of H2S over a runtime of
270 hours, 2.19 mg/g of carbon was deposited. In a test without addition of H2S, this amount was
already reached after 22 hours. The differential pressure across the reactor was constant for the
whole runtime. Due to the addition of sulfur 10 % of the catalyst was deactivated, which corresponds
to a specific catalyst consumption of around 0.03 g/kWhSyngas. This degree of deactivation is higher
than can be explained by the effect of sulfur alone (figure 7.20). However, the results show the great
potential that lies in the addition of sulfur to the synthesis gas for the reduction or even prevention
of coking.
7.5. Visual evaluation of carbon deposits
Besides quantitative evaluation, a visual evaluation provides additional information on the type and
consistency of carbon deposits. Therefore selected samples were analyzed by means of microscopy.
Figure 7.23: States of polymeric carbon coverage on a catalyst pellet
Figure 7.23 shows the different states of polymeric carbon coverage on a catalyst pellet. Depending
on the intensity of coking, the pellet can be covered only partially, or fully, or fully covered with
agglomeration between the individual catalyst pellets.
Figure 7.24: SEM photos of polymeric carbon deposits on the catalyst resulting from C2H4 after (a) 22 h,
(b) 70 h runtime; operating conditions: 320°C reactor oven temperature, 40 vol. % H2O, 0.5 vol. % C2H4
Clean Ni-catalyst Partial, even carbon deposition
Full, evencarbon deposition
Full, agglomerated carbon deposition
a) b)200 µm 100 µm

Methanation Tests with Contaminated Syngas - Results
101
Due to the temperatures of the catalyst occurred in the tested methanation concept only polymeric
carbon deposits were expected (chapter 4.2.1). This assumption was confirmed by the samples
analyzed, in which no graphitic carbon was found. Figure 7.24 shows SEM photos of carbon deposits
formed from ethylene after different runtimes. After shorter tests (runtime of 22 h), layers of carbon
can be found on the surface of the catalyst. Photos taken with a higher resolution showed that these
deposits consist mainly of carbon filaments (figure 7.25) and minor amounts of carbon layers (figure
7.26). After a longer runtime (70 h), areas with pitting/erosion of the surface were found; these were
covered with polymeric carbon deposits, which indicates that in these areas catalytic material was
removed by filamentous carbon deposits. Pitting could be found only on one sample. However, all
analyzed samples with carbon deposits promoted by C2H4 and C2H4/tar mixtures contain mainly
filamentous carbon. It can therefore be assumed that other catalyst samples are also affected by
catalyst destruction, which is important if regeneration of a catalyst becomes an issue.
The samples which had H2S added to synthesis gas containing C2H4 and tars showed lower numbers
of carbon filaments but more carbon layers and other unstructured, amorphous deposits.
Since only a small number of samples were analyzed by means of SEM, it is important to note that
the results presented here are not necessarily representative for all samples.
Figure 7.25: SEM photos of polymeric carbon filaments resulting from C2H4
Figure 7.26: SEM photos of polymeric carbon layers resulting from C2H4
10 µm 400 nm
2 µm 400 nm

Methanation Tests with Contaminated Syngas - Results
102
7.6. Summary and conclusion bottle-mixed syngas tests
Carbon deposition, which is promoted by different contaminations like ethylene and tars, can cause
severe problems during methanation. While the main focus of the tests was on a quantitative
analysis of carbon deposition, catalytic activity and conversion of the different contaminations were
also considered.
The results of the investigation into coking behavior show that coke accumulates linearly with the
runtime under the specified operating conditions, which makes it possible to partially replace long-
term tests with extrapolation of shorter tests.
The addition of C2H4 in amounts higher 0.3-0.35 vol. % to clean synthesis gas leads to severe
formation of carbon on the catalyst. The amount of deposited carbon depends on the reactor
temperatures and the ethylene content; it increases strongly with the amount of C2H4 added, and
increases and then decreases with rising temperature.
The addition of a representative tar mixture to the clean synthesis gas also leads to carbon
formation. Higher syngas water contents and lower temperatures reduce the coking rate. Tars cause
considerably less coking than ethylene. Therefore, the direct conversion of tars during methanation
can be assumed as being less problematic than the conversion of ethylene. In all methanation tests
performed, ethylene and tars were fully converted under typical methanation conditions.
Simultaneous conversion of C2H4 and tars showed that the magnitude of carbon deposition is
determined by the C2H4 content, while tars give the trend to stronger coking at higher temperatures.
Since typical concentrations of ethylene and tars in synthesis gas are in a range where severe coking
can be expected, ways to reduce coking need to be found. One such option could be the addition of
certain sulfur species, like H2S, to the synthesis gas, which was successfully tried in several
methanation tests carried out in the course of this investigation. The results clearly show that minor
amounts of H2S added to the syngas can significantly reduce coking, thus proving the great potential
of this method.

Bench-Scale Tests with Real Syngas from Gasification
103
Chapter 8
8. Bench-Scale Tests with Real Synthesis Gas Produced in
Allothermal Gasification
8.1. Investigation focus and program
The aim of the bench-scale tests was to apply the proposed concept of methanation using real
synthesis gas produced in thermal gasification. The focus of the tests was on the performance of the
catalyst under the realistic conditions of usage of contaminated synthesis gas. In the method
proposed some of the contaminations, such as particles, alkalis and sulfur species, are removed by
the hot gas cleaning unit prior to methanation whereas higher hydrocarbons remain in the syngas
and are converted during methanation.
Before five long-term tests with runtimes of up to 200 hours were performed, an existing, indirectly
heated gasifier was modified and connected with a newly built gas cleaning unit and a bench-scale
methanation reactor. During the tests gas compositions and contaminations were measured at all
stages of the process. The main test results are catalyst degradation rates, which were evaluated on
the basis of the temperatures measured in the reactor. Further important results gained are
conversion rates of higher hydrocarbons during methanation and removal efficiency of the hot gas
cleaning unit. After each test the amount of carbon deposited on the catalyst was measured using
the TPO method. The results thus obtained can serve as a basis for further process improvements
and for the design of large-scale concepts.
8.2. Test rig assembly and setup
8.2.1. Test rig assembly
The test rig assembly for the bench-scale tests consists of an indirectly heated, fluidized bed gasifier,
a hot gas cleaning unit and a methanation reactor. An additional gas mixing station provides bottle-
mixed gases for reducing of the catalysts (figure 8.1). Different analysis systems measure gas
compositions and contaminations at different points of the process.

Bench-Scale Tests with Real Syngas from Gasification
104
Figure 8.1: Photo of the bench-scale test rig for SNG production with real synthesis gas from gasification
Lab-scale gasifier
The indirectly heat fluidized bed gasifier (figure 8.2) is used to produce a realistic synthesis gas from
lignite and biomass. It was constructed and modified in the course of various previous studies [10],
[178]. The nominal fuel power is 5 kW, but it typically operates at 1-2 kW. The whole system is
designed for pressures up to 4 bars. To overcome the pressure losses of the downstream parts,
operation at an overpressure of 0.5-1 bar is sufficient.
The gasification reactor consists of a bubbling fluidized bed, which has an inner diameter of 60 mm
and a length of around 150 mm. A well-dimensioned freeboard prevents the excessive discharge of
bed material while providing enough resistance time to allow a high amount of coke to be converted,
which is important for long-term operations. The main bed material is olivine (Magnolithe, Austria)
with a medium grain size of 250 µm. Water steam is used for fluidization of the bed and as a
gasification medium; the steam is generated by a commercial steam generator as used in
conventional steam stations for irons. The steam flow is measured and regulated by means of an
orifice flow measurement and a proportional valve. Additionally, it is also possible to use N2 for
fluidization. An electrical tube furnace heats the reactor up to 850°C to provide the heat required for
the endothermic gasification reactions.
Gasifier
Methanation andgas-cleaning test rig
Gas mixing station

Bench-Scale Tests with Real Syngas from Gasification
105
Figure 8.2: Flow sheet of the indirectly heated, fluidized bed gasifier
The used fuel-feed system was newly designed for the tests within this work and replaces the
previously used fuel input described in [10]. The new system consists of a screw conveyor, which
doses the fuel from a fuel reservoir, and a feed-lock system to pressurize the fuel and feed it into the
fluidized bed. The feed-lock system also prevents air from getting into the reactor and blocks the
release of gasification gases from the reactor by purging with N2. It consists of three pneumatic ball
valves which alternately open and close to transport the fuel into the reactor. Purging and
pressurization takes place between the two ball valves fitted close to the reactor. Due to the
programmed sequence, fuel drops into the reactor every 15 seconds. For safety reasons, the lowest
ball valve only opens if the pressure above it is slightly higher than the reactor pressure and if the
two upper ball valves are closed.
A cyclone filter and a sinter metal filter remove particles from the gas. Since the sinter metal filter
operates at around 350°C, alkalis also condensate on the filter cake. A jet-pulse filter-cleaning system
removes the filter cake when the differential pressure of the filter becomes too high. A pressure-
retaining valve at the outlet of the gasification system keeps the system pressure constant. The
synthesis gas leaves the reactor with a temperature of around 350-400°C.
A large number of pressure sensors and thermocouples enable the monitoring of all important
operating parameters. The use of a Bernecker&Rainer (B&R) industrial control system makes the
whole assembly fully automatized and consequently allows unsupervised operation, which is
important for long-term testing.
PD
F
MFC N2: max. 3500 ml/min
PD
T
PD
Cyclone filter
Sinter metal filter
Automatic filter cleaning
Differential pressure sensor (filter)
Feed-lock system
N2-purging and pressurizing
Differential pressure sensor (reactor)
Orifice flow measurement
Steam regulation
valve
Steam generator
Pressure retaining
valve
Demineralization
Reactor oven with fluidized bed reactor
P
Pressure sensor (steam)
P Pressure sensor (reactor)
P Pressure sensor (N2)
P
Pressure sensor
Fuel reservoir
Screw conveyor
Purging
N2
N2
5 thermo-couples
SPE
Port for SPE-sample
Water
Exhaust
Pressurized air
Exhaust
Pressurized air
Outlet / to methanation
test rig

Bench-Scale Tests with Real Syngas from Gasification
106
Gas cleaning and methanation unit
Trace-heated lines connect the gasifier with the gas cleaning and methanation unit (figure 8.3). The
adsorptive hot gas cleaning unit consists of two tubular fixed bed reactors. The larger reactor 1 has
an inner diameter of 54 mm, a length of 800 mm and a total useable volume of around 1.7 liters.
Reactor 2 has an inner diameter of 34 mm, a length of 600 mm and a volume of around 0.5 liters.
Both reactors are placed in reactor ovens which can be heated up to 700°C (larger reactor) and 450°C
(smaller reactor). A 6 mm tube in the center of the reactors supports axially displaceable
thermocouples for measuring various reactor temperatures.
Both the methanation reactor and the gas mixing station are the same as those used in the bench-
scale methanation tests with clean synthesis gas (chapter 5.1).
Figure 8.3: Flow sheet of the bench-scale hot gas cleaning and methanation unit
A large number of valves enable a variable interconnection of the different reactors. This is necessary
especially for the start-up procedure or when one of the gas cleaning reactors needs to be replaced
during operation. A gas meter is used to measure and control the volume flow of the methanation
reactor. Since the gas contains a large amount of water, a condenser and a silica gel adsorber remove
it before it reaches the gas meter. After each reactor, sample ports allow the taking of gas samples
for the micro-GC and SPA samples; these ports are also directly connected with the permanent gas
analyzer. Therefore the full spectrum of measuring techniques can be applied at all stages of the
process.
T T T
PD
Flare
Natural gas
SPE
Port for SPE-
sample
SPE
Port for SPE-
sample
SPE
Port for SPE-
sample
16 thermo-couples
Dif
fern
enti
al p
ress
ure
sen
sor
2 thermo-couples
2 thermo-couples
Hot gas cleaning 2
Methanation reactor
Hot gas cleaning 1
Pre
ssu
rize
d a
ir
(rea
cto
r co
olin
g)
To GA / gas sample bag
Condenser
Silica gelGas meter
From gasifier
Trace heated lines
3 z
on
e h
eati
ng
Volumeflow measurement unit
To GA / gas sample bag
To GA / gas sample bag
From gas mixing station

Bench-Scale Tests with Real Syngas from Gasification
107
Gas analysis unit
The gas analysis unit for the bench-scale methanation tests with real synthesis gas (figure 8.4)
consists of a permanent gas analyzer and a tar-sampling unit constructed according to the tar
protocol. Before the gas reaches the gas analyzer, washing bottles with IPA remove tars from the
synthesis gas as they would damage the gas analyzer. Solenoid valves enable switching between
different sample ports (gasifier, gas cleaning and methanation).
The tar-sampling unit takes a slip stream coming from the gasifier, but it is also possible to connect it
with the sample ports of the different reactors.
Further analysis equipment and techniques used are the micro-GC (for analysis of contaminations),
detector tubes, and the SPA method (for tar sampling). Chapter 6.2.3 provides a detailed description
of the different analysis methods.
Figure 8.4: Flow sheet of the gas analysis unit for methanation and gasification tests
8.2.2. Test setup and operating conditions
Fuel
The gasification was performed with biomass and lignite. Standard wood pellets according to the
ENplus-A1 standard were used as a biogenic fuel. The lignite was of the high-quality type
RWE PowerSPLIT, which is normally used in fluidized bed applications. After crushing, the grain size
was between 2-4 mm, which is ideal for the feed-system of the gasifier. Table 8.1 shows the main
parameters of the two fuels. Tests 1-4 of the long-term tests presented in the next section were
performed with lignite, biomass was used for test 5.
Lignite was used for two reasons: first, because this research was initially part of a European coal
research project CO2freeSNG [26] and funded by it, and, secondly, because lignite represents a kind
of ‘worst-case biomass scenario’. The gasification properties as well as the gas qualities that can be
reached using the chosen type of lignite are similar to those of biomass, the main difference being
the higher amount of sulfur contaminations caused by lignite. Thus, if the applied gas cleaning
concept works with lignite-derived synthesis gas, it should work with all kinds of biomass-derived
gases.
Activated carbon
Condenser unit
Pump unit
From gasifier
Exhaust Tar sampling according tar protocol
Washing bottlesVolume-sampling module
From methanation
From gas cleaning 1
From gas cleaning 2
-20°C +20°C
-20°C +20°C
Gas analyzer H2, O2
Gas analyzer CO, CO2, CH4

Bench-Scale Tests with Real Syngas from Gasification
108
Table 8.1: Fuel parameters for the used lignite and biomass
Wood pellets (ENplus-A1)
RWE PowerSPLIT [179]
C [wt. %] 47.6 53.6 H [wt. %] 5.8 3.9 O [wt. %] 39.0 19.2 N [wt. %] < 0.2 0.6 S [wt. %] 0.04 0.35 H2O [wt. %] 6.9 19.0
Ash [wt. %] 0.47 3.5 Fixed carbon [wt. %] 17.4 [180] 35.5 Volatiles [wt. %] 74.2 [180] 42 LHV [kJ/kg] 18100 19800
xH2O,min [kgH2O/kgFuel,Wet] 0.208 0.431
Gasifier operating conditions
The main purpose of the gasifier is to provide a constant and representative flow of synthesis gas.
Therefore, the operating conditions were set accordingly (table 8.2). The main requirement for the
synthesis gas is a water content in the range of 40 vol. % and a constant gas flow. Operation at low
fuel inputs ensures long-term operation of the gasifier due to high carbon conversion rates.
Furthermore, the GHSV of the methanation reactor can be kept lower at reduced fuel inputs as the
methanation reactor is connected in-line with the gasifier.
Table 8.2: Operating parameters for the real gas methanation tests
Lignite Biomass Test 1 Test 2 Test 3 Test 4 Test 5
Bed Temp. [°C] 770-820 770-820 770-820 770-820 790-810 Fuel input [kW] 0.7-1 0.7-1 0.7-1 0.7-1 1-1.3 Pressure [bar] 0.5 0.5 0.5 0.5 0.5 Steam flow [kg/h] 0.35-0.4 0.34-0.38 0.33-0.37 0.33-0.37 0.22-0.28
Sorbent Desulf. 1 ZnO ZnO ZnO ZnO ZnO Temp. Desulf. 1 ≈300°C ≈300°C ≈300°C ≈300°C ≈300°C Sorbent Desulf. 2 AC AC GS6+AC GS6 - Temp. Desulf. 2 ≈300°C ≈300°C ≈300°C ≈300°C -
Catalyst Meth. EVT01 EVT05 EVT05 EVT05 EVT05 Inlet-Temp. Meth. 275-300°C 275-300°C 275-300°C 275-300°C 275-300°C GHSV Meth. [h-1] ≈3000 ≈2700 ≈2500 ≈2500 ≈2500
Gas cleaning operating conditions
The two hot gas cleaning reactors can be filled with different types of sorbents. Zinc oxide is the most
common adsorbent for hot removal of H2S. The commercial ZnO sorbent Clariant/Südchemie
ActiSorb S2 had performed well in previous desulfurization tests and was therefore used in the first
reactor. The temperature of the ZnO adsorber was around 300°C. At that temperature the
equilibrium H2S concentration is below 0.1 ppm.

Bench-Scale Tests with Real Syngas from Gasification
109
The second reactor was used for testing various other sorbent types. ZnO is probably not able to
remove organic sulfur species completely. Promising alternatives to it are different impregnated
activated carbons and a sorbent on basis of copper-/manganese oxide. Since those materials also
showed hydrodesulphurization activity, a short ZnO bed was placed after them. The filling of the
second reactor for the five long-term tests presented in the next section was chosen accordingly:
Test 1: ROZ3 (AC), Test 2: ROZ3 (AC), Test 3: FCDS-GS6 (CuO/MnO) + ROZ3 (AC), Test 4: FCDS-GS6
(CuO/MnO), Test 5: empty. Chapter 3.2 provides more information about the sorbent materials used.
To prevent condensation of tars the operating temperature was set to around 300°C.
Methanation operating conditions
Due to its promising results during the bench-scale methanation tests with clean synthesis gas, the
catalyst EVT05 was also used for the tests with real gas, except for test 1, in which EVT01 was used.
The inlet temperature for the methanation tests was between 275 and 300°C, which is a few degrees
lower than the results of chapter 7 would suggest. Therefore, future tests will operate with inlet
temperatures of 300-330°C. Since the focus of the tests was on the degradation behavior of the
catalyst, the reactor was not actively cooled. Active cooling would influence the temperature
profiles, which are the basis for the evaluation of the degradation. The typical outlet temperatures
were in the range 350-420°C. The methanation reactor was typically operated with a GHSV between
2500-3000 h-1.

Bench-Scale Tests with Real Syngas from Gasification
110
8.3. Results
The following section presents the results of gasification, hot gas cleaning and methanation obtained
in five long-term tests. Tests 1-4 were performed with lignite, whereas wood pellets were used in
test 5.
8.3.1. Gasification
Since the main purpose of gasification was to produce a representative synthesis gas, the main
results are gas compositions and contaminations of the synthesis gas. Parameter studies on
gasification were not performed within this thesis, but a large number of parameter variations were
carried out in previous works [181], [155], [182] [178].
Figure 8.5 shows average permanent gas compositions on a dry basis and without N2 for synthesis
gas produced by gasification of wood pellets and lignite. In practice gasifiers always have to deal with
fluctuating gas compositions. The gasifier used in the tests of this investigation also showed certain
fluctuations in gas compositions, which were mainly due to a non-steady fuel input and variations of
the bed temperature. Therefore, typical ranges of gas compositions are shown additionally.
However, some fluctuations may even exceed those ranges.
Figure 8.5: Mean permanent gas composition from gasification of woody biomass and lignite (dry, N2-free),
gasification temperature ≈800°C, σ ≈6 (biomass), σ ≈4 (lignite)
The permanent gas compositions of biomass and lignite are fairly similar. Due to the higher amount
of volatiles in biomass, its gasification produces a higher amount of CH4 and therefore a lower
amount of H2. The mean gas composition of biomass gasification corresponds well to the standard
synthesis gas composition defined and used for the methanation tests described in previous
chapters. Since this standard syngas gas composition is based on equilibrium calculations, the
measured gas composition from gasification is in or close to equilibrium (except CH4). This
equilibrium-like gas composition results from operation at low fuel power and therefore long times
of residence of the gas in the gasification reactor. Average gas residence times in the fluidized bed
are around 1.6 s, whereas average residence times in the whole reactor are around 30 s, which is due
to the large freeboard of the gasifier.
0
10
20
30
40
50
60
H2 CO CO2 CH4
Gas
co
mp
osi
tio
n [
vol.
%]
Lignite (left bar)
Woody biomass (right bar)
H2 CO CO2 CH4
Typical range

Bench-Scale Tests with Real Syngas from Gasification
111
Figure 8.6 presents the synthesis gas compositions on a wet basis including N2. Nitrogen is produced
by purging of the fuel input. During the tests with biomass modifications of the feed-lock system
allowed a reduction of N2 purging so that lower amounts were present in the syngas. The medium
water content of around 42 vol. %, was slightly higher than the water content of the standard syngas.
Figure 8.6: Mean permanent gas composition from gasification of woody biomass and lignite,
gasification temperature ≈800°C, σ ≈6 (biomass), σ ≈4 (lignite)
Besides the desired syngas components, synthesis gas also contains certain amounts of higher
hydrocarbons, the main species found being C2H4 (around 0.8 vol. % for biomass and 0.35 vol. % for
lignite – figure 8.7). The higher amount of volatiles in biomass led to the formation of higher amounts
of hydrocarbons in biomass gasification, in analogy to the higher CH4 content.
Figure 8.7: Mean C2-C4 content from gasification of woody biomass and lignite,
gasification temperature ≈800°C, σ ≈6 (biomass), σ ≈4 (lignite)
A comparison of the C2-C4 amounts with results from the Agnion HPR pilot plant shows that they
match well for biomass [7] as well as for gasification of lignite [26]. Compared to the Güssing
FICFB gasifier [9], the measured C2-C4 amounts are 3-4 times lower. This could be due to the longer
0
10
20
30
40
50
H2 CO CO2 CH4 N2 H2O
Gas
co
mp
osi
tio
n [
vol.
%]
Lignite (left bar)
Woody biomass (right bar)
H2 CO CO2 CH4 N2 H2O
Typical range
0.001
0.01
0.1
1
C2H4 [vol. %]C2H6 [vol. %]C3H6 [vol. %]C3H8 [vol. %]C4H10 [vol. %]
Gas
co
mp
osi
tio
n [
vol.
%]
Lignite (left bar)
Woody biomass (right bar)
C2H4 C2H6 C3H6 C3H8 C4H10
Typical range
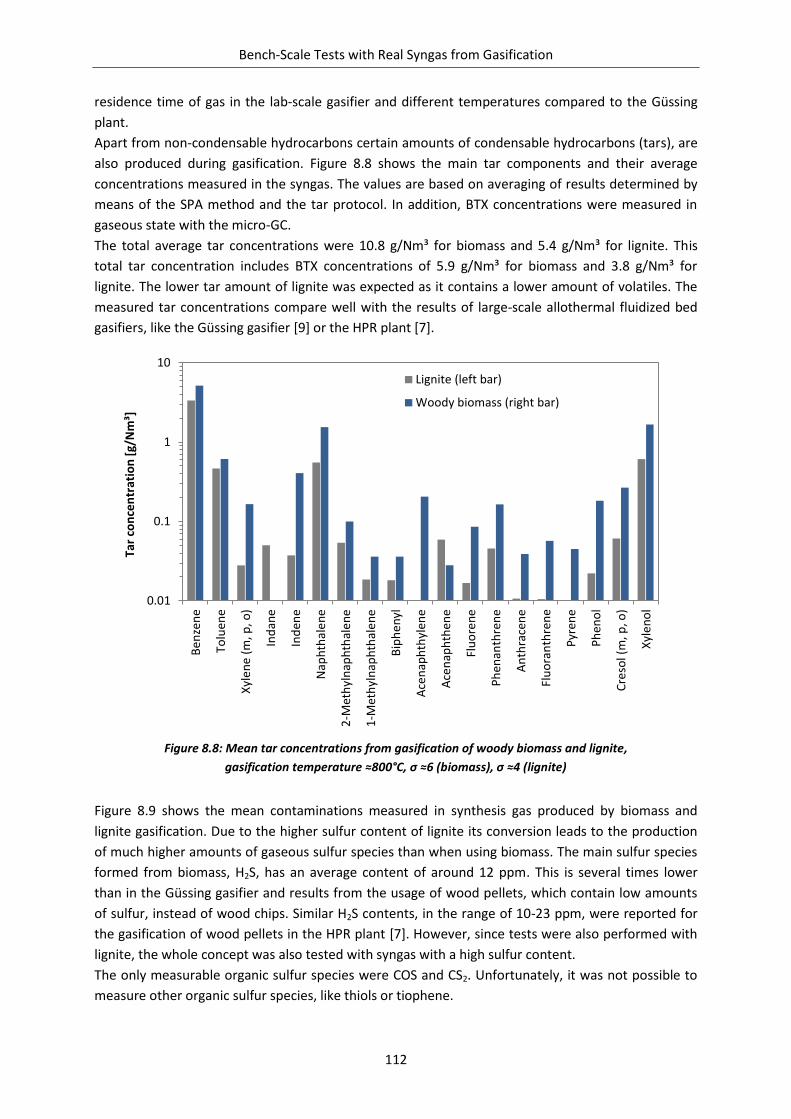
Bench-Scale Tests with Real Syngas from Gasification
112
residence time of gas in the lab-scale gasifier and different temperatures compared to the Güssing
plant.
Apart from non-condensable hydrocarbons certain amounts of condensable hydrocarbons (tars), are
also produced during gasification. Figure 8.8 shows the main tar components and their average
concentrations measured in the syngas. The values are based on averaging of results determined by
means of the SPA method and the tar protocol. In addition, BTX concentrations were measured in
gaseous state with the micro-GC.
The total average tar concentrations were 10.8 g/Nm³ for biomass and 5.4 g/Nm³ for lignite. This
total tar concentration includes BTX concentrations of 5.9 g/Nm³ for biomass and 3.8 g/Nm³ for
lignite. The lower tar amount of lignite was expected as it contains a lower amount of volatiles. The
measured tar concentrations compare well with the results of large-scale allothermal fluidized bed
gasifiers, like the Güssing gasifier [9] or the HPR plant [7].
Figure 8.8: Mean tar concentrations from gasification of woody biomass and lignite,
gasification temperature ≈800°C, σ ≈6 (biomass), σ ≈4 (lignite)
Figure 8.9 shows the mean contaminations measured in synthesis gas produced by biomass and
lignite gasification. Due to the higher sulfur content of lignite its conversion leads to the production
of much higher amounts of gaseous sulfur species than when using biomass. The main sulfur species
formed from biomass, H2S, has an average content of around 12 ppm. This is several times lower
than in the Güssing gasifier and results from the usage of wood pellets, which contain low amounts
of sulfur, instead of wood chips. Similar H2S contents, in the range of 10-23 ppm, were reported for
the gasification of wood pellets in the HPR plant [7]. However, since tests were also performed with
lignite, the whole concept was also tested with syngas with a high sulfur content.
The only measurable organic sulfur species were COS and CS2. Unfortunately, it was not possible to
measure other organic sulfur species, like thiols or tiophene.
0.01
0.1
1
10
Be
nze
ne
Tolu
ene
Xyl
en
e (
m, p
, o)
Ind
ane
Ind
ene
Nap
hth
ale
ne
2-M
eth
yln
aph
thal
en
e
1-M
eth
yln
aph
thal
en
e
Bip
he
nyl
Ace
nap
hth
ylen
e
Ace
nap
hth
ene
Flu
ore
ne
Ph
enan
thre
ne
An
thra
cen
e
Flu
ora
nth
ren
e
Pyr
ene
Ph
eno
l
Cre
sol (
m, p
, o)
Xyl
en
ol
Tar
con
cen
trat
ion
[g/
Nm
³]
Lignite (left bar)
Woody biomass (right bar)

Bench-Scale Tests with Real Syngas from Gasification
113
Figure 8.9: Mean contaminations from gasification of woody biomass and lignite,
gasification temperature ≈800°C, σ ≈6 (biomass), σ ≈4 (lignite)
8.3.2. Adsorptive hot gas cleaning
The main purpose of adsorptive hot gas cleaning was the removal of sulfur contaminations without
influencing the other synthesis gas components. Contaminations were measured after the first
reactor, which contained ZnO only and after the second reactor, which contained, depending on the
test, ZnO, activated carbons or CuO/MnO sorbents. The comparison of measured contaminations
after gas cleaning of fully contaminated syngas (figure 8.10) shows that all measurable sulfur species
were below the detection limit of around 0.1 ppm for H2S and 0.2 ppm for COS. The complete
removal of sulfur was both independent of the type of fuel used and of whether ZnO was used with
other sorbents or alone. It can therefore be claimed that under the applied conditions ZnO
(ActiSorb S2) allows the removal of H2S and COS to an extent which is sufficient for catalytic
applications. The permanent gas compositions, as well as other contaminations and tars, were not
measurably influenced by hot gas cleaning.
Figure 8.10: Comparison of the mean contaminations resulting from gasification of lignite before and after
hot gas desulfurization with ZnO at ≈300°C, GHSV gas cleaning ≈ 500 h-1
0.1
1
10
100
1000
H2S [ppm] COS [ppm] CS2 [ppm] NH3 [ppm] HCl
Gas
co
mp
osi
tio
n [
pp
m]
Lignite (left bar)
Woody biomass (right bar)
H2S COS CS2 NH3 HCl
Typical range
0.1
1
10
100
1000
10000
H2S [ppm] COS [ppm] NH3 [ppm] BTX C2-C4
Gas
co
mp
osi
tio
n [
pp
m]
Gasification Gas Cleaning
H2S COS NH3 BTX C2-C4
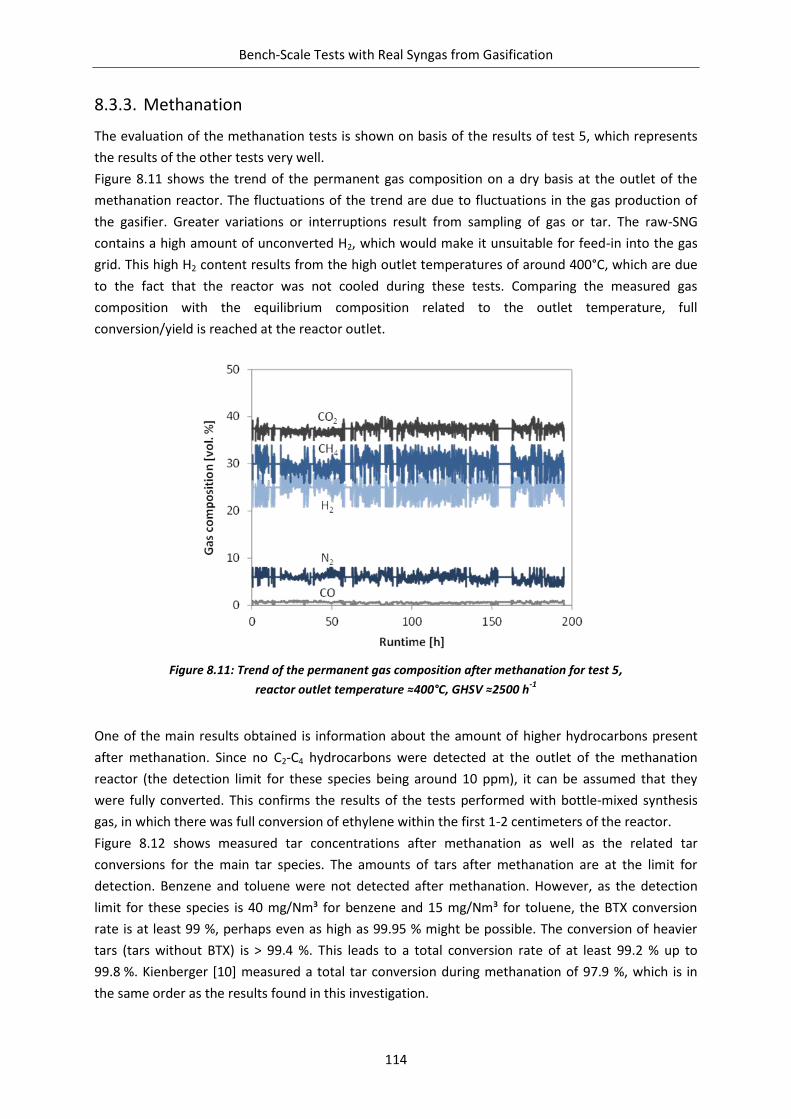
Bench-Scale Tests with Real Syngas from Gasification
114
8.3.3. Methanation
The evaluation of the methanation tests is shown on basis of the results of test 5, which represents
the results of the other tests very well.
Figure 8.11 shows the trend of the permanent gas composition on a dry basis at the outlet of the
methanation reactor. The fluctuations of the trend are due to fluctuations in the gas production of
the gasifier. Greater variations or interruptions result from sampling of gas or tar. The raw-SNG
contains a high amount of unconverted H2, which would make it unsuitable for feed-in into the gas
grid. This high H2 content results from the high outlet temperatures of around 400°C, which are due
to the fact that the reactor was not cooled during these tests. Comparing the measured gas
composition with the equilibrium composition related to the outlet temperature, full
conversion/yield is reached at the reactor outlet.
Figure 8.11: Trend of the permanent gas composition after methanation for test 5,
reactor outlet temperature ≈400°C, GHSV ≈2500 h-1
One of the main results obtained is information about the amount of higher hydrocarbons present
after methanation. Since no C2-C4 hydrocarbons were detected at the outlet of the methanation
reactor (the detection limit for these species being around 10 ppm), it can be assumed that they
were fully converted. This confirms the results of the tests performed with bottle-mixed synthesis
gas, in which there was full conversion of ethylene within the first 1-2 centimeters of the reactor.
Figure 8.12 shows measured tar concentrations after methanation as well as the related tar
conversions for the main tar species. The amounts of tars after methanation are at the limit for
detection. Benzene and toluene were not detected after methanation. However, as the detection
limit for these species is 40 mg/Nm³ for benzene and 15 mg/Nm³ for toluene, the BTX conversion
rate is at least 99 %, perhaps even as high as 99.95 % might be possible. The conversion of heavier
tars (tars without BTX) is > 99.4 %. This leads to a total conversion rate of at least 99.2 % up to
99.8 %. Kienberger [10] measured a total tar conversion during methanation of 97.9 %, which is in
the same order as the results found in this investigation.

Bench-Scale Tests with Real Syngas from Gasification
115
Figure 8.12: Measured tar concentration after methanation and the related tar conversion for test 5,
reactor outlet temperature ≈400°C, GHSV ≈2500 h-1
During methanation the trend of the differential pressure of the reactor (figure 8.13) provides
important information: an increased value indicates blockage of the reactor due to severe coking.
Neither in test 5 nor in the other tests was such an increase observed.
The fluctuations in differential pressure are due to gas flow fluctuations. Since the correlation
between differential pressure and gas flow is quadratic, even minor gas flow variations result in
considerable variations of the pressure.
Figure 8.13: Trend of the differential pressure across the methanation reactor over the runtime for test 5
0
10
20
30
40
50
60
Be
nze
ne
Tolu
ene
Xyl
en
e
Ind
ane
Ind
ene
Nap
hth
ale
ne
2-M
eth
yln
aph
t.
1-M
eth
yln
aph
t.
Bip
he
nyl
Ace
nap
hty
len
e
Ace
nap
hte
ne
Flu
ore
ne
Ph
enan
thre
ne
An
thra
cen
e
Flu
ora
nth
ren
e
Pyr
ene
Ph
eno
l
Cre
sol
Xyl
en
ol
0.80
0.85
0.90
0.95
1.00
Tar
con
cen
trat
ion
[m
g/N
m³]
Tar
con
vers
ion
[-]

Bench-Scale Tests with Real Syngas from Gasification
116
Coking during the test with real synthesis gas
The differential pressure trend indicates that the coking which occurred is not severe enough to
cause a blockage of the reactor voids. To quantify the amount of deposited carbon, catalyst samples
from different points of the reactor were analyzed by means of the TPO method. The results (shown
in figure 8.14) confirm previous findings of this investigation: most of the coking occurred in the inlet
zone of the reactor, and no carbon deposits were found on the catalyst far after the inlet zone; i.e.
most of the reactor was free of carbon deposits.
The amount of carbon deposited in the inlet zone is high compared to the tests with bottle-mixed
synthesis gases, where carbon contents above 5 mg/g had led to a significant rise of the differential
pressure, whereas in the real-gas tests carbon contents of 35 mg/g did not cause an increase. The
main difference between the tests with bottle-mixed syngas and the bench-scale tests with real
synthesis gas is that despite gas cleaning, the latter, probably contains certain amounts of catalyst
poisons, such as organic sulfur. By slowly deactivating the catalyst these poisons shift the main
reaction zone, thus causing carbon deposits to become more dispersed. No coking occurs after the
main reaction zone as all the hydrocarbons are converted in the inlet zone.
Figure 8.14: Measured catalyst carbon contents at different points of the methanation reactor after test 5
As in the tests with bottle-mixed synthesis gas, the majority of carbon deposits were of a filamentous
kind (figure 8.15); in addition, minor amounts of polymeric carbon layers were visible under the
electron microscope. What was different from the tests with bottle-mixed syngas was the presence
of laminar (probably graphitic) carbon deposits (figure 8.16). Since the operating conditions of the
lab-scale and the bench-scale methanation reactor were quite similar, the carbon deposits occurred
might be influenced by the gas compositions or the contaminations (or they were just not detected
on the samples of the tests with bottle-mixed gases).
Unlike in the tests with bottle-mixed syngas, the tests with real gas led to the formation of a high
amount of broken catalyst pellets (figure 8.17) in the inlet zone. Although thermal stressing cannot
be ruled out as a possible cause, the destructive behavior of filamentous carbon is a much more
likely explanation [109]. The fact that the broken catalyst pellets were observed only in areas with
severe coking also points to that.
250
300
350
400
450
500
550
0
5
10
15
20
25
30
35
40
0.0 0.2 0.4 0.6 0.8 1.0
Re
acto
r te
mp
era
ture
[°C
]
Car
bo
n c
on
ten
t [m
g Car
bo
n/g
Cat
alys
t]
Scaled reactor length [-]
35.7
8.7
0.69 0.10 0.11
Temperature

Bench-Scale Tests with Real Syngas from Gasification
117
Figure 8.15: SEM-photos of polymeric carbon filaments on a catalyst sample taken after
longtime real gas tests
Figure 8.16: SEM-photos of laminar (graphitic) carbon deposits on a catalyst sample taken after
longtime real gas tests
Figure 8.17: SEM-photo of cracks on a catalyst tab after 200 h runtime with real synthesis gas
10 µm 1 µm
10 µm 400 nm
200 µm1 mm

Bench-Scale Tests with Real Syngas from Gasification
118
Catalyst deactivation
In all tests with real synthesis gas, deactivation of the catalyst occurred; the displacement of the
temperature profile measured in the reactor is a clear indication of that. Figure 8.18 depicts such
temperature profiles for different runtimes. This deactivation is most probably caused by organic
sulfur species which could not be removed during hot gas cleaning; unfortunately, quantification of
these sulfur species was not possible. Although the tar species used in the tests with bottle-mixed
syngas did not cause any deactivation of the catalyst, deactivation due to other tar species cannot be
excluded. Further investigations are necessary to better understand the reasons for this deactivation.
Figure 8.18: Axial temperature trends in the methanation reactor for different runtimes for test 5
It is possible to quantify the deactivation by determining the integral area under the curve of the
reactor temperature. The area represents the released heat and it is therefore an indicator for the
activity of the catalyst. The amount of deactivation can be calculated as follows: To get the active
temperature profile, the inert temperature profile (Tinert) is subtracted from the temperature profile
of a particular runtime (Tt). By integrating the active temperature profile over the length (l) one gets
the active-catalyst-area aCatalyst (equation 8.1).
( ) ∫ (
) 8.1
( )
8.2
Normalizing the active-catalyst-area after a certain runtime to the active-catalyst-area at the
beginning, one gets the normalized-active-catalyst-area an,Catalyst (equation 8.2). Figure 8.19 shows the
trend of the normalized-active-catalyst-area for the five long-term tests with real synthesis gas.
Due to variation of the synthesis gas composition, the synthesis gas flow and the resulting gas
compositions after methanation, a useful comparison is only possible by relating the active-catalyst-
area to a representative value, such as synthesis gas power or SNG power.
250
300
350
400
450
500
550
0 0.2 0.4 0.6 0.8 1
Tem
pe
ratu
re [
°C]
Scaled reactor length [-]
0 h10 h
40 h
90 h
150 h
190 h

Bench-Scale Tests with Real Syngas from Gasification
119
Since the decrease of the normalized-active-catalyst-area corresponds to the loss of catalyst active, it
becomes possible to calculate the specific amount of catalyst consumption. Figure 8.20 shows the
calculated specific catalyst consumption values of the five bench-scale test runs. The high variations
are mainly due to fluctuations in the supply of syngas and inconsistent determination of values such
as syngas power.
Figure 8.19: Measured catalyst degradation for tests 1-5 expressed by the normalized-active-catalyst-area
The tests with lignite (tests 1-4) show a linear decrease of the catalyst-area (catalyst consumption),
whereas the amount of degradation in test 5 (using biomass) decreases with runtime. One
explanation for this reduction is that the sulfur concentration of the feed might have fallen for some
unknown reason.
The average catalyst consumption values measured are between 0.13-0.34 g/kWhSyngas. According to
the catalyst consumption value determined for synthesis gas containing H2S (figure 7.20) these
measured consumption values would be equivalent to around 4-10.5 ppm of H2S.
In test 1 a different catalyst and a slightly higher H2O content of synthesis gas was used than in the
other tests. Therefore, a direct comparison of test 1 with tests 2-5 is not possible. The results of tests
with lignite (2-4) show a greater extent of catalyst consumption than those in which biomass was
used (5). This might be explained by the greater amounts of sulfur contaminations found in lignite-
derived synthesis gas. Although H2S was below 0.2 ppm in the feed stream for methanation, a certain
amount of organic sulfur was probably still present in the syngas.
However, due to certain unknown parameters, such as organic sulfur contents of synthesis gas, slight
variations between the different tests, and multiple determinations not having been carried out, a
clear explanation of the differences in the extent of catalyst consumption in the different tests is not
possible. Nevertheless, the values obtained provide useful clues as to the extent of catalyst
consumption.
0.80
0.85
0.90
0.95
1.00
0 50 100 150 200
No
rmal
ize
d a
ctiv
e c
atal
yst
are
a [-
]
Runtime [h]
Test 1
Test 2
Test 3
Test 4
Test 5

Bench-Scale Tests with Real Syngas from Gasification
120
Figure 8.20: Measured specific catalyst consumptions for tests 1-5
When assessing the results, the cost factor also has to be taken into account. Assuming a catalyst
costs of 70 €/kg, additional costs of 0.9-2.4 ct/kWhSyngas would be incurred due to the consumption of
the catalyst. Considering the low feed-in price for natural gas of, currently, around 2.7 ct/kWh
(November 2013), such a high cost for a catalyst would clearly be uneconomical for lignite-to-SNG
systems.
However, further research should make it possible to reduce catalyst consumption. If that, together
with rising gas prices or the availability of additional funding, leads to an increase in revenues, the
concept proposed here can be a real alternative for the future as it will allow economical operation
of small-scale, decentralized biomass-to-SNG plants.
Test 1
Test 5
Test 2
Test 4
Test 3
0.0
0.5
1.0
1.5
2.0
2.5
3.0
3.5
4.0
0
0.1
0.2
0.3
0.4
0.5
0.6
0 50 100 150 200
Runtime [h]
Cat
alys
t co
nsu
mp
tio
n [
g/kW
hSy
nga
s]
Cat
alys
t co
sts
[€ct
/kW
hSy
nga
s]

Conclusion
121
Chapter 9
9. Conclusion
This thesis makes a contribution to the development of a methanation process that allows the
production of substitute natural gas in small-scale, decentralized facilities. Smaller plant sizes require
a reduction of plant complexity, which can be achieved by introducing a reduced form of gas cleaning
and a simplified methanation process. With reduced gas cleaning certain contaminations remain in
the synthesis gas. These contaminations may harm the methanation catalyst; however, a certain
extent of deactivation of the catalyst can be accepted if it helps to reduce plant complexity. The
maximum degree of catalyst deactivation acceptable (extent of catalyst consumption) is a matter of
economics. The achievable amount depends on parameters such as the type of catalyst used, the
operating conditions and the gas compositions and contaminations. This thesis therefore seeks to
investigate the methanation process itself and, in particular, the influences of different
contaminations present in synthesis gas.
The results of bench-scale methanation tests show that the polytropic reactor concept proposed in
this thesis is a good alternative to existing concepts as it combines a simple design with lower
catalyst volumes. It allows clean synthesis gas to be fully converted up to around 230°C without
noticeable deactivation of the catalyst, and the SNG thus produced is, after conditioning, suitable for
feed-in into the gas grid.
Figure 9.1: Influence of contaminations on the specific amount of catalyst consumption;
parameters: 330°C reactor inlet temperature, tar mixture with 6 g/Nm³, H2S = 0.5 ppm, 40 vol. % H2O
Synthesis gas complexity
Syngas Syngas+ C2H4
Syngas+ C2H4
+ Tar
Syngas+ C2H4
+ Tar+ H2S
Realsyngas
0.7 vol. % C2H4
0.5 vol. % C2H4
Lignite
Biomass
PoisoningCoking
0.0
0.5
1.0
1.5
2.0
2.5
0.00
0.05
0.10
0.15
0.20
0.25
0.30
0.35
Cat
alys
tco
nsu
mp
tio
n[g
/kW
hSy
nga
s]
Cat
alys
tco
sts
[€ct
/kW
hSy
nga
s]

Conclusion
122
The situation is even more complex if different types of contaminations are present in synthesis gas.
Hydrocarbon-based contaminations are directly converted in the inlet zone of the methanation
reactor. However, certain hydrocarbon types and concentrations can cause coking of the catalyst.
Figure 9.1 summarizes the resulting extent of catalyst deactivation, expressed as specific catalyst
consumption values, for methanation with different contaminations.
The addition of 0.3-0.35 vol. % of ethylene to clean synthesis gas results in coking of the methanation
catalyst. C2H4 contents of above 0.5 vol. %, as are typical of biomass-derived synthesis gas, lead to
severe coking and therefore high specific catalyst consumption values. If, in addition to C2H4, tars are
also present in the syngas, coking and consequently the specific degree of catalyst consumption are
reduced. Further addition of minor amounts (< 1 ppm) of H2S allows methanation without deposition
of carbon despite the presence of C2H4 and tars. Since H2S is a strong catalyst poison, it slightly
deactivates the catalyst, but with low (acceptable) catalyst consumption.
These results were obtained under controlled and well reproducible lab-scale conditions.
Unfortunately, bench-scale methanation tests with real synthesis gas from thermal gasification
caused a much higher deactivation rate although the operating conditions of methanation and the
amounts of C2H4 and tars were the same order, the main difference being probably the larger
amount of organic sulfur contaminations in the feed, which could not be removed completely by the
form of gas cleaning applied. Coking also occurred in the bench-scale methanation test. Since it was
sufficiently low, it was, however, not the reason for the high degree of catalyst deactivation.
Figure 9.2, which shows the various degrees of catalyst deactivation in relation to sulfur
concentrations, provides a different view of the results. It illustrates clearly that methanation
without consumption of the catalyst is not possible with the proposed concept, but that the extent of
deactivation is fairly low for sulfur concentrations of 0.7 to 1 ppm.
Figure 9.2: Influence of sulfur concentration and ethylene content on specific catalyst consumption
0.0
0.5
1.0
1.5
2.0
2.5
0
0.1
0.2
0.3
0.4
0 1 2 3 4 5
Cat
alys
t co
nsu
mp
tio
n [
g/kW
hSy
nga
s]
Sulfur concentration [ppm]
1 vol. % C2H4
0.7 %
0.5 %
Syngas
Real syngas
Biomass
Lignite
Syngas + HC
Cat
alys
tco
sts
[€ct
/kW
hSy
nga
s]

Conclusion
123
In summary it can be said that a complete conversion of higher hydrocarbons is possible. The
deposition of carbon, which occurs in the process, can be prevented or minimized by adding traces of
hydrogen sulfide. Although further investigations are necessary, the results show the great potential
of the proposed concept for the production of SNG and contribute to a better understanding of the
various factors influencing methanation.
Further investigations will have to look at ways of reducing catalyst deactivation resulting from
methanation with real synthesis gas. Since catalyst degradation is probably caused by insufficient
removal of sulfur contaminations and not by the methanation process itself, the optimization of the
gas cleaning process seems to be the next logical step to take. Rather than aiming at complete
removal of sulfur, which may result in coking, this thesis advocates the addition of traces of H2S as a
simple and economical solution.

References
124
10. References
[1]. Karl, J. Dezentrale Energiesysteme. München Wien : Oldenbourg Verlag, 2012.
[2]. Moore, F. T. Economies of scale: Some statistical evidence. Quarterly Journal of Economics. 1959, 73, pp. 232-245.
[3]. U.S. Department of Energy. Practical experience gained during the first twenty years of operation of the great plains gasification plant and implications for future projects. Department of Energy. 2006.
[4]. Kopyscinski, J., Schildhauer, T. J. and Biollaz, S. M. A. Production of synthetic natural gas (SNG) from coal and dry biomass - A technology review from 1950 to 2009, doi:10.106/j.fuel.2010.01.027. Fuel. 2010.
[5]. Dinjus, E. and Dahmen, N. The bioloq process - concept, technology and state of development. Motortechnische Zeitschrift. 2010, 71.
[6]. Karl, J. Biomass Heatpipe Reformer - Design and Performance of an indirectly heated steam gasifier. doi:10.1007/s13399-013-0102-6. Biomass Conversion and Biorefinery. 2013.
[7]. Gallmetzer, G., et al. The agnion Heatpipe-Reformer - operating experiences and evaluation of fuel conversion and syngas composition. Biomass Conversion and Biorefinery. 2012, 3, pp. 207-215.
[8]. Kern, S., Pfeifer, C. and Hofbauer, H. Gasification of wood in a dual fluidized bed gasifier: Influence of fuel feeding on process performance. Chemcial Engineering Sience. 2013, 90, pp. 284-298.
[9]. Pfeifer, C., Koppatz, S. and Hofbauer, H. Steam gasification of various feedstocks at a dual fluidised bed gasifier: Impact of operation conditions and bed materials. Biomass Conversion and Biorefinery. 2011, 1, pp. 39-53.
[10]. Kienberger, T. Methanierung biogener Synthesegase mit Hinblick auf die direkte Umsetzung von höheren Kohlenwasserstoffen, Fortschritt-Bericht VDI Reihe 6, Nr. 595. Düsseldorf : VDI Verlag, 2010.
[11]. Thau, A. Die Stadtgasindustrie. Deutsches Museum - Abhandlung und Berichte. Berlin : VDI Verlag GmbH, 1935.
[12]. Karl, J., Baumhakl, C. and Kienberger, T. Substitute Natural Gas aus Kohle - Technologie und Wirkungsgrade. [book auth.] M. Beckmann and A. Hurtado. Kraftwerkstechnik. Neuruppin : TK Verlag, 2009.
[13]. Bone, W. A. and Coward, H. F. The direct union of carbon and hydrogen - synthesis of methane. Journal of the Chemical Society, Transactions. 1908, 93, pp. 1975-1993.
[14]. Sabatier, P. and Senderens, J. B. New synthesis of methane. Comptes rendus de l'Académie des sciences. 1902, 134, pp. 514-516.
[15]. Elworthy, H. S. Manufacture of gas for illuminating, heating, or power purposes. 943,627 United States, 14 12 1909.
[16]. Fischer, F. Gesammelte Abhandlungen zur Kenntnis der Kohle. Berlin : Gebrüder Borntraiger, 1932. Vol. 10.
[17]. Herrlett, U. Update und Weiterentwicklung der Lurgi/BASF Methanisierungstechnologie. Conference proceeding "Fach-Kolloquium Methanisierung und Second Generation Fuels" 29.-30.5.2012, Nürnberg.
[18]. Eisenlohr, K. H., Moeller, F. W. and Dry, M. Influence of certain reaction parameters on methanation of coal gas to SNG. Fuels ACS. 1974, 19, pp. 1-9.

References
125
[19]. Haldor Topsoe. From solid fuels to substitute natural gas (SNG) using TREMP. Lyngby : Haldor Topsoe, 2009.
[20]. Höhnlein, B., Menzer, R. and Range, J. High temperature methanation in the long-distance nuclear energy transport system. Applied Catalysis. 1981, 1, pp. 125-139.
[21]. Haldor Topsoe. World's largest SNG plant goes on-stream in China with catalysts and process technology from Haldor Topsoe. Press release - 28.10.2013. Lyngby
[22]. Strakey, J. P., Forney, A. J. and Haynes, W. P. Methanation in coal gasification processes. Pittsburgh : Pittsburgh Energy Research Center, 1975.
[23]. Lee, B. S. Development of the HYGAS process for converting coal to synthetic pipeline gas. Journal of Petroleum Technology. 1972, 24, pp. 1407-1410.
[24]. White, G. A., Roszkowski, T. R. and Stanbridge, D. W. The RMProcess. ACS Fuels. 1974, 19, pp. 57-69.
[25]. Strakey, J. P., Forney, A. J. and Hayner, W. P. Methanation in coal gasification processes. Pittsburgh : NTIS, 1975.
[26]. Baumhakl, C., et al. Substitute natural gas from coal with internal sequestration of CO2 (CO2freeSNG). Final report. Bruessels - Luxembourg : Publications Office of the European Union, 2013.
[27]. Martin, J. W. Liquid-phase methanation/shift process development. Final technical report. s.l. : Chem Systems, Inc., 1982.
[28]. Götz, M., et al. Evaluation of organic and ionic liquids for three-phase methanation and biogas purification processes. Energy Fuels. 2013, 27, pp. 4705-4716.
[29]. Streeter, R. C. Recent developments in fluidized-bed methanation research. Proceedings 9th synthetic pipeline gas symposium. Chicago , 1977.
[30]. Friedrichs, G. and Wismann, G. Untersuchung über die Einsatzmöglichkeiten gekühlter Gas/Feststoff-Druckwirbelschichten, insbesondere der COMFLUX-Technik für chemische Prozesse. Abschlußbericht. s.l. : Thyssengas-GmbH, 1986.
[31]. Dakota Gasification Company. [Online] [Cited: 12 11 2013.] www.dakotagas.com.
[32]. Davy Process Technology. Successful startup of Datang phase 1 SNG plant in China. Press release - Davy Process Technology - 09/2012. London
[33]. Higman, C. State of the gasification industry - the updated worldwide gasification database. Conference proceeding Gasification Technologies Conference, Colorado Springs 2013.
[34]. Hofbauer, H., Koch, R. and Aichernig, C. Biomass CHP plant Güssing - A success story. Proceeding expert meeting on pyrolysis and gasification of biomass and waste. Strasbourg, 2002.
[35]. Knoef, H. A. M. Handbook biomass gasification, Second edition. Enschede : BTG Biomass Technology Group BV, 2012.
[36]. Seiffert, M., et al. Bio-SNG - Demonstration of the production and utilization of synthetic natural gas (SNG) from solid biofuels. Final project report TREN/05/FP6EN/S07.56632/019895. 2009.
[37]. Kopyscinski, J., Schildhauer, T. J. and Biollaz, S. M. A. Employing catalyst fluidization to enable carbon management in the synthetic natural gas production from biomass. Chemical Engineering & Technology. 2009, 32, pp. 343-347.
[38]. Kopyscinski, J., et al. Synthetic natural gas from wood: Reactions of ethylene in fluidised bed methanation. Applied Catalysis A: General. 2013, 462-463, pp. 150-156.
[39]. Gunnarsson, I. The GoBiGas-project. Presentation on the Nordic Baltic Bioenergy, 21.-22. May 2013. Oslo

References
126
[40]. Metz, T. Allotherme Vergasung von Biomasse in indirekt beheizten Wirbelschichten. VDI Fortschrittsbericht Reihe 6, Nr. 554. Düsseldorf : VDI Verlag, 2007.
[41]. Karl, J. Distributed generation of substitute natural gas from biomass. Proceedings 16th European biomass conference and exhibition, 2.-6. June 2008. Valencia
[42]. Lawrence Graham. LG advises JSC Naftogaz in US$3.656 bn credit agreement. Press release Lawrence Graham, 6.2.2013.
[43]. KEPCO-Uhde. KEPCO-Uhde pushing ahead with Indonesia SNG project. Press release KEPCO-Uhde, 1.1.2013.
[44]. Metz, T. Siemens Kohlevergasungstechnologie - Syngas für Second Generation Fuels. Conference proceeding "Fach-Kolloquium Methanisierung and Second Generation Fuels" 29.-30.5.2012, Nürnberg .
[45]. Synthesis Energy Systems Inc. Hainan Dongfang Henghe Energy selects SES technology for its coal gasification project in china. Press release, 9.4.2013. Houston.
[46]. Great Point Energy Inc. Wanxiang and GreatPoint Energy announce 1.25 billion investment and agree to construct world's most efficient coal-to-natural gas production in china. Press Release, 21.5.2012. Cambridge .
[47]. Amick, P. E-Gas technology and POSCO Gwangyang project update. Presentation on the Coal Asia Conference. New Delhi, 2012.
[48]. Haldor Topsoe. CPI has awarded Haldor Topsoe the contract for a 2 billion Nm³ per year Coal to SNG plant in Xinjiang. Press release 07.03.2012.
[49]. Yang, C. J. and Jackson, R. B. China's synthetic natural gas revolution. Nature Climate Change. 2013, 3, pp. 852-854.
[50]. Milne, T. A., Evans, R. J. and Abatzoglou, N. Biomass gasifier 'tars': Their nature, formation and conversion. Colorado, USA : NREL, 1998.
[51]. Rabou, L., et al. Tar in biomass producer gas, the energy research centre of the netherlands (ECN) experience: An enduring challange. Energy Fuels. 2009, 23, pp. 6189-6198.
[52]. Frank, N. Umsetzung von Kohlenwasserstoffen in SOFCs. Dissertation Technische Universität München. s.l. : Dr. Hut, 2010.
[53]. Salo, K. and Mojtahedi, W. Fate of alkali and trace metals in biomass gasification. Biomass and Bioenergy. 1998, 15, pp. 263-267.
[54]. Cummer, K. R. and Brown, R. C. Ancillary equipment for biomass gasification. Biomass and Bioenergy. 2002, 23, pp. 113-128.
[55]. Pinto, F. et al. Comparison of a pilot scale gasification installation performance when air or oxygen is used as gasification medium 2 - Sulphur and nitrogen compounds abatement. Fuel. 2012, 97, pp. 770-782.
[56]. Zuber, C. Untersuchung von Schwefelverbindungen und deren Entfernung beim Prozess der Biomassevergasung. Masterarbeit TU Graz. Graz, 2012.
[57]. Zwart, R. W. R. Gas cleaning downstream biomass gasification, Status report 2009. Petten : ECN, 2009.
[58]. Espinal, J. F., Truong, T. N. and Mondragon, F. Mechanisms of NH3 formation during the reaction of H2 with nitorgen containing carbonaceous materials. Carbon. 2007, 45, pp. 2273-2279.
[59]. Atimtay, A. T. and Harrison, D. P. Desulfurization of hot coal gas. Berlin : Springer-Verlag, 1996.
[60]. Westmoreland, P. R. and Harrison, D. P. Evaluation of candidate solids for high-temperature desulfurization of low-Btu gases. Environmental Sience & Technology. 1976, 10, pp. 659-661.
References
127
[61]. Garces, H. F., et al. Low temperature H2S dry-desulfurization with zinc oxide. Microporous and Mesoporous Materials. 2010, 127, pp. 190-197.
[62]. Brunson, R., Flessner, U. and Morse, P. Catalysts for hydrogene management. Petroleum Technology Quarterly - Catalysis. 2013, 04.
[63]. BASF. R5-12 ZnO for H2S Removal. Technical Bulletin. Houston : BASF, 2002.
[64]. Schweiger, A. Reinigung von heissen Produktgasen aus Biomassevergasern für den Einsatz in Oxidkeramischen Brennstoffzellen. Dissertation TU Graz. Graz, 2008.
[65]. Hederer, H. Trockenentschwefelung für Kombikraftwerke mit Kohlevergasung. Chemie Ingenieur Technik. 1989, 12, pp. 948-952.
[66]. Slimane, R. B. and Abbasian, J. Regenerable mixed metal oxide sorbents for coal gas desulfurization at moderate temperatures. Advances in Environmental Research. 2000, 4, pp. 147-162.
[67]. Katalambula, H., Bawagan, A. and Takeda, S. Mineral attachment to calcium-based sorbent particles during in situ desulfurization in coal gasification processes. Fuel Processing Technology. 2001, 73, pp. 75-93.
[68]. Chen, S., et al. Incorporating IGCC and CaO sorption-enhanced process for power generation with CO2 capture. Applied Energy. 2012, pp. 285-294.
[69]. Hepworth, M. T., Berns, J. J. and Sadecki, K. A. Kinetics of Mn-based sorbents for hot coal gas desulfurization. Minneapolis : Department of Civil Engineering, University of Minnesota, 1997.
[70]. Yi, K. Ceria-zirconia oxide high temperature desulfurization sorbent. Dissertation Louisiana State University. Louisiana, 2004.
[71]. Schmalfeld, J. Die Veredelung und Umwandlung von Kohle. Hamburg : DGMK, 2008.
[72]. Sitthikhankaew, R., et al. Comparative study of hydrogen sulfide adsorption by using alkaline impregnated activated carbons for hot fuel gas purification. Energy Procedia. 2011, 9, pp. 15-24.
[73]. Sakanishi, K., et al. Simultaneous removal of H2S and COS using activated carbons and their supported catalysts. Catalysis Today. 2005, 104, pp. 94-100.
[74]. Cal, M. P., Strickler, B. W. and Lizzio, A. A. High temperature hydrogen sulfide adsorption on activated carbon. Carbon. 2000, 38, pp. 1757-1774.
[75]. Bader, A., et al. Modelling of a chemical reactor for simulation of a methanisation plant. Proceeding Modelica 2011, Dresden, 2011.
[76]. Vannice, M. A. The catalytic synthesis of hydrocarbons from H2/CO mixtures over the group VIII metals. Journal of Catalysis. 1975, pp. 449-461.
[77]. Bartholomew, C. H. and Vance, C. K. Effects of support on the kinetics of carbon hydrogenation on nickel. Journal of Catalysis. 1985, 91, pp. 78-84.
[78]. Bengaard, H. S., et al. Steam reforming and graphite formation on Ni catalysts. Journal of Catalysis. 2002, 209, pp. 365-384.
[79]. Hayes, R. E., Thomas, W. J. and Hayes, K. E. A study of the nickel-catalyzed methanation reaction. Journal of Catalysis. 1985, 92, pp. 312-326.
[80]. Yadav, R. and Rinker, R. G. Step-response kinetics of methanation over Ni/Al2O3 catalyst. Industrial & Engineering Chemistry Research. 1992, 31, pp. 502-508.
[81]. Alstrup, I. On the kinetics of CO methanation on nickel surfaces. Journal of Catalysis. 1995, 151, pp. 216-225.
[82]. Klose, J. and Baerns, M. Kinetics of methanation of carbon monoxide on an aluminia-supported nickel catalyst. Journal of Catalysis. 1984, 85, pp. 105-116.

References
128
[83]. Liu, P., et al. Water-gas-shift reaction on a Ni2P(001) catalyst: Formation of oxy-phosphides and highly active reaction sites. Journal of Catalysis. 2009, 262, pp. 294-303.
[84]. Rodriguez, J. A. Gold-based catalysts for the water-gas shift reaction: Active sites and reaction mechanism. Catalysis Today. 2011, 160, pp. 3-10.
[85]. Jakdetchai, O. and Nakajima, T. Mechanism of the water-gas shift reaction over Cu(110), Cu(111) and Cu(100) surfaces: an AM1-d study. Journal of Molecular Structure. 2002, 619, pp. 51-58.
[86]. Tang, Q., Chen, Z. and He, X. A theoretical study of the water gas shift reaction mechanism on Cu(111) model system. Surface Sience. 2009, 603, pp. 2138-2144.
[87]. Inui, T., Funabiki, M. and Takegami, Y. Simultaneous methanation of CO and CO2 on supported Ni-based composite catalysts. Industrial & Engineering Chemistry Product Research and Development. 1980, 19, pp. 385-388.
[88]. Rostrup-Nielsen, J. R. Steam reforming catalysts. Copenhagen : Teknisk Forlag A/S, 1975. ISBN 8757104948.
[89]. Xu, J. and Froment, G. F. Methane steam reforming, methanation and water-gas shift: I. Intrinsic Kinetics. AIChE Journal. 1989, 35, pp. 88-96.
[90]. Rostrup-Nielsen and R., J. Activity of nickel catalysts for steam reforming of hydrocarbons. Journal of Catalysis. 1973, 31, pp. 173-199.
[91]. Korre, S. C. and Klein, M. T. Hydrocracking of polynuclear aromatic hydrocarbons. Development of rate laws through inhibition studies. Industrial & Engineering Chemistry Research. 1997, 36, pp. 2041-2050.
[92]. Korre, S. C., Klein, M. T. and Quann, R. J. Polynuclear aromatic hydrocarbons hydrogenation. 1. Experimental reaction pathways and kinetics. Industrial & Engineering Chemistry Research. 1995, 34, pp. 101-117.
[93]. Usui, K., et al. Catalytic hydrocracking of petroleum-derived asphaltenes by transition metal-loaded zeolite catalysts. Fuel. 2004, 83, pp. 1899-1906.
[94]. Ising, M. Zur katalystischen Spaltung teerartiger Kohlenwasserstoffe bei der Wirbelschichtvergasung von Biomasse. Dissertation Universität Dortmund. Dortmund : Fraunhofer IRB Verlag, 2002.
[95]. Coll, R., et al. Steam reforming model compounds of biomass gasification tars: conversion at different operating conditions and tendency towards coke formation. Fuel Processing Technology. 2001, 74, pp. 19-31.
[96]. Jess, A. Catalytic upgrading of tarry fuel gases: A kinetic study with model components. Chemical Engineering and Processing. 1996, 35, pp. 487-494.
[97]. Kinoshita, C. M., Wang, Y. and Zhou, J. Effect of reformer conditions on catalytic reforming of biomass-gasification tars. Industrial & Engineering Chemistry Research. 1995, 34, pp. 2949-2954.
[98]. Dayton, D. A review of the literature on catalytic biomass tar destruction. NREL Milestone Completion Report. Colorado : NREL, 2002.
[99]. Vosecký, M., et al. Efficient tar removal from biomas producer gas at moderate temperatures via steam reforming on nickel-based catalyst. Proceedings 17th European Biomass Conference and Exhibition, Hamburg. 2009.
[100]. Kienberger, T., et al. Desulfurization and in situ tar reduction within catalytic methanation of biogenous synthesis gas. Fuel. 2013, 107, pp. 102-112.
[101]. Jakobsen, H. A. Fixed bed reactors. Lecture note for reactor technologies, Norwegian University of Science and Technology. 2011.
[102]. Albright, L. F. Albright's chemical engineering handbook. Boca Raton : Taylor & Francis Group, 2009.

References
129
[103]. Ancheyta, J. Modeling and simulation of catalytic reactors for petroleum refining. Hoboken : John Wiley & Sons Inc., 2011.
[104]. Mears, D. E. Tests for transport limitations in experimental catalytic reactors. Industrial & Engineering Chemistry Process Design and Development. 1971, 10, pp. 541-547.
[105]. Bartholomew, C. H. Mechanisms of catalyst deactivation. Applied Catalysis. 2001, 212, pp. 17-60.
[106]. Forzatti, P. and Lietti, L. Catalyst deactivation. Catalysis Today. 1999, 52, pp. 165-181.
[107]. Moulijn, J. A., Diepen, A. E. van and Kapteijn, F. Catalyst deactivation: is it predictable? What to do? Applied Catalysis A. 2001, 212, pp. 3-16.
[108]. Seemann, M. Methanation of biosyngas in a fluidized bed reactor - Development of a one-step synthesis process. Dissertation ETH Zürich. Zürich, 2006.
[109]. Baker, R. T. K., et al. Nucleation and growth of carbon deposits from the nickel catalyzed decomposition of acetylene. Journal of catalysis. 1972, 26, pp. 51-62.
[110]. Tavares, M. T., Alstrup, I. and Bernardo, C. A. A. Coking and decoking during methanation and methane decomposition on Ni-Cu supported catalysts. Material and Corrosion. 1999, 50, pp. 681-685.
[111]. Goddard, W. A., et al. Methanation of CO over Ni catalyst: A theoretical study. Pasadena : Caltech, 1976.
[112]. McCarty, J. G. and Wise, H. Hydrogenation of surface carbon on alumina-supported nickel. Journal of catalysis. 1979, 57, pp. 406-416.
[113]. Bartholomew, C. H. Carbon deposition in steam reforming and methanation. Catalysis Reviews: Science and Engineering. 1982, 24, pp. 67-112.
[114]. Trimm, D. L . Coke formation and minimisation during steam reforming reactions. Catalysis Today. 1997, 37, pp. 233-238.
[115]. De Bokx, P. K., et al. The formation of filamentous carbon on iron and nickel catalysts. Journal of catalysis. 1985, 96, pp. 454-467.
[116]. Coad, J. P. and Rivière, J. C. Auger spectroscopy of carbon on nickel. Surface sience. 1971, 25, pp. 609-624.
[117]. Bartholomew, C. H., Strasburg, M. V. and Hsieh, H. Effects of Support on Carbon Formation and Gasification on Nickel during Carbon Monoxide Hydrogenation. Applied Catalysis. 1988, 36, pp. 147-162.
[118]. Trimm, D. L. The formation and removal of coke from nickel catalysts. Catalysis Reviews: Sience and Engineering. 1977, 16:1, pp. 155-189.
[119]. Rostrup-Nielsen, J. and Trimm, D. L. Mechanisms of carbon formation on nickel-containing catalysts. Journal of catalysis. 1977, 48, pp. 155-165.
[120]. Gilliland, E. R. and Harriott, P. Reactivity of deposited carbon. Industrial and Engineering Chemistry. 1954, 46, pp. 2195-2202.
[121]. Gates, B. C., Katzer, J. R. and Schuit, G. C. A. Chemistry of catalytic processes. New York : McGraw-Hill, 1979.
[122]. Gardner, D. C. and Bartholomew, C. H. Kinetics of carbon deposition during methanation. Industrial & Engineering Chemistry Product Research and Development. 1981, 20, pp. 80-87.
[123]. Erekson, E.J., Sughrue, E. L. and Bartholomew, C. H. Catalyst degradation in high temperature methanation. Fuel Processing Technology. 5, pp. 91-101.
[124]. Bernardo, C. A. and Lobo, L. S. Kinetics of carbon formation from acetylene on nickel. Journal of catalysis. 1975, 37, pp. 267-278.
[125]. Lobo, L. S. and Trimm, D. L. Complexe temperature dependencies of the rate of carbon deposition on nickel. Nature Physical Sience. 1971, 234, pp. 15-16.

References
130
[126]. Ozaki, J., et al. Carbon deposition on a Ni/Al2O3 catalyst in low-temperature gasification using C6-hydrocarbons as surrogate biomass tar. Fuel Processing Technology. 2012, 102, pp. 30-34.
[127]. Wood, B. J., et al. Shift conversion and methanation in coal gasification. s.l. : DOE, 1980. DOE/ET/11030-T1.
[128]. Wentrecek, P. W., et al. Deactivation of aluminia-supported nickel and ruthenium catalysts by sulfur compounds. Journal of Catalysis. 1980, 61, pp. 232-241.
[129]. Rostrup-Nielsen, J. R. Sulfur-passivated nickel catalysts for carbon-free steam reforming of methane. Journal of catalysis. 1983, 85, pp. 31-43.
[130]. Bitter, J. H. Platinum based bifunctional catalysts. PhD Thesis University of Twente. 1997.
[131]. Bernardo, C. and Trimm, D. L. Structural factors in the deposition of carbon on nickel. Carbon. 1976, Vol. 14, 4, pp. 225-228.
[132]. Vance, C. K. and Bartholomew, C. H. Hydrogenation of carbon dioxide on group viii metals: Effects of support on activity/selectivity and adsorption properties of nickel. Applied Catalysis. 1983, Vol. 7, 2, pp. 169-177.
[133]. Moeller, A. D. and Bartholomew, C. H. Deactivation by carbon of nickel, nickel-ruthenium and nickel-molybdenum methanation catalyts. Industrial & Engineering Chemistry Product Research and Development. 1982, 21, pp. 390-397.
[134]. Schober, R. Regenerierung von Methanierungskatalysatoren mithilfe von Mikrowellen. Diploma Thesis, University of Technology Graz. Graz, 2009.
[135]. Mueller, N., Kern, C. and Jess, A. Direct detection of coking and regeneration of single particles and fixed bed reactors by electrical sensors. Applied Catalysis A: General. 2010, 382, pp. 254-262.
[136]. Bartholdy, J., Zeuthen, P. and Massoth, F. E. Temperature-programmed oxidation studies of aged hydroprocessing catalysts. Applied Catalysis A. 1995, 129, pp. 33-42.
[137]. Larachi, F., et al. Kinetics of carbon oxide evolution in temperature-programmed oxidation of carbonaceous laydown deposited on wet catalysts. Catalysis Today. 2001, 64, pp. 163-177.
[138]. Isarangura na ayuthaya, S., et al. Carbon deposits effects on the selective catalytic reduction of NO over zeolites using temperature programmed oxidation technique. Applied Catalysis B: Environmental. 2003, 43, pp. 1-12.
[139]. Kopyscinski, J. Production of synthetic natural gas in a fluidized bed reactor. Disseration ETH Zurich. Zurich, 2010.
[140]. Bartholomew, C. H. Mechansims of nickel catalyst poisoning. Catalyst Deactivation 1987. s.l. : Elsevier Science, 1987.
[141]. Bartholomew, C. H., Weatherbee, G. D. and Jarvi, G. A. Sulfur poisoning of nickel methanation catalysts. Journal of Catalysis. 1979, 60, pp. 257-269.
[142]. Oudar, J. Sulfur adsorption and poisoning of metallic catalysts. Catalysis Review: Science and Engineering. 1980, 22, pp. 171-195.
[143]. He, H. P., et al. Sulphur tolerant shift reaction catalysts for nickel-based SOFC anode. Solid State Ionics. 2008, 179, pp. 1478-1482.
[144]. Rangan, M., Yung, M. and Medlin, J. W. Experimental and computational investigations of sulfur-resistant bimetallic catalysts for reforming of biomass gasification products. Journal of Catalysis. 2011, 282, pp. 249-257.
[145]. Trimm, D. L. The regeneration or disposal of deactivated heterogeneous catalysts. Applied Catalysis A. 2001, 212, pp. 153-160.
[146]. Dufresne, P. Hydroprocessing catalysts regeneration and recycling. Applied Catalysis A. 2007, 322, pp. 67-75.

References
131
[147]. Rostrup-Nielsen, J. R. Some principles relating to the regeneration of sulfur-poisoned nickel catalyst. Journal of Catalysis. 1971, 21, pp. 171-178.
[148]. Oliphant, J. L., et al. Chemisorption of hydrogen sulfide on nickel and ruthenium catalysts. Journal of Catalysis. 1978, 51, pp. 229-242.
[149]. Li, L., et al. Regeneration of sulfur deactivated Ni-based biomass syngas cleaning catalysts. Industrial & Engineering Chemistry Research. 2010, 49, pp. 10144-10148.
[150]. Ashrafi, M., et al. Experimental study of model biogas catalytic steam reforming. Energy & Fuels. 2008, 22, pp. 4190-4195.
[151]. Sehested, J., Gelten, J. A. P. and Helveg, S. Sintering of nickel catalysts: Effects of time, atmosphere, temperature, nickel-carrier interactions, and dopants. Applied Catalysis A. 309, pp. 237-246.
[152]. BASF. Sicherheitsdatenblatt Katalysator G1-80 Tabletten 5x5. 2009.
[153]. Südchemie. Sicherheitsdatenblatt ActiSorb S7. 2009.
[154]. Shi, Z. Nickel carbonyl: toxicity and human health. The Sience of the Total Environment. 1994, 148, pp. 293-298.
[155]. Kienberger, Thomas. Methanierung biogener Synthesegase mit Hinblick auf die direkte Umsetzung von höheren Kohlenwasserstoffen. Dissertation TU Graz, Graz, 2010.
[156]. Kopyscinski, J., et al. Applying spatially resolved concentration and temperature measurements in a catalytic plate reactor for the kinetic study of CO methanation. Journal of Catalysis. 2010, 271, pp. 262-279.
[157]. Zhang, J., et al. Kinetic investigation of carbon monoxide hydrogenation under realistic conditions of methanation of biomass derived syngas. Fuel. 2013, 111, pp. 845-854.
[158]. DVGW. DVGW G260 - Technische Regel Gasbeschaffenheit. Bonn, 2012.
[159]. DVGW. 57 Technische Regel - Arbeitsblatt DVGW G262. Bonn : DVGW, 2011.
[160]. Hall, K.R. Landolt-Börnstein: Vapor pressure and antoine constants for oxygen containing organic compounds. Berlin Heidelberg : Springer, 2000. Vol. 20B.
[161]. Neuwirth, M. Auslegung und Inbetriebnahme eines Versuchsstandes zur Untersuchung des Einflusses höherer Kohlenwasserstoffe auf die Methanierung. Diplomarbeit Universität Erlangen-Nürnberg. Nürnberg, 2012.
[162]. ABB Automation GmbH. Advance optima continuous gas analyzers AO2000 Series. Operator's Manual 42/24-10 EN. Frankfurt, Germany, 2013. 10.
[163]. Lenior, T. Micro process gas chromatograph analyses with sample conditioning. Amsterdam : Analytical Solutions and Products BV, 2012.
[164]. Heinlein, J. Methodenentwicklung zur Messung von Gaskomponenten aus der Biomasse- und Kohlevergasung an einem Mikro-GC. Diplomarbeit Universität Erlangen-Nürnberg. Nürnberg, 2012.
[165]. ABB Automation GmbH. AO2000-MultiFID 14. Start-Up and Mainenance Manual 41/24-105 EN Rev. 4. Frankfurt : ABB Automation GmbH, 2012. 4.
[166]. Mörsch, O. Entwicklung einer online Methode zur Bestimmung des Teergehalts im Gas aus der Vergasung von Biomasse. Dissertation Universität Stuttgart. Stuttgart, 1999.
[167]. Hirning, J. Inbetriebnahme und Kalibrierung eines Flammenionisationsdetektors zur Messung höherer Kohlenwasserstoffe. Bachelorarbeit Universität Erlangen-Nürnberg. Nürnberg, 2012.
[168]. Baumhakl, C. and Karellas, S. Tar analysis from biomass gasification by means of online fluorescence spectroscopy. Optics and Lasers in Engineering. 2011, 49, pp. 885-891.
[169]. Sun, R., et al. Analysis of gas-phase polycyclic aromatic hydrocarbon mixtures by laser-induced fluorescence. Optics and Lasers in Engineering. 2010, 48, pp. 1231-1237.

References
132
[170]. Meng, X., et al. Tar formation in a steam O2-blown CFB gasifier and a steam blown PBFB (BabyHPR): Comparison between different on-line measurement techniques and the off-line SPA sampling and analysis methode. Fuel Processing Technology. 2012, 100, pp. 16-29.
[171]. Skoog, D. A. Leary, J. J. Principles of instrumental analysis. Philadelphia : Saunders College Publishing, 1992.
[172]. Dräger Safety AG. Dräger-Tubes and CMS Handbook. Lübeck : Dräger Saftey AG & Co. KGaA, 2011.
[173]. DIN Deutsches Institut für Normung e. V. Biomassevergasung - Teer und Staub in Produktgasen - Probenahme und analytische Bestimmung; Deutsche Fassung CEN/TS 15439:2006. Vornorm. Berlin : Beuth Verlag GmbH, 2006.
[174]. Brage, C., et al. Use of amino phase adsorbent for biomass tar sampling and separation. Fuel. 1997, 76, pp. 137-142.
[175]. Reil, S., et al. Vergleich verschiedener Methoden zur Teeranalytik auf Basis von SPA und nasschemischen Verfahren bei der thermochemischen Biomassevergasung. Conference Proceedings 5. Statuskonferenz Energetische Biomassenutzung 14-15.11.2013. Leipzig.
[176]. Knjaskov, K. Untersuchungen zu Kohlenstoffablagerungen in der Methanierung durch Teere. Masterarbeit Universität Erlangen-Nürnberg. Nürnberg, 2012.
[177]. Bartholomew, C. H. and Farrauto, R. J. Fundamentals of industrial catalytic processes. Hoboken : John Wiley & Sons, 2006. pp. 262-300.
[178]. Zeltner, T. Methanierung von Synthesegas aus der allothermen Kohlevergasung. Diplomarbeit Universität Erlangen-Nürnberg. Nürnberg, 2012.
[179]. RWE Power. PowerSPLIT - Analyseanhaltswerte ab Lieferwerk. 2007.
[180]. Chirone, R., et al. Fluidized bed combustion of pelletized biomass and waste-derived fuels. Combustion and Flame. 2008, 155, pp. 21-36.
[181]. Mühlberger, T. Ermittlung optimaler Betriebszustände eines biomassebetriebenen Wirbelschichtvergasers. Diplomarbeit Technische Universität Graz. Graz, 2009.
[182]. Mair, S. Methanierung von Synthesegasen aus der allothermen Wirbelschichtvergasung. Diplomarbeit Technische Universität Graz. Graz, 2010.