Synthesis and Enantioseparation of Chiral Au Nanoclusters ...
95
S1 Electronic supporting information Synthesis and Enantioseparation of Chiral Au13 Nanoclusters Protected by Bis-N-heterocyclic Carbene Ligands Hong Yi, [a] Kimberly M. Osten, [a] Tetyana I. Levchenko, [b] Yoshitaka Aramaki* [a] , Takashi Ooi*, [a,c] Masakazu Nambo,* [a] and Cathleen M. Crudden* [a,b] [a] Institute of Transformative Bio-Molecules (WPI-ITbM) Nagoya University Furo, Chikusa, Nagoya 464-8602, Japan. [b] Department of Chemistry, Queen’s University, Chernoff Hall, Kingston, Ontario K7L 3N6, Canada. [c] Department of Molecular and Macromolecular Chemistry, Graduate School of Engineering, Nagoya University, Nagoya 464-8601, Japan. Table of Contents 1 Materials and instrumentation .......................................................................... 2 1.1 Materials .................................................................................................................. 2 1.2 NMR spectroscopy and elemental analysis ............................................................... 2 1.3 Mass spectrometry ................................................................................................... 2 1.4 UV-vis absorbance, fluorescence spectroscopy, and quantum yield measurements.... 2 1.5 Chiral high performance liquid chromatography ....................................................... 3 1.6 Circular dichroism spectroscopy............................................................................... 3 1.7 X-ray crystallography ............................................................................................... 4 2 Experimental procedures................................................................................... 4 2.1 Synthesis of dibenzimidazolium salts 1a-g................................................................ 4 2.2 Synthesis of bis-NHC dinuclear gold(I) halide complexes 2a-g ................................. 8 2.3 Synthesis of [Au13(bisNHC)5X2]X3 clusters ............................................................ 11 2.4 Chiral separation and cluster stability tests ............................................................. 16 3 Characterization data ...................................................................................... 21 3.1 UV-vis, fluorescence and ESI mass spectra of clusters............................................ 21 3.2 X-ray crystallographic data..................................................................................... 28 3.3 NMR spectra .......................................................................................................... 32 4 References......................................................................................................... 95 Electronic Supplementary Material (ESI) for Chemical Science. This journal is © The Royal Society of Chemistry 2021
Transcript of Synthesis and Enantioseparation of Chiral Au Nanoclusters ...

S1
Electronic supporting information
Synthesis and Enantioseparation of Chiral Au13
Nanoclusters Protected by Bis-N-heterocyclic Carbene
Ligands
Hong Yi,[a] Kimberly M. Osten,[a] Tetyana I. Levchenko,[b] Yoshitaka Aramaki*[a], Takashi Ooi*,[a,c]Masakazu Nambo,*[a] and Cathleen M. Crudden*[a,b]
[a] Institute of Transformative Bio-Molecules (WPI-ITbM) Nagoya University Furo, Chikusa, Nagoya 464-8602,
Japan.
[b] Department of Chemistry, Queen’s University, Chernoff Hall, Kingston, Ontario K7L 3N6, Canada.
[c] Department of Molecular and Macromolecular Chemistry, Graduate School of Engineering, Nagoya University,
Nagoya 464-8601, Japan.
Table of Contents
1 Materials and instrumentation .......................................................................... 2 1.1 Materials .................................................................................................................. 2 1.2 NMR spectroscopy and elemental analysis ............................................................... 2 1.3 Mass spectrometry ................................................................................................... 2 1.4 UV-vis absorbance, fluorescence spectroscopy, and quantum yield measurements .... 2 1.5 Chiral high performance liquid chromatography ....................................................... 3 1.6 Circular dichroism spectroscopy ............................................................................... 3 1.7 X-ray crystallography ............................................................................................... 4
2 Experimental procedures ................................................................................... 4 2.1 Synthesis of dibenzimidazolium salts 1a-g ................................................................ 4 2.2 Synthesis of bis-NHC dinuclear gold(I) halide complexes 2a-g ................................. 8 2.3 Synthesis of [Au13(bisNHC)5X2]X3 clusters ............................................................ 11 2.4 Chiral separation and cluster stability tests ............................................................. 16
3 Characterization data ...................................................................................... 21 3.1 UV-vis, fluorescence and ESI mass spectra of clusters............................................ 21 3.2 X-ray crystallographic data..................................................................................... 28 3.3 NMR spectra .......................................................................................................... 32
4 References......................................................................................................... 95
Electronic Supplementary Material (ESI) for Chemical Science.This journal is © The Royal Society of Chemistry 2021

S2
1 Materials and instrumentation
1.1 Materials All reactions and analyses were performed under ambient conditions unless otherwise specified. Benzimidazole, potassium carbonate, sodium borohydride, ammonium hexafluorophosphate, sodium trifluoroacetate, 1,2-bis(chloromethyl)benzene, 1,2-bis(bromomethyl)benzene, 1,3-bis(bromomethyl)benzene, 1,4-bis(bromomethyl)benzene, and 1-(bromomethyl)-2,3,4,5,6-pentafluorobenzene were purchased from TCI and Wako Chemical Corporation. Chloro(dimethylsulfide)gold(I),1 1-benzyl-1H-benzo[d]imidazole,2 1-benzyl-[2-13C]-1H-benzo[d]imidazole,3,2 1-(4-fluorobenzyl)-1H-benzo[d]imidazole,4 1-(naphthalen-2-ylmethyl)-1H-benzo[d]imidazole,5 1-(pyridin-2-ylmethyl)-1H-benzo[d]imidazole,6 and 1,2-bis((1H-benzo[d]imidazol-1-yl)methyl)benzene7 were synthesized according to literature procedures. Hydrochloric acid (35.0-37.0 %), acetonitrile, ethyl acetate, methanol and dichloromethane (DCM) were purchased from Wako and Kanto Chemical Corporation. Absolute ethanol (99.5%) is purchased from Wako Chemical Corporation. All commercially obtained reagents and solvents were used as received. 1.2 NMR spectroscopy and elemental analysis 1H, 13C{1H}, and COSY NMR spectra were recorded on a JEOL ECA-II 600 MHz spectrometer. 19F NMR spectra were recorded on a JEOL ECA-II 400 MHz spectrometer. All 1H NMR spectra were referenced to CD2Cl2 at 5.32 ppm or DMSO-d6 at 2.50 ppm; all 13C NMR spectra were referenced to CD2Cl2 at 53.84 ppm or DMSO- d6 at 39.52 ppm. All spectra were recorded at room temperature. All NMR data was processed and displayed using MestReNova software. In cases of residual contaminants in the NMR spectra, these are noted on each spectrum. Elemental analyses were performed on a Yanaco MT-6 analyzer. 1.3 Mass spectrometry Electrospray ionization mass spectra (ESI-MS) of clusters were recorded on a Bruker Compact QTOF mass spectrometer. Acetonitrile-dichloromethane (1:1 v/v) dispersions of samples (ca. 0.1 mg/mL) were infused at a flow rate of 180 µL/hr by a syringe pump. Parameters were as follows: end plate offset 500 V, capillary 3.6 kV, nebulizer 0.3 Bar, dry gas 3.0 L/min and dry temp 200 oC. The instrument was first calibrated with ESI Tuning Mix (Agilent Technologies) under the same parameters as an external reference. 1.4 UV-vis absorbance, fluorescence spectroscopy, and quantum yield
measurements UV-vis absorbance spectra were recorded on a Shimadzu UV-1800 spectrometer or on an Agilent Cary60 spectrophotometer using 1 cm pathlength quartz cuvettes as dilute dichloromethane, acetonitrile, or methanol solutions of cluster samples. The fluorescence excitation and emission spectra, and fluorescence excitation-emission matrix (EEM) data for cluster [3a]Cl3 dissolved in dichloromethane were recorded on a Horiba Duetta Fluorescence and Absorbance Spectrometer with EzSpecTM software using a 1 cm pathlength quartz cuvettes. Relative fluorescence quantum yield (Φ!) was determined by the

S3
comparative method.8 According to the method, the fluorescence quantum yield of a sample is related to that of a standard by the following expression:
Φ! = (Astd/A) (F/Fstd) (n/nstd)2 Φ!(std)
where F and Fstd are the areas under the fluorescence emission curves of the sample and the standard, respectively. A and Astd are the absorbances of the samples and standard at the excitation wavelengths, respectively. n and nstd are the refractive indices of solvents used for the sample and standard, respectively. Zinc phthalocyanine (ZnPc, Acros Organics) solution in freshly distilled pyridine was employed as the standard (ΦF(std) = 0.30).9 The refractive indexes of the solvents were taken to be npyridine = 1.5095 and nDCM = 1.4242 (both at 20 °C).10 All solutions were filtered using 0.2 µm PTFE syringe filters (BasicTM Fisher), diluted to desired A, placed into 1 cm pathlength quartz fluorescence cuvettes with graded seal tube, sealed with rubber septa, and deoxygenated by purging with argon. In several independent measurements, sample and standard solutions were prepared to have equal absorbances (between 0.04 and 0.05) at their respective excitation wavelengths after purging. UV-vis absorbance spectra were recorded on an Agilent Cary60 spectrophotometer with the corresponding pure solvents for background correction. Fluorescence emission spectra were recorded for the same solutions on a Horiba Duetta Fluorescence and Absorbance Spectrometer with EzSpecTM software. Both the sample and standard were excited at the same relevant wavelength (indicated for each particular dataset). The spectra were corrected for wavelength-dependent instrument sensitivity. The areas under the fluorescence emission curves were calculated numerically using Origin Pro 2016 software. The absolute quantum yield of [3a]Cl3 solutions in dichloromethane was measured on a C11347-11 Quantaurus-QY Absolute PL quantum yield spectrometer (Hamamatsu Photonics K.K.) equipped with 3.3 inch integrating sphere to measure all luminous flux and cooled, back-thinned CCD sensor for detection at 1024 photosensitive channels. The same procedure was implemented for the sample preparation as in the case of the relative quantum yield measurements. 1.5 Chiral high performance liquid chromatography Chromatographic separation of cluster enantiomers was achieved on a Shimadzu LC-2010CHT HPLC system equipped with a Daicel CHIRALPAK IE-3 column (3µm, 250 mm×4.6 mm). A 10 mm path length UV-vis detector was used with the detection wavelength set to 350 nm. Analytes were eluted at a flow rate of 1.0 mL/min using MeOH/trifluoroacetic acid(TFA)/diethylamine(DEA) (100:0.1:0.1 volume ratio). For large-scale separations, a preparative scale Diacel CHIRALPAK IE-3 column (5µm, 250 mm×10.0 mm) was used with a flow rate of 2.0 mL/min and the same eluent system. 1.6 Circular dichroism spectroscopy Circular dichroism (CD) spectra were recorded on a JASCO J-720WN CD-spectrometer using a 5 mm path length quartz cuvette. Samples were dissolved in dichloromethane, and a blank spectrum of solvent was subtracted from each sample spectrum. A scanning speed of 100 nm/min and data pitch of 0.1 nm was used to record four spectra, which were then averaged. All spectra were recorded at room temperature.
S4
1.7 X-ray crystallography Crystals of [3a]Cl3 of appropriate quality for X-ray diffraction studies were covered with a thin layer of hydrocarbon oil (Paratone-N). A suitable crystal was then selected, attached to a glass fiber or a microsampler, and quickly placed in a low-temperature stream of nitrogen. Data were collected at Nagoya University using a Rigaku FR-X with Pilatus 200K with fine-focus sealed tube Mo Ka radiation (l = 0.71073 Å), with the crystal cooled to −150 °C. The structure was solved using intrinsic phasing (SHELXT) and refined using SHELXL-2014.11
2 Experimental procedures
2.1 Synthesis of dibenzimidazolium salts 1a-g General procedure for the synthesis of dibenzimidazolium salts 1a-e
The following procedure for the preparation of dibenzimidazolium salts 1a-e was adapted from the literature.12 A 25 mL glass pressure tube was charged with: (1) for salts 1a-c and 1e, the appropriate mono-alkylated benzimidazole (2.0 mmol) and 1,2-bis(chloromethyl)- or 1,2-bis(bromomethyl)benzene (1.0 mmol); or (2) for salt 1d, 1,2-bis((1H-benzo[d]imidazol-1-yl)methyl)benzene (1.0 mmol) and 1-(bromomethyl)-2,3,4,5,6-pentafluorobenzene (2.2 mmol). Acetonitrile (10 mL) was added, the tube was capped and the mixture was then heated in an 80 °C oil bath for 12 hours, and then cooled to room temperature. After cooling, the solvent was removed in vacuo to afford the crude solid. The crude solid was washed with EtOAc (3 x 10 mL) and dried in vacuo to afford the pure product as a white powder. Yields and characterization data for each compound are listed below.
N N NN
Br
FF
FF
F
N N N NArAr
N N ArX- X-
XX
2 eq.
MeCN, 80 ℃1a-e
1a, X = Cl
F
1c, X = Cl 1e, X = Br1b, X = Br
Ar = F
1d, X = Br
FF
F F
MeCN, 80 ℃
2 eq.

S5
Synthesis of 1,1’-(dibenzyl)-3,3’-(1,2-xylylene)dibenzimidazolium dichloride (1a) 1-Benzyl-1H-benzo[d]imidazole (416.0 mg, 2.0 mmol) and 1,2-bis(chloromethyl)benzene (174.0 mg, 1.0 mmol) afforded the title compound 1a in 81 % yield (480.1 mg). 1H NMR (DMSO-d6, 600 MHz): δ 10.39 (s, 2H NCHN),
8.07 (d, 3J = 7.8 Hz, 2H), 8.00 (d, 3J = 7.8 Hz, 2H), 7.67 – 7.62 (m, 4H), 7.59 (d, 3J = 7.8 Hz, 4H), 7.44 – 7.40 (m, 6H), 7.38 – 7.36 (m, 2H), 7.25 – 7.24 (m, 2H), 6.21 (s, 4H, NCH2Ar), 5.86 (s, 4H, NCH2Ar). 13C{1H} NMR (DMSO- d6, 151 MHz): δ 143.21 (NCHN), 134.06, 132.24, 131.44, 130.99, 129.36, 128.94, 128.76, 128.69, 128.34, 126.90, 126.78, 114.32, 114.05, 49.98 (NCH2Ar), 47.69 (NCH2Ar). ESI-MS (m/z) for [C36H32N4Cl]+: calculated 555.2310, found 555.2314. Synthesis of 1,1’-(dibenzyl)-3,3’-(1,2-xylylene)di[2-13C]benzimidazolium dichloride (13C-1a)
1-Benzyl-[2-13C]-1H-benzo[d]imidazole (209.0 mg, 1.0 mmol) and 1,2-bis(chloromethyl)benzene (87.0 mg, 0.5 mmol) afforded the title compound 13C-1a in 79 % yield (233.8 mg). 1H NMR (DMSO- d6, 600 MHz): δ 10.24 (d, 1JC-H = 220.2 Hz, 2H, NCHN), 8.02 – 7.99 (m, 4H), 7.68
– 7.63 (m, 4H), 7.57 (d, 3J = 7.6 Hz, 4H), 7.45 – 7.41 (m, 6H), 7.39 – 7.36 (m, 2H), 7.25 – 7.23 (m, 2H), 6.14 (d, 3JC-H = 4.2 Hz, 4H), 5.84 (d, 3JC-H = 4.2 Hz, 4H). 13C{1H} NMR (DMSO- d6, 151 MHz): δ 143.17 (NCHN), 134.01, 132.14, 131.44, 131.05, 129.40, 128.98, 128.76, 128.73, 128.33, 126.96, 126.82, 114.24, 114.07, 50.01 (NCH2Ar), 47.63 (NCH2Ar). ESI-MS (m/z) for [13C2C34H32N4Cl]+: calculated 557.2375, found 557.2378. Synthesis of 1,1’-(dibenzyl)-3,3’-(1,2-xylylene)dibenzimidazolium dibromide (1b)
1-Benzyl-1H-benzo[d]imidazole (416.0 mg, 2.0 mmol) and 1,2-bis(bromomethyl)benzene (262.0 mg, 1.0 mmol) afforded the title compound 1b in 96 % yield (651.2 mg). 1H NMR (DMSO- d6, 600 MHz): δ 9.93 (s, 2H, NCHN),
8.01 (d, 3J = 8.0 Hz, 2H), 7.93 (d, 3J = 7.8 Hz, 2H), 7.70 – 7.66 (m, 4H), 7.54 (d, 3J = 7.6 Hz, 4H), 7.46 – 7.42 (m, 6H), 7.40 – 7.39 (m, 2H), 7.26 – 7.24 (m, 2H), 6.03 (s, 4H, NCH2Ar), 5.80 (s, 4H, NCH2Ar). 13C{1H} NMR (DMSO- d6, 151 MHz): δ 142.98 (NCHN), 133.93, 132.02, 131.39, 131.06, 129.41, 128.97, 128.74, 128.33, 126.97, 126.84, 114.21, 114.10, 50.06 (NCH2Ar), 47.72 (NCH2Ar). Note that one carbon was not found, likely due to peak overlap. ESI-MS (m/z) for [C36H32N4Br]+: calculated 599.1805, found 599.1812.
N N N N
Cl- Cl-1a
N N N N
Cl- Cl-13C-1a* *
* = 13C-labeled
N N N N
Br- Br-1b

S6
Synthesis of 1,1’-(di-4-fluorobenzyl)-3,3’-(1,2-xylylene)dibenzimidazolium dichloride (1c)
1-(4-Fluorobenzyl)-1H-benzo[d]imidazole (452.0 mg, 2.0 mmol) and 1,2-bis(chloromethyl)benzene (174.0 mg, 1.0 mmol) afforded the title compound 1c in 73 % yield (456.9 mg). 1H NMR (DMSO- d6, 600 MHz): δ 10.35 (s, 2H NCHN), 8.05 (d, J = 7.9 Hz, 2H), 8.03 (d, J = 7.9
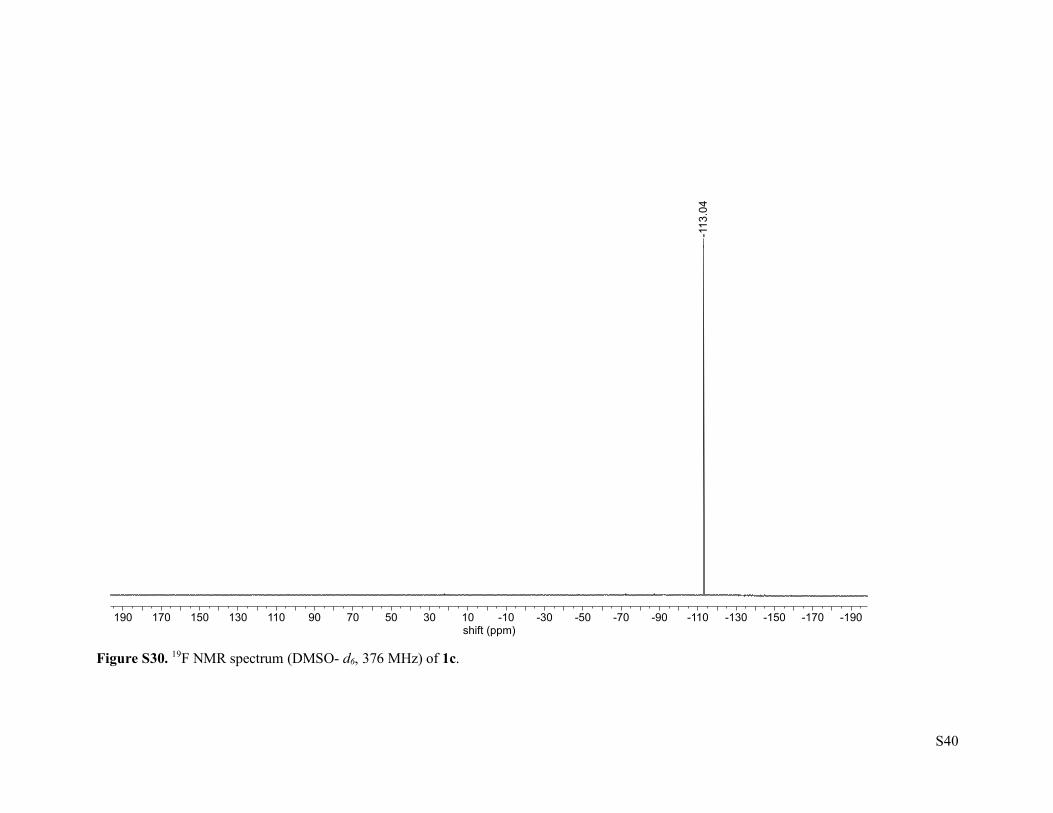
Hz, 2H), 7.70 – 7.64 (m, 8H), 7.44 – 7.42 (m, 2H), 7.27 – 7.24 (m, 6H), 6.18 (s, 4H, NCH2Ar), 5.85 (s, 4H, NCH2Ar). 13C{1H} NMR (DMSO- d6, 151 MHz): δ 162.18 (d, 1JF-C = 245.2 Hz, C6H4F C-4), 143.19 (NCHN), 132.19, 131.45, 130.93, 130.87, 130.26, 129.37, 128.80, 126.91, 126.79, 115.80 (d, 2JF-C = 22.6 Hz, C6H4F C-3), 114.31, 114.04, 49.23 (NCH2Ar), 47.69 (NCH2Ar). 19F NMR (DMSO- d6, 376 MHz): δ -113.04. ESI-MS (m/z) for [C36H30F2N4Cl]+: calculated 591.2122, found 591.2121. Synthesis of 1,1’-(di-pentafluorobenzyl)-3,3’-(1,2-xylylene)dibenzimidazolium dibromide (1d)
Note that due to difficulty in isolating 1-(pentafluorobenzyl)-1H-benzo[d]imidazole, the procedure was modified from that used for other salts. This route is best suited to alkylation with benzyl bromides, and not chlorides, due to their
lower reactivity with the starting material. 1,2-Bis((1H-benzo[d]imidazol-1-yl)methyl)benzene (338.0 mg, 1.0 mmol) and 1-(bromomethyl)-2,3,4,5,6-pentafluorobenzene (570.1 mg, 2.2 mmol) afforded the title compound 1d in 92 % yield (781.0 mg). 1H NMR (DMSO- d6, 600 MHz): δ10.15 (s, 2H NCHN), 8.08 (d, 3J = 8.4 Hz, 2H), 7.96 (d, 3J = 8.4 Hz, 2H), 7.79 (t, 3J = 7.8 Hz, 2H), 7.70 (t, 3J = 7.8 Hz, 2H), 7.37 (dd, J = 5.7, 3.3 Hz, 2H), 7.11 (dd, J = 5.4, 3.5 Hz, 2H), 6.15 (s, 4H, NCH2Ar), 6.07 (s, 4H, NCH2Ar). 13C{1H} NMR (DMSO- d6, 151 MHz): δ 145.34 (d, 1JF-C = 250.7 Hz, C6F5), 143.78 (NCHN), 141.37 (d, 1JF-C = 252.2 Hz, C6F5), 137.21 (d, 1JF-C = 253.7 Hz, C6F5), 131.84, 131.16, 131.00, 129.08, 127.82, 127.44, 127.02, 114.37, 113.47, 107.77 (t, 2JF-C = 16.6 Hz, C6F5), 47.77 (NCH2Ar), 38.25 (NCH2Ar). 19F NMR (DMSO- d6, 376 MHz): δ -140.26 (d, 3J = 22.6 Hz, 4F, ortho-C6F5), -152.64 (t, 3J = 22.6 Hz. 2F, para-C6F5), -161.41 (t, 3J = 22.6 Hz, 4F, meta-C6F5). ESI-MS (m/z) for [C36H22F10N4Br]+: calculated 779.0863, found 779.0866.
N N N N
Cl- Cl-1c
FF
N N N N
1dBr- Br-
F
F F
F
FF
F
F
FF

S7
Synthesis of 1,1’-(di(naphthalen-2-ylmethyl))-3,3’-(1,2-xylylene)dibenzimidazolium dibromide (1e)
1-(Naphthalen-2-ylmethyl)-1H-benzo[d]imidazole (516.0 mg, 2.0 mmol) and 1,2-bis(bromomethyl)benzene (262.0 mg, 1.0 mmol) afforded the title compound 1e in 83 % yield (646.7 mg). 1H NMR (DMSO- d6, 600 MHz): δ
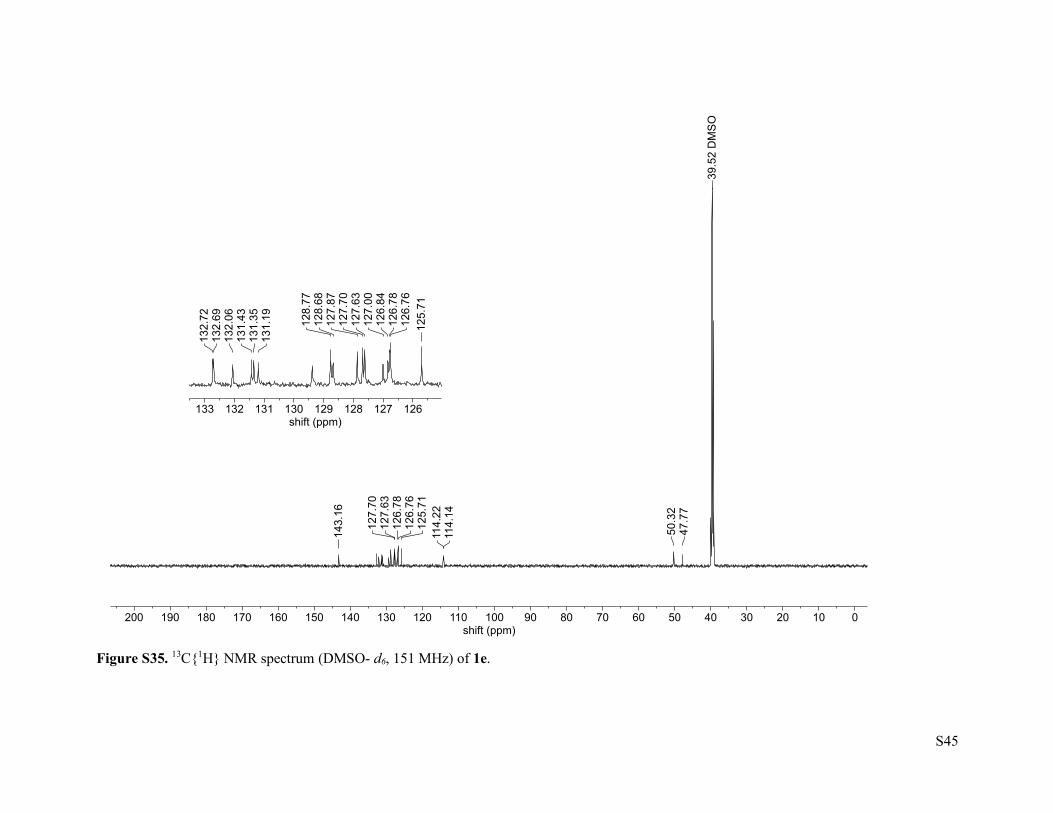
10.11 (s, 2H NCHN), 8.17 (s, 2H), 8.05 (d, 3J = 7.7 Hz, 2H), 7.98 (dd, J = 12.5, 8.3 Hz, 4H), 7.95 – 7.91 (m, 4H), 7.66 – 7.64 (m, 6H), 7.57 – 7.55 (m, 4H), 7.46 (dd, J = 5.5, 3.3 Hz, 2H), 7.28 (dd, J = 5.2, 3.6 Hz, 2H), 6.14 (s, 4H, NCH2Ar), 6.00 (s, 4H, NCH2Ar). 13C{1H} NMR (DMSO- d6, 151 MHz): δ 143.16 (NCHN), 132.72, 132.69, 132.06, 131.43, 131.35, 131.19, 129.39, 128.77, 128.68, 127.87, 127.70, 127.63, 127.00, 126.84, 126.78, 126.76, 125.71, 114.22, 114.14, 50.32 (NCH2Ar), 47.77 (NCH2Ar). ESI-MS (m/z) for [C44H36N4Br]+: calculated 699.2118, found 699.2114. Synthesis of 1,1’-(dibenzyl)-3,3’-(1,3-xylylene)dibenzimidazolium dibromide (1f)
The general procedure for the synthesis of 1a-e was used, with the exception of the use of 1,3-bis(bromomethyl)benzene as starting material. 1-Benzyl-1H-benzo[d]imidazole (416.0 mg, 2.0 mmol) and 1,3-
bis(bromomethyl)benzene (262.0 mg, 1.0 mmol) afforded the title compound 1f in 87 % yield (589.8 mg). 1H NMR (DMSO- d6, 600 MHz): δ 10.31 (s, 2H NCHN), 7.98 (d, 3J = 8.4 Hz, 2H), 7.91 (d, 3J = 8.1 Hz, 3H), 7.62 (t, 3J = 7.8 Hz, 2H), 7.59 – 7.52 (m, 8H), 7.50 – 7.46 (m, 1H), 7.43 – 7.41 (m, 4H), 7.39 – 7.37 (m, 2H), 5.85 (s, 4H, NCH2Ar), 5.84 (s, 4H, NCH2Ar). 13C{1H} NMR (DMSO- d6, 151 MHz): δ 142.82 (NCHN), 134.75, 133.95, 131.02, 130.95, 129.75, 129.00, 128.75, 128.69, 128.63, 128.36, 126.79, 126.70, 114.05, 114.01, 50.03 (NCH2Ar), 49.77 (NCH2Ar). ESI-MS (m/z) for [C36H32N4Br]+: calculated 599.1805, found 599.1804. Synthesis of 1,1’-(di(naphthalen-2-ylmethyl))-3,3’-(1,4-xylylene)dibenzimidazolium dibromide (1g)
The general procedure for the synthesis of 1a-e was used, with the exception of the use of 1,4-bis(bromomethyl)benzene as starting material. 1-(Naphthalen-2-ylmethyl)-1H-benzo[d]imidazole
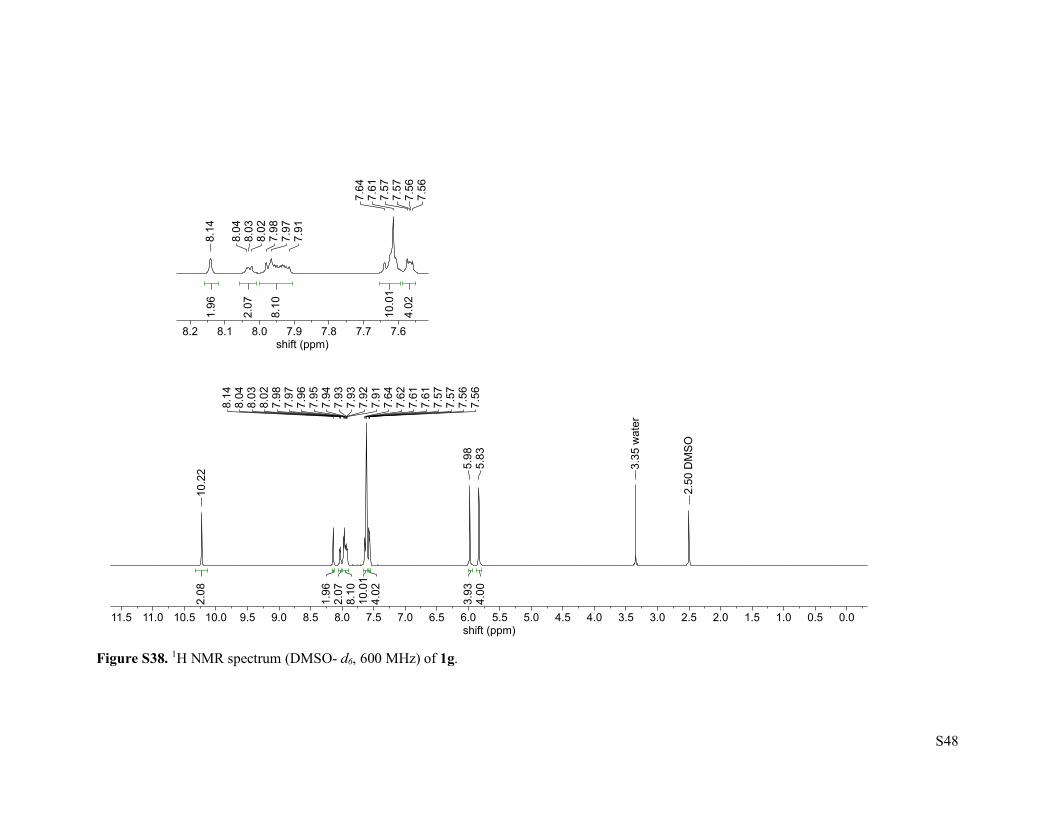
(516.0 mg, 2.0 mmol) and 1,4-bis(bromomethyl)benzene (262.0 mg, 1.0 mmol) afforded the title compound 1g in 83 % yield (645.74 mg). 1H NMR (DMSO- d6, 600 MHz): δ 10.22 (s, 2H NCHN), 8.14 (s, 2H), 8.05 – 8.02 (m, 2H), 8.00 – 7.90 (m, 8H), 7.67 – 7.59 (m, 10H), 7.57 – 7.56 (m, 4H), 5.98 (s, 4H, NCH2Ar), 5.83 (s, 4H, NCH2Ar). 13C{1H} NMR (DMSO- d6, 151 MHz): δ 142.90 (NCHN), 134.53, 132.74, 132.69, 131.30, 131.17, 131.02, 128.91, 128.81, 127.88, 127.73, 127.70, 126.84, 126.79, 126.78, 125.73, 114.10, 113.99, 50.26 (NCH2Ar), 49.57 (NCH2Ar). Note that one carbon was not found, likely due to peak overlap. ESI-MS (m/z) for [C44H36N4Br]+: calculated 699.2118, found 699.2117.
N N N N
Br- Br-1e
N N N N
Br- Br-1f
N NN N
Br-Br-
1g

S8
2.2 Synthesis of bis-NHC dinuclear gold(I) halide complexes 2a-g General procedure for the synthesis of complexes 2a-g
A 25 mL glass pressure tube was charged with the appropriate benzimidazolium salt 1a-g (0.30 mmol), (Me2S)AuCl (0.60 mmol), K2CO3 (1.8 mmol) and acetone (10 mL). The mixture was heated in a 60 °C oil bath for 12 hours, and then cooled to room temperature. After cooling, the solvent was removed in vacuo to afford the crude residue. Purification of the residue by flash column chromatography on silica gel (Fuji Silysia Chromatorex PSQ60AB silica; 20:1 DCM/MeOH eluent; ~3x10 cm column size, Rf (DCM) = 0.4) afforded the pure complex as a white powder. Yields and characterization data for each compound are listed below. Synthesis of 1,1’-(dibenzyl)-3,3’-(1,2-xylylene)dibenzo[d]imidazol-2-ylidene digold(I) dichloride (2a)
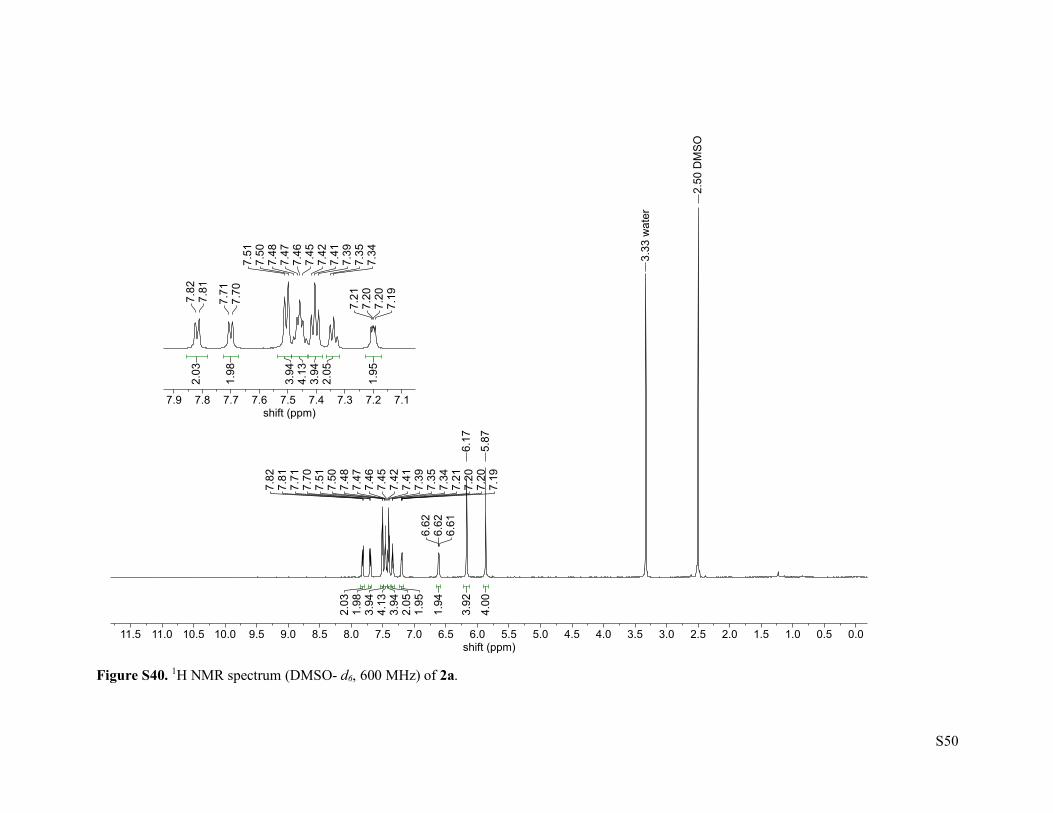
1a (177.0 mg, 0.30 mmol) afforded complex 2a in 61 % yield (179.7 mg). 1H NMR (DMSO- d6, 600 MHz): δ 7.82 (d, 3J = 7.4 Hz, 2H), 7.70 (d, 3J = 7.2 Hz, 2H), 7.51 (d, 3J = 7.6 Hz, 4H), 7.48 – 7.45 (m, 4H), 7.41 (t, 3J = 7.5 Hz, 4H), 7.35 – 7.34 (m, 2H), 7.21 -7.19 (m, 2H), 6.65 –
6.58 (m, 2H), 6.17 (s, 4H, NCH2Ar), 5.87 (s, 4H, NCH2Ar). 13C{1H} NMR (DMSO- d6, 151 MHz): δ 178.80 (NCN), 135.75, 133.31, 133.09, 132.79, 128.90, 128.19, 128.15, 127.31, 125.42, 125.00, 124.90, 112.74, 112.68, 51.64 (NCH2Ar), 48.63 (NCH2Ar). ESI-MS (m/z) for [C36H30Au2N4Cl]+: calculated 947.1485, found 947.1487. Synthesis of 1,1’-(dibenzyl)-3,3’-(1,2-xylylene)di[2-13C]benzo[d]imidazol-2-ylidene digold(I) dichloride (13C-2a)
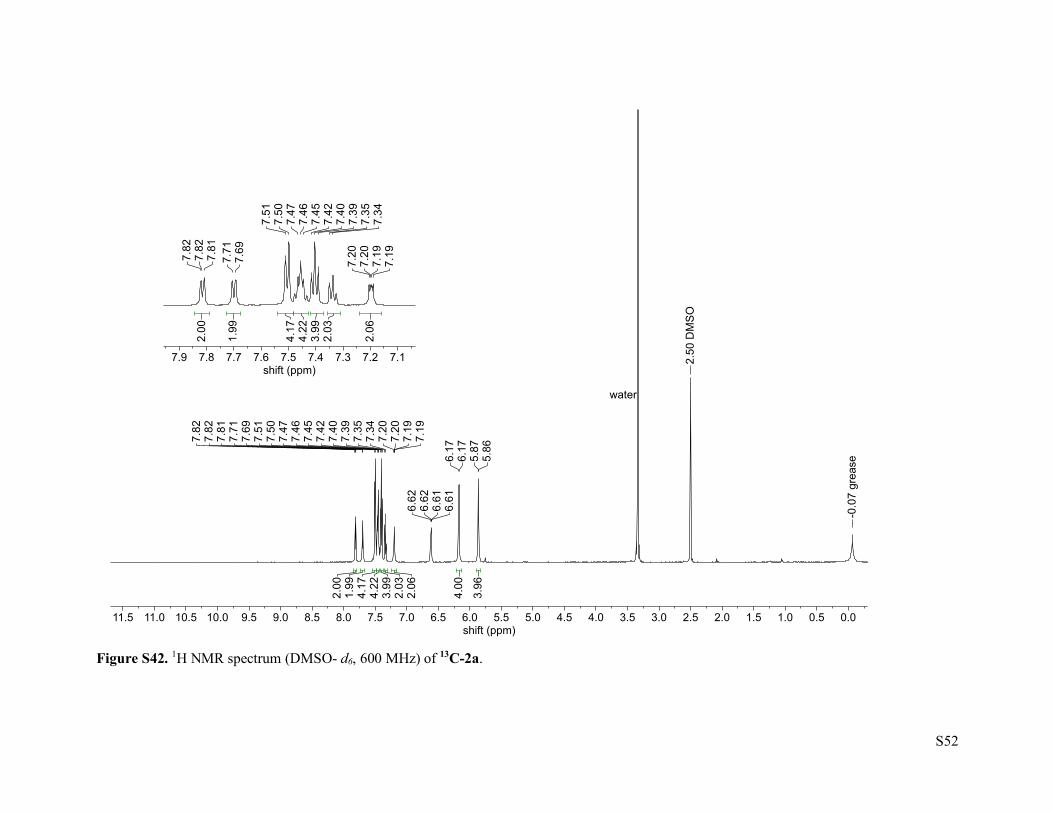
13C-1a (177.6 mg, 0.30 mmol) afforded complex 13C-2a in 58 % yield (171.4 mg). 1H NMR (DMSO- d6, 600 MHz): δ 7.84 – 7.79 (m, 2H), 7.70 (d, 3J = 7.1 Hz, 2H), 7.50 (d, 3J = 7.6 Hz, 4H), 7.47 – 7.45 (m, 4H), 7.40 (t, 3J = 7.5 Hz, 4H), 7.35 – 7.34 (m, 2H), 7.20 (dd, J = 5.7, 3.3 Hz, 2H), 6.61 (dd, J = 5.1, 3.7 Hz, 2H), 6.17 (d, 3JC-H =
5.1 Hz, 4H, NCH2Ar), 5.87 (d, 3JC-H = 5.3 Hz, 4H, NCH2Ar). 13C{1H} NMR (DMSO- d6, 151 MHz): δ 178.82 (NCN), 135.76, 133.32, 133.10, 132.79, 128.91, 128.21, 128.17, 127.33, 125.42, 125.02, 124.91, 112.75, 112.68, 51.74 (NCH2Ar), 48.77 (NCH2Ar). ESI-MS (m/z) for [13C2C34H30Au2N4Cl]+: calculated 949.1555, found 949.1550.
(Me2S)AuCl (2 eq.)K2CO3 (6 eq.)
Acetone, 60 ℃12 hr
Ar2N N N N Ar1Ar11a-h
2a-gAuX
AuX
N N N N
2aAu
Cl
Au
Cl
* = 13C-labeled
N N N N
13C-2aAu
Cl
Au
Cl
* *

S9
Synthesis of 1,1’-(dibenzyl)-3,3’-(1,2-xylylene)dibenzo[d]imidazol-2-ylidene digold(I) dibromide (2b)
1b (203.4 mg, 0.30 mmol) afforded complex 2b in 65 % yield (208.6 mg). 1H NMR (DMSO- d6, 600 MHz): δ 7.83 – 7.81 (m, 2H), 7.71 – 7.68 (m, 2H), 7.51 (d, 3J = 7.4 Hz, 4H), 7.49 – 7.45 (m, 4H), 7.40 (t, 3J = 7.6 Hz, 4H), 7.35 – 7.34 (m, 2H), 7.20 (dd, J = 5.7, 3.3 Hz, 2H), 6.64
(dd, J = 5.5, 3.5 Hz, 2H), 6.17 (s, 4H, NCH2Ar), 5.87 (s, 4H, NCH2Ar). 13C{1H} NMR (DMSO- d6, 151 MHz): δ 181.63 (NCN), 135.72, 133.31, 133.02, 132.73, 128.90, 128.21, 127.34, 125.54, 125.05, 124.94, 112.78, 112.71, 51.59 (NCH2Ar), 48.58 (NCH2Ar). Note that one carbon was not found, likely due to peak overlap. ESI-MS (m/z) for [C36H30Au2N4Br]+: calculated 991.0979, found 991.0981. Synthesis of 1,1’-(di-4-fluorobenzyl)-3,3’-(1,2-xylylene)dibenzo[d]imidazol-2-ylidene digold(I) dichloride (2c)
1c (187.8 mg, 0.30 mmol) afforded complex 2c in 53 % yield (161.8 mg). 1H NMR (DMSO- d6, 600 MHz): δ 7.84 (d, 3J = 7.9 Hz, 2H), 7.69 (d, 3J = 7.9 Hz, 2H), 7.57 (dd, J = 8.5, 5.5 Hz, 4H), 7.47 – 7.45 (m, 4H), 7.24 (t, 3J = 8.8 Hz, 4H), 7.20 (dd, J = 5.7,
3.3 Hz, 2H), 6.61 (dd, J = 5.3, 3.6 Hz, 2H), 6.16 (s, 4H, NCH2Ar), 5.85 (s, 4H, NCH2Ar). 13C{1H} NMR (DMSO- d6, 151 MHz): δ 178.76 (NCN), 161.84 (d, 1JF-C = 244.6 Hz, C6H4F C-4), 133.27, 133.10, 132.71, 132.00, 129.61, 129.55, 128.17, 125.46, 125.04, 124.94, 115.78 (d, 2JF-C = 22.65 Hz, C6H4F C-3), 112.69, 50.88 (NCH2Ar), 48.67 (NCH2Ar). 19F NMR (DMSO- d6, 376 MHz): δ -113.82. ESI-MS (m/z) for [C36H28Au2F2N4Cl]+: calculated 983.1296, found 983.1293. Synthesis of 1,1’-(dipentafluorobenzyl)-3,3’-(1,2-xylylene)dibenzo[d]imidazol-2-ylidene digold(I) dibromide (2d)
1d (257.4 mg, 0.30 mmol) afforded complex 2d in 65 % yield (208.6 mg). 1H NMR (DMSO- d6, 600 MHz): δ 7.94 (d, 3J = 8.3 Hz, 2H), 7.66 (d, 3J = 8.2 Hz, 2H), 7.57 (t, 3J = 7.8 Hz, 2H), 7.49 (t, 3J = 7.8 Hz, 2H), 7.19 – 7.13 (m, 2H), 6.62 – 6.54 (m, 2H),
6.09 (s, 4H, NCH2Ar), 5.92 (s, 4H, NCH2Ar). 13C{1H} NMR (DMSO- d6, 151 MHz): δ 182.18 (NCN), 145.20 (d, 1JF-C = 256.7 Hz, C6F5), 140.60 (d, 1JF-C = 119.3 Hz, C6F5), 136.97 (d, 1JF-C = 125.3 Hz, C6F5), 133.29, 133.15, 132.28, 128.09, 125.46, 125.17, 112.73, 112.23, 110.19 (t, 2JF-C = 28.7 Hz, C6F5), 49.05 (NCH2Ar), 40.06 (NCH2Ar). 19F NMR (DMSO- d6, 376 MHz): -140.22 (d, 3J = 22.6 Hz, 4F, ortho-C6F5), -153.87 (t, 3J = 22.7 Hz, 2F, para-C6F5), -161.61 (t, 3J = 22.6 Hz, 4F, meta-C6F5). ESI-MS (m/z) for [C36H20Au2F10N4Br]+: calculated 1171.0037, found 1171.0048.
N N N N
2bAu
Br
Au
Br
N N N N
2cAu
Cl
Au
Cl
F F
N N N N
2dAu
Br
Au
Br
F FFF
FF
FF
FF

S10
Synthesis of 1,1’-(di(naphthalen-2-ylmethyl))-3,3’-(1,2-xylylene)dibenzo[d]imidazol-2-ylidene digold(I) dibromide (2e)
1e (233.7 mg, 0.30 mmol) afforded complex 2e in 55 % yield (178.5 mg, Rf (DCM) = 0.3). 1H NMR (DMSO- d6, 600 MHz): δ 8.03 (s, 2H), 7.95 (d, J = 8.5 Hz, 2H), 7.92 – 7.85 (m, 6H), 7.76 – 7.69 (m, 2H), 7.64 (d, 3J = 8.4 Hz, 2H), 7.58 – 7.50 (m,
4H), 7.49 – 7.42 (m, 4H), 7.22 (dd, J = 5.5, 3.4 Hz, 2H), 6.71 – 6.65 (m, 2H), 6.21 (s, 4H, NCH2Ar), 6.04 (s, 4H, NCH2Ar). 13C{1H} NMR (DMSO- d6, 151 MHz): δ 181.81 (NCN), 133.37, 133.28, 133.06, 132.85, 132.68, 132.54, 128.71, 128.21, 127.83, 127.67, 126.67, 126.44, 125.59, 125.05, 124.97, 112.79, 112.74, 51.84 (NCH2Ar), 48.64 (NCH2Ar). Note that two carbons were not found, likely due to peak overlap. ESI-MS (m/z) for [C44H34Au2N4Br]+: calculated 1091.1298, found 1091.1307. Synthesis of 1,1’-(dibenzyl)-3,3’-(1,3-xylylene)dibenzo[d]imidazol-2-ylidene digold(I) dibromide (2f)
1f (203.4 mg, 0.30 mmol) afforded complex 2f in 45 % yield (144.6 mg, 45 % yield). 1H NMR (DMSO- d6, 600 MHz): δ 7.73 (d, 3J = 8.2 Hz, 2H), 7.65 – 7.58 (m, 3H), 7.48 – 7.46 (m, 6H), 7.43 – 7.35 (m, 7H), 7.32 – 7.30 (m, 4H), 5.81 (s, 4H, NCH2Ar), 5.74 (s, 4H, NCH2Ar).
13C{1H} NMR (DMSO- d6, 151 MHz): δ 180.52 (NCN), 136.24, 135.68, 132.62, 132.50, 129.36, 128.81, 128.14, 127.34, 126.21, 124.69, 124.65, 112.63, 112.46, 51.63 (NCH2Ar), 51.12 (NCH2Ar). Note that one carbon was not found, likely due to peak overlap. ESI-MS (m/z) for [C36H30Au2N4Br]+: calculated 991.0979, found 991.0976. Synthesis of 1,1’-(di(naphthalen-2-ylmethyl))-3,3’-(1,4-xylylene)dibenzo[d]imidazol-2-ylidene digold(I) dibromide (2g)
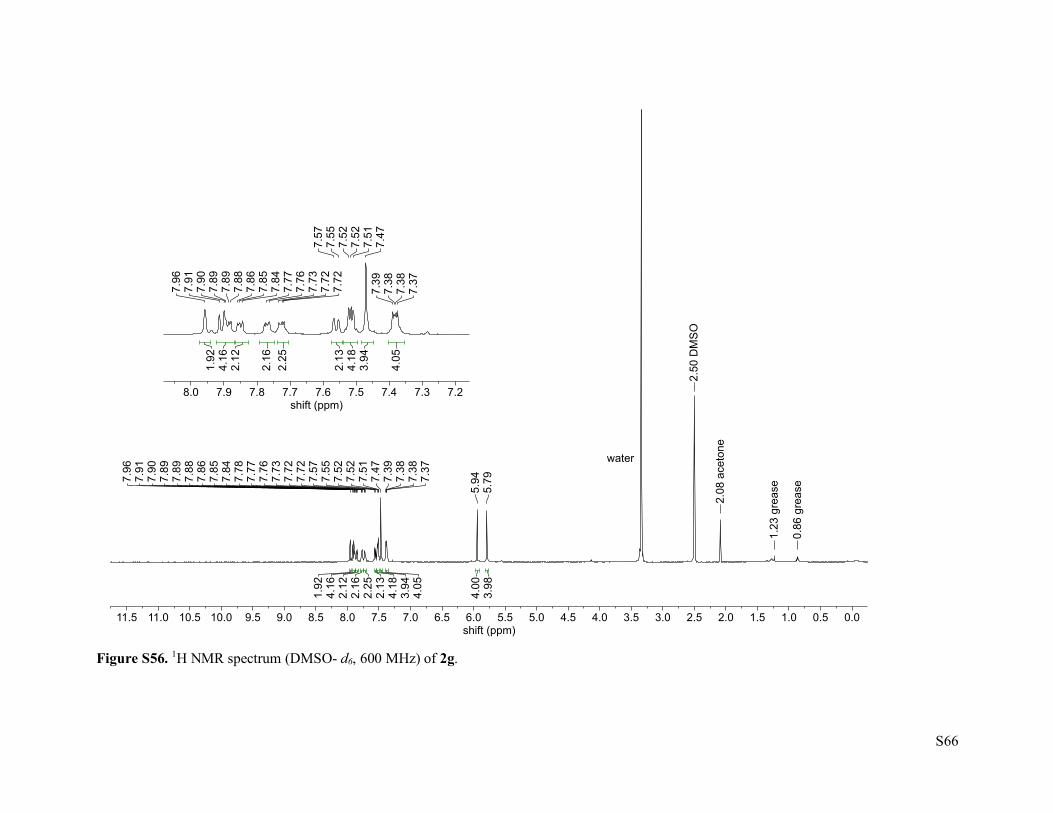
1g (233.4 mg, 0.30 mmol) afforded complex 2g in 33 % yield (115.8 mg). 1H NMR (DMSO- d6, 600 MHz): δ 7.96 (s, 2H), 7.92 – 7.87 (m, 4H), 7.87 – 7.84 (m, 2H), 7.78 – 7.76 (m, 2H), 7.75 – 7.70 (m, 2H), 7.56 (d, 3J = 8.3 Hz, 2H), 7.54 – 7.50 (m, 4H), 7.47 (s, 4H), 7.38 (dd, J =
6.0, 3.1 Hz, 4H), 5.94 (s, 4H, NCH2Ar), 5.79 (s, 4H, NCH2Ar). 13C NMR (DMSO- d6, 151 MHz): δ 180.76 (NCN), 135.73, 133.22, 132.81, 132.66, 132.64, 132.51, 128.64, 127.77, 127.64, 126.65, 126.44, 126.38, 124.96, 124.80, 112.66, 51.70 (NCH2Ar), 51.07 (NCH2Ar). Note that three carbons were not found, likely due to peak overlap. ESI-MS (m/z) for [C44H34Au2N4Br]+: calculated 1091.1292, found 1091.1296.
N N N N
2eAu
Br
Au
Br
N N N N
2fAu
Br
Au
Br
N NN N
2gAu
Br
Au
Br

S11
2.3 Synthesis of [Au13(bisNHC)5X2]X3 clusters General procedure for synthesis of gold nanoclusters [3a-e]X3
The synthesis of gold nanoclusters [3a-e]X3 was adapted from previously published procedures.13 In a 50 mL round bottom flask, the appropriate gold complex 2a-e (ca. 40 mg, 0.04 mmol) was suspended in DCM/EtOH (2:1 v/v, 30 mL). The mixture was sonicated to form a homogenous suspension, then cooled to 0 °C in an ice bath. To the stirring solution was added a sonicated solution of sodium borohydride (3.0 mg, 0.08 mmol) in ethanol (99.5%, 10 mL). The mixture was stirred for 1 hour, then removed from the ice bath and stirred 2 hours at room temperature. Concentrated HCl (6.5 µL, 0.08 mmol) was added (see Figure S1 showing the positive effect of HCl treatment on cluster distribution), and the mixture was stirred for 1 hour at room temperature, then pumped to dryness in vacuo. The crude residue was extracted with EtOH (4 x 2 mL), and the supernatant solutions were filtered through celite, removing a beige to brown precipitate. The eluent from this filtration was dried in vacuo yielding the crude cluster mixture as a red-orange to dark red residue. The crude cluster mixtures were purified by silica gel column chromatography (Fuji Silysia Chromatorex PSQ60AB silica; 9:1 to 3:1 DCM/MeOH eluent; ~3x10 cm column size). The final red band on column yields the purified clusters [3a-e]X3 (cluster Rf (9:1 DCM/MeOH) = 0.3-0.4). See below for yields (based on Au) and characterization data.
Figure S1. UV-vis spectrum (left) and ESI-MS (right) of crude 3a cluster mixture before (red) and after (black) HCl treatment.
N NNNAr ArAu Au
X X
[Au13(bisNHCAr)5X2]X3
1) NaBH4 (2.0 eq.), DCM/EtOH, 0 oC - rt, 3 hr
2) Conc. HCl (2.0 eq.), rt, 1 hr[3a-e]X32a-e
3a, X = Cl
F
3c, X = Cl 3e, X = Br3b, X = Br
Ar = F
3d, X = Br
F F
FF

S12
Synthesis of [Au13(bisNHCPh)5Cl2]Cl3 ([3a]Cl3) 2a (78.5 mg, 0.08 mmol) afforded the desired nanocluster [3a]Cl3 as a red solid in 43 % yield after column purification (28.1 mg). Red needle crystals of [3a]Cl3 suitable for X-ray crystallography were grown from a solution of column purified cluster (13.4 mg) in DCM (~2 mL, 6 mg/mL) layered with hexanes (~2 mL) left capped at room temperature for one day. The crystals were washed with DCM-Hex (1:4 v/v; 3 x 1 mL), removing an orange powdery precipitate and pale orange supernatant solution, which were dried in vacuo (3.9 mg and 3.6 mg, respectively). Several crystals were reserved under DCM-Hex (1:4 v/v) for X-ray analysis. The remaining were dried in vacuo yielding dark red needles (3.4 mg, 25 % recovery). 1H NMR (CD2Cl2, 600 MHz): δ 7.88 (d, 3J = 8.4 Hz, 5H), 7.55 (t, 3J = 8.1 Hz, 5H), 7.47 (d, 2J = 16.2 Hz, 5H, d-NCH2Ar), 7.38 (d, 3J = 7.8 Hz, 5H), 7.25 (t, 3J = 8.1 Hz, 5H), 7.19 (d, 2J = 16.2 Hz, 5H, b-NCH2Ar), 7.17 (t, 3J = 7.5 Hz, 5H), 7.07 (t, 3J = 8.1 Hz, 5H), 7.01 (d, 3J = 8.4 Hz, 5H), 7.00 (t, 3J = 7.5 Hz, 5H), 6.95 (t, 3J = 7.5 Hz, 5H), 6.88 (t, 3J = 7.5 Hz, 5H), 6.87 (d, 2J = 15.0 Hz, 5H, c-NCH2Ar), 6.82 (d, 3J = 7.2 Hz, 10H), 6.78 (d, 2J = 13.8 Hz, 5H, a-NCH2Ar), 6.71 (d, 3J = 7.2 Hz, 10H), 6.52 (t, 3J = 7.8 Hz, 10H), 6.50 – 6.46 (m, 15H), 6.42 (d, 3J = 6.6 Hz, 5H), 6.15 (t, 3J = 7.5 Hz, 5H), 6.13 (d, 3J = 7.8 Hz, 5H), 5.40 (d, 2J = 16.2 Hz, 5H, d-NCH2Ar), 4.79 (d, 2J = 15.0 Hz, 5H, c-NCH2Ar), 4.53 (d, 2J = 16.2 Hz, 5H, b-NCH2Ar), 3.48 (d, 2J = 13.8 Hz, 5H, a-NCH2Ar). UV-vis (DCM): characteristic absorbances at 287, 325, 454, and 526 nm. ESI-MS (m/z): major peak [Au13(C36H30N4)5Cl2]3+: calculated 1741.2477, found 1741.2606; minor peak [Au13(C36H30N4)5Cl2]Cl2+: calculated 2629.8532, found 2629.8871. Elemental analysis: calculated (%) for C180H150Au13Cl5N20: C, 40.55; H, 2.86; N, 5.25; found: C, 40.60; H, 3.30; N, 4.87. Synthesis of [Au13(bisNHCPh)5Cl2][PF6]3 and [Au13(bisNHCPh)5Cl2][CO2CF3]3
([3a][PF6]3 and [3a][CO2CF3]3) Anion exchange of cluster [3a]Cl3 was performed to isolate PF6 as well as trifluoroacetate (CO2CF3) salts of the cluster for comparison by NMR spectroscopy. The general procedure for anion exchange is as follows. To a methanol (3 mL) solution of the cluster (5 mg, 9 x 10⁻⁴ mmol) was added an excess of the desired anion salt, either NH4PF6 or Na(CO2CF3) (10 eq., 0.009 mmol). The solution was stirred for 1 hour, then dried in vacuo. The residue was dissolved in DCM and syringe filtered (<0.45 µm PTFE filter) to remove excess salts. The filtrate was dried in vacuo yielding the anion exchanged clusters [3a][PF6]3 and [3a][CO2CF3]3 in 88 and 57 % yields, respectively. Some notable shift differences were observed in the 1H NMR spectra of the clusters depending on the anion, especially for two of the NCH2Ar proton peaks (see below and Figures S58-61). [3a][PF6]3: 1H NMR (CD2Cl2, 600 MHz): δ 7.52 (d, 2J = 16.1 Hz, 5H, d-NCH2Ar), 7.21 (d, 2J = 17.1 Hz, 5H, b-NCH2Ar), 6.90 (d, 2J = 14.6 Hz, 5H, c-NCH2Ar), 6.78 (d, 2J = 13.7 Hz, 5H, a-NCH2Ar), 4.91 (d, 2J = 16.2 Hz, 5H, d-NCH2Ar), 4.49 (d, 2J = 16.6 Hz, 5H, b-NCH2Ar), 4.16 (d, 2J = 14.7 Hz, 5H, c-NCH2Ar), 3.48 (d, 2J = 13.7 Hz, 5H, a-NCH2Ar). [3a][CO2CF3]3: 1H NMR (CD2Cl2, 600 MHz): δ 7.52 (d, 2J = 16.3 Hz, 5H, d-NCH2Ar), 7.21 (d, 2J = 15.9 Hz, 5H, b-NCH2Ar), 6.86 (d, 2J = 14.6 Hz, 5H, c-NCH2Ar), 6.77 (d, 2J = 13.7 Hz, 5H, a-NCH2Ar), 5.18 (d, 2J = 16.2 Hz, 5H, d-NCH2Ar), 4.53 (d, 2J = 16.1 Hz, 5H, b-NCH2Ar), 4.50 (d, 2J = 14.3 Hz, 5H, c-NCH2Ar), 3.48 (d, 2J = 13.7 Hz, 5H, a-NCH2Ar).

S13
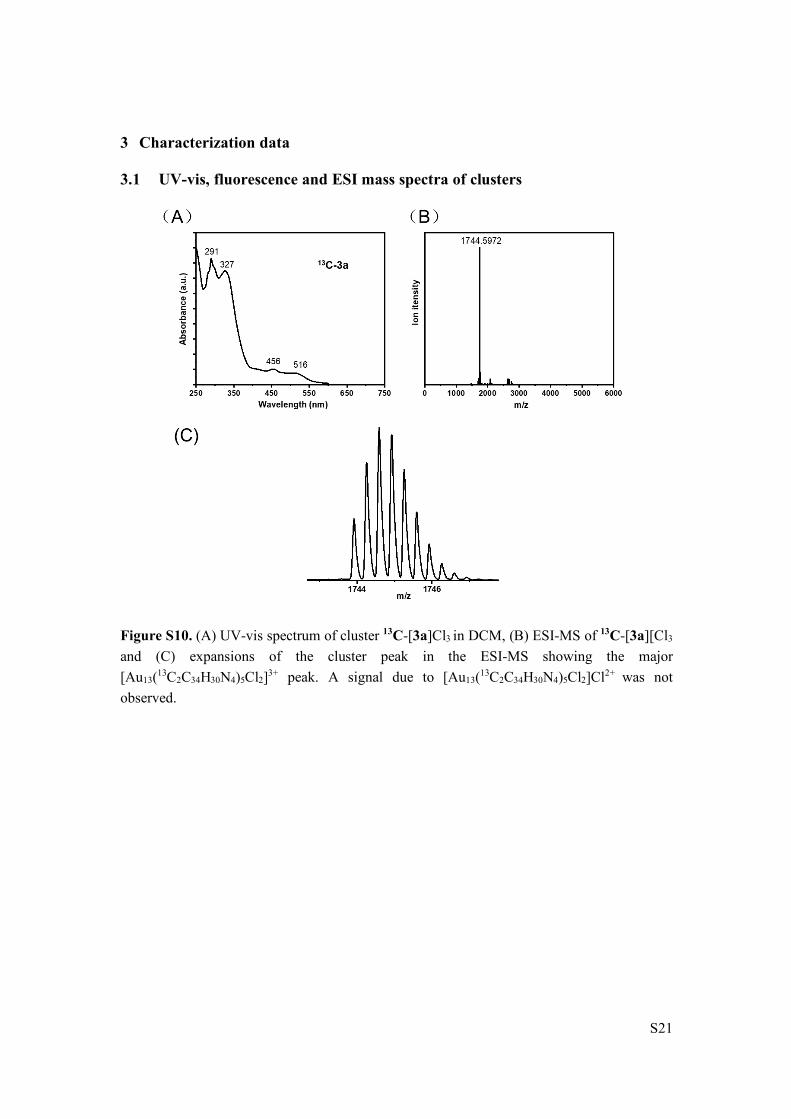
Synthesis of [2-13C]-labeled [Au13(bisNHCPh)5Cl2]Cl3 (13C-[3a]Cl3) 13C-2a (46.7 mg, 0.047 mmol) afforded the desired nanocluster 13C-[3a]Cl3 as a red solid in 49 % yield after column chromatography (19.1 mg). After purification, the cluster was washed with DCM-Hex (1:4 v/v; 3 x 1 mL) and pentane (3 x 1 mL) and dried in vacuo yielding a red powder (15.3 mg, 39 %). Note that the cluster still contained some gold complex impurities by NMR spectroscopy; therefore, a portion of the purified cluster (5.16 mg, 9.7 x 10⁻⁴ mmol) was anion exchanged to the PF6 salt as described above, yielding 13C-[3a][PF6]3 as a red solid (5.1 mg, 93 % yield). The PF6 salt was crystallized by dissolving the residue in DCM (~1 mL) and adding hexanes until a precipitate formed (~1 mL). The precipitate was redissolved by adding DCM dropwise, then the vial was capped and left at room temperature for 3 days, after which red needles had formed. The crystals were washed with DCM/Hexanes (1:4 v/v; 2 x 1 mL), then pentane (2 x 1 mL) before being dried in vacuo for several hours (1.8 mg, 35 % crystal yield). 13C-[3a]Cl3: 1H NMR (CD2Cl2, 600 MHz): δ 7.87 (m, 5H), 7.56 (t, 3J = 7.7 Hz, 5H), 7.49 – 7.37 (m, 10H), 7.27 – 7.17 (m, 15H), 7.09 – 6.93 (m, 20H), 6.89 – 6.76 (m, 25H), 6.71 (d, 3J = 7.4 Hz, 10H), 6.53 – 6.46 (m, 25H), 6.40 (d, 3J = 7.4 Hz, 5H), 6.16 – 6.11 (m, 10H), 5.37 (dd, 2JH-H = 16.1 Hz, 3JC-H = 6.4 Hz, 5H, d-NCH2Ar), 4.74 (dd, 2JH-H = 14.9 Hz, 3JC-H = 2.9 Hz, 5H, c-NCH2Ar), 4.52 (dd, 2JH-H = 16.4 Hz, 3JC-H = 3.3 Hz, 5H, b-NCH2Ar), 3.48 (dd, 2JH-H = 13.9 Hz, 3JC-H = 4.3 Hz, 5H, a-NCH2Ar). 13C{1H} NMR (CD2Cl2, 151 MHz): δ 207.51 (d, J = 9.7 Hz, carbene), 207.05 (d, J = 7.6 Hz, unknown), 206.61 (d, J = 9.8 Hz, carbene), 206.06 (d, J = 9.9 Hz, unknown). ESI-MS (m/z): major peak [Au13(13C2C34H30N4)5Cl2]3+: calculated 1744.5923, found 1744.5972. 13C-[3a][PF6]3: 1H NMR (CD2Cl2, 600 MHz): δ 7.70 (d, 3J = 8.4 Hz, 5H), 7.58 (t, 3J = 7.3 Hz, 5H), 7.52 (dd, 2JH-H = 16.0 Hz, 3JC-H = 4.6 Hz, 5H, d-NCH2Ar), 7.38 (d, 3J = 8.2 Hz, 5H), 7.30 (t, 3J = 7.3 Hz, 5H), 7.23 (t, 3J = 7.6 Hz, 5H), 7.20 (dd, 2JH-H = 15.4 Hz, 3JC-H = 4.6 Hz, 5H, b-NCH2Ar), 7.11 (t, 3J = 7.3 Hz, 5H), 7.03 – 6.97 (m, 10H), 6.95 – 6.92 (m, 10H), 6.89 (dd, 2JH-
H = 14.7 Hz, 3JC-H = 4.7 Hz, 5H, c-NCH2Ar), 6.77 (d, 2JH-H = 13.7 Hz, 3JC-H = 4.8 Hz, 5H, a-NCH2Ar), 6.74 – 6.64 (m, 20H), 6.54 – 6.47 (m 25H), 6.20 (t, 3J = 7.4 Hz, 5H), 6.14 (d, 3J = 8.7 Hz, 10H), 4.90 (d, 2JH-H = 16.1 Hz, 3JC-H = 6.5 Hz, 5H, d-NCH2Ar), 4.49 (d, 2JH-H = 16.6 Hz, 3JC-H = 3.5 Hz, 5H, b-NCH2Ar), 4.16 (d, 2JH-H = 14.8 Hz, 3JC-H = 2.8 Hz, 5H, c-NCH2Ar), 3.48 (d, 2JH-H = 13.6 Hz, 3JC-H = 4.4 Hz, 5H, a-NCH2Ar). 13C{1H} NMR (CD2Cl2, 151 MHz): δ 207.51 (d, J = 9.6 Hz, carbene), 207.03 (d, J = 8.8 Hz, unknown), 206.55 (d, J = 9.9 Hz, carbene), 205.98 (d, J = 10.0 Hz, unknown).

S14
Synthesis of [Au13(bisNHCPh)5Br2]Br3 ([3b]Br3) 2b (41.7 mg, 0.04 mmol) afforded nanocluster [3b]Br3 as a red solid in 27 % yield after column chromatography (9.1 mg). The cluster was crystallized by dissolving the residue in DCM (~1 mL) and adding hexanes until a precipitate formed (~2 mL). The precipitate was redissolved by adding DCM dropwise, then the vial was capped and left at room temperature for 3 days, after which small red needles had formed. The crystals were washed with hexanes (2 x 0.5 mL) before being dried in vacuo for several hours (4.1 mg, 12 % crystal yield). 1H NMR (CD2Cl2, 600 MHz): δ 7.91 (d, 3J = 8.4 Hz, 5H), 7.55 (t, 3J = 7.8 Hz, 5H), 7.44 (d, 2J = 16.1 Hz, 5H, d-NCH2Ar), 7.40 (d, 3J = 8.0 Hz, 5H), 7.24 (t, 3J = 8.0 Hz, 5H), 7.20 (d, 2J = 16.6 Hz, 5H, b-NCH2Ar), 7.18 (t, 3J = 7.8 Hz, 5H), 7.08 (t, 3J = 7.6 Hz, 5H), 7.02 (t, 3J = 7.5 Hz, 5H), 7.01 (d, 3J = 8.3 Hz, 5H), 6.96 (t, 3J = 8.1 Hz, 5H), 6.89 (d, 2J = 15.0 Hz, 5H, c-NCH2Ar), 6.86 – 6.84 (m, 15H), 6.78 (d, 2J = 13.8 Hz, 5H, a-NCH2Ar), 6.63 (d, 3J = 7.4 Hz, 10H), 6.53 (t, 3J = 7.7 Hz, 20H), 6.43 (d, 3J = 7.5 Hz, 5H), 6.40 (d, 3J = 8.4 Hz, 5H), 6.16 – 6.12 (m, 10H), 5.40 (d, 2J = 16.2 Hz, 5H, d-NCH2Ar), 4.77 (d, 2J = 14.7 Hz, 5H, c-NCH2Ar), 4.57 (d, 2J = 16.6 Hz, 5H, b-NCH2Ar), 3.47 (d, 2J = 13.8 Hz, 5H, a-NCH2Ar).. UV-vis (DCM): characteristic absorbances at 318, 338, 407, 455, and 516 nm. ESI-MS (m/z): major peak [Au13(C36H30N4)5Br2]3+: calculated 1771.2134, found 1771.2202; minor peak [Au13(C36H30N4)5Br2]Br2+: calculated 2696.7768, found 2696.7931. Synthesis of [Au13(bisNHCAr)5Cl2]Cl3 (Ar = 4-fluorophenyl, [3c]Cl3) 2c (40.7 mg, 0.04 mmol) afforded nanocluster [3c]Cl3 as a red powder in 22 % yield after column chromatography (7.6 mg). 1H NMR (CD2Cl2, 600 MHz): δ 7.93 (d, 3J = 8.2 Hz, 5H), 7.56 (t, 3J = 7.7 Hz, 5H), 7.45 (d, 2J = 16.3 Hz, 5H, d-NCH2Ar), 7.36 (d, 3J = 7.8 Hz, 5H), 7.28 (t, 3J = 7.8 Hz, 5H), 7.19 – 7.09 (m, 20H, ArH + b-NCH2Ar), 7.01 – 6.97 (m, 5H), 6.90 – 6.81 (m, 20H, ArH + c-NCH2Ar), 6.78 – 6.75 (m, 10H), 6.67 (d, 2J = 13.8 Hz, 5H, a-NCH2Ar), 6.50 (d, 3J = 7.2 Hz, 5H), 6.46 (d, 3J = 8.3 Hz, 5H), 6.30 – 6.23 (m, 20H), 6.14 (d, 3J = 8.2 Hz, 5H), 5.62 (d, 2J = 16.3 Hz, 5H, d-NCH2Ar), 5.05 (d, 2J = 14.7 Hz, 5H, c-NCH2Ar), 4.53 (d, 2J = 16.4 Hz, 5H, b-NCH2Ar), 3.43 (d, 2J = 14.0 Hz, 5H, a-NCH2Ar). 19F NMR (DMSO-d6, 376 MHz): δ -111.47 (s, 5F), -112.65 (s, 5F). UV-vis (DCM): characteristic absorbances at 292, 326, 409, 455, and 516 nm. ESI-MS (m/z): major peak [Au13(C36H28N4F2)5Cl2]3+: calculated 1801.2163, found 1801.2099; minor peak [Au13(C36H28N4F2)5Cl2]Cl2+: calculated 2719.8061, found 2719.8191. Elemental analysis: calculated (%) for C180H140Au13Cl5F10N20: C, 39.23; H, 2.56; N, 5.08; found: C, 38.93; H, 2.90; N, 4.68.
S15
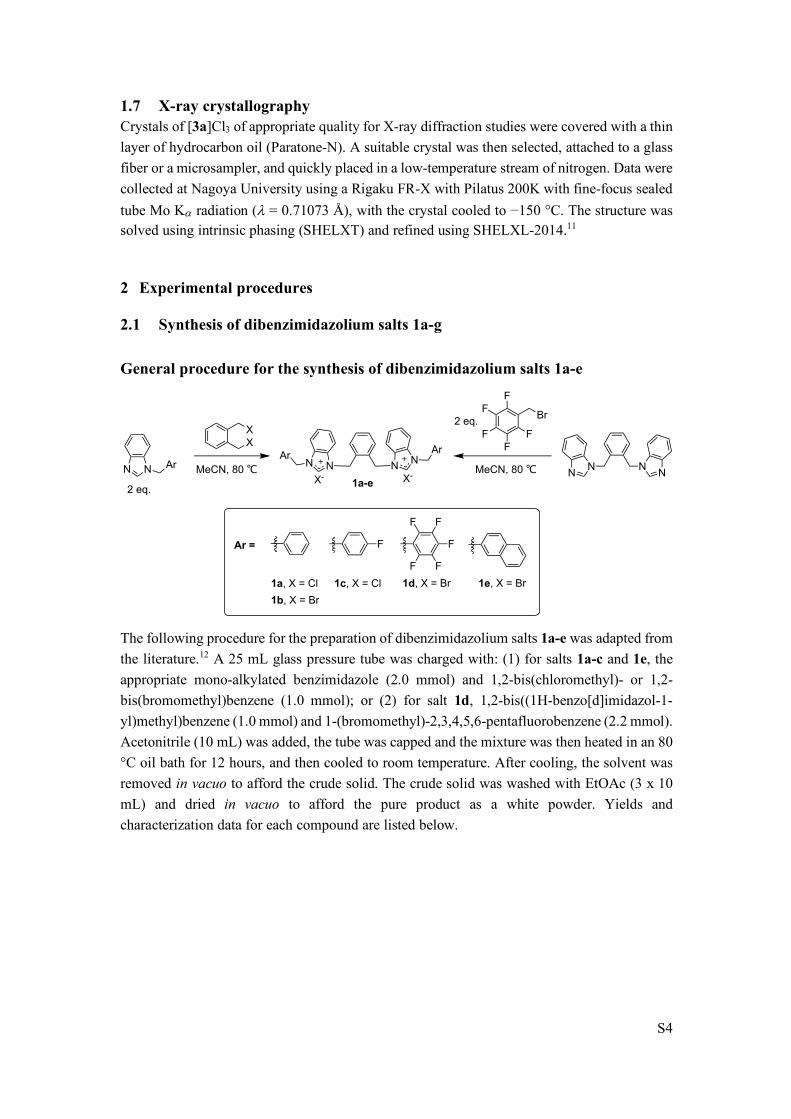
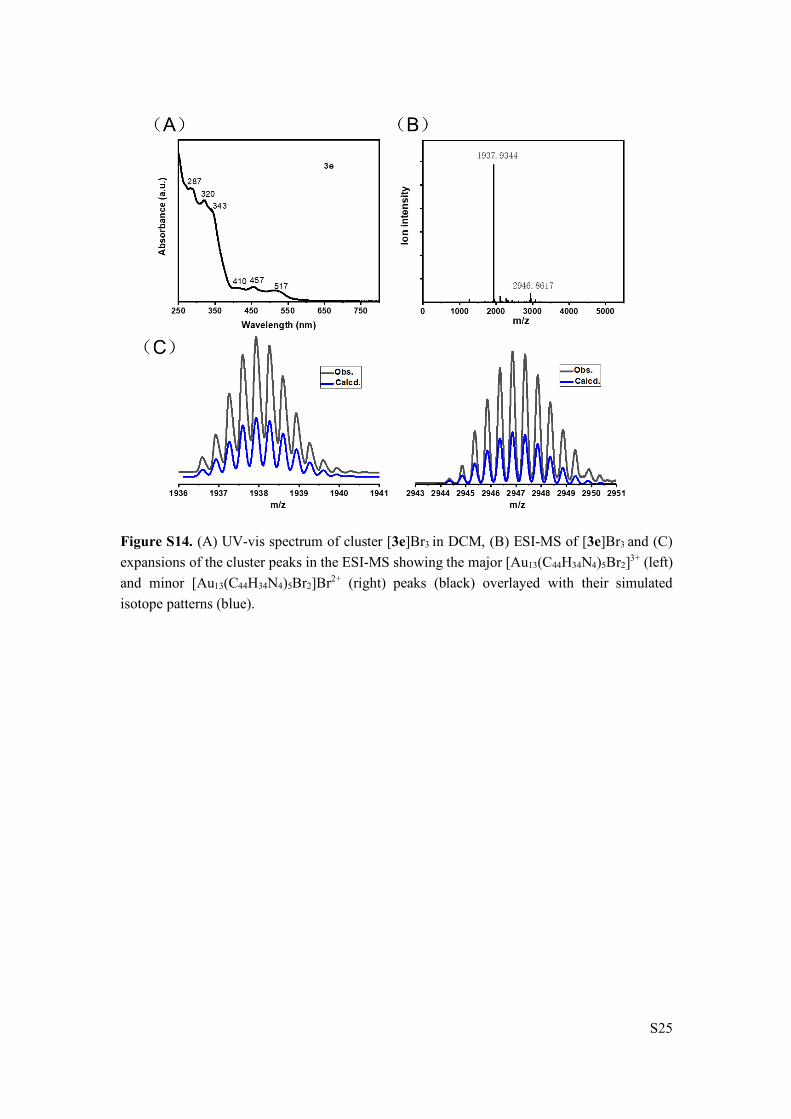
Synthesis of [Au13(bisNHCAr)5Br2]Br3 (Ar = pentafluorophenyl, [3d]Br3) 2d (45.0 mg, 0.04 mmol) afforded nanocluster [3d]Br3 as a red solid in 25 % yield after column chromatography (10.0 mg). 1H NMR (CD2Cl2, 600 MHz): δ 7.78 (d, 3J = 8.4 Hz, 5H), 7.62 (t, 3J = 7.5 Hz, 5H), 7.58 (d, 2J = 16.5 Hz, c-NCH2Ar), 7.39 (t, 3J = 7.5 Hz, 5H), 7.25 (d, 3J = 7.9 Hz, 5H), 7.21 (t, 3J = 7.9 Hz, 5H), 7.19 – 7.17 (m, 10H), 6.91 (t, 3J = 7.4 Hz, 5H), 6.79 (d, 2J = 14.7 Hz, 5H, b-NCH2Ar), 6.65 (d, 3J = 6.6 Hz, 5H), 6.59 (d, 2J = 14.7 Hz, 5H, a-NCH2Ar), 6.39 (d, 2J = 15.7 Hz, 5H, d-NCH2Ar), 6.32 (d, 3J = 8.4 Hz, 5H), 6.19 (d, 3J = 7.4 Hz, 5H), 5.74 (d, 2J = 15.8 Hz, 5H, d-NCH2Ar), 5.46 (d, 2J = 16.5 Hz, 5H, c-NCH2Ar), 5.22 (d, 2J = 14.8 Hz, 5H, b-NCH2Ar), 3.94 (d, 2J = 14.7 Hz, 5H, a-NCH2Ar). 19F NMR (DMSO- d6 376 MHz): -141.07 (br m, 15F, ortho-C6F5), -143.20 (br m, 5F, ortho-C6F5), -151.16 (t, 3J = 22.3 Hz, 5F, para-C6F5), -152.23 (t, 3J = 20.5 Hz, 5F, para-C6F5), -160.05 (br m, 10F, meta-C6F5), -162.39 (br m, 10F, meta-C6F5). UV-vis (DCM): characteristic absorbances at 281, 292, 325, 446, and 517 nm. ESI-MS (m/z): major peak [Au13(C36H20N4F10)5Br2]3+: calculated 2071.0564, found 2071.0750; minor peak [Au13(C36H20N4F10)5Br2]Br2+: calculated 3146.5413, found 3146.5816. Synthesis of [Au13(bisNHCAr)5Br2]Br3 (Ar = 2-naphthyl, [3e]Br3) 2e (46.6 mg, 0.04 mmol) afforded nanocluster [3e]Br3 as a red solid in 30 % yield after column chromatography (11.2 mg). 1H NMR (CD2Cl2, 600 MHz): δ 7.97 (d, 3J = 8.3 Hz, 5H), 7.71 (d, 2J = 16.0 Hz, 5H, d-NCH2Ar), 7.61 (d, 3J = 7.8 Hz, 5H), 7.57 (t, 3J = 7.7 Hz, 5H), 7.46 (d, 2J = 16.9 Hz, 5H, c-NCH2Ar), 7.42 (d, 3J = 8.1 Hz, 5H), 7.32 – 7.16 (m, 45H), 7.07 (d, 3J = 8.1 Hz, 5H), 6.97 (d, 2J = 13.5 Hz, 5H, a-NCH2Ar), 6.93 – 6.90 (m, 10H, ArH + b-NCH2Ar), 6.82 – 6.71 (m, 30H), 6.58 (d, 3J = 8.5 Hz, 5H), 6.50 (d, 3J = 7.3 Hz, 5H), 6.42 (t, 3J = 7.9 Hz, 5H), 5.69 (d, 3J = 8.3 Hz, 5H), 5.63 (d, 3J = 8.4 Hz, 5H), 5.57 (d, 2J = 16.0 Hz, d-NCH2Ar), 5.02 (d, 2J = 16.7 Hz, c-NCH2Ar), 4.86 (d, 2J = 14.4 Hz, b-NCH2Ar), 3.71 (d, 2J = 13.6 Hz, a-NCH2Ar). UV-vis (DCM): characteristic absorbances at 287, 320, 343, 410, 457, 517 nm. ESI-MS (m/z): major peak [Au13(C44H34N4)5Br2]3+: calculated 1937.5978, found 1937.9344; minor peak [Au13(C44H34N4)5Br2]Br2+: calculated 2947.3567, found 2946.8617. Reduction of complexes 2f and 2g
N N N N
2fAu
Br
Au
Br
N NN N
2gAu
Br
Au
Br
1) NaBH4 (2.0 eq.), DCM/EtOH, 0 oC - rt, 3 hr
2) Conc. HCl (2.0 eq.), rt, 1 hrComplicated
mixturesor

S16
Complexes 2f and 2g were reduced with sodium borohydride using the general method described above. The crude cluster mixtures were characterized by ESI-MS and showed only complicated mixtures of smaller gold complexes and some trace unidentifiable clusters, with no Au13 clusters present (see Figure S2). Attempts to purify the crude clusters by column chromatography yielded only mixtures, therefore further attempts at cluster synthesis using complexes 2f and 2g were not pursued.
Figure S2. ESI-MS of the crude mixtures from the reduction of (a) 2g and (b) 2h under standard conditions.
2.4 Chiral separation and cluster stability tests
0.0
0.5
1.0
1.5
2.0
2.55x10
Intens.
1000 2000 3000 4000 5000 m/z
2851.2364
1823.1799
1012.0345
1249.1511
(a)
0
1
2
3
4
5x10Intens.
1000 2000 3000 4000 5000 m/z
1012.0248
1540.5206
1979.2787
(b)

S17
Experimental procedure for large scale separation of racemic 3a by chiral HPLC Cluster [3a]Cl3 (5.0 mg) was dissolved in 1.0 mL MeOH. Chromatographic separation of the cluster enantiomers was then carried out on a Shimadzu LC-2010CHT HPLC system equipped with a Diacel CHIRALPAK IE-3 column (5µm, 250 mm×10.0 mm) by direct injection of this solution. MeOH/TFA/DEA (1:0.1:0.1 volume ratio) was used as eluent with a flow rate of 2.0 mL/min. Once the first cluster peak started to elute, the column eluent was collected into a 50 mL vial. Due to partial peak overlap of the two enantiomers, the intermediate fractions at the tail end of the first enantiomer peak and the beginning of the second enantiomer peak were not collected in order to avoid significant mixing of the two enantiomers. The remainder of second enantiomer was then collected into a 50 mL vial. After separation, the solvents were removed in vacuo. To remove excess acid and amine impurities, the residues were dissolved in DCM and washed with water until the extracted aqueous phase was a neutral pH. The organic phase was then dried in vacuo to yield the cluster enantiomers as red residues (enantiomer 1: 2.0 mg; enantiomer 2: 1.5 mg). Each fraction was then re-evaluated by chiral HPLC to check the enantiomeric excess of the isolated fractions, as well as characterized by UV-vis spectroscopy (Figure S3). ESI-MS and NMR spectroscopic data indicated partial anion exchange to the trifluoroacetate species [3a][CO2CF3]3 had most likely taken place, therefore each enantiomer was anion exchanged to the PF6 salt via the method described previously, which resulted in identical 1H NMR spectroscopic peaks for each cluster enantiomer, which were consistent with independently prepared and isolated [3a][PF6]3 (see Figures S4-5). We have checked the separation of 3c-3e by chiral HPLC under the same conditions as 3a. Au13 nanoclusters 3c and 3d can be separated, while 3e can’t be separated (Figure S6).
Figure S3. UV-vis spectra (DCM) of the two cluster fractions isolated by chiral HPLC separation of racemic [3a]Cl3.
250 300 350 400 450 500 550 600 6500.0
0.1
0.2
0.3
0.4
0.5
0.6
0.7 racemic chiral en1 chiral en2
400 450 500 550
0.02
0.04
0.06
0.08
0.10
0.12
0.14
0.16
Inte
nsity
wavenumber / nm
Inte
nsity
wavenumber / nm
406 455518

S18
Figure S4. ESI-MS spectra of the two cluster fractions isolated by chiral HPLC separation of racemic [3a]Cl3.
Figure S5. 1H NMR (CD2Cl2, 600 MHz) spectra of (a) independently isolated [3a][CO2CF3]3, (b) first cluster enantiomer fraction isolated by chiral HPLC separation of racemic [3a]Cl3, (c) second cluster enantiomer fraction isolated by chiral HPLC separation of racemic [3a]Cl3, (d) first cluster enantiomer fraction exchanged to [3a][PF6]3, (c) second cluster enantiomer fraction enantiomer fraction exchanged to [3a][PF6]3, and (d) independently isolated [3a][PF6]3.
3.23.43.63.84.04.24.44.64.85.05.25.45.65.86.06.26.46.66.87.07.27.47.67.8shift(ppm)
(a)
(b)
(c)
(d)
(e)
(f)
[3a][CO2CF3]3
[3a][PF6]3
HPLC fraction 1 – PF6 exchanged
HPLC fraction 1
HPLC fraction 2
HPLC fraction 2 – PF6 exchanged

S19
Figure S6. Enantioseparation of 3c and 3d could be affected under the same conditions employed for 3a, however cluster 3e could not be resolved under these conditions.
Thermal stability of cluster 3a Cluster [3a]Cl3 (0.3 mg) was dissolved in acetonitrile (3.0 mL). The sample was then transferred into a 1 cm2 quartz cuvette fitted with a sealable screw cap top. The sample was heated at 60 oC in an oil bath, and changes to the UV-vis spectrum were monitored over time. The UV-vis spectrum showed no discernible changes over 3 days of heating (see Figure 6A in manuscript). The emission spectra of Cluster [3a]Cl3 for 3 days at 60 oC in MeCN solution are checked. No obvious change of emission spectra was observed after 3 days (Figure S7).
Figure S7. Emission spectra of Cluster [3a]Cl3 for 3 days at 60 oC in MeCN
Chiral stability of cluster 3a under thermal treatment The isolated enantiomer 1 (1.2 mg, 88 % ee) from chiral HPLC separation of racemic [3a]Cl3 was dissolved in MeOH (3.0 mL). The sample was transferred to three separate glass reaction tubes (1.0 mL each) and the tubes were sealed with Teflon lined caps. The three solutions were then heated for 1 hour at 60 oC, 80 oC and 100 oC, after which they were cooled and the cluster
600 700 800 900
Inte
nsity
Wavelength (nm)
0h 1h 3h 5h 7h 12h 24h 48h 72h
S20
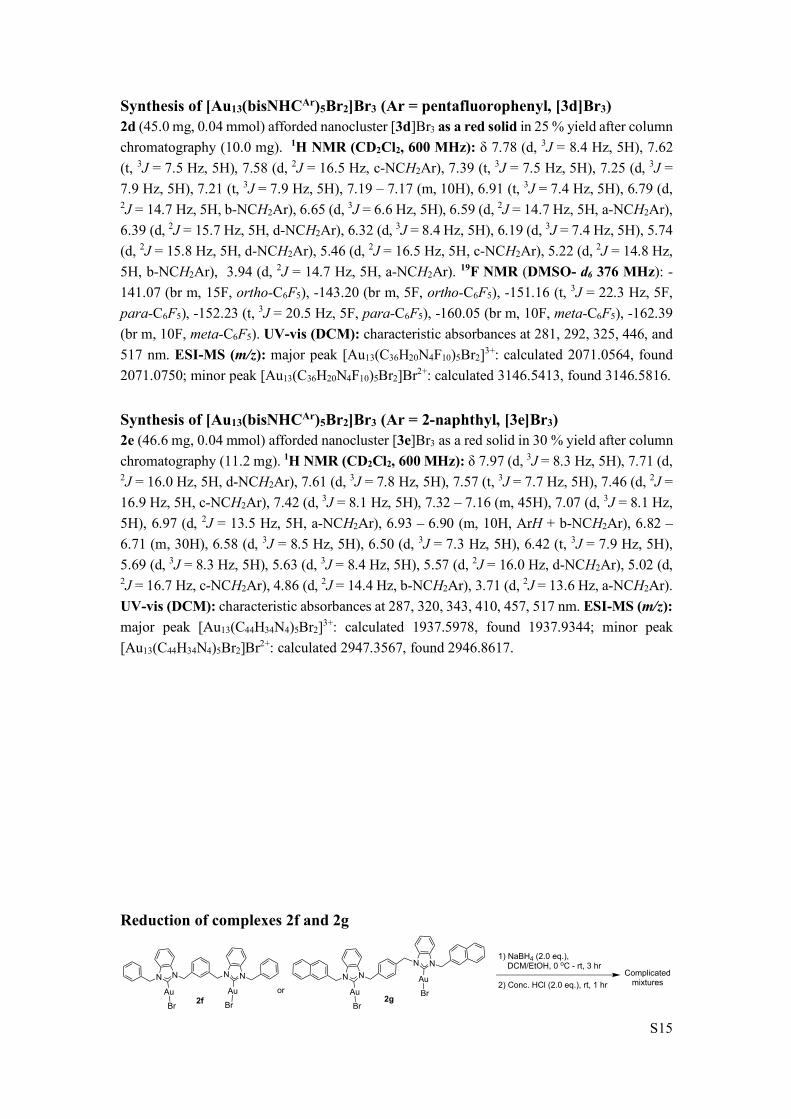
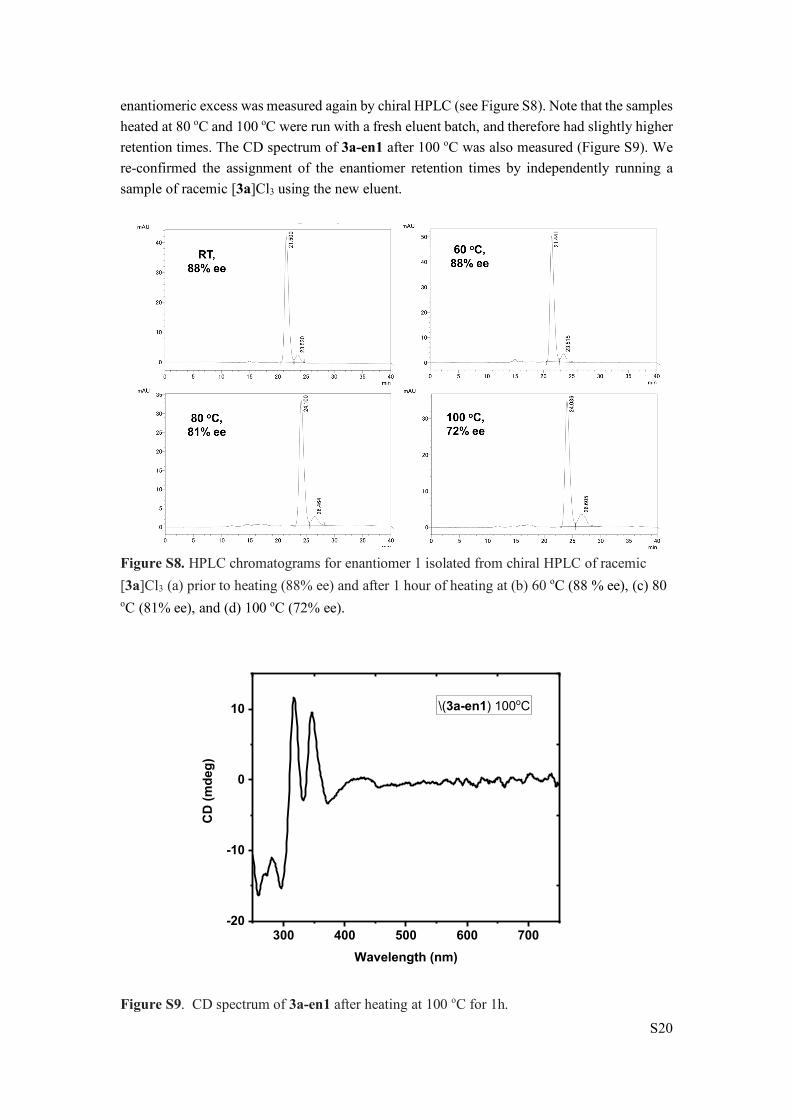
enantiomeric excess was measured again by chiral HPLC (see Figure S8). Note that the samples heated at 80 oC and 100 oC were run with a fresh eluent batch, and therefore had slightly higher retention times. The CD spectrum of 3a-en1 after 100 oC was also measured (Figure S9). We re-confirmed the assignment of the enantiomer retention times by independently running a sample of racemic [3a]Cl3 using the new eluent.
Figure S8. HPLC chromatograms for enantiomer 1 isolated from chiral HPLC of racemic [3a]Cl3 (a) prior to heating (88% ee) and after 1 hour of heating at (b) 60 oC (88 % ee), (c) 80 oC (81% ee), and (d) 100 oC (72% ee).
Figure S9. CD spectrum of 3a-en1 after heating at 100 oC for 1h.
300 400 500 600 700-20
-10
0
10
CD
(mde
g)
Wavelength (nm)
\(3a-en1) 100oC
S21
3 Characterization data
3.1 UV-vis, fluorescence and ESI mass spectra of clusters
Figure S10. (A) UV-vis spectrum of cluster 13C-[3a]Cl3 in DCM, (B) ESI-MS of 13C-[3a][Cl3
and (C) expansions of the cluster peak in the ESI-MS showing the major [Au13(13C2C34H30N4)5Cl2]3+ peak. A signal due to [Au13(13C2C34H30N4)5Cl2]Cl2+ was not observed.

S22
Figure S11. (A) UV-vis spectrum of cluster [3b]Br3 in DCM, (B) ESI-MS of [3b]Br3 and (C) expansions of the cluster peaks in the ESI-MS showing the major [Au13(C36H30N4)5Br2]3+ (left) and minor [Au13(C36H30N4)5Br2]Br2+ (right) peaks (black) overlayed with their simulated isotope patterns (blue).

S23
Figure S12. (A) UV-vis spectrum of cluster [3c]Cl3 in DCM, (B) ESI-MS of [3c]Cl3 and (C) expansions of the cluster peaks in the ESI-MS showing the major [Au13(C36H28N4F2)5Cl2]3+ (left) and minor [Au13(C36H28N4F2)5Cl2]Cl2+ (right) peaks (black) overlayed with their simulated isotope patterns (blue).

S24
Figure S13. (A) UV-vis spectrum of cluster [3d]Br3 in DCM, (B) ESI-MS of [3d]Br3 and (C) expansions of the cluster peaks in the ESI-MS showing the major [Au13(C36H20N4F20)5Cl2]3+ (left) and minor [Au13(C36H20N4F20)5Br2]Br2+ (right) peaks (black) overlayed with their simulated isotope patterns (blue).
S25
Figure S14. (A) UV-vis spectrum of cluster [3e]Br3 in DCM, (B) ESI-MS of [3e]Br3 and (C) expansions of the cluster peaks in the ESI-MS showing the major [Au13(C44H34N4)5Br2]3+ (left) and minor [Au13(C44H34N4)5Br2]Br2+ (right) peaks (black) overlayed with their simulated isotope patterns (blue).

S26
Figure S15. Excitation and fluorescence emission spectra of [3a]Cl3. Excitation monitored the
emission at 784 nm; emission was excited at lmax of excitation bands. Spectra were recorded using excitation band pass 5 nm, emission band pass 5 nm, integration time 0.5 s, and detector accumulation 1. The emission profile and its maximum were the same for all examined excitation wavelengths.
Figure S16. 3D (A) and 2D (B) plots of EEM data for [3a]Cl3. Spectra were recorded using excitation band pass 5 nm, emission band pass 5 nm, integration time 0.5 s, and detector accumulation 1.
300 400 500 600 700 800 9000
3000
6000
9000
0
3000
6000
9000
Exc Em Em Em Em
516456
408
Emission Intensity
Exci
tatio
n In
tens
ity
Wavelength (nm)
784325

S27
Figure S17. Absorbance spectra of reference ZnPc versus cluster [3a]Cl3 samples. Inset: zoomed area showing the matched absorbance. Fixed spectral bandwidth for the instrument is 1.5 nm; signal averaging time 0.1 s.
Figure S18. Emission spectra (excited at 398 nm) used to calculate fluorescence quantum yield of cluster [3a]Cl3 by the comparative method. Spectra were recorded using excitation band pass 5 nm, emission band pass 5 nm, integration time 0.2 s, and detector accumulation 1. Integrated areas: [3a]Cl3 sample (orange) 135286; ZnPc standard (dark cyan) 167530.
400 500 600 7000.0
0.3
0.6
0.040
0.044
3a ZnPc
Abso
rban
ce
Wavelength (nm)
396 400
600 700 800 9000
1000
2000
3000
Abso
rban
ce
Wavelength (nm)
3a ZnPc

S28
3.2 X-ray crystallographic data
Table S1. Crystal data and structure refinement for [3a]Cl3
Empirical formula C180H150Au13Cl5N20
Formula weight 5331.01
Temperature 123(2) K
Wavelength 0.71073 Å
Crystal system Orthorhombic
Space group Pna21
Unit cell dimensions a = 33.830(4) Å a = 90°.
b = 28.509(3) Å b = 90°.
c = 19.234(2) Å g = 90°.
Volume 18550(4) Å3
Z 4
Density (calculated) 1.939 Mg/m3
Absorption coefficient 10.389 mm-1
F(000) 10096
Crystal size 0.30 x 0.04 x 0.01 mm3
Theta range for data collection 3.1 to 27.5°.
Index ranges -43<=h<=43, -36<=k<=36, -24<=l<=24
Reflections collected 181504
Independent reflections 41330 [R(int) = 0.0637]
Completeness to theta = 27.5° 0.949
Absorption correction Numerical (Multi-scan)
Refinement method Full-matrix least-squares on F2 (SHELX-2018/3)
Data / restraints / parameters 41330 / 1410 / 1955
Goodness-of-fit on F2 1.137
Final R indices [I>2sigma(I)] R1 = 0.0531, wR2 = 0.1123
R indices (all data) R1 = 0.0952, wR2 = 0.1420
Extinction coefficient n/a
Largest diff. peak and hole 4.056 and -1.870 e.Å-3

S29
Figure S19. Full ORTEP diagram showing the X-ray structure of [3a]Cl3 with thermal ellipsoids at 50% probability. H atoms have been omitted for clarity (legend: Au - yellow; Cl - green; C – grey; N - blue).
Figure S20. Alternative views of the X-ray structure of [3a]Cl3 highlighting the central Au13 core and atoms directly attached to Au; all other atoms are removed for clarity (legend: Au - yellow; Cl - green; C – grey).

S30
Figure S21. Unit cell of the X-ray structure of [3a]Cl3 showing four cluster molecules as two pairs of enantiomers.
S31
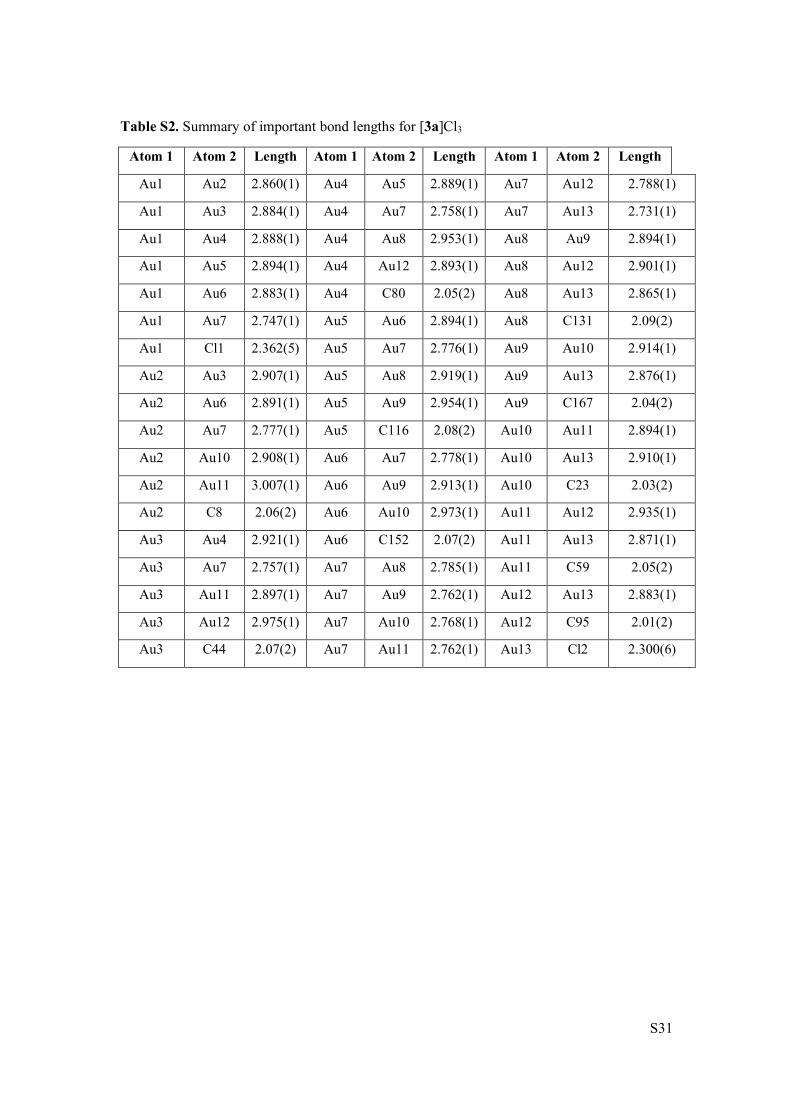
Table S2. Summary of important bond lengths for [3a]Cl3
Atom 1 Atom 2 Length Atom 1 Atom 2 Length Atom 1 Atom 2 Length
Au1 Au2 2.860(1) Au4 Au5 2.889(1) Au7 Au12 2.788(1)
Au1 Au3 2.884(1) Au4 Au7 2.758(1) Au7 Au13 2.731(1)
Au1 Au4 2.888(1) Au4 Au8 2.953(1) Au8 Au9 2.894(1)
Au1 Au5 2.894(1) Au4 Au12 2.893(1) Au8 Au12 2.901(1)
Au1 Au6 2.883(1) Au4 C80 2.05(2) Au8 Au13 2.865(1)
Au1 Au7 2.747(1) Au5 Au6 2.894(1) Au8 C131 2.09(2)
Au1 Cl1 2.362(5) Au5 Au7 2.776(1) Au9 Au10 2.914(1)
Au2 Au3 2.907(1) Au5 Au8 2.919(1) Au9 Au13 2.876(1)
Au2 Au6 2.891(1) Au5 Au9 2.954(1) Au9 C167 2.04(2)
Au2 Au7 2.777(1) Au5 C116 2.08(2) Au10 Au11 2.894(1)
Au2 Au10 2.908(1) Au6 Au7 2.778(1) Au10 Au13 2.910(1)
Au2 Au11 3.007(1) Au6 Au9 2.913(1) Au10 C23 2.03(2)
Au2 C8 2.06(2) Au6 Au10 2.973(1) Au11 Au12 2.935(1)
Au3 Au4 2.921(1) Au6 C152 2.07(2) Au11 Au13 2.871(1)
Au3 Au7 2.757(1) Au7 Au8 2.785(1) Au11 C59 2.05(2)
Au3 Au11 2.897(1) Au7 Au9 2.762(1) Au12 Au13 2.883(1)
Au3 Au12 2.975(1) Au7 Au10 2.768(1) Au12 C95 2.01(2)
Au3 C44 2.07(2) Au7 Au11 2.762(1) Au13 Cl2 2.300(6)

S32
3.3 NMR spectra
Figure S22. 1H NMR spectrum (DMSO-d6, 600 MHz) of 1a.
0.00.51.01.52.02.53.03.54.04.55.05.56.06.57.07.58.08.59.09.510.010.511.011.5shift(ppm)
4.02
3.94
2.05
2.14
6.05
3.98
4.06
1.96
1.93
2.03
2.50
2.50DMSO
2.50
3.39water
5.86
6.21
7.24
7.37
7.38
7.41
7.43
7.58
7.59
7.64
8.00
8.01
8.06
8.08
10.39
7.17.27.37.47.57.67.77.87.98.08.18.2shift(ppm)
2.05
2.14
6.05
3.98
4.06
1.96
1.93
7.24
7.37
7.38
7.40
7.41
7.42
7.43
7.58
7.59
7.63
7.64
7.65
8.00
8.01
8.06
8.08

S33
Figure S23. 13C{1H} NMR spectrum (DMSO- d6, 151 MHz) of 1a.
0102030405060708090100110120130140150160170180190200shift(ppm)
39.52DMSO
47.69
49.98
114.05
114.32
126.78
126.90
128.34
128.69
128.94
143.21
126127128129130131132133134135shift(ppm)
126.78
126.90
128.34
128.69
128.76
128.94
129.36
130.99
131.44
132.24
134.06

S34
Figure S24. 1H NMR spectrum (DMSO- d6, 600 MHz) of 13C-1a.
0.00.51.01.52.02.53.03.54.04.55.05.56.06.57.07.58.08.59.09.510.010.511.011.5shift(ppm)
4.26
4.00
2.16
2.42
6.42
4.16
4.47
4.12
0.88
0.86
2.50
2.50
2.50DMSO
2.50
2.51
3.35water
5.83
5.84
6.13
6.14
7.23
7.24
7.25
7.36
7.38
7.39
7.41
7.42
7.43
7.44
7.44
7.45
7.56
7.57
7.63
7.64
7.66
7.67
7.68
7.99
8.01
8.02
10.05
10.42
7.17.27.37.47.57.67.77.87.98.08.1shift(ppm)
2.16
8.85
4.16
4.47
4.12
7.23
7.24
7.257.41
7.42
7.43
7.56
7.57
7.64
7.66
7.67
7.99
8.01
8.02

S35
Figure S25. 13C{1H} NMR spectrum (DMSO- d6, 151 MHz) of 13C-1a.
0102030405060708090100110120130140150160170180190200shift(ppm)
39.10
39.24
39.38
39.52DMSO
39.66
39.80
39.94
47.63
50.01
114.07
114.24
126.82
126.96
128.33
128.73
128.76
128.98
129.40
131.05
131.44
132.14
134.01
143.17
125127129131133135shift(ppm)
126.82
126.96
128.33
128.73
128.76
128.98
131.05
131.44
132.14
134.01

S36
Figure S26. 1H NMR spectrum (DMSO- d6, 600 MHz) of 1b.
0.00.51.01.52.02.53.03.54.04.55.05.56.06.57.07.58.08.59.09.510.010.511.011.5shift(ppm)
3.89
3.94
1.96
1.97
6.27
4.22
4.49
2.04
2.40
1.96
2.50DMSO
3.36water
5.80
6.03
7.40
7.42
7.43
7.44
7.54
7.55
7.67
7.68
7.92
8.00
8.02
9.93
7.17.27.37.47.57.67.77.87.98.08.1shift(ppm)
1.96
1.97
6.27
4.22
4.49
2.04
2.40
7.25
7.257.40
7.42
7.43
7.44
7.54
7.55
7.67
7.68
7.92
7.94
8.00
8.02

S37
Figure S27. 13C{1H} NMR spectrum (DMSO- d6, 151 MHz) of 1b.
0102030405060708090100110120130140150160170180190200shift(ppm)
39.52DMSO
47.72
50.06
114.10
114.21
126.84
128.33
128.74
128.97
133.93
142.98
126127128129130131132133134shift(ppm)
126.84
126.97
128.33
128.74
128.97
129.41
131.06
131.39
132.02
133.93

S38
Figure S28. 1H NMR spectrum (DMSO- d6, 600 MHz) of 1c.
0.00.51.01.52.02.53.03.54.04.55.05.56.06.57.07.58.08.59.09.510.010.511.011.5shift(ppm)
4.00
3.76
6.18
1.99
8.23
3.99
1.93
2.50DMSO
3.38water
5.85
6.18
7.24
7.26
7.26
7.27
7.42
7.43
7.43
7.44
7.64
7.65
7.65
7.66
7.68
7.69
7.70
8.02
8.03
8.04
8.06
10.35
7.17.27.37.47.57.67.77.87.98.08.1shift(ppm)
6.18
1.99
8.23
3.99
7.24
7.26
7.26
7.27
7.43
7.43
7.447.65
7.65
7.68
7.69
7.70
8.02
8.03
8.04
8.06

S39
Figure S29. 13C{1H} NMR spectrum (DMSO- d6, 151 MHz) of 1c.
0102030405060708090100110120130140150160170180190200shift(ppm)
39.52DMSO
47.69
49.23
114.04
114.31
115.74
115.89
126.79
126.91
130.87
130.93
143.19
161.37
162.99
114116118120122124126128130132shift(ppm)
114.04
114.31
115.74
115.89
126.79
126.91
128.80
129.37
130.26
130.87
130.93
131.45
132.19
S40
Figure S30. 19F NMR spectrum (DMSO- d6, 376 MHz) of 1c.
-190-170-150-130-110-90-70-50-30-101030507090110130150170190shift(ppm)
-113.04

S41
Figure S31. 1H NMR spectrum (DMSO- d6, 600 MHz) of 1d.
0.00.51.01.52.02.53.03.54.04.55.05.56.06.57.07.58.08.59.09.510.010.511.011.5shift(ppm)
4.00
3.89
2.08
2.09
2.09
2.08
2.04
2.06
2.02
2.50DMSO
3.36water
6.07
6.15
7.10
7.11
7.11
7.12
7.36
7.37
7.37
7.38
7.69
7.70
7.71
7.77
7.79
7.80
7.96
7.97
8.07
8.08
10.15
7.07.17.27.37.47.57.67.77.87.98.08.18.2shift(ppm)
2.08
2.09
2.09
2.08
2.04
2.06
7.10
7.11
7.11
7.12
7.36
7.37
7.37
7.38
7.70
7.71
7.77
7.79
7.80
7.96
7.97
8.07
8.08

S42
Figure S32. 13C{1H} NMR spectrum (DMSO- d6, 151 MHz) of 1d.
0102030405060708090100110120130140150160170180190200shift(ppm)
38.25
39.52DMSO
47.77
107.65
107.77
107.87
113.47
114.37
127.02
127.44
127.82
129.08
131.00
131.16
131.84
136.37
138.05
140.53
142.20
143.78
144.51
146.17
134136138140142144146shift(ppm)
136.37
138.05
140.53
142.20
143.78
144.51
146.17
110115120125130shift(ppm)
107.65
107.77
107.87
113.47
114.37
127.02
127.44
127.82
129.08
131.00
131.16
131.84

S43
Figure S33. 19F NMR spectrum (DMSO- d6, 376 MHz) of 1d.
-190-170-150-130-110-90-70-50-30-101030507090110130150170190shift(ppm)
4.04
2.00
4.15
-161.47
-161.41
-161.35
-152.70
-152.64
-152.58
-140.23
-140.17
-140.6-140.4-140.2-140.0shift(ppm)
4.15
-140.23
-140.17
-153.0-152.8-152.6-152.4shift(ppm)
2.00
-152.70
-152.64
-152.58
-161.5-161.0shift(ppm)
4.04
-161.47
-161.41
-161.35

S44
Figure S34. 1H NMR spectrum (DMSO- d6, 600 MHz) of 1e.
0.00.51.01.52.02.53.03.54.04.55.05.56.06.57.07.58.08.59.09.510.010.511.011.5shift(ppm)
4.04
3.92
1.98
1.96
4.06
6.07
3.87
4.10
1.95
1.97
2.00
2.50DMSO
3.35water
6.00
6.14
7.28
7.45
7.55
7.56
7.56
7.57
7.64
7.65
7.66
7.92
7.93
7.93
7.93
7.94
7.96
7.98
7.99
8.00
8.05
8.06
8.17
10.11
7.27.37.47.57.67.77.87.98.08.18.2shift(ppm)
1.98
1.96
4.06
6.07
3.87
4.10
1.95
1.97
7.27
7.28
7.28
7.29
7.55
7.56
7.56
7.57
7.64
7.65
7.66
7.93
7.93
7.93
7.96
7.98
7.99
8.05
8.17
S45
Figure S35. 13C{1H} NMR spectrum (DMSO- d6, 151 MHz) of 1e.
0102030405060708090100110120130140150160170180190200shift(ppm)
39.52DMSO
47.77
50.32
114.14
114.22
125.71
126.76
126.78
127.63
127.70
143.16
126127128129130131132133shift(ppm)
125.71
126.76
126.78
126.84
127.00
127.63
127.70
127.87
128.68
128.77
131.19
131.35
131.43
132.06
132.69
132.72

S46
Figure S36. 1H NMR spectrum (DMSO- d6, 600 MHz) of 1f.
0.00.51.01.52.02.53.03.54.04.55.05.56.06.57.07.58.08.59.09.510.010.511.011.5shift(ppm)
8.00
2.17
3.87
1.06
8.21
1.92
3.03
2.10
2.02
2.50DMSO
3.40water
5.84
5.85
7.38
7.39
7.41
7.42
7.43
7.48
7.49
7.53
7.54
7.56
7.56
7.57
7.61
7.62
7.64
7.91
7.92
7.97
7.99
10.31
7.27.37.47.57.67.77.87.98.0shift(ppm)
2.17
3.87
1.06
8.21
1.92
3.03
2.10
7.38
7.39
7.41
7.42
7.43
7.48
7.49
7.54
7.56
7.57
7.61
7.62
7.64
7.91
7.92
7.97
7.99

S47
Figure S37. 13C{1H} NMR spectrum (DMSO- d6, 151 MHz) of 1f.
-20-100102030405060708090100110120130140150160170180190200210220shift(ppm)
39.52DMSO
49.77
50.03
114.01
114.05
126.70
126.79
128.36
128.63
128.69
128.75
129.00
129.75
130.95
131.02
133.95
134.75
142.82
126127128129130131132133134135shift(ppm)
126.70
126.79
128.36
128.63
128.69
128.75
129.00
129.75
130.95
131.02
133.95
134.75
S48
Figure S38. 1H NMR spectrum (DMSO- d6, 600 MHz) of 1g.
0.00.51.01.52.02.53.03.54.04.55.05.56.06.57.07.58.08.59.09.510.010.511.011.5shift(ppm)
4.00
3.93
4.02
10.01
8.10
2.07
1.96
2.08
2.50DMSO
3.35water
5.83
5.98
7.56
7.56
7.57
7.57
7.61
7.61
7.62
7.64
7.91
7.92
7.93
7.93
7.94
7.95
7.96
7.97
7.98
8.02
8.03
8.04
8.14
10.22
7.67.77.87.98.08.18.2shift(ppm)
4.02
10.01
8.10
2.07
1.96
7.56
7.56
7.57
7.57
7.61
7.64
7.91
7.97
7.98
8.02
8.03
8.04
8.14

S49
Figure S39. 13C{1H} NMR spectrum (DMSO- d6, 151 MHz) of 1g.
0102030405060708090100110120130140150160170180190200shift(ppm)
49.57
50.26
113.99
114.10
126.78
126.79
127.70
127.73
128.91
142.90
125126127128129130131132133134135shift(ppm)
125.73
126.78
126.79
126.84
127.70
127.73
127.88
128.81
128.91
131.02
131.17
131.30
132.69
132.74
134.53
S50
Figure S40. 1H NMR spectrum (DMSO- d6, 600 MHz) of 2a.
0.00.51.01.52.02.53.03.54.04.55.05.56.06.57.07.58.08.59.09.510.010.511.011.5shift(ppm)
4.00
3.92
1.94
1.95
2.05
3.94
4.13
3.94
1.98
2.03
2.50DMSO
3.33water
5.87
6.17
6.61
6.62
6.62
7.19
7.20
7.20
7.21
7.34
7.35
7.39
7.41
7.42
7.45
7.46
7.47
7.48
7.50
7.51
7.70
7.71
7.81
7.82
7.17.27.37.47.57.67.77.87.9shift(ppm)
1.95
2.05
3.94
4.13
3.94
1.98
2.03
7.19
7.20
7.20
7.21
7.34
7.35
7.39
7.41
7.42
7.45
7.46
7.47
7.48
7.50
7.51
7.70
7.71
7.81
7.82

S51
Figure S41. 13C{1H} NMR spectrum (DMSO- d6, 151 MHz) of 2a.
0102030405060708090100110120130140150160170180190200shift(ppm)
48.63
51.64
112.68
112.74
124.90
125.00
125.42
127.31
128.15
128.19
128.90
132.79
133.09
133.31
135.75
178.80
DMSO
124126128130132134136shift(ppm)
124.90
125.00
125.42
127.31
128.15
128.19
128.90
132.79
133.09
133.31
135.75
S52
Figure S42. 1H NMR spectrum (DMSO- d6, 600 MHz) of 13C-2a.
0.00.51.01.52.02.53.03.54.04.55.05.56.06.57.07.58.08.59.09.510.010.511.011.5shift(ppm)
3.96
4.00
2.06
2.03
3.99
4.22
4.17
1.99
2.00
-0.07grease
2.50DMSO
5.86
5.87
6.17
6.17
6.61
6.61
6.62
6.62
7.19
7.19
7.20
7.20
7.34
7.35
7.39
7.40
7.42
7.45
7.46
7.47
7.50
7.51
7.69
7.71
7.81
7.82
7.82
water
7.17.27.37.47.57.67.77.87.9shift(ppm)
2.06
2.03
3.99
4.22
4.17
1.99
2.00
7.19
7.19
7.20
7.20
7.34
7.35
7.39
7.40
7.42
7.45
7.46
7.47
7.50
7.51
7.69
7.71
7.81
7.82
7.82

S53
Figure S43. 13C{1H} NMR spectrum (DMSO- d6, 151 MHz) of 13C-2a.
0102030405060708090100110120130140150160170180190200shift(ppm)
39.52DMSO
48.65
51.62
112.68
112.75
124.91
125.02
125.42
127.33
128.17
128.21
128.91
132.79
133.10
133.32
135.76
178.82
4748495051525354shift(ppm)
48.65
51.62
115120125130135shift(ppm)
112.68
112.75
124.91
125.02
125.42
127.33
128.17
128.21
128.91
132.79
133.10
133.32
135.76

S54
Figure S44. 1H NMR spectrum (DMSO- d6, 600 MHz) of 2b.
0.00.51.01.52.02.53.03.54.04.55.05.56.06.57.07.58.08.59.09.510.010.511.011.5shift(ppm)
4.00
4.00
2.07
2.06
2.13
4.13
4.04
4.15
2.17
2.18
2.50DMSO
3.34water
5.87
6.17
6.63
6.64
6.64
6.65
7.20
7.20
7.21
7.21
7.34
7.35
7.39
7.40
7.42
7.46
7.46
7.47
7.47
7.48
7.51
7.52
7.69
7.69
7.70
7.81
7.82
7.83
7.83
7.27.37.47.57.67.77.8shift(ppm)
2.06
2.13
4.13
4.04
4.15
2.17
2.18
7.20
7.20
7.21
7.21
7.34
7.35
7.39
7.40
7.42
7.46
7.46
7.47
7.47
7.48
7.51
7.52
7.69
7.69
7.70
7.81
7.83
7.83

S55
Figure S45. 13C{1H} NMR spectrum (DMSO- d6, 151 MHz) of 2b.
0102030405060708090100110120130140150160170180190200shift(ppm)
48.58
51.59
112.71
112.78
124.94
125.05
125.54
127.34
128.21
128.90
132.73
133.02
133.31
135.72
181.63
DMSO
124126128130132134136shift(ppm)
124.94
125.05
125.54
127.34
128.21
128.90
132.73
133.02
133.31
135.72

S56
Figure S46. 1H NMR spectrum (DMSO- d6, 600 MHz) of 2c.
0.00.51.01.52.02.53.03.54.04.55.05.56.06.57.07.58.08.59.09.510.010.511.011.5shift(ppm)
4.00
3.88
2.01
2.01
4.02
4.09
4.05
2.11
2.04
2.50DMSO
5.85
6.16
6.60
6.61
6.61
6.62
7.19
7.19
7.20
7.20
7.23
7.24
7.26
7.45
7.46
7.47
7.56
7.57
7.57
7.58
7.69
7.70
7.83
7.85
water
7.17.27.37.47.57.67.77.8shift(ppm)
2.01
4.02
4.09
4.05
2.11
2.04
7.19
7.19
7.20
7.20
7.23
7.24
7.26
7.45
7.46
7.47
7.56
7.57
7.57
7.69
7.70
7.83
7.85

S57
Figure S47. 13C{1H} NMR spectrum (DMSO-d6, 151 MHz) of 2c.
0102030405060708090100110120130140150160170180190200shift(ppm)
48.67
50.88
112.69
115.70
115.85
124.94
125.04
125.46
128.17
129.55
129.61
132.00
132.71
133.10
133.27
161.03
162.65
178.76
DMSO
123125127129131133135shift(ppm)
124.94
125.04
125.46
128.17
129.55
129.61
132.00
132.71
133.10
133.27
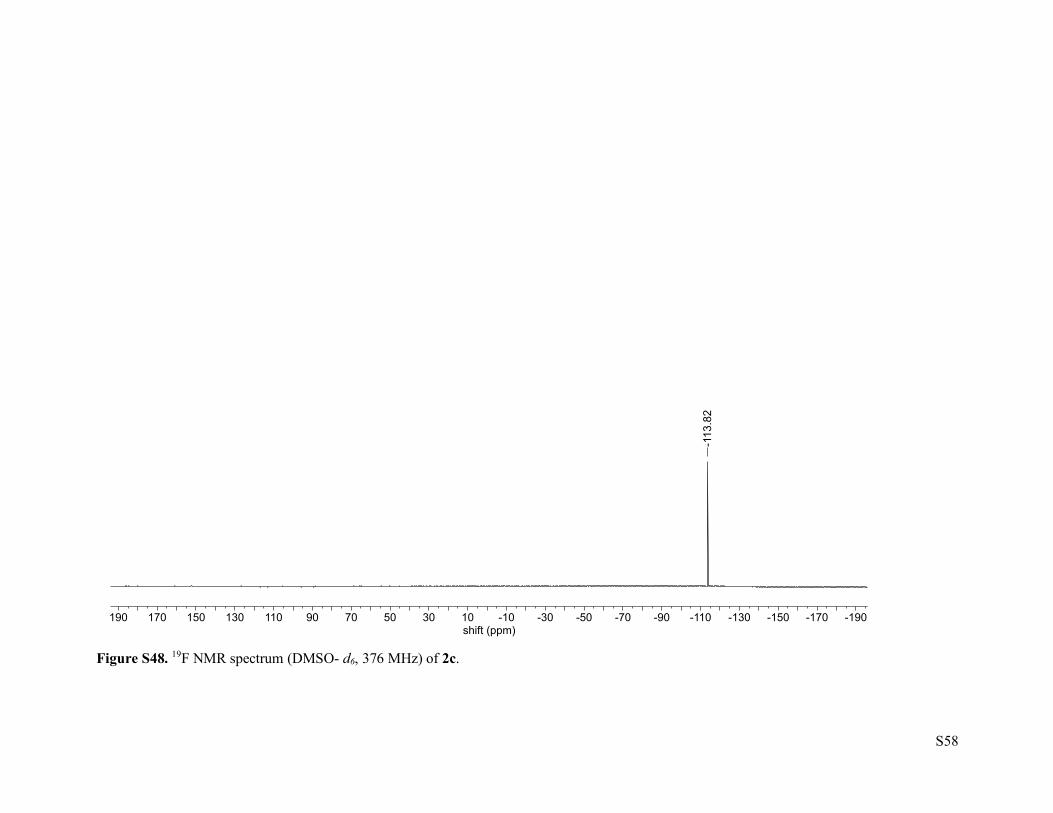
S58
Figure S48. 19F NMR spectrum (DMSO- d6, 376 MHz) of 2c.
-190-170-150-130-110-90-70-50-30-101030507090110130150170190shift(ppm)
-113.82

S59
Figure S49. 1H NMR spectrum (DMSO- d6, 600 MHz) of 2d.
0.00.51.01.52.02.53.03.54.04.55.05.56.06.57.07.58.08.59.09.510.010.511.011.5shift(ppm)
4.00
4.01
2.12
2.10
2.11
2.07
2.18
1.97
2.08Acetone
2.50DMSO
5.75DCM
5.92
6.09
6.57
6.58
6.597.15
7.16
7.17
7.47
7.49
7.50
7.55
7.57
7.58
7.65
7.66
7.93
7.94
water
7.17.27.37.47.57.67.77.87.98.0shift(ppm)
2.10
2.11
2.07
2.18
1.97
7.15
7.16
7.177.47
7.49
7.50
7.55
7.57
7.58
7.65
7.66
7.93
7.94

S60
Figure S50. 13C{1H} NMR spectrum (DMSO- d6, 151 MHz) of 2d.
0102030405060708090100110120130140150160170180190200shift(ppm)
40.06
49.05
54.92DCM
110.12
110.19
110.31
112.23
112.73
125.17
125.46
128.09
132.28
133.15
133.29
136.45
138.11
140.20
141.78
144.35
146.05
182.18
DMSO
124126128130132134136138140142144146shift(ppm)
125.17
125.46
128.09
132.28
133.15
133.29
136.45
138.11
140.20
141.78
144.35
146.05

S61
Figure S51. 19F NMR spectrum (DMSO- d6, 376 MHz) of 2d.
-190-170-150-130-110-90-70-50-30-101030507090110130150170190shift(ppm)
4.00
1.60
4.40
-161.67
-161.61
-161.55
-153.93
-153.87
-153.80
-140.25
-140.19-140.8-140.4-140.0-139.6
shift(ppm)
4.40
-140.25
-140.19
-154.4-154.0-153.6shift(ppm)
1.60
-153.93
-153.87
-153.80
-162.0-161.6-161.2shift(ppm)
4.00
-161.67
-161.61
-161.55

S62
Figure S52. 1H NMR spectrum (DMSO- d6, 600 MHz) of 2e.
0.00.51.01.52.02.53.03.54.04.55.05.56.06.57.07.58.08.59.09.510.010.511.011.5shift(ppm)
4.00
3.85
1.92
1.95
4.02
3.98
2.04
1.93
6.00
2.20
2.06
1.23grease
2.50DMSO
3.33water
6.04
6.21
6.68
6.69
6.69
7.22
7.22
7.22
7.23
7.45
7.45
7.46
7.53
7.53
7.54
7.63
7.64
7.71
7.72
7.86
7.87
7.88
7.89
7.90
7.90
7.91
7.95
7.96
8.03
7.27.37.47.57.67.77.87.98.08.1shift(ppm)
1.95
4.02
3.98
2.04
1.93
6.00
2.20
2.06
7.22
7.22
7.22
7.237.45
7.45
7.46
7.53
7.53
7.54
7.63
7.64
7.71
7.89
7.90
7.90
7.91
7.95
7.96
8.03

S63
Figure S53. 13C{1H} NMR spectrum (DMSO- d6, 151 MHz) of 2e.
0102030405060708090100110120130140150160170180190200shift(ppm)
48.64
51.84
112.74
112.79
124.97
125.05
126.44
126.67
127.67
127.83
128.71
132.54
132.68
132.85
133.28
181.81
DMSO
124126128130132134shift(ppm)
124.97
125.05
125.59
126.44
126.67
127.67
127.83
128.21
128.71
132.54
132.68
132.85
133.06
133.28
133.37

S64
Figure S54. 1H NMR spectrum (DMSO- d6, 600 MHz) of 2f.
0.00.51.01.52.02.53.03.54.04.55.05.56.06.57.07.58.08.59.09.510.010.511.011.5shift(ppm)
4.00
4.00
4.10
7.02
6.15
3.13
2.11
2.50DMSO
3.33water
5.74
5.81
7.30
7.31
7.32
7.35
7.37
7.38
7.38
7.40
7.41
7.42
7.46
7.47
7.48
7.61
7.61
7.63
7.73
7.74
7.27.37.47.57.67.77.8shift(ppm)
4.10
7.02
6.15
3.13
2.11
7.30
7.31
7.32
7.35
7.37
7.38
7.38
7.40
7.41
7.42
7.46
7.47
7.48
7.61
7.61
7.63
7.73
7.74

S65
Figure S55. 13C{1H} NMR spectrum (DMSO- d6, 151 MHz) of 2f.
0102030405060708090100110120130140150160170180190200shift(ppm)
51.12
51.63
112.46
112.63
124.65
124.69
126.21
127.34
128.14
128.81
129.36
132.50
132.62
135.68
136.24
180.52
DMSO
124126128130132134136138shift(ppm)
124.65
124.69
126.21
127.34
128.14
128.81
129.36
132.50
132.62
135.68
136.24
S66
Figure S56. 1H NMR spectrum (DMSO- d6, 600 MHz) of 2g.
0.00.51.01.52.02.53.03.54.04.55.05.56.06.57.07.58.08.59.09.510.010.511.011.5shift(ppm)
3.98
4.00
4.05
3.94
4.18
2.13
2.25
2.16
2.12
4.16
1.92
0.86grease
1.23grease
2.08acetone
2.50DMSO
5.79
5.947.37
7.38
7.38
7.39
7.47
7.51
7.52
7.52
7.55
7.57
7.72
7.72
7.73
7.76
7.77
7.78
7.84
7.85
7.86
7.88
7.89
7.89
7.90
7.91
7.96 water
7.27.37.47.57.67.77.87.98.0shift(ppm)
4.05
3.94
4.18
2.13
2.25
2.16
2.12
4.16
1.92
7.37
7.38
7.38
7.39
7.47
7.51
7.52
7.52
7.55
7.57
7.72
7.72
7.73
7.76
7.77
7.84
7.85
7.86
7.88
7.89
7.89
7.90
7.91
7.96
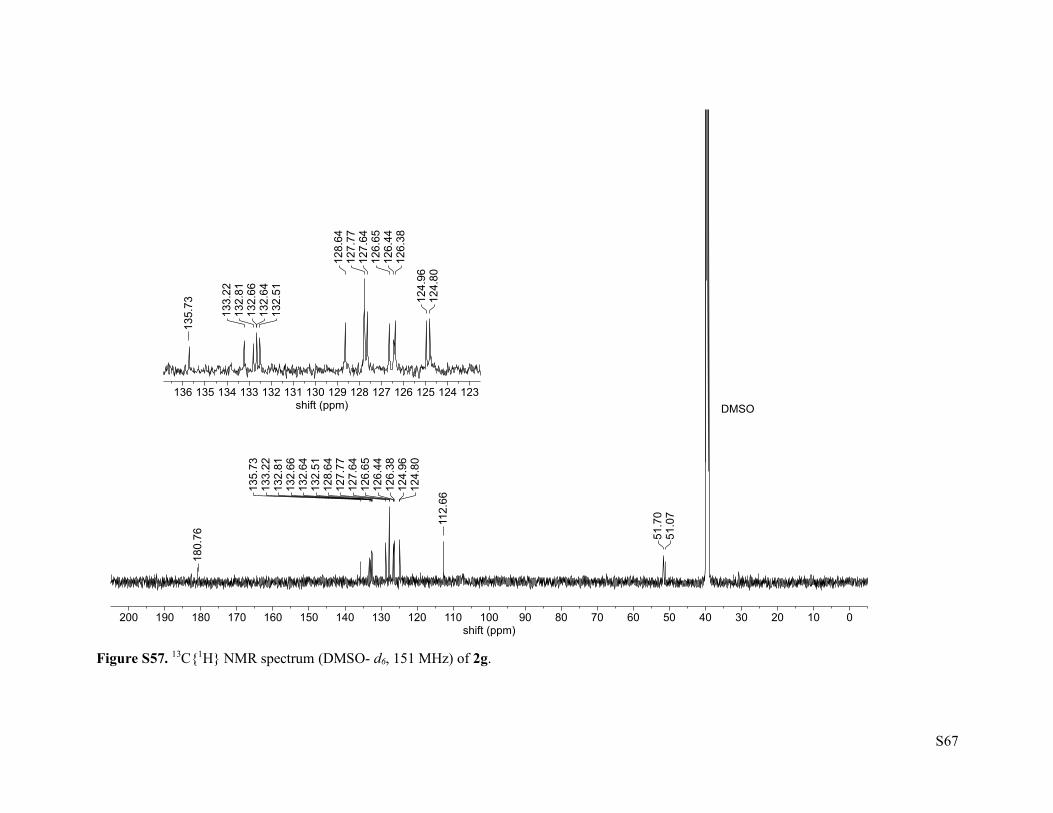
S67
Figure S57. 13C{1H} NMR spectrum (DMSO- d6, 151 MHz) of 2g.
0102030405060708090100110120130140150160170180190200shift(ppm)
51.07
51.70
112.66
124.80
124.96
126.38
126.44
126.65
127.64
127.77
128.64
132.51
132.64
132.66
132.81
133.22
135.73
180.76
DMSO
123124125126127128129130131132133134135136shift(ppm)
124.80
124.96
126.38
126.44
126.65
127.64
127.77
128.64
132.51
132.64
132.66
132.81
133.22
135.73
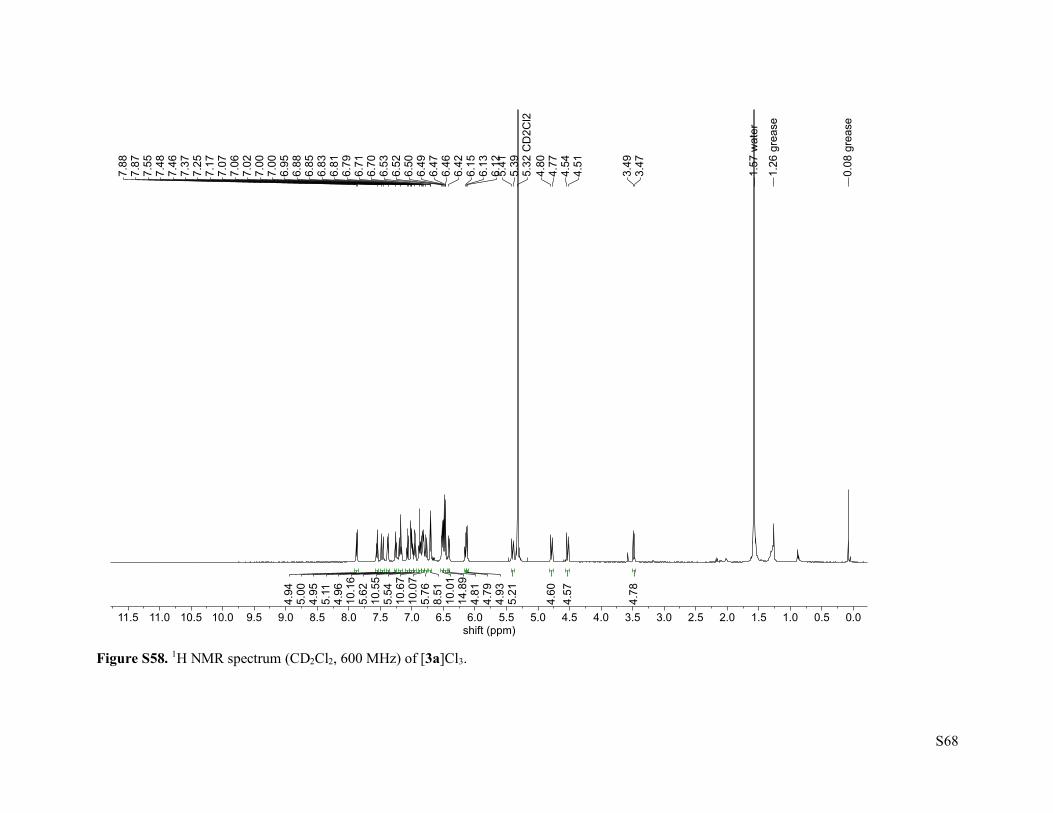
S68
Figure S58. 1H NMR spectrum (CD2Cl2, 600 MHz) of [3a]Cl3.
0.00.51.01.52.02.53.03.54.04.55.05.56.06.57.07.58.08.59.09.510.010.511.011.5shift(ppm)
4.78
4.57
4.60
5.21
4.93
4.79
4.81
14.89
10.01
8.51
5.76
10.07
10.67
5.54
10.55
5.62
10.16
4.96
5.11
4.95
5.00
4.94
0.08grease
1.26grease
1.57water
3.47
3.49
4.51
4.54
4.77
4.80
5.32CD2Cl2
5.39
5.41
6.12
6.13
6.15
6.42
6.46
6.47
6.49
6.50
6.52
6.53
6.70
6.71
6.79
6.81
6.83
6.85
6.88
6.95
7.00
7.00
7.02
7.06
7.07
7.17
7.25
7.37
7.46
7.48
7.55
7.87
7.88

S69
Figure S59. 1H NMR spectrum (CD2Cl2, 600 MHz) of [3a]Cl3 showing expanded aryl and alkyl regions.
6.06.16.26.36.46.56.66.76.86.97.07.17.27.37.47.57.67.77.87.9shift(ppm)
4.93
4.79
4.81
14.89
10.01
8.51
5.76
10.07
10.67
5.54
10.55
5.62
10.16
4.96
5.11
4.95
5.00
4.94
6.12
6.13
6.15
6.40
6.42
6.46
6.47
6.49
6.50
6.50
6.52
6.53
6.70
6.71
6.77
6.79
6.81
6.83
6.85
6.88
6.95
6.96
7.00
7.00
7.02
7.06
7.07
7.17
7.20
7.24
7.25
7.27
7.37
7.38
7.46
7.48
7.54
7.55
7.56
7.87
7.88
7.89
3.33.43.53.63.73.83.94.04.14.24.34.44.54.64.74.84.95.05.15.25.35.45.55.6shift(ppm)
4.78
4.57
4.60
5.21
3.47
3.49
4.51
4.54
4.77
4.80
5.39
5.41

S70
Figure S60. 1H-1H COSY NMR spectrum (CD2Cl2, 600 MHz) of [3a]Cl3.
3.03.23.43.63.84.04.24.44.64.85.05.25.45.65.86.06.26.46.66.87.07.27.47.67.88.0shift(ppm)
3.0
3.5
4.0
4.5
5.0
5.5
6.0
6.5
7.0
7.5
8.0
f1(ppm)

S71
Figure S61. 1H NMR spectrum (CD2Cl2, 600 MHz) of [3a][PF6]3.
0.00.51.01.52.02.53.03.54.04.55.05.56.06.57.07.58.08.59.09.510.010.511.011.5shift(ppm)
0.83
0.84
0.83
0.86
1.74
0.96
4.62
1.93
1.78
1.22
1.09
2.22
2.33
1.18
3.21
1.31
1.17
1.06
1.08
1.00
0.88grease
1.26grease
1.53water
3.47
3.49
4.15
4.17
4.48
4.51
4.89
4.92
5.32CD2Cl2
5.56Aucomplex
5.81Aucomplex
6.14
6.16
6.19
6.21
6.22
6.46
6.48
6.49
6.50
6.51
6.70
6.71
6.73
6.74
6.77
6.79
6.89
6.91
6.92
6.93
6.95
6.98
7.00
7.01
7.02
7.10
7.11
7.12
7.19
7.21
7.22
7.24
7.25
7.29
7.29
7.30
7.32
7.38
7.39
7.51
7.54
7.57
7.58
7.60
7.70
7.71

S72
Figure S62. 1H NMR spectrum (CD2Cl2, 600 MHz) of [3a][PF6]3 showing expanded aryl and alkyl regions. ESI-MS suggests the Au complex is [L2Au2]Cl2.
5.45.55.65.75.85.96.06.16.26.36.46.56.66.76.86.97.07.17.27.37.47.57.67.7shift(ppm)
1.74
0.96
4.62
1.93
1.78
1.22
1.09
2.22
2.33
1.18
3.21
1.31
1.17
1.06
1.08
1.00
5.56Aucomplex
5.81Aucomplex
6.14
6.16
6.19
6.21
6.226.46
6.48
6.49
6.50
6.51
6.70
6.71
6.73
6.77
6.79
6.91
6.93
6.95
7.00
7.01
7.10
7.11
7.19
7.22
7.24
7.25
7.30
7.32
7.38
7.39
7.51
7.54
7.58
7.60
7.70
7.71
3.43.53.63.73.83.94.04.14.24.34.44.54.64.74.84.95.0shift(ppm)
0.83
0.84
0.83
0.86
3.47
3.49
4.15
4.17
4.48
4.51
4.89
4.92

S73
Figure S63. 1H NMR spectrum (CD2Cl2, 600 MHz) of [3a][CO2CF3]3.
0.00.51.01.52.02.53.03.54.04.55.05.56.06.57.07.58.08.59.09.510.010.511.011.5shift(ppm)
4.29
8.94
4.85
6.32
5.14
4.78
23.08
10.03
16.44
6.38
6.46
6.75
12.12
7.96
17.94
9.04
6.82
12.49
5.00
0.88grease
1.26grease
1.61water
3.47
3.49
4.49
4.51
4.51
4.54
5.16
5.19
5.32CD2Cl2
5.61Aucomplex
6.10
6.11
6.15
6.26
6.27
6.46
6.47
6.48
6.48
6.49
6.71
6.72
6.75
6.76
6.79
6.85
6.87
6.90
6.91
6.92
6.94
6.96
6.97
6.98
6.99
7.00
7.01
7.07
7.08
7.09
7.19
7.19
7.20
7.20
7.22
7.23
7.26
7.27
7.29
7.36
7.37
7.50
7.53
7.55
7.56
7.71
7.73

S74
Figure S64. 1H NMR spectrum (CD2Cl2, 600 MHz) of [3a][CO2CF3]3 showing expanded aryl and alkyl regions. ESI-MS suggests the Au complex is [L2Au2]Cl2.
5.45.55.65.75.85.96.06.16.26.36.46.56.66.76.86.97.07.17.27.37.47.57.67.7shift(ppm)
6.32
5.14
4.78
23.08
10.03
16.44
6.38
6.46
6.75
12.12
7.96
17.94
9.04
6.82
12.49
5.00
5.61Aucomplex
6.10
6.11
6.15
6.16
6.26
6.27
6.46
6.47
6.48
6.48
6.49
6.71
6.72
6.75
6.76
6.79
6.91
6.96
6.98
6.99
7.00
7.07
7.08
7.09
7.19
7.20
7.20
7.22
7.27
7.36
7.37
7.50
7.53
7.55
7.56
7.71
7.73
3.33.43.53.63.73.83.94.04.14.24.34.44.54.64.74.84.95.05.15.25.35.4shift(ppm)
4.29
8.94
4.85
3.47
3.49
4.49
4.51
4.51
4.54
5.16
5.19
5.32CD2Cl2

S75
Figure S65. 1H NMR spectrum (CD2Cl2, 600 MHz) of 13C-[3a]Cl3.
0.00.51.01.52.02.53.03.54.04.55.05.56.06.57.07.58.08.59.09.510.010.511.011.5shift(ppm)
4.4
3
5.0
0
4.7
7
4.5
2
10
.25
6.3
12
5.7
31
0.0
13
1.5
72
8.4
12
8.2
81
9.9
66
.32
4.7
3
0.8
8H
ex
1.2
6H
ex
1.8
7w
ate
r
3.4
3M
eO
H3
.45
3.4
63
.48
3.4
94
.50
4.5
14
.54
4.5
54
.72
4.7
34
.76
4.7
65
.32
CD
2C
l25
.34
5.3
55
.38
5.4
05
.64
Au
co
mp
lex
5.8
1A
uc
om
ple
x6
.00
Au
co
mp
lex
6.1
16
.13
6.1
46
.39
6.4
16
.48
6.5
16
.70
6.7
26
.75
6.8
06
.89
6.9
57
.00
7.0
27
.07
7.1
87
.26
7.3
67
.38
7.4
57
.48
7.5
67
.86
7.8
8

S76
Figure S66. 1H NMR spectrum (CD2Cl2, 600 MHz) of 13C-[3a]Cl3 showing expanded aryl and alkyl regions. ESI-MS suggests the Au complex is [L2Au2]Cl2.
5.55.65.75.85.96.06.16.26.36.46.56.66.76.86.97.07.17.27.37.47.57.67.77.87.98.0shift(ppm)
10.25
6.31
25.73
10.01
31.57
28.41
28.28
19.96
6.32
4.73
5.64Aucomplex
5.80
5.81LAu2Cl2
5.99
6.00LAu2Cl2
6.11
6.13
6.14
6.39
6.41
6.48
6.51
6.70
6.72
6.75
6.80
6.89
6.95
7.00
7.02
7.07
7.18
7.26
7.36
7.38
7.45
7.48
7.56
7.86
7.88
3.43.53.63.73.83.94.04.14.24.34.44.54.64.74.84.95.05.15.25.35.4shift(ppm)
4.43
5.00
4.77
4.52
3.43MeOH
3.45
3.46
3.48
3.49
4.50
4.51
4.54
4.55
4.72
4.73
4.76
4.76
5.32CD2Cl2
5.34
5.35
5.38
5.40

S77
Figure S67. 13C{1H} NMR spectrum (CD2Cl2, 151 MHz) of 13C-[3a]Cl3. ESI-MS suggests the Au complex is [L2Au2]Cl2.
102030405060708090100110120130140150160170180190200210220shift(ppm)
53.29
53.57
53.84CD2Cl2
54.11
54.39
180.44LAu2Cl2
192.85Aucomplex
206.00
206.10
206.57
206.67
207.02
207.46
207.56
205.5206.0206.5207.0207.5208.0shift(ppm)
206.00
206.10
206.57
206.67
207.02
207.15
207.46
207.56

S78
Figure S68. 1H NMR spectrum (CD2Cl2, 600 MHz) of 13C-[3a][PF6]3.
0.00.51.01.52.02.53.03.54.04.55.05.56.06.57.07.58.08.59.09.510.010.511.011.5shift(ppm)
5.00
4.98
4.81
5.11
10.59
4.96
24.26
17.25
6.18
5.67
10.10
10.56
5.20
10.66
5.08
4.84
5.05
5.13
4.90
1.52
1.53
1.53water
1.53
5.32CD2Cl2
6.14
6.14
6.15
6.15
6.20
6.47
6.49
6.50
6.50
6.51
6.70
6.71
6.73
6.76
6.77
6.91
6.92
6.93
6.93
6.93
6.94
6.98
6.98
6.99
6.99
7.00
7.00
7.01
7.01
7.01
7.09
7.10
7.11
7.11
7.11
7.22
7.23
7.25
7.29
7.29
7.30
7.30
7.30
7.31
7.37
7.39
7.57
7.57
7.58
7.58
7.58
7.59
7.59
7.69
7.71

S79
Figure S69. 1H NMR spectrum (CD2Cl2, 600 MHz) of 13C-[3a][PF6]3 showing expanded aryl and alkyl regions.
6.16.26.36.46.56.66.76.86.97.07.17.27.37.47.57.67.77.8shift(ppm)
10.59
4.96
25.98
20.28
6.18
5.67
10.10
10.56
5.20
10.66
5.08
4.84
5.05
5.13
4.90
6.14
6.14
6.15
6.15
6.19
6.20
6.21
6.47
6.49
6.50
6.50
6.51
6.68
6.70
6.71
6.73
6.76
6.77
6.78
6.79
6.93
6.93
6.93
6.94
6.99
7.01
7.01
7.11
7.11
7.11
7.22
7.23
7.29
7.29
7.30
7.30
7.30
7.37
7.39
7.57
7.58
7.58
7.58
7.59
7.59
7.69
7.71
3.43.53.63.73.83.94.04.14.24.34.44.54.64.74.84.95.0shift(ppm)
5.00
4.98
4.81
5.11
3.46
3.47
3.48
3.49
4.14
4.16
4.17
4.47
4.48
4.50
4.50
4.88
4.90
4.91
4.92

S80
Figure S70. 13C{1H} NMR spectrum (CD2Cl2, 151 MHz) of 13C-[3a][PF6]3.
102030405060708090100110120130140150160170180190200210220shift(ppm)
53.48
53.66
53.84CD2Cl2
54.02
54.20
205.96
206.02
206.52
206.58
207.00
207.06
207.48
207.55
204.0205.0206.0207.0208.0209.0shift(ppm)
205.96
206.02
206.52
206.58
207.00
207.06
207.48
207.55

S81
Figure S71. 1H NMR spectrum (CD2Cl2, 600 MHz) of [3b]Br3.
0.00.51.01.52.02.53.03.54.04.55.05.56.06.57.07.58.08.59.09.510.010.511.011.5shift(ppm)
4.71
4.64
4.64
4.56
9.78
4.96
4.67
19.83
9.68
5.20
12.25
6.69
5.45
10.08
5.18
15.98
5.54
5.51
5.00
4.46
0.88hex
1.27hex
1.57water
3.46
3.48
4.55
4.58
4.76
4.78
5.32CD2Cl2
5.39
5.42
6.14
6.15
6.16
6.40
6.41
6.43
6.52
6.53
6.54
6.62
6.63
6.79
6.85
6.86
6.88
6.90
6.96
7.00
7.01
7.02
7.08
7.18
7.19
7.22
7.24
7.39
7.41
7.43
7.45
7.55
7.90
7.92
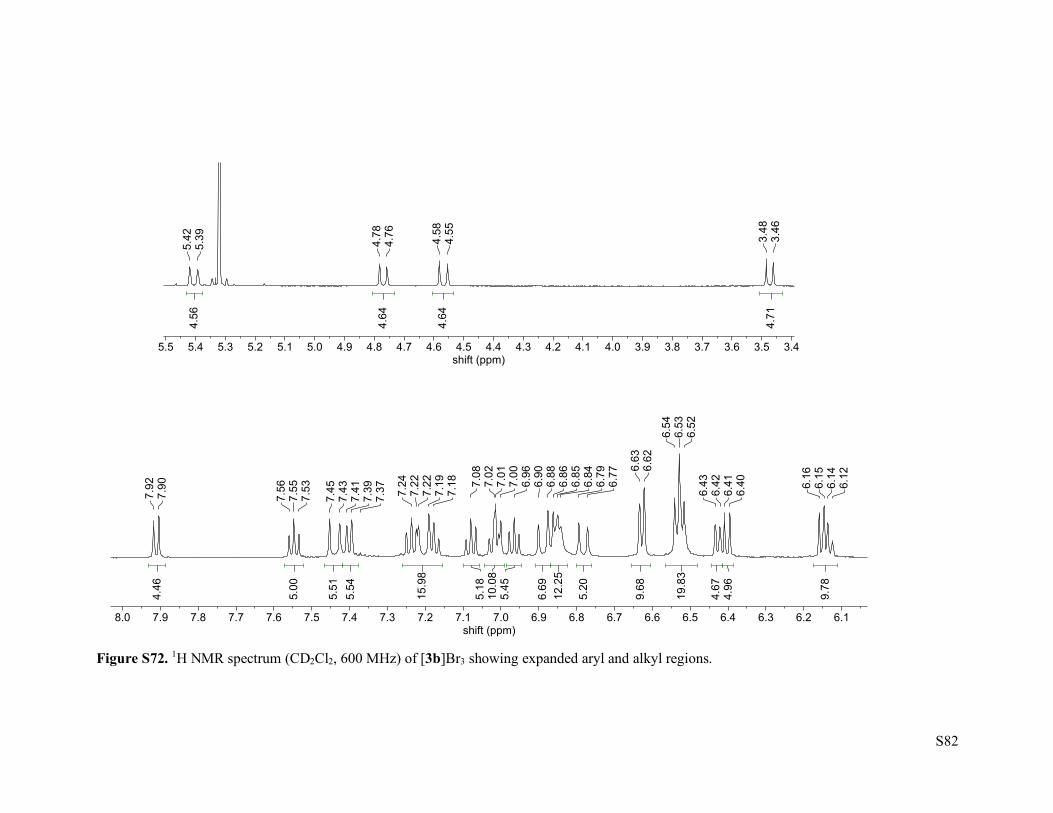
S82
Figure S72. 1H NMR spectrum (CD2Cl2, 600 MHz) of [3b]Br3 showing expanded aryl and alkyl regions.
6.16.26.36.46.56.66.76.86.97.07.17.27.37.47.57.67.77.87.98.0shift(ppm)
9.78
4.96
4.67
19.83
9.68
5.20
12.25
6.69
5.45
10.08
5.18
15.98
5.54
5.51
5.00
4.46
6.12
6.14
6.15
6.16
6.40
6.41
6.42
6.43
6.52
6.53
6.54
6.62
6.63
6.77
6.79
6.84
6.85
6.86
6.88
6.90
6.96
7.00
7.01
7.02
7.08
7.18
7.19
7.22
7.22
7.24
7.37
7.39
7.41
7.43
7.45
7.53
7.55
7.56
7.90
7.92
3.43.53.63.73.83.94.04.14.24.34.44.54.64.74.84.95.05.15.25.35.45.5shift(ppm)
4.71
4.64
4.64
4.56
3.46
3.48
4.55
4.58
4.76
4.78
5.39
5.42
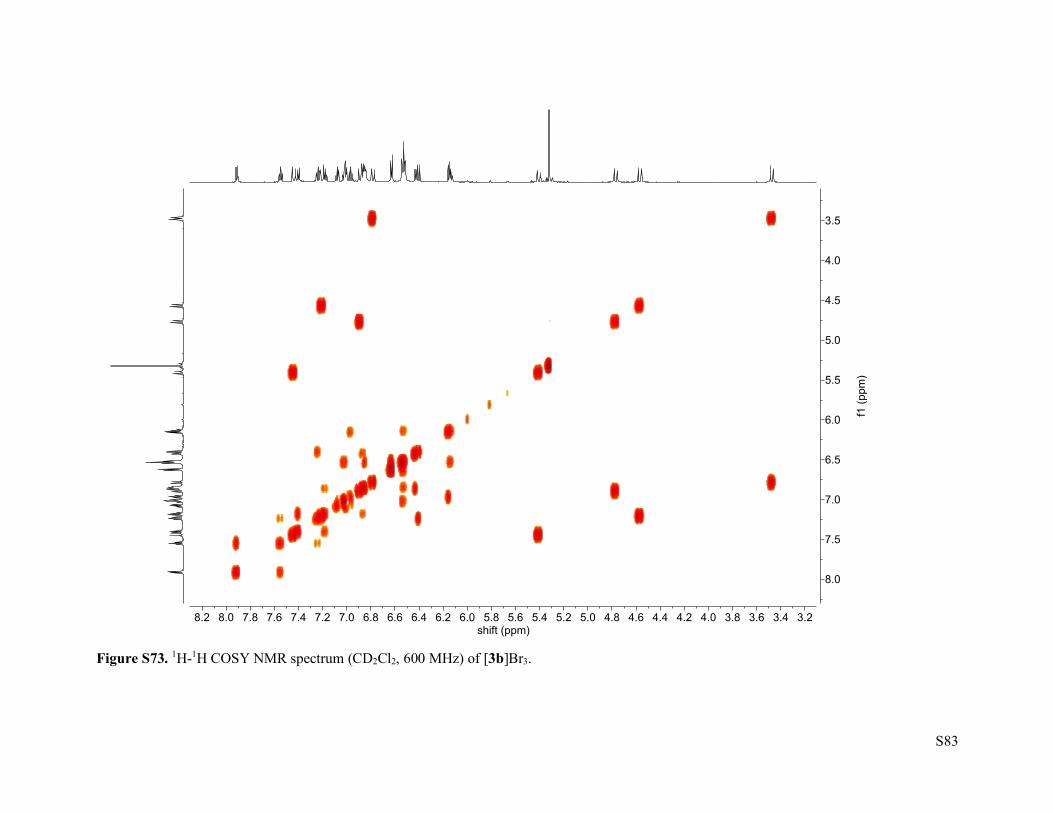
S83
Figure S73. 1H-1H COSY NMR spectrum (CD2Cl2, 600 MHz) of [3b]Br3.
3.23.43.63.84.04.24.44.64.85.05.25.45.65.86.06.26.46.66.87.07.27.47.67.88.08.2shift(ppm)
3.5
4.0
4.5
5.0
5.5
6.0
6.5
7.0
7.5
8.0
f1(ppm)
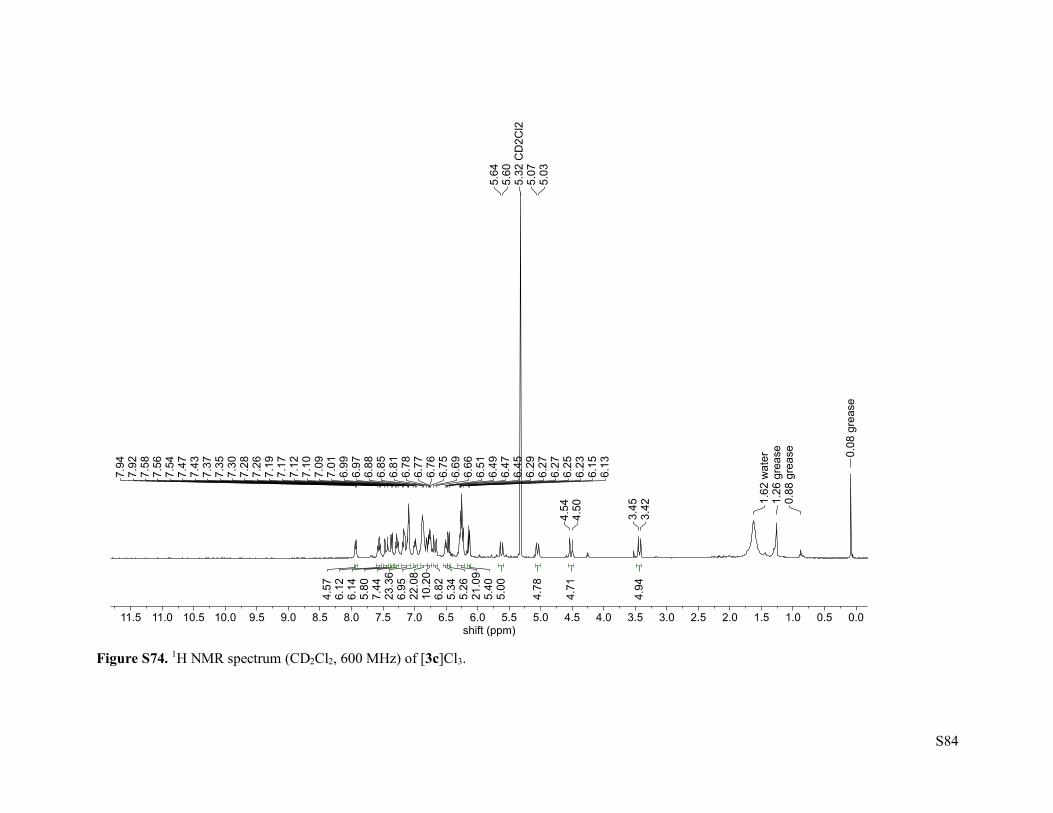
S84
Figure S74. 1H NMR spectrum (CD2Cl2, 600 MHz) of [3c]Cl3.
0.00.51.01.52.02.53.03.54.04.55.05.56.06.57.07.58.08.59.09.510.010.511.011.5shift(ppm)
4.94
4.71
4.78
5.00
5.40
21.09
5.26
5.34
6.82
10.20
22.08
6.95
23.36
7.44
5.80
6.14
6.12
4.57
0.08grease
0.88grease
1.26grease
1.62water
3.42
3.45
4.50
4.54
5.03
5.07
5.32CD2Cl2
5.60
5.64
6.13
6.15
6.23
6.25
6.27
6.27
6.29
6.45
6.47
6.49
6.51
6.66
6.69
6.75
6.76
6.77
6.78
6.81
6.85
6.88
6.97
6.99
7.01
7.09
7.10
7.12
7.17
7.19
7.26
7.28
7.30
7.35
7.37
7.43
7.47
7.54
7.56
7.58
7.92
7.94
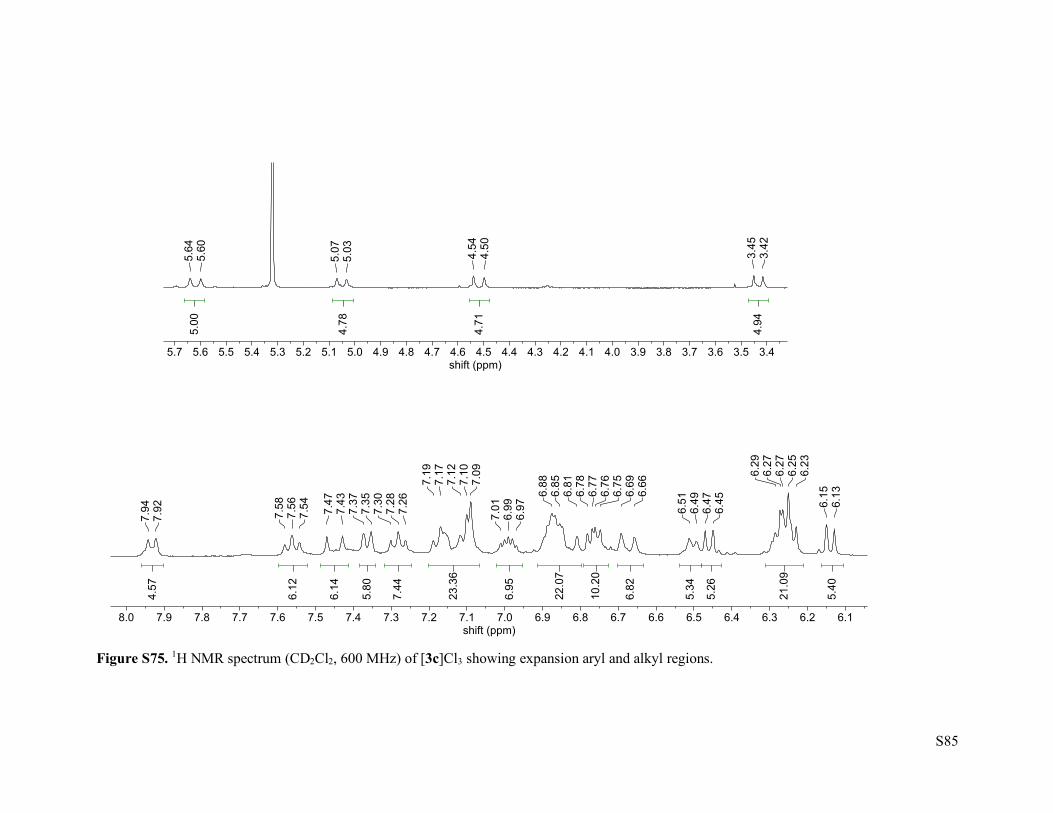
S85
Figure S75. 1H NMR spectrum (CD2Cl2, 600 MHz) of [3c]Cl3 showing expansion aryl and alkyl regions.
6.16.26.36.46.56.66.76.86.97.07.17.27.37.47.57.67.77.87.98.0shift(ppm)
5.40
21.09
5.26
5.34
6.82
10.20
22.07
6.95
23.36
7.44
5.80
6.14
6.12
4.57
6.13
6.15
6.23
6.25
6.27
6.27
6.29
6.45
6.47
6.49
6.516.66
6.69
6.75
6.76
6.77
6.78
6.81
6.85
6.88
6.97
6.99
7.01
7.09
7.10
7.12
7.17
7.19
7.26
7.28
7.30
7.35
7.37
7.43
7.47
7.54
7.56
7.58
7.92
7.94
3.43.53.63.73.83.94.04.14.24.34.44.54.64.74.84.95.05.15.25.35.45.55.65.7shift(ppm)
4.94
4.71
4.78
5.00
3.42
3.45
4.50
4.54
5.03
5.07
5.60
5.64

S86
Figure S76. 1H-1H COSY NMR spectrum (CD2Cl2, 600 MHz) of [3c]Cl3.
3.43.63.84.04.24.44.64.85.05.25.45.65.86.06.26.46.66.87.07.27.47.67.88.08.2shift(ppm)
3.5
4.0
4.5
5.0
5.5
6.0
6.5
7.0
7.5
8.0
f1(ppm)
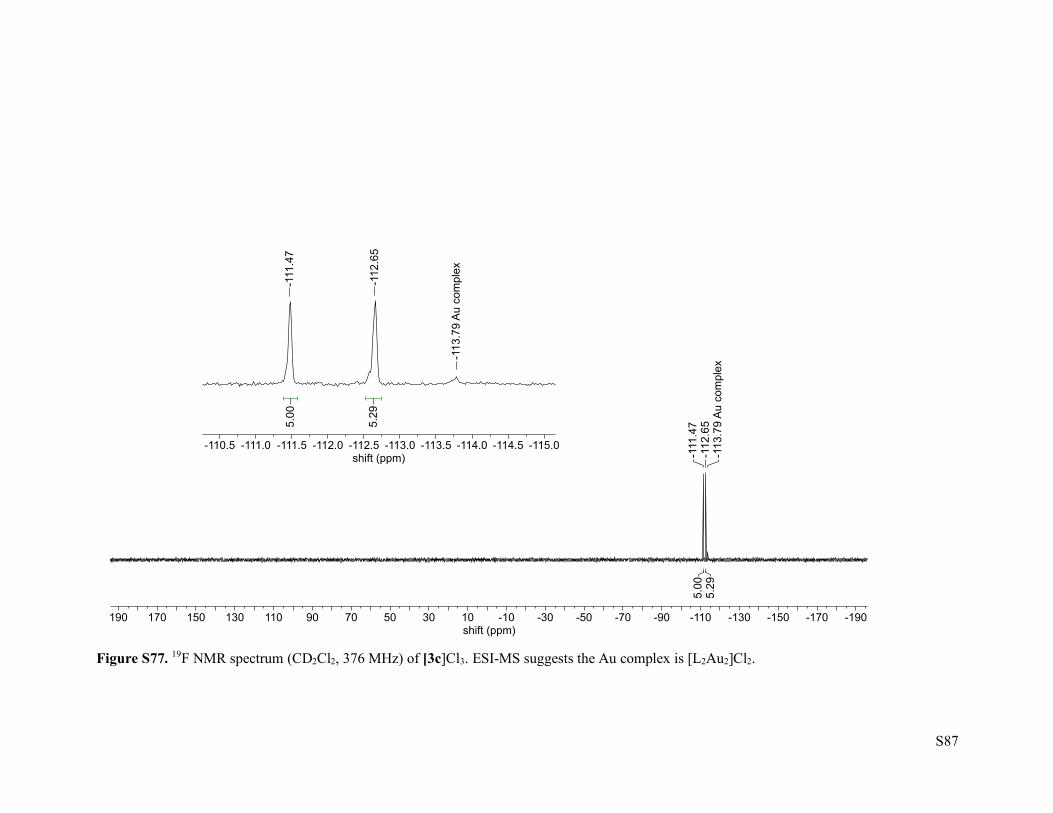
S87
Figure S77. 19F NMR spectrum (CD2Cl2, 376 MHz) of [3c]Cl3. ESI-MS suggests the Au complex is [L2Au2]Cl2.
-190-170-150-130-110-90-70-50-30-101030507090110130150170190shift(ppm)
5.29
5.00
-113.79Aucomplex
-112.65
-111.47
-115.0-114.5-114.0-113.5-113.0-112.5-112.0-111.5-111.0-110.5shift(ppm)
5.29
5.00
-113.79Aucomplex
-112.65
-111.47

S88
Figure S78. 1H NMR spectrum (CD2Cl2, 600 MHz) of [3d]Br3.
0.00.51.01.52.02.53.03.54.04.55.05.56.06.57.07.58.08.59.09.510.010.511.011.5shift(ppm)
4.24
4.28
5.52
4.37
4.83
5.04
4.62
4.91
5.12
4.74
5.26
11.30
7.65
6.30
5.99
5.60
5.84
5.00
0.08grease
1.26grease
3.93
3.96
5.21
5.24
5.45
5.48
5.73
5.766.18
6.19
6.32
6.33
6.38
6.40
6.65
6.66
6.78
6.80
6.91
7.16
7.18
7.19
7.20
7.21
7.22
7.25
7.26
7.38
7.39
7.41
7.56
7.59
7.61
7.62
7.64
7.77
7.78
CD2Cl2

S89
Figure S79. 1H NMR spectrum (CD2Cl2, 600 MHz) of [3d]Br3 showing the expanded aryl and alkyl regions.
6.06.16.26.36.46.56.66.76.86.97.07.17.27.37.47.57.67.77.87.9shift(ppm)
4.83
5.04
4.62
4.91
5.12
4.74
5.26
11.30
7.65
6.30
5.99
5.60
5.84
5.00
6.18
6.19
6.32
6.33
6.38
6.40
6.57
6.60
6.65
6.66
6.78
6.80
6.90
6.91
6.92
7.16
7.18
7.19
7.20
7.21
7.22
7.25
7.26
7.38
7.39
7.41
7.56
7.59
7.61
7.62
7.64
7.77
7.78
3.94.04.14.24.34.44.54.64.74.84.95.05.15.25.35.45.55.65.75.8shift(ppm)
4.24
4.28
5.52
4.37
3.93
3.96
5.21
5.24
5.45
5.48
5.73
5.76
solventimpurity

S90
Figure S80. 1H-1H COSY NMR spectrum (CD2Cl2, 600 MHz) of [3d]Br3.
3.84.04.24.44.64.85.05.25.45.65.86.06.26.46.66.87.07.27.47.67.88.0shift(ppm)
4.0
4.5
5.0
5.5
6.0
6.5
7.0
7.5
8.0
f1(ppm)
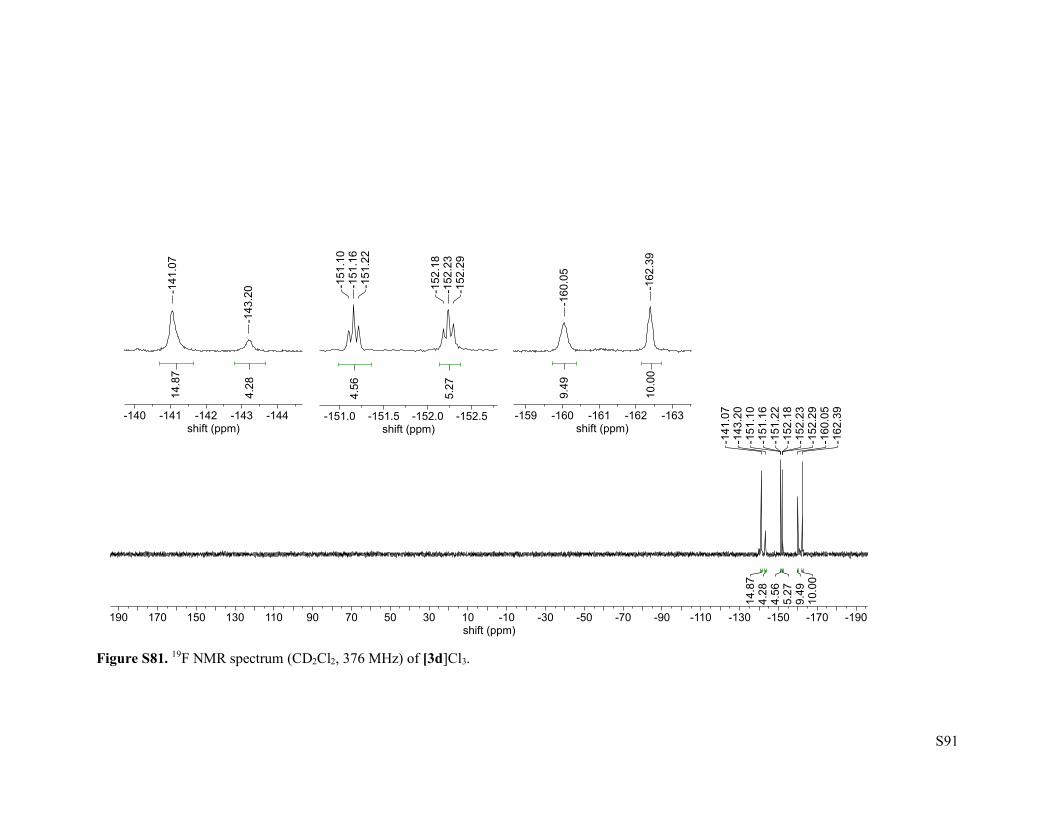
S91
Figure S81. 19F NMR spectrum (CD2Cl2, 376 MHz) of [3d]Cl3.
-190-170-150-130-110-90-70-50-30-101030507090110130150170190shift(ppm)
10.00
9.49
5.27
4.56
4.28
14.87
-162.39
-160.05
-152.29
-152.23
-152.18
-151.22
-151.16
-151.10
-143.20
-141.07
-144-143-142-141-140shift(ppm)
4.28
14.87
-143.20-141.07
-152.5-152.0-151.5-151.0shift(ppm)
5.27
4.56
-152.29
-152.23
-152.18
-151.22
-151.16
-151.10
-163-162-161-160-159shift(ppm)
10.00
9.49
-162.39
-160.05

S92
Figure S82. 1H NMR spectrum (CD2Cl2, 600 MHz) of [3e]Br3.
0.00.51.01.52.02.53.03.54.04.55.05.56.06.57.07.58.08.59.09.510.010.511.011.5shift(ppm)
4.71
4.51
4.84
5.12
5.09
5.08
5.28
5.07
5.27
31.39
10.84
6.29
5.50
45.83
6.35
6.69
6.84
4.73
5.11
5.00
1.57water
3.70
3.72
4.85
4.87
5.00
5.03
5.55
5.58
5.62
5.63
5.68
5.69
6.41
6.42
6.44
6.49
6.50
6.57
6.58
6.71
6.73
6.74
6.75
6.77
6.77
6.79
6.80
6.81
6.82
6.90
6.91
6.92
6.93
6.96
6.98
7.06
7.07
7.16
7.17
7.18
7.19
7.19
7.20
7.21
7.22
7.23
7.23
7.24
7.25
7.26
7.28
7.29
7.30
7.41
7.43
7.45
7.48
7.55
7.57
7.58
7.60
7.61
7.70
7.73
7.96
7.98
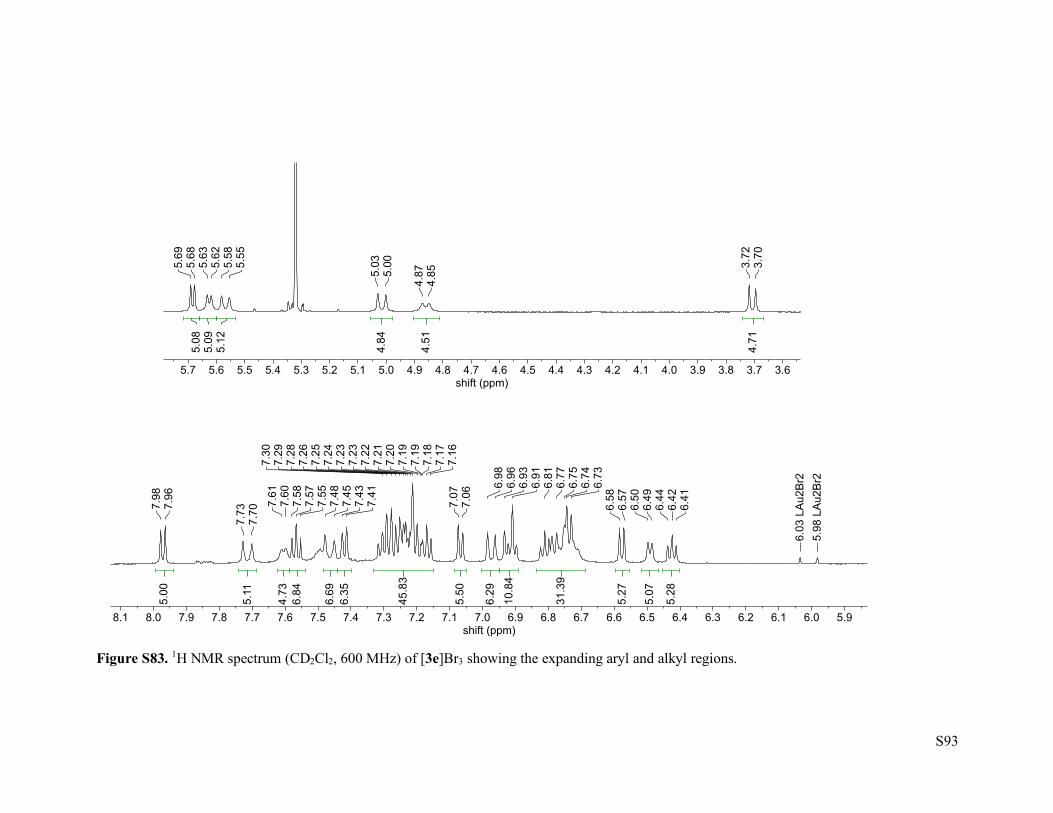
S93
Figure S83. 1H NMR spectrum (CD2Cl2, 600 MHz) of [3e]Br3 showing the expanding aryl and alkyl regions.
5.96.06.16.26.36.46.56.66.76.86.97.07.17.27.37.47.57.67.77.87.98.08.1shift(ppm)
5.28
5.07
5.27
31.39
10.84
6.29
5.50
45.83
6.35
6.69
6.84
4.73
5.11
5.00
5.98LAu2Br2
6.03LAu2Br2
6.41
6.42
6.44
6.49
6.50
6.57
6.586.73
6.74
6.75
6.77
6.81
6.91
6.93
6.96
6.98
7.06
7.07
7.16
7.17
7.18
7.19
7.19
7.20
7.21
7.22
7.23
7.23
7.24
7.25
7.26
7.28
7.29
7.30
7.41
7.43
7.45
7.48
7.55
7.57
7.58
7.60
7.61
7.70
7.737.96
7.98
3.63.73.83.94.04.14.24.34.44.54.64.74.84.95.05.15.25.35.45.55.65.7shift(ppm)
4.71
4.51
4.84
5.12
5.09
5.08
3.70
3.72
4.85
4.87
5.00
5.03
5.55
5.58
5.62
5.63
5.68
5.69

S94
Figure S84. 1H-1H COSY NMR spectrum (CD2Cl2, 600 MHz) of [3e]Br3.
3.63.84.04.24.44.64.85.05.25.45.65.86.06.26.46.66.87.07.27.47.67.88.08.2shift(ppm)
3.5
4.0
4.5
5.0
5.5
6.0
6.5
7.0
7.5
8.0
f1(ppm)

S95
4 References
1. Holz, J.; Ayerbe Garcia, M.; Frey, W.; Krupp, F.; Peters, R., Diastereoselective synthesis, structure and reactivity studies of ferrocenyloxazoline gold(I) and gold(II) complexes. Dalton. Trans. 2018, 47, 3880-3905. 2. Kose, O.; Saito, S., Cross-coupling reaction of alcohols for carbon-carbon bond formation using pincer-type NHC/palladium catalysts. Org. Biomol. Chem. 2010, 8, 896-900. 3. Mathias, L. J.; Overberger, C. G., Carbon-13 nuclear magnetic resonance chemical shifts of substituted benzimidazoles and 1,3-diazaazulene. J. Org. Chem. 1978, 43, 3526-3530. 4. Tessier, J.; Schmitzer, A. R., Benzimidazolium salts prevent and disrupt methicillin-resistant Staphylococcus aureus biofilms. RSC Advances 2020, 10, 9420-9430. 5. Wright, B. D.; Deblock, M. C.; Wagers, P. O.; Duah, E.; Robishaw, N. K.; Shelton, K. L.; Southerland, M. R.; DeBord, M. A.; Kersten, K. M.; McDonald, L. J.; Stiel, J. A.; Panzner, M. J.; Tessier, C. A.; Paruchuri, S.; Youngs, W. J., Anti-tumor activity of lipophilic imidazolium salts on select NSCLC cell lines. Med. Chem. Res. 2015, 24, 2838-2861. 6. Dinda, J.; Adhikary, S. D.; Seth, S. K.; Mahapatra, A., Carbazole functionalized luminescent silver(i), gold(I) and gold(III)–N-heterocyclic carbene complexes: a new synthetic disproportionation approach towards Au(I)–NHC to provide Au(III)–NHC. New J. Chem. 2013, 37, 431-438. 7. Fatima, T.; Haque, R. A.; Iqbal, M. A.; Razali, M. R., A new approach for the synthesis of tetrabenzimidazolium salt as a precursor for the tetra-N-heterocyclic carbene dinuclear silver(I) complex. J. Organomet. Chem. 2017, 831, 50-54. 8 (a) Parker, C. A.; Rees, W. T. Correction of fluorescent spectra and measurement of fluorescent quantum yield. Analyst 1960, 85, 587-597; (b) Demas, J. N.; Crosby, G. A., Measurement of photoluminescence quantum yields. J. Phys. Chem. 1971, 75, 991-1024; (c) Rhys-Williams, A. T.; Winfield, S. A.; Miller, J. N. Relative fluorescence quantum yields using a computer controlled luminescence spectrometer. Analyst 1983, 108, 1067-1071; (d) Eaton, D. F. Reference materials for fluorescence measurements. Pure & Appl. Chem. 1988, 60 (7), 1107-1114; (e) Forgues, F. S.; Lavabre, D. Are fluorescence quantum yields so tricky to measure? A demonstration using familiar stationery products. J. Chem. Educ. 1999, 76, 1260-1264. 9 Seybold P. G.; Gouterman M. Porphyrins XIII: Fluorescence spectra and Quantum Yields. J. Mol. Spectrosc. 1969, 31, 1-13. 10 CRC Handbook of Chemistry and Physics, Internet Version 2005, David R. Lide, ed., CRC Press, Boca Raton, FL, 2005. 11. Sheldrick, G. M., SHELXT - integrated space-group and crystal-structure determination. Acta Crystallogr A Found Adv 2015, 71, 3-8. 12. (a) Baker, M. V.; Brown, D. H.; Simpson, P. V.; Skelton, B. W.; White, A. H.; Williams, C. C., Palladium, rhodium and platinum complexes of ortho-xylyl-linked bis-N-heterocyclic carbenes: Synthesis, structure and catalytic activity. J. Organomet. Chem. 2006, 691, 5845-5855; (b) Yılmaz, Ü.; Sireci, N.; Deniz, S.; Küçükbay, H., Synthesis and microwave-assisted catalytic activity of novel bis-benzimidazole salts bearing furfuryl and thenyl moieties in Heck and Suzuki cross-coupling reactions. Appl. Organomet. Chem. 2010, 24, 414–420. 13. (a) Narouz, M. R.; Takano, S.; Lummis, P. A.; Levchenko, T. I.; Nazemi, A.; Kaappa, S.; Malola, S.; Yousefalizadeh, G.; Calhoun, L. A.; Stamplecoskie, K. G.; Häkkinen, H.; Tsukuda, T.; Crudden, C. M., Robust, Highly Luminescent Au13 Superatoms Protected by N-Heterocyclic Carbenes. J. Am. Chem. Soc. 2019, 141, 14997-15002; (b) Shichibu, Y.; Konishi, K., HCl-induced nuclearity convergence in diphosphine-protected ultrasmall gold clusters: a novel synthetic route to "magic-number" Au13 clusters. Small 2010, 6, 1216-1220.