Synthesis of Novel Silanes with Functional Head Groups ... · Synthesis of Novel Silanes with...
135
Synthesis of Novel Silanes with Functional Head Groups, Surface Modifications, and Characterization Dissertation Zur Erlangung des akademischen Grades “Doktor der Naturwissenschaften” (Dr. rer. nat) am Fachbereich Chemie, Pharmazie und Geowissenschaften der Johannes Gutenberg-Universität Mainz Xiaosong Li Geboren am 15-02-1979 in Peking, China Mainz, 2008
Transcript of Synthesis of Novel Silanes with Functional Head Groups ... · Synthesis of Novel Silanes with...

Synthesis of Novel Silanes with Functional Head
Groups, Surface Modifications, and
Characterization
Dissertation
Zur Erlangung des akademischen Grades
“Doktor der Naturwissenschaften”
(Dr. rer. nat)
am Fachbereich Chemie, Pharmazie und Geowissenschaften der
Johannes Gutenberg-Universität Mainz
Xiaosong Li
Geboren am 15-02-1979
in Peking, China
Mainz, 2008

Die vorliegende Arbeit wurde in der Zeit von 2005 bis 2008 im Max-Planck-Institut für
Polymerforschung in Mainz unter der Anleitung von Herrn Prof. Dr. Wolfgang Knoll und
Dr. Ulrich Jonas ausgeführt.

für
Yang Liu, meine Frau
für ihre Liebe

The deeper we look into nature, the more we recognize that it is full of life, and the more profoundly we
know that all life is a secret and that we are united with all life that is in nature. Man can no longer live for
himself alone. We realize that all life is valuable, and that we are united to all this life.
by Albert Schweitzer

Abstract (English):
The aim of this thesis was to investigate novel techniques to create complex
hierarchical chemical patterns on silica or quartz surfaces with micro to nanometer sized
features. These modified surfaces were used for functional group-selective surface
reactions and site-selective assembly of colloidal particles. For this purpose, novel
functionalized triethoxysilanes were synthesized by a modular convergent approach,
coupling 3-aminopropyltriethoxysilane and an amino-reactive fragment. After deposition
of these silanes as molecular layers onto planar silica and quartz surfaces, the functional
groups of these silanes form new functional surfaces (by liquid- or vapor phase
silanization) or even lateral functional patterns (by micro-contact printing or
photolithography) that allow further chemical reactions at these surfaces.
By the above mentioned modular approach triethoxysilanes with terminal t-butyl-,
maleimide-, succinimidyl-, and alkyne moieties were synthesized and surface layers were
prepared with them. Kinetic experiments with varying hydrolysis- and incubation times
were performed while monitoring changes in hydrophilicity of the functional surfaces
and the layer thickness to study the efficiency of silanization process. From these results
the hydrolysis conditions could be optimized in order to form uniform and well defined
self-assembled surface layers. In model reactions it was shown that their head groups can
further bind appropriate molecules due to their characteristic chemical reactivities.
Furthermore, a series of novel photosensitive silanes with 1-(4,5-dimethoxy-2-
nitrophenyl)ethanol (CH3-NVoc) protected -OH, -COOH and -NH2 functionalities, and
3,5-dimethoxybenzoin (Bzn)-protected -NH2 group were synthesized and characterized.
UV-Vis spectra of both CH3-NVoc and Bzn silanes were recorded in solution phase and
as SAMs on quartz surfaces for different irradiation times at the respective deprotection
wavelengths to optimize the photodeprotection step. By irradiation through a gold mask
in a UV mask aligner (365 nm) or a crosslinker (254 nm), both CH3-NVoc and Bzn
SAMs could be patterned with functional (photodeprotected / irradiated) and protected

(unirradiated) regions, respectively. The obtained functional pattern could be visualized
by site-selective staining with fluorescent probes. Furthermore, site-selective colloid
absorption could be observed on the photosensitive silane layer patterns after local
deprotection with light.
Abstract (Deutsch):
Synthese neuartiger Silane mit funktionalisierten Kopfgruppen, Oberflächen-
modifizierung und Charakterisierung
Ziel dieser Arbeit war die Anwendung und Untersuchung neuer Techniken zur
Herstellung komplexer chemischer Strukturen mit Abmessungen im Mikro- bis
Nanometerbereich auf Silicium- oder Quarzoberflächen. Diese modifizierten Oberflächen
wurden für selektive Oberflächenreaktionen der funktionellen Gruppen sowie Seiten-
selektiver Selbstorganisation kolloidaler Partikel benutzt. Zu diesem Zwecke wurden
neue funktionalisierte Triethoxysilane konvergent baukastenartig synthetisiert, was durch
eine Kupplung von 3-Aminopropyltriethoxysilan mit einem für Amine reaktiven
Fragment gelang. Nach Aufbringung dieser Silane als molekulare Schicht auf Quarz-
und Silicumoberflächen, bilden die funktionellen Gruppen der Silane neue
funktionalisierte Oberflächen (durch Flüssig- oder Gasphasensilanisierung) oder sogar
seitliche funktionalisierte Strukturen (durch Mikrokontanktdrucken oder
Photolithographie), was weitere chemische Reaktionen an diesen Oberflächen
ermöglichen.
Das Baukastenprinzip wurde verwendet um Triethoxysilane mit terminalen t-Butyl-,
Maleinimid-, Succinimidyl- und Alkinreste zu synthetisieren und Oberflächenschichten
mit ihnen herzustellen. Um die Effizienz des Silanisierungsprozesses zu bestimmen
wurden Kinetik-Experimente mit unterschiedlicher Hydrolyse- und Inkubationszeit durch
Messung der Schichtdicke und der Hydrophilie der funktionalisierten Oberflächen
durchgeführt. Mit den Ergebnissen konnten optimierte Hydrolysebedingungen geschaffen
werden, um einheitliche und wohl definierte selbstangeordnete Oberflächenschichten zu
bilden. In Modellversuchen wurde gezeigt, dass ihre Kopfgruppen durch ihre
charakteristische chemische Reaktivität geeignete Moleküle binden können.
Weiterhin wurde eine Reihe neuer photosensitiver Silane mit 1-(4,5-dimethoxy-2-
nitrophenyl)ethanol geschützten -OH, -COOH und -NH2 – Gruppen sowie mit 3,5-
dimethoxybenzoin (Bzn)-geschützten –NH2-Gruppen synthetisiert und charakterisiert.
Die UV-VIS Spektren der CH3-NVoc- und Bzn-geschützten Silane wurde in Lösung und
als SAMs auf einer Quartzoberfläche bei unterschiedlichen Bestrahlungsdauern und der
jeweiligen Deprotektierungs-Wellenlänge aufgenommen, um die photoinduzierte
Entschützung zu optimieren. Durch die Bestrahlung durch eine Goldmaske in einem UV
Gerät (365 nm) oder einem Vernetzungsapparat (254 nm) konnten sowohl auf den CH3-
NVoc- als auch auf den Bzn- SAMs Muster mit funktionalisierten (photodeprotektierten/
bestrahlten) und geschützten (unbestrahlten) Regionen gebildet werden. Die erhaltenen
funktionalisierten Muster konnten durch Seiten-selektive Anfärbung mit
Fluoreszenzmarkenr visualisiert werden. Weiterhin konnte nach lokaler Bestrahlung mit
Licht colloidale Seiten-selektive Absorption auf der photosensitiven Silanoberfläche
beobachtet werden.

I
Contents
1 Introduction 1
2 Principles of Patterned Silane Layers on Substrate Surfaces 5
2.1 Introduction to Silanes 7
2.2 Property of Silica Substrate Surfaces 8
2.3 Silanization of Silica Substrate Surfaces 9
2.4 Micro-contact Printing 11
2.5 Photolithography 12
3 Principles of Characterizations 15
3.1 Contact Angle Measurement 15
3.2 Atomic Force Microscopy 17
3.3 Ellipsometry 20
3.4 UV-Vis Spectroscopy 22
3.5 Confocal Microscopy 23
3.6 Optical Microscopy 24
4 Novel Silanes for Chemical Modifications on Silica Surfaces 27
4.1 Introduction 27
4.2 Synthesis Approach 30
4.2.1 Modular Approach A 30
4.2.2 Modular Approach B 32
4.3 Surface Modification and Characterization 34
4.3.1 Formation of Functional Surfaces 34
4.3.2 Kinetic Investigation of the Hydrolysis Process 37
4.3.3 Silane Deposition on Silica Surfaces 38
4.4 Surface Chemical Reactions on Modified Silica Surfaces 47
II
4.4.1 Deprotection of t-Butyl Ester Surface 48
4.4.2 Succinimidyl Surface with Amino Groups 50
4.4.3 Maleimide Surface with Thiol Groups 52
4.4.4 Huisgen 1, 3-Cycloaddition on Alkyne Surface 54
4.5 Summary 57
5 Patterning of Photoprotected Silane Layer 59
5.1 Introduction 59
5.2 Synthesis Approach 65
5.3 Time Dependent Irradiation and UV-Vis Measurement in Solution 68
5.4 Surface Modifications and Characterizations 71
5.5 Water Condensation Patterns on Site-selectively Irradiated Surfaces 75
5.6 Colloidal Assembly on Site-Selectively Irradiated Surfaces 76
5.7 Fluorescence Labelling of Silane Patterns 80
5.7.1 Fluorescence Dyes 80
5.7.2 Results 81
5.8 Discussion and Summary 82
6 Experimental Section 83
6.1 General 83
6.2 Silane Deposition on Silica Substrate Surfaces 86
6.2.1 Solution Phase Silanization 86
6.2.2 Vapor Phase Silanization 87
6.2.3 Micro-contact Printing 88
6.2.4 Photolithography 89
6.3 Synthesis of the Compounds 90
6.3.1 Synthesis of tert-butyl 11-(triethoxysilyl)undecanoate (2) 90
6.3.2 Synthesis of 2,5-dioxopyrrolidin-1-yl 11-(triethoxysilyl)undecanoate (4) 92

III
6.3.3 Synthesis of 3-(2,5-dioxo-2,5-dihydro-1H-pyrrol-1-yl)-N-(3-(triethoxysilyl) propyl) propanamide (6) 94
6.3.4 Synthesis of 6-(2,5-dioxo-2,5-dihydro-1H-pyrrol-1-yl)-N-(3-(triethoxysilyl) propyl) hexanamide (8) 96
6.3.5 Synthesis of N-(3-(triethoxysilyl)propyl)undec-10-ynamide (10) 98
6.3.6 1-(4,5-dimethoxy-2-nitrophenyl)ethyl 3-(triethoxysilyl)propylcarbamate (14a) and 1-(4,5-dimethoxy-2-nitrophenyl)ethyl 11-(triethoxysilyl)decylcarbamate (14b) 99
6.3.7 1-(4, 5-Dimethoxy-2-nitrophenyl) ethyl 3-(triethoxysilyl) propyl carbonate (16a) and 1-(4, 5-dimethoxy-2-nitrophenyl) ethyl 11-(triethoxysilyl) undecyl carbonate (16b) 104
6.3.8 1-(4, 5-Dimethoxy-2-nitrophenyl) ethyl 5-(triethoxysilyl) pentanoate (18) 106
6.3.9 1-(3,5-Dimethoxyphenyl)-2-oxo-2-phenylethyl 3-(triethoxysilyl) propyl carbamate (22) 108
7 Summary 112
Bibliography 114
Curriculum Vitae 122
Acknowledgements 124

IV
Abbreviations and Acronyms
2-D Two dimensional
3-D Three dimensional
AFM Atomic force microscopy
APTE Aminopropyltriethoxysilane
Ar Argon
t-Bu tert-Butyl
Bzn Benzoin
CCD Charged-coupled device
CH2Cl2 Dichloromethane
DCC Dicyclohexylcarbodiimide
DIC Differential interference contrast
DNA Deoxynucleic acid
DMAP 4-Dimethylaminopyridine
EPR Electron paramagnetic resonance
ESR Electron spin resonance
Et Ethyl
EtOH Ethanol
HMDS Hexamethyldisilazane
MBAAm Methylenebisacrylamide
Mili-Q Deionised water
n-BuLi n-Butyl lithium
NIPAAm N-isopropylacrylamide
NMR Nuclear magnetic resonance
NVoc Nitroveratryloxycarbonyl
OTE Octadecyltriethoxysilane
PDMS Polymethyldisiloxane
Piranha Solution of conc. H2SO4/30%H2O2 (7:3 v/v)
V
PMMA Polymethylmethacrylate
PS Polystyrene
PTFE Polytetrafloroethylene
Rf Retention factor
RMS Root mean square
RNA Ribonucleic acid
SA Sodium acrylate
SAMs Self-assembled monolayers
THF Tetrahydrofuran
TLC Thin layer chromatography

Chapter 1 Introduction
1
Chapter 1
Introduction
The first concepts in nanotechnology was in “There’s plenty of room at the
bottom,” a talk given by physicist Richard Feynman at an American Physical Society
meeting in 1959. Feynman described a process by which the ability to manipulate
individual atoms and molecules might be developed, using one set of precise tools to
build and operate another proportionally smaller set, so on down to the needed scale.
Then in 1974, Professor Norio Taniguchi from Tokyo Science University first defined the
term “Nano-technology” as: “Nano-technology consists of the processing of separation,
consolidation, and deformation of materials by one atom or by one molecule.” [Taniguchi
1974]
Two main approaches are used in nanotechnology. In the “top-down” approach,
nano-objects are constructed from larger entities without atomic-level control. It is based
on miniaturization of macroscale components down to nanometer level. In the last
decades great improvements have already been achieved in this aspect (e.g. lithography

Chapter 1 Introduction
2
patterning of surfaces with the photoresist technology). However, top down techniques
usually suffer from limitation in the degree of miniaturization, which in most cases lies
above 100nm (e.g. the minimum feature size in photolithography is limited by the
diffraction limit of the irradiation wavelength). [Xia 1998]
In the “bottom-up” approach, materials and devices are built from molecular
components which assemble themselves chemically by principles of molecular
recognition. Molecular assemblies on the substrate surface, called self-assembled
monolayers (SAMs), form the basis for these interactions by defining the chemistry on
the surface. In a so-called self-organization process, micro- to nanoscaled objects can
spontaneously organized and aggregate into stable, well-defined structures on SAMs, due
to favorable interactions between the chemical groups located at their outmost surface
layer. [Jonas 2002a]
The site-selective adsorption of molecules and mesoscopic objects at predefined
positions on solid surfaces is a key fabrication step and a major challenge in many
applications, such as multifunctional biosensors and novel electronic, mechanical, and
photonic devices [del Campo 2005]. In this context, this thesis aims at the development
of novel surface functionalization procedures as a basis for further surface reactions or
the assembly of nano-scaled objects onto planar surfaces, which have been modified with
specific chemical functional patterns of silane layers. The functional patterns, that define
the site-selective adsorption, were obtained by a photolithographic process using photo-
reactive silane layers or micro-contact printing with PDMS stamps.

Chapter 1 Introduction
3
Figure 1.1: (a) Schematic illustration of a silane layer on a silica substrate bearing photoprotecting groups.
Upon irradiation through a mask, a photochemical reaction is induced on the surface, which liberates new
functional groups on the photoactivated regions. (b) Schematic illustration of the micro-contact printing
process with a PDMS stamp soaked with a functional silane, which forms after the stamping the new
functional patterns on the silica substrate surface.
The characteristic features of silica surfaces, their surface modification and
patterning are viewed in Chapter 2. Special emphasis is placed on the alkoxysilane
chemistry, due to the process of hydrolysis and condensation in solution and adsorption
onto the surface. The photolithographic technique and micro-contact printing are
presented.
After introducing the main characterization techniques used for this thesis in
Chapter 3, modifications of different functionalized surfaces and the corresponding sur-
face chemical reactions are described in Chapter 4. There, silanization techniques are
introduced. Hydrolysis and condensation mechanisms in solution are investigated by 1H
NMR, AFM, and ellipsometry. Finally a modular synthesis approach and details are
presented.
Synthesis approaches for novel photoprotecting silanes bearing 4,5-dimethoxy-2-
Chapter 1 Introduction
4
nitrophenyl and 3’,5’-dimethoxybenzoinyl photoprotecting groups for chemical
patterning are introduced in Chapter 5. For these silanes UV-Vis measurements both in
solution phase and solid state are carried out for optimizing the irradiation time for silane
activations. Colloidal assembly and fluorescent dye labeling are performed on the
patterned surfaces modified with these molecules by subsequent irradiation.
Finally, Chapter 6 presents the experimental details of the modifications of the
substrate surfaces, including solution and vapor phase silanization, micro-contact printing,
and photolithography. Details for the techniques of fluorescence labeling, colloidal
assembly, and synthesis details are also reported.
Chapter 2 Principles of Patterned Silane Layers on Substrate Surfaces
5
Chapter 2
Principles of Patterned Silane Layers on Substrate
Surfaces
Self-assembly is the fundamental concept which generates structural organizations
on all scales, from molecules even to galaxies. In modern technology, the application of
self-assembly in the bottom up approach is often based on the formation of self-
assembled monolayers (SAMs) of molecules which adsorb to a surface and aggregate
into a dense monolayer, often they are covalently bound to the substrate surfaces. The
newly formed functional surfaces provide the possibilities to manufacture and attach
mesoscale objects onto these surfaces, based on attractive interactions between the
outmost surface molecules on the substrate and the objects. This approach potentially
provides a new fabrication method in the quest for miniaturization, which may lead to
smaller and lighter devices especially in microelectronics, optics, and sensors.
Rather than having to use a technique such as chemical vapor deposition or
molecular beam epitaxy to add molecules to a surface (often with poor control over the

Chapter 2 Principles of Patterned Silane Layers on Substrate Surfaces
6
thickness of the molecular layer), self-assembled monolayers can be prepared simply by
adding a solution of the desired molecule onto the substrate surface and washing off the
excess. This simple process makes SAMs inherently manufacturable and technologically
attractive for building superlattices and for surface engineering.
SAMs can range from disordered to highly ordered and oriented layer structures
and can incorporate a wide range of groups both in the alkyl chain and at the terminal
functionality. Therefore, a variety of surfaces with specific interactions can be produced
with fine chemical control. Due to their dense and stable structure, SAMs provide an
ideal platform in the bottom up approach.
substrate substrate substrate
SAM patterns withdifferent functionalities
(a) (b) (c) Figure 2.1: (a) A substrate to be modified by SAM; (b) SAM on the substrate surface with lateral
functionalized patterns; (c) formation of a complex structure via self-assembly due to different attractive
forces between the surface and the mesoscale objects.
When SAMs are combined with photolithography or micro-contact printing as “top-
down” technique, lateral functionalized patterns onto the planar substrate with micro to
nanometer dimensions can be created. These patterns can define the spatial location of
attracted corresponding objects (Figure 2.1). For instance, in the 1990s Hammond and
co-workers managed to self-assemble polyelectrolytes on laterally modified thiol
substrates on gold whereas Vossmeyer and co-workers self-assembled gold nano-crystals
on patterned silicon oxide surfaces [Chen 2000, Vossmeyer 1998]. Even though
Hammond was using a metal and Vossmeyer with an oxide surface, both groups had
modified their patterned surfaces with self-assembled monolayers (SAMs). Patterns of
oxidized SAMs (or random copolymers) on silica are also reported being produced by

Chapter 2 Principles of Patterned Silane Layers on Substrate Surfaces
7
using extreme ultraviolet interferometric lithography [Gates 2005]. Most often SAMs are
monolayers of either thiol or disulfide groups on gold or silane layers on silicon oxide
surfaces that can chemically modify the surface of the substrate.
Other oxide surfaces, such as Al2O3, ZrO2, SnO2, TiO2 or NbO2, are generally
modified with carboxylic acids or phosphonic acid, but some times also with chloro- or
alkoxy silanes. Since precious metal surfaces, such as gold, may be mainly of academic
interest and somewhat limited to a restricted number of technical applications this
dissertation will only deal with silanes on silicon oxide surfaces, since it is more relevant
for a wider range of potential applications (like many inorganic oxidic surfaces and
oxidized polymer surfaces, e.g.).
2.1 Introduction to Silanes
Modifications of hydrophilic substrates by grafting organic chains with specific
molecules are of great importance for both science and industry. Organosilanes with
particular functional groups are used extensively for generating organic monolayers on
silica substrates. They provide a wide field of applications from biosensors for antibody
immobilization to lubricants.
The word “silane” comes from the combination of “silicon + methane”, the silicon
analogue of methane. More generally, a silane is any analogue of organic compounds (in
particular hydrocarbons) with the silicon centre replacing a carbon atom. The surface-
active silane molecule, which could form SAMs on silicon oxide surfaces spontaneously,
should have an anchor group, suitable for strong interactions or even chemical bond with
the substrate surface, a mesogenic or spacer group responsible for the two-dimensional
packing by favourable lateral interactions between adjacent SAM molecules, and a head
group determining the properties of the newly formed surface.
Such silanes that form the monolayers possess either a chloro- or alkoxy silane

Chapter 2 Principles of Patterned Silane Layers on Substrate Surfaces
8
anchor group that can interact with the silicon surface via physisorption or chemisorption.
Alkoxy silanes are often preferred since they are less reactive and therefore much easier
to handle under ambient laboratory conditions. In addition, they can be purified by
passivating the silica gel column first with hydrophobic silane such as
hexamethlydisilazane (HMDS). The very high reactivity of the chlorosilanes makes it
difficult to handle them under regular laboratory conditions (e.g. H2O in air). Furthermore,
chlorosilanes produce HCl during hydrolysis which auto-catalyses the hydrolysis reaction
and silanol condensation. An alkyl spacer separates then the anchor group from the
functional head groups, which define the surface properties of the substrate and control
the interaction with complementary objects.
Figure 2.2: Cartoon of a surface-active molecule and the profile of a fragment of a self-assembled mono-
layer.
Monolayers with a thickness of up to 10nm possess only molecular dimensions and
they are therefore also referred to ultra-thin films. Depending on their functionalities,
these films can substantially alter the properties of the surface, such as friction, adhesion,
chemical resistance, wettability, etc. [Xia 2000].
2.2 Property of Silica Substrate Surfaces
Silicon dioxide (SiO2) is a hard inorganic solid where Si atoms in the lattice are sp3-
hybridised and bound to four oxygen atoms in a 3-dimensional tetrahedral network.
Because of the interaction between the free p-electron pairs of the oxygen and the empty
d-orbitals of silicon, the bonding energy of the Si-O bond in general is very high. When
silica and silicon wafers with oxide layer are immersed into water, they are known to

Chapter 2 Principles of Patterned Silane Layers on Substrate Surfaces
9
acquire a negative surface charge, primarily through the dissociation of terminal silanol
groups (pKA of Si-OH is ca. 7.5). Figure 2.3 shows the lattice of silicon dioxide.
Figure 2.4 Silicon dioxide structure: (a) disordered surface structure; (b) bulk crystal lattice (white: silicon,
red: oxygen) [Dobkin web resource].
Upon reaction with a strong acid such as Piranha solution (which is a mixture of
conc. H2SO4 / 30%H2O2, 7:3 v/v), coordinated SiO2 surface bonds can be broken, thus
generating more “reactive” surfaces with hydroxyl groups. The concentration of Si-OH
group on a pre-cleaned silica substrate surface is reported to be ~5 1014 groups / cm2
[Zhuravlev 1987]. The high polarity of the hydroxyl groups gives the reactivity to the
surface with the anchor groups of silanes.
2.3 Silanization of Silica Substrate Surfaces
Surface modification can occur by physisorption, due to attractive forces between
the surface and the organo silane, or they can be chemisorbed via formation of covalent
bonds between the silane and the silanol groups on the surface (Figure 2.5). Chemisorbed
layers are more versatile and stable due to the stronger interaction with the surface
compared to those with the physisorbed films [Fadeev 1999].
The first step in the silanization process is the hydrolysis of the alkoxysilanes to
give hydroxyl silanes that can then interact with the silicon dioxide surface and further

Chapter 2 Principles of Patterned Silane Layers on Substrate Surfaces
10
condensate to form covalent bonds. Another possibility is that the hydroxyl silanes first
condensate and then adsorb onto the surface when the anchor groups bear more than one
functional group, such as di- or tri-functionalised alkoxysilanes. Condensation of these
groups and the formation of a pre-polymer leads to aggregates of polymerised silanes
which, when adsorbed onto the surface, may form an inhomogeneous layer. Extended
silane condensation (forming large polymers) prior to adsorption to the surface has to be
prevented so that a homogeneous coating can form via surface diffusion of physisorbed
silanes [Ishida 1984].
SiROEt
OEtOEt
SiROH
OHOH
H2O, H+, OH-
- EtOHHO
SiO
SiO
SiO
SiOH
R R R R
HO HO O OHSiO
R On
m
- H2O
HOSi
OSi
OSi
O
R R R
O O HOn
OSi
OSi
OSi
OSi
OO O O O
O O OH OH H H
H H H
OSi
OSi
OSi
OSi
OO O O O
O O OH OHO
SiO
SiO
Si
R R R
HOn- H2O
silica substrate silica substrate
(b)(a)
(c) (d)
SiROEt
OEtOEt
SiROH
OHOH
H2O, H+, OH-
- EtOH
(a)
HOSi O Si
R R
O O
OSi
OSi
OO O
O OH H
H H
silica substrate
(c)
OH
H
HOSi Si
R R
OSi
OSi
OO O
O O
silica substrate
O- H2O
(d)
Process 1:
Process 2:
Figure 2.5: (a) Hydrolysis of the alkoxy silane in solution; (b) pre-polymeric condensation in solution; (c)
physisorption of hydrolyzed alkoxy silane or polymerized silane aggregates onto silica substrate surface;
(d) condensation of a silane with the surface and formation of a silane layer. Process 1 and 2 are competing
with each other.

Chapter 2 Principles of Patterned Silane Layers on Substrate Surfaces
11
2.4 Micro-contact Printing
Microcontact printing uses a polydimethylsiloxane (PDMS) stamp to deposit
molecules on surfaces. The stamp is first “inked” with a solution of molecules, often
proteins or thiols that can either coat the stamp or, in the case of small molecules, are
absorbed onto the PDMS in the form of a solid solution. The stamp is dried and pressed
onto the surface to be patterned. The soft PDMS stamp makes conformal contact with the
surface and molecules are transferred directly from the stamp to the surface in the space
of a short time scale, usually a few seconds.
The stamps for microcontact printing are made using topgraphically patterned
substrates, the so-called masters. This substrates form a mould in which liquid PDMS is
crosslinked. On demoulding, a flexible transparent stamp is obtained, with structures that
can be as small as 100nm and in extreme cases even below.
Figure 2.6: (a) Fabrication of a PDMS stamp by the polymerization of PDMS on a patterned master; (b)
micro-contact print of thiol molecules on a gold surface and the formation of a patterned thiol SAM
[Whitesides 2001].
Microcontact printing is a very powerful method for surface structuring. Patterns
Chapter 2 Principles of Patterned Silane Layers on Substrate Surfaces
12
can be made on many different materials and on flat or curved surfaces. Repeated
printing using different stamps can be used to make complex surface patterns of more
than one kind of molecule. Besides molecules, nanoscale objects such as colloidal
particles can also be patterned using microcontact printing.
In this thesis, microcontact printing is used to pattern silica substrate surfaces with
silanes: a stamp is used to apply a silane to certain areas of a silica surface. Additionally,
after the transfer is complete, the silica substrate may be briefly dipped into a solution of
a second silane, which fills the remaining bare areas. If suitable functional silanes are
chosen, marked contrasts in properties such as hydrophilicity or protein binding may be
obtained.
2.5 Photolithography
Photolithography has been the major tool for micro-fabrication in the
semiconductor industry since the 1950s. Its basis is in an optical projection system in
which the image of a reticle is reduced and projected onto a thin film of photoresist that is
spin-coated on a wafer, through a high numerical aperture lens system. Contact
lithography is the most common technique used to produce high resolution patterns. It
refers to the fact that the radiation mask is placed right on top of the photoresist wafer to
be patterned, so the mask features are reproduced without size reduction and need for a
complex optical system. The irradiated parts of the resist undergo a chemical
transformation and thus can be removed in an alkaline developer solution in the case of a
positive-tone resist.
Chapter 2 Principles of Patterned Silane Layers on Substrate Surfaces
13
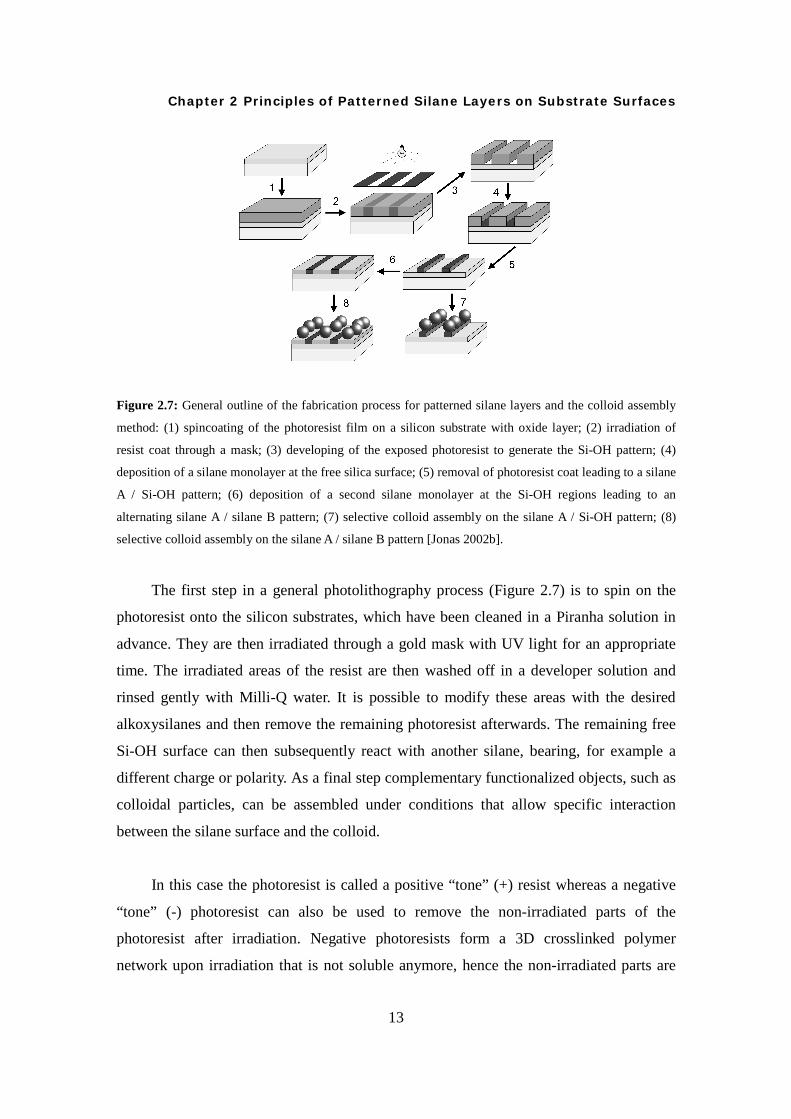
Figure 2.7: General outline of the fabrication process for patterned silane layers and the colloid assembly
method: (1) spincoating of the photoresist film on a silicon substrate with oxide layer; (2) irradiation of
resist coat through a mask; (3) developing of the exposed photoresist to generate the Si-OH pattern; (4)
deposition of a silane monolayer at the free silica surface; (5) removal of photoresist coat leading to a silane
A / Si-OH pattern; (6) deposition of a second silane monolayer at the Si-OH regions leading to an
alternating silane A / silane B pattern; (7) selective colloid assembly on the silane A / Si-OH pattern; (8)
selective colloid assembly on the silane A / silane B pattern [Jonas 2002b].
The first step in a general photolithography process (Figure 2.7) is to spin on the
photoresist onto the silicon substrates, which have been cleaned in a Piranha solution in
advance. They are then irradiated through a gold mask with UV light for an appropriate
time. The irradiated areas of the resist are then washed off in a developer solution and
rinsed gently with Milli-Q water. It is possible to modify these areas with the desired
alkoxysilanes and then remove the remaining photoresist afterwards. The remaining free
Si-OH surface can then subsequently react with another silane, bearing, for example a
different charge or polarity. As a final step complementary functionalized objects, such as
colloidal particles, can be assembled under conditions that allow specific interaction
between the silane surface and the colloid.
In this case the photoresist is called a positive “tone” (+) resist whereas a negative
“tone” (-) photoresist can also be used to remove the non-irradiated parts of the
photoresist after irradiation. Negative photoresists form a 3D crosslinked polymer
network upon irradiation that is not soluble anymore, hence the non-irradiated parts are
Chapter 2 Principles of Patterned Silane Layers on Substrate Surfaces
14
removed. The most common (+) photoresist system is the diazonaphthoquinon-Novolak-
sytem, which is comprised of 3 major components; namely naphthoquinone as the
photoactive component, a Novolak resin and a developer. The resin is a condensation
product of phenol and/or cresol and formaldehyde that does not change upon irradiation.
However, the diazonaphthoquinon (DNQ) is transformed into an indene carbonic acid
during irradiation via a Wolff rearrangement and can be washed off afterwards with an
aqueous basic developer.
Photolithographic methods using electromagnetic radiation such as UV can usually
create the feature sizes of around 90nm. To go even further down with the resolution is a
goal that scientists are very eager to achieve. Energetic particles, (i.e. electrons and ions)
are an attractive means since their de Broglie wavelengths (which depend on the velocity
of the electrons) are less than 0.1nm, which minimizes the effects of diffraction that limit
many photolithographic processes [Xia 1999].
Comparing to the conventional photolithography, this thesis will present an
alternative technique, termed direct monolayer lithography, that requires less process
steps and makes use of a silane monolayer that carries photo-reactive groups as the
protecting groups, which forms the lateral functional patterns on the surface by photo-
deprotection process when the substrate are irradiated through a mask.
Chapter 3 Principles of Characterizations
15
Chapter 3
Principles of Characterizations
3.1 Contact Angle Measurement
Contact angle measurement of a liquid droplet (usually water) on a planar substrate
surface is a popular and uncomplicated means to characterise the hydrophobicity or
hydrophilicity of this surface [Ulman 1991]. The shape of a droplet resting on a surface
depends on the material properties of the liquid, the air (or vapour) around it, and the
surface on which it is placed. The measurement is performed at the base of the droplet, in
contact with the surface. Figure 3.1 illustrates such contact angle measurement.
Chapter 3 Principles of Characterizations
16
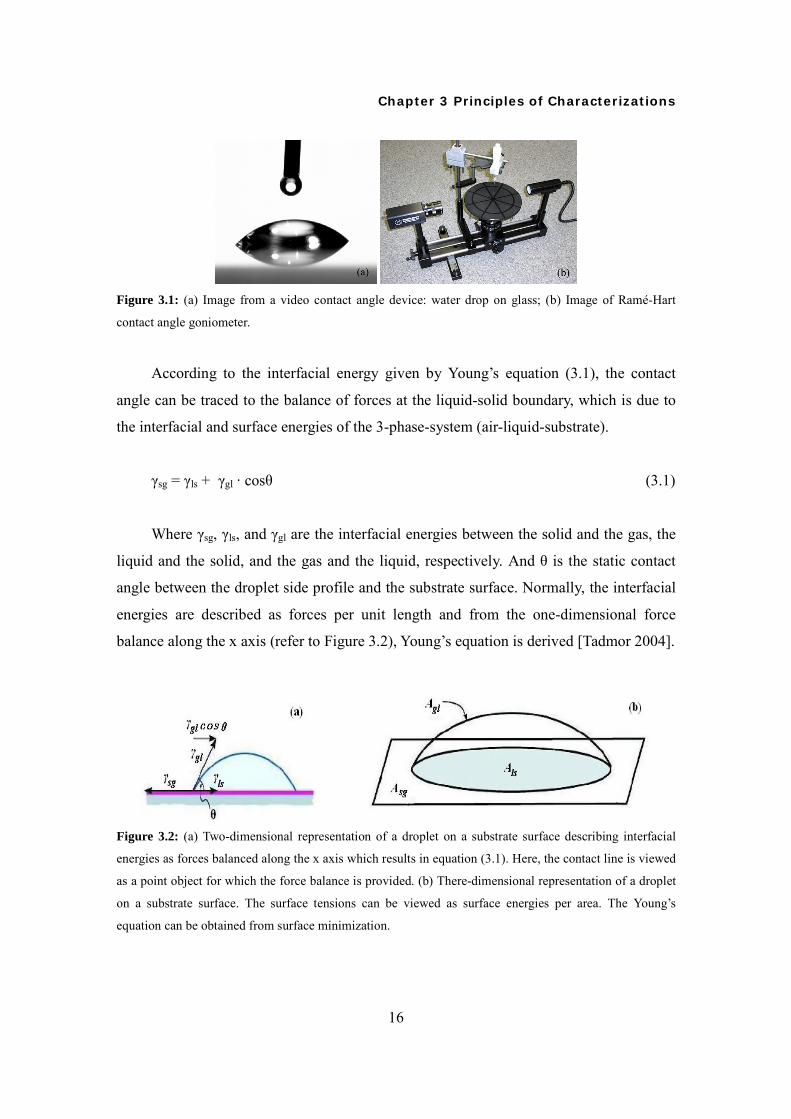
Figure 3.1: (a) Image from a video contact angle device: water drop on glass; (b) Image of Ramé-Hart
contact angle goniometer.
According to the interfacial energy given by Young’s equation (3.1), the contact
angle can be traced to the balance of forces at the liquid-solid boundary, which is due to
the interfacial and surface energies of the 3-phase-system (air-liquid-substrate).
γsg = γls + γgl · cosθ (3.1)
Where γsg, γls, and γgl are the interfacial energies between the solid and the gas, the
liquid and the solid, and the gas and the liquid, respectively. And θ is the static contact
angle between the droplet side profile and the substrate surface. Normally, the interfacial
energies are described as forces per unit length and from the one-dimensional force
balance along the x axis (refer to Figure 3.2), Young’s equation is derived [Tadmor 2004].
Figure 3.2: (a) Two-dimensional representation of a droplet on a substrate surface describing interfacial
energies as forces balanced along the x axis which results in equation (3.1). Here, the contact line is viewed
as a point object for which the force balance is provided. (b) There-dimensional representation of a droplet
on a substrate surface. The surface tensions can be viewed as surface energies per area. The Young’s
equation can be obtained from surface minimization.

Chapter 3 Principles of Characterizations
17
From Equation (3.1) it appears that there is only one thermodynamic contact angle
(θ). However, our daily experience shows that droplets can show a series of contact
angles ranging from the so-called advancing contact angle (θA) with the water droplet
spreading on the surface, up to the so-called receding contact angle (θR) with the water
droplet retracting from the surface, which are the maximum and minimum values the
contact angle can obtain. This difference between advancing and receding contact angles
is referred to as contact angle hysteresis. Surface imperfections, such as contamination,
can lead to contact angle hysteresis and removing of such anomalies can greatly reduce
the hysteresis. Consequently, most descriptions assume that the contact angle hysteresis is
caused by surface flaws. However, even molecularly smooth and homogeneous surfaces
can also show hysteresis. Anyway, contact angle hysteresis should be considered as a
source of information on the behavior of liquid-solid interfaces: large hysteresis leads to
pinning of a droplet and lower tendency for dewetting, small hysteresis leads to effective
dewetting [Oener 2000].
The contact angle is very sensitive to the chemical composition and the values can
range from about 0° (very hydrophilic, e.g. pure SiO2 surface) to 120° (very hydrophobic,
e.g. methylene head groups on self-assembled monolayers). Thus the contact angle
measurement is well suited for monitoring the deposition of silanes onto the silica surface
[Boos 2004].
3.2 Atomic Force Microscopy
The atomic force microscope (AFM), sometimes also called scanning force
microscope (SFM), was invented by Gerd Binig, Calvin Quate and Christoph Gerber in
1986. With the AFM both, conductor as well as insulators can be imaged at molecular
resolution. Thomas Albrecht and Calvin Quate were the first who imaged an insulator,
boron nitride, and could see the periodic structure at atomic resolution. AFM can be
operated in vacuum, air or liquids including water. This opened a wide range of
applications for this technique at the molecular or atomic scale.

Chapter 3 Principles of Characterizations
18
The AFM measures the surface topography of a sample with a sharp stylus, called a
“tip”. The tip is a few microns long and located at the end of a cantilever that is 100 to
200µm long. It is usually made of Si or Si3N4 and is capable of measuring forces between
10-8 to10-6 N. Forces between the tip and the sample surface cause the cantilever to bend
and deflect [Ulman 1991].
A laser beam is reflected from the backside of the cantilever and is focused on a
photodiode sensor. When the cantilever is deflected, the position of the laser spot on the
detector changes. The force acting on the cantilever is proportional to the deflection.
Therefore by adjusting a force setpoint, the force between tip and sample is also adjusted.
This results in a signal, which is recorded in a computer (Figure 3.3). The feedback of the
computer controls the z translator (called piezoelectric scanner) to adjust the tip or
sample up or down in order to restore the tip to its original deflection. The sample is
scanned in the x, y-plane and the computer stores the vertical position of the z translator
at each point and assembles the 3-D image.
Figure 3.3: The sample is placed on the piezoelectric scanner, which can move in xyz. The photo-detector
measures the vertical deflection of the cantilever with a resolution smaller than 10Å. The feedback of the
computer controls the vertical position with respect to the corresponding (x, y) coordinates, which is
translated into a 3-D map of the measured surface property.

Chapter 3 Principles of Characterizations
19
Three fundamental operating techniques are usually performed with AFM, namely
contact mode, non-contact mode, and intermittent contact mode (also referred to as
tapping mode). In the contact mode, where the tip makes soft “physical contact” with the
sample, the tip is attached to the end of a cantilever with a low spring constant (lower
than the effective spring constant holding the atoms of the sample together). The contact
force causes the cantilever to bend to accommodate changes in topography. Usually the
cantilever is in strong contact with the sample surface and the force between the
cantilever and the sample is repulsive. In the non-contact mode, the cantilever is held on
the order of tens to hundreds of angstroms from the sample surface. Due to the long-
range van der Waals interactions the force between the cantilever and the sample is
attractive. In the tapping mode, the tip is periodically oscillated over the sample and
changes in the oscillation frequency or amplitude by interaction of the tip with surface
features are detected (Figure 3.4).
Figure 3.4: (a) Illustration of contact mode; (b) illustration of non-contact mode [Howland 1996].
Once the AFM has detected the cantilever deflection, it can generate the
topographic data set by operating in two modes: constant height mode and constant force
mode. In constant height mode, the spatial variation of the cantilever deflection can be
used directly to generate the topographic data set since the height of the scanner is fixed
when it scans. In constant force mode, the deflection of the cantilever can be used as an
input to a feedback circuit that moves the scanner up and down in z direction, responding
to the topography by keeping the cantilever deflection constant. By doing so the image is
generated from the scanner’s motion. With the cantilever deflection being held constant,
Chapter 3 Principles of Characterizations
20
the total force applied to the sample is constant [Boos 2004].
Contact mode is usually applied to “hard” materials where the rather large force
won’t damage the surface. For “soft” materials, such as colloids, non-contact or inter-
mittent contact mode is applied to avoid the damage of the samples.
3.3 Ellipsometry
Ellipsometry measures the change of polarization upon reflection or transmission.
Typically, ellipsometry is done only in the reflection setup. The exact nature of the
polarization change is determined by the sample's properties (thickness, complex
refractive index or dielectric function tensor). Although optical techniques are inherently
diffraction limited, ellipsometry exploits phase information and the polarization state of
light, and can achieve angstrom resolution. In its simplest form, the technique is
applicable to thin films with thickness less than a nanometer to several micrometers. The
sample must be composed of a small number of discrete, well-defined layers that are
optically homogeneous, isotropic, and non-absorbing.
Experimental Setup
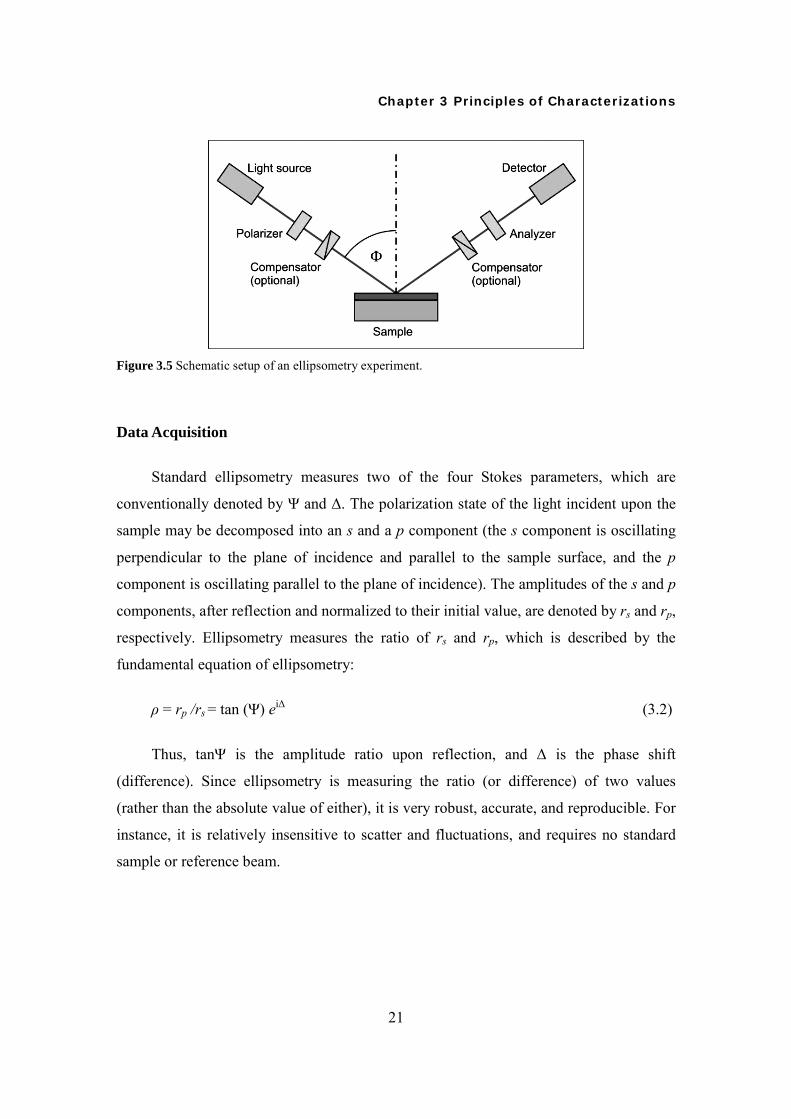
Electromagnetic radiation is emitted by a light source and linearly polarized by a
polarizer, it can pass an optional compensator (retarder, quarter wave plate), and falls
onto the sample. After reflection the radiation passes a compensator (optional) and a
second polarizer, which is called analyzer, and falls into the detector. Instead of the
compensators some ellipsometers use a phase-modulator in the path of the incident light
beam (Figure 3.5). Ellipsometry is a specular optical technique (the angle of incidence
equals the angle of reflection). The incident and the reflected beam span the plane of
incidence. Light, which is polarized parallel or perpendicular to the plane of incidence, is
called p or s polarized, respectively.
Chapter 3 Principles of Characterizations
21
Figure 3.5 Schematic setup of an ellipsometry experiment.
Data Acquisition
Standard ellipsometry measures two of the four Stokes parameters, which are
conventionally denoted by Ψ and ∆. The polarization state of the light incident upon the
sample may be decomposed into an s and a p component (the s component is oscillating
perpendicular to the plane of incidence and parallel to the sample surface, and the p
component is oscillating parallel to the plane of incidence). The amplitudes of the s and p
components, after reflection and normalized to their initial value, are denoted by rs and rp,
respectively. Ellipsometry measures the ratio of rs and rp, which is described by the
fundamental equation of ellipsometry:
ρ = rp /rs = tan (Ψ) ei∆ (3.2)
Thus, tanΨ is the amplitude ratio upon reflection, and ∆ is the phase shift
(difference). Since ellipsometry is measuring the ratio (or difference) of two values
(rather than the absolute value of either), it is very robust, accurate, and reproducible. For
instance, it is relatively insensitive to scatter and fluctuations, and requires no standard
sample or reference beam.

Chapter 3 Principles of Characterizations
22
Data Analysis
Ellipsometry is an indirect method, i.e. in general the measured Ψ and ∆ cannot be
converted directly into the optical constants of the sample. Normally, a model analysis
must be performed. Direct inversion of Ψ and ∆ is only possible in very simple cases of
isotropic, homogeneous and infinitely thick films. In all other cases a layer model must
be established, which considers the optical constants (refractive index or dielectric
function tensor) and thickness parameters of all individual layers of the sample including
the correct layer sequence. Using an iterative procedure (least-squares minimization)
unknown optical constants and/or thickness parameters are varied, and Ψ and ∆ values
are calculated using the Fresnel equations. The calculated Ψ and ∆ values, which match
the experimental data best, provide the optical constants and thickness parameters of the
sample.
3.4 UV-Vis Spectroscopy
Ultraviolet-visible spectroscopy involves the absorption of ultraviolet or visible
light by a molecule causing the promotion of an electron from a ground electronic state to
an excited electronic state. The absorption spectra, which are due to the light absorption,
are then measured. The spectra range from 200 to 800nm, where the quantitative
absorption is defined by Lambert-Beer’s law (3.5), which is based on a beam of light
passing through a solution of known thickness b and concentration c of the adsorbing
species depicted by the transmittance T
T = P/P0 , (3.3)
where P0 is the intensity of the incident beam and P the resulting intensity of the beam
after absorption by the solution. Upon transmittance the photons interact with the
molecules in solution. The absorbance A of the solution is then defined as

Chapter 3 Principles of Characterizations
23
A = - log10T = log (P0 /P) . (3.4)
Absorbance is directly proportional to the path length b and concentration c of the
solution, which can be described by Lambert-Beer’s law:
A = εbc (3.5)
where ε is a proportionality constant called “molar absorptivity” with unit of Lmol-1 cm-1.
The linear relationship in Beer’s law only holds for dilute solutions. With higher
concentrated solutions (>0.01M) the distance between neighbouring species is reduced
leading to interactions that change the ability to absorb at a given wavelength, which
causes deviation from the linear relationship between absorbance and concentration.
3.5 Confocal Microscopy
Confocal microscopy is an imaging technique used to increase micrograph contrast
and/or to reconstruct three-dimensional images by using a spatial pinhole to eliminate
out-of-focus light or flare in specimens that are thicker than the focal plane. In confocal
microscopy, a laser beam is used as the excitation light. After reflecting on a dichroic
mirror the laser hits two xy galvanometric scanners; these mirrors scan the laser across
the sample. Dye in the sample fluoresces and the emitted light gets descanned by the
same scanners that are used to scan the excitation light from the laser. The emitted light is
through the dichroic mirror and is focused onto the pinhole plane. The light that passes
through the pinhole is measured by a detector, i.e. a photomultiplier tube.
The confocal aperture (pinhole) is placed in front of the photodetector, such that the
fluorescent light from points on the sample that are not within the focal plane will be
obstructed by the pinhole. In this way, out-of-focus information (both above and below
the focal plane) is greatly reduced (Fig.3.6). Light excited in the sample in the focal point
of the lens is precisely imaged in the opening of the detector pinhole. In this way, a single

Chapter 3 Principles of Characterizations
24
point anywhere in a 3D sample can be accurately imaged with a resolution of >1µm. By
scanning this point laterally through the focal plane, a 2D image of a slice parallel to the
sample surface can be made. As the laser scans across the sample with the help of mirrors,
the analog light signal, detected by the photomultiplier, is converted into a digital signal,
contributing to a computer monitor attached to the confocal microscope.
Figure 3.6: Confocal principle: laser light (green) reflects on dichroic mirror and is emitted at the focal
point in the focal plane (red light). The emitted light is then passed through the dichroic mirror and focused
onto the pinhole by a microscope objective. Light emitted out-of-focus (faint red light) is not focused on
the pinhole [Olympus Web Resouce].
The advantage of using a confocal microscope is that it is really efficient at
rejecting out of focus fluorescent light. The best horizontal resolution of a confocal
micro-scope is about 0.2 microns, and the best vertical resolution is about 0.5 microns.
[Wilhelm 1998]
3.6 Optical Microscopy
Optical Microscopy is a widely used method to visually magnify small objects by
the use of light, with the resolution around half the wavelength of light (practically
around 0.5µm for separated points). There are two modes for the illumination:

Chapter 3 Principles of Characterizations
25
transmission mode, where the light source is on the opposite side of the specimen with
respect to the eyepieces (partially transparent samples required), and reflection mode,
where the illumination comes from the same side as the eyepieces, and the reflected light
is observed (non-transparent samples can be investigated). Figure 3.7 shows the light
paths of the two modes.
Figure 3.7 Scheme of an optical microscope and light paths for transmission mode and reflection mode
[Davidson 1999].
When the light from a microscope lamp passes through a condenser and then either
through or around the sample, some of it passes without disturbance of its path and some
is attenuated. The decreased intensity of light passing through the sample can be due to
absorption or diffraction and deflection. The term Brightfield Microscopy is applied
when direct light is projected straightly on our retina and the brightest light we observe is
where there is no object. Thus, the background is brighter than the specimen. Weakly
absorbing samples often require to be stained. Darkfield microscopy, on the other hand,
only allows diffracted rays to pass to the eyepiece so that the scattering specimen appears
as bright object on a dark background (Figure 3.8).

Chapter 3 Principles of Characterizations
26
Figure 3.8 Illustrations of darkfield and brightfield methods [Davidson 1999, Krüger 2001].
Another microscopy technique often being used is differential interference contrast
(DIC): light from an incandescent source is passed through a linear polariser, so that the
electric field vectors of all transmitted light are parallel. The light then passes through a
prism where it is split in two beams that pass through the condenser lens as parallel
beams with perpendicular polarization. They then pass through the specimen and in any
part of the specimen in which adjacent regions differ in refractive index, the two beams
are delayed or refracted. When they are combined again by a second Wollaston prism
before the objective lens, an interference contrast is created that can be observed as
differences in intensity and color whose shadow effects lead to a kind of 3-D appearance
of the specimen (Figure 3.9) [Davidson 1999].

Chapter 4 Novel Silanes for Chemical Modifications on Silica Surfaces
27
Chapter 4
Novel Silanes for Chemical Modifications on Silica
Surfaces
The aim of this chapter is to describe how different ω-functionalized triethoxy
silanes were synthesized by modular approaches. From these silanes new functional
surface layers and the lateral functional patterns were obtained by using surface
modification methods and standard micro-contact printing technique. The resulting silane
layers could be further modified by reactive species and corresponding surface chemical
reactions occurred between the functionalities of the chemical or biological substances
and the newly formed functional surfaces.
4.1 Introduction
Independent control of surface structure and chemical properties and the resulting
structures-property relationships are both scientifically interesting and technologically

Chapter 4 Novel Silanes for Chemical Modifications on Silica Surfaces
28
important. For many applications, controlling the properties of interfaces (or surfaces) is
very important. It ultimately defines how this interface interacts with its environment
through its surface chemistry and physical topography, for example the dewetting of a
water droplet on a plant leaf.
Since chemical surface properties are generally considered to be controlled by the
outmost 5-10Å at a substrate surface, surface properties of substrates depend critically
upon the chemical and physical details of molecular structure on the surface of the
substrates. A practical technique to modify the surfaces with desired properties is the
deposition of ultrathin molecular films to screen the substrate surfaces.
Silane SAMs are especially suitable for the studies of surface phenomena due to
ease of preparation, type of functional groups, mixtures, and the control over the surface
functional group concentration. These surfaces can be produced to have surface energies
which span the range from very high energy surfaces (metal surfaces (e.g. copper: 2000
mJ·m-2, 300K) or pure silicon dioxide surface, -surface –OH groups (1400 mJ·m-2,
300K)) to “Teflon-like” surfaces (surface –CF3 groups: 18.3 mJ·m-2, 300K) [Israelachvili
2002]. By choosing different head groups for the surface active silane molecules, special
chemical properties can be introduce to the substrate surfaces and achieve the desired
functions for the substrate. For example, silane SAMs with succinimidyl ester as the head
group can be used to immobilize amino groups, such as protein adsorption [Ulman 1996].
In the work of this chapter, we designed and synthesized the following triethoxy
silanes with specific head groups to modify the silica substrate surfaces and achieved the
surface chemical reactions on these surfaces to show the characteristic reactivity (Figure
4.1). Tert-butyl ester in 11-triethoxysilanyl-undecanoic acid tert-butyl ester (a) acts as
protecting group, which can be deprotected by trifluoroacetic acid (TFA).

Chapter 4 Novel Silanes for Chemical Modifications on Silica Surfaces
29
compound 2:
CH3
H3CCH3
O
O
SiOEt
OEtOEt
9
(a)substrate
O OO O
substrate
O OHO OH
TFA
compound 4:
N
O
O
O
O
SiOEt
OEtOEt
9
(b)substrate
O OO O
NO
O NO
O
substrate
O NHO NH
R1 R1
R1 NH2
compound 6 & 8:
N
O
O
O
NH
Si OEtOEt
OEtn
n = 1,4(c) substrate
NO
O NO
O
substrate
NO
O NO
O
HS
R2
HS
R2
R2 SH
compound 10:
O
NH
SiOEt
OEtOEt7
(d) substrate substrate
NN
N
R3
NN
N
R3
R3 N3
Figure 4.1: (a) tert-butyl 11-(triethoxysilyl)undecanoate; (b) 2,5-dioxopyrrolidin-1-yl 11-
(triethoxysilyl)undecanoate; (c) 3-(2,5-dioxo-2,5-dihydro-1H-pyrrol-1-yl)-N-(3-(triethoxysilyl)propyl)
propanamide and 6-(2,5-dioxo-2,5-dihydro-1H-pyrrol-1-yl)-N-(3-(triethoxysilyl)propyl)hexanamide; (d) N-
(3-(triethoxysilyl)propyl)undec-10-ynamide.
The silica surface modified with tert-butyl ester can be functionally patterned by
micro-contact printing with a TFA-soaked PDMS stamp in several minutes. For 11-
triethoxysilanyl-undecanoic acid-2,5-dioxo-pyrrolidin-1-yl ester (b), the succinimidyl
group is an activated ester, which has high reactivity with amino group to form amide
bonds. Thus the surface modified with silane (b) can capture chemical or biological
amino components (e.g. peptides and proteins). The maleimide surfaces modified by
silane (c) can couple to thiol groups by an addition reaction on the double bond in the

Chapter 4 Novel Silanes for Chemical Modifications on Silica Surfaces
30
maleimide ring. Thus, the modification of substrate surfaces with maleimide silane (c)
provides a basic for thiol immobilization and investigation. For silane (d), the terminal
alkyne group can couple with azide groups to yield 1,2,3-triazoles via a Huisgen 1, 3-
dipolar cycloaddition reaction. The unique properties of this reaction in solution (high
selectivity, quantitative yields, no byproducts, simple reaction conditions) could provide
access to a range of novel, functionalized surfaces by analogy to the Sharpless click
chemistry concept for solution phase synthesis [Lummerstorfer 2004].
4.2 Synthesis Approach
The synthetic strategy applied in this work is aiming at an easy route to introduce
many different functional groups by a simple and modular synthesis concept. In these
compounds, one end, the anchor group, is a triethoxysilyl group for the reaction with the
hydroxylated silica surface, whereas the other end has a functional head group suitable
for the newly desired substrate surface. In between, the spacer should have chain lengths
suitable for the formation of self-assembled monolayers by the lateral interactions
between two adjacent silane molecules.
Functional HeadSi
EtO
EtO
EtO
+ Si
EtO
EtO
EtO
+
Si
EtO
EtOEtO
Functional Head
Functional Head Functional Head
Functional Head
Modular Approach A
Modular Approach B
(anchor group)
(anchor group)
HSi(OEt)3

Chapter 4 Novel Silanes for Chemical Modifications on Silica Surfaces
31
Two modular approaches were applied in the present work. The first approach
based on the bond formation between two molecules carrying anchor group
(triethoxysilyl) and head group, respectively. The second one was applied for the
synthesis of silane molecules carrying complex head groups which need more steps to
achieve. Due to the instability of triethoxysilyl group, it is introduced as the anchor group
at the last step, called hydrosilylation to avoid the decomposition.
4.2.1 Modular Approach A
The modular approach starts from the commercially available aminopropyl-
triethoxysilane (APTE) and couples a variety of functional groups to the amino function
via amide bond formation.
H2N Si
OEt
OEt
OEtR1 OH
O+
NH
Si
OEt
OEt
OEt
R
O
N
O
O
R1 : NO
Modular approach A:
N-hydroxysuccinimide (NHS) is widely used for synthesizing various amide
derivatives. NHS can form an activated ester with a carboxylic acid by activation with a
carbodiimide, which has a high affinity for the nucleophilic attack of amines, because the
electron-withdrawing group (imide unit) enhances the electrophilic character of the
carbonyl group in the acid. Figure 4.2 shows the mechanism of the route via the activated
NHS ester.

Chapter 4 Novel Silanes for Chemical Modifications on Silica Surfaces
32
C
O
R OH
NHO
O
OCO
R O N
O
O
H2N R'
δ
δ
δ NHO
O
O
-
R C
OHN R'
activated ester
Figure 4.2: The mechanism of amide bond formation via a NHS activated ester derivative.
For the preparation of the activated NHS ester, the carboxylic acid was reacted with
NHS in the presence of N,N’-dicyclohexylcarbodiimide (DCC). Carbodiimide
esterification occurs between equal molar mixtures of acids and alcohols. The
condensation is driven by the formal addition of water (the condensation product from
the esterification) across the carbodiimide group to produce the stable dicyclohexyl urea
(DCU) as byproduct. It bears advantage of avoiding the need to prepare and handle
preactivated and labile acid derivatives such as acid chlorides. Figure 4.3 shows the
mechanism of DCC esterification.
C
O
R OH- H+
C
O
R O
N C N
H+
O
CRO
C
NH
N
H+
HO R'
δ
δ
R C O R'
OHN C
HN
O+
DCU (precipitate)
Figure 4.3: The mechanism of the DCC esterification.
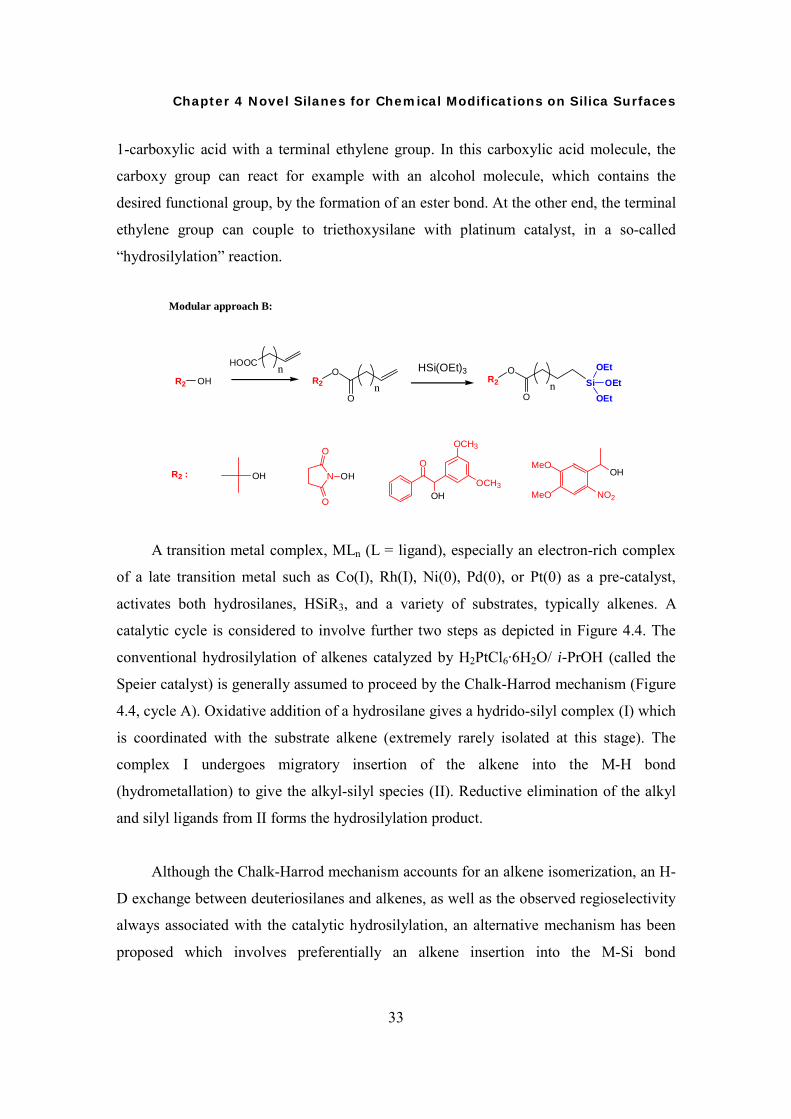
4.2.2 Modular Approach B
The second modular approach for the strategy is based on a commercially available
Chapter 4 Novel Silanes for Chemical Modifications on Silica Surfaces
33
1-carboxylic acid with a terminal ethylene group. In this carboxylic acid molecule, the
carboxy group can react for example with an alcohol molecule, which contains the
desired functional group, by the formation of an ester bond. At the other end, the terminal
ethylene group can couple to triethoxysilane with platinum catalyst, in a so-called
“hydrosilylation” reaction.
Modular approach B:
R2 OH
HOOC
O
OR2
n
nO
OR2 n Si
OEtOEt
OEt
HSi(OEt)3
R2 : N
O
O
OHO
OH
OCH3
OCH3OH
MeO
MeO
OH
NO2
A transition metal complex, MLn (L = ligand), especially an electron-rich complex
of a late transition metal such as Co(I), Rh(I), Ni(0), Pd(0), or Pt(0) as a pre-catalyst,
activates both hydrosilanes, HSiR3, and a variety of substrates, typically alkenes. A
catalytic cycle is considered to involve further two steps as depicted in Figure 4.4. The
conventional hydrosilylation of alkenes catalyzed by H2PtCl6·6H2O/ i-PrOH (called the
Speier catalyst) is generally assumed to proceed by the Chalk-Harrod mechanism (Figure
4.4, cycle A). Oxidative addition of a hydrosilane gives a hydrido-silyl complex (I) which
is coordinated with the substrate alkene (extremely rarely isolated at this stage). The
complex I undergoes migratory insertion of the alkene into the M-H bond
(hydrometallation) to give the alkyl-silyl species (II). Reductive elimination of the alkyl
and silyl ligands from II forms the hydrosilylation product.
Although the Chalk-Harrod mechanism accounts for an alkene isomerization, an H-
D exchange between deuteriosilanes and alkenes, as well as the observed regioselectivity
always associated with the catalytic hydrosilylation, an alternative mechanism has been
proposed which involves preferentially an alkene insertion into the M-Si bond

Chapter 4 Novel Silanes for Chemical Modifications on Silica Surfaces
34
(silylmetallation) by using Rh(I) or Co(III) catalyst precursor to form the β-silylalkyl-
hydrido intermediate (III), followed by reductive elimination to complete the
hydrosilylation (Figure 4.4,cycle B). [Hayashi 1999]
Figure 4.4: Mechanism of hydrosilylation of olefins catalyzed by transition metal complexes.
The alkene chain of the carboxylic acid should have an efficient length that can
supply enough lateral interaction between two adjacent molecules in order to form the
self-assemblies.
4.3 Surface Modification and Characterization
4.3.1 Formation of Functional Surfaces
For the preparation of the silane monolayers two general techniques are used,
namely adsorption from a silane solution and deposition of the silane from the vapor
phase.
Chapter 4 Novel Silanes for Chemical Modifications on Silica Surfaces
35
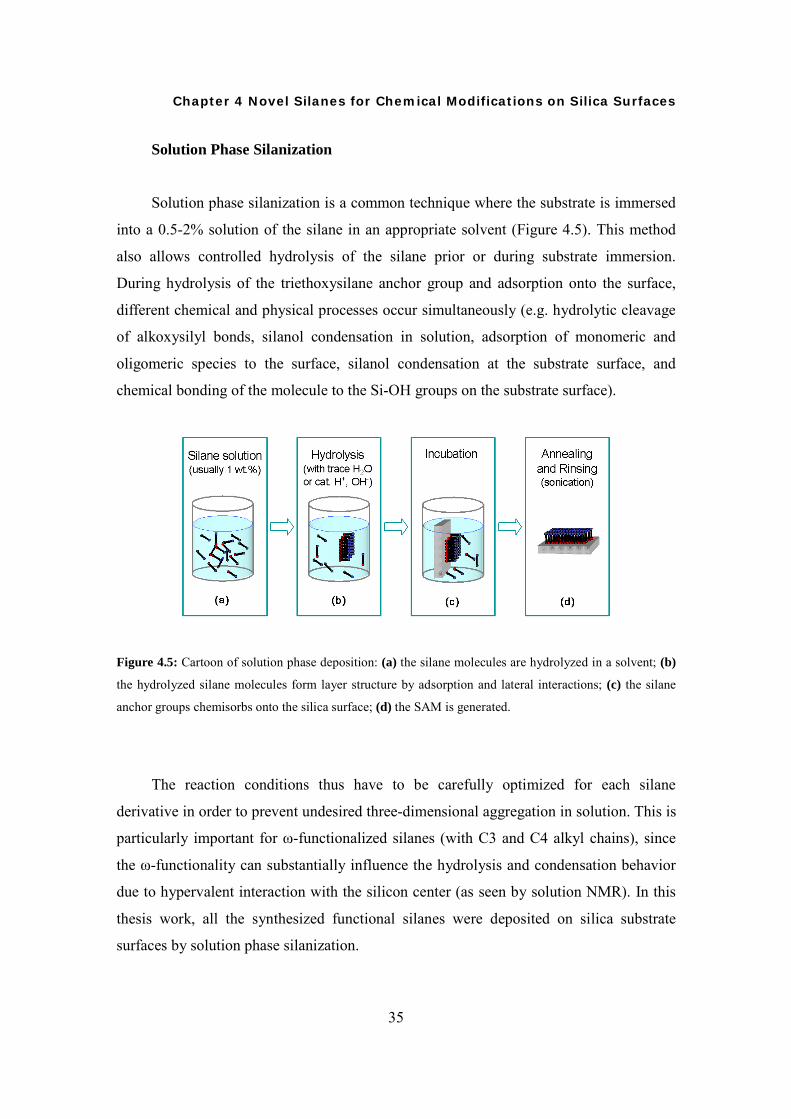
Solution Phase Silanization
Solution phase silanization is a common technique where the substrate is immersed
into a 0.5-2% solution of the silane in an appropriate solvent (Figure 4.5). This method
also allows controlled hydrolysis of the silane prior or during substrate immersion.
During hydrolysis of the triethoxysilane anchor group and adsorption onto the surface,
different chemical and physical processes occur simultaneously (e.g. hydrolytic cleavage
of alkoxysilyl bonds, silanol condensation in solution, adsorption of monomeric and
oligomeric species to the surface, silanol condensation at the substrate surface, and
chemical bonding of the molecule to the Si-OH groups on the substrate surface).
Figure 4.5: Cartoon of solution phase deposition: (a) the silane molecules are hydrolyzed in a solvent; (b)
the hydrolyzed silane molecules form layer structure by adsorption and lateral interactions; (c) the silane
anchor groups chemisorbs onto the silica surface; (d) the SAM is generated.
The reaction conditions thus have to be carefully optimized for each silane
derivative in order to prevent undesired three-dimensional aggregation in solution. This is
particularly important for ω-functionalized silanes (with C3 and C4 alkyl chains), since
the ω-functionality can substantially influence the hydrolysis and condensation behavior
due to hypervalent interaction with the silicon center (as seen by solution NMR). In this
thesis work, all the synthesized functional silanes were deposited on silica substrate
surfaces by solution phase silanization.

Chapter 4 Novel Silanes for Chemical Modifications on Silica Surfaces
36
Vapor Phase Silanization
If the boiling point of the silane is low enough at a given pressure, another
silanization technique could be applied: vapor phase silanization. The setup is shown as
Figure 4.6. Compared to solution phase deposition, vapor phase deposition should lead to
a more defined monolayer since hydrolysis, condensation and covalent bonding occur
exclusively at the substrate surface.
Figure 4.6: Vapor phase deposition in a closed vessel containing only the substrate and the pure silane.
In this thesis, vapor phase silanization was used for the passivating processes of the
glasswares with hexamethyldisilazane (HMDS). The mechanism of this reaction is shown
in Figure 4.7.
SiNH
Si
CH3
H3CH3C
CH3
CH3
CH3
substrate
OH OH
substrate
O
Si
CH3H3C CH3
O
Si
CH3H3C CH3
NH3
Figure 4.7: Reaction of HMDS at the Si-OH surface.
Upon the reaction with silanol groups at the silica surface, the HMDS molecule is
cleaved, and trimethylsilyl groups are covalently bound to the surface, with ammonia as a

Chapter 4 Novel Silanes for Chemical Modifications on Silica Surfaces
37
side product. HMDS has a reasonably low boiling point and a high vapor pressure (129°C,
1024mbar). It is thus possible to perform the vapor phase silanization at room
temperature and ambient pressure for 30 minutes. The resulting contact angle was 74°,
which is characteristic for non-polar, hydrophobic trimethylsilyl groups at the silica
surface [Fadeev 1999].
4.3.2 Kinetic Investigation of the Hydrolysis Process
In order to anchor triethoxy silane to the silanol groups on the silica substrate
surface, its ethoxy groups have to be hydrolyzed in solution to the more active silanol
groups that can bind covalently to the silica surface. In order to investigate the kinetics of
hydrolysis, 1H NMR spectra of the solution were recorded at different reaction times.
Since hydrolysis results in the formation of three hydroxyl groups attached to the silicon
atom and 3 molar equivalents of ethanol, the decrease of the ethoxy methyl and
methylene groups and the increase of the ethanol methyl and methylene groups in the 1H
NMR spectra can be used to quantitatively follow the process (Figure 4.8b).
To find the optimum reaction conditions for obtaining a smooth surface layer,
contact angle measurement, atomic force microscopy (AFM), and ellipsometry analysis
were used to monitor the quality of the final surface after surface modification under
different conditions.

Chapter 4 Novel Silanes for Chemical Modifications on Silica Surfaces
38
Figure 4.8: Hydrolysis of triethoxysilane into trihydroxysilan; (a) 1H NMR spectra of hydrolysis: decrease
of ethoxy –CH2 at 3.80ppm, increase of EtOH –CH2 at 3.70ppm, decrease of ethoxy –CH3 at 1.22ppm, and
increase of EtOH –CH3 at 1.23ppm; (b) Kinetic plot for monitoring the hydrolysis of alkyne triethoxysilane
using 1µL 1N HCl as a catalyst in a 1mL d8-THF silane solution (0.103mol/L). The calculations of the
transformation percentage were based on the increase of EtOH –CH2 and the decrease of ethoxy –CH2.
The 1H NMR kinetic experiments for the hydrolysis in solution were carried out
using 1mL of 1% (w/w %) solution of undec-10-ynoic acid (triethoxysilanyl-propyl)-
amide in deuterated THF with 1µL 1N HCl as catalyst. More ethanol was present in the
hydrolysis system than ethoxy groups after 5 minutes. And after about 40 minutes nearly
all ethoxy groups had been hydrolyzed. That means the solution was appropriate for the
incubation of the silica substrates in the next silanization step.
4.3.3 Silane Deposition on Silica Surfaces
Chemisorption on silica surfaces occurs when the silicon or quartz wafers are
immersed into the hydrolyzed silane solution. The optimum time for the surface reaction
Chapter 4 Novel Silanes for Chemical Modifications on Silica Surfaces
39
can be monitored by placing the silicon wafers into the hydrolyzing solution at different
hydrolysis times and measuring the contact angle of the resulting layers. The contact
angle increases with time from less than 10o, which is the contact angle of the pure silica
surface (hardly to measure the accurate degree due to the complete wetting behavior), to
a steady value of a characteristic degree which depends on the polarity of the newly
formed surface.
When the contact angle remains constant, the functional silane monolayer formation
is completed, possibly followed by a multilayer formation after longer adsorption time.
The layer thickness measured by ellipsometer can be used to investigate a proper
adsorption time for silanization of different silanes.
t-Butyl Functional Silane
The water contact angle analysis shows a kinetic process of the polarity change of
the silica surfaces by the formation of t-butyl-functional silane layer in Figure 4.9. In the
hydrolysis dependence measurement (Figure 4.9b), all the samples were prepared in t-
butyl silane solution (1% w/w, THF) with different hydrolysis times and 1 hour of
incubation. The result shows that the hydrophobicity increased with a longer hydrolysis
time, due to a more complete coverage of the substrate surface with the silane molecules.
After about 50 minutes, the value of the water contact angle reached a maximum plateau.
This can be explained as the bare hydrophilic silica substrate surface was completely
covered by hydrophobic t-butyl functionalities. According to the findings in the
incubation dependence measurements and in agreement with the NMR hydrolysis
experiments, we chose 1 hour of hydrolysis for the following samples.
The substrate samples with 10 min, 20 min and 40 min of incubation in the silane
solution with 1 hour of hydrolysis process have been analyzed by water contact angle.
The data were totally unproductable, which could due to the silane layer formation was
not homogeneous and complete. Thus we optimized the incubation time up to more than
1 hour.

Chapter 4 Novel Silanes for Chemical Modifications on Silica Surfaces
40
compound 2:
CH3
H3CCH3
O
O
SiOEt
OEtOEt
9
(a)
SiSi
O OO O
O OOO O
substrate
CH3
H3CCH3
O
O
SiOH
OHOH
9
THF
H+/OH-
substrate
Figure 4.9: (a) Reaction scheme of the hydrolysis of t-butyl silane in the presence of a catalytic amount of
acid or base; (b) increase of hydrophobicity as a function of hydrolysis time of the silane solution and
visualized by an increase of contact angle (incubation time was fixed as 60 minutes); (c) water contact
angle analysis of the incubation time dependence of the surface layer formation (each samples were
immersed into the silanization solution with a fixed hydrolysis time of 60 minutes).
The result in Figure 4.9c shows only a weak change in water contact angles and
their hysteresis with the increase of the incubation time. From this result it was concluded
that the number of t-butyl functionalities does not change after immersing the substrates
into the silanization solution for an efficient time period. The constance of the contact
angle hysteresis shows the roughness and heterogeneity of the functional surface had not
changed in 6 hours of incubation.
Qualitative roughness values of the functional silane layer surface with different
incubation times were measured by AFM (tapping mode). On each t-butyl surface sample,
Chapter 4 Novel Silanes for Chemical Modifications on Silica Surfaces
41
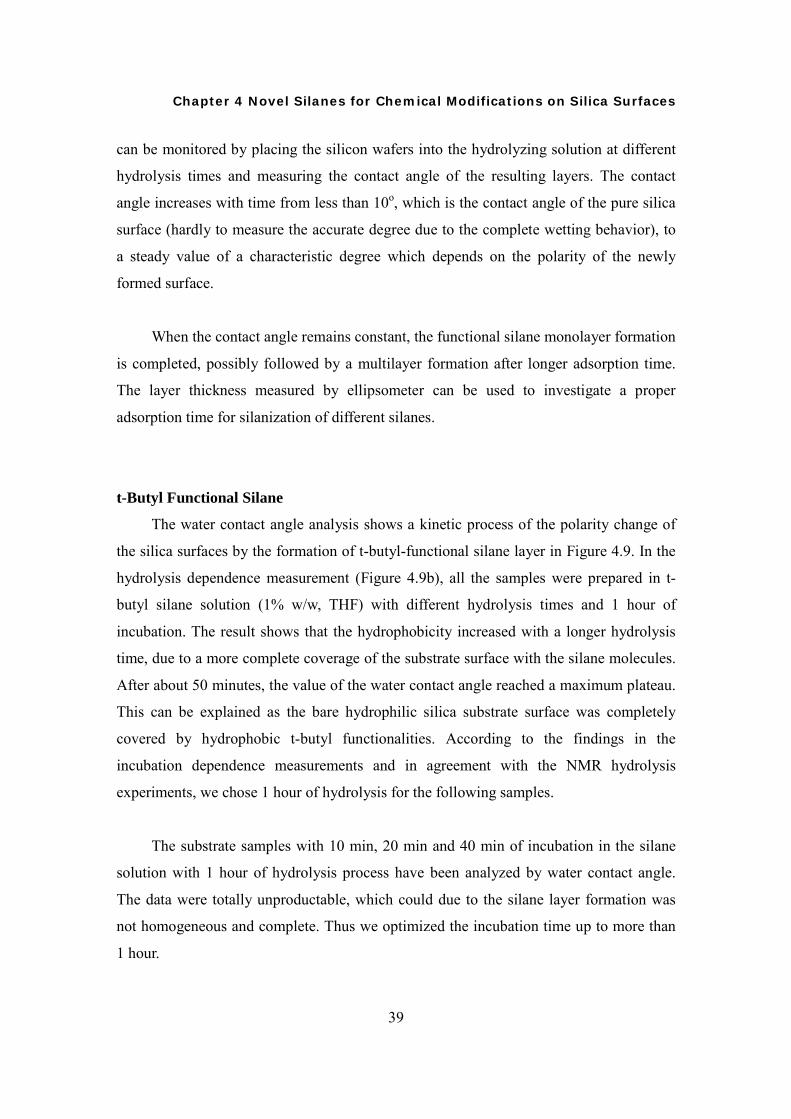
four different positions were chosen to average the measurements. In Figure 4.10a, the
root mean squared roughness varied from 0.4nm to 0.8nm (0.3nm for a bare silica
surface) with the incubation time increasing from 1 hour to 5 hours. The results show that
the roughness remained essentially constant during 5 hours of the incubation time. This
behavior would explain the observation that the hysteresis is independent of the
incubation time.
Figure 4.10: Incubation dependence measurements of (a) surface roughness and (b) layer thickness by
atomic force microscopy and ellipsometry, respectively. 0.6nm of RMS roughness and 1.2nm of thickness
shows a well defined self-assembled t-butyl monolayer.
Figure 4.10b shows the layer thickness increasing with incubation time. At 1 hour
of incubation, the layer thickness (1.2nm ± 0.15nm) was measured, which increased to
1.8nm as the incubation time went up to 5 hours. This could be explained as longer the
incubation, the more silane molecules could accumulate at the substrate surface. Due to
polymerization of the trifunctional silane anchor groups by covalent bonds, the formed
multilayer structure would not be destroyed and rinsed off by sonication. But the constant
water contact angle shows that the overall surface density of the exposed t-butyl
functionalities stays constant even on the multilayer structure.
In summary, the optimal parameters for the modification with the t-butyl functional
silane are 1 hour of prehydrolysis of the silane solution and 1 hour of incubation time,
which will lead to a uniform and well defined monolayer on silica surfaces.

Chapter 4 Novel Silanes for Chemical Modifications on Silica Surfaces
42
Succinimidyl Functional Silane
Similar, the triethoxy silane with a succinimidyl head group was investigated in the
same ways.
compound 4:
(a)
N
O
O
O
O
SiOEt
OEtOEt
9
substrate
O OO O
NO
O NO
O
SiSiO OO
O O
substrate
THF
H+/OH-N
O
O
O
O
SiOH
OHOH
9
Figure 4.11: (a) Reaction scheme of the hydrolysis of succinimidyl silane in presence of catalytic amounts
of acid or base; (b) increase of hydrophobicity as a function of hydrolysis time of the silane solution and
visible as increase of contact angle (incubation time was fixed as 60 minutes); (c) water contact angle
analysis of the incubation time dependence of the surface layer formation (each sample was immersed into
the silanization solution with a fixed hydrolysis time of 60 minutes).
In hydrolysis dependence research, succinimidyl silane molecules were dissolved in
THF and stirred for 10 minutes up to 50 minutes. The silica substrates were immersed
into the corresponding hydrolysis solution for 1 hour. In Figure 4.11b, the static water
contact angle reached to the most hydrophobic value with 40 minutes of hydrolysis time.
This indicates that after 40 minutes, the succinimidyl silane molecules had been
hydrolyzed efficiently to deposit on silica surface and trihydroxysilanyl anchor groups

Chapter 4 Novel Silanes for Chemical Modifications on Silica Surfaces
43
had reacted with all the available Si-OH groups covalently. The hysteresis is smallest at
10 minutes indicates a smoother surface, but the static water contact angle has not reach
its maximum, which means the succinimidyl functionality has not been deposited on the
surface completely. Thus a longer hydrolysis time is necessary.
In incubation time dependence research, the silane solution was hydrolyzed for 40
minutes (due to the previous hydrolysis dependence research, 40 minutes of hydrolysis
time is efficient) to incubate the silica substrates for corresponding time. The
measurement result shows there were no obvious change of the water contact angles and
their hysteresis. We can conclude that a longer incubation time (up to 5 hours) did not
influence the concentration of succinimidyl functional groups on silica surface. The
constant contact angle hysteresis can be explained with the results showing in Figure
4.12a. The root mean square roughness varied in a relatively small range from 1.1nm to
1.7nm. This slight change of the surface roughness is not enough to change the hysteresis.
Figure 4.12: Incubation dependence investigation of (a) surface roughness and (b) layer thickness by
atomic force microscopy and ellipsometry, respectively.
The increase of succinimidyl functional layer thickness showing in Figure 4.12b
means that the layer thickness increases during the incubation process. The surface
absorbs increasing amounts of silane molecules to form a multilayer structure while it is
immersed in the solution. Thus in order to form a uniform succinimidyl functional

Chapter 4 Novel Silanes for Chemical Modifications on Silica Surfaces
44
surface, we optimized the hydrolysis as 40 minutes and incubation time as 1 hour,
respectively.
Maleimide Functional Surface
As in the cases described above, the formation of the functional layer on silica
surface by maleimide functional silane molecules was characterized by water contact
angle measurement, AFM, and ellipsometry (Figure 4.13 and 4.14).
compound 6:
(a)
N
O
O
O
NH
Si OEtOEt
OEt4 N
OO N
OON
O
O
O
NH
Si OHOH
OH4
THF
H+/OH-
substrate
SiSiO OO
O O
substrate
Figure 4.13: (a) Reaction scheme of the hydrolysis of triethoxy silane with maleimide head group in
presence of catalytic amounts of acid or base; (b) increase of hydrophobicity as a function of hydrolysis
time of the silane solution and visible as increase of contact angle (incubation time was fixed at 60
minutes); (c) water contact angle analysis of the incubation time dependence of the surface layer formation
(each samples were immersed into the silanization solution with fixed hydrolysis time at 60 minutes).
The static water contact angle reached its maximum with 60 minutes for hydrolysis

Chapter 4 Novel Silanes for Chemical Modifications on Silica Surfaces
45
and 1 hour for the incubation process. The surface polarity and roughness did not change
with longer incubation time, as confirmed by the constant water contact angle values and
hysteresis. From root mean square roughness analysis by AFM, the roughness did not
change obviously (ave. is 1.9 nm), which is reflected by a constant contact angle
hysteresis. And comparing with the t-butyl surface (RMS roughness = 0.8nm, contact
angle hysteresis = 30o), the rougher maleimide surface causes a larger contact angle
hysteresis (c.a. 40o).
Figure 4.14: Incubation dependence measurements of (a) surface roughness and (b) layer thickness by
atomic force microscopy and ellipsometry, respectively.
After 3 hours of incubation the maleimide surface layer thickness increased rapidly,
indicating a multilayer structure had been achieved. Thus the surface modification
condition for maleimide functional silane can be optimized as 1 hour of hydrolysis and 1
hour of incubation in analogy to the previously described t-butyl- and succinimidyl
functional silanes.
Alkyne Functional Silane
As seen in the 1H NMR kinetic experiment discussed above, after about 40 minutes
hydrolysis nearly all ethoxy groups of the alkyne silane molecules had been hydrolyzed.
The same conditions were used in the hydrolysis kinetic experiment measured by water

Chapter 4 Novel Silanes for Chemical Modifications on Silica Surfaces
46
contact angle, which is alkyne triethoxy silane dissolved in THF (1%, w/w) in the
presence of catalyst amount of 1N HCl. The static contact angle reached the highest value
after 40 minutes, indicating that the alkyne terminal functional groups had completely
covered the silica surface (Figure 4.15b). In the first 3 hours of incubation process, the
static contact angels and hysteresis stayed constant, which indicates the surface polarity
and roughness did not change on the corresponding silica substrates. As the incubation
time increases from 3 hours up to 5 hours, an increase of advancing contact angles and
hysteresis was observed.
compound 10:
(a)
O
NH
SiOEt
O EtOEt7
SiSiO OO
O O
substrate
O
NH
SiOH
OHOH7
substrate
THF
H+/OH-
Figure 4.15: (a) Reaction scheme of the hydrolysis of triethoxy silane with alkyne head group in presence
of catalytic amounts of acid or base; (b) increase of hydrophobicity as a function of hydrolysis time of the
silane solution and visible as increase of contact angles (incubation time was fixed at 60 minutes); (c) water
contact angle analysis of the incubation time dependence of the surface layer formation (each sample was
immersed into the silanization solution with a fixed hydrolysis time of 60 minutes).
This increase can be explained in Figure 4.16, which shows an increase of the root

Chapter 4 Novel Silanes for Chemical Modifications on Silica Surfaces
47
mean square roughness after 3 hours. This rougher surface layer could be caused by 3D
aggregates of silane molecules depositing on the silica substrates and forming
inhomogeneous multilayer structures. This multilayer formation could also be seen by the
increase of the layer thickness by ellipsometry (Figure 4.16b).
Figure 4.16: Incubation dependence measurements of (a) surface roughness and (b) layer thickness by
atomic force microscopy and ellipsometry, respectively.
Thus the surface modification condition for alkyne functional silane are optimal as
1 hour of hydrolysis (in the presence of catalytic amounts of 1N HCl) and 1 hour of
incubation, which leads to a uniform and well defined alkyne functional layer with 0.7nm
thickness.
In summary, the modular approaches of silane synthesis can be used generally to
introduce functional head groups on silane molecules. The deposition of triethoxysilanes
is a fast process, the silanes were covalently bound to substrate surfaces within 1 hour of
hydrolysis and 1 hour of incubation. The silanization process introduces newly formed
silane layers to the surfaces with functional head groups. The change of polarity, surface
roughness and layer thickness can be monitored by water contact angle, AFM and
ellipsometry. The new chemical properties will be monitored in the following.

Chapter 4 Novel Silanes for Chemical Modifications on Silica Surfaces
48
4.4 Surface Chemical Reactions on Modified Silica Surfaces
The modified silica substrates with t-butyl, succinimidyl, maleimide, and alkyne
functional silanes were studied in the corresponding surface chemical reactions in order
to investigate possible applications.
substrate
O O O O
substrate
O OH O OH
substrate
O O O O
NO
O NO
O
substrate
O NH O NH
R1 R1
R1 NH2TFA
(a) (b)
substrate
NO
O NO
O
substrate
NO
O NO
O
H S
R2
H S
R2
R2 SH
substrate substrate
NNN
R3
NNN
R3
R3 N3
(c) (d)
Figure 4.17: Surface chemical reactions tested with the modified silane surfaces (a) the t-butyl ester
surface being deprotected by trifluoroacetic acid (TFA) to obtain a carboxylic surface, not accessible by
direct silanization; (b) the surface with succinimidyl activated ester being coupled with an amino group to
yield an amide (R1: HO-CH2CH2-); (c) the surface with maleimide groups being coupled with a thiol by an
addition reaction (R2: n-octanyl); (d) the surface with terminal alkyne groups being coupled with azide
groups by Huisgen 1, 3-cycloaddition reaction in the presence of Cu(I) as catalyst (R3-N3: bisazido
tetraethylene glycol).
4.4.1 Deprotection of t-Butyl Ester Surface
Carboxylic groups on substrate surfaces are very attractive in the field of surface
chemistry, since the surface could be modified, for example by esterification with an

Chapter 4 Novel Silanes for Chemical Modifications on Silica Surfaces
49
alcohol derivative or it could be negatively charged by adjusting the surface environment
to basic conditions. A major problem consists of the fact that triethoxy silanes carrying
carboxylic groups are not stable in their free form. The acid group will catalyze the
hydrolysis of ethoxy groups into silanol groups and accelerate the silane condensation
beyond control. Thus the carboxylic groups were protected during the synthesis and
silanization by the formation of t-butyl ester. Then the protecting groups can be
deprotected by TFA under quick and mild conditions to yield carboxylic surfaces.
[Greene 1999]
The silica substrates with t-butyl ester layers were developed in the solution of TFA
/ CH2Cl2 (90%, v/v) for 1 minute, 5 minutes, and 10 minutes. Then the substrates were
rinsed with dichloromethane, THF, and Mili-Q water, and dried in a stream of nitrogen.
The change of the water contact angles and layer thickness were measured for different
developing times (Figure 4.17).
substrate
O O O O
substrate
O OH O OHTFA
(a)
Figure 4.17: (a) Reaction scheme of t-butyl ester surface being deprotected by trifluoroacetic acid (TFA) to

Chapter 4 Novel Silanes for Chemical Modifications on Silica Surfaces
50
achieve carboxylic surface; (b) water contact angles dropped about 25 degrees after the t-butyl ester
surfaces were developed in TFA / CH2Cl2 (90%, v/v) solution; (c) the layer thickness decreased about 0.2
nm after the substrates were deprotected by TFA.
It was found that the water contact angle dropped about 25 degree after 1 minute of
treatment by TFA solution due to the formation of free carboxylic acid groups after
deprotection. While the t-butyl protecting groups were released, the layer thickness
decreased by about 0.2 nm.
4.4.2 Succinimidyl Surface with Amino Groups
The development of strategies to immobilize groups of biopolymers to substrates
has given rise the field pf biochips and has dramatically increased the rate and scope of
discoveries in basic and applied science. Examples include the development of DNA
chips for genome analysis, the preparation of protein chips for evaluation of protein-
substrate interactions, and the construction of peptide and carbohydrate chips for the
evaluation of ligand-receptor interactions and enzymatic activities. A key challenge in
biochip technology has been the development of reliable and reproducible chemicals for
the immobilization of ligands to a single substrate. [Houseman 2003]
The N-succinimidyl activated ester has been used extensively to promote the
coupling of carboxylic acids and amines for carbodiimide-mediated aminolysis. The high
selectivity toward amines has been attributed to stabilization of the transition state by
hydrogen bonding between the amine and the succinimidyl carbonyl group. Thus
activated ester-modified surfaces could be coupled to biologically relevant molecules
using approaches developed for solid phase synthesis. In this section, we report the
activity of succinimidyl surface with amines and provide a potentially new route for the
immobilization of biomolecules. [Wojtyk 2002]

Chapter 4 Novel Silanes for Chemical Modifications on Silica Surfaces
51
Figure 4.18: (a) Reaction scheme of N-succinimidyl activated surface with aminoethanol to yield a
hydrophilic hydroxyl surface; (b) water contact angle dropped to about 45 degree with 12 hours exposure to
aminoethanol solution.
Two kinds of 1.0 10-3mol/L of aminoehtanol and octylamine solutions were made
up in the mixture of phosphate-buffered saline (PBS) solution (pH = 7.4) and ethanol (8:2,
v/v). The silica substrates with N-succinimidyl silane layer were immersed in these two
kinds of solutions for 12 hours. The samples were taken out of the amine solution when
they needed to be characterized, rinsed with dichloromethane and Mili-Q water and dried
in the stream of nitrogen. Aminoethanol molecules were coupled to the activated surfaces
and yield a hydrophilic surface by the hydroxyl groups. The process can be monitored in
Figure 4.18b. On the contrary, octylamine kept the hydrophobicity of the surface, which
could hardly be distinguished by water contact angle measurement. But the increase of
the layer thickness can be monitored by ellipsometry. The calculated alkyl chain of
octylamine is about 1nm, which matches the increase of the layer thickness from 1.5 nm
to about 3.0 nm.
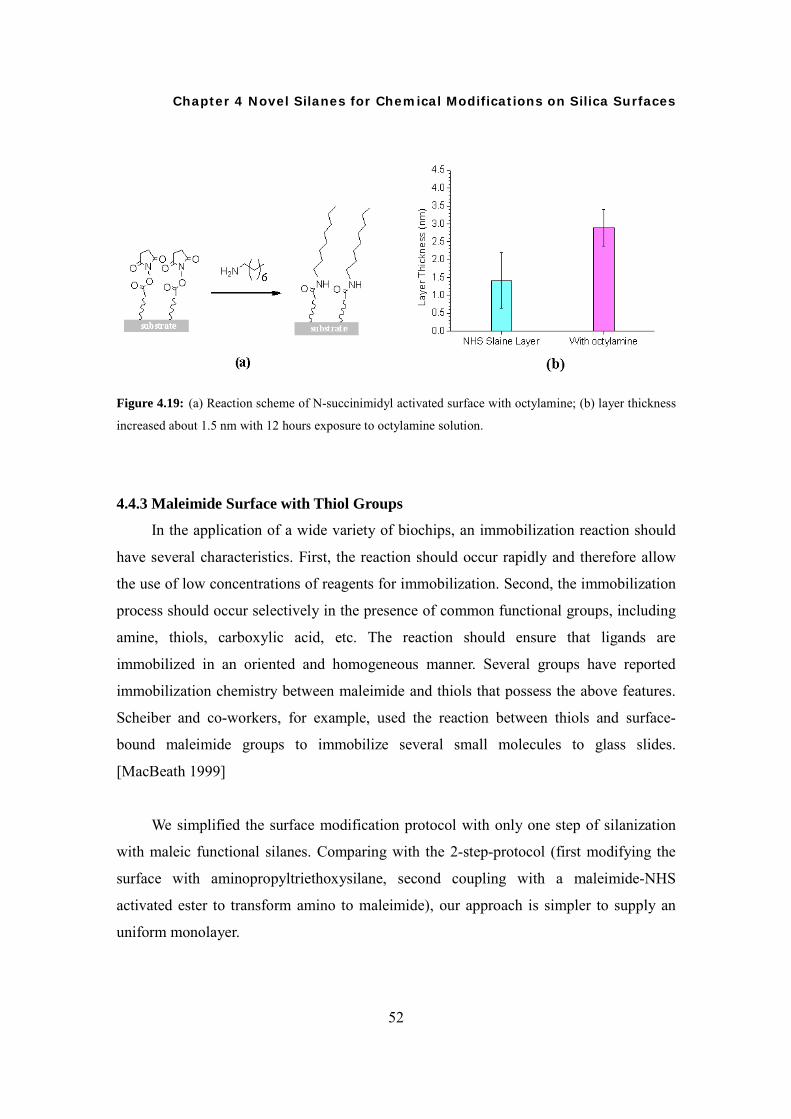
Chapter 4 Novel Silanes for Chemical Modifications on Silica Surfaces
52
Figure 4.19: (a) Reaction scheme of N-succinimidyl activated surface with octylamine; (b) layer thickness
increased about 1.5 nm with 12 hours exposure to octylamine solution.
4.4.3 Maleimide Surface with Thiol Groups
In the application of a wide variety of biochips, an immobilization reaction should
have several characteristics. First, the reaction should occur rapidly and therefore allow
the use of low concentrations of reagents for immobilization. Second, the immobilization
process should occur selectively in the presence of common functional groups, including
amine, thiols, carboxylic acid, etc. The reaction should ensure that ligands are
immobilized in an oriented and homogeneous manner. Several groups have reported
immobilization chemistry between maleimide and thiols that possess the above features.
Scheiber and co-workers, for example, used the reaction between thiols and surface-
bound maleimide groups to immobilize several small molecules to glass slides.
[MacBeath 1999]
We simplified the surface modification protocol with only one step of silanization
with maleic functional silanes. Comparing with the 2-step-protocol (first modifying the
surface with aminopropyltriethoxysilane, second coupling with a maleimide-NHS
activated ester to transform amino to maleimide), our approach is simpler to supply an
uniform monolayer.
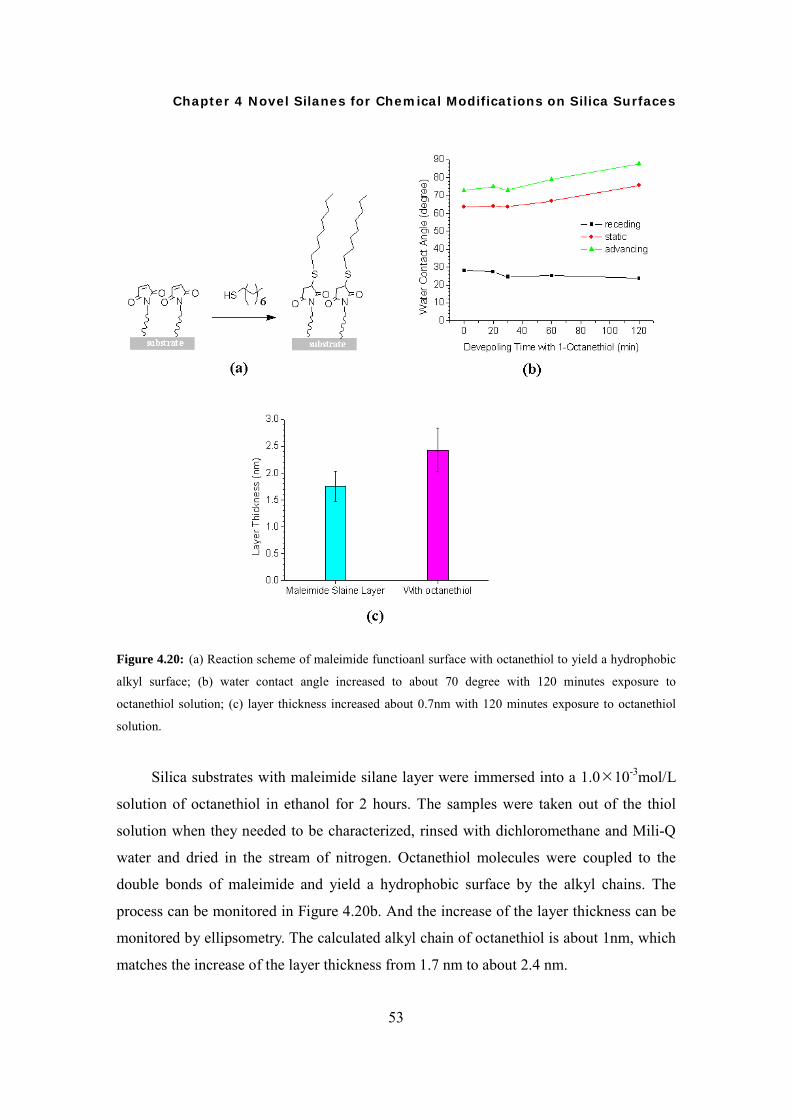
Chapter 4 Novel Silanes for Chemical Modifications on Silica Surfaces
53
Figure 4.20: (a) Reaction scheme of maleimide functioanl surface with octanethiol to yield a hydrophobic
alkyl surface; (b) water contact angle increased to about 70 degree with 120 minutes exposure to
octanethiol solution; (c) layer thickness increased about 0.7nm with 120 minutes exposure to octanethiol
solution.
Silica substrates with maleimide silane layer were immersed into a 1.0 10-3mol/L
solution of octanethiol in ethanol for 2 hours. The samples were taken out of the thiol
solution when they needed to be characterized, rinsed with dichloromethane and Mili-Q
water and dried in the stream of nitrogen. Octanethiol molecules were coupled to the
double bonds of maleimide and yield a hydrophobic surface by the alkyl chains. The
process can be monitored in Figure 4.20b. And the increase of the layer thickness can be
monitored by ellipsometry. The calculated alkyl chain of octanethiol is about 1nm, which
matches the increase of the layer thickness from 1.7 nm to about 2.4 nm.

Chapter 4 Novel Silanes for Chemical Modifications on Silica Surfaces
54
4.4.4 Huisgen 1, 3-Cycloaddition on Alkyne Surface
“Click chemistry” is a chemical philosophy introduced by K. Barry Sharpless in
2001 and describes chemistry tailored to generate substances quickly and reliably by
joining small units together. This is inspired by the fact that nature also generates
substances by joining small modular units. [Kolb 2001] The modular approach for click
chemistry is based on a few highly selective and quantitative couping reactions for the
assembly of new molecules from individual “building blocks”. The Azide-Alkyne
Huisgen Cycloaddition is a 1, 3-dipolar cycloaddition between an azide and a terminal or
internal alkyne to give a 1, 2, 3-triazole. Huisgen was the first to understand the scope of
this organic reaction. [Lummerstorfer 2004] The mechanism of Huisgen reaction can be
shown as Figure 4.21.
R1
R2R1 R2
R3N
NN
δ δ
NN
NR3
R1 R2 Figure 4.21: Mechanism of Huisgen 1, 3-dipolar cycloaddition.
In our work, we modified the surface with terminal alkyne silanes and monitored
the activity of Huisgen reaction on the alkyne surface with bisazido tetraethylene glycol.
Lateral patterns transformation by micro-contact printing:
PDMS stamp was inked with the alkyne silane solution (0.5% wt. conc. in THF,
hydrolyzed for 1 hour) and evaporated to dryness at room temperature. Then the stamp
was pressed against a silica substrate for 2 minutes, and the substrate was backed at 70oC
for 1 hour and sonicated in THF for 10 minutes. The silane molecules formed a self-
assembled layer on the silica surface that reproduced the stamp's pattern.

Chapter 4 Novel Silanes for Chemical Modifications on Silica Surfaces
55
Figure 4.22: Transformation of the silane as patterned layers on silica substrates and the corresponding
surface click chemistry reactions.
Huisgen 1, 3-cycloaddition reaction on substrate surfaces:
Both fully alkyne-funtionalized and micro-contact printed silica wafers were dipped
into 10mL of aqueous solution of bisazido tetraethylene glycol (conc. wt. 5%, t-Bu / H2O
= 1:1) with 0.05g of CuCl as catalyst for 24 hours at room temperature. Afterward, the
wafers were rinsed with toluene, acetone, and ethanol. Finally, they were sonicated in
ethanol for 10 minutes and blow-dried in nitrogen.
Figure 4.23 shows the change of water contact angle and layer thickness and
indicates the Huisgen 1, 3-cycloaddition reaction took place on the alkyne-functionalized
surface. A higher hysteresis indicates a change in surface chemistry. From the data, we
can conclude that the new layer surface formed by azide coupling is rougher than the
silane monolayer. And a smaller layer thickness value hints the molecules are not
standing straight upward on the substrate surface.

Chapter 4 Novel Silanes for Chemical Modifications on Silica Surfaces
56
substrate
NHO
Si OOO
NHO
SiO
O
NHO
SiO
O
NHO
SiO
NHO
Si OOO
NHO
SiO O
NHO
SiO
O
NHO
SiO
N
O
O
O
O
N
NN
NN
N
O
O
O
O
N
NN
NN
N
O
O
O
O
N
NN
NN
N
O
O
O
O
N
NN
NN
N3O
N3
t-Butanol/H2O (1:1)Cu(I)
41.8nm
2.1nm
substrate(a)
Figure 4.23: (a) scheme of the Huisgen 1, 3-cycloaddition reaction on alkyne-functionalized surface and
calculated thicknesses of the silane monolayer and the layer after the surface reaction with assumption all
the molecules standing straight up; (b), (c) changing of water contact angle and layer thickness after the
surface click chemistry reaction, respectively.
Alkyne functional patterns were also introduced to silica surface by microcontact
printing. And by using the same condition for click chemistry as previously, bisazido
tetraethylene glycol was reacted on the functional patterns and enhance the thickness of
the reacting regions. From Figure 4.24a, we can observe that the self-assembled silane
patterns have a thickness of 50 nm as in average. And after the reaction, the thickness of
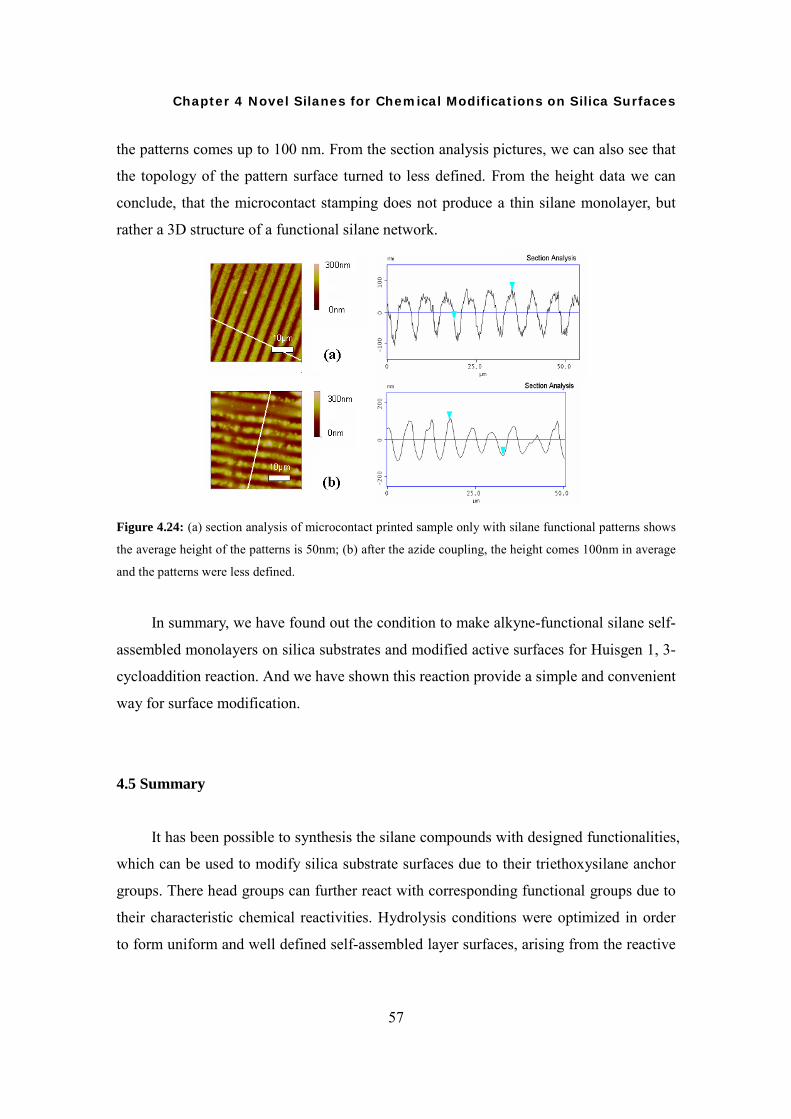
Chapter 4 Novel Silanes for Chemical Modifications on Silica Surfaces
57
the patterns comes up to 100 nm. From the section analysis pictures, we can also see that
the topology of the pattern surface turned to less defined. From the height data we can
conclude, that the microcontact stamping does not produce a thin silane monolayer, but
rather a 3D structure of a functional silane network.
Figure 4.24: (a) section analysis of microcontact printed sample only with silane functional patterns shows
the average height of the patterns is 50nm; (b) after the azide coupling, the height comes 100nm in average
and the patterns were less defined.
In summary, we have found out the condition to make alkyne-functional silane self-
assembled monolayers on silica substrates and modified active surfaces for Huisgen 1, 3-
cycloaddition reaction. And we have shown this reaction provide a simple and convenient
way for surface modification.
4.5 Summary
It has been possible to synthesis the silane compounds with designed functionalities,
which can be used to modify silica substrate surfaces due to their triethoxysilane anchor
groups. There head groups can further react with corresponding functional groups due to
their characteristic chemical reactivities. Hydrolysis conditions were optimized in order
to form uniform and well defined self-assembled layer surfaces, arising from the reactive

Chapter 4 Novel Silanes for Chemical Modifications on Silica Surfaces
58
alkoxysilanes group. Kinetic experiments with varying hydrolysis time and incubation
time were performed to study the efficiency of silanization. The changes in hydrophilicity
of functional surfaces and their layer thickness were clearly visible in the surface
reactions, which imply the surfaces were functionalized as we had expected.
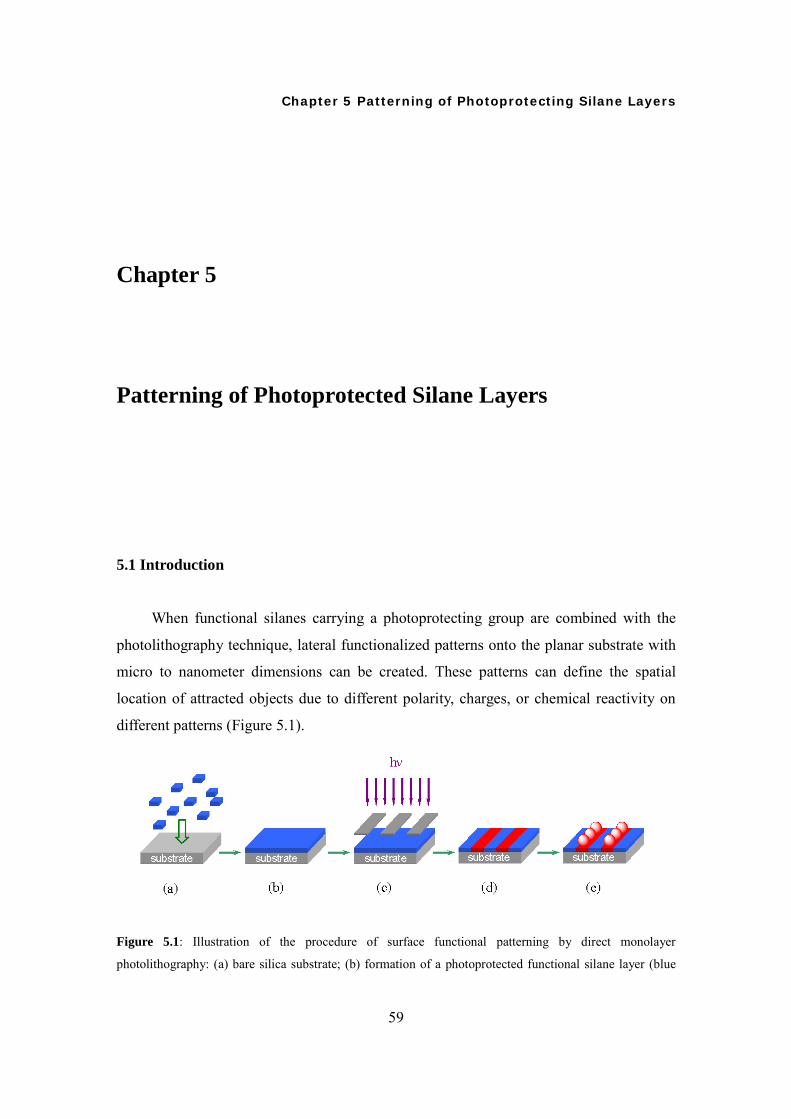
Chapter 5 Patterning of Photoprotecting Silane Layers
59
Chapter 5
Patterning of Photoprotected Silane Layers
5.1 Introduction
When functional silanes carrying a photoprotecting group are combined with the
photolithography technique, lateral functionalized patterns onto the planar substrate with
micro to nanometer dimensions can be created. These patterns can define the spatial
location of attracted objects due to different polarity, charges, or chemical reactivity on
different patterns (Figure 5.1).
Figure 5.1: Illustration of the procedure of surface functional patterning by direct monolayer
photolithography: (a) bare silica substrate; (b) formation of a photoprotected functional silane layer (blue

Chapter 5 Patterning of Photoprotecting Silane Layers
60
color representing the photoprotecting group, e.g. NVoc groups or benzoin derivatives); (c) irradiation of
the photoprotected surface through a mask; (d) resulting chemical patterns on the substrate surface with the
deprotected functionality in red (for instance, amino, hydroxyl, or carboxylic group) and the non-irradiated,
protected regions in blue; (e) site-selective deposition of molecules or mesoscopic objects (red spheres)
onto the irradiated regions.
Light directed chemical patterning has so far found many applications in medicinal-
biological areas. For example, light directed synthesis of DNA arrays has emerged as a
powerful tool for parallel hybridization-based analysis of DNA and RNA sequences and
provides a versatile probe method for microfabricating probe arrays with densities of
1 107 unique sequences per cm2 [McGall 1997]. In modern microelectronic industry, the
use of semiconducting and metallic nano-particles is advancing rapidly. Vossmeyer and
co-workers have developed a process for generating complex, spatially separated patterns
of multiple types of these nano-particles by using lithographic patterning of organic
monolayers that contain photo-labile groups and are covalently bound to the silica surface
[Vossmeyer 1998]. This concept could be further expanded towards the control of
mesoscale assembly as demonstrated by regioselective colloid assembly after direct
monolayer patterning with light [Jonas 2002a].
The requirement for a photoprotected silane is that the photoprotecting group
should be sensitive to light but relatively stable to all chemical reagents encountered
during the whole layer preparation and modification process in the ground state manifold
[Pillai 1980]. The wavelength of the light chosen should be that it will only be absorbed
by the protecting group and will not affect other parts of the silane molecule. Moreover,
photo-deprotection should not harm the protected functionality and the resulting
photoproduct should be easily removed. Another factor of great importance is the lifetime
of the excited state, which is responsible for the deprotection reaction. That means, the
longer the excited state before cleavage occurs, the more the chances are for undesirable
quenching processes to arise, which in turn reduces the efficiency of the cleavage
reaction. This of course, would hinder the removal of the photo-protecting group and
might labilise the quenching species [Becker 1991].
Chapter 5 Patterning of Photoprotecting Silane Layers
61
The common procedure to introduce photosensitive moieties onto a substrate
involves first the modification of a surface to introduce functional groups (e. g. amino,
carboxyl, hydroxyl groups), which then react in a second step with the photosensitive
protecting groups. Since all of the chemical reactions occur at the surface, the
disadvantage of this approach lies in the limited control over the reaction yield, layer
composition and analysis of the product. Nevertheless, many scientists have used this
technique in the past for post-modification of functionalized gold or silica surfaces
[Vossmeyer 1997, Stenger 1992, Elender 1996]. The approach taken in this section is
based on a surface modification process that uses functionalized alkoxysilanes, carrying
covalently attached photoprotecting groups. These silanes are synthesized prior to
deposition onto the surface. The advantage of synthesizing a silane that directly
incorporates a photoprotecting group versus post-modification of a surface lies in the
specific preparation of a well defined molecular structure and the possibility to prepare
mixed monolayers. By this approach, the photo-reactive silane can be fully characterized
by NMR and mass spectrometry prior to deposition, which is much more difficult after
bonding to a surface. By this method, the highly defined, quantitative reactions of the
protected surface functionalities and full control over the layer preparation process can be
achieved due to synthesis and purification prior to layer fabrication. Patterning of the
adsorbed silane layer can be achieved in the same way as in conventional
photolithography by irradiation through a mask.
One of the most popular carbamate protecting group is the nitroveratryloxycarbonyl
group (NVoc) used for protection of the amine group, which upon deprotection
decarboxylates to give an aldehyde, the free amine and CO2. However, NVoc protection
can also be used for photoprotection of alcohols and carboxylic acids leading to the
corresponding NVoc ester and carbonates [del Campo 2005].

Chapter 5 Patterning of Photoprotecting Silane Layers
62
H3CO
H3CO
NO2
O X2
OX1
H3CO
H3CO
N
O X2
OX1
O
OH3CO
H3CO
N
O X2
OX1
O
OH H3CO
H3CO
N
O X2
OX1
O
OH
H3CO
H3COO
NOH
OO
X2
X1
H3CO
H3CO
NO
O
X1
OHX2
O+
hν
hν
X1 = -CH3, -H
X2 = -NR1R2, -R, -OR
Figure 5.2: Mechanism of the photolytic cleavage of NVoc-protected carbonyl compounds.
The mechanism of NVoc photo-deprotection is shown in Figure 5.2, where the nitro
group is firstly excited by irradiation to produce a diradical, then the primary
photochemical process is an intramolecular hydrogen-abstraction from the benzyl C-H
bond in ortho-position by the excited nitro group. An electron distribution then follows to
form an azinic acid (aci-nitro group), which rearranges to the nitroso group. The only
problem associated with the NVoc group is the potential side reaction of the formed
aldehyde photoproduct with the released amine group to give an imine [Cameron 1991].
This problem can be addressed by the introduction of a methyl group at the benzylic
position, as discussed further below.
Benzoin esters (Bzn) have also become very popular as photoprotecting groups due
to their excellent photosensitivity. In 1964 Sheehan and co-workers showed that it was
possible to cyclize benzoin acetate into 2-substituted benzofuran and to release the
carboxylic acid group by irradiation at 366 nm with a high pressure mercury lamp with a
Pyrex filter [Sheehan 1964, Sheehan 1971]. The carboxylic acid was thereby released
with a high quantum yield (Φ = 0.64) thus making it attractive for the protection of
carboxylic acids. They also found out that substitution of the benzylic ring can
significantly increase the rate of the reaction and that 3’,5’-dimethoxybenzoin led to a
fast and smooth cyclization upon photolysis. The benzoin substituents play a major role
in determining the photolysis mechanism. Whereas 4,4’-dimethoxybenzoin only gave
trace amounts of benzofuran, 3’,5’-dimethoxybenzoin leads to a very smooth cyclisation,
with a high deprotection yield in the case of the acid moiety. On the other hand, if no
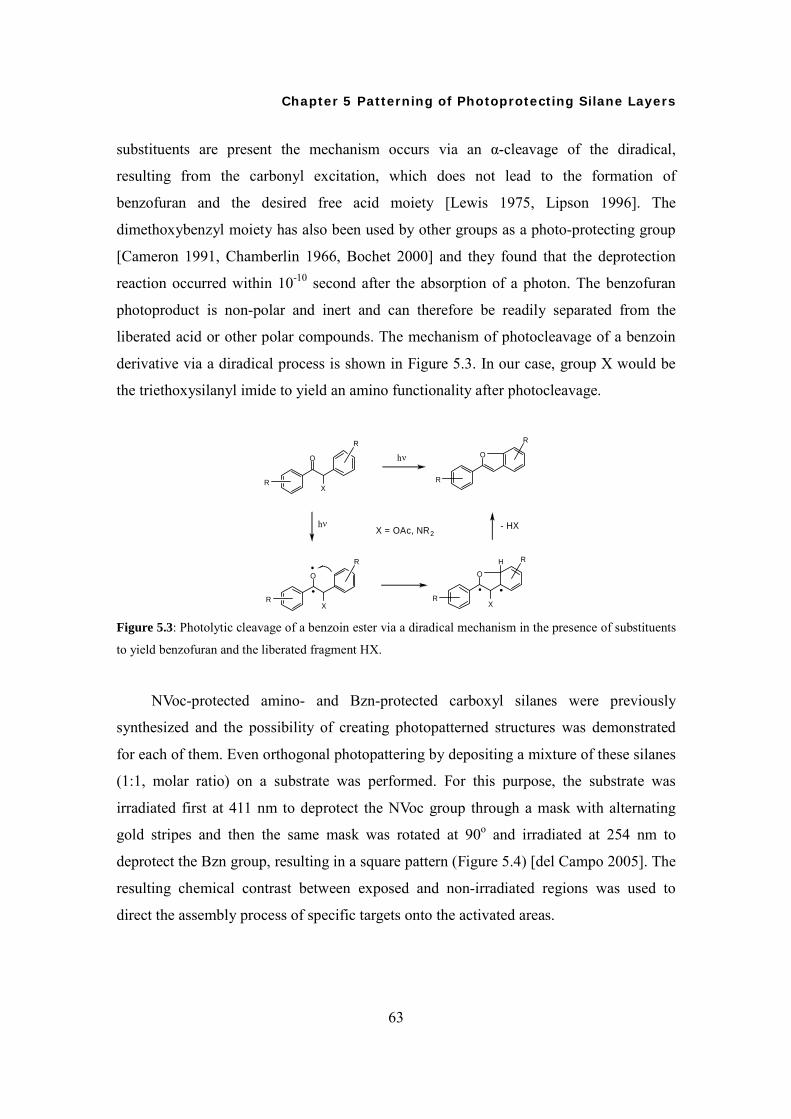
Chapter 5 Patterning of Photoprotecting Silane Layers
63
substituents are present the mechanism occurs via an α-cleavage of the diradical,
resulting from the carbonyl excitation, which does not lead to the formation of
benzofuran and the desired free acid moiety [Lewis 1975, Lipson 1996]. The
dimethoxybenzyl moiety has also been used by other groups as a photo-protecting group
[Cameron 1991, Chamberlin 1966, Bochet 2000] and they found that the deprotection
reaction occurred within 10-10 second after the absorption of a photon. The benzofuran
photoproduct is non-polar and inert and can therefore be readily separated from the
liberated acid or other polar compounds. The mechanism of photocleavage of a benzoin
derivative via a diradical process is shown in Figure 5.3. In our case, group X would be
the triethoxysilanyl imide to yield an amino functionality after photocleavage.
O
X
O
X
O
X
H
OR
R
R
R
R
R
R
R
hν
hν
- HXX = OAc, NR2
Figure 5.3: Photolytic cleavage of a benzoin ester via a diradical mechanism in the presence of substituents
to yield benzofuran and the liberated fragment HX.
NVoc-protected amino- and Bzn-protected carboxyl silanes were previously
synthesized and the possibility of creating photopatterned structures was demonstrated
for each of them. Even orthogonal photopattering by depositing a mixture of these silanes
(1:1, molar ratio) on a substrate was performed. For this purpose, the substrate was
irradiated first at 411 nm to deprotect the NVoc group through a mask with alternating
gold stripes and then the same mask was rotated at 90o and irradiated at 254 nm to
deprotect the Bzn group, resulting in a square pattern (Figure 5.4) [del Campo 2005]. The
resulting chemical contrast between exposed and non-irradiated regions was used to
direct the assembly process of specific targets onto the activated areas.
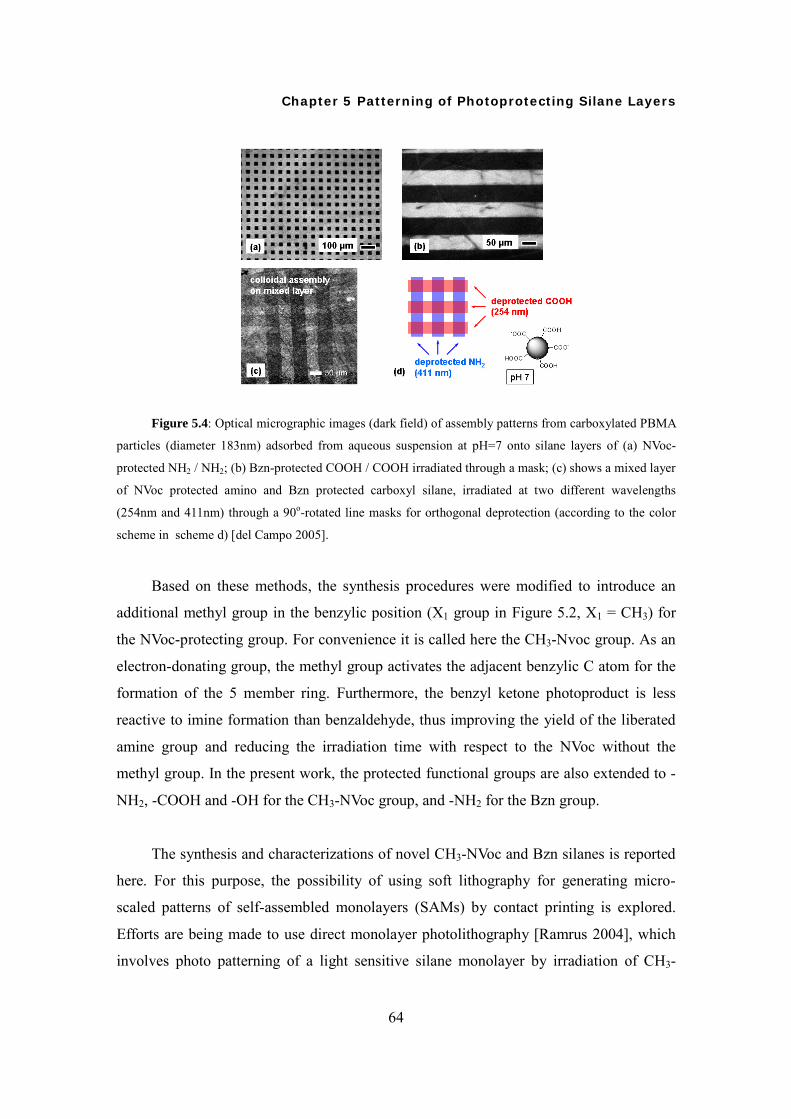
Chapter 5 Patterning of Photoprotecting Silane Layers
64
Figure 5.4: Optical micrographic images (dark field) of assembly patterns from carboxylated PBMA
particles (diameter 183nm) adsorbed from aqueous suspension at pH=7 onto silane layers of (a) NVoc-
protected NH2 / NH2; (b) Bzn-protected COOH / COOH irradiated through a mask; (c) shows a mixed layer
of NVoc protected amino and Bzn protected carboxyl silane, irradiated at two different wavelengths
(254nm and 411nm) through a 90o-rotated line masks for orthogonal deprotection (according to the color
scheme in scheme d) [del Campo 2005].
Based on these methods, the synthesis procedures were modified to introduce an
additional methyl group in the benzylic position (X1 group in Figure 5.2, X1 = CH3) for
the NVoc-protecting group. For convenience it is called here the CH3-Nvoc group. As an
electron-donating group, the methyl group activates the adjacent benzylic C atom for the
formation of the 5 member ring. Furthermore, the benzyl ketone photoproduct is less
reactive to imine formation than benzaldehyde, thus improving the yield of the liberated
amine group and reducing the irradiation time with respect to the NVoc without the
methyl group. In the present work, the protected functional groups are also extended to -
NH2, -COOH and -OH for the CH3-NVoc group, and -NH2 for the Bzn group.
The synthesis and characterizations of novel CH3-NVoc and Bzn silanes is reported
here. For this purpose, the possibility of using soft lithography for generating micro-
scaled patterns of self-assembled monolayers (SAMs) by contact printing is explored.
Efforts are being made to use direct monolayer photolithography [Ramrus 2004], which
involves photo patterning of a light sensitive silane monolayer by irradiation of CH3-

Chapter 5 Patterning of Photoprotecting Silane Layers
65
NVoc silanes through a mask at 411 nm using mask aligner, and of Bzn silane through a
mask at 254 nm using a UV crosslinker.
5.2 Synthesis Approach
CH3-NVoc:
Synthesis of CH3-NVoc protected silanes with -NH2, -COOH and -OH terminated
groups was achieved in a four-step procedure (Figure 5.5). Commercially available 3,4-
dimethoxy acetophenone was nitrated using standard nitration procedures. This was in
turn converted to the corresponding alcohol in 96% yield. The unsaturated precursors
with different length (n =1 or 9) of alkyl chains were obtained by chloroformylation, or
Mitsunobu reaction. Further hydrosilylation of these precursors afforded the CH3-NVoc
protected -NH2, -COOH and -OH silanes in around 60-70 % yield.
MeO
MeO
OMeO
MeO
O
NO2
68% HNO3
0 oC reflux
MeO
MeO
OH
NO2
NaBH4, EtOH
(11) (12)60% yield 96% yield
NaHCO3dioxane/H2O/0oC
H2N MeO
MeO
O
NO2
O
NH
~70% yield
HSi(OEt)3
H2PtCl6
MeO
MeO
O
NO2
O
NH Si(OEt)3
~50% yield
THF, -70oC
triphosgene(12)
(13a) n=1(13b) n=9
(14a) n=1(14b) n=9
nn = 1, 9
n
n = 1, 9
n
MeO
MeO
O
NO2CDI/THF
HO O
O
MeO
MeO
O
NO2
O
Si(OEt)3OHSi(OEt)3
H2PtCl6
(12) n nn = 1, 9 n = 1, 9
80~90% yield ~50% yield(15a) n=1(15b) n=9
(16a) n=1(16b) n=9
n

Chapter 5 Patterning of Photoprotecting Silane Layers
66
MeO
MeO
O
NO2
HOOC
PPh3/ DEAD THF/ 0° C
O
MeO
MeO
O
NO2
OSi(OEt)3HSi(OEt)3
H2PtCl6(12)
80~90% yield ~50% yield(17) (18) Figure 5.5: Synthesis of CH3-NVoc protected -NH2, -OH, and -COOH functional triethoxysilanes.
Benzoin:
The synthesis of the benzoin protected silane was carried out via a benzotriazole
mediated conversion of benzaldehyde to a benzoin protected urethane bearing a double
bond at the terminal position of the propyl chain for further hydrosilylation. This
procedure involves first the activation of benzaldehyde with benzotriazole to yield an
acyl anion equivalent 19 (Figure 5.6) that can then be easily lithiated and trapped with the
electrophilic dimethoxybenzaldehyde during acid work-up [Katritzky 1995]. After
chloroformylation of the aryl ketone, the last step involves the hydrosilylation of the
double bond with triethoxysilane to yield the desired silane.
Figure 5.6: Synthesis of benzotriazole-activated benzaldehyde starting from benzaldehyde, benzotriazole,
absolute ethanol, triethylorthoformate and catalytic amounts of sulfuric acid.
The next step was an benzoin condensation to yield the benzoin product (Fig. 5.7).
In order for the condensation to occur lithiation of 19 with n-BuLi at -78oC and
quenching with the electrophile had to be perbormed very fast in order to avoid partial
decomposition of the resulting anion intermediate and hence low yields. Even though the
product was stored under argon and below -10oC it was readily seen that its color had

Chapter 5 Patterning of Photoprotecting Silane Layers
67
changed from yellow to dark red. FD-mass spectrometry confirmed the decomposition of
the product. Therefore the next reaction step had to be carried out as soon as the pure
benzoin compound had been isolated. This step involved the urethane formation with the
alcohol moiety 20 and allylamine (Fig. 5.7).
Figure 5.7: Synthesis of 3’,5’-dimethoxybenzoin via lithiation of the benzotriazole derivate 19.
Urethane formation of 20 was carried out by two steps, first chloroformylation of
the hydroxyl group, followed by reaction with allylamine to obtain the urethane bearing a
double bond at the terminal position of the propyl chain for further hydrosilylation
(Figure 5.8a). Due to the highly toxic nature of phosgene gas, triphosgene was used as the
substitute to perform the desired chemical transformation. The reaction requires only one
third mole-equivalent of triphosgene compared to phosgene [Eckert 1987]. After
purification by column chromatography in the dark, the pure compound of 21 was
isolated and subjected to hydrosilylation with triethoxysilane to yield the desired
photoprotected product (Figure 5.8b).
(a)

Chapter 5 Patterning of Photoprotecting Silane Layers
68
(b)
Figure 5.8: (a) Chloroformylation of the hydroxyl group by triphosgene, followed by reaction with
allylamine to obtain the urethane bearing a double bond at the terminal position of the propyl chain; (b)
Hydrosilylation with hexacholoroplatinic acid and triethoxysilane.
5.3 Time Dependent Irradiation and UV-Vis Measurement in Solution
In Figure 5.9 is presented the absorption spectrum of a 0.1 % solution of the R-CO-
Me-NVoc compound in THF solution. This compound has an absorption maximum at
∼280 nm corresponding to the carboxyl moiety and at ∼350 nm due to the nitro group on
the methoxy substituted benzene ring. For following the photocleavage process and its
kinetics the solution was irradiated at 365 nm from a UV crosslinker and was monitored
by UV-Vis spectroscopy. We observe that there is an increase of the absorbance for peak
at ∼265 nm and apperance of a new peak at ∼390 nm. By UV irradiation, the nitro group
is excited, intramolecular H abstraction occurs, and a nitroso derivative is formed [Ottl
1998] and these new absorption bands probably belong to the 3,4-dimethoxy-6-
nitrosoacetophenone photoproduct [Braun 2003, Min 2005].

Chapter 5 Patterning of Photoprotecting Silane Layers
69
Figure 5.9: Kinetic research by UV-Vis spectroscopy of R-CO-Me-NVoc (CH3-NVoc protected -COOH
silane).
In Figure 5.10 is depicted the spectral evolution upon irradiation at 365 nm for the
same compound in THF solution in acidic conditions (HCl) We also observe the
appearance of a new peak at ~366 nm which is about 20 nm blue shifted with respect to
the solution without catalyst. This might be due to the protonation of the photoproduct
and thus not having exactly the same species in both cases. Besides this when comparing
the absorbance evolution at the different pH it is observed that for the acidic conditions,
the photoproduct is remarkably degraded after 20 minutes while for the other conditions
after this irradiation time there is no significant evidence of degradation as it is extracted
from the insets.

Chapter 5 Patterning of Photoprotecting Silane Layers
70
300 350 400 450 500 550 6000,0
0,4
0,8
1,2
1,6
2,0A
bsor
banc
e (a
. u.)
Wavelength (nm)
H+ catalyst 0'' 60'' 240'' 600'' 1200''
0 200 400 600 800 1000 1200
0,2
0,4
0,6
0,8
1,0
Abs
orba
nce
(a. u
.)
Irradiation Time (s)
λ = 366 nm
Figure 5.10: UV/VIS absorption spectra of the R-CO-Me-NVoc silane 0.1% wt solution in THF, irradiated
at 365 nm with acidic catalyst.
In Figure 5.11 is presented the absorption spectrum of benzoin silane 0.1 % wt in
THF solution. It has an absorption maximum at ∼247 nm and at ∼290 nm. The kinetics of
the photocleavage of the benzoin silane upon irradiation of this solution at 254 nm from a
UV crosslinker was monitored by UV-Vis spectroscopy. It shows a decrease at ~250 nm,
an increase of the absorbance for the peak at ∼290 nm and a new peak appears at ∼304
nm corresponding to the photoproduct. This follows the same behaviour described in the
literature for benzoin compounds [Sheehan 1971].

Chapter 5 Patterning of Photoprotecting Silane Layers
71
Figure 5.11: Kinetic research by UV-Vis spectroscopy of (a) CH3-NVoc protected OH- silane; (b) benzoin
protected amino silane in THF solution with the irradiation of 365nm and 254nm, respectively.
5.4 Surface Modifications and Characterizations
Bzn Protected NH2 Silane:
Bzn silane was deposited onto silica and quartz substrates by solution phase
silanization. The hydrolysis time for the triethoxysilanyl anchor group was optimized by
measuring the water contact angle for each surface layer prepared after the given
hydrolysis time. Figure 5.12a shows the time dependence of the water contact angle on
Bzn silane surfaces. The samples were prepared in Bzn silane solution (1% w/w, THF)
with different hydrolysis times and 1 hour of incubation. The result shows that the
hydrophobicity increased with longer hydrolysis times, due to a more complete coverage
of the substrate surface with the silane molecules. After about 120 minutes, the value of
the water contact angle reached a maximum plateau, which indicates that the hydrophilic
silica substrate surface was completely covered by hydrophobic Bzn functionalities.
Figure 5.12b shows the layer thickness (~0.4 nm) of the Bzn SAM with 2 hours of
prehydrolysis and 1 hour of incubation (investigated by ellipsometry), which fits well
with the expected monolayer thickness. Further more, after the substrate was irradiated
by UV light at 254 nm for 2 minutes and followed by sonication of 10 minutes in THF,
the thickness reduced about 0.1 nm to 0.3 nm nominal thickness. This phenomenon could
be explained by that the Bzn protecting groups were released from the surface.
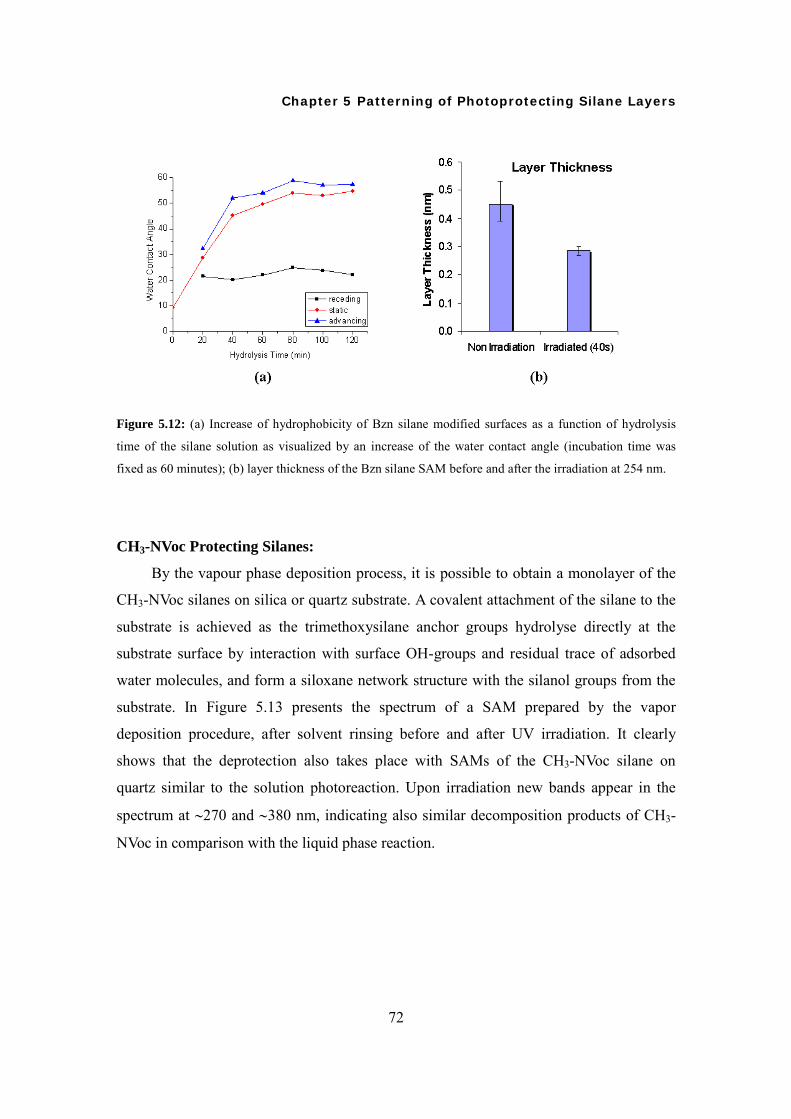
Chapter 5 Patterning of Photoprotecting Silane Layers
72
Figure 5.12: (a) Increase of hydrophobicity of Bzn silane modified surfaces as a function of hydrolysis
time of the silane solution as visualized by an increase of the water contact angle (incubation time was
fixed as 60 minutes); (b) layer thickness of the Bzn silane SAM before and after the irradiation at 254 nm.
CH3-NVoc Protecting Silanes:
By the vapour phase deposition process, it is possible to obtain a monolayer of the
CH3-NVoc silanes on silica or quartz substrate. A covalent attachment of the silane to the
substrate is achieved as the trimethoxysilane anchor groups hydrolyse directly at the
substrate surface by interaction with surface OH-groups and residual trace of adsorbed
water molecules, and form a siloxane network structure with the silanol groups from the
substrate. In Figure 5.13 presents the spectrum of a SAM prepared by the vapor
deposition procedure, after solvent rinsing before and after UV irradiation. It clearly
shows that the deprotection also takes place with SAMs of the CH3-NVoc silane on
quartz similar to the solution photoreaction. Upon irradiation new bands appear in the
spectrum at ∼270 and ∼380 nm, indicating also similar decomposition products of CH3-
NVoc in comparison with the liquid phase reaction.

Chapter 5 Patterning of Photoprotecting Silane Layers
73
Figure 5.13: UV-Vis spectra of the R-CO-Me-NVoc silane monolayer on a quartz substrate before and after
irradiation. Upon irradiation new peaks appear due to the formation of new species with the CH3-NVoc
deprotection.
To check the topography of the surfaces after the silane deposition, the films were
characterised using AFM (tapping mode). As can be observed in Figure 5.14a (left), the
substrate is covered by silane “islands”, which are removed after rinsing several times
with ethanol. After rinsing a smooth surface of silane monolayer is obtained (Figure
5.14a right), indicating that the silane aggregates weakly bound by physisorbtion on the
SAM have been removed. To the same conclusion lead the absorption spectra depicted in
Figure 5.14b, where the absorption decreases and it remains constant during several
posterior rinsing steps.

Chapter 5 Patterning of Photoprotecting Silane Layers
74
Figure 5.14: (a) Atomic force microscope images (10 10 µm2) and height profiles (along the indicated
horizontal line) of a silane vapor deposited sample before (left) and after (right) rinsing. (b) Absorption
spectra of the film without and with rinsing treatment. After several rinsing steps the absorbance remains
constant.
The thickness of each monolayer was measured by ellipsometric measurements and
was found to be about 1.4 nm which is in complete accordance to the values found for
these types of molecules [del Campo 2005]. The static water contact angle for the R-CO-
Me-NVoc was around 65º for the NVoc surface. After deprotection and ethanol rinsing of
the photoproduct, the value decreased slightly, indicating liberation of the more polar
carboxyl groups.
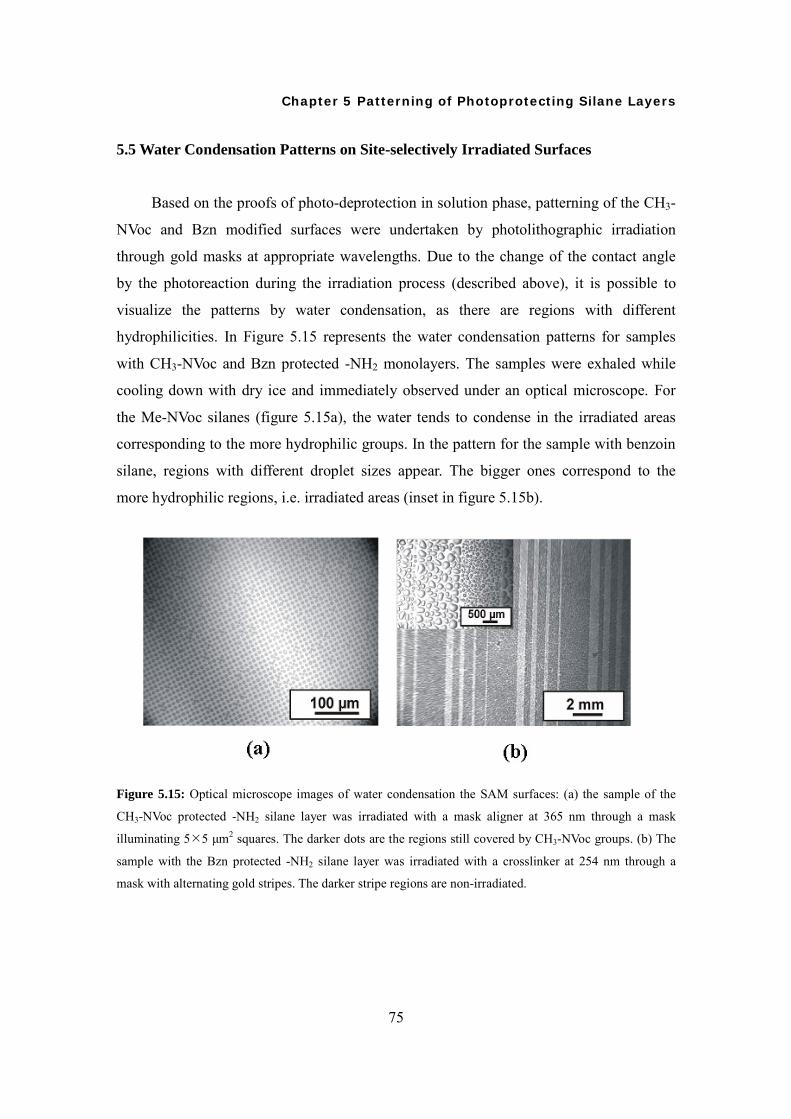
Chapter 5 Patterning of Photoprotecting Silane Layers
75
5.5 Water Condensation Patterns on Site-selectively Irradiated Surfaces
Based on the proofs of photo-deprotection in solution phase, patterning of the CH3-
NVoc and Bzn modified surfaces were undertaken by photolithographic irradiation
through gold masks at appropriate wavelengths. Due to the change of the contact angle
by the photoreaction during the irradiation process (described above), it is possible to
visualize the patterns by water condensation, as there are regions with different
hydrophilicities. In Figure 5.15 represents the water condensation patterns for samples
with CH3-NVoc and Bzn protected -NH2 monolayers. The samples were exhaled while
cooling down with dry ice and immediately observed under an optical microscope. For
the Me-NVoc silanes (figure 5.15a), the water tends to condense in the irradiated areas
corresponding to the more hydrophilic groups. In the pattern for the sample with benzoin
silane, regions with different droplet sizes appear. The bigger ones correspond to the
more hydrophilic regions, i.e. irradiated areas (inset in figure 5.15b).
Figure 5.15: Optical microscope images of water condensation the SAM surfaces: (a) the sample of the
CH3-NVoc protected -NH2 silane layer was irradiated with a mask aligner at 365 nm through a mask
illuminating 5 5 µm2 squares. The darker dots are the regions still covered by CH3-NVoc groups. (b) The
sample with the Bzn protected -NH2 silane layer was irradiated with a crosslinker at 254 nm through a
mask with alternating gold stripes. The darker stripe regions are non-irradiated.

Chapter 5 Patterning of Photoprotecting Silane Layers
76
5.6 Colloidal Assembly on Site-Selectively Irradiated Surfaces
By tailoring the surface functionalities, it allows colloidal particles to selectively
self-assemble on silane layer patterns and thus study mesoscale assembly in a model
system [Lee 2002, Tieke 2001]. Selective self-assembly of colloidal particles at surfaces
due to attractive electrostatic interactions has become very popular in recent years. The
ability to harness intrinsic interactions between surfaces leads to novel and elegant
methods for self-organised deposition of colloidal particles, where the driving forces are
electrostatic interactions, surface tension, Van del Waals forces, and capillary forces.
These interactions between the particles and the surface can be tuned by modifying the
pH conditions and the particle structure, and therefore it is possible to control the
preferred region of colloidal deposition, so that 2D or even 3D structures can be created
by controlling these forces [Im 2002, Burmeister 1999]. Hence, another approach to
characterize the photopatterned silanes on quartz substrates in our work was by colloidal
particle deposition.
For the particle assembly of the colloidal particles on the patterns, the substrates
were completely immersed into a suspension with 1-3% solid content and were vertically
lifted from the solution as shown in Figure 5.16 [Cheng 2006, Fustin 2003, Fustin 2004].
The patterns with the colloids were characterized by optical microscopy, scanning
electron microscopy and atomic force microscopy.

Chapter 5 Patterning of Photoprotecting Silane Layers
77
Figure 5.16: Fabrication scheme for the site-selective colloidal deposition: (a) after a photolithography
process the substrate with a patterned silane layer is vertically lifted from a colloidal suspension, and the
colloidal particles are preferrably to depositing on the photodeprotected region due to capillary forces and
favourable interactions between the particles surface and the deprotected functional groups; (b) after the
drying process, the colloidal particle patterns are obtained.
The influence of particle functionalities and pH effect on the assembly process on
patterned R-CO-Me-NVoc (abbreviated term for Me-NVoc protected carboxylic silane)
samples was studied by using PMMA-NH2 (abbreviated term for amidine-modified
polymethylmethacrylate particles) and PS-NH2 particles (quaternary amine functionalised
polystyrene amidine modified colloids) at pH 3/4 (respectively) and pH 6.
In the present work, amidine-modified polymethacrylate particles (PMMA-NH2, φ
= 250 nm) were obtained according to the procedure described in Cheng’s article [Cheng
2006]. Quaternary amine functionalised polystyrene amidine terminated colloidal
particles (PS-NH2, φ = 130 nm) were prepared according to a modified synthesis of
Vancso and coworkers [Dziomkina 2006]. Silica particles (φ = 15 nm) were purchased
from Akzo Nobel. The patterns with the colloids were characterized by optical
microscopy, scanning electron microscopy and atomic force microscopy.
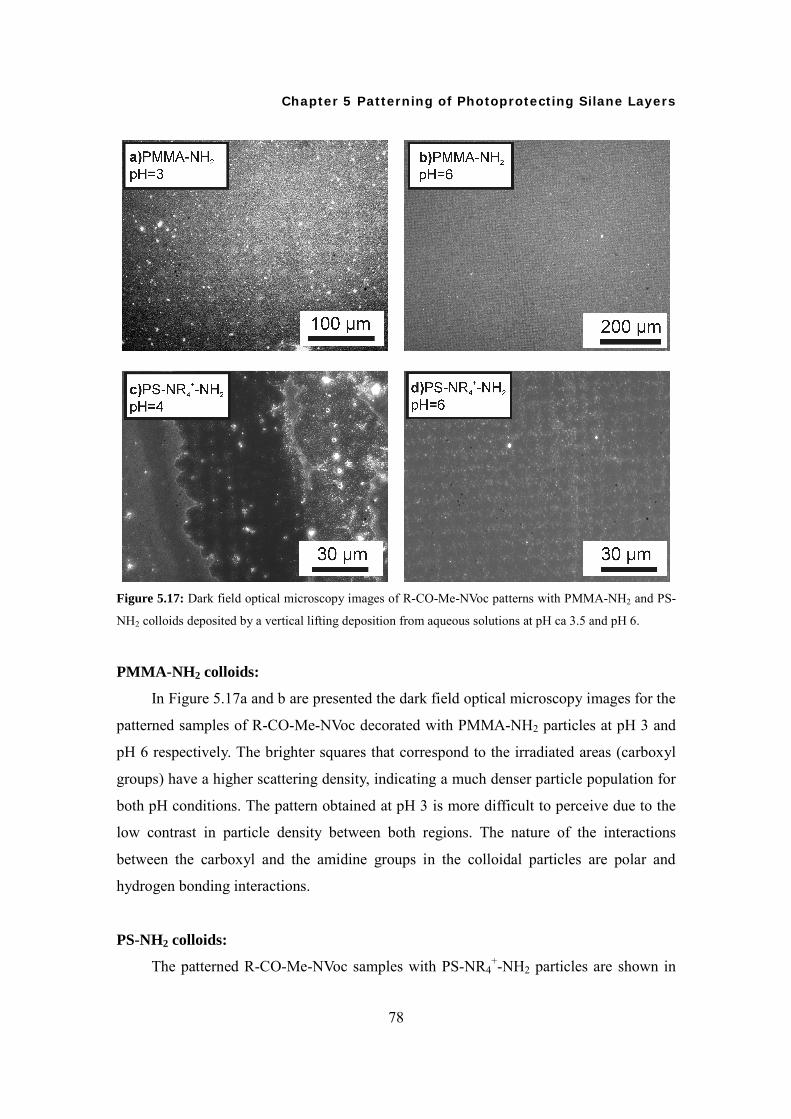
Chapter 5 Patterning of Photoprotecting Silane Layers
78
Figure 5.17: Dark field optical microscopy images of R-CO-Me-NVoc patterns with PMMA-NH2 and PS-
NH2 colloids deposited by a vertical lifting deposition from aqueous solutions at pH ca 3.5 and pH 6.
PMMA-NH2 colloids:
In Figure 5.17a and b are presented the dark field optical microscopy images for the
patterned samples of R-CO-Me-NVoc decorated with PMMA-NH2 particles at pH 3 and
pH 6 respectively. The brighter squares that correspond to the irradiated areas (carboxyl
groups) have a higher scattering density, indicating a much denser particle population for
both pH conditions. The pattern obtained at pH 3 is more difficult to perceive due to the
low contrast in particle density between both regions. The nature of the interactions
between the carboxyl and the amidine groups in the colloidal particles are polar and
hydrogen bonding interactions.
PS-NH2 colloids:
The patterned R-CO-Me-NVoc samples with PS-NR4+-NH2 particles are shown in

Chapter 5 Patterning of Photoprotecting Silane Layers
79
Figure 5.17c and d. At pH 4 the colloids go preferentially to the irradiated areas observed
in the case of PMMA-NH2. Surprisingly at higher pH (pH 6) the PS particles go to the
protected NVoc regions, but for this behaviour we have currently no explanation.
Silica particles:
For checking if the characterisation of the patterns could also be done with much
smaller particles, silica spheres of 15 nm of diameter were used. Silica particles close to
neutral pH conditions usually carry hydroxyl surface group from the preparation process.
The experiments were conducted for R-CO-Me-NVoc and R-NH-Me-NVoc patterned
SAMs with aqueous silica solutions at pH ~6.5, and the experimental procedure for
deposition was the same vertical lifting deposition method as described for the previous
systems. For both kinds of silanes, the silica particles do attach with a high selectivity to
the irradiated areas (pattern with R-NH-Me-NVoc shown in Figure 5.18). At the working
pH the particles are not charged (pKa ~7.5) and therefore polar and hydrogen bond
interactions would be the driving forces for the interactions.
Figure 5.18: (a) Optical microscopy image of a patterned R-NH-Me-NVoc sample with silica particles (φ =
15 nm) deposited by a vertical lifting deposition at pH ~6.5; (b) AFM topography and (c) section profile of
one of the squares with the silica particles.
In Figure 5.18, a new feature due to the colloidal deposition method can also be

Chapter 5 Patterning of Photoprotecting Silane Layers
80
observed: a “tail” in the square appears in the vertical lifting direction due to the fact that
the water drop has this shape in the drying process.
5.7 Fluorescence Labelling of Silane Patterns
Since the irradiation experiments were supposed to yield active -COOH, -OH and -
NH2 groups, their presence had to be verified. A common and well known method is
fluorescence staining by specific interaction or reaction with fluorophore dyes. The
presence of a fluorescence pattern with the geometry of the irradiation mask would be
indicative of the successful liberation of the expected functional group during
photodeprotection.
5.7.1 Fluorescence Dyes
In order to visualize the patterns by means of fluorescent dyes, two different dye
structures ATTO 635 and Alexa Fluor 488 (AF488) in aqueous solutions were used (as
shown in Figure 5.19). The patterned SAM films were immersed in different dye
solutions between 1 to 10 minutes, then washed intensively with the solvent and were
visualized by confocal laser scanning fluorescence microscopy using the excitation lines
of 488 nm for AF488 and 635 nm for ATTO635 according to the excitation maximum for
each dye. In both cases the contrast has been adjusted to see the image better.
N
CH3
H3C CH3
N
CH3
CH3
OH
OO
F3C O
H3C
H3C
OH2N
SO3 SO3
NH2
C
O
O
N O C
O
O
O
6
5
2Li
(a) ATTO 635 (b) Alexa Fluor 488 Figure 5.19: Structures of fluorescence dyes (a) ATTO 635; (b) Alexa Fluor 488 for carboxylic acid
coupling.

Chapter 5 Patterning of Photoprotecting Silane Layers
81
5.7.2 Results
In Figure 5.20, the fluorescent patterns of the R-CO-Me-NVoc silane with the
different dyes used are presented. The squares in both figures correspond to the regions
that were irradiated with the mask aligner. The adsorption of the dyes to the carboxyl
moieties (irradiated areas, the squares in the figures) or to the NVoc groups (non
irradiated areas) can be controlled by playing with the dye structures. In the case of the
sample decorated with ATTO 635 (Figure 5.20 left), the higher fluorescence signal
corresponds to the irradiated areas, whereas for the sample decorated with AF488 (Figure
5.20 right), the higher intensity corresponds to non-illuminated regions. These results
might mean that the main driving force in the process studied is the electrostatic
interactions. When a dye with a positive core as ATTO 635 is used, it mainly directs to
the negative parts of the monolayer, i.e. to the irradiated areas. When the chosen dye has
a negative core, as in the case of Alexa Fluor 488, electrostatic repulsion with the
carboxyl groups on the surface are present and there is a low amount of dye in the
deprotected area. The presence of dye in the Me-NVoc domains indicates that there is
non-specific adsorption due to polar and aromatic interactions.
Figure 5.20: Fluorescence microscopy images of patterned SAMs of R-CO-Me-NVoc silane labelled with
ATTO 635 (left), and Alexa Fluor 488 (right).
Chapter 5 Patterning of Photoprotecting Silane Layers
82
5.8 Discussion and Summary
In summary, the synthesis, characterization and surface modification of CH3-NVoc
silanes terminated with -OH, -COOH and -NH2 functionalities, and a Bzn-protecting
silane with a -NH2 functional group is demonstrated. Selective adsorption of colloidal
particles from colloidal suspensions onto the hydrophilic patterns in the deprotected
regions after mask irradiation was possible due to the directing influence of the liberated
functional groups. Particles of different diameters ranging from few hundred nanometers
to smaller colloidal particles could be deposited by this method. Photodeprotection of
CH3-NVoc silane was possible at lower wavelengths than NVoc silanes previously
reported [del Campo 2005] and less irradiation time required.

Chapter 6 Experimental Section
83
Chapter 6
Experimental Section
6.1 General
All chemicals and solvents were purchased from Acros Organics (B-2440 Geel),
Fluka Chemie AG (D-82024 Taufkirchen), ABCR (D-76189 Karlsruhe), Fisher Scientific
UK Ltd. (GB-Loughborough, Leics. LE11 5RG), Merck KGaA (D-64271 Darmstadt),
Riedel-de-Haen (D-30926 Seelze) and Sigma-Aldrich Chemie GmbH (D-89555
Steinheim), with p.a. purity, and were used as received (unless stated otherwise). Solvents
were dried over molecular sieves (4 Å) or with known literature procedures.
Chromatography:
Preparative column chromatography and flash column chromatography were
carried out using Merck silica gel (63-200 µm) and (43-63 µm), respectively. Analytical
thin layer chromatography was carried out using Merck silica gel G/UV254 using a UV
Chapter 6 Experimental Section
84
lamp, potassium permanganate solution, and “Bromocresol Green” solution to visualize
the components. Preparative thin layer chromatography was carried out with TLC plates
(20cm 20cm, 2mm layer thickness, SIL G-200 UV254) purchased from Macherey-Nagel,
Germany.
“Bromocresol green solution”: 0.04g of commercial “Bromocresol green” powder
was dissolved into 100mL of ethanol. NaOH solution (0.1N) was added by titration till
the solution turned to green.
Melting Point:
Melting points were measured with a semi-automatic melting point apparatus Büchi
B-545.
Mass Spectra:
Mass spectra were recorded with Field Desorption (FD) using a ZAB 2-SE-FPD
from VG-Instruments.
NMR Measurement:
Solution 1H-NMR and 13C-NMR spectra were measured on a Bruker Spectrospin
250. All measurements were done at room temperature, referenced to TMS (δ = 0ppm)
and calibrated by the deuterated solvent. The chemical shifts are given in parts per
million and the coupling constants in Hz. The following abbreviations are used in this
thesis: s-singlet, t-triplet, q-quartet, m-multiplet, br-broad.
IR Spectra:
Infrared spectra were measured on a Perkin Elmer Paragon 1000 FT-IR
spectrometer. The wavenumbers are given in cm-1 and the following abbreviations are

Chapter 6 Experimental Section
85
used: br-broad, s-strong, w-weak.
UV-Vis Spectra:
UV-Vis spectra were recorded on Perkin Elmer L9 UV-Vis NIR spectrometer, and
the axes were denoted with wavelength (nm) and relative absorbance.
Contact Angle Microscopy:
For contact angle measurements a Drop Shape Analysis System DSA 10 by Kruess,
Germany was used, combined with a CCD camera for image capturing.
Optical Microscopy:
Optical microscopy images were recorded on a Zeiss Axioscope with reflected light
microscopy (HBO lamp) with a digital camera (Zeiss AxioCam), which was attached to
the microscope.
Atomic Force Microscopy:
All the images in this thesis were recorded under ambient conditions by a
MultiMode Atomic Force Microscope Dimension 3100 connected to a NanoScope IIIa
controller. The microscope was operated in tapping mode. The substrates to be measured
had a size of 2cm 1cm and were sucked onto the sample holder by vacuum.
Ellipsometry:
The thickness of the SAMs was measured on a Nanofilme Ellipsometer made by
Nanofilm Technologie GmbH. The wavelength of the incidence laser beam was 532nm,
with 70o as the incidence angle. The refracted indices of silicon substrate and the SiO2
layer on the surface were assumed n(Si) = 4.17 and n(SiO2) = 1.46, respectively.
Chapter 6 Experimental Section
86
Confocal Microscopy:
The microscope used was a commercial LSM setup manufactured by Carl Zeiss
(Jena, Germany) consisting of the module LSM 510 and the inverted microscope model
Axiovert 200. The types of laser included an Argon laser (457nm, 488nm, 514nm with an
output power of 3mW, 10mW, and 15mW, respectively), a green He/Ne laser (543.5nm,
1mW) and a red He/Ne laser (632.8nm, 5mW). Two objective lenses were used; namely a
ZEISS Plan-Neofluar (with 20 magnification and a numerical aperture of 0.5), and a
ZEISS C-Apochromat (with 40 magnification and a numerical aperture of 1.2).
Kinetic Experiments:
The conditions in the NMR tube were the same as in a real hydrolysis experiment.
This means that a 1% solution of the silane in deuterated THF was made up to which the
catalyst was added just before the NMR measurement. It was thus possible to calculate
from the liquid 1H-NMR spectrum the percentage of transformation of the ethoxy CH2
and CH3 peaks into free ethanolic CH2 and CH3 peaks, which were formed upon
hydrolysis of the ethoxy substituents attached to the silicon atom.
6.2 Silane Deposition on Silica Substrate Surfaces
Silica wafers (2cm 1cm), provided by Waker Siltronic with a 1.6 nm native oxide
layer, were placed into a fresh Piranha solution (conc. H2SO4 / 30% H2O2 = 7:3 v/v) for 1
hour at 80oC for cleaning and then rinsed with copious amount of Mili-Q water (R =
18MΩ·cm), and were blow dried in a stream of nitrogen.
6.2.1 Solution Phase Silanization
Butyl silane (2), succinimidyl silane (4), maleimide silane (6, 8) were prehydrolised
Chapter 6 Experimental Section
87
as a 1 wt% solution in THF for 1 hour. Alkyne silane (10) was prehydrolised as a 1 wt%
solution in THF with the presence of 0.1 wt% of 1N HCl for 1 hour. After filtration of the
hydrolised solutions through 0.2µm PTFE (Teflon) filter, the clean substrates were then
immersed into the silane solution for 1 hour. After deposition the substrates were gently
rinsed with THF and then tempered at 80oC for 1 hour in a vacuum oven. They were
sonicated in an ultrasonic bath in the sequence of dichloromethane, dichloromethane
/methanol, and methanol for 10 minutes each to remove any unspecifically adsorbed
silanes and then blown dry in nitrogen stream for further use.
3’,5’-Dimethoxybenzoin silane (22) was prehydrolised as a 2 wt% solution in THF
for 2 hours, and filtrated through a 0.2µm PTFE (Teflon) filter. The clean substrates were
then immersed into the silane solution for 1 hour, then rinsed gently with THF, baked at
95oC for 1 hour in a vacuum oven. Finally the substrates were sonicated in the sequence
of dichloromethane, dichloromethane/methanol, and methanol for 10 minutes each.
6.2.2 Vapor Phase Silanization
Monolayers of CH3-NVoc silanes (14a, b; 16a, b; and 18) were obtained by vapor
phase deposition technique. Clean substrates were exposed to vapors of silanes at room
temperature using ambient pressure and afterwards baking at 100°C overnight, rinsed
with ethanol and Milli-Q water and dried with a N2 stream.
Passivation Process of Glassware
In this thesis, vapor phase silanization was used for the passivation processe of the
glassware with hexamethyldisilazane (HMDS). The mechanism of this reaction is shown
in figure 6.1.

Chapter 6 Experimental Section
88
Figure 6.1 Reaction of HMDS at the glass surface.
Upon the reaction with the silanol groups at the glass surface, the HMDS molecule
is cleaved, and trimethylsilyl groups are covalently bounded to the surface, with ammonia
being released. HMDS has a reasonably low boiling point and a high vapor pressure
(129oC, 1024 mbar; at room temperature 26.6 mbar). It is thus possible to perform the
vapor phase silanization at room temperature and ambient pressure for 30 minutes. The
resulting contact angle was 74o, which is characteristic for non-polar, hydrophobic
trimethylsilyl groups at the silica surface [Fadeev 1999].
6.2.3 Micro-contact Printing
Preparation of PDMS stamps:
40g of Sylgard 184 (PDMS) was taken in a beaker. 4g of Sylgard 184 curing agent
was added and stirred vigorously till bubbles rise. This mixture was then degassed by
keeping it in a desiccator using argon/vacuum. It was left in the desiccator for 20 minutes
till all the bubbles were gone. Masters for microcontact printing were taken in a petri dish
and the above mixture was poured over it (approximately 2 mm above the master). It was
then kept in the oven for curing overnight (for harder stamps) at 70oC.
After removing the masters with PDMS from the oven, they were separated by
using a sharp scalpel. The stamps were cleaned with Milli-Q water, N2 stream and then
O2 plasma for 1 minute (to avoid back pattern transfer). Stamps were dipped in the
stamping solution or to be stamped was placed on the top of the stamp, when it was

Chapter 6 Experimental Section
89
allowed to dry with a stream of N2. The coated stamps were placed on the substrate
(previously cleaned with O2 plasma) and a slight pressure was applied. After removing
the stamps, they were rinsed with Milli-Q water, N2 stream was passed and the patterns
were characterized by AFM. Patterns of nano- and micrometer scales were obtained.
Most of the experiments were carried out in a clean room, but experiments carried out in
normal laboratory conditions were also successful.
The CH3-NVoc silanes are found to be good candidates for creating micro and
nanometer patterns with micro-contact printing. Silanes synthesized and used in this work
are CH3-NVoc silanes with -NH2, -COOH and -OH terminated functionalities. The micro
contact printed SAMs were characterized by scanning probe microscopy. Patterns were
obtained from 870 nm to 8 µm. Details of the experimental procedure of microcontact
printing are given in the previous chapters.
6.2.4 Photolithography
UV crosslinker with 2.8 mW cm-2 (365 nm):
CH3-NVoc silanes were photodeptotected using this crosslinker in solution as well
as on surface.
Mask aligner (365 nm):
CH3-NVoc silanes (14a, b; 16a, b; and 18) were irradiated through a
photolithography mask with the mask aligner to create patterns of activated and non-
activated areas with the shape of the mask. Benzoin silane (22) was not irradiated through
with a mask aligner, as there was no possibility of switching the wavelength to 254 nm,
which is required for the deprotection of these silanes.
UV crosslinker with 3 mW cm-2 (254 nm):
Benzoin silanes were photodeptotected using this crosslinker in solution, on surface
(with and without the mask) for creating the patterns.
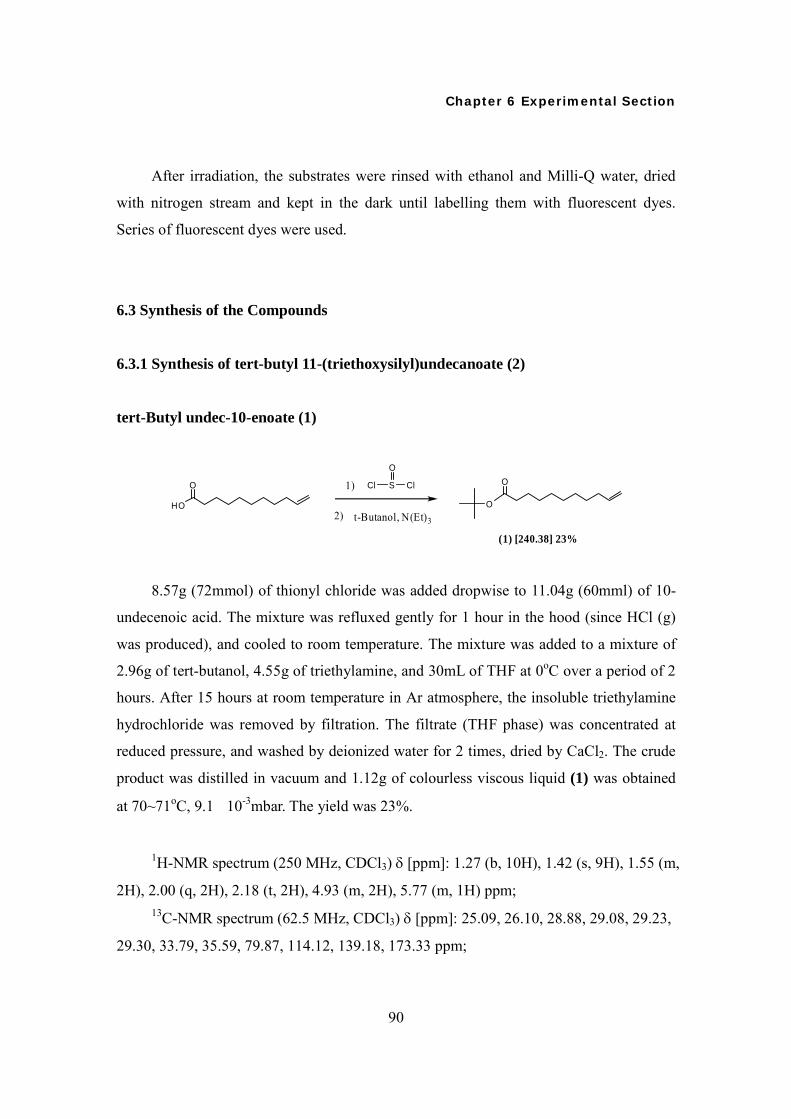
Chapter 6 Experimental Section
90
After irradiation, the substrates were rinsed with ethanol and Milli-Q water, dried
with nitrogen stream and kept in the dark until labelling them with fluorescent dyes.
Series of fluorescent dyes were used.
6.3 Synthesis of the Compounds
6.3.1 Synthesis of tert-butyl 11-(triethoxysilyl)undecanoate (2)
tert-Butyl undec-10-enoate (1)
HO
O 1) Cl S
O
Cl
2) t-Butanol, N(Et)3
O
O
(1) [240.38] 23%
8.57g (72mmol) of thionyl chloride was added dropwise to 11.04g (60mml) of 10-
undecenoic acid. The mixture was refluxed gently for 1 hour in the hood (since HCl (g)
was produced), and cooled to room temperature. The mixture was added to a mixture of
2.96g of tert-butanol, 4.55g of triethylamine, and 30mL of THF at 0oC over a period of 2
hours. After 15 hours at room temperature in Ar atmosphere, the insoluble triethylamine
hydrochloride was removed by filtration. The filtrate (THF phase) was concentrated at
reduced pressure, and washed by deionized water for 2 times, dried by CaCl2. The crude
product was distilled in vacuum and 1.12g of colourless viscous liquid (1) was obtained
at 70~71oC, 9.1×10⁻³mbar. The yield was 23%.
1H-NMR spectrum (250 MHz, CDCl3) δ [ppm]: 1.27 (b, 10H), 1.42 (s, 9H), 1.55 (m,
2H), 2.00 (q, 2H), 2.18 (t, 2H), 4.93 (m, 2H), 5.77 (m, 1H) ppm; 13C-NMR spectrum (62.5 MHz, CDCl3) δ [ppm]: 25.09, 26.10, 28.88, 29.08, 29.23,
29.30, 33.79, 35.59, 79.87, 114.12, 139.18, 173.33 ppm;

Chapter 6 Experimental Section
91
IR spectrum (wavenumber): 3075cm-1 (alkenyl “C-H” stretches), 2977~2854cm-1
(alkyl “C-H” stretches), 1731cm-1 (ester “C=O” stretches), 1641cm-1 (alkenyl “C=C”
stretches), 1366~1151 cm-1 (alkyl “C-H” bending vibrations).
FD-MS (m/z):241.6 (M+).
tert-Butyl 11-(triethoxysilyl)undecanoate (2)
O
O HSi(OEt)3
H2PtCl6O
O
Si
OEt
OEt
OEt
(1) (2) [404.66] 31%
0.41g (2mmol) of tert-butyl undec-10-enoate (1) was dissolved in 3.29g (20mmol)
of triethoxysilane followed by 8 drops of H2PtCl6/iso-propanol solution (20mg H2PtCl6 in
1mL iso-propanol). The mixture was heated to 80°C in Ar atmosphere for 14 hours and
cooled down to room temperature. The excess of triethoxysilane was eliminated under
vacuum. The residue was purified by column chromatography (Si-gel, eluent:
dichloromethane) and 0.25g of colourless viscous liquid (2) was obtained (Rf = 0.6,
dichloromethane). The yield was 31%.
1H-NMR spectrum (250 MHz, CDCl3) δ [ppm]: δ (ppm) 0.61 (t, 2H), 1.18~1.24 (m,
23H), 1.42 (s, 9H), 1.55 (m, 2H), 2.18 (t, 2H), 3.78 (q, 6H) ppm; 13C-NMR spectrum (62.5 MHz, CDCl3) δ [ppm]: 10.46, 18.39, 22.84, 25.21, 28.21,
29.19, 29.32, 29.39, 29.57, 33.26, 35.72, 58.38, 79.97, 173.46 ppm;
IR spectrum (wavenumber): 2973, 2925, 2854, 1731, 1366, 1076, 955, 785 cm-1.
FD-MS (m/z):405.9 (M+).
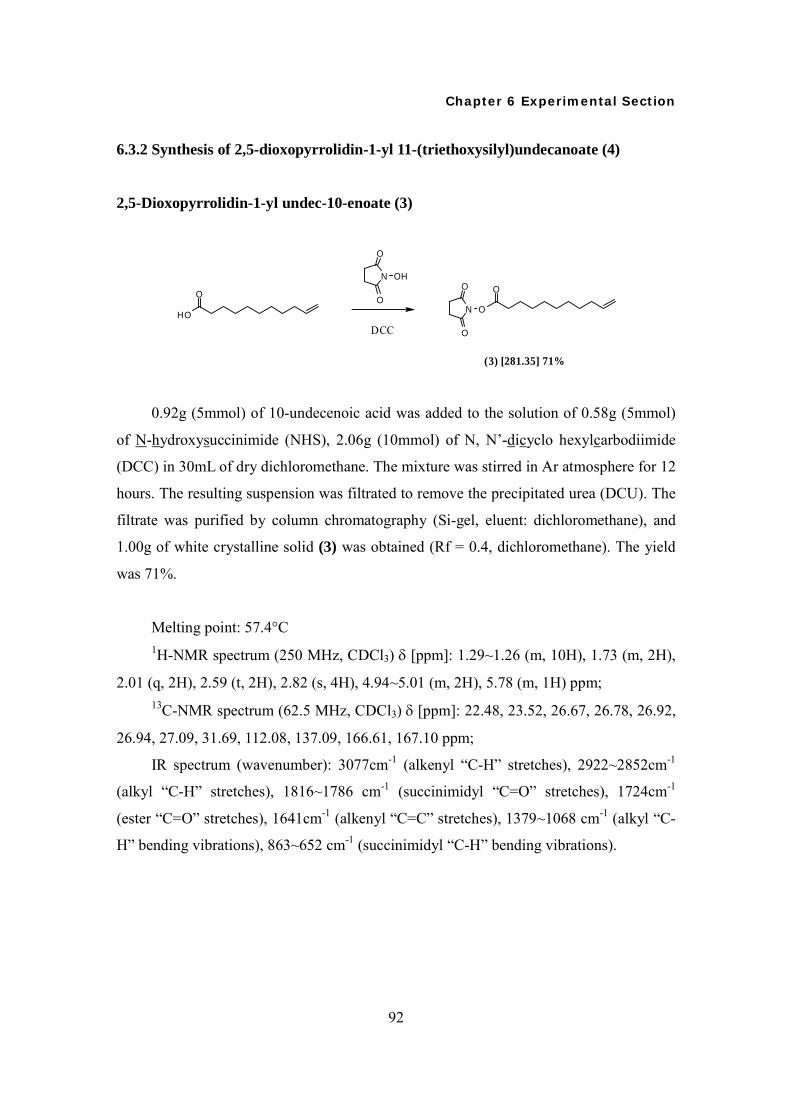
Chapter 6 Experimental Section
92
6.3.2 Synthesis of 2,5-dioxopyrrolidin-1-yl 11-(triethoxysilyl)undecanoate (4)
2,5-Dioxopyrrolidin-1-yl undec-10-enoate (3)
N
O
O
OH
HO
O
DCC
O
N
O
O
O
(3) [281.35] 71%
0.92g (5mmol) of 10-undecenoic acid was added to the solution of 0.58g (5mmol)
of N-hydroxysuccinimide (NHS), 2.06g (10mmol) of N, N’-dicyclo hexylcarbodiimide
(DCC) in 30mL of dry dichloromethane. The mixture was stirred in Ar atmosphere for 12
hours. The resulting suspension was filtrated to remove the precipitated urea (DCU). The
filtrate was purified by column chromatography (Si-gel, eluent: dichloromethane), and
1.00g of white crystalline solid (3) was obtained (Rf = 0.4, dichloromethane). The yield
was 71%.
Melting point: 57.4°C 1H-NMR spectrum (250 MHz, CDCl3) δ [ppm]: 1.29~1.26 (m, 10H), 1.73 (m, 2H),
2.01 (q, 2H), 2.59 (t, 2H), 2.82 (s, 4H), 4.94~5.01 (m, 2H), 5.78 (m, 1H) ppm; 13C-NMR spectrum (62.5 MHz, CDCl3) δ [ppm]: 22.48, 23.52, 26.67, 26.78, 26.92,
26.94, 27.09, 31.69, 112.08, 137.09, 166.61, 167.10 ppm;
IR spectrum (wavenumber): 3077cm-1 (alkenyl “C-H” stretches), 2922~2852cm-1
(alkyl “C-H” stretches), 1816~1786 cm-1 (succinimidyl “C=O” stretches), 1724cm-1
(ester “C=O” stretches), 1641cm-1 (alkenyl “C=C” stretches), 1379~1068 cm-1 (alkyl “C-
H” bending vibrations), 863~652 cm-1 (succinimidyl “C-H” bending vibrations).
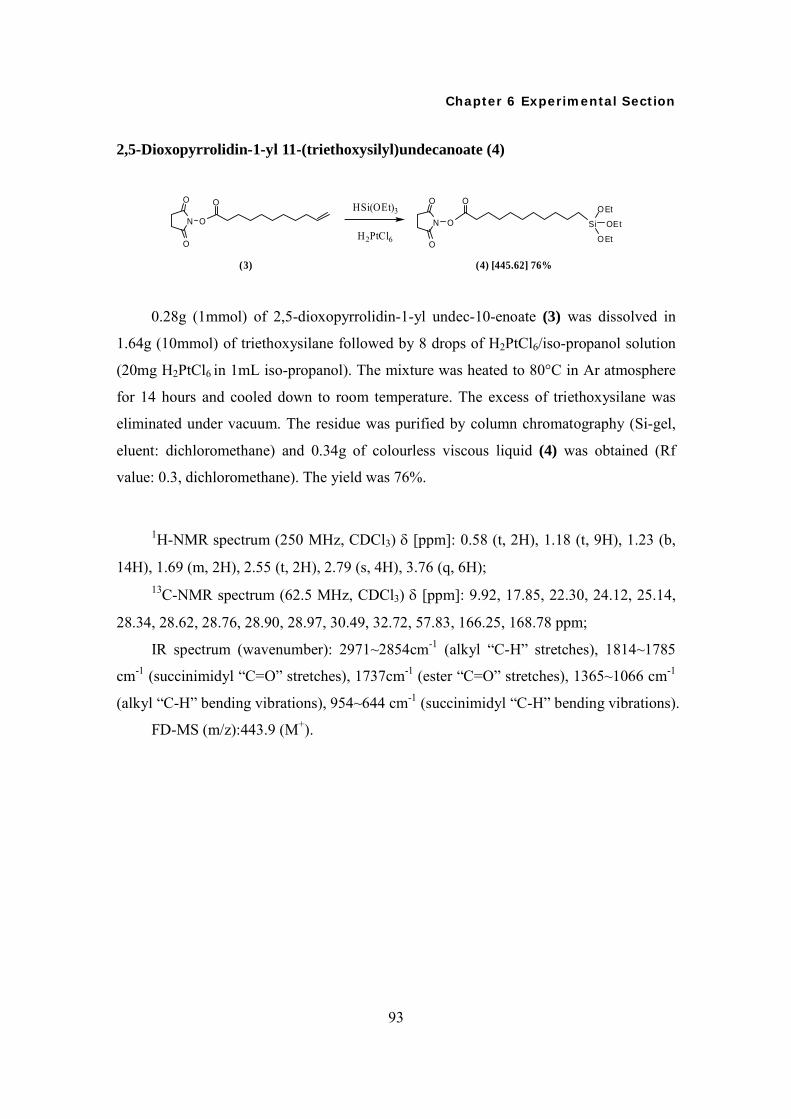
Chapter 6 Experimental Section
93
2,5-Dioxopyrrolidin-1-yl 11-(triethoxysilyl)undecanoate (4)
O
N
O
O
O
(3)
HSi(OEt)3
H2PtCl6O
O
Si
OEt
OEt
OEt
(4) [445.62] 76%
N
O
O
0.28g (1mmol) of 2,5-dioxopyrrolidin-1-yl undec-10-enoate (3) was dissolved in
1.64g (10mmol) of triethoxysilane followed by 8 drops of H2PtCl6/iso-propanol solution
(20mg H2PtCl6 in 1mL iso-propanol). The mixture was heated to 80°C in Ar atmosphere
for 14 hours and cooled down to room temperature. The excess of triethoxysilane was
eliminated under vacuum. The residue was purified by column chromatography (Si-gel,
eluent: dichloromethane) and 0.34g of colourless viscous liquid (4) was obtained (Rf
value: 0.3, dichloromethane). The yield was 76%.
1H-NMR spectrum (250 MHz, CDCl3) δ [ppm]: 0.58 (t, 2H), 1.18 (t, 9H), 1.23 (b,
14H), 1.69 (m, 2H), 2.55 (t, 2H), 2.79 (s, 4H), 3.76 (q, 6H); 13C-NMR spectrum (62.5 MHz, CDCl3) δ [ppm]: 9.92, 17.85, 22.30, 24.12, 25.14,
28.34, 28.62, 28.76, 28.90, 28.97, 30.49, 32.72, 57.83, 166.25, 168.78 ppm;
IR spectrum (wavenumber): 2971~2854cm-1 (alkyl “C-H” stretches), 1814~1785
cm-1 (succinimidyl “C=O” stretches), 1737cm-1 (ester “C=O” stretches), 1365~1066 cm-1
(alkyl “C-H” bending vibrations), 954~644 cm-1 (succinimidyl “C-H” bending vibrations).
FD-MS (m/z):443.9 (M+).

Chapter 6 Experimental Section
94
6.3.3 Synthesis of 3-(2,5-dioxo-2,5-dihydro-1H-pyrrol-1-yl)-N-(3-(triethoxysilyl)
propyl) propanamide (6)
2,5-Dioxopyrrolidin-1-yl 3-(2,5-dioxo-2,5-dihydro-1H-pyrrol-1-yl)propanoate (5)
H2N OH
OOO O
DMF
OH
O
N
O
O
N
O
O
OH
DCC
O
O
N
O
O
N
O
O
(5) [266.21] 46%
0.89g (10mmol) of 3-aminopropionic acid was added to a solution of maleic
anhydride (0.98g, 10mmol) in 10mL of DMF. The suspension was stirred for 1 hour after
3-aminopropionic acid had dissolved. The resulting solution was cooled in an ice bath
and 1.44g (12.5mmol) of NHS was added followed by DCC (4.12g, 20mmol). After 5
minutes, the ice bath was removed and the solution was stirred for 8 hours. The resulting
suspension was filtrated to remove the precipitated DCU. The filtrate (DMF phase) was
poured on 50mL of water, and this mixture was extracted with CH2Cl2 (2×50mL). The
CH2Cl2 phase was dried by Na2CO3. The solution was filtrated and the solvent was
evaporated. The residue was redissolved in CH2Cl2, and the product was precipitated with
petroleum ether. 1.23g of light yellow solid was obtained as (5). The yield was 46%.
1H-NMR spectrum (250 MHz, CDCl3) δ [ppm]: 2.81 (s, 4H), 3.00 (t, 2H), 3.92 (t,
2H), 6.72 (s, 2H) ppm; 13C-NMR spectrum (62.5 MHz, CDCl3) δ [ppm]: 25.50, 29.68, 32.94, 134.27,
165.97, 168.73, 170.06 ppm;
IR spectrum (wavenumber): 1824~1782cm-1 (maleic “C=O” and succinimidyl
“C=O” stretches), 1716cm-1 (ester “C=O” stretches), 836~652cm-1 (maleic “C-H”
bending vibrations).
Melting point: 162.3oC
FD-MS (m/z):267.0 (M+).

Chapter 6 Experimental Section
95
3-(2,5-Dioxo-2,5-dihydro-1H-pyrrol-1-yl)-N-(3-(triethoxysilyl)propyl)propanamide
(6)
O
O
N
O
O
N
O
O H2N SiOEt
OEtOEt
dry CH2Cl2
O
N
O
O
NH
SiOEt
OEtOEt
(5) (6) [372.49] 64%
0.11 g (0.5mmol) of APTE was added to the solution of (5) (0.13g, o.5mmol) in
10mL of dry CH2Cl2. The solution was stirred in Ar atmosphere for 8 hours. The solvent
was eliminated under vacuum and the residue was purified by column chromatography
(Si-gel, eluent: CH2Cl2/acetone 9:1) and 0.12g of colourless viscous liquid as (6) was
obtained (Rf = 0.6, CH2Cl2/acetone 9:1). The yield was 64%.
1H-NMR spectrum (250 MHz, acetone-d6) δ [ppm]: 0.59 (t, 2H), 1.19 (t, 9H), 1.55
(m, 2H), 2.46 (t, 2H), 3.13 (q, 2H), 3.74~3.82 (m, 8H), 6.87 (s, 2H) ppm; 13C-NMR spectrum (62.5 MHz, acetone-d6) δ [ppm]: 8.36, 18.82, 23.76, 29.80,
35.03, 42.46, 58.71, 135.15, 170.05, 171.33 ppm;
IR spectrum (wavenumber): 3296cm-1 (amide “N-H” stretches), 1701cm-1 (maleic
“C=O” stretches), 1635cm-1 (amide “C=O” stretches), 695cm-1 (maleic “C-H” bending
vibrations).
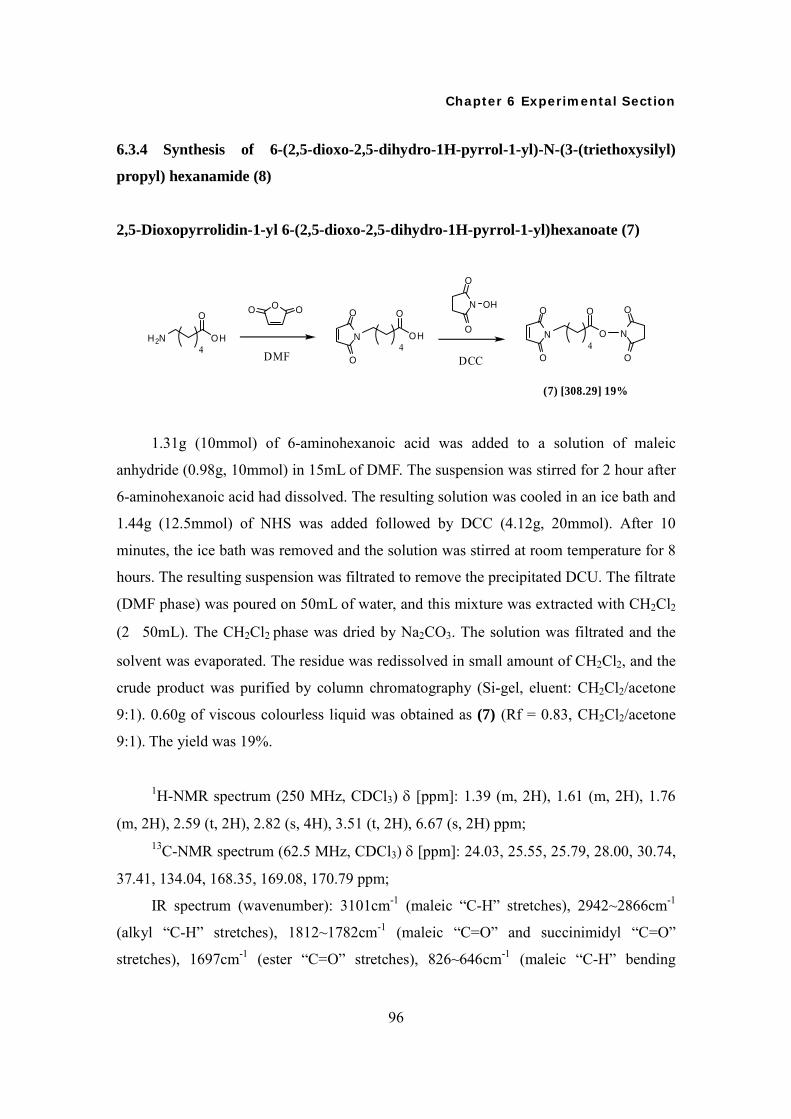
Chapter 6 Experimental Section
96
6.3.4 Synthesis of 6-(2,5-dioxo-2,5-dihydro-1H-pyrrol-1-yl)-N-(3-(triethoxysilyl)
propyl) hexanamide (8)
2,5-Dioxopyrrolidin-1-yl 6-(2,5-dioxo-2,5-dihydro-1H-pyrrol-1-yl)hexanoate (7)
H2N OH
OOO O
DMF
OH
O
N
O
O
N
O
O
OH
DCC
O
O
N
O
O
N
O
O
(7) [308.29] 19%
44 4
1.31g (10mmol) of 6-aminohexanoic acid was added to a solution of maleic
anhydride (0.98g, 10mmol) in 15mL of DMF. The suspension was stirred for 2 hour after
6-aminohexanoic acid had dissolved. The resulting solution was cooled in an ice bath and
1.44g (12.5mmol) of NHS was added followed by DCC (4.12g, 20mmol). After 10
minutes, the ice bath was removed and the solution was stirred at room temperature for 8
hours. The resulting suspension was filtrated to remove the precipitated DCU. The filtrate
(DMF phase) was poured on 50mL of water, and this mixture was extracted with CH2Cl2
(2×50mL). The CH2Cl2 phase was dried by Na2CO3. The solution was filtrated and the
solvent was evaporated. The residue was redissolved in small amount of CH2Cl2, and the
crude product was purified by column chromatography (Si-gel, eluent: CH2Cl2/acetone
9:1). 0.60g of viscous colourless liquid was obtained as (7) (Rf = 0.83, CH2Cl2/acetone
9:1). The yield was 19%.
1H-NMR spectrum (250 MHz, CDCl3) δ [ppm]: 1.39 (m, 2H), 1.61 (m, 2H), 1.76
(m, 2H), 2.59 (t, 2H), 2.82 (s, 4H), 3.51 (t, 2H), 6.67 (s, 2H) ppm; 13C-NMR spectrum (62.5 MHz, CDCl3) δ [ppm]: 24.03, 25.55, 25.79, 28.00, 30.74,
37.41, 134.04, 168.35, 169.08, 170.79 ppm;
IR spectrum (wavenumber): 3101cm-1 (maleic “C-H” stretches), 2942~2866cm-1
(alkyl “C-H” stretches), 1812~1782cm-1 (maleic “C=O” and succinimidyl “C=O”
stretches), 1697cm-1 (ester “C=O” stretches), 826~646cm-1 (maleic “C-H” bending
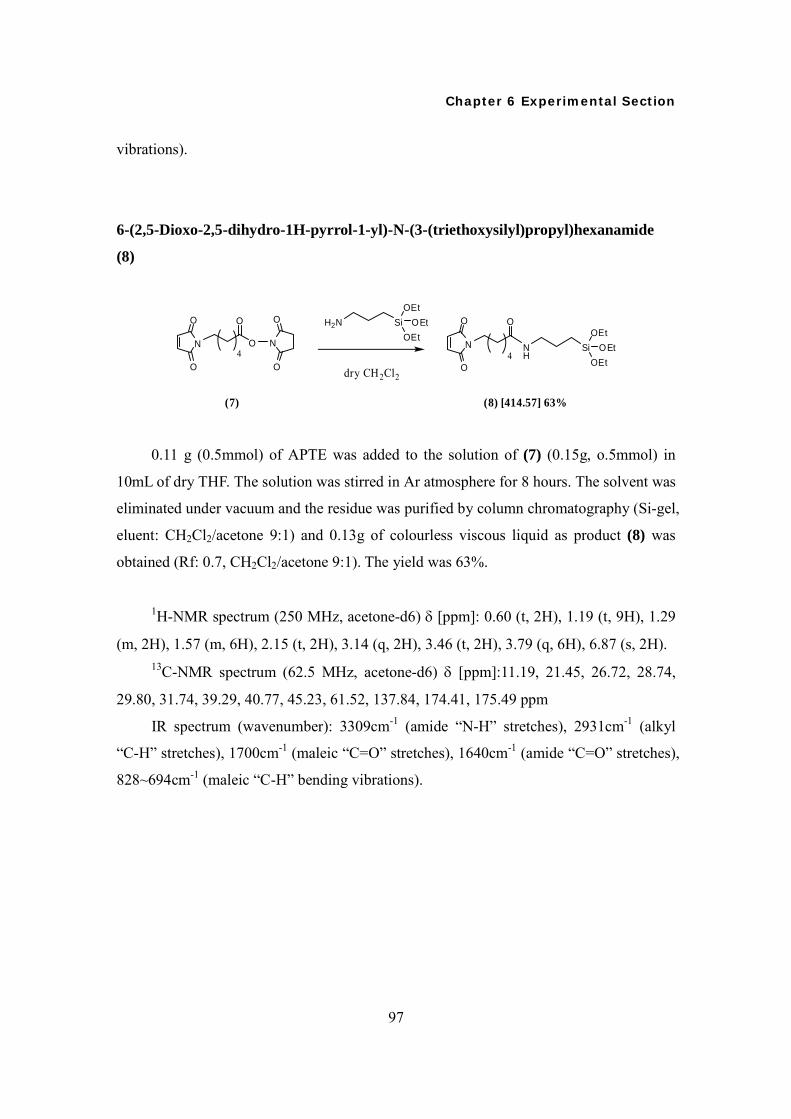
Chapter 6 Experimental Section
97
vibrations).
6-(2,5-Dioxo-2,5-dihydro-1H-pyrrol-1-yl)-N-(3-(triethoxysilyl)propyl)hexanamide
(8)
O
O
N
O
O
N
O
O H2N SiOEt
OEtOEt
dry CH2Cl2
O
N
O
O
NH
SiOEt
OEtOEt
(7) (8) [414.57] 63%
4 4
0.11 g (0.5mmol) of APTE was added to the solution of (7) (0.15g, o.5mmol) in
10mL of dry THF. The solution was stirred in Ar atmosphere for 8 hours. The solvent was
eliminated under vacuum and the residue was purified by column chromatography (Si-gel,
eluent: CH2Cl2/acetone 9:1) and 0.13g of colourless viscous liquid as product (8) was
obtained (Rf: 0.7, CH2Cl2/acetone 9:1). The yield was 63%.
1H-NMR spectrum (250 MHz, acetone-d6) δ [ppm]: 0.60 (t, 2H), 1.19 (t, 9H), 1.29
(m, 2H), 1.57 (m, 6H), 2.15 (t, 2H), 3.14 (q, 2H), 3.46 (t, 2H), 3.79 (q, 6H), 6.87 (s, 2H). 13C-NMR spectrum (62.5 MHz, acetone-d6) δ [ppm]:11.19, 21.45, 26.72, 28.74,
29.80, 31.74, 39.29, 40.77, 45.23, 61.52, 137.84, 174.41, 175.49 ppm
IR spectrum (wavenumber): 3309cm-1 (amide “N-H” stretches), 2931cm-1 (alkyl
“C-H” stretches), 1700cm-1 (maleic “C=O” stretches), 1640cm-1 (amide “C=O” stretches),
828~694cm-1 (maleic “C-H” bending vibrations).

Chapter 6 Experimental Section
98
6.3.5 Synthesis of N-(3-(triethoxysilyl)propyl)undec-10-ynamide (10)
2,5-Dioxopyrrolidin-1-yl undec-10-ynoate (9)
(9) [279.33] 74%
OH
ON
O
O
OH
DCC, THFO
O
N
O
O
0.91g (5mmol) of undec-10-ynoic acid was added to the solution of 0.58g (5mmol)
of N-hydroxysuccinimide (NHS), 2.06g (10mmol) of N, N’-dicyclo hexylcarbodiimide
(DCC) in 30mL of dry THF. The mixture was stirred in Ar atmosphere for 8 hours. The
resulting suspension was filtrated to remove the precipitated urea (DCU). The filtrate was
purified by column chromatography (Si-gel, eluent: dichloromethane), and 1.03g of white
crystalline solid (9) was obtained (Rf = 0.47, dichloromethane). The yield was 74%.
1H-NMR spectrum (250 MHz, CDCl3) δ [ppm]: 1.31 (m, ~8H), 1.50 (t, ~2H), 1.72
(m, 2.15H), 1.92 (m, 0.92H), 2.15 (m, 1.96H), 2.58 (t, 2.03H), 2.81 (s, 4H); 13C-NMR spectrum (62.5 MHz, CDCl3) δ [ppm]: 18.32, 24.49, 25.55, 28.35, 28.54,
28.64, 28.73, 28.87, 30.87, 68.09, 64.66, 188.62, 169.16 ppm;
FD-MS [m/z]: 280.5 (55%, M+).
Melting point: 66.7oC.

Chapter 6 Experimental Section
99
N-(3-(triethoxysilyl)propyl)undec-10-ynamide (10)
O
O
N
O
O
NH
O
SiOEt
OEtOEt
APTE
dry CH2Cl2
(10) [385.61] 52%(9)
0.11 g (0.5mmol) of APTE was added to the solution of 2,5-dioxopyrrolidin-1-yl
undec-10-ynoate (9) (0.14g, o.5mmol) in 10mL of dry THF. The solution was stirred in
Ar atmosphere for 8 hours. The solvent was eliminated under vacuum and the residue
was purified by column chromatography (Si-gel, eluent: hexane/ethylacetate 1:1) and
0.10g of colourless viscous liquid (10) was obtained (Rf = 0.58, hexane/ethylacetate 1:1).
The yield was 52%.
1H-NMR spectrum (250 MHz, CD2Cl2) δ [ppm]: 0.55 (t, 2.0H), 1.15 (t, 8.6H), 1.25
(m, 8.39H), 1.52 (m, 6.48H), 1.92 (m, 0.95H), 2.07 (m, 5.33H), 3.15 (q, 2.04H), 3.74 (q,
5.7H), 5.76 (s, 0.91H) ppm; 13C-NMR spectrum (62.5 MHz, CD2Cl2) δ [ppm]: 8.22, 18.67, 18.82, 23.56, 26.33,
29.08, 29.25, 29.51, 29.81, 37.26, 42.27, 58.91, 88.42, 85.24 ppm;
FD-MS [m/z]: 386.9 (100%, M+).
6.3.6 1-(4,5-dimethoxy-2-nitrophenyl)ethyl 3-(triethoxysilyl)propylcarbamate (14a)
and 1-(4,5-dimethoxy-2-nitrophenyl)ethyl 11-(triethoxysilyl)decylcarbamate (14b)
1-(4,5-dimethoxy-2-nitrophenyl)ethanone (11):
10mL of 68% HNO3 was cooled to 0οC. 2g of 3,4-dimethoxy acetophenone was
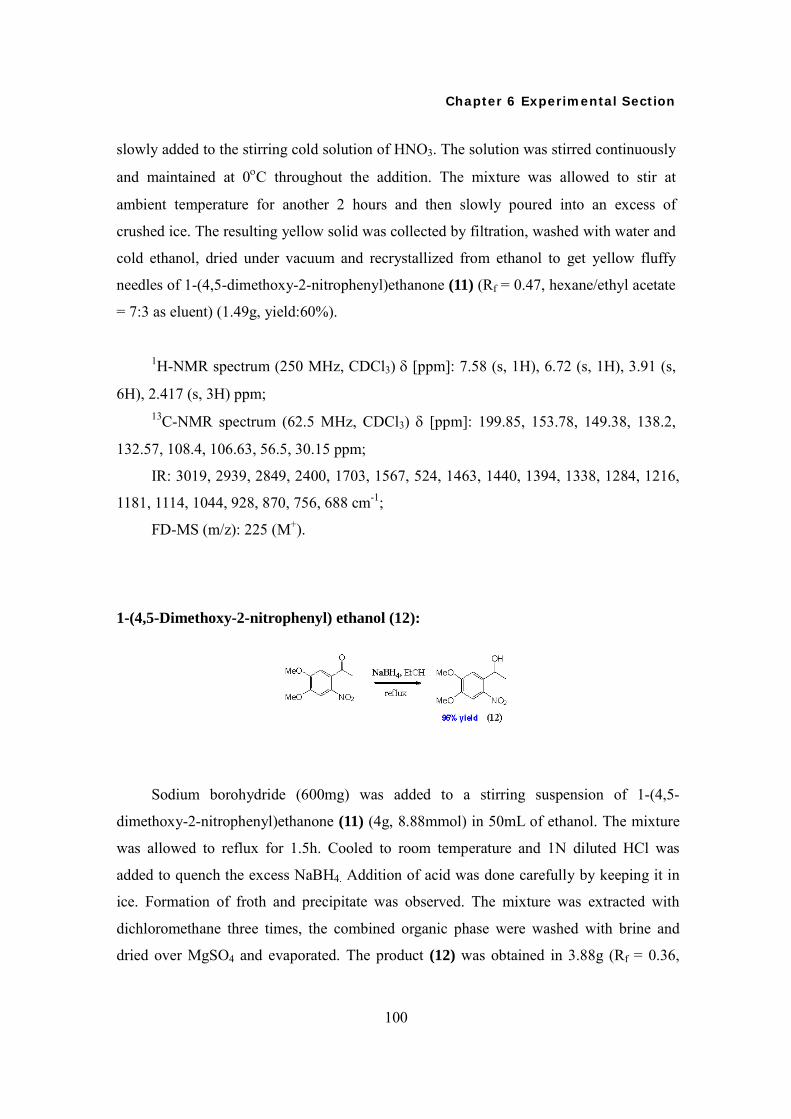
Chapter 6 Experimental Section
100
slowly added to the stirring cold solution of HNO3. The solution was stirred continuously
and maintained at 0οC throughout the addition. The mixture was allowed to stir at
ambient temperature for another 2 hours and then slowly poured into an excess of
crushed ice. The resulting yellow solid was collected by filtration, washed with water and
cold ethanol, dried under vacuum and recrystallized from ethanol to get yellow fluffy
needles of 1-(4,5-dimethoxy-2-nitrophenyl)ethanone (11) (Rf = 0.47, hexane/ethyl acetate
= 7:3 as eluent) (1.49g, yield:60%).
1H-NMR spectrum (250 MHz, CDCl3) δ [ppm]: 7.58 (s, 1H), 6.72 (s, 1H), 3.91 (s,
6H), 2.417 (s, 3H) ppm; 13C-NMR spectrum (62.5 MHz, CDCl3) δ [ppm]: 199.85, 153.78, 149.38, 138.2,
132.57, 108.4, 106.63, 56.5, 30.15 ppm;
IR: 3019, 2939, 2849, 2400, 1703, 1567, 524, 1463, 1440, 1394, 1338, 1284, 1216,
1181, 1114, 1044, 928, 870, 756, 688 cm-1;
FD-MS (m/z): 225 (M+).
1-(4,5-Dimethoxy-2-nitrophenyl) ethanol (12):
Sodium borohydride (600mg) was added to a stirring suspension of 1-(4,5-
dimethoxy-2-nitrophenyl)ethanone (11) (4g, 8.88mmol) in 50mL of ethanol. The mixture
was allowed to reflux for 1.5h. Cooled to room temperature and 1N diluted HCl was
added to quench the excess NaBH4. Addition of acid was done carefully by keeping it in
ice. Formation of froth and precipitate was observed. The mixture was extracted with
dichloromethane three times, the combined organic phase were washed with brine and
dried over MgSO4 and evaporated. The product (12) was obtained in 3.88g (Rf = 0.36,

Chapter 6 Experimental Section
101
hexane/ethyl acetate = 7:3 as eluent) (96% yield) and used without purification for further
reactions.
1H-NMR spectrum (250 MHz, CDCl3) δ [ppm]: 7.447 (s, 1H), 7.21 (s, 1H), 5.45 (q,
1H), 3.96 (s, 6H), 2.70 (bs, 1H), 1.46 (d, 3H) ppm; 13C-NMR spectrum (62.5 MHz, CDCl3) δ [ppm]: 152.3, 146.2, 138.1, 135.7, 107.1,
106.2, 64.3, 55.0, 23.0 ppm;
IR spectrum: 3441, 3019, 1582, 1519, 1463, 1440, 1335, 1273, 1215, 1163, 1099,
1061, 1024, 928, 878, 850, 754, 668 cm-1;
FD-MS (m/z): 227 (M+).
1-(4,5-Dimethoxy-2-nitrophenyl)ethyl allylcarbamate (13a) and 1-(4,5-dimethoxy-2-
nitrophenyl)ethyl undec-10-enylcarbamate (13b):
2g (8.8mmol) of 1-(4,5-dimethoxy 2-nitrophenyl) ethanol (12) and triphosgene
(2.068g, 6.98mmol) were taken in a 100mL two-neck-flask. 25mL of dry THF was added
to it with a syringe. The reaction mixture was stirred at -70οC under argon for 2 hours to
form the corresponding chloroformate of (12) as reactive intermediate. 0.50g
(8.8mmol)of allylamine (or alternatively 1.48g of undec-10-en-1-amine), sodium
hydrogencarbonate (1.7g, 22mmol) and water (20mL) were placed into a round bottom
flask and cooled in an ice bath. To this mixture was added dropwise the solution of the
chloroformate of (12) (stirring at -70οC) under vigorous stirring. The mixture was
allowed to stir overnight. After adding 1N HCl, the mixture was extracted three times
with dichloromethane. The organic phase was dried over magnesium sulphate; the
solvent was evaporated to get a yellow solid as 13a (Rf = 0.66, hexane/ethyl acetate = 7:3
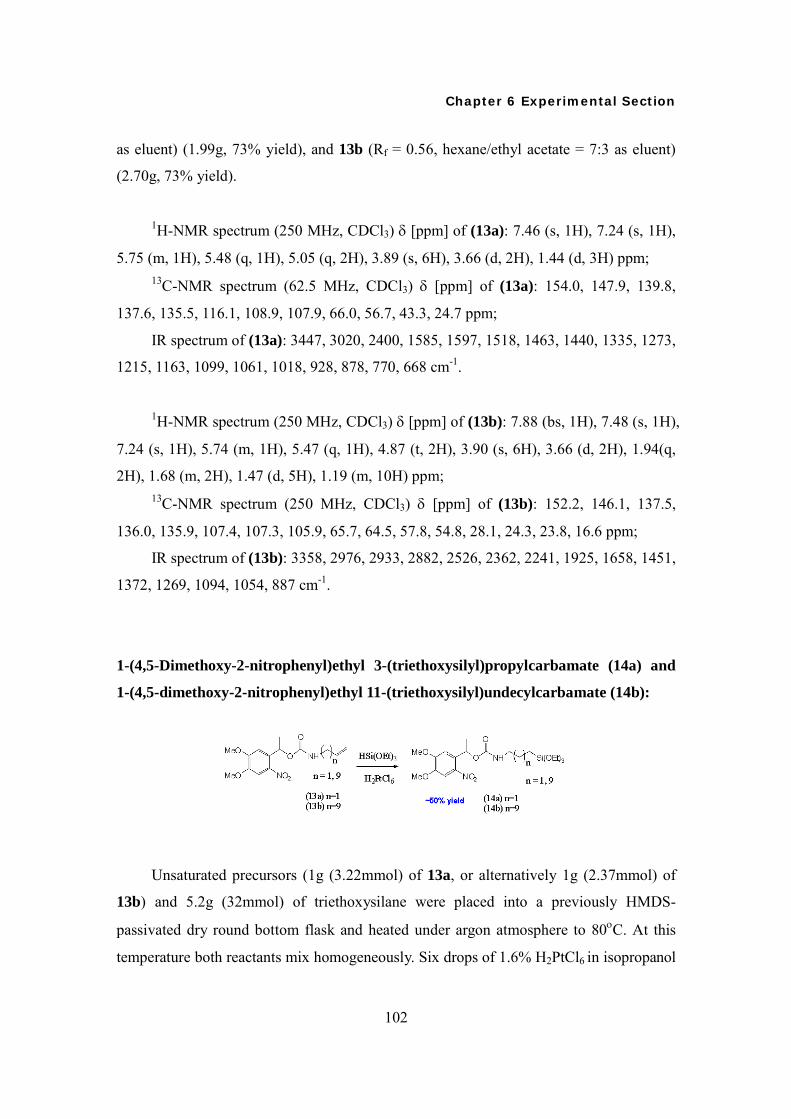
Chapter 6 Experimental Section
102
as eluent) (1.99g, 73% yield), and 13b (Rf = 0.56, hexane/ethyl acetate = 7:3 as eluent)
(2.70g, 73% yield).
1H-NMR spectrum (250 MHz, CDCl3) δ [ppm] of (13a): 7.46 (s, 1H), 7.24 (s, 1H),
5.75 (m, 1H), 5.48 (q, 1H), 5.05 (q, 2H), 3.89 (s, 6H), 3.66 (d, 2H), 1.44 (d, 3H) ppm; 13C-NMR spectrum (62.5 MHz, CDCl3) δ [ppm] of (13a): 154.0, 147.9, 139.8,
137.6, 135.5, 116.1, 108.9, 107.9, 66.0, 56.7, 43.3, 24.7 ppm;
IR spectrum of (13a): 3447, 3020, 2400, 1585, 1597, 1518, 1463, 1440, 1335, 1273,
1215, 1163, 1099, 1061, 1018, 928, 878, 770, 668 cm-1.
1H-NMR spectrum (250 MHz, CDCl3) δ [ppm] of (13b): 7.88 (bs, 1H), 7.48 (s, 1H),
7.24 (s, 1H), 5.74 (m, 1H), 5.47 (q, 1H), 4.87 (t, 2H), 3.90 (s, 6H), 3.66 (d, 2H), 1.94(q,
2H), 1.68 (m, 2H), 1.47 (d, 5H), 1.19 (m, 10H) ppm; 13C-NMR spectrum (250 MHz, CDCl3) δ [ppm] of (13b): 152.2, 146.1, 137.5,
136.0, 135.9, 107.4, 107.3, 105.9, 65.7, 64.5, 57.8, 54.8, 28.1, 24.3, 23.8, 16.6 ppm;
IR spectrum of (13b): 3358, 2976, 2933, 2882, 2526, 2362, 2241, 1925, 1658, 1451,
1372, 1269, 1094, 1054, 887 cm-1.
1-(4,5-Dimethoxy-2-nitrophenyl)ethyl 3-(triethoxysilyl)propylcarbamate (14a) and
1-(4,5-dimethoxy-2-nitrophenyl)ethyl 11-(triethoxysilyl)undecylcarbamate (14b):
Unsaturated precursors (1g (3.22mmol) of 13a, or alternatively 1g (2.37mmol) of
13b) and 5.2g (32mmol) of triethoxysilane were placed into a previously HMDS-
passivated dry round bottom flask and heated under argon atmosphere to 80οC. At this
temperature both reactants mix homogeneously. Six drops of 1.6% H2PtCl6 in isopropanol
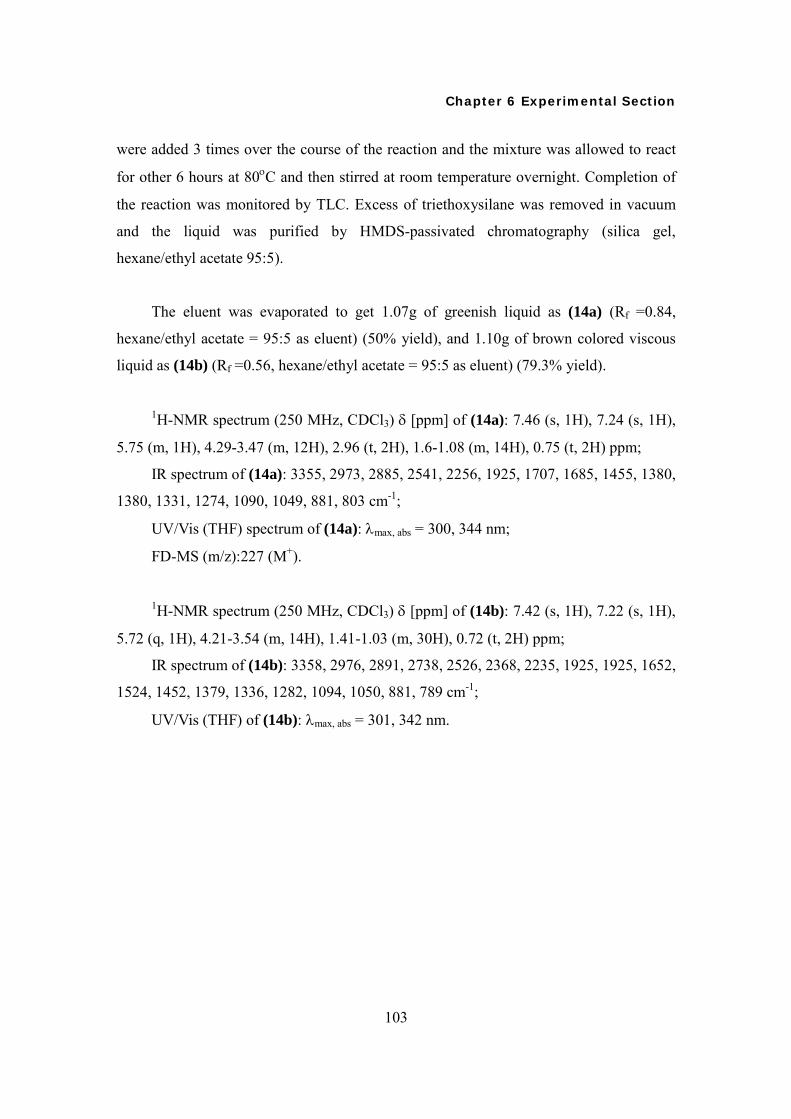
Chapter 6 Experimental Section
103
were added 3 times over the course of the reaction and the mixture was allowed to react
for other 6 hours at 80οC and then stirred at room temperature overnight. Completion of
the reaction was monitored by TLC. Excess of triethoxysilane was removed in vacuum
and the liquid was purified by HMDS-passivated chromatography (silica gel,
hexane/ethyl acetate 95:5).
The eluent was evaporated to get 1.07g of greenish liquid as (14a) (Rf =0.84,
hexane/ethyl acetate = 95:5 as eluent) (50% yield), and 1.10g of brown colored viscous
liquid as (14b) (Rf =0.56, hexane/ethyl acetate = 95:5 as eluent) (79.3% yield).
1H-NMR spectrum (250 MHz, CDCl3) δ [ppm] of (14a): 7.46 (s, 1H), 7.24 (s, 1H),
5.75 (m, 1H), 4.29-3.47 (m, 12H), 2.96 (t, 2H), 1.6-1.08 (m, 14H), 0.75 (t, 2H) ppm;
IR spectrum of (14a): 3355, 2973, 2885, 2541, 2256, 1925, 1707, 1685, 1455, 1380,
1380, 1331, 1274, 1090, 1049, 881, 803 cm-1;
UV/Vis (THF) spectrum of (14a): λmax, abs = 300, 344 nm;
FD-MS (m/z):227 (M+).
1H-NMR spectrum (250 MHz, CDCl3) δ [ppm] of (14b): 7.42 (s, 1H), 7.22 (s, 1H),
5.72 (q, 1H), 4.21-3.54 (m, 14H), 1.41-1.03 (m, 30H), 0.72 (t, 2H) ppm;
IR spectrum of (14b): 3358, 2976, 2891, 2738, 2526, 2368, 2235, 1925, 1925, 1652,
1524, 1452, 1379, 1336, 1282, 1094, 1050, 881, 789 cm-1;
UV/Vis (THF) of (14b): λmax, abs = 301, 342 nm.
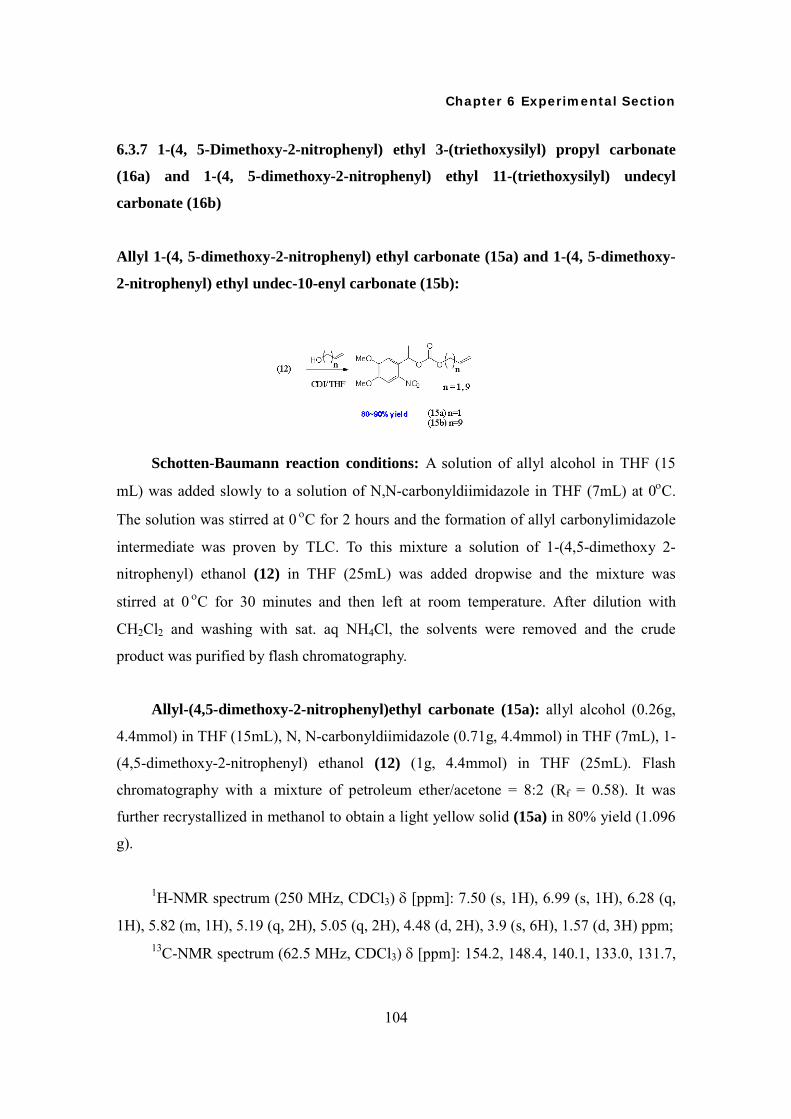
Chapter 6 Experimental Section
104
6.3.7 1-(4, 5-Dimethoxy-2-nitrophenyl) ethyl 3-(triethoxysilyl) propyl carbonate
(16a) and 1-(4, 5-dimethoxy-2-nitrophenyl) ethyl 11-(triethoxysilyl) undecyl
carbonate (16b)
Allyl 1-(4, 5-dimethoxy-2-nitrophenyl) ethyl carbonate (15a) and 1-(4, 5-dimethoxy-
2-nitrophenyl) ethyl undec-10-enyl carbonate (15b):
Schotten-Baumann reaction conditions: A solution of allyl alcohol in THF (15
mL) was added slowly to a solution of N,N-carbonyldiimidazole in THF (7mL) at 0οC.
The solution was stirred at 0 οC for 2 hours and the formation of allyl carbonylimidazole
intermediate was proven by TLC. To this mixture a solution of 1-(4,5-dimethoxy 2-
nitrophenyl) ethanol (12) in THF (25mL) was added dropwise and the mixture was
stirred at 0 οC for 30 minutes and then left at room temperature. After dilution with
CH2Cl2 and washing with sat. aq NH4Cl, the solvents were removed and the crude
product was purified by flash chromatography.
Allyl-(4,5-dimethoxy-2-nitrophenyl)ethyl carbonate (15a): allyl alcohol (0.26g,
4.4mmol) in THF (15mL), N, N-carbonyldiimidazole (0.71g, 4.4mmol) in THF (7mL), 1-
(4,5-dimethoxy-2-nitrophenyl) ethanol (12) (1g, 4.4mmol) in THF (25mL). Flash
chromatography with a mixture of petroleum ether/acetone = 8:2 (Rf = 0.58). It was
further recrystallized in methanol to obtain a light yellow solid (15a) in 80% yield (1.096
g).
1H-NMR spectrum (250 MHz, CDCl3) δ [ppm]: 7.50 (s, 1H), 6.99 (s, 1H), 6.28 (q,
1H), 5.82 (m, 1H), 5.19 (q, 2H), 5.05 (q, 2H), 4.48 (d, 2H), 3.9 (s, 6H), 1.57 (d, 3H) ppm; 13C-NMR spectrum (62.5 MHz, CDCl3) δ [ppm]: 154.2, 148.4, 140.1, 133.0, 131.7,

Chapter 6 Experimental Section
105
119.4, 108.1, 107.9, 72.4, 68.8, 56.8, 18.0 ppm;
IR spectrum: 3450, 3018, 2399, 1597, 1522, 1428, 1217, 928, 771, 669 cm-1.
1-(4,5-dimethoxy-2-nitrophenyl)ethyl undec-10-enyl carbonate (15b): undec-10-
en-1-ol (0.75g, 4.4mmol) in THF (15mL), N,N-carbonyldiimidazole (0.71g, 4.4mmol) in
THF (7mL), 1-(4,5-dimethoxy-2-nitrophenyl) ethanol (1g, 4.4mmol) in THF (25mL).
Flash chromatography with a mixture of petroleum ether/acetone = 8:2 (Rf = 0.56)
afforded 82% (1.477g) of product (15b).
1H-NMR spectrum (250 MHz, CDCl3) δ [ppm]: 7.47 (s, 1H), 7.23 (s, 1H), 5.72 (m,
1H), 5.47 (q, 1H), 4.87 (t, 2H), 3.92 (s, 6H), 3.54 (t, 2H), 2.20 (s, 2H), 1.94(q, 2H), 1.45
(m, 5H), 1.21 (m, 10H) ppm; 13C-NMR spectrum (62.5 MHz, CDCl3) δ [ppm]: 154.1, 148.0, 139.6, 137.4, 114.5,
108.8, 107.9, 66.0, 63.4, 56.7, 34.1, 33.1, 29.3, 26.1, 24.7 ppm;
IR spectrum: 3423, 3019, 2930, 2855, 2400, 1638, 1519, 1464, 1640, 1335, 1273,
1215, 1020, 928, 756, 669 cm-1.
1-(4, 5-Dimethoxy-2-nitrophenyl) ethyl 3-(triethoxysilyl) propyl carbonate (16a) and
1-(4, 5-dimethoxy-2-nitrophenyl) ethyl 11-(triethoxysilyl) undecyl carbonate (16b):
The unsaturated precursors (0.63g (2.02mmol) of (15a), or alternatively 1g
(2.36mmol) of (15b)) and 3.8g (23mmol) of triethoxysilane were placed into a previously
HMDS-passivated dry round bottom flask and heated under argon atmosphere to 80οC.
At this temperature both reactants mix homogeneously. Six drops of 1.6% H2PtCl6 in

Chapter 6 Experimental Section
106
isopropanol were added in 3 times over the course of the reaction and the mixture was
allowed to react for other 6 hours at 80οC and then stirred at room temperature overnight.
Completion of the reaction was monitored by TLC. Excess of triethoxysilane was
removed in vacuum and the liquid was purified by HMDS-passivated chromatography
(silica gel, hexane/ethyl acetate 95:5).
Product (16a) (Rf = 0.84, hexane/ethyl acetate 95:5) was obtained in 0.76g (50%
yield), and product (16b) (Rf = 0.82, hexane/ethyl acetate 95:5) was 0.72g (50% yield).
1H-NMR spectrum (250 MHz, CDCl3) δ [ppm] of (16a): 7.42 (s, 1H), 6.99 (s, 1H),
5.70 (q, 1H), 4.2-3.5 (m, 14H), 1.68-1.05 (m, 14H) ppm;
IR spectrum of (16a): 3490, 2974, 2236, 2082, 1885, 1750, 1639, 1578, 1639, 1578,
1521, 1465, 1382, 1336, 1274, 1220, 1166, 1166, 1105, 1051, 968, 891, 835, 786, 758
cm-1;
UV/Vis (THF) spectrum of (16a): λmax, abs = 280, 341 nm.
1H-NMR spectrum (250 MHz, CDCl3) δ [ppm] of (16b): 7.49 (s, 1H), 7.18 (s, 1H),
5.48 (q, 1H), 4.19-3.75 (m, 14H), 1.45-1.14 (m, 30H), 0.79 (t, 2H) ppm;
IR spectrum of (16b): 3385, 2975, 2871, 1923, 1655, 1451, 1325, 1271, 1088, 1047,
880 cm-1;
UV/Vis (THF) spectrum of (16b): λmax, abs = 301, 345 nm.
6.3.8 1-(4, 5-Dimethoxy-2-nitrophenyl) ethyl 5-(triethoxysilyl) pentanoate (18)
1-(4, 5-Dimethoxy-2-nitrophenyl) ethyl but-3-enoate (17):

Chapter 6 Experimental Section
107
Mitsunobu reaction conditions: A solution of diethylazodicarboxylate (DEAD,
0.77g 4.4mmol), in THF (20mL) is added dropwise to a solution of triphenylphosphine
(1.15g, 4.4mmol), vinyl acetic acid (0.37g, 4.4mmol), and 1g (4.4mmol) of 1-(4,5-
dimethoxy-2-nitrophenyl) ethanol (12) in THF (30mL) at 0οC. After stirring the mixture
overnight at room temperature, the solvent was removed in vacuum and 5mL of
dichloromethane was added. After overnight stirring, colorless needles of diethyl
hydrazinedicarboxylate precipitated. The precipitate was removed by filtration, the
filtrate evaporated in vacuum and the product was purified by flash chromatography (Si-
gel, dichloromethane/ethyl acetate 95:5). 1.04g of product (17) was obtained (Rf = 0.53,
80% yield). 1H-NMR spectrum (250 MHz, CDCl3) δ [ppm]: 7.51 (s, 1H), 6.93 (s, 1H), 6.42 (q,
1H), 5.85 (m, 1H), 5.10 (q, 2H), 5.05 (m, 2H), 3.88 (s, 6H), 3.05 (d, 2H), 1.55 (d, 3H)
ppm;
IR spectrum: 3358, 2981, 2933, 2889, 2520, 2368, 2235, 1925, 1658, 1524, 1457,
1372, 1336, 1275, 1094, 1057, 887 cm-1.
1-(4, 5-Dimethoxy-2-nitrophenyl) ethyl 5-(triethoxysilyl) pentanoate (18):
0.93g (3.15mmol) of (17) and 5.09g (31.5mmol) of triethoxysilane were placed into
a previously HMDS-passivated dry round bottom flask and heated under argon
atmosphere to 80οC. At this temperature both reactants mix homogeneously. Six drops of
1.6% H2PtCl6 in isopropanol were added in 3 times over the course of the reaction and the
mixture was allowed to react for 6 hours at 80οC and then stirred at room temperature
overnight. Completion of the reaction was monitored by TLC. Excess of triethoxysilane
was removed in vacuum and the liquid was purified by passivated chromatography (silica

Chapter 6 Experimental Section
108
gel, hexane/ethyl acetate 95:5). Product (18) (Rf = 0.8, hexane/ethyl acetate 95:5) was
obtained in 0.78g (50% yield).
1H-NMR spectrum (250 MHz, CDCl3) δ [ppm]: 7.50 (s, 1H), 7.19 (s, 1H), 5.65 (m,
1H), 4.14-3.70 (m, 12H), 1.46-1.11 (m, 16H), 0.77 (t, 2H) ppm;
IR spectrum: 3423, 2971, 2934, 1736, 1618, 1583, 1522, 1463, 1370, 1336, 1274,
1274, 1220, 1169, 1103, 1081, 1052, 955, 873, 794, 758 cm-1;
UV/Vis (THF) spectrum: λmax, abs = 296, 340 nm.
6.3.9 1-(3,5-Dimethoxyphenyl)-2-oxo-2-phenylethyl 3-(triethoxysilyl) propyl
carbamate (22)
1-(Ethoxy (phenyl) methyl)-1H-benzotriazole (19):
A mixture of benzaldehyde (2.12g, 20mmol), benzotriazole (2.98g, 25mmol),
absolute EtOH (1.84g, 40mmol), triethyl orthoformate (8.88g 60mmol), and a catalytic
amount of sulfuric acid (6 drops) was stirred in THF (30mL) for 2 hours at room
temperature and followed by refluxing for 3 hours. Diethylether (200mL) was then added,
and the solution was washed with saturated Na2CO3 solution (2×100mL) and water
(100mL). The solvent was dehydrated by dry CaCl2. Evaporation of the solvents gave a
residue, which was chromatographed on silica gel (hexane/ethylacetate=15:4). 3.29g of
colorless viscous liquid (19) was obtained (Rf = 0.59, hexane/ethylacetate=15:4). The
yield was 65%.
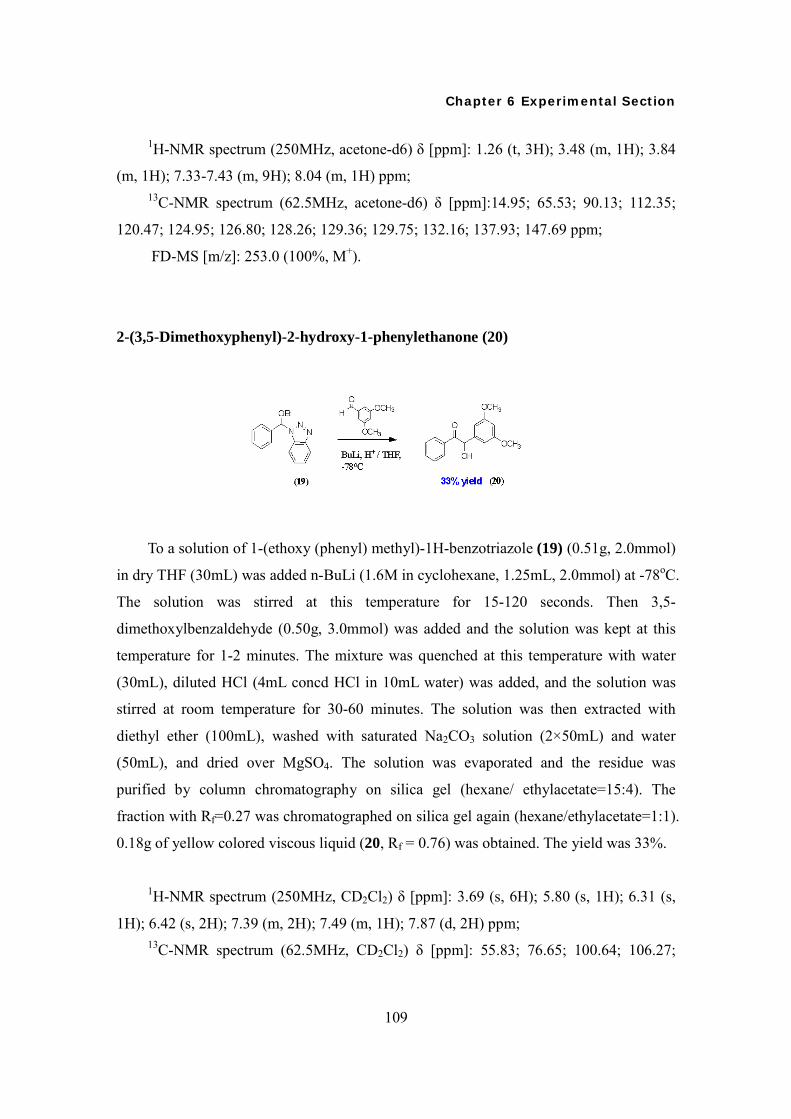
Chapter 6 Experimental Section
109
1H-NMR spectrum (250MHz, acetone-d6) δ [ppm]: 1.26 (t, 3H); 3.48 (m, 1H); 3.84
(m, 1H); 7.33-7.43 (m, 9H); 8.04 (m, 1H) ppm; 13C-NMR spectrum (62.5MHz, acetone-d6) δ [ppm]:14.95; 65.53; 90.13; 112.35;
120.47; 124.95; 126.80; 128.26; 129.36; 129.75; 132.16; 137.93; 147.69 ppm;
FD-MS [m/z]: 253.0 (100%, M+).
2-(3,5-Dimethoxyphenyl)-2-hydroxy-1-phenylethanone (20)
To a solution of 1-(ethoxy (phenyl) methyl)-1H-benzotriazole (19) (0.51g, 2.0mmol)
in dry THF (30mL) was added n-BuLi (1.6M in cyclohexane, 1.25mL, 2.0mmol) at -78oC.
The solution was stirred at this temperature for 15-120 seconds. Then 3,5-
dimethoxylbenzaldehyde (0.50g, 3.0mmol) was added and the solution was kept at this
temperature for 1-2 minutes. The mixture was quenched at this temperature with water
(30mL), diluted HCl (4mL concd HCl in 10mL water) was added, and the solution was
stirred at room temperature for 30-60 minutes. The solution was then extracted with
diethyl ether (100mL), washed with saturated Na2CO3 solution (2×50mL) and water
(50mL), and dried over MgSO4. The solution was evaporated and the residue was
purified by column chromatography on silica gel (hexane/ ethylacetate=15:4). The
fraction with Rf=0.27 was chromatographed on silica gel again (hexane/ethylacetate=1:1).
0.18g of yellow colored viscous liquid (20, Rf = 0.76) was obtained. The yield was 33%.
1H-NMR spectrum (250MHz, CD2Cl2) δ [ppm]: 3.69 (s, 6H); 5.80 (s, 1H); 6.31 (s,
1H); 6.42 (s, 2H); 7.39 (m, 2H); 7.49 (m, 1H); 7.87 (d, 2H) ppm; 13C-NMR spectrum (62.5MHz, CD2Cl2) δ [ppm]: 55.83; 76.65; 100.64; 106.27;

Chapter 6 Experimental Section
110
129.20; 129.52; 134.19; 134.43; 142.4; 161.85; 199.41ppm;
FD-MS [m/z]: 272.4 (100%, M+).
1-(3, 5-Dimethoxyphenyl)-2-oxo-2-phenylethyl allyl carbamate (21)
To a solution of 2-(3, 5-dimethoxyphenyl)-2-hydroxy-1-phenylethanone (20) (0.16g,
0.59mmol) in dry THF (10mL) was added triethylamine (0.18g, 1.8mmol) at -78oC. The
reaction mixture was stirred under argon atmosphere for 6 hours. Allylamine (0.034g,
0.59mmol) was dissolved in 5mL of dry THF. This solution was added dropwise to the
reaction mixture at -78oC. After 2 hours, the mixture was allowed to stir overnight at
room temperature. 100mL of diethylether was added to the mixture. The organic phase
was washed to neutral with Milli-Q water and dehydrated with dry MgSO4. The solvent
was evaporated and gave a residue which was chramatographed on silica gel
(hexane/ethylacetate 15:4). 0.09g of yellow colored viscous liquid (21, Rf = 0.2) was
obtained. The yield was 43%.
1H-NMR spectrum (250MHz, CDCl3) δ [ppm]: 3.73 (s, 6H); 3.74-3.81 (m, 2H);
4.50 (m, 1H); 5.10 (m, 1H); 5.83 (m, 1H); 6.34 (s, 1H); 6.46 (s, 1H); 6.58 (s, 1H); 7.40
(m, 2H); 7.53 (m, 1H); 7.91 (m, 2H) ppm; 13C-NMR spectrum (62.5MHz, CDCl3) δ [ppm]: 43.51; 55.30; 76.11; 100.39;
105.76; 116.24; 128.63; 129.05; 133.44; 133.90; 135.86; 140.99; 155.35; 161.20; 198.69
ppm;
FD-MS [m/z]: 355.3 (45%, M+);
UV/Vis (THF) spectrum: λmax, abs = 247nm.

Chapter 6 Experimental Section
111
1-(3,5-Dimethoxyphenyl)-2-oxo-2-phenylethyl 3-(triethoxysilyl) propylcarbamate
(22)
0.36g (1mmol) of allyl-carbamic acid 1-(3,5-dimethoxy-phenyl)-2-oxo-2-phenyl-
ethyl ester (21) was dissolved in 1.64g (10mmol) of triethoxysilane followed by 8 drops
of H2PtCl6/iso-propanol solution (20mg H2PtCl6 in 1mL iso-propanol). The mixture was
heated to 80°C in Ar atmosphere for 14 hours and cooled down to room temperature.
The excess of triethoxysilane was eliminated under vacuum. The residue was
purified by HMDS-passivated column chromatography (Si-gel, eluent: dichloromethane)
and 0.23g of colourless viscous liquid (22) was obtained (Rf = 0.24). The yield was 47%.
1H-NMR spectrum (250MHz, CD2Cl2) δ [ppm]: 0.55 (t, 2H); 1.15 (t, 9H); 1.60 (m,
2H); 2.40 (m, 2H); 3.70 (s, 6H); 3.75 (q, 6H); 6.37 (s, 1H); 6.52 (s, 2H); 6.67 (s,1H); 7.39
(m, 2H); 7.51 (m, 1H); 7.88 (m, 2H) ppm; 13C-NMR spectrum (62.5MHz, CD2Cl2) δ [ppm]: 10.87; 18.70; 23.34; 44.50; 55.96;
58.73; 77.95; 101.30; 107.08; 129.20; 134.04; 135.29; 136.36; 161.84; 173.61; 194.18
ppm;
FD-MS [m/z]: 521.1 (100%, M+);
UV/Vis (THF) spectrum: λmax, abs = 246nm.

Chapter 7 Summary
112
Chapter 7
Summary
The aim of this thesis was to investigate novel techniques to create complex
hierarchical chemical patterns on silica or quartz surfaces with micro to nanometer sized
features. These modified surfaces were used for functional group-selective surface
reactions and site-selective assembly of colloidal particles. For this purpose, novel
functionalized triethoxysilanes were synthesized by a modular convergent approache,
coupling 3-aminopropyltriethoxysilane and an amino-reactive fragment. After deposition
of these silanes as molecular layers onto planar silica and quartz surfaces, the functional
groups of these silanes form new functional surfaces (by liquid- or vapor phase
silanization) or even lateral functional patterns (by micro-contact printing or
photolithography) that allow further chemical reactions at these surfaces.
By the above mentioned modular approach triethoxysilanes with terminal t-butyl-,
maleimide-, succinimidyl-, and alkyne moieties were synthesized and surface layers were
prepared with them. Kinetic experiments with varying hydrolysis- and incubation times
were performed while monitoring changes in hydrophilicity of the functional surfaces
and the layer thickness to study the efficiency of silanization process. From these results
the hydrolysis conditions could be optimized in order to form uniform and well defined
self-assembled surface layers. In model reactions it was shown that their head groups can
further bind appropriate molecules due to their characteristic chemical reactivities.
Chapter 7 Summary
113
Furthermore, a series of novel photosensitive silanes with 1-(4,5-dimethoxy-2-
nitrophenyl)ethanol (CH3-NVoc)-protected -OH, -COOH and -NH2 functionalities, and
3,5-dimethoxybenzoin (Bzn)-protected -NH2 group were synthesized and characterized.
UV-Vis spectra of both CH3-NVoc and Bzn silanes were recorded in solution phase and
as SAMs on quartz surfaces for different irradiation times at the respective deprotection
wavelengths to optimize the photodeprotection step. By irradiation through a gold mask
in a UV mask aligner (365 nm) or a crosslinker (254 nm), both CH3-NVoc and Bzn
SAMs could be patterned with functional (photodeprotected / irradiated) and protected
(unirradiated) regions, respectively. The obtained functional pattern could be visualized
by site-selective staining with fluorescent probes. Furthermore, site-selective colloid
absorption could be observed on the photosensitive silane layer patterns after local
deprotection with light.
114
Bibliography
[Becker 1991] H.G.O Becker. Einfuehrung in die Photochemie. Deutscher Verlag d.
Wissenschaften, Berlin (1991).
[Bochet 2000] C. G. Bochet: Wavelength-Selective Cleavage of Photolabile Protecting
Groups, Tetrahedron Lett., 41, 6341-6346 (2000).
[Bochet 2002] Ch. G. Bochet: Photolabile Protecting Groups and Linkers, J. Chem. Soc.,
Perkin Trans. 1, 67, 125-162 (2002).
[Boos 2004] Diana Boos: Synthesis and Characterization of photoreactive Silanes for the
Self-Assembly on Functionalised Silica Surfaces, dissertation (2004), University of
Mainz.
[Braun 2003] F. Braun, L. Eng, S. Trogisch, B. Voit: Novel Labile Protected Amine
Terpolymers for the Preparation of Patterned Functionalized Surfaces: Synthesis and
Characterization, Macromolecular Chemistry and Physics, 204, 1486-1496 (2003).
[Burmeister 1999] F. Burmeister, W. Badowsky, T. Braun, W. Wieperich, J. Boneberg, P.
Leiderer, Colloidal Monolayer Lithography: A Flexible Approach for Nanostructuring of
Surfaces, Appl. Surf. Sci., 144, 461-466 (1999).
[Cameron 1991] J. F. Cameron, J. M. J. Frechet: Photogeneration of Organic Bases from

115
o-Nitrophenyl-Derived Carbamates, J. Am. Chem. Soc., 113, 4303-4313 (1991).
[Chamberlin 1966] J. W. Chamberlin: Use of the 3,5-Dimethoxybenzyloxycarbonyl
Group as a Photosensitive N-Protecting Group. J. Org. Chem., 31, 1658-1660 (1966).
[Chen 2000] K. M. Chen, X. Jiang, L. C. Kimerling, P. T. Hammond: Selectivity Self-
organization of Colloids on Patterned Polyelectrolyte Templates, Langmuir 16, 7825-
7834 (2000).
[Cheng 2006] W. Cheng, J. Wang, U. Jonas, G. Fytas, N. Stefanou, Observation and
Tuning of Hypersonic Bandgaps in Colloidal Crystals, Nat. Mater., 5, 830-836 (2006).
[Corey 1965] E. J. Corey, D. Seebach: Carbanions of 1,3-Dithianes. Reagents for C-C
Bond Formation by Nucleophilic Displacement and Carbonyl Addition, Angew. Chem.
Int. Ed. Engl., 4, 1075-1077 (1965).
[Davidson 1999] M. W. Davidson, M. Abramowitz, “Optical Microscopy”, Internet
article, http://micro.magnet.fsu.edu/primer/opticalmicroscopy.html, © 1998-2007 by M.
W. Davidson, M. Abramowitz, Olympus America Inc., and the Florida State University.
[del Campo 2005] A. Del Campo, D. Boos, H. W. Spiess, U. Jonas: Surface Modification
with Orthogonal Photosensitive Silanes for Sequential Chemical Lithography and Site-
selective Particle Deposition, Angew. Chem. Int. Ed. Engl. 44, 4707-4712 (2005).
[Dobkin web resource] D. M. Dobkin, “Silicon Dioxide: Properties and Applications”,
http://www.batnet.com/enigmatics/semiconductor_processing/CVD_Fundamentals/films/
SiO2_properties.html
[Dziomkina 2006] N. V. Dziomkina, M. A. Hempenius, G. J. Vancso: Synthesis of
Cationic Core-Shell Latex Particles, European Polymer Journal, 42, 81-91 (2006).

116
[Eckert 1987] H. Eckert, B. Forster: Triphosgene, a Crystalline Phosgene Substitute,
Angew. Chem. Int. Ed. Engl., 26, 984-985 (1987).
[Elender 1996] G.Elender, M.Kuener, E.Sackmann: Functionalisation of Si/SiO2 and
Glass Surfaces with Ultrathin Dextran Films and Deposition of Lipid Bilayers,
Biosensensors and Bioelectronics, 11, 565-577 (1996).
[Fadeev 1999] A. Y. Fadeev, T. J. McCarthy: Trialkylsilane Monolayers Covalently
Attached to Silicon Surfaces: Wettability Studies Indicating that Molecular Topography
Contributes to Contact Angle Hysteresis, Langmuir 15, 3759-3766 (1999).
[Fustin 2003] C. A. Fustin, G. Glasser, H. W. Spiess, U. Jonas: Site-Selective Growth of
Colloid Crystals with Photonic Properties on Chemically Patterned Surfaces, Adv. Mater.,
15, 1025-1028 (2003).
[Fustin 2004] Charles-André Fustin, Gunnar Glasser, Hans W. Spiess, Ulrich Jonas:
Parameters Influencing the Templated Growth of Colloidal Crystals on Chemically
Patterned Surfaces, Langmuir, 20, 9114-9123 (2004).
[Gates 2005] B. D. Gates, Q. Xu, M. Stewart, D. Ryan, C. G. Willson, G. M. Whitesides:
New Approaches to Nanofabrication: Molding, Printing, and Other Techniques, Chem.
Rev. 105, 1171-1196 (2005).
[Greene 1999] Theodora W. Green, Peter G. M. Wuts: Protective Groups in Organic
Synthesis (Third Edition); page 404-408, Wiley-Interscience Publication 1999.
[Hayashi 1999] Tamio Hayashi: Comprehensive Asymmetric Catalysis; page 319-333,
Springer 1999.
[Houseman 2003] Benjamin T. Houseman, Ellen S. Gawalt, Milan Mrksich: Maleimid-
Functionalized Self-Assembled Monolayers for the Preparation of Peptide and
117
Carbohydrate Biochips, Langmuir, 19, 1552-1531 (2003).
[Howland 1996] R. Howland, L. Benatar, “A Practical Guide to Scanning Probe
Microscopy”, Thermomicroscopes, Inc., Sunnyvale, CA, 1996, p73.
[Im 2002] S. H. Im, Y. T. Lim, D. J. Suh, O. O. Park: Three Dimensional Self-Assembly
of Colloids at a Water-Air Interface: A Novel Technique for the Fabrication of Photonic
Bandgap Crystals, Adv. Mater., 14, 1367-1369 (2002).
[Ishida 1984] H. Ishida, J. D. Miller: Substrate Effects of the Chemisorbed and
Physisorbed Layers of Methacryl Silane Modified Particulate Minerals, Macromolecules,
17, 1659-1666 (1984).
[Israelachvili 2002] Jacob Israelachvili: Intermolecular & Surfae Forces, Academic Press
(2002), London, UK
[Jonas 2002a] U. Jonas, A. del Campo, C. Kruger, G. Glasser, D. Boos: Colloidal
Assemblies on Patterned Silane Layers, Proc. Nat. Acad. Sci., 99, 5034-5039 (2002).
[Jonas 2002b] U. Jonas, C. Krueger: The Effect of Polar, Nonpolar, and Electrostatic
Interactions and Wetting Behaviour on the Particle Assembly at Patterned Surfaces, J.
Supramol. Chem., 2, 255-270 (2002).
[Katritzky 1995] A. R. Katritzky, H. Lang, Z. Wang, Z, Zhang, H. Song: Benzotriazole-
Mediated Conversions of Aromatic and Heteroaromatic Aldehydes to Functionalized
Ketones, J. Org. Chem., 60, 7619-7624 (1995).
[Kolb 2001] Hartmuth C. Kolb, M. G. Finn, K. Barry Sharpless: Click Chemistry:
Diverse Chemical Function from a Few Good Reactions. Angew. Chem. Int. Ed, 40,
2004-2021 (2001).
118
[Krüger 2001] Christian Krüger: Kolloidale Organisation auf lithographisch hergestellten
Silanschichten: Neue Möglichkeiten der Strukturbildung auf Oberflächen, dissertation
(2001), University of Mainz.
[Lee 2002] I. Lee, H. Zheng, M. F. Rubner, P. T. Hammond: Controlled Cluster Size in
Patterned Particle Arrays via Directed Adsorption on Confined Surfaces, Adv. Mater., 14,
572-577 (2002).
[Lewis 1975] F. D. Lewis, R. T. Lauterbach, H. G. Heine, W. Hartmann, H. Rudolph:
Photochemical α Cleavage of Benzoin Derivatives. Polar Transition States for Free-
Radical Formation, J. Am. Chem. Soc., 97, 1519-1525 (1975).
[Lipson 1996] M. Lipson, N. J. Turro: Picosecond Investigation of the Effect of Solvent
on the Photochemistry of Benzoin, J. Photochem. Photobiol. A. Chem., 99, 93-96 (1996).
[Lummerstorfer 2004] Thomas Lummerstorfer, Helmuth Hoffmann: Click Chemistry on
Surfaces: 1, 3-Dipolar Cycloaddition Reactions of Azide-Terminated Monolayers on
Silica. J. Phys. Chem. B, 108, 3963-3966 (2004).
[MacBeath 1999] Gavin MacBeath, Angela N. Koehler, Stuart L. Schreiber: Printing
Samll Molecules as Microarrays and Detecting Protein-Ligand Interactions en Mass. J.
Am. Chem. Soc., 121, 7967-7968 (1999).
[McGall 1997] G. H. McGall, A. D. Barone, M. Diggelmann, S. P. A. Fodor, E. Gentalen,
N. Ngo: The Efficiency of Light-Directed Synthesis of DNA Arrays on Glass Substrates,
J. Am.Chem.Soc., 119, 5081-5090 (1997).
[Min 2005]. S. Min, K. Ahn, J. Kim: Patterned Fluorescence Images Using a
Photocleavable NVOC-Protected Quinizarin, Bulletin of Korean Chemical Society, 26,
(9), 1437-1439 (2005).
119
[Oener 2000] D. Oener, T. J. McCarthy: Ultrahydrophobic Surfaces. Effects of
Topography Length Scales on Wettability, Langmuir 16, 7777-7782 (2000).
[Olympus Web Resouce] http://www.olympusfluoview.com/theory/index.html
[Ottl 1998] J. Ottl, D. Gabriel, G. Marriott: Preparation and Photoactivation of Caged
Fluorophores and Caged Proteins Using a New Class of Heterobifunctional,
Photocleavable Cross-Linking Reagents, Bioconjugate Chemistry, 9, 143-151 (1998).
[Pillai 1980] V. N. R. Pillai: Photoremovable Protecting Groups in Organic Synthesis,
Synthesis, 1, 1-26 (1980).
[Ramrus 2004] D. A. Ramrus, J. C. Berg: Characterization and Adhesion Testing of
Mixed Silane-treated Surface, J. Adhesion Sci. Technol., 18, 1395-1414 (2004).
[Sheehan 1964] J. C. Sheehan, R. M.Wilson: Photolysis of Desyl Compounds. A New
Photolytic Cyclization, J. Am. Chem. Soc., 86, 5277-5281 (1964).
[Sheehan 1971] J. C. Sheehan, R. M. Wilson, A. W. Oxford: The Photolysis of Methoxy-
Substituted Benzoin Esters. A Photosensitive Protecting Group for Carboxylic Acids, J.
Am. Chem. Soc., 93, 7222-7228 (1971).
[Stenger 1992] D. Stenger, J. H. Georger, C. S. Dulcey, J. J. Hickman, A. S. Rudolph, T.
B. Nielsen, S. M. McCort, J. M. Calvert: Coplanar Molecular Assemblies of Amino- and
Perfluorinated Alkylsilanes: Characterization and Geometric Definition of Mammalian
Cell Adhesion and Growth, J. Am. Chem. Soc., 114, 8435-8442 (1992).
[Stowell 1996] M. Stowell, R. S. Rock, D. C. Rees, S. I. Chan, A. A. Noyes: Efficient
Synthesis of Photolabile Alkoxy Benzoin Protecting Groups, Tetrahedron Lett., 37, 307-
310 (1996).
120
[Tadmor 2004] R. Tadmor: Line Energy and the Relation between Advancing, Receding,
and Young Contact Angles, Langmuir 20, 7659-7664 (2004).
[Taniguchi 1974] N. Taniguchi: On the Basic Concept of Nano-Technology, Proc. Intl.
Conf. Prod. Eng. Tokyo, Part II, Japan Society of Precision Engineering, 1974.
[Tieke 2001] B. Tieke, K.-F. Fulda, A. Kampes, Mono- and Multilayers of Spherical
Polymer Particles Prepared by Langmuir-Blodgett and Self-Assembly Techniques. In M.
Rosoff (eds.), Nano-Surface Chemistry, pp. 213-242. Marcl Dekker, New York (2001).
[Ulman 1991] A. Ulman, A Introduction to Ultrathin Organic Films from Langmuir-
Blodgett to Self-Assembly, Academic Press, London, UK (1991).
[Vossmeyer 1997] T. Vossmeyer, E. DeIonno, J. R. Heat: Light-Directed Assembly of
Nanoparticles, Angew. Chem. Int. Ed. Engl., 36, 1080-1084 (1997).
[Vossmeyer 1998] T. Vossmeyer, S. Jia, E. DeIonno, M. R. Diehl, S. H. Kim, X. Peng, A.
P. Alivisatos, J. R.Heath: Combinatorial Approaches Toward Patterning Nanocrystals, J.
Appl. Phy. 84, 3664-3670 (1998).
[Whitesides 2001] G. M. Whitesides, J. C. Love, “The Art of Building Small”, Scientific
American 285, 38-47(2001).
[Wilhelm 1998] S. Wilhelm, B. Groeber, M. Gluch, H. Heinz, “Confocal Laser Scanning
Microscopy: Principles”, Internet article, www.zeiss.de, Carl Zeiss Jena (1998).
[Wojtyk 2002] J. T. C. Wojtyk, K. A. Morin, R. Boukherroub, D. D. M. Wayner:
Modification of Porous Silicon Surfaces with Activated Ester Monolayers. Langmuir, 18,
6081-6087 (2002).

121
[Xia 1998] Y. Xia, G. M. Whitesides: Soft Lithography, Angew. Chem. Int. Ed. Engl., 37,
550-575 (1998).
[Xia 1999] Y. Xia, J. A. Rogers, K. E. Paul, G. M. Whitesides: Unconventional Methods
for Fabricating and Patterning Nanostructures, Chem. Rev., 99, 1823-1848 (1999).
[Xia 2000] Y. Xia, B.Gates, Y. Yin, Y. Lu: Monodispersed Colloidal Spheres: Old
Materials with New Applications, Adv. Mater., 12, 693-713 (2000).
[Zhuravlev 1987] L. T. Zhuravlev: Concentration of Hydroxyl Groups on the Surface of
Amorphous Silicas, Langmuir, 3, 316-318 (1987).

122
Curriculum Vitae
Xiaosong Li
Personal Details:
Date of Birth: 15-02-1979
Place of Birth: Peking, China
Nationality: China
University Education:
01/2005-01/2008 Ph.D. Studies
Max Planck Institute for Polymer Research &
Johannes Gutenberg-University of Mainz
03/2003-12/2004 Master of Science
Max Planck Institute for Polymer Research &
Johannes Gutenberg-University of Mainz
09/1997-07/2001 Bachelor of Science
Peking University
School Education:
09/1994-07/1997 Beijing No. 22 Middle School (Senior High School)
09/1991-07/1994 Beijing No. 22 Middle School (Junior High School)
09/1985-07/1991 Beijing He-Ping-Li No. 9 Elementary School