TECHNISCHE UNIVERSITÄT MÜNCHEN - TUM · Dr. Franco Moritz, Dr. Sara Forcisi and Dr. Chloe...
193
TECHNISCHE UNIVERSITÄT MÜNCHEN Lehrstuhl für Analytische Lebensmittelchemie Comprehensive Characterization of Dissolved Organic Matter by Using Chemical Fractionation and High Resolution Organic Structural Spectroscopy Yan Li Vollständiger Abdruck der von der Fakultät Wissenschaftszentrum Weihenstephan für Ernährung, Landnutzung und Umwelt der Technischen Universität München zur Erlangung des akademischen Grades eines Doktors der Naturwissenschaften genehmigte Dissertation. Vorsitzender: Prof. Dr. Jürgen Geist Prüfer der Dissertation: 1. apl. Prof. Dr. Philippe Schmitt-Kopplin 2. Prof. Dr. Michael Rychlik 3. Prof. Dr. Boris P. Koch (Hochschule Bremerhaven) Die Dissertation wurde am 15.02.2017 bei der Technischen Universität München eingereicht und durch die Fakultät Wissenschaftszentrum Weihenstephan am 29.05.2017 angenommen.
Transcript of TECHNISCHE UNIVERSITÄT MÜNCHEN - TUM · Dr. Franco Moritz, Dr. Sara Forcisi and Dr. Chloe...

TECHNISCHE UNIVERSITÄT MÜNCHEN
Lehrstuhl für Analytische Lebensmittelchemie
Comprehensive Characterization of Dissolved Organic Matter by
Using Chemical Fractionation and High Resolution Organic Structural
Spectroscopy
Yan Li
Vollständiger Abdruck der von der Fakultät Wissenschaftszentrum Weihenstephan für Ernährung,
Landnutzung und Umwelt der Technischen Universität München zur Erlangung des akademischen
Grades eines
Doktors der Naturwissenschaften
genehmigte Dissertation.
Vorsitzender: Prof. Dr. Jürgen Geist
Prüfer der Dissertation: 1. apl. Prof. Dr. Philippe Schmitt-Kopplin
2. Prof. Dr. Michael Rychlik
3. Prof. Dr. Boris P. Koch
(Hochschule Bremerhaven)
Die Dissertation wurde am 15.02.2017 bei der Technischen Universität München eingereicht und
durch die Fakultät Wissenschaftszentrum Weihenstephan am 29.05.2017 angenommen.


i
For my parents
For Dr. Ayer Yediler
ii
Acknowledgements
First and foremost thanks to my supervisors Dr. Norbert Hertkorn and Prof. Dr. Philippe
Schmitt-Kopplin. Thanks to both of them for their supervision of my thesis and guidance to
the DOM world with their state-of-art instruments together with their careful yet open-minded
scientific attitudes and continuously high motivation as well as their great efforts for my
future career. Particular thanks to Prof. Dr. Philippe Schmitt-Kopplin for his wide research
areas and creative ideas, and Dr. Norbert Hertkorn for his expertise on NMR. Further thanks
to Prof. Dr. Boris P. Koch for taking time on paper discussions, DOC measurement and
arrangement of North Sea sampling trip. Additionally thanks to Dr. Michael Gonsior for being
my external supervisor in the thesis committee as well as his guidance on fluorescence
spectroscopy.
My great thanks to wonderful BGC colleagues. BGC is an amazing group to work in from
both academic and social point of view, where I have learnt a lot and meanwhile have enjoyed
myself. Special thanks to Dr. Mourad Harir for the patient but cheerful guidance and endless
discussions on the experiments, data analysis and papers, and Dr. Basem Kanawati for the
guidance on FT-ICR MS measurements. Dr. Mourad Harir’s persistence to work and Dr.
Basem Kanawati’s passion to learn different subjects have set good examples for my future
work. Great thanks to Dr. Marianna Lucio for the guidance on statistical data analysis which
improves the thesis to a great level, Dr. Silke Heinzmann for the guidance and help on NMR,
Dr. Franco Moritz, Dr. Sara Forcisi and Dr. Chloe Roullier-Gall for the insightful discussions,
Dr. Alesia Walker for the help on the introduction of FT-ICR MS and thesis writing, and
Kirill Smirnov for the help on data visualization by using R and MATLAB. Also thanks to the
technical assistance from Brigitte Look, Silvia Thaller and Jenny Uhl. Appreciation of the
wonderful PhD period with the nice colleagues including Tanja Maier, Theresa Bader, Sabine
Dvorski, Daniel Hemmler, Juliana Valle, Alexander Ruf, Ryan Bruce Gil and Nina Sillner.
Also great thanks to the knowledgeable and nice cooperation partners. Many thanks to Dr.
Peter Herzsprung for the organization of Elbe River sampling, guidance of fluorescence
spectroscopy and useful discussions, Prof. Stefan Peiffer for the cooperation of the peatland
study, and Prof. Rudolf Jaffe for lab exchange on size exclusion chromatography.
China Scholarhip Counser (CSC) and other funding sources are appreciated. I appreciate the
48-month financial support from CSC and 3-month financial support from Helmholtz

iii
Zentrum Muenchen. I am grateful to HELENA for the support in the conferences in ALSO
(2015) and NOM6 (2015), and the lab exchange in National High Magnetic Field Lab and
Florida International University (2016), and International Humic Substances Society (IHSS)
for the travel awards during the 17th
IHSS conference (2014).
Many thanks to my friends with whom we have had great fun in our wonderful period of life.
It was a great period that we have met people from different cultures and backgrounds, and
have had a great time together.
Deepest thanks to Dr. Ayfer Yediler who teaches me how to work, live and behave with her
great efforts. Gratitude to her for introducing me to BGC during my master study, finding a
nice student house for me where I have made friends and have the opportunity to enjoy the
fantastic location, and giving me her care, love and encouragement during the study.
Moreover, gratitude to her for showing me how to live in a colorful life and taking me to
galleries, museums, operas, ballets and so on. Without her, everything would not have been
possible.
My most significant thanks to my family for their unconditioned and constant love and
support. They provide me with the excellent background and give me the freedom to pursue
what I want without caring about social burdens.
iv
Summary
Dissolved organic matter (DOM) is an essential participant in the global carbon cycle of all
terrestrial ecosystems. However, its molecular compositions and structures remain largely ill-
defined even today due to extreme molecular heterogeneity and polydispersity. This thesis
focused on improving solid phase extraction (SPE) and SPE-based fractionation of freshwater
and marine DOM. The obtained DOM fractions were extensively characterized by optical
(UV and fluorescence) and NMR spectroscopy as well as by ultrahigh resolution FT-ICR
mass spectrometry.
Suwannee River (SR) water was used to study the effects of critical SPE variables such as
loading mass, concentration, flow rate and up-scaling on the extraction selectivity of the SPE
sorbents. High-field NMR and FT-ICR mass spectra of eluates, permeates and wash fluids
served to optimize DOM retention which reached 89% of DOC (dissolved organic carbon) at
a DOM/sorbent ratio of 1:800.
A polarity-based stepwise SPE procedure with separate collection of aliquots of methanolic
eluates produced molecularly distinct DOM fractions different from LC-based fractionation.
Reduction of sample complexity improved spectral resolution, and analogous clustering
according to fractions was obtained for fluorescence, NMR and mass spectra.
The molecular selectivity and leaching behavior of 24 SPE sorbents with SR and North Sea
(NS) water under conditions of pH=2 sorption and methanolic elution produced higher DOC
recovery in case of SR DOM. Analogous sorption mechanisms operated for both DOM
materials and the molecular distinction reflected intrinsic properties of SR and NS DOM. The
widely used HLB sorbent was found to leach.
From here, a phase-optimized solid phase extraction (POP-SPE) method was developed for
SR DOM isolation which jointly used several complementary SPE cartridges in succession.
POP SPE produced desirable overall DOM recovery and molecularly diverse fractions with
superior spectral resolution.
v
Zusammenfassung
Gelöstes organisches Material (dissolved organic matter, DOM) ist ein wesentlicher
Teilnehmer des globalen Kohlenstoffkreislaufes in allen terrestrischen Ökosystemen.
Allerdings bleiben dessen molekulare Zusammensetzung und chemische Struktur aufgrund
der extremen molekularen Heterogenität und Polydispersität bis heute weitgehend ungeklärt.
Diese Arbeit konzentrierte sich auf die Verbesserung der Festphasenextraktion (SPE) und die
SPE-basierte Fraktionierung von Süß- und Seewasser DOM. Die erhaltenen DOM-Fraktionen
wurden durch optische (UV- und Fluoreszenz-) und NMR-Spektroskopie sowie durch
ultrahochauflösende FT-ICR-Massenspektrometrie umfassend charakterisiert.
Suwannee River (SR) Wasser wurde verwendet, um die Auswirkungen von kritischen SPE-
Variablen wie Beladung, Konzentration, Durchfluss und Aufwärtsskalierung auf die
Extraktionsselektivität des SPE-Sorbens zu untersuchen. Hochfeld-NMR- und FT-ICR-
Massenspektren von Eluaten, Permeaten und Waschflüssigkeiten dienten zur Optimierung der
DOM-Retention, die 89% des DOC (gelöster organischer Kohlenstoff) bei einem DOM /
Sorbentverhältnis von 1:800 erreichte.
Ein polaritätsbasiertes schrittweises SPE-Verfahren mit separater Sammlung von Aliquots an
methanolischem Eluat erzeugte molekular unterschiedliche DOM-Fraktionen, die sich von
einer Fraktionierung auf LC-Basis unterscheiden. Die Verminderung der Probenkomplexität
verbesserte die spektrale Auflösung und es wurde ein analoges Clustering nach Fraktionen für
Fluoreszenz-, NMR- und Massenspektren erhalten.
Die molekulare Selektivität und die Stabilität von 24 SPE-Sorbentien mit SR und Nordsee
(NS) Wasser unter Bedingungen von Sorption bei pH = 2 und methanolischer Elution ergab
eine höhere DOC-Ausbeute im Falle von SR DOM, was bei gleichartigem
Trennmechanismus die Bedeutung der intrinsischen Eigenschaften von DOM widerspiegelt.
Das weit verbreitete HLB-Sorbens ist unter diesen Trennbedingungen nicht stabil.
Ausgehend hiervon wurde für die SR-DOM-Isolation eine phasenoptimierte
Festphasenextraktion (POP SPE) entwickelt, die mehrere hintereinandergeschaltete
komplementäre SPE-Kartuschen verwendete. POP SPE produzierte eine sehr gute Gesamt-
DOM-Rückgewinnung; die isolierten, molekular verschiedenen Fraktionen zeigten durchwegs
verbesserte spektrale Auflösung bezogen auf das unfraktionierte Ausgangsmaterial.

vi
Publications
1. Yan Li, Mourad Harir, Marianna Lucio, Basem Kanawati, Kirill Smirnov, Ruth Flerus,
Boris P. Koch, Philippe Schmitt-Kopplin, Norbert Hertkorn (2016). Proposed guidelines
for solid phase extraction of Suwannee River dissolved organic matter. Analytical
Chemistry (88), 6680-6688.
2. Yan Li, Mourad Harir, Marianna Lucio, Michael Gonsior, Boris P. Koch, Philippe Schmitt-
Kopplin, Norbert Hertkorn (2016). Comprehensive structure-selective characterization of
dissolved organic matter by reducing molecular complexity and increasing analytical
dimensions. Water Research (106), 477-487.
3. Chloé Roullier-Gall, Daniel Hemmler, Michael Gonsior, Yan Li, Maria Nikolantonaki,
Alissa Aron, Christian Coelho, Philippe Schmitt-Kopplin, Regis Gougeon (2017). Sulfites
and the wine sulfur metabolome. Food Chemistry (237), 106-113.
4. Yan Li, Mourad Harir, Jenny Uhl, Basem Kanawati, Marianna Lucio, Kirill Smirnov,
Boris P. Koch, Philippe Schmitt-Kopplin, Norbert Hertkorn (2017). How representative are
dissolved organic matter (DOM) extracts? A comprehensive study of sorbent selectivity
for DOM isolation. Water Research (116), 316-323.
5. Yan Li, Mourad Harir, Basem Kanawati, Michael Gonsior, Boris P. Koch, Philippe
Schmitt-Kopplin, Norbert Hertkorn (2017). Insights into dissolved organic matter
compositions and structures by phase-optimized solid phase extraction. Analytical
Chemistry. To be submitted.
vii
Contents
1 General Introduction ........................................................................................................................ 2
1.1 Introduction to DOM ............................................................................................................... 2
1.1.1 Definition of DOM .......................................................................................................... 2
1.1.2 Structures of DOM .......................................................................................................... 2
1.1.3 DOM from different origin .............................................................................................. 7
1.1.4 Functions of DOM ......................................................................................................... 14
1.2 Isolation techniques of DOM ................................................................................................ 16
1.3 Characterization approaches of DOM ................................................................................... 19
1.4 Objectives of the thesis .......................................................................................................... 20
1.5 References ............................................................................................................................. 22
2 Materials and Methods .................................................................................................................. 30
2.1 Sample preparation ................................................................................................................ 30
2.2 DOC measurement ................................................................................................................ 30
2.3 High-field FT-ICR MS analysis ............................................................................................ 30
2.4 NMR analysis ........................................................................................................................ 31
2.5 Optical spectroscopy ............................................................................................................. 31
2.6 Statistical analysis ................................................................................................................. 32
2.7 References ............................................................................................................................. 32
3 Review of the Relevant Literature ................................................................................................. 35
3.1 Isolation of DOM .................................................................................................................. 35
3.1.1 Physical isolation ........................................................................................................... 35
3.1.2 Chemical isolation ......................................................................................................... 36
3.1.3 Combination of physical and chemical isolation ........................................................... 46
3.2 Characterization of DOM ...................................................................................................... 47
3.2.1 Bulk analysis ................................................................................................................. 47
3.2.2 Optical spectroscopy ..................................................................................................... 49
3.2.3 Mass spectrometry (MS) ............................................................................................... 52

viii
3.2.4 Magnetic nuclear resonance (NMR) spectroscopy ........................................................ 64
3.2.5 Complementary analysis of DOM ................................................................................. 71
3.3 References ............................................................................................................................. 73
4 Proposed Guidelines for Solid Phase Extraction of Suwannee River Dissolved Organic Matter . 85
4.1 Summary ............................................................................................................................... 85
4.2 Author contributions .............................................................................................................. 86
5 Comprehensive Structure Selective Characterization of Dissolved Organic Matter by Reducing
Molecular Complexity and Increasing Analytical Dimensions ............................................................. 88
5.1 Summary ............................................................................................................................... 88
5.2 Author contributions .............................................................................................................. 89
6 How Representative Are Dissolved Organic Matter (DOM) Extracts? A Comprehensive Study of
Sorbent Selectivity for DOM Isolation .................................................................................................. 91
6.1 Abstract ................................................................................................................................. 91
6.2 Introduction ........................................................................................................................... 92
6.3 Methods ................................................................................................................................. 94
6.3.1 Sample Preparation ........................................................................................................ 94
6.3.2 DOC measurement ........................................................................................................ 95
6.3.3 FT-ICR MS analysis ...................................................................................................... 95
6.3.4 NMR analysis ................................................................................................................ 96
6.3.5 Statistical analysis ......................................................................................................... 96
6.4 Results and discussion ........................................................................................................... 97
6.4.1 Extraction efficiency ..................................................................................................... 97
6.4.2 FT-ICR mass spectrometry ............................................................................................ 99
6.4.3 1H NMR spectroscopic assessment of leaching behavior ............................................ 108
6.5 Conclusions ......................................................................................................................... 110
6.6 Acknowledgements ............................................................................................................. 110
6.7 References ........................................................................................................................... 110
7 Insights into Dissolved Organic Matter Compositions and Structures by Phase-optimized Solid
Phase Extraction (POP SPE) ............................................................................................................... 118

ix
7.1 Abstract ............................................................................................................................... 118
7.2 Introduction ......................................................................................................................... 119
7.3 Experimental section ........................................................................................................... 121
7.3.1 Sample preparation ...................................................................................................... 121
7.3.2 DOC measurement ...................................................................................................... 122
7.3.3 High-field FT-ICR MS analysis .................................................................................. 122
7.3.4 NMR analysis .............................................................................................................. 122
7.3.5 Optical spectroscopy ................................................................................................... 123
7.4 Results and discussions ....................................................................................................... 123
7.4.1 DOC recovery .............................................................................................................. 123
7.4.2 NMR spectra ................................................................................................................ 124
7.4.3 FT-ICR mass spectra ................................................................................................... 131
7.4.4 Fluorescence spectra .................................................................................................... 141
7.4.5 Complementary analysis ............................................................................................. 143
7.5 Conclusions ......................................................................................................................... 144
7.6 Acknowledgements ............................................................................................................. 144
7.7 References ........................................................................................................................... 144
8 Conclusions and Future Directions ............................................................................................. 152
8.1 Optimization of SPE procedure during eluting step ............................................................ 152
8.2 Further adaption of stepwise SPE of DOM and its applications ......................................... 153
8.3 POP SPE of DOM ............................................................................................................... 156
8.4 Advanced structure-related complementary analysis .......................................................... 156
8.5 References ........................................................................................................................... 157
9 Appendix ..................................................................................................................................... 159
9.1 Appendix 1: Supplementary Information for Chapter 6 ...................................................... 160
9.2 Appendix 2: Author contributions to Chapter 6 .................................................................. 172
9.3 Appendix 3: Author contributions to Chapter 7 .................................................................. 173
10 Curriculum Vitae ..................................................................................................................... 174
x
List of figures
Fig. 1-1 Approximate concentrations of DOM in ecosystems. .................................................. 7
Fig. 1-2 Workflow of this thesis. .............................................................................................. 21
Fig. 3-1 Current available approaches for DOM characterization by mass spectrometry. ...... 52
Fig. 3-2 Van Krevelen diagram of groups of various compounds and the lines indicative of
chemical reactivities. ................................................................................................................ 62
Fig. 3-3 Volumetric pixels in the form of analytical space for DOM characterization. .......... 72
Fig. 6-1 DOC recoveries of DOM extracts obtained with 24 commercially available sorbents.
The ratio was calculated with DOC recovery of SR DOM / DOC recovery of NS DOM.
Purple: non-polar; blue: mixed mode with anion exchange; orange: moderately non-polar and
mixed mode with cation exchange; green: weekly non-polar and mid-polar; red: polar and
strong ion exchange. ................................................................................................................. 98
Fig. 6-2 Average H/C and O/C elemental ratios of (left panel): SR DOM extracts, and (right
panel): NS DOM extracts derived from negative ESI FT-ICR mass spectra. Bubble size
indicated the average intensity obtained by FT-ICR mass spectra. The shaded section
indicates two groups of polar and strong ion exchange SPE resins, differing in relative
oxygen-deficiency (cf. text) ................................................................................................... 102
Fig. 6-3 Average mass-edited H/C ratios of (left panel): SR DOM extracts, and (right panel):
NS DOM extracts derived from negative ESI FT-ICR mass spectra. Bubble size indicated the
average intensity obtained by FT-ICR mass spectra .............................................................. 103
Fig. 6-4 (A) PCA of SR SPE-DOM extracts derived from negative ESI FT-ICR mass spectra;
(B) van Krevelen diagrams of the masses detected in common, unique in group A and unique
in group B; (C) mass-edited H/C ratios of the masses detected in common, unique in group A
and unique in group B. ........................................................................................................... 106
Fig. 6-5 (A) PCA of NS SPE-DOM extracts derived from negative ESI FT-ICR mass spectra;
(B) van Krevelen diagrams of the masses detected in common, unique in group A and unique
in group B; (C) mass-edited H/C ratios of the masses detected in common, unique in group A
and unique in group B. ........................................................................................................... 107
Fig. 6-6 PCA of original SR SPE-DOM extracts derived from 1H NMR section integrals (0.01
ppm resolution). ..................................................................................................................... 109
Fig. 7-1 1H NMR spectra (800 MHz, CD3OD) of (upper panel) individual and (middle panel)
POP SPE Suwannee River eluates. Bottom panel: Area-normalized superposition of (left)
individual and (right) POP SPE-eluates; color code: C8 (blue), MAX (red), PPL (green). ... 125

xi
Fig. 7-2 1H NMR difference spectra (800 MHz, CD3OD) of Suwannee River DOM: POP SPE
minus individual SPE cartridges: intensity > 0 is more abundant in POP SPE cartridges;
intensity < 0 is less abundant in POP SPE cartridges.Numbers provided denotes ratio of
difference / total integral; from top to bottom: C8 (blue, 1st), MAX (red, 2
nd), PPL (green, 3
rd).
Superposition of area-normalized 1H NMR spectra for both individual and POP SPE eluates
(Fig. 7-1) confirmed the abundance order of the key substructures in accordance with the
substructure integral values (Table 7-1): unsaturated Csp2H units eluates individual versus
POP SPE: C8 > PPL >> MAX versus 1_C8 > 3_PPL > 2_MAX; OCHn units: PPL > MAX >
C8 versus POP SPE-3PPL > -2MAX > -1C8; XCCH: MAX > PPL > C8 versus POP SPE-
2MAX > -3PPL > -1C8, and CCCH: C8 > MAX > PPL versus POP SPE-1C8 >POP SPE-
2MAX > POP SPE-3PPL. ...................................................................................................... 128
Fig. 7-3 13
C NMR spectra of SR DOM extracts obtained by POP SPE-1C8, -2MAX and -
3PPL respectively. Superimposed protonated carbon NMR resonances CH+CH2+CH3 (the
first column); DEPT-45 13
C NMR spectra (the second column) and multiplicity-edited 13
C
NMR spectra of CH (the third column), CH2 (the fourth column) and CH3 (the fifth column).
................................................................................................................................................ 130
Fig. 7-4 Negative electrospray 12T FT-ICR mass spectra of (Panel A) individual SPE eluates
and (panel B) POP SPE eluates; (left columns) mass spectra; (center columns): van Krevelen
diagrams and (right columns): mass-edited H/C ratios. The bottom row denotes the
consolidated molecular compositions of all three respective POP SPE eluates; bubble areas
correspond to the mass peak intensities. ................................................................................ 132
Fig. 7-5 Negative electrospray 12T FT-ICR mass spectra: comparative analysis of individual
SPE extract MAX and extract POP SPE-2MAX. Top panel: molecular compositions common
in both extracts MAX and POP SPE 2_MAX; center panel: molecular compositions unique to
individual extract MAX; bottom panel: molecular compositions unique to extract POP SPE-
2MAX. Left panels: van Krevelen diagrams of SR DOM extracts; right panels: mass edited
H/C ratios of SR DOM extracts. ............................................................................................ 135
Fig. 7-6 Negative electrospray 12T FT-ICR mass spectra: comparative analysis of individual
SPE extract PPL and extract POP SPE-3PPL. Top panel: molecular compositions common to
both extracts PPL and POP SPE 3_PPL; center panel: molecular compositions unique to
individual extract PPL; bottom panel: molecular compositions unique to extract POP SPE-
3PPL. Left panels: van Krevelen diagrams of SR DOM extracts; right panel: mass edited H/C
ratios of SR DOM extracts. .................................................................................................... 137
Fig. 7-7 Comparison of consolidated individual SPE extracts and consolidated POP SPE
extracts: Venn diagrams of the assigned molecular compositions: Venn diagram showing
counts of POP SPE extracts (blue) and individual extracts (yellow) in individual SPE extracts;
van Krevelen diagrams and mass edited H/C ratios of the molecular compositions, from top to
bottom: common to consolidated individual and POP SPE extracts; center: unique in
consolidated POP SPE extracts; bottom: unique to consolidated individual SPE extracts. ... 138
xii
Fig. 7-8 Comparison of the three individual SPE extracts, with (panel A) Venn diagrams,
showing the counts of the assigned molecular compositions; respective (left panels) van
Krevelen diagrams and (right panels) mass-edited H/C ratios of the respective (panel B)
unique and (panel C) shared compositions in (top row) all three SPE cartridges and respective
pairs of eluates as depicted in the figure. ............................................................................... 140
Fig. 7-9 Comparison and evolution of the three POP SPE extracts, with (panel A) Venn
diagrams, showing the counts of the assigned molecular compositions; respective (left panels)
van Krevelen diagrams and (right panels) mass-edited H/C ratios of the respective (left
column) unique, denoting manifest eluates, and (right column) computed shared molecular
compositions ........................................................................................................................... 141
Fig. 7-10 Excitation and emission matrix (EEM) fluorescence spectra of the (top row)
individual and (bottom row) POP SPE eluates....................................................................... 142
Fig. 8-113
C NMR spectra (12
CD3OD; 125 MHz) and 13
C NMR section integrals of River Elbe
DOM obtained by sequential elution of SPE/PPL with equal aliquots of methanol, showing a
continual decrease of carboxylic content and continual increase of aromatic carbon during
stepwise fractionation. ............................................................................................................ 154
Fig. 8-2 1H NMR spectra (
12CD3OD, 800 MHz) and 1H NMR section integrals of Elbe River
DOM obtained by sequential elution of SPE/PPL with equal aliquots of methanol, showing a
distinct presence of carbohydrates in the initial fraction, followed by a continual decrease of
CRAM and a continual increase of aliphatic protons during stepwise fractionation. ............ 155

xiii
List of tables
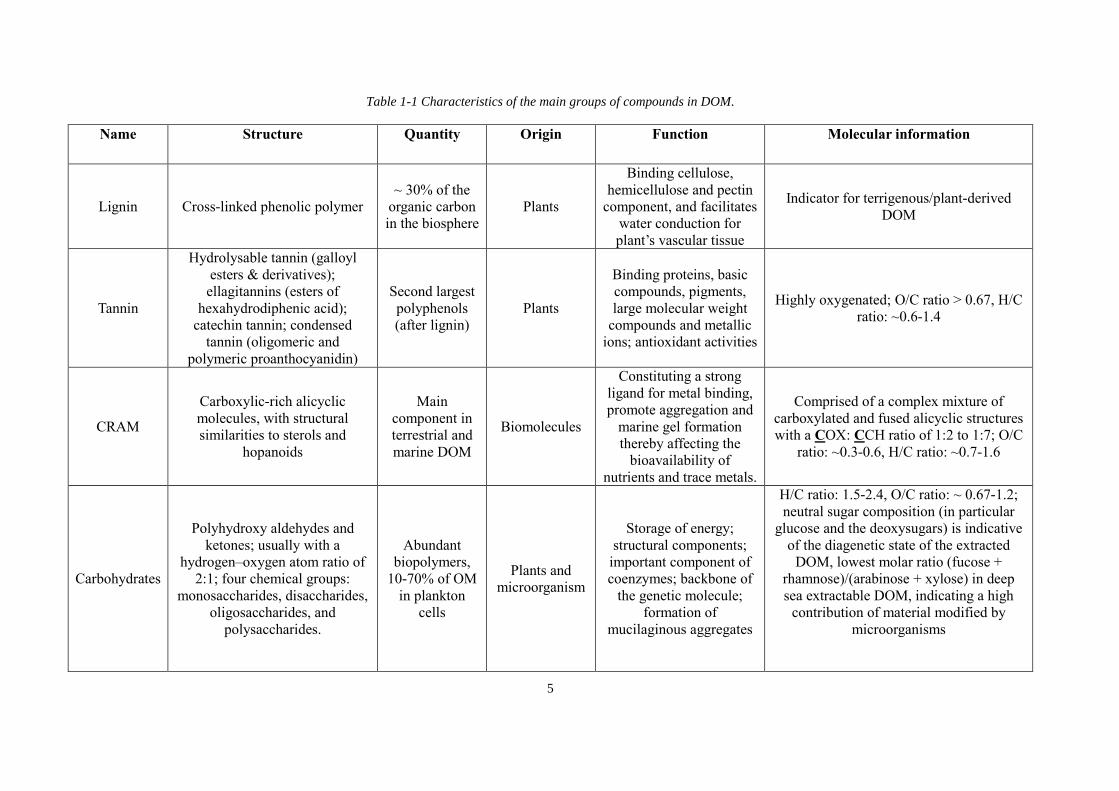
Table 1-1 Characteristics of the main groups of compounds in DOM ...................................... 5
Table 1-2 Molecular characteristics of DOM from different origin .......................................... 8
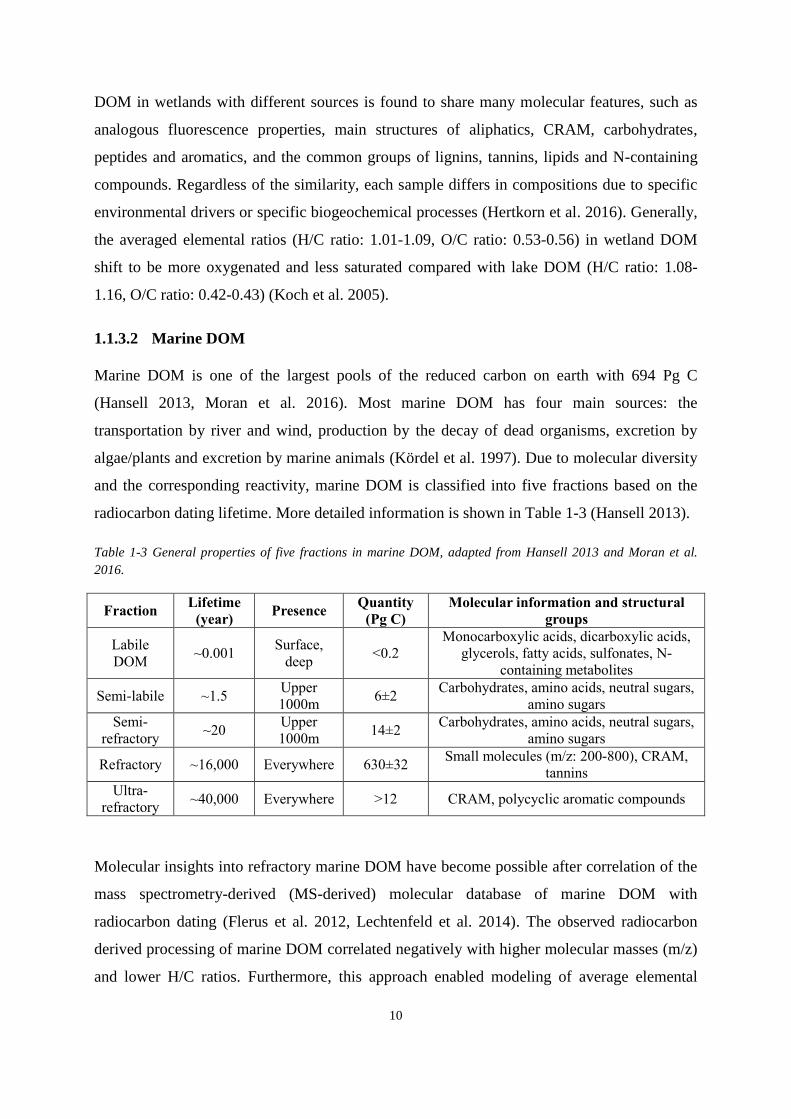
Table 1-3 General properties of five fractions in marine DOM. .............................................. 10
Table 1-4 Differences between surface and deep marine DOM. ............................................. 11
Table 1-5 Summary of DOM isolation techniques .................................................................. 17
Table 1-6 Comprehensive characterization approaches of DOM ............................................ 19
Table 3-1 Characteristics of optical indices ............................................................................. 51
Table 3-2 Characteristics of fluorescence peaks ...................................................................... 51
Table 3-3 Excitation-emission matrix fluorescence (EEM) spectra ........................................ 51
Table 3-4 Characteristics of ionization modes ......................................................................... 57
Table 3-5 General characteristics of mass analyzers................................................................ 61
Table 3-6 General tools used for MS-derived data visualization ............................................. 63
Table 3-7 Substructure properties of DOM at different 1H chemical shifts ............................. 67
Table 3-8 Key substructures at different 13
C chemical shifts ................................................... 68
Table 3-9 Properties of 1H and
13C NMR spectra .................................................................... 68
Table 3-10 Characteristics of 2D NMR spectra ....................................................................... 71
Table 7-1 1H NMR section integral (800 MHz, CD3OD) for key substructures of eluates
(manual integration) ............................................................................................................... 126
Table 7-2 13
C NMR section integral (125 MHz, 12
CD3OD; percent of total carbon) and key
substructures of eluates. Middle: substructures used for NMR-derived reverse mixing model
with nominal H/C and O/C ratios provided. Bottom: Percentage of methine, methylene and
methyl carbon related to total protonated 13
C NMR integrals as derived from 13
C DEPT NMR
spectra of eluates according to carbon multiplicity (left 3 colums) and relative proportions of
the CHn units binding to oxygen versus carbon chemical environments (cf. Fig. 7-3).......... 129
Table 7-3 Counts of mass peaks as computed from negative ESI FT-ICR mass spectra for
singly charged ions with nitrogen rule check and 500 ppb tolerance. Left panels: individual
SPE-eluates; center panel, shaded: consolidated POP SPE eluates; right panels: individual
POP SPE-eluates. ................................................................................................................... 133
xiv
List of abbreviations
AI: aromaticity index
APCI: atmospheric pressure chemical ionization
APPI: atmospheric pressure photoionization
CDOM: chromophoric dissolved organic matter
CE: capillary electrophoresis
CI: chemical ionization
COSY: correlation spectroscopy
CRAM: carboxylic-rich alicyclic molecules
DBE: double bond equivalent
DEPT: distortionless enhancement by polarization transfer
DESI: desorption electrospray ionization
DOC: dissolved organic carbon
DOM: dissolved organic matter
EEM: excitation-emission matrix
EI: electron ionization
ESI: electrospray ionization
FT-ICR: Fourier transformation ion cyclotron resonance
GC: gas chromatography
HILIC: hydrophilic interaction liquid chromatography
HMBC: heteronuclear multiple bond correlation
HSQC: heteronuclear single quantum coherence

xv
IC: ion chromatography
IHSS: International Humic Substances Society
IP: ion trap
JRES: J-resolved spectroscopy
LC: liquid chromatography
LDI: laser desorption/ionization
MALDI: matrix-assisted laser desorption/ionization
MS: mass spectrometry
NOM: natural organic matter
PARAFAC: parallel factor analysis
POP: phase-optimized
RO/ED: reverse osmosis / electrodialysis
SEC: size exclusion chromatography
SPE: solid phase extraction
STOCSY: statistical total correlation spectroscopy
TOCSY: total correlation spectroscopy
TOF: time of flight
UF: ultrafiltration
1
Chapter 1
General Introduction
2
1 General Introduction
1.1 Introduction to DOM
1.1.1 Definition of DOM
Natural organic matter (NOM) refers to organic materials in water, soil or sediment derived
from the activities of plants and animals (other than humans) in the environment (Brezonik
and Arnold, 2011). A fraction of NOM that passes through the filter (pore size: 0.1-1.0 µm,
mostly 0.45 µm) is defined as dissolved organic matter (DOM), and the fraction that is
retained on the filter is called particulate organic matter (POM) (Kördel et al. 1997, Mopper et
al. 2007, Nebbioso and Piccolo 2013). The definition of DOM is quite operational, rather than
according to its chemical structures, due to its molecular heterogeneity and polydispersity
(Hertkorn et al. 2007). Moreover, DOM can not only be dissolved but also be colloidal.
1.1.2 Structures of DOM
DOM is a mixture of organic compounds with abiotic and biotic origin such as lignins,
tannins, carboxylic-rich alicyclic molecules (CRAM), black carbon, carbohydrates, lipids,
peptides to name a few. The general properties of these key classes of DOM constituents are
listed in Table 1-1.
Lignins are the second most abundant terrestrial biopolymer, consisting ~ 30% of the organic
carbon in the biosphere (Boerjan et al. 2003). Biologically, lignins bind cellulose,
hemicellulose and pectin components, and facilitate water conduction for plant’s vascular
tissue. Chemically, lignins are cross-linked phenolic polymers, rendering them certain optical
characteristics, for example, absorption of ultraviolet radiation and possessing fluorescent
properties (Fichot et al. 2016). The compositions of lignins vary among plant species.
Generally, they are hydrophobic as well as aromatic, and contain small amounts of incomplete
or modified monolignols. They have become widely used biomarkers for terrestrial DOM in
the ocean (Hernes and Benner 2003).
Besides lignins, tannins are the second most abundant group of plant phenolics (Melone et al.
2013a, b). These polyhydroxyphenols are the secondary metabolites of plants and display two
main biological activities. Tannins bind proteins, basic compounds, pigments, large molecular
weight compounds and metal ions and they possess pronounced antioxidative quality (Melone
et al. 2013a, b). Tannins are typically divided into four chemical groups: hydrolysable tannins

3
(galloyl esters and derivatives), ellagitannins (esters of hexahydrodiphenic acid), catechin
tannins and condensed tannins (oligomeric and polymeric proanthocyanidin) (Melone et al.
2013a, b). Generally, tannins are highly oxygenated, with the atomic O/C ratios regularly
exceeding 0.67.
Carboxylic rich alicyclic molecules (CRAM) incorporate the major components of terrestrial
and marine DOM (Hertkorn et al. 2006, Simpson et al. 2007), and are comprised of the
carboxylated and fused alicyclic structures with a COX: CCH ratio of 1:2 to 1:7 (Hertkorn et
al. 2006). CRAM distribute in the compositional section with O/C ratios of ~0.3-0.6 and H/C
ratios: ~0.7-1.6. CRAM originate from biomolecules with structural similarities to sterols and
hopanoids, and actively involved in ecosystem processes such as complexation with metals,
aggregation and formation of marine gels (Hertkorn et al. 2006).
Carbohydrates make up one of the most abundant DOM pools, e.g. with ~ 10-70% of OM in
planktonic exudates (Engbrodt and Kattner 2005). In marine DOM, they account for up to 50%
of the total components in surface water whereas less than 30% in deep water (Benner et al.
1992). Chemically, they are constituted of polyhydroxy aldehydes and ketones, usually with a
hydrogen–oxygen atom ratio of 2:1, and cover the elemental section with H/C ratios of ~1.5-
2.4 and O/C ratios of ~ 0.67-1.2. There are typically four chemical groups of carbohydrates:
monosaccharides, disaccharides, oligosaccharides and polysaccharides. They serve diverse
functions in DOM activities such as storage of energy, structural components, important
component of coenzymes, backbone of the genetic molecule, formation of mucilaginous
aggregates and so on. Furthermore, the proportions of certain neutral sugars, in particular
glucose and the deoxysugars, can be used as indicator of the diagenetic state of the extracted
DOM. For example, a low molar ratio (fucose + rhamnose) / (arabinose + xylose) in deep sea
extractable DOM can imply a high contribution of material modified by microorganisms
(Engbrodt and Kattner 2005, Hunag et al. 2003).
Lipids account for an appreciable portion of DOM pool as well as ~ 3-20% biogenic carbon.
They consist of structurally heterogeneous groups of hydrophilic and hydrophobic small
molecules such as fatty acids, glycerolipids, glycerophospholipids, sphingolipids,
saccharolipids, polyketides, sterol lipids and prenol lipids. They play a significant role in the
DOM pool like storing energy, signaling, and acting as structural components of cell
membranes. Chemically, they are highly saturated and less oxygenated (H/C ratios: 1.5-2.0,
O/C ratios: 0-0.3). In DOM studies, they have been widely employed as biomarkers for

4
terrigenous and planktonic POM/DOM in various aquatic and sedimentary environments
(Bourguet et al. 2009, Mannino and Harvey 1999).
Amino acids, another significant contributor to the DOM pool, contain amide, amine and
carboxyl functional groups, along with aliphatic side-chains. They actively participate in
comprising proteins, neurotransmitter transport and biosynthesis. Moreover, they have been
widely applied as molecular indicators for bioavailable DOM in marine and groundwater
systems (Benner and Kaiser 2010).
5
Table 1-1 Characteristics of the main groups of compounds in DOM.
Name Structure Quantity Origin Function Molecular information
Lignin Cross-linked phenolic polymer
~ 30% of the
organic carbon
in the biosphere
Plants
Binding cellulose,
hemicellulose and pectin
component, and facilitates
water conduction for
plant’s vascular tissue
Indicator for terrigenous/plant-derived
DOM
Tannin
Hydrolysable tannin (galloyl
esters & derivatives);
ellagitannins (esters of
hexahydrodiphenic acid);
catechin tannin; condensed
tannin (oligomeric and
polymeric proanthocyanidin)
Second largest
polyphenols
(after lignin)
Plants
Binding proteins, basic
compounds, pigments,
large molecular weight
compounds and metallic
ions; antioxidant activities
Highly oxygenated; O/C ratio > 0.67, H/C
ratio: ~0.6-1.4
CRAM
Carboxylic-rich alicyclic
molecules, with structural
similarities to sterols and
hopanoids
Main
component in
terrestrial and
marine DOM
Biomolecules
Constituting a strong
ligand for metal binding,
promote aggregation and
marine gel formation
thereby affecting the
bioavailability of
nutrients and trace metals.
Comprised of a complex mixture of
carboxylated and fused alicyclic structures
with a COX: CCH ratio of 1:2 to 1:7; O/C
ratio: ~0.3-0.6, H/C ratio: ~0.7-1.6
Carbohydrates
Polyhydroxy aldehydes and
ketones; usually with a
hydrogen–oxygen atom ratio of
2:1; four chemical groups:
monosaccharides, disaccharides,
oligosaccharides, and
polysaccharides.
Abundant
biopolymers,
10-70% of OM
in plankton
cells
Plants and
microorganism
Storage of energy;
structural components;
important component of
coenzymes; backbone of
the genetic molecule;
formation of
mucilaginous aggregates
H/C ratio: 1.5-2.4, O/C ratio: ~ 0.67-1.2;
neutral sugar composition (in particular
glucose and the deoxysugars) is indicative
of the diagenetic state of the extracted
DOM, lowest molar ratio (fucose +
rhamnose)/(arabinose + xylose) in deep
sea extractable DOM, indicating a high
contribution of material modified by
microorganisms

6
Name Structure Quantity Origin Function Molecular information
Lipids
Hydrophilic and hydrophobic
small molecules, such as fatty
acids, glycerolipids,
glycerophospholipids,
sphingolipids, saccharolipids,
and polyketides; sterol lipids and
prenol lipids
A small portion
of DOM;
3-20% of
biogenic carbon
Microorganism
Storing energy, signaling,
and acting as structural
components of cell
membranes
Highly saturated & less oxygenated (H/C
ratio: 1.5-2.0, O/C ratio: 0-0.3);
biomarkers for terrigenous and planktonic
POM/DOM in various aquatic and
sedimentary environments
Amino acids
Containing amine and carboxyl
functional groups, along with a
side-chain
Small portion
of DOM Microorganism
Comprising proteins;
neurotransmitter transport
and biosynthesis
Molecular indicator for bioavailable DOM
in marine and groundwater system; key
source of nitrogen

7
1.1.3 DOM from different origin
The global carbon cycle distributes distinct DOM across ecosystems (Battin et al. 2009,
Bianchi 2011). The concentrations and qualities of DOM from different origin play a
significant role in the ecosystem in terms of DOM mobility, degradability and bioavailability
(Hedges et al. 1997). The DOM origin commonly provides a rough estimation of its
concentrations and consitituents, which the subsequent experiemal designs highly rely on. The
general concentrations (average or the range) of DOM samples from different origin (Kördel
et al. 1997) are shown in Fig. 1-1.
Fig. 1-1 Approximate concentrations of DOM in ecosystems, adapted from Kördel et al. 1997.
Generally, groups of compounds such as lignins, tannins, carbohydrates, amino acids, lipids
and aromatics are constituents in DOM, but their quantities vary significantly in different
DOM systems. For example, Nordic Lake DOM contained larger amounts of carbohydrates
and amino acids than Suwannee River DOM (http://humicsubstances.org/sugar.html and
http://humicsubstances.org/aminoacid.html). The detailed general molecular characteristics of
different DOM samples are summarized in Table 1-2.

8
Table 1-2 Molecular characteristics of DOM from different origin.
DOM type Abundant compounds Key structural and molecular characteristics
Freshwater
DOM CRAM, aliphatics, lignin, amino acids, tannins
Aliphatic in nature, N-containing compounds, high aromaticity, relativelg high
unsaturation
Marine DOM
(surface)
Carbohydrate-related substructures, oxygenated
aliphatics and acetate derivatives, CRAM, peptides,
lipids
Fewer methyl esters, higher DBE than freshwater DOM, more S-containg compounds
Marine DOM
(deep)
Carboxylic acids and ketones, C-based aliphatics,
CRAM, black carbon
More molecularly diverse than surface marine DOM, black sulfur, larger molecular
weight
Sedimentary
DOM
Lignins, tannin, black carbon, peptides, amino acids,
aliphatic compounds
Highly unsaturated compounds, N-containing compounds (S-containing compounds
in early digenetic region), DBE: 8.40-8.95
Soil DOM Lignins, black carbon, lipids, carbohydrates O/C: 0.4 (0.28-0.47), H/C: 1.50 (1.30-1.74), DBE: 6.35 (3.89-7.85), enriched of N-,
S-containing compounds, lowest unsaturation than other DOM
Groundwater
DOM Lignins, aromatics, amino acids, terpenoid
Smaller molecular weight, highly aliphatic, small fractions of bioavailble DOM and
bacterial-derived DOM, deplete in oxygen-containing functional groups, 5% of
aromatic carbon

9
1.1.3.1 Freshwater DOM
Frshwater DOM is formed as a product of autochthonous production/degradation (self-
production of microorganism/flora/fauna, metabolism, and natural decay) and allochthonous
input (leaching of plants and soils, and discharge by human beings) in rivers and lakes
(Kördel et al. 1997). Approximately 0.4 Pg C/year of the terrestrial and freshwater DOM is
transported into marine system via discharge (Hedges et al. 1997). Thus, these DOM are not
only essential to the global carbon and other elements cycles, but also crucial to the
biogeochemical balance of their specific ecosystem.
The main structural components in freshwater DOM consist of aliphatics (linear terpenoids),
CRAM, carbohydrates, peptides, lipids and small amounts of aromatics (Sleighter and
Hatcher 2008). Considerable variance is observed in structures among freshwater DOM of
different origin such as rivers, estuaries, lakes, and mangroves, e.g. lignins, tannins, lipids and
aromatics, especially those highly oxygenated tannins (O/C ratio: 0.67-1.0; H/C ratio: 0.6-0.8)
are depleted in coastal DOM (Sleighter and Hatcher 2008).
Lakes are reported to be shaped by precipitation, inflow and outflow of tributories, water
residence time and temperature, but its DOM commonly includes lipids, peptides,
carbohydrates, lignins, tannins and N-, S-containing compounds (Kellerman et al. 2014,
Kellerman et al. 2015, Goldberg et al. 2015, Zhang et al. 2014). The oxidized aromatic
compounds are preferentially removed during organic matter degradation whereas rather
saturated aliphatics and N-containing compounds more resistant to degradation are more
likely to persist in aquatic systems (Kellerman et al. 2014, 2015). Moreover, certain N-
containing components (proteinaceous materials) in relatively cold high-elevation lakes are
found to be rather refractory with 100-200 year residence time and those autochthonous
proteins can accumulate over a long time period. Seasonal shifts in the compositions and
structures of lake DOM are also observed. For example, more proteins are produced in spring
or summer time (Goldberg et al. 2015). A systematic study of DOM during and after
cyanobacterial bloom (summer to fall) in Taihu lake demonstrated the loss of HC-O units
(commonly carbohydrates) and aliphatic oxygenated groups and an increase in carbon bound
methyl, methylene and methine carbon as well as the reduction in molecular diversity. The
seasonal DOM transformation resulted in the smaller molecules, increased abundance of
CHNO compounds, and rapid processing or vanishing of simple carbohydrates and amino
acids type compounds in the metabolic pathways (Zhang et al. 2014).
10
DOM in wetlands with different sources is found to share many molecular features, such as
analogous fluorescence properties, main structures of aliphatics, CRAM, carbohydrates,
peptides and aromatics, and the common groups of lignins, tannins, lipids and N-containing
compounds. Regardless of the similarity, each sample differs in compositions due to specific
environmental drivers or specific biogeochemical processes (Hertkorn et al. 2016). Generally,
the averaged elemental ratios (H/C ratio: 1.01-1.09, O/C ratio: 0.53-0.56) in wetland DOM
shift to be more oxygenated and less saturated compared with lake DOM (H/C ratio: 1.08-
1.16, O/C ratio: 0.42-0.43) (Koch et al. 2005).
1.1.3.2 Marine DOM
Marine DOM is one of the largest pools of the reduced carbon on earth with 694 Pg C
(Hansell 2013, Moran et al. 2016). Most marine DOM has four main sources: the
transportation by river and wind, production by the decay of dead organisms, excretion by
algae/plants and excretion by marine animals (Kördel et al. 1997). Due to molecular diversity
and the corresponding reactivity, marine DOM is classified into five fractions based on the
radiocarbon dating lifetime. More detailed information is shown in Table 1-3 (Hansell 2013).
Table 1-3 General properties of five fractions in marine DOM, adapted from Hansell 2013 and Moran et al.
2016.
Fraction Lifetime
(year) Presence
Quantity
(Pg C)
Molecular information and structural
groups
Labile
DOM ~0.001
Surface,
deep <0.2
Monocarboxylic acids, dicarboxylic acids,
glycerols, fatty acids, sulfonates, N-
containing metabolites
Semi-labile ~1.5 Upper
1000m 6±2
Carbohydrates, amino acids, neutral sugars,
amino sugars
Semi-
refractory ~20
Upper
1000m 14±2
Carbohydrates, amino acids, neutral sugars,
amino sugars
Refractory ~16,000 Everywhere 630±32 Small molecules (m/z: 200-800), CRAM,
tannins
Ultra-
refractory ~40,000 Everywhere >12 CRAM, polycyclic aromatic compounds
Molecular insights into refractory marine DOM have become possible after correlation of the
mass spectrometry-derived (MS-derived) molecular database of marine DOM with
radiocarbon dating (Flerus et al. 2012, Lechtenfeld et al. 2014). The observed radiocarbon
derived processing of marine DOM correlated negatively with higher molecular masses (m/z)
and lower H/C ratios. Furthermore, this approach enabled modeling of average elemental

11
compositions of the slowest degradating fractions in the DOM pool. The molecular formulae
of the most persistent compounds covered a narrow range: H/C ratio at 1.17±0.13, O/C ratio
0.52±0.10 as well as molecular weights at 360±28 and 497±51 m/z (Flerus et al. 2012, Lechtenfeld
et al. 2014). Based on the previous results, molecular transformation of marine DOM by
microorganisms was investigated for a relatively short (70 days) and a rather long (2 years)
term (Koch et al. 2014). Using glucose as substrate, the molecular characteristics of DOM
after short term microbial incubation were different from those of the refractory marine DOM,
and those after long term incubation showed the similarity with this microbial-derived marine
organic matter (Koch et al. 2014). In addition to the molecular information and the formation
of refractory marine DOM, a rough quantification of refractory marine DOM together with
the compositional relationships was also possible. Marine DOM was shown to be degraded
faster with larger molecular size, and it was estimated that the production rates of the small,
refractory marine DOM ranged at 0.11-0.14 Gt/year carbon and ~0.005 Gt/year for dissolved
orgniac nitrogen in the deep ocean (Walker et al. 2016).
However, due to non-ambiguous distinction of structural groups among the marine DOM
fractions as well as operation problems (Hansell 2013), the two terms of surface (<25 m) and
deep (>2400 m) marine DOM are applied more widely in the studies. In general, the five
fractions are present in both surface and deep marine DOM, but vary significantly in
proportions. There are less than 25% of carbohydrates, amino acids, lipids and amino sugars
in deep marine DOM whereas these compounds constitute high percentage (25-50%) in the
surface marine DOM (Koch et al. 2005). More detailed properties of surface and deep marine
DOM are shown in Table 1-4 (Hedges et al. 1997).
Table 1-4 Differences between surface and deep marine DOM, adapted from Hedge et al. 1997.
Sample C/N ratio ∆14
C (‰) δ13C (‰) δ15
N (‰)
Surface 16.5±0.7 -263±23 -21.7±0.2 +7.9±0.8
Deep 18.6±0.6 -546±14 -21.7±0.3 +8.1±0.6
Detailed comparison of open ocean surface and deep marine DOM (the South Atlantic Ocean)
by NMR spectroscopy and MS presented the structural differences occurred mainly in five
groups (Hertkorn et al. 2013). First, oxygenated aliphatics declined from surface to deep, and
12
they declined for methine, methylene and methyl carbon. Second, fewer methyl esters were
found in surface marine DOM than at the fluorescence maximum at 48 depth, probably as a
result of direct exposure to sunlight. In addition, the carbon-based aliphatics, CRAM as well
as other carboxylic acids and ketones increased from surface to deep. The molecular diversity
of marine DOM and the average molecular weights slightly increased with depth. Certain
rather aliphatic CHOS and CHNOS molecular series were exclusively observed in the surface
DOM whereas the unsaturated and rather oxygenated CHO and CHNO series were enriched
in the deep (Hertkorn et al. 2013). Aromatic CHOS molecules (black sulfur) were solely
detected in abyssal marine DOM near the ocean floor at 5446m depth. Nevertheless, the
surface and deep marine DOM still share more than 50% of common molecular formulae, and
those shared molecular compositions covered in analogous sections of H/C and O/C ratios as
computed for the refractory DOM (Hertkorn et al. 2013).
Along gradient from riverine to marine waters (from land to sea), the DOM was found to
become more aliphatic and less oxygenated but a considerable proportion of common
formulae remained (Sleighter and Hatcher 2008). Marine DOM was found to share ~1/3 of
the formulae with terrestrial DOM, which might be attributed to the presence of refractory
DOM or arise from isomers with different chemical structures at the same formulae (Koch et
al. 2005, Sleighter and Hatcher 2008).
1.1.3.3 Groundwater DOM
Groundwater DOM has the important origin from surface plant litter and soils, and it serves as
a carbon and energy source for heterotrophic metabolism and drives the bioremediation of
many pollutants (Shen et al. 2014).
Lignin phenols, as biomarkers of plant-derived DOM, were relatively deplete in groundwater
DOM with low concentrations, indicative of substantial removal of plant-derived compounds
during transportation (Shen et al. 2014). Biotic transformation was observed in plant-derived
DOM in groundwater system, and depletion of oxygen resulted in decrease of aromatic
compounds and carbohydrates together with increase of aliphatics (Einsiedl et al. 2007). By
using certain amino acids (e.g. glycine) as indicators of bioavailable DOM and specific amino
acids (e.g. D-enantiomers) as biomarkers of bacterial-derived DOM, groundwater DOM was
reported to contain a small bioavailable fraction and a small bacterial-derived fraction (Shen
et al. 2014). Compared to surface DOM, it exhibited lower molecular weights. After linking
13
the hydrology with composition and bioactivity of groundwater DOM, a conceptual regional
chromatography model was applied to groundwater systems demonstrating a selective
removal and differential retention of DOM during transport from surface to ground waters.
The DOM sorption processes were rather complex and were highly related to the molecular
properties such as molecular size, hydrophobicity, charge and so on. For instance, large and
hydrophobic molecules like lignins were retained longer through soil columns whereas the
small and hydrophilic molecules such as amino acids and carbohydrates eluted faster to the
groundwater (Shen et al. 2014).
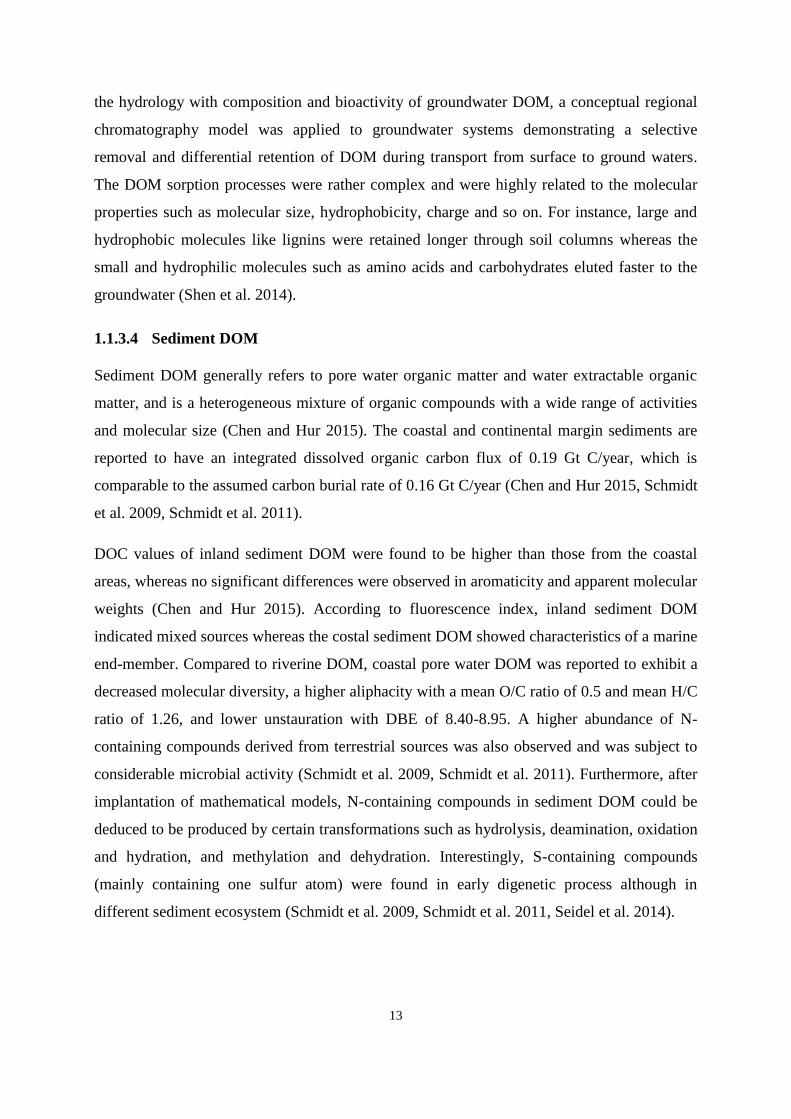
1.1.3.4 Sediment DOM
Sediment DOM generally refers to pore water organic matter and water extractable organic
matter, and is a heterogeneous mixture of organic compounds with a wide range of activities
and molecular size (Chen and Hur 2015). The coastal and continental margin sediments are
reported to have an integrated dissolved organic carbon flux of 0.19 Gt C/year, which is
comparable to the assumed carbon burial rate of 0.16 Gt C/year (Chen and Hur 2015, Schmidt
et al. 2009, Schmidt et al. 2011).
DOC values of inland sediment DOM were found to be higher than those from the coastal
areas, whereas no significant differences were observed in aromaticity and apparent molecular
weights (Chen and Hur 2015). According to fluorescence index, inland sediment DOM
indicated mixed sources whereas the costal sediment DOM showed characteristics of a marine
end-member. Compared to riverine DOM, coastal pore water DOM was reported to exhibit a
decreased molecular diversity, a higher aliphacity with a mean O/C ratio of 0.5 and mean H/C
ratio of 1.26, and lower unstauration with DBE of 8.40-8.95. A higher abundance of N-
containing compounds derived from terrestrial sources was also observed and was subject to
considerable microbial activity (Schmidt et al. 2009, Schmidt et al. 2011). Furthermore, after
implantation of mathematical models, N-containing compounds in sediment DOM could be
deduced to be produced by certain transformations such as hydrolysis, deamination, oxidation
and hydration, and methylation and dehydration. Interestingly, S-containing compounds
(mainly containing one sulfur atom) were found in early digenetic process although in
different sediment ecosystem (Schmidt et al. 2009, Schmidt et al. 2011, Seidel et al. 2014).
14
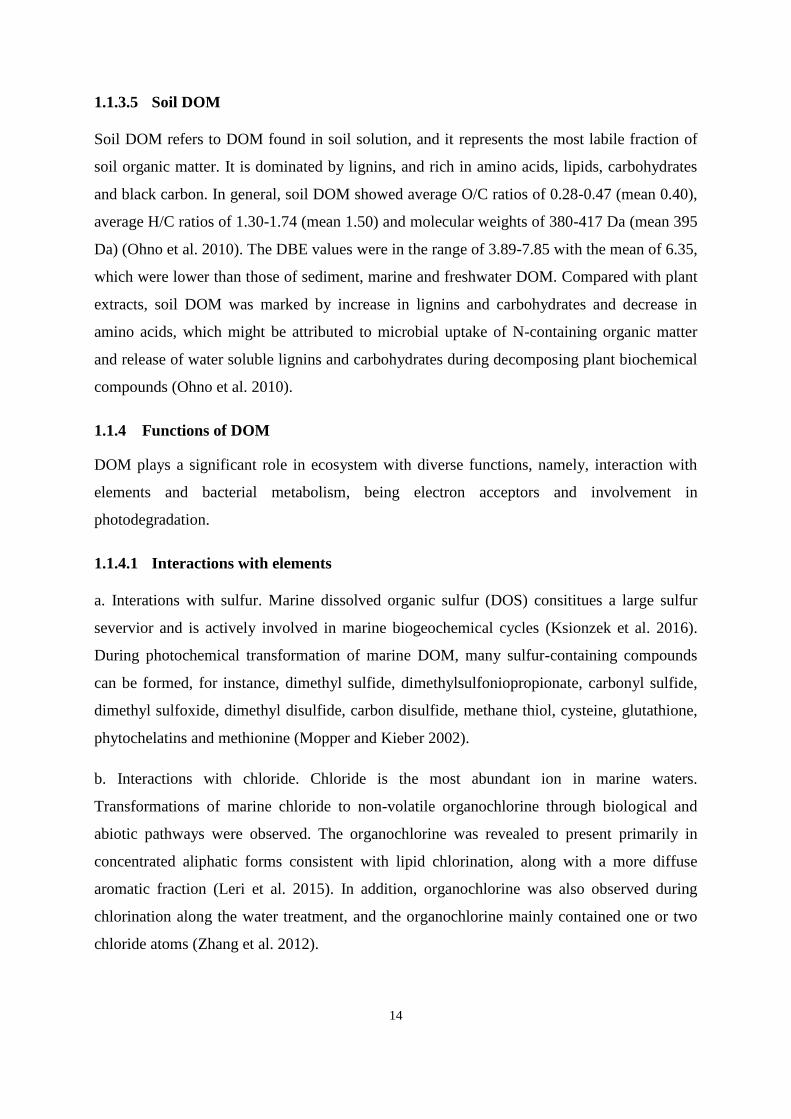
1.1.3.5 Soil DOM
Soil DOM refers to DOM found in soil solution, and it represents the most labile fraction of
soil organic matter. It is dominated by lignins, and rich in amino acids, lipids, carbohydrates
and black carbon. In general, soil DOM showed average O/C ratios of 0.28-0.47 (mean 0.40),
average H/C ratios of 1.30-1.74 (mean 1.50) and molecular weights of 380-417 Da (mean 395
Da) (Ohno et al. 2010). The DBE values were in the range of 3.89-7.85 with the mean of 6.35,
which were lower than those of sediment, marine and freshwater DOM. Compared with plant
extracts, soil DOM was marked by increase in lignins and carbohydrates and decrease in
amino acids, which might be attributed to microbial uptake of N-containing organic matter
and release of water soluble lignins and carbohydrates during decomposing plant biochemical
compounds (Ohno et al. 2010).
1.1.4 Functions of DOM
DOM plays a significant role in ecosystem with diverse functions, namely, interaction with
elements and bacterial metabolism, being electron acceptors and involvement in
photodegradation.
1.1.4.1 Interactions with elements
a. Interations with sulfur. Marine dissolved organic sulfur (DOS) consititues a large sulfur
severvior and is actively involved in marine biogeochemical cycles (Ksionzek et al. 2016).
During photochemical transformation of marine DOM, many sulfur-containing compounds
can be formed, for instance, dimethyl sulfide, dimethylsulfoniopropionate, carbonyl sulfide,
dimethyl sulfoxide, dimethyl disulfide, carbon disulfide, methane thiol, cysteine, glutathione,
phytochelatins and methionine (Mopper and Kieber 2002).
b. Interactions with chloride. Chloride is the most abundant ion in marine waters.
Transformations of marine chloride to non-volatile organochlorine through biological and
abiotic pathways were observed. The organochlorine was revealed to present primarily in
concentrated aliphatic forms consistent with lipid chlorination, along with a more diffuse
aromatic fraction (Leri et al. 2015). In addition, organochlorine was also observed during
chlorination along the water treatment, and the organochlorine mainly contained one or two
chloride atoms (Zhang et al. 2012).

15
c. Interactions with iron species. Iron is an important micronutrient for plants and
mircroorganisms in the ecosystem, and is found to be strongly associated with DOM. The
ferric iron could be stabilized by DOM as small iron oxide colloids (able to pass a 0.45 µm
dialysis membrane), which affects its bioavailability (Peiffer et al. 1999). In addition, positive
correlation of DOM and iron concentration was observed, and the coupling of DOM with iron
fluxes could imply that DOM exports partially was caused by increasing activities in iron
reduction (Knorr 2013).
1.1.4.2 Interactions with bacterial metabolism
a. DOM production from microbial degradation. Microorganisms metabolized terrigenous
DOM in brown-water streams at the cost of low carbon use efficiency and shifted its
composition (from fluorescence and absorbance) towards less aromatic and low molecular
weight compounds (Fasching et al. 2014). In addition, microbial DOM generated from
exometabolites by marine bacteria exhibited a large proportion of refractory molecules
(CRAM), and showed a dominant role for bacteria in shaping the refractory nature of marine
DOM (Lechtenfeld et al. 2015).
b. Modification by bacterial metabolism. Phosphate limitation greatly influenced both the
amount and the composition of the secreted DOM molecules by heterotrophic bacteria. Under
phosphate limitation, the composition of the exo-metabolome changed during bacterial
growth, showing an increase in highly unsaturated, phenolic and polyphenolic compounds,
while under phosphate surplus conditions the secreted DOM molecules were mainly peptides
and highly unsaturated compounds. (Romano et al. 2014).
1.1.4.3 Involvement in photodegradation
a. DOM photoproducts. DOM photoproducts were classified into four groups: low molecular-
weight carbonyl compounds with MW<200; carbon gases; unidentified bleached organic
matter and N-, P- containing compounds (Moran and Zepp 1997). A bacterial assay
experiment showed that the photoproducts could simulate biomass production or activities by
1.5- to 6- fold. DOM photoproducts were found to meet large proportions of the bacterial
carbon and nitrogen demands (Moran and Zepp 1997). In addition, polyols were found during
photo-transformation of DOM in oligotrophic surface ocean, and they accounted for 2% of
total molecular signatures in 1H NMR spectra (Gonsior et al. 2014).

16
b. Molecular alteration of DOM compounds. Selective photodegradation of DOM molecules
was observed with application of multiple analytical approaches. Under oxygen atmosphere,
structures of lignic and lipidic origin were most photolabile in comparison with
carbohydrates, alkylbenzenes, or N-containing structures that accumulated in the system.
Under nitrogen atmosphere the acids remained fairly stable. Under UV/Vis irradiation indirect
photolysis were suggested to be the major pathway in DOM degradation (Schmitt-Kopplin et
al. 1998). Similar results were also found by other authors (Stubbins et al. 2010). Aromatic
compounds were found to be most photoactive, with 90% being lost upon irradiation. The
photoproduced DOM pool was enriched of aliphatic compounds and a small number of
aromatics (including condensed aromatics). The refractory condensed aromatics were
removed significantly whereas CRAM actually shifted towards more refractory regions
instead of getting removed (Stubbins et al. 2010).
1.2 Isolation techniques of DOM
DOM isolation is an essential and error-prone step, which has a significant effect on both
overall recovery and the molecular composition and structure. Different isolation methods
have been applied for DOM, and those methods normally are based on the solubility, charge,
molecular weight, polarity and so on (Minor et al. 2014, Perminova et al. 2009, Sandron et al.
2015). More recently, studies have shown that selective isolation of DOM provides more
detailed information of the structures than studying the complex bulk materials (Koch et al.
2008, Woods et al. 2012). A general summary of DOM isolation methods is listed in Table 1-
5 and more detailed decriptions can be found in Chapter 3.

17
Table 1-5 Summary of DOM isolation techniques.
Technique Mechanism Advantage Drawbacks DOC
recovery Specific DOM characteristics
UF
Separation through a
semipermeable membrane by
force
Large volumes and fast
speed; least chemical
alteration
Highly dependent on
experimental procedures
and equipment; membrane
fouling; further desalting
for marine DOM needed
Marine
samples:
8-55%;
freshwaters:
up to 80%
Only high molecular weight
fraction of DOM retained;
reduction in the recovery of high
molecular weight compounds at
increased salinity
RO/ED
RO is similar to UF, but uses the
applied force to overcome
osmotic pressure. ED removes
salts through ion-exchange
membranes under the influence of
an applied electric potential
difference
Large volumes and fast
speed; high DOC recovery
High time and cost
requirement; harsh
chemical conditions
Oceanic water:
70-75%;
freshwater:
~90%
For marine DOM, a relatively
lower proportion of carbohydrate
carbon and a relatively greater
proportion of alkyl carbon is
reocvered; C/N ratios are most
representative of authentic water
SPE
Based on the solute partition
coefficient between sorbent and
aqueous phases
Facile and flexible;
low cost
Relatively harsh chemical
condition; side reactions
Marine DOM:
≤65%;
freshwater
DOM:
~40-90%
Highly sorbent selective
RP LC
Based on differential partitioning
between the mobile and
stationary phases
Specific fractionation
according to polarity of
analytes and selectivity of
columns
Low volumes Not measured
O/C ratios abd double bond
equivalents (DBE) decreased
whereas H/C ratios increased with
separation.
CE
According to ionic mobility
and/or partitioning into an
alternative phase via non-covalent
interactions or gradients in
conductivity and pH
Low injection volumes,
reduced complexity,
improved spectra
resolution
Artefacts from separation
conditions and
instrumental constrains
Not measured Larger molecules deteriorating
into smaller components
SEC According to hydrodynamic
molecular size
Reduced complexity,
improved spectra
resolution
Not particularly accurate;
potential artefact; lack of
standard calibration of
analytes
Not measured Aquatic DOM with molecular
weight 0.55-7.13 kDa

18
Technique Mechanism Advantage Drawbacks DOC
recovery Specific DOM characteristics
HILIC
Normal-phase HPLC with a polar
stationary phase but utilizes
partial aqueous mobile phase
Improved resolution; more
detailed structural
information revealed
Large consumption of
organic solvents;
interactions of DOM with
sorbents
Not measured Good for polar retention;
selective
IC
Based on the affinity of ions and
polar molecules to the ion
exchanger
Quantification of certain
groups of compounds
Strict sample pretreatment;
highly selective
Limited
recovery
Better for polar compounds such
as lipids and carbohydrates in
DOM
GC Based on interaction of gaseous
compounds with the column
Quantification and
identification of certain
groups of compounds;
possible access to library
if coupled with certain
mass analyzers
Proper sample
pretreatment and operation
conditions required;
selective towards small
volatile molecules;
chemical derivatization is
required
Not measured
Volatile compounds and easily
derivatised into volatile species;
lignins, PAHs
Passive
sampling
Membrane with anion exchange
resin
A range of temporal and
spatial experiment and
“average” signals of
sample
Impossible for short time
period sampling 72-89%
Larger proportions of aromatics
and extraction of carbohydrates
RO/ED
with SPE
Combination of RO/ED and SPE
process Increased DOC recovery
Higher cost and more labor
intensive
Up to 98% for
marine DOM
More representative nature of
DOM

19
1.3 Characterization approaches of DOM
The chemically-diverse DOM samples require multi-level complementary analytical
approaches for their comprehensive characterization; on the other hand, complementary
analysis of DOM samples generates large data sets, and their joint assessment enables in-
depth elucidation of DOM characteristics (Hertkorn et al. 2007). Common DOM
characterization approaches are listed in Table 1-6. Up to date, comprehensive DOM
characterization has enabled remarkable distinctions of e.g. freshwater, marine, atmospheric
and extraterrestrial DOM with measurement of FT-ICR MS and NMR spectroscopy
((Hertkorn et al. 2013, 2016, Schmitt-Kopplin et al. 2010a, b), and as well merged the DOM
molecular features with interconnected optical properties with structural spectroscopy
(Kellerman et al. 2015, Hertkorn et al. 2016).
Table 1-6 Comprehensive characterization approaches of DOM.
DOM isolation /
characterization
method
General
capability
Specific utility in DOM
characterization Drawbacks
Elemental analysis
abundance of
elemental
composition;
elemental ratios
Fundanmental bulk
parameters; evaluation of
MS-derived results
Not in-depth
Isotope analysis Isotope
abundance
Tracing the DOM and
apparent ages (14
C)
No in-depth resolution
of molecular diversity
Optical spectroscopy Optical signals
Quick, sensitive & powerful
tool for rough estimate of
origin, content and chemical
environment
Highly selective
towards sp2 carbon
chemical environment
FT-ICR mass
spectrometry
Detection of
molecular
formulas
Sensitive; elucidation of
CHO, CHOS, CHNO and
CHNOS molecular formulas
based on excellent mass
accuracy and mass resolution
Selective in ionization
NMR spectroscopy
In depth
structural
analysis of NOM
Multinuclear and
multidimensional NMR
spectroscopy of NOM
fractions defines close-range
atomic orders of DOM
molecules
Insensitive
Mathematical data
evaluation: statistical
total correction
spectroscopy
(STOCSY)
Correlations
within and across
methods
enables testable cross
correlation between NMR,
MS, and separation
techniques
Indirect correlations in
polydisperse DOM;
individual methods see
different aspects of
molecular structures

20
1.4 Objectives of the thesis
DOM occurs in all ecosystems and carries biological and biogeochemical signatures (Battin
2009), but its decisive role in the global carbon and other element cycles is still not well
understood due to its polydispersity and molecular heterogenuiety (Hertkorn et al. 2007).
At present, DOM isolation by means of SPE represents a fair compromise between field work
capability and acceptable yield in the range of 40-60 % of DOC recovery, depending on DOM
source (Dittmar et al. 2008). Meanwhile the low-resolutin methods are not robust enough to
resovle DOM bulk parameters (Ritchie and Perdue 2003).
The remarkably different molecular signatures, however, can be deduced by high resolution
separation and high-performance organic structural spectroscopy (Gasper et al. 2010,
Hertkorn et al. 2007, Woods et al. 2011). High resolution separation has provided complexity-
reduced DOM fractions, providing more improved resolution than bulk materials. Modern
high resolution organic structural spectroscopy, especially FT-ICR MS and NMR, has
demonstrated the outstanding molecular diversity of DOM obtained from various sources
such as freshwater, marine and atmosphere (Einsiedl et al. 2007, Hertkorn et al. 2006,
Schmitt-Kopplin et al. 2010).
The main objective of the thesis is to develop a comprehensive approach of DOM
characterization using chromatographic and spectroscopic techniques with the following
specific goals (workflow of this thesis shown in Fig. 1-2):
1. Improving DOM isolation techniques to extract fractions more presentative of original
samples (high DOC recovery as well as considerable molecular information).
2. In-depth isolation of DOM with SPE and to be followed by spectroscopic analysis of the
structure-selective fractions.
3. In-depth characterization of DOM fractions by applying complementary instrumental
analysis such as high resolution FT-ICR mass spectrometry, optical and NMR spectroscopy.
4. Statistical total correlation spectroscopy (STOCSY) for joint mathematical classification of
mass, optical and NMR spectra and bidirectional statistical correlation, statistical correlation
spectroscopy within and across methods.
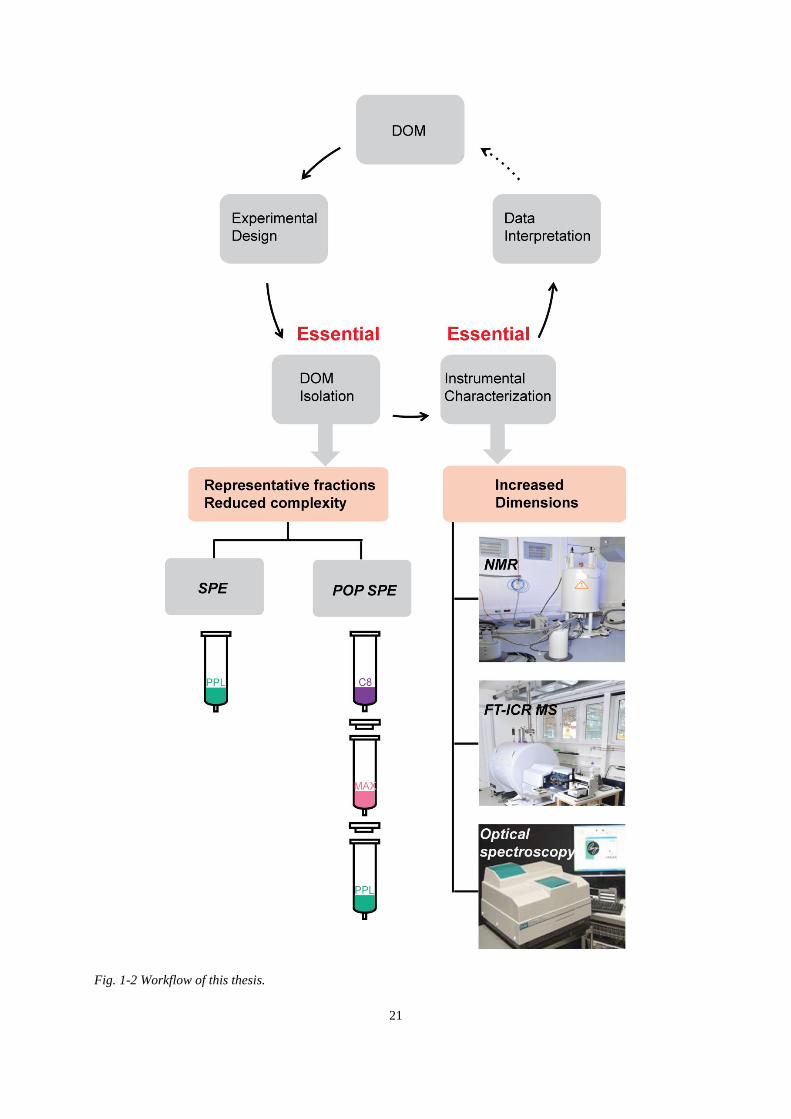
21
Fig. 1-2 Workflow of this thesis.

22
1.5 References
Battin, T.J., Luyssaert, S., Kaplan, L.A., Aufdenkampe, A.K., Richter, A. and Tranvik, L.J.
(2009) The boundless carbon cycle. Nat Geosci 2(9), 598-600.
Benner, R. and Kaiser, K. (2010) Biological and photochemical transformations of amino
acids and lignin phenols in riverine dissolved organic matter. Biogeochemistry 102(1-3), 209-
222.
Bianchi, T.S. (2011) The role of terrestrially derived organic carbon in the coastal ocean: a
changing paradigm and the priming effect. Proc Natl Acad Sci U S A 108(49), 19473-19481.
Boerjan, W., Ralph, J. and Baucher, M. (2003) Lignin biosynthesis. Annu Rev Plant Biol 54,
519-546.
Benner, R., Pakulski, J.D., McCarthy, M., Hedges, J.I. and Hatcher, P.G.. (1992) Bulk
chemical characteristics of dissolved organic matter in the ocean. Science 255, 1561–1564.
Bourguet, N., Gouty, M., Ghiglione, J.-P., Pujo-Pay, M., Mével, G., Momzikoff, A.,
Mousseau, L., Guigue, C., Garcia, N., Raimbault, P., Pete, R., Oriol, L. and Lefèvre, D. (2009)
Lipid biomarkers and bacterial lipase activities as indicators of organic matter and bacterial
dynamics in contrasted regimes at the DYFAMED site, NW Mediterranean. Deep-Sea Res PT
II 56, 1454-1469.
Brezonik, P.L. and Arnold, W.A. (2011) Water chemistry: an introduction to the chemistry of
natural and engineered aquatic systems. Oxford University Press. ISBN: 9780199730728.
Chen, M. and Hur, J. (2015) Pre-treatments, characteristics, and biogeochemical dynamics of
dissolved organic matter in sediments: A review. Water Res 79, 10-25.
Dittmar, T., Koch, B., Hertkorn, N. and Kattner, G. (2008) A simple and efficient method for
the solid-phase extraction of dissolved organic matter (SPE-DOM) from seawater. Limnol
and Oceanogr-Meth 6(6), 230-235.
Einsiedl, F., Hertkorn, N., Wolf, M., Frommberger, M., Schmitt-Kopplin, P. and Koch B. P.
(2007) Rapid biotic molecular transformation of acids in a karst aquifer. Geochim
Cosmochim Ac 71, 5474-5482.

23
Engbrodt, R. and Kattner G. (2005) On the biogeochemistry of dissolved carbohydrates in the
Greenland Sea (Arctic). Org Geochem 36, 937-948.
Fasching, C., Behounek, B., Singer, G.A. and Battin, T.J. (2014) Microbial degradation of
terrigenous dissolved organic matter and potential consequences for carbon cycling in brown-
water streams. Sci Rep 4, 4981.
Fichot, C.G., Benner, R., Kaiser, K., Shen, Y., Amon, R.M.W., Ogawa, H. and Lu, C.-J.
(2016) Predicting Dissolved Lignin Phenol Concentrations in the Coastal Ocean from
Chromophoric Dissolved Organic Matter (CDOM) Absorption Coefficients. Front Mar Sci 3,
7.
Flerus, R., Lechtenfeld, O.J., Koch, B.P., McCallister, S.L., Schmitt-Kopplin, P., Benner, R.,
Kaiser, K. and Kattner, G. (2012) A molecular perspective on the ageing of marine dissolved
organic matter. Biogeosciences 9(6), 1935-1955.
Goldberg, S.J., Ball, G.I., Allen, B.C., Schladow, S.G., Simpson, A.J., Masoom, H., Soong, R.,
Graven, H.D. and Aluwihare, L.I. (2015) Refractory dissolved organic nitrogen accumulation
in high-elevation lakes. Nat Commun 6, 6347.
Gonsior, M., Hertkorn, N., Conte, M.H., Cooper, W.J., Bastviken, D., Druffel, E. and Schmitt-
Kopplin, P. (2014) Photochemical production of polyols arising from significant photo-
transformation of dissolved organic matter in the oligotrophic surface ocean. Mar Chem 163,
10-18.
Hansell, D.A. (2013) Recalcitrant dissolved organic carbon fractions. Ann Rev Mar Sci 5,
421-445.
Hedges, J.I., Keil, R.G. and Benner, R. (1997) What happens to terrestrial organic matter in
the ocean? Org Geochem 27(5-6), 195-212.
Hernes, P.J. and Benner, R. (2003) Photochemical and microbial degradation of dissolved
lignin phenols: Implications for the fate of terrigenous dissolved organic matter in marine
environments. J Geophys Res 108(C9), 3291.
Hertkorn, N., Benner, R., Frommberger, M., Schmitt-Kopplin, P., Witt, M., Kaiser, K.,
Kettrup, A. and Hedges, J.I. (2006) Characterization of a major refractory component of
marine dissolved organic matter. Geochim Cosmochim Ac 70 (12), 2990-3010.
24
Hertkorn, N., Harir, M., Koch, B.P., Michalke, B. and Schmitt-Kopplin, P. (2013) High-field
NMR spectroscopy and FTICR mass spectrometry: powerful discovery tools for the
molecular level characterization of marine dissolved organic matter. Biogeosciences 10(3),
1583-1624.
Hertkorn, N., Harir, M., Cawley, K.M., Schmitt-Kopplin, P. and Jaffé, R. (2016) Molecular
characterization of dissolved organic matter from subtropical wetlands: a comparative study
through the analysis of optical properties, NMR and FTICR/MS. Biogeosciences 13(8), 2257-
2277.
Huang, C.-C., Guo, L., Santschi, P. H., Alvarado-Quiroz, N. and Haye, J. M. (2003)
Distribution of carbohydrate species in the Gulf of Mexico. Mar Chem, 81, 119-135.
Kellerman, A.M., Dittmar, T., Kothawala, D.N. and Tranvik, L.J. (2014) Chemodiversity of
dissolved organic matter in lakes driven by climate and hydrology. Nat Commun 5, 3804.
Kellerman, A.M., Kothawala, D.N., Dittmar, T. and Tranvik, L.J. (2015) Persistence of
dissolved organic matter in lakes related to its molecular characteristics. Nat Geosci 8(6), 454-
457.
Knorr K.-H. (2013) DOC-dynamics in a small headwater catchment as driven by redox
fluctuations and hydrological flow paths-are DOC exports mediated by iron
reduction/oxidation cycles? Biogeosciences 10, 891-904.
Koch, B.P., Witt, M., Engbrodt, R., Dittmar, T. and Kattner, G. (2005) Molecular formulae of
marine and terrigenous dissolved organic matter detected by electrospray ionization Fourier
transform ion cyclotron resonance mass spectrometry. Geochim Cosmochim Ac 69(13),
3299-3308.
Koch, B.P., Kattner, G., Witt, M. and Passow, U. (2014) Molecular insights into the microbial
formation of marine dissolved organic matter: recalcitrant or labile? Biogeosciences 11(15),
4173-4190.
Kördel, W., Dassenakis, M., Lintelmann, J. and Padberg, S. (1997) The importance of natural
organic material for environmental processes in waters and soils (Technical Report). Pure
Appl Chem 69(7), 1571-1600.

25
Ksionzek, K.B., Lechtenfeld, O.J., McCallister, S.L., Schmitt-Kopplin, P., Geuer, J.K.,
Geibert, W. and Koch, B.P. (2016) Dissolved organic sulfur in the ocean: Biogeochemistry of
a petagram inventory. Science 354(6311), 456-459.
Lechtenfeld, O.J., Kattner, G., Flerus, R., McCallister, S.L., Schmitt-Kopplin, P. and Koch,
B.P. (2014) Molecular transformation and degradation of refractory dissolved organic matter
in the Atlantic and Southern Ocean. Geochim Cosmochim Ac 126, 321-337.
Lechtenfeld, O.J., Hertkorn, N., Shen, Y., Witt, M. and Benner, R. (2015) Marine
sequestration of carbon in bacterial metabolites. Nat Commun 6, 6711.
Leri, A.C., Mayer, L.M., Thornton, K.R., Northrup, P.A., Dunigan, M.R., Ness, K.J. and
Gellis, A.B. (2015) A marine sink for chlorine in natural organic matter. Nat Geosci 8(8),
620-624.
Mannino, A. and Harvey, R. (1999) Lipid composition in particulate and dissolved organic
matter in the Delaware Estuary: sources and diagenetic patterns. Geochim Cosmochim Ac, 63,
2219-2235.
Melone, F., Saladino, R., Lange, H. and Crestini, C. (2013a) Tannin structural elucidation and
quantitative (3)(1)P NMR analysis. 1. Model compounds. J Agric Food Chem 61(39), 9307-
9315.
Melone, F., Saladino, R., Lange, H. and Crestini, C. (2013b) Tannin structural elucidation and
quantitative (3)(1)P NMR analysis. 2. Hydrolyzable tannins and proanthocyanidins. J Agric
Food Chem 61(39), 9316-9324.
Minor, E.C., Swenson, M.M., Mattson, B.M. and Oyler, A.R. (2014) Structural
characterization of dissolved organic matter: a review of current techniques for isolation and
analysis. Environ Sci Process Impacts 16(9), 2064-2079.
Mopper, K. and Kieber, D.J. (2002) Photochemistry and the cycling of carbon, sulfur,
nitrogen and phosphorus. In book: Biogeochemistry of Marine Dissolved Organic Matter,
Edition: 1st, Chapter: 9, Publisher: Academic Press, Editors: Dennis A. Hansell, Craig A.
Carlson, pp.455-507. DOI: 10.1016/B978-012323841-2/50011-7.
Mopper, K., Stubbins, A., Ritchie, J.D., Bialk, H.M. and Hatcher, P.G. (2007) Advanced
instrumental approaches for characterization of marine dissolved organic matter: extraction

26
techniques, mass spectrometry, and nuclear magnetic resonance spectroscopy. Chem Rev
107(2), 419-442.
Moran, M.A. and Zepp, R.G. (1997) Role of photoreactions in the formation of biologically
labile compounds from dissolved organic matter. Limnol Oceanogr 42(6), 1307-1316.
Moran, M.A., Kujawinski, E.B., Stubbins, A., Fatland, R., Aluwihare, L.I., Buchan, A.,
Crump, B.C., Dorrestein, P.C., Dyhrman, S.T., Hess, N.J., Howe, B., Longnecker, K.,
Medeiros, P.M., Niggemann, J., Obernosterer, I., Repeta, D.J. and Waldbauer, J.R. (2016)
Deciphering ocean carbon in a changing world. Proc Natl Acad Sci U S A 113(12), 3143-
3151.
Nebbioso, A. and Piccolo, A. (2013) Molecular characterization of dissolved organic matter
(DOM): a critical review. Anal Bioanal Chem 405(1), 109-124.
Ohno, T., He, Z., Sleighter, R.L., Honeycutt, C.W. and Hatcher, P.G. (2010) Ultrahigh
resolution mass spectrometry and indicator species analysis to identify marker components of
soil- and plant biomass- derived organic matter fractions. Environ Sci Technol 44(22), 8594-
8600.
Peiffer, S., Walton-Day, K. and Macalady, D. L. (1999) The interaction of natural organic
matter with iron in a wetland (Tennessee Park, Colorado) receiving acid mine drainage. Aquat
Geochem 5, 207-223.
Perminova, I.V., Konstantinov, A.I., Kunenkov, E.V., Gaspar, A., Schmitt-Kopplin, P.,
Hertkorn, N., Kulikova, N.A. and Hatfield, K. (2009) Separation technology as a powerful
tool for unfolding molecular complexity of natural organic matter and humic substances. DOI:
10.1002/9780470494950.ch13.
Ritchie, J.D. and Perdue, E.M. (2003) Proton-binding study of standard and reference fulvic
acids, humic acids, and natural organic matter. Geochim Cosmochim Ac 67(1), 85-96.
Romano, S. Dittmar, T., Bondarev, V., Weber, R. J. M., Viant, M. R. and Schulz-Vogt, H. N.
(2014) Exo-metabolome of pseudovibrio sp. FO-BEG1 analyzed by ultra-high reolution mass
spectrometry and the effect of phosphate limitation. PLOS ONE 9(5): e96038.
Sandron, S., Rojas, A., Wilson, R., Davies, N.W., Haddad, P.R., Shellie, R.A., Nesterenko,
P.N., Kelleher, B.P. and Paull, B. (2015) Chromatographic methods for the isolation,

27
separation and characterisation of dissolved organic matter. Environ Sci Process Impacts
17(9), 1531-1567.
Schmidt, F., Elvert, M., Koch, B.P., Witt, M. and Hinrichs, K.-U. (2009) Molecular
characterization of dissolved organic matter in pore water of continental shelf sediments.
Geochimi Cosmochim Ac 73(11), 3337-3358.
Schmidt, F., Koch, B.P., Elvert, M., Schmidt, G., Witt, M. and Hinrichs, K.U. (2011)
Diagenetic transformation of dissolved organic nitrogen compounds under contrasting
sedimentary redox conditions in the Black Sea. Environ Sci Technol 45(12), 5223-5229.
Schmitt-Kopplin, P, Hertkorn, N., Schulten, H.-R., Kettrup, A. (1998) Structural changes in a
dissolved soil humic acid during photochemical degradation processes under O2 and N2
atmosphere. Environ. Sci. Technol. 32, 2531-2541.
Schmitt-Kopplin, P., Gelencser, A., Dabek-Zlotorzynska, E., Kiss, G., Hertkorn, N., Harir, M.,
Hong, Y. and Gebefugi, I. (2010a) Analysis of the unresolved organic fraction in atmospheric
aerosols with ultrahigh-resolution mass spectrometry and nuclear magnetic resonance
spectroscopy: organosulfates as photochemical smog constituents. Anal Chem 82(19), 8017-
8026.
Schmitt-Kopplin, P., Gabelica, Z., Gougeon, R.D., Fekete, A., Kanawati, B., Harir, M.,
Gebefuegi, I., Eckel, G. and Hertkorn, N. (2010b) High molecular diversity of extraterrestrial
organic matter in Murchison meteorites reveal 40 years after its fall. Proc Natl Acad Sci U S
A 107(7), 2763-2768.
Seidel, M., Beck, M., Riedel, T., Waska, H., Suryaputra, IG.N.A., Schnetger, B., Niggemann,
J., Simon, M. and Dittmar, T. (2014) Biogeochemistry of dissolved organic matter in an
anoxic intertidal creek bank. Geochim Cosmochim Ac, 140, 418-434.
Shen, Y., Chapelle, F.H., Strom, E.W. and Benner, R. (2014) Origins and bioavailability of
dissolved organic matter in groundwater. Biogeochemistry 122(1), 61-78.
Sleighter, R.L. and Hatcher, P.G. (2008) Molecular characterization of dissolved organic
matter (DOM) along a river to ocean transect of the lower Chesapeake Bay by ultrahigh
resolution electrospray ionization Fourier transform ion cyclotron resonance mass
spectrometry. Mar Chem 110(3-4), 140-152.

28
Stubbins, A., Spencer, R.G.M., Chen, H., Hatcher, P.G., Mopper, K., Hernes, P.J., Mwamba,
V.L., Mangangu, A.M., Wabakanghanzi, J.N. and Six, J. (2010) Illuminated darkness:
Molecular signatures of Congo River dissolved organic matter and its photochemical
alteration as revealed by ultrahigh precision mass spectrometry. Limnol Oceanogr 55(4),
1467-1477.
Walker, B.D., Beaupré, S.R., Guilderson, T.P., McCarthy, M.D. and Druffel, E.R.M. (2016)
Pacific carbon cycling constrained by organic matter size, age and composition relationships.
Nat Geosci 9, 888-891.
Woods, G.C., Simpson, M.J. and Simpson, A.J. (2012) Oxidized sterols as a significant
component of dissolved organic matter: evidence from 2D HPLC in combination with 2D and
3D NMR spectroscopy. Water Res 46(10), 3398-3408.
Zhang, H., Zhang, Y., Shi, Q., Ren, S., Yu, J., Ji, F., Luo, W., Yang, M. (2012)
Characterization of low molecular weight natural organic matter along the treatment trait of a
waterworks using Fourier transform ion cyclotron resonance mass spectrometry. Water Res.
46, 5197-5204.
Zhang, F., Harir, M., Moritz, F., Zhang, J., Witting, M., Wu, Y., Schmitt-Kopplin, P., Fekete,
A., Gaspar, A. and Hertkorn, N. (2014) Molecular and structural characterization of dissolved
organic matter during and post cyanobacterial bloom in Taihu by combination of NMR
spectroscopy and FTICR mass spectrometry. Water Res 57, 280-294.
29
Chapter 2
Materials and Methods

30
2 Materials and Methods
2.1 Sample preparation
DOM Samples were taken in Suwannee River in May 2012 as described by Green et al.
(Green et al. 2015), and in June 2012 in the Southern North Sea (54.1757 N / 7.8977 E; RV
Heincke, Expedition HE 426 II). Water samples were immediately filtered after collection
with 0.47 μm GF/F glass fiber (Whatman, precombusted at 450 oC) and adjusted to pH 2
(concentrated HCl, Merck) prior to SPE. The SPE experiments were done according to our
previous developed protocol (Li et al., 2016). The SPE extracts were kept at -25°C in the dark
prior to further analysis (Flerus et al., 2011).
2.2 DOC measurement
DOC was determined by high temperature catalytic oxidation and subsequent non-dispersive
infrared spectroscopy and chemiluminescence detection (TOC-VCPN, Shimadzu). Final DOC
concentrations are average values of triplicate measurements. If the standard variation or the
coefficient of variation exceeded 0.1 μM or 1 %, respectively, up to two additional analyses
were performed and outliers were eliminated. After each batch of five samples, one reference
standard (DOC-DSR, Hansell Research Lab, University of Miami, USA), one ultrapure water
blank and one potassium hydrogen phthalate standard were measured. The limit of detection
(3σ of the blank) and quantitation (9σ of the blank) was 7 and 21 μmol C L−1
, respectively.
The accuracy was ±5 % (Flerus et al., 2012). Samples (100 μL of methanol eluates – equivalent to
1 mL SR water and 50 mL NS water, and 500 μL water solutions of permeate and wash) were
evaporated and re-dissolved in 1 mL ultrapure water for analysis.
2.3 High-field FT-ICR MS analysis
High-field FT-ICR mass spectra of DOM solutions were acquired by a 12 T Bruker Solarix
mass spectrometer (Bruker Daltonics, Bremen, Germany) and an Apollo II electrospray
ionization (ESI) source in negative ionization mode. Samples were diluted in methanol to ~5
μg/mL DOC, and then injected into the electrospray source at a flow rate of 120 μL/h with a
nebulizer gas pressure of 138 kPa and a drying gas pressure of 103 kPa. Spectra were first
externally calibrated based on clusters of arginine in methanol (5 μg/mL), and internal
calibration was systematically performed using specific DOM reference mass list, reaching
accuracy values lower than 500 ppb. The spectra were acquired with a time domain of 4 Mega
words over a mass range of m/z 150-1000 amu, and 500 scans were accumulated for each

31
mass spectrum. Elemental formulae were computed for each peak in a batch mode by using
custom-built software (Tziotis et al., 2011). Final elemental formulae were generated and
categorized into groups containing CHO, CHNO, CHOS and CHONS molecular series which
were used to reconstruct the group-selective mass spectra (CHO and CHNO series were
assigned in the second study due to the limited sulfur content in SR DOM). The computed
average values for H, C, N and O (atom %) and the H/C, O/C and C/N ratios as well as DBE,
DBE/C, mass-to-charge (m/z) and aromaticity were based upon intensity weighted averages
of mass peaks with assigned molecular formulae.
2.4 NMR analysis
1H NMR detected spectra of eluates were acquired with a 800 MHz Bruker Avance III
spectrometer (B0 = 18.7 T) at 283 K with 0.05-2 mg of solid obtained by evaporation of
original methanol-h4 solution, dissolved in approx. 110-150 µL CD3OD (Merck. 99.95% 2H)
solution with a 5 mm z-gradient 1H/
13C/
15N/
31P QCI cryogenic probe (90° excitation pulses:
13C ~
1H ~ 10 µs; B0 = 18.7 T) with Bruker standard pulse sequences in sealed 2.0 or 2.5 mm
Bruker MATCH tubes. Detailed parameters of NMR have been described by Hertkorn et al.
(Hertkorn et al., 2013, 2016). 1H NMR chemical shift reference of HD2OD was 3.3 ppm.
1H
NMR spectra were recorded with solvent suppression with pre-saturation and 1 ms spin-lock
(noesypr1d), 5 s acquisition time (aq), 5 s relaxation delay (d1), typically 512-2048 scans, and
1 Hz exponential line broadening. A phase sensitive, gradient enhanced TOCSY NMR
spectrum with solvent suppression (dipsi2etgpsi19) was acquired for an acquisition time of 1 s,
a mixing time of 100 ms, and a relaxation delay of 1 s (spectral width of 9615.4 Hz, 16 scans,
1523 increments; computation to a 16384 × 2048 matrix).
13CNMR spectra used cpmg_cpd_d5 for T2 relaxation; 14 s relaxation delay; typically 30000-
65000 scans) with an acquisition time of 1s and an exponential line broadening of 12.5Hz. 13
C
DEPT NMR spectra (distortionless enhanced polarization transfer) were acquired with aq = 1
s and d1 = 2 s. The NMR section integrals were obtained by using Bruker AMIX software
(version 3.9.4) with a bucket resolution of 0.01 ppm chemical shifts for 1H NMR and 1 ppm
chemical shift for 13
C NMR, and with exclusion of methanol and water.
2.5 Optical spectroscopy
SPE extracts were dried and re-dissolved in Milli-Q water at the original concentrations and
then diluted to achieve raw absorbance of less than 0.4 at 300 nm. The dilution factor was

32
used to calculate the initial fluorescence intensity. The dilution was necessary to be able to
correct for inner filtering effects and to not exceed the linear range of fluorescence response.
Absorbance and EEM spectra were recorded simultaneously using a Horiba Aqualog
fluorometer at excitation wavelengths from 240 to 500 nm (3 nm increments) and an emission
range between 230 to 600 nm (~3 nm increments). The fluorescence was then corrected for
Raleigh scattering and inner filter effects. The raw fluorescence intensity was then normalized
to a 1 ppm Starna quinine sulfate reference cell (Gonsior et al., 2013).
2.6 Statistical analysis
The R package “pvclust” (RStudio, Version 0.98.978) was used to apply hierarchical cluster
analysis (HCA) via multiscale bootstrap resampling. HCA of the eluates was based on
Euclidean distance and Ward’s linkages. Two types of p-values were calculated for each
cluster: approximately unbiased (au) and bootstrap (bp) p-values. Clusters with au larger than
95% were marked by red rectangles. The 1H NMR section integrals were obtained by using
Bruker AMIX software (version 3.9.4) with a bucket resolution of 0.01 ppm chemical shift,
and with exclusion of methanol and water. EEM fluorescence spectroscopy data were
pretreated into one-dimensional data set, and then analyzed as well with the R package
“pvclust”. HCA of the FT-ICR MS data was obtained with Hierarchical Clustering Explorer,
and the principal component analysis (PCA) was performed using the software SIMCA-P9.0.
2.7 References
Flerus, R., Koch, B.P., Schmitt-Kopplin, P., Witt, M. and Kattner, G. (2011) Molecular level
investigation of reactions between dissolved organic matter and extraction solvents using FT-
ICR MS. Mar Chem 124(1-4), 100-107.
Flerus, R., Lechtenfeld, O.J., Koch, B.P., McCallister, S.L., Schmitt-Kopplin, P., Benner, R.,
Kaiser, K. and Kattner, G. (2012) A molecular perspective on the ageing of marine dissolved
organic matter. Biogeosciences 9(6), 1935-1955.
Gonsior, M., Schmitt-Kopplin, P. and Bastviken, D., 2013. Depth-dependent molecular
composition and photo-reactivity of dissolved organic matter in a boreal lake under winter
and summer conditions. Biogeosciences 10(11), 6945-6956.

33
Green, N.W.; Mclnnis, D.; Hertkorn, N.; Maurice, P.A. and Perdue E.M. (2015) Suwannee
River natural organic matter: isolation of the 2R101N reference sample by reverse osmosis.
Environ Eng Sci 32, 1-7.
Hertkorn, N., Harir, M., Koch, B.P., Michalke, B. and Schmitt-Kopplin, P. (2013) High-field
NMR spectroscopy and FTICR mass spectrometry: powerful discovery tools for the
molecular level characterization of marine dissolved organic matter. Biogeosciences 10(3),
1583-1624.
Hertkorn, N., Harir, M., Cawley, K.M., Schmitt-Kopplin, P. and Jaffé, R. (2016) Molecular
characterization of dissolved organic matter from subtropical wetlands: a comparative study
through the analysis of optical properties, NMR and FTICR/MS. Biogeosciences 13(8), 2257-
2277.
Li, Y., Harir, M., Lucio, M., Kanawati, B., Smirnov, K., Flerus, R., Koch, B.P., Schmitt-
Kopplin, P. and Hertkorn, N. (2016) Proposed Guidelines for Solid Phase Extraction of
Suwannee River Dissolved Organic Matter. Anal Chem 88(13), 6680-6688.
Tziotis, D., Hertkorn, N. and Schmitt-Kopplin, P. (2011) Kendrick-analogous network
visualisation of ion cyclotron resonance Fourier transform mass spectra: Improved options for
the assignment of elemental composition and the classification of organic molecular
complexity. Eur J Mass Spectrom 17(4), 415-421.
34
Chapter 3
Review of the Relevant Literature

35
3 Review of the Relevant Literature
3.1 Isolation of DOM
3.1.1 Physical isolation
3.1.1.1 Ultrafiltration (UF)
UF is one of the most widely applied methods for DOM isolation; UF employs
semimembranes to separate compounds with different molecular size. During UF of DOM,
high molecular weight fraction (typically m/z of 1k Da) is retained on the semipermeable
membrane whereas small molecules together with salts and ions are penetrated through the
membrane by force (pressure or concentration gradients) (Perminova et al. 2009).
UF normally allows for processing of large volumes of waer with a fast flow rate and large
surface area of membranes, rendering it suitable for large scale sample pretreatment. Another
advantage of UF is that its application does not require any chemical pretreatment of samples
and therefore chemical alterations of DOM are limited. It is reported that by using UF DOC
recoveries reached at the range of 8-55% for marine DOM and up to 80% for freshwater
DOM (Minor et al. 2014, Sandron et al. 2015).
The limitations of UF reside in the following aspects (Minor et al. 2014, Perminova et al.
2009, Sandron et al. 2015). First and the most important one is that DOM fraction only with
high molecular weights is extracted, leaving the small DOM molecules passing through the
membrane. Second, significant variance of DOM fractionation and DOC recovery is regularly
observed which highly depends on the experimental procedures and equipment applied.
Additionally, membrane fouling is also a problem. When marine DOM is subjected to UF
treatment, an additional desalting step is needed afterwards. Increase in salinity was found to
have an effect of reducing the recovery of high molecular weight compounds by UF (Kruger
et al. 2011).
3.1.1.2 Reverse osmosis / electrodialysis (RO/ED)
RO, quite similar to UF, concentrates DOM using an applied force to overcome osmotic
pressure, and consecutive ED removes salts through ion-exchange membranes under the
influence of an applied electric potential difference. When RO is coupled with ED, DOM
fractions with satisfactory DOC recovery as well as largely decreased salt content are
obtained (Minor et al. 2014, Sandron et al. 2015).

36
This technique can be performed to process large volumes at fast speeds, which is beneficial
for large-scaleDOM isolation. The greatest advantage of RO/ED compared with UF alone is
that salts are considerably removed, which makes it an appropriate pretreatment before
applying to advanced structural spectroscopy, especially in the case of marine DOM isolation
(Minor et al. 2014, Sandron et al. 2015). RO/ED has showed the capacity to isolate DOM
efficiently, with ~ 90% DOC recovery for freshwater DOM and an average of 75% DOC
recovery for marine DOM (Minor et al. 2014, Sandron et al. 2015). The obtained isolated
samples showed the consistent UV-visible absorbance spectra and molar C/N ratios similar to
the original marine samples, indicating no bias for/against these two properties (Chen et al.
2014, Tfaily et al. 2012). Compared with UF isolated samples, RO/ED samples contained a
relatively lower proportion of carbohydrate carbon and a relatively greater proportion of alkyl
carbon (Serkiz and Perdue 1990, Koprivnjak et al. 2009).
However, RO/ED is currently more expensive than other isolation methods; in addition, a
chemically harsh condition at pH 12 (0.01 M NaOH) is needed to remove adsorbed organic
matter, which might cause the degradation of certain molecules (Sandron et al. 2015).
3.1.2 Chemical isolation
3.1.2.1 Solid phase extraction (SPE)
For more than three decades SPE has been and still is the most extensively applied method for
DOM isolation due to the low cost and flexible usage. SPE works based on the solute partition
coefficient between sorbents and aqueous phases, and therefore is highly influenced by the
physical and chemical properties of the sorbents and solutes (Minor et al. 2014, Sandron et al.
2015). In practice, SPE isolation of DOM follows a chronology of five steps. First, SPE
sorbents are conditioned to the respective optimal conditions. Second, DOM samples are
loaded on the sorbents, and some molecules are retained on the sorbents whereas the others
pass through the sorbents under the given experimental conditions. Third, the sorbents with
adsorbed DOM are washed with certain solvents to get rid of impurities. Fourth, the sorbents
are dried. Finally, the retained DOM is eluted with certain organic solvents such as methanol,
acetonitrile or acetone to isolate these operational defined DOM fractions (Li et al. 2016a).
There are mainly two modes of SPE operation for DOM isolation, namely, simultaneous
elution of DOM molecules with a desired wide range of properties by a single solvent, and
stepwise selective fractionation of DOM molecules using different sorbents/eluting solvents
37
or successive collection of individual fractions with limited quantities of solvents. Due to ease
of operation and less chemical changes/solvents involved, the first category has been the most
applied SPE method. (This paragraph was adapted from Li et al. 2016a ©copyright ACS
publication)
Since the 1980s, scientists have investigated different types of SPE sorbents to improve DOC
recovery (Thurman and Malcolm 1981). The classical XAD and improved DAX resins were
the first generation sorbents for DOM isolation, which enabled a recovery of hydrophobic
acids in the range from 19-90% (Perdue and Ritche 2003, Thurman and Malcolm 1981).
These were substituted by the second generation of silica-based sorbents as a result of
laborious works and commercial availability (Kim et al. 2003, Kruger et al. 2011, Tfaily et al.
2012). More recently, polymer-based sorbents have been widely utilized owing to their
stability at wide pH ranges and easy to follow extraction procedures. In particular, the sorbent
of functionalized styrene-divinylbenzene copolymer (PPL) (Dittmar et al. 2008) capable to
extract hydrophobic and certain polar compounds like phenols showed both appreciable DOM
recovery as well as adequate depiction of intrinsic DOM molecular diversity inherent to
different sources such as river, ground, lake and sea water (Dittmar et al. 2008). In
comparison with classical XAD-2 resins, which are also styrene divinylbenzene polymers
polymers, contemporary PPL resin features larger specific surface area (600 versus 300 m2/g),
and proprietary functionalization for improved retention of polar compounds such as phenols.
Compared with silica-based sorbent C18 and classical XAD-8 resin, PPL resin isolated
representative DOM components with abundance of aliphatic groups, and was recommended
for DOM extraction from natural waters (Perminova et al. 2014). (This paragraph was adapted
from Li et al. 2016a ©copyright ACS publication)
With increasing focus on the molecular composition of the obtained SPE extracts instead of
merely evaluating DOC recovery, the DOM extraction selectivity of the SPE cartridges with
respect to certain DOM compounds has drawn awareness, and DOM extracts obtained with
different functionalized SPE sorbents have been compared (Minor et al. 2014, Sandron et al.
2015). While PPL was reported to retain higher proportions of nitrogen-containing
compounds from both fresh- and marine waters (Dittmar et al. 2008, Perminova et al. 2014,
Zherebker et al. 2016), C18 had shown affinity to more saturated molecules in arctic marine
DOM and distinct DOM from oligotrophic Lake Superior (Perminova et al. 2014, Li and
Minor 2015); on the other hand, HLB could not completely elute freshwater DOM
38
compounds with high molecular weights (Raeke et al. 2016). (This paragraph was adapted
from Li et al. 2016c ©copyright Elsevier)
The second category is still attractive because of the well classified individual fractions and
the rather representative overall DOM fractions. Typically, XAD series (XAD-2, 4, 7 and 8)
were applied first, and later diethylaminoethylcellulose (DEAE cellulose) came into use (Imai
et al. 2001, He and Hur 2015), and more recently new materials such as certain polymer-
based sorbents and ion exchangers were tested. With this method, DOM sample could be
extracted into six fractions based on polarity and charge: hydrophobic base, hydrophobic acid,
hydrophobic neutral, hydrophilic base, hydrophilic acid and hydrophilic neutral. A novel SPE
method for DOM fractionation used polymer-based materials nonpolar ENV, cation
exchanger Strata X-C and anion exchanger Strata X-AW in sequence, and used different
eluting solvents like methanol, HCl and NaOH. After stepwise eluting and correction, 57-64%
of total DOC recovery was obtained with hydrophobic acids, hydrophobic neutrals,
hydrophilic acids and hydrophilic neutrals accounting for large proportions of total DOC
(Ratpukdi et al. 2009).
One new modification tried to combine the first and second SPE categories: two different
online SPE sorbents embracing different sorption mechanisms (nonpolar PPL and activated
carbon Hypercarb) were coupled in sequence, then the normal SPE procedure was performed,
finally the two sorbents were separated and eluted individually. This new method obtained
considerably higher overall DOC recoveries than using only a single PPL cartridge, showing
the potential as an improved SPE method, especially recommendable for high carbohydrates
contained DOM samples (Swenson et al. 2014).
Comparisons of SPE and RO/ED on DOM isolation have been made based on DOC recovery,
molecular composition, time and costs (Green et al. 2014, Li et al. 2016a). SPE with PPL,
SPE with XAD and RO/ED were applied for isolation of surface and deep marine DOM on
large scale (Green et al. 2014). The DOC recovery obtained by the three methods showed the
pattern: RO/ED > SPE with PPL >> SPE with XAD; SPE with XAD selectively extracted
carbon-enriched compounds whereas RO/ED isolates was most representative of the original
samples; SPE with PPL was the most economical in terms of initial costs, operator costs and
running costs (Green et al. 2014). In the case of isolating Suwannee River water sample,
RO/ED produced a slightly higher DOC recovery than SPE with PPL cartridge (RO/ED:
94.2% and PPL: 89%), and these two extracts contained distinctive structural and molecular

39
information (Li et al. 2016a). Although a rather satisfactory overall congruence of the extracts
was observed with respect to NMR line shape distribution, RO/ED extract was more
representative of original sample by NMR results. However, RO/ED extract was distinct from
original water and SPE extracts in FT-ICR MS analysis, which might be caused by the
molecules of low and large molecular weights (m/z: 150-250 and 650-730). SPE extract was
found to discriminate against two groups of molecules, namely, the highly oxygenated
compounds with O/C ratios > 0.9 and more saturated region of lipids (Li et al. 2016a).
3.1.2.2 Reversed-phase liquid chromatography (RP LC)
Based on differential partitioning between the mobile and stationary phases, RP LC
fractionates the polydisperse and heterogeneous DOM into different groups of fractions
according to polarity, molecular weight and degree of unsaturation (Sandron et al. 2015). In
the RP LC system, the analogous nonpolar C18 columns were chosen although different
DOM samples and mobile phases were applied (Koch et al. 2008, Stenson A. 2008).
Generally, the polar fractions elute first whereas the nonpolar fractions last. After isolation,
the obtained fractions can be further measured at online or offline mode by advanced
structural spectroscopy such as FT-ICR MS or NMR spectroscopy, and have revealed
improved resolution and more detailed compositional/structural characteristics. It is
noteworthy that the mobile phase and eluting solvents chosen in the RP LC system should be
amenable to the subsequent instrumental analysis (Koch et al. 2008, Simpson et al. 2004,
Stenson et al. 2008).
With water-acetonitrile as gradient mobile phase, co-eluting occurred and DOM samples were
eluted out within the first 10 min, indicative of the poor separation. After adding ion pair
reagent, the chromatograms were improved to a great extent with most compounds eluting out
gradually during 10-27 min. 105 fractions were collected and subjected to NMR
characterization. The early rather polar fractions presented high proportions of aliphatics,
CRAMs, carbohydrates and considerable amounts of aromatics (Simpson et al. 2004).
Later, it was observed that RP LC-based fractionation was quite selective and complicated,
and O/C ratios, molecular weights and carbon skeletons were involved in defining the elution
sequence. For instance, higher O/C ratios, lower molecular weights, and carbon-skeletons
more densely covered with hydroxl, carboxy and/or carbonyl groups were found in earlier
fractions (Stenson 2008). Moreover, a buffer-free RP LC model for DOM fractionation was

40
developed and the rather resolved UV and fluorescence data of the separated peaks were
observed (Koch et al. 2008). In the chromatogram, the early and late peaks were well resolved
while the second and third fractions still had overlaps which were subjected to 2-dimensional
(2-D) separation prior to mass spectrometry. A general trend was observed in this study that
with the decrease in polarity, the O/C ratios and unsaturation (DBE values) decreased as well
whereas the H/C ratio increased continuously. No ambiguous trends in molecular weights
were observed, which might be attributed to the non-continual effects of the 2-D separation on
the mass spectrometry (Koch et al. 2008).
It summarizes that RP LC fractionation of DOM is a polarity-based separationin which due to
the molecular complexity of DOM O/C ratios, H/C ratios, unsaturation, carbon-skeletons,
molecular weights and others show influences on the fractionation sequence.
3.1.2.3 Capillary electrophoresis (CE)
CE separates compounds according to ionic mobility and/or partitioning into an alternative
phase via non-covalent interactions, and it can also concentrate samples through gradients in
conductivity and pH (Schmitt-Kopplin and Kettrup 2003, He et al. 2014, Gaspar et al. 2010).
CE has the simplicity in the setup of the instrument and requires only a small volume of
samples. Compared with chromatography, CE has different techniques of injection into the
capillary as well as the different means by which the sample is driven through the column by
electroosmosis instead of hydrodynamic pumping (Perminova et al. 2009, Schmitt-Kopplin
and Kettrup 2003). Among different CE techniques, capillary zone electrophoresis (CZE) is
the basic and the mostly referred separation, and it is highly affected by the separation buffer
pH and the electroosmotic flow. Free-flow electrophoresis (FFE) is one CZE method, which
has been successfully applied to NOM and metabolic analysis (Gaspar et al. 2010, Perminova
et al. 2009).
As is known, NOM is a complex mixture of anionic polyelectrolytes in aquatic solution and
covers a wide range of electrophoretic mobilities. CZE-separated FFE produced different
Suwannee River NOM fractions with low molecular weights and an unresolved hump across
the entire mass range in the electropherogram, and also demonstrated high contribution of low
molecular weight fractions at higher mobility together with a superimposition of low
molecular weight signals at low mobility in the mass spectra (Schmitt-Kopplin and Kettrup
2003). Based on the success of this approach, FFE were tried to obtain 96 fractions of
41
Suwannee River fulvic acid in a preparative scale, and then the fractions were further
subjected to FT-ICR MS measurement (Gaspar et al. 2010). The fractions changed from with
relatively low O/C ratios, high H/C ratios and low molecular weights to those with higher O/C
ratios, lower H/C ratios and higher molecular weights when proceeding from lower to higher
electrophoretic mobility. Moreover, low aromatic indices together with low proportions of
oxygen atoms at the low mobility regions were observed whereas two different groups were
found at high mobility regions: compounds deplete in oxygen atoms with high aromaticity
index and low molecular weights; components saturated with heteroatoms with low
aromaticity index and large molecular weights. Interestingly, the constituents present in low
mobility regions showed average H/C and O/C ratios typtical of CRAMs, and were suggested
that CRAMs with open aliphatic chains showed lower mobility region while those with
alicyclic geometry showed relatively higher mobility (Gaspar et al. 2010).
In addition, different CE methods have also been developed for complex mixtures.
Counterbalance CE uses the reversed electroosmosmotic flow with low pH and high
concentration buffer, applied on NOM fractionation for the first time (Cottrell et al. 2013).
After optimizing the operation conditions such as buffer concentration, pH, stacking, organic
modifier, capillary length and temperature, an electropherogram comprised up to hundreds of
peaks superimposed on the hump was observed. Eight Suwannee River NOM fractions were
collected and analyzed by optical spectroscopy. UV absorbance at 254 nm presented the
classic Gaussian distribution of the eight fractions with fraction 4 and 5 accounting for the
majority. Fluorescence spectra showed the main four NOM peaks (A, C, M and T) with peak
A consisting of ~ 50% of the total fluorescence in all fractions except fraction 4 (Cottrell et al.
2013).
Capillary electrokinetic fractionation separates samples under the influence of a homogeneous
electrical field where only compounds with moderate mobilities between leading electrolyte
and terminating electrolyte can be identified, a potential for fractionation of complex samples
(He et al. 2014). Four different groups of standards were investigated and showed the
predictable pH-depending behaviors for the structure features: carboxylic groups got ionized
at low pH with enhancement at pH 4; phenolic groups at high pH with enhancement at pH 10;
in the mixed profile of carboxylic groups and phenolic groups, the first enhancement caused
by carboxylic acids and the second one by phenolic acids; sulfonic groups were ionized all
over the pH range. This established method was further applied to two real red wine samples
42
from different vintages, and showed the selectivity to fractionate sulfur-containing
compounds at pH 1.66 (He et al. 2014).
3.1.2.4 Size exclusion chromatography (SEC)
SEC separates mixtures of compounds according to differences in molecular size, and is used
for the determination as well as quantification of the distribution of molecular weights in the
samples. In a SEC system, compounds first pass through a SEC column which functions as a
sieve and then elute at different rates according to molecular size: molecules with larger size
require less time or elution volume to get eluted whereas the small molecules need large time
or elution volume (Perminova et al. 2009). However, SEC is not based on molecular size
alone, and many factors influence the fractionation such as stationary phase, ionic strength,
buffer pH, concentration of the sample, hydrophobicity and organic modifiers (Hoque et al.
2003, Perminova et al. 2009).
As one of the most widely applied methods in the fractionation of humic substances and
NOM, plenty of researches have worked on SEC. Perminova et al. summarized the size of the
common materials (eg. NOM and humic substances, peptides, virus, bacteria, sugars and so
on), conversion scale between molecular size and weight based on dextran scale, and the
separation scale of different isolation methods. SEC turned out to be a suitable technique for
DOM isolation due to its wide coverage of mass range (100-100000 Da) with NOM and
humic subastances at the range of ~100-100000 Da (Perminova et al. 2009). They illustrated
the mechanism of SEC, non-exclusion effects such as ionic exclusion and sorption in detail
and summarized the averaged molecular weights of DOM, NOM and humic substances from
different environments. In general, the molecular weights of different samples followed this
pattern: Suwannee River fulvic acid, aquatic HS, aquatic DOM < Suwannee River humic
acid, soil fulvic acid, soil solution humic substances and coal humic acid < bottom sediment
humic substances, soil humic acid and peat humic substances. This work suggested that SEC
provides meaningful estimation of the trends in molecular weights of DOM, NOM and humic
substances (Perminova et al. 2009).
But there are some uncertainties needed to take into consideration. The concentration of the
electrolytes can influence the elution volumes: the higher the concentration (before reaching a
complete suppression of ion-exclusion interactions), the greater in the shifts of the elution
volumes to larger values. The changes in buffer pH have a significant effect on SEC. For

43
instance, at pH 4.2, the strong carboxylic groups dissociated, resulting in the early eluting at
the void volume of the column. Generally, the elution volumes shifted to larger values with
the decrease of pH. As the pH reached ~ 2, one broad diffuse peak could be observed,
indicative of a strong specific sorption of humic substances on the column (Hoque et al.
2003).
SEC is capable to generate more homogeneous DOM fractions whose structures are
significantly altered based on size. According to the NMR results, the early SEC fractions
were enriched with carbohydrates and aromatics; the middle fractions were abundant of
CRAMs; the late fractions exhibited strong signals of aliphatics (Woods et al. 2010).
3.1.2.5 Hydrophilic interaction liquid chromatography (HILIC)
HILIC is a normal-phase HPLC with a polar stationary phase but utilizes high percentage of
organic solvents as mobile phase, a separation suitable for polar compounds (Sandron et al.
2015). In the HILIC system, the compounds are retained on the polar stationary phase
according to the mechanism of partition or ion exchange, and get eluted with the increase of
their hydrophilicity: the hydrophobic compounds elute first whereas the hydrophilic ones
elute out last (Woods et al. 2011, Woods et al. 2012). During HILIC process, many factors
may influence the separation such as hydrogen-bonding, dipole-dipole interaction and
hydrophobic retention (Sandron et al. 2015)
HILIC has been applied for the first time to separate a polydisperse and highly heterogeneous
mixture of DOM. 80 fractions of Suwannee River DOM were collected after 60 runs in order
to get sufficient amount for NMR measurement as well as for fluorescence spectroscopy. The
isolated fractions showed a much better improved resolution in NMR spectra with numerous
sharp peaks which indicated the presence of the individual compounds. They differed from
fraction to fraction structurally and showed the patterns of the functional groups as follows:
the aromatic groups were found most abundant in mid-polar fractions, slightly different from
the previous studies; CRAMs and aliphatics varied in the earliest and latest fractions, but in
general showed the trend that decreased with the hydrophilicity; carbohydrates increased with
the hydrophilicity as expected. Those fractions were also measured by fluorescence
spectroscopy, classified according to relative proportions of certain fluorescent
peaks/components, and further statistically associated with NMR functional groups. The
fractions demonstrated the variability across the polarity gradient in fluorescence data:

44
quinone-influenced signals were most abundant in hydrophobic fractions while amino acid-
type fluorescence were most prominent in hydrophilic fractions. After the association analysis,
the most hydrophobic fractions were discovered to be enriched of CRAMs and aliphatics
which also carried the majority of the fluorescence signals, whereas the hydrophilic materials
were highly correlated with carbohydrates together with high contributions from amino acid
fluorescence (Woods et al. 2011).
Proceeding from these, a two-dimensional (2-D) HILIC/HILIC system were developed for
DOM isolation. In this system, two highly orthogonal HILIC columns were chosen, and the
first dimension was run for long periods of time (~ 2h) with high percentage of organic
solvent as mobile phase (95% acetonitrile) whereas the second dimension was run for short
time (3.4 min) to avoid diffusion with 50% acetonitrile. 126 fractions with 70 replicates were
obtained and subjected to extensive 1-D 1H NMR measurement, and certain fractions were
subjected to multidimensional NMR measurement for in-depth elucidation of the structures.
Most of the fractions were found to contain large amount of highly oxidized sterols.
Furthermore, the hydrophobic and hydrophilic fractions probably shared the similar structural
backbone, but the hydrophilic fractions contained higher proportions of COOH or OH groups
(Woods et al. 2012).
However, according to the previous study of DOM isolation by RP LC, a relatively large
proportion of hydrophobic molecules are present in DOM, which indicates HILIC might not
be capable to separate those components in a satisfactory manner. Overall, HILIC is an
appropriate separation method for DOM, and can be used as a complementary to RP LC.
3.1.2.6 Ion exchange chromatography (IC)
IC separates compounds based on the affinity of ions and polar molecules to the ion exchange
resin; IC is especially used for isolation of polar compounds in DOM such as lipids, amino
acids and carbohydrates. Due to the requirement of the system (low salinity levels),
pretreatment of DOM samples is necessary (Sandron et al. 2014)
Neutral sugars have been separated and purified from marine DOM samples, and further
measured by radiocarbon analysis for an improved interpretation of global carbon cycling.
After acid hydrolysis, marine DOM was separated by an anion exchange column to obtain
carbohydrates which were then purified by two cation exchange columns to get neutral sugars.
Those neutral sugars were further purified by two amino functionalized columns to get
45
individual sugar compounds for compound-specific radiocarbon analysis (Repeta and
Aluwihare 2006).
Recently, a more facile IC separation method of neutral sugars has been developed with the
utilization of pulsed amperometric detection (Sandron et al. 2014). The IC system was applied
on artificial DOM with an anion exchange column and pulsed ampeometric detection, and
then on the marine and freshwater DOM (DOM samples were pretreated with SPE process
using PPL cartridges). Peaks corresponding to certain neutral sugars were present, but with
low intensity (slightly higher than the baseline) (Sandron et al. 2014). This low intensity
might be attributed to the inappropriate sample pretreatment. It is known that SPE of DOM
samples with PPL cartridges discriminates against carbohydrates, which implied that certain
sugar compounds in that study were not or poorly extracted by SPE.
3.1.2.7 Gas chromatography (GC)
GC separates molecules based on interactions of volatile compounds with the columns, and is
suitable for certain compounds which are volatile or can be derivatised into volatiles (Sandron
et al. 2015). Due to the complexity and the presence of large polyfunctional molecules in
DOM samples, sample pretreatment like CuO-oxidation and chemical reduction is applied
first to make the large-size and polydisperse DOM molecules degraded into species amenable
for GC, and then derivation processes are performed to protect and derivatise DOM’s
functional groups with acidic protons such as COOH, OH, NH and SH (Arakawa and
Aluwihare 2015).
The most widely application of GC for DOM is the separation of lignins and tannins, and if
coupled with mass spectrometry, structures of lignins could be characterized. Normally, the
DOM samples are pretreated by CuO-oxidation first, and then derivatised prior to GC
(Sandron et al. 2014). A new GC method was recently developed for DOM separation and
characterization by using 2-D GC×GC and coupled to mass spectrometry. This advanced
method provided unsurpassed chromatographic resolution, and has enabled the separation of
homologous molecules along predictable trajectories in 2-D retention time spaces which could
further complement the information of mass spectra and aid in molecular interpretation. With
this method, some novel compounds (e.g. lignin-derived cyclobutane photodimers) were
discovered which escaped detection by previous methods, and the sterically constained
46
benzene polycarboxylic acid isomers were found to be strongly retained on the second
chromatographic dimension (Ball and Aluwihare 2014).
Another application of GC in the assessment of DOM molecular structures referred to the
distinction of the carbon backbone, and was used for characterization of the functional group
when coupled to mass spectrometry as well (Arakawa and Aluwihare 2015). After
pretreatment by selective chemical reduction and derivation procedure, DOM samples were
separated into different backbone structures by GC. A new method with 2-D GC×GC coupled
with mass spectrometry was capable to separate DOM comprehensively with improved
chromatographic resolution. It showed that reduced compounds corresponded to alicyclic
hydrocarbons in the size range from C10 to C17, and cyclic terpenoids were the only
biomolecular class with contiguous, alicyclic carbon backbones of this size.
3.1.3 Combination of physical and chemical isolation
Combination of SPE and RO/ED has been applied to surface and deep marine DOM, and it
has been also compared with the individual isolation methods (Green et al. 2014). There, the
samples were extracted by SPE with PPL cartridge first and then the wastes from SPE process
were subject to RO/ED. This combined technique enabled high DOC recovery (98% for deep
marine DOM and 101% for the surface one), and was representative of original water samples
in terms of C/N ratios.
Passive sampling was also been applied on DOM isolation, which was consisted of a
molecular weight selective membrane and an anion exchange resin. ~ 72-89% of DOC
recovery for Lake Ontario was obtained by this method, with the structural groups extremely
similar to the fraction isolated by the same anion exchange resin. However, the carbohydrate
groups were discriminated against by this method when compared with the original Suwannee
River RO sample, which might be attributed to the selectivity of this anion exchange resin. In
general, it was cost-effective, easy use, and allowed for a range of temporal and spatial
experiments that would be very difficult or impossible to perform using conventional
approaches. The most fundamental difference between this method and the others resided in
the time scale that the DOM information provided by passive sampling was rather integrative
(with 1-2 weeks of time period) whereas other isolation methods provided a “snapshot” of
DOM in time (Lam and Simpson 2006).
47
3.2 Characterization of DOM
3.2.1 Bulk analysis
3.2.1.1 Elemental analysis
The determination of H, C, O, N, S and P gives the percentages of the elemental compositions
and relevant elemental ratios. It is the most fundamental bulk information for DOM
characterization (Kördel et al. 1997). The first function of elemental analysis is to check the
reliability of the results obtained by other measurement such as highly advanced structural
spectroscopy. For example, a general assessment of the FT-ICR MS measurement is possible
by comparing the FT-ICR MS-derived H/C and O/C ratios with the original elemental ratios
of the same sample (Li et al. 2016a). The second function of elemental analysis is to obtain
rough estimates of the changes in DOM samples by checking different samples. For instance,
variations in elemental ratios and elemental compositions are common among DOM from
different sources or occur after certain chemical/physical treatments (Kördel et al. 1997).
3.2.1.2 Titration
The acid-base properties of DOM are of great significance, as it moderates the acid-base
balance in the natural waters and complexes formation with other elements or organic
compounds in the environment. The functional groups of carboxylic acids and phenolic
groups are widely measured and reported for the general acid-base properties, which are
obtained by the indirect titration or direct titration. Indirect titration has the advantages of
simplicity to use and no additional acidity involved whereas direct titration provides more
detailed information about the thermodynamics of the proton-binding (Driver and Perdue
2015, Ritchie and Perdue 2003). These parameters serve as instrumental information on
which further studies such as SPE and RP LC highly rely on.
The content of carboxylic groups in IHSS samples showed the order as follows: terrestrial
fulvic acids > aquatic fulvic acids > Suwannee River NOM > aquatic humic acids > terrestrial
humic acids; the content of phenols was higher in aquatic samples than the terrestrial samples,
whereas it was rather similar in fulvic acids and humic acids (Ritchie and Perdue 2003). The
carboxylic contents were found to be much higher than phenolic contents, with approximately
ratio of 4:1. Moreover, the Suwannee River NOM sample showed the logK for carboxylic
groups of ~4 and logK for phenolic groups of ~10, with average logK for proton-binding at
4.02 (Driver and Perdue 2015). This explains well the necessity for pH adjustment to pH=2

48
during SPE of Suwannee River NOM by hydrophobic sorbents: DOM molecules can retain on
the SPE sorbents very well under pH conditions which are by 2 units lower than the
significant logK (Li et al. 2016a).
3.2.1.3 Isotope analysis and radiocarbon analysis
Isotope analysis identifies the isotope signatures in the chemical compounds, and can be used
to trace the sources and understand the dynamic cycling processes in DOM studies. The two
major isotopes used in DOM studies are 13
C and 15
N, whose ratioes may be altered by
biological and geophysical processes (Guo and Sun 2009).
Carbon has three natural isotopes 12
C, 13
C and 14
C, with the abundance of 98.89%, 1.11% and
10-10
%, respectively. δ13
C isotope is widely used in DOM studies for trace the origin based on
the assumption that DOM from different origin has a distinct δ13
C isotope value. A general
trend is observed for DOM with different sources: the value ranges from -35‰ to -25‰ for
terrestrial derived DOM; it is in the range of -18‰ and -8‰ for marsh macrophytes; and
intermediate for the marine phytoplankton (Guo and Sun 2009). The variation in the values is
mainly attributed to the isotope fractionation during carbon metabolism in the plants in which
13C commonly becomes progressively enriched as well as the isotope composition in different
source materials.
Nitrogen has two natural isotopes 14
N and 15
N, with the abundance of 99.63% and 0.37%,
respectively. δ15
N isotope is used for tracing and distinguishing nitrogen sources and
monitoring certain nitrogen-dependent biogeochemical processes such as nitrification and
microbial processes. Generally, the δ15
N values range from -10‰ to 20‰ in different DOM
samples (Guo and Sun 2009).
The radioactive 14
C with a half-life of 5730±40 years is used to determine the apparent age in
organic materials by radiocarbon dating method. It serves as a proxy for DOM ages with the
time scale of ~50,000 years based on the assumption that negligible exchange of organic
carbon is involved in the studied ecosystem. The radiocarbon values typically are -263±23‰
and -546±14‰ for marine surface and deep DOM, respectively (Guo and Sun 2009).
However, due to the complexity of the ecosystem, it is advisable to measure the compound-
specific radiocarbon analysis for the better representation of the age of the DOM source (Guo
and Sun 2009). For instance, individual sugar compounds were isolated and collected in
49
marine DOM for the compound-specific radiocarbon analysis so as to understand the role of
carbohydrates in the cycling system (Repeta and Aluwihare 2006).
3.2.2 Optical spectroscopy
3.2.2.1 UV-visible spectroscopy
The application of UV-visible spectroscopy provides the rough estimates of DOM
concentration, sources and certain functional groups. It boasts the advantages of low cost,
ease of use and satisfactory reliability at high sensitivity, rendering it one of the most widely
used techniques in DOM characterization. But it is highly selective to the chromophoric DOM
instead of the overall DOM pool, and can be easily affect by ion strength and pH changes
(Minor et al. 2014). Two absorbance indices are extensively applied in DOM studies.
The specific UV absorbance (SUVA254) measures the absorbance at the wavelength of 254
nm at normalized DOM concentrations. It has been used as an indictor of the relative
aromaticity in DOM samples, in which a higher SUVA254 value is associated with greater
aromatic content (Weishaar et al. 2003). SUVA254 also correlates to the hydrophobicity or
hydrophilicity in DOM samples: hydrophilic fractions were associated with low SUVA254 (<
3) whereas hydrophobic fractions of supposedly higher aromaticity were associated with low
SUVA254 (> 4) (Weishaar et al., 2003).
The specific absorption slope ratio (SR) is a ratio of UV spectral wavelength sections at 275-
295 and 350-400 nm (Weishaar et al., 2003). Lower SR roughly correlates to larger molecular
weight and higher aromaticity in DOM (Weishaar et al., 2003). Generally, large SR associates
to marine DOM (ranging from ~1.7 for coastal DOM and up to ~4.6 for photobleached
offshore DOM), whereas smaller values (SR < 1) were recorded for terrestrial DOM (Helms et
al., 2008).
3.2.2.2 Fluorescence spectroscopy
Fluorescence spectroscopy measures the fluorescence properties in DOM samples. Similar to
UV-visible spectroscopy, it is efficient as well as powerful to collect DOM information like
rough quantification of the concentration, characterization of certain functional groups and
monitoring the reactivity, but only works on chromophoric DOM (Minor et al. 2014).
Excitation-emission matrix fluorescence (EEM), as one of the most widely applied technique
in the structure assessment of DOM, acquires a range of emission spectra from the excitation

50
spectra. EEM spectra provide rich information in terms of fluorescence indices and
fluorescence peaks (Jaffé et al. 2014). The general characteristics of fluorescence indices
together with UV indices are listed in Table 3-1.
The fluorescence index (FI) is used as a proxy for DOM sources (Fasching et al., 2014). FI
values ranging near 1.7-2.0 is reported to represent DOM with low aromaticity (12-17%)
whereas lower FI in the range of 1.3-1.5 indicates DOM of higher aromaticity (McKnight et
al. 2001).
The freshness index (β/α) is a measure of fresh microbially produced DOM (Fasching et al.
2014). The β/α value >1 suggests a predominantly autochthonous origin or freshly released
DOM, while β/α < 1 may indicate low production of, or aged DOM (Huguet et al. 2009).
The humification index (HIX) is another proposed indicator of DOM humification degree,
where high values denote extensive humic character and unsaturation derived from
terrigenous sources (Huguet et al. 2009, Ohno 2002).
Fluorescence peaks in EEM spectra can be related to the DOM sources and components, like
protein-like materials or phytoplankton-derived materials. There are generally seven
fluorescence peaks in EEM spectra, each corresponding to specific DOM characteristics,
more detailed information is available in Table 3-2. The fluorescence peaks are traditionally
used by ‘peak picking’ method, and nowadays extensively applied together with the statistical
method parallel factor analysis (PARAFAC) (Murphy et al. 2013, Stedmon and Bro 2008).
EEM with PARAFAC model quantifies the fluorescence peaks (or chemical components) into
defined proportions which can be further statistically associated with other spectroscopic
results such as NMR and FT-ICR MS, and has been successfully perform to access the
environmental dynamics (Jaffé et al. 2014, Kellerman et al. 2015, Woods et al. 2011).
However, the PARAFAC model only works under certain conditions which meet its
assumptions: changes in the concentration of an analyte only influence its fluorescence
intensity (not shape); a linear dependence between fluorescence and concentration is assumed;
components are unique with respect to their concentration profile, emission spectra and
excitation spectra; individual components do not influence each other (Murphy et al. 2013).
The properties of EEM spectra can be found in Table 3-3.
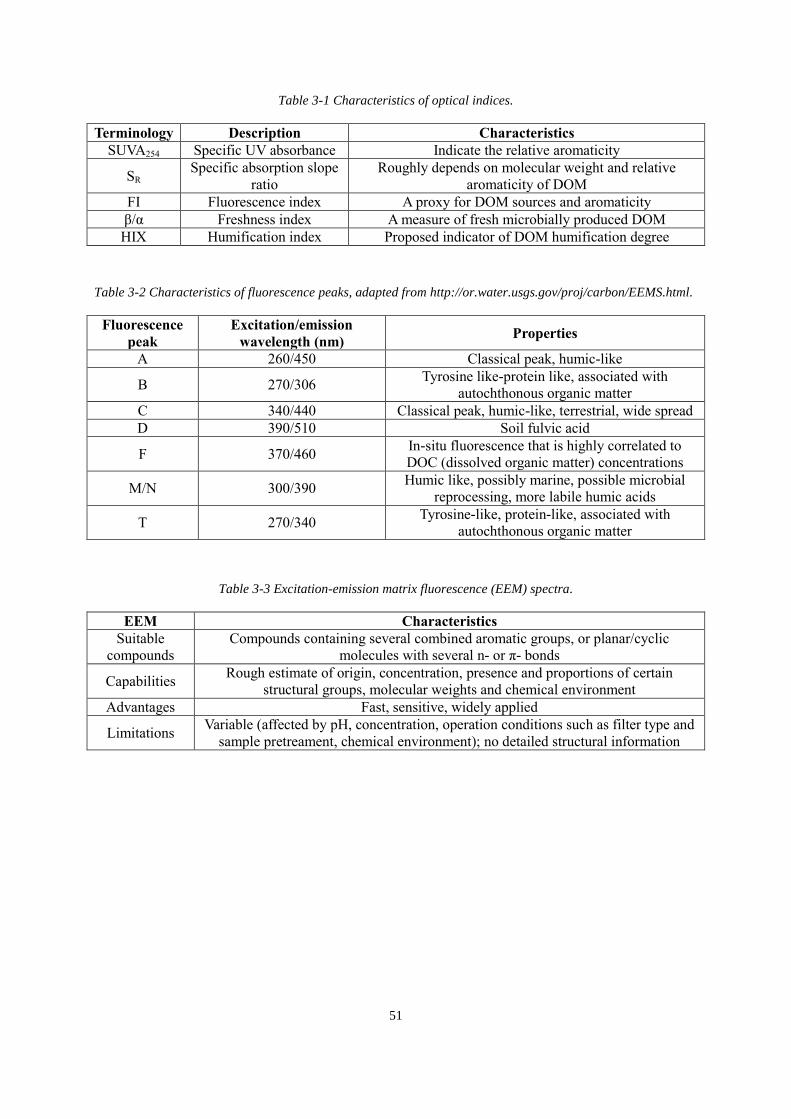
51
Table 3-1 Characteristics of optical indices.
Terminology Description Characteristics
SUVA254 Specific UV absorbance Indicate the relative aromaticity
SR Specific absorption slope
ratio
Roughly depends on molecular weight and relative
aromaticity of DOM
FI Fluorescence index A proxy for DOM sources and aromaticity
β/α Freshness index A measure of fresh microbially produced DOM
HIX Humification index Proposed indicator of DOM humification degree
Table 3-2 Characteristics of fluorescence peaks, adapted from http://or.water.usgs.gov/proj/carbon/EEMS.html.
Fluorescence
peak
Excitation/emission
wavelength (nm) Properties
A 260/450 Classical peak, humic-like
B 270/306 Tyrosine like-protein like, associated with
autochthonous organic matter
C 340/440 Classical peak, humic-like, terrestrial, wide spread
D 390/510 Soil fulvic acid
F 370/460 In-situ fluorescence that is highly correlated to
DOC (dissolved organic matter) concentrations
M/N 300/390 Humic like, possibly marine, possible microbial
reprocessing, more labile humic acids
T 270/340 Tyrosine-like, protein-like, associated with
autochthonous organic matter
Table 3-3 Excitation-emission matrix fluorescence (EEM) spectra.
EEM Characteristics
Suitable
compounds
Compounds containing several combined aromatic groups, or planar/cyclic
molecules with several n- or π- bonds
Capabilities Rough estimate of origin, concentration, presence and proportions of certain
structural groups, molecular weights and chemical environment
Advantages Fast, sensitive, widely applied
Limitations Variable (affected by pH, concentration, operation conditions such as filter type and
sample pretreament, chemical environment); no detailed structural information

52
3.2.3 Mass spectrometry (MS)
Fig. 3-1 Current available approaches for DOM characterization by mass spectrometry, adapted from Gross
2011, Hertkorn et al. 2006, 2008 and Kujawinski 2011.
3.2.3.1 Characteristics of ionization modes
Mass spectrometry (MS) generates ions from inorganic/organic compounds with appropriate
methods and separates those ions according to the mass-to-charge (m/z) and detects them
qualitatively and quantitatively by their m/z and abundance. The application of MS in DOM
studies provides the information on molecular weights and chemical composition which can
be further interpreted into different groups of compounds (Gross 2011, Kujawinski 2011,

53
Mopper et al. 2007, Nebbioso and Piccolo 2013). A general workflow of DOM
characterization by MS can be found in Fig. 3-1.
Before applying DOM samples into the MS instrument, it is necessary to know the basic
functions of different ionization modes. Nowadays, plenty of ionization modes are available.
A general summary of the properties of the different ionization modes is listed in Table 3-4.
Electron ionization (EI), as the classical ionization method, ionizes the gaseous neutrals with a
beam of energetic electrons with an energy of 10-60 eV shooting on them (Gross 2011). EI is
suitable for low to medium polarity, non-ionic organic compounds with the molecular weight
up to 1,000 amu, which should also be non-thermo-labile and volatile. Generally, it has been
applied to a wide variety of different groups of molecules such as aliphatics, aromatic
hydrocarbons and their derivatives, heterocycles, flavones, steroids, terpenes and so on.
Moreover, EI spectra are usually measured at standard conditions and highly reproducible,
allowing for the use of EI mass spectral databases available for mass peak assignment. It is a
hard ionization technique, requiring high energy to get wanted molecules ionized, and in
certain conditions molecular ions are too weak or absent due to the fragmentation (Gross
2011).
Chemical ionization (CI) is a soft ionization method in MS and generates ions based on ion-
molecule interactions, in which gaseous molecules interact with ions (Gross 2011). The
distinct mechanism of CI requires bimolecular processes to generate ions, which implies that
enough ion-molecule collisions have to be induced. Thus the sensitivity of CI highly depends
on the experiment conditions like the reagent gas, pressure, temperature of the ion source and
the nature of the samples. In general, the molecules applicable for EI can be also analyzed by
CI, and CI is commonly suitable for organic compounds with the mass range from 80 to 1200
amu (Gross 2011).
Atmospheric pressure chemical ionization (APCI) generates ions based on ion-molecule
reactions at atmospheric pressure instead of in a vacuum, and a corona discharge-powered
plasma is applied for ionization (Gross 2011). The neutral molecules are heated for
vaporization prior to ionization. Although high temperature up to ~500 oC is used for
vaporization, it is still softer than the traditional CI. Typically, non-thermolabile, moderately
polar and semi-volatile samples are suitable for atmospheric pressure photoionization (APPI),
and the mass range of APPI can reach to 1,000 amu.

54
Atmospheric pressure photoionization (APPI), as an alternative or a complement for APCI,
generates ions based on ion-molecule reactions at atmospheric pressure with UV light source
to replace the corona plasma (Gross 2011). The energy of UV photons and the ionization
energies of the molecules are essential and can affect the APPI initiation. In the APPI process,
ions are actively generated from neutrals. This mode is applicable to semi-volatile, low- to
medium-polar compounds with the molecular weight up to 1,000 amu. This ionization mode
shows certain drawbacks: inefficient ion production, mixed ion formation, addition of
dopants, and ionization depending on the dopant type.
Laser desorption/ionization (LDI) gets samples evaporated and ionized by using laser
irradiation (Gross 2011). It can be applied to analyse organic/inorganic salts, molecules with
large conjugated π-electron systems and UV-absorbing polymers. It can also be applied to
samples at low mass range. In LDI, the range up to m/z 105 can be employed for the detection
of ions. Recently, LDI has showed good sensitivity for N-containing aromatic species,
polycyclic aromatic hydrocarbons, shale oils, ship diesel and Suwannee River DOM (Ruger et
al. 2015). However, ions in LDI mode get produced depending on the polarity of analytes,
ionization energy and impurities; fragmentation may occur.
Matrix-assisted laser desorption/ionization (MALDI) uses a suitable matrix material to which
is intimately mixed with the samples. This mixture is then subjected to laser pulses which
initiate vaporization followed by soft ionization (Gross 2011). MALDI spectra provide singly
or doubly charged ions which can be interpreted easily. Compared with LDI, MALDI is
softer, resulting in exclusion of detailed MS/MS information. Similar to LDI, MALDI
generates ions depending on many parameters such as the polarity of analytes, ionization
energy, matrix type and impurities. In general, the samples can be measured by MALDI
should be either neutral or ionic with no/few salts. Theoretically, MALDI could detect
unlimited high mass range; the common practical upper mass limit is near m/z 3×10⁵. In order
to attentuate the interference resulting from matrix ions, analyte molecules should have m/z >
3×10³. So far MALDI has been successfully applied to proteins, peptides, carbohydrates and
other large biomolecules, which occur in DOM as well.
Electrospray ionization (ESI), the most employed ionization method in MS, generates ions
directly from the infused solution by applying to a conductive capillary high voltage (> kV)
(Gross 2011). Unlike the ionization methods described above which actively create ions, ESI
is more like a method of ion transfer. In ESI mode, analytes are present in the volatile sample

55
solution, and then get ionized during and after transfer into the gas phase, which renders it as
a rather soft ionization process. Due to its softness, intact molecular ions are obtained.
Generally, ESI is applicable for small polar molecules, medium polar compounds with the
mass range of 10 to 103 amu, ionic metal complexes and large molecules like proteins. In ESI
mode, the detected m/z can reach up to 3×10³ amu. Its wide application range of analytes
acceptance of both polarity and mass renders it compatible with different separation
techniques such as LC, GC and IC. However, ESI has certain drawbacks like susceptibility to
contaminants, relatively low ion currents, complex spectra due to production of cluster ions,
and multiply charged ion signals.
In desorption electrospray ionization (DESI) mode, an electronically charged plume is
directed on the sample surface, and then ions are withdrawn and transported through air to the
mass analyzer (Gross 2011). DESI allows the analytes to be measured without sample
preparation, as the greatest advantage of this technique, which makes it possible for high-
throughput analysis. The analytes subjected to DESI mode should meet two requirements: soft
surface of samples and the surface exposed to electrospray plume. DESI serves well for polar
and non-polar compounds with low to moderate mass range, and typically m/z can reach up to
1×10³ amu. The intrinsic limitation of DESI is that the detection of the analytes highly
depends on the matrix applied and DESI performace is critically affected by many parameters
in terms of angle, gas flow rate, liquid flow rate, temperature and salts.
Different ionization mode in MS has been applied on characterization of DOM/humic
substances and the corresponding comparisons among them are also available. LDI was
applied to Suwannee River fulvic acid, and showed ions essentially distributed at every m/z
value in the range of 200-700 m/z with the absence of ions at high mass range. This
phenomenon was attributed to the complexity of DOM compounds and the potential
fragmentation occurred during LDI mode. Due to the polydispersity of DOM compounds
together with the complexity in the ion formation, the general assumption that compounds get
equally ionized and that the ions represent parent ions instead of fragmentation ions might not
be applicable on LDI mode. (Fievre et al. 1997)
ESI showed the limitations on the fractions of Suwannee River fulivc acid and humic acid
with large molecular weight. When the compounds are above 1000 amu, their intact ions were
not observed (Reemtsma 2009, These and Reemtsma 2003). A systematic study compared
ESI, APCI and APPI in both positive and negative modes on Suwannee River fulvic acid at
56
m/z of 200-1000 amu. Generally, larger number of detected peaks as well as the assigned
formulae was obtained in negative mode than in positive mode, rendering negative mode
predominately applied in MS of DOM for future studies (Hertkorn et al. 2008). The number
decreased in the order: APCI > ESI > APPI in negative mode, whereas it showed the pattern:
APPI > APCI > ESI in positive mode. The obtained orders were derived from the theoretical
expectation that ESI ionizes a wide range of compounds while APCI and APPI are applicable
for less polar and smaller molecules. This behavior clearly indicated that high selectivity in
ionization modes occurred in the case of polydisperse and molecular heterogenueous DOM.
Interestingly, APCI shared approximately half of the negative ions with both ESI and APPI.
Moreover, ESI was found to be more selective for the compounds with high O/C ratios (0.3-
0.75), APPI more selective for aromatic compounds, and APCI emphasized components with
relatively smaller O/C ratios (0.2-0.4) (Hertkorn et al. 2008).
MALDI was competent to measure small moieties (m/z: 200-1200) and macromolecules
together with aggregates formed within DOM (m/z: 1200-15000) (Wang et al. 2014).
Compared with ESI at 200-800 m/z range, MALDI preferentially ionized more unsaturated
and aromatic DOM constituents with lower O/C ratios (< 0.5) whereas ESI was selective for
more polar compounds with higher O/C ratios. In MALDI mode, compounds with aromatic
structures, moderate O/C ratios (0.25-0.7) and lower H/C ratios were liable to form even m/z
ions while those with higher H/C ratios were more likely to form odd m/z ions. Furthermore,
approximately half of molecules identified by MALDI belonged to aromatic groups which
could get ionized by MALDI as they were liable to absorb electrons (Cao et al. 2015).
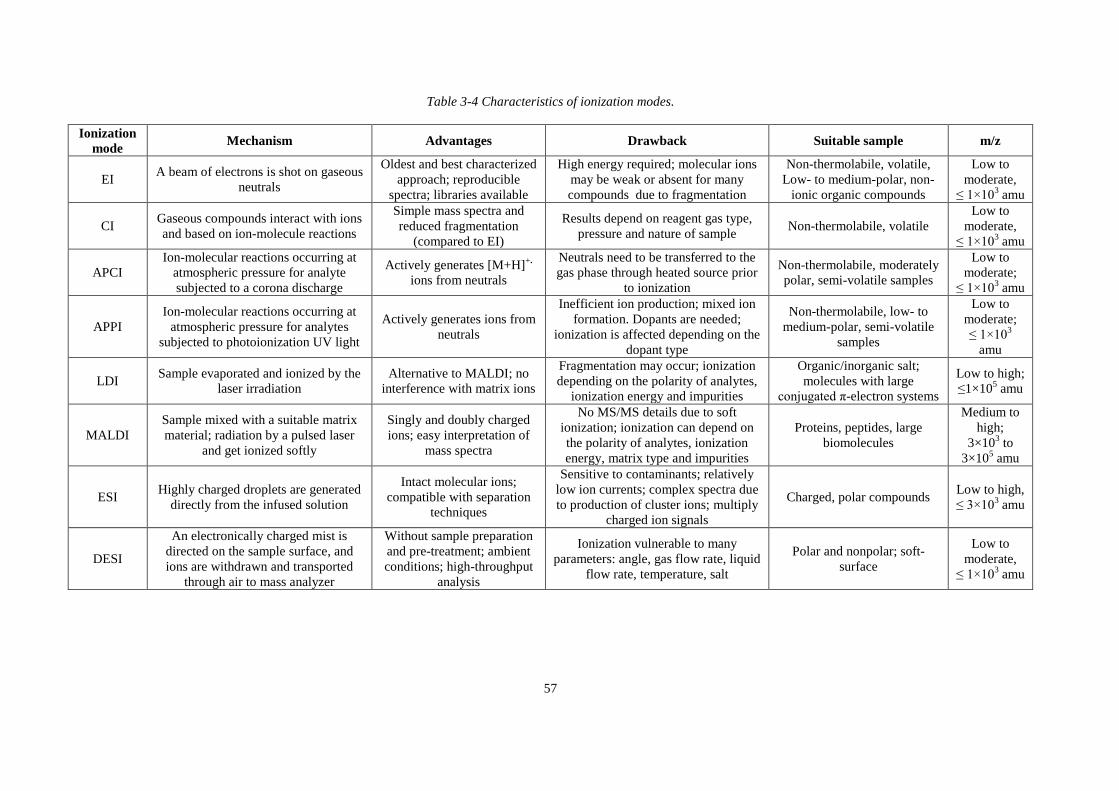
57
Table 3-4 Characteristics of ionization modes.
Ionization
mode Mechanism Advantages Drawback Suitable sample m/z
EI A beam of electrons is shot on gaseous
neutrals
Oldest and best characterized
approach; reproducible
spectra; libraries available
High energy required; molecular ions
may be weak or absent for many
compounds due to fragmentation
Non-thermolabile, volatile,
Low- to medium-polar, non-
ionic organic compounds
Low to
moderate,
≤ 1×10³ amu
CI Gaseous compounds interact with ions
and based on ion-molecule reactions
Simple mass spectra and
reduced fragmentation
(compared to EI)
Results depend on reagent gas type,
pressure and nature of sample Non-thermolabile, volatile
Low to
moderate,
≤ 1×10³ amu
APCI
Ion-molecular reactions occurring at
atmospheric pressure for analyte
subjected to a corona discharge
Actively generates [M+H]+.
ions from neutrals
Neutrals need to be transferred to the
gas phase through heated source prior
to ionization
Non-thermolabile, moderately
polar, semi-volatile samples
Low to
moderate;
≤ 1×10³ amu
APPI
Ion-molecular reactions occurring at
atmospheric pressure for analytes
subjected to photoionization UV light
Actively generates ions from
neutrals
Inefficient ion production; mixed ion
formation. Dopants are needed;
ionization is affected depending on the
dopant type
Non-thermolabile, low- to
medium-polar, semi-volatile
samples
Low to
moderate;
≤ 1×10³
amu
LDI Sample evaporated and ionized by the
laser irradiation
Alternative to MALDI; no
interference with matrix ions
Fragmentation may occur; ionization
depending on the polarity of analytes,
ionization energy and impurities
Organic/inorganic salt;
molecules with large
conjugated π-electron systems
Low to high;
≤1×10⁵ amu
MALDI
Sample mixed with a suitable matrix
material; radiation by a pulsed laser
and get ionized softly
Singly and doubly charged
ions; easy interpretation of
mass spectra
No MS/MS details due to soft
ionization; ionization can depend on
the polarity of analytes, ionization
energy, matrix type and impurities
Proteins, peptides, large
biomolecules
Medium to
high;
3×10³ to
3×10⁵ amu
ESI Highly charged droplets are generated
directly from the infused solution
Intact molecular ions;
compatible with separation
techniques
Sensitive to contaminants; relatively
low ion currents; complex spectra due
to production of cluster ions; multiply
charged ion signals
Charged, polar compounds Low to high,
≤ 3×10³ amu
DESI
An electronically charged mist is
directed on the sample surface, and
ions are withdrawn and transported
through air to mass analyzer
Without sample preparation
and pre-treatment; ambient
conditions; high-throughput
analysis
Ionization vulnerable to many
parameters: angle, gas flow rate, liquid
flow rate, temperature, salt
Polar and nonpolar; soft-
surface
Low to
moderate,
≤ 1×10³ amu
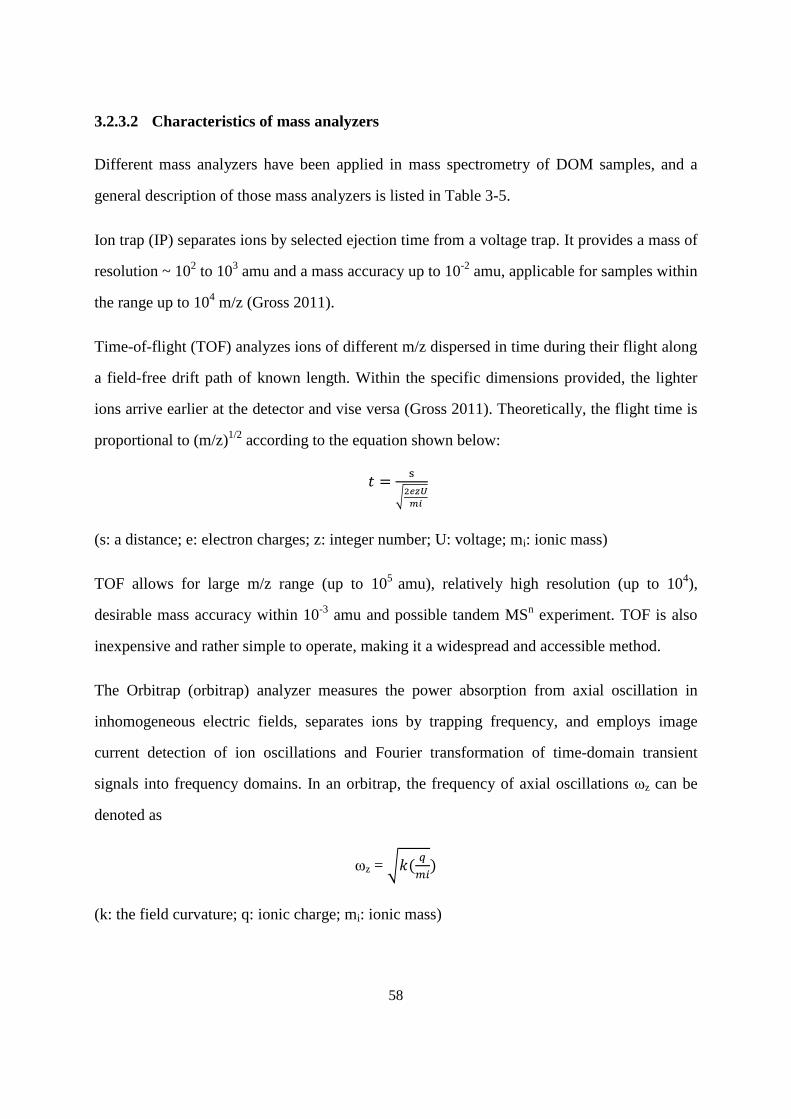
58
3.2.3.2 Characteristics of mass analyzers
Different mass analyzers have been applied in mass spectrometry of DOM samples, and a
general description of those mass analyzers is listed in Table 3-5.
Ion trap (IP) separates ions by selected ejection time from a voltage trap. It provides a mass of
resolution ~ 102 to 10
3 amu and a mass accuracy up to 10
-2 amu, applicable for samples within
the range up to 104 m/z (Gross 2011).
Time-of-flight (TOF) analyzes ions of different m/z dispersed in time during their flight along
a field-free drift path of known length. Within the specific dimensions provided, the lighter
ions arrive earlier at the detector and vise versa (Gross 2011). Theoretically, the flight time is
proportional to (m/z)1/2
according to the equation shown below:
𝑡 =s
√2𝑒𝑧𝑈
𝑚𝑖
(s: a distance; e: electron charges; z: integer number; U: voltage; mi: ionic mass)
TOF allows for large m/z range (up to 105
amu), relatively high resolution (up to 104),
desirable mass accuracy within 10-3
amu and possible tandem MSn experiment. TOF is also
inexpensive and rather simple to operate, making it a widespread and accessible method.
The Orbitrap (orbitrap) analyzer measures the power absorption from axial oscillation in
inhomogeneous electric fields, separates ions by trapping frequency, and employs image
current detection of ion oscillations and Fourier transformation of time-domain transient
signals into frequency domains. In an orbitrap, the frequency of axial oscillations ωz can be
denoted as
ωz = √𝑘(𝑞
𝑚𝑖)
(k: the field curvature; q: ionic charge; mi: ionic mass)

59
It shows that the frequency ωz depends on the field curvature, ionic charge and ionic mass,
independent of the velocity. Here, the frequency is proportional to (q/m)1/2
.
The resolving power R can be calculated as
R= 𝑚
𝛥𝑚 =
1
2𝛥𝜔𝑧√𝑘𝑞
𝑚
It suggests that orbitrap offers good resolving power at both low and high m/z values (low:
50-250 m/z; high: 800-2000 m/z). Overall, orbitrap serves well for the compounds within the
mass range of 104 amu, exhibits the resolution as high as 10
5 amu, and reaches the mass
accuracy to 10-4
amu (Gross 2011).
Fourier Transfer Ion Cyclontron Resonance (FT-ICR) analyzes trapped ions in a strong
homogeneous magnetic field (Lorenz force), separates them by cyclotron frequency, and
employs image current detection and Fourier transformation of transient signals (Marshall et
al. 1998, Nikolaev et al. 2016). In a FT-ICR mass spectrometer, the cyclotron frequency fc
can be denoted as
fc = 𝑞𝐵
2𝜋𝑚𝑖
(B: magnetic field; q: ionic charge; mi: ionic mass)
Thus, the cyclotron frequency is proportional to the magnetic field B and (q/m), independent
of velocity (Marshall et al. 1998, Nikolaev et al. 2016). The magnetic field B is crucial to the
FT-ICR system. It correlates positively with resolving power and scan speed, and its square
associates with upper mass limit, ion trapping time, ion energy as well as number of trapped
ions. However, there are other parameters jointly influence the resolution and accuracy such
as ICR cell and operation conditions (Gross 2011, Marshall et al. 1998, Kido Soule et al.
2010).
Different from orbitrap, the resolving power R of FT-ICR increases linearly with magnetic
field B, and is proportional to q/m. FT-ICR mass spectrometry outperforms orbitrap mass

60
spectrometry at relatively moderate mass range. In general, FT-ICR boasts an
overwhelmingly high mass resolution and mass accuracy (R: 106; Δm < 10
-5 amu), and is
suitable for analytes up to m/z ~ 104 (Gross 2011, Marshall 1998).
Due to its ultra-high resolution together with its exceptional mass accuracy, FT-ICR MS has
been dominatingly applied in MS for DOM molecular characterization. It offers thousands of
discrete molecular masses with high accuracy which allows for the precise assignment of the
elemental formulas. However, FT-ICR mass spectrometers are expensive, limiting their
accessibility. Other mass analyzers on the other hand show the potential for DOM molecular
characterization. When DOM samples get selectively fractionated into mixtures with reduced
complexity, TOF is capable to achieve fairly resolved mass peaks. For instance, following
defunctionalization and coupling with GC, TOF has been successfully performed on the
characterization of alicyclic terpenoids in Suwannee River fulvic acids in DOM samples
(Arakawa and Aluwihare 2015).
Orbitrap demonstrates the ability to characterize the CHO compounds below 250 Da in a
complex mixture and most major ionizable molecules in DOM (exception of sulfur- and
phosphorus-containing compounds) (Hawkes et al. 2016). As expected, fewer mass peaks and
molecular formulas were obtained by orbitrap, as well as lower resolution. Orbitrap was
found to detect ions in 100-200 m/z range with highest intensity whereas FT-ICR produced
low intensity mass peaks at both low and high masses with a maximum ion abundance
detected around an intermediate mass (400-600 m/z) (Remucal et al. 2012). This distinct
distribution of ions in these two mass analyzers can be probably explained by their resolution
equations mentioned above. Thus, orbitrap is an attractive and alternative in terms of
relatively satisfactory performance and low cost, and is advised to be used as an alternative
for FT-ICR in case of small DOM molecules without heteroatoms (except oxygen).

61
Table 3-5 General characteristics of mass analyzers.
Mass analyzer Mechanism Mass range (m/z) Resolution Accuracy (amu)
IT Selected ejection time 104 10
2-10
3 10
-2
TOF Arrival time of flights 105 10
4 10
-3
Orbitrap Trapping frequency 104 10
5 10
-4
FT-ICR Cyclotron frequency 104 10
6 10
-5
3.2.3.3 MS-derived data analysis and visualization
Once the MS measurement is finished, data analysis is necessary so that meaningful
information can be drawn from it. MS-derived data analysis and visualization includes
employment of formula assignment, Kendrick mass defect (KMD) analysis, van Krevelen
diagram vidualization, aromaticity index computation and application of Netcalc analysis.
Detailed properties of these tools of data analysis and visualization are listed in Table 3-6.
For the measured mass spectra, certain steps should be taken in order to obtain an
aumbiguously reliable formula assignment. Generally, the core elements for DOM molecular
composition are restricted to C, H, O, N, S, P and 13
C based mass peaks on the actual
elemental analysis, and acknowledgement of these restrictions will attenuate the likelihood of
false assignment to some extent. Then, the assigned formulae are examined by different
chemical rules, namely, double bond equivalents (DBE), nitrogen rules and conservative
thresholds for molecular ratios. In addition, other optional applications can also be helpful, for
example, sorting the molecular formulas into homogenous series as well as calculation of
isotope ratios and predicted carbon number of intense mass peaks (Koch et al. 2007).
Once the accurate formulae are assigned, two basic tools can be implemented to visualize the
mass data. KMD analysis is applied for the recognition of homogenous series in a plot which
is consisted of KMD as the y-axis and the nominal Kendrick mass as x-axis. Basically,
compounds with the same constitution of heteroatoms and number of rings plus double bonds
but different counts of groups have identical KMD. The mass scale of CH2 is defined as
14.000 Da, and its corresponding IUPAC mass is 14.015650 Da. The CH2-based Kendrick
mass is defined as Kendrick mass = (14.000/14.015650) × IUPAC mass.

62
KMD = Nominal Kendrick mass – Kendrick mass
The common van Krevelen diagram is consisted of H/C ratios vs. O/C ratios. It provides
assessment of different molecular groups together with certain chemical reactions, and the
adapted version even offers information about the distribution of heteroatom-containing (N,
S, P…) compounds in DOM (Hertkorn et al. 2008, Kim et al. 2003, Mopper et al. 2007,
Schmitt-Kopplin et al. 2010). It is noteworthy that this plot provides the rough estimates of
the molecular compositions, which is not sufficient enough to assign to unumbigous classes
(Fig. 3-2). For example, the lignins and CRAMs overlap in the same region. Furthermore,
there are no strict boundaries among different molecular classes of compounds in van
Krevelen diagrams (Hertkorn et al. 2006, Minor et al. 2014, Kim et al. 2003).
Fig. 3-2 Van Krevelen diagram of groups of various compounds and the lines indicative of chemical reactivities,
adapted from Hertkorn et al. 2008.
Certain structural estimates can be deduced from extreme elemental ratios such as strongly
hydrogen-deficient molecules. As an example, the aromaticity index (AI) or a modified AI
can be calculated from molecular formulas as below (Koch and Dittmar 2006):
AI = 1+𝐶−𝑂−𝑆−0.5𝐻
𝐶−𝑂−𝑆−𝑁−𝑃
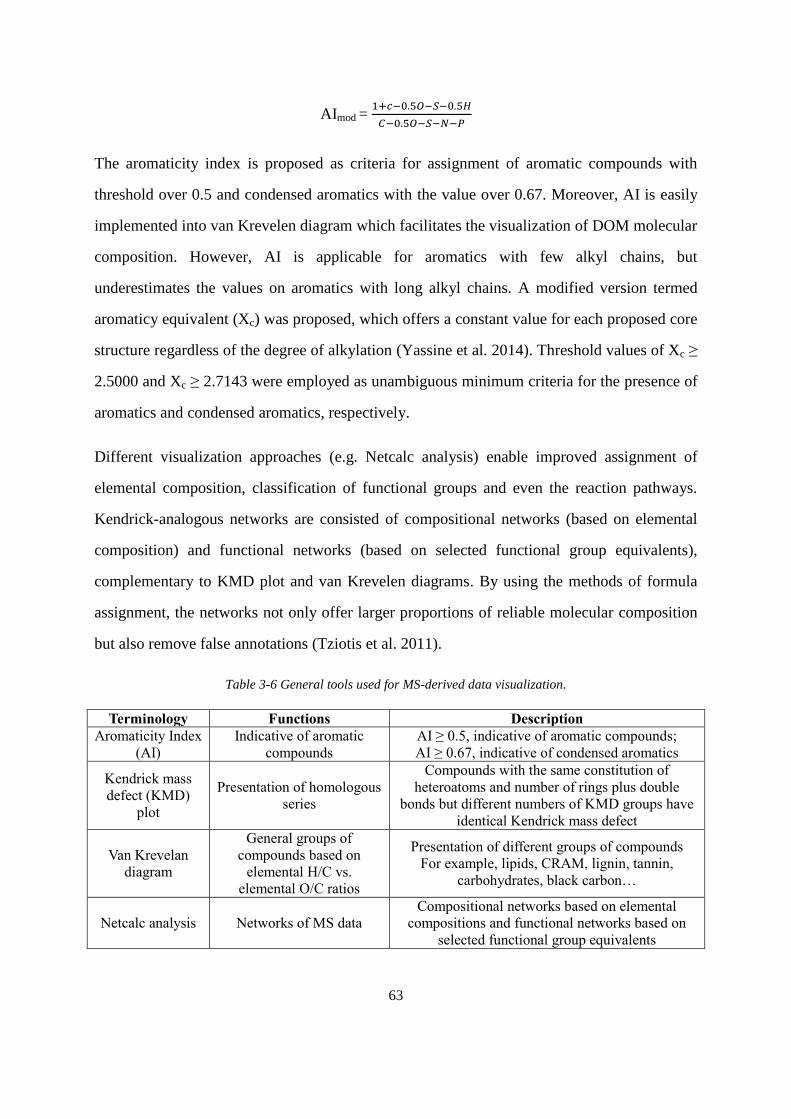
63
AImod = 1+𝑐−0.5𝑂−𝑆−0.5𝐻
𝐶−0.5𝑂−𝑆−𝑁−𝑃
The aromaticity index is proposed as criteria for assignment of aromatic compounds with
threshold over 0.5 and condensed aromatics with the value over 0.67. Moreover, AI is easily
implemented into van Krevelen diagram which facilitates the visualization of DOM molecular
composition. However, AI is applicable for aromatics with few alkyl chains, but
underestimates the values on aromatics with long alkyl chains. A modified version termed
aromaticy equivalent (Xc) was proposed, which offers a constant value for each proposed core
structure regardless of the degree of alkylation (Yassine et al. 2014). Threshold values of Xc ≥
2.5000 and Xc ≥ 2.7143 were employed as unambiguous minimum criteria for the presence of
aromatics and condensed aromatics, respectively.
Different visualization approaches (e.g. Netcalc analysis) enable improved assignment of
elemental composition, classification of functional groups and even the reaction pathways.
Kendrick-analogous networks are consisted of compositional networks (based on elemental
composition) and functional networks (based on selected functional group equivalents),
complementary to KMD plot and van Krevelen diagrams. By using the methods of formula
assignment, the networks not only offer larger proportions of reliable molecular composition
but also remove false annotations (Tziotis et al. 2011).
Table 3-6 General tools used for MS-derived data visualization.
Terminology Functions Description
Aromaticity Index
(AI)
Indicative of aromatic
compounds
AI ≥ 0.5, indicative of aromatic compounds;
AI ≥ 0.67, indicative of condensed aromatics
Kendrick mass
defect (KMD)
plot
Presentation of homologous
series
Compounds with the same constitution of
heteroatoms and number of rings plus double
bonds but different numbers of KMD groups have
identical Kendrick mass defect
Van Krevelan
diagram
General groups of
compounds based on
elemental H/C vs.
elemental O/C ratios
Presentation of different groups of compounds
For example, lipids, CRAM, lignin, tannin,
carbohydrates, black carbon…
Netcalc analysis Networks of MS data
Compositional networks based on elemental
compositions and functional networks based on
selected functional group equivalents

64
3.2.4 Magnetic nuclear resonance (NMR) spectroscopy
NMR is a technique that detects the spinning frequency of magnetic atomic nuclei which are
placed in the homogeneous magnetic field and got irradiated by radiofrequency of several
hundreds of MHz (Claridge 2016, Simpson 2012). Observation of the NMR signals requires
the samples to be NMR-active, in other words, the samples should have magnetically active
nuclides such as 1H,
2D,
13C,
15N,
19F and
31P. Generally, the magnetically active nuclides
have (2I+1) spin states for a spin with the magnetic quantum number I. The effects of static
field on the magnetic moment enable a percession around the applied field, referred to as
Larmor procession. The direction of the motion is determined by the sign of gyromagnetic
ratio γ, a unique constant for each NMR-active nuclide, which shows the number of rotations
(per second) per unit of applied magnetic field. NMR occurs when two requirements are
fulfilled. The first condition should be the required energy (ΔE), which can be described as
below.
ΔE=hγBo/2π
(h: Planck’s constant; γ: gyromagnetic ratio; Bo: magnetic field in tesla)
For a nuclear spin, near half of the spins align with the magnetic moment parallel to the
applied magnetic field with the other near half antiparallel to the field, resulting in parallel
(the α state, generally lower energy) and antiparallel (the β state) states. The difference in spin
population between these two states can be described by Boltzmann equation:
Nα/Nβ= exp(ΔE/kT)
(Nα the number of spins at α state; Nβ: the number of spins at β state; ΔE: the energy
difference between α and β states; k: Boltzmann constant; T: temperature in Kelvin)
According to this equation, certain approaches can be taken to perturb the Boltzmann
distribution: using higher magnetic field Bo; choosing an NMR-active nuclide with larger
gyromagnetic ratio γ; and decreasing the temperature T.

65
The second condition to make NMR occur is that the frequency matches that of the Larmor
precession for resonance conditions (Claridge 2016, Simpson 2012). If the frequency of
applied radio frequency is well tuned to the Larmor frequency, the net magnetization can be
tipped to different angles. The maximum signal intensities can be obtained at 90o or 270
o
pulse angle, whereas no/few signals at 180o or 360
o pulse angle. After excitation, relaxation
occurs. There are two basic relaxation types: spin-spin relaxation and spin-lattice relaxation.
The emitted signal from the excited nuclide, known as free induction decay (FID), is detected
as a time-dependent oscillating voltage due to the spin relaxation, and is applied with Fourier
transformation to change the time domain data into frequency domain data so that meaningful
sample information can be drawn (Claridge 2016, Simpson 2012).
The signals generated in 1-D NMR spectrum are generally using modified single-pulse
sequence. A pulse sequence in 1-D NMR spectroscopy is consisted of three distinct time
periods: relaxation delay; preparation time and the detection time. Ideally, sufficient S/N
ratios will accumulate following repeated pulse cycles.
NMR has been widely used for DOM structural characterization with both qualitative
identification and quantitative measurement of the functional groups. Different types of NMR
are available, and among them solution-state and solid-state NMR are extensively utilized.
Generally, solid-state NMR is performed on the solid samples like sediments and soils, while
solution-state NMR is applied to liquid samples such as the extracted DOM, even possible for
DOM samples at natural conditions without pretreatment. Solution-state NMR offers the
advantage over solid-state NMR to allow multidimensional NMR spectroscopy for in-depth
structural elucidation of relationships between groups of atomic nuclei (Hertkorn et al. 2014,
Mopper et al. 2007, Simpson et al. 2012).
3.2.4.1 1H NMR
1H NMR spectra enable the expedient identification and quantification of a broad range of
DOM constituents such as aliphatics, CRAM, carbohydrates, olefins and aromatics (Hertkorn

66
et al., 2013). The most significant features of 1H NMR spectra for DOM characterization
reside in two aspects: firstly, non-discrimination compared to other techniques such as mass
spectrometry or optical spectroscopy; secondly, desirable sensitivity compared to other NMR
measurements. For this reason, 1H NMR spectroscopy is advisable to be applied for screening
DOM structures. The chemical shifts and the corresponding DOM structures are summarized
in Table 3-7.
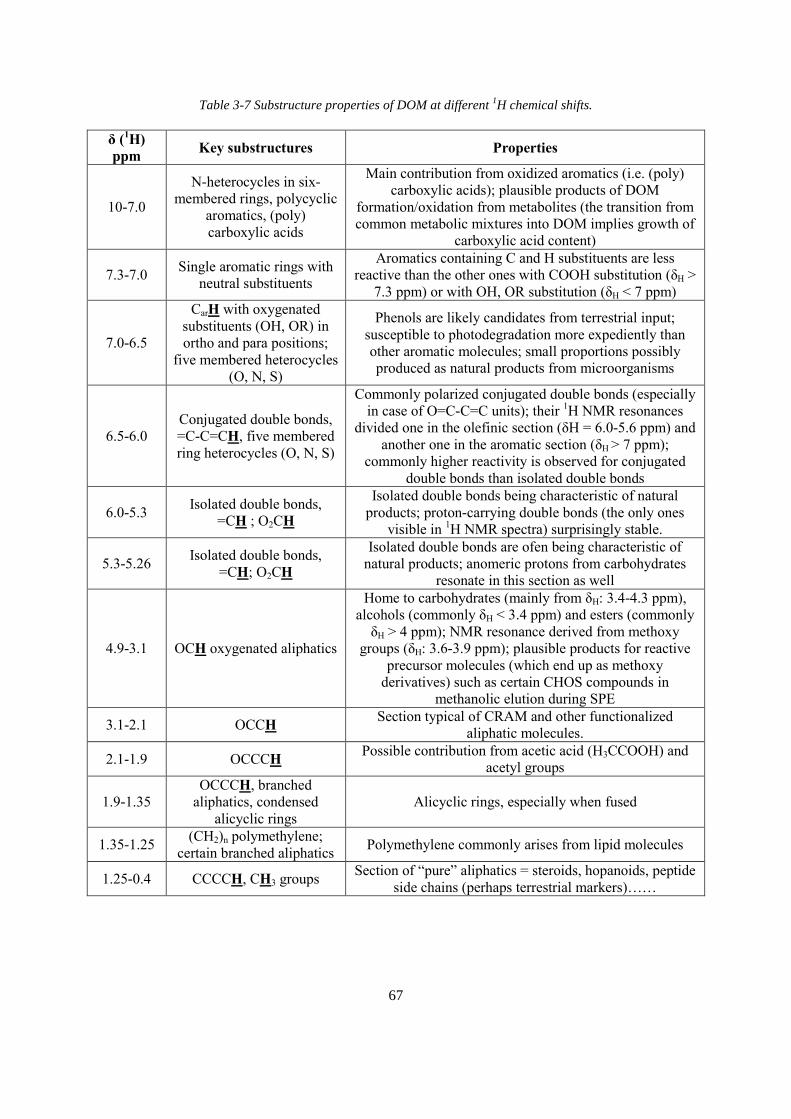
67
Table 3-7 Substructure properties of DOM at different 1H chemical shifts.
δ (1H)
ppm Key substructures Properties
10-7.0
N-heterocycles in six-
membered rings, polycyclic
aromatics, (poly)
carboxylic acids
Main contribution from oxidized aromatics (i.e. (poly)
carboxylic acids); plausible products of DOM
formation/oxidation from metabolites (the transition from
common metabolic mixtures into DOM implies growth of
carboxylic acid content)
7.3-7.0 Single aromatic rings with
neutral substituents
Aromatics containing C and H substituents are less
reactive than the other ones with COOH substitution (δH >
7.3 ppm) or with OH, OR substitution (δH < 7 ppm)
7.0-6.5
CarH with oxygenated
substituents (OH, OR) in
ortho and para positions;
five membered heterocycles
(O, N, S)
Phenols are likely candidates from terrestrial input;
susceptible to photodegradation more expediently than
other aromatic molecules; small proportions possibly
produced as natural products from microorganisms
6.5-6.0
Conjugated double bonds,
=C-C=CH, five membered
ring heterocycles (O, N, S)
Commonly polarized conjugated double bonds (especially
in case of O=C-C=C units); their 1H NMR resonances
divided one in the olefinic section (δH = 6.0-5.6 ppm) and
another one in the aromatic section (δH > 7 ppm);
commonly higher reactivity is observed for conjugated
double bonds than isolated double bonds
6.0-5.3 Isolated double bonds,
=CH ; O2CH
Isolated double bonds being characteristic of natural
products; proton-carrying double bonds (the only ones
visible in 1H NMR spectra) surprisingly stable.
5.3-5.26 Isolated double bonds,
=CH; O2CH
Isolated double bonds are ofen being characteristic of
natural products; anomeric protons from carbohydrates
resonate in this section as well
4.9-3.1 OCH oxygenated aliphatics
Home to carbohydrates (mainly from δH: 3.4-4.3 ppm),
alcohols (commonly δH < 3.4 ppm) and esters (commonly
δH > 4 ppm); NMR resonance derived from methoxy
groups (δH: 3.6-3.9 ppm); plausible products for reactive
precursor molecules (which end up as methoxy
derivatives) such as certain CHOS compounds in
methanolic elution during SPE
3.1-2.1 OCCH Section typical of CRAM and other functionalized
aliphatic molecules.
2.1-1.9 OCCCH Possible contribution from acetic acid (H3CCOOH) and
acetyl groups
1.9-1.35
OCCCH, branched
aliphatics, condensed
alicyclic rings
Alicyclic rings, especially when fused
1.35-1.25 (CH2)n polymethylene;
certain branched aliphatics Polymethylene commonly arises from lipid molecules
1.25-0.4 CCCCH, CH3 groups Section of “pure” aliphatics = steroids, hopanoids, peptide
side chains (perhaps terrestrial markers)……
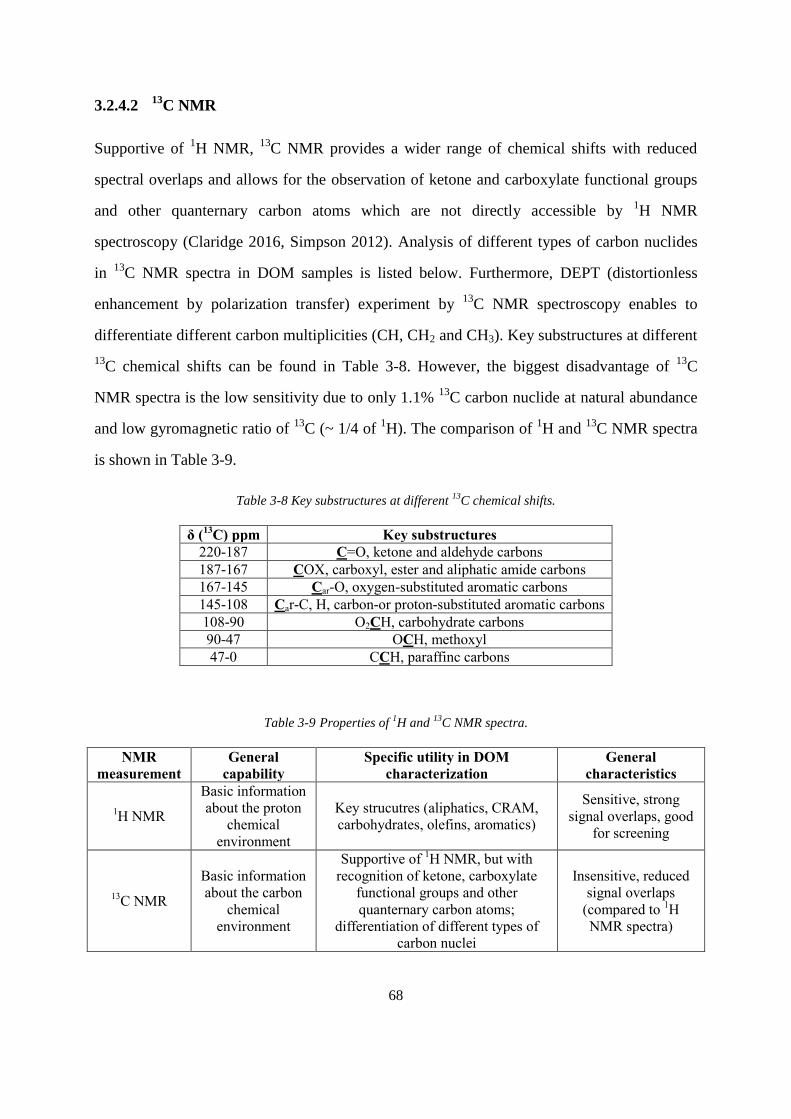
68
3.2.4.2 13C NMR
Supportive of 1H NMR,
13C NMR provides a wider range of chemical shifts with reduced
spectral overlaps and allows for the observation of ketone and carboxylate functional groups
and other quanternary carbon atoms which are not directly accessible by 1H NMR
spectroscopy (Claridge 2016, Simpson 2012). Analysis of different types of carbon nuclides
in 13
C NMR spectra in DOM samples is listed below. Furthermore, DEPT (distortionless
enhancement by polarization transfer) experiment by 13
C NMR spectroscopy enables to
differentiate different carbon multiplicities (CH, CH2 and CH3). Key substructures at different
13C chemical shifts can be found in Table 3-8. However, the biggest disadvantage of
13C
NMR spectra is the low sensitivity due to only 1.1% 13
C carbon nuclide at natural abundance
and low gyromagnetic ratio of 13
C (~ 1/4 of 1H). The comparison of
1H and
13C NMR spectra
is shown in Table 3-9.
Table 3-8 Key substructures at different 13
C chemical shifts.
δ (13
C) ppm Key substructures
220-187 C=O, ketone and aldehyde carbons
187-167 COX, carboxyl, ester and aliphatic amide carbons
167-145 Car-O, oxygen-substituted aromatic carbons
145-108 Car-C, H, carbon-or proton-substituted aromatic carbons
108-90 O2CH, carbohydrate carbons
90-47 OCH, methoxyl
47-0 CCH, paraffinc carbons
Table 3-9 Properties of 1H and
13C NMR spectra.
NMR
measurement
General
capability
Specific utility in DOM
characterization
General
characteristics
1H NMR
Basic information
about the proton
chemical
environment
Key strucutres (aliphatics, CRAM,
carbohydrates, olefins, aromatics)
Sensitive, strong
signal overlaps, good
for screening
13C NMR
Basic information
about the carbon
chemical
environment
Supportive of 1H NMR, but with
recognition of ketone, carboxylate
functional groups and other
quanternary carbon atoms;
differentiation of different types of
carbon nuclei
Insensitive, reduced
signal overlaps
(compared to 1H
NMR spectra)

69
3.2.4.3 2-D NMR
A 2-D NMR spectrum is obtained with two Fourier transformations on a matrix of data, and
cross peaks that correlate information on one axis with data on the other are generated in a 2-
D spectrum. A 2-D NMR pulse sequence contains four distinct time periods: relaxation delay,
evolution time, mixing time and detection period. Different from the preparation time in 1-D
NMR pulse sequence, here two individual parts (evolution and mixing) are observed.
Evolution time involves imparting the phase character to the spins in the sample, whereas the
mixing time involves transmitting the phase-encoded spins with phase information to other
spins (Claridge 2016, Simpson 2012). The widely applied 2-D NMR spectroscopy teniques
are discussed below.
1H,
1H JRES (J-resolved spectroscopy) is a homonuclear NMR experiment with
1H chemical
shift along F2 axis and proton-proton coupling along the F1 axis. It separates chemical shifts
from scalar couplings and allows for examination one parameter without complications
arising from others. It is sensitive, and can reveal abundant molecular signatures (coupling
constants and multiplicity) with reduced signal overlap (Claridge 2016, Simpson 2012).
1H,
1H TOSCY (total correlation spectroscopy) detects homonuclear correlations in the same
spin system no matter whether they are directly connected to each other, which enables
remote protons to be correlated within a continuous coupling system. In comparison with
correlation spectroscopy (COSY) experiments, it avoids the problem of possible cancelation
of antiphase cross peaks at higher linewidth (Claridge 2016, Simpson 2012). During TOCSY
experiment, mixing time is of significance. The long mixing time generally allows for the
observation of cross peaks from spins that are many bonds away. In the application on DOM,
it is advisable for detection of minor signatures with absorptive line shape.
1H,
1H COSY (correlation spectroscopy) measures the homonuclear proton correlations of
scalar couplings, an alternative to TOSCY. Compared with TOCSY, it is less sensitive and
has the possibility to cancelation of antiphase cross peaks at higher linewidth. However, it
allows for improved resolution of small couplings at high number of F1 increments with

70
attenuation from differential relaxation (Claridge 2016, Simpson 2012). For instance, COSY
spectra presented more meaningful definition than TOSCY spectra for marine DOM at
aliphatic section where superposition of abundant TOSCY cross peaks dominated the region
(Hertkorn et al. 2013).
1H,
13C HSQC (heteronuclear single quantum coherence), as widely applied heteronuclear
single bond correlation spectroscopy, correlates 1H resonances with
13C resonances across
single H-C bonds with only single quantum magnetization (Claridge 2016, Simpson 2012). It
is flexible for modification and extension of sequence. It provides absorptive line shape, and
features good combination of sensitivity and large information content. In addition, the DEPT
HSQC allows for informative NMR spectral editing according to carbon multiplicity. One
classical example to exhibit the power of HSQC on DOM is the characterization of seven
major groups in marine ultrafiltrated DOM (Hertkorn et al. 2006).
1H,
13C HMBC (heteronuclear multiple bond correlation) measures multiple bond correlations
of 1H resonances with
13C resonances. It is less sensitive than HSQC and homonuclear NMR,
but boasts the superconnectivity information and better resolution which allows for
assembling of extended spin system across quaternary carbon and heteroatoms (Claridge 2016,
Simpson 2012).
During 2-D NMR experiment, the measuring time shows the trend: TOSCY < JRES < COSY
< HSQC << HMBC (HMBC requires more than 5 times than HSQC). A systematic summary
of the 2-D NMR spectra can be found in Table 3-10.

71
Table 3-10 Characteristics of 2D NMR spectra.
NMR
measurement General capability
Specific utility in DOM
characterization
1H-
1H JRES
(J-resolved
spectroscopy)
Separating chemical shifts
from scalar couplings,
allowing examination one
parameter without
complications arising from
others
Sensitive; revealing abundant molecular
signatures (coupling constants and
multiplicity); reduced signal overlaps
1H-
1H TOCSY
(total correlation
spectroscopy)
Relayed proton J-couplings
with a coupled spin system
(remote protons could be
correlated within a
continuous coupling
network)
Sensitive; detection of minor signatures
with absorptive line shape; particularly
important for the structure determination
of high molecular weight substances
with limited space spin systems
1H-
1H COSY
(correlation
spectroscopy)
Homonuclear correlation
based on scalar couplings
(directly bonded 1H)
Sensitive; improved resolution of small
couplings at high number of F1
increments with attenuation from
differential relaxation; possibility of
cancelation of antiphase cross peaks at
higher linewidth
1H-
13C HSQC
(heteronuclear
single quantum
coherence)
Atoms directly bonded to
each, one-bond correlation
Absorptive line shape; good
combination of sensitivity and large
information content; informative NMR
spectral editing according to carbon
multicity feasible
1H-
13C HMBC
(heteronuclear
multiple bond
correlation)
Correlations across multiple
bonds, long-range
correlation
Discrimination in favor of abundant
molecular signals; excellent peak
dispersion; allowing assembly of
extended spin systems across
heteroatoms and quaternary carbon
3.2.5 Complementary analysis of DOM
The polydisperse and molecularly heterogeneous DOM samples are rich in compositional
information, resulting in the requirement of the complementary instrumental analysis
(Hertkorn et al. 2007). In theory, isolation techniques selectively collect structure-specific
DOM fractions, which are subjected to different characterization approaches with distinct
characteristics: optical spectroscopy relies on the presence and chemical environments of π-
and n-electrons, and are therefore strongly structure-selective; FT-ICR MS shows rather
ionization selectivity and only presents mass spectra of the ionized compounds; NMR
provides the overall non-discriminative characterization and quantification of functional

72
groups in DOM samples. Three main analytical techinques, namely NMR spectroscopy, FT-
ICR mass sepectrometry and separation jointly define a volumetric pixel space (Fig. 3-3)
which describes the nominal capacity of these techniques to differentiate DOM characteristics
(Hertkorn et al. 2007). The intrinsic nominal resolution of separation, NMR and FT-ICR MS
were 102-4
, 102-5
and 104-5
buckets, respectively. When two techniques were hyphenated, the
expansion widened significantly, for instance, separation/NMR, separation/MS and NMR/MS
could reach up to 104-9
, 106-9
and 106-10
buckets respectively. It was estimated that the
expansion of current available analytical techniques could reach 108-14
buckets (Hertkorn et al.
2007). Thus, it’s highly encouraging to combine different organic spectroscopy techniques for
DOM characterization.
Up to date, remarkable distinctions of e.g. freshwater, marine, atmospheric and extraterrestrial
DOM have been made with combination of FT-ICR MS and NMR spectroscopy (Hertkorn et
al. 2013, Schmitt-Kopplin et al. 2010), and DOM molecular features have been merged with
corresponding optical properties with structural spectroscopy (Kellerman et al. 2015,
Hertkorn et al. 2016).
Fig. 3-3 Volumetric pixels in the form of analytical space for DOM characterization, adapted from Hertkorn et
al. 2007.
In addition, complementary analysis of DOM samples with multi-level approaches generates
large data sets, and their joint assessment enables in-depth elucidation or overall
representation of DOM biogeochemical activities. DOM molecules have been successfully

73
associated with environmental parameters, optical characteristics, bacterial genes and
backterioplankton communities (Lucas et al. 2016, Osterholtz et al. 2016, Traving et al.
2016), and link these correlated information to help us understand the DOM-related activities
in a broader view. For example, cyanobacteria was found to be strongly correlated with
protease activity; seasonal variation affected the function and community composition;
community dynamics did not link to the pattern of substrate utilization capacity directly and
the nitrogen-containing DOM was suggested to be of great significance to the
bacteriaplankton (Traving et al. 2016).
3.3 References
Arakawa, N. and Aluwihare, L. (2015) Direct identification of diverse alicyclic terpenoids in
Suwannee River Fulvic Acid. Environ Sci Technol 49(7), 4097-4105.
Ball, G. I. and Aluwihare L. (2014) CuO-oxidized dissolved organic matter (DOM)
investigated with comprehensive two dimensional gas chromatography-time of flight-mass
spectrometry (GC × GC-TOF-MS). Org Geochem75, 87–98.
Cao, D., Huang, H., Hu, M., Cui, L., Geng, F., Rao, Z., Niu, H., Cai, Y. and Kang, Y. (2015)
Comprehensive characterization of natural organic matter by MALDI- and ESI-Fourier
transform ion cyclotron resonance mass spectrometry. Anal Chim Acta 866, 48-58.
Chen, H., Stubbins, A., Perdue, E.M., Green, N.W., Helms, J.R., Mopper, K. and Hatcher,
P.G. (2014) Ultrahigh resolution mass spectrometric differentiation of dissolved organic
matter isolated by coupled reverse osmosis-electrodialysis from various major oceanic water
masses. Mar Chem 164, 48-59.
Claridge, T.D.W. (2016) High-Resolution NMR Techniques in Organic Chemistry, 3rd
Edition. Elsevier Science. ISBN: 9780080999869.
74
Cottrell, B.A., Cheng, W.R., Lam, B., Cooper, W. J., and Simpson, A. J. (2013) An enhanced
capillary electrophoresis method for characterizing natural organic matter. Analyst, 138,
1174-1179.
Dittmar, T., Koch, B., Hertkorn, N. and Kattner, G. (2008) A simple and efficient method for
the solid-phase extraction of dissolved organic matter (SPE-DOM) from seawater. Limnol
Oceanogr-Meth 6(6), 230-235.
Driver, S.J. and Perdue, E.M. (2015) Acid-Base Chemistry of Natural Organic Matter,
Hydrophobic Acids, and Transphilic Acids from the Suwannee River, Georgia, as Determined
by Direct Potentiometric Titration. Environ Eng Sci 32(1), 66-70.
Fievre, A., Solouki, T., Marshall, A.G. and Cooper W.T. (1997). High-resolution Fourier
transform ion cyclotron resonance mass spectrometry of humic and fulvic acids by laser
desorption/ionization and electrospray ionization. Energ Feul 11, 554-560.
Gaspar, A., Harir, M., Hertkorn, N. and Schmitt-Kopplin, P. (2010) Preparative free-flow
electrophoretic offline ESI-Fourier transform ion cyclotron resonance/MS analysis of
Suwannee River fulvic acid. Electrophoresis 31(12), 2070-2079.
Green, N.W., Perdue, E.M., Aiken, G.R., Butler, K.D., Chen, H., Dittmar, T., Niggemann, J.
and Stubbins, A. (2014) An intercomparison of three methods for the large-scale isolation of
oceanic dissolved organic matter. Mar Chem 161, 14-19.
Gross, J.H. (2011) Mass spectrometry. Springer. ISBN: 978-3-642-42346-8.
Guo, L. and Sun M. (2009) Chapter 6: Isotope composition of organic matter in seawater.
Practical guidelines for the analysis of seawater. CRC Press. DOI:
10.1201/9781420073072.ch6.
Hawkes, J.A., Dittmar, T., Patriarca, C., Tranvik, L. and Bergquist, J. (2016) Evaluation of
the Orbitrap Mass Spectrometer for the Molecular Fingerprinting Analysis of Natural
Dissolved Organic Matter. Anal Chem 88(15), 7698-7704.

75
He, W. and Hur, J. (2015) Conservative behavior of fluorescence EEM-PARAFAC
components in resin fractionation processes and its applicability for characterizing dissolved
organic matter. Water Res 83, 217-226.
He, Y., Harir, M., Chen, G., Gougeon, R.D., Zhang, L., Huang, X. and Schmitt-Kopplin, P.
(2014) Capillary electrokinetic fractionation mass spectrometry (CEkF/MS): technology setup
and application to metabolite fractionation from complex samples coupled at-line with
ultrahigh-resolution mass spectrometry. Electrophoresis 35(14), 1965-1975.
Hertkorn, N., Benner, R., Frommberger, M., Schmitt-Kopplin, P., Witt, M., Kaiser, K.,
Kettrup, A. and Hedges, J.I. (2006) Characterization of a major refractory component of
marine dissolved organic matter. Geochim Cosmochim Ac 70(12), 2990-3010.
Hertkorn, N., Ruecker, C., Meringer, M., Gugisch, R., Frommberger, M., Perdue, E.M., Witt,
M. and Schmitt-Kopplin, P. (2007). High-precision frequency measurements: indispensable
tools at the core of the molecular-level analysis of complex systems. Anal Bioanal Chem
389(5), 1311-1327.
Hertkorn, N., Frommberger, M., Witt, M., Koch, B.P., Schmitt-Kopplin, P. and Perdue, E.M.,
2008. Natural organic matter and the event horizon of mass spectrometry. Anal Chem 80(23),
8908-8919.
Hertkorn, N., Harir, M., Koch, B.P., Michalke, B. and Schmitt-Kopplin, P. (2013) High-field
NMR spectroscopy and FTICR mass spectrometry: powerful discovery tools for the
molecular level characterization of marine dissolved organic matter. Biogeosciences 10(3),
1583-1624.
Hertkorn, N., Harir, M., Cawley, K.M., Schmitt-Kopplin, P. and Jaffé, R. (2016) Molecular
characterization of dissolved organic matter from subtropical wetlands: a comparative study
through the analysis of optical properties, NMR and FTICR/MS. Biogeosciences 13(8), 2257-
2277.
76
Hoque, E., Wolf, M., Teichmann, G., Peller, E., Schimmack, W. and Buckau, G. (2003)
Influence of ionic strength and organic modifier concentrations on characterization of aquatic
fulvic and humic acids by high-performance size-exclusion chromatography. J Chromatogr A
1017(1-2), 97-105.
Imai, A., Fukushima, T., Matsushige, K. and Hwan Kim, Y. (2001) Fractionation and
characterization of dissolved organic matter in a shallow eutrophic lake, its inflowing rivers,
and other organic matter sources. Water Res 35(17), 4019-4028.
Kellerman, A.M., Dittmar, T., Kothawala, D.N. and Tranvik, L.J. (2014) Chemodiversity of
dissolved organic matter in lakes driven by climate and hydrology. Nat Commun 5, 3804.
Kellerman, A.M., Kothawala, D.N., Dittmar, T. and Tranvik, L.J. (2015) Persistence of
dissolved organic matter in lakes related to its molecular characteristics. Nat Geosci 8(6),
454-457.
Kido Soule, M.C., Longnecker, K., Giovannoni, S.J. and Kujawinski, E.B. (2010) Impact of
instrument and experiment parameters on reproducibility of ultrahigh resolution ESI FT-ICR
mass spectra of natural organic matter. Org Geochem 41(8), 725-733.
Kim, S., Kramer, R.W. and Hatcher, P.G. (2003) Graphical Method for Analysis of Ultrahigh-
Resolution Broadband Mass Spectra of Natural Organic Matter, the Van Krevelen Diagram.
Anal Chem 75(20), 5336-5344.
Kim, S., Simpson, A.J., Kujawinski, E.B., Freitas, M.A. and Hatcher, P.G. (2003) High
resolution electrospray ionization mass spectrometry and 2D solution NMR for the analysis of
DOM extracted by C18 solid phase disk. Org Geochem 34(9), 1325-1335.
Koch, B.P., Witt, M., Engbrodt, R., Dittmar, T. and Kattner, G. (2005) Molecular formulae of
marine and terrigenous dissolved organic matter detected by electrospray ionization Fourier
transform ion cyclotron resonance mass spectrometry. Geochim Cosmochim Ac 69(13),
3299-3308.
77
Koch, B.P., Dittmar, T., Witt, M. and Kattner, G. (2007) Fundamentals of molecular formula
assignment to ultrahigh resolution mass data of natural organic matter. Anal Chem 79(4),
1758-1763.
Koch, B.P., Ludwichowski, K.-U., Kattner, G., Dittmar, T. and Witt, M. (2008) Advanced
characterization of marine dissolved organic matter by combining reversed-phase liquid
chromatography and FT-ICR-MS. Mar Chem 111(3-4), 233-241.
Koch, B.P., Kattner, G., Witt, M. and Passow, U. (2014) Molecular insights into the microbial
formation of marine dissolved organic matter: recalcitrant or labile? Biogeosciences 11(15),
4173-4190.
Koprivnjak, J.F., Pfromm, P.H., Ingall, E., Vetter, T.A., Schmitt-Kopplin, P., Hertkorn, N.,
Frommberger, M., Knicker, H. and Perdue, E.M. (2009) Chemical and spectroscopic
characterization of marine dissolved organic matter isolated using coupled reverse osmosis–
electrodialysis. Geochim Cosmochim Ac 73(14), 4215-4231.
Kördel, W., Dassenakis, M., Lintelmann, J. and Padberg, S. (1997) The importance of natural
organic material for environmental processes in waters and soils (Technical Report). Pure
Appl Chem 69(7), 1571-1600.
Kruger, B.R., Dalzell, B.J. and Minor, E.C. (2011) Effect of organic matter source and
salinity on dissolved organic matter isolation via ultrafiltration and solid phase extraction.
Aquat Sci 73(3), 405-417.
Kujawinski, E.B. (2011) The impact of microbial metabolism on marine dissolved organic
matter. Ann Rev Mar Sci 3, 567-599.
Lam, B. and Simpson, A.J. (2006) Passive sampler for dissolved organic matter in freshwater
environments. Anal Chem 78(24), 8194-8199.

78
Li, H. and Minor, E.C. (2015) Dissolved organic matter in Lake Superior: insights into the
effects of extraction methods on chemical composition. Environ Sci Process Impacts 17(10),
1829-1840.
Li, Y., Harir, M., Lucio, M., Kanawati, B., Smirnov, K., Flerus, R., Koch, B.P., Schmitt-
Kopplin, P. and Hertkorn, N. (2016a) Proposed Guidelines for Solid Phase Extraction of
Suwannee River Dissolved Organic Matter. Anal Chem 88(13), 6680-6688.
Li, Y., Harir, M., Lucio, M., Gonsior, M., Koch, B. P., Schmitt-Kopplin, P. and Hertkorn, N.
(2016b) Comprehensive structure-selective characterization of dissolved organic matter by
reducing molecular complexity and increasing analytical dimensions. Water Res 106, 477-487.
Lucus, J., Koester, I., Wichels, A., Niggemann, J., Dittmar, T., Callies, U., Wiltshire, K.H.
and Gerdts G. (2016). Short-term dynamics of North Sea bacterioplankton – dissolved organic
matter coherence on molecular level. Front Microbiol 7, 321.
Marshall, A.G., Hendrickson, C.L. and Jackson, G.S. (1998). Fouier transform ion cyclontron
resonance mass spectrometry: a primer. Mass Spectrom Rev 17, 1-35.
Minor, E.C., Swenson, M.M., Mattson, B.M. and Oyler, A.R. (2014) Structural
characterization of dissolved organic matter: a review of current techniques for isolation and
analysis. Environ Sci Process Impacts 16(9), 2064-2079.
Mopper, K., Stubbins, A., Ritchie, J.D., Bialk, H.M. and Hatcher, P.G. (2007) Advanced
instrumental approaches for characterization of marine dissolved organic matter: extraction
techniques, mass spectrometry, and nuclear magnetic resonance spectroscopy. Chem Rev
107(2), 419-442.
Murphy, K.R., Stedmon, C.A., Graeber, D. and Bro, R. (2013) Fluorescence spectroscopy and
multi-way techniques. PARAFAC. Anal Meth 5(23), 6557.
Nebbioso, A. and Piccolo, A. (2013) Molecular characterization of dissolved organic matter
(DOM): a critical review. Anal Bioanal Chem 405(1), 109-124.
79
Nikolaev, E.N., Kostyukevich, Y.I. and Vladimirov, G.N. (2016) Fourier transform ion
cyclotron resonance (FT ICR) mass spectrometry: Theory and simulations. Mass Spectrom
Rev 35(2), 219-258.
Osterholz, H., Singer, G., Wemheuer, B., Daniel, R., Simon, M., Niggemann, J. and Dittmar,
T. (2016) Deciphering associations between dissolved organic molecules and bacterial
communities in a pelagic marine system. ISME J. 10(7), 1717-1730.
Perdue E.M. and Ritche J.D. Dissolved organic matter in fresh waters, Treatise on
Geochemistry (eds, Holland H.D. and Turekian K.K.), Elsevier-Pergamon, Oxford, 2003, Vol.
5, 273-318.
Perminova, I.V., Konstantinov, A.I., Kunenkov, E.V., Gaspar, A., Schmitt-Kopplin, P.,
Hertkorn, N., Kulikova, N.A. and Hatfield, K. (2009) Separation technology as a powerful
tool for unfolding molecular complexity of natural organic matter and humic substances. DOI:
10.1002/9780470494950. ch13.
Perminova, I.V., Dubinenkov, I.V., Kononikhin, A.S., Konstantinov, A.I., Zherebker, A.Y.,
Andzhushev, M.A., Lebedev, V.A., Bulygina, E., Holmes, R.M., Kostyukevich, Y.I., Popov,
I.A. and Nikolaev, E.N. (2014) Molecular mapping of sorbent selectivities with respect to
isolation of Arctic dissolved organic matter as measured by Fourier transform mass
spectrometry. Environ Sci Technol 48(13), 7461-7468.
Raeke, J., Lechtenfeld, O.J., Wagner, M., Herzsprung, P. and Reemtsma, T. (2016) Selectivity
of solid phase extraction of freshwater dissolved organic matter and its effect on ultrahigh
resolution mass spectra. Environ Sci Process Impacts 18(7), 918-927.
Ratpukdi, T., Rice, J.A., Chilom, G., Bezbaruah, A. and Khan, E. (2009) Rapid Fractionation
of Natural Organic Matter in Water Using a Novel Solid-Phase Extraction Technique. Water
Environ Res 81(11), 2299-2308.

80
Reemtsma, T. (2009) Determination of molecular formulas of natural organic matter
molecules by (ultra-) high-resolution mass spectrometry: status and needs. J Chromatogr A
1216(18), 3687-3701.
Remucal, C.K., Cory, R.M., Sander, M. and McNeill, K. (2012) Low molecular weight
components in an aquatic humic substance as characterized by membrane dialysis and
orbitrap mass spectrometry. Environ Sci Technol 46(17), 9350-9359.
Repeta, D.J. and Aluwihare, L.I. (2006) Radiocarbon analysis of neutral sugars in high-
molecular-weight dissolved organic carbon: Implications for organic carbon cycling. Limnol
Oceanogr 51(2), 1045-1053.
Ritchie, J.D. and Perdue, E.M. (2003) Proton-binding study of standard and reference fulvic
acids, humic acids, and natural organic matter. Geochim Cosmochim Ac 67(1), 85-96.
Ruger, C.P., Sklorz, M., Schwemer, T. and Zimmermann, R. (2015) Characterisation of ship
diesel primary particulate matter at the molecular level by means of ultra-high-resolution
mass. Anal Bioanal Chem 407(20), 5923-5937
Sandron, S., Rojas, A., Wilson, R., Davies, N.W., Haddad, P.R., Shellie, R.A., Nesterenko,
P.N., Kelleher, B.P. and Paull, B. (2015) Chromatographic methods for the isolation,
separation and characterisation of dissolved organic matter. Environ Sci Process Impacts
17(9), 1531-1567.
Sandron, S., Wilson, R., Larragy, R., McCaul, M.V., Nesterenko, P.N., Kelleher, B. and Paull,
B. (2014) Investigation into dissolved neutral sugars and their microbial conversion in natural
and artificially produced dissolved organic matter using ion chromatography with pulsed
amperometric detection and reversed-phase liquid chromatography-high resolution mass
spectrometry. Anal. Methods 6(1), 107-114.
Schmitt-Kopplin, P. and Kettrup, A. (2003) Capillary electrophoresis--electrospray
ionization--mass spectrometry for the characterization of natural organic matter: an evaluation
81
with free flow electrophoresis-off-line flow injection electrospray ionization-mass
spectrometry. Electrophoresis 24(17), 3057-3066.
Schmitt-Kopplin, P., Gelencser, A., Dabek-Zlotorzynska, E., Kiss, G., Hertkorn, N., Harir, M.,
Hong, Y. and Gebefugi, I. (2010) Analysis of the unresolved organic fraction in atmospheric
aerosols with ultrahigh-resolution mass spectrometry and nuclear magnetic resonance
spectroscopy: organosulfates as photochemical smog constituents. Anal Chem 82(19), 8017-
8026.
Schmitt-Kopplin, P., Liger-Belair, G., Koch, B.P., Flerus, R., Kattner, G., Harir, M.,
Kanawati, B., Lucio, M., Tziotis, D., Hertkorn, N. and Gebefügi, I. (2012) Dissolved organic
matter in sea spray: a transfer study from marine surface water to aerosols. Biogeosciences
9(4), 1571-1582.
Simpson, A.J., Simpson, M.J. and Soong, R. (2012) Nuclear magnetic resonance spectroscopy
and its key role in environmental research. Environ Sci Technol 46(21), 11488-11496.
Simpson, A.J., Tseng, L.H., Simpson, M.J., Spraul, M., Braumann, U., Kingery, W.L.,
Kelleherc, B. P. and Hayes, M.H.B (2004). The application of LC-NMR and LC-SPE-NMR
to compositional studies of natural organic matter. Analyst, 129, 1216-1222.
Simpson, J. (2012) Organic Structure Determination Using 2-D NMR Spectroscopy, 2nd
Edition. Academic Press. ISBN: 9780123849700.
Serkiz, S.M. and Perdue, E.M. (1990) Isolation of dissolved organic matter from the
suwannee river using reverse osmosis. Water Res 24(7), 911-916.
Stedmon, C.A. and Bro, R. (2008) Characterizing dissolved organic matter fluorescence with
parallel factor analysis: a tutorial. Limnol Oceanogr-Meth 6(11), 572-579.
Stenson, A.C. (2008) Reversed-Phase Chromatography Fractionation Tailored to Mass
Spectral Characterization of Humic Substances. Environ Sci Technol 42(6), 2060-2065.

82
Swenson, M.M., Oyler, A.R. and Minor, E.C. (2014) Rapid solid phase extraction of
dissolved organic matter. Limnol Oceanogr-Meth 12(10), 713-728.
Tfaily, M.M., Hodgkins, S., Podgorski, D.C., Chanton, J.P. and Cooper, W.T. (2012)
Comparison of dialysis and solid-phase extraction for isolation and concentration of dissolved
organic matter prior to Fourier transform ion cyclotron resonance mass spectrometry. Anal
Bioanal Chem 404(2), 447-457.
Thurman, E. M. and Malcolm R. L. (1981) Preparative isolation of aquatic humic substances.
Environ Sci Technol 15, 463-466.
Traving, S.J., Bentzon-Tilia, M., Knudsen-Leerbeck, H., Mantikci, M., Hansen, J.L.S.,
Stedmon, C.A., Sørensen, H., Markager, S. and Riemann, L. (2016) Coupling
bacterioplankton populations and environment to community function in coastal temperate
waters. Front Microbiol 7, 1533.
Tziotis, D., Hertkorn, N. and Schmitt-Kopplin, P. (2011) Kendrick-analogous network
visualisation of ion cyclotron resonance Fourier transform mass spectra: Improved options for
the assignment of elemental compositions and the classification of organic molecular
complexity. Eur J Mass Spectrom 17(4), 415-421.
Wang, R. Druckenmüller, K., Elbers, G. Cuenther, K. and Croué, J.-P. (2014) Analysis of
aquatic-phase natural organic matter by optimized LDI-MS method. J Mass Spectrom 49,
154-160.
Woods, G. C., Simpson, M. J., Kelleher, B. P., McCaul, M., Kingery, W. L. and Simpson A. J.
(2010) Online high-performance size exclusion chromatography-nuclear magnetic resonance
for the characterization of dissolved organic matter. Environ Sci Technol 44, 624-630.
Woods, G.C., Simpson, M.J., Koerner, P.J., Napoli, A. and Simpson, A.J. (2011) HILIC-
NMR: toward the identification of individual molecular components in dissolved organic
matter. Environ Sci Technol 45(9), 3880-3886.
83
Woods, G.C., Simpson, M.J. and Simpson, A.J. (2012) Oxidized sterols as a significant
component of dissolved organic matter: evidence from 2D HPLC in combination with 2D and
3D NMR spectroscopy. Water Res 46(10), 3398-3408.
Zherebker, A.Y., Perminova, I.V., Konstantinov, A.I., Volikov, A.B., Kostyukevich, Y.I.,
Kononikhin, A.S. and Nikolaev, E.N. (2016) Extraction of humic substances from fresh
waters on solid-phase cartridges and their study by Fourier transform ion cyclotron resonance
mass spectrometry. J Anal Chem 71(4), 372-378.
84
Chapter 4
Proposed Guidelines for Solid Phase
Extraction of Suwannee River Dissolved
Organic Matter
Published as: Yan Li, Mourad Harir, Marianna Lucio, Basem Kanawati, Kirill Smirnov, Ruth
Flerus, Boris P. Koch, Philippe Schmitt-Kopplin, Norbert Hertkorn (2016).
Proposed guidelines for solid phase extraction of Suwannee River dissolved
organic matter. Analytical Chemistry (88), 6680-6688. © Copyright
ACS.publications

85
4 Proposed Guidelines for Solid Phase Extraction of Suwannee
River Dissolved Organic Matter
4.1 Summary
This work proposes improved guidelines for DOM isolation by means of SPE with PPL
sorbent, which has become an established method for isolation of DOM from natural waters
due to ease of application and appreciable carbon recovery. Suwannee River water was
chosen to systematically study the effects of critical SPE variables such as loading mass,
concentration, flow rate and up-scaling on the extraction selectivity of PPL sorbent. FT-ICR
MS and 1H NMR spectroscopy were employed to interpret the DOM chemical space of
eluates as well as permeates and wash liquids with molecular resolution. Up to 89% DOC
recovery was obtained with a DOC/PPL mass ratio of 1:800 at 20 mg/L DOC concentration.
With larger loading volumes applied, less highly oxygenated compounds were retained on
PPL sorbent. Effects of flow rate were marginal. Up-scaling had limited effects on the
extraction selectivity with the exception of increased self-esterification with methanol solvent,
resulting in methyl ester groups. Furthermore, SPE/PPL extract showed the highly
representative characteristics by comparing with authentic water and reverse osmosis samples.
These findings are useful to reproducibly isolate DOM with representative molecular
compositions from various sources and concentrations as well as to minimize potential
inconsistencies among interlaboratory comparative studies.
86
4.2 Author contributions
Yan Li, Mourad Harir, Philippe Schmitt-Kopplin and Norbert Hertkorn designed the
experiment;
Yan Li conducted the experiment, measured on FT-ICR MS with the help of Basem Kanawati
and measured on NMR with the help of Norbert Hertkorn;
Marianna Lucio and Kirill Smirnov helped to evaluate the data;
Ruth Flerus and Boris P. Koch measured DOC and gave great inputs on paper correction;
Yan Li wrote the paper together with Mourad Harir and Norbert Hertkorn with great
contributions from Basem Kanawati and Philippe Schmitt-Kopplin.

87
Chapter 5
Comprehensive Structure Selective
Characterization of Dissolved Organic
Matter by Reducing Molecular
Complexity and Increasing Analytical
Dimensions
Published as: Yan Li, Mourad Harir, Marianna Lucio, Michael Gonsior, Boris P. Koch,
Philippe Schmitt-Kopplin, Norbert Hertkorn (2016). Comprehensive structure-
selective characterization of dissolved organic matter by reducing molecular
complexity and increasing analytical dimensions. Water Research. (106), 477-
487.© Copyright Elsevier.

88
5 Comprehensive Structure Selective Characterization of
Dissolved Organic Matter by Reducing Molecular Complexity
and Increasing Analytical Dimensions
5.1 Summary
Deciphering the molecular codes of dissolved organic matter (DOM) improves our
understanding of its role in the global element cycles and its active involvement in ecosystem
services. This study demonstrates comprehensive characterization of DOM by an initial
polarity-based stepwise SPE with single methanol elution of the cartridges, but separate
collection of equal aliquots of eluates. The reduction of molecular complexity in the
individual DOM fractions attenuates intermolecular interactions and substantially increases
the disposable resolution of any structure selective characterization. Suwannee River DOM
(SR DOM) was used to collect five distinct SPE fractions with overall 91% DOC recovery.
Optical spectroscopy (UV and fluorescence spectroscopy), FT-ICR MS and NMR
spectroscopy showed analogous hierarchical clustering among the five eluates corroborating
the robustness of this approach. Two abundant moderately hydrophobic fractions contained
most of the SR DOM compounds, with substantial proportions of aliphatics, carboxylic-rich
alicyclic molecules, carbohydrates and aromatics. A minor early eluting hydrophilic fraction
was highly aliphatic and presented a large diversity of alicyclic carboxylic acids, whereas the
two late eluting, minor hydrophobic fractions appeared as a largely defunctionalized mixture
of aliphatic molecules. Comparative mass analysis showed that fractionation of SR DOM was
governed by multiple molecular interactions depending on O/C ratio, molecular weight and
aromaticity. The traditional optical indices SUVA254 and fluorescence index (FI) indicated the
relative aromaticity in agreement with FT-ICR mass and NMR spectra; the classical
fluorescent peaks A and C were observed in all four latter eluates. This versatile approach can
be easily expanded to preparative scale under field conditions, and transferred to different
DOM sources and SPE conditions.

89
5.2 Author contributions
Yan Li, Mourad Harir, Philippe Schmitt-Kopplin and Norbert Hertkorn designed the
experiment;
Yan Li conducted the experiment, measured on FT-ICR MS independently and measured on
NMR with the help of Norbert Hertkorn;
Marianna Lucio created a new method for EEM analysis;
Michael Gonsior measured optical spectroscopy and corrected the manuscript;
Boris P. Koch measured DOC and gave great inputs on paper preparation and correction;
Yan Li wrote the paper together with Mourad Harir and Norbert Hertkorn with great
contributions from Philippe Schmitt-Kopplin.
90
Chapter 6
How Representative Are Dissolved
Organic Matter (DOM) Extracts? A
Comprehensive Study of Sorbent
Selectivity for DOM Isolation
Published as: Yan Li, Mourad Harir, Jenny Uhl, Basem Kanawati, Marianna Lucio, Kirill
Smirnov, Boris P. Koch, Philippe Schmitt-Kopplin, Norbert Hertkorn (2016).
How Representative are dissolved organic matter (DOM) extracts? A
comprehensive study of sorbent selectivity for DOM isolation. Water Research.
Under revision. Reproduced with permission from Water Research. ©
Copyright Elsevier.
91
6 How Representative Are Dissolved Organic Matter (DOM)
Extracts? A Comprehensive Study of Sorbent Selectivity for
DOM Isolation
6.1 Abstract
Solid phase extraction (SPE) has become a widespread method for isolating dissolved organic
matter (DOM) of diverse origin such as fresh and marine waters. This study investigated the
DOM extraction selectivity of 24 commercially available SPE sorbents under identical
conditions (pH = 2, methanol elution) on the example of Suwannee River (SR) water and
North Sea (NS) water by using DOC analysis and Fourier transform ion cyclotron resonance
mass spectrometry (FT-ICR MS). Proton nuclear magnetic resonance (1H NMR) spectroscopy
was employed to assess leaching behavior, and HLB sorbent was found to leach substantially,
among others. Scatter of average H/C and O/C elemental ratios and gross alignment in mass-
edited H/C ratios according to five established coarse SPE characteristics was near identical
for SR DOM and NS DOM. FTMS-based principal component analysis (PCA) provided
essentially analogous alignment of SR DOM and NS DOM molecular compositions according
to the five established groups of SPE classification, and corroborated the sorption-
mechanism-based selectivity of DOM extraction in both cases. Evaluation of structural blanks
and leaching of SPE cartridges requires NMR spectroscopy because FT-ICR mass
spectrometry alone will not reveal inconspicuous displacements of continual bulk signatures
caused by leaching of SPE resin constituents.
Keywords: DOM, SPE, NMR, FT-ICR MS, sorbent selectivity, leaching
92
6.2 Introduction
Dissolved organic matter (DOM) is a collection of organic compounds with ~50% carbon
content and variable proportions of heteroatoms such as oxygen, nitrogen, sulphur and
phosphorus (Perdue and Ritchie, 2003; Hertkorn et al., 2007). As one of the most abundant
contributors to global carbon and other element cycles (Battin et al., 2009; Bianchi, 2011;
Hertkorn et al., 2007; Ksionzek et al., 2016; Perdue and Ritchie, 2003), DOM is widely
distributed in all terrestrial ecosystems and found in oceans, rivers, lakes, permafrost and soil,
to name a few. DOM features ecosystem-dependent composition and structure and performs
an array of relevant ecosystem services such as influencing microbial metabolism in waters,
affecting greenhouse gas production and defining speciation of key nutrient and trace
elements (Duarte and Duarte, 2015; Goldberg et al., 2015; Lucas et al., 2016; Mann et al.,
2015;Osterholz et al., 2016). However, owing to its extensive molecular heterogeneity and
polydispersity, a vast majority of DOM constituents remains unknown at the molecular level
(Hertkorn et al., 2007; Minor et al., 2014; Sandron et al., 2015).
To this day, one of the most relevant challenges preceding DOM molecular characterization is
efficient and reproducible collection of representative samples with appreciable recovery.
DOM molecular structures reproduce ecosystems characteristics and vary significantly
depending on origin (Hertkorn et al., 2016; Kruger et al., 2011). For instance, freshwater
DOM shows high proportions of linear terpenoids (Lam et al., 2007) and carboxyl-rich
alicyclic molecules (CRAM) (Arakawa and Aluwihare, 2015; Hertkorn et al., 2006). Marine
DOM is composed of labile, semilabile and refractory components, encompassing compound
classes as diverse as (labile) carbohydrates and (refractory) black carbon (Moran et al., 2016),
thereby covering a wide range from polar to nonpolar compounds. While deep seawater DOM
is enriched in CRAM (Hertkorn et al, 2006), surface seawater DOM contains up to 50%
polysaccharides (Benner et al., 1992), particularly in nutrient-rich upwelling areas of high
biological productivity.
93
DOM collection is a key as well as an error-prone step which directly influences the overall
coverage and the consecutive instrumental analysis, and substantial efforts have been invested
to improve the isolation methods of polydisperse and molecularly heterogeneous DOM
(Minor et al., 2014; Nebbioso and Piccolo, 2013; Sandron et al., 2015). After more than two
decades’ endeavour, solid phase extraction (SPE) has become an established and widely used
DOM isolation method combining ease of use and high extraction efficiency (≥ 40% DOC
recovery) (Dittmar et al., 2008; Green et al., 2014; Kim et al., 2003; Tfaily et al., 2012). In
particular, SPE with certain sorbents like PPL, C18 and HLB has enabled a broad coverage of
DOM constituents in one single collection (Dittmar et al., 2008; Li and Minor, 2015;
Perminova et al., 2014; Raeke et al., 2016; Ward et al., 2013).
With increasing focus on the molecular compositions of the obtained SPE extracts instead of
merely evaluating DOC recovery, the DOM extraction selectivity of the SPE cartridges with
respect to certain DOM compounds has drawn awareness, and DOM extracts obtained with
different functionalized SPE sorbents have been com-pared (Minor et al., 2014; Sandron et
al., 2015). While PPL was reported to retain higher proportions of nitrogen-containing
compounds from both fresh- and marine waters (Dittmar et al., 2008; Perminova et al., 2014;
Zherebker et al., 2016), C18 had shown affinity to more saturated molecules in arctic marine
DOM and distinct DOM from oligotrophic Lake Superior (Li and Minor, 2015; Perminova et
al., 2014); on the other hand, HLB could not completely elute freshwater DOM compounds
with high molecular weight (Raeke et al., 2016). How-ever, the selectivity of relevant
commercially available SPE sorbents of potential use for DOM isolation in fresh and marine
water bodies has not yet been systematically investigated, and a structure-selective assessment
of SPE leading behaviour is missing about entirely.
Our work firstly aimed to address the representativeness of SPE extracts in terms of DOC
recovery and molecu-lar compositions by using 24 commercially available sorbents with
different functionalities under identical con-ditions of extraction and elution (pH = 2;
methanol elution). Suwannee River water (SR DOM) and North Sea water (NS DOM) were
chosen to represent freshwater and oceanic DOM. Molecular elucidation of SPE selectiv-ity

94
was achieved mainly with Fourier transform ion cyclotron resonance mass spectrometry (FT-
ICR MS).
In addition, structure-selective leaching behaviour of all these SPE sorbents was evaluated
with proton nuclear magnetic resonance (1H NMR) spectroscopy. High-field NMR
spectroscopy provides the capability for quantita-tive and non-destructive de novo
determination of chemical environments in polydisperse and molecularly heterogeneous
environmental samples such as DOM (Hertkorn et al., 2007; Lam et al., 2007). Quantitative
relationships between number of spins and area of NMR resonances operate in absence of
differential NMR relaxation (Hertkorn 2015). This key feature implies the use of NMR
spectroscopy as a quantitative reference for complementary structure-selective analytical
methods, like mass spectrometry, which detects gas phase ions and is subject to ionization
selectivity in case of complex mixtures (Hertkorn et al., 2008). NMR spectroscopy is
particularly informative in the description of aliphatic chemical environments which are based
on sp3-hybridized carbon.
6.3 Methods
6.3.1 Sample Preparation
Samples were taken in Suwannee River in May 2012 as described by Green et al. (Green et
al., 2014), and in June 2014 in the Southern North Sea (54.1757 N / 7.8977 E; RV Heincke,
Expedition HE 426 II). Water samples were immediately filtered after collection with 0.47 μm
GF/F glass fiber (Whatman, precombusted at 450 oC) and adjusted to pH 2 (concentrated HCl,
Merck). The acidified SR and NS water samples were stored at 4oC in the dark and
consecutively subjected to SPE by using 24 commercially available cartridges (2OH, C1, C2,
C8, C18, C18OH, CBA, CH, CN-E, CN-U, DPA-6S, ENV, HLB, MAX, MCX, NH2, PH,
PPL, SAX, SCX, SI, Strata XC, WAX and WCX) as shown in Table S1. Blanks were
performed using acidified Milli-Q water (pH 2). SPE procedures were performed in triplicates
according to our standard protocols (Li et al, 2016). 1 mL SR water and 50 mL NS water were

95
loaded on the cartridges, respectively, and eluted with 1 mL methanol. After SPE, the extracts
were kept at -25 oC in the dark prior to further analysis (Flerus et al., 2011).
6.3.2 DOC measurement
DOC was determined by high temperature catalytic oxidation and subsequent non-dispersive
infrared spectros-copy and chemiluminescence detection (TOC-VCPN, Shimadzu). Final
DOC concentrations are average values of triplicate measurements. If the standard variation
or the coefficient of variation exceeded 0.1 μM or 1 %, respectively, up to two additional
analyses were performed and outliers were eliminated. After each batch of five samples, one
reference standard (DOC-DSR, Hansell Research Lab, University of Miami, USA), one
ultrapure water blank and one potassium hydrogen phthalate standard were measured. The
limit of detection (3σ of the blank) and quantitation (9σ of the blank) was 7 and 21 μmol C
L−1, respectively. The accuracy was ±5 %. POC was determined by the difference between
TOC and DOC measurements (Koch et al., 2014). Samples (100 μL of methanol eluates –
equivalent to 1 mL SR water and 50 mL NS water) were evaporated and re-dissolved in 1 mL
ultrapure water for analysis.
6.3.3 FT-ICR MS analysis
High field Fourier transform ion cyclotron resonance mass spectra were acquired by a 12 T
Bruker Solarix mass spectrometer (Bruker Daltonics, Bremen, Germany) and an Apollo II
electrospray ionization (ESI) source in negative ionization mode. Samples were diluted in
methanol at a concentration of ~5 μg/mL, and injected into electrospray source at a flow rate
of 120 μL/h with a nebulizer gas pressure of 138 kPa and a drying gas pressure of 103 kPa.
Spectra were firstly calibrated externally on clusters of arginine in methanol (10 μg/mL), and
then internally calibrated using extended CHO molecular series present in natural organic
matter, reaching accuracy values lower than 500 ppb. The spectra were acquired with a time
domain of 4 Mega words over a mass range of m/z 150-1000 amu, and 500 scans were
accumulated for each spectrum. Elemental formulas were calculated for each peak in a batch
mode by using in-house written software (Tziotis et al., 2011).
96
6.3.4 NMR analysis
All 1H NMR spectra of SPE extracts (600 µL) were acquired with a Bruker Avance III 500
MHz spectrometer (B0 = 11.7 T) at 283 K from redissolved solids in CD3OD (99.95% 2H;
Merck) with Bruker standard pulse se-quences using sealed 2.0 and 2.5 mm Bruker Match
tubes. 1H NMR chemical shift reference of HD2COD was 3.30 ppm. 1H NMR spectra were
recorded with solvent suppression by pre-saturation and 1 ms spin-lock (noesypr1d), 5 s
acquisition time, 5 s relaxation delay (d1), typically 1024 scans, 1 Hz exponential line
broadening. 1H NMR spectra of SR DOM and NS DOM were acquired from ~2 mg of
isolated solid with a Bruker Avance III 800 MHz spectrometer (B0 = 18.7 T) in Bruker 3.0
mm Match tubes at otherwise identical conditions (Fig. S2).
6.3.5 Statistical analysis
Principal component analysis (PCA) was performed with SIMCA P-9.0. Because of the huge
differences in mass peak amplitude between leachate and DOM molecules in certain SPE
eluates, FT-ICR MS mass peak intensities were transposed into decadal logarithmic values
prior to matrix generation; zeroes were substituted by ones (log 1 = 0). Only assigned mass
peaks present in ≥3 extracts were chosen for PCA analysis in order to reduce the matrix
complexity; consolidated (logarithmic values of) mass peak intensities were used. According
to place-ment in PCA, two groups were defined: group A and group B, respectively (Figures 4
and 5). Mathematical comparison between group A and group B was performed by using
Matrix Generator and, after filtering using mass peaks present in ≥3 extracts of each group A
and B, led to the distinction of (a) assigned mass peaks pre-sent in group A (union, and not
intersection counts), (b) assigned mass peaks present in group B (union, and not intersection
counts), and (c) assigned mass peaks present in both groups A and B (intersection count).
PCA-derived and other van Krevelen diagrams as well as mass-edited H/C ratios have been
computed from averaged mass peak intensities. 1H NMR data section integrals were obtained
by AMIX (Version 3.4.2, Bruker) at 0.01 ppm section integral bucket resolution with the
exclusion of HDO and HD2COD in the 1H NMR chemical shift range from 0.5 – 9.5 ppm.

97
6.4 Results and discussion
6.4.1 Extraction efficiency
24 commercially available SPE sorbents with distinctive functionalities were chosen for
isolation of SR DOM and NS DOM. All the cartridges were used under identical conditions
(pH = 2; methanol elution) instead of under the manufacturers’ instructions because
comparison of DOC recovery and molecular structures under the same chemical
environments of pH and solvent will attenuate certain selective adsorption and potential side
reactions of DOM, like e.g. hydrolysis or pH-dependent dissociation. According to Fig. 1 and
Fig. S1, DOC recoveries varied significantly not only among sorbents but also between the
freshwater and marine sources. In general, DOC recoveries were comparatively higher in case
of SR DOM with values ranging from 20-90%, and to this effect lower in case of NS DOM
with values ranging from 10-50%. The nominal ratios of DOC recovery as expressed by SR
DOC/NS DOC varied from ~ 3.5 in case of SCX and NH2 down to ~ 1 in case of CBA, Strata
XC and WCX (Fig. 6-1). Other studies had also observed a significant decrease in DOC
recovery when dealing with marine DOM, and had attributed this phenomenon to the smaller
molecular size and higher polarity in marine DOM (Dittmar et al., 2008; Osterholz et al.,
2016). However, DOC recoveries of NS DOM were lowest when polar or ion exchange
sorbents were employed (Fig. 1 and Fig. S1). This probably results from the fact that marine
DOM is comprised of compounds with a wide range of polarities that cannot be extracted by
one single sorbent with considerable recovery. In comparison, freshwater DOM, which
contains large proportions of non-polar compounds (Lam et al., 2007; Ratpukdi et al., 2009)
could be readily extracted by sorbents with non-polar functionalities, such as C8, C18, HLB
and PPL (Dittmar et al., 2008; Perminova et al., 2014; Raeke et al., 2016; Li et al., 2016).
Common commercially available SPE sorbents comprise mainly silica-based and polymer-
based materials (Fig. 6-1 and Fig. S1; Table S1). DOC recoveries were relatively high with
polymer-based sorbents but more variable with silica-based sorbents (Fig. 1). For example,
polymer-based sorbents such as DPA-6S, PPL, ENV and HLB exhibited higher DOC

98
recoveries, indicating high extraction efficiency, which may be affected by a variable degree
of leaching from sorbents. Among the silica based cartridges, those with the mechanism of
polar or ion exchange showed lower recoveries than those with non-polar mechanism. In
addition, DOC recoveries in non-polar silica-based sorbents corresponded to their specified
carbon loadings (Table S1), with higher carbon load-ing resulting in higher DOC recovery.
For instance, in the series of C1, C2, C8 and C18 sorbents, a continual increase in DOC
recovery was observed (Fig. 6-1 and Fig. S1; Table S1).
Fig. 6-1 DOC recoveries of DOM extracts obtained with 24 commercially available sorbents. The ratio
was calculated with DOC recovery of SR DOM / DOC recovery of NS DOM. Purple: non-polar; blue:
mixed mode with anion exchange; orange: moderately non-polar and mixed mode with cation
exchange; green: weekly non-polar and mid-polar; red: polar and strong ion exchange.

99
6.4.2 FT-ICR mass spectrometry
Negative electrospray ionization (ESI) FT-ICR mass spectra of 24 SPE extracts allowed clear
distinction of CHO, CHOS and CHNO molecular series and initially provided insights into its
key chemical characteristics such as average elemental ratios, average molecular weight and
relative unsaturation and oxygenation (Table S2 and S3). Van Krevelen diagrams and mass-
edited H/C ratios showed larger scatter in case of NS SPE-DOM extracts when compared
with SR SPE-DOM extracts (Fig. 6-2 and Fig. 6-3). The nominal variance of NS DOM and
SR DOM ranged near ∆(H/C) ~ 0.55 vs. 0.40, and ∆(O/C) ~ 0.35 vs. 0.30. This was consistent
with a more pronounced extraction selectivity in case of marine DOM as already indicated by
the higher variations of NS DOC recovery described above (Fig. 6-1). Moreover, NS DOM
extracts showed a higher H/C ratio and a lower O/C ratio than the SR DOM extracts. This was
in agreement with 1H NMR spectra that indicated higher aliphaticity of NS DOM compared
with SR DOM (38% vs. 30% for purely aliphatic units CCCH; Fig. S2, Table S4), but lower
content of unsaturated Csp2H units than found in SR DOM (6% vs. 11%; Table S4).
In general, clustering according to decrease in average H/C and increase in average O/C ratio
of SR DOM fol-lowed the order: polar or strong ion exchange < weakly non-polar or mid-
polar < mid non-polar & mixed mode with cation exchange < mixed mode with anion
exchange < non-polar (Fig. 6-2). With the exception of “polar and strong ion exchange”
resins, the average molecular weights of the SR DOM extracts were largely confined to a
rather narrow range of m/z ~380-400. For NS DOM extracts, “polar and strong ion exchange”
SPE resins cov-ered a relatively large range of low average mass (m/z ~ 290 – 360), weakly
non-polar and mid polar resins produced NSDOM ranging from m/z ~ 360 – 390, whereas all
other DOM extracts covered a narrow mass range of m/z ~ 370 – 390 (Fig. 6-3; Table S3). In
case of SR DOM, the polar and strong ion exchange extracts NH2, 2OH and SCX were most
oxygen-depleted (O/C ratio < 0.3), of lowest average mass (m/z < 360; Fig. 6-2, Fig. 6-3), and
their mass spectra were strongly depleted of organic matter signatures, suggesting dominant
contributions by molecules leaching from the SPE cartridges (Fig. S4, Fig. S5) in agreement
with 1H NMR spectra (Fig. S3). Analogous, but attenuated behavior was demonstrated for the

100
other members of this series, i.e. SI, SAX, CN-U and CN-E resins, all of which showed
weaker oxygen-depletion (O/C ratio ~ 0.30-0.36) and a low average mass (m/z ~ 360-390).
All these samples showed visible proportions of common DOM signatures in its mass spectra
(Fig. S4, Fig. S5). Overall, these results clearly demonstrated that polar sorbents exhibited
stronger affinity to less oxygenated compounds under the selected experimental conditions
whereas non-polar sorbents were enriched in rather oxygenated and more unsaturated
compounds, which also had produced pronounced signatures of organic matter in their MS-
derived van Krevelen diagrams (Figs. S4-S7).
A notable example is the SPE series C1, C2, C8 and C18, in which the DOC yield had
increased continually with carbon loading as expected (cf. above; Fig. 6-1 and Table S1);
however, the relative aliphaticity of the respective SPE extracts was not increased as seemed
likely. In both SR DOM and NS DOM extracts, average H/C ratios decreased while retaining
a similar average mass range when SPE sorbents changed from C1 through C18 (Fig. 6-2,
Fig. 6-3; Table S2, Table S3). Probably, aliphatic interactions were not decisive in this DOM
isolation process but relative unsaturation also played a role. A gradual increase in average
DBE and DBE/C in the DOM extracts was observed when C1 increased to C18, still
validating the polarity-based separation that non-polar sorbents preferentially extract non-
polar compounds. However, a continual increase in average O/C ratios was found as well,
implying a decisive role of oxygen-containing functional groups in DOM retention. As
nominal unsatura-tion of DOM molecules may refer to aromatic, olefinic, and carbonyl
double bonds as well as alicyclic rings, a certain importance of carboxylic groups in this DOC
retention series might apply.
The SPE sorbents most widely used for DOM isolation are PPL, C18 and HLB, and belong to
the group of non-polar sorbents. Both respective SR DOM and NS DOM extracts project on a
limited average mass range (SR / NS DOM: m/z ~ 390 / 380; Tab. S2, Fig. 3) and a rather
confined area of average H/C and O/C ratios (Fig. 6-2 and Fig. 6-3). Compared to PPL, C18
extracted SR DOM and NS DOM compounds with slightly higher saturation (higher H/C
ratios and lower O/C ratios; Table S2 and Table S3), in accordance with previous findings

101
when isolating arctic DOM, oligotrophic Lake Superior DOM and other freshwater DOM (Li
and Minor, 2015; Perminova et al., 2014; Raeke et al., 2016). HLB extracts showed higher
average O/C ratios than C18 extracts, in analogy to the finding that HLB extracts of
freshwater contained a comparatively higher proportion of oxygen-rich compounds (Raeke et
al., 2016).
FTMS-derived principal component analysis (PCA) of the SR SPE-DOM extracts produced a
well separated clustering according to proposed SPE sorption mechanisms, with a continual
evolution from “non-polar” to “polar and strong ion exchange” SPE resins (Fig. 4A) while the
count of assigned molecular compositions fol-lowed these trends as well: non-polar > mixed
mode with anion exchange > mid-polar and mixed mode with cation exchange > weakly non-
polar and mid-polar > polar and strong ion exchange (Fig. 6-4; Table S2). This finding implies
that non-polar interactions caused optimum retention for Suwannee River DOM. The acidic
characteristics of SR DOM facilitated anion exchange-based retention as well, explaining the
improved DOM retention characteristics compared with those of cation exchange-based SPE
resins.

102
Fig. 6-2 Average H/C and O/C elemental ratios of (left panel): SR DOM extracts, and (right panel): NS DOM extracts derived from negative ESI FT-ICR mass
spectra. Bubble size indicated the average intensity obtained by FT-ICR mass spectra. The shaded section indicates two groups of polar and strong ion
exchange SPE resins, differing in relative oxygen-deficiency (cf. text)
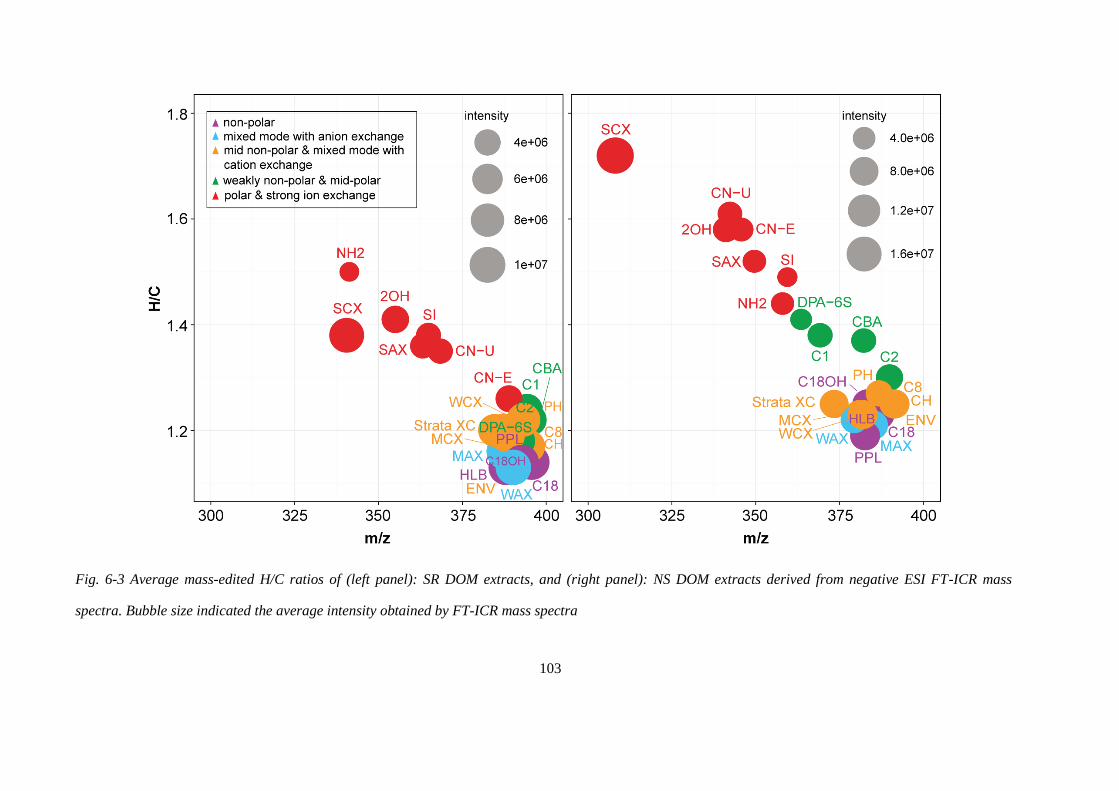
103
Fig. 6-3 Average mass-edited H/C ratios of (left panel): SR DOM extracts, and (right panel): NS DOM extracts derived from negative ESI FT-ICR mass
spectra. Bubble size indicated the average intensity obtained by FT-ICR mass spectra

104
Two major groups of molecular compositions, group A and group B, contributed to the
distinction of SR DOM in the FT-ICR MS-derived PCA analysis (Fig. 4A). According to van
Krevelen diagrams and mass-edited H/C ratios, molecular compositions common in both
groups A and B reflected an overall ~50% of total molecular compositions, and were largely
comprised of a contiguous assembly of low mass (m/z < 500) CHO compounds of average
H/C and O/C ratio, with an admixture of <10% of assigned numbers of CHNO and CHOS
com-pounds. The latter were primarily saturated (H/C ratio > 2) and unsaturated (H/C ratio ~
1.65) sulfolipids (Hertkorn et al., 2016). Molecular compositions unique to group A were
more numerous than the common ones, whereas those specific to group B comprised a very
few scattered CHO, CHNO, CHOS and CHNOS compounds of no conceivable structural
relevance (Fig. 4B, Fig. 4C). The molecular compositions unique to group A (i. e. those
present in mid- to non-polar SPE-DOM) were comprised of ~50% CHO, ~35% CHNO and
~15% CHOS compounds (Fig. 6-4B, Fig. 6-4C). While the CHO compounds encircled those
common to groups A in the van Krevelen diagram, while reaching out to remarkable
oxygenation (O/C ratio up to 0.9), the unique CHNO com-pounds were clustered at a H/C
ratio of 1.1 ± 0.2 and a O/C ratio of 0.5 ± 0.1 and a mass range of m/z ~ 350 ± 100, indicative
of common DOM molecules with a restricted overall chemical diversity (Fig. 6-4B and Fig.
6-4C). CHOS compounds represented a set of rather low mass (m/z ~ 350-450) unsaturated
sulfolipids at a H/C ratio of 1.40 ± 0.15, with O/C ratios of 0.2 ± 0.1 and a peculiar set of
aromatic black sulfur CHOS compounds (Hertkorn et al., 2013, 2016) with an aromaticity
index above 0.5 (Koch and Dittmar, 2006), showing a H/C ratio of 0.8 ± 0.2, and a O/C ratio
of 0.23 ± 0.15. Overall, the molecular compositions present in group A (common to group A
and group B plus unique to group A) comprised the entire inventory of Suwannee River
organic molecules whereas those present in group B (common to group A and group B plus
unique to group B) represented a subset of limited chemical diversity as demonstrated by the
smaller area covered in van Krevelen diagrams and mass-edited H/C ratios, which showed
fewer CHNO and CHOS compounds.
105
In comparison with SR DOM, PCA assessment of NS DOM showed a related but clearly
distinct pattern, again corroborating relevant differences in chemical diversity. At first,
clustering according to groups of SPE resins was, although of the same order, less distinct
than in case of SR DOM (Fig. 6-4A, Fig. 6-5A). While similar counts of shared molecular
compositions, common to groups A and group B, were observed for SR DOM and NS DOM,
the latter comprised ~20% of CHNO compounds which were nearly absent in shared SR
DOM molecular com-positions. Overall, CHO compounds of NS DOM were displaced to
higher saturation (H/C ratio > 0.8) at lesser oxygenation (O/C ratio < 0.65), while saturated
sulfolipids seemed common to both SR DOM and NS DOM. The CHOS compounds unique
to group A in NS DOM were distinct from those found in SR DOM, more numerous and
reached to higher mass (up to m/z ~ 480) (Fig. 6-4, Fig. 6-5). However, CHNO compounds
unique to group A contributed ~50% of the total number of molecular formulas. They were
highly diverse as shown by its substantial mass range (m/z ~ 220 – 550) and coverage of a
large area in van Krevelen diagrams, considerably exceeding the respective range observed
for unique SR DOM CHNO molecular series, and even extending into the aromatic region
(O/C ratio 0.38 ± 0.15; H/C ratio: 0.5 ± 0.2; m/z ~ 390 ± 30). CHO compounds unique to
group A in NS DOM again reached to greater oxygenation as well as broader bandwidth of
unsaturation than those common to groups A and B, in analogy to SR DOM (cf. above).

106
Fig. 6-4 (A) PCA of SR SPE-DOM extracts derived from negative ESI FT-ICR mass spectra; (B) van Krevelen diagrams of the masses detected in common,
unique in group A and unique in group B; (C) mass-edited H/C ratios of the masses detected in common, unique in group A and unique in group B.

107
Fig. 6-5 (A) PCA of NS SPE-DOM extracts derived from negative ESI FT-ICR mass spectra; (B) van Krevelen diagrams of the masses detected in common,
unique in group A and unique in group B; (C) mass-edited H/C ratios of the masses detected in common, unique in group A and unique in group B.
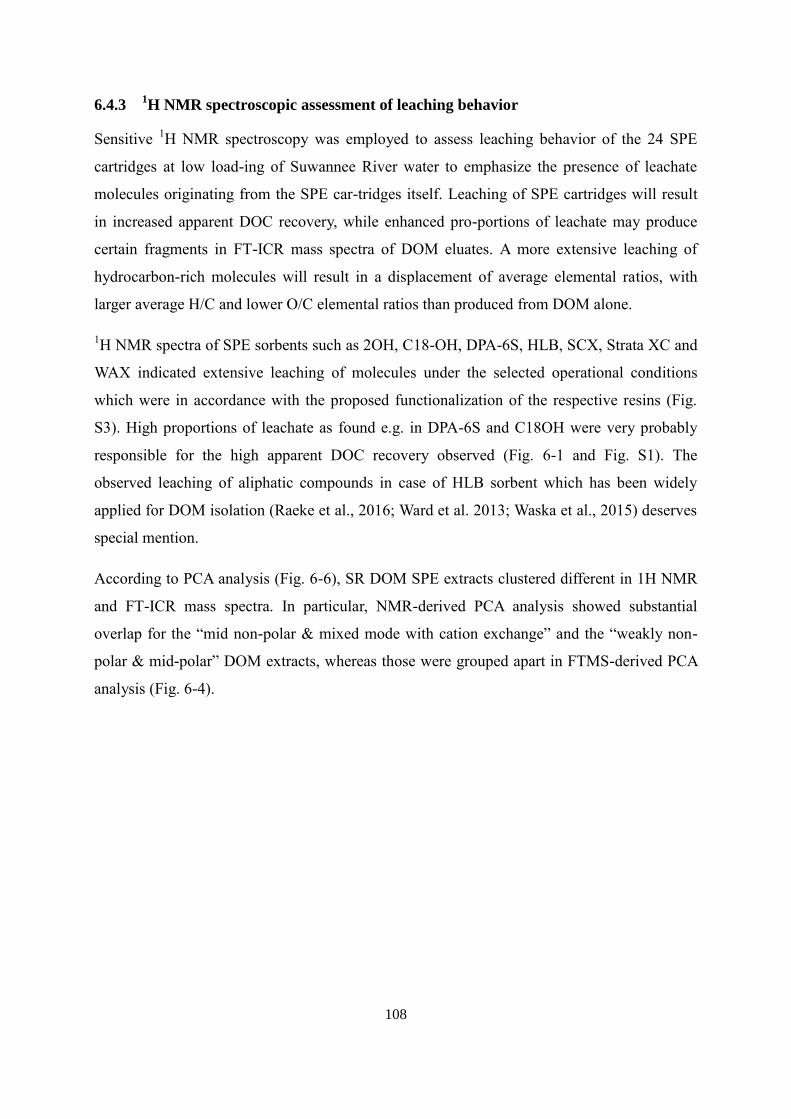
108
6.4.3 1H NMR spectroscopic assessment of leaching behavior
Sensitive 1H NMR spectroscopy was employed to assess leaching behavior of the 24 SPE
cartridges at low load-ing of Suwannee River water to emphasize the presence of leachate
molecules originating from the SPE car-tridges itself. Leaching of SPE cartridges will result
in increased apparent DOC recovery, while enhanced pro-portions of leachate may produce
certain fragments in FT-ICR mass spectra of DOM eluates. A more extensive leaching of
hydrocarbon-rich molecules will result in a displacement of average elemental ratios, with
larger average H/C and lower O/C elemental ratios than produced from DOM alone.
1H NMR spectra of SPE sorbents such as 2OH, C18-OH, DPA-6S, HLB, SCX, Strata XC and
WAX indicated extensive leaching of molecules under the selected operational conditions
which were in accordance with the proposed functionalization of the respective resins (Fig.
S3). High proportions of leachate as found e.g. in DPA-6S and C18OH were very probably
responsible for the high apparent DOC recovery observed (Fig. 6-1 and Fig. S1). The
observed leaching of aliphatic compounds in case of HLB sorbent which has been widely
applied for DOM isolation (Raeke et al., 2016; Ward et al. 2013; Waska et al., 2015) deserves
special mention.
According to PCA analysis (Fig. 6-6), SR DOM SPE extracts clustered different in 1H NMR
and FT-ICR mass spectra. In particular, NMR-derived PCA analysis showed substantial
overlap for the “mid non-polar & mixed mode with cation exchange” and the “weakly non-
polar & mid-polar” DOM extracts, whereas those were grouped apart in FTMS-derived PCA
analysis (Fig. 6-4).
109
Fig. 6-6 PCA of original SR SPE-DOM extracts derived from 1H NMR section integrals (0.01 ppm
resolution).
In the course of this and other studies (e.g. Li et al., 2016; unpublished data) we have
repeatedly observed that the individual combinations of SPE and DOM produced a very
complex evolution of DOM and cartridge-specific, structure selective blank and leaching
behavior in NMR spectra, which depend on many conditions, in particular the loading mass
ratio of DOM / SPE (Li et al., 2016). In this study, we simply wanted to assess the extent and
selectivity of leaching of SPE cartridges under realistic conditions of DOM extraction by
NMR spectroscopy. It is clear that at higher DOM / SPE mass ratios, higher proportions of
DOM will be retained, but in-creased shares of DOM may be transferred to permeates and
wash liquids as well (Li et al., 2016). In case of larger cartridge size and higher loading of
DOC, FT-ICR mass spectra with common DOM characteristics such as smooth, skewed near
Gaussian-type mass peak distributions dominated by ∆m(CH2) and ∆m(H2) which appear
inconspicuous on sight and mathematical analysis may hid substantial leaching of aliphatic
compounds which are clearly visible and perhaps even dominant in 1H NMR spectra, relevant
examples include CN-E and certain C8 cartridges (data not shown). Owing to chemical
diversity and polydispersity of all DOM, these mutual dependencies, which are governed by

110
an array of diverse intermolecular interactions between DOM and SPE resin molecules are
very complex and depend on individual conditions. A further complication is an often
undisclosed alteration of proprietary conditions in the manufacture of commercial SPE resins
which is even more elaborate because various SPE cartridge sizes even by the same
manufacturer may behave differently. This important cautionary note wants to draw
awareness to the complexity of DOM/SPE interactions, and to the necessity to perform
credible studies of structural blanks especially in case of using SPE for isolation of
polydisperse and molecularly heterogeneous DOM.
6.5 Conclusions
In a set of 24 different SPE resins, which were classified into five established groups of
sorption mechanisms, analogous molecular interactions operated for both Suwannee river
water and North Sea water at pH = 2 and methanol elution. While leaching of some resins
caused inflation of bulk DOC recovery and displacement of averaged mass spectral
properties, carefully performed NMR spectroscopy on adapted series of samples will allow a
reliable assessment of structural blanks. With the exception of strongly polar and ion
exchanging resins, the distinction of freshwater and marine DOM by SPE appears driven by
intrinsic molecular properties of DOM rather than by peculiar specific interactions. Coupling
of distinctive sorbents under the same operational conditions may achieve a more
comprehensive extraction of DOM from various sources.
6.6 Acknowledgements
The authors are thankful to China Scholarship Council (CSC) for the financial support of Yan
Li. The authors appreciate partial financial support from International Humic Substances
Society (IHSS) for Dr. Norbert Hertkorn during sampling campaign in May 2012. We are also
grateful to the Captain and crew of RV Heincke. Claudia Burau is acknowledged for support
in DOC analyses.
6.7 References
Arakawa, N. and Aluwihare, L. (2015) Direct identification of diverse alicyclic terpenoids in
Suwannee River fluvic acid. Environ Sci Technol 49, 4097-4105.
Battin, T.J., Luyssaert, S., Kaplan, L.A., Aufdenkampe, A.K., Richter, A. and Tranvik, L.J.
(2009) The boundless carbon cycle. Nat Geosci 2(9), 598-600.

111
Benner, R., Pakulski, J.D., McCarthy, M., Hedges, J.I. and Hatcher, P.G. (1992) Bulk
chemical characteristics of dissolved organic matter in the ocean. Science 255, 1561–1564.
Bianchi, T.S. (2011) The role of terrestrially derived organic carbon in the coastal ocean: a
changing paradigm and the priming effect. Proc Natl Acad Sci U S A 108(49), 19473-19481.
Chen, M. and Hur, J. (2015) Pre-treatments, characteristics, and biogeochemical dynamics of
dissolved organic matter in sediments: A review. Water Res 79, 10-25.
Croué, J.-P. (2004) Isolation of Humic and Non-Humic NOM Fractions: Structural
Characterization. Environ-mental Monitoring and Assessment 92(1-3), 193-207.
Dittmar, T., Koch, B., Hertkorn, N. and Kattner, G. (2008) A simple and efficient method for
the solid-phase extraction of dissolved organic matter (SPE-DOM) from seawater. Limnol
Oceanogr-Meth 6(6), 230-235.
Duarte, R.M. and Duarte, A.C. (2015) Unraveling the structural features of organic aerosols
by NMR spectros-copy: a review. Magn Reson Chem 53(9), 658-666.
Flerus, R., Koch, B.P., Schmitt-Kopplin, P., Witt, M. and Kattner, G. (2011) Molecular level
investigation of reactions between dissolved organic matter and extraction solvents using FT-
ICR MS. Mar Chem 124(1-4), 100-107.
Goldberg, S.J., Ball, G.I., Allen, B.C., Schladow, S.G., Simpson, A.J., Masoom, H., Soong,
R., Graven, H.D. and Aluwihare, L.I. (2015) Refractory dissolved organic nitrogen
accumulation in high-elevation lakes. Nat Commun 6, 6347.
Green, N.W.; Mclnnis, D., Hertkorn, N.; Maurice, P.A. and Perdue E.M. (2014) Suwannee
River natural organic matter: isolation of the 2R101N reference sample by reverse osmosis.
Environ Eng Sci 32, 1-7.
Green, N.W., Perdue, E.M., Aiken, G.R., Butler, K.D., Chen, H., Dittmar, T., Niggemann, J.
and Stubbins, A. (2014) An intercomparison of three methods for the large-scale isolation of
oceanic dissolved organic matter. Mar Chem 161, 14-19.
He, W. and Hur, J. (2015) Conservative behavior of fluorescence EEM-PARAFAC
components in resin fraction-ation processes and its applicability for characterizing dissolved
organic matter. Water Res 83, 217-226.

112
Hertkorn, N., Ruecker, C., Meringer, M., Gugisch, R., Frommberger, M., Perdue, E.M., Witt,
M. and Schmitt-Kopplin, P. (2007) High-precision frequency measurements: indispensable
tools at the core of the molecu-lar-level analysis of complex systems. Anal Bioanal Chem
389(5), 1311-1327.
Hertkorn, N., Frommberger, M., Witt, M., Koch, B.P., Schmitt-Kopplin, P. and Perdue, E.M.
(2008) Natural organic matter and the event horizon of mass spectrometry. Anal Chem 80(23),
8908-8919.
Hertkorn, N., Harir, M. and Schmitt-Kopplin, P. (2015) Nontarget analysis of Murchison
soluble organic matter by high-field NMR spectroscopy and FTICR mass spectrometry. Magn
Reson Chem 53(9), 754-768.
Hertkorn, N., Harir, M., Cawley, K.M., Schmitt-Kopplin, P. and Jaffé, R. (2016) Molecular
characterization of dissolved organic matter from subtropical wetlands: a comparative study
through the analysis of optical properties, NMR and FTICR/MS. Biogeosciences 13(8), 2257-
2277.
Kellerman, A.M., Kothawala, D.N., Dittmar, T. and Tranvik, L.J. (2015) Persistence of
dissolved organic matter in lakes related to its molecular characteristics. Nat Geosci 8(6), 454-
457.
Kim, S., Simpson, A.J., Kujawinski, E.B., Freitas, M.A. and Hatcher, P.G. (2003) High
resolution electrospray ionization mass spectrometry and 2D solution NMR for the analysis of
DOM extracted by C18 solid phase disk. Org Geochem 34(9), 1325-1335.
Koch, B.P. and Dittmar, T. (2006) From mass to structure: an aromaticity index for high-
resolution mass data of natural organic matter. Rapid Commun Mass Sp 20(5), 926-932.
Koch B.P., Kattner G., Witt M., Passow U. (2014). Molecular insights into the microbial
formation of marine dissolved organic matter: Recalcitrant or labile? Biogeosciences, 11,
4173-4190.
Koprivnjak, J.F., Pfromm, P.H., Ingall, E., Vetter, T.A., Schmitt-Kopplin, P., Hertkorn, N.,
Frommberger, M., Knicker, H. and Perdue, E.M. (2009) Chemical and spectroscopic
characterization of marine dissolved or-ganic matter isolated using coupled reverse osmosis–
electrodialysis. Geochim Cosmochim Ac 73(14), 4215-4231.
113
Ksionzek K.B., Lechtenfeld O.J., McCallister S.L., Schmitt-Kopplin P., Geuer J.K., Geibert
W., Koch B.P. (2016). Dissolved organic sulfur in the ocean: Biogeochemistry of a petagram
inventory. Science, 354, 456-459.
Kruger, B.R., Dalzell, B.J. and Minor, E.C. (2011) Effect of organic matter source and salinity
on dissolved or-ganic matter isolation via ultrafiltration and solid phase extraction. Aquat Sci
73(3), 405-417.
Kujawinski, E.B. (2011) The impact of microbial metabolism on marine dissolved organic
matter. Ann Rev Mar Sci 3, 567-599.
Lam, B. and Simpson, A.J. (2006) Passive sampler for dissolved organic matter in freshwater
environments. Anal Chem 78(24), 8194-8199.
Lam, B., Baer, A., Alaee, M., Lefebvre, B., Moser, A., Williams, A. and Simpson, A.J. (2007)
Major Structural Components in Freshwater Dissolved Organic Matter. Environ Sci Technol
41(24), 8240-8247.
Lara, R.J. and Thomas, D.N. (1994) Isolation of Marine Dissolved Organic Matter:
Evaluation of Sequential Combinations of XAD Resins 2, 4, and 7. Anal Chem 66(14), 2417-
2419.
Leenheer, J.A., Wershaw, R., Reddy, M.M., (1995) Strong-acid, carboxyl-group structures in
fulvic acid from the Suwannee River, Georgia.2. Major structures. Environ Sci Technol 29(2),
399-405.
Li, H. and Minor, E.C. (2015) Dissolved organic matter in Lake Superior: insights into the
effects of extraction methods on chemical composition. Environ Sci Process Impacts 17(10),
1829-1840.
Li, Y., Harir, M., Lucio, M., Kanawati, B., Smirnov, K., Flerus, R., Koch, B.P., Schmitt-
Kopplin, P. and Hertkorn, N. (2016) Proposed Guidelines for Solid Phase Extraction of
Suwannee River Dissolved Organic Matter. Anal Chem 88(13), 6680-6688.
Lucas, J., Koester, I., Wichels, A., Niggemann, J., Dittmar, T., Callies, U., Wiltshire, K.H. and
Gerdts, G. (2016) Short-Term Dynamics of North Sea Bacterioplankton-Dissolved Organic
Matter Coherence on Molecular Level. Front Microbiol 7, 321.
114
Mann, P.J., Eglinton, T. I., McIntyre C. P., Zimov, N., Davydova, A., Vonk, J. E., Holmes, R.
M. and Spencer, R. G. M. (2016) Utilization of ancient permafrost carbon in headwaters of
Arctic fluvial networks. Nat. Commun. 6, 7856.
Minor, E.C., Swenson, M.M., Mattson, B.M. and Oyler, A.R. (2014) Structural
characterization of dissolved organic matter: a review of current techniques for isolation and
analysis. Environ Sci Process Impacts 16(9), 2064-2079.
Moran, M. A.; Kujawinski, E. B.; Stubbins, A.; Fatand, R.; Aluwihare, A.; Buchan, A.;
Crump, B. C.; Dorrestein, P. C.; Dyhrman, S. T.; Hess, N. J.; Howe, B.; Longnecker, K.;
Medeiros, P. M.;Niggemann, J.; Obernosterer., I.; Repeta, D. J. and Waldbauer, J. R. (2016)
Deciphering ocean carbon in a changing world. Proc Natl Acad Sci U S A 113(12), 3143-
3151.
Nebbioso, A. and Piccolo, A. (2013) Molecular characterization of dissolved organic matter
(DOM): a critical review. Anal Bioanal Chem 405(1), 109-124.
Nkambule, T.I., Krause, R.W.M., Haarhoff, J. and Mamba, B.B. (2011) Treatability and
characterization of Natural Organic Matter (Kashiyama et al.) in South African waters using
newly developed methods. Physics and Chemistry of the Earth, Parts A/B/C 36(14-15), 1159-
1166.
Osterholz, H., Singer, G., Wemheuer, B., Daniel, R., Simon, M., Niggemann, J. and Dittmar,
T. (2016) Deciphering associations between dissolved organic molecules and bacterial
communities in a pelagic marine system. ISME J. 10(7), 1717-1730.
Perdue E. M. and Ritche J. D. (2003). Dissolved organic matter in fresh waters, Treatise on
Geochemistry (eds, Holland H. D. and Turekian K. K.), Elsevier-Pergamon, Oxford, Vol. 5,
273-318.
Perminova, I.V., Dubinenkov, I.V., Kononikhin, A.S., Konstantinov, A.I., Zherebker, A.Y.,
Andzhushev, M.A., Lebedev, V.A., Bulygina, E., Holmes, R.M., Kostyukevich, Y.I., Popov,
I.A. and Nikolaev, E.N. (2014) Mo-lecular mapping of sorbent selectivities with respect to
isolation of Arctic dissolved organic matter as measured by Fourier transform mass
spectrometry. Environ Sci Technol 48(13), 7461-7468.

115
Raeke, J., Lechtenfeld, O.J., Wagner, M., Herzsprung, P. and Reemtsma, T. (2016) Selectivity
of solid phase extraction of freshwater dissolved organic matter and its effect on ultrahigh
resolution mass spectra. Environ Sci Process Impacts 18, 918-927.
Ratpukdi, T., Rice, J.A., Chilom, G., Bezbaruah, A. and Khan, E. (2009) Rapid Fractionation
of Natural Organic Matter in Water Using a Novel Solid-Phase Extraction Technique. Water
Environ Res 81(11), 2299-2308.
Sandron, S., Rojas, A., Wilson, R., Davies, N.W., Haddad, P.R., Shellie, R.A., Nesterenko,
P.N., Kelleher, B.P. and Paull, B. (2015) Chromatographic methods for the isolation,
separation and characterisation of dissolved organic matter. Environ Sci Process Impacts
17(9), 1531-1567.
Swenson, M.M., Oyler, A.R. and Minor, E.C. (2014) Rapid solid phase extraction of dissolved
organic matter. Limnol Oceanogr-Meth 12(10), 713-728.
Thurman, E.M. and Malcolm, R.L. (1981) Preparative isolation of aquatic humic substances.
Environ Sci Tech-nol 15(4), 463-466.
Tfaily, M.M., Hodgkins, S., Podgorski, D.C., Chanton, J.P. and Cooper, W.T. (2012)
Comparison of dialysis and solid-phase extraction for isolation and concentration of dissolved
organic matter prior to Fourier transform ion cyclotron resonance mass spectrometry. Anal
Bioanal Chem 404(2), 447-457.
Tziotis, D., Hertkorn, N. and Schmitt-Kopplin, P. (2011) Kendrick-analogous network
visualisation of ion cyclo-tron resonance Fourier transform mass spectra: improved options
for the assignment of elemental compositions and the classification of organic molecular
complexity. Eur J Mass Spectrom (Chichester, Eng) 17(4), 415-421.
Ward, N.D., Keil, R.G., Medeiros, P.M., Brito, D.C., Cunha, A.C., Dittmar, T., Yager, P.L.,
Krusche, A.V. and Richey, J.E. (2013) Degradation of terrestrially derived macromolecules in
the Amazon River. Nat Geosci 6(7), 530-533.
Waska, H.; Koschinsky, A.; Chancho, M.J.R. and Dittmar, T. (2015) Investigating the
potential of solid-phase extraction and Fourier-transform ion cyclotron resonance mass
spectrometry (FT-ICR-MS) for the isolation and identification of dissolved metal-organic
complexes from natural waters. Mar Chem 173, 78-92.
116
Zhang, F., Harir, M., Moritz, F., Zhang, J., Witting, M., Wu, Y., Schmitt-Kopplin, P., Fekete,
A., Gaspar, A. and Hertkorn, N. (2014) Molecular and structural characterization of dissolved
organic matter during and post cyanobacterial bloom in Taihu by combination of NMR
spectroscopy and FTICR mass spectrometry. Water Res 57, 280-294.
Zherebker, A.Y., Perminova, I.V., Konstantionov, A.I., Volikov, A.B., Kostyukevich, Y.I.,
Kononikhin, A.S., Nikolaev, E.N., (2016) Extraction of humic substances from fresh waters
on solid-phase cartridges and their study by Fourier transform ion cyclotron resonance mass
spectrometry. J Anal Chem 71(4), 372-378.

117
Chapter 7
Insights into Dissolved Organic Matter
Compositions and Structures by Phase-
optimized Solid Phase Extraction (POP
SPE)
Published as: Yan Li, Mourad Harir, Basem Kanawati, Michael Gonsior, Boris P. Koch,
Philippe Schmitt-Kopplin, Norbert Hertkorn (2017). Insight into Dissolved
Organic Matter Composition and Structure by Phase-optimized Solid Phase
Extraction (POP SPE). Analytical Chemistry. To be submitted.
118
7 Insights into Dissolved Organic Matter Compositions and
Structures by Phase-optimized Solid Phase Extraction (POP
SPE)
7.1 Abstract
This proof of concept study proposes a novel and effective fractionation of Suwannee River
dissolved organic matter (SR DOM) by phase-optimized solid phase extraction (POP SPE),
coupling three sorbents with different selectivity in sequence and separate collection of
fractions by isocratic elution of methanol. POP SPE had advantages over the traditional SPE
with individual sorbents in terms of desirable DOC recovery, overall more representative
compounds and selectively fractionated functional groups. High-field Fourier transform ion
cyclotron (FT-ICR) mass spectra showed the wide coverage of compositional groups and
mass ranges in POP SPE fractions. 1H nuclear magnetic resonance (NMR) displayed the
variations of aromatics, olefins, carbohydrates in POP SPE extracts, and 13
C NMR spectra
presented selectivity of carbonyl carbons, functionalized aromatics, methyl, methylene and
methine groups. Blue shift in fluorescence spectra was observed in the first two eluting POP
SPE fractions, indicative of smaller molecular weights and less extent of aromatic
condensation. This method possesses enhanced isolation expectancies, improved isolation
power and selective separation resulting in reduced intermolecular interactions, and has the
potential as a more standardized approach for isolation of variable and heterogeneous DOM
samples which are not possible to be well extracted by single sorbent.
119
7.2 Introduction
Dissolved organic matter (DOM) is the largest reservoir of organic carbon on Earth and it is
widely distributed in all terrestrial ecosystems (Bianchi 2011). DOM is an extremely complex
(super)mixture of organic compounds with ~50% of carbon content and variable proportions
of heteroatoms such as oxygen, nitrogen, sulfur and phosphorus which cannot be resolved into
individual compounds at present (Hertkorn et al. 2007). Hence, DOM molecular diversity
which reflects key ecosystem processes and services such as speciation of nutrient and trace
metals, binding and mobility of organic molecules and pollutants, biodiversity and food web
composition, to name a few (Fasching et al. 2014, Kujawinski 2011, Lucas et al. 2016, Moran
et al. 2016, Osterholz et al. 2016), is poorly constrained and understood at present (Hertkorn
et al. 2007, Ksionzek et al. 2016). The concentration, composition and structure of DOM
results from the integration cross interdependent physical, chemical and biological processes
with different spatial and temporal resolution. Remarkable variance in the molecular
compositions may be observed in individual DOM samples even if average bulk DOM
properties are often confined to rather narrow, ecosystem-specific ranges (Kruger et al. 2011,
Perdue and Ritchie 2003).
While carbohydrates, peptides and lipids are present in soil, aquatic and marine DOM, and
can be retrieved by degradative analysis (Shen et al. 2014), the linkages of these key structural
units remain largely unknown even today (Bianchi 2011). Other prominent DOM constituents
like combustion-derived black carbon (Schmidt et al., 2009), black nitrogen (Knicker 2010),
black sulfur (Hertkorn et al. 2013, 2016), lignin-oxidation (DiDonato et al. 2016, Waggoner et
al. 2015) and photodegradation products (Gonsior et al. 2014, Schmitt-Kopplin et al. 1998)
result primarily from abiotic reactions and hence cover a larger compositional and structural
diversity than biologically derived molecules. One of the most relevant prerequisites of DOM
molecular characterization is a reproducible collection of representative samples with
appreciable recovery.
The last two decades brought significant improvements of DOM isolation techniques, and
solid phase extraction (SPE), preferentially with functionalized styrene-divinylbenzene
polymer (PPL sorbent) (Minor et al. 2014, Nebbioso and Piccolo 2013, Sandron et al. 2015,
Thurman and Malcolm 1981), has emerged as a widespread method due to its satisfactory
DOC recovery (~50%) and ease of use, in particular for demanding field work. The observed
range of DOM recovery when using PPL sorbent, for instance, was 43% for marine DOM, 65%
120
for salt marsh DOM, and >80% for Suwannee River DOM (Dittmar et al. 2008, Li et al.
2016a, Raeke et al. 2016), indicating a substantial compositional and structural variance of
these DOM. Alternative SPE sorbents frequently applied for DOM isolation were C18, which
preferentially retains colored dissolved organic matter (CDOM) rich in Csp2-units (Kim et al.
2003), and HLB and XAD (Perminova et al. 2009). While it will remain impossible to extract
the entire complement of organic molecules from polydisperse DOM with one single SPE
sorbent, PPL resin appears to recover the largest bandwidth of aliphatic molecules with a
sizable range of polarities.
Non-target molecular characterization of DOM attempts to describe the entire pool of carbon
and its chemical environments by means of information-rich structure-selective methods such
as fluorescence spectroscopy (determines chromophoric dissolved organic matter, CDOM),
ultrahigh-resolution FT-ICR mass spectrometry (determines thousands of molecular
compositions directly out of mixtures) and NMR spectroscopy (detects atomic environments
of primarily hydrogen and carbon). However, even these advanced methods often suffer from
extensive selectivity and loss of information, when applied to the characterization of
polydisperse DOM. Optical spectroscopy primarily detects Csp2-based structures with limited
structural resolution (Hertkorn et al., 2016), while standard FT-ICR mass spectrometry
inevitably detects only ions and furthermore projects all different isomers onto single
molecular compositions (Hertkorn et al. 2007, 2008). NMR spectra offer unparalleled,
quantitative insights into structural detail, but suffer from a comparatively low sensitivity and
massive projection of a huge number of atomic environments on limited ranges of chemical
shift. Furthermore, the NMR linewidth is affected by (differential) transverse NMR relaxation
which might interfere with the quantitative relationships between area of NMR resonances
and number of accountable nuclear spins.
The intractability of DOM molecular diversity does not only arise from the huge number of
different chemical environments present in the samples but also on the interactions between
molecules, which operate on different time scales and are often pH- and concentration
dependent. Fractionation of DOM, e.g. by liquid chromatography (Koch et al. 2008, Stenson
et al. 2008, Woods et al. 2011, 2012), parallel and sequential elution by multiple SPE
cartridges (Ratpukdi et al. 2009, Swenson et al. 2014), and 2-dimensional gas
chromatography (Arakawa and Aluwihare 2015, Ball and Aluwihare 2014) efficiently reduces
DOM molecular complexity. This attenuates the extent of projection of data in any analytical

121
methods as well as decreases the operating molecular interactions. Cleaner and more
informative spectra are obtained, when consolidated information from multiple DOM
fractions is confronted with the respective data from bulk DOM (Gaspar et al. 2009, Li et al.
2016b).
Stationary Phase Optimized Selectivity Liquid Chromatography (SOS-LC) (Deconinck et al.
2015, 2016, Delahaye and Lynen 2014, Nyiredy et al. 2006, 2007), or in brief, phase-
optimized (POP) separation, is a method in which the stationary phase becomes a tunable
parameter (Deconinck, 2016; Delahaye and Lynen 2014), and dedicated kits of columns and
algorithms are available for mixture fractionation to produce short overall analysis time at
optimal resolution of individual compounds which may often differ widely in polarity
(Deconinck et al. 2015, 2016, Delahaye and Lynen 2014, Nyiredy et al. 2006, 2007). This
study transfers the POP-concept to a SPE-based fractionation of Suwannee River DOM using
a sequence of three distinctive and complementary, non-leaching SPE sorbents with
appreciable DOM retention selected from a previous study of 24 SPE sorbents (Li et al.,
2016c).
The selection of SPE sorbents for sequential adsorption of Suwannee River water was aimed
at a desirable maximum overall diversity of retained DOM molecules by POP SPE, with
meaningful distinction in the individual eluates. For optimum differentiation of DOM
constituents, a decreasing order of selectivity was used as follows: C8 (1st) → MAX (2
nd) →
PPL (3rd
) with three POP SPE fractions to be collected separately. Characterization of these
sequential POP SPE extracts alongside with the traditional SPE extracts resulting from single
sorbents was performed by fluorescence and nuclear magnetic resonance (NMR)
spectroscopy as well as high-field Fourier transform ion cyclotron mass spectrometry (FT-
ICR MS).
7.3 Experimental section
7.3.1 Sample preparation
Suwannee River water DOM (SR DOM, 80 mg/L) was collected and filtered immediately
after sampling as described by Green et al. in May 2012 (Green et al. 2015). Filtered sample
was adjusted to pH 2 with 10 N HCl (31%, Merck, Germany) of analytical grade, and
followed by SPE and POP SPE. SPE with individual sorbents (100 mg C8 (Agilent), 120 mg
MAX (Waters) and 100 mg PPL (Agilent, Bond Elut)) and blanks were performed according

122
to our method (Li et al. 2016a). In POP SPE scheme, C8, MAX and PPL cartridges were
coupled in sequence by Luer adaptors. Blanks were used with acidified Milli-Q water (HCl,
pH 2). All the experiments were performed in triplicates, and a volume of 18.75 mL SR DOM
was loaded on each so that overload was avoided (Li el al. 2016a). After loading the sample,
the POP SPE cartridges were rinsed with 3 mL of pH 2 Milli-Q water, and then dispersed
from the POP scheme. They were dried separately with nitrogen gas for 10 min, and eluted
with 1 mL methanol respectively. The final eluates collected from POP SPE were named as
POP SPE-1C8, -2MAX and -3PPL. POP SPE was conducted over 60 replicates in order to get
enough samples for 13
C NMR. All of these eluates were kept at -20°C in the dark prior to
further analysis.
7.3.2 DOC measurement
DOC concentrations were measured by high temperature catalytic oxidation with a Shimadzu
TOC-VCPN analyzer. 100 μL aliquots of the eluates were evaporated and re-dissolved in 1
mL ultra-pure water for DOC analysis (Flerus et al. 2012).
7.3.3 High-field FT-ICR MS analysis
High-field FT-ICR mass spectra were acquired by a 12 T Bruker Solarix mass spectrometer
(Bruker Daltonics, Bremen, Germany) and an Apollo II electrospray ionization (ESI) source
in negative ionization mode. Samples were diluted in methanol to ~5 μg/mL DOC, and then
injected into the electrospray source at a flow rate of 120 μL/h with a nebulizer gas pressure
of 138 kPa and a dry gas pressure of 103 kPa. Spectra were first externally calibrated based
on clusters of arginine in methanol (5 μg/mL), and internal calibration was systematically
performed using specific DOM reference mass list, reaching accuracy values lower than 500
ppb. The spectra were acquired with a time domain of 4 Mega words over a mass range of
m/z 150-1000 amu, and 500 scans were accumulated for each mass spectrum. Elemental
formulae were computed for each peak in a batch mode by using custom-built software
(Tziotis et al. 2011). Final elemental formulae were generated and categorized into groups
containing CHO, CHNO, CHOS or CHNOS molecular series which were used to reconstruct
the group-selective mass spectra.
7.3.4 NMR analysis
1H NMR detected spectra of eluates were acquired with a 800 MHz Bruker Avance III
spectrometer (B0 = 18.7 T) and 13
C NMR spectra were with 500 MHz spectrometer (B0=11.7
123
T) at 283 K with ~0.3-30 mg of solid (~0.1-1 mg for 1H NMR and 17-30 mg for
13C NMR)
obtained by evaporation of original methanol-h4 solution, dissolved in approx. 200 µL
CD3OD (Merck. 99.95% 2H) solution with a 3 mm z-gradient QCO
13C (
15N,
31P) /
1H
cryogenic probe (90° excitation pulses: 13
C ~ 5.3 and 1H ~ 17 µs) with Bruker standard pulse
sequences in sealed 3 mm Bruker MATCH tubes. Detailed parameters of NMR have been
described by Hertkorn et al. (Hertkorn et al. 2013, 2016). 1H NMR chemical shift reference of
CD3OD was 3.3 ppm and 13
C NMR chemical shift reference of CD3OD was 49.00 ppm. 1H
NMR spectra were recorded with solvent suppression with pre-saturation and 1 ms spin-lock
(noesypr1d), 5 s acquisition time, 5 s relaxation delay (d1), typically 2048 scans. 13
C DEPT
NMR spectra (distortionless enhanced polarization transfer) were acquired with aq = 1 s and
d1 = 2 s. The NMR section integrals were obtained by using Bruker AMIX software (version
3.9.4) with a bucket resolution of 0.01 ppm chemical shifts for 1H NMR and 1 ppm chemical
shift for 13
C NMR, and with exclusion of methanol and water.
7.3.5 Optical spectroscopy
1 mL of the eluates were dried and re-dissolved in Milli-Q water at the original concentrations
and then diluted to achieve raw absorbance of less than 0.4 at 300 nm. The dilution factor was
used to calculate initial fluorescence intensity. The dilution was necessary to be able to correct
for inner filtering effects and to not exceed the linear range of fluorescence response.
Absorbance and EEM spectra were recorded simultaneously using a Horiba Aqualog
fluorometer at excitation wavelengths from 240 to 500 nm (3 nm increments) and an emission
range between 230 to 600 nm (~3 nm increments). The fluorescence was then corrected for
Raleigh scattering and inner filter effects. The raw fluorescence intensity was then normalized
to a 1 ppm Starna quinine sulfate reference cell (Gonsior et al. 2013).
7.4 Results and discussions
7.4.1 DOC recovery
Based on a previous study of 24 commercially available SPE sorbents eluted, three SPE
sorbents were selected for a sequential POP-based DOM elution from Suwannee River water:
the moderately non-polar SPE resin C8 (1st), the non-polar mixed mode with moderate anion
exchange polymer MAX (2nd
), and the modified non-polar PPL (3rd
). These three SPE
cartridges all had retained complex, but somewhat complementary mixtures of DOM
molecules at appreciable recovery, with limited (C8) to absent leaching (MAX and PPL). The

124
DOC recoveries of the three individual SPE extracts from Suwannee River water produced in
this study with methanolic elution at pH = 2 for cartridges C8 (48±2%), MAX (25±1%) and
PPL (70±4%) were consistent with our previous findings (Li et al. 2016c).
The DOC recovery of the three POP SPE extracts was 47±1% (POP SPE-1C8), 6±0.5% (POP
SPE-2MAX), and 5±0.3% (POP SPE-3PPL), respectively. This demonstrated a fair
congruence for the two initial C8 eluates but very extensive fractionation and extraction
selectivity among the consecutive pairs of eluates MAX / POP SPE-2MAX and PPL / POP
SPE-3PPL. Surprisingly, the overall DOC extraction yield of the POP SPE sequential elution
(~58%) was lower than that of PPL alone (~70%) testifying to a rather complex and dynamic
behavior of molecular interactions effecting the retention of polydisperse DOM by SPE. The
lower DOC recovery in POP SPE was mainly due to the operating conditions for MAX which
was recommended by the manufactures. In our study, a homogenous condition was applied
for three cartridges with different functionaries in order to minimize the side reactions as well
as easy operation.
7.4.2 NMR spectra
All 1H NMR spectra of the three individual DOM extracts showed the typical characteristics
of complex organic matter, with broad, smooth bulk envelopes across the entire range of
chemical shift, resulting from superposition of a huge number (> 106) number of individual
NMR resonances, each denoting an individual atomic environment of DOM. From higher to
lower field (from right to left), aliphatics, carboxylic-rich alicyclic molecules (CRAM)
(Hertkorn et al. 2006), carbohydrates-like and methoxy, olefins and aromatics were observed
in variable proportions (Table 7-1): aromatics and olefic protons declined in the order eluates
C8 < PPL << MAX; OCH-units increased according to eluates MAX < C8 < PPL, while
functionalized aliphatics (XCCH units, like CRAM: X = HOOC) increased slightly from
eluates C8 < PPL ~ MAX; Finally, pure aliphatic chemical environments (CCCH units)
increased in the order PPL < C8 < MAX. Overall, eluate MAX was particularly rich in
aliphatics but depleted in unsaturated carbon and oxygenated aliphatics; eluate C8 showed
abundant unsaturated aromatic and olefinic protons while being depleted in functionalized
aliphatics. Eluate PPL showed substantial unsaturation, high content of oxygenated aliphatics
and was depleted in extended aliphatic systems.

125
Fig. 7-1 1H NMR spectra (800 MHz, CD3OD) of individual (upper panel) and (middle panel) POP SPE
Suwannee River eluates. Bottom panel: Area-normalized superposition of (left) individual and (right) POP SPE-
eluates; color code: C8 (blue), MAX (red), PPL (green).

126
Table 7-1 1H NMR section integral (800 MHz, CD3OD) for key substructures of eluates (manual integration)
δ(1H)
[ppm]
key
substructures C8 MAX PPL
POP SPE
C8
POP SPE
MAX
POP SPE
PPL
∆
C8
∆
MAX
∆
PPL
10.0 - 7.0
ppm =CarH 6.5 1.7 5.5 6.9 2.3 1.4 0.4 0.7 -4.1
7.0 - 5.0
ppm =CH, O2CH 5.9 2.7 5.8 5.7 4.3 3.3 -0.2 1.6 -2.5
5.0 - 3.1
ppm OCH 23.2 19.9 26.2 22.9 28.2 39.7 -0.3 8.3 13.5
3.1 - 1.9
ppm XCCH 29.1 32.5 32.2 27.8 35.7 30.3 -1.3 3.2 -1.9
1.9 - 0.5
ppm CCCH 35.5 43.4 30.5 36.7 29.5 25.3 1.2 -13.9 -5.2
At closer inspection, manual superposition revealed near identical curvature of 1H NMR
resonances in eluates C8 and MAX, ranging from δH ~ 2.75 – 1.75, implying remarkable
superficial resemblance of functionalized aliphatic units in these two eluates. When
comparing POP SPE eluates, remarkable congruence was found for POP SPE eluates -2MAX
and -3PPL from δH ~ 3.0 – 2.3, implying superficial resemblance of functionalized aliphatic
units with higher oxygen content (smaller average distance).
Comparison of POP SPE and individual SPE
In case of eluate C8, the difference 1H NMR spectrum“POP SPE minus individual eluate”
provided strictly aliphatic NMR resonances at δH of 0.6, 0.9 and 1.38 ppm which likely
indicated selective leaching in eluate POP SPE-1C8, driving all other aliphatic NMR
resonances to higher apparent abundance in individual eluate C8. The difference 1H NMR
spectrum POP SPE-2MAX minus MAX already denoted substantial disparity, with the ratio
of “total difference 1H NMR integral / average
1H NMR integral of the two eluates” reaching
33%. Here, functionalized and oxygenated aliphatics (δH: 2.1 - 4.4 ppm) were enriched in
eluate POP SPE-2MAX, and purely aliphatic units (CCCH; δH: < 2.0 ppm) were enriched in
individual eluate MAX. With +1/3 of total average NMR integral, the difference 1H NMR
spectrum of eluates POP SPE-3PPL minus PPL again denoted substantial distinction between
these two eluates. Here, unsaturated protons (δH > 5.5 ppm) as well as functionalized and
normal aliphatics (δH < 2.5 ppm) were depleted in eluate PPLwhereas OCH-units were
enriched in eluate POP SPE-3PPL. The large resonance at (δH: 3.65 ± 0.15 ppm) corresponded
to aliphatic methyl esters and likely originated from transesterification of labile DOM
molecules during elution from a large cartridge (cf. Fig. 7-2; Schmitt-Kopplin et al., 2010).
127
Frequently, the amplitude of this NMR resonance depends on rather subtle variations of
sample conditions (Fig. 7-2). In general, larger cartridges with increased residence time of
methanol during methanol elution tends to increase this overall NMR amplitude, but other
DOM invariably shows this NMR resonance. Even when the variability of this NMR
resonance may appear as a nuisance, it nevertheless makes other NMR-invisible labile protons
amenable for NMR characterization.
However, even non-recognition of this extra NMR resonance would not modify the essential
distinction between these eluates. The dominant positive aliphatic NMR resonances found in
difference NMR spectrum POP SPE-1C8 minus C8 were also found in the difference NMR
spectrum POP SPE-3PPL minus PPL, although at much smaller amplitude; NMR resonances
originating from acetate and acetyl groups (δH: 2.0 ± 0.15 ppm) were rather prominent in
eluate POP SPE-3PPL.
Three POP SPE fractions showed different 13
C NMR resonance envelopes: 1C8 typical of
terrestrial DOM whereas 2MAX and 3PPL similar to marine DOM (Figure 5, Hertkorn et al.
2013, 2016). Carbonyl carbon, oxygenated aromatics and C-aromatics were dominant in 1C8
fraction, in line with 1H NMR results that 1C8 was enriched of aromatics. Carbohydrate
related NMR resonances (i.e. HCO and HCO2 groups) were abundant in 3PPL fraction,
corroborating the above 1H spectra.

128
Fig. 7-2 1H NMR difference spectra (800 MHz, CD3OD) of Suwannee River DOM: POP SPE minus individual
SPE cartridges: intensity > 0 is more abundant in POP SPE cartridges; intensity < 0 is less abundant in POP
SPE cartridges.Numbers provided denotes ratio of difference / total integral; from top to bottom: C8 (blue, 1st),
MAX (red, 2nd
), PPL (green, 3rd
). Superposition of area-normalized 1H NMR spectra for both individual and
POP SPE eluates (Fig. 7-1) confirmed the abundance order of the key substructures in accordance with the
substructure integral values (Table 7-1): unsaturated Csp2H units eluates individual versus POP SPE: C8 >
PPL >> MAX versus 1_C8 > 3_PPL > 2_MAX; OCHn units: PPL > MAX > C8 versus POP SPE-3PPL > -
2MAX > -1C8; XCCH: MAX > PPL > C8 versus POP SPE-2MAX > -3PPL > -1C8, and CCCH: C8 > MAX >
PPL versus POP SPE-1C8 >POP SPE-2MAX > POP SPE-3PPL.

129
The individual 13
C DEPT-45, -90 and -135 NMR spectra were measured and further
computed to present the meaningful methine (CH), methylene (CH2) and methyl (CH3),
shown in Fig. 7-3. HCar-C group was selectively enriched in 1C8 extract whereas O-HC-O
and HC-O groups were characterized in 3PPL extract, in agreement with the 13
C NMR spectra
above. 2MAX was abundant in HC-O and oxygenated methylene (H2C-O) groups. Overall,
POP SPE had the separation power enhanced with combination of optimized phases, and
extracted DOM with different carbon characteristics.
Table 7-2 13
C NMR section integral (125 MHz, 12
CD3OD; percent of total carbon) and key substructures of
eluates. Middle: substructures used for NMR-derived reverse mixing model with nominal H/C and O/C ratios
provided. Bottom: Percentage of methine, methylene and methyl carbon related to total protonated 13
C NMR
integrals as derived from 13
C DEPT NMR spectra of eluates according to carbon multiplicity (left 3 colums) and
relative proportions of the CHn units binding to oxygen versus carbon chemical environments (cf. Fig. 7-3).
δ (13
C) ppm 220-
187
187-
167
167-
145
145-
108
108-
90
90-
47 47-0
H/C
ratio O/C ratio
Key substructures C=O COX Car-O C
ar-
C,H O2CH OCH CCH
POP SPE-1C8 4.4 18.4 9.6 20.6 4.4 15.4 27.2 1.132 0.750
POP SPE-2MAX 1.9 14.2 3.0 8.2 5.4 32.1 35.2 1.303 0.762
POP SPE-3PPL 3.0 13.3 1.1 7.4 7.4 39.9 28.0 1.240 0.854
C8 2.8 14.0 6.2 14.3 3.1 39.1 20.5 1.115 0.823
MAX 1.3 13.2 1.3 6.6 3.6 32.6 41.3 1.386 0.688
PPL 4.9 18.3 5.0 15.1 3.0 19.5 34.3 1.245 0.720
NMR mixing model C=O COOH Car-O Car-H O2CH OCH CH2
H/C ratio 0 1 0 1 1 1 2
O/C ratio 1 2 1 0 2 1 0

130
Fig. 7-3 13
C NMR spectra of SR DOM extracts obtained by POP SPE-1C8, -2MAX and -3PPL respectively. Superimposed protonated carbon NMR resonances CH+CH2+CH3
(the first column); DEPT-45 13
C NMR spectra (the second column) and multiplicity-edited 13
C NMR spectra of CH (the third column), CH2 (the fourth column) and CH3 (the fifth
column).
131
7.4.3 FT-ICR mass spectra
MS-derived bulk parameters of individual SPE eluates
All three individual SPE eluates showed abundant mass peaks with a mass peak distribution
of common, polydisperse DOM such as a skewed, near Gaussian distribution of a few
thousands of mass peaks with dominant mass spacings of methylene (Δm = 14.654 Da) and
H2 (Δm = 2.1234 Da) (Fig.7-4). The counts of assigned molecular formulas grew from eluate
MAX (ne = 3172) < C8 (ne = 3466) < PPL (ne = 3899), and the proportions of CHO
continually increased from PPL < MAX < C8, while MAX showed the smallest proportion of
CHOS compounds (~2%) and the highest proportion of CHNO compounds (~36%). The
computed average H/C ratios declined in the order MAX > C8 > PPL, corresponding to a
concomitant increase in average DBE/C, equivalent to a mounting average unsaturation of
retained DOM molecules. On the other hand, the average O/C ratios evolved according to
MAX ~ C8 < PPL, while the average masses followed the order MAX < PPL < C8 (Table 7-
3).
The absence of universal trends in the evolution of eluates C8 → MAX → PPL testified for
the individuality of the operating molecular interactions of DOM retention in the three
selected SPE cartridges. However, relevant characteristics of eluates emerged already at this
bulk resolution: The C8 extract (ne = 3466) was a CHO-rich, less oxygenated (O/C ratio <
0.8) high mass complement of DOM molecules with nevertheless notable contributions of
both CHNO and CHOS molecules at intermediate to elevated nominal unsaturation which
could arise from C=C and C=O double bonds as well as from alicyclic rings. The MAX
extract (ne = 3172) contained ~2/3 highly oxygenated CHO molecules up to an O/C ratio of
0.9 and ~1/3 of slightly less oxygenated CHNO molecules. It was further depleted in CHOS
compounds and in higher mass molecules and showed a rather low aromaticity. The PPL
extract showed the highest count of assigned molecular compositions (ne = 3899) with a
sizable share of rather saturated CHOS molecules of variable oxygenation (O/C ratio: 0.3-
0.8), and contained aromatic as well as highly oxygenated CHO molecules.
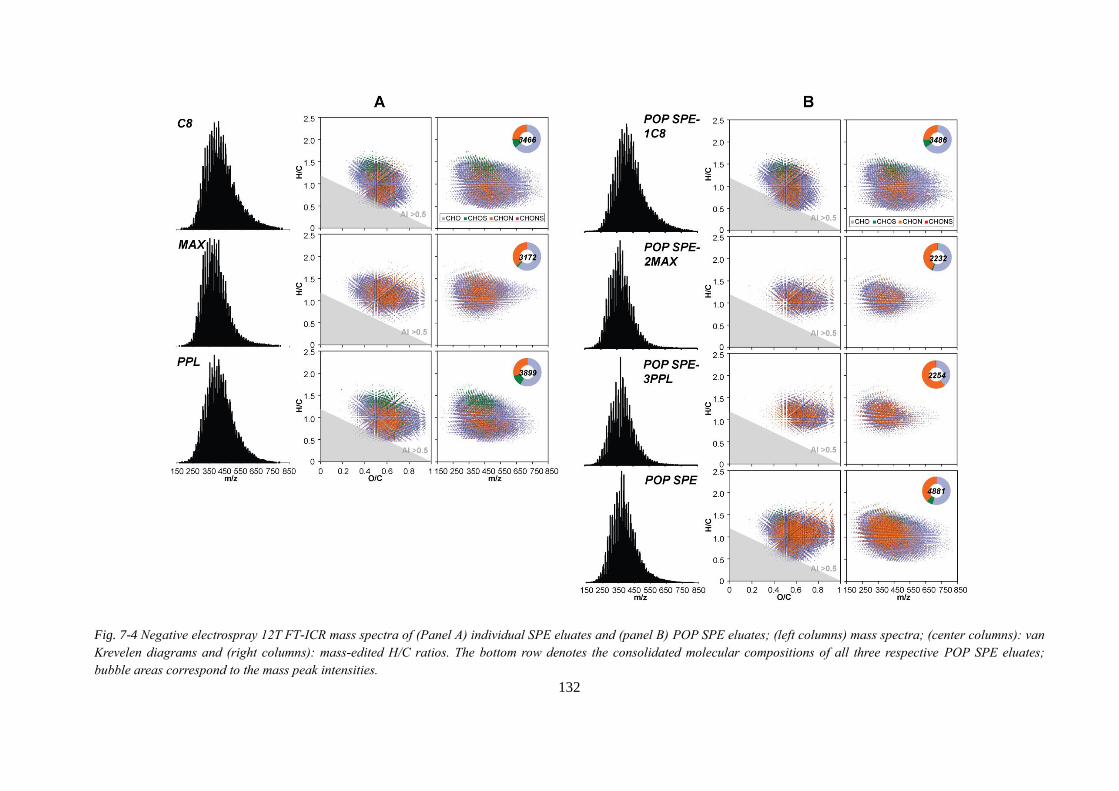
132
Fig. 7-4 Negative electrospray 12T FT-ICR mass spectra of (Panel A) individual SPE eluates and (panel B) POP SPE eluates; (left columns) mass spectra; (center columns): van
Krevelen diagrams and (right columns): mass-edited H/C ratios. The bottom row denotes the consolidated molecular compositions of all three respective POP SPE eluates;
bubble areas correspond to the mass peak intensities.

133
Table 7-3 Counts of mass peaks as computed from negative ESI FT-ICR mass spectra for singly charged ions
with nitrogen rule check and 500 ppb tolerance. Left panels: individual SPE-eluates; center panel, shaded:
consolidated POP SPE eluates; right panels: individual POP SPE-eluates.
members of
molecular series C8 MAX PPL
POP
SPE
POP-
1C8
POP-
2MAX
POP-
3PPL
CHO-compounds 2244
(64.8%)
1950
(61.5%)
2270
(58.2%)
2664
(54.6%)
2260
(64.8%)
1241
(55.6%)
900
(39.9%)
CHOS-compounds 351
(10.1%)
66
(2.1%)
498
(12.8%)
353
(7.2%)
356
(10.2%)
42
(1.9%)
6
(0.3%)
CHNO-compounds 870
(25.1%)
1152
(36.3%)
1118
(28.7%)
1850
(37.9%)
870
(25.0%)
947
(42.4%)
1336
(59.3%)
CHNOS-compounds 1
(0%)
4
(0.1%)
13
(0.3%)
14
(0.3%)
0
(0%)
2
(0.1%)
12
(0.5%)
total number of
assigned mass peaks 3465 3172 3899 4881 3486 2232 2254
average H [%] 4.48 5.08 4.14 4.51 4.44 4.53 4.35
average C [%] 54.56 54.47 52.63 52.08 54.57 51.70 49.63
average O [%] 40.41 39.90 42.49 41.87 40.42 43.08 44.50
average N [%] 0.31 0.52 0.39 0.71 0.31 0.67 1.51
average S [%] 0.23 0.02 0.35 0.11 0.25 0.02 0.01
computed average
H/C ratio 0.99 1.12 0.94 1.03 0.99 1.05 1.05
computed average
O/C ratio 0.56 0.55 0.61 0.59 0.56 0.62 0.67
computed average
C/N ratio 205 122 157 86 205 90 38
computed average
C/S ratio 633 7263 401 1263 582 6893 13235
double bond
equivalent (DBE)
average
11.1 8.8 10.7 9.6 11.1 8.6 8.4
DBE/C average 0.53 0.48 0.56 0.52 0.53 0.51 0.52
mass weighted
average 455.8 414.0 438.6 420.1 455.8 390.4 393.5
MS-derived bulk properties of POP SPE eluates
All three singular POP SPE eluates again showed a mass peak distribution typical of a
polydisperse DOM as described above for the individual SPE eluates. However, the counts of
assigned molecular formulae declined from eluate POP SPE-1C8 (ne = 3486) to eluates POP
SPE-2MAX and POP SPE-3PPL (ne = 2232 and 2254). Also, the proportions of CHO
molecules continually decreased in the order eluate POP SPE-1C8 (~70%) > POP SPE-
2MAX (~60%) > POP SPE-3PPL (< 40%), while the remainder were mainly CHNO
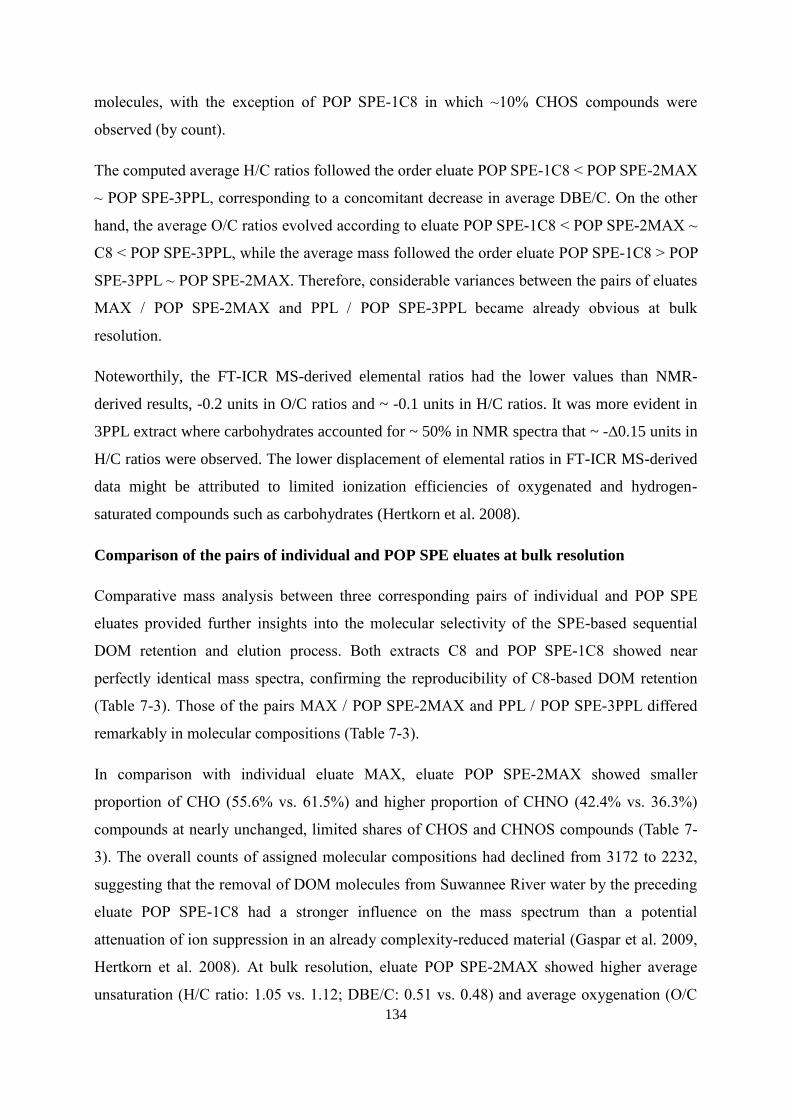
134
molecules, with the exception of POP SPE-1C8 in which ~10% CHOS compounds were
observed (by count).
The computed average H/C ratios followed the order eluate POP SPE-1C8 < POP SPE-2MAX
~ POP SPE-3PPL, corresponding to a concomitant decrease in average DBE/C. On the other
hand, the average O/C ratios evolved according to eluate POP SPE-1C8 < POP SPE-2MAX ~
C8 < POP SPE-3PPL, while the average mass followed the order eluate POP SPE-1C8 > POP
SPE-3PPL ~ POP SPE-2MAX. Therefore, considerable variances between the pairs of eluates
MAX / POP SPE-2MAX and PPL / POP SPE-3PPL became already obvious at bulk
resolution.
Noteworthily, the FT-ICR MS-derived elemental ratios had the lower values than NMR-
derived results, -0.2 units in O/C ratios and ~ -0.1 units in H/C ratios. It was more evident in
3PPL extract where carbohydrates accounted for ~ 50% in NMR spectra that ~ -∆0.15 units in
H/C ratios were observed. The lower displacement of elemental ratios in FT-ICR MS-derived
data might be attributed to limited ionization efficiencies of oxygenated and hydrogen-
saturated compounds such as carbohydrates (Hertkorn et al. 2008).
Comparison of the pairs of individual and POP SPE eluates at bulk resolution
Comparative mass analysis between three corresponding pairs of individual and POP SPE
eluates provided further insights into the molecular selectivity of the SPE-based sequential
DOM retention and elution process. Both extracts C8 and POP SPE-1C8 showed near
perfectly identical mass spectra, confirming the reproducibility of C8-based DOM retention
(Table 7-3). Those of the pairs MAX / POP SPE-2MAX and PPL / POP SPE-3PPL differed
remarkably in molecular compositions (Table 7-3).
In comparison with individual eluate MAX, eluate POP SPE-2MAX showed smaller
proportion of CHO (55.6% vs. 61.5%) and higher proportion of CHNO (42.4% vs. 36.3%)
compounds at nearly unchanged, limited shares of CHOS and CHNOS compounds (Table 7-
3). The overall counts of assigned molecular compositions had declined from 3172 to 2232,
suggesting that the removal of DOM molecules from Suwannee River water by the preceding
eluate POP SPE-1C8 had a stronger influence on the mass spectrum than a potential
attenuation of ion suppression in an already complexity-reduced material (Gaspar et al. 2009,
Hertkorn et al. 2008). At bulk resolution, eluate POP SPE-2MAX showed higher average
unsaturation (H/C ratio: 1.05 vs. 1.12; DBE/C: 0.51 vs. 0.48) and average oxygenation (O/C
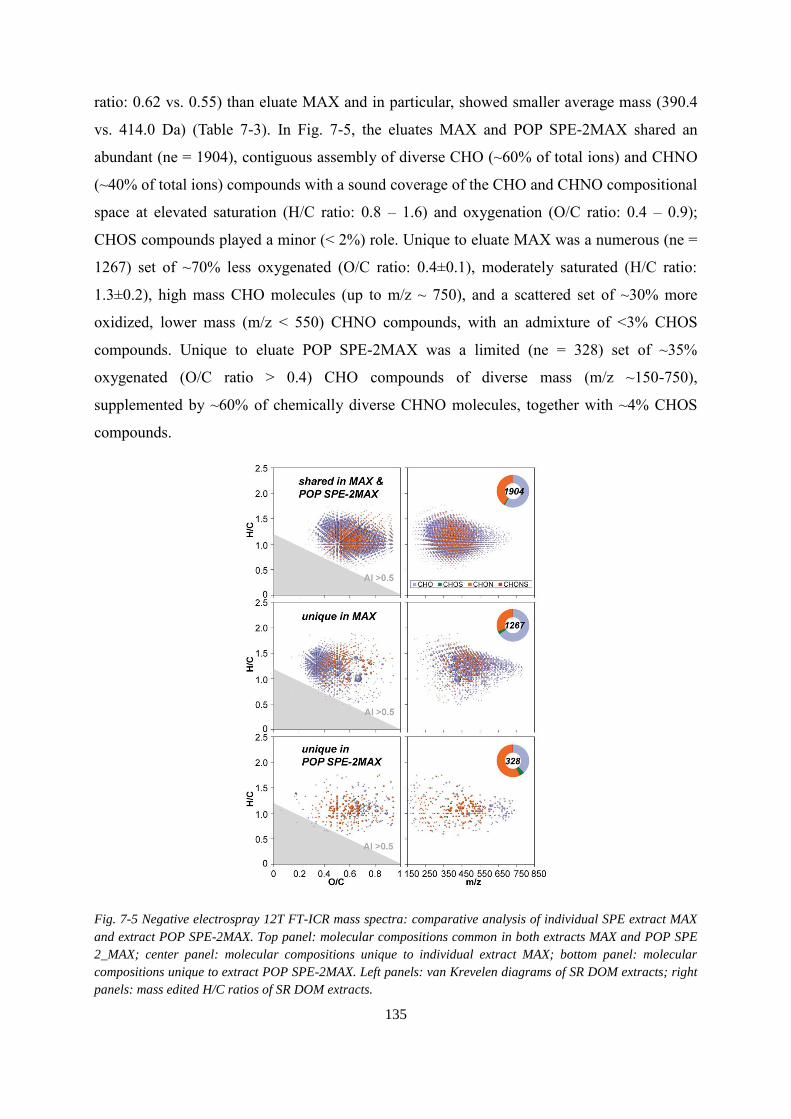
135
ratio: 0.62 vs. 0.55) than eluate MAX and in particular, showed smaller average mass (390.4
vs. 414.0 Da) (Table 7-3). In Fig. 7-5, the eluates MAX and POP SPE-2MAX shared an
abundant (ne = 1904), contiguous assembly of diverse CHO (~60% of total ions) and CHNO
(~40% of total ions) compounds with a sound coverage of the CHO and CHNO compositional
space at elevated saturation (H/C ratio: 0.8 – 1.6) and oxygenation (O/C ratio: 0.4 – 0.9);
CHOS compounds played a minor (< 2%) role. Unique to eluate MAX was a numerous (ne =
1267) set of ~70% less oxygenated (O/C ratio: 0.4±0.1), moderately saturated (H/C ratio:
1.3±0.2), high mass CHO molecules (up to m/z ~ 750), and a scattered set of ~30% more
oxidized, lower mass (m/z < 550) CHNO compounds, with an admixture of <3% CHOS
compounds. Unique to eluate POP SPE-2MAX was a limited (ne = 328) set of ~35%
oxygenated (O/C ratio > 0.4) CHO compounds of diverse mass (m/z ~150-750),
supplemented by ~60% of chemically diverse CHNO molecules, together with ~4% CHOS
compounds.
Fig. 7-5 Negative electrospray 12T FT-ICR mass spectra: comparative analysis of individual SPE extract MAX
and extract POP SPE-2MAX. Top panel: molecular compositions common in both extracts MAX and POP SPE
2_MAX; center panel: molecular compositions unique to individual extract MAX; bottom panel: molecular
compositions unique to extract POP SPE-2MAX. Left panels: van Krevelen diagrams of SR DOM extracts; right
panels: mass edited H/C ratios of SR DOM extracts.

136
The eluates PPL and POP SPE-3PPL shared an abundant set (ne = 1428) of ~55% of rather
oxygenated CHO (O/C ratio: 0.4 – 0.95) and ~45% CHNO (O/C ratio: 0.4 – 0.8) compounds;
common CHOS and CHNOS compounds were nearly absent. Unique to PPL (ne = 2470)
were CHO (~65%), CHOS (~25%) and CHNO (~20%) compounds, which clearly differed in
average saturation. CHOS compounds were comparatively saturated of average oxygenation,
and ranged of m/z ~ 250-550, with a narrower bandwidth at higher unsaturation. CHNO
compounds were preferentially unsaturated (H/C ratio < 1), of considerable oxygenation (O/C
ratio: 0.4 – 0.8) and mass range (m/z ~ 400-650). CHO compounds covered all H/C, O/C
ratios and mass range of CHOS and CHNO compounds, and reached out to lower
oxygenation (O/C ratio > 0.25) and to higher mass (m/z < 750) than both CHOS and CHNO
compounds. Unique to eluate POP SPE-3PPL (ne = 826) was an extended set (~80%) of
oxidized CHNO (O/C ratio 0.35 – 0.9) compounds with H/C ratios ranging from 0.85 – 1.75,
accompanied by ~20% of more saturated CHO with a broad mass range (m/z ~ 180-750). The
compositional differences between eluates PPL and POP SPE-3PPL were rather pronounced
(Fig. 7-6). Here, the overall counts of assigned molecular compositions had declined from
3899 to 2254 while shifts in relative proportions of CHO (58.2% vs. 39.9%), CHNO (28.7%
vs. 59.3%) and CHOS (12.8% vs. 0.3%) were particularly distinctive. Apparently, POP SPE-
1C8 had already removed the vast majority of ionizable CHOS compounds from Suwannee
River water. Compared with the single PPL eluate, the eluate POP SPE-3PPL appeared more
saturated (H/C ratio: 1.05 vs. 0.94; DBE/C: 0.52 vs. 0.56) and more oxygenated (O/C ratio:
0.67 vs. 0.61), and showed significantly smaller average mass (393.5 vs. 438.6 Da). Overall,
eluate POP SPE-3PPL showed higher counts (1336 vs. 1118) and molecular diversity of
CHNO compounds than the single eluate PPL, confirming the presence of ion suppression in
all three individual Suwannee River DOM isolates.

137
Fig. 7-6 Negative electrospray 12T FT-ICR mass spectra: comparative analysis of individual SPE extract PPL
and extract POP SPE-3PPL. Top panel: molecular compositions common to both extracts PPL and POP SPE
3_PPL; center panel: molecular compositions unique to individual extract PPL; bottom panel: molecular
compositions unique to extract POP SPE-3PPL. Left panels: van Krevelen diagrams of SR DOM extracts; right
panel: mass edited H/C ratios of SR DOM extracts.
Comparison of consolidated individual and POP SPE extracts
Comparison of consolidated individual (ne = 5263) and consolidated POP SPE extracts (ne =
4881) provided 4259 common molecular compositions, distributed among CHO (~60%),
CHNO (~30%) and CHOS (~10%) molecular series. Overall, CHO compounds covered a
similar but slightly larger area in van Krevelen diagrams than CHNO compounds, i.e. were
chemically more diverse. In comparison, CHOS compounds appeared on average more
saturated, less oxygenated and of lower mass (Fig. 7-7). Compounds unique to POP SPE
extracts (ne = 621) were mainly CHNO (~80%) compounds which were well oxygenated
(maximum at a O/C ratio: 0.62±0.12) and reached to m/z ~ 550. About ~20% CHO
compounds were even more oxygenated (O/C ratio > 0.6), and reached to higher mass, up to
m/z ~ 750. Respective unique CHOS and CHNOS compounds were very few. In contrast,
CHO (~40%), CHNO (~40%) and CHOS (~30%) compounds unique to consolidated
individual SPE extracts (ne = 1003) occupied distinct sections in van Krevelen diagrams and

138
in mass-edited H/C ratios, confirming fundamentally different chemical structures. CHOS
compounds were fairly oxygenated (O/C ratio: 0.5-0.9) and covered a wide range of relative
(un)saturation (H/C ratio: 0.5-1.6) at rather low masses (m/z < 550). Respective CHNO
compounds appeared to represent two distinct groups: one fairly saturated (H/C ratio: 1.1-1.6)
and passively oxygenated (O/C ratio: 0.3-0.7) set and another unsaturated (H/C ratio < 1) but
oxygenated (O/C ratio: 0.4-0.9) set of molecules. Unique CHO molecules were primarily
strongly oxidized (O/C ratio: 0.6-0.95), and of high mass, up to m/z ~ 800.
Fig. 7-7 Comparison of consolidated individual SPE extracts and consolidated POP SPE extracts: Venn
diagrams of the assigned molecular compositions: Venn diagram showing counts of POP SPE extracts (blue)
and individual extracts (yellow) in individual SPE extracts; van Krevelen diagrams and mass edited H/C ratios
of the molecular compositions, from top to bottom: common to consolidated individual and POP SPE extracts;
center: unique in consolidated POP SPE extracts; bottom: unique to consolidated individual SPE extracts.

139
Comparison of individual selectivity within individual and POP SPE eluates
The two groups of individual and POP SPE eluates were divided by definition into three
single sections, three paired sections and a single common section for each system.
Comparing the FT-ICR mass spectra of these seven combinations better reveal the effects of
projection and ion suppression, which made common high quality FT-ICR mass spectra of
DOM seemingly look alike (Hertkorn et al. 2008), and the distinction of the individual eluates
became much more apparent (Fig. 7-8 and 7-9). Already, the total counts of consolidated
molecular compositions in individual eluates (ne = 5263) exceeds that of consolidated POP
SPE eluates (ne = 4881); this effects largely arises from the depletion of molecules in eluates
POP SPE-2MAX and POP SPE-3PPL compared with the respective individual eluates MAX
(ne = 2232 vs. 3172) and PPL (ne = 2254 vs. 3899). This had two major consequences: the
count of molecular compositions common to all three eluates was much smaller in POP SPE
(ne = 930) than in the individual eluates (ne = 1875); otherwise, the proportion of C8-derived
unique (ne = 1952 vs. 513) and common molecular compositions were enhanced in POP SPE
eluates. The overall coverage of the compositional space by molecular compositions common
to all three eluates was substantially larger in the consolidated individual than the
consolidated POP SPE eluates; this meant that the individual disparity between the POP SPE
eluates was considerably larger than that of the individual eluates. The molecular
compositions unique to eluates C8 in both systems followed the order CHO > CHNO >
CHOS, with a relatively higher proportion of CHO molecules in the eluate POP SPE 1-C8
(~65% vs. ~55%). They were also much more numerous (ne = 1952 vs. 513), but
interestingly, covered analogous spaces in both van Krevelen diagrams as well as mass-edited
H/C ratios. While CHOS compounds were of intermediate unsaturation (H/C ratio: 1.3 ± 0.3),
oxygenation (O/C ratio: 0.5 ± 0.15) at rather low masses (m/z < 550), CHNO compounds
were, at only slightly higher oxygenation, considerably more unsaturated (H/C ratio > 0.5)
and reached to aromatic compounds with AI > 0.5 (Koch and Dittmar 2006).

140
Fig. 7-8 Comparison of the three individual SPE extracts, with (panel A) Venn diagrams, showing the counts of
the assigned molecular compositions; respective (left panels) van Krevelen diagrams and (right panels) mass-
edited H/C ratios of the respective (panel B) unique and (panel C) shared compositions in (top row) all three
SPE cartridges and respective pairs of eluates as depicted in the figure.
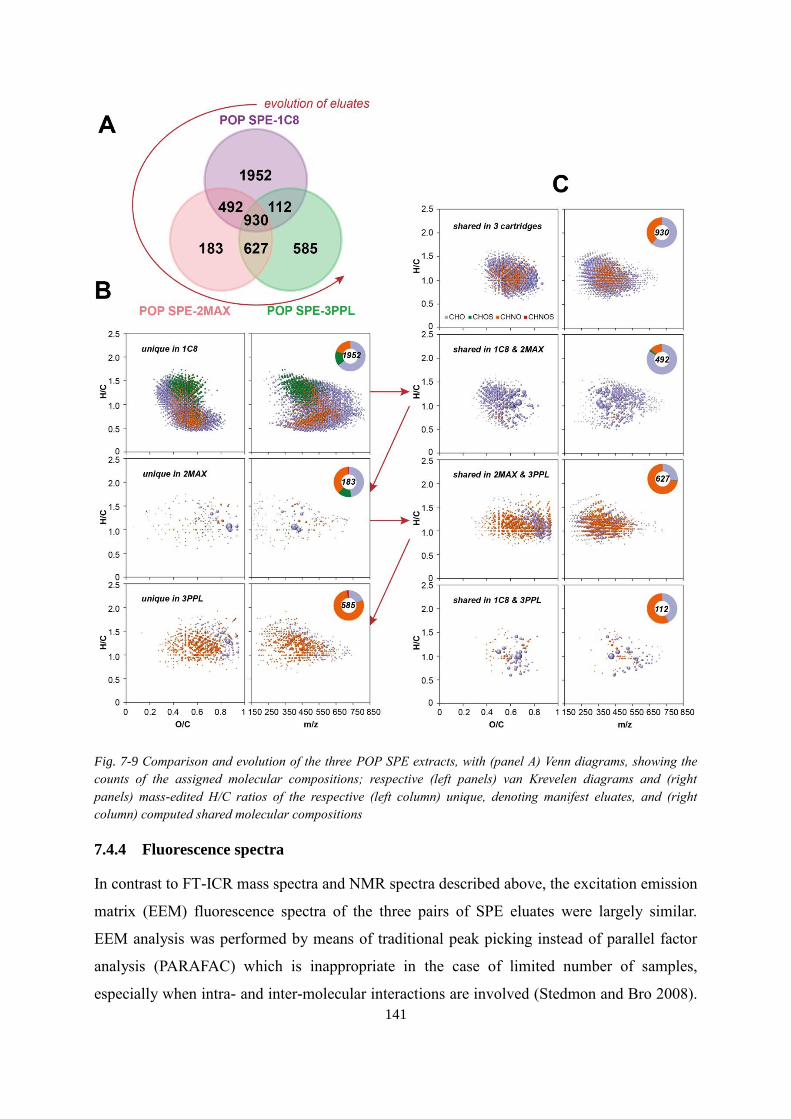
141
Fig. 7-9 Comparison and evolution of the three POP SPE extracts, with (panel A) Venn diagrams, showing the
counts of the assigned molecular compositions; respective (left panels) van Krevelen diagrams and (right
panels) mass-edited H/C ratios of the respective (left column) unique, denoting manifest eluates, and (right
column) computed shared molecular compositions
7.4.4 Fluorescence spectra
In contrast to FT-ICR mass spectra and NMR spectra described above, the excitation emission
matrix (EEM) fluorescence spectra of the three pairs of SPE eluates were largely similar.
EEM analysis was performed by means of traditional peak picking instead of parallel factor
analysis (PARAFAC) which is inappropriate in the case of limited number of samples,
especially when intra- and inter-molecular interactions are involved (Stedmon and Bro 2008).
142
Classical fluorescent peaks A (Ex/Em of 240/430 nm; humic-like DOM) and C (Ex/Em of
335/440 nm; humic-like, terrestrial DOM) were prominent in the three individual and in the
three POP SPE eluates (Fig. 7-10; http://or.water.usgs.gov/proj/carbon/EEMS.html). The
EEM spectra of the C8-derived extracts were nearly identical as expected, while the two pairs
of MAX- and PPL-derived extracts showed relative blue shifts (shorter excitation and
emission wavelengths) indicative of lower molecular weights and smaller proportions of
aromatic compounds and aromatic condensation (Rodriguez et al. 2014) in agreement with
FT-ICR mass and NMR spectra (Fig. 4; Table 1, Table 3). Very small blue shifts in the order
of 2 nm were observed between the pairs of eluates MAX / POP SPE-2MAX and PPL / POP
SPE-3PPL, suggesting further decrease in molecular weight from individual to POP SPE
eluates as observed again in FT-ICR mass spectra.
Fluorescence spectroscopy selectively detects the excitation and emission wavelength of π-
and n-electrons, and is selectively influenced by long and short intra- and/or inter molecular
interactions (Lacowics 2006). While the reduced molecular complexity in POP SPE eluates
appeared to have no perceptible effect on the EEM spectra, a conceivable attenuation of
intermolecular interactions in POP SPE eluates, which was expected to increase fluorescence,
was also too small to be recognized (Rodriguez et al. 2014).
Fig. 7-10 Excitation and emission matrix (EEM) fluorescence spectra of the (top row) individual and (bottom
row) POP SPE eluates.
143
7.4.5 Complementary analysis
During solid phase extraction of polydisperse DOM, the composition of the complex organic
mixture was continually altered because the molecules which were most strongly binded to
the solid phase were progressively depleted from the solution phase. Hence, from top to
bottom (in a standard elution set-up) a continuous reorganization of the DOM assembly took
place. This was a dynamic process which encompassed organic molecules of considerable
chemical diversity as well as divergent time scales of weakening and strengthening
intermolecular interactions. We have recently demonstrated chemoselective sequential elution
of Suwannee River organic matter from PPL cartridges, and chemically diverse DOM
compositions were observed in the five fractions (Li et al., 2016b).
The C8 cartridge effectively removed almost half of DOM molecules from Suwannee River
water, leaving a depleted organic matter for consecutive POP SPE-2MAX and -3PPL. In
general, the C8 cartridges caused depletion of aromatic and purely aliphatic molecules while
oxygen-rich molecules were less effectively retained. This left DOM molecules rich in
oxygen-containing functional groups available for consecutive elution.
Due to constant elution condition (methanol, pH = 2), the MAX cartridge did not operate with
maximum retention and recovery capacity under the conditions recommended by the
manufacture that washing with 5% NH4OH and eluting with acid-containing organic solvent.
We have observed color on MAX cartridges following elution; rinsing with acidified
methanol (2% HCOOH) provided minor lipid-rich effluents and color was still retained on the
cartridges, implying substantial shares of non-elution DOM molecules. The commonly rather
efficient PPL cartridge then obviously could draw from only a minor abundance and diversity
of DOM molecules.
In short, this version of POP SPE did not serve to increase the overall yield of DOM
extraction from Suwannee River water, because PPL alone showed larger yield (~70%) than
the consolidated POP SPE eluates (~60%). However, the production of three pairs of eluates
which behaved remarkably similar in NMR, FT-ICR MS and fluorescence spectra had
provided better understanding of intrinsic molecules diversity of Suwannee River water which
is normally hidden by projection of many molecular or atomic properties on limited ranges of
data. Comparative mathematical analysis revealed appreciable molecular differences between
144
these fractions which could serve in further work for targeted enrichment of certain classes of
compounds.
Furthermore, the molecular and structural diversity of DOM varies significantly among
different sources. It is well known that PPL cartridges have good performances on freshwater
DOM but have drimination against carbohydrates and lipids with around 50% recovery for
marine DOM (Dittmar et al. 2008, Raeke et al. 2016). The setup of POP SPE shows the
potential to extract a more representative DOM fraction on molecular level across a wide
range of DOM samples.
7.5 Conclusions
Phase-optimized solid phase extraction (POP SPE) of DOM produced novel fractionation
different from individual SPE eluates. Compositional and structural properties of DOM
molecules will drive DOM fractionation while reorganization of complex mixtures during the
SPE-based fractionation will expose new binding sites for DOM-sorbent interaction during
elution. This kind of complexity reduction operates semi-orthogonal to known DOM
fractionation procedures and offers substantial potential in investigating fundamental
molecular differences between e.g. soil, freshwater and marine derived DOM, which share
many common molecular compositions but may behave different in POP SPE based
experiments.
7.6 Acknowledgements
The authors are thankful to China Scholarship Council (CSC) for the financial support of Yan
Li and International Humic Substances Society (IHSS) for the final support of Dr. Norbert
Hertkorn during the Suwannee River sampling campaign in May 2012. The authors appreciate
Claudia Burau (AWI) for DOC measurement and Jenna Luek (University of Maryland) for
optical spectroscopy measurement.
7.7 References
Arakawa, N. and Aluwihare, L. (2015) Direct identification of diverse alicyclic terpenoids in
Suwannee River Fulvic Acid. Environ Sci Technol 49(7), 4097-4105.
Ball, G. I. and Aluwihare L. (2014) CuO-oxidized dissolved organic matter (DOM)
investigated with comprehensive two dimensional gas chromatography-time of flight-mass
spectrometry (GC × GC-TOF-MS). Org Geochem 75, 87–98.
145
Bianchi, T.S. (2011) The role of terrestrially derived organic carbon in the coastal ocean: a
changing paradigm and the priming effect. Proc Natl Acad Sci U S A 108(49), 19473-19481.
Deconinck, E., Kamugisha, A., Van Campenhout, P., Courselle, P. and De Beer, J.O. (2015)
Development of a Stationary Phase Optimised Selectivity Liquid Chromatography based
screening method for adulterations of food supplements for the treatment of pain. Talanta 138,
240-246.
Deconinck, E., Ghijs, L., Kamugisha, A. and Courselle, P. (2016) Comparison of three
development approaches for Stationary Phase Optimised Selectivity Liquid Chromatography
based screening methods Part II: A group of structural analogues (PDE-5 inhibitors in food
supplements). Talanta 148, 346-355.
Delahaye, S. and Lynen, F. (2014) Implementing stationary-phase optimized selectivity in
supercritical fluid chromatography. Anal Chem 86(24), 12220-12228.
DiDonato, N., Chen, H., Waggoner, D. and Hatcher P.G. (2016) Potential origin and formation
for molecular components of humic acids in soils. Geochim Cosmochim Ac 178, 210-222.
Fasching, C., Behounek, B., Singer, G.A. and Battin, T.J. (2014) Microbial degradation of
terrigenous dissolved organic matter and potential consequences for carbon cycling in brown-
water streams. Sci Rep 4, 4981.
Flerus, R., Lechtenfeld, O.J., Koch, B.P., McCallister, S.L., Schmitt-Kopplin, P., Benner, R.,
Kaiser, K. and Kattner, G. (2012) A molecular perspective on the ageing of marine dissolved
organic matter. Biogeosciences 9(6), 1935-1955.
Gaspar, A., Harir, M., Hertkorn, N. and Schmitt-Kopplin, P. (2010) Preparative free-flow
electrophoretic offline ESI-Fourier transform ion cyclotron resonance/MS analysis of
Suwannee River fulvic acid. Electrophoresis 31(12), 2070-2079.
Gonsior, M., Schmitt-Kopplin, P. and Bastviken, D. (2013). Depth-dependent molecular
composition and photo-reactivity of dissolved organic matter in a boreal lake under winter
and summer conditions. Biogeosciences 10 (11), 6945-6956.
Gonsior, M., Hertkorn, N., Conte, M.H., Cooper, W.J., Bastviken, D., Druffel, E. and Schmitt-
Kopplin, P. (2014) Photochemical production of polyols arising from significant photo-
146
transformation of dissolved organic matter in the oligotrophic surface ocean. Mar Chem 163,
10-18.
Green, N.W., McInnis, D., Hertkorn, N., Maurice, P.A. and Perdue, E.M. (2015) Suwannee
River Natural Organic Matter: Isolation of the 2R101N Reference Sample by Reverse
Osmosis. Environ Eng Sci 32(1), 38-44.
Hertkorn, N., Benner, R., Frommberger, M., Schmitt-Kopplin, P., Witt, M., Kaiser, K.,
Kettrup, A. and Hedges, J.I. (2006) Characterization of a major refractory component of
marine dissolved organic matter. Geochim Cosmochim Ac 70(12), 2990-3010.
Hertkorn, N., Ruecker, C., Meringer, M., Gugisch, R., Frommberger, M., Perdue, E.M., Witt,
M. and Schmitt-Kopplin, P. (2007) High-precision frequency measurements: indispensable
tools at the core of the molecular-level analysis of complex systems. Anal Bioanal Chem
389(5), 1311-1327.
Hertkorn, N., Frommberger, M., Witt, M., Koch, B.P., Schmitt-Kopplin, P. and Perdue, E.M.
(2008) Natural organic matter and the event horizon of mass spectrometry. Anal Chem 80(23),
8908-8919.
Hertkorn, N., Harir, M., Koch, B.P., Michalke, B. and Schmitt-Kopplin, P. (2013) High-field
NMR spectroscopy and FTICR mass spectrometry: powerful discovery tools for the
molecular level characterization of marine dissolved organic matter. Biogeosciences 10(3),
1583-1624.
Hertkorn, N., Harir, M., Cawley, K.M., Schmitt-Kopplin, P. and Jaffé, R. (2016) Molecular
characterization of dissolved organic matter from subtropical wetlands: a comparative study
through the analysis of optical properties, NMR and FTICR/MS. Biogeosciences 13(8), 2257-
2277.
Kim, S., Simpson, A.J., Kujawinski, E.B., Freitas, M.A. and Hatcher, P.G. (2003) High
resolution electrospray ionization mass spectrometry and 2D solution NMR for the analysis of
DOM extracted by C18 solid phase disk. Org Geochem 34(9), 1325-1335.
Knicker, H. (2010) “Black nitrogen” – an important fraction in determining the recalcitrance
of charcoal. Org Geochem 41, 947-950.

147
Koch, B.P. and Dittmar, T. (2006) From mass to structure: an aromaticity index for high-
resolution mass data of natural organic matter. Rapid Commun Mass Sp 20(5), 926-932.
Koch, B.P., Ludwichowski, K.-U., Kattner, G., Dittmar, T. and Witt, M. (2008) Advanced
characterization of marine dissolved organic matter by combining reversed-phase liquid
chromatography and FT-ICR-MS. Mar Chem 111(3-4), 233-241.
Ksionzek, K.B., Lechtenfeld, O.J., McCallister, S.L., Schmitt-Kopplin, P., Geuer, J.K.,
Geibert, W. and Koch, B.P. (2016) Dissolved organic sulfur in the ocean: Biogeochemistry of
a petagram inventory. Science 354(6311), 456-459.
Kruger, B.R., Dalzell, B.J. and Minor, E.C. (2011) Effect of organic matter source and salinity
on dissolved organic matter isolation via ultrafiltration and solid phase extraction. Aquat Sci
73(3), 405-417.
Kujawinski, E.B. (2011) The impact of microbial metabolism on marine dissolved organic
matter. Ann Rev Mar Sci 3, 567-599.
Lacowics, J. R. (2006) Principle of fluorescence spectroscopy. Springer.
Li, Y., Harir, M., Lucio, M., Kanawati, B., Smirnov, K., Flerus, R., Koch, B.P., Schmitt-
Kopplin, P. and Hertkorn, N. (2016a) Proposed Guidelines for Solid Phase Extraction of
Suwannee River Dissolved Organic Matter. Anal Chem 88(13), 6680-6688.
Li, Y. Harir, M., Lucio, M., Gonsior, M., Koch, B. P., Schmitt-Kopplin, P., Hertkorn, N.
(2016b) Comprehensive structure-selective characterization of dissolved organic matter by
reducing molecular complexity and increasing analytical dimensions. Water Res 106, 477-
487.
Li, Y., Harir, M., Uhl, J., Kanawati, B., Lucio, M., Smirnov, K., Koch, B. P., Schmitt-Kopplin,
P. and Hertkorn N. (2016c) How Representative Are Dissolved Organic Matter (DOM)
Extracts? A Comprehensive Study of Sorbent Selectivity for DOM Isolation. Water Res, under
revision.
Lucas, J., Koester, I., Wichels, A., Niggemann, J., Dittmar, T., Callies, U., Wiltshire, K.H. and
Gerdts, G. (2016) Short-Term Dynamics of North Sea Bacterioplankton-Dissolved Organic
Matter Coherence on Molecular Level. Front Microbiol 7, 321.

148
Minor, E.C., Swenson, M.M., Mattson, B.M. and Oyler, A.R. (2014) Structural
characterization of dissolved organic matter: a review of current techniques for isolation and
analysis. Environ Sci Process Impacts 16(9), 2064-2079.
Moran, M.A., Kujawinski, E.B., Stubbins, A., Fatland, R., Aluwihare, L.I., Buchan, A.,
Crump, B.C., Dorrestein, P.C., Dyhrman, S.T., Hess, N.J., Howe, B., Longnecker, K.,
Medeiros, P.M., Niggemann, J., Obernosterer, I., Repeta, D.J. and Waldbauer, J.R. (2016)
Deciphering ocean carbon in a changing world. Proc Natl Acad Sci U S A 113(12), 3143-
3151.
Nebbioso, A. and Piccolo, A. (2013) Molecular characterization of dissolved organic matter
(DOM): a critical review. Anal Bioanal Chem 405(1), 109-124.
Nyiredy, S., Szűcs, Z. and Szepesy, L. (2006) Stationary-Phase Optimized Selectivity LC
(SOS-LC): Separation Examples and Practical Aspects. Chromatographia 63(S13), S3-S9.
Nyiredy, S., Szucs, Z. and Szepesy, L. (2007) Stationary phase optimized selectivity liquid
chromatography: Basic possibilities of serially connected columns using the "PRISMA"
principle. J Chromatogr A 1157(1-2), 122-130.
Osterholz, H., Dittmar, T. and Niggemann, J. (2014) Molecular evidence for rapid dissolved
organic matter turnover in Arctic fjords. Mar Chem 160, 1-10.
Perdue E. M. and Ritche J. D.Dissolved organic matter in fresh waters, Treatise on
Geochemistry (eds, Holland H. D. and Turekian K. K.), Elsevier-Pergamon, Oxford, 2003,
Vol. 5, 273-318.
Perminova, I.V., Dubinenkov, I.V., Kononikhin, A.S., Konstantinov, A.I., Zherebker, A.Y.,
Andzhushev, M.A., Lebedev, V.A., Bulygina, E., Holmes, R.M., Kostyukevich, Y.I., Popov,
I.A. and Nikolaev, E.N. (2014) Molecular mapping of sorbent selectivities with respect to
isolation of Arctic dissolved organic matter as measured by Fourier transform mass
spectrometry. Environ Sci Technol 48(13), 7461-7468.
Raeke, J., Lechtenfeld, O.J., Wagner, M., Herzsprung, P. and Reemtsma, T. (2016) Selectivity
of solid phase extraction of freshwater dissolved organic matter and its effect on ultrahigh
resolution mass spectra. Environ Sci Process Impacts 18(7), 918-927.
149
Ratpukdi, T., Rice, J.A., Chilom, G., Bezbaruah, A. and Khan, E. (2009) Rapid Fractionation
of Natural Organic Matter in Water Using a Novel Solid-Phase Extraction Technique. Water
Environ Res 81(11), 2299-2308.
Rodriguez, F.J., Schlenger, P. and Garcia-Valverde, M. (2014) A comprehensive structural
evaluation of humic substances using several fluorescence techniques before and after
ozonation. Part I: structural characterization of humic substances. Sci Total Environ 476-477,
718-730.
Sandron, S., Rojas, A., Wilson, R., Davies, N.W., Haddad, P.R., Shellie, R.A., Nesterenko,
P.N., Kelleher, B.P. and Paull, B. (2015) Chromatographic methods for the isolation,
separation and characterisation of dissolved organic matter. Environ Sci Process Impacts
17(9), 1531-1567.
Schmidt, F., Elvert, M., Koch, B.P., Witt, M. and Hinrichs, K.-U. (2009) Molecular
characterization of dissolved organic matter in pore water of continental shelf sediments.
Geochim Cosmochim Ac 73(11), 3337-3358.
Schmitt-Kopplin, P, Hertkorn, N., Schulten, H.-R., Kettrup, A. (1998) Structural changes in a
dissolved soil humic acid during photochemical degradation processes under O2 and N2
atmosphere. Environ. Sci. Technol. 32, 2531-2541.
Schmitt-Kopplin, P., Gelencser, A., Dabek-Zlotorzynska, E., Kiss, G., Hertkorn, N., Harir, M.,
Hong, Y. and Gebefugi, I. (2010) Analysis of the unresolved organic fraction in atmospheric
aerosols with ultrahigh-resolution mass spectrometry and nuclear magnetic resonance
spectroscopy: organosulfates as photochemical smog constituents. Anal Chem 82(19), 8017-
8026.
Shen, Y., Chapelle, F.H., Strom, E.W. and Benner, R. (2014) Origins and bioavailability of
dissolved organic matter in groundwater. Biogeochemistry 122(1), 61-78.
Stedmon, C.A. and Bro, R. (2008) Characterizing dissolved organic matter fluorescence with
parallel factor analysis: a tutorial. Limnol Oceanogr-Meth 6(11), 572-579.
Stenson, A.C. (2008) Reversed-Phase Chromatography Fractionation Tailored to Mass
Spectral Characterization of Humic Substances. Environ. Sci. Technol. 42(6), 2060-2065.

150
Swenson, M.M., Oyler, A.R. and Minor, E.C. (2014) Rapid solid phase extraction of dissolved
organic matter. Limnol Oceanogr-Meth 12(10), 713-728.
Thurman, E.M. and Malcolm, R.L. (1981) Preparative isolation of aquatic humic substances.
Environ Sci Technol 15(4), 463-466.
Tziotis, D., Hertkorn, N. and Schmitt-Kopplin, P. (2011) Kendrick-analogous network
visualisation of ion cyclotron resonance Fourier transform mass spectra: improved options for
the assignment of elemental compositions and the classification of organic molecular
complexity. Eur J Mass Spectrom (Chichester) 17(4), 415-421.
Waggoner, D. C., Chen, H., Willoughby, A. S. and Hatcher P. G. (2015) Formation of black
carbon-like and alicyclic aliphatic compounds by hydroxyl radical initiated degradation of
lignin. Org Geochem 82, 69-76.
Woods, G.C., Simpson, M.J., Koerner, P.J., Napoli, A. and Simpson, A.J. (2011) HILIC-
NMR: toward the identification of individual molecular components in dissolved organic
matter. Environ Sci Technol 45(9), 3880-3886.
Woods, G.C., Simpson, M.J. and Simpson, A.J. (2012) Oxidized sterols as a significant
component of dissolved organic matter: evidence from 2D HPLC in combination with 2D and
3D NMR spectroscopy. Water Res 46(10), 3398-3408.

151
Chapter 8
Conclusions and Future Directions

152
8 Conclusions and Future Directions
8.1 Optimization of SPE procedure during eluting step
The SPE method of DOM isolation has been evaluated in detail with respect to the influence
of all critical parameters such as loading mass, concentration, flow rate and up-scaling on the
example of Suwannee River water (Li et al., 2016a). Owing to the molecular heterogeneity
and polydispersity of DOM in general and the substantial variance of individual molecules
present in any individual DOM, these parameters have to be adapted in principle for every
individual combination of SPE resin and DOM sample. However, DOM can be grouped
according to origin, like freshwater, estuarine, marine, soil and atmospheric DOM. These
materials will share more common bulk characteristics and proportions of certain leading
molecules. The definition of optimum SPE conditions in terms of loading mass, concentration,
flow rate and up-scaling would contribute to obtain reproducible DOM fractions from
different natural environments. An observance of good experimental practice would also
minimize the potential inconsistencies among different labs, allowing for a reasonable
comparison of different DOM samples.
One critical question is the origin of the methoxy NMR resonance in 1H and
13C NMR spectra
of SPE eluates which can be differentiated by heteronuclear 1H,
13C HSQC NMR
spectroscopy into aliphatic and aromatic methyl ethers and aliphatic and aromatic methyl
ethers (Zhang et al. 2014). In accordance with others, previous studies (Flerus et al. 2011,
McIntyre and McRae 2005), we have also observed potential transesterification reactions
happening during methanolic elution at pH = 2. The extent of this reaction does not only
depend on DOM alone but also on the SPE cartridge manufacturers and even batch type and
size of SPE cartridge delivered from the same manufacturer. It appears that manufactures
regularly change their SPE cartridge production process without disclosing this proprietary
information to the scientific community. The pH value of two is sufficiently low to induce
transesterification reactions of methanol with reactive DOM precursor molecules. In the case
of CHOS compounds, this side reaction is not entirely destructive because it makes otherwise
NMR-invisible compounds in complex mixtures such as sulfate esters amenable to NMR
analysis. Otherwise, formation of methyl esters which can be solely detected by NMR
spectroscopy inflates the apparent carbon recovery of the isolation process and causes
displacement towards higher mass molecules in FT-ICR mass spectra.

153
Flerus et al. (Flerus et al. 2011) clearly demonstrated that esterification of marine DOM
occurred in methanol extract at 20 oC for 4 weeks in the dark. In our study, the change in
DOC recovery remained within 5% when esterification occurred under the experimental
conditions. Systematic studies using various labelled forms of methanol, e.g. CD3OD,
13CD3OD,
13CH3OH in conjunction with NMR and mass spectrometry could advance the
mechanistic understanding of this side reaction and its dependence of DOM properties.
Further method development of avoiding/attenuating esterification could focus on practical
aspects of the SPE process such as careful drying preceding methanol elution, a wash step
with small amounts of pure water following the wash step with acidic water, while collecting
this initial fraction separately. Using mixed solvents like gradients of water / methanol
mixtures during the eluting step, instead of applying pure methanol, would be also helpful to
mitigate esterification (McIntyre and McRae 2005). Certain criteria such as the overall DOC
recovery, molecular compositions and structures should be addressed.
Methanol is an versatile and benign SPE elution solvent in many respects: it appears to
dissolve the broadest bandwidth of different DOM molecules and is particularly beneficial for
NMR spectroscopy: its 1H NMR (δH = 3.30 ppm) and
13C NMR resonances (δC = 49 ppm) do
not overly interfere with NMR resonances originating from DOM itself. Acetonitrile which is
an attractive alternative solvent, interferes in 1H NMR spectra (δH = 1.93 ppm) with critical
aliphatic DOM molecules and in 13
C NMR spectra with critical aromatic DOM molecules (δC
= 117.3 ppm; its aliphatic NMR resonance (δH = 1.25 ppm) resides at the upfield section of
aliphatic DOM molecules). Nevertheless, acetonitrile shows different extraction selectivity
with commonly smaller extraction yield in the SPE process of DOM (Flerus et al., 2011) and
may be used in sequence and in parallel with methanolic elution to further gain valuable
insight into the molecular characteristics of DOM.
8.2 Further adaption of stepwise SPE of DOM and its applications
Selective fractionation of SR DOM by means of stepwise SPE elution which collects limited
quantities of eluate separately has been proposed by us as a very facile method to obtain
distinct, complexity reduced DOM fractions (Li et al., 2016b). Spectral resolution in FT-MS,
NMR and optical spectra is greatly improved in comparison with those of bulk DOM, and
these three complementary structure-selective correlated data have shown analogous
hierarchical clustering according to the fractions. SPE of DOM follows primarily a polarity-

154
based mechanism, different from LC-based fractionation of DOM. For instance, sequential
elution of Elbe Rive DOM provided continual decrease of carboxylic content but continual
increase of aromatics (Fig. 8-1). Within the elution sequence the aliphatic groups increased
whereas the CRAMs decreased as well as the carbohydrates and methoxl groups (Fig. 8-2).
Fig. 8-113
C NMR spectra (12
CD3OD; 125 MHz) and 13
C NMR section integrals of River Elbe DOM obtained by
sequential elution of SPE/PPL with equal aliquots of methanol, showing a continual decrease of carboxylic
content and continual increase of aromatic carbon during stepwise fractionation.
Further work can be done based on the preliminary findings. First of all, this method can be
applied to different DOM materials, for instance, soil, riverine, marine and atmospheric DOM.
Fractions can be compared by in-depth spectroscopic analysis to reveal insights into their
molecular and structural information. Stable (12/13
C, 1/2
H and 14/15
N) as well as radiocarbon
(14
C) isotope studies will add valuable insights about DOM temporal evolution. This will
contribute to a better comprehension to the participation of DOM compounds in various
ecosystem processes. An attractive example would be a comparison of the DOM fractions
from land to sea, i.e. from riverine though estuarine to marine origin.
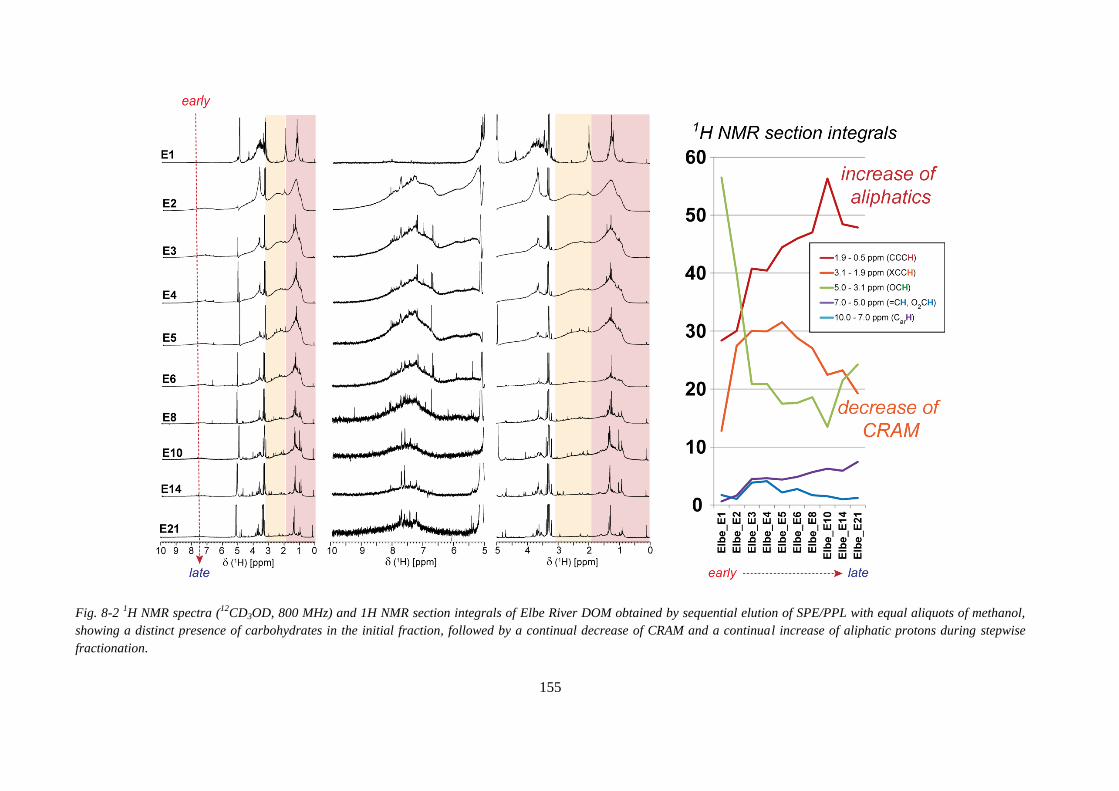
155
Fig. 8-2 1H NMR spectra (
12CD3OD, 800 MHz) and 1H NMR section integrals of Elbe River DOM obtained by sequential elution of SPE/PPL with equal aliquots of methanol,
showing a distinct presence of carbohydrates in the initial fraction, followed by a continual decrease of CRAM and a continual increase of aliphatic protons during stepwise
fractionation.

156
8.3 POP SPE of DOM
The behavior of 24 commercially available SPE sorbents has been investigated under SPE
conditions of pH = 2 and methanolic elution for Suwannee River and North Sea DOM (cf.
chapter 6 of this thesis). Pronounced selectivity and leaching behavior towards different SPE
resins and DOM composition has been observed. The selectivity was based on sorption
mechanisms, and has shown distinct behaviors towards CHNO, CHOS compounds,
unsaturated compounds, and lipids. While the widely used HLB cartridge was found to leach
under these conditions, SPE resins C8, MAX and PPL have shown rather high recovery for
DOM isolation at limited leaching. These extracts have shown rather distinct and
complementary information.
The subsequently developed phase-optimized SPE (POP SPE) which combines several
cartridges with different sorbent phases for the isolation of polydisperse and molecularly
heterogeneous DOM can be further improved:
1. The sequence of the SPE sorbents on DOM isolation can be further varied. In combination
with sequential elution by pure and mixed solvents in-depth fine fractionation of DOM can be
carried out. Application of careful bulk, isotope and spectroscopic characterization in
combination with comprehensive integrated data analysis will reveal highly improved
understanding of DOM structures, evolution and functions in the environment.
2. These optimized separation and characterization protocols POP SPE should be adapted to
different DOM materials like soil, freshwater, estuarine, marine and atmospheric DOM.
8.4 Advanced structure-related complementary analysis
The highlight of this thesis is the characterization of DOM by complementary high resolution
organic structural spectroscopy (optical spectroscopy, 12T FT-ICR MS, 500 and 800 MHz
NMR spectroscopy). With these highly resolving techniques, the compositional information
of DOM can be revealed in great detail, especially after the sample complexity has been
reduced by SPE. In order to make the best of the data information about DOM structures,
complementary analysis is highly needed (Hertkorn et al. 2007). Mainly two directions of the
structure-related complementary analysis can be addressed further.
1. Association of the three complementary aspects of structural information. The complex
DOM samples produce data-rich spectra and complementary analysis will reveal critical

157
hidden relationships necessary for understanding of DOM structures and functions. For
example, certain functional groups related to sp2-hybridized carbon are related to the specific
fluorescence peaks and are positioned in specific sections of mass spectra-derived van
Krevelen diagrams and NMR spectra.
2. Correlation of these structure-related DOM characteristics with multiple connected data
sets such as environmental parameters, biological activities and genetic fingerprints (Lucas et
al 2016, Osterholtz et al. 2016, Traving et al. 2016). Recent endeavours of combining data
from experimental conditions, spectroscopic characterization, metagenomics and
metatranscriptomics in the field of metabolomics can be adapted to environmental samples to
reveal the functioning of “the boundless carbon cycle” (Battin 2009).
8.5 References
Battin, T.J., Luyssaert, S., Kaplan, L.A., Aufdenkampe, A.K., Richter, A. and Tranvik, L.J.
(2009) The boundless carbon cycle. Nat Geosci 2(9), 598-600.
Flerus, R., Koch, B.P., Schmitt-Kopplin, P., Witt, M. and Kattner, G. (2011) Molecular level
investigation of reactions between dissolved organic matter and extraction solvents using FT-
ICR MS. Mar Chem 124(1-4), 100-107.
Hertkorn, N., Ruecker, C., Meringer, M., Gugisch, R., Frommberger, M., Perdue, E.M., Witt,
M. and Schmitt-Kopplin, P. (2007). High-precision frequency measurements: indispensable
tools at the core of the molecular-level analysis of complex systems. Anal Bioanal Chem
389(5), 1311-1327.
Li, Y., Harir, M., Lucio, M., Kanawati, B., Smirnov, K., Flerus, R., Koch, B.P., Schmitt-
Kopplin, P. and Hertkorn, N. (2016a) Proposed Guidelines for Solid Phase Extraction of
Suwannee River Dissolved Organic Matter. Anal Chem 88(13), 6680-6688.
Li, Y., Harir, M., Lucio, M., Gonsior, M., Koch, B. P., Schmitt-Kopplin, P., Hertkorn, N.
(2016b) Comprehensive structure-selective characterization of dissolved organic matter by
reducing molecular complexity and increasing analytical dimensions. Water Res 106, 477-
487.

158
Lucus, J., Koester, I., Wichels, A., Niggemann, J., Dittmar, T., Callies, U., Wiltshire, K.H.
and Gerdts G. (2016). Short-term dynamics of North Sea bacterioplankton – dissolved organic
matter coherence on molecular level. Front Microbiol 7, 321.
McIntyre, C. and McRae, C. (2005) Proposed guidelines for sample preparation and ESI-MS
analysis of humic substances to avoid self-esterification. Org Geochem 36(4), 543-553.
Murphy, K.R., Stedmon, C.A., Graeber, D. and Bro, R. (2013) Fluorescence spectroscopy and
multi-way techniques. PARAFAC. Anal Meth 5(23), 6557.
Osterholz, H., Singer, G., Wemheuer, B., Daniel, R., Simon, M., Niggemann, J. and Dittmar,
T. (2016) Deciphering associations between dissolved organic molecules and bacterial
communities in a pelagic marine system. ISME J 10(7), 1717-1730.
Traving, S.J., Bentzon-Tilia, M., Knudsen-Leerbeck, H., Mantikci, M., Hansen, J.L.S.,
Stedmon, C.A., Sørensen, H., Markager, S. and Riemann, L. (2016) Coupling
bacterioplankton populations and environment to community function in coastal temperate
waters. Front Microbiol 7, 1533.
Zhang, F., Harir, M., Moritz, F., Zhang, J., Witting, M., Wu, Y., Schmitt-Kopplin, P., Fekete,
A., Gaspar, A. and Hertkorn, N. (2014) Molecular and structural characterization of dissolved
organic matter during and post cyanobacterial bloom in Taihu by combination of NMR
spectroscopy and FTICR mass spectrometry. Water Res 57, 280-294.

159
9 Appendix
160
9.1 Appendix 1: Supplementary Information for Chapter 6
Supplementary Information for
Chapter 6
Published as: Yan Li, Mourad Harir, Jenny Uhl, Basem Kanawati, Marianna Lucio, Kirill
Smirnov, Boris P. Koch, Philippe Schmitt-Kopplin, Norbert Hertkorn (2016).
How Representative are dissolved organic matter (DOM) extracts? A
comprehensive study of sorbent selectivity for DOM isolation. Water Research.
Under revision. (Electronic supplementary material, published online).
Reproduced with permission from Water Research. © Copyright Elsevier.
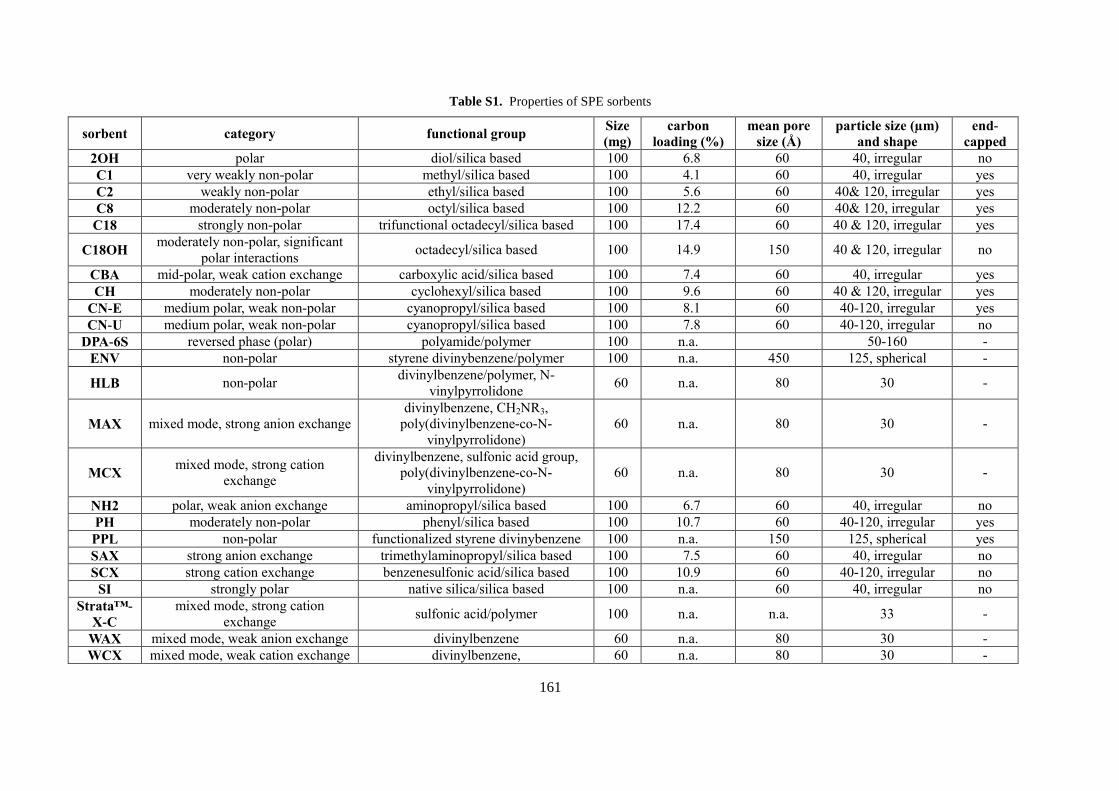
161
Table S1. Properties of SPE sorbents
sorbent category functional group Size
(mg)
carbon
loading (%)
mean pore
size (Å)
particle size (µm)
and shape
end-
capped
2OH polar diol/silica based 100 6.8 60 40, irregular no
C1 very weakly non-polar methyl/silica based 100 4.1 60 40, irregular yes
C2 weakly non-polar ethyl/silica based 100 5.6 60 40& 120, irregular yes
C8 moderately non-polar octyl/silica based 100 12.2 60 40& 120, irregular yes
C18 strongly non-polar trifunctional octadecyl/silica based 100 17.4 60 40 & 120, irregular yes
C18OH moderately non-polar, significant
polar interactions octadecyl/silica based 100 14.9 150 40 & 120, irregular no
CBA mid-polar, weak cation exchange carboxylic acid/silica based 100 7.4 60 40, irregular yes
CH moderately non-polar cyclohexyl/silica based 100 9.6 60 40 & 120, irregular yes
CN-E medium polar, weak non-polar cyanopropyl/silica based 100 8.1 60 40-120, irregular yes
CN-U medium polar, weak non-polar cyanopropyl/silica based 100 7.8 60 40-120, irregular no
DPA-6S reversed phase (polar) polyamide/polymer 100 n.a. 50-160 -
ENV non-polar styrene divinybenzene/polymer 100 n.a. 450 125, spherical -
HLB non-polar divinylbenzene/polymer, N-
vinylpyrrolidone 60 n.a. 80 30 -
MAX mixed mode, strong anion exchange
divinylbenzene, CH2NR3,
poly(divinylbenzene-co-N-
vinylpyrrolidone)
60 n.a. 80 30 -
MCX mixed mode, strong cation
exchange
divinylbenzene, sulfonic acid group,
poly(divinylbenzene-co-N-
vinylpyrrolidone)
60 n.a. 80 30 -
NH2 polar, weak anion exchange aminopropyl/silica based 100 6.7 60 40, irregular no
PH moderately non-polar phenyl/silica based 100 10.7 60 40-120, irregular yes
PPL non-polar functionalized styrene divinybenzene 100 n.a. 150 125, spherical yes
SAX strong anion exchange trimethylaminopropyl/silica based 100 7.5 60 40, irregular no
SCX strong cation exchange benzenesulfonic acid/silica based 100 10.9 60 40-120, irregular no
SI strongly polar native silica/silica based 100 n.a. 60 40, irregular no
Strata™-
X-C
mixed mode, strong cation
exchange sulfonic acid/polymer 100 n.a. n.a. 33 -
WAX mixed mode, weak anion exchange divinylbenzene 60 n.a. 80 30 -
WCX mixed mode, weak cation exchange divinylbenzene, 60 n.a. 80 30 -
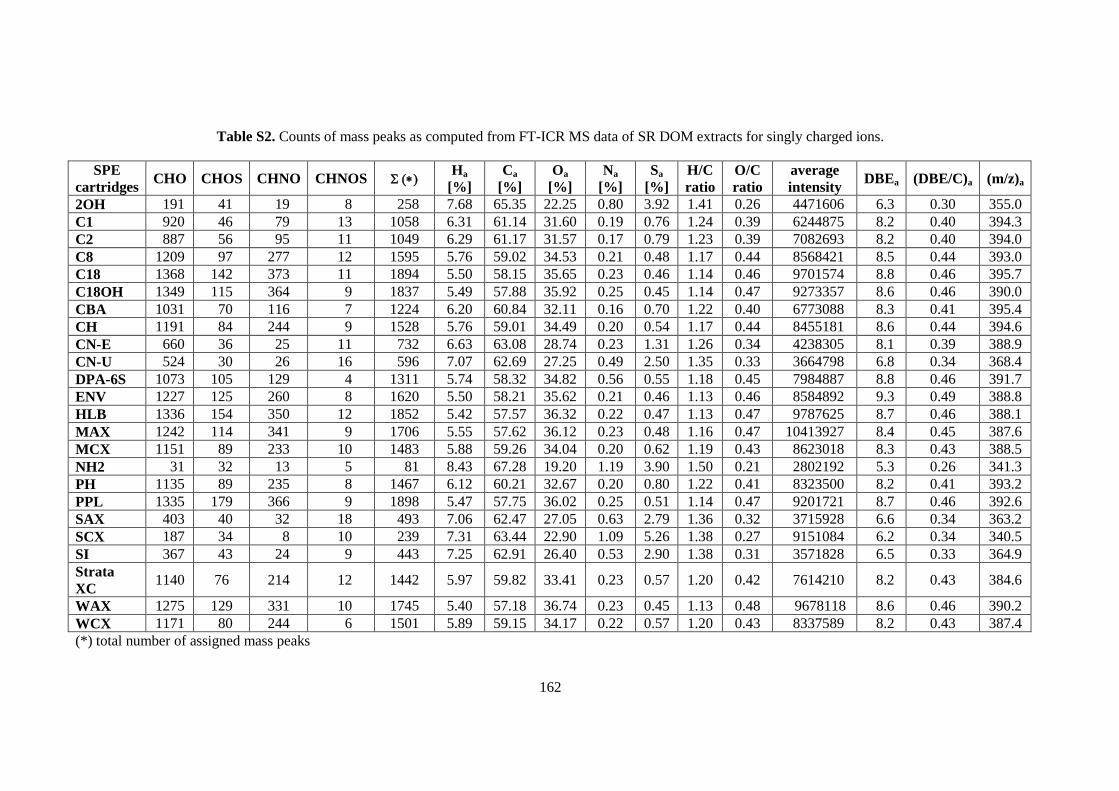
162
Table S2. Counts of mass peaks as computed from FT-ICR MS data of SR DOM extracts for singly charged ions.
SPE
cartridges CHO CHOS CHNO CHNOS
Ha
[%]
Ca
[%]
Oa
[%]
Na
[%]
Sa
[%]
H/C
ratio
O/C
ratio
average
intensity DBEa (DBE/C)a (m/z)a
2OH 191 41 19 8 258 7.68 65.35 22.25 0.80 3.92 1.41 0.26 4471606 6.3 0.30 355.0
C1 920 46 79 13 1058 6.31 61.14 31.60 0.19 0.76 1.24 0.39 6244875 8.2 0.40 394.3
C2 887 56 95 11 1049 6.29 61.17 31.57 0.17 0.79 1.23 0.39 7082693 8.2 0.40 394.0
C8 1209 97 277 12 1595 5.76 59.02 34.53 0.21 0.48 1.17 0.44 8568421 8.5 0.44 393.0
C18 1368 142 373 11 1894 5.50 58.15 35.65 0.23 0.46 1.14 0.46 9701574 8.8 0.46 395.7
C18OH 1349 115 364 9 1837 5.49 57.88 35.92 0.25 0.45 1.14 0.47 9273357 8.6 0.46 390.0
CBA 1031 70 116 7 1224 6.20 60.84 32.11 0.16 0.70 1.22 0.40 6773088 8.3 0.41 395.4
CH 1191 84 244 9 1528 5.76 59.01 34.49 0.20 0.54 1.17 0.44 8455181 8.6 0.44 394.6
CN-E 660 36 25 11 732 6.63 63.08 28.74 0.23 1.31 1.26 0.34 4238305 8.1 0.39 388.9
CN-U 524 30 26 16 596 7.07 62.69 27.25 0.49 2.50 1.35 0.33 3664798 6.8 0.34 368.4
DPA-6S 1073 105 129 4 1311 5.74 58.32 34.82 0.56 0.55 1.18 0.45 7984887 8.8 0.46 391.7
ENV 1227 125 260 8 1620 5.50 58.21 35.62 0.21 0.46 1.13 0.46 8584892 9.3 0.49 388.8
HLB 1336 154 350 12 1852 5.42 57.57 36.32 0.22 0.47 1.13 0.47 9787625 8.7 0.46 388.1
MAX 1242 114 341 9 1706 5.55 57.62 36.12 0.23 0.48 1.16 0.47 10413927 8.4 0.45 387.6
MCX 1151 89 233 10 1483 5.88 59.26 34.04 0.20 0.62 1.19 0.43 8623018 8.3 0.43 388.5
NH2 31 32 13 5 81 8.43 67.28 19.20 1.19 3.90 1.50 0.21 2802192 5.3 0.26 341.3
PH 1135 89 235 8 1467 6.12 60.21 32.67 0.20 0.80 1.22 0.41 8323500 8.2 0.41 393.2
PPL 1335 179 366 9 1898 5.47 57.75 36.02 0.25 0.51 1.14 0.47 9201721 8.7 0.46 392.6
SAX 403 40 32 18 493 7.06 62.47 27.05 0.63 2.79 1.36 0.32 3715928 6.6 0.34 363.2
SCX 187 34 8 10 239 7.31 63.44 22.90 1.09 5.26 1.38 0.27 9151084 6.2 0.34 340.5
SI 367 43 24 9 443 7.25 62.91 26.40 0.53 2.90 1.38 0.31 3571828 6.5 0.33 364.9
Strata
XC 1140 76 214 12 1442 5.97 59.82 33.41 0.23 0.57 1.20 0.42 7614210 8.2 0.43 384.6
WAX 1275 129 331 10 1745 5.40 57.18 36.74 0.23 0.45 1.13 0.48 9678118 8.6 0.46 390.2
WCX 1171 80 244 6 1501 5.89 59.15 34.17 0.22 0.57 1.20 0.43 8337589 8.2 0.43 387.4
(*) total number of assigned mass peaks

163
Table S3. Counts of mass peaks as computed from FT-ICR MS data of NS DOM extracts for singly charged ions.
SPE
cartridges CHO CHOS CHNO CHNOS
Ha
[%]
Ca
[%]
Oa
[%]
Na
[%]
Sa
[%]
H/C
ratio
O/C
ratio
average
intensity DBEa (DBE/C)a (m/z)a
2OH 132 72 64 18 286 8.57 64.94 20.28 1.56 4.65 1.58 0.23 5246668 4.5 0.22 341.1
C1 718 92 123 27 960 7.40 64.12 26.17 0.80 1.50 1.38 0.31 4774477 6.7 0.32 369.2
C2 900 127 303 19 1349 6.63 61.32 30.84 0.47 0.73 1.30 0.38 6077560 7.6 0.37 389.9
C8 1254 399 949 42 2644 6.14 58.98 33.03 0.95 0.91 1.25 0.42 8571800 7.8 0.41 386.7
C18 1274 458 1036 47 2815 6.01 58.47 33.58 1.00 0.93 1.23 0.43 9139953 7.8 0.42 386.8
C18OH 1309 435 993 38 2284 6.12 58.85 33.11 0.99 0.94 1.25 0.42 8528194 7.7 0.41 383.3
CBA 714 101 104 21 940 7.13 62.54 28.29 0.51 1.53 1.37 0.34 4755935 6.9 0.33 382.2
CH 1178 350 830 37 2395 6.16 59.31 32.95 0.80 0.78 1.25 0.42 8322768 7.9 0.41 391.4
CN-E 291 67 77 27 462 8.29 62.88 22.89 1.48 4.46 1.58 0.27 4442221 4.5 0.22 345.7
CN-U 280 87 68 21 456 8.35 62.11 23.47 1.10 4.97 1.61 0.28 4543800 4.0 0.20 342.3
DPA-6S 370 67 94 21 552 7.37 62.63 25.29 2.30 2.40 1.41 0.30 3656535 6.2 0.32 364.3
ENV 1169 390 929 35 2523 5.85 58.04 34.15 1.12 0.84 1.21 0.44 7642038 8.0 0.43 384.5
HLB 1231 461 1068 47 2807 5.74 57.50 34.53 1.26 0.97 1.20 0.45 8740834 8.0 0.44 382.6
MAX 1205 244 930 36 2415 5.91 58.66 33.91 0.91 0.61 1.21 0.43 8973866 8.1 0.43 384.9
MCX 1204 316 825 31 2376 6.05 58.93 33.31 0.87 0.84 1.23 0.42 8243136 7.8 0.42 381.0
NH2 35 40 23 14 112 7.51 62.42 21.36 2.16 6.55 1.44 0.26 3987440 5.9 0.30 358.0
PH 880 146 393 38 1457 6.49 61.34 30.58 0.75 0.84 1.27 0.37 5832630 7.8 0.39 386.8
PPL 1228 468 1121 69 2886 5.65 57.01 34.98 1.45 0.92 1.19 0.46 8391180 8.1 0.44 382.6
SAX 192 57 62 21 332 8.24 65.03 21.74 1.45 3.54 1.52 0.25 4110567 5.2 0.25 349.6
SCX 486 142 88 27 743 10.42 72.61 14.29 0.49 2.19 1.72 0.15 18280711 3.1 0.16 308.1
SI 45 28 36 23 132 7.48 60.18 23.29 2.57 6.48 1.49 0.29 3523599 5.7 0.28 360.9
Strata
XC 1200 239 696 26 2161 6.30 60.31 31.77 0.84 0.79 1.25 0.40 7380022 7.6 0.40 373.4
WAX 889 127 523 26 1565 6.02 59.06 33.25 0.88 0.79 1.22 0.42 6139175 7.9 0.42 379.4
WCX 1201 331 824 30 2386 6.05 59.17 33.10 0.85 0.82 1.23 0.42 8356873 7.9 0.42 381.9
(*) total number of assigned mass peaks

164
Figure S1. DOC recoveries of DOM extracts obtained with 24 commercially available sorbents. The
ratio was calculated with DOC recovery of SR DOM/ DOC recovery of NS DOM. Purple: non-polar;
blue: mixed mode with anion exchange; orange: moderately non-polar and mixed mode with cation
exchange; green: weekly non-polar and mid-polar; red: polar and strong ion exchange.
Table S4. 1H NMR (800 MHz, CD3OD, 283K) section integrals of SR DOM and NS DOM.
(1H) [ppm] key substructures SR DOM NS DOM
10.0 - 7.0 ppm CarH 5.1 3.2
7.0 - 5.1 ppm =CH, O2CH 5.6 3.0
4.9 - 3.1 ppm OCH 25.8 27.2
3.1 - 1.9 ppm OCCH 33.3 28.8
1.9 - 0.5 ppm CCCH 30.2 37.8
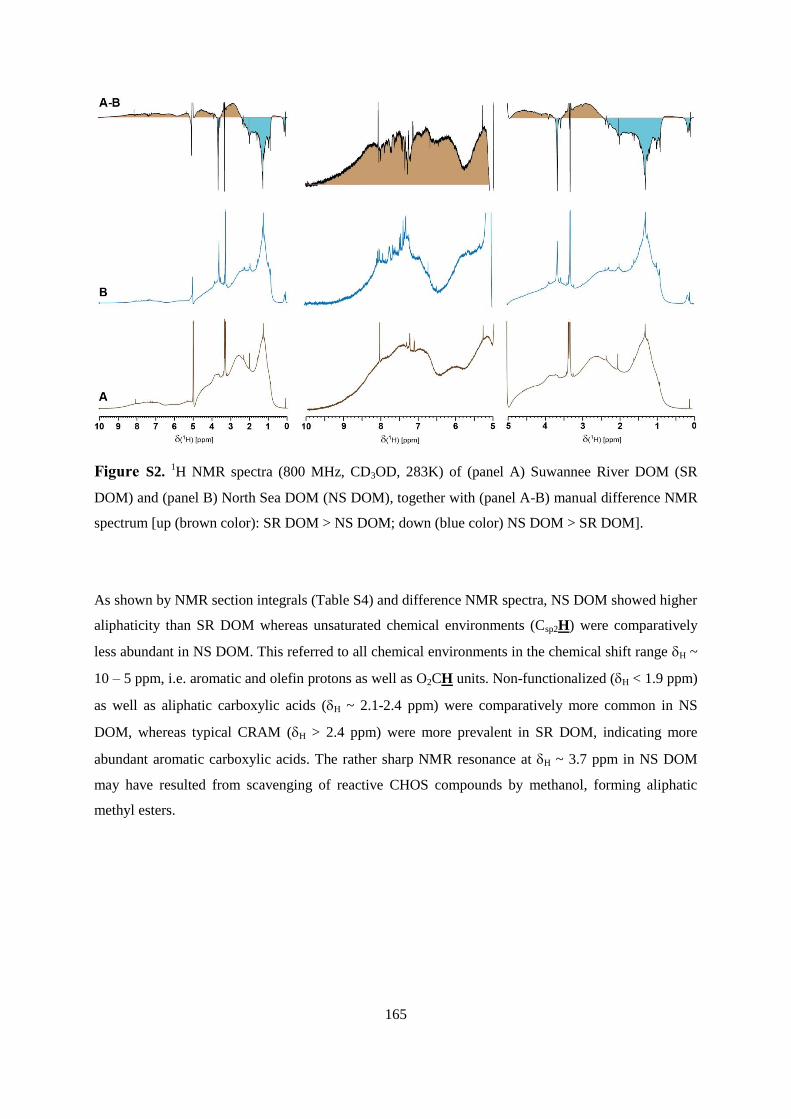
165
Figure S2. 1H NMR spectra (800 MHz, CD3OD, 283K) of (panel A) Suwannee River DOM (SR
DOM) and (panel B) North Sea DOM (NS DOM), together with (panel A-B) manual difference NMR
spectrum [up (brown color): SR DOM > NS DOM; down (blue color) NS DOM > SR DOM].
As shown by NMR section integrals (Table S4) and difference NMR spectra, NS DOM showed higher
aliphaticity than SR DOM whereas unsaturated chemical environments (Csp2H) were comparatively
less abundant in NS DOM. This referred to all chemical environments in the chemical shift range H ~
10 – 5 ppm, i.e. aromatic and olefin protons as well as O2CH units. Non-functionalized (H < 1.9 ppm)
as well as aliphatic carboxylic acids (H ~ 2.1-2.4 ppm) were comparatively more common in NS
DOM, whereas typical CRAM (H > 2.4 ppm) were more prevalent in SR DOM, indicating more
abundant aromatic carboxylic acids. The rather sharp NMR resonance at H ~ 3.7 ppm in NS DOM
may have resulted from scavenging of reactive CHOS compounds by methanol, forming aliphatic
methyl esters.

166
Figure S3. 1H NMR spectra (500 MHz, CD3OD) of SR SPE-DOM extracts obtained with different
cartridges. The spectra of blanks were shown on the left of each extract.
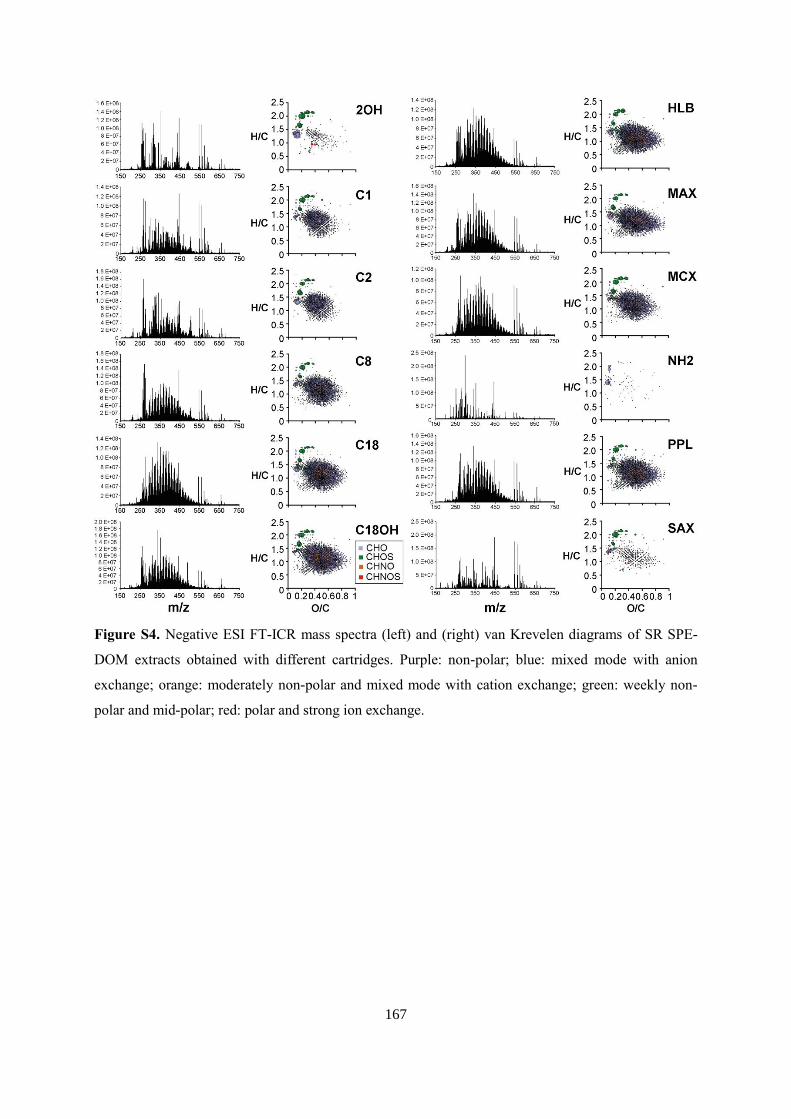
167
Figure S4. Negative ESI FT-ICR mass spectra (left) and (right) van Krevelen diagrams of SR SPE-
DOM extracts obtained with different cartridges. Purple: non-polar; blue: mixed mode with anion
exchange; orange: moderately non-polar and mixed mode with cation exchange; green: weekly non-
polar and mid-polar; red: polar and strong ion exchange.
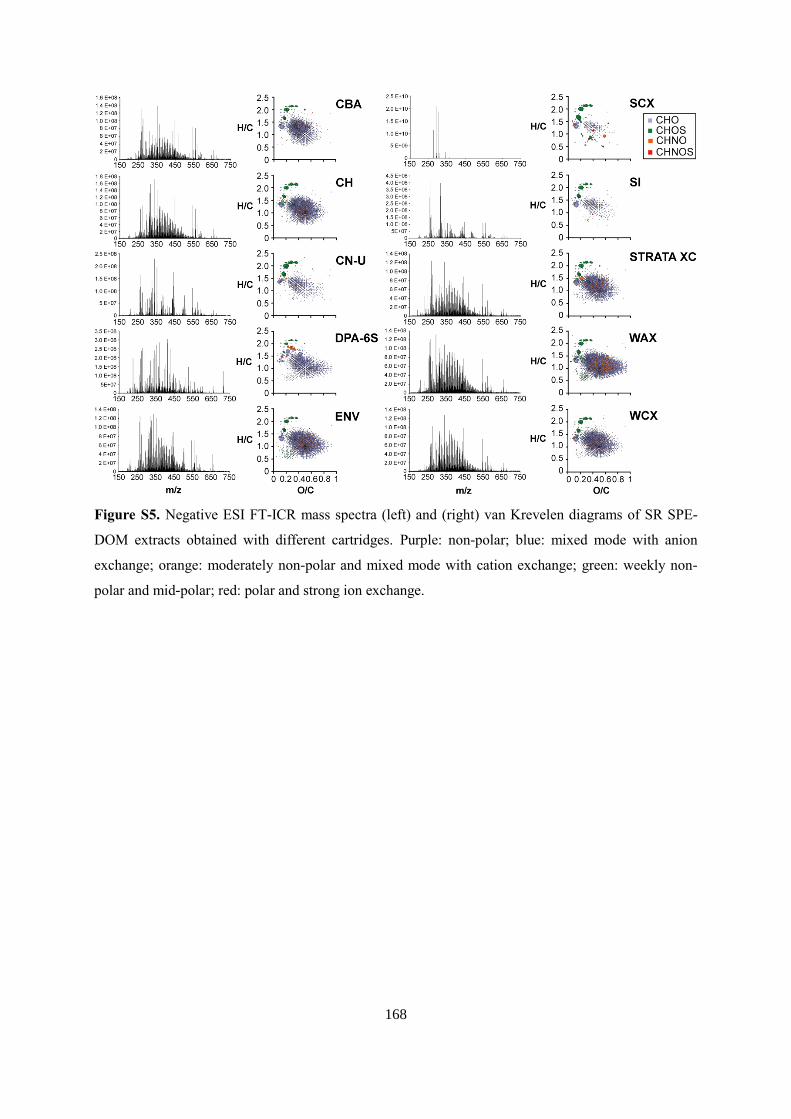
168
Figure S5. Negative ESI FT-ICR mass spectra (left) and (right) van Krevelen diagrams of SR SPE-
DOM extracts obtained with different cartridges. Purple: non-polar; blue: mixed mode with anion
exchange; orange: moderately non-polar and mixed mode with cation exchange; green: weekly non-
polar and mid-polar; red: polar and strong ion exchange.

169
Figure S6. Negative ESI FT-ICR mass spectra (left) and (right) van Krevelen diagrams of NS SPE-
DOM extracts obtained with different cartridges. Purple: non-polar; blue: mixed mode with anion
exchange; orange: moderately non-polar and mixed mode with cation exchange; green: weekly non-
polar and mid-polar; red: polar and strong ion exchange.

170
Figure S7. Negative ESI FT-ICR mass spectra (left) and (right) van Krevelen diagrams of NS SPE-
DOM extracts obtained with different cartridges. Purple: non-polar; blue: mixed mode with anion
exchange; orange: moderately non-polar and mixed mode with cation exchange; green: weekly non-
polar and mid-polar; red: polar and strong ion exchange.
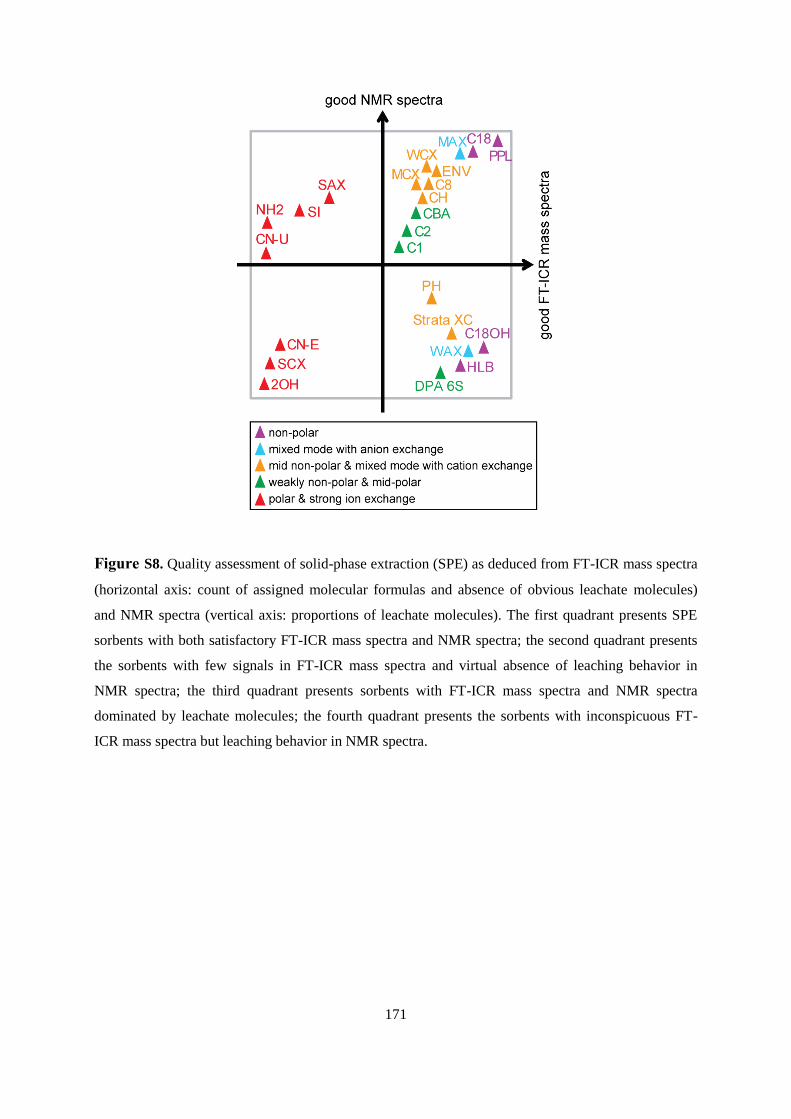
171
Figure S8. Quality assessment of solid-phase extraction (SPE) as deduced from FT-ICR mass spectra
(horizontal axis: count of assigned molecular formulas and absence of obvious leachate molecules)
and NMR spectra (vertical axis: proportions of leachate molecules). The first quadrant presents SPE
sorbents with both satisfactory FT-ICR mass spectra and NMR spectra; the second quadrant presents
the sorbents with few signals in FT-ICR mass spectra and virtual absence of leaching behavior in
NMR spectra; the third quadrant presents sorbents with FT-ICR mass spectra and NMR spectra
dominated by leachate molecules; the fourth quadrant presents the sorbents with inconspicuous FT-
ICR mass spectra but leaching behavior in NMR spectra.

172
9.2 Appendix 2: Author contributions to Chapter 6
Yan Li, Mourad Harir, Philippe Schmitt-Kopplin and Norbert Hertkorn designed the
experiment;
Jenny Uhl conducted the experiment, measured on FT-ICR MS. Yan Li analysed the FT-ICR
mass spectra with the help of Mourad Harir and Basem Kanawati, and Yan Li measured on
NMR with the help of Norbert Hertkorn;
Marianna Lucio and Kirill Smirnov helped to evaluate the data;
Boris P. Koch measured DOC and gave great inputs on paper correction;
Yan Li wrote the paper together with Mourad Harir and Norbert Hertkorn with great
contributions from Boris P. Koch and Philippe Schmitt-Kopplin.

173
9.3 Appendix 3: Author contributions to Chapter 7
Yan Li, Mourad Harir, Philippe Schmitt-Kopplin and Norbert Hertkorn designed the
experiment;
Yan Li conducted the experiment, measured on FT-ICR MS with the help of Mourad Harir
and on NMR with the help of Norbert Hertkorn;
Michael Gonsior measured on fluorescence spectroscopy;
Boris P. Koch measured DOC and gave insightful inputs;
Yan Li wrote the paper together with Mourad Harir and Norbert Hertkorn with great
contributions from Boris P. Koch and Philippe Schmitt-Kopplin.

174
10 Curriculum Vitae
Persönliche Daten Name Yan Li
Geschlecht Weiblich
Staatsangehörigkeit Chinesisch
Geburtsdatum 26. Juni 1987
Geburtsort Changzhou, Jiangsu, VR China
E-Mail [email protected]
Telefonnummer 017661432448
Anschrift
Kaulbachstr. 25
80539, München
Deutschland
Aktuelle Beschäftigung Doktorandin
Ausbildung
09. 2012 – 12.2016 Doktorandin am Helmholtz Zentrum München (betreut durch Dr.
Norbert Hertkorn) und an der Technischen Universität
München (Doktor-Vater: Prof. Dr. Philippe Schmitt-
Kopplin), finanziert durch ein Stipendium des China
Scholarship Council
Doktorarbeit: „Comprehensive characterization of dissolved
organic matter by using chemical fractionation and high
resolution organic structural spectroscopy“
09. 2009 - 03. 2012 Studium der Pharmazeutischen Ingenieurwissenschaften zur
Erlangung des Diploms (MS) an der “East China University
of Science and Technology (ECUST), Shanghai”
09. 2011 - 01 2012 Diplomarbeit: „Catalytic wet air oxidation of selected antibiotics
in water and wastewater“ (ECUST)
06. 2010 - 09. 2010 Forschungsaufenthalt am Institut für Ökologische Chemie,
Helmholtz Zentrum München, Neuherberg, Deutschland
09. 2005 - 06. 2009 Studium der Pharmazeutischen Ingenieur an der Changzhou
University, Jiangsu, China zur Erlangung von Bachelor of
Science
Forschungsinteressen Umfassende Charakterisierung von natürlicher organischer Materie (NOM) mittels
hochauflösender chemischer Fraktionierung und organischer Strukturspektroskopie,
wie Massenspektrometrie, NMR und Fluoreszenz-Spektroskopie. Aufklärung von
NOM-Prozessierung in verschiedenen Ökosystemen; Erweiterung durch
Einbeziehung von stabilen und Radioisotopen ist höchst wünschenswert.
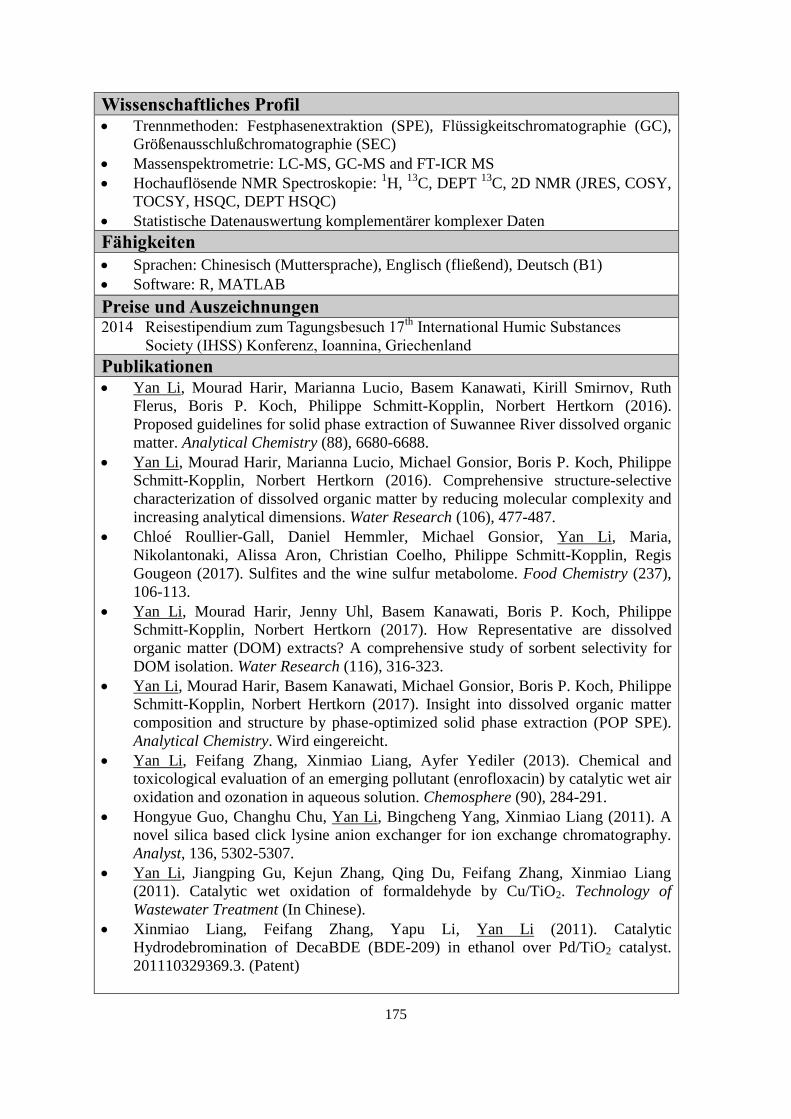
175
Wissenschaftliches Profil Trennmethoden: Festphasenextraktion (SPE), Flüssigkeitschromatographie (GC),
Größenausschlußchromatographie (SEC)
Massenspektrometrie: LC-MS, GC-MS and FT-ICR MS
Hochauflösende NMR Spectroskopie: 1H,
13C, DEPT
13C, 2D NMR (JRES, COSY,
TOCSY, HSQC, DEPT HSQC)
Statistische Datenauswertung komplementärer komplexer Daten
Fähigkeiten
Sprachen: Chinesisch (Muttersprache), Englisch (fließend), Deutsch (B1)
Software: R, MATLAB
Preise und Auszeichnungen 2014 Reisestipendium zum Tagungsbesuch 17
th International Humic Substances
Society (IHSS) Konferenz, Ioannina, Griechenland
Publikationen Yan Li, Mourad Harir, Marianna Lucio, Basem Kanawati, Kirill Smirnov, Ruth
Flerus, Boris P. Koch, Philippe Schmitt-Kopplin, Norbert Hertkorn (2016).
Proposed guidelines for solid phase extraction of Suwannee River dissolved organic
matter. Analytical Chemistry (88), 6680-6688.
Yan Li, Mourad Harir, Marianna Lucio, Michael Gonsior, Boris P. Koch, Philippe
Schmitt-Kopplin, Norbert Hertkorn (2016). Comprehensive structure-selective
characterization of dissolved organic matter by reducing molecular complexity and
increasing analytical dimensions. Water Research (106), 477-487.
Chloé Roullier-Gall, Daniel Hemmler, Michael Gonsior, Yan Li, Maria,
Nikolantonaki, Alissa Aron, Christian Coelho, Philippe Schmitt-Kopplin, Regis
Gougeon (2017). Sulfites and the wine sulfur metabolome. Food Chemistry (237),
106-113.
Yan Li, Mourad Harir, Jenny Uhl, Basem Kanawati, Boris P. Koch, Philippe
Schmitt-Kopplin, Norbert Hertkorn (2017). How Representative are dissolved
organic matter (DOM) extracts? A comprehensive study of sorbent selectivity for
DOM isolation. Water Research (116), 316-323.
Yan Li, Mourad Harir, Basem Kanawati, Michael Gonsior, Boris P. Koch, Philippe
Schmitt-Kopplin, Norbert Hertkorn (2017). Insight into dissolved organic matter
composition and structure by phase-optimized solid phase extraction (POP SPE).
Analytical Chemistry. Wird eingereicht.
Yan Li, Feifang Zhang, Xinmiao Liang, Ayfer Yediler (2013). Chemical and
toxicological evaluation of an emerging pollutant (enrofloxacin) by catalytic wet air
oxidation and ozonation in aqueous solution. Chemosphere (90), 284-291.
Hongyue Guo, Changhu Chu, Yan Li, Bingcheng Yang, Xinmiao Liang (2011). A
novel silica based click lysine anion exchanger for ion exchange chromatography.
Analyst, 136, 5302-5307.
Yan Li, Jiangping Gu, Kejun Zhang, Qing Du, Feifang Zhang, Xinmiao Liang
(2011). Catalytic wet oxidation of formaldehyde by Cu/TiO2. Technology of
Wastewater Treatment (In Chinese).
Xinmiao Liang, Feifang Zhang, Yapu Li, Yan Li (2011). Catalytic
Hydrodebromination of DecaBDE (BDE-209) in ethanol over Pd/TiO2 catalyst.
201110329369.3. (Patent)
176
Konferenzen Poster: Proposed Guidelines for Solid Phase Extraction (SPE) of Suwannee River
Dissolved Organic Matter (SR DOM), 2015, ASLO Aquatic Science Meeting,
Granada, Spanien.
Weiterbildungskurs: Parallel Factor Analysis (PARAFAC), 2015, NOM6 (6th
Specialist Conference on Natural Organic Matter in Drinking Water), Malmö,
Schweden.
Vortrag: Study of pH Effect on Solid Phase Extraction (SPE) of Suwannee River
Dissolved Organic Matter (SR DOM), 2014, International Humic Substances
Society (IHSS), 17. Internationale Konferenz: Natural Organic Matter: Structure,
Dynamics, Innovative Applications, Ioannina, Griechenland.
Poster: Study of pH Effect on Solid Phase Extraction (SPE) of Suwannee River
Dissolved Organic Matter (SR DOM), 2014, International Humic Substances
Society (IHSS), 17. Internationale Konferenz: Natural Organic Matter: Structure,
Dynamics, Innovative Applications, Ioannina, Griechenland.
Zusätzliche wissenschaftliche Erfahrung 06. 2016 Laboraustausch, Prof. Dr. Rudolf Jaffe,
Florida International University (Miami)
Größenausschlußchromatographie von DOM
05. 2016 User Summer School in National High Magnetic Field Lab
(Tallahassee)
02. 2016 Laboraustausch, Dr. Peter Herzsprung,
Helmholtz Zentrum für Umweltforschung (UFZ Magdeburg)
Fluoreszenz-Spektroskopie von DOM inclusive
Auswerteverfahren
10. 2015 Laboraustausch, Prof. Dr. Boris Koch,
Alfred-Wegener-Institut (AWI) Bremerhaven,
Helmholtz Zentrum für Polar und Meeresforschung,
Fraktionierung von Meerwasser-DOM
05. 2014 Laborbesuch, Prof. Dr. Stefan Peiffer,
Universität Bayreuth,
Umfassende Charakterisierung von DOM in Moorgebieten
assoziiert mit Fe- und S-bezogenen Redoxgradienten