
The Asteroid Impact Threat From Physical Parameters to ...
72
Lehrstuhl für Raumfahrttechnik Technische Universität München Prof. Prof. h.c. Dr. Dr. h.c. Ulrich Walter Semesterarbeit The Asteroid Impact Threat From Physical Parameters to Information LRT-SA 2016/17 ESA-SSA-NEO-RP-0165 Felix Stadler Betreuer: Dr. Detlef Koschny Lehrstuhl für Raumfahrttechnik / Institute of Aeronautics Technische Universität München
Transcript of The Asteroid Impact Threat From Physical Parameters to ...

Lehrstuhl für Raumfahrttechnik Technische Universität MünchenProf. Prof. h.c. Dr. Dr. h.c.Ulrich Walter
Semesterarbeit
The Asteroid Impact ThreatFrom Physical Parameters to Information
LRT-SA 2016/17
ESA-SSA-NEO-RP-0165
Felix Stadler
Betreuer: Dr. Detlef Koschny
Lehrstuhl für Raumfahrttechnik / Institute of Aeronautics
Technische Universität München

Page 2

From Physical Parameters to Information
Felix Stadler
Zusammenfassung
Das Ziel der vorliegenden Arbeit ist die Erstellung einer nicht-statistischen Skalafür Einschläge von Asteroiden und anderen Himmelsobjekten, die für die Kom-munikation mit Katastrophenschutzbehörden und der Öffentlichkeit verwendetwerden kann.Zunächst wird ein Überblick über die Folgen eines Einschlags dargestellt. Durchein einfaches mathematisches Modell werden diese mit den Parametern deseinschlagenden Objekts verknüpft. Mithilfe einer Analyse von bereits existieren-den Skalen für Einschläge und für andere Bereiche wird daraus eine neue, aufSchadenszonen basierende Skala erstellt.
Page II
From Physical Parameters to Information
Felix Stadler
Abstract
The following paper aims to provide a non-probabilistic impact scale that can beused for communication with emergency agencies and the general public.An overview is given on the effects of the impact of an asteroid or other celes-tial object. These are linked to the parameters of the impactor using a simplemathematical model. With the help of an analysis of existing scales regardingimpacts and other domains, a new scale is proposed that is based on damagezones.
Page III

From Physical Parameters to Information
Felix Stadler
Contents
1 Introduction 1
2 Airburst and Impact Effects 22.1 Thermal Radiation . . . . . . . . . . . . . . . . . . . . . . . . . . 22.2 Air Blast . . . . . . . . . . . . . . . . . . . . . . . . . . . . . . . . 22.3 Seismic Effects . . . . . . . . . . . . . . . . . . . . . . . . . . . . 32.4 Cratering and Ejecta . . . . . . . . . . . . . . . . . . . . . . . . . 32.5 Atmosphere Poisoning . . . . . . . . . . . . . . . . . . . . . . . . 32.6 Tsunami . . . . . . . . . . . . . . . . . . . . . . . . . . . . . . . . 32.7 Airburst . . . . . . . . . . . . . . . . . . . . . . . . . . . . . . . . 4
3 Parameters and Their Influence 63.1 Impactor Diameter . . . . . . . . . . . . . . . . . . . . . . . . . . 63.2 Impactor Density and Mass . . . . . . . . . . . . . . . . . . . . . 63.3 Impactor Velocity . . . . . . . . . . . . . . . . . . . . . . . . . . . 63.4 Impact Angle . . . . . . . . . . . . . . . . . . . . . . . . . . . . . 73.5 Impactor Porosity . . . . . . . . . . . . . . . . . . . . . . . . . . . 73.6 Impactor Composition . . . . . . . . . . . . . . . . . . . . . . . . 73.7 Target Parameters . . . . . . . . . . . . . . . . . . . . . . . . . . 7
4 Quantitative Translation between Parameters and Effects 94.1 Kinetic Energy . . . . . . . . . . . . . . . . . . . . . . . . . . . . 94.2 Atmospheric Entry . . . . . . . . . . . . . . . . . . . . . . . . . . 104.3 Fireball & Thermal Radiation . . . . . . . . . . . . . . . . . . . . 104.4 Airblast . . . . . . . . . . . . . . . . . . . . . . . . . . . . . . . . 124.5 Cratering . . . . . . . . . . . . . . . . . . . . . . . . . . . . . . . 144.6 Atmosphere Poisoning . . . . . . . . . . . . . . . . . . . . . . . . 144.7 Seismic Effects . . . . . . . . . . . . . . . . . . . . . . . . . . . . 154.8 Water Impacts . . . . . . . . . . . . . . . . . . . . . . . . . . . . 16
5 Threat Scales for Asteroid Impacts 185.1 Torino Impact Hazard Scale . . . . . . . . . . . . . . . . . . . . . 195.2 Palermo Technical Impact Hazard Scale . . . . . . . . . . . . . . 195.3 Broomfield Hazard Scale . . . . . . . . . . . . . . . . . . . . . . . 215.4 Boslough Airburst Warning Scale . . . . . . . . . . . . . . . . . . 22
6 Scales and Descriptions of Other Domains 246.1 Earthquakes . . . . . . . . . . . . . . . . . . . . . . . . . . . . . 24
Page IV

From Physical Parameters to Information
Felix Stadler
6.1.1 Richter Scale & Moment Magnitude Scale . . . . . . . . . 246.1.2 Modified Mercalli Intensity Scale . . . . . . . . . . . . . . 266.1.3 Japanese Meteorological Agency Seismic Intensity Scale 26
6.2 Tsunamis . . . . . . . . . . . . . . . . . . . . . . . . . . . . . . . 286.2.1 Magnitude . . . . . . . . . . . . . . . . . . . . . . . . . . . 286.2.2 Sieberg–Ambraseys Tsunami Intensity Scale . . . . . . . 306.2.3 Papadopoulos–Imamura Tsunami Intensity Scale . . . . . 30
6.3 Storms . . . . . . . . . . . . . . . . . . . . . . . . . . . . . . . . . 336.3.1 Beaufort Wind Force Scale . . . . . . . . . . . . . . . . . 336.3.2 Saffir–Simpson Hurricane Wind Scale . . . . . . . . . . . 336.3.3 Fujita Scale and Enhanced Fujita Scale . . . . . . . . . . 36
6.4 Explosions and Nuclear Incidents . . . . . . . . . . . . . . . . . . 376.4.1 Volcanic Explosivity Index . . . . . . . . . . . . . . . . . . 376.4.2 International Nuclear Event Scale . . . . . . . . . . . . . . 376.4.3 Chemical and Nuclear Explosions . . . . . . . . . . . . . 39
7 Introducing a New Hazard Scale 407.1 General Issues . . . . . . . . . . . . . . . . . . . . . . . . . . . . 407.2 Description of the Scale . . . . . . . . . . . . . . . . . . . . . . . 417.3 Advantages and Disadvantages . . . . . . . . . . . . . . . . . . . 457.4 Quantitative Foundation . . . . . . . . . . . . . . . . . . . . . . . 47
8 Conclusion 51
A Sources 52
B Appendix 56B.1 Code . . . . . . . . . . . . . . . . . . . . . . . . . . . . . . . . . . 56B.2 Figures . . . . . . . . . . . . . . . . . . . . . . . . . . . . . . . . 57
Page V

From Physical Parameters to Information
Felix Stadler
Figures
2.1 World Population Density Map . . . . . . . . . . . . . . . . . . . . 4
5.1 Torino Impact Hazard Scale . . . . . . . . . . . . . . . . . . . . . 195.2 Broomfield Hazard Scale . . . . . . . . . . . . . . . . . . . . . . . 22
6.1 Volcanic Explosivity Index . . . . . . . . . . . . . . . . . . . . . . 376.2 International Nuclear Event Scale . . . . . . . . . . . . . . . . . . 38
7.1 Zone map for impact in Saskatchewan, Canada . . . . . . . . . . 417.2 Mapping key . . . . . . . . . . . . . . . . . . . . . . . . . . . . . 427.3 Zone map for impact in Munich, Germany . . . . . . . . . . . . . 457.4 Zone map for impact in the Southern Pacific . . . . . . . . . . . . 467.5 Effects over distance for three different impactors . . . . . . . . . 487.6 Comparison between overpressure and thermal exposure . . . . 49
B.1 Fireball radius for three different impactors . . . . . . . . . . . . . 58B.2 Crater diameter for three different impactors . . . . . . . . . . . . 58B.3 Thermal exposure over distance for three different impactors . . 59B.4 Overpressure over distance for three different impactors . . . . . 59B.5 Wind peak velocity over distance for three different impactors . . 60B.6 Richter magnitude over distance for three different impactors . . 60B.7 Run-up over distance for three different impactors . . . . . . . . . 61B.8 Run-in over distance for three different impactors . . . . . . . . . 61
Page VI
From Physical Parameters to Information
Felix Stadler
Tables
4.1 Ignition factors for 1 Mt explosion . . . . . . . . . . . . . . . . . . 114.2 Air blast damage with respect to distance from explosion . . . . . 134.3 Simplified correlation between run-up and Papadopoulos–Imamura
Tsunami Intensity Scale stages [30] . . . . . . . . . . . . . . . . 17
5.1 Torino Impact Hazard Scale . . . . . . . . . . . . . . . . . . . . . 20
6.1 Modified Mercalli Scale . . . . . . . . . . . . . . . . . . . . . . . . 256.2 Japanese Meteorological Agency Seismic Intensity Scale . . . . 276.3 JMA for reinforced concrete buildings . . . . . . . . . . . . . . . . 286.4 Beaufort Scale . . . . . . . . . . . . . . . . . . . . . . . . . . . . 346.5 Saffir–Simpson Hurricane Wind Scale . . . . . . . . . . . . . . . 356.6 Fujita and Enhanced Fujita scales . . . . . . . . . . . . . . . . . 36
Page VII

From Physical Parameters to Information
Felix Stadler
Symbols
Adeep m initial wave amplitude
∆ km distance from earthquake epicenter to point of measurement
ε - fraction of impact energy converted into wave energy
η - luminous efficiency, fraction of impact energy converted to
thermal radiation
µ Pa shear strength of the faulted rock
Φ MJ/m2 thermal exposure
ρi kg/m3 impactor density
ρt kg/m3 target density
ρwater kg/m3 ocean water density
θ ° impact angle
c0 m/s ambient speed of sound in air
d m average displacement on fault
E Mt TNT, J yield or impact energy
Ew erg wave energy
Ekin J kinetic energy
f - fraction of the fireball visible above the horizon
fB 1/yr annual background impact frequency
gE m2 gravitational acceleration on Earth’s surface
H m average tsunami height on the coast closest to the source
h m maximum wave amplitude on the coast measured foot to crest
h m maximum wave amplitude on the coast measured foot to crest
hdeep m ocean depth at the point of impact
hin m Run-in, distance that the tsunami travels inland from the shore
Hmax m maximum wave height observed on the shore or measured by
mareograph
Page VIII

From Physical Parameters to Information
Felix Stadler
hup m Run-up, height of the tsunami wave at the shore
I - Soloviev Tsunami Strength Scale value
L m impactor diameter before point of impact
L0 m impactor diameter before atmospheric entry
M - Imamura-Iida Tsunami Strength Scale value
mb - Body-wave Magnitude Scale value
mi kg impactor mass before atmospheric entry
ML - Local Magnitude Scale value or Richter Scale value
MO 10�7 Nm Seismic Moment
MS - Surface Wave Magnitude Scale value
Mt - Abe-Hatori Tsunami Strength Scale value
MW - Moment Magnitude Scale value
Meff - calculated Richter Scale Value at distance ∆ from impact site
ML - Murty-Loomis Tsunami Strength Scale value
P0 bar ambient pressure
pI - impact probability
px bar pressure at crossover point rxPS - Palermo Technical Hazard Scale value
r m distance to fireball center
R - relative risk
rx m crossover point
Rf� m fireball radius
S m2 fault area
t yr time
v0 m/s impactor velocity before atmospheric entry
vi m/s impactor velocity before point of impact
Page IX

From Physical Parameters to Information
Felix Stadler
Acronyms
INES International Nuclear Event ScaleMMI Modified Mercalli Intensity ScaleJMA Japanese Meteorolocial Agency Seismic Intensity ScaleVEI Volcanic Explosivity Index
Page X

Introduction
1. Introduction
For all of recorded history, there has never been a person that was killed by animpact of an asteroid or other celestial object [26]. Impacts are rare and largeimpacts even rarer, but nevertheless they possess an enormous potential forharm. In the event of an upcoming impact, it may be crucial to take appropriatemeasures. For this, emergency agencies and the general public - laymen withlittle knowledge of impacts and their consequences - need to know what toexpect.
In order to characterize and communicate about emergencies, scales have pro-ven a valuable tool. There have been several attempts to create scales for im-pact events, but for public communication, most of them are of limited useful-ness.The following pages provide an overview on impactors1, impact effects and theircorrelation, analyze existing scales and use this information to propose a newscale for communication with emergency agencies and the general public.
1For simplicity, asteroids, meteroids, comets and other objects that enter the atmosphere willbe called impactors, regardless of whether there is an impact on the ground or not.
Page 1

Airburst and Impact Effects
2. Airburst and Impact Effects
An impact causes a variety of different effects, several of which are linked.This section provides a qualitative overview. A quantitative approach is given insection 4.
Due to lack of data on actual impact events, the resulting effects have historical-ly been modeled after point-mass explosions like chemical and nuclear explosi-ons. More recent calculations however have shown that this underestimates theimpact effects (see [10]).
2.1. Thermal Radiation
Beyond a certain velocity, an impact typically causes an explosion. The thermalradiation released may ignite materials close to the impact site but its intensitydrops quickly with distance.When an explosion occurs, the temperature is such that the fireball is opaqueat first. Only after it has expanded and cooled down, it transitions and becomestransparent. This means that there are two heatwaves from radiation: The firstone of the opaque fireball and a more intense second one, when the confinedradiation of the fireball is released. [4; 21]
Thermal radiation can be shielded by objects such as buildings or landscapefeatures and at large distances, the fireball is shielded by the horizon. While thelatter can easily be accounted for in mathematical models, the previous makesit difficult to predict the effects without detailed knowledge of the surroundings.
2.2. Air Blast
The air blast caused by the impact explosion can be broken down into two phe-nomena.First is the pressure blast wave caused by the rapid expansion and compressionof air during the explosion. Second is the wind following the pressure wave.While most damage is induced by overpressure, objects with high drag are par-ticularly vulnerable to the high winds.
Page 2

Airburst and Impact Effects
2.3. Seismic Effects
Large impactors beyond several hundred meters in diameter cause noticeableseismic effects. These can be described by the same measures that are usedfor earthquakes. Richter-Scale and Mercalli-Scale values can be assigned tothe seismic activity, see section 4.7.
Along with seismic effects, impactors may also trigger volcanic effects. Yet, theprobability of such an event is much lower as this could only happen at veryspecific sites. Although a freak incident like an impact at the Yellowstone Cal-dera triggering a supervolcanic eruption is possible in theory, the likelihood ofsuch an event is miniscule.
2.4. Cratering and Ejecta
Crater size plays a minor role compared to thermal radiation and air blast whenlooking at the hazard to human life since the latter have a larger range andvery thorough effect. It does, of course, make a considerable difference when itcomes to structures and infrastructure.
When it comes to crater size, two different kinds of craters can be defined:the so-called transient crater which is formed at the point of impact and thefinal crater that results from the subsequent collapse of the transient crater. Forthe purpose of damage assessment, the relevant crater size is that of the finalcrater. It indicates the region in which the ground has been reshaped.
For small impacts, the ejecta usually stay within the radius of the fireball. Onlyduring large impacts with impact energies over 1018 J, where the fireball reachesthe upper layers of the atmosphere, the ejecta may escape the dense lowerlayers and reach significantly wider distances [16].
2.5. Atmosphere Poisoning
Injection of dust and water vapor may play a significant role for larger impactors.The effects range from local ozone depletion to situations similar to what iswidely known as „Nuclear Winter“, causing wide-scale extinction events.
2.6. Tsunami
More than 70% of the earth’s surface is water [36]. Since the probability of anasteroid impact is generally the same everywhere on earth [32], the majority ofimpactors hit the ocean rather than land.
Page 3

Airburst and Impact Effects
Considering that a large share of the world population lives at or near the coast(see fig. 2.1), tsunamis created by impact – also called cosmogenic tsunamis –pose a significant hazard.
Fig. 2.1.: World Population Density Map (data from 2000) [28]
Tsunamis can be characterized by two parameters [3]:
• Run-up, which is the height of the tsunami wave at the shore.
• Run-in, which is the distance that the tsunami travels inland from the sho-re.
Since no cosmogenic tsunamis have been recorded yet, all known interacti-on models of impactors with water of different depths are purely theoretical andcontain numerous uncertainties [25](p.295). The energy-carrying wave-spectrumcomponents of cosmogenic tsunamis travel significantly slower than those oftsunamis caused by seismotectonic activity1, which arguably leads to differentbehavior and different effects on the shore, such as less run-in.
2.7. Airburst
Some of the effects described in the previous sections assume a single, non-fragmented impactor. This is not necessarily the case. In fact, there are threepossible instances:
• The impactor reaches the ground in one single piece.
• The impactor disintegrates and reaches the ground in several pieces.
• The impactor disintegrates and explodes in the atmosphere.
1by a factor of two for typical cases, see [25](p.303)
Page 4

Airburst and Impact Effects
Whether an impactor fragments and to what degree depends a lot on its compo-sition. Diameter does likely make a difference, but it is not clear in which way asthere are opposing findings and opinions on this matter [4]. Very small objectshowever can be assumed to burn up in the atmosphere. It is not quite clear whatthe effect of an airburst above water is, but it is assumed that they do not causea tsunami.Existing models are quite complex and, due to the lack of real-life data, diffi-cult to verify. This makes predictions difficult except for impactors with extremeparameters.
Page 5

Impactor Parameters and Their Influence
3. Parameters and Their Influence
For assessing the threat posed by it, an impactor can be described by the fol-lowing parameters. Other existing impactor characteristics such as albedo maybe relevant for determining some of the following parameters but do not signifi-cantly influence the impact process itself.The influence of the parameters on kinetic energy varies. Kinetic energy andultimately impact energy (i.e. kinetic energy at the point of impact) is the mostimportant factor for characterizing impact effects.
3.1. Impactor Diameter
Along with mass, diameter may be considered the most important parameter ofan impactor. It affects mass and therefore kinetic energy over-proportionally bythe power of three and its value range is virtually unrestricted at the top. Withoptical and IR measurements, it is also one the easier parameters to determine.This is why diameter is often used to convey the destructive potential of animpactor in one single figure.
3.2. Impactor Density and Mass
Density is used to calculate mass from diameter. It typically ranges from roughly600 kg/m3 (porous ice) to 8000 kg/m3 (solid iron) and is influenced by composi-tion and porosity.Along with diameter, mass may be considered the most important parameter ofan impactor as it proportionally affects kinetic energy.
3.3. Impactor Velocity
After the tandem of diameter and mass, velocity is the next most significantparameter.Velocity is limited to a range from 11 km/s to 72 km/s. Faster object surpassthe escape velocity of the solar system and cannot be held in sun orbit whichis typically required for a significant probability of a collision with earth. Slowerobjects are accelerated by gravity before collision. [16]Velocity affects kinetic energy over-proportionally by the power of two.
Page 6

Impactor Parameters and Their Influence
3.4. Impact Angle
The impact angle ranges from 0° (tangential to earth’s surface) to 90° (perpen-dicular). Empirical records place the most probable angle at 45°. [16]While the impact angle obviously does not affect kinetic energy before enteringthe atmosphere, it has significant influence on the path through the atmosphereand how much of the impactor burns up before reaching the ground. Therefore,it also affects crater size and ejecta.In case of a disintegrating impactor, for a low angle the breakup may occur atmore than double the height compared to a steep angle. Impact energy variesby a factor of about two as well.
3.5. Impactor Porosity
Porosity, along with composition, is used to assess the density of an impactor.It can be as high as 35% (i.e. up to 35% of an impactor’s volume can be void)[17]. This void can fill with gas and expand when heated during atmosphericentry. Combined with the lower structural integrity that typically comes with highporosity, this increases the likelihood of a breakup in the atmosphere.
3.6. Impactor Composition
Composition, along with porosity, is used to assess density.Impactors can be classified according to their composition. In the case of me-teorites, the top level categories are
• stony meteorites
• stony-iron meteorites
• iron meteorites
each of which consists of several sub-categories. These help to estimate thedensity of the impactor. [17]
3.7. Target Parameters
The topic of target parameters is a complex one and the exact influence of someof them is hard to quantify simply because of their sheer variety.The most basic parameters include whether the impactor hits (respectively burstsabove) land or water. In the first case, geological composition, porosity and den-sity do play a role and typically range from ice (1000 kg/m3) over porous rock
Page 7

Impactor Parameters and Their Influence
(1500 kg/m3) to dense rock (3000 kg/m3). In the latter case, the deciding factorsare water depth and – except for small impactors or very deep water – the pa-rameters of the ground beneath. These influence the properties of a potentialtsunami, cratering, ejecta and amount of evaporation.
More difficult to put into numbers are the shape of the landscape and, for asses-sing the damage, differences in construction of man-made structures. An impactinto a mountain range will have different effects than one into flatland. Also, theconsequences to cities of European-style brick buildings would be different tothose of third-world tin shacks or to those of Japanese earthquake resistanthigh-rise buildings.
Page 8
Quantitative Translation between Parameters and Effects
4. Quantitative Translation betweenParameters and Effects
In this section, a simple model is created that links the parameters of the impac-tor to the effects.
Since there is hardly any data available from actual impacts, these are usual-ly modeled after chemical or nuclear explosions. However, these point-sourceexplosion models tend to underestimate the effects of an impactor having highdownward velocity [10].Between chemical and nuclear explosions, there are differences due to energydensity [21]. In terms of energy per unit mass, asteroids possess about four totwenty times that of TNT [16] while the one of nuclear explosion devices is largerby several magnitudes. Therefore, an impact is likely to be closer to a chemicalexplosion. Data on large explosions, however, is almost exclusively available fornuclear explosions which has to be kept in mind.
Large parts of the following quantitative translation are based on the Earth Im-pact Effects model by Collins et al. [16]. Since the aim is to aid creation of aone-dimensional warning scale which is only possible when neglecting less in-fluential factors, the model is being simplified further.
A Matlab script of the model is provided in the appendix.
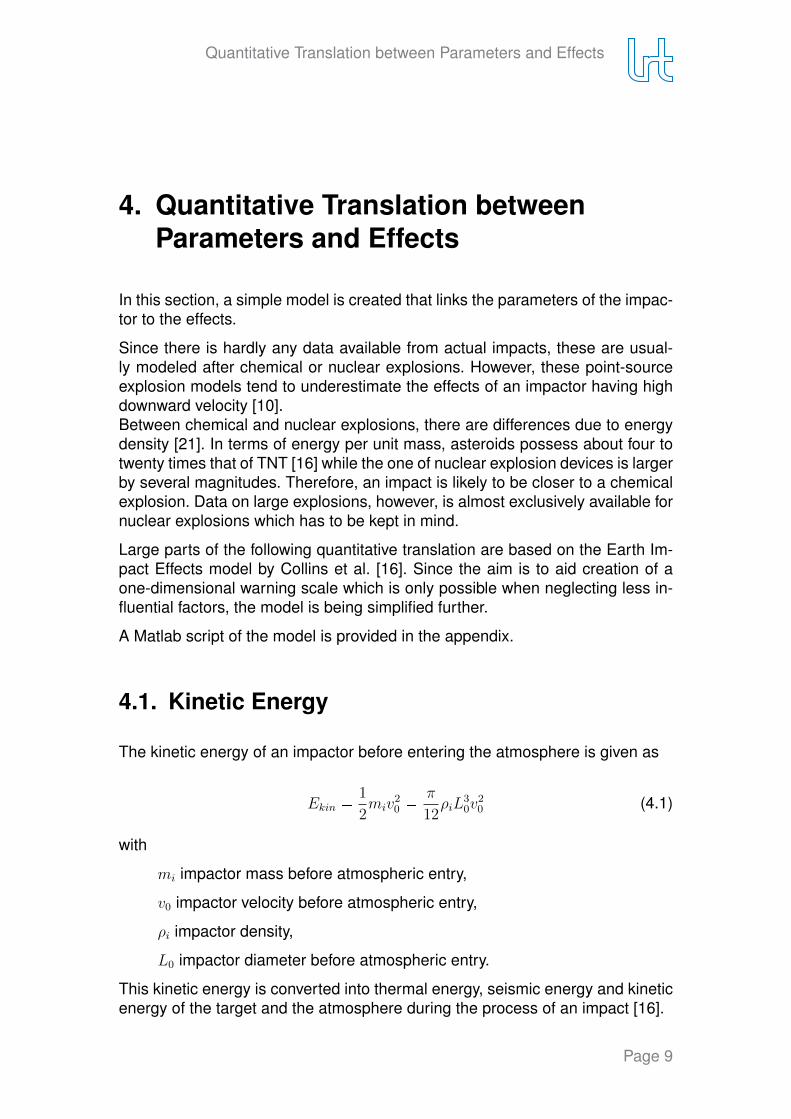
4.1. Kinetic Energy
The kinetic energy of an impactor before entering the atmosphere is given as
Ekin �1
2miv
20 �
π
12ρiL
30v
20 (4.1)
with
mi impactor mass before atmospheric entry,
v0 impactor velocity before atmospheric entry,
ρi impactor density,
L0 impactor diameter before atmospheric entry.
This kinetic energy is converted into thermal energy, seismic energy and kineticenergy of the target and the atmosphere during the process of an impact [16].
Page 9

Quantitative Translation between Parameters and Effects
4.2. Atmospheric Entry
The three cases of atmospheric entry can be quantified as follows:
• The impactor reaches the ground in one single piece. The effects can beassessed from the impact energy.
• The impactor disintegrates and reaches the ground in several pieces. The-se pieces disperse over a larger area than an intact impactor would. Theeffects can be assessed from the cumulated impact energies of the piecesbut due to the spread may differ from the effects of an intact impactor.
• The impactor disintegrates and explodes in the atmosphere. Large partsof the kinetic energy are converted into blast energy.
For impactors that do not disintegrate in the atmosphere, impact energy is ge-nerally in the same order of magnitude as the kinetic energy before atmosphericentry Ekin. How much it deviates depends mainly on impact angle.Considering that most impact effects are typically insensitive to deviations wi-thin the order of a magnitude of E, the influence of atmospheric entry can beneglected for bigger, non-fragmenting impactors.Modeling disintegrating impactors and airburst is quite complex and, similar towater impacts, only gives reliable results for numerical modeling and numerousinput parameters [40].
For the sake of simplicity, only non-disintegrating impactors will be consideredin the creation of the scale. Airbursts in particular depend on multiple factorsthat cannot be represented in a simple scale. It has to be noted, however, thatfor smaller impactors, which are much more common than large ones, disinte-gration and airbursts are likely outcomes [16].
4.3. Fireball & Thermal Radiation
When compared to actual impacts, the Earth Impact Effects model places theyield within the order of a magnitude of what has been determined by examiningthe effects. The exception are cases with unusual or extreme parameters wherelarger deviations are possible. [17]
Using yield scaling, the fireball radius in meters Rf� can be calculated as
Rf� � 0.002E1{3 (4.2)
with the impact energy or yield E in Joules (which, for our purpose, we considerequal to the kinetic energy Ekin) [16]. This means that the fireball radius growsprogressively slower with respect to the impact energy. Considering that theimpactors in question have a kinetic energy in the order of Tera- to Petajoules
Page 10

Quantitative Translation between Parameters and Effects
Tab. 4.1.: Ignition factors for 1 Mt explosion [16; 21]
Φignition(1 Mt) in MJ/m2)
Clothing 1.0
Plywood 0.67
Grass 0.38
Newspaper 0.33
Deciduous trees 0.25
Third degree burns 0.42
Second degree burns 0.25
First degree burns 0.13
and greater, impact energy deviations of a magnitude have little effect on fireballsize.
The thermal exposure Φ at a distance r from the fireball can be calculated as
Φ �ηE
2πr2(4.3)
with
η � 10�3 luminous efficiency1, fraction of impact energy converted to ther-mal radiation
E impact energy, which for simplification we equate with the kinetic energybefore atmospheric entry Ekin, see section 4.2
r distance to fireball center [16]
Shading due to the curvature of the earth is neglected as it is only significantat very large distances where thermal radiation does not play a major role anymore.
Using table 4.1, the minimum thermal exposure at which different materials igni-te can be computed as
ΦignitionpEq � Φignitionp1Mtq � E1{6 (4.4)
with the impact energy E in Mt [16]. This can be compared to the thermal ex-posure at a specific place Φ (equation 4.3) to determine the effects.
1empirical data suggests a value between 10�2 and 10�4, so 10�3 is assumed [16]
Page 11
Quantitative Translation between Parameters and Effects
4.4. Airblast
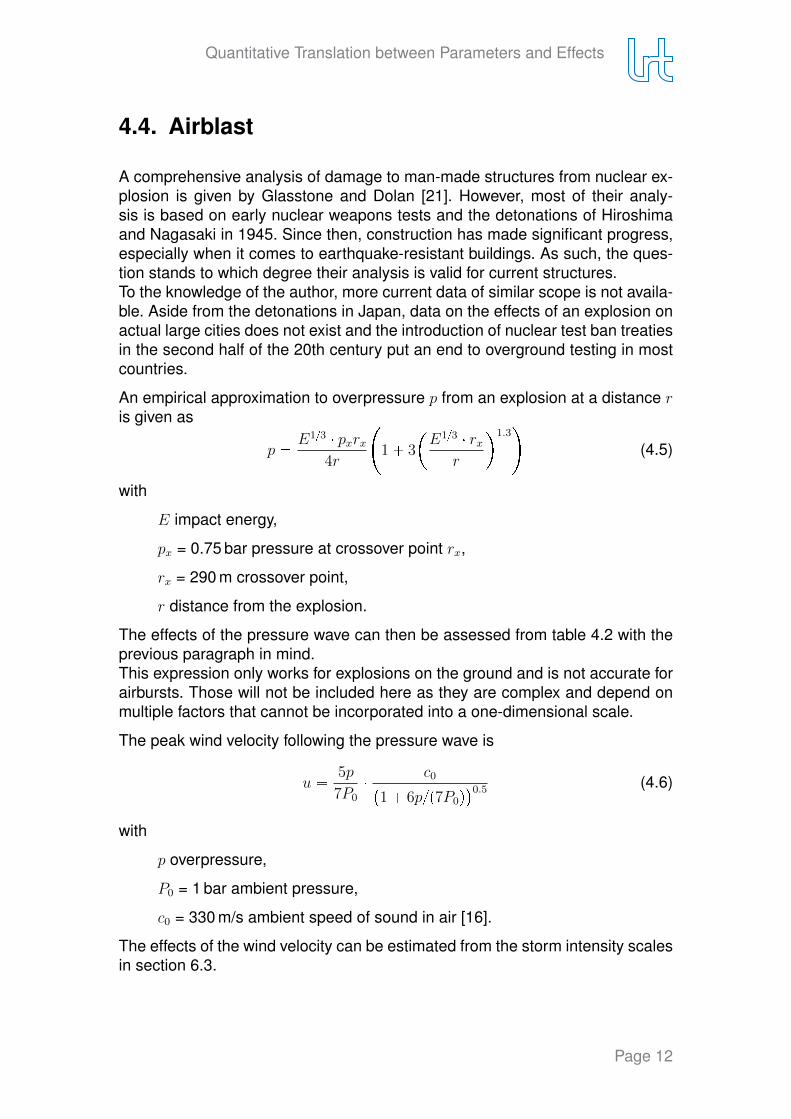
A comprehensive analysis of damage to man-made structures from nuclear ex-plosion is given by Glasstone and Dolan [21]. However, most of their analy-sis is based on early nuclear weapons tests and the detonations of Hiroshimaand Nagasaki in 1945. Since then, construction has made significant progress,especially when it comes to earthquake-resistant buildings. As such, the ques-tion stands to which degree their analysis is valid for current structures.To the knowledge of the author, more current data of similar scope is not availa-ble. Aside from the detonations in Japan, data on the effects of an explosion onactual large cities does not exist and the introduction of nuclear test ban treatiesin the second half of the 20th century put an end to overground testing in mostcountries.
An empirical approximation to overpressure p from an explosion at a distance ris given as
p �E1{3 � pxrx
4r
�1 � 3
�E1{3 � rx
r
1.3�
(4.5)
with
E impact energy,
px = 0.75 bar pressure at crossover point rx,
rx = 290 m crossover point,
r distance from the explosion.
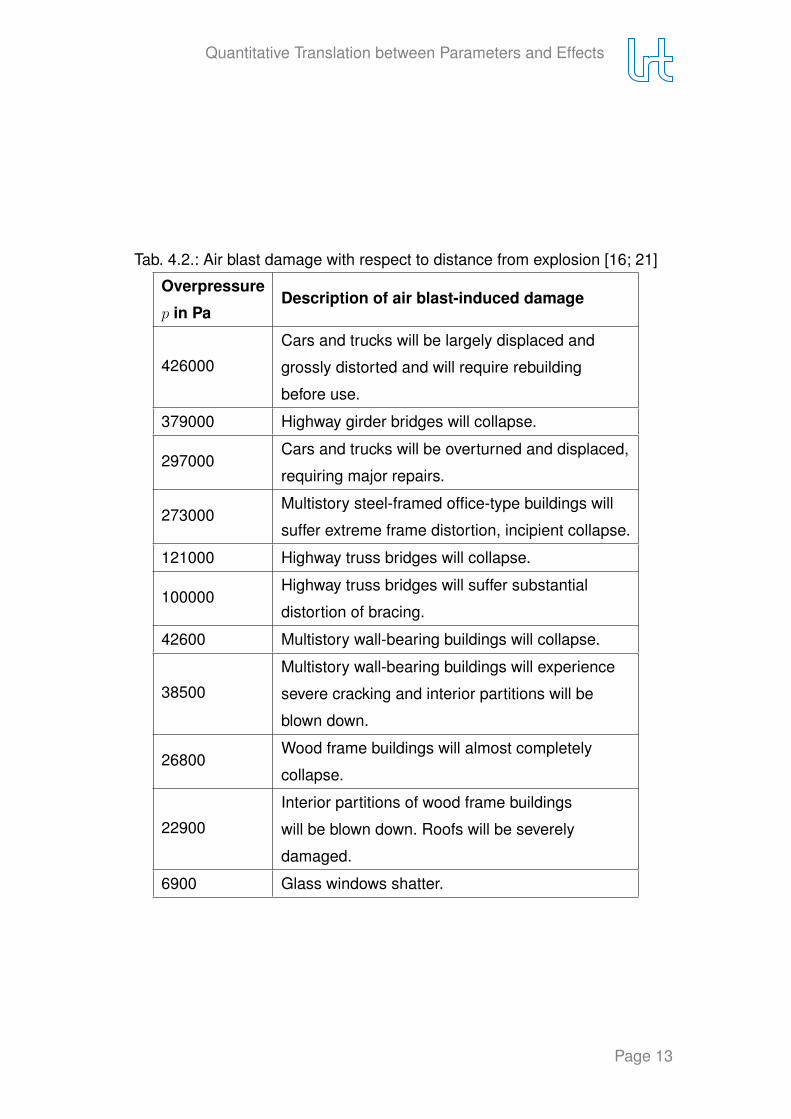
The effects of the pressure wave can then be assessed from table 4.2 with theprevious paragraph in mind.This expression only works for explosions on the ground and is not accurate forairbursts. Those will not be included here as they are complex and depend onmultiple factors that cannot be incorporated into a one-dimensional scale.
The peak wind velocity following the pressure wave is
u �5p
7P0
�c0�
1 � 6p{p7P0q�0.5 (4.6)
with
p overpressure,
P0 = 1 bar ambient pressure,
c0 = 330 m/s ambient speed of sound in air [16].
The effects of the wind velocity can be estimated from the storm intensity scalesin section 6.3.
Page 12
Quantitative Translation between Parameters and Effects
Tab. 4.2.: Air blast damage with respect to distance from explosion [16; 21]
Overpressure
p in PaDescription of air blast-induced damage
426000
Cars and trucks will be largely displaced and
grossly distorted and will require rebuilding
before use.
379000 Highway girder bridges will collapse.
297000Cars and trucks will be overturned and displaced,
requiring major repairs.
273000Multistory steel-framed office-type buildings will
suffer extreme frame distortion, incipient collapse.
121000 Highway truss bridges will collapse.
100000Highway truss bridges will suffer substantial
distortion of bracing.
42600 Multistory wall-bearing buildings will collapse.
38500
Multistory wall-bearing buildings will experience
severe cracking and interior partitions will be
blown down.
26800Wood frame buildings will almost completely
collapse.
22900
Interior partitions of wood frame buildings
will be blown down. Roofs will be severely
damaged.
6900 Glass windows shatter.
Page 13

Quantitative Translation between Parameters and Effects
4.5. Cratering
According to Collins et al. [16], the final crater diameter can be calculated as
Dfr � 1.45
�ρiρt
13
L0.78v0.44i g�0.22E sinpθq
13 (4.7)
with
ρi impactor density,
ρt target density,
L impactor diameter before point of impact,
vi impactor velocity before point of impact,
gE = 9.81 m/s2 gravitational acceleration on Earth’s surface,
θ impact angle.
We will assume θ= 45° as the most probable impact angle, ρt = 2000 kg/m3 asthe average ground density and, using equation 4.1, approximate equation 4.7as
Daprx � 1.45
�1
ρt
13
�
�12
πE
14
� g�0.22E sinpθq
13 (4.8)
� 1.8
�1
ρt
13
� E14 � g�0.22
E (4.9)
which is a function of the single variable E (impact energy).This is of course a very rough simplification, but sufficient for our purpose.
4.6. Atmosphere Poisoning
Atmosphere poisoning can be classified into three broad categories:
• As a lower limit, an impact energy of 1019 J (corresponding to an impactordiameter of roughly 1 km at typical velocity and density) is regarded ascausing significant water vapor injections and regional ozone loss.
• At more than 1020 J (2 km), climatological effects are to be expected on aglobal scale. Nitrous oxide produced by the ejecta plume may destroy theozone shield.
Page 14
Quantitative Translation between Parameters and Effects
• Beyond 1021 J (few km), sulfate and dust levels in the atmosphere mayreduce sunlight and halt photosynthesis. Reentering ejecta may cause fur-ther drop of light levels. [20]
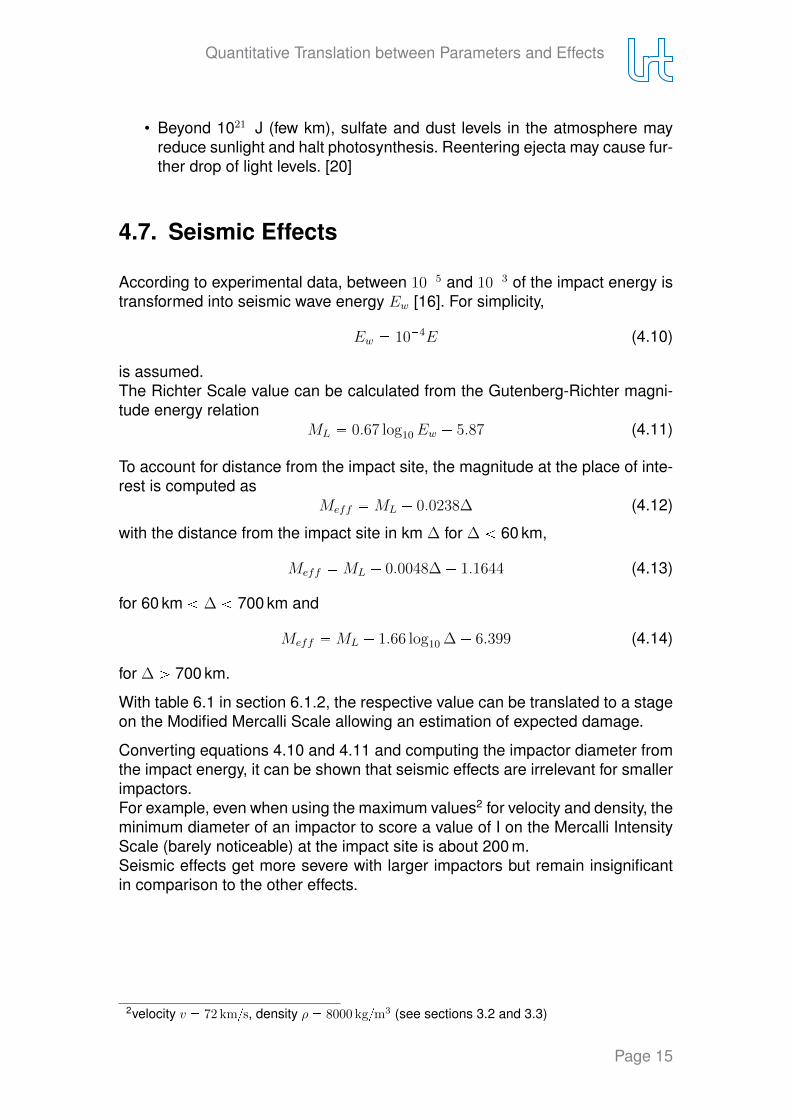
4.7. Seismic Effects
According to experimental data, between 10�5 and 10�3 of the impact energy istransformed into seismic wave energy Ew [16]. For simplicity,
Ew � 10�4E (4.10)
is assumed.The Richter Scale value can be calculated from the Gutenberg-Richter magni-tude energy relation
ML � 0.67 log10Ew � 5.87 (4.11)
To account for distance from the impact site, the magnitude at the place of inte-rest is computed as
Meff �ML � 0.0238∆ (4.12)
with the distance from the impact site in km ∆ for ∆ 60 km,
Meff �ML � 0.0048∆ � 1.1644 (4.13)
for 60 km ∆ 700 km and
Meff �ML � 1.66 log10 ∆ � 6.399 (4.14)
for ∆ ¡ 700 km.
With table 6.1 in section 6.1.2, the respective value can be translated to a stageon the Modified Mercalli Scale allowing an estimation of expected damage.
Converting equations 4.10 and 4.11 and computing the impactor diameter fromthe impact energy, it can be shown that seismic effects are irrelevant for smallerimpactors.For example, even when using the maximum values2 for velocity and density, theminimum diameter of an impactor to score a value of I on the Mercalli IntensityScale (barely noticeable) at the impact site is about 200 m.Seismic effects get more severe with larger impactors but remain insignificantin comparison to the other effects.
2velocity v � 72 km{s, density ρ � 8000 kg{m3 (see sections 3.2 and 3.3)
Page 15

Quantitative Translation between Parameters and Effects
4.8. Water Impacts
Descriptions of water impacts are highly complex and unreliable. Numerical mo-dels appear to provide better results but are difficult to verify as until today thereis no real-life data from a water impact.The model can be split into two sections:
• The impact itself and what part of the impact energy is being translatedinto cratering of the sea floor, thermal energy (vaporization) and tsunamiwave energy. This depends mainly on water depth and the composition ofboth the impactor and the sea floor.
• The tsunami wave and its propagation. This depends mostly on the shapeof the seafloor and the coast.
Since most of these factors are highly dependent on impact location, it is nearlyimpossible to make an accurate model of universal scope. However, Bailey [3]offers an analytical model that will be simplified further for our purpose of givinga very rough estimation.
The depth of a cavity caused by an impactor is
dcavity � 3.84 �
�ε
ρwatergE
1{4
E1{4 (4.15)
with
ε = 0.15 fraction of impact energy converted into wave energy,
ρwater = 1020 kg/m3 sea water density,
gE gravitational acceleration on Earth’s surface,
E impact energy.
The initial wave amplitude can be calculated as
Adeep � dcavity
�1 �
2r
3dcavity
�1.53
(4.16)
with
dcavity cavity depth in the ocean (see equation 4.15),
r horizontal distance from the impact.
Tsunamis progressively build up in height when propagating into shallower wa-ter. The run-up or height of the tsunami wave at the shore is defined as
hup � 1.09 � A4{5deeph
1{5deep (4.17)
and run-in or distance that the tsunami travels inland from the shore as
hin � 10agEhupp
3
2dcavityq
0.375 (4.18)
with
Page 16

Quantitative Translation between Parameters and Effects
Adeep initial wave amplitude (see equation 4.16),
hdeep ocean depth at the point of impact,
gE gravitational acceleration on Earth’s surface.
The run-up can be translated to the corresponding stage of the Papadopou-los–Imamura Tsunami Intensity Scale (section 6.2.3) using table 4.3.For the creation of the scale, we will assume hdeep = 3688 m as the averagedepth of the ocean [33]. This is, of course, a very coarse simplification. Theactual depth and therefore run-up and run-in depend on the individual impactlocation.Run-in is also highly dependent on terrain. In general, a mountainous coastlinewill stop a tsunami wave much sooner than a flat one.
Given the many uncertainties and simplifications, it has to be noted that thewhole model is only able to provide an idea of the dimensions of the effects.The effects of an actual impact will very likely deviate from the model.
Tab. 4.3.: Simplified correlation between run-up and Papadopoulos–ImamuraTsunami Intensity Scale stages [30]
Run-up in m <1 2 4 8 16 32
Stage number I-V VI VII-VIII IX-X XI XII
Page 17

Threat Scales for Asteroid Impacts
5. Threat Scales for Asteroid Impacts
So far, there have been several attempts at creating a scale for impact hazards.These scales vary in usefulness for communication with the general public.Both the Torino Impact Hazard Scale and the Palermo Impact Hazard Scaleare probabilistic. This poses a major problem for public communication and isgenerally discouraged, as can be seen in an excerpt from a risk communicationguide by the U.S. Department of Health and Human Services:
„A discussion of statistical probabilities and how they translate into a’relatively minimal-risk scenario for the average citizen‘ might be finefor scientists, but for the general public such a discussion will onlyconfuse the issue and fail to meet the goals of informing and easingconcerns. If the risk is low, say, ’the risk to the public is low.‘ “ [29]
With regard to impact hazards, the main difficulties are illustrated as follows:
„One of the more difficult concepts to explain the lay audiences isthe concept of risk and statistical probability. Statistically the risk ofimpact fatalities is high; however, the expectation of death due toimpact within ones lifetime is very small [...] Percentages and pro-babilities are very difficult for people to understand – and relianceon them alone should be avoided when communicating with the pu-blic. ’Never a statistic without a story,‘ should be the rule of thumb,providing context to numbers. In addition, return period/recurrenceintervals are easier to contextualize than are probabilities. However,it is essential to explain that, for example, ’on average an encountershould be expected every 100 years,‘ so that the population under-stands that if 100 years passes without an encounter, it does notnecessarily mean the scientists are wrong – or that an encounter willhappen on day 101.“ [18]
As such, there were voices among the scientist community demanding a newscale:
„’We already have a couple of different scales, the Palermo scale,the Torino scale, but the viewpoint from those that have more back-ground and expertise in communications with the public is that thosescales are too complex[.] [...] They are just not understandable bythe general public, and we needed a more simplified tool.‘ “ [11]
A very simple scale called Broomfield Hazard scale was introduced with the goalto satisfy this request. It can be debated, however, how simple such a scale mustbe to be understood and how simple it may be before it loses its validity.
Page 18

Threat Scales for Asteroid Impacts
5.1. Torino Impact Hazard Scale
The Torino Impact Hazard Scale (fig. 5.1 and tab. 5.1) rates the hazard froma potential impactor event based on its kinetic energy and the probability of animpact. The probability of a potential impact changes with time due to new mea-surements and recalculations and gets more accurate, therefore a Torino Scalevalue is only meaningful in context with the potential impact date. [7]
The Torino Scale108
108
100
1
(5km)
(1km)
(100 m)
(20 m)
Kin
etic
Ene
rgy
(Mt)
Global
Regional
Local
No Conse-quence
0
1
2
6 7 10
9
83
45
Collision Probability10-8 10-6 10-4 10-2 >0.99
Events having no likely
consequences
Events meriting careful
monitoring
Events meriting concern
Threatening events
Certain collisions
Fig. 5.1.: Torino Scale diagram [6]. For the respective description, see tab. 5.1
Due to the scale’s probabilistic nature, it is of limited usefulness for its intendedpurpose, public communication. Apart from the issue of understanding (or notunderstanding) statistics, it can be difficult to convey why the scale value of acertain potential impactor can change over time. Without in-depth knowledgeabout the whole measuring process and concepts such as keyholes, this maybe interpreted as incompetence on the part of scientists or emergency agencies– leading to a subsequent loss of public credibility.
5.2. Palermo Technical Impact Hazard Scale
The Palermo Technical Impact Hazard Scale is a logarithmic scale that compa-res the impact probability and expected yield of an object to the average riskposed by objects of the same size. It is computed as
Page 19

Threat Scales for Asteroid Impacts
Tab.
5.1.
:Tor
ino
Sca
leac
cord
ing
to[5
;27]
No
Haz
ard
0Th
elik
elih
ood
ofa
colli
sion
isze
ro,o
ris
solo
was
tobe
effe
ctiv
ely
zero
.Als
oap
plie
sto
smal
lobj
ects
such
as
met
eors
and
bodi
esth
atbu
rnup
inth
eat
mos
pher
eas
wel
las
infre
quen
tmet
eorit
efa
llsth
atra
rely
caus
eda
mag
e.
Nor
mal
1
Aro
utin
edi
scov
ery
inw
hich
apa
ssne
arth
eE
arth
ispr
edic
ted
that
pose
sno
unus
uall
evel
ofda
nger
.Cur
rent
calc
ulat
ions
show
the
chan
ce
ofco
llisi
onis
extre
mel
yun
likel
yw
ithno
caus
efo
rpub
licat
tent
ion
orpu
blic
conc
ern.
New
tele
scop
icob
serv
atio
nsve
rylik
ely
will
lead
tore
-ass
ignm
entt
oLe
vel0
.
2
Adi
scov
ery,
whi
chm
aybe
com
ero
utin
ew
ithex
pand
edse
arch
es,o
fan
obje
ctm
akin
ga
som
ewha
tclo
sebu
tnot
high
lyun
usua
lpas
sne
ar
the
Ear
th.W
hile
mer
iting
atte
ntio
nby
astro
nom
ers,
ther
eis
noca
use
forp
ublic
atte
ntio
nor
publ
icco
ncer
nas
anac
tual
colli
sion
isve
ry
unlik
ely.
New
tele
scop
icob
serv
atio
nsve
rylik
ely
will
lead
tore
-ass
ignm
entt
oLe
vel0
.
3
Acl
ose
enco
unte
r,m
eriti
ngat
tent
ion
byas
trono
mer
s.C
urre
ntca
lcul
atio
nsgi
vea
1%or
grea
terc
hanc
eof
colli
sion
capa
ble
oflo
caliz
ed
dest
ruct
ion.
Mos
tlik
ely,
new
tele
scop
icob
serv
atio
nsw
illle
adto
re-a
ssig
nmen
tto
Leve
l0.
Atte
ntio
nby
publ
ican
dby
publ
icof
ficia
lsis
mer
ited
ifth
een
coun
teri
sle
ssth
ana
deca
deaw
ay.
Mer
iting
Att
entio
n
b y Ast
rono
mer
s
4
Acl
ose
enco
unte
r,m
eriti
ngat
tent
ion
byas
trono
mer
s.C
urre
ntca
lcul
atio
nsgi
vea
1%or
grea
terc
hanc
eof
colli
sion
capa
ble
ofre
gion
al
deva
stat
ion.
Mos
tlik
ely,
new
tele
scop
icob
serv
atio
nsw
illle
adto
re-a
ssig
nmen
tto
Leve
l0.
Atte
ntio
nby
publ
ican
dby
publ
icof
ficia
lsis
mer
ited
ifth
een
coun
teri
sle
ssth
ana
deca
deaw
ay.
5
Acl
ose
enco
unte
rpos
ing
ase
rious
,but
still
unce
rtai
nth
reat
ofre
gion
alde
vast
atio
n.
Crit
ical
atte
ntio
nby
astro
nom
ers
isne
eded
tode
term
ine
conc
lusi
vely
whe
ther
orno
taco
llisi
onw
illoc
cur.
Ifth
een
coun
teri
sle
ssth
ana
deca
deaw
ay,g
over
nmen
talc
ontin
genc
ypl
anni
ngm
aybe
war
rant
ed.
6
Acl
ose
enco
unte
rby
ala
rge
obje
ctpo
sing
ase
rious
buts
tillu
ncer
tain
thre
atof
agl
obal
cata
stro
phe.
Crit
ical
atte
ntio
nby
astro
nom
ers
isne
eded
tode
term
ine
conc
lusi
vely
whe
ther
orno
taco
llisi
onw
illoc
cur.
Ifth
een
coun
teri
sle
ssth
anth
ree
deca
des
away
,gov
ernm
enta
lcon
tinge
ncy
plan
ning
may
bew
arra
nted
.Th
reat
enin
g
7
Ave
rycl
ose
enco
unte
rby
ala
rge
obje
ct,w
hich
ifoc
curr
ing
this
cent
ury,
pose
san
unpr
eced
ente
dbu
tstil
lunc
erta
inth
reat
ofa
glob
al
cata
stro
phe.
Fors
uch
ath
reat
inth
isce
ntur
y,in
tern
atio
nalc
ontin
genc
ypl
anni
ngis
war
rant
ed,e
spec
ially
tode
term
ine
urge
ntly
and
conc
lusi
vely
whe
ther
orno
taco
llisi
onw
illoc
cur.
8A
colli
sion
isce
rtai
n,ca
pabl
eof
caus
ing
loca
lized
dest
ruct
ion
fora
nim
pact
over
land
orpo
ssib
lya
tsun
amii
fclo
seof
fsho
re.
Suc
hev
ents
occu
ron
aver
age
betw
een
once
per5
0ye
ars
and
once
pers
ever
al10
00ye
ars.
9A
colli
sion
isce
rtai
n,ca
pabl
eof
caus
ing
unpr
eced
ente
dre
gion
alde
vast
atio
nfo
rala
ndim
pact
orth
eth
reat
ofa
maj
orts
unam
ifor
an
ocea
nim
pact
.Suc
hev
ents
occu
ron
aver
age
betw
een
once
per1
0,00
0ye
ars
and
once
per1
00,0
00ye
ars.
Cer
tain
Col
lisio
ns10
Aco
llisi
onis
cert
ain,
capa
ble
ofca
usin
ggl
obal
clim
atic
cata
stro
phe
that
may
thre
aten
the
futu
reof
civi
lizat
ion
asw
ekn
owit,
whe
ther
impa
ctin
gla
ndor
ocea
n.S
uch
even
tsoc
curo
nav
erag
eon
cepe
r100
,000
year
s,or
less
ofte
n.
Page 20

Threat Scales for Asteroid Impacts
PS � log10 �R (5.1)
where the relative risk R is given as
R �pIfB � t
(5.2)
with the impact probability of the the object pI and the time in years until impactt.
fB � 0.03 � E�4{5 (5.3)
is the annual background impact frequency or the annual probability of an im-pact event with a yield E in Megatons TNT as big or bigger than the event inquestion. [15]Events with values smaller than -2 are unlikely to have consequences, valuesbetween -2 and 0 merit monitoring and positive values may be cause for con-cern. An object classified with a value of 2 is one hundred times more likely toimpact than statistically average. [15]
The Palermo Scale was created as an instrument to be used among experts.It lacks visualization, it is unintuitive and it requires extensive explanation forunderstanding. As such, it is not a useful tool for communication with the public.
5.3. Broomfield Hazard Scale
The Broomfield Hazard Scale (Fig. 5.2) was introduced in September 2014 asan attempt to create a non-probabilistic scale for communication with the gene-ral public [11; 24].
The scale is simple and easy to understand – at the cost of several issues:
• The scale is graded after one single impactor parameter: impactor size. Itassumes average values or a small range of values for all other parame-ters (density and velocity) or neglects them.
• No differentiation between land and sea impacts. Target parameters areneglected.
• The descriptions of the impact hazard are vague and „subject to interpre-tation“ [24].
• The small number of classes results in energy potential differences of fac-tor 20 within one class. It could be argued that impactors at either extremeof one class have vastly different effects and are hardly comparable.
Page 21

Threat Scales for Asteroid Impacts
Broomfield Hazard Scale
Class Object size Energy potential Impact hazard Color scale
1 <10 m <50 kt Visible fireball
2 10 – 30 m 50 kt – 1 Mt Localized damage possible
3 20 – 80 m 1 – 20 Mt City-wide damage
4 60 – 230 m 20 – 500 Mt Regional damage
5 160 – 800 m 500 Mt – 20 Gt Country-wide destruction
6 >600 m >20 Gt Global destruction
Sizes (in meters) are indications only: given size range is based on 3g/cc, the velocity range 15-25km [sic!]Energy potential expressed in tons of TNT equivalent
Fig. 5.2.: Broomfield Hazard Scale [24]
This raises the question whether the Broomfield Hazard Scale is oversimplifiedand too constricted to be useful.Some of these points have already been recognized by the creators of the scaleand it has been suggested to include „blast radius information (distance plusseverity of effects)“ [24].Aside from these issues that come with the nature of the scale, the choice ofcolors leaves room for improvement: While the range from green to red and –to a certain degree – black is widely understood with respect to the severity of asignal or warning, this may less be the case for indigo when viewed on its ownand without context.
5.4. Boslough Airburst Warning Scale
The Boslough Airburst Warning Scale or, more in line with the other impact ha-zard scales, Bucharest Airburst Warning Scale is a little known scale that wasfirst proposed in 2011 [9; 19].The scale only covers the aspect of airbursts. It lacks a quantitative translationfrom impactor parameters to scale values but consists of qualitative descripti-ons. In contrast to the other impact hazard scales, it contains instructions onhow to react to a specific scale value, which is typically seen as helpful for pu-blic communication (see [42]). Therefore, parts of it may be used for improvingexisting scales or creating a new one.
Boslough Airburst Warning Scale [9]
1. High-altitude airburst with no possible damage. Bright light in sky followed bysonic boom. No recommended action.
Page 22

Threat Scales for Asteroid Impacts
2. High-altitude airburst with minor damage. Possible hazard from broken win-dows and dust from sonic boom, shaking of structures. Recommended acti-on: avoid standing near windows and anticipate respiratory hazard from dustin buildings. 2008 TC3 would have probably been this class.
3. High-altitude airburst with major damage. Possible hazard from many brokenwindows and unsecured structures like trailers blowing down due to blastwave. Recommended action: take cover in basements or strong structures.Consider leaving area.
4. Low-altitude airburst with heavy blast damage: Tunguska-class event. Struc-tures within blast zone destroyed. Recommended action: evacuate blast zoneand take cover outside that zone.
5. Low-altitude airburst with heavy thermal damage: Libyan Desert Glass classevent. Fireball zone surrounded by blast zone. Everything within fireball zoneincinerated, everything within blast zone blown down. Recommended action:evacuate fireball and blast zones, and take cover outside those zones.
Page 23
Scales and Descriptions of Other Domains
6. Scales and Descriptions of OtherDomains
There is a variety of scales from other domains such as natural hazards. Mostof them are phenomenological, specific to a certain location – so called intensityscales – and used for description and classification after an event. Scales thatcan be used to predict the severity of an event are usually confined to onesingle physical aspect instead of providing a comprehensive assessment of allthe expected effects.
6.1. Earthquakes
6.1.1. Richter Scale & Moment Magnitude Scale
The Richter Scale or Local Magnitude Scale ML is a logarithmic representationof seismograph amplitude. Whole number increases translate to tenfold incre-ases in measured seismograph amplitude and 31-fold increases in releasedenergy. [37]Earthquakes with values below 2.0 are called „microearthquakes“, large earth-quakes score 8.0 or higher.The Richter Scale is not in use any more and has mostly been replaced by theMoment Magnitude Scale – despite the false notion in the media where MomentMagnitude Scale values are often designated as „... on the Richter Scale“. [37]
Aside from the disused Richter Scale, there are several Magnitude scales withdifferent strengths and weaknesses for different purposes. Worth mentioningare the Surface Wave Magnitude Scale MS, the Body-Wave Magnitude Scalemb and the Moment Magnitude Scale MW . The latter is currently the preferredscale to classify medium and large earthquakes.Magnitude scales categorize the earthquake as a whole – in contrast to theintensity scales in the following sections 6.1.2 and 6.1.3 which describe thelocal effects at specific site. [37]
The Moment Magnitude Scale is given as
MW �2
3logpMOq � 10.7 (6.1)
The Seismic Moment MO can be calculated along faults as
Page 24
Scales and Descriptions of Other Domains
Tab.
6.1.
:Mod
ified
Mer
calli
Sca
le[3
8;39
;41]
Mer
calli
Inte
nsity
Equ
ival
ent
Ric
hter
Mag
nitu
de
Witn
ess
Obs
erva
tions
and
Dam
age
Des
crip
tions
I1.
0to
2.0
F elt
byve
ryfe
wpe
ople
;bar
ely
notic
eabl
e.
II2.
0to
3.0
F elt
bya
few
peop
le,e
spec
ially
onup
perfl
oors
.
III3.
0to
4.0
Not
icea
b le
indo
ors,
espe
cial
lyon
uppe
rfloo
rs,b
utm
ayno
tbe
reco
gniz
edas
anea
rthq
uake
.
IV4.
0F e
ltby
man
yin
door
s,fe
wou
tdoo
rs.M
ayfe
ellik
ehe
avy
truc
kpa
ssin
gby
.
V4.
0to
5.0
F elt
byal
mos
teve
ryon
e,so
me
peop
leaw
aken
ed.S
mal
lobj
ects
mov
ed.T
rees
and
pole
sm
aysh
ake.
VI
5.0
to6.
0Fe
ltby
ever
yone
.Diffi
cult
tost
and.
Som
ehe
avy
furn
iture
mov
ed,s
ome
plas
terf
alls
.
Chi
mne
ysm
aybe
slig
htly
dam
aged
.
VII
6.0
Slig
htto
mod
erat
eda
mag
ein
wel
lbui
lt,or
dina
ryst
ruct
ures
.Con
side
rabl
eda
mag
eto
poor
lybu
iltst
ruct
ures
.Som
ew
alls
may
fall.
VIII
6.0
to7.
0Li
ttle
dam
age
insp
ecia
llybu
iltst
ruct
ures
.Con
side
rabl
eda
mag
eto
ordi
nary
build
ings
,
seve
reda
mag
eto
poor
lybu
iltst
ruct
ures
.Som
ew
alls
colla
pse.
IX7.
0C
onsi
dera
ble
dam
age
tosp
ecia
llybu
iltst
ruct
ures
,bui
ldin
gssh
ifted
offf
ound
atio
ns.
Gro
und
crac
ked
notic
eabl
y.W
hole
sale
dest
ruct
ion.
Land
slid
es.
X7.
0to
8.0
Mos
t mas
onry
and
fram
est
ruct
ures
and
thei
rfou
ndat
ions
dest
roye
d.G
roun
dba
dly
crac
ked.
Land
slid
es.W
hole
sale
dest
ruct
ion.
XI
8.0
T ota
ldam
age.
Few
,ifa
ny,s
truc
ture
sst
andi
ng.B
ridge
sde
stro
yed.
Wid
ecr
acks
ingr
ound
.
Wav
esse
enon
grou
nd.
XII
8.0
orgr
eate
rTo
tald
amag
e.W
aves
seen
ongr
ound
.Obj
ects
thro
wn
upin
toai
r.
Page 25

Scales and Descriptions of Other Domains
MO � µSd (6.2)
with
µ shear strength of the faulted rock,
S fault area,
d average displacement on the fault. [37]
Comparing the Moment Magnitude Scale to the Richter Scale, the values aresimilar for medium earthquakes but deviate for small and large ones.
While neither of the Magnitude scales include verbal descriptions, their preva-lence in the media has made them familiar to many people, particularly to thosewho live in regions regularly affected by earthquakes. The mathematical basismay not be understood by the general public, but many people are aware thatvalues below 4.0 mean none to little harm while values of 7.0 and higher corre-spond to considerable damage in the vicinity of the epicenter.
6.1.2. Modified Mercalli Intensity Scale
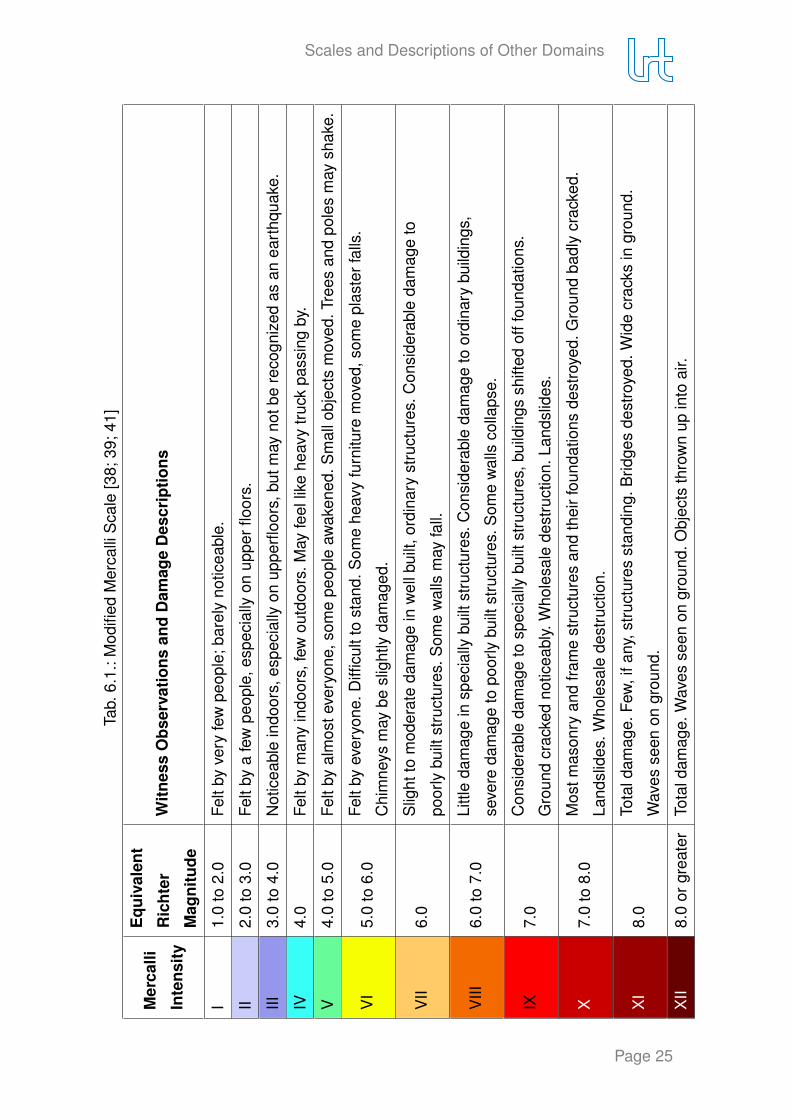
The most widely used intensity scale for earthquakes is the Modified MercalliIntensity Scale (MMI) (see tab. 6.1). Its twelve stages range from barely no-ticeable to complete destruction and are given for a specific location, not theearthquake itself. The MMI only ranks the visible effects of an earthquake anddoes not have a mathematical foundation [38]. However, rough translations bet-ween MMI ranks and the equivalent Richter Scale magnitudes (section 6.1.1)exist (see again tab. 6.1).
6.1.3. Japanese Meteorological Agency Seismic IntensityScale
Analogous to the MMI (section 6.1.2), the Japanese Meteorolocial Agency Seis-mic Intensity Scale (JMA) (see tab. 6.2) is a non-mathematical scale that des-cribes the local effects of an earthquake. Like the MMI, the JMA has been ex-tended with time. Compared to its predecessor, the Japanese Seismic IntensityScale (see [8]), stage 5 and 6 of the JMA have been split into „upper“ and „lower“to provide finer graduation for more severe effects.In addition to the categories of human perception and the general indoors andoutdoors situation, there are multiple tables that describe the effects more spe-cifically. These include scales covering the effects on reinforced-concrete buil-dings, wooden houses, large-scale structures such as skyscrapers, the situationof ground and slopes and the influence on utilities and infrastructure.
Page 26

Scales and Descriptions of Other DomainsTa
b.6.
2.:J
apan
ese
Met
eoro
logi
calA
genc
yS
eism
icIn
tens
ityS
cale
[2]
Sei
smic
inte
nsity
Hum
anpe
rcep
tion
and
reac
tion
Indo
orsi
tuat
ion
Out
door
situ
atio
n
0Im
perc
eptib
leto
peop
le,b
ut
reco
rded
byse
ism
omet
ers.
--
1Fe
ltsl
ight
lyby
som
epe
ople
keep
ing
quie
tin
build
ings
.-
-
2
Felt
bym
any
peop
leke
epin
gqu
iet
inbu
ildin
gs.S
ome
peop
lem
aybe
awok
en.
Han
ging
obje
cts
such
asla
mps
swin
g
slig
htly
.-
3
Felt
bym
ostp
eopl
ein
build
ings
.
Felt
byso
me
peop
lew
alki
ng.M
any
peop
lear
eaw
oken
.
Dis
hes
incu
pboa
rds
may
rattl
e.E
lect
ricw
ires
swin
gsl
ight
ly.
4
Mos
tpeo
ple
are
star
tled.
Felt
by
mos
tpeo
ple
wal
king
.Mos
tpeo
ple
are
awok
en.
Han
ging
obje
cts
such
asla
mps
swin
g
sign
ifica
ntly
,and
dish
esin
cupb
oard
sra
ttle.
Uns
tabl
eor
nam
ents
may
fall.
Ele
ctric
wire
ssw
ing
sign
ifica
ntly
.Tho
sedr
ivin
gve
hicl
esm
ay
notic
eth
etre
mor
.
5Lo
wer
Man
ype
ople
are
frig
hten
edan
d
feel
the
need
toho
ldon
to
som
ethi
ngst
able
.
Han
ging
obje
cts
such
asla
mps
swin
gvi
olen
tly.
Dis
hes
incu
pboa
rds
and
item
son
book
shel
ves
may
fall.
Man
yun
stab
leor
nam
ents
fall.
Uns
ecur
edfu
rnitu
rem
aym
ove,
and
unst
able
furn
iture
may
topp
leov
er.
Inso
me
case
s,w
indo
ws
may
brea
kan
dfa
ll.Pe
ople
notic
e
elec
tric
itypo
les
mov
ing.
Roa
dsm
aysu
stai
nda
mag
e.
5U
pper
Man
ype
ople
find
itha
rdto
mov
e;
wal
king
isdi
fficu
ltw
ithou
thol
ding
onto
som
ethi
ngst
able
.
Dis
hes
incu
pboa
rds
and
item
son
book
shel
ves
are
mor
elik
ely
tofa
ll.TV
sm
ayfa
llfro
mth
eir
stan
ds,a
ndun
secu
red
furn
iture
may
topp
le
over
.
Win
dow
sm
aybr
eak
and
fall,
unre
info
rced
conc
rete
-blo
ck
wal
lsm
ayco
llaps
e,po
orly
inst
alle
dve
ndin
gm
achi
nes
may
topp
leov
er,a
utom
obile
sm
ayst
opdu
eto
the
diffi
culty
of
cont
inue
dm
ovem
ent.
6Lo
wer
Itis
diffi
cult
tore
mai
nst
andi
ng.
Man
yun
secu
red
furn
iture
mov
esan
dm
ay
topp
leov
er.D
oors
may
beco
me
wed
ged
shut
.W
allt
iles
and
win
dow
sm
aysu
stai
nda
mag
ean
dfa
ll.
6U
pper
Itis
impo
ssib
leto
rem
ain
stan
ding
orm
ove
with
outc
raw
ling.
Peop
le
may
beth
row
nth
roug
hth
eai
r.
Mos
tuns
ecur
edfu
rnitu
rem
oves
,and
ism
ore
likel
yto
topp
leov
er.
Wal
ltile
san
dw
indo
ws
are
mor
elik
ely
tobr
eak
and
fall.
Mos
tunr
einf
orce
dco
ncre
te-b
lock
wal
lsco
llaps
e.
7M
ostu
nsec
ured
furn
iture
mov
esan
dto
pple
s
over
,orm
ayev
enbe
thro
wn
thro
ugh
the
air.
Wal
ltile
san
dw
indo
ws
are
even
mor
elik
ely
tobr
eak
and
fall.
Rei
nfor
ced
conc
rete
-blo
ckw
alls
may
colla
pse.
Page 27

Scales and Descriptions of Other Domains
Tab. 6.3.: JMA for reinforced concrete buildings [2]Seismic
intensity
Reinforced-concrete buildings
High earthquake
resistance
Low earthquake
resistance
5 Upper -Cracks may form in walls, crossbeams
and pillars.
6 LowerCracks may form in walls, crossbeams
and pillars.
Cracks are more likely to form in walls,
crossbeams and pillars.
6 UpperCracks are more likely to form in walls,
crossbeams and pillars.
Slippage and X-shaped cracks may be
seen in walls, crossbeams and pillars.
Pillars at ground level or on intermediate
floors may disintegrate, and buildings may
collapse.
7
Cracks are even more likely to form in
walls, crossbeams and pillars. Ground
level or intermediate floors may sustain
significant damage. Buildings may lean in
some cases.
Slippage and X-shaped cracks are more
likely to be seen in walls, crossbeams and
pillars. Pillars at ground level or on
intermediate floors are more likely to
disintegrate, and buildings are more likely
to collapse.
As an example, tab. 6.3 shows the scale for reinforced-concrete buildings. Thisscale clearly illustrates one of the problems in creating meaningful one-dimensionalscales from a multitude of parameters: phrases such as „may form“, „are morelikely to form“ and „are even more likely to form“ are highly subjective and hardlyuseful when assigning a scale value to an event.Another difficulty demonstrated by the JMA is the existence of regional andalso temporal differences. The scale is intended for the use in Japan and ear-thquakes with similar parameters might be categorized much differently in othercountries due to variations in construction. Also, the scale has to be checkedevery five years and – if necessary – modified to account for constructional im-provements in terms of earthquake resistance [2].
6.2. Tsunamis
6.2.1. Magnitude
Over the years, a number of scales for quantitative description of tsunamis havebeen developed.
Page 28
Scales and Descriptions of Other Domains
One of the most simple scales for tsunami strength is the Imamura-Iida Scalewhich is calculated as
M � log2Hmax (6.3)
with the maximum wave height in meters Hmax, observed on the shore or mea-sured by mareograph. This translates to a six-point scale from -1 to 4.
A more refined scale has been proposed by Soloviev:
I �1
2� log2H (6.4)
with the average tsunami height in meters on the coast closest to the source H.Both scales only consider one parameter and are insensitive to deviations of thatparameter. This is why the scales are likely to continue to be used, particularlyfor the categorization of historic tsunamis of which not much data is available.However, this simplicity also limits their relevance.
The Abe-Hatori Scale on the other hand also accounts for the weakening ofwaves with increasing distance from the source:
Mt � a log h� b log ∆ �D (6.5)
with
h maximum wave amplitude on the coast measured from the foot of thecrest to the top in meters,
∆ distance from the earthquake epicenter to the point of measurement inkilometers
a, b, D constants that make the scale resemble the seismological magni-tude scale (section 6.1.1).
A categorization based on the potential energy of the tsunami wave is put for-ward by the Murty-Loomis Scale:
ML � 2plogEw � 19q (6.6)
with the wave energy in erg Ew.While being the least ambiguous among the tsunami magnitude scales, thisapproach raises the problem of how to determine the wave energy. It shouldalso be noted that the wave energy does not translate directly to the severity ofdestruction on the coast. As such, the scale is effective for physical descriptionof the tsunami but not for the description of its effects. [25]
Neither of the four magnitude scales includes verbal descriptions and their va-lues do not hold much meaning to non-experts. For public communication, thescales in the following sections 6.2.2 and 6.2.3 are better suited.
Page 29

Scales and Descriptions of Other Domains
6.2.2. Sieberg–Ambraseys Tsunami Intensity Scale
The Sieberg–Ambraseys Tsunami Intensity Scale was one of the first attemptsto categorize the effects of a tsunami. Therefore, it has less stages and is muchless descriptive than the Papadopoulos–Imamura Tsunami Intensity Scale (sec-tion 6.2.3).As an intensity scale, it only categorizes the effects at a specific site and is notbased on parameters of the tsunami or the location.
Sieberg–Ambraseys Tsunami Intensity Scale [25](p.12)
1. Very light. Waves can only be registered by special tide gauges (mareogra-phs).
2. Light. Waves noticed by those living along the shore. On very flat shoreswaves are generally noticed.
3. Rather strong. Waves generally noticed. Flooding of gently sloping coasts.Light sailing vessels carried away on shore. Slight damage to light structuressituated near the coasts. In estuaries, reversal of the river flow some distanceupstream.
4. Strong. Significant flooding of the shore. Buildings, embankments, dikes,and cultivated ground near coast damaged. Small and average vessels car-ried either inland or out to sea. Coasts littered with debris.
5. Very strong. General significant flooding of the shore. Quay-walls and solidstructures near the sea damaged. Light structures destroyed. Severe scou-ring of cultivated land. Littering of the coast with floating items, fish, andsea animals thrown up on the shore. With the exception of big ships allother types of vessels carried inland or out to sea. Bores formed in estua-ries of rivers. Harbor works damaged. People drowned. Wave accompaniedby strong roar.
6. Disastrous. Partial or complete destruction of manmade structures for so-me distance from the shore. Strong flooding of coasts. Big ships severelydamaged. Trees uprooted or broken. Many casualties.
6.2.3. Papadopoulos–Imamura Tsunami Intensity Scale
The Papadopoulos–Imamura Tsunami Intensity Scale describes the effects of atsunami at a specific site according to the following criteria [25]:
a) influence upon people,
b) impact on natural and artificial objects, including boats of different sizes,
c) damage caused to buildings.
Page 30

Scales and Descriptions of Other Domains
Like the Sieberg–Ambraseys Tsunami Intensity Scale (section 6.2.2), the Papa-dopoulos–Imamura Tsunami Intensity Scale is not based on parameters. It isstructured into twelve stages.
Papadopoulos–Imamura Tsunami Intensity Scale [25](p.14)
I. Not felt1
a) Not felt even in most favorable circumstances;
b) No effect;
c) No damage;
II. Scarcely felt
a) Felt by some people in light boats. Not observed on the shore;
b) No effect;
c) No damage;
III. Weak
a) Felt by most people in light boats. Observed by some people on theshore;
b) No effect;
c) No damage;
IV. Largely observed
a) Felt by all people in light boats and some on large vessels. Observedby most people on shore;
b) Some light boats are slightly carried onto the shore;
c) No damage;
V. Strong
a) Felt by all people on large vessels. Observed by all people on shore.Some people are frightened and run-up elevations;
b) Many light vessels are carried inland over significant distances, someof them collide with each other or are overturned. The wave leaveslayers of sand in places with favorable conditions. Limited flooding ofcultivated land along the coast;
c) Limited flooding of coastal structures, buildings and territories (gar-dens, etc.) near residential houses;
VI. Slightly damaging
a) Many people are frightened and run-up elevations;
1Registered only by special instruments.
Page 31
Scales and Descriptions of Other Domains
b) Most light vessels are carried inland over significant distances, under-go strong collisions with each other, or are overturned;
c) Some wooden structures are destroyed and flooded. Most brick buil-dings have survived;
VII. Damaging
a) Most people are frightened and try to run away onto elevations;
b) Most light vessels are damaged. Some large vessels undergo signifi-cant vibrations. Objects of varying dimensions and stability (strength)are overturned and shifted from their positions. The wave leaves layersof sand and accumulates pebbles. Some floating structures are was-hed away to sea;
c) Many wooden structures are damaged, some are totally wiped awayor carried out to sea by the wave. Destructions of first degree andflooding of some brick buildings;
VIII. Heavily damaging
a) All people run-up elevations, some are carried out to sea by the wave;
b) Most light vessels are damaged, many are carried away by the wave.Some large vessels are carried upshore and undergo collisions witheach other. Large objects are washed away. Erosion and littering ofthe coast. Widespread flooding. Insignificant damage in antitsunamiplantations of trees. Many floating structures are carried away by thewave, some are partially damaged;
c) Most wooden structures are carried away by the wave or completelywiped off the earth’s surface. Destructions of second degree in somebrick buildings. Most concrete buildings are not damaged, some haveundergone destruction of first degree and flooding;
IX. Destructive
a) Many people are carried away by the wave;
b) Most light vessels are destroyed and carried away by the wave. Manylarge vessels are carried inland over large distances, some are de-stroyed. Broad erosion and littering of the coast. Local subsidence ofthe ground. Partial destruction of antitsunami plantations of trees. Mostfloating structures are carried away, many are partially damaged;
c) Destructions of third degree in many brick buildings. Some concretebuildings have undergone destructions of second degree;
X. Very destructive
a) General panic. Most people are carried away by the wave;
b) Most large vessels are carried inland over large distances, many aredestroyed or have undergone collisions with buildings. Small rocks
Page 32
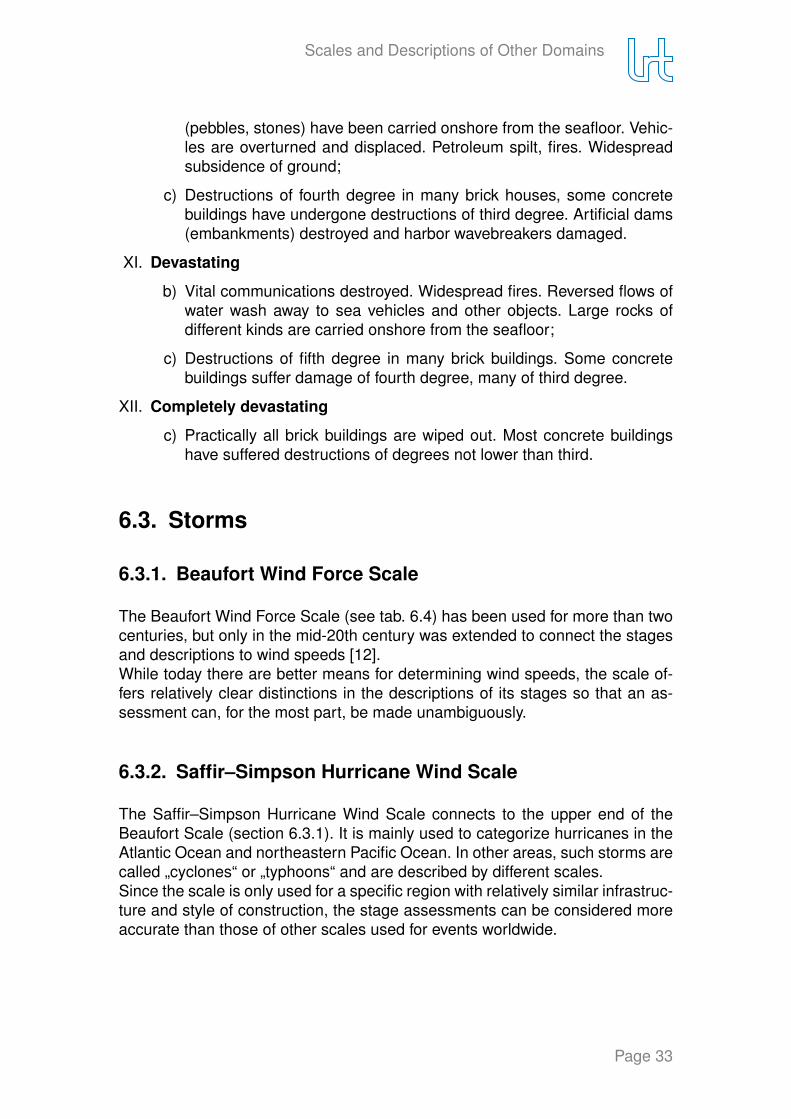
Scales and Descriptions of Other Domains
(pebbles, stones) have been carried onshore from the seafloor. Vehic-les are overturned and displaced. Petroleum spilt, fires. Widespreadsubsidence of ground;
c) Destructions of fourth degree in many brick houses, some concretebuildings have undergone destructions of third degree. Artificial dams(embankments) destroyed and harbor wavebreakers damaged.
XI. Devastating
b) Vital communications destroyed. Widespread fires. Reversed flows ofwater wash away to sea vehicles and other objects. Large rocks ofdifferent kinds are carried onshore from the seafloor;
c) Destructions of fifth degree in many brick buildings. Some concretebuildings suffer damage of fourth degree, many of third degree.
XII. Completely devastating
c) Practically all brick buildings are wiped out. Most concrete buildingshave suffered destructions of degrees not lower than third.
6.3. Storms
6.3.1. Beaufort Wind Force Scale
The Beaufort Wind Force Scale (see tab. 6.4) has been used for more than twocenturies, but only in the mid-20th century was extended to connect the stagesand descriptions to wind speeds [12].While today there are better means for determining wind speeds, the scale of-fers relatively clear distinctions in the descriptions of its stages so that an as-sessment can, for the most part, be made unambiguously.
6.3.2. Saffir–Simpson Hurricane Wind Scale
The Saffir–Simpson Hurricane Wind Scale connects to the upper end of theBeaufort Scale (section 6.3.1). It is mainly used to categorize hurricanes in theAtlantic Ocean and northeastern Pacific Ocean. In other areas, such storms arecalled „cyclones“ or „typhoons“ and are described by different scales.Since the scale is only used for a specific region with relatively similar infrastruc-ture and style of construction, the stage assessments can be considered moreaccurate than those of other scales used for events worldwide.
Page 33
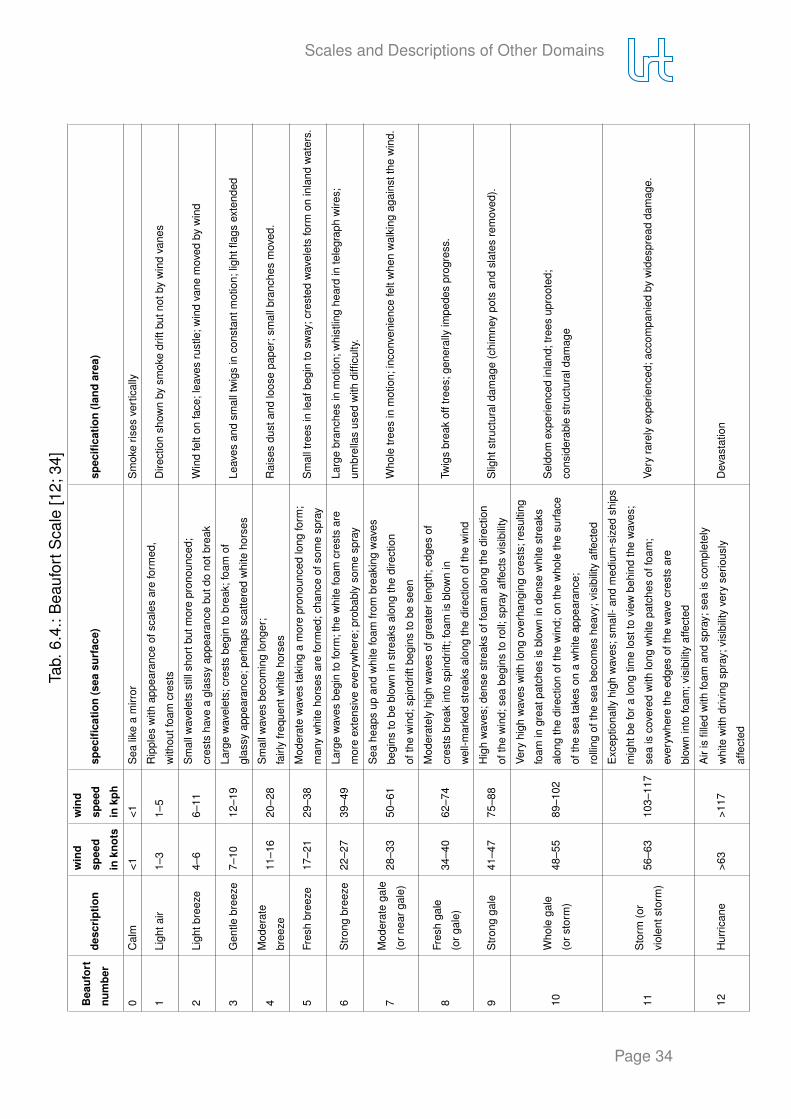
Scales and Descriptions of Other DomainsTa
b.6.
4.:B
eauf
ortS
cale
[12;
34]
Bea
ufor
t
num
ber
desc
ript
ion
win
d
spee
d
inkn
ots
win
d
spee
d
inkp
h
spec
ifica
tion
(sea
surf
ace)
spec
ifica
tion
(land
area
)
0C
alm
<1<1
Sea
like
am
irror
Sm
oke
rises
vert
ical
ly
1Li
ghta
ir1–
31–
5R
ippl
esw
ithap
pear
ance
ofsc
ales
are
form
ed,
with
outf
oam
cres
tsD
irect
ion
show
nby
smok
edr
iftbu
tnot
byw
ind
vane
s
2Li
ght b
reez
e4–
66–
11S
mal
l wav
elet
sst
illsh
ortb
utm
ore
pron
ounc
ed;
cres
tsha
vea
glas
syap
pear
ance
butd
ono
tbre
akW
ind
felt
onfa
ce;l
eave
sru
stle
;win
dva
nem
oved
byw
ind
3G
entle
bree
ze7–
1012
–19
Larg
ew
avel
ets;
cres
tsbe
gin
tobr
eak;
foam
of
glas
syap
pear
ance
;per
haps
scat
tere
dw
hite
hors
esLe
aves
and
smal
ltw
igs
inco
nsta
ntm
otio
n;lig
htfla
gsex
tend
ed
4M
oder
ate
bree
ze11
–16
20–2
8S
mal
lwav
esbe
com
ing
long
er;
fairl
yfre
quen
twhi
teho
rses
Rai
ses
dust
and
loos
epa
per;
smal
lbra
nche
sm
oved
.
5F r
esh
bree
ze17
–21
29–3
8M
oder
ate
wav
esta
king
am
ore
pron
ounc
edlo
ngfo
rm;
man
yw
hite
hors
esar
efo
rmed
;cha
nce
ofso
me
spra
yS
mal
l tre
esin
leaf
begi
nto
sway
;cre
sted
wav
elet
sfo
rmon
inla
ndw
ater
s.
6S
trong
bree
ze22
–27
39–4
9La
rge
wav
esbe
gin
tofo
rm;t
hew
hite
foam
cres
tsar
e
mor
eex
tens
ive
ever
ywhe
re;p
roba
bly
som
esp
ray
Larg
ebr
anch
esin
mot
ion;
whi
stlin
ghe
ard
inte
legr
aph
wire
s;
umbr
ella
sus
edw
ithdi
fficu
lty.
7M
oder
ate
gale
(orn
earg
ale)
28–3
350
–61
Sea
heap
sup
and
whi
tefo
amfro
mbr
eaki
ngw
aves
begi
nsto
bebl
own
inst
reak
sal
ong
the
dire
ctio
n
ofth
ew
ind;
spin
drift
begi
nsto
bese
en
Who
letre
esin
mot
ion;
inco
nven
ienc
efe
ltw
hen
wal
king
agai
nstt
hew
ind.
8F r
esh
gale
(org
ale)
34–4
062
–74
Mod
erat
ely
high
wav
esof
grea
terl
engt
h;ed
ges
of
cres
tsbr
eak
into
spin
drift
;foa
mis
blow
nin
wel
l-mar
ked
stre
aks
alon
gth
edi
rect
ion
ofth
ew
ind
T wig
sbr
eak
offt
rees
;gen
eral
lyim
pede
spr
ogre
ss.
9S
trong
gale
41–4
775
–88
Hig
hw
aves
;den
sest
reak
sof
foam
alon
gth
edi
rect
ion
ofth
ew
ind;
sea
begi
nsto
roll;
spra
yaf
fect
svi
sibi
lity
Slig
htst
ruct
ural
dam
age
(chi
mne
ypo
tsan
dsl
ates
rem
oved
).
10W
hole
gale
(ors
torm
)48
–55
89–1
02
V ery
high
wav
esw
ithlo
ngov
erha
ngin
gcr
ests
;res
ultin
g
foam
ingr
eatp
atch
esis
blow
nin
dens
ew
hite
stre
aks
alon
gth
edi
rect
ion
ofth
ew
ind;
onth
ew
hole
the
surfa
ce
ofth
ese
ata
kes
ona
whi
teap
pear
ance
;
rolli
ngof
the
sea
beco
mes
heav
y;vi
sibi
lity
affe
cted
Sel
dom
expe
rienc
edin
land
;tre
esup
root
ed;
cons
ider
able
stru
ctur
alda
mag
e
11S
tor m
(or
viol
ents
torm
)56
–63
103–
117
Exc
eptio
nally
high
wav
es;s
mal
l-an
dm
ediu
m-s
ized
ship
s
mig
htbe
fora
long
time
lost
tovi
ewbe
hind
the
wav
es;
sea
isco
vere
dw
ithlo
ngw
hite
patc
hes
offo
am;
ever
ywhe
reth
eed
ges
ofth
ew
ave
cres
tsar
e
blow
nin
tofo
am;v
isib
ility
affe
cted
V ery
rare
lyex
perie
nced
;acc
ompa
nied
byw
ides
prea
dda
mag
e.
12H
urric
ane
>63
>117
Air
isfil
led
with
foam
and
spra
y;se
ais
com
plet
ely
whi
tew
ithdr
ivin
gsp
ray;
visi
bilit
yve
ryse
rious
ly
affe
cted
Dev
asta
tion
Page 34

Scales and Descriptions of Other Domains
Tab.
6.5.
:Saf
fir–S
imps
onH
urric
ane
Win
dS
cale
[13]
Cat
e-
gor y
Sus
tain
ed
Win
dsT y
pes
ofD
amag
eD
ueto
Hur
rica
neW
inds
164
-82
kt
119-
153
km/h
Very
dang
erou
sw
inds
will
prod
uce
som
eda
mag
e:W
ell-c
onst
ruct
edfra
me
hom
esco
uld
have
dam
age
toro
ofsh
ingl
es,v
inyl
sidi
ngan
dgu
tters
.Lar
gebr
anch
esof
trees
will
snap
and
shal
low
lyro
oted
trees
may
beto
pple
d.E
xten
sive
dam
age
topo
wer
lines
and
pole
s,lik
ely
will
resu
ltin
pow
erou
tage
sth
at
coul
dla
sta
few
tose
vera
lday
s.
283
-95
kt
154-
177
km/h
Ext
rem
ely
dang
erou
sw
inds
will
caus
eex
tens
ive
dam
age:
Wel
l-con
stru
cted
fram
eho
mes
coul
d
sust
ain
maj
orro
ofan
dsi
ding
dam
age.
Man
ysh
allo
wly
root
edtre
esw
illbe
snap
ped
orup
root
ed
and
bloc
knu
mer
ous
road
s.N
ear-
tota
lpow
erlo
ssis
expe
cted
with
outa
ges
that
coul
dla
stfro
m
seve
rald
ays
tow
eeks
.
396
-112
kt
178-
208
km/h
Dev
asta
ting
dam
age
will
occu
r:W
ell-b
uilt
fram
edho
mes
may
incu
rmaj
orda
mag
eor
rem
oval
ofro
ofde
ckin
gan
dga
ble
ends
.Man
ytre
esw
illbe
snap
ped
orup
root
ed,b
lock
ing
num
erou
sro
ads.
Ele
ctric
ityan
dw
ater
will
beun
avai
labl
efo
rsev
eral
days
tow
eeks
afte
rthe
stor
mpa
sses
.
411
3-13
6kt
209-
251
km/h
Cat
astro
phic
dam
age
will
occu
r:W
ell-b
uilt
fram
edho
mes
can
sust
ain
seve
reda
mag
ew
ithlo
ss
ofm
osto
fthe
roof
stru
ctur
ean
d/or
som
eex
terio
rwal
ls.M
ostt
rees
will
besn
appe
dor
upro
oted
and
pow
erpo
les
dow
ned.
Falle
ntre
esan
dpo
wer
pole
s,w
illis
olat
ere
side
ntia
lare
as.P
ower
outa
ges
will
last
wee
ksto
poss
ibly
mon
ths.
Mos
toft
hear
eaw
illbe
unin
habi
tabl
efo
rwee
ksor
mon
ths.
5
137
kt
orhi
gher
252
km/h
orhi
gher
Cat
astro
phic
dam
age
will
occu
r:A
high
perc
enta
geof
fram
edho
mes
will
bede
stro
yed,
with
tota
l
roof
failu
rean
dw
allc
olla
pse.
Falle
ntre
esan
dpo
wer
pole
sw
illis
olat
ere
side
ntia
lare
as.P
ower
outa
ges
will
last
forw
eeks
topo
ssib
lym
onth
s.M
osto
fthe
area
will
beun
inha
bita
ble
forw
eeks
orm
onth
s.
Page 35
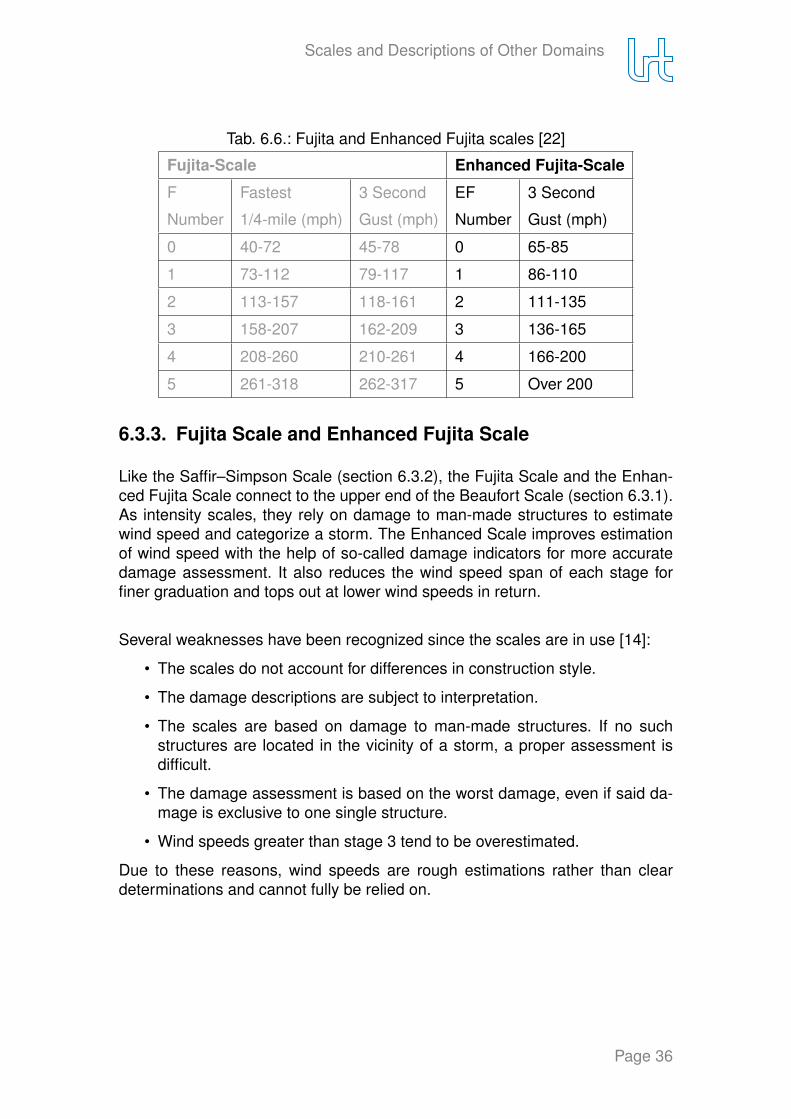
Scales and Descriptions of Other Domains
Tab. 6.6.: Fujita and Enhanced Fujita scales [22]
Fujita-Scale Enhanced Fujita-Scale
F
Number
Fastest
1/4-mile (mph)
3 Second
Gust (mph)
EF
Number
3 Second
Gust (mph)
0 40-72 45-78 0 65-85
1 73-112 79-117 1 86-110
2 113-157 118-161 2 111-135
3 158-207 162-209 3 136-165
4 208-260 210-261 4 166-200
5 261-318 262-317 5 Over 200
6.3.3. Fujita Scale and Enhanced Fujita Scale
Like the Saffir–Simpson Scale (section 6.3.2), the Fujita Scale and the Enhan-ced Fujita Scale connect to the upper end of the Beaufort Scale (section 6.3.1).As intensity scales, they rely on damage to man-made structures to estimatewind speed and categorize a storm. The Enhanced Scale improves estimationof wind speed with the help of so-called damage indicators for more accuratedamage assessment. It also reduces the wind speed span of each stage forfiner graduation and tops out at lower wind speeds in return.
Several weaknesses have been recognized since the scales are in use [14]:
• The scales do not account for differences in construction style.
• The damage descriptions are subject to interpretation.
• The scales are based on damage to man-made structures. If no suchstructures are located in the vicinity of a storm, a proper assessment isdifficult.
• The damage assessment is based on the worst damage, even if said da-mage is exclusive to one single structure.
• Wind speeds greater than stage 3 tend to be overestimated.
Due to these reasons, wind speeds are rough estimations rather than cleardeterminations and cannot fully be relied on.
Page 36
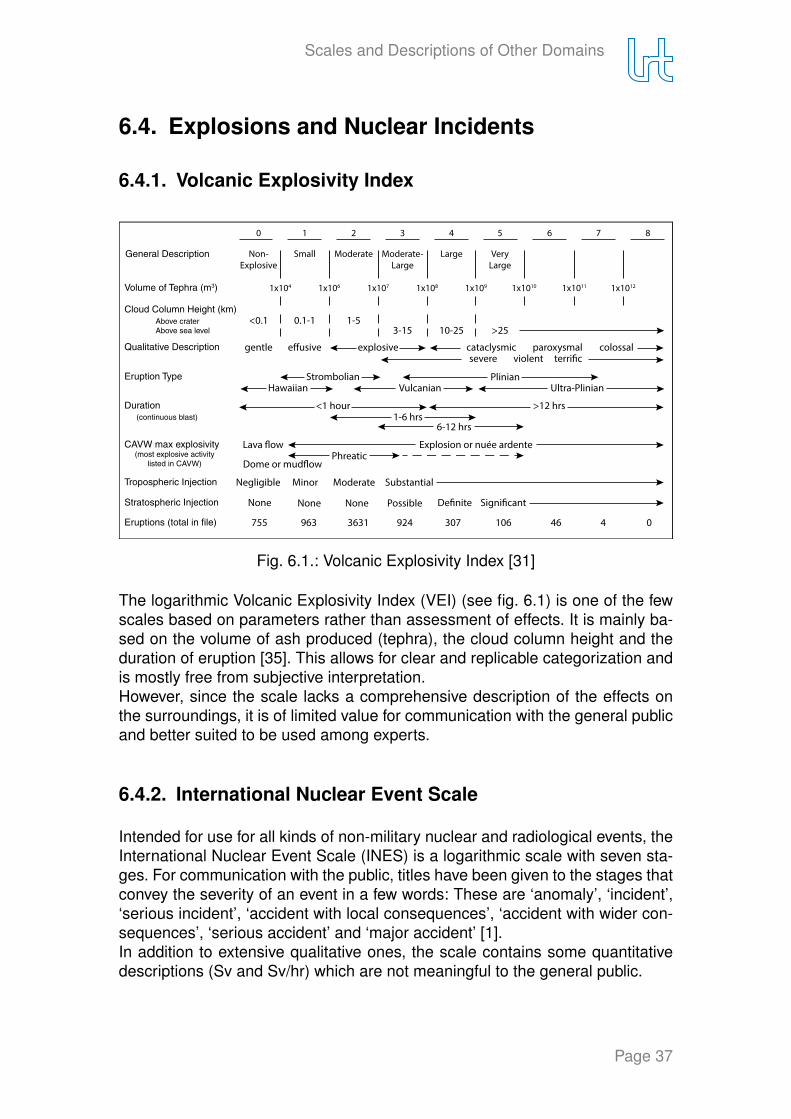
Scales and Descriptions of Other Domains
6.4. Explosions and Nuclear Incidents
6.4.1. Volcanic Explosivity Index
Eruptions (total in file)
CAVW max explosivity(most explosive activity
listed in CAVW)
Duration(continuous blast)
General Description
Volume of Tephra (m3)
Stratospheric Injection
Tropospheric Injection
Cloud Column Height (km) Above crater Above sea level
Qualitative Description
Eruption Type
Non-Explosive
Small Moderate Moderate-Large
Large Very Large
0 1 2 3 4 5 6 7 8
1x10⁴ 1x10⁶ 1x10⁷ 1x10⁸ 1x10⁹ 1x10¹⁰ 1x10¹¹ 1x10¹²
<0.1 0.1-1 1-53-15 10-25 >25
gentle e�usive explosive cataclysmic paroxysmal colossalsevere violent terri�c
Strombolian PlinianHawaiian Vulcanian Ultra-Plinian
<1 hour >12 hrs1-6 hrs
6-12 hrs
Lava �ow Explosion or nuée ardentePhreatic
Dome or mud�ow
Negligible Minor Moderate Substantial
None None None Possible De�nite Signi�cant
755 963 3631 924 307 106 46 4 0
Fig. 6.1.: Volcanic Explosivity Index [31]
The logarithmic Volcanic Explosivity Index (VEI) (see fig. 6.1) is one of the fewscales based on parameters rather than assessment of effects. It is mainly ba-sed on the volume of ash produced (tephra), the cloud column height and theduration of eruption [35]. This allows for clear and replicable categorization andis mostly free from subjective interpretation.However, since the scale lacks a comprehensive description of the effects onthe surroundings, it is of limited value for communication with the general publicand better suited to be used among experts.
6.4.2. International Nuclear Event Scale
Intended for use for all kinds of non-military nuclear and radiological events, theInternational Nuclear Event Scale (INES) is a logarithmic scale with seven sta-ges. For communication with the public, titles have been given to the stages thatconvey the severity of an event in a few words: These are ‘anomaly’, ‘incident’,‘serious incident’, ‘accident with local consequences’, ‘accident with wider con-sequences’, ‘serious accident’ and ‘major accident’ [1].In addition to extensive qualitative ones, the scale contains some quantitativedescriptions (Sv and Sv/hr) which are not meaningful to the general public.
Page 37

Scales and Descriptions of Other Domains
Def
ence
in d
epth
50 m
Sv/
h.
Fig. 6.2.: International Nuclear Event Scale [1]Page 38

Scales and Descriptions of Other Domains
6.4.3. Chemical and Nuclear Explosions
In fact a metric rather than a scale, chemical and nuclear explosions are cha-racterized by yield which is typically given in Tons TNT. Yield is the amount ofreleased energy. Since there is usually no direct way to measure it, particularlyin the case of nuclear explosions, determining yield can be complex and difficultand usually comes with a high level of uncertainty.
As a means of communication with the public, yield is not useful. While manypeople may have heard the unit „Tons TNT“ (or rather the multiples „KilotonsTNT“ or „Megatons TNT“), few have an intuitive understanding of how mucha Ton TNT of released energy is and what extent of damage this relates to.Therefore it holds no more meaning than other energy units such as Joule.
Page 39
Introducing a New Hazard Scale
7. Introducing a New Hazard Scale
7.1. General Issues
As can be seen in sections 5 and 6, the creation of a hazard scale often comeswith several difficulties. The most significant are:
• Number of stages:With few stages, one stage encompasses a large variance of effects.Events classified as the same stage can therefore have vastly differentconsequences. If the severity of an event cannot accurately be told fromthe stage value, the scale loses its benefit. This issue comes into play allthe more with impact hazard scales where effects cover a vast range from„shooting star“ to „global annihilation“.With more stages, chances are higher that predicted events are categori-zed incorrectly since small deviations and errors are more likely to makea difference. It also becomes more difficult to differentiate verbal descrip-tions of stages from one another to the point where the finer graduationmay lose its meaning.
• Projection:Complex multidimensional models are hard to understand for the generalpublic and have to be projected into a one-dimensional scale. This promptsthe question which parts of a model can safely be simplified and to whatdegree before the scale becomes pointless.
• Regional differences:Despite similar parameters, the effects caused by an impactor may varyconsiderably among different regions. This is due to different geologicalconditions, construction styles and infrastructure.For illustration, one may consider the 2016 Kumamoto (Japan) earthqua-ke and the the 2011 Haiti earthquake. Despite both of them scoring a 7.0Magnitude and occuring in a densely populated area, the latter’s conse-quences were much more severe. In Kumamoto, around 50 people diedand 3000 were injured whereas in Haiti the deathtoll alone was in the orderof hundred thousands.
The proposed scale that is presented in the following section addresses the firstand the second issue. The last issue cannot be solved generally for a scale ofglobal scope. For better results, the scale would have to be adjusted to regionalcircumstances.
Page 40

Introducing a New Hazard Scale
7.2. Description of the Scale
The scale consists of eleven stages representing zones. Each of these zonescorresponds to a certain level of impact effect intensity. In the simplest case, thezones are circle-shaped and expand radially from the impact site in descendingorder of severity. As an example, see fig. 7.1.
Fig. 7.1.: Zone map for impact of 1015 J impactor in Saskatchewan, Canada, atdifferent magnification levels. The flat and relatively homogenous
terrain is likely to provide circle-shaped zones. Map background: [23].
Page 41
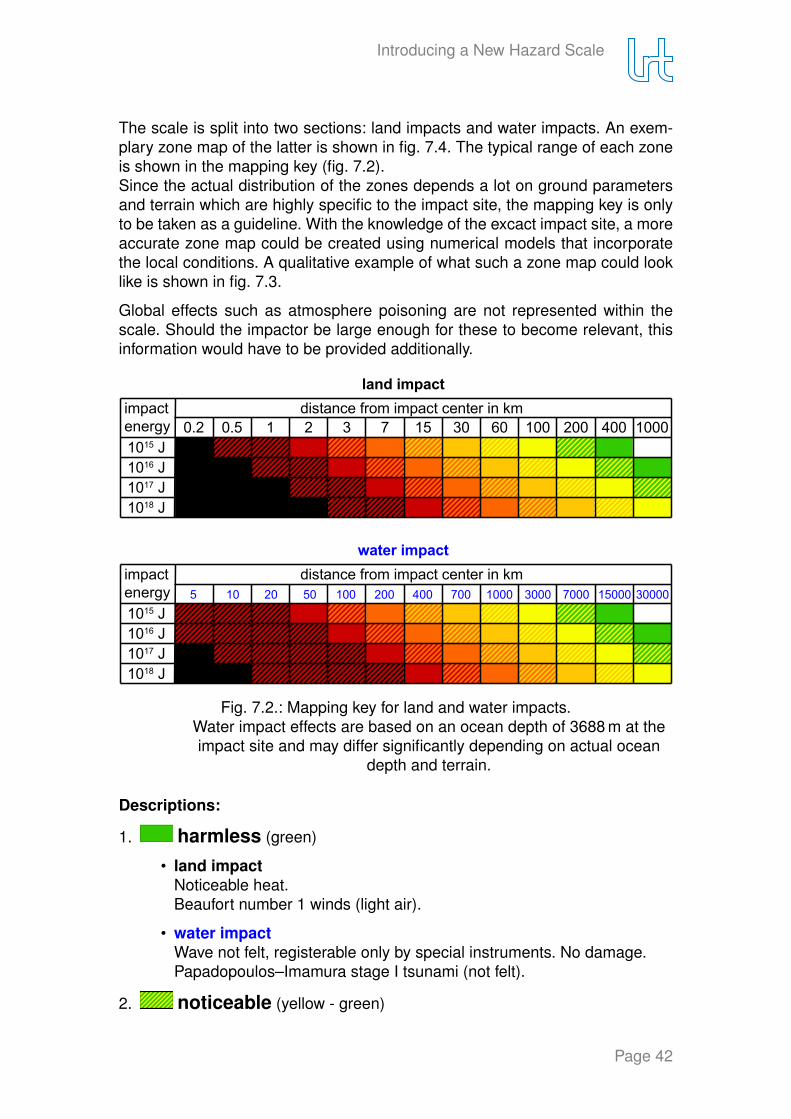
Introducing a New Hazard Scale
The scale is split into two sections: land impacts and water impacts. An exem-plary zone map of the latter is shown in fig. 7.4. The typical range of each zoneis shown in the mapping key (fig. 7.2).Since the actual distribution of the zones depends a lot on ground parametersand terrain which are highly specific to the impact site, the mapping key is onlyto be taken as a guideline. With the knowledge of the excact impact site, a moreaccurate zone map could be created using numerical models that incorporatethe local conditions. A qualitative example of what such a zone map could looklike is shown in fig. 7.3.
Global effects such as atmosphere poisoning are not represented within thescale. Should the impactor be large enough for these to become relevant, thisinformation would have to be provided additionally.
distance from impact center in kmimpact energy 0.2 0.5 1 2 3 7 15 30 60 100 200 400 10001015 J1016 J1017 J1018 J
distance from impact center in kmimpact energy 50 100 200 400 700 1000 3000 7000 15000 300005 10 201015 J1016 J1017 J1018 J
land impact
water impact
Fig. 7.2.: Mapping key for land and water impacts.Water impact effects are based on an ocean depth of 3688 m at theimpact site and may differ significantly depending on actual ocean
depth and terrain.
Descriptions:
1.0.5
harmless (green)
• land impactNoticeable heat.Beaufort number 1 winds (light air).
• water impactWave not felt, registerable only by special instruments. No damage.Papadopoulos–Imamura stage I tsunami (not felt).
2.0.5
noticeable (yellow - green)
Page 42

Introducing a New Hazard Scale
• land impactStrong heat.Beaufort number 1 winds (light air).
• water impactNoticeable wave, but no damage.Papadopoulos–Imamura stage III tsunami (weak).
3.0.5
weak (yellow)
• land impactFirst degree burns if exposed.Beaufort number 1 winds (light air).
• water impactNoticeable wave, may be observed on the shore. Some light boats slight-ly carried onto the shore.Papadopoulos–Imamura stage IV tsunami (largely observed).
4.0.5
detrimental (orange - yellow)
• land impactThird degree burns, grass and deciduous trees ignite if exposed.Beaufort number 3 winds (gentle breeze).
• water impactLimited flooding of coastal land and structures. Many light vessels car-ried inland.Papadopoulos–Imamura stage V tsunami (strong).
5.0.5
harmful (orange)
• land impactClothing and trees ignite if exposed.Beaufort number 3 winds (gentle breeze).
• water impactMany light vessels carried inland. Some wooden structures destroyed.Papadopoulos–Imamura stage VI tsunami (slightly damaging).
6.0.5
severe (dark orange - orange)
• land impactFirestorm. Glass windows shatter.Beaufort number 8 winds (gale), Saffir-Simpson category 1 winds (verydangerous winds, some damage).
• water impactSome people carried away to sea. Most light vessels damaged, somelarge vessels carried ashore. Many floating structures carried out to sea.Many wooden structures damaged or carried out to sea.Papadopoulos–Imamura stage VIII tsunami (heavily damaging).
Page 43

Introducing a New Hazard Scale
7.0.5
damaging (dark orange)
• land impactDevastation. Firestorm. Roofs are severely damaged, wood frame buil-dings collapse.Saffir-Simpson category 2 winds (extremely dangerous winds, extensi-ve damage).
• water impactMost people carried away. Most large vessels carried inland, vehiclesoverturned and displaced. Fires. Artificial dams destroyed, harbor wa-vebreakers damaged.Papadopoulos–Imamura stage X tsunami (very destructive).
8.0.5
disruptive (red - dark orange)
• land impactWidespread devastation. Firestorm. Multistory wall-bearing buildings col-lapse.Saffir-Simpson category 5 winds (catastrophic damage).
• water impactVehicles carried out to sea. Most buildings severely damaged. Widespreadfires.Papadopoulos–Imamura stage XI tsunami (devastating).
9.0.5
destructive (red)
• land impactNear-complete devastation. Extreme firestorm. Steel-framed buildingssuffer extreme distortions, all other buildings and most bridges collapse.Cars and trucks are overturned and displaced.
• water impactBrick buildings wiped out, most concrete buildings severely damaged.Papadopoulos–Imamura stage XII tsunami (completely devastating).
10.0.5
devastating (black - red)
• land impactImmediate vicinity of the fireball. Complete devastation. Extreme fire-storm. All buildings and bridges collapse. Cars and trucks are largelydisplaced and grossly distorted.
• water impactImmediate vicinity of the impact cavity. All buildings wiped out.
11.0.5
annihilating (black)
• land impactRange of crater and fireball. Complete devastation without exception.Terrain is entirely reshaped.
Page 44
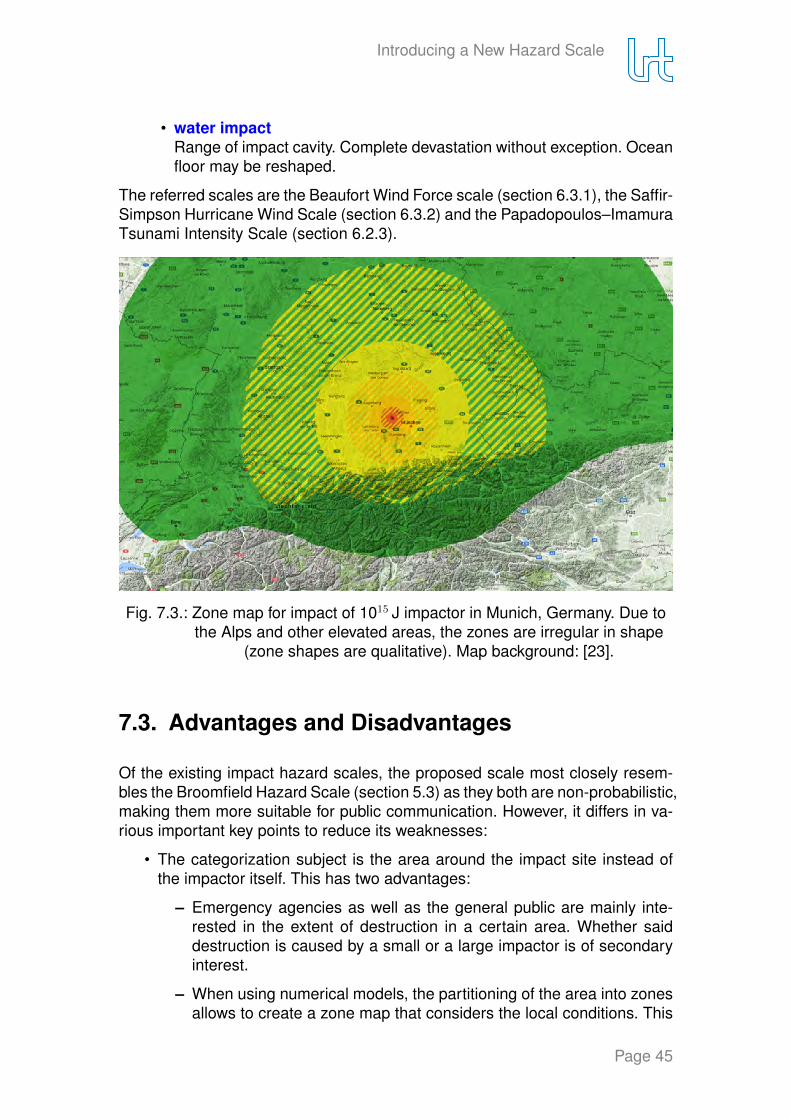
Introducing a New Hazard Scale
• water impactRange of impact cavity. Complete devastation without exception. Oceanfloor may be reshaped.
The referred scales are the Beaufort Wind Force scale (section 6.3.1), the Saffir-Simpson Hurricane Wind Scale (section 6.3.2) and the Papadopoulos–ImamuraTsunami Intensity Scale (section 6.2.3).
Fig. 7.3.: Zone map for impact of 1015 J impactor in Munich, Germany. Due tothe Alps and other elevated areas, the zones are irregular in shape
(zone shapes are qualitative). Map background: [23].
7.3. Advantages and Disadvantages
Of the existing impact hazard scales, the proposed scale most closely resem-bles the Broomfield Hazard Scale (section 5.3) as they both are non-probabilistic,making them more suitable for public communication. However, it differs in va-rious important key points to reduce its weaknesses:
• The categorization subject is the area around the impact site instead ofthe impactor itself. This has two advantages:
– Emergency agencies as well as the general public are mainly inte-rested in the extent of destruction in a certain area. Whether saiddestruction is caused by a small or a large impactor is of secondaryinterest.
– When using numerical models, the partitioning of the area into zonesallows to create a zone map that considers the local conditions. This
Page 45

Introducing a New Hazard Scale
Fig. 7.4.: Zone map for impact of 1015 J impactor in the Southern Pacific (top).Since the tsunami only affects coastal regions, an alternative
rendering (bottom) may be preferable to prevent confusion (affectedcoast area is qualitative). Map background: [23].
Page 46

Introducing a New Hazard Scale
can provide a much higher accuracy and a better idea of the impactconsequences.
• Instead of diameter, the scale is based on kinetic energy which is calcula-ted from several parameters, one of which is diameter.It may be argued that diameter is more intuitive for the layman and easierto determine. This would certainly be the case if an impactor’s diameterwas easily recognizable for the general public which could then reproducethe classification. But since only experts have the means to detect andmeasure impactors long before impact, the classification of an impactorcan only be done by experts in any case. At this point, using a more tan-gible physical property does not bring any advantage.While it may not be possible to determine some of the necessary parame-ters with high precision, this would still be more accurate than assumingaverage values.
• The scale provides a much higher number of stages. This allows for a mo-re precise estimation of the damage extent. However, this also means thatinaccurate input parameters or impact models are more likely to lead to anincorrect classification of an area.For a simpler, less detailed scale, stages can also be left out. The cor-responding zones would then merge with the zones of the next-higherstages.
• With the exception of black which is universally understood, the stage co-lors are limited to the range of traffic light colors. To account for a highernumber of stages, mixed colors are used. This allows a much more intuiti-ve understanding when colors are viewed without context.
• The extent of destruction in the zones is described in-depth.Impacts are extremely rare. Unlike for storms, earthquakes, tsunamis andvolcano eruptions in some parts of the world, there is no intuitive under-standing of their consequences. So whenever applicable, the values ofhazard scales from other, more common domains are referenced in orderto provide a better idea of what to expect.
However, the advantage of zones and a high number of stages is also a han-dicap: For meaningful results, the exact impact location and the impactors pa-rameters have to be known which is not always a given. Otherwise, a scale ofsuch detail conjures the misleading impression of a high degree of accuracywhich – in this case – is not sufficiently grounded in reality.
7.4. Quantitative Foundation
For illustration, the effects of three different impactors have been plotted accor-ding to the quantitative model in section 4. In order to cover a wide range, theimpact energies were selected as E � 1017 J, E � 1020 J and E �1023 J. The
Page 47

Introducing a New Hazard Scale
Fig. 7.5.: Effects over distance for three different impactors,color coded for effects (top) and impact energy (bottom)
Page 48

Introducing a New Hazard Scale
Fig. 7.6.: Comparison between overpressure and thermal exposure
lowest impact energy corresponds to that of the Tunguska event, whereas thehighest is similar to that of the Chicxulub impactor.A summary of the graphs is shown in fig. 7.5, single graphs for each effect areavailable in the appendix. Comparing the plots, it can be shown that the effectsdo not scale in proportion to each other.
In figure 7.6, thermal exposure and overpressure have been picked as an ex-ample while the other effects were discarded for a clearer view.Choosing an arbitrary point X on the overpressure plot of the middle impactor,the corresponding thermal exposure at the same distance is visible at point A.The same overpressure value is selected for a higher impact energy which natu-rally puts the point X* at a greater distance from the impact. If the effects scaledproportionally, the corresponding thermal exposure value were to be expectedat point A*. In reality, it is at point B* which, in this case, deviates from A* by afactor of ten.Similar relationships can be observed between most of the effects. The excepti-on are those that are linked directly, such as pressure p and wind peak velocityu.The consequence is that between two differently sized impacts, the extent ofsingle effects in the same zone will differ. Whether that difference is significantdepends on the difference of the selected impact energies, which means thatthe zones are only reasonably accurate for a certain range of impact energies.Since they are much more common, the zones are defined with respect to smallimpactors (1015 - 1016 J). It is also prudent to assume that the mathematicalmodel fits smaller impactors much better since it has been created after rela-
Page 49

Introducing a New Hazard Scale
tively small explosions. Data on very large explosions, let alone actual impacts,is even more limited and it is difficult to discern how the effects would behave.
For the mapping key (fig. 7.2), impact energies from 1015 J to 1018 J have beenconsidered. The mapping key can be extended for impactors of higher impactenergies. Impactors of lower impact energies are likely to burn up in the atmos-phere which is why it makes little sense to cover them within this scale.
Since some of the effects described in section 2 dominate the others in termsof destructive potential, the scale is primarily adjusted with respect to those. Animpact-induced earthquake, for example, does little damage compared to theoverpressure caused by the same impactor and can therefore be neglected.For land impacts, the dominating effects are overpressure and thermal expos-ure. In case of a water impact, the tsunami wave overpowers all the other effects,which is why there are separate mapping keys for land and water impacts.
Page 50

Conclusion
8. Conclusion
Unlike previous scales, the proposed scale is suitable to provide an image of thedamage extent of an impact by separating the affected area into multiple zones.
The accuracy of the scale hinges on the mathematical impact effects modelwhich, to date, is rather primitive. Significant deviations from the effects of anactual impact are to be expected, especially for water impacts. This issue couldbe circumvented by using numerical models adjusted to individual impacts atthe cost of significantly more effort and resources. Regardless of the mathe-matical model, the scale requires a precise impact location to give meaningfulresults.Some effects have been neglected either because their destructive potential isdiminutive in comparison or because they occur on a global level and cannot befitted into a zone map. Since the effects scale disproportionately, the scale beco-mes less accurate for bigger impactors. It only covers impactors that reach theground, so a question mark remains with respect to impactors that disintegrateinto an airburst.
As is the case for all hazard scales, this scale can never paint the entire picture.For public communication, the scale should always be used as one tool amongmany.
Page 51

Sources
A. Sources
[1] International Atomic Energy Agency. INES - The International Nucle-ar and Radiological Event Scale - User’s Manual. 2009. URL http:
//www.webcitation.org/5xIjE1vS9.
[2] Japan Meteorological Agency. Tables explaining the JMA Seismic Inten-sity Scale. Accessed 23.06.2016 URL http://www.jma.go.jp/jma/en/
Activities/inttable.html.
[3] Nicholas J. Bailey. NEOimpactor - A Tool for Assessing Earths Vulernabi-lity to the NEO Impact Hazard. Dissertation, University of Southhampton,2009.
[4] Nicholas J. Bailey, Graham G. Swinerd, Hugh G. Lewis, und R. Crowther.Global vulnerability to near-Earth object impact. Risk Management, feb2010.
[5] Michael J. S. Belton, Thomas H. Morgan, Nalin H. Samarasinha, und Do-nald K. Yeomans. Mitigation of Hazardous Comets and Asteroids. Cam-bridge University Press, 2004. ISBN 0 521 82764 7.
[6] Richard P. Binzel. The Torino Impact Hazard Scale, 1999. Accessed16.05.2016 URL http://neo.jpl.nasa.gov/torino_scale.html.
[7] Richard P. Binzel. The Torino Impact Hazard Scale. Planetary and SpaceScience, (48):297–303, 2000.
[8] B.A. Bolt, W.L.Horn, G. A. Macdonald, und R. F. Scott. Geological Hazards.Springer-Verlag, 1975. ISBN 978-1-4615-7101-8.
[9] Mark Boslough. Airburst warning and response. Acta Astronautica. URLhttp://dx.doi.org/10.1016/j.actaastro.2013.09.007.
[10] M.B.E. Boslough und D.A. Crawford. Low-altitude airbursts and the impactthreat. International Journal of Impact Engineering, (35):1441–1448, 2008.
[11] Charlie Brennan. Secure World Foundation’s ’Broomfield scale’confronts cosmic threats, 12 2014. Accessed 17.05.2016 URLhttp://www.dailycamera.com/science_environment/ci_27174354/
new-broomfield-scale-confronts-cosmic-threats-secure-world-foundation.
Page 52
[12] Encyclopædia Britannica. Beaufort scale. Accessed 06.06.2016 URLhttp://www.britannica.com/science/Beaufort-scale.
[13] National Hurricane Center. Saffir-Simpson Hurricane Wind Scale. Acces-sed 06.06.2016 URL http://www.nhc.noaa.gov/aboutsshws.php.
[14] NOAA / National Weather Service Strom Prediction Center. The Enhan-ced Fujita Scale. Accessed 07.06.2016 URL http://www.spc.noaa.gov/
efscale/.
[15] Paul Chodas. The Palermo Technical Impact Hazard Scale, 2005. Acces-sed 06.06.2016 URL http://neo.jpl.nasa.gov/risk/doc/palermo.html.
[16] Gareth S. Collins, H. Jay Melosh, , und Robert A. Marcus. Earth Impact Ef-fects Program: A Web-based computer program for calculating the regionalenvironmental consequences of a meteoroid impact on Earth. Meteoritics& Planetary Science, 40(6):817–840, 2005.
[17] B. A. Doodkorte. NEO Impact Assessment Tools: Database and Quantifi-cation of Uncertainty. (ESA-SSA-NEO-RP-0155), 2016.
[18] Matteo Emanuelli, Bruno Sarli, Niels van der Pas, Lauren Lyons, BehnooshMeskoob, Daniele Paglialunga, und Shripad Jagdale. The near earth ob-ject threat: An effective public communication strategy. 65th InternationalAstronautical Congress, Toronto, Canada, 2014.
[19] Milton Garces. Warning Shot: The Cheliabinsk Impactor, November 2013.Accessed 17.06.2016 URL http://isoundhunter.blogspot.de/2013/11/
warning-shot-cheliabinsk-impactor.html.
[20] Victoria Garshnek, David Morrison, und Frederick M. Burkle Jr. The miti-gation, management, and survivability of asteroid/comet impact with Earth.Space Policy, (16):213–222, 2000.
[21] Samuel Glasstone und Philip J. Dolan. The Effects of Nuclear Wea-pons. United States Department of Defense, Energy Research and Deve-lopment Administration, 1977. URL https://www.fourmilab.ch/etexts/
www/effects/.
[22] Elaine Godfrey. The Enhanced Fujita Tornado Scale, 2008. Ac-cessed 07.06.2016 URL http://www.ncdc.noaa.gov/oa/satellite/
satelliteseye/educational/fujita.html.
[23] Google. Google Maps. Accessed 03.08.2016 .
[24] IAWN. Workshop on Communicating About Asteroid Impact Warnings andMitigation Plans, September 2014. Accessed 17.05.2016 URL http://
swfound.org/media/186555/iawn_communication_workshop_report.pdf.
[25] Boris W. Levin und Mikhail A. Nosov. Physics of Tsunamis. Springer Inter-national Publishing Switzerland, 2. Auflage, 2016. ISBN 978-3-319-24037-4.
Page 53

[26] David Morrison, Clark R. Chapman, Duncan Steel, und Richard P. Binzel.Impacts and the public: communicating the nature of the impact hazard.Mitigation of Hazardous Comets and Asteroids, S. 353–390, 2004.
[27] NASA. NASA Near Earth Object Program - The Torino Impact Hazard Sca-le. Accessed 17.05.2016 URL http://neo.jpl.nasa.gov/torino_scale.
html.
[28] NASA NEO. Population Density, 2000. Accessed 04.07.2016 URL http:
//neo.sci.gsfc.nasa.gov/view.php?datasetId=SEDAC_POP.
[29] U.S. Department of Health und Human Services Public Health Service.Communicating in a Crisis: Risk Communication Guidelines for Public Of-ficials. Rockville, MD, 2002.
[30] Gerassimos A. Papadopoulos und Fumihiko Imamura. A proposal for anew tsunami intensity scale. ITS 2001 Proceedings, 5(5-1):569–577, 2001.
[31] Global Volcanism Program. Eruption Data Criteria. Accessed23.06.2016 URL https://web.archive.org/web/20121013133931/http:
//www.volcano.si.edu/world/eruptioncriteria.cfm.
[32] Clemens Rumpf, Hugh G. Lewis, und Peter M. Atkinson. The Global ImpactDistribution of Near-Earth Objects. Icarus, 265:207–209, feb 2016.
[33] National Ocean Service. How deep is the ocean? Accessed 23.07.2016URL http://oceanservice.noaa.gov/facts/oceandepth.html.
[34] Royal Meteorological Society. Beaufort Scale for Land Areas. Ac-cessed 06.06.2016 URL https://www.rmets.org/weather-and-climate/
observing/beaufort-scale.
[35] United States Geological Survey. Volcanic Explosivity Index. Ac-cessed 24.06.2016 URL http://ete.cet.edu/gcc/style/docs/VEI_
information.pdf.
[36] U.S. Geological Survey. How much water is there on, in, and abo-ve the Earth? Accessed 04.07.2016 URL http://water.usgs.gov/edu/
earthhowmuch.html.
[37] U.S. Geological Survey. Measuring the Size of an Earthquake. Accessed30.06.2016 URL http://earthquake.usgs.gov/learn/topics/measure.
php.
[38] U.S. Geological Survey. The Modified Mercalli Intensity Scale. Accessed05.06.2016 URL http://earthquake.usgs.gov/learn/topics/mercalli.
php.
[39] U.S. Geological Survey. The Severity of an Earthquake. Acces-sed 05.06.2016 URL http://pubs.usgs.gov/gip/earthq4/severitygip.
html.
Page 54

[40] V. V.v Svetsov, I. V. Nemtchinov, und A. V. Teterev. Disintegration of LargeMeteroids in Earth’s Atmosphere: Theoretical Models. Icarus, 116:131–153, 1995.
[41] Michigan Tech University. Modified Mercalli Intensity Scale. Accessed05.06.2016 URL http://www.geo.mtu.edu/UPSeis/Mercalli.html.
[42] Michael S. Wogaltera, Vincent C. Conzolaa, und Tonya L. Smith-Jackson.Research-based guidelines for warning design and evaluation. AppliedErgonomics, (33):219–230, 2002.
Page 55
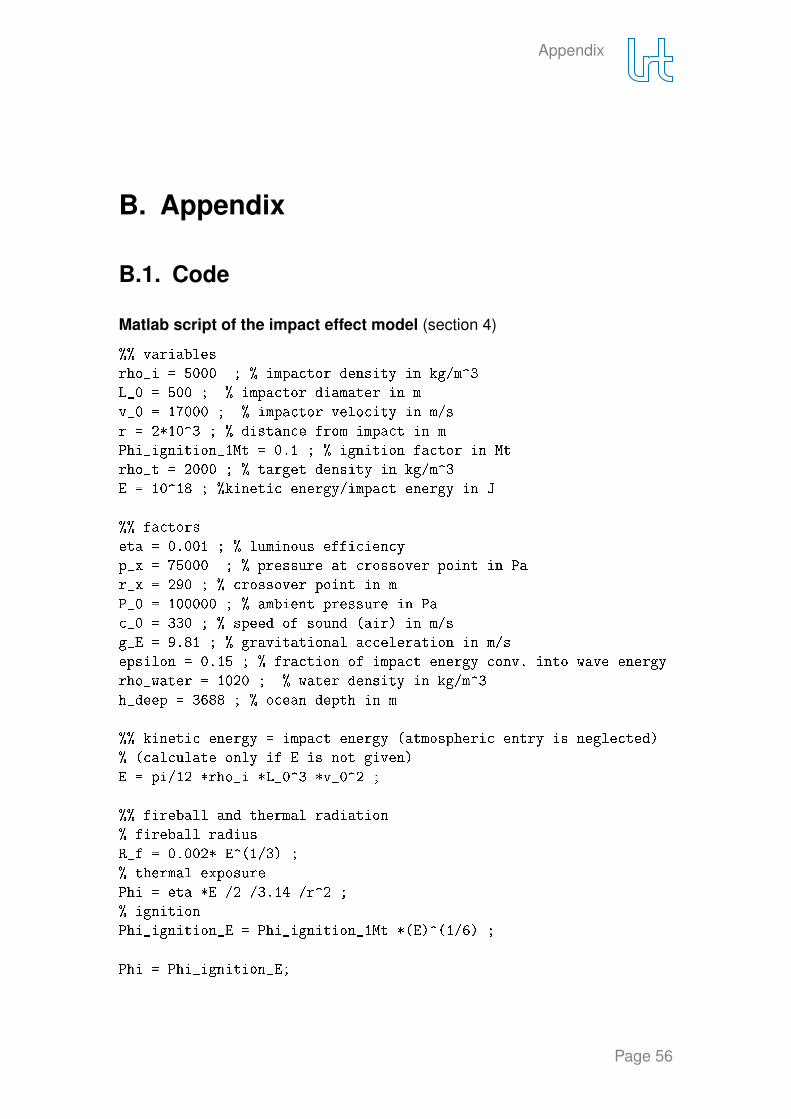
Appendix
B. Appendix
B.1. Code
Matlab script of the impact effect model (section 4)
%% variables
rho_i = 5000 ; % impactor density in kg/m^3
L_0 = 500 ; % impactor diamater in m
v_0 = 17000 ; % impactor velocity in m/s
r = 2*10^3 ; % distance from impact in m
Phi_ignition_1Mt = 0.1 ; % ignition factor in Mt
rho_t = 2000 ; % target density in kg/m^3
E = 10^18 ; %kinetic energy/impact energy in J
%% factors
eta = 0.001 ; % luminous efficiency
p_x = 75000 ; % pressure at crossover point in Pa
r_x = 290 ; % crossover point in m
P_0 = 100000 ; % ambient pressure in Pa
c_0 = 330 ; % speed of sound (air) in m/s
g_E = 9.81 ; % gravitational acceleration in m/s
epsilon = 0.15 ; % fraction of impact energy conv. into wave energy
rho_water = 1020 ; % water density in kg/m^3
h_deep = 3688 ; % ocean depth in m
%% kinetic energy = impact energy (atmospheric entry is neglected)
% (calculate only if E is not given)
E = pi/12 *rho_i *L_0^3 *v_0^2 ;
%% fireball and thermal radiation
% fireball radius
R_f = 0.002* E^(1/3) ;
% thermal exposure
Phi = eta *E /2 /3.14 /r^2 ;
% ignition
Phi_ignition_E = Phi_ignition_1Mt *(E)^(1/6) ;
Phi = Phi_ignition_E;
Page 56
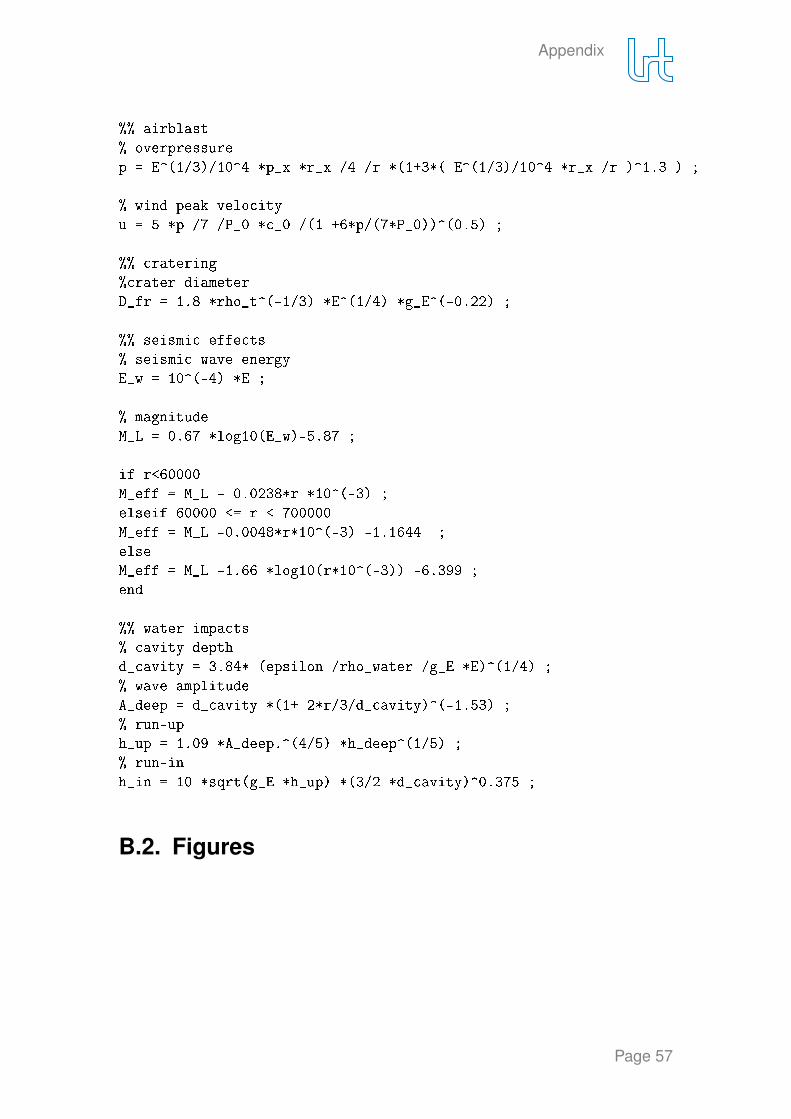
Appendix
%% airblast
% overpressure
p = E^(1/3)/10^4 *p_x *r_x /4 /r *(1+3*( E^(1/3)/10^4 *r_x /r )^1.3 ) ;
% wind peak velocity
u = 5 *p /7 /P_0 *c_0 /(1 +6*p/(7*P_0))^(0.5) ;
%% cratering
%crater diameter
D_fr = 1.8 *rho_t^(-1/3) *E^(1/4) *g_E^(-0.22) ;
%% seismic effects
% seismic wave energy
E_w = 10^(-4) *E ;
% magnitude
M_L = 0.67 *log10(E_w)-5.87 ;
if r<60000
M_eff = M_L - 0.0238*r *10^(-3) ;
elseif 60000 <= r < 700000
M_eff = M_L -0.0048*r*10^(-3) -1.1644 ;
else
M_eff = M_L -1.66 *log10(r*10^(-3)) -6.399 ;
end
%% water impacts
% cavity depth
d_cavity = 3.84* (epsilon /rho_water /g_E *E)^(1/4) ;
% wave amplitude
A_deep = d_cavity *(1+ 2*r/3/d_cavity)^(-1.53) ;
% run-up
h_up = 1.09 *A_deep.^(4/5) *h_deep^(1/5) ;
% run-in
h_in = 10 *sqrt(g_E *h_up) *(3/2 *d_cavity)^0.375 ;
B.2. Figures
Page 57

Appendix
Fig. B.1.: Fireball radius for three different impactors
Fig. B.2.: Crater diameter for three different impactors
Page 58

Appendix
Fig. B.3.: Thermal exposure over distance for three different impactors
Fig. B.4.: Overpressure over distance for three different impactors
Page 59

Appendix
Fig. B.5.: Wind peak velocity over distance for three different impactors
Fig. B.6.: Richter magnitude over distance for three different impactors
Page 60

Appendix
Fig. B.7.: Run-up over distance for three different impactors
Fig. B.8.: Run-in over distance for three different impactors
Page 61