The Open Biomarkers Journal › images › clinimark › output › ...Atopic Dermatitis (AD) is a...
8
1875-3183/20 Send Orders for Reprints to [email protected] 47 DOI: 10.2174/1875318302010010047, 2020, 10, 47-54 The Open Biomarkers Journal Content list available at: https://openbiomarkerjournal.com RESEARCH ARTICLE Stratum Corneum Biomarkers in Atopic Dermatitis: Biological and Spatial Variability Ruzica Jurakic Toncic 1 , Sanja Kezic 2 , Suzana Ljubojevic Hadzavdic 1 , Branka Marinovic 1 and Ivone Jakasa 3,* 1 Department of Dermatology and Venereology, University Hospital Center, Zagreb and University of Zagreb School of Medicine, Zagreb, Croatia 2 Amsterdam UMC, Coronel Institute of Occupational Health, Amsterdam, Netherlands 3 Department of Chemistry and Biochemistry, Faculty of Food Technology and Biotechnology, University of Zagreb, Laboratory for Analytical Chemistry, Zagreb, Croatia Abstract: Background: Atopic dermatitis is a highly heterogeneous skin disease, mainly affecting children. Introduction of biological therapies has urged the development of biomarkers to facilitate personalized therapy. Stratum corneum biomarkers emerged as a promising non-invasive alternative to skin biopsy, yet validation of spatial and biological variability is essential for their application in clinical research. Objective: To assess spatial and biological variability of stratum corneum biomarkers for atopic dermatitis. Methods: Stratum corneum was collected from 17 atopic dermatitis patients by consecutive application of eight adhesive tapes to a lesional skin site and 2 cm and 4 cm from the lesion. Two non-lesional sites at a 2 cm distance from the same lesion were collected to determine biological variability. Filaggrin degradation products (NMF) were determined by liquid chromatography and thirteen cytokines (IL-4, IL-13, IL-18, IL-31, IL-33, CCL17, CCL22, CCL27, CXCL8, IL-1α, IL-RA, IL-18, IL-22) by multiplex immunoassay. Results: Biomarker levels showed gradual changes from lesional to non-lesional skin sites at 2 cm and 4 cm; magnitude and direction of change were biomarker-specific. Intra-subject variability ranged from 17.3% (NMF) to 85.1% (CXCL8). Biomarker levels from two stratum corneum depths were highly correlated; several biomarkers showed significant depth dependence. Conclusion: Stratum corneum enables non-invasive collection of relevant immune and epidermal biomarkers, but biomarker-specific spatial and biological variability emphasizes the importance of standardized procedures for stratum corneum collection. Keywords: Atopic dermatitis, Biomarkers, Non-invasive, Cytokines, Filaggrin, Stratum corneum. Article History Received: December 30, 2019 Revised: March 17, 2020 Accepted: April 06, 2020 1. INTRODUCTION Atopic Dermatitis (AD) is a common inflammatory skin disease affecting up to 20% of children and 7-10% of adults [1, 2]. The disease is characterized by the impaired skin barrier and aberrant immune response, and clinically manifests through recurrent dermatitis, dry and inflamed skin, severe itch * Address correspondence to this author at the Department of Chemistry and Biochemistry, Faculty of Food Technology and Biotechnology, University of Zagreb, Laboratory for Analytical Chemistry, Pierottijeva 6, Zagreb, Croatia; Tel: ++385-1-4605068; E-mail: [email protected] and tendency toward bacterial and viral infections. AD has a strong genetic component; the highest known risk is associated with loss-of-function mutation in the Filaggrin Gene (FLG) [3]. Functional consequences of FLG mutations are not completely understood. Various studies showed reduced skin hydration in the FLG mutation carriers, which can be explained by the fact that filaggrin degradation products are the main ingredients of Natural Moisturizing Factors (NMF) [ 4]. FLG mutations are also associated with alterations in the structure and composition of the principal barrier of the skin, the Stratum
Transcript of The Open Biomarkers Journal › images › clinimark › output › ...Atopic Dermatitis (AD) is a...
1875-3183/20 Send Orders for Reprints to [email protected]
47
DOI: 10.2174/1875318302010010047, 2020, 10, 47-54
The Open Biomarkers JournalContent list available at: https://openbiomarkerjournal.com
RESEARCH ARTICLE
Stratum Corneum Biomarkers in Atopic Dermatitis: Biological and SpatialVariability
Ruzica Jurakic Toncic1, Sanja Kezic2, Suzana Ljubojevic Hadzavdic1, Branka Marinovic1 and Ivone Jakasa3,*
1Department of Dermatology and Venereology, University Hospital Center, Zagreb and University of Zagreb School of Medicine, Zagreb, Croatia2Amsterdam UMC, Coronel Institute of Occupational Health, Amsterdam, Netherlands3Department of Chemistry and Biochemistry, Faculty of Food Technology and Biotechnology, University of Zagreb, Laboratory for AnalyticalChemistry, Zagreb, Croatia
Abstract:
Background:
Atopic dermatitis is a highly heterogeneous skin disease, mainly affecting children. Introduction of biological therapies has urged the developmentof biomarkers to facilitate personalized therapy. Stratum corneum biomarkers emerged as a promising non-invasive alternative to skin biopsy, yetvalidation of spatial and biological variability is essential for their application in clinical research.
Objective:
To assess spatial and biological variability of stratum corneum biomarkers for atopic dermatitis.
Methods:
Stratum corneum was collected from 17 atopic dermatitis patients by consecutive application of eight adhesive tapes to a lesional skin site and 2cm and 4 cm from the lesion. Two non-lesional sites at a 2 cm distance from the same lesion were collected to determine biological variability.Filaggrin degradation products (NMF) were determined by liquid chromatography and thirteen cytokines (IL-4, IL-13, IL-18, IL-31, IL-33,CCL17, CCL22, CCL27, CXCL8, IL-1α, IL-RA, IL-18, IL-22) by multiplex immunoassay.
Results:
Biomarker levels showed gradual changes from lesional to non-lesional skin sites at 2 cm and 4 cm; magnitude and direction of change werebiomarker-specific. Intra-subject variability ranged from 17.3% (NMF) to 85.1% (CXCL8). Biomarker levels from two stratum corneum depthswere highly correlated; several biomarkers showed significant depth dependence.
Conclusion:Stratum corneum enables non-invasive collection of relevant immune and epidermal biomarkers, but biomarker-specific spatial and biologicalvariability emphasizes the importance of standardized procedures for stratum corneum collection.
Keywords: Atopic dermatitis, Biomarkers, Non-invasive, Cytokines, Filaggrin, Stratum corneum.
Article History Received: December 30, 2019 Revised: March 17, 2020 Accepted: April 06, 2020
1. INTRODUCTIONAtopic Dermatitis (AD) is a common inflammatory skin
disease affecting up to 20% of children and 7-10% of adults [1,2]. The disease is characterized by the impaired skin barrierand aberrant immune response, and clinically manifeststhrough recurrent dermatitis, dry and inflamed skin, severe itch
* Address correspondence to this author at the Department of Chemistry andBiochemistry, Faculty of Food Technology and Biotechnology, University ofZagreb, Laboratory for Analytical Chemistry, Pierottijeva 6, Zagreb, Croatia;Tel: ++385-1-4605068; E-mail: [email protected]
and tendency toward bacterial and viral infections. AD has astrong genetic component; the highest known risk is associatedwith loss-of-function mutation in the Filaggrin Gene (FLG) [3].Functional consequences of FLG mutations are not completelyunderstood. Various studies showed reduced skin hydration inthe FLG mutation carriers, which can be explained by the factthat filaggrin degradation products are the main ingredients ofNatural Moisturizing Factors (NMF) [4]. FLG mutations arealso associated with alterations in the structure andcomposition of the principal barrier of the skin, the Stratum
48 The Open Biomarkers Journal, 2020, Volume 10 Toncic et al.
Corneum (SC). SC is comprised of flattened cells(corneocytes) filled with keratin filaments that are aggregatedby filaggrin, surrounded by a cornified envelope and embeddedin the lipid matrix. The SC contains a large number of bio-molecules crucial for the skin barrier and for antimicrobial andimmune response, including various proteases, antimicrobialproteins and cytokines of different signature. An abundance ofa wide range of bio-molecules in the SC and its accessibilitymakes SC a promising biological medium to collect relevantbiomarkers [5 - 9]. SC can easily and non-invasively becollected using adhesive tapes, a technique that has evidencedits potential for the study of various inflammatory skin diseasessuch as AD, psoriasis and contact dermatitis.
Most studies utilizing this technique are focused on AD.One of the reasons is the large heterogeneity of AD, reflectedin different pathophysiologies and clinical phenotypes; thishampers diagnostics, disease severity assessment and therapy[9, 10]. Introduction of novel monoclonal therapies is a majorbreakthrough in therapy for AD, yet clinical trials havedemonstrated that not all patients benefit from it and somepatients experience adverse effects [11, 12]. Identification ofmolecular signature facilitating definition of endotypes wouldtherefore be of great importance. Development of biologicsinitiated a cascade of studies on the potential biomarkers forthe stratification of AD [10, 13], but most of them are focusedon blood samples and there are only a few studies with skinbiomarkers, mainly from skin biopsy [14 - 16]. As infants arethe most affected population, a biopsy is not feasible, soalternative, non-invasive biomarkers are needed. In recentexploratory studies, we and other researchers have shown thepotential of SC biomarkers [5, 6, 17]. There is, however, a needto further evaluate and validate this technique before it can beroutinely applied in research and clinics. This is why in thepresent study, we investigate several factors that might be ofrelevance: i) difference between lesional and non-lesional skin,ii) the effect of the distance from the lesion, iii) the influence ofthe SC depth from which a tape is taken, iv) intra-subjectvariability assessed by collection of SC from two similar skinsites (2 cm from the same lesion), and v) analytical variability.
2. METHODS AND MATERIALS
2.1. SubjectsSeventeen AD patients, three males and fourteen females,
with a mean age of 29 years (range 19-40), all Caucasians,were recruited between May and July 2019 at the outpatientclinic of the Dermatology Department of University HospitalCentre in Zagreb. The patients met the Hanifin and Rajka(1980) criteria for the diagnosis of AD [18]. Severity of diseasewas assessed using the Scoring Atopic Dermatitis (SCORAD)tool [19]. All patients had moderate or severe AD (meanSCORAD was 46.0, range 28.8-76.1). The skin samples weretaken from the forearm (15 patients), neck (1 patient) and leg(1 patient), depending on the location of the lesion.
Written informed consent was obtained from all subjectsprior to the study. The experimental protocol was approved bythe Medical Ethical Committees of University Hospital CentreZagreb and the University of Zagreb School of Medicine. Thestudy was conducted in conformity with the Declaration ofHelsinki principles.
2.2. Sampling of the Stratum CorneumThe SC was sampled using the previously described
method [20]. Circular adhesive tapes (22 mm diameter, 3.8cm2, D-Squame Discs; Monaderm, Monaco) were placed ontothe volar forearm skin spot applying a pressure of 225 g/cm2
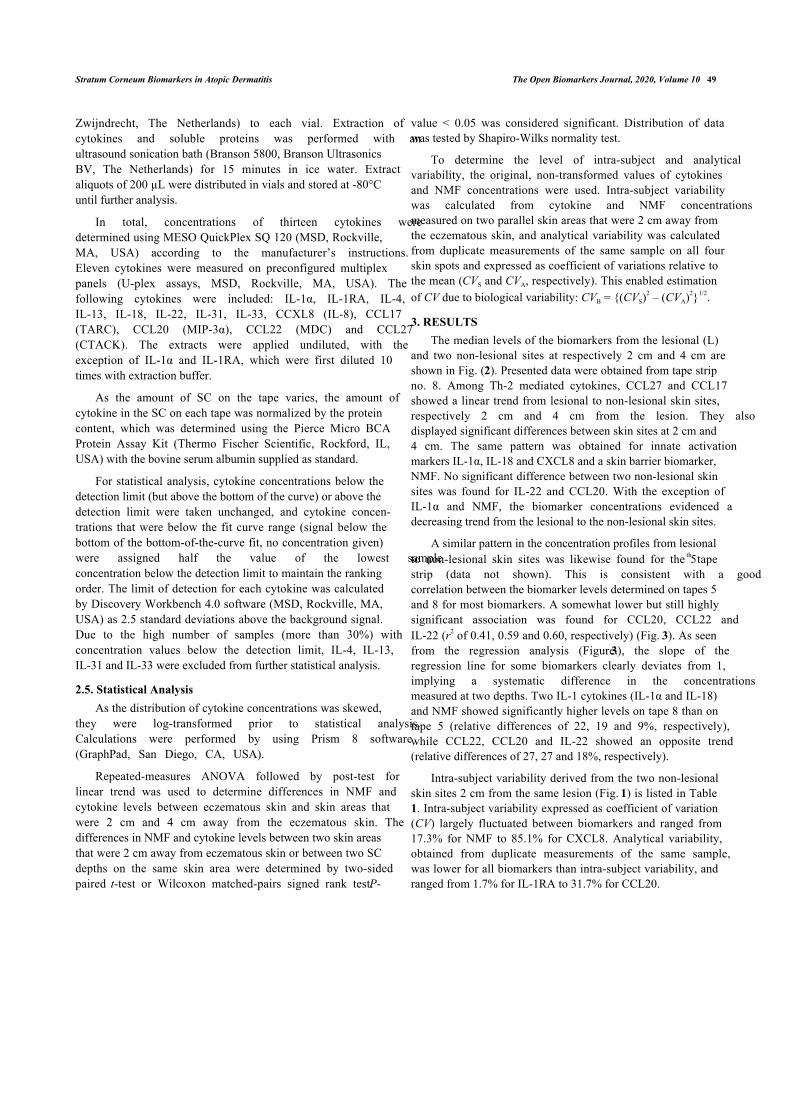
for 10 sec, using a D-Squame Pressure Instrument D500(CuDerm Corporation, Dallas, TX, USA). The tape strips weregently removed with tweezers and placed individually incryovials. Sequentially, eight consecutive tape strips werecollected from each of the four different sites on the lowervolar forearm; from eczematous skin area, from two skin areasthat were 2 cm away from eczematous skin to determineintrapersonal variability, and from skin area that was 4 cmaway from eczematous skin and immediately stored at -80°C(Fig. 1).
Fig. (1). Skin sites from which the stratum corneum samples werecollected.
2.3. Determination of Filaggrin Degradation Products inthe SC
NMF was defined as the sum of the concentrations ofhistidine, 2-pyrrolidone-5-carboxylic acid (PCA), and transand cis isomers of Urocanic Acid (UCA). The 4th and 7th
consecutive tape strips from each skin area were used tomeasure NMF levels at two different SC depths. NMF wasdetermined according to the slightly adapted method describedin detail elsewhere [20]. Briefly, NMF components on the 4th
and 7th consecutive tape strips were extracted with 600 µL ofMillipore water and subsequently analyzed by High-Performance Liquid Chromatography (HPLC).
As the amount of the SC on the tape strips varies, the NMFconcentration in the SC on each tape was normalized by thetotal protein content. Due to incomplete extraction recovery ofSC proteins by water, the second extraction of proteins fromthe tape stripping was performed with 0.1 mol/L KOHsolution. Proteins in both extracts were determined using thePierce Micro BCA Protein Assay Kit (Thermo FischerScientific, Rockford, IL, USA), with bovine serum albuminsupplied as standard. NMF levels in the SC were expressed asmmol NMF/g protein.
2.4. Cytokine Analysis in Tape StripsThe 5th and 8th consecutive tape strips from each skin area
were used to measure cytokine levels at two different SCdepths. The cytokines were extracted from the tape by adding1.2 mL phosphate-buffered saline (Merck, Darmstadt,Germany) containing 0.005% Tween 20 (Sigma-Aldrich,
Stratum Corneum Biomarkers in Atopic Dermatitis The Open Biomarkers Journal, 2020, Volume 10 49
Zwijndrecht, The Netherlands) to each vial. Extraction ofcytokines and soluble proteins was performed with anultrasound sonication bath (Branson 5800, Branson UltrasonicsBV, The Netherlands) for 15 minutes in ice water. Extractaliquots of 200 µL were distributed in vials and stored at -80°Cuntil further analysis.
In total, concentrations of thirteen cytokines weredetermined using MESO QuickPlex SQ 120 (MSD, Rockville,MA, USA) according to the manufacturer’s instructions.Eleven cytokines were measured on preconfigured multiplexpanels (U-plex assays, MSD, Rockville, MA, USA). Thefollowing cytokines were included: IL-1α, IL-1RA, IL-4,IL-13, IL-18, IL-22, IL-31, IL-33, CCXL8 (IL-8), CCL17(TARC), CCL20 (MIP-3α), CCL22 (MDC) and CCL27(CTACK). The extracts were applied undiluted, with theexception of IL-1α and IL-1RA, which were first diluted 10times with extraction buffer.
As the amount of SC on the tape varies, the amount ofcytokine in the SC on each tape was normalized by the proteincontent, which was determined using the Pierce Micro BCAProtein Assay Kit (Thermo Fischer Scientific, Rockford, IL,USA) with the bovine serum albumin supplied as standard.
For statistical analysis, cytokine concentrations below thedetection limit (but above the bottom of the curve) or above thedetection limit were taken unchanged, and cytokine concen-trations that were below the fit curve range (signal below thebottom of the bottom-of-the-curve fit, no concentration given)were assigned half the value of the lowest sampleconcentration below the detection limit to maintain the rankingorder. The limit of detection for each cytokine was calculatedby Discovery Workbench 4.0 software (MSD, Rockville, MA,USA) as 2.5 standard deviations above the background signal.Due to the high number of samples (more than 30%) withconcentration values below the detection limit, IL-4, IL-13,IL-31 and IL-33 were excluded from further statistical analysis.
2.5. Statistical AnalysisAs the distribution of cytokine concentrations was skewed,
they were log-transformed prior to statistical analysis.Calculations were performed by using Prism 8 software(GraphPad, San Diego, CA, USA).
Repeated-measures ANOVA followed by post-test forlinear trend was used to determine differences in NMF andcytokine levels between eczematous skin and skin areas thatwere 2 cm and 4 cm away from the eczematous skin. Thedifferences in NMF and cytokine levels between two skin areasthat were 2 cm away from eczematous skin or between two SCdepths on the same skin area were determined by two-sidedpaired t-test or Wilcoxon matched-pairs signed rank test. P-
value < 0.05 was considered significant. Distribution of datawas tested by Shapiro-Wilks normality test.
To determine the level of intra-subject and analyticalvariability, the original, non-transformed values of cytokinesand NMF concentrations were used. Intra-subject variabilitywas calculated from cytokine and NMF concentrationsmeasured on two parallel skin areas that were 2 cm away fromthe eczematous skin, and analytical variability was calculatedfrom duplicate measurements of the same sample on all fourskin spots and expressed as coefficient of variations relative tothe mean (CVS and CVA, respectively). This enabled estimationof CV due to biological variability: CVB = {(CVS)
2 – (CVA)2}1/2.
3. RESULTSThe median levels of the biomarkers from the lesional (L)
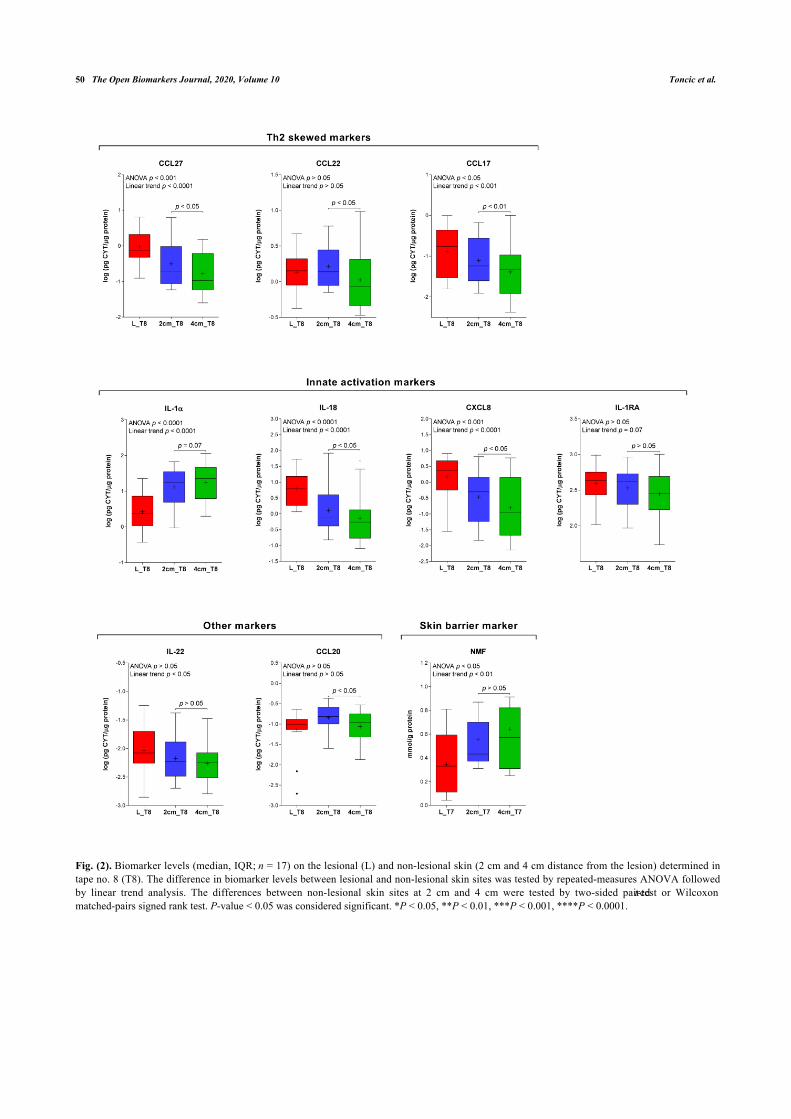
and two non-lesional sites at respectively 2 cm and 4 cm areshown in Fig. (2). Presented data were obtained from tape stripno. 8. Among Th-2 mediated cytokines, CCL27 and CCL17showed a linear trend from lesional to non-lesional skin sites,respectively 2 cm and 4 cm from the lesion. They alsodisplayed significant differences between skin sites at 2 cm and4 cm. The same pattern was obtained for innate activationmarkers IL-1α, IL-18 and CXCL8 and a skin barrier biomarker,NMF. No significant difference between two non-lesional skinsites was found for IL-22 and CCL20. With the exception ofIL-1α and NMF, the biomarker concentrations evidenced adecreasing trend from the lesional to the non-lesional skin sites.
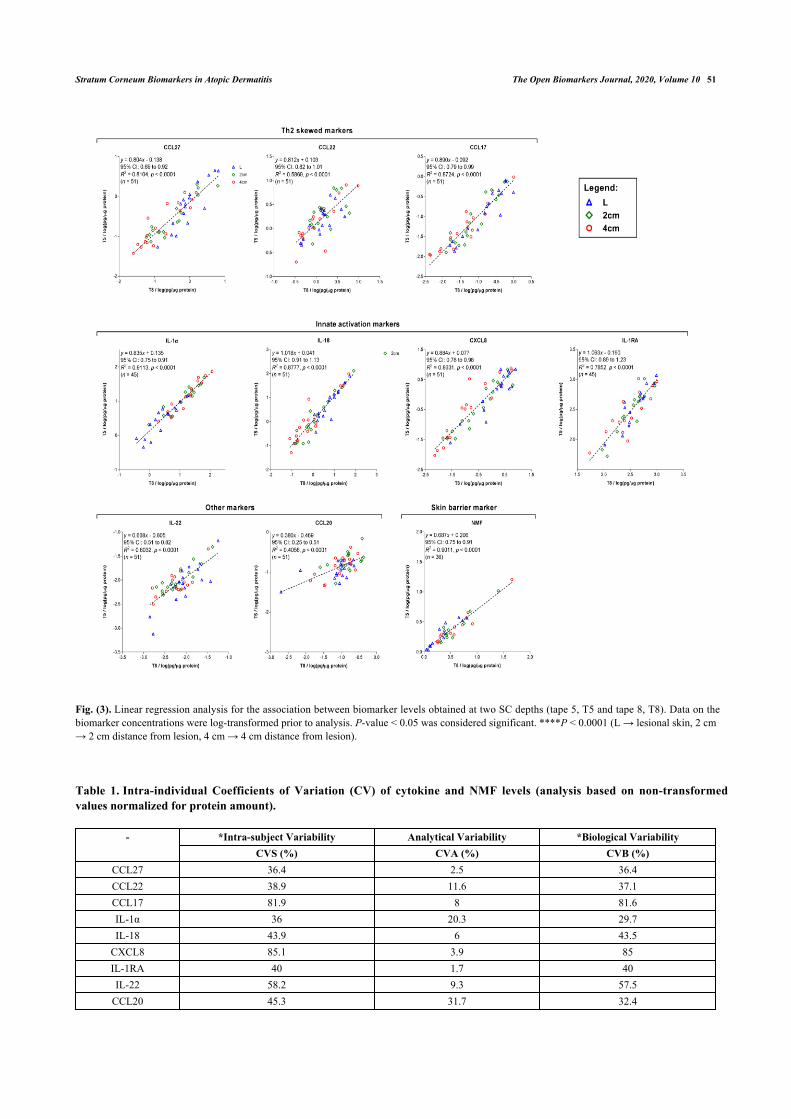
A similar pattern in the concentration profiles from lesionalto non-lesional skin sites was likewise found for the 5th tapestrip (data not shown). This is consistent with a goodcorrelation between the biomarker levels determined on tapes 5and 8 for most biomarkers. A somewhat lower but still highlysignificant association was found for CCL20, CCL22 andIL-22 (r2 of 0.41, 0.59 and 0.60, respectively) (Fig. 3). As seenfrom the regression analysis (Figure. 3), the slope of theregression line for some biomarkers clearly deviates from 1,implying a systematic difference in the concentrationsmeasured at two depths. Two IL-1 cytokines (IL-1α and IL-18)and NMF showed significantly higher levels on tape 8 than ontape 5 (relative differences of 22, 19 and 9%, respectively),while CCL22, CCL20 and IL-22 showed an opposite trend(relative differences of 27, 27 and 18%, respectively).
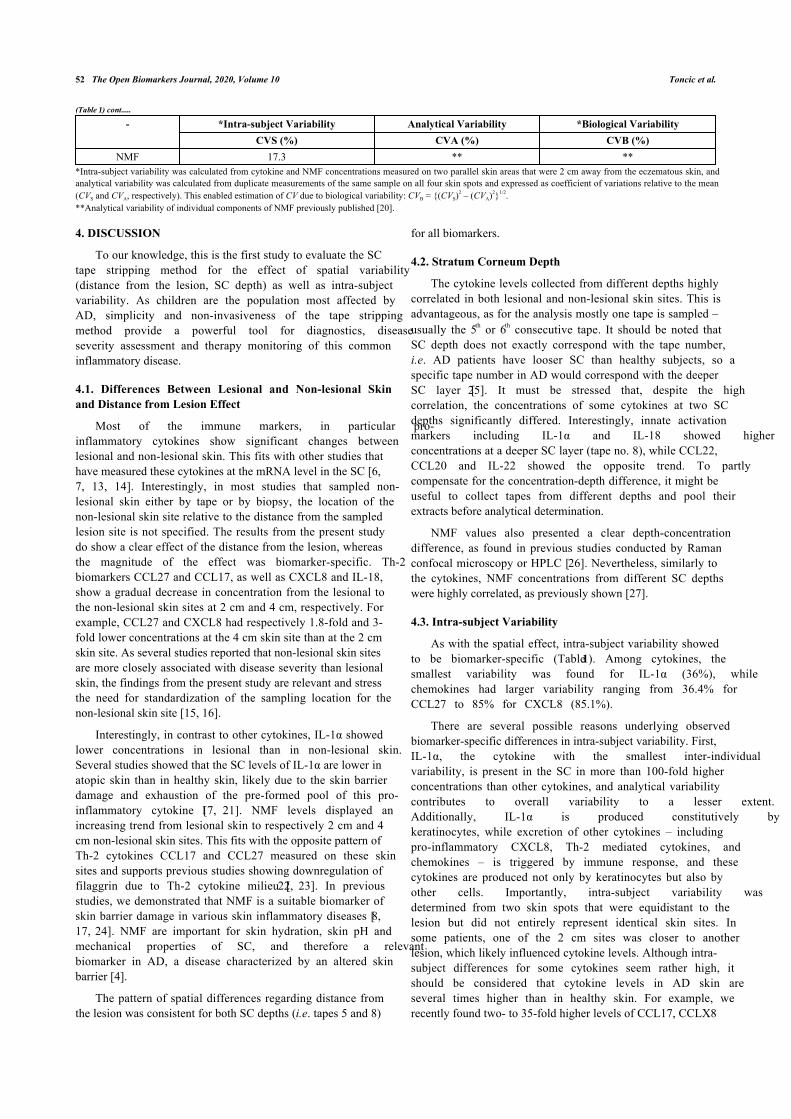
Intra-subject variability derived from the two non-lesionalskin sites 2 cm from the same lesion (Fig. 1) is listed in Table1. Intra-subject variability expressed as coefficient of variation(CV) largely fluctuated between biomarkers and ranged from17.3% for NMF to 85.1% for CXCL8. Analytical variability,obtained from duplicate measurements of the same sample,was lower for all biomarkers than intra-subject variability, andranged from 1.7% for IL-1RA to 31.7% for CCL20.
50 The Open Biomarkers Journal, 2020, Volume 10 Toncic et al.
Fig. (2). Biomarker levels (median, IQR; n = 17) on the lesional (L) and non-lesional skin (2 cm and 4 cm distance from the lesion) determined intape no. 8 (T8). The difference in biomarker levels between lesional and non-lesional skin sites was tested by repeated-measures ANOVA followedby linear trend analysis. The differences between non-lesional skin sites at 2 cm and 4 cm were tested by two-sided paired t-test or Wilcoxonmatched-pairs signed rank test. P-value < 0.05 was considered significant. *P < 0.05, **P < 0.01, ***P < 0.001, ****P < 0.0001.
Stratum Corneum Biomarkers in Atopic Dermatitis The Open Biomarkers Journal, 2020, Volume 10 51
Fig. (3). Linear regression analysis for the association between biomarker levels obtained at two SC depths (tape 5, T5 and tape 8, T8). Data on thebiomarker concentrations were log-transformed prior to analysis. P-value < 0.05 was considered significant. ****P < 0.0001 (L → lesional skin, 2 cm→ 2 cm distance from lesion, 4 cm → 4 cm distance from lesion).
Table 1. Intra-individual Coefficients of Variation (CV) of cytokine and NMF levels (analysis based on non-transformedvalues normalized for protein amount).
- *Intra-subject Variability Analytical Variability *Biological VariabilityCVS (%) CVA (%) CVB (%)
CCL27 36.4 2.5 36.4CCL22 38.9 11.6 37.1CCL17 81.9 8 81.6IL-1α 36 20.3 29.7IL-18 43.9 6 43.5
CXCL8 85.1 3.9 85IL-1RA 40 1.7 40IL-22 58.2 9.3 57.5
CCL20 45.3 31.7 32.4
52 The Open Biomarkers Journal, 2020, Volume 10 Toncic et al.
- *Intra-subject Variability Analytical Variability *Biological VariabilityCVS (%) CVA (%) CVB (%)
NMF 17.3 ** ***Intra-subject variability was calculated from cytokine and NMF concentrations measured on two parallel skin areas that were 2 cm away from the eczematous skin, andanalytical variability was calculated from duplicate measurements of the same sample on all four skin spots and expressed as coefficient of variations relative to the mean(CVS and CVA, respectively). This enabled estimation of CV due to biological variability: CVB = {(CVS)
2 – (CVA)2}1/2.**Analytical variability of individual components of NMF previously published [20].
4. DISCUSSION
To our knowledge, this is the first study to evaluate the SCtape stripping method for the effect of spatial variability(distance from the lesion, SC depth) as well as intra-subjectvariability. As children are the population most affected byAD, simplicity and non-invasiveness of the tape strippingmethod provide a powerful tool for diagnostics, diseaseseverity assessment and therapy monitoring of this commoninflammatory disease.
4.1. Differences Between Lesional and Non-lesional Skinand Distance from Lesion Effect
Most of the immune markers, in particular pro-inflammatory cytokines show significant changes betweenlesional and non-lesional skin. This fits with other studies thathave measured these cytokines at the mRNA level in the SC [6,7, 13, 14]. Interestingly, in most studies that sampled non-lesional skin either by tape or by biopsy, the location of thenon-lesional skin site relative to the distance from the sampledlesion site is not specified. The results from the present studydo show a clear effect of the distance from the lesion, whereasthe magnitude of the effect was biomarker-specific. Th-2biomarkers CCL27 and CCL17, as well as CXCL8 and IL-18,show a gradual decrease in concentration from the lesional tothe non-lesional skin sites at 2 cm and 4 cm, respectively. Forexample, CCL27 and CXCL8 had respectively 1.8-fold and 3-fold lower concentrations at the 4 cm skin site than at the 2 cmskin site. As several studies reported that non-lesional skin sitesare more closely associated with disease severity than lesionalskin, the findings from the present study are relevant and stressthe need for standardization of the sampling location for thenon-lesional skin site [15, 16].
Interestingly, in contrast to other cytokines, IL-1α showedlower concentrations in lesional than in non-lesional skin.Several studies showed that the SC levels of IL-1α are lower inatopic skin than in healthy skin, likely due to the skin barrierdamage and exhaustion of the pre-formed pool of this pro-inflammatory cytokine [17, 21]. NMF levels displayed anincreasing trend from lesional skin to respectively 2 cm and 4cm non-lesional skin sites. This fits with the opposite pattern ofTh-2 cytokines CCL17 and CCL27 measured on these skinsites and supports previous studies showing downregulation offilaggrin due to Th-2 cytokine milieu [22, 23]. In previousstudies, we demonstrated that NMF is a suitable biomarker ofskin barrier damage in various skin inflammatory diseases [8,17, 24]. NMF are important for skin hydration, skin pH andmechanical properties of SC, and therefore a relevantbiomarker in AD, a disease characterized by an altered skinbarrier [4].
The pattern of spatial differences regarding distance fromthe lesion was consistent for both SC depths (i.e. tapes 5 and 8)
for all biomarkers.
4.2. Stratum Corneum Depth
The cytokine levels collected from different depths highlycorrelated in both lesional and non-lesional skin sites. This isadvantageous, as for the analysis mostly one tape is sampled –usually the 5th or 6th consecutive tape. It should be noted thatSC depth does not exactly correspond with the tape number,i.e. AD patients have looser SC than healthy subjects, so aspecific tape number in AD would correspond with the deeperSC layer [25]. It must be stressed that, despite the highcorrelation, the concentrations of some cytokines at two SCdepths significantly differed. Interestingly, innate activationmarkers including IL-1α and IL-18 showed higherconcentrations at a deeper SC layer (tape no. 8), while CCL22,CCL20 and IL-22 showed the opposite trend. To partlycompensate for the concentration-depth difference, it might beuseful to collect tapes from different depths and pool theirextracts before analytical determination.
NMF values also presented a clear depth-concentrationdifference, as found in previous studies conducted by Ramanconfocal microscopy or HPLC [26]. Nevertheless, similarly tothe cytokines, NMF concentrations from different SC depthswere highly correlated, as previously shown [27].
4.3. Intra-subject Variability
As with the spatial effect, intra-subject variability showedto be biomarker-specific (Table 1). Among cytokines, thesmallest variability was found for IL-1α (36%), whilechemokines had larger variability ranging from 36.4% forCCL27 to 85% for CXCL8 (85.1%).
There are several possible reasons underlying observedbiomarker-specific differences in intra-subject variability. First,IL-1α, the cytokine with the smallest inter-individualvariability, is present in the SC in more than 100-fold higherconcentrations than other cytokines, and analytical variabilitycontributes to overall variability to a lesser extent.Additionally, IL-1α is produced constitutively bykeratinocytes, while excretion of other cytokines – includingpro-inflammatory CXCL8, Th-2 mediated cytokines, andchemokines – is triggered by immune response, and thesecytokines are produced not only by keratinocytes but also byother cells. Importantly, intra-subject variability wasdetermined from two skin spots that were equidistant to thelesion but did not entirely represent identical skin sites. Insome patients, one of the 2 cm sites was closer to anotherlesion, which likely influenced cytokine levels. Although intra-subject differences for some cytokines seem rather high, itshould be considered that cytokine levels in AD skin areseveral times higher than in healthy skin. For example, werecently found two- to 35-fold higher levels of CCL17, CCLX8
(Table 1) cont.....
Stratum Corneum Biomarkers in Atopic Dermatitis The Open Biomarkers Journal, 2020, Volume 10 53
and IL-18 in AD patients compared to healthy subjects [5, 8],so inter-individual differences largely outweigh intra-individual variability. To compensate, at least partly, for largevariability of some biomarkers, multiple sampling isrecommended.
4.4. Limitations of the Study
There are several limitations to this study. First, themajority of subjects were women (80%), and furthermore all ofthem were Caucasian adults. This limits the generalizability ofour findings to the general AD population, and emphasizes theneed for evaluation of biomarker variability in the investigatedpopulation.
CONCLUSION
This study evaluates for the first time relevant samplingconditions that might affect the validity of SC biomarkers inAD: distance from the lesion and SC depth. The findings arerelevant as they reveal a biomarker-specific effect regardingsampling location. Biomarker-specific intra-subject variabilityshould also be taken into account by study design andstatistical power calculations. Evaluation of the samplingprocedure and magnitude of intra-subject variability representan important step in the validation of SC biomarkers. Tapestripping is a minimally invasive procedure, with the addedadvantage that it provides insight into the skin barrier functionand immune response. This is why SC biomarkers have a largepotential in clinical trials and clinical practice.
LIST OF ABBREVIATIONS
AD = Atopic Dermatitis
CV = Coefficient of Variation
Cis-UCA = Cis-Urocanic Acid
FLG = Filaggrin Gene
His = Histidine
NMF = Natural Moisturizing Factors
PCA = Pyroglutamic Acid
SC = Stratum Corneum
SCORAD = SCORing Atopic Dermatitis
Trans-UCA = Trans-Urocanic Acid
AUTHORS’ CONTRIBUTION
S. Kezic, I. Jakasa and R. Jurakic Toncic had full access toall of the data in the study and take responsibility for theintegrity of the data and the accuracy of the data analysis.Study concept and design: all authors. Acquisition andinterpretation of data: all authors. Drafting of the manuscript:S. Kezic, I. Jakasa and S. Ljubojevic Hadzavdic. Criticalrevision of the manuscript for important intellectual content: allauthors. Administrative, technical and material support: allauthors. Study supervision: all authors.
ETHICS APPROVAL AND CONSENT TO PARTI-CIPATE
The experimental protocol was approved by the MedicalEthical Committees of University Hospital Centre Zagreb
(02/21 AG) and the University of Zagreb School of Medicine,Croatia (380-59-10106-19-111/51).
HUMAN AND ANIMAL RIGHTS
No animals were used in this research. All human researchprocedures followed were in conformity with the ethicalstandards of the committee responsible for humanexperimentation (institutional and national), and with theHelsinki Declaration of 1975, as revised in 2013.
CONSENT FOR PUBLICATION
Written informed consent was obtained from all subjectsprior to the study.
AVAILABILITY OF DATA AND MATERIALS
The datasets used and/or analyzed during the current studyare available from the corresponding author IJ upon reasonablerequest.
FUNDING
Financial support for this study was provided by CroatianScience Foundation, Croatia (grant number IP-2018-01-5978).
CONFLICT OF INTEREST
The author declares no conflict of interest, financial orotherwise.
ACKNOWLEDGEMENTS
We acknowledge support from the CA COST ActionCA16113 CliniMARK.
REFERENCES
Weidinger S, Beck LA, Bieber T, Kabashima K, Irvine AD. Atopic[1]dermatitis. Nat Rev Dis Primers 2018; 4(1): 1.[http://dx.doi.org/10.1038/s41572-018-0001-z] [PMID: 29930242]Weidinger S, Novak N. Atopic dermatitis. Lancet 2016; 387(10023):[2]1109-22.[http://dx.doi.org/10.1016/S0140-6736(15)00149-X] [PMID:26377142]Drislane C, Irvine AD. The role of filaggrin in atopic dermatitis and[3]allergic disease. Ann Allergy Asthma Immunol 2020; 124(1): 36-43.[http://dx.doi.org/10.1016/j.anai.2019.10.008] [PMID: 31622670]Thyssen JP, Kezic S. Causes of epidermal filaggrin reduction and their[4]role in the pathogenesis of atopic dermatitis. J Allergy Clin Immunol2014; 134(4): 792-9.[http://dx.doi.org/10.1016/j.jaci.2014.06.014] [PMID: 25065719]Koppes SA, Brans R, Ljubojevic Hadzavdic S, Frings-Dresen MH,[5]Rustemeyer T, Kezic S. Stratum corneum tape stripping: Monitoringof inflammatory mediators in atopic dermatitis patients using topicaltherapy. Int Arch Allergy Immunol 2016; 170(3): 187-93.[http://dx.doi.org/10.1159/000448400] [PMID: 27584583]Kim BE, Goleva E, Kim PS, et al. Side-by-side comparison of skin[6]biopsies and skin tape stripping highlights abnormal stratum corneumin atopic dermatitis. J Invest Dermatol 2019; 139(11): 2387-2389.e1.[http://dx.doi.org/10.1016/j.jid.2019.03.1160] [PMID: 31176708]Guttman-Yassky E, Diaz A, Pavel AB, et al. Use of tape strips to[7]detect immune and barrier abnormalities in the skin of children withearly-onset atopic dermatitis. JAMA Dermatol 2019; 155(12):1358-70.[http://dx.doi.org/10.1001/jamadermatol.2019.2983] [PMID:31596431]McAleer MA, Jakasa I, Hurault G, et al. Systemic and stratum[8]corneum biomarkers of severity in infant AD include markers of innateand Th-related immunity and angiogenesis. Br J Dermatol 2019;
54 The Open Biomarkers Journal, 2020, Volume 10 Toncic et al.
180(3): 586-96.[http://dx.doi.org/10.1111/bjd.17088] [PMID: 30132823]Castelo-Soccio L. Stripping away barriers to find relevant skin[9]biomarkers for pediatric atopic dermatitis. JAMA Dermatol 2019;155(12): 1342-3.[http://dx.doi.org/10.1001/jamadermatol.2019.2792] [PMID:31596425]Czarnowicki T, He H, Krueger JG, Guttman-Yassky E. Atopic[10]dermatitis endotypes and implications for targeted therapeutics. JAllergy Clin Immunol 2019; 143(1): 1-11.[http://dx.doi.org/10.1016/j.jaci.2018.10.032] [PMID: 30612663]Moyle M, Cevikbas F, Harden JL, Guttman-Yassky E. Understanding[11]the immune landscape in atopic dermatitis: The era of biologics andemerging therapeutic approaches. Exp Dermatol 2019; 28(7): 756-68.[http://dx.doi.org/10.1111/exd.13911] [PMID: 30825336]Gooderham MJ, Hong HC, Eshtiaghi P, Papp KA. Dupilumab: A[12]review of its use in the treatment of atopic dermatitis. J Am AcadDermatol 2018; 78(3)(Suppl. 1): S28-36.[http://dx.doi.org/10.1016/j.jaad.2017.12.022] [PMID: 29471919]Dyjack N, Goleva E, Rios C, et al. Minimally invasive skin tape strip[13]RNA sequencing identifies novel characteristics of the type 2-highatopic dermatitis disease endotype. J Allergy Clin Immunol 2018;141(4): 1298-309.[http://dx.doi.org/10.1016/j.jaci.2017.10.046] [PMID: 29309794]Brunner PM, Pavel AB, Khattri S, et al. Baseline IL-22 expression in[14]patients with atopic dermatitis stratifies tissue responses tofezakinumab. J Allergy Clin Immunol 2019; 143(1): 142-54.[http://dx.doi.org/10.1016/j.jaci.2018.07.028] [PMID: 30121291]Esaki H, Brunner PM, Renert-Yuval Y, et al. Early-onset pediatric[15]atopic dermatitis is TH2 but also TH17 polarized in skin. J Allergy ClinImmunol 2016; 138(6): 1639-51.[http://dx.doi.org/10.1016/j.jaci.2016.07.013] [PMID: 27671162]Ungar B, Garcet S, Gonzalez J, et al. An integrated model of atopic[16]dermatitis biomarkers highlights the systemic nature of the disease. JInvest Dermatol 2017; 137(3): 603-13.[http://dx.doi.org/10.1016/j.jid.2016.09.037] [PMID: 27825969]Hulshof L, Hack DP, Hasnoe QCJ, et al. A minimally invasive tool to[17]study immune response and skin barrier in children with atopicdermatitis. Br J Dermatol 2019; 180(3): 621-30.[http://dx.doi.org/10.1111/bjd.16994] [PMID: 29989151]Hanifin JM, Raika G. Diagnostic features of atopic eczema. Acta[18]
Derm Venereol Suppl (Stockh) 1980; 92: 44-7.Severity scoring of atopic dermatitis: The scorad index. Consensus[19]report of the european task force on atopic dermatitis. Dermatology(Basel) 1993; 186(1): 23-31.[http://dx.doi.org/10.1159/000247298] [PMID: 8435513]Dapic I, Jakasa I, Yau N, Kezic S, Kammeyer A. Evaluation of an[20]HPLC method for the determination of natural moisturizing factors inthe human stratum corneum. Anal Lett 2013; 46: 2133-44.[http://dx.doi.org/10.1080/00032719.2013.789881]Kezic S, O’Regan GM, Lutter R, et al. Filaggrin loss-of-function[21]mutations are associated with enhanced expression of IL-1 cytokinesin the stratum corneum of patients with atopic dermatitis and in amurine model of filaggrin deficiency. J Allergy Clin Immunol 2012;129(4): 1031-9.e1.[http://dx.doi.org/10.1016/j.jaci.2011.12.989] [PMID: 22322004]Howell MD, Kim BE, Gao P, et al. Cytokine modulation of atopic[22]dermatitis filaggrin skin expression. J Allergy Clin Immunol 2009;124(3)(Suppl. 2): R7-R12.[http://dx.doi.org/10.1016/j.jaci.2009.07.012] [PMID: 19720210]Kezic S, O’Regan GM, Yau N, et al. Levels of filaggrin degradation[23]products are influenced by both filaggrin genotype and atopicdermatitis severity. Allergy 2011; 66(7): 934-40.[http://dx.doi.org/10.1111/j.1398-9995.2010.02540.x] [PMID:21261659]Koppes SA, Ljubojević Hadžavdić S, Jakasa I, et al. Effect of[24]allergens and irritants on levels of natural moisturizing factor andcorneocyte morphology. Contact Dermat 2017; 76(5): 287-95. a[http://dx.doi.org/10.1111/cod.12770] [PMID: 28295421]Clausen ML, Slotved HC, Krogfelt KA, Agner T. Tape stripping[25]technique for stratum corneum protein analysis. Sci Rep 2016; 6:19918.[http://dx.doi.org/10.1038/srep19918] [PMID: 26817661]Kezic S, Kemperman PM, Koster ES, et al. Loss-of-function[26]mutations in the filaggrin gene lead to reduced level of naturalmoisturizing factor in the stratum corneum. J Invest Dermatol 2008;128(8): 2117-9.[http://dx.doi.org/10.1038/jid.2008.29] [PMID: 18305568]Koppes SA, Kemperman P, Van Tilburg I, et al. Determination of[27]natural moisturizing factors in the skin: Raman microspectroscopyversus HPLC. Biomarkers 2017; 22(6): 502-7. b[http://dx.doi.org/10.1080/1354750X.2016.1256428] [PMID:27805415]
© 2020 Jurakic Toncic et al.
This is an open access article distributed under the terms of the Creative Commons Attribution 4.0 International Public License (CC-BY 4.0), a copy of which isavailable at: https://creativecommons.org/licenses/by/4.0/legalcode. This license permits unrestricted use, distribution, and reproduction in any medium, provided theoriginal author and source are credited.