The Renminbi’s Role in the Global Monetary System PAPER SERIES Forschungsinstitut zur Zukunft der...
107
econstor www.econstor.eu Der Open-Access-Publikationsserver der ZBW – Leibniz-Informationszentrum Wirtschaft The Open Access Publication Server of the ZBW – Leibniz Information Centre for Economics Nutzungsbedingungen: Die ZBW räumt Ihnen als Nutzerin/Nutzer das unentgeltliche, räumlich unbeschränkte und zeitlich auf die Dauer des Schutzrechts beschränkte einfache Recht ein, das ausgewählte Werk im Rahmen der unter → http://www.econstor.eu/dspace/Nutzungsbedingungen nachzulesenden vollständigen Nutzungsbedingungen zu vervielfältigen, mit denen die Nutzerin/der Nutzer sich durch die erste Nutzung einverstanden erklärt. Terms of use: The ZBW grants you, the user, the non-exclusive right to use the selected work free of charge, territorially unrestricted and within the time limit of the term of the property rights according to the terms specified at → http://www.econstor.eu/dspace/Nutzungsbedingungen By the first use of the selected work the user agrees and declares to comply with these terms of use. zbw Leibniz-Informationszentrum Wirtschaft Leibniz Information Centre for Economics Prasad, Eswar; Ye, Lei Working Paper The renminbi's role in the global monetary system Discussion Paper series, Forschungsinstitut zur Zukunft der Arbeit, No. 6335 Provided in Cooperation with: Institute for the Study of Labor (IZA) Suggested Citation: Prasad, Eswar; Ye, Lei (2012) : The renminbi's role in the global monetary system, Discussion Paper series, Forschungsinstitut zur Zukunft der Arbeit, No. 6335, http:// nbn-resolving.de/urn:nbn:de:101:1-201205026008 This Version is available at: http://hdl.handle.net/10419/58835
Transcript of The Renminbi’s Role in the Global Monetary System PAPER SERIES Forschungsinstitut zur Zukunft der...
econstor www.econstor.eu
Der Open-Access-Publikationsserver der ZBW – Leibniz-Informationszentrum WirtschaftThe Open Access Publication Server of the ZBW – Leibniz Information Centre for Economics
Nutzungsbedingungen:Die ZBW räumt Ihnen als Nutzerin/Nutzer das unentgeltliche,räumlich unbeschränkte und zeitlich auf die Dauer des Schutzrechtsbeschränkte einfache Recht ein, das ausgewählte Werk im Rahmender unter→ http://www.econstor.eu/dspace/Nutzungsbedingungennachzulesenden vollständigen Nutzungsbedingungen zuvervielfältigen, mit denen die Nutzerin/der Nutzer sich durch dieerste Nutzung einverstanden erklärt.
Terms of use:The ZBW grants you, the user, the non-exclusive right to usethe selected work free of charge, territorially unrestricted andwithin the time limit of the term of the property rights accordingto the terms specified at→ http://www.econstor.eu/dspace/NutzungsbedingungenBy the first use of the selected work the user agrees anddeclares to comply with these terms of use.
zbw Leibniz-Informationszentrum WirtschaftLeibniz Information Centre for Economics
Prasad, Eswar; Ye, Lei
Working Paper
The renminbi's role in the global monetary system
Discussion Paper series, Forschungsinstitut zur Zukunft der Arbeit, No. 6335
Provided in Cooperation with:Institute for the Study of Labor (IZA)
Suggested Citation: Prasad, Eswar; Ye, Lei (2012) : The renminbi's role in the global monetarysystem, Discussion Paper series, Forschungsinstitut zur Zukunft der Arbeit, No. 6335, http://nbn-resolving.de/urn:nbn:de:101:1-201205026008
This Version is available at:http://hdl.handle.net/10419/58835
DI
SC
US
SI
ON
P
AP
ER
S
ER
IE
S
Forschungsinstitut zur Zukunft der ArbeitInstitute for the Study of Labor
The Renminbi’s Role in the Global Monetary System
IZA DP No. 6335
February 2012
Eswar PrasadLei (Sandy) Ye
The Renminbi’s Role in the
Global Monetary System
Eswar Prasad Cornell University, Brookings Institution,
NBER and IZA
Lei (Sandy) Ye Cornell University
Discussion Paper No. 6335 February 2012
IZA
P.O. Box 7240 53072 Bonn
Germany
Phone: +49-228-3894-0 Fax: +49-228-3894-180
E-mail: [email protected]
Any opinions expressed here are those of the author(s) and not those of IZA. Research published in this series may include views on policy, but the institute itself takes no institutional policy positions. The Institute for the Study of Labor (IZA) in Bonn is a local and virtual international research center and a place of communication between science, politics and business. IZA is an independent nonprofit organization supported by Deutsche Post Foundation. The center is associated with the University of Bonn and offers a stimulating research environment through its international network, workshops and conferences, data service, project support, research visits and doctoral program. IZA engages in (i) original and internationally competitive research in all fields of labor economics, (ii) development of policy concepts, and (iii) dissemination of research results and concepts to the interested public. IZA Discussion Papers often represent preliminary work and are circulated to encourage discussion. Citation of such a paper should account for its provisional character. A revised version may be available directly from the author.
IZA Discussion Paper No. 6335 February 2012
ABSTRACT
The Renminbi’s Role in the Global Monetary System* We analyze three related but distinct concepts concerning the renminbi’s role in the global monetary system: (i) “internationalization” of the currency; (ii) currency convertibility; and (iii) reserve currency status. Their sequencing in relation to other policy goals such as financial sector reforms and exchange rate flexibility will affect their benefit-risk tradeoffs. We describe the measures taken and progress attained in each of these areas, and discuss the implications of these changes for the balance and sustainability of China’s own economic development as well as the associated implications for the global monetary system. While China is actively promoting the internationalization of its currency, it is a long way from attaining full convertibility or meeting other prerequisites for achieving reserve currency status. Ultimately, China will proceed with capital account convertibility in its own controlled and gradual manner, with the goal being an open capital account but with significant administrative and other “soft” controls. The renminbi will play an increasingly important role in the international monetary system but is unlikely to displace the U.S. dollar anytime soon. JEL Classification: F3 Keywords: international monetary system, reserve currency, capital account liberalization,
convertibility, exchange rate flexibility Corresponding author: Eswar Prasad Cornell University Dyson School of Applied Economics and Management 440 Warren Hall Ithaca, NY 14853 USA E-mail: [email protected]
* An initial version of this paper was presented at the November 2011 Federal Reserve Bank of San Francisco conference on “Asia’s Role in the Post-Crisis Global Economy.” The authors thank Sun Tao, Shang-Jin Wei and other colleagues for helpful comments and discussions.
1
1. Introduction
China’s economy is now the second largest in the world and is a key driver of global growth. Of
the currencies of the world’s six largest economies, China’s renminbi is the only one without
reserve currency status. Even though the economy has neither a flexible exchange rate nor an
open capital account, the Chinese government has recently taken a number of steps to increase
the international use of the renminbi. Given China’s sheer size and its rising shares of global
GDP and trade, these steps are gaining traction and portend a rising role for the renminbi in
global trade and finance.
In this paper, we analyze three aspects of the renminbi’s role in the international
monetary system: (1) the trajectory of the renminbi’s use in the denomination and settlement of
cross-border trade and financial transactions, referred to as the currency’s “internationalization”;
(2) the likelihood and timing of China’s path to currency convertibility; and (3) the prospects for
the renminbi attaining reserve currency status. The paper evaluates these three related but distinct
elements within a unified conceptual framework and evaluates their implications in two
dimensions: first, for the balance and sustainability of China’s own economic development; and
second, for the associated implications for the global monetary system.2
A currency’s international usage and its convertibility are different concepts, and neither
one is a necessary or sufficient condiiton for the other. Both conditions have to be met, however,
for a currency to become an international reserve currency. Given China’s size and growth
prospects, it is widely seen as inevitable that the renminbi will eventually become a reserve
currency.3 Here we consider the typical prerequisites for a reserve currency and evaluate China’s
progress in each of these dimensions. These prerequisites include:
• Economic size: A country’s GDP as well as its shares of global trade and finance are
important, although not crucial, determinants of its reserve currency status.
2A burgeoning literature looking at specific aspects of China’s exchange rate management and capital account liberalization includes Frankel (2005, 2011), Eichengreen (2011b), Lardy and Douglass (2011), and Yam (2011). 3 See, e.g., Chen, Peng and Shu (2009); and Subramanian (2011). Dobson and Masson (2009) and Kroeber (2011)
offer more skeptical views. Angeloni et al. (2011) discuss probabilities of alternative scenarios and argue that the
renminbi may gain more prominence if the euro does not mount a serious challenge to the dominance of the U.S.
dollar.
2
• Open capital account: Reserves must be acceptable as payments to a country’s trade and
financial partners, which requires that the currency be easily tradable in global financial
markets. This is difficult if a country imposes restrictions on capital flows and if its
foreign exchange markets are thin and subject to the government’s direct control.
• Flexible exchange rate: Reserve currencies are typically traded freely and their external
value is market determined, although this does not preclude occasional bouts of
intervention by the country’s central bank in foreign exchange markets. It is worth
emphasizing that an open capital account is not synonymous with a freely floating
exchange rate.
• Financial market development: A country needs to have a broad range of deep and liquid
financial markets, especially government bond markets, to provide “safe” assets that can
be held by other countries’ central banks. Turnover in these bond markets, which is a
measure of liquidity, is also important.
• Macroeconomic policies: Investors in a country’s sovereign assets must have faith in its
economic policies, especially the commitment to low inflation and sustainable levels of
public debt, so that the value of the currency is not in danger of being eroded.
This study seeks to provide fresh analytical perspectives on the relative importance of
and trade-offs among the factors listed above. For instance, the Swiss franc is a global reserve
currency even though Switzerland’s shares of global GDP and trade are quite modest. Moreover,
many of the major reserve currency economies—the euro zone, Japan and the U.S.—have large
and rising public debt burdens, which raises questions about their macroeconomic stability but
has not (yet) affected their currencies’ status as reserve currencies. Some analysts have in fact
extrapolated from the U.S. experience to argue that China must run large current account deficits
if it wants to provide reserve assets to the rest of the world. But this is neither a necessary nor
sufficient condition for attaining reserve currency status.
We begin, in section 2, by documenting and evaluating the evolution of China’s capital
account openness in both de jure and de facto terms. These measures together reflect the extent
to which broad restrictions on capital inflows and outflows are relaxed through official policy
changes or the avoidance of capital controls. This analysis is complemented by a narrative
account of measures to open up the capital account as well as an empirical evaluation of how
China’s capital flows and stocks of external assets and liabilities have evolved during the last
3 decade. Although a number of restrictions on both inflows and, especially, outflows have been
loosened in recent years, China still has a substantial capital control regime. In de facto terms,
however, its integration into global financial markets has proceeded more quickly.
In section 3, we analyze the costs and benefits of capital account liberalization for China
and how its sequencing relative to other policy changes affects the risk/benefit trade-off. A large
literature documents that opening up the capital account without a flexible exchange rate is risky.
In addition, the level of domestic financial market development and the composition of a
country’s external balance sheet also affect the magnitude of these risks. An examination of
China’s international investment position, both in terms of evolution over time and from a cross-
country perspective, suggests that the economy faces only modest risks from a more open capital
account in terms of vulnerability to external shocks. The bigger risks may be domestic ones that
are related to sequencing—a more open capital account can hurt financial stability and constrain
monetary policy in the absence of a more flexible exchange rate and a better-developed financial
system. There is also a larger debate about the ultimate objective—free convertibility, which
involves minimal restrictions, or full convertibility, defined as unrestricted capital flows but with
significant regulatory oversight through reporting and registration requirements (Yam 2011).
In section 4, we investigate the renminbi’s potential to become a global reserve currency.
Attaining reserve currency status has intangible benefits, including prestige, as well as tangible
ones. A reserve currency earns seigniorage revenues from abroad—inflation reduces the value of
foreign (and domestic) investors’ holdings of the currency—and provides easier access to cheap
foreign financing of debt issued in the domestic currency, a privilege that in the case of the U.S.
has been called an “exorbitant privilege.” To the extent that this status results in a greater
denomination of trade transactions in China’s own currency, domestic importers and exporters
would face lower currency risk. The potential costs of having a reserve currency include reduced
control of the currency’s external value and possibly a more volatile exchange rate. This status in
principle entails a greater burden of responsibility because domestic monetary policy has more
spillover effects to other economies.
We provide an empirical evaluation of the progress China has made, and how it compares
with other reserve currency and major emerging market economies, in terms of the prerequisites
for attaining reserve currency status. Given China’s specific circumstances, we discuss the
relative importance of these prerequisites and the dimensions in which China might break the

4 mold. We discuss how factors like greater exchange rate flexibility, deeper financial markets,
and interest rate liberalization can promote the process of internationalization of the renminbi
while maintaining a favorable benefit/risk trade-off during the transition.
In section 5, we show that the renminbi is already on the path to ascendance as a global
currency. Renminbi trade settlement in Hong Kong has expanded rapidly, the issuance of
renminbi-denominated bonds both in Hong Kong and the Mainland is picking up, and there are
signs that some central banks are considering holding renminbi-denominated assets in their
foreign exchange reserve portfolios. These shifts are still modest in terms of their absolute
magnitudes and could soon hit their limits unless China’s capital account becomes more open.
In section 6, we review the implications of the increasingly prominent renminbi for the
global monetary system, with a particular focus on the implications for the U.S. dollar. We
examine trends in the quantity and composition of renminbi-denominated assets and the pace of
China’s financial development. We then assess the implications of China’s capital account
convertibility for the pace of its reserve accumulation and its reliance on U.S. dollar assets for
these reserves. We also examine different policy measures taken by the Chinese government to
diversify foreign assets through purchases of “hard” assets and investments managed by a
sovereign wealth fund, along with encouragement of foreign investment by Chinese corporations
and households. This has major implications for discerning future patterns of global financial
flows.
Finally, we discuss the potential inclusion of the renminbi in the Special Drawing Rights
(SDR) basket, which currently includes the reserve currencies of four advanced economies. We
analyze the economic and political factors that will guide the decision of whether or not to
incorporate the renminbi into the SDR basket and highlight the economic and geopolitical
implications of this decision.
5
2. Openness of the Capital Account We begin by evaluating the degree of openness of China’s capital account, using both de jure
measures of capital account restrictiveness and de facto measures of financial integration.
Conventional measures of de jure integration show little, if any, change for China over the past
decade. For example, the popular Chinn-Ito index (Chinn and Ito 2008) has not registered any
change in China’s de jure openness since 1993. Such measures rely on binary indicators from the
International Monetary Fund’s Annual Report on Exchange Arrangements and Exchange
Restrictions (AREAER). These binary measures change only when there is a relatively drastic
policy change related to specific capital account items.4 By contrast, de facto capital account
openness has gone up by leaps and bounds.
Capital Controls
Although de jure measures may not capture changes over time in a country’s openness to capital
flows, they are still useful as an indicator of the relative degree of openness across economies in
a given year. Table 2-1 shows the Chinn-Ito index for all the reserve currency economies and
several key emerging markets in 1990 (when data are available), 2000, and 2009.5 A higher
value corresponds to a greater degree of de jure openness. The reserve currency economies all
have the same index value of 2.48, which is the maximum and indicates a fully open capital
account. The value of the index for China in 2009 is –1.15, signaling a relatively closed capital
account and indicating that China’s capital controls are, on paper, quite stringent.
Despite the broad capital account restrictions, the Chinese government has taken a
number of steps to ease these restrictions. In 2007, the limit on foreign exchange purchases by
residents for remittance abroad for personal reasons was increased to $50,000 a year. More
recently, the government has been encouraging outflows by institutional investors (e.g., pension
funds and insurance companies) and corporations in order to offset some of the pressures for
currency appreciation arising from trade surpluses and capital inflows. For instance, in 2009, the
government dropped ex ante review and approval requirements for outward remittances of funds
4 Other commonly used measures of de jure openness have been created by Schindler (2009) and Miniane (2004).
The Schindler data set is only available up to 2005 and shows little variation over time for China. The Miniane data
set does not include China. 5This index takes values from –1.84 (closed) to +2.48 (open). The index for Germany is used instead of that of the
euro area, because no separate index is available for the latter.
6 for direct investment abroad. Controls on inflows are also being gradually eased, although with
many restrictions still in place. The upper limit on portfolio investments by individual Qualified
Foreign Institutional Investors has been raised but still remains at a modest $1 billion, and the
period for which these investments are “locked up” has been reduced.
There are many other subtle or limited changes that are often not captured by standard de
jure indices, which tend to be aggregated across different categories of inflows or outflows. In
appendix A, we provide a detailed documentation of significant changes to capital account
restrictions during the past decade, based on annual IMF AREAER reports. The appendix
indicates that the number and magnitude of relaxations to capital account restrictions have
intensified in the past few years, consistent with the active promotion of the renminbi as an
international currency. In most cases, constraints on inflows and outflows have been made less
stringent rather than being eliminated entirely.
De Facto Openness
An alternative and complementary approach to evaluating an economy’s financial openness is to
analyze de facto measures of integration into global financial markets. A standard measure in the
academic literature is the economy’s gross assets plus liabilities position (i.e., its gross external
position) in either levels or as a ratio to GDP (see Kose et al. 2009). Figure 2-1 shows these two
measures for China from 2004 to 2010. The level of its gross external position has grown
rapidly, roughly tripling in size over the last five years to more than $6 trillion. The ratio of its
gross assets plus liabilities to GDP is now greater than 1.
Next, we examine the degree of China’s financial openness relative to the reserve
currency areas and other key emerging markets. In terms of levels, China’s gross external
position exceeds those of all the other key emerging markets and also Switzerland (figure 2-2).
As a share of GDP, its openness lags behind those of the reserve currency economies. Among
emerging markets, however, China’s de facto measure of openness is relatively high, exceeding
the levels of countries such as Brazil and India. To the extent that de facto openness is somewhat
higher and grows more than the rise in de jure openness, recent steps taken to selectively loosen
capital account restrictions do seem to have stoked greater financial flows (see box 2.1).

7
To summarize the evidence from de facto and de jure measures of openness, China still
has an extensive capital control regime in place, but it is selectively and cautiously dismantling
these controls. Partly as a result of this dismantling, the country’s capital account is becoming
increasingly open in de facto terms, although even by this measure the degree of China’s
financial openness is much lower than that of the reserve currency economies.
8
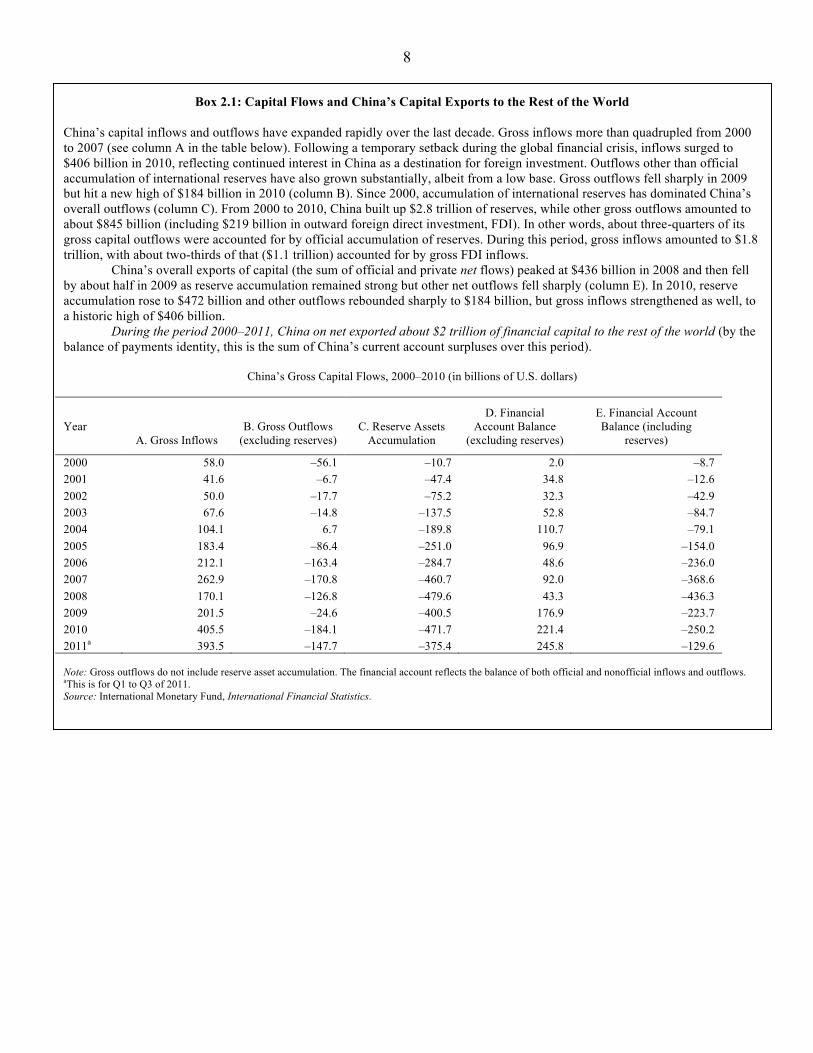
Box 2.1: Capital Flows and China’s Capital Exports to the Rest of the World
China’s capital inflows and outflows have expanded rapidly over the last decade. Gross inflows more than quadrupled from 2000
to 2007 (see column A in the table below). Following a temporary setback during the global financial crisis, inflows surged to
$406 billion in 2010, reflecting continued interest in China as a destination for foreign investment. Outflows other than official
accumulation of international reserves have also grown substantially, albeit from a low base. Gross outflows fell sharply in 2009 but hit a new high of $184 billion in 2010 (column B). Since 2000, accumulation of international reserves has dominated China’s
overall outflows (column C). From 2000 to 2010, China built up $2.8 trillion of reserves, while other gross outflows amounted to
about $845 billion (including $219 billion in outward foreign direct investment, FDI). In other words, about three-quarters of its
gross capital outflows were accounted for by official accumulation of reserves. During this period, gross inflows amounted to $1.8
trillion, with about two-thirds of that ($1.1 trillion) accounted for by gross FDI inflows.
China’s overall exports of capital (the sum of official and private net flows) peaked at $436 billion in 2008 and then fell
by about half in 2009 as reserve accumulation remained strong but other net outflows fell sharply (column E). In 2010, reserve
accumulation rose to $472 billion and other outflows rebounded sharply to $184 billion, but gross inflows strengthened as well, to
a historic high of $406 billion.
During the period 2000–2011, China on net exported about $2 trillion of financial capital to the rest of the world (by the
balance of payments identity, this is the sum of China’s current account surpluses over this period).
China’s Gross Capital Flows, 2000–2010 (in billions of U.S. dollars)
Year A. Gross Inflows
B. Gross Outflows (excluding reserves)
C. Reserve Assets Accumulation
D. Financial Account Balance
(excluding reserves)
E. Financial Account Balance (including
reserves)
2000 58.0 –56.1 –10.7 2.0 –8.7
2001 41.6 –6.7 –47.4 34.8 –12.6
2002 50.0 –17.7 –75.2 32.3 –42.9
2003 67.6 –14.8 –137.5 52.8 –84.7
2004 104.1 6.7 –189.8 110.7 –79.1
2005 183.4 –86.4 –251.0 96.9 –154.0
2006 212.1 –163.4 –284.7 48.6 –236.0
2007 262.9 –170.8 –460.7 92.0 –368.6
2008 170.1 –126.8 –479.6 43.3 –436.3
2009 201.5 –24.6 –400.5 176.9 –223.7
2010 405.5 –184.1 –471.7 221.4 –250.2
2011a 393.5 –147.7 –375.4 245.8 –129.6 Note: Gross outflows do not include reserve asset accumulation. The financial account reflects the balance of both official and nonofficial inflows and outflows. aThis is for Q1 to Q3 of 2011. Source: International Monetary Fund, International Financial Statistics.
9
3. Sequencing and Cost/Benefit Trade-Offs Related to Capital Account
Liberalization
The literature on financial openness indicates that its potential benefits—both in terms of risk
sharing and growth—become apparent only after a country has attained a high level of financial
integration. For a country that is in the process of opening up its capital account, there are
significant transitional risks if it falls below certain threshold conditions, especially those related
to domestic financial and institutional development. A difficult paradox results from the fact that
financial opening itself serves as a catalyst for financial market development and improvements
in institutions, especially corporate governance. There is no general recipe for how to strike the
right balance between these “collateral benefits” and the risks of premature capital account
liberalization (see Kose et al. 2009). The transitional risks cannot be eliminated, but they can be
mitigated through supporting conditions such as greater exchange rate flexibility and a more
selective approach to capital account liberalization that is designed to attain certain specific
collateral benefits (Prasad and Rajan 2008).
There is a large literature indicating that opening up the capital account without a flexible
exchange rate is risky.6 A fixed or tightly managed nominal exchange rate makes it harder to
cope with capital flow volatility because the exchange rate cannot act as a shock absorber. This
combination of policies also reduces the independence of domestic monetary policy, impeding
the central bank’s ability to use monetary policy instruments such as interest rates to maintain
domestic price stability. Despite its relatively closed capital account, this constraint applies to
China as well because the capital account tends to become porous as interest differentials with
the rest of the world increase and the incentives to evade controls become larger (Goodfriend and
Prasad 2007). Moreover, if either expectations or fundamentals shift in a way that makes it
difficult to sustain the existing level of a managed exchange rate, capital flows could intensify
and make the exchange rate harder to manage.
The value of the renminbi is tightly managed against the U.S. dollar, but it was allowed
to appreciate gradually against the dollar starting in July 2005. With the onset of the global
financial crisis, the hard peg to the dollar was reinstituted in July 2008, before being relaxed
6 See Prasad, Rumbaugh and Wang (2005) for references and a discussion of this issue in the context of China. Also
see Yu (2011).
10 again in June 2010. Table 3-1 provides a cross-country comparison of exchange rate volatility,
measured as the standard deviation of changes in monthly exchange rates over the relevant
period. The volatility of China’s nominal exchange rate against the dollar is the lowest among
the major emerging market economies.
To get a broader perspective on de facto exchange rate flexibility, we examine the
volatility of the trade-weighted nominal and real effective exchange rates. China’s effective
exchange rate measures, which tend to track each other closely, are more volatile than the
nominal exchange rate. The gap in exchange rate volatility relative to other emerging markets is
smaller using these measures, but China still has the lowest level of volatility in this group. In
other words, China displays more flexibility in its effective exchange rate, which is ultimately
what matters for trade competitiveness. But the tight control of the nominal value of the renminbi
relative to the dollar still has the effect of hindering the independence of monetary policy and
creating other adverse side effects that inhibit the rebalancing of the economy.
Two factors are crucial in determining the magnitude of the risks from an open capital
account in the presence of a fixed exchange rate. One is the level of financial development.
Broader and deeper financial markets help absorb capital inflows and direct them to productive
activities and, more broadly, help to cope with capital flow volatility. We discuss China’s
financial market development in greater detail later in the paper. The second factor is the
structure of a country’s capital flows, especially inflows. We now examine this factor.
Figure 3-1 shows that China’s gross capital inflows since 2000 have been mostly in the
form of foreign direct investment. The amount of portfolio inflows and other investments
together have traditionally been small, although in 2010 total inflows in these categories
exceeded FDI inflows. An examination of China’s international investment position confirms
that FDI liabilities account for 63 percent of China’s total (gross) external liabilities (table 3-2).
FDI and portfolio equity together account for 72 percent of external liabilities. FDI is considered
the best type of capital inflow because it is stable and often brings with it transfers of
technological and managerial expertise. Portfolio equity flows tend to be associated with the
collateral benefit of developing and deepening domestic equity markets, but tend to be more
volatile than FDI. Nevertheless, this structure of liabilities—dominated by FDI and portfolio
equity—is consistent with the objective of sharing risk across countries, with foreign investors
bearing capital as well as currency risk on such investment.
11
Another determinant of external vulnerability for emerging market economies,
particularly those with fixed or managed exchange rates, is the level of external debt. Short-term
foreign-currency-denominated external debt has been the scourge of emerging markets and was a
major source of vulnerability for Latin American and Asian economies during the 1980s and
1990s. China has traditionally had a low level of external debt, and the ratio of external debt to
GDP in fact declined from a peak of 18 percent in 1994 to just 9 percent in 2010 (figure 3-2).
China’s external debt level is also low by international standards (figure 3-3), suggesting that this
is not a source of risk from capital account opening. And of course the stock of foreign exchange
reserves of more than $3 trillion provides an additional level of insurance.
Indeed, China’s overall external balance sheet shows that its economy is quite well
insulated from external shocks as net foreign assets amounted to nearly $1.8 trillion at the end of
2010. In other words, China has enough foreign assets to not only meet all its external debt
obligations but also to more than cover all its foreign liabilities. By contrast, other emerging
markets—like Brazil, India and South Africa—have negative net foreign asset positions,
although these are quite small for the latter two countries (table 3-3).
The reserve currency economies have diverse net international positions. The U.S. has a
particularly large negative net foreign asset position, amounting to $2.5 trillion in 2010.
Germany, Japan and Switzerland have net asset positions, with Japan’s position in particular
being a massive $3.1 trillion. The U.K. and also the euro area as a whole have negative net asset
positions. This diversity suggests that the signs of the net positions are themselves not crucial for
reserve currency status. In other words, it is not essential for a country to run persistent current
account deficits, as suggested by the Triffin dilemma, for its currency to attain reserve currency
status. In fact, the average current account balance as a ratio to GDP during the period 2000–
2007 was positive (or, in the case of the euro zone as a whole, essentially zero) for all reserve
currency economies except the U.K. and the U.S. (table 3-4).
In short, China is not subject to the traditional risks associated with opening up the capital
account in advance of increasing exchange rate flexibility. Nevertheless, this combination of
policies could complicate domestic macroeconomic policy management as a more open capital
account with an inflexible exchange rate further erodes the operational independence of
monetary policy.
12
Moreover, liberalizing capital flows poses significant short-term risks to the financial
system if not coupled with appropriate domestic financial reform policies. Liberalizing outflows
further without interest rate liberalization could cause households to shift deposits out of the
banking sector. The return on those deposits is constrained by the government and has resulted in
real rates that are significantly negative. Banking sector earnings are heavily dependent on net
interest margins that are mandated by the government through the deposit rate ceiling and
lending rate floor (Lardy and Douglass 2011). Hence, massive deposit withdrawals can impose
systemically damaging liquidity shocks on the banking sector, with potentially broader
macroeconomic repercussions. Related concerns that speculative and volatile capital inflows
might destabilize the financial system could be mitigated with a more flexible exchange rate
(Eichengreen 2011b). Indeed, the expectations of renminbi appreciation that have resulted from
the tight management of the renminbi’s value may be fueling more speculative inflows.
The data on the international investment position that we presented above and the
combination of policies discussed above highlight the major risk for China’s external balance
sheet, which is in fact the asset position (Prasad 2011). As was noted above, China’s external
liabilities are not vulnerable to the valuation changes associated with an appreciating foreign
currency, because they are mostly denominated in renminbi. But with foreign exchange reserves
accounting for nearly 70 percent of total external assets, the risk comes from valuation losses that
would result from the renminbi’s eventual appreciation. If the managed exchange rate results in
further reserve accumulation through foreign exchange intervention to offset the effects of trade
surpluses and capital inflows, then these risks will continue to rise.
Liberalization of outflows would not only reduce reserve accumulation but would also
generate more collateral benefits. Indeed, a number of steps have already been taken in this
direction and could be intensified and broadened to involve more private sector participation.
Liberalizing outflows provides Chinese households with opportunities to diversify their savings
portfolios internationally and stimulates domestic financial reforms by creating competition for
domestic banks that currently have a captive domestic source of funds. Initiatives to encourage
corporate outflows have focused on large state-owned firms and a concentrated set of sectors
such as natural resources (Scissors 2011; Rosen and Hanemann 2009). For the renminbi to take
on a more international role, FDI outflows should involve more participation from the private
sector.
13
The issue of sequencing becomes complex in this context. In the absence of financial
market development, the benefits of capital account opening may be limited even if the risks are
low, as in the case of China. For instance, Chinese households are in principle allowed to send
the equivalent of $50,000 a year out of the country, a large amount for an economy with a per
capita income of about $5,000. But the absence of well-developed securities markets makes it
difficult for most households to take advantage of these opportunities to pursue the international
diversification of their savings portfolios.
In this context, the liberalization of inflows is an important part of the overall picture.
This liberalization would allow foreign investors to play a role in developing and deepening
China’s financial markets. For instance, there is a large body of evidence that liberalizing
portfolio inflows helps improve liquidity in the domestic equity markets of emerging economies.
This, along with the entry of foreign banks, would increase competition in the banking sector,
which in turn would be beneficial for private savers and borrowers. Other segments of China’s
financial sector, including the insurance sector, have been dependent on capital controls and
other entry restrictions to stay competitive. These segments will face greater competition with
more open inflows. With effective regulation, this could lead to significant efficiency gains.
Capital account liberalization could also have broader benefits. An open capital account
would catalyze progress toward China’s objective of making Shanghai an international financial
center. Capital account opening, especially if accompanied by greater exchange rate flexibility,
could also strengthen China’s domestic economic structure. It would facilitate financial sector
reforms, allowing for a rebalancing of growth away from reliance on exports and investment-
driven growth, to a more balanced model of growth, with higher private consumption.7
An interesting issue is whether there is a policy goal short of full capital account
convertibility that provides a better risk/benefit trade-off. Yam (2011) has argued that the long-
term objective for China ought to be full capital account convertibility, which he defines as
relaxation of capital controls but maintenance of “soft” controls in the form of registration and
reporting requirements for regulatory purposes. He draws a careful distinction between this and
an entirely unfettered capital flow regime, referred to as free capital account convertibility. This
is a subtle but important distinction that may resonate well with the Chinese leadership, given
7 See Prasad (2009) for a more detailed discussion of these issues.

14 that full convertibility by this definition provides a path to an open capital account without
entirely ceding control to market forces.
15
4. Evaluating China on Conditions for Attaining Global Currency Status
In this section, we review China’s progress in meeting the criteria thought to be essential for a
reserve currency and also provide cross-country perspectives on these indicators.
Domestic Financial Market Development
Financial market development in the home country is one of the key determinants of a currency’s
international status.8 Historically, each reserve currency has risen on the international stage under
unique circumstances and spurred by different motivations, but one constant is that this rise has
always required financial markets that can cope with the varied and voluminous demands of
financial market participants. The relevant aspects of financial market development are the
following:
• Breadth: the availability of a broad range of financial instruments, including markets for
hedging risk;
• Depth: a large volume of financial instruments in specific markets; and
• Liquidity: a high level of turnover (trading volume).
Without a sufficiently large debt market, the renminbi cannot be credibly used in
international transactions. If there is insufficient liquidity in markets for renminbi-denominated
assets, the currency will not be attractive to foreign investors. Other central banks and large
institutional investors will demand renminbi-denominated government and corporate debt as
“safe” assets for their portfolios. At the same time, both importers and exporters may be
concerned about greater exchange rate volatility resulting from an open capital account if they do
not have access to derivatives markets to hedge foreign exchange risk. Thus, depth, breadth and
liquidity are all relevant considerations in assessing the readiness of a country’s financial sector
to cope with an open capital account and elevate its currency to reserve currency status.
Furthermore, from a political-economic perspective, a large financial sector helps
overcome objections to a more international currency from the exporting sector, which may fear
lost competitiveness if demand for the currency as a reserve asset leads to its appreciation.
8 See Tavlas (1991); Chinn and Frankel (2007); Forbes (2009); and Obstfeld (2011b).
16 Historical episodes of the rise of international currencies such as the dollar, the mark, and the yen
suggest that this factor has in fact played an important role in the past (Eichengreen and
Flandreau 2010). In China’s case, these pressures may be balanced. The exporting sector indeed
benefits substantially from the managed exchange rate but, conversely, China’s
internationalization of the currency is driven by a national-scale promotion unseen in previous
historical episodes (Frankel 2011). This should mitigate any pressures that may arise from
exporting interests.
In this section, we assess the progress that China has made in various aspects of financial
market development and discuss the close relationship among those reforms, capital account
openness, and the international role of the currency. Our main conclusion is that China falls short
on many key dimensions of financial market development, and its steps to aggressively promote
its currency’s international role are likely to be impeded over the medium term by the
weaknesses of its financial system.
China’s financial system remains bank-dominated, with the state directly controlling
most of the banking system. Figure 4-1 shows that total domestic credit provided by the banking
sector, which stood at $8.8 trillion as of March 2011, outweighs the size of the equity and bond
markets combined. Domestic credit allocation is still very much controlled by the state and is
disproportionately directed toward enterprises, especially state-owned enterprises, rather than
households. Table 4-1 shows the breakdown of total loans from the banking system to the
resident and corporate sectors for 2007–10. In these years, the share of loans to the corporate
sector remained at roughly 80 percent. Credit allocation through the banking sector is supported
by massive deposits in the banking system, amounting to 186 percent of GDP in 2010. This ratio
is far higher than that of the other major reserve currency economies, except for the U.K., and
also other major emerging market economies (see figure 4-2).
The size and structure of the banking sector in China seem unsuitable for promoting the
international use of the renminbi on a large scale. Policies that favor the banking sector relative
to the rest of the financial system—including the interest rate structure that inhibits competition
by setting a floor for lending rates and a ceiling for deposit rates—are detrimental to broader
financial market development. The future reforms and development of the banking system will
have significant implications for the development of China’s more nascent financial markets,
including the corporate bond market (Hale 2007). The credit distortions in the banking system
17 also hamper the development of a more competitive domestic private enterprise sector. It will be
difficult to achieve a liquid debt market without more active participation from private firms as
well as households.
One dimension in which China has made progress is the development of its equity
markets. In 2005, reforms were introduced to allow nontradable shares in Chinese companies to
float freely. These reforms had a dramatic effect. Market capitalization and turnover surged
immediately thereafter and have grown sixfold since 2005, while trading volume has climbed
more than tenfold (table 4-2). Both stock market capitalization and turnover took a big hit in
2008, both in absolute terms and relative to GDP, as a result of the global financial crisis (figure
4-3). Both measures rebounded sharply in 2009 before declining modestly in 2010. As of 2010,
capitalization and turnover in Chinese equity markets exceeded those of other individual
economies—with the notable exception of the U.S., which remains dominant in terms of its share
of global equity market capitalization and turnover (table 4-3). Although equity markets do in
principle provide renminbi-denominated instruments that can be held by both domestic and
foreign investors, there are still significant restrictions on foreign investors’ participation in these
markets. Moreover, Chinese stock markets are volatile and prone to concerns about governance.
For these reasons, the country’s deep equity markets may be of limited help in making the
renminbi an international currency in the near future.
Next, we examine the current state of the debt market in China and how well prepared it
is for supporting the renminbi’s role as an international currency. Figure 4-4 shows that the stock
of domestic debt securities has risen sharply during the last few years, but from a very low base.
Nonfinancial corporate debt was practically nonexistent until 2005. Table 4-4 shows that the
turnover in both government and corporate debt markets has also risen sharply in recent years.
By most measures, the size and liquidity of China’s debt market currently lag far behind
those of existing reserve currency economies. Table 4-5 provides a broad comparison of
government and corporate bond market size and turnover in 2010 across a number of key
economies. The U.S. debt market remains unrivaled both in terms of depth and liquidity, with the
turnover in the Treasury bond market dwarfing the turnover in government debt markets of other
major economies. The size of China’s government bond market, measured by the market value
of the stock of outstanding bonds, was about $2.4 trillion at the end of 2010, compared with $8.9
trillion for the U.S. The turnover ratio on government bonds in China is 1.0, compared with a
18 ratio of 14.3 for the U.S. The turnover of government bonds in India is also roughly twice that in
China, although the absolute size of India’s government bond market is much smaller.9 Both
these countries restrict foreign investors’ participation in their government bond markets, an
issue that could affect their two currencies’ scope to become reserve currencies.
China has a relatively high turnover ratio in its corporate bond market. This is consistent
with the rapid growth of the corporate debt market, even though that market is still small in
absolute terms, at about one-twelfth the size of the U.S. corporate bond market. It is interesting
to note that the market value of outstanding corporate bonds in China is greater than the
corresponding figure for Germany and about half that for Japan (in Japan, the turnover ratio on
these bonds is very low).
Figure 4-5 shows the size of the global domestic debt securities market by residence of
issuance in December 2010. Although the currency breakdown for domestic debt is not
available, sources at the Bank for International Settlements suggest that domestic debt is largely
denominated in domestic currency (Committee on the Global Financial System 2007, 18).
China’s domestic debt market is valued at $3 trillion, significantly lower than that of the top
three reserve currency areas—the U.S., the euro area, and Japan. The U.S. domestic debt
securities market had a capital value of more than $25 trillion. Interestingly, the quantity of
China’s outstanding domestic securities is greater than that of the U.K. and Switzerland, two
reserve currency economies. This suggests that the size of the domestic debt market per se does
not necessarily prevent the Chinese currency from going global.
China’s aspirations to make the renminbi a global reserve currency rest in particular on
the pace of development of the government debt market. Obstfeld (2011b) has argued that the
Triffin dilemma today is not a current account issue but, rather, a fiscal issue. In a world with
mobile capital flows, the accumulation of reserves by other countries does not necessarily imply
that the reserve currency economy has to run current account deficits. However, reserve
currencies are expected to issue high-quality and creditworthy government debt or government-
9In the absence of clear documentation, the turnover data for China and Japan in tables IV-4 and IV-5 assume that
the original source presents rolling annual turnover data on a quarterly basis. If the turnover data were in fact
quarterly measures, then the annual bond turnover for these economies would be higher. E.g., the turnover of China’s government and corporate bonds in 2010 would be $7.2 billion and $2.9 billion, respectively. Similarly, the
turnover ratio (calculated using the value of outstanding bonds as of December 2010) would be 3.0 and 4.6,
respectively. For Japan, the corresponding government and corporate bond turnover would be $46 trillion and $0.3
trillion, and their ratios would be 4.34 and 0.28. The 2011 China Financial Stability Report states that the turnover
of the nation’s interbank bond market was 64 trillion yuan ($9.6 trillion) in 2010 (PBC 2011).
19 backed debt instruments that can serve as a hedge against domestic currency depreciation during
a global downturn. With a more international renminbi, China is expected to play a more active
role in this regard. This implies that government debt in China should rise as the currency fills
the role of a reserve currency.
The current level of government debt in China is relatively low compared with reserve
currency areas and with other major emerging markets (figure 4-6). This is an ex ante advantage
for China before internationalizing its currency, given that it provides more credibility about
government’s fiscal and inflation policies. If the economy moves toward a more flexible
exchange rate and pursues a more independent monetary policy, then it will also require a more
diversified set of government bonds across the yield curve spectrum to fully implement its
inflation and output objectives. Thus, the structure and size of the government debt market are
intimately linked not just to how the renminbi progresses as an international currency but also to
China’s own economic development.
Although the domestic debt market is a major indicator of financial market development,
it does not provide a full picture about the currency’s potential use in international financial
transactions. Hence, we also analyze the relative size of international debt securities (i.e., debt
issued outside the home country) in different currencies of issuance. The existing reserve
currencies clearly dominate, with the U.S. dollar and the euro accounting for 83 percent of
outstanding international bonds and notes in 2010 (table 4-6). The top five reserve currencies
together account for 96 percent of these instruments. Only a paltry 0.1 percent of international
debt is denominated in renminbi. The same is true for other major emerging market currencies.
For instance, it is interesting to note that India, another large and fast-growing emerging market
aspiring to have a reserve currency, also has a minuscule share of international debt securities
denominated in its currency.
Although the absolute size of the debt securities market in China is small from a cross-
country perspective, it should not mask the country’s rapid growth in these markets. As was
discussed above, domestic debt securities, especially corporate sector debt, were at negligible
levels only a decade ago. The domestic debt securities market grew at an average annual rate of
30.3 percent from December 1998 to December 2010 (see figure 4-4 above). Though the
outstanding stock of international bonds and notes issued in China was only $19 billion in 2010,
this was up from essentially zero in 2005. The share of nonfinancial corporate debt in total
20 domestic debt outstanding is also rising, accounting for a share of 17 percent and a value of $522
billion at the end of 2010. Furthermore, as discussed above, turnover in the corporate bond
market has grown rapidly since the early 2000s.
The growth of China’s debt markets suggests that the pace of the country’s financial
market development is consistent with its intention to make its currency accepted as an
international currency. Nevertheless, achieving reserve currency status for the renminbi is
probably a much longer-term goal. There is some evidence that the ascension of a country’s
currency to reserve currency status is best approximated by a logistic, rather than a linear,
function of the key determinants of achieving that status (Chinn and Frankel 2007). In other
words, the marginal gain toward reserve currency status would be higher if China were to
increase its share of world debt markets from, say, 50 to 51 percent rather than from 5 to 6
percent. If this is the correct model for analyzing reserve currency status, then China still has a
long way to go in further developing its financial markets to meet the challenges of an
international currency.
Overall, there has been progress in the development of China’s financial markets during
the last decade, in terms of breadth, depth and liquidity (Lin 2009, 2011). But this progress
remains modest to date. There are still significant gaps to fill in terms of achieving sufficiently
large and liquid debt markets. More important, the structure and quality of debt markets will also
need reorientation to fully prepare for a currency used widely in international financial
transactions and reserve holdings. With relatively low external and government debt positions,
China’s debt markets can in principle expand rapidly without serious threat to inflation
credibility or vulnerability to external risks. Effective regulation of corporate debt markets is an
important priority so these markets can expand without generating financial instability.
Moreover, to satisfy their demand for relatively safe renminbi-denominated assets, foreign
investors—both official and private—will eventually need to be given greater access to China’s
debt markets if the renminbi is to become a true international currency.
Financial Market Development Related to International Trade and Financial Transactions
An important criterion for achieving international or reserve currency status is the share of an
economy in world trade and its trade interconnectedness with other economies. Although having
21 large trade flows is neither a necessary nor sufficient condition for a country to have an
international currency, it does boost the potential for the economy’s currency to serve as an
invoice currency. This is an underlying implication of Krugman’s (1995) triangle model of
currency invoicing—whereby economies are more likely to use the currency of the large nation,
as measured by trade, due to economies of scale.
Figure 4-7 shows that Chinese imports and exports have grown dramatically during the
past two decades. Trade flows contracted in 2008–9, but have since rebounded and together
stood at $3.2 trillion, or 54 percent of GDP, in 2010. The value of China’s total trade is now only
slightly lower than that of the U.S. (figure 4-8). For an economy of its size, China also has a high
ratio of total trade to GDP, higher than that of the U.S. and other key emerging markets. Table 4-
7 shows that China now accounts for 9 percent of world trade, behind only the shares of the U.S.
and the euro area (figures for the euro area include within–euro area trade). These indicators are
suggestive of China’s size and rising prominence in world trade.
In addition to trade volumes, another important criterion is the degree to which an
economy is interconnected with other economies through trade linkages. This has implications
for the incentives of traders in other countries to settle their transactions in the home country’s
currency. On the basis of a variety of criteria, Errico and Massara (2011) find that, in 2010,
China was the second most interconnected country in terms of its trade flows, up from fifth in
2000. China is also ranked second in terms of the size of its trade, giving it the top rank in terms
of overall systemic trade importance. The U.S. ranks first in size and nineteenth in terms of
interconnectedness, giving it the rank of sixth in systemic trade importance.10
The pace of the internationalization of China’s currency depends on its use in
international financial transactions as well. The choice of currency for denomination and
settlement of trade flows is contingent on the extent to which that currency can also be used in
international financial transactions.
We first examine the renminbi’s role in foreign exchange markets. As emerging markets
play an increasingly important role in global finance, more international financial transactions
will involve direct exchanges of currencies that do not involve the U.S. dollar or other reserve
currencies as a vehicle currency. Foreign exchange market turnover is a good indicator of a
10 The Netherlands has the highest rank in terms of interconnectedness; it is a small but very open economy with
extensive trade linkages. The systemic trade importance ranks of some other countries are as follows: Germany (2),
Korea (7), Japan (9), India (14), Russia (19) and Brazil (20).
22 currency’s potential for developing into a vehicle currency. As of 2010, the renminbi accounted
for less than 1 percent (out of 200 percent, as each transaction involves two currencies) of all
turnover in foreign exchange markets (table 4-8). This is true of other emerging markets’
currencies as well. The U.S. dollar is dominant in this dimension, accounting in 2010 for 85
percent of turnover. The five reserve currencies together accounted for 162 percent of total
turnover.
In terms of the geographic distribution of foreign exchange turnover, however, China has
the advantage of having Hong Kong as an important financial center for settling foreign
exchange transactions. In 2010, Hong Kong accounted for 5 percent of global foreign exchange
market turnover (table 4-9). This puts the renminbi on a competitive footing relative to other
emerging market currencies in terms of attaining the role of an international currency.
Rather than looking at the foreign exchange market as an aggregate, we can also analyze
the spot and derivatives markets separately. Table 4-10 shows the shares of average daily
turnover in April 2010 in the spot market as well as the four types of foreign exchange
derivatives as defined by the Bank for International Settlements: outright forwards, foreign
exchange swaps, currency swaps, and options and other instruments. Spot transactions make up
24 percent of all foreign exchange transactions in China, a smaller share than for other reserve
currency economies or even other emerging markets, all of which have spot transaction shares
exceeding 30 percent. Furthermore, China’s use of foreign exchange swaps is limited compared
with the reserve currency economies, all of which appear to rely heavily on this derivative
instrument. By contrast, China and other emerging markets such as Brazil and India rely much
more on outright forwards. Outright forwards are more likely to be used as instruments to hedge
foreign currency risk, whereas foreign exchange swaps are often used to fund institutions’
foreign exchange balances. The relatively higher use of outright forwards probably reflects the
simpler goal of hedging against the renminbi’s potential future appreciation, rather than more
sophisticated forms of foreign exchange risk management.
Table 4-11 compares the levels of turnover in April 2010 for major currencies across
each of these foreign exchange markets. China’s currency has the lowest spot transactions
turnover among all economies in the group. Its turnover in outright forwards is higher than that
of other emerging markets, which is consistent with the data presented above. Levels of activity
in renminbi foreign exchange swaps, currency swaps and options markets are also very limited.
23 The renminbi’s foreign exchange derivatives trading volume across the board is far smaller than
that of the major reserve currencies. It is interesting to note that India’s development in these
markets appears roughly similar to that of China, though India’s foreign exchange spot
transaction turnover is somewhat higher.
The underdevelopment of the spot and derivatives markets for trading in the renminbi can
be attributed to limited market participation. It was not until 2005 that China allowed
nonfinancial firms and nonbanking financial institutions to participate in the spot foreign
exchange market on a limited basis. Forward transactions were introduced on the China Foreign
Exchange Trade System around the same time.
Some other steps to broaden China’s financial markets can also be traced back to the
mid-2000s. In 2005, China lifted prohibitions against banks trading in equity and commodity-
based derivative products. The development of the over-the-counter (OTC) interest rate
derivative market followed that, with the first interest rate swaps issued in 2006. As of October
2011, the gross notional amounts outstanding of OTC interest rate derivatives denominated in
euros and U.S. dollars were $93 trillion and $86 trillion, respectively (table 4-12). The same
measure for the renminbi is about $389 billion, less than half the comparable figures even for
Brazil and India.
Although most derivatives markets in China are still nascent, the economy does have a
major presence in the commodity futures market. For example, as measured by the number of
futures/options traded, three of China’s commodity futures exchanges were among the top 20
derivatives exchanges in the world in 2010. Using data from the Futures Industry Association,
we calculate that the number of contracts traded at the three exchanges is roughly 7 percent of all
trades at the 78 exchanges worldwide for which data are reported. Although this is encouraging
in terms of broader financial development, it is not clear that a large commodity derivatives
market is as useful as, say, a large financial derivatives market, from the perspective of
promoting international use of a currency.
The development of a more diverse and liquid derivatives market in China will support a
more global renminbi. To some extent, commercial policies that direct activity toward Hong
Kong are substituting for some roles that would normally be provided by vibrant domestic
financial markets. Figure 4-9 shows that both the amount of renminbi deposits and the number of
institutions authorized to conduct renminbi businesses in Hong Kong rose sharply from October
24 2010 to October 2011. As the Mainland spot and derivatives markets expand in terms of size,
liquidity and access, it will be possible to conduct more of these activities onshore and set the
stage for the renminbi to develop as an international settlement currency.
To sum up, thus far the use of commercial policies to increase the offshore use of the
renminbi has been the centerpiece of China’s currency internationalization process. Although
this has been effective in promoting the renminbi’s global role without risking the potential
deleterious effects of capital account liberalization, the full potential of the Chinese currency’s
international use cannot be realized without more active onshore development. This development
would encourage private initiatives to use the renminbi for trade and financial transactions.
Ultimately, it will be difficult to fully develop China’s foreign exchange and derivatives markets
in the absence of substantial capital account liberalization.
Macroeconomic Policies
A critical attribute of a reserve currency is that it should be “widely acceptable as payment at a
predictable value, even when liquidated without notice” (Obstfeld 2011b, p.3). This implies that
macroeconomic policies that anchor long-run inflationary expectations and foster
macroeconomic stability are crucial conditions for a reserve currency. As was noted above,
China has a low level of explicit public debt relative to the major reserve currency economies.
This is a positive situation from the perspective of macroeconomic stability, even if it means a
limited availability of “safe” renminbi-denominated assets. Moreover, China’s general
government budget deficit is small—the International Monetary Fund estimates that the
country’s deficit was 1.6 percent in 2011, and it is expected to decline to below 1 percent in
2012. In conjunction with the manageable level of public debt, this implies that China has room
to counter domestic and external shocks using fiscal policy.
Despite its tightly managed exchange rate, which has compromised the independence of
monetary policy, China has had a relatively stable inflation rate in the recent past. Table 4-13
shows that the reserve currency economies have had relatively moderate levels of inflation
volatility in recent decades, as measured by the standard deviation of annual inflation rates.
During the years 2000–2010, the period of the Great Moderation followed by the global financial
and economic crisis, inflation was well contained in most major economies. The standard

25 deviations of annual consumer price index inflation in the reserve currency economies were all
around 1 percent. During this period, the standard deviations of inflation in emerging markets
were in the range of 3 to 4 percent, with China coming in lowest, with a standard deviation of 2
percent. In short, China’s track record in terms of the level and volatility of inflation should not
be an impediment to its status as a global currency. Indeed, even though the major advanced
economies had to deal with occasional bouts of high inflation during the 1970s and 1980s, this
does not seem to have scarred them in terms of their reserve currency status (figure 4-10). One
concern, however, is that the People’s Bank of China may intrinsically have less credibility vis-
à-vis inflation compared with the central banks of the reserve currency economies because its
operational independence is constrained by China’s managed exchange rate regime. This could
become a more serious issue, as discussed above, if capital account liberalization proceeds at a
fast pace while the exchange rate remains tightly controlled.
Another policy reform that has implications for domestic financial development as well
as cross-border financial flows is interest rate liberalization. At present, Chinese banks are
subject to a floor on their lending rates and a ceiling on their deposit rates. In effect, the
intermediation spread is fixed by the government and banks cannot compete for deposits by
offering higher interest rates.
As Lardy (2011) and others (IMF 2011) have argued, liberalization of interest rates is an
important element of financial sector reform. It would increase competition among banks and
reduce the intermediation spread. Moreover, it could help shift domestic demand away from
investment (by raising the price of capital) and towards household consumption (by raising the
returns on savings). It would also help in creating a market-determined yield curve for
government securities. This in turn would help catalyze corporate bond market development by
making it easier to price those bonds off a yield curve for government securities, thereby
expanding the range of bonds available to both domestic and foreign investors. This reform,
which has been stalled for a long time, is a good example of one that would help make progress
towards both domestic and international objectives of the Chinese government.
26
5. The Renminbi’s International Presence
The renminbi is already making its presence felt on the international stage, in part as the result of
policy actions by the Chinese government and in part because of the sheer size and growing role
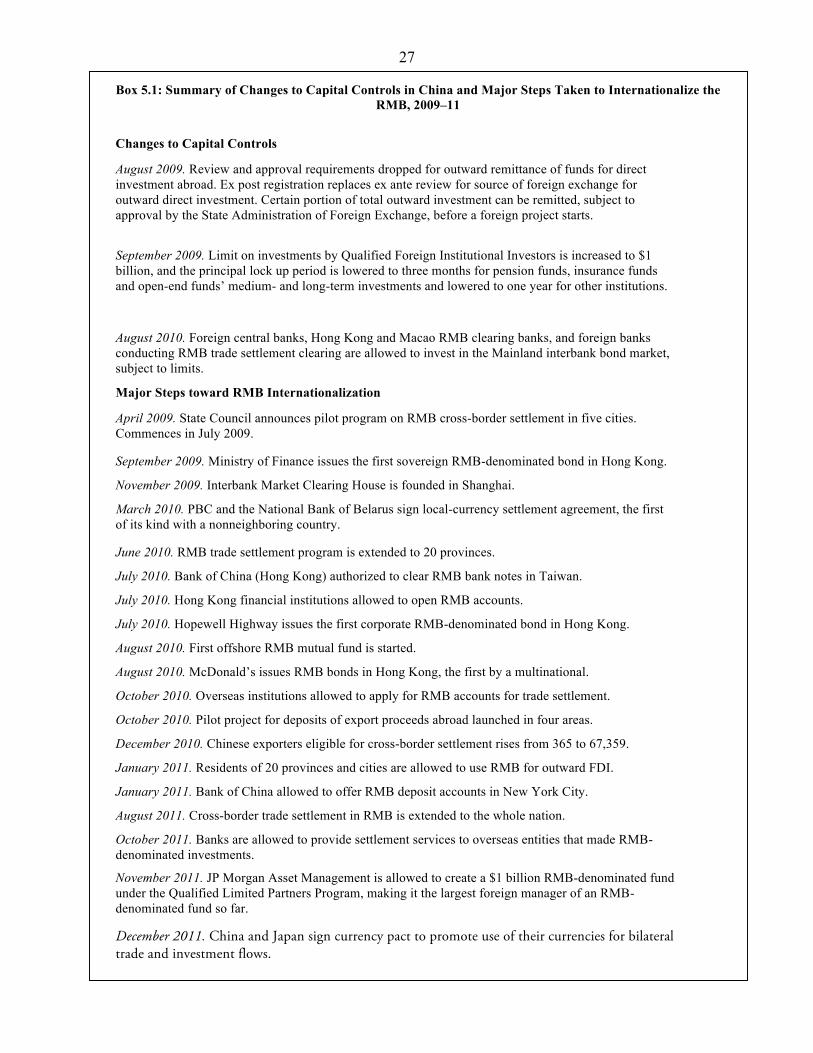
of China in international trade and finance. Box 5.1 provides a summary of the major actions
taken by the Chinese government since 2009 to open up its capital account and to promote the
international use of its currency. A fuller and more detailed description of all these measures is
given in appendix B. Such a broad and concerted policy of promoting the internationalization of
a currency is historically unprecedented (Frankel 2011). In this section, we evaluate the progress
that has been made in different dimensions related to the renminbi’s ascendance as a global
currency.
Currency Markets
The renminbi now trades on both onshore (CNY) and offshore (CNH) markets. Onshore trade
takes place through the China Foreign Exchange Trade System, which is in effect managed by
the People’s Bank of China (PBC). The offshore trades mostly take place on the Hong Kong
Interbank Market. Two separate exchange rates prevail due to Mainland government regulations
that mandate these separate markets for the trading of renminbi. Contrary to the CNY, which is
subject to the Mainland’s capital account restrictions, the CNH market is relatively less regulated
and not subject to direct official control or intervention (Hui and Bunning 2010).
Figure 5-1 shows the exchange rate of the renminbi against the U.S. dollar on both
onshore and offshore exchanges.11 Despite the absence of exchange controls on the CNH, the
two rates have moved in lockstep for much of the period since the end of 2010. The two
exchange rates became more closely linked after a series of developments in the last quarter of
2010 boosted renminbi-denominated financial transactions. This includes the approval granted to
financial institutions and banks in Hong Kong to open renminbi accounts and for Hong Kong
banks to access the onshore interbank market; activation of a swap line between the PBC and the
11 In addition to these spot rates, other renminbi-related exchange rates are the dollar-settled nondeliverable forwards
rate (NDF) and the trade settlement exchange rate. The NDF market predates the CNH market, and it precludes
participation by Mainland residents. However, the NDF is linked to the onshore CNY exchange rate in the sense that
its value is derived from expected future CNY spot rates. The trade-settlement exchange rate is the one that prevails
for cross-border trade transactions, for which the CNH rate does not apply.
27
Box 5.1: Summary of Changes to Capital Controls in China and Major Steps Taken to Internationalize the
RMB, 2009–11
Changes to Capital Controls
August 2009. Review and approval requirements dropped for outward remittance of funds for direct
investment abroad. Ex post registration replaces ex ante review for source of foreign exchange for
outward direct investment. Certain portion of total outward investment can be remitted, subject to
approval by the State Administration of Foreign Exchange, before a foreign project starts.
September 2009. Limit on investments by Qualified Foreign Institutional Investors is increased to $1
billion, and the principal lock up period is lowered to three months for pension funds, insurance funds
and open-end funds’ medium- and long-term investments and lowered to one year for other institutions.
August 2010. Foreign central banks, Hong Kong and Macao RMB clearing banks, and foreign banks
conducting RMB trade settlement clearing are allowed to invest in the Mainland interbank bond market,
subject to limits.
Major Steps toward RMB Internationalization
April 2009. State Council announces pilot program on RMB cross-border settlement in five cities.
Commences in July 2009.
September 2009. Ministry of Finance issues the first sovereign RMB-denominated bond in Hong Kong.
November 2009. Interbank Market Clearing House is founded in Shanghai.
March 2010. PBC and the National Bank of Belarus sign local-currency settlement agreement, the first
of its kind with a nonneighboring country.
June 2010. RMB trade settlement program is extended to 20 provinces.
July 2010. Bank of China (Hong Kong) authorized to clear RMB bank notes in Taiwan.
July 2010. Hong Kong financial institutions allowed to open RMB accounts.
July 2010. Hopewell Highway issues the first corporate RMB-denominated bond in Hong Kong.
August 2010. First offshore RMB mutual fund is started.
August 2010. McDonald’s issues RMB bonds in Hong Kong, the first by a multinational.
October 2010. Overseas institutions allowed to apply for RMB accounts for trade settlement.
October 2010. Pilot project for deposits of export proceeds abroad launched in four areas.
December 2010. Chinese exporters eligible for cross-border settlement rises from 365 to 67,359.
January 2011. Residents of 20 provinces and cities are allowed to use RMB for outward FDI.
January 2011. Bank of China allowed to offer RMB deposit accounts in New York City.
August 2011. Cross-border trade settlement in RMB is extended to the whole nation.
October 2011. Banks are allowed to provide settlement services to overseas entities that made RMB-
denominated investments.
November 2011. JP Morgan Asset Management is allowed to create a $1 billion RMB-denominated fund
under the Qualified Limited Partners Program, making it the largest foreign manager of an RMB-
denominated fund so far.
December 2011. China and Japan sign currency pact to promote use of their currencies for bilateral trade and investment flows.
28 Hong Kong Monetary Authority; and a flurry of renminbi-denominated bond issuance activities.
These measures have lowered transaction costs for (eligible) financial market participants to
access both markets.
Before this period, renminbi-related activities in the offshore market were quite limited,
which contributed to a marked deviation of the CNH exchange rate from that of the CNY—the
renminbi was more valuable offshore. The direction of this persistent gap is something of a
puzzle. Equally oddly, a deviation of the two exchange rates appears to have resurfaced
temporarily during the middle of 2011, but this time in the opposite direction—the CNH
exchange rate rose markedly above the CNY exchange rate, and this gap persisted for a while.
Although discerning the factors behind the relative movements of these exchange rates is beyond
the scope of this paper, the offshore renminbi market and its diversified set of trading
environments for the same currency highlight the increasing use of the renminbi in Hong Kong
for bond issuance and other financial activities. At the same time, it is a reflection of the unique
path that the Chinese government has chosen for internationalizing its currency. Such markets
will no doubt contribute to a more global Chinese currency. At present, however, offshore
renminbi trading is still restricted by a variety of regulations that limit market participation to a
select group—most notably, financial institutions. The extent of the influence of offshore
financial transactions on the global use of the renminbi will depend on how these regulations
evolve over time.
Cross-Border Renminbi Settlement in Hong Kong
China has a major advantage in undertaking capital account liberalization in a controlled
manner—its access to an international financial center, Hong Kong. Indeed, Hong Kong has
become the testing ground for a number of initiatives to promote the international use of the
renminbi. In 2004, personal renminbi business was initiated in Hong Kong by allowing residents
there to open deposit accounts denominated in renminbi. Since then, a number of initiatives have
been put in place, including allowing cross-border settlements of trade transactions and bond
issuances in renminbi.
Given China’s rapidly expanding trade volumes, which are documented above,
promoting a greater use of the renminbi in trade settlement is a logical first step in the currency’s
29 internationalization process (Eichengreen 2011b). Figure 5-2 shows data on cross-border
settlements of trade in renminbi since the first quarter of 2010. In a relatively short period, cross-
border trade settlement in the Chinese currency has expanded to $93 billion (at the end of the
third quarter of 2011). During the first three quarters of 2011, renminbi trade settlements
amounted to about 8 percent of China’s total trade in goods and services.
Data for these settlement transactions broken down by imports and exports are available
on a limited basis and indicate that most of the renminbi trade settlement is for imports by China,
which allows foreign traders to acquire renminbi. By contrast, there is little settlement in
renminbi of China’s exports, suggesting that recipients of exports from China either have limited
amounts of the currency or are disinclined to reduce their holdings. One interpretation of this
one-sided pattern of trade settlements is that it reflects the desire of foreign traders to go long on
the renminbi in anticipation of its appreciation and that trade settlement provides one channel for
doing so. This is another indication of how China’s rising trade and financial integration with
global markets will make it increasingly difficult to tightly manage the currency’s external value.
Figure 5-3 provides a complementary perspective by showing the monthly amount of
remittances of renminbi used for cross-border settlement in Hong Kong. During 2011, these
remittances averaged roughly $25 billion per month, more than double the average for 2010.
Cross-border renminbi settlement is not confined exclusively to Hong Kong, but its banks play a
dominant role. It is estimated that Hong Kong banks handled about 73 percent of China’s
renminbi trade settlement in 2010 and that this proportion rose to 86 percent in the first quarter
of 2011 (HKMA 2011). The geographic coverage for cross-border trade settlement in renminbi
has been expanded rapidly during the past two years and was extended to the entire Mainland on
June 23, 2011.
Another major development is the rising issuance of renminbi-denominated bonds in
Hong Kong, otherwise know as dim sum bonds. Panel A of figure 5-4 shows that from 2007 to
2010, the issuance of these bonds nearly tripled, to about $6 billion in 2010. In the second
quarter of 2011 alone, issuance surged to nearly $11 billion, a pace that was sharply higher than
in 2010 and that signaled a rapid expansion of these instruments (panel B). Issuances fell off in
the last quarter of 2011, although it is hard to tell if this signaled a shift in the attractiveness of
these bonds for issuers or simply reflected weaker global financial market conditions as the euro
debt crisis continued to fester.
30
An alternative approach to gauging the importance of the offshore use of renminbi is to
see how much the currency is used for interbank clearing transactions. After various lines of
renminbi business had been started, as discussed above, the Hong Kong Interbank Market
initiated an RMB settlement system on March 6, 2006, to provide a variety of check clearing,
RMB square position, remittance processing, and bank card payment services. Figure 5-5 shows
that renminbi clearing transactions were virtually zero until mid-2010, when financial institutions
in Hong Kong were allowed to open renminbi-denominated accounts. Since then, both the
volume and value of transactions have increased dramatically. The total value of transactions hit
a peak of nearly $550 billion in August 2010, but both transaction volume and value fell in
September 2011.
Although the scales remains modest, the initiation and rapid expansion of different
elements of the offshore renminbi market are encouraging signs of the currency’s prospects of
getting a significant foothold in the Asian region’s trade and financial transactions. Some caveats
are in order, however. First, dim sum bond issuance remains somewhat narrow in scope, in that
such issuance is still heavily confined to banking and financial institutions. Second, a large
portion of the issuance currently comes from Mainland China. These two trends are evident from
the breakdowns shown in panels B and C of figure 5-4. Third, various reports suggest that a
significant portion of cross-border renminbi settlement is used mainly for cross-border arbitrage
between Mainland companies and their Hong Kong subsidiaries.12 These factors imply that the
influence of offshore renminbi use still has some ways to go to reach its full potential.
The Renminbi Creates Ripples in the Central Banking World
The PBC has established a series of bilateral swap lines with other central banks in order to
facilitate and expand the use of the renminbi in international trade and financial transactions.
China had in fact established swap lines with other central banks even before it started to actively
promote the international use of its currency. Most notably, it had arranged six of them with
other Association of Southeast Asian Nations + 3 economies under the Chiang Mai Initiative in
the early 2000s.13 Although China established bilateral local currency swap agreements with the
12 See, e.g., “Renminbi Threat to Dollar Could be Stalling,” Financial Times, November 23, 2011. 13 The Chiang Mai Initiative refers to the initiative of Association of Southeast Asian Nations + 3 economies to set
up bilateral central bank swap lines among their members to deal with country-specific liquidity crunches.
31 Philippines, South Korea, and Japan, most of the other swap arrangements (e.g., the one with
Thailand) were dollar–renminbi swaps. Under these arrangements, China would provide U.S.
dollars in exchange for the local currency of the counterparty economy.14 In other words, the
foreign exchange reserves of economies like China would often serve as an additional credit line
facility if the counterparty economy were to face a liquidity crunch due to a balance of payments
or financial crisis.
Since 2008, China’s bilateral swap lines with foreign central banks have directly
supported the renminbi’s greater international use, though their liquidity-supporting role remains
relevant. Appendix C shows the counterparty, date, and the value of each of these swap lines. In
contrast to the norm for previous swap lines, these arrangements are all designed for settlement
in local currencies. The amounts of these bilateral agreements have been relatively small so far,
no more than the equivalent of $63 billion. The extent to which these swap lines have been
drawn upon appears to be limited. The Hong Kong Monetary Authority (HKMA) activated its
bilateral swap line with the PBC in October 2010, more than a year and a half after the swap line
was set up. At the end of 2010, the amount of bilateral swaps outstanding for the HKMA was 20
billion yuan, or about $3 billion (HKMA 2010). The PBC mentions in its 2010 Annual Report
that “at end-2010, overall volume of currency swap agreements reached 803.5 billion yuan. The
PBC also conducted 30 billion yuan of local currency swap operations at the request of a number
of monetary authorities” (PBC 2010, 33). This suggests that only 10 billion yuan, about $1.5
billion, were drawn outside of Hong Kong. Nevertheless, the PBC is clearly making an active
effort to make the central banks of a broad group of economies comfortable and familiar with
renminbi-denominated instruments and financial facilities.
Another noteworthy development is that, despite its lack of convertibility, the renminbi is
already beginning to play a modest role in a few central banks’ reserve portfolios. Malaysia and
Nigeria are widely believed to have pioneered this trend, starting in the second half of 2011. The
Central Bank of Nigeria issued a statement on September 5, 2011, announcing that it “has
finalized arrangements to diversify its external reserves holdings by including the Chinese
renminbi (RMB) to the existing currency mix of United States dollars (USD), the euro (EUR)
14The swap lines with Korea and Japan were established in 2002 and are “two-way”—either party can provide
liquidity. The swap with the Philippines was established in 2003 and, though denominated in local currency, it is a
one-way swap such that China would provide RMB liquidity in return for Philippines’ currency should the
Philippines need to draw upon the credit line (see Henning 2009; Ito 2011).
32 and the British pound sterling (GBP).”15 Furthermore, Chile’s internally managed Central Bank
investment portfolio now has 0.3 percent of its assets allocated to renminbi-denominated
instruments, according to its September 2011 Monetary Policy Report.
Official statements and other accounts suggest that other central banks are also
considering adding renminbi assets to their reserve portfolios (see appendix D). An interesting
point is that these holdings cannot in principle be counted as reserves by the International
Monetary Fund, given the present status of the renminbi’s (lack of) convertibility. But this does
not seem to matter for these central banks, because they view renminbi-denominated assets, just
as they do other major reserve currency-denominated assets, as providing insurance against
balance of payments pressures. All these moves are modest in size but are symbolically
important in signaling the shift in perception about the renminbi’s stability and its future role in
the international monetary system.
In December 2011, China and Japan signed a pact to promote the use of their currencies
for bilateral trade and investment flows.16 Trade between the two economies amounted to about
$300 billion in 2010, while bilateral financial flows are estimated to be less than $100 billion.
Assuming that all these transactions are currently settled in dollars and will eventually be settled
in the two countries’ currencies, the effect on switching from dollar-intermediated transactions
would still be relatively modest at the global level. Moreover, given the lack of convertibility of
the renminbi, these moves may have a limited impact in the short run. Over time, the effects
could be larger, especially because the decline in currency transaction costs and exchange rate
uncertainty could boost trade and financial flows between the two countries. China has also
given permission for Japan’s Bank for International Cooperation to issue a yuan-denominated
bond, while Japan has indicated that it will buy some Chinese government bonds, presumably to
add to its reserve portfolio. Again, these moves are more important symbolically than
quantitatively, but they may be setting the stage for more significant developments as China’s
capital account becomes more open.
15“Nigeria Approves Inclusion of Chinese Renminbi in External Reserves,” Central Bank of Nigeria Press Release,
September 5, 2011. 16 “Enhanced Cooperation for Financial Markets Development between China and Japan,” People’s Bank of China,
December 25, 2011.
33
6. Implications of the Renminbi’s Ascendance for the International Monetary
System
The analysis so far has made the point that the renminbi’s prospects as a global currency will be
shaped by broader domestic policies, especially those related to financial market development,
exchange rate flexibility and capital account liberalization. In this section, we discuss the
potential impact of the renminbi’s rise on the competitive balance among global reserve
currencies. We also discuss the effects that the internationalization of the renminbi could have on
the structure of global capital flows.
Implications of a Rising Renminbi for China-U.S. Financial Flows
One of the defining statistics in global finance is China’s massive stock of foreign exchange
reserves, which stood at $3.2 trillion at the end of 2011 (figure 6-1, upper panel). This level of
reserves—the equivalent of about 50 percent of China’s GDP, and more than all of China’s
external liabilities combined—is far greater than any level that could be justified on the basis of
precautionary reasons. In the last quarter of 2010 and the first two quarters of 2011, reserve
accumulation averaged nearly $200 billion each quarter (figure 6-1, lower panel). This pace fell
off sharply in the third quarter of 2011, down to nearly zero. The stock of reserves in fact
declined slightly in the last quarter of 2011, although this may largely be due to valuation effects
associated with the weakening of the dollar against the euro. The pace of reserve accumulation is
expected to pick up again when—or if—global financial markets settle down and the euro zone
and U.S. economies begin to recover.
China does not report the currency composition of its foreign exchange reserve holdings,
but it is widely believed that about two-thirds are in U.S.-dollar-denominated instruments. Data
based on the U.S. Treasury International Capital System (TIC) provide at best a partial picture
because they track the country of the purchasing agents rather than the owners of U.S. securities.
Table 6-1 indicates that, based on the TIC data, China holds about 12 percent of outstanding
Treasury bills, notes and bonds, up from 2 percent a decade ago. The total value of China’s
reported holdings of Treasuries and agency bonds at the end of 2010 was $1.3 trillion, which is
almost certainly an underestimate of the actual amount. Panel A of figure 6-2 shows that China’s
vast holdings of U.S. securities are mostly in the form of long-term Treasury bonds and, second
34 to that, agency debt.17 China invests a relatively small amount in U.S. equities. From a cross-
country perspective, China’s total holdings of U.S. securities ranks as the highest in absolute
volume (figure 6-2, panel B), notwithstanding the likely underestimation. One striking feature is
that China holds only a small amount of U.S. equities, compared with the reserve currency
economies.
The composition of U.S. portfolio investment in Chinese securities (which excludes
foreign direct investment) is quite different. Figure 6-3 shows that the U.S. invests only a modest
amount of roughly $100 billion in Chinese securities. More important, much of this investment
goes into Chinese equity markets as opposed to debt. The same pattern holds for U.S. investment
in other key emerging markets and advanced economies.
China’s capital account liberalization could have significant effects on the volume and,
more important, the composition of investments in the U.S. The major channel for capital flows
to the U.S. is of course the official accumulation of foreign exchange reserves. This pattern of
flows poses a significant risk for China on the asset side of its external balance sheet. High and
rising U.S. debt levels are likely to adversely affect productivity growth in the U.S. Given the
relatively high productivity growth in China, even a slowdown in its growth could leave a large
productivity growth gap between the two countries. The resulting appreciation of the renminbi
against the dollar, whenever it happens, will erode the domestic currency value of China’s stock
of U.S. Treasuries.
Why is China continuing to accumulate so many reserves? In addition to the
precautionary motive for holding reserves, a more straightforward explanation of China’s reserve
accumulation is that it results from a mercantilist policy of keeping the currency undervalued in
order to gain a competitive advantage for the country’s exports. China has in fact tried to offset
some of this pressure on its currency by liberalizing outflows, as discussed above. But the lack of
financial market development makes it difficult for households to diversity their portfolios
internationally. Moreover, it contributes to the high and rising household saving rate in China
(Chamon and Prasad 2010; Lardy 2011). A more flexible exchange rate and a broader financial
system that facilitates hedging against currency risk would reduce reserve accumulation, while
simultaneously reducing the “fear of floating.” A deeper and broader financial system would also
17 Interestingly, China held a significant portion of short-term U.S. Treasuries in 2009. This, however, decreased
quickly in the subsequent year.
35 reduce the risks from the greater capital flow volatility to which China will be exposed as the
capital account becomes more open. For instance, a richer set of derivatives markets would
enable private agents, including corporations, to insure against a variety of risks associated with
capital flows, mitigating the need for reserves as a public insurance mechanism.
Shifting away from policies that intensify reserve accumulation would also allow China
to change the structure of its foreign investments. In particular, capital outflows would reduce the
pressure on the currency. In the absence of well-developed financial markets that facilitate
foreign investments by households, this is to some extent being done by the government. China’s
sovereign wealth fund, the China Investment Corporation (CIC), and other large institutional
investors are already moving aggressively into investments that offer higher yields than U.S.
Treasuries or government bonds of other reserve currency economies. Table 6-2 shows that CIC
is shifting away from government bonds into higher-yielding assets. The share of equity holdings
in its portfolio rose from 36 percent in 2009 to 48 percent in 2010. Among its diversified fixed-
income securities, roughly a third were invested in corporate bonds in 2010, compared with 13
percent in 2009.
As Chinese financial markets become more developed and private investors increase the
international diversification of their portfolios, these shifts in China’s outward investment
patterns are likely to become more pronounced. Thus, the various policy reforms that are needed
to support the international role of the renminbi could also create significant changes in China’s
economy and the patterns of its capital inflows and outflows.
Will the Renminbi Knock the Dollar Off Its Pedestal?
The U.S. dollar remains by far the dominant global reserve currency. Its status was threatened by
the rising prominence of the euro, with that currency’s share of global foreign exchange reserves
rising by nearly 7 percentage points, from 18 to 25 percent, during the period 1999–2003 (figure
6-4). Much of the increase in the euro’s share was matched by a decline in the dollar’s share.
Since then, however, the shares of the euro and dollar have stabilized, with the dollar’s share
standing at 63 percent in 2010. However, these figures need to be interpreted with caution,
because a rising share of global reserves cannot be “allocated” across the reserve currencies
(figure 6-5). This is because certain countries do not report the currency composition of their
reserve holdings to the International Monetary Fund. Two prominent cases are China and India,
36 which together account for about $3.5 trillion of global foreign exchange reserves. Given the
sheer size of their reserve holdings, however, it is highly probable that the currency composition
of these two countries’ reserves is largely concentrated in dollars and that the broader
composition is similar to that of global allocated reserves. Other indicators, such as the dollar’s
share of cross-border foreign currency liabilities of non-U.S. banks, confirm the currency’s
dominance in global finance (figure 6-6).
Despite its status as the dominant existing reserve currency, there are major concerns
about the future of the U.S. dollar, related to the uncertain prospects for U.S. macroeconomic
stability. Although the Federal Reserve clearly has strong worldwide credibility for its inflation-
fighting credentials, rising public debt poses a more serious concern. Figure 6-7 shows that U.S.
gross general government debt is about 90 percent of GDP, and IMF forecasts indicate that it
could reach 110 percent of GDP, or nearly $21 trillion, by 2016. This is dangerous and
unprecedented terrain for the world’s largest economy. The paradox is that, given the
weaknesses in Japan and the euro zone, along with emerging markets’ demand for “safe” assets
as they accumulate even more reserves, this rising debt may cement the dollar’s dominant status
in the global financial system.
Figure 6-7 also shows the gulf that still exists between China and the U.S. in the
availability of safe and liquid assets such as government bonds. The depth, breadth and liquidity
of U.S. financial markets suggest that its currency will serve as a potent buffer against threats to
its dominant status. Rather than catching up to the U.S. by building up debt, the challenge for
China is to develop its other financial markets and increase the availability of high-quality
renminbi-denominated assets.
The Renminbi and the SDR
The International Monetary Fund’s Special Drawing Rights constitute an international reserve
asset created by the IMF. Its value is based on a basket of four reserve currencies—the U.S.
dollar, the euro, the Japanese yen and the pound sterling. SDRs are distributed among IMF
members on the basis of their quotas at their institution. The stock of SDRs now stands at
37 roughly $320 billion.18 SDRs can in principle be exchanged for “freely usable” currencies but
cannot be used directly in private transactions. This means that increasing the stock of SDRs
does not increase the total liquidity of the global monetary system unless a substitution account
is used. But such substitution accounts that would result in the net creation of global liquidity via
SDR issuance may not be practical, in part because SDRs are not backed by a global central bank
and have no support from a fiscal authority (Obstfeld 2011c).
There was considerable discussion in 2011 about a proposal to include the renminbi in
the basket of currencies that constitute the SDR. The French government, during its presidency
of the Group of Twenty in 2011, promoted this proposal at different venues, viewing it as an
important component of the reform of the international monetary system. At a G-20 Conference
in Nanjing in March 2011, French president Nicolas Sarkozy put the issue squarely on the table:
“Isn’t it the time today to reach agreement on the timetable for enlarging the basket of SDRs to
include new emerging currencies, such as the yuan? Who could deny the major role the yuan
plays in the international monetary system? Tribute is thus paid to the economic power and the
political power of China, a major monetary power.”
The communiqué issued at the conclusion of the November 2011 G-20 Summit in
Cannes contained this language: “We agreed that the SDR basket composition should continue to
reflect the role of currencies in the global trading and financial system and be adjusted over time
to reflect currencies’ changing role and characteristics. The SDR composition assessment should
be based on existing criteria, and we ask the IMF to further clarify them. A broader SDR basket
will be an important determinant of its attractiveness, and in turn influence its role as a global
reserve asset. This will serve as a reference for appropriate reforms. We look forward to
reviewing the composition of the SDR basket in 2015, and earlier if warranted, as currencies
meet the criteria, and call for further analytical work of the IMF in this regard, including on
potential evolution.” During his final press conference at the conclusion of that summit, Sarkozy
was more explicit: “The yuan is a clear candidate [for inclusion in the SDR basket], given
China’s commitment—which I noted with satisfaction—to gradual convertibility.”
China itself has been more circumspect about the prospects of expanding the SDR basket.
The deputy governor of the People’s Bank of China (and also head of the State Administration of
18 This is based on a stock of about 204 billion SDRs converted to U.S. dollars at the November 23, 2011, exchange
rate of 0.643 SDRs per $1.
38 Foreign Exchange), Yi Gang, urged the IMF to conduct more research into a shadow SDR and
argued that “the IMF should consider including currencies of the BRICS [Brazil, Russia, India,
China and South Africa—the world’s largest fast-growing emerging economies] countries and
other emerging economies when it next reviews its Special Drawing Right (SDR) system by
2015.” But Yi was also quoted as saying that “China is in no hurry as the SDR has so far been
only a symbolic currency basket.”19
SDRs currently account for about 5 percent of world official reserve asset holdings, so
the direct effect of including the renminbi in the SDR basket would not be substantial. But the
symbolic effect would be substantial, as even the prospect of the renminbi becoming a part of the
SDR basket would encourage central banks around the world to begin adding renminbi assets to
their reserve portfolios. Technically, the renminbi cannot become a part of the SDR basket
because it is not a convertible currency. However, the notion that a freely usable currency ought
to qualify for the SDR basket has been thrust into the debate, based on the argument that the
renminbi already meets the criteria for a freely usable currency, given that it is being increasingly
used in trade settlement transactions and in the denomination of deposit accounts offshore.
The IMF’s position in 2010 was clear and was summarized as follows in a report on its
Executive Board’s discussion of the matter: “Directors noted that although China has become the
third-largest exporter of goods and services on a five-year average basis and has taken steps to
facilitate international use of its currency, the Chinese renminbi does not currently meet the
criteria to be a freely usable currency and it would therefore not be included in the SDR basket at
this time. Directors urged that this issue be kept under review in light of developments.”20 Thus,
it appeared that the IMF intends to apply the convertibility criterion strictly, which would be
logical because any currency that is part of the SDR basket would presumably automatically be
counted as an official reserve currency.
Technically, the SDR basket consists of the four currencies that are (1) issued by IMF
members (or monetary unions that include IMF members) that are the largest exporters, and (2)
have been determined by the IMF to be “freely usable.” The latter condition was added as a
formal criterion only in 2000 and is clearly open to interpretation, as is the number of countries
whose currencies are in the SDR basket. The IMF’s operational definition of a freely usable
19 See “China FX Head Proposes Adding BRICS Currencies to SDR,” Reuters, May 5, 2011. 20 “IMF Executive Board Completes the 2010 Review of SDR Valuation,” IMF Public Information Notice 10/149.
39 currency requires that it be (1) widely used to make payments for international transactions, and
(2) widely traded in the principal exchange markets. Thus, the criterion of convertibility is not
strictly essential for a currency’s inclusion in the SDR basket. By contrast, the IMF’s own
Balance of Payments definition of a freely usable currency is one that is liquid, convertible and
used for the settlement of international transactions. The composition of the SDR basket is
governed by operational rather than technical criteria, so the lack of convertibility is not a
hindrance to including the renminbi (or other emerging market currencies) in the basket.
In November 2011, the IMF proposed the following indicators for evaluating a
currency’s potential for inclusion in the SDR basket:21
• Volume of transactions in foreign exchange spot markets
• Volume of transactions in foreign exchange derivatives markets and over-the-counter
derivatives
• Existence of an appropriate market-based interest rate instrument
• Currency composition of official reserve holdings.
There are no clear benchmarks for any of these criteria, suggesting that—as long as some
minimal thresholds are met on each of them—whether or not to include a currency in the SDR
basket is ultimately a political decision. China probably already meets the first criterion and is
making progress on the second one. Interest rate liberalization would be necessary to meet the
third one. The IMF has left itself considerable room to maneuver in response to shifting political
winds. For instance, when considering the currency composition of reserves, the IMF coyly
suggests that an ancillary indicator could be the number of countries holding a currency in their
international reserve portfolios. This would certainly suit China well—as indicated in appendix
D, a number of countries have begun to publicly discuss the possibility and desirability of
holding renminbi assets in their reserve portfolios, even if the actual (or proposed) amounts are
small as of now.
21“IMF Executive Board Discusses Criteria for Broadening the SDR Currency Basket,” IMF Public Information
Notice 11/137. For more details on the underlying analysis, see “Criteria for Broadening the SDR Currency Basket,”
International Monetary Fund, September 2011.
40
7. Conclusion
Given its size and economic clout, China is adopting a unique approach to the renminbi’s role in
the global monetary system. We refer to this as “capital account liberalization with Chinese
characteristics.” As with virtually all other major reforms, China is striking out on its own path to
a more open capital account. This is likely to involve removing explicit controls even while
attempting to exercise “soft” control over inflows and outflows through administrative and other
measures. The medium-term objective, which we believe will be achieved in the next five years,
is an open capital account but with numerous administrative controls and regulations still in
place. This will allow the renminbi to play an increasingly significant role in global trade and
finance, but in a manner that allows the government to retain some control over capital flows.
Indeed, the renminbi is beginning to play a role in international trade transactions and
also starting to appear in the reserve portfolios of certain emerging market central banks. The
bilateral currency pact to which China and Japan agreed in December 2011 is an interesting
example of how China is attempting to reduce its dependence on the dollar while other countries,
especially in the Asian region, appear eager to participate in such agreements because they see
advantages to tighter trade and financial links with China. These shifts, which are more symbolic
than substantive at present, will develop critical mass over time and have the potential to start
transforming the global monetary system.
The Chinese government’s recent policy actions are indicative of its serious intent to
broaden the global role of its currency. The potential for the renminbi to develop quickly into an
international currency is not without historical precedent. The U.S. dollar rose from being a
currency with a limited international role to being a serious competitor to the pound sterling in
just over a decade (Eichengreen and Flandreau 2010). The big challenge for the Chinese
government is to back up its modest international policy actions with substantial domestic
reforms. To promote its broader international ambitions without waiting for its domestic policy
reforms to catch up, China will need to continue promoting the international use of the renminbi
using Hong Kong as a platform. Over the medium term, as the capital account becomes more
open and financial markets become more developed, this strategy will shift more toward the
promotion of Shanghai as an international financial center.
41
Although China’s rapidly growing size and dynamism are enormous advantages that will
help promote the international use of its currency, its low level of financial market development
is a major constraint on the likelihood of the renminbi attaining reserve currency status.
Moreover, in the absence of an open capital account and free convertibility of the currency, it is
unlikely that the renminbi will become a prominent reserve currency, let alone challenge the
dollar’s dominance. On the basis of the anticipated pace of reforms, we believe that the renminbi
will become a competitive reserve currency within the next decade, eroding but not displacing
the dollar’s dominance.
Even with only gradual financial market development, we foresee that the renminbi will
be included in the basket of currencies that constitute the International Monetary Fund’s Special
Drawing Rights basket within the next five years. The IMF needs China a lot more than China
needs the IMF, and the prospect of the renminbi’s inclusion in the SDR basket could be seen as a
way for the IMF—and the international community that it represents—to exercise leverage over
China in internalizing the global repercussions of its domestic policies.
The Chinese government’s approach to policies that promote the renminbi’s use as an
international currency is inherently linked to domestic macroeconomic objectives and financial
market development. The impact of the renminbi on the global monetary system and whether it
contributes to greater global financial stability depends on the manner and speed with which
China opens up its capital account and develops its financial markets, what other policy changes
are put in place to support this process, and what the implications are for China’s own growth
and stability.
The big question now is whether China’s government will use the goal of making the
renminbi a global currency to catalyze momentum on a broad agenda of domestic policy reforms
that are required to support this goal. Ultimately, the path of China’s growth and its role in the
global economy will depend on those policy choices.
42
Appendix A: Changes to Capital Controls in China, 2004–10
This appendix extends the documentation of changes to capital controls in Prasad and Wei (2007) to January 31, 2011. Reference source: IMF’s Annual Reports on Exchange
Arrangements and Exchange Restrictions (AREAER, 2004–11). All items are quotations from original source. Changes during 2004
January 1. Under the Closer Economic Partnership Arrangement, (1) the asset requirement for Hong Kong Special Administrative Region (SAR)–incorporated banks to open branches in Mainland China was reduced to $6 billion from $20 billion; (2) the requirement that a representative office be set up in Mainland China before a Hong Kong SAR bank established a joint venture bank or joint venture !nance company in Mainland China was lifted; and (3) for Mainland China branches of Hong Kong banks to apply to conduct renminbi business, the minimum number of years of business operations on the Mainland required of the banks was reduced to two years from three years. June 27. Foreign-funded domestic banks were not permitted to convert proceeds from debt contracted abroad into renminbi and were not allowed to purchase foreign exchange for servicing such debts.
June 27. Capital remitted as inward foreign direct investment can be converted into renminbi only on the basis of a written payment order by the foreign-invested enterprise. December 1. Foreign heirs, including those from Hong Kong and Macao, were permitted to take inheritances out of the country. Emigrants were allowed to take legally obtained personal assets up to the equivalent of $200,000; for larger amounts, staggered transfers were required to be made over a minimum period of two years. Changes during 2005
January 15. The reserve requirements on accounts denominated in domestic and foreign currencies were uni!ed at 3 percent. Changes during 2006 April 13. Domestic banks’ overseas foreign exchange fund management services for customers was expanded; qualified banks are allowed to combine renminbi funds of domestic institutions and individuals and purchase foreign exchange within limits to invest in fixed-income products abroad; qualified fund management firms and other securities firms are allowed to combine within limits foreign exchange funds of domestic institutions and individuals for overseas portfolio investments, including for stocks; insurance institutions’ securities investment business abroad was expanded; qualified insurance companies are allowed to purchase foreign currency to
43 invest in fixed-income products and currency market instruments abroad, with the foreign exchange purchase amount subject to a certain proportion of the insurance institution’s total assets. July 1. The limit on the amount of foreign exchange used in Chinese enterprises’ direct investments abroad was abolished. September 1. Nonresidents may purchase domestic real estate based on actual needs and for their own use. Changes during 2007
February 1. The limit on foreign exchange purchases by residents for remittance abroad for personal reasons was increased to $50,000 a year. Resident individuals’ foreign exchange receipts up to $50,000 may be processed with a bank on proof of identity.
March 2. The State Administration of Foreign Exchange (SAFE) reduced the 2007 short-term external debt quotas of Chinese-funded banks to 30 percent and those of nonbank financial institutions and foreign-funded banks to 60 percent of their 2006 equivalents. In addition, Chinese-funded banks were required to reduce their outstanding short-term external debts to 30 percent or less and nonbank financial institutions and foreign-funded banks to 60 percent or less of their 2006 quotas by March 31, 2008. August 30. The SAFE fully decentralized the task of verification of sources of foreign exchange capital for outward investment. SAFE branches were authorized to verify sources of foreign exchange capital for outward investment projects of $10 million or more. December 9. The overall Qualified Foreign Institutional Investors (QFII) quota was raised to $30 billion from $10 billion. Changes during 2008
March 7. Regulated financial institutions that meet risk management requirements were allowed to trade in gold futures on the domestic market. July 14. The registration management system for the provision of trade credit between residents and nonresidents was implemented for advance receipts of export payments. August 29. The amount of capital remitted as inward foreign direct investment that may be converted to renminbi only with a written payment order by the company making the foreign investment was reduced to $50,000 from $200,000. October 1. The registration management system for the provision of trade credit between residents and nonresidents was implemented for deferred payments of imports.
44 November 15. The registration management system for the provision of trade credit between residents and nonresidents was implemented for advance receipts of import payments. December 1. The registration management system for the provision of trade credit between residents and nonresidents was implemented for deferred payments of exports. Changes during 2009
August 1. The protocol for review of the source of foreign exchange funds for outward direct investment changed from ex ante examination to ex post registration, and the review and approval requirement for outward remittances of funds for outward direct investments was canceled. During the preparatory stage before the formal startup of the foreign project, with SAFE approval, domestic institutions may remit a certain percentage of the total investment abroad.
September 29. With respect to Qualified Domestic Institutional Investors, the net amount of funds remitted abroad by securities dealers for investment in securities abroad must not exceed approved investment limits. September 29. The upper limit on individual QFII investments was raised from $800 million to $1 billion, and the principal lock-up period for medium- and long-term investments by pension funds, insurance funds, and open-end funds was decreased to three months from 6 to 12 months; the principal lock-up period for other institutions was decreased from three years to one year. Changes during 2010
August 17. Foreign CBs, monetary authorities, Hong Kong SAR and Macao SAR RMB clearing banks, and foreign banks engaged in RMB trade clearing were allowed to invest in the China interbank bond market. These investments have several limitations, but there is no minimum holding period.
45
Appendix B: Recent Developments Pertaining to the International Use of the
Renminbi
This appendix documents recent developments related to the greater international use of the renminbi and other relevant financial market developments. A variety of official and unofficial sources were used in compiling this appendix. “AREAER” refers to the IMF’s Annual Reports on Exchange Arrangements and Exchange Restrictions; “HKMA” is the Hong Kong Monetary Authority; and “PBC” stands for the People’s Bank of China. Changes during 2004
January 18. Mainland residents are allowed to use renminbi-denominated bankcards for tourism-related payments in the Hong Kong Special Administrative Region (SAR). (AREAER 2004, 229, “Arrangement for payments and receipts” change.) January. Personal renminbi businesses are launched. (HKMA) February 25. Participating banks in the Hong Kong SAR can establish renminbi-denominated accounts, accept renminbi deposits, provide RMB–Hong Kong dollar exchange services, and effect renminbi remittances for residents and specified commercial customers in Hong Kong. (AREAER 2004, 229, “Arrangement for payments and receipts” change.) February 25. The number of primary dealers for open market operations is raised by the PBC after some securities companies, insurance companies and rural credit cooperatives unions were approved as primary dealers. (PBC) April 1. The amount for which documentary evidence is required in order to surrender foreign exchange is raised to the equivalent of $50,000 from $20,000. (AREAER 2004, 229, “Proceeds from invisible transactions and current transfers” change.) May 1. The amount of previous current account foreign exchange income that qualifying enterprises are allowed to retain is increased to the equivalent of 30 percent or 50 percent from 20 percent. (AREAER 2004, 229, “Exports and export proceeds” change) May 1. The definition of qualifying enterprises is adjusted to include enterprises with specifically allowed foreign exchange business. Previously, the list included enterprises with specific foreign exchange volume or capital amounts. (AREAER 2004, 229, “Exports and export proceeds” change.) August 12. The PBC puts forth clearing and reflow mechanisms for banking in renminbi in the Macao SAR. (PBC) September 8. Mainland China residents are allowed to use renminbi-denominated bank cards for tourism-related payments in the Macao SAR. (AREAER 2005, 235, “Arrangement for payments and receipts” change.)
46 November 1. The PBC allows qualified securities firms to issue short-term financing bills to qualified institutional investors in the interbank market. (PBC) November 3. Participating banks in the Macao SAR are allowed to open renminbi-denominated accounts; accept renminbi deposits; provide exchange services between renminbi, the Hong Kong dollar, and the Macao pataca; and effect renminbi remittances for residents and designated commercial customers in the Macao SAR. (AREAER 2005, 235, “Arrangement for payments and receipts” change.) November 17. The China Development Bank is approved for the issuance of bonds with floating interest rates around the seven-day repo benchmark rate on the interbank market. (PBC) December 28. For the first time, the PBC issues forward central bank bills. (PBC) Changes during 2005 January 1. The limit on the amount of renminbi that a domestic or foreign resident can bring in and out of China per time is increased to 20,000 yuan from 6,000 yuan. (PBC) January 1. Persons paying for their own studies abroad are allowed to purchase foreign exchange up to $20,000 in addition to tuition and fees. The amount had been $20,000, including tuition and fees. (AREAER 2006, 300, “Payments for invisible transactions and current transfers” change.) January 10. Residents of Mainland China may use certain renminbi-denominated bank cards for purchases in Thailand and for withdrawing cash and making purchases in Korea and Singapore. (AREAER 2006, 300, “Arrangements for payments and receipts” change.) January 15. The reserve requirements on accounts denominated in domestic and foreign currency are unified at 3 percent. (AREAER 2006, 300, “Provisions specific to commercial banks and other credit institutions” change.) February 18. The PBC and other government ministries announce that international development organizations that are eligible can issue renminbi-denominated bonds. (PBC) April 6. A pilot program intended to allow commercial banks’ setup of fund management firms is announced. (PBC) April 30. The PBC approves the Pan-Asian Index Fund’s access to the interbank bond market in China, making it the first institutional investor outside China to do so. (PBC) May 18. The interbank foreign exchange market formally puts forth foreign currency trading. The China Foreign Exchange Trading System offers trading of eight currency pairs. (PBC) June 15. The PBC puts forth forward bond transactions on the interbank bond market. (PBC)
47 June 17. Notice that would allow insurance companies to invest in overseas stock markets is issued. (PBC) August 2. The number of banks allowed to conduct forward transactions and interbank forward transactions is expanded, and the restrictions on maturity are lifted. (AREAER 2006, 299, “Exchange arrangement” change.) August 2. Domestic institutions that are allowed to conduct current account transactions can retain foreign exchange equivalent to 50 percent (previously, 30 percent) or 80 percent (previously, 50 percent) of their foreign exchange earnings from current transactions in the previous year; domestic institutions or enterprises that had no current foreign exchange income in the previous year could retain up to the equivalent of $200,000 (previously, $100,000). (AREAER 2006, 300, “Exports and export proceeds” change.) August 2. The PBC starts renminbi swaps on the foreign exchange market. (PBC) August 3. Limits on foreign exchange purchases for private travel are increased: (1) If travel is for six months or less, the limit is increased to the equivalent of $5,000 from $3,000; (2) if travel is for a period exceeding six months, the limit is increased to $8,000 from $5,000. (AREAER 2006, 300, “Payments for invisible transactions and current transfers” change.) August 9. The PBC starts a credit asset and mortgage loan securitization pilot program, for which the China Construction Bank and China Development Bank are chosen as pilot institutions. (PBC) August 15. Interbank foreign exchange forward trading products are introduced by the China Foreign Exchange Trading System. The Industrial and Commercial Bank of China and China Construction Bank complete two forward deals of the U.S. dollar against the renminbi on the same day. August 16. The State Administration of Foreign Exchange (SAFE) issues a notice that allows annual balance control to replace the case-by-case approval used when domestic banks designated for foreign exchange make guarantees for Chinese companies engaged in investment overseas. This system now applies to all banks designated as qualified for domestic foreign exchange, and all qualified domestic institutions’ foreign investment enterprises can now accept domestic guarantees. (PBC) August 30. The State Council approves a policy that allows commercial banks to invest in asset-backed securities. (PBC) September 22. The SAFE issues notice to extend the coverage of foreign exchange trading positions. (PBC) October 9. The Asian Development Bank and the International Finance Corporation are approved for the issuance of renminbi-denominated bonds valued at 1 billion yuan and 1.13
48 billion yuan, respectively, on the interbank bond market, marking the first time that foreign institutional investors participate in the Chinese bond market. (PBC) November 1. The PBC expands its position squaring and clearing services to Hong Kong banks conducting renminbi businesses in order to meet renminbi business development needs. Furthermore, the PBC also expands renminbi business for Hong Kong residents and raises cash exchange limits. December 5. Renminbi-denominated cards may be used in France, Germany, Indonesia, Luxembourg, the Philippines, Spain, the United States and Vietnam. (AREAER 2006, 300, “Arrangements for payments and receipts” change.) December 8. The PBC approves China Construction Bank and China Development Bank’s pilot issuance of asset-backed securities on the interbank market. (PBC) December 13. The PBC issues a circular to streamline administrative procedures, expand the investor base and increase market transparency in the corporate bond market. (PBC) December 15. Renminbi-denominated cards may be used in Belgium and Japan. (AREAER 2006, 300, “Arrangements for payments and receipts” change.) December 18. The number of banks permitted to be market makers is increased from 13 to 21. (AREAER, 272, “Exchange arrangement” change.) December 28. Thirteen banks are introduced to be market makers in foreign exchange. (AREAER 2006, 300, “Exchange arrangement” change.) Changes during 2006
January 4. Over-the-counter transactions and market makers are put forth on the interbank foreign exchange market. (PBC) January 24. The PBC announces pilot renminbi interest rate swaps on the interbank market. (PBC) March 10. The China Foreign Exchange Trading System and the Chicago Mercantile Exchange (CME) sign an agreement that provides China’s financial sector with access to the electronic trading of CME’s interest rate and foreign exchange products (PBC). April 15. On approval, qualified fund management firms and other securities management companies now may, within a certain limit, combine foreign exchange funds owned by domestic institutions and individuals and use the funds overseas for portfolio investments, including for stocks. (AREAER 2007, 273, “Provisions specific to institutional investors” change.) April 18. The PBC allows commercial banks to invest in financial products abroad on behalf of domestic clients. (PBC)
49 May 1. Residents are now allowed to purchase foreign exchange up to $20,000 a year for current account transactions. (AREAER 2007, 272, “Payment for invisible transactions and current transfers” change.) July. The PBC issues a circular that puts forth brokerage business on the interbank bond and lending markets. (PBC)
September 1. The Interim Implementing Regulations on Qualified Foreign Institutional Investors (QFII) Securities Investments in China is abolished, and the administration of QFII Securities Investments in China starts. (AREAER 2007, 273, “Provisions specific to institutions investors” change.). October 20. Any foreign exchange transaction that is eligible for spot settlement under the regulations becomes eligible for forward settlement. (AREAER 2007, 272, “Exchange arrangement” change.) December 11. China provides full national treatment for foreign banks. Under its World Trade Organization agreement, foreign banks, after being incorporated locally, are permitted to engage in the same range of financial services as Chinese banks, including taking retail renminbi deposits, and they are regulated and supervised in the same way as domestic banks. Foreign bank branches that have the China Banking and Regulatory Commission’s approval to conduct renminbi business may accept fixed-term deposits from Chinese citizens living in China in the amount of no less than 1 million renminbi per transaction. (AREAER 2007, 272, “Provision specific to commercial banks and other credit institutions” change.) December 29. The China Foreign Exchange Trading System founds its own clearinghouse in order to better control clearing risks and improve market liquidity. (PBC) Changes during 2007
January 4. The Shanghai Interbank Offered Rate (SHIBOR) is officially launched. (PBC) January 14. The PBC allows domestic financial institutions to issue renminbi financial bonds in Hong Kong, subject to approval. January 15. The number of market-maker banks is increased from 21 to 22. (AREAER 2007, 273, “Exchange arrangement” change.) February 1. The limit on foreign exchange purchases by residents for current transactions is increased to $50,000 a year from $20,000. Resident individuals’ foreign exchange purchases up to this limit are processed with personal identification; and, after bank declarations; foreign exchange purchases in excess of this limit may be processed after bank verification of actual-need documents stipulated by the SAFE. (AREAER 2008, 321, “Payment for invisible transactions and current transfers” change.)
50 March 20. A notice that allows corporate annuity funds access to the interbank bond market is issued. April 9. The China Foreign Exchange Trading System puts forth a new trading platform that synthesizes renminbi spot, forward and options transactions against other currencies plus pair transactions among foreign currencies. (PBC) June 7. The Shanghai Gold Exchange obtains the PBC’s approval to admit operational units of foreign banks as its members. (PBC) June 26. Renminbi bond issuance starts in Hong Kong. (PBC) July 5. The Qualified Domestic Institutional Investor (QDII) program starts. August 12. Domestic institutions are now allowed to retain foreign exchange receipts from current account transactions in their foreign exchange current accounts according to their operational needs. The previous limits on the retention of foreign exchange receipts are eliminated. (AREAER 2008, 321, “Exports and export proceeds” change.) August 17. Renminbi swaps against the U.S. dollar, euro, yen, Hong Kong dollar, and pound sterling are introduced in the interbank foreign exchange market. (PBC) August 20. The SAFE puts forth a pilot program that allows domestic residents to invest in securities overseas under controllable risks. (PBC) September 3. The National Association of Financial Market Institutional Investors—which includes members of the interbank market, foreign exchange market and gold market—is formed. (PBC) September 29. The PBC introduces forward rate agreements. (PBC) Changes during 2008
January 18. The PBC fully puts forth interest rate swaps. (PBC) July 25. The China Domestic Foreign Currency Payment System is started. August 5. The foreign exchange income of domestic institutions and individuals is now allowed to be deposited abroad, under the terms and conditions specified by the Foreign Exchange Administration Department; however, these regulations have not yet been issued. (AREAER 2009, 539, “Exports and export proceeds” change.) August 20. The SAFE approves a pilot program to allow for individual domestic and foreign currency exchange business in Beijing and Shanghai, subject to approval. (PBC)
51 August. The ceiling on the initial investment amount for each new institutional investor is raised to $1 billion from $800 million (Lardy and Douglass 2011, 11). December. The China Banking and Regulatory Commission now allows commercial banks to provide loans to firms for cross-border mergers-and-acquisitions purposes (Lardy and Douglass 2011, 10).
Changes during 2009
January 7. The PBC eliminates restrictions that previously stipulated that a bond must exceed 500 million yuan in value to be traded on the interbank bond market. (PBC) March 16. The PBC and HKMA start a cross-border multicurrency payment arrangement. March 17. The SAFE announces the “Notice on the Decision on Short-Term External Debt Quotas for Financial Institutions in 2009,” which raises the short-term debt quotas of financial institutions. (PBC) March 18. The PBC now allows fund management companies to open bond accounts on the interbank bond market under the category of a specific asset management portfolio. (PBC) April 8. The State Council announces a pilot program that allows exporters and importers in five cities—Shanghai, Guangzhou, Shenzhen, Zhuhai, and Dongguan—to settle cross-border trade deals in renminbi. (PBC) May 14 and June 24. The PBC approves the Bank of East Asia’s and the Hong Kong and Shanghai Banking Corporation (China)’s issuance of 4 billion yuan and 3 billion yuan, respectively, in renminbi-denominated bonds in Hong Kong. (PBC) May. The Ministry of Commerce announced new rules regarding project approval that seek to shorten the time to gain approval, raise value thresholds, and boost discretionary power of the ministry’s local branches (Lardy and Douglass 2011, 10). July. Renminbi cross-border trade settlement starts in pilot cities. (PBC) September 28. The Ministry of Finance of China announces the issuance of the first sovereign renminbi-denominated bond in Hong Kong. (HKMA) November 28. The Interbank Market Clearing House Co., Ltd., is formally established in Shanghai. (PBC) December 14. The PBC broadens the range of transactions for which it provides renminbi position squaring and clearing for banks in Macao. (PBC)
Changes during 2010
52 March 24. The PBC and the National Bank of the Republic of Belarus sign a bilateral local currency settlement agreement. This represents the first such agreement for general trade transactions that China has signed with a nonneighboring country. (PBC) June 22. The PBC, along with other ministries, jointly announces the “Notice on Expansion of the Pilot Renminbi Settlement of Cross-Border Trade Program.” This measure broadens the geographic coverage of the renminbi-settlement pilot program. Cross-border-settlement business is also expanded beyond trade items to other balance of payment items. Current account transactions between 20 provinces and cities on the Mainland and the rest of the world may now be settled in renminbi. Previously, transactions had to be settled in convertible currencies. (PBC) July 7. Hopewell Highway Infrastructural Ltd announces the issuance of renminbi-denominated bonds in Hong Kong, marking the first corporate dim sum bond issuance. July 13. The Bank of China (Hong Kong) is authorized to serve as the clearing bank for renminbi banknotes in Taiwan. (PBC) July 19. Financial institutions in the Hong Kong SAR—including banks, securities brokerages and insurance companies—are now allowed to open renminbi accounts. In addition, individuals and corporations can now undertake payments and transfers of renminbi between these banks and interbank settlement in renminbi. To facilitate the use of the renminbi in trade transactions, foreign banks engaged in such settlements were allowed to open renminbi correspondent accounts with Chinese banks as of July 2009 (AREAER 2011, 631, “Nonresident Accounts” Change.) August 19. McDonald’s announces the issuance of renminbi bonds worth 200 billion yuan, marking the first issuance of renminbi bonds by a multinational corporation. (Financial Times) August. The first offshore renminbi mutual fund is started. (Standard and Chartered Bank) October 1. Nonresident nonbank institutions accepting payments for exports to China in renminbi are now allowed to deposit the proceeds from such transactions in correspondent accounts with Chinese Mainland banks. Limited trade financing is also possible through the correspondent accounts (AREAER 2011, 632, “Nonresident accounts” change.) October 1. Pilot projects for the depositing of export proceeds abroad are launched in four areas: Beijing, Guangdong (including Shenzhen), Shandong (including Qingdao) and Jiangsu. Eligible domestic enterprises in pilot project areas may apply to local SAFE branches to deposit export proceeds abroad and, on approval, participate in the pilot projects. In accordance with the relevant regulations, the opening and closing of external accounts and funds receipts and payments must be processed and the relevant information reported to the SAFE. (AREAER 2011, 632, “Exports and export proceeds” change.) October. A currency swap line between HKMA and PBC is activated after the 8 billion renminbi quota for the Bank of China is exhausted.
53 November 22. The PBC authorizes the China Foreign Exchange Trading System to set up direct Russian ruble trading with the renminbi on the interbank foreign exchange market. (PBC) November 24. Caterpillar announces the issuance of 1 billion yuan worth of renminbi-denominated bonds. (Financial Times) November. Issuances of renminbi-denominated sovereign bonds are conducted through the Central Moneymarkets Unit. (HKMA) December 8. The number of Chinese exporters allowed to participate in renminbi settlement is increased from 365 to 67,359. (PBC) December 15. The Russian Moscow Interbank Currency Exchange starts renminbi–ruble trading. (PBC) December. The “Bank of China (Hong Kong) Offshore RMB Bond Index,” the first Hong Kong renminbi bond index, is launched. Changes during 2011
January 1. The SAFE classifies foreign exchange market makers into three types to increase liquidity in China’s foreign exchange market and boost its development: spot trading market makers, forwards and swap trading market makers, and comprehensive market makers. Twenty-six banks have been approved as spot market makers, and 18 have been approved as forward swap market makers. Currently there are no comprehensive market makers. (AREAER 2011, 632, “Exchange arrangement” change.) January 6. Resident enterprises in 20 provinces and cities on the Mainland are now allowed to use renminbi for outward foreign direct investment in countries that accept such settlement. Previously, such payments had to be settled in convertible currencies. Banks in Hong Kong can provide renminbi funds to facilitate these transactions. (AREAER 2011, 632, “Arrangements for payments and receipts” change, HKMA.) January. The Bank of China is approved to set up renminbi-denominated deposit accounts in New York City. February 14. The PBC allows RMB-FOREX options trading on the interbank foreign exchange market. (PBC) February. The Qualified Limited Foreign Partner (QLFP) pilot program starts in Shanghai. Third quarter. Renminbi-denominated corporate bond issuance exceeds that of euro-denominated sales for the first time (Financial Times, September 29, 2011). June 23. The PBC signed a new bilateral local currency settlement agreement with the Central Bank of the Russian Federation. (PBC)
54 August 23. Cross-border trade settlement in renminbi is extended to the entire nation. (PBC) September 14. HSBC announces that it has become the first foreign bank to offer renminbi services and products in Taiwan. October 14. The PBC announces rules that permit banks to provide settlement services to overseas entities that have made direct investments denominated in renminbi. October 16. The Chinese Gold & Silver Exchange launches the world’s first renminbi-denominated gold contract in Hong Kong. (CNBC, October 16) October 17. The Ministry of Commerce issues an announcement that allows foreign direct investment in renminbi from outbound investors. November 10. The PBC signs an agreement with the Austrian Central Bank to allow the latter to invest in the interbank bond market in China. (PBC) November. JP Morgan Asset Management is allowed to create a $1 billion renminbi-denominated fund under the Qualified Limited Partners Program, making it the largest foreign manager of a renminbi-denominated funds so far. December 16. Renminbi offshore is allowed to be used for purchasing equities in Mainland China (Financial Times, December 18, 2011).
December 25. China and Japan agree to promote local currency cross-border transactions, direct foreign exchange, bond market development, and other programs.

55
Appendix C: Bilateral Local Currency Central Bank Swap Agreements with
China since 2008
Bank Date Amount
(billion yuan)
U.S. Dollar Equivalent
(billion)
Bank of Korea 12 Dec. 2008 180 26.3
26 Oct. 2011 360 56.5
Hong Kong Monetary Authority 20 Jan. 2009 200 29.2
22 Nov. 2011 400 62.9
Bank Negara Malaysia 8 Feb. 2009 80 11.7
National Bank of the Republic of Belarus 11 March 2009 20 2.9
Bank of Indonesia 23 March 2009 100 14.6
Central Bank of Argentina 2 April 2009 70 10.2
Central Bank of Iceland 9 June 2010 3.5 0.5
Monetary Authority of Singapore 23 July 2010 150 22.1
New Zealand Reserve Bank 18 April 2011 25 3.8
Central Bank of the Republic of Uzbekistan 19 April 2011 0.7 0.11
Central Bank of Mongolia 19 April 2011 5 0.8
National Bank of Kazakhstan 13 June 2011 7 1.1
Bank of Thailand 22 Dec. 2011 70 11.1
State Bank of Pakistan 23 Dec. 2011 10 1.6
Central Bank of the United Arab Emirates 17 Jan. 2012 35 5.5
Notes: The bilateral agreement with South Korea was extended to 360 billion yuan on October 26, 2011, from the
previous agreement. The bilateral agreement with Hong Kong on November 22, 2011, replaces the previous
agreement of January 20, 2009. The bilateral agreements listed above cover the years after 2008. A number of
bilateral of agreements signed before 2008, mostly under the Chang Mai Initiative, are not included. Many of those
agreements are not in the local currency.
Source: People’s Bank of China.
56
Appendix D: Additions of Renminbi to Central Bank Reserves across the
World September 5, 2011. The Central Bank of Nigeria’s governor, Limido Sanusi, remarks that one-tenth of the nation’s reserves of $33 billion would eventually be diversified with the renminbi. He also mentions the next day that the renminbi would replace some current euro holdings. Furthermore, he says that Nigeria is allowed to purchase bonds denominated in renminbi in Hong Kong and Shanghai. (Reuters)
The Central Bank of Nigeria issues a statement on the same day that it “has finalized arrangements to diversify its external reserves holdings by including the Chinese Renminbi (RMB) to the existing currency mix of United States dollars (USD), the euro (EUR) and the British pound sterling (GBP).” (CBN, 2011.) September 19, 2011. The Financial Times reports that the Central Bank of Malaysia has purchased RMB bonds for its reserve portfolio. September 2011. Chile’s Central Bank adds yuan to its internal portfolio. It composes 0.3 percent of total internally managed investment portfolio. (Chile’s Monetary Policy Report, September 2011.) December 25, 2011. China and Japan enter a pact to promote direct yuan–yen trades and settlement of transactions directly in each other’s currencies. Japan indicates that it will buy Chinese bonds as part of its reserve portfolio (according to the Financial Times, one official was quoted as saying that this was intended as an expression of economic cooperation rather than a serious attempt to further diversify Japan’s reserve holdings). Other central banks that are reportedly considering adding renminbi-denominated reserves: South Korea (Financial Times, May 4, 2011) Mongolia (China Daily, September 7, 2011) South Africa (EconoMonitor RGE, September 22, 2011) Venezuela (CNN, September 29, 2011)
57
References and Bibliography Aziz, Jahangir, Steven Dunaway, and Eswar Prasad, eds. 2006. China and India: Learning from
Each Other: Reforms and Policies for Sustained Growth. Washington: International Monetary Fund.
Angeloni, Ignazio, Agnès Bénassy-Quéré, Benjamin Carton, Zsolt Darvas, Christophe Destais, Jean Pisani-Ferry, André Sapir, and Shahin Vallée. 2011. Global Currencies for
Tomorrow: A European Perspective. CEPII Research Report. Paris: CEPII. Chamon, Marcos, Kai Liu, and Eswar S. Prasad. 2010. Income Uncertainty and Household
Savings in China. NBER Working Paper 16565. Cambridge, Mass.: National Bureau of Economic Research.
Chamon, Marcos, and Eswar Prasad. 2010.“Why Are Saving Rates of Urban Households in China Rising?” American Economic Journal: Macroeconomics 2, no. 1: 93–130.
Chen, Xiaoli, and Yin-Wong Cheung. 2011. “Renminbi Going Global,” China and the World Economy 19, no. 2: 1–18.
Chen, Hongyi, Wensheng Peng, and Chang Shu. 2009. “The Potential of the Renminbi as an International Currency.” Manuscript, Hong Kong Monetary Authority.
Chinn, Menzie, and Jeffrey A. Frankel. 2007. “Will the Euro Eventually Surpass the Dollar as Leading International Reserve Currency?” In G7 Current Account Imbalances:
Sustainability and Adjustment, edited by Richard Clarida. Chicago: University of Chicago Press.
———. 2008.“Why the Euro Will Rival the Dollar.” International Finance 11, no. 1: 49–73. Chinn, Menzie, and Hiro Ito. 2008. “A New Measure of Financial Openness.” Journal of
Comparative Policy Analysis 10, no. 3: 309–322. Committee on the Global Financial System. 2007. Financial Stability and Local Currency Bond
Markets. Committee on the Global Financial System Paper 28. Basel: Bank for International Settlements.
Dobson, Wendy, and Paul R. Masson. 2009. “Will the Renminbi Become a World Currency?” China Economic Review 20, no. 1: 124–35.
Eichengreen, Barry. 2009. “Dollar Dilemma: The World’s Top Currency Faces Competition.” Foreign Affairs 88, no. 5: 53–68.
———. 2011a. Exorbitant Privilege: The Rise and Fall of the Dollar and the Future of the International Monetary System. New York: Oxford University Press.
———. 2011b. “The Renminbi as an International Currency.” Manuscript, University of California, Berkeley.
Eichengreen, Barry, and Marc Flandreau. 2010. The Federal Reserve, the Bank of England and the Rise of the Dollar as an International Currency, 1914–39. BIS Working Paper 328. Basel: Bank for International Settlements.
Eichengreen, Barry, and Jeffrey Frankel. 1996. “The SDR, Reserve Currencies, and the Future of the International Monetary System.” In The Future of the SDR in Light of Changes in the International Financial System, edited by M. Mussa, J. Boughton, and P. Isard. Washington: International Monetary Fund.
Errico, Luca, and Alexander Massara. 2011. Assessing Systemic Trade Interconnectedness—An
Empirical Approach. IMF Working Paper 11/214. Washington: International Monetary Fund.
58 Forbes, Kristin. 2009. “Financial Deepening and Global Currency Usage.” In The Euro at Ten:
The Next Global Currency? edited by Jean Pisani-Ferry and Adam Posen. Washington: Peterson Institute of International Economics.
Frankel, Jeffrey. 2005. On the Renminbi: The Choice between Adjustment under a Fixed
Exchange Rate and Adjustment under a Flexible Rate. NBER Working Paper 11274. Cambridge, Mass.: National Bureau of Economic Research.
———. 2011. “Historical Precedents for the Internationalization of the RMB.” Paper prepared for workshop organized by Council on Foreign Relations and China Development Research Foundation, Beijing, November 1.
Goldberg, Linda. 2010. “Is the International Role of the Dollar Changing?” Federal Reserve
Bank of New York Current Issue 16, no. 1. Goodfriend, Marvin, and Eswar Prasad. 2007. “A Framework for Independent Monetary Policy
in China.” CESifo Economic Studies 53, no. 1: 2–41. Green, Stephen, Kelvin Lau, and Robert Minikin. 2011. China: In, Out, Shake It All About.
London: Global Research, Standard and Charter Bank. Hale, Galina. 2007. “Prospects for China’s Corporate Bond Market.” Federal Reserve Bank of
San Francisco Economic Letter 2007-07, March 16. Henning, Randall. 2009. The Future of the Chiang Mai Initiative: An Asian Monetary Fund?
Policy Brief 09-5. Washington: Peterson Institute for International Economics. HKMA (Hong Kong Monetary Authority). 2010. Annual Report 2010. Hong Kong: Hong Kong
Monetary Authority. ———. 2011. “Hong Kong: The Premier Offshore Renminbi Business Centre.” HKMA
Publications and Research Reference Materials, September. Hu, Fred. 2008. “The Role of the Renminbi in the World Economy.” Cato Journal 28, no. 2:
219–24. Hui, Daniel, and Dominic Bunning. 2010. The Offshore Renminbi: A Practical Primer on the
CNH Market. London: HSBC Global Research. International Monetary Fund. 2011. People’s Republic of China: Spillover Report for the 2011
Article IV Consultation and Selected Issues. IMF Country Report 11/193. Washington: International Monetary Fund.
———. Various years. Annual Reports on Exchange Arrangements and Exchange Restrictions. Washington: International Monetary Fund.
Ito, Takatoshi. 2011. The Internationalization of the RMB: Opportunities and Pitfalls. Working Paper. New York: Council on Foreign Relations.
Jing, Li. 2007. “The Rise of the Renminbi in Asia: Cost-Benefit Analysis and Road Map.” Chinese Economy 40, no. 4 (July–August).
King, Michael, and Dagfinn Rime. 2010. “The $4 Trillion Question: What Explains FX Growth since the 2007 Survey?” Quarterly Review (Bank for International Settlements), December.
Kose, M. Ayhan, and Eswar Prasad. 2010. Emerging Markets: Resilience and Growth amid Global Turmoil. Washington: Brookings Institution Press.
Kose, M. Ayhan, Eswar Prasad, Kenneth Rogoff, and Shang-Jin Wei. 2009. “Financial Globalization: A Reappraisal.” IMF Staff Papers 56, no. 1: 8–62.
Kroeber, Arthur. 2011. The Chinese Yuan Grows Up Slowly: Fact and Fiction about China’s Currency Internationalization. Policy Paper. Washington: New America Foundation.
Krugman, Paul. 1995. Currency and Crises. Cambridge, Mass.: MIT Press.
59 Lane, Philip R., and Gian Maria Milesi-Ferretti. 2007. “The External Wealth of Nations Mark II:
Revised and Extended Estimates of Foreign Assets and Liabilities, 1970–2004.” Journal
of International Economics 73, no. 2: 223–50. Lardy, Nicholas. 2011. Sustaining China’s Growth after the Global Financial Crisis.
Washington: Peterson Institute for International Economics. Lardy, Nicholas, and Patrick Douglass. 2011. Capital Account Liberalization and the Role of the
Renminbi. Working Paper 11-6. Washington: Peterson Institute for International Economics.
Lee, Jong-Wha. 2010. “Will the Renminbi Emerge as an International Reserve Currency?” Manuscript, Korea University, Seoul.
Lago, Isabelle Mateos, Rupa Duttagupta, and Rishi Goyal. 2009. The Debate on the International Monetary System. IMF Staff Position Note 09/26. Washington: International Monetary Fund.
Lin, Justin Yifu, Xifang Sun, and Ye Jiang. 2009. “Toward a Theory of Optimal Financial Structure.” Policy Research Working Paper 5038. Washington, World Bank.
Lin, Justin Yifu. 2011. Demystifying the Chinese Economy. Cambridge, U.K.: Cambridge
University Press.
Maziad, Samar, Pascal Farahmand, Shengzu Wang, Stephanie Segal, and Faisal Ahmed. 2011. Internationalization of Emerging Market Currencies: A Balance between Risks and
Rewards. IMF Staff Discussion Note 11/17. Washington: International Monetary Fund. McCauley, Robert. 2011. “The Internationalization of the Renminbi.” Speech given at Second
International Conference on the Chinese Economy, Hong Kong Institute for Monetary Research.
Maziad, Samar, et al. 2011. Internationalization of Emerging Market Currencies: A Balance between Risks and Rewards. IMF Staff Discussion Note 11/17. Washington: International Monetary Fund.
Miniane, Jacques. 2004. “A New Set of Measures on Capital Account Restrictions.” IMF Staff
Papers 51, no. 2: 276–308. Murphy, Melissa, and Wen Jin Yuan. 2009. “Is China Ready to Challenge the Dollar?
Internationalization of the Renminbi and Its Implications for the United States,” Report of the Freeman Chair in China Studies. Washington: Center for Strategic and International Studies.
Obstfeld, Maurice. 2011a. “International Liquidity: The Fiscal Dimension.” Keynote speech at Bank of Japan, Institute of Monetary and Economic Studies, International Conference, Tokyo, June 2–3.
———. 2011b. “The International Monetary System: Living with Asymmetry.” Manuscript, University of California, Berkeley, September 2.
———. 2011c. “The SDR as an International Reserve Asset: What Future?” Manuscript, University of California, Berkeley, March 27.
PBC (People’s Bank of China). 2010. Annual Report 2010. Beijing: People’s Bank of China. ———. 2011. China Financial Stability Report. Beijing: People’s Bank of China. Pettis, Michael. 2005. “Buy Abroad, Benefit at Home.” Far Eastern Economic Review 168
(July–August): 27–29. Prasad, Eswar. 2004. China’s Growth and Integration into the World Economy: Prospects and
Challenges. IMF Occasional Paper 232. Washington: International Monetary Fund. ———. 2009. “Is the Chinese Growth Miracle Built to Last?” China Economic Review 20: 103–
60
23. ———. 2011. “Role Reversal in Global Finance.” NBER Working Paper 17497. Cambridge,
Mass.: National Bureau of Economic Research. (Forthcoming in Proceedings of the 2011 Jackson Hole Symposium, Federal Reserve Bank of Kansas City.)
Prasad, Eswar, and Raghuram Rajan. 2008. “A Pragmatic Approach to Capital Account Liberalization.” Journal of Economic Perspectives 22, no. 3: 149–72.
Prasad, Eswar, Thomas Rumbaugh, and Qing Wang. 2005. Putting the Cart before the Horse? Capital Account Liberalization and Exchange Rate Flexibility in China. IMF Policy Discussion Paper. Washington: International Monetary Fund.
Prasad, Eswar, and Shang-Jin Wei. 2007. “China’s Approach to Capital Inflows: Patterns and Possible Explanations.” In Capital Controls and Capital Flows in Emerging Economies: Policies, Practices, and Consequences, edited by Sebastian Edwards. Chicago: University of Chicago Press for National Bureau of Economic Research.
Ranjan, Rajiv, and Anand Prakash. 2010. Internationalization of Currency: The Case of the
Indian Rupee and Chinese Renminbi. Reserve Bank of India Staff Studies, Department of Economic Analysis and Policy. New Delhi: Reserve Bank of India.
Rosen, Daniel H., and Thilo Hanemann. 2009. China’s Changing Outbound Foreign Direct Investment Profile: Drivers and Policy Implications. Policy Brief 09-14. Washington: Peterson Institute for International Economics.
Schindler, Martin. 2009. “Measuring Financial Integration: A New Data Set.” IMF Staff Papers 56, no. 1: 222–38.
Scissors, David. 2011. “Chinese Outward Investment: More Opportunity than Danger,” Heritage Foundation Backgrounder #2579. Subramanian, Arvind. 2011. Renminbi Rules: The Conditional Imminence of the Reserve
Currency Transition. Working Paper 11-14. Washington: Peterson Institute for International Economics.
Stier, Olaf, Kerstin Bernoth, and Alexander Fisher. 2010. “Internationalization of the Chinese Renminbi: An Opportunity for China.” German Institute of Economic Research Weekly
Report 6, no. 17/2010. Subacchi, Paola. 2010. One Currency, Two Systems: China’s Renminbi Strategy. International
Economics Briefing Paper 2010/01. London: Chatham House. Tavlas, George. 1991. “On the International Use of Currencies: The Case of the Deutsche Mark.”
Essays in International Finance, Princeton University, No. 181, March. Ulrich, Jing, et al. 2011. RMB Internationalization: Progress, Future Steps and Implications.
Hands-On China Report. New York: J. P. Morgan. Wei, Lingling. 2011. “New Move to Make Yuan a Global Currency.” Wall Street Journal,
January 12. Wu, Friederich, Rongfang Pan, and Di Wang. 2010. “Renminbi’s Potential to Become a Global
Currency.” China and the World Economy 18, no. 1: 63–81. Yam, Joseph. 2011. A Safe Approach to Convertibility for the Renminbi. Working Paper 5. Hong
Kong: Institute for Global Economics and Finance, Chinese University of Hong Kong. Yu, Yongding. 2011. “The Renminbi’s Journey to the World.” Project Syndicate Commentary,
May 27.
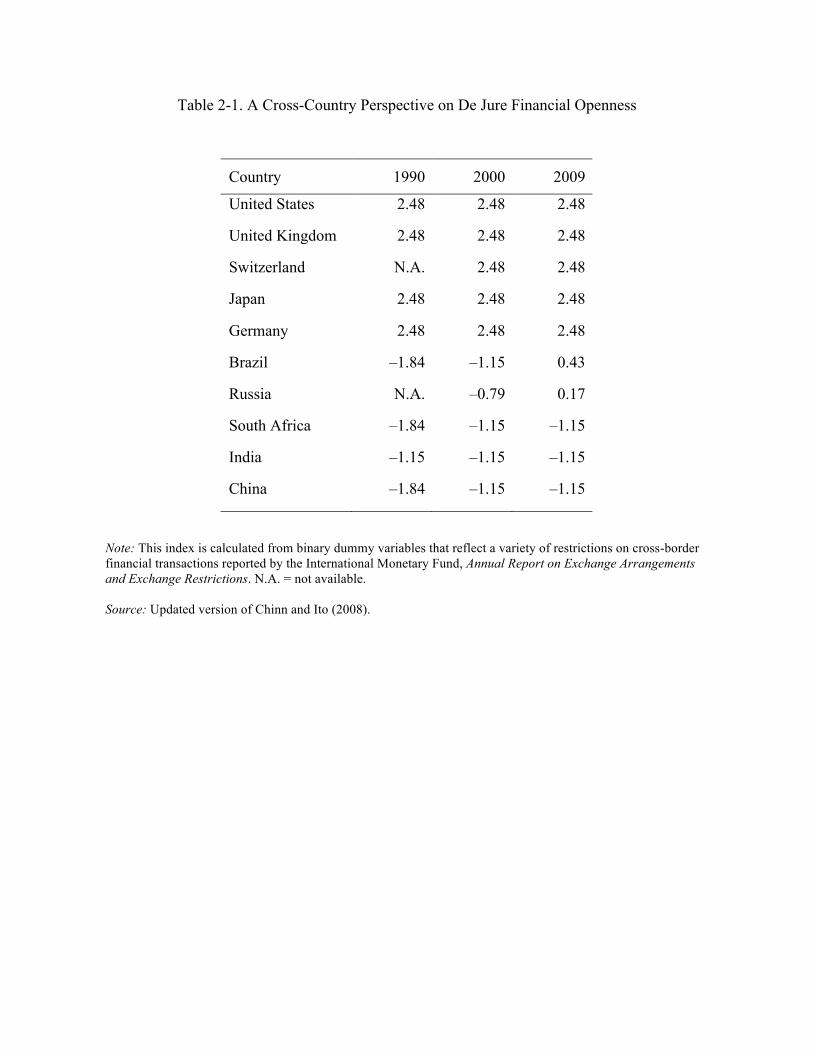
Table 2-1. A Cross-Country Perspective on De Jure Financial Openness
Country 1990 2000 2009
United States 2.48 2.48 2.48
United Kingdom 2.48 2.48 2.48
Switzerland N.A. 2.48 2.48
Japan 2.48 2.48 2.48
Germany 2.48 2.48 2.48
Brazil –1.84 –1.15 0.43
Russia N.A. –0.79 0.17
South Africa –1.84 –1.15 –1.15
India –1.15 –1.15 –1.15
China –1.84 –1.15 –1.15
Note: This index is calculated from binary dummy variables that reflect a variety of restrictions on cross-border
financial transactions reported by the International Monetary Fund, Annual Report on Exchange Arrangements
and Exchange Restrictions. N.A. = not available.
Source: Updated version of Chinn and Ito (2008).

Table 3-1. Exchange Rate Volatility
(percentage standard deviation of monthly log changes)
1995–2011 2005–11a
Country Nominal NEER REER Nominal NEER REER
Brazil 4.2 4.0 4.0 3.7 3.2 3.1
China 0.3 1.3 2.0 0.4 1.3 1.9
India 1.6 1.5 1.6 2.0 1.6 1.7
Russiab 6.1 6.1 5.3 2.8 2.1 4.1
South Africa 3.9 3.5 3.4 4.4 3.5 3.5
Note: “NEER” and “REER” stand for the (trade-weighted) nominal effective exchange rate and real effective
exchange rate, respectively. The nominal exchange rate for each currency is its monthly period-average
exchange rate relative to the U.S. dollar.
aData for 2011 go through October.
b NEER data for Russia start in July 1995.
Sources: International Monetary Fund, International Financial Statistics; NEER and REER data are from Bank
for International Settlements data using broad weights (58 economies).
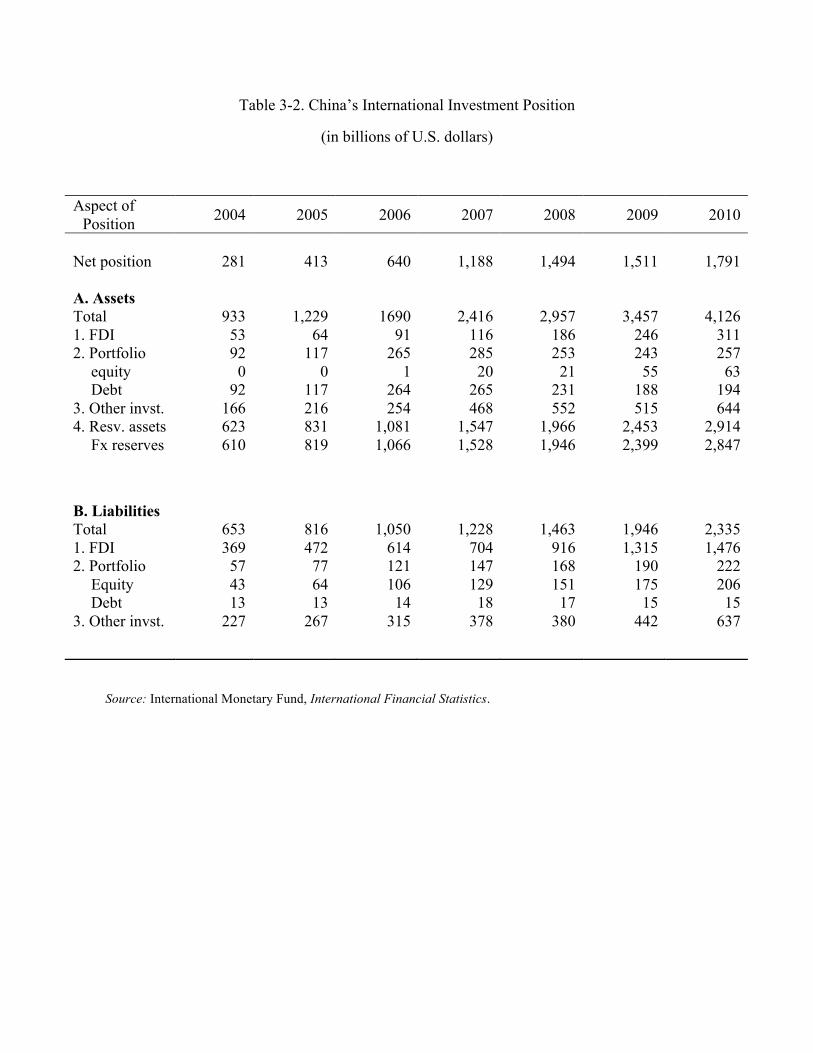
Table 3-2. China’s International Investment Position
(in billions of U.S. dollars)
Source: International Monetary Fund, International Financial Statistics.
Aspect of
Position 2004 2005 2006 2007 2008 2009 2010
Net position 281 413 640 1,188 1,494 1,511 1,791
A. Assets
Total 933 1,229 1690 2,416 2,957 3,457 4,126
1. FDI 53 64 91 116 186 246 311
2. Portfolio 92 117 265 285 253 243 257
equity 0 0 1 20 21 55 63
Debt 92 117 264 265 231 188 194
3. Other invst. 166 216 254 468 552 515 644
4. Resv. assets 623 831 1,081 1,547 1,966 2,453 2,914
Fx reserves 610 819 1,066 1,528 1,946 2,399 2,847
B. Liabilities
Total 653 816 1,050 1,228 1,463 1,946 2,335
1. FDI 369 472 614 704 916 1,315 1,476
2. Portfolio 57 77 121 147 168 190 222
Equity 43 64 106 129 151 175 206
Debt 13 13 14 18 17 15 15
3. Other invst. 227 267 315 378 380 442 637
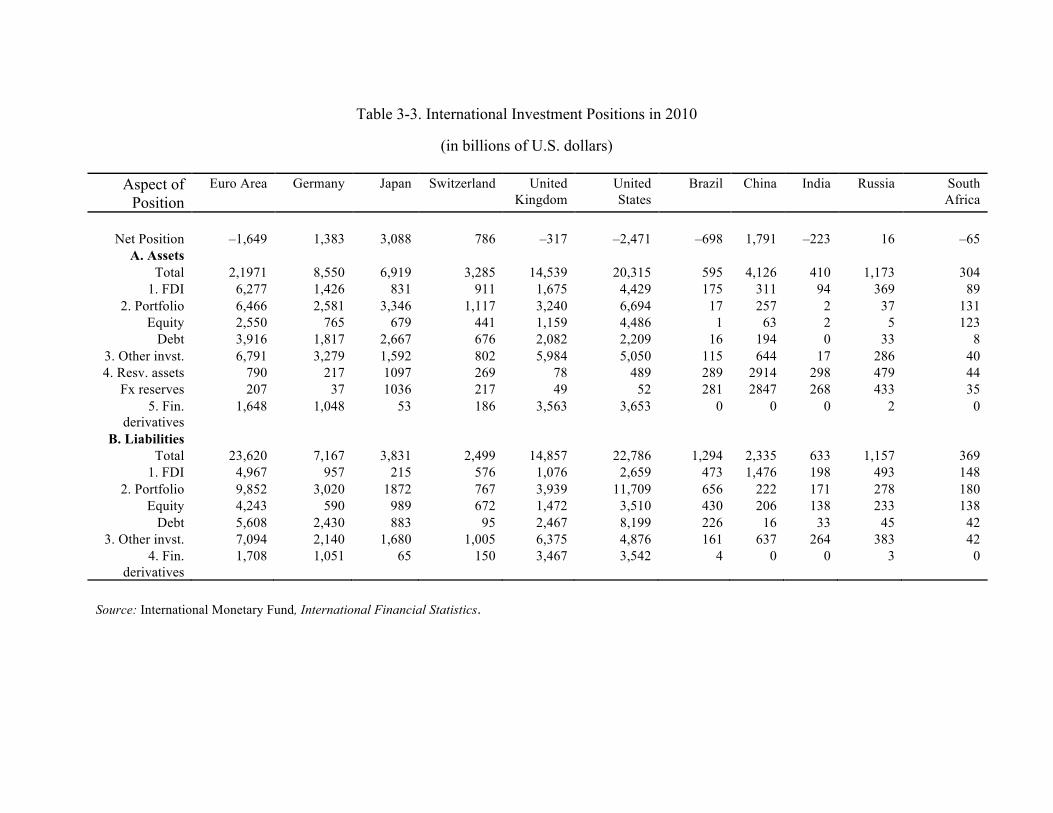
Table 3-3. International Investment Positions in 2010
(in billions of U.S. dollars)
Aspect of
Position
Euro Area Germany Japan Switzerland United
Kingdom
United
States
Brazil China India Russia South
Africa
Net Position –1,649 1,383 3,088 786 –317 –2,471 –698 1,791 –223 16 –65
A. Assets
Total 2,1971 8,550 6,919 3,285 14,539 20,315 595 4,126 410 1,173 304
1. FDI 6,277 1,426 831 911 1,675 4,429 175 311 94 369 89
2. Portfolio 6,466 2,581 3,346 1,117 3,240 6,694 17 257 2 37 131
Equity 2,550 765 679 441 1,159 4,486 1 63 2 5 123
Debt 3,916 1,817 2,667 676 2,082 2,209 16 194 0 33 8
3. Other invst. 6,791 3,279 1,592 802 5,984 5,050 115 644 17 286 40
4. Resv. assets 790 217 1097 269 78 489 289 2914 298 479 44
Fx reserves 207 37 1036 217 49 52 281 2847 268 433 35
5. Fin.
derivatives
1,648 1,048 53 186 3,563 3,653 0 0 0 2 0
B. Liabilities
Total 23,620 7,167 3,831 2,499 14,857 22,786 1,294 2,335 633 1,157 369
1. FDI 4,967 957 215 576 1,076 2,659 473 1,476 198 493 148
2. Portfolio 9,852 3,020 1872 767 3,939 11,709 656 222 171 278 180
Equity 4,243 590 989 672 1,472 3,510 430 206 138 233 138
Debt 5,608 2,430 883 95 2,467 8,199 226 16 33 45 42
3. Other invst. 7,094 2,140 1,680 1,005 6,375 4,876 161 637 264 383 42
4. Fin.
derivatives
1,708 1,051 65 150 3,467 3,542 4 0 0 3 0
Source: International Monetary Fund, International Financial Statistics.
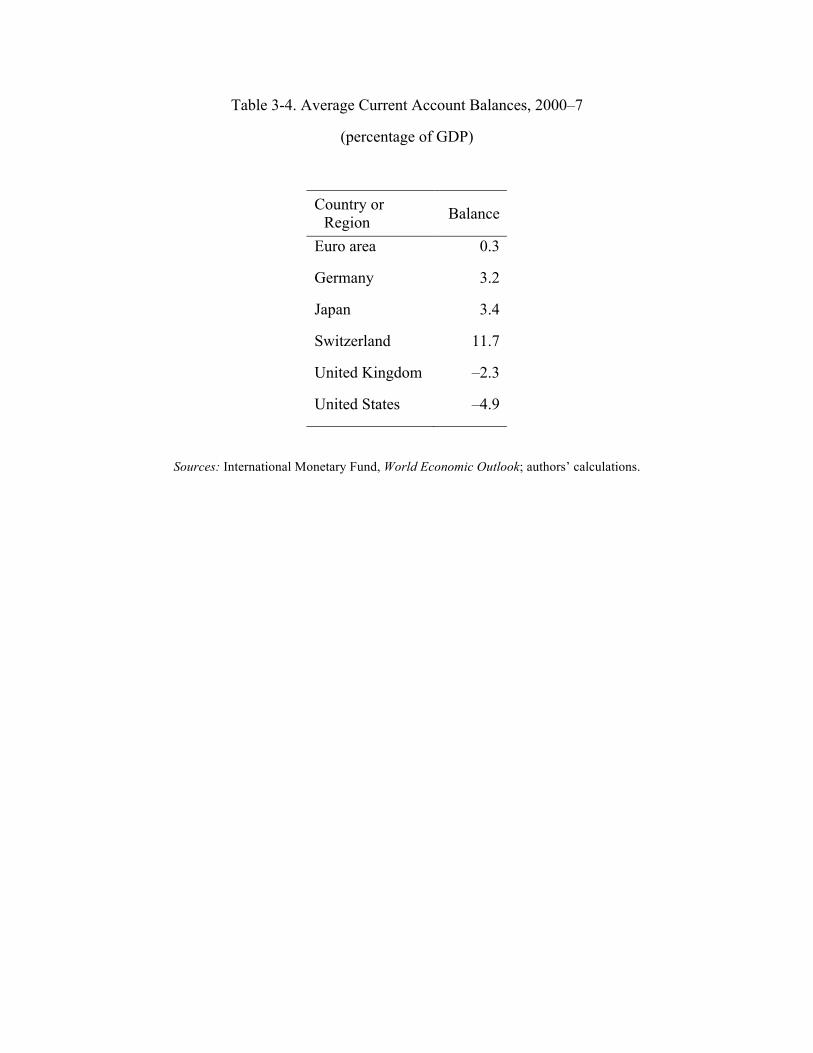
Table 3-4. Average Current Account Balances, 2000–7
(percentage of GDP)
Country or
Region Balance
Euro area 0.3
Germany 3.2
Japan 3.4
Switzerland 11.7
United Kingdom –2.3
United States –4.9
Sources: International Monetary Fund, World Economic Outlook; authors’ calculations.
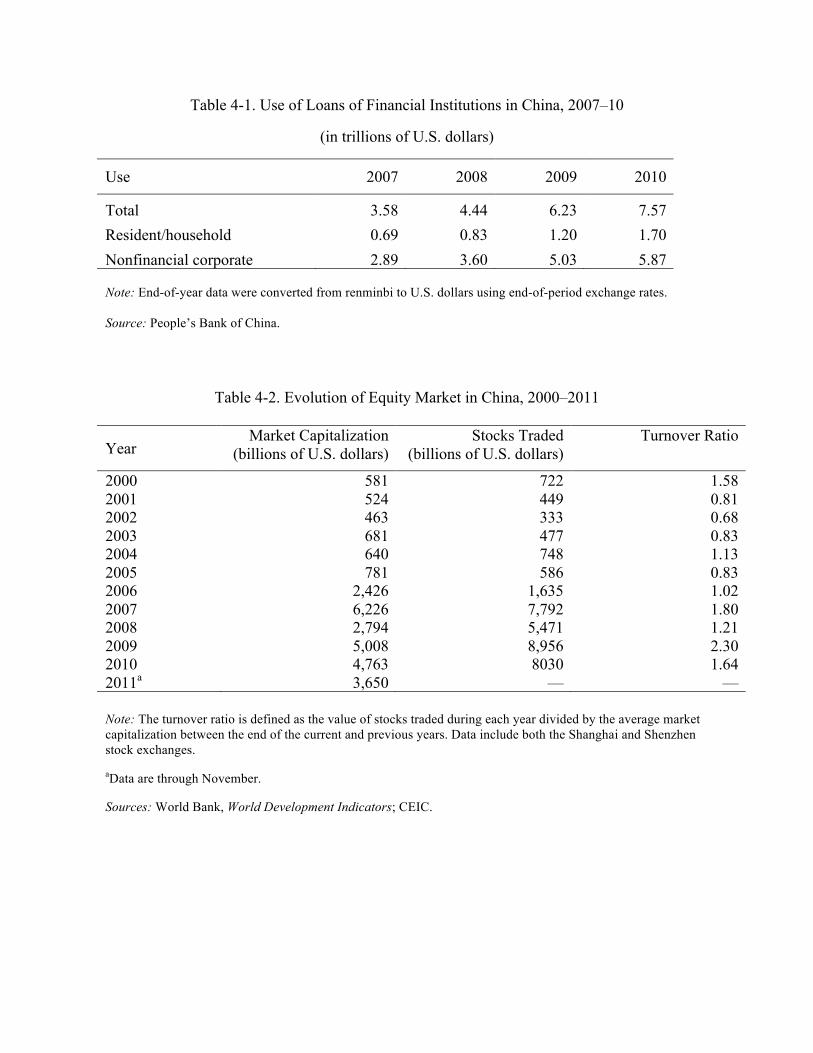
Table 4-1. Use of Loans of Financial Institutions in China, 2007–10
(in trillions of U.S. dollars)
Use 2007 2008 2009 2010
Total 3.58 4.44 6.23 7.57
Resident/household 0.69 0.83 1.20 1.70
Nonfinancial corporate 2.89 3.60 5.03 5.87
Note: End-of-year data were converted from renminbi to U.S. dollars using end-of-period exchange rates.
Source: People’s Bank of China.
Table 4-2. Evolution of Equity Market in China, 2000–2011
Year Market Capitalization
(billions of U.S. dollars)
Stocks Traded
(billions of U.S. dollars)
Turnover Ratio
2000 581 722 1.58
2001 524 449 0.81
2002 463 333 0.68
2003 681 477 0.83
2004 640 748 1.13
2005 781 586 0.83
2006 2,426 1,635 1.02
2007 6,226 7,792 1.80
2008 2,794 5,471 1.21
2009 5,008 8,956 2.30
2010 4,763 8030 1.64
2011a 3,650 — —
Note: The turnover ratio is defined as the value of stocks traded during each year divided by the average market
capitalization between the end of the current and previous years. Data include both the Shanghai and Shenzhen
stock exchanges.
aData are through November.
Sources: World Bank, World Development Indicators; CEIC.
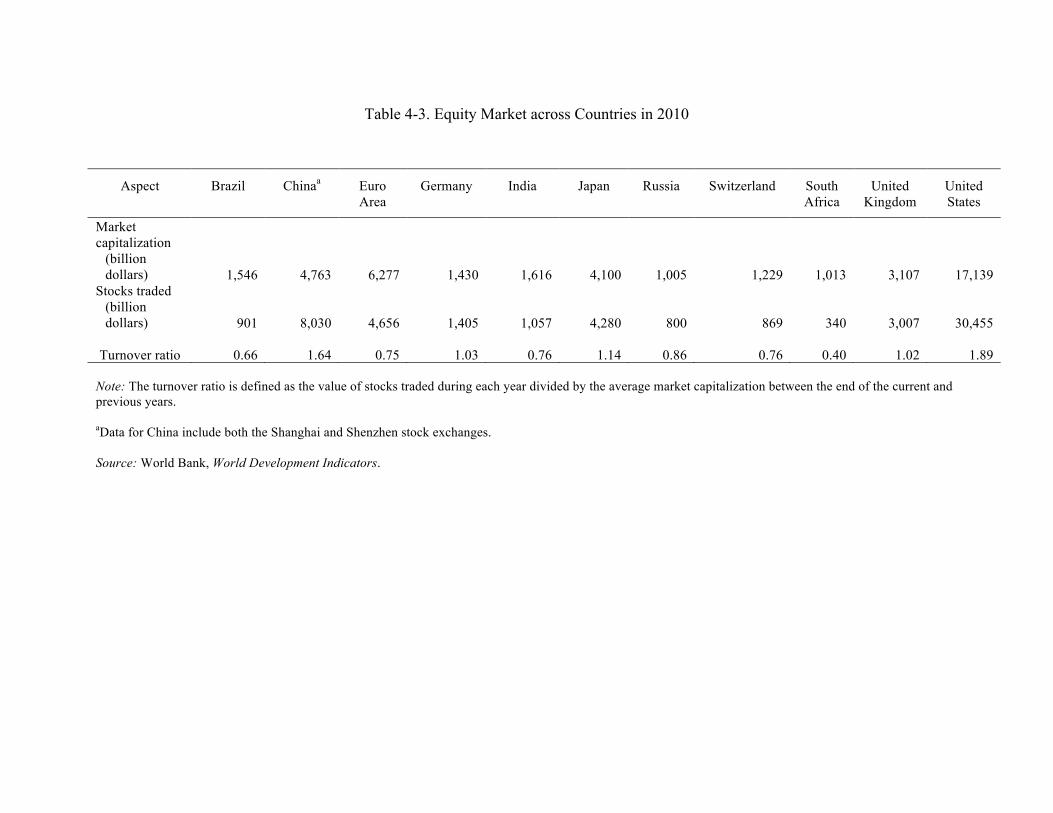
Table 4-3. Equity Market across Countries in 2010
Aspect Brazil Chinaa Euro
Area
Germany India Japan Russia Switzerland South
Africa
United
Kingdom
United
States
Market
capitalization
(billion
dollars) 1,546 4,763 6,277 1,430 1,616 4,100 1,005 1,229 1,013 3,107 17,139
Stocks traded
(billion
dollars) 901 8,030 4,656 1,405 1,057 4,280 800 869 340 3,007 30,455
Turnover ratio 0.66 1.64 0.75 1.03 0.76 1.14 0.86 0.76 0.40 1.02 1.89
Note: The turnover ratio is defined as the value of stocks traded during each year divided by the average market capitalization between the end of the current and
previous years.
aData for China include both the Shanghai and Shenzhen stock exchanges.
Source: World Bank, World Development Indicators.

Table 4-4. Turnover of Government and Corporate Bonds, China
Government Bonds Corporate Bonds
Year Turnover
(billion U.S. dollars)
Turnover
Ratio
Turnover
(billion U.S. dollars)
Turnover
Ratio
2002 11 0.03 0.3 0.04
2003 105 0.25 0.2 0.02
2004 97 0.17 0.6 0.03
2005 214 0.27 40 0.73
2006 273 0.26 78 0.78
2007 623 0.43 114 0.79
2008 1,518 0.79 213 0.91
2009 1,170 0.57 478 1.12
2010 2,299 0.96 776 1.25
Note: Turnover is defined as the value of bonds traded on the secondary market divided by the average amount
of bonds outstanding between the end of the previous and current quarters. Repurchase transactions are
excluded. Corporate bonds include those issued by nonfinancial and financial corporations.
Sources: AsianBondsOnline, Asian Development Bank; authors’ calculations.
Table 4-5. Government and Corporate Bond Turnover, 2010: A Cross-Country Perspective
(billions of U.S. dollars or percent)
Government Corporate Country
Amount
Outstanding Turnover
Turnover
Ratio
Amount
Outstanding Turnover
Turnover
Ratio
United
States 8,853 126,756 14.3 7,519 3,922 0.5
Euro area 7,926 — — 5,536 — —
Germany 1,400 7,834 5.6 335 — —
China
2,388
2,299
1.0
620
776
1.3
Japan 10,480 12,076 1.2 1,107 76 0.1
India 520 1155 2.2 191 141 0.7
Note: The amounts of government and corporate bonds outstanding and their turnover are expressed in billions
of U.S. dollars. Corporate bonds for China, the euro area, Germany, and Japan include those issued by
nonfinancial and financial corporations. No disaggregated information is given for the United States and India.
Sources: U.S. Census Bureau, Statistical Abstract of the United States; Securities Industry and Financial Markets
Association; European Central Bank; Bundesbank; Federal Financial Supervisory Authority; AsianBondsOnline,
Asian Development Bank; CEIC data; Securities and Exchange Board of India; authors’ calculations.
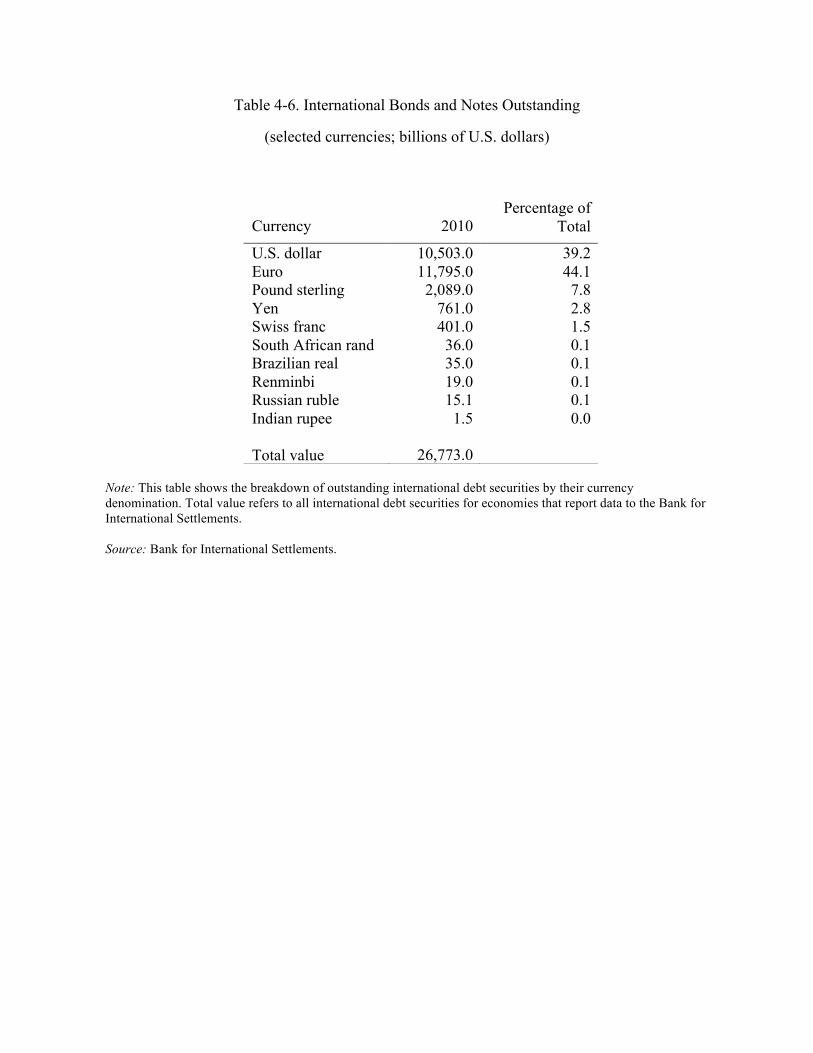
Table 4-6. International Bonds and Notes Outstanding
(selected currencies; billions of U.S. dollars)
Note: This table shows the breakdown of outstanding international debt securities by their currency
denomination. Total value refers to all international debt securities for economies that report data to the Bank for
International Settlements.
Source: Bank for International Settlements.
Currency 2010
Percentage of
Total
U.S. dollar 10,503.0 39.2
Euro 11,795.0 44.1
Pound sterling 2,089.0 7.8
Yen 761.0 2.8
Swiss franc 401.0 1.5
South African rand 36.0 0.1
Brazilian real 35.0 0.1
Renminbi 19.0 0.1
Russian ruble 15.1 0.1
Indian rupee 1.5 0.0
Total value 26,773.0
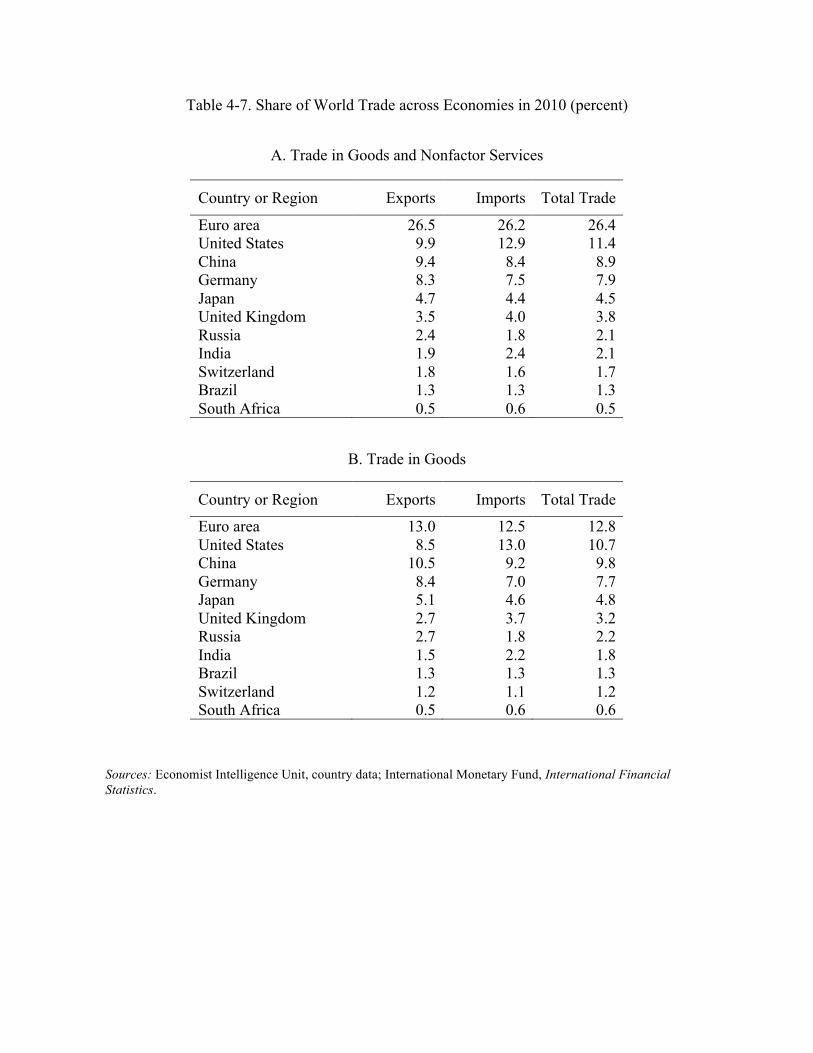
Table 4-7. Share of World Trade across Economies in 2010 (percent)
A. Trade in Goods and Nonfactor Services
Country or Region Exports Imports Total Trade
Euro area 26.5 26.2 26.4
United States 9.9 12.9 11.4
China 9.4 8.4 8.9
Germany 8.3 7.5 7.9
Japan 4.7 4.4 4.5
United Kingdom 3.5 4.0 3.8
Russia 2.4 1.8 2.1
India 1.9 2.4 2.1
Switzerland 1.8 1.6 1.7
Brazil 1.3 1.3 1.3
South Africa 0.5 0.6 0.5
B. Trade in Goods
Country or Region Exports Imports Total Trade
Euro area 13.0 12.5 12.8
United States 8.5 13.0 10.7
China 10.5 9.2 9.8
Germany 8.4 7.0 7.7
Japan 5.1 4.6 4.8
United Kingdom 2.7 3.7 3.2
Russia 2.7 1.8 2.2
India 1.5 2.2 1.8
Brazil 1.3 1.3 1.3
Switzerland 1.2 1.1 1.2
South Africa 0.5 0.6 0.6
Sources: Economist Intelligence Unit, country data; International Monetary Fund, International Financial
Statistics.
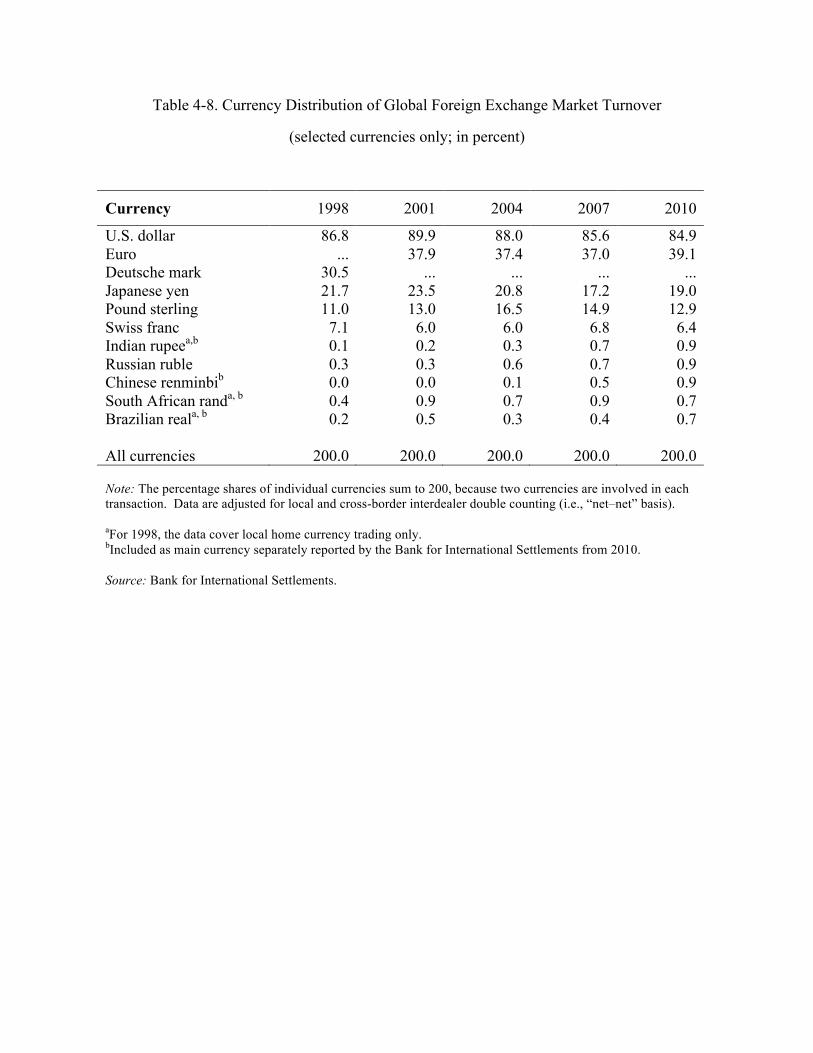
Table 4-8. Currency Distribution of Global Foreign Exchange Market Turnover
(selected currencies only; in percent)
Currency 1998 2001 2004 2007 2010
U.S. dollar 86.8 89.9 88.0 85.6 84.9
Euro ... 37.9 37.4 37.0 39.1
Deutsche mark 30.5 ... ... ... ...
Japanese yen 21.7 23.5 20.8 17.2 19.0
Pound sterling 11.0 13.0 16.5 14.9 12.9
Swiss franc 7.1 6.0 6.0 6.8 6.4
Indian rupeea,b
0.1 0.2 0.3 0.7 0.9
Russian ruble 0.3 0.3 0.6 0.7 0.9
Chinese renminbib 0.0 0.0 0.1 0.5 0.9
South African randa, b
0.4 0.9 0.7 0.9 0.7
Brazilian reala, b
0.2 0.5 0.3 0.4 0.7
All currencies
200.0
200.0
200.0
200.0
200.0
Note: The percentage shares of individual currencies sum to 200, because two currencies are involved in each
transaction. Data are adjusted for local and cross-border interdealer double counting (i.e., “net–net” basis).
aFor 1998, the data cover local home currency trading only.
bIncluded as main currency separately reported by the Bank for International Settlements from 2010.
Source: Bank for International Settlements.
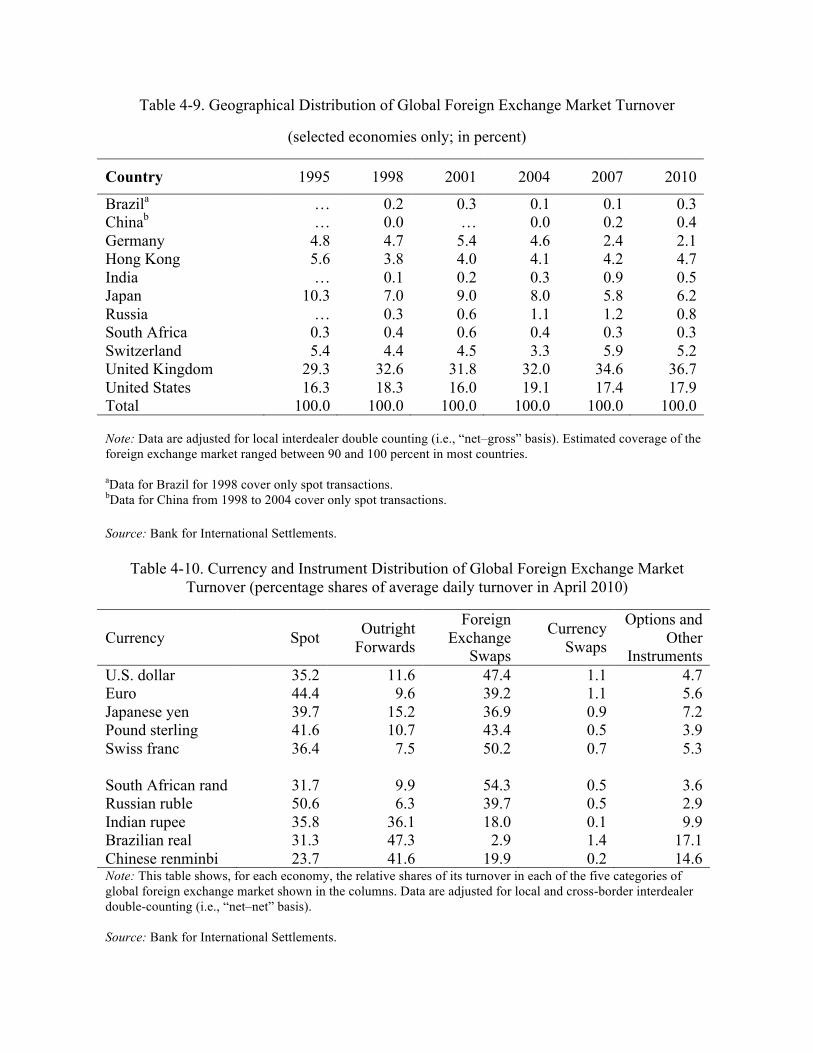
Table 4-9. Geographical Distribution of Global Foreign Exchange Market Turnover
(selected economies only; in percent)
Country 1995 1998 2001 2004 2007 2010
Brazila … 0.2 0.3 0.1 0.1 0.3
Chinab … 0.0 … 0.0 0.2 0.4
Germany 4.8 4.7 5.4 4.6 2.4 2.1
Hong Kong 5.6 3.8 4.0 4.1 4.2 4.7
India … 0.1 0.2 0.3 0.9 0.5
Japan 10.3 7.0 9.0 8.0 5.8 6.2
Russia … 0.3 0.6 1.1 1.2 0.8
South Africa 0.3 0.4 0.6 0.4 0.3 0.3
Switzerland 5.4 4.4 4.5 3.3 5.9 5.2
United Kingdom 29.3 32.6 31.8 32.0 34.6 36.7
United States 16.3 18.3 16.0 19.1 17.4 17.9
Total 100.0 100.0 100.0 100.0 100.0 100.0
Note: Data are adjusted for local interdealer double counting (i.e., “net–gross” basis). Estimated coverage of the
foreign exchange market ranged between 90 and 100 percent in most countries.
aData for Brazil for 1998 cover only spot transactions.
bData for China from 1998 to 2004 cover only spot transactions.
Source: Bank for International Settlements.
Table 4-10. Currency and Instrument Distribution of Global Foreign Exchange Market
Turnover (percentage shares of average daily turnover in April 2010)
Currency Spot Outright
Forwards
Foreign
Exchange
Swaps
Currency
Swaps
Options and
Other
Instruments
U.S. dollar 35.2 11.6 47.4 1.1 4.7
Euro 44.4 9.6 39.2 1.1 5.6
Japanese yen 39.7 15.2 36.9 0.9 7.2
Pound sterling 41.6 10.7 43.4 0.5 3.9
Swiss franc 36.4 7.5 50.2 0.7 5.3
South African rand
31.7
9.9
54.3
0.5
3.6
Russian ruble 50.6 6.3 39.7 0.5 2.9
Indian rupee 35.8 36.1 18.0 0.1 9.9
Brazilian real 31.3 47.3 2.9 1.4 17.1
Chinese renminbi 23.7 41.6 19.9 0.2 14.6 Note: This table shows, for each economy, the relative shares of its turnover in each of the five categories of
global foreign exchange market shown in the columns. Data are adjusted for local and cross-border interdealer
double-counting (i.e., “net–net” basis).
Source: Bank for International Settlements.
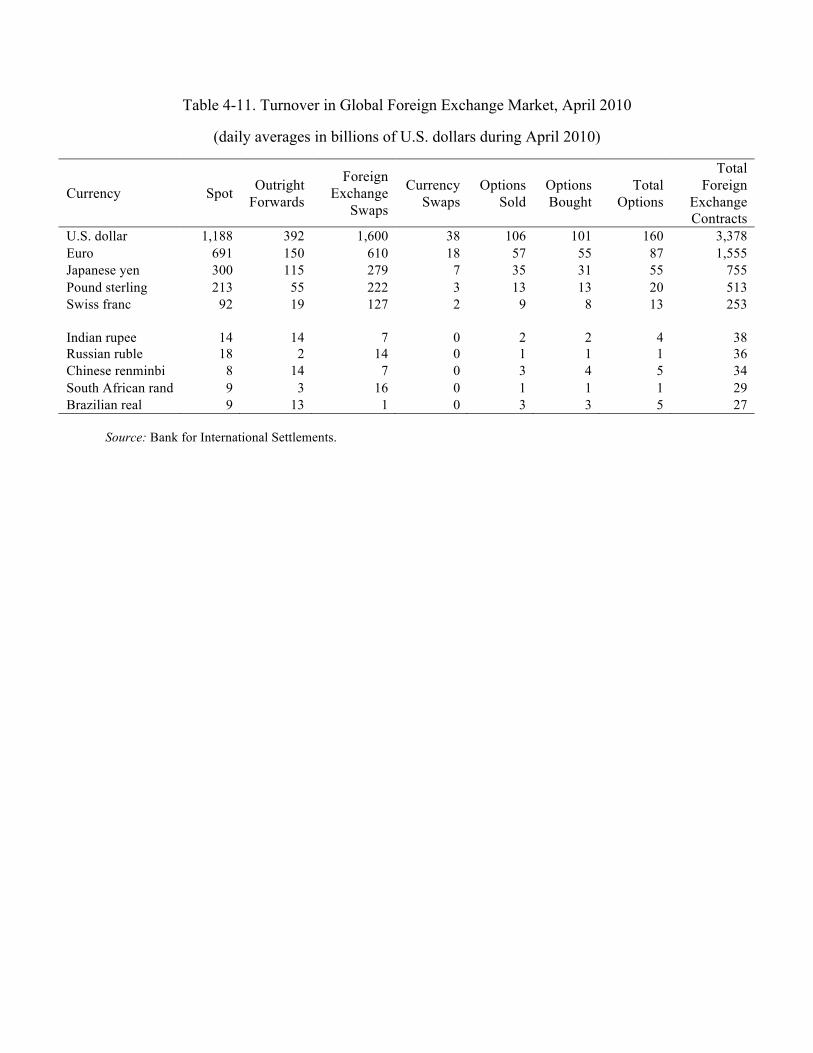
Table 4-11. Turnover in Global Foreign Exchange Market, April 2010
(daily averages in billions of U.S. dollars during April 2010)
Currency Spot Outright
Forwards
Foreign
Exchange
Swaps
Currency
Swaps
Options
Sold
Options
Bought
Total
Options
Total
Foreign
Exchange
Contracts
U.S. dollar 1,188 392 1,600 38 106 101 160 3,378
Euro 691 150 610 18 57 55 87 1,555
Japanese yen 300 115 279 7 35 31 55 755
Pound sterling 213 55 222 3 13 13 20 513
Swiss franc 92 19 127 2 9 8 13 253
Indian rupee 14 14 7 0 2 2 4 38
Russian ruble 18 2 14 0 1 1 1 36
Chinese renminbi 8 14 7 0 3 4 5 34
South African rand 9 3 16 0 1 1 1 29
Brazilian real 9 13 1 0 3 3 5 27
Source: Bank for International Settlements.
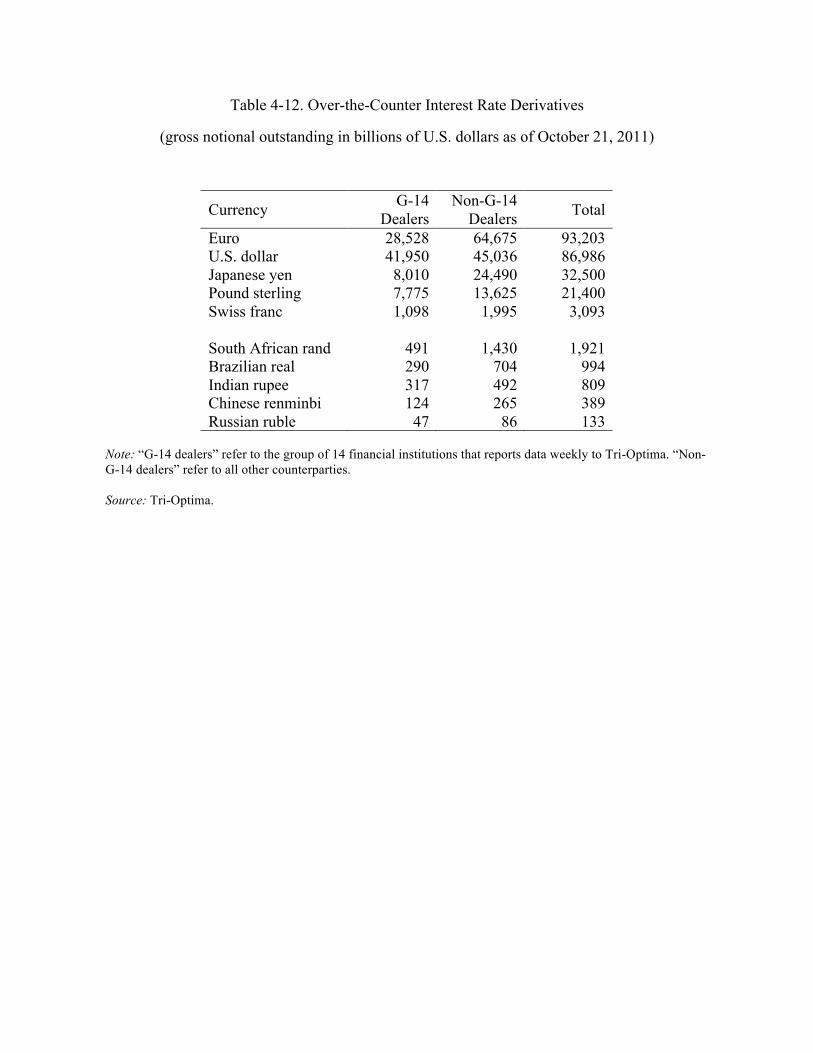
Table 4-12. Over-the-Counter Interest Rate Derivatives
(gross notional outstanding in billions of U.S. dollars as of October 21, 2011)
Currency G-14
Dealers
Non-G-14
Dealers Total
Euro 28,528 64,675 93,203
U.S. dollar 41,950 45,036 86,986
Japanese yen 8,010 24,490 32,500
Pound sterling 7,775 13,625 21,400
Swiss franc 1,098 1,995 3,093
South African rand
491
1,430
1,921
Brazilian real 290 704 994
Indian rupee 317 492 809
Chinese renminbi 124 265 389
Russian ruble 47 86 133
Note: “G-14 dealers” refer to the group of 14 financial institutions that reports data weekly to Tri-Optima. “Non-
G-14 dealers” refer to all other counterparties.
Source: Tri-Optima.
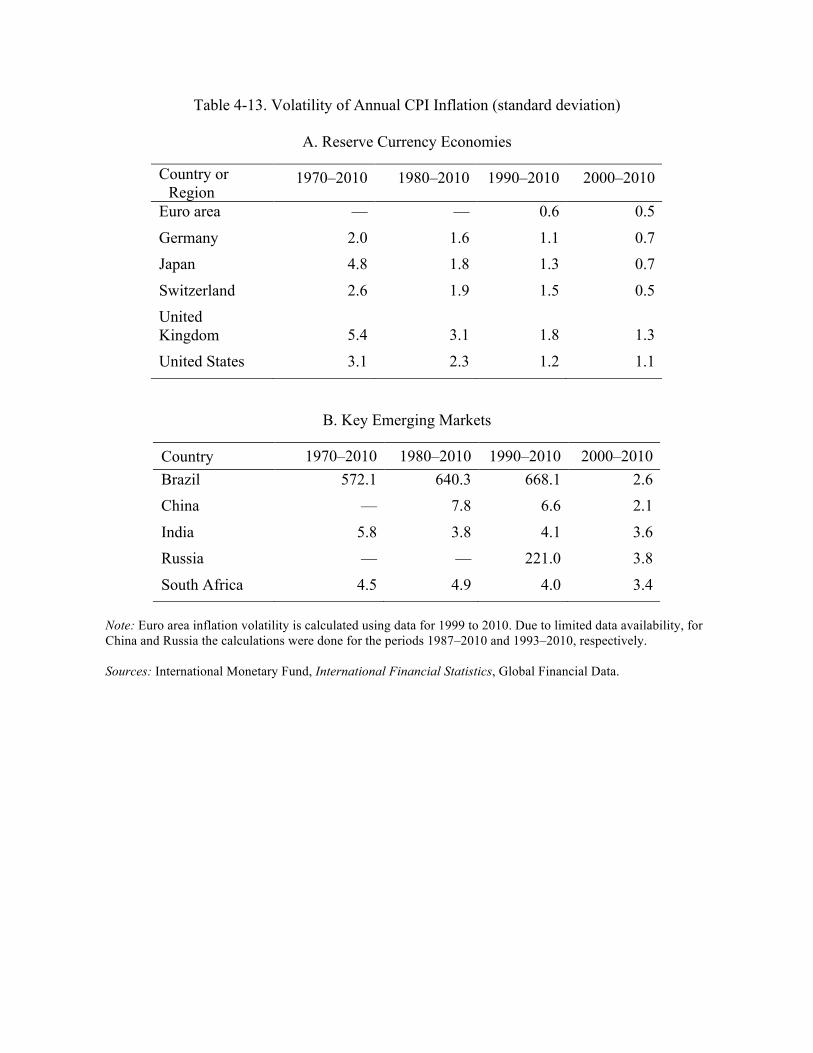
Table 4-13. Volatility of Annual CPI Inflation (standard deviation)
A. Reserve Currency Economies
Country or
Region 1970–2010 1980–2010 1990–2010 2000–2010
Euro area — — 0.6 0.5
Germany 2.0 1.6 1.1 0.7
Japan 4.8 1.8 1.3 0.7
Switzerland 2.6 1.9 1.5 0.5
United
Kingdom 5.4 3.1 1.8 1.3
United States 3.1 2.3 1.2 1.1
B. Key Emerging Markets
Country 1970–2010 1980–2010 1990–2010 2000–2010
Brazil 572.1 640.3 668.1 2.6
China — 7.8 6.6 2.1
India 5.8 3.8 4.1 3.6
Russia — — 221.0 3.8
South Africa 4.5 4.9 4.0 3.4
Note: Euro area inflation volatility is calculated using data for 1999 to 2010. Due to limited data availability, for
China and Russia the calculations were done for the periods 1987–2010 and 1993–2010, respectively.
Sources: International Monetary Fund, International Financial Statistics, Global Financial Data.
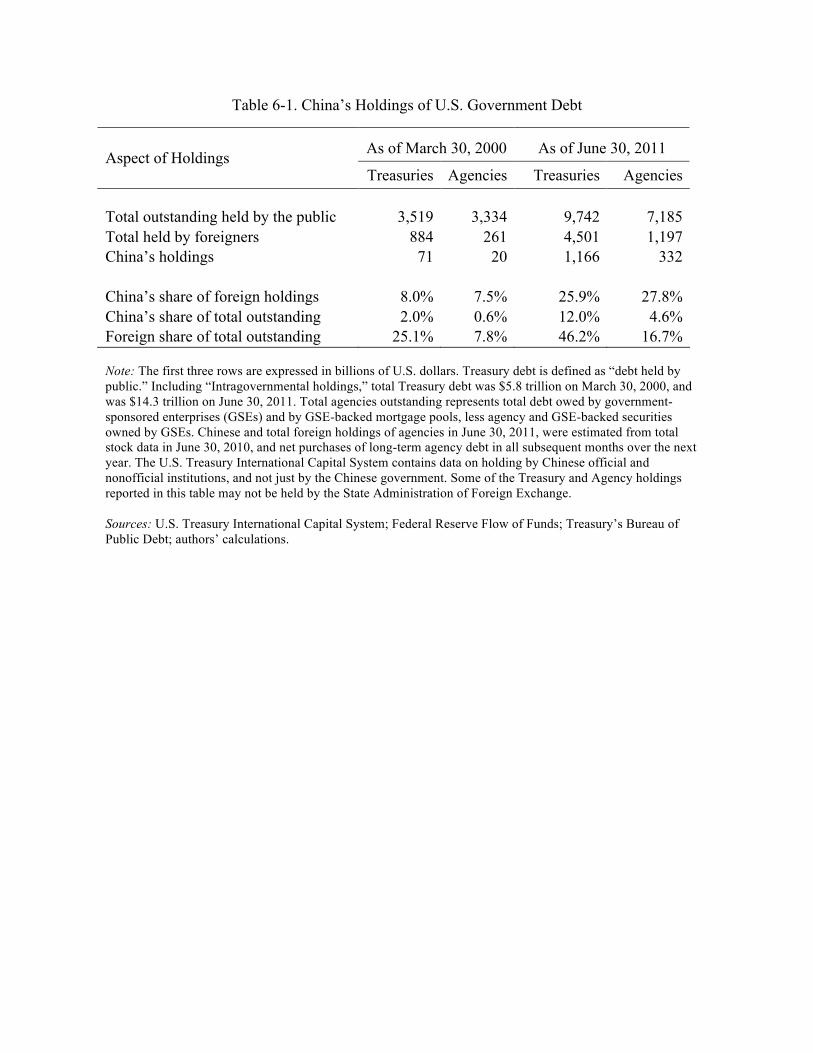
Table 6-1. China’s Holdings of U.S. Government Debt
As of March 30, 2000 As of June 30, 2011 Aspect of Holdings
Treasuries Agencies Treasuries Agencies
Total outstanding held by the public 3,519 3,334 9,742 7,185
Total held by foreigners 884 261 4,501 1,197
China’s holdings 71 20 1,166 332
China’s share of foreign holdings 8.0% 7.5% 25.9% 27.8%
China’s share of total outstanding 2.0% 0.6% 12.0% 4.6%
Foreign share of total outstanding 25.1% 7.8% 46.2% 16.7%
Note: The first three rows are expressed in billions of U.S. dollars. Treasury debt is defined as “debt held by
public.” Including “Intragovernmental holdings,” total Treasury debt was $5.8 trillion on March 30, 2000, and
was $14.3 trillion on June 30, 2011. Total agencies outstanding represents total debt owed by government-
sponsored enterprises (GSEs) and by GSE-backed mortgage pools, less agency and GSE-backed securities
owned by GSEs. Chinese and total foreign holdings of agencies in June 30, 2011, were estimated from total stock data in June 30, 2010, and net purchases of long-term agency debt in all subsequent months over the next
year. The U.S. Treasury International Capital System contains data on holding by Chinese official and
nonofficial institutions, and not just by the Chinese government. Some of the Treasury and Agency holdings
reported in this table may not be held by the State Administration of Foreign Exchange.
Sources: U.S. Treasury International Capital System; Federal Reserve Flow of Funds; Treasury’s Bureau of
Public Debt; authors’ calculations.
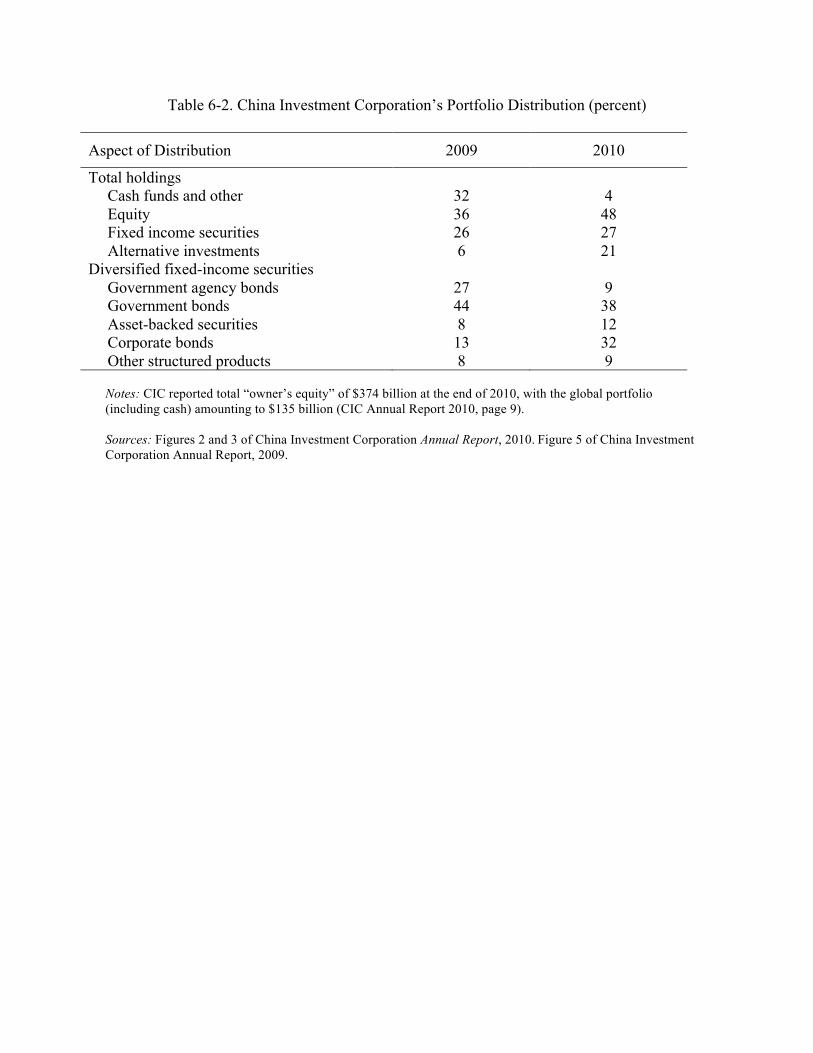
Table 6-2. China Investment Corporation’s Portfolio Distribution (percent)
Aspect of Distribution 2009 2010
Total holdings Cash funds and other 32 4 Equity 36 48 Fixed income securities 26 27 Alternative investments 6 21
Diversified fixed-income securities Government agency bonds 27 9 Government bonds 44 38 Asset-backed securities 8 12 Corporate bonds 13 32 Other structured products 8 9
Notes: CIC reported total “owner’s equity” of $374 billion at the end of 2010, with the global portfolio
(including cash) amounting to $135 billion (CIC Annual Report 2010, page 9).
Sources: Figures 2 and 3 of China Investment Corporation Annual Report, 2010. Figure 5 of China Investment
Corporation Annual Report, 2009.
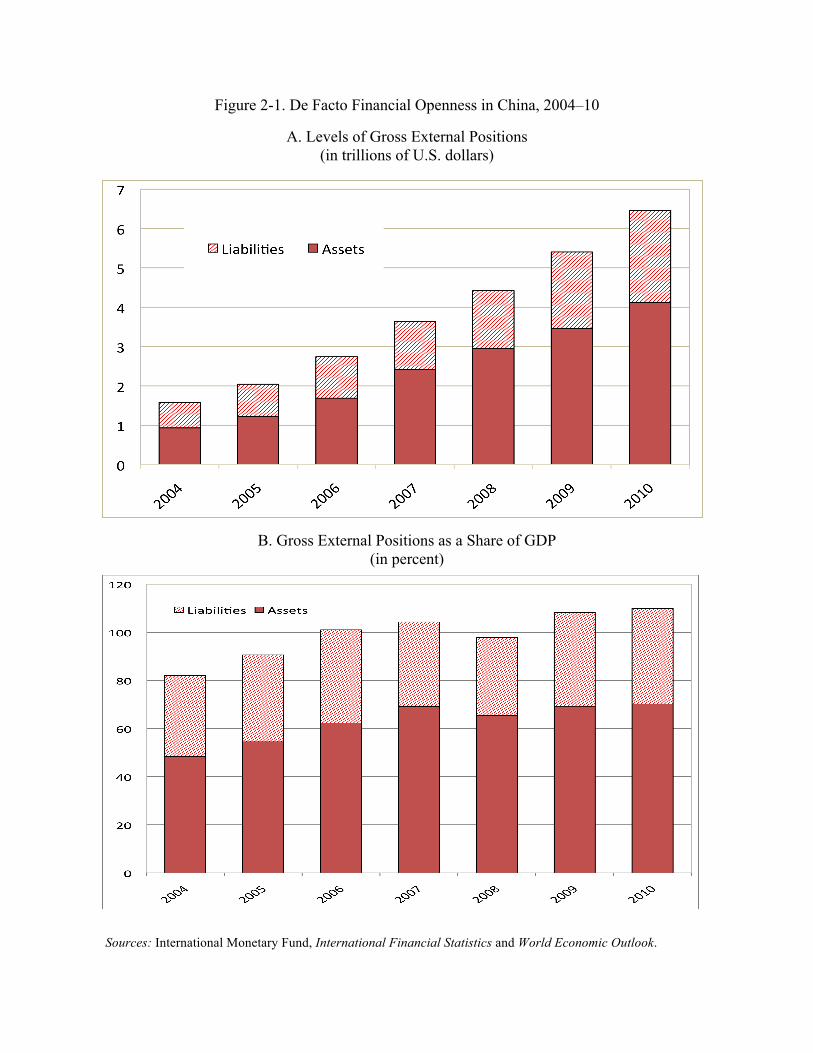
Figure 2-1. De Facto Financial Openness in China, 2004–10
A. Levels of Gross External Positions
(in trillions of U.S. dollars)
B. Gross External Positions as a Share of GDP
(in percent)
Sources: International Monetary Fund, International Financial Statistics and World Economic Outlook.

Figure 2-2. De Facto Financial Openness across Economies
A. Levels of Gross External Positions
(in trillions of U.S. dollars)
B. Gross External Positions as a Share of GDP
(in percent)
Sources: International Monetary Fund, International Financial Statistics and World Economic Outlook.
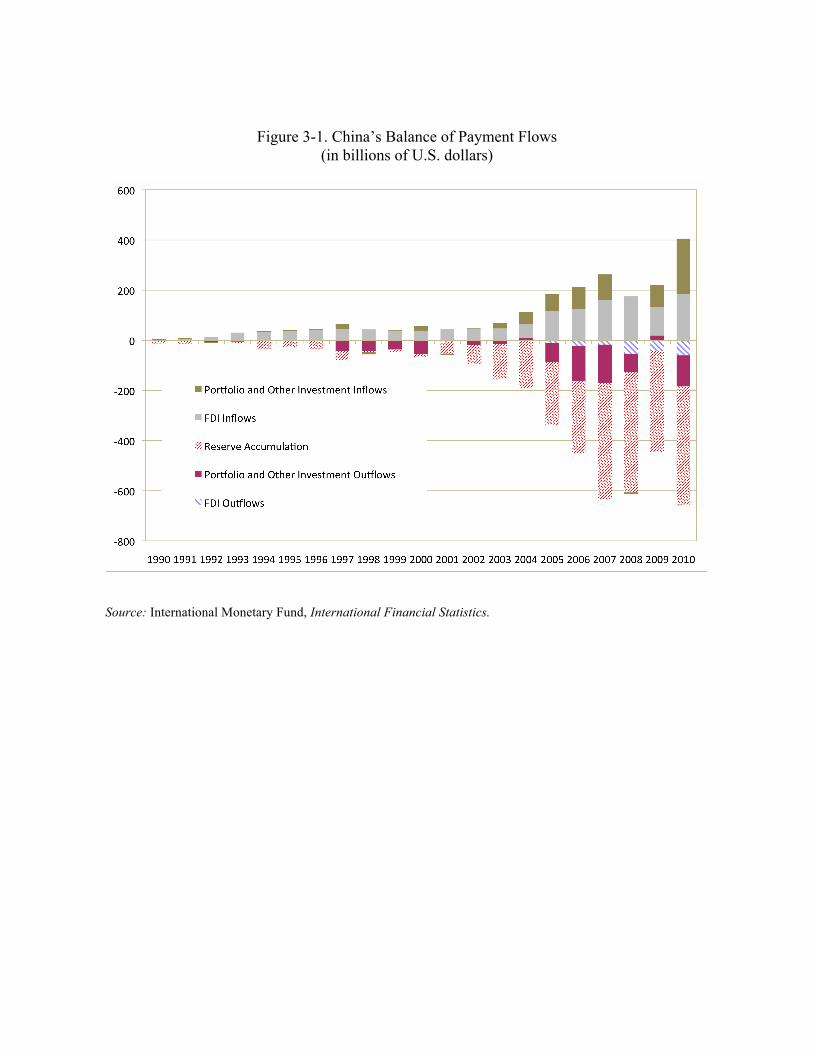
Figure 3-1. China’s Balance of Payment Flows
(in billions of U.S. dollars)
Source: International Monetary Fund, International Financial Statistics.
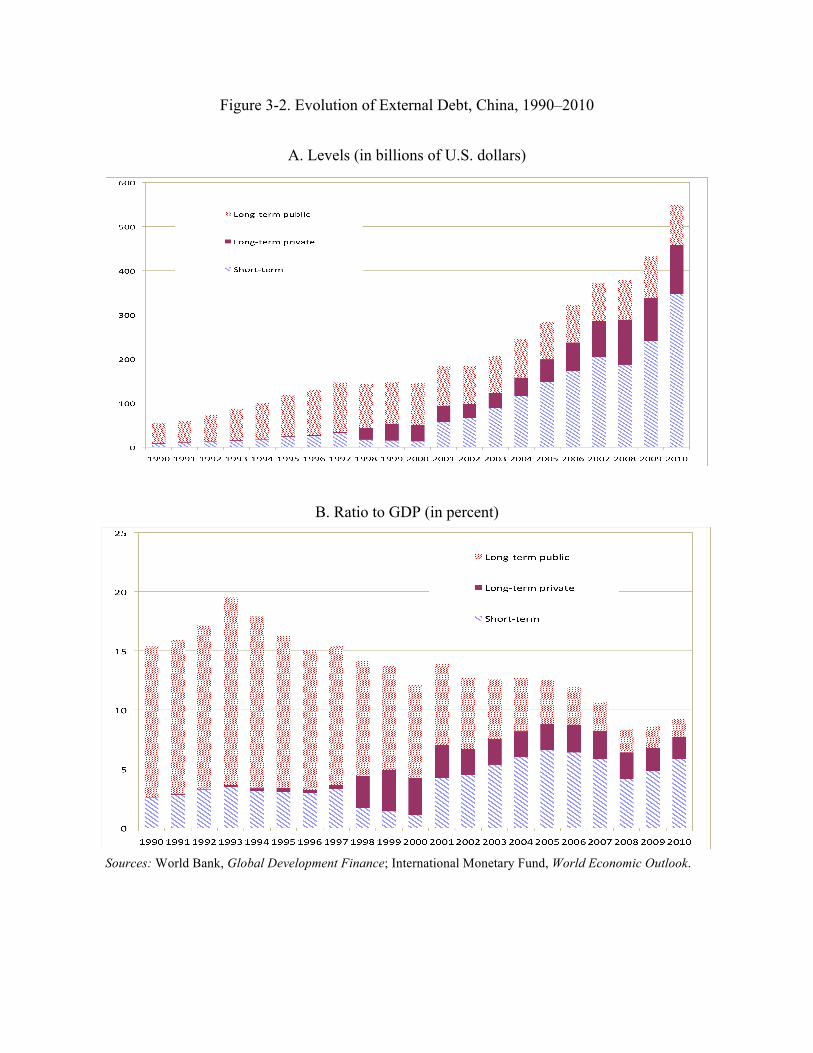
Figure 3-2. Evolution of External Debt, China, 1990–2010
A. Levels (in billions of U.S. dollars)
B. Ratio to GDP (in percent)
Sources: World Bank, Global Development Finance; International Monetary Fund, World Economic Outlook.
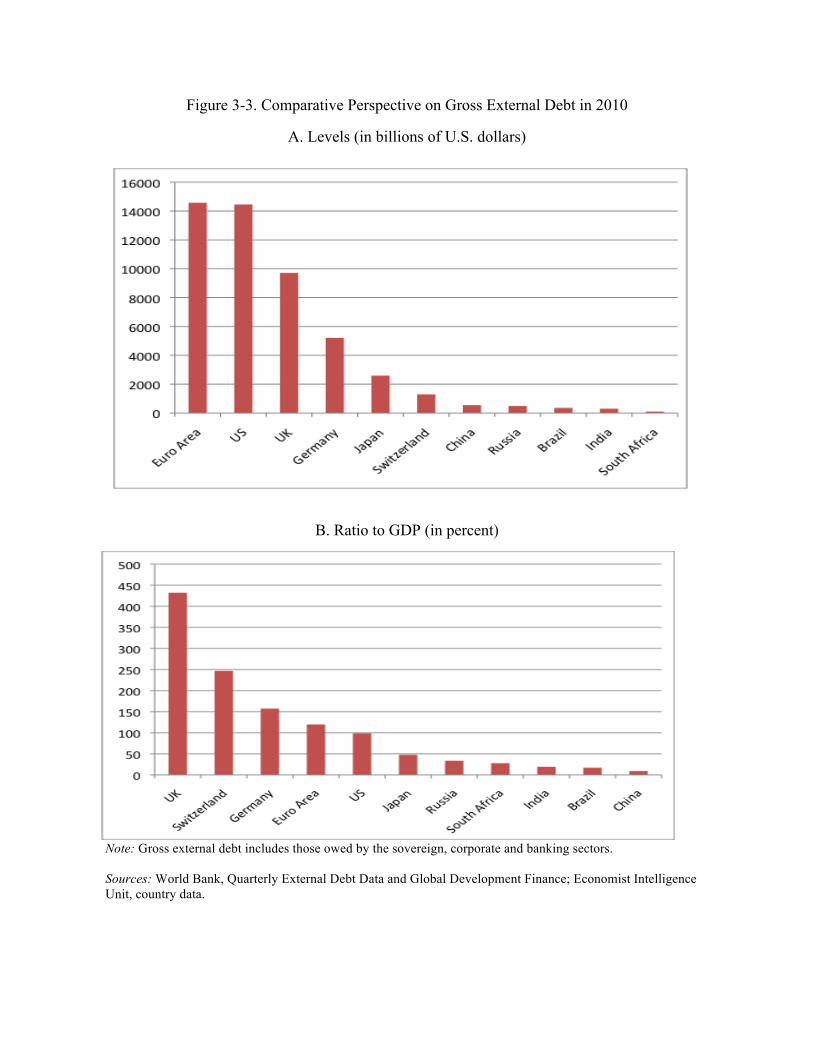
Figure 3-3. Comparative Perspective on Gross External Debt in 2010
A. Levels (in billions of U.S. dollars)
B. Ratio to GDP (in percent)
Note: Gross external debt includes those owed by the sovereign, corporate and banking sectors.
Sources: World Bank, Quarterly External Debt Data and Global Development Finance; Economist Intelligence
Unit, country data.
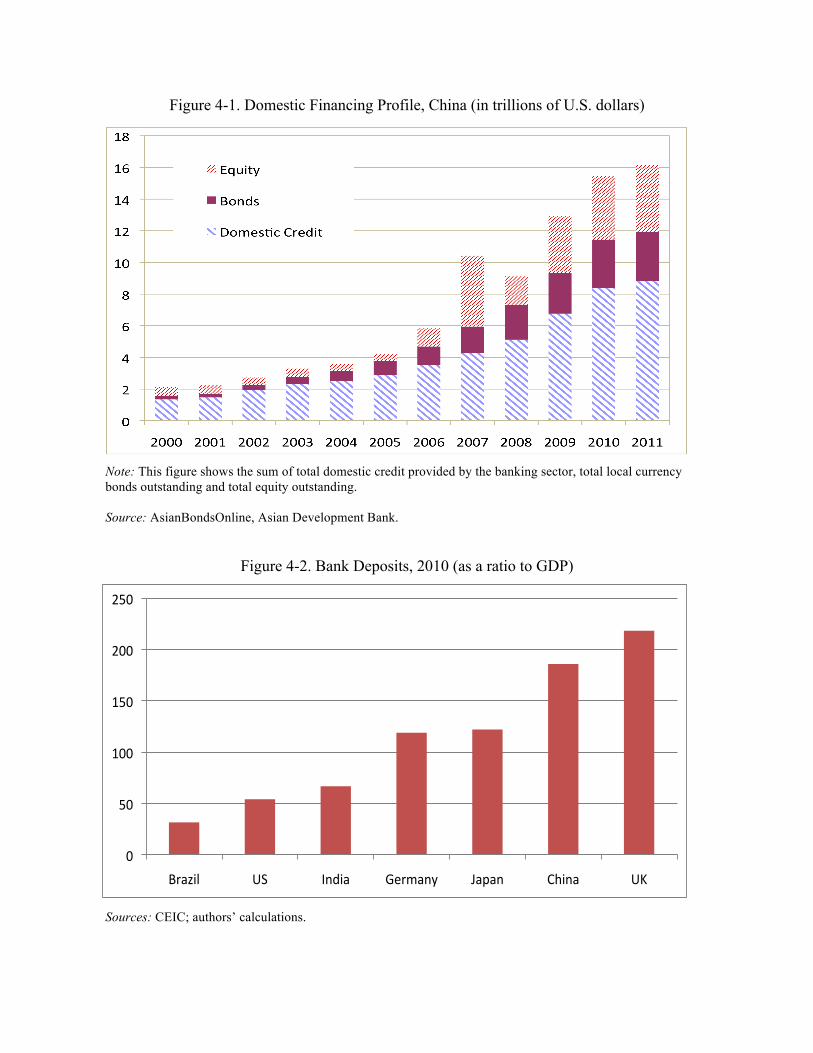
Figure 4-1. Domestic Financing Profile, China (in trillions of U.S. dollars)
Note: This figure shows the sum of total domestic credit provided by the banking sector, total local currency
bonds outstanding and total equity outstanding.
Source: AsianBondsOnline, Asian Development Bank.
Figure 4-2. Bank Deposits, 2010 (as a ratio to GDP)
Sources: CEIC; authors’ calculations.
!"
#!"
$!!"
$#!"
%!!"
%#!"
&'()*+" ,-" ./0*(" 12'3(/4" 5(6(/" 78*/(" ,9"
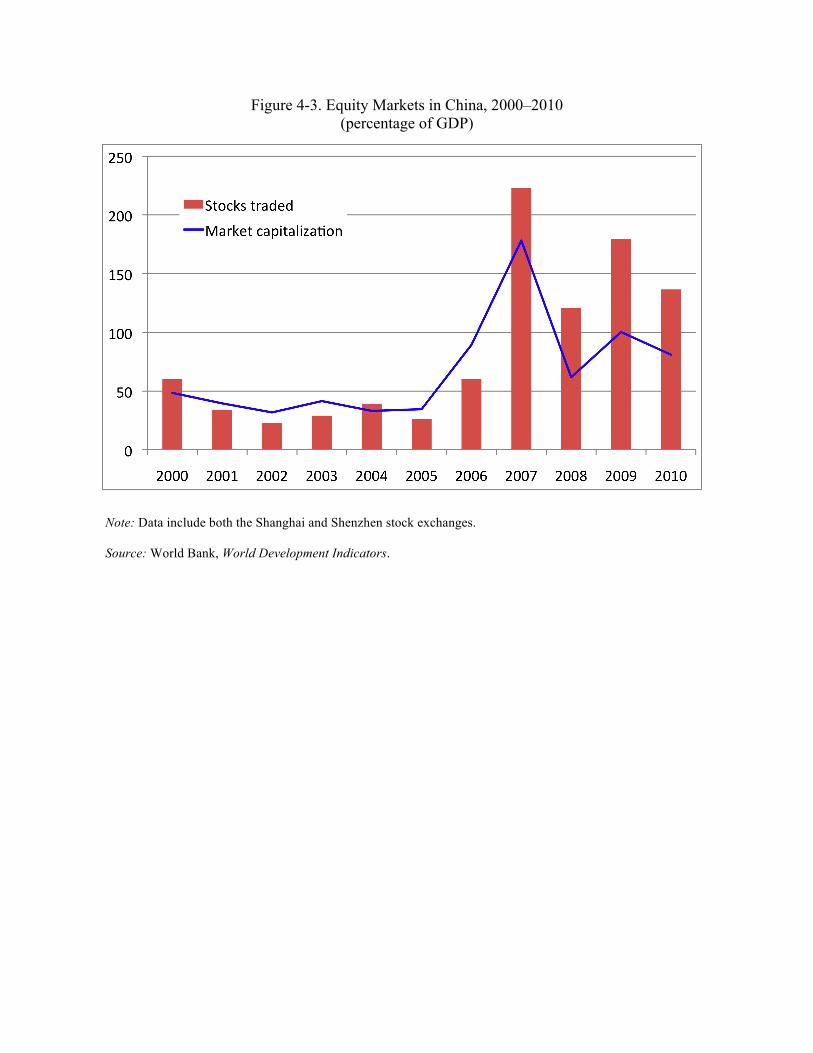
Figure 4-3. Equity Markets in China, 2000–2010
(percentage of GDP)
Note: Data include both the Shanghai and Shenzhen stock exchanges.
Source: World Bank, World Development Indicators.
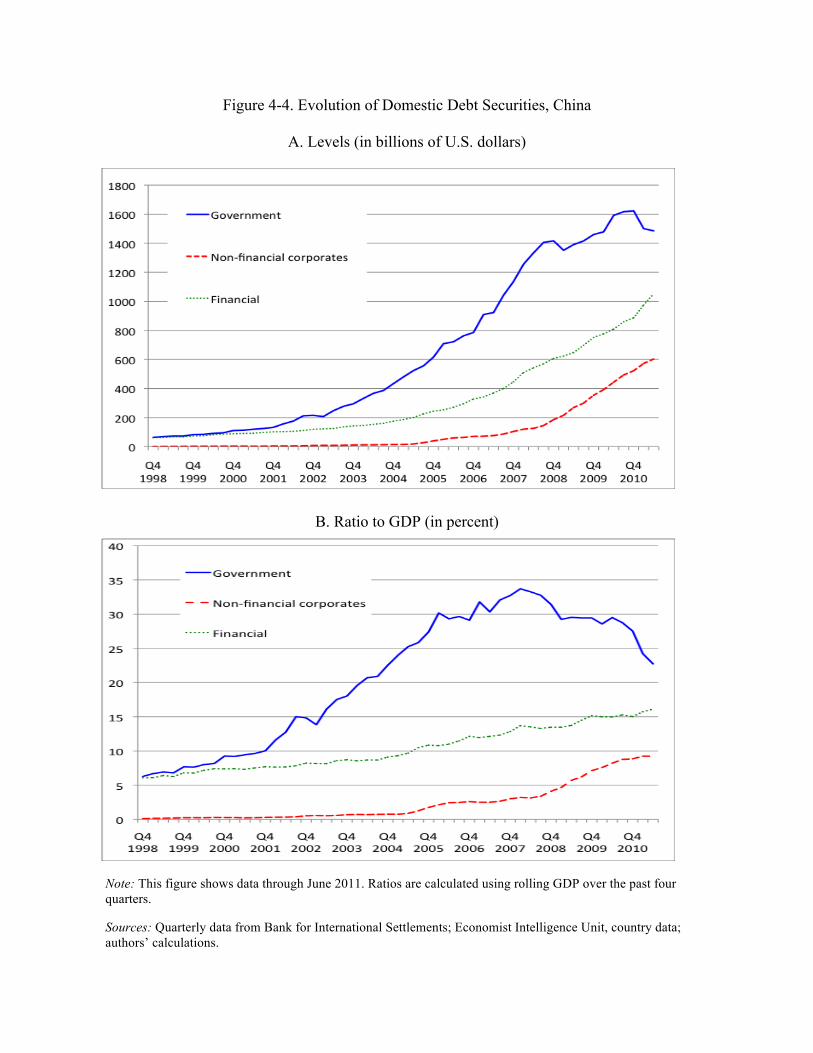
Figure 4-4. Evolution of Domestic Debt Securities, China
A. Levels (in billions of U.S. dollars)
B. Ratio to GDP (in percent)
Note: This figure shows data through June 2011. Ratios are calculated using rolling GDP over the past four
quarters.
Sources: Quarterly data from Bank for International Settlements; Economist Intelligence Unit, country data;
authors’ calculations.
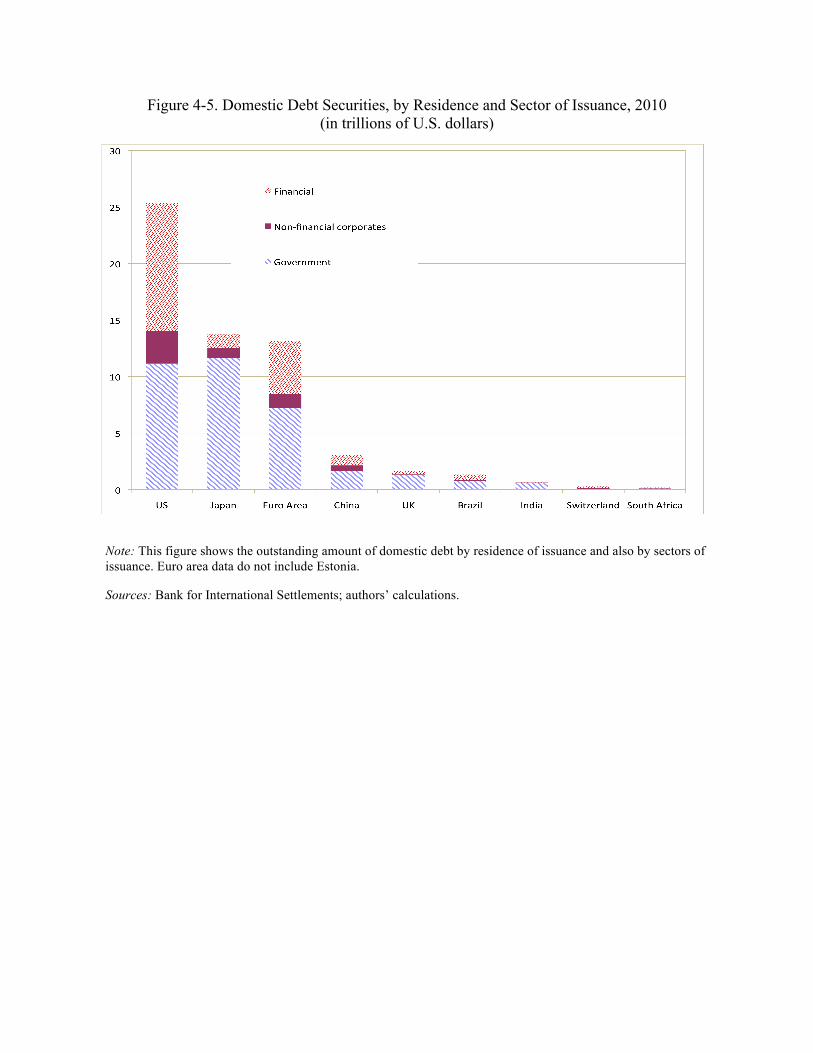
Figure 4-5. Domestic Debt Securities, by Residence and Sector of Issuance, 2010
(in trillions of U.S. dollars)
Note: This figure shows the outstanding amount of domestic debt by residence of issuance and also by sectors of
issuance. Euro area data do not include Estonia.
Sources: Bank for International Settlements; authors’ calculations.
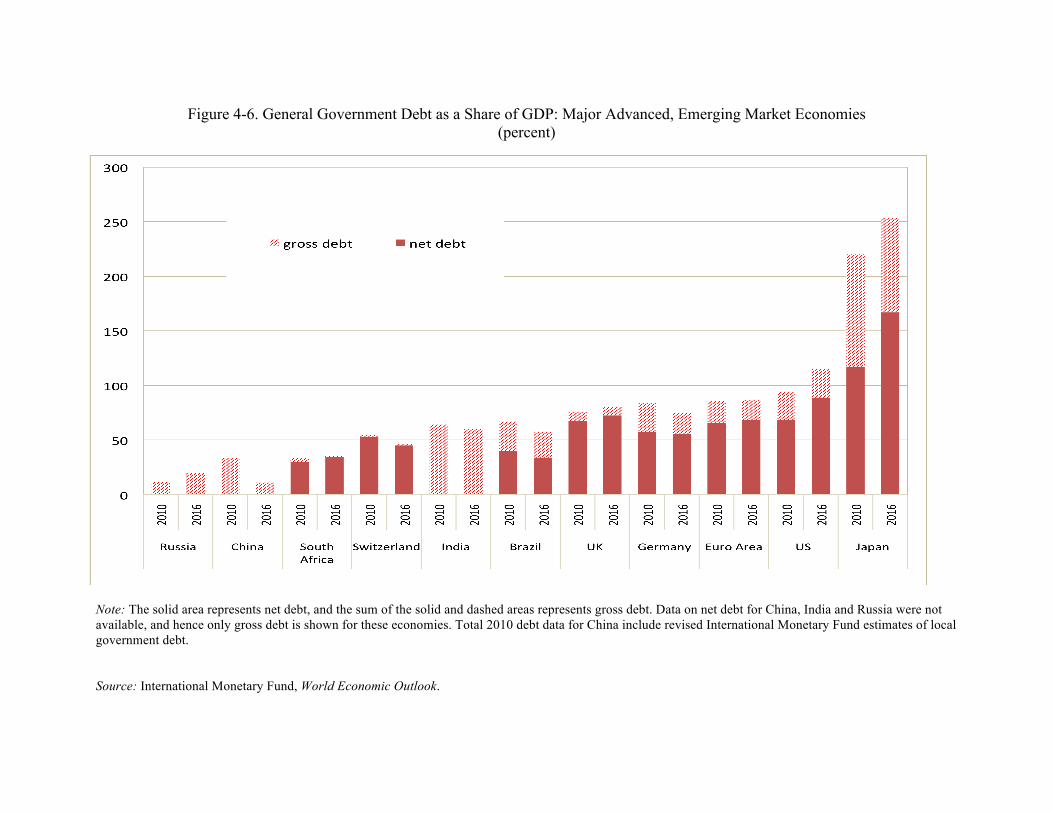
Figure 4-6. General Government Debt as a Share of GDP: Major Advanced, Emerging Market Economies
(percent)
Note: The solid area represents net debt, and the sum of the solid and dashed areas represents gross debt. Data on net debt for China, India and Russia were not
available, and hence only gross debt is shown for these economies. Total 2010 debt data for China include revised International Monetary Fund estimates of local
government debt.
Source: International Monetary Fund, World Economic Outlook.
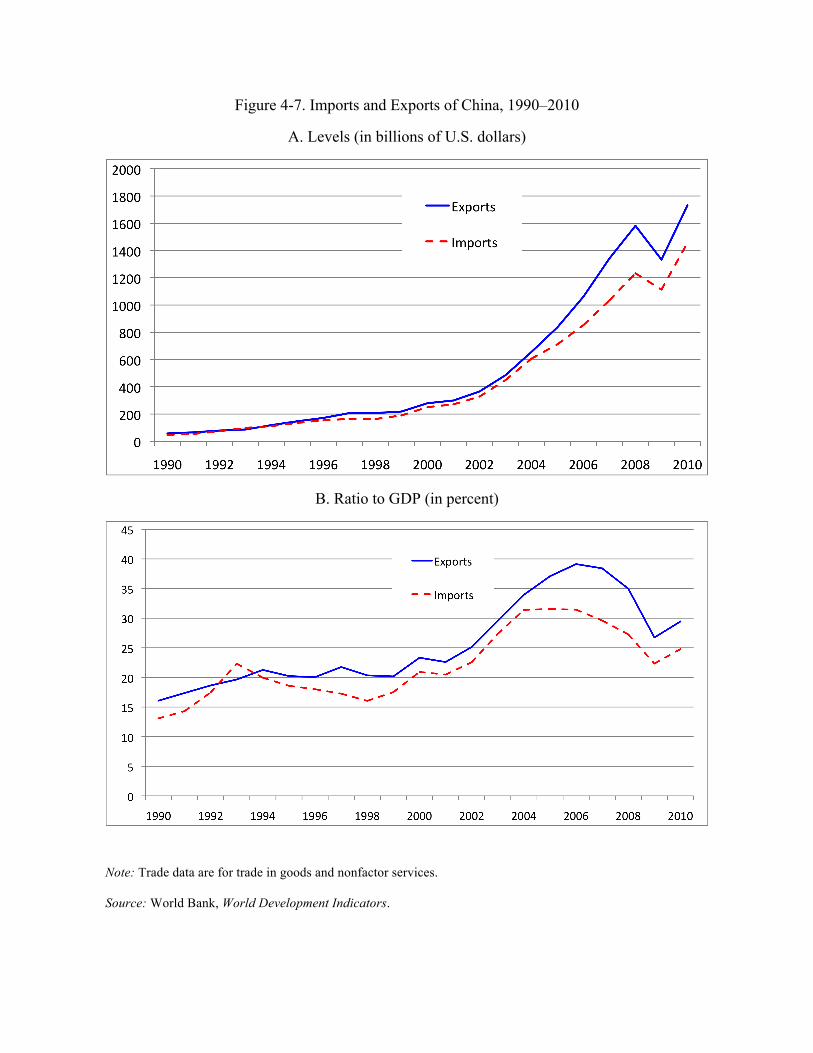
Figure 4-7. Imports and Exports of China, 1990–2010
A. Levels (in billions of U.S. dollars)
B. Ratio to GDP (in percent)
Note: Trade data are for trade in goods and nonfactor services.
Source: World Bank, World Development Indicators.
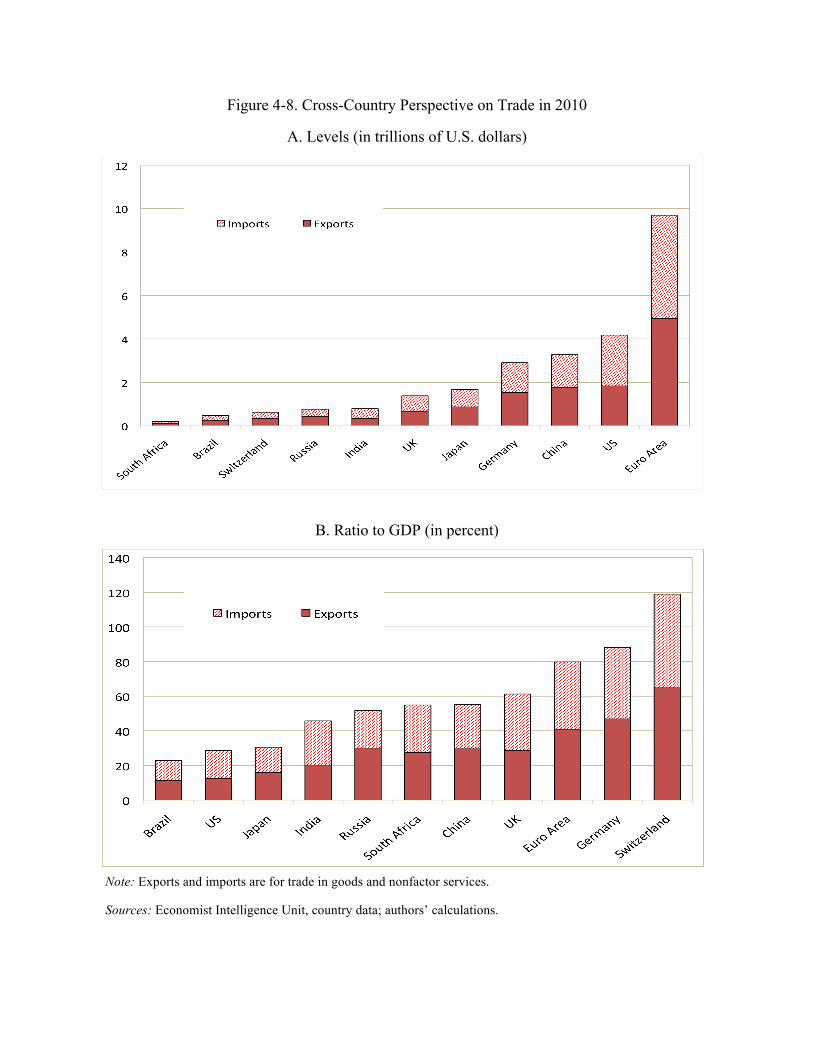
Figure 4-8. Cross-Country Perspective on Trade in 2010
A. Levels (in trillions of U.S. dollars)
B. Ratio to GDP (in percent)
Note: Exports and imports are for trade in goods and nonfactor services.
Sources: Economist Intelligence Unit, country data; authors’ calculations.
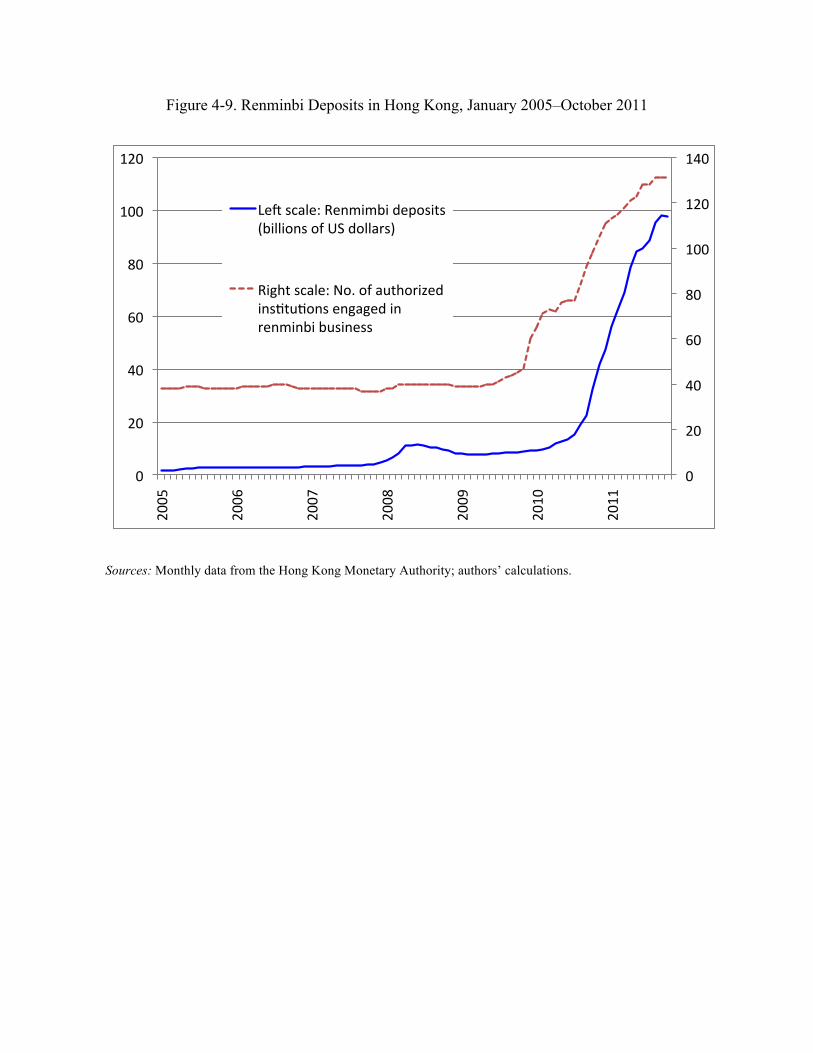
Figure 4-9. Renminbi Deposits in Hong Kong, January 2005–October 2011
Sources: Monthly data from the Hong Kong Monetary Authority; authors’ calculations.
!"
#!"
$!"
%!"
&!"
'!!"
'#!"
'$!"
!"
#!"
$!"
%!"
&!"
'!!"
'#!"#!!("
#!!%"
#!!)"
#!!&"
#!!*"
#!'!"
#!''"
+,-"./01,2"3,456576"8,9:.6;."
<76116:4.":=">?"8:[email protected]"
36BC;"./01,2"D:E":="0F;C:@6G,8"
64.H;FH:4.",4B0B,8"64"
@,456476"7F.64,.."
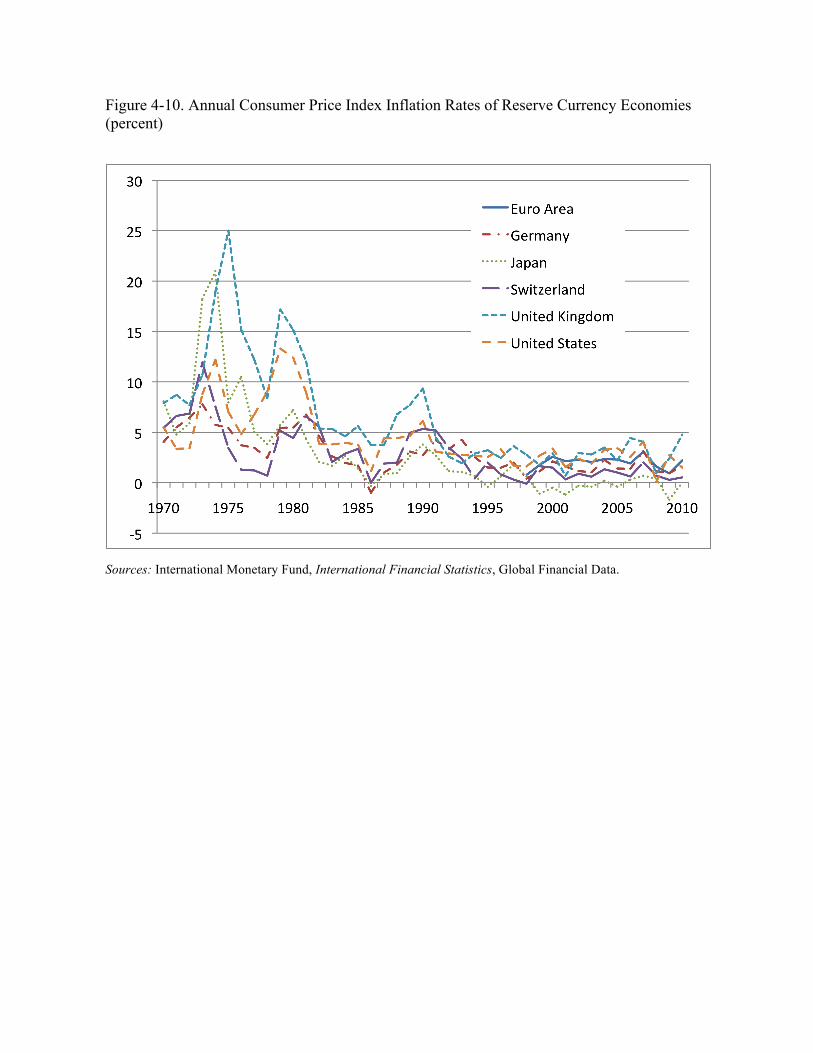
Figure 4-10. Annual Consumer Price Index Inflation Rates of Reserve Currency Economies
(percent)
Sources: International Monetary Fund, International Financial Statistics, Global Financial Data.
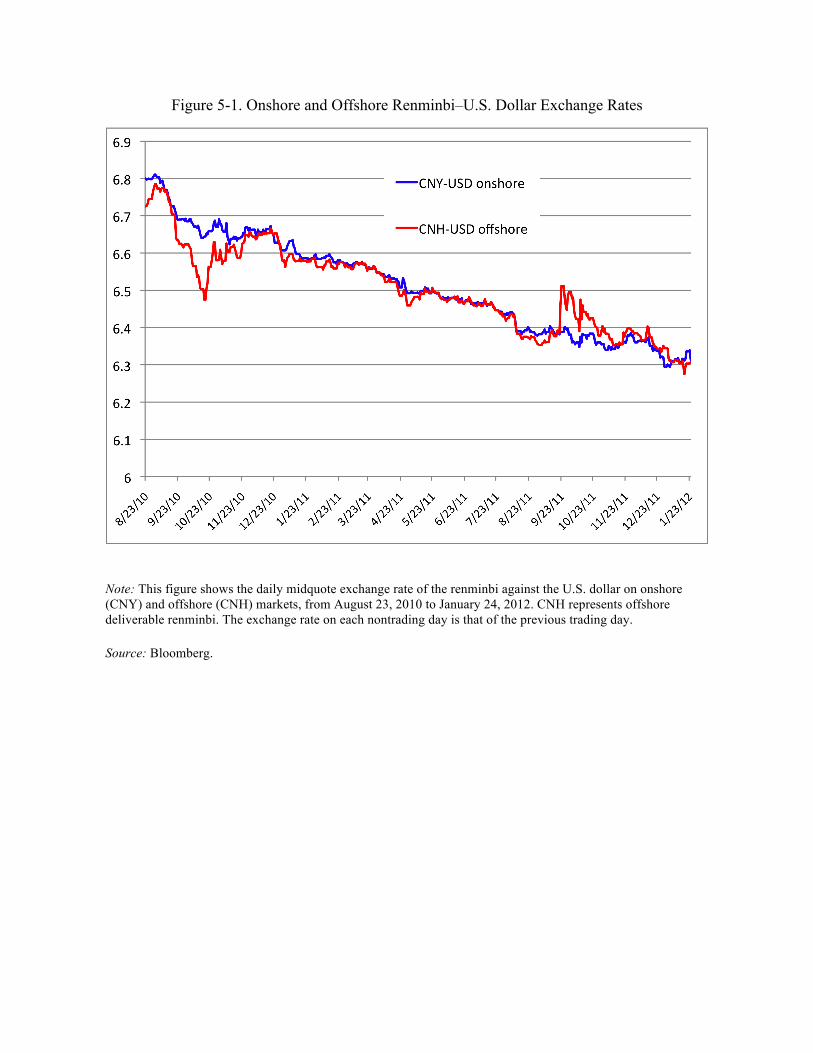
Figure 5-1. Onshore and Offshore Renminbi–U.S. Dollar Exchange Rates
Note: This figure shows the daily midquote exchange rate of the renminbi against the U.S. dollar on onshore
(CNY) and offshore (CNH) markets, from August 23, 2010 to January 24, 2012. CNH represents offshore
deliverable renminbi. The exchange rate on each nontrading day is that of the previous trading day.
Source: Bloomberg.
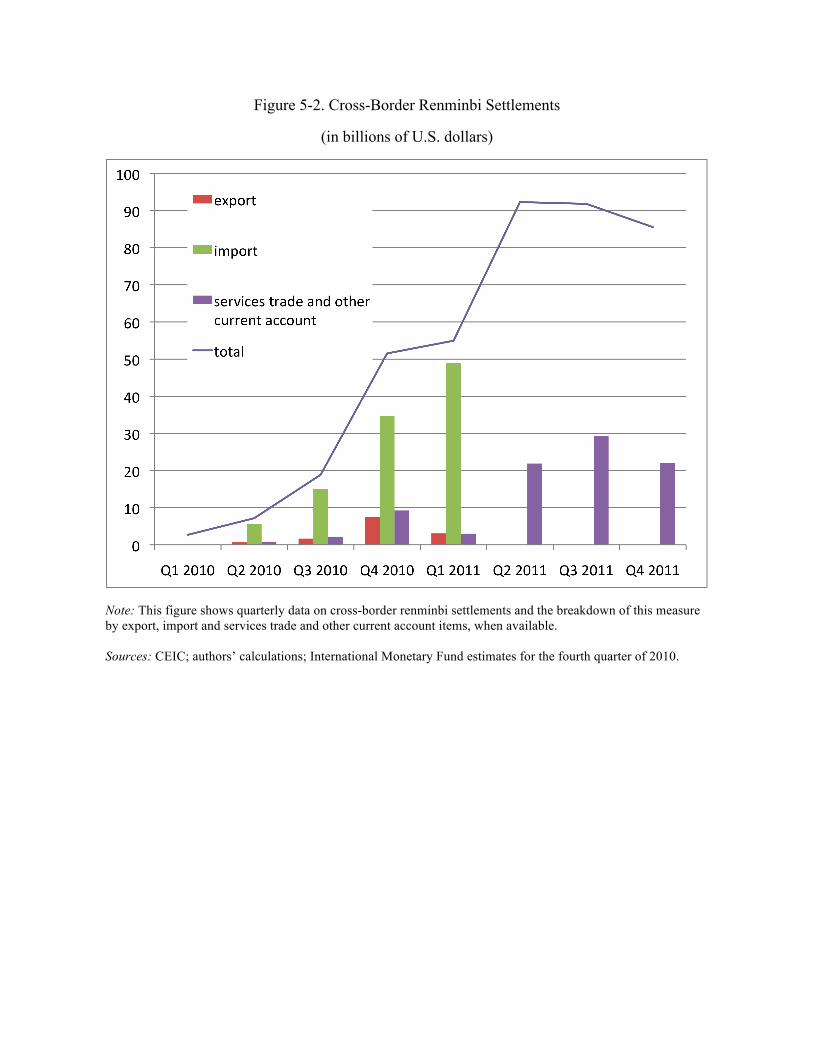
Figure 5-2. Cross-Border Renminbi Settlements
(in billions of U.S. dollars)
Note: This figure shows quarterly data on cross-border renminbi settlements and the breakdown of this measure
by export, import and services trade and other current account items, when available.
Sources: CEIC; authors’ calculations; International Monetary Fund estimates for the fourth quarter of 2010.
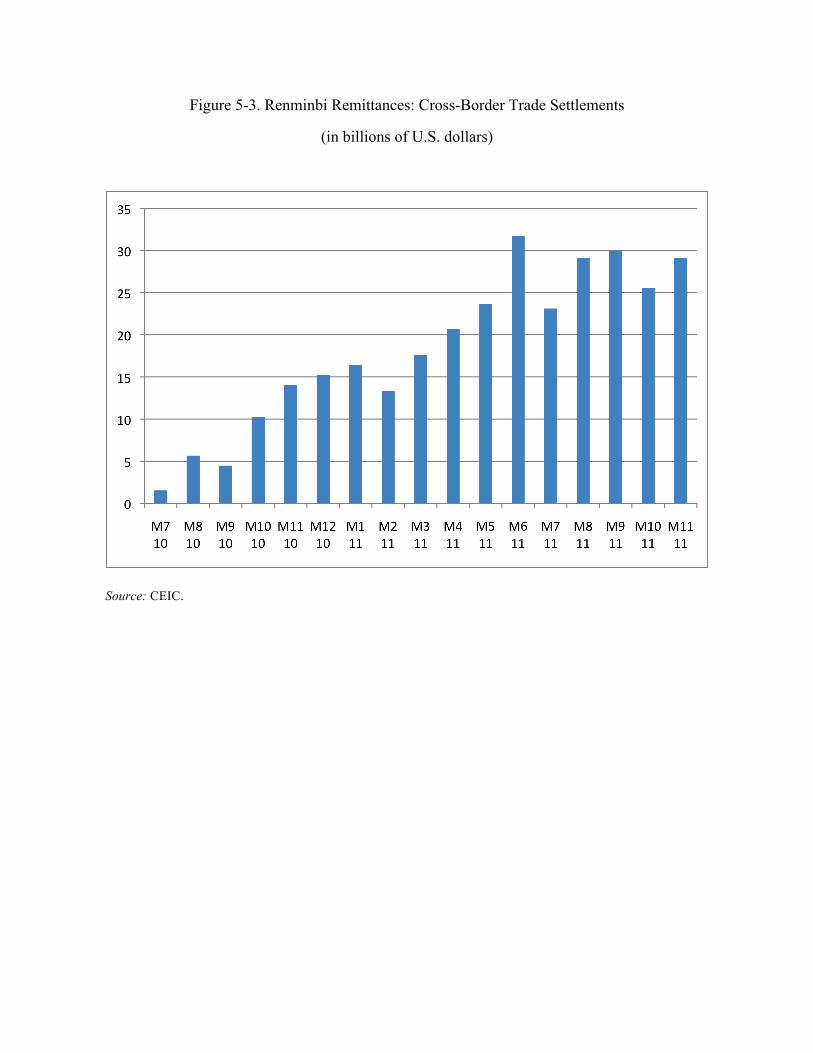
Figure 5-3. Renminbi Remittances: Cross-Border Trade Settlements
(in billions of U.S. dollars)
Source: CEIC.
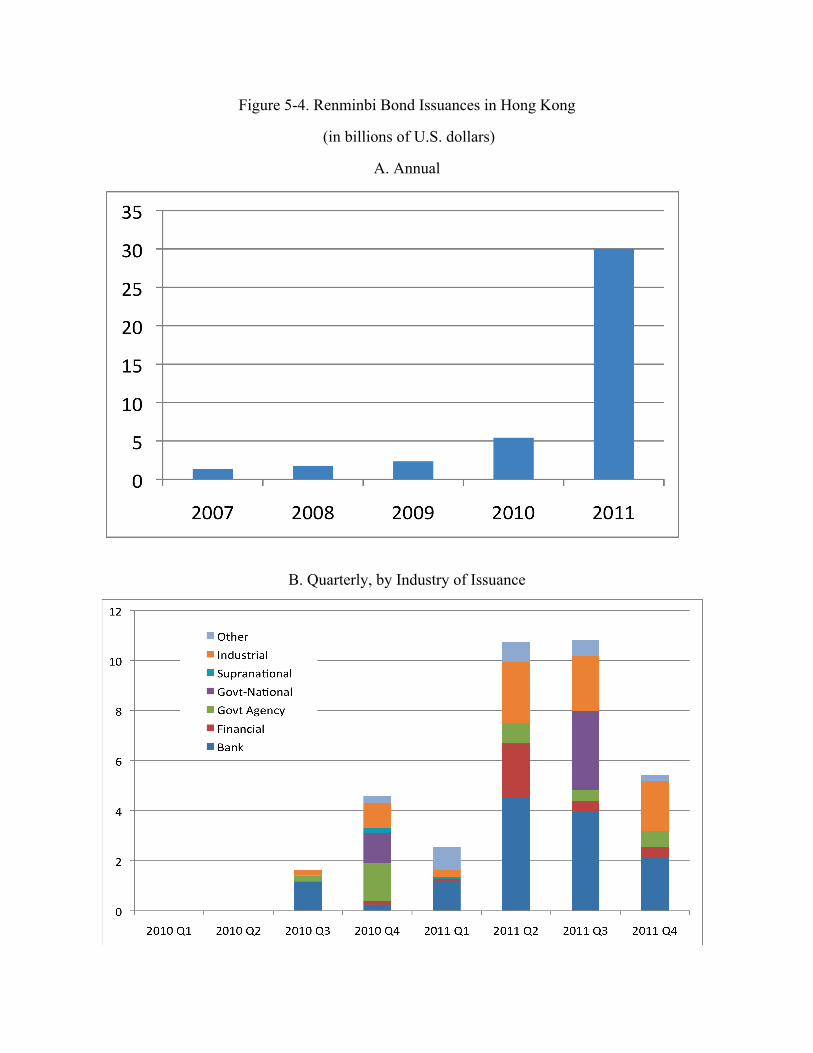
Figure 5-4. Renminbi Bond Issuances in Hong Kong
(in billions of U.S. dollars)
A. Annual
B. Quarterly, by Industry of Issuance
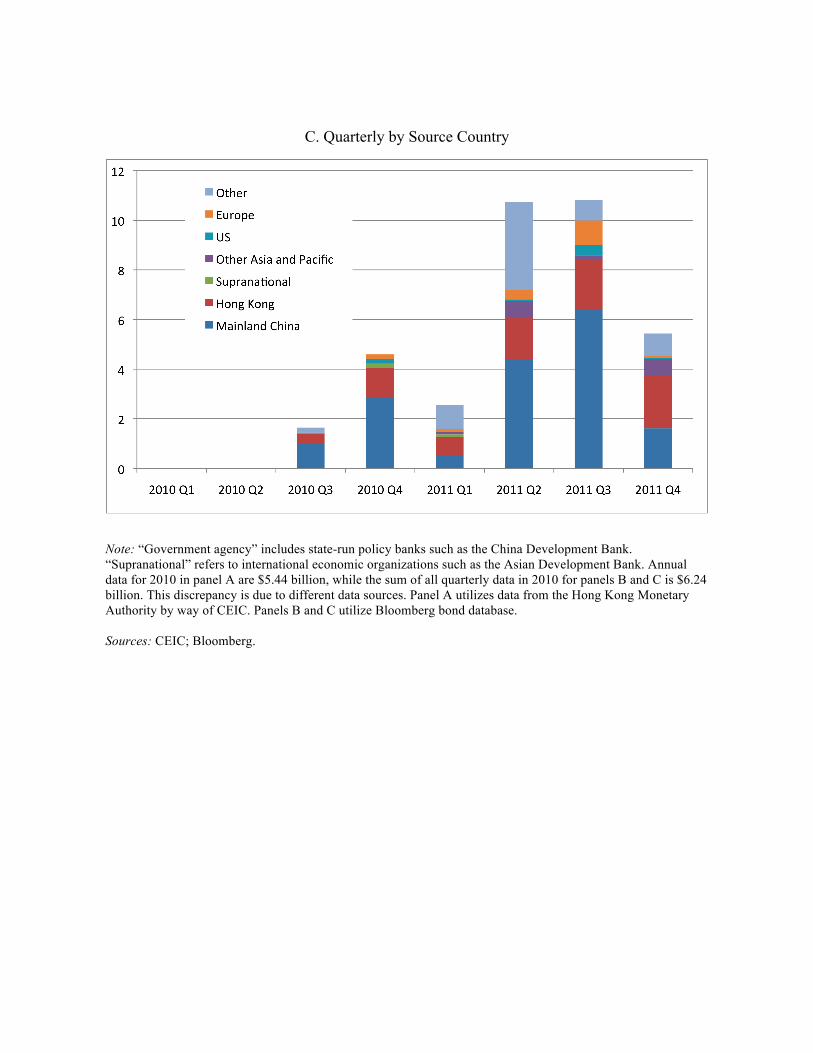
C. Quarterly by Source Country
Note: “Government agency” includes state-run policy banks such as the China Development Bank.
“Supranational” refers to international economic organizations such as the Asian Development Bank. Annual
data for 2010 in panel A are $5.44 billion, while the sum of all quarterly data in 2010 for panels B and C is $6.24
billion. This discrepancy is due to different data sources. Panel A utilizes data from the Hong Kong Monetary
Authority by way of CEIC. Panels B and C utilize Bloomberg bond database.
Sources: CEIC; Bloomberg.
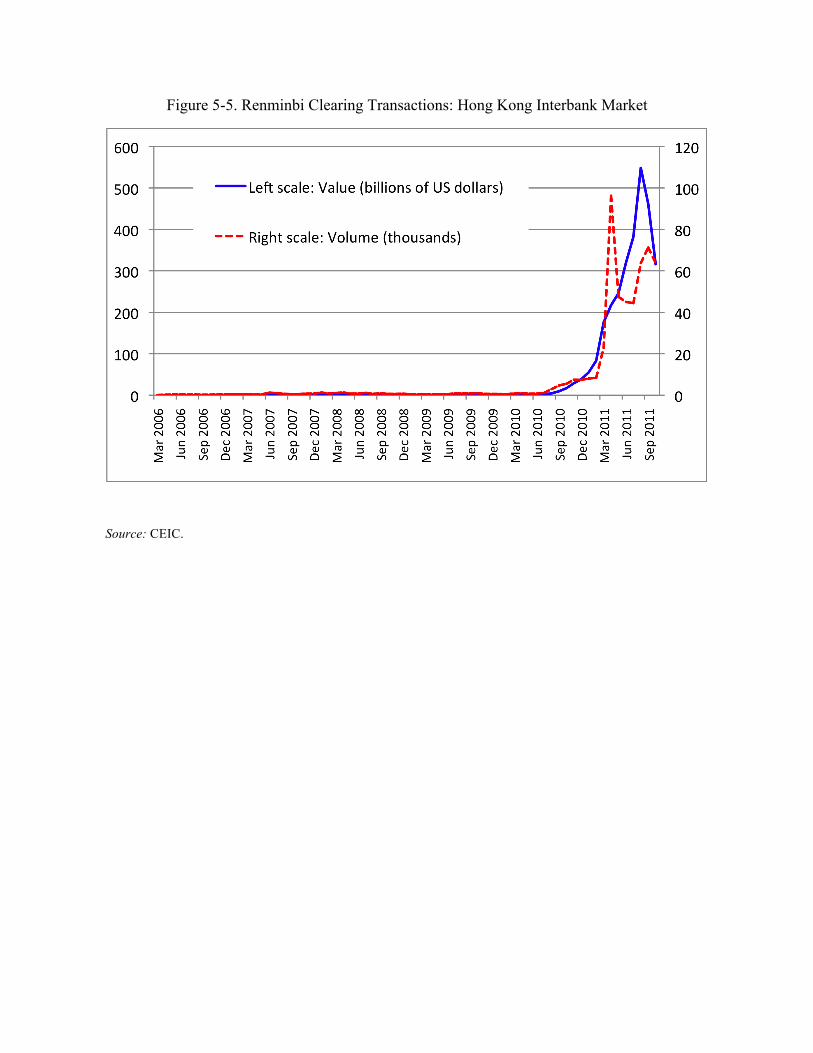
Figure 5-5. Renminbi Clearing Transactions: Hong Kong Interbank Market
Source: CEIC.
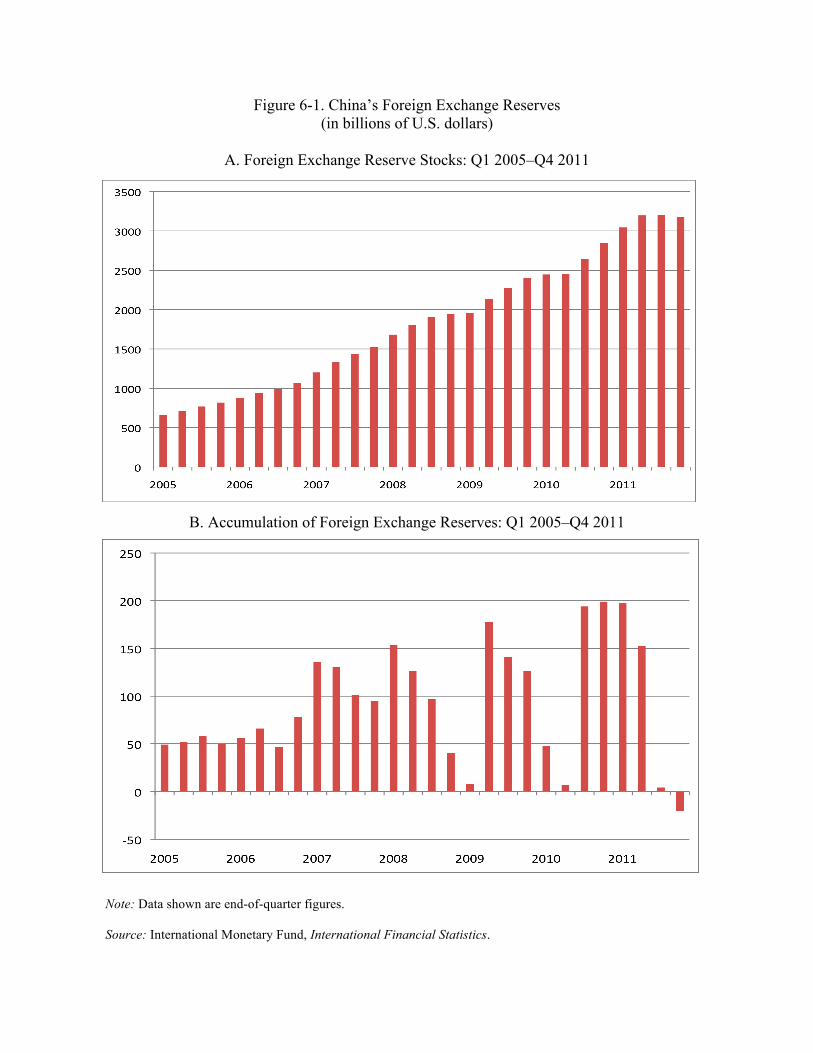
Figure 6-1. China’s Foreign Exchange Reserves
(in billions of U.S. dollars)
A. Foreign Exchange Reserve Stocks: Q1 2005–Q4 2011
B. Accumulation of Foreign Exchange Reserves: Q1 2005–Q4 2011
Note: Data shown are end-of-quarter figures.
Source: International Monetary Fund, International Financial Statistics.
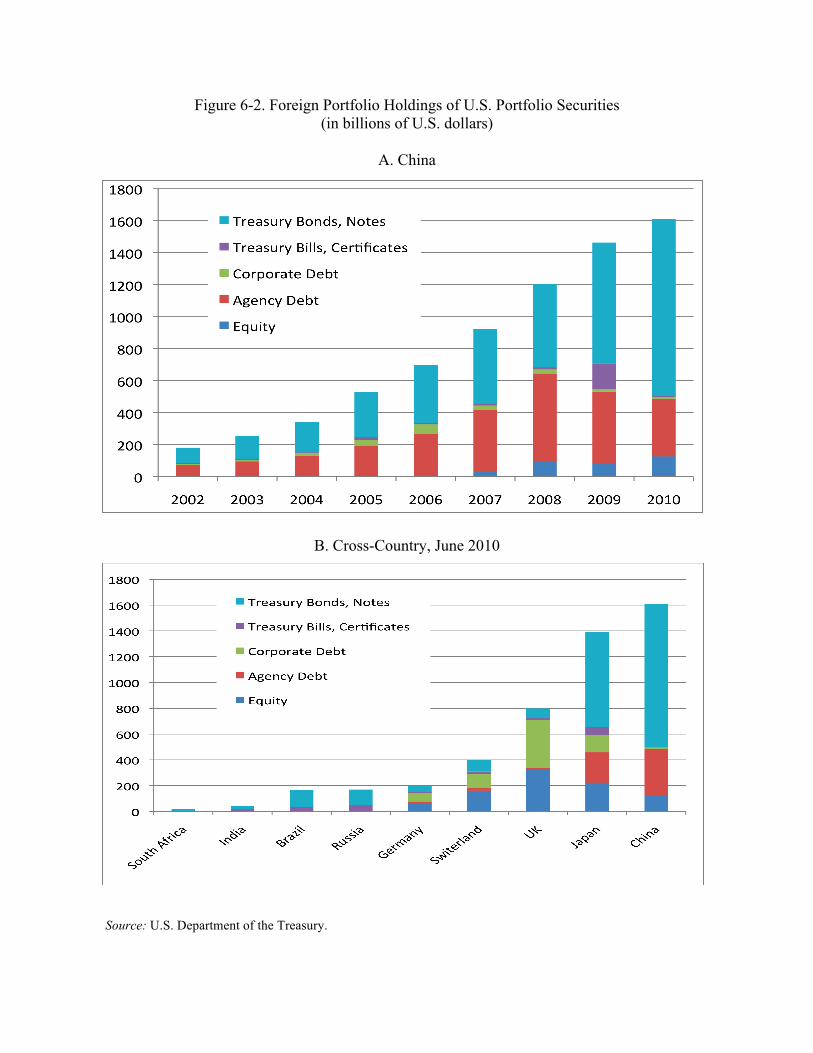
Figure 6-2. Foreign Portfolio Holdings of U.S. Portfolio Securities
(in billions of U.S. dollars)
A. China
B. Cross-Country, June 2010
Source: U.S. Department of the Treasury.
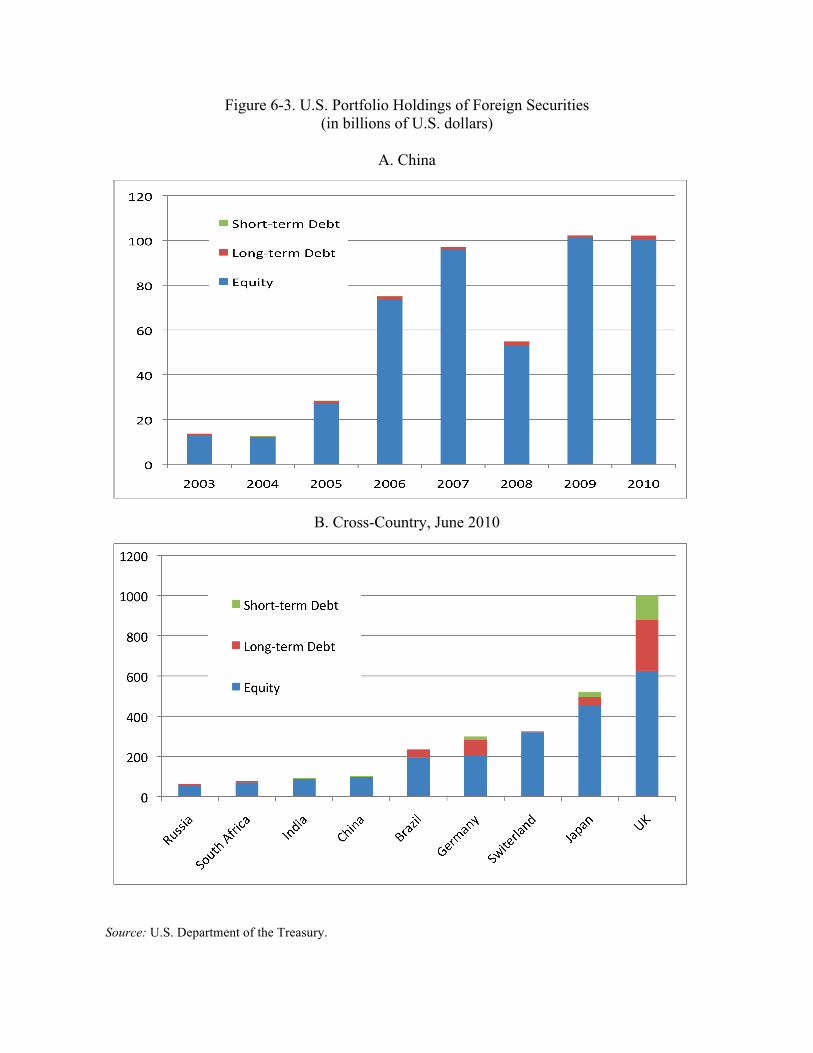
Figure 6-3. U.S. Portfolio Holdings of Foreign Securities
(in billions of U.S. dollars)
A. China
B. Cross-Country, June 2010
Source: U.S. Department of the Treasury.
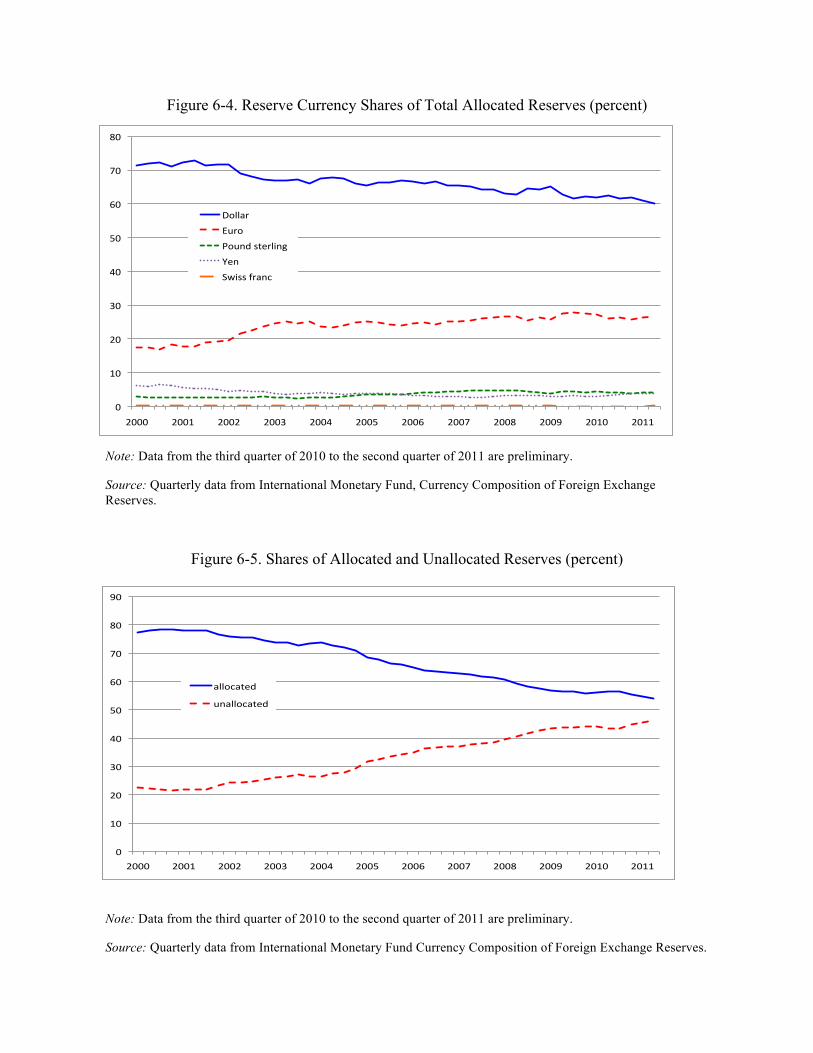
Figure 6-4. Reserve Currency Shares of Total Allocated Reserves (percent)
Note: Data from the third quarter of 2010 to the second quarter of 2011 are preliminary.
Source: Quarterly data from International Monetary Fund, Currency Composition of Foreign Exchange
Reserves.
Figure 6-5. Shares of Allocated and Unallocated Reserves (percent)
Note: Data from the third quarter of 2010 to the second quarter of 2011 are preliminary.
Source: Quarterly data from International Monetary Fund Currency Composition of Foreign Exchange Reserves.
!"
#!"
$!"
%!"
&!"
'!"
(!"
)!"
*!"
$!!!" $!!#" $!!$" $!!%" $!!&" $!!'" $!!(" $!!)" $!!*" $!!+" $!#!" $!##"
,-../0"
120-"
3-245"6780.94:"
;84"
<=966">0/4?"
!"
#!"
$!"
%!"
&!"
'!"
(!"
)!"
*!"
+!"
$!!!" $!!#" $!!$" $!!%" $!!&" $!!'" $!!(" $!!)" $!!*" $!!+" $!#!" $!##"
,--./,012"
34,--./,012"
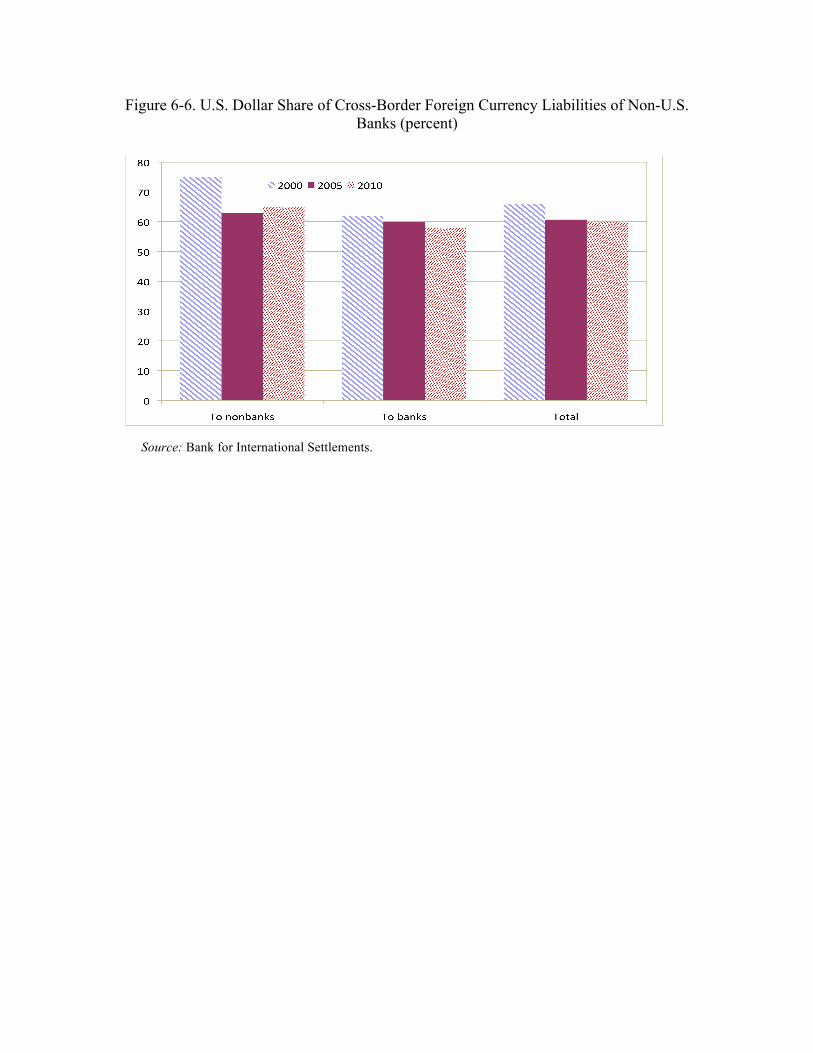
Figure 6-6. U.S. Dollar Share of Cross-Border Foreign Currency Liabilities of Non-U.S.
Banks (percent)
Source: Bank for International Settlements.
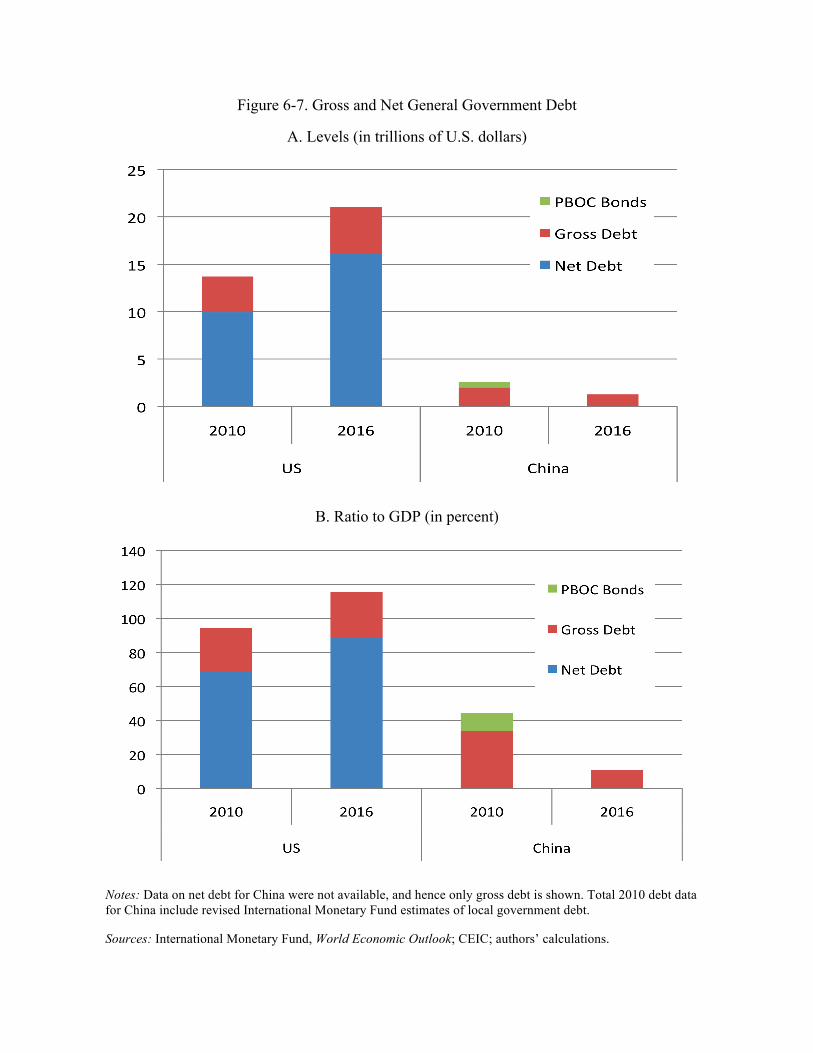
Figure 6-7. Gross and Net General Government Debt
A. Levels (in trillions of U.S. dollars)
B. Ratio to GDP (in percent)
Notes: Data on net debt for China were not available, and hence only gross debt is shown. Total 2010 debt data
for China include revised International Monetary Fund estimates of local government debt.
Sources: International Monetary Fund, World Economic Outlook; CEIC; authors’ calculations.