PATENT VALIDATION AT THE COUNTRY LEVEL - THE ROLE OF FEES AND TRANSLATION … · 2012-05-22 ·...
31
MÜNCHNER BETRIEBSWIRTSCHAFTLICHE BEITRÄGE MUNICH BUSINESS RESEARCH PATENT VALIDATION AT THE COUNTRY LEVEL - THE ROLE OF FEES AND TRANSLATION COSTS 2007-12 DIETMAR HARHOFF, KARIN HOISL, BETTINA REICHL, BRUNO VAN POTTELSBERGHE DE LA POTTERIE LMU LUDWIG-MAXIMILIANS-UNIVERSITÄT MÜNCHEN MUNICH SCHOOL OF MANAGEMENT
Transcript of PATENT VALIDATION AT THE COUNTRY LEVEL - THE ROLE OF FEES AND TRANSLATION … · 2012-05-22 ·...

MÜNCHNER BETRIEBSWIRTSCHAFTLICHE BEITRÄGE
MUNICH BUSINESS RESEARCH
PATENT VALIDATION AT THE COUNTRY LEVEL -
THE ROLE OF FEES AND TRANSLATION COSTS
2007-12
DIETMAR HARHOFF, KARIN HOISL, BETTINA REICHL,
BRUNO VAN POTTELSBERGHE DE LA POTTERIE
LMU LUDWIG-MAXIMILIANS -UNIVERSITÄT MÜNCHEN
MUNICH SCHOOL OF MANAGEMENT
1
Patent Validation at the Country Level - The Role of Fees and Translation costs
Dietmar Harhoff abc, Karin Hoisl a, Bettina Reichl d, Bruno van Pottelsberghe de la Potterie* bde
a Institute for Innovation Research, Technology Management and Entrepreneurship (INNO-tec),
University of Munich b Centre for Economic Policy Research (CEPR), London, UK
c Zentrum für Europäische Wirtschaftsforschung (ZEW), Mannheim, Germany d European Patent Office (EPO), Munich, Germany
e Université Libre de Bruxelles (U.L.B.), Solvay Business School, ECARES, CEB - Solvay SA Chair of Innovation,
Abstract:
One feature of the European patent system that is heavily criticized nowadays is related to its complex fragmentation and the induced cost burden for applicants. Once a patent is granted by the EPO, the assignee must validate (and often translate) it and pay the renewal fees to keep it in force in each country in which the applicant seeks protection. The objective of this paper is to assess to what extent validation and renewal fees as well as translation costs affect the validation behavior of applicants. We rely on a gravity model that aims at explaining patent flows between inventor and target countries within the European patent system. The results show that the size of countries, their wealth and the distance between their capital cities are significant determinants of patent flows. Validation fees and renewal fees further affect the validation behavior of applicants. Translation costs seem to have an impact as well. The important role played by fees suggests that the implementation of cost-reducing policy interventions like the London Protocol would induce a significant increase in the number of patents validated in each European country.
JEL Classification: O30, O31, O38, O57
Keywords: patent fees, validation fees, renewal fees, gravity model
Acknowledgement The authors thank Nicolas van Zeebroeck for developing the methodology to identify validations and for constructing the dataset (the methodology described in van Pottelsberghe and van Zeebroeck (2008) and in van Zeebroeck (2007)). The authors are grateful to the EPO for providing access to patent renewal data.
* Corresponding author: Karin Hoisl, e-mail address: [email protected].
2
1 Introduction
At the creation of the European Patent Convention in 1977, the ultimate objective of the eight
founding countries1 was to create a Community Patent - i.e., a patent that would be unique for
all the member states, and automatically cover the whole geographical area, like in the U.S..
They, however, started with the creation of a European patent that was to be granted by the
European Patent Office (EPO). The key characteristic of this system was that the granting
process was centralized and standardized at the EPO. Once granted, however, the patent had
to be effectively enforced in each member state of the EPC for which the applicant desired to
have patent protection. To achieve this protection, the applicant had to validate (i.e., pay the
validation fees) his or her patent at the national patent office of the respective state, pay the
translation costs if required, and pay the renewal fees each consecutive year for which
protection had to be maintained.
Since then the European Patent Convention (EPC) has enjoyed a constant increase in its
success, as witnessed by two key indicators. First, the number of patent applications at the
EPO has nearly continuously increased, from a few thousands in the early eighties to more
than 200,000 in 2006. Second, the number of member states has also been frequently
leveraged, to reach 322 in 2007. In each of these countries, the applicant would have to
undergo the process just described. Obviously, the post-grant European system is fragmented
and complex.
This complexity has triggered criticisms from the business sector and intense policy debates
across Europe. The bone of contention, for about 30 years, is related to the costs induced by
the geographical fragmentation – and hence the complexity - of the system. As clearly
illustrated by van Pottelsberghe and François (2006), the total costs composed of national
validation fees, national renewal fees, the frequent translations requirement, and the potential
enforcement or litigation issues must be multiplied by the number of countries in which
protection is sought. This fragmentation leads to a patent system that is much more expensive
than in the USA or Japan in both absolute and relative terms.3
1 On October 7, 1977, the EPC entered into force for Belgium, Germany, France, Luxembourg, Netherlands,
Switzerland and United Kingdom and on May 1, 1978 Sweden joined the EPC, see http://www.epo.org/about-us/epo/member-states.html#contracting (accessed on July 19, 2007).
2 See Annex A.1 for a summary of the current members of the EPC. 3 van Pottelsberghe and François (2006) argue that for a proper international comparison of costs, the market
size and the average number of claims of a patent must be taken into account. For instance, comparing

3
High costs and complexity are a burden perceived by firms and other types of applicants, who
regularly complain about it. At the same time, filing fees may be an appropriate instrument
for patent offices to deter marginal patent applications. Any attempt of deterring minor
applications would, however, depend on detailed knowledge as to how elastic the demand for
patent applications is with respect to patenting costs. As shown by Peeters and van
Pottelsberghe (2006) and Park (2003), there seems to be no causal relationship between firms’
perceptions of high patenting costs and their actual patenting behaviour. While some
empirical evidence has been provided on the negative impact of filing and examination fees at
national patent offices on patenting activity, there is so far no empirical evidence on the
impact of validation fees and early renewal fees on the validation behaviours adopted by
applicants.4
The broader objective of this paper is to provide a better understanding of the determinants of
validation behaviours adopted by applicants once their patent has been granted by the EPO.
We focus on the role which national validation fees, early renewal fees and translation costs
play in an applicant’s decision-making. Two specific research questions are investigated in
this respect. First, to what extent do post-grant fees vary across the member states of the EPC?
Second, do variations in these fees affect the validation behaviour of applicants? We hope that
our answers to these research questions will matter for policy makers for three distinct
reasons. First, the answers will provide additional insights into the effects of the
fragmentation of the European patent system in the post-grant stage. Second, they can be used
to effectively leverage patent fees to design a sound patent system. Third, as national patent
offices are the recipients of these validations, the econometric results may help them to
understand the factors that drive foreign applicants to seek or forego patent validation in their
jurisdiction.
The paper is structured as follows. The next section briefly describes the European patent
system and the grant process at the EPO. Section 3 presents the gravity model, traditionally
cumulated filing fees up to grant and translation costs for EP and US patent applications, they show that for an effective protection in 13 countries of the EPC, the cost per claim per capita is 10 times higher in Europe compared to the US.
4 de Rassenfosse and van Pottelsberghe (2007) provide empirical evidence suggesting that filing and examination fees at 29 EPC national patent offices substantially affect the number of priority filings in these offices. van Pottelsberghe and François (2006) display graphical evidence suggesting that cumulated filing, examination fees and translation costs do affect the number of applications (second filings and priority filings) at three large patent offices (EPO, USPTO and JPO).
4
used to explain international trade flows, it is used here to explain validation behaviours (or
patent flows) within the European patent system. The variables and data sources are described
in Section 4. Section 5 contains the empirical results and our interpretation, and section 6
concludes.
2 Grant and Validation Procedure
The European Patent Office (EPO) conducts the search, examination and grant procedures on
behalf of the 32 (as of March 2007) contracting states to the European Patent Convention
(EPC). An EP patent application must be filed in one of the official languages of the EPO,
i.e., English, German or French, the so called procedural languages.5 The European granting
procedure starts with a formality check, then a search report is drawn up containing all
documents, or prior art, which could impede the patentability of the invention or describe the
state of the art succinctly. The search report is generally published 18 months after the first
filing (priority date) of the patent. The objective of the substantive examination is to check
whether the invention meets the requirements of the EPC: novelty, inventive step, and
industrial applicability. In case of a successful examination, the European patent is granted,
often after some negotiation between examiner and applicant concerning the wording of
claims and other elements of the application.6
After grant, a European (EP) patent has to be converted into a national patent in each state for
which protection is desired, then having the same legal status as patents granted in the
respective national procedures.7 In general this validation process requires the filing of a
translation of the patent specification and the payment of national validation/publication fees
within a specified term.
5 Applicants from countries that do not have one of the EPO’s procedural languages as their official language
can file the EP patent application in their own language. However, a translation into one of the three official languages must be submitted within three months. See http://www.epo.org/patents/Grant-procedure/Filing-an-application.html (accessed on May 22, 2007).
6 In case the examination is not successful, the EPO refuses to grant the patent. The applicant has to keep a term of two months for filing an appeal against the decision of rejection. A large share, about 35%, of patent applications at the EPO are withdrawn by the applicants during the search and examination processes (Lazaridis / van Pottelsberghe, 2007).
7 See http://www.epo.org/patents/Grant-procedure/Filing-an-application/European-applications/national-validation.html (accessed on May 22, 2007).

5
According to Art. 65(1) EPC
"any contracting state can prescribe that if the text, in which the European Patent Office intends to grant a European patent or maintain a European patent as amended for that state, is not drawn up in one of its official languages, the applicant for or proprietor of the patent must supply to its central industrial property office a translation of this text in one of its official languages at his option or, where that state has prescribed the use of one specific official language, in that language".
However, for those member states having English, French or German as official language, no
validation is required for patents that have been granted in the official language of these
countries:
"… no action need to be taken by the patentee before the national patent authorities for the European patent to acquire that effect [the effect of a national patent validated in a contracting state], provided it was published by the EPO in a language prescribed by the state concerned pursuant to Article 65(1) EPC or the state does not require a translation of the patent specification" (National Law Relating to the EPC, p. 95).
From the third year after application, the applicant has to pay renewal fees. During the
examination procedure renewal fees are paid to the EPO, Art. 86 (1), (3) EPC states:
"Renewal fees shall be paid to the European Patent Office in accordance with the Implementing Regulations in respect of European patent applications. These fees shall be due in respect of the third year and each subsequent year, calculated from the date of filing of the application. ….. If the renewal fee and any additional fee have not been paid in due time the European patent application shall be deemed to be withdrawn".
After grant, national renewal fees have to be paid in those states where the patent had been
validated and is to be kept alive. In case the applicant fails to pay the renewal fees in due time,
the patent is no longer in force. Finally, a patent expires at the latest 20 years after its
application date.
6
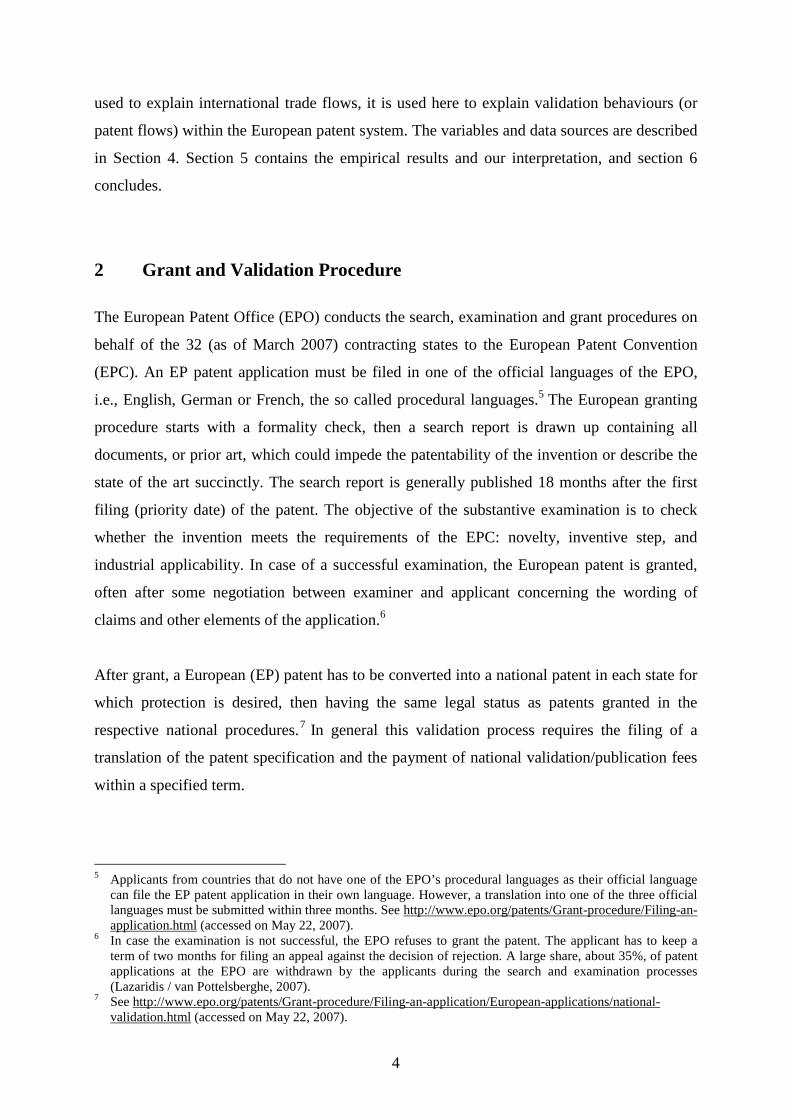
Figure 1: Application and renewal procedure at the EPO for patent applications directly
filed with the EPO The most important steps of the application and the validation procedure at the EPO, from the
decision to file a patent at the EPO until the effective validation of this patent in several
national patent offices, are summarized in Figure 1. The stages are intentionally simplified as
the routes to the EPO are actually diverse (first filings, second filings, PCT applications).8
The focus of our analysis is rather on the right-hand side of Figure 1. In particular, we try to
answer the following questions: In which countries are granted patents generally validated?
What are the broad factors that motivate this decision? And, in particular, is this choice also
motivated by fees or translation costs? The next section presents the empirical model that is
used to provide some answers to these questions.
3 The Gravity Model
The gravity model has become widely accepted in economics to predict bilateral trade flows
between two destinations (e.g., Tinbergen (1962); Geraci and Prewo (1977); and Abrams
(1980)) or to forecast migration and commuting between cities or countries (Karemera et al.,
8 See Stevnsborg and van Pottelsberghe (2007) for an in-depth description of filing procedures at the EPO.
0
Designation of EPC member
states (and extension
states)
years 1 3 4 5 6 9 8 7 2
application EPO publication
grant or refusal (mean grant lag: 4 years)
priority date
priority year
expiry after 20 years 1.5
from third year after application at
the EPO until grant: payment of renewal fees to the
EPO
validation procedure+
3 months*
* term to submit the application in one of the three official languages of the EPO. + translation (if required) and payment of the validation fee (if required).
…
Post-grant: - bundle of national patents - payment of the renewal fees to the national offices
7
2000). The model has been derived from the 'Law of Gravity'9 developed by Isaac Newton in
the 17th century. Generally, the log-linear equation quantifies different kinds of flows (most
frequently trade flows) from country A to country B. These flows can be explained by
economic forces of both countries (e.g., the GDP) and other factors supporting or impeding
these flows (e.g., the distance between the two countries).
Although the explanatory power of the gravity model has been recognized for long, scholars
have continuously worked on finding stronger theoretical foundations (e.g., Linnemann
(1966) and Bergstrand (1984)) as well as better econometric specifications (e.g., Matyas
(1998) and Egger (2002)). For instance, Egger (2000) proposes to use a panel regression
framework. Most notably, results show that the model can be improved by adding additional
explanatory variables to further increase the explanatory power of the specification
(Greenwood, 1975). A substantial step forward in the model specification was introduced by
Bergstrand (1985). The author argues that the assumption of perfect product substitutability
across countries does not hold. Therefore, to avoid a misspecification of the gravity model,
prices have to be included as additional explanatory variables, and the author finds indeed that
price terms derived from utility and production functions play a substantial role in explaining
international trade flows. Additionally, Bergstrand (1985: 480) argues that prices “lend
behavioral content to the gravity equation”, which may increase the explanatory power of the
model.
Relying on the gravity model to analyze international flows of patent applications is not new,
but neither is it frequent. Table 1 shows that existing research contributions arrive at
contradicting conclusions regarding the impact of patent fees and geographical distance.
Whereas Slama (1981) finds that the distance between source and destination country matters,
Eaton and Kortum (1996) and Eaton et al. (2004) detect only a slight elasticity of patent flows
with respect to distance. Furthermore, Eaton et al. (2004) show that filing and designation
fees10 do matter with respect to the designation decision of applicants, but Park (2003)
observes an inelastic demand of applicants with respect to filing fees11.
9 F = G*(m1*m2) / r
2, where F is the magnitude of the gravitational force effective between the two masses m1 and m2, which are separated by the distance r; G is the gravitational constant, see http://www.britannica.com/ eb/article-61465/gravitation (accessed on May 2nd, 2007).
10 Eaton et al. (2004) use EPO filing and designation fees for the years 1990 to 2000. 11 The study of Park (2003) includes filing fees for the destination countries. In particular, fees for EPO direct
filings and EPO filings via PCT as well as national filing fees for the U.S. and Japan are employed for the years 1980 to 2000.

8
Study Sample Countries Dependent variable
Explanatory variables
Research question
Main results
Slama (1981)
national patent application data (1967-1978)
27 countries (source countries = destination countries)
patent flows from source to destina-tion country
• GDP • population • distance • membership in
economic organizations (e.g., CMEA, EC, EFTA)
determinants of international patent application flows
• positive GDP-related elasticity
• negative distance related elasticity
Bosworth (1983)
UK patent data (1974)
1 source country (UK) destination countries excluding UK
patent flows from UK to destination countries
• GDP • exports • activities of
subsidiaries with UK parents
• differences on international patent laws
factors influencing the decision of firms to transfer technology across national borders
• positive GDP-related elasticity
• positive significant impact of foreign subsidiaries
• positive export related elasticity
Park (2003)
EPO patent application data (1986-1999)
30 source countries and 19 EPO destination countries
EP patent flows from source to destination country per source country worker
• GDP • distance • R&D stocks • IP index • patent filing
fees
extent and determinants of patenting at the EPO
• positive and significant impact of R&D stock and of the strength of patent protection
• demand for EP patents is inelastic to filing fees
Eaton et al. (2004)
EPO and WIPO patent data and simulated data (1991-2000)
3 source countries (EPO, JP and US) and 16 EPO destination countries
flow of patent applications across nations
• GDP • distance • filing costs
determinants of the decision to patent in a foreign country
• only slight distance related elasticity
• positive patent filing and designation fee related elasticity
• increasing designation propensity over time
Table 1: Summary of the literature relying on the gravity model to explain patent flows
An important drawback of the existing research using EP patent data is the fact that it focuses
on patent filing data, i.e. the authors model the designation decision rather than the validation
decision. As Eaton et al. (2004) themselves state, after June 30, 1999, as from the 8th
designated country, designation of each additional country is free of charge. Therefore, after
1999 most applicants designated the full set of EPC member states (Eaton et al., 2004).
However, van Pottelsberghe and van Zeebreock (2008) show that whereas the mean number
of EPC member states increased between 1980 and 2005, the number of validated states

9
remained rather stable. Consequently, using information on designated states might lead to
biased results with respect to patent flows, especially in the most recent past. Clearly, it is
preferable to use data on actual validations (or, equivalently, national patent publications
derived from an EPO patent grant).
From an economics perspective, it is plausible to assume that the patent protection strategies
adopted by firms are guided by expectations about the cost/benefit induced by a validation
and renewal in a country. In that context, the benefits could be expressed in terms of market
size and wealth, respectively measured by the population of a country and its GDP per capita.
The distance from the home market to the targeted market must be controlled for, as it may
have a negative impact. Long distances generally induce additional costs such as translation
costs and travel expenses. Long distances may also be responsible for higher transportation
costs for the goods the patent owner wants to export to the target country under patent
protection.12
In addition to these traditional factors and in the context of the European patent grant
procedure, government-imposed transaction costs might play an important role as well.
Similarly to Bergstrand (1985) for trade flows, we may assume that prices have to be
accounted for. More precisely, the validation and early renewal fees, and the translation
required by the EPC member states might considerably affect the geographical distribution of
patent families. Validation and renewal fees may in a theoretical sense be compared to custom
tariffs that bias trade flows.
In the following, a gravity model will be used to analyze the validation behavior of countries
within the geographical area of the EPC. In particular, the determinants of applicants'
validations across countries are to be examined. To do so, the following basic model (1) is to
be used:
12 Maskus and Penubarti (1995) provide an empirical insight into the impact of patent systems on trade flows.

10
where
PAB = flows of patent validations between country A and country B YA, YB = GDP per capita of countries A and B, respectively NA, NB = total population of countries A and B, respectively DAB = distance between country A and country B FB = Fees (validation or renewal) and translation requirements in country B
Similarly to Bergstrand (1985), we aim at accounting for relative prices. As explained in
section 2, three types of fees may be imposed by national patent offices regarding the
validation of patents granted by the EPO: validation fees, renewal fees and translation costs.
These three types of costs are incurred to various extents across the EPC member states.
4 Empirical Implementation and Descriptive Statistics
The empirical analysis relies on patents that were granted by the EPO in the years 1995, 1999,
and 2003 and that were validated in at least one EPC member state. Patent applications that
have not yet or have not at all been granted and granted patents, which had not been validated
in any of the EPC member states, were excluded from the dataset. Overall, the sample
contains 130,018 patents granted by the EPO and validated in one of the EPC countries. The
overall sample was divided into three sub-samples according to the grant year. In particular,
54,429 (40.9%) patents were granted in 2003, 36,271 (27.3%) patents were granted in 1999,
and 42,318 (31.8%) patents were granted in 1995.
The patent data was extracted from different data sources. The EPASYS database as of
January 15, 2006 provided filing and grant dates, the country of origin of the applicants, the
language of the official proceedings at the EPO, and the technical classification of the patent
application (IPC classes). To construct the validation variable, data on the laps of patents as
well as information about renewals were needed. Data on the lapse of patents were extracted
from the EPASYS database as of December 2006 and data on renewal payments were
received from the EPO post grant system as of December 2006.
)1(lnlnlnlnlnlnln 6543210 εβββββββ +⋅+⋅+⋅+⋅+⋅+⋅+= BABBABAAB FDNNYYP

11
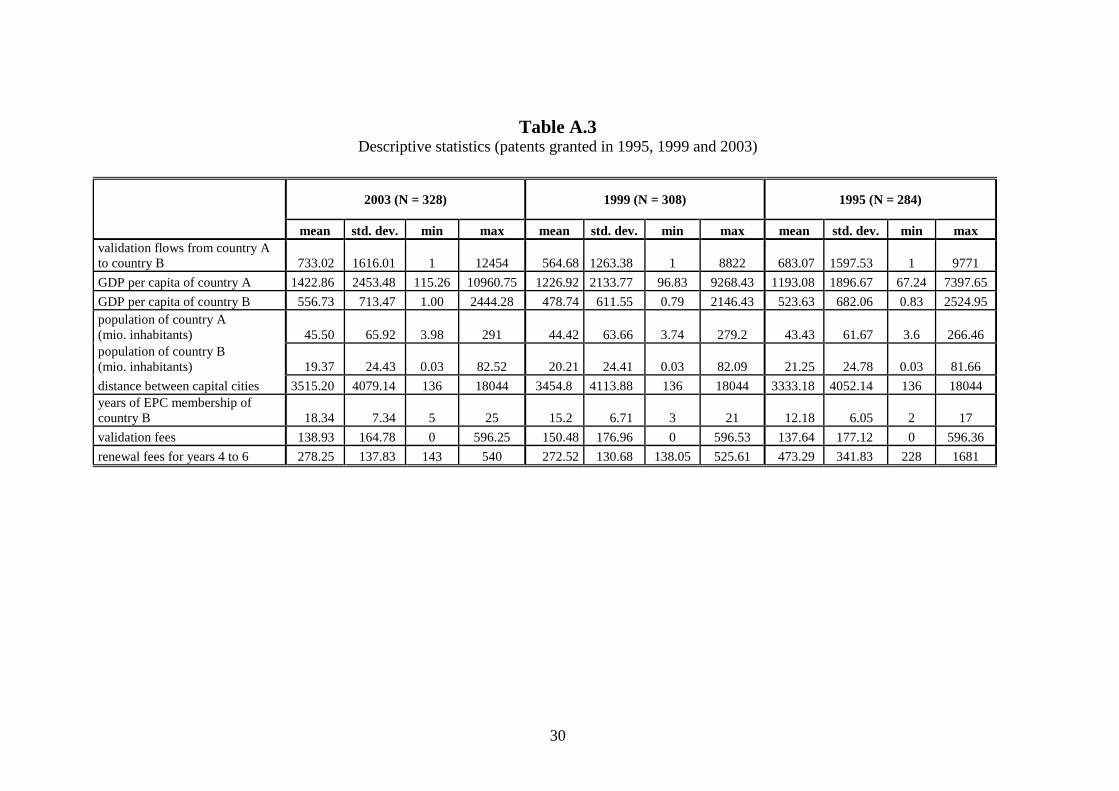
Table A.3 in the appendix presents selected descriptive statistics of the dependent and
independent variables described here after.
Patent validation flows – This variable is defined as the volume of patent validation flows
between pairs of applicant13 (= source) and validation14 (= destination) countries. Applicant
countries include non-EPC states such as the USA, Israel, Japan and Korea. In particular, the
number of patents granted in country A that were validated in country B represent the patent
validation flow of the country pair AB. Country pairs for which the applicant country is
concordant with the validation country were dropped from the dataset, since gravity models
explain flows across countries and not within countries. To construct this variable, a number
of assumptions had to be made15: (i) it is assumed that if renewal fees had been paid for a
particular patent in a contracting state, the patent had been initially validated in that particular
country; (ii) that if a patent lapses in a certain country, this means that the patent had been
validated in this country. Whenever patents lapsed within 365 days after grant, the patent was
removed from the dataset, since these patents have to be considered as lapsed ab initio. This
means that these patents were actually never validated in the respective country. Following
the advice of an EPO expert, information on patent lapses were preferred over renewal
information, in case both databases contained conflicting results (this occurred in only 0.66%
of the cases).
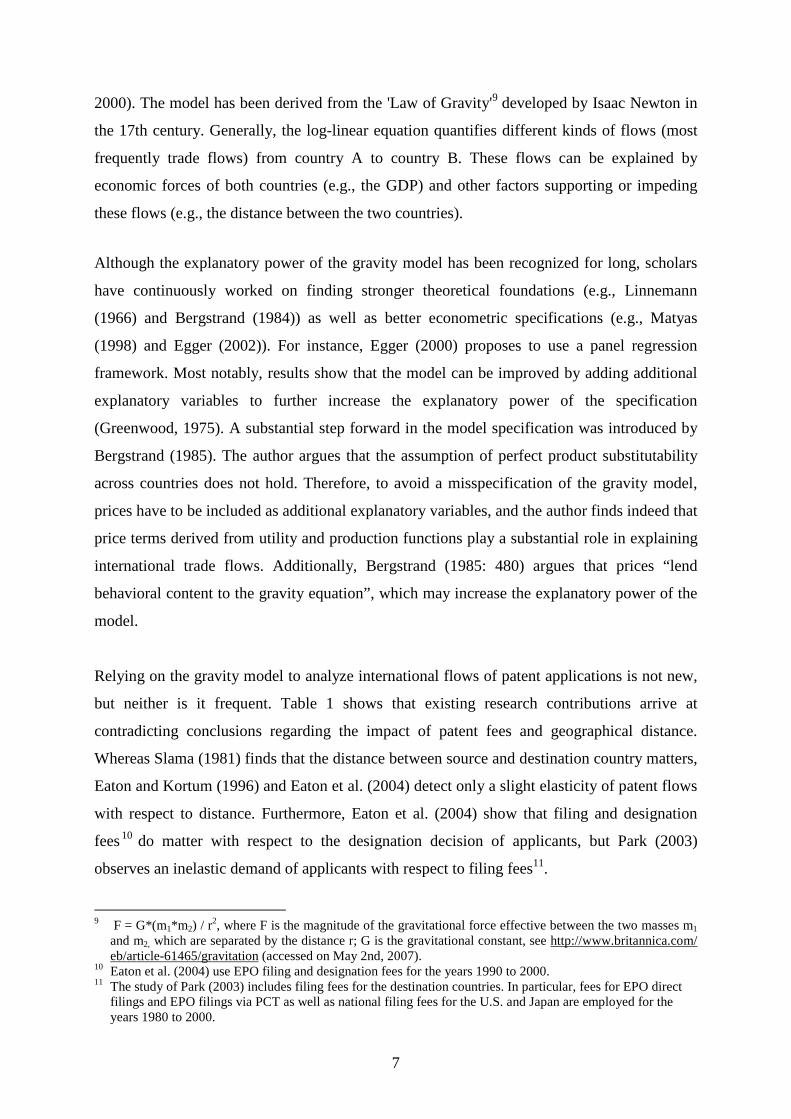
Figure 2 shows the share of EPO granted patents that were validated in each EPC contracting
states in 1995 and 2003. In 2003, 95% of all patents granted by the EPO were validated in
Germany (DE), 80% were validated in France (FR), and 75% in the United Kingdom (UK).
Generally, smaller countries seem to be less attractive (i.e., the share of patents validated is
smaller than 40%). Furthermore, different trends can be observed, which may be related to the
age of membership in the EPC. The early members (e.g., The Netherlands (NL), Spain (ES),
Belgium (BE), Switzerland (CH), Luxembourg (LU), and Austria (AT)) and especially the
13 Applicant countries: Austria (AT), Australia (AU), Belgium (BE), Canada (CA), Switzerland (CH), Germany
(DE), Denmark (DK), Spain (ES), Finland (FI), France (FR), United Kingdom (UK), Ireland (IE), Israel (IL), Italy (IT), Japan (JP), Korea (KR), The Netherlands (NL), Norway (NO), Sweden (SE), USA (US) (selection criteria: minimum of 100 patents granted in the three years under consideration, i.e. 1995, 1999 and 2003).
14 Validated countries: Austria (AT), Belgium (BE), Switzerland (CH), Cyprus (CY), Germany (DE), Denmark (DK), Spain (ES), Finland (FI), France (FR), United Kingdom (UK), Greece (GR), Ireland (IE), Luxembourg (LU), Monaco (MC), The Netherlands (NL), Portugal (PT), and Sweden (SE) (IT was excluded due to lack of validation data).
15 These assumptions are similar to those made in van Pottelsberghe and van Zeebroeck (2008) to analyse the evolution of geographical scope and length of renewals of the patents granted by the EPO.

12
United Kingdom (UK), show a downward trend in the share of patents validated in these
countries between 1995 and 2003. On the other hand, the more recent EPC member states like
Portugal (PT), Ireland (IE) or Finland (FI) have become more attractive over time. However,
as the growth in the number of EPO granted patents has been considerable over the past 20
years, the absolute number of validations per country also has increased over time.
Figure 2: Share of granted EP patents validated in EPC contracting states (by grant
year),
Table A.3 in the appendix shows that the average number of patent validation flows between
applicant and validation countries amounts to 733, ranging from 1 to 12,454. The average
number of patent flows is lower in 1995 (683) and the lowest in 1999 (565). These differences
arise due to the variation in the number of patents in the three sub-samples.
GDP per capita and population - Yearly data on the GDP in current prices (US dollars in
billions) and the population of the different countries in million persons was obtained from
the World Economic Outlook Database as of September 2006, which is made available by the
International Monetary Fund.16 Since Monaco was missing in this database, data from the
United Nations Statistics Division17 were also used. The estimates for Monaco were prepared
based on the assumption that the level of GDP per capita is proportional to that of France. The
GDP per capita is taken as a proxy for the wealth of a country. The population variable is
used as a proxy for the size of a country. 16 See http://www.imf.org/external/pubs/ft/weo/2006/02/data/index.aspx (accessed on April 5, 2007). 17 See http://unstats.un.org/unsd/snaama/dnllist.asp (accessed on April 5, 2007).
0.0
0.1
0.2
0.3
0.4
0.5
0.6
0.7
0.8
0.9
1.0
DE FR UK NL ES SE CH BE AT DK GR LU IE MC PT FI CY
countries
shar
e of
pat
ents
val
idat
ed
1995 2003

13
Whereas the applicant countries exhibit on average 45.5 million inhabitants, the validation
countries possess less than half as many inhabitants, i.e., their average population amounts to
19.4 million inhabitants. The difference can be explained by the fact that applicants from
large non-EU countries, e.g., the USA, Japan or Australia can apply for a patent, but cannot
be targeted for validation. However, the population does not differ much between the three
sub-samples. A slight decrease in 2003 is due to the entry of two small countries, i.e. Cyprus
(entry in 1998) and Finland (entry in 1996), into the EPC. In 2003, the average GDP per
capita of the countries A (applicant countries) amounts to 1,422.86 billion US dollars. The
mean GDP per capita of the countries B (validation countries) is much smaller and amounts to
556.73 billion US dollars. In 1995 and 1999, the mean GDP per capita is almost constant
(Table A.3).
Distance between capital cities - The distance between the two capital cities in kilometers is
provided by Kristian Skrede Gleditsch, Department of Government, University of Essex.18
Overall, the distance between the two countries amounts to on average 3515 kilometres
(Table A.3).
EPC membership duration - The average number of years of EPC membership of the
validation countries (countries B) amounts to 18.3, ranging between 5 and 25 years.19 This
variable is used to test whether the age of membership would reflect a learning by doing
practice. As the transfer rate of domestic priority filings to the EPO increases with the
duration of membership to the EPC (de Rassenfosse and van Pottelsberghe, 2007), one may
expect that this duration also affects the geographical scope targeted by firms.
Languages - Information on official and spoken languages of European countries was
provided on the webpage of the "Nations Online Project".20 The language dummy takes the
value one, if a pair of countries shares a common language and zero, otherwise.
Validation fee – The variable contains the fee a patent holder has to pay in a country to
validate a patent granted by the EPO.21 Validation fees differ considerably across countries.
18 See http://privatewww.essex.ac.uk/~ksg/capdist.html (accessed on March 30, 2007). 19 For the entry of the member countries into the EPC see Table A.1 in the appendix. 20 See http://www.nationsonline.org/oneworld/european_languages.htm (accessed on March 30, 2007).
14
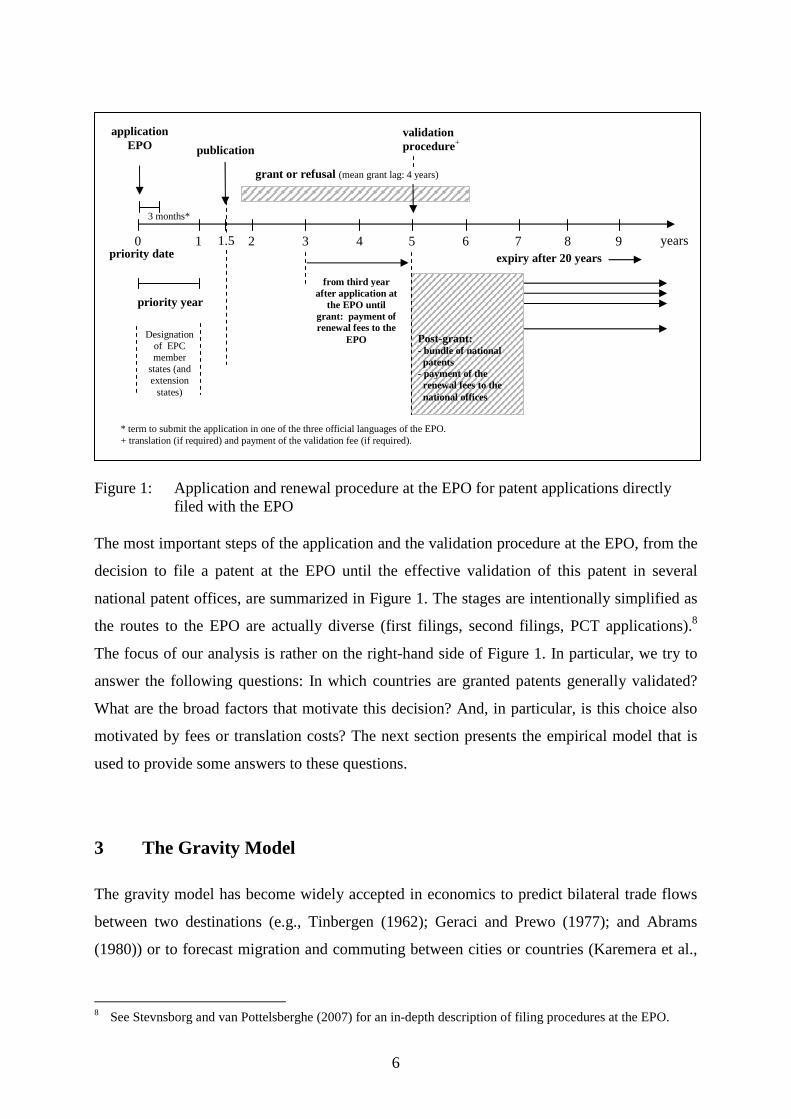
Most of the countries charge a fixed fee. Belgium (BE), Switzerland (CH), Luxembourg
(LU), Monaco (MC), and the UK do not charge validation fees. Austria (AT), Finland (FI),
Sweden (SE), Denmark (DK), and Spain (ES) charge an additional page-based fee for patents
exceeding a certain number of pages (see Table A.2 in the appendix). For these countries, the
average number of pages per patent was used to compute the total validation fees. 22 The
average number of pages per patent for EPO applications in 2000 and 2001 was provided by
the EPO.23 Overall, validation fees were calculated according to formula (2):
)2(SFFF PB
FB
VB ⋅+=
where VBF denotes the validation fee for destination country B and F
BF the fixed validation
fee for country B. PBF refers to the page-based fee if charged by country B, otherwise P
BF is
zero. Finally, S denotes the average number of pages per specification. The value of S was
set to the actual mean number of 21.24 pages per patent.
Figure 3: Validation fee per country and per year in Euro24 (2003)
21 Information on validation fees was extracted from the Official Journal and the National Law Relating to the
EPC. 22 Page-based fee in 2003: FI: € 10 p.p. in excess of 4 pages; DK: € 10.80 p.p. in excess of 35 pages; AT: € 25
p.p. in excess of 5 pages; ES: € 10 p.p. in excess of 22 pages; SE: € 16.86 p.p. in excess of 8 pages. 23 Since the number of pages per specification was only available on applicant country basis and not – as
required – on validation country basis, the mean number of pages per specification over the full set of applicant countries was used to calculate the page based fee.
24 Exchange rates were obtained from the following internal EPO documents: CA/D 1/03, CA/D 1/99, CA/D 1/95.
0
100
200
300
400
500
600
BE LU MC CH UK NL FR IE FI CY PT AT SE DK DE ES GR
countries of validation
vali
dati
on f
ee
2003 fixed fee 2003 fee per page

15
As described before, according to National Law Relating to the EPC (p. 95) in case a patent is
granted in one of the official languages of the country in which the patent should be validated
no validation action is required, i.e. no validation fee has to be paid. Therefore, information
about the procedural language was used to correct the validation fee variable for these cases.
The average validation fee for patents granted in 2003 amounts to 135 Euro; ranging between
0 and 596 Euro (Table A.3). Figure 3 displays validation fees by country in 2003.
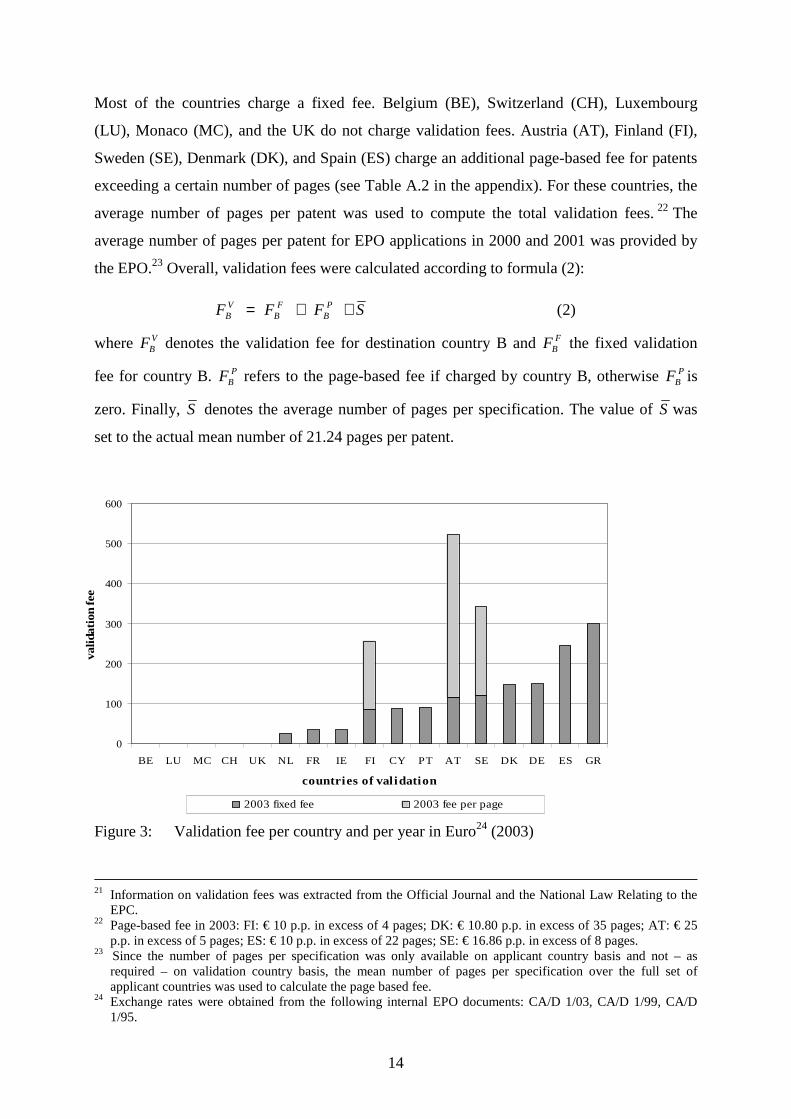
Renewal fees – Cumulative national renewal fees for the years 4 to 6 from the date of filing
of the application at the EPO are used. The patent years 4 to 6 were chosen because it seems
logical to assume that the fees that are requested during the first years after grant matter most
for the decision to validate a patent in a particular country. According to Harhoff and Wagner
(2006) the average grant lag at the EPO has been 4 years.
The renewal fees for the years 4 to 6 amount on average to 278 Euro, ranging between 143
Euro and 540 Euro. Interestingly, the mean and maximum renewal fee for 1995 is almost
twice as high as for the other two years (Table A.3). The difference occurs, since - after 1995
- Switzerland (CH) and The Netherlands (NL) abolished renewal fees of the 4th year.
Additionally, Finland (FI) and Germany (DE) reduced their yearly renewal fees after 1995.
Figure 4: Renewal fee by country in 2003 in Euro for the years 4 to 6 from the EP
application date (see table A.2 in the appendix)
0
100
200
300
400
500
600
LU ES MC PT GR UK BE FR CY DE SE AT IE FI DK NL CH
countries of validation
rene
wal
fees
(yea
rs 4
to 6
)
4th 5th 6th

16
Figure 4 provides the renewal fees for patents granted in 2003, for each EPC member state.
Interestingly, United Kingdom, The Netherlands and Switzerland do not charge a renewal fee
before the 5th year from the EP application date. However, the latter two countries charge
very high renewal fees for the 5th and the 6th year. Therefore, when comparing the total
amounts to be paid for the three years, The Netherlands and Switzerland actually request the
highest renewal fees.
Translation costs - The validated countries are classified in three cost groups according to
the level of costs of translation incurred by the patent holder. In general, translations into
Nordic languages are more expensive than translations into languages spoken in central or
Southern Europe. Therefore, the dummy variable "low translation costs" takes the value 1 for
Spain (ES), Greece (GR), Portugal (PT), and the Netherlands (NL). The dummy "high
translation costs" takes the value 1 if the country of validation is Sweden (SE), Denmark
(DK), or Finland (FI). The third dummy variable "no translation required"25 takes the value 1
if the validated country is Germany (DE), France (FR), United Kingdom (UK), Austria (AT),
Switzerland (CH), Belgium (BE), Ireland (IE), Monaco (MC), or Luxembourg (LU). For
Cyprus (CY) no translation is required as well, since patents have always been validated
simultaneously in Greece (GR), and the two countries share a common language (see Table
A.2 in the appendix).
Figure 5 provides the average costs (validation fees and costs plus renewal fees) to be paid to
validate a patent in a particular contracting state to the EPC and to keep it in force for the
years 4 to 6 from the filing date at the EPO. Costs were sorted by translation cost groups.
Austria appears to be the most expensive with respect to the validation and the renewal fee.
Taking all three cost categories into account, the Nordic countries (Denmark, Sweden and
Finland) are probably the most expensive due to high translation costs.
25 The translation cost dummies were only factored into a specification using a reduced sample (Table 4). In
particular, only patents were considered that were validated simultaneously in Germany, France and United Kingdom. This restriction was necessary, since otherwise the analysis at the country level prevented from taking common languages into account. EP patent applications have to be filed in one of the official languages of the EPO, i.e., English, German or French. To validate a patent in a particular country, the specification has to be translated into the official language of this country. For validation countries that have the language of the official proceedings as their official language(s), no translation is required.

17
Figure 5: Average costs (validation fees and renewal fees) to be paid to validate a patent in a particular member state of the EPC and to keep it in force for the years 4 to 6
(patents granted in 2003), costs sorted by translation cost groups.
The first research question that motivated the present analysis was to assess whether
validation costs (composed of validation fees, renewal fees, and translation costs) vary
substantially across countries. Figure 5 all too amply demonstrates that there is indeed a
strong heterogeneity across countries. Nordic countries seem to be the least attractive
countries for validation if only fees and translation costs are considered. However, Figure 2
suggests that this is far from being the case, which means that other factors may also play a
role, for example, the size of a country and its wealth. This calls for a multivariate analysis,
which is presented in the next section.
5 Empirical results
The 2003 sub-sample provides the basis of the estimates of our first gravity model.
Subsequently, for the grant years 1999 and 1995, separate gravity models will be provided for
comparison purposes and in order to test the stability of the parameters. The sub-sample 2003
is composed of 328 country pairs, the sub-sample 1999 is composed of 308 country pairs,
0
100
200
300
400
500
600
700
800
900
LU MC UK BE FR CY IE DE CH AT PT ES GR NL DK SE FI
countries of val idation
aver
age
cost
s
renewal fee validation fee
no translation needed / low translation costs
medium translation costs
high trans-lation costs
0
100
200
300
400
500
600
700
800
900
LU MC UK BE FR CY IE DE CH AT PT ES GR NL DK SE FI
countries of val idation
aver
age
cost
s
renewal fee validation fee
no translation needed / low translation costs
medium translation costs
high trans-lation costs
18
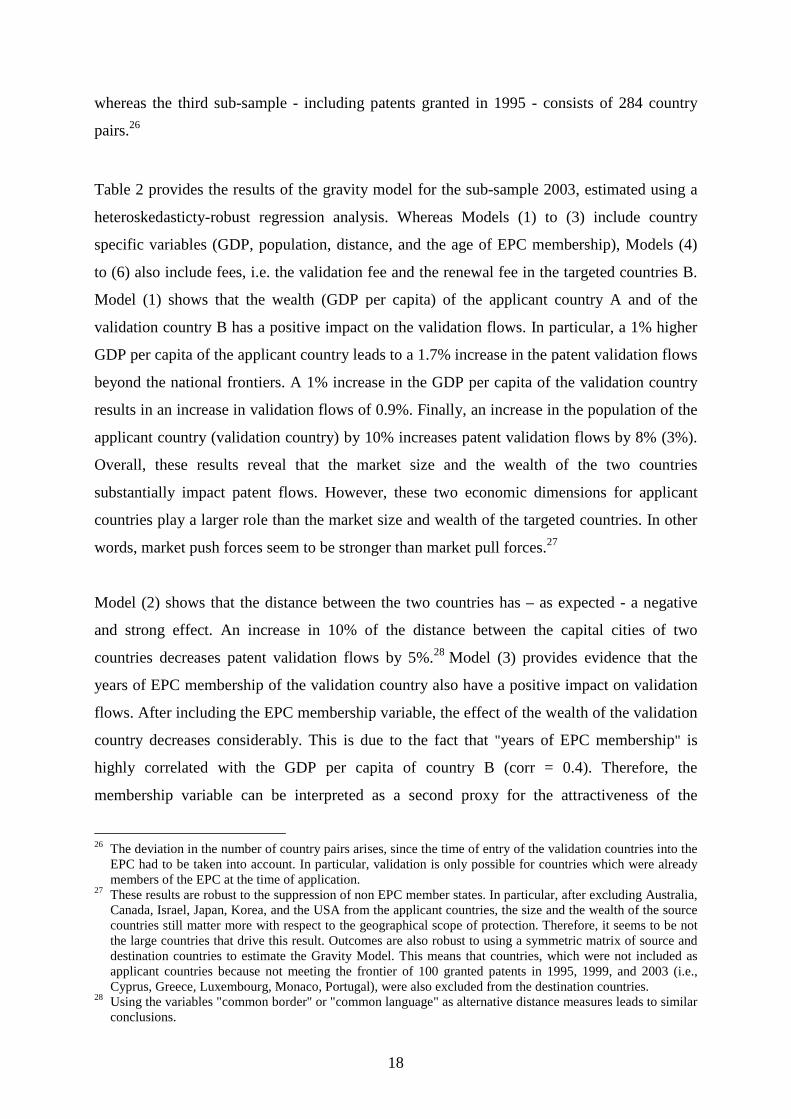
whereas the third sub-sample - including patents granted in 1995 - consists of 284 country
pairs.26
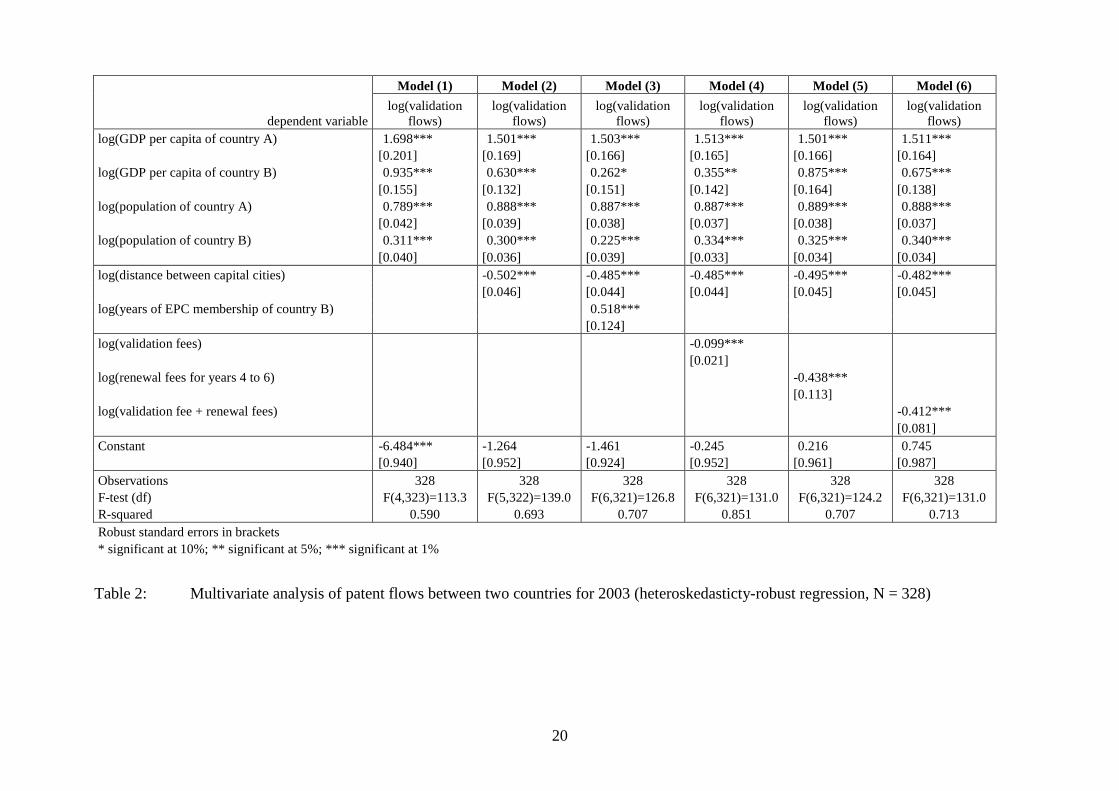
Table 2 provides the results of the gravity model for the sub-sample 2003, estimated using a
heteroskedasticty-robust regression analysis. Whereas Models (1) to (3) include country
specific variables (GDP, population, distance, and the age of EPC membership), Models (4)
to (6) also include fees, i.e. the validation fee and the renewal fee in the targeted countries B.
Model (1) shows that the wealth (GDP per capita) of the applicant country A and of the
validation country B has a positive impact on the validation flows. In particular, a 1% higher
GDP per capita of the applicant country leads to a 1.7% increase in the patent validation flows
beyond the national frontiers. A 1% increase in the GDP per capita of the validation country
results in an increase in validation flows of 0.9%. Finally, an increase in the population of the
applicant country (validation country) by 10% increases patent validation flows by 8% (3%).
Overall, these results reveal that the market size and the wealth of the two countries
substantially impact patent flows. However, these two economic dimensions for applicant
countries play a larger role than the market size and wealth of the targeted countries. In other
words, market push forces seem to be stronger than market pull forces.27
Model (2) shows that the distance between the two countries has – as expected - a negative
and strong effect. An increase in 10% of the distance between the capital cities of two
countries decreases patent validation flows by 5%.28 Model (3) provides evidence that the
years of EPC membership of the validation country also have a positive impact on validation
flows. After including the EPC membership variable, the effect of the wealth of the validation
country decreases considerably. This is due to the fact that "years of EPC membership" is
highly correlated with the GDP per capita of country B (corr = 0.4). Therefore, the
membership variable can be interpreted as a second proxy for the attractiveness of the
26 The deviation in the number of country pairs arises, since the time of entry of the validation countries into the
EPC had to be taken into account. In particular, validation is only possible for countries which were already members of the EPC at the time of application.
27 These results are robust to the suppression of non EPC member states. In particular, after excluding Australia, Canada, Israel, Japan, Korea, and the USA from the applicant countries, the size and the wealth of the source countries still matter more with respect to the geographical scope of protection. Therefore, it seems to be not the large countries that drive this result. Outcomes are also robust to using a symmetric matrix of source and destination countries to estimate the Gravity Model. This means that countries, which were not included as applicant countries because not meeting the frontier of 100 granted patents in 1995, 1999, and 2003 (i.e., Cyprus, Greece, Luxembourg, Monaco, Portugal), were also excluded from the destination countries.
28 Using the variables "common border" or "common language" as alternative distance measures leads to similar conclusions.
19
validation country. After all, those countries most interested in granting their own firms
simple and low-cost access to patent protection in major European export economies would
have been most interested to join the EPC early. Indeed, Germany, France, UK, Switzerland,
Belgium, and the Netherlands were the first countries to become members of the EPC in
1977. Models (4) to (6) confirm that fees do influence the validation behavior of applicants.
In particular, fees have a negative and significant impact on the geographical scope chosen by
the applicants. The validation fee elasticity amounts to -0.1 (Model 4), the renewal fee
elasticity amounts to -0.4 (Model 5). Results stay robust if the sum of both fees is factored
into the regression (Model 6).
Table 3 contains separate results for the three sampling periods. Model (1) refers to grant year
1995, Model (2) to grant year 1999, and Model (3) summarizes the results with respect to
grant year 2003. As already mentioned the deviation in the number of observations is due to a
later entry of certain countries into the EPC. To test whether differences in the results
disappear after excluding the later entrants from the sample, Models (2b) and (3b) estimate
the effects of the explanatory variables only for those country pairs available in 1995.
Comparing the results of the full sub-samples (Models (2a) and (3a)) with the reduced sub-
samples reveals that excluding later entrants leads to similar coefficients of the explanatory
variables. An exception is the variable measuring GDP per capita of the validation country in
2003. The coefficient decreases by 50% after excluding the new entrants, i.e., Finland and
Cyprus. Moreover, the negative impact of fee variable of the 1999 sub-sample becomes larger
and more significant after including the new entrants (the impact of fees increases by 40%).
20
Model (1) Model (2) Model (3) Model (4) Model (5) Model (6)
dependent variable log(validation
flows) log(validation
flows) log(validation
flows) log(validation
flows) log(validation
flows) log(validation
flows) log(GDP per capita of country A) 1.698*** 1.501*** 1.503*** 1.513*** 1.501*** 1.511*** [0.201] [0.169] [0.166] [0.165] [0.166] [0.164] log(GDP per capita of country B) 0.935*** 0.630*** 0.262* 0.355** 0.875*** 0.675*** [0.155] [0.132] [0.151] [0.142] [0.164] [0.138] log(population of country A) 0.789*** 0.888*** 0.887*** 0.887*** 0.889*** 0.888*** [0.042] [0.039] [0.038] [0.037] [0.038] [0.037] log(population of country B) 0.311*** 0.300*** 0.225*** 0.334*** 0.325*** 0.340*** [0.040] [0.036] [0.039] [0.033] [0.034] [0.034] log(distance between capital cities) -0.502*** -0.485*** -0.485*** -0.495*** -0.482*** [0.046] [0.044] [0.044] [0.045] [0.045] log(years of EPC membership of country B) 0.518*** [0.124] log(validation fees) -0.099*** [0.021] log(renewal fees for years 4 to 6) -0.438*** [0.113] log(validation fee + renewal fees) -0.412*** [0.081] Constant -6.484*** -1.264 -1.461 -0.245 0.216 0.745 [0.940] [0.952] [0.924] [0.952] [0.961] [0.987] Observations 328 328 328 328 328 328 F-test (df) F(4,323)=113.3 F(5,322)=139.0 F(6,321)=126.8 F(6,321)=131.0 F(6,321)=124.2 F(6,321)=131.0 R-squared 0.590 0.693 0.707 0.851 0.707 0.713 Robust standard errors in brackets * significant at 10%; ** significant at 5%; *** significant at 1%
Table 2: Multivariate analysis of patent flows between two countries for 2003 (heteroskedasticty-robust regression, N = 328)

21
Model (1) Model (2a) Model (2b) Model (3a) Model (3b) 1995 1999 1999 2003 2003
dependent variable log(validation
flows) log(validation
flows) log(validation
flows) log(validation
flows) log(validation
flows) log(GDP per capita of country A) 2.507*** 2.287*** 2.300*** 1.511*** 1.429*** [0.200] [0.184] [0.171] [0.164] [0.164] log(GDP per capita of country B) 1.263*** 0.497*** 0.514*** 0.675*** 0.327** [0.133] [0.107] [0.107] [0.138] [0.147] log(population of country A) 0.969*** 0.892*** 0.893*** 0.888*** 0.896*** [0.042] [0.039] [0.034] [0.037] [0.037] log(population of country B) 0.471*** 0.317*** 0.302*** 0.340*** 0.288*** [0.028] [0.026] [0.025] [0.034] [0.033] log(distance between capital cities) -0.446*** -0.458*** -0.428*** -0.482*** -0.446*** [0.053] [0.042] [0.038] [0.045] [0.043] log(validation fee + renewal fees) -0.215** -0.521*** -0.315*** -0.412*** -0.377*** [0.098] [0.081] [0.069] [0.081] [0.085] Constant -6.494*** -0.796 -2.209** 0.745 1.870* [1.103] [0.987] [0.892] [0.987] [0.964] Observations 283 308 283 328 283
F-test (df) F(6,276)=
169.4 F(6,301)=
146.2 F(6,276)=
192.0 F(6,321)=
131.0 F(6,276)=
127.8 R-squared 0.792 0.770 0.810 0.713 0.703 Robust standard errors in brackets / * significant at 10%; ** significant at 5%; *** significant at 1% Table 3: Multivariate analysis of patent flows between two countries for 1995, 1999,
and 2003 (heteroskedasticty-robust regression)
Overall, our results show that the wealth of the two countries becomes less important over
time. This effect occurs despite of the fact that the difference in wealth of the countries,
included in the analysis, does not dissipate over time. Patent protection appears to have
become more important even in the less wealthy countries. Given the global impact of TRIPS,
this is not completely surprising. The effect of the size of the two countries as well as the
distance between the capital cities stays rather constant over time. Conversely, the impact of
fees (sum of validation and renewal fee) becomes increasingly important over time. A
possible explanation for this outcome is that due to an increasing number of member states,
applicants have to choose among an increasing number of validation countries. Given that the
applicants may not have more resources at their disposal (most firms have relatively inelastic
budgets for patent filing), they may face an increasingly difficult trade-off over time. It is
consistent with this view that the cost elasticity has increased over time.

22
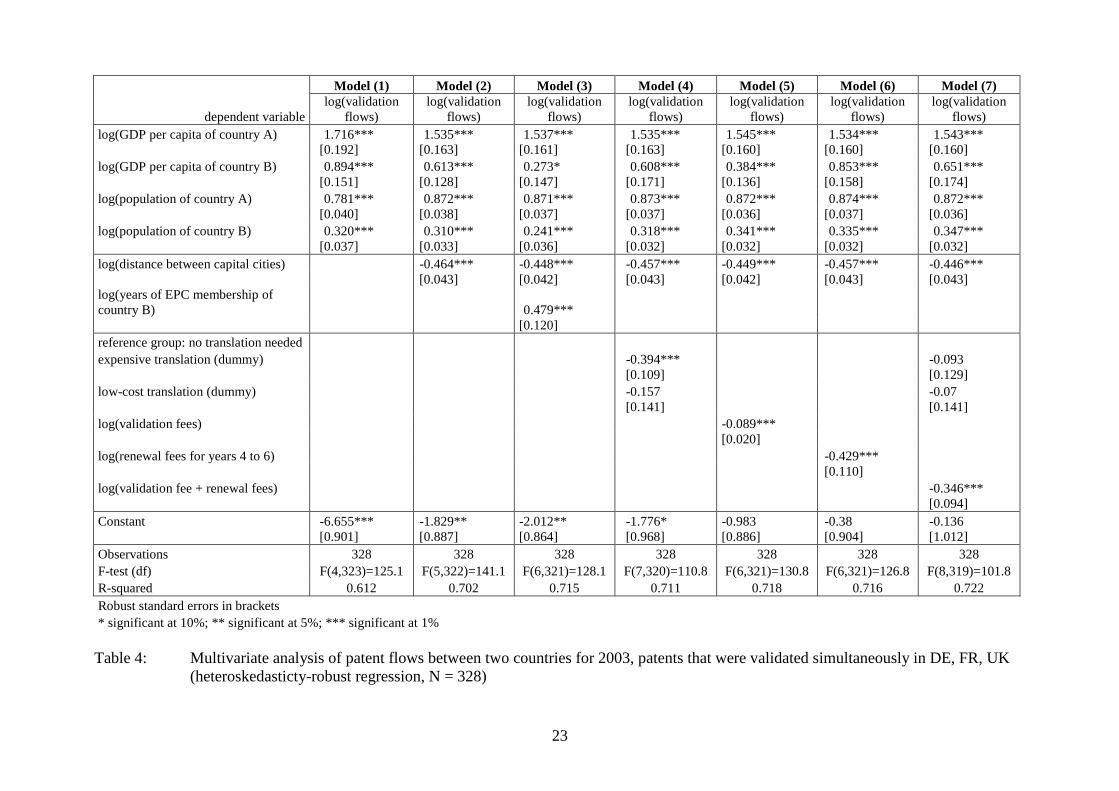
Table 4 provides results of OLS regressions, also taking translation costs into account. To
avoid biased results, only patents were considered that had been validated in Germany, France
and the United Kingdom. This leads to a reduction of the overall sample from 130,018 patents
to 91,515 patents. This restriction had to be made since estimating the determinants of the
validation behaviour at the country level prevents us from taking common languages into
account. EP patent applications have to be filed in one of the official languages of the EPO,
i.e., English, German or French. To validate a patent, the specification has to be translated
into the official language of the validation country. In case, the official language of the
validation country is concordant with one of the three official languages at the EPO, no
translation is required. Assume, for instance, that the EP application was filed in German.
Consequently, no translation would be required to validate the granted patent in Germany,
Austria, and Switzerland. By using only patents validated in Germany, France and United
Kingdom, we assumed that translations into the three languages German, French, and English
had already been available. Therefore, translation costs for all German, English, or French
speaking countries could be set to zero. It is evident from these comments that the variability
of our translation cost variable is somewhat limited and that one should not expect very
precise estimates of the respective coefficients, given the measurement error problems.
Comparing the outcomes of Table 4 with those using the full sub-sample 2003 (Table 2)
reveals that the results do not change with respect to the size and the sign of the coefficients
or their significance. Validation and renewal fees still have a negative impact on the
validation behaviour (Models 5 to 7). The “high-cost translation” dummy is associated with a
negative and significant parameter when alone included in the model. The “low-cost
translation” dummy is also negative but is not significant at the 10% level. The significant
effect of “expensive translations” however disappears after including validation and renewal
fees in the regression (Model 7). The lack of significance of the translation cost dummies in
Model (7) may be caused by the fact that it is not possible to include actual translation costs
for the different EPC member states, since translation costs vary considerably across different
translation bureaus or law firms. Thus, our results provide first empirical evidence of an
impact of translation costs. However, additional evidence is needed, possibly at the patent
level, to obtain a more precise assessment of their impact.
23
Model (1) Model (2) Model (3) Model (4) Model (5) Model (6) Model (7)
dependent variable log(validation
flows) log(validation
flows) log(validation
flows) log(validation
flows) log(validation
flows) log(validation
flows) log(validation
flows) log(GDP per capita of country A) 1.716*** 1.535*** 1.537*** 1.535*** 1.545*** 1.534*** 1.543*** [0.192] [0.163] [0.161] [0.163] [0.160] [0.160] [0.160] log(GDP per capita of country B) 0.894*** 0.613*** 0.273* 0.608*** 0.384*** 0.853*** 0.651*** [0.151] [0.128] [0.147] [0.171] [0.136] [0.158] [0.174] log(population of country A) 0.781*** 0.872*** 0.871*** 0.873*** 0.872*** 0.874*** 0.872*** [0.040] [0.038] [0.037] [0.037] [0.036] [0.037] [0.036] log(population of country B) 0.320*** 0.310*** 0.241*** 0.318*** 0.341*** 0.335*** 0.347*** [0.037] [0.033] [0.036] [0.032] [0.032] [0.032] [0.032] log(distance between capital cities) -0.464*** -0.448*** -0.457*** -0.449*** -0.457*** -0.446*** [0.043] [0.042] [0.043] [0.042] [0.043] [0.043] log(years of EPC membership of country B) 0.479*** [0.120] reference group: no translation needed expensive translation (dummy) -0.394*** -0.093 [0.109] [0.129] low-cost translation (dummy) -0.157 -0.07 [0.141] [0.141] log(validation fees) -0.089*** [0.020] log(renewal fees for years 4 to 6) -0.429*** [0.110] log(validation fee + renewal fees) -0.346*** [0.094] Constant -6.655*** -1.829** -2.012** -1.776* -0.983 -0.38 -0.136 [0.901] [0.887] [0.864] [0.968] [0.886] [0.904] [1.012] Observations 328 328 328 328 328 328 328 F-test (df) F(4,323)=125.1 F(5,322)=141.1 F(6,321)=128.1 F(7,320)=110.8 F(6,321)=130.8 F(6,321)=126.8 F(8,319)=101.8 R-squared 0.612 0.702 0.715 0.711 0.718 0.716 0.722 Robust standard errors in brackets * significant at 10%; ** significant at 5%; *** significant at 1% Table 4: Multivariate analysis of patent flows between two countries for 2003, patents that were validated simultaneously in DE, FR, UK
(heteroskedasticty-robust regression, N = 328)
24
6 Concluding Remarks
The objective of this paper was twofold. First, it was to assess to what extent validation fees,
renewal fees and translation costs vary across the EPC member states. Second, it was to
evaluate whether these fees/cost do affect the validation behaviour of applicants once the
patent is granted by the EPO.
The statistical analysis clearly indicates that validation fees, early renewal fees (years 4 to 6)
and translation costs substantially vary across countries. Nordic countries, the Netherlands,
Switzerland and Austria have the highest combinations of fees/cost within the EPC
boundaries.
The quantitative analysis provided interesting results as well. First, the major factors affecting
the validation behavior of countries are the size (number of inhabitants) and the wealth (GDP
per capita) of both the applicant countries and the targeted countries. However, it clearly
appears that the size and wealth of the applicant country play a more important role than the
economic characteristics of the targeted countries. Additionally, distance and the age of EPC
membership of the destination country are important factors that need to be controlled for to
understand the patent flows within the EPC member states.
Validation and renewal fees have a substantial negative impact on the validation behavior of
applicants, in addition to the aforementioned factors. These results suggest that the current
fragmented market for technology in Europe has important implications for innovators. The
implementation of the community patent, regularly debated by European policymakers over
the past 30 years, would clearly substantially reduce the cost of enforcing a patent in Europe
once it is granted, and definitely influence the applicants' behavior in that matter.
Translation costs, which could only be approximated through dummy variables, also have an
impact on validations, but this impact disappears when fees are included in the model. These
fees are much better measured, as data on them are publicly available. We may assume
relatively safely that translation costs, should they be easy to measure, also play an important
role. Therefore, the nearly implemented London Protocol, which will reduce the translation
requirements, and hence the translation costs, will lead to further growth in the demand for
patent validations in each national patent office. Given that applicants appear to file many

25
marginal applications in these days (see van Pottelsberghe and van Zeebroeck, 2008), the
impact of the London Protocol may be a mixed blessing.
Future research may better clarify the relative role of the various factors accounted for in the
aggregated model presented in this paper. A first improvement would be to confirm these
results at the patent level. This would allow us to have a more detailed approximation of
applicants’ behavior, but also to take into account the role of the technological specialization
that applicants may have developed.
26
References
Abrams, R. K. (1980). International Trade Flows under Flexible Exchange Rates, Federal
Reserve Bank of Kansas City, Economic Review 65(3): 3–10.
Archontopoulos, E. / Guellec, D. /. Stevnsborg, N. / van Pottelsberghe de la Potterie, B./ van
Zeebroeck, N. (2007). When Small is Beautiful: Measuring the Evolution and
Consequences of the Voluminosity of Patent Applications at the EPO, Information
Economics and Policy 19(2): 103-132.
Bergstrand, J.H. (1984). The Gravity Equation and the Factor Proportions Theory of
International Trade: A Theoretical and Empirical Synthesis, Federal Reserve Bank of
Boston.
Bosworth, D.L. (1984). Foreign Patent Flows to and from the United Kingdom, Research
Policy 13: 115-124.
Bergstrand, J.H. (1985). The Gravity Equation in International Trade: Some Microeconomic
Foundations and Empirical Evidence, The Review of Economics and Statistics 67(3):
474-481.
de Rassenfosse, G. / van Pottelsberghe de la Potterie, B. (2007). Per un Pugno di Dollari: A
First Look at the Price Elasticity of Patents, CEPR Working Paper 6499.
Deng, Y. (2003). A Dynamic Stochastic Analysis of International Patent Application and
Renewal Processes, Working Paper.
Deng, Y. (2006). Trade Balance of Patent Rights: Who Gains what from International Patent
Harmonization, and Why?, Working Paper.
Eaton, J. / Kortum, S. (1996). Trade in Ideas Patenting and Productivity in the OECD,
Journal of International Economics 40(3-4): 251-278.
Eaton, J. / Kortum, S. / Lerner, J. (2004). International Patenting and the European Patent
Office: A Quantitative Assessment, in Patents, Innovation and Economic
Performance: OECD Conference Proceedings, Paris and Washington, D.C.:
Organisation for Economic Co-operation and Development, 2004, pp. 27-52.
Egger, P. (2000). A Note on the Proper Econometric Specification of the Gravity Equation,
Economics Letters 66: 25-31.
Egger, P. (2002). An Econometric View on the Estimation of Gravity Models and the
Calculation of Trade Potentials, The World Economy 25(2): 297-312.
27
Geraci, V.J. / Prewo, W. (1977). Bilateral Trade Flows and Transport Costs, The Review of
Economics and Statistics 64: 67-74.
Greenwood, M.J. (1975). Research on Internal Migration in the U.S.: A Survey, in: Journal of
Economic Literature 13: 397-435.
Guellec, D. / van Pottelsberghe de la Potterie, B. (2001). The Internationalisation of
Technology Analysed with Patent Data, Research Policy 30(8): 1253-1266.
Guellec, D. / van Pottelsberghe de la Potterie, B. (2007). The Economics of the European
Patent System. Oxford University Press. Oxford, 250 p.
Harhoff, Dietmar / Wagner, Stefan (2006). Modeling the Duration of Patent Examination at
the European Patent Office, CEPR Discussion Paper 5283.
Karemera, D. / Oguledo, V.I. / Davis, B. (2000). A Gravity Model Analysis of International
Migration to North America, Applied Economics 32(13): 1745-1755.
Lazaridis, G. / van Pottelsberghe de la Potterie, B. (2007) The Rigour of EPO’s Patentability
Criteria: An Insight into the “Induced Withdrawals”, World Patent Information,
forthcoming.
Linnemann, H. (1966). An Econometric Study of International Trade Flows, North-Holland
Publishing Company, Amsterdam.
Maskus K.E. / Penubarti, M. (1995). How Trade-Related Are Intellectual Property Rights?,
Journal of International Economics 39(3-4): 227-48.
Matyas, L. (1998). The Gravity Model: Some Econometric Considerations, The World
Economy 21(3): 397-401.
Park, W.G. (2003). Internal EPO Report, February 28, 2003, Munich.
Peeters, C. / van Pottelsberghe de la Potterie, B (2006). Innovation Strategy and the Patenting
Behavior of Firms, Journal of Evolutionary Economics 16 (1-2): 109-135.
Roland Berger (2005). Study on the Cost of Patenting in Europe, prepared on behalf of the
EPO by Roland Berger Market Research.
Slama, J. (1981). Analysis by Means of a Gravitation Model of International Flows of Patent
Applications in the Period 1967-1978, in: World Patent Information 3(1): 2-8.
28
Stevnsborg, N./ van Pottelsberghe de la Potterie, B. (2007). Patenting Procedures and Filing
Strategies at the EPO, in Guellec, D. and van Pottelsberghe de la Potterie, B. (Eds.),
The Economics of the European Patent System, Chapter 6, Oxford University Press,
Oxford, 155-183.
Tinbergen, J. (1962). Shaping the World Economy: Suggestions for an International
Economic Policy, The Twentieth Century Fund, New York.
van Pottelsberghe de la Potterie, B. / François, D. (2006). The Cost Factor in Patent Systems.
CEPR Discussion Paper 5944.
van Pottelsberghe de la Potterie, B. / van Zeebreock, N. (2008). A brief History of Space and
Time: The Scope-Year Index as a Patent Value Indicator based on Families and
Renewals, Scientometrics 75 (2), forthcoming, May 2008.
van Zeebroeck, N. (2007). The Puzzle of Patent Value Indicators. Université Libre de
Bruxelles, Working Papers CEB, 07-023.
29
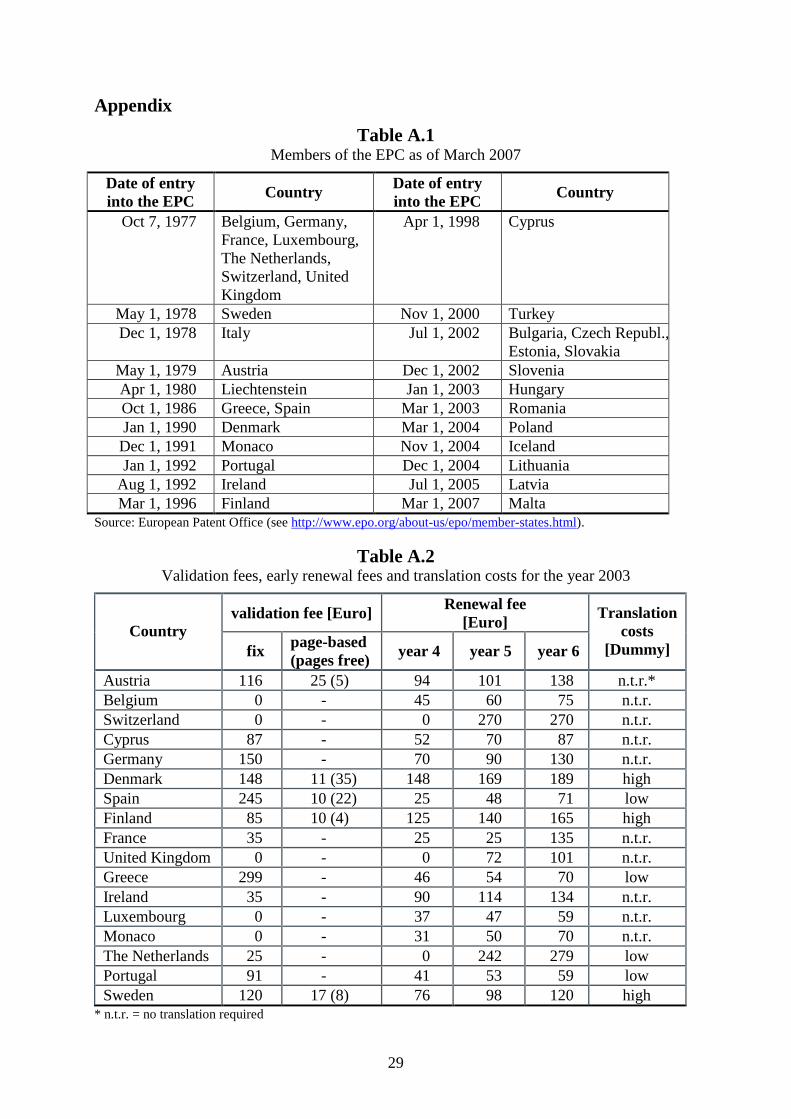
Appendix
Table A.1 Members of the EPC as of March 2007
Date of entry into the EPC
Country Date of entry into the EPC
Country
Oct 7, 1977 Belgium, Germany, France, Luxembourg, The Netherlands, Switzerland, United Kingdom
Apr 1, 1998 Cyprus
May 1, 1978 Sweden Nov 1, 2000 Turkey Dec 1, 1978 Italy Jul 1, 2002 Bulgaria, Czech Republ.,
Estonia, Slovakia May 1, 1979 Austria Dec 1, 2002 Slovenia Apr 1, 1980 Liechtenstein Jan 1, 2003 Hungary Oct 1, 1986 Greece, Spain Mar 1, 2003 Romania Jan 1, 1990 Denmark Mar 1, 2004 Poland Dec 1, 1991 Monaco Nov 1, 2004 Iceland Jan 1, 1992 Portugal Dec 1, 2004 Lithuania
Aug 1, 1992 Ireland Jul 1, 2005 Latvia Mar 1, 1996 Finland Mar 1, 2007 Malta
Source: European Patent Office (see http://www.epo.org/about-us/epo/member-states.html).
Table A.2 Validation fees, early renewal fees and translation costs for the year 2003
validation fee [Euro] Renewal fee [Euro] Country
fix page-based (pages free)
year 4 year 5 year 6
Translation costs
[Dummy]
Austria 116 25 (5) 94 101 138 n.t.r.* Belgium 0 - 45 60 75 n.t.r. Switzerland 0 - 0 270 270 n.t.r. Cyprus 87 - 52 70 87 n.t.r. Germany 150 - 70 90 130 n.t.r. Denmark 148 11 (35) 148 169 189 high Spain 245 10 (22) 25 48 71 low Finland 85 10 (4) 125 140 165 high France 35 - 25 25 135 n.t.r. United Kingdom 0 - 0 72 101 n.t.r. Greece 299 - 46 54 70 low Ireland 35 - 90 114 134 n.t.r. Luxembourg 0 - 37 47 59 n.t.r. Monaco 0 - 31 50 70 n.t.r. The Netherlands 25 - 0 242 279 low Portugal 91 - 41 53 59 low Sweden 120 17 (8) 76 98 120 high
* n.t.r. = no translation required
30
Table A.3
Descriptive statistics (patents granted in 1995, 1999 and 2003)
2003 (N = 328) 1999 (N = 308) 1995 (N = 284)
mean std. dev. min max mean std. dev. min max mean std. dev. min max validation flows from country A to country B 733.02 1616.01 1 12454 564.68 1263.38 1 8822 683.07 1597.53 1 9771
GDP per capita of country A 1422.86 2453.48 115.26 10960.75 1226.92 2133.77 96.83 9268.43 1193.08 1896.67 67.24 7397.65
GDP per capita of country B 556.73 713.47 1.00 2444.28 478.74 611.55 0.79 2146.43 523.63 682.06 0.83 2524.95 population of country A (mio. inhabitants) 45.50 65.92 3.98 291 44.42 63.66 3.74 279.2 43.43 61.67 3.6 266.46 population of country B (mio. inhabitants) 19.37 24.43 0.03 82.52 20.21 24.41 0.03 82.09 21.25 24.78 0.03 81.66
distance between capital cities 3515.20 4079.14 136 18044 3454.8 4113.88 136 18044 3333.18 4052.14 136 18044 years of EPC membership of country B 18.34 7.34 5 25 15.2 6.71 3 21 12.18 6.05 2 17
validation fees 138.93 164.78 0 596.25 150.48 176.96 0 596.53 137.64 177.12 0 596.36
renewal fees for years 4 to 6 278.25 137.83 143 540 272.52 130.68 138.05 525.61 473.29 341.83 228 1681