The Role of TNFR2 in Experimentally Induced ... · aus dem lehrstuhl fÜr immunologie professor dr....
84
AUS DEM LEHRSTUHL FÜR IMMUNOLOGIE PROFESSOR DR. DANIELA N. MÄNNEL DER FAKULTÄT FÜR MEDIZIN DER UNIVERSITÄT REGENSBURG THE ROLE OF TNFR2 IN EXPERIMENTALLY INDUCED GLOMERULONEPHRITIS Inaugural – Dissertation zur Erlangung des Doktorgrades der Medizin der Fakultät für Medizin der Universität Regensburg vorgelegt von Eva Elisabeth Pfeifer 2012
Transcript of The Role of TNFR2 in Experimentally Induced ... · aus dem lehrstuhl fÜr immunologie professor dr....
AUS DEM LEHRSTUHL FÜR IMMUNOLOGIE PROFESSOR DR. DANIELA N. MÄNNEL
DER FAKULTÄT FÜR MEDIZIN DER UNIVERSITÄT REGENSBURG
THE ROLE OF TNFR2 IN EXPERIMENTALLY INDUCED GLOMERULONEPHRITIS
Inaugural – Dissertation zur Erlangung des Doktorgrades
der Medizin
der Fakultät für Medizin
der Universität Regensburg
vorgelegt von Eva Elisabeth Pfeifer
2012

Dekan:
Prof. Dr. Dr. Torsten E. Reichert
1. Berichterstatter:
Prof. Dr. Daniela N. Männel
2. Berichterstatter:
Prof. Dr. Bernd Salzberger
Tag der mündlichen Prüfung:
15.06.2012
FÜR MEINE GROSSVÄTER
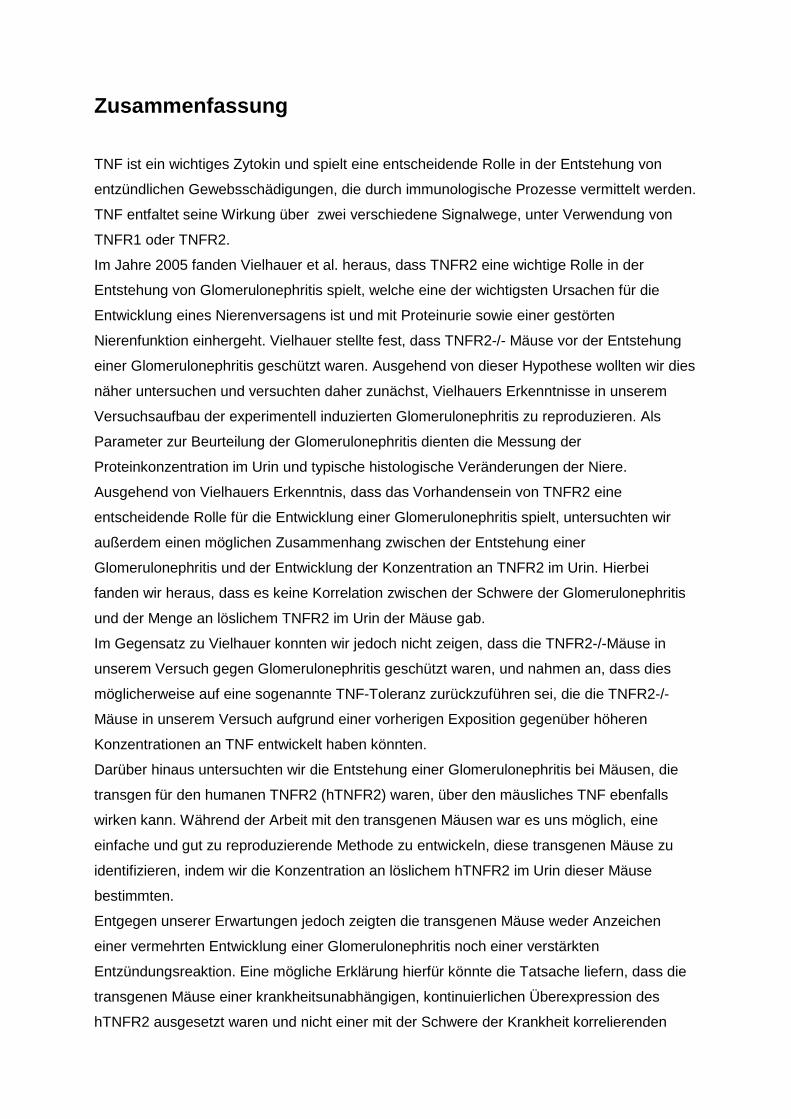
Zusammenfassung
TNF ist ein wichtiges Zytokin und spielt eine entscheidende Rolle in der Entstehung von
entzündlichen Gewebsschädigungen, die durch immunologische Prozesse vermittelt werden.
TNF entfaltet seine Wirkung über zwei verschiedene Signalwege, unter Verwendung von
TNFR1 oder TNFR2.
Im Jahre 2005 fanden Vielhauer et al. heraus, dass TNFR2 eine wichtige Rolle in der
Entstehung von Glomerulonephritis spielt, welche eine der wichtigsten Ursachen für die
Entwicklung eines Nierenversagens ist und mit Proteinurie sowie einer gestörten
Nierenfunktion einhergeht. Vielhauer stellte fest, dass TNFR2-/- Mäuse vor der Entstehung
einer Glomerulonephritis geschützt waren. Ausgehend von dieser Hypothese wollten wir dies
näher untersuchen und versuchten daher zunächst, Vielhauers Erkenntnisse in unserem
Versuchsaufbau der experimentell induzierten Glomerulonephritis zu reproduzieren. Als
Parameter zur Beurteilung der Glomerulonephritis dienten die Messung der
Proteinkonzentration im Urin und typische histologische Veränderungen der Niere.
Ausgehend von Vielhauers Erkenntnis, dass das Vorhandensein von TNFR2 eine
entscheidende Rolle für die Entwicklung einer Glomerulonephritis spielt, untersuchten wir
außerdem einen möglichen Zusammenhang zwischen der Entstehung einer
Glomerulonephritis und der Entwicklung der Konzentration an TNFR2 im Urin. Hierbei
fanden wir heraus, dass es keine Korrelation zwischen der Schwere der Glomerulonephritis
und der Menge an löslichem TNFR2 im Urin der Mäuse gab.
Im Gegensatz zu Vielhauer konnten wir jedoch nicht zeigen, dass die TNFR2-/-Mäuse in
unserem Versuch gegen Glomerulonephritis geschützt waren, und nahmen an, dass dies
möglicherweise auf eine sogenannte TNF-Toleranz zurückzuführen sei, die die TNFR2-/-
Mäuse in unserem Versuch aufgrund einer vorherigen Exposition gegenüber höheren
Konzentrationen an TNF entwickelt haben könnten.
Darüber hinaus untersuchten wir die Entstehung einer Glomerulonephritis bei Mäusen, die
transgen für den humanen TNFR2 (hTNFR2) waren, über den mäusliches TNF ebenfalls
wirken kann. Während der Arbeit mit den transgenen Mäusen war es uns möglich, eine
einfache und gut zu reproduzierende Methode zu entwickeln, diese transgenen Mäuse zu
identifizieren, indem wir die Konzentration an löslichem hTNFR2 im Urin dieser Mäuse
bestimmten.
Entgegen unserer Erwartungen jedoch zeigten die transgenen Mäuse weder Anzeichen
einer vermehrten Entwicklung einer Glomerulonephritis noch einer verstärkten
Entzündungsreaktion. Eine mögliche Erklärung hierfür könnte die Tatsache liefern, dass die
transgenen Mäuse einer krankheitsunabhängigen, kontinuierlichen Überexpression des
hTNFR2 ausgesetzt waren und nicht einer mit der Schwere der Krankheit korrelierenden
Konzentration an mäuslichem TNFR2, die entscheidenden Einfluss auf die Entwicklung der
Glomerulonephritis hat.
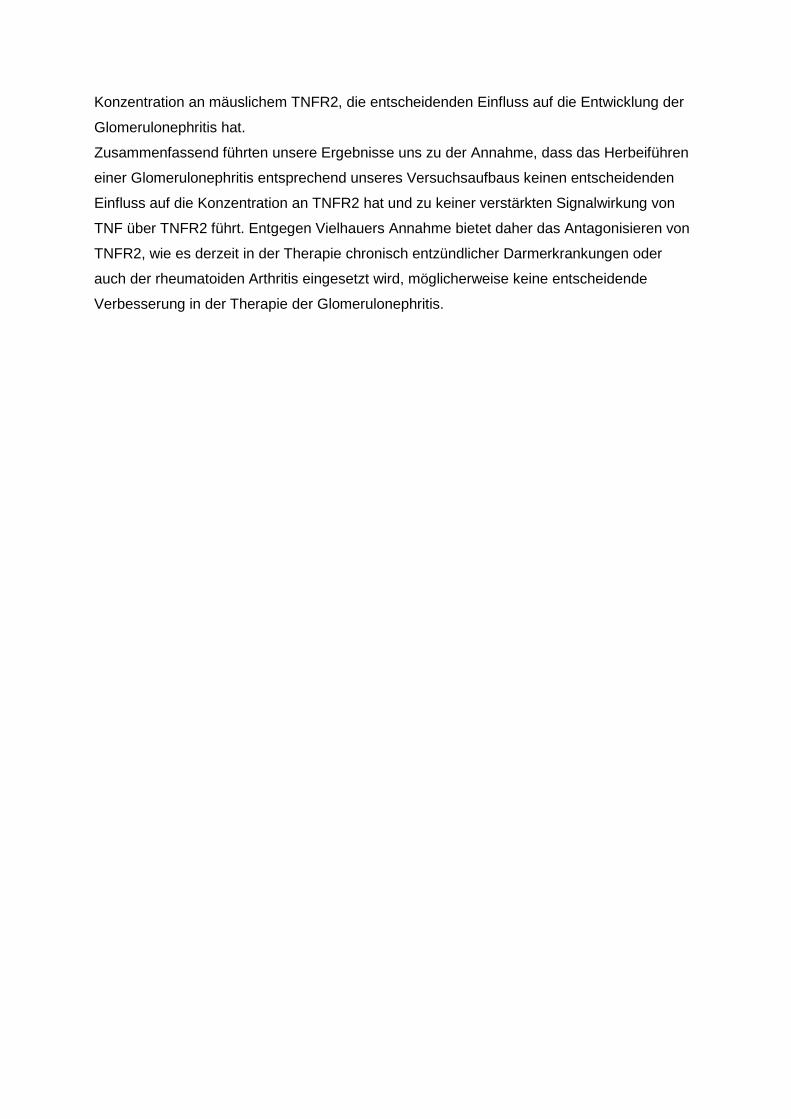
Zusammenfassend führten unsere Ergebnisse uns zu der Annahme, dass das Herbeiführen
einer Glomerulonephritis entsprechend unseres Versuchsaufbaus keinen entscheidenden
Einfluss auf die Konzentration an TNFR2 hat und zu keiner verstärkten Signalwirkung von
TNF über TNFR2 führt. Entgegen Vielhauers Annahme bietet daher das Antagonisieren von
TNFR2, wie es derzeit in der Therapie chronisch entzündlicher Darmerkrankungen oder
auch der rheumatoiden Arthritis eingesetzt wird, möglicherweise keine entscheidende
Verbesserung in der Therapie der Glomerulonephritis.

Abstract TNF is an important cytokine and acts as mediator of inflammatory tissue damage which is
caused by immunologically mediated processes. TNF provides its effects via two signalling
pathways using its two receptors, TNFR1 and TNFR2.
In 2005 Vielhauer et al. revealed that TNFR2 plays an important role in the development of
glomerulonephritis, which is one of the most important causes for renal failure and leads to
proteinuria and renal dysfunction. Vielhauer found that TNFR2-/- mice were protected from
the development of glomerulonephritis. Based on this hypothesis, we intended to further
investigate and, therefore, tried to reproduce it in our experimental setup of
glomerulonephritis induction. As parameters for the development of glomerulonephritis we
observed proteinuria and typical histological changes in the renal structure. We also tested
whether we could find a correlation between the development of glomerulonephritis and the
concentration of TNFR2 in urine. We found out that amounts of soluble mTNFR2 in urine
showed no correlation to the severity of disease.
However, we were not able to reproduce Vielhauer’s findings, since TNFR2-/- mice in our
setup were not protected against glomerulonephritis. We assumed that his findings could be
explained by the presence of a so-called TNF-tolerance that has developed in the organism
of TNFR2-/- mice because of former exposure to higher levels of TNF.
Furthermore, we intended to study the development of experimental glomerulonephritis in
mice that were transgenic for human TNFR2 (hTNFR2), which is able to interact with mouse
TNF in a functional way. Working with these transgenic mice, we were able to establish an
easy and reproducible way to identify mice that were transgenic for the hTNFR2 by detecting
soluble hTNFR2 in urine of these mice.
Contrary to our expectations, mice transgenic for hTNFR2 showed no signs of increased
pathology and no enhanced inflammatory response to the induction of glomerulonephritis.
One possible explanation may be provided by the fact that the mice we used in our
experimental setup were exposed to constitutive overexpression of hTNFR2 instead of
disease-correlating levels of mouse TNFR2 which may have an important impact on the
development of glomerulonephritis. According to these findings, we assumed that inducing
glomerulonephritis in mice according to our experimental protocol has no striking impact on
the concentration of signalling TNFR2. Contrary to Vielhauer’s assumptions, antagonizing
TNFR2 might not provide such special improvement in treatment of glomerulonephritis as
TNF blockade does in the current clinical treatment of other chronic inflammatory diseases
such as inflammatory bowel diseases or rheumatoid arthritis.
Table of Contents I __________________________________________________________________________
Table of Contents
Table of Contents ................................................................................................................... I
List of Figures ........................................................................................................................III
Abbreviations ........................................................................................................................ V
1 Introduction ........................................................................................................................ 1
1.1 Glomerulonephritis ....................................................................................................... 1
1.1.1 Renal Physiology ................................................................................................... 1
1.1.2 Pathophysiology of Glomerulonephritis .................................................................. 4
1.1.3 Clinical Symptoms of Glomerulonephritis .............................................................. 5
1.2 Tumor Necrosis Factor................................................................................................. 6
1.2.1 Structure of TNF .................................................................................................... 6
1.2.2 Discovery of TNF ................................................................................................... 6
1.2.3 TNF-Receptors and Signaling Pathways ............................................................... 7
1.2.4 Functions of TNF ................................................................................................... 9
1.2.5 Anti-TNF-Therapies ..............................................................................................10
1.3 Role of TNF in Renal Diseases ...................................................................................11
1.3.1 Role of TNF and TNF-Receptors in Glomerulonephritis ........................................12
1.4 Aim of the Study..........................................................................................................13
2 Materials and Methods ......................................................................................................15
2.1 Methods ......................................................................................................................15
2.1.1 Induction of Glomerulonephritis ............................................................................15
2.1.2 Measurement of Proteinuria .................................................................................16
2.1.3 ELISAs for Measuring the Soluble Mouse TNFRII, Human TNFRII and Mouse TNF
in Urine and Serum .......................................................................................................17
2.1.4 Phenotyping of Mice Transgenic for hTNFR2 .......................................................19
2.1.5 Measurement of Creatinine in Serum and Urine ...................................................20
2.1.6 Fixation and Staining of Mouse Kidney Tissue .....................................................21
2.1.7 Statistics ...............................................................................................................23
2.2 Materials .....................................................................................................................24
2.2.1 Chemicals.............................................................................................................24
2.2.2 Consumables .......................................................................................................24
2.2.3 Instruments ...........................................................................................................25
2.2.4 Buffer Solutions ....................................................................................................25
2.2.5 Assay Kits.............................................................................................................26
2.2.6 Antibodies.............................................................................................................26
Table of Contents II __________________________________________________________________________
2.2.7 Animals ................................................................................................................26
2.2.8 Others ..................................................................................................................27
3 Results ..............................................................................................................................28
3.1 Glomerulonephritis Induction in TNFR2-/- Mice and Control Animals ..........................28
3.1.1 Proteinuria ............................................................................................................28
3.1.2 Creatinine Concentration ......................................................................................29
3.1.3 Relation of Proteinuria to Creatinine .....................................................................30
3.1.4 Histological Findings .............................................................................................31
3.2 Glomerulonephritis Induction in hTNFR2tg Mice and Control Animals ........................34
3.2.1 Proteinuria ............................................................................................................34
3.2.2 Creatinine Concentration ......................................................................................35
3.2.3 Relation of Proteinuria to Creatinine .....................................................................37
3.2.4 Histological Findings .............................................................................................38
3.3 Glomerulonephritis Induction in hTNFR2tg Mice and Control Animals – Part 2 ........39
3.3.1 Proteinuria ............................................................................................................39
3.3.2 Creatinine Concentration ......................................................................................40
3.3.3 Relation of Proteinuria to Creatinine .....................................................................41
3.3.4 mTNFR2 Concentration ........................................................................................42
3.3.5 hTNFR2 Concentration .........................................................................................43
3.3.6 Histological Findings .............................................................................................45
3.4 mTNFR2 Concentration in Urine With and Without Induction of Glomerulonephritis ...46
3.5 Titration of Anti-GBM-Serum in Induction of Glomerulonephritis .................................48
3.6 Phenotyping of hTNFR2tg Mice ..................................................................................51
4 Discussion .........................................................................................................................52
4.1 Development of Glomerulonephritis in TNFR2-deficient Mice .....................................52
4.2 Development of Glomerulonephritis in hTNFR2-transgenic Mice ................................54
4.3 Phenotyping of hTNFR2-transgenic Mice ....................................................................57
4.4 Detection of Soluble TNFR2 in Urine ..........................................................................58
4.5 Conclusion ..................................................................................................................59
5 References ........................................................................................................................61
6 Acknowledgments………………………………………………………………………………....68
7 Curriculum Vitae…………………………………………………………………………………...70
List of Figures III __________________________________________________________________________
List of Figures
Figure 1: Schematical anatomy of the renal corpuscle. .......................................................... 3
Figure 2: Overview of the signaling pathways of TNF, TNFR1 and TNFR2. .......................... 9
Figure 3: Experimental setup of the induction of glomerulonephritis. ....................................15
Figure 4: Schematical overview of the induction of glomerulonephritis with rabbit anti-GBM
serum. ..................................................................................................................................16
Figure 5: Schematical overview of the sandwich-ELISA method ..........................................19
Figure 6: Development of proteinuria in TNFR2-/- animals and control animals during
glomerulonephritis ................................................................................................................29
Figure 7: Creatinine concentration in urine of TNFR2-/- animals and control animals during
glomerulonephritis ................................................................................................................30
Figure 8: Relation of proteinuria to creatinine concentration in urine of TNFR2-/- animals and
control animals during glomerulonephritis.............................................................................31
Figure 9: Comparison of two glomeruli after the induction of glomerulonephritis ..................31
Figure 10: Development of proteinuria in TNFR2-/- animals and control animals during
glomerulonephritis ................................................................................................................33
Figure 11: Survival of TNFR2-/- mice and control animals during glomerulonephritis. ..........34
Figure 12: Development of proteinuria in hTNFR2tg animals and control animals during
glomerulonephritis ................................................................................................................35
Figure 13: Creatinine concentration in urine of hTNFR2tg animals and control animals during
glomerulonephritis ................................................................................................................36
Figure 14: Creatinine concentration in serum of hTNFR2tg animals and control animals
during glomerulonephritis .....................................................................................................36
Figure 15: Relation of proteinuria to creatinine concentration in urine in hTNFR2tg animals
and control animals during glomerulonephritis ......................................................................37
Figure 16: Comparison of two glomeruli after the induction of glomerulonephritis.................38
Figure 17: Development of proteinuria in hTNFR2tg animals and control animals during
glomerulonephritis ................................................................................................................40
Figure 18: Creatinine concentration in urine of hTNFR2tg animals and control animals during
glomerulonephritis ................................................................................................................41
Figure 19: Relation of proteinuria to creatinine concentration in urine of hTNFR2tg animals
and control animals during glomerulonephritis ......................................................................42
Figure 20: mTNFR2 concentration in urine of hTNFR2tg animals and control animals during
glomerulonephritis ................................................................................................................42
Figure 21: mTNFR2 concentration in serum of hTNFR2tg animals and control animals during
glomerulonephritis ................................................................................................................43
List of Figures IV __________________________________________________________________________
Figure 22: hTNFR2 concentration in urine of hTNFR2tg animals during glomerulonephritis .44
Figure 23: hTNFR2 concentration in serum of hTNFR2tg animals during glomerulonephritis
.............................................................................................................................................44
Figure 24: Comparison of two glomeruli after the induction of glomerulonephritis.................45
Figure 25: mTNFR2 concentration in urine of CD45.1 mice during glomerulonephritis .........47
Figure 26: mTNFR2 concentration in urine of CD45.1 mice after immunisation ....................48
Figure 27: Development of proteinuria in CD45.1 mice during glomerulonephritis ................49
Figure 28: Development of proteinuria in mice pretreated with PBS, E. coli LPS and
humanTNF during glomerulonephritis ...................................................................................50
Figure 29: Survival of mice pretreated with PBS, E. coli LPS and humanTNF during
glomerulonephritis ................................................................................................................51
Figure 30: hTNFR2 concentration in urine of hTNFR2tg mice and littermates ......................51
Abbreviations __________________________________________________________________________
V
Abbreviations
AIDS acquired immunodeficiency syndrome
ATPase adenosin triphosphatase
BSA bovine serum albumine
cDNA copy desoxyribonucleic acid
Con-A concanavalin A
d day
DISC death inducing signaling complex
DNA desoxyribonucleic acid
ELISA enzyme-linked immunoabsorbent assay
ERK extracellular signal related kinase
FADD Fas-associated protein with death domain
g gram
GBM glomerular basement membrane
GFR glomerular filtration rate
h hour
H.E. hematoxylin and eosin
hicp75TNFR2 intracellular human tumor necrosis factor receptor type 2
HRP horseradish peroxidase
hTNFR2 human tumor necrosis factor receptor type 2
hTNFR2tg transgenic for human tumor necrosis factor receptor type 2
i.p. intraperitoneal
IgG immunglobulin G
IKK IκB proteinkinase
JNK c-Jun-N-terminal kinase
kDa kilodaltons
LPS lipopolysaccharide
MAPK mitogen activated protein kinase
mg milligram
min. minute
mL milliliter
mTNFR2 mouse tumor necrosis factor type 2
NaCl sodium chloride
NF-κB nuclear factor-kappa B
Abbreviations __________________________________________________________________________
VI
ng nanogram
nm nanometer
No. Number
OD optical density
PAS periodic acid-schiff
PBS phosphate buffered saline
pg picogram
pI3K phosphoinositide 3-kinase
RIP receptor interacting protein
sec. second
sTNF soluble tumor necrosis factor
TACE tumor necrosis factor alpha converting enzyme
TIM tumor necrosis factor receptor associated factor interacting motif
TNF tumor necrosis factor
TNFR1 tumor necrosis factor receptor type 1
TNFR2 tumor necrosis factor receptor type 2
TNFR2-/- tumor necrosis factor receptor type 2-deficient
TRADD tumor necrosis factor receptor associated death domain
TRAF tumor necrosis factor receptor associated factor
µg microgram
µL microliter
°C degree celsius

Introduction __________________________________________________________________________
1
1 Introduction
1.1 Glomerulonephritis
The term glomerulonephritis involves a number of different renal diseases which are
accompanied by glomerular inflammation and cellular proliferation (Chadban and Atkins,
2005).
The different forms of glomerulonephritis can be classified into primary and secondary forms.
Primary forms of glomerulonephritis evolve from intrinsic kidney causes which are mainly
autoimmune processes or which develop due to unknown reasons. Secondary forms of
glomerulonephritis describe the renal involvement in different systemic disorders such as
systemic lupus erythemathosus or systemic vasculitis (Chadban and Atkins, 2005; Herold,
2009).
The different forms of glomerulonephritis can also be characterized by histological criteria.
Depending on the histological findings non-proliferative forms of glomerulonephritis can be
separated from proliferative forms which show signs of hypercellularity. Minimal-change
glomerulonephritis, focal segmental glomerulosclerosis and membranous glomerulonephritis
are regarded as non-proliferative forms which clinically lead to symptoms of the nephrotic
syndrome, whereas post-infectious glomerulonephritis, membrano-proliferative
glomerulonephritis and rapidly progressive glomerulonephritis belong to the proliferative
forms showing clinical signs of the nephritic syndrome. Proliferative forms are likely to
progress to end-stage renal failure more often than non-proliferative forms (Stahl et al., 2004,
Herold, 2009).
1.1.1 Renal Physiology
The renal perfusion requires about 20% of the cardiac output (Deetjen and Speckmann,
1999). This reflects the importance of the different renal functions and metabolic activities.
One of the most important functions is the elimination of substances that are obligatory
excreted by urine such as urea, creatinine, and uric acid. Moreover, the kidneys are involved
both in the regulation of the electrolyte and water balance and in the regulation of the acid-
base metabolism. In addition, important hormones are produced in the kidneys for example
erythropoietin, which induces the red cell production, or other certain enzymes which
regulate the blood pressure such as renin. (Huppelsberg and Walter, 2003)
Introduction __________________________________________________________________________
2
The kidney can be separated into cortex and medulla. The renal functional structures are the
nephrons which are composed of a filtering component, the renal corpuscle, and an
absorbing and secreting component, the renal tubule.
Blood reaches the renal corpuscle through the vas afferens and leaves it after filtration
through the vas efferens. Together they form the vascular pole.
The renal corpuscle, which serves the filtration of the primary urine, consists of the
glomerulus and the Bowman’s capsule. The glomerulus is composed of a tuft of small
capillaries with a fenestrated endothelium (Lüllmann-Rauch, 2003). The endothelium is
covered by the glomerular basement membrane which is lined by podocytes. Podocytes form
the visceral layer of the Bowman’s capsule and have several foot processes which surround
the capillaries and form filtration slits (Pavenstädt et al., 2003; Rodewald and Karnovsky,
1974). The parietal layer of the Bowman’s capsule consists of squamous epithelial cells
(Lüllmann-Rauch, 2003).
The cell layers described above form the renal filtration system which, on the one hand, is
permeable for water, ions, and other small molecules but, on the other hand, prevents larger
molecules, especially proteins such as the important albumin, from penetrating the
glomerular barrier, thereby retaining them in the circulation (Haraldsson and Sörensson,
2004).
The so-called filtrated primary urine is collected between the visceral and the parietal layer of
the Bowman’s capsule and leaves the renal corpuscle at the urinary pole into the proximal
convoluted tubule (Lüllmann-Rauch, 2003). This primary urine not only contains the
substances that are obligatorily excreted by urine but also molecules such as glucose, amino
acids, and electrolytes. These molecules mostly have to be reabsorbed. During the passage
through the proximal tubule nearly all of the amino acids and glucose and about two-thirds of
the filtrated NaCl are resorbed from the lumen (Silbernagl, 1991). The required gradient is
maintained by the Na+/K+-ATPase. The primary urine then reaches the loop of Henle where a
concentration gradient is built up and more NaCl is resorbed into the interstitium. The
following distal convoluted tubule and collecting tubule are responsible for the final
concentration and composition of the primary urine. The antidiuretic hormone (ADH) is
responsible for the concentration of the urine. The concentrated urine reaches the renal
pelvis, the bladder and is eliminated via the ureter (Huppelsberg and Walter, 2003, Schmidt
et al., 2004).
Physiological urine contains only small proteins which make up for about 150mg/d (Herold,
2009, Ehrich et al., 1984).
Renal function can be measured by quantifying the amount of liquid that is filtrated by the
nephrons in a certain time. This volume is called glomerular filtration rate (GFR) and
indicates the functional status of the kidney.
Introduction __________________________________________________________________________
3
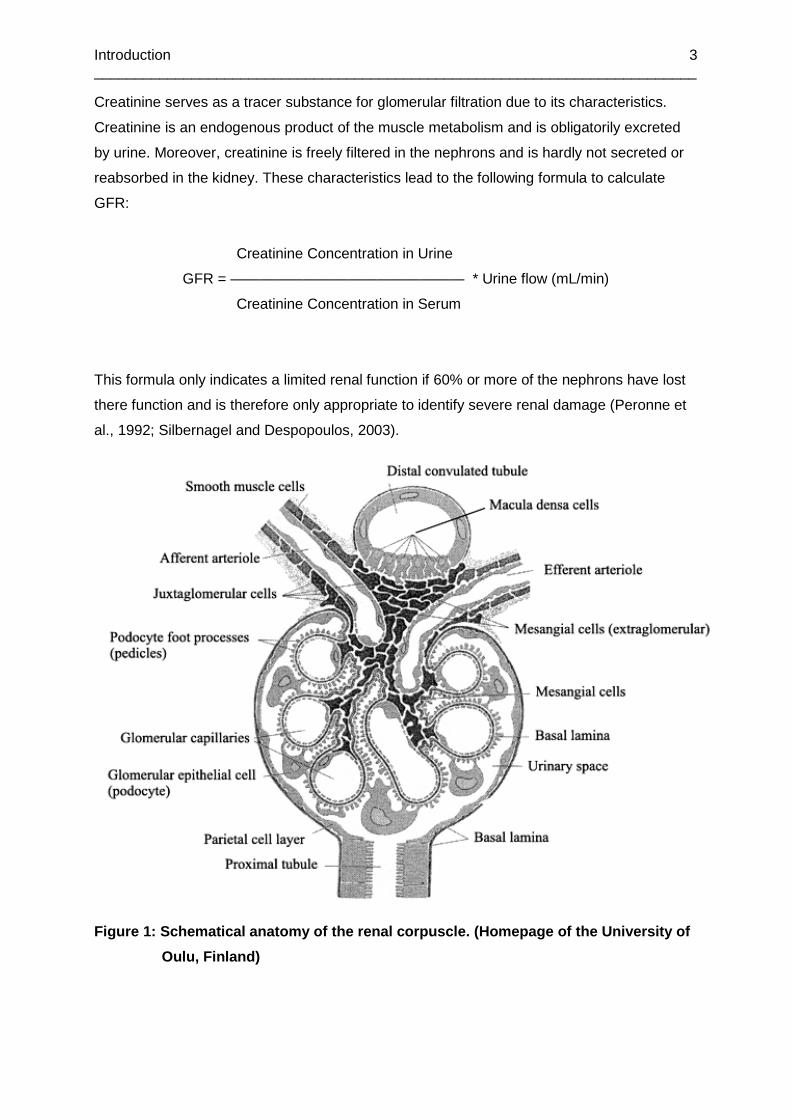
Creatinine serves as a tracer substance for glomerular filtration due to its characteristics.
Creatinine is an endogenous product of the muscle metabolism and is obligatorily excreted
by urine. Moreover, creatinine is freely filtered in the nephrons and is hardly not secreted or
reabsorbed in the kidney. These characteristics lead to the following formula to calculate
GFR:
Creatinine Concentration in Urine
GFR = ———————————————— * Urine flow (mL/min)
Creatinine Concentration in Serum
This formula only indicates a limited renal function if 60% or more of the nephrons have lost
there function and is therefore only appropriate to identify severe renal damage (Peronne et
al., 1992; Silbernagel and Despopoulos, 2003).
Figure 1: Schematical anatomy of the renal corpuscl e. (Homepage of the University of
Oulu, Finland)
Introduction __________________________________________________________________________
4
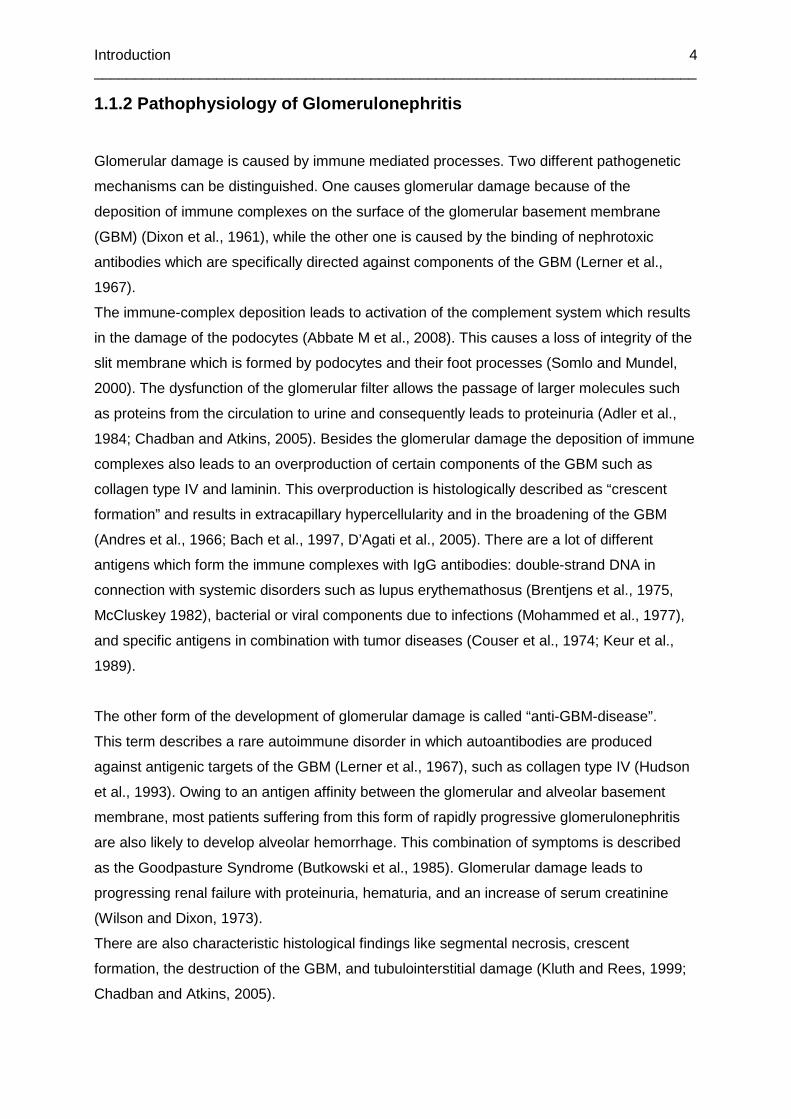
1.1.2 Pathophysiology of Glomerulonephritis
Glomerular damage is caused by immune mediated processes. Two different pathogenetic
mechanisms can be distinguished. One causes glomerular damage because of the
deposition of immune complexes on the surface of the glomerular basement membrane
(GBM) (Dixon et al., 1961), while the other one is caused by the binding of nephrotoxic
antibodies which are specifically directed against components of the GBM (Lerner et al.,
1967).
The immune-complex deposition leads to activation of the complement system which results
in the damage of the podocytes (Abbate M et al., 2008). This causes a loss of integrity of the
slit membrane which is formed by podocytes and their foot processes (Somlo and Mundel,
2000). The dysfunction of the glomerular filter allows the passage of larger molecules such
as proteins from the circulation to urine and consequently leads to proteinuria (Adler et al.,
1984; Chadban and Atkins, 2005). Besides the glomerular damage the deposition of immune
complexes also leads to an overproduction of certain components of the GBM such as
collagen type IV and laminin. This overproduction is histologically described as “crescent
formation” and results in extracapillary hypercellularity and in the broadening of the GBM
(Andres et al., 1966; Bach et al., 1997, D’Agati et al., 2005). There are a lot of different
antigens which form the immune complexes with IgG antibodies: double-strand DNA in
connection with systemic disorders such as lupus erythemathosus (Brentjens et al., 1975,
McCluskey 1982), bacterial or viral components due to infections (Mohammed et al., 1977),
and specific antigens in combination with tumor diseases (Couser et al., 1974; Keur et al.,
1989).
The other form of the development of glomerular damage is called “anti-GBM-disease”.
This term describes a rare autoimmune disorder in which autoantibodies are produced
against antigenic targets of the GBM (Lerner et al., 1967), such as collagen type IV (Hudson
et al., 1993). Owing to an antigen affinity between the glomerular and alveolar basement
membrane, most patients suffering from this form of rapidly progressive glomerulonephritis
are also likely to develop alveolar hemorrhage. This combination of symptoms is described
as the Goodpasture Syndrome (Butkowski et al., 1985). Glomerular damage leads to
progressing renal failure with proteinuria, hematuria, and an increase of serum creatinine
(Wilson and Dixon, 1973).
There are also characteristic histological findings like segmental necrosis, crescent
formation, the destruction of the GBM, and tubulointerstitial damage (Kluth and Rees, 1999;
Chadban and Atkins, 2005).
Introduction __________________________________________________________________________
5
In order to find out something about the immunologic pathways which are responsible for the
glomerular damage and increased glomerular permeability in connection with
glomerulonephritis, anti-GBM glomerulonephritis is often induced in experimental models
from various species as “passive anti-GBM nephritis” or “nephrotoxic nephritis”. “Passive
anti-GBM nephritis” is induced by the intravenous injection of nephrotoxic antibodies directed
against GBM. These antibodies can be maintained by immunizing another species with an
extract of renal tissue of the laboratory animal. Therefore, they are later able to bind to the
GBM of the laboratory animal. To accelerate and specify this binding the laboratory animal is
pre-immunised with IgG of the other species. This, in turn, should induce the specific
production of antibodies against these IgGs. In the following, the application of the
heterologous anti-GBM-antibodies leads to the formation of immune complexes with the
produced antibodies of the laboratory animal. The immune complexes are able to activate
both the complement system and inflammatory cells such as granulocytes and monocytes
which mediate the formation of glomerular crescents as well as leading to a loss of
glomerular function (Dixon et al., 1961; Wilson and Dixon, 1973).
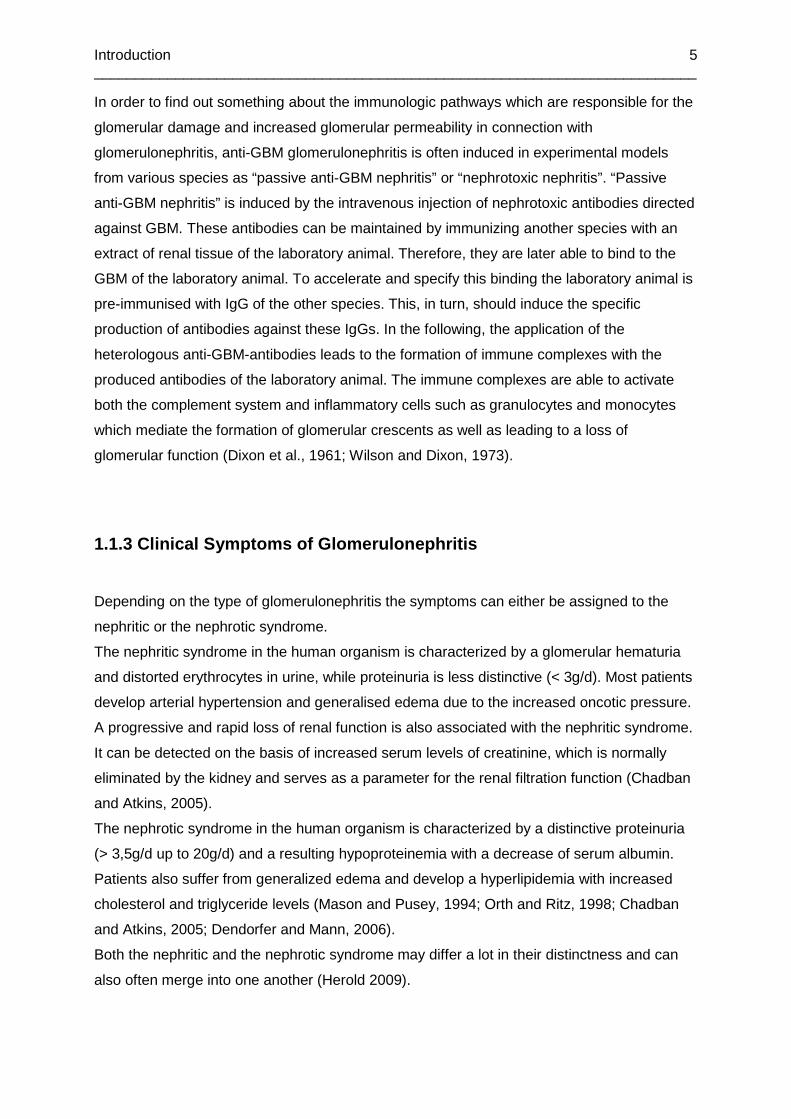
1.1.3 Clinical Symptoms of Glomerulonephritis
Depending on the type of glomerulonephritis the symptoms can either be assigned to the
nephritic or the nephrotic syndrome.
The nephritic syndrome in the human organism is characterized by a glomerular hematuria
and distorted erythrocytes in urine, while proteinuria is less distinctive (< 3g/d). Most patients
develop arterial hypertension and generalised edema due to the increased oncotic pressure.
A progressive and rapid loss of renal function is also associated with the nephritic syndrome.
It can be detected on the basis of increased serum levels of creatinine, which is normally
eliminated by the kidney and serves as a parameter for the renal filtration function (Chadban
and Atkins, 2005).
The nephrotic syndrome in the human organism is characterized by a distinctive proteinuria
(> 3,5g/d up to 20g/d) and a resulting hypoproteinemia with a decrease of serum albumin.
Patients also suffer from generalized edema and develop a hyperlipidemia with increased
cholesterol and triglyceride levels (Mason and Pusey, 1994; Orth and Ritz, 1998; Chadban
and Atkins, 2005; Dendorfer and Mann, 2006).
Both the nephritic and the nephrotic syndrome may differ a lot in their distinctness and can
also often merge into one another (Herold 2009).

Introduction __________________________________________________________________________
6
1.2 Tumor Necrosis Factor
Tumor necrosis factor (TNF, TNFSF2 = tumor necrosis factor superfamily member 2,
formally also known as cachectin), a member of the TNF/TNF-R superfamily, is a cytokine
which plays an important role in many different functions of the immune system such as the
regulation of the activity of immune cells, the immune response to infections, local or
systemic inflammation, and the organogenesis and homeostasis of the secondary lymphoid
organs (Beutler and Cerami, 1989; Aggarwal 2003; Hehlgans and Pfeffer, 2005).
1.2.1 Structure of TNF
TNF is produced as a 26-kDa 233-amino acid-long type II transmembrane protein. It exists
as a stable homotrimer in its membrane-bound form (Kriegler et al., 1988; Tang et al., 1996)
but is also biologically active in a soluble form (sTNF). sTNF is a trimer, too, and is released
by proteolytic cleavage of the membrane–integrated form. This cleavage reaction is
catalyzed by TACE, the TNF-α Converting Enzyme, a membrane-bound metalloprotease and
disintegrin (Black et al., 1997, Solomon et al., 1999).
1.2.2 Discovery of TNF
Experimental researches and observations over the last 100 years brought up the theory of
an immune response to tumor diseases. In 1968 a cytokine produced by lymphocytes was
discovered and was named lymphotoxin (Kolb and Granger, 1968). In 1975 another cytokine
produced by macrophages was identified and characterized. It was found to initiate necrosis
of cells in an animal model of fibrosarcoma. Following these findings this cytokine was
named tumor necrosis factor (Carswell et al., 1975).
As further researches showed a close functional similarity of lymphotoxin and tumor necrosis
factor, they were grouped in a large cytokine family, the TNF/TNF-R superfamily.
In 1985 Bruce Beutler revealed that the hormone cachectin, which until then was known to
modulate the metabolism of both neoplastic and non-neoplastic cells, was the same protein
as the detected TNF (Beutler et al., 1975). These investigations also disclosed the crucial
role of TNF in important immune responses such as sepsis (Beutler et al., 1985).

Introduction __________________________________________________________________________
7
1.2.3 TNF-Receptors and Signaling Pathways
TNF is able to bind to two different types of transmembrane type I receptors which are
responsible for the different effects of TNF (Hohmann et al., 1989).
TNFR1 (p55) is a 55 kDa, 425-amino acid-long glycoprotein. It is constitutively expressed on
nearly all types of cells and tissues and is mainly responsible for the known effects of TNF.
TNFR2 (p75) is a 75 kDa, 452-amino acid-long glycoprotein which is mainly expressed on
activated cells belonging to the immune system but also on other cells, for example epithelial
or renal intrinsic cells.
The membrane-bound form of the TNF homotrimer is capable of activating both TNFR1 and
TNFR2 whereas the soluble TNF trimer mainly induces responses mediated by TNFR1 (Grell
et al., 1995).
Similar to the two forms of TNF both receptors can also be cleaved from the membrane and
can exist as soluble receptors. This process is often described as “shedding” of the TNF
receptor. The soluble receptors are capable of binding TNF and, therefore, antagonizing or
inhibiting the effects of TNF (Nophar et al., 1990; Engelmann et al., 1990; Wallach et al.,
1991).
TNFR1 contains an intracellular death domain and, hence, is capable of inducing apoptosis
(Tartaglia et al., 1993). When the TNF homotrimer binds to TNFR1 the receptor is able to
ligate TRADD (TNF-receptor associated protein via death domain). This ligation provides the
further binding of FADD (Fas-associated protein with death domain) and, therefore, the
recruitment of Caspase 8. Together FADD and Caspase 8 form the death inducing signaling
complex (DISC). If sufficient levels of Caspase 8 are reached the autoproteolytic activation is
initiated and the resulting effector caspases induce apoptosis (Schulze-Osthoff et al., 1995).
Whereas the death signaling effects of TNF are rather marginal compared to those of the
other receptors containing an intracellular death domain such as Fas, the induction of
specific transcription of inflammatory genes is the main effect mediated by the two TNF-
receptors. This induction is mediated by both TNFR1 and TNFR2.
As described in the death signaling pathway TNFR1 is able to ligate TRADD when the TNF
homotrimer is bound. In addition to TRADD the death domain is capable of binding the
kinase RIP (Receptor interacting protein) and recruiting TRAF2 (TNF-receptor associated
factor). These ligations provide the activation of IKK (IκB proteinkinase) and therefore the
release of NF-κB, an important transcription factor which is responsible for the transcription
of various genes. Among these genes are those responsible for the regulation and
development of the immune system, cell proliferation, cell differentiation, and inflammatory
Introduction __________________________________________________________________________
8
processes. Additionally, NF-κB plays a role in the prevention of apoptosis and, therefore,
antagonizes the effects of the death signaling pathway of TNFR1 (Chinnaiyan et al., 1996;
Legler et al., 2003; Dempsey et al., 2003).
The release of NF-κB can also be mediated by TNFR2. TNFR2 contains an intracellular TIM
(TRAF-interacting motif) domain which is capable of binding TRAF2 when the TNF trimer is
bound to the receptor. As in the TNFR1 mediated pathway this ligation leads to the release
of NF-κB and the effects on transcription described above. Besides the NF-κB pathway other
signal transduction pathways are activated via TNFR2 which are important for the regulation
of immune response, inflammatory processes and apoptosis, such as JNK (c-Jun N-terminal
kinase), p38 MAPK (mitogen activated protein kinase), ERK (extracellular signal related
kinase), pI3K (phosphoinositide 3-kinase) and AKT (also known as protein kinase B) (Darnay
et al., 1998; Lee et al., 2000, Dempsey et al., 2003).
As mentioned above most effects of TNF are mediated by TNFR1 but in a few cases the
interaction of TNFR1 with TNFR2, by the formation of hetero complexes, is essential to
acquire the required activation of TNFR1 (Pinckard et al., 1997).
Studies also revealed that TNFR2 is able to intensify the effects mediated by TNFR1 (Wajant
et al., 2003), amongst others because it leads to an increased concentration of bound TNF
trimers which are consequently available for TNFR1 (Tartaglia et al., 1993).
Introduction __________________________________________________________________________
9
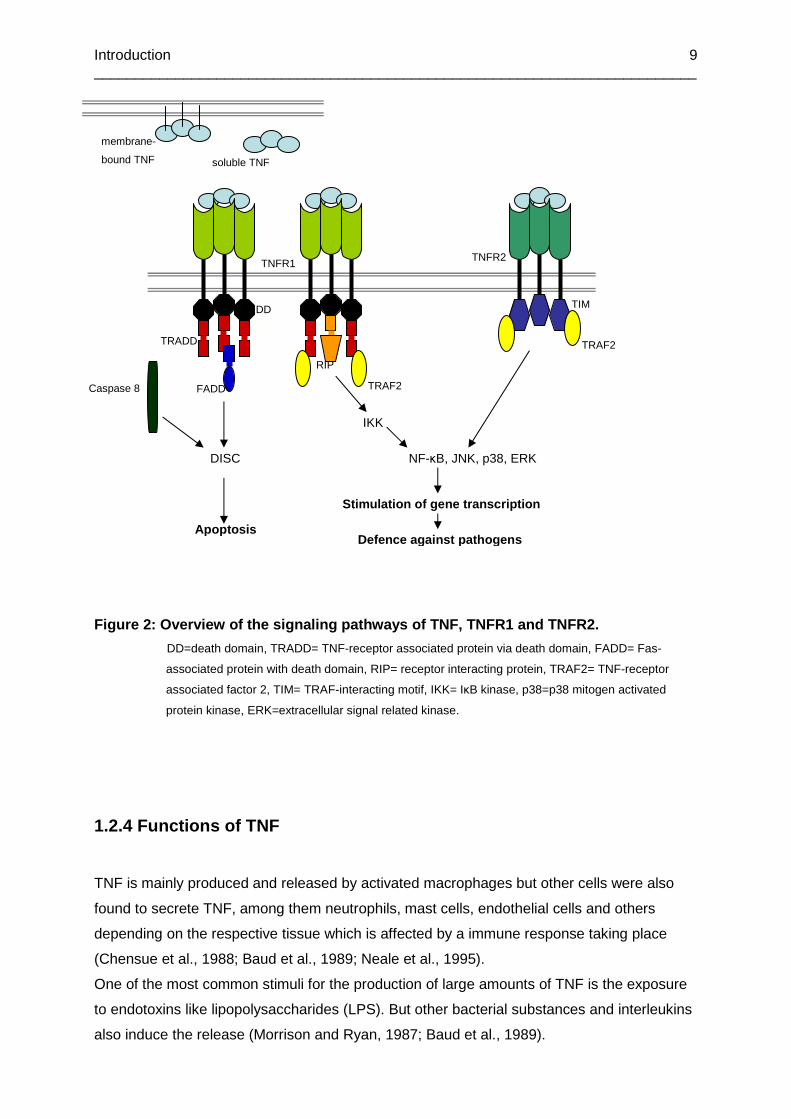
Figure 2: Overview of the signaling pathways of TNF , TNFR1 and TNFR2.
DD=death domain, TRADD= TNF-receptor associated protein via death domain, FADD= Fas-
associated protein with death domain, RIP= receptor interacting protein, TRAF2= TNF-receptor
associated factor 2, TIM= TRAF-interacting motif, IKK= IκB kinase, p38=p38 mitogen activated
protein kinase, ERK=extracellular signal related kinase.
1.2.4 Functions of TNF
TNF is mainly produced and released by activated macrophages but other cells were also
found to secrete TNF, among them neutrophils, mast cells, endothelial cells and others
depending on the respective tissue which is affected by a immune response taking place
(Chensue et al., 1988; Baud et al., 1989; Neale et al., 1995).
One of the most common stimuli for the production of large amounts of TNF is the exposure
to endotoxins like lipopolysaccharides (LPS). But other bacterial substances and interleukins
also induce the release (Morrison and Ryan, 1987; Baud et al., 1989).
IKK
NF-κB, JNK, p38, ERK
Stimulation of gene transcription
Defence against pathogens
DISC
Apoptosis
TRAF2
TRAF2
TNFR1 TNFR2
TIM DD
TRADD
FADD
RIP
membrane-
bound TNF soluble TNF
Caspase 8
Introduction __________________________________________________________________________
10
In addition to the induction of necrosis of certain types of tumor cells, TNF plays a crucial role
in various processes concerning the immune response to bacteria, viruses and parasites, the
regulation of the inflammatory response, and several autoimmune diseases.
In the regulation of the immune response TNF acts as an early inflammatory mediator and
enables the host to defend itself against pathogens. This is accomplished by the recruitment
of T-cells and macrophages which lead to the production of other proinflammatory cytokines.
Inflammatory cells such as neutrophils are also recruited and their proliferation is induced by
TNF (Van der Poll et al., 1992). This results in the release of chemokines and cell adhesion
molecules which are responsible for the local inflammatory response (Roach et al., 2002;
Aggarwal, 2003).
Besides its own function as an early inflammatory mediator TNF is also able to induce the
production of acute-phase proteins in the liver which affect coagulation, vascular
permeability, and the complement system such as C-reactive protein and complement
factors (Perlmutter et al., 1986; Meijer et al., 1993).
Contrary to the described proinflammatory effects there are also immunosuppressive impacts
of TNF such as the induction of apoptosis of activated T-cells and neutrophils (Zheng et al.,
1995; Elzey et al., 2001). Furthermore, studies revealed that TNF promotes the regression of
autoimmune reactivity (Cope, 1998).
Studies in the past also discovered that besides its host defensive effects TNF is a mediator
in various pathologies and autoimmune diseases and that its release can have systemic
endotoxic effects (Tracey et al., 1986; Kollias et al., 1999).
A dysregulation of the production of TNF resulting in a prolonged overproduction may lead to
inflammatory disorders, for example the induction of sepsis and the development of a septic
shock syndrome as a response to bacteria. In this case high levels of TNF are brought into
connection with various symptoms that characterize sepsis such as fever, falling blood
pressure, systemic edema, and the progressing multi-organ failure (Tracey et al., 1986;
Kilbourn et al., 1990).
TNF and its overproduction are also involved in other pathologies, for example AIDS and the
accompanying cachexia, transplant rejection (Dörge et al., 1994), and various autoimmune
disorders such as rheumatoid arthritis and inflammatory bowel diseases (Kollias et al., 1999).
1.2.5 Anti-TNF-Therapies
Dysregulation in the production of TNF and resulting high levels of TNF are not only
responsible for immune responses such as sepsis but also for various autoimmune disorders

Introduction __________________________________________________________________________
11
caused by the proinflammatory effects of TNF. These findings led to the development of a
new way to treat patients who suffer from chronic inflammatory diseases. It provides the
opportunity to antagonize TNF by the application of monoclonal antibodies which bind to TNF
or the application of recombinant soluble human TNFR2. These monoclonal antibodies are
available as chimeric mouse-human antibodies (Infliximab, distributed as Remicade®),
recombinant human antibodies (Adalimumab, distributed as Humira®) and humanized
antibodies (Certolizumab, distributed as Cimzia®). Furthermore, a fusion protein consisting
of the soluble form of the human TNFR2 and the Fc portion of human IgG1 (Etanercept,
distributed as Enbrel®) has been developed.
Anti-TNF-antibodies are indicated for the treatment of chronic inflammatory diseases such as
inflammatory bowel diseases (van Dullemen et al., 1995; Suenaert et al., 2002), rheumatoid
arthritis (Feldmann and Maini, 2001), ankylosing spondylitis, and psoriasis (Mease et al.,
2000; Reimold, 2003; Antoni et al., 2005). Anti-TNF antibodies are administered if the basis
therapy containing glucocorticoids and Methotrexat provide no sufficient amelioration of the
symptoms.
Several clinical studies confirmed the efficiency of anti-TNF antibody therapies. But apart
from the high costs of these therapies patients have to cope with the risk of adverse side
effects which may turn out as unpredictable due to the contrasting effects of TNF as
described above (Kollias and Kontoyiannis, 2003; Reimold, 2003). Among these adverse
side effects are the risk of the reactivation of arrested tuberculosis and other infections, the
formation of auto-antibodies resulting in the development of lupus-like syndromes.
In the treatment of multiple sclerosis anti-TNF-antibody therapy even deteriorated symptoms
and led to an exacerbation of the disease (Sicotte and Voskuhl, 2001).
Among others, these findings have led to the consideration that developing therapy
opportunities aiming at the TNF-receptors instead of TNF itself may provide an alternative,
improved option (Kollias and Kontoyiannis, 2002).
1.3 Role of TNF in Renal Diseases
Several studies in the past few years revealed that TNF plays a decisive role in renal injuries
and diseases (Bertani et al., 1989; Tomosugi et al., 1989; Vielhauer and Mayadas, 2007).
Renal mesangial cells, glomerular and tubular epithelial cells were found to produce high
amounts of TNF, but only when exposed to cell damage or stimulation (Tipping et al., 1991;
Timoshanko et al., 2003). Increased levels of TNF were discovered in several experimentally
Introduction __________________________________________________________________________
12
induced renal injuries such as endotoxin-induced renal failure (Ramesh et al., 2007),
obstruction-induced renal tubular cell apoptosis, cisplatin-induced (Ramesh and Reeves,
2003) and ischema-induced renal injury (Donnahoo et al., 1999). Other animal models which
focused on the damage of glomerular structures revealed that animals which were exposed
to experimentally-induced nephrotoxic nephritis developed glomerular injuries due to high
systemic TNF levels (Le Hir et al., 1998).
These various models showed that TNF is an important mediator of different processes
which lead to renal injury and failure such as apoptosis of renal cells, resulting in renal
dysfunction, the induced production of other members of the inflammatory response, and the
recruitment of proinflammatorily active cells.
These findings were confirmed by the fact that treatment with TNF inhibitors and the soluble
TNF-receptor led to the improvement of renal functions and alleviation of renal damage
(Hruby et al., 1991; Lan et al., 1997).
In addition, TNF-deficient mice were found to develop less distinctive injuries, suffered less
from nephrotic symptoms, and showed fewer histological alterations such as crescent
formation and inflammatory infiltrates (Le Hir et al., 1998).
Clinical researches also revealed increased production of TNF in patients who developed
rejection reactions after kidney transplantation as one example for a special immunological
situation (Kutukculer et al., 1995). Histological analysis of renal biopsies showed that both
renal parenchymal cells and mononuclear leukocytes were responsible for high levels of TNF
resulting in an excessive inflammatory and immune response (Morel et al., 1993; Noel et al.,
2000, Al-Lamki et al., 2001).
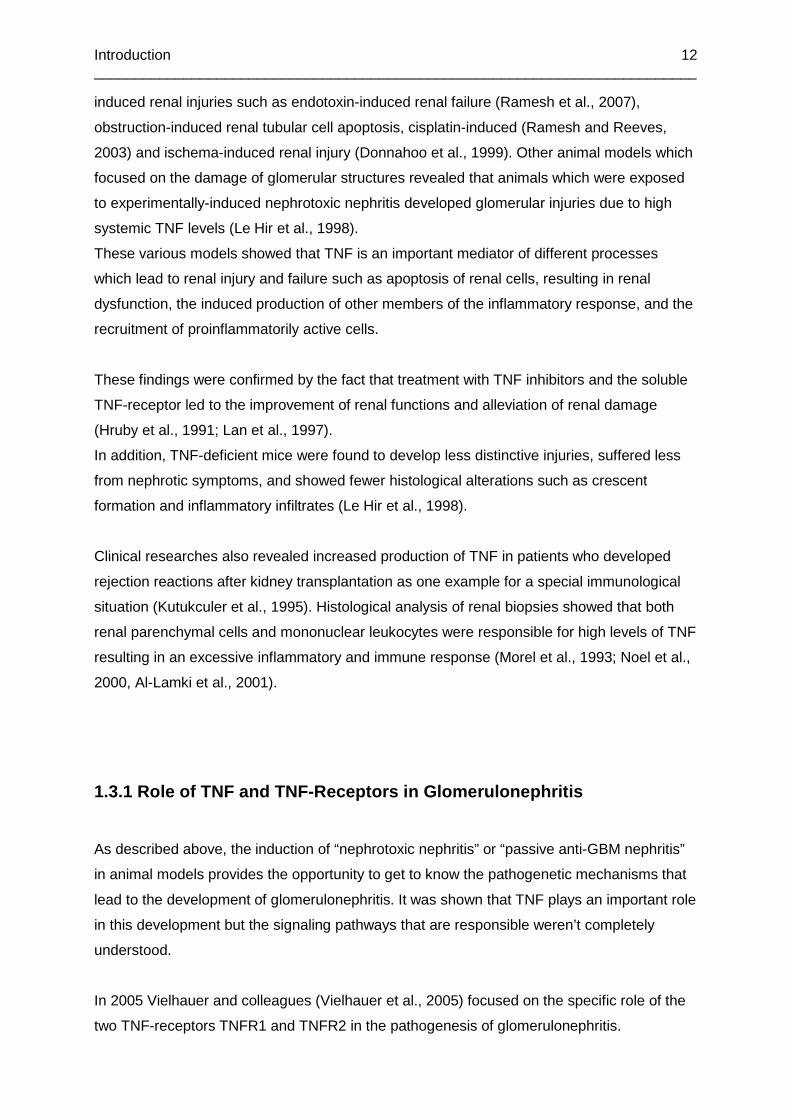
1.3.1 Role of TNF and TNF-Receptors in Glomerulonep hritis
As described above, the induction of “nephrotoxic nephritis” or “passive anti-GBM nephritis”
in animal models provides the opportunity to get to know the pathogenetic mechanisms that
lead to the development of glomerulonephritis. It was shown that TNF plays an important role
in this development but the signaling pathways that are responsible weren’t completely
understood.
In 2005 Vielhauer and colleagues (Vielhauer et al., 2005) focused on the specific role of the
two TNF-receptors TNFR1 and TNFR2 in the pathogenesis of glomerulonephritis.

Introduction __________________________________________________________________________
13
They induced accelerated nephrotoxic nephritis in mice and examined the role of the two
TNF-receptors by looking at different parameters characterizing glomerulonephritis such as
the development of proteinuria, glomerular lesions, activation of the complement system, T-
cell and macrophage infiltration, and complement deposition.
They found out that TNFR2-deficient mice developed a less severe and a later onset of
proteinuria than TNFR1-deficient or wild type mice. Furthermore, they were not affected by
other symptoms related to the nephrotic syndrome. Neither glomerular lesions nor infiltration
of inflammatory cells such as T-cells and macrophages were observed in the histological
analyses of the kidneys of TNFR2-deficient mice. In addition TNFR2-deficient mice showed
lower activation of the complement system and lower amounts of glomerular complement
deposition.
Vielhauer also examined the renal expression of TNFR2 both in mice suffering from
nephrotoxic nephritis and mice that were not exposed to any treatment. Kidney stainings
revealed that the receptor was expressed on intrinsic renal cells such as glomerular
endothelial cells in glomerulonephritis-affected mice but could not be found on the renal cells
of the untreated mice.
In order to find out whether this renal TNFR2 expression was responsible for the progression
of glomerulonephritis, Vielhauer compared bone marrow-chimeric mice. He showed that
TNFR2 on intrinsic renal cells and not on bone marrow-derived cells such as T cells or
macrophages is required for the development of the disease.
On the basis of these findings he put forward his hypothesis that TNFR2 plays a central role
in the inflammatory processes in glomerulonephritis and that, therefore, TNFR2-deficient
mice are protected from glomerulonephritis.
1.4 Aim of the Study
On the basis of the hypothesis proposed by Vielhauer (Vielhauer et al., 2005) we intended to
investigate whether the protection of the TNFR2-deficient mice against the development of
experimental glomerulonephritis could be reproduced in our experimental setup of
glomerulonephritis induction. As appropriate parameters for the development of
glomerulonephritis we intended to examine whether TNFR2-deficient mice developed less
severe proteinuria and less severe glomerular damage than C57Bl/6 control animals.
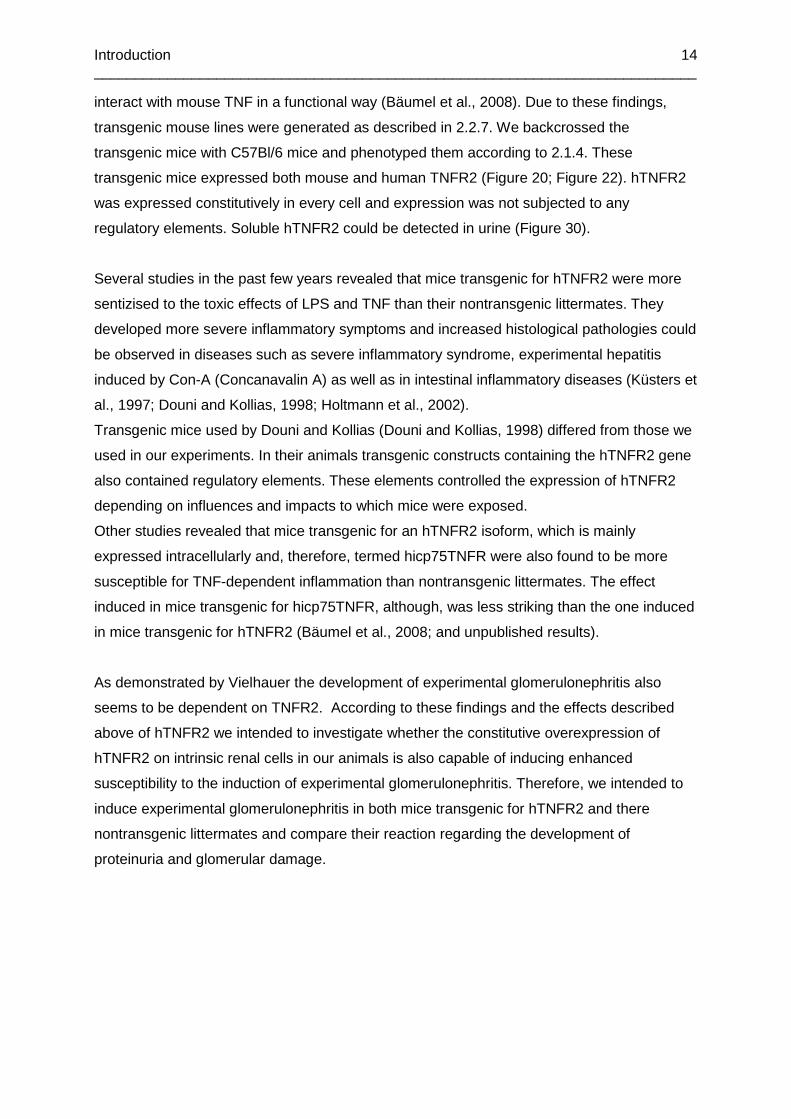
Furthermore, we intended to study the development of experimental glomerulonephritis in
mice that were transgenic for the human TNFR2 (hTNFR2). Apparently, hTNFR2 is able to
Introduction __________________________________________________________________________
14
interact with mouse TNF in a functional way (Bäumel et al., 2008). Due to these findings,
transgenic mouse lines were generated as described in 2.2.7. We backcrossed the
transgenic mice with C57Bl/6 mice and phenotyped them according to 2.1.4. These
transgenic mice expressed both mouse and human TNFR2 (Figure 20; Figure 22). hTNFR2
was expressed constitutively in every cell and expression was not subjected to any
regulatory elements. Soluble hTNFR2 could be detected in urine (Figure 30).
Several studies in the past few years revealed that mice transgenic for hTNFR2 were more
sentizised to the toxic effects of LPS and TNF than their nontransgenic littermates. They
developed more severe inflammatory symptoms and increased histological pathologies could
be observed in diseases such as severe inflammatory syndrome, experimental hepatitis
induced by Con-A (Concanavalin A) as well as in intestinal inflammatory diseases (Küsters et
al., 1997; Douni and Kollias, 1998; Holtmann et al., 2002).
Transgenic mice used by Douni and Kollias (Douni and Kollias, 1998) differed from those we
used in our experiments. In their animals transgenic constructs containing the hTNFR2 gene
also contained regulatory elements. These elements controlled the expression of hTNFR2
depending on influences and impacts to which mice were exposed.
Other studies revealed that mice transgenic for an hTNFR2 isoform, which is mainly
expressed intracellularly and, therefore, termed hicp75TNFR were also found to be more
susceptible for TNF-dependent inflammation than nontransgenic littermates. The effect
induced in mice transgenic for hicp75TNFR, although, was less striking than the one induced
in mice transgenic for hTNFR2 (Bäumel et al., 2008; and unpublished results).
As demonstrated by Vielhauer the development of experimental glomerulonephritis also
seems to be dependent on TNFR2. According to these findings and the effects described
above of hTNFR2 we intended to investigate whether the constitutive overexpression of
hTNFR2 on intrinsic renal cells in our animals is also capable of inducing enhanced
susceptibility to the induction of experimental glomerulonephritis. Therefore, we intended to
induce experimental glomerulonephritis in both mice transgenic for hTNFR2 and there
nontransgenic littermates and compare their reaction regarding the development of
proteinuria and glomerular damage.

Materials and Methods __________________________________________________________________________
15
2 Materials and Methods
2.1 Methods
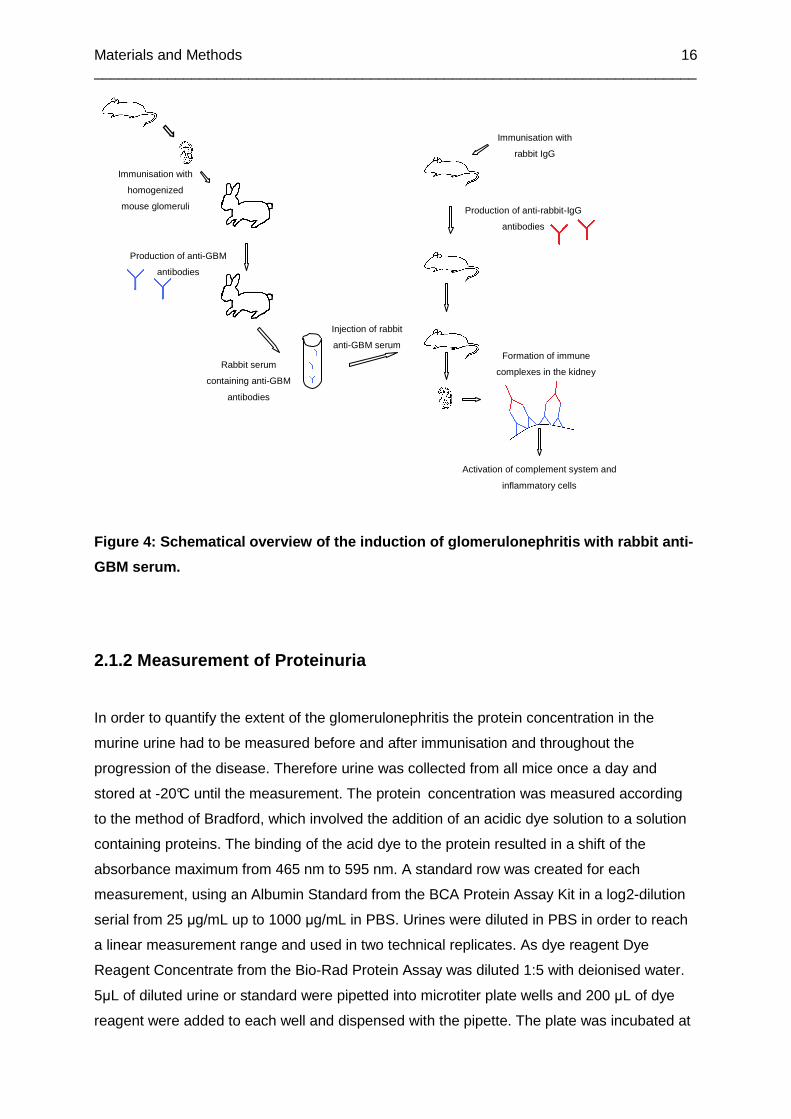
2.1.1 Induction of Glomerulonephritis
First the mice were immunised by injecting 200 µL of a 1:1 emulsion of 0,2 mg rabbit IgG and
complete Freund’s Adjuvans subcutaneously. This should result in the production of
antibodies against rabbit IgG.
6 days after the immunisation 250 µL of rabbit “anti-GBM-serum” were injected into the retro-
bulbar blood vessel of each mouse. For this purpose the mice were sedated with Ketanest-
Xylazin by injecting 100 µL per 10g body weight intraperitoneally (i.p.). The rabbit “anti-GBM-
serum” was produced by Drs. Männel, Echtenacher, and Witzgall by immunising Chinchilla
rabbits with a solution containing an extract of homogenized glomeruli isolated from mouse
kidneys for several times. The blood was taken and serum was produced. The specificity of
the binding of the serum to the murine glomerular basement membrane was tested on
paraffin sections of mouse kidneys. The specific binding could be detected up to a dilution of
1:10,000. In all our experiments serum of rabbit No. 194 was used. In experiment 3.1, 3.2,
3.3, 3.4, and 3.5 serum was used which was taken at August 17, 2006 after the 5th
immunisation of the rabbit. In experiment 3.7 serum was used which was taken at August 22,
2006 as well after the 5th immunisation of the rabbit.
Experimental setup:
Days from induction of glomerulonephritis:
Figure 3: Experimental setup of the induction of gl omerulonephritis.
-6 0
6 15
Urine
Urine Urine and Serum
Immunisation
Serum application
Materials and Methods __________________________________________________________________________
16
Figure 4: Schematical overview of the induction of glomerulon ephritis with rabbit anti-
GBM serum.
2.1.2 Measurement of Proteinuria
In order to quantify the extent of the glomerulonephritis the protein concentration in the
murine urine had to be measured before and after immunisation and throughout the
progression of the disease. Therefore urine was collected from all mice once a day and
stored at -20°C until the measurement. The protein concentration was measured according
to the method of Bradford, which involved the addition of an acidic dye solution to a solution
containing proteins. The binding of the acid dye to the protein resulted in a shift of the
absorbance maximum from 465 nm to 595 nm. A standard row was created for each
measurement, using an Albumin Standard from the BCA Protein Assay Kit in a log2-dilution
serial from 25 µg/mL up to 1000 µg/mL in PBS. Urines were diluted in PBS in order to reach
a linear measurement range and used in two technical replicates. As dye reagent Dye
Reagent Concentrate from the Bio-Rad Protein Assay was diluted 1:5 with deionised water.
5µL of diluted urine or standard were pipetted into microtiter plate wells and 200 µL of dye
reagent were added to each well and dispensed with the pipette. The plate was incubated at
Immunisation with
homogenized
mouse glomeruli
Production of anti-GBM
antibodies
Rabbit serum
containing anti-GBM
antibodies
Immunisation with
rabbit IgG
Production of anti-rabbit-IgG
antibodies
Injection of rabbit
anti-GBM serum Formation of immune
complexes in the kidney
Activation of complement system and
inflammatory cells
Materials and Methods __________________________________________________________________________
17
room temperature for 5 minutes. Depending on the protein concentration of the urine sample
different color changes of the dye reagent were observed and the absorbance was measured
at 595nm in the photometer. The protein concentrations in the urine samples were then
calculated by using the standard row in a linear way.
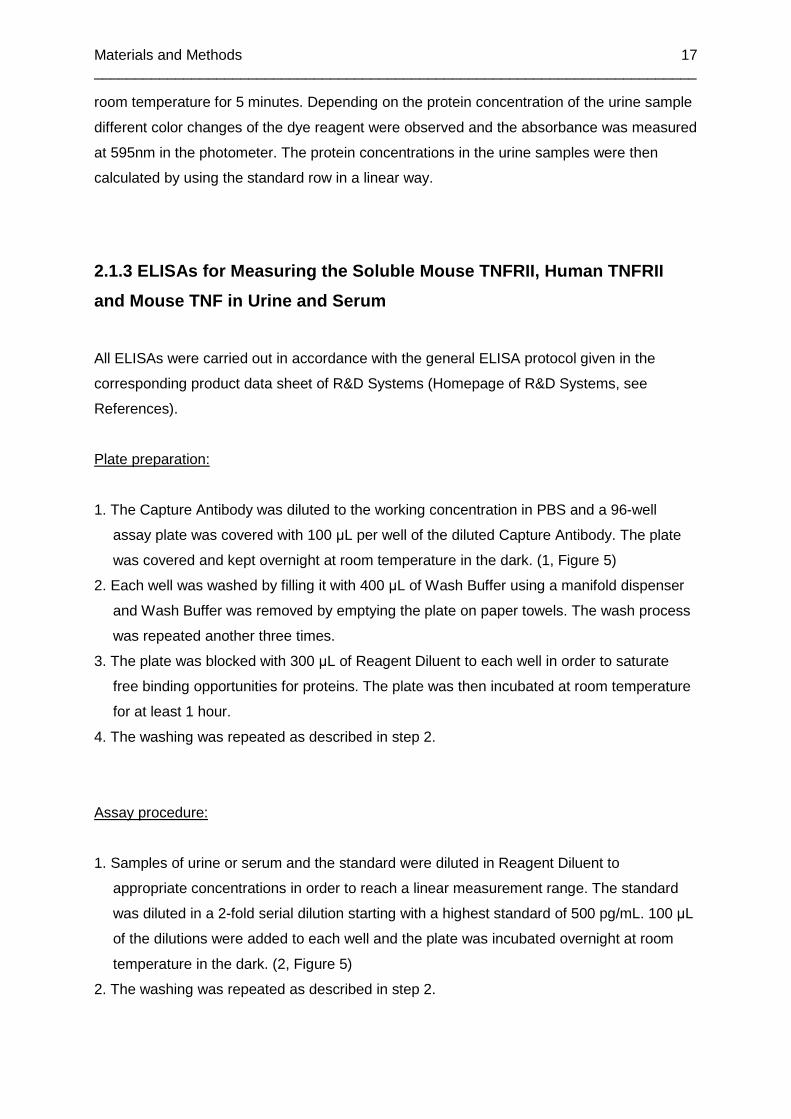
2.1.3 ELISAs for Measuring the Soluble Mouse TNFRII , Human TNFRII
and Mouse TNF in Urine and Serum
All ELISAs were carried out in accordance with the general ELISA protocol given in the
corresponding product data sheet of R&D Systems (Homepage of R&D Systems, see
References).
Plate preparation:
1. The Capture Antibody was diluted to the working concentration in PBS and a 96-well
assay plate was covered with 100 µL per well of the diluted Capture Antibody. The plate
was covered and kept overnight at room temperature in the dark. (1, Figure 5)
2. Each well was washed by filling it with 400 µL of Wash Buffer using a manifold dispenser
and Wash Buffer was removed by emptying the plate on paper towels. The wash process
was repeated another three times.
3. The plate was blocked with 300 µL of Reagent Diluent to each well in order to saturate
free binding opportunities for proteins. The plate was then incubated at room temperature
for at least 1 hour.
4. The washing was repeated as described in step 2.
Assay procedure:
1. Samples of urine or serum and the standard were diluted in Reagent Diluent to
appropriate concentrations in order to reach a linear measurement range. The standard
was diluted in a 2-fold serial dilution starting with a highest standard of 500 pg/mL. 100 µL
of the dilutions were added to each well and the plate was incubated overnight at room
temperature in the dark. (2, Figure 5)
2. The washing was repeated as described in step 2.

Materials and Methods __________________________________________________________________________
18
3. The biotinylated Detection Antibody was diluted in Reagent Diluent and 100 µL were
added to each well in order to bind to the protein which should be detected. The plate was
incubated for another 2 hours at room temperature. (3, Figure 5)
4. The washing was repeated as described in step 2.
5. Streptavidin-HRP was diluted 1:200 in Reagent Diluent and 100 µL were added to each
well in order to bind to the biotin attached to the Detection Antibody. The plate was
incubated for 20 minutes in the dark. (4, Figure 5)
6. The washing was repeated as described in step 2.
7. 100 µL of the Substrate Solution, containing an 1:1 mixture of H2O2 and
Tetramethylbenzidine were added to each well and the plate was incubated for 20 min. at
room temperature in the dark. Streptavidin-HRP catalyzed the oxidation of
Tetramethylbenzidine with H2O2 which resulted in a colour change to blue. (5, Figure 5)
8. 50 µL of 2 N H2SO4 were added as Stop Solution to each well in order to stop the reaction
which leads to a yellow colouration.
9. The optical density was then immediately measured at 450nm.
(1) (2) (3) (4) (5)
Materials and Methods __________________________________________________________________________
19
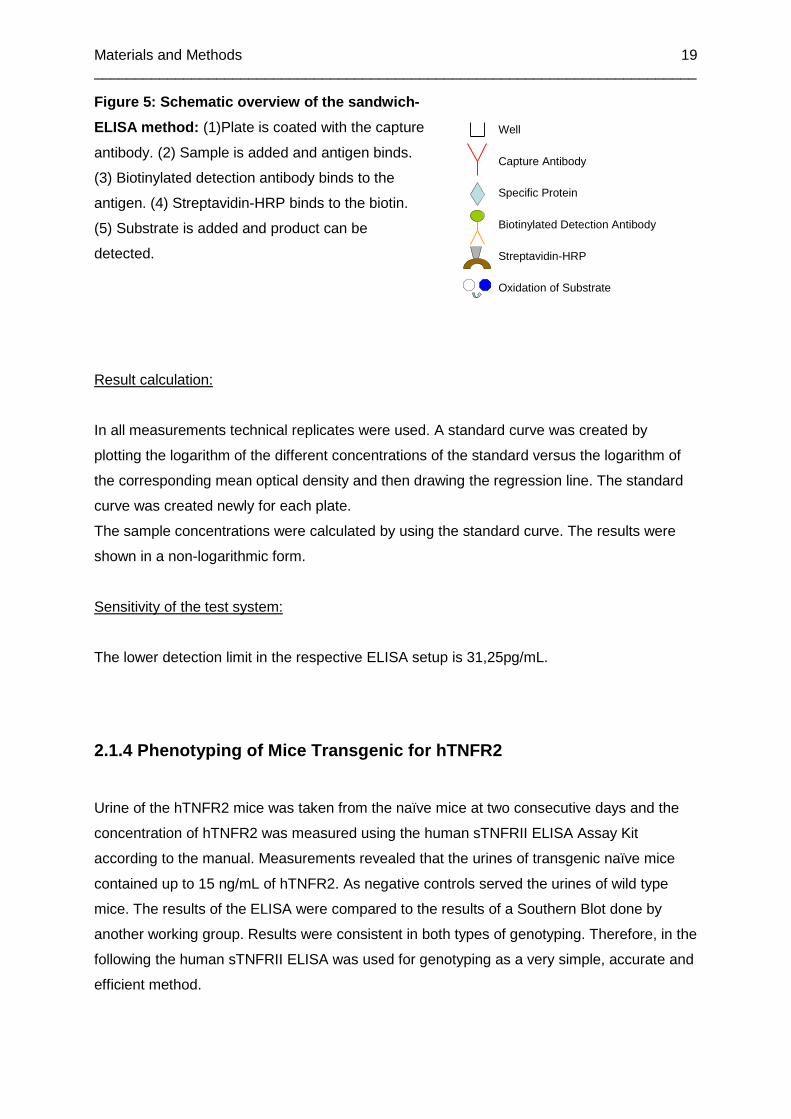
Oxidation of Substrate
Streptavidin-HRP
Biotinylated Detection Antibody
Specific Protein
Capture Antibody
Well
Figure 5: Schematic overview of the sandwich-
ELISA method: (1)Plate is coated with the capture
antibody. (2) Sample is added and antigen binds.
(3) Biotinylated detection antibody binds to the
antigen. (4) Streptavidin-HRP binds to the biotin.
(5) Substrate is added and product can be
detected.
Result calculation:
In all measurements technical replicates were used. A standard curve was created by
plotting the logarithm of the different concentrations of the standard versus the logarithm of
the corresponding mean optical density and then drawing the regression line. The standard
curve was created newly for each plate.
The sample concentrations were calculated by using the standard curve. The results were
shown in a non-logarithmic form.
Sensitivity of the test system:
The lower detection limit in the respective ELISA setup is 31,25pg/mL.
2.1.4 Phenotyping of Mice Transgenic for hTNFR2
Urine of the hTNFR2 mice was taken from the naïve mice at two consecutive days and the
concentration of hTNFR2 was measured using the human sTNFRII ELISA Assay Kit
according to the manual. Measurements revealed that the urines of transgenic naïve mice
contained up to 15 ng/mL of hTNFR2. As negative controls served the urines of wild type
mice. The results of the ELISA were compared to the results of a Southern Blot done by
another working group. Results were consistent in both types of genotyping. Therefore, in the
following the human sTNFRII ELISA was used for genotyping as a very simple, accurate and
efficient method.
Materials and Methods __________________________________________________________________________
20
2.1.5 Measurement of Creatinine in Serum and Urine
Creatinine levels were measured in urine and serum in order to quantify the extend of
glomerular damage of mice in the anti-GBM glomerulonephritis experiment.
The assay was carried out in accordance with the QuantiChromTM Creatinine Assay Kit
protocol given in the corresponding product data sheet of BioAssay Systems (Homepage of
Bio Assay Systems, see Reference).
Serum assay:
1. Standard was diluted in deionised water to a concentration of 2 mg/100mL. 30 µL of both
standard and undiluted serum were added in technical replicates to the wells of a 96-well
assay plate.
2. Working Reagent was prepared by mixing 100 µL Reagent A and 100 µL Reagent B per
well. 200 µL Working Reagent were quickly added to each well using a multi-channel
pipette.
3. The optical density was measured at 510nm after 1 min (OD1) and after 5 min (OD5).
Urine assay:
1. Standard was used in the stock concentration of 50mg/100mL. 5 µL of both standard and
undiluted urine were added in technical replicates to the wells of a 96-well assay plate.
2. Working Reagent was prepared by mixing 50 µL Reagent A and 50 µL Reagent B with
100µL tap water. 200 µL Working Reagent were quickly added to each well using a multi-
channel pipette.
3. The optical density was measured at 510nm after 1 min (OD1) and after 5 min (OD5).
Calculation:
The concentration of creatinine in the respective serum or urine samples was calculated
referring to the following formula:
Creatinine [mg/100mL] = (OD5Sample – OD1Sample)/(OD5Standard – OD1Stanard) * [Standard]
Materials and Methods __________________________________________________________________________
21
Sensitivity of the test system:
The lower detection limit in the respective creatinine assay setup is 2mg/100mL.
2.1.6 Fixation and Staining of Mouse Kidney Tissue
On day 15 after the induction of glomerulonephritis, blood was taken by retro-bulbar bleeding
of all mice, they were killed by cervical dislocation and both kidneys were removed.
Cryo-fixation and sectioning:
1. The right kidney of each mouse was put into mounting medium at room temperature, snap
frozen in liquid nitrogen immediately and then stored at -80°C.
2. The mounted and frozen kidneys were sectioned with a thickness of 5-10 µm, put on a
slide and were then fixed and dehydrated with cold acetone for 10 min at -20°C. After that
they had to be dried for 10 min at room temperature.
3. The whole cryosection had to be encircled with a hydrophobic emulsion using Dako Pen
and then dried again at room temperature for 15 min.
4. The slides were stored at -20°C until staining.
Paraffin fixation and sectioning:
1. The left kidney of each mouse was put into buffered formalin solution and fixed for 3
months at +8°C.
2. The kidneys were rinsed with tap water for 2-6 h and then dehydrated in ascending alcohol
series (20% Isopropanol, 40% Isopropanol, 60% Isopropanol, 80% Isopropanol, 90%
Isopropanol, twice 100% Isopropanol for 1 h each, 100% Isopropanol for 16 h).
3. Then they were put three times into Xylol for one hour before they were paraffinated in
Paraffin at 55-65°C for 4 h, 16h and again 4 h. The n they were embedded in hot paraffin
and sectioned with a thickness of 5-10 µm. The sections were applied to slides and ready
for staining.

Materials and Methods __________________________________________________________________________
22
H.E. Staining:
The H.E. staining method was used to gain an overview of the tissue structure.
1. The slides with paraffin sections were placed in a slide holder and first thermally
deparaffinized for 35 min at 72°C in the heating ca binet and then twice chemically
deparaffinized in Xylol for 10 min.
2. The slides were then dehydrated and the Xylol was washed out by putting them twice into
99% Ethanol for 1 min, twice into 96% Ethanol for 1 min and once into 70% Ethanol. After
that they were well rinsed with deionised water.
3. The slides were then put into Haematoxylin for 3 min, rinsed with deionised water, and put
into tap water for 5 min to allow the staining to develop.
4. The slides were fast dipped into 2% HCl-Ethanol for about 10 times, twice rinsed in tap
water for one minute, and finally rinsed with deionised water for 2 min. Excessive water
had to be removed by blotting the slide holder against paper towels.
5. The slides were then put into aqueous Eosin for a maximum of 10 sec and then shortly
rinsed in tap water.
6. After that the slides were shortly dipped into 70% Ethanol, then twice put into 96%
Ethanol for 5 sec, twice into 99% Ethanol for 1 min, and twice into Xylol for 3 min.
7. The slides were then cover slipped using Entellan™ and dried overnight.
8. As a result the nuclei should be stained blue or violet, cytoplasm, collagen, and
erythrocytes should be stained purple.
9. The slides were analyzed using the Leitz Diaplan microscope and pictures were taken
using the Color View™ camera.
Periodic Acid-Schiff Staining:
The PAS staining method was used to demonstrate the carbohydrates in the tissue and
therefore to visualize glomerular structures and lesions.
1. The slides with paraffin sections were placed in a slide holder and first thermally
deparaffinized for 35 min at 72°C in the heating ca binet and then twice chemically
deparaffinized in Xylol for 10 min.
2. The slides were then dehydrated and the Xylol was washed out by putting them twice into
99% Ethanol for 1 min, twice into 96% Ethanol for 1 min, and once into 70% Ethanol. After
that they were well rinsed with deionised water.
3. The slides were oxidized in Periodic Acid Solution for 5 min and then rinsed with deionised
water.
Materials and Methods __________________________________________________________________________
23
4. After that they were put into Schiff’s Reagent for 2 min and rinsed with tap water.
5. The slides were then counterstained in Haematoxylin for 2 min and again rinsed with
lukewarm tap water.
6. After that the slides were dipped twice into 70% Ethanol for 10 sec and then twice put into
96% Ethanol for another 10 sec, twice into 100% Propanol for 10 sec, and twice into Xylol
for 2 min.
7. The slides were then cover slipped using Entellan™ and dried overnight.
8. As a result glycogen and basement membranes should be stained purple, the nuclei blue,
proteins and cytoplasm should be stained yellow.
9. The slides were analyzed using the Leitz Diaplan and pictures were taken using the Color
View™ camera.
Staining of mTNFR2:
1. The stored slides with cryo sections were rehydrated in Wash Buffer for 10 min.
2. Then they were blocked with Block Buffer for 30 min at room temperature.
3. After that the slides had to be washed three times with Wash Buffer for 10 min.
4. During the washing the antibody dilution was prepared in Staining Buffer by diluting the
anti-mTNFR2 AF 647 antibody 1:100. The slides were then stained for 30 min at room
temperature.
5. The washing was repeated as described in step 3.
6. The slides were then covered with mounting medium and analyzed at the Zeiss Axio.
2.1.7 Statistics
Statistics were done by using a T-test. Significance was determined for values of p<0,05.
Materials and Methods __________________________________________________________________________
24
2.2 Materials
2.2.1 Chemicals
Acetone, Lot. No. 0688950 (Acros, New Jersey, USA)
BD OptEIA™ Substrate Reagent A&B, Cat. No. 51-2607 and 51-2606, Lot. No. 85847 and
91028 (Becton Dickinson, Heidelberg)
Bio RAD™ Protein Assay, Cat. No. 500-0006, Lot. No. 106819 (Bio RAD, München)
Bovine Serum Albumin (BSA), Cat. No. P06-1391050, Lot. No. 108 (PAN Biotech GmbH,
Aidenbach)
Complete Freund’s Adjuvans, Lot. No. 014K8927 9007-81-2 (Sigma Aldrich, Deisenhofen)
Crystal Mount™ Aqueous Mounting Medium (for staining) Lot. No. 025K1195 (Sigma Aldrich,
Deisenhofen)
Dako Pen™, Lot. No. 00040914 (Dako, Glostrup, DK)
Entellan™, Lot. No. 1007961.0500 (Merck, Darmstadt)
Eosin-G solution, 0.5% aqueous, Lot. No. X8832 (Roth, Karlsruhe)
Mayers Hämalaun, Lot. No. 109249250 (Merck, Darmstadt)
Mounting Medium Killik (for cryosections), Lot. No. 200830 (Bio Optica, Milano, I)
Periodic Acid Solution, Lot. No. 395-1 (Sigma Aldrich, Deisenhofen)
Schiff Reagent, Lot. No. 395-2 (Sigma Aldrich, Deisenhofen)
Streptavidin HRP, Part. No. 890803, Lot. No. AEM5407092 (R&D Systems, Wiesbaden)
Tween™ 20, Lot. No. 1337618 32807046 (Fluka, Buchs, CH)
Xylol, Lot. No. 9713.3 (Roth, Karlsruhe)
2.2.2 Consumables
Assay plates, used for ELISAS, 96-well BD Falcon™™, REF 353912, Lot.No. 012835
(Becton Dickinson, Heidelberg)
BD Falcon Microtest Tissue Culture plates, 96-well, REF 353075 (Becton Dickinson,
Heidelberg)
Cover slips (Marienfeld, Lauda-Königshofen)
Embedding caskets for paraffin fixation, Lot. No. 053761(Kabe, Nürnbrecht-Eisenroth)
Materials and Methods __________________________________________________________________________
25
Eppendorf tubes, 1.5 mL and 2 mL (Eppendorf Hamburg)
Microscope Slides (Engelbrecht, Edermünden)
Needles (Becton Dickinson, Heidelberg)
Pipettes (Sarstedt, Nürnbrecht)
Specimen Molds for cryo fixation: Cryomold Standard, Lot. No. 2-0114557 (DiaTec,
Hallstadt)
Syringes, 1 ml, 2 mL and 5 mL (Becton Dickinson, Heidelberg)
Tips, steril (Sarstedt, Nürnbrecht)
2.2.3 Instruments
Camera for microscopy: Color View™, Soft Imaging Systems (Olympus, Münster)
Centrifuge: Centrifuge 5418 (Eppendorf, Hamburg)
Microscopes: Leitz Diaplan™ (Leitz, Wetzlar)
Zeiss Axio™ (Zeiss, Göttingen)
Photometer: Bio Photometer (Eppendorf, Hamburg)
Reader for the ELISA plates: Molecular Devices Emax™ (MWG Biotech, Ebersberg)
Scales: Mettler™ PJ 400 (Mettler-Toledo, Giessen)
Sartorius™ CP 224S (Sartorius, Göttingen)
2.2.4 Buffer Solutions
Buffered Formalin Solution, pH 7.4, containing: 9.07 g KH2PO4
11.86 g Na2HPO4 soluted in 860 ml of
deionised water
140 ml Formalin (37% stock solution)
PBS, pH 7.3, containing: 137 mM NaCl
1.5 mM KH2 PO4
6.5 mM Na2HPO4
2.7 MM KCl
Reagent Diluent: 1% BSA in PBS
Wash Buffer: 0.05% Tween 20 in PBS
Materials and Methods __________________________________________________________________________
26
2.2.5 Assay Kits
BCA Protein Assay Kit™, Prod. No. 23225, Lot. No. IH114297B (Thermo Scientific,
Schwerte)
QuantiChrom™ Creatinine Assay Kit, Cat. No. DICT-500 (BioAssay Systems, Hayward,
USA)
ELISAs:
Mouse sTNF RII/ TNFRSF1B, Cat. No. DY426 (R&D Systems, Wiesbaden)
Mouse TNF-α/ TNFSF1A, Cat. No. DY410 (R&D Systems, Wiesbaden)
Human sTNF RII/ TNFRSF1B, Cat. No. DY726 (R&D Systems, Wiesbaden)
2.2.6 Antibodies
Chrom Pure Rabbit IgG, whole molecule, Code: 011-000-003, Lot. No. 79330 (Jackson
Immuno Research, Suffolk, UK)
Anti-mTNFR2 antibody: Hamster Anti Mouse CD120b: ALEXA 647, MCA2351A647, Batch
No. 0105 (Serotec, Düsseldorf)
2.2.7 Animals
The animals were kept according to the keeping regulations. They were exposed to a 12-
hour day and night rhythm and achieved a standard diet and tap water.
C57Bl/6, 8-10 weeks old (Charles River, Sulzfeld)
C57Bl/6, 7 months old (Charles River, Sulzfeld)
hp75tg (huTNFR2tg), 8-10 weeks old
(To generate hp75TNFRtg mice, full length hp75TNFR-cDNA was cloned into HindIII
and XhoI sites of an expression vector driven by the human ubiquitin C promotor. The
sequence of the cloned hp75TNFR construct was confirmed by automated sequencing.
The transgenic hp75TNFR fragment was released by using Ndel/KpnI digestion of the
Materials and Methods __________________________________________________________________________
27
vector and microinjected into pronuclei of fertilized oocytes prepared from FvB mice
using standard protocols. The offspring were screened for transgene integration by
DNA extraction from tail biopsies. The purified DNA was analyzed by Southern blot
analysis using a α-P32.dCTP-labeled hp75TNFR-cDNA fragment as probe. As positive
control, a part of the transgenic hp75TNFR fragment was removed by EcoRI digestion
of the vector (on the basis of Bäumel et al., 2008). Confirmed hp75tg founder mice
were backcrossed to the F2 and F3 generation with C57Bl/6 mice and genotypizised
both by Southern Blots and ELISAs, according to 2.1.4 Phenotyping of Mice Transgenic
for hTNFR2. Nontransgenic littermates served as control animals.)
C57Bl/6, 8 weeks old (Charles River, Sulzfeld)
P75-/-, 8-10 weeks old (Breed of the Department of Immunology)
P75-/-, 11-12 months old (Breed of the Department of Immunology)
CD45.1, 10 weeks old (Breed of the Department of Immunology)
2.2.8 Others
Ketanest-Xylazin, containing 0.9 mL Ketamin 5%, Lot. No. 72201-10 (WDT, Garbsen)
0.48 mL Xylazin 2%, Lot. No. 0056 (Serumwerk, Bernburg)
4.62 mL PBS, sterile
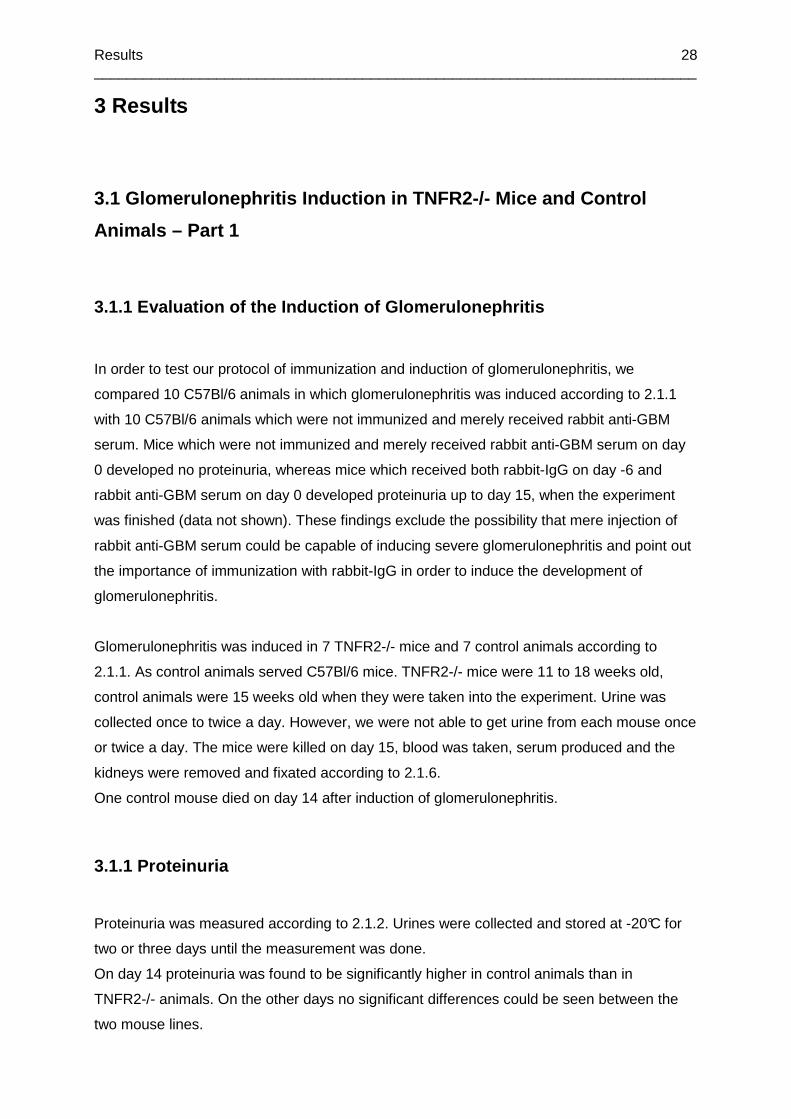
Results __________________________________________________________________________
28
3 Results
3.1 Glomerulonephritis Induction in TNFR2-/- Mice a nd Control
Animals – Part 1
3.1.1 Evaluation of the Induction of Glomerulonephr itis
In order to test our protocol of immunization and induction of glomerulonephritis, we
compared 10 C57Bl/6 animals in which glomerulonephritis was induced according to 2.1.1
with 10 C57Bl/6 animals which were not immunized and merely received rabbit anti-GBM
serum. Mice which were not immunized and merely received rabbit anti-GBM serum on day
0 developed no proteinuria, whereas mice which received both rabbit-IgG on day -6 and
rabbit anti-GBM serum on day 0 developed proteinuria up to day 15, when the experiment
was finished (data not shown). These findings exclude the possibility that mere injection of
rabbit anti-GBM serum could be capable of inducing severe glomerulonephritis and point out
the importance of immunization with rabbit-IgG in order to induce the development of
glomerulonephritis.
Glomerulonephritis was induced in 7 TNFR2-/- mice and 7 control animals according to
2.1.1. As control animals served C57Bl/6 mice. TNFR2-/- mice were 11 to 18 weeks old,
control animals were 15 weeks old when they were taken into the experiment. Urine was
collected once to twice a day. However, we were not able to get urine from each mouse once
or twice a day. The mice were killed on day 15, blood was taken, serum produced and the
kidneys were removed and fixated according to 2.1.6.
One control mouse died on day 14 after induction of glomerulonephritis.
3.1.1 Proteinuria
Proteinuria was measured according to 2.1.2. Urines were collected and stored at -20°C for
two or three days until the measurement was done.
On day 14 proteinuria was found to be significantly higher in control animals than in
TNFR2-/- animals. On the other days no significant differences could be seen between the
two mouse lines.
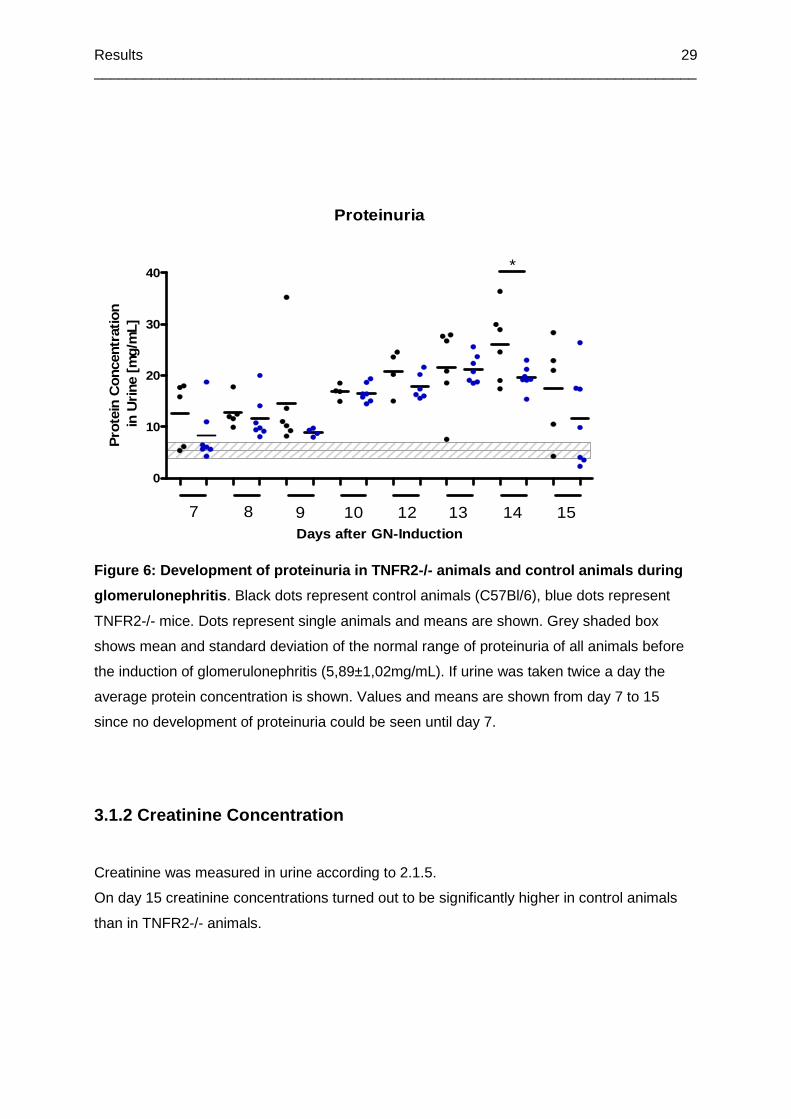
Results __________________________________________________________________________
29
Proteinuria
0
10
20
30
40
7 8 9 10 12 13 14 15Days after GN-Induction
Pro
tein
Con
cent
ratio
n in
Urin
e [m
g/m
L]
*
Figure 6: Development of proteinuria in TNFR2-/- an imals and control animals during
glomerulonephritis . Black dots represent control animals (C57Bl/6), blue dots represent
TNFR2-/- mice. Dots represent single animals and means are shown. Grey shaded box
shows mean and standard deviation of the normal range of proteinuria of all animals before
the induction of glomerulonephritis (5,89±1,02mg/mL). If urine was taken twice a day the
average protein concentration is shown. Values and means are shown from day 7 to 15
since no development of proteinuria could be seen until day 7.
3.1.2 Creatinine Concentration
Creatinine was measured in urine according to 2.1.5.
On day 15 creatinine concentrations turned out to be significantly higher in control animals
than in TNFR2-/- animals.
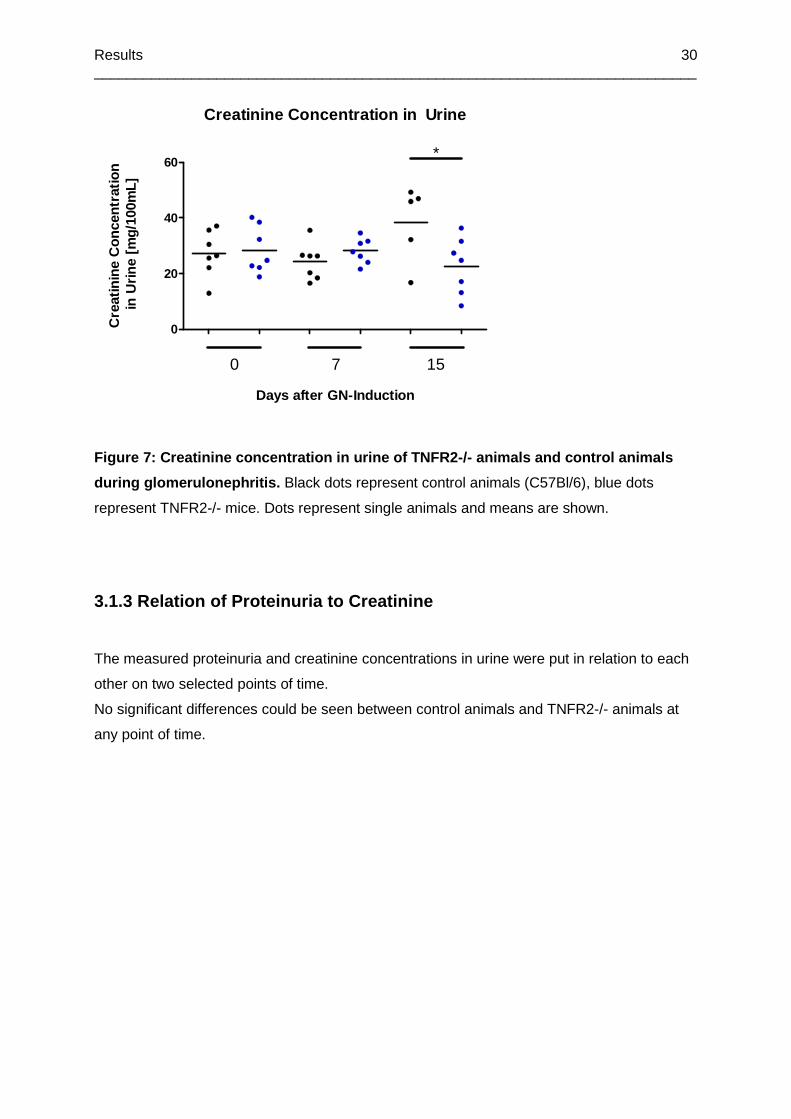
Results __________________________________________________________________________
30
Creatinine Concentration in Urine
0
20
40
60
0 7 15
*
Days after GN-Induction
Cre
atin
ine
Con
cent
ratio
n in
Urin
e [m
g/10
0mL]
Figure 7: Creatinine concentration in urine of TNFR 2-/- animals and control animals
during glomerulonephritis. Black dots represent control animals (C57Bl/6), blue dots
represent TNFR2-/- mice. Dots represent single animals and means are shown.
3.1.3 Relation of Proteinuria to Creatinine
The measured proteinuria and creatinine concentrations in urine were put in relation to each
other on two selected points of time.
No significant differences could be seen between control animals and TNFR2-/- animals at
any point of time.
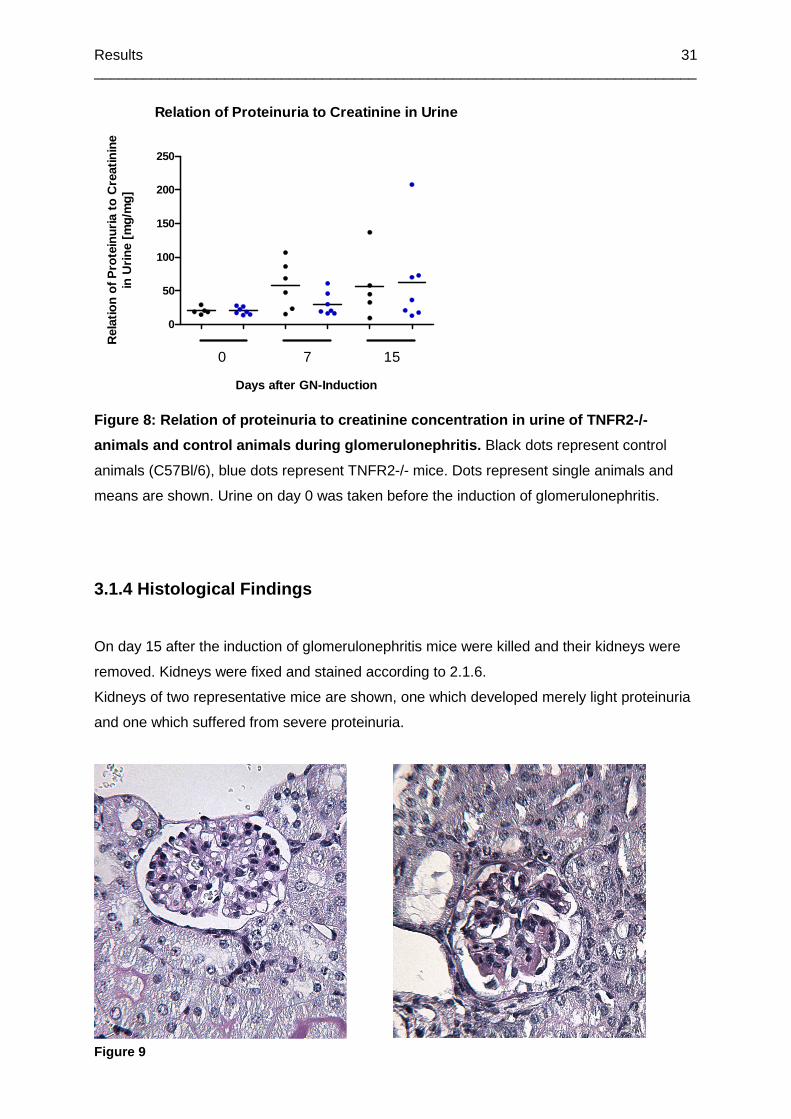
Results __________________________________________________________________________
31
Relation of Proteinuria to Creatinine in Urine
0
50
100
150
200
250
0 7 15
Days after GN-Induction
Rel
atio
n of
Pro
tein
uria
to
Cre
atin
ine
in U
rine
[mg/
mg]
Figure 8: Relation of proteinuria to creatinine con centration in urine of TNFR2-/-
animals and control animals during glomerulonephrit is. Black dots represent control
animals (C57Bl/6), blue dots represent TNFR2-/- mice. Dots represent single animals and
means are shown. Urine on day 0 was taken before the induction of glomerulonephritis.
3.1.4 Histological Findings
On day 15 after the induction of glomerulonephritis mice were killed and their kidneys were
removed. Kidneys were fixed and stained according to 2.1.6.
Kidneys of two representative mice are shown, one which developed merely light proteinuria
and one which suffered from severe proteinuria.
Figure 9

Results __________________________________________________________________________
32
Figure 9: Comparison of two glomeruli after the ind uction of glomerulonephritis.
On the left: PAS-stained mouse kidney. After the induction of glomerulonephritis the
respective mouse merely developed light proteinuria in a range between 5mg/mL and
12mg/mL. There are no lesions visible by light microscopy. Normal cellularity and no
clustering of cells can be seen. The glomerular capillaries show open lumens and the
Bowman’s capsule can be seen as a very narrow structure surrounding the glomerulum.
On the right: PAS-stained mouse kidney. After the induction of glomerulonephritis the
respective mouse developed severe proteinuria up to a concentration of 27mg/mL on day 15.
There are signs of mesangial hypercellularity and the formation of crescents can be seen.
The constitution of glomerular capillaries is partially broken up and the lumina can not be
identified. These findings suggest severe glomerular damage in the course of crescentic or
mesangoproliferative glomerulonephritis and correlate with the severe proteinuria.
3.2 Glomerulonephritis Induction in TNFR2-/- Mice a nd Control
Animals – Part 2
Glomerulonephritis was induced in 8 TNFR2-/- mice and 7 control animals according to 2.1.1
using the respective rabbit anti-GBM serum (see 2.1.1). As control animals served C57Bl/6
mice. TNFR2-/- mice were 11 to 12 months old, control animals were 7 months old when
they were taken into the experiment. On day -18 before the induction of glomerulonephritis,
all animals were moved from a keeping facility with a very high standard of hygiene to a
facility with a lower standard.
Urine was collected once a day. The mice were killed on day 13. One TNFR2-/- mice and
one control animal died immediately after the injection of the rabbit anti-GBM serum. Two
TNFR2-/- mice and 5 control animals died during glomerulonephritis.
3.2.1 Proteinuria
Proteinuria was measured according to 2.1.2. Urines were collected and stored at -20°C for
the time of the experiment until the measurement was done on day 13 after the induction of
glomerulonephritis.
On day 2 to 4 after the induction of glomerulonephritis control animals showed an increase in
protein levels in urine, which, on day 3, were found to be significantly higher than in TNFR2-/-
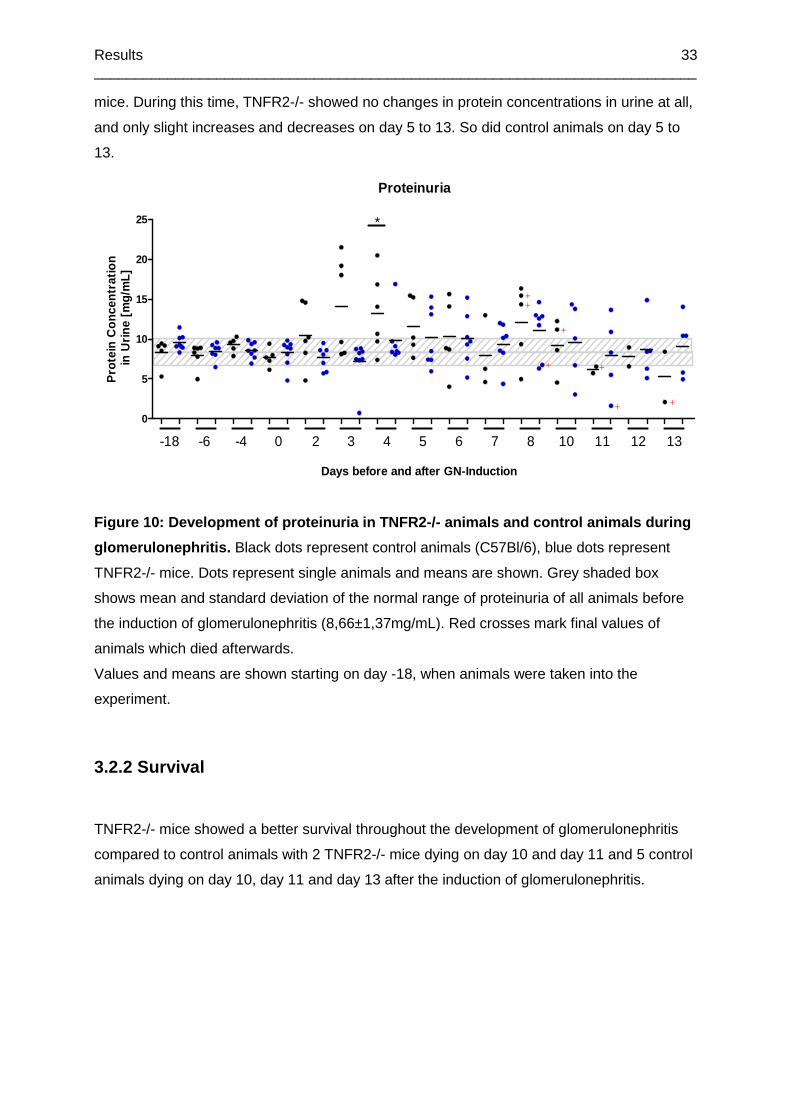
Results __________________________________________________________________________
33
mice. During this time, TNFR2-/- showed no changes in protein concentrations in urine at all,
and only slight increases and decreases on day 5 to 13. So did control animals on day 5 to
13.
Proteinuria
0
5
10
15
20
25 *
++
+
+
+
++
-18 -6 -4 0 2 3 4 5 6 7 8 10 11 12 13
Days before and after GN-Induction
Pro
tein
Con
cent
ratio
n in
Urin
e [m
g/m
L]
Figure 10: Development of proteinuria in TNFR2-/- a nimals and control animals during
glomerulonephritis. Black dots represent control animals (C57Bl/6), blue dots represent
TNFR2-/- mice. Dots represent single animals and means are shown. Grey shaded box
shows mean and standard deviation of the normal range of proteinuria of all animals before
the induction of glomerulonephritis (8,66±1,37mg/mL). Red crosses mark final values of
animals which died afterwards.
Values and means are shown starting on day -18, when animals were taken into the
experiment.
3.2.2 Survival
TNFR2-/- mice showed a better survival throughout the development of glomerulonephritis
compared to control animals with 2 TNFR2-/- mice dying on day 10 and day 11 and 5 control
animals dying on day 10, day 11 and day 13 after the induction of glomerulonephritis.

Results __________________________________________________________________________
34
Survival
0 2 4 6 8 10 12 140
25
50
75
100ControlTNFR2-/-
Days after GN-Induction
Per
cent
sur
viva
l
Figure 11: Survival of TNFR2-/- mice and control an imals during glomerulonephritis.
Black line represents control animals, blue line represents TNFR2-/- mice.
3.2 Glomerulonephritis Induction in hTNFR2tg Mice a nd Control
Animals – Part 1
Glomerulonephritis was induced in 13 hTNFR2tg mice and 9 control animals according to
2.1.1. As control animals served littermates of the hTNFR2tg mice. All mice were 12 weeks
old when they were taken into the experiment. Urine was collected once to twice a day.
However, we were not able to get urine from each mouse once or twice a day. The mice
were killed on day 14, blood was taken, serum produced and the kidneys were removed and
fixated according to 2.1.6.
3.2.1 Proteinuria
Proteinuria was measured according to 2.1.2. Urines were collected and stored at -20°C for
two or three days until the measurement was done.
No significant difference in proteinuria could be seen between control animals and hTNFR2tg
animals at any point of time.
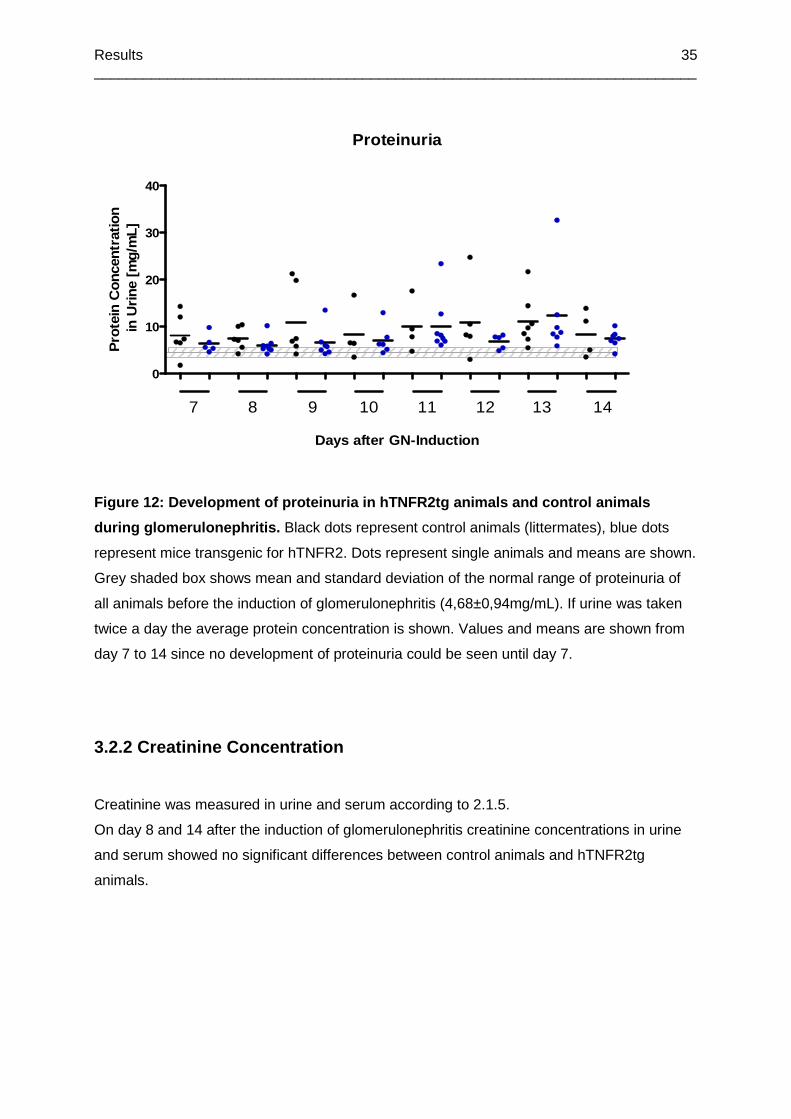
Results __________________________________________________________________________
35
Proteinuria
0
10
20
30
40
7 8 9 10 11 12 13 14
Days after GN-Induction
Pro
tein
Con
cent
ratio
n in
Urin
e [m
g/m
L]
Figure 12: Development of proteinuria in hTNFR2tg a nimals and control animals
during glomerulonephritis. Black dots represent control animals (littermates), blue dots
represent mice transgenic for hTNFR2. Dots represent single animals and means are shown.
Grey shaded box shows mean and standard deviation of the normal range of proteinuria of
all animals before the induction of glomerulonephritis (4,68±0,94mg/mL). If urine was taken
twice a day the average protein concentration is shown. Values and means are shown from
day 7 to 14 since no development of proteinuria could be seen until day 7.
3.2.2 Creatinine Concentration
Creatinine was measured in urine and serum according to 2.1.5.
On day 8 and 14 after the induction of glomerulonephritis creatinine concentrations in urine
and serum showed no significant differences between control animals and hTNFR2tg
animals.
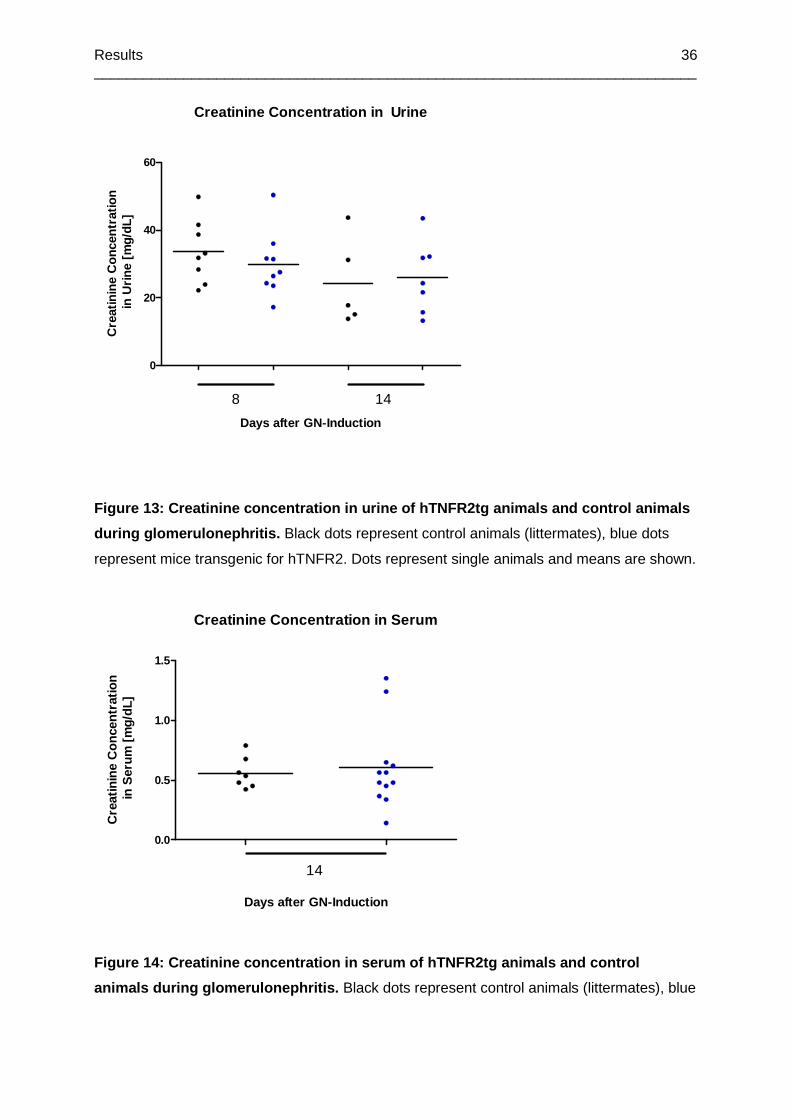
Results __________________________________________________________________________
36
Creatinine Concentration in Urine
0
20
40
60
8 14
Days after GN-Induction
Cre
atin
ine
Con
cent
ratio
n in
Urin
e [m
g/dL
]
Figure 13: Creatinine concentration in urine of hTNFR2tg anima ls and control animals
during glomerulonephritis. Black dots represent control animals (littermates), blue dots
represent mice transgenic for hTNFR2. Dots represent single animals and means are shown.
Creatinine Concentration in Serum
0.0
0.5
1.0
1.5
14
Days after GN-Induction
Cre
atin
ine
Con
cent
ratio
n in
Ser
um [
mg/
dL]
Figure 14: Creatinine concentration in serum of hTN FR2tg animals and control
animals during glomerulonephritis. Black dots represent control animals (littermates), blue
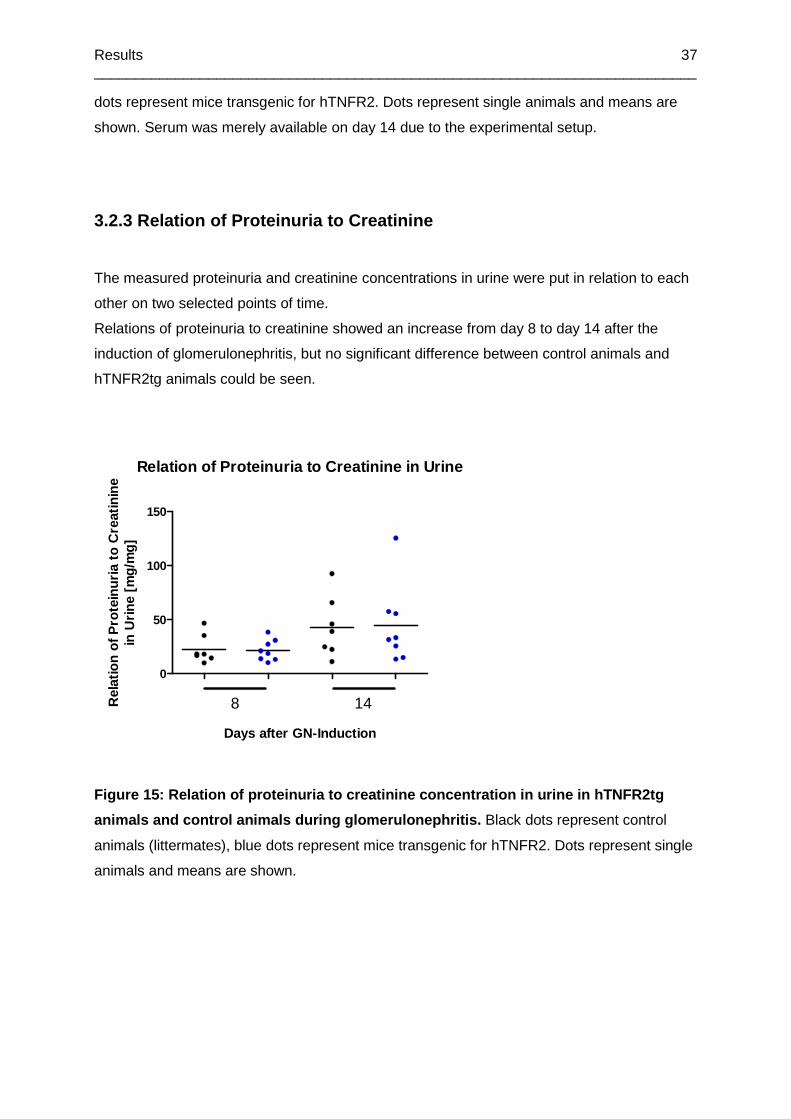
Results __________________________________________________________________________
37
dots represent mice transgenic for hTNFR2. Dots represent single animals and means are
shown. Serum was merely available on day 14 due to the experimental setup.
3.2.3 Relation of Proteinuria to Creatinine
The measured proteinuria and creatinine concentrations in urine were put in relation to each
other on two selected points of time.
Relations of proteinuria to creatinine showed an increase from day 8 to day 14 after the
induction of glomerulonephritis, but no significant difference between control animals and
hTNFR2tg animals could be seen.
Relation of Proteinuria to Creatinine in Urine
0
50
100
150
8 14
Days after GN-Induction
Rel
atio
n of
Pro
tein
uria
to
Cre
atin
ine
in U
rine
[mg/
mg]
Figure 15: Relation of proteinuria to creatinine concentration in urine in hTNFR2tg
animals and control animals during glomerulonephrit is. Black dots represent control
animals (littermates), blue dots represent mice transgenic for hTNFR2. Dots represent single
animals and means are shown.
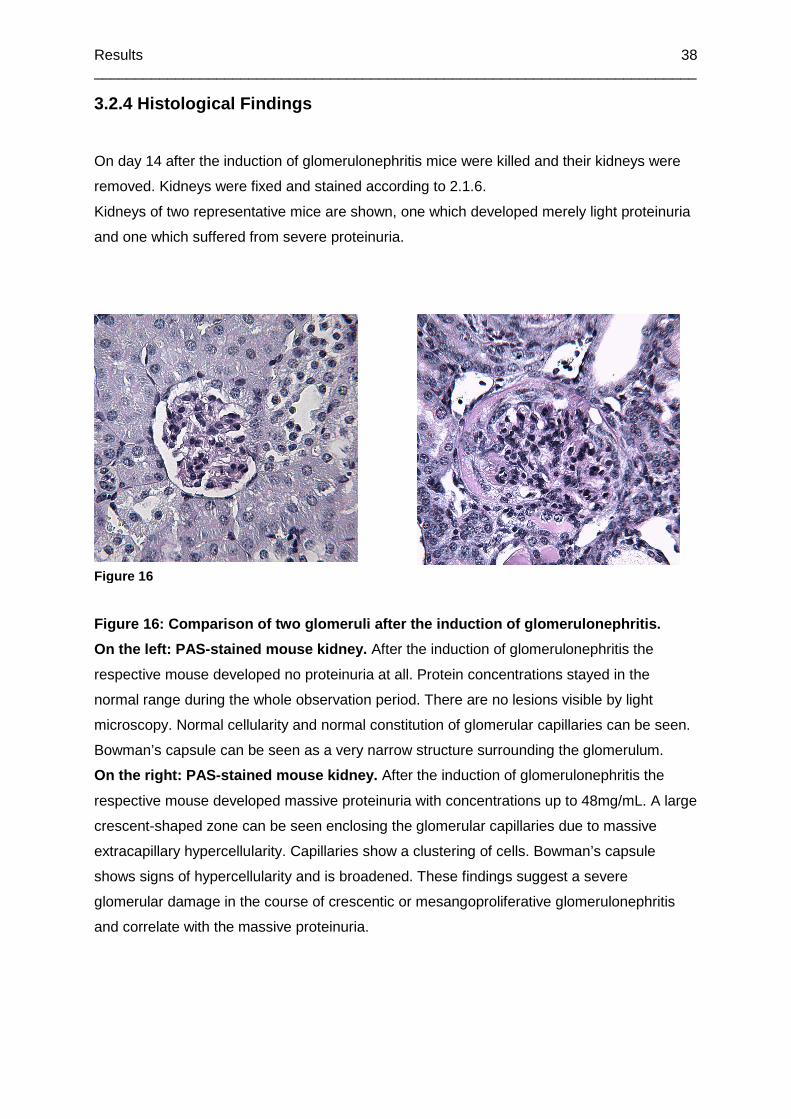
Results __________________________________________________________________________
38
3.2.4 Histological Findings
On day 14 after the induction of glomerulonephritis mice were killed and their kidneys were
removed. Kidneys were fixed and stained according to 2.1.6.
Kidneys of two representative mice are shown, one which developed merely light proteinuria
and one which suffered from severe proteinuria.
Figure 16: Comparison of two glomeruli after the in duction of glomerulonephritis.
On the left: PAS-stained mouse kidney. After the induction of glomerulonephritis the
respective mouse developed no proteinuria at all. Protein concentrations stayed in the
normal range during the whole observation period. There are no lesions visible by light
microscopy. Normal cellularity and normal constitution of glomerular capillaries can be seen.
Bowman’s capsule can be seen as a very narrow structure surrounding the glomerulum.
On the right: PAS-stained mouse kidney. After the induction of glomerulonephritis the
respective mouse developed massive proteinuria with concentrations up to 48mg/mL. A large
crescent-shaped zone can be seen enclosing the glomerular capillaries due to massive
extracapillary hypercellularity. Capillaries show a clustering of cells. Bowman’s capsule
shows signs of hypercellularity and is broadened. These findings suggest a severe
glomerular damage in the course of crescentic or mesangoproliferative glomerulonephritis
and correlate with the massive proteinuria.
Figure 16

Results __________________________________________________________________________
39
3.3 Glomerulonephritis Induction in hTNFR2tg Mice a nd Control
Animals – Part 2
The experiment as described in 3.2 was repeated with younger mice. Glomerulonephritis
was induced in 12 hTNFR2tg mice and 12 control animals according to 2.1.1. As control
animals served littermates of the hTNFR2tg mice. All mice were 8 weeks old when they were
taken into the experiment. Urine was collected once to twice a day. However, we were not
able to get urine from each mouse once or twice a day. The mice were killed on day 15,
blood was taken, serum produced and the kidneys were removed and fixed according to
2.1.6.
One of the littermates died on day 9 after induction of glomerulonephritis, one of the
hTNFR2tg mice on day 11. Two littermates and one hTNFR2tg mice were killed on day 12
after they developed ascites.
3.3.1 Proteinuria
Proteinuria was measured according to 2.1.2. Urines were collected and stored at -20°C for
two or three days until the measurement was done.
No significant difference in proteinuria could be seen between control animals and hTNFR2tg
animals at any point of time.
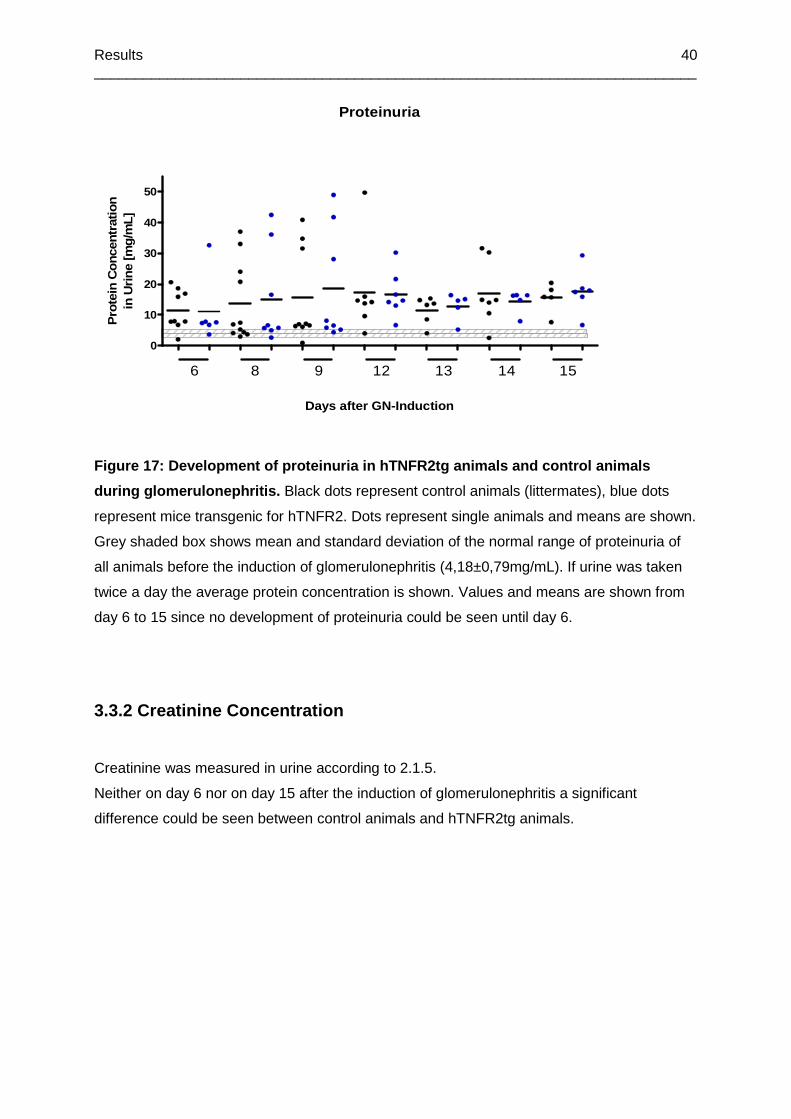
Results __________________________________________________________________________
40
Proteinuria
0
10
20
30
40
50
6 8 9 12 13 14 15
Days after GN-Induction
Pro
tein
Con
cent
ratio
nin
Urin
e [m
g/m
L]
Figure 17: Development of proteinuria in hTNFR2tg a nimals and control animals
during glomerulonephritis. Black dots represent control animals (littermates), blue dots
represent mice transgenic for hTNFR2. Dots represent single animals and means are shown.
Grey shaded box shows mean and standard deviation of the normal range of proteinuria of
all animals before the induction of glomerulonephritis (4,18±0,79mg/mL). If urine was taken
twice a day the average protein concentration is shown. Values and means are shown from
day 6 to 15 since no development of proteinuria could be seen until day 6.
3.3.2 Creatinine Concentration
Creatinine was measured in urine according to 2.1.5.
Neither on day 6 nor on day 15 after the induction of glomerulonephritis a significant
difference could be seen between control animals and hTNFR2tg animals.
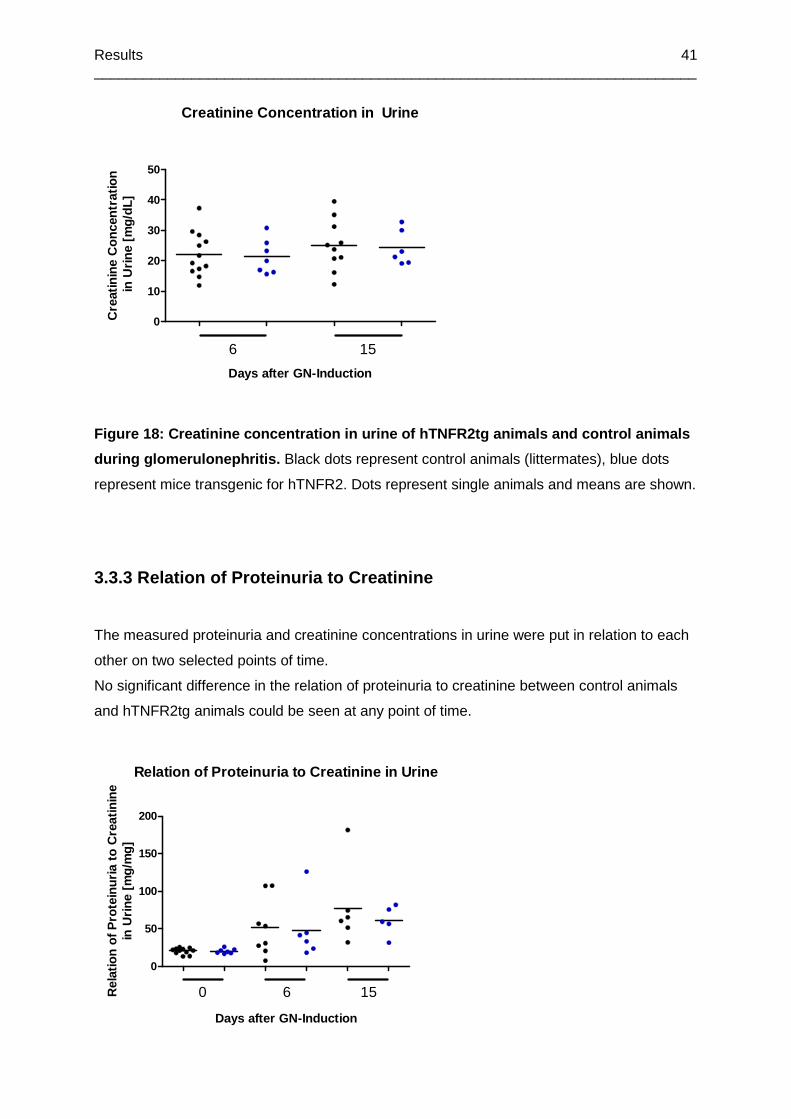
Results __________________________________________________________________________
41
Creatinine Concentration in Urine
0
10
20
30
40
50
6 15
Days after GN-Induction
Cre
atin
ine
Con
cent
ratio
n in
Urin
e [m
g/dL
]
Figure 18: Creatinine concentration in urine of hTNFR2tg anima ls and control animals
during glomerulonephritis. Black dots represent control animals (littermates), blue dots
represent mice transgenic for hTNFR2. Dots represent single animals and means are shown.
3.3.3 Relation of Proteinuria to Creatinine
The measured proteinuria and creatinine concentrations in urine were put in relation to each
other on two selected points of time.
No significant difference in the relation of proteinuria to creatinine between control animals
and hTNFR2tg animals could be seen at any point of time.
Relation of Proteinuria to Creatinine in Urine
0
50
100
150
200
0 6 15
Days after GN-Induction
Rel
atio
n of
Pro
tein
uria
to
Cre
atin
ine
in U
rine
[mg/
mg]

Results __________________________________________________________________________
42
Figure 19: Relation of proteinuria to creatinine co ncentration in urine of hTNFR2tg
animals and control animals during glomerulonephrit is. Black dots represent control
animals (littermates), blue dots represent mice transgenic for hTNFR2. Dots represent single
animals and means are shown. Urine on day 0 was taken before the induction of
glomerulonephritis.
3.3.4 mTNFR2 Concentration
In order to see whether secretion of mTNFR2 is changing during glomerulonephritis the
concentration of mTNFR2 was measured in urine and serum during glomerulonephritis
according to 2.1.3.
No significant difference in mTNFR2 concentrations both in urine and serum could be seen
between hTNFR2tg animals and control animals after the induction of glomerulonephritis.
Concentrations of mTNFR2 turned out to be higher in urine than in serum.
mTNFR2 Concentration in Urine
0
10
20
30
0 6 15
Days after GN-Induction
mTN
FR
2 C
once
ntra
tion
in U
rine
[ng/
mL]
Figure 20: mTNFR2 concentration in urine of hTNFR2t g animals and control animals
during glomerulonephritis. Black dots represent control animals (littermates), blue dots
represent mice transgenic for hTNFR2. Dots represent single animals and means are shown.
Urine on day 0 was taken before the induction of glomerulonephritis.
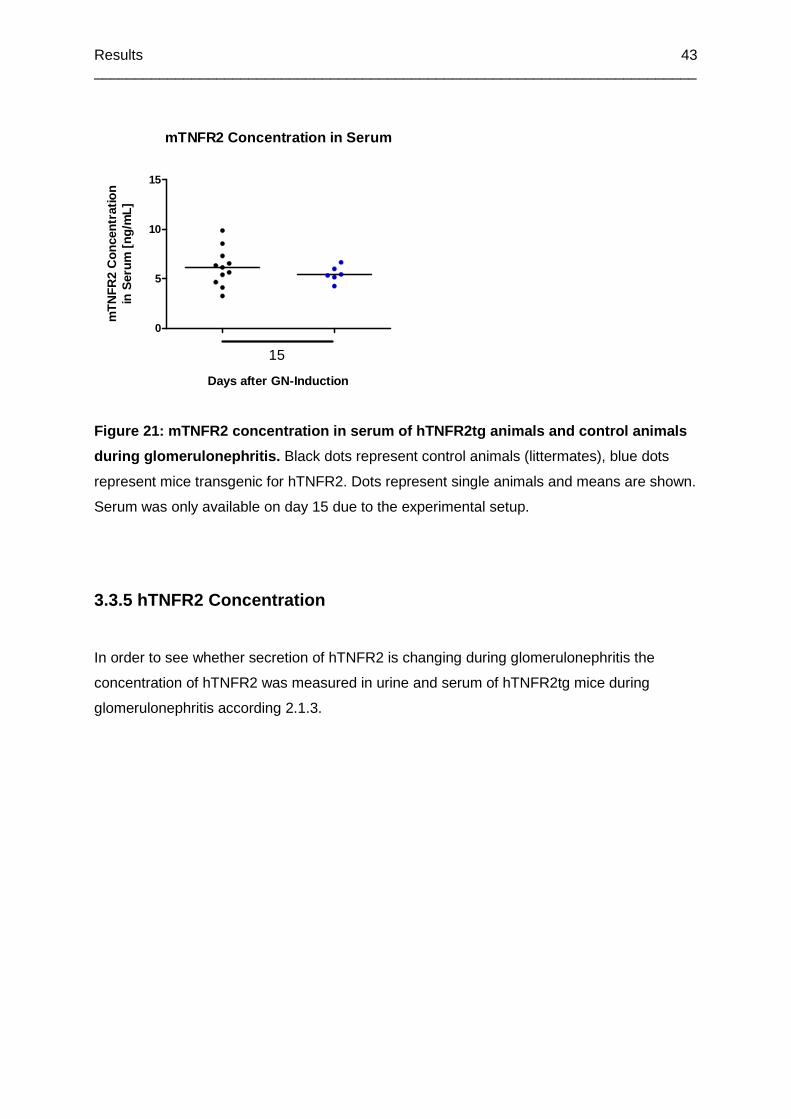
Results __________________________________________________________________________
43
mTNFR2 Concentration in Serum
0
5
10
15
15
Days after GN-Induction
mT
NFR
2 C
once
ntra
tion
in S
erum
[ng
/mL]
Figure 21: mTNFR2 concentration in serum of hTNFR2t g animals and control animals
during glomerulonephritis. Black dots represent control animals (littermates), blue dots
represent mice transgenic for hTNFR2. Dots represent single animals and means are shown.
Serum was only available on day 15 due to the experimental setup.
3.3.5 hTNFR2 Concentration
In order to see whether secretion of hTNFR2 is changing during glomerulonephritis the
concentration of hTNFR2 was measured in urine and serum of hTNFR2tg mice during
glomerulonephritis according 2.1.3.
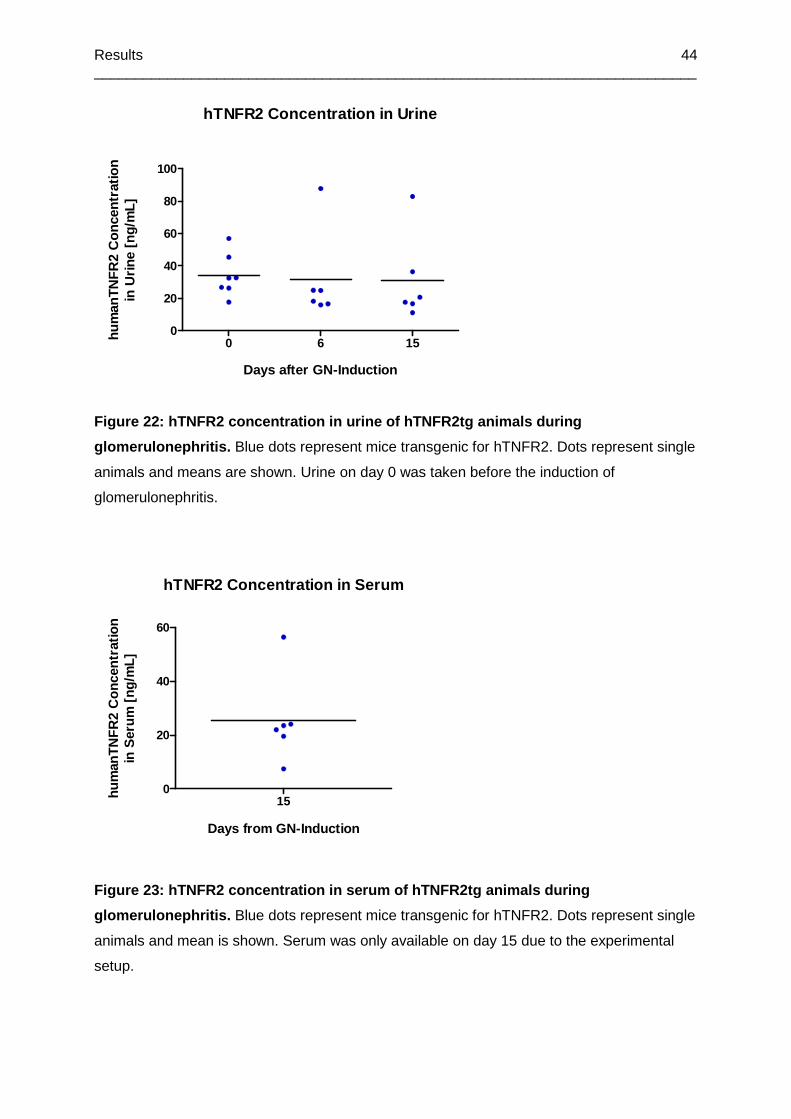
Results __________________________________________________________________________
44
hTNFR2 Concentration in Urine
0 6 150
20
40
60
80
100
Days after GN-Induction
hum
anTN
FR
2 C
once
ntra
tion
in U
rine
[ng/
mL]
Figure 22: hTNFR2 concentration in urine of hTNFR2t g animals during
glomerulonephritis. Blue dots represent mice transgenic for hTNFR2. Dots represent single
animals and means are shown. Urine on day 0 was taken before the induction of
glomerulonephritis.
hTNFR2 Concentration in Serum
150
20
40
60
Days from GN-Induction
hum
anTN
FR
2 C
once
ntra
tion
in S
erum
[ng
/mL]
Figure 23: hTNFR2 concentration in serum of hTNFR2t g animals during
glomerulonephritis. Blue dots represent mice transgenic for hTNFR2. Dots represent single
animals and mean is shown. Serum was only available on day 15 due to the experimental
setup.

Results __________________________________________________________________________
45
3.3.6 Histological Findings
On day 15 after the induction of glomerulonephritis mice were killed and their kidneys were
removed. Kidneys were fixed and stained according to 2.1.6.
Kidneys of two representative mice are shown, left kidney was taken from a mouse which
developed merely light proteinuria and right kidney was taken from a mouse which suffered
from severe proteinuria.
Figure 24: Comparison of two glomeruli after the in duction of glomerulonephritis.
On the left: PAS-stained mouse kidney. After the induction of glomerulonephritis the
respective mouse developed no proteinuria at all. Protein concentrations stayed in the
normal range during the whole observation period. There are no lesions visible by light
microscopy. Glomerular capillaries show normal lumina and no signs of hypercellularity can
be seen. Bowman’s capsule can be seen as a narrow structure surrounding the glomerulum.
On the right: PAS-stained mouse kidney. After the induction of glomerulonephritis the
respective mouse developed massive proteinuria with concentrations up to 49mg/mL. The
formation of crescents can be seen as a sign of massive mesangial hypercellularity. The
constitution of glomerular capillaries is mainly broken up and no capillary lumens can be
identified. These findings suggest a severe glomerular damage and correlate with the
massive proteinuria.
Figure 24
Results __________________________________________________________________________
46
3.4 mTNFR2 Concentration in Urine With and Without Induction of
Glomerulonephritis
In order to determine whether mice already secrete mTNFR2 with the urine after the
immunisation with rabbit-IgG or merely after the induction of glomerulonephritis, we
performed two experiments. In one experiment 9 CD45.1 mice were used which were 10
weeks old when they were taken into the experiment. The mice were immunised and
glomerulonephritis was induced according to 2.1.1. The other experiment used 6 CD45.1
mice which were 7 weeks old when they were taken into the experiment. These mice were
only immunised on day 0 according to 2.1.1 but got no further treatment. Mice were killed on
day 14 or 15 respectively.
Concentration of mTNFR2 in urine was measured according to 2.1.3.
In the first experiment concentrations of mTNFR2 increased significantly until day 12 with the
exception of day -3 and day -1.
In the second experiment concentrations of mTNFR2 increased significantly on day 1, day 2,
day 7, day 9, and day 12. Furthermore, a significant increase could be seen from day 1 to
day 2 and from day 6 to day 7.

Results __________________________________________________________________________
47
mTNFR2 Concentration in Urine
-6 -5 -4 -3 -2 -1 0 2 4 6 8 12 14 150
20
40
60
80
100
120 **
**
**
**
*
Days before or after GN-Induction
mT
NF
R2
Con
cent
ratio
nin
Urin
e [n
g/m
L]
Figure 25: mTNFR2 concentration in urine of CD45.1 mice during glomerulonephritis.
Mice were immunised on day -6, urine on day -6 was taken before the immunisation. Values
on day -6 represent base levels without any treatment of the mice. Glomerulonephritis was
induced on day 0. Dots represent single animals and means are shown.
mTNFR2 Concentration in Urine
0 1 2 4 5 6 7 8 9 11 12 13 140
50
100
150
200
*
*
**
**
*
Days after Immunisation
mTN
FR2
Con
cent
ratio
nin
Urin
e [n
g/m
L]
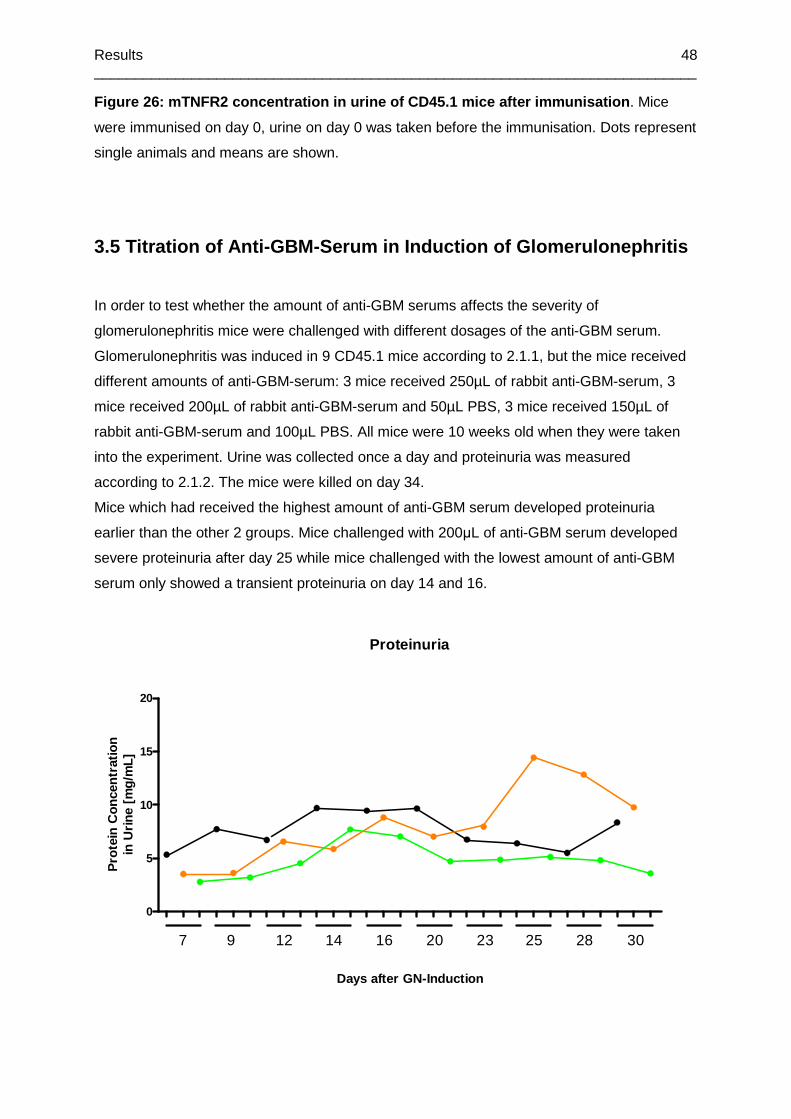
Results __________________________________________________________________________
48
Figure 26: mTNFR2 concentration in urine of CD45.1 mice after immunisation . Mice
were immunised on day 0, urine on day 0 was taken before the immunisation. Dots represent
single animals and means are shown.
3.5 Titration of Anti-GBM-Serum in Induction of Glo merulonephritis
In order to test whether the amount of anti-GBM serums affects the severity of
glomerulonephritis mice were challenged with different dosages of the anti-GBM serum.
Glomerulonephritis was induced in 9 CD45.1 mice according to 2.1.1, but the mice received
different amounts of anti-GBM-serum: 3 mice received 250µL of rabbit anti-GBM-serum, 3
mice received 200µL of rabbit anti-GBM-serum and 50µL PBS, 3 mice received 150µL of
rabbit anti-GBM-serum and 100µL PBS. All mice were 10 weeks old when they were taken
into the experiment. Urine was collected once a day and proteinuria was measured
according to 2.1.2. The mice were killed on day 34.
Mice which had received the highest amount of anti-GBM serum developed proteinuria
earlier than the other 2 groups. Mice challenged with 200µL of anti-GBM serum developed
severe proteinuria after day 25 while mice challenged with the lowest amount of anti-GBM
serum only showed a transient proteinuria on day 14 and 16.
Proteinuria
0
5
10
15
20
7 9 12 14 16 20 23 25 28 30
Days after GN-Induction
Pro
tein
Con
cent
ratio
nin
Urin
e [m
g/m
L]

Results __________________________________________________________________________
49
Figure 27: Development of proteinuria in CD45.1 mic e during glomerulonephritis. Mice
received different amounts of rabbit anti-GBM-serum: black dots represent mice which
received 250µL, orange dots represent mice which received 200µL, green dots represent
mice which received 150µL. Dots represent means of 3 animals in each case. Values are
shown from day 7 to 30 since no development of proteinuria could be seen until day 7.
3.6 Induction of Glomerulonephritis after pretreatm ent with E. coli
LPS and humanTNF
Glomerulonephritis was induced in 30 C57Bl/6 mice according to 2.1.1. Deviant from the
standard operating procedure of immunization and glomerulonephritis induction described in
2.1.1, mice were pretreated before the injection of rabbit anti-GBM serum on day 0, in order
to investigate the influence of precursory activation of the immune system on the
development of glomerulonephritis. Pretreatment was accomplished on day -1 according to
the following: 10 animals received 20µg E. coli LPS in 200µL PBS, 10 animals received 20µg
humanTNF 200µL PBS and 10 animals merely received 200µL PBS and, therefore, served
as control group.
Animals were 6 weeks old when they were taken into the experiment. Urine was collected
once a day, whereas it was not possible to get urine from every mouse on every day. The
mice were killed on day 15.
4 animals of the group which received E. coli LPS died during glomerulonephritis.
3.6.1 Proteinuria
Proteinuria was measured according to 2.1.2. Urines were collected and stored at -20°C for
the time of the experiment until the measurement was done after the experiment was
finished. Animals which received E. coli LPS developed high amounts of proteinuria during
the development of glomerulonephritis, with an immediate increase on day 1. Mice which
received humanTNF also showed increased levels of proteinuria up from day 1 but levels
were lower compared to those of the LPS group. Control animals developed merely slight
proteinuria throughout the experiment.
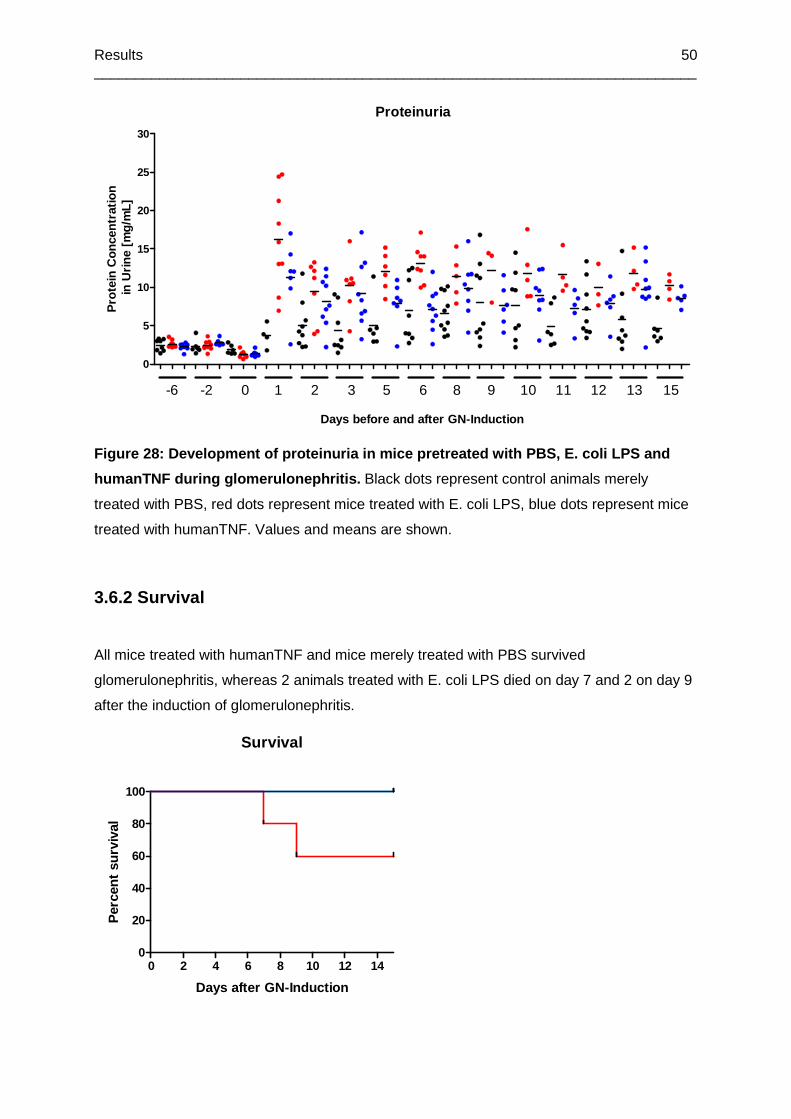
Results __________________________________________________________________________
50
Proteinuria
0
5
10
15
20
25
30
-6 -2 0 1 2 3 5 6 8 9 10 11 12 13 15
Days before and after GN-Induction
Pro
tein
Con
cent
ratio
n in
Urin
e [m
g/m
L]
Figure 28: Development of proteinuria in mice pretr eated with PBS, E. coli LPS and
humanTNF during glomerulonephritis. Black dots represent control animals merely
treated with PBS, red dots represent mice treated with E. coli LPS, blue dots represent mice
treated with humanTNF. Values and means are shown.
3.6.2 Survival
All mice treated with humanTNF and mice merely treated with PBS survived
glomerulonephritis, whereas 2 animals treated with E. coli LPS died on day 7 and 2 on day 9
after the induction of glomerulonephritis.
Survival
0 2 4 6 8 10 12 140
20
40
60
80
100
Days after GN-Induction
Per
cent
sur
viva
l
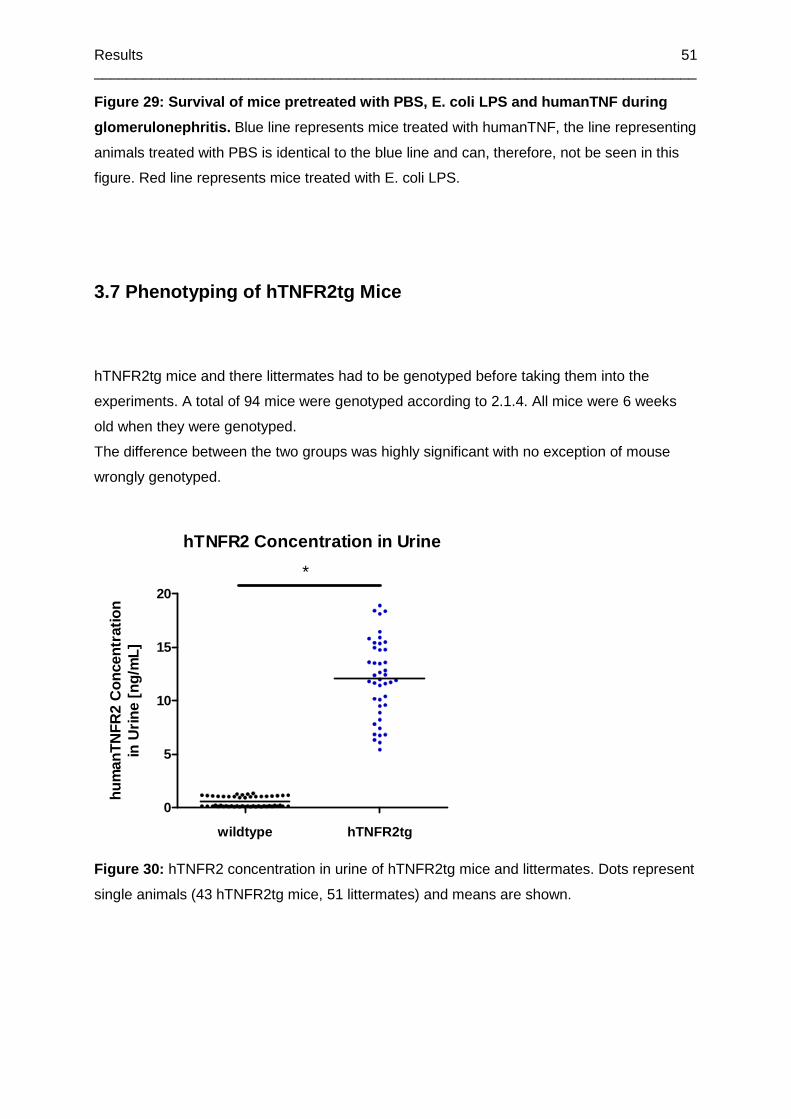
Results __________________________________________________________________________
51
Figure 29: Survival of mice pretreated with PBS, E. coli LPS and humanTNF during
glomerulonephritis. Blue line represents mice treated with humanTNF, the line representing
animals treated with PBS is identical to the blue line and can, therefore, not be seen in this
figure. Red line represents mice treated with E. coli LPS.
3.7 Phenotyping of hTNFR2tg Mice
hTNFR2tg mice and there littermates had to be genotyped before taking them into the
experiments. A total of 94 mice were genotyped according to 2.1.4. All mice were 6 weeks
old when they were genotyped.
The difference between the two groups was highly significant with no exception of mouse
wrongly genotyped.
hTNFR2 Concentration in Urine
wildtype hTNFR2tg
0
5
10
15
20
hum
anT
NF
R2
Con
cent
ratio
nin
Urin
e [n
g/m
L]
*
Figure 30: hTNFR2 concentration in urine of hTNFR2tg mice and littermates. Dots represent
single animals (43 hTNFR2tg mice, 51 littermates) and means are shown.
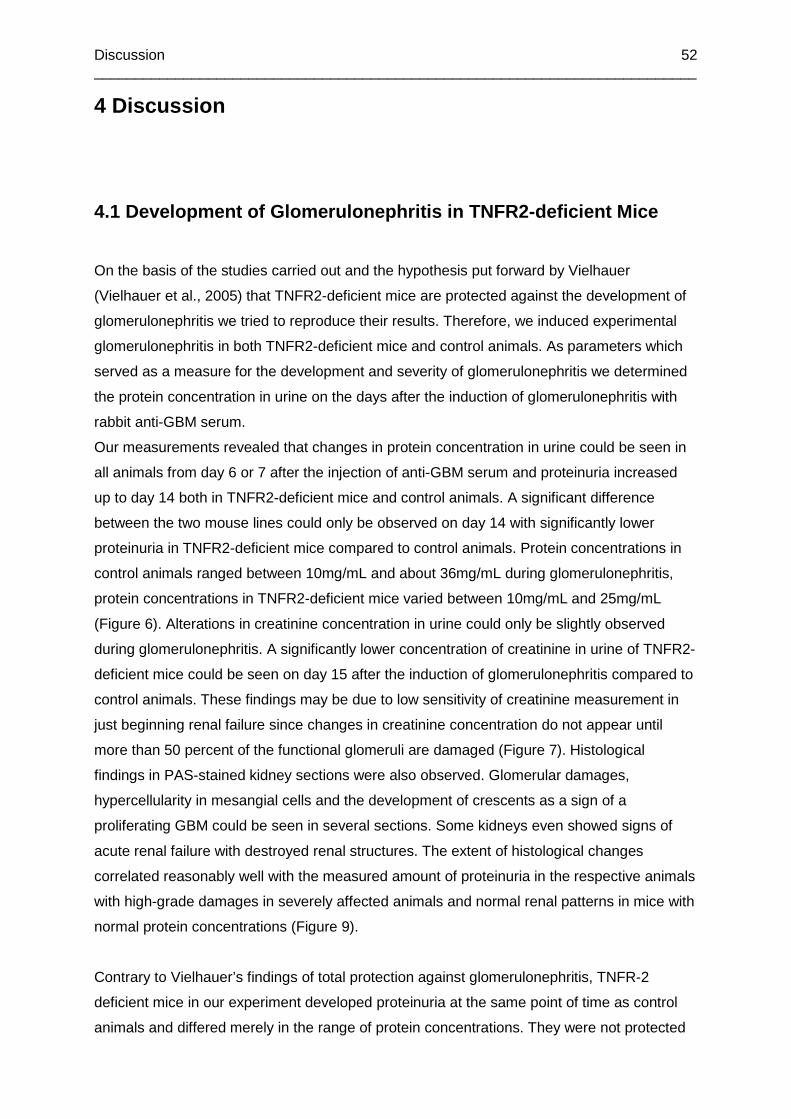
Discussion __________________________________________________________________________
52
4 Discussion
4.1 Development of Glomerulonephritis in TNFR2-defi cient Mice
On the basis of the studies carried out and the hypothesis put forward by Vielhauer
(Vielhauer et al., 2005) that TNFR2-deficient mice are protected against the development of
glomerulonephritis we tried to reproduce their results. Therefore, we induced experimental
glomerulonephritis in both TNFR2-deficient mice and control animals. As parameters which
served as a measure for the development and severity of glomerulonephritis we determined
the protein concentration in urine on the days after the induction of glomerulonephritis with
rabbit anti-GBM serum.
Our measurements revealed that changes in protein concentration in urine could be seen in
all animals from day 6 or 7 after the injection of anti-GBM serum and proteinuria increased
up to day 14 both in TNFR2-deficient mice and control animals. A significant difference
between the two mouse lines could only be observed on day 14 with significantly lower
proteinuria in TNFR2-deficient mice compared to control animals. Protein concentrations in
control animals ranged between 10mg/mL and about 36mg/mL during glomerulonephritis,
protein concentrations in TNFR2-deficient mice varied between 10mg/mL and 25mg/mL
(Figure 6). Alterations in creatinine concentration in urine could only be slightly observed
during glomerulonephritis. A significantly lower concentration of creatinine in urine of TNFR2-
deficient mice could be seen on day 15 after the induction of glomerulonephritis compared to
control animals. These findings may be due to low sensitivity of creatinine measurement in
just beginning renal failure since changes in creatinine concentration do not appear until
more than 50 percent of the functional glomeruli are damaged (Figure 7). Histological
findings in PAS-stained kidney sections were also observed. Glomerular damages,
hypercellularity in mesangial cells and the development of crescents as a sign of a
proliferating GBM could be seen in several sections. Some kidneys even showed signs of
acute renal failure with destroyed renal structures. The extent of histological changes
correlated reasonably well with the measured amount of proteinuria in the respective animals
with high-grade damages in severely affected animals and normal renal patterns in mice with
normal protein concentrations (Figure 9).
Contrary to Vielhauer’s findings of total protection against glomerulonephritis, TNFR-2
deficient mice in our experiment developed proteinuria at the same point of time as control
animals and differed merely in the range of protein concentrations. They were not protected
Discussion __________________________________________________________________________
53
against glomerular damage either since histological changes could be observed both in
TNFR2-deficient mice and control animals.
The protection Vielhauer observed in his TNFR2-deficient mice could be explained by the
mechanism of TNF-induced apoptosis and the role TNFR2 plays in this signalling pathway.
Wajant and Pfizenmaier (Wajant et al., 2003) described the mechanism of TNFR2-induced
apoptosis a few years ago. According to their findings, stimulation of TNFR2 results in an
increased production and release of membrane-bound TNF, which is capable to activate
TNFR1 and therefore TNFR1-induced apoptosis via signalling pathways described above.
Besides this increased TNF-expression, activated TNFR2 is able to inhibit the TNFR1-
induced expression of anti-apoptotic genes, which subsequently leads to an enhanced cell
death. These findings may suggest that mice lacking TNFR2 and, thus, the TNF inhibitor
soluble TNFR2 as well as TNFR2 signalling, are protected against TNF-induced apoptosis to
a certain amount and therefore, amongst others against glomerular damage leading to the
development of proteinuria.
One possible way of explaining the susceptibility to glomerulonephritis we observed in our
TNFR2-deficient mice may be the difference in levels of TNF to which mice were exposed
during the experiment and before. These levels may be possibly different between our mice
and the ones Vielhauer examined due to different ways of keeping the animals and,
therefore, different exposures to pathogens challenging the murine immune system, for
example LPS. LPS is usually known to induce the production of proinflammatory cytokines
amongst others TNF and, therefore, plays a leading role in the immune response and the
development of sepsis. Freudenberg and Galanos (Freudenberg and Galanos, 1988)
discovered that a regular administration of a non-lethal dose of LPS leads to the
development of a certain tolerance and an attenuated immune response to further exposure
to toxic amounts of LPS. This dampened immune response is mainly contributed to the
decreased production of proinflammatory mediators such as TNF. Further studies revealed a
relationship and cross tolerance between LPS and TNF according to which animals
constantly exposed to non-lethal doses of TNF or LPS subsequently are refractory to usually
toxic doses of both TNF and LPS (Fraker et al., 1988). Due to the lack of TNFR2 and its
TNF-antagonizing effects described above, TNFR2-deficient mice may constantly be
exposed to higher levels of endogenous TNF produced because of external immunological
challenges. This may lead to the development of tolerance towards proinflammatory effects
of TNF and, therefore, a lower susceptibility to inflammatory diseases such as experimentally
induced glomerulonephritis. Mice not exposed to high levels of TNF due to immunological
non-challenging keeping conditions (as in our experiment) may not develop a comparable
tolerance to TNF. This missing tolerance to TNF and the not existing cross tolerance to LPS

Discussion __________________________________________________________________________
54
may, therefore, explain the susceptibility to the development of glomerulonephritis with the
leading symptoms of proteinuria and glomerular damages in our TNFR2-deficient mice.
A too strong induction of glomerulonephritis might overcome the deleterious effect of TNFR2
seen by Vielhauer’s group.
To eliminate the possibility of too highly dosed injections of rabbit anti-GBM serum, we
investigated the effect of different doses of serum on the development of glomerulonephritis.
Dosages below 250µL of anti-GBM serum, however, did not induce proteinuria before day
12.
We came to the conclusion that the amount of 250µL rabbit anti-GBM serum, which we used
in all our experiments, was most likely adequate to induce glomerulonephritis (Figure 27).
However, because of the method of injecting the serum into the retro-bulbar blood vessels it
was difficult to determine the actually injected amount of serum in each individual mouse. On
account of this, the lacking development of glomerulonephritis in some animals may be owed
to low serum injection.
4.2 Development of Glomerulonephritis in hTNFR2-tra nsgenic Mice
As mentioned above various studies in the past few years revealed an increased
susceptibility to inflammatory diseases in mice which were transgenic for the human TNFR2
and, therefore, expressed human TNFR2 constitutively. According to these findings, we
wanted to investigate whether hTNFR2-transgenic mice were more likely than non-
transgenic animals to develop increased proteinuria and severe glomerular damage after the
experimental induction of glomerulonephritis. We induced glomerulonephritis in two
independent experiments both consisting of hTNFR2-transgenic mice and their non-
transgenic littermates which served as control animals.
Our measurements revealed that first increases in protein concentration in urine could be
seen on day 6 after the induction of glomerulonephritis and that no difference in the starting
point of time between transgenic mice and littermates could be observed. Highest values of
proteinuria up to about 32mg/mL in the first experiment and up to about 49mg/mL in the
second experiment were reached on day 12 and occurred in both transgenic mice and
littermates. Some animals, both transgenic and non-transgenic, of each group did not
Discussion __________________________________________________________________________
55
develop any proteinuria at all after the injection of rabbit anti-GBM serum (Figure 12, Figure
17). Creatinine concentrations in urine in all animals were not significantly lower during
glomerulonephritis (Figure 13, Figure 18). Histological findings in PAS-stained sections
correlated with the measured proteinuria and showed severe glomerular damage and signs
of acute renal failure in single animals whereas those who did not develop proteinuria
showed no signs of glomerular changes
(Figure 16, Figure 24). Additionally, no changes in concentrations of soluble hTNFR2 in urine
could be observed during glomerulonephritis in transgenic mice which could have been
expected because of the constitutive expression of soluble hTNFR2 (Figure 22). Soluble
mTNFR2 concentrations in urine merely decreased slightly and without any significant
difference between transgenic animals and littermates (Figure 20).
Contrary to our expectations based on previous studies our measurements revealed that
mice transgenic for human TNFR2 were not more susceptible to experimental
glomerulonephritis compared to their non-transgenic littermates and showed no signs of
increased inflammatory response to the injected anti-GBM serum.
Previous studies with mice transgenic for hTNFR2 revealed an increase in pathology and
inflammatory symptoms due to the overexpression of hTNFR2 as well in experimental
hepatitis, as in severe inflammatory syndrome and inflammatory bowel diseases. The
overexpression of hTNFR2, which was held responsible for these effects could both be
demonstrated by increased levels of shedded soluble receptor and elevated expression of
cell surface receptor (Douni and Kollias, 1998; Küsters et al., 2002; Holtmann et al., 2002).
According to our data, these findings could not be transferred to the development of
experimental glomerulonephritis as an example of inflammatory renal disease in hTNFR2
transgenic mice. One possible explanation for this difference may be provided by the
difference in the gene expression of hTNFR2 in our animals compared to those used by
Douni and Kollias as described above. Douni and Kollias revealed that mice being exposed
to Con-A induced hepatitis or merely to a challenge with LPS showed upregulated
expression of hTNFR2 in their sera compared to transgenic mice which were not exposed to
any treatment. Sera levels of soluble human TNFR2 turned out to be correlating with the
severity of pathology in the treated mice. Therefore, Douni and Kollias reasoned that induced
and not constitutive expression of hTNFR2 is responsible for the increased pathologic effects
in their experimental setup. In contrast to this regulated expression, our mice transgenic for
hTNRF2 expressed hTNFR2 constitutively and were, therefore, not able to enhance the
expression when treated with rabbit anti-GBM serum. This lacking ability of upregulation may
be causal for the equal susceptibility in transgenic mice and their littermates.
Discussion __________________________________________________________________________
56
Another possible explanation for our discovery may be provided by findings which revealed
different amounts of expression of mTNFR2 and human TNFR2 on renal cells. For example,
recent studies by Hoffmann (Hoffmann et al., 2009) investigated the expression and
localization of TNFR2 on renal cells during renal allograft rejection in rats. They revealed
high expression of TNFR2 on intrinsic renal cells such as podocytes and tubular epithelial
cells in control animals which were not exposed to any treatment. There was an even higher
expression in animals which suffered from acute transplant rejection and elevated levels of
TNFR2 could be observed in their urine.
These findings describing the constitutive expression of TNFR2 on intrinsic renal cells which
could be detected without the presence of any inflammatory progress or disease might
provide a possibility to explain the lacking impact of the expression of hTNFR2 on the
development of inflammatory renal diseases such as glomerulonephritis. Interestingly, we
also found higher levels of mTNFR2 in urine than in serum.
Additional constitutive and non-regulated expression of hTNFR2 might not be capable to
induce further increase of inflammatory symptoms on top of the symptoms already caused by
elevated expression of mTNFR2. This seems very likely especially in light of the fact that
spontaneous release of mTNFR2 in urine was found to about 17ng/mL while hTNFR2 in
urine of transgenic mice was about 23ng/mL. The relatively high amount of secreted
mTNFR2 might be completely sufficient to prevent the above mentioned development of
tolerance and, therefore, no additional effect of the hTNFR2 is to be expected.
This hypothesis could be supported by the fact that concentrations of hTNFR2 did not
change significantly during the development of glomerulonephritis and, furthermore, did not
differ from those in untreated animals in our experiments (Figure 22, Figure 30).
We failed to analyse the expression and localization of mTNFR2 on sections of both kidneys
from mice suffering from glomerulonephritis and normal mice kidneys since we were not able
to stain mTNFR2 specifically with anti-mTNFR2 AF 647 antibody according to 2.1.6 Fixation
and Staining of Mouse Kidney.
Therefore, we are not able to make a statement concerning the localization and extent of
expression of mTNFR2 in kidneys affected by glomerulonephritis.
Another study group at our department examined the effects of the presence of hTNFR2 in
Con A-induced hepatitis. Along the lines of our experimental design they compared mice
transgenic for hTNFR2 with their non-transgenic littermates and could not observe any
difference in the reaction to experimental hepatitis between transgenic and non-transgenic
Discussion __________________________________________________________________________
57
mice. Mice showed no changes in concentrations of relevant liver enzymes and no
histological differences could be seen (unpublished).
These findings might present another experimental setup in which overexpression of
hTNFR2, additionally to the expression of mTNFR2, did neither increase inflammatory
symptoms nor organ failure.
4.3 Phenotyping of hTNFR2-transgenic Mice
Since the mice transgenic for hTNFR2 we used in our experiments were crossed back to
C57Bl/6 mice up to the F2 and F3 generation we had to genotype them clearly and
distinguish them from their littermates before they could be taken into the experiment.
A first genotyping was carried out by Southern Blots, for which a small part of the tail had to
be cut off from the mice. In order to develop a non-invasive and more definite way of typing
we examined whether soluble hTNFR2 could be detected in the urine of mice transgenic for
hTNFR2.
According to 2.1.4 we collected urine from all animals which had to be typed and measured
soluble hTNFR2. Concentrations turned out to range between 5ng/mL and 20ng/mL in about
half of the animals, whereas the other half showed concentrations below the detection limit
which was determined at 1.25ng/mL because of the experimental setup (Figure 30).
Therefore, we claimed mice with concentrations of hTNFR2 below detection limit as non-
transgenic littermates and mice with concentration above detection limit as mice transgenic
for hTNFR2.
To verify our hypothesis we compared our findings with those detected by Southern Blots.
Results consisted in 7 of 9 cases and animals which could not be definitely genotyped by
Southern Blot showed unambiguous concentrations of hTNFR2 in their urine.
Hence, the constitutive overexpression and, therefore, constitutive elimination of soluble
hTNFR2 in urine of mice transgenic for hTNFR2 provides the opportunity of definite
identification of transgenic animals.
Summing up these findings, we were able to establish a non-invasive, easily accomplished
and very effective way to phenotype mice transgenic for hTNFR2. Moreover, the method
turned out be highly sensitive and reproducible.

Discussion __________________________________________________________________________
58
4.4 Detection of Soluble TNFR2 in Urine
Several studies on the TNF receptors over the past few years discovered the existence of
both cell surface and soluble TNF receptors. These soluble forms are shedded from the
membrane and are capable of binding TNF thus antagonizing its effects. In 1990 Engelmann
first described the detection and purification of soluble forms of TNF receptors from human
urine (Engelmann et al., 1990). Further studies revealed a correlation between the
concentration of soluble TNF receptors in serum and urine and the extent of activity of
certain diseases such as chronic inflammatory bowel diseases. Especially the measurement
of soluble TNF receptors in urine turned out to be an appropriate and above all non-invasive
method of assessing disease activity and therapeutic outcome in patients suffering from
chronic inflammatory bowel diseases (Hadziselimovic et al., 1995). In particular, levels of
TNFR2 were found to be increased in infectious or chronic inflammatory diseases and turned
out to be correlating with the severity of disease (Diez-Ruiz et al., 1995). These correlations
and further studies on the kinetics of receptor shedding lead to the assumption that cleavage
of cell surface TNFR2 may be a highly controlled mechanism both in the presence (Aderka et
al., 1998) and absence of TNF (Douni and Kollias, 1998).
In order to assess the concentration of soluble mTNFR2 in urine during the development of
glomerulonephritis, we measured soluble mTNFR2 on day 0 before the induction and on day
6 and 15 after the induction of experimental glomerulonephritis. Both hTNFR2-trangenic mice
and littermates showed a decreased level of soluble TNFR2 in urine during
glomerulonephritis declining from about 17ng/mL before induction and about 10ng/mL on day
6 and 15 (Figure 20).
To distinguish whether immunisation with rabbit IgG or induction of glomerulonephritis with
rabbit anti-GBM serum leads to the described effect on concentrations of soluble mTNFR2
we compared mice in two experiments. Animals in the first experiment were exposed both to
immunisation with rabbit IgG and, 6 days later, to the induction of glomerulonephritis while
animals in the second experiment only received immunisation with rabbit IgG.
Mice in the first experiment showed a base level of about 8±4ng/mL of soluble mTNFR2 in
urine without any preceded treatment. After immunisation concentrations of soluble mTNFR2
went up to a mean of 39±36ng/mL on day 1 and were, in the following, significantly increased
on nearly all points of time up to day 12. They nearly gained back their base level by day 6
after immunisation. After the induction of glomerulonephritis on day 7 an increase of soluble
mTNFR2 in urine up to a mean of 35±27ng/mL could be seen on the second day after the
induction of glomerulonephritis. Single animals developed concentrations up to 92ng/mL. Up
Discussion __________________________________________________________________________
59
to day 15 after the induction of glomerulonephritis a decrease of soluble TNFR2
concentrations to the base level of 10±9ng/mL could be observed in most animals (Figure
25).
Mice in the second experiment turned out to have higher base levels of soluble mTNFR2 in
urine of 30±12ng/mL. Immunisation with rabbit IgG led to a significantly increased
concentration of soluble mTNFR2 up 64±28ng/mL on day 1 and 119±33ng/mL on day 2 after
immunisation. Concentrations went back to the base level of 23±10ng/mL by day 6 but
showed a significant second increase of concentrations up to 86±24ng/mL on day 7 after
immunisation without having the mice exposed to any further treatment. Apart from a slight
increase on day 12 up to 78±46ng/mL, concentrations of soluble mTNFR2 decreased to a
level of about 37±29ng/mL by day 14 (Figure 26).
Summing up, both experiments showed the same development in the elimination of soluble
mTNFR2 in urine with a first significant increase on day 1 and 2 after immunisation and a
second one on day 7, regardless of whether immunisation was followed by the injection of
anti-GBM serum on day 6 or not.
Interestingly, it turned out that all animals in both experiments showed relatively high
amounts of soluble mTNFR2 in their urine ranging between 5ng/mL and 50ng/mL without
being exposed to any treatment at all (Figure 25, Figure 26). This supports the idea that
continuously secreted TNFR2 is available to dampen inflammatory TNF effects.
These findings suggest that treatment with rabbit anti-GBM serum had no impact on the
concentration of soluble mTNFR2 in the urine. Our measurements lead to the conclusion that
merely immunisation with rabbit IgG, probably triggering a systemic immune response, is
responsible for the described kinetics in the shedding an elimination of TNFR2 in urine.
Hence, the actual development of glomerulonephritis can not be implicated with varying
concentrations of TNFR2.
4.5 Conclusion
First of all, we were not able to reproduce the findings described by Vielhauer (Vielhauer et
al., 2005). TNFR2-deficient mice in our experimental setup did not turn out to be protected
against the development of experimental glomerulonephritis. We, therefore, assume that the
existence of protection may be dependent on the presence of a so-called TNF-tolerance that

Discussion __________________________________________________________________________
60
has developed in the organism because of accidental exposure to TNF in preceded diseases
or because of certain keeping conditions. To verify this hypothesis further experiments
comparing TNFR2-deficient mice and control animals in different environments would
provide more information.
Contrary to our expectations, mice transgenic for hTNFR2 showed no signs of increased
pathology and no enhanced inflammatory response to the induction of glomerulonephritis. As
mentioned above, one possible explanation may be provided by the differences in the way
the transgenic fragment was integrated into the murine DNA. We assume that regulated
expression and, therefore, disease-correlating levels of hTNFR2 instead of constitutive
overexpression may have an important impact on the development of glomerulonephritis.
Generating mice transgenic for hTNFR2 by integrating regulatory elements may offer a future
possibility to examine the impact of additional regulated expression of hTNFR2 during
experimental glomerulonephritis and to investigate whether enhanced susceptibility to
glomerulonephritis can be observed.
In addition, we found out that amounts of soluble mTNFR2 in urine showed no correlation to
the severity of disease during glomerulonephritis in contrast to former studies (Hoffmann et
al., 2009). Furthermore, elimination of soluble mTNFR2 in urine turned out to be merely
dependent on immunisation and independent of the following treatment with rabbit anti-GBM
serum to induce glomerulonephritis.
According to these findings, we assume that inducing glomerulonephritis in mice according to
our experimental protocol has no striking impact on the concentration and, therefore
possibly, on the elimination of TNFR2. Contrary to Vielhauer’s assumptions, antagonizing
TNFR2 might not provide such special opportunities in the treatment of glomerulonephritis as
it does in the treatment of other chronic inflammatory diseases such as inflammatory bowel
diseases or rheumatoid arthritis as mentioned above.
References __________________________________________________________________________
61
5 References
Abbate M, Zoja C, Corna D, Rottoli D, Zanchi C, Azzollini N, Tomasoni S, Berlingeri S, Noris M, Morigi M, Remuzzi G (2008).
“Complement-mediated dysfunction of glomerular filtration barrier accelerates progressive renal injury.” J Am Soc Nephrol.
Jun;19(6):1158-67.
Aderka D, Sorkine P, Abu-Abid S, Lev D, Setton A, Cope AP, Wallach D, Klausner J (1998). “Shedding kinetics of soluble tumor
necrosis factor (TNF) receptors after systemic TNF leaking during isolated limb perfusion. Relevance to the pathophysiology of
septic shock.” J Clin Invest. Feb 1;101(3):650-9.
Adler S, Baker PJ, Pritzl P, Couser WG (1984). “Detection of terminal complement components in experimental immune
glomerular injury.” Kidney Int. Dec;26(6):830-7.
Aggarwal BB (2003). “Signalling pathways of the TNF superfamily: a double-edged sword.“ Nat Rev Immunol. Sep;3(9):745-56.
Review.
Al-Lamki RS, Wang J, Skepper JN, Thiru S, Pober JS, Bradley JR (2001). “Expression of tumor necrosis factor receptors in
normal kidney and rejecting renal transplants.” Lab Invest. Nov;81(11):1503-15.
Andres GA, Accinni L, Hsu KC, Zabriskie JB, Seegal BC (1966). “Electron microscopic studies of human glomerulonephritis with
ferritin-conjugated antibody. Localization of antigen-antibody complexes in glomerular structures of patients with acute
glomerulonephritis.” J Exp Med. Feb 1;123(2):399-412.
Antoni C, Krueger GG, de Vlam K, Birbara C, Beutler A, Guzzo C, Zhou B, Dooley LT, Kavanaugh A; IMPACT 2 Trial
Investigators (2005). “Infliximab improves signs and symptoms of psoriatic arthritis: results of the IMPACT 2 trial.” Ann Rheum
Dis. Aug;64(8):1150-7. Epub 2005 Jan 27.
Bach D, Klein BC, Grabensee B (1997). “Long-term clinical course and histopathologic scoring in acute crescentic
glomerulonephritis.” Ren Fail 19: 85-98.
Baud L, Ardaillou R (1994). “Tumor necrosis factor alpha in glomerular injury.” Kidney Int 45 (Suppl 45): 32-36.
Baud L, Oudinet JP, Bens M, Noe L, Peraldi MN, Rondeau E, Etienne J, Ardaillou R (1989). “Production of tumor necrosis factor
by rat mesangial cells in response to bacterial lipopolysaccharide.” Kidney Int. May; 35(5):1111-8.
Bäumel M, Lechner A, Hehlgans T, Männel DN (2008). “Enhanced susceptibility to Con A-induced liver injury in mice transgenic
for the intracellular isoform of human TNF receptor type 2.” J Leukoc Biol. Jul;84(1):162-9. Epub 2008 Apr 24.
Bertani T, Abbate M, Zoja C, Corna D, Perico N, Ghezzi P, Remuzzi G (1989). “Tumor necrosis factor induces glomerular
damage in the rabbit.” Am J Pathol. Feb;134(2):419-30.
Beutler B, Cerami A (1989). “The biology of cachectin/TNF--a primary mediator of the host response.” Annu Rev Immunol.
;7:625-55.
Beutler B, Greenwald D, Hulmes JD, Chang M, Pan YC, Mathison J, Ulevitch R, Cerami A (1985). “Identity of tumour necrosis
factor and the macrophage-secreted factor cachectin.” Nature. Aug 8-14;316(6028):552-4.
Beutler B, Milsark IW, Cerami AC (1985). “Passive immunisation against cachectin/tumor necrosis factor protects mice from
lethal effect of endotoxin.” Science. Aug 30;229(4716):869-71.

References __________________________________________________________________________
62
Black RA, Rauch CT, Kozlosky CJ, Peschon JJ, Slack JL, Wolfson MF, Castner BJ, Stocking KL, Reddy P, Srinivasan S,
Nelson N, Boiani N, Schooley KA, Gerhart M, Davis R, Fitzner JN, Johnson RS, Paxton RJ, March CJ, Cerretti DP (1997). “A
metalloproteinase disintegrin that releases tumour-necrosis factor-alpha from cells.” Nature. Feb 20;385(6618):729-33.
Brentjens JR, Sepulveda M, Baliah T, Bentzel C, Erlanger BF, Elwood C, Montes M, Hsu KC, Andres GA (1975). “Interstitial
immune complex nephritis in patients with systemic lupus erythematosus.” Kidney Int. May;7(5):342-50.
Butkowski RJ, Wieslander J, Wisdom BJ, Barr JF, Noelken ME, Hudson BG (1985). “Properties of the globular domain of type
IV collagen and its relationship to the Goodpasture antigen.” J Biol Chem. Mar 25;260(6):3739-47.
Carswell EA, Old LJ, Kassel RL, Green S, Fiore N, Williamson B (1975). “An endotoxin-induced serum factor that causes
necrosis of tumors.” Proc Natl Acad Sci U S A. Sep;72(9):3666-70.
Chadban SJ, Atkins RC (2005). “Glomerulonephritis.” Lancet May 21-27;365(9473):1797-806.
Chensue SW, Remick DG, Shmyr-Forsch C, Beals TF, Kunkel SL (1988). “Immunohistochemical demonstration of cytoplasmic
and membrane-associated tumor necrosis factor in murine macrophages.” Am J Pathol. Dec;133(3):564-72.
Chinnaiyan AM, Tepper CG, Seldin MF, O'Rourke K, Kischkel FC, Hellbardt S, Krammer PH, Peter ME, Dixit VM (1996).
“FADD/MORT1 is a common mediator of CD95 (Fas/APO-1) and tumor necrosis factor receptor-induced apoptosis.” J Biol
Chem. Mar 1;271(9):4961-5.
Cohen AH, Border WA, Shankel E, Glassock RJ (1981). “Crescentic glomerulonephritis: immune vs. nonimmune mechanisms”.
Am J Nephrol 1(2): 78-83.
Cope AP (1998). “Regulation of autoimmunity by proinflammatory cytokines.” Curr Opin Immunol. Dec;10(6):669-76.
Couser WG, Wagonfeld JB, Spargo BH, Lewis EJ (1974). “Glomerular deposition of tumor antigen in membranous nephropathy
associated with colonic carcinoma.” Am J Med. Dec;57(6):962-70.
D’Agati VD, Jennette JC, Silva FG (2005). “Atlas of Nontumor Pathology. Non-Neoplastic Kidney Diseases.“ American Registry
of Pathology, Washington, DC. 189-198.
Daniels BS, Hauser EB, Deen WM, Hostetter TH (1992). “Glomerular basement membrane: in vitro studies of water and protein
permeability”. Am J Physiol. Jun; 262(6 Pt 2):F919-26.
Darnay BG, Haridas V, Ni J, Moore PA, Aggarwal BB (1998). “Characterization of the intracellular domain of receptor activator
of NF-kappaB (RANK). Interaction with tumor necrosis factor receptor-associated factors and activation of NF-kappab and c-Jun
N-terminal kinase.” J Biol Chem. Aug 7;273(32):20551-5.
Deetjen P, Speckmann EJ (1999). „Niere“. Physiologie. München, Urban & Fischer: 371-407.
Dempsey PW, Doyle SE, He JQ, Cheng G (2003). “The signaling adaptors and pathways activated by TNF superfamily.”
Cytokine Growth Factor Rev. Jun-Aug;14(3-4):193-209.
Dendorfer U, Mann J (2006). „Glomerulonephritis.“ Dtsch Med Wochenschr. Jan 20;131(3):93-100; quiz 101-4.
Diez-Ruiz A, Tilz GP, Zangerle R, Baier-Bitterlich G, Wachter H, Fuchs D (1995). “Soluble receptors for tumour necrosis factor
in clinical laboratory diagnosis.” Eur J Haematol. Jan;54(1):1-8. Review.
References __________________________________________________________________________
63
Dixon FJ, Feldman JD, Vasquez JJ (1961). “Experimental glomerulonephritis. The pathogenesis of a laboratory model
resembling the spectrum of human glomerulonephritis.” J Exp Med. May 1;113:899-920.
Donnahoo KK, Meng X, Ayala A, Cain MP, Harken AH, Meldrum DR (1999). “Early kidney TNF-alpha expression mediates
neutrophil infiltration and injury after renal ischemia-reperfusion.“ Am J Physiol. Sep;277(3 Pt 2):R922-9.
Dörge SE, Roux-Lombard P, Dayer JM, Koch KM, Frei U, Lonnemann G (1994). “Plasma levels of tumor necrosis factor (TNF)
and soluble TNF receptors in kidney transplant recipients.” Transplantation. Nov 15;58(9):1000-8.
Douni E, Kollias G (1998). “A critical role of the p75 tumor necrosis factor receptor (p75TNF-R) in organ inflammation
independent of TNF, lymphotoxin alpha, or the p55TNF-R.“ J Exp Med. Oct 5;188(7):1343-52.
Ehrich JH, Foellmer HG, Krull F, Winnecken HJ, Wurster U (1984). “Significance, sources of error and limits of protein diagnosis
in urine. II. Normal values and classification of pathologic proteinurias.Monatsschr Kinderheilkd. Mar;132(3): 144-50.
Elzey BD, Griffith TS, Herndon JM, Barreiro R, Tschopp J, Ferguson TA (2001). “Regulation of Fas ligand-induced apoptosis by
TNF.” J Immunol. Sep 15;167(6):3049-56.
Engelmann H, Novick D, Wallach D (1990). “Two tumor necrosis factor-binding proteins purified from human urine. Evidence for
immunological cross-reactivity with cell surface tumor necrosis factor receptors.” J Biol Chem. Jan 25;265(3):1531-6.
Feldmann M, Maini RN (2001). “Anti-TNF alpha therapy of rheumatoid arthritis: what have we learned?” Annu Rev
Immunol.;19:163-96.
Fraker DL, Stovroff MC, Merino MJ, Norton JA (1988). “Tolerance to tumor necrosis factor in rats and the relationship to
endotoxin tolerance and toxicity.” J Exp Med. Jul 1;168(1):95-105.
Freudenberg MA, Galanos C (1988). “Induction of tolerance to lipopolysaccharide (LPS)-D-galactosamine lethality by
pretreatment with LPS is mediated by macrophages.” Infect Immun. May;56(5):1352-7.
Grell M, Douni E, Wajant H, Löhden M, Clauss M, Maxeiner B, Georgopoulos S, Lesslauer W, Kollias G, Pfizenmaier K,
Scheurich P (1995). „The transmembrane form of tumor necrosis factor is the prime activating ligand of the 80 kDa tumor
necrosis factor receptor.” Cell. Dec 1;83(5):793-802.
Hadziselimovic F, Emmons LR, Gallati H (1995). “Soluble tumour necrosis factor receptors p55 and p75 in the urine monitor
disease activity and the efficacy of treatment of inflammatory bowel disease.” Gut. Aug;37(2):260-3.
Haraldsson B, Sörensson J (2004) “Why Do We Not All Have Proteinuria? An Update of Our Current Understanding of the
Glomerular Barrier”. News Physiol Sci 19: 7-10.
Hehlgans T, Pfeffer K (2005). “The intriguing biology of the tumour necrosis factor/tumour necrosis factor receptor superfamily:
players, rules and the games.” Immunology. May;115(1):
Herold G (2009), “Nephrologie”. Innere Medizin. Köln: 566-615.
Hohmann HP, Remy R, Brockhaus M, van Loon AP (1989). “Two different cell types have different major receptors for human
tumor necrosis factor (TNF alpha).” J Biol Chem. Sep 5;264(25):14927-34.
Holtmann MH, Douni E, Schütz M, Zeller G, Mudter J, Lehr HA, Gerspach J, Scheurich P, Galle PR, Kollias G, Neurath MF
(2002). “Tumor necrosis factor-receptor 2 is up-regulated on lamina propria T cells in Crohn's disease and promotes
experimental colitis in vivo.” Eur J Immunol. Nov;32(11):3142-51.
References __________________________________________________________________________
64
Hruby ZW, Shirota K, Jothy S, Lowry RP (1991). “Antiserum against tumor necrosis factor-alpha and a protease inhibitor reduce
immune glomerular injury.” Kidney Int. Jul;40(1):43-51.
Hudson BG, Reeders ST, Tryggvason K (1993). “Type IV collagen: structure, gene organization, and role in human diseases.
Molecular basis of Goodpasture and Alport syndromes and diffuse leiomyomatosis.” J Biol Chem. Dec 15;268(35):26033-6.
Huppelsberger J, Walter K (2003). “Wasser- und Elektrolythaushalt, Nierenfunktion.“ Kurzlehrbuch Physiologie. Stuttgart,
Thieme: 178-201.
Keur I, Krediet RT, Arisz L (1989). “Glomerulopathy as a paraneoplastic phenomenon.” Neth J Med. Jun;34(5-6):270-84.
Kilbourn RG, Gross SS, Jubran A, Adams J, Griffith OW, Levi R, Lodato RF (1990). “NG-methyl-L-arginine inhibits tumor
necrosis factor-induced hypotension: implications for the involvement of nitric oxide.” Proc Natl Acad Sci U S A. May;87(9):3629-
32.
Kluth DC, Rees AJ (1999). “Anti-glomerular basement membrane disease.” J Am Soc Nephrol. Nov;10(11):2446-53.
Kolb WP, Granger GA (1968). “Lymphocyte in vitro cytotoxicity: characterization of human lymphotoxin.” Proc Natl Acad Sci U S
A. Dec;61(4):1250-5.
Kollias G, Douni E, Kassiotis G, Kontoyiannis D (1999). “The function of tumour necrosis factor and receptors in models of multi-
organ inflammation, rheumatoid arthritis, multiple sclerosis and inflammatory bowel disease.” Ann Rheum Dis. Nov;58 Suppl
1:I32-9.
Kollias G, Kontoyiannis D (2002). “Role of TNF/TNFR in autoimmunity: specific TNF receptor blockade may be advantageous to
anti-TNF treatments.” Cytokine Growth Factor Rev. Aug-Oct;13(4-5):315-21.
Kriegler M, Perez C, DeFay K, Albert I, Lu SD (1988). “A novel form of TNF/cachectin is a cell surface cytotoxic transmembrane
protein: ramifications for the complex physiology of TNF.” Cell. Apr 8;53(1):45-53.
Küsters S, Tiegs G, Alexopoulou L, Pasparakis M, Douni E, Künstle G, Bluethmann H, Wendel A, Pfizenmaier K, Kollias G,
Grell M (1997). “In vivo evidence for a functional role of both tumor necrosis factor (TNF) receptors and transmembrane TNF in
experimental hepatitis.“ Eur J Immunol. Nov;27(11):2870-5.
Kutukculer N, Shenton BK, Clark K, Rigg KM, Forsythe JL, Kirby JA, Proud G, Taylor RM (1995). “Renal allograft rejection: the
temporal relationship and predictive value of plasma TNF (alpha and beta), IFN-gamma and soluble ICAM-1.” Transpl Int.
;8(1):45-50.
Lan HY, Yang N, Metz C, Mu W, Song Q, Nikolic-Paterson DJ, Bacher M, Bucala R, Atkins RC (1997). “TNF-alpha up-regulates
renal MIF expression in rat crescentic glomerulonephritis.” Mol Med. Feb;3(2):136-44.
Le Hir M, Haas C, Marino M, Ryffel B (1998). “Prevention of crescentic glomerulonephritis induced by anti-glomerular
membrane antibody in tumor necrosis factor-deficient mice.” Lab Invest. 1998 Dec;78(12):1625-31.
Lee ZH, Kwack K, Kim KK, Lee SH, Kim HH (2000). “Activation of c-Jun N-terminal kinase and activator protein 1 by receptor
activator of nuclear factor kappaB.” Mol Pharmacol. Dec;58(6):1536-45.
Legler DF, Micheau O, Doucey MA, Tschopp J, Bron C (2003). “Recruitment of TNF receptor 1 to lipid rafts is essential for
TNFalpha-mediated NF-kappaB activation.” Immunity. May;18(5):655-64.
References __________________________________________________________________________
65
Lerner RA, Glassock RJ, Dixon FJ (1967). “The role of anti-glomerular basement membrane antibody in the pathogenesis of
human glomerulonephritis.” J Exp Med. Dec 1;126(6):989-1004.
Lüllmann-Rauch R (2003). “Niere“. Histologie. Stuttgart, Thieme: 376-95.
Mason PD, Pusey CD (1994). “Glomerulonephritis: diagnosis and treatment.” BMJ. Dec 10;309(6968):1557-63.
McCluskey RT (1982). “Evidence for an immune complex disorder in systemic lupus erythematosus (SLE).” Am J Kidney Dis.
Jul;2(1 Suppl 1):119-25.
McDevitt H, Munson S, Ettinger R, Wu A (2002). “Multiple roles for tumor necrosis factor-alpha and lymphotoxin alpha/beta in
immunity and autoimmunity”. Arthritis Res. 4 Suppl 3:S141-52. Epub 2002 May 9.
Mease PJ, Goffe BS, Metz J, VanderStoep A, Finck B, Burge DJ (2000). “Etanercept in the treatment of psoriatic arthritis and
psoriasis: a randomised trial.” Lancet. Jul 29;356(9227):385-90.
Meijer C, Huysen V, Smeenk RT, Swaak AJ (1993). “Profiles of cytokines (TNF alpha and IL-6) and acute phase proteins (CRP
and alpha 1AG) related to the disease course in patients with systemic lupus erythematosus.” Lupus. Dec;2(6):359-65.
Mohammed I, Ansell BM, Holborow EJ, Bryceson AD (1977). “Circulating immune complexes in subacute infective endocarditis
and post-streptococcal glomerulonephritis.” J Clin Pathol. Apr;30(4):308-11.
Morel D, Normand E, Lemoine C, Merlio JP, Velours J, Astier T, Bonnet F, Aparicio M, Potaux L, Bloch B (1993). “Tumor
necrosis factor alpha in human kidney transplant rejection-analysis by in situ hybridization.” Transplantation. Apr;55(4):773-7.
Morrison DC, Ryan JL (1987). “Endotoxins and disease mechanisms.” Annu Rev Med.;38:417-32.
Neale TJ, Rüger BM, Macaulay H, Dunbar PR, Hasan Q, Bourke A, Murray-McIntosh RP, Kitching AR (1995). “Tumor necrosis
factor-alpha is expressed by glomerular visceral epithelial cells in human membranous nephropathy.” Am J Pathol. Jun;
146(6):1444-54.
Noel C, Copin MC, Hazzan M, Labalette M, Susen S, Lelievre G, Dessaint JP (2000). “Immunomodulatory effect of
pentoxifylline during human allograft rejection: involvement of tumor necrosis factor-alpha and adhesion molecules.”
Transplantation. Mar 27;69(6):1102-7.
Nophar Y, Kemper O, Brakebusch C, Englemann H, Zwang R, Aderka D, Holtmann H, Wallach D (1990). “Soluble forms of
tumor necrosis factor receptors (TNF-Rs). The cDNA for the type I TNF-R, cloned using amino acid sequence data of its soluble
form, encodes both the cell surface and a soluble form of the receptor.” EMBO J. Oct;9(10):3269-78.
Orth SR, Ritz E (1998). “Nephrotic syndrome“. Internist (Berlin). Dec;39(12):1246-52.
Pavenstädt H, Kriz W, Kretzler M (2003). “Cell biology of the glomerular podocyte”. Physiol Rev. Jan;83(1): 253-307.
Perlmutter DH, Dinarello CA, Punsal PI, Colten HR (1986). “Cachectin/tumor necrosis factor regulates hepatic acute-phase
gene expression.” J Clin Invest. Nov;78(5):1349-54.
Perrone RD, Madias NE, Levey AS (1992). “Serum creatinine as an index of renal function: new insights into old concepts.” Clin
Chem. Oct;38(10):1933-53.
Pinckard JK, Sheehan KC, Schreiber RD (1997). “Ligand-induced formation of p55 and p75 tumor necrosis factor receptor
heterocomplexes on intact cells.” J Biol Chem. Apr 18;272(16):10784-9.
References __________________________________________________________________________
66
Ramesh G, Kimball SR, Jefferson LS, Reeves WB (2007). “Endotoxin and cisplatin synergistically stimulate TNF-alpha
production by renal epithelial cells.” Am J Physiol Renal Physiol. Feb;292(2):F812-9. Epub 2006 Oct 10.
Ramesh G, Reeves WB (2003). “TNFR2-mediated apoptosis and necrosis in cisplatin-induced acute renal failure.” Am J Physiol
Renal Physiol. Oct;285(4):F610-8. Epub 2003 Jul 15.
Reimold AM (2003). “New indications for treatment of chronic inflammation by TNF-alpha blockade.” Am J Med Sci.
Feb;325(2):75-92.
Roach DR, Bean AG, Demangel C, France MP, Briscoe H, Britton WJ (2002). “TNF regulates chemokine induction essential for
cell recruitment, granuloma formation, and clearance of mycobacterial infection.” J Immunol. May 1;168(9):4620-7.
Rodewald R, Karnovsky MJ (1974). “Porous substructure of the glomerular slit diaphragm in the rat and mouse.” J Cell Biol.
Feb;60(2):423-33.
Schmidt R, Lang F, Heckmann M, Kurtz A (2004). “Niere“. Physiologie des Menschen mit Pathophysiologie. Heidelberg,
Springer: 668-99.
Schulze-Osthoff K, Ferrari D, Los M, Wesselborg S, Peter ME (1998). “Apoptosis signaling by death receptors.” Eur J Biochem.
Jun 15;254(3):439-59.
Sicotte NL, Voskuhl RR (2001). “Onset of multiple sclerosis associated with anti-TNF therapy.” Neurology. Nov 27;57(10):1885-
8.
Silbernagel S, Despopoulos A (2003). “Niere.“ Taschenatlas der Physiologie. Stuttgart, Thieme: 148-186.
Silbernagl S (1991). “Niere, Salz- und Wasserhaushalt.“ Taschenatlas der Physiologie. Stuttgart, Thieme.
Silbernagl S, Klinke R (2001). “Die Funktion der Nieren.“ Lehrbuch der Physiologie. Stuttgart, Thieme: 287-336.
Solomon KA, Pesti N, Wu G, Newton RC (1999). “Cutting edge: a dominant negative form of TNF-alpha converting enzyme
inhibits proTNF and TNFRII secretion.” J Immunol. Oct 15;163(8):4105-8.
Somlo S, Mundel P (2000). “Getting a foothold in nephrotic syndrome.” Nat Genet. Apr;24(4):333-5.
Stahl RAK, Schlöndorff D, Braun N, Boesken W, Kühn K, Risler T. “Leitlinien-basierte Empfehlungen für die Praxis: G4
Glomeruläre Nierenkrankheiten“. Stand Dezember 2004.
Suenaert P, Bulteel V, Lemmens L, Noman M, Geypens B, Van Assche G, Geboes K, Ceuppens JL, Rutgeerts P (2002). “Anti-
tumor necrosis factor treatment restores the gut barrier in Crohn's disease.” Am J Gastroenterol. Aug;97(8):2000-4.
Tang P, Hung M-C, Klostergaard J(1996). “Human pro-tumor necrosis factor is a homotrimer.” Biochemistry. Jun
25;35(25):8216-25.
Tartaglia LA, Ayres TM, Wong GH, Goeddel DV (1993). “A novel domain within the 55 kd TNF receptor signals cell death.” Cell.
Sep 10;74(5):845-53.
Tartaglia LA, Pennica D, Goeddel DV (1993). “Ligand passing: the 75-kDa tumor necrosis factor (TNF) receptor recruits TNF for
signaling by the 55-kDa TNF receptor.” J Biol Chem. Sep 5;268(25):18542-8.
Tartaglia LA, Rothe M, Hu YF, Goeddel DV (1993). “Tumor necrosis factor's cytotoxic activity is signaled by the p55 TNF
receptor.” Cell. Apr 23;73(2):213-6.
References __________________________________________________________________________
67
Timoshanko JR, Sedgwick JD, Holdsworth SR, Tipping PG (2003). “Intrinsic renal cells are the major source of tumor necrosis
factor contributing to renal injury in murine crescentic glomerulonephritis.” J Am Soc Nephrol. Jul;14(7):1785-93.
Tipping PG, Leong TW, Holdsworth SR (1991). ”Tumor necrosis factor production by glomerular macrophages in anti-
glomerular basement membrane glomerulonephritis in rabbits.” Lab Invest. Sep;65(3):272-9.
Tomosugi NI, Cashman SJ, Hay H, Pusey CD, Evans DJ, Shaw A, Rees AJ (1989). “Modulation of antibody-mediated
glomerular injury in vivo by bacterial lipopolysaccharide, tumor necrosis factor, and IL-1.” J Immunol. May 1;142(9):3083-90.
Tracey KJ, Beutler B, Lowry SF, Merryweather J, Wolpe S, Milsark IW, Hariri RJ, Fahey TJ 3rd, Zentella A, Albert JD, et al
(1986). “Shock and tissue injury induced by recombinant human cachectin.” Science Oct 24;234(4775):470-4.
van der Poll T, van Deventer SJ, Hack CE, Wolbink GJ, Aarden LA, Büller HR, ten Cate JW (1992). “Effects on leukocytes after
injection of tumor necrosis factor into healthy humans.” Blood. Feb 1;79(3):693-8.
van Dullemen HM, van Deventer SJ, Hommes DW, Bijl HA, Jansen J, Tytgat GN, Woody J (1995). “Treatment of Crohn's
disease with anti-tumor necrosis factor chimeric monoclonal antibody (cA2).” Gastroenterology. Jul;109(1):129-35.
Vielhauer V, Mayadas TN (2007). “Functions of TNF and its receptors in renal disease: distinct roles in inflammatory tissue
injury and immune regulation.” Semin Nephrol. May;27(3):286-308.
Vielhauer V, Stavrakis G, Mayadas TN (2005). “Renal cell-expressed TNF receptor 2, not receptor 1, is essential for the
development of glomerulonephritis.” J Clin Invest. May;115(5):1199-209. Epub 2005 Apr 1.
Wajant H, Pfizenmaier K, Scheurich P (2003). “Tumor necrosis factor signaling.” Cell Death Differ. Jan;10(1):45-65.
Wallach D, Engelmann H, Nophar Y, Aderka D, Kemper O, Hornik V, Holtmann H, Brakebusch C (1991). “Soluble and cell
surface receptors for tumor necrosis factor.” Agents Actions Suppl. ;35:51-7. Review.
Wilson CB, Dixon FJ (1973). “Anti-glomerular basement membrane antibody-induced glomerulonephritis.” Kidney Int.
Feb;3(2):74-89.
Zheng L, Fisher G, Miller RE, Peschon J, Lynch DH, Lenardo MJ (1995). “Induction of apoptosis in mature T cells by tumour
necrosis factor.” Nature. Sep 28;377(6547):348-51.
Product data sheet of mouse sTNF RII/ TNFRSF1B DuoSet ELISA, September 2006, R&D Systems (2010-01-13)
http://www.rndsystems.com/pdf/dy426.pdf
Product data sheet of mouse sTNF RII/ TNFRSF1B DuoSet ELISA, October 2008, R&D Systems (2010-01-13)
http://www.rndsystems.com/pdf/dy410.pdf
Product data sheet of human sTNF RII/ TNFRSF1B DuoSet ELISA, November 2008, R&D Systems (2010-01-13)
http://www.rndsystems.com/pdf/DY726.pdf
Product data sheet of QuantiChrom Creatinine Assay Kit (DICT-500), 2005, Bio Assay Systems (2010-01-21)
http://www.bioassaysys.com/Search.asp?Key=blood
Homepage of the University of Oulu, Finland (2010-01-19)
http://herkules.oulu.fi/isbn9514264290/html/x782.html

Acknowledgments __________________________________________________________________________
68
6 Acknowledgments
Mein besonderer Dank gilt Frau Prof. Dr. Daniela N. Männel für die Anregung dieses
interessanten Themas sowie für ihre freundliche Unterstützung, fachliche Beratung und ihre
stets offene Tür während der Entstehung dieser Arbeit.
Einen großen Dank auch an Herrn Prof. Bernd Salzberger für seine Arbeit als
Zweitgutachter.
Ganz herzlich möchte ich mich auch bei Frau Dr. Petra Rümmele für die Unterstützung und
Beratung bei der Erstellung und Auswertung der Nieren-Histologie bedanken.
Danken möchte ich auch Prof. Dr. Thomas Hehlgans für regelmäßige Anregungen und
Unterstützung im Rahmen der Mittwoch-Seminare und besonders für die Mithilfe bei
Experimenten mit humanTNFR2 transgenen Mäusen.
Mein Dank gilt allen Mitarbeitern des Institutes für Immunologie der Universität Regensburg
für die angenehme und stets freundliche Arbeitsatmosphäre sowie für Rat und Tat.
Insbesondere bedanken möchte ich mich bei Herrn Dr. Sven Mostböck, Frau Dr. Anja
Lechner, Frau Dorothea Weber-Steffens und Frau Karin Holz.
Einen großen Dank verdient Dr. Johannes Polz für seine Betreuung und Anleitung, seinen
positiv-kritischen Beistand und sein stets offenes Ohr.
Und – last but not least – möchte ich mich bei meinen Eltern bedanken, die mir durch ihre
stetige Unterstützung und ihren Glauben in mich mein Studium und damit diese Promotion
ermöglicht haben. Mama, dir vor allem auch ein Dankeschön für das Korrekturlesen und die
frühe und stetige Heranführung an die englische Sprache, durch die mir das Verfassen
dieser Arbeit viel Freude bereitet hat.
__________________________________________________________________________
69
Im Rahmen dieser Arbeit entstanden folgende Veröffentlichungen:
Eva Pfeifer, Johannes Polz, Sybille Grieβl, Sven Mostböck, Thomas Hehlgans, Daniela N.
Männel (2012). “Inflammation augments the development of experimen tal
glomerulonephritis by accelerating proteinuria and enhancing mortality.” European
Cytokine Network. Volume 23, Number 1, 12-4.
Eva Pfeifer, Johannes Polz, Sybille Grieβl, Sven Mostböck, Thomas Hehlgans, Daniela N.
Männel (2012). “Mechanisms of immune complex-mediated experimental
glomerulonephritis: possible role of the balance be tween endogenous TNF and
soluble TNF receptor type 2.” European Cytokine Network. Volume 23, Number 1, 15-20.
Curriculum Vitae _________________________________________________________________________
70
Curriculum Vitae
Persönliche Daten:
Eva Elisabeth Pfeifer,
geboren am 09.03.1986 in Villingen-Schwenningen
Schulbildung:
1992 – 1996 Grundschule Kirchdorf
1996 – 2005 Gymnasium am Romäusring, Villingen-Schwenningen
2005 Abitur mit der Note 1,0
Studium:
seit 2005 Humanmedizin an der Universität Regensburg
Wahlfächer: Sportmedizin, Akupunktur
Sprachkurse: Spanisch, Englisch Konversation, Italienisch
2007
2011
1. Abschnitt der Ärztlichen Prüfung mit der Note 2,0
2. Abschnitt der Ärztlichen Prüfung mit der Note 1,5
Famulaturen:
2008 Praxisklinik 2000 für Orthopädie und Chirurgie, Freiburg im Breisgau
2009 Traumatologische Notaufnahme, Spital Bruneck, Südtirol
2009 Anästhesiologie, Universitätsklinikum Regensburg
2010 Urologie, Universitätsklinikum Regensburg
2010 Allgemeinmedizin, Regensburg
Praktisches Jahr:
2010-2011 Caritas-Krankenhaus St. Josef Regensburg, Klinik für Chirurgie
Schulthess-Klinik, Zürich (Wahlfach Orthopädie)
Universitätsklinikum Regensburg, Klinik für Innere Medizin
Beruflicher Werdegang:
Seit 15.01.2012 Anstellung als Assistenzärztin in der Abteilung für Chirurgie im Klinikum
Weinheim.
Dossenheim, den ____________________________
Eva Elisabeth Pfeifer