The submarine volcano eruption at the island of El Hierro
6
The submarine volcano eruption at the island of El Hierro: physical-chemical perturbation and biological response E. Fraile-Nuez 1¥ , M. Gonza ´lez-Da ´vila 2 *, J. M. Santana-Casiano 2 *, J. Arı ´stegui 2 *, I. J. Alonso-Gonza ´lez 3{ , S. Herna ´ndez-Leo ´n 2 *, M. J. Blanco 4 , A. Rodrı ´guez-Santana 5 , A. Herna ´ndez-Guerra 2 *, M. D. Gelado-Caballero 5 , F. Eugenio 2 *, J. Marcello 2 *, D. de Armas 1 , J. F. Domı ´nguez-Yanes 1¥ , M. F. Montero 2 *, D. R. Laetsch 3{ , P. Ve ´lez-Belchı ´ 1¥ , A. Ramos 6{ , A. V. Ariza 2 *, I. Comas-Rodrı ´guez 2 * & V. M. Benı ´tez-Barrios 1¥ 1 Instituto Espan ˜ol de Oceanografı ´a, Centro Oceanogra ´ fico de Canarias (IEO-COC). Santa Cruz de Tenerife, Spain, 2 Universidad de Las Palmas de Gran Canaria, Instituto de Oceanografı ´a y Cambio Global (IOCAG). Las Palmas, Spain, 3 Universidad de Las Palmas de Gran Canaria, Banco Espan ˜ol de Algas (BEA). Las Palmas, Spain, 4 Instituto Geogra ´ fico Nacional, Centro Geofı ´sico de Canarias. Santa Cruz de Tenerife, Spain, 5 Universidad de Las Palmas de Gran Canaria, Facultad de Ciencias del Mar. Las Palmas, Spain, 6 Universidad de Las Palmas de Gran Canaria, Instituto Universitario de Sistemas Inteligentes y Aplicaciones Nume ´ricas en Ingenierı ´a (IUSIANI). Las Palmas, Spain On October 10 2011 an underwater eruption gave rise to a novel shallow submarine volcano south of the island of El Hierro, Canary Islands, Spain. During the eruption large quantities of mantle-derived gases, solutes and heat were released into the surrounding waters. In order to monitor the impact of the eruption on the marine ecosystem, periodic multidisciplinary cruises were carried out. Here, we present an initial report of the extreme physical-chemical perturbations caused by this event, comprising thermal changes, water acidification, deoxygenation and metal-enrichment, which resulted in significant alterations to the activity and composition of local plankton communities. Our findings highlight the potential role of this eruptive process as a natural ecosystem-scale experiment for the study of extreme effects of global change stressors on marine environments. A ctive submarine volcanoes constitute a significant source of mantle-derived gases, solutes and heat to the ocean. Their emissions react with seawater leading to important physical-chemical anomalies that may strongly impact the marine ecosystem 1,2 . However, the impacts of short-term submarine volcanic activity on the surrounding biota, especially planktonic communities, are still poorly understood. Here, we provide evidence that one of the richest and most sensitive marine ecosystems of the subtropical northeast Atlantic Ocean has been dramatically affected by the recent submarine eruption at the island of El Hierro (Canary Islands). Results After three months of volcanic unrest, characterized by more than 10,000 earthquakes (M#4.3) and 5 cm of ground deformation, on October 10 2011 the national seismic network recorded a substantial decrease of seismicity together with continuous volcanic tremor, indicating the beginning of an eruptive phase. Since then, regular multidisciplinary monitoring has been carried out in order to quantify environmental impacts caused by the submarine eruption (Figure 1). Periodic bathymetric measurements located the main vent 1.8 km offshore of the southern coast of El Hierro and indicated a major uplift of the volcano, raising it from 300 m depth to just 88 m below the surface. Conductivity-Temperature-Depth measurements of the waters affected by the volcanic emissions revealed tem- perature and salinity anomalies of 13uC and 20.3, respectively, at 80 m depth and 290 m from the volcano. Maximum temperature anomalies of 118.8uC were observed over the crater at 210 m depth using expendable bathythermograph probes (Figure 2). The release of CO 2 produced total inorganic carbon concentrations ranging from 4,000 to 7,500 mmol kg 21 causing water acidification of up to 2.8 units within the first 100 m depth and 2 km from the volcano. These high CO 2 levels generated high pCO 2 (partial pressure of CO 2 ) waters with values ranging from 12,000 to 150,000 matm at the surface. The most affected part of the water column was the layer SUBJECT AREAS: OCEANOGRAPHY ADAPTATION CLIMATE CHANGE BIODIVERSITY Received 14 May 2012 Accepted 11 June 2012 Published 5 July 2012 Correspondence and requests for materials should be addressed to E.F.-N. (eugenio. fraile@oceanografia. esca.ieo.es) * Instituto de Oceanografı ´a y Cambio Global (IOCAG). { Banco Espan ˜ol de Algas (BEA). { Instituto Universitario de Sistemas Inteligentes y Aplicaciones Nume ´ricas en Ingenierı ´a (IUSIANI). ¥ A ´ rea de medio marino y proteccio ´n ambiental (IEO-COC). SCIENTIFIC REPORTS | 2 : 486 | DOI: 10.1038/srep00486 1
Transcript of The submarine volcano eruption at the island of El Hierro
The submarine volcano eruption at theisland of El Hierro: physical-chemicalperturbation and biological responseE. Fraile-Nuez1¥, M. Gonzalez-Davila2*, J. M. Santana-Casiano2*, J. Arıstegui2*, I. J. Alonso-Gonzalez3{,S. Hernandez-Leon2*, M. J. Blanco4, A. Rodrıguez-Santana5, A. Hernandez-Guerra2*,M. D. Gelado-Caballero5, F. Eugenio2*, J. Marcello2*, D. de Armas1, J. F. Domınguez-Yanes1¥,M. F. Montero2*, D. R. Laetsch3{, P. Velez-Belchı1¥, A. Ramos6{, A. V. Ariza2*, I. Comas-Rodrıguez2*
& V. M. Benıtez-Barrios1¥
1Instituto Espanol de Oceanografıa, Centro Oceanografico de Canarias (IEO-COC). Santa Cruz de Tenerife, Spain, 2Universidadde Las Palmas de Gran Canaria, Instituto de Oceanografıa y Cambio Global (IOCAG). Las Palmas, Spain, 3Universidad de LasPalmas de Gran Canaria, Banco Espanol de Algas (BEA). Las Palmas, Spain, 4Instituto Geografico Nacional, Centro Geofısico deCanarias. Santa Cruz de Tenerife, Spain, 5Universidad de Las Palmas de Gran Canaria, Facultad de Ciencias del Mar. Las Palmas,Spain, 6Universidad de Las Palmas de Gran Canaria, Instituto Universitario de Sistemas Inteligentes y Aplicaciones Numericas enIngenierıa (IUSIANI). Las Palmas, Spain
On October 10 2011 an underwater eruption gave rise to a novel shallow submarine volcano south of theisland of El Hierro, Canary Islands, Spain. During the eruption large quantities of mantle-derived gases,solutes and heat were released into the surrounding waters. In order to monitor the impact of the eruptionon the marine ecosystem, periodic multidisciplinary cruises were carried out. Here, we present an initialreport of the extreme physical-chemical perturbations caused by this event, comprising thermal changes,water acidification, deoxygenation and metal-enrichment, which resulted in significant alterations to theactivity and composition of local plankton communities. Our findings highlight the potential role of thiseruptive process as a natural ecosystem-scale experiment for the study of extreme effects of global changestressors on marine environments.
Active submarine volcanoes constitute a significant source of mantle-derived gases, solutes and heat to theocean. Their emissions react with seawater leading to important physical-chemical anomalies that maystrongly impact the marine ecosystem1,2. However, the impacts of short-term submarine volcanic activity
on the surrounding biota, especially planktonic communities, are still poorly understood. Here, we provideevidence that one of the richest and most sensitive marine ecosystems of the subtropical northeast AtlanticOcean has been dramatically affected by the recent submarine eruption at the island of El Hierro (Canary Islands).
ResultsAfter three months of volcanic unrest, characterized by more than 10,000 earthquakes (M#4.3) and 5 cm ofground deformation, on October 10 2011 the national seismic network recorded a substantial decrease ofseismicity together with continuous volcanic tremor, indicating the beginning of an eruptive phase. Since then,regular multidisciplinary monitoring has been carried out in order to quantify environmental impacts caused bythe submarine eruption (Figure 1).
Periodic bathymetric measurements located the main vent 1.8 km offshore of the southern coast of El Hierroand indicated a major uplift of the volcano, raising it from 300 m depth to just 88 m below the surface.Conductivity-Temperature-Depth measurements of the waters affected by the volcanic emissions revealed tem-perature and salinity anomalies of 13uC and 20.3, respectively, at 80 m depth and 290 m from the volcano.Maximum temperature anomalies of 118.8uC were observed over the crater at 210 m depth using expendablebathythermograph probes (Figure 2). The release of CO2 produced total inorganic carbon concentrations rangingfrom 4,000 to 7,500 mmol kg21 causing water acidification of up to 2.8 units within the first 100 m depth and 2 kmfrom the volcano. These high CO2 levels generated high pCO2 (partial pressure of CO2) waters with valuesranging from 12,000 to 150,000 matm at the surface. The most affected part of the water column was the layer
SUBJECT AREAS:OCEANOGRAPHY
ADAPTATION
CLIMATE CHANGE
BIODIVERSITY
Received14 May 2012
Accepted11 June 2012
Published5 July 2012
Correspondence andrequests for materials
should be addressed toE.F.-N. (eugenio.
*Instituto deOceanografıa yCambio Global
(IOCAG).
{Banco Espanol deAlgas (BEA).
{ Instituto Universitariode Sistemas
Inteligentes yAplicaciones
Numericas enIngenierıa (IUSIANI).
¥ Area de mediomarino y proteccion
ambiental (IEO-COC).
SCIENTIFIC REPORTS | 2 : 486 | DOI: 10.1038/srep00486 1
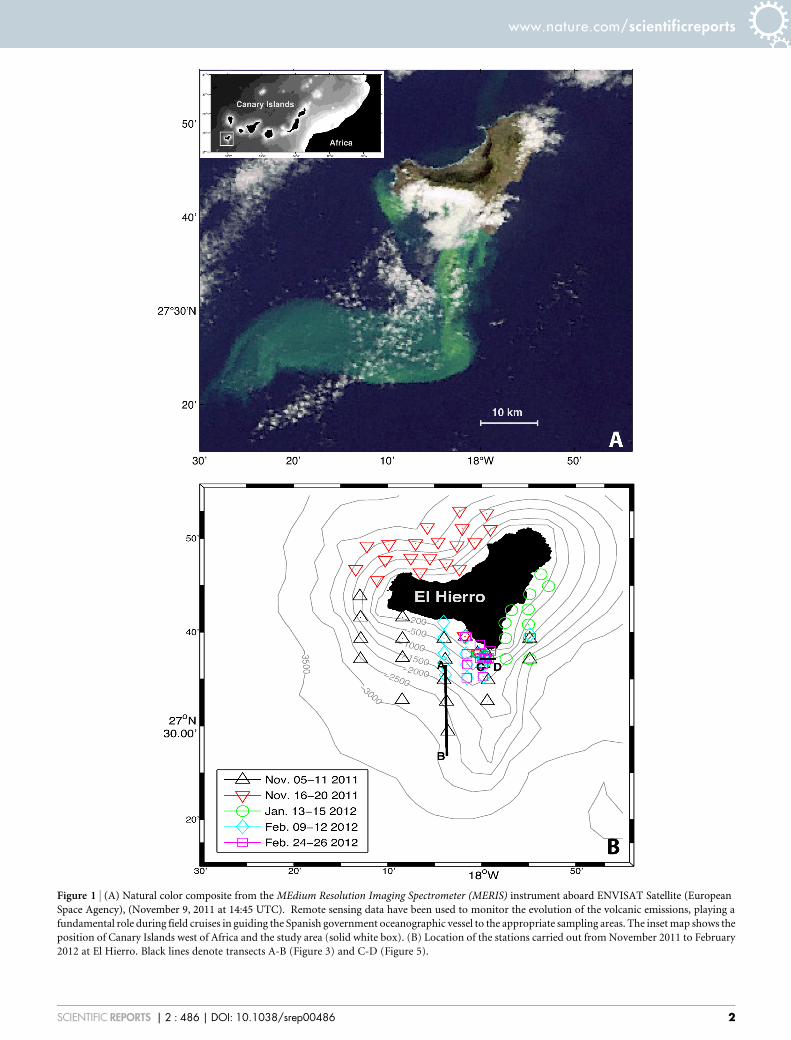
Figure 1 | (A) Natural color composite from the MEdium Resolution Imaging Spectrometer (MERIS) instrument aboard ENVISAT Satellite (EuropeanSpace Agency), (November 9, 2011 at 14:45 UTC). Remote sensing data have been used to monitor the evolution of the volcanic emissions, playing a
fundamental role during field cruises in guiding the Spanish government oceanographic vessel to the appropriate sampling areas. The inset map shows the
position of Canary Islands west of Africa and the study area (solid white box). (B) Location of the stations carried out from November 2011 to February
2012 at El Hierro. Black lines denote transects A-B (Figure 3) and C-D (Figure 5).
www.nature.com/scientificreports
SCIENTIFIC REPORTS | 2 : 486 | DOI: 10.1038/srep00486 2

from 75 to 125 m depth which experienced oxygen depletion near toanoxic levels, enhanced light attenuation (transmittance decrease),negative redox potential, pH decrease, maximum concentrations ofreduced sulfur and total Fe(II) species (200 and 50 mmol kg21,respectively) and higher concentrations of dissolved Cu, Cd, Pband Al with maximum values of 6.1, 6.7, 5.8 and 2,122 nM, respect-ively.
These physical-chemical anomalies had a major impact on localpelagic communities. No fish schools were acoustically detectedwithin the volcano affected area, and many dead fish were observedfloating at the surface. Due to low light penetration, the upper limit ofthe deep scattering layer (produced by plankton and nekton echoes)was around 100 m shallower than usual in waters affected by thevolcano. There, diel vertical migration was rather weak or absent as aconsequence of anoxic levels in shallow layers (Figure 3). Small
picoplankton communities showed a variable response to the vol-canic emissions. Picophytoplankton at surface layers were not affec-ted. However, at 75 m depth, Prochlorococcus showed a three-foldand Synechococcus a two-fold significant decline of abundance (t-test, p,0.06 and p50.1, respectively), compared to far-field stations.Conversely, heterotrophic bacterial abundances (particularly largecells with high green fluorescence) increased dramatically with depthat stations affected by the volcanic emissions. The distinct responseof the picophytoplankton groups to the volcano’s influence is sug-gestive of ecotype selection under the rapidly changing conditions.Indeed, preliminary phylogenetic analyses of 16S rDNA from surfacewaters revealed Prochlorococcus ecotypes characterized by lowerchlorophyll b/a ratios and higher cupric ion tolerance (HighLight-adapted3, HLI and HLII) (Figure 4). The lack of HLI eco-types in waters affected by the volcanic emissions may indicate a
Figure 2 | Vertical profiles of temperature, dissolved oxygen and transmittance at the volcano station. Flow cytometry plots of green fluorescence versus
side scatter (size) identify different bacterial groups at 25 m and 160 m. HNA and LNA (High/Low Nucleic Acid content bacteria) are typical bacteria
groups found in the water column outside the area of volcanic influence.
Figure 3 | Night echogram from a 38 kHz echo sounder showing vertical distribution of the migrant and Migrant and Deep Scattering Layers (ML andDSL) across the volcano affected area. Color bar refers to volume backscattering strength (Sv) in decibels.
www.nature.com/scientificreports
SCIENTIFIC REPORTS | 2 : 486 | DOI: 10.1038/srep00486 3
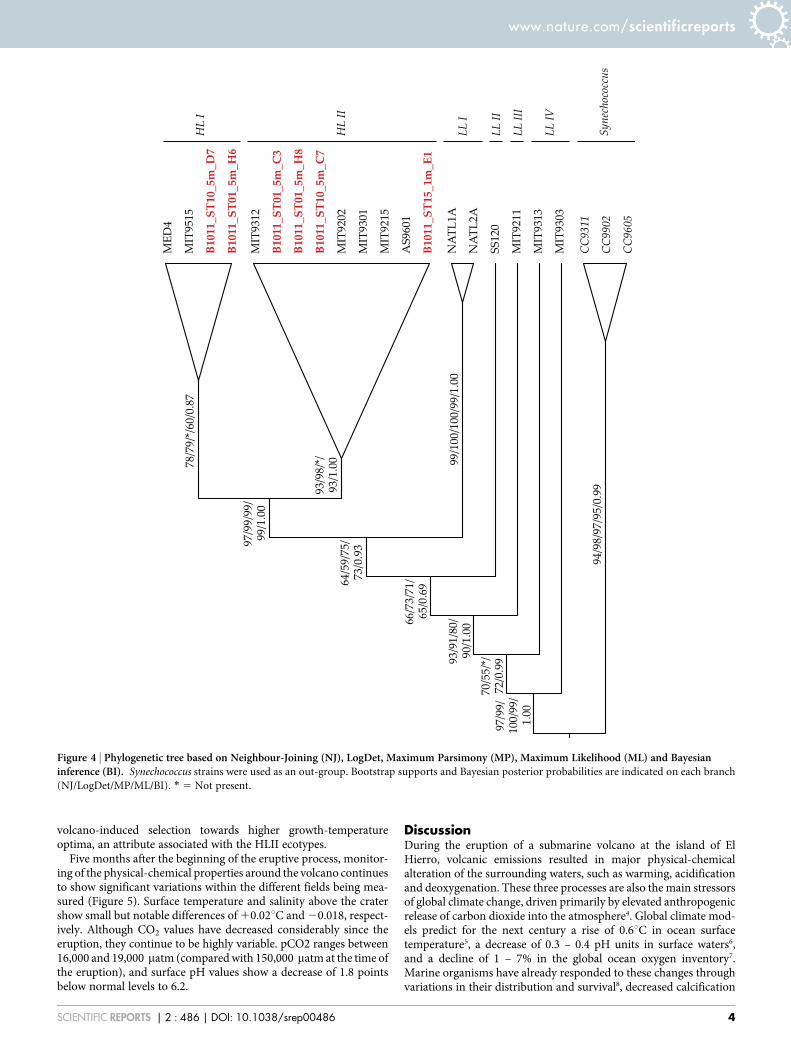
volcano-induced selection towards higher growth-temperatureoptima, an attribute associated with the HLII ecotypes.
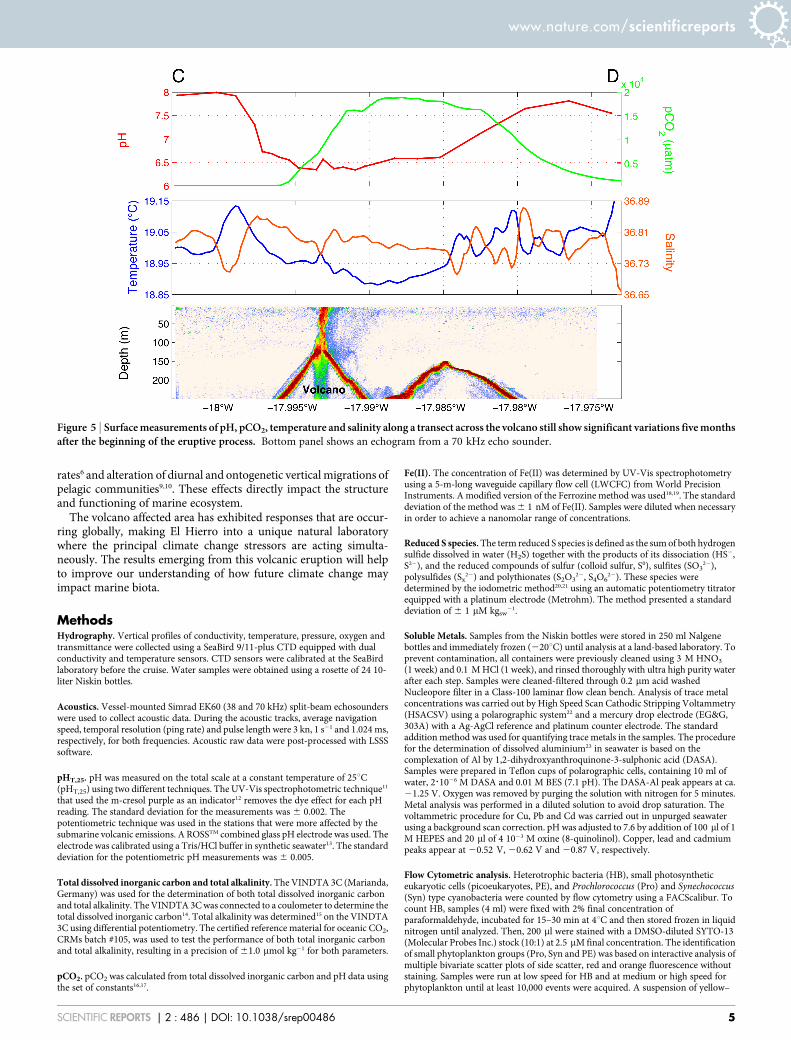
Five months after the beginning of the eruptive process, monitor-ing of the physical-chemical properties around the volcano continuesto show significant variations within the different fields being mea-sured (Figure 5). Surface temperature and salinity above the cratershow small but notable differences of 10.02uC and 20.018, respect-ively. Although CO2 values have decreased considerably since theeruption, they continue to be highly variable. pCO2 ranges between16,000 and 19,000 matm (compared with 150,000 matm at the time ofthe eruption), and surface pH values show a decrease of 1.8 pointsbelow normal levels to 6.2.
DiscussionDuring the eruption of a submarine volcano at the island of ElHierro, volcanic emissions resulted in major physical-chemicalalteration of the surrounding waters, such as warming, acidificationand deoxygenation. These three processes are also the main stressorsof global climate change, driven primarily by elevated anthropogenicrelease of carbon dioxide into the atmosphere4. Global climate mod-els predict for the next century a rise of 0.6uC in ocean surfacetemperature5, a decrease of 0.3 – 0.4 pH units in surface waters6,and a decline of 1 – 7% in the global ocean oxygen inventory7.Marine organisms have already responded to these changes throughvariations in their distribution and survival8, decreased calcification
Figure 4 | Phylogenetic tree based on Neighbour-Joining (NJ), LogDet, Maximum Parsimony (MP), Maximum Likelihood (ML) and Bayesianinference (BI). Synechococcus strains were used as an out-group. Bootstrap supports and Bayesian posterior probabilities are indicated on each branch
(NJ/LogDet/MP/ML/BI). * 5 Not present.
www.nature.com/scientificreports
SCIENTIFIC REPORTS | 2 : 486 | DOI: 10.1038/srep00486 4
rates6 and alteration of diurnal and ontogenetic vertical migrations ofpelagic communities9,10. These effects directly impact the structureand functioning of marine ecosystem.
The volcano affected area has exhibited responses that are occur-ring globally, making El Hierro into a unique natural laboratorywhere the principal climate change stressors are acting simulta-neously. The results emerging from this volcanic eruption will helpto improve our understanding of how future climate change mayimpact marine biota.
MethodsHydrography. Vertical profiles of conductivity, temperature, pressure, oxygen andtransmittance were collected using a SeaBird 9/11-plus CTD equipped with dualconductivity and temperature sensors. CTD sensors were calibrated at the SeaBirdlaboratory before the cruise. Water samples were obtained using a rosette of 24 10-liter Niskin bottles.
Acoustics. Vessel-mounted Simrad EK60 (38 and 70 kHz) split-beam echosounderswere used to collect acoustic data. During the acoustic tracks, average navigationspeed, temporal resolution (ping rate) and pulse length were 3 kn, 1 s21 and 1.024 ms,respectively, for both frequencies. Acoustic raw data were post-processed with LSSSsoftware.
pHT,25. pH was measured on the total scale at a constant temperature of 25uC(pHT,25) using two different techniques. The UV-Vis spectrophotometric technique11
that used the m-cresol purple as an indicator12 removes the dye effect for each pHreading. The standard deviation for the measurements was 6 0.002. Thepotentiometric technique was used in the stations that were more affected by thesubmarine volcanic emissions. A ROSSTM combined glass pH electrode was used. Theelectrode was calibrated using a Tris/HCl buffer in synthetic seawater13. The standarddeviation for the potentiometric pH measurements was 6 0.005.
Total dissolved inorganic carbon and total alkalinity. The VINDTA 3C (Marianda,Germany) was used for the determination of both total dissolved inorganic carbonand total alkalinity. The VINDTA 3C was connected to a coulometer to determine thetotal dissolved inorganic carbon14. Total alkalinity was determined15 on the VINDTA3C using differential potentiometry. The certified reference material for oceanic CO2,CRMs batch #105, was used to test the performance of both total inorganic carbonand total alkalinity, resulting in a precision of 61.0 mmol kg21 for both parameters.
pCO2. pCO2 was calculated from total dissolved inorganic carbon and pH data usingthe set of constants16,17.
Fe(II). The concentration of Fe(II) was determined by UV-Vis spectrophotometryusing a 5-m-long waveguide capillary flow cell (LWCFC) from World PrecisionInstruments. A modified version of the Ferrozine method was used18,19. The standarddeviation of the method was 6 1 nM of Fe(II). Samples were diluted when necessaryin order to achieve a nanomolar range of concentrations.
Reduced S species. The term reduced S species is defined as the sum of both hydrogensulfide dissolved in water (H2S) together with the products of its dissociation (HS2,S22), and the reduced compounds of sulfur (colloid sulfur, S0), sulfites (SO3
22),polysulfides (Sx
22) and polythionates (S2O322, S4O6
22). These species weredetermined by the iodometric method20,21 using an automatic potentiometry titratorequipped with a platinum electrode (Metrohm). The method presented a standarddeviation of 6 1 mM kgsw
21.
Soluble Metals. Samples from the Niskin bottles were stored in 250 ml Nalgenebottles and immediately frozen (220uC) until analysis at a land-based laboratory. Toprevent contamination, all containers were previously cleaned using 3 M HNO3
(1 week) and 0.1 M HCl (1 week), and rinsed thoroughly with ultra high purity waterafter each step. Samples were cleaned-filtered through 0.2 mm acid washedNucleopore filter in a Class-100 laminar flow clean bench. Analysis of trace metalconcentrations was carried out by High Speed Scan Cathodic Stripping Voltammetry(HSACSV) using a polarographic system22 and a mercury drop electrode (EG&G,303A) with a Ag-AgCl reference and platinum counter electrode. The standardaddition method was used for quantifying trace metals in the samples. The procedurefor the determination of dissolved aluminium23 in seawater is based on thecomplexation of Al by 1,2-dihydroxyanthroquinone-3-sulphonic acid (DASA).Samples were prepared in Teflon cups of polarographic cells, containing 10 ml ofwater, 2?1026 M DASA and 0.01 M BES (7.1 pH). The DASA-Al peak appears at ca.21.25 V. Oxygen was removed by purging the solution with nitrogen for 5 minutes.Metal analysis was performed in a diluted solution to avoid drop saturation. Thevoltammetric procedure for Cu, Pb and Cd was carried out in unpurged seawaterusing a background scan correction. pH was adjusted to 7.6 by addition of 100 ml of 1M HEPES and 20 ml of 4 1023 M oxine (8-quinolinol). Copper, lead and cadmiumpeaks appear at 20.52 V, 20.62 V and 20.87 V, respectively.
Flow Cytometric analysis. Heterotrophic bacteria (HB), small photosyntheticeukaryotic cells (picoeukaryotes, PE), and Prochlorococcus (Pro) and Synechococcus(Syn) type cyanobacteria were counted by flow cytometry using a FACScalibur. Tocount HB, samples (4 ml) were fixed with 2% final concentration ofparaformaldehyde, incubated for 15–30 min at 4uC and then stored frozen in liquidnitrogen until analyzed. Then, 200 ml were stained with a DMSO-diluted SYTO-13(Molecular Probes Inc.) stock (10:1) at 2.5 mM final concentration. The identificationof small phytoplankton groups (Pro, Syn and PE) was based on interactive analysis ofmultiple bivariate scatter plots of side scatter, red and orange fluorescence withoutstaining. Samples were run at low speed for HB and at medium or high speed forphytoplankton until at least 10,000 events were acquired. A suspension of yellow–
Figure 5 | Surface measurements of pH, pCO2, temperature and salinity along a transect across the volcano still show significant variations five monthsafter the beginning of the eruptive process. Bottom panel shows an echogram from a 70 kHz echo sounder.
www.nature.com/scientificreports
SCIENTIFIC REPORTS | 2 : 486 | DOI: 10.1038/srep00486 5
green 1 mm latex beads (,105 beads ml21 for phytoplankton and ,106 beads ml21 forHB) was added as an internal standard (Polysciences, Inc.). Cell abundances werecalculated from bead concentrations. The bead solution was checked daily byepifluorescence microscopy counting.
DNA extraction. Samples (50 ml) were filtered through 50 mm polycarbonate filtersand 0.2 mm pore size cellulose acetate syringe filters. The cellulose acetate filters werestored in liquid nitrogen. For DNA extraction, the filter membranes were extractedusing sterile scissors and forceps and processed using the NucleoSpinH Plant II kit(Macherey-Nagel, Germany) with a Proteinase K (Takara, Japan) digestion step (0.2mg/ml) at 55uC for 1 h. DNA concentration and purity was determined byspectrophotometry and DNA was stored at 220uC.
rDNA clone libraries and sequencing. Partial rDNA operons (.4,400 nt from 16SrDNA-Helix 4 [H39] to 23S rDNA-Helix H4 [H2735]) were amplified using universalSSU rRNA (SSU-4-forw, 59-GATCCTKGCTCAGGATKAACGCTGGC-39) andcyanobacterial- specific ptLSU (CD-rev, 59-GCCGGCTCATTCTTCAAC-39)24
primers. PCR reactions (25 ml) contained 75 ng DNA, primers (0.4 mM), dNTPs(200 mM), 1X KAPATaq buffer and 0.5 U/ml KAPATaq DNA polymerase (KAPABiosystems, USA), and was subjected to the following program: 95uC for 3 min, 30cycles of 95uC for 1 min, 55uC for 2 min and 72uC for 3 min, and 72uC for 5 min.Clone libraries were constructed using the TOPO TA CloningH Kit (Invitrogen,USA) following manufacturer’s instructions (pCRH2.1-TOPOH vector, TOP10Escherichia coli cells). Positive clones were used as template for an additional PCRreaction. PCR products were purified using the NucleoSpinH Extract II kit(Macherey-Nagel GmbH & Co. KG, Germany) and sequencing was performed at acommercial sequencing service (Macrogen Inc., Korea) using the primers:Seq_16S_H4_forw (59-TKGCTCAGGATKAACGCTGGC-39),Seq_16S_pos874_forw (59-ACTCAAAGGAATTGACG-39), Seq_16S_39_rev (59-ACTTAACCCRACATCTCACGACACG-39) and Seq_16S_49_rev (59-TACGGCTACCTTGTTACGACTTC-39)25.
Alignment and phylogenetic analyses. Six Prochlorococcus sequences wereidentified by BLAST26 and deposited on GenBank [JQ670967-JQ670972]. Thesesequences were combined with 16S rDNA database sequences of Prochlorococcusstrains (MED4: BX548174, MIT9515: CP000552, MIT9312: CP000111, MIT9202:AF115269, MIT9301: CP000576, MIT9215: CP000825, AS9601: CP000551,NATL1A: CP000553, NATL2A: CP000095, SS120: AE017126, MIT9211: CP000878,MIT9313: NC_005071, MIT9303: CP000554) and Synechococcus (outgroup) strains(CC9902: CP000097, CC9311: CP000435, CC9605: CP000110) and manually alignedusing SEAVIEW427 considering the 16S rDNA secondary structure of Synechococcussp. PCC6301. Alignments are available upon request. A total of 1,397 unambiguouslyaligned positions were used for analyses with maximum likelihood (ML), Bayesianinference (BI), distance methods (NJ), and maximum parsimony (MP). ML wasperformed using RAxML v7.2.828 for 10 runs and 1,000 (thorough) bootstrap (BS)replicates under the GTR1I1C model. BI was carried out through MrBayes v3.1.229
with two independent MCMC runs of four Metropolis-coupled chains under theGTR1I1C model, assuming default priors. Chains were sampled every 1.000generations for 5x10⁶ generations. Convergence of chains was assessed using Tracer1.5 (http://tree.bio.ed.ac.uk/software/tracer/) and the first 500 trees were discarded asburn-in. NJ was carried out using SEAVIEW427 performing 1,000 BS replicates underthe HKY model and using LogDet distances. MP was carried out using PHYLIP v3.52(http://evolution.genetics.washington.edu/phylip.html) with 10 random starts, 1,000BS replicates and retaining the best 10,000 trees.
1. Hall-Spencer, J. M. et al. Volcanic carbon dioxide vents show ecosystem effects ofocean acidification. Nature 454, 96 (2008).
2. Resing, J. A. et al. Chemistry of hydrothermal plumes above submarine volcanoesof the Mariana. Arc. Geochem. Geophys. Geosyst. 10, Q02009, doi:10.1029/2008GC002141. (2009).
3. Johnson, Z. I. et al. Niche partitioning among Prochlorococcus ecotypes alongocean-scale environmental gradients. Science 311, 1737 (2006).
4. Gruber, N. Warming up, turning sour, losing breath: ocean biogeochemistryunder global change. Phil. Trans. R. Soc. A 369, 1980, doi:10.1098/rsta.2011.0003(2011).
5. Intergovernmental Panel on Climate Change. Summary for Policymakers. InClimate Change 2007: The Physical Science Basis. Working Group I Contributionto the Fourth Assessment Report of the IPCC (eds Solomon, S. et al), CambridgeUniv. Press, Cambridge (2007).
6. Orr, J. C. et al. Anthropogenic ocean acidification over the twenty-first centuryand its impact on calcifying organisms. Nature 437, 681–686 (2005).
7. Keeling, R. F., Kortzinger, A. & Gruber, N. Ocean deoxygenation in a warmingworld. Annu. Rev. Mar. Sci. 2, 199–229 (2010).
8. Burrows, M. T. et al. The pace of shifting climate in marine and terrestrialecosystems. Science 334, 652–655 (2011).
9. Ekau, W., Auel, H., Poertner, H.-O. & Gilbert, D. Impacts of hypoxia on thestructure and processes in pelagic communities (zooplankton,macroinvertebrates and fish). Biogeosciences 7, 1669–1699 (2010).
10. Stramma, L., Schmidtko, S., Levin, L. A. & Johnson, G. C. Ocean oxygen minimaexpansions and their biological impacts. Deep-Sea Res. I 57, 587–595 (2010).
11. Clayton, T. D. & Byrne, R. H. Spectrophotometric seawater pH measurements:total hydrogen ion concentration scale calibration of m-cresol purple and at-searesults. Deep-Sea Res. I 40, 2115–2129 (1993).
12. Gonzalez-Davila, M., Santana-Casiano, J. M., Rueda, M. J., Llinas, O. & Gonzalez-Davila, E. F. Seasonal and interannual variability of sea surface carbon dioxidespecies at the European Station for Time Series in the Ocean at the Canary Islands(ESTOC) between 1996 and 2000. Global Biogeochem. Cycles 17, 1076 (2003).
13. Millero, F. J. The pH of estuarine seawater. Limnol. Oceanogr. 31, 839–847 (1986).14. Dickson, A. G., Sabine, C. L. & Christian, J. R. (Eds.) Guide to best practices for ocean
CO2 measurements. PICES Special Publication 3, IOCCP report No. 8 (2007).15. Mintrop, L. Versatile instruments for the determination of titration alkalinity.
Manual for versions 3S and 3C (2008).16. Mehrbach, C., Culberson, C. H., Hawlay, J. E., & Pytkowicz, R. M. Measurement of
the apparent dissociation constants of carbonic acid in seawater at atmosphericpressure. Limnol. Oceanogr. 18, 897–907 (1973).
17. Dickson, A. G. & Millero, F. J. A comparison of the equilibrium constants for thedissociation of carbonic acid in seawater media. Deep-Sea Res. 34, 1733–1743(1987).
18. Santana-Casiano, J. M., Gonzalez-Davila, M. & Millero, F. J. Oxidation ofnanomolar level of Fe(II) with oxygen in natural waters. Environ. Sci. Technol. 39,2073–2079 (2005).
19. Gonzalez-Davila, M., Santana-Casiano, J. M. & Millero, F. J. Oxidation of iron(II)nanomolar with H2O2 in seawater. Geochim. Cosmochim. Acta 69, 83–93 (2005).
20. Konovalov, S. K. et al. Intercalibration of CoMSBlack-93a chemical data;unification methods for dissolved oxygen and hydrogen sulfide analyses andsampling strategies of CoMSBlack-94a cruise. Rep. Inst. Mar. Sci. Edermil, Turkey.(1994).
21. Konovalov, S. K. & Romanov, A. S. Spectrophotometric and iodometric methodsfor the detection of hydrogen sulfide in the Black Sea: comparison of the results ofanalysis. Phys. Oceanogr. 10, 365–377 (1999).
22. Hernandez-Brito, J. J., Cardona-Castellano, P., Siruela-Matos, V. & Perez-Pena,J. A. High-speed computerized polarographic system for cathodic strippingvoltammetry in seawater. Electroanalysis 6, 1141 (1994).
23. Hernandez-Brito, J. J., Gelado-Caballero, M. D., Perez-Pena, J. & Herrera-Melian,J. A. Fast determination of Aluminum reactive to 1,2-Dihydroxyanthra-quinone-3-sulfonic Acid in Sea-Water. Analyst 119, 1593–1597 (1994).
24. Marin, B., Nowack, E. C. M. & Melkonian, M. A plastid in the making: Evidencefor a second primary endosymbiosis. Protist 156, 425–432 (2005).
25. Marin, B. & Melkonian, M. Molecular Phylogeny and Classification of theMamiellophyceae class. nov. (Chlorophyta) based on Sequence Comparisons ofthe Nuclear- and Plastid-encoded rRNA Operons. Protist 161, 304–336 (2010).
26. Altschul, S. F., Gish, W., Miller, W., Myers, E. W. & Lipman, D. J. Basic LocalAlignment Search Tool. Journal of Molecular Biology 215, 403–410 (1990).
27. Gouy, M., Guindon, S. & Gascuel, O. SeaView version 4: a multiplatform graphicaluser interface for sequence alignment and phylogenetic tree building. MolecularBiology and Evolution 27, 221-224 (2010).
28. Stamatakis, A. RAxML-VI-HPC: Maximum Likelihood-based PhylogeneticAnalyses with Thousands of Taxa and Mixed Models. Bioinformatics 22, 2688–2690 (2006).
29. Huelsenbeck, J. P. & Ronquist, F. MRBAYES: Bayesian inference of phylogeny.Bioinformatics 17, 754–755 (2001).
AcknowledgmentsThis study has been supported by the Instituto Espanol de Oceanografıa (I.E.O). TheEuropean project CARBOCHANGE-264879 has supported the analyses of carbon dioxide,reduced S species and Fe. We thank the Captain of the R/V Ramon Margalef, Luis Gago, andits crew for the help during this research.
Author contributions:E.F-N. organised, designed and coordinated the study. M.G-D. and J.M.S-C carried out andinterpreted the analyses of carbon dioxide, reduced S species and Fe. J.A. and M.F.M.conducted and interpreted the cytometric analyses. I.J.A-G and D.R.L. conducted andinterpreted the total DNA extractaction, rDNA clone libraries and sequencing, and thealignment and phylogenetic analyses. S.H-L. and A.V.A. carried out and interpreted theacoustic measurements. M.J.B. carried out the geophysical studies. E.F-N., A.R-S., A.H-G.,P.V-B., I.C-R. and V.M.B-B. conducted and interpreted the physical analyses. M.D.G-C.analysed and interpreted the soluble metals. F.E., J.M. and A.R. processed the satelliteimages. D.d.A. and J.F.D-Y. analysed and interpreted the oxygen data. All authors discussedthe results and contributed to the final manuscript.
Additional informationCompeting financial interests: The authors declare no competing financial interests.
License: This work is licensed under a Creative CommonsAttribution-NonCommercial-NoDerivative Works 3.0 Unported License. To view a copyof this license, visit http://creativecommons.org/licenses/by-nc-nd/3.0/
How to cite this article: Fraile-Nuez, E. et al. The submarine volcano eruption at the islandof El Hierro: physical-chemical perturbation and biological response. Sci. Rep. 2, 486;DOI:10.1038/srep00486 (2012).
www.nature.com/scientificreports
SCIENTIFIC REPORTS | 2 : 486 | DOI: 10.1038/srep00486 6