Thermo-Economic Evaluation of Aqua-Ammonia Solar ...
29
entropy Article Thermo-Economic Evaluation of Aqua-Ammonia Solar Absorption Air Conditioning System Integrated with Various Collector Types Adil Al-Falahi * , Falah Alobaid and Bernd Epple Institut Energiesysteme und Energietechnik, Technische Universität Darmstadt, Otto-Berndt-Straße 2, 64287 Darmstadt, Germany; [email protected] (F.A.); [email protected] (B.E.) * Correspondence: [email protected]; Tel.: +49-6151/16-20724; Fax: +49-(0)-6151/16-22690 Received: 23 August 2020; Accepted: 11 October 2020; Published: 16 October 2020 Abstract: The main objective of this paper is to simulate solar absorption cooling systems that use ammonia mixture as a working fluid to produce cooling. In this study, we have considered different configurations based on the ammonia–water (NH 3 –H 2 O) cooling cycle depending on the solar thermal technology: Evacuated tube collectors (ETC) and parabolic trough (PTC) solar collectors. To compare the configurations we have performed the energy, exergy, and economic analysis. The effect of heat source temperature on the critical parameters such as coefficient of performance (COP) and exegetic efficiency has been investigated for each configuration. Furthermore, the required optimum area and associated cost for each collector type have been determined. The methodology is applied in a specific case study for a sports arena with a 700~800 kW total cooling load. Results reveal that (PTC/NH 3 -H 2 O)configuration gives lower design aspects and minimum rates of hourly costs (USD 11.3/h) while (ETC/NH 3 -H 2 O) configuration (USD 12.16/h). (ETC/NH 3 -H 2 O) gives lower thermo-economic product cost (USD 0.14/GJ). The cycle coefficient of performance (COP) (of 0.5). Keywords: solar cooling; absorption cycles; solar thermal collector; parabolic trough collectors; solar energy; ammonia 1. Introduction In recent years, the predominant technology in cooling systems worldwide is the conventional vapor compression cycle, which is known for its significant consumption of electricity due to the existence of a compressor and extremely high peak loads on the hottest summer days [1,2]. Solar energy is an attractive solution for operating air conditioning systems. It saves electricity and thus primary energy sources (natural gas or oil), and decreases the emission of air-polluting gases and greenhouse gases causing global warming. The air conditioning cooling loads and the available solar power match well with each other along the day and seasons. Therefore, solar air conditioning also leads to reducing the peak electric power demand, and thus reduces the initial cost used due to the expensive peak electricity [3]. According to the Internal Energy Agency (IEA), global energy demand will increase by 35% between 2010 and 2035 [4]. This increase is associated with world population and economic growth, especially in developing countries [5]. Heat-driven refrigeration cycles are a promising solution in this context. Absorption cycles are heat-driven cycles that can use solar energy directly without the need to transform it into electric energy. The other benefit of using the heat-driven cycle is the fact that the highest cooling demand is associated with the high solar energy in summer and that offers a good chance for the heat-driven cycle to match the cooling demand efficiently. The temperature of the thermal energy source can affect the selection of the cooling technology as well as the performance of the cycle. The driving temperature depends on the solar energy capturing Entropy 2020, 22, 1165; doi:10.3390/e22101165 www.mdpi.com/journal/entropy
Transcript of Thermo-Economic Evaluation of Aqua-Ammonia Solar ...

entropy
Article
Thermo-Economic Evaluation of Aqua-AmmoniaSolar Absorption Air Conditioning System Integratedwith Various Collector Types
Adil Al-Falahi * , Falah Alobaid and Bernd Epple
Institut Energiesysteme und Energietechnik, Technische Universität Darmstadt, Otto-Berndt-Straße 2,64287 Darmstadt, Germany; [email protected] (F.A.); [email protected] (B.E.)* Correspondence: [email protected]; Tel.: +49-6151/16-20724; Fax: +49-(0)-6151/16-22690
Received: 23 August 2020; Accepted: 11 October 2020; Published: 16 October 2020�����������������
Abstract: The main objective of this paper is to simulate solar absorption cooling systems that useammonia mixture as a working fluid to produce cooling. In this study, we have considered differentconfigurations based on the ammonia–water (NH3–H2O) cooling cycle depending on the solar thermaltechnology: Evacuated tube collectors (ETC) and parabolic trough (PTC) solar collectors. To compare theconfigurations we have performed the energy, exergy, and economic analysis. The effect of heat sourcetemperature on the critical parameters such as coefficient of performance (COP) and exegetic efficiencyhas been investigated for each configuration. Furthermore, the required optimum area and associatedcost for each collector type have been determined. The methodology is applied in a specific case study fora sports arena with a 700~800 kW total cooling load. Results reveal that (PTC/NH3-H2O)configurationgives lower design aspects and minimum rates of hourly costs (USD 11.3/h) while (ETC/NH3-H2O)configuration (USD 12.16/h). (ETC/NH3-H2O) gives lower thermo-economic product cost (USD0.14/GJ). The cycle coefficient of performance (COP) (of 0.5).
Keywords: solar cooling; absorption cycles; solar thermal collector; parabolic trough collectors; solarenergy; ammonia
1. Introduction
In recent years, the predominant technology in cooling systems worldwide is the conventionalvapor compression cycle, which is known for its significant consumption of electricity due to theexistence of a compressor and extremely high peak loads on the hottest summer days [1,2]. Solar energyis an attractive solution for operating air conditioning systems. It saves electricity and thus primaryenergy sources (natural gas or oil), and decreases the emission of air-polluting gases and greenhousegases causing global warming. The air conditioning cooling loads and the available solar power matchwell with each other along the day and seasons. Therefore, solar air conditioning also leads to reducingthe peak electric power demand, and thus reduces the initial cost used due to the expensive peakelectricity [3]. According to the Internal Energy Agency (IEA), global energy demand will increaseby 35% between 2010 and 2035 [4]. This increase is associated with world population and economicgrowth, especially in developing countries [5]. Heat-driven refrigeration cycles are a promisingsolution in this context. Absorption cycles are heat-driven cycles that can use solar energy directlywithout the need to transform it into electric energy. The other benefit of using the heat-driven cycle isthe fact that the highest cooling demand is associated with the high solar energy in summer and thatoffers a good chance for the heat-driven cycle to match the cooling demand efficiently.
The temperature of the thermal energy source can affect the selection of the cooling technology aswell as the performance of the cycle. The driving temperature depends on the solar energy capturing
Entropy 2020, 22, 1165; doi:10.3390/e22101165 www.mdpi.com/journal/entropy

Entropy 2020, 22, 1165 2 of 29
technology that can be adopted and efficiently available. Most of the cooling technologies are workingin the range of 80–100 ◦C, which can be easily achieved using different low-cost solar energy collectors.Two kinds of absorption cycles are commercially available; depending on the refrigerant–absorbent pair;these two cycles are water–lithium bromide (H2O–LiBr) and ammonia–water (NH3–H2O) mixtures.
Kurem and Horuz [6] carried out a comprehensive study to investigate and analyze theabsorption heat pump and using water–lithium bromide (H2O–LiBr) and ammonia–water (NH3–H2O)mixtures. The authors highlighted and pinpointed the advantages and disadvantages of both solutions.They concluded that the absorption heat transformer systems using water–lithium bromide solutionproduce better COP than that of using an ammonia–water solution.
Said et al. [7] presented an experimental investigation of a solar thermal powered ammonia–waterabsorption refrigeration system. The focus of this study lies in the design of the components of theabsorption chiller, the ice storages, and the solar collector field as well as the integration of the dataacquisition and control unit. The results of the experiments indicated a chiller coefficient of performance(COP) of 0.69 and a cooling capacity of 10.1 kW at 114/23/−2 (◦C) representing the temperatures of thegenerator inlet, the condenser/absorber inlet, and the evaporator outlet respectively.
One of the advantages of absorption air-conditioning (ACC) cycles is the possibility of usingseveral heat sources as input to the generator. Calise et al. [8] presented design of a novel solar-assistedcombined cycle power plant. The system includes a solar loop equipped with a double-stage absorptionchiller driven by high-temperature high-vacuum non-concentrating flat-plate solar thermal collectors.The simulation also includes a detailed thermo-economic model that accurately evaluates system capitaland operating costs as a function of design and operating parameters. The simulation results show thata very high thermal efficiency of solar collectors—on average equal to 34%—is achieved. Results fromthe economic point of view were also satisfactory. Neyer et al. [9] analyzed the influence of differentheat rejection units to a solar- or combined heat and power systems(CHP)-driven single-/half-effectammonia/water absorption chiller. The simulation results are used to analyze the annual impact on thetechnical and economic performance of the new single-/half-effect concept in various configurationsand boundary conditions. They concluded that application for solar- and CHP-driven systemsare reaching non-renewable primary energy savings of 30–70% at almost equal costs compared toconventional systems.
Different types of solar thermal energy collectors can be used with single-effect absorption cycles.Aman et al. [10] developed a thermodynamic based on a 10 kW air-cooled ammonia–water absorptionchiller driven by flat plate collector (FPC) for domestic application. Both energy and exergy analyseshave been conducted to enhance the thermal performance of the cooling system. The analysesuncovered that the absorber is where the most exergy loss occurs (63%) followed by the generator (13%)and the condenser (11%). Bellos et al. [11] tested four solar collectors (evacuated tube collectors ETC,flat plate collectors FPC, parabolic through collectors PTC, and compound parabolic collectors CPC) inan absorption cooling system. A financial comparison between the four optimized systems proves thatevacuated tube collectors are the most beneficial technology. On the other hand, a system with parabolictrough collectors is the exergetic optimum one, but its high capital cost renders it an unprofitablesolution. Fong et al. [12], investigated a comparative study of different types of solar cooling systemsfor buildings in a subtropical city, which is commonly featured with long hot, and humid summer.The results show that solar electric compression refrigeration and solar absorption refrigeration hadthe highest energy saving and it will provide a promising application potential of solar cooling forbuildings in the subtropical region.
In a recent study, Al-Falahi Adil [13] investigated the energy performance of a solar absorptionair-conditioning system integrated with ETC, in the climate of Baghdad, Iraq. It was concluded thatthe seasonal collector efficiency and solar fractions are 54% and 58% respectively and absorption chillerCOP was 0.44. Another study was presented by Galindo et al. [14], where they report experimentalresults of an absorption cooling system with a nominal capacity of 5 kW based on a parabolic troughcollector, which operates with the ammonia-lithium nitrate mixture. The results of the parametric

Entropy 2020, 22, 1165 3 of 29
analysis revealed that the PTC field can provide up to 6.5 kW of useful heat to the absorption coolingsystem at temperatures up to 105 ◦C with thermal efficiencies up to 19.8% and exergy efficiency up to14.93. The maximum value of the solar coefficient of performance reached 0.07. Cabrera et al. [15]presented a survey of the existing experiences and realizations on applications of PTC in solar coolingsystems. as well as evaluated the use of the new collectors as an occasional alternative to other solarthermal collectors in air conditioning applications by dynamical simulation. The results for the casestudies developed in this work show that PTC presents similar levelized costs of energy for coolingthan flat plate collectors (FPC) and lower than evacuated tube collectors (ETC) and compound paraboliccollectors (CPC).
Jakob et al. [16], presented a design of an air conditioning by diffusion absorption using themixture NH3-H2O, with a cooling capacity of 2.5 kW. The unit was built and tested, achieving amaximum COP of 0.38. The collector used was an indirectly coupled flat plate collector (FPC).
Parabolic trough collectors are frequently employed for a solar steam generation because relativelyhigh temperatures can be obtained without serious degradation in the collector efficiency. Qu et al. [17]developed a model of solar absorption cooling and heating system driven by PTC using transientsystem simulation software. The system incorporates 52 m2 of parabolic trough solar collectors;a 16 kW absorption chiller capacity. The performances of the system have been analyzed and validatedwith experimental data under various solar radiations and wind velocity. They concluded that theabsorption air conditioning (AAC) cycle may potentially provide 20% of the heating and 39% of thecooling demands of the building. Tzivanidis and Bellos [18] developed a numerical model is in order tosimulate the dynamic performance of a solar cooling system. Many parameters have been investigatedthrough sensitivity analyses and their optimum values are determined. The results proved that byusing a PTC module with an aperture area of 14 m2, a building area of about 25 m2 can be cooledfor 13 h daily during the summer period. The optimum specific mass flow rate was determined to0.03 kg/s m2 and the optimum storage tank volume to 0.3 m3. Moreover, they presented a case studyfor a typical building of 100 m2 with very satisfying results, where four PTC modules are used inparallel connection.
Molero-Villar et al. [19] developed a complete solar thermal cooling system using TRNSYS modelto compare a configuration with just hot storage (of typical capacity 40 L/m2 of solar collector surface)and a configuration with both, hot and cool storages. In their study, they analyzed the effect of othervariables on the optimal configuration: collector efficiency curve, COP of the absorption chiller, storagesize, and temperature set-points of the chillers. They concluded that the most suitable configuration isvery sensible to the solar collector area. As the collector area increases, the advantages of cool storagevanish. Increasing the collector area tends to increase the temperature of the hot storage, leading tohigher thermal losses in both the collector and the tank. When the storage volume is concentrated inone tank, these effects are mitigated.
Said [20] demonstrated and developed an alternate design for a 24 h operating solar-poweredabsorption refrigeration technology. The development includes an in-depth review of the design andoperation of the conventional and solar-assisted absorption refrigeration systems coming-up withnew alternative designs, detailed thermodynamic analysis of some of the new alternative designs,and selection of the most suitable alternative design. The analysis indicates that continuously operatinga solar-powered ammonia–water absorption system with refrigerant storage is the most suitablealternative design for an uninterrupted supply of cooling effect.
Abdelhay et al. [21] carried out a parametric study to investigate the effects of the differentdesign and operating parameters on the polygeneration plant energetic and exergetic parameters.Results reveal that the highest exergy loss was found to occur in PTC solar field with about82.42% of the plant exergy destruction and for the cooling part to balance between the COP ofthe absorption refrigeration system and PTC area, the generator temperature should be 85–90 ◦C.Moreover, an economic evaluation of the proposed integrated system showed the unit cooling price(0.003 $/kW h) and the highest exergetic efficiency is (23.95%). The absorption chiller capacity was

Entropy 2020, 22, 1165 4 of 29
3.6TR (Ton of Refrigeration). In the same regard, Leiva et al. [22] performed a comparison between thelevelized cost and thermo-economic methodologies of a solar polygeneration plant. They concludedthat through the study they found differences between the two methods and this represent an increaseof about 35.1% in the case of the electricity, and a reduction in the cost associated to the water, cooling,and heat production by around 34.4%, 78.1%, and 97.6%, respectively.
Related to thermo-economics, Al-Falahi [23] presented the design and thermo-economic evaluationof absorption air conditioning (AAC) to compare two various collectors (PTC, ETC). The results revealthat parabolic trough collectors combined with H2O–LiBr (PTC/H2O–LiBr)gives lower design aspectsand minimum rates of hourly costs (USD 5.2/h), while ETC/H2O–LiBr configuration give USD 5.6/h.The H2O–LiBr thermo-economic product cost is USD 0.14/GJ. The cycle coefficient of performanceCOP was in the range of 0.5 to 0.9. Salehi [24] studied the feasibility of solar assisted absorptionheat pumps for space heating; in this study, single-effect LiBr/H2O and NH3/H2O absorption andabsorption compression-assisted heat pumps are analyzed for heating loads of 50–2 MW(MegaWatt).Utilizing geothermal hot springs as heat sources for refrigerant evaporation. the results show that themaximum achievable exergy efficiency for the NH3-H2O and LiBr-H2O absorption systems is 0.23 and0.25, respectively. while, the solar heating system has the highest product unit cost, mainly due toits high capital costs. The minimum obtainable product unit costs for the NH3/H2O and LiBr/H2Oabsorption systems are about 22 $/GJ and 55 $/GJ, respectively.
Marc [25] studied an experimental solar absorption cooling. The solar field consists of 36double-glazed flat-plate solar collectors of a total aperture area of 90 m2 coupled to a single-effectabsorption chiller with cooling capacity at 30 kW at 90/30/11 (◦C) representing the temperatures ofthe generator, the condenser, and the evaporator respectively. The maximum electrical coefficientof performance was 1.65. Zhai [26] used the evacuated tube solar field for 8 kW cooling capacity.The system consumed and amount of 92 m2 of solar area. Lopez et al. [27] performed energy andexergy analysis to compare several system cooling cycles configurations and different solar thermaltechnologies: evacuated tube, parabolic trough, and linear Fresnel solar collectors. The results showthat NH3-H2O/(ETC or PTC) combinations offer the best efficiencies. In their work ammonia-basedworking fluid mixture is considered.
It is clear from the literature that solar energy has a great influence on refrigeration and/or airconditioning processes. Different types and configurations of solar collectors have been applied forsuch purposes. The most commonly used was the evacuated tube and parabolic through collectorsespecially for large capacities. Moreover, it has been noticed that H2O-LiBr and NH3-H2O have beenused for most of the research activities in this regard for air conditioning applications. The novelty ofthis work emerged from the connection type between the solar field and the absorption chiller. A flashevaporation tank has been used as an intermediate unit between both parts to generate steam; knownas direct or in situ concept system, in which two-phase flow is allowed in the collector receiver sothat steam is generated directly. The sub-cooled water is heated to boiling and steam forms directlyin the receiver tube. The system use water, a superior heat transport fluid. The flash system uses asensible heat change in the working fluid, which makes the temperature differential across the collectorrelatively high. The rapid increase in water vapor pressure with temperature requires a correspondingincrease in system operating pressure to prevent boiling. The main objective of this work is to optimizeand design NH3-H2O absorption air conditioning systems that are operated by different types of solarcollectors (ETC and PTC), based on energy, exergy, design, and cost. Selecting the best operatingcondition is also been the focus. The following general outlines are proposed for this work:
X NH3-H2O absorption cycles have been studied under different operating conditions. The selectionwas made based on the best-operating conditions.
X Two different types of solar collectors (ETC and PTC) have been compared while combining themwith absorption cycles.
X A detailed mathematical model has been performed.
Entropy 2020, 22, 1165 5 of 29
X The comparison is performed based on the terms of energy, exergy, design, cost, and thermo-economic. The design technique of modeling has been adopted in this study.
X Based on the optimized selection, a case study for 700–800 kW (200–230 TR) cooling load hasbeen performed.
2. Thermal Solar Cooling System Description
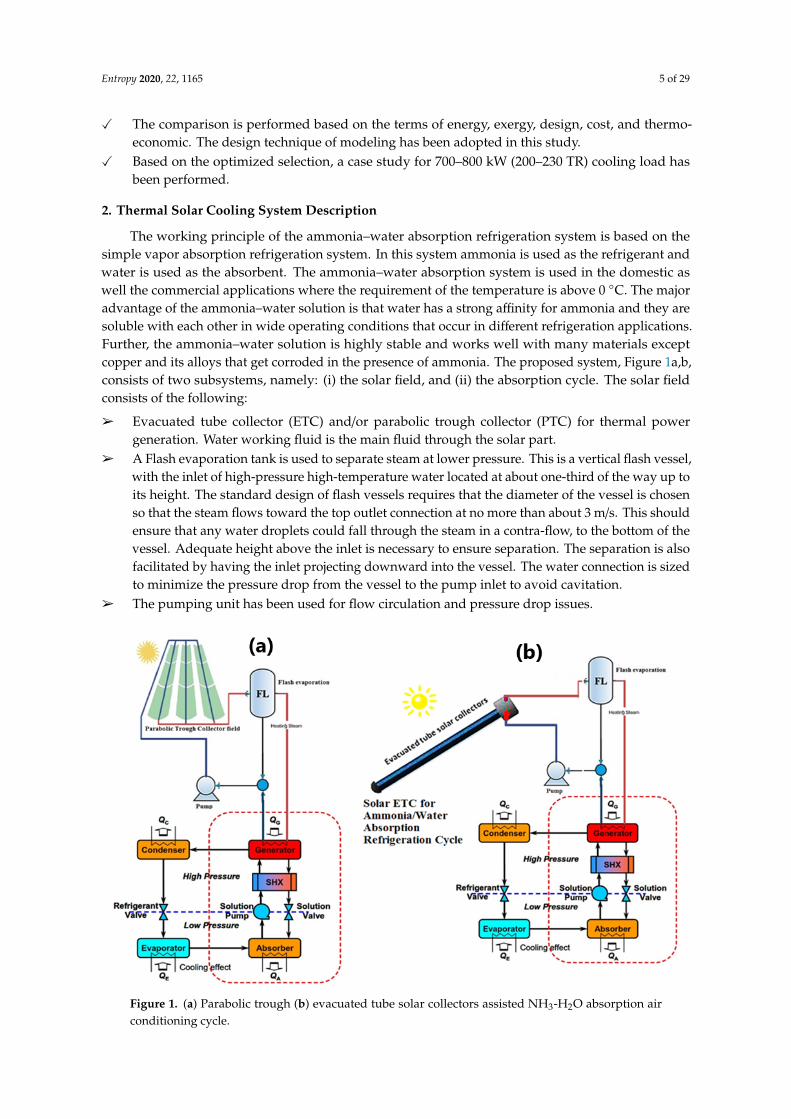
The working principle of the ammonia–water absorption refrigeration system is based on thesimple vapor absorption refrigeration system. In this system ammonia is used as the refrigerant andwater is used as the absorbent. The ammonia–water absorption system is used in the domestic aswell the commercial applications where the requirement of the temperature is above 0 ◦C. The majoradvantage of the ammonia–water solution is that water has a strong affinity for ammonia and they aresoluble with each other in wide operating conditions that occur in different refrigeration applications.Further, the ammonia–water solution is highly stable and works well with many materials exceptcopper and its alloys that get corroded in the presence of ammonia. The proposed system, Figure 1a,b,consists of two subsystems, namely: (i) the solar field, and (ii) the absorption cycle. The solar fieldconsists of the following:
â Evacuated tube collector (ETC) and/or parabolic trough collector (PTC) for thermal powergeneration. Water working fluid is the main fluid through the solar part.
â A Flash evaporation tank is used to separate steam at lower pressure. This is a vertical flash vessel,with the inlet of high-pressure high-temperature water located at about one-third of the way up toits height. The standard design of flash vessels requires that the diameter of the vessel is chosenso that the steam flows toward the top outlet connection at no more than about 3 m/s. This shouldensure that any water droplets could fall through the steam in a contra-flow, to the bottom of thevessel. Adequate height above the inlet is necessary to ensure separation. The separation is alsofacilitated by having the inlet projecting downward into the vessel. The water connection is sizedto minimize the pressure drop from the vessel to the pump inlet to avoid cavitation.
â The pumping unit has been used for flow circulation and pressure drop issues.
Entropy 2020, 22, x 6 of 27
In the condenser, the high-pressure, high-temperature refrigerant vapor leaving the generator is passed to the condenser where it is cooled by cooling water. The refrigerant saturated vapor is condensed to a liquid. This liquid is then flowed through an expansion refrigerant valve and to the evaporator.
Figure 1. (a) Parabolic trough (b) evacuated tube solar collectors assisted NH3-H2O absorption air conditioning cycle.
The cycle is considered a closed cycle related to the working flowed through it.
3. Methodology, Assumptions and Mathematical Model
The proposed configurations in this work are required iterative programming in order to calculate the complicated streams (recycle and backward streams). Hence; to develop a specific model for this innovative kind of plan, the Simulink software, a product of a MATLAB work, has been chosen for its high versatility and capacity to handle unsteady situations. Two models were built according to the proposed configurations (ETC/NH3-H2O and PTC/NH3-H2O) and the design calculation method. The system border streams (outlet temperature, ambient temperature, inlet cooling water temperature, etc.) are assigned by the user than the entire design data (area, length, volume, mass flow rate, etc.) Will then be calculated. Therefore; a user would assign the amount of needed cooling load on the evaporator then all possible data for all the system units would be calculated in sequence. Specifying the system cooling load would calculate the required thermal load. Besides; the required design limits and performance calculations would be pass out instantly. The design operating conditions and assumptions that have been considered in this work are listed in Table 1.
Figure 1. (a) Parabolic trough (b) evacuated tube solar collectors assisted NH3-H2O absorption airconditioning cycle.

Entropy 2020, 22, 1165 6 of 29
The absorption refrigeration cycle (NH3-H2O) consists of an absorber, a generator, a condenser,an evaporator, expansion valves, a solution heat exchanger (SHX), and a solution pump as illustratedin Figure 1.
â In the evaporator, low-pressure liquid-vapor mixture refrigerant pure ammonia (NH3), evaporateson the outer surface of the evaporator’s tube bundle. Heat is supplied to the evaporatorby water flowing inside the evaporator’s tubes; this chilled water is subsequently used forrefrigeration. The refrigerant vapor leaving the evaporator as saturated vapor enters the absorberat low-temperature and low-pressure conditions.
â In the absorber, The refrigerant vapor is then absorbed and dissolved by the weak ammonia–water(NH3-H2O) solution coming from the generator. It is worth mentioning that the weak solution isthe solution with less amount of refrigerant, i.e., highly concentrated by water. The heat liberatedduring the absorption process is removed by using cooling water flowing inside the tubes.
â The solution pump receives a strong NH3-H2O solution and delivers it at high pressure to thegenerator via the solution heat exchanger. Note that the solution is a saturated liquid and hencethe pump work is very small.
â In the generator, the high-pressure solution entering the generator is heated and the ammoniain the solution is vaporized. The heat for this process could be provided by solar energy or agas burner. The remaining weak NH3-H2O solution exits via the heat exchanger to the absorberthrough a pressure-reducing solution valve.
â A solution heat exchanger (SHX) is included here; as the solution after the pump requires heatingand the hot solution leaves the generator would increase the absorber temperature if it were notcooled before entry.
â In the condenser, the high-pressure, high-temperature refrigerant vapor leaving the generator ispassed to the condenser where it is cooled by cooling water. The refrigerant saturated vapor iscondensed to a liquid. This liquid is then flowed through an expansion refrigerant valve and tothe evaporator.
The cycle is considered a closed cycle related to the working flowed through it.
3. Methodology, Assumptions and Mathematical Model
The proposed configurations in this work are required iterative programming in order to calculatethe complicated streams (recycle and backward streams). Hence; to develop a specific model for thisinnovative kind of plan, the Simulink software, a product of a MATLAB work, has been chosen forits high versatility and capacity to handle unsteady situations. Two models were built according tothe proposed configurations (ETC/NH3-H2O and PTC/NH3-H2O) and the design calculation method.The system border streams (outlet temperature, ambient temperature, inlet cooling water temperature,etc.) are assigned by the user than the entire design data (area, length, volume, mass flow rate, etc.)Will then be calculated. Therefore; a user would assign the amount of needed cooling load on theevaporator then all possible data for all the system units would be calculated in sequence. Specifyingthe system cooling load would calculate the required thermal load. Besides; the required designlimits and performance calculations would be pass out instantly. The design operating conditions andassumptions that have been considered in this work are listed in Table 1.

Entropy 2020, 22, 1165 7 of 29
Table 1. Data assumptions for the evacuated tube collector/parabolic trough collector (ETC/PTC)/NH3-H2O configuration.
Unit Process Assigned Data Calculated Data
Absorptionair-conditioning cycle
(AAC):(ETC/PTC)/NH3-H2O
X Solar radiation: 500 W/m2
X Ambient temperature: 25 ◦CX Average relative humidity: 15%X ETC top temperature: 100–200 ◦CX PTC top temperature: 200–300 ◦CX Absorber temperature: 30–35 ◦CX Generator temperature: 80–90 ◦CX Condenser temperature: 40–45 ◦CX Hot air temperature: 35 ◦CX Target cooled air temperature: 20 ◦CX Evaporator temperature: 5–10 ◦CX Cooling load: 14–57 kW (50–200 TR)X Condenser effectiveness: 80%X Fan system efficiency: 85%X Pumping system efficiency: 75%X Plant life time: 20 yearX Interest rate: 5%X Load factor: 90%X Specific electric power cost: 0.065
$/kWhX Water steam is the solar field
working fluid
Solar Field:
â Solar field top pressure, barâ Solar field pressure loss, barâ Total solar field area, m2
â Solar field thermal load, kWâ Number of solar collectors, #â Solar field mass flow rate, kg/sâ Solar field inlet temperature, ◦Câ Efficiency, %â Exergy destruction, kW
Flash Tank:
â * Flash tank design dataâ Total mass flow rate, kg/sâ Dryness fraction, %â Flash tank water flow rate, kg/sâ Steam flow rate, kg/sâ Exergy destruction, kW
AAC Unit:
â Weak and strong solutions, kg/sâ * Design dataâ Thermal power, kWâ Total cycle flow rate, kg/sâ Generator power, kWâ Cooling fan power, kWâ COPâ COPmaxâ Relative performanceâ Exergy destruction, kW
Pump:
â Power, kWâ Outlet temperature, ◦Câ Exergy destruction, kW
Cost and Performance:
â Units hourly costs, $/hâ Total hourly costs, $/hâ Total power, kWâ LPC, $/kWhâ Thermo-economic cost, $/GJâ Total exergy destruction
rate, kW
Notes:
� Data are run out based on steady-state operating conditions.� Ambient temperature is fixed as 25 ◦C for all process runs.� Solar radiation is fixed at 500 W/m2.� * Design data means area, length, width, etc.
Saturated liquid and vapor phases of pressure, temperature, enthalpy, specific volume, and specificentropy are recorded after the modeled blocks and lookup tables. The source of physical propertiesis obtained by the chemistry book on the National Institute of Standards and Technology NIST

Entropy 2020, 22, 1165 8 of 29
website [28]. Generally, the optimization process has been done in order to bring down costs andtechno-economic solutions.
3.1. Thermodynamic Model
A schematic diagram of the main component of the proposed is shown in Figure 1.The mathematical approaches used in the analysis for solar absorption air conditioning (AAC)plants are performed according to the 1st and 2nd laws of thermodynamics. The following assumptionsare considered in the developed mathematical model of the system:
(1) The system runs in a steady-state condition.(2) Heat losses to the surroundings are neglected.
The thermodynamic model of each component is explained in the following section.
3.1.1. ETC Model
For ETC, the solar collector instantaneous efficiency can be determined from its characteristiccurve using solar irradiance, mean collector, and ambient temperatures. The curve used for FPC isexpressed by Equation (1) [29,30]:
ηetc = ηo − a1
(To − TambIs
)− a2
(To − TambIs
)2.Is (1)
where ηetc is the ETC efficiency, ηo = 0.665, a1 = 2.9 W/m2. ◦C, a2 = 0.0019 W/m2. ◦C2, Is is the solar fluxover the collector area (W/m2), To is the outlet collector top temperature (◦C), and ambient temperatureTamb in (◦C).The useful collector thermal load Qth (kW), may exist according to the following relation;
Qth = M.col ×Cp × (To − Ti) (2)
where, M.col in kg/s, Cp in kJ/kg ◦C and the temperature difference is in ◦C.
The collector total area At (m2), is estimated based on the collector energy balance equation as afunction of collector efficiencies using;
At =Qth
ηetc × Is(3)
As shown in Equation (3), if the value of the heat exiting the collector is fixed, the necessarycollector area is inversely proportional to solar radiation. This is why the value of solar radiation isfundamental for the development of projects involving solar energy. The ETC module aperture areaAetc, m2 can be calculated as;
Aetc = Dt × Lt ×NOT (4)
where, Dt is the tube diameter (m), Lt is the tube length (m), and NOT is the number of tubesper one module. The total number of evacuated tube collectors NOC can be calculated from thefollowing equation.
NOC =At
Aetc(5)
The number of loops NOL, loop area Aloop, and the loop length, Lloop can be calculated by assigningthe hydraulic mass flow rate M.
hyd, kg/s. M.col will be calculated based on the load between the flash
tank and the AAC unit:
NOL =M.
colM.
hyd(6)
Aloop =At
NOL(7)

Entropy 2020, 22, 1165 9 of 29
Lloop =Aloop
Lt(8)
3.1.2. PTC Model
The corresponding efficiency equation for the medium-high temperature parabolic troughcollectors (PTC) is given in Equation (9) [30]:
ηptc = ηo − a11(To − Tamb) − a21
(To − TambIs
)− a31
(To − TambIs
)2(9)
where, a11 = 4.5 × 10⁻⁶ 1/◦C, a21 = 0.039 W/m2. ◦C, a31 = 3 × 10⁻⁴ W2/m2. ◦C2, ηo = 0.75.The thermal efficiency of a PTC is the captured or gained useful energy divided by the incident
radiation on the aperture plane, as shown in Equation (10)
ηPTC =Qu
APTC × Is(10)
where ηPTC is the thermal efficiency of the collector; Qu is the useful power (W); APTC is the aperturearea of the collector (m2); and I is the solar radiation absorbed in the aperture plane (W/m2).
The modification of Equation (10) yields Equation (11):
APTC =Qu
ηPTC × Is(11)
However, the required land area for the installation of solar collectors is higher than the aperturearea of collectors. This value varies approximately between three to four times the aperture area ofcollectors. The land area is greater because there is a distance between collectors besides the requiredspace for pipes and other accessories of the system. The collector useful energy equation may existaccording to the following relation:
Qu = M.col × ∆ho−i (12)
where ∆h is the enthalpy difference across the collector in kJ/kg, and M.col is the total field mass flow
rate in kg/s. The PTC total length LPTC is then calculated based on collector width Wc (m) and glassenvelope diameter Denv (m):
LPTC =APTC
Wc −Denv(13)
By knowing the total mass flow rate, which is calculated from the boiler heat exchanger load,and by assigning the hydraulic mass flow rate as an input, the total number of loops Nloop, loop areaAloop, loop width Wloop, and the number of solar PTC’s (NPTC′s) are then calculated as follows;
Nloop =M.
colM.
hyd(14)
Aloop =APTCNloop
(15)
Wloop =Aloop
Lm(16)
where Lm (m) is assigned as module length.
NPTC′s =APTC
Lm(Wc −Denv)(17)

Entropy 2020, 22, 1165 10 of 29
Total pressure losses Ptloss are calculated based on major and minor losses along the field length.The general loss equation is performed as following [31,32]:
Ptloss = Nloop × ∆Ploop (18)
where
∆Ploop =32× f × Lloop ×M.
hyd2
ρ×π2 ×Dt(19)
Dt is the inner tube diameter (m)
f = [(1.82× log Re) − 1.64]−2 (20)
Re = 4×M.
hyd
µ×π×Dt(21)
3.1.3. Flashing Tank
Flash Cyclone tank design data are calculated as follows:Tube Inlet and outlet tank steam area Ati based on steam velocity Vst, m/s, and vapor density
ρv, kg/m3:
Ati =Mst
ρv ×Vst(22)
Tube diameter Dt (m):
Dt =
(Ati × 4π
)0.5
(23)
Flash tank height H f st (m) [31]:H f st = 7.15×Dt (24)
Flash tank width W f st (m):W f st = 3.5×Dt (25)
Flash tank total volume Vol f st (m3):
Vol f st =
(pi4
)×W f st
2×H f st (26)
Flashing enthalpy h f sh is equal to the enthalpy coming from the solar collector hcol, kJ/kg:
h f sh = hcol (27)
The flashing dryness fraction X f sh is calculated based on flashing enthalpy h f sh, liquid enthalpyh f , (kJ/kg) and dry vapor enthalpy hg (kJ/kg):
X f sh =h f sh − h f
hg − h f(28)
The total mass flow rate Mtotal (kg/s), and unvaporized water Mw (kg/s) are given by Equations (29)and (60), respectively:
Mtotal =Mst
X f sh(29)
Mw =(1−X f sh
)×Mtotal (30)
Entropy 2020, 22, 1165 11 of 29
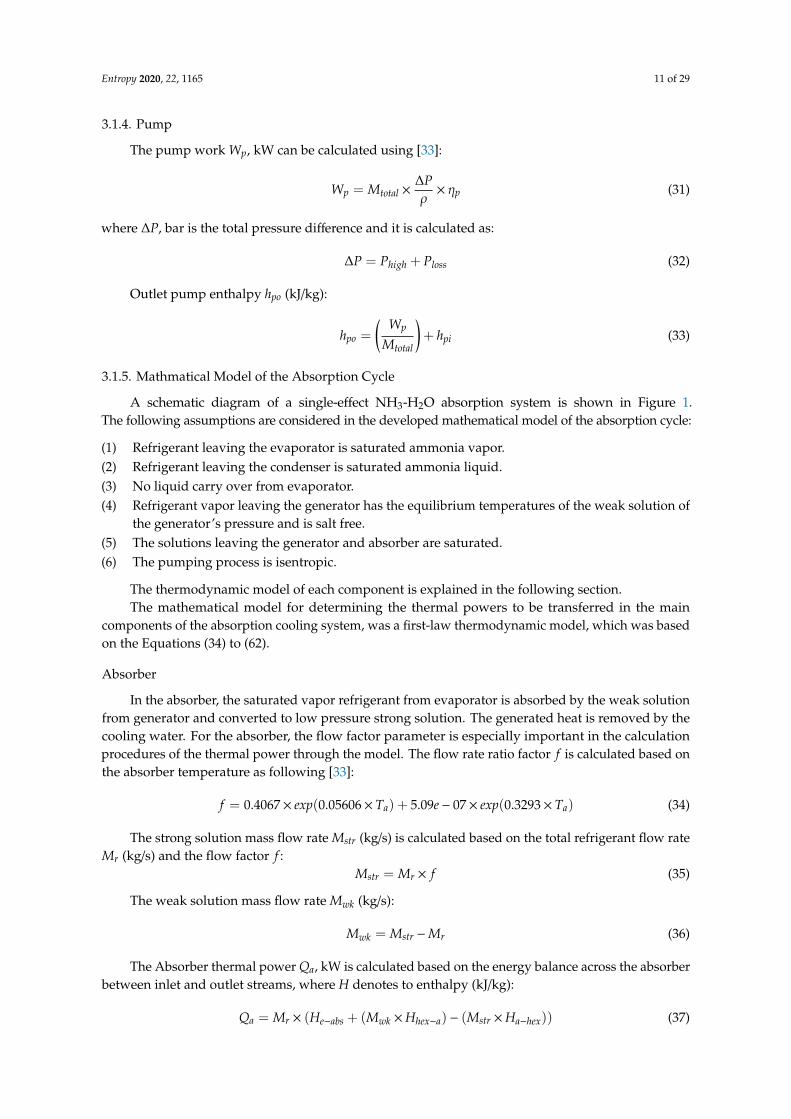
3.1.4. Pump
The pump work Wp, kW can be calculated using [33]:
Wp = Mtotal ×∆Pρ× ηp (31)
where ∆P, bar is the total pressure difference and it is calculated as:
∆P = Phigh + Ploss (32)
Outlet pump enthalpy hpo (kJ/kg):
hpo =
(Wp
Mtotal
)+ hpi (33)
3.1.5. Mathmatical Model of the Absorption Cycle
A schematic diagram of a single-effect NH3-H2O absorption system is shown in Figure 1.The following assumptions are considered in the developed mathematical model of the absorption cycle:
(1) Refrigerant leaving the evaporator is saturated ammonia vapor.(2) Refrigerant leaving the condenser is saturated ammonia liquid.(3) No liquid carry over from evaporator.(4) Refrigerant vapor leaving the generator has the equilibrium temperatures of the weak solution of
the generator’s pressure and is salt free.(5) The solutions leaving the generator and absorber are saturated.(6) The pumping process is isentropic.
The thermodynamic model of each component is explained in the following section.The mathematical model for determining the thermal powers to be transferred in the main
components of the absorption cooling system, was a first-law thermodynamic model, which was basedon the Equations (34) to (62).
Absorber
In the absorber, the saturated vapor refrigerant from evaporator is absorbed by the weak solutionfrom generator and converted to low pressure strong solution. The generated heat is removed by thecooling water. For the absorber, the flow factor parameter is especially important in the calculationprocedures of the thermal power through the model. The flow rate ratio factor f is calculated based onthe absorber temperature as following [33]:
f = 0.4067× exp(0.05606× Ta) + 5.09e− 07× exp(0.3293× Ta) (34)
The strong solution mass flow rate Mstr (kg/s) is calculated based on the total refrigerant flow rateMr (kg/s) and the flow factor f :
Mstr = Mr × f (35)
The weak solution mass flow rate Mwk (kg/s):
Mwk = Mstr −Mr (36)
The Absorber thermal power Qa, kW is calculated based on the energy balance across the absorberbetween inlet and outlet streams, where H denotes to enthalpy (kJ/kg):
Qa = Mr × (He−abs + (Mwk ×Hhex−a) − (Mstr ×Ha−hex)) (37)
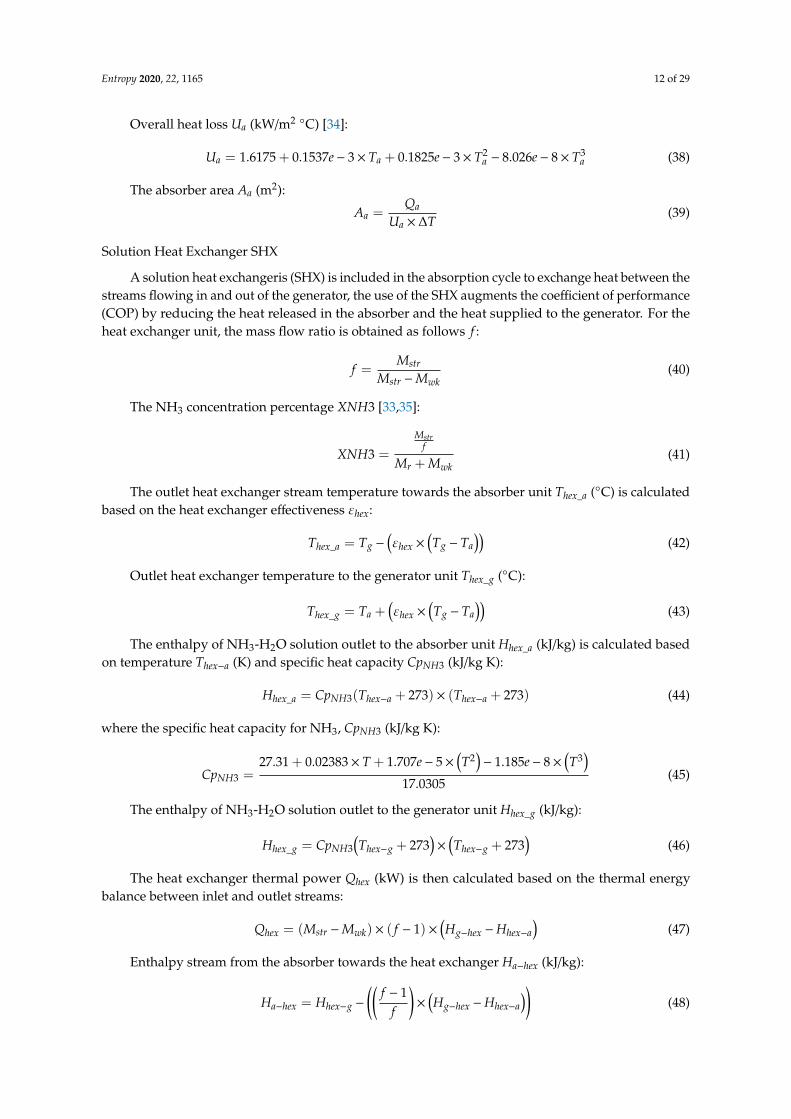
Entropy 2020, 22, 1165 12 of 29
Overall heat loss Ua (kW/m2 ◦C) [34]:
Ua = 1.6175 + 0.1537e− 3× Ta + 0.1825e− 3× T2a − 8.026e− 8× T3
a (38)
The absorber area Aa (m2):
Aa =Qa
Ua × ∆T(39)
Solution Heat Exchanger SHX
A solution heat exchangeris (SHX) is included in the absorption cycle to exchange heat between thestreams flowing in and out of the generator, the use of the SHX augments the coefficient of performance(COP) by reducing the heat released in the absorber and the heat supplied to the generator. For theheat exchanger unit, the mass flow ratio is obtained as follows f :
f =Mstr
Mstr −Mwk(40)
The NH3 concentration percentage XNH3 [33,35]:
XNH3 =
Mstrf
Mr + Mwk(41)
The outlet heat exchanger stream temperature towards the absorber unit Thex_a (◦C) is calculatedbased on the heat exchanger effectiveness εhex:
Thex_a = Tg −(εhex ×
(Tg − Ta
))(42)
Outlet heat exchanger temperature to the generator unit Thex_g (◦C):
Thex_g = Ta +(εhex ×
(Tg − Ta
))(43)
The enthalpy of NH3-H2O solution outlet to the absorber unit Hhex_a (kJ/kg) is calculated basedon temperature Thex−a (K) and specific heat capacity CpNH3 (kJ/kg K):
Hhex_a = CpNH3(Thex−a + 273) × (Thex−a + 273) (44)
where the specific heat capacity for NH3, CpNH3 (kJ/kg K):
CpNH3 =27.31 + 0.02383× T + 1.707e− 5×
(T2
)− 1.185e− 8×
(T3
)17.0305
(45)
The enthalpy of NH3-H2O solution outlet to the generator unit Hhex_g (kJ/kg):
Hhex_g = CpNH3(Thex−g + 273
)×
(Thex−g + 273
)(46)
The heat exchanger thermal power Qhex (kW) is then calculated based on the thermal energybalance between inlet and outlet streams:
Qhex = (Mstr −Mwk) × ( f − 1) ×(Hg−hex −Hhex−a
)(47)
Enthalpy stream from the absorber towards the heat exchanger Ha−hex (kJ/kg):
Ha−hex = Hhex−g −
((f − 1
f
)×
(Hg−hex −Hhex−a
))(48)

Entropy 2020, 22, 1165 13 of 29
Mean temperature Thexm (◦C):
Thexm =Thex−a + Thex−g
2(49)
Overall heat loss Uhex (kW/m2 ◦C):
Uhex = 1.6175 + 0.1537e− 3× T1hexm
+ 0.1825e− 3× T2hexm− 8.026e− 8× T3
hexm(50)
Heat exchanger area Ahex (m2):
Ahex =Qhex
Uhex × ∆T(51)
Generator
The strong solution is introduced to the generator, where heat energy is supplied by hot water orsteam. The heat energy separates the refrigerant vapor from the solution and a high water concentratedsolution is exits to HEX. The outlet enthalpy to the HEX, Hg_hex (kJ/kg) is calculated based on the energybalance between both units and flow rate ratio [34–36]:
Hg_hex =
(QgMr
)−Hg−cond +
(f ×Hhex−g
)f − 1
(52)
Overall heat loss Ug (kW/m2 ◦C) through the generator tubes is calculated as following [36]:
Ug = 1.6175 + 0.1537e− 3× T1g + 0.1825e− 3× T2
g − 8.026e− 8× T3g (53)
Generator area Ag (m2):
Ag =Qg
Ug × ∆T(54)
Inlet driving steam mass flow rate Ms, (kg/s) is calculated based on the latent heat h f g, (kJ/kg)from the heat source:
Ms =Qg
0.95× h f g(55)
where h f g is the latent heat of distillate vapor evaporation (pure ammonia) [33–36]:
h f g = −46.53× exp(0.02096× T) + 1305× exp(−0.001835× T) (56)
Condenser
In the condenser, the ammonia vapor is liquefied by means of the cooling water supplied by theauxiliary cooling system. Once the ammonia has been condensed. The condenser thermal power Qc
(Kw) can be calculated using:Qc = Mr ×
(Hg−cond −Hcond−e
)(57)
The overall heat loss Uc (kW/m2 ◦C):
Uc = 1.6175 + 0.1537e− 3× T1c + 0.1825e− 3× T2
c − 8.026e− 8× T3c (58)
The condenser area Ac, (m2):
Ac =Qc
Uc × ∆T(59)
Entropy 2020, 22, 1165 14 of 29
Inlet cooling water enthalpy Hccwi (kJ/kg):
Hccwi = 421.2× exp(0.004008× Tccwi
)− 435.9× exp
(−0.007559× Tccwi
)(60)
Outlet cooling water enthalpy Hccwo (kJ/kg):
Hccwo =( Qc
Mcw
)+ Hccwi (61)
Evaporator
In the evaporator, the low-pressure, low temperature refrigerant (after the refrigerant expansionvalve) is sprayed over the evaporator tube, where the cold water circulates through the tubes and getschilled. The refrigerant mass flow rate Mr (kg/s) can be calculated based on the energy balance acrossthe evaporator [36]:
Mr =Qe
He−abs −Hcond−e(62)
where Qe is a thermal load on evaporator unit, (kW).
3.1.6. Availability, Cost, and Performance
The availability, cost, and performance were calculated based on the formulas provided in thereferences [37–41]. The availability equation for any system goes under a steady-state, uniform flowprocess can be developed with the first and second law of thermodynamics. Neglecting the changesin kinetic and potential energy. The general form of the availability can be defined by the followingequation [37]:
A2 −A1 = Aq + Aw + A f i −A f o − I (63)
where A2 − A1 = 0 is the non-flow availability change in a steady-state condition, Aq =∑J
(1− Tamb/TJ
)QJ is the availability transfer due to the heat transfer between the control volume
and its surroundings, Aw = −Wcv + Po(V2 −V1) is equal to the negative value of the work producedby the control volume Wcv but in most cases, the control volume has a constant volume, thereforeAw can be further simplified, and I = Tamb.Sgen is the availability of destruction in the process. Theflow availability is expressed as A f i,o =
∑i,om.
i.oa f i,o. Thus, the general form in steady-state conditionwould become:
0 = Aq + Aw + A f i −A f o − I (64)
In conventional economic analysis, a cost balance is usually formulated for the overall systemoperating at steady state as following:∑
outC. =
∑inC. + ZIC&OM (65)
where C. the cost rate according to inlet and outlet streams, and ZIC&OM is the capital investment andoperating and maintenance costs. In exergy costing a cost is associated with each exergy stream. Thus,for inlet and outlet streams of matter with associated rates of exergy transfer E.
i,o, power W., and theexergy transfer rate associated with heat transfer Equation E.
q, can write as follows:
C.i,o = ci,oE.
i,o (66)
C.w = cwW. (67)
C.q = cqE.
q (68)
where ci,o, w, q denote average costs per unit of exergy in (USD/Kj) for inlet (i), outlet (o), power (w),and energy (q) respectively. For hourly costs estimation, the following correlations are considered:
Entropy 2020, 22, 1165 15 of 29
For cost analysis, the amortization factor A f is estimated based on the following relation:
A f =i.(1 + i)LTp
(1 + i)LTp− 1
(69)
Collector investment cost ICcol (USD) is calculated based on the following area correlation:
ICcol = 150×A0.95col (70)
operating and maintenance cost OMCcol is then calculated (USD):
OMCcol = 0.15× ICcol (71)
Total annual cost TACcol (USD/y) is then calculated based on operating and maintenance cost andinvestment cost parameters as following:
TACcol = (ICcol + OMCcol) ×A f (72)
hourly costs are calculated Zcol (USD/h):
Zcol =TACcol
OH × 365(73)
Flashing tank investment cost IC f sh (USD) is calculated based on the following total tank volumeVol f st correlation:
IC f sh =Vol f st × 6.3e3
3.8(74)
The total annual cost TAC f sh USD/y is then calculated:
TAC f sh = IC f sh ×A f (75)
hourly costs are calculated Z f sh (USD/h):
Z f sh =TAC f sh
OH × 365(76)
Absorption cycle investment cost ICaac (USD), is calculated based on the following totalarea correlation:
ICaac = 150×A0.8aac (77)
Total annual cost TACaac (USD/y) is then calculated:
TACaac = ICaac ×A f , (78)
hourly costs are calculated Zaac (USD/h):
Zaac =TACaac
OH × 365(79)
Pump investment cost ICp (USD) is calculated based on the following pump power correlation:
ICp = 3500×W0.47p (80)

Entropy 2020, 22, 1165 16 of 29
Total annual cost TACp (USD/y) is then calculated:
TACp = ICp ×A f (81)
hourly costs are calculated Zp (USD/h):
Zp =TACp
OH × 365(82)
Total hourly costs Ztot (USD/h) is then calculated based on all parameters as following:
Ztot = Zcol + Z f sh + Zaac + Zp (83)
Total Plant Costs TPC (USD/y) is also calculated based on the total annual costs for all unit:
TPC = TACcol + TAC f sh + TACaac + TACp (84)
The total thermo-economic equation is calculated based on the cost and exergy stream throughthe proposed cycles (USD/GJ):
cp = 1000×
(Wtot × cw) +(
Ztot3600
)Ex f o
(85)
where, cp is the thermo-economic product cost (USD/GJ), cw is the power cost in (USD/kWh) (~0.065),and Wtot is the total cycle power (kW), Ex f o is the exergy stream outlet from the system to the user (kW).
For performance calculations, the COP is calculated based on evaporator Qe and generator Qg
thermal powers:
COP =Qe
Qg(86)
where the Max COP is found as:
COPmax =(Te + 273.15) ×
(Tg − Ta
)(Tg + 273.15
)× (Tc − Te)
(87)
and the relative performance ratio RPR could be then estimated as:
RPR =COP
COPmax(88)
The values of the design variables in Table 1 will be used in this work. The equations comprisingthe mathematical model of the combined system are utilized in MATLAB software, and the results arepresented hereafter.
4. Results and Comments
As illustrated earlier, the proposed cycles for the current study are two cycles. Therefore, it isvery important to optimize the absorption air conditioning AAC cycle before the attachment of solarcollectors. Such optimization would reduce the design aspects, such as area. Meanwhile, lowering ofthe cost values and the thermo-economic product cost goes to the end-user. For such optimizationpurposes, different operating conditions have been examined in this section. The optimization processesaddressed the effect of different operating conditions on COP, COPmax, Exergy destruction rate, massflow rates, and design aspects such as areas and volume.

Entropy 2020, 22, 1165 17 of 29
4.1. Optimization of NH3-H2O Cycle
4.1.1. Absorber Temperature Effect
The effect of changing absorber temperature on the system performance parameters is shownin Figure 2 such as COPmax, exergy destruction rate, mass flow rates, and design aspects. The datahas been obtained at different cooling loads (50–150 TR), and different values of absorber operatingtemperature (30–35 ◦C). The effect of absorber temperature on the COPmax of the absorption cycle isillustrated in Figure 2a. Increasing the absorber temperature would cause a notable decrease in theCOPmax. This was happened because of the following relation between the absorber temperature and
COPmax (COPmax =(Te+273.15)×(Tg−Ta)(Tg+273.15)×(Tc−Te)
). In general, the COPmax was in the relatively higher range of
1.2–1.4. Figure 2b shows that there is no significant change in the exergy destruction rate. The samebehavior was noticed on the total mass flow rate as shown in Figure 2c. The mass flow rate has notbeen changed vs. the increasing absorber temperature.
Entropy 2020, 22, x 16 of 27
collectors. Such optimization would reduce the design aspects, such as area. Meanwhile, lowering of the cost values and the thermo-economic product cost goes to the end-user. For such optimization purposes, different operating conditions have been examined in this section. The optimization processes addressed the effect of different operating conditions on COP, COPmax, Exergy destruction rate, mass flow rates, and design aspects such as areas and volume.
4.1. Optimization of NH3-H2O Cycle
4.1.1. Absorber Temperature Effect
The effect of changing absorber temperature on the system performance parameters is shown in Figure 2 such as COPmax, exergy destruction rate, mass flow rates, and design aspects. The data has been obtained at different cooling loads (50–150 TR), and different values of absorber operating temperature (30–35 °C). The effect of absorber temperature on the COPmax of the absorption cycle is illustrated in Figure 2a. Increasing the absorber temperature would cause a notable decrease in the COPmax. This was happened because of the following relation between the absorber temperature and
COPmax (𝐶𝑂𝑃 = ( . )×. ×( )). In general, the COPmax was in the relatively higher range of 1.2–
1.4. Figure 2b shows that there is no significant change in the exergy destruction rate. The same behavior was noticed on the total mass flow rate as shown in Figure 2c. The mass flow rate has not been changed vs. the increasing absorber temperature.
The effect of absorber temperature on the flow rate is not significantly high while comparing against the refrigerant load. The same behavior was noticed in Figure 2d. Absorber temperature has no effect on the ETC mass flow rate. A minor reduction in the AAC area has been noticed in Figure 2e. For instance, the total AAC area has been decreased from 65 down to 62 m2 at 150 TR load. Figure 2f shows that there is no effect on the evaporator fan cooler unit. The effect would happen in case of the change in evaporator temperature. Figure 2g reflected the change in the absorber area by the cause of absorber temperature. The area has been decreased significantly. Figure 2h shows that by increasing the absorber temperature the NH3 concentration has been decreased with no effect of the cooling load.
Figure 2. NH3-H2O data results based on the effect of absorber temperature parameter.
4.1.2. Condenser Temperature Effect.
Error! Reference source not found. shows the data result based on the effect of condenser temperature on the other design parameters such as COPmax, exergy destruction rate, mass flow rates, and design aspects. Data has been obtained at different refrigerant loads (50–150 TR), and at different
Figure 2. NH3-H2O data results based on the effect of absorber temperature parameter.
The effect of absorber temperature on the flow rate is not significantly high while comparingagainst the refrigerant load. The same behavior was noticed in Figure 2d. Absorber temperature hasno effect on the ETC mass flow rate. A minor reduction in the AAC area has been noticed in Figure 2e.For instance, the total AAC area has been decreased from 65 down to 62 m2 at 150 TR load. Figure 2fshows that there is no effect on the evaporator fan cooler unit. The effect would happen in case of thechange in evaporator temperature. Figure 2g reflected the change in the absorber area by the cause ofabsorber temperature. The area has been decreased significantly. Figure 2h shows that by increasingthe absorber temperature the NH3 concentration has been decreased with no effect of the cooling load.
4.1.2. Condenser Temperature Effect
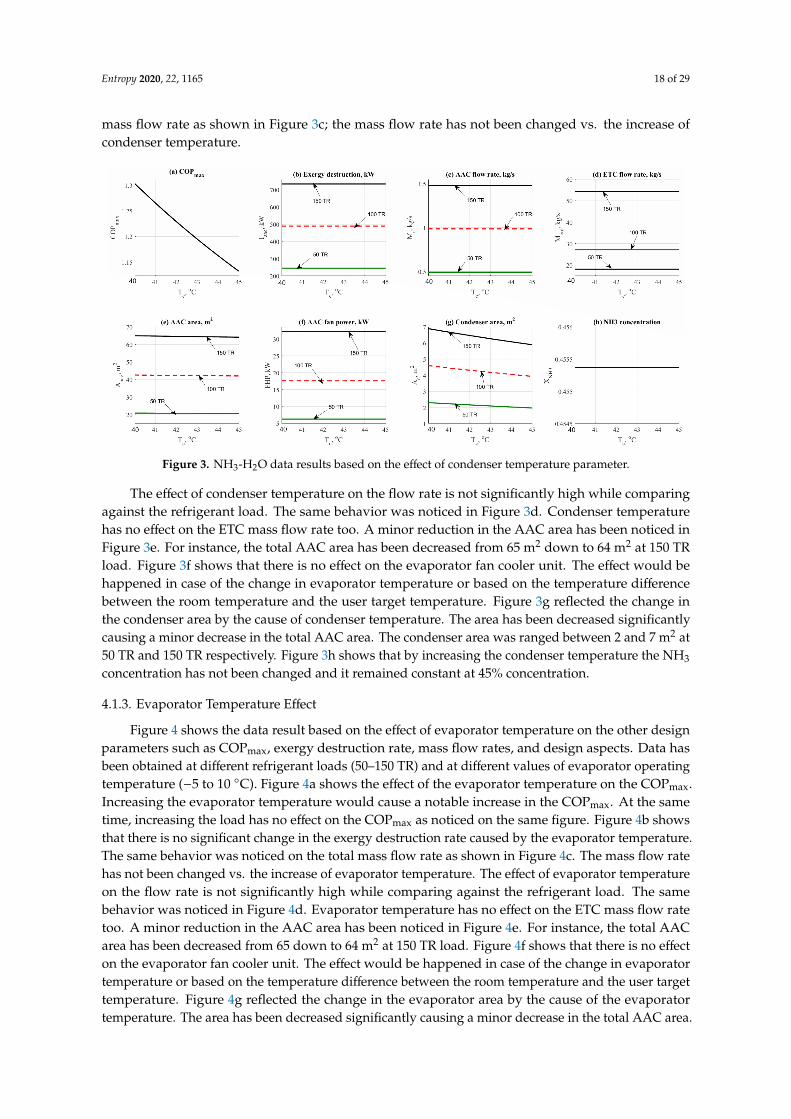
Figure 3 shows the data result based on the effect of condenser temperature on the other designparameters such as COPmax, exergy destruction rate, mass flow rates, and design aspects. Data hasbeen obtained at different refrigerant loads (50–150 TR), and at different values of condenser operatingtemperature (40–45 ◦C). Figure 3a shows the effect of condenser temperature on the COPmax. Increasingthe condenser temperature would cause a notable decrease in the COPmax. At the same time, increasingthe load has no effect on the COPmax as noticed on the same figure. Figure 3b shows that there isno significant change in the exergy destruction rate. The same behavior was noticed on the total
Entropy 2020, 22, 1165 18 of 29
mass flow rate as shown in Figure 3c; the mass flow rate has not been changed vs. the increase ofcondenser temperature.
Entropy 2020, 22, x 17 of 27
values of condenser operating temperature (40–45 °C). Figure 3a shows the effect of condenser temperature on the COPmax. Increasing the condenser temperature would cause a notable decrease in the COPmax. At the same time, increasing the load has no effect on the COPmax as noticed on the same figure. Figure 3b shows that there is no significant change in the exergy destruction rate. The same behavior was noticed on the total mass flow rate as shown in Figure 3c; the mass flow rate has not been changed vs. the increase of condenser temperature.
The effect of condenser temperature on the flow rate is not significantly high while comparing against the refrigerant load. The same behavior was noticed in Figure 3d. Condenser temperature has no effect on the ETC mass flow rate too. A minor reduction in the AAC area has been noticed in Figure 3e. For instance, the total AAC area has been decreased from 65 m2 down to 64 m2 at 150 TR load. Figure 3f shows that there is no effect on the evaporator fan cooler unit. The effect would be happened in case of the change in evaporator temperature or based on the temperature difference between the room temperature and the user target temperature. Figure 3g reflected the change in the condenser area by the cause of condenser temperature. The area has been decreased significantly causing a minor decrease in the total AAC area. The condenser area was ranged between 2 and 7 m2 at 50 TR and 150 TR respectively. Figure 3h shows that by increasing the condenser temperature the NH3 concentration has not been changed and it remained constant at 45% concentration.
Figure 3. NH3-H2O data results based on the effect of condenser temperature parameter.
4.1.3. Evaporator Temperature Effect
Figure 4 shows the data result based on the effect of evaporator temperature on the other design parameters such as COPmax, exergy destruction rate, mass flow rates, and design aspects. Data has been obtained at different refrigerant loads (50–150 TR) and at different values of evaporator operating temperature (–5 to 10 °C). Figure 4a shows the effect of the evaporator temperature on the COPmax. Increasing the evaporator temperature would cause a notable increase in the COPmax. At the same time, increasing the load has no effect on the COPmax as noticed on the same figure. Figure 4b shows that there is no significant change in the exergy destruction rate caused by the evaporator temperature. The same behavior was noticed on the total mass flow rate as shown in Figure 4c. The mass flow rate has not been changed vs. the increase of evaporator temperature. The effect of evaporator temperature on the flow rate is not significantly high while comparing against the refrigerant load. The same behavior was noticed in Figure 4d. Evaporator temperature has no effect on the ETC mass flow rate too. A minor reduction in the AAC area has been noticed in Figure 4e. For instance, the total AAC area has been decreased from 65 down to 64 m2 at 150 TR load. Figure 4f shows that there is no effect on the evaporator fan cooler unit. The effect would be happened in case of the change in evaporator temperature or based on the temperature difference between the room
Figure 3. NH3-H2O data results based on the effect of condenser temperature parameter.
The effect of condenser temperature on the flow rate is not significantly high while comparingagainst the refrigerant load. The same behavior was noticed in Figure 3d. Condenser temperaturehas no effect on the ETC mass flow rate too. A minor reduction in the AAC area has been noticed inFigure 3e. For instance, the total AAC area has been decreased from 65 m2 down to 64 m2 at 150 TRload. Figure 3f shows that there is no effect on the evaporator fan cooler unit. The effect would behappened in case of the change in evaporator temperature or based on the temperature differencebetween the room temperature and the user target temperature. Figure 3g reflected the change inthe condenser area by the cause of condenser temperature. The area has been decreased significantlycausing a minor decrease in the total AAC area. The condenser area was ranged between 2 and 7 m2 at50 TR and 150 TR respectively. Figure 3h shows that by increasing the condenser temperature the NH3
concentration has not been changed and it remained constant at 45% concentration.
4.1.3. Evaporator Temperature Effect
Figure 4 shows the data result based on the effect of evaporator temperature on the other designparameters such as COPmax, exergy destruction rate, mass flow rates, and design aspects. Data hasbeen obtained at different refrigerant loads (50–150 TR) and at different values of evaporator operatingtemperature (−5 to 10 ◦C). Figure 4a shows the effect of the evaporator temperature on the COPmax.Increasing the evaporator temperature would cause a notable increase in the COPmax. At the sametime, increasing the load has no effect on the COPmax as noticed on the same figure. Figure 4b showsthat there is no significant change in the exergy destruction rate caused by the evaporator temperature.The same behavior was noticed on the total mass flow rate as shown in Figure 4c. The mass flow ratehas not been changed vs. the increase of evaporator temperature. The effect of evaporator temperatureon the flow rate is not significantly high while comparing against the refrigerant load. The samebehavior was noticed in Figure 4d. Evaporator temperature has no effect on the ETC mass flow ratetoo. A minor reduction in the AAC area has been noticed in Figure 4e. For instance, the total AACarea has been decreased from 65 down to 64 m2 at 150 TR load. Figure 4f shows that there is no effecton the evaporator fan cooler unit. The effect would be happened in case of the change in evaporatortemperature or based on the temperature difference between the room temperature and the user targettemperature. Figure 4g reflected the change in the evaporator area by the cause of the evaporatortemperature. The area has been decreased significantly causing a minor decrease in the total AAC area.

Entropy 2020, 22, 1165 19 of 29
The evaporator area was ranged between 10 and 35 m2 at 50 and 150 TR respectively Figure 4h showsthat by increasing the evaporator temperature the NH3 concentration has not been changed and itremained constant at 45% concentration.
Entropy 2020, 22, x 18 of 27
temperature and the user target temperature. Figure 4g reflected the change in the evaporator area by the cause of the evaporator temperature. The area has been decreased significantly causing a minor decrease in the total AAC area. The evaporator area was ranged between 10 and 35 m2 at 50 and 150 TR respectively Figure 4h shows that by increasing the evaporator temperature the NH3
concentration has not been changed and it remained constant at 45% concentration.
Figure 4. NH3-H2O data results based on the effect of evaporator temperature parameter.
4.1.4. Generator Temperature Effect
The generator operating temperature has a great influence on this cycle. Figure 5 shows the data result based on the effect of generator temperature on the other design parameters such as COPmax, exergy destruction rate, mass flow rates, and design aspects. Data has been obtained at different refrigerant loads (50–150 TR) and different values of the generator operating temperature (80 to 95 °C). Figure 5a shows the effect of the generator temperature on the COPmax. Increasing the generator temperature would cause a notable increase in the COPmax from 1.45 to 1.8. The driving temperature depends on the solar energy capturing technology that can be adopted and efficiently available. At the same time as shown in Figure 5b that the exergy destruction has also increased as a normal reflection to the generator temperature changing. The same behavior was noticed on the total mass flow rate as shown in Figure 5c. The mass flow rate has been changed to be increasing vs. the increasing generator temperature.
The effect of generator temperature on the flow rate is significantly high. The same behavior was noticed in Figure 5d. Generator temperature has a remarkable effect on the ETC mass flow rate too. A minor reduction in the total AAC area has been noticed in Figure 5e. For instance, the total AAC area has been decreased from 65 down to 62 m2 at 150 TR load. Figure 5f shows that there is no effect on the generator fan cooler unit. Figure 5g reflected the change in the generator area by the cause of the generator temperature. The area has been remarkably decreased causing a minor decrease in the total AAC area. The generator area was ranged between 1.5 and 5 m2 at 50 and 150 TR respectively Figure 5h shows that by increasing the generator temperature the NH3 concentration has not been changed and it remained constant at 45% concentration.
Figure 4. NH3-H2O data results based on the effect of evaporator temperature parameter.
4.1.4. Generator Temperature Effect
The generator operating temperature has a great influence on this cycle. Figure 5 shows the dataresult based on the effect of generator temperature on the other design parameters such as COPmax,exergy destruction rate, mass flow rates, and design aspects. Data has been obtained at differentrefrigerant loads (50–150 TR) and different values of the generator operating temperature (80 to 95 ◦C).Figure 5a shows the effect of the generator temperature on the COPmax. Increasing the generatortemperature would cause a notable increase in the COPmax from 1.45 to 1.8. The driving temperaturedepends on the solar energy capturing technology that can be adopted and efficiently available. At thesame time as shown in Figure 5b that the exergy destruction has also increased as a normal reflectionto the generator temperature changing. The same behavior was noticed on the total mass flow rateas shown in Figure 5c. The mass flow rate has been changed to be increasing vs. the increasinggenerator temperature.
The effect of generator temperature on the flow rate is significantly high. The same behavior wasnoticed in Figure 5d. Generator temperature has a remarkable effect on the ETC mass flow rate too.A minor reduction in the total AAC area has been noticed in Figure 5e. For instance, the total AACarea has been decreased from 65 down to 62 m2 at 150 TR load. Figure 5f shows that there is no effecton the generator fan cooler unit. Figure 5g reflected the change in the generator area by the cause ofthe generator temperature. The area has been remarkably decreased causing a minor decrease in thetotal AAC area. The generator area was ranged between 1.5 and 5 m2 at 50 and 150 TR respectivelyFigure 5h shows that by increasing the generator temperature the NH3 concentration has not beenchanged and it remained constant at 45% concentration.

Entropy 2020, 22, 1165 20 of 29Entropy 2020, 22, x 19 of 27
Figure 5. NH3-H2O data results based on the effect of generator temperature parameter.
4.1.5. Solar Field Top Temperature Effect
Solar field top temperature is considered a very important parameter in this cycle. Figures 6 and 7 show the variations on the performance and design parameters for both operational cases ETC and PTC. For ETC, the temperature range was 110 to 200 °C. The temperature range for PTC was 150 to 300 °C. Figure 6a shows the effect of ETC top temperature on the solar field mass flow rate.
The figure shows that increasing the top temperature would reduce the total mass flow rate as a normal result extracted from the energy balance across the solar field. The same behavior was also noticed in Figure 7a which represents the PTC operation. However, PTC conceded lower flow rates which means lower costs. The difference is considered huge if we compared between 50 to 300 kg/s @ 150 TR for the ETC and 15 to 65 kg/s @ 150 TR for the PTC. The same behavior was also noticed for both collector’s type related to the total cycle flow rate as shown in Figures 6b and 7b.
Figures 6c and 7c also reflects the advantage of using PTC rather than ETC. The figure shows that the dryness fraction was in increasing mode by the increase of the solar filed operating temperature. ETC gives a range of 10% to 20% of generating steam while the PTC gave 20% to 40% which is considered attractive and reasonable. For both cases, flash tank volume has been presented in Figures 6d and 7d. The difference is quite clear with an advantage to the PTC.
Increasing the top solar field temperature would decrease the flashing tank volume. However, ECT will need larger tanks because of lower dryness fraction in comparison against the PTC operation. Figures 6e and 7e shows the effect of solar temperature on the solar field design area. The changes in Figures 6e and 7e were not massive; however, lower area, i.e., lower costs and control are recorded for the PTC as expected.
For instance, at 150 TR, ETC will consume about 45,000 to 50,000 m2. However, the PTC will consume about 45,000 down to 40,000 m2 under the same operating conditions. For ETC, Figure 6f–h represents the effect on the thermal power, kW, flashing, and solar field exergy destruction rates, kW. Increasing the operating temperature would increase thermal power and exergy destruction rates as well.
Figure 7f,g shows that increasing the PTC temperature would decrease the number of units and the number of loops as well. The number of loops parameter is affected by the total PTC area required for the load. Figure 7h shows the effect on PTC thermal power. The figure shows a decreasing behavior vs. the increasing of the top solar field temperature. Generally, increasing the load from the AAC unit would request more solar field areas leading to the increase of mass flow rate and exergy destruction rates.
Figure 5. NH3-H2O data results based on the effect of generator temperature parameter.
4.1.5. Solar Field Top Temperature Effect
Solar field top temperature is considered a very important parameter in this cycle. Figures 6 and 7show the variations on the performance and design parameters for both operational cases ETC andPTC. For ETC, the temperature range was 110 to 200 ◦C. The temperature range for PTC was 150 to300 ◦C. Figure 6a shows the effect of ETC top temperature on the solar field mass flow rate.
Entropy 2020, 22, x 20 of 27
A value of 150~200 °C and 250~300 °C would be recommended in this study for ETC and PTC solar collectors respectively. Based on the currently obtained results, it is quite interesting to assign the operating temperature as follows:
Ta = 35 °C. Tc = 43 °C. Te = 7~10 °C. Tg = 85~90 °C. ETC Thigh = 150~200 °C. PTC Thigh = 250~300 °C.
Figure 6. NH3-H2O data results based on the effect of ETC outlet top temperature.
Figure 7. NH3-H2O data results based on the effect of PTC outlet top temperature.
4.1.6. Cooling Load Effect
The cooling load effect on ETC/NH3-H2O and PTC/NH3-H2O cycles are shown in Figures 8 and 9. Both figures addressed the effect on hourly costs, Levelized power cost, and thermo-economic product cost. As expected, the behavior on the figure was in varying mode due to the load and energy demand for all units. Solar collectors recorded the highest values of hourly costs among the other units as shown in Figures 8a and 9a.
Figure 6. NH3-H2O data results based on the effect of ETC outlet top temperature.

Entropy 2020, 22, 1165 21 of 29
Entropy 2020, 22, x 20 of 27
A value of 150~200 °C and 250~300 °C would be recommended in this study for ETC and PTC solar collectors respectively. Based on the currently obtained results, it is quite interesting to assign the operating temperature as follows:
Ta = 35 °C. Tc = 43 °C. Te = 7~10 °C. Tg = 85~90 °C. ETC Thigh = 150~200 °C. PTC Thigh = 250~300 °C.
Figure 6. NH3-H2O data results based on the effect of ETC outlet top temperature.
Figure 7. NH3-H2O data results based on the effect of PTC outlet top temperature.
4.1.6. Cooling Load Effect
The cooling load effect on ETC/NH3-H2O and PTC/NH3-H2O cycles are shown in Figures 8 and 9. Both figures addressed the effect on hourly costs, Levelized power cost, and thermo-economic product cost. As expected, the behavior on the figure was in varying mode due to the load and energy demand for all units. Solar collectors recorded the highest values of hourly costs among the other units as shown in Figures 8a and 9a.
Figure 7. NH3-H2O data results based on the effect of PTC outlet top temperature.
The figure shows that increasing the top temperature would reduce the total mass flow rate as anormal result extracted from the energy balance across the solar field. The same behavior was alsonoticed in Figure 7a which represents the PTC operation. However, PTC conceded lower flow rateswhich means lower costs. The difference is considered huge if we compared between 50 to 300 kg/s @150 TR for the ETC and 15 to 65 kg/s @ 150 TR for the PTC. The same behavior was also noticed forboth collector’s type related to the total cycle flow rate as shown in Figures 6b and 7b.
Figures 6c and 7c also reflects the advantage of using PTC rather than ETC. The figure shows thatthe dryness fraction was in increasing mode by the increase of the solar filed operating temperature.ETC gives a range of 10% to 20% of generating steam while the PTC gave 20% to 40% which is consideredattractive and reasonable. For both cases, flash tank volume has been presented in Figures 6d and 7d.The difference is quite clear with an advantage to the PTC.
Increasing the top solar field temperature would decrease the flashing tank volume. However,ECT will need larger tanks because of lower dryness fraction in comparison against the PTC operation.Figures 6e and 7e shows the effect of solar temperature on the solar field design area. The changes inFigures 6e and 7e were not massive; however, lower area, i.e., lower costs and control are recorded forthe PTC as expected.
For instance, at 150 TR, ETC will consume about 45,000 to 50,000 m2. However, the PTC willconsume about 45,000 down to 40,000 m2 under the same operating conditions. For ETC, Figure 6f–hrepresents the effect on the thermal power, kW, flashing, and solar field exergy destruction rates, kW.Increasing the operating temperature would increase thermal power and exergy destruction ratesas well.
Figure 7f,g shows that increasing the PTC temperature would decrease the number of unitsand the number of loops as well. The number of loops parameter is affected by the total PTC arearequired for the load. Figure 7h shows the effect on PTC thermal power. The figure shows a decreasingbehavior vs. the increasing of the top solar field temperature. Generally, increasing the load from theAAC unit would request more solar field areas leading to the increase of mass flow rate and exergydestruction rates.
A value of 150~200 ◦C and 250~300 ◦C would be recommended in this study for ETC and PTCsolar collectors respectively. Based on the currently obtained results, it is quite interesting to assign theoperating temperature as follows:
â Ta = 35 ◦C.â Tc = 43 ◦C.

Entropy 2020, 22, 1165 22 of 29
â Te = 7~10 ◦C.â Tg = 85~90 ◦C.â ETC Thigh = 150~200 ◦C.â PTC Thigh = 250~300 ◦C.
4.1.6. Cooling Load Effect
The cooling load effect on ETC/NH3-H2O and PTC/NH3-H2O cycles are shown in Figures 8 and 9.Both figures addressed the effect on hourly costs, Levelized power cost, and thermo-economic productcost. As expected, the behavior on the figure was in varying mode due to the load and energy demandfor all units. Solar collectors recorded the highest values of hourly costs among the other units asshown in Figures 8a and 9a.
Entropy 2020, 22, x 21 of 27
However, PTC was recorded lower by 8% against the ETC related to the hourly costs parameter. The main reason for this was referring to the increasing in collector operating temperature (250 vs. 150 °C). Increasing the collector temperature will generate more steam for the AAC unit. AAC, pumps, and flashing tanks are shown in Figures 8b,c and 9b. It was clear on the figures that the flashing tank is recorded higher than the pump and the AAC unit based on the total tank volume. PTC operation was recorded lower in flashing tank hourly cost because it has lower tank volume 0.2–0.3 $/h vs. USD 0.5–2.2/h. Figures 8d and 9d show the effect of cooling load on the levelized power cost, USD /kWh.
The results are nearly the same based on the close results between the two configurations related to the pumping unit. The levelized power cost was ranged between USD 0.07/kWh to USD 0.08/kWh for PTC, ETC respectively. The same close behavior was noticed while comparing related to the thermo-economic product cost. Results were centralized 0.1 to USD 1/GJ for both configurations with a minor advantage to the ETC (Figures 8e and 9e). As anticipated, increasing the load would increase the cost of exergy. Solar PTC and/or ETC are considered the main cause of such an effect related to the large area needed to cover on the load. Figures 8f and 9f show the effect on the generator thermal power which is recorded increasing vs. the increase of cooling load.
Figure 8. ETC-NH3-H2O data results based on the effect of cooling load.
Figure 9. PTC-NH3-H2O data results based on the effect of cooling load.
Figure 8. ETC-NH3-H2O data results based on the effect of cooling load.
Entropy 2020, 22, x 21 of 27
However, PTC was recorded lower by 8% against the ETC related to the hourly costs parameter. The main reason for this was referring to the increasing in collector operating temperature (250 vs. 150 °C). Increasing the collector temperature will generate more steam for the AAC unit. AAC, pumps, and flashing tanks are shown in Figures 8b,c and 9b. It was clear on the figures that the flashing tank is recorded higher than the pump and the AAC unit based on the total tank volume. PTC operation was recorded lower in flashing tank hourly cost because it has lower tank volume 0.2–0.3 $/h vs. USD 0.5–2.2/h. Figures 8d and 9d show the effect of cooling load on the levelized power cost, USD /kWh.
The results are nearly the same based on the close results between the two configurations related to the pumping unit. The levelized power cost was ranged between USD 0.07/kWh to USD 0.08/kWh for PTC, ETC respectively. The same close behavior was noticed while comparing related to the thermo-economic product cost. Results were centralized 0.1 to USD 1/GJ for both configurations with a minor advantage to the ETC (Figures 8e and 9e). As anticipated, increasing the load would increase the cost of exergy. Solar PTC and/or ETC are considered the main cause of such an effect related to the large area needed to cover on the load. Figures 8f and 9f show the effect on the generator thermal power which is recorded increasing vs. the increase of cooling load.
Figure 8. ETC-NH3-H2O data results based on the effect of cooling load.
Figure 9. PTC-NH3-H2O data results based on the effect of cooling load. Figure 9. PTC-NH3-H2O data results based on the effect of cooling load.
However, PTC was recorded lower by 8% against the ETC related to the hourly costs parameter.The main reason for this was referring to the increasing in collector operating temperature (250 vs.150 ◦C). Increasing the collector temperature will generate more steam for the AAC unit. AAC, pumps,

Entropy 2020, 22, 1165 23 of 29
and flashing tanks are shown in Figure 8b,c and Figure 9b. It was clear on the figures that the flashingtank is recorded higher than the pump and the AAC unit based on the total tank volume. PTC operationwas recorded lower in flashing tank hourly cost because it has lower tank volume 0.2–0.3 $/h vs. USD0.5–2.2/h. Figures 8d and 9d show the effect of cooling load on the levelized power cost, USD /kWh.
The results are nearly the same based on the close results between the two configurations relatedto the pumping unit. The levelized power cost was ranged between USD 0.07/kWh to USD 0.08/kWhfor PTC, ETC respectively. The same close behavior was noticed while comparing related to thethermo-economic product cost. Results were centralized 0.1 to USD 1/GJ for both configurations with aminor advantage to the ETC (Figures 8e and 9e). As anticipated, increasing the load would increasethe cost of exergy. Solar PTC and/or ETC are considered the main cause of such an effect related tothe large area needed to cover on the load. Figures 8f and 9f show the effect on the generator thermalpower which is recorded increasing vs. the increase of cooling load.
4.2. Case Study Results
The case study presented in this section compares between two configurations at a specificload point. The case study was about a sports arena which is located in Baghdad, Iraq. The arenais a USD 14 million, 3000-seat indoor sports facility is focused around basketball, volleyball, andathletics. The whole project will be centrally air-conditioned by a 700–800 kW solar absorption cycle.The evaporator will be designed to work between 7 and 12 ◦C. Table 2 shows the data results for twoconfigurations in case of using the solar absorption cycle. A 200 TR cooling load has been selected asan example of such a comparison. Environmental operating conditions are fixed at a specific value forsimplicity. From solar field results, PTC/NH3-H2O resulted in the lowest in the area needed, and itis quite important to reduce the needed area. ETC/NH3-H2O comes next. For design aspects suchas flashing tank design, it was clear the operation of PTC/NH3-H2O gives the lowest results whichwere the most favorable, at 3.8 m3, followed by ETC/NH3-H2O with 7.8 m3. The same behavior wasalso noticed related to the dryness fraction. The same behavior is also noticed related to the exergydestruction rate. The results reveal that PTC is considered an advantage to the cycle vs. the ETCoperation. PTC/NH3-H2O recorded lower in the absorber area with 21 m2. Minimum driving steamwas recorded by PTC/NH3-H2O (1.8 kg/s) which lead to low flashing tank volume and lower solar fieldarea. COP was found remarkable related to PTC/NH3-H2O cycle. For hourly costs, PTC/NH3-H2O isnoticed as the lowest among the rest. By achieving USD11.3/h, PTC/NH3-H2O is considered the bestoption for this case study. Lower hourly costs for the solar field is considered the vital term to judgethe system cost. Thermo-economic cost is nearly the same for two configurations within the range ofUSD 0.14–0.15/GJ with an advantage to PTC/NH3-H2O configurations.
Table 2. Data results based on 200 TR load case study.
Solar radiation, W/m2 500
Tamb, ◦C 25
Ta, Te, Tg, Tc, Tcol, ◦C 30, 10, 90, 40, 175 30, 10, 90, 40, 250
Load, TR 200
Target cooled air, ◦C 20
Interest rate, % 5
Load factor, % 95
Plant life time, yr 20
Electric cost, $/kWh 0.065
Fans efficiency, % 80~85
Pumps efficiency, % 75

Entropy 2020, 22, 1165 24 of 29
Table 2. Cont.
Configuration: ETC/NH3-H2O PTC/NH3-H2O
Solar field:
Total solar field area, m2 1.188e4 1.102e4
Solar thermal power, kW 3612 4051
Inlet temperature, ◦C 91.82 92.04
Mass flow rate, kg/s 10.17 8.727
Inlet exergy, kW 5646 4217
Exergy destruction, kW 4683 5143
Flash tank:
Height/Width, m 3.381/1.655 2.743/1.343
Volume, m3 7.276 3.883
Total flow rate, kg/s 10.17 8.727
Water content, kg/s 8.551 6.91
Dryness fraction 0.1595 0.208
Exergy destruction, kW 391.1 515.6
AAC unit:
Qa, kW 1251 1153
Aa, m2 23.37 21.3
Mstr, kg/s 1.428 1.428
Mwk, kg/s 0.778 0.778
Xhex-NH3 0.4554 0.4554
Ahex, m2 7.837 6.73
Qg, kW 1407 1256
Ag, m2 5.123 4.574
Driving steam flow, kg/s 2.07 1.848
Qc, kW 694.9 694.9
Ac, m2 9.1 9.1
Mr, kg/s 0.6505 0.6505
Qe, kW 703.4 703.4
Ae, m2 41.15 41.15
FHP, kW 70.64 70.64
Mair, kg/s 119.5~120 119.5~120
COP/COPmax 0.5/1.559 0.5/1.559
RPR 0.3206 0.3591
Exergy destruction, kW 1010 977.3
Fan exergy destruction, kW 164 164
Pump unit:
Wp, kW 12.63 18.97~19
Exergy destruction, kW 64.7 62.25

Entropy 2020, 22, 1165 25 of 29
Table 2. Cont.
Cost and Thermo-economics:
Zcol, USD/h 11.75 10.93
Zfsh, USD/h 0.11 0.06
Zaac, USD/h 0.0487 0.04716
Zp+f, USD/h 0.256 0.2652
Ztot, USD/h 12.16 11.3
LPC, USD/h 0.089 0.0744
cp, USD/GJ 0.144 0.1554
5. Conclusions
A two configurations of solar-assisted NH3-H2O absorption refrigeration system was proposed,modeled, and simulated in this paper. A Flash evaporation tank has been used as a steam generationunit between the solar part and absortion chiller. A parametric study on the effect of the temperatureof the absorption cycle component on the performance of the system is carried out and the results arepresented. In addition, energy, exergy and cost analyses are presented in this work. According to theanalysis results, the following conclusions can be drawn:
� Design aspects, such as solar area and flashing tank volume were found to have a great influenceon the cycle cost.
� Increasing the cooling load increases the required solar field area and the flow rate of the heattransfer fluid.
� Optimization of the operating conditions, such as temperatures, has been performed for twoconfigurations. The following values of operating conditions are considered the best, related todesign aspects, COP, exergy destruction rate, and cost:
# Ta = 35 ◦C.# Tc = 43 ◦C.# Te = 7~10 ◦C.# Tg = 85~90 ◦C.# ETC Thigh = 150~200 ◦C.# PTC Thigh = 250~300 ◦C.
� A case study is presented in a sports arena located in Baghdad, Iraq, for which the needed coolingload was in the range of 700 to 800 kW. PTC/NH3-H2O was recorded the best based on design andhourly costs. The required solar area was in the range of 2000–2500 m2. While the total hourlycosts were in the range of USD 11.3–12.6/h which is quite attractive.
� PTC/NH3-H2O gives the lowest values related to exergy destruction rates for all units. As expected,the solar filed would harvest a larger amount of exergy destruction rates for two configurationsdue to the large area and mass flow rate effect. The PTC/NH3-H2O exergy destruction rate resultsare in the range of 4600–5000 kW.
� PTC/NH3-H2O gives the lowest value of flashing tank design aspects such as width, 1.343 m,height, 2.743 m, and volume, 3.883 m3. ETC/NH3-H2O comes next with a total flashing tankequal to ~7.276 m3.
� It is quite clear that PTC/NH3-H2O followed by ETC/NH3-H2O have a remarkable result accordingto the terms of energy, design, and cost. Generally, the PTC system is considered the best choicefor the NH3-H2O solar cooling system.

Entropy 2020, 22, 1165 26 of 29
Author Contributions: Conceptualization, A.A.-F.; methodology, A.A.-F.; validation, A.A.-F.; formal analysis,A.A.-F.; investigation, A.A.-F.; data curation, A.A.-F.; writing—original draft preparation, A.A.-F.; writing—reviewand editing, F.A.; supervision, B.E. All authors have read and agreed to the published version of the manuscript.
Funding: This research received no external funding.
Acknowledgments: The corresponding author would like to thank the Technical University of Darmstadt,enabling the open-access publication of this paper.
Conflicts of Interest: The authors declare no conflict of interest.
Nomenclature
A Availability, kW, Area, m2
At Tube cross-sectional area, m2
Af Amortization factor, 1/yAAC Absorption Air ConditioningC Thermo-economic cost stream, USD/kJCp Specific heat capacity, kJ/kg ◦C @ constant pressureCOP Coefficient of PerformanceD Diameter, mDenv Collector glass envelope diameter, mE Exergy stream, kWETC Evacuated Tube Collectorf FunctionFHP Fan power, kWH, h Height, m, Enthalpy, kJ/kgHdish Dish parabola height, mIs Solar intensity, W/m2
i Interest rate, %L Length, mLm Module length, mLMT Logarithmic Mean Temperature, ◦CLPC Levelized Power Cost, USD/kWhLTp Plant life time, yM Mass flow rate, kg/sNOT Number of TubesNOC Number of CollectorsNOL Number of LoopsP Power, or Pressure, bar∆P Pressure, barQ Thermal power, kWRPR Relative Performance RatioRe Raynold’s NumberS, s Entropy, kJ/kg ◦CSHX Solution Heat ExchangerT Temperature, ◦CU Overall heat transfer coefficient, W/m2 ◦CV, Vol Volume, cm3
v Velocity, m/sW Power, Work, kWWc Collector width, mX Concentration percentage, %Z Hourly cost, USD/h

Entropy 2020, 22, 1165 27 of 29
Subscripts
a, abs Absorber
air Air
amb Ambient
a-hex From absorber to heat exchanger stream
c Condenser
c-evp From condenser to evaporator stream
col Collector
cw Cooling water
e Evaporator
etc Evacuated tube collector
e-abs From evaporator to absorber stream
f Liquid phase
fan Fan
fsh Flashing tank
fst Flashing steam
g Generator, vapor phase
g-hex From generator to heat exchanger stream
i Inlet
loop Loop
o Out
p Pump
ptc Parabolic trough collectorpi,o Pump inlet and outlet
q Heat
r Refrigerant
s Steam
st Steam
str Strong
t Turbine, total
w Water
wk Weak solutionGreekη Efficiency, %ρ Density, kg/m3
µ Dynamic viscosity, Pa.s
References
1. Zeyghami, M.; Goswami, D.Y.; Stefanakos, E. A review of solar thermo-mechanical refrigeration and coolingmethods. Renew. Sustain. Energy Rev. 2015, 51, 1428–1445. [CrossRef]
2. Hassan, H.; Mohamad, A. A review on solar-powered closed physisorption cooling systems. Renew. Sustain.Energy Rev. 2012, 16, 2516–2538. [CrossRef]
3. Baniyounes, A.M.; Ghadi, Y.Y.; Rasul, M.G.; Khan, M.M.K. An overview of solar assisted air conditioning inQueensland’s sub-tropical regions, Australia. Renew. Sustain. Energy Rev. 2013, 26, 781–804. [CrossRef]
4. Al-Alili, A.; Hwang, Y.; Radermacher, R. Review of solar thermal air conditioning technologies. Int. J. Refrig.2014, 39, 4–22. [CrossRef]
5. Baniyounes, A.M.; Liu, G.; Rasul, M.; Khan, M. Comparison study of solar cooling technologies for aninstitutional building in subtropical Queensland, Australia. Renew. Sustain. Energy Rev. 2013, 23, 421–430.[CrossRef]
6. Kurem, E.; Horuz, I. A comparison between ammonia-water and water-lithium bromide solutions inabsorption heat transformers. Int. Commun. Heat Mass Transf. 2001, 28, 427–438. [CrossRef]

Entropy 2020, 22, 1165 28 of 29
7. Said, S.; Spindler, K.; El-Shaarawi, M.; Siddiqui, M.; Schmid, F.; Bierling, B.; Khan, M. Design, construction andoperation of a solar powered ammonia–water absorption refrigeration system in Saudi Arabia. Int. J. Refrig.2016, 62, 222–231. [CrossRef]
8. Calise, F.; Libertini, L.; Vicidomini, M. Design and optimization of a novel solar cooling system for combinedcycle power plants. J. Clean. Prod. 2017, 161, 1385–1403. [CrossRef]
9. Neyer, D.; Ostheimer, M.; Hauer, N.; Halmdienst, C.; Pink, W. Application of an adapted single-/half-effectNH3/H2O absorption chiller in tri-generation and solar cooling systems. Sol. Energy 2018, 173, 715–727.[CrossRef]
10. Aman, J.; Ting, D.-K.; Henshaw, P. Residential solar air conditioning: Energy and exergy analyses of anammonia–water absorption cooling system. Appl. Therm. Eng. 2014, 62, 424–432. [CrossRef]
11. Bellos, E.; Tzivanidis, C.; Antonopoulos, K.A. Exergetic, energetic and financial evaluation of a solar drivenabsorption cooling system with various collector types. Appl. Therm. Eng. 2016, 102, 749–759. [CrossRef]
12. Fong, K.; Chow, T.; Lee, C.; Lin, Z.; Chan, L. Comparative study of different solar cooling systems forbuildings in subtropical city. Sol. Energy 2010, 84, 227–244. [CrossRef]
13. Al-Falahi, A.; Alobaid, F.; Epple, B. A New Design of an Integrated Solar Absorption Cooling System Drivenby an Evacuated Tube Collector: A Case Study for Baghdad, Iraq. Appl. Sci. 2020, 10, 3622. [CrossRef]
14. Galindo-Luna, Y.R.; Franco, W.R.G.; Carrasco, U.D.; Romero, R.; Jiménez-García, J.C. Integration of theExperimental Results of a Parabolic Trough Collector (PTC) Solar Plant to an Absorption Air-ConditioningSystem. Appl. Sci. 2018, 8, 2163. [CrossRef]
15. Cabrera, F.; Fernández-García, A.; Silva, R.; Pérez-García, M. Use of parabolic trough solar collectors for solarrefrigeration and air-conditioning applications. Renew. Sustain. Energy Rev. 2013, 20, 103–118. [CrossRef]
16. Jakob, U.; Eicker, U.; Schneider, D.; Taki, A.; Cook, M. Simulation and experimental investigation into diffusionabsorption cooling machines for air-conditioning applications. Appl. Therm. Eng. 2008, 28, 1138–1150.[CrossRef]
17. Qu, M.; Yin, H.; Archer, D.H. A solar thermal cooling and heating system for a building: Experimental andmodel based performance analysis and design. Sol. Energy 2010, 84, 166–182. [CrossRef]
18. Tzivanidis, C.; Bellos, E. The use of parabolic trough collectors for solar cooling–A case study for Athensclimate. Case Stud. Therm. Eng. 2016, 8, 403–413. [CrossRef]
19. Molero-Villar, N.; Cejudo-López, J.; Domínguez-Muñoz, F.; Carrillo-Andrés, A. A comparison of solarabsorption system configurations. Sol. Energy 2012, 86, 242–252. [CrossRef]
20. Said, S.A.; El-Shaarawi, M.A.; Siddiqui, M.U. Alternative designs for a 24-h operating solar-poweredabsorption refrigeration technology. Int. J. Refrig. 2012, 35, 1967–1977. [CrossRef]
21. Abdelhay, A.; Fath, H.; Nada, S. Solar driven polygeneration system for power, desalination and cooling.Energy 2020, 198, 117341. [CrossRef]
22. Leiva-Illanes, R.; Escobar, R.; Cardemil, J.M.; Alarcón-Padilla, D.-C. Comparison of the levelized cost andthermoeconomic methodologies–Cost allocation in a solar polygeneration plant to produce power, desaltedwater, cooling and process heat. Energy Convers. Manag. 2018, 168, 215–229. [CrossRef]
23. Al-Falahi, A.; Alobaid, F.; Epple, B. Design and Thermo-Economic Comparisons of an Absorption AirConditioning System Based on Parabolic Trough and Evacuated Tube Solar Collectors. Energies 2020, 13, 3198.[CrossRef]
24. Salehi, S.; Yari, M.; Rosen, M. Exergoeconomic comparison of solar-assisted absorption heat pumps, solarheaters and gas boiler systems for district heating in Sarein Town, Iran. Appl. Therm. Eng. 2019, 153, 409–425.[CrossRef]
25. Marc, O.; Sinama, F.; Praene, J.-P.; Lucas, F.; Castaing-Lasvignottes, J. Dynamic modeling and experimentalvalidation elements of a 30 kW LiBr/H2O single effect absorption chiller for solar application. Appl. Therm. Eng.2015, 90, 980–993. [CrossRef]
26. Zhai, X.; Li, Y.; Cheng, X.; Wang, R. Experimental Investigation on a Solar-powered Absorption RadiantCooling System. Energy Procedia 2015, 70, 552–559. [CrossRef]
27. López-Villada, J.; Ayoua, D.S.; Bruno, J.C.; Coronas, A. Modelling, simulation and analysis of solar absorptionpower-cooling systems. Int. J. Refrig. 2014, 39, 125–136. [CrossRef]
28. Available online: https://webbook.nist.gov/chemistry/name-ser/ (accessed on 3 February 2020).29. Vakiloroaya, V.; Ha, Q.; Skibniewski, M.J. Modeling and experimental validation of a solar-assisted direct
expansion air conditioning system. Energy Build. 2013, 66, 524–536. [CrossRef]

Entropy 2020, 22, 1165 29 of 29
30. Carles Bruno, J.; Ló pez-Villada, J.; Letelier, E.; Romera, S.; Coronas, A. Modelling and Optimisation of SolarOrganic Rankine Cycle Engines for Reverse Osmosis Desalination; Elsevier: Amsterdam, The Netherlands, 2008.
31. Nafey, A.S.; Sharaf, M.A.; García-Rodríguez, L. A New Visual Library for Design and Simulation of SolarDesalination Systems (SDS); Elsevier: Amsterdam, The Netherlands, 2010.
32. Eldean, M.A.S.; Soliman, A.M. A new visual library for modeling and simulation of renewable energydesalination systems (REDS). Desalin. Water Treat. 2013, 51, 6905–6920. [CrossRef]
33. Singh, R.; Kumar, D.R. Theoritical Analysis of Nh3-H2o Refrigeration System Coupled with Diesel Engine:A Thermodynamic Study. IOSR J. Mech. Civ. Eng. 2014, 11, 29–36. [CrossRef]
34. Vanderzee, E.C.; King, D.L. The enthalpies of solution and formation of ammonia. J. Chem. Thermodyn. 1972,4, 675–683. [CrossRef]
35. Ge, Y.; Tassou, S.; Chaer, I. Modelling and performance evaluation of a low-temperature ammonia-waterabsorption refrigeration system. Int. J. Low-Carbon Technol. 2009, 4, 68–77. [CrossRef]
36. Shankar Ganesh, N.; Srinivas, T. Evaluation of thermodynamic properties of ammonia/water mixture up to100bar for power application systems. J. Mech. Eng. Res. 2011, 3, 25–39.
37. Li, K.W. Applied Thermodynamics: Availability Method and Energy Conversion; CRC Press: Boca Raton, FL,USA, 1995.
38. Sharaf, M.A. Design and Simulation of Solar Desalination Systems. Ph.D. Thesis, Suez Canal University,Ismailia Governorate, Egypt, 2011.
39. Sharaf, M.A.; Nafey, A.S.; García-Rodríguez, L. Author’s Personal Copy Thermo-Economic Analysis of SolarThermal Power Cycles Assisted MED-VC (Multi Effect Distillation-Vapor Compression) Desalination Processes;Elsevier: Amsterdam, The Netherlands, 2011.
40. Sharaf, M.; Nafey, A.; Desalination, L.G.-R. Exergy and Thermo-Economic Analyses of A Combined Solar OrganicCycle with Multi Effect Distillation (MED) Desalination Process; Elsevier: Amsterdam, The Netherlands, 2011.
41. Castro, M.M.; Song, T.W.; Pinto, J.M. Minimization of operational costs in cooling water systems. Chem. Eng.Res. Des. 2000, 78, 192–201. [CrossRef]
Publisher’s Note: MDPI stays neutral with regard to jurisdictional claims in published maps and institutionalaffiliations.
© 2020 by the authors. Licensee MDPI, Basel, Switzerland. This article is an open accessarticle distributed under the terms and conditions of the Creative Commons Attribution(CC BY) license (http://creativecommons.org/licenses/by/4.0/).