TOBWAAN AO KARIKIRAKEAN KIRIBATI
37
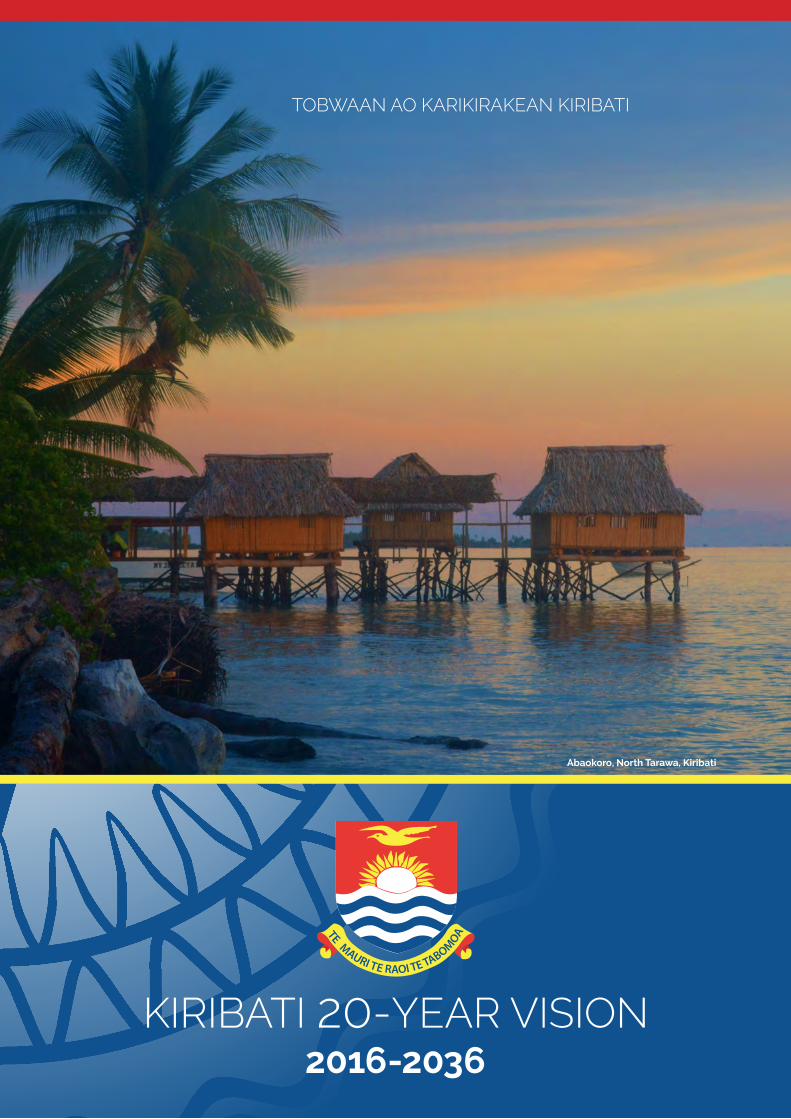
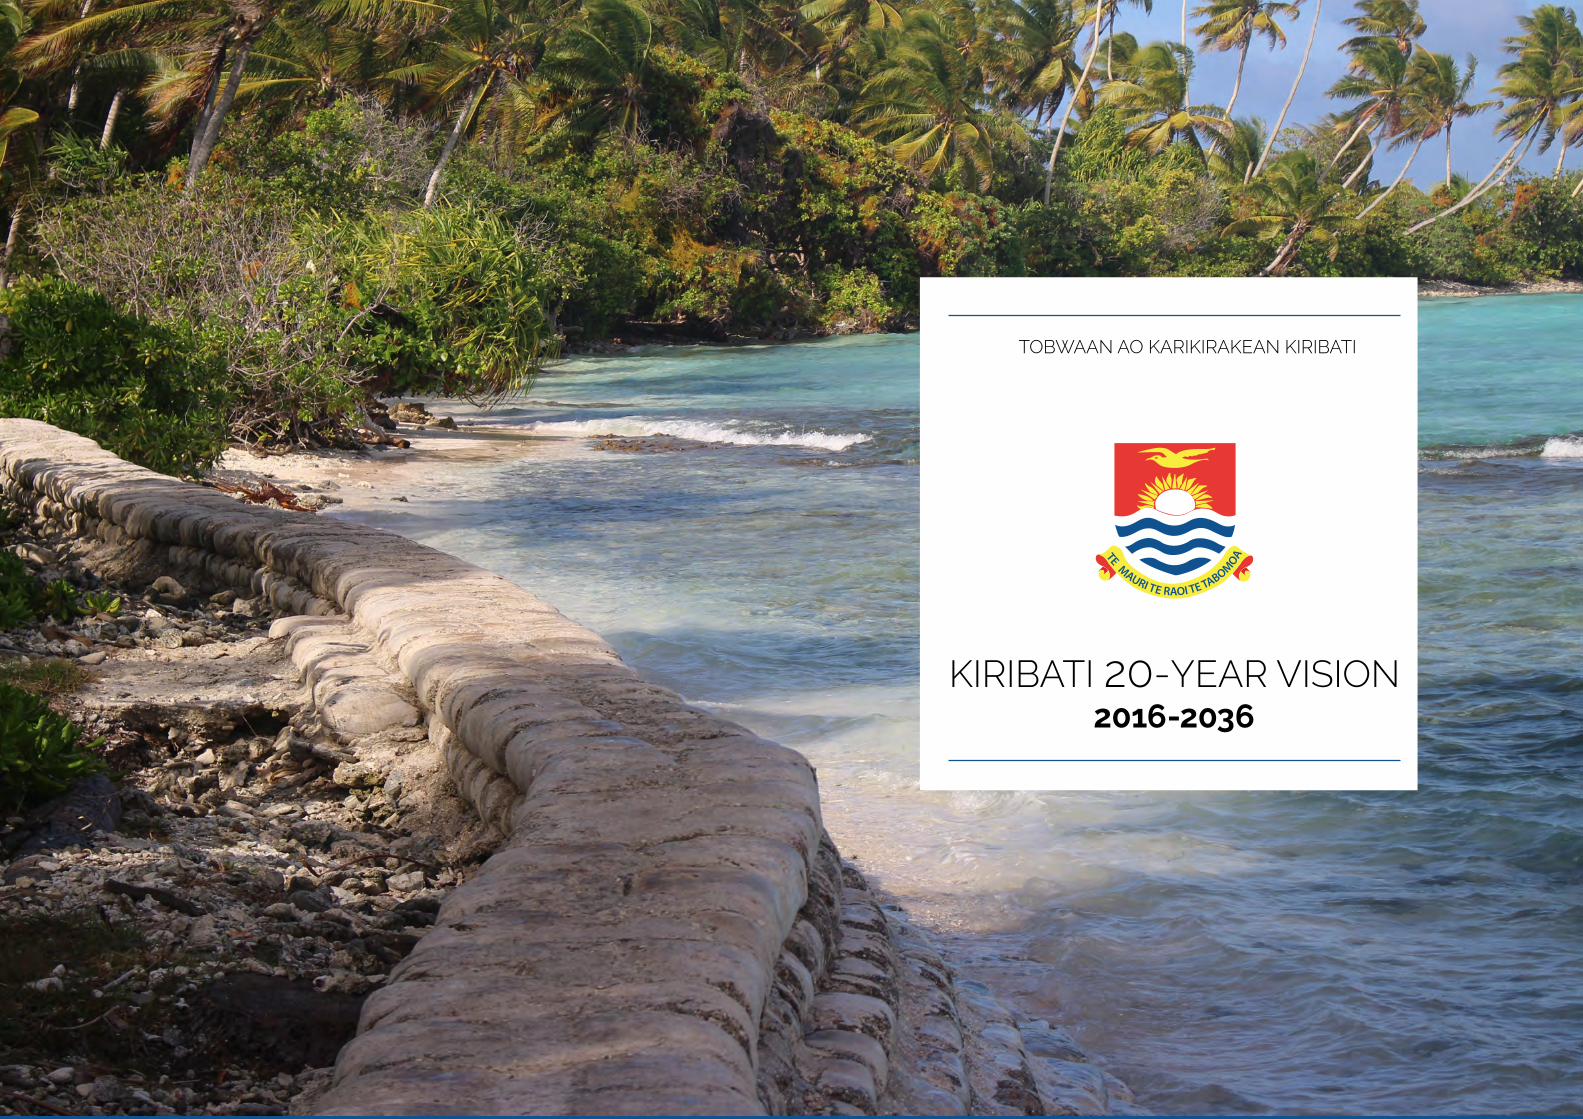
TOBWAAN AO KARIKIRAKEAN KIRIBATI Abaokoro, North Tarawa, Kiribati 2016-2036 KIRIBATI 20-YEAR VISION
Transcript of TOBWAAN AO KARIKIRAKEAN KIRIBATI
TOBWAAN AO KARIKIRAKEAN KIRIBATI
Abaokoro, North Tarawa, Kiribati
2016-2036KIRIBATI 20-YEAR VISION
KIRIBATI 20-YEAR VISION 2016-2036 KIRIBATI 20-YEAR VISION 2016-20362 1
2016-2036KIRIBATI 20-YEAR VISION
TOBWAAN AO KARIKIRAKEAN KIRIBATI
KIRIBATI 20-YEAR VISION 2016-2036 KIRIBATI 20-YEAR VISION 2016-20362 3
TABLE OF CONTENTABBREVIATIONS
Abbreviations ................................................................................................................................................... 2List of Tables and Figures ................................................................................................................................. 4Foreword ........................................................................................................................................................... 6Executive Summary .......................................................................................................................................... 8Introduction ....................................................................................................................................................10Vision .. 11Mission 11Guiding Principles and Values .......................................................................................................................11PILLAR 1: WEALTH ...........................................................................................................................................12
Natural Capital .................................................................................................................................................................................12Accelerating Macroeconomic Stability for Long Term Development .....................................................................................12Promoting Inclusive Trade and Private Sector for Sustainable Development ....................................................................14Maximising Returns through Sustainable Fisheries and Marine Development ................................................................16Improving Land Use for Sustainable Development ............................................................................................................................20
Human Capital .................................................................................................................................................................................22Having Highly Educated and Skilled Population by the Year 2036 for quality outputs ...........................................22
Increasing Employment Opportunities for I-Kiribati ...........................................................................................................................26Developing a Highly Skilled, Qualified and Efficient Workforce ..................................................................................................28Ensuring Accessible and Affordable Quality Healthcare System ................................................................................................31
Cultural Capital ................................................................................................................................................................................35PILLAR 2: PEACE AND SECURITY ...................................................................................................................38
Developing a Secure and Peaceful Kiribati ............................................................................................................................38PILLAR 3: INFRASTRUCTURE FOR DEVELOPMENT .......................................................................................42
Improving Connectivity and Accessibility .............................................................................................................................42Airfields ...........................................................................................................................................................................................................................42Air Transport .................................................................................................................................................................................................................43Sea Transport ...............................................................................................................................................................................................................43Coastal Infrastructure .............................................................................................................................................................................................45ICT.......................................................................................................................................................................................................................................45Land Transport ............................................................................................................................................................................................................46
Improving Access to Utility and Social Infrastructure........................................................................................................46Energy as a foundation of the KV20 ..............................................................................................................................................................46
PILLAR 4: GOVERNANCE ................................................................................................................................52Creating a Corruption–free Society ..........................................................................................................................................52
Cross Cutting Issues ............................................................................................................................................................................................................54Gender, Youth, Vulnerable Groups, Equity .............................................................................................................................54Environment, Climate Change and Sustainable Development .....................................................................................55
Strategic and Inclusive Partnerships ............................................................................................................58DELIVERING THE KV20 ...................................................................................................................................59
Implementation ...............................................................................................................................................................................59The Kiribati Development Plan ..................................................................................................................................................59The Vision Delivery Secretariat ...................................................................................................................................................59
Monitoring and Evaluation ............................................................................................................................60Annex 1: KV20 Implementation Matrix ........................................................................................................62
AKL Air Kiribati Limited
ATHKL Amalgamated Telecom Holdings (Kiribati) Limited
CARE Care, Assess, Reward and Evaluate
CDs Communicable Diseases
CEDAW Convention of the Elimination of all forms of Discrimination against Women
CRPD Convention on the Rights of persons with Disabilities
CSO Community Service Obligation
DCC Development Coordinating Committee
EU European Union
FDI Foreign Direct Investment
FRESH Fast, Reliable, Efficient, High-Spirit-ed and Honest
GLUP General Land Use Plan
GOK Government of Kiribati
GDP Gross Domestic Product
GPI Gender Parity Index
JAXA Japan Aerospace and Exploratory Agency
KAP III Kiribati Adaptation Programme Phase III
KDP Kiribati Development Plan
KFL Kiribati Fish Ltd
KIRIWATSAN Kiribati Water and Sanitation Project
KIT Kiribati institute of Technology
KOIFWP Kiribati Outer Island Food and Water Project
KOIL Kiribati Oil Company Ltd’s
KPA Kiribati Ports Authority
KPF Kiribati Provident Fund
KPS Kiribati Police Service
KSEC Kiribati Solar Energy Company
KNSL Kiribati National Shipping Line
KNTO Kiribati National Tourism Office
KTC Kiribati Teachers College
KV20 Kiribati Vision 20
M&E Monitoring and Evaluation
MFED Ministry of Finance and Economic Development
MTC Marine Training Centre
MSP Ministry Strategic Plan
MOP Ministry Operations Plan
NCDs Non-Communicable Diseases
OB Office of Te Beretitenti
OHS Occupational Health and Safety
PEC Pacific Environment Community
PIPA Phoenix Islands Protected Area
PTR Pupil Teacher Ratio
PUB Public Utilities Board
RERF Revenue Equalisation Reserve Fund
RMNCA Reproductive, Maternal, Neonatal, Child and Adolescence Health
RSE Recognised Seasonal Employers
SID Small Island Developing States
STSISP South Tarawa Sanitation Improvement Sector Project
SWP Seasonal Workers Programme
UNCAC United Nations Convention against Corruption
VFR Visiting Family and Relatives
KIRIBATI 20-YEAR VISION 2016-2036 KIRIBATI 20-YEAR VISION 2016-20364 5
Figure 1: Kiribati Real Growth Rate and GDP Per Capita 2005-2015 ...................................................................................................... 13Figure 2: Revenue, Expenditure, Deficits and Surpluses, Kiribati, 2007-2016 ................................................................................... 13Figure 3: Public and Private Sector KPF Contributors, Kiribati, 2009-2016 ......................................................................................... 14Figure 4: Number of Registered Businesses per Island .................................................................................................................................. 15Figure 5: Export and Import Trends (AUD), 1995-2015 ................................................................................................................................. 16Figure 6: Total Trends in Fishing License Revenue (AUD Million), 2006-2015 .................................................................................. 15Figure 7: Potential Benefits of Sustainable Tourism ......................................................................................................................................... 17Figure 8: Visitors arrival by Air and Purpose: Tarawa and Kiritimati ......................................................................................................... 18Figure 9: Outcome and Strategies for Natural Capital .................................................................................................................................... 18Figure 10: Trends in School Enrolment 2013-2016 ............................................................................................................................................. 21Figure 11: Proportion of Survival and Transition Rate........................................................................................................................................ 23Figure 12: Proportion of Certified and Qualified School Teachers, 2013-2016 .................................................................................. 23Figure 13: Outcome and Strategies for Education and Training ................................................................................................................. 24Figure 14: Trends in Overseas Employment for SWP and RSE (2010-2016) ......................................................................................... 25Figure 15: Seafarers’ Remittances (2000 to 2016) ................................................................................................................................................. 26Figure 16: Outcome and Strategies for Increasing Access to Decent Employment Opportunities. .................................... 27Figure 17: % of Public Service Employees by Age ............................................................................................................................................... 28Figure 18: Potential Skills Gap (2018-2021) .............................................................................................................................................................. 29Figure 19: Public Service Employees’ Qualifications ........................................................................................................................................... 29Figure 20: Outcome and Strategies for Developing a Highly Skilled and Qualified Workforce .............................................. 30Figure 21: Number of Registered Cases of Diabetes and Hypertension per Island (2016) ........................................................ 31Figure 22: Incidence of Leprosy by Island in Kiribati (2010-2015)............................................................................................................. 32Figure 23: Incidence of TB Cases on South Tarawa (2015) .............................................................................................................................. 33Figure 24: Under 5 Infant and Neonatal Mortality Rate in Pacific .............................................................................................................. 33Figure 25: Outcome and Strategies towards Ensuring Accessible and Affordable Quality Healthcare System. .......... 34Figure 26: Outcome and Strategies for Developing Cultural Capital ....................................................................................................... 36Figure 27: Trend in Crime Rates (2012-2016) .......................................................................................................................................................... 39Figure 28: Proportion of Criminal Cases in 2016 ................................................................................................................................................... 39Figure 29: Outcome and Strategies for Developing a Secure, Safer and Peaceful Kiribati ......................................................... 56Figure 30: Outcome and Strategies for Improving Connectivity and Accessibility ........................................................................ 41Figure 31: Annual Petroleum Sales by Product (2010-2016) ......................................................................................................................... 46Figure 32: Annual Petroleum Import by Product (2010-2016) ..................................................................................................................... 47Figure 33: Consumption Trend by Sector ................................................................................................................................................................. 47Figure 34: Power Generation and Sales Compared to Number of Utility Customers ................................................................... 47Figure 35: Power Generation Compared to Diesel Use and Energy Efficiency .................................................................................. 48Figure 36: Trend in Power Contribution from Solar System Installed ...................................................................................................... 49Figure 37: Outcome and Strategies for Improving Access to Utility and Social Infrastructure................................................ 50Figure 38: Outcome and Strategies for Creating a Corrupt-free Society ............................................................................................... 53Table 1: School Enrolment 2013-2016 ................................................................................................................................................................... 22Table 2: Gender Parity Index 2011-2014 ............................................................................................................................................................... 23Table 3: Literacy and Numeracy Proficiency Level (%) ................................................................................................................................. 24Table 4: 2016 - June, 2017 Complaints Record ................................................................................................................................................. 27Table 5: Age Distribution of Public Service Employees ............................................................................................................................... 28Table 6: Number of Retirees (2018-2021) ............................................................................................................................................................. 29Table 7: Number of Staff with Qualifications ...................................................................................................................................................... 29Table 8: Trend in Crime Rates (2012-2016) .......................................................................................................................................................... 38
LIST OF TABLES AND FIGURES
KIRIBATI 20-YEAR VISION 2016-2036 KIRIBATI 20-YEAR VISION 2016-20366 7
FOREWORD
Warm Greetings from the heart of the Central Pacific, an island nation surrounded by a vast ocean and vulnerable to the adverse impacts of climate change.
I am very pleased to introduce the Kiribati 20 year vision development plan known as the KV20. The KV20 is Kiribati’s long term development blueprint for the period 2016-2036. This development blue print aims to transform Kiribati into a wealthier, healthier and peaceful country. The road to this KV20 began under the leadership of the present government administration. This is also the first long-term national development plan for Kiribati.
The process to get to this KV20 was guided by the whole-of-country approach. The strategy has resulted into a document that honours a legacy of the past, embraces our presence and at the same time looks forward and prepares for the future with hope and anticipation. The process of formulating the development blue print was characterised by inclusive consultations conducted for the Gilbert and the Line and Phoenix Island Groups as well as internal consultations with Government Ministries and agencies, business communities and churches which guaranteed valuable inputs from diverse and inclusive contributors, making it a vision for our nation.
This KV20 draws strength from the unique opportunity it presents for both the government and citizens of Kiribati to collaborate towards improving the quality of life for all I-Kiribati. The Vision identified four pillars that will enable transformative development for our nation and these include wealth, peace and security, infrastructure and governance.
The Vision, widely informed by the will of the people desires to see Kiribati rise to its full potential through maximising revenue and output from natural, human and cultural capital. The Vision recognises that sustainability of natural resources must be the fabric of this vision to ensure that the development aspirations today do not compromise
the availability of resources for the future generations. The people of Kiribati feel that their future should be more prosperous, equitable, sustainable and thriving, and that is the very essence of this vision.
This KV20 offers a consolidated framework for development through which the National Development Plans and Ministry Strategic Plans can be aligned by mainstreaming the KV20 strategies during the medium term planning process, in order to provide a meaningful development outcome as envisioned in the KV20. The KV20 fosters alignment between policy areas of respective ministries and paves an innovative path for government, stakeholders, donors and development partners to further collaborate to realise transformative development.
The KV20 provides an implementation process that unlocks the potential of Kiribati by presenting the vision, facilitating commitment and consistent cooperation for all. The vision also seeks to ensure that its implementation, monitoring and evaluation adopts an inclusive consultative mechanism as its formulation.
This KV20 is the culmination of commendable commitment, hard-work and dedication which would not have been possible without the many individuals who gave their time, provided information and participated in the formulation process. I am therefore very pleased to hand over this plan to the people of Kiribati in general, and more specifically to the public, private, and social sector stakeholders in order for the citizens of Kiribati to take ownership, inspire, empower and drive its execution for the benefit of the current and future generations .
Health, Peace and Prosperity.
HE Taneti Maamau Beretitenti Republic of Kiribati
KIRIBATI 20-YEAR VISION 2016-2036 KIRIBATI 20-YEAR VISION 2016-20368 9
EXECUTIVE SUMMARY
The KV20 is a long term development blueprint for Kiribati. It covers the period 2016 to 2036. It is motivated by a collective aspiration for a better society by the year 2036. The vision of the KV20 is for Kiribati to become a wealthy, healthy and peaceful nation. It seeks to achieve the development aspiration by maximising the development benefits from fisheries and tourism as key productive sectors. The development of these sectors are expected to stimulate the development of other sectors through backward and forward sectoral linkages.
The contribution of fisheries and tourism sectors to the country’s development aspirations is expected to directly contribute to achieving the Sustainable Development Goals (SDGs) for Kiribati by 2036. The Vision is a product of a participatory and inclusive consultative process involving views from I-Kiribati and widely informed by the underlying challenges and inputs from various sector plans.
The Vision is anchored on four pillars: Wealth; Peace and Security; Infrastructure; and Governance. The Wealth Pillar aims to develop the natural capital, human capital and cultural capital to improve economic growth and reduce poverty.
Development of natural capital will include implementing measures aimed at maximising revenue from fisheries and marine resources, improving contribution of the tourism sector to GDP, implementing strategies to support the development of an inclusive trade and private sector, and to improve land use and planning with the objective of creating additional land for commercial development.
The human capital component seeks to create a highly educated and skilled population, increase access to decent employment; develop a highly skilled, qualified and efficient work force and accessible and affordable quality healthcare system. The Vision recognises that creating a globally competitive and healthy human resource base is critical to achieving the overall goal of the Vision given its linkages to employment opportunities.
The Vision further seeks to develop cultural capital by implementing measures to safeguard and revive traditional skills and knowledge. The development of cultural capital is expected to support the development of the tourism industry.
The Vision recognises the importance of security towards creating a more secure living and working environment. The Peace and Security Pillar aims to create a secure, safer and peaceful Kiribati by formally establishing and strengthening the National Security governance policy frameworks, relevant institutions and strategic partnerships.
The Infrastructure Pillar aims at improving connectivity and accessibility in relation to economic and social infrastructure. The Vision will seek to improve the transport and ICT infrastructure. It also aims to improve access to utility and social infrastructure. The Vision recognizes the significant cross-cutting role of infrastructure as a backbone in providing basic services and creating an enabling environment for the development of the fisheries and tourism.
The Governance Pillar aims to create a corruption-free society by strengthening national and local traditional governance policy and legislative frameworks; fostering and strengthening the integrity and independence of institutions mandated to promote good governance and eliminate corruption; strengthen strategic partnerships and institutionalise anti-corruption and good governance principles in the public service and education systems in Kiribati. Governance will be an essential component that will be streamlined in all undertakings and to every approach to implementing the Vision.
In addition to the core Pillars, the Vision also acknowledges the importance of gender, youth, vulnerable groups, disability, equity and partnership as cross-cutting principles. The vision will mainstream equity in all the sector programmes and projects to be implemented. The aim is to implement measures across all sectors to create equal opportunities for all clusters in the society including women, youth, people living with disability and other vulnerable groups. The Vision recognises Kiribati’s vulnerability to climate change as a key constraint to achieving the desired outcomes. The Vision underscores the need to mainstream climate change adaptation and mitigation into various programmes. Mainstreaming climate change into development programming will ensure that the working environment is sensitive to environment conservation, climate change and sustainable development. The environment conservation adaptation and mitigation measures will reduce risks and ensure that the development programmes implemented create sustainable development for all.
The Vision has earmarked a transshipment hub to be developed in Betio and Kiritimati as major flagship projects under the fisheries priority sector. While the flagship projects are expected to take a lead role in generating rapid, widely shared growth, they are by no means the only projects the country will be implementing. By the same token, there are many ongoing projects and others planned for the future. All of these deserve attention and support. The full details will be found in the successive Sector Plans or Ministry Strategic Plans.
KIRIBATI 20-YEAR VISION 2016-2036 KIRIBATI 20-YEAR VISION 2016-203610 11
INTRODUCTION
The KV20 is an ambitious, long term development planning framework and the first of its kind for Kiribati. Its overall objective is to bolster national efforts in transforming the lives of an I-Kiribati and economy into a resilient, wealthy, healthy and secure nation. It marks a shift in our development planning process whereby long term vision and people centered focus on socio-economic development is introduced to guide our short to medium term planning processes. In keeping with its long term vision, the KV20 will allow economic planning to focus beyond the 4-year cycle of government, which has been the main limitation to sustaining and implementing long term programmes and strategies.
To ensure relevance, practicality and ownership of the KV20, the plan was developed through a process led by government sectors including the national consultations that were designed to garner inputs, direction and views from the communities, civil societies and the private sector. It is therefore critical that the active engagement of all stakeholders is maintained throughout the implementation and monitoring of the KV20 to ensure that this plan stays true to its Vision in ensuring a whole of country partnership and people centered approach.
The Government key ministries have already commenced the integration of the KV20 development aspirations into the respective Ministry strategic plans (MSPs) and Ministry Operation Plans (MOPs) to reflect the priorities, outcomes and targets in the KV20. It is envisaged that the Kiribati Development Plan (KDP) and the Ministry Strategic Plans shall become the implementing mechanisms for the KV20; and with a participatory M&E system to be spearheaded by the Ministry of Finance and Economic Development (MFED) to ensure that the plan reflects the current realities.
Furthermore, catapulting economic development to achieve our targets within the next 20 years can only be possible if Kiribati focuses its attention on two of its productive sectors, fisheries and tourism. Adequate investment and a conducive environment need to be developed for these sectors to thrive. To this end, the four (4) pillars, namely wealth and health, peace and security, infrastructure for development and governance are intended to complement, support and cultivate an enabling environment in order to promote the evolution of investment into fisheries and tourism.
The outcomes and strategies for the four pillars will therefore be read as a means to achieve the overall outcome of strengthening the fisheries and tourism sectors as the backbone of Kiribati’s economy during and after the implementation of this strategy.
KIRIBATI 20-YEAR VISION 2016-2036 KIRIBATI 20-YEAR VISION 2016-203612 13
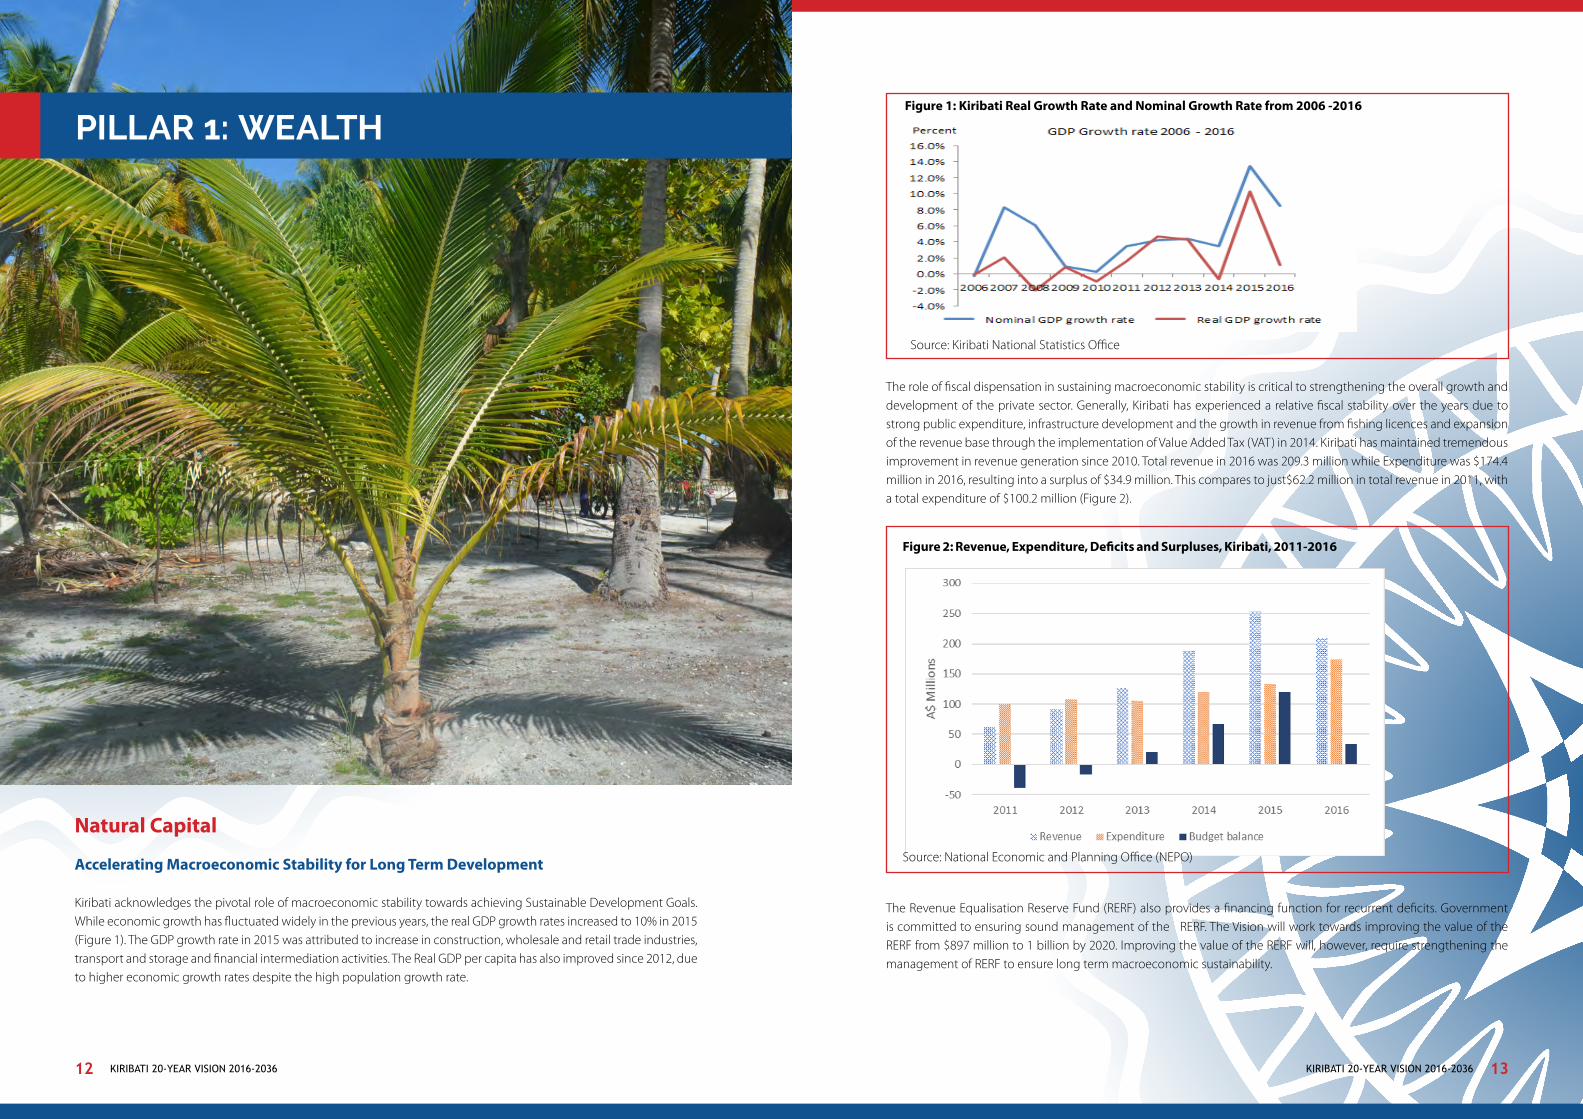
The role of fiscal dispensation in sustaining macroeconomic stability is critical to strengthening the overall growth and development of the private sector. Generally, Kiribati has experienced a relative fiscal stability over the years due to strong public expenditure, infrastructure development and the growth in revenue from fishing licences and expansion of the revenue base through the implementation of Value Added Tax (VAT) in 2014. Kiribati has maintained tremendous improvement in revenue generation since 2010. Total revenue in 2016 was 209.3 million while Expenditure was $174.4 million in 2016, resulting into a surplus of $34.9 million. This compares to just$62.2 million in total revenue in 2011, with a total expenditure of $100.2 million (Figure 2).
The Revenue Equalisation Reserve Fund (RERF) also provides a financing function for recurrent deficits. Government is committed to ensuring sound management of the RERF. The Vision will work towards improving the value of the RERF from $897 million to 1 billion by 2020. Improving the value of the RERF will, however, require strengthening the management of RERF to ensure long term macroeconomic sustainability.
PILLAR 1: WEALTH
Natural Capital
Accelerating Macroeconomic Stability for Long Term Development
Kiribati acknowledges the pivotal role of macroeconomic stability towards achieving Sustainable Development Goals. While economic growth has fluctuated widely in the previous years, the real GDP growth rates increased to 10% in 2015 (Figure 1). The GDP growth rate in 2015 was attributed to increase in construction, wholesale and retail trade industries, transport and storage and financial intermediation activities. The Real GDP per capita has also improved since 2012, due to higher economic growth rates despite the high population growth rate.
Figure 1: Kiribati Real Growth Rate and Nominal Growth Rate from 2006 -2016
Source: Kiribati National Statistics Office
Figure 2: Revenue, Expenditure, Deficits and Surpluses, Kiribati, 2011-2016
Source: National Economic and Planning Office (NEPO)
KIRIBATI 20-YEAR VISION 2016-2036 KIRIBATI 20-YEAR VISION 2016-203614 15
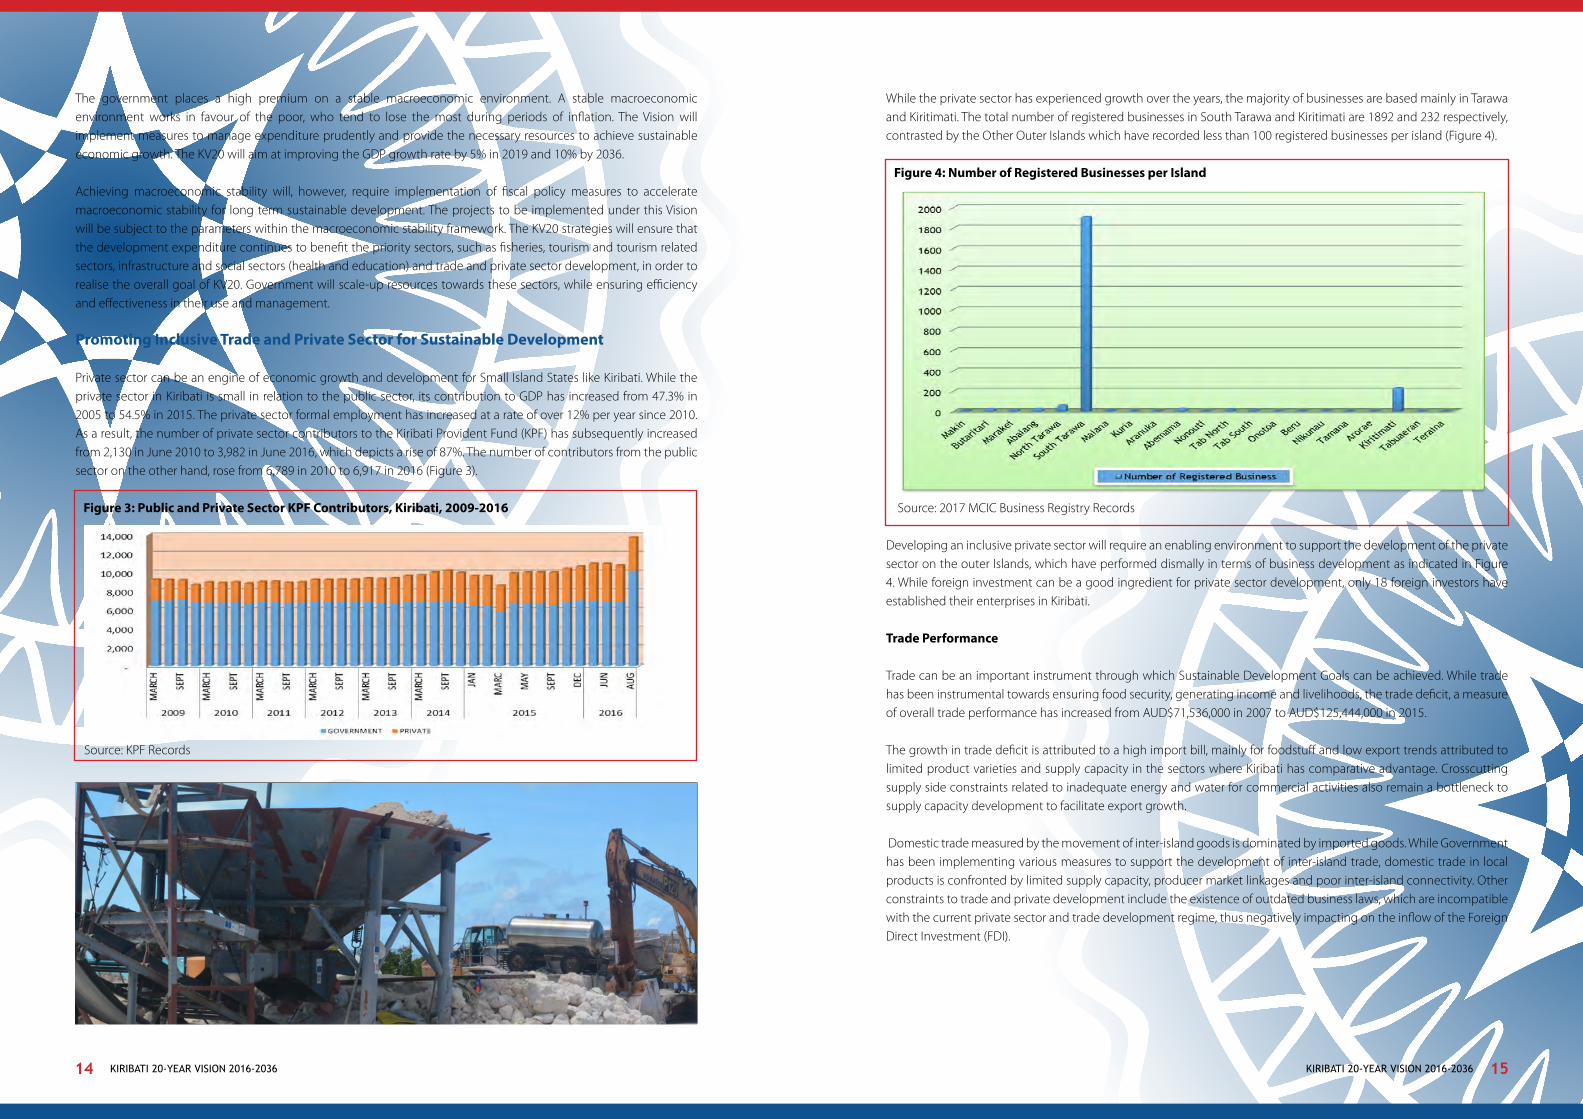
While the private sector has experienced growth over the years, the majority of businesses are based mainly in Tarawa and Kiritimati. The total number of registered businesses in South Tarawa and Kiritimati are 1892 and 232 respectively, contrasted by the Other Outer Islands which have recorded less than 100 registered businesses per island (Figure 4).
Figure 4: Number of Registered Businesses per Island
Source: 2017 MCIC Business Registry Records
Developing an inclusive private sector will require an enabling environment to support the development of the private sector on the outer Islands, which have performed dismally in terms of business development as indicated in Figure 4. While foreign investment can be a good ingredient for private sector development, only 18 foreign investors have established their enterprises in Kiribati.
Trade Performance
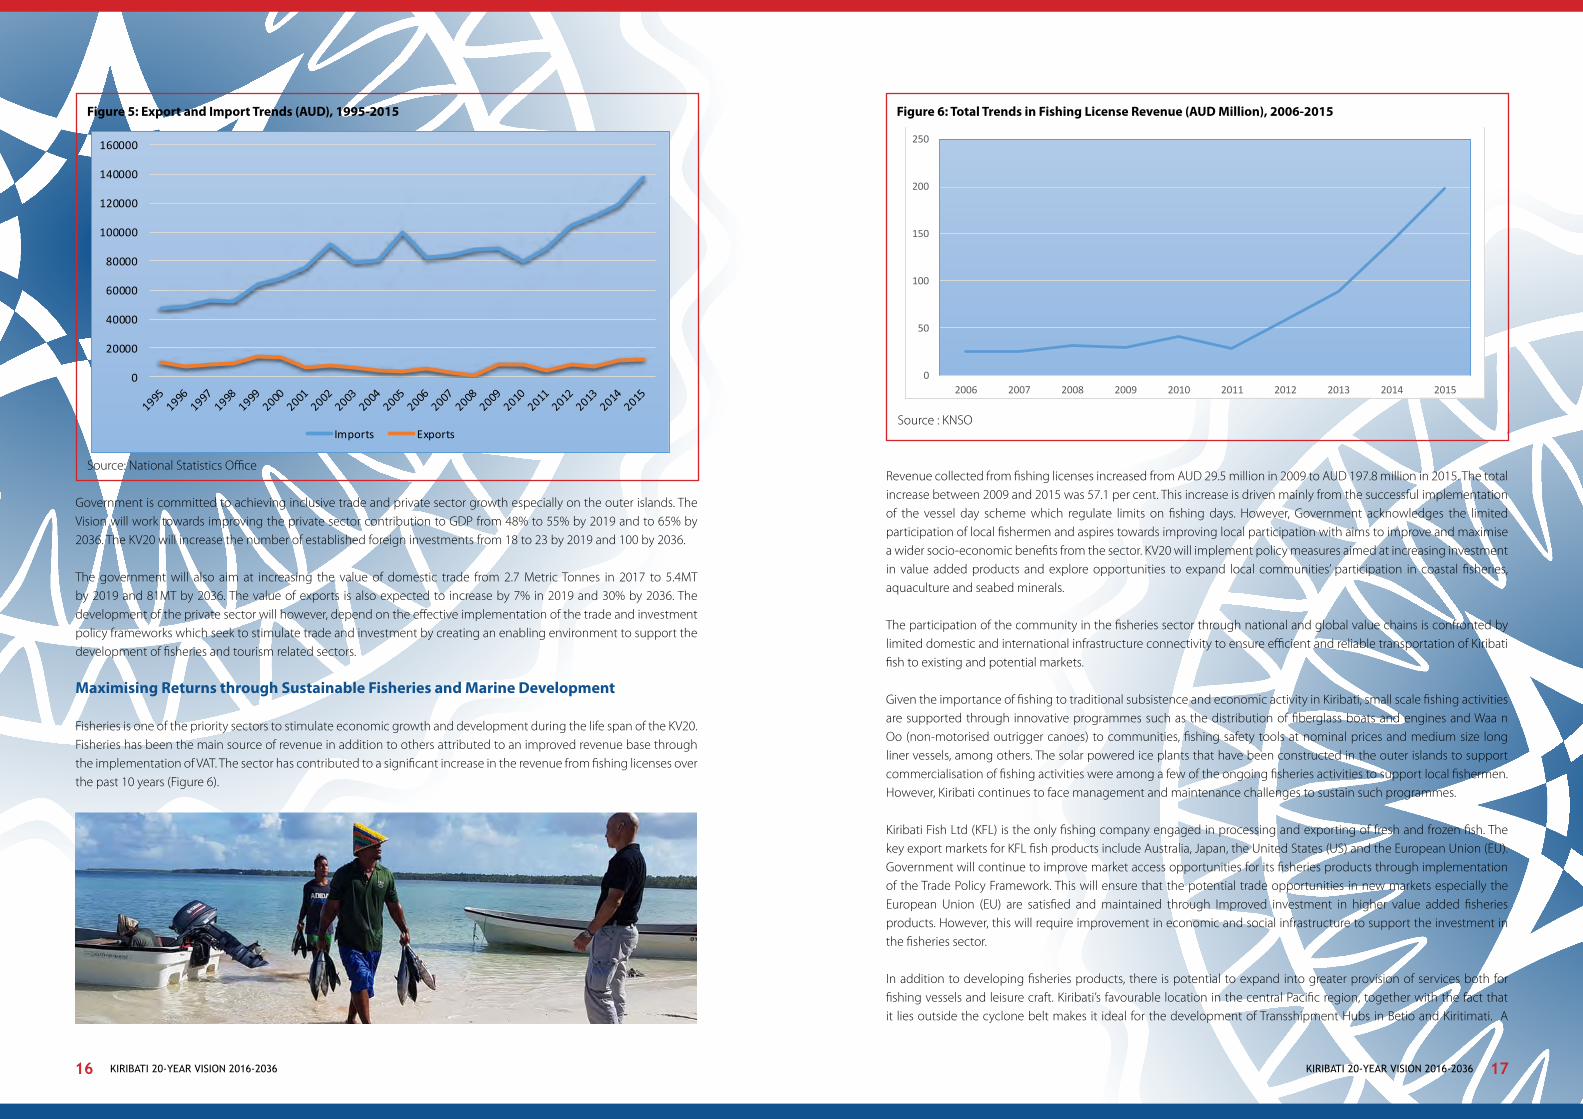
Trade can be an important instrument through which Sustainable Development Goals can be achieved. While trade has been instrumental towards ensuring food security, generating income and livelihoods, the trade deficit, a measure of overall trade performance has increased from AUD$71,536,000 in 2007 to AUD$125,444,000 in 2015.
The growth in trade deficit is attributed to a high import bill, mainly for foodstuff and low export trends attributed to limited product varieties and supply capacity in the sectors where Kiribati has comparative advantage. Crosscutting supply side constraints related to inadequate energy and water for commercial activities also remain a bottleneck to supply capacity development to facilitate export growth.
Domestic trade measured by the movement of inter-island goods is dominated by imported goods. While Government has been implementing various measures to support the development of inter-island trade, domestic trade in local products is confronted by limited supply capacity, producer market linkages and poor inter-island connectivity. Other constraints to trade and private development include the existence of outdated business laws, which are incompatible with the current private sector and trade development regime, thus negatively impacting on the inflow of the Foreign Direct Investment (FDI).
The government places a high premium on a stable macroeconomic environment. A stable macroeconomic environment works in favour of the poor, who tend to lose the most during periods of inflation. The Vision will implement measures to manage expenditure prudently and provide the necessary resources to achieve sustainable economic growth. The KV20 will aim at improving the GDP growth rate by 5% in 2019 and 10% by 2036.
Achieving macroeconomic stability will, however, require implementation of fiscal policy measures to accelerate macroeconomic stability for long term sustainable development. The projects to be implemented under this Vision will be subject to the parameters within the macroeconomic stability framework. The KV20 strategies will ensure that the development expenditure continues to benefit the priority sectors, such as fisheries, tourism and tourism related sectors, infrastructure and social sectors (health and education) and trade and private sector development, in order to realise the overall goal of KV20. Government will scale-up resources towards these sectors, while ensuring efficiency and effectiveness in their use and management.
Promoting Inclusive Trade and Private Sector for Sustainable Development
Private sector can be an engine of economic growth and development for Small Island States like Kiribati. While the private sector in Kiribati is small in relation to the public sector, its contribution to GDP has increased from 47.3% in 2005 to 54.5% in 2015. The private sector formal employment has increased at a rate of over 12% per year since 2010. As a result, the number of private sector contributors to the Kiribati Provident Fund (KPF) has subsequently increased from 2,130 in June 2010 to 3,982 in June 2016, which depicts a rise of 87%. The number of contributors from the public sector on the other hand, rose from 6,789 in 2010 to 6,917 in 2016 (Figure 3).
Figure 3: Public and Private Sector KPF Contributors, Kiribati, 2009-2016
Source: KPF Records
KIRIBATI 20-YEAR VISION 2016-2036 KIRIBATI 20-YEAR VISION 2016-203616 17
Figure 6: Total Trends in Fishing License Revenue (AUD Million), 2006-2015
Source : KNSO
Revenue collected from fishing licenses increased from AUD 29.5 million in 2009 to AUD 197.8 million in 2015. The total increase between 2009 and 2015 was 57.1 per cent. This increase is driven mainly from the successful implementation of the vessel day scheme which regulate limits on fishing days. However, Government acknowledges the limited participation of local fishermen and aspires towards improving local participation with aims to improve and maximise a wider socio-economic benefits from the sector. KV20 will implement policy measures aimed at increasing investment in value added products and explore opportunities to expand local communities’ participation in coastal fisheries, aquaculture and seabed minerals.
The participation of the community in the fisheries sector through national and global value chains is confronted by limited domestic and international infrastructure connectivity to ensure efficient and reliable transportation of Kiribati fish to existing and potential markets.
Given the importance of fishing to traditional subsistence and economic activity in Kiribati, small scale fishing activities are supported through innovative programmes such as the distribution of fiberglass boats and engines and Waa n Oo (non-motorised outrigger canoes) to communities, fishing safety tools at nominal prices and medium size long liner vessels, among others. The solar powered ice plants that have been constructed in the outer islands to support commercialisation of fishing activities were among a few of the ongoing fisheries activities to support local fishermen. However, Kiribati continues to face management and maintenance challenges to sustain such programmes.
Kiribati Fish Ltd (KFL) is the only fishing company engaged in processing and exporting of fresh and frozen fish. The key export markets for KFL fish products include Australia, Japan, the United States (US) and the European Union (EU). Government will continue to improve market access opportunities for its fisheries products through implementation of the Trade Policy Framework. This will ensure that the potential trade opportunities in new markets especially the European Union (EU) are satisfied and maintained through Improved investment in higher value added fisheries products. However, this will require improvement in economic and social infrastructure to support the investment in the fisheries sector.
In addition to developing fisheries products, there is potential to expand into greater provision of services both for fishing vessels and leisure craft. Kiribati’s favourable location in the central Pacific region, together with the fact that it lies outside the cyclone belt makes it ideal for the development of Transshipment Hubs in Betio and Kiritimati. A
Figure 5: Export and Import Trends (AUD), 1995-2015
Source: National Statistics Office
Government is committed to achieving inclusive trade and private sector growth especially on the outer islands. The Vision will work towards improving the private sector contribution to GDP from 48% to 55% by 2019 and to 65% by 2036. The KV20 will increase the number of established foreign investments from 18 to 23 by 2019 and 100 by 2036.
The government will also aim at increasing the value of domestic trade from 2.7 Metric Tonnes in 2017 to 5.4MT by 2019 and 81MT by 2036. The value of exports is also expected to increase by 7% in 2019 and 30% by 2036. The development of the private sector will however, depend on the effective implementation of the trade and investment policy frameworks which seek to stimulate trade and investment by creating an enabling environment to support the development of fisheries and tourism related sectors.
Maximising Returns through Sustainable Fisheries and Marine Development
Fisheries is one of the priority sectors to stimulate economic growth and development during the life span of the KV20. Fisheries has been the main source of revenue in addition to others attributed to an improved revenue base through the implementation of VAT. The sector has contributed to a significant increase in the revenue from fishing licenses over the past 10 years (Figure 6).
0
20000
40000
60000
80000
100000
120000
140000
160000
Imports Exports
0
50
100
150
200
250
2006 2007 2008 2009 2010 2011 2012 2013 2014 2015

KIRIBATI 20-YEAR VISION 2016-2036 KIRIBATI 20-YEAR VISION 2016-203618 19
Transshipment Hub will involve developing the capacity of the jetty and wharf to be able to resupply, service and repair vessels in the sub-region including purse seiners and long liner boats, small fishing vessels, ferries and inter-island transportation and pleasure vessels such as cruise ships and yachts.
Maximising returns from sustainable fisheries and marine resources will be an ultimate goal of the Government. The vision aims at increasing fisheries and marine resource revenue from AUD$154 million to AUD$227 million by 2019 and AUD$1.2 billion by 2036. Government will develop a transshipment hub in Betio by 2027 and in Kiritimati by 2036 to attract transshipment activities in Kiribati with aims to provide services like refuel, resupply, net mending and maintenance and repair services for fishing and other vessels operating in the region due to the vast distances between fishing grounds and other current hub locations.
Government will continue to implement policy measures to support the participation of the local private sector in the fishing industry, create a conducive investment climate to increase Foreign Direct Investment (FDI) in the fisheries sector, work with outer islands in promoting foreign investment in integrated catching and processing and facilitating exports of value added fisheries products. In line with Government’s aspiration to promote coastal fisheries, Government will also implement policy measures to strengthen the national quality infrastructure, improve the development of aquaculture, seabed mining and at the same time ensure sustainability of fisheries and marine resources.
Developing Sustainable Tourism
Government recognises the potential contribution of tourism towards stimulating economic development, providing employment, income generation as well as supporting the retention of cultural traditions, sustainable management of national environmental assets and wider contribution towards social–economic benefits. The sector can support the development of other sectors like agriculture through forward and backward linkages.
Figure 7: Potential Benefits of Sustainable Tourism
The growth of the tourism sector however, has been stagnant and limited to narrow tourism products and markets over the years. The current tourism industry is focused only on South Tarawa and Kiritimati. A breakdown of visitors by purpose of visit shows business related travel as the dominant category of tourist visitors (Figure 8) while pleasure travel is largely made up of fishing focused visitors.
Figure 8: Visitors arrival by Air and Purpose: Tarawa and Kiritimati
Source: KNTO
The growth in holiday arrivals remained static since 2011, with the total holiday arrivals estimated at 1383 in 2013 and 1412 in 2015. The Phoenix Islands Protected Area (PIPA) which could be a jewel in the crown of the Kiribati national tourism industry remains under exploited. The vision of PIPA is to become a premier location for small number of high yield travelers seeking to explore a unique aquatic and terrestrial environment.
The tourism sector in Kiribati does not provide a rich range of activities and experiences based on its cultural and environmental resources. The typical visitor to Tarawa may possibly see cultural performance at the hotel or be limited to a cultural gathering, but it is difficult for the visitors to access and learn about the local way of life and traditions. There are some tours available that focus on WWII relics, but avenues that open up the culture to the visitors are insignificant.
The World War II heritage sites that could be a significant point of interest for some visitors still receive relatively scant attention. At the same time, most of the significant gun emplacements and bunker sites are not in an attractive state that could market Kiribati as a tourist destination.
Marketing Kiribati to inform the tourists of the potential attractions and facilities remain a key constraint to tourism development. Destination marketing is faced by underdeveloped and outdated tourism promotion related websites. Lack of dive operators also creates a major gap in the array of tourism products.
Government will continue to implement measures aimed at boosting revenue in the tourism sector. The Vision aims at increasing the % contribution of tourism to GDP from 3.6% in 2016 to 20% by 2019 and to 50% by 2036. KV20 will implement tourism development measures aimed at increasing investment in high yielding tourism products such as cultural tourism and eco-tourism, strengthening human capacity in the tourism and hospitality sector in high end tourism products, strengthening institutional and regulatory frameworks, investment in destination marketing, strengthening infrastructure connectivity and upgrading tourism related sites and facilities.
Economic Benefits • Increased Employment • High Level of Unskilled Jobs• Business Opportunities• Increased Tax Revenue and Foreign Exchange
Social Benefits• Preserve Culture and Heritage• Improve Services /Infrastructure • Improved Quality of Life• Reduce Urban Drift
Sustainable Tourism
development
Environmental Benefits• Protect Natural Assets• Manage use and impacts• Inform and educate • Alternative economic use of resources
0
500
1,000
1,500
2,000
2,500
2006 2007 2008 2009 2010 2011 2012 2013 2014 2015
BUSINESS PLEASURE VFR TRANSIT OTHERS
KIRIBATI 20-YEAR VISION 2016-2036 KIRIBATI 20-YEAR VISION 2016-203620 21
Improving Land Use for Sustainable Development Land is a vital factor of production in the economy. The total land area is 811 km2, of which 37% is under customary land ownership and the remaining is state land, including all islands in the Line and Phoenix Group. The country’s population is heavily concentrated in the urban areas of South Tarawa, where 51% of the population lives. The performance of key growth sectors of the economy and the attachment of the communities to land all affect access and utilisation of land in Kiribati. A large proportion of land in South Tarawa is leased by Government for a period of 99 years under the Native Lands Ordinance. General land use planning for designated areas is determined by the Central Land Planning Board established under the Land Planning Ordinance. Land tenure on state lands such as Kiritimati, Tabuaeran and Teraina is governed by the State Lands Act and the State Pre-Emptive Act, which combines land tenure with planning requirements for the sustainable use of land resources
Secure access to land can contribute to social and economic development and guarantees tenure, which builds more investor confidence, be they small or large. While improving land use is critical to sustainable development, land scarcity, squatting, contesting of land ownership titles and policy requirements for subleasing Government leased lands in regard to 100% landowner’s consent (which usually comes at an expensive price) are major obstacles to private sector development in urban areas and to a lesser extent, expansion of public services. Weak monitoring and enforcement and political governance challenges related to land ownership contribute to non-compliance with the general land use plan. This is evident in disorderly development in most areas of South Tarawa and limited land to support commercial activities. Land scarcity, especially for commercial purposes in South Tarawa, implies that there is need for substantive investment in land reclamation. Lack of a national land policy and weak administration of the relevant legislative framework has significantly contributed to poor land use, especially for commercial purposes, thus affecting the establishment of investment.
In addition to land issues, soil quality in Kiribati is generally poor, thus constraining the development of agricultural activities. Other factors that constrain agricultural activities include lack of comprehensive agriculture strategy that takes into consideration the prioritisation of crops and livestock development, weak and/or absence of essential infrastructure and supporting mechanisms to facilitate large scale production for domestic trade. There is need to promote and sustain knowledge, information and good practices for sustainable management of natural resources.
Government recognises the need to strengthen land use planning and administration to create transparent procedures for obtaining land for private sector development by strengthening the national land policy and legislative framework. The Vision will develop updated the General Land Use Plan (GLUP) for South Tarawa by 2019. GLUPs will also be developed for Kiritimati, Tabuaera, Teraina and PIPA by the year 2023. Additional investment will be targeted towards increasing land area designated for commercial purposes from 121.4 acres to 220 acres on South Tarawa and Kiritimati by the year 2023. The Vision also aims to reclaim and raise land up to 2m above sea level to address land scarcity and minimise the impacts of climate change. The targeted areas for land reclamation are mainly on South Tarawa (Temaiku, Bikenibeu, Bairiki, Betio, and lagoon) and Kiritimati where additional 767 acres of land will be developed by the year 2036.
In 2014, government bought land in Fiji on the island of Vanua Levu. This piece of land is called Natovatu and is 5,461 acres in size. With the assistance of the Secretariat of the Pacific Community, a land capability map has been developed showing the land to have the potential for forestry, livestock, farming and other. Government through the engagement of private sector (both local and foreign) and relevant Ministries.
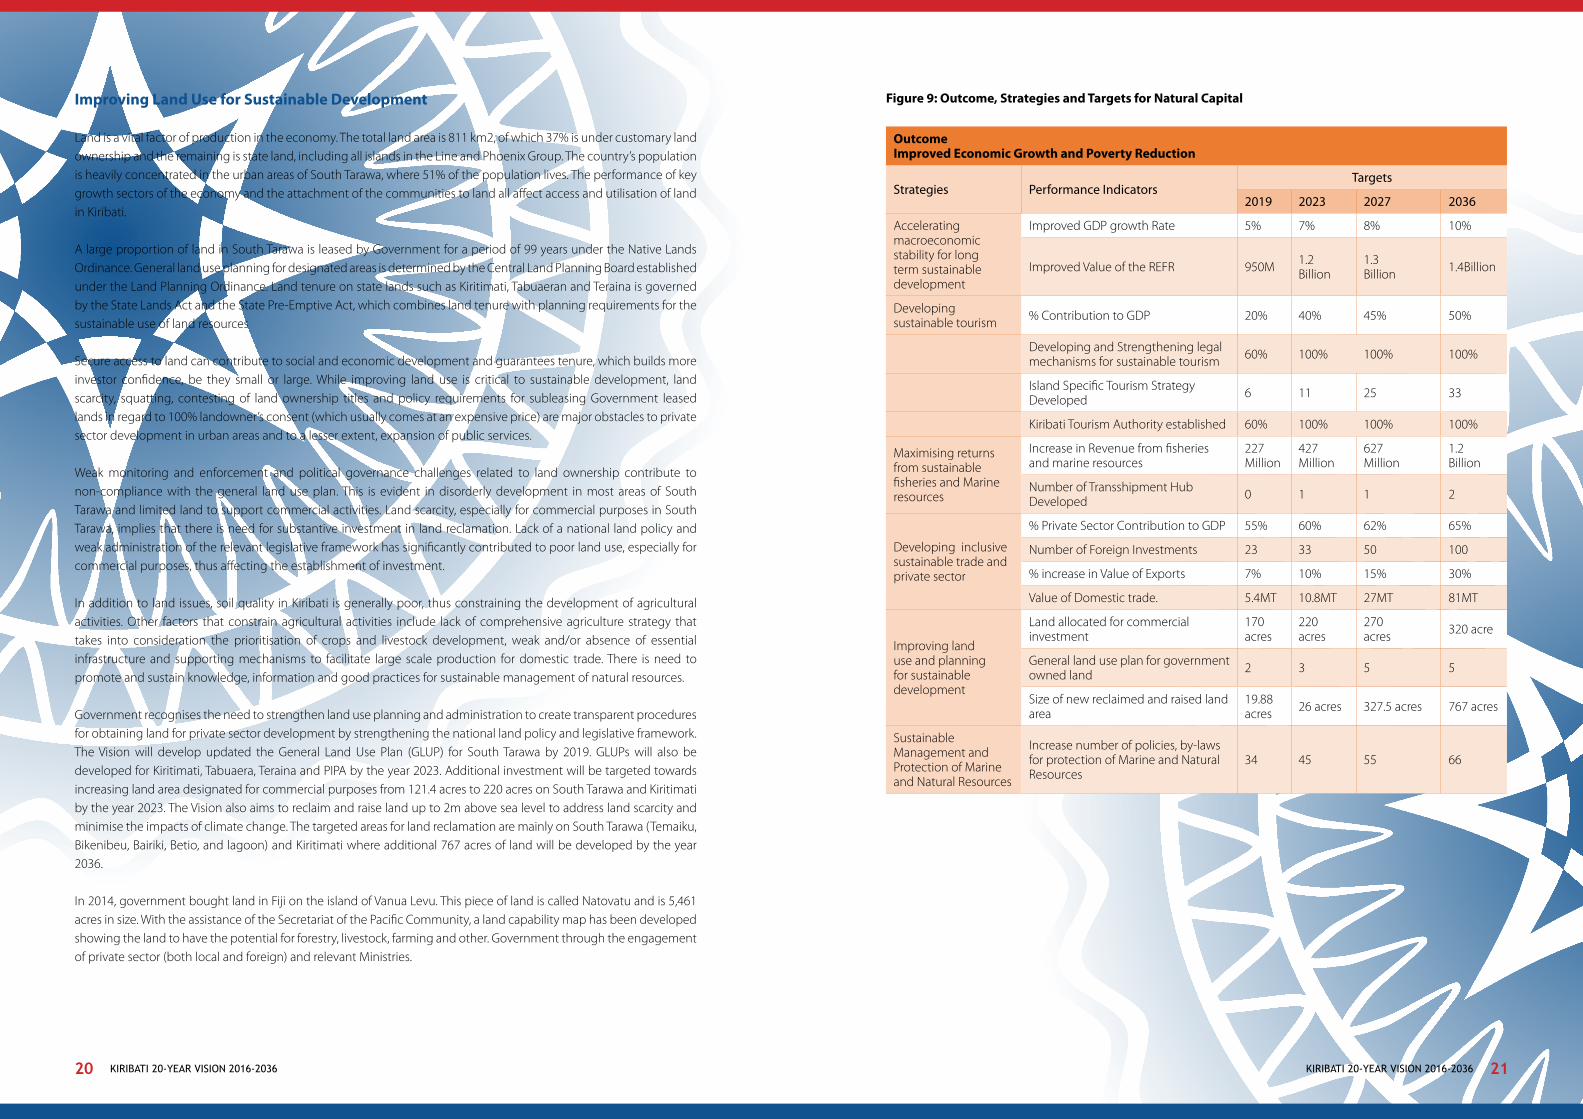
Figure 9: Outcome, Strategies and Targets for Natural Capital
OutcomeImproved Economic Growth and Poverty Reduction
Strategies Performance Indicators Targets
2019 2023 2027 2036
Accelerating macroeconomic stability for long term sustainable development
Improved GDP growth Rate 5% 7% 8% 10%
Improved Value of the REFR 950M 1.2 Billion
1.3Billion 1.4Billion
Developing sustainable tourism % Contribution to GDP 20% 40% 45% 50%
Developing and Strengthening legal mechanisms for sustainable tourism 60% 100% 100% 100%
Island Specific Tourism Strategy Developed 6 11 25 33
Kiribati Tourism Authority established 60% 100% 100% 100%
Maximising returns from sustainable fisheries and Marine resources
Increase in Revenue from fisheries and marine resources
227Million
427 Million
627Million
1.2 Billion
Number of Transshipment Hub Developed 0 1 1 2
Developing inclusive sustainable trade and private sector
% Private Sector Contribution to GDP 55% 60% 62% 65%
Number of Foreign Investments 23 33 50 100
% increase in Value of Exports 7% 10% 15% 30%
Value of Domestic trade. 5.4MT 10.8MT 27MT 81MT
Improving land use and planning for sustainable development
Land allocated for commercial investment
170 acres
220acres
270acres 320 acre
General land use plan for government owned land 2 3 5 5
Size of new reclaimed and raised land area
19.88 acres 26 acres 327.5 acres 767 acres
Sustainable Management and Protection of Marine and Natural Resources
Increase number of policies, by-laws for protection of Marine and Natural Resources
34 45 55 66
KIRIBATI 20-YEAR VISION 2016-2036 KIRIBATI 20-YEAR VISION 2016-203622 23
Human Capital
Having Highly Educated and Skilled Population by the Year 2036 for quality outputs
Kiribati’s main potential lies in its major asset, its people, through their creativity, work ethic, education, entrepreneurial and soft skills. Creating a globally competitive and adaptive human resource base is critical to achieving the overall outcome of the KV20.
Just like any other country, the nuclear family is the basic social unit, which is the main genesis of human resource development. The role of the nuclear family in the context of Human Capital is crucial, as it is a child rearing institution. The constituents of human capital are nurtured through a family system, from the womb to tomb. Investment in human capital, through the family system, is also critical during early childhood development. Early childhood development is important in laying the social and attitudinal foundation of the Human Capital.
Strengthening the roles of parents in early childhood development through Positive Parenting and Young Couples Program is important in nurturing the development of human capital. There is need to implement such a programme to equip the parents and child caregivers such as grandparents and members of the extended family and community with the ability to apply positive parenting styles. The use of positive parenting can create a new generation of young I-Kiribati with positive attitudes and behaviour.
The Positive Parenting and Young Couples programme should be complemented by the existing formal education system. The basic education system consists of the first twelve years of schooling. It is made up of pre-school (years 1 to 3) primary school (grades 1 to 6) and Junior Secondary School (Forms 1 to 3). The Primary and JSS are supplemented by 4 years of Senior Secondary Schooling, from Forms 4 to 7. The primary and junior secondary level of schooling are compulsory and free.
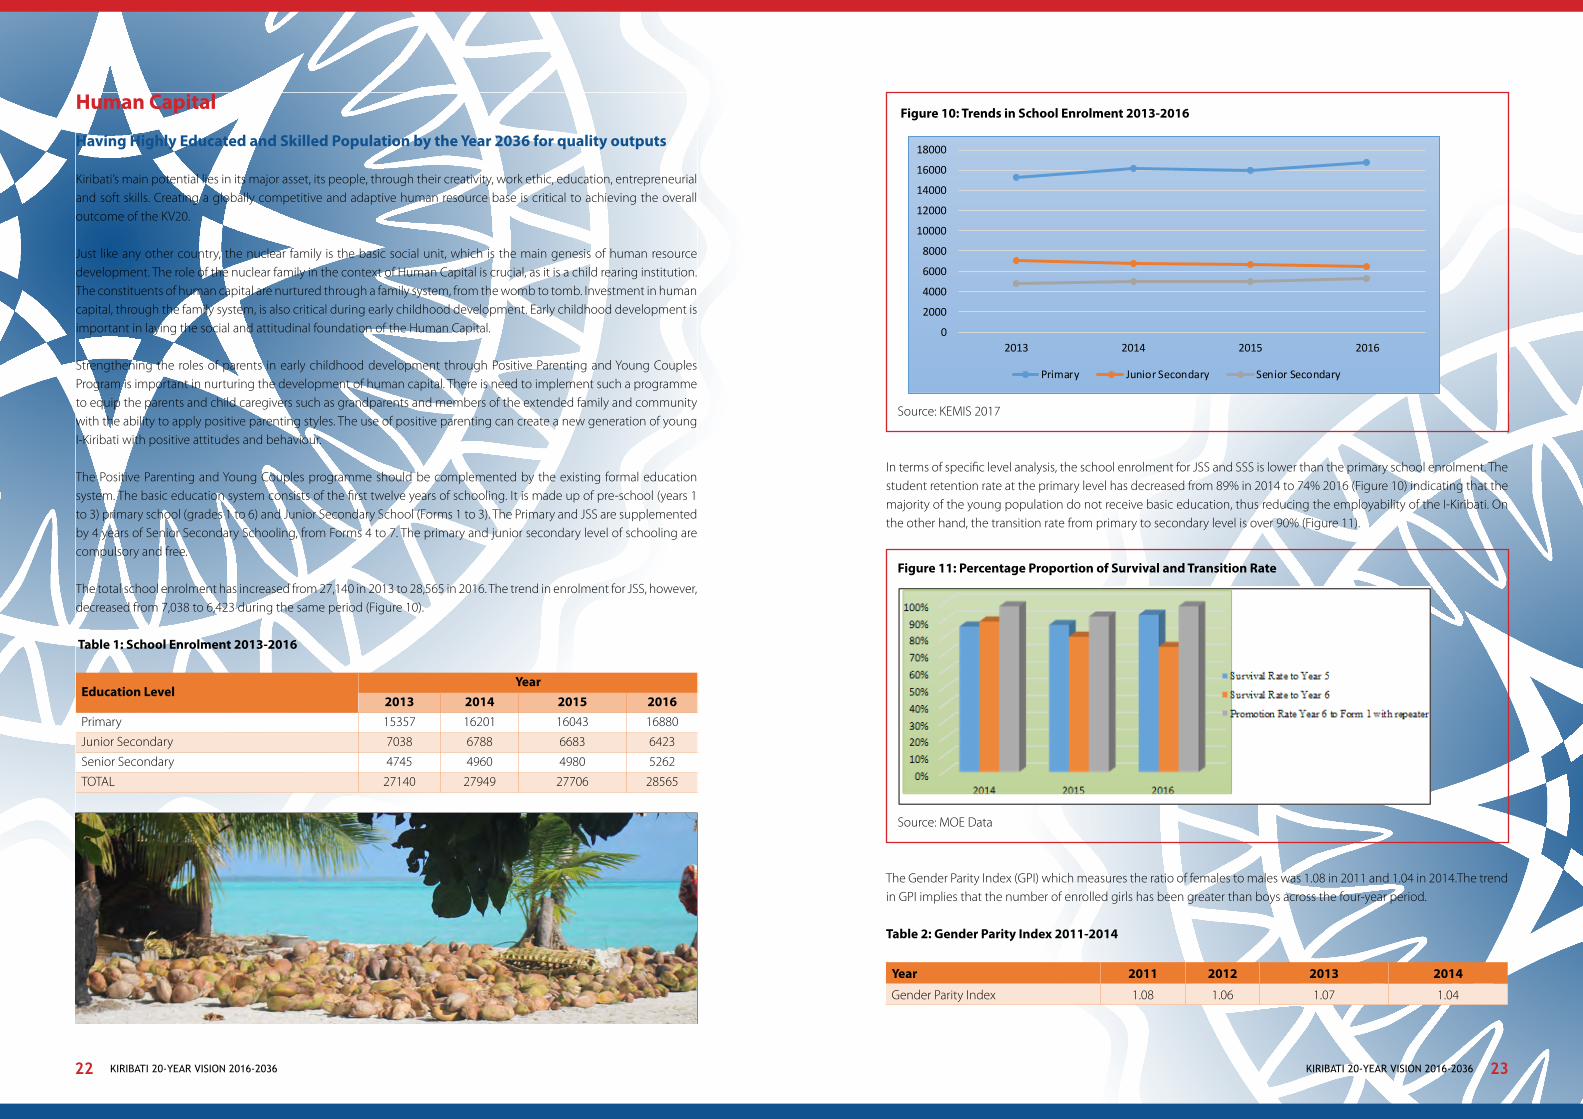
The total school enrolment has increased from 27,140 in 2013 to 28,565 in 2016. The trend in enrolment for JSS, however, decreased from 7,038 to 6,423 during the same period (Figure 10).
Table 1: School Enrolment 2013-2016
Education LevelYear
2013 2014 2015 2016Primary 15357 16201 16043 16880
Junior Secondary 7038 6788 6683 6423
Senior Secondary 4745 4960 4980 5262
TOTAL 27140 27949 27706 28565
Figure 10: Trends in School Enrolment 2013-2016
Source: KEMIS 2017
In terms of specific level analysis, the school enrolment for JSS and SSS is lower than the primary school enrolment. The student retention rate at the primary level has decreased from 89% in 2014 to 74% 2016 (Figure 10) indicating that the majority of the young population do not receive basic education, thus reducing the employability of the I-Kiribati. On the other hand, the transition rate from primary to secondary level is over 90% (Figure 11).
Figure 11: Percentage Proportion of Survival and Transition Rate
Source: MOE Data
The Gender Parity Index (GPI) which measures the ratio of females to males was 1.08 in 2011 and 1.04 in 2014.The trend in GPI implies that the number of enrolled girls has been greater than boys across the four-year period.
Table 2: Gender Parity Index 2011-2014
Year 2011 2012 2013 2014
Gender Parity Index 1.08 1.06 1.07 1.04
0
2000
4000
6000
8000
10000
12000
14000
16000
18000
2013 2014 2015 2016
Primary Junior Secondary Senior Secondary
KIRIBATI 20-YEAR VISION 2016-2036 KIRIBATI 20-YEAR VISION 2016-203624 25
The literacy level has improved from 29% in 2012 to 73% in 2015 for Year 4, while numeracy has also improved from 66% in 2012 to 93% in 2015 for the same level. For Year 6, literacy and numeracy levels have also improved from 40% in 2012 to 56% in 2015 and from 43% in 2012 to 72% in 2015, respectively (Table 3). 1
Table 3: Literacy and Numeracy Proficiency Level (%)
Year 4 Year 62012 2015 2012 2015
Numeracy 66 93 43 72
Literacy 29 73 40 56
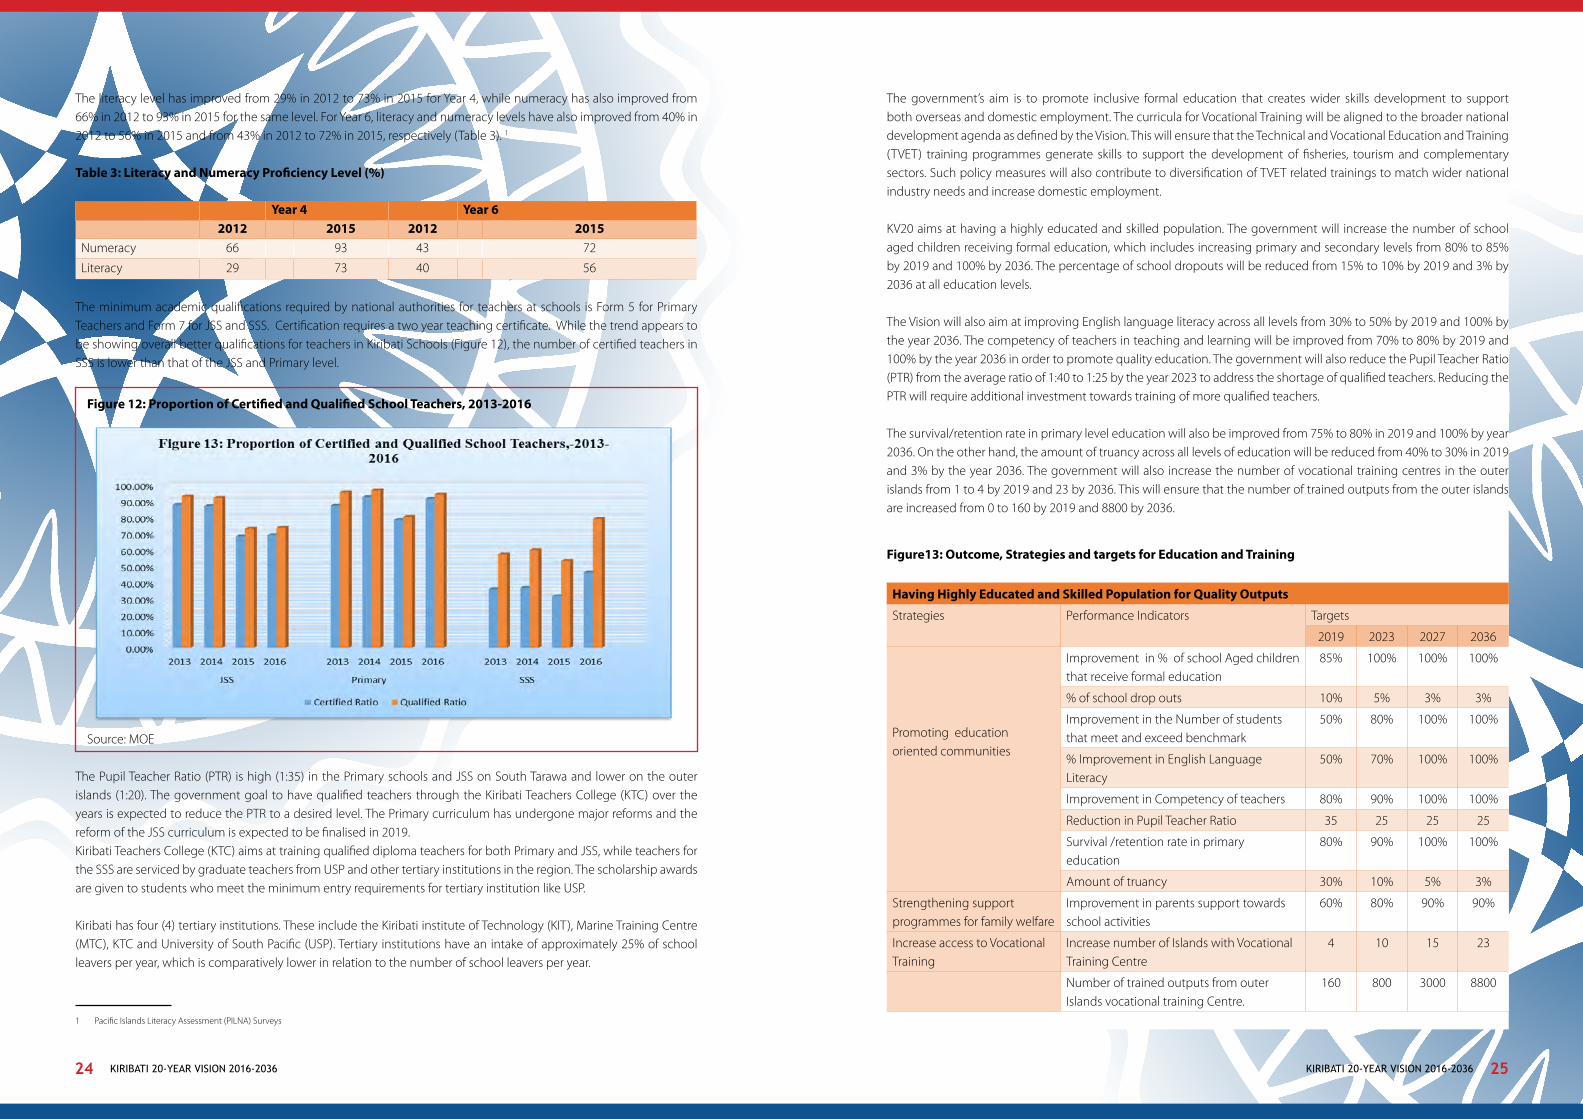
The minimum academic qualifications required by national authorities for teachers at schools is Form 5 for Primary Teachers and Form 7 for JSS and SSS. Certification requires a two year teaching certificate. While the trend appears to be showing overall better qualifications for teachers in Kiribati Schools (Figure 12), the number of certified teachers in SSS is lower than that of the JSS and Primary level.
Figure 12: Proportion of Certified and Qualified School Teachers, 2013-2016
Source: MOE
The Pupil Teacher Ratio (PTR) is high (1:35) in the Primary schools and JSS on South Tarawa and lower on the outer islands (1:20). The government goal to have qualified teachers through the Kiribati Teachers College (KTC) over the years is expected to reduce the PTR to a desired level. The Primary curriculum has undergone major reforms and the reform of the JSS curriculum is expected to be finalised in 2019.Kiribati Teachers College (KTC) aims at training qualified diploma teachers for both Primary and JSS, while teachers for the SSS are serviced by graduate teachers from USP and other tertiary institutions in the region. The scholarship awards are given to students who meet the minimum entry requirements for tertiary institution like USP.
Kiribati has four (4) tertiary institutions. These include the Kiribati institute of Technology (KIT), Marine Training Centre (MTC), KTC and University of South Pacific (USP). Tertiary institutions have an intake of approximately 25% of school leavers per year, which is comparatively lower in relation to the number of school leavers per year.
1 Pacific Islands Literacy Assessment (PILNA) Surveys
The government’s aim is to promote inclusive formal education that creates wider skills development to support both overseas and domestic employment. The curricula for Vocational Training will be aligned to the broader national development agenda as defined by the Vision. This will ensure that the Technical and Vocational Education and Training (TVET) training programmes generate skills to support the development of fisheries, tourism and complementary sectors. Such policy measures will also contribute to diversification of TVET related trainings to match wider national industry needs and increase domestic employment.
KV20 aims at having a highly educated and skilled population. The government will increase the number of school aged children receiving formal education, which includes increasing primary and secondary levels from 80% to 85% by 2019 and 100% by 2036. The percentage of school dropouts will be reduced from 15% to 10% by 2019 and 3% by 2036 at all education levels.
The Vision will also aim at improving English language literacy across all levels from 30% to 50% by 2019 and 100% by the year 2036. The competency of teachers in teaching and learning will be improved from 70% to 80% by 2019 and 100% by the year 2036 in order to promote quality education. The government will also reduce the Pupil Teacher Ratio (PTR) from the average ratio of 1:40 to 1:25 by the year 2023 to address the shortage of qualified teachers. Reducing the PTR will require additional investment towards training of more qualified teachers.
The survival/retention rate in primary level education will also be improved from 75% to 80% in 2019 and 100% by year 2036. On the other hand, the amount of truancy across all levels of education will be reduced from 40% to 30% in 2019 and 3% by the year 2036. The government will also increase the number of vocational training centres in the outer islands from 1 to 4 by 2019 and 23 by 2036. This will ensure that the number of trained outputs from the outer islands are increased from 0 to 160 by 2019 and 8800 by 2036.
Figure13: Outcome, Strategies and targets for Education and Training
Having Highly Educated and Skilled Population for Quality Outputs
Strategies Performance Indicators Targets
2019 2023 2027 2036
Promoting education oriented communities
Improvement in % of school Aged children that receive formal education
85% 100% 100% 100%
% of school drop outs 10% 5% 3% 3%
Improvement in the Number of students that meet and exceed benchmark
50% 80% 100% 100%
% Improvement in English Language Literacy
50% 70% 100% 100%
Improvement in Competency of teachers 80% 90% 100% 100%
Reduction in Pupil Teacher Ratio 35 25 25 25
Survival /retention rate in primary education
80% 90% 100% 100%
Amount of truancy 30% 10% 5% 3%
Strengthening support programmes for family welfare
Improvement in parents support towards school activities
60% 80% 90% 90%
Increase access to Vocational Training
Increase number of Islands with Vocational Training Centre
4 10 15 23
Number of trained outputs from outer Islands vocational training Centre.
160 800 3000 8800

KIRIBATI 20-YEAR VISION 2016-2036 KIRIBATI 20-YEAR VISION 2016-203626 27
Figure 15: Seafarers’ Remittances (2000 to 2016)
Source: MLHRD Despite increasing access to employment opportunities being one of the priorities of the Government, complaints regarding the abuse of workers and other matters related to working conditions and environment have been an issue in the recent past. This can be confirmed by 5 complaints related to recruiting agencies employing I-Kiribati on fishing vessels and 10 onshore individual complaints received in 2016 and 2017 (Table 4).
Table 4: 2016 - June, 2017 Complaints Record
2016 - June, 2017 Complaints Record
No. Recruiting Agencies - Fishing vessels Complaints No. of cases
1 Family allotment 1
2 No return airfare 1
3 Mistreatment at workplace 3
No. Onshore Workplace Individual Complaints
1 Termination without notice 1
2 Unpaid allowance 1
3 Underpaid below minimum wage 2
4 Unpaid overtime 1
5 Unfair Termination 1
6 OHS Issues 4
Total 15
The Vision recognises the need to implement measures to increase access to decent employment opportunities. Government will ensure that complaints from workers in relation to labour welfare issues are reduced from 197 by 80% in 2019 and 100% by 2036. Ensuring decent employment will, however, require effective enforcement of relevant labour laws and good contract negotiations with domestic and overseas employers.
The government is committed to ensuring that the Vision creates decent employment opportunities for its citizens. The National Labour Migration Policy will be implemented. The KV20 seeks to increase the level of decent employment of seasonal overseas workers from 300 by 30% by 2019 and 100% by 2036. New overseas labour markets will also be increased from 4 by 30% in 2019 and 100% by 2036.
Increasing Employment Opportunities for I-Kiribati
The unemployment2 rate still stands at 30.6%, with youth unemployment rate at 54%. The annual labour force entrants in the formal and informal sector including the international market is 3,200. The total number of employed I-Kiribati has increased from 2,033 in 2009 to 3,435 in 2015. The upward trend in employment is attributed to a strong growth in the private sector registered at 59% during the period of 2009 to 2015.
Government has established strategic partnerships with overseas employment countries and agencies with a view to expanding employment opportunities through the overseas employment markets. The current overseas employment schemes include the Recognised Seasonal Employers (RSE) Scheme, Seasonal Workers Programme (SWP), Micro-States Employment Pilot Scheme in Northern Australia, and Seafarers. The RSE contributes 2% of total employment in Kiribati while SWP contributes 0.8%.
Figure 14: Trends in Overseas Employment for SWP and RSE (2010-2016) Source: MLHRD
The seasonal employment schemes, through the RSE and SWP, have successfully contributed to a more reliable and sustainable mobile labour force in recent years. The number of seafarers employed overseas, however, has steadily declined, contributing to a fall in remittances. Seafarers’ remittances were $7.2 million at the end of 2015 compared to $5.6 million in 2014 and $12.5 million at its peak in 2002 (Figure 15). There were 855 seamen were employed at the end of 2015. The growth in remittances experienced in 2015 may not be sustained in future years due to lower forecasts for international shipping.
2 Kiribati Population Census 2010, KNSO
KIRIBATI 20-YEAR VISION 2016-2036 KIRIBATI 20-YEAR VISION 2016-203628 29
Overall, the vision seeks to reduce the unemployment rate from 31% to 25% in 2019 and to 5% by 2036. The reduction in unemployment will assist in reducing the rural-urban drift measured by the current rural-urban population distribution of 43%-57%. The Vision aims to reduce the rate to 45%-55% in 2019 and 70%-30% by 2036. The reduction in the unemployment rate, however, will require development of the private sector, including through investment in fisheries and tourism, supporting the development of SMEs and improving the overall business enabling environment through the implementation of Trade and Investment Policy Frameworks.
Government will also implement policy measures aimed at coherently addressing cross-cutting issues related to improving access to quality training, increasing the labour supply and strengthening the implementation of a strong English language policy to ensure that all I-Kiribati are highly educated and competitive in the domestic and overseas labour markets.
Figure 16: Outcome, Strategies and targets for Increasing Access to Decent Employment Opportunities.
Increased Access to Decent Employment Opportunities
Strategies Performance Indicators Targets
2019 2023 2027 2036
Increasing overseas and domestic employment opportunities
% increase in seasonal overseas workers 30% 60% 80% 100%
% increase in new overseas labour markets 30% 60% 80% 100%
Reduction in National Unemployment rate 25% 15% 10% 5%
% decrease in rural –urban drift 55% 50% 40% 30%
Decent work for all
% of domestic workplaces practised OHS and tripartism
20% 50% 75% 95%
% reduction in complaints from workers in relation to labour welfare issues
80% 100% 100% 100%
Developing a Highly Skilled, Qualified and Efficient Workforce
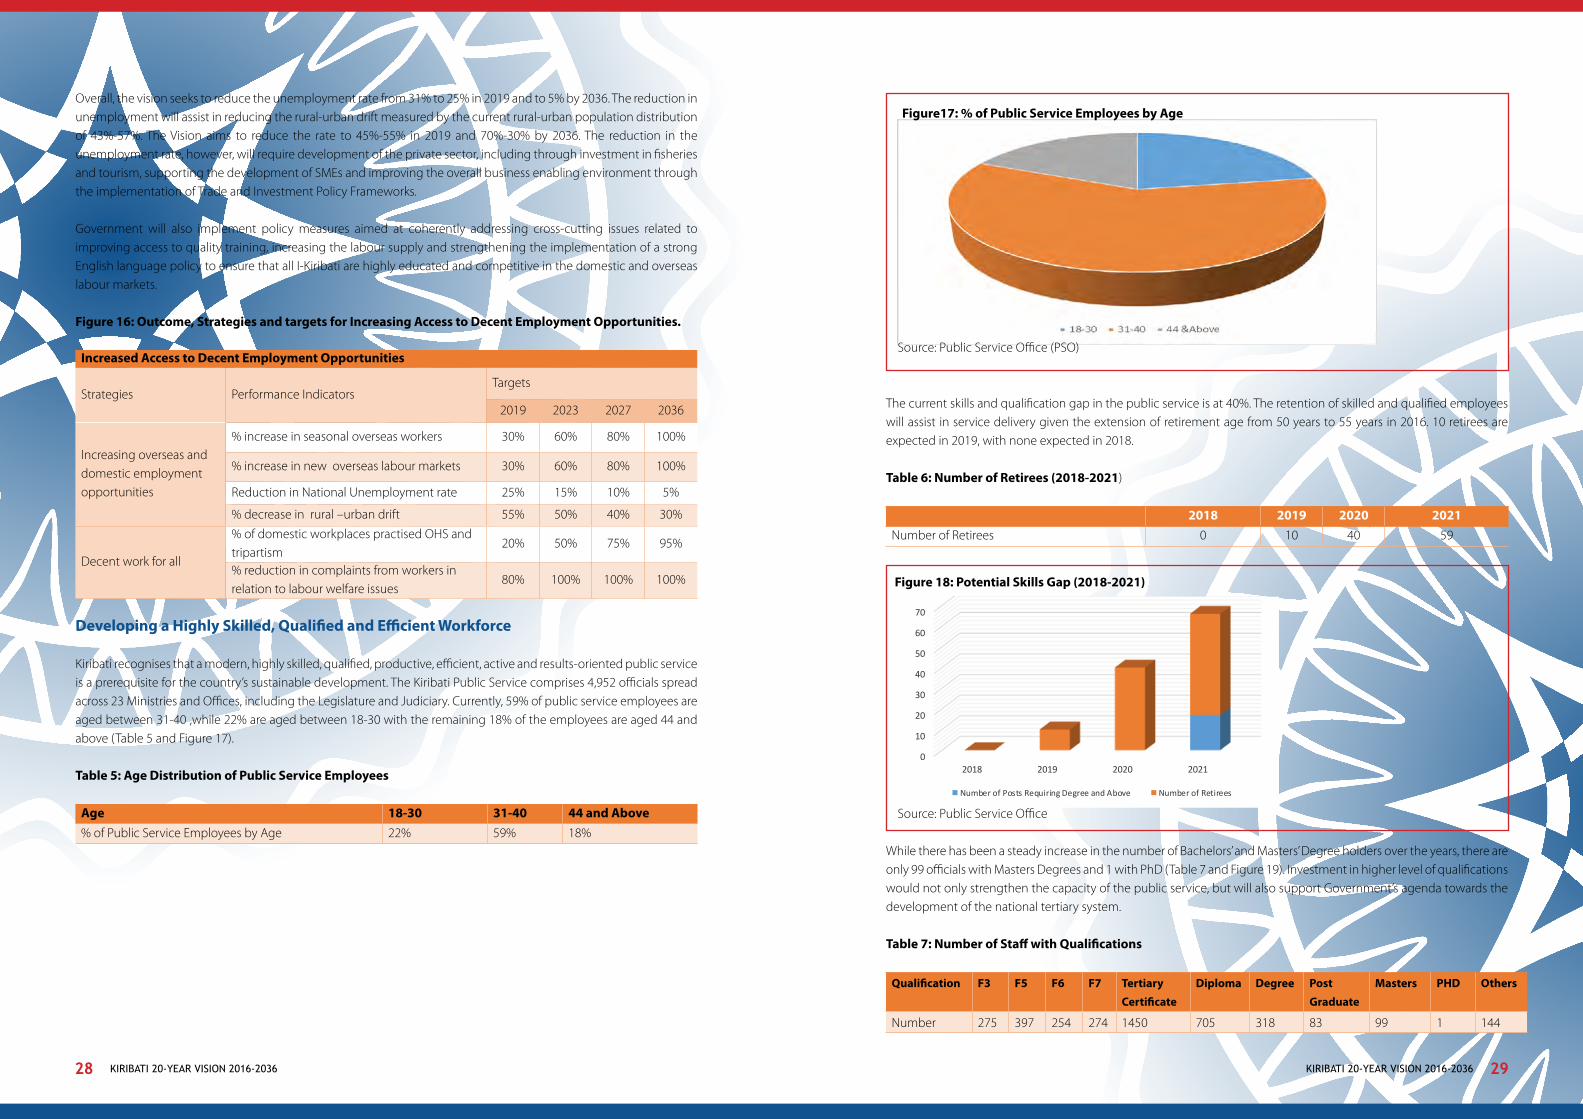
Kiribati recognises that a modern, highly skilled, qualified, productive, efficient, active and results-oriented public service is a prerequisite for the country’s sustainable development. The Kiribati Public Service comprises 4,952 officials spread across 23 Ministries and Offices, including the Legislature and Judiciary. Currently, 59% of public service employees are aged between 31-40 ,while 22% are aged between 18-30 with the remaining 18% of the employees are aged 44 and above (Table 5 and Figure 17).
Table 5: Age Distribution of Public Service Employees
Age 18-30 31-40 44 and Above% of Public Service Employees by Age 22% 59% 18%
Figure17: % of Public Service Employees by Age
Source: Public Service Office (PSO)
The current skills and qualification gap in the public service is at 40%. The retention of skilled and qualified employees will assist in service delivery given the extension of retirement age from 50 years to 55 years in 2016. 10 retirees are expected in 2019, with none expected in 2018.
Table 6: Number of Retirees (2018-2021)
2018 2019 2020 2021Number of Retirees 0 10 40 59
Figure 18: Potential Skills Gap (2018-2021)
Source: Public Service Office
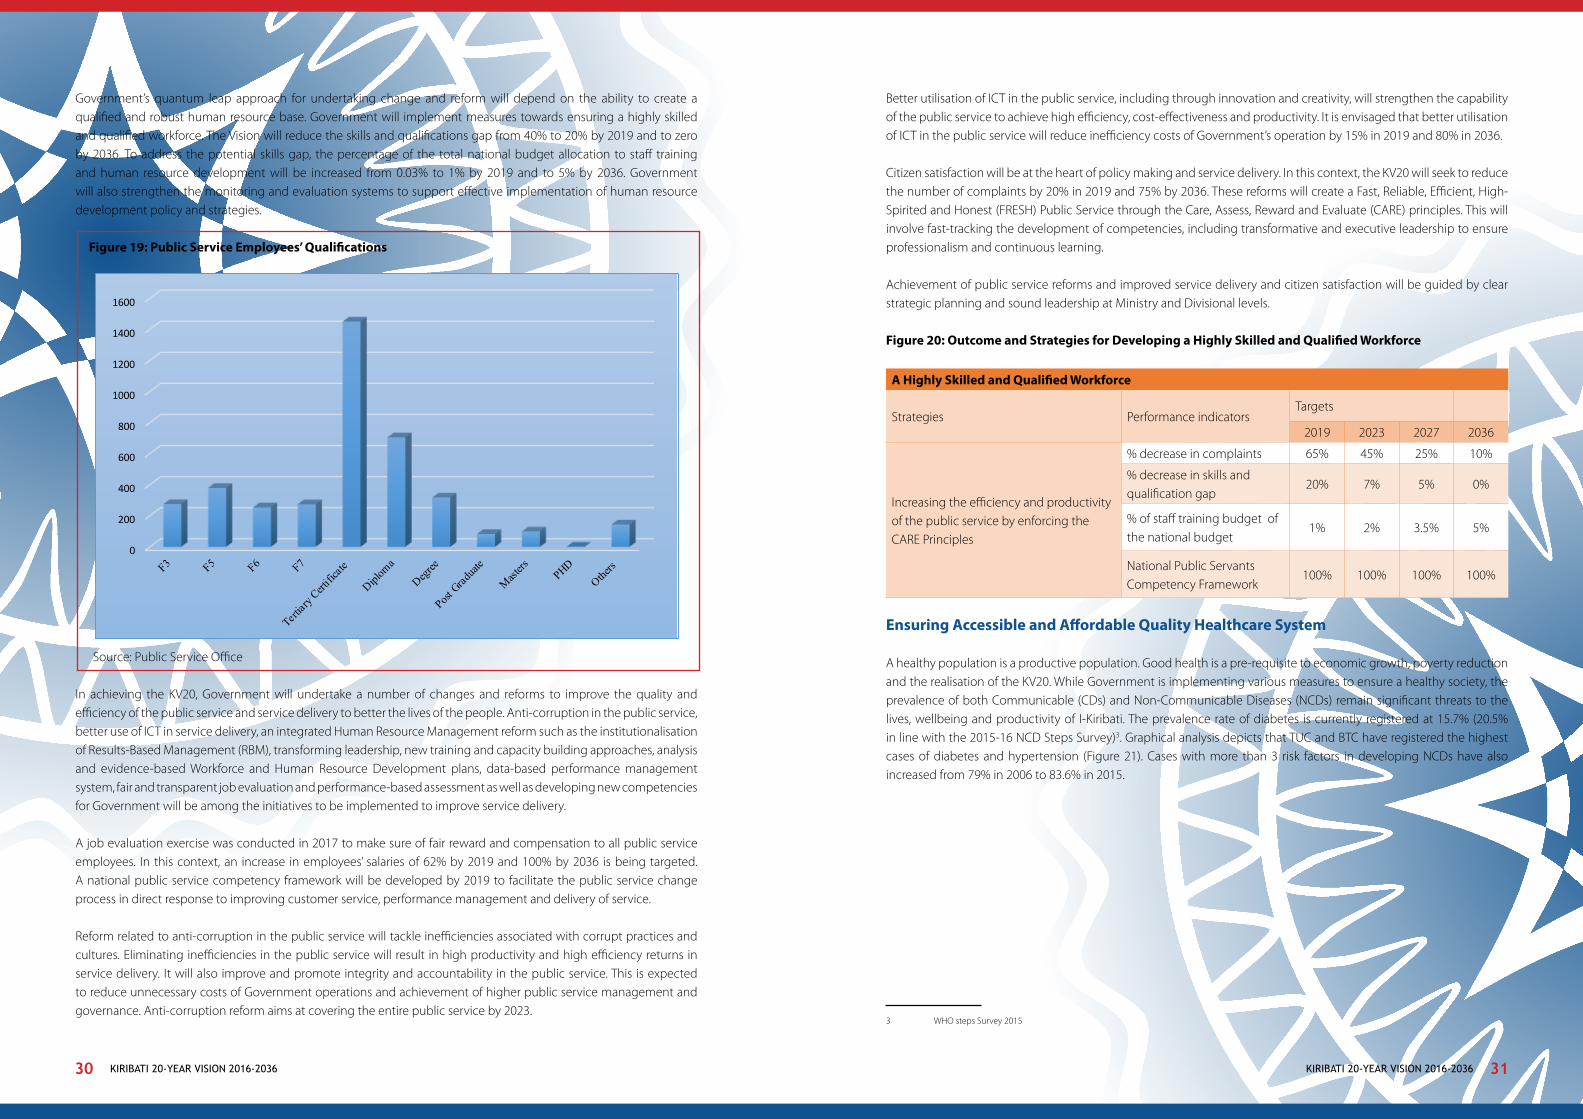
While there has been a steady increase in the number of Bachelors’ and Masters’ Degree holders over the years, there are only 99 officials with Masters Degrees and 1 with PhD (Table 7 and Figure 19). Investment in higher level of qualifications would not only strengthen the capacity of the public service, but will also support Government’s agenda towards the development of the national tertiary system.
Table 7: Number of Staff with Qualifications
Qualification F3 F5 F6 F7 Tertiary
Certificate
Diploma Degree Post
Graduate
Masters PHD Others
Number 275 397 254 274 1450 705 318 83 99 1 144
0
10
20
30
40
50
60
70
2018 2019 2020 2021
Number of Posts Requiring Degree and Above Number of Retirees
KIRIBATI 20-YEAR VISION 2016-2036 KIRIBATI 20-YEAR VISION 2016-203630 31
Government’s quantum leap approach for undertaking change and reform will depend on the ability to create a qualified and robust human resource base. Government will implement measures towards ensuring a highly skilled and qualified workforce. The Vision will reduce the skills and qualifications gap from 40% to 20% by 2019 and to zero by 2036. To address the potential skills gap, the percentage of the total national budget allocation to staff training and human resource development will be increased from 0.03% to 1% by 2019 and to 5% by 2036. Government will also strengthen the monitoring and evaluation systems to support effective implementation of human resource development policy and strategies.
Figure 19: Public Service Employees’ Qualifications
Source: Public Service Office
In achieving the KV20, Government will undertake a number of changes and reforms to improve the quality and efficiency of the public service and service delivery to better the lives of the people. Anti-corruption in the public service, better use of ICT in service delivery, an integrated Human Resource Management reform such as the institutionalisation of Results-Based Management (RBM), transforming leadership, new training and capacity building approaches, analysis and evidence-based Workforce and Human Resource Development plans, data-based performance management system, fair and transparent job evaluation and performance-based assessment as well as developing new competencies for Government will be among the initiatives to be implemented to improve service delivery.
A job evaluation exercise was conducted in 2017 to make sure of fair reward and compensation to all public service employees. In this context, an increase in employees’ salaries of 62% by 2019 and 100% by 2036 is being targeted. A national public service competency framework will be developed by 2019 to facilitate the public service change process in direct response to improving customer service, performance management and delivery of service.
Reform related to anti-corruption in the public service will tackle inefficiencies associated with corrupt practices and cultures. Eliminating inefficiencies in the public service will result in high productivity and high efficiency returns in service delivery. It will also improve and promote integrity and accountability in the public service. This is expected to reduce unnecessary costs of Government operations and achievement of higher public service management and governance. Anti-corruption reform aims at covering the entire public service by 2023.
0
200
400
600
800
1000
1200
1400
1600
Better utilisation of ICT in the public service, including through innovation and creativity, will strengthen the capability of the public service to achieve high efficiency, cost-effectiveness and productivity. It is envisaged that better utilisation of ICT in the public service will reduce inefficiency costs of Government’s operation by 15% in 2019 and 80% in 2036.
Citizen satisfaction will be at the heart of policy making and service delivery. In this context, the KV20 will seek to reduce the number of complaints by 20% in 2019 and 75% by 2036. These reforms will create a Fast, Reliable, Efficient, High-Spirited and Honest (FRESH) Public Service through the Care, Assess, Reward and Evaluate (CARE) principles. This will involve fast-tracking the development of competencies, including transformative and executive leadership to ensure professionalism and continuous learning.
Achievement of public service reforms and improved service delivery and citizen satisfaction will be guided by clear strategic planning and sound leadership at Ministry and Divisional levels.
Figure 20: Outcome and Strategies for Developing a Highly Skilled and Qualified Workforce
A Highly Skilled and Qualified Workforce
Strategies Performance indicators Targets
2019 2023 2027 2036
Increasing the efficiency and productivity of the public service by enforcing the CARE Principles
% decrease in complaints 65% 45% 25% 10%
% decrease in skills and qualification gap
20% 7% 5% 0%
% of staff training budget of the national budget
1% 2% 3.5% 5%
National Public Servants Competency Framework
100% 100% 100% 100%
Ensuring Accessible and Affordable Quality Healthcare System
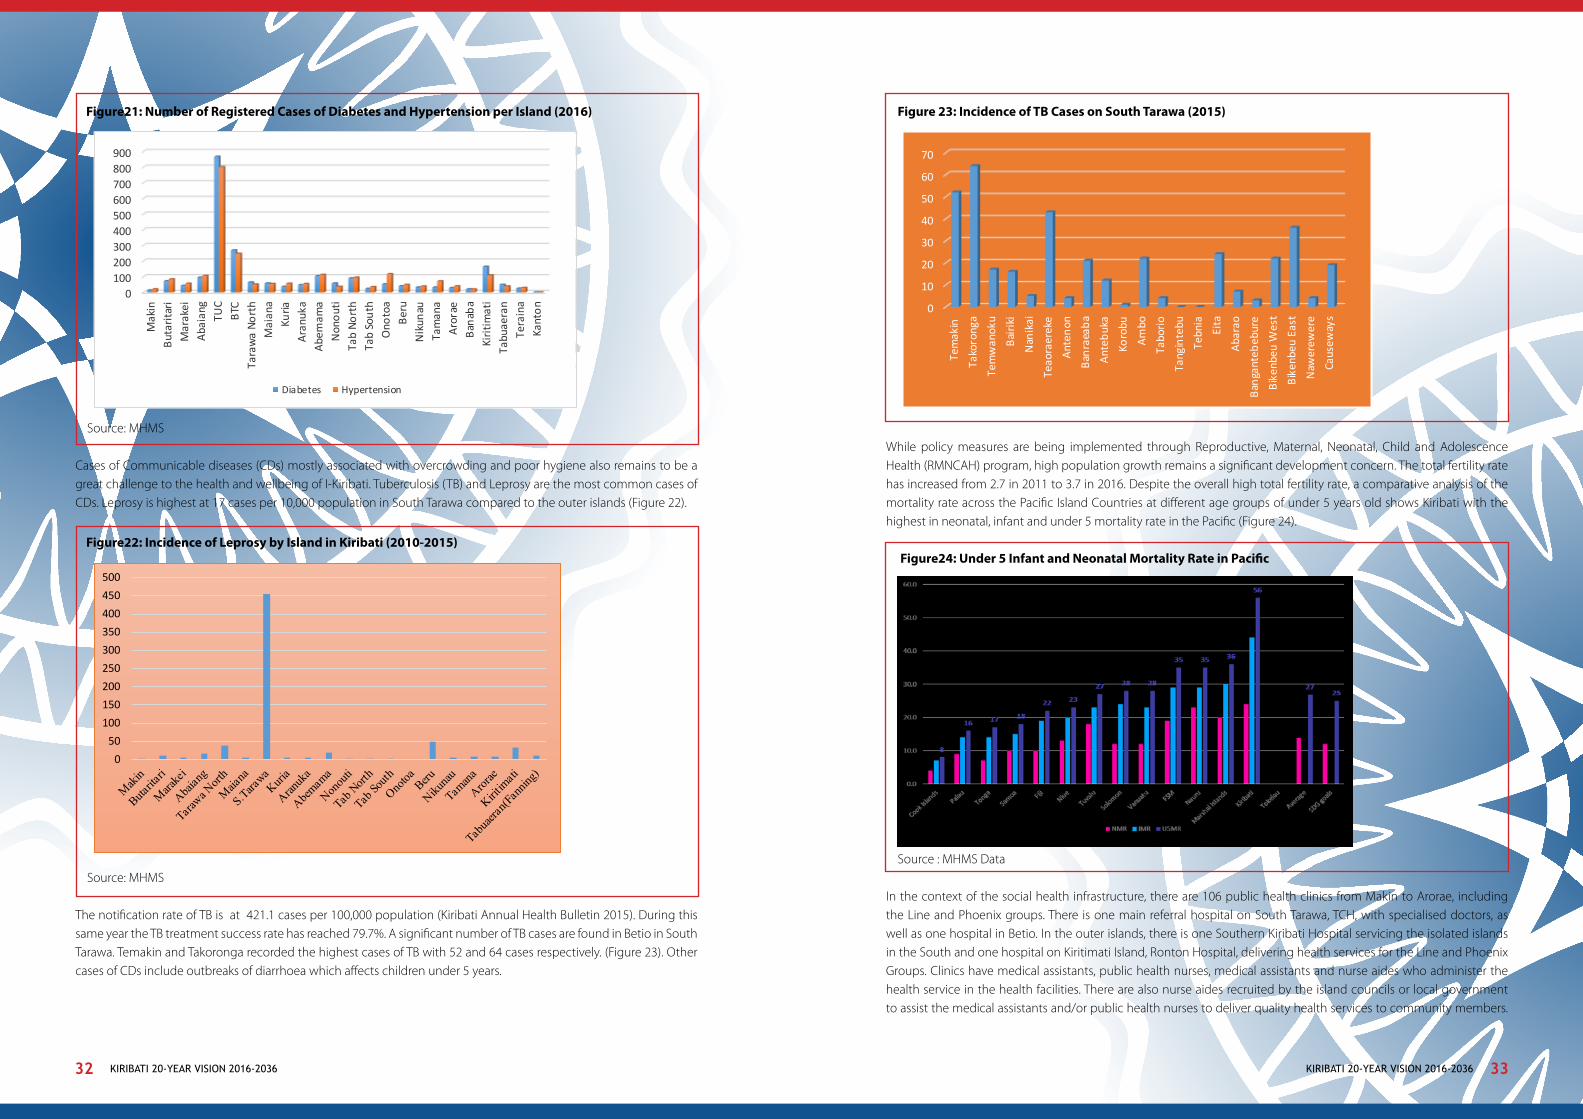
A healthy population is a productive population. Good health is a pre-requisite to economic growth, poverty reduction and the realisation of the KV20. While Government is implementing various measures to ensure a healthy society, the prevalence of both Communicable (CDs) and Non-Communicable Diseases (NCDs) remain significant threats to the lives, wellbeing and productivity of I-Kiribati. The prevalence rate of diabetes is currently registered at 15.7% (20.5% in line with the 2015-16 NCD Steps Survey)3. Graphical analysis depicts that TUC and BTC have registered the highest cases of diabetes and hypertension (Figure 21). Cases with more than 3 risk factors in developing NCDs have also increased from 79% in 2006 to 83.6% in 2015.
3 WHO steps Survey 2015
KIRIBATI 20-YEAR VISION 2016-2036 KIRIBATI 20-YEAR VISION 2016-203632 33
Figure21: Number of Registered Cases of Diabetes and Hypertension per Island (2016)
Source: MHMS
Cases of Communicable diseases (CDs) mostly associated with overcrowding and poor hygiene also remains to be a great challenge to the health and wellbeing of I-Kiribati. Tuberculosis (TB) and Leprosy are the most common cases of CDs. Leprosy is highest at 17 cases per 10,000 population in South Tarawa compared to the outer islands (Figure 22).
Figure22: Incidence of Leprosy by Island in Kiribati (2010-2015)
Source: MHMS
The notification rate of TB is at 421.1 cases per 100,000 population (Kiribati Annual Health Bulletin 2015). During this same year the TB treatment success rate has reached 79.7%. A significant number of TB cases are found in Betio in South Tarawa. Temakin and Takoronga recorded the highest cases of TB with 52 and 64 cases respectively. (Figure 23). Other cases of CDs include outbreaks of diarrhoea which affects children under 5 years.
0100200300400500600700800900
Mak
inB
utar
itar
iM
arak
eiA
baia
ngTU
CB
TCTa
raw
a N
ort
hM
aian
aKu
riaA
ranu
kaA
bem
ama
Non
out
iTa
b N
ort
hTa
b So
uth
Ono
toa
Ber
uN
ikun
auTa
man
aA
rora
eB
anab
aKi
riti
mat
iTa
buae
ran
Tera
ina
Kant
on
Diabetes Hypertension
0
50
100
150
200
250
300
350
400
450
500
Figure 23: Incidence of TB Cases on South Tarawa (2015)
While policy measures are being implemented through Reproductive, Maternal, Neonatal, Child and Adolescence Health (RMNCAH) program, high population growth remains a significant development concern. The total fertility rate has increased from 2.7 in 2011 to 3.7 in 2016. Despite the overall high total fertility rate, a comparative analysis of the mortality rate across the Pacific Island Countries at different age groups of under 5 years old shows Kiribati with the highest in neonatal, infant and under 5 mortality rate in the Pacific (Figure 24).
Figure24: Under 5 Infant and Neonatal Mortality Rate in Pacific
Source : MHMS Data
In the context of the social health infrastructure, there are 106 public health clinics from Makin to Arorae, including the Line and Phoenix groups. There is one main referral hospital on South Tarawa, TCH, with specialised doctors, as well as one hospital in Betio. In the outer islands, there is one Southern Kiribati Hospital servicing the isolated islands in the South and one hospital on Kiritimati Island, Ronton Hospital, delivering health services for the Line and Phoenix Groups. Clinics have medical assistants, public health nurses, medical assistants and nurse aides who administer the health service in the health facilities. There are also nurse aides recruited by the island councils or local government to assist the medical assistants and/or public health nurses to deliver quality health services to community members.
0
10
20
30
40
50
60
70
Tem
akin
Tako
rong
a
Tem
wan
oku
Bai
riki
Nan
ikai
Teao
raer
eke
Ant
enon
Ban
raea
ba
Ant
ebuk
a
Koro
bu
Am
bo
Tabo
rio
Tang
inte
bu
Tebn
ia
Eita
Aba
rao
Ban
gant
ebeb
ure
Bik
enbe
u W
est
Bik
enbe
u E
ast
Naw
erew
ere
Caus
eway
s
KIRIBATI 20-YEAR VISION 2016-2036 KIRIBATI 20-YEAR VISION 2016-203634 35
Doctor-patient ratio and nurse-patient ratio in South Tarawa is still an ongoing challenge high at 1:2240 and 1:1000 respectively.
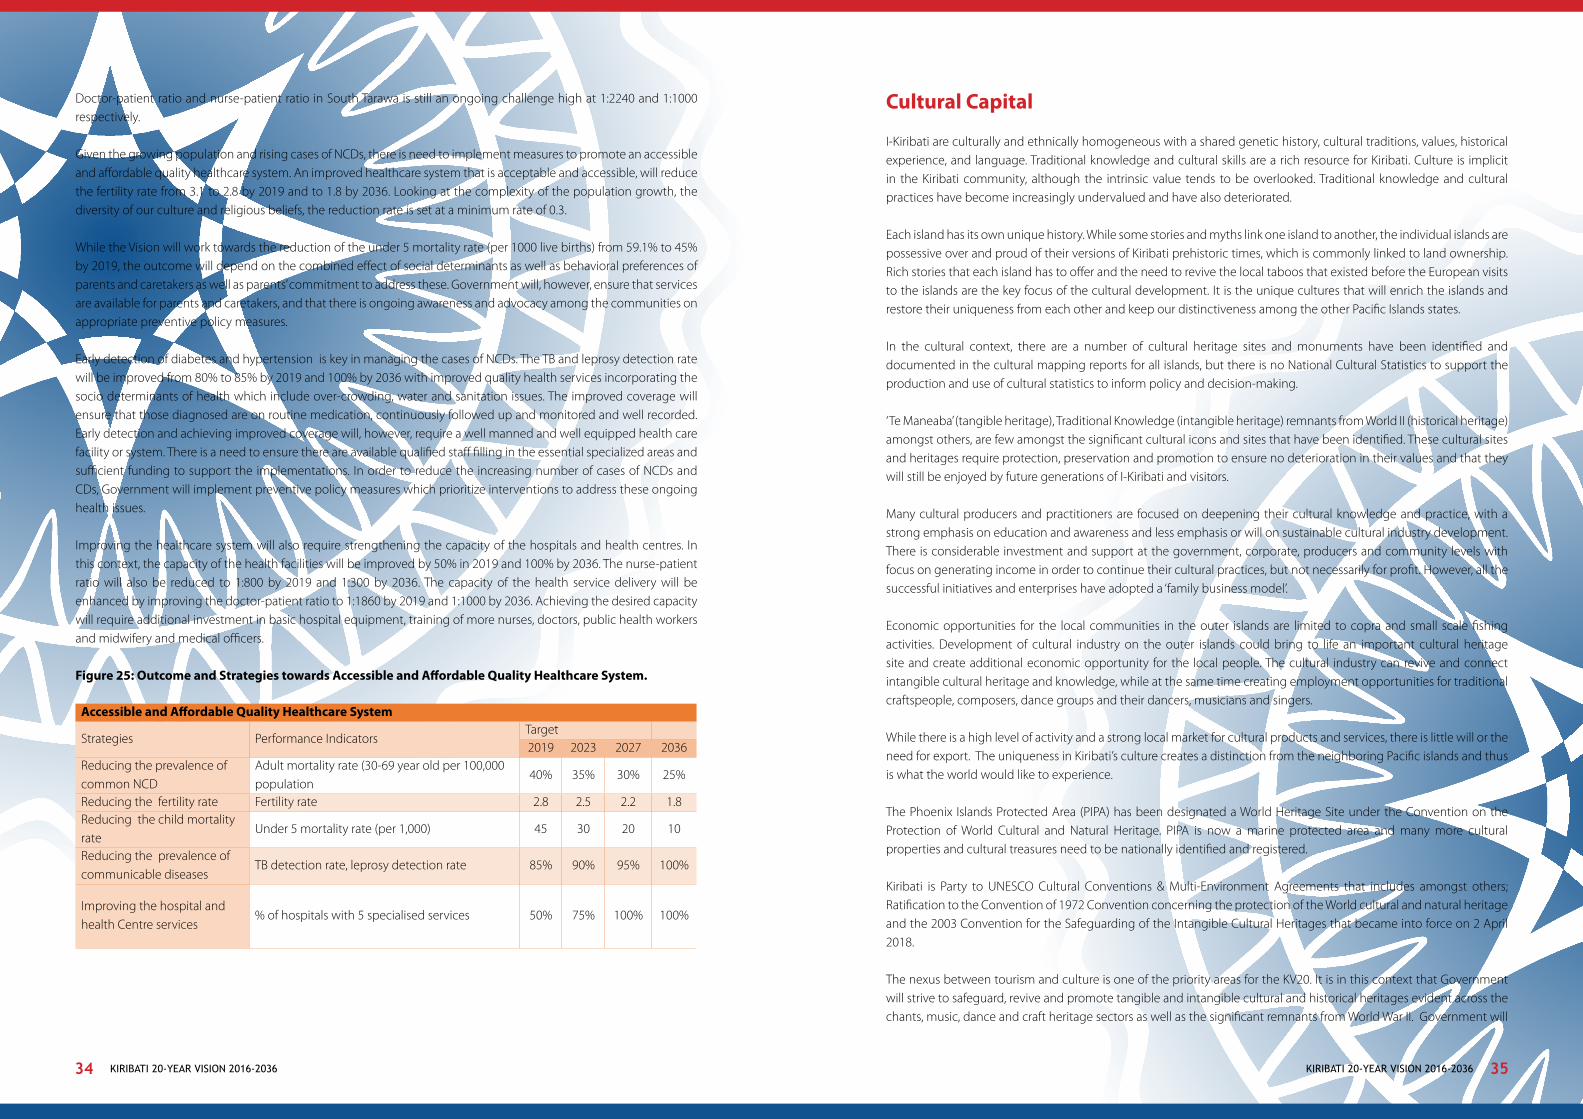
Given the growing population and rising cases of NCDs, there is need to implement measures to promote an accessible and affordable quality healthcare system. An improved healthcare system that is acceptable and accessible, will reduce the fertility rate from 3.1 to 2.8 by 2019 and to 1.8 by 2036. Looking at the complexity of the population growth, the diversity of our culture and religious beliefs, the reduction rate is set at a minimum rate of 0.3.
While the Vision will work towards the reduction of the under 5 mortality rate (per 1000 live births) from 59.1% to 45% by 2019, the outcome will depend on the combined effect of social determinants as well as behavioral preferences of parents and caretakers as well as parents’ commitment to address these. Government will, however, ensure that services are available for parents and caretakers, and that there is ongoing awareness and advocacy among the communities on appropriate preventive policy measures.
Early detection of diabetes and hypertension is key in managing the cases of NCDs. The TB and leprosy detection rate will be improved from 80% to 85% by 2019 and 100% by 2036 with improved quality health services incorporating the socio determinants of health which include over-crowding, water and sanitation issues. The improved coverage will ensure that those diagnosed are on routine medication, continuously followed up and monitored and well recorded. Early detection and achieving improved coverage will, however, require a well manned and well equipped health care facility or system. There is a need to ensure there are available qualified staff filling in the essential specialized areas and sufficient funding to support the implementations. In order to reduce the increasing number of cases of NCDs and CDs, Government will implement preventive policy measures which prioritize interventions to address these ongoing health issues.
Improving the healthcare system will also require strengthening the capacity of the hospitals and health centres. In this context, the capacity of the health facilities will be improved by 50% in 2019 and 100% by 2036. The nurse-patient ratio will also be reduced to 1:800 by 2019 and 1:300 by 2036. The capacity of the health service delivery will be enhanced by improving the doctor-patient ratio to 1:1860 by 2019 and 1:1000 by 2036. Achieving the desired capacity will require additional investment in basic hospital equipment, training of more nurses, doctors, public health workers and midwifery and medical officers.
Figure 25: Outcome and Strategies towards Accessible and Affordable Quality Healthcare System.
Accessible and Affordable Quality Healthcare System
Strategies Performance IndicatorsTarget 2019 2023 2027 2036
Reducing the prevalence of common NCD
Adult mortality rate (30-69 year old per 100,000 population
40% 35% 30% 25%
Reducing the fertility rate Fertility rate 2.8 2.5 2.2 1.8Reducing the child mortality rate
Under 5 mortality rate (per 1,000) 45 30 20 10
Reducing the prevalence of communicable diseases
TB detection rate, leprosy detection rate 85% 90% 95% 100%
Improving the hospital and health Centre services
% of hospitals with 5 specialised services 50% 75% 100% 100%
Cultural Capital
I-Kiribati are culturally and ethnically homogeneous with a shared genetic history, cultural traditions, values, historical experience, and language. Traditional knowledge and cultural skills are a rich resource for Kiribati. Culture is implicit in the Kiribati community, although the intrinsic value tends to be overlooked. Traditional knowledge and cultural practices have become increasingly undervalued and have also deteriorated.
Each island has its own unique history. While some stories and myths link one island to another, the individual islands are possessive over and proud of their versions of Kiribati prehistoric times, which is commonly linked to land ownership. Rich stories that each island has to offer and the need to revive the local taboos that existed before the European visits to the islands are the key focus of the cultural development. It is the unique cultures that will enrich the islands and restore their uniqueness from each other and keep our distinctiveness among the other Pacific Islands states.
In the cultural context, there are a number of cultural heritage sites and monuments have been identified and documented in the cultural mapping reports for all islands, but there is no National Cultural Statistics to support the production and use of cultural statistics to inform policy and decision-making. ‘Te Maneaba’ (tangible heritage), Traditional Knowledge (intangible heritage) remnants from World II (historical heritage) amongst others, are few amongst the significant cultural icons and sites that have been identified. These cultural sites and heritages require protection, preservation and promotion to ensure no deterioration in their values and that they will still be enjoyed by future generations of I-Kiribati and visitors.
Many cultural producers and practitioners are focused on deepening their cultural knowledge and practice, with a strong emphasis on education and awareness and less emphasis or will on sustainable cultural industry development. There is considerable investment and support at the government, corporate, producers and community levels with focus on generating income in order to continue their cultural practices, but not necessarily for profit. However, all the successful initiatives and enterprises have adopted a ‘family business model’.
Economic opportunities for the local communities in the outer islands are limited to copra and small scale fishing activities. Development of cultural industry on the outer islands could bring to life an important cultural heritage site and create additional economic opportunity for the local people. The cultural industry can revive and connect intangible cultural heritage and knowledge, while at the same time creating employment opportunities for traditional craftspeople, composers, dance groups and their dancers, musicians and singers.
While there is a high level of activity and a strong local market for cultural products and services, there is little will or the need for export. The uniqueness in Kiribati’s culture creates a distinction from the neighboring Pacific islands and thus is what the world would like to experience.
The Phoenix Islands Protected Area (PIPA) has been designated a World Heritage Site under the Convention on the Protection of World Cultural and Natural Heritage. PIPA is now a marine protected area and many more cultural properties and cultural treasures need to be nationally identified and registered.
Kiribati is Party to UNESCO Cultural Conventions & Multi-Environment Agreements that includes amongst others; Ratification to the Convention of 1972 Convention concerning the protection of the World cultural and natural heritage and the 2003 Convention for the Safeguarding of the Intangible Cultural Heritages that became into force on 2 April 2018.
The nexus between tourism and culture is one of the priority areas for the KV20. It is in this context that Government will strive to safeguard, revive and promote tangible and intangible cultural and historical heritages evident across the chants, music, dance and craft heritage sectors as well as the significant remnants from World War II. Government will
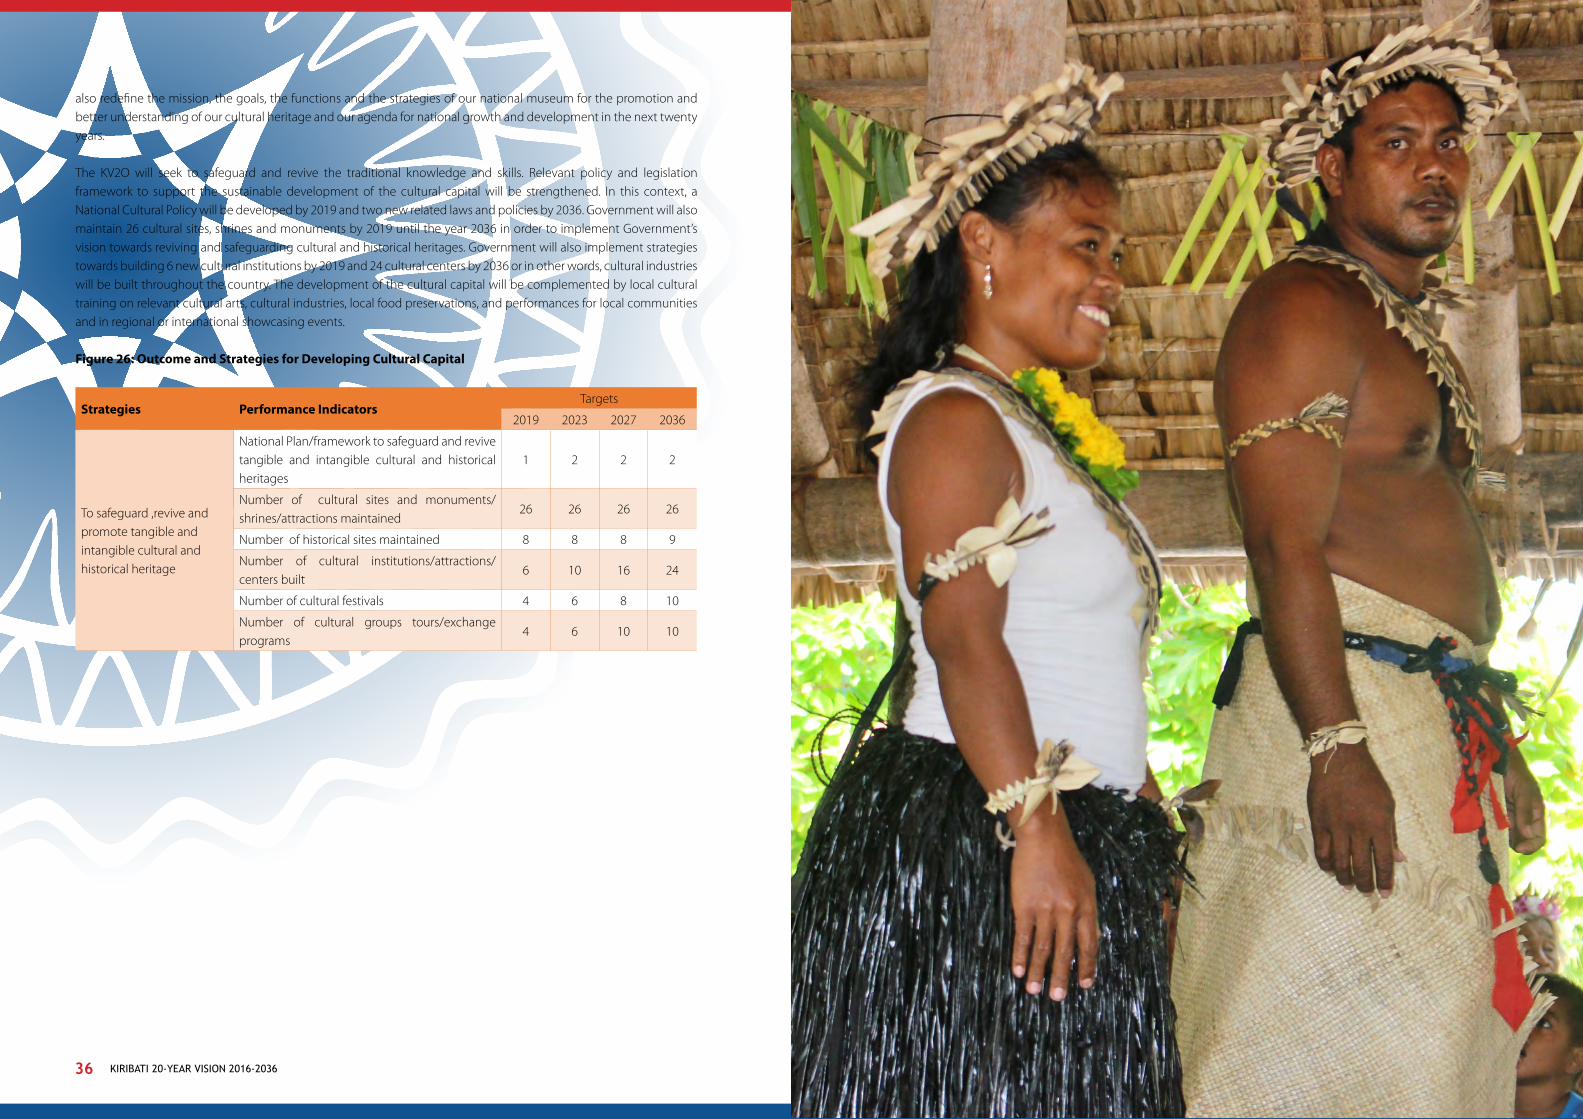
KIRIBATI 20-YEAR VISION 2016-2036 KIRIBATI 20-YEAR VISION 2016-203636 37
also redefine the mission, the goals, the functions and the strategies of our national museum for the promotion and better understanding of our cultural heritage and our agenda for national growth and development in the next twenty years.
The KV2O will seek to safeguard and revive the traditional knowledge and skills. Relevant policy and legislation framework to support the sustainable development of the cultural capital will be strengthened. In this context, a National Cultural Policy will be developed by 2019 and two new related laws and policies by 2036. Government will also maintain 26 cultural sites, shrines and monuments by 2019 until the year 2036 in order to implement Government’s vision towards reviving and safeguarding cultural and historical heritages. Government will also implement strategies towards building 6 new cultural institutions by 2019 and 24 cultural centers by 2036 or in other words, cultural industries will be built throughout the country. The development of the cultural capital will be complemented by local cultural training on relevant cultural arts, cultural industries, local food preservations, and performances for local communities and in regional or international showcasing events. Figure 26: Outcome and Strategies for Developing Cultural Capital
Strategies Performance Indicators Targets
2019 2023 2027 2036
To safeguard ,revive and promote tangible and intangible cultural and historical heritage
National Plan/framework to safeguard and revive tangible and intangible cultural and historical heritages
1 2 2 2
Number of cultural sites and monuments/shrines/attractions maintained
26 26 26 26
Number of historical sites maintained 8 8 8 9
Number of cultural institutions/attractions/centers built
6 10 16 24
Number of cultural festivals 4 6 8 10
Number of cultural groups tours/exchange programs
4 6 10 10
KIRIBATI 20-YEAR VISION 2016-2036 KIRIBATI 20-YEAR VISION 2016-203638 39
PILLAR 2: PEACE AND SECURITY
Developing a Secure and Peaceful Kiribati
Peace and security contributes towards socio-economic stability. While peace and security is important towards achieving sustainable development goals, there has been a general increase in the number of crimes over the years (See Table 8 and Figure 27).
Table 8: Trend in Crime Rates (2012-2016)
Year 2012 2013 2014 2015 2016
Number of Crimes 5655 4060 4903 4148 4670
Figure 27: Trend in Crime Rates (2012-2016)
Source :KPS
Liquor offences however, remain to be the highest among the common cases of crime at 30%, followed by Law and public order offences at 22% and offences against endangering life at 20%, among others.
Figure 28: Proportion of Criminal Cases in 2016
Source: KPS
Although Government recognises the importance of peace and security towards creating sustainable development, there is a lack of centralised and coordinated border management mechanism, and a national security policy to serve as a guide on security issues.
In a broader security context, the government is also cognisant of the importance of maintaining its sovereignty in light of the projections for climate change and sea level rise. In most islands, coastal erosion and inundation is becoming the new norm and which has led to loss of precious and already limited land space and resources, such as fresh water. If left unabated, it has the potential to create future tensions and insecurity among I-Kiribati, who will have to compete for these limited resources.
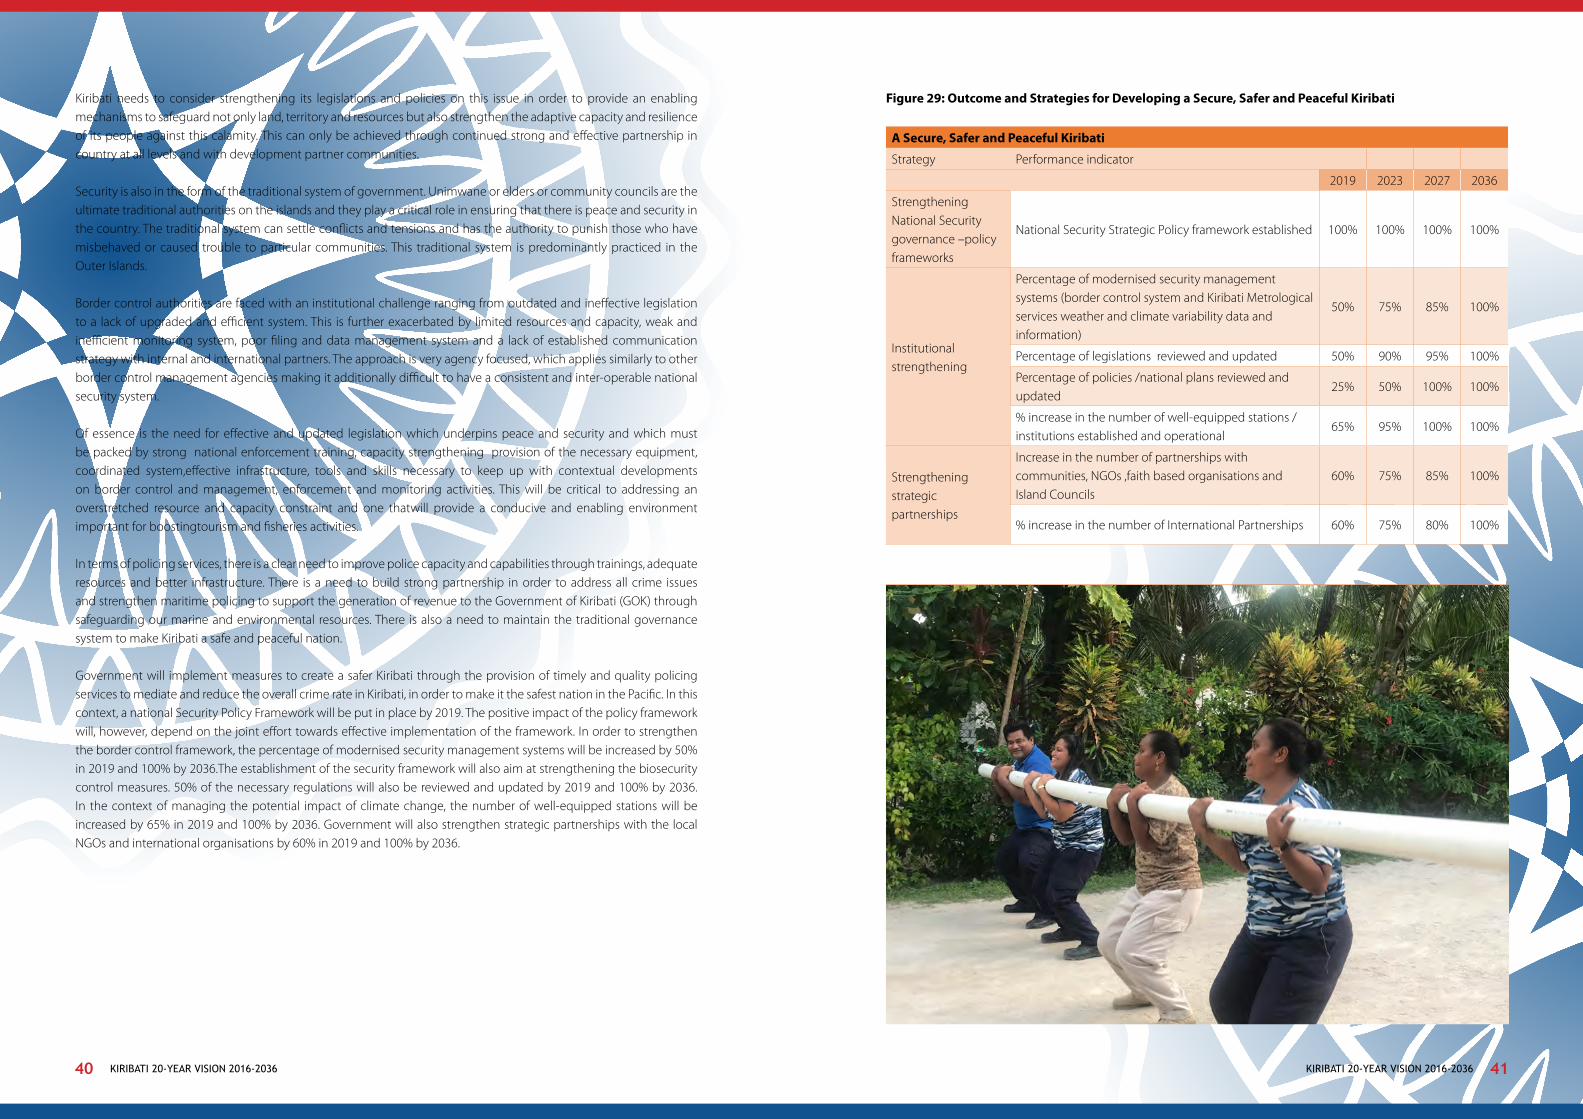
KIRIBATI 20-YEAR VISION 2016-2036 KIRIBATI 20-YEAR VISION 2016-203640 41
Kiribati needs to consider strengthening its legislations and policies on this issue in order to provide an enabling mechanisms to safeguard not only land, territory and resources but also strengthen the adaptive capacity and resilience of its people against this calamity. This can only be achieved through continued strong and effective partnership in country at all levels and with development partner communities.
Security is also in the form of the traditional system of government. Unimwane or elders or community councils are the ultimate traditional authorities on the islands and they play a critical role in ensuring that there is peace and security in the country. The traditional system can settle conflicts and tensions and has the authority to punish those who have misbehaved or caused trouble to particular communities. This traditional system is predominantly practiced in the Outer Islands.
Border control authorities are faced with an institutional challenge ranging from outdated and ineffective legislation to a lack of upgraded and efficient system. This is further exacerbated by limited resources and capacity, weak and inefficient monitoring system, poor filing and data management system and a lack of established communication strategy with internal and international partners. The approach is very agency focused, which applies similarly to other border control management agencies making it additionally difficult to have a consistent and inter-operable national security system.
Of essence is the need for effective and updated legislation which underpins peace and security and which must be packed by strong national enforcement training, capacity strengthening provision of the necessary equipment, coordinated system,effective infrastructure, tools and skills necessary to keep up with contextual developments on border control and management, enforcement and monitoring activities. This will be critical to addressing an overstretched resource and capacity constraint and one thatwill provide a conducive and enabling environment important for boostingtourism and fisheries activities.
In terms of policing services, there is a clear need to improve police capacity and capabilities through trainings, adequate resources and better infrastructure. There is a need to build strong partnership in order to address all crime issues and strengthen maritime policing to support the generation of revenue to the Government of Kiribati (GOK) through safeguarding our marine and environmental resources. There is also a need to maintain the traditional governance system to make Kiribati a safe and peaceful nation.
Government will implement measures to create a safer Kiribati through the provision of timely and quality policing services to mediate and reduce the overall crime rate in Kiribati, in order to make it the safest nation in the Pacific. In this context, a national Security Policy Framework will be put in place by 2019. The positive impact of the policy framework will, however, depend on the joint effort towards effective implementation of the framework. In order to strengthen the border control framework, the percentage of modernised security management systems will be increased by 50% in 2019 and 100% by 2036.The establishment of the security framework will also aim at strengthening the biosecurity control measures. 50% of the necessary regulations will also be reviewed and updated by 2019 and 100% by 2036. In the context of managing the potential impact of climate change, the number of well-equipped stations will be increased by 65% in 2019 and 100% by 2036. Government will also strengthen strategic partnerships with the local NGOs and international organisations by 60% in 2019 and 100% by 2036.
Figure 29: Outcome and Strategies for Developing a Secure, Safer and Peaceful Kiribati
A Secure, Safer and Peaceful Kiribati
Strategy Performance indicator
2019 2023 2027 2036
Strengthening National Security governance –policy frameworks
National Security Strategic Policy framework established 100% 100% 100% 100%
Institutional strengthening
Percentage of modernised security management systems (border control system and Kiribati Metrological services weather and climate variability data and information)
50% 75% 85% 100%
Percentage of legislations reviewed and updated 50% 90% 95% 100%
Percentage of policies /national plans reviewed and updated
25% 50% 100% 100%
% increase in the number of well-equipped stations /institutions established and operational
65% 95% 100% 100%
Strengthening strategic partnerships
Increase in the number of partnerships with communities, NGOs ,faith based organisations and Island Councils
60% 75% 85% 100%
% increase in the number of International Partnerships 60% 75% 80% 100%
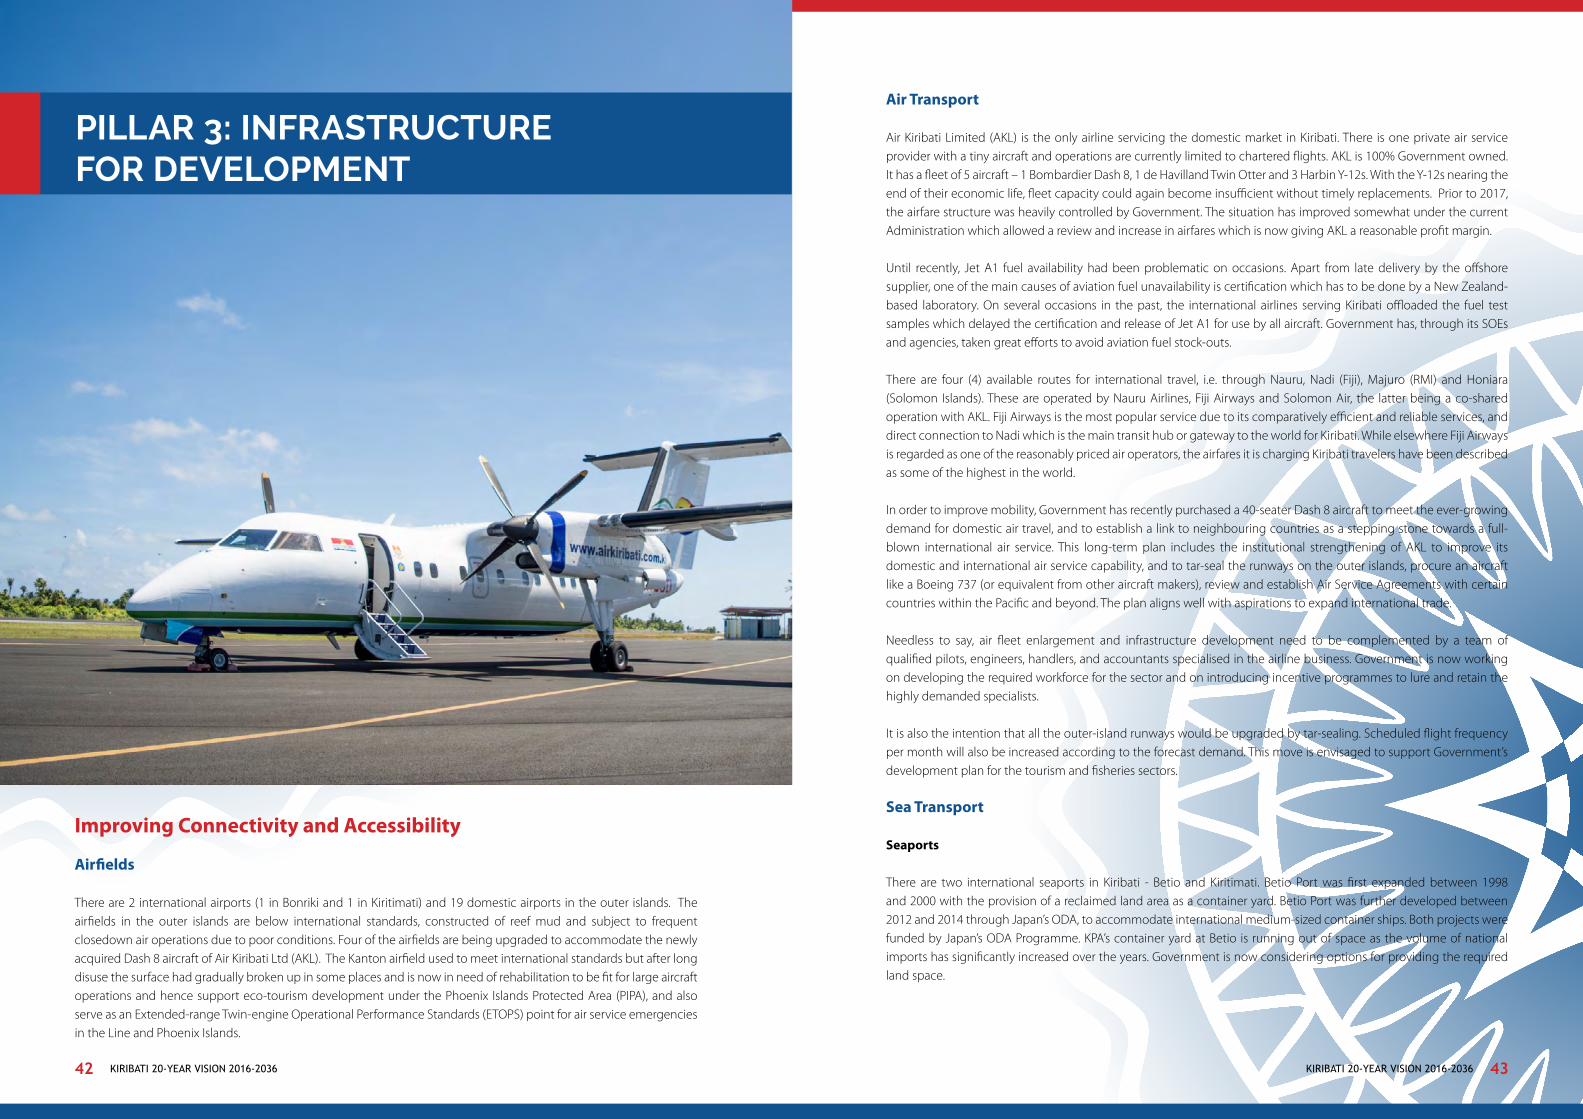
KIRIBATI 20-YEAR VISION 2016-2036 KIRIBATI 20-YEAR VISION 2016-203642 43
PILLAR 3: INFRASTRUCTURE FOR DEVELOPMENT
Improving Connectivity and Accessibility
Airfields
There are 2 international airports (1 in Bonriki and 1 in Kiritimati) and 19 domestic airports in the outer islands. The airfields in the outer islands are below international standards, constructed of reef mud and subject to frequent closedown air operations due to poor conditions. Four of the airfields are being upgraded to accommodate the newly acquired Dash 8 aircraft of Air Kiribati Ltd (AKL). The Kanton airfield used to meet international standards but after long disuse the surface had gradually broken up in some places and is now in need of rehabilitation to be fit for large aircraft operations and hence support eco-tourism development under the Phoenix Islands Protected Area (PIPA), and also serve as an Extended-range Twin-engine Operational Performance Standards (ETOPS) point for air service emergencies in the Line and Phoenix Islands.
Air Transport
Air Kiribati Limited (AKL) is the only airline servicing the domestic market in Kiribati. There is one private air service provider with a tiny aircraft and operations are currently limited to chartered flights. AKL is 100% Government owned. It has a fleet of 5 aircraft – 1 Bombardier Dash 8, 1 de Havilland Twin Otter and 3 Harbin Y-12s. With the Y-12s nearing the end of their economic life, fleet capacity could again become insufficient without timely replacements. Prior to 2017, the airfare structure was heavily controlled by Government. The situation has improved somewhat under the current Administration which allowed a review and increase in airfares which is now giving AKL a reasonable profit margin.
Until recently, Jet A1 fuel availability had been problematic on occasions. Apart from late delivery by the offshore supplier, one of the main causes of aviation fuel unavailability is certification which has to be done by a New Zealand-based laboratory. On several occasions in the past, the international airlines serving Kiribati offloaded the fuel test samples which delayed the certification and release of Jet A1 for use by all aircraft. Government has, through its SOEs and agencies, taken great efforts to avoid aviation fuel stock-outs.
There are four (4) available routes for international travel, i.e. through Nauru, Nadi (Fiji), Majuro (RMI) and Honiara (Solomon Islands). These are operated by Nauru Airlines, Fiji Airways and Solomon Air, the latter being a co-shared operation with AKL. Fiji Airways is the most popular service due to its comparatively efficient and reliable services, and direct connection to Nadi which is the main transit hub or gateway to the world for Kiribati. While elsewhere Fiji Airways is regarded as one of the reasonably priced air operators, the airfares it is charging Kiribati travelers have been described as some of the highest in the world.
In order to improve mobility, Government has recently purchased a 40-seater Dash 8 aircraft to meet the ever-growing demand for domestic air travel, and to establish a link to neighbouring countries as a stepping stone towards a full-blown international air service. This long-term plan includes the institutional strengthening of AKL to improve its domestic and international air service capability, and to tar-seal the runways on the outer islands, procure an aircraft like a Boeing 737 (or equivalent from other aircraft makers), review and establish Air Service Agreements with certain countries within the Pacific and beyond. The plan aligns well with aspirations to expand international trade.
Needless to say, air fleet enlargement and infrastructure development need to be complemented by a team of qualified pilots, engineers, handlers, and accountants specialised in the airline business. Government is now working on developing the required workforce for the sector and on introducing incentive programmes to lure and retain the highly demanded specialists.
It is also the intention that all the outer-island runways would be upgraded by tar-sealing. Scheduled flight frequency per month will also be increased according to the forecast demand. This move is envisaged to support Government’s development plan for the tourism and fisheries sectors.
Sea Transport
Seaports
There are two international seaports in Kiribati - Betio and Kiritimati. Betio Port was first expanded between 1998 and 2000 with the provision of a reclaimed land area as a container yard. Betio Port was further developed between 2012 and 2014 through Japan’s ODA, to accommodate international medium-sized container ships. Both projects were funded by Japan’s ODA Programme. KPA’s container yard at Betio is running out of space as the volume of national imports has significantly increased over the years. Government is now considering options for providing the required land space.

KIRIBATI 20-YEAR VISION 2016-2036 KIRIBATI 20-YEAR VISION 2016-203644 45
While there are two ports in Kiritimati, the port is only good for use by small fishing boats due to sedimentation and coral regrowth within the channel connecting London Port to the open sea. The Port near Tabwakea (known simply as KPA) consists of a pier that extends well beyond the reef. It was built by the Japan Aerospace and Exploratory Agency (JAXA), previously NASDA, in 2012 to service JAXA’s HOPE-X Project (space launch project) which unfortunately fell through. As a result, the pier is considered unsafe for shipping operations and its usability limited to large vessels.
The international ports are relatively well-equipped with lifting machinery and delivery equipment as well as experienced personnel. As such, their efficiency in the handling of cargo is therefore good in comparison to other Pacific countries.
In the outer islands, seaports (or shipping points) exist only in the form of narrow channels cut through the reef-flat, with docks in some islands. They hardly have proper cargo-handling facilities and equipment which means operations are inefficient, cumbersome and unsafe. At most islands, vessels have no choice but to offload passengers and cargoes, miles away from shore, onto small outboard motor boats which then have to traverse across the expansive reef flats to shore. This operation is restricted to high tides contributing to prolonged and expensive shipping turnaround times. This type of operation is extremely risky in bad weather. In fact, a number of fatalities, injuries and cargo losses had happened from the practice.
Domestic sea transport is largely dominated by the private sector though their presence is only prominent in lucrative sectors. While the Kiribati National Shipping Line (KNSL) is the only Government owned shipping company that provided shipping service in Kiribati prior to the entry of the private sector, it currently focuses on providing shipping services to those routes considered to be non-lucrative by the private sector. The situation of KNSL has been deteriorating over the years, with only 1 vessel which currently does not operate. To manage the situation, the Government has purchased 2 vessels to be operated by KNSL to address market failure in the domestic shipping service sector.
Connectivity and accessibility to the Outer Islands from the Capital (South Tarawa) is challenging due to inadequate infrastructure (wharves, ramps, piers and ports), boat channels, passages and Aids To Navigation (AToNs). To address the current situation, there are development plans to improve maritime infrastructure on the outer islands which includes hydrography surveying and updating of all outdates nautical charts in Kiribati. This will enable smooth connectivity and fast accessibility with the aim to facilitate domestic trade and migration between islands in order to improve social and economic benefits.
Government will work towards improving connectivity in the shipping industry. In this context, the number of shipping voyages per month will be increased to 30 by 2019 and to 60 by 2036. However, the development of the shipping industry will require additional investment in maritime infrastructure, building human resource capacity through
training of qualified Marine Surveyors, Marine Officers (Classes), Naval Architects, Hydrographers and Marine Engineers as well as Marine Infrastructural Engineers and Maritime Lawyers. Development of maritime infrastructure along with a well set-up slipway, a decent dry-dock which can accommodate small to medium sized vessels and a fully established Maritime Authority of Kiribati as a Regulatory body. This will create an enabling environment to support an efficient shipping operation which will improve the economic viability of currently uneconomical sectors.
Coastal Infrastructure
The impact of climate change remains a great challenge to the sustainability of coastal infrastructure. The devastating impacts of Cyclone Pam in 2015 is an example. Government continues to implement various coastal protection programmes to replace the popular “sandbag” seawall with a more robust seawall design. A “mass concrete” seawall design was successfully trialed in mid-2015. The design is being adopted for protecting coastal public assets throughout the country.
While seawall construction is one of the programmes being implemented to reinforce costal protection, it is not always the best solution to coastal erosion. As such, Government, through the Kiribati Adaption Programme (KAP) III under the Office of Te Beretitenti (OB), is also implementing alternative eco-friendly coastal protection programmes such as mangrove planting, and groyne and beach replenishment. As part of its activities under KAPIII, MELAD has planted 175,873 mangroves on South Tarawa and the outer islands. MELAD is further targeting an additional 25,000 mangroves every year. Non-structural options include “inaction” and community resettlement/asset relocation.
ICT
Development of ICT infrastructure has been one of the development priority areas given its linkages with other drivers of growth. The ICT Policy and regulatory framework developed provides a sustainable benchmark through private sector participation in the ICT industry to foster improved ICT connectivity. While Amalgamated Telecom Holdings (Kiribati) Limited (ATHKL) is the major player in the ICT industry, a second service provider (OceanLink) has been issued with a license to operate in Kiribati, thus encourage a healthy competitive environment in the ICT industry.
The 4G services are available in South Tarawa, Abemama, Tabiteuea North and Onotoa, while 3G services are available on South Tarawa, North Tarawa, Abaiang, Marakei, Maiana and Kiritimati. In addition, 2G services are also available on Abemama, Tabiteuea North and Onotoa. Other islands have VSAT systems set up at Island Council premises which the people on the islands can access.
The current internet connectivity uses satellite technology due to lack of submarine cables landing on the islands. The Government plans to improve internet and mobile connectivity on the outer islands. It is expected that most of the outer islands would have internet and mobile services by the end of 2018 or early 2019.
In order to improve international connectivity, there is need to upgrade the international gateway connectivity for the major hubs of South Tarawa in the Gilberts Group and Kiritimati in the Line Group to a more reliable and efficient connectivity. Government, in partnership with the World Bank and ADB intends to address this by connecting South Tarawa and Kiritimati to a fiber optics submarine cable. The Tarawa connection will increase internet penetration to 67% once the submarine cable has been established. Improved connectivity in the Line and Phoenix Islands is expected to support internet penetration to 6% of the population in Kiritimati, thus contributing to about 72% of the total internet penetration by the second quarter of 2019, once the project is completed.
Government further intends to improve ICT connectivity in Butaritari, Abemama and Tabiteuea North through fiber based submarine cable, which can further be used to connect neighbouring islands of Makin, Aranuka and Kuria and Tabiteuea South. It is expected that such additional connectivity will increase internet penetration to 87% through submarine cable capacity. In general, the % of internet penetration will be increased to 47% by 2019 and 100% by 2036.
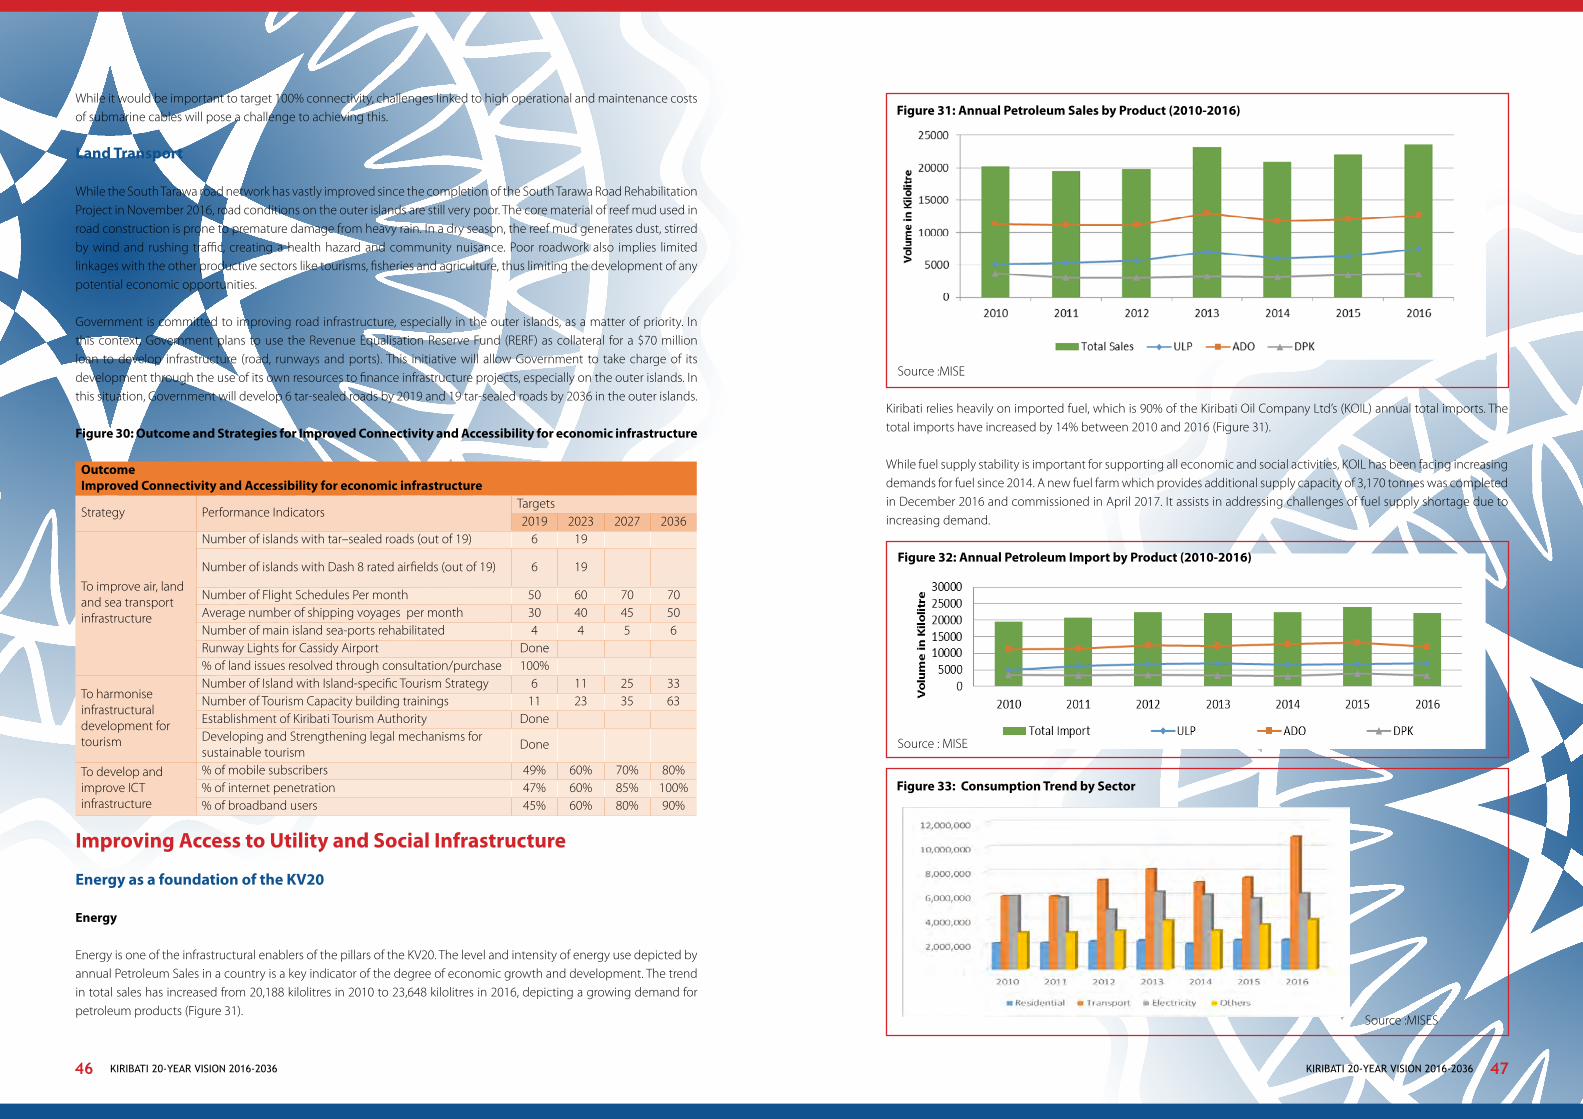
KIRIBATI 20-YEAR VISION 2016-2036 KIRIBATI 20-YEAR VISION 2016-203646 47
While it would be important to target 100% connectivity, challenges linked to high operational and maintenance costs of submarine cables will pose a challenge to achieving this. Land Transport
While the South Tarawa road network has vastly improved since the completion of the South Tarawa Road Rehabilitation Project in November 2016, road conditions on the outer islands are still very poor. The core material of reef mud used in road construction is prone to premature damage from heavy rain. In a dry season, the reef mud generates dust, stirred by wind and rushing traffic, creating a health hazard and community nuisance. Poor roadwork also implies limited linkages with the other productive sectors like tourisms, fisheries and agriculture, thus limiting the development of any potential economic opportunities.
Government is committed to improving road infrastructure, especially in the outer islands, as a matter of priority. In this context, Government plans to use the Revenue Equalisation Reserve Fund (RERF) as collateral for a $70 million loan to develop infrastructure (road, runways and ports). This initiative will allow Government to take charge of its development through the use of its own resources to finance infrastructure projects, especially on the outer islands. In this situation, Government will develop 6 tar-sealed roads by 2019 and 19 tar-sealed roads by 2036 in the outer islands.
Figure 30: Outcome and Strategies for Improved Connectivity and Accessibility for economic infrastructure
OutcomeImproved Connectivity and Accessibility for economic infrastructure
Strategy Performance IndicatorsTargets2019 2023 2027 2036
To improve air, land and sea transport infrastructure
Number of islands with tar–sealed roads (out of 19) 6 19
Number of islands with Dash 8 rated airfields (out of 19) 6 19
Number of Flight Schedules Per month 50 60 70 70Average number of shipping voyages per month 30 40 45 50Number of main island sea-ports rehabilitated 4 4 5 6Runway Lights for Cassidy Airport Done% of land issues resolved through consultation/purchase 100%
To harmonise infrastructural development for tourism
Number of Island with Island-specific Tourism Strategy 6 11 25 33Number of Tourism Capacity building trainings 11 23 35 63Establishment of Kiribati Tourism Authority DoneDeveloping and Strengthening legal mechanisms for sustainable tourism
Done
To develop and improve ICT infrastructure
% of mobile subscribers 49% 60% 70% 80%% of internet penetration 47% 60% 85% 100%% of broadband users 45% 60% 80% 90%
Improving Access to Utility and Social Infrastructure
Energy as a foundation of the KV20
Energy
Energy is one of the infrastructural enablers of the pillars of the KV20. The level and intensity of energy use depicted by annual Petroleum Sales in a country is a key indicator of the degree of economic growth and development. The trend in total sales has increased from 20,188 kilolitres in 2010 to 23,648 kilolitres in 2016, depicting a growing demand for petroleum products (Figure 31).
Figure 31: Annual Petroleum Sales by Product (2010-2016)
Source :MISE
Kiribati relies heavily on imported fuel, which is 90% of the Kiribati Oil Company Ltd’s (KOIL) annual total imports. The total imports have increased by 14% between 2010 and 2016 (Figure 31).
While fuel supply stability is important for supporting all economic and social activities, KOIL has been facing increasing demands for fuel since 2014. A new fuel farm which provides additional supply capacity of 3,170 tonnes was completed in December 2016 and commissioned in April 2017. It assists in addressing challenges of fuel supply shortage due to increasing demand.
Figure 32: Annual Petroleum Import by Product (2010-2016)
Source : MISE
Figure 33: Consumption Trend by Sector
Source :MISES
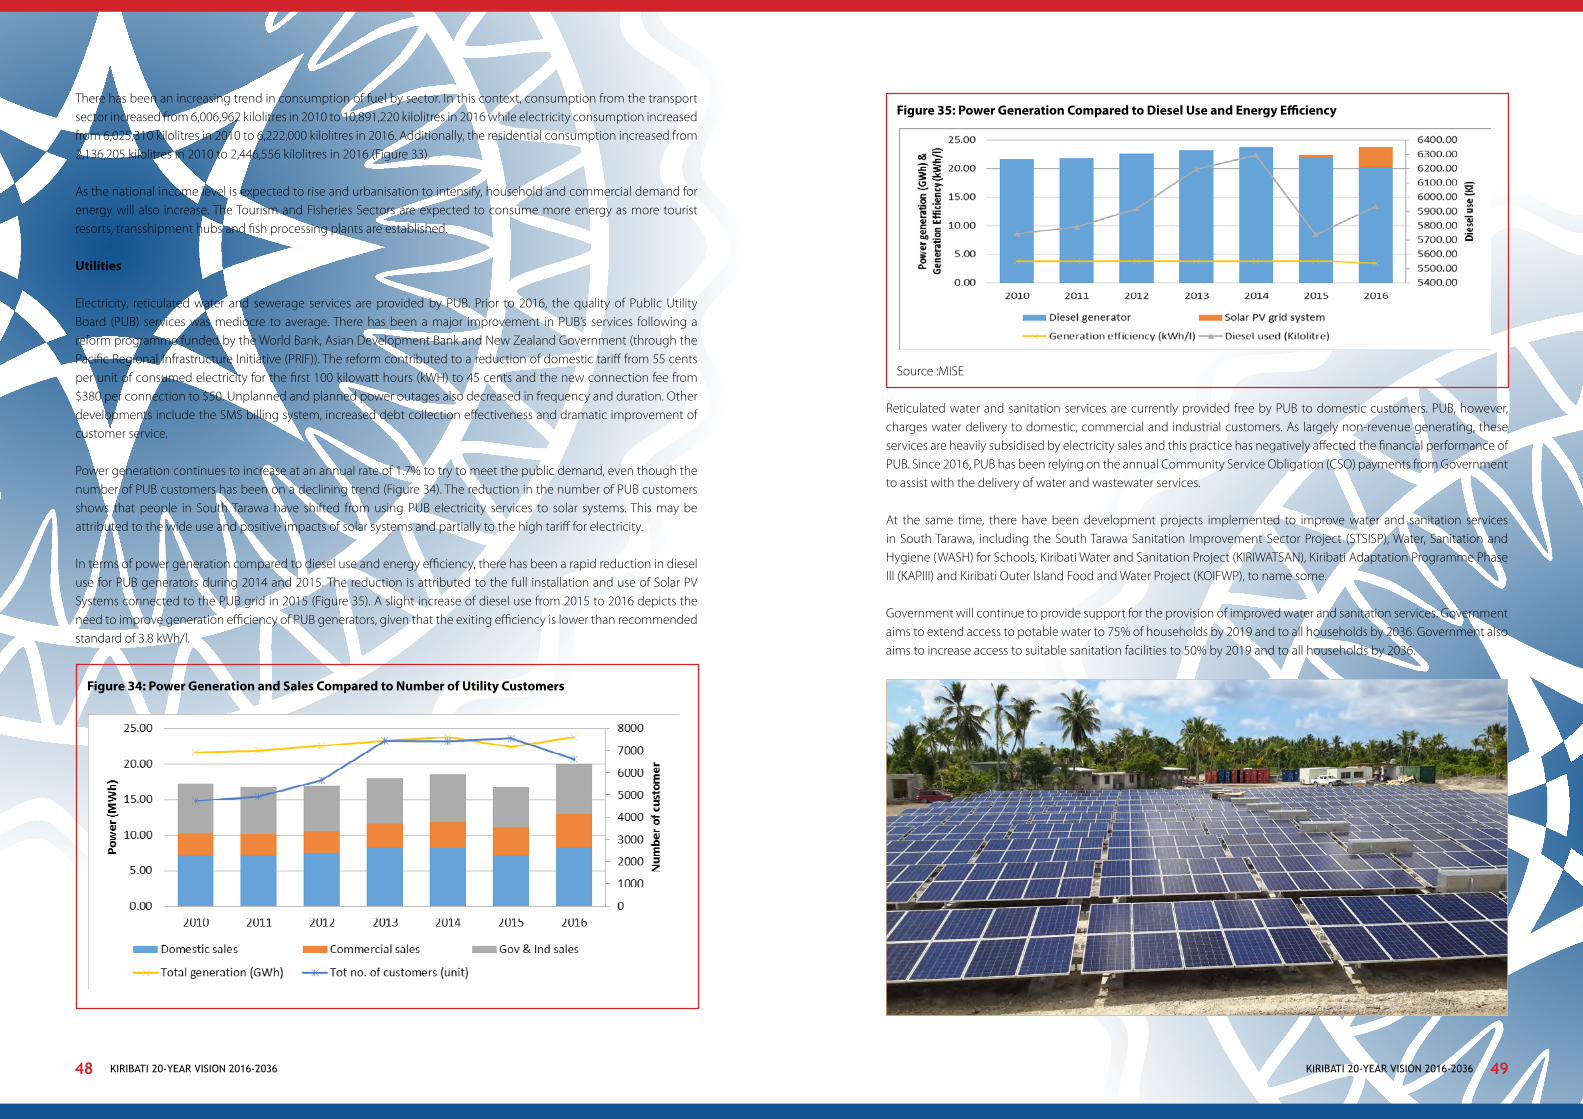
KIRIBATI 20-YEAR VISION 2016-2036 KIRIBATI 20-YEAR VISION 2016-203648 49
There has been an increasing trend in consumption of fuel by sector. In this context, consumption from the transport sector increased from 6,006,962 kilolitres in 2010 to 10,891,220 kilolitres in 2016 while electricity consumption increased from 6,025,310 kilolitres in 2010 to 6,222,000 kilolitres in 2016. Additionally, the residential consumption increased from 2,136,205 kilolitres in 2010 to 2,446,556 kilolitres in 2016 (Figure 33).
As the national income level is expected to rise and urbanisation to intensify, household and commercial demand for energy will also increase. The Tourism and Fisheries Sectors are expected to consume more energy as more tourist resorts, transshipment hubs and fish processing plants are established.
Utilities
Electricity, reticulated water and sewerage services are provided by PUB. Prior to 2016, the quality of Public Utility Board (PUB) services was mediocre to average. There has been a major improvement in PUB’s services following a reform programme funded by the World Bank, Asian Development Bank and New Zealand Government (through the Pacific Regional Infrastructure Initiative (PRIF)). The reform contributed to a reduction of domestic tariff from 55 cents per unit of consumed electricity for the first 100 kilowatt hours (kWH) to 45 cents and the new connection fee from $380 per connection to $50. Unplanned and planned power outages also decreased in frequency and duration. Other developments include the SMS billing system, increased debt collection effectiveness and dramatic improvement of customer service.
Power generation continues to increase at an annual rate of 1.7% to try to meet the public demand, even though the number of PUB customers has been on a declining trend (Figure 34). The reduction in the number of PUB customers shows that people in South Tarawa have shifted from using PUB electricity services to solar systems. This may be attributed to the wide use and positive impacts of solar systems and partially to the high tariff for electricity.
In terms of power generation compared to diesel use and energy efficiency, there has been a rapid reduction in diesel use for PUB generators during 2014 and 2015. The reduction is attributed to the full installation and use of Solar PV Systems connected to the PUB grid in 2015 (Figure 35). A slight increase of diesel use from 2015 to 2016 depicts the need to improve generation efficiency of PUB generators, given that the exiting efficiency is lower than recommended standard of 3.8 kWh/l.
Figure 34: Power Generation and Sales Compared to Number of Utility Customers
Figure 35: Power Generation Compared to Diesel Use and Energy Efficiency
Source :MISE
Reticulated water and sanitation services are currently provided free by PUB to domestic customers. PUB, however, charges water delivery to domestic, commercial and industrial customers. As largely non-revenue generating, these services are heavily subsidised by electricity sales and this practice has negatively affected the financial performance of PUB. Since 2016, PUB has been relying on the annual Community Service Obligation (CSO) payments from Government to assist with the delivery of water and wastewater services.
At the same time, there have been development projects implemented to improve water and sanitation services in South Tarawa, including the South Tarawa Sanitation Improvement Sector Project (STSISP), Water, Sanitation and Hygiene (WASH) for Schools, Kiribati Water and Sanitation Project (KIRIWATSAN), Kiribati Adaptation Programme Phase III (KAPIII) and Kiribati Outer Island Food and Water Project (KOIFWP), to name some.
Government will continue to provide support for the provision of improved water and sanitation services. Government aims to extend access to potable water to 75% of households by 2019 and to all households by 2036. Government also aims to increase access to suitable sanitation facilities to 50% by 2019 and to all households by 2036.
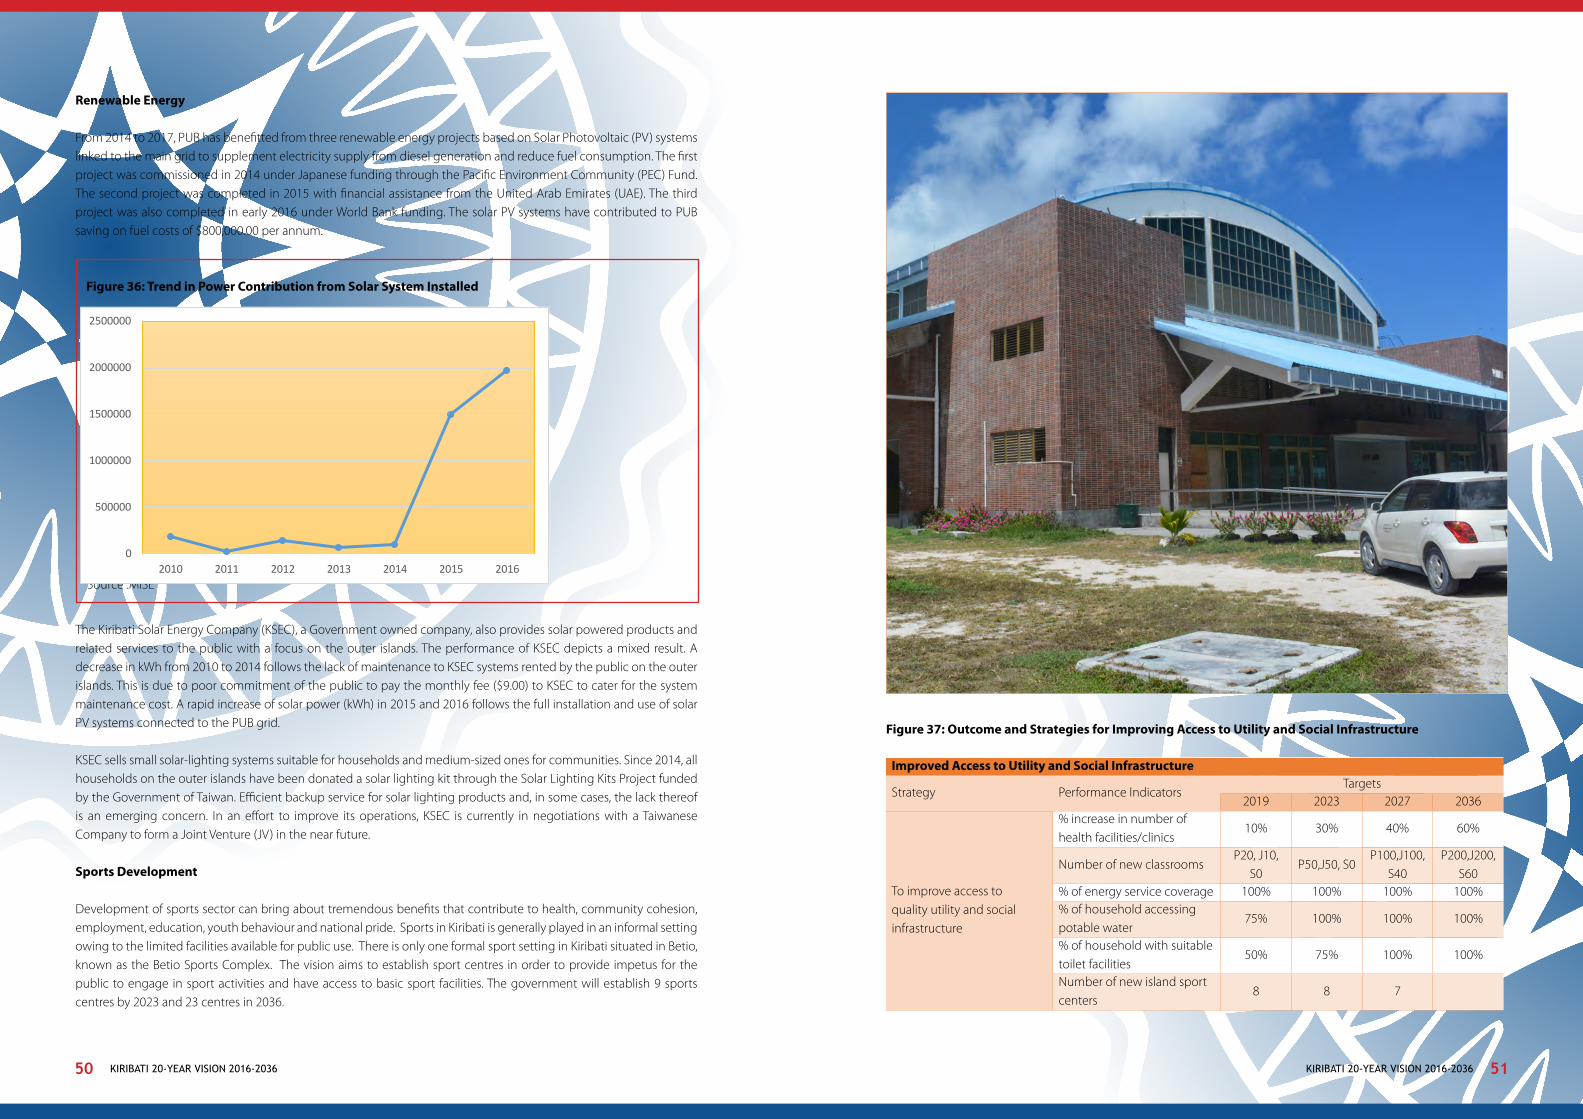
KIRIBATI 20-YEAR VISION 2016-2036 KIRIBATI 20-YEAR VISION 2016-203650 51
Renewable Energy
From 2014 to 2017, PUB has benefitted from three renewable energy projects based on Solar Photovoltaic (PV) systems linked to the main grid to supplement electricity supply from diesel generation and reduce fuel consumption. The first project was commissioned in 2014 under Japanese funding through the Pacific Environment Community (PEC) Fund. The second project was completed in 2015 with financial assistance from the United Arab Emirates (UAE). The third project was also completed in early 2016 under World Bank funding. The solar PV systems have contributed to PUB saving on fuel costs of $800,000.00 per annum.
Figure 36: Trend in Power Contribution from Solar System Installed
Source :MISE
The Kiribati Solar Energy Company (KSEC), a Government owned company, also provides solar powered products and related services to the public with a focus on the outer islands. The performance of KSEC depicts a mixed result. A decrease in kWh from 2010 to 2014 follows the lack of maintenance to KSEC systems rented by the public on the outer islands. This is due to poor commitment of the public to pay the monthly fee ($9.00) to KSEC to cater for the system maintenance cost. A rapid increase of solar power (kWh) in 2015 and 2016 follows the full installation and use of solar PV systems connected to the PUB grid.
KSEC sells small solar-lighting systems suitable for households and medium-sized ones for communities. Since 2014, all households on the outer islands have been donated a solar lighting kit through the Solar Lighting Kits Project funded by the Government of Taiwan. Efficient backup service for solar lighting products and, in some cases, the lack thereof is an emerging concern. In an effort to improve its operations, KSEC is currently in negotiations with a Taiwanese Company to form a Joint Venture (JV) in the near future.
Sports Development
Development of sports sector can bring about tremendous benefits that contribute to health, community cohesion, employment, education, youth behaviour and national pride. Sports in Kiribati is generally played in an informal setting owing to the limited facilities available for public use. There is only one formal sport setting in Kiribati situated in Betio, known as the Betio Sports Complex. The vision aims to establish sport centres in order to provide impetus for the public to engage in sport activities and have access to basic sport facilities. The government will establish 9 sports centres by 2023 and 23 centres in 2036.
0
500000
1000000
1500000
2000000
2500000
2010 2011 2012 2013 2014 2015 2016
Figure 37: Outcome and Strategies for Improving Access to Utility and Social Infrastructure
Improved Access to Utility and Social Infrastructure
Strategy Performance Indicators Targets
2019 2023 2027 2036
To improve access to quality utility and social infrastructure
% increase in number of health facilities/clinics
10% 30% 40% 60%
Number of new classroomsP20, J10,
S0P50,J50, S0
P100,J100, S40
P200,J200, S60
% of energy service coverage 100% 100% 100% 100%% of household accessing potable water
75% 100% 100% 100%
% of household with suitable toilet facilities
50% 75% 100% 100%
Number of new island sport centers
8 8 7
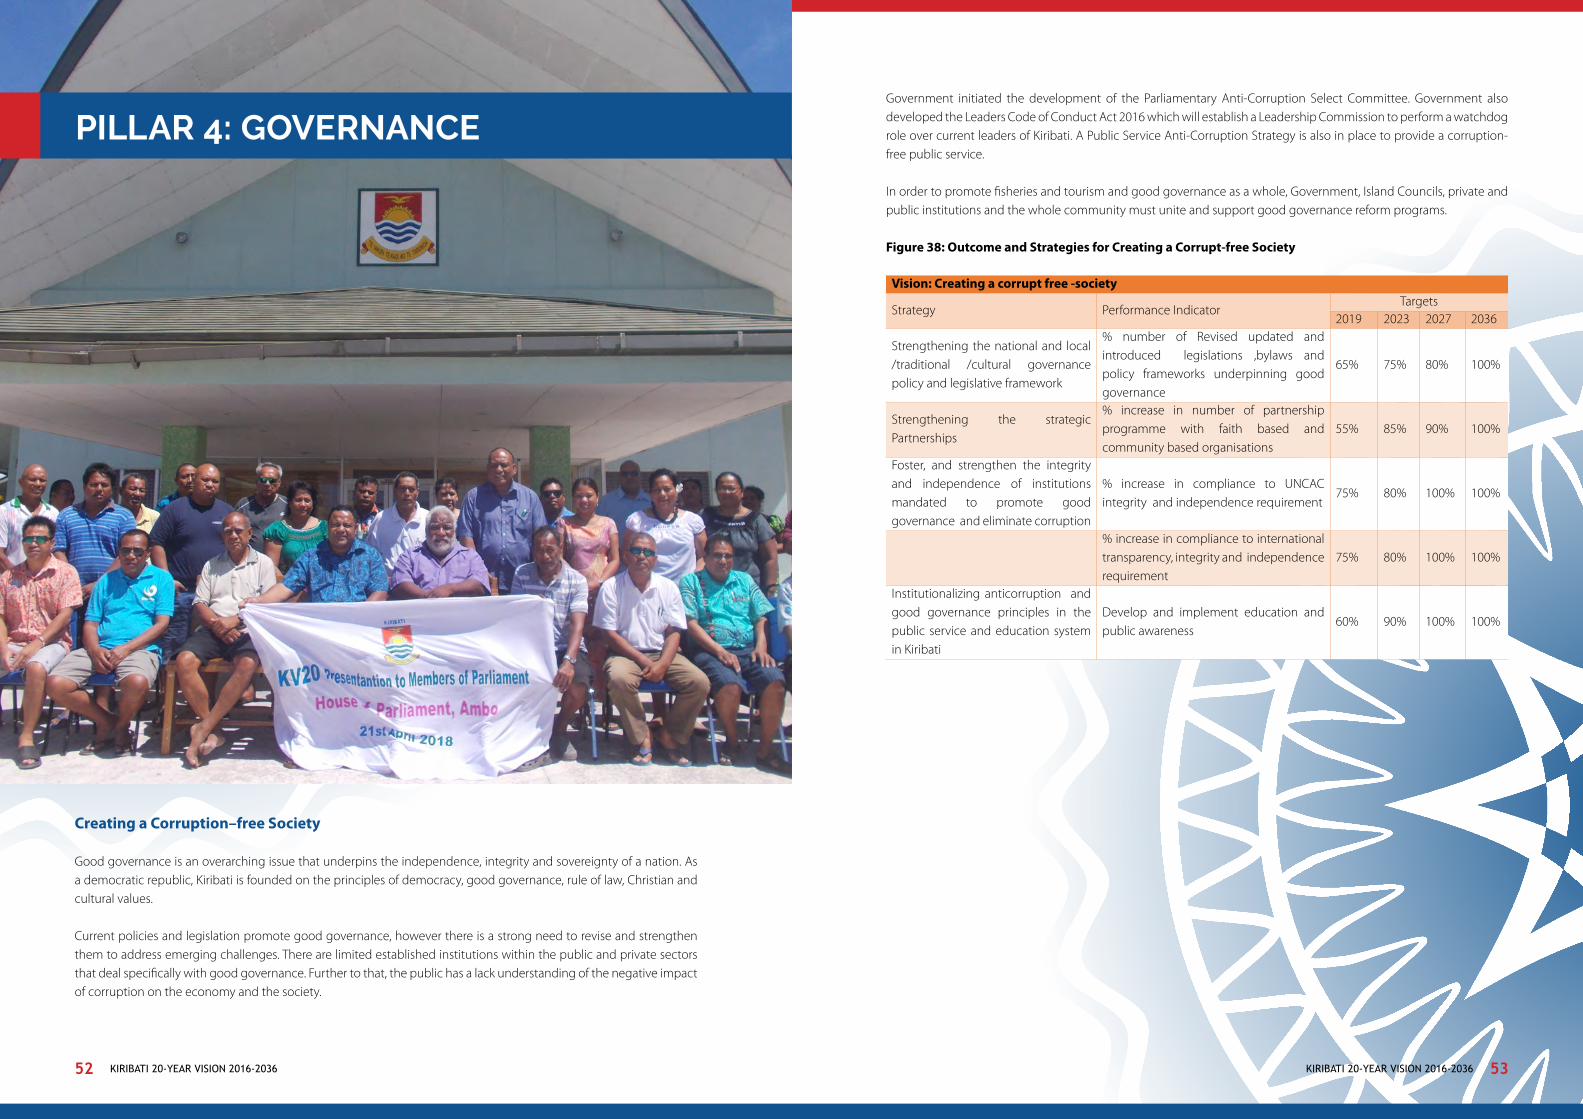
KIRIBATI 20-YEAR VISION 2016-2036 KIRIBATI 20-YEAR VISION 2016-203652 53
PILLAR 4: GOVERNANCE
Creating a Corruption–free Society
Good governance is an overarching issue that underpins the independence, integrity and sovereignty of a nation. As a democratic republic, Kiribati is founded on the principles of democracy, good governance, rule of law, Christian and cultural values.
Current policies and legislation promote good governance, however there is a strong need to revise and strengthen them to address emerging challenges. There are limited established institutions within the public and private sectors that deal specifically with good governance. Further to that, the public has a lack understanding of the negative impact of corruption on the economy and the society.
Government initiated the development of the Parliamentary Anti-Corruption Select Committee. Government also developed the Leaders Code of Conduct Act 2016 which will establish a Leadership Commission to perform a watchdog role over current leaders of Kiribati. A Public Service Anti-Corruption Strategy is also in place to provide a corruption-free public service.
In order to promote fisheries and tourism and good governance as a whole, Government, Island Councils, private and public institutions and the whole community must unite and support good governance reform programs.
Figure 38: Outcome and Strategies for Creating a Corrupt-free Society
Vision: Creating a corrupt free -society
Strategy Performance Indicator Targets
2019 2023 2027 2036
Strengthening the national and local /traditional /cultural governance policy and legislative framework
% number of Revised updated and introduced legislations ,bylaws and policy frameworks underpinning good governance
65% 75% 80% 100%
Strengthening the strategic Partnerships
% increase in number of partnership programme with faith based and community based organisations
55% 85% 90% 100%
Foster, and strengthen the integrity and independence of institutions mandated to promote good governance and eliminate corruption
% increase in compliance to UNCAC integrity and independence requirement
75% 80% 100% 100%
% increase in compliance to international transparency, integrity and independence requirement
75% 80% 100% 100%
Institutionalizing anticorruption and good governance principles in the public service and education system in Kiribati
Develop and implement education and public awareness
60% 90% 100% 100%
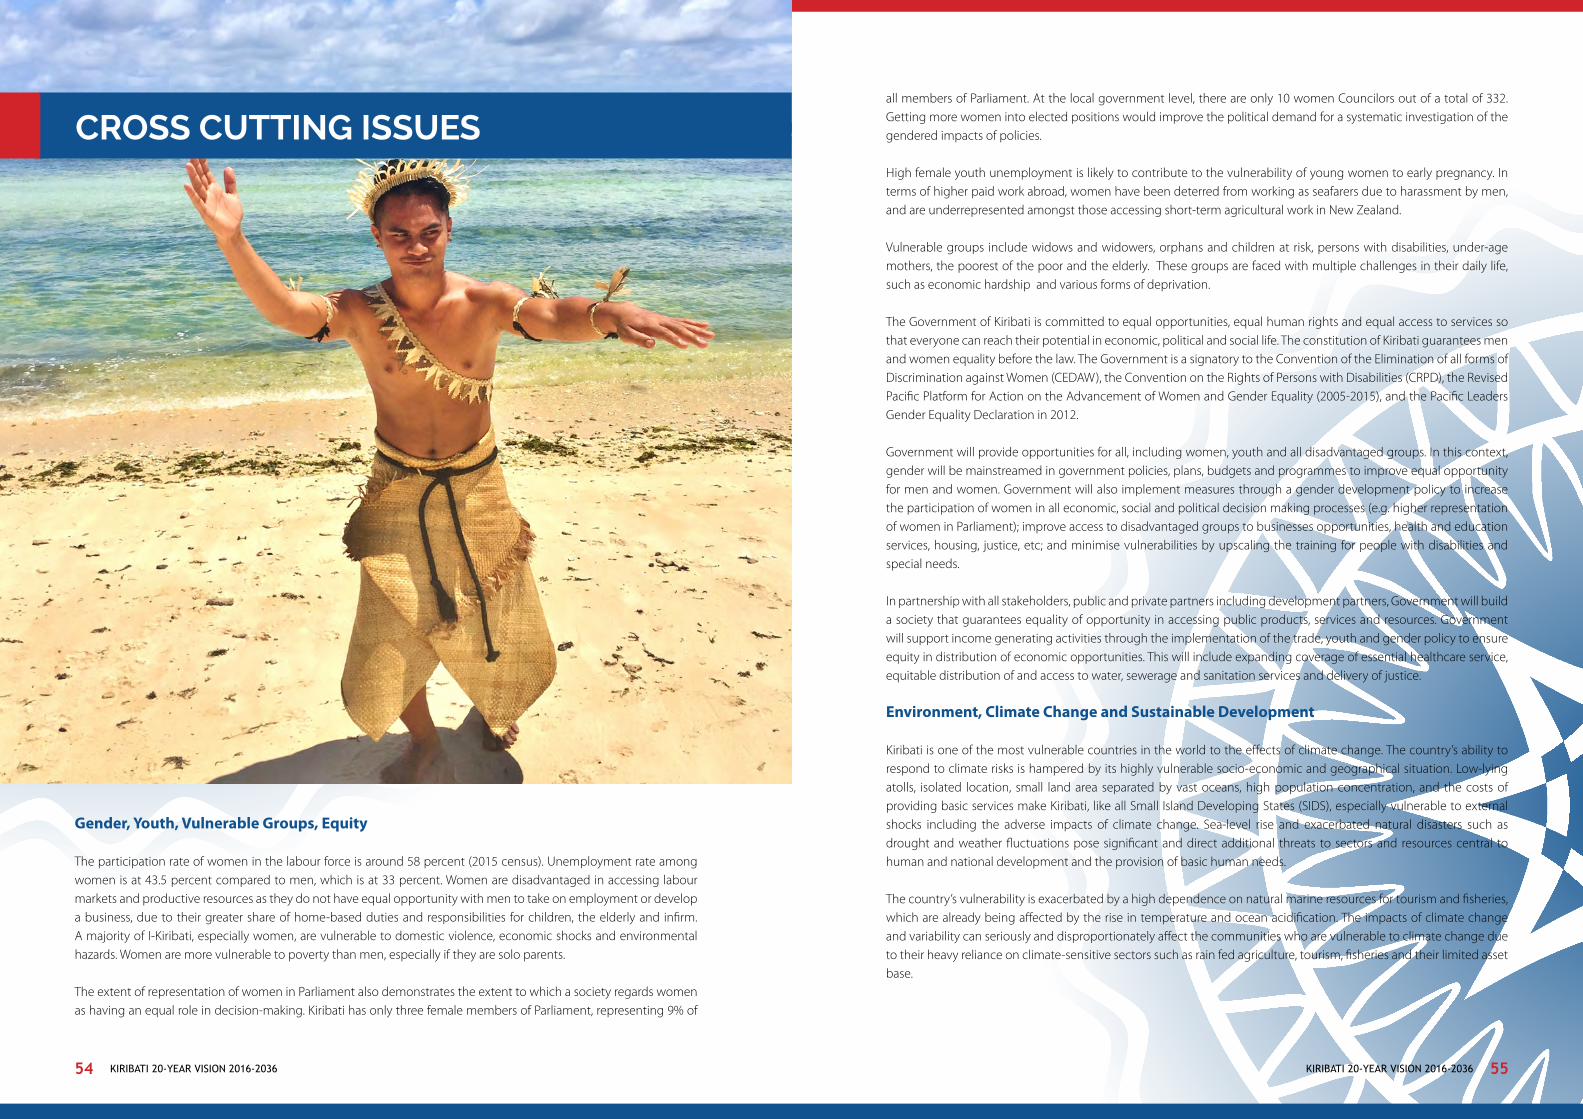
KIRIBATI 20-YEAR VISION 2016-2036 KIRIBATI 20-YEAR VISION 2016-203654 55
Gender, Youth, Vulnerable Groups, Equity
The participation rate of women in the labour force is around 58 percent (2015 census). Unemployment rate among women is at 43.5 percent compared to men, which is at 33 percent. Women are disadvantaged in accessing labour markets and productive resources as they do not have equal opportunity with men to take on employment or develop a business, due to their greater share of home-based duties and responsibilities for children, the elderly and infirm. A majority of I-Kiribati, especially women, are vulnerable to domestic violence, economic shocks and environmental hazards. Women are more vulnerable to poverty than men, especially if they are solo parents.
The extent of representation of women in Parliament also demonstrates the extent to which a society regards women as having an equal role in decision-making. Kiribati has only three female members of Parliament, representing 9% of
CROSS CUTTING ISSUESall members of Parliament. At the local government level, there are only 10 women Councilors out of a total of 332. Getting more women into elected positions would improve the political demand for a systematic investigation of the gendered impacts of policies.
High female youth unemployment is likely to contribute to the vulnerability of young women to early pregnancy. In terms of higher paid work abroad, women have been deterred from working as seafarers due to harassment by men, and are underrepresented amongst those accessing short-term agricultural work in New Zealand.
Vulnerable groups include widows and widowers, orphans and children at risk, persons with disabilities, under-age mothers, the poorest of the poor and the elderly. These groups are faced with multiple challenges in their daily life, such as economic hardship and various forms of deprivation.
The Government of Kiribati is committed to equal opportunities, equal human rights and equal access to services so that everyone can reach their potential in economic, political and social life. The constitution of Kiribati guarantees men and women equality before the law. The Government is a signatory to the Convention of the Elimination of all forms of Discrimination against Women (CEDAW), the Convention on the Rights of Persons with Disabilities (CRPD), the Revised Pacific Platform for Action on the Advancement of Women and Gender Equality (2005-2015), and the Pacific Leaders Gender Equality Declaration in 2012.
Government will provide opportunities for all, including women, youth and all disadvantaged groups. In this context, gender will be mainstreamed in government policies, plans, budgets and programmes to improve equal opportunity for men and women. Government will also implement measures through a gender development policy to increase the participation of women in all economic, social and political decision making processes (e.g. higher representation of women in Parliament); improve access to disadvantaged groups to businesses opportunities, health and education services, housing, justice, etc; and minimise vulnerabilities by upscaling the training for people with disabilities and special needs.
In partnership with all stakeholders, public and private partners including development partners, Government will build a society that guarantees equality of opportunity in accessing public products, services and resources. Government will support income generating activities through the implementation of the trade, youth and gender policy to ensure equity in distribution of economic opportunities. This will include expanding coverage of essential healthcare service, equitable distribution of and access to water, sewerage and sanitation services and delivery of justice.
Environment, Climate Change and Sustainable Development Kiribati is one of the most vulnerable countries in the world to the effects of climate change. The country’s ability to respond to climate risks is hampered by its highly vulnerable socio-economic and geographical situation. Low-lying atolls, isolated location, small land area separated by vast oceans, high population concentration, and the costs of providing basic services make Kiribati, like all Small Island Developing States (SIDS), especially vulnerable to external shocks including the adverse impacts of climate change. Sea-level rise and exacerbated natural disasters such as drought and weather fluctuations pose significant and direct additional threats to sectors and resources central to human and national development and the provision of basic human needs.
The country’s vulnerability is exacerbated by a high dependence on natural marine resources for tourism and fisheries, which are already being affected by the rise in temperature and ocean acidification. The impacts of climate change and variability can seriously and disproportionately affect the communities who are vulnerable to climate change due to their heavy reliance on climate-sensitive sectors such as rain fed agriculture, tourism, fisheries and their limited asset base.

KIRIBATI 20-YEAR VISION 2016-2036 KIRIBATI 20-YEAR VISION 2016-203656 57
In order to reduce vulnerability to climate change, Government will continue to implement and build on existing policy measures towards building adaptive and mitigation capacity, particularly of the most vulnerable people. The policy measures will also reduce exposure or sensitivity to climate impacts. In addition, Government will mainstream climate change adaptation and mitigation through development and effective implementation of strategies that fully integrate climate change concerns into various programmes, to ensure that the working environment is sensitive to climate change and sustainable development given the overreliance on tourism and fisheries sectors which are highly vulnerable to the impact of climate change. Sufficient technical capacity and human resources to successfully mainstream climate change adaptation and mitigation measures will also be heightened for effective implementation of climate change related adaptation measures. Government will improve its capacity to access and utilise the existing Climate Finance Mechanisms. Government will also undertake an evaluation of risks to poverty reduction activities associated with climate variability and change, and identify effective, efficient and equitable adaptation measures to reduce those risks and harness opportunities for building adaptive capacity for greater and more sustainable development for all.
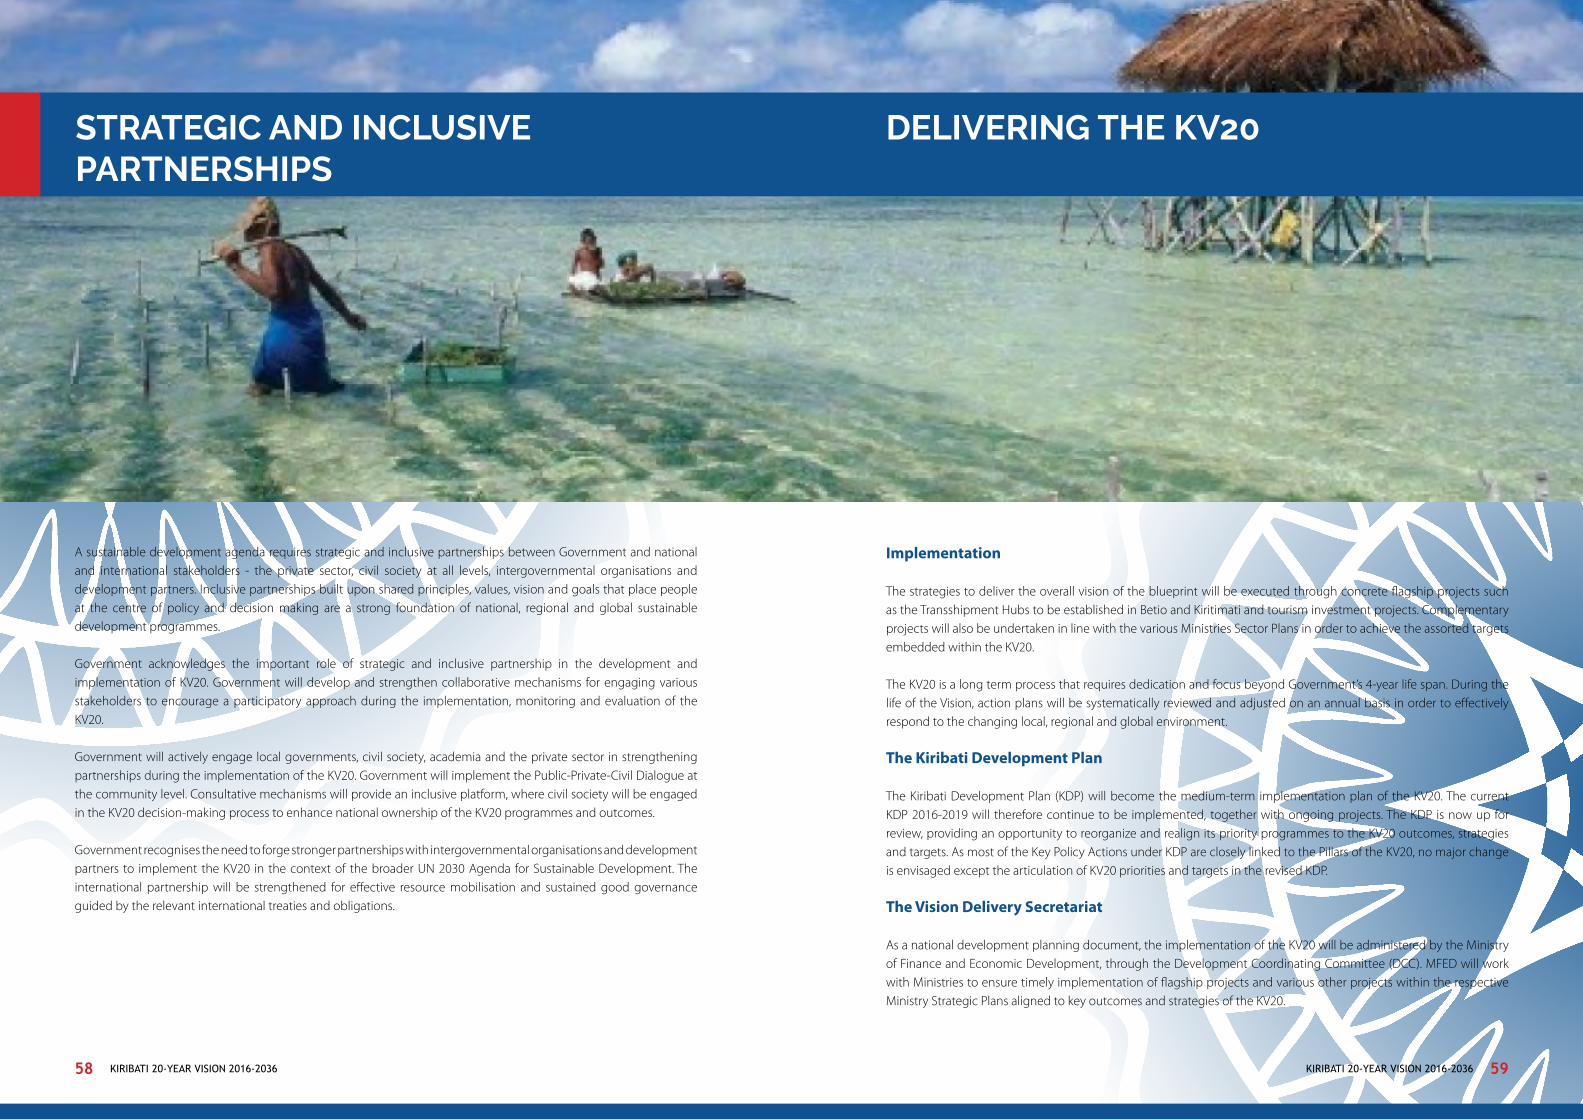
KIRIBATI 20-YEAR VISION 2016-2036 KIRIBATI 20-YEAR VISION 2016-203658 59
A sustainable development agenda requires strategic and inclusive partnerships between Government and national and international stakeholders - the private sector, civil society at all levels, intergovernmental organisations and development partners. Inclusive partnerships built upon shared principles, values, vision and goals that place people at the centre of policy and decision making are a strong foundation of national, regional and global sustainable development programmes.
Government acknowledges the important role of strategic and inclusive partnership in the development and implementation of KV20. Government will develop and strengthen collaborative mechanisms for engaging various stakeholders to encourage a participatory approach during the implementation, monitoring and evaluation of the KV20.
Government will actively engage local governments, civil society, academia and the private sector in strengthening partnerships during the implementation of the KV20. Government will implement the Public-Private-Civil Dialogue at the community level. Consultative mechanisms will provide an inclusive platform, where civil society will be engaged in the KV20 decision-making process to enhance national ownership of the KV20 programmes and outcomes.
Government recognises the need to forge stronger partnerships with intergovernmental organisations and development partners to implement the KV20 in the context of the broader UN 2030 Agenda for Sustainable Development. The international partnership will be strengthened for effective resource mobilisation and sustained good governance guided by the relevant international treaties and obligations.
Implementation
The strategies to deliver the overall vision of the blueprint will be executed through concrete flagship projects such as the Transshipment Hubs to be established in Betio and Kiritimati and tourism investment projects. Complementary projects will also be undertaken in line with the various Ministries Sector Plans in order to achieve the assorted targets embedded within the KV20.
The KV20 is a long term process that requires dedication and focus beyond Government’s 4-year life span. During the life of the Vision, action plans will be systematically reviewed and adjusted on an annual basis in order to effectively respond to the changing local, regional and global environment.
The Kiribati Development Plan
The Kiribati Development Plan (KDP) will become the medium-term implementation plan of the KV20. The current KDP 2016-2019 will therefore continue to be implemented, together with ongoing projects. The KDP is now up for review, providing an opportunity to reorganize and realign its priority programmes to the KV20 outcomes, strategies and targets. As most of the Key Policy Actions under KDP are closely linked to the Pillars of the KV20, no major change is envisaged except the articulation of KV20 priorities and targets in the revised KDP.
The Vision Delivery Secretariat
As a national development planning document, the implementation of the KV20 will be administered by the Ministry of Finance and Economic Development, through the Development Coordinating Committee (DCC). MFED will work with Ministries to ensure timely implementation of flagship projects and various other projects within the respective Ministry Strategic Plans aligned to key outcomes and strategies of the KV20.
STRATEGIC AND INCLUSIVE PARTNERSHIPS
DELIVERING THE KV20
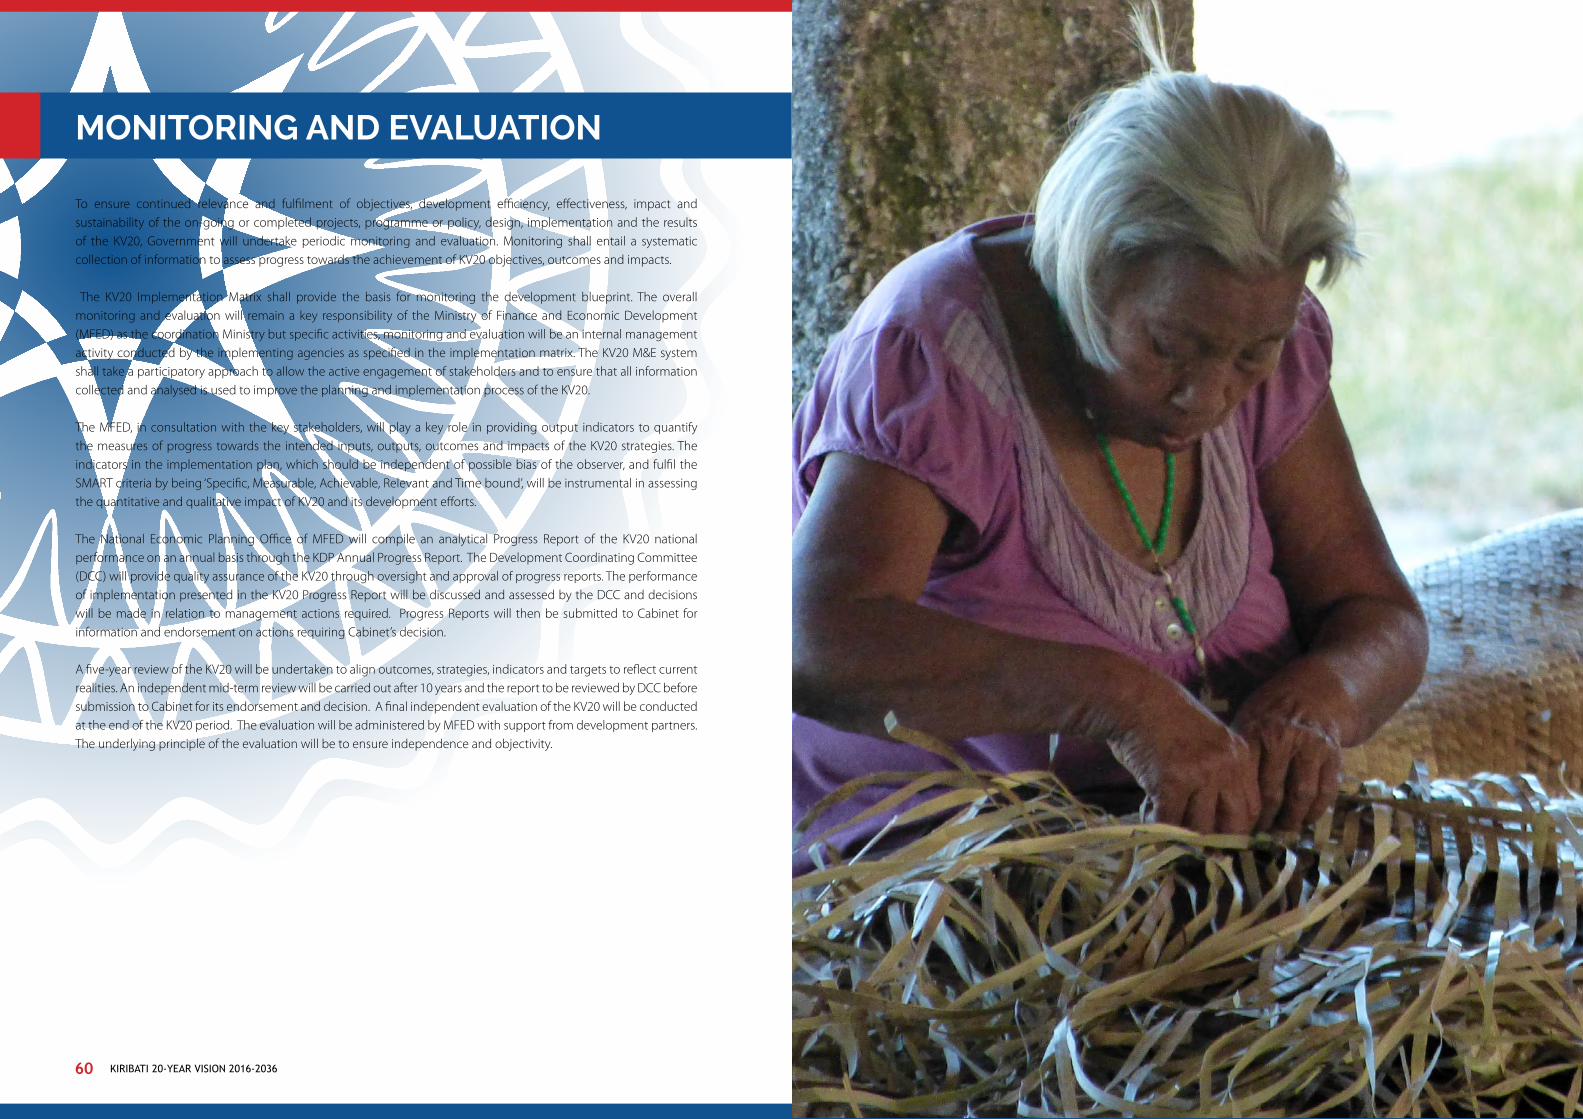
KIRIBATI 20-YEAR VISION 2016-2036 KIRIBATI 20-YEAR VISION 2016-203660 61
To ensure continued relevance and fulfilment of objectives, development efficiency, effectiveness, impact and sustainability of the on-going or completed projects, programme or policy, design, implementation and the results of the KV20, Government will undertake periodic monitoring and evaluation. Monitoring shall entail a systematic collection of information to assess progress towards the achievement of KV20 objectives, outcomes and impacts.
The KV20 Implementation Matrix shall provide the basis for monitoring the development blueprint. The overall monitoring and evaluation will remain a key responsibility of the Ministry of Finance and Economic Development (MFED) as the coordination Ministry but specific activities, monitoring and evaluation will be an internal management activity conducted by the implementing agencies as specified in the implementation matrix. The KV20 M&E system shall take a participatory approach to allow the active engagement of stakeholders and to ensure that all information collected and analysed is used to improve the planning and implementation process of the KV20.
The MFED, in consultation with the key stakeholders, will play a key role in providing output indicators to quantify the measures of progress towards the intended inputs, outputs, outcomes and impacts of the KV20 strategies. The indicators in the implementation plan, which should be independent of possible bias of the observer, and fulfil the SMART criteria by being ‘Specific, Measurable, Achievable, Relevant and Time bound’, will be instrumental in assessing the quantitative and qualitative impact of KV20 and its development efforts.
The National Economic Planning Office of MFED will compile an analytical Progress Report of the KV20 national performance on an annual basis through the KDP Annual Progress Report. The Development Coordinating Committee (DCC) will provide quality assurance of the KV20 through oversight and approval of progress reports. The performance of implementation presented in the KV20 Progress Report will be discussed and assessed by the DCC and decisions will be made in relation to management actions required. Progress Reports will then be submitted to Cabinet for information and endorsement on actions requiring Cabinet’s decision.
A five-year review of the KV20 will be undertaken to align outcomes, strategies, indicators and targets to reflect current realities. An independent mid-term review will be carried out after 10 years and the report to be reviewed by DCC before submission to Cabinet for its endorsement and decision. A final independent evaluation of the KV20 will be conducted at the end of the KV20 period. The evaluation will be administered by MFED with support from development partners. The underlying principle of the evaluation will be to ensure independence and objectivity.
MONITORING AND EVALUATION
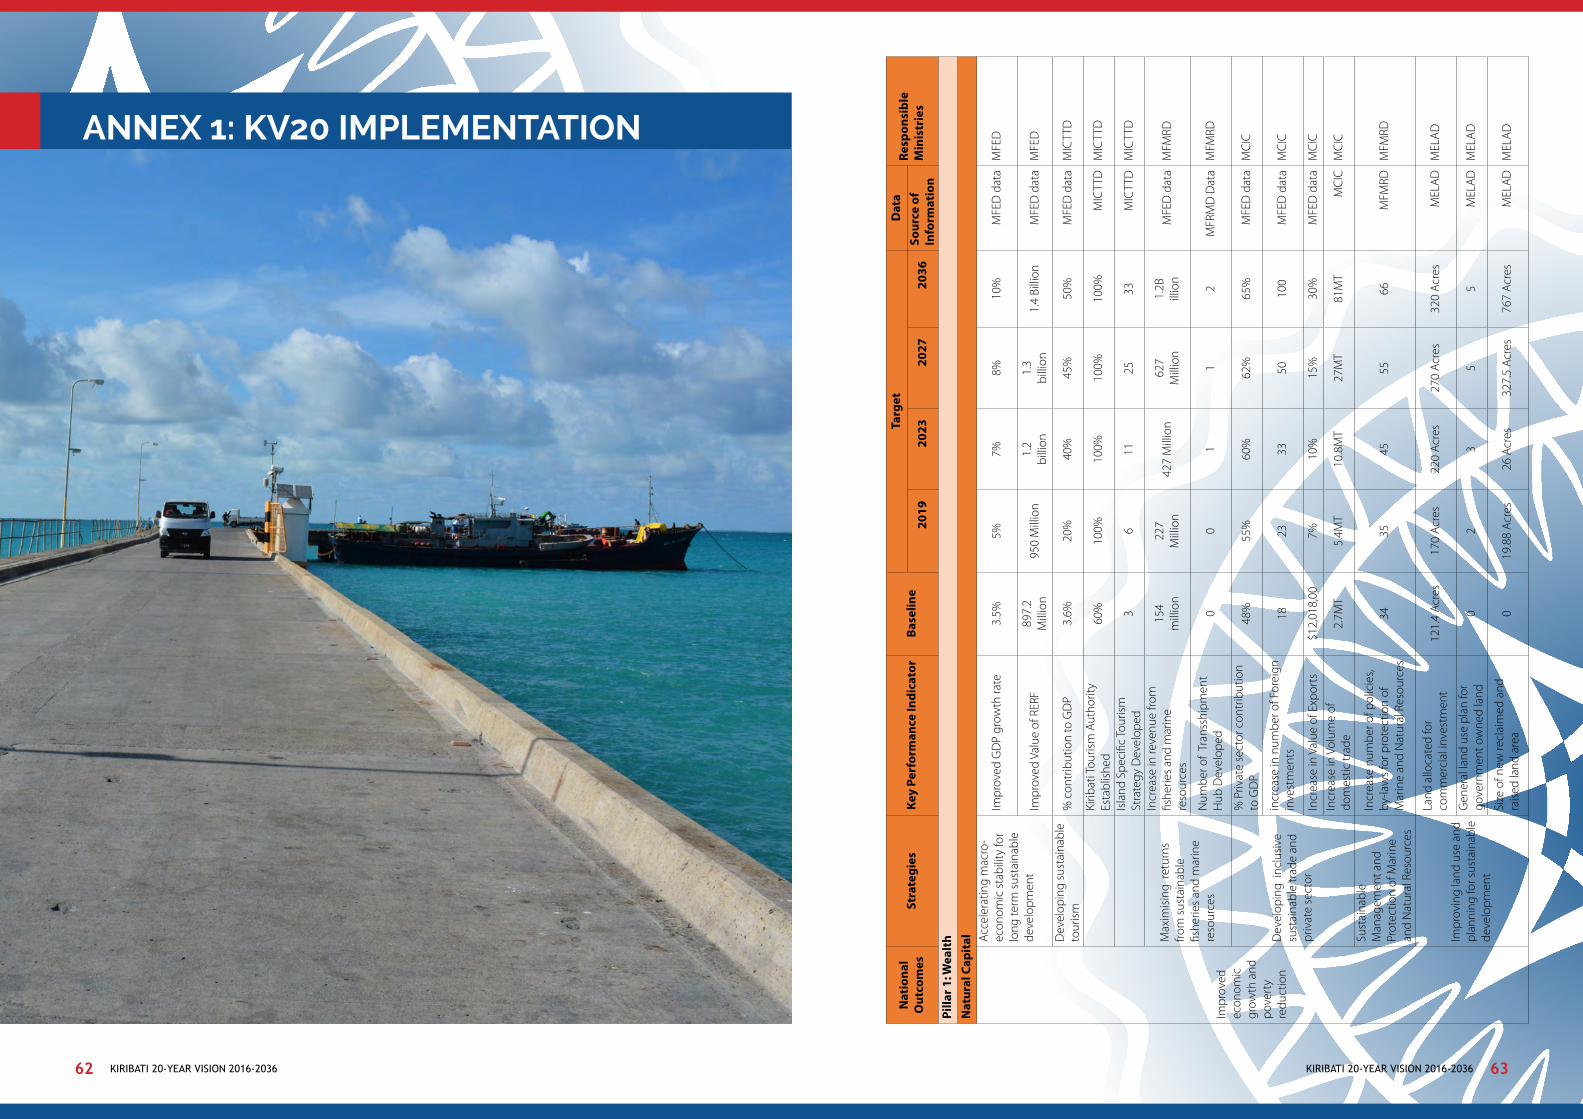
KIRIBATI 20-YEAR VISION 2016-2036 KIRIBATI 20-YEAR VISION 2016-203662 63
Nat
iona
l O
utco
mes
St
rate
gies
Key
Perf
orm
ance
Indi
cato
rBa
selin
eTa
rget
Dat
a Re
spon
sibl
e M
inis
trie
s20
1920
2320
2720
36So
urce
of
Info
rmat
ion
Pilla
r 1: W
ealt
h N
atur
al C
apit
al
Impr
oved
ec
onom
ic
grow
th a
nd
pove
rty
redu
ctio
n
Acc
eler
atin
g m
acro
-ec
onom
ic s
tabi
lity
for
long
term
sus
tain
able
de
velo
pmen
t
Impr
oved
GD
P gr
owth
rate
3.5%
5%7%
8%10
%M
FED
dat
aM
FED
Impr
oved
Val
ue o
f RER
F89
7.2
Mill
ion
950
Mill
ion
1.2
billi
on1.
3bi
llion
1.4
Billi
on
MFE
D d
ata
MFE
D
Dev
elop
ing
sust
aina
ble
tour
ism
%
con
trib
utio
n to
GD
P3.
6%20
%40
%45
%50
%M
FED
dat
aM
ICTT
D
Kirib
ati T
ouris
m A
utho
rity
Esta
blis
hed
60
%10
0%10
0%10
0%10
0%M
ICTT
DM
ICTT
D
Isla
nd S
peci
fic T
ouris
m
Stra
tegy
Dev
elop
ed3
611
2533
MIC
TTD
MIC
TTD
Max
imis
ing
retu
rns
from
sus
tain
able
fis
herie
s an
d m
arin
e re
sour
ces
Incr
ease
in re
venu
e fro
m
fishe
ries
and
mar
ine
reso
urce
s
154
mill
ion
227
Mill
ion
427
Mill
ion
627
Mill
ion
1.2B
illio
nM
FED
dat
aM
FMRD
Num
ber o
f Tr
anss
hipm
ent
Hub
Dev
elop
ed0
01
12
MFR
MD
Dat
a M
FMRD
Dev
elop
ing
incl
usiv
e
sust
aina
ble
trad
e an
d pr
ivat
e se
ctor
% P
rivat
e se
ctor
con
trib
utio
n to
GD
P48
%55
%60
%62
%65
%M
FED
dat
aM
CIC
incr
ease
in n
umbe
r of F
orei
gn
inve
stm
ents
1823
3350
100
MFE
D d
ata
MC
IC
Incr
ease
in V
alue
of E
xpor
ts$1
2,01
8,00
7%10
%15
%30
%M
FED
dat
aM
CIC
Incr
ease
in V
olum
e of
do
mes
tic tr
ade
2.7M
T5.
4MT
10.8
MT
27M
T81
MT
MC
ICM
CIC
Sust
aina
ble
Man
agem
ent a
nd
Prot
ectio
n of
Mar
ine
and
Nat
ural
Res
ourc
es
Incr
ease
num
ber o
f pol
icie
s, by
-law
s fo
r pro
tect
ion
of
Mar
ine
and
Nat
ural
Res
ourc
es34
3545
5566
MFM
RDM
FMRD
Impr
ovin
g la
nd u
se a
nd
plan
ning
for s
usta
inab
le
deve
lopm
ent
Land
allo
cate
d fo
r co
mm
erci
al in
vest
men
t12
1.4
Acr
es17
0 A
cres
220
Acr
es27
0 A
cres
320
Acr
esM
ELA
DM
ELA
D
Gen
eral
land
use
pla
n fo
r go
vern
men
t ow
ned
land
02
35
5M
ELA
DM
ELA
D
Size
of n
ew re
clai
med
and
ra
ised
land
are
a0
19.8
8 A
cres
26 A
cres
327.
5 A
cres
767
Acr
esM
ELA
DM
ELA
D ANNEX 1: KV20 IMPLEMENTATION MATRIX
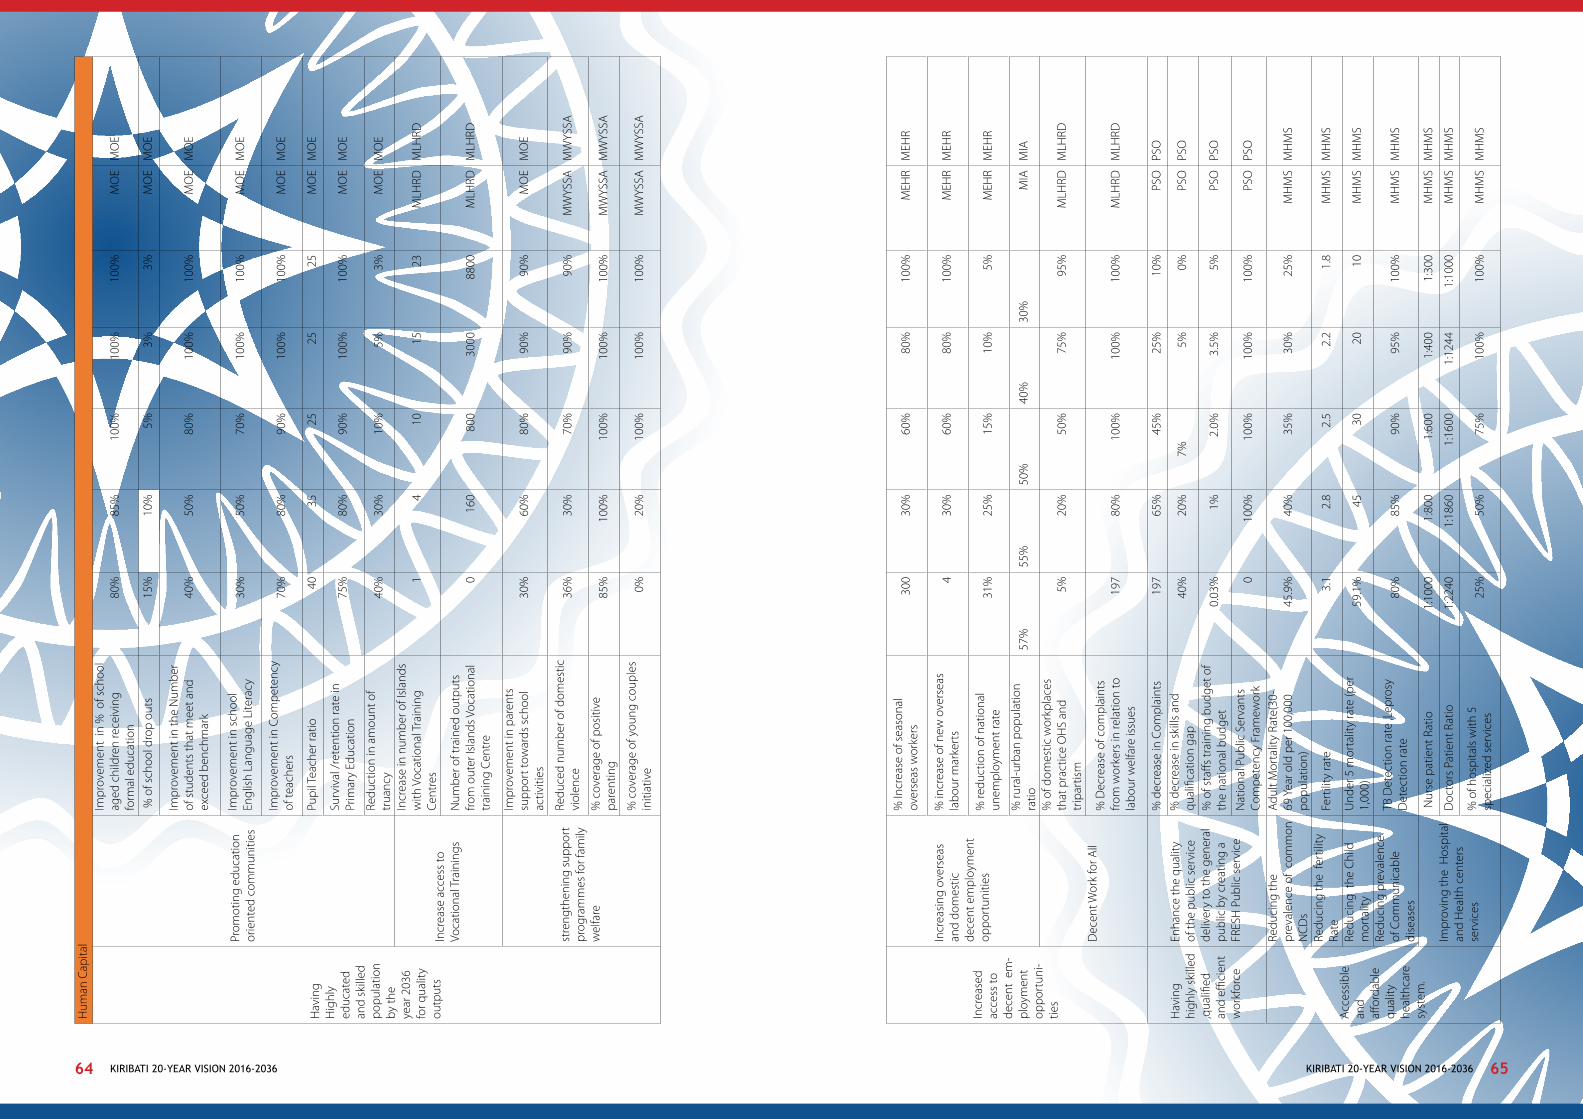
KIRIBATI 20-YEAR VISION 2016-2036 KIRIBATI 20-YEAR VISION 2016-203664 65
Hum
an C
apita
l
Hav
ing
Hig
hly
educ
ated
an
d sk
illed
po
pula
tion
by th
e ye
ar 2
036
for q
ualit
y ou
tput
s
Prom
otin
g ed
ucat
ion
orie
nted
com
mun
ities
Impr
ovem
ent
in %
of s
choo
l ag
ed c
hild
ren
rece
ivin
g fo
rmal
edu
catio
n 80
%85
%10
0%10
0%10
0%M
OE
MO
E
% o
f sch
ool d
rop
outs
15
%10
%5%
3%3%
MO
EM
OE
Impr
ovem
ent i
n th
e N
umbe
r of
stu
dent
s th
at m
eet a
nd
exce
ed b
ench
mar
k40
%50
%80
%10
0%10
0%M
OE
MO
E
Impr
ovem
ent i
n sc
hool
En
glis
h La
ngua
ge L
itera
cy
30%
50%
70%
100%
100%
MO
EM
OE
Impr
ovem
ent i
n Co
mpe
tenc
y of
teac
hers
70
%80
%90
%10
0%10
0%M
OE
MO
E
Pupi
l Tea
cher
ratio
4035
2525
25M
OE
MO
E
Surv
ival
/re
tent
ion
rate
in
Prim
ary
Educ
atio
n 75
%80
%90
%10
0%10
0%M
OE
MO
E
Redu
ctio
n in
am
ount
of
trua
ncy
40%
30%
10%
5%3%
MO
EM
OE
Incr
ease
acc
ess
to
Voca
tiona
l Tra
inin
gs
Incr
ease
in n
umbe
r of I
slan
ds
with
Voc
atio
nal T
rain
ing
Cent
res
14
1015
23M
LHRD
MLH
RD
Num
ber o
f tra
ined
out
puts
fro
m o
uter
Isla
nds V
ocat
iona
l tr
aini
ng C
entr
e0
160
800
3000
8800
MLH
RDM
LHRD
stre
ngth
enin
g su
ppor
t pr
ogra
mm
es fo
r fam
ily
wel
fare
Impr
ovem
ent i
n pa
rent
s su
ppor
t tow
ards
sch
ool
activ
ities
30%
60%
80%
90%
90%
MO
EM
OE
Redu
ced
num
ber o
f dom
estic
vi
olen
ce36
%30
%70
%90
%90
%M
WYS
SAM
WYS
SA
% c
over
age
of p
ositi
ve
pare
ntin
g85
%10
0%10
0%10
0%10
0%M
WYS
SAM
WYS
SA
% c
over
age
of y
oung
cou
ples
in
itiat
ive
0%20
%10
0%10
0%10
0%M
WYS
SAM
WYS
SA
Incr
ease
d ac
cess
to
dece
nt e
m-
ploy
men
t op
port
uni-
ties
Incr
easi
ng o
vers
eas
and
dom
estic
de
cent
em
ploy
men
t op
port
uniti
es
% In
crea
se o
f sea
sona
l ov
erse
as w
orke
rs30
030
%60
%80
%10
0%M
EHR
MEH
R
% in
crea
se o
f new
ove
rsea
s la
bour
mar
kert
s4
30%
60%
80%
100%
MEH
RM
EHR
% re
duct
ion
of n
atio
nal
unem
ploy
men
t rat
e31
%25
%15
%10
%5%
MEH
RM
EHR
% ru
ral-u
rban
pop
ulat
ion
ratio
57
%55
%50
%
40%
30%
MIA
MIA
Dec
ent W
ork
for A
ll
% o
f dom
estic
wor
kpla
ces
that
pra
ctic
e O
HS
and
trip
artis
m
5%20
%50
%75
%95
%M
LHRD
MLH
RD
% D
ecre
ase
of c
ompl
aint
s fro
m w
orke
rs in
rela
tion
to
labo
ur w
elfa
re is
sues
197
80%
100%
100%
100%
MLH
RDM
LHRD
Hav
ing
high
ly s
kille
d ,q
ualifi
ed
and
effici
ent
wor
kfor
ce
Enha
nce
the
qual
ity
of th
e pu
blic
ser
vice
de
liver
y to
the
gene
ral
publ
ic b
y cr
eatin
g a
FRES
H P
ublic
ser
vice
% d
ecre
ase
in C
ompl
aint
s19
765
%45
%25
%10
%PS
OPS
O
% d
ecre
ase
in s
kills
and
qu
alifi
catio
n ga
p40
%20
%7%
5%0%
PSO
PSO
% o
f sta
ffs tr
aini
ng b
udge
t of
the
natio
nal b
udge
t0.
03%
1%2.
0%3.
5%5%
PSO
PSO
Nat
iona
l Pub
lic S
erva
nts
Com
pete
ncy
Fram
ewor
k0
100%
100%
100%
100%
PSO
PSO
Acc
essi
ble
and
affor
dabl
e qu
ality
he
alth
care
sy
stem
.
Redu
cing
the
prev
alen
ce o
f co
mm
on
NC
Ds
Adu
lt M
orta
lity
Rate
(30-
69 Y
ear o
ld p
er 1
00,0
00
popu
latio
n)45
.9%
40%
35%
30%
25%
MH
MS
MH
MS
Redu
cing
the
fert
ility
Ra
teFe
rtili
ty ra
te3.
12.
82.
52.
21.
8M
HM
SM
HM
S
Redu
cing
the
Chi
ld
mor
talit
y U
nder
5 m
orta
lity
rate
(per
1,
000)
59.1
%45
3020
10M
HM
SM
HM
S
Redu
cing
pre
vale
nce
of C
omm
unic
able
di
seas
es
TB D
etec
tion
rate
,Lep
rosy
D
etec
tion
rate
80
%85
%90
%95
%10
0%M
HM
SM
HM
S
Impr
ovin
g th
e H
ospi
tal
and
Hea
lth c
ente
rs
serv
ices
Nur
se p
atie
nt R
atio
1:10
001:
800
1:60
01:
400
1:30
0M
HM
SM
HM
S
Doc
tors
Pat
ient
Rat
io1:
2240
1:18
601:
1600
1:12
441:
1000
MH
MS
MH
MS
% o
f hos
pita
ls w
ith 5
sp
ecia
lized
ser
vice
s25
%50
%75
%10
0%10
0%M
HM
SM
HM
S

KIRIBATI 20-YEAR VISION 2016-2036 KIRIBATI 20-YEAR VISION 2016-203666 67
Cultu
ral C
apita
l
Tra
ditio
nal
skill
s an
d kn
owle
dge
safe
guar
ded,
no
uris
hed
and
revi
ved
To s
afeg
uard
,rev
ive
and
prom
ote
tang
ible
and
in
tang
ible
cul
tura
l and
hi
stor
ical
her
itage
s
Nat
iona
l Pla
n/fra
mew
ork
to
safe
guar
d an
d re
vive
tang
ible
an
d in
tang
ible
cul
tura
l an
d hi
stor
ical
her
itage
s de
velo
ped
01
22
2M
IAM
IA
num
ber o
f le
vel o
f cul
tura
l si
tes
and
mon
umen
ts/
shrin
es/a
ttra
ctio
ns
mai
ntai
ned
026
2626
26M
IAM
IA
num
ber o
f his
toric
al s
ites
mai
ntai
ned
08
88
9M
IAM
IA
Num
ber o
f cul
tura
l in
stitu
tions
/att
ract
ions
/ce
ntre
s bu
ilt3
610
1624
MIA
MIA
Num
ber o
f cul
tura
l fes
tival
s 2
46
810
MIA
MIA
Num
ber o
f cul
tura
l gro
ups
tour
s/ex
chan
ge p
rogr
ams
14
610
10M
IAM
IA
PILL
AR
2: P
EAC
E A
ND
SEC
URI
TY
A s
ecur
e,
safe
r and
Pe
acef
ul
Kirib
ati
Stre
ngth
enin
g N
atio
nal
Secu
rity
gove
rnan
ce –
polic
y fra
mew
orks
Nat
iona
l Sec
urity
Str
ateg
ic
Polic
y fra
mew
ork
esta
blis
hed
0%10
0%10
0%10
0%10
0%M
OJ
MO
J, KP
S,
MEL
AD
, MFA
I and
O
B,M
FMRD
,MH
MS
Inst
itutio
nal
stre
ngth
enin
g
Num
ber o
f mod
erni
zed
secu
rity
man
agem
ent
syst
ems
(bor
der c
ontr
ol
syst
em a
nd K
iriba
ti M
etro
logi
cal s
ervi
ces
wea
ther
an
d cl
imat
e va
riabi
lity
data
an
d in
form
atio
n)
15%
50%
75%
85%
100%
OB
MO
J, KP
S, M
ELA
D,
MFA
I and
OB
% n
umbe
r of l
egis
latio
ns
revi
ewed
and
upd
ated
10%
50%
90%
95%
100%
MO
J,OB
MO
J,OB,
OA
G
% n
umbe
r of p
olic
ies
/na
tiona
l pla
ns re
view
ed a
nd
upda
ted
0%25
%50
%10
0%10
0%O
BO
B
% In
crea
se in
the
num
ber
of w
ell-e
quip
ped
stat
ions
/in
stitu
tions
est
ablis
hed
and
oper
atio
nal
10%
65%
95%
100%
100%
OB
OB
Stre
ngth
enin
g st
rate
gic
part
ners
hips
In
tern
atio
nal P
artn
ersh
ips
25%
60%
75%
85%
10
0%
MFA
I
PILL
AR
3: IN
FRA
STRU
CTU
RE F
OR
DEV
ELO
PMEN
T Ec
onom
ic In
frast
ruct
ure:
1. L
ogis
tical
Inte
rcon
nect
ivity
Pro
gram
me,
2. I
CT
Prog
ram
me
and
3. R
oad
Reha
bilit
atio
n Pr
ogra
mm
e
Impr
oved
co
nnec
tivity
an
d ac
cess
ibili
ty
To i
mpr
ove
Air,
Lan
d an
d Se
a Tr
ansp
ort
infra
stru
ctur
e
Num
ber o
f isl
ands
with
tar-
seal
ed ro
ad(o
ut o
f 19)
06
19M
ICTD
MIC
TTD
Num
ber o
f isl
ands
with
Das
h 8
rate
d ai
rfiel
d(ou
t of 1
9)0
619
MIC
TDM
ICTT
D
Num
ber o
f Flig
ht s
ched
ules
pe
r mon
th
40 (3
6 do
mes
tic, 4
In
tern
atio
nal)
50 (4
2 do
mes
tic, 8
In
tern
atio
nal)
60 (5
0 do
mes
tic, 1
0 In
tern
atio
nal)
70 (6
0 do
emes
tic, 1
0 In
tern
atio
nal)
70 (6
0 do
emes
tic,
10
Inte
rnat
iona
l)
MIC
TDM
ICTT
D
Ave
rage
Num
ber o
f shi
ppin
g vo
yage
s pe
r mon
th24
3040
4550
MIC
TTD
MIC
TTD
Num
ber o
f mai
n is
land
sea
-po
rts
reha
bilit
ated
44
45
6M
ICTT
DM
ICTT
D
Runw
ay L
ight
s fo
r Cas
sidy
A
irpor
t1
done
MIC
TTD
- KI
AP
MIC
TTD
% o
f lan
d is
sues
reso
lved
th
roug
h co
nsul
tatio
n/pu
rcha
se10
0%10
0%
MIC
TTD
to
iden
tify
inlin
e w
ith A
irpor
t up
grad
ing
MIC
TTD
and
M
ELA
D
To h
arm
onis
e in
frast
ruct
ural
de
velo
pmen
t for
to
uris
m
Num
ber o
f Isl
and
with
Isla
nd-
spec
ific
Tour
ism
Str
ateg
y3
611
2533
MIC
TTD
MIC
TTD
Num
ber o
f Tou
rism
Cap
acity
bu
ildin
g tr
aini
ngs
811
2335
63M
ICTT
DM
ICTT
D
Esta
blis
hmen
t of K
iriba
ti To
uris
m A
utho
rity
60%
Don
eM
ICTT
DM
ICTT
D
Dev
elop
ing
and
Stre
ngth
enin
g le
gal
mec
hani
sms
for s
usta
inab
le
tour
ism
60%
Don
eM
ICTT
DM
ICTT
D
To I
mpr
ove
ICT
infra
stru
ctur
e de
velo
pmen
t
Num
ber o
f mob
ile
conn
ectiv
ity23
,000
49%
60%
70%
80%
CCK,
ATH
KL,IT
UM
ICTD
% In
tern
et p
enet
ratio
n11
.50%
47%
60%
85%
100%
CCK
MIC
TD
Num
ber o
f bro
adba
nd u
sers
592
45%
65%
80%
90%
CCK,
ATH
KL,IT
UM
ICTD

KIRIBATI 20-YEAR VISION 2016-2036 KIRIBATI 20-YEAR VISION 2016-203668 69
Impr
oved
soc
ial i
nfra
stru
ctur
e se
rvic
es: S
ocia
l Inf
rast
ruct
ure
1. R
enew
able
ene
rgy
2. W
ater
and
san
itatio
n 3.
Civ
il w
orks
and
pub
lic s
ervi
ces
Impr
oved
ac
cess
to
util
ity
and
soci
al
infra
stru
ctur
e
To im
prov
e ac
cess
to
qual
ity u
tility
and
soc
ial
infra
stru
ctur
e
% in
crea
se in
Num
ber o
f Pu
blic
Hea
lth F
acili
ties/
Cent
res
103
10%
30%
40%
60%
MH
MS
MIS
E
Num
ber o
f new
cla
ssro
oms
Prim
ary
926,
JSS
-330
,SSS
- 106
P20,
J10,
S0
P50,
J50,
S0
P100
, J10
0,
S40
P200
, J20
0,
S60
MO
EM
OE
Ener
gy s
ervi
ce c
over
age
90%
100%
100%
100%
100%
MPW
UM
ISE
Perc
enta
ge o
f hou
seho
ld
acce
ssin
g po
tabl
e w
ater
60%
75%
100%
100%
100
MPW
UM
ISE
Perc
enta
ge o
f hou
seho
ld
with
sui
tabl
e to
ilet f
acili
ties
15%
50%
75%
100%
100%
MPW
UM
ISE
Num
ber o
f new
isla
nd s
port
ce
nter
s1
88
70
MW
YSSA
MW
YSSA
PILL
AR
4:G
OVE
RNA
NC
E
Cre
atin
g a
corr
upt -
free
so
ciet
y
Stre
ngth
en n
atio
nal
and
loca
l /tr
aditi
onal
/cu
ltura
l gov
erna
nce
polic
y an
d le
gisl
ativ
e fra
me
wor
k.
Revi
sed,
upd
ates
and
in
trod
uce
legi
slat
ions
, by
e-la
ws
and
polic
y fra
me
wor
ks u
nder
pinn
ing
good
go
vern
ance
5%65
%75
%80
%10
0%M
OJ
MO
J
Stre
ngth
en s
trat
egic
pa
rtne
rshi
p
Forg
ed s
tron
g pa
rtne
rshi
p pr
ogra
m w
ith fa
ith-b
ased
an
d co
mm
unity
bas
ed
orga
niza
tions
30%
55%
85%
90%
100%
MO
JM
OJ
Fost
er, a
nd s
tren
gthe
n th
e in
tegr
ity a
nd
inde
pend
ence
of
inst
itutio
ns m
anda
ted
to p
rom
ote
good
go
vern
ance
and
el
imin
ates
cor
rupt
ion
% o
f com
plia
nce
to U
NC
AC
in
tegr
ity a
nd in
depe
nden
ce
requ
irem
ent
40%
75%
80%
100%
100%
MO
JM
OJ
% o
f com
plia
nce
to
Inte
rnat
iona
l Tra
nspa
renc
y in
tegr
ity a
nd in
depe
nden
ce
requ
irem
ent
25%
75%
80%
100%
100
%M
OJ
MO
J
Inst
itutio
naliz
ing
anti-
corr
uptio
n an
d go
od
gove
rnan
ce p
rinci
ples
in
the
publ
ic s
ervi
ce
and
educ
atio
n sy
stem
s in
Kiri
bati
Dev
elop
and
impl
emen
t ed
ucat
iona
l and
pub
lic
awar
enes
s10
%60
%90
%10
0%10
0%M
OJ
MO
J