Voice pathology detection using interlaced derivative ...
25
Voice Pathology Detection Using Interlaced Derivative Pattern on Glottal Source Excitation Ghulam Muhammad 1,* , Mansour Alsulaiman 1 , Zulfiqar Ali 1,2 , Tamer A. Mesallam 3,4,5 , Mohamed Farahat 3,4 , Khalid H. Malki 3,4 , Ahmed Al-nasheri 1 , Mohamed A. Bencherif 1 1 Digital Speech Processing Group, Department of Computer Engineering, College of Computer and Information Sciences, King Saud University, Riyadh 11543, Saudi Arabia. 2 Centre for Intelligent Signal and Imaging Research (CISIR), Department of Electrical and Electronic Engineering, Universiti Teknology PETRONAS, Tronoh 31750, Perak, Malaysia. 3 ENT Department, College of Medicine, King Saud University, Riyadh, Saudi Arabia. 4 Research Chair of Voice, Swallowing, and Communication Disorders, King Saud University, Riyadh, Saudi Arabia. 5 ENT Department, College of Medicine, Menoufiya University, Shebin Alkoum, Egypt. Keywords: Interlaced derivative pattern (IDP), AVPD, SVD, MEEI, Voice pathology detection, Glottal source excitation Abstract: In this paper, we propose a voice pathology detection and classification method using an interlaced derivative pattern (IDP), which involves an n-th order directional derivative, on a spectro-temporal description of a glottal source excitation signal. It is shown previously that directional information is useful to detect pathologies due to its encoding ability along time, frequency, and time- frequency axes. The IDP, being an n-th order derivative, is capable of describing more information than a first order derivative pattern by combining
Transcript of Voice pathology detection using interlaced derivative ...

Voice Pathology Detection Using Interlaced Derivative
Pattern on Glottal Source Excitation
Ghulam Muhammad1,* , Mansour Alsulaiman1, Zulfiqar Ali1,2, Tamer A. Mesallam3,4,5,
Mohamed Farahat3,4 , Khalid H. Malki3,4, Ahmed Al-nasheri1, Mohamed A. Bencherif1
1Digital Speech Processing Group, Department of Computer Engineering, College of
Computer and Information Sciences, King Saud University, Riyadh 11543, Saudi
Arabia.
2Centre for Intelligent Signal and Imaging Research (CISIR), Department of Electrical
and Electronic Engineering, Universiti Teknology PETRONAS, Tronoh 31750, Perak,
Malaysia.
3ENT Department, College of Medicine, King Saud University, Riyadh, Saudi Arabia.
4Research Chair of Voice, Swallowing, and Communication Disorders, King Saud
University, Riyadh, Saudi Arabia.
5ENT Department, College of Medicine, Menoufiya University, Shebin Alkoum,
Egypt.
Keywords: Interlaced derivative pattern (IDP), AVPD, SVD, MEEI, Voice
pathology detection, Glottal source excitation
Abstract:
In this paper, we propose a voice pathology detection and classification method
using an interlaced derivative pattern (IDP), which involves an n-th order
directional derivative, on a spectro-temporal description of a glottal source
excitation signal. It is shown previously that directional information is useful to
detect pathologies due to its encoding ability along time, frequency, and time-
frequency axes. The IDP, being an n-th order derivative, is capable of
describing more information than a first order derivative pattern by combining

all the directional information into one. In the IDP, first-order derivatives are
calculated in four directions, and these derivatives are thresholded with the center
value of each directional channel to produce the final IDP. A support vector
machine is used as a classification technique. Experiments are conducted using
three different databases, which are the Massachusetts Eye and Ear Infirmary
database, Saarbrucken Voice Database, and Arabic Voice Pathology Database.
Experimental results show that the IDP based features give higher accuracy than
that using other related features in all the three databases. The accuracies using
cross-databases are also high using the IDP features.
1. INTRODUCTION
Automatic detection of vocal fold pathologies is an interest to the researchers of
speech or voice community, as well as the respective medical community. This is
due to its non-invasive nature, free from subjective biasness, and relatively low cost.
There have been a lot of researches to detect voice pathology by analyzing voice.
The main emphasis was to develop a feature or a feature vector that can effectively
distinguish between normal and pathological voices. The features can broadly be
divided into two groups, one imported from speech or speaker recognition
applications, and the other from voice quality measurements. The features that came
from speech or speaker recognition applications include Mel-frequency cepstral
coefficients (MFCC), linear prediction cepstral coefficients (LPCC), and relative
spectra per- ceptual linear prediction (RASTA-PLP) [1–3]. On the other hand, the
features coming from voice quality measurements are, among others, shimmer,
jitter, harmonic-to-noise ratio, and cepstral peak prominence [3]. Recently, features
from audio and image process- ing applications are also integrated in voice
pathology detection. These features include MPEG-7 audio features [4], fractal
analysis [5], modulation spectrum [6], formants [35]. The use of nonlinear features
have studied too in the field of voice pathology detection [29–32].
Though there exists a lot of related works, most of them use the Massachusetts
Eye and Ear Infirmary (MEEI) database [7], where normal and pathological samples
are recorded in two different environments. Therefore, for a classification technique,
it is not clear whether the classifier is classifying pathologies or environments. There
are some works that use other databases; however, many of them are using only one
database at a time. The question arises: are the existing voice pathology detection
techniques database dependent? For example, Markaki and Stylianou showed that
normalized modulation spectral features achieve more than 92% detection rate in the
MEEI database, but it drops below 80% in a cross-database experiment [8]. The
same features set without normalization have a detection rate of 94.1% in the MEEI
database, and 62.3% in cross-database. The normalization increases the accuracy in
the cross-database scenario at the expense of a decrease in a single database
experiment. There- fore, there is a need to develop such a features set that achieve a
high accuracy in both single database and cross-database experiments. These
features should also visually justify the detection.
In this paper, a set of features are proposed to detect voice pathology from a glottal
source excitation signal. A voice signal is a convolution between a source signal
(originated from the lung) and the vocal tract filter. In a voiced signal, the vocal folds
open and close in a periodic manner that produces pitch of the signal. The vocal tract
is simply shaping the signal to produce a desired phone. In this study, we refer voice
pathology to an abnormality in voice caused by pathology in the vocal fold(s). Vocal
folds contribute to the glottal source excitation, and therefore, any abnormality in the
glottal source excitation is an indication of voice pathology. There are some
researches of voice pathology detection using the glottal source excitation [9–12]. For
example, glottal formant frequency and bandwidth, spectral balances, and center of
gravity are extracted from the glottal source signal to detect voice pathology in [10].
Features from dynamics of average glottal source and mucosal wave spectrum are used
to detect voice pathology in [11]. In [9], a power spectral density envelop of the
glottal source is utilized in a form of a specific harmonic-to-harmonic relationship.
Back in 1975, Koike and Markel first showed the use of inverse filtering (residue
output) in voice pathology detection in an experiment involving only 10 normal
persons and 10 patients having voice pathology [12]. Residue signal is also used in
[13] for voice pathology detection. There are several techniques to estimate the
glottal source excitation from the voice signal. A good review of this topic can be
found in [14].
In this paper, the first-order derivative of the glottal source excitation is utilized to
extract features. It is well-known that a first-order derivative (without smoothing)
generally decreases the signal-to-noise ratio. Any weak disturbances caused by
irregular vibrations of the vocal folds (due to the location and the shape of the
pathology, elasticity of the tissues, etc.) are emphasized in the first- order derivative
signal. This derivative signal is further processed to have a spectrum. The spectrum is
divided into several bands, whose center frequencies are ‘Mel’ spaced. An interlaced
derivative pattern (IDP) [15,16] is extracted from the spectro-temporal representation
of the first-order derivative of the glottal source. The IDP is a texture descriptor, and
successfully applied to applications including gender recognition from faces [15] and
automatic speech recognition [16]. A support vector machine (SVM) is applied for
classification. Three different databases are used to evaluate the proposed method for
voice pathology detection and classification. The major contributions of this paper are
(i) to develop a method using the IDP to detect and classify voice pathologies, (2) to
use first-order derivative in the glottal source excitation to lower the signal-to-noise
ratio to enhance the weak noises arisen from the closing and opening of the
pathological vocal folds, (3) to validate the performance of the proposed method using
multiple databases, and using cross-database, and (4) to investigate the use of the voice
signal and the glottal source excitation by an inverse filtering in the proposed method.
The rest of the paper is organized as follows. Section 2 describes the proposed
method; Section 3 presents the experiments; Section 4 gives the discussion, and
Section 5 draws some conclusions.

∼
Figure 1: Block diagram of the proposed IDP based voice pathology detection and
classification method.
2. PROPOSED METHOD
Fig. 1 shows a block diagram of the proposed IDP based voice pathology detection
and classification method. First, a glottal source excitation signal is estimated using
an interactive adaptive inverse filtering (IAIF) technique from an input voice signal.
First-order derivative of the glottal signal is calculated for further processing. The
Fourier transform is applied to the frames of the first-order derivative signal to get a
spectrum. 24 band-pass filters (BPFs), whose center frequencies are spaced on a Mel
scale, are utilized to get the contributions of 24 different frequency bands. The filter
outputs are then log-compressed. The IDP encodes an n-th order directional
derivative pattern of the spectro-temporal description (whose horizontal axis
represents the frame number, and vertical axis represents the filter number). The IDP
features are fed to an SVM classifier.
2.1 Glottal source excitation
There are several techniques to estimate the glottal source excitation. In this study, we
used the IAIF algorithm [17], which is publicly available at http://users.aalto.fi/
traitio/research.html. In the IAIF algorithm, high-pass filtering is applied to remove low

frequency fluctuations. Using the linear predictive coding, the effect of the vocal tract
filter is estimated, and is canceled out through inverse filtering. The effect of the lip
radiation is canceled through integration. This process is done iteratively to get a good
estimation of the glottal source [17]. By inverse filtering, the effect of vocal tract filtering
is eliminated. We do not need spectral information of vocal tract filtering, because we are
concerned about glottal signal (which is affected by vocal fold pathologies), not speech
characteristics. The spectral characteristics that we are interested in are produced by
irregular vibrations of the vocal folds, not the spectral characteristics produced by the
vocal tract shaping.
Once the glottal source waveform is estimated, a first-order derivative operation is
applied to the waveform to get the derivative wave. This derivative wave has a lower
signal-to-noise ratio, which is useful to find the weak noise contribution that arises
from vocal fold pathologies. For a good phonation, energy is mostly concentrated in
lower frequencies due to low glottal formant frequencies; however, because of
irregular vibration of the vocal folds in case of pathology, energy is significant also in
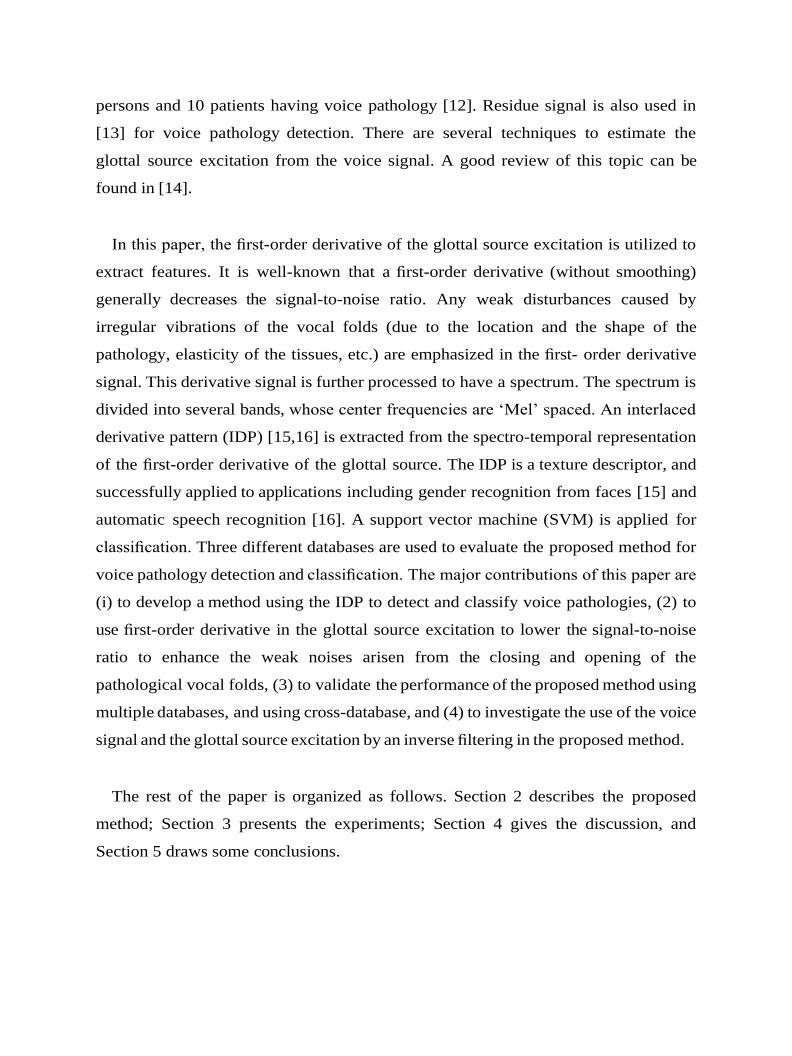
higher frequencies. Fig. 2 shows examples of the spectrums of the glottal source
signal and its first-order derivative signal of a pathological sample. From the figure, we
can see that in the higher frequencies there is more energy in the first-order derivative
signal spectrum than in the original glottal source signal (see the zoomed-in
frequency range [2000–4000] Hz in (e) and (f) of Fig. 2). This justifies the use of first-
order derivative signal for further processing. The signal is framed, where the frame
size is 30 milliseconds, and Hamming windowed. The frames are overlapped by 50%.
The Fourier transform is applied to each frame to get a spectrogram from the first-
order derivative signal. 24-BPFs are applied to the spectrogram. From experiments,
we found that outputs of filters 17–24 are not discriminative to this task; therefore,
we retained the outputs of the first 16 filters.
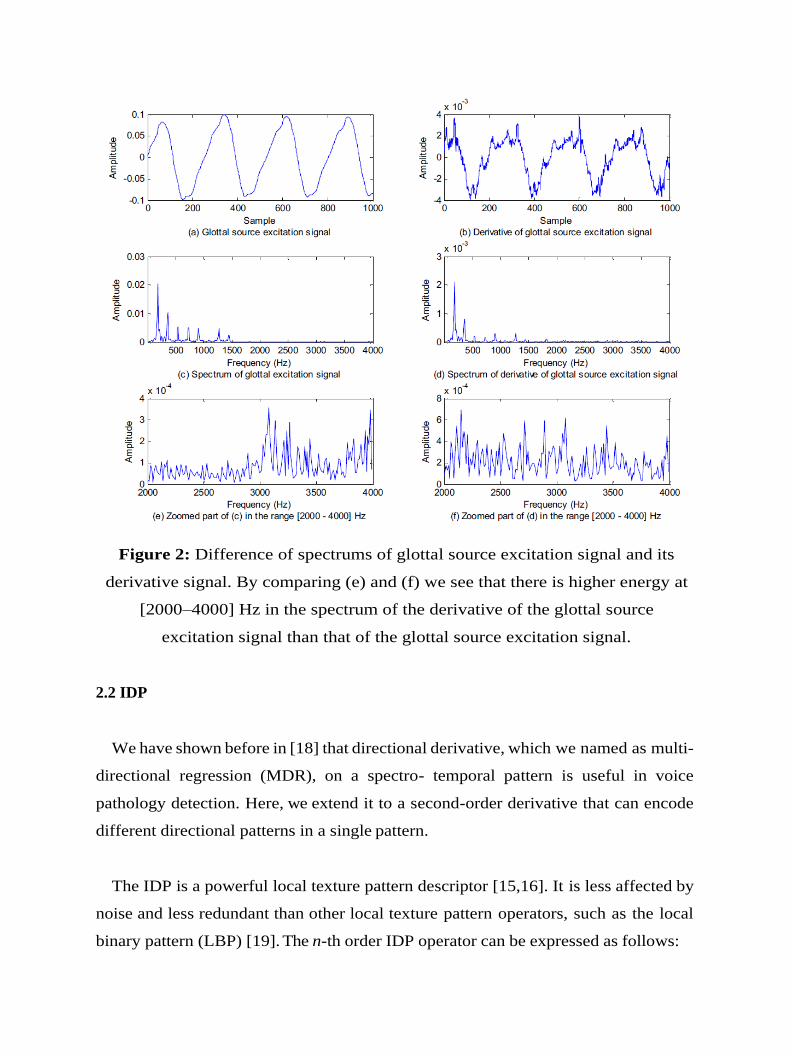
Figure 2: Difference of spectrums of glottal source excitation signal and its
derivative signal. By comparing (e) and (f) we see that there is higher energy at
[2000–4000] Hz in the spectrum of the derivative of the glottal source
excitation signal than that of the glottal source excitation signal.
2.2 IDP
We have shown before in [18] that directional derivative, which we named as multi-
directional regression (MDR), on a spectro- temporal pattern is useful in voice
pathology detection. Here, we extend it to a second-order derivative that can encode
different directional patterns in a single pattern.
The IDP is a powerful local texture pattern descriptor [15,16]. It is less affected by
noise and less redundant than other local texture pattern operators, such as the local
binary pattern (LBP) [19]. The n-th order IDP operator can be expressed as follows:

In the proposed method, an IDP is produced for the spectro-temporal (spectrogram)
description of the first-order derivative of the glottal source. The spectro-temporal
description can be considered as an image. The IDP is a four-channel derivative image,
representing four directional n-th order derivative in 0°, 45°, 90°, and 135°, respectively.
These directions capture temporal, rising temporal-frequency, frequency, and falling
temporal-frequency, respectively, information of the spectrogram. This information is
further enhanced by taking one more order derivative. The order of derivatives is derived
from the order of the IDP operator; i.e., for an n-th order IDP operator, the IDP images with
four (n-1)-th order derivative channels are produced. These derivative channels present more
detailed description of the spectrogram in four directions. A 3 × 3 neighborhood is selected
around each point in the spectrogram. For each neighbor, the direction between the center
and the neighbor is computed, and the IDP channel with the same direction is selected [15],
[16]. Fig. 3 illustrates the 2nd-order IDP operator.
The neighbor is thresholded with the center value in the selected IDP channel, and the result
is encoded as a binary number. This thresholding actually encodes the binary result of the
first-order derivative among local neighbors and produces an extra order to the IDP operator.
Therefore, in each direction, only the derivatives for the center point and its neighbor point
in that particular direction will be calculated. The IDP encodes the relationships in the
particular directions. In this way, the IDP keeps only the more important information and
makes the process much faster. It produces an 8-bit representation of each value of the Mel-
spectrogram. The spectro-temporal directional derivative pattern [20], multi directional
Fig. 3. Illustration of the IDP calculation: (a) a spectro-temporal
pattern, where horizontal axis and vertical axis represent frame and
filter, respectively, (b) first-order derivative along four directions, and
(c) final IDP value for the central element P0.

derivative pattern [21], and LBP [5] were applied to speech processing
applications before; however, they provide first-order derivative information and
are incapable of describing more detailed information, while the IDP gives n-th
order derivative that can encode more information in a compact form. This is
because the amplitude of the n-the derivative of a peak-shaped signal is inversely
proportional to the n-th power of the width of the signal. The higher the value of n
is, the more discrimination between a narrow spectral peak and a broad spectral
peak is. To restrict an increase in computation, we use 2nd-order IDP. Fig. 4
shows examples of the IDP and first-order derivative of the glottal source
excitation for (a) a normal sample, (b) a pathological sample of vocal fold cyst,
(c) a pathological sample of vocal fold polyp, and (d) a pathological sample of
vocal fold paralysis. From the figure, it is obvious that there is more energy
(yellow color dominant) in the high number of filters (filters 8–16) in the
pathological sample and less energy (red color dominant) in the normal sample.
Also, the distribution of energy in different filters for various pathology types is
different. In case of polyp, high filters have less energy (red color), and filters 3–8
have high energy (green color). In case of cyst, filters 5–14 have medium energy
(yellow color), and in case of paralysis, high energy is present in filters 10–14.
So, the difference is visually distinguishable, which may help a doctor to have a
primary guess of the pathology type. After this stage, we have 16 features per
frame to feed into the SVM classifier.


Figure 4: Examples of the IDP for a normal and different types of pathological
samples.
3. EXPERIMENT
3.1 Database
Three databases were used for the experiments to evaluate the robustness of the
proposed method. The databases are the MEEI database, Saarbruecken Voice
Database (SVD) [22], and Arabic Voice Pathology Database (AVPD). The speakers
in MEEI database samples are native English, those in SVD are native German,
while those in AVPD are native Arabs. Only sustained vowel/a/samples were used.
Three pathologies, which are vocal folds cysts, unilateral vocal fold paralysis, and

vocal fold polyp, are chosen because these three are common in all the three
databases. The number of samples and the gender distribution are given in Table
1. All the files, where necessary, were downsampled to have a uniform sampling
frequency of 25 KHz.
We chose the MEEI database, because it is the most commonly used database in
voice pathology detection research despite its several limitations. The SVD is a freely
downloadable database [22]. It has been recorded by the Institute of Phonetics of
Saarland University in Germany. This database contains sustained vowels /a/, /i/ and
/u/ with different intonations, normal, low, high and low-high-low, spoken by a large
number of normal persons and patients having voice pathology. Very few studies of
voice pathology detection have been done on this database [23].
Table 1: Normal and pathological samples (No. of Male speakers + No. of Female
Speakers) from three different databases.
Database Normal Pathological
Cysts Paralysis Polyp Total
AVPD 118 (93 + 25) 13 (7 + 6) 32 (16 + 16) 30 (14 + 16) 75
MEEI 53 (21 + 32) 10 (6 + 4) 70 (38 + 32) 15 (8 + 7) 95
SVD 262 (137 +
125) 6 (5 + 1)
194 (121 + 73)
44 (19 + 25) 244
3.1.1 Arabic Voice Pathology Database (AVPD)
The MEEI database has a limitation in the sense that the pathological
samples and the normal samples were recorded in two different environments.
Therefore, in the experiment with the MEEI database, it is not clear whether the
system detects pathology or environment. With the support of National Plans
for Science and Technology (NPST), Saudi Arabia, we started to develop
AVPD that contains samples of sustained vowels, Arabic digits, some common
words, and paragraphs. The selected text covers all Arabic phonemes. All
speakers record three utterances of each vowel /a/, /u/ and /i/, while isolated
words and continuous speech are recorded once to avoid making a burden on
patients. All the speakers were clinically assessed. In case of pathology, the

perceptual severity of voice disorders was rated on a scale of 1–3, where 3
represents the most severe case. This severity rating was associated to each
sample naming upon consensus of a panel of three expert medical doctors. A
total of five types of vocal folds pathologies were considered including sulcus,
nodules, polyp, cyst, and paralysis The samples were collected in different
sessions at Communication and Swallowing Disorders Unit, King AbdulAziz
University Hospital, King Saud University, Riyadh, Saudi Arabia, by
experienced phoniatricians in a sound-treated room using a standardized
recording protocol. The sampling frequency is 50 KHz (which we
downsampled to recorded by using Kay Pentax computerized speech lab (CSL
Model 4300). The AVPD will be made publicly available by the end of 2015.
3.2 Classification
For detection and classification, the SVM with radial basis function (RBF) as a
kernel was used [24]. There are several advantages of the SVM such as (1) it can
provide a good out-of-sample generalization, if the parameters are properly chosen,
(2) it can produce a unique solution, unlike neural networks, because the optimality
problem is convex, and (3) with the help of kernels, it can achieve the flexibility of
the form of the threshold separating the classes. Moreover, the SVM has been
extensively utilized in voice pathology detection research [4], [6], [8], [26], [28],
[33]. As the principle of SVM is heavily discussed in the literature, we do not
provide the details of it in this paper. The RBF was used because it has less
restriction than other kernels and is more general than the linear kernels. For a single
database experiment, five-fold cross validation approach was utilized, where there
was no overlap between training and testing samples in a fold. In the five-fold cross-
validation, the normal samples and the pathological samples are randomly divided
into five equal groups each. In each iteration, four groups each from the normal and
the pathological samples are used for training, while the remaining samples are used
for testing. Therefore, at the end of five iterations, all the five groups are tested. The
optimization parameter (C) and the kernel parameter (γ) were selected by using an
extensive grid search on training samples. The average values of C and γ in our
experiments were 2.5 and 0.192, respectively. The overall accuracy (ACC),
sensitivity (SN), specificity (SP), and area under the receiver operating characteristic
curve (AUC) were obtained by averaging over five folds. For cross-database
experiments, there was no fold, because training and testing samples were from
different databases. In case of classification experiments, one-versus-rest approach
was utilized. As we are using frame level features, the decision on a file is taken
based on the majority frames. For example, if the majority of frames in a voice signal
are classified as normal, the voice signal is classified as normal.
3.3. Results
3.3.1. Pathology detection
The results on the pathology detection are given in Table 2. The proposed method is
compared with 12 MFCC features plus their velocity coefficients [1], [25], and 22 MDVP
parameters [26]. From the table, we see that the proposed IDP based method outperforms the
other two in all the three databases. In case of SVD and AVPD, the improvement of the
proposed method is significant. The proposed method achieves average accuracies of 99.2%,
93.2%, and 91.5% by using MEEI database, SVD, and AVPD, respectively (confidence
interval 95%, α = 0.05). Table 3 shows the detection accuracies in cross-database
experiments. There were nine experiments for each of the methods. Six experiments were
with one database training and another database testing, while the remaining three were with
two databases training and the third database testing. From Table 3, we find that training with
MEEI database does not provide a good result, because the system is not well trained for
normal and pathology for their different recording environments. The proposed method
achieves a good detection accuracy when the system was trained with SVD or AVPD. When
the system was trained with two databases, the accuracy of the proposed method goes past
87% in all the three cases; however, those for the other two methods are still below 77%.
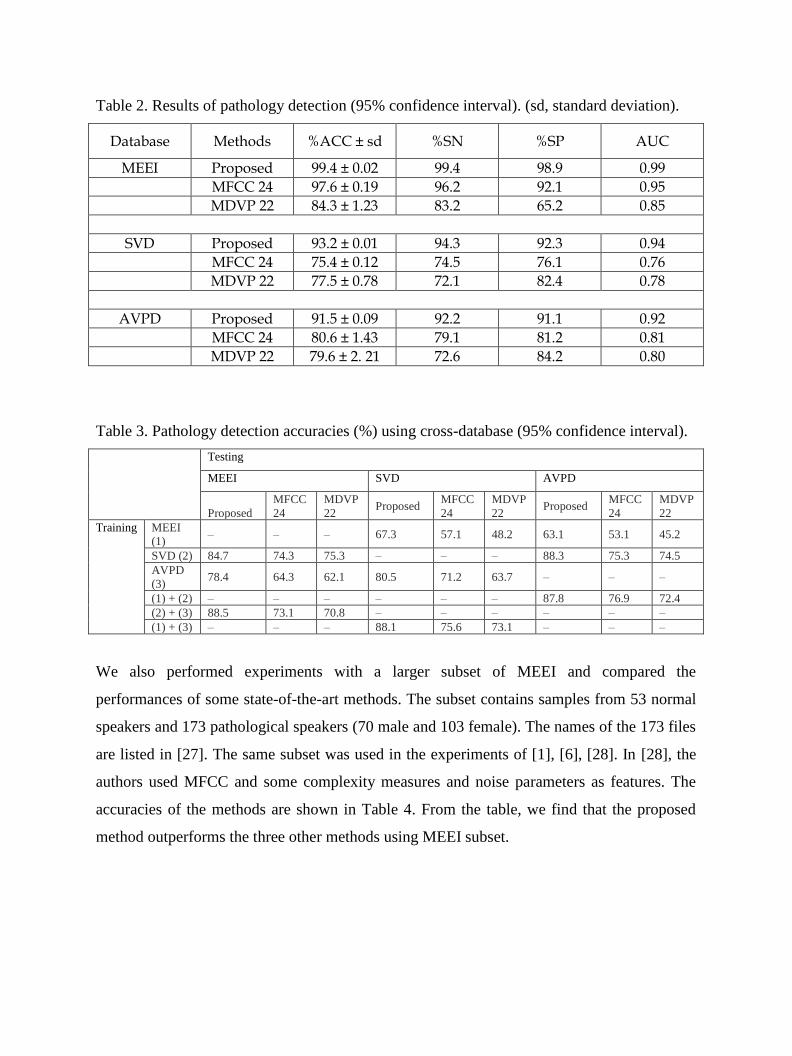
Table 2. Results of pathology detection (95% confidence interval). (sd, standard deviation).
Database Methods %ACC ± sd %SN %SP AUC
MEEI Proposed 99.4 ± 0.02 99.4 98.9 0.99
MFCC 24 97.6 ± 0.19 96.2 92.1 0.95
MDVP 22 84.3 ± 1.23 83.2 65.2 0.85
SVD Proposed 93.2 ± 0.01 94.3 92.3 0.94
MFCC 24 75.4 ± 0.12 74.5 76.1 0.76
MDVP 22 77.5 ± 0.78 72.1 82.4 0.78
AVPD Proposed 91.5 ± 0.09 92.2 91.1 0.92
MFCC 24 80.6 ± 1.43 79.1 81.2 0.81
MDVP 22 79.6 ± 2. 21 72.6 84.2 0.80
Table 3. Pathology detection accuracies (%) using cross-database (95% confidence interval).
Testing
MEEI SVD AVPD
Proposed
MFCC
24
MDVP
22 Proposed
MFCC
24
MDVP
22 Proposed
MFCC
24
MDVP
22
Training MEEI
(1) – – – 67.3 57.1 48.2 63.1 53.1 45.2
SVD (2) 84.7 74.3 75.3 – – – 88.3 75.3 74.5
AVPD
(3) 78.4 64.3 62.1 80.5 71.2 63.7 – – –
(1) + (2) – – – – – – 87.8 76.9 72.4
(2) + (3) 88.5 73.1 70.8 – – – – – –
(1) + (3) – – – 88.1 75.6 73.1 – – –
We also performed experiments with a larger subset of MEEI and compared the
performances of some state-of-the-art methods. The subset contains samples from 53 normal
speakers and 173 pathological speakers (70 male and 103 female). The names of the 173 files
are listed in [27]. The same subset was used in the experiments of [1], [6], [28]. In [28], the
authors used MFCC and some complexity measures and noise parameters as features. The
accuracies of the methods are shown in Table 4. From the table, we find that the proposed
method outperforms the three other methods using MEEI subset.
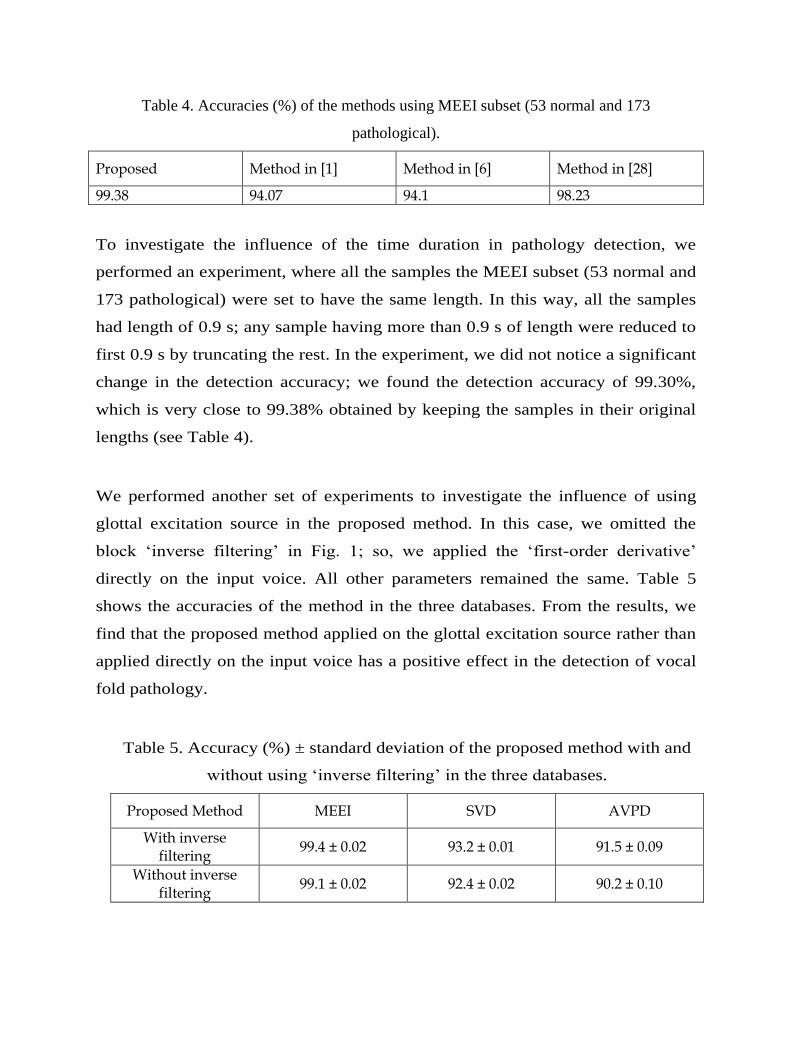
Table 4. Accuracies (%) of the methods using MEEI subset (53 normal and 173
pathological).
Proposed Method in [1] Method in [6] Method in [28]
99.38 94.07 94.1 98.23
To investigate the influence of the time duration in pathology detection, we
performed an experiment, where all the samples the MEEI subset (53 normal and
173 pathological) were set to have the same length. In this way, all the samples
had length of 0.9 s; any sample having more than 0.9 s of length were reduced to
first 0.9 s by truncating the rest. In the experiment, we did not notice a significant
change in the detection accuracy; we found the detection accuracy of 99.30%,
which is very close to 99.38% obtained by keeping the samples in their original
lengths (see Table 4).
We performed another set of experiments to investigate the influence of using
glottal excitation source in the proposed method. In this case, we omitted the
block ‘inverse filtering’ in Fig. 1; so, we applied the ‘first-order derivative’
directly on the input voice. All other parameters remained the same. Table 5
shows the accuracies of the method in the three databases. From the results, we
find that the proposed method applied on the glottal excitation source rather than
applied directly on the input voice has a positive effect in the detection of vocal
fold pathology.
Table 5. Accuracy (%) ± standard deviation of the proposed method with and
without using ‘inverse filtering’ in the three databases.
Proposed Method MEEI SVD AVPD
With inverse filtering
99.4 ± 0.02 93.2 ± 0.01 91.5 ± 0.09
Without inverse filtering
99.1 ± 0.02 92.4 ± 0.02 90.2 ± 0.10
3.3.2. Pathology classification
Fig. 5 shows the classification accuracies of the methods when the same
database was used for training and testing, but the samples were not
overlapped between training and testing in an iteration. The proposed method
achieves the best accuracy with the SVD; cyst has the highest accuracy,
followed by paralysis and polyp. In all three databases and all the three
pathological cases, the proposed method performs far better than the other two
methods (significant at 95% confidence interval). The IDP-based method
gives 98.2%, 95.3%, and 94.2% accuracies for cyst, paralysis, and polyp,
respectively, when the AVPD was used. Table 6 shows a confusion matrix of
the proposed method. From the confusion matrix, we find that cyst and polyp
were confused between each other by the system, while paralysis were equally
confused with cyst and polyp.
Fig. 5. Voice pathology classification accuracy (%) of the methods using the
same database training and testing (samples are not overlapped between
training and testing in the same iteration).
Table 6. Confusion matrix of the proposed method for voice pathology
classification.
MEEI SVD AVPD
Output→ Cyst Paralysis Polyp Cyst Paralysis Polyp Cyst Paralysis Polyp
Input↓
Cyst 99.1 0 0.9 99.5 0 0.5 98.2 0.4 1.4
Paralysis 2.6 94.3 3.1 3.4 95.9 0.7 1.4 95.3 3.3
Polyp 3.9 1.6 94.5 4.3 0.6 95.1 3.0 2.8 94.2
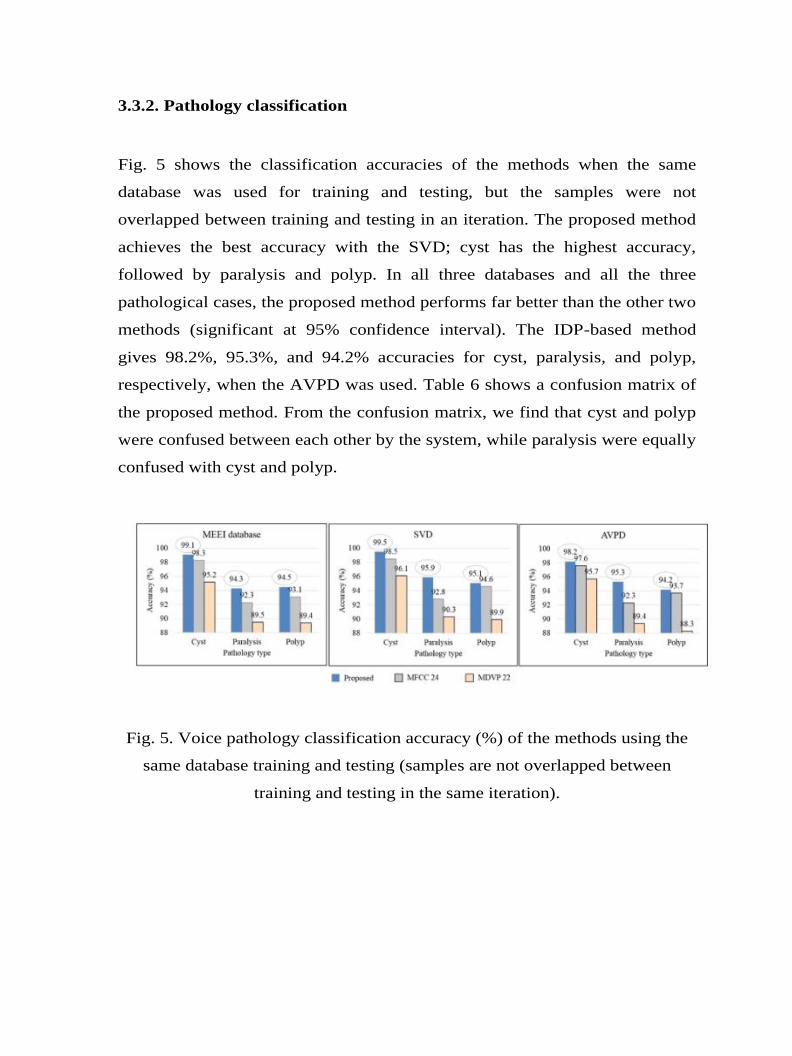
Fig. 6 shows the classification accuracies of the methods when the two
databases’ samples were used for training and the third for training. The
objective of this type of experiments is to verify if the methods can really
perform pathology classification irrespective to recording place, setup,
speakers’ native language dependency, etc. The classification accuracy of the
proposed method never drops below 80% (confidence interval = 95%) in any
of the experiments or in any pathological case. This can definitely prove the
robustness of the method considering the fact that the training and the testing
datasets are different. The other two methods’ accuracies are relatively low,
mostly below 80%.
Fig. 6. Voice pathology classification accuracy (%) of the methods using two
databases training and the third database testing.

4. Discussion
An automatic voice pathology detection and classification based on the IDP on
the first derivative of the glottal source excitation signal is proposed. First, the
glottal source signal is separated from the voice signal by an iterative method,
because the glottal source signal can give a clue whether the voice is normal or
pathologic. The irregularity of the vocal folds vibration caused by different
pathologies produces some weak signals that are associated to the glottal source
signal; otherwise, a normal voice produces a fine regular pattern. These weak
signals are emphasized by taking the first-order derivative of the glottal source
signal. The 2-nd order IDP is calculated on the Mel-spectrogram of the first-order
derivative signal. The IDP encodes the relationship along temporal, rising
temporal-frequency, frequency, and falling temporal-frequency patterns.
Qiu et al. discovered that some neurons in the primary auditory cortex of
mammals are driven to spectro-temporal patterns [34]. Conventional features like
MFCC fails to incorporate spectro-temporal pattern in the same coefficient.
Therefore, we need directional derivative that can encode changes along both
spectral and temporal domain. A first-order derivative [18], [20] operators can
detect the change; however, we need a huge number of features to cover the
major directions. The IDP not only uses second-order derivatives, but also
encodes all the directions into a compact one. Vocal folds' vibration depends on
several factors such as mucus present on the vocal folds tissue, stiffness, tension,
muscles in the larynx, closing and opening of the folds, etc. These factors are
affected differently for various voice pathologies due to the position and the size
of the pathologies. Therefore, the vibration varies from one type of pathology to
another. This vibration produces glottal source excitation frequencies, and these
frequencies are enhanced by a second-order derivative operator, such as the IDP.
The proposed method was evaluated in three different databases, namely,

the MEEI database, the SVD, and the AVPD. First, the method was tested on
each database separately, and compared with two other methods. In the MEEI
database, the proposed method achieved 99.4% detection accuracy, while in the
SVD and the AVPD it gained accuracy of 93.2% and 91.5%, respectively. These
accuracies are far better than the accuracies obtained by the two other methods.
In terms of classification accuracy, the proposed method achieved around 99%
accuracy in case of cyst, and between 94% and 96% accuracy in case of paralysis
and polyp. In the experiments, we observed that the frequency information
between 3 kHz and 5 kHz in case of cyst is different than that in case of paralysis
and polyp.
In order to verify the robustness of the proposed method irrespective of the
recording environments, speakers’ native languages, etc., we performed the inter
database experiments, where the training and the testing databases were different.
When training with the MEEI database, and testing with another database, the
performance is low; this is due to the confusion of the classifier whether the
trained models are for normal/pathology or different environments. The
performance is increased when two databases were used for training and the third
database for testing. In all the cases, the proposed method outperformed the other
two methods. We chose only three types of pathologies because these three are
common in all the three databases.
There are perceptual characteristics for each voice disorders; some of these
characteristics overlap, however, others are more specific for certain disorders.
For example, the dysphonia in vocal fold paralysis (unilateral) is characterized
mainly by weak and breathy voice character due to incomplete glottis closure
during phonation, also diplophonia (double pitch) could be there as the two vocal
folds are vibrating in a different rate. Polyp and cyst share almost the same voice
characteristics of dysphonia including strained voice character, intermittent voice
breaks, and sometimes diplophonia due to mass-difference of the vibrating vocal
folds. Despite this, a trained clinician can distinguish between cyst and polyp by
perceptually measuring the hoarseness and poor voice quality. On the contrary,
as an automated method is not as intelligent as a human, there are some
confusions between cyst and polyp pathologies in the proposed method (see
Table 6); however, this amount of confusion is small (3%–4%), because, we
believe, the proposed features are highly discriminative.
To visualize the distinguishing capability between normal and pathological
samples, and between different types of pathological samples, of the proposed
features, we draw some examples in Fig. 4. We showed that different pathologies
contribute differently in different frequency bands. Due to the position and the
shape of the pathologies, and the presence of mucus, tension, and various
stiffness of the vocal folds, the opening and closing of the vocal folds show
different behavior during the vibration, and therefore produce different
frequencies in the output [36]. These frequencies are captured in different filters.
A more in-depth investigation on why a particular pathology affects a specific
frequency region is needed, and this will be one of our future works.
To the best of our knowledge, this is the first study of multi-database
experiments for detection and classification. In [8], the authors experimented
with two databases (cross-database) for pathology detection only; however, to do
so, they had to normalize the features, which resulted in performance degradation
in a single database experiment. In our proposed method, we use derivatives that
eliminate the need for normalization.
5. Conclusion
A voice pathology detection and classification method based on IDP of the
glottal source was proposed. The method was compared with conventional
MFCC and MDVP parameters in three different databases. The proposed method
outperformed the other two in all the experiments. In cross-database experiments,

the accuracies reached up to 88.5% for detection and 90.3% for classification. So,
the proposed method is to some extent database independent. The proposed work
will be extended to encode higher order derivative information to improve the
performance in a future study. We will also dig more on the performance
comparison based on severity level (AVPD has severity information associated to
each sample).
Acknowledgment
This project was funded by the National Plan for Science, Technology and
Innovation (MAARIFAH), King Abdulaziz City for Science and Technology,
Kingdom of Saudi Arabia, Award Number (12-MED-2474-02).
References
[1] J.I. Godino-Llorente, P. Gomes-Vilda, M. Blanco-Velasco, Dimensionality
reduction of a pathological voice quality assessment system based on
Gaussian mixture models and short-term cepstral parameters, IEEE Trans.
Biomed. Eng. 53 (October (10)) (2006) 1943–1953.
[2] M. Shamim Hossain, G. Muhammad, Cloud-assisted speech and face
recognition framework for health monitoring, Mob. Netw. Appl. 20 (3) (2015)
391–399, http://dx.doi.org/10.1007/s11036-015-0586-3.
[3] Kay Elemetrics, Multi-Dimensional Voice Program (MDVP) [Computer
Program] (2012).
[4] G. Muhammad, M. Melhem, Pathological voice detection and binary
classification using MPEG-7 audio features, Biomed. Signal Process. Controls
11 (2014) 1–9.
[5] Z. Ali, I. Elamvazuthi, M. Alsulaiman, G. Muhammad, Detection of voice
pathology using fractal dimension in a multiresolution analysis of normal and
disordered speech signals, J. Med. Syst. 40 (20) (2016), 10 pages.
[6] M. Markaki, Y. Stylianou, Voice pathology detection and discrimination based
on modulation spectral features, IEEE Trans. Speech Audio Process. 19 (7)
(2011) 1938–1948.
[7] Kay Elemetrics Corp., Disordered Voice Database, Version 1.03 (CD-ROM),
MEEI, Voice and Speech Lab, Boston, MA (October 1994).
[8] M. Markaki, Y. Stylianou, Normalized modulation spectral features for
cross-database voice pathology detection, in: Proceedings of InterSpeech,
Brighton, U.K., September, 2009.
[9] P. Gomez-Vilda, R. Fernández-Baillo, V. Rodellar-Biarge, V. Nieto Lluis, A.

Álvarez-Marquina, L. Miguel Mazaira-Fernández, R. Martínez-Olalla, J.I.
Godino-Llorente, Glottal Source biometrical signature for voice pathology
detection, Speech Commun. 51 (2009) 759–781.
[10] T. Drugman, T. Dubuisson, T. Dutoit, On the mutual information between
source and filter contributions for voice pathology detection, Proceedings of
InterSpeech (2009).
[11] P. Gomez-Vilda, R. Fernández-Baillo, A. Nieto, F. Díaz, F.J. Fernández-Camacho,
V. Rodellar, A. Álvarez, R. Martínez, Evaluation of voice pathology based on the
estimation of vocal fold biomechanical parameters, J. Voice 21 (4) (2007) 450–
476.
[12] Y. Koike, J. Markel, Application of inverse filtering for detecting laryngeal
pathology, Ann. Otol. Rhinol. Laryngol. 84 (January–February) (1975) 117–
124.
[13] M. Rosa, J.C. Pereira, M. Grellet, Adaptive estimation of residue signal for voice
pathology diagnosis, IEEE Trans. Biomed. Eng. 47 (January (1)) (2000) 96–
104.
[14] T. Drugman, B. Bozkurt, T. Dutoit, A comparative study of glottal source
estimation techniques, Comput. Speech Lang. 26 (January (1)) (2012).
[15] A. Shobeirinejad, Y. Gao, Gender classification using interlaced derivative patterns,
20th International Conference on Pattern Recognition (ICPR) (2010) 1509–1512.
[16] G. Muhammad, Automatic speech recognition using interlaced derivative pattern for
cloud based healthcare system, Clust. Comput. 18 (June (2)) (2015) 795–802.
[17] P. Alku, Glottal wave analysis with pitch synchronous iterative adaptive inverse
filtering, Speech Commun. 11 (2–3) (1992) 109–118.
[18] G. Muhammad, T. Mesallam, K. Almalki, M. Farahat, A. Mahmood, M. Alsulaiman,
Multi directional regression (MDR) based features for automatic voice disorder detection,
J. Voice Elsevier 26 (6) (2012), pp. 817. e19-817. e27.
[19] T. Ahonen, A. Hadid, M. Pietikainen, Face description with local binary patterns:
application to face recognition, IEEE Trans. Pattern Anal. Mach. Intell. 28
(December (12)) (2006).
[20] G. Muhammad, M. Masud, A. Alelaiwi, M.A. Rahman, A. Karime, A. Alamri, M.
Shamim Hossain, Spectro-temporal directional derivative based automatic speech
recognition for a serious game scenario, Multimed. Tools Appl. 74 (14) (2015) 5313–
5327, http://dx.doi.org/10.1007/s11042-014-1973-7.
[21] A. Mahmood, M. Alsulaiman, G. Muhammad, Automatic speaker recognition using
multi directional local features (MDLF), Arab. J. Sci. Eng. 39 (5) (2014) 3799–3811.
[22] W.J. Barry, M. P̈ utzer, Saarbrucken Voice Database, Institute of Phonetics,
Univ. of Saarland, 2016 http://www.stimmdatenbank.coli.uni-saarland.de/.
[23] D. Martínez, E. Lleida, A. Ortega, A. Miguel, J. Villalba, Voice pathology detection
on the saarbruecken voice database with calibration and fusion of scores using
MultiFocal Toolkit, in: Proc. of IberSPEECH 2012, CCIS 328, Springer, Berlin,
Heidelberg, 2012, pp. 99–109.
[24] S. Abe, Support Vector Machines for Pattern Classification, Springer-Verlag, Berlin,
Heidelberg, New York, 2005.
[25] N. Sáenz-Lechón, J.I. Godino-Llorente, V. Osma-Ruiz, P. Gómez-Vilda,
Methodological issues in the development of automatic systems for voice pathology

detection, Biomed. Signal Process. Control 1 (April (2)) (2006) 120–128.
[26] M.K. Arjmandi, M. Pooyan, M. Mikaili, M. Vali, A. Moqarehzadeh, Identification of
voice disorders using long-time features and support vector machine with different
feature reduction methods, J. Voice 25 (November (6)) (2011) 275–289.
[27] Parsa, D. Jamieson, Identification of pathological voices using glottal noise
measures, J. Speech Lang. Hear. Res. 43 (2) (2000) 469–485.
[28] J. Arias-Londono, J. Godino-Llorente, N. Saen-Lechon, V. Osma-Ruiz, G.
Castellanos-Dominguez, Automatic detection of pathological voices using
complexity measures, noise parameters and mel-cepstral coefficients, IEEE
Trans. Biomed. Eng. 58 (2) (2011) 370–379.
[29] J.H. Hansen, L. Gavidia-Ceballos, J.F. Kaiser, A nonlinear operator-based
speech feature analysis method with application to vocal fold pathology
assessment, IEEE Trans. Biomed. Eng. 45 (3) (1998) 300–313.
[30] J.B. Alonso, J. De Leon, I. Alonso, M.A. Ferrer, Automatic detection of
pathologies in the voice by HOS based parameters, EURASIP J. Appl. Signal
Process. 4 (2001) 275–284.
[31] M.A. Little, P.E. McSharry, S.J. Roberts, D.A. Costello, I.M. Moroz,
Exploiting nonlinear recurrence and fractal scaling properties for voice
disorder detection, Biomed. Eng. Online 6 (1) (2007) 23,
http://dx.doi.org/10.1186/ 1475-925X-6-23.
[32] P. Henríquez, J.B. Alonso, M.A. Ferrer, C.M. Travieso, J.I. Godino-Llorente,
F. Díaz-de-María, Characterization of healthy and pathological voice
through measures based on nonlinear dynamics, IEEE Trans. Audio Speech
Lang. Process. 17 (6) (2009) 1186–1195.
[33] A. Akbaria, M. Khalil, Arjmandi, Employing linear prediction residual signal
of wavelet sub-bands in automatic detection of laryngeal pathology, Biomed.
Signal Process. Control 18 (2015) 293–302.
[34] A. Qiu, C. Schreiner, M. Escabi, Gabor analysis of auditory midbrain receptive
fields: spectro-temporal and binaural composition, J. Neurophysiol. 90 (2003)
456–476.
[35] G. Muhammad, M. Alsulaiman, A. Mahmood, Z. Ali, Automatic voice
disorder classification using vowel formants, in: IEEE International
Conference on Multimedia and Expo (ICME)—Workshop MUST-EH 2011,
Barcelona, July, 2011.
[36] A. Al-nasheri, G. Muhammad, M. Alsulaiman, Z. Ali, Investigation of voice
pathology detection and classification on different frequency regions using
correlation functions, J. Voice (2016), http://dx.doi.org/10.1016/j.jvoice.2016.
01.014.


![Edge Detection by Helmholtz Principle - Paris …helios.mi.parisdescartes.fr/~desolneux/papers/DMM_Edge...Edge Detection 273 “detection” [8, 9, 12, 17, 20, 25, 26, 30, 33]. We](https://static.fdokument.com/doc/165x107/5f43514ee5762e0cb9160927/edge-detection-by-helmholtz-principle-paris-desolneuxpapersdmmedge-edge.jpg)