


Sprachen
Seiten
Rechtliche

Screening and Characterization of Oleaginous Yeasts
and Modeling of Flocculation-based Algae Harvest
Felix R. Bracharz
Vollständiger Abdruck der von der Fakultät für Chemie der Technischen Universität
München zur Erlangung des akademischen Grades eines Doktors der
Naturwissenschaften genehmigten Dissertation.
Vorsitzender: Prof. Dr. rer. nat. Tom Nilges
Prüfer der Dissertation: 1. Prof. Dr. rer. nat. Thomas Brück
2. Prof. Dr. rer. nat. Wolfgang Liebl
Die Dissertation wurde am 23.3.2017 bei der Technischen Universität München
eingereicht und durch die Fakultät für Chemie am 6.7.2017 angenommen.
Technische Universität München
Fakultät Chemie
Professur für Industrielle Biokatalyse
__________________________________________________________________________
∼ 2 ∽
Eidesstattliche Erklärung
Hiermit versichere ich, dass ich die vorliegende Dissertation selbstständig verfasst, sowie die
Ausführungen und Gedanken, welche anderen Schriften sinngemäß oder wörtlich
entnommen wurden, sowie weitere Quellen und Hilfsmittel kenntlich gemacht habe. Die
vorliegende Arbeit wurde bisher weder in gleicher noch ähnlicher Form einer anderen
Prüfungsbehörde vorgelegt oder anderweitig veröffentlicht.
München, den ………………….

__________________________________________________________________________
∼ 3 ∽
Acknowledgments
Prof. Thomas Brück has given me tremendous support throughout my work in this group. He
was never too busy to aid me by critically reviewing my work or discuss strategies on how to
approach scientific questions. It was an enriching experience to witness the group develop and
flourish in this challenging scientific and academic environment. Further, I am deeply grateful
to my students, some of which truly excelled at their work. I have grown personally and
professionally by working with Isabel Aschenbrenner, Kathrin Bach, Daniel Helmdach, Dominik
Schum, Valeria Guidolin and all others.
I thank Veronika Redai for her patience, encouragement and the great deal of work she has
put into our oil yeast projects. Even in the most dire of times, I could always count on the
constructive scientific and culinary feedback of my office neighbor Johannes Schmidt. Further,
I thank Martina Haack and Tom Schuffenhauer for the technical support and the unique office
atmosphere. Norbert Mehlmer and Christian Görner were incessant sources of ideas and
provided me with great scientific feedback. Finally, I want to thank Farah Qoura for passing on
the things he learned at Clariant.
Special appreciation goes to my colleagues and friends: Markus Reinbold, Wojtech Jurkowski,
Gülnaz Celik, Samer Younes, Dania Awad, Elias Kassab, Matthias Glemser, Wolfgang
Mischko, Monika Fuchs and Mahmoud Masri.
__________________________________________________________________________
∼ 4 ∽
Summary
This thesis comprises the characterization and genetic engineering of the non-conventional
oleaginous yeast Cutaneotrichosporon oleaginosus as well as optimization of flocculation of
the microalgae Scenedesmus obtusiusculus.
Part 1: Screening and Characterization of Oleaginous Yeast
Oleaginous organisms are a promising, renewable source of single cell oil (SCO), which in turn
holds great potential for replacing plant based lipids. In contrast to the latter, production of SCO
yields much higher lipid contents (up to 80% g/g biomass) and does not directly compete with
food supply.
In this work, oleaginous yeasts were isolated from environmental samples and together with
commercial strains screened for lipid productivity. Out of a total of 102 strains,
Cutaneotrichosporon oleaginosus ATCC 20509 emerged as the most suitable strain for lipid
production in semisynthetic as well as natural substrate. Lipid productivity of the respective
strain was not improved by random in vivo mutagenesis and directed evolution.
Lipid accumulation in microorganisms is mainly induced by limitation of nutrients such as
nitrogen, phosphorus or sulfur. By testing different methods of nutrient limitations in C.
oleaginosus, depletion of nitrogen was confirmed as the most suitable way of inducing lipid
accumulation. Sulfur and phosphate limitation had much more pronounced effects on growth
kinetics, whereas sulfur limitation did not result in significantly increased triglyceride yields.
An essential step in understanding the process of lipid accumulation is the elucidation of the
underlying signaling network. The two target-of-rapamycin-complexes (TORCs) are central
integrators of metabolic signals including carbon and nitrogen availability. TORC1 is
specifically inhibited by rapamycin, leading to a cell state of simulated nutrient limitation.
Supplementation with rapamycin increased intracellular lipid content of C. oleaginosus and
affected growth kinetics, but not cell granularity or microscopic features except for Nile red
fluorescence. Further, the spectrum of intracellular fatty acids was shifted towards a pattern
characteristic for lipid accumulation. This indicated the inhibition of the target of rapamycin
complex 1 (TORC 1), but not TORC 2. A homology based signaling network around TORC
was assembled, showing similarity to Schizosaccharomyces pombe in some cases (e.g.
signaling of carbon availability) whereas other regulatory paths (e.g. autophagy) were highly
dissimilar to any described species.
Another important way of improving lipid productivity in oleaginous organisms is genetic
engineering. Classic bottlenecks of triglyceride synthesis (diacylglycerol acyltransferase or
lysophosphatidic acid acyltransferase) were overexpressed in C.oleaginosus, but did not yield
__________________________________________________________________________
∼ 5 ∽
the expected increase in lipid content or productivity. This indicated, that both enzymatic steps
are not rate-limiting for lipid synthesis in C. oleaginosus cultivated in full medium. Generation
of knockout strains using CRISPR-Cas9 presumably failed due to unfavorable codon usage
and weak promoter strength of the respective nuclease and respective insufficient expression
levels.
Part 2: Energy-efficient Harvest of the Microalgae S. obtusiusculus by Flocculation
Another potential source of SCO are microalgae, which have the added benefit of being
phototrophic and hence use a zero-value substrate. A main disadvantage however is the low
achievable biomass concentration in the culture arising from limited RuBisCO efficiency and
shading of cells. Consequently, the process step of harvesting and dewatering of microalgae
makes up 20% of the cost of algae biomass. Whereas many other methods of harvest, such
as filtration or centrifugation are energy- and labor-intensive, flocculation-sedimentation is a
simple and efficient alternative, which is explored in this work.
Experiments are conducted using the microalgae Scenedesmus obtusiusculus A189, a newly
isolated strain of Chlorophyta with high growth rates in fresh and brackish water as well as
high lipid and carbohydrate content. Cultivation is done in artificial salt water, which is
especially challenging for flocculation-sedimentation procedures due to its high ionic strength
and somewhat higher density. The focus of this work is on non-sterile cultivation to mimic open
pond cultivation.
The effects and relationships of different factors on flocculation efficiency (FE) and the
complexity of interaction between those factors are explored. In summary, modified tannin was
comparable in performance to chitosan. However, its much lower price, independence of
culture pH and very high effectiveness in the absence of algae organic matter make it an
interesting alternative. Further, a synergy between those two agents was observed despite
their mechanistic similarity.
Entirely independent of added polymeric substances, autoflocculation was induced by pH shift,
whereas a >96% FE was achieved using Ca(OH)2 at a cost of $40 / ton algae biomass. This
is comparable to previously published values achieved in fresh water. However, raising the pH
to the required range (~ pH 10.5 - 11) exacerbates the reuse of the respective medium, which
likely relates to buffering effects.
__________________________________________________________________________
∼ 6 ∽
Zusammenfassung
Die Arbeit umfasst im ersten Teil die Charakterisierung und genetische Modifikation der nicht-
konventionellen, ölbildenden Hefe Cutaneotrichosporon oleaginosus sowie im zweiten Teil die
Optimierung der Ernte der Mikroalge Scenedesmus obtusiusculus über Flokkulation.
Teil 1: Screening und Charakterisierung ölbildender Hefen
Öl-akkumulierende Organismen sind eine vielversprechende, nachhaltige Quelle von
Einzelleröl, mit dem Potential, bestehende Pflanzen-basierte Lipide zu ersetzen. Im Gegensatz
zu Pflanzenlipiden konkurriert die Produktion von Einzelleröl nicht mit der
Nahrungsmittelproduktion und weist weitaus höhere Lipidausbeuten (bis zu 80% g/g
Biomasse) auf.
In dieser Arbeit wurden Öl-bildende Hefen aus Umweltproben isoliert und zusammen mit aus
Stammsammlungen beschafften Stämmen auf Lipidproduktivität selektiert. Aus insgesamt 102
Stämmen wurde Cutaneotrichosporon oleaginosus ATCC 20509 als der am besten geeignete
Stamm zur Produktion von Lipiden sowohl auf semisynthetischem als auch natürlichem
Substrat identifiziert. Das Ziel einer Steigerung der Lipidproduktivität konnte durch zufällige in
vivo Mutagenese und gerichtete Evolution nicht erreicht werden.
Lipidakkumulation in Mikroorganismen wird vor allem durch die Limitierung bestimmter
Nährstoffe wie Schwefel, Stickstoff oder Phosphor induziert. Verschiedene Limitierungen
wurden in C. oleaginosus getestet und Stickstofflimitierung als geeignetste Methode zur
Induktion von Lipidakkumulation bestätigt. Schwefel- und Phosphorlimitierung hatten
ausgeprägte, negative Effekte auf die Wachstumskinetik und Schwefellimitierung resultierte
nicht in einem signifikant erhöhten Lipidgehalt.
Ein essentieller Schritt für ein besseres Verständnis der Lipidakkumulierung ist die Aufklärung
des betreffenden Signalnetzwerkes. Zwei target of rapamycin Komplexe (TORC1, TORC2)
sind zentrale Komplexe für die Integration metabolischer Signale wie die Verfügbarkeit von
Kohlenstoff- oder Stickstoffquellen. TORC1 wird spezifisch von Rapamycin inhibiert, was in
der Zelle zu einem simulierten Zustand der Nährstofflimitierung führt. Zugabe von Rapamycin
führte zur Erhöhung des intrazellulären Lipidanteils in C. oleaginosus und beeinflusste die
Wachstumskinetik, nicht jedoch Zellgranularität oder mikroskopisch erkennbare Zellstrukturen
abgesehen von einer erhöhten Nilrotfluoreszenz. Dies weist auf eine Hemmung des TORC1,
nicht jedoch des TORC2 hin. Ein Homologie-basiertes Signalnetzwerk um die TORCs zeigte
gewisse Ähnlichkeiten zu S. pombe im Hinblick auf Detektion von Kohlenstoffverfügbarkeit auf,
__________________________________________________________________________
∼ 7 ∽
wobei andere regulatorische Pfade, wie Induktion von Autophagie, sich stark von anderen,
beschriebenen Organismen unterschieden.
Eine weitere Möglichkeit zur Erhöhung des Lipidgehaltes in Mikroorganismen besteht in der
genetischen Modifikation. In anderen Organismen als limitierende, enzymatische Schritte der
Triglyceridsynthese identifizierte Enzyme (Diacylglycerolacyltransferase und
Lysophosphatidatacyltransferase) führten jedoch in Überexpressionsexperimenten in C.
oleaginosus nicht zu einer erhöhten Lipidausbeute oder –produktivität. Dies ist ein Hinweis
darauf, dass beide enzymatischen Schritte möglicherweise in C. oleaginosus nicht limitierend
für die Produktion von Triglyceriden sind. Herstellung von Knockout-Stämmen über CRISPR-
Cas9 scheiterte wahrscheinlich an ungünstiger Codonnutzung des betreffenden Genes, zu
schwacher Promotorstärke und der daraus resultierenden unzureichenden Expressionsraten
der Nuklease.
Teil 2: Energieeffiziente Ernte der Mikroalge S. obtusiusculus über Flokkulation
Eine weitere potentielle Quelle für Einzelleröl sind Mikroalgen. Diese haben den zusätzlichen
Vorteil, Licht als Energiequelle zu nutzen. Einer der Hauptnachteile ist die niedrige
Biomassekonzentration im Medium, welche sich einerseits durch die niedrige RuBisCO-
effizienz sowie Zellverschattung während der Kultivierung begründet. Daraus folgt, dass die
Algenernte und die damit einhergehende Entwässerung etwa 20% der Gesamtkosten für die
Produktion von Algenbiomasse ausmachen. Während viele andere Erntemethoden, wie
Filtration oder Zentrifugation energie- und arbeitsintensiv sind, stellt die Flokkulation-
Sedimentation eine einfache und effiziente Alternative dar.
Die betreffenden Experimente wurden mit der Mikroalge Scenedesmus obtusiusculus A189
durchgeführt, welche erst kürzlich isoliert wurde und sowohl hohe Wachstumsraten als auch
hohe Lipid und Kohlenhydratanteile aufweist. Die Kultivierungen wurden in künstlichem
Brackwasser durchgeführt, welches aufgrund der hohen Ionenstärke und höheren Dichte eine
besondere Herausforderung für die Flokkulation-Sedimentation darstellt. Der Fokus der Arbeit
liegt auf nicht-steriler Kultivierung, wie sie während der open pond Kultivierung vorkommt.
Auf die Effekte und Beziehungen verschiedener Faktoren auf die Flokkulationseffizienz (FE)
und die aus der Interaktion der betreffenden Faktoren entspringende Komplexität wurde
experimentell eingegangen. Zusammengefasst ist modifiziertes Tannin, welches bisher als
Flokkulationsmittel kaum beschrieben wurde, vergleichbar zum weitaus etablierteren
Chitosan. Die pH-Unabhängigkeit und der geringere Preis qualifizieren modifizierte Tannine
als besonders vielversprechende Alternative. Des Weiteren wurden trotz gleichem
__________________________________________________________________________
∼ 8 ∽
mechanistischem Ansatz zwischen den beiden beschriebenen Flokkulationsmitteln
synergistische Effekte gefunden.
Vollständig unabhängig von zugefügten Polymeren kann Autoflokkulation über einen pH-shift
ins Basische induziert werden. FEs von mehr als 96% wurden mit Ca(OH)2 erreicht, was in
Kosten von etwa $40 pro Tonne Algenbiomasse resultierte. Dies ist vergleichbar mit früheren
Studien, in denen jedoch weniger produktive Algenstämme in Frischwasser kultiviert wurden.
Die Änderung des pH-Wertes auf die benötigten, basischen Werte impliziert jedoch
Herausforderungen bei der Rezyklierung des Mediums, die bei der Nutzung biologischer
Polymere weitaus weniger prägnant sind.

__________________________________________________________________________
∼ 9 ∽
List of related articles
The following related articles were generated during the thesis:
[1] Bracharz, F., Beukhout, T., Mehlmer, N., & Brück, T. (2017). Opportunities and challenges
in the development of Cutaneotrichosporon oleaginosus ATCC 20509 as a new cell factory for
custom tailored microbial oils. Microbial cell factories, 16(1), 178.
[2] Bracharz, F., Redai, V. Bach, K. Qoura, F. & Brück, T. (2017) The effects of TORC signal
interference on lipogenesis in the oleaginous yeast Trichosporon oleaginosus. BMC
Biotechnology in print
[3] Görner, C., Redai, V., Bracharz, F., Schrepfer, P., Garbe, D., & Brück, T. (2016). Genetic
engineering and production of modified fatty acids by the non-conventional oleaginous yeast
Trichosporon oleaginosus ATCC 20509. Green Chemistry. 18, 2037-2046
[4] Kourist, R., Bracharz, F., Lorenzen, J., Kracht, O. N., Chovatia, M., Daum, C., ... &
Grigoriev, I. V. (2015). Genomics and Transcriptomics Analyses of the Oil-Accumulating
Basidiomycete Yeast Trichosporon oleaginosus: Insights into Substrate Utilization and
Alternative Evolutionary Trajectories of Fungal Mating Systems. mBio, 6(4), e00918-15.
[5] Brück, W., Bracharz, F., Brück, D. W., & Brück, T. B. (2015). Von der Krebsschale in die
Creme. Biologie in unserer Zeit,45(3), 160-167.

__________________________________________________________________________
∼ 10 ∽
Sections containing previously published data
Sections of paper [2] (The effects of TORC signal interference on lipogenesis in the oleaginous
yeast Trichosporon oleaginosus, BMC Biotechnology) were introduced into sections 2.3.5.4,
2.3.7.2 and 2.4.6 as well as Supplemental 26-29 of this thesis.
Contributions of the respective paper were as follows:
FB, VR and TB conceived the study and participated in its design and coordination. FB, VR,
KB carried out the experimental work relating to the effects of rapamycin on Trichsporon
oleaginosus growth. FQ supervised the experimental work and prepared scientific reports. FB
carried out detailed bioinformatic studies to reconstruct the cell signaling pathways involved in
rapamycin addition to the cultivation medium. The manuscript was drafted by FB and finalized
by TB. The final manuscript version was approved by all authors.
Sections of paper [1] (Opportunities and challenges in the development of
Cutaneotrichosporon oleaginosus ATCC 20509 as a new cell factory for custom tailored
microbial oils) were introduced into in section 2.1.3- 2.1.6 in this thesis.
Contributions of the respective paper were as follows:
FB conceived the review in its design. TB contributed information about phylogeny microbial
and biochemical properties associated with the genus. The manuscript was drafted and
finalized by all authors. All authors read and approved the final manuscript.
Raw data from sections 2.4.1, 2.4.4, 2.4.5, 2.4.8 and 3.4 were at least in part obtained by
students in the course of internships or during Bachelors' or Masters' Theses. Details are given
in the respective sections.
__________________________________________________________________________
∼ 11 ∽
Table of Contents
1 General Introduction ........................................................................................................ 19
1.1 Context ..................................................................................................................... 19
1.2 ABV Consortial research project .............................................................................. 20
2 Screening and Characterization of Oleaginous Yeast .................................................... 21
2.1 Introduction .............................................................................................................. 21
2.1.1 Oleaginous Organisms ..................................................................................... 21
2.1.2 Mechanism of Lipid Accumulation .................................................................... 23
2.1.3 Cutaneotrichosporon oleaginosus .................................................................... 24
2.1.3.1 Origin and Phylogeny ................................................................................ 24
2.1.3.2 Substrate Spectrum ................................................................................... 24
2.1.3.3 Substrate Preferences ............................................................................... 25
2.1.3.4 Growth Inhibition ........................................................................................ 26
2.1.3.5 Cell Wall and Sugars ................................................................................. 27
2.1.3.6 Fatty Acid Content ..................................................................................... 27
2.1.3.7 Mechanism and Regulation of Lipid Accumulation .................................... 28
2.1.4 Fermentations of Cutaneotrichosporon oleaginosus ........................................ 30
2.1.4.1 Chemostat, Batch and Fed-Batch ............................................................. 30
2.1.4.2 Other Modeling .......................................................................................... 31
2.1.5 Genetic Modification of Cutaneotrichosporon oleaginosus ............................... 32
2.1.5.1 Random Mutagenesis ................................................................................ 32
2.1.5.2 Agrobacterium mediated transformation ................................................... 32
2.1.6 Model Organism Yarrowia lipolytica ................................................................. 32
2.2 Materials .................................................................................................................. 34
2.2.1 Instruments ....................................................................................................... 34
2.2.2 Consumables .................................................................................................... 35
2.2.3 Chemicals ......................................................................................................... 36
2.2.4 Strains ............................................................................................................... 37
2.2.5 Primers ............................................................................................................. 39

__________________________________________________________________________
∼ 12 ∽
2.2.6 RNA Synthesis .................................................................................................. 39
2.2.7 Software ............................................................................................................ 40
2.3 Methods ................................................................................................................... 41
2.3.1 Media and Buffer .............................................................................................. 41
2.3.1.1 Yeast Peptone Dextrose (YPD) ................................................................. 41
2.3.1.2 Yeast and Mold Medium (YM) ................................................................... 41
2.3.1.3 Minimal Nitrogen Medium S (MNM-S) ....................................................... 41
2.3.1.4 Minimal Nitrogen Medium S (MNM-S) ....................................................... 41
2.3.1.5 LB-Miller .................................................................................................... 41
2.3.1.6 Agar Plates ................................................................................................ 41
2.3.1.7 Agrobacterium tumefaciens medium ......................................................... 42
2.3.1.8 Spheroplasting Buffers .............................................................................. 42
2.3.1.9 Yeast Selection Plates ............................................................................... 42
2.3.1.10 Algae Hydrolysate ..................................................................................... 42
2.3.2 Isolation of Oleaginous Yeast Strains ............................................................... 42
2.3.2.1 Environmental Samples ............................................................................. 42
2.3.2.2 Isolation Procedure .................................................................................... 43
2.3.2.3 High-Throughput Determination of Growth ................................................ 43
2.3.2.4 High-Throughput Lipid Estimation ............................................................. 44
2.3.3 Lipid Analytics ................................................................................................... 44
2.3.3.1 Sudan Black B Staining ............................................................................. 44
2.3.3.2 Nile Red Staining ....................................................................................... 45
2.3.3.3 Fluorescence Microscopy .......................................................................... 46
2.3.3.4 Fluorescence Activated Cell Sorting .......................................................... 46
2.3.3.5 Fatty Acid Determination ........................................................................... 46
2.3.3.6 Gravimetric Lipid Quantification ................................................................. 47
2.3.3.7 Biomass Determination ............................................................................. 47
2.3.4 Molecular Biology Methods ............................................................................... 47
2.3.4.1 Isolation of Yeast Genomic DNA ............................................................... 47
2.3.4.2 Isolation of Genomic DNA ......................................................................... 48
__________________________________________________________________________
∼ 13 ∽
2.3.4.3 Determination of DNA Concentration ........................................................ 48
2.3.4.4 Strain Determination (18S rRNA) .............................................................. 48
2.3.4.5 Agarose Gel Electrophoresis ..................................................................... 49
2.3.4.6 Agrobacterium tumefaciens mediated transformation ............................... 49
2.3.4.7 Spheroplast transformation ....................................................................... 50
2.3.4.8 E. coli Heat Shock Transformation ............................................................ 50
2.3.4.9 Gibson Assembly ....................................................................................... 50
2.3.4.10 Dga2 and Slc1 Overexpression Plasmids ................................................. 50
2.3.4.11 Cas9 Gene Editing .................................................................................... 51
2.3.4.12 Localization of ATMT Insertion Sites ......................................................... 52
2.3.5 Microbiological and Biochemical Methods ........................................................ 54
2.3.5.1 Flask Cultivation ........................................................................................ 54
2.3.5.2 Culture Stocks ........................................................................................... 54
2.3.5.3 Ura and Ade Selection Media .................................................................... 54
2.3.5.4 Rapamycin and Caffeine Supplementation ............................................... 54
2.3.5.5 Western Blotting ........................................................................................ 54
2.3.5.6 Ethylmethanesulfonate mutagenesis (EMS) ............................................. 55
2.3.5.7 Directed Evolution ..................................................................................... 55
2.3.5.8 Sugar Analytics .......................................................................................... 55
2.3.6 Bioprocessing Methods .................................................................................... 56
2.3.6.1 48x 10 ml Fermentation ............................................................................. 56
2.3.6.2 1 l Fermentation ......................................................................................... 56
2.3.7 Bioinformatics ................................................................................................... 56
2.3.7.1 Codon Tables and Codon Adaption Indices .............................................. 56
2.3.7.2 Assembly of TORC Network ...................................................................... 57
2.4 Results and Discussion ............................................................................................ 58
2.4.1 Isolation of Oleaginous Yeast Strains ............................................................... 58
2.4.1.1 Isolation from Environmental Samples ...................................................... 58
2.4.1.2 Lipid Content of Isolates ............................................................................ 60
2.4.1.3 Fatty Acid Spectrum of Isolates ................................................................. 62
__________________________________________________________________________
∼ 14 ∽
2.4.2 Cultivation on Natural Substrate ....................................................................... 63
2.4.2.1 Optimization of Hydrolysis ......................................................................... 63
2.4.3 Oleaginous Yeast Screening ............................................................................ 65
2.4.3.1 High-throughput Determination of Growth ................................................. 65
2.4.3.2 High-throughput Lipid Estimation .............................................................. 65
2.4.3.3 Strain Characterization .............................................................................. 65
2.4.4 Mutagenesis and Repeated Selection .............................................................. 67
2.4.4.1 EMS Mutagenesis ..................................................................................... 67
2.4.4.2 FACS Nile-Red Staining ............................................................................ 67
2.4.4.3 Mutagenesis and Repeated Selection ....................................................... 68
2.4.5 Media Optimization ........................................................................................... 70
2.4.5.1 Dry Biomass and Lipid Content ................................................................. 70
2.4.5.2 Analysis of Growth Curve Parameters ...................................................... 72
2.4.5.3 Comparison of Nutrient Limitations ........................................................... 73
2.4.6 Effect of TORC Inhibition on Lipogenesis and Growth ..................................... 75
2.4.6.1 Caffeine Supplementation ......................................................................... 75
2.4.6.2 Rapamycin Effect on Nile Red Fluorescence ............................................ 76
2.4.6.3 Rapamycin Effect on Lipid Content ........................................................... 77
2.4.6.4 Rapamycin Effect on Growth Kinetics ....................................................... 78
2.4.6.5 Rapamycin Effect on Fatty Acid Spectrum ................................................ 80
2.4.7 Assembly of TORC Signaling Network ............................................................. 81
2.4.8 Genetic Modification of Cutaneotrichosporon oleaginosus ............................... 85
2.4.8.1 Codon Tables and Codon Adaption Indices .............................................. 85
2.4.8.2 Localization of ATMT Insertion Site ........................................................... 88
2.4.8.3 Overexpression of Dga and Slc ................................................................. 88
2.4.8.4 CRISPR Cas9 – In vivo expression ........................................................... 90
2.5 Conclusion and Outlook ........................................................................................... 93
3 Flocculation of the Microalgae Scenedesmus obtusiusculus .......................................... 96
3.1 Introduction .............................................................................................................. 96
3.1.1 Algae as Biological Feedstock .......................................................................... 96
__________________________________________________________________________
∼ 15 ∽
3.1.2 Algae Harvest ................................................................................................... 96
3.1.2.1 Physical Methods ...................................................................................... 97
3.1.3 Flocculation of Microalgae ................................................................................ 97
3.1.4 Scenedesmus obtusiusculus ............................................................................ 99
3.1.4.1 Flocculation of S. obtusiusculus .............................................................. 100
3.2 Materials ................................................................................................................ 102
3.2.1 Instruments ..................................................................................................... 102
3.2.2 Consumables .................................................................................................. 102
3.2.3 Chemicals ....................................................................................................... 103
3.2.4 Strains ............................................................................................................. 103
3.2.5 Software .......................................................................................................... 103
3.3 Methods ................................................................................................................. 104
3.3.1 Media .............................................................................................................. 104
3.3.2 Algae Cultivation and Growth ......................................................................... 105
3.3.2.1 Growth Curves and Modeling .................................................................. 106
3.3.2.2 Aerated Flasks ......................................................................................... 106
3.3.2.3 Bubble Column Reactor .......................................................................... 106
3.3.2.4 3 l Fermentation (Infors reactor) .............................................................. 107
3.3.3 Absorbance Measurement (OD) ..................................................................... 107
3.3.4 Biomass Determination ................................................................................... 108
3.3.5 Flocculation Procedure ................................................................................... 108
3.3.6 Measurement of Compression ........................................................................ 108
3.3.7 Zeta Potential Measurement ........................................................................... 109
3.3.8 Statistical Analyses ......................................................................................... 110
3.3.8.1 Simplex Lattice Design ............................................................................ 110
3.3.8.2 Growth Phase Dependency of Flocculation ............................................ 110
3.4 Results and Discussion .......................................................................................... 111
3.4.1 General Validation .......................................................................................... 111
3.4.1.1 Format of Flocculation Experiments ........................................................ 111
3.4.1.2 OD-Biomass Correlation .......................................................................... 112
__________________________________________________________________________
∼ 16 ∽
3.4.1.3 OD680 Measurement in 96-microwell plate ............................................... 113
3.4.2 pH Shift ........................................................................................................... 114
3.4.3 Tannin and Chitosan Flocculation .................................................................. 119
3.4.4 Tannin/Chitosan Interaction ............................................................................ 120
3.4.5 Growth Phase Dependency of Tannin and Chitosan Flocculation ................. 123
3.4.5.1 Effect of Growth Phase ............................................................................ 124
3.4.5.2 Other Effects ............................................................................................ 126
3.4.5.3 Time and Other Effects ............................................................................ 126
3.4.5.4 Algae Organic Matter Effects ................................................................... 127
3.5 Conclusion and Outlook ......................................................................................... 129
4 Bibliography .................................................................................................................. 131
5 List of Figures ................................................................................................................ 147
6 List of Tables ................................................................................................................. 152
7 List of Supplementary Materials .................................................................................... 154
Supplemental ....................................................................................................................... 159

__________________________________________________________________________
∼ 17 ∽
List of Symbols and Abbreviations
(v/v) Volume per volume LPA Lysophosphatidic acid
(w/w) Weight per weight MetOH Methanol
µg Microgram mg Milligram
µL Microliter min Minutes
µM Micromolar ml Milliliter
ACAT Acyl-CoA:cholesterol acyltransferase
mM Millimolar
ACL ATP-citrate lyase MNM C Minimal nitrogen medium fermentation
ACS Acyl-CoA synthase MNM S Minimal nitrogen medium standard
ADT Acyl-DHAP reductase NAD Nicotinamide adenine dinucleotide
AGAT Acyl-G-3-P acyltransferase NADP NAD phosphate
AMP Adenosine monophosphate NCBI National Center for Biotechnology Information
AMP Adenosine monophosphate ng Nanogram
Ara Arabinose NHEJ Non-homologous end joining
ATCC American Type Culture Collection
OD600 Optical density
ATMT Agrobacterium tumefaciens mediated transformation
OriV Origin of replication V
ATP Adenosine triphosphate PA Phosphatic acid
bp Basepair PAGE Polyacrylamide gel electrophoresis
Cas CRISPR -associated PAM Protospacer adjacent motif
cDNA Coding DNA PAP Phosphatidate phosphatase
CFU Colony forming units PCR Polymerase chain reaction
CoA Coenzyme A PEG Polyethylene glycol
CRISPR Clustered regularly interspaced short palindromic repeats
PUFA Poly unsaturated fatty acid
crRNA CRISPR RNA RGR Ribozyme-gRNA-Ribozyme complex
DAG Diacylglycerol rpm Revolutions per minutes
DF dilution factor s Seconds
Dga Diacylglycerol acyltransferase
SBB Sudan black B
DHAP Dihydroxyacetone phosphate SCO Single cell oil
DHAPAT DHAP acyltransferase SDS Sodium dodecyl sulfate
DMP Dimetoxypropane S-IMAS Solid induction medium with acetosyringon
DMSO Dimethyl sulfoxide TAE TRIS-Acetat-EDTA
DNA Deoxyribonucleic acid TAG Triacylyglycerol
dNTP Desoxynukleosidtriphosphate TCA Trichloro acetic acid
DSMZ Deutsche Sammlung von Mikroorganismen und Zellkulturen
T-DNA Transfer DNA
DTT Dithiothreitol TFA Total cellular fatty acid content
EDTA Ethylenediaminetetraacetic acid
TOR Target of rapamycin
EMS Ethyl methanesulfonate TORC TOR complex
ER Endoplasmic reticulum tracrRNA Transactivating CRISPR RNA
EtOH Ethanol Tris Tris(hydroxymethyl)aminomethane
FAME Fatty acid methyl ester tRNA Transfer RNA
FI Arbitrary fluorescence units VLC Very long chain
__________________________________________________________________________
∼ 18 ∽
FID Flame ionisation detector VLCPUFA Very long chain poly unsaturated fatty acids
G3P Glycerol-3-phosphate Xyl Xylose
Gal Galactose YFP Yellow fluorescent protein
GAT Glycerol-3-phosphate acyltransferase
YPD Yeast extract peptone dextrose
GC Gas chromatography HR Homologous recombination
GDH Glycerol-aldehyde-3-phosphate dehydrogenase
FDBM Final dry biomass concentration
Glc Glucose FA Fatty acid
GPD Glyceraldehyde-3-phosphate dehydrogenase
CCD Central composite design
gRNA Guide RNA YM Yeast and mold medium
h Hour FACS Flourescent activated flow cytometry
hph Hygromycin B resistance gene
PTFE Polytetrafluorethylene
IDH Isocitrate dehydrogenase FE Flocculation efficiency
kB Kilobasepairs DLS Dynamic light scattering
L Liter AOM Algae organic matter
Lac Lactose RSD Response surface design
LB Lysogeny broth
II General Introduction __________________________________________________________________________
∼ 19 ∽
1 General Introduction
1.1 Context
The second law of thermodynamics states, that the total entropy of a closed system always
increases over time. Thus it appears to be the nature of the universe to follow a stream of
increasing entropy towards a state in which all energy is equally distributed, a scenario termed
“heat death of the universe”. Seeing life from this perspective entails, that living organisms are
local, spatially restricted entities, which maintain a low-entropy zone in respect to their
environment. This is achieved either by the dissipation of heat (enthalpy-driven growth) or
generation of products with lower entropy than their substrate (entropy-driven growth)[1].
Inside this low entropy zone created by organisms, conditions for chemical reactions are
emerging, which would be impossible or at least infinitely improbable to occur by chance in an
environment without life. It appears obvious to harness these mechanisms for the benefit of
humankind. Owed to the high complexity and small component size of living systems, for most
of human history they were considered as black boxes, often “inspirited” by a supreme, non-
material force. However, this did not stop knowingly or unknowingly applying biotechnology,
such as the principles of mutation and selection in agriculture or fermentation processes[2].
Nowadays, one of the most demanding technological and social tasks is the transition from a
society with wasteful and linear production streams to one with cyclic streams and sustainable
resource management. This includes issues of energy supply and replacing fossil oil-derived
products. In the long term, decreasing supply of these products will cause raising prices for oil,
gas and associated commodities. However, with rising prices, more and more invasive
technologies (fracking or oil sand mining) are employed. So far, the devastating ecological
effects of these methods are not factored into the price of the resulting commodities and limits
to exploitation of natural resources are only given by political or social intervention.
Accordingly, technological innovations for facilitating a more sustainable way of living are
required. This thesis focuses on questions in regards to the production of low value products
from microbial organisms by addressing lipid accumulation in Cutaneotrichosporon
oleaginosus and energy efficient harvest of the algae Scenedesmus obtusiusculus.

II General Introduction __________________________________________________________________________
∼ 20 ∽
1.2 ABV Consortial research project
The work described in this thesis was conducted as part of the work on the “Advanced Biomass
Value” (ABV) research project. The goal of the project was the development of an integrated
biorefinery, which operates ecologically, economically and without the generation of waste
streams. The process can be broken down into two main process streams: The production of
high value lubricant additives as well as a low value alkane mix suitable for usage as aircraft
fuel (Figure 1).
Figure 1: Structure of the ABV Process
The basis of the project is the generation of algal biomass by growth in closed circuit reactors.
The extraction of lipids via supercritical CO2 avoids the use of toxic solvents. Enzymatic
functionalization of the generated lipids facilitates the usage of tailor-made lipid profiles, which
can be adapted for different application fields.
The remaining algal biomass is enzymatically hydrolyzed and used as substrate for oleaginous
yeast. The very high lipid content of these yeast enables the direct transformation of generated
biomass to alkanes using thermocatalytic means. Residues of these processes are used as
CO2 adsorbent building materials.
II Screening and Characterization of Oleaginous Yeast __________________________________________________________________________
∼ 21 ∽
2 Screening and Characterization of Oleaginous
Yeast
2.1 Introduction
2.1.1 Oleaginous Organisms
First descriptions of lipid accumulating microorganisms date back more than 100 years[3].
Making use of a somewhat arbitrary threshold, which dates back to a paper by Ratledge[4],
organisms exceeding a triacylglycerol (TGA) content of 20% w/w dry biomass are referred to
as oleaginous. Single celled oleaginous species are found in fungi (both yeasts and molds),
bacteria and both pro- and eukaryotic algae[5], [6], and can exhibit lipid contents of more than
80% w/w lipids[7]. The first more in-depth research was done in Germany with the goal of
commercial, large scale production of microbial oil as fuel replacement, especially during world
war I and II[8]. During that time, it was found that lipid accumulation was not a constitutive
feature, but an adaptive reaction to certain environmental conditions. For oleaginous
organisms, an environment which is abundant in a carbon source, usually carbohydrates, but
lacks nutrients such as phosphorus, nitrogen, iron or sulfur, making proliferation impossible,
the organism reacts by converting the excess carbon into fatty acids and incorporating them
into triglycerides. Those triglycerides are stored in specialized organelles, lipid bodies (also
known as lipid droplets, oil bodies or adiposomes). However, they are not to be confused with
liposomes, which are confined by a phospholipid double layer, whereas lipid bodies display
micelle-like monolayers)[9].
As nitrogen is commonly the easiest nutrient to deplete for heterotrophic organisms and yields
the most prominent effects[5], [6], [10], [11], nitrogen deficient media are used in most cases
to induce lipid accumulation. To quantify and evaluate this effect, the Carbon to Nitrogen ratio
(C:N ratio) of the medium was consulted, leading to the insight, that with increasing C:N ratios,
the lipid share is increasing. In contrast, under very strong nitrogen limitation, lipid yield suffers
from the small amount of biomass[12].
Consulting the C:N ratios, under defined conditions, process modeling can be done with decent
accuracy, however this approach does not do justice to the complexity of factors involved in
the process of lipid accumulation. Oxygen supply, carbon source, the form in which the
nitrogen is supplied to the cell (protein, amino acid, ammonium or urea), or the absolute
concentration of available carbon source strongly impacts on lipid productivity as well[13].
Compared to plant oils, lipids from microorganisms (or single cell oil, SCO) have a number of
favorable properties: They can be produced in much shorter production cycles independent of
II Screening and Characterization of Oleaginous Yeast __________________________________________________________________________
∼ 22 ∽
seasons or weather[6] and exhibit higher lipid yields, thus generating smaller waste streams.
They also do not compete with food crop for land, avoiding the “food vs. fuel” dilemma of first
generation biofuel[14]. Hence, SCOs are considered a second generation biofuel, as they are
using inexpensive and sustainable bio-based feedstock or possibly waste streams[15].
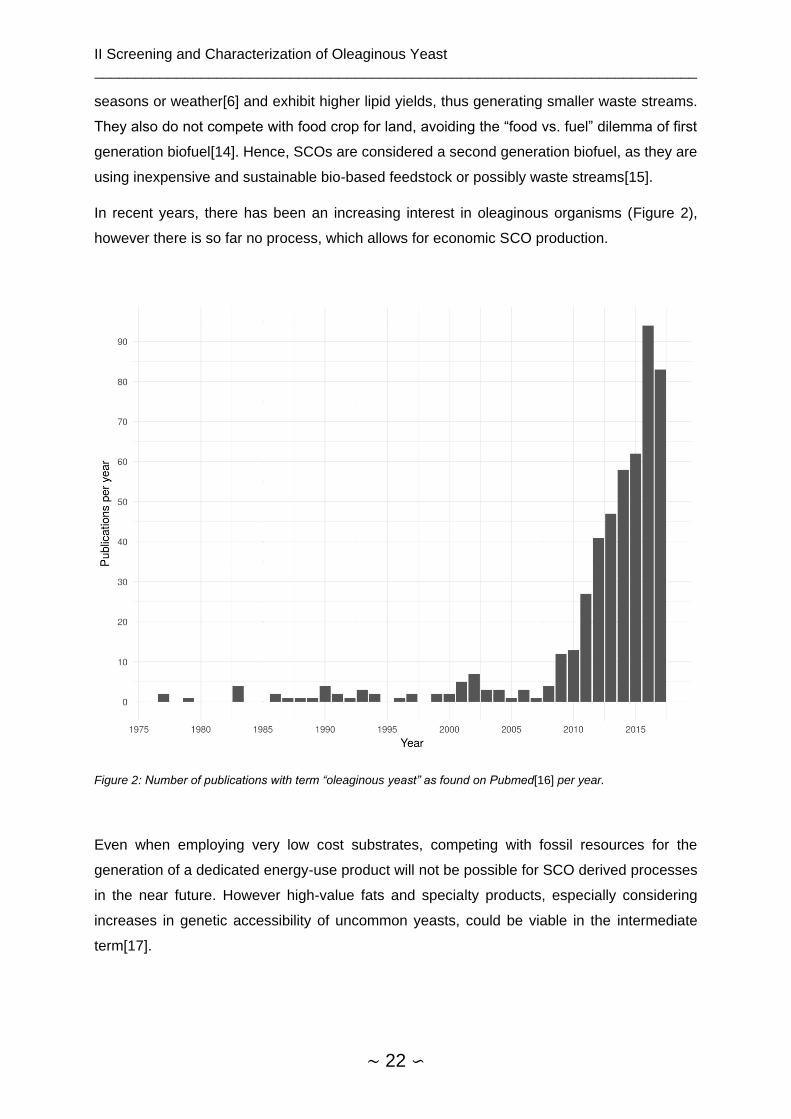
In recent years, there has been an increasing interest in oleaginous organisms (Figure 2),
however there is so far no process, which allows for economic SCO production.
Figure 2: Number of publications with term “oleaginous yeast” as found on Pubmed[16] per year.
Even when employing very low cost substrates, competing with fossil resources for the
generation of a dedicated energy-use product will not be possible for SCO derived processes
in the near future. However high-value fats and specialty products, especially considering
increases in genetic accessibility of uncommon yeasts, could be viable in the intermediate
term[17].
II Screening and Characterization of Oleaginous Yeast __________________________________________________________________________
∼ 23 ∽
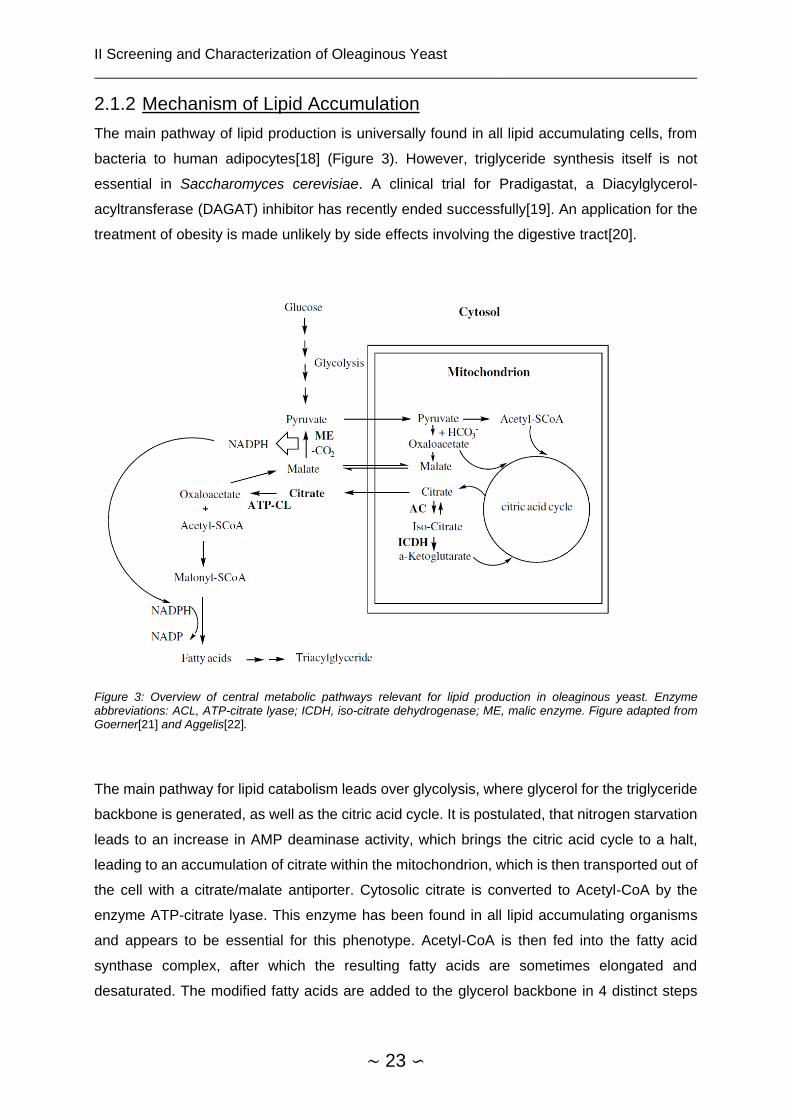
2.1.2 Mechanism of Lipid Accumulation
The main pathway of lipid production is universally found in all lipid accumulating cells, from
bacteria to human adipocytes[18] (Figure 3). However, triglyceride synthesis itself is not
essential in Saccharomyces cerevisiae. A clinical trial for Pradigastat, a Diacylglycerol-
acyltransferase (DAGAT) inhibitor has recently ended successfully[19]. An application for the
treatment of obesity is made unlikely by side effects involving the digestive tract[20].
Figure 3: Overview of central metabolic pathways relevant for lipid production in oleaginous yeast. Enzyme abbreviations: ACL, ATP-citrate lyase; ICDH, iso-citrate dehydrogenase; ME, malic enzyme. Figure adapted from Goerner[21] and Aggelis[22].
The main pathway for lipid catabolism leads over glycolysis, where glycerol for the triglyceride
backbone is generated, as well as the citric acid cycle. It is postulated, that nitrogen starvation
leads to an increase in AMP deaminase activity, which brings the citric acid cycle to a halt,
leading to an accumulation of citrate within the mitochondrion, which is then transported out of
the cell with a citrate/malate antiporter. Cytosolic citrate is converted to Acetyl-CoA by the
enzyme ATP-citrate lyase. This enzyme has been found in all lipid accumulating organisms
and appears to be essential for this phenotype. Acetyl-CoA is then fed into the fatty acid
synthase complex, after which the resulting fatty acids are sometimes elongated and
desaturated. The modified fatty acids are added to the glycerol backbone in 4 distinct steps
II Screening and Characterization of Oleaginous Yeast __________________________________________________________________________
∼ 24 ∽
occurring at the endoplasmatic reticulum (ER). SNARE-like proteins then facilitate the budding
of the lipid droplets from the ER[22].
As oleaginous yeasts are poorly characterized in comparison to e.g. Saccharomyces
cerevisiae, little is known about the regulatory framework behind lipid accumulation, and no
evidence on the protein level has so far been obtained. However, much can be inferred from
S. cerevisiae research and TORC (target of rapamycin complex) related pathways play a key
role in lipid accumulation. TORC components, some of which are strongly conserved from
yeast to mammals, have been found in Yarrowia lipolytica[23] and Cutaneotrichosporon
oleaginosus[24].The TOR complex is a central controlling complex of cell proliferation and
homeostasis. It processes information about the current status of the cell, possible energy or
nutrient deficiencies. It is active in favorable growth conditions, but is inhibited when for
example nitrogen supply is depleting[25]. TORC1 can therefore be assumed to be the crucial
element for lipid accumulation regarding cell signaling. TORC2 on the other hand functions as
a controller of cell polarization the cytoskeleton and is also closely tied into control of
proliferation. However, it is not sensitive to rapamycin and its signaling inputs are so far poorly
characterized.
2.1.3 Cutaneotrichosporon oleaginosus
2.1.3.1 Origin and Phylogeny
C. oleaginosus was isolated by Moon et al. in 1987 from samples taken from factory drains of
the Iowa State University Dairy Farm[26]. It was deposited under the name Candida curvata D
at the American type culture collection, and since then was reclassified to Apiotrichum
curvatum[12], Cryotoccus curvatus[27], Trichosporon cutaneum[28] and since 2011 as
Trichosporon oleaginosus[29]. Liu et al. published a comprehensive phylogenetic study of the
Tremellomycetes[30], placing T. oleaginosus in the genus of Cutaneotrichosporon while
keeping its epithet. C. oleaginosus forms basidiocarps, sexual reproduction and ethanol
fermentation are, like for any other species of this genus, not observed[31]. It also grows in
filamentous form, presumably in nature preferred as filamentous fungus in soil and on leaf
litter[32]. The GC content of the genome is high with 61%[24] and the organism is strongly
adapted to changing nutrient supply, as oleaginous properties and very low maintenance
energy show [12], [33], [34].
2.1.3.2 Substrate Spectrum
C. oleaginosus does not grow on cellulosic material and in general on untreated,
polysaccharide-based substrates[35]. Predicted cellulases[24], are presumed to only be of
intracellular relevance. However, it readily utilizes glucose, galactose, cellobiose, xylose,

II Screening and Characterization of Oleaginous Yeast __________________________________________________________________________
∼ 25 ∽
sucrose, lactose as carbon source[36]–[38]. Liang et al.[36] reported depletion of arabinose in
C. oleaginosus cultivation medium, but Meo[39] showed that arabinose titers decrease very
slowly and the sugar is not used for generation of biomass. The results suggest that C.
oleaginosus is suffering from arabinose transporter deficiency[40] and/or cofactor imbalance
of arabinose oxidoreductase pathway[41]. The strain is able to metabolize ammonium,
nitrate[42] and urea[24], [43] up to a concentration of 1 g/l without sacrificing for growth[44].
Furthermore, the yeast is able to metabolize glycerol[45] even from industrial origin[44], N-
acetylglucosamine[46], volatile fatty acids[42] and ethanol and able to metabolize 4-
hydroxymethylfurfural[36]. The related Candida sp. can also use n-alkanes as carbon source,
but this has not yet been shown for C. oleaginosus[47]. Regarding the biochemistry of
substrate utilization only two lactose hydrolases were studied more in depth, yielding that C.
oleaginosus contains a high activity, highly specific beta-galactosidase requiring metal ions as
cofactors as well as a cofactor-independent lower activity and lower specificity beta
glycosidase[48].
2.1.3.3 Substrate Preferences
In batch experiments, Meo[39] found the highest biomass yield with mannose as substrate,
followed by galactose and glucose. Xylose and arabinose showed significantly lower biomass
and lipid yield. No diauxic effect between hexose sugars has been observed so far[39], [49].
Indeed, a mixture of sugars leads to higher substrate assimilation- and maximum growth rates
than individual sugars[39]. However in the presence of mannose and glucose, metabolization
of galactose was somewhat delayed[39] and in the presence of glucose, xylose consumption
was greatly decreased[50]. In flask experiments glucose, mannose and xylose resulted in
comparable lipid content, however the lipid yield was highest with glucose followed by
mannose and xylose. Again, xylose and galactose resulted in lower biomass and lipid yield. In
chemostat experiments with single carbon sources, xylose was the most suitable sugar to
achieve high lipid yield followed by lactose and sucrose[38]. However, Görner et al. found lipid
productivity with xylose to be significantly better than with glucose or N-acetyl glucosamine,
both of which were comparable[51]. This hints at possible metabolization by
phosphoketolases, which would yield 1.3 mol AcCoa / 100 g xylose as opposed to 1 mol AcCoa
/ 100 g xylose over the pentose phosphate way. Over glycolysis, 1.1 mol AcCoa can be
generated from 100 g glucose[52]. In general, metabolic flux from lactose or xylose as carbon
source to lipid appears to be less favorable[53], but this likely depends on the presence of
further carbon sources and possibly cultivation conditions. Preferred carbon source for lipid
accumulation were asparagine and urea, which yielded higher lipid than yeast extract[44].
In R. toruloides, lipid accumulation can be induced by nitrogen, phosphate or sulfur
starvation[54]–[56]. Meo[39] evaluated these limitations by employing different C:N, C:P and
II Screening and Characterization of Oleaginous Yeast __________________________________________________________________________
∼ 26 ∽
C:S ratios in fed batch cultivations in two phases. In the first phase, limitation ratios of batch
media were varied, whereas in the second phase, limitation ratios of feed were changed. C:N
ratios of batch media between 5 and 20 g/g showed no strong variation. Maximum lipid content
was observed at C:N of 15 g/g. For subsequent feeding of this culture, C:N ratios showed to
have a significant impact. Whereas lipid content decreased moderately with decreasing C:N
ratio, there was a strong decrease between C:N 75 g/g (48% g/g lipids per biomass) and C/N
50 g/g (21% g/g lipid content). This is supported by results from Park et al.[57], whereas Ykema
et al. found the critical C:N ratio at 11 g/g. Variation of C/S or C/P ratios of batch media also
had little impact on lipid content and no lipid accumulation was induced by sulfate limitation
(max 15% g/g lipid content after feeding). A C:P ratio of 702 g/g was sufficient for the
accumulation of 40% g/g lipids, but subsequent feeding required absence of phosphate for
cells to remain at this level.
Described pH optima for lipid yield differ vastly between 4.8[58] and 7[42], owing to the wide
spectrum of substrates (natural, semi-defined and synthetic) and fermentation modes. In
synthetic media, small differences in pH between 5 and 6, values which are most commonly
used for cultivation, have no significant effect on lipid production[39].
There is no comprehensive model capable of predicting biomass yield and lipid content for C.
oleaginosus grown in arbitrary complex media. Solely relying on carbon source concentration
and C:N:S:P ratio for predictions is insufficient for this task as interaction effects with other
fermentation parameters and concentrations of media constituents are likely (see linear
modeling).
2.1.3.4 Growth Inhibition
Acidic saccharification of natural, polymeric substrates is accompanied by the generation of
inhibitory byproducts[59]. These comprise weak organic acids, furan derivatives and phenolic
compounds[60]. C. oleaginosus has been shown to be resistant against some of these
compounds and proliferated comparatively well growth in non-detoxified hydrolysates[61].
Growth is significantly inhibited by 1 g/l furfural[61] to 20% w/w final dry biomass (FDBM)
compared to the control, however at higher concentrations, FDBM remains constant[53].
Inhibition by HMF, polyhydroxybutyrate (PHB) and syringaldehyde is low at 1 g/l (<5% w/w
FDBM), whereas vanillin at the same concentration reduces FDBM by 20% w/w at 1 g/l and
40% w/w at 1.5 g/l. Volatile fatty, despite their general suitability as substrate, impair growth at
moderate concentrations (43% w/w FDBM reduction at 5 g/l for acetic acid[62]). Up to 40 g/l
potassium acetate (KAc), only growth rate and lag phase, but not final biomass are
impaired[63]. Glycerin concentrations beyond 20 g/l[64] and 100 g/l glucose (Data not
published) are inhibitory, maximum growth rate decreases by 20% at concentrations of 100 g/l
II Screening and Characterization of Oleaginous Yeast __________________________________________________________________________
∼ 27 ∽
glycerin and 80% at 150 g/l[44]. High initial pH appears to lead to an increase in lag phase
duration[63].
Lipid content (LC) is impacted in a similar way as FDBM. Furfural reduces LC to 40% w/w
compared to the control, reduction of LC by PHB and syringaldehyde are below 5% w/w.
Inhibition of both growth and lipid content can depend on substrate utilization: Grown on
glucose, 1 g/l vanillin reductions of 22% w/w FDBM and 10% w/w LC were observed. With
xylose as main carbon sources, the reduction was 30% w/w FDBM and 22% w/w LC[53]. In
the presence of inhibitors, an inoculum of 10% v/v of overnight culture is recommended.
2.1.3.5 Cell Wall and Sugars
The cell wall of C. oleaginosus consists mostly of neutral carbohydrate (63% w/w), the
remainder is comprised of protein (11% w/w), glucosamine (9% w/w) and glucuronic acid (13%
w/w)[32]. The comparatively low amount of neutral carbohydrates compared to other yeasts
(S. cerevisiae: 80-90% w/w[65], C. albicans: 80% w/w[66]) combined with the high amount of
chitin are characteristics, which are more typical for cell walls of filamentous fungi. Mannose
content is significantly lower than for S. cerevisiae and content of uronic acids is unusually high
for fungi in general. The cell wall is susceptible to digestion by Novozyme 234[67].
It is known that yeasts can accumulate large amounts of disaccharides, trehalose or
polysaccharides such as glycogen or pullulan[68]. With increasing limitation, lipid content as
well as carbohydrate content in C. oleaginosus increase[12]. However, lipid accumulation
continues even in the stationary phase and is accompanied by decrease in intracellular
carbohydrates[69]. The main notion is that, not as previously hypothesized[12], glucose (or
any corresponding carbon source) uptake is the rate limiting step for lipid production, but that
the subsequent conversion to fatty acids is the main bottleneck. This leads to accumulation of
sugars in the cell, which act as a “short term” storage product[70]. No studies have further
qualitatively characterized these sugars. However, amongst the highly upregulated genes
under nitrogen limiting conditions is an Endoglucanase[24] (Triol1|310356), possibly
associated with the decomposition of intracellular polysaccharides.
2.1.3.6 Fatty Acid Content
Temperature had no significant effect on the fatty acid (FA) spectrum of C. oleaginosus
between 27 and 33°C in liquid medium[71]. However grown at 15°C on solid medium, FA
content shifts towards longer chain and higher unsaturated fatty acid content[72]. No
differences were found between cells grown at pH 6 and 7, whereas at pH 8 the concentration
of C18:0 and at pH 9 concentrations of C16:0 and C18:2 were increased[63]. In comparison
to glucose as carbon source, FA content was strongly shifted in favor of C18:2 when galactose
or arabinose were used. FA spectra of cells grown on cellobiose, mannose and xylose were
not significantly different from those grown on glucose[53]. In different carbon sources,
II Screening and Characterization of Oleaginous Yeast __________________________________________________________________________
∼ 28 ∽
presence of inhibitory hydrolysis byproducts (furfural, PHB, syringaldehyde and vanillin) shifted
the FA spectrum on average away from C16:0, C18:0 and C18:1 towards C18:2[53]. A similar
effect was observed for ammonia as nitrogen source as compared to nitrate[42]. Using volatile
fatty acids (VFAs) as substrate on average decreased the amount of C18:2 and using
propionate as substrate made the generation of odd-numbered fatty acids such as C17:0 or
C17:1 possible[42], which are usually not found in yeast. FA desaturase inhibitors were used
to modify the FA spectrum in a related strain[73], but not yet in C. oleaginosus. The same
applies to oxygen starvation during lipid production phase, which is reported to modify fatty
acid content in different oleaginous yeasts[74]. Effects of different genetic modifications on FA
distribution in C. oleaginosus are shown in Supplemental 2.
2.1.3.7 Mechanism and Regulation of Lipid Accumulation
Relevance of citrate has described early as part of the “standard model” of lipid accumulation
by Ratledge[68]. Fatty acid synthesis requires Acetyl-CoA (AcCoA) and Malonyl-CoA. AMP-
dependent isocitrate dehydrogenase (IDH) shows activity at very low AMP concentrations, as
they are present during nitrogen limitation[75]. Citrate accumulates in the mitochondrion and
is exported into the cytosol via a citrate/malate antiporter. ATP-citrate-lyase cleaves citrate to
acetyl-CoA and oxaloacetate, which is reintroduced into the citric acid cycle[68]. Presence of
ACL is considered a defining feature of oleaginous yeasts[76], but non-oleaginous strains with
ACL have been described[4]. Supply of NADH has not been fully elucidated, but both
introduction of glucose-6-phosphate (by glucose-6-phosphate dehydrogenase, G6PDH) into
the pentose phosphate way and shunting of pyruvate to oxaloacetate by malic enzyme are
likely sources of reducing equivalents.
Kourist et al.[24] described a transcriptomic analysis of in C. oleaginosus, comparing nitrogen
limited medium containing glucose as carbon source with full complex medium. Amongst the
most strongly upregulated genes were amino acid and ammonium transporters, many
proteases were upregulated to facilitate the recycling of nitrogen in nonessential peptides and
proteins. Within central nitrogen metabolism, equilibrium shifted away from ammonium and
glutamine towards glutamate, which in turn is responsible for nitrogen supply to non-essential
amino acids over transamination. The mitochondrial isocitrate exporter (Triol1|270035) was
not upregulated and hence the export of citrate to cytosol is most likely not a rate limiting step.
Supply of Acetyl-CoA (AcCoA) and Malonyl-CoA (MaCoA) for lipid synthesis was ensured by
upregulation of ATP-citrate lyase (ACL) and AcCoA-Carboxylase (ACC). The two constituents
needed for the production of fatty acids are processed by fatty acid synthases (FAS1, FAS2):
Both genes were upregulated. NADPH supply required for FA synthesis was most likely served
over G6PDH, as glucose-6-phosphate dehydrogenase was upregulated, but malic enzyme
(Triol1|326761) was not.
II Screening and Characterization of Oleaginous Yeast __________________________________________________________________________
∼ 29 ∽
The detection of lipid stress and relevant cell signaling pathways were addressed in detail by
Bracharz et al. Target of rapamycin complexes (TORCs) were identified as central, conserved
integrators of stress signals. Involvement of TORC1 in response to nutrient stress was
confirmed by inhibition with rapamycin, leading to a raise in lipid content and a shift in fatty acid
spectrum towards a pattern typical for nitrogen limitation. A homology based TORC signaling
network assembled by the authors indicates, that cell signaling response to carbon depletion
is conserved, whereas response to nitrogen limitation and autophagy are not.

II Screening and Characterization of Oleaginous Yeast __________________________________________________________________________
∼ 30 ∽
2.1.4 Fermentations of Cutaneotrichosporon oleaginosus
2.1.4.1 Chemostat, Batch and Fed-Batch
As C. oleaginosus was isolated from a dairy farm, many earlier publications focused on whey
or whey permeate as substrate, achieving between 0.13 g/l culture/hour for batch experiment
and 0.38 g/l/h for chemostat cultivation. Highest lipid productivities were commonly between
0.4 and 0.6 g/l/h, 1 g/l/h for chemostat with partial recycling appears to be an outlier.
Fermentation pH was mostly set between 5 and 6 (see substrate and growth preferences)
whereas temperature was almost kept at 30°C. Lipid yield was around 16 ± 8.4 g/ 100 g
substrate on average while stoichiometric maximum of lipid yield is 33 g lipids / 100 g sugar[77].
Average lipid content was at 39.3 ± 14.4 with a maximum of 74% w/w and lipid production was
at 14.3 ± 11.8 g/l with a maximum of 49 g/l. Average lipid production was higher at samples
quantified by GC/FID (17.1 g/l) in comparison to gravimetric measurements (11.4 g/l), which
was however not significant at α=0.05. Single-stage continuous fermentation requires shorter
average residence time than batch fermentation for sugar utilization[78] and showed on
average higher lipid productivity. An overview of C. oleaginosus fermentations reported in
literature can be found in Supplemental 1, Supplemental 2 and Supplemental 3.
If applied properly, statistical design of experiments and linear models can be suitable tools for
finding interacting independent variables or making predictions about yield. Using a Plackett-
Burman design, Zheng et al.[79] tested the influence of different media supplements and
cultivation parameters on C. oleaginosus FDBM with H2 producing sludge as substrate.
Acetate concentration had the strongest positive impact on FDBM, followed by pH, EDTA
content (Metal limitation) and pH. Increasing concentrations of ammonium chloride,
magnesium sulfate and peptone had a negative effect. Significant dependent variables were
picked for a central composite design (CCD), but as effects of single dependent variables are
confounded with higher order effects in the screening, not all significant factors might have
been included. From the CCD, almost only found linear effects and two way interactions:
Effects of ammonium chloride and acetate concentration were interacting with pH, ammonium
chloride effect further interacted with acetate and EDTA with magnesium sulfate. Model quality
is questionable, as experimental confirmation fit poorly with the predicted FDBMs.
Vega et al. optimized FDBM of C. oleaginosus on banana juice[80] containing 25% w/w sugars.
A second order CCD was employed to find optimal pH, concentration of substrate as well as
asparagine and yeast extract supplementation. The factors initial pH (4.8-6.2) and asparagine
concentration (15-255 mg/l) were not significant. Factor yeast extract was only significant at
juice concentrations under 19% v/v, indicating a lack of nutrients in the juice. Optimum growth
was achieved at 21% v/v juice (5% w/w sugars), beyond which growth was impaired. In a 2-
level full factorial design, method of sterilization, aeration plug and all previous variables were
II Screening and Characterization of Oleaginous Yeast __________________________________________________________________________
∼ 31 ∽
used as factors. Significantly higher yields were obtained with filter sterilization over
autoclaving and milk filters over dispo plugs. With a 2 factor second order CCD, interaction
effect between cultivation temperature and substrate concentrations were found: As juice
concentration is increased, the optimal temperatures decreased.
Cui et al. used a Box-Behnken design to estimate effects of substrate (glycerol) concentration,
pH and temperature on lipid productivity[64]. Both glycerol concentration (10-30 g/l) and
temperature (27-33°C) had more significant effects on biomass yield than pH (5-6). At pH 6,
temperature optimum was 30°C and optimal glycerol concentration was 20 g/l. For biomass,
the significant factors were glycerol (negative), glycerol quadratic (negative), temperature
(negative) and the interaction effect between temperature and pH (positive). For the lipid
content pH (positive), glycerol (negative) and glycerol quadratic (negative) were significant
factors. The optimum was positioned at pH 6, 20 g/l glycerol and 30°C. Experimental
confirmation fit well with predicted cell dry weight and lipid content.
2.1.4.2 Other Modeling
Ykema et al.[12] used a kinetic model to predict lipid production in a chemostat using semi-
defined medium and glucose as substrate in dependence of dilution rate and C:N ratio. The
model predicted lipid production in dependence of C:N ratio well, but did not capture the
dynamics of carbohydrate content. Due to its scope, dependence of productivity was modeled
only in dependence of few parameters and is therefore applicable only in these defined
conditions. The same applies to Browns’ approach [78], [81] of separating growth into three
phases and modeling nitrogen, non-lipid biomass, lactose and lipids using a set of differential
equations.
II Screening and Characterization of Oleaginous Yeast __________________________________________________________________________
∼ 32 ∽
2.1.5 Genetic Modification of Cutaneotrichosporon oleaginosus
2.1.5.1 Random Mutagenesis
N-methyl-N'-nitro-N'-nitrosoguanidine (MNNG) and ICR-170 were suitable mutagens for
generating amino acid auxotrophic mutants of C. oleaginosus, whereas mutagenesis with ethyl
methanesulfonate (EMS) and UV irradiation were less successful[82]. Fatty acid and
unsaturated fatty acid auxotrophs were generated by Ykema et al.[82], mutants were created
with a modified fatty acid distributions by intraspecific spheroblast fusion with methionine
auxotrophs[83]. Also, revertants were characterized for their modified FA spectrum[84] and
growth on whey permeate[85]. Fatty acid mutants were also generated by mutagenesis with
EMS[86] and characterized (Supplemental 2). As opposed to the description of Ochsner et
al[67] for strain T. dermatis (DSM70698), plasmid transformation into C. oleaginosus did not
yield stable transformants (data not published).
2.1.5.2 Agrobacterium mediated transformation
Görner et al. established a method for the stable integration of expression cassettes into the
C. oleaginosus genome using agrobacterium mediated transformation (ATMT)[51]. Codon
optimized yellow fluorescent protein was expressed using glyceraldehyde-3-phosphate
dehydrogenase (GDH) promoter and the respective GDH terminator from C. oleaginosus.
Selection was done by also expressing hygromycin b phosphotransferase (hph gene) from E.
coli using a truncated GDH promoter. Following this proof of concept, different bacterial
enzymes for fatty acid modification were expressed to change the fatty acid spectrum of neutral
and phospholipids. The approach suffers from the fact, that the GDH appears to be
downregulated in limiting conditions[24], limiting productivity of tailor made lipids in C.
oleaginosus. So far, no other promoters for functional heterologous expression are described.
2.1.6 Model Organism Yarrowia lipolytica
A process of C. oleaginosus fermentation with whey permeate as substrate for production of
triglycerides was already patented in 1980[87]. However, since then, no further attempts at
commercialization have been conducted. The majority of oleaginous yeast research has been
focused on the organism Yarrowia lipolytica, which resulted in a sizeable body of literature with
over 2'400 articles. As the main metabolic paths leading to synthesis of triglycerides are highly
conserved, many of the findings could be transferable to other oleaginous yeasts. However, it
is becoming apparent, that the bottlenecks in these pathways are not the same:
Overexpression of endogenous diacylglycerol acyltransferases or lysophosphatidic acid
acyltransferase did not yield significantly higher lipid contents in C. oleaginosus. The lipid
content of Y. lipolytica wild type is typically around 20[88]-35% w/w[89], [90].
II Screening and Characterization of Oleaginous Yeast __________________________________________________________________________
∼ 33 ∽
However, this metric can be raised to 45% w/w[89] or even up to 90% w/w with sophisticated
genetic engineering[91]. This also yielded in excess of 25 g l-1 lipids, a value which was
achieved by cultivation of wild type C. oleaginosus. Further, Y. lipolytica requires engineering
for utilization of xylose and sucrose or to overcome strong diauxic effects[92].
II Screening and Characterization of Oleaginous Yeast __________________________________________________________________________
∼ 34 ∽
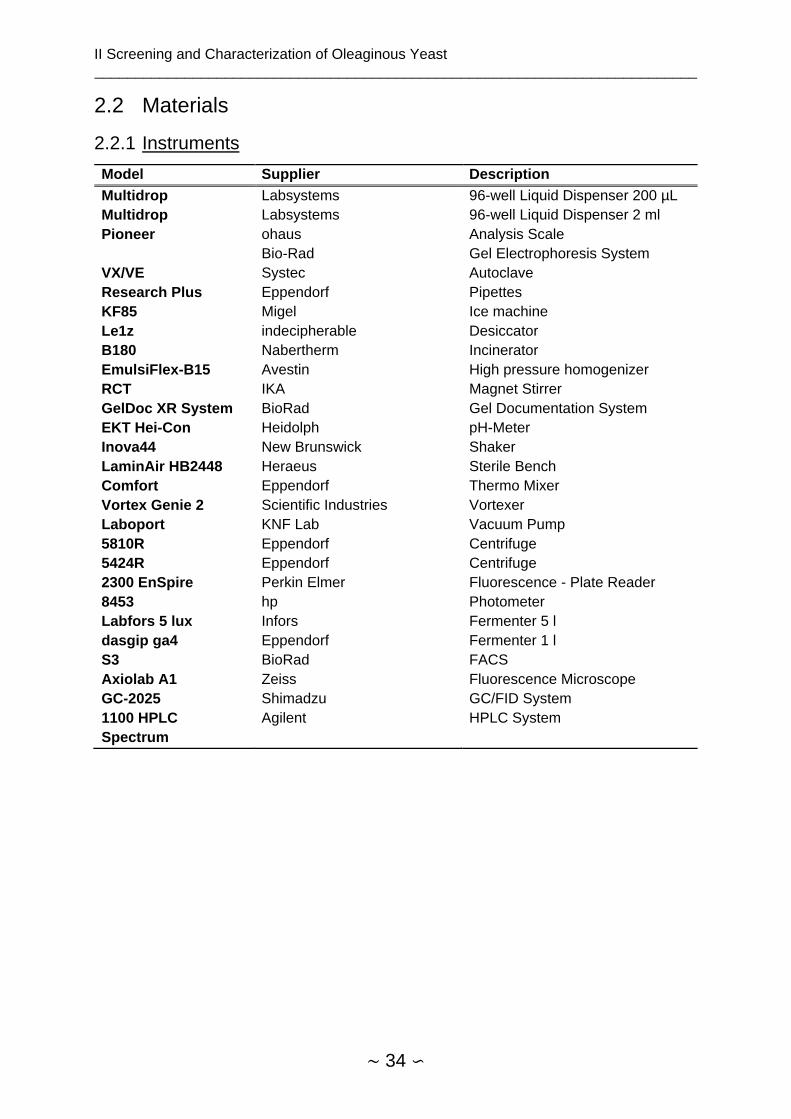
2.2 Materials
2.2.1 Instruments
Model Supplier Description
Multidrop Labsystems 96-well Liquid Dispenser 200 µL
Multidrop Labsystems 96-well Liquid Dispenser 2 ml
Pioneer ohaus Analysis Scale
Bio-Rad Gel Electrophoresis System
VX/VE Systec Autoclave
Research Plus Eppendorf Pipettes
KF85 Migel Ice machine
Le1z indecipherable Desiccator
B180 Nabertherm Incinerator
EmulsiFlex-B15 Avestin High pressure homogenizer
RCT IKA Magnet Stirrer
GelDoc XR System BioRad Gel Documentation System
EKT Hei-Con Heidolph pH-Meter
Inova44 New Brunswick Shaker
LaminAir HB2448 Heraeus Sterile Bench
Comfort Eppendorf Thermo Mixer
Vortex Genie 2 Scientific Industries Vortexer
Laboport KNF Lab Vacuum Pump
5810R Eppendorf Centrifuge
5424R Eppendorf Centrifuge
2300 EnSpire Perkin Elmer Fluorescence - Plate Reader
8453 hp Photometer
Labfors 5 lux Infors Fermenter 5 l
dasgip ga4 Eppendorf Fermenter 1 l
S3 BioRad FACS
Axiolab A1 Zeiss Fluorescence Microscope
GC-2025 Shimadzu GC/FID System
1100 HPLC
Spectrum
Agilent HPLC System
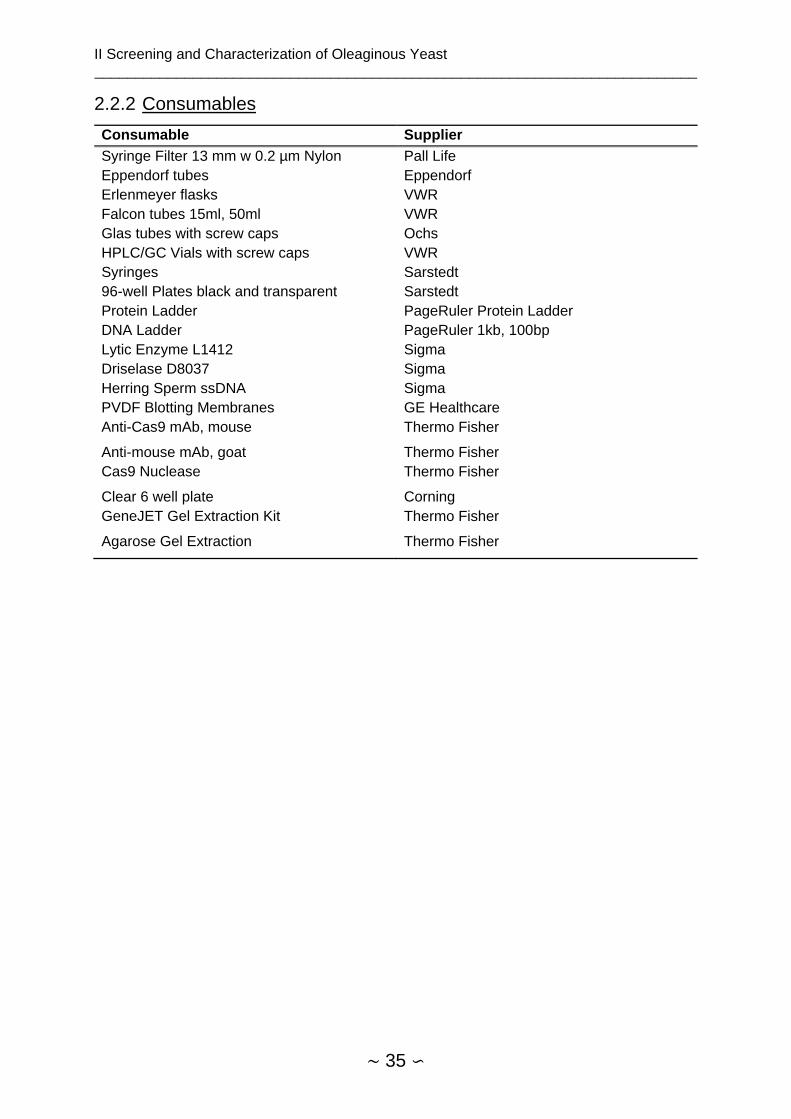
II Screening and Characterization of Oleaginous Yeast __________________________________________________________________________
∼ 35 ∽
2.2.2 Consumables
Consumable Supplier
Syringe Filter 13 mm w 0.2 µm Nylon Pall Life
Eppendorf tubes Eppendorf
Erlenmeyer flasks VWR
Falcon tubes 15ml, 50ml VWR
Glas tubes with screw caps Ochs
HPLC/GC Vials with screw caps VWR
Syringes Sarstedt
96-well Plates black and transparent Sarstedt
Protein Ladder PageRuler Protein Ladder
DNA Ladder PageRuler 1kb, 100bp
Lytic Enzyme L1412 Sigma
Driselase D8037 Sigma
Herring Sperm ssDNA Sigma
PVDF Blotting Membranes GE Healthcare
Anti-Cas9 mAb, mouse Thermo Fisher
Anti-mouse mAb, goat Thermo Fisher
Cas9 Nuclease Thermo Fisher
Clear 6 well plate Corning
GeneJET Gel Extraction Kit Thermo Fisher
Agarose Gel Extraction Thermo Fisher
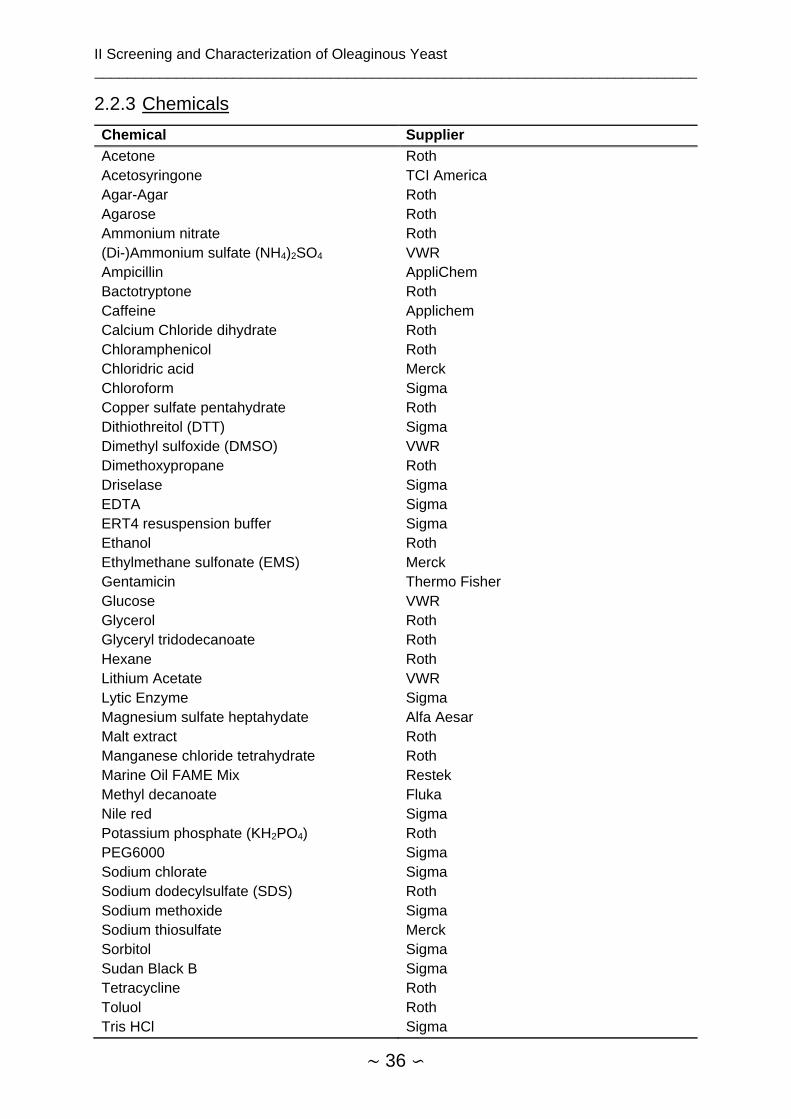
II Screening and Characterization of Oleaginous Yeast __________________________________________________________________________
∼ 36 ∽
2.2.3 Chemicals
Chemical Supplier
Acetone Roth
Acetosyringone TCI America
Agar-Agar Roth
Agarose Roth
Ammonium nitrate Roth
(Di-)Ammonium sulfate (NH4)2SO4 VWR
Ampicillin AppliChem
Bactotryptone Roth
Caffeine Applichem
Calcium Chloride dihydrate Roth
Chloramphenicol Roth
Chloridric acid Merck
Chloroform Sigma
Copper sulfate pentahydrate Roth
Dithiothreitol (DTT) Sigma
Dimethyl sulfoxide (DMSO) VWR
Dimethoxypropane Roth
Driselase Sigma
EDTA Sigma
ERT4 resuspension buffer Sigma
Ethanol Roth
Ethylmethane sulfonate (EMS) Merck
Gentamicin Thermo Fisher
Glucose VWR
Glycerol Roth
Glyceryl tridodecanoate Roth
Hexane Roth
Lithium Acetate VWR
Lytic Enzyme Sigma
Magnesium sulfate heptahydate Alfa Aesar
Malt extract Roth
Manganese chloride tetrahydrate Roth
Marine Oil FAME Mix Restek
Methyl decanoate Fluka
Nile red Sigma
Potassium phosphate (KH2PO4) Roth
PEG6000 Sigma
Sodium chlorate Sigma
Sodium dodecylsulfate (SDS) Roth
Sodium methoxide Sigma
Sodium thiosulfate Merck
Sorbitol Sigma
Sudan Black B Sigma
Tetracycline Roth
Toluol Roth
Tris HCl Sigma
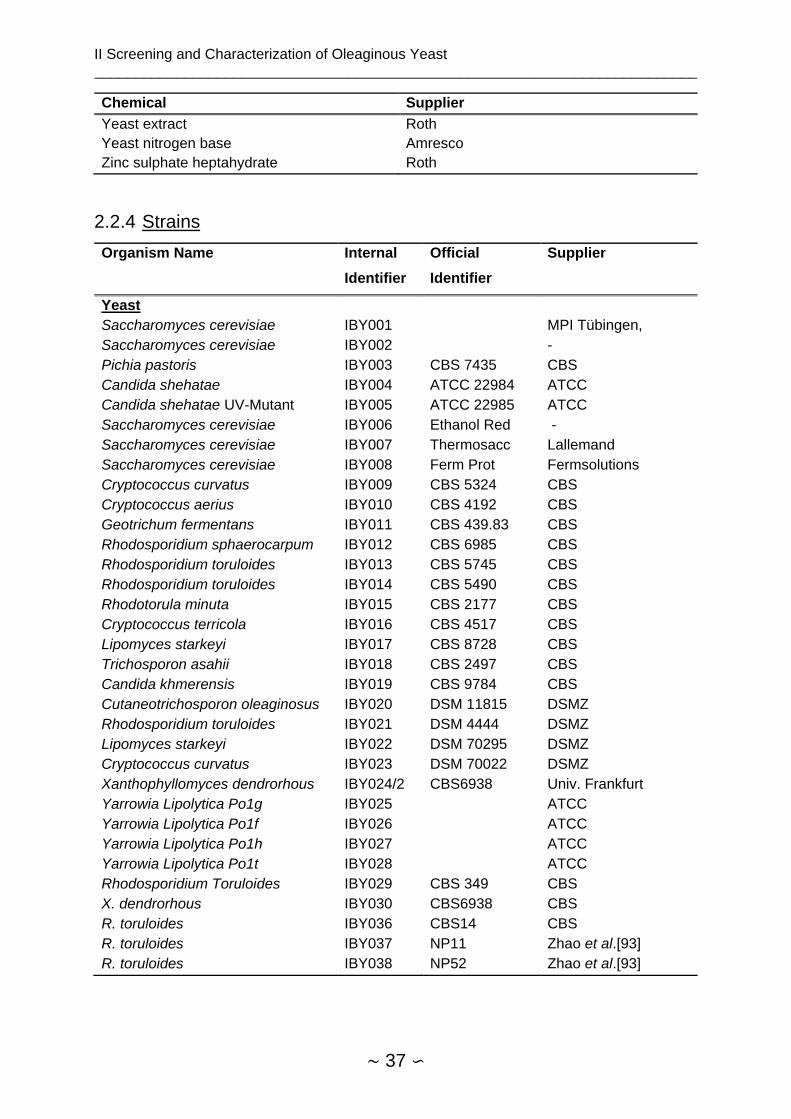
II Screening and Characterization of Oleaginous Yeast __________________________________________________________________________
∼ 37 ∽
Chemical Supplier
Yeast extract Roth
Yeast nitrogen base Amresco
Zinc sulphate heptahydrate Roth
2.2.4 Strains
Organism Name Internal
Identifier
Official
Identifier
Supplier
Yeast
Saccharomyces cerevisiae IBY001 MPI Tübingen,
Saccharomyces cerevisiae IBY002 -
Pichia pastoris IBY003 CBS 7435 CBS
Candida shehatae IBY004 ATCC 22984 ATCC
Candida shehatae UV-Mutant IBY005 ATCC 22985 ATCC
Saccharomyces cerevisiae IBY006 Ethanol Red -
Saccharomyces cerevisiae IBY007 Thermosacc Lallemand
Saccharomyces cerevisiae IBY008 Ferm Prot Fermsolutions
Cryptococcus curvatus IBY009 CBS 5324 CBS
Cryptococcus aerius IBY010 CBS 4192 CBS
Geotrichum fermentans IBY011 CBS 439.83 CBS
Rhodosporidium sphaerocarpum IBY012 CBS 6985 CBS
Rhodosporidium toruloides IBY013 CBS 5745 CBS
Rhodosporidium toruloides IBY014 CBS 5490 CBS
Rhodotorula minuta IBY015 CBS 2177 CBS
Cryptococcus terricola IBY016 CBS 4517 CBS
Lipomyces starkeyi IBY017 CBS 8728 CBS
Trichosporon asahii IBY018 CBS 2497 CBS
Candida khmerensis IBY019 CBS 9784 CBS
Cutaneotrichosporon oleaginosus IBY020 DSM 11815 DSMZ
Rhodosporidium toruloides IBY021 DSM 4444 DSMZ
Lipomyces starkeyi IBY022 DSM 70295 DSMZ
Cryptococcus curvatus IBY023 DSM 70022 DSMZ
Xanthophyllomyces dendrorhous IBY024/2 CBS6938 Univ. Frankfurt
Yarrowia Lipolytica Po1g IBY025 ATCC
Yarrowia Lipolytica Po1f IBY026 ATCC
Yarrowia Lipolytica Po1h IBY027 ATCC
Yarrowia Lipolytica Po1t IBY028 ATCC
Rhodosporidium Toruloides IBY029 CBS 349 CBS
X. dendrorhous IBY030 CBS6938 CBS
R. toruloides IBY036 CBS14 CBS
R. toruloides IBY037 NP11 Zhao et al.[93]
R. toruloides IBY038 NP52 Zhao et al.[93]

II Screening and Characterization of Oleaginous Yeast __________________________________________________________________________
∼ 38 ∽
Organism Name Internal
Identifier
Official
Identifier
Supplier
Bacteria
Streptomyces rapamycinicus IBB018 DSM 41530 DSMZ
Escherichia coli DH5a
Escherichia coli NEB10 NEB
Escherichia coli XL10Gold Agilent
Agrobacterium tumefaciens AGL1 BAA101 DSMZ
Algae
Scenedesmus obtusiusculus A189 EMAU
Environmental isolates NZ and WO were obtained from Christian Görner[21]:
NZ -Ireland, Letterkenny -Crab Shells -nA
WO -Germany,Ebersberg -Soil Sample -48°7'52.85"N 11°58'32.29"E
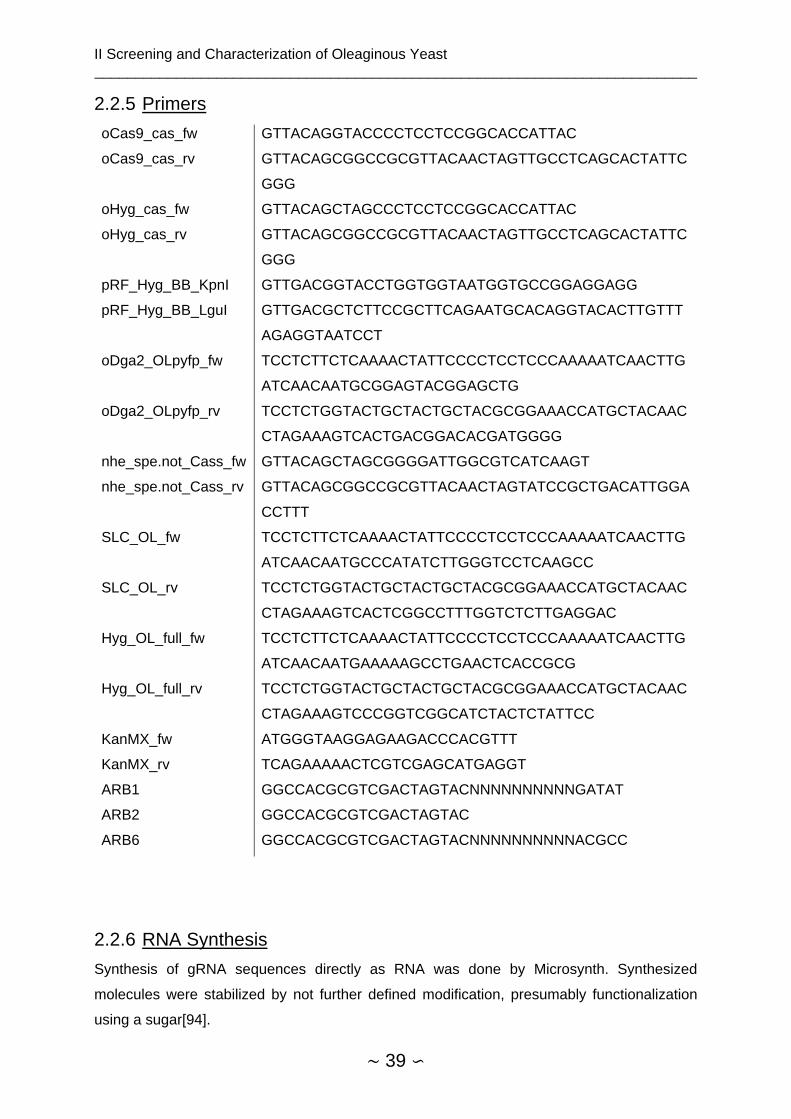
II Screening and Characterization of Oleaginous Yeast __________________________________________________________________________
∼ 39 ∽
2.2.5 Primers
oCas9_cas_fw GTTACAGGTACCCCTCCTCCGGCACCATTAC
oCas9_cas_rv GTTACAGCGGCCGCGTTACAACTAGTTGCCTCAGCACTATTC
GGG
oHyg_cas_fw GTTACAGCTAGCCCTCCTCCGGCACCATTAC
oHyg_cas_rv GTTACAGCGGCCGCGTTACAACTAGTTGCCTCAGCACTATTC
GGG
pRF_Hyg_BB_KpnI GTTGACGGTACCTGGTGGTAATGGTGCCGGAGGAGG
pRF_Hyg_BB_LguI GTTGACGCTCTTCCGCTTCAGAATGCACAGGTACACTTGTTT
AGAGGTAATCCT
oDga2_OLpyfp_fw TCCTCTTCTCAAAACTATTCCCCTCCTCCCAAAAATCAACTTG
ATCAACAATGCGGAGTACGGAGCTG
oDga2_OLpyfp_rv TCCTCTGGTACTGCTACTGCTACGCGGAAACCATGCTACAAC
CTAGAAAGTCACTGACGGACACGATGGGG
nhe_spe.not_Cass_fw GTTACAGCTAGCGGGGATTGGCGTCATCAAGT
nhe_spe.not_Cass_rv GTTACAGCGGCCGCGTTACAACTAGTATCCGCTGACATTGGA
CCTTT
SLC_OL_fw TCCTCTTCTCAAAACTATTCCCCTCCTCCCAAAAATCAACTTG
ATCAACAATGCCCATATCTTGGGTCCTCAAGCC
SLC_OL_rv TCCTCTGGTACTGCTACTGCTACGCGGAAACCATGCTACAAC
CTAGAAAGTCACTCGGCCTTTGGTCTCTTGAGGAC
Hyg_OL_full_fw TCCTCTTCTCAAAACTATTCCCCTCCTCCCAAAAATCAACTTG
ATCAACAATGAAAAAGCCTGAACTCACCGCG
Hyg_OL_full_rv TCCTCTGGTACTGCTACTGCTACGCGGAAACCATGCTACAAC
CTAGAAAGTCCCGGTCGGCATCTACTCTATTCC
KanMX_fw ATGGGTAAGGAGAAGACCCACGTTT
KanMX_rv TCAGAAAAACTCGTCGAGCATGAGGT
ARB1 GGCCACGCGTCGACTAGTACNNNNNNNNNNGATAT
ARB2 GGCCACGCGTCGACTAGTAC
ARB6 GGCCACGCGTCGACTAGTACNNNNNNNNNNACGCC
2.2.6 RNA Synthesis
Synthesis of gRNA sequences directly as RNA was done by Microsynth. Synthesized
molecules were stabilized by not further defined modification, presumably functionalization
using a sugar[94].
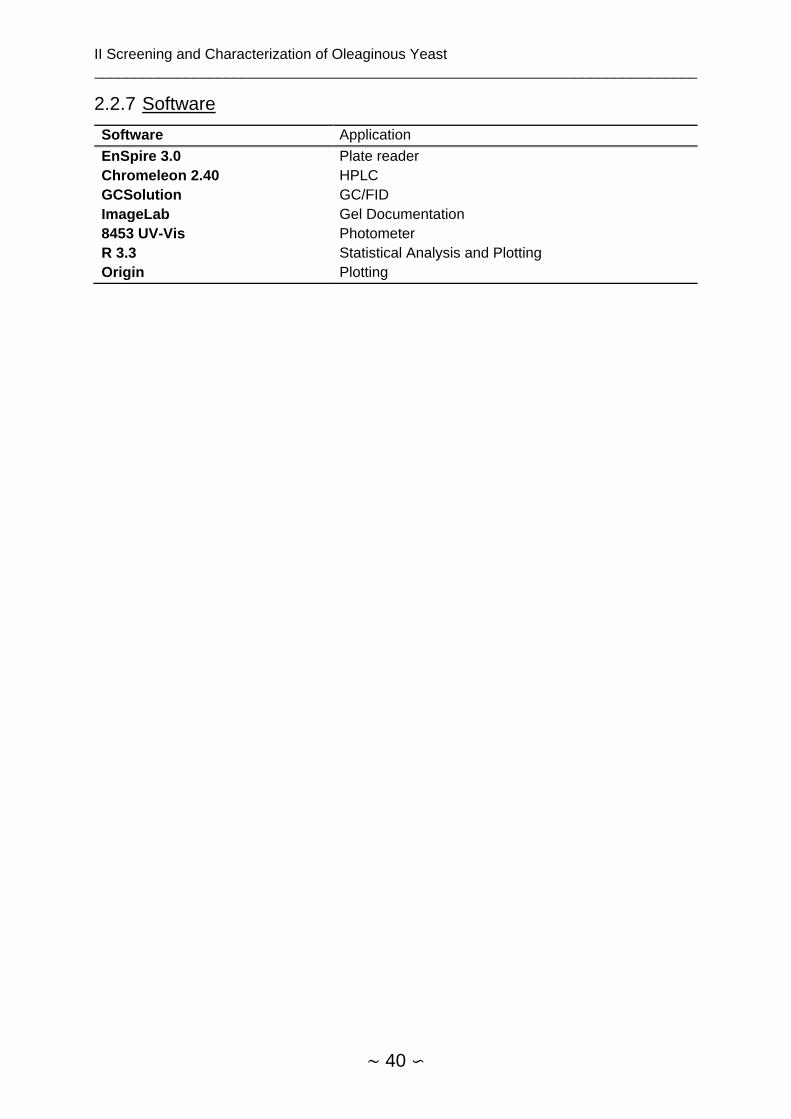
II Screening and Characterization of Oleaginous Yeast __________________________________________________________________________
∼ 40 ∽
2.2.7 Software
Software Application
EnSpire 3.0 Plate reader
Chromeleon 2.40 HPLC
GCSolution GC/FID
ImageLab Gel Documentation
8453 UV-Vis Photometer
R 3.3 Statistical Analysis and Plotting
Origin Plotting

II Screening and Characterization of Oleaginous Yeast __________________________________________________________________________
∼ 41 ∽
2.3 Methods
2.3.1 Media and Buffer
It is not uncommon to prepare and autoclave YPD in a single vessel, especially when required
only as substrate for proliferation of recombinant microorganisms. For physiological studies
however, this should be avoided due to formation of toxic and unpredictable compounds by
Maillard reaction and caramelization[95], a form of pyrolysis. All media were prepared using
bidestilled water (ddH2O).
2.3.1.1 Yeast Peptone Dextrose (YPD)
A 40% Glucose stock was sterilized by autoclaving. A base medium was prepared containing
peptone 20 yeast extract 10 (g/l). Glucose was subsequently added to the base medium to a
final concentration of 2%.
2.3.1.2 Yeast and Mold Medium (YM)
YM was prepared in the same way as YPD, however the base medium contained peptone 5
yeast extract 3 and malt extract 3 (g/l) and glucose was added to a final concentration of 1%.
2.3.1.3 Minimal Nitrogen Medium S (MNM-S)
A 40% w/v Glucose stock was sterilized by autoclaving. A base medium was prepared
containing yeast extract 0.75 KH2PO4 0.4 and MgSO4x7H2O 1.5 (g/l). Approximately 80% of
the total required amount of water was added and the solution was autoclaved. A 10x NPS
Stock (Nitrogen, Phosphate, Sulfur) was prepared containing CaCl2x2H2O 2.2 (NH4)2SO4
0.012 Na2HPO4 9.1 (g/l) and autoclaved. A 1000x stock of a trace element solution based on
Meesters et al.[45] was prepared containing ZnSO4x7H2O 0.55 MnCl2x4H2O 24.2
CuSO4x5H2O 25 FeSO4 25 (g/l) and sterile filtered.
After sterilization, the base medium was supplemented with the NPS stock, the trace elements
as well as glucose to a final concentration of 2%.
2.3.1.4 Minimal Nitrogen Medium S (MNM-S)
An adapted MNM-S medium for fed batch fermentations containing higher concentrations of
phosphate and ammonium was prepared in the same way as MNM-S and consists of the same
components, but the NPS-solution contains (NH4)2SO4 0.3 and Na2HPO4 0.91 (g/l).
2.3.1.5 LB-Miller
Base media components, tryptone 10 yeast extract 5 and NaCl 5 (g/l) were weighed, water
was added and the media were autoclaved.
2.3.1.6 Agar Plates
All plates were created by adding 20 g/l agar to the base medium before autoclaving.
II Screening and Characterization of Oleaginous Yeast __________________________________________________________________________
∼ 42 ∽
2.3.1.7 Agrobacterium tumefaciens medium
While routinely cultivated in LB, Agrobacterium tumefaciens mediated transformation was
achieved in liquid induction medium containing acetosyringone, K2HPO4 2.05, KH2PO4 1.45
g/l, NaCl 0.15, MgSO4·7H2O 0.5 (g/l) 2-4-Morpholineethanesulfonic acid monohydrate (MES),
7.8 g/l; glucose, 1.8 g/l; as well as CaCl2·2H2O 67.0. FeSO4·7H2O 2.5, (NH4)2SO4 0.5 and
acetosyringone 39.24 (mg/l) and glycerol 5% (v/v). A trace elements solution with Na2MoO4,
MnSO4·H2O, ZnSO4·7H2O, CuSO4·5H2O (100 mg each) H3BO3 in 1L ddH20, 5% (v/v), pH 5.6)
and solid induction medium with acetosyringone were used.
2.3.1.8 Spheroplasting Buffers
Buffer II contained sorbitol 2 M, EDTA 0.1, DTT 0.1 and TrisHCl 10 mM at pH 7.5. Buffer III
consisted of sorbitol 1.5 M, EDTA 0.1, DTT 0.1, TrisHCl 10 mM at pH 7.5. Recovery Buffer SY
comprised sorbitol 1 M and 67% v/v YPD. SYTC contained PEG6000 20% v/v, TrisHCl 10 mM
and CaCl 10 mM.
2.3.1.9 Yeast Selection Plates
5-FOA Medium contained YNB 1.7, NH4SO4 5, Uracil 0.035 and 5-FOA 1 g/l as needed. Final
glucose and agar concentrations were 2 and 20 g/l respectively.
Adenine (Ade) selection plates contained YNB 1.7, NH4SO4 5, KCl 7.6 and amino acid mix 1.4
g. Amino acid mix did not contain histidine, leucine, tryptophane and adenine. Leucine 60,
histidine 20, tryptophan 20 as well as adenine 10 mg/l as needed were added. Final glucose
and agar concentrations were 2 and 20 g/l respectively. Uracil (Ura) selection plates contained
YNB 1.7, NH4SO4 5, KCl 7.6 and Aminoacid mix 1.4 g. Aminoacid mix was. Leucine 60,
histidine 20, tryptophan 20 as well as uracil 20 mg/l as needed were added. Final glucose and
agar concentrations were 2 and 20 g/l respectively.
2.3.1.10 Algae Hydrolysate
Algae Hydrolysate was prepared by hydrolyzing Scenedesmus obtusiusculus A189 at 50 g/l in
50 mM sodium acetate buffer at 50°C and 120 rpm using 0.5% Cellulase (CelliCtec 2 from
Novozymes). Buffer and enzyme were sterile filtered and algae biomass were autoclaved dry
before the hydrolysis was performed for 72 hours.
2.3.2 Isolation of Oleaginous Yeast Strains
2.3.2.1 Environmental Samples
Seven environmental samples were obtained in Romania, Mexico, France and Kenya. Sample
sites were chosen according to the following criteria: High abundance of carbohydrates, high
temperature in the summer, possibly high variability of nutrient availability, which would
II Screening and Characterization of Oleaginous Yeast __________________________________________________________________________
∼ 43 ∽
encourage storage of carbon and high general biodiversity. Samples were taken by collecting
approximately 10 g of material in a 50 ml falcon tube and stored at 5°C until strain isolation.
Table 1: Environmental samples used for the isolation of new yeast strains
Number Sample Description Sample Origin Location
1 BC40 CS Sand France 50°02′08″N
2°01′51″E
2 P Beach Sand Mexico 21°16′48″N
89°40′12″W
3 PF EG Leaves Romania 46°43'56.8"N
23°32'08.1"E
4 PF NTC Soil sample Romania 46°43'50.3"N
23°32'01.4"E
5 PF H1W Soil sample Romania 46°44'32.3"N
23°32'12.3"E
6 ND1 Soil sample Kenya 1°19'10.5"S
36°47'43.5"E
7 PF RB Sand Romania 46°43'50.3"N
23°32'01.4"E
8 4U1 Brown algae Kenya 4°15'57.4"S
39°35'56.8"E
9 4U2 Green algae Kenya 4°15'57.4"S
39°35'56.8"E
2.3.2.2 Isolation Procedure
50 ml of YPD or YM containing chloramphenicol and ampicillin (1 mg/l) were inoculated using
10 mg of environmental sample and cultivated at 28°C and 120 rpm. After 24 hours, 10 µl of
the culture was taken and diluted 1:1000. 100 µL of this dilution were subsequently plated out
on YPD plates. Colonies were distinguished visually and cells evaluated using brightfield
microscopy at 100-fold magnification. Subsequently, only yeasts were further cultivated,
stained with Sudan Black B, Nile red and genetically identified (Section 2.3.3).
2.3.2.3 High-Throughput Determination of Growth
Determination of growth was achieved using a modified protocol of the Centraalbureau voor
Schimmelcultures of the Royal Netherlands Academy of Arts and Sciences (CBS KNAWL).
The organization manages a strain collection containing over 51’000 strains (01.05.2016).
Microplate wells (Nunc clear, 96-wells, flat bottom) were filled with 100 µl media using a
Labsystems multidrop dispenser in a sterile bench. Inoculation was done from agar plates
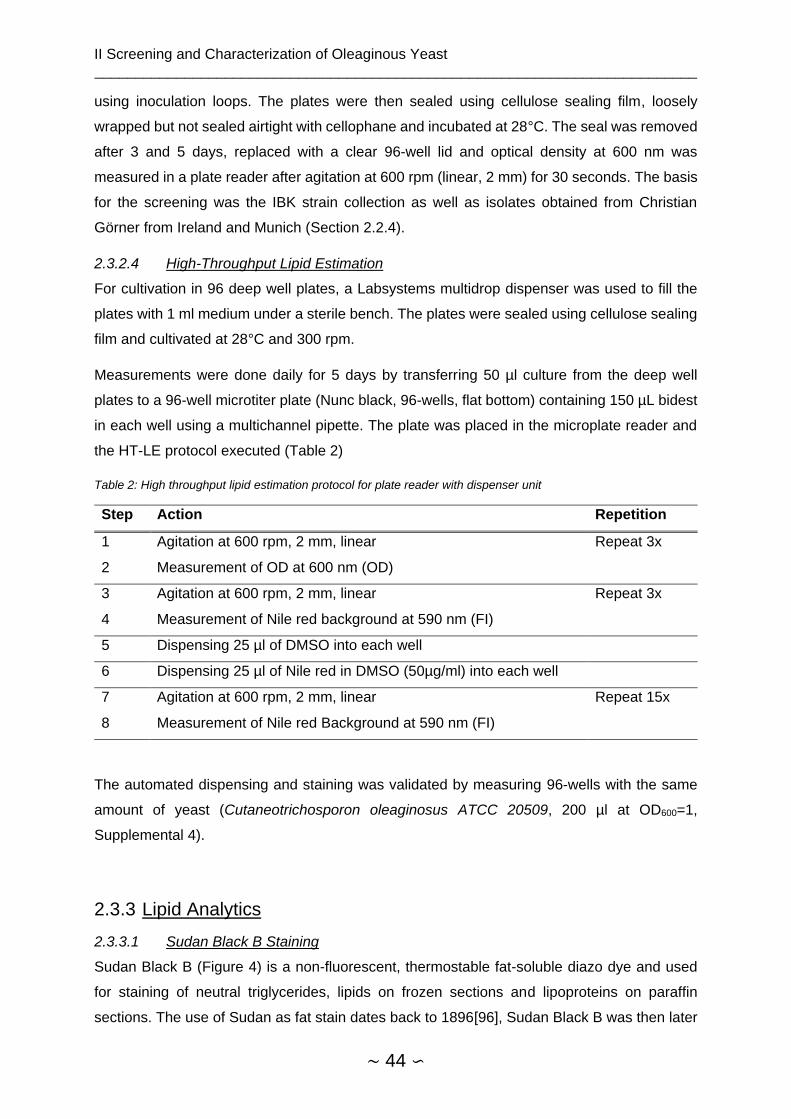
II Screening and Characterization of Oleaginous Yeast __________________________________________________________________________
∼ 44 ∽
using inoculation loops. The plates were then sealed using cellulose sealing film, loosely
wrapped but not sealed airtight with cellophane and incubated at 28°C. The seal was removed
after 3 and 5 days, replaced with a clear 96-well lid and optical density at 600 nm was
measured in a plate reader after agitation at 600 rpm (linear, 2 mm) for 30 seconds. The basis
for the screening was the IBK strain collection as well as isolates obtained from Christian
Görner from Ireland and Munich (Section 2.2.4).
2.3.2.4 High-Throughput Lipid Estimation
For cultivation in 96 deep well plates, a Labsystems multidrop dispenser was used to fill the
plates with 1 ml medium under a sterile bench. The plates were sealed using cellulose sealing
film and cultivated at 28°C and 300 rpm.
Measurements were done daily for 5 days by transferring 50 µl culture from the deep well
plates to a 96-well microtiter plate (Nunc black, 96-wells, flat bottom) containing 150 µL bidest
in each well using a multichannel pipette. The plate was placed in the microplate reader and
the HT-LE protocol executed (Table 2)
Table 2: High throughput lipid estimation protocol for plate reader with dispenser unit
Step Action Repetition
1 Agitation at 600 rpm, 2 mm, linear Repeat 3x
2 Measurement of OD at 600 nm (OD)
3 Agitation at 600 rpm, 2 mm, linear Repeat 3x
4 Measurement of Nile red background at 590 nm (FI)
5 Dispensing 25 µl of DMSO into each well
6 Dispensing 25 µl of Nile red in DMSO (50µg/ml) into each well
7 Agitation at 600 rpm, 2 mm, linear Repeat 15x
8 Measurement of Nile red Background at 590 nm (FI)
The automated dispensing and staining was validated by measuring 96-wells with the same
amount of yeast (Cutaneotrichosporon oleaginosus ATCC 20509, 200 µl at OD600=1,
Supplemental 4).
2.3.3 Lipid Analytics
2.3.3.1 Sudan Black B Staining
Sudan Black B (Figure 4) is a non-fluorescent, thermostable fat-soluble diazo dye and used
for staining of neutral triglycerides, lipids on frozen sections and lipoproteins on paraffin
sections. The use of Sudan as fat stain dates back to 1896[96], Sudan Black B was then later
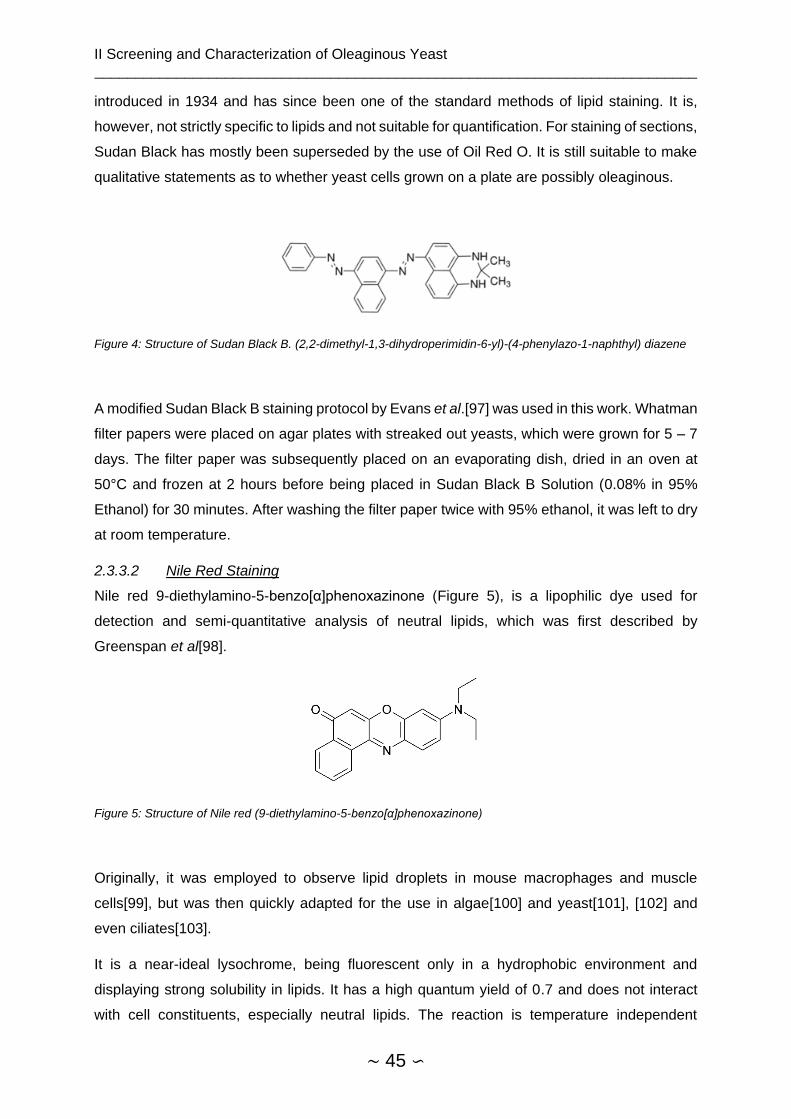
II Screening and Characterization of Oleaginous Yeast __________________________________________________________________________
∼ 45 ∽
introduced in 1934 and has since been one of the standard methods of lipid staining. It is,
however, not strictly specific to lipids and not suitable for quantification. For staining of sections,
Sudan Black has mostly been superseded by the use of Oil Red O. It is still suitable to make
qualitative statements as to whether yeast cells grown on a plate are possibly oleaginous.
Figure 4: Structure of Sudan Black B. (2,2-dimethyl-1,3-dihydroperimidin-6-yl)-(4-phenylazo-1-naphthyl) diazene
A modified Sudan Black B staining protocol by Evans et al.[97] was used in this work. Whatman
filter papers were placed on agar plates with streaked out yeasts, which were grown for 5 – 7
days. The filter paper was subsequently placed on an evaporating dish, dried in an oven at
50°C and frozen at 2 hours before being placed in Sudan Black B Solution (0.08% in 95%
Ethanol) for 30 minutes. After washing the filter paper twice with 95% ethanol, it was left to dry
at room temperature.
2.3.3.2 Nile Red Staining
Nile red 9-diethylamino-5-benzo[α]phenoxazinone (Figure 5), is a lipophilic dye used for
detection and semi-quantitative analysis of neutral lipids, which was first described by
Greenspan et al[98].
Figure 5: Structure of Nile red (9-diethylamino-5-benzo[α]phenoxazinone)
Originally, it was employed to observe lipid droplets in mouse macrophages and muscle
cells[99], but was then quickly adapted for the use in algae[100] and yeast[101], [102] and
even ciliates[103].
It is a near-ideal lysochrome, being fluorescent only in a hydrophobic environment and
displaying strong solubility in lipids. It has a high quantum yield of 0.7 and does not interact
with cell constituents, especially neutral lipids. The reaction is temperature independent

II Screening and Characterization of Oleaginous Yeast __________________________________________________________________________
∼ 46 ∽
between 20 and 50°C. However, the reaction is sensitive to a number of parameters: cell
density and dye concentration, structure and composition of the cells or solvent
concentration[98].
Cooksey, who first popularized the application of Nile red for staining of lipid droplets,
described it as a “semi-quantitative method”, as there is no possibility to generate a stable
standard lipid and stain it[104], which could then be used to create a standard curve. Hence,
the Nile red fluorescence remains an estimator, not a quantifier for the lipid content.
Nevertheless, due to its easy, fast and cost efficient application, Nile red staining remains one
of the standard methods in lipid research.
Samples were analyzed according to a modified protocol from Sitepu et al.[105] Cell density
was adjusted to OD600=1.0 using ddH2O and 200 µL of the dilution was transferred to a black
96-well Nunc plate. 25 µL of DMSO were added to each well and initial absorbance reading
was taken at 600 nm and fluorescence was measured at 590 nm with an excitation at 530 nm
to obtain the background. 25 µL Nile red solution in DMSO (50 µg/ml), were added to each
well and the plate was shaken for 30 seconds at 600 rpm (linear). The fluorescence was then
measured again for 15 minutes in 60 s interval to obtain the staining kinetics.
2.3.3.3 Fluorescence Microscopy
Microscopy was done using an AxioLab A1 equipped with an Axio Cam ICm1 from Zeiss. The
Zeiss E-PI 10x/20 oculars offered a 10x magnification whereas the Zeiss A-plan objectives
with 10x, 40x and 100x magnification were used. For staining of lipid bodies, cells were washed
with ddH2O and resuspended in 25 µg/ml Nile red in DMSO. The suspension was vortexed and
incubated for 10 minutes in darkness. Subsequently, cells were again washed with ddH20 twice
and 8 µl of the suspension was placed on a Roth microscope slide and analyzed.
2.3.3.4 Fluorescence Activated Cell Sorting
Cells were washed with ddH2O and set to a concentration of OD600=1. 200 µl of the dilution
were filtered through a 100 µm filter and 25 µl of 50 µg/ml Nile red in DMSO were added,
yielding a final concentration of 20% v/v DMSO and 5 µg/ml Nile red. The suspension was
incubated for 10 minutes in darkness before analysis in an S3 cell sorter.
2.3.3.5 Fatty Acid Determination
Fatty acid profiles were determined by simultaneous extraction and transesterification of yeast
lipids to generate fatty acid methyl esters (FAMEs) which was quantified using GC-FID.
Transesterification was done in DURAN screw top reagent tubes and tops with PTFE septa. A
modified protocol from Griffiths et al was used[106]. Lyophilized samples were weighed (10-
20 mg) and added to 450 µl Toluol and 50 µl C-19 TAG-Stock in hexane to determine
transesterification efficiency. 100 µl 2,2-dimethoxypropane (DMP) and 1 ml sodium methoxide

II Screening and Characterization of Oleaginous Yeast __________________________________________________________________________
∼ 47 ∽
(25% w/v) in methanol are added. After shaking at 800 rpm (orbital, horizontal) and 80°C for
20 minutes, the tubes were cooled down on ice for 5 minutes and 1 ml of HCl in methanol are
added. The incubation step was repeated and 400 µl ddH2O and 360 µl hexane with 40 µl C10
methyl ester stock were added. The tubes were vortexed for 30 seconds, centrifuged for 1
minute at 1200 rcf and 200 µl of the upper phase was transferred to GC Vials.
Fatty Acid analysis using GC-FID was performed on a GC-2010 by Shimadzu with a PEG
column (polyethylene glycol, length 30 m, ID 0.32 mm, film 0.25 μm)
1 μL of sample was injected with the injector being at 240°C using a split ratio of 1:10. The
column was heated to 150°C for 1 min and the temperature was subsequently increased by
5°C per minute until a temperature of 240°C was achieved. This temperature was held for 6
minutes. Column flow was set to 3 mL/min with H2 as carrier gas. Signals were obtained by
FID at 245°C.
2.3.3.6 Gravimetric Lipid Quantification
Total cell lipids were determined by using a modified Method by Folch et al[107]. For this, 12
ml of ddH2O washed culture were homogenized using an Avestin Emulsiflex at 1200 bar
pressure at the sample port (8 bar chamber pressure). 3 falcons were filled with 4 ml of
homogenizate and 6 ml of Folch solution were added. Extraction was done overnight at room
temperature and 120 rpm. Subsequently, 1.2 ml of 0.9% NaCl were added to aid phase
separation. The lower phase was then taken out using a syringe, added to pre-weighed glass
vessels and the chloroform was fully evaporated under a stream of nitrogen. The weight of the
triplicate samples was averaged to yield the total amount of lipids for yeast cells in 4 ml of
culture.
2.3.3.7 Biomass Determination
Preweighed 2 ml Eppendorf tubes were filled with 2 ml of culture, centrifuged at 14.4k g,
washed with ddH2O and dried at 60°C overnight. The dry biomass from 2 ml culture was
determined by weighing the Eppendorf tubes again and subtracting the weight of the empty
tubes.
2.3.4 Molecular Biology Methods
2.3.4.1 Isolation of Yeast Genomic DNA
Genomic DNA of yeast from the culture collection as well as of own isolates was extracted
using the Yeast DNA Extraction Reagent Kit from Thermo Scientific according to the
manufacturer’s recommendations.

II Screening and Characterization of Oleaginous Yeast __________________________________________________________________________
∼ 48 ∽
2.3.4.2 Isolation of Genomic DNA
1.5 ml of liquid culture in the exponential growth phase were pelleted at max rpm and
resuspended in Harju buffer containing Triton X-100 2%, SDS 1%, NaCl 100mM, TrisHCl pH8
10 mM and EDTA 1 mM. Tubes were subjected twice to a liquid nitrogen bath for 2 minutes
and transferred to a 95°C water bath. After adding 200 µl of chloroform, samples were vortexed
for 2 minutes and pelleted. The upper, aqueous phase was transferred to a tube containing
400 µl ice-cold ethanol. After mixing by inversion or gentle vortexing, samples were frozen at
-20°C. After centrifugation, supernatant was discarded and the pellet was washed with 0.5 ml
of 70% ethanol. Cells were pelleted again and the supernatant was discarded. After air drying
the pellets at room temperature under a nitrogen stream, they were resuspended in water.
2.3.4.3 Determination of DNA Concentration
DNA was determined according to recommendations from Promega[108]. Absorption at 230
nm (chaotropic salts), 260 nm (DNA), 280 nm (protein) and 320 nm (turbidity) was measured
in a HP Photometer Workstation Ag using a Hellma Traycell 5.800 Quarz Microcuvette.
1 𝐷𝑁𝐴 𝐶𝑜𝑛𝑐𝑒𝑛𝑡𝑟𝑎𝑡𝑖𝑜𝑛 [𝑚𝑔/𝜇𝑙] = 𝐷𝐹 × 50 × 𝐴260𝑛𝑚 − 𝐴320𝑛𝑚
2 𝐷𝑁𝐴 𝑌𝑖𝑒𝑙𝑑 [𝑚𝑔] = [𝐷𝑁𝐴] × 𝑉
3 DNA Purity (Protein) =𝐴260𝑛𝑚−𝐴320𝑛𝑚
𝐴280𝑛𝑚−𝐴320𝑛𝑚
4 DNA Purity (Salt) =𝐴260𝑛𝑚
𝐴230𝑛𝑚
Concentration of DNA was determined by measuring the absorption of DNA at 260 nm and
correcting for general turbidity as well as the dilution factor (DF). The yield was calculated by
the concentration in relation to the total volume of the elution (V). The purity of the DNA was
calculated by again correcting DNA concentration for turbidity and relating it to protein
concentration corrected for turbidity. A typical value for A260nm/280nm is 1.7 – 2.0. Lower values
indicate significant contaminations. The A320nm should be as low as possible. It is usually close
to 0. The salt purity should be greater than 1.5. Lower values can indicate the presence of
chaotropic salts such as thiocyanate salt, which may interfere with any subsequent DNA
modification or transformation.
2.3.4.4 Strain Determination (18S rRNA)
Ribosomal RNA (rRNA) serves as a widely used genomic marker for phylogenetic research,
as it is present in all cells containing gDNA and consists of strongly conserved as well highly
variable regions[109]. In this work, a forward primer binding to the internal transcribed spacer
1 (ITS1) between the 18S and 5.8S rRNA Region was used. The reverse primer binds in the
D1D2 Region within the 26S rRNA (Figure 6).
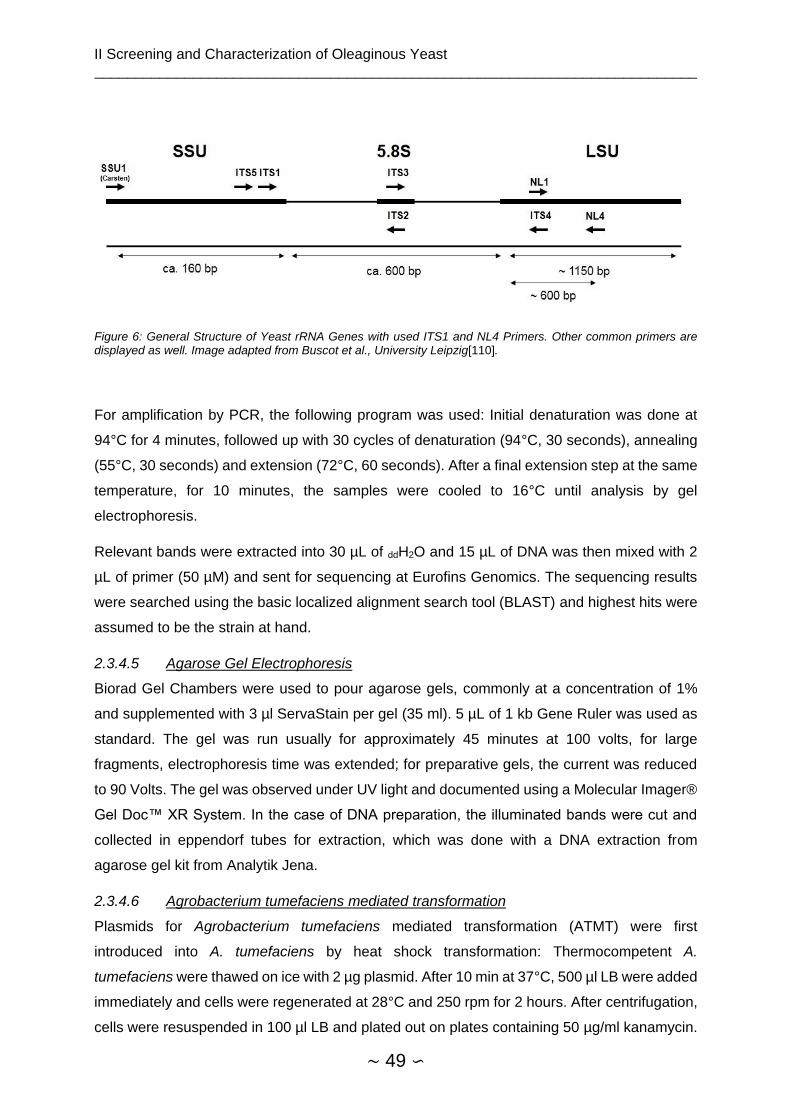
II Screening and Characterization of Oleaginous Yeast __________________________________________________________________________
∼ 49 ∽
Figure 6: General Structure of Yeast rRNA Genes with used ITS1 and NL4 Primers. Other common primers are displayed as well. Image adapted from Buscot et al., University Leipzig[110].
For amplification by PCR, the following program was used: Initial denaturation was done at
94°C for 4 minutes, followed up with 30 cycles of denaturation (94°C, 30 seconds), annealing
(55°C, 30 seconds) and extension (72°C, 60 seconds). After a final extension step at the same
temperature, for 10 minutes, the samples were cooled to 16°C until analysis by gel
electrophoresis.
Relevant bands were extracted into 30 µL of ddH2O and 15 µL of DNA was then mixed with 2
µL of primer (50 µM) and sent for sequencing at Eurofins Genomics. The sequencing results
were searched using the basic localized alignment search tool (BLAST) and highest hits were
assumed to be the strain at hand.
2.3.4.5 Agarose Gel Electrophoresis
Biorad Gel Chambers were used to pour agarose gels, commonly at a concentration of 1%
and supplemented with 3 µl ServaStain per gel (35 ml). 5 µL of 1 kb Gene Ruler was used as
standard. The gel was run usually for approximately 45 minutes at 100 volts, for large
fragments, electrophoresis time was extended; for preparative gels, the current was reduced
to 90 Volts. The gel was observed under UV light and documented using a Molecular Imager®
Gel Doc™ XR System. In the case of DNA preparation, the illuminated bands were cut and
collected in eppendorf tubes for extraction, which was done with a DNA extraction from
agarose gel kit from Analytik Jena.
2.3.4.6 Agrobacterium tumefaciens mediated transformation
Plasmids for Agrobacterium tumefaciens mediated transformation (ATMT) were first
introduced into A. tumefaciens by heat shock transformation: Thermocompetent A.
tumefaciens were thawed on ice with 2 µg plasmid. After 10 min at 37°C, 500 µl LB were added
immediately and cells were regenerated at 28°C and 250 rpm for 2 hours. After centrifugation,
cells were resuspended in 100 µl LB and plated out on plates containing 50 µg/ml kanamycin.

II Screening and Characterization of Oleaginous Yeast __________________________________________________________________________
∼ 50 ∽
For transformation into C. oleaginosus, an overnight culture of A. tumefaciens carrying the
plasmid in LB with 30 µg/ml kanamycin at 28°C was used to inoculate a 10 ml shake flask
culture containing L-Imas medium and cultivated at the same temperature for 6 hours.
Meanwhile, an overnight culture of C. oleaginosus was centrifuged and resuspended in L-
IMAS medium to achieve an OD600 of 0.5. Of each culture, 500 µl were taken and mixed. 100
µl of this mixture were plated on a blotting membrane, which in turn was placed on S-IMAS
agar plates. After 48 hours of incubation at 24°C, membranes were transferred to YPD agar
plates containing varying amounts of hygromycin B or gentamicin (G418) and 300 µg
cefotaxime. C. oleaginosus transformants were cultivated in YPD and insertions of expression
cassettes were checked via PCR.
2.3.4.7 Spheroplast transformation
All procedure steps were done in 6-well plates. The original spheroplasting transformation by
Glumoff et al. [111] required the Novozyme 234 mix, which is not available anymore. An
alternative combination of enzymes for cell wall degradation based on the same paper was
chosen. For each 10^8 cells, 7 mg lytic enzyme and 0.94 mg driselase were solved in 1 ml of
Buffer II. An overnight culture of C. oleaginosus was washed and resuspended in Buffer II /
enzyme mix. After incubation for 2 h at 28°C without shaking, osmosensitivity was checked by
adding 50 µl 10% SDS to a sample of 500 µl cell suspension. Spheroplasts were washed twice
in Buffer III and subsequently recovered in Buffer SY. After 1 hour at 28° without shaking, cells
were washed and resuspended in 100 µl SYTC. 1-5 µg template DNA and 20-30 µg carrier
DNA were added and after 45 minutes of incubation, 600 µl of SYTC were added for
regeneration overnight at 28°C. Cells were plated out the next day on YPD or selection plates.
2.3.4.8 E. coli Heat Shock Transformation
CaCl2 competent cells were thawed on ice for 10 minutes with 1-5 μl of ligation or Gibson
assembly sample or 1 μl of plasmid at 50 μg/ml for retransformation. The tube was carefully
flicked to mix DNA with the cells and placed on ice for 30 minutes. Heat shock at 42°C was
applied for 30 minutes without mixing and again placed on ice for 5 minutes. 1 ml of LB Medium
was added and shaken at 250 rpm for 60 minutes. Cells were centrifuged for 3 minutes at 3000
rcf, resuspended in LB and plated on prewarmed selection plates (37°C). Plates were
cultivated overnight at 37°C
2.3.4.9 Gibson Assembly
Gibson Assembly was done according to NEB recommendations[112].
2.3.4.10 Dga2 and Slc1 Overexpression Plasmids
For convenience, all cloning strategies are based on a Biobrick-like system, in which multiple
cassettes containing the same restriction sites can subsequently be cloned into a vector
backbone.
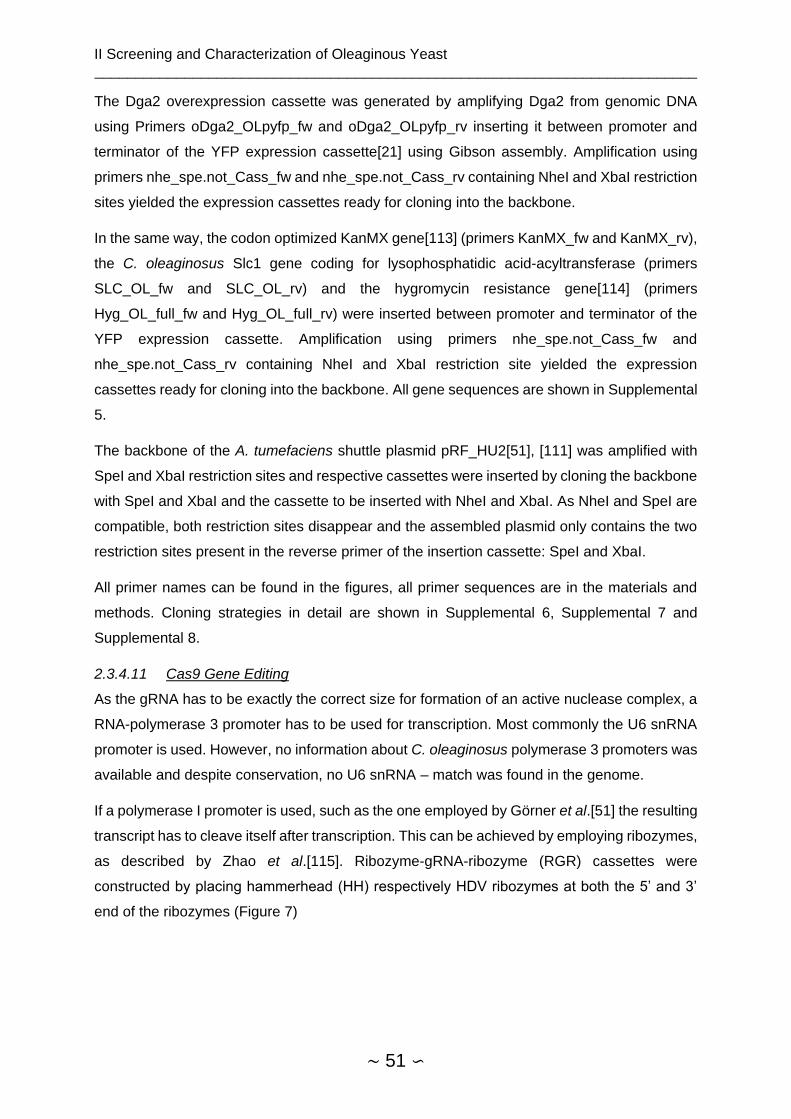
II Screening and Characterization of Oleaginous Yeast __________________________________________________________________________
∼ 51 ∽
The Dga2 overexpression cassette was generated by amplifying Dga2 from genomic DNA
using Primers oDga2_OLpyfp_fw and oDga2_OLpyfp_rv inserting it between promoter and
terminator of the YFP expression cassette[21] using Gibson assembly. Amplification using
primers nhe_spe.not_Cass_fw and nhe_spe.not_Cass_rv containing NheI and XbaI restriction
sites yielded the expression cassettes ready for cloning into the backbone.
In the same way, the codon optimized KanMX gene[113] (primers KanMX_fw and KanMX_rv),
the C. oleaginosus Slc1 gene coding for lysophosphatidic acid-acyltransferase (primers
SLC_OL_fw and SLC_OL_rv) and the hygromycin resistance gene[114] (primers
Hyg_OL_full_fw and Hyg_OL_full_rv) were inserted between promoter and terminator of the
YFP expression cassette. Amplification using primers nhe_spe.not_Cass_fw and
nhe_spe.not_Cass_rv containing NheI and XbaI restriction site yielded the expression
cassettes ready for cloning into the backbone. All gene sequences are shown in Supplemental
5.
The backbone of the A. tumefaciens shuttle plasmid pRF_HU2[51], [111] was amplified with
SpeI and XbaI restriction sites and respective cassettes were inserted by cloning the backbone
with SpeI and XbaI and the cassette to be inserted with NheI and XbaI. As NheI and SpeI are
compatible, both restriction sites disappear and the assembled plasmid only contains the two
restriction sites present in the reverse primer of the insertion cassette: SpeI and XbaI.
All primer names can be found in the figures, all primer sequences are in the materials and
methods. Cloning strategies in detail are shown in Supplemental 6, Supplemental 7 and
Supplemental 8.
2.3.4.11 Cas9 Gene Editing
As the gRNA has to be exactly the correct size for formation of an active nuclease complex, a
RNA-polymerase 3 promoter has to be used for transcription. Most commonly the U6 snRNA
promoter is used. However, no information about C. oleaginosus polymerase 3 promoters was
available and despite conservation, no U6 snRNA – match was found in the genome.
If a polymerase I promoter is used, such as the one employed by Görner et al.[51] the resulting
transcript has to cleave itself after transcription. This can be achieved by employing ribozymes,
as described by Zhao et al.[115]. Ribozyme-gRNA-ribozyme (RGR) cassettes were
constructed by placing hammerhead (HH) respectively HDV ribozymes at both the 5’ and 3’
end of the ribozymes (Figure 7)
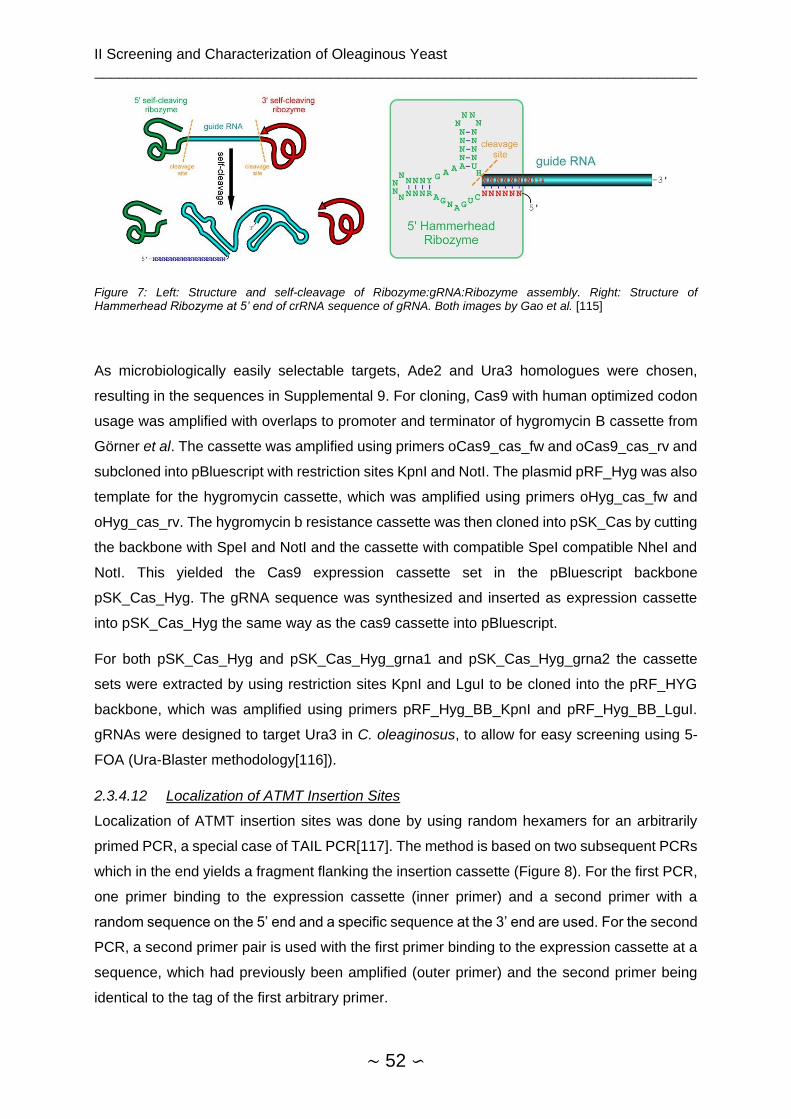
II Screening and Characterization of Oleaginous Yeast __________________________________________________________________________
∼ 52 ∽
Figure 7: Left: Structure and self-cleavage of Ribozyme:gRNA:Ribozyme assembly. Right: Structure of Hammerhead Ribozyme at 5’ end of crRNA sequence of gRNA. Both images by Gao et al. [115]
As microbiologically easily selectable targets, Ade2 and Ura3 homologues were chosen,
resulting in the sequences in Supplemental 9. For cloning, Cas9 with human optimized codon
usage was amplified with overlaps to promoter and terminator of hygromycin B cassette from
Görner et al. The cassette was amplified using primers oCas9_cas_fw and oCas9_cas_rv and
subcloned into pBluescript with restriction sites KpnI and NotI. The plasmid pRF_Hyg was also
template for the hygromycin cassette, which was amplified using primers oHyg_cas_fw and
oHyg_cas_rv. The hygromycin b resistance cassette was then cloned into pSK_Cas by cutting
the backbone with SpeI and NotI and the cassette with compatible SpeI compatible NheI and
NotI. This yielded the Cas9 expression cassette set in the pBluescript backbone
pSK_Cas_Hyg. The gRNA sequence was synthesized and inserted as expression cassette
into pSK_Cas_Hyg the same way as the cas9 cassette into pBluescript.
For both pSK_Cas_Hyg and pSK_Cas_Hyg_grna1 and pSK_Cas_Hyg_grna2 the cassette
sets were extracted by using restriction sites KpnI and LguI to be cloned into the pRF_HYG
backbone, which was amplified using primers pRF_Hyg_BB_KpnI and pRF_Hyg_BB_LguI.
gRNAs were designed to target Ura3 in C. oleaginosus, to allow for easy screening using 5-
FOA (Ura-Blaster methodology[116]).
2.3.4.12 Localization of ATMT Insertion Sites
Localization of ATMT insertion sites was done by using random hexamers for an arbitrarily
primed PCR, a special case of TAIL PCR[117]. The method is based on two subsequent PCRs
which in the end yields a fragment flanking the insertion cassette (Figure 8). For the first PCR,
one primer binding to the expression cassette (inner primer) and a second primer with a
random sequence on the 5’ end and a specific sequence at the 3’ end are used. For the second
PCR, a second primer pair is used with the first primer binding to the expression cassette at a
sequence, which had previously been amplified (outer primer) and the second primer being
identical to the tag of the first arbitrary primer.
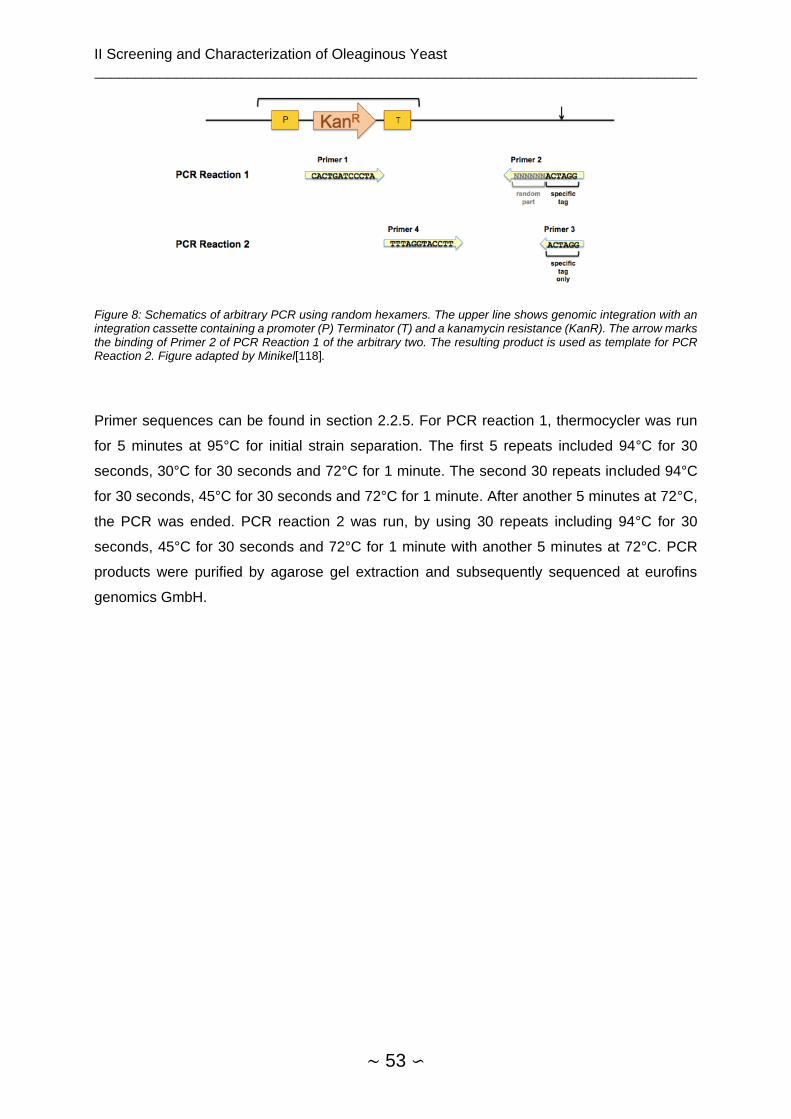
II Screening and Characterization of Oleaginous Yeast __________________________________________________________________________
∼ 53 ∽
Figure 8: Schematics of arbitrary PCR using random hexamers. The upper line shows genomic integration with an integration cassette containing a promoter (P) Terminator (T) and a kanamycin resistance (KanR). The arrow marks the binding of Primer 2 of PCR Reaction 1 of the arbitrary two. The resulting product is used as template for PCR Reaction 2. Figure adapted by Minikel[118].
Primer sequences can be found in section 2.2.5. For PCR reaction 1, thermocycler was run
for 5 minutes at 95°C for initial strain separation. The first 5 repeats included 94°C for 30
seconds, 30°C for 30 seconds and 72°C for 1 minute. The second 30 repeats included 94°C
for 30 seconds, 45°C for 30 seconds and 72°C for 1 minute. After another 5 minutes at 72°C,
the PCR was ended. PCR reaction 2 was run, by using 30 repeats including 94°C for 30
seconds, 45°C for 30 seconds and 72°C for 1 minute with another 5 minutes at 72°C. PCR
products were purified by agarose gel extraction and subsequently sequenced at eurofins
genomics GmbH.

II Screening and Characterization of Oleaginous Yeast __________________________________________________________________________
∼ 54 ∽
2.3.5 Microbiological and Biochemical Methods
2.3.5.1 Flask Cultivation
If not stated differently, yeasts were routinely cultivated at 28°C and 120 rpm for flasks with a
volume larger than 30 ml and 15 ml as well as 50 ml Falcons. If not stated otherwise, flasks
with baffles were used to allow for sufficient aeration.
2.3.5.2 Culture Stocks
5 ml of overnight culture were centrifuged at 3000 rpm for 5 minutes. The pellet was
resuspended in 0.5 ml YPD and 0.5 ml 50% Glycerol. Tubes were placed on ice for 30 minutes
before being stored at -80°C.
2.3.5.3 Ura and Ade Selection Media
Ura3 clones were selected by plating 20% v/v on 5-FOA plates. 80% v/v of cells were plated
on Ura+ plates and then replicated on Ura- plates to find auxotroph strains. Ade2 clones were
selected by plating cells out on Ade+ plates and replicating them on Ade- plates as soon as
colonies were visible.
2.3.5.4 Rapamycin and Caffeine Supplementation
C. oleaginosus was cultivated as triplicate in YPD with different concentrations of rapamycin
solution for 7 days at 28°C in 500 mL baffled shake flasks. Cultivation was carried out in 100
ml YPD and nitrogen limitation medium (MNM) with glucose. Cells from an overnight culture
grown YPD medium under the same cultivation conditions were washed in ddH2O and used to
inoculate all cultivations at OD600=0.5. Where applicable, rapamycin was added 8 hours after
inoculation and adjusted to varying concentrations. 6 ml samples were taken daily for analysis
of cell-dry weight, lipid content and fatty acid distribution.
Online OD measurements were conducted by measuring real-time backscatter at 525 nm with
a Cell Growth Quantifier (Aquila biolabs - Baesweiler) using 100 mL YPD in 250 mL shake
flask without baffles for 72 hours. Rapamycin concentration was adjusted to 5 µM 8 hours after
inoculation. The backscatter signal was calibrated with a manual 2 point OD600 measurement
by an HP 8453 photometer.
2.3.5.5 Western Blotting
C. oleaginosus protein was extracted by taking growing in YPD for 5 days at 120 rpm and 28°C
in baffled flasks. 50 ml of culture were washed twice with ddH2O and resuspended in 10 ml
ERT4 resuspension buffer in a 50 ml falcon. After high pressure homogenizing at 8 bars (2400
bar at outlet) for 4 times, cell fragments were spun down for 1 hour at maximum speed and
4°C. 30 ml of ice cold 13.3% TCA in acetone with 0.2% DTT and frozen overnight at -20°C.
The next day, falcons were centrifuged at 14.4 k rcf and 4°C for 10 minutes. After washing with
MeOH (0.2% DTT) to discard the TCA, cells were again washed with acetone (0.2% DTT) and
II Screening and Characterization of Oleaginous Yeast __________________________________________________________________________
∼ 55 ∽
after centrifugation, pellets were air dried for 5 minutes and resuspended in 8 M urea.
Sonification was used to aid resuspension and different concentrations of the sample were
loaded on a PAGE.
Western blotting for detection of Cas9 was done by introducing 30 µl of C. oleaginosus protein
extract as well as 10 µl of Cas9 protein (20 µg/ml) as positive control were loaded on a 12%
SDS-gel for 2 hours at 100 Volts. It was then blotted semidry on a PDVF membrane overnight
at 4°C and 30 Volts. The membrane was blocked with TBST and 5% milk powder overnight
again at 4°C. After washing with TBS, a monoclonal mouse anti-Cas9 antibody was used,
followed by an anti-mouse antibody coupled to horseradish peroxidase. Ecl Reagent was used
for detection.
2.3.5.6 Ethylmethanesulfonate mutagenesis (EMS)
EMS induces random mutations in DNA. The ethyl group of EMS typically reacts with guanine
or cytosine (Fig. 7), making the formation of the third hydrogen bond impossible. During DNA
replication, a thymine or adenine base are then placed instead of the target base of EMS. The
mutations, which therefore occur mostly are C/G to A/T transitions, but double strand breaks,
which are repaired by homologous recombination (HR) or non-homologous end joining (NHEJ)
have been described[119], [120]. Considering results of extremely poor homologous
recombination in Cutaneotrichosporon oleaginosus (Data not shown), NHEJ appears to be
much more likely in this organism. This was also previously described for Y. lipolytica[121].
2.3.5.7 Directed Evolution
Directed evolution was done by cultivation of C. oleaginosus in 50 ml YPD and MNM-S for 96
hours at 120 rpm at 30°C. After staining cells with Nile red as described in section 2.3.3.2,
150’000 cells of subpopulations of cells with the lowest and highest 5% fluorescence were
sorted into eppendorf tubes. Recultivation and sorting procedure were repeated 3 times.
2.3.5.8 Sugar Analytics
Sugar concentration of hydrolysate was determined by HPLC-RI. Samples were prepared by
filtration over a 10 kD centrifugation filter (14.4 rcf for 10 minutes). Subsequently, 5 µl sample
were injected on a HPX-87P column (8% cross-linked resin, lead ionic, Bio-Rad) and separated
at 70°C with bidest as mobile phase. Run time was 30 minutes at 0.4 ml/minute and detection
was done at 50°C and RI signal of samples was aligned with that of internal standard curves.

II Screening and Characterization of Oleaginous Yeast __________________________________________________________________________
∼ 56 ∽
2.3.6 Bioprocessing Methods
2.3.6.1 48x 10 ml Fermentation
16 different base media with different C:N, C:P and C:S ratios (Supplemental 10) were
supplemented with modified Meesters et al.[45] trace elements solution (Section 2.3.1.3). The
pH was set at 6.5 with acetic acid and the temperature was adjusted to 28°C. 100 µl samples
for OD600 measurement were taken every 4 hours. At the end of the cultivation (34 hours)
culture samples were taken for gravimetric lipid determination (5 ml), fatty acid determination
(2 ml) and dry biomass determination (2 ml). All cultivations were done as triplicate. C.
oleaginosus grown overnight in YPD was washed with 20 mM NaPi buffer and used to inoculate
to an OD600 of 1.
Using R, growth curve parameters were extracted (lag phase, maximum growth rate, maximum
achieved OD). All growth curves and corresponding fitted growth curves predictions can be
found in Supplemental 11 and Supplemental 12. As suggested by the grofit package[122],
Gompertz, logistic and Richards functions were used to approximate growth curves
(Supplemental 13).
2.3.6.2 1 l Fermentation
A DASGIP ga4 4x parallel fermenter by Eppendorf (Hamburg, Germany) was used for
evaluation of Dga2 overexpressing C. oleaginosus clones. Inoculation was done with 50 ml
preculture of C. oleaginosus wild type and Dga2 clones 1, 5 and 6 grown in YPD overnight.
Initially, X ml YPD were used as base medium with 500 g/l glucose being fed at 0-50 ml/h. pH
was set at 6.5 using 12% v/v H3PO4 and 3 M NaOH. pO2 was kept over 30% of total oxygen
solubility by stirring between 200 and 500 rpm and aeration between 0 and 1 v/v/h. Analysis
of dry biomass, lipids and Nile red was done as described in section 2.3.3.2.
2.3.7 Bioinformatics
2.3.7.1 Codon Tables and Codon Adaption Indices
Transcripts were obtained from JGI, however, these sequences also included non-coding
regions[123]. In the case of the TOP20 and the GDH Codon Usage, coding regions within
these transcripts were extracted by hand by following the annotation given by the JGI
database. For the full dataset, Transdecoder[124] was used to extract the ORFs. Notepad++
v 6.7.7 [125] was used to check the resulting, large number of sequences of sequences[126].
CodonW and Kazusa’s Codon Usage Analyser[127] were used to generate the codon tables.
Codon distributions of different groups were averaged and compared. The Codon Adaption
Index (CAI), a measure of how strongly the codon usage of a gene of interest represents the
II Screening and Characterization of Oleaginous Yeast __________________________________________________________________________
∼ 57 ∽
codon usage of a specific organism, was determined using CAICalculator2[128] and
CAIcal[129].
2.3.7.2 Assembly of TORC Network
Previously published genomic and transcriptomic data of C. oleaginosus[24] were searched
for TORC homologues using sequences from Schizosaccharomyces pombe, Saccharomyces
cerevisiae, Candida curvata and Cryptococcus neoformans.

II Screening and Characterization of Oleaginous Yeast __________________________________________________________________________
∼ 58 ∽
2.4 Results and Discussion
2.4.1 Isolation of Oleaginous Yeast Strains
The isolation studies presented here were executed under my guidance as part of the Bachelor’s thesis “Isolation, characterization and mutagenesis of oleaginous yeast” by Valeria Guidolin (2014). The data were reevaluated and discussed for this chapter.
2.4.1.1 Isolation from Environmental Samples
A total of 26 visually distinct colonies were obtained by the isolation procedure described in
section 2.3.2.2. Each isolate was given a unique isolate number (Table 3). Using bright field
microscopy, isolate 18, 21, 23, 25 and 26 were identified as mycelia forming. As the primary
interest was the isolation of unicellular yeasts, isolates with hyphae-like phenotype were
excluded from further analysis. In Table 3, they were categorized as molds, however it could
not be excluded for the regarding colonies to be hyphae-forming actinomycetes. In general, it
is possible for some yeast to form pseudohyphae, which usually occurs under stress
conditions, which were not present during the isolation procedure[130]. A number of isolates
were visually identified as bacteria, as they were small in size (< 2 μm) and often displayed
flagella.
Sudan Black B (SBB) Stain was used to determine which strains were to be further
characterized (Table 4). Strains that showed positive staining with SBB were subsequently
cultivated in full medium (YPD), genomic DNA was extracted and strain determination with
rRNA sequencing was done as described in the methods section.
Extraction of gDNA and amplification of rRNA sequences was successful for all strains. Hence,
the identity of all strains was determined, yet no oleaginous strain displayed sufficient deviation
from known rRNA sequences to justify further phylogenetic characterization.
Table 3: List of obtained isolates with isolate number and source (number and identifier of environmental sample). Colony description and result of Sudan Black B Stain (SBB) are shown on the right, whereas SBB stain was only applied to yeast.
Sample
Number
Isolate
Number
Environmental Sample Categorized as SBB
Stain
4 1 PF NTC Bacterium
7 2 PF RB Bacterium
7 3 PF RB Bacterium
6 4 ND1 Bacterium
6 5 ND1 Bacterium
7 6 PF RB Bacterium
3 7 PF EG Bacterium
3 8 PF EG Yeast -
3 9 PF EG Yeast -
8 10 4U1 Yeast +
8 11 4U1 Yeast +
9 12 4U2 Yeast +
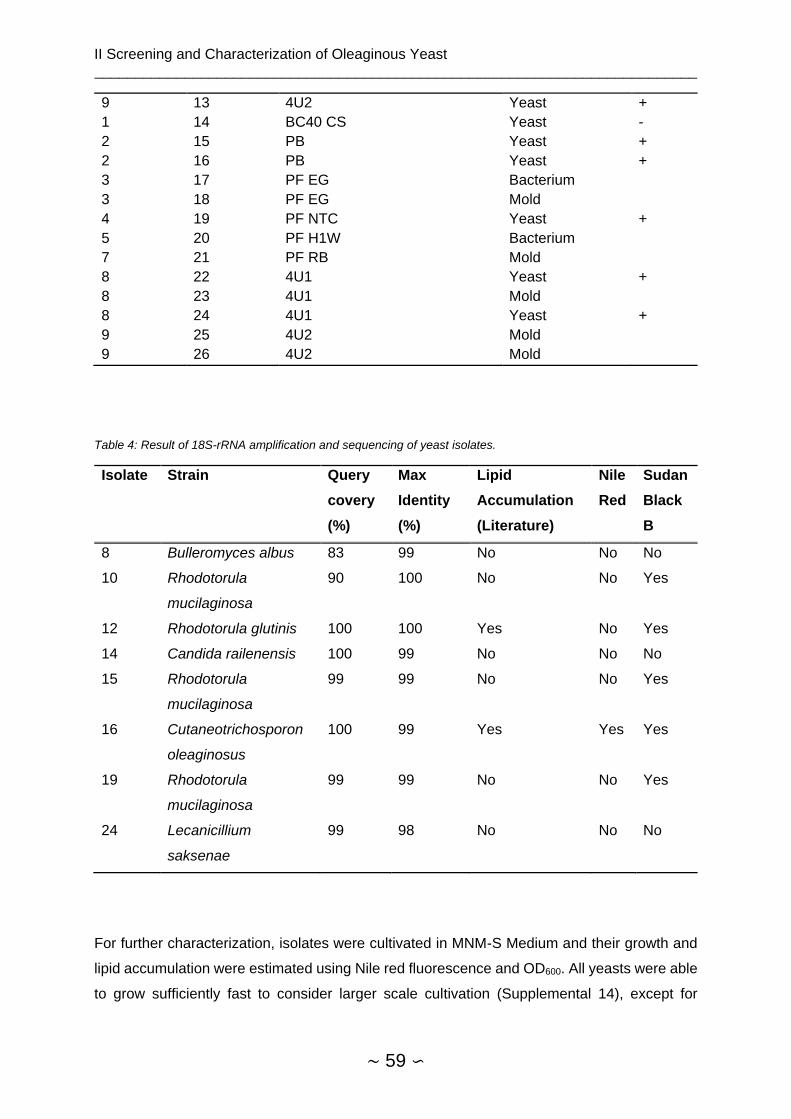
II Screening and Characterization of Oleaginous Yeast __________________________________________________________________________
∼ 59 ∽
9 13 4U2 Yeast +
1 14 BC40 CS Yeast -
2 15 PB Yeast +
2 16 PB Yeast +
3 17 PF EG Bacterium
3 18 PF EG Mold
4 19 PF NTC Yeast +
5 20 PF H1W Bacterium
7 21 PF RB Mold
8 22 4U1 Yeast +
8 23 4U1 Mold
8 24 4U1 Yeast +
9 25 4U2 Mold
9 26 4U2 Mold
Table 4: Result of 18S-rRNA amplification and sequencing of yeast isolates.
Isolate Strain Query
covery
(%)
Max
Identity
(%)
Lipid
Accumulation
(Literature)
Nile
Red
Sudan
Black
B
8 Bulleromyces albus 83 99 No No No
10 Rhodotorula
mucilaginosa
90 100 No No Yes
12 Rhodotorula glutinis 100 100 Yes No Yes
14 Candida railenensis 100 99 No No No
15 Rhodotorula
mucilaginosa
99 99 No No Yes
16 Cutaneotrichosporon
oleaginosus
100 99 Yes Yes Yes
19 Rhodotorula
mucilaginosa
99 99 No No Yes
24 Lecanicillium
saksenae
99 98 No No No
For further characterization, isolates were cultivated in MNM-S Medium and their growth and
lipid accumulation were estimated using Nile red fluorescence and OD600. All yeasts were able
to grow sufficiently fast to consider larger scale cultivation (Supplemental 14), except for
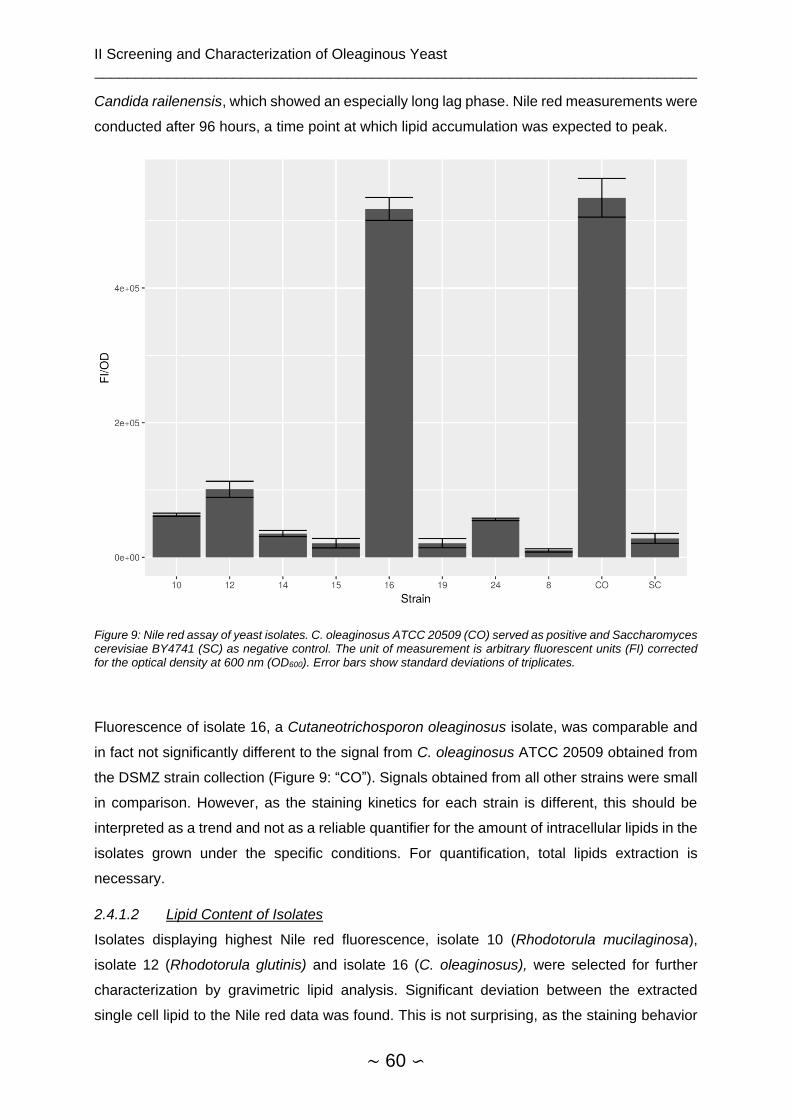
II Screening and Characterization of Oleaginous Yeast __________________________________________________________________________
∼ 60 ∽
Candida railenensis, which showed an especially long lag phase. Nile red measurements were
conducted after 96 hours, a time point at which lipid accumulation was expected to peak.
Figure 9: Nile red assay of yeast isolates. C. oleaginosus ATCC 20509 (CO) served as positive and Saccharomyces cerevisiae BY4741 (SC) as negative control. The unit of measurement is arbitrary fluorescent units (FI) corrected for the optical density at 600 nm (OD600). Error bars show standard deviations of triplicates.
Fluorescence of isolate 16, a Cutaneotrichosporon oleaginosus isolate, was comparable and
in fact not significantly different to the signal from C. oleaginosus ATCC 20509 obtained from
the DSMZ strain collection (Figure 9: “CO”). Signals obtained from all other strains were small
in comparison. However, as the staining kinetics for each strain is different, this should be
interpreted as a trend and not as a reliable quantifier for the amount of intracellular lipids in the
isolates grown under the specific conditions. For quantification, total lipids extraction is
necessary.
2.4.1.2 Lipid Content of Isolates
Isolates displaying highest Nile red fluorescence, isolate 10 (Rhodotorula mucilaginosa),
isolate 12 (Rhodotorula glutinis) and isolate 16 (C. oleaginosus), were selected for further
characterization by gravimetric lipid analysis. Significant deviation between the extracted
single cell lipid to the Nile red data was found. This is not surprising, as the staining behavior
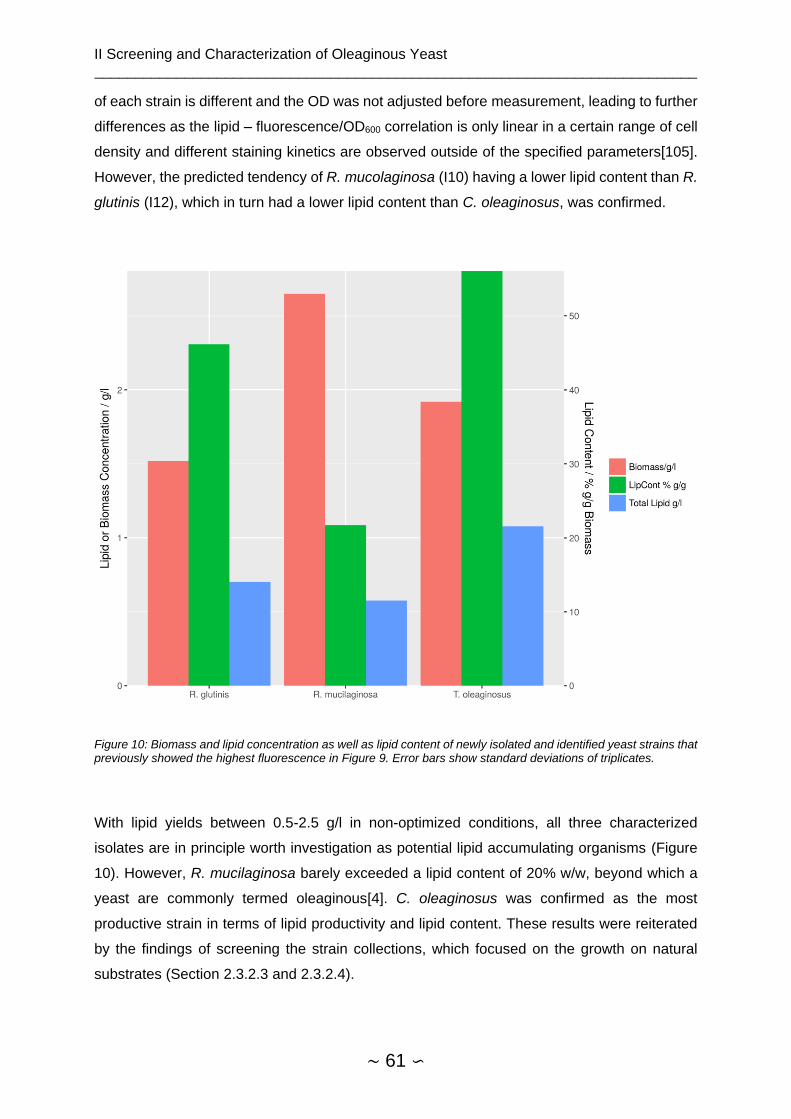
II Screening and Characterization of Oleaginous Yeast __________________________________________________________________________
∼ 61 ∽
of each strain is different and the OD was not adjusted before measurement, leading to further
differences as the lipid – fluorescence/OD600 correlation is only linear in a certain range of cell
density and different staining kinetics are observed outside of the specified parameters[105].
However, the predicted tendency of R. mucolaginosa (I10) having a lower lipid content than R.
glutinis (I12), which in turn had a lower lipid content than C. oleaginosus, was confirmed.
Figure 10: Biomass and lipid concentration as well as lipid content of newly isolated and identified yeast strains that previously showed the highest fluorescence in Figure 9. Error bars show standard deviations of triplicates.
With lipid yields between 0.5-2.5 g/l in non-optimized conditions, all three characterized
isolates are in principle worth investigation as potential lipid accumulating organisms (Figure
10). However, R. mucilaginosa barely exceeded a lipid content of 20% w/w, beyond which a
yeast are commonly termed oleaginous[4]. C. oleaginosus was confirmed as the most
productive strain in terms of lipid productivity and lipid content. These results were reiterated
by the findings of screening the strain collections, which focused on the growth on natural
substrates (Section 2.3.2.3 and 2.3.2.4).
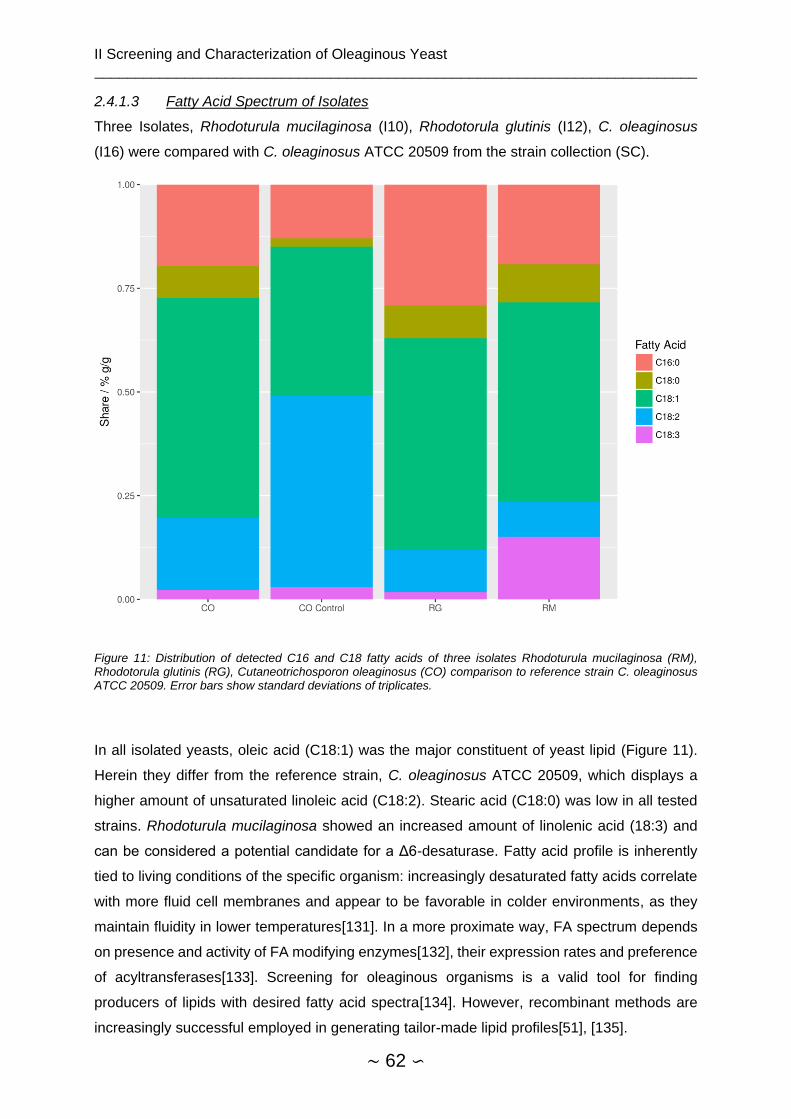
II Screening and Characterization of Oleaginous Yeast __________________________________________________________________________
∼ 62 ∽
2.4.1.3 Fatty Acid Spectrum of Isolates
Three Isolates, Rhodoturula mucilaginosa (I10), Rhodotorula glutinis (I12), C. oleaginosus
(I16) were compared with C. oleaginosus ATCC 20509 from the strain collection (SC).
Figure 11: Distribution of detected C16 and C18 fatty acids of three isolates Rhodoturula mucilaginosa (RM), Rhodotorula glutinis (RG), Cutaneotrichosporon oleaginosus (CO) comparison to reference strain C. oleaginosus ATCC 20509. Error bars show standard deviations of triplicates.
In all isolated yeasts, oleic acid (C18:1) was the major constituent of yeast lipid (Figure 11).
Herein they differ from the reference strain, C. oleaginosus ATCC 20509, which displays a
higher amount of unsaturated linoleic acid (C18:2). Stearic acid (C18:0) was low in all tested
strains. Rhodoturula mucilaginosa showed an increased amount of linolenic acid (18:3) and
can be considered a potential candidate for a Δ6-desaturase. Fatty acid profile is inherently
tied to living conditions of the specific organism: increasingly desaturated fatty acids correlate
with more fluid cell membranes and appear to be favorable in colder environments, as they
maintain fluidity in lower temperatures[131]. In a more proximate way, FA spectrum depends
on presence and activity of FA modifying enzymes[132], their expression rates and preference
of acyltransferases[133]. Screening for oleaginous organisms is a valid tool for finding
producers of lipids with desired fatty acid spectra[134]. However, recombinant methods are
increasingly successful employed in generating tailor-made lipid profiles[51], [135].
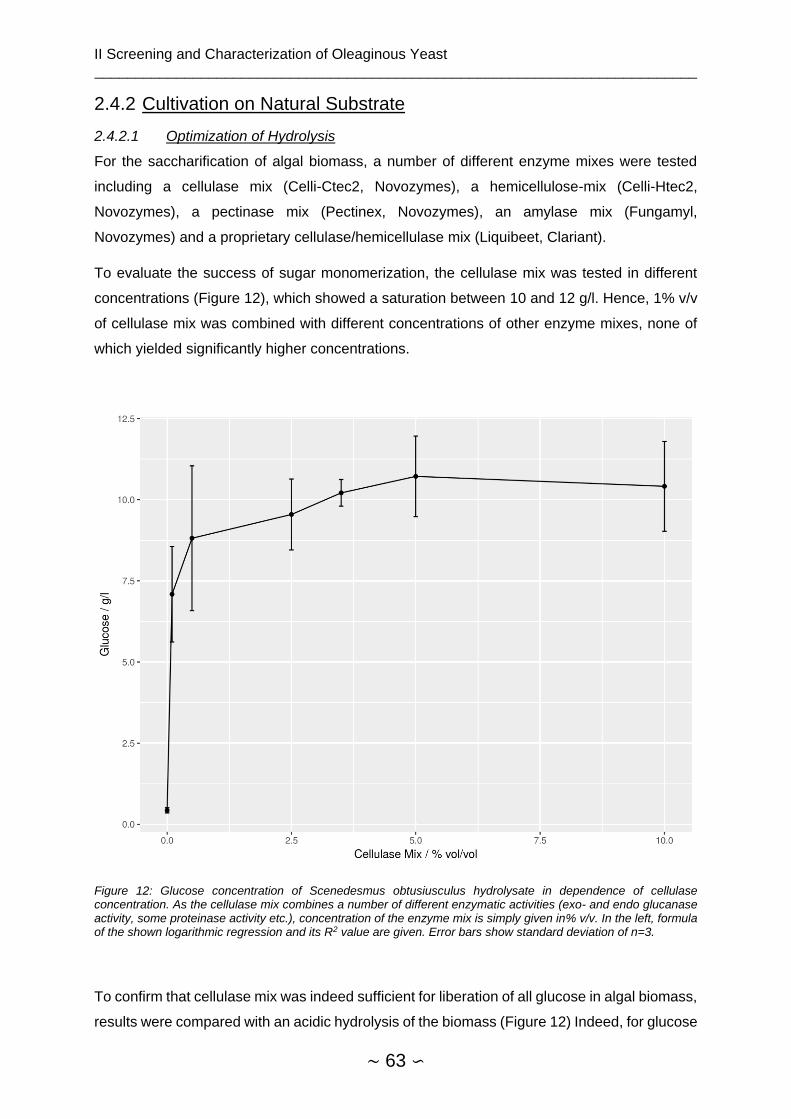
II Screening and Characterization of Oleaginous Yeast __________________________________________________________________________
∼ 63 ∽
2.4.2 Cultivation on Natural Substrate
2.4.2.1 Optimization of Hydrolysis
For the saccharification of algal biomass, a number of different enzyme mixes were tested
including a cellulase mix (Celli-Ctec2, Novozymes), a hemicellulose-mix (Celli-Htec2,
Novozymes), a pectinase mix (Pectinex, Novozymes), an amylase mix (Fungamyl,
Novozymes) and a proprietary cellulase/hemicellulase mix (Liquibeet, Clariant).
To evaluate the success of sugar monomerization, the cellulase mix was tested in different
concentrations (Figure 12), which showed a saturation between 10 and 12 g/l. Hence, 1% v/v
of cellulase mix was combined with different concentrations of other enzyme mixes, none of
which yielded significantly higher concentrations.
Figure 12: Glucose concentration of Scenedesmus obtusiusculus hydrolysate in dependence of cellulase concentration. As the cellulase mix combines a number of different enzymatic activities (exo- and endo glucanase activity, some proteinase activity etc.), concentration of the enzyme mix is simply given in% v/v. In the left, formula of the shown logarithmic regression and its R2 value are given. Error bars show standard deviation of n=3.
To confirm that cellulase mix was indeed sufficient for liberation of all glucose in algal biomass,
results were compared with an acidic hydrolysis of the biomass (Figure 12) Indeed, for glucose
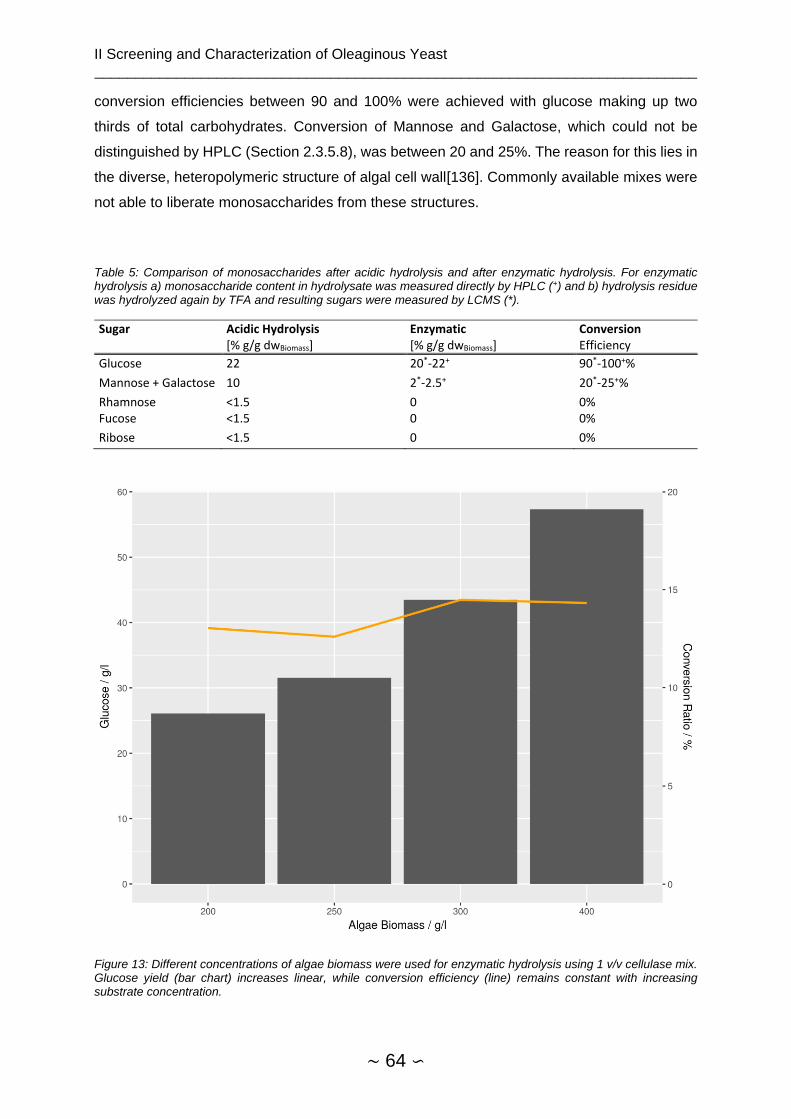
II Screening and Characterization of Oleaginous Yeast __________________________________________________________________________
∼ 64 ∽
conversion efficiencies between 90 and 100% were achieved with glucose making up two
thirds of total carbohydrates. Conversion of Mannose and Galactose, which could not be
distinguished by HPLC (Section 2.3.5.8), was between 20 and 25%. The reason for this lies in
the diverse, heteropolymeric structure of algal cell wall[136]. Commonly available mixes were
not able to liberate monosaccharides from these structures.
Table 5: Comparison of monosaccharides after acidic hydrolysis and after enzymatic hydrolysis. For enzymatic hydrolysis a) monosaccharide content in hydrolysate was measured directly by HPLC (+) and b) hydrolysis residue was hydrolyzed again by TFA and resulting sugars were measured by LCMS (*).
Sugar Acidic Hydrolysis Enzymatic Conversion [% g/g dwBiomass] [% g/g dwBiomass] Efficiency
Glucose 22 20*-22+ 90*-100+%
Mannose + Galactose 10 2*-2.5+ 20*-25+%
Rhamnose <1.5 0 0% Fucose <1.5 0 0%
Ribose <1.5 0 0%
Figure 13: Different concentrations of algae biomass were used for enzymatic hydrolysis using 1 v/v cellulase mix. Glucose yield (bar chart) increases linear, while conversion efficiency (line) remains constant with increasing substrate concentration.
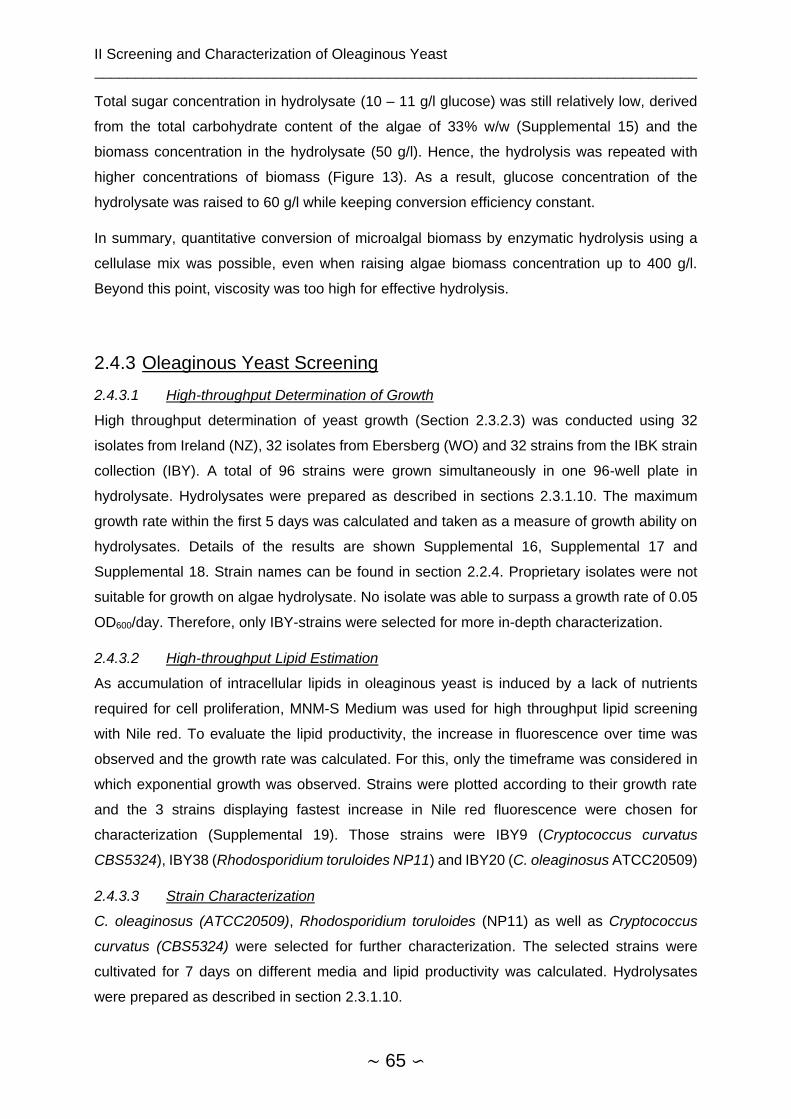
II Screening and Characterization of Oleaginous Yeast __________________________________________________________________________
∼ 65 ∽
Total sugar concentration in hydrolysate (10 – 11 g/l glucose) was still relatively low, derived
from the total carbohydrate content of the algae of 33% w/w (Supplemental 15) and the
biomass concentration in the hydrolysate (50 g/l). Hence, the hydrolysis was repeated with
higher concentrations of biomass (Figure 13). As a result, glucose concentration of the
hydrolysate was raised to 60 g/l while keeping conversion efficiency constant.
In summary, quantitative conversion of microalgal biomass by enzymatic hydrolysis using a
cellulase mix was possible, even when raising algae biomass concentration up to 400 g/l.
Beyond this point, viscosity was too high for effective hydrolysis.
2.4.3 Oleaginous Yeast Screening
2.4.3.1 High-throughput Determination of Growth
High throughput determination of yeast growth (Section 2.3.2.3) was conducted using 32
isolates from Ireland (NZ), 32 isolates from Ebersberg (WO) and 32 strains from the IBK strain
collection (IBY). A total of 96 strains were grown simultaneously in one 96-well plate in
hydrolysate. Hydrolysates were prepared as described in sections 2.3.1.10. The maximum
growth rate within the first 5 days was calculated and taken as a measure of growth ability on
hydrolysates. Details of the results are shown Supplemental 16, Supplemental 17 and
Supplemental 18. Strain names can be found in section 2.2.4. Proprietary isolates were not
suitable for growth on algae hydrolysate. No isolate was able to surpass a growth rate of 0.05
OD600/day. Therefore, only IBY-strains were selected for more in-depth characterization.
2.4.3.2 High-throughput Lipid Estimation
As accumulation of intracellular lipids in oleaginous yeast is induced by a lack of nutrients
required for cell proliferation, MNM-S Medium was used for high throughput lipid screening
with Nile red. To evaluate the lipid productivity, the increase in fluorescence over time was
observed and the growth rate was calculated. For this, only the timeframe was considered in
which exponential growth was observed. Strains were plotted according to their growth rate
and the 3 strains displaying fastest increase in Nile red fluorescence were chosen for
characterization (Supplemental 19). Those strains were IBY9 (Cryptococcus curvatus
CBS5324), IBY38 (Rhodosporidium toruloides NP11) and IBY20 (C. oleaginosus ATCC20509)
2.4.3.3 Strain Characterization
C. oleaginosus (ATCC20509), Rhodosporidium toruloides (NP11) as well as Cryptococcus
curvatus (CBS5324) were selected for further characterization. The selected strains were
cultivated for 7 days on different media and lipid productivity was calculated. Hydrolysates
were prepared as described in section 2.3.1.10.
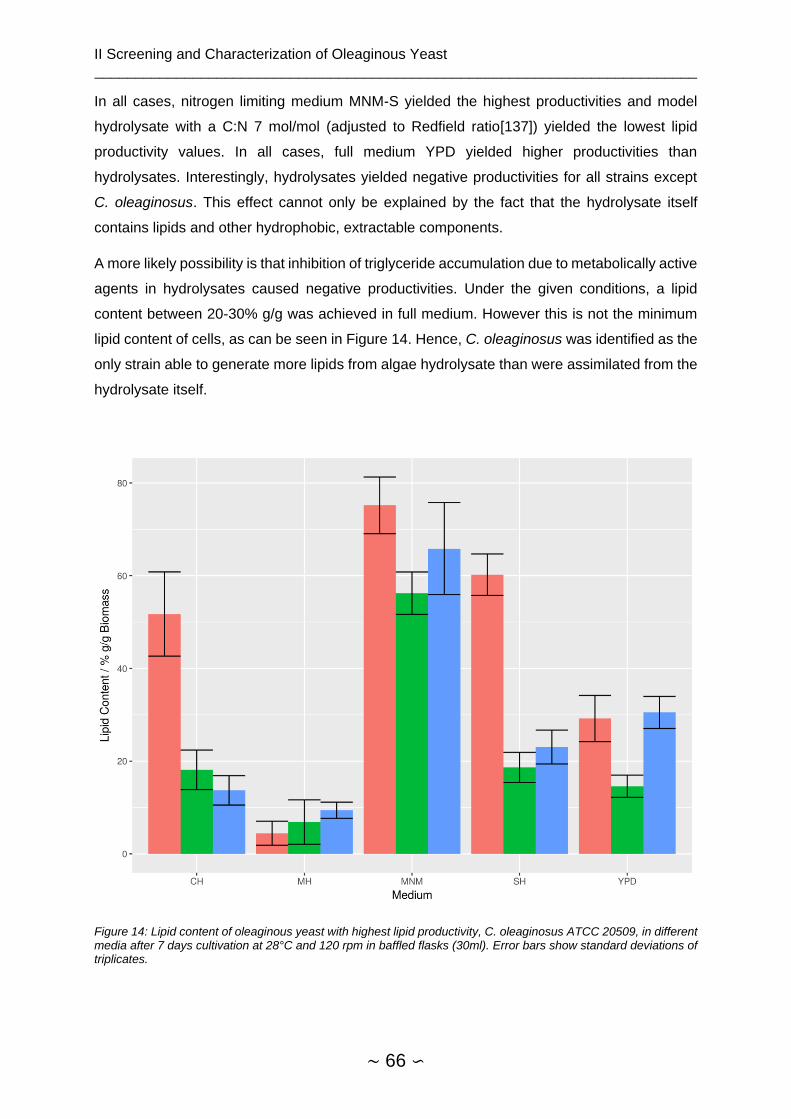
II Screening and Characterization of Oleaginous Yeast __________________________________________________________________________
∼ 66 ∽
In all cases, nitrogen limiting medium MNM-S yielded the highest productivities and model
hydrolysate with a C:N 7 mol/mol (adjusted to Redfield ratio[137]) yielded the lowest lipid
productivity values. In all cases, full medium YPD yielded higher productivities than
hydrolysates. Interestingly, hydrolysates yielded negative productivities for all strains except
C. oleaginosus. This effect cannot only be explained by the fact that the hydrolysate itself
contains lipids and other hydrophobic, extractable components.
A more likely possibility is that inhibition of triglyceride accumulation due to metabolically active
agents in hydrolysates caused negative productivities. Under the given conditions, a lipid
content between 20-30% g/g was achieved in full medium. However this is not the minimum
lipid content of cells, as can be seen in Figure 14. Hence, C. oleaginosus was identified as the
only strain able to generate more lipids from algae hydrolysate than were assimilated from the
hydrolysate itself.
Figure 14: Lipid content of oleaginous yeast with highest lipid productivity, C. oleaginosus ATCC 20509, in different media after 7 days cultivation at 28°C and 120 rpm in baffled flasks (30ml). Error bars show standard deviations of triplicates.

II Screening and Characterization of Oleaginous Yeast __________________________________________________________________________
∼ 67 ∽
C. oleaginosus ATCC20509 was chosen as the basis for any further work, including
modification and fermentation approaches. As a first step, the lipid content in different media
was determined and compared. Whereas model hydrolysate served as a negative - and MNM-
S as positive control, lipid content on algae hydrolysates was lower than in MNM-S medium.
However, both lipid content and productivity were higher than in full medium (YPD). This
confirms, that C. oleaginosus can not only grow on algal hydrolysate, but also displays
significant lipid accumulation (Figure 14).
2.4.4 Mutagenesis and Repeated Selection
Preliminary testing of EMS mutagenesis (2.4.4.1) presented here was executed under my guidance as part of the Bachelor’s thesis “Isolation, characterization and mutagenesis of oleaginous yeast” 2014. The data were reevaluated and discussed for this chapter.
2.4.4.1 EMS Mutagenesis
Colony forming units (CFU) declined with an increased exposure time to ethylmethane
sulfonate (EMS) in an inverse fashion. Samples with cell survival rates under 30% were pooled
and used for subsequent directed evolution. R. toruloides showed higher resistance to EMS
than C. oleaginosus, which could potentially be attributed to higher ploidy levels[138] or cell
wall constitution[139].
2.4.4.2 FACS Nile-Red Staining
To establish a FACS staining protocol with Nile red, the quality of the stain was estimated by
the capacity to distinguish cells with high intracellular lipid content (grow in lipid induction
medium, MNM-S) from low intracellular lipid content (grown in full medium, YPD). Hence, the
goal was to maximize the quotient in measured fluorescence between the two samples. Total
concentration of cells, Nile red concentration and DMSO concentration were varied. However,
changes in the staining procedure yielded no significantly improved result (Figure 15).
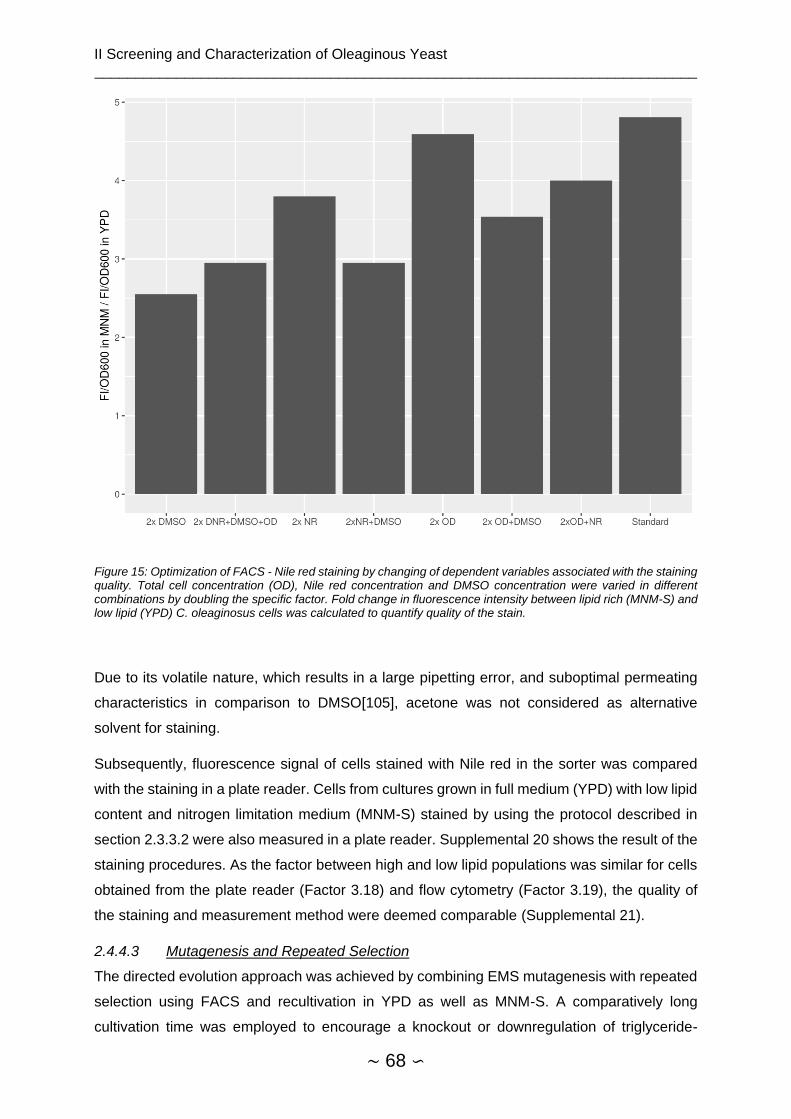
II Screening and Characterization of Oleaginous Yeast __________________________________________________________________________
∼ 68 ∽
Figure 15: Optimization of FACS - Nile red staining by changing of dependent variables associated with the staining quality. Total cell concentration (OD), Nile red concentration and DMSO concentration were varied in different combinations by doubling the specific factor. Fold change in fluorescence intensity between lipid rich (MNM-S) and low lipid (YPD) C. oleaginosus cells was calculated to quantify quality of the stain.
Due to its volatile nature, which results in a large pipetting error, and suboptimal permeating
characteristics in comparison to DMSO[105], acetone was not considered as alternative
solvent for staining.
Subsequently, fluorescence signal of cells stained with Nile red in the sorter was compared
with the staining in a plate reader. Cells from cultures grown in full medium (YPD) with low lipid
content and nitrogen limitation medium (MNM-S) stained by using the protocol described in
section 2.3.3.2 were also measured in a plate reader. Supplemental 20 shows the result of the
staining procedures. As the factor between high and low lipid populations was similar for cells
obtained from the plate reader (Factor 3.18) and flow cytometry (Factor 3.19), the quality of
the staining and measurement method were deemed comparable (Supplemental 21).
2.4.4.3 Mutagenesis and Repeated Selection
The directed evolution approach was achieved by combining EMS mutagenesis with repeated
selection using FACS and recultivation in YPD as well as MNM-S. A comparatively long
cultivation time was employed to encourage a knockout or downregulation of triglyceride-
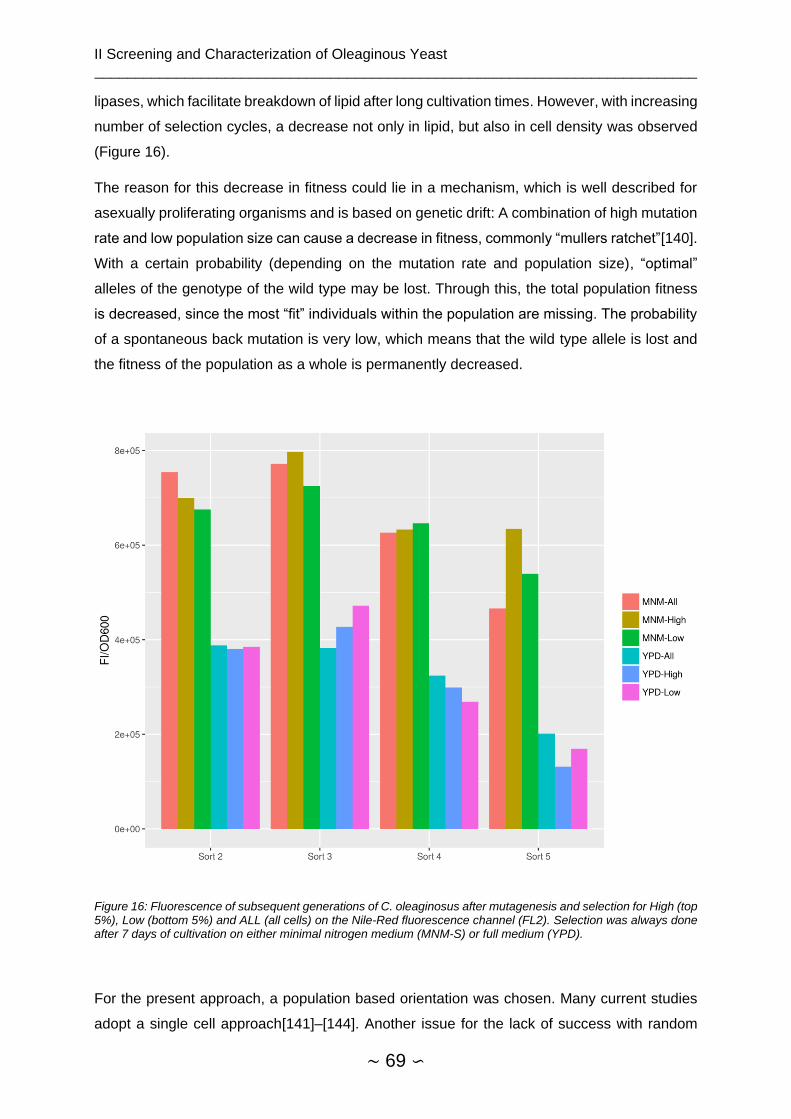
II Screening and Characterization of Oleaginous Yeast __________________________________________________________________________
∼ 69 ∽
lipases, which facilitate breakdown of lipid after long cultivation times. However, with increasing
number of selection cycles, a decrease not only in lipid, but also in cell density was observed
(Figure 16).
The reason for this decrease in fitness could lie in a mechanism, which is well described for
asexually proliferating organisms and is based on genetic drift: A combination of high mutation
rate and low population size can cause a decrease in fitness, commonly “mullers ratchet”[140].
With a certain probability (depending on the mutation rate and population size), “optimal”
alleles of the genotype of the wild type may be lost. Through this, the total population fitness
is decreased, since the most “fit” individuals within the population are missing. The probability
of a spontaneous back mutation is very low, which means that the wild type allele is lost and
the fitness of the population as a whole is permanently decreased.
Figure 16: Fluorescence of subsequent generations of C. oleaginosus after mutagenesis and selection for High (top 5%), Low (bottom 5%) and ALL (all cells) on the Nile-Red fluorescence channel (FL2). Selection was always done after 7 days of cultivation on either minimal nitrogen medium (MNM-S) or full medium (YPD).
For the present approach, a population based orientation was chosen. Many current studies
adopt a single cell approach[141]–[144]. Another issue for the lack of success with random

II Screening and Characterization of Oleaginous Yeast __________________________________________________________________________
∼ 70 ∽
mutagenesis methods might be effective DNA repair mechanisms or high ploidy level. Further,
a high rate of genetically destructive mutations might cause a narrow “mutagenic index”
between an insufficient amount of mutations and lethal “overmutation” of cells. Indeed, for
ATCC 20509, EMS might not be an ideal mutagen[82], as m-nitro-nitrosoguanidine yielded
higher numbers of auxotrophic mutant in a replication screening approach[82]. As EMS also
induces double strand breaks and C. oleaginosus does not favor homologous recombination
as repair mechanism, mutagenized cells might resort to the much more error prone non-
homologous end joining, which in turn could yield a higher number of non-viable cells in relation
to every mutation. In relation to Y. lipolytica, mostly recombinant methods have been employed
so far[88], but using lower density of high lipid subpopulations in combination with EMS
mutagenesis, lipid productivity was raised by 55%[145]. The described approach has the
advantage of not selecting a few hundred thousand cells, but billions of cells. The genetic
variation is much higher, Mullers ratchet is avoided and the selection system in itself is more
easily controllable.
2.4.5 Media Optimization
Fermentations in 48x format were planned together with- and conducted by Andrea Meo[39]. The resulting data were not previously analyzed or published in any work and are evaluated and discussed for this chapter.
For media optimization, cultivation was done in a 48x parallel fermenter. C:N, C:P and C:S
ratios were varied individually to estimate the impact of the respective limitations in a full
synthetic medium.
2.4.5.1 Dry Biomass and Lipid Content
At the end of the cultivation time after 72 hours, fatty acid spectrum and dry biomass were
determined (Figure 17). With increasing nitrogen stress, an increase in lipid content with a
peak at a C:N ratio of 145 g/g was observed. Raising the C:N ratio even higher lead to a
decrease in lipid share, which can be explained by recruitment of lipid reserves of the cells for
survival even in the presence of ample glucose. Biomass continuously decreased with
increasing C:N ratio, owing to a lack of nitrogen in the medium required for cell proliferation.
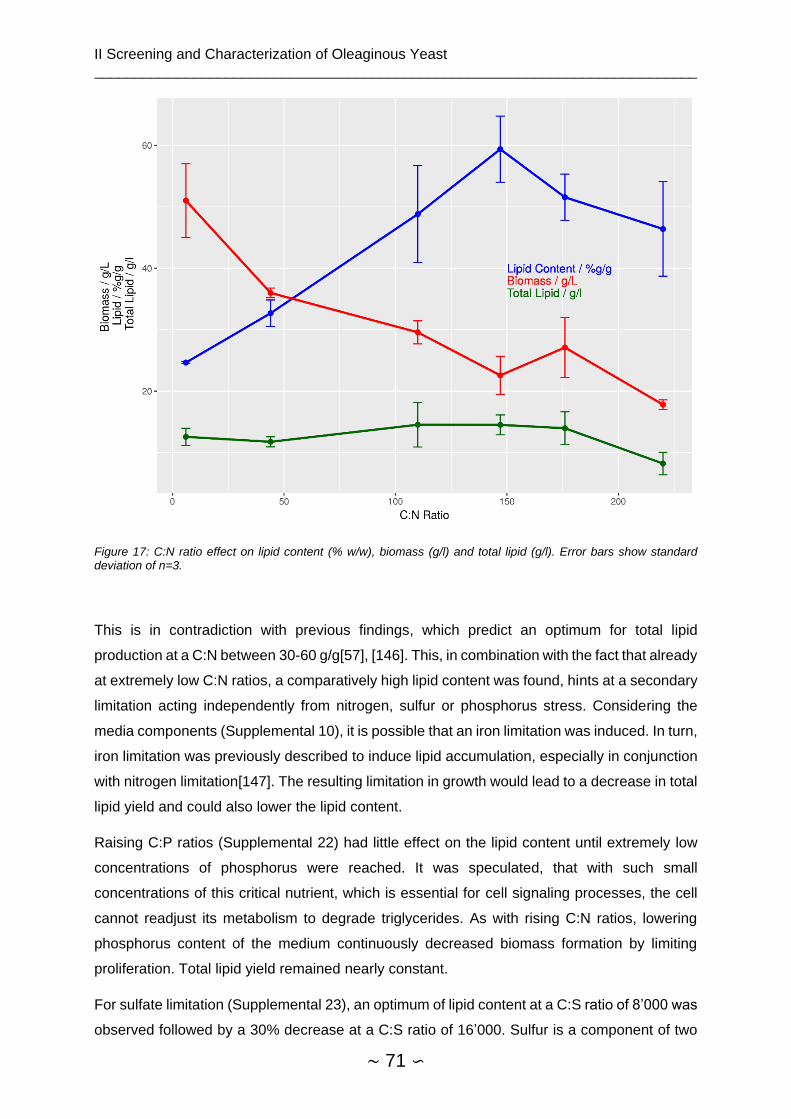
II Screening and Characterization of Oleaginous Yeast __________________________________________________________________________
∼ 71 ∽
Figure 17: C:N ratio effect on lipid content (% w/w), biomass (g/l) and total lipid (g/l). Error bars show standard deviation of n=3.
This is in contradiction with previous findings, which predict an optimum for total lipid
production at a C:N between 30-60 g/g[57], [146]. This, in combination with the fact that already
at extremely low C:N ratios, a comparatively high lipid content was found, hints at a secondary
limitation acting independently from nitrogen, sulfur or phosphorus stress. Considering the
media components (Supplemental 10), it is possible that an iron limitation was induced. In turn,
iron limitation was previously described to induce lipid accumulation, especially in conjunction
with nitrogen limitation[147]. The resulting limitation in growth would lead to a decrease in total
lipid yield and could also lower the lipid content.
Raising C:P ratios (Supplemental 22) had little effect on the lipid content until extremely low
concentrations of phosphorus were reached. It was speculated, that with such small
concentrations of this critical nutrient, which is essential for cell signaling processes, the cell
cannot readjust its metabolism to degrade triglycerides. As with rising C:N ratios, lowering
phosphorus content of the medium continuously decreased biomass formation by limiting
proliferation. Total lipid yield remained nearly constant.
For sulfate limitation (Supplemental 23), an optimum of lipid content at a C:S ratio of 8’000 was
observed followed by a 30% decrease at a C:S ratio of 16’000. Sulfur is a component of two
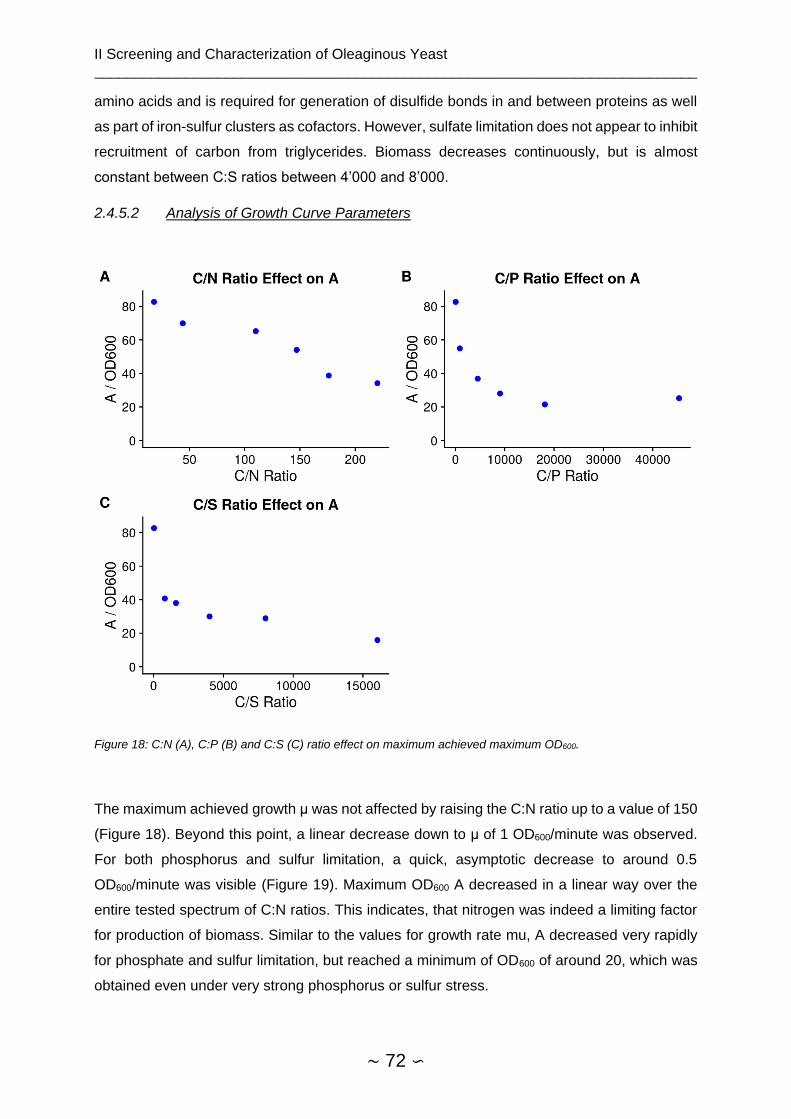
II Screening and Characterization of Oleaginous Yeast __________________________________________________________________________
∼ 72 ∽
amino acids and is required for generation of disulfide bonds in and between proteins as well
as part of iron-sulfur clusters as cofactors. However, sulfate limitation does not appear to inhibit
recruitment of carbon from triglycerides. Biomass decreases continuously, but is almost
constant between C:S ratios between 4’000 and 8’000.
2.4.5.2 Analysis of Growth Curve Parameters
Figure 18: C:N (A), C:P (B) and C:S (C) ratio effect on maximum achieved maximum OD600.
The maximum achieved growth μ was not affected by raising the C:N ratio up to a value of 150
(Figure 18). Beyond this point, a linear decrease down to μ of 1 OD600/minute was observed.
For both phosphorus and sulfur limitation, a quick, asymptotic decrease to around 0.5
OD600/minute was visible (Figure 19). Maximum OD600 A decreased in a linear way over the
entire tested spectrum of C:N ratios. This indicates, that nitrogen was indeed a limiting factor
for production of biomass. Similar to the values for growth rate mu, A decreased very rapidly
for phosphate and sulfur limitation, but reached a minimum of OD600 of around 20, which was
obtained even under very strong phosphorus or sulfur stress.
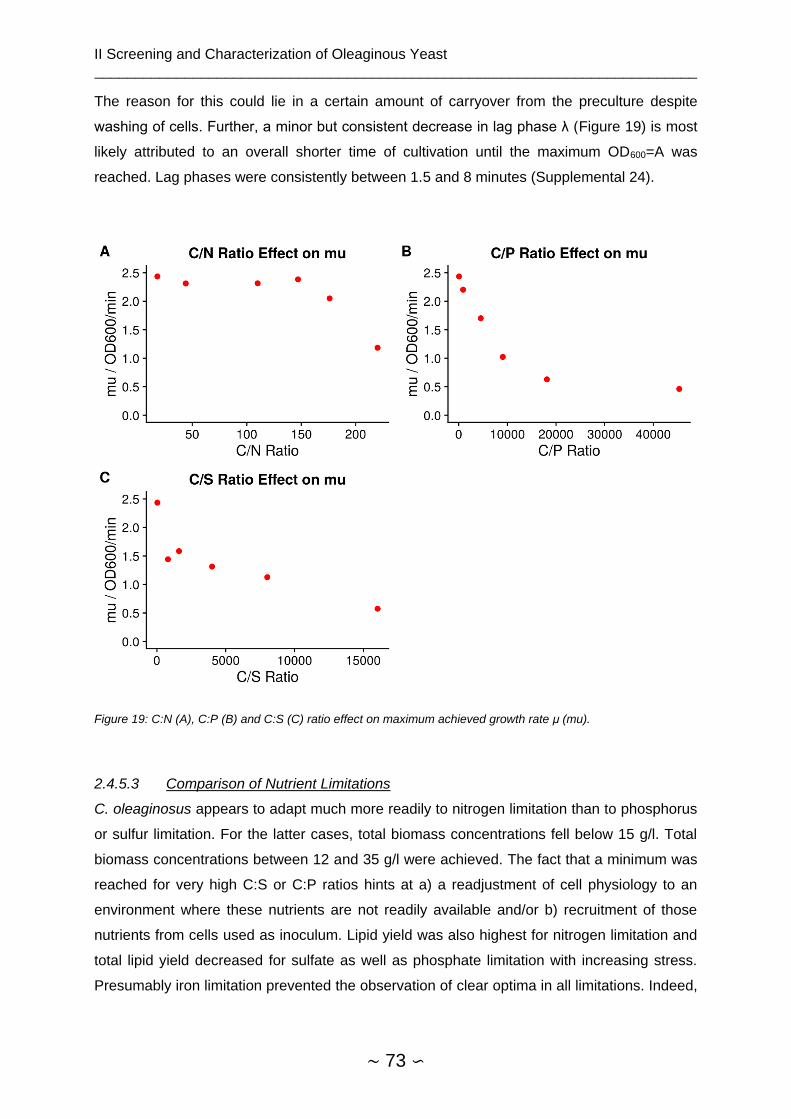
II Screening and Characterization of Oleaginous Yeast __________________________________________________________________________
∼ 73 ∽
The reason for this could lie in a certain amount of carryover from the preculture despite
washing of cells. Further, a minor but consistent decrease in lag phase λ (Figure 19) is most
likely attributed to an overall shorter time of cultivation until the maximum OD600=A was
reached. Lag phases were consistently between 1.5 and 8 minutes (Supplemental 24).
Figure 19: C:N (A), C:P (B) and C:S (C) ratio effect on maximum achieved growth rate μ (mu).
2.4.5.3 Comparison of Nutrient Limitations
C. oleaginosus appears to adapt much more readily to nitrogen limitation than to phosphorus
or sulfur limitation. For the latter cases, total biomass concentrations fell below 15 g/l. Total
biomass concentrations between 12 and 35 g/l were achieved. The fact that a minimum was
reached for very high C:S or C:P ratios hints at a) a readjustment of cell physiology to an
environment where these nutrients are not readily available and/or b) recruitment of those
nutrients from cells used as inoculum. Lipid yield was also highest for nitrogen limitation and
total lipid yield decreased for sulfate as well as phosphate limitation with increasing stress.
Presumably iron limitation prevented the observation of clear optima in all limitations. Indeed,
II Screening and Characterization of Oleaginous Yeast __________________________________________________________________________
∼ 74 ∽
for C. oleaginosus, fermentation using combined nitrogen and iron limitation was successfully
applied[147].
For Meo[39], sulfate limitation also did not result in accumulation of lipids. In fact, lipid content
decreased with increasing sulfate stress in batch (C:S 869 g/g) and fed-batch (C:S 4344 g/g)
cultivations. These results, in combination with the data presented in this work, indicate, that it
is not possible to use sulfate limitation for the accumulation of lipids. As cells were washed
before inoculation, carryover is not impossible, but unlikely. Regarding phosphorus limitation,
C:P ratios between 702-35177 g/g were tested in a fed-batch fermentation, resulting in a
maximum lipid content of 40% g/g. This is 30% lower than with nitrogen limitation, but sufficient
to establish phosphorus limitation as viable alternative to nitrogen limitation in C. oleaginosus.
Interestingly, for batch processes, C:P ratio had no impact on lipid content. It can be followed
that time point of induction of nutrient stress could be a relevant factor.
It can be argued, that the chosen scales of limitation ratios make comparison challenging,
however these scales were applied due to data from literature[54], [55], [148] as well as
preliminary experiments[39]. In conclusion, presence of organic nitrogen, cultivation mode and
possibly other limitations could play important roles. Little is known about how limitations relate
to each other. It is possible, that some limitations are additive or even show emergent
properties under certain cultivation conditions. This relates to the questions of a) how nutrient
presence is detected, b) how nutrient limitation is signaled and c) what the consequences of
this limitation on the protein level are. While some progress has been made in clarifying these
processes[4], [23], [89], [149], many details remain elusive.

II Screening and Characterization of Oleaginous Yeast __________________________________________________________________________
∼ 75 ∽
2.4.6 Effect of TORC Inhibition on Lipogenesis and Growth
To explore C. oleaginosus cell signaling pathways related to lipid accumulation and to evaluate
the possibility of intervention in this network to raise lipid production, the effect of TORC was
evaluated. This was done by testing target of rapamycin 1 (TORC1) inhibition by caffeine by
and rapamycin.
2.4.6.1 Caffeine Supplementation
Caffeine was added to cultures grown in full medium (YPD) at concentrations between 0 and
100 mM. Cultivation was monitored for 7 days. Cytotoxic effects were observed (Figure 20),
however for fluorescence, no significant differences were found (Supplemental 25).
Figure 20: Growth of C. oleaginosus cells grown in YPD with and without caffeine supplementation at different concentrations between 0 and 100 mM measured using OD600.
As the absorption spectrum of caffeine is far from the emission spectrum of Nile red, a
quenching effect can be dismissed. It is more likely, that cytotoxic effects of caffeine also
interfere with lipid accumulation. Pleiotropic effects of caffeine were described, but are poorly
understood. In S. cerevisiae, these effects include interference of DNA repair and
II Screening and Characterization of Oleaginous Yeast __________________________________________________________________________
∼ 76 ∽
recombination pathways, the delay of cell cycle progression and modulation of intracellular
calcium homeostasis.
It is apparent, that the compound enters the cells and impacts on cell physiology with at least
cytostatic effect[150]. However, it appears not to inhibit TORC1 to a degree sufficient to affect
accumulation of lipids. Another possibility is that pleiotropic effects of caffeine drown potential
inhibition of TORC1. This suggests a more targeted approach for the inhibition of the TOR
complex 1 using rapamycin.
2.4.6.2 Rapamycin Effect on Nile Red Fluorescence
Cultivation of C. oleaginosus in full YPD medium does not lead to nutrient limitation and is
associated with a low accumulation of intracellular lipids. Supplementation of this medium with
rapamycin (20 µM, [151]) after 8 hours cultivation time resulted in significantly higher Nile red
fluorescence (corrected for OD) signal indicating an increased lipid production (Figure 21). The
increase of 66% FI/OD at 72 hours subsequently decreased to 44% (92 hours) and 40% after
116 hours respectively. During cultivation, no decrease in OD was observed, indicating that
the cell growth was not affected by the applied rapamycin concentrations.
It is reported that Nile red is a semi-quantitative lipid stain [152], as its specific fluorescent
signal is dependent on the fatty acid profile, the type of lipid (phospho-, triacylglyceride or
steran) and the protein content within intracellular lipid bodies.

II Screening and Characterization of Oleaginous Yeast __________________________________________________________________________
∼ 77 ∽
Figure 21: Effect of Rapamycin on Nile red Fluorescence: C. oleaginosus grown in YPD without (YPD) and with 20 µM rapamycin (YPD+R) supplementation. At different time points, Nile red fluorescence (FI) and OD600 were measured. The ratio between the latter is plotted on the y axis and is a semi-quantitative indicator of lipid content. Stars show significance at α=0.05 and error bars show standard deviation of n=3.
2.4.6.3 Rapamycin Effect on Lipid Content
To confirm an increase in lipid yield, a gravimetric biomass and lipid determination was
conducted using cells grown in cultures containing between 0 and 40 µM rapamycin. The
addition of 40 µM rapamycin resulted in a maximum lipid increase of 38% compared to controls
without rapamycin. Moreover, at 5 µM rapamycin the total biomass production is significantly
increased. These data contrast reports on the effects of rapamycin on algae and bacterial
growth, where supplementation of the compound resulted in decreased biomass formation in
line with its established cell cycle inhibition effects[153], [154].
Due to the expected logarithmic dependency (Supplemental 26), effects of rapamycin on lipid
content (Figure 22) saturate at low concentrations. To confirm the effect of rapamycin on
intracellular lipogenesis, a one tailed Welch’s t-test between samples was applied in the
absence and presence of rapamycin. The null hypothesis of both sample sets being of the
same distribution is rejected with p=0.003 and a confidence interval of 1.4-5% g/g increase in
the absence and presence of rapamycin.

II Screening and Characterization of Oleaginous Yeast __________________________________________________________________________
∼ 78 ∽
Figure 22: Effect of Rapamycin on Lipid Content and Biomass: Total lipid content (green) and dry biomass (red) of C. oleaginosus after 72 hours of cultivation in YPD are measured with different concentrations of rapamycin supplementation between 0 and 40 µM. Error bars show standard deviation of n=3 and the star shows significance at α=0.05 in comparison to culture without rapamycin supplementation. The blue line shows a robust logarithmic fit of the lipid content in dependence of rapamycin concentration as described in Supplemental 26.
2.4.6.4 Rapamycin Effect on Growth Kinetics
As initial data suggested that at 5 µM rapamycin (at t=8h cultivation time) cell growth was
enhanced, a real-time backscatter measurement was used in order to compare cellular growth
in the absence and presence of rapamycin (Figure 23). Cell growth was sufficiently described
by a fit to a Richards’ curve [155], which allowed extraction of μmax (maximum growth rate), λ
(lag phase duration) and A (maximum OD600) values (Table 6).
Interestingly, significant differences in the growth parameters of each culture were observed.
For the rapamycin treated culture, the maximum growth rate µmax (12% increase) and the
maximum optical density (19% increase) were elevated compared to controls.

II Screening and Characterization of Oleaginous Yeast __________________________________________________________________________
∼ 79 ∽
Table 6: Comparison of growth curve parameters extracted from Richards’ fit: Maximum growth rate (μmax), lag phase (λ) and maximum cell density (A) of C. oleaginosus cultivated in YPD with and without rapamycin. All values are given with standard deviations.
YPD YPD + 5 μM rapamycin Change /%
μmax / OD600/hour 1.2068 ± 1.779*10-3 1.349 ± 1.362*10-3 11.79 ± 2.6*10-3
λ / minutes 12.433 ± 23.104*10-3 12.151 ± 5.776*10-3 -2.27 ± 3.13*10-3
A /OD600 30.754 ± 7.421*10-3 36.578 ± 6.73*10-3 18.93 ± 0.46*10-3
This translates to a change in the maximum growth rate from a nominal 1.2 to 1.35 OD600/hour
and an increase in the maximum cell density from OD 30.8 (61 g/l) to OD 36.6 (71 g/l)
respectively. Hence, in the presence of 5 µM rapamycin the cell density increased by 19%
concomitantly with a 25% lipid increase. These cumulative values translate to a 49% improved
space time yield compared to controls in the absence of rapamycin.
Figure 23: Online-OD Measurement: Growth curves of C. oleaginosus without (YPD) and with 5 µM rapamycin (YPD+R) obtained by measuring backscatter with an online OD system. Thin lines (YPD fit, YPD+R fit) show fit of Richards’ growth curves.
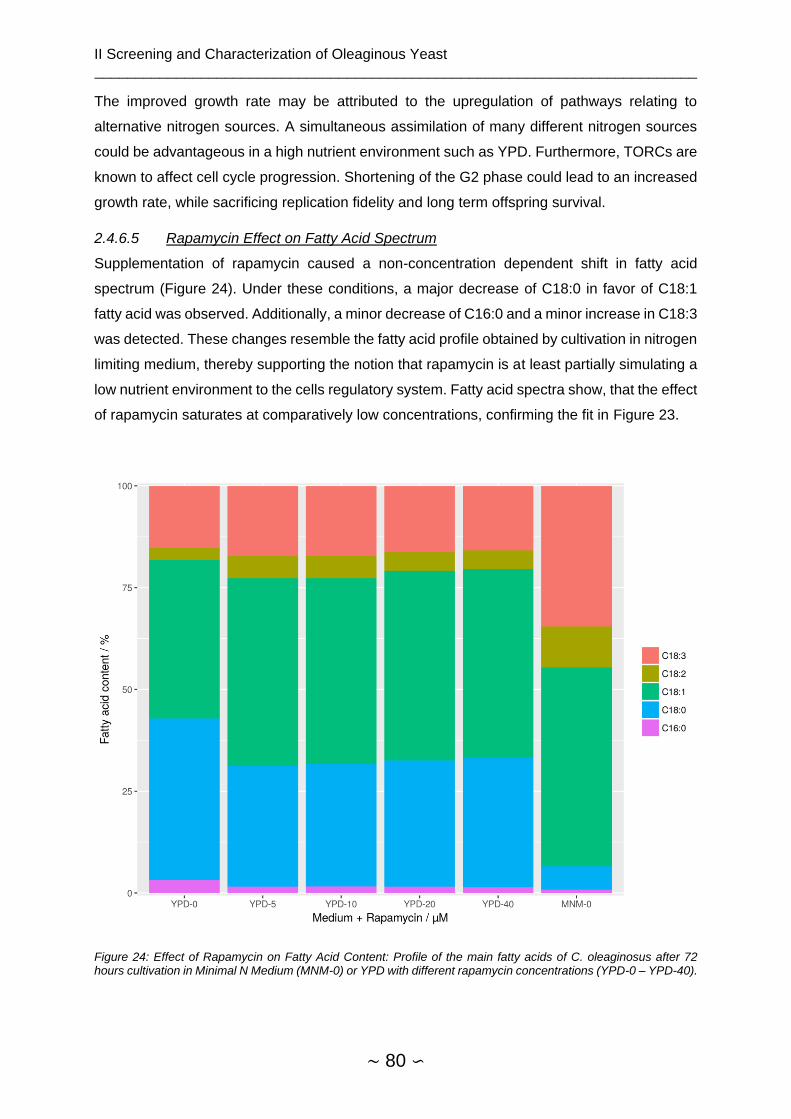
II Screening and Characterization of Oleaginous Yeast __________________________________________________________________________
∼ 80 ∽
The improved growth rate may be attributed to the upregulation of pathways relating to
alternative nitrogen sources. A simultaneous assimilation of many different nitrogen sources
could be advantageous in a high nutrient environment such as YPD. Furthermore, TORCs are
known to affect cell cycle progression. Shortening of the G2 phase could lead to an increased
growth rate, while sacrificing replication fidelity and long term offspring survival.
2.4.6.5 Rapamycin Effect on Fatty Acid Spectrum
Supplementation of rapamycin caused a non-concentration dependent shift in fatty acid
spectrum (Figure 24). Under these conditions, a major decrease of C18:0 in favor of C18:1
fatty acid was observed. Additionally, a minor decrease of C16:0 and a minor increase in C18:3
was detected. These changes resemble the fatty acid profile obtained by cultivation in nitrogen
limiting medium, thereby supporting the notion that rapamycin is at least partially simulating a
low nutrient environment to the cells regulatory system. Fatty acid spectra show, that the effect
of rapamycin saturates at comparatively low concentrations, confirming the fit in Figure 23.
Figure 24: Effect of Rapamycin on Fatty Acid Content: Profile of the main fatty acids of C. oleaginosus after 72 hours cultivation in Minimal N Medium (MNM-0) or YPD with different rapamycin concentrations (YPD-0 – YPD-40).

II Screening and Characterization of Oleaginous Yeast __________________________________________________________________________
∼ 81 ∽
In Euglena gracilis, supplementation of rapamycin led to an increase in lipid amount but almost
no change in fatty acid profile was reported [151]. The reason for this appears to lie in the
different mechanism of rapamycin response between this algae and previously identified
yeasts or animal cells[151]. This observation in this study motivated us to use a bioinformatics
approach to investigate the effects of rapamycin on C. oleaginosus cell signaling network and
lipogenesis.
2.4.7 Assembly of TORC Signaling Network
A homology-based TORC signaling network, including upstream and downstream elements
(Figure 25), was assembled. A table of all proposed pathway components can be found in
Supplemental 27. The SNF1/AMPK pathway is highly conserved from yeast to mammals, and
homologues of its main components could also be detected in C. oleaginosus. These
homologues termed Elm1, Sak1 and Tos3 are kinases which phosphorylate and activate Snf1
(orthologue to the mammalian AMPK), which in turn is a central regulator required for energy
homeostasis. In S. cerevisiae Snf1 is mainly responsible for adaption to a glucose limiting
environment[156]. Inactivation of Snf1 is caused by dephosphorylation initiated by the
Reg1/Glc7 complex[156]. In a low carbon environment, phosphorylated Snf is translocated to
the nucleus, where it phosphorylates the transcriptional activator Sip4. Subsequently, Sip4
activates the transcription of glucose-repressed genes[156]. This process is conserved in
ascomycetes S. cerevisiae and S. pombe alike. Interestingly, activated Snf1 also inhibits
Acc1p, which is responsible for catalysis of acetyl-CoA to Malonyl-CoA, a main precursor for
the production of fatty acids[157]. This indicates a direct link between metabolic signaling under
nutrient stress conditions and the regulation of cellular lipid biosynthesis.
Furthermore, Snf1 is reported to inhibit the Tsc1/Tsc2 complex in model yeasts and in
mammals. Moreover, the Tsc1/Tsc2 complex further integrates signals from other pathways,
including the MAPK/ERK pathway[158], cytokines, hypoxia signals and Wnt signaling
respectively. More recently, it has been suggested that in yeast, involvement of other factors,
especially in reaction to low nutrient content is feasible [159]. However, a direct inhibition of
TORC1 by Vps34, an essential gene which channels amino acid availability to the Tsc1/Tsc2
complex, has been reported in yeasts and mammals [158], [160].
More specifically, TORC1 itself receives inputs from RheB over the Tsc1/2 axis and directly
from the EGO complex. In model yeasts this EGO is composed of the kinases Gtr1/2 and
Npr2/3 respectively. However, in C. oleaginosus, we could not detect homologous of the Npr3
or Ego1-Ego3 complexes, which indicates that the absence of amino acids in the medium are
not sensed via the EGO involved signaling. Inhibition of the TORC1 complex by rapamycin
occurs via initial formation of an Fkh1 protein-rapamycin complex (mammalian homologue
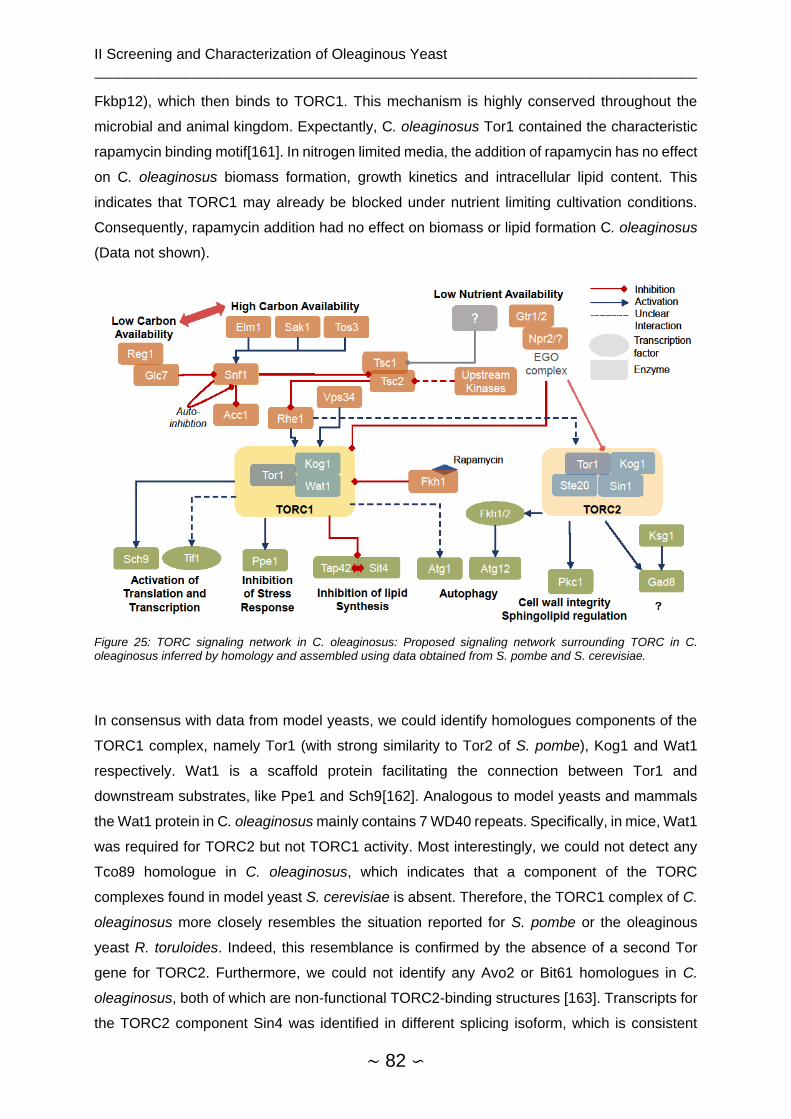
II Screening and Characterization of Oleaginous Yeast __________________________________________________________________________
∼ 82 ∽
Fkbp12), which then binds to TORC1. This mechanism is highly conserved throughout the
microbial and animal kingdom. Expectantly, C. oleaginosus Tor1 contained the characteristic
rapamycin binding motif[161]. In nitrogen limited media, the addition of rapamycin has no effect
on C. oleaginosus biomass formation, growth kinetics and intracellular lipid content. This
indicates that TORC1 may already be blocked under nutrient limiting cultivation conditions.
Consequently, rapamycin addition had no effect on biomass or lipid formation C. oleaginosus
(Data not shown).
Figure 25: TORC signaling network in C. oleaginosus: Proposed signaling network surrounding TORC in C. oleaginosus inferred by homology and assembled using data obtained from S. pombe and S. cerevisiae.
In consensus with data from model yeasts, we could identify homologues components of the
TORC1 complex, namely Tor1 (with strong similarity to Tor2 of S. pombe), Kog1 and Wat1
respectively. Wat1 is a scaffold protein facilitating the connection between Tor1 and
downstream substrates, like Ppe1 and Sch9[162]. Analogous to model yeasts and mammals
the Wat1 protein in C. oleaginosus mainly contains 7 WD40 repeats. Specifically, in mice, Wat1
was required for TORC2 but not TORC1 activity. Most interestingly, we could not detect any
Tco89 homologue in C. oleaginosus, which indicates that a component of the TORC
complexes found in model yeast S. cerevisiae is absent. Therefore, the TORC1 complex of C.
oleaginosus more closely resembles the situation reported for S. pombe or the oleaginous
yeast R. toruloides. Indeed, this resemblance is confirmed by the absence of a second Tor
gene for TORC2. Furthermore, we could not identify any Avo2 or Bit61 homologues in C.
oleaginosus, both of which are non-functional TORC2-binding structures [163]. Transcripts for
the TORC2 component Sin4 was identified in different splicing isoform, which is consistent
II Screening and Characterization of Oleaginous Yeast __________________________________________________________________________
∼ 83 ∽
with previous findings in S. cerevisiae [160]. Notably, in S. cerevisiae, mutation of Sin4 leads
to rapamycin resistance[164]. In analogy, the presence of Sin4 isoforms detected in C.
oleaginosus could render the TOC2 complex resistant to rapamycin.
Downstream of primary TOC effects, significant differences between signals in model yeasts
and C. oleaginosus affecting autophagy were identified. Particularly, genes essential to the
autophagy signaling pathway, namely Atg13, Atg17, Atg31, Atg29 could not found in C.
oleaginosus. In this respect, the C. oleaginosus system may resemble the regulatory system
of Drosophila melanogaster, in which hyperphosphorylated Atg1 in conjunction with Atg13 are
sufficient to inhibit autophagy. In the model yeast S. cerevisiae the autophagy signaling is by
far more complex and therefore may not apply to C. oleaginosus [165]. Further, individual
autophagy related homologues (Atg5, Atg6, Atg16) were found, but the actual signaling
pathway appears to differ significantly from other yeast systems.
The other main signaling pathways for regulation of lipid biosynthesis, transcriptional and
translational initiation appear to be conserved with high similarity. In S. cerevisiae, TORC1
inhibition liberates Tap42 and Sit4 from being bound to each other. This in turn activates the
downstream transcription factors, Gat1 and Gln3. After Gat1 and Gln3 transport to the nucleus,
these transcription factors induce the accumulation of lipids. Our bioinformatics analysis
indicates that a similar mechanism is likely for C. oleaginosus. The highly conserved Sch9 is
homologous to the mammalian S6K, which is responsible for activation of ribosomal protein
S6 and therefore directly controls translation. By contrast, no homologue to Gaf1, which in S.
pombe is central for the response to nitrogen stress[166], was identified. The absence of Gaf1
therefore may modulate the cell cycle in C. oleaginosus. Nonetheless, Ppe1 homologue a
kinase acting within the S. pombe stress response which also affects the cell cycle[167] was
identified.
TORC2 activation, especially in yeast, remains elusive. In S. pombe, interaction with Rhe1 is
confirmed[168]. Furthermore, it was reported in mammals, that activation can be achieved by
growth factors (PI3K axis). Furthermore, ribosomal association of the complex suggests its
activation by nutrients. Especially the latter is also likely for yeast[169], considering the effect
on growth in S. pombe[170]. In C. oleaginosus however, little can be reported about the effects
of downstream TORC2 elements due to the absence of detailed cell biology studies.
Active TORC2 activates Fkh1/2 in S. cerevisiae (FOXO genes in mammals), which affects
autophagy related genes, life span and stress response[163], [171], [172],. TORC2 as well as
the highly conserved Kinase Ksg1 activate Gad8 by phosphorylation[173]. The subsequent
cellular effects strongly depend on the organism. For S. cerevisiae, this impacts on actin
organization and cell wall synthesis, whereas for C. elegans mainly lipid metabolism and
growth are affected. For the related and well described yeast, S. pombe, changes in amino

II Screening and Characterization of Oleaginous Yeast __________________________________________________________________________
∼ 84 ∽
acid uptake and general changes in stress response are described[163]. Lack Rho/Rac
homologues indicate strong differences in the regulation of actin organization from S. pombe.
A confirmed element of TORC2 is Pkc activation, as was described for the closely related and
pathogenic Cryptococcus curvatus. Pkc itself is involved in regulation of sphingolipid
biosynthesis, which impacts the structural integrity of the cell wall[174]. Most recently, the
GATA transcription factor Gaf1 was reported to be responsible for sexual development in yeast
and upregulation of amino acid transporters[166]. It is activated as response to nitrogen stress
about 10 to 120 minutes after the onset of nitrogen stress. Therefore, it can be hypothesized
that it is part of a first, reversible response to nutrient stress. Persisting lack of nitrogen would
then trigger the second, delayed phase which includes elevated mating in S. pombe.
Two factors indicate, that the observed effects are not due to rapamycin involvement with
TORC2: Rapamycin resistance of TORC2 was structurally substantiated by Avo3 (Ste20),
which wraps around the Fkpb-binding domain of Tor1/2[175]. Prolonged exposure of certain
mammalian cell types to rapamycin showed inhibited assembly of TORC2[176], however this
was not observed in unicellular organisms[163] and therefore appears unlikely for C.
oleaginosus. Secondly, no obvious differences in cell morphology were observed using
microscopy (Supplemental 28) and FACS (Supplemental 29), indicating that for C.
oleaginosus, rapamycin does not impact on cytoskeleton and actin organization, which are
commonly affected by TORC2.

II Screening and Characterization of Oleaginous Yeast __________________________________________________________________________
∼ 85 ∽
2.4.8 Genetic Modification of Cutaneotrichosporon oleaginosus
Overexpression of Dga1/2 and Slc (2.4.8.3) as well as CRISPR/Cas9 based gene editing presented here were executed in part under my guidance as part of the Bachelor’s thesis “Genetic Modification of Trichosporon oleaginosus” Kathrin bach 2016. The data were reevaluated and discussed for this chapter.
2.4.8.1 Codon Tables and Codon Adaption Indices
The codon adaption index (CAI) describes the frequency of a specific codon being used in a
gene in relation to the most commonly used codon for the relating amino acid. It can take
values from 0 (only the least common codons are used) to 1 (only the most common codons
are used) and is calculated by determining the weight of each of codon for each amino acid.
The distribution is then matched with a reference set containing the frequency of the most
frequent codon for each amino acid. Since tRNA distributions vary in organisms, the
expression rate of homo- or heterologous proteins can significantly drop, when uncommon
codons are used. The CAI can be used as a weak predictor for success of expression[177],
although little consistency has been found by correlating the quality of a heterologous
expression and CAI. Other parameters, such as GC content, stability, amino acid half-life,
solubility and factors that strongly impact on folding such as disordered or fibrous regions have
to be considered as well. However, in contrast to heterologous expression on established
platforms such as E. coli, the impact of these factors on expression in C. oleaginosus is
unknown. As a rule of thumb, CAIs below 0.5 can be considered unfavorable and values over
0.8 as favorable for expression in E. coli[178], but much lower minimum values, such as 0.084
for E. coli or 0.041 for S. cerevisiae were suggested as well. [179]
For codon optimization and determination of codon adaption indices (CAI), codon tables were
generated to describe the codon usage of C. oleaginosus. In previous work[51], this was not
examined in detail and solely the codon distribution of the glycerinaldehyd-3-phosphat
dehydrogenase (GDH) gene was used to optimize the expressed genes. In this work, codon
tables from GDH, the entire transcriptome, as well as the top 10 transcribed genes in both
MNM-S as well as YPD Medium were considered (Table 7).
Table 7: Genes with 10 highest transcription rates as indicated by the Reads per Kilobase of Transcript per Million reads Mapped (RPKM) under lipid accumulating (MNM) and proliferating conditions (YPD).
Locus Tag Gene RPKM
MNM
RPKM
YPD
Triol1|249059 Aldo/keto reductase family protein 14968.89 572.1
Triol1|289369 Ubiquitin 11784.53 3151.76
Triol1|308253 Delta 9 Fatty acid desaturase 11246.62 7204.26
Triol1|283928 - 10995.83 2875.96
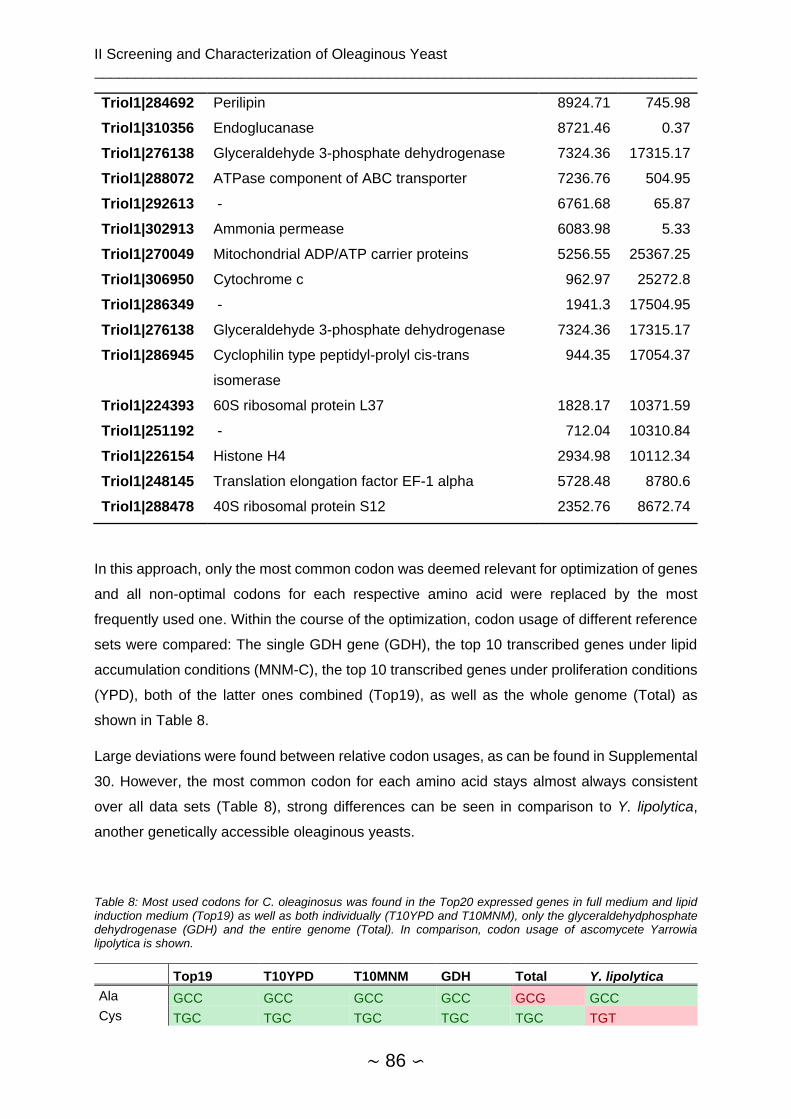
II Screening and Characterization of Oleaginous Yeast __________________________________________________________________________
∼ 86 ∽
Triol1|284692 Perilipin 8924.71 745.98
Triol1|310356 Endoglucanase 8721.46 0.37
Triol1|276138 Glyceraldehyde 3-phosphate dehydrogenase 7324.36 17315.17
Triol1|288072 ATPase component of ABC transporter 7236.76 504.95
Triol1|292613 - 6761.68 65.87
Triol1|302913 Ammonia permease 6083.98 5.33
Triol1|270049 Mitochondrial ADP/ATP carrier proteins 5256.55 25367.25
Triol1|306950 Cytochrome c 962.97 25272.8
Triol1|286349 - 1941.3 17504.95
Triol1|276138 Glyceraldehyde 3-phosphate dehydrogenase 7324.36 17315.17
Triol1|286945 Cyclophilin type peptidyl-prolyl cis-trans
isomerase
944.35 17054.37
Triol1|224393 60S ribosomal protein L37 1828.17 10371.59
Triol1|251192 - 712.04 10310.84
Triol1|226154 Histone H4 2934.98 10112.34
Triol1|248145 Translation elongation factor EF-1 alpha 5728.48 8780.6
Triol1|288478 40S ribosomal protein S12 2352.76 8672.74
In this approach, only the most common codon was deemed relevant for optimization of genes
and all non-optimal codons for each respective amino acid were replaced by the most
frequently used one. Within the course of the optimization, codon usage of different reference
sets were compared: The single GDH gene (GDH), the top 10 transcribed genes under lipid
accumulation conditions (MNM-C), the top 10 transcribed genes under proliferation conditions
(YPD), both of the latter ones combined (Top19), as well as the whole genome (Total) as
shown in Table 8.
Large deviations were found between relative codon usages, as can be found in Supplemental
30. However, the most common codon for each amino acid stays almost always consistent
over all data sets (Table 8), strong differences can be seen in comparison to Y. lipolytica,
another genetically accessible oleaginous yeasts.
Table 8: Most used codons for C. oleaginosus was found in the Top20 expressed genes in full medium and lipid induction medium (Top19) as well as both individually (T10YPD and T10MNM), only the glyceraldehydphosphate dehydrogenase (GDH) and the entire genome (Total). In comparison, codon usage of ascomycete Yarrowia lipolytica is shown.
Top19 T10YPD T10MNM GDH Total Y. lipolytica
Ala GCC GCC GCC GCC GCG GCC
Cys TGC TGC TGC TGC TGC TGT

II Screening and Characterization of Oleaginous Yeast __________________________________________________________________________
∼ 87 ∽
Asp GAC GAC GAC GAC GAC GAC
Glu GAG GAG GAG GAG GAG CAG
Phe TTC TTC TTC TTC TTC TTC
Gly GGC GGC GGC GGC GGC GGC/GGT
His CAC CAC CAC CAC CAC CAC
Ile ATC ATC ATC ATC ATC CTG
Lys AAG AAG AAG AAG AAG AAG
Leu AAG AAG AAG AAG AAG CTG
Met ATG ATG ATG ATG ATG ATG
Asn AAC AAC AAC AAC AAC AAC
Pro CCC CCC CCC CCC CCG CCC
Arg CGC CGC CGC CGC CGC CGA
Ser TCG TCG TCG TCG TCG TCT/TCC
Thr ACC ACC ACC ACC ACC ACC
Val GTC GTC GTC GTC GTC GTG
Trp TGG TGG TGG TGG TGG TGG
Tyr TAC TAC TAC TAC TAC TAC
End TAG/TAA TAG/TAA TAG TGA TGA TAA
Table 9: Genes expressed in Cutaneotrichosporon oleaginosus with their corresponding CAI before optimization. Stars shows optimization and expression done by Görner[51]. CAI after optimization is 1 in all cases. Dga1, Dga2 and Slc1 were not codon optimized
Gene Origin CAI before
optimization
Yellow fluorescent Protein (YFP)* Aequorea victoria 0.808
Hygromycin phosphotransferase
(HygR)*
Escherichia coli 0.440
Delta-9-elongase (IgASE2)* Isochrysis galbana 0.540
Delta-12/Omega-3 desaturase
(Fm1)*
Fusarium moniliforme 0.671
Linoleic acid isomerase (PAI)* Propionibacterium acnes 0.619
Kanamycin aminophos-
photransferase (APH3 II)
Streptomyces kanamyceticus 0.279
CRISPR associated protein 9 (CAS9) Streptococcus pyogenes
(humanized)
0.435
Acylglycerol-phosphate-
acyltransferase (SLC1)
endogenous 0.687
Diacyl-glycerol-acyltransferase
(DGA1)
endogenous 0.526
Diacyl-glycerol-acyltransferase
(DGA2)
endogenous 0.351
II Screening and Characterization of Oleaginous Yeast __________________________________________________________________________
∼ 88 ∽
Table 9 shows an overview of all heterologously expressed genes in C. oleaginosus. The full
sequence of the genes is shown in Supplemental 5.
2.4.8.2 Localization of ATMT Insertion Site
Thermal asymmetric interlaced polymerase chain reaction was used to identify the locus of
insertion of the YFP expression cassette of the YFP expression clone previously generated by
Görner et al[51]. Sequencing of fragment obtained by arbitrary PCR yielded a sequence with
high congruence to C. oleaginosus genomic DNA at locus scaffold_1: 458750-459800 of the
JGI assembly of the respective organism[123].
The respective sequence was identified as a putative carbamate kinase according to homology
to a Leucobacter sp. gene with a maximum score of 38.1, query cover of 38% and identity
value of 34%. Details of the insertion site are shown in Supplemental 31. The result shows that
arbitrary PCR can in principal be used to determine loci of insertion sites in ATMT mutants.
However, it cannot be excluded that the expression cassettes were integrated multiple times
into the genome. In this case, only one of the integration loci might be found by random
hexamer amplification. Variation of hexamer primers and PCR conditions are usually employed
to alleviate this downside.
2.4.8.3 Overexpression of Dga and Slc
Slc1 and Dga2 were chosen for homologous overexpression due to their essential role in
triglyceride synthesis (Section 2.1.2). First, C. oleaginosus clones obtained by ATMT were
checked for integration of the expression cassettes. Genomic DNA was extracted from
different clones and the resistance cassettes were amplified and sequenced (Figure 26).
Bands at the expected height (1147 bp) were extracted and sequenced, always yielding the
expected sequence of the hygromycin B resistance cassette. The genomic integration of
cassettes was confirmed for clones 1, 5, and 6 of pRF_HygDga2. Expected fragment size for
pRF_KanSlc was 810 bp and clones 2, 4 and 7 were confirmed by sequencing. However,
subsequent subcultivation led to an unexplained loss of growth on G418 selection plates. Thus,
the respective clones were not further investigated.
Nile red fluorescence of C. oleaginosus Dga2 overexpressing clones did not display
significantly higher fluorescence than the wild type (Supplemental 32, all other clones in
Supplemental 33). Indeed, clone 1 and 6 showed lower fluorescence than the wild type. This
served as a first indicator, that Dga overexpression does not yield higher lipid accumulation in
C. oleaginosus. The same clones were used for fermentation in YPD.
To exclude the possibility, that nutrient or oxygen limitation was the reason for insufficient Dga2
expression, a fermentation using all three clones and the wild type was conducted.

II Screening and Characterization of Oleaginous Yeast __________________________________________________________________________
∼ 89 ∽
Figure 26: Segments of hygromycin resistance cassette used to confirm the insertion of the expression cassettes into the C. oleaginosus genome. For pRF_HygDga2, the expected size was 1147 bp (lower band), while for pRF_Kan_SLc, the expected size was 810 bp.
Figure 27: Nile red fluorescence of C. oleaginosus Dga wild type and overexpressing clones 1, 5 and 6 (Dga1-K1, Dga1-K5 and Dga1-K6 respectively) after 96 hours grown in YPD in baffled 50 ml flasks. Star shows significantly high values than the wild type as determined by a two tailed t-test assuming equal variances (α=0.05). Error bars show standard deviations of triplicates.

II Screening and Characterization of Oleaginous Yeast __________________________________________________________________________
∼ 90 ∽
For fermentation, clone 5 of the overexpression mutants was significantly higher than the wild
type. However due to the high deviations and inconsistency between clones and wild type, the
result remains inconclusive (Figure 27). Corresponding to work done by Goerner[21], it
remains unclear how many expression cassettes were inserted into the genome. This was a
source of variation between the different clones. Also, no data about actual expression levels
of Dga2 are available, which would require further transcriptomic analyses or characterization
on the protein level. Table 9 shows, that the CAI of Dga2 was 0.35, which is not favorable for
expression. A higher number of integrations at favorable loci for clone 5 is possible, but
speculation based. Deviations in fatty acid spectrum were observed (Supplemental 34,
Supplemental 35), but were inconsistent throughout clones. Specifically, possible substrate
preference of diacylglycerol acyltransferase for specific fatty acids, which was previously
described[180], could therefore not be confirmed.
In summary, it cannot be shown beyond reasonable doubt, that Dga2 expression yields a
higher lipid content in C. oleaginosus. This is contrasted by data obtained in other organisms.
Acylglycerolphosphatidate acyltransferase and diacylglycerol acyltransferase were chosen for
their high potential of raising lipid accumulation. In S. cerevisiae, overexpression of Dga led to
a 171% raise in lipids (lipid content of 15% g/g)[181]. In Y. lipolytica, overexpression of the
endogenous Dga led to a 206% raise in lipids (lipid content of 72% g/g)[182] or a 246% raise
in Nile red fluorescence[183]. Overexpression of Slc1 resulted in an 87% raise in Y.
lipolytica[183]. Assuming sufficient expression of Dga2, which is somewhat speculative, it can
be followed that the last step of lipid synthesis, conversion of diacylglycerol to triacylglycerol,
might not a rate limiting step in C. oleaginosus as opposed to other yeast.
2.4.8.4 CRISPR Cas9 – In vivo expression
With the current ATMT based methodology, overexpression of heterologous or homologous
genes is possible. However, there is currently no possibility for the induction of deletions in C.
oleaginosus. Multiple approaches using homologous recombination were not successful (Data
not shown). The CRISPR-Cas9 system however would make deletions possible and hence
was tested. Subsequent to the procedure described in section 2.3.4.6, clones obtained by
ATMT were checked for integration of the expression cassette by PCR. Figure 28 shows
positive clones containing the resistance cassette and hence Cas9. Fragment identity of clones
one and two was confirmed by sequencing.

II Screening and Characterization of Oleaginous Yeast __________________________________________________________________________
∼ 91 ∽
Figure 28: Detection of Cas9 expression cassette in ATMT clones. Positive clones of pRFHyg_Cas9gRNA show a signal at: 1. 5772 bp, 2. 4238 bp, 3. 3546 bp
After cultivation on YPD, Cas9 activity should have generated Ura3 clones with preferred
growth on 5-FOA in comparison to the wild type. However, sequencing of a total of 20 clones
per gRNA approach (gRNA1 and gRNA2, both targeted at Ura3 of C. oleaginosus as described
in Supplemental 9) yielded no knockout mutant. This suggests Cas9 inactivity. Lack of Cas9
nuclease activity can be founded in lack of Cas9 expression, insufficient transport to the
nucleus as facilitated by the NLS sequence, insufficient gRNA expression, lack of ribozyme
cleavage or heavy offsite activity leading to death of cells expressing Cas9 nuclease.
Figure 29: Western blot showing absence of Cas9 expression in two C. oleaginosus clones containing the Cas9 gene cassette (K1, K2) as well as the wildtype as negative control. 10 ng of Cas9 nuclease served as positive control.
As a first step, protein expression was checked by western blotting protein extract of wild type
C. oleaginosus and clones with integrated Cas9 expression cassettes. The control yielding 10
ng of Cas9 was visible, however the two isolated clones showed no expression (Figure 29).
While sufficient to yield hygromycin B resistance, the truncated version of the GDH promoter
is likely not suitable for acceptable Cas9 expression for genome editing. This could also be
II Screening and Characterization of Oleaginous Yeast __________________________________________________________________________
∼ 92 ∽
associated with suboptimal codon usage of humanized Cas9, as all expression cassettes by
Görner et al.[51] contained codon optimized genes. A codon optimized version of the
expression cassette could not be finished in time.

II Screening and Characterization of Oleaginous Yeast __________________________________________________________________________
∼ 93 ∽
2.5 Conclusion and Outlook
Firstly, the isolation and characterization of new oleaginous yeasts was shown. Yeast
substrains were discovered, which exhibited fatty acid profiles of triglycerides and possibly
phospholipids significantly different from the described literature values as well as the tested
reference strain. The results remain to be confirmed, but varying fatty acid profiles are a
promising starting point for discovering and transgenic testing of different fatty acid modifying
enzymes in oleaginous yeast.
A fundamental issue in the procedure of isolating new strains lies in the first step of cultivation:
Due to the exponential nature of cell proliferation, fast growing strains will always outpace
slower strains until the latter are no longer detectable in the culture. There are two main
adjustments that can be made to alleviate this problem.
1. One of the main issues is the balance between screening pressure in the form of
different media compositions and cultivation conditions, and the amount of strains that
can be obtained. In this work, only one cultivation condition with two different media
was chosen, representing a strong screening pressure. More media and cultivation
conditions could be tested, which would possibly yield useful strains, but also slow
growing yeast with possibly specialized requirements in their environmental conditions.
These, of course, are undesirable in an industrial environment.
2. Another possibility is the direct single cell isolation using a fluorescent activated cell
sorter (FACS). This would possibly allow “in situ” staining with Nile red and isolation
according to lipid content. Obviously, the restrictions given in the first point would still
apply.
A second important point is the collection of environmental samples. There are a number of
facilities with yeast collections, some with many decades of experience in the field of isolation
and maintenance of strains, such as: The Centraalbureau voor Schimmelcultures (CBS), the
Phaff Yeast Collection, the American Type Culture Collection (ATCC) or the National
Collection of Yeast Cultures (NCYC). At this point, obtaining new strains can only be
accomplished by combining unusual areas of isolation with new screening methods. However,
it is questionable, whether current “top performers” in relation to lipid productivity can be beaten
by other natural isolates by significant amounts. As the evolutionary process is aimed at
survival and not industrial productivity, further improvement will most likely only be possible
through recombinant methods. The technology of single cell oil production is in a similar
situation as the technology for amino acid production: Improvements through new strains are
unlikely and process-related optimization have been described extensively. Most likely, only
cis- or transgenic modifications or even biosystem engineering allow for further improvement.

II Screening and Characterization of Oleaginous Yeast __________________________________________________________________________
∼ 94 ∽
The sorting experiments yielded the insight, that the average fluorescence per well obtained
from measurements in a plate reader is comparable to the distributions obtained from the
FACS: A staining method was established and applied in a directed evolution approach. No
improved strains could be obtained from this, presumably due to unfit mutation patterns and
the “Mullers ratchet” effect.
The supplementation of caffeine yielded toxic effects but no changes in fluorescence and
therefore presumably no change in lipid content. By supplementing the pricy compound
rapamycin, a sustainable increase in lipids was observed. The fatty acid profile changed
towards a pattern characteristic for lipid accumulation. For the first time, lipogenesis was
induced in an oleaginous yeast without compromising on growth, resulting in a 1.4-fold
increase in total lipid yield. We observed an increase in growth as well as lipid content in the
absence of nutrient limitation, using YPD as model substrate with high nutrient content. TORC1
in Cutaneotrichosporon oleaginosus can be inhibited by rapamycin, impacting on growth
characteristics and lipid accumulation. However, considering a lack of reduction in growth and
comparatively minor increases in lipid accumulation, inactivation of TORC1 is not sufficient to
induce a cell state resembling nitrogen starvation.
It is possible, that C. oleaginosus either relies on TORC2 inhibition, requires additive signals
of both complexes or employs another unknown pathway for full activation of nitrogen stress
response and associated lipid accumulation. However, TORC2 regulation of lipid synthesis
and its strong involvement in the upregulation of amino acid transporters[163], one of the
defining features of lipid accumulation in C. oleaginosus, make TORC2 involvement in nutrient
limitation response in this yeast likely.
Proteomic and transcriptomic approaches are excellent tools for elucidating how rapamycin
impacts on C. oleaginosus physiology. Comparing these data with previously obtained
information about transcriptomic changes[24] in the presence of nitrogen stress will allow for
pinpointing more clearly the relevance of TORC1 for lipid accumulation. Employing
metabolomic strategies might be a promising approach for a more in-depth study of key
intermediates, such as glutamine and glutamate as components of central nitrogen
metabolism.
For these reasons, further exploration of C. oleaginosus, despite challenges in its genetic
accessibility, is worthwhile. Already as wild type, the strain displays high lipid content, fast
growth to high biomass concentrations and a favorable fatty acid spectrum, which is modifiable.
Further genetic engineering would allow the development of C. oleaginosus to a high potential
organism for the production of lipids and secondary metabolites
II Screening and Characterization of Oleaginous Yeast __________________________________________________________________________
∼ 95 ∽
Overexpression of Dga2 or Slc1 did not yield a confirmed increase in lipid- content or
productivity. Slc1 clones did not yield stable transformants, possibly associated with the
mechanism of G418 resistance using the KanMX cassette used for the respective clones.
Dga2 clones were stable and integration into the genome was confirmed. However, increase
in Nile red fluorescence or lipid content was not significant for cultivation both in flasks and
fermenters. Insufficient overexpression due to low CAI value of Dga2 sequence is possible,
however the respective metabolic step also appears to be non-rate-limiting, which contrasts
previous results in S. cerevisiae or Y. lipolytica. Cas9 expression using a homologous
truncated GDH promoter did not yield sufficient expression for gene editing, as confirmed by
western blot.

III Flocculation of the Microalgae Scenedesmus obtusiusculus __________________________________________________________________________
∼ 96 ∽
3 Flocculation of the Microalgae Scenedesmus
obtusiusculus
3.1 Introduction
3.1.1 Algae as Biological Feedstock
Microalgae are a potential sustainable feedstock with application in the food, biofuel and
cosmetic industry[184]. Algae biomass does not compete with food production and is distinct
from terrestrial plant biomass by high areal productivity and space time yields[185]. While
biomass production in open and closed bioreactors systems are becoming increasingly
efficient, harvest and downstream processing of algae biomass remains a major challenge in
industrial process development. At present, harvesting accounts for up to 30% of the total
production cost[186]. The challenge of algae biomass harvesting mainly results from small cell
size, colloidal stability and low biomass concentrations. As a result, a number of different
solutions have been suggested to address this issue[187] including centrifugation[188], [189],
filtration[190], flotation[191], [192] and different methodologies of flocculation by employing
physical[193], chemical[194], or biological[195] means. Flocculation-sedimentation is regarded
as very efficient, however the process conditions strongly depend on the selected algae strain,
the specific flocculant, media composition, culture age and cell density. Due to the large
number of possible flocculation agents and numerous factors affecting this process step, the
application of the Design-of-Experiments (DoE) methodology is a suitable tool for obtaining an
accurate description of optimal harvesting conditions[196]. As algae harvesting significantly
adds to the total production cost of algal biomass[187], the development of effective and robust
flocculation processes is key to developing economically viable industrial processes[197]–
[199].
3.1.2 Algae Harvest
The entire process of separating biomass from algae itself can be divided into three, often not
entirely distinct, steps[200]: thickening, dewatering and drying. In culture, biomass
concentration of algal culture is between 0.1 to 1% w/v, which is raised to approximately 5%
w/v by thickening. Dewatering is used to further decrease the water content to a dry biomass
concentration of 20%. At this point, microalgal biomass exists in the form of a sludge. The
employed methods for the first two steps are laid out in section 3.3 and are herein referred to
as algae harvest in the strict sense. Some subsequent processing steps, such as lipid
extraction, require even further lowering of water content. This treatment, colloquially known
as drying, is in most cases highly energy intensive and often lacks economic feasibility when
low-value products are generated[201]. Hence, current research also focuses on the possibility

III Flocculation of the Microalgae Scenedesmus obtusiusculus __________________________________________________________________________
∼ 97 ∽
of wet extraction[202]. In summary, no universally applicable, robust and cost efficient process
for harvest of different algae strains has been found so far[186].
3.1.2.1 Physical Methods
Centrifugation is a very robust process step, which is in principal applicable to all microalgae.
It is very fast in comparison with other methods and highly effective. However, with decreasing
size of cells, the required g-forces rise significantly and in turn, so does the demand for energy.
Further, cleaning, maintenance and repair of centrifuges are costly and labor-intensive[187].
Hence, this method is only applicable and economically feasible for very high-value products,
such as pharmaceuticals or food supplements. Nevertheless, optimization approaches of
centrifuge and impeller design are in development and can lead to a significant decrease in
energy demand[203].
Filtration is a suitable method for harvest of large microalgae such as Spirulina sp., a
cyanobacteria. Smaller microalgae such as S. obtusiusculus demand smaller pore sizes and
in turn higher energy demand[204]. Further, filtration membranes are prone to biofouling and
clogging, which raises labor-intensity of this process step[205], [206]. Some disadvantages are
partly offset by the high number of available filters for specialized applications.
Air flotation or dissolved air flotation enable harvest by passing air through algae culture
medium. This causes algal cells to adhere to the introduced gas bubbles and rise to the
surface, where they are typically harvested by a skimmer. This can also be done in combination
with chemical supplementation (suspended air flotation).
Gravity based sedimentation is one of the simplest methods at potentially low cost. However,
depending on the size of the algae[207] and the density of the medium, settling can take very
long, even to the point of biomass degradation. Additionally, the resulting concentrated algal
slurry is of low stability as suspension, as the negative surface charge still causes cells to repel
each other.
3.1.3 Flocculation of Microalgae
Suspensions in general are stabilized either by steric properties and/or by a surface charge of
their suspended particles. For the latter, flocculation is often a promising strategy to break the
suspension. Indeed, with increasing strength of surface charge, flocculation efficiency
commonly increases[208]. In an optimal case, the respective flocculation agent is cheap,
readily available, non-toxic and bio-degradable, requires low dosing and does not interfere with
downstream processes. In waste water treatment, flocculation is a well-established method for
liquid-solid separation[208] and much of the work done with algae builds on those commercial
products.

III Flocculation of the Microalgae Scenedesmus obtusiusculus __________________________________________________________________________
∼ 98 ∽
Flocculation of algae can be induced by overcoming the negative algal surface charge[209].
Different mechanistic approaches are suggested for this: The entire surface charge can be
neutralized, especially by changing the pH. A variation of this is the electrostatic patch
mechanism, in which only certain areas on the cell surface are neutralized or modified, which
leads to agglomeration of cells at patches with complementary patch charges. Flocs can be
formed by bridging of multiple cells, which in turn start to “collect” further algae. This
mechanism is commonly called sweeping flocculation.
Iron or aluminium salts are very common, cheaply available flocculation agents. However, high
loadings are typically required for the induction of flocculation and downstream processing and
media recycling are problematic with high concentrations of metal ions[187]. Specifically in S.
obtusiusculus, aluminium salts have been shown to inhibit phosphate availability in the
cell[210].
Synthetic polymers are another class of flocculants with common application in waste water
treatment. They are highly stable and capture particles or algae by bridging or sweeping
flocculation. The high stability can become a disadvantage as many of the polymers, such as
polyacrylamide, are not biodegradable.
Acidic flocculation of microalgae can be induced, as the surface of cells is typically controlled
by deprotonation of carboxylic groups. By decreasing pH to approximately 3, those groups,
and in turn for the most part the algae surface, become uncharged[209]. In contrast, lowering
the surface charge by raising the pH can lead to the attraction of cationic counter ions
(specifically Mg2+), which attach to the cell surface. Subsequently other cells attach to this now
positively charged surface[211].
Oxidants can also be used to modify the respective functional groups. Ozone, chlorine and
potassium permanganate have been used successfully used for flocculation[212], [213].
However, effects are dose- and strain dependent and often also entirely disrupt algae
spheroplasts[214].
Biological flocculants are cells, cell wall components or biologically derived products which can
be used for flocculation. Commonly, the mechanism of flocculation is the same as for synthetic
polymers as bio-derived flocculants are also cationic polymers, but lower dosages are
sometimes required[215]. Further, they are non-toxic, highly biodegradable and hence in
principal suitable for harvest and media recycling of microalgae.
Examples for this include chitosan, xanthan or tannin. Chitosan has been applied as
flocculation agent for over 40 years[216], however the high price has prevented its application
in larger scales. Xanthan has been used as flocculant in fresh water for harmful algae
III Flocculation of the Microalgae Scenedesmus obtusiusculus __________________________________________________________________________
∼ 99 ∽
blooms[215]. Very little work has been done to characterize tannin as flocculant, although it is
commercially available as de-emulsifier[217].
In addition, tannin was used in wastewater treatment[218] and flocculation of the
cyanobacterium Microcystis aeruginosa, where it was only effective at pH values under 7 and
9 respectively, depending on method of preparation. Flocculation efficiencies (FE) of over 90%
were reached. Polysepar CFL 25 was previously used as flocculant for Scenedesmus
acuminatus cultivated in fresh water with 70% FE at 70 mg/l[219]. Another tannin-based
product, Tanfloc, was used at a concentration of 5 mg/l to harvest Chlorella vulgaris at 250
mg/l dry biomass concentration.
This work focuses on microalgae harvest induced by a) alkaline pH shift and b) biological
flocculants with a focus on tannins. Both methods are in principle applicable for industrial
processes. A common challenge of biological flocculants lies in lack of robustness. This is
addressed in this work by employing tannin, which has previously gathered little attention as
flocculation agent.
3.1.4 Scenedesmus obtusiusculus
All experiments were conducted using Scenedesmus obtusiusculus A189, a green microalgae
species between 2 and 10 μm in size which grows in fresh as well as in salt water. The
respective strain A189 was isolated by Schultze et al.[220], who also optimized media
composition for high lipid and carbohydrate content without sacrificing for biomass productivity.
This optimized medium was limited in nitrogen and contained artificial sea salt. The high
practical and process relevance is given by the high similarity of this medium to brackish sea
water, which was demonstrated by the authors.
Nitrogen limitation verifiably affects composition of algae cell wall. Under nitrate starvation, the
content of total glucans of Scenedesmus obtusiusculus A189 increased from 22% (control) to
34% w/w. The β-glucan content rose from 16.0% (100% N, control) to 23.5% (30% N)[221]. In
another strain of the same species, nitrogen limitation also affected the otherwise fast
metabolic adaptation to irradiance changes for the worse. Whereas adaption to irradiance was
fast in non-limiting conditions, change of metabolic flux towards lipid accumulation was
comparatively slow[222].
Growth as colony on plates has been described especially with supply of organic
phosphate[223]. During sporulation phase, DNA content of cells transiently increases and a
shift in pigment spectrum was reported[224]. In general, lipid droplets, polyphosphate granules
and starch grains appear to serve as storage entities and vary in size and composition within
the night and day cycle in this species[225]. A characterization of biomass composition was
III Flocculation of the Microalgae Scenedesmus obtusiusculus __________________________________________________________________________
∼ 100 ∽
attempted by Toledo-Cervantes et al.[226], which did not yield fully plausible results. Again,
the fast growth of the species was nonetheless confirmed.
As previously mentioned, flocculation behavior is determined by surface charge and in turn
constituents of the cell wall. Little is known about cell wall composition of S. obtusiusculus.
Electron microscopy studies were previously published[227] and calcium deficiency has been
shown to impact on cell wall assembly[228].
3.1.4.1 Flocculation of S. obtusiusculus
Flocculation of other S. obtusiusculus strains in fresh water medium was previously described:
Flocculation with chitosan was optimized with response surface methodology (RSM), yielding
92% flocculation efficiency (FE) with 214 mg Chitosan/l culture[197]. In another approach with
optimized pH (7.5-8.5), chitosan dosage was lowered to 50 mg/l[229]. Further, full flocculation
was achieved using a combination of bacteria and iron salts with successful recycling of the
medium[230]. This idea of bioflocculation was further pursued by employing extracellular
biopolymers of Scenedesmus obliquus[231]. Aluminium salts were especially effective in the
absence of phosphate in the medium[232].
It was reported, that in comparison to biological flocculants, induction of autoflocculation by pH
shift is the most inexpensive method for flocculation-sedimentation[233]. The resulting medium
supernatant is in principle reusable, however this most likely only applies to low numbers of
recycling cycles for the medium. The issues of accumulation of salts and evolutionary pressure
leading to selection for algae with low surface potential are unsolved by this method. Calcium
hydroxide is reported to be the most cost efficient base for induction of flocculation[211]. In
another instance, basic pH shift to alkaline conditions was used successfully and yielded the
lowest cost in comparison to other flocculation methods[234]. Further, magnesium ions appear
to be necessary for induction of autoflocculation, which is consistent with the proposed
mechanism of trapping of ions between negatively charged algal surface.
It has been known for some time, that higher concentrations of microalgae require lower
loadings of flocculant per dry harvested biomass[235]. Thus, pre-flocculation cell density in the
culture as well as surface charge should be as high as possible[235]. In fresh water,
Scenedesmus sp. was also harvested by using cationic starch. This effect is pH
independent[236]. As mentioned above, induction of flocculation by low pH is possible for many
algae, including Scenedesmus sp.[237]. Flocculation efficiencies of over 90% were achieved
and interestingly, algae organic matter in the medium actually aided the harvesting process.
In a more exotic approach, sodium dodecyl sulfate (SDS) and cetyl trimethylammonium
bromide (CTAB) were used as flocculant, whereas only with the latter, sufficiently high Fes
were achieved. In this instance, flotation instead of sedimentation was used for liquid/solid

III Flocculation of the Microalgae Scenedesmus obtusiusculus __________________________________________________________________________
∼ 101 ∽
separation. Using electroflocculation, 98% FE was achieved by optimizing voltage and
electrode material[238]. Chitosan was also used in combination with iron chloride as ballasting
compound[239], which yielded better FEs than the polymer alone. Regarding flocculation in
salt water, Chitosan was also successfully applied[240]. However, the experiments did not
extend to any Scenedesmus sp. strain and, if tested, showed pH dependence of the respective
flocculant.
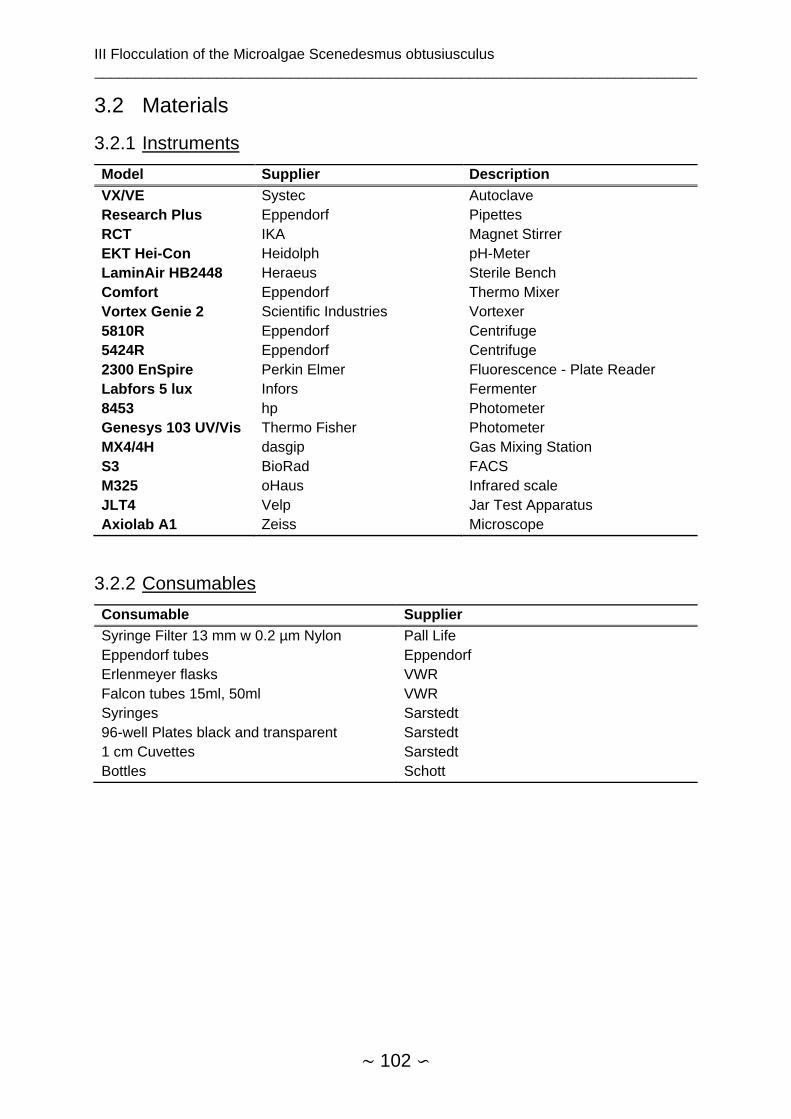
III Flocculation of the Microalgae Scenedesmus obtusiusculus __________________________________________________________________________
∼ 102 ∽
3.2 Materials
3.2.1 Instruments
Model Supplier Description
VX/VE Systec Autoclave
Research Plus Eppendorf Pipettes
RCT IKA Magnet Stirrer
EKT Hei-Con Heidolph pH-Meter
LaminAir HB2448 Heraeus Sterile Bench
Comfort Eppendorf Thermo Mixer
Vortex Genie 2 Scientific Industries Vortexer
5810R Eppendorf Centrifuge
5424R Eppendorf Centrifuge
2300 EnSpire Perkin Elmer Fluorescence - Plate Reader
Labfors 5 lux Infors Fermenter
8453 hp Photometer
Genesys 103 UV/Vis Thermo Fisher Photometer
MX4/4H dasgip Gas Mixing Station
S3 BioRad FACS
M325 oHaus Infrared scale
JLT4 Velp Jar Test Apparatus
Axiolab A1 Zeiss Microscope
3.2.2 Consumables
Consumable Supplier
Syringe Filter 13 mm w 0.2 µm Nylon Pall Life
Eppendorf tubes Eppendorf
Erlenmeyer flasks VWR
Falcon tubes 15ml, 50ml VWR
Syringes Sarstedt
96-well Plates black and transparent Sarstedt
1 cm Cuvettes Sarstedt
Bottles Schott
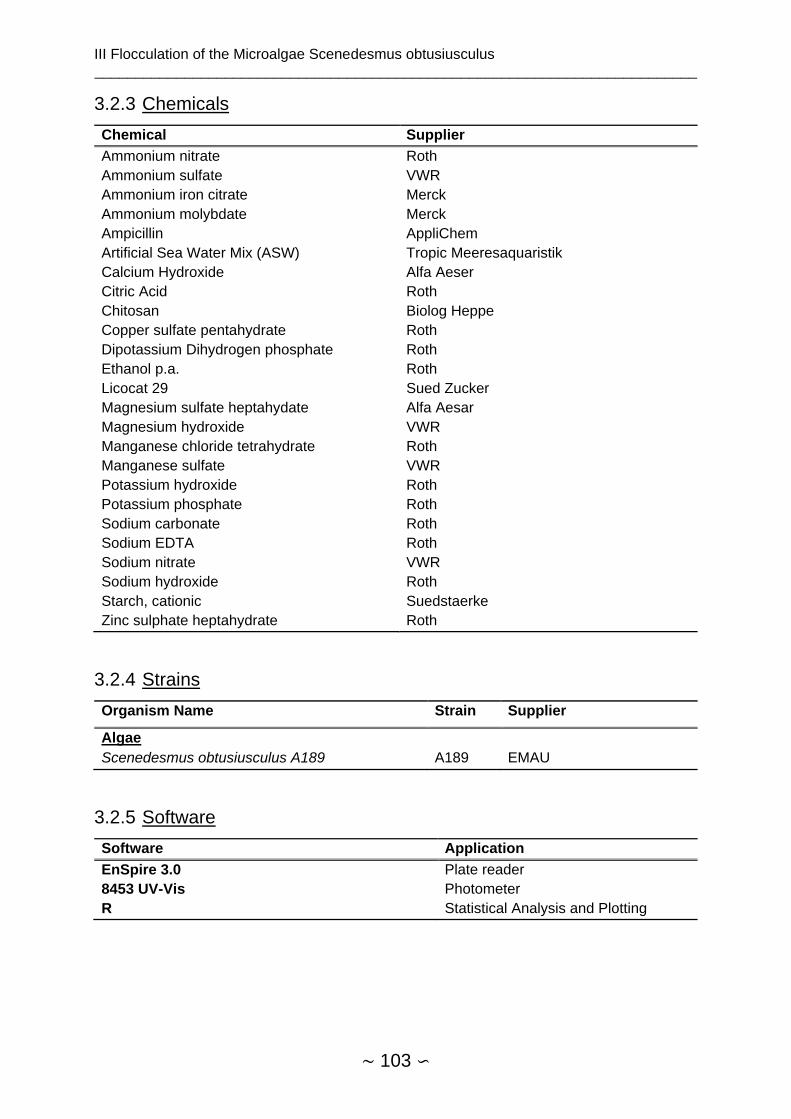
III Flocculation of the Microalgae Scenedesmus obtusiusculus __________________________________________________________________________
∼ 103 ∽
3.2.3 Chemicals
Chemical Supplier
Ammonium nitrate Roth
Ammonium sulfate VWR
Ammonium iron citrate Merck
Ammonium molybdate Merck
Ampicillin AppliChem
Artificial Sea Water Mix (ASW) Tropic Meeresaquaristik
Calcium Hydroxide Alfa Aeser
Citric Acid Roth
Chitosan Biolog Heppe
Copper sulfate pentahydrate Roth
Dipotassium Dihydrogen phosphate Roth
Ethanol p.a. Roth
Licocat 29 Sued Zucker
Magnesium sulfate heptahydate Alfa Aesar
Magnesium hydroxide VWR
Manganese chloride tetrahydrate Roth
Manganese sulfate VWR
Potassium hydroxide Roth
Potassium phosphate Roth
Sodium carbonate Roth
Sodium EDTA Roth
Sodium nitrate VWR
Sodium hydroxide Roth
Starch, cationic Suedstaerke
Zinc sulphate heptahydrate Roth
3.2.4 Strains
Organism Name Strain Supplier
Algae
Scenedesmus obtusiusculus A189 A189 EMAU
3.2.5 Software
Software Application
EnSpire 3.0 Plate reader
8453 UV-Vis Photometer
R Statistical Analysis and Plotting
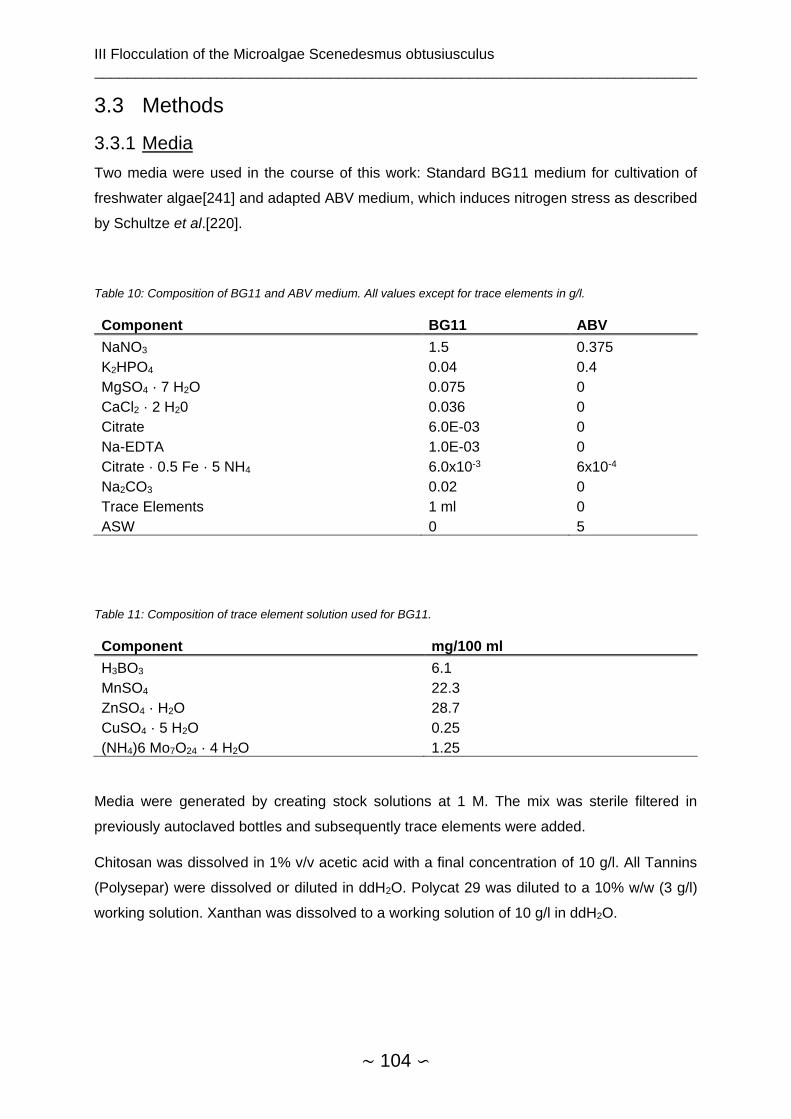
III Flocculation of the Microalgae Scenedesmus obtusiusculus __________________________________________________________________________
∼ 104 ∽
3.3 Methods
3.3.1 Media
Two media were used in the course of this work: Standard BG11 medium for cultivation of
freshwater algae[241] and adapted ABV medium, which induces nitrogen stress as described
by Schultze et al.[220].
Table 10: Composition of BG11 and ABV medium. All values except for trace elements in g/l.
Component BG11 ABV
NaNO3 1.5 0.375
K2HPO4 0.04 0.4
MgSO4 · 7 H2O 0.075 0
CaCl2 · 2 H20 0.036 0
Citrate 6.0E-03 0
Na-EDTA 1.0E-03 0
Citrate · 0.5 Fe · 5 NH4 6.0x10⁻³ 6x10⁻⁴
Na2CO3 0.02 0
Trace Elements 1 ml 0
ASW 0 5
Table 11: Composition of trace element solution used for BG11.
Component mg/100 ml
H3BO3 6.1
MnSO4 22.3
ZnSO4 · H2O 28.7
CuSO4 · 5 H2O 0.25
(NH4)6 Mo7O24 · 4 H2O 1.25
Media were generated by creating stock solutions at 1 M. The mix was sterile filtered in
previously autoclaved bottles and subsequently trace elements were added.
Chitosan was dissolved in 1% v/v acetic acid with a final concentration of 10 g/l. All Tannins
(Polysepar) were dissolved or diluted in ddH2O. Polycat 29 was diluted to a 10% w/w (3 g/l)
working solution. Xanthan was dissolved to a working solution of 10 g/l in ddH2O.

III Flocculation of the Microalgae Scenedesmus obtusiusculus __________________________________________________________________________
∼ 105 ∽
3.3.2 Algae Cultivation and Growth
Proliferation of microorganism occurs by cell division and is therefore inherently exponential in
absence of limitations in terms of e.g. nutrient availability, nutrient assimilation or any other
required elements such as reducing agents or, in the case of photosynthetic microbes,
electromagnetic radiation in the visible spectrum[242].
Nutrient requirements of microalgae extend to nitrate required for any amino acids and hence
protein biosynthesis and phosphate as energy carrier in the form of ATP. Further, metal ions
including copper, calcium, iron, magnesium and potassium are required for e.g. electron
transduction elements, pigments, and protein cofactors.
Limited by environmental restrictions, exponential growth only occurs under ideal, non-limited
conditions. In real cultures, inoculation of media with microorganism is typically followed by a
lag phase, during which adaption of cells to the new environment takes place. After a certain
amount of time, given unlimited conditions, the maximum growth rate μ is achieved (Figure
30), which is followed by a depletion of resources or decreasing capability for assimilation due
to high cell density. For algae, light limitation is at this point commonly limiting growth, as cells
increasingly shade each other. Linear growth is then followed by a stationary phase, after
which cell death occurs[243].
Figure 30: Typical parameters derived from growth curves: length of lag phase λ, growth rate represented by the maximum slope μ and the maximum cell growth A. Image adapted by Kahm et al.[122].

III Flocculation of the Microalgae Scenedesmus obtusiusculus __________________________________________________________________________
∼ 106 ∽
3.3.2.1 Growth Curves and Modeling
Growth curves can be modeled in different ways. A common way is the determination of a
timeframe, in which a logarithmic relationship can be observed between time and cell count,
OD or biomass at the respective time points. This is commonly done for low numbers of
measurement points. However, the method is flawed, as the determination which time points
are included in the fit is often made on a subjective basis and linear regression over a subset
of data points is not an optimal use of measured data. A better possibility is the fit of a sigmoidal
growth curve to the data[244].
There are a number of different formulas applicable for microbiological growth, but the goal is
always extraction of key parameters, as shown in Figure 30. Growth curves differ in the number
of estimated parameters, most of which resemble a biological function. In detail, maximum
achieved cell density A, maximum growth rate μmax and lag phase duration λ are estimated.
Formulae of employed growth curves are shown in Supplemental 13.
It was previously shown, that a Gompertz model is suitable for most applications[244]. For
higher numbers of data points, modified Gompertz or Richards fits can be used, as the higher
number of data points offsets the increased degrees of freedom required for the estimation of
the higher number of parameters by the model. In general, 3 parameter models are preferred
as they are simpler, more easy to interpret, and more stable due to lower autocorrelation[244].
3.3.2.2 Aerated Flasks
Precultivation was done in 2 l or 5 l Schott bottles aerated with approximately 1 l/min air, which
was supplemented with 2% v/v CO2 (Figure 31). The pH was initially set, but not controlled
during cultivation. Flocculation was done after 14 days of cultivation or reaching OD680 of 1.6.
Media were ABV or BG11 as described in section 3.3.1. Irradiation was continuous using
fluorescent tubes at approximately 50 µmol photons m-2s-1. Inoculation was done to an OD680
of 0.25.
3.3.2.3 Bubble Column Reactor
Construction and maintenance of the bubble column reactor was done by Matthias Glemser.
Algae were cultivated in an aerated 30 l bubble column reactor under a constant stream of air
at 275 l/min (Figure 31). A Milwaukee MC122 pH sensor was used to stabilize the pH at 8 by
controlling CO2 injections into the air stream. Culture growth and conditions were monitored
using OD680and microscopy. Temperature was at 28±2°C and cultures were continuously
irradiated with fluorescent tubes at approximately 240 µMol photons m-2s-1. Cultures were
grown for 21 days to a concentration of OD680=1.4-1.6, as given in the results section.
Inoculation cell density was OD680=0.25.

III Flocculation of the Microalgae Scenedesmus obtusiusculus __________________________________________________________________________
∼ 107 ∽
3.3.2.4 3 l Fermentation (Infors reactor)
3 l ABV medium were sterile filtered and added to the reactor and cultures were inoculated to
an OD680 of 0.1-0.2. Regulation of pH to 8 was done by CO2 injections into the culture, similarly
to cultivation in the bubble column. Air stream was set at 1 l/l culture/h and stirrer was at 400
rpm. Irradiation was set at 10%, approximately 74 µMol photons m-2s-1 (Figure 31).
Figure 31: Experimental setup for S. obtusiusculus cultivation in aerated flask (A), bubble column reactor (B) and Infors reactor (C).
3.3.3 Absorbance Measurement (OD)
The main analytical tool for flocculation is measurement of absorbance, often termed optical
density or short OD. Absorbance is a unit free estimate of the absorption, reflection and
scattering in a sample. Mathematically, it is the decadic logarithm of the ratio of incident to
transmitted radiant power through a material. Commonly for DNA measurements, UV light
between 200 and 320 nm is used for sample analysis. For microbiological measurements,
wavelengths between 580 and 720 nm are used. Wavelengths, time points and photometers
were varied for this work. Commonly for flocculation, OD at 680 nm (OD680) was measured.
OD measurement itself was done in a Genesys 103 UV-Vis by Thermo-Fisher using 1 cm
cuvettes. The linear range was determined to be between OD600 0 to 0.5. After measurement,
dilution factors were then applied to receive the actual OD value. All measurements were done
at room temperature, between 24-28°C. Mixing of samples immediately before measurement
is key to receive a representative value for uniformly distributed algae.
The method was adapted for use in 96-well plates by using an Enspire 2 plate reader by Perkin
Elmer. For this, a 96-well plate was filled with 200 μl of flocculation sample. The plate was
III Flocculation of the Microalgae Scenedesmus obtusiusculus __________________________________________________________________________
∼ 108 ∽
shaken inside the reader for five seconds at 300 rpm (linear) and subsequently OD at 680 nm
was measured for every well as triplicate. Results were compared to the measurements
obtained by the genesis photometer in section 3.4.1.3.
3.3.4 Biomass Determination
The main assumption of measuring the optical density is, that obtained values correlate with
the amount of biomass or the number of cells in the culture. This was addressed by a
OD/Biomass correlation as shown in section 3.4.1.2.
For the calibration curve, biomass concentration was determined by centrifuging 50 ml of
culture cells at 10’000 rcf for five minutes, washed once with bi-destilled water and dried to
constant weight in an Ohause M325 infrared scale. Previously, the number of washes was
varied to estimate the effect of salt on dry biomass estimation.
3.3.5 Flocculation Procedure
150 ml algae suspension were poured in a 250 ml beaker, which in turn was placed in a VELP
Scientifica JLT4 jar test apparatus. The rotation was set to 300 rpm for 3 minutes using 3.5 cm
x 2.5 cm paddle stirrers. Immediately after stirring started, flocculant was added in different
concentrations from stock solutions as described in 3.3.1. Settling times were varied, samples
were always taken 2 cm below the surface. This was estimated by using markings on the
pipette tip. Samples were measured as described in section 3.4.1.3. After measurement of
absorbance, flocculation efficiency (FE) was calculated according to FE=1 - (ODf - ODi)
whereas ODf is OD of supernatant after flocculation and ODi is the initial OD of the culture.
For evaluation of the 15 ml and 50 ml formats, falcons were filled with the respective amount
of algae culture, pH was set between 10 to 12 to induce autoflocculation and vortexed for 30
seconds. FE was measured in the same way as for the jar test procedure after 1 hour of
sedimentation.
3.3.6 Measurement of Compression
Upon completion of all OD measurements, 100 ml of flocculated algae culture was stirred and
decanted into a graded settling cone. Volume of algal biomass after flocculation was read after
30 minutes of sedimentation. Compression factor was calculated according to CF=SVf/SVi
whereas SVf is the sediment volume of algae biomass after flocculation and SVi is the initial
volume of the culture (=100 ml). Compression factor CF multiplied with flocculation efficiency
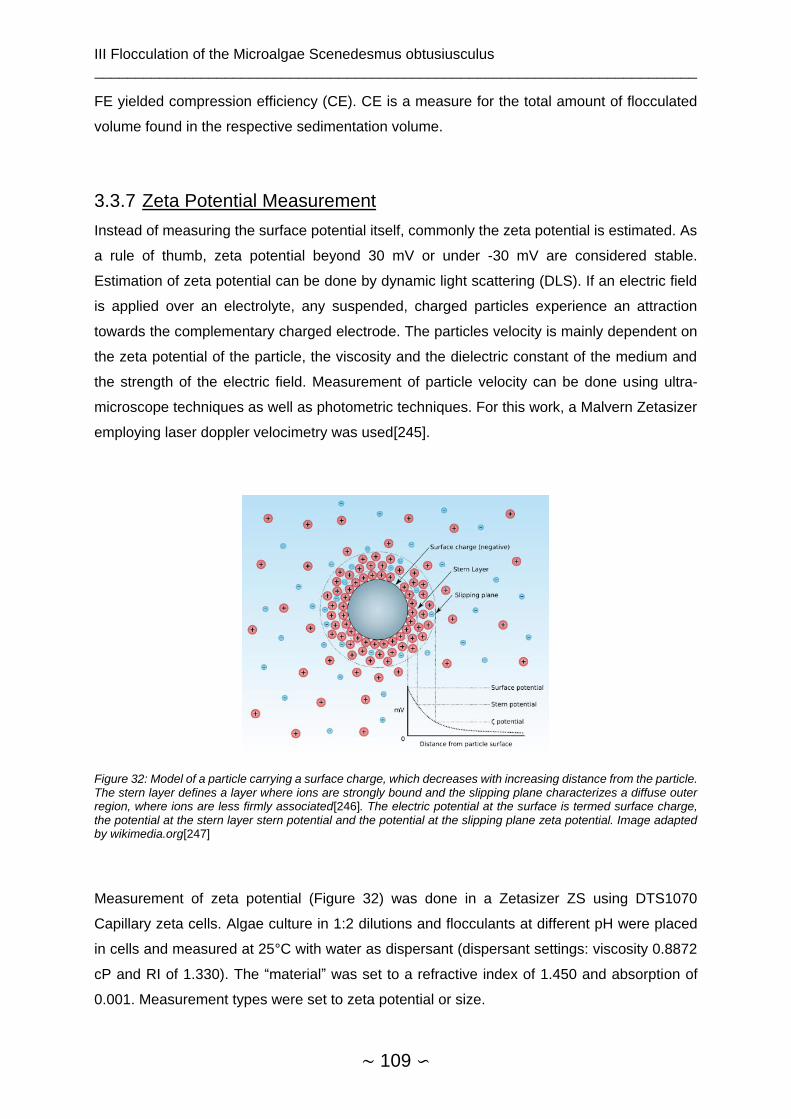
III Flocculation of the Microalgae Scenedesmus obtusiusculus __________________________________________________________________________
∼ 109 ∽
FE yielded compression efficiency (CE). CE is a measure for the total amount of flocculated
volume found in the respective sedimentation volume.
3.3.7 Zeta Potential Measurement
Instead of measuring the surface potential itself, commonly the zeta potential is estimated. As
a rule of thumb, zeta potential beyond 30 mV or under -30 mV are considered stable.
Estimation of zeta potential can be done by dynamic light scattering (DLS). If an electric field
is applied over an electrolyte, any suspended, charged particles experience an attraction
towards the complementary charged electrode. The particles velocity is mainly dependent on
the zeta potential of the particle, the viscosity and the dielectric constant of the medium and
the strength of the electric field. Measurement of particle velocity can be done using ultra-
microscope techniques as well as photometric techniques. For this work, a Malvern Zetasizer
employing laser doppler velocimetry was used[245].
Figure 32: Model of a particle carrying a surface charge, which decreases with increasing distance from the particle. The stern layer defines a layer where ions are strongly bound and the slipping plane characterizes a diffuse outer region, where ions are less firmly associated[246]. The electric potential at the surface is termed surface charge, the potential at the stern layer stern potential and the potential at the slipping plane zeta potential. Image adapted by wikimedia.org[247]
Measurement of zeta potential (Figure 32) was done in a Zetasizer ZS using DTS1070
Capillary zeta cells. Algae culture in 1:2 dilutions and flocculants at different pH were placed
in cells and measured at 25°C with water as dispersant (dispersant settings: viscosity 0.8872
cP and RI of 1.330). The “material” was set to a refractive index of 1.450 and absorption of
0.001. Measurement types were set to zeta potential or size.

III Flocculation of the Microalgae Scenedesmus obtusiusculus __________________________________________________________________________
∼ 110 ∽
3.3.8 Statistical Analyses
3.3.8.1 Simplex Lattice Design
A mixture design, specifically a simplex lattice design was used to estimate the effect of tannin,
chitosan and water on flocculation efficiency (Section 3.3.5). Analysis was conducted as
described by Natrella[248]. Following the Scheffé polynomial design[249] the respective
regression model omits the intercept and includes all main linear and cross term effects, but
no square or other higher order effects. These adjustments are made because this type of
mixture model is restricted in that all factors sum up to a constant. Culture for the respective
experiment was at OD680=3.6 and at t=113 h. Cultivation was done in an infors fermenter
(Section 3.3.2.4). For flocculation procedure, pH was set to 7, flocculant was added and
samples were stirred at 300 rpm for 5 minutes. Flocculation efficiency (FE) was measured after
30 minutes.
Table 12: Coded and raw measurement levels of 23 mixture simplex lattice design using different mixtures of tannin, chitosan and ddH2O as well as run- and experiment order.
Run Tannin Chitosan ddH2O Tannin Chitosan ddH2O
Order Number coded coded coded mg/l mg/ml ml
9 1 0.33 0 0.66 40 0 20
6 2 0 0 1 0 0 30
7 3 0.66 0.33 0 80 10 0
4 4 0.33 0.66 0 40 20 0
8 5 0.33 0.33 0.33 40 10 10
1 6 0 0.33 0.66 0 10 20
5 7 0 1 0 0 30 0
10 8 1 0 0 120 0 0
3 9 0.66 0 0.33 80 0 10
2 10 0 0.66 0.33 0 20 10
3.3.8.2 Growth Phase Dependency of Flocculation
S. obtusiusculus A189 was cultivated in ABV medium as described in Section 3.3.8.2. Varied
factors were time, adjusted pH, flocculation agent and flocculant concentration (Supplemental
36) according to a full factorial 23 design with four total replications at each respective time
point. Flocculation agents tannin (Polysepar CFL-PT) and chitosan (Heppe A90/400/A1) were
tested at 40 and 80 mg/l culture respectively. The pH was set to either pH 8 or 9. At time points
t=120, 145, 170, 195 and 220 hours, flocculation procedure as described in section 3.3.5 was
conducted. Moreover, at each time point, zeta potential was measured according to section
3.3.7 and bacterial populations were estimated by FACS. Additionally, at time points t=170 and
220 h, replicates of the 23 full factorial design of the respective time point with cells in medium
without algae organic matter (AOM) were conducted. For this, cells were centrifuged at 14.4 g
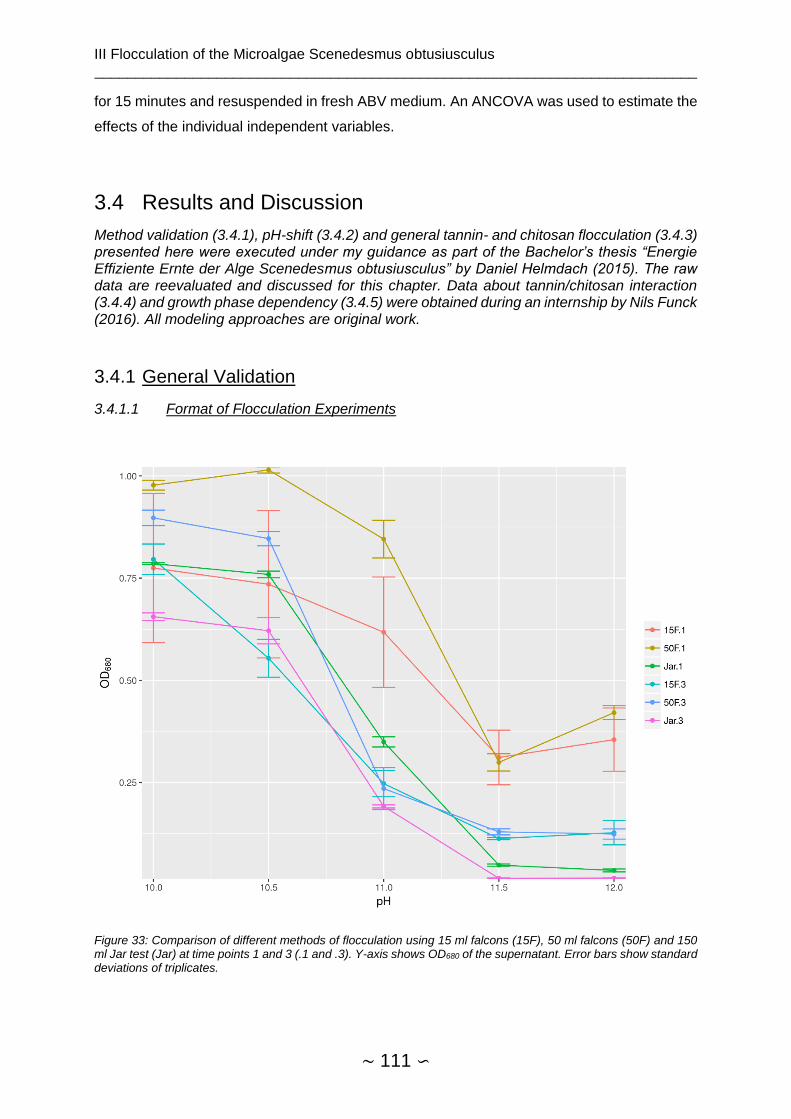
III Flocculation of the Microalgae Scenedesmus obtusiusculus __________________________________________________________________________
∼ 111 ∽
for 15 minutes and resuspended in fresh ABV medium. An ANCOVA was used to estimate the
effects of the individual independent variables.
3.4 Results and Discussion
Method validation (3.4.1), pH-shift (3.4.2) and general tannin- and chitosan flocculation (3.4.3) presented here were executed under my guidance as part of the Bachelor’s thesis “Energie Effiziente Ernte der Alge Scenedesmus obtusiusculus” by Daniel Helmdach (2015). The raw data are reevaluated and discussed for this chapter. Data about tannin/chitosan interaction (3.4.4) and growth phase dependency (3.4.5) were obtained during an internship by Nils Funck (2016). All modeling approaches are original work.
3.4.1 General Validation
3.4.1.1 Format of Flocculation Experiments
Figure 33: Comparison of different methods of flocculation using 15 ml falcons (15F), 50 ml falcons (50F) and 150 ml Jar test (Jar) at time points 1 and 3 (.1 and .3). Y-axis shows OD680 of the supernatant. Error bars show standard deviations of triplicates.

III Flocculation of the Microalgae Scenedesmus obtusiusculus __________________________________________________________________________
∼ 112 ∽
Autoflocculation was induced by supplementation of algal medium with NaOH. After adjusting
pH, OD680 of the supernatant was measured at different time points. Flocculation using 15 ml
falcons showed a relative standard deviation (RSD) of 23% after 1 hour and 10% after three
hours. RSD of 50 ml falcon were 4% after 1 hour and 8% after 3 hours and for the jar test 4%
after 1 hour and 4% after 3 hours respectively. Hence, estimation of flocculation efficiency
using 15 ml falcons was considered too unreliable for application. A comparison of all
flocculation methods is shown in Figure 33. RSD of 50 ml falcons were acceptable, however
independent of sedimentation time, quantitative harvest was not achieved. In summary, 50 ml
falcons might be suitable for high throughput estimation of flocculating activity, however for
modeling, only a standard jar test gives sufficiently accurate results. Hence, all subsequent
experiments were conducted using the jar test procedure as described in section 3.3.5.
3.4.1.2 OD-Biomass Correlation
First, the effect of salt and soluble organic matter in the medium on the estimation of dry algal
biomass was assessed (Table 13). As expected, omitting the washing step leads to
overestimation of dry biomass concentration in the medium. However, already a single
washing step is sufficient for removal of most non-cellular biomass and subsequent washing
does not yield significantly lower biomass concentrations.
Table 13: Evaluation of the effect of salt and soluble organic matter on estimation of dry biomass
ddH2O Washing Step Dry Biomass / g/10 ml culture
0 6.2
1 0.8
2 0.76
3 0.78
4 0.79
Correlation of OD680 to algal biomass was highly significant (Figure 34) with an R2 of 0.994.
This applies to S. obtusiusculus grown in ABV medium and was used as standard to estimate
biomass concentration from OD680 values obtained by flocculation experiments.

III Flocculation of the Microalgae Scenedesmus obtusiusculus __________________________________________________________________________
∼ 113 ∽
Figure 34: OD680 / Biomass correlation for S. obtusiusculus. Samples were washed once before determination of dry biomass. Regression formula is DBM/g/l=0.0028+0.418*OD680 with an R2 of 0.994.
3.4.1.3 OD680 Measurement in 96-microwell plate
Time did not have an effect on OD680 of algal suspension measured inside a 96-well plate
(Supplemental 37) and spatial distribution was uniform inside the well (Supplemental 38).
Additional shaking between measurements did not yield a more constant OD680 value over
time (Supplemental 39). More precisely, shaking resulted in decreasing concentrations over
time, which was attributed to possible adhering of algae cells to the wall of the 96-well plate.
Consequently, all subsequent protocols only included one initial shaking step at 300 rpm
(linear). With reliable constant behavior OD measurements of algal cultures in a 96-well format
regarding time and space, a linear measurement spectrum in terms of algae concentration was
defined.
For this, an algal suspension at 0.72 g/l, corresponding to an OD680 of 1.6 in a Genesys cuvette
photometer and an OD680 of 0.5 for the plate reader was prepared as serial dilution.
Measurement of the dilutions showed the much broader linear area of OD680 measurements
for the plate reader compared to the cuvette based photometer (Figure 35). Furthermore, the
higher quality of estimations is reflected in the R2 values of the fits. For the photometer,
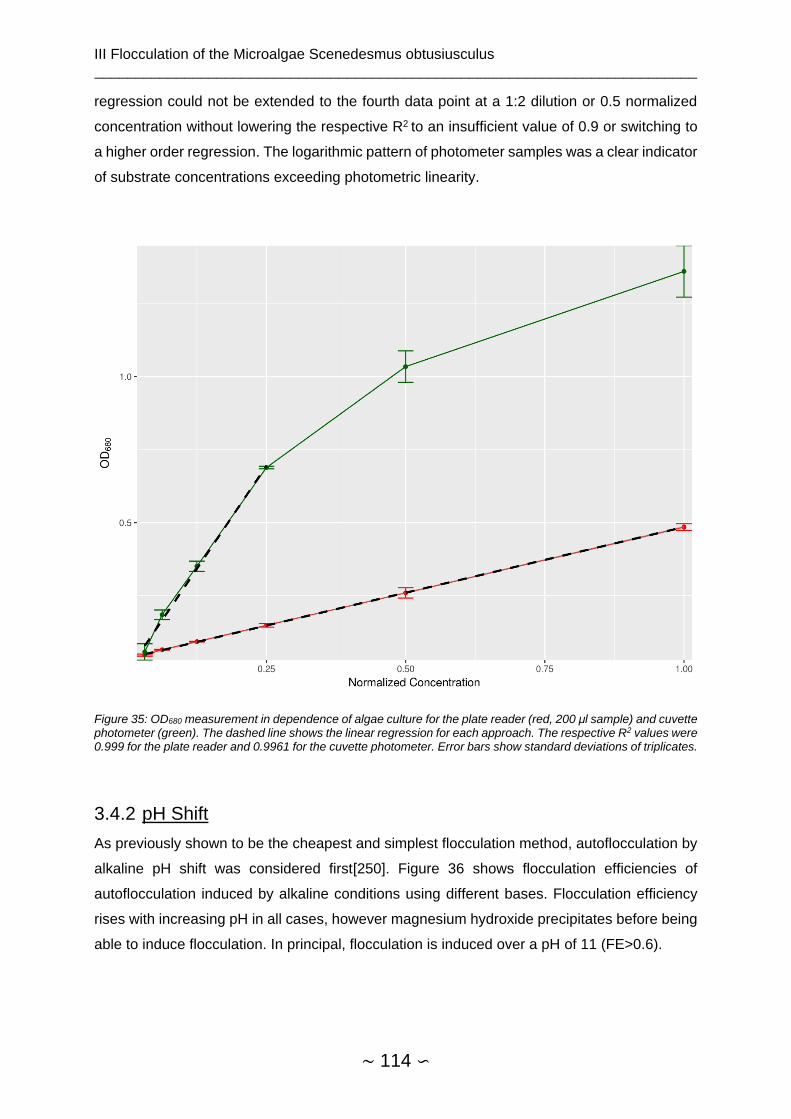
III Flocculation of the Microalgae Scenedesmus obtusiusculus __________________________________________________________________________
∼ 114 ∽
regression could not be extended to the fourth data point at a 1:2 dilution or 0.5 normalized
concentration without lowering the respective R2 to an insufficient value of 0.9 or switching to
a higher order regression. The logarithmic pattern of photometer samples was a clear indicator
of substrate concentrations exceeding photometric linearity.
Figure 35: OD680 measurement in dependence of algae culture for the plate reader (red, 200 μl sample) and cuvette photometer (green). The dashed line shows the linear regression for each approach. The respective R2 values were 0.999 for the plate reader and 0.9961 for the cuvette photometer. Error bars show standard deviations of triplicates.
3.4.2 pH Shift
As previously shown to be the cheapest and simplest flocculation method, autoflocculation by
alkaline pH shift was considered first[250]. Figure 36 shows flocculation efficiencies of
autoflocculation induced by alkaline conditions using different bases. Flocculation efficiency
rises with increasing pH in all cases, however magnesium hydroxide precipitates before being
able to induce flocculation. In principal, flocculation is induced over a pH of 11 (FE>0.6).
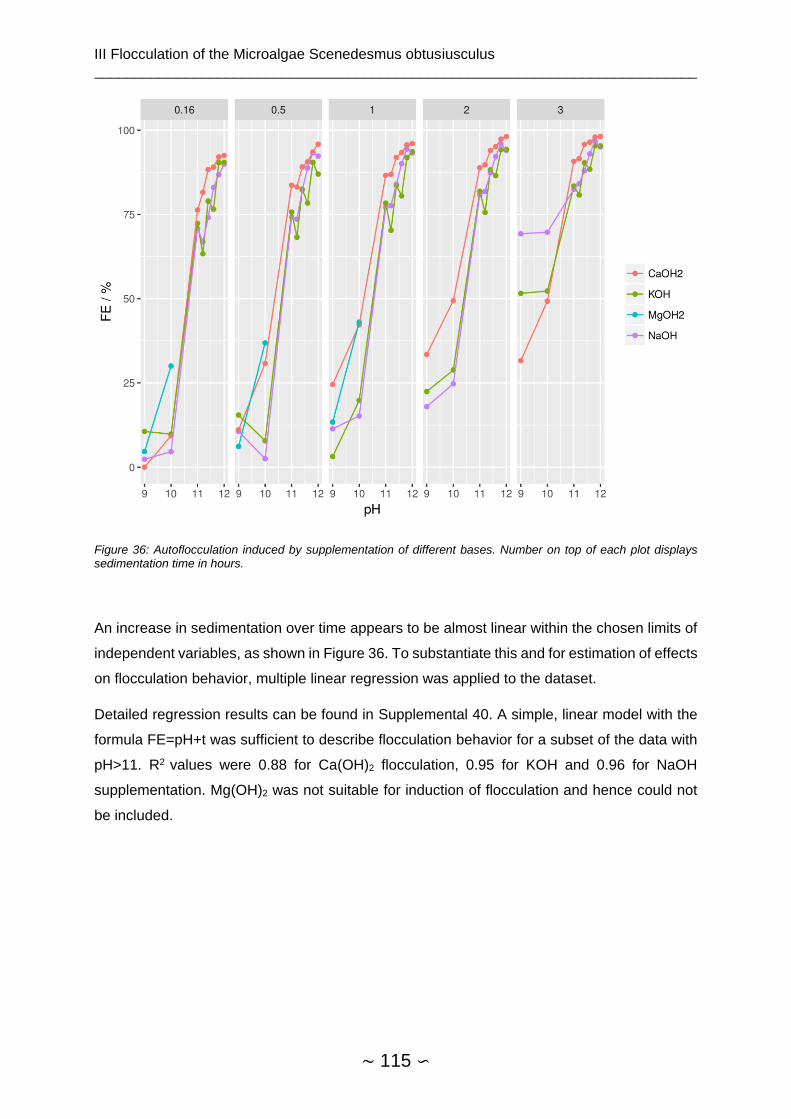
III Flocculation of the Microalgae Scenedesmus obtusiusculus __________________________________________________________________________
∼ 115 ∽
Figure 36: Autoflocculation induced by supplementation of different bases. Number on top of each plot displays sedimentation time in hours.
An increase in sedimentation over time appears to be almost linear within the chosen limits of
independent variables, as shown in Figure 36. To substantiate this and for estimation of effects
on flocculation behavior, multiple linear regression was applied to the dataset.
Detailed regression results can be found in Supplemental 40. A simple, linear model with the
formula FE=pH+t was sufficient to describe flocculation behavior for a subset of the data with
pH>11. R2 values were 0.88 for Ca(OH)2 flocculation, 0.95 for KOH and 0.96 for NaOH
supplementation. Mg(OH)2 was not suitable for induction of flocculation and hence could not
be included.
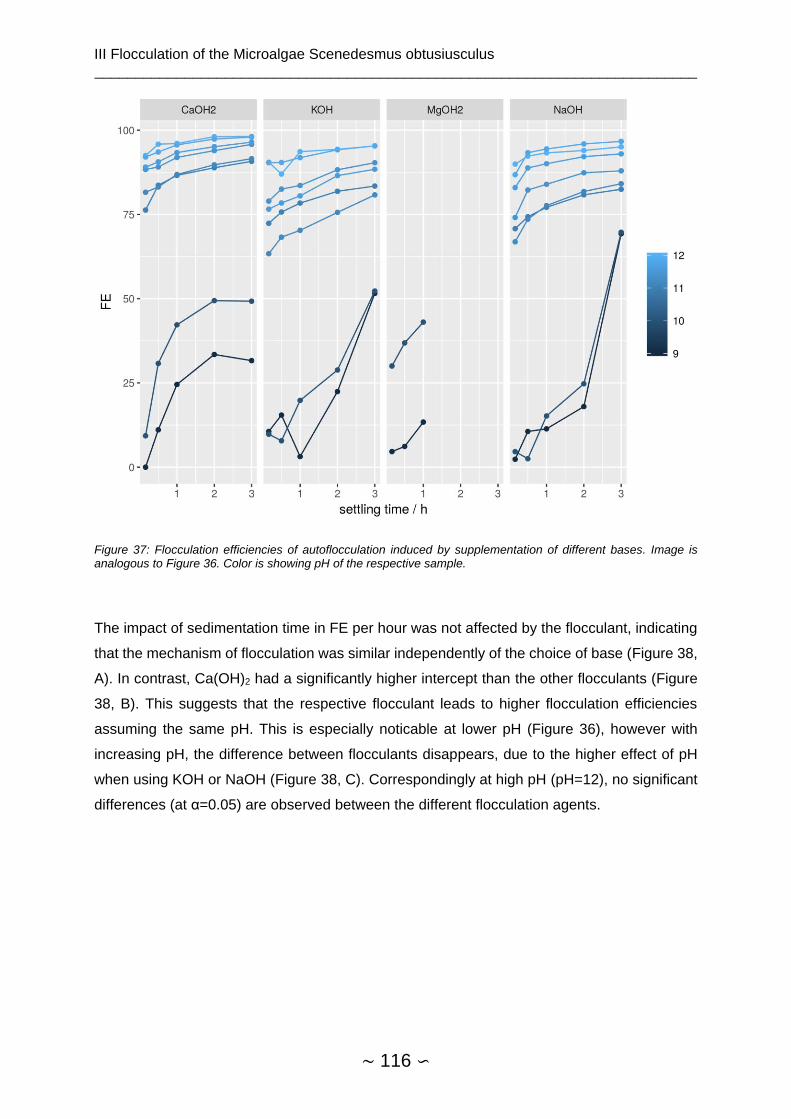
III Flocculation of the Microalgae Scenedesmus obtusiusculus __________________________________________________________________________
∼ 116 ∽
Figure 37: Flocculation efficiencies of autoflocculation induced by supplementation of different bases. Image is analogous to Figure 36. Color is showing pH of the respective sample.
The impact of sedimentation time in FE per hour was not affected by the flocculant, indicating
that the mechanism of flocculation was similar independently of the choice of base (Figure 38,
A). In contrast, Ca(OH)2 had a significantly higher intercept than the other flocculants (Figure
38, B). This suggests that the respective flocculant leads to higher flocculation efficiencies
assuming the same pH. This is especially noticable at lower pH (Figure 36), however with
increasing pH, the difference between flocculants disappears, due to the higher effect of pH
when using KOH or NaOH (Figure 38, C). Correspondingly at high pH (pH=12), no significant
differences (at α=0.05) are observed between the different flocculation agents.
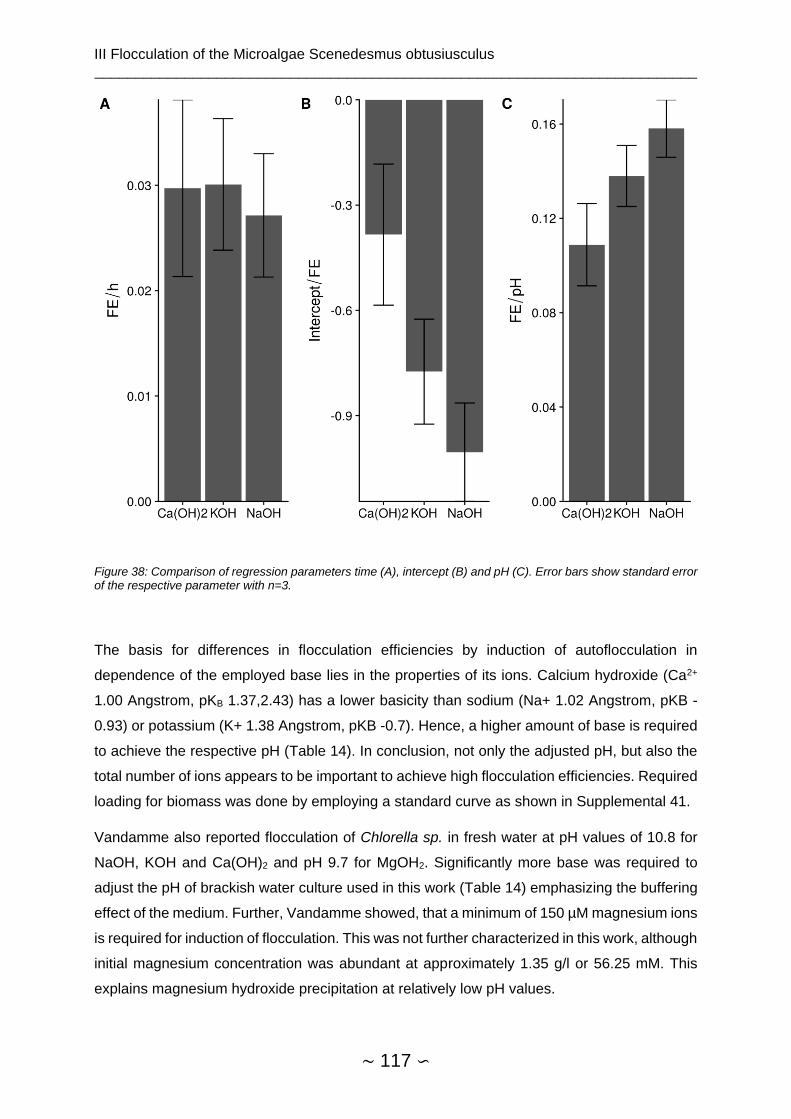
III Flocculation of the Microalgae Scenedesmus obtusiusculus __________________________________________________________________________
∼ 117 ∽
Figure 38: Comparison of regression parameters time (A), intercept (B) and pH (C). Error bars show standard error of the respective parameter with n=3.
The basis for differences in flocculation efficiencies by induction of autoflocculation in
dependence of the employed base lies in the properties of its ions. Calcium hydroxide (Ca2+
1.00 Angstrom, pKB 1.37,2.43) has a lower basicity than sodium (Na+ 1.02 Angstrom, pKB -
0.93) or potassium (K+ 1.38 Angstrom, pKB -0.7). Hence, a higher amount of base is required
to achieve the respective pH (Table 14). In conclusion, not only the adjusted pH, but also the
total number of ions appears to be important to achieve high flocculation efficiencies. Required
loading for biomass was done by employing a standard curve as shown in Supplemental 41.
Vandamme also reported flocculation of Chlorella sp. in fresh water at pH values of 10.8 for
NaOH, KOH and Ca(OH)2 and pH 9.7 for MgOH2. Significantly more base was required to
adjust the pH of brackish water culture used in this work (Table 14) emphasizing the buffering
effect of the medium. Further, Vandamme showed, that a minimum of 150 µM magnesium ions
is required for induction of flocculation. This was not further characterized in this work, although
initial magnesium concentration was abundant at approximately 1.35 g/l or 56.25 mM. This
explains magnesium hydroxide precipitation at relatively low pH values.
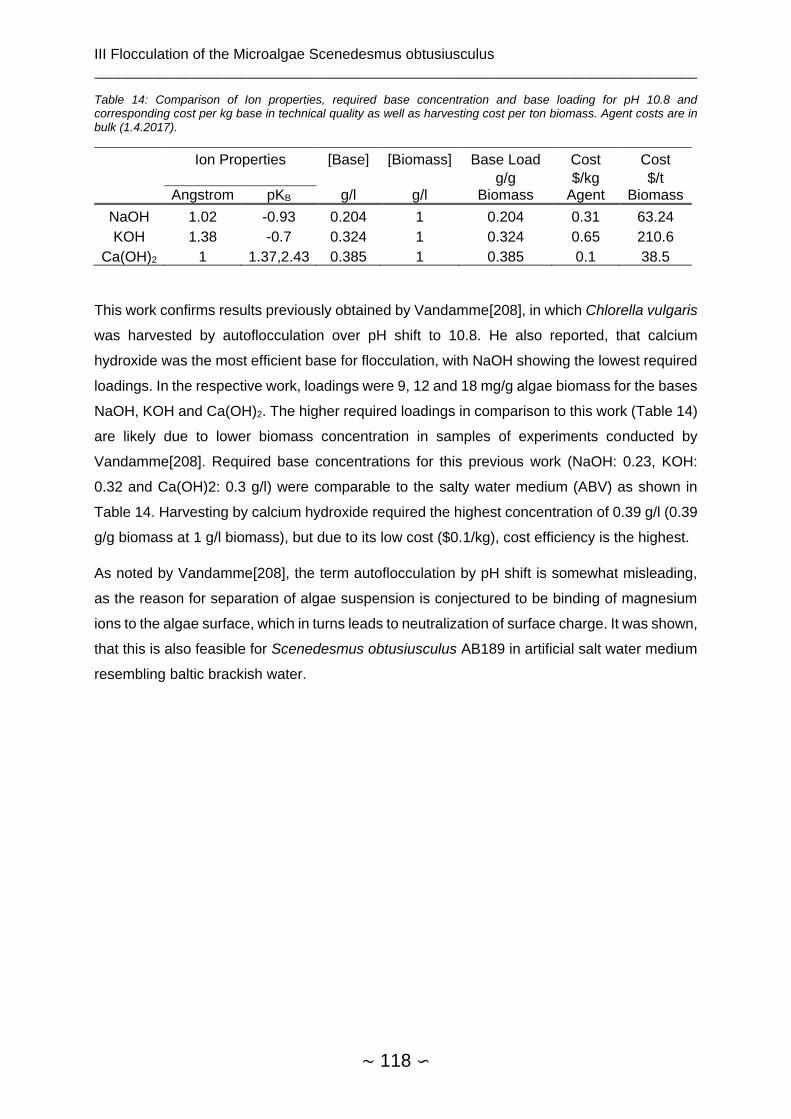
III Flocculation of the Microalgae Scenedesmus obtusiusculus __________________________________________________________________________
∼ 118 ∽
Table 14: Comparison of Ion properties, required base concentration and base loading for pH 10.8 and corresponding cost per kg base in technical quality as well as harvesting cost per ton biomass. Agent costs are in bulk (1.4.2017).
Ion Properties [Base] [Biomass] Base Load Cost Cost
g/l g/l g/g
Biomass $/kg
Agent $/t
Biomass Angstrom pKB
NaOH 1.02 -0.93 0.204 1 0.204 0.31 63.24
KOH 1.38 -0.7 0.324 1 0.324 0.65 210.6
Ca(OH)2 1 1.37,2.43 0.385 1 0.385 0.1 38.5
This work confirms results previously obtained by Vandamme[208], in which Chlorella vulgaris
was harvested by autoflocculation over pH shift to 10.8. He also reported, that calcium
hydroxide was the most efficient base for flocculation, with NaOH showing the lowest required
loadings. In the respective work, loadings were 9, 12 and 18 mg/g algae biomass for the bases
NaOH, KOH and Ca(OH)2. The higher required loadings in comparison to this work (Table 14)
are likely due to lower biomass concentration in samples of experiments conducted by
Vandamme[208]. Required base concentrations for this previous work (NaOH: 0.23, KOH:
0.32 and Ca(OH)2: 0.3 g/l) were comparable to the salty water medium (ABV) as shown in
Table 14. Harvesting by calcium hydroxide required the highest concentration of 0.39 g/l (0.39
g/g biomass at 1 g/l biomass), but due to its low cost ($0.1/kg), cost efficiency is the highest.
As noted by Vandamme[208], the term autoflocculation by pH shift is somewhat misleading,
as the reason for separation of algae suspension is conjectured to be binding of magnesium
ions to the algae surface, which in turns leads to neutralization of surface charge. It was shown,
that this is also feasible for Scenedesmus obtusiusculus AB189 in artificial salt water medium
resembling baltic brackish water.
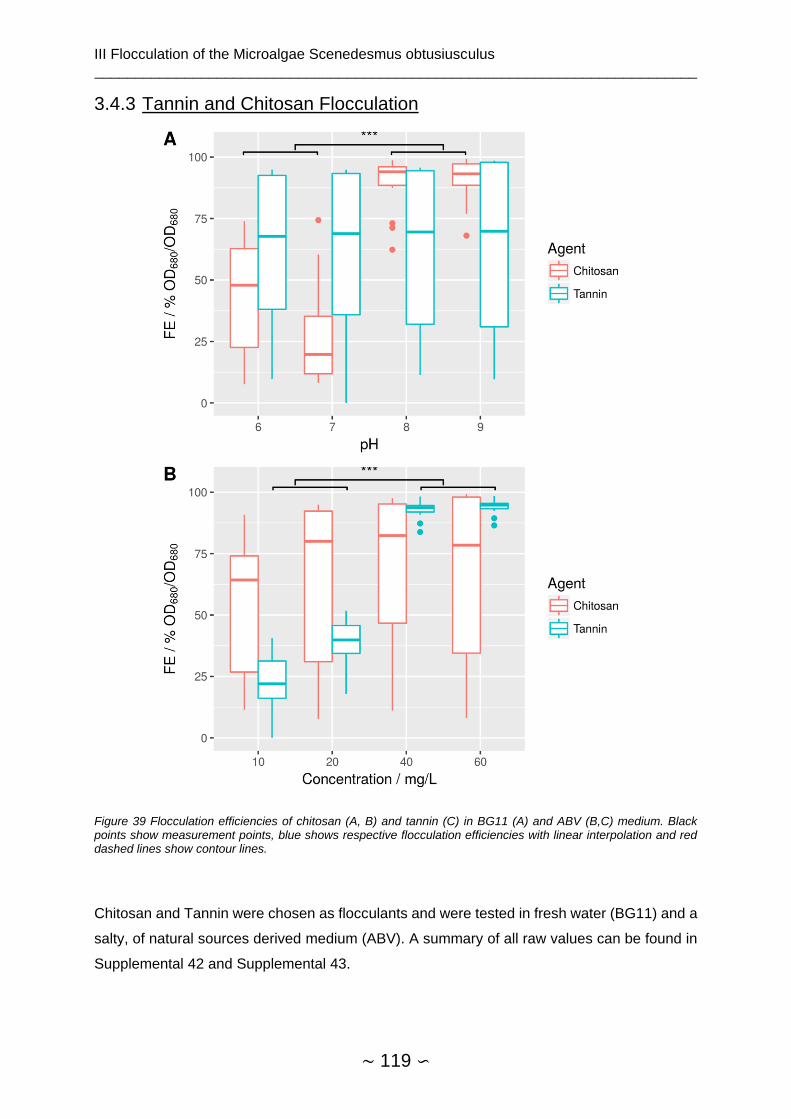
III Flocculation of the Microalgae Scenedesmus obtusiusculus __________________________________________________________________________
∼ 119 ∽
3.4.3 Tannin and Chitosan Flocculation
Figure 39 Flocculation efficiencies of chitosan (A, B) and tannin (C) in BG11 (A) and ABV (B,C) medium. Black points show measurement points, blue shows respective flocculation efficiencies with linear interpolation and red dashed lines show contour lines.
Chitosan and Tannin were chosen as flocculants and were tested in fresh water (BG11) and a
salty, of natural sources derived medium (ABV). A summary of all raw values can be found in
Supplemental 42 and Supplemental 43.
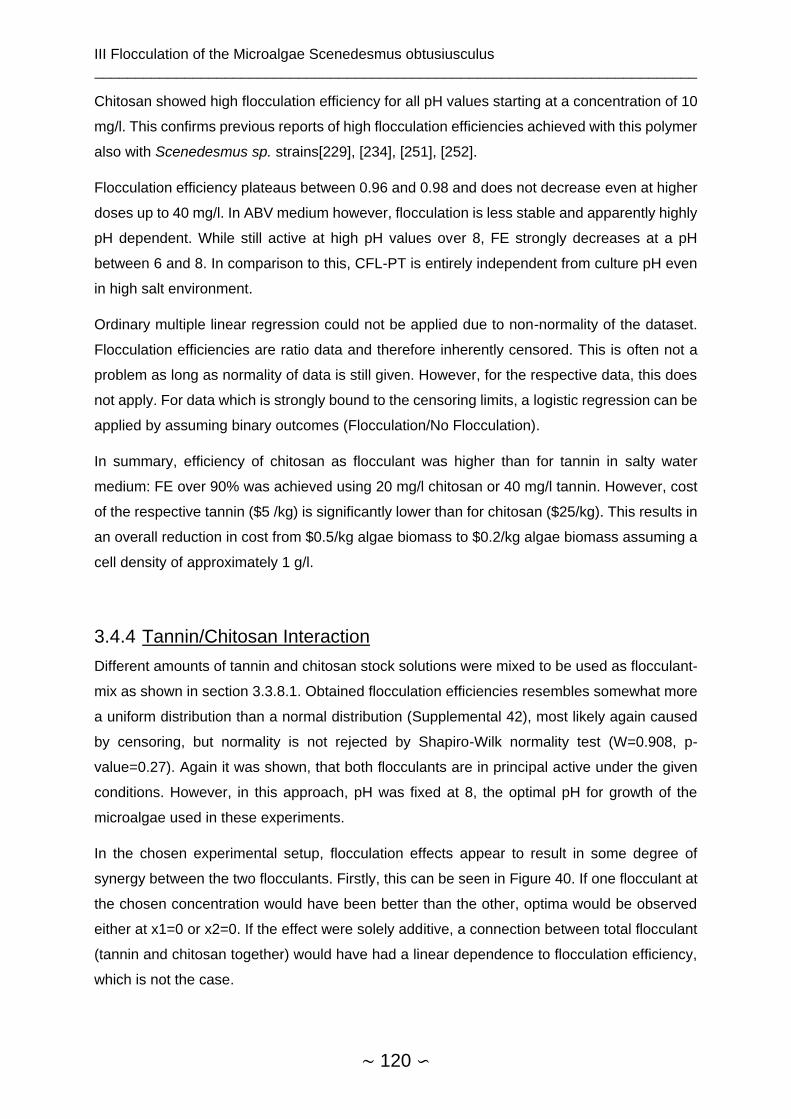
III Flocculation of the Microalgae Scenedesmus obtusiusculus __________________________________________________________________________
∼ 120 ∽
Chitosan showed high flocculation efficiency for all pH values starting at a concentration of 10
mg/l. This confirms previous reports of high flocculation efficiencies achieved with this polymer
also with Scenedesmus sp. strains[229], [234], [251], [252].
Flocculation efficiency plateaus between 0.96 and 0.98 and does not decrease even at higher
doses up to 40 mg/l. In ABV medium however, flocculation is less stable and apparently highly
pH dependent. While still active at high pH values over 8, FE strongly decreases at a pH
between 6 and 8. In comparison to this, CFL-PT is entirely independent from culture pH even
in high salt environment.
Ordinary multiple linear regression could not be applied due to non-normality of the dataset.
Flocculation efficiencies are ratio data and therefore inherently censored. This is often not a
problem as long as normality of data is still given. However, for the respective data, this does
not apply. For data which is strongly bound to the censoring limits, a logistic regression can be
applied by assuming binary outcomes (Flocculation/No Flocculation).
In summary, efficiency of chitosan as flocculant was higher than for tannin in salty water
medium: FE over 90% was achieved using 20 mg/l chitosan or 40 mg/l tannin. However, cost
of the respective tannin ($5 /kg) is significantly lower than for chitosan ($25/kg). This results in
an overall reduction in cost from $0.5/kg algae biomass to $0.2/kg algae biomass assuming a
cell density of approximately 1 g/l.
3.4.4 Tannin/Chitosan Interaction
Different amounts of tannin and chitosan stock solutions were mixed to be used as flocculant-
mix as shown in section 3.3.8.1. Obtained flocculation efficiencies resembles somewhat more
a uniform distribution than a normal distribution (Supplemental 42), most likely again caused
by censoring, but normality is not rejected by Shapiro-Wilk normality test (W=0.908, p-
value=0.27). Again it was shown, that both flocculants are in principal active under the given
conditions. However, in this approach, pH was fixed at 8, the optimal pH for growth of the
microalgae used in these experiments.
In the chosen experimental setup, flocculation effects appear to result in some degree of
synergy between the two flocculants. Firstly, this can be seen in Figure 40. If one flocculant at
the chosen concentration would have been better than the other, optima would be observed
either at x1=0 or x2=0. If the effect were solely additive, a connection between total flocculant
(tannin and chitosan together) would have had a linear dependence to flocculation efficiency,
which is not the case.

III Flocculation of the Microalgae Scenedesmus obtusiusculus __________________________________________________________________________
∼ 121 ∽
Figure 40: Surface response showing flocculation efficiencies with different ratios of tannin (x1), chitosan (x2) and H2O (x3). Concentrations are between 0 and 30 mg/l Chitosan and 0 and 120 mg/l tannin. Culture was at OD600=3.6 and at t=113 h Levels are shown in Table 15.
Secondly, the interdependent effect between these two factors can be seen in Supplemental
43. The cofactor for x1:x2 interaction (e.g. between the two flocculants) is the highest of the
entire regression. In theory, the mechanism of flocculation should be similar for both
flocculation agents: they are both functionalized biopolymers and presumably exert their
functionality over bridging and sweeping flocculation. There are however differences in charge
density and polymer lengths. DLS allowed for estimation of hydrodynamic particle size as well
as zeta potential: Tannin has both a lower zeta potential (-52.7±2.2 mV) and smaller size (z-
average: 8016+-3687 nm) than chitosan (-34.8±1.4 mV and 106±55 nm). A detailed summary
of all model parameters can be found in Supplemental 43.
It could be speculated that the reason for possible synergistic effects while maintaining the
same mechanistic pattern could lie in the diverse and complex structure of algae cell surface.
Cell wall polymers are not evenly distributed, which could lead to different preferences of
different cell wall surface areas for different flocculants.
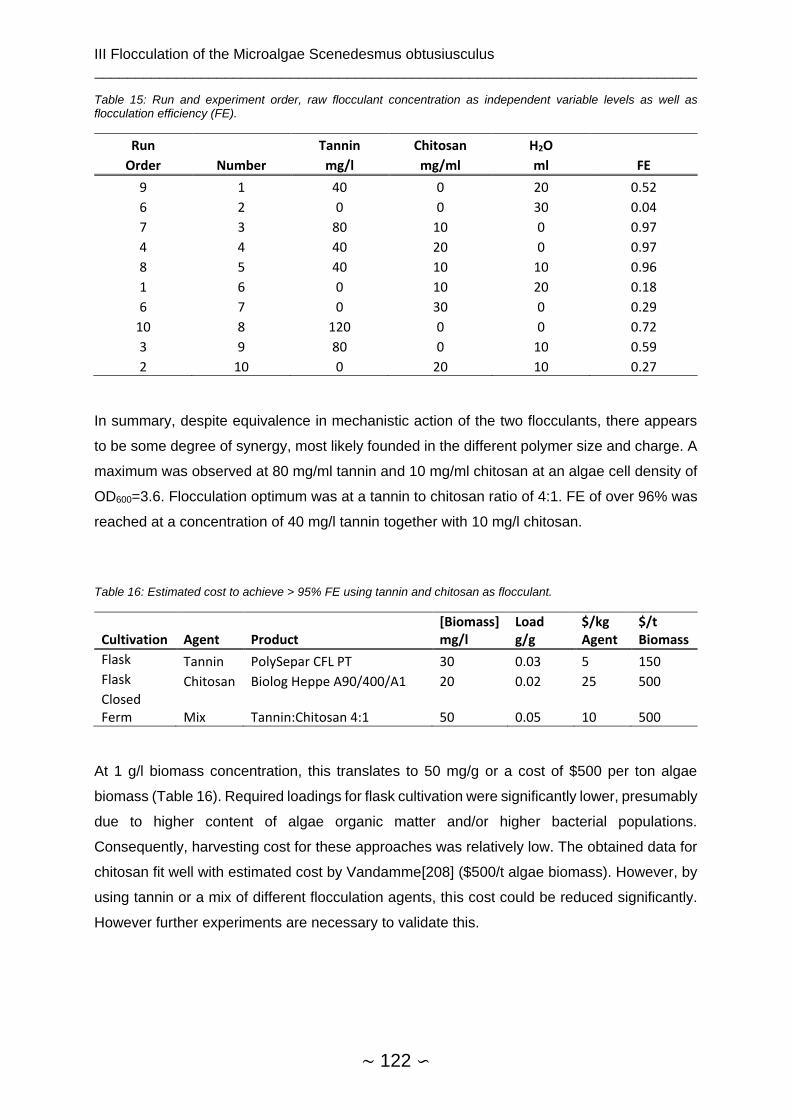
III Flocculation of the Microalgae Scenedesmus obtusiusculus __________________________________________________________________________
∼ 122 ∽
Table 15: Run and experiment order, raw flocculant concentration as independent variable levels as well as flocculation efficiency (FE).
Run Tannin Chitosan H2O
Order Number mg/l mg/ml ml FE
9 1 40 0 20 0.52
6 2 0 0 30 0.04
7 3 80 10 0 0.97
4 4 40 20 0 0.97
8 5 40 10 10 0.96
1 6 0 10 20 0.18
6 7 0 30 0 0.29
10 8 120 0 0 0.72
3 9 80 0 10 0.59
2 10 0 20 10 0.27
In summary, despite equivalence in mechanistic action of the two flocculants, there appears
to be some degree of synergy, most likely founded in the different polymer size and charge. A
maximum was observed at 80 mg/ml tannin and 10 mg/ml chitosan at an algae cell density of
OD600=3.6. Flocculation optimum was at a tannin to chitosan ratio of 4:1. FE of over 96% was
reached at a concentration of 40 mg/l tannin together with 10 mg/l chitosan.
Table 16: Estimated cost to achieve > 95% FE using tannin and chitosan as flocculant.
Cultivation Agent Product
[Biomass] mg/l
Load g/g
$/kg Agent
$/t Biomass
Flask Tannin PolySepar CFL PT 30 0.03 5 150 Flask Chitosan Biolog Heppe A90/400/A1 20 0.02 25 500 Closed Ferm Mix Tannin:Chitosan 4:1 50 0.05 10 500
At 1 g/l biomass concentration, this translates to 50 mg/g or a cost of $500 per ton algae
biomass (Table 16). Required loadings for flask cultivation were significantly lower, presumably
due to higher content of algae organic matter and/or higher bacterial populations.
Consequently, harvesting cost for these approaches was relatively low. The obtained data for
chitosan fit well with estimated cost by Vandamme[208] ($500/t algae biomass). However, by
using tannin or a mix of different flocculation agents, this cost could be reduced significantly.
However further experiments are necessary to validate this.
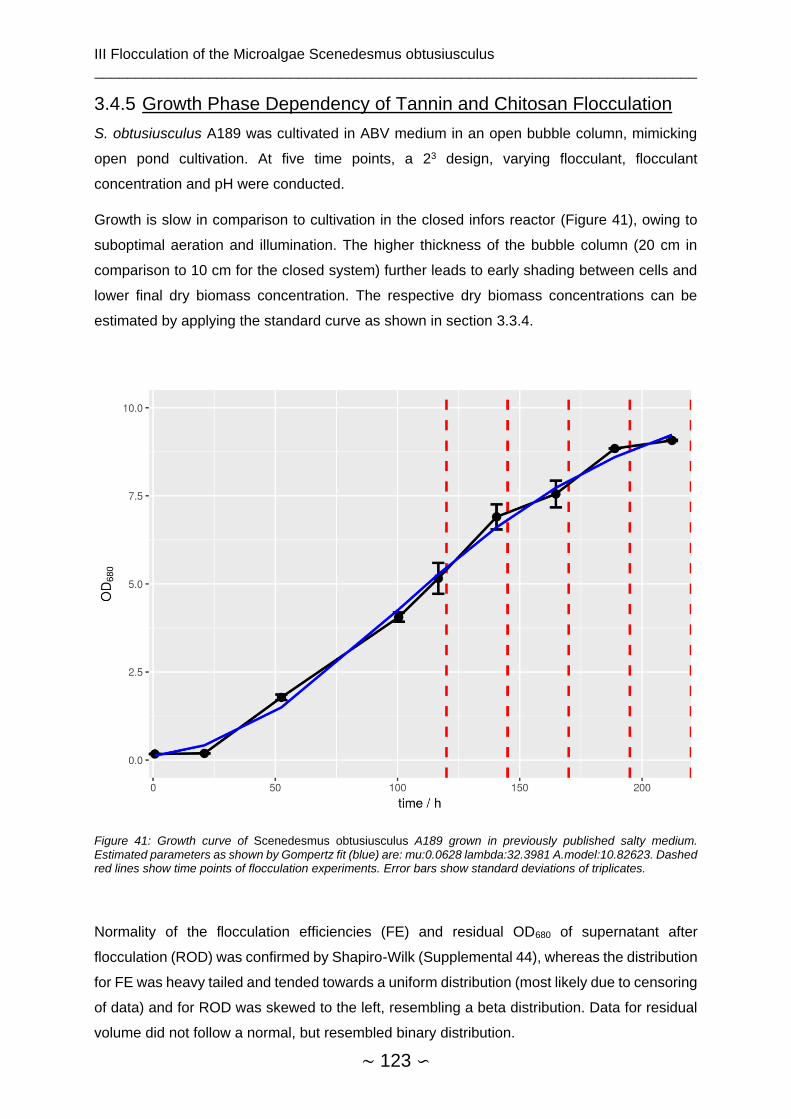
III Flocculation of the Microalgae Scenedesmus obtusiusculus __________________________________________________________________________
∼ 123 ∽
3.4.5 Growth Phase Dependency of Tannin and Chitosan Flocculation
S. obtusiusculus A189 was cultivated in ABV medium in an open bubble column, mimicking
open pond cultivation. At five time points, a 23 design, varying flocculant, flocculant
concentration and pH were conducted.
Growth is slow in comparison to cultivation in the closed infors reactor (Figure 41), owing to
suboptimal aeration and illumination. The higher thickness of the bubble column (20 cm in
comparison to 10 cm for the closed system) further leads to early shading between cells and
lower final dry biomass concentration. The respective dry biomass concentrations can be
estimated by applying the standard curve as shown in section 3.3.4.
Figure 41: Growth curve of Scenedesmus obtusiusculus A189 grown in previously published salty medium. Estimated parameters as shown by Gompertz fit (blue) are: mu:0.0628 lambda:32.3981 A.model:10.82623. Dashed red lines show time points of flocculation experiments. Error bars show standard deviations of triplicates.
Normality of the flocculation efficiencies (FE) and residual OD680 of supernatant after
flocculation (ROD) was confirmed by Shapiro-Wilk (Supplemental 44), whereas the distribution
for FE was heavy tailed and tended towards a uniform distribution (most likely due to censoring
of data) and for ROD was skewed to the left, resembling a beta distribution. Data for residual
volume did not follow a normal, but resembled binary distribution.

III Flocculation of the Microalgae Scenedesmus obtusiusculus __________________________________________________________________________
∼ 124 ∽
3.4.5.1 Effect of Growth Phase
There appears to be no significant time effect on zeta potential (Figure 42). Repeated Measure
ANOVA shows no significant differences between time points. This contrast previous results
obtained in the closed infors reactor, where a clear increase in zeta potential over time was
observed (Supplemental 46).
Figure 43 shows differences in flocculation efficiency over time are significant according to
multiple measure ANOVA (α=0.05). By simple linear regression, time was found to be
significant both as linear and quadratic term. However, time effect accounted for approximately
25% of variation found between samples. In summary, an increase of flocculation efficiency
over time was found, which however just captures a small amount of variation and effect sizes
were small.
Figure 42: Zeta potential in mV over time of open bubble column reactor cultivation as shown in Figure 41. Error bars show standard deviations of triplicates.
Similarly, differences in residual OD680 (ROD) over time were significant according to multiple
measure ANOVA (Supplemental 47, p=0.0133). Time as linear factor explains only 27% of
variance of residual OD and adding quadratic factors yielded no improvement. Interestingly,

III Flocculation of the Microalgae Scenedesmus obtusiusculus __________________________________________________________________________
∼ 125 ∽
no direct effect of time on residual volume was observed, even if subsetting the data into a
high and a low residual volume set (Supplemental 47).
While smaller in size, bacteria and cell fragments made up the majority of the culture at the
end of cultivation (Supplemental 48). Only few agglomerated cells were found. Two distinct
bacterial populations, neither of which were fluorescent on the FL2 channel (indicating the
absence of chlorophyll) could be separated by side scatter. Count and share of both
populations as well as the total number of events was observed over time (Supplemental 48).
All populations showed exponential growth over time. In addition, the share of bacterial
population 1 in relation to the total events is rising exponentially, whereas population 2 stays
roughly constant in share. Extrapolating the shown growth kinetics, it can be assumed, that
bacterial populations in time overgrow algae.
The impact of bacterial populations on all dependent variables is shown in Supplemental 49:
Effect on residual volume cannot be estimated due to binary distribution. Despite an apparent
correlation to FE, the effects cannot be untangled from other factors correlating with time. In
other words, in the prediction of said dependent variables, time and bacterial populations show
collinearity with each other and other factors.
In the same way as effects of bacterial populations, effect of zeta potential on dependent
variables could not be estimated. In this case, zeta potential had no clear effect on flocculation
efficiency and residual volume, however there was some positive correlation to residual OD.
Lack of effect of zeta potential is most likely owed to small variability of this factor: As shown
in Supplemental 50, multiple measure ANOVA showed no significant differences.
In relation to calculating the harvesting efficiency (Section 3.3.5), the question arises, whether
flocculation efficiency and residual volume relate to each other in a meaningful way.
Even if dividing the dataset into low and high residual volumes (owed to the binary distribution,
Supplemental 44), no apparent dependency can be found between the two factors. Taking into
account the previous results, this indicates, that the factors affecting flocculation efficiency are
different or do so in a different way than factors who exert an effect on the residual volume and
therefore the compression factor.

III Flocculation of the Microalgae Scenedesmus obtusiusculus __________________________________________________________________________
∼ 126 ∽
3.4.5.2 Other Effects
Figure 43: Effect of factors pH, flocculant concentration and flocculation agent on flocculation efficiency (FE). Differences between pH values and flocculant concentrations are significant (p=5*10-4 and p=2.2*10-3 respectively), whereas differences between flocculation agent are not (p=0.26). Testing was done using Welch’s-test.
Concentration and pH are significant factors, however the flocculant itself is not (Supplemental
45). This is due to absence of captured interaction effects as opposed to section 3.3.8.1. On
average, increase of flocculant dose leads to higher FE, whereas increase of pH from 8 to 9
decreases flocculation efficiency. Supplemental 51 shows the effect of the independent
variables on residual volume (RV). In contrast to flocculation efficiency, the compression is
almost solely dependent on the type of flocculant. Apart from one value, separation is linear.
3.4.5.3 Time and Other Effects
Three models were generated to predict flocculation efficiency from the four independent
variables: The first regression contained all linear and interaction effects as well as a quadratic
time effect. The second model was selected according to the Akaike information criterion (AIC),
whereas the third model was chosen based on reverse factor elimination based on p-values.
Supplemental 53 and Supplemental 54 show corresponding formulas, and R2 values.

III Flocculation of the Microalgae Scenedesmus obtusiusculus __________________________________________________________________________
∼ 127 ∽
Comparison of cofactors in pareto charts (Supplemental 55) shows the main effects of each
model. By comparing the different models (Supplemental 52, Supplemental 53 and
Supplemental 54) it is demonstrated, that the main coefficients are stable: The strongest effect
is always given by the concentration of flocculant (x2), whereas an increase from 40 to 80 mg/l
raises FE by approximately 15%. However, this can be somewhat offset by a negative
interaction effect between flocculant concentration (x2) and pH (x1): Flocculation efficiency
decreases by 10%, if pH is raised to 9 while the concentration is raised by the respective
amount. This indicates, that an increase in pH, (which has a negative linear effect of
approximately 4%) cannot be offset by a doubling of flocculant concentration. Tannin yields
7% higher flocculation efficiency compared to chitosan. However, it interacts negatively with
concentration. The reason for the negative interaction of factor level tannin with concentration
is possibly the censoring of data, yielding a non-linear effect of tannin on flocculation. The
same applies to interaction of tannin with time (x3) The interaction with pH is minor in effect
size and in fact not significant, so it is not included in the model using reverse factor elimination.
Time (x3) has a small positive impact both in a linear and quadratic fashion. As expected, there
are no 3-way interactions consistent with all models. High order interactions of significant
impact are rarely found. Box-Cox transformation yielded no substantial improvement of
regression results.
3.4.5.4 Algae Organic Matter Effects
Boxplots of flocculation efficiency (Figure 44) in dependence of algae organic matter, time, pH,
flocculation concentration and flocculation agent show clear increase of FE, when algae
organic matter is not present in the medium. Moreover, this increase is much stronger for
tannin than it is for chitosan, indicating an interaction.
The models (Supplemental 56, Supplemental 57 and Supplemental 58) are dominated by the
positive interaction between factor level tannin and the presence of algae organic matter
(AOM). In other words, flocculation efficiency always increases if AOM is removed (+10% FE),
however if tannin is used, increase is another 25% FE higher in comparison to using chitosan.
pH has a negative effect, which was already previously shown (Section 3.4.3). Interestingly in
the present model, effect of pH with concentration is positive. This contradicts the result of the
previous model (Section 3.4.3), in which this interaction effect was negative. R2 values of the
models are comparable, consequently the relevant difference might lie in the way the two
mentioned factors interact depending on the presence of AOM. However further experiments
are required for elucidation of these effects.
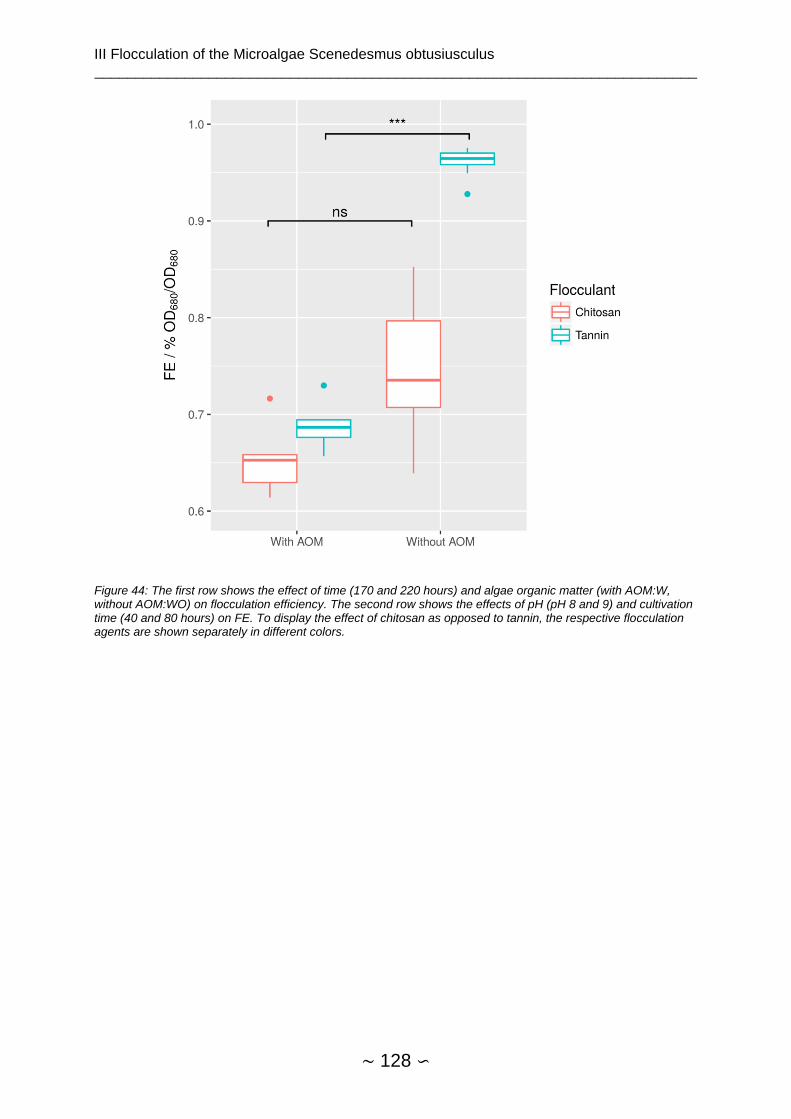
III Flocculation of the Microalgae Scenedesmus obtusiusculus __________________________________________________________________________
∼ 128 ∽
Figure 44: The first row shows the effect of time (170 and 220 hours) and algae organic matter (with AOM:W, without AOM:WO) on flocculation efficiency. The second row shows the effects of pH (pH 8 and 9) and cultivation time (40 and 80 hours) on FE. To display the effect of chitosan as opposed to tannin, the respective flocculation agents are shown separately in different colors.
III Flocculation of the Microalgae Scenedesmus obtusiusculus __________________________________________________________________________
∼ 129 ∽
3.5 Conclusion and Outlook
Measurement of flocculation efficiency in a plate reader was established by
a) showing the absence of sedimentation or adhesion effects in 96-well plates, when
samples are not shaken over time and
b) demonstrating linear interval of cell density in comparison to the cuvette photometer.
As flocculation format, the jar test was confirmed as the only method yielding reproducible and
reliable results. Flocculation-sedimentation tests in falcons, at best, yield proximate, semi-
quantitative values not suitable for accurate modeling. Induction of autoflocculation by pH shift
was possible for NaOH, KOH and Ca(OH)2, but not for Mg(OH)2, due to high concentration of
salts already present in the artificial brackish water medium. NaOH required the lowest amount
of base to set a pH sufficient for flocculation, but Ca(OH)2 yielded slightly higher flocculation
efficiencies in a shorter time. Further, it was also the cheapest flocculant and therefore
considered the best choice in the current setting. Cost was approximately $40 per ton biomass.
The tannin agent CFL PT by Polysepar, which was characterized as flocculation agent for the
first time in this work, is a feasible choice for harvest of microalgae S. obtusiusculus cultivated
in optimized, salty water medium. Its advantages are its much lower price in comparison to
chitosan comparable performance (~ 90% cost reduction). Furthermore, tannin has a strong
advantage in the absence of algae organic matter over chitosan A90/400/A1 by Heppe.
Dependence of tannin with pH appears to be lower than for chitosan, which means that at very
high pH values of algae culture (>9), chitosan still might be the more favorable choice in this
respect.
Interestingly, chitosan and tannin, despite presumed same mechanistic effect, appear to
exhibit synergistic effects when used together. This is possibly owed to the different and
complementary properties of the respective polymers in terms of chain length, particle size and
zeta potential.
Measuring kinetics and different cultivation parameters as shown in section 3.3.8.2 showed
the complexity of algae response to time. Some of those complex interactions during
flocculation procedure could not be untangled. This applies for example to the possible effect
of bacterial populations or zeta potential, which could not be evaluated in a model due to high
collinearity. As shown in the difference between models for x1/x2/x3/time and AOM effect,
small differences in the setup of the experiment can significantly change some effects, while
others remain stable.
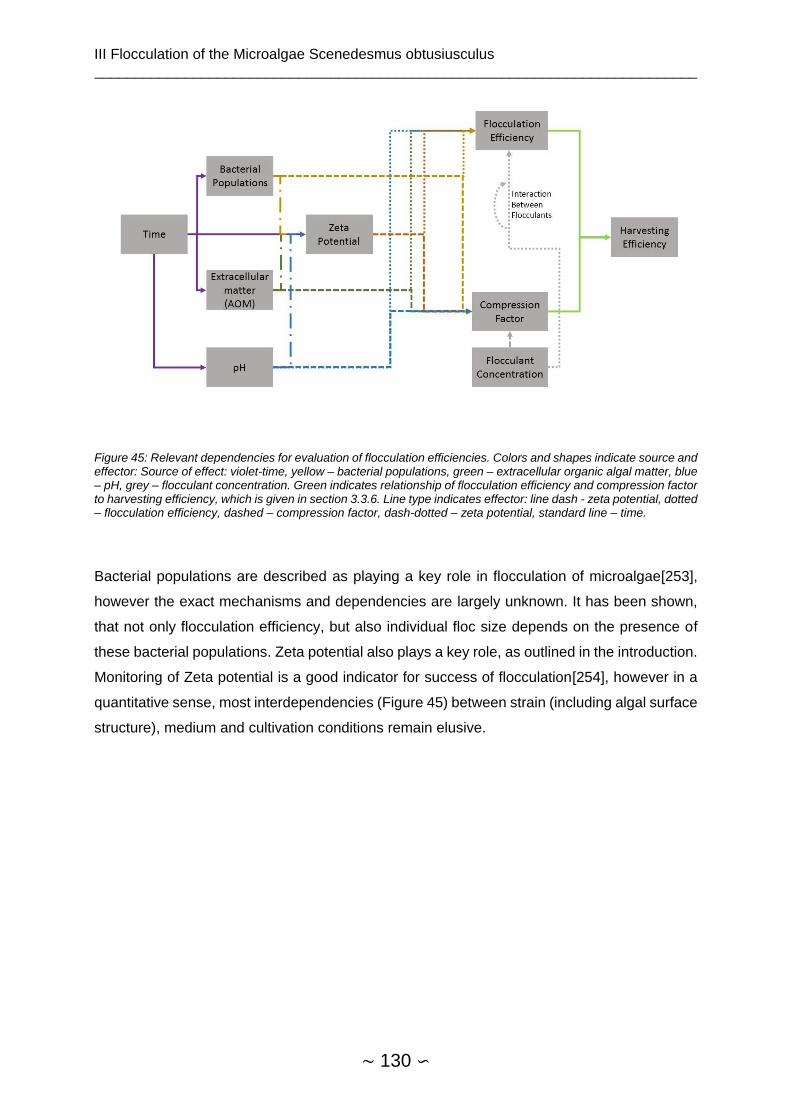
III Flocculation of the Microalgae Scenedesmus obtusiusculus __________________________________________________________________________
∼ 130 ∽
Figure 45: Relevant dependencies for evaluation of flocculation efficiencies. Colors and shapes indicate source and effector: Source of effect: violet-time, yellow – bacterial populations, green – extracellular organic algal matter, blue – pH, grey – flocculant concentration. Green indicates relationship of flocculation efficiency and compression factor to harvesting efficiency, which is given in section 3.3.6. Line type indicates effector: line dash - zeta potential, dotted – flocculation efficiency, dashed – compression factor, dash-dotted – zeta potential, standard line – time.
Bacterial populations are described as playing a key role in flocculation of microalgae[253],
however the exact mechanisms and dependencies are largely unknown. It has been shown,
that not only flocculation efficiency, but also individual floc size depends on the presence of
these bacterial populations. Zeta potential also plays a key role, as outlined in the introduction.
Monitoring of Zeta potential is a good indicator for success of flocculation[254], however in a
quantitative sense, most interdependencies (Figure 45) between strain (including algal surface
structure), medium and cultivation conditions remain elusive.

IV Bibliography __________________________________________________________________________
∼ 131 ∽
4 Bibliography
[1] U. von Stockar and J.-S. Liu, “Does microbial life always feed on negative entropy? Thermodynamic analysis of microbial growth,” Biochim. Biophys. Acta - Bioenerg., vol. 1412, no. 3, pp. 191–211, 1999.
[2] R. Renneberg and V. Berkling, Biotechnologie fur Einsteiger. Springer Spektrum, 2013.
[3] W. M, “Microbial fat: micro-organisms as potential fat producers,” Prog. Ind. Microbiol., vol. 1, pp. 181–245, 1959.
[4] C. Boulton and C. Ratledge, “Correlation of Lipid Accumulation in Yeasts with Possession of ATP : Citrate Lyase,” J. Gen. Microbiol., vol. 127, pp. 169–176, 1981.
[5] H. M. Alvarez and A. Steinbüchel, “Triacylglycerols in prokaryotic microorganisms.,” Appl. Microbiol. Biotechnol., vol. 60, no. 4, pp. 367–76, Dec. 2002.
[6] Q. Li, W. Du, and D. Liu, “Perspectives of microbial oils for biodiesel production.,” Appl. Microbiol. Biotechnol., vol. 80, no. 5, pp. 749–56, Oct. 2008.
[7] J. M. Ageitos, J. A. Vallejo, P. Veiga-Crespo, and T. G. Villa, “Oily yeasts as oleaginous cell factories,” Appl. Microbiol. Biotechnol., vol. 90, no. 4, pp. 1219–27, May 2011.
[8] C. Ratledge, “Microbial Lipids,” in Biotechnology, Weinheim, Germany: Wiley-VCH Verlag GmbH, 2008, pp. 133–197.
[9] C. Ratledge and P. S. S. Dawson, Biotechnology for the Oils and Fats Industry. The American Oil Chemists Society, 1984.
[10] C. Ratledge, “Fatty acid biosynthesis in microorganisms being used for Single Cell Oil production,” Biochimie, vol. 86, no. 11, pp. 807–815, 2004.
[11] Y. Chisti, “Biodiesel from microalgae beats bioethanol.,” Trends Biotechnol., vol. 26, no. 3, pp. 126–31, Mar. 2008.
[12] A. Ykema, E. C. Verbree, H. W. van Verseveld, and H. Smit, “Mathematical modelling of lipid production by oleaginous yeasts in continuous cultures.,” Antonie Van Leeuwenhoek, vol. 52, no. 6, pp. 491–506, 1986.
[13] R. Wang, J. Wang, R. Xu, Z. Fang, and A. Liu, “Oil Production by the Oleaginous Yeast Lipomyces starkeyi using Diverse Carbon Sources,” BioResources, vol. 9, no. 4, pp. 7027–7040, Oct. 2014.
[14] J. C. Escobar, E. S. Lora, O. J. Venturini, E. E. Yáñez, E. F. Castillo, and O. Almazan, “Biofuels: Environment, technology and food security,” Renew. Sustain. Energy Rev., vol. 13, no. 6–7, pp. 1275–1287, Aug. 2009.
[15] S. Papanikolaou and G. Aggelis, “Lipids of oleaginous yeasts. Part II: Technology and potential applications,” Eur. J. Lipid Sci. Technol., vol. 113, no. 8, pp. 1052–1073, Aug. 2011.
[16] “Home - PubMed - NCBI.” [Online]. Available: https://www.ncbi.nlm.nih.gov/pubmed/. [Accessed: 30-Jan-2017].
[17] C. Huang, X. Chen, L. Xiong, X. Chen, L. Ma, and Y. Chen, “Single cell oil production from low-cost substrates: the possibility and potential of its industrialization.,” Biotechnol. Adv., vol. 31, no. 2, pp. 129–39.
[18] J. M. Rutkowski, J. H. Stern, and P. E. Scherer, “The cell biology of fat expansion.,” J. Cell Biol., vol. 208, no. 5, pp. 501–12, Mar. 2015.

IV Bibliography __________________________________________________________________________
∼ 132 ∽
[19] C. D. Meyers, A. Amer, T. Majumdar, and J. Chen, “Pharmacokinetics, pharmacodynamics, safety, and tolerability of pradigastat, a novel diacylglycerol acyltransferase 1 inhibitor in overweight or obese, but otherwise healthy human subjects.,” J. Clin. Pharmacol., vol. 55, no. 9, pp. 1031–41, Sep. 2015.
[20] H. Denison et al., “Proof of mechanism for the DGAT1 inhibitor AZD7687: results from a first-time-in-human single-dose study.,” Diabetes. Obes. Metab., vol. 15, no. 2, pp. 136–43, Feb. 2013.
[21] C. Görner, “Genetic Engineering of the Oleaginous Yeast Trichosporon oleaginosus and the Bacteria Escherichia Coli Aimed at the Production of High Value Lipids and Bioactive Diterpenes,” Technical University Munich, 2016.
[22] S. Papanikolaou and G. Aggelis, “Lipids of oleaginous yeasts. Part I: Biochemistry of single cell oil production,” Eur. J. Lipid Sci. Technol., vol. 113, no. 8, pp. 1031–1051, Aug. 2011.
[23] Z. Zhu et al., “A multi-omic map of the lipid-producing yeast Rhodosporidium toruloides,” Nat. Commun., vol. 3, p. 1112, 2012.
[24] R. Kourist et al., “Genomics and Transcriptomics Analyses of the Oil-Accumulating Basidiomycete Yeast Trichosporon oleaginosus : Insights into Substrate Utilization and Alternative Evolutionary Trajectories of Fungal Mating Systems,” MBio, vol. 6, no. 4, pp. e00918-15, Sep. 2015.
[25] S. Wullschleger, R. Loewith, and M. N. Hall, “TOR Signaling in Growth and Metabolism,” Cell, vol. 124, no. 3, pp. 471–84, Feb. 2006.
[26] N. J. Moon et al., “Conversion of Cheese Whey and Whey Permeate to Oil and Single-Cell Protein,” J. Dairy Sci., vol. 61, no. 11, pp. 1537–1547, Nov. 1978.
[27] C. Ratledge, “Single cell oils — have they a biotechnological future?,” Trends Biotechnol., vol. 11, no. 7, pp. 278–284, 1993.
[28] R. S. Moreton, “Yeast lipid estimation by enzymatic and nuclear magnetic resonance methods.,” Appl. Environ. Microbiol., vol. 55, no. 11, pp. 3009–11, Nov. 1989.
[29] P. Gujjari, S.-O. S. O. Suh, K. Coumes, and J. J. J. Zhou, “Characterization of oleaginous yeasts revealed two novel species: Trichosporon cacaoliposimilis sp. nov. and Trichosporon oleaginosus sp. nov.,” Mycologia, vol. 103, no. 5, 2011.
[30] X.-Z. Liu et al., “Towards an integrated phylogenetic classification of the Tremellomycetes,” Stud. Mycol., vol. 81, pp. 85–147, Jun. 2015.
[31] C. A. Morrow and J. A. Fraser, “Sexual reproduction and dimorphism in the pathogenic basidiomycetes,” FEMS Yeast Res., vol. 9, no. 2, pp. 161–177, 2009.
[32] J. Depree, G. W. Emerson, and P. A. Sullivan, “The cell wall of the oleaginous yeast Trichosporon cutaneum,” J. Gen. Microbiol., vol. 139, no. 9, pp. 2123–2133, Sep. 1993.
[33] A. Ykema, R. H. A. Bakels, I. I. G. S. Verwoert, H. Smit, and H. W. van Verseveld, “Growth yield, maintenance requirements, and lipid formation in the oleaginous yeast Apiotrichum curvatum,” Biotechnol. Bioeng., vol. 34, no. 10, pp. 1268–1276, Dec. 1989.
[34] P. Van Bodegom, “Microbial maintenance: A critical review on its quantification,” Microb. Ecol., vol. 53, no. 4, pp. 513–523, 2007.
[35] B. A. . Glatz, M. D. . Floetenmeyer, and E. G. Hammond, “Fermentation of bananas and other food wastes to produce microbial lipid,” J. Food Prot., vol. 48, no. 7, pp. 574–577, 1985.
[36] Y. Liang, K. Jarosz, A. T. Wardlow, J. Zhang, and Y. Cui, “Lipid Production by
IV Bibliography __________________________________________________________________________
∼ 133 ∽
Cryptococcus curvatus on Hydrolysates Derived from Corn Fiber and Sweet Sorghum Bagasse Following Dilute Acid Pretreatment,” Appl. Biochem. Biotechnol., vol. 173, no. 8, pp. 2086–2098, Aug. 2014.
[37] J. B. M. Rattray, Biotechnology and the fats and oils industry — An overview, vol. 61, no. 11. 1984.
[38] C. T. Evans and C. Ratledge, “A comparison of the oleaginous yeast, Candida curvata, grown on different carbon sources in continuous and batch culture.,” Lipids, vol. 18, no. 9, pp. 623–9, Sep. 1983.
[39] A. Meo, “Lipidherstellung aus verdünnten Zuckergemischen mit Trichosporon oleaginosus,” Technische Universität München, 2016.
[40] E. P. Knoshaug, M. A. Franden, B. U. Stambuk, M. Zhang, and A. Singh, “Utilization and transport of l-arabinose by non-Saccharomyces yeasts,” Cellulose, vol. 16, no. 4, pp. 729–741, Aug. 2009.
[41] C. D. Smolke, The metabolic pathway engineering handbook : fundamentals. CRC Press/Taylor & Francis, 2010.
[42] Y. Zheng, Z. Chi, B. K. Ahring, and S. Chen, “Oleaginous yeast Cryptococcus curvatus for biofuel production: Ammonia’s effect,” Biomass and Bioenergy, vol. 37, pp. 114–121, Feb. 2012.
[43] T. Behrend, E. Gui~ho, J. Tredick, and H. J. Phaff, “DNA base composition and DNA relatedness among species of,” Antonie Van Leeuwenhoek, vol. 50, pp. 17–32, 1984.
[44] D. R. Iassonova, “Lipid synthesis and encapsulation by Cryptococcus curvatus,” Iowa State University, 2009.
[45] P. A. E. P. Meesters, G. N. M. Huijberts, and G. Eggink, “High-cell-density cultivation of the lipid accumulating yeast Cryptococcus curvatus using glycerol as a carbon source,” Appl. Microbiol. Biotechnol., vol. 45, no. 5, pp. 575–579, Jun. 1996.
[46] S. Wu, C. Hu, X. Zhao, and Z. K. Zhao, “Production of lipid from N-acetylglucosamine by Cryptococcus curvatus,” Eur. J. Lipid Sci. Technol., vol. 112, no. 7, pp. 727–733, Apr. 2010.
[47] C. Ratledge, “Production of fatty acids and lipid by a Candida sp. growing on a fraction of n-alkanes predominating in tridecane,” Biotechnol. Bioeng., vol. 10, no. 4, pp. 511–533, 1968.
[48] M. West, G. W. Emerson, and P. A. Sullivan, “Purification and properties of two lactose hydrolases from Trichosporon cutaneum,” J. Gen. Microbiol., vol. 136, no. 8, pp. 1483–1490, Aug. 1990.
[49] X. Yang et al., “Simultaneous utilization of glucose and mannose from spent yeast cell mass for lipid production by Lipomyces starkeyi,” Bioresour. Technol., vol. 158, pp. 383–387, Apr. 2014.
[50] X. Yu, Y. Zheng, X. Xiong, and S. Chen, “Co-utilization of glucose, xylose and cellobiose by the oleaginous yeast Cryptococcus curvatus,” Biomass and Bioenergy, vol. 71, pp. 340–349, Dec. 2014.
[51] C. Görner, V. Redai, F. Bracharz, P. Schrepfer, D. Garbe, and T. Brück, “Genetic engineering and production of modified fatty acids by the non-conventional oleaginous yeast Trichosporon oleaginosus ATCC 20509,” Green Chem., vol. 18, no. 7, pp. 2037–2046, Mar. 2016.
[52] S. Fakas, S. Papanikolaou, A. Batsos, M. Galiotou-Panayotou, A. Mallouchos, and G. Aggelis, “Evaluating renewable carbon sources as substrates for single cell oil
IV Bibliography __________________________________________________________________________
∼ 134 ∽
production by Cunninghamella echinulata and Mortierella isabellina,” Biomass and Bioenergy, vol. 33, no. 4, pp. 573–580, Apr. 2009.
[53] X. Yu, J. Zeng, Y. Zheng, and S. Chen, “Effect of lignocellulose degradation products on microbial biomass and lipid production by the oleaginous yeast Cryptococcus curvatus,” Process Biochem., vol. 49, no. 3, pp. 457–465, Mar. 2014.
[54] S. Wu, X. Zhao, H. Shen, Q. Wang, and Z. K. Zhao, “Microbial lipid production by Rhodosporidium toruloides under sulfate-limited conditions,” Bioresour. Technol., vol. 102, no. 2, pp. 1803–1807, 2011.
[55] S. Wu, C. Hu, G. Jin, X. Zhao, and Z. K. Zhao, “Phosphate-limitation mediated lipid production by Rhodosporidium toruloides,” Bioresour. Technol., vol. 101, no. 15, pp. 6124–6129, Aug. 2010.
[56] Y. Li, Z. Zhao, and F. Bai, “High-density cultivation of oleaginous yeast Rhodosporidium toruloides Y4 in fed-batch culture,” Enzyme Microb. Technol., vol. 41, no. 3, pp. 312–317, 2007.
[57] W.-S. Park, P. A. Murphy, and B. A. Glatz, “Lipid metabolism and cell composition of the oleaginous yeast Apiotrichum curvatum grown at different carbon to nitrogen ratios,” Can. J. Microbiol., vol. 36, no. 5, pp. 318–326, 1990.
[58] A. Ykema, E. C. Verbree, M. M. Kater, and H. Smit, “Optimization of lipid production in the oleaginous yeast Apiotrichum curvatum in wheypermeate,” Appl. Microbiol. Biotechnol., vol. 29, no. 2–3, pp. 211–218, Sep. 1988.
[59] S. Larsson et al., “The generation of fermentation inhibitors during dilute acid hydrolysis of softwood,” Enzyme Microb. Technol., vol. 24, no. 3, pp. 151–159, 1999.
[60] Z. Ruan, “Developing Novel Biological Processes to Convert Lignocellulose into lipid based biofuel,” Michigan State University, 2014.
[61] X. Yu, Y. Zheng, K. M. Dorgan, and S. Chen, “Oil production by oleaginous yeasts using the hydrolysate from pretreatment of wheat straw with dilute sulfuric acid,” Bioresour. Technol., vol. 102, no. 10, pp. 6134–6140, May 2011.
[62] G. Christophe, J. L. Deo, V. Kumar, R. Nouaille, P. Fontanille, and C. Larroche, “Production of oils from acetic acid by the oleaginous yeast Cryptococcus curvatus,” Appl. Biochem. Biotechnol., vol. 167, no. 5, pp. 1270–1279, 2012.
[63] Z. Chi, Y. Zheng, J. Ma, and S. Chen, “Oleaginous yeast Cryptococcus curvatus culture with dark fermentation hydrogen production effluent as feedstock for microbial lipid production,” Int. J. Hydrogen Energy, vol. 36, no. 16, pp. 9542–9550, Aug. 2011.
[64] Y. Cui, J. W. Blackburn, and Y. Liang, “Fermentation optimization for the production of lipid by Cryptococcus curvatus: Use of response surface methodology,” Biomass and Bioenergy, vol. 47, pp. 410–417, Dec. 2012.
[65] G. H. Fleet, “Composition and Structure of Yeast Cell Walls,” Springer New York, 1985, pp. 24–56.
[66] P. A. Sullivan, C. Y. Yin, C. Molloy, M. D. Templeton, and M. G. Shepherd, “An analysis of the metabolism and cell wall composition of Candida albicans during germ-tube formation.,” Can. J. Microbiol., vol. 29, no. 11, pp. 1514–25, Nov. 1983.
[67] U. a Ochsner, V. Glumoff, M. Kälin, a Fiechter, and J. Reiser, “Genetic transformation of auxotrophic mutants of the filamentous yeast Trichosporon cutaneum using homologous and heterologous marker genes.,” Yeast, vol. 7, no. 5, pp. 513–524, 1991.
[68] C. T. Evans and C. Ratledge, “The Physiological Significance of Citric Acid in the Control of Metabolism in Lipid-Accumulating Yeasts,” Biotechnol. Genet. Eng. Rev., vol. 3, no.
IV Bibliography __________________________________________________________________________
∼ 135 ∽
February 2015, pp. 349–376, 1985.
[69] S. S. Tchakouteu, A. Chatzifragkou, O. Kalantzi, A. a. Koutinas, G. Aggelis, and S. Papanikolaou, “Oleaginous yeast Cryptococcus curvatus exhibits interplay between biosynthesis of intracellular sugars and lipids,” Eur. J. Lipid Sci. Technol., vol. 117, no. 5, p. n/a, May 2015.
[70] P. Meeuwse, “Production of fungal lipids Kinetic modeling and process design,” Wageningen, 2011.
[71] R. S. Moreton, Single cell oil. Longman Scientific & Technical, 1988.
[72] N. J. Moon and E. G. Hammond, “Oil production by fermentation of lactose and the effect of temperature on the fatty acid composition1,” J. Am. Oil Chem. Soc., vol. 55, no. 10, pp. 683–688, Oct. 1978.
[73] R. S. Moreton, “Modification of fatty acid composition of lipid accumulating yeasts with cyclopropene fatty acid desaturase inhibitors,” Appl. Microbiol. Biotechnol., vol. 22, no. 1, pp. 41–45, 1985.
[74] I. R. Sitepu et al., “Manipulation of culture conditions alters lipid content and fatty acid profiles of a wide variety of known and new oleaginous yeast species,” Bioresour. Technol., vol. 144, pp. 360–369, Sep. 2013.
[75] C. Ratledge, “Regulation of lipid accumulation in oleaginous micro-organisms.,” Biochem. Soc. Trans., vol. 30, no. Pt 6, pp. 1047–1050, 2002.
[76] B. G. Park, M. Kim, J. Kim, H. Yoo, and B.-G. Kim, “Systems biology for understanding and engineering of heterotrophic oleaginous microorganisms,” Biotechnol. J., vol. 12, no. 1, p. 1600104, Jan. 2017.
[77] C. Ratledge and Z. Cohen, “Microbial and algal oils: Do they have a future for biodiesel or as commodity oils?,” Lipid Technol., vol. 20, no. 7, pp. 155–160, Jul. 2008.
[78] B. D. Brown, “A kinetic study on the oleaginous yeast, Candda curvata D,” Iowa State University, 1984.
[79] Y. Zheng, Z. Chi, and S. Chen, “Biodiesel and Biohydrogen Co-Production with Treatment of High Solid Food Waste Final Report Biodiesel and Biohydrogen Co-Production with Treatment of High Solid Food Waste Ecology Publication Number 09-07-065,” 2009.
[80] E. Z. Vega, B. A., and E. G. Glatz, “Optimization of Banana Juice Fermentation for the Production of Microbial Oil,” Appl. Environ. Microbiol., vol. 54, no. 3, pp. 748–752, 1988.
[81] B. Douglas Brown, K. H. Hsu, E. G. Hammond, and B. A. Glatz, “A relationship between growth and lipid accumulation in Candida curvata D,” J. Ferment. Bioeng., vol. 68, no. 5, pp. 344–352, 1989.
[82] A. Ykema, E. C. Verbree, H. J. J. Nijkamp, and H. Smit, “Isolation and characterization of fatty acid auxotrophs from the oleaginous yeast Apiotrichum curvatum,” Appl. Microbiol. Biotechnol., vol. 32, no. 1, pp. 76–84, 1989.
[83] I. G. S. I. G. S. Verwoert et al., “Modification of the fatty-acid composition in lipids of the oleaginous yeast Apiotrichum curvatum by intraspecific spheroplast fusion,” Appl. Microbiol. Biotechnol., vol. 32, no. 3, pp. 327–333, 1989.
[84] A. Ykema, E. C. Verbree, I. I. G. S. Verwoert, K. H. van der Linden, H. J. J. Nijkamp, and H. Smit, “Lipid production of revertants of Ufa mutants from the oleaginous yeast Apiotrichum curvatum,” Appl. Microbiol. Biotechnol., vol. 33, no. 2, pp. 176–182, May 1990.

IV Bibliography __________________________________________________________________________
∼ 136 ∽
[85] A. Ykema, M. M. Kater, and H. Smit, “Lipid production in wheypermeate by an unsaturated fatty acid mutant of the oleaginous yeastApiotrichum curvatum,” Biotechnol. Lett., vol. 11, no. 7, pp. 477–482, Jul. 1989.
[86] M. Hassan, P. J. Blanc, A. Pareilleux, and G. Goma, “Selection of fatty acid auxotrophs from the oleaginous yeast Cryptococcus curvatus and production of cocoa butter equivalents in batch culture,” Biotechnol. Lett., vol. 16, no. 8, pp. 819–824, Aug. 1994.
[87] N. J. Moon and E. G. Hammond, “Process for converting whey permeate to oil-containing yeast,” 4235933, 25-Nov-1980.
[88] Z. Xue et al., “Production of omega-3 eicosapentaenoic acid by metabolic engineering of Yarrowia lipolytica.,” Nat. Biotechnol., vol. 31, no. 8, pp. 734–740, Jul. 2013.
[89] G.-Y. Wang, Y. Zhang, Z.-M. Chi, G.-L. Liu, Z.-P. Wang, and Z.-M. Chi, “Role of pyruvate carboxylase in accumulation of intracellular lipid of the oleaginous yeast Yarrowia lipolytica ACA-DC 50109,” Appl. Microbiol. Biotechnol., vol. 99, no. 4, pp. 1637–1645, Feb. 2015.
[90] R. Ledesma-Amaro and J.-M. Nicaud, “Yarrowia lipolytica as a biotechnological chassis to produce usual and unusual fatty acids,” Prog. Lipid Res., vol. 61, pp. 40–50, Jan. 2016.
[91] J. Blazeck et al., “Harnessing Yarrowia lipolytica lipogenesis to create a platform for lipid and biofuel production,” Nat. Commun., vol. 5, p. 3131, Jan. 2014.
[92] J. Blazeck, A. Hill, M. Jamoussi, A. Pan, J. Miller, and H. S. Alper, “Metabolic engineering of Yarrowia lipolytica for itaconic acid production,” Metab. Eng., vol. 32, pp. 66–73, 2015.
[93] X. Zhao, X. Kong, Y. Hua, B. Feng, and Z. Zhao, “Medium optimization for lipid production through co-fermentation of glucose and xylose by the oleaginous yeastLipomyces starkeyi,” Eur. J. Lipid Sci. Technol., vol. 110, no. 5, pp. 405–412, 2008.
[94] M. L. Kelley, Ž. Strezoska, K. He, A. Vermeulen, and A. van B. Smith, “Versatility of chemically synthesized guide RNAs for CRISPR-Cas9 genome editing,” J. Biotechnol., vol. 233, pp. 74–83, Sep. 2016.
[95] T. Tanaka et al., “A hidden pitfall in the preparation of agar media undermines microorganism cultivability.,” Appl. Environ. Microbiol., vol. 80, no. 24, pp. 7659–66, Dec. 2014.
[96] T. L. Hartman, “The Use of Sudan Black B as a Bacterial Fat Stain,” Stain Technol., Jul. 2009.
[97] C. T. Evans, C. Ratledge, and S. C. Gilbert, “A rapid screening method for lipid-accumulating yeast using a replica-printing technique,” J. Microbiol. Methods, vol. 4, no. 3–4, pp. 203–210, 1985.
[98] P. Greenspan, E. P. Mayer, and S. D. Fowler, “Nile red: a selective fluorescent stain for intracellular lipid droplets.,” J. Cell Biol., vol. 100, no. 3, pp. 965–73, Mar. 1985.
[99] P. Greenspan and S. D. Fowler, “Spectrofluorometric studies of the lipid probe, nile red.,” J. Lipid Res., vol. 26, no. 7, pp. 781–789, 1985.
[100] K. E. Cooksey, J. B. Guckert, S. A. Williams, and P. R. Callis, “Fluorometric determination of the neutral lipid content of microalgal cells using Nile Red,” J. Microbiol. Methods, vol. 6, no. 6, pp. 333–345, Sep. 1987.
[101] K. Kimura, M. Yamaoka, and Y. Kamisaka, “Rapid estimation of lipids in oleaginous fungi and yeasts using Nile red fluorescence.,” J. Microbiol. Methods, vol. 56, no. 3, pp. 331–8, Mar. 2004.
IV Bibliography __________________________________________________________________________
∼ 137 ∽
[102] Y. Kamisaka, N. Noda, T. Sakai, and K. Kawasaki, “Lipid bodies and lipid body formation in an oleaginous fungus, Mortierella ramanniana var. angulispora,” Biochim. Biophys. Acta - Mol. Cell Biol. Lipids, vol. 1438, no. 2, pp. 185–198, May 1999.
[103] T. A. Cole, A. K. Fok, M. S. Ueno, and R. D. Allen, “Use of nile red as a rapid measure of lipid content in ciliates.,” Eur. J. Protistol., vol. 25, no. 4, pp. 361–8, Jun. 1990.
[104] “A.I.M. Interview: Dr. Keith Cooksey,” Algae Industry Magazine, 2011. [Online]. Available: http://www.algaeindustrymagazine.com/aim-interview-dr-keith-cooksey/. [Accessed: 13-May-2016].
[105] I. R. Sitepu et al., “An improved high-throughput Nile red fluorescence assay for estimating intracellular lipids in a variety of yeast species,” J. Microbiol. Methods, vol. 91, no. 2, pp. 321–328, 2012.
[106] M. J. Griffiths, R. P. van Hille, and S. T. L. Harrison, “Selection of direct transesterification as the preferred method for assay of fatty acid content of microalgae.,” Lipids, vol. 45, no. 11, pp. 1053–60, Nov. 2010.
[107] J. Folch, M. Lees, and S. G. H. Sloane, “A simple method for the isolation and purification of total lipides from animal tissues.,” J. Biol. Chem., vol. 226, no. 1, pp. 497–509, May 1957.
[108] “How do I determine the concentration, yield and purity of a DNA sample?” [Online]. Available: https://www.promega.de/resources/pubhub/enotes/how-do-i-determine-the-concentration-yield-and-purity-of-a-dna-sample. [Accessed: 13-May-2016].
[109] J. Rajendhran and P. Gunasekaran, “Microbial phylogeny and diversity: Small subunit ribosomal RNA sequence analysis and beyond,” Microbiol. Res., vol. 166, no. 2, pp. 99–110, 2011.
[110] “Lehrstuhl für Terrestrische Ökologie - Universität Leipzig,” François Buscot, 2016. [Online]. Available: http://www.uni-leipzig.de/~terroek/.
[111] V. Glumoff, O. Käppeli, A. Fiechter, and J. Reiser, “Genetic transformation of the filamentous yeast, Trichosporon cutaneum, using dominant selection markers.,” Gene, vol. 84, no. 2, pp. 311–8, Dec. 1989.
[112] N. E. Biolabs, “Gibson Assembly Master Mix,” Manual, pp. 1–16, 2012.
[113] A. Wach, A. Brachat, R. Pöhlmann, and P. Philippsen, “New heterologous modules for classical or PCR-based gene disruptions inSaccharomyces cerevisiae,” Yeast, vol. 10, no. 13, pp. 1793–1808, Dec. 1994.
[114] Z. Zheng, A. Hayashimoto2, Z. Li, and N. Murai, “Hygromycin Resistance Gene Cassettes for Vector Construction and Selection of Transformed Rice Protoplasts’,” Plant Physiol, vol. 97, pp. 832–835, 1991.
[115] Y. Gao and Y. Zhao, “Self-processing of ribozyme-flanked RNAs into guide RNAs in vitro and in vivo for CRISPR-mediated genome editing,” J. Integr. Plant Biol., vol. 56, no. 4, pp. 343–349, 2014.
[116] J. Berman and P. E. Sudbery, “Candida albicans: A molecular revolution built on lessons from budding yeast,” Nat. Rev. Genet., vol. 3, no. 12, pp. 918–932, Dec. 2002.
[117] S. Das, J. C. Noe, S. Paik, and T. Kitten, “An improved arbitrary primed PCR method for rapid characterization of transposon insertion sites,” J. Microbiol. Methods, vol. 63, no. 1, pp. 89–94, Oct. 2005.
[118] E. V. Minikel, “Arbitrarily Primed Pcr,” 2014. [Online]. Available: http://www.cureffi.org/media/2014/10/arbitrarily-primed-pcr.png. [Accessed: 17-Feb-2017].

IV Bibliography __________________________________________________________________________
∼ 138 ∽
[119] F. Winston, “EMS and UV Mutagenesis in Yeast,” in Current Protocols in Molecular Biology, no. SUPPL. 82, F. M. Ausubel, R. Brent, R. E. Kingston, D. D. Moore, J. G. Seidman, J. A. Smith, and K. Struhl, Eds. Hoboken, NJ, USA: John Wiley & Sons, Inc, 2001, pp. 1–5.
[120] “How to use chemical mutagens for mutagenesis. Hirokazu Inoue Background During the 1970s, de Serres and his colleagues (Brockman,” Mutagenesis, pp. 1970–1972, 1988.
[121] G. Barth et al., “Physiology and genetics of the dimorphic fungus Yarrowia lipolytica,” FEMS Microbiol. Rev., vol. 19, no. 4, pp. 219–237, Apr. 1997.
[122] M. Kahm, G. Hasenbrink, H. Lichtenberg-frate, J. Ludwig, and M. Kschischo, “Grofit: Fitting biological growth curves,” J. Stat. Softw., vol. 33, no. 7, pp. 1–21, 2010.
[123] “JGI MycoCosm Trichosporon oleaginosus Genome.” [Online]. Available: http://genome.jgi.doe.gov/Triol1/Triol1.home.html. [Accessed: 11-May-2016].
[124] B. J. Haas et al., “De novo transcript sequence reconstruction from RNA-seq using the Trinity platform for reference generation and analysis.,” Nat. Protoc., vol. 8, no. 8, pp. 1494–512, Aug. 2013.
[125] “Notepad++.” [Online]. Available: https://notepad-plus-plus.org/. [Accessed: 11-May-2016].
[126] “Correspondence Analysis of Codon Usage.” [Online]. Available: http://codonw.sourceforge.net/. [Accessed: 11-May-2016].
[127] Y. Nakamura, T. Gojobori, and T. Ikemura, “Codon usage tabulated from international DNA sequence databases: status for the year 2000.,” Nucleic Acids Res., vol. 28, no. 1, p. 292, Jan. 2000.
[128] G. Wu, D. E. Culley, and W. Zhang, “Predicted highly expressed genes in the genomes of Streptomyces coelicolor and Streptomyces avermitilis and the implications for their metabolism.,” Microbiology, vol. 151, no. Pt 7, pp. 2175–87, Jul. 2005.
[129] P. Puigbò, I. G. Bravo, and S. Garcia-Vallve, “CAIcal: a combined set of tools to assess codon usage adaptation.,” Biol. Direct, vol. 3, p. 38, Jan. 2008.
[130] O. Zaragoza and J. M. Gancedo, “Pseudohyphal growth is induced in Saccharomyces cerevisiae by a combination of stress and cAMP signalling.,” Antonie Van Leeuwenhoek, vol. 78, no. 2, pp. 187–94, Aug. 2000.
[131] B. Aricha et al., “Differences in membrane fluidity and fatty acid composition between phenotypic variants of Streptococcus pneumoniae.,” J. Bacteriol., vol. 186, no. 14, pp. 4638–44, Jul. 2004.
[132] H. Guillou, D. Zadravec, P. G. P. Martin, and A. Jacobsson, “The key roles of elongases and desaturases in mammalian fatty acid metabolism: Insights from transgenic mice,” Prog. Lipid Res., vol. 49, no. 2, pp. 186–199, 2010.
[133] L. Aymé, S. Baud, B. Dubreucq, F. Joffre, and T. Chardot, “Function and Localization of the Arabidopsis thaliana Diacylglycerol Acyltransferase DGAT2 Expressed in Yeast,” PLoS One, vol. 9, no. 3, p. e92237, Mar. 2014.
[134] D. Lamers et al., “Selection of oleaginous yeasts for fatty acid production.,” BMC Biotechnol., vol. 16, no. 1, p. 45, May 2016.
[135] S. Papanikolaou and G. Aggelis, “Yarrowia lipolytica: A model microorganism used for the production of tailor-made lipids,” Eur. J. Lipid Sci. Technol., vol. 112, no. 6, pp. 639–654, Apr. 2010.

IV Bibliography __________________________________________________________________________
∼ 139 ∽
[136] H. Takeda, “Classification of Chlorella strains by cell wall sugar composition,” Phytochemistry, vol. 27, no. 12, pp. 3823–3826, 1988.
[137] R. Ptacnik, T. Andersen, and T. Tamminen, “Performance of the Redfield Ratio and a Family of Nutrient Limitation Indicators as Thresholds for Phytoplankton N vs. P Limitation,” Ecosystems, vol. 13, no. 8, pp. 1201–1214, Dec. 2010.
[138] L. Mezger-Freed, “Effect of Ploidy and Mutagens on Bromodeoxyuridine Resistance in Haploid and Diploid Frog Cells,” Nat. New Biol., vol. 235, no. 60, pp. 245–246, Feb. 1972.
[139] X. Bin Zhang and Y. Ohta, “Binding of Mutagens by Fractions of the Cell Wall Skeleton of Lactic Acid Bacteria on Mutagens,” J. Dairy Sci., vol. 74, no. 5, pp. 1477–1481, May 1991.
[140] J. Haigh, “The accumulation of deleterious genes in a population—Muller’s Ratchet,” Theor. Popul. Biol., vol. 14, no. 2, pp. 251–267, Oct. 1978.
[141] M. F. Montero, M. Aristizábal, and G. García Reina, “Isolation of high-lipid content strains of the marine microalga Tetraselmis suecica for biodiesel production by flow cytometry and single-cell sorting,” J. Appl. Phycol., vol. 23, no. 6, pp. 1053–1057, 2011.
[142] M. Terashima, E. S. Freeman, R. E. Jinkerson, and M. C. Jonikas, “A fluorescence-activated cell sorting-based strategy for rapid isolation of high-lipid Chlamydomonas mutants.,” Plant J., vol. 81, no. 1, pp. 147–59, Jan. 2015.
[143] B. Xie et al., “High-throughput fluorescence-activated cell sorting for lipid hyperaccumulating Chlamydomonas reinhardtii mutants.,” Plant Biotechnol. J., vol. 12, no. 7, pp. 872–82, Sep. 2014.
[144] D. K. Y. Lim, H. Schuhmann, K. Sharma, and P. M. Schenk, “Isolation of High-Lipid Tetraselmis suecica Strains Following Repeated UV-C Mutagenesis, FACS, and High-Throughput Growth Selection,” BioEnergy Res., vol. 8, no. 2, pp. 750–759, Nov. 2014.
[145] L. Liu, A. Pan, C. Spofford, N. Zhou, and H. S. Alper, “An evolutionary metabolic engineering approach for enhancing lipogenesis in Yarrowia lipolytica,” Metab. Eng., vol. 29, pp. 36–45, 2015.
[146] T. Braunwald et al., “Effect of different C/N ratios on carotenoid and lipid production by Rhodotorula glutinis,” Appl. Microbiol. Biotechnol., vol. 97, no. 14, pp. 6581–6588, 2013.
[147] M. Hassan, P. J. Blanc, L.-M. Granger, A. Pareilleux, and G. Goma, “Influence of nitrogen and iron limitations on lipid production by Cryptococcus curvatus grown in batch and fed-batch culture,” Process Biochem., vol. 31, no. 4, pp. 355–361, May 1996.
[148] C. T. Evans and C. Ratledge, “Effect of Nitrogen Source on Lipid Accumulation in Oleaginous Yeasts,” J. Gen. Microbiol., vol. 130, pp. 1693–1704, 1984.
[149] C. Ratledge, “The role of malic enzyme as the provider of NADPH in oleaginous microorganisms: A reappraisal and unsolved problems,” Biotechnol. Lett., vol. 36, no. 8, pp. 1557–1568, 2014.
[150] I. A. Calvo et al., “Genome-wide screen of genes required for caffeine tolerance in fission yeast.,” PLoS One, vol. 4, no. 8, p. e6619, Jan. 2009.
[151] S. Mukaida, T. Ogawa, K. Ohishi, Y. Tanizawa, D. Ohta, and M. Arita, “The effect of rapamycin on biodiesel-producing protist Euglena gracilis,” Biosci. Biotechnol. Biochem., vol. 80, no. 6, pp. 1223–1229, Jun. 2016.
[152] J. Rumin et al., “The use of fluorescent Nile red and BODIPY for lipid measurement in microalgae.,” Biotechnol. Biofuels, vol. 8, p. 42, 2015.
IV Bibliography __________________________________________________________________________
∼ 140 ∽
[153] J. B. Madeira, C. A. Masuda, C. M. Maya-Monteiro, G. S. Matos, M. Montero-Lomelí, and B. L. Bozaquel-Morais, “TORC1 inhibition induces lipid droplet replenishment in yeast.,” Mol. Cell. Biol., vol. 35, no. 4, pp. 737–46, 2015.
[154] N. F. Brown, M. Stefanovic-Racic, I. J. Sipula, and G. Perdomo, “The mammalian target of rapamycin regulates lipid metabolism in primary cultures of rat hepatocytes,” Metabolism., vol. 56, no. 11, pp. 1500–1507, 2007.
[155] F. J. Richards, “A Flexible Growth Function for Empirical Use,” J. Exp. Bot., vol. 10, no. 2, pp. 290–301, 1959.
[156] K. Hedbacker and M. Carlson, “SNF1/AMPK pathways in yeast.,” Front. Biosci., vol. 13, pp. 2408–20, 2008.
[157] M. Zhang, L. Galdieri, and A. Vancura, “The yeast AMPK homolog SNF1 regulates acetyl coenzyme A homeostasis and histone acetylation.,” Mol. Cell. Biol., vol. 33, no. 23, pp. 4701–4717, 2013.
[158] R. Wang and B. Levine, “Autophagy in cellular growth control,” FEBS Lett., vol. 584, no. 7, pp. 1417–1426, 2010.
[159] J. Huang and D. M. Brendan, “The TSC1–TSC2 complex: a molecular switchboard controlling cell growth,” Biochem. J., vol. 290, no. 5497, pp. 1717–1721, 2009.
[160] E. Jacinto, “What controls TOR?,” IUBMB Life, vol. 60, no. 8, pp. 483–496, 2008.
[161] J. Choi, J. Chen, S. L. Schreiber, and J. Clardy, “Structure of the FKBP12-rapamycin complex interacting with the binding domain of human FRAP.,” Science, vol. 273, no. 5272, pp. 239–42, Jul. 1996.
[162] N. Chantaravisoot and F. Tamanoi, “mTOR Signaling and Human Cancer,” in Structure, Function and Regulation of TOR complexes from Yeasts to Mammals Part B, vol. 28, no. 10, Cambridge: Academic Press, 2010, pp. 301–316.
[163] N. Cybulski and M. N. Hall, “TOR complex 2: a signaling pathway of its own,” Trends Biochem. Sci., vol. 34, no. 12, pp. 620–627, 2009.
[164] L. Zhang, N. Liu, X. Ma, and L. Jiang, “The transcriptional control machinery as well as the cell wall integrity and its regulation are involved in the detoxification of the organic solvent dimethyl sulfoxide in Saccharomyces cerevisiae,” FEMS Yeast Res., vol. 13, no. 2, pp. 200–218, Mar. 2013.
[165] Y. Chen and D. J. Klionsky, “The regulation of autophagy - unanswered questions.,” J. Cell Sci., vol. 124, no. Pt 2, pp. 161–170, 2011.
[166] D. Laor, A. Cohen, M. Kupiec, and R. Weisman, “TORC1 Regulates Developmental Responses to Nitrogen Stress via Regulation of the GATA Transcription Factor Gaf1,” MBio, vol. 6, no. 4, pp. e00959-15, Sep. 2015.
[167] M. Yanagida, N. Ikai, M. Shimanuki, and K. Sajiki, “Nutrient limitations alter cell division control and chromosome segregation through growth-related kinases and phosphatases.,” Philos. Trans. R. Soc. Lond. B. Biol. Sci., vol. 366, no. 1584, pp. 3508–20, Dec. 2011.
[168] T. Matsuo, Y. Otsubo, J. Urano, F. Tamanoi, and M. Yamamoto, “Loss of the TOR Kinase Tor2 Mimics Nitrogen Starvation and Activates the Sexual Development Pathway in Fission Yeast,” Mol. Cell. Biol., vol. 27, no. 8, pp. 3154–3164, 2007.
[169] R. Weisman, A. Cohen, and S. M. Gasser, “TORC2--a new player in genome stability,” EMBO Mol. Med., vol. 6, no. 8, pp. 995–1002, Aug. 2014.
[170] N. Ikai, N. Nakazawa, T. Hayashi, and M. Yanagida, “The reverse, but coordinated, roles

IV Bibliography __________________________________________________________________________
∼ 141 ∽
of Tor2 (TORC1) and Tor1 (TORC2) kinases for growth, cell cycle and separase-mediated mitosis in Schizosaccharomyces pombe.,” Open Biol., vol. 1, no. 3, p. 110007, 2011.
[171] A. Pic et al., “The forkhead protein Fkh2 is a component of the yeast cell cycle transcription factor SFF,” EMBO J., vol. 19, no. 14, pp. 3750–3761, Jul. 2000.
[172] P. C. Hollenhorst, M. E. Bose, M. R. Mielke, U. Müller, and C. A. Fox, “Forkhead genes in transcriptional silencing, cell morphology and the cell cycle: Overlapping and distinct functions for FKH1 and FKH2 in Saccharomyces cerevisiae,” Genetics, vol. 154, no. 4, pp. 1533–1548, 2000.
[173] W. Du, G. M. Forte, D. Smith, and J. Petersen, “Phosphorylation of the amino-terminus of the AGC kinase Gad8 prevents its interaction with TORC2,” Open Biol., vol. 6, no. 3, p. 150189, Mar. 2016.
[174] H. Lee, A. Khanal Lamichhane, H. M. Garraffo, K. J. Kwon-Chung, and Y. C. Chang, “Involvement of PDK1, PKC and TOR signalling pathways in basal fluconazole tolerance in Cryptococcus neoformans.,” Mol. Microbiol., vol. 84, no. 1, pp. 130–46, Apr. 2012.
[175] C. Gaubitz et al., “Molecular Basis of the Rapamycin Insensitivity of Target Of Rapamycin Complex 2,” Mol. Cell, vol. 58, no. 6, pp. 977–988, 2015.
[176] D. D. Sarbassov et al., “Prolonged Rapamycin Treatment Inhibits mTORC2 Assembly and Akt/PKB,” Mol. Cell, vol. 22, no. 2, pp. 159–168, Apr. 2006.
[177] U. Roymondal, S. Das, and S. Sahoo, “Predicting gene expression level from relative codon usage bias: an application to Escherichia coli genome.,” DNA Res., vol. 16, no. 1, pp. 13–30, Feb. 2009.
[178] M. Allert, J. C. Cox, and H. W. Hellinga, “Multifactorial determinants of protein expression in prokaryotic open reading frames.,” J. Mol. Biol., vol. 402, no. 5, pp. 905–18, Oct. 2010.
[179] “Structural Genomics Resource.” [Online]. Available: http://www.ysbl.york.ac.uk/sgTarget/help_selection.html. [Accessed: 13-May-2016].
[180] B. Chen et al., “Two types of soybean diacylglycerol acyltransferases are differentially involved in triacylglycerol biosynthesis and response to environmental stresses and hormones,” Sci. Rep., vol. 6, p. 28541, Jun. 2016.
[181] Y. Kamisaka, N. Tomita, K. Kimura, K. Kainou, and H. Uemura, “DGA1 (diacylglycerol acyltransferase gene) overexpression and leucine biosynthesis significantly increase lipid accumulation in the Δsnf2 disruptant of Saccharomyces cerevisiae,” Biochem. J., vol. 408, no. 1, pp. 61–68, 2007.
[182] A. Beopoulos, R. Haddouche, P. Kabran, T. Dulermo, T. Chardot, and J. M. Nicaud, “Identification and characterization of DGA2, an acyltransferase of the DGAT1 acyl-CoA:diacylglycerol acyltransferase family in the oleaginous yeast Yarrowia lipolytica. New insights into the storage lipid metabolism of oleaginous yeasts,” Appl. Microbiol. Biotechnol., vol. 93, no. 4, pp. 1523–1537, 2012.
[183] A. M. Silverman, K. Qiao, P. Xu, and G. Stephanopoulos, “Functional overexpression and characterization of lipogenesis-related genes in the oleaginous yeast Yarrowia lipolytica,” Appl. Microbiol. Biotechnol., pp. 3781–3798, 2016.
[184] A. M. Sanghvi and Y. M. Lo, “Present and potential industrial applications of macro- and microalgae.,” Recent Pat. Food. Nutr. Agric., vol. 2, no. 3, pp. 187–194, 2010.
[185] P. Schlagermann, G. Göttlicher, R. Dillschneider, R. Rosello-Sastre, and C. Posten, “Composition of Algal Oil and Its Potential as Biofuel,” J. Combust., vol. 2012, pp. 1–14,

IV Bibliography __________________________________________________________________________
∼ 142 ∽
2012.
[186] A. I. Barros, A. L. Gonçalves, M. Simões, and J. C. M. Pires, “Harvesting techniques applied to microalgae: A review,” Renew. Sustain. Energy Rev., vol. 41, pp. 1489–1500, 2015.
[187] E. Molina Grima, E.-H. Belarbi, F. G. Acién Fernández, A. Robles Medina, and Y. Chisti, “Recovery of microalgal biomass and metabolites: process options and economics,” Biotechnol. Adv., vol. 20, no. 7–8, pp. 491–515, 2003.
[188] K.-Y. Show, D.-J. Lee, J.-H. Tay, T.-M. Lee, and J.-S. Chang, “Microalgal drying and cell disruption – Recent advances,” Bioresour. Technol., vol. 184, pp. 258–266, 2015.
[189] A. J. Dassey and C. S. Theegala, “Harvesting economics and strategies using centrifugation for cost effective separation of microalgae cells for biodiesel applications,” Bioresour. Technol., vol. 128, pp. 241–245, Jan. 2013.
[190] N. Rossignol, L. Vandanjon, P. Jaouen, and F. Quéméneur, “Membrane technology for the continuous separation microalgae/culture medium: compared performances of cross-flow microfiltration and ultrafiltration,” Aquac. Eng., vol. 20, no. 3, pp. 191–208, 1999.
[191] J. Masson, E. Liberto, J. C. Beolor, H. Brevard, C. Bicchi, and P. Rubiolo, “Oxygenated heterocyclic compounds to differentiate Citrus spp. essential oils through metabolomic strategies,” Food Chem., vol. 206, pp. 223–233, 2016.
[192] J. Hanotu, H. C. H. Bandulasena, and W. B. Zimmerman, “Microflotation performance for algal separation,” Biotechnol. Bioeng., vol. 109, no. 7, pp. 1663–1673, Jul. 2012.
[193] A. K. Lee, D. M. Lewis, P. J. Ashman, A. K. Lee, D. M. Lewis, and P. J. Ashman, “Harvesting of marine microalgae by electroflocculation: The energetics, plant design, and economics,” Appl. Energy, vol. 108, no. C, pp. 45–53, 2013.
[194] S. Şirin, R. Trobajo, C. Ibanez, and J. Salvadó, “Harvesting the microalgae Phaeodactylum tricornutum with polyaluminum chloride, aluminium sulphate, chitosan and alkalinity-induced flocculation,” J. Appl. Phycol., vol. 24, no. 5, pp. 1067–1080, Oct. 2012.
[195] W. Zhou et al., “Filamentous fungi assisted bio-flocculation: A novel alternative technique for harvesting heterotrophic and autotrophic microalgal cells,” Sep. Purif. Technol., vol. 107, pp. 158–165, 2013.
[196] L. Pérez, J. L. Salgueiro, R. Maceiras, Á. Cancela, and Á. Sánchez, “An effective method for harvesting of marine microalgae: pH induced flocculation,” Biomass and Bioenergy, vol. 97, pp. 20–26, 2017.
[197] B. Riaño, B. Molinuevo, and M. C. García-González, “Optimization of chitosan flocculation for microalgal-bacterial biomass harvesting via response surface methodology,” Ecol. Eng., vol. 38, no. 1, pp. 110–113, 2012.
[198] Y. Shen, Y. Cui, and W. Yuan, “Flocculation Optimization of Microalga Nannochloropsis oculata,” Appl. Biochem. Biotechnol., vol. 169, no. 7, pp. 2049–2063, Apr. 2013.
[199] D. Surendhiran and M. Vijay, “Exploration on bioflocculation of Nannochloropsis oculata using response surface methodology for biodiesel production.,” ScientificWorldJournal., vol. 2014, p. 202659, 2014.
[200] M. J. Griffiths, R. P. van Hille, and S. T. L. Harrison, “Lipid productivity, settling potential and fatty acid profile of 11 microalgal species grown under nitrogen replete and limited conditions,” J. Appl. Phycol., vol. 24, no. 5, pp. 989–1001, Oct. 2012.
[201] D. L. Sills et al., “Quantitative Uncertainty Analysis of Life Cycle Assessment for Algal
IV Bibliography __________________________________________________________________________
∼ 143 ∽
Biofuel Production,” Environ. Sci. Technol., vol. 47, no. 2, pp. 687–694, Jan. 2013.
[202] A. Sathish and R. C. Sims, “Biodiesel from mixed culture algae via a wet lipid extraction procedure,” Bioresour. Technol., vol. 118, pp. 643–647, Aug. 2012.
[203] R. Plat, “Gravitational and centrifugal oil-water separators with plate pack internals,” Delft University Press, 1994.
[204] D. Vandamme, I. Foubert, and K. Muylaert, “Flocculation as a low-cost method for harvesting microalgae for bulk biomass production,” Trends Biotechnol., vol. 31, no. 4, pp. 233–239, 2013.
[205] L. Christenson and R. Sims, “Production and harvesting of microalgae for wastewater treatment, biofuels, and bioproducts,” Biotechnol. Adv., vol. 29, no. 6, pp. 686–702, 2011.
[206] Huang Haiou, “Microfiltration membrane fouling in water treatment: Impact of chemical attachments,” Beijing Normal University, 2006.
[207] I. Larocque, A. Mazumder, M. Proulx, D. R. Lean, and F. R. Pick, “Sedimentation of algae: relationships with biomass and size distribution,” Can. J. Fish. Aquat. Sci., vol. 53, no. 5, pp. 1133–1142, May 1996.
[208] D. Vandamme, “Flocculation based harvesting processes for microalgae biomass production,” KU Leuven, 2013.
[209] A. Pandey, D. J. D. J. Lee, Y. Chisti, and C. R. Soccol, Biofuels from Algae. Newnes, 2013.
[210] M. Greger, J.-E. Tillberg, and M. Johansson, “Aluminium effects on Scenedesmus obtusiusculus with different phosphorus status. II. Growth, photosynthesis and pH,” Physiol. Plant., vol. 84, no. 2, pp. 202–208, Feb. 1992.
[211] D. Vandamme, I. Foubert, I. Fraeye, B. Meesschaert, and K. Muylaert, “Flocculation of Chlorella vulgaris induced by high pH: Role of magnesium and calcium and practical implications,” Bioresour. Technol., vol. 105, pp. 114–119, 2012.
[212] R. Henderson, S. A. Parsons, and B. Jefferson, “The impact of algal properties and pre-oxidation on solid–liquid separation of algae,” Water Res., vol. 42, no. 8–9, pp. 1827–1845, Apr. 2008.
[213] A. Sukenik and G. Shelef, “Algal autoflocculation: verification and proposed mechanism,” Biotechnol. Bioeng., vol. 26, no. 2, pp. 142–147, Feb. 1984.
[214] A. Sukenik, B. Teltch, A. W. W. Wachs, G. Shelef, I. Nir, and D. Levanon, “Effect of oxidants on microalgal flocculation,” Water Res., vol. 21, no. 5, pp. 533–539, May 1987.
[215] J. Chen and G. Pan, “Harmful algal blooms mitigation using clay/soil/sand modified with xanthan and calcium hydroxide,” J. Appl. Phycol., vol. 24, no. 5, pp. 1183–1189, Oct. 2012.
[216] M.-B. Gidas, O. Garnier, and N. K. Gidas, “Performance Of Chitosan As A PrimaryCoagulant For The Wastewater Treatment,” WIT Trans. Ecol. Environ., vol. 33, 1970.
[217] Separ-Chemie, “Hocheffektive Chemikalien zur industriellen Abwasserreinigung.” [Online]. Available: https://www.separchemie.de/produkte/. [Accessed: 23-Feb-2017].
[218] J. Beltrán-Heredia and J. Sánchez-Martín, “Municipal wastewater treatment by modified tannin flocculant agent,” Desalination, vol. 249, no. 1, pp. 353–358, 2009.
[219] F. Bleeke, M. Milas, D. Winckelmann, and G. Klöck, “Optimization of freshwater microalgal biomass harvest using polymeric flocculants,” Int. Aquat. Res., vol. 7, no. 3,
IV Bibliography __________________________________________________________________________
∼ 144 ∽
pp. 235–244, Sep. 2015.
[220] C. Schulze, J. Reinhardt, M. Wurster, J. G. Ortiz-Tena, V. Sieber, and S. Mundt, “A one-stage cultivation process for lipid- and carbohydrate-rich biomass of Scenedesmus obtusiusculus based on artificial and natural water sources,” Bioresour. Technol., vol. 218, pp. 498–504, 2016.
[221] C. Schulze, M. Wetzel, J. Reinhardt, M. Schmidt, L. Felten, and S. Mundt, “Screening of microalgae for primary metabolites including β-glucans and the influence of nitrate starvation and irradiance on β-glucan production,” J. Appl. Phycol., vol. 28, no. 5, pp. 2719–2725, Oct. 2016.
[222] J. Cabello, M. Morales, and S. Revah, “Dynamic photosynthetic response of the microalga Scenedesmus obtusiusculus to light intensity perturbations,” Chem. Eng. J., vol. 252, pp. 104–111, 2014.
[223] T. J. Monahan, “Effects of organic phosphate on the growth and morphology of Scenedesmus obtusiusculus (Chlorophyceae),” Phycologia, vol. 16, no. 2, pp. 133–137, Jun. 1977.
[224] G. Das, “Aspects of metabolic development in an illuminated synchronous culture of Scenedesmus obtusiusculus,” Can. J. Bot., vol. 51, no. 1, pp. 113–120, Jan. 1973.
[225] I. Sundberg and M. Nilshammar-Holmvall, “The Diurnal Variation in Phosphate Uptake and ATP Level in Relation to Deposition of Starch, Lipid, and Polyphosphate in Synchronized Cells of Scenedesmus,” Zeitschrift für Pflanzenphysiologie, vol. 76, no. 3, pp. 270–279, Sep. 1975.
[226] A. Toledo-Cervantes, M. Morales, E. Novelo, and S. Revah, “Carbon dioxide fixation and lipid storage by Scenedesmus obtusiusculus,” Bioresour. Technol., vol. 130, pp. 652–658, 2013.
[227] M. Nilshammar and B. Walles, “Electron microscope studies on cell differentiation in synchronized cultures of the green alga Scenedesmus,” Protoplasma, vol. 79, no. 3–4, pp. 317–332, Sep. 1974.
[228] M. Nilshammar, B. Walles, and A. Kylin, “The effect of calcium deficiency on the ultrastructure of the green alga Scenedesmus,” Zeitschrift für Pflanzenphysiologie, vol. 66, no. 3, pp. 197–205, Feb. 1972.
[229] B. Nigam and P. Ramanathan, “Application of chitosan as a flocculant for the cultures of the green alga: Scenedesmus acutus.,” Arch. Hydrobiol., vol. 88, no. 3, pp. 378–387, 1980.
[230] D.-G. Kim, “Harvest of Scenedesmus sp. with bioflocculant and reuse of culture medium for subsequent high-density cultures,” Bioresour. Technol., no. 102, pp. 3163–3168, 2011.
[231] S.-L. Guo et al., “Characterization of flocculating agent from the self-flocculating microalga Scenedesmus obliquus AS-6-1 for efficient biomass harvest,” Bioresour. Technol., vol. 145, pp. 285–289, 2013.
[232] M. Greger and M. Johansson, “Aggregation effects due to aluminum adsorption to cell walls of the unicellular green alga Scenedesmus obtusiusculus,” Phycol. Res., vol. 52, pp. 53–58, 2004.
[233] M. Castrillo, L. M. Lucas-Salas, C. Rodríguez-Gil, and D. Martínez, “High pH-induced flocculation–sedimentation and effect of supernatant reuse on growth rate and lipid productivity of Scenedesmus obliquus and Chlorella vulgaris,” Bioresour. Technol., vol. 128, pp. 324–329, Jan. 2013.
IV Bibliography __________________________________________________________________________
∼ 145 ∽
[234] L. Chen, C. Wang, W. Wang, and J. Wei, “Optimal conditions of different flocculation methods for harvesting Scenedesmus sp. cultivated in an open-pond system,” Bioresour. Technol., vol. 133, pp. 9–15, 2013.
[235] J. A. Gerde, L. Yao, J. Lio, Z. Wen, and T. Wang, “Microalgae flocculation: Impact of flocculant type, algae species and cell concentration,” Algal Res., vol. 3, pp. 30–35, 2014.
[236] D. Vandamme, I. Foubert, B. Meesschaert, and K. Muylaert, “Flocculation of microalgae using cationic starch,” J. Appl. Phycol., vol. 22, no. 4, pp. 525–530, Aug. 2010.
[237] J. Liu et al., “Freshwater microalgae harvested via flocculation induced by pH decrease,” Biotechnol. Biofuels, vol. 6, no. 1, p. 98, 2013.
[238] F. Bleeke, G. Quante, D. Winckelmann, and G. Klöck, “Effect of voltage and electrode material on electroflocculation of Scenedesmus acuminatus,” Bioresour. Bioprocess., vol. 2, no. 1, p. 36, Dec. 2015.
[239] K. V. Gorin et al., “Methods coagulation/flocculation and flocculation with ballast agent for effective harvesting of microalgae,” Bioresour. Technol., vol. 193, pp. 178–184, 2015.
[240] J. Morales, J. de la Noüe, and G. Picard, “Harvesting marine microalgae species by chitosan flocculation,” Aquac. Eng., vol. 4, no. 4, pp. 257–270, Jan. 1985.
[241] R. Y. Stanier, R. Kunisawa, M. Mandel, and G. Cohen-Bazire, “Purification and properties of unicellular blue-green algae (order Chroococcales).,” Bacteriol. Rev., vol. 35, no. 2, pp. 171–205, Jun. 1971.
[242] P. Halldal, “Ultraviolet Action Spectra of Photosynthesis and Photosynthetic Inhibition in a Green and a Red Alga,” Physiol. Plant., vol. 17, no. 2, pp. 414–421, Apr. 1964.
[243] W. R. Hill, M. G. Ryon, and E. M. Schilling, “Light Limitation in a Stream Ecosystem: Responses by Primary Producers and Consumers,” Ecology, vol. 76, no. 4, pp. 1297–1309, Jun. 1995.
[244] M. H. Zwietering, I. Jongenburger, F. M. Rombouts, Van ’ A. K., and T. Riet, “Modeling of the Bacterial Growth Curve,” Appl. Environ. Microbiol., pp. 1875–1881, 1990.
[245] Malvern, “Zeta Potential: An Introduction.” .
[246] R. J. Hunter, Zeta potential in colloid science : principles and applications. Academic Press, 1981.
[247] “Diagram of zeta potential and slipping plane.svg - Wikimedia Commons,” 2012. [Online]. Available: https://commons.wikimedia.org/wiki/File:Diagram_of_zeta_potential_and_slipping_plane.svg. [Accessed: 23-Feb-2017].
[248] M. Natrella, NIST/SEMATECH Engineering Statistics Handbook | NIST. NIST/SEMATECH, 2003.
[249] H. Scheffé, “Experiments with mixtures,” J. R. Stat. Soc. Ser. B, vol. 20, no. 2, pp. 344–360, 1958.
[250] M. Castrillo, L. M. M. Lucas-Salas, C. Rodríguez-Gil, and D. Martínez, “High pH-induced flocculation-sedimentation and effect of supernatant reuse on growth rate and lipid productivity of Scenedesmus obliquus and Chlorella vulgaris,” Bioresour. Technol., vol. 128, pp. 324–329, 2013.
[251] R. Divakaran and V. N. Sivasankara Pillai, “Flocculation of algae using chitosan,” J. Appl. Phycol., vol. 14, no. 5, pp. 419–422, 2002.

IV Bibliography __________________________________________________________________________
∼ 146 ∽
[252] S. Fierro, M. del Pilar Sánchez-Saavedra, and C. Copalcúa, “Nitrate and phosphate removal by chitosan immobilized Scenedesmus,” Bioresour. Technol., vol. 99, no. 5, pp. 1274–1279, Mar. 2008.
[253] J. Lee, D.-H. Cho, R. Ramanan, B.-H. Kim, H.-M. Oh, and H.-S. Kim, “Microalgae-associated bacteria play a key role in the flocculation of Chlorella vulgaris,” Bioresour. Technol., vol. 131, pp. 195–201, Mar. 2013.
[254] R. K. Henderson, S. A. Parsons, and B. Jefferson, “Successful Removal of Algae through the Control of Zeta Potential,” Sep. Sci. Technol., vol. 43, no. 7, pp. 1653–1666, May 2008.
[255] N. J. Moon, E. G. Hammond, and B. A. Glatz, “Conversion of Cheese Whey and Whey Permeate to Oil and Single-Cell Protein,” J. Dairy Sci., vol. 61, no. 11, pp. 1537–1547, Nov. 1978.
[256] M. Hassan, P. J. Blanc, A. Pareilleux, and G. Goma, “Production of cocoa butter equivalents from prickly-pear juice fermentation by an unsaturated fatty acid auxotroph of Cryptococcus curvatus grown in batch culture,” Process Biochem., vol. 30, no. 7, pp. 629–634, Jan. 1995.
[257] H.-J. Daniel, M. Reuss, and C. Syldatk, “Production of sophorolipids in high concentration from deproteinized whey and rapeseed oil in a two stage fed batch process using Candida bombicola ATCC 22214 and Cryptococcus curvatus ATCC 20509,” Biotechnol. Lett., vol. 20, no. 12, pp. 1153–1156, 1998.
[258] Z. Gong, H. Shen, Q. Wang, X. Yang, H. Xie, and Z. K. Zhao, “Efficient conversion of biomass into lipids by using the simultaneous saccharification and enhanced lipid production process,” Biotechnol. Biofuels, vol. 6, no. 1, p. 36, 2013.
[259] A. Meo, X. L. Priebe, and D. Weuster-Botz, “Lipid production with Trichosporon oleaginosus in a membrane bioreactor using microalgae hydrolysate,” J. Biotechnol., vol. 241, pp. 1–10, Jan. 2017.
[260] M. Hassan, P. Blanc, L.-M. Granger, A. Pareilleux, and G. Goma, “Lipid production by an unsaturated fatty acid auxotroph of the oleaginous yeast Apiotrichum curvatum grown in single-stage continuous culture,” Appl. Microbiol. Biotechnol., vol. 40, no. 4, pp. 483–488, Dec. 1993.

V List of Figures __________________________________________________________________________
∼ 147 ∽
5 List of Figures
Figure 1: Structure of the ABV Process ................................................................................. 20
Figure 2: Number of publications with term “oleaginous yeast” as found on Pubmed[16] per
year. ....................................................................................................................................... 22
Figure 3: Overview of central metabolic pathways relevant for lipid production in oleaginous
yeast. Enzyme abbreviations: ACL, ATP-citrate lyase; ICDH, iso-citrate dehydrogenase; ME,
malic enzyme. Figure adapted from Goerner[21] and Aggelis[22]. ........................................ 23
Figure 4: Structure of Sudan Black B. (2,2-dimethyl-1,3-dihydroperimidin-6-yl)-(4-phenylazo-
1-naphthyl) diazene ................................................................................................................ 45
Figure 5: Structure of Nile red (9-diethylamino-5-benzo[α]phenoxazinone) ........................... 45
Figure 6: General Structure of Yeast rRNA Genes with used ITS1 and NL4 Primers. Other
common primers are displayed as well. Image adapted from Buscot et al., University
Leipzig[110]. ........................................................................................................................... 49
Figure 7: Left: Structure and self-cleavage of Ribozyme:gRNA:Ribozyme assembly. Right:
Structure of Hammerhead Ribozyme at 5’ end of crRNA sequence of gRNA. Both images by
Gao et al. [115] ....................................................................................................................... 52
Figure 8: Schematics of arbitrary PCR using random hexamers. The upper line shows genomic
integration with an integration cassette containing a promoter (P) Terminator (T) and a
kanamycin resistance (KanR). The arrow marks the binding of Primer 2 of PCR Reaction 1 of
the arbitrary two. The resulting product is used as template for PCR Reaction 2. Figure adapted
by Minikel[118]. ...................................................................................................................... 53
Figure 9: Nile red assay of yeast isolates. C. oleaginosus ATCC 20509 (CO) served as positive
and Saccharomyces cerevisiae BY4741 (SC) as negative control. The unit of measurement is
arbitrary fluorescent units (FI) corrected for the optical density at 600 nm (OD600). Error bars
show standard deviations of triplicates. .................................................................................. 60
Figure 10: Biomass and lipid concentration as well as lipid content of newly isolated and
identified yeast strains that previously showed the highest fluorescence in Figure 9. Error bars
show standard deviations of triplicates. .................................................................................. 61
Figure 11: Distribution of detected C16 and C18 fatty acids of three isolates Rhodoturula
mucilaginosa (RM), Rhodotorula glutinis (RG), Cutaneotrichosporon oleaginosus (CO)
comparison to reference strain C. oleaginosus ATCC 20509. Error bars show standard
deviations of triplicates. .......................................................................................................... 62
Figure 12: Glucose concentration of Scenedesmus obtusiusculus hydrolysate in dependence
of cellulase concentration. As the cellulase mix combines a number of different enzymatic
activities (exo- and endo glucanase activity, some proteinase activity etc.), concentration of
V List of Figures __________________________________________________________________________
∼ 148 ∽
the enzyme mix is simply given in% v/v. In the left, formula of the shown logarithmic regression
and its R2 value are given. Error bars show standard deviation of n=3. ................................. 63
Figure 13: Different concentrations of algae biomass were used for enzymatic hydrolysis using
1 v/v cellulase mix. Glucose yield (bar chart) increases linear, while conversion efficiency (line)
remains constant with increasing substrate concentration. .................................................... 64
Figure 14: Lipid content of oleaginous yeast with highest lipid productivity, C. oleaginosus
ATCC 20509, in different media after 7 days cultivation at 28°C and 120 rpm in baffled flasks
(30ml). Error bars show standard deviations of triplicates. .................................................... 66
Figure 15: Optimization of FACS - Nile red staining by changing of dependent variables
associated with the staining quality. Total cell concentration (OD), Nile red concentration and
DMSO concentration were varied in different combinations by doubling the specific factor. Fold
change in fluorescence intensity between lipid rich (MNM-S) and low lipid (YPD) C.
oleaginosus cells was calculated to quantify quality of the stain. ........................................... 68
Figure 16: Fluorescence of subsequent generations of C. oleaginosus after mutagenesis and
selection for High (top 5%), Low (bottom 5%) and ALL (all cells) on the Nile-Red fluorescence
channel (FL2). Selection was always done after 7 days of cultivation on either minimal nitrogen
medium (MNM-S) or full medium (YPD). ................................................................................ 69
Figure 17: C:N ratio effect on lipid content (% w/w), biomass (g/l) and total lipid (g/l). Error bars
show standard deviation of n=3. ............................................................................................ 71
Figure 18: C:N (A), C:P (B) and C:S (C) ratio effect on maximum achieved maximum OD600.
............................................................................................................................................... 72
Figure 19: C:N (A), C:P (B) and C:S (C) ratio effect on maximum achieved growth rate μ (mu).
............................................................................................................................................... 73
Figure 20: Growth of C. oleaginosus cells grown in YPD with and without caffeine
supplementation at different concentrations between 0 and 100 mM measured using OD600.
............................................................................................................................................... 75
Figure 21: Effect of Rapamycin on Nile red Fluorescence: C. oleaginosus grown in YPD without
(YPD) and with 20 µM rapamycin (YPD+R) supplementation. At different time points, Nile red
fluorescence (FI) and OD600 were measured. The ratio between the latter is plotted on the y
axis and is a semi-quantitative indicator of lipid content. Stars show significance at α=0.05 and
error bars show standard deviation of n=3. ............................................................................ 77
Figure 22: Effect of Rapamycin on Lipid Content and Biomass: Total lipid content (green) and
dry biomass (red) of C. oleaginosus after 72 hours of cultivation in YPD are measured with
different concentrations of rapamycin supplementation between 0 and 40 µM. Error bars show
standard deviation of n=3 and the star shows significance at α=0.05 in comparison to culture
without rapamycin supplementation. The blue line shows a robust logarithmic fit of the lipid
content in dependence of rapamycin concentration as described in Supplemental 26. ......... 78

V List of Figures __________________________________________________________________________
∼ 149 ∽
Figure 23: Online-OD Measurement: Growth curves of C. oleaginosus without (YPD) and with
5 µM rapamycin (YPD+R) obtained by measuring backscatter with an online OD system. Thin
lines (YPD fit, YPD+R fit) show fit of Richards’ growth curves. .............................................. 79
Figure 24: Effect of Rapamycin on Fatty Acid Content: Profile of the main fatty acids of C.
oleaginosus after 72 hours cultivation in Minimal N Medium (MNM-0) or YPD with different
rapamycin concentrations (YPD-0 – YPD-40). ....................................................................... 80
Figure 25: TORC signaling network in C. oleaginosus: Proposed signaling network surrounding
TORC in C. oleaginosus inferred by homology and assembled using data obtained from S.
pombe and S. cerevisiae. ....................................................................................................... 82
Figure 26: Segments of hygromycin resistance cassette used to confirm the insertion of the
expression cassettes into the C. oleaginosus genome. For pRF_HygDga2, the expected size
was 1147 bp (lower band), while for pRF_Kan_SLc, the expected size was 810 bp. ............ 89
Figure 27: Nile red fluorescence of C. oleaginosus Dga wild type and overexpressing clones
1, 5 and 6 (Dga1-K1, Dga1-K5 and Dga1-K6 respectively) after 96 hours grown in YPD in
baffled 50 ml flasks. Star shows significantly high values than the wild type as determined by
a two tailed t-test assuming equal variances (α=0.05). Error bars show standard deviations of
triplicates. ............................................................................................................................... 89
Figure 28: Detection of Cas9 expression cassette in ATMT clones. Positive clones of
pRFHyg_Cas9gRNA show a signal at: 1. 5772 bp, 2. 4238 bp, 3. 3546 bp .......................... 91
Figure 29: Western blot showing absence of Cas9 expression in two C. oleaginosus clones
containing the Cas9 gene cassette (K1, K2) as well as the wildtype as negative control. 10 ng
of Cas9 nuclease served as positive control. ......................................................................... 91
Figure 30: Typical parameters derived from growth curves: length of lag phase λ, growth rate
represented by the maximum slope μ and the maximum cell growth A. Image adapted by Kahm
et al.[122]. ............................................................................................................................. 105
Figure 31: Experimental setup for S. obtusiusculus cultivation in aerated flask (A), bubble
column reactor (B) and Infors reactor (C). ............................................................................ 107
Figure 32: Model of a particle carrying a surface charge, which decreases with increasing
distance from the particle. The stern layer defines a layer where ions are strongly bound and
the slipping plane characterizes a diffuse outer region, where ions are less firmly
associated[246]. The electric potential at the surface is termed surface charge, the potential at
the stern layer stern potential and the potential at the slipping plane zeta potential. Image
adapted by wikimedia.org[247] ............................................................................................. 109
Figure 33: Comparison of different methods of flocculation using 15 ml falcons (15F), 50 ml
falcons (50F) and 150 ml Jar test (Jar) at time points 1 and 3 (.1 and .3). Y-axis shows OD680
of the supernatant. Error bars show standard deviations of triplicates. ................................ 111

V List of Figures __________________________________________________________________________
∼ 150 ∽
Figure 34: OD680 / Biomass correlation for S. obtusiusculus. Samples were washed once before
determination of dry biomass. Regression formula is DBM/g/l=0.0028+0.418*OD680 with an R2
of 0.994. ............................................................................................................................... 113
Figure 35: OD680 measurement in dependence of algae culture for the plate reader (red, 200
μl sample) and cuvette photometer (green). The dashed line shows the linear regression for
each approach. The respective R2 values were 0.999 for the plate reader and 0.9961 for the
cuvette photometer. Error bars show standard deviations of triplicates. .............................. 114
Figure 36: Autoflocculation induced by supplementation of different bases. Number on top of
each plot displays sedimentation time in hours. ................................................................... 115
Figure 37: Flocculation efficiencies of autoflocculation induced by supplementation of different
bases. Image is analogous to Figure 36. Color is showing pH of the respective sample. ... 116
Figure 38: Comparison of regression parameters time (A), intercept (B) and pH (C). Error bars
show standard error of the respective parameter with n=3. ................................................. 117
Figure 39 Flocculation efficiencies of chitosan (A, B) and tannin (C) in BG11 (A) and ABV (B,C)
medium. Black points show measurement points, blue shows respective flocculation
efficiencies with linear interpolation and red dashed lines show contour lines. .................... 119
Figure 40: Surface response showing flocculation efficiencies with different ratios of tannin
(x1), chitosan (x2) and H2O (x3). Concentrations are between 0 and 30 mg/l Chitosan and 0
and 120 mg/l tannin. Culture was at OD600=3.6 and at t=113 h Levels are shown in Table 15.
............................................................................................................................................. 121
Figure 41: Growth curve of Scenedesmus obtusiusculus A189 grown in previously published
salty medium. Estimated parameters as shown by Gompertz fit (blue) are: mu:0.0628
lambda:32.3981 A.model:10.82623. Dashed red lines show time points of flocculation
experiments. Error bars show standard deviations of triplicates. ......................................... 123
Figure 42: Zeta potential in mV over time of open bubble column reactor cultivation as shown
in Figure 41. Error bars show standard deviations of triplicates. .......................................... 124
Figure 43: Effect of factors pH, flocculant concentration and flocculation agent on flocculation
efficiency (FE). Differences between pH values and flocculant concentrations are significant
(p=5*10-4 and p=2.2*10-3 respectively), whereas differences between flocculation agent are not
(p=0.26). Testing was done using Welch’s-test. ................................................................... 126
Figure 44: The first row shows the effect of time (170 and 220 hours) and algae organic matter
(with AOM:W, without AOM:WO) on flocculation efficiency. The second row shows the effects
of pH (pH 8 and 9) and cultivation time (40 and 80 hours) on FE. To display the effect of
chitosan as opposed to tannin, the respective flocculation agents are shown separately in
different colors. ..................................................................................................................... 128
Figure 45: Relevant dependencies for evaluation of flocculation efficiencies. Colors and
shapes indicate source and effector: Source of effect: violet-time, yellow – bacterial
V List of Figures __________________________________________________________________________
∼ 151 ∽
populations, green – extracellular organic algal matter, blue – pH, grey – flocculant
concentration. Green indicates relationship of flocculation efficiency and compression factor to
harvesting efficiency, which is given in section 3.3.6. Line type indicates effector: line dash -
zeta potential, dotted – flocculation efficiency, dashed – compression factor, dash-dotted –
zeta potential, standard line – time. ...................................................................................... 130
VI List of Tables __________________________________________________________________________
∼ 152 ∽
6 List of Tables
Table 1: Environmental samples used for the isolation of new yeast strains ......................... 43
Table 2: High throughput lipid estimation protocol for plate reader with dispenser unit ......... 44
Table 3: List of obtained isolates with isolate number and source (number and identifier of
environmental sample). Colony description and result of Sudan Black B Stain (SBB) are shown
on the right, whereas SBB stain was only applied to yeast. ................................................... 58
Table 4: Result of 18S-rRNA amplification and sequencing of yeast isolates. ....................... 59
Table 5: Comparison of monosaccharides after acidic hydrolysis and after enzymatic
hydrolysis. For enzymatic hydrolysis a) monosaccharide content in hydrolysate was measured
directly by HPLC (+) and b) hydrolysis residue was hydrolyzed again by TFA and resulting
sugars were measured by LCMS (*). ..................................................................................... 64
Table 6: Comparison of growth curve parameters extracted from Richards’ fit: Maximum
growth rate (μmax), lag phase (λ) and maximum cell density (A) of C. oleaginosus cultivated
in YPD with and without rapamycin. All values are given with standard deviations. .............. 79
Table 7: Genes with 10 highest transcription rates as indicated by the Reads per Kilobase of
Transcript per Million reads Mapped (RPKM) under lipid accumulating (MNM) and proliferating
conditions (YPD). ................................................................................................................... 85
Table 8: Most used codons for C. oleaginosus was found in the Top20 expressed genes in full
medium and lipid induction medium (Top19) as well as both individually (T10YPD and
T10MNM), only the glyceraldehydphosphate dehydrogenase (GDH) and the entire genome
(Total). In comparison, codon usage of ascomycete Yarrowia lipolytica is shown. ................ 86
Table 9: Genes expressed in Cutaneotrichosporon oleaginosus with their corresponding CAI
before optimization. Stars shows optimization and expression done by Görner[51]. CAI after
optimization is 1 in all cases. Dga1, Dga2 and Slc1 were not codon optimized ..................... 87
Table 10: Composition of BG11 and ABV medium. All values except for trace elements in g/l.
............................................................................................................................................. 104
Table 11: Composition of trace element solution used for BG11. ........................................ 104
Table 12: Coded and raw measurement levels of 23 mixture simplex lattice design using
different mixtures of tannin, chitosan and ddH2O as well as run- and experiment order. ...... 110
Table 13: Evaluation of the effect of salt and soluble organic matter on estimation of dry
biomass ................................................................................................................................ 112
Table 14: Comparison of Ion properties, required base concentration and base loading for pH
10.8 and corresponding cost per kg base in technical quality as well as harvesting cost per ton
biomass. Agent costs are in bulk (1.4.2017). ....................................................................... 118
Table 15: Run and experiment order, raw flocculant concentration as independent variable
levels as well as flocculation efficiency (FE). ....................................................................... 122

VI List of Tables __________________________________________________________________________
∼ 153 ∽
Table 16: Estimated cost to achieve > 95% FE using tannin and chitosan as flocculant. .... 122

VII Supplemental __________________________________________________________________________
∼ 154 ∽
7 List of Supplementary Materials
Supplemental 1: Summary of reported batch and fed-batch fermentations of C. oleaginosus.
Cultivation modes include Batch, fed-batch, flask, simultaneous saccharification and
fermentation (SSF) as well as a membrane bioreactor approach. If not stated differently, lipid
accumulation is induced via nitrogen limitation. Aeration is given in volume air per volume
culture per hour if not stated differently. In some cases, aeration was adjusted by setting
oxygen concentration in the culture over a threshold value (>10%, >20%). Biomass (CX) and
lipid concentration (CL) are given in g/l and lipid content (YLX) is given in g/l/h. LA shows the
method of lipid quantification (Fatty acid extraction and GC analysis (f) or total gravimetric lipid
analysis (G)). Substrate yield YLS is shown in gram lipid per 100 g sugar. ......................... 159
Supplemental 2: Fatty Acid Mutants of C. oleaginosus described in literature. ................... 162
Supplemental 3: Overview of reported continuous fermentations of C. oleaginosus. Cultivation
mode is continuous, except for one case of partial recycling. Descriptions apply of
Supplemental 2 apply with additions: TR shows residence time in hours and dilution rate RD
is given in hours-1. ................................................................................................................ 163
Supplemental 4: Validation of automated Nile red screening. The mean relative fluorescence
units (RFU) was 384011 with a standard deviation of 14630. resulting in a relative standard
deviation of 3.8%. Fluorescence over the plate was normally distributed (Shapiro-Wilk: DF:48;
Statistic 0.96894; p-value 0.23026). ..................................................................................... 164
Supplemental 5: Sequences of relevant genes expressed in C. oleaginosus as shown in Table
9. .......................................................................................................................................... 164
Supplemental 6: Cloning strategy for pRF2_HSlc. ............................................................... 166
Supplemental 7: Cloning strategy for pRF2_KDga2. ........................................................... 167
Supplemental 8: Cloning strategy for pRF_Cas_Hyg_gRNA. .............................................. 168
Supplemental 9: DNA sequences of gRNAs used in this work. ........................................... 169
Supplemental 10: Media components of full synthetic base medium used for media
optimization. ......................................................................................................................... 170
Supplemental 11: Table of growth curve parameters obtained for media optimization, part 1.
............................................................................................................................................. 171
Supplemental 12: Table of growth curve parameters obtained for media optimization, part 2.
............................................................................................................................................. 172
Supplemental 13: Growth curves as used in this work and implemented in R package grofit.
Image adapted by Kahm et al[122]. ..................................................................................... 173
Supplemental 14: Growth of isolates and reference strains in MNM-S at 28°C and 120 rpm at
30 ml volume in baffled flasks. ............................................................................................. 173
VII Supplemental __________________________________________________________________________
∼ 155 ∽
Supplemental 15: Composition of dried algae S. obtusiusculus A189 as determined by the ABV
consortium. ........................................................................................................................... 174
Supplemental 16: Result of high-throughput determination of growth: IBY Strains. ............ 174
Supplemental 17: Result of high-throughput determination of growth: WO Strains. ............ 175
Supplemental 18: Result of high-throughput determination of growth: NZ Strains. ............. 175
Supplemental 19: Result of high-throughput lipid estimation screen of IBY culture collection.
............................................................................................................................................. 176
Supplemental 20: FACS protocol for selection of high and low production yeast
subpopulations. Aggregates were excluded in panel 1 and 2. In panel 3, the yeast population
was selected, excluding possible fragments. Panel 6 was used to observe the kinetics of
staining and panel 7 contains the gates for sorting (Sorting Hi and Sorting Low). ............... 177
Supplemental 21: Comparison of Nile red fluorescence of cells grown in YPD and MNM-S after
staining as described in section 2.3.3.3. For measurement in the plate reader (see upper
picture), the factor between low and high lipid C. oleaginosus is 47725.6/15011.75=3.18,
whereas for FACS (lower picture) it is 604.4/189.4=3.19. .................................................... 178
Supplemental 22: C:P g/g ratio effect on lipid content, biomass and total lipid. Error bars show
standard deviations of triplicates. ......................................................................................... 179
Supplemental 23: C:S g/g ratio effect on lipid content, biomass and total lipid. Error bars show
standard deviations of triplicates. ......................................................................................... 179
Supplemental 24: Dependency of lag phase λ on C:N, C:P and C:S ratio. .......................... 180
Supplemental 25 Kinetics of Nile red Fluorescence of C. oleaginosus cells grown in YPD with
and without caffeine supplementation at different concentrations between 0 and 100 mM. Nile
red is corrected for OD600 and is used as an estimator for lipid content. .............................. 181
Supplemental 26: Analytical plots of robust regression using M-estimation of yeast lipid content
in dependence of rapamycin concentration in full cultivation medium. Data points 9 and 7, both
of which outliers causing deviation at [rapamycin]=10 were excluded due to high Cook’s
distance. The resulting fit was plotted in Figure 22 and was based on the formula shown at the
bottom of the supplemental. ................................................................................................. 182
Supplemental 27: Table of C. oleaginosus homologues in TORC signaling network. ......... 183
Supplemental 28: 200 µL C. oleaginosus cells grown for 72 hours in YPD with and without 5
µM rapamycin supplementation were pelleted, washed with ddH2O and resuspended in the
same amount of water. 25 µL DMSO and 25 µL Nile red (50 mg/ml) in DMSO were added and
incubated in darkness for 10 minutes. Images were taken on a Zeiss Axio Lab A1 with an Axio
Cam ICm1 (Oberkochen, Germany). Fluorescence was measured with a 525/25 filter with an
exposure time of 500 ms. ..................................................................................................... 187
VII Supplemental __________________________________________________________________________
∼ 156 ∽
Supplemental 29: FACS of Rapamycin treated cells. 50 µL of cells were diluted and measured
in a BioRad S3 Sorter using 488 nm excitation. The measurement was done after 48 hours of
cultivation. ............................................................................................................................ 188
Supplemental 30: Deviations in Codon Usages. Green: YPD, Red: MNM. ......................... 189
Supplemental 31: Insertion site of YFP expression cassettes in clone described by Goerner et
al[51]. The sequence obtained by the fragment derived from TAIL PCR is ..................................
GCGGGCCCGAGACCCCCTCCCAGGGACGCATCGTGGCCGGCATCACCTCGCTCCACA
GGTGCGGTTGTTGGCGCCTATATCTCCGACATCACCGATGGGGAAGATCGGGCTCGCC
ACTTCGGGCTCATGAACGCTTGTTTCGGCATGAAATGGTGGCAGGCCCCGTGGCCGGA
GGACAGTTGGGCGCCATCTCCTTGAATGTAAAAA ........................................................ 190
Supplemental 32: Nile red fluorescence of C. oleaginosus wild type and Dga overexpressing
clones 1, 5 and 6 after 96 hours grown in YPD in baffled 50 ml flasks. Error bars show standard
deviations of triplicates. ........................................................................................................ 190
Supplemental 33: Nile red fluorescence of C. oleaginosus wild type and Dga overexpressing
clones after 96 hours grown in YPD in baffled 50 ml flasks. Error bars show standard deviations
of triplicates. ......................................................................................................................... 191
Supplemental 34: Supplemental: Fatty acid spectra of Dga1 mutants (clone 1, 5 and 6) and
wild type C. oleaginosus grown in a 1 l infors fermenter in YPD and glucose feed. Fatty acids
distributions can be assumed to be from a common distribution, with C16:0=29 ± 3% g/g,
C18:0=9 ± 2% g/g, C18:1=43 ± 2% g/g, C18:2=18 ± 5% g/g and C18:0=1 ± 0% g/g. ......... 191
Supplemental 35: Main fatty acids produced by C. oleaginosus wild type (wt) as well as Dga2
overexpressing clones 1 (K1), 5 (K5) and 6 (K6) at different time points during fermentation.
............................................................................................................................................. 192
Supplemental 36: List of all tested combinations of independent variables time (x1), pH (x2),
flocculant concentration (x3) and flocculation agent (x4) as well as resulting flocculation
efficiency (FE) and residual volume (RV) in ml per 100 ml sample. ..................................... 193
Supplemental 37: Time effect on OD680 of algal suspension measured inside a well of a 96-
well plate. No significant sedimentation or adhesion effects are observed. Error bars show
standard deviations of triplicates. ......................................................................................... 194
Supplemental 38: Spatial distribution of algal biomass as measured by OD680. Protocol as
described in section 3.3.3 was run. Dilutions were: 1:1 (a), 1:10 (b) and 1:20 (c). Measurement
was done in a clear 96 well nunc plate. Values show OD680. ............................................... 195
Supplemental 39: Time course of OD680 of algal suspension in 96-well plate with included
shaking. Algae culture (at OD680=0.52) was placed in a 96-well and OD680 was measured every
300 seconds. The plate was shaken at 300 rpm (linear, orbital, double orbital) every 600
minutes. Measurement points taken immediately after shaking (Shake) contrast those taken
after sedimentation time (Sedim). Error bars show standard deviations of triplicates. ......... 196

VII Supplemental __________________________________________________________________________
∼ 157 ∽
Supplemental 40: Regression parameters of linear regression as shown in section 3.4.2 .. 197
Supplemental 41: Change in pH of ABV medium caused by addition of different bases: KOH
(red circles), NaOH (blue triangles) and Ca(OH)2 (Green plus signs). Stock solutions of added
bases were 1M for NaOH and KOH and 1 g/l for CaOH2. Logarithmic regression yielded the
following cofactors with respective R2 values: 6.4+0.69*log(KOH) with R2=0.96,
5+0.55*log(Ca(OH)2) with R2=0.86 and 7+0.64*log(NaOH) with R2=0.96. .......................... 198
Supplemental 42: Analytic plots of regression of simplex design as described in section 3.3.8.1.
............................................................................................................................................. 199
Supplemental 43: Parameters of multiple linear regression of simplex design as described in
section 3.3.8.1. ..................................................................................................................... 199
Supplemental 44: Distributions for flocculation efficiencies (A) residual OD (B) and residual
volume (C). Shapiro Wilk was for A W=0.96, p=0.124, for B W=0.98, p=0.3 and for C W=0.64,
p=1.3x10⁻⁸. .......................................................................................................................... 200
Supplemental 45: Time effect on bacterial populations measured by FACS. Figures on the left
column show total numbers of events as count, whereas the right column shows share to the
total number of events. Row 1 shows bacterial population 1 as identified in Supplemental 48,
Row 2 shows bacterial population 2, row 3 shows total number of events. Blue line shows
simple linear regression (second order). .............................................................................. 201
Supplemental 46: Zeta potential of two cultivations (A,B) of S. obtusiusculus in ABV medium
in closed infors bioreactor as described in section 3.3.2.4. .................................................. 202
Supplemental 47: Absence of time dependence on residual volume for subsetted dataset.
Subsetting was done, since residual volume followed a binary distribution. Subsets were
FE<50 (A) and FE>50 (B) .................................................................................................... 203
Supplemental 48: Scatterplots and histograms of flow cytometry of S. obtusiusculus cultivated
in a bubble column reactor after 7 days. .............................................................................. 204
Supplemental 49: Impact of bacterial populations 1 and 2 on all dependent variables FE, RV
and ROD. Regression is shown as blue line. Coefficients are: FE~0.48+0.5*BP1S (R2=0.23),
FE~0.29+5.33*BP1S (R2=0.14), RV~46+9*BP1S (R2=0), RV~68+-373*BP1S (R2=0),
OD~0.69+0.58*BP1S (R2=0.08), OD~0.15+12.63*BP1S (R2=0.2). ..................................... 205
Supplemental 50: Effect of Zeta potential on all dependent variables FE, RV and ROD.
Regression is shown as blue line, coefficients are: FE~0.67+0.007*Zeta (R2=0),
RV~54.31+0.52*Zeta (R2=0), ROD~2.2+0.12*Zeta (R2=0.15) ............................................. 205
Supplemental 51: Effect of factor flocculation agent on residual volume (RV). .................... 206
Supplemental 52: Full x1/x2/x3/FM ANCOVA model parameters. ....................................... 207
Supplemental 53: AIC reduced x1/x2/x3/FM ANCOVA model parameters .......................... 208
Supplemental 54: Reversed factor elimination reduced x1/x2/x3/FM ANCOVA model
parameters ........................................................................................................................... 209
VII Supplemental __________________________________________________________________________
∼ 158 ∽
Supplemental 55: Pareto charts shows effect sizes of x1/x2/x3/FM-models ordered by size of
the full model (A), the reduced model according to the AIC (B) and the reduced model
according to reverse factor elimination (C). .......................................................................... 210
Supplemental 56: Full x1/x2/x3/FM/AOM ANCOVA model parameters. .............................. 211
Supplemental 57: AIC reduced x1/x2/x3/FM/AOM ANCOVA model parameters. ............... 212
Supplemental 58: Reversed factor elimination reduced x1/x2/x3/FM/AOM ANCOVA model
parameters. .......................................................................................................................... 213
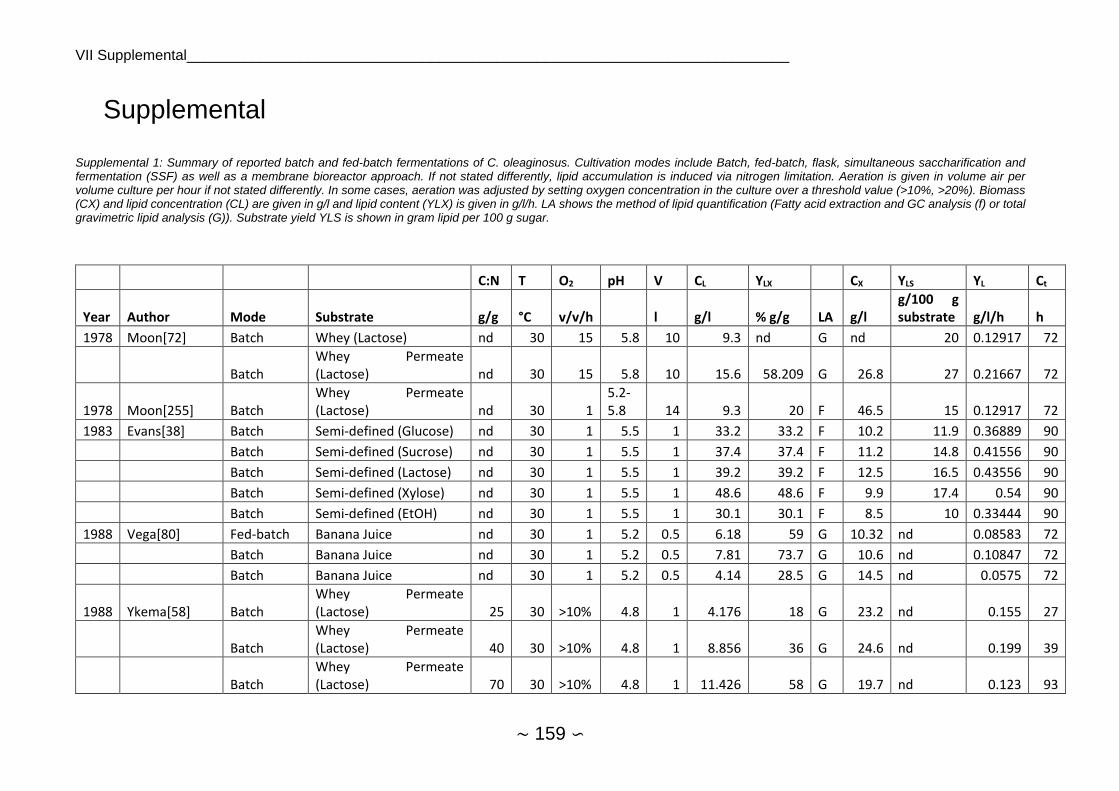
VII Supplemental__________________________________________________________________________
∼ 159 ∽
Supplemental
Supplemental 1: Summary of reported batch and fed-batch fermentations of C. oleaginosus. Cultivation modes include Batch, fed-batch, flask, simultaneous saccharification and fermentation (SSF) as well as a membrane bioreactor approach. If not stated differently, lipid accumulation is induced via nitrogen limitation. Aeration is given in volume air per volume culture per hour if not stated differently. In some cases, aeration was adjusted by setting oxygen concentration in the culture over a threshold value (>10%, >20%). Biomass (CX) and lipid concentration (CL) are given in g/l and lipid content (YLX) is given in g/l/h. LA shows the method of lipid quantification (Fatty acid extraction and GC analysis (f) or total gravimetric lipid analysis (G)). Substrate yield YLS is shown in gram lipid per 100 g sugar.
C:N T O2 pH V CL YLX CX YLS YL Ct
Year Author Mode Substrate g/g °C v/v/h l g/l % g/g LA g/l g/100 g substrate g/l/h h
1978 Moon[72] Batch Whey (Lactose) nd 30 15 5.8 10 9.3 nd G nd 20 0.12917 72
Batch Whey Permeate (Lactose) nd 30 15 5.8 10 15.6 58.209 G 26.8 27 0.21667 72
1978 Moon[255] Batch Whey Permeate (Lactose) nd 30 1
5.2-5.8 14 9.3 20 F 46.5 15 0.12917 72
1983 Evans[38] Batch Semi-defined (Glucose) nd 30 1 5.5 1 33.2 33.2 F 10.2 11.9 0.36889 90
Batch Semi-defined (Sucrose) nd 30 1 5.5 1 37.4 37.4 F 11.2 14.8 0.41556 90
Batch Semi-defined (Lactose) nd 30 1 5.5 1 39.2 39.2 F 12.5 16.5 0.43556 90
Batch Semi-defined (Xylose) nd 30 1 5.5 1 48.6 48.6 F 9.9 17.4 0.54 90
Batch Semi-defined (EtOH) nd 30 1 5.5 1 30.1 30.1 F 8.5 10 0.33444 90
1988 Vega[80] Fed-batch Banana Juice nd 30 1 5.2 0.5 6.18 59 G 10.32 nd 0.08583 72
Batch Banana Juice nd 30 1 5.2 0.5 7.81 73.7 G 10.6 nd 0.10847 72
Batch Banana Juice nd 30 1 5.2 0.5 4.14 28.5 G 14.5 nd 0.0575 72
1988 Ykema[58] Batch Whey Permeate (Lactose) 25 30 >10% 4.8 1 4.176 18 G 23.2 nd 0.155 27
Batch Whey Permeate (Lactose) 40 30 >10% 4.8 1 8.856 36 G 24.6 nd 0.199 39
Batch Whey Permeate (Lactose) 70 30 >10% 4.8 1 11.426 58 G 19.7 nd 0.123 93

VII Supplemental__________________________________________________________________________
∼ 160 ∽
Fed-batch Whey Permeate (Lactose) 40 30 >10% 4.8 1 29.75 35 G 85 nd 0.372 70
1989 Ykema[58] Partial Recycling
Whey Permeate (Lactose) 40 30 >10% 4.8 1 30.162 33 G 91.4 nd 0.43089 70
1995 Hassan[256] Fed-batch Full Synthetic (Glucose) N-lim 32.4 30 >20% 5.5 1.8 3.825 22.5 F 17 12.75 0.14712 26
Fed-batch Full Synthetic (Glucose) Fe-lim 3.5 30 >20% 5.5 1.8 1.62 9 F 18 3 0.06231 26
1996 Meesters[45] Fed-batch Semi-defined (Glycerol) 20 30 1.2 5.5 0.5 29.5 25 F 118 11 0.59 50
1998 Daniel[257] Batch Whey Permeate (Lactose) ng 30 ng 5.8 1.5 19.992 58.8 F 34 19.99 0.13788 145
1995 Hassan[256] Batch Prickly-Pear Juice 50 30 >20% 5.5 1.8 8.75 46 G 19.02 21 0.25 35
2011 Chi[42] Fed-batch Semi Defined (Volatile Fatty Acids) nd 30 1 7 2 37 G 68.8 nd 0.51 72
2011 Yu[61] Batch Wheat straw hydrolysate nd 28 nd nd 0.05 5.8 33.5 F 17.2 4.7 0.03452 168
Batch Wheat straw hydrolysate, detoxified nd 28 nd nd 0.05 4.2 27.1 F 15.6 3.403 0.025 168
2012 Cui[64] Fed-batch Semi-defined (Glucose) 30 30.2 0.6 5.5 1 17.4 52.8875 G 32.9 36 0.06042 288
Fed-batch Semi-defined (Glucose) 30 30.2 0.6 6 1 21.8 48.9888 G 44.5 26 0.07569 288
2012 Christophe[62] Fed-batch Full Synthetic (Glucose) Phase 1 nd 30 0.5 6 4 1.67 16 G 10.46 11 0.06973 24
Fed-batch Full Synthetic (Acetate) Phase 2 50 30 0.5 6 4 6.89 51 G 13.5 15 0.1377 50
Batch Full Synthetic (Glucose) nd 30 nd nd 0.25 3.31 47.3 G 7 15 0.03449 96
Batch Full Synthetic (Acetate) nd 30 nd nd 0.25 0.83 27.8 G 3 19 0.00869 96
2013 Gong[258] Flask Corn Stover Hydrolysate nd 30 nd nd 0.05 6 nd G nd nd 0.125 48
Flask,SSF Corn Stover nd 30 nd nd 0.05 7.2 43.4 G 16.5 nd 0.15 48
2014 Gong[49] Flask Corn Stover Hydrolysate nd 30 nd nd 0.05 12.07 43.6 G 27.7 15.6 0.14375 72
Flask,SSF Corn Stover nd 30 nd nd 0.05 14.4 nd G nd 15.2 0.18625 72
2014 Liang[36] Flask Sorghum Baghasse Hydrolysate nd 26 nd nd 0.04 10.8 40 G 27 14 0.075 144
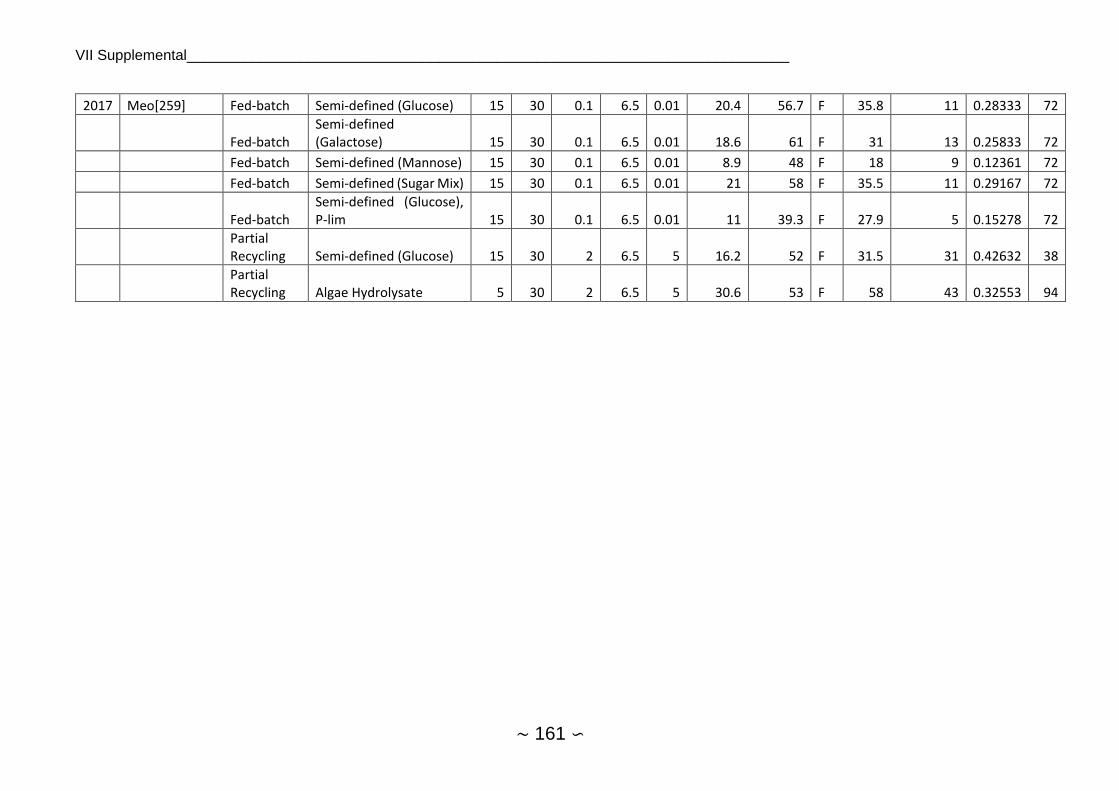
VII Supplemental__________________________________________________________________________
∼ 161 ∽
2017 Meo[259] Fed-batch Semi-defined (Glucose) 15 30 0.1 6.5 0.01 20.4 56.7 F 35.8 11 0.28333 72
Fed-batch Semi-defined (Galactose) 15 30 0.1 6.5 0.01 18.6 61 F 31 13 0.25833 72
Fed-batch Semi-defined (Mannose) 15 30 0.1 6.5 0.01 8.9 48 F 18 9 0.12361 72
Fed-batch Semi-defined (Sugar Mix) 15 30 0.1 6.5 0.01 21 58 F 35.5 11 0.29167 72
Fed-batch Semi-defined (Glucose), P-lim 15 30 0.1 6.5 0.01 11 39.3 F 27.9 5 0.15278 72
Partial Recycling Semi-defined (Glucose) 15 30 2 6.5 5 16.2 52 F 31.5 31 0.42632 38
Partial Recycling Algae Hydrolysate 5 30 2 6.5 5 30.6 53 F 58 43 0.32553 94
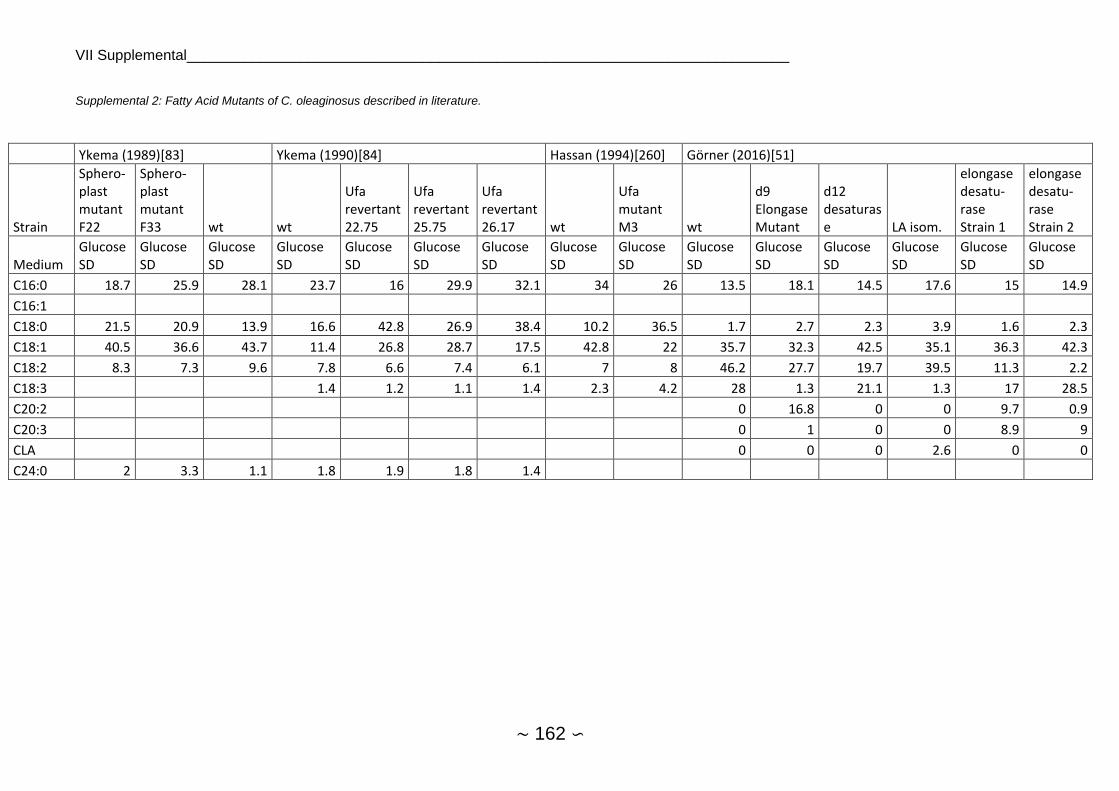
VII Supplemental__________________________________________________________________________
∼ 162 ∽
Supplemental 2: Fatty Acid Mutants of C. oleaginosus described in literature.
Ykema (1989)[83] Ykema (1990)[84] Hassan (1994)[260] Görner (2016)[51]
Strain
Sphero-plast mutant F22
Sphero-plast mutant F33 wt wt
Ufa revertant 22.75
Ufa revertant 25.75
Ufa revertant 26.17 wt
Ufa mutant M3 wt
d9 Elongase Mutant
d12 desaturase LA isom.
elongase desatu-rase Strain 1
elongase desatu-rase Strain 2
Medium Glucose SD
Glucose SD
Glucose SD
Glucose SD
Glucose SD
Glucose SD
Glucose SD
Glucose SD
Glucose SD
Glucose SD
Glucose SD
Glucose SD
Glucose SD
Glucose SD
Glucose SD
C16:0 18.7 25.9 28.1 23.7 16 29.9 32.1 34 26 13.5 18.1 14.5 17.6 15 14.9
C16:1
C18:0 21.5 20.9 13.9 16.6 42.8 26.9 38.4 10.2 36.5 1.7 2.7 2.3 3.9 1.6 2.3
C18:1 40.5 36.6 43.7 11.4 26.8 28.7 17.5 42.8 22 35.7 32.3 42.5 35.1 36.3 42.3
C18:2 8.3 7.3 9.6 7.8 6.6 7.4 6.1 7 8 46.2 27.7 19.7 39.5 11.3 2.2
C18:3 1.4 1.2 1.1 1.4 2.3 4.2 28 1.3 21.1 1.3 17 28.5
C20:2 0 16.8 0 0 9.7 0.9
C20:3 0 1 0 0 8.9 9
CLA 0 0 0 2.6 0 0
C24:0 2 3.3 1.1 1.8 1.9 1.8 1.4
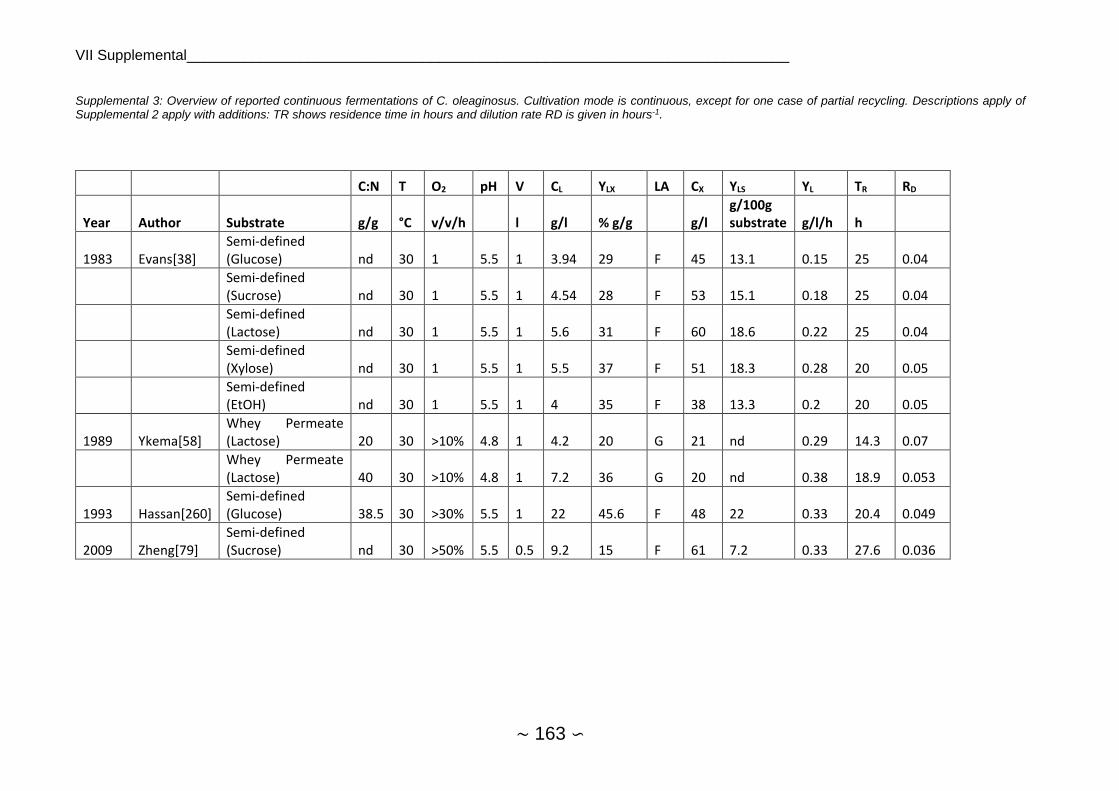
VII Supplemental__________________________________________________________________________
∼ 163 ∽
Supplemental 3: Overview of reported continuous fermentations of C. oleaginosus. Cultivation mode is continuous, except for one case of partial recycling. Descriptions apply of Supplemental 2 apply with additions: TR shows residence time in hours and dilution rate RD is given in hours-1.
C:N T O2 pH V CL YLX LA CX YLS YL TR RD
Year Author Substrate g/g °C v/v/h l g/l % g/g g/l g/100g substrate g/l/h h
1983 Evans[38] Semi-defined (Glucose) nd 30 1 5.5 1 3.94 29 F 45 13.1 0.15 25 0.04
Semi-defined (Sucrose) nd 30 1 5.5 1 4.54 28 F 53 15.1 0.18 25 0.04
Semi-defined (Lactose) nd 30 1 5.5 1 5.6 31 F 60 18.6 0.22 25 0.04
Semi-defined (Xylose) nd 30 1 5.5 1 5.5 37 F 51 18.3 0.28 20 0.05
Semi-defined (EtOH) nd 30 1 5.5 1 4 35 F 38 13.3 0.2 20 0.05
1989 Ykema[58] Whey Permeate (Lactose) 20 30 >10% 4.8 1 4.2 20 G 21 nd 0.29 14.3 0.07
Whey Permeate (Lactose) 40 30 >10% 4.8 1 7.2 36 G 20 nd 0.38 18.9 0.053
1993 Hassan[260] Semi-defined (Glucose) 38.5 30 >30% 5.5 1 22 45.6 F 48 22 0.33 20.4 0.049
2009 Zheng[79] Semi-defined (Sucrose) nd 30 >50% 5.5 0.5 9.2 15 F 61 7.2 0.33 27.6 0.036
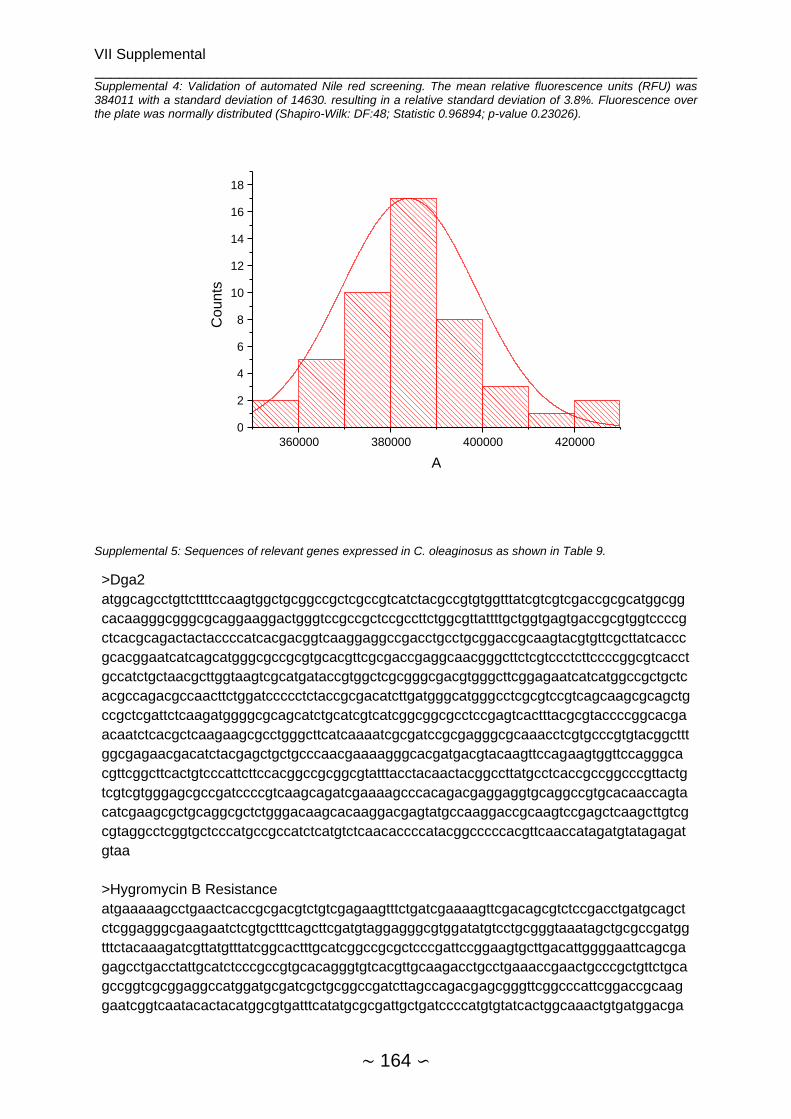
VII Supplemental __________________________________________________________________________
∼ 164 ∽
Supplemental 4: Validation of automated Nile red screening. The mean relative fluorescence units (RFU) was 384011 with a standard deviation of 14630. resulting in a relative standard deviation of 3.8%. Fluorescence over the plate was normally distributed (Shapiro-Wilk: DF:48; Statistic 0.96894; p-value 0.23026).
Supplemental 5: Sequences of relevant genes expressed in C. oleaginosus as shown in Table 9.
>Dga2
atggcagcctgttcttttccaagtggctgcggccgctcgccgtcatctacgccgtgtggtttatcgtcgtcgaccgcgcatggcgg
cacaagggcgggcgcaggaaggactgggtccgccgctccgccttctggcgttattttgctggtgagtgaccgcgtggtccccg
ctcacgcagactactaccccatcacgacggtcaaggaggccgacctgcctgcggaccgcaagtacgtgttcgcttatcaccc
gcacggaatcatcagcatgggcgccgcgtgcacgttcgcgaccgaggcaacgggcttctcgtccctcttccccggcgtcacct
gccatctgctaacgcttggtaagtcgcatgataccgtggctcgcgggcgacgtgggcttcggagaatcatcatggccgctgctc
acgccagacgccaacttctggatccccctctaccgcgacatcttgatgggcatgggcctcgcgtccgtcagcaagcgcagctg
ccgctcgattctcaagatggggcgcagcatctgcatcgtcatcggcggcgcctccgagtcactttacgcgtaccccggcacga
acaatctcacgctcaagaagcgcctgggcttcatcaaaatcgcgatccgcgagggcgcaaacctcgtgcccgtgtacggcttt
ggcgagaacgacatctacgagctgctgcccaacgaaaagggcacgatgacgtacaagttccagaagtggttccagggca
cgttcggcttcactgtcccattcttccacggccgcggcgtatttacctacaactacggccttatgcctcaccgccggcccgttactg
tcgtcgtgggagcgccgatccccgtcaagcagatcgaaaagcccacagacgaggaggtgcaggccgtgcacaaccagta
catcgaagcgctgcaggcgctctgggacaagcacaaggacgagtatgccaaggaccgcaagtccgagctcaagcttgtcg
cgtaggcctcggtgctcccatgccgccatctcatgtctcaacaccccatacggcccccacgttcaaccatagatgtatagagat
gtaa
>Hygromycin B Resistance
atgaaaaagcctgaactcaccgcgacgtctgtcgagaagtttctgatcgaaaagttcgacagcgtctccgacctgatgcagct
ctcggagggcgaagaatctcgtgctttcagcttcgatgtaggagggcgtggatatgtcctgcgggtaaatagctgcgccgatgg
tttctacaaagatcgttatgtttatcggcactttgcatcggccgcgctcccgattccggaagtgcttgacattggggaattcagcga
gagcctgacctattgcatctcccgccgtgcacagggtgtcacgttgcaagacctgcctgaaaccgaactgcccgctgttctgca
gccggtcgcggaggccatggatgcgatcgctgcggccgatcttagccagacgagcgggttcggcccattcggaccgcaag
gaatcggtcaatacactacatggcgtgatttcatatgcgcgattgctgatccccatgtgtatcactggcaaactgtgatggacga
360000 380000 400000 420000 0
2
4
6
8
10
12
14
16
18
Coun
ts
A
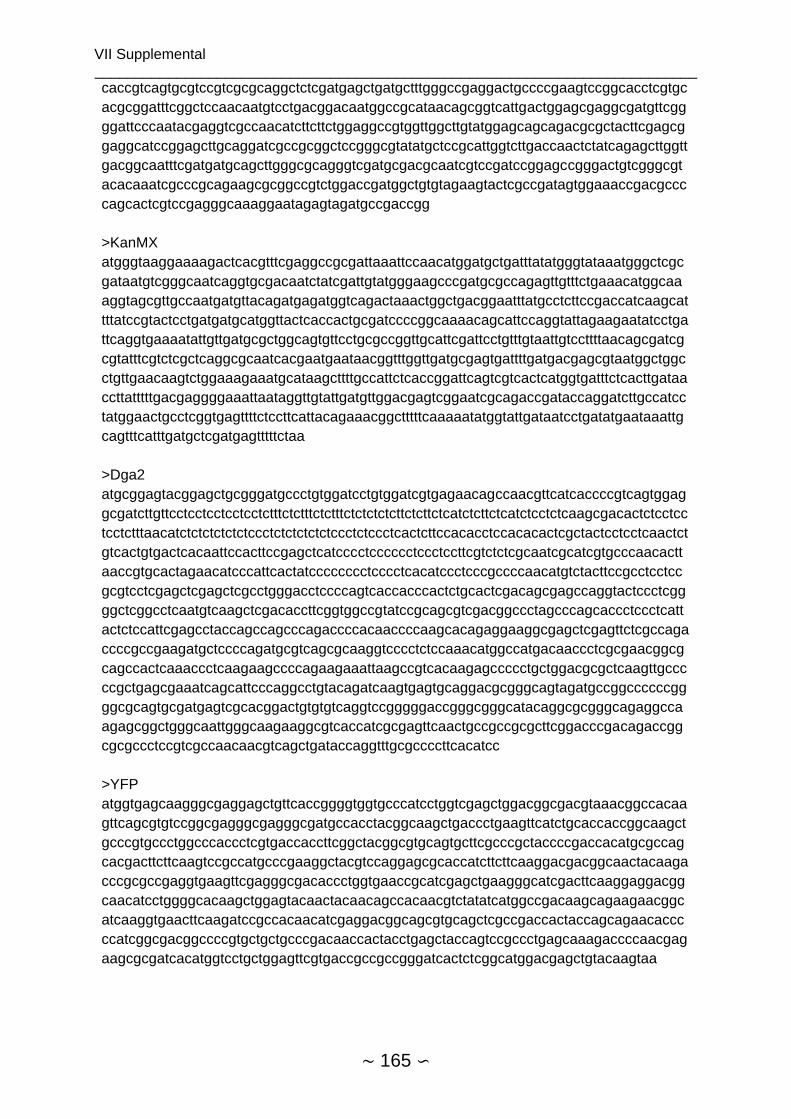
VII Supplemental __________________________________________________________________________
∼ 165 ∽
caccgtcagtgcgtccgtcgcgcaggctctcgatgagctgatgctttgggccgaggactgccccgaagtccggcacctcgtgc
acgcggatttcggctccaacaatgtcctgacggacaatggccgcataacagcggtcattgactggagcgaggcgatgttcgg
ggattcccaatacgaggtcgccaacatcttcttctggaggccgtggttggcttgtatggagcagcagacgcgctacttcgagcg
gaggcatccggagcttgcaggatcgccgcggctccgggcgtatatgctccgcattggtcttgaccaactctatcagagcttggtt
gacggcaatttcgatgatgcagcttgggcgcagggtcgatgcgacgcaatcgtccgatccggagccgggactgtcgggcgt
acacaaatcgcccgcagaagcgcggccgtctggaccgatggctgtgtagaagtactcgccgatagtggaaaccgacgccc
cagcactcgtccgagggcaaaggaatagagtagatgccgaccgg
>KanMX
atgggtaaggaaaagactcacgtttcgaggccgcgattaaattccaacatggatgctgatttatatgggtataaatgggctcgc
gataatgtcgggcaatcaggtgcgacaatctatcgattgtatgggaagcccgatgcgccagagttgtttctgaaacatggcaa
aggtagcgttgccaatgatgttacagatgagatggtcagactaaactggctgacggaatttatgcctcttccgaccatcaagcat
tttatccgtactcctgatgatgcatggttactcaccactgcgatccccggcaaaacagcattccaggtattagaagaatatcctga
ttcaggtgaaaatattgttgatgcgctggcagtgttcctgcgccggttgcattcgattcctgtttgtaattgtccttttaacagcgatcg
cgtatttcgtctcgctcaggcgcaatcacgaatgaataacggtttggttgatgcgagtgattttgatgacgagcgtaatggctggc
ctgttgaacaagtctggaaagaaatgcataagcttttgccattctcaccggattcagtcgtcactcatggtgatttctcacttgataa
ccttatttttgacgaggggaaattaataggttgtattgatgttggacgagtcggaatcgcagaccgataccaggatcttgccatcc
tatggaactgcctcggtgagttttctccttcattacagaaacggctttttcaaaaatatggtattgataatcctgatatgaataaattg
cagtttcatttgatgctcgatgagtttttctaa
>Dga2
atgcggagtacggagctgcgggatgccctgtggatcctgtggatcgtgagaacagccaacgttcatcaccccgtcagtggag
gcgatcttgttcctcctcctcctcctctttctctttctctttctctctctcttctcttctcatctcttctcatctcctctcaagcgacactctcctcc
tcctctttaacatctctctctctctccctctctctctctccctctccctcactcttccacacctccacacactcgctactcctcctcaactct
gtcactgtgactcacaattccacttccgagctcatcccctcccccctccctccttcgtctctcgcaatcgcatcgtgcccaacactt
aaccgtgcactagaacatcccattcactatcccccccctcccctcacatccctcccgccccaacatgtctacttccgcctcctcc
gcgtcctcgagctcgagctcgcctgggacctccccagtcaccacccactctgcactcgacagcgagccaggtactccctcgg
ggctcggcctcaatgtcaagctcgacaccttcggtggccgtatccgcagcgtcgacggccctagcccagcaccctccctcatt
actctccattcgagcctaccagccagcccagaccccacaaccccaagcacagaggaaggcgagctcgagttctcgccaga
ccccgccgaagatgctccccagatgcgtcagcgcaaggtcccctctccaaacatggccatgacaaccctcgcgaacggcg
cagccactcaaaccctcaagaagccccagaagaaattaagccgtcacaagagccccctgctggacgcgctcaagttgccc
ccgctgagcgaaatcagcattcccaggcctgtacagatcaagtgagtgcaggacgcgggcagtagatgccggccccccgg
ggcgcagtgcgatgagtcgcacggactgtgtgtcaggtccgggggaccgggcgggcatacaggcgcgggcagaggcca
agagcggctgggcaattgggcaagaaggcgtcaccatcgcgagttcaactgccgccgcgcttcggacccgacagaccgg
cgcgccctccgtcgccaacaacgtcagctgataccaggtttgcgccccttcacatcc
>YFP
atggtgagcaagggcgaggagctgttcaccggggtggtgcccatcctggtcgagctggacggcgacgtaaacggccacaa
gttcagcgtgtccggcgagggcgagggcgatgccacctacggcaagctgaccctgaagttcatctgcaccaccggcaagct
gcccgtgccctggcccaccctcgtgaccaccttcggctacggcgtgcagtgcttcgcccgctaccccgaccacatgcgccag
cacgacttcttcaagtccgccatgcccgaaggctacgtccaggagcgcaccatcttcttcaaggacgacggcaactacaaga
cccgcgccgaggtgaagttcgagggcgacaccctggtgaaccgcatcgagctgaagggcatcgacttcaaggaggacgg
caacatcctggggcacaagctggagtacaactacaacagccacaacgtctatatcatggccgacaagcagaagaacggc
atcaaggtgaacttcaagatccgccacaacatcgaggacggcagcgtgcagctcgccgaccactaccagcagaacaccc
ccatcggcgacggccccgtgctgctgcccgacaaccactacctgagctaccagtccgccctgagcaaagaccccaacgag
aagcgcgatcacatggtcctgctggagttcgtgaccgccgccgggatcactctcggcatggacgagctgtacaagtaa
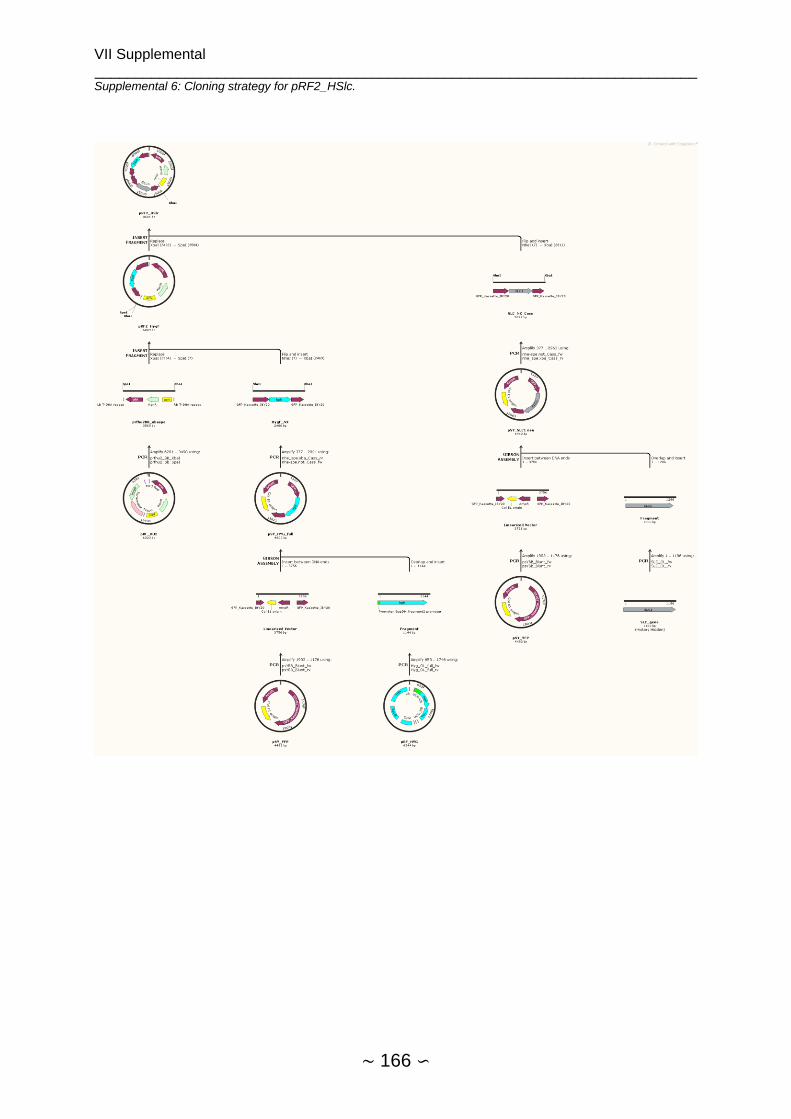
VII Supplemental __________________________________________________________________________
∼ 166 ∽
Supplemental 6: Cloning strategy for pRF2_HSlc.

VII Supplemental __________________________________________________________________________
∼ 167 ∽
Supplemental 7: Cloning strategy for pRF2_KDga2.
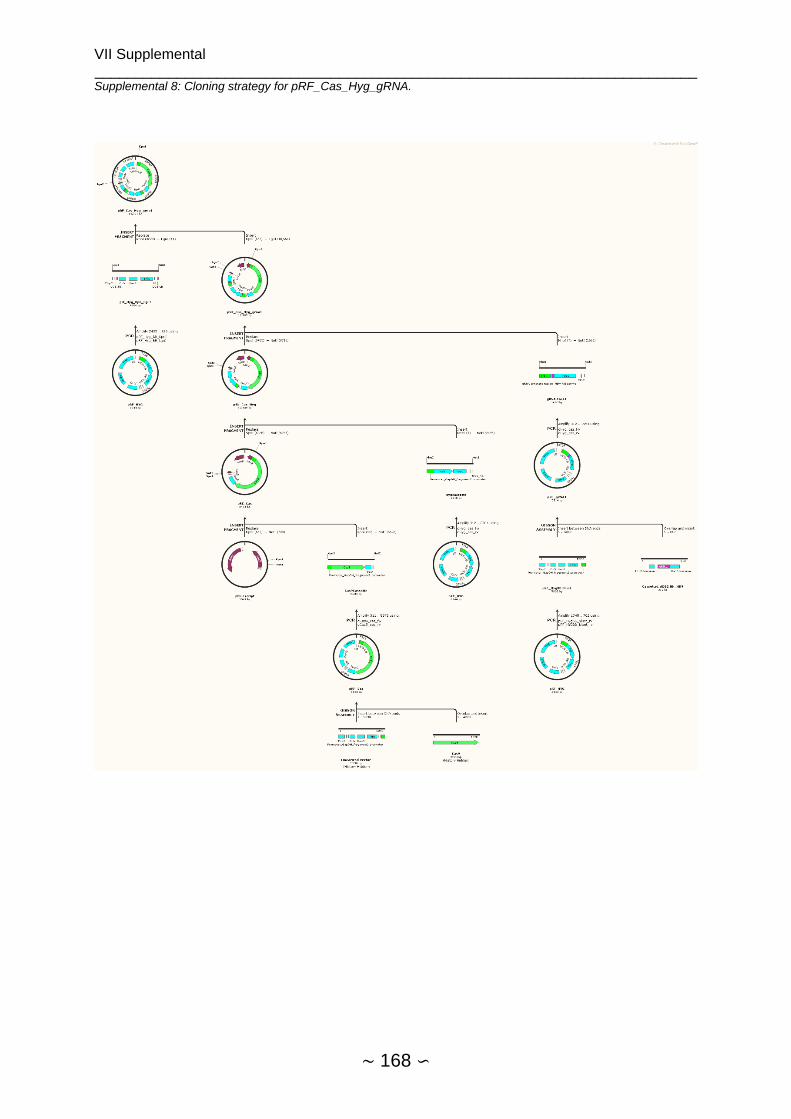
VII Supplemental __________________________________________________________________________
∼ 168 ∽
Supplemental 8: Cloning strategy for pRF_Cas_Hyg_gRNA.
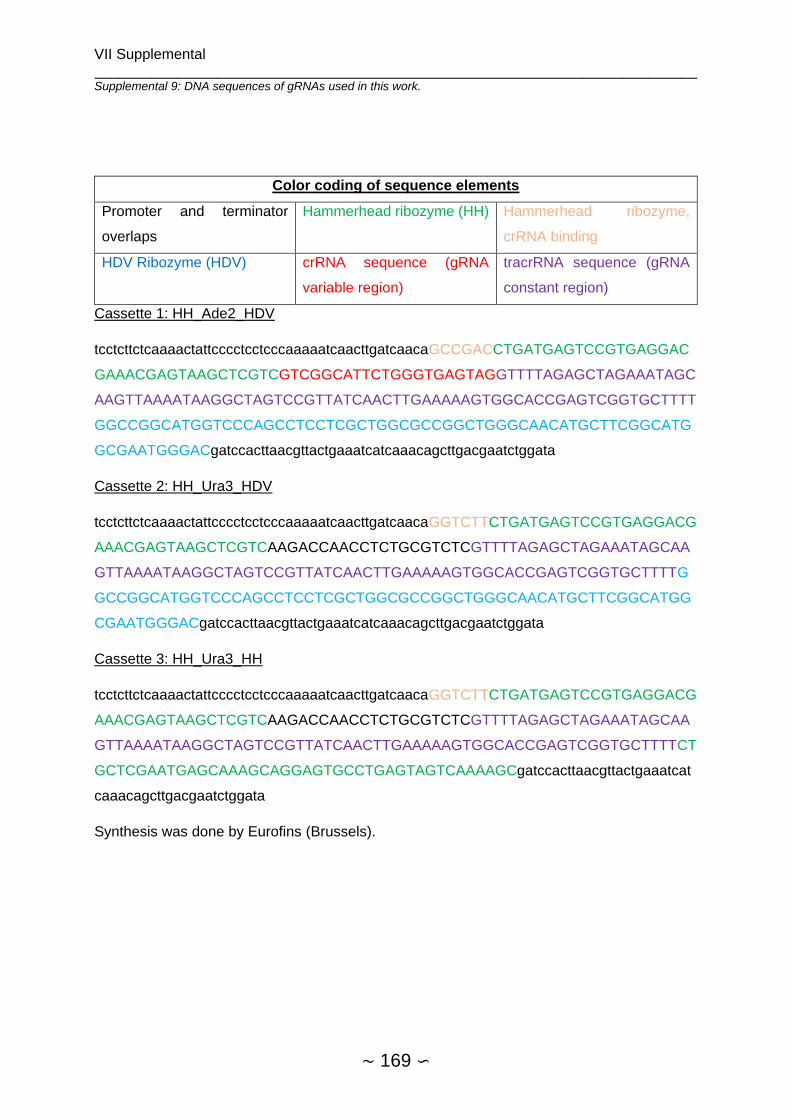
VII Supplemental __________________________________________________________________________
∼ 169 ∽
Supplemental 9: DNA sequences of gRNAs used in this work.
Cassette 1: HH_Ade2_HDV
tcctcttctcaaaactattcccctcctcccaaaaatcaacttgatcaacaGCCGACCTGATGAGTCCGTGAGGAC
GAAACGAGTAAGCTCGTCGTCGGCATTCTGGGTGAGTAGGTTTTAGAGCTAGAAATAGC
AAGTTAAAATAAGGCTAGTCCGTTATCAACTTGAAAAAGTGGCACCGAGTCGGTGCTTTT
GGCCGGCATGGTCCCAGCCTCCTCGCTGGCGCCGGCTGGGCAACATGCTTCGGCATG
GCGAATGGGACgatccacttaacgttactgaaatcatcaaacagcttgacgaatctggata
Cassette 2: HH_Ura3_HDV
tcctcttctcaaaactattcccctcctcccaaaaatcaacttgatcaacaGGTCTTCTGATGAGTCCGTGAGGACG
AAACGAGTAAGCTCGTCAAGACCAACCTCTGCGTCTCGTTTTAGAGCTAGAAATAGCAA
GTTAAAATAAGGCTAGTCCGTTATCAACTTGAAAAAGTGGCACCGAGTCGGTGCTTTTG
GCCGGCATGGTCCCAGCCTCCTCGCTGGCGCCGGCTGGGCAACATGCTTCGGCATGG
CGAATGGGACgatccacttaacgttactgaaatcatcaaacagcttgacgaatctggata
Cassette 3: HH_Ura3_HH
tcctcttctcaaaactattcccctcctcccaaaaatcaacttgatcaacaGGTCTTCTGATGAGTCCGTGAGGACG
AAACGAGTAAGCTCGTCAAGACCAACCTCTGCGTCTCGTTTTAGAGCTAGAAATAGCAA
GTTAAAATAAGGCTAGTCCGTTATCAACTTGAAAAAGTGGCACCGAGTCGGTGCTTTTCT
GCTCGAATGAGCAAAGCAGGAGTGCCTGAGTAGTCAAAAGCgatccacttaacgttactgaaatcat
caaacagcttgacgaatctggata
Synthesis was done by Eurofins (Brussels).
Color coding of sequence elements
Promoter and terminator
overlaps
Hammerhead ribozyme (HH) Hammerhead ribozyme,
crRNA binding
HDV Ribozyme (HDV) crRNA sequence (gRNA
variable region)
tracrRNA sequence (gRNA
constant region)
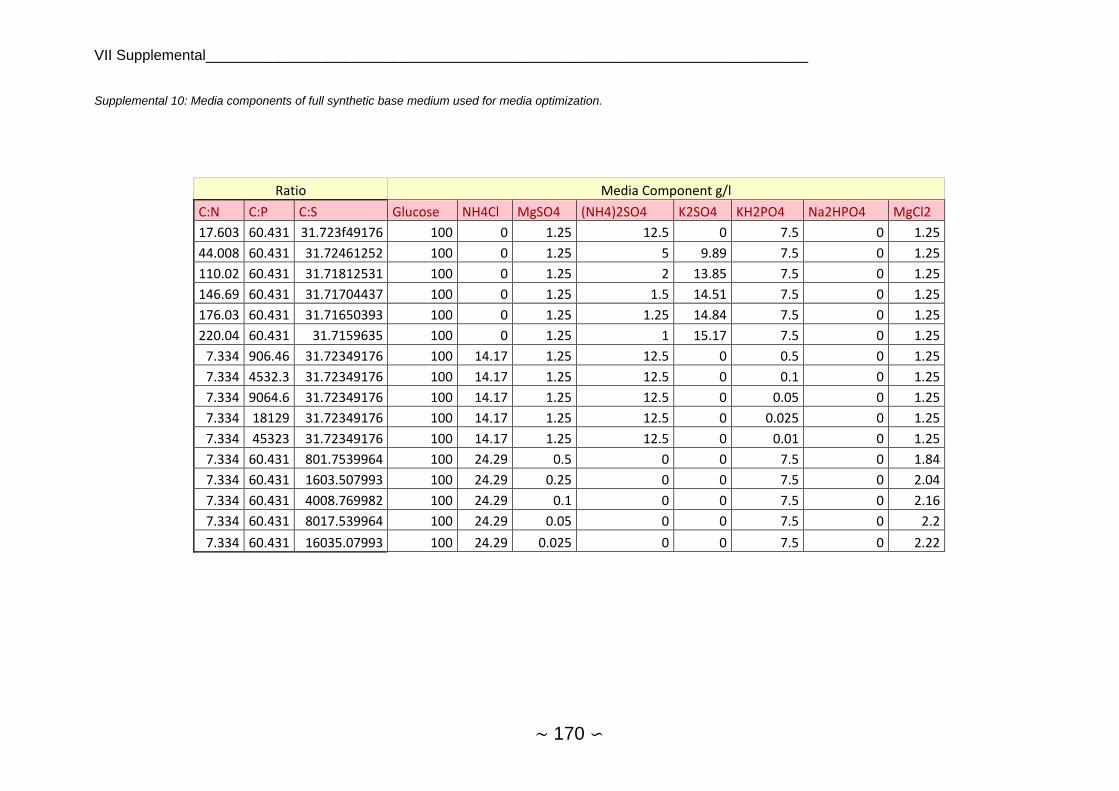
VII Supplemental__________________________________________________________________________
∼ 170 ∽
Supplemental 10: Media components of full synthetic base medium used for media optimization.
Ratio Media Component g/l
C:N C:P C:S Glucose NH4Cl MgSO4 (NH4)2SO4 K2SO4 KH2PO4 Na2HPO4 MgCl2
17.603 60.431 31.723f49176 100 0 1.25 12.5 0 7.5 0 1.25
44.008 60.431 31.72461252 100 0 1.25 5 9.89 7.5 0 1.25
110.02 60.431 31.71812531 100 0 1.25 2 13.85 7.5 0 1.25
146.69 60.431 31.71704437 100 0 1.25 1.5 14.51 7.5 0 1.25
176.03 60.431 31.71650393 100 0 1.25 1.25 14.84 7.5 0 1.25
220.04 60.431 31.7159635 100 0 1.25 1 15.17 7.5 0 1.25
7.334 906.46 31.72349176 100 14.17 1.25 12.5 0 0.5 0 1.25
7.334 4532.3 31.72349176 100 14.17 1.25 12.5 0 0.1 0 1.25
7.334 9064.6 31.72349176 100 14.17 1.25 12.5 0 0.05 0 1.25
7.334 18129 31.72349176 100 14.17 1.25 12.5 0 0.025 0 1.25
7.334 45323 31.72349176 100 14.17 1.25 12.5 0 0.01 0 1.25
7.334 60.431 801.7539964 100 24.29 0.5 0 0 7.5 0 1.84
7.334 60.431 1603.507993 100 24.29 0.25 0 0 7.5 0 2.04
7.334 60.431 4008.769982 100 24.29 0.1 0 0 7.5 0 2.16
7.334 60.431 8017.539964 100 24.29 0.05 0 0 7.5 0 2.2
7.334 60.431 16035.07993 100 24.29 0.025 0 0 7.5 0 2.22
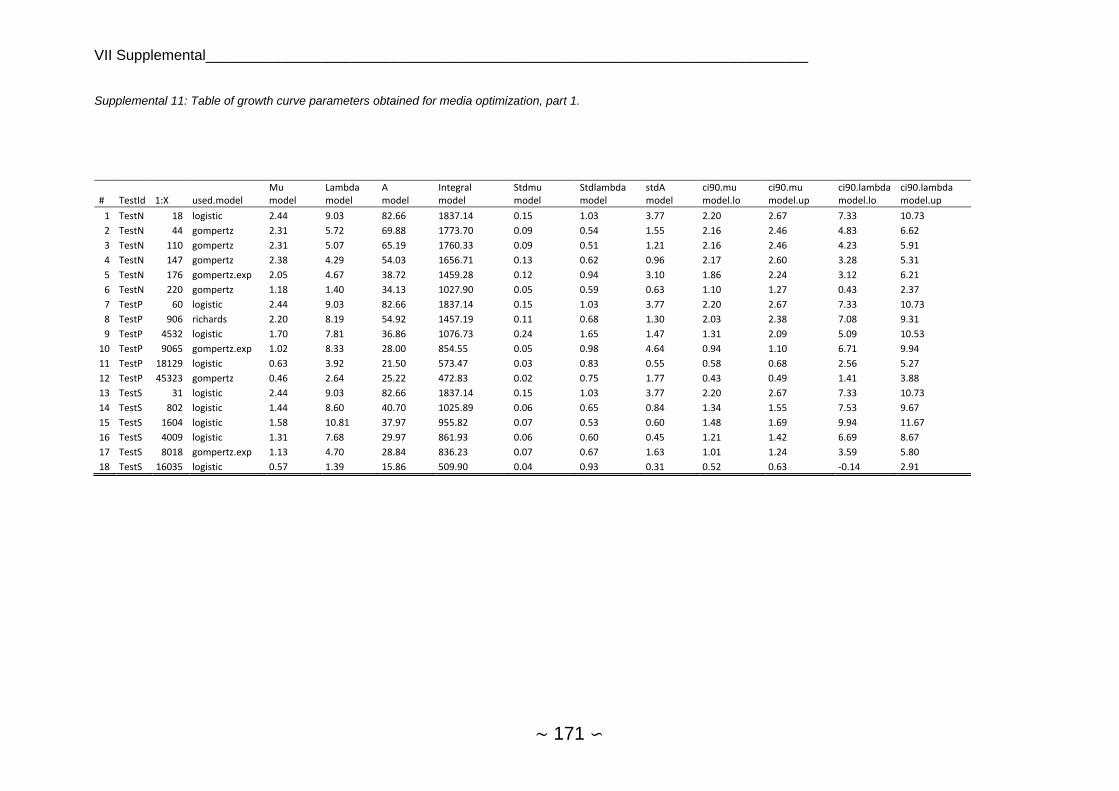
VII Supplemental__________________________________________________________________________
∼ 171 ∽
Supplemental 11: Table of growth curve parameters obtained for media optimization, part 1.
# TestId 1:X used.model Mu model
Lambda model
A model
Integral model
Stdmu model
Stdlambda model
stdA model
ci90.mu model.lo
ci90.mu model.up
ci90.lambda model.lo
ci90.lambda model.up
1 TestN 18 logistic 2.44 9.03 82.66 1837.14 0.15 1.03 3.77 2.20 2.67 7.33 10.73
2 TestN 44 gompertz 2.31 5.72 69.88 1773.70 0.09 0.54 1.55 2.16 2.46 4.83 6.62
3 TestN 110 gompertz 2.31 5.07 65.19 1760.33 0.09 0.51 1.21 2.16 2.46 4.23 5.91
4 TestN 147 gompertz 2.38 4.29 54.03 1656.71 0.13 0.62 0.96 2.17 2.60 3.28 5.31
5 TestN 176 gompertz.exp 2.05 4.67 38.72 1459.28 0.12 0.94 3.10 1.86 2.24 3.12 6.21
6 TestN 220 gompertz 1.18 1.40 34.13 1027.90 0.05 0.59 0.63 1.10 1.27 0.43 2.37
7 TestP 60 logistic 2.44 9.03 82.66 1837.14 0.15 1.03 3.77 2.20 2.67 7.33 10.73
8 TestP 906 richards 2.20 8.19 54.92 1457.19 0.11 0.68 1.30 2.03 2.38 7.08 9.31
9 TestP 4532 logistic 1.70 7.81 36.86 1076.73 0.24 1.65 1.47 1.31 2.09 5.09 10.53
10 TestP 9065 gompertz.exp 1.02 8.33 28.00 854.55 0.05 0.98 4.64 0.94 1.10 6.71 9.94
11 TestP 18129 logistic 0.63 3.92 21.50 573.47 0.03 0.83 0.55 0.58 0.68 2.56 5.27
12 TestP 45323 gompertz 0.46 2.64 25.22 472.83 0.02 0.75 1.77 0.43 0.49 1.41 3.88
13 TestS 31 logistic 2.44 9.03 82.66 1837.14 0.15 1.03 3.77 2.20 2.67 7.33 10.73
14 TestS 802 logistic 1.44 8.60 40.70 1025.89 0.06 0.65 0.84 1.34 1.55 7.53 9.67
15 TestS 1604 logistic 1.58 10.81 37.97 955.82 0.07 0.53 0.60 1.48 1.69 9.94 11.67
16 TestS 4009 logistic 1.31 7.68 29.97 861.93 0.06 0.60 0.45 1.21 1.42 6.69 8.67
17 TestS 8018 gompertz.exp 1.13 4.70 28.84 836.23 0.07 0.67 1.63 1.01 1.24 3.59 5.80
18 TestS 16035 logistic 0.57 1.39 15.86 509.90 0.04 0.93 0.31 0.52 0.63 -0.14 2.91
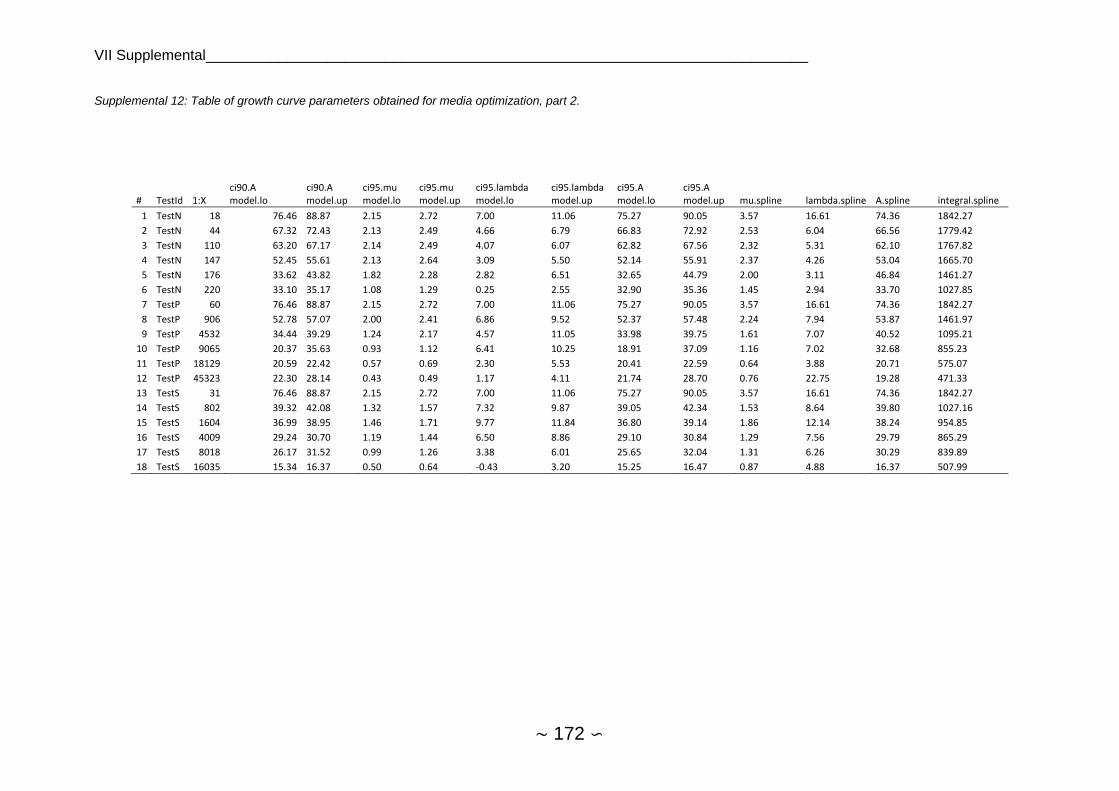
VII Supplemental__________________________________________________________________________
∼ 172 ∽
Supplemental 12: Table of growth curve parameters obtained for media optimization, part 2.
# TestId 1:X ci90.A model.lo
ci90.A model.up
ci95.mu model.lo
ci95.mu model.up
ci95.lambda model.lo
ci95.lambda model.up
ci95.A model.lo
ci95.A model.up mu.spline lambda.spline A.spline integral.spline
1 TestN 18 76.46 88.87 2.15 2.72 7.00 11.06 75.27 90.05 3.57 16.61 74.36 1842.27
2 TestN 44 67.32 72.43 2.13 2.49 4.66 6.79 66.83 72.92 2.53 6.04 66.56 1779.42
3 TestN 110 63.20 67.17 2.14 2.49 4.07 6.07 62.82 67.56 2.32 5.31 62.10 1767.82
4 TestN 147 52.45 55.61 2.13 2.64 3.09 5.50 52.14 55.91 2.37 4.26 53.04 1665.70
5 TestN 176 33.62 43.82 1.82 2.28 2.82 6.51 32.65 44.79 2.00 3.11 46.84 1461.27
6 TestN 220 33.10 35.17 1.08 1.29 0.25 2.55 32.90 35.36 1.45 2.94 33.70 1027.85
7 TestP 60 76.46 88.87 2.15 2.72 7.00 11.06 75.27 90.05 3.57 16.61 74.36 1842.27
8 TestP 906 52.78 57.07 2.00 2.41 6.86 9.52 52.37 57.48 2.24 7.94 53.87 1461.97
9 TestP 4532 34.44 39.29 1.24 2.17 4.57 11.05 33.98 39.75 1.61 7.07 40.52 1095.21
10 TestP 9065 20.37 35.63 0.93 1.12 6.41 10.25 18.91 37.09 1.16 7.02 32.68 855.23
11 TestP 18129 20.59 22.42 0.57 0.69 2.30 5.53 20.41 22.59 0.64 3.88 20.71 575.07
12 TestP 45323 22.30 28.14 0.43 0.49 1.17 4.11 21.74 28.70 0.76 22.75 19.28 471.33
13 TestS 31 76.46 88.87 2.15 2.72 7.00 11.06 75.27 90.05 3.57 16.61 74.36 1842.27
14 TestS 802 39.32 42.08 1.32 1.57 7.32 9.87 39.05 42.34 1.53 8.64 39.80 1027.16
15 TestS 1604 36.99 38.95 1.46 1.71 9.77 11.84 36.80 39.14 1.86 12.14 38.24 954.85
16 TestS 4009 29.24 30.70 1.19 1.44 6.50 8.86 29.10 30.84 1.29 7.56 29.79 865.29
17 TestS 8018 26.17 31.52 0.99 1.26 3.38 6.01 25.65 32.04 1.31 6.26 30.29 839.89
18 TestS 16035 15.34 16.37 0.50 0.64 -0.43 3.20 15.25 16.47 0.87 4.88 16.37 507.99

VII Supplemental __________________________________________________________________________
Supplemental 13: Growth curves as used in this work and implemented in R package grofit. Image adapted by Kahm et al[122].
Supplemental 14: Growth of isolates and reference strains in MNM-S at 28°C and 120 rpm at 30 ml volume in baffled flasks.
0 22 44 66 88 110
0,0
0,2
0,4
0,6
0,8
1,0
OD
600
Cultivation time [hours]
TO
15
16
10
14
8
19
24
12
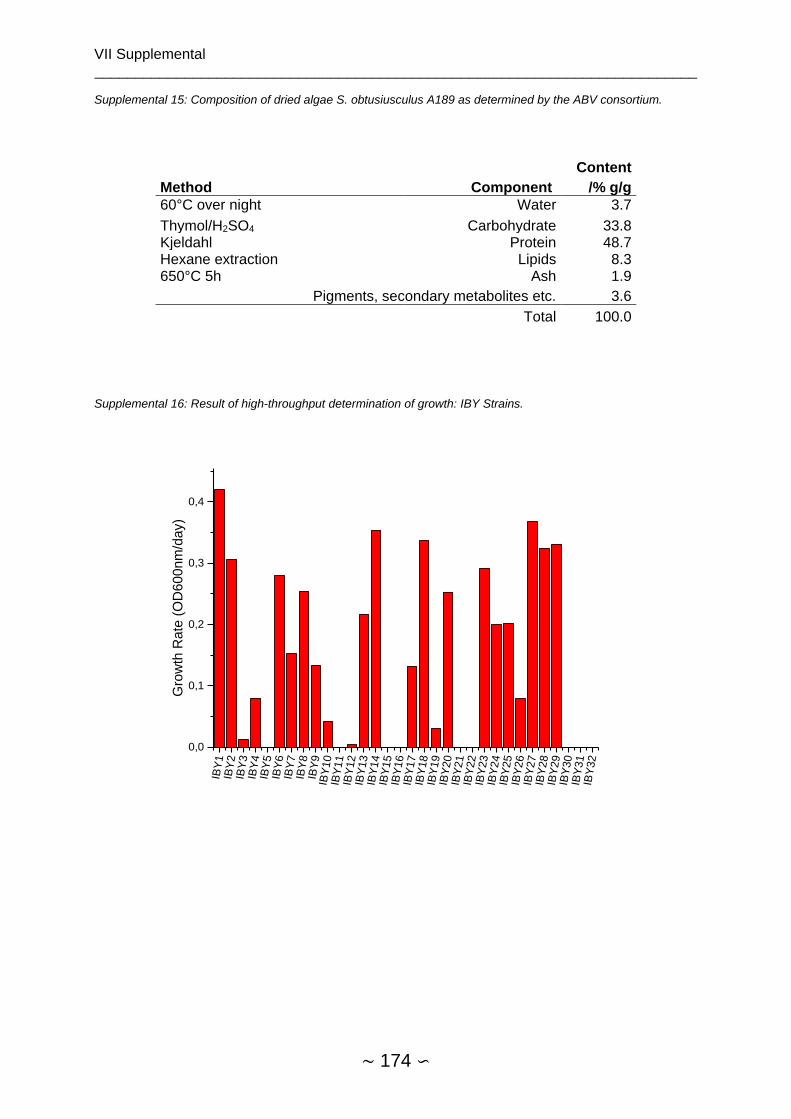
VII Supplemental __________________________________________________________________________
∼ 174 ∽
Supplemental 15: Composition of dried algae S. obtusiusculus A189 as determined by the ABV consortium.
Method Component
Content
/% g/g
60°C over night Water 3.7
Thymol/H2SO4 Carbohydrate 33.8 Kjeldahl Protein 48.7 Hexane extraction Lipids 8.3 650°C 5h Ash 1.9
Pigments, secondary metabolites etc. 3.6
Total 100.0
Supplemental 16: Result of high-throughput determination of growth: IBY Strains.
IBY
1IB
Y2
IBY
3IB
Y4
IBY
5IB
Y6
IBY
7IB
Y8
IBY
9IB
Y10
IBY
11
IBY
12
IBY
13
IBY
14
IBY
15
IBY
16
IBY
17
IBY
18
IBY
19
IBY
20
IBY
21
IBY
22
IBY
23
IBY
24
IBY
25
IBY
26
IBY
27
IBY
28
IBY
29
IBY
30
IBY
31
IBY
32
0,0
0,1
0,2
0,3
0,4
Gro
wth
Rate
(O
D600nm
/day)

VII Supplemental __________________________________________________________________________
∼ 175 ∽
Supplemental 17: Result of high-throughput determination of growth: WO Strains.
WO
1W
O2
WO
3W
O4
WO
5W
O6
WO
7W
O8
WO
9W
O10
WO
11
WO
12
WO
13
WO
14
WO
15
WO
16
WO
17
WO
18
WO
19
WO
20
WO
21
WO
22
WO
23
WO
24
WO
25
WO
26
WO
27
WO
28
WO
29
WO
30
WO
31
WO
32
0,00
0,01
0,02
0,03
0,04
0,05
0,06
0,07G
row
th R
ate
(O
D6
00
nm
/da
y)
Supplemental 18: Result of high-throughput determination of growth: NZ Strains.
NZ
1N
Z2
NZ
3N
Z4
NZ
5N
Z6
NZ
7N
Z8
NZ
9N
Z10
NZ
11
NZ
12
NZ
13
NZ
14
NZ
15
NZ
16
NZ
17
NZ
18
NZ
19
NZ
20
NZ
21
NZ
22
NZ
23
NZ
24
NZ
25
NZ
26
NZ
27
NZ
28
NZ
29
NZ
30
NZ
31
NZ
32
0,000
0,005
0,010
0,015
0,020
0,025
0,030
0,035
Gro
wth
Ra
te (
OD
60
0n
m/d
ay)

VII Supplemental __________________________________________________________________________
Supplemental 19: Result of high-throughput lipid estimation screen of IBY culture collection.
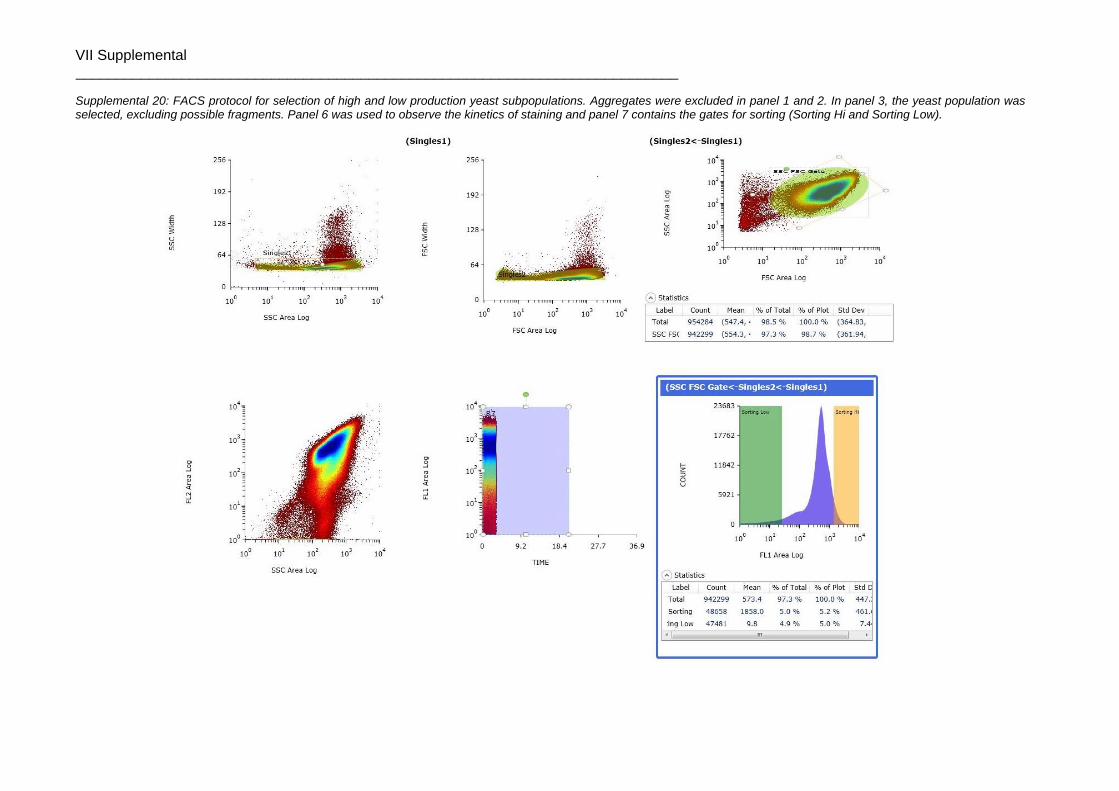
VII Supplemental __________________________________________________________________________
Supplemental 20: FACS protocol for selection of high and low production yeast subpopulations. Aggregates were excluded in panel 1 and 2. In panel 3, the yeast population was selected, excluding possible fragments. Panel 6 was used to observe the kinetics of staining and panel 7 contains the gates for sorting (Sorting Hi and Sorting Low).
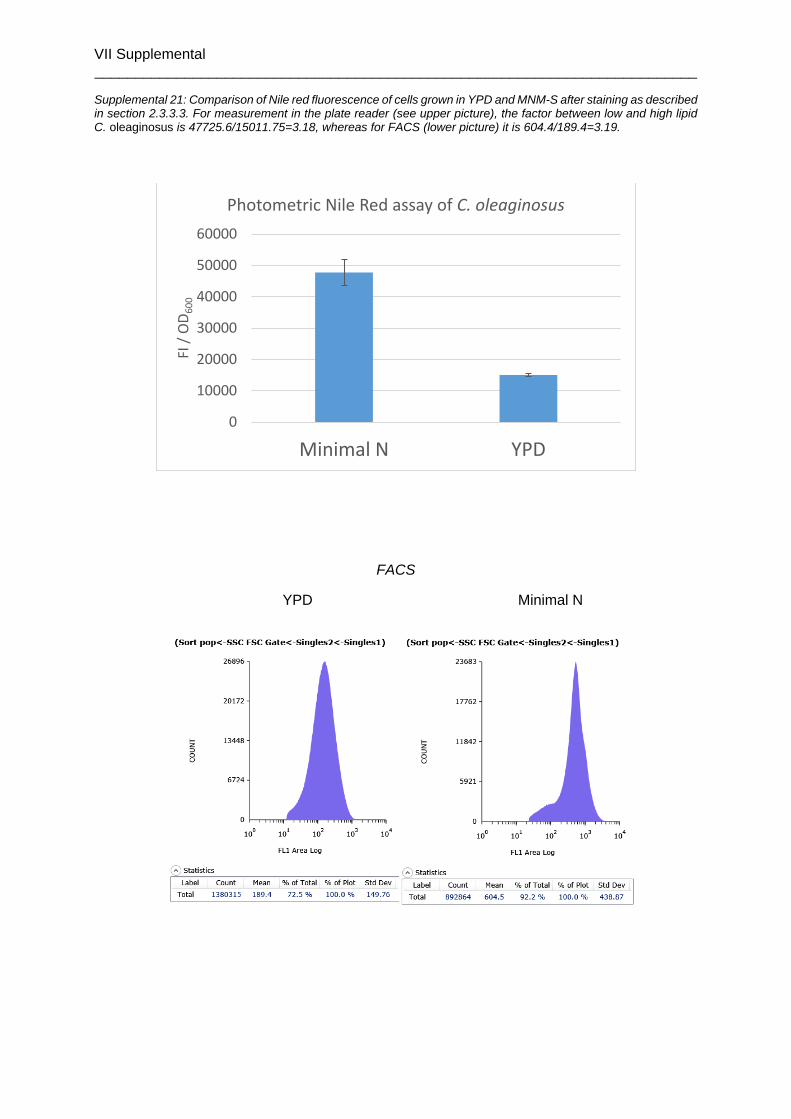
VII Supplemental __________________________________________________________________________
Supplemental 21: Comparison of Nile red fluorescence of cells grown in YPD and MNM-S after staining as described in section 2.3.3.3. For measurement in the plate reader (see upper picture), the factor between low and high lipid C. oleaginosus is 47725.6/15011.75=3.18, whereas for FACS (lower picture) it is 604.4/189.4=3.19.
FACS
YPD Minimal N
0
10000
20000
30000
40000
50000
60000
Minimal N YPD
FI /
OD
60
0
Photometric Nile Red assay of C. oleaginosus
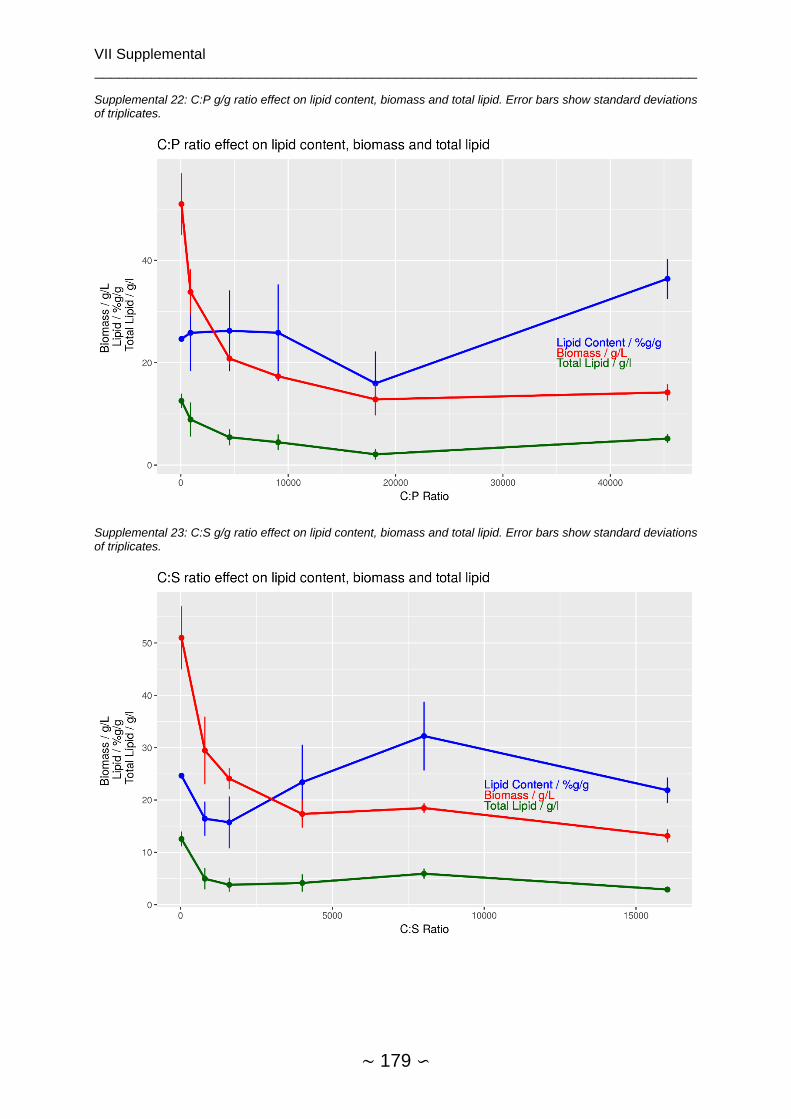
VII Supplemental __________________________________________________________________________
∼ 179 ∽
Supplemental 22: C:P g/g ratio effect on lipid content, biomass and total lipid. Error bars show standard deviations of triplicates.
Supplemental 23: C:S g/g ratio effect on lipid content, biomass and total lipid. Error bars show standard deviations of triplicates.
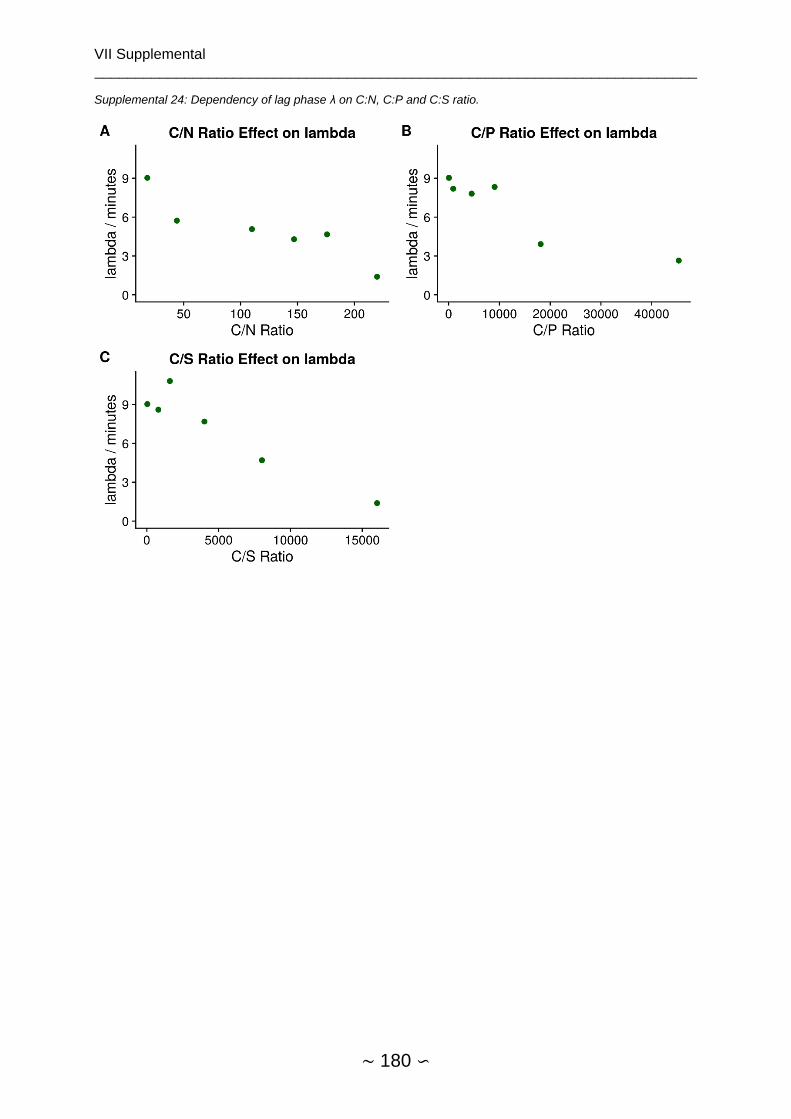
VII Supplemental __________________________________________________________________________
∼ 180 ∽
Supplemental 24: Dependency of lag phase λ on C:N, C:P and C:S ratio.

VII Supplemental __________________________________________________________________________
∼ 181 ∽
Supplemental 25 Kinetics of Nile red Fluorescence of C. oleaginosus cells grown in YPD with and without caffeine supplementation at different concentrations between 0 and 100 mM. Nile red is corrected for OD600 and is used as an estimator for lipid content.

VII Supplemental __________________________________________________________________________
∼ 182 ∽
Supplemental 26: Analytical plots of robust regression using M-estimation of yeast lipid content in dependence of rapamycin concentration in full cultivation medium. Data points 9 and 7, both of which outliers causing deviation at [rapamycin]=10 were excluded due to high Cook’s distance. The resulting fit was plotted in Figure 22 and was based on the formula shown at the bottom of the supplemental.
Lipid content=13.1996+0.3197*log([Rapamycin])
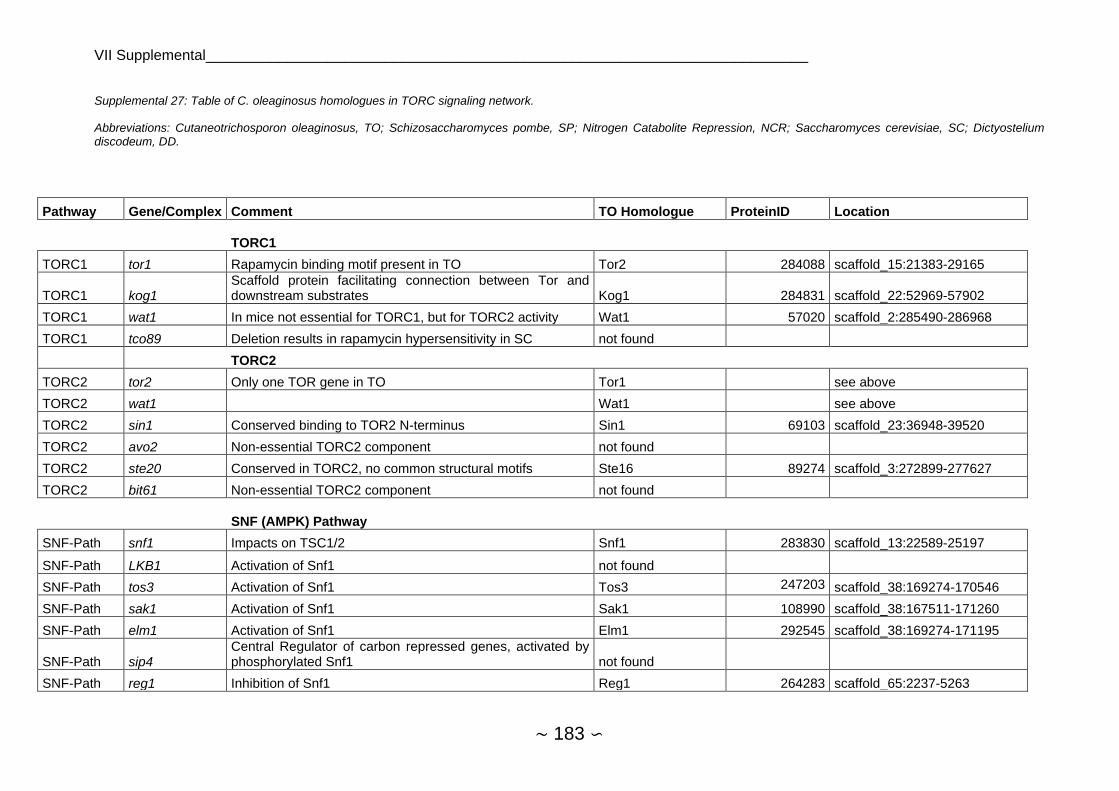
VII Supplemental__________________________________________________________________________
∼ 183 ∽
Supplemental 27: Table of C. oleaginosus homologues in TORC signaling network.
Abbreviations: Cutaneotrichosporon oleaginosus, TO; Schizosaccharomyces pombe, SP; Nitrogen Catabolite Repression, NCR; Saccharomyces cerevisiae, SC; Dictyostelium discodeum, DD.
Pathway Gene/Complex Comment TO Homologue ProteinID Location
TORC1
TORC1 tor1 Rapamycin binding motif present in TO Tor2 284088 scaffold_15:21383-29165
TORC1 kog1 Scaffold protein facilitating connection between Tor and downstream substrates Kog1 284831 scaffold_22:52969-57902
TORC1 wat1 In mice not essential for TORC1, but for TORC2 activity Wat1 57020 scaffold_2:285490-286968
TORC1 tco89 Deletion results in rapamycin hypersensitivity in SC not found
TORC2
TORC2 tor2 Only one TOR gene in TO Tor1 see above
TORC2 wat1 Wat1 see above
TORC2 sin1 Conserved binding to TOR2 N-terminus Sin1 69103 scaffold_23:36948-39520
TORC2 avo2 Non-essential TORC2 component not found
TORC2 ste20 Conserved in TORC2, no common structural motifs Ste16 89274 scaffold_3:272899-277627
TORC2 bit61 Non-essential TORC2 component not found
SNF (AMPK) Pathway
SNF-Path snf1 Impacts on TSC1/2 Snf1 283830 scaffold_13:22589-25197
SNF-Path LKB1 Activation of Snf1 not found
SNF-Path tos3 Activation of Snf1 Tos3 247203 scaffold_38:169274-170546
SNF-Path sak1 Activation of Snf1 Sak1 108990 scaffold_38:167511-171260
SNF-Path elm1 Activation of Snf1 Elm1 292545 scaffold_38:169274-171195
SNF-Path sip4 Central Regulator of carbon repressed genes, activated by phosphorylated Snf1 not found
SNF-Path reg1 Inhibition of Snf1 Reg1 264283 scaffold_65:2237-5263

VII Supplemental__________________________________________________________________________
∼ 184 ∽
SNF-Path glc7 Glc7 250471 scaffold_71:27846-28984
SNF-Path arf3 Activated by Snf1 in low energy environment not found
TSC Complex/TORC Upstream
TSC PATH FKBP12 Forms complex with rapamycin and inhibits TORC1 Fkh1 275378 scaffold_36:88698-89351
TSC PATH tsc2 Tuberin homologue Tsc2 285856 scaffold_33:86602-92917
TSC PATH tsc1 Hamartin homologue Tsc1 315493 scaffold_117:6411-9393
TSC PATH Vps34 Signals Availability of amino acids, bypassing Tsc/RheB axis Vps34 268904 scaffold_4:261651-264613
TSC PATH RheB Connects TSC-Complex to TORC1, possibly TORC2 Rhb1 237912 scaffold_71:7565-8434
TSC PATH Erk/Rsk Inhibition of Tsc complex (Erk signaling) Erk/Rsk-like 315969 scaffold_130:19790-24650
TSC PATH Rtp801/L Activates TSc1/2, conducts signals concerning DNA damage, other stressors not found
TSC PATH gtr1
Make up EGO complex localized at vacuolar membrane, confers amino acid availability to TORC. Possibly bypasses Tsc1/2 Rheb axis.
Gtr1 300143 scaffold_8:334087-335551
TSC PATH gtr2 Gtr2 238031 scaffold_4:169222-170531
TSC PATH ego1 not found
TSC PATH ego2 not found
TSC PATH ego3 not found
TSC PATH npr2
Possible TORC1 inhibitors in response to amino acid scarcity
Npr2 257923 scaffold_15:100949-103201
TSC PATH npr3 not found
TSC PATH acc1 Acetyl-CoA carboxylase, required for initiation of fatty acid synthesis Acc1 329998 scaffold_61:23648-31248
TORC1 Downstream
Translation S6k1 Ribosomal s6 kinase. Initiation of translation and ribosome biogenesis in eukaryotes Sch9 307993 scaffold_27:135937-139531
Translation S6 Ribosomal Protein S6, in eukaryotes S6b 282616 scaffold_5:384088-385762
Translation 4E-BP1 Repression of translation, targets elF4E in eukaryotes not found
Translation elF4E Initiation of translation, helicase, in eukaryotes Cdc33-like 280911 scaffold_120:13833-15119
Translation Cdc33-like 298705 scaffold_1:475432-477187
Metabolism gaf1 Modulates sexual development in SP not found
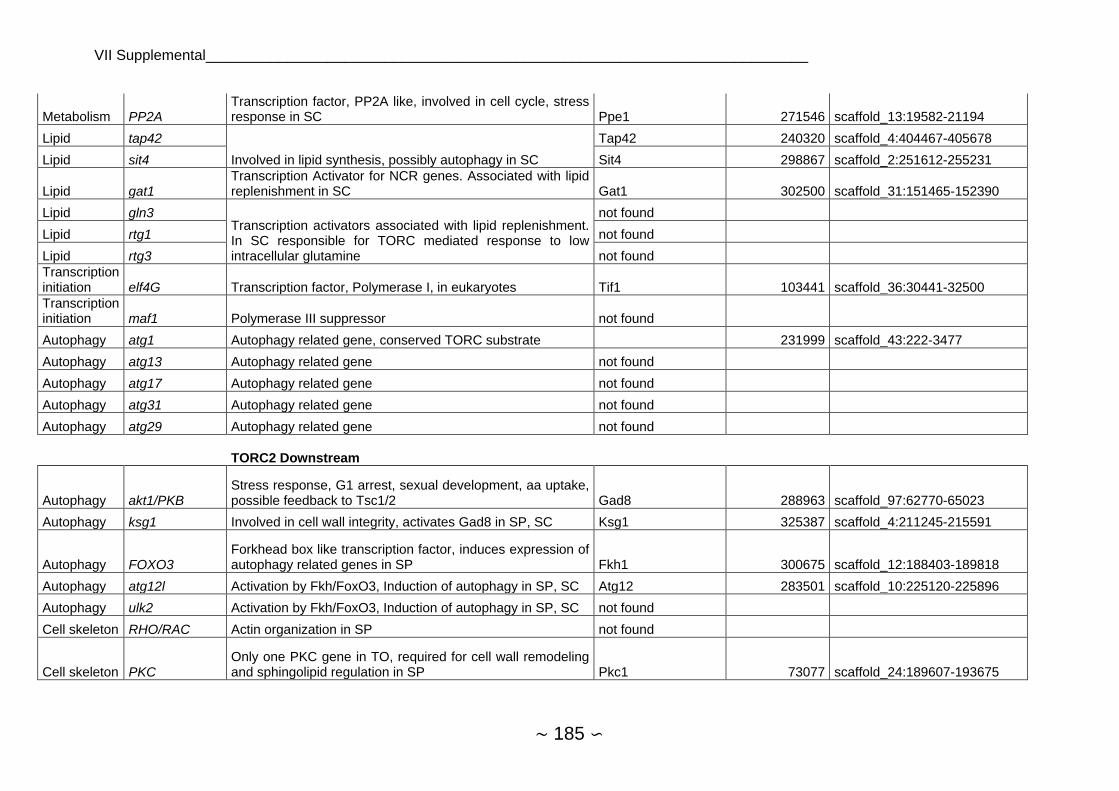
VII Supplemental__________________________________________________________________________
∼ 185 ∽
Metabolism PP2A Transcription factor, PP2A like, involved in cell cycle, stress response in SC Ppe1 271546 scaffold_13:19582-21194
Lipid tap42
Involved in lipid synthesis, possibly autophagy in SC
Tap42 240320 scaffold_4:404467-405678
Lipid sit4 Sit4 298867 scaffold_2:251612-255231
Lipid gat1 Transcription Activator for NCR genes. Associated with lipid replenishment in SC Gat1 302500 scaffold_31:151465-152390
Lipid gln3 Transcription activators associated with lipid replenishment. In SC responsible for TORC mediated response to low intracellular glutamine
not found
Lipid rtg1 not found
Lipid rtg3 not found
Transcription initiation elf4G Transcription factor, Polymerase I, in eukaryotes Tif1 103441 scaffold_36:30441-32500
Transcription initiation maf1 Polymerase III suppressor not found
Autophagy atg1 Autophagy related gene, conserved TORC substrate 231999 scaffold_43:222-3477
Autophagy atg13 Autophagy related gene not found
Autophagy atg17 Autophagy related gene not found
Autophagy atg31 Autophagy related gene not found
Autophagy atg29 Autophagy related gene not found
TORC2 Downstream
Autophagy akt1/PKB Stress response, G1 arrest, sexual development, aa uptake, possible feedback to Tsc1/2 Gad8 288963 scaffold_97:62770-65023
Autophagy ksg1 Involved in cell wall integrity, activates Gad8 in SP, SC Ksg1 325387 scaffold_4:211245-215591
Autophagy FOXO3 Forkhead box like transcription factor, induces expression of autophagy related genes in SP Fkh1 300675 scaffold_12:188403-189818
Autophagy atg12l Activation by Fkh/FoxO3, Induction of autophagy in SP, SC Atg12 283501 scaffold_10:225120-225896
Autophagy ulk2 Activation by Fkh/FoxO3, Induction of autophagy in SP, SC not found
Cell skeleton RHO/RAC Actin organization in SP not found
Cell skeleton PKC Only one PKC gene in TO, required for cell wall remodeling and sphingolipid regulation in SP Pkc1 73077 scaffold_24:189607-193675

VII Supplemental__________________________________________________________________________
∼ 186 ∽
Autophagy PKBA Inhibited by Pdk1, affects actin organization, chemotaxi, cell movement in DD not found
Other
Autophagy atg5 Autophagy related gene Atg5 285573 scaffold_30:25886-27199
Autophagy atg6 Autophagy related gene Atg6 268673 scaffold_3:492871-494478
Autophagy atg99 Autophagy related gene Atg99 327958 scaffold_26:111275-114356
Autophagy atg16 Autophagy related gene Atg16 183500 scaffold_77:6693-7765
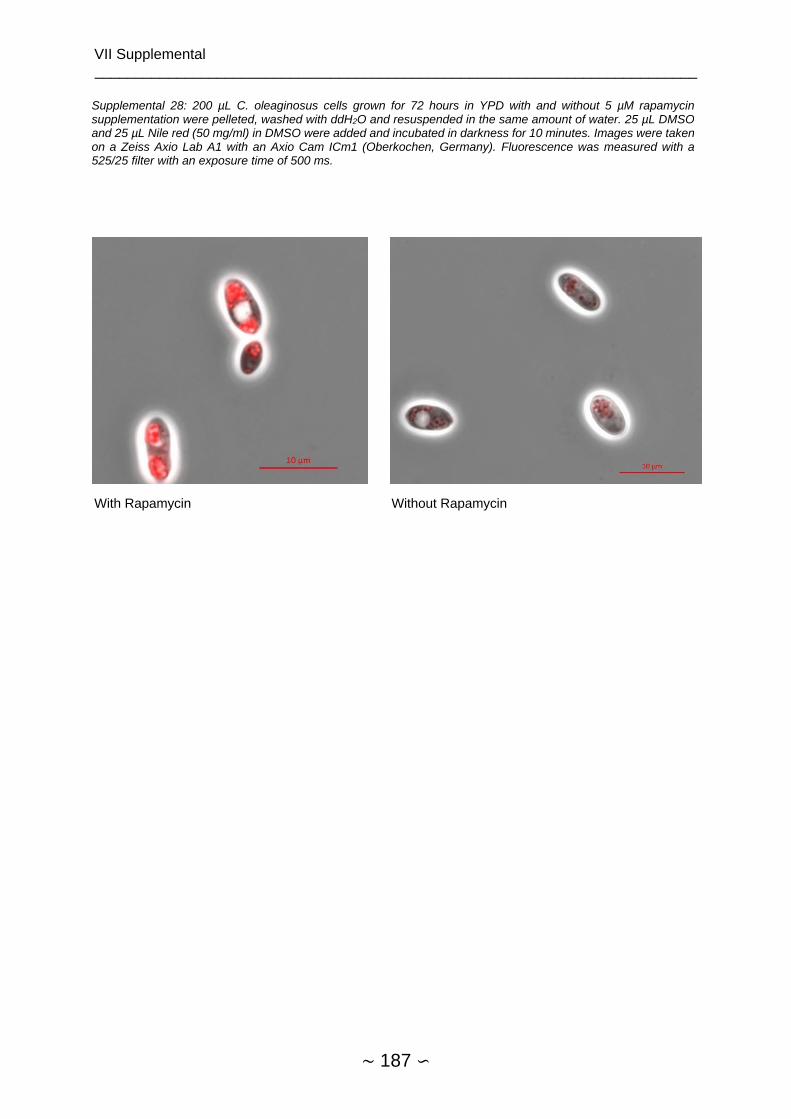
VII Supplemental __________________________________________________________________________
∼ 187 ∽
Supplemental 28: 200 µL C. oleaginosus cells grown for 72 hours in YPD with and without 5 µM rapamycin supplementation were pelleted, washed with ddH2O and resuspended in the same amount of water. 25 µL DMSO and 25 µL Nile red (50 mg/ml) in DMSO were added and incubated in darkness for 10 minutes. Images were taken on a Zeiss Axio Lab A1 with an Axio Cam ICm1 (Oberkochen, Germany). Fluorescence was measured with a 525/25 filter with an exposure time of 500 ms.
With Rapamycin Without Rapamycin

VII Supplemental __________________________________________________________________________
∼ 188 ∽
Supplemental 29: FACS of Rapamycin treated cells. 50 µL of cells were diluted and measured in a BioRad S3 Sorter using 488 nm excitation. The measurement was done after 48 hours of cultivation.
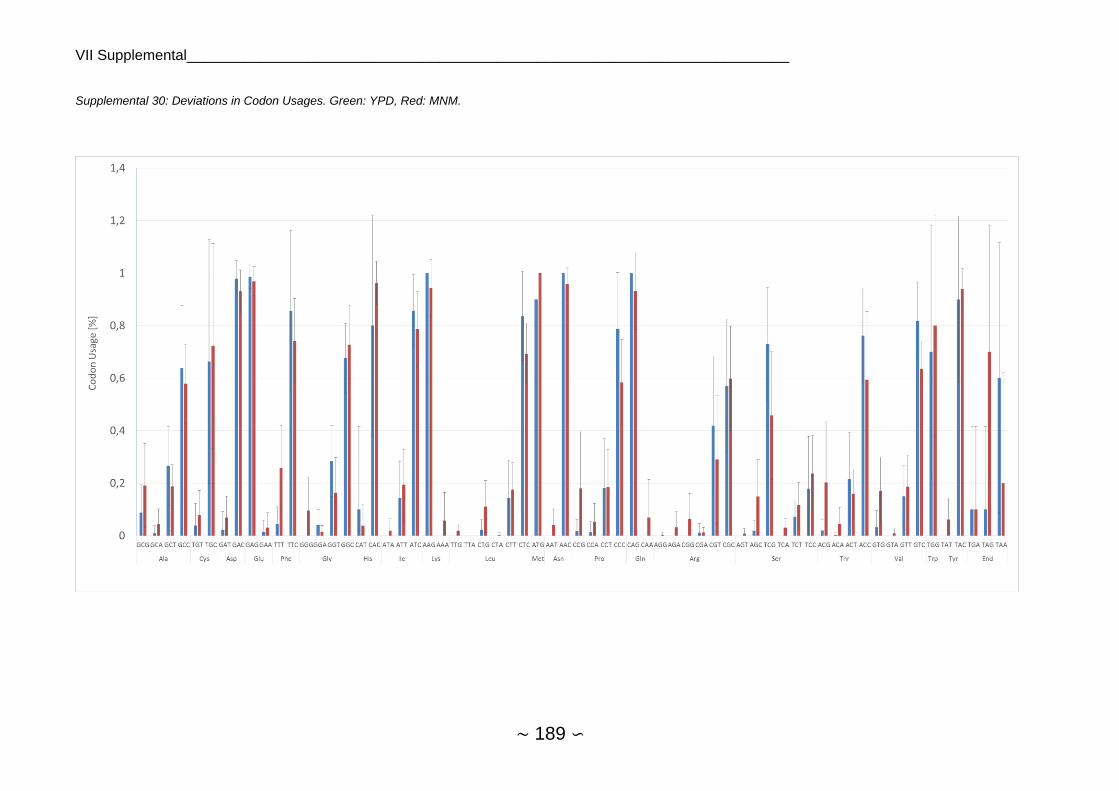
VII Supplemental__________________________________________________________________________
∼ 189 ∽
Supplemental 30: Deviations in Codon Usages. Green: YPD, Red: MNM.

VII Supplemental __________________________________________________________________________
∼ 190 ∽
Supplemental 31: Insertion site of YFP expression cassettes in clone described by Goerner et al[51]. The sequence obtained by the fragment derived from TAIL PCR is GCGGGCCCGAGACCCCCTCCCAGGGACGCATCGTGGCCGGCATCACCTCGCTCCACAGGTGCGGTTGTTGGCGCCTATATCTCCGACATCACCGATGGGGAAGATCGGGCTCGCCACTTCGGGCTCATGAACGCTTGTTTCGGCATGAAATGGTGGCAGGCCCCGTGGCCGGAGGACAGTTGGGCGCCATCTCCTTGAATGTAAAAA
Supplemental 32: Nile red fluorescence of C. oleaginosus wild type and Dga overexpressing clones 1, 5 and 6 after 96 hours grown in YPD in baffled 50 ml flasks. Error bars show standard deviations of triplicates.
0
50000
100000
150000
200000
250000
300000
350000
wt dga-Klon1* dga-Klon5 dga-Klon6*
FI /
OD
60
0
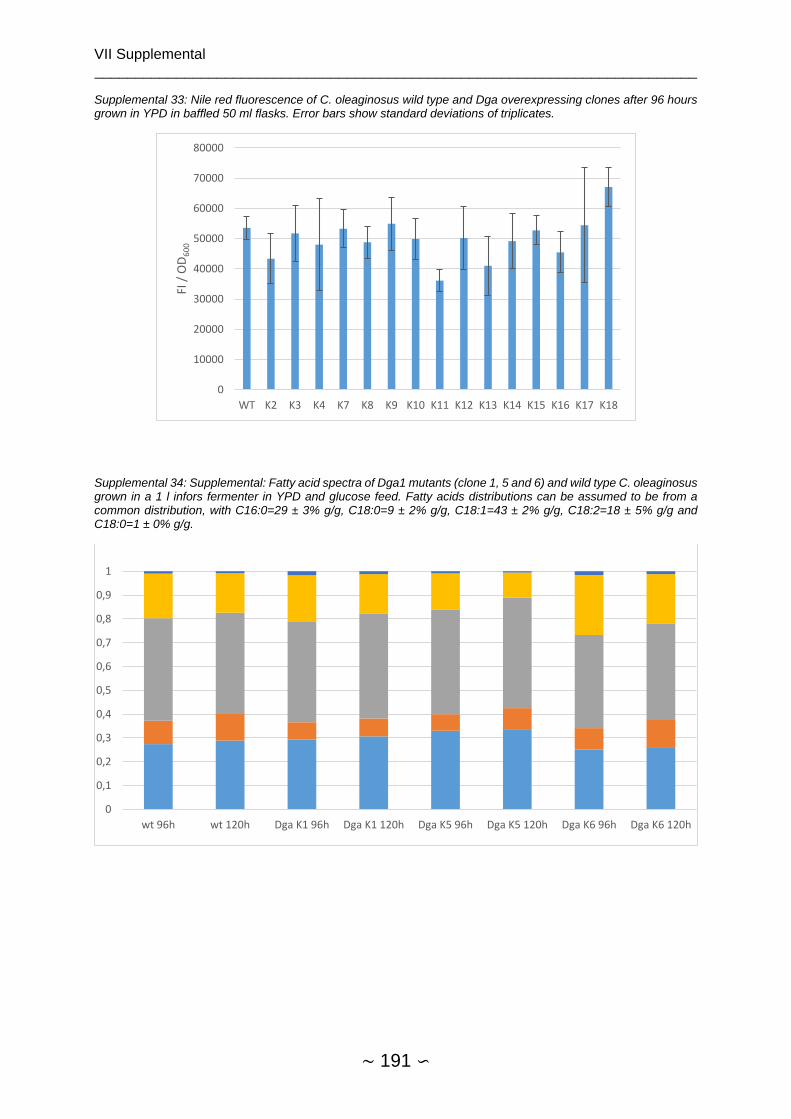
VII Supplemental __________________________________________________________________________
∼ 191 ∽
Supplemental 33: Nile red fluorescence of C. oleaginosus wild type and Dga overexpressing clones after 96 hours grown in YPD in baffled 50 ml flasks. Error bars show standard deviations of triplicates.
Supplemental 34: Supplemental: Fatty acid spectra of Dga1 mutants (clone 1, 5 and 6) and wild type C. oleaginosus grown in a 1 l infors fermenter in YPD and glucose feed. Fatty acids distributions can be assumed to be from a common distribution, with C16:0=29 ± 3% g/g, C18:0=9 ± 2% g/g, C18:1=43 ± 2% g/g, C18:2=18 ± 5% g/g and C18:0=1 ± 0% g/g.
0
10000
20000
30000
40000
50000
60000
70000
80000
WT K2 K3 K4 K7 K8 K9 K10 K11 K12 K13 K14 K15 K16 K17 K18
FI /
OD
60
0
0
0,1
0,2
0,3
0,4
0,5
0,6
0,7
0,8
0,9
1
wt 96h wt 120h Dga K1 96h Dga K1 120h Dga K5 96h Dga K5 120h Dga K6 96h Dga K6 120h

VII Supplemental __________________________________________________________________________
∼ 192 ∽
Supplemental 35: Main fatty acids produced by C. oleaginosus wild type (wt) as well as Dga2 overexpressing clones 1 (K1), 5 (K5) and 6 (K6) at different time points during fermentation.
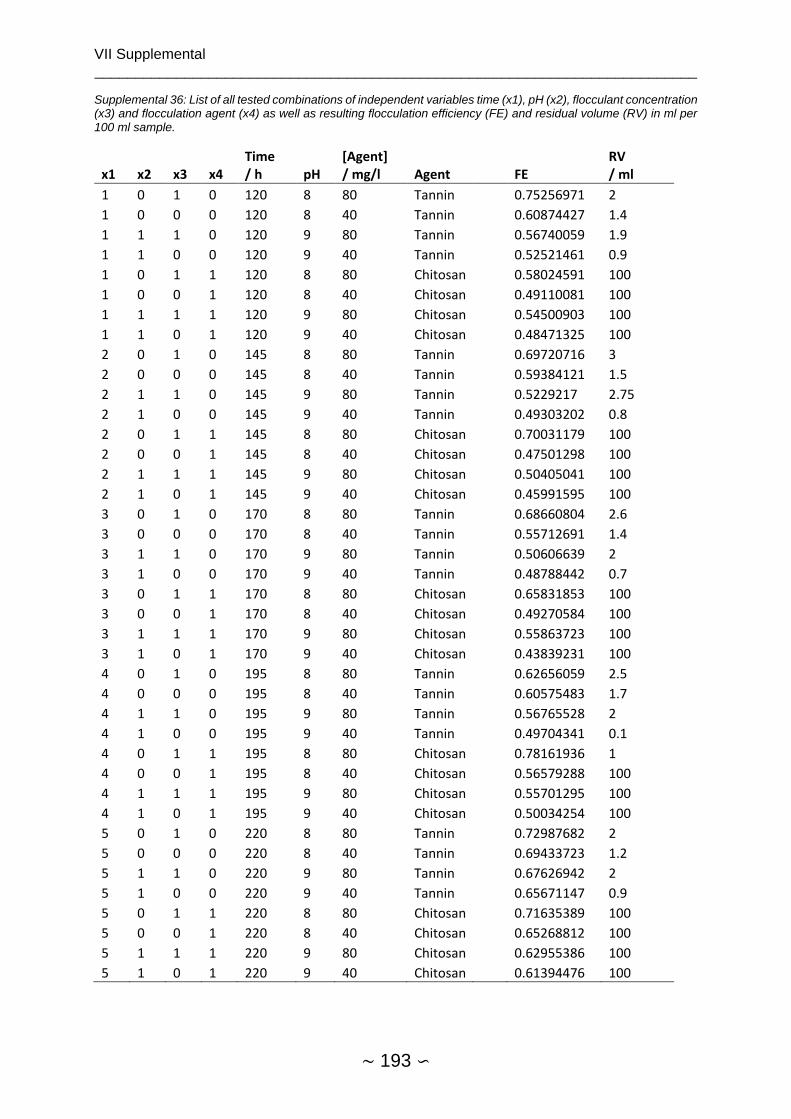
VII Supplemental __________________________________________________________________________
∼ 193 ∽
Supplemental 36: List of all tested combinations of independent variables time (x1), pH (x2), flocculant concentration (x3) and flocculation agent (x4) as well as resulting flocculation efficiency (FE) and residual volume (RV) in ml per 100 ml sample.
x1 x2 x3 x4 Time / h pH
[Agent] / mg/l Agent
FE
RV / ml
1 0 1 0 120 8 80 Tannin 0.75256971 2
1 0 0 0 120 8 40 Tannin 0.60874427 1.4
1 1 1 0 120 9 80 Tannin 0.56740059 1.9
1 1 0 0 120 9 40 Tannin 0.52521461 0.9
1 0 1 1 120 8 80 Chitosan 0.58024591 100
1 0 0 1 120 8 40 Chitosan 0.49110081 100
1 1 1 1 120 9 80 Chitosan 0.54500903 100
1 1 0 1 120 9 40 Chitosan 0.48471325 100
2 0 1 0 145 8 80 Tannin 0.69720716 3
2 0 0 0 145 8 40 Tannin 0.59384121 1.5
2 1 1 0 145 9 80 Tannin 0.5229217 2.75
2 1 0 0 145 9 40 Tannin 0.49303202 0.8
2 0 1 1 145 8 80 Chitosan 0.70031179 100
2 0 0 1 145 8 40 Chitosan 0.47501298 100
2 1 1 1 145 9 80 Chitosan 0.50405041 100
2 1 0 1 145 9 40 Chitosan 0.45991595 100
3 0 1 0 170 8 80 Tannin 0.68660804 2.6
3 0 0 0 170 8 40 Tannin 0.55712691 1.4
3 1 1 0 170 9 80 Tannin 0.50606639 2
3 1 0 0 170 9 40 Tannin 0.48788442 0.7
3 0 1 1 170 8 80 Chitosan 0.65831853 100
3 0 0 1 170 8 40 Chitosan 0.49270584 100
3 1 1 1 170 9 80 Chitosan 0.55863723 100
3 1 0 1 170 9 40 Chitosan 0.43839231 100
4 0 1 0 195 8 80 Tannin 0.62656059 2.5
4 0 0 0 195 8 40 Tannin 0.60575483 1.7
4 1 1 0 195 9 80 Tannin 0.56765528 2
4 1 0 0 195 9 40 Tannin 0.49704341 0.1
4 0 1 1 195 8 80 Chitosan 0.78161936 1
4 0 0 1 195 8 40 Chitosan 0.56579288 100
4 1 1 1 195 9 80 Chitosan 0.55701295 100
4 1 0 1 195 9 40 Chitosan 0.50034254 100
5 0 1 0 220 8 80 Tannin 0.72987682 2
5 0 0 0 220 8 40 Tannin 0.69433723 1.2
5 1 1 0 220 9 80 Tannin 0.67626942 2
5 1 0 0 220 9 40 Tannin 0.65671147 0.9
5 0 1 1 220 8 80 Chitosan 0.71635389 100
5 0 0 1 220 8 40 Chitosan 0.65268812 100
5 1 1 1 220 9 80 Chitosan 0.62955386 100
5 1 0 1 220 9 40 Chitosan 0.61394476 100
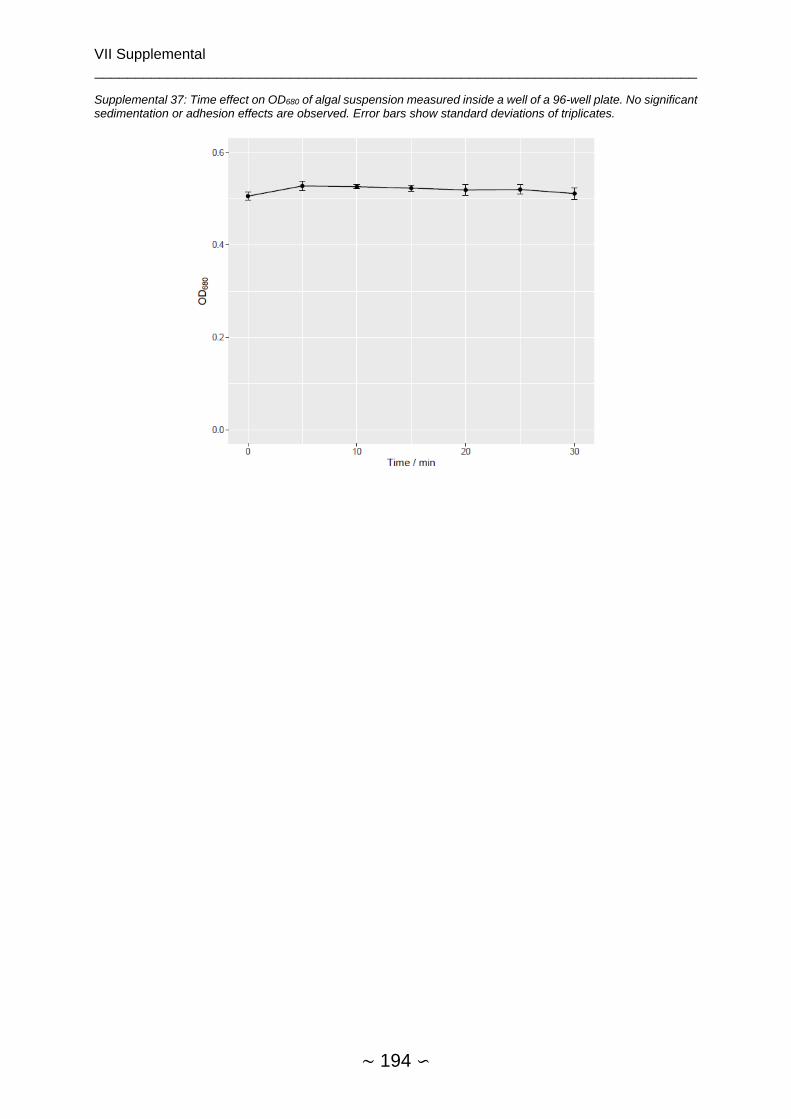
VII Supplemental __________________________________________________________________________
∼ 194 ∽
Supplemental 37: Time effect on OD680 of algal suspension measured inside a well of a 96-well plate. No significant sedimentation or adhesion effects are observed. Error bars show standard deviations of triplicates.

VII Supplemental __________________________________________________________________________
∼ 195 ∽
Supplemental 38: Spatial distribution of algal biomass as measured by OD680. Protocol as described in section 3.3.3 was run. Dilutions were: 1:1 (a), 1:10 (b) and 1:20 (c). Measurement was done in a clear 96 well nunc plate. Values show OD680.

VII Supplemental __________________________________________________________________________
∼ 196 ∽
Supplemental 39: Time course of OD680 of algal suspension in 96-well plate with included shaking. Algae culture (at OD680=0.52) was placed in a 96-well and OD680 was measured every 300 seconds. The plate was shaken at 300 rpm (linear, orbital, double orbital) every 600 minutes. Measurement points taken immediately after shaking (Shake) contrast those taken after sedimentation time (Sedim). Error bars show standard deviations of triplicates.
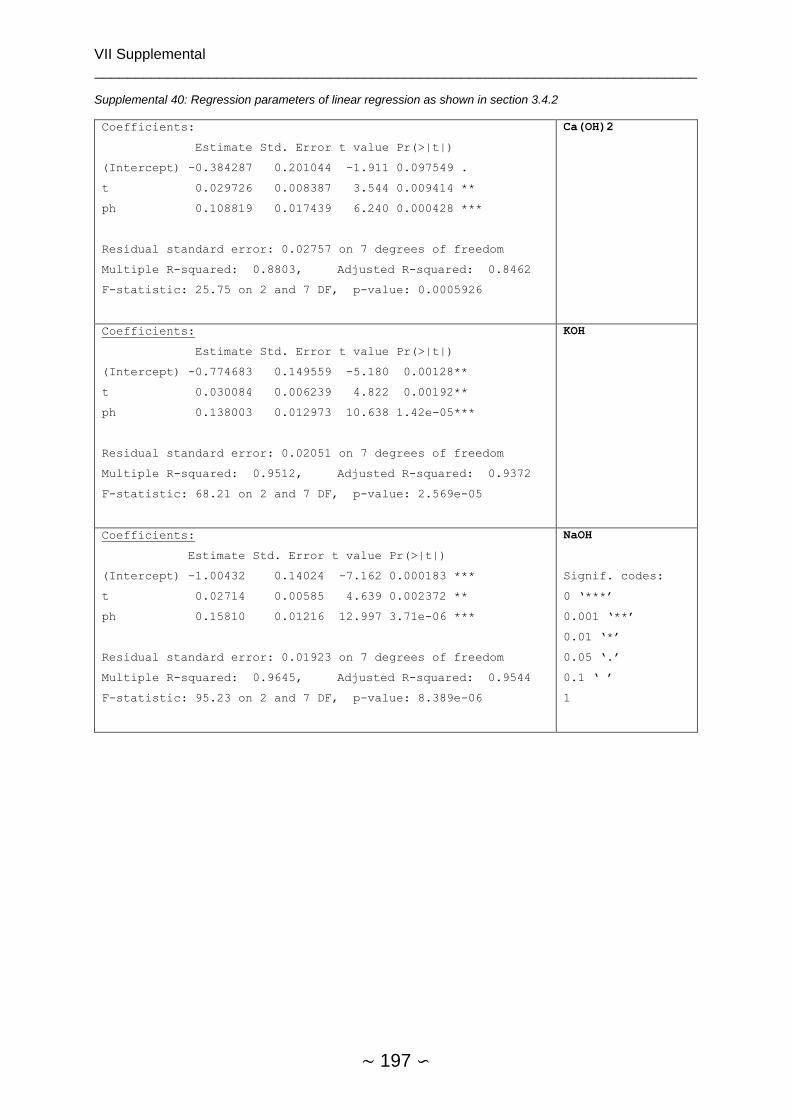
VII Supplemental __________________________________________________________________________
∼ 197 ∽
Supplemental 40: Regression parameters of linear regression as shown in section 3.4.2
Coefficients:
Estimate Std. Error t value Pr(>|t|)
(Intercept) -0.384287 0.201044 -1.911 0.097549 .
t 0.029726 0.008387 3.544 0.009414 **
ph 0.108819 0.017439 6.240 0.000428 ***
Residual standard error: 0.02757 on 7 degrees of freedom
Multiple R-squared: 0.8803, Adjusted R-squared: 0.8462
F-statistic: 25.75 on 2 and 7 DF, p-value: 0.0005926
Ca(OH)2
Coefficients:
Estimate Std. Error t value Pr(>|t|)
(Intercept) -0.774683 0.149559 -5.180 0.00128**
t 0.030084 0.006239 4.822 0.00192**
ph 0.138003 0.012973 10.638 1.42e-05***
Residual standard error: 0.02051 on 7 degrees of freedom
Multiple R-squared: 0.9512, Adjusted R-squared: 0.9372
F-statistic: 68.21 on 2 and 7 DF, p-value: 2.569e-05
KOH
Coefficients:
Estimate Std. Error t value Pr(>|t|)
(Intercept) -1.00432 0.14024 -7.162 0.000183 ***
t 0.02714 0.00585 4.639 0.002372 **
ph 0.15810 0.01216 12.997 3.71e-06 ***
Residual standard error: 0.01923 on 7 degrees of freedom
Multiple R-squared: 0.9645, Adjusted R-squared: 0.9544
F-statistic: 95.23 on 2 and 7 DF, p-value: 8.389e-06
NaOH
Signif. codes:
0 ‘***’
0.001 ‘**’
0.01 ‘*’
0.05 ‘.’
0.1 ‘ ’
1
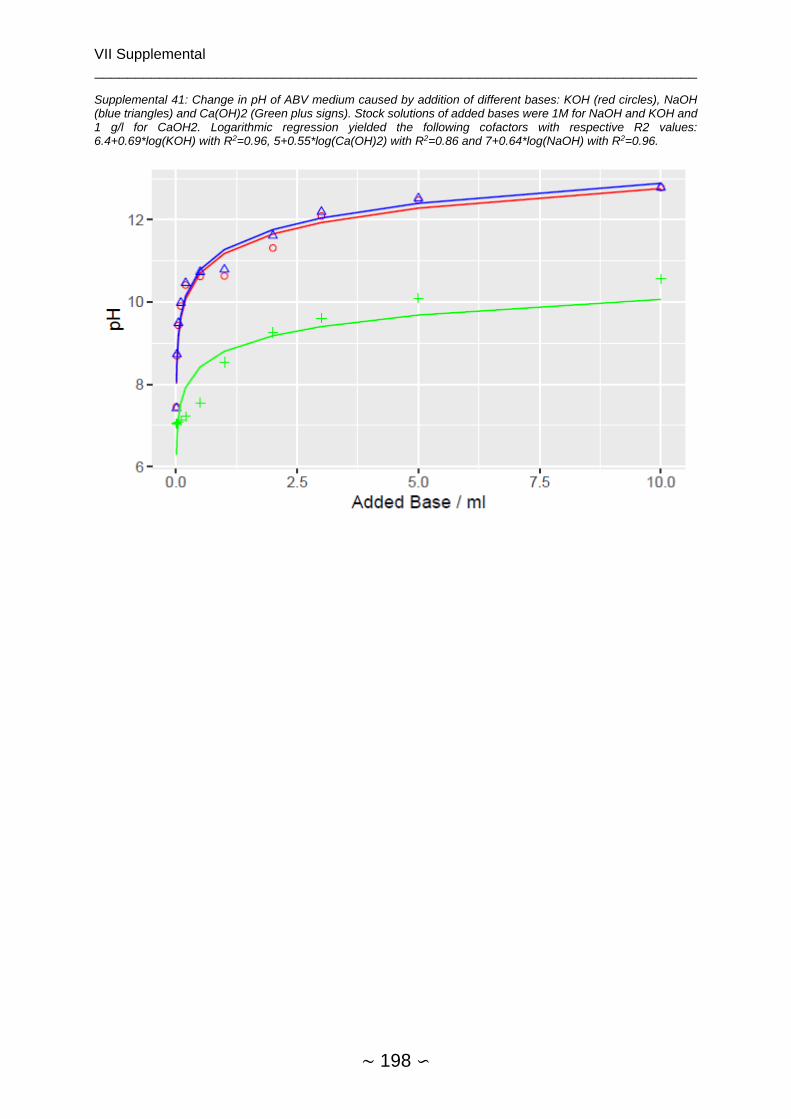
VII Supplemental __________________________________________________________________________
∼ 198 ∽
Supplemental 41: Change in pH of ABV medium caused by addition of different bases: KOH (red circles), NaOH (blue triangles) and Ca(OH)2 (Green plus signs). Stock solutions of added bases were 1M for NaOH and KOH and 1 g/l for CaOH2. Logarithmic regression yielded the following cofactors with respective R2 values: 6.4+0.69*log(KOH) with R2=0.96, 5+0.55*log(Ca(OH)2) with R2=0.86 and 7+0.64*log(NaOH) with R2=0.96.

VII Supplemental __________________________________________________________________________
∼ 199 ∽
Supplemental 42: Analytic plots of regression of simplex design as described in section 3.3.8.1.
Supplemental 43: Parameters of multiple linear regression of simplex design as described in section 3.3.8.1.
lm(formula = FE ~ -1 + x1 + x2 + x3 + x1 * x2 + x1 *
x3 + x2 * x3, data = FlokN3)
Signif. codes: Estimate Std. Error t value Pr(>|t|)
x1 0.64997 0.12039 5.399 0.0057 **
x2 0.28468 0.12039 2.365 0.0773 .
x3 0.02875 0.12039 0.239 0.8230
x1:x2 2.44685 0.53294 4.591 0.0101 *
x1:x3 1.18384 0.53294 2.221 0.0905 .
x2:x3 0.52895 0.53294 0.993 0.3771
Residual standard error: 0.1279 on 4 degrees of freedom
Multiple R-squared: 0.9842, Adjusted R-squared: 0.9604
F-statistic: 41.47 on 6 and 4 DF, p-value: 0.001471```
Signif. codes: 0 ‘***’ 0.001 ‘**’ 0.01 ‘*’ 0.05 ‘.’ 0.1 ‘ ’ 1
Residual standard error: 0.03901 on 31 degrees of freedom
Multiple R-squared: 0.851, Adjusted R-squared: 0.8125
F-statistic: 22.13 on 8 and 31 DF, p-value: 8.679e-11

VII Supplemental __________________________________________________________________________
∼ 200 ∽
Supplemental 44: Distributions for flocculation efficiencies (A) residual OD (B) and residual volume (C). Shapiro Wilk was for A W=0.96, p=0.124, for B W=0.98, p=0.3 and for C W=0.64, p=1.3x10⁻⁸.
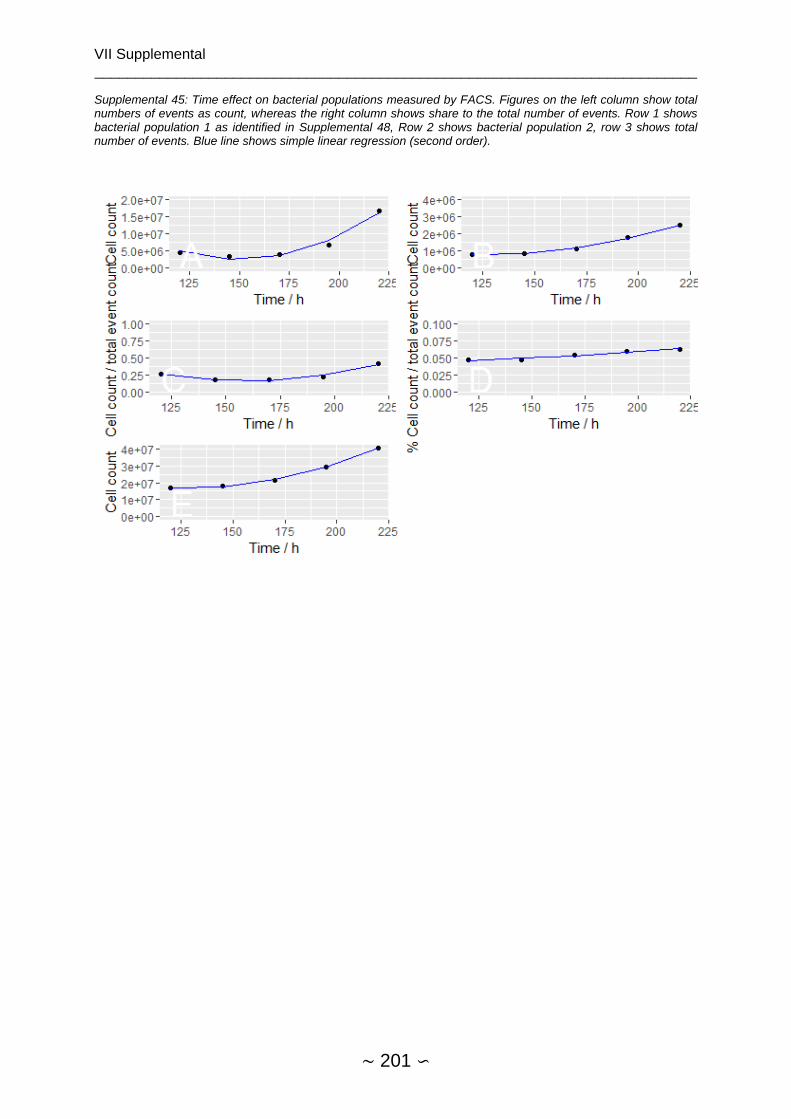
VII Supplemental __________________________________________________________________________
∼ 201 ∽
Supplemental 45: Time effect on bacterial populations measured by FACS. Figures on the left column show total numbers of events as count, whereas the right column shows share to the total number of events. Row 1 shows bacterial population 1 as identified in Supplemental 48, Row 2 shows bacterial population 2, row 3 shows total number of events. Blue line shows simple linear regression (second order).

VII Supplemental __________________________________________________________________________
∼ 202 ∽
Supplemental 46: Zeta potential of two cultivations (A,B) of S. obtusiusculus in ABV medium in closed infors bioreactor as described in section 3.3.2.4.
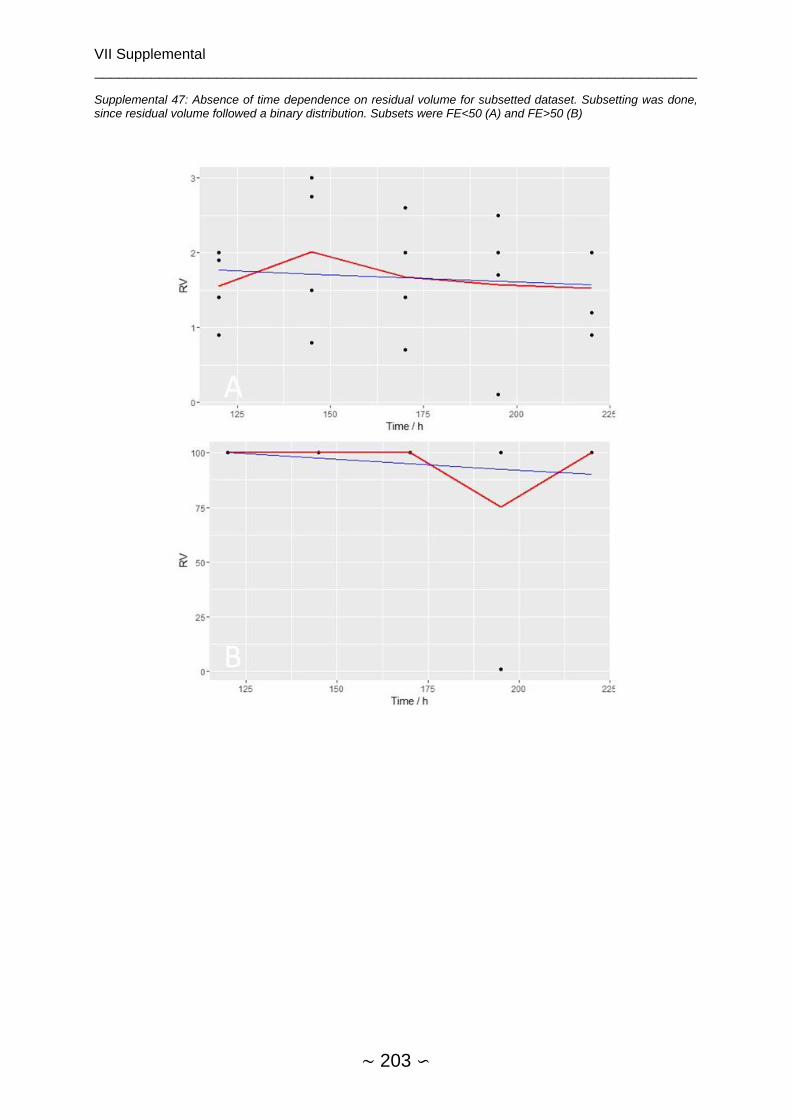
VII Supplemental __________________________________________________________________________
∼ 203 ∽
Supplemental 47: Absence of time dependence on residual volume for subsetted dataset. Subsetting was done, since residual volume followed a binary distribution. Subsets were FE<50 (A) and FE>50 (B)
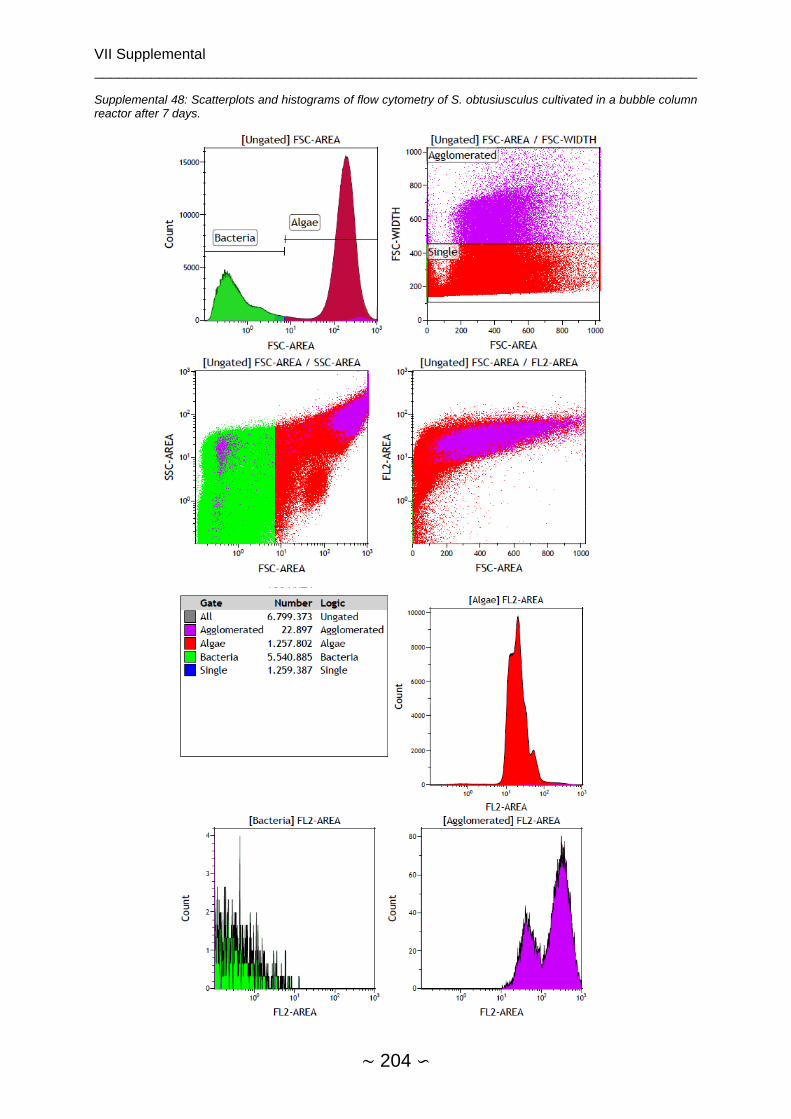
VII Supplemental __________________________________________________________________________
∼ 204 ∽
Supplemental 48: Scatterplots and histograms of flow cytometry of S. obtusiusculus cultivated in a bubble column reactor after 7 days.
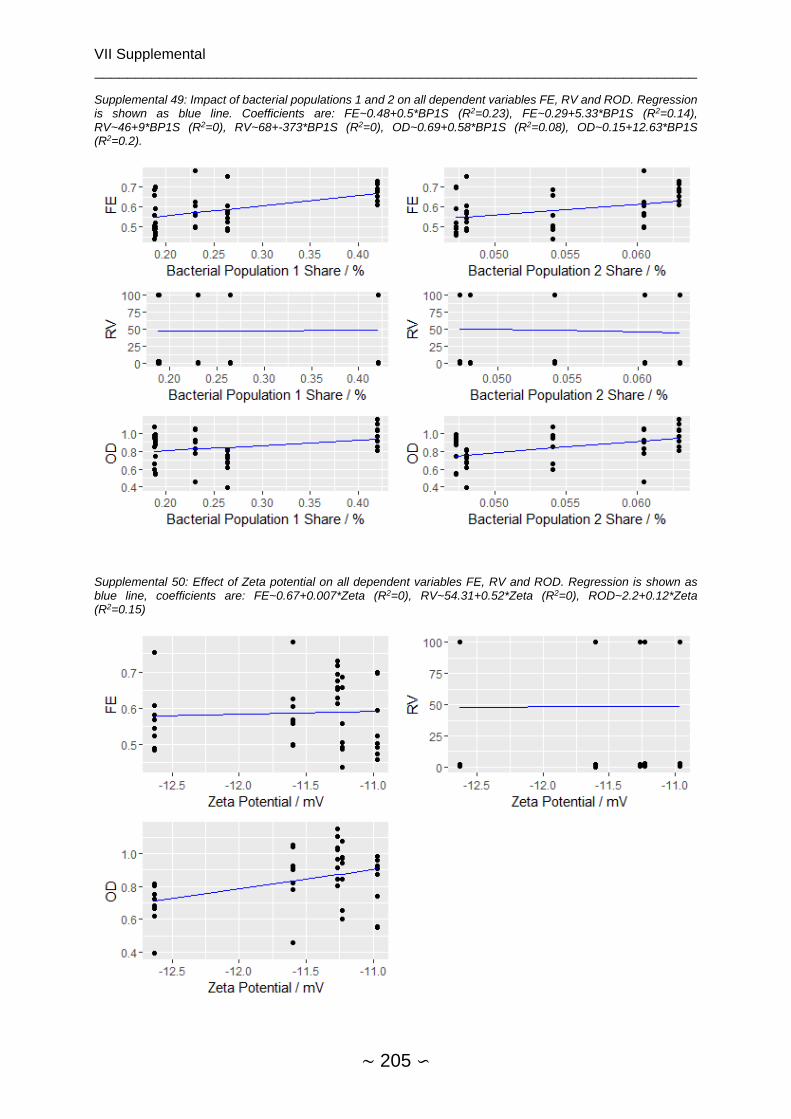
VII Supplemental __________________________________________________________________________
∼ 205 ∽
Supplemental 49: Impact of bacterial populations 1 and 2 on all dependent variables FE, RV and ROD. Regression is shown as blue line. Coefficients are: FE~0.48+0.5*BP1S (R2=0.23), FE~0.29+5.33*BP1S (R2=0.14), RV~46+9*BP1S (R2=0), RV~68+-373*BP1S (R2=0), OD~0.69+0.58*BP1S (R2=0.08), OD~0.15+12.63*BP1S (R2=0.2).
Supplemental 50: Effect of Zeta potential on all dependent variables FE, RV and ROD. Regression is shown as blue line, coefficients are: FE~0.67+0.007*Zeta (R2=0), RV~54.31+0.52*Zeta (R2=0), ROD~2.2+0.12*Zeta (R2=0.15)
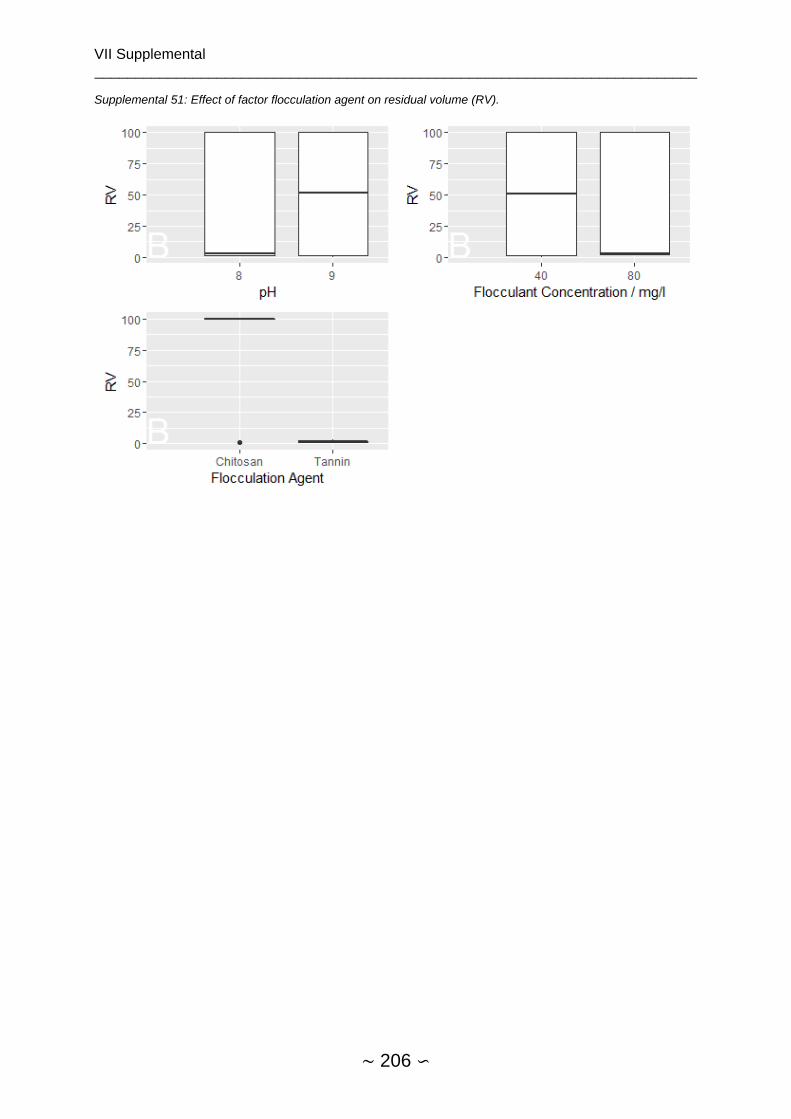
VII Supplemental __________________________________________________________________________
∼ 206 ∽
Supplemental 51: Effect of factor flocculation agent on residual volume (RV).

VII Supplemental __________________________________________________________________________
∼ 207 ∽
Supplemental 52: Full x1/x2/x3/FM ANCOVA model parameters.
lm(formula=FE ~ x1 + x2 + x3 + FM + x1:x2 + x1:x3 + x2:x3 +
x1:FM + x2:FM + x3:FM + x1:x2:x3 + x1:x2:FM + x1:x3:FM +
x2:x3:FM + x1:x2:x3:FM + I(x3 * x3), data=FlokN7)
Coefficients:
Estimate Std. Error t value Pr(>|t|)
(Intercept) 0.500997 0.018373 27.268 < 2e-16 ***
x1 -0.035998 0.023934 -1.504 0.14618
x2 0.151910 0.023934 6.347 1.78e-06 ***
x3 0.041395 0.011967 3.459 0.00213 **
FMTannin 0.076501 0.023934 3.196 0.00401 **
I(x3 * x3) 0.017231 0.003576 4.819 7.32e-05 ***
x1:x2 -0.092519 0.033848 -2.733 0.01185 *
x1:x3 -0.011506 0.016924 -0.680 0.50336
x2:x3 -0.006043 0.016924 -0.357 0.72430
x1:FMTannin -0.043985 0.033848 -1.299 0.20665
x2:FMTannin -0.065306 0.033848 -1.929 0.06611 .
x3:FMTannin -0.023085 0.016924 -1.364 0.18575
x1:x2:x3 -0.001641 0.023934 -0.069 0.94594
x1:x2:FMTannin 0.042001 0.047869 0.877 0.38934
x1:x3:FMTannin 0.019897 0.023934 0.831 0.41434
x2:x3:FMTannin -0.023870 0.023934 -0.997 0.32899
x1:x2:x3:FMTannin 0.031100 0.033848 0.919 0.36773
Signif. codes: 0 ‘***’ 0.001 ‘**’ 0.01 ‘*’ 0.05 ‘.’ 0.1 ‘ ’ 1
Residual standard error: 0.03784 on 23 degrees of freedom
Multiple R-squared: 0.896, Adjusted R-squared: 0.8236
F-statistic: 12.38 on 16 and 23 DF, p-value: 9.926e-08

VII Supplemental __________________________________________________________________________
∼ 208 ∽
Supplemental 53: AIC reduced x1/x2/x3/FM ANCOVA model parameters
lm(formula=FE ~ x1 + x2 + x3 + FM + I(x3 * x3) + x1:x2 + x1:x3 +
x2:x3 + x1:FM + x2:FM + x3:FM + x1:x3:FM, data=FlokN7)
Coefficients:
Estimate Std. Error t value Pr(>|t|)
(Intercept) 0.506247 0.016893 29.969 < 2e-16 ***
x1 -0.046499 0.020156 -2.307 0.02896 *
x2 0.141410 0.020156 7.016 1.53e-07 ***
x3 0.043886 0.009200 4.770 5.65e-05 ***
FMTannin 0.066001 0.020156 3.274 0.00290 **
I(x3 * x3) 0.017231 0.003477 4.955 3.43e-05 ***
x1:x2 -0.071518 0.023274 -3.073 0.00480 **
x1:x3 -0.012327 0.011637 -1.059 0.29887
x2:x3 -0.011023 0.008229 -1.340 0.19154
x1:FMTannin -0.022985 0.023274 -0.988 0.33213
x2:FMTannin -0.044306 0.023274 -1.904 0.06767 .
x3:FMTannin -0.035021 0.011637 -3.009 0.00562 **
x1:x3:FMTannin 0.035447 0.016457 2.154 0.04034 *
Signif. codes: 0 ‘***’ 0.001 ‘**’ 0.01 ‘*’ 0.05 ‘.’ 0.1 ‘ ’ 1
Residual standard error: 0.0368 on 27 degrees of freedom
Multiple R-squared: 0.8845, Adjusted R-squared: 0.8332
F-statistic: 17.23 on 12 and 27 DF, p-value: 1.253e-09
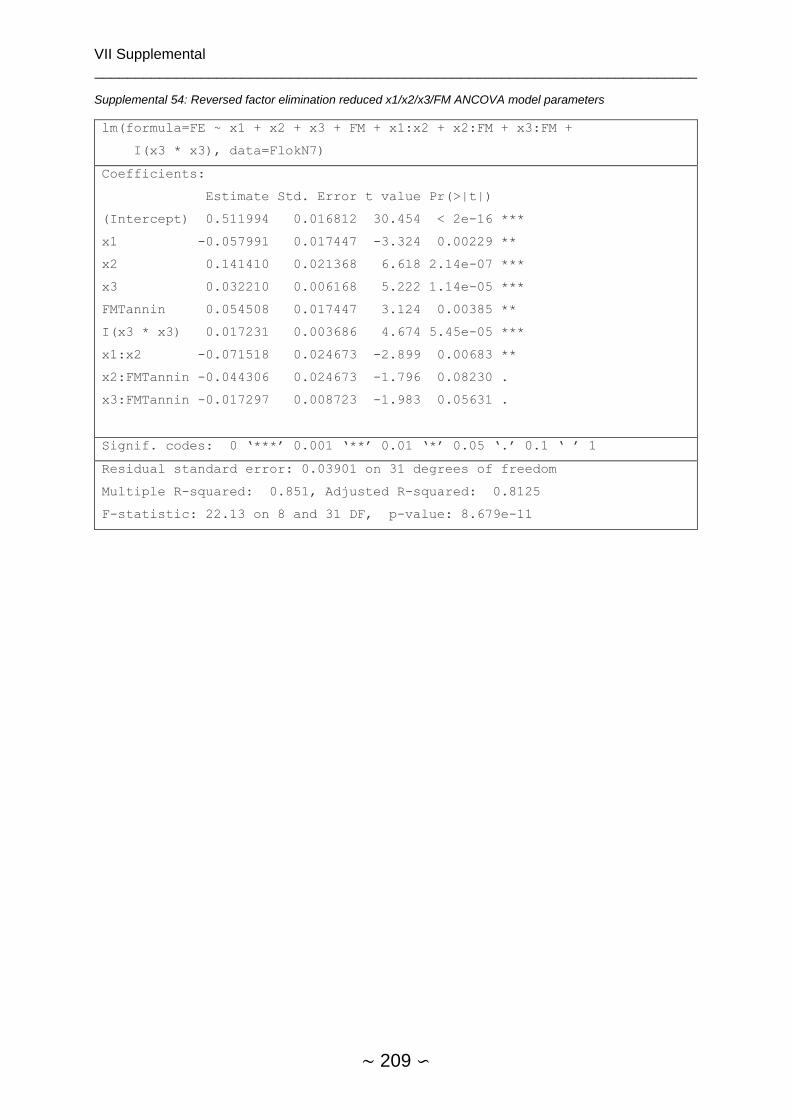
VII Supplemental __________________________________________________________________________
∼ 209 ∽
Supplemental 54: Reversed factor elimination reduced x1/x2/x3/FM ANCOVA model parameters
lm(formula=FE ~ x1 + x2 + x3 + FM + x1:x2 + x2:FM + x3:FM +
I(x3 * x3), data=FlokN7)
Coefficients:
Estimate Std. Error t value Pr(>|t|)
(Intercept) 0.511994 0.016812 30.454 < 2e-16 ***
x1 -0.057991 0.017447 -3.324 0.00229 **
x2 0.141410 0.021368 6.618 2.14e-07 ***
x3 0.032210 0.006168 5.222 1.14e-05 ***
FMTannin 0.054508 0.017447 3.124 0.00385 **
I(x3 * x3) 0.017231 0.003686 4.674 5.45e-05 ***
x1:x2 -0.071518 0.024673 -2.899 0.00683 **
x2:FMTannin -0.044306 0.024673 -1.796 0.08230 .
x3:FMTannin -0.017297 0.008723 -1.983 0.05631 .
Signif. codes: 0 ‘***’ 0.001 ‘**’ 0.01 ‘*’ 0.05 ‘.’ 0.1 ‘ ’ 1
Residual standard error: 0.03901 on 31 degrees of freedom
Multiple R-squared: 0.851, Adjusted R-squared: 0.8125
F-statistic: 22.13 on 8 and 31 DF, p-value: 8.679e-11
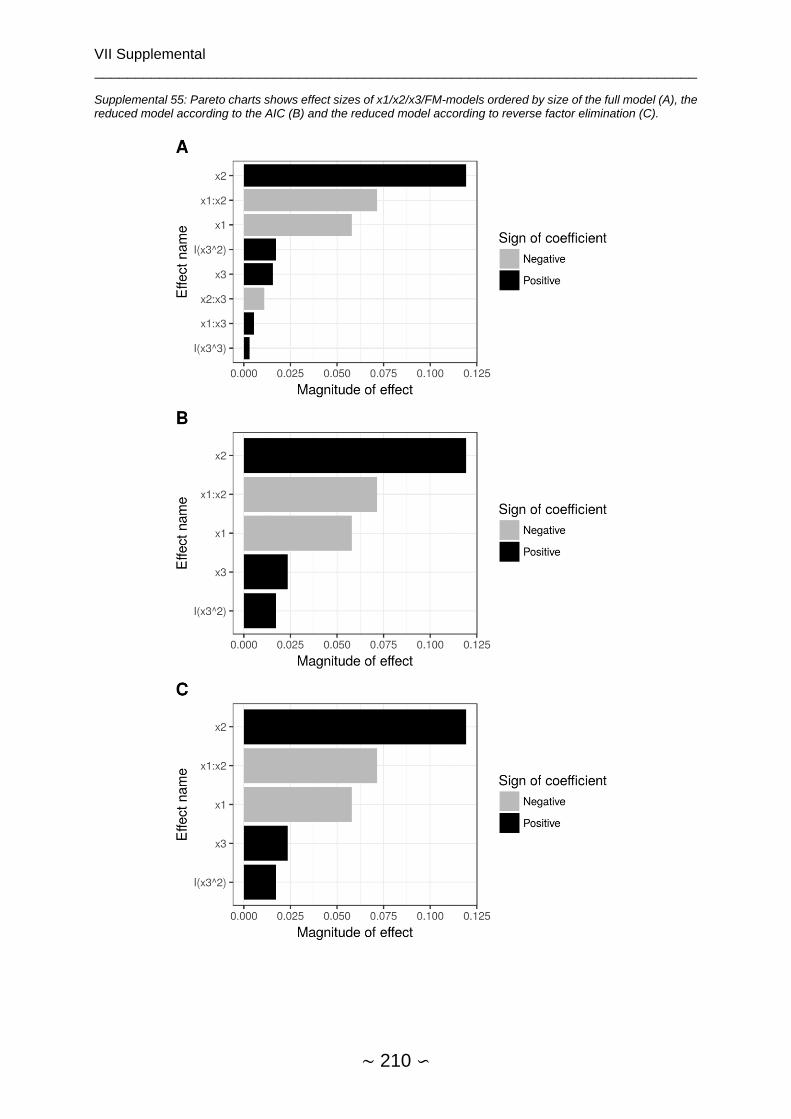
VII Supplemental __________________________________________________________________________
∼ 210 ∽
Supplemental 55: Pareto charts shows effect sizes of x1/x2/x3/FM-models ordered by size of the full model (A), the reduced model according to the AIC (B) and the reduced model according to reverse factor elimination (C).

VII Supplemental __________________________________________________________________________
∼ 211 ∽
Supplemental 56: Full x1/x2/x3/FM/AOM ANCOVA model parameters.
lm(formula=FE ~ x1 * x2 * x3 + I(x3 * x3) + FM * AOM, data=FlokN7aom)
Coefficients:
Estimate Std. Error t value Pr(>|t|)
(Intercept) 0.58163 0.04383 13.270 1.12e-11 ***
x1 -0.12623 0.05286 -2.388 0.026423 *
x2 0.01637 0.05286 0.310 0.759911
x3 0.04412 0.02643 1.669 0.109887
I(x3 * x3) NA NA NA NA
FMTannin 0.02929 0.03738 0.783 0.442098
AOMWO 0.09208 0.03738 2.463 0.022483 *
x1:x2 0.09885 0.07476 1.322 0.200292
x1:x3 0.02626 0.03738 0.702 0.490123
x2:x3 -0.01372 0.03738 -0.367 0.717348
FMTannin:AOMWO 0.24432 0.05286 4.622 0.000147 ***
x1:x2:x3 -0.02694 0.05286 -0.510 0.615633
Signif. codes: 0 ‘***’ 0.001 ‘**’ 0.01 ‘*’ 0.05 ‘.’ 0.1 ‘ ’ 1
Residual standard error: 0.07476 on 21 degrees of freedom
Multiple R-squared: 0.8713, Adjusted R-squared: 0.8101
F-statistic: 14.22 on 10 and 21 DF, p-value: 3.176e-07
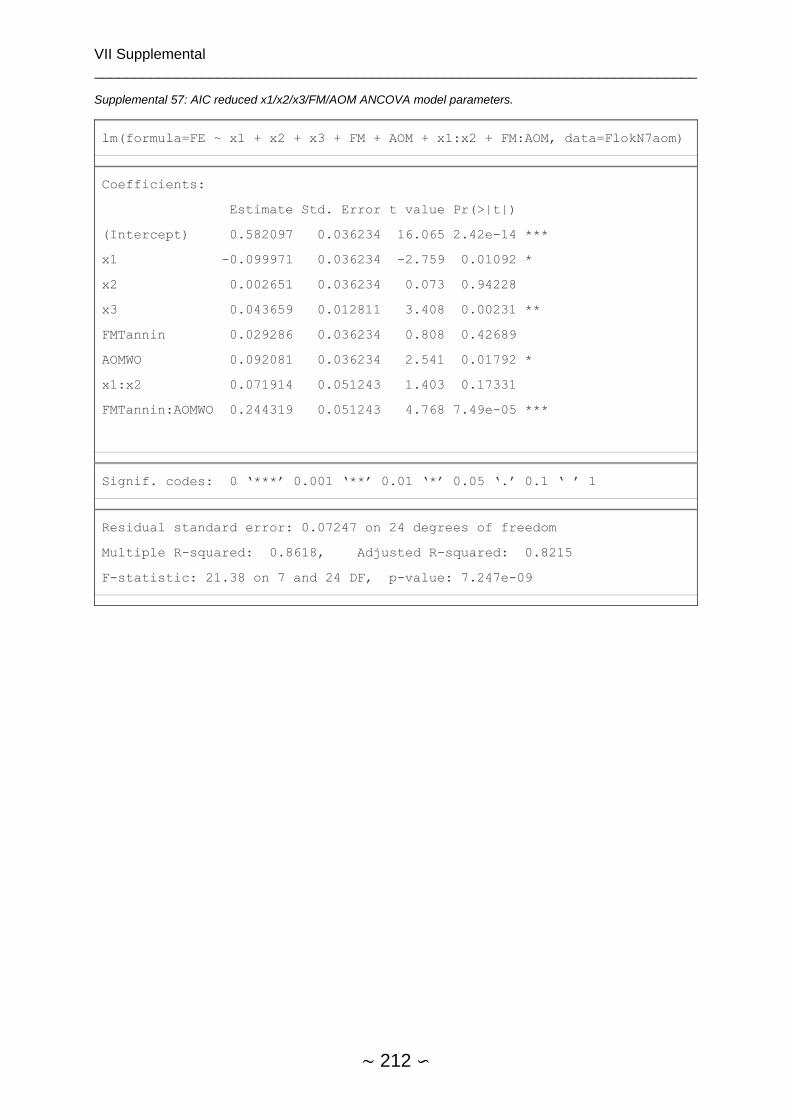
VII Supplemental __________________________________________________________________________
∼ 212 ∽
Supplemental 57: AIC reduced x1/x2/x3/FM/AOM ANCOVA model parameters.
lm(formula=FE ~ x1 + x2 + x3 + FM + AOM + x1:x2 + FM:AOM, data=FlokN7aom)
Coefficients:
Estimate Std. Error t value Pr(>|t|)
(Intercept) 0.582097 0.036234 16.065 2.42e-14 ***
x1 -0.099971 0.036234 -2.759 0.01092 *
x2 0.002651 0.036234 0.073 0.94228
x3 0.043659 0.012811 3.408 0.00231 **
FMTannin 0.029286 0.036234 0.808 0.42689
AOMWO 0.092081 0.036234 2.541 0.01792 *
x1:x2 0.071914 0.051243 1.403 0.17331
FMTannin:AOMWO 0.244319 0.051243 4.768 7.49e-05 ***
Signif. codes: 0 ‘***’ 0.001 ‘**’ 0.01 ‘*’ 0.05 ‘.’ 0.1 ‘ ’ 1
Residual standard error: 0.07247 on 24 degrees of freedom
Multiple R-squared: 0.8618, Adjusted R-squared: 0.8215
F-statistic: 21.38 on 7 and 24 DF, p-value: 7.247e-09
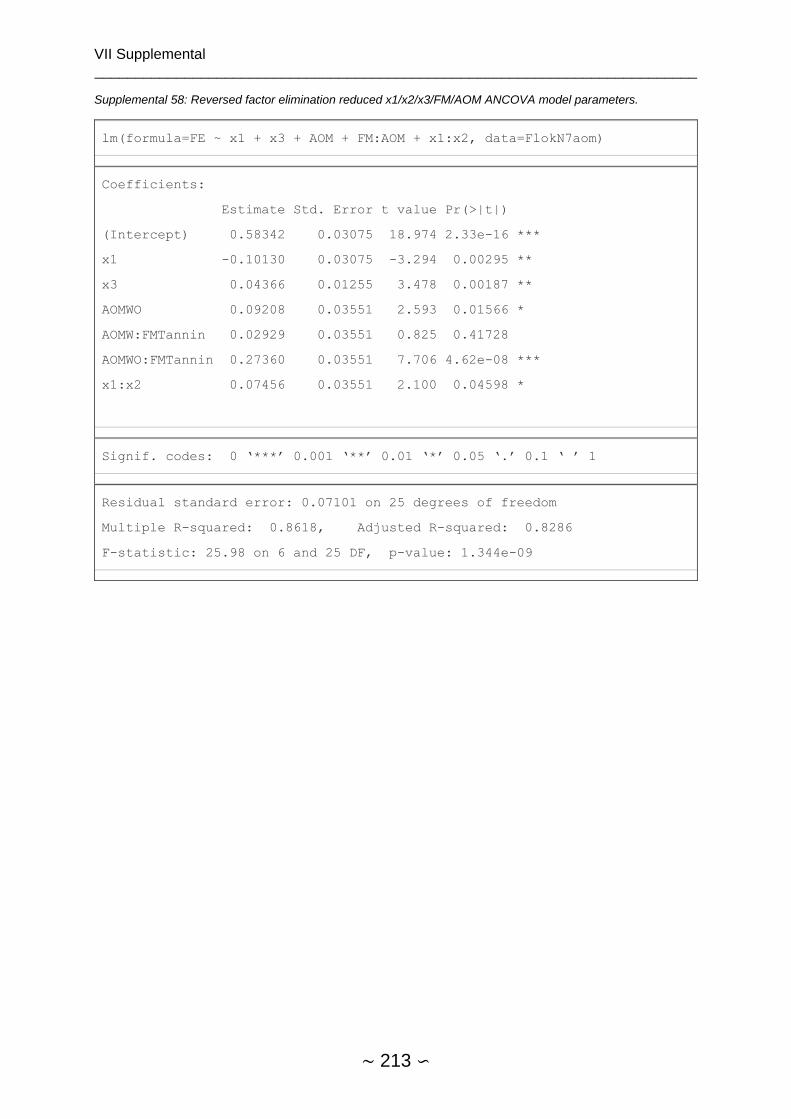
VII Supplemental __________________________________________________________________________
∼ 213 ∽
Supplemental 58: Reversed factor elimination reduced x1/x2/x3/FM/AOM ANCOVA model parameters.
lm(formula=FE ~ x1 + x3 + AOM + FM:AOM + x1:x2, data=FlokN7aom)
Coefficients:
Estimate Std. Error t value Pr(>|t|)
(Intercept) 0.58342 0.03075 18.974 2.33e-16 ***
x1 -0.10130 0.03075 -3.294 0.00295 **
x3 0.04366 0.01255 3.478 0.00187 **
AOMWO 0.09208 0.03551 2.593 0.01566 *
AOMW:FMTannin 0.02929 0.03551 0.825 0.41728
AOMWO:FMTannin 0.27360 0.03551 7.706 4.62e-08 ***
x1:x2 0.07456 0.03551 2.100 0.04598 *
Signif. codes: 0 ‘***’ 0.001 ‘**’ 0.01 ‘*’ 0.05 ‘.’ 0.1 ‘ ’ 1
Residual standard error: 0.07101 on 25 degrees of freedom
Multiple R-squared: 0.8618, Adjusted R-squared: 0.8286
F-statistic: 25.98 on 6 and 25 DF, p-value: 1.344e-09
Top Related