
06272006 Development and Evaluation of a Knowledge-Based P… · Die Erkenntnisse aus der Theorie...
126
Christoph Schmaltz Internationales Informationsmanagement [email protected] Universität Hildesheim Fachbereich III – Informations- und Kommunikationswissenschaften Institut für Angewandte Sprachwissenschaft Development and Evaluation of a Knowledge-Based Process Prototype A Case Study at the United Nations Office for Project Services - M.A. Thesis - Erstgutachter: Dr. Folker Caroli Zweitgutachter: Dr. Thomas Mandl
Transcript of 06272006 Development and Evaluation of a Knowledge-Based P… · Die Erkenntnisse aus der Theorie...

Christoph Schmaltz
Internationales Informationsmanagement
Universität Hildesheim
Fachbereich III – Informations- und Kommunikationswissenschaften
Institut für Angewandte Sprachwissenschaft
Development and Evaluation of a Knowledge-Based Process Prototype
A Case Study at the United Nations Office for Project Services
- M.A. Thesis -
Erstgutachter: Dr. Folker Caroli
Zweitgutachter: Dr. Thomas Mandl

Abstract The objective of this M.A. thesis is the development and evaluation of a system that
enables the effective and efficient access to relevant knowledge objects and provides
process transparency.
In the beginning, fundamental terms and concepts of knowledge management and
usability are introduced briefly. This theoretical foundation serves as the basis for the
prototyping-oriented development of the tool.
Finally, the tool is evaluated by users. Based on these insights, recommendations are
made to further enhance the usability and thus the value of the system.
As a result, a hypertext-based knowledge map is developed which takes its users
directly to process-specific information and facilitates the understanding of complex
processes.
Keywords Knowledge, Knowledge Maps, Usability, Evaluation, Prototyping-oriented Life-Cycle Zusammenfassung Das Ziel der vorliegenden Arbeit ist die Entwicklung und Evaluierung eines Systems,
das zur Schaffung von Prozesstransparenz beiträgt und dem Nutzer gleichzeitig
ermöglicht, effektiv und effizient auf relevante Wissensobjekte zuzugreifen.
Dafür werden am Anfang grundlegende Begriffe und Konzepte des
Wissensmanagements sowie aus dem Bereich der Usability erklärt und dargestellt.
Die Erkenntnisse aus der Theorie werden dann durch die prototypische Entwicklung
des Tools schrittweise in die Praxis umgesetzt.
Zum Schluss wird der auf diese Weise entwickelte Prototyp durch Endnutzer evaluiert.
Die daraus gewonnen Erkenntnisse fließen in die Empfehlungen für die Verbesserung
des Systems ein.
Durch diese Arbeit entsteht eine Hypertext-basierte Wissenslandkarte, die den Nutzer
direkt zu prozess-spezifischen Wissensobjekten führt und das Verständnis komplexer
Prozesse vereinfacht.
Schlüsselbegriffe Wissen, Wissenskarten, Usability, Evaluation, Prototyping Lebenszyklus

Eigenständigkeitserklärung nach §31 Abs. 5 RaPo Hiermit erkläre ich, dass ich die vorliegende Arbeit selbständig abgefasst und
nicht anderweitig zu Prüfungszwecken verwendet habe.
Weiterhin erkläre ich, dass ich die Arbeit ausschließlich unter Verwendung der
angegebenen Quellen und Hilfsmittel erstellt und alle wörtlichen und
sinngemäßen Zitate aus diesen Quellen geeignet gekennzeichnet habe.
Hildesheim, im Juni 2006 ChristophSchmaltz

Contents Overview
Contents Overview............................................................................ I
Table of Contents............................................................................. II
List of Figures...................................................................................V
List of Tables ...................................................................................VI
List of Abbreviations .....................................................................VII
1 Introduction ................................................................................ 1
2 Theoretical Foundation ............................................................. 8
3 The Development of the Mine Action Process Prototype ... 22
4 The Evaluation of the Mine Action Process Prototype........ 47
5 Retrospective and Perspective .............................................. 95
References .................................................................................... 100
Appendix I ..................................................................................... 108
Appendix II .................................................................................... 111

Table of Contents
Contents Overview............................................................................ I
Table of Contents............................................................................. II
List of Figures...................................................................................V
List of Tables ...................................................................................VI
List of Abbreviations .....................................................................VII
1 Introduction ................................................................................ 1
1.1 Organizational Context.................................................................................. 1 1.2 Motivation and Objectives ............................................................................. 4 1.3 Structure of the Thesis .................................................................................. 6
2 Theoretical Foundation ............................................................. 8
2.1 Knowledge Management............................................................................... 8 2.1.1 Definition of Knowledge......................................................................... 9 2.1.2 Dichotomies of Knowledge .................................................................. 10 2.1.3 Definition of Knowledge Management ................................................. 12 2.1.4 Concepts of Knowledge Management ................................................. 13
2.2 Methodology Knowledge Maps ................................................................... 15 2.2.1 Definition ............................................................................................. 15 2.2.2 Benefits and Challenges...................................................................... 16 2.2.3 Knowledge Map Classification............................................................. 17
2.3 Usability ...................................................................................................... 18 2.3.1 Definition ............................................................................................. 19 2.3.2 Attributes............................................................................................. 19 2.3.3 Evaluation ........................................................................................... 20
3 The Development of the Mine Action Process Prototype ... 22
3.1 Methodology Prototyping............................................................................. 23 3.1.1 Definition ............................................................................................. 23 3.1.2 Classification of Prototypes ................................................................. 23
3.1.3 The Prototyping-oriented Life-Cycle Model.......................................... 24 3.1.4 Prototyping vs. Traditional Software Development Models .................. 25 3.1.5 The Suitability of the Prototyping Methodology for this Work ............... 27
3.2 Analysis ...................................................................................................... 28 3.2.1 Business Requirements....................................................................... 28 3.2.2 Objectives ........................................................................................... 29 3.2.3 Target Audience .................................................................................. 30
3.3 Design......................................................................................................... 31 3.3.1 Functional Requirements..................................................................... 31 3.3.2 Technical Context................................................................................ 33
3.4 Implementation............................................................................................ 35 3.4.1 Platform............................................................................................... 35 3.4.2 Architecture ......................................................................................... 37 3.4.3 Navigation ........................................................................................... 38 3.4.4 Screen Layout Composition................................................................. 41 3.4.5 Other MAPP Elements ........................................................................ 42 3.4.6 Assessment of the Prototyping Methodology....................................... 44
3.5 Summary..................................................................................................... 45
4 The Evaluation of the Mine Action Process Prototype........ 47
4.1 Methodology Usability Testing..................................................................... 48 4.1.1 Definition ............................................................................................. 48 4.1.2 Test Methods....................................................................................... 49 4.1.3 The Usability Testing Process ............................................................. 51 4.1.4 The Suitability of Usability Testing Methodology.................................. 53
4.2 Analysis ...................................................................................................... 54 4.2.1 Objectives ........................................................................................... 54 4.2.2 Target Audience .................................................................................. 55
4.3 Design......................................................................................................... 55 4.3.1 Task Scenarios.................................................................................... 55 4.3.2 Questionnaire ...................................................................................... 57
4.4 Conducting.................................................................................................. 59 4.4.1 Pretest................................................................................................. 59 4.4.2 Actual Test Run................................................................................... 60
4.5 Analysis of Task Scenario Results and Interpretation.................................. 61 4.5.1 Scenario 1 ........................................................................................... 62 4.5.2 Scenario 2 ........................................................................................... 65

4.5.3 Scenario 3 ........................................................................................... 66 4.5.4 Scenario 4 ........................................................................................... 68 4.5.5 Scenario 5 ........................................................................................... 69 4.5.6 Scenario 6 ........................................................................................... 71 4.5.7 Non-Scenario Specific Results ............................................................ 72 4.5.8 Assessment of Test Method Thinking Aloud........................................ 73
4.6 Analysis of the Questionnaire Results and Interpretation ............................ 75 4.6.1 Part I ................................................................................................... 75 4.6.2 Part II................................................................................................... 77 4.6.3 Part III.................................................................................................. 80 4.6.4 Part IV ................................................................................................. 83 4.6.5 Assessment of Test Method Questionnaire ......................................... 84
4.7 Suggestions for Redesign ........................................................................... 85 4.7.1 Priority I ............................................................................................... 85 4.7.2 Priority II .............................................................................................. 87 4.7.3 Priority III ............................................................................................. 91
4.8 Summary..................................................................................................... 92
5 Retrospective and Perspective .............................................. 95
References .................................................................................... 100
Appendix I ..................................................................................... 108
Mine Action Process Prototype – 1st Layer............................................................ 108 Mine Action Process Prototype – 2nd Layer........................................................... 109 Mine Action Process Prototype – 3rd Layer ........................................................... 110
Appendix II .................................................................................... 111
Questionnaire ....................................................................................................... 111

List of Figures
Figure 1-1: Main Parties involved in a typical Mine Action Project................................. 3 Figure 1-2: Framework of the M.A. Thesis .................................................................... 6 Figure 1-3: Different Methodologies applied in the M.A. Thesis .................................... 7 Figure 2-1: Data-Information-Knowledge Continuum .................................................... 9 Figure 2-2: Process Categories of Knowledge Management ...................................... 13 Figure 2-3: Evaluation in the Software Development Lifecycle.................................... 20 Figure 3-1: Classifications of Prototypes..................................................................... 23 Figure 3-2: Prototyping-oriented Software Life-Cycle.................................................. 24 Figure 3-3: Prototyping Activities ................................................................................ 25 Figure 3-4: Connection between Technical Context and MAPP.................................. 35 Figure 3-5: Connection between Browser Interface, Visio Viewer and MAU Document
Library................................................................................................................. 36 Figure 3-6: Framework of MAPP ................................................................................ 37 Figure 3-7: MAPP's Twofold Topology........................................................................ 38 Figure 3-8: Navigation Means on 3rd Layer................................................................ 39 Figure 3-9: Information Box ........................................................................................ 42 Figure 3-10: Embedded Document Library in Process MineAction/2/1/2a................... 43 Figure 4-1: Overview of Questionnaire Results – Intranet Usage................................ 75 Figure 4-2: Overview of Questionnaire Results – Process Proficiency........................ 76 Figure 4-3: Rewording of Process Step in MineAction/2/2 – II .................................... 85 Figure 4-4: Rewording of Process Step in MineAction/2/3 .......................................... 86 Figure 4-5: Rewording of Intranet Navigation: Knowledge Enabled MAU Processes .. 87 Figure 4-6: Rework Process Link................................................................................ 88 Figure 4-7: Redesign of the Information Box with Breadcrumb Navigation.................. 89 Figure 4-8: Redesign of the Information Box............................................................... 90 Figure 4-9: Redesign of Process Navigation Elements ............................................... 90 Figure 4-10: Time Measure Symbol............................................................................ 91 Figure 4-11: Redesign - Process continues on next slide ........................................... 92

List of Tables
Table 3-1: Symbols used in MAPP ............................................................................. 40 Table 4-1: Dimensions of USE and WAMMI Questionnaires....................................... 50 Table 4-2: Six-Point Likert-Scale ................................................................................ 59 Table 4-3: Scenario 1 - Time Measures...................................................................... 63 Table 4-4: Scenario 2 - Time Measures...................................................................... 65 Table 4-5: Scenario 3 - Time Measures...................................................................... 67 Table 4-6: Scenario 4 - Time Measures...................................................................... 68 Table 4-7: Scenario 5 - Time Measures...................................................................... 70 Table 4-8: Scenario 6 - Time Measures...................................................................... 71 Table 4-9: Questionnaire Results – Attitude towards UNOPS Intranet........................ 76 Table 4-10: Questionnaire Results – Attractiveness of MAPP..................................... 77 Table 4-11: Questionnaire Results – Ease of Navigation of MAPP ............................. 77 Table 4-12: Questionnaire Results – Usefulness/Helpfulness of MAPP...................... 78 Table 4-13: Questionnaire Results – Ease of Learning of MAPP................................ 78 Table 4-14: Questionnaire Results – Ease of Use of MAPP ....................................... 79 Table 4-15: Questionnaire Results – Satisfaction with MAPP ..................................... 80 Table 4-16: Questionnaire Results – Attainment of MAPP Objectives ........................ 81 Table 4-17: Questionnaire Results – Attainment of MAPP Objectives ........................ 81 Table 4-18: Questionnaire Results – Benefit for other UNOPS Divisions / Units......... 82 Table 4-19: Priority of Redesign according to the Level of Severity ............................ 85

List of Abbreviations
Abbreviation Description
DPKO
ISO
KM
MAPP
MAU
MAU HQ
MAU Field
SOP
TOR
UN
UNDP
UNMAS
UNOPS
Department of Peacekeeping Operations
International Standard Organization
Knowledge Management
Mine Action Process Prototype
Mine Action Unit
Mine Action Unit Headquarters
Mine Action Unit Field
Standard Operating Procedure
Terms of Reference
United Nations
United Nations Development Programme
United Nations Mine Action Services
United Nations Office for Project Services

Page 1 of 116
1 Introduction
“The mark of a well educated person is not necessarily in knowing
all the answers, but in knowing where to find them.” (Douglas Everett)
This thesis is based on a project that was carried out at the Mine Action Unit (MAU) of
the United Nations Office for Project Services (UNOPS).
To better comprehend this project, its objectives and its accompanying ramifications,
one must understand the organizational context in which it was embedded. After
describing the context, the motivation for this work is explained and its objectives are
listed. The chapter concludes with a depiction of the structure of the thesis.
1.1 Organizational Context
The United Nations
Shortly after the Second World War ended, 51 independent states gathered together in
San Francisco to establish the United Nations. Since its foundation on October 24th in
1995, 191 countries have become members of the system.
The initial six main organs1 of the UN have since been complemented by various other
agencies, including UNOPS.2
Since the foundation of the UN, world society has changed considerably, but without a
corresponding development in the structure and culture of the organization. The current
Secretary-General Kofi Annan has recognized this, and earlier this year called for
drastic actions to transform and revitalize the United Nations (cf. UN (2006)).
“[…] nearly every process in the Organization will need to be revisited as we seek to
eliminate redundant steps and engineer more efficient ways of doing things.”
(ibid: p.12)
However, the UN’s decentralized structure impedes top-down directives. United
Nations agencies instead have to audit their own operations.
1 General Assembly, Security Council, Economic and Social Council, Trusteeship Council, Secretariat, and International Court of Justice 2 The official chart of the United Nations system can be found here: http://www.un.org/aboutun/chart.html
Introduction
Page 2 of 116
United Nations Office for Project Services The United Nations Office for Project Services was founded on January 1, 1995. Its
purpose was and still is to manage project resources to help developing nations and
countries in transition.
Due to its special status as a self-financing entity within the United Nations system
UNOPS must submit itself to the market rules while still adhering to the values
embodied in the United Nations Charter. It is thus essential for the organization to be
aware of one’s business processes3 and, secondly, that knowledge must be shared
organization-wide to reduce (project) costs and improve customer satisfaction by
enhancing the quality of services provided.4
UNOPS renders services in the fields of “protection of international waters and
biodiversity, micro-credit programmes, mine action, logistics for electoral assistance,
physical infrastructure and public works as well loan administration and supervision”,
mainly to other UN agencies and programs (cf. UNOPS (2006)).
The type of services include selecting and hiring project personnel, procuring goods,
contracting, organizing training, managing financial resources and administering and
supervising loan activities.
Whatever service is provided in the end, the same truth applies to UNOPS as to any
other company competing in a market-based economy: Clients’ success equals
UNOPS’ success. To be successful UNOPS must be capable of meeting and
exceeding its clients’ expectations in terms of product and service quality, delivery time
and costs.
UNOPS Mine Action Unit
The Mine Action Unit is “directly responsible for all UNOPS involvement in mine action,
including the execution of nearly all of the UN mine action projects” (ICBL5 (2006)).
The people working at UNOPS MAU possess profound technical and legal expertise in
mine action, hands-on experience in project management and deep knowledge of
supporting field personnel and the procurement of goods and equipment.
3 To ease reading the term process will be used throughout the thesis. Davenport (Davenport (1993): p.222) defines a process as “a specific ordering of work activities across time and place, with a beginning, an end, clearly identified inputs and outputs: a structure for action“. A business process is basically a process that is strongly influenced by an organization’s business goals. 4 UNOPS itself acknowledges the competitive advantage of knowledge and promotes its share and
transfer within the organization. (cf. UNOPS Internet 2006) 5 International Campaign to Ban Landmines
Introduction
Page 3 of 116
This unique combination of skills enables UNOPS MAU to efficiently provide mine
action project management services tailored to its clients’ and host countries’ needs.
The Mine Action Unit carries out a multitude of activities:
§ Establishment of national mine action centers and development of national
mine action plans and policies covering standards and quality assurance for
survey, clearance, accreditation, mine awareness/mine risk education, and
victim assistance;
§ Launching of mine survey and clearance operations through the use of
manual, mine detection dogs and mechanical systems in mine-affected
areas; and
§ Strengthening of medical treatment, rehabilitation and vocational services for
mine victims. UNOPS MAU is present in 16 of the world’s heavily mine contaminated countries on
behalf of its major clients United Nations Mine Action Service (UNMAS)6 and the United
Nations Development Programme (UNDP).
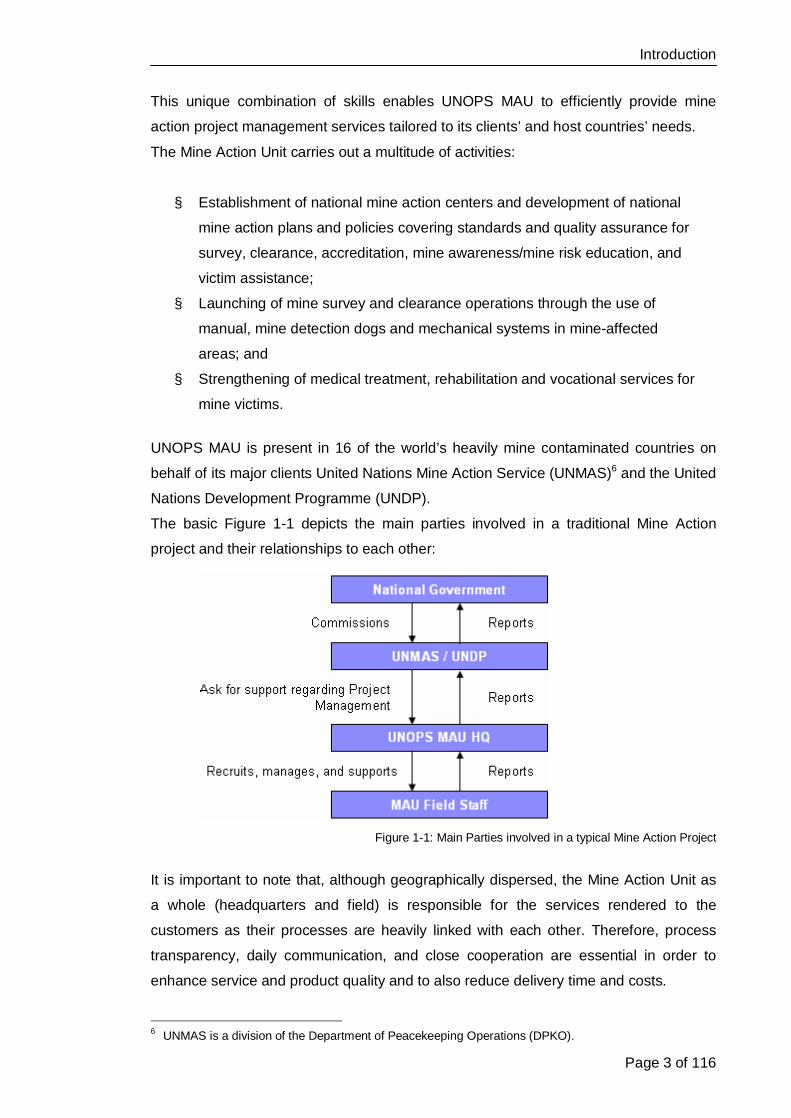
The basic Figure 1-1 depicts the main parties involved in a traditional Mine Action
project and their relationships to each other:
Figure 1-1: Main Parties involved in a typical Mine Action Project
It is important to note that, although geographically dispersed, the Mine Action Unit as
a whole (headquarters and field) is responsible for the services rendered to the
customers as their processes are heavily linked with each other. Therefore, process
transparency, daily communication, and close cooperation are essential in order to
enhance service and product quality and to also reduce delivery time and costs.
6 UNMAS is a division of the Department of Peacekeeping Operations (DPKO).

Introduction
Page 4 of 116
1.2 Motivation and Objectives The United Nations Office for Project Services is a truly international organization. As
projects are carried out all over the world, its diverse workforce is located in various
countries.
Over the years the organization has seen a steady and organic growth by responding
to its customers’ increasing needs in a flexible and efficient manner.
New units have been created, new portfolios have been set up, new projects have
been allocated and additional staff have been employed.
However, past management decisions did not fully take these fundamental changes
into account. Moreover, benefits of emerging management concepts, e.g. Knowledge
and Process Management were largely ignored.
To face today’s challenges a transition program was initiated half a year ago to
restructure the organization and to optimize UNOPS’ competitiveness.
In this context, the executive management’s intention was to foster the effectiveness
and efficiency of business practice by creating process transparency, and identifying
and applying existing knowledge and expertise.
Although not directly governed as part of this transition program, the project aimed at
improving the ability of MAU to succeed in the marked place.
Given the field-based nature of MAU projects and the organizational set-up, MAU
headquarters and field processes are closely intertwined. Thus, close communication
and interaction are essential.
It is therefore important that there is a common process understanding between staff in
headquarters and the field. Moreover, knowledge needs to be available to everyone, at
any time, and at any location to assure an effective collaboration.
However, almost no adequate documentation that could have facilitated process
understanding was available then. Most employees only had a basic understanding of
how MAU operated.
In addition, shortcomings in the exploitation of knowledge objects were identified.
Objects remotely stored proved difficult to locate and access. Moreover, it was not
always clear which was the latest version. Furthermore, past practice entailed giving a
CD comprising documents and additional information to field officers.
Introduction
Page 5 of 116
But this medium had four main disadvantages:
§ Content was not always up to date
§ Data was sometimes redundant
§ User-unfriendly presentation of information
§ The tricky question remained: What information/documentation is really needed
and, indeed, even available for a particular process step? Given those problems the objective of the thesis was the development and evaluation
of a suitable tool that ought to:
1. document MAU processes in an appropriate manner to enhance process
understanding among MAU headquarters and field staff;
2. facilitate the effective and efficient access to process-specific information to
take full advantage of the knowledge and expertise residing within the
organization; In this context, process understanding means, among other things, to provide process
transparency and increase MAU staff awareness that their work does not have any
functional borders. Rather their actions impact on subsequent steps in the value chain,
and thus eventually affect the quality of service provided to the customer.
Moreover, facilitating knowledge access refers to providing all relevant information for a
specific process step at hand that users can be certain is the latest version.
Introduction
Page 6 of 116
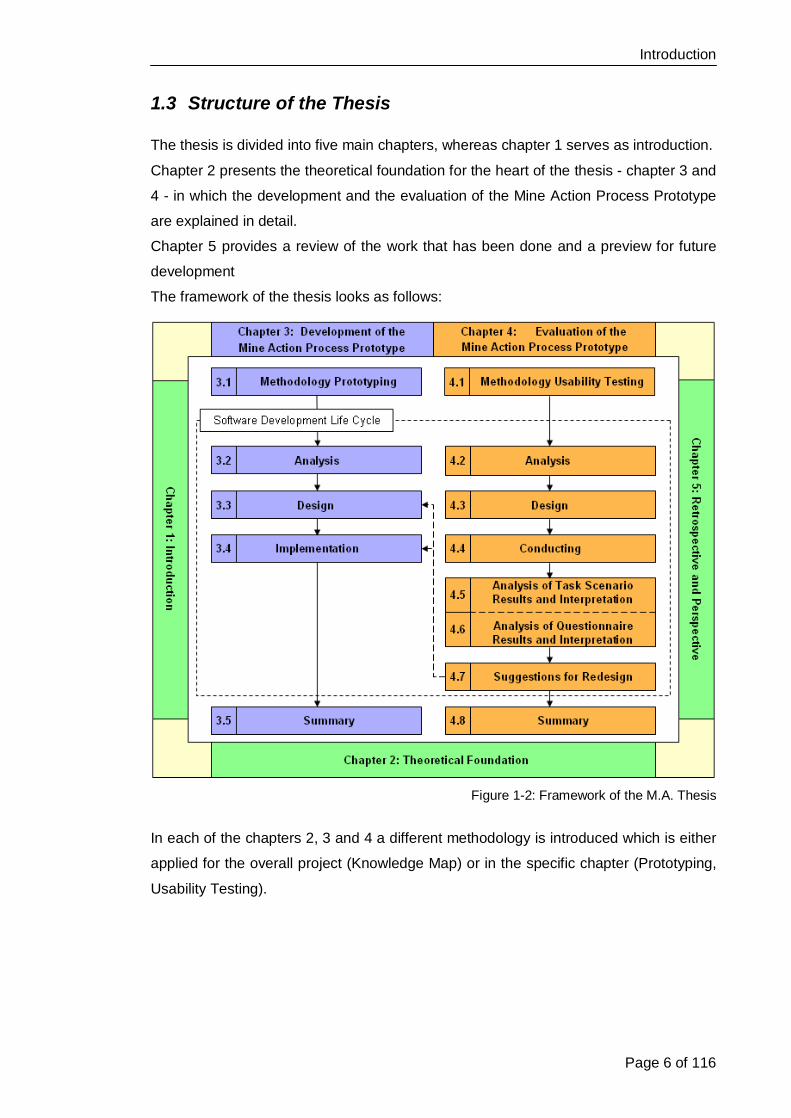
1.3 Structure of the Thesis The thesis is divided into five main chapters, whereas chapter 1 serves as introduction.
Chapter 2 presents the theoretical foundation for the heart of the thesis - chapter 3 and
4 - in which the development and the evaluation of the Mine Action Process Prototype
are explained in detail.
Chapter 5 provides a review of the work that has been done and a preview for future
development
The framework of the thesis looks as follows:
Figure 1-2: Framework of the M.A. Thesis
In each of the chapters 2, 3 and 4 a different methodology is introduced which is either
applied for the overall project (Knowledge Map) or in the specific chapter (Prototyping,
Usability Testing).
Introduction
Page 7 of 116
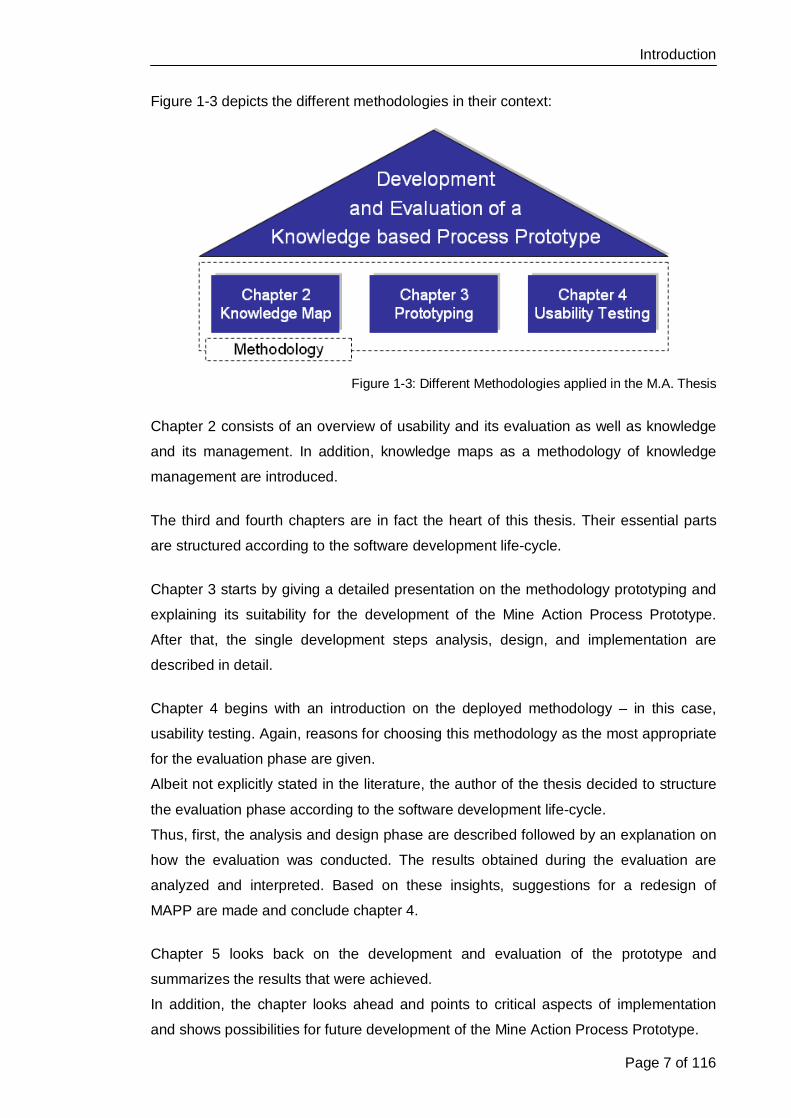
Figure 1-3 depicts the different methodologies in their context:
Figure 1-3: Different Methodologies applied in the M.A. Thesis
Chapter 2 consists of an overview of usability and its evaluation as well as knowledge
and its management. In addition, knowledge maps as a methodology of knowledge
management are introduced.
The third and fourth chapters are in fact the heart of this thesis. Their essential parts
are structured according to the software development life-cycle.
Chapter 3 starts by giving a detailed presentation on the methodology prototyping and
explaining its suitability for the development of the Mine Action Process Prototype.
After that, the single development steps analysis, design, and implementation are
described in detail.
Chapter 4 begins with an introduction on the deployed methodology – in this case,
usability testing. Again, reasons for choosing this methodology as the most appropriate
for the evaluation phase are given.
Albeit not explicitly stated in the literature, the author of the thesis decided to structure
the evaluation phase according to the software development life-cycle.
Thus, first, the analysis and design phase are described followed by an explanation on
how the evaluation was conducted. The results obtained during the evaluation are
analyzed and interpreted. Based on these insights, suggestions for a redesign of
MAPP are made and conclude chapter 4.
Chapter 5 looks back on the development and evaluation of the prototype and
summarizes the results that were achieved.
In addition, the chapter looks ahead and points to critical aspects of implementation
and shows possibilities for future development of the Mine Action Process Prototype.

Page 8 of 116
2 Theoretical Foundation
„Even for practical purposes theory generally turns out the
most important thing in the end.” (Oliver Wendell Holmes)
This chapter lays the theoretical foundation on which the thesis is based. It was
requested to develop a tool based on the concepts of knowledge maps
Hence, it is necessary to clarify what knowledge is and to gain an understanding of
what sort of knowledge can be used in knowledge maps.
Since such maps are a methodology of knowledge management (KM) a short
introduction is given on this management concept (Section 2.1). It is followed by an
extensive section on knowledge maps including the different kinds of maps and their
benefits and challenges (Section 2.2).
The development of a tool does not end with its implementation. Instead, extensive
usability evaluation is essential, as a product will not be accepted if it is only useful but
not usable (and of course vice versa).
Thus, fundamental definitions of usability, its principles, and an evaluation conclude
this chapter (Section 2.3).
2.1 Knowledge Management The term “knowledge worker” was first coined by Peter Drucker back in the 1960s, but
it was not until the 1990s that knowledge management attracted the attention of
practitioners and academics alike.7 In addition to land, capital and labor, knowledge
emerged as the key asset of a modern and competitive company.8
This evolution is rooted in the fact that today’s enterprises are confronted with fierce
international competition and a customer which has an “unprecedented choice of
goods and services” to choose from (Davenport/Prusak (1998): p.13). Therefore,
creativity and innovation are key to success. Machines are not helpful in this context,
but humans who are capable of knowing, judging and acting are. Ergo, “increasingly,
companies will differentiate themselves on the basis of what they know” (ibid: p. 13)
and on their capability to manage their knowledge.
7 Liebowitz (Liebowitz (1999)) provides an overview of the development of KM. 8 Of course, knowledge has always played a role in small, medium and large enterprises, but, in fact, it was not actively exploited.
Theoretical Foundation
Page 9 of 116
2.1.1 Definition of Knowledge Although data, information, and knowledge are very common terms today, people have
difficulties in distinguish their proper usage.
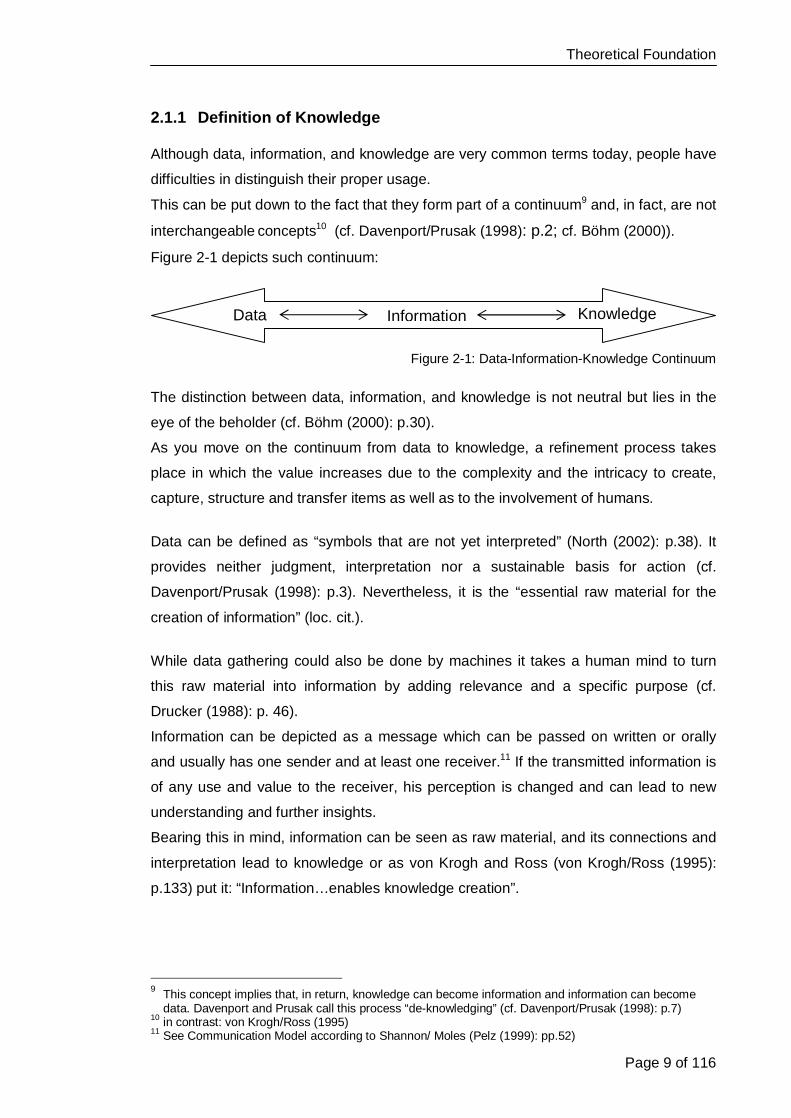
This can be put down to the fact that they form part of a continuum9 and, in fact, are not
interchangeable concepts10 (cf. Davenport/Prusak (1998): p.2; cf. Böhm (2000)).
Figure 2-1 depicts such continuum:
Figure 2-1: Data-Information-Knowledge Continuum
The distinction between data, information, and knowledge is not neutral but lies in the
eye of the beholder (cf. Böhm (2000): p.30).
As you move on the continuum from data to knowledge, a refinement process takes
place in which the value increases due to the complexity and the intricacy to create,
capture, structure and transfer items as well as to the involvement of humans.
Data can be defined as “symbols that are not yet interpreted” (North (2002): p.38). It
provides neither judgment, interpretation nor a sustainable basis for action (cf.
Davenport/Prusak (1998): p.3). Nevertheless, it is the “essential raw material for the
creation of information” (loc. cit.).
While data gathering could also be done by machines it takes a human mind to turn
this raw material into information by adding relevance and a specific purpose (cf.
Drucker (1988): p. 46).
Information can be depicted as a message which can be passed on written or orally
and usually has one sender and at least one receiver.11 If the transmitted information is
of any use and value to the receiver, his perception is changed and can lead to new
understanding and further insights.
Bearing this in mind, information can be seen as raw material, and its connections and
interpretation lead to knowledge or as von Krogh and Ross (von Krogh/Ross (1995):
p.133) put it: “Information…enables knowledge creation”.
9 This concept implies that, in return, knowledge can become information and information can become data. Davenport and Prusak call this process “de-knowledging” (cf. Davenport/Prusak (1998): p.7) 10 in contrast: von Krogh/Ross (1995) 11 See Communication Model according to Shannon/ Moles (Pelz (1999): pp.52)
Data Knowledge Information

Theoretical Foundation
Page 10 of 116
The definition given by Davenport and Prusak makes it clear:
“Knowledge is a fluid mix of framed experience, values, contextual information, and
expert insight that provides a framework for evaluating and incorporating new
experiences and information. It originates and is applied in the minds of knowers. In
organizations, it often becomes embedded not only in documents or repositories but
also in organizational routines, processes, practices, and norms.”
(Davenport/Prusak (1998): p.5)
It comes to the reader’s attention that knowledge is a very seductive, but elusive and
hard-to-catch concept. The reason for that is the different use of the term knowledge
depending on varying perspectives.
“Knowledge can be viewed both as a thing to be stored and manipulated and as a
process of simultaneously knowing and acting – that is applying expertise.”
(Zack (1999): p.46)
The first view corresponds to the cognitivist perspective, whereas the second view is
supported by constructivist advocates.12 In this M.A. thesis the latter perspective is
applied, i.e. knowledge is considered as a result of social processes running in human
brains. With this decision the author acknowledges that not all knowledge can easily be
captured and disseminated, as if they were stocks in a warehouse.
2.1.2 Dichotomies of Knowledge Dichotomies are contrasting pairs which instead of defining the different sorts of
knowledge in detail focus on the differences of each pair (cf. Romhardt (1998): p.27). A
multitude of dichotomies from various sciences can be found in literature.13
For this work, the following three pairs are the most relevant in an organizational
context.
Explicit Knowledge vs. Implicit Knowledge
Explicit knowledge can be “precisely and formally articulated, although removed from
the original context of creation or use […]” (Zack (1999): p.46). The term explicit
knowledge is often used as synonym for codified knowledge14. It means that this kind
of knowledge is documented and resides in reports, training manuals, and project 12 To read more about these two perspectives, see von Krogh and Ross (von Krogh/Ross (1995): pp.12);
Henschel (Henschel (2001): pp.165; Thiel (Thiel (2002): pp.12) 13 cf. Romhardt (1998): p.27 14 The process or rather strategy is called Codification. The opposite strategy is called Personification and is related to implicit knowledge. To read more about these two strategies, see Hansen et al. (1999).

Theoretical Foundation
Page 11 of 116
guides etc., and can thus be easily transferred. In this case, the borderline between
knowledge and information becomes blurred and the terms are often used
synonymously (cf. Figure 2-1: Data-Information-Knowledge Continuum).
Most scholars make either no distinction between the terms implicit knowledge and
tacit knowledge15 or see implicit knowledge as an integral part of the tacit dimension.16
However, the author of this thesis assumes that implicit knowledge and tacit knowledge
are two different concepts. To support this view, it is helpful to take a look at the
Merriam Webster Dictionary. There it is stated that tacit equals “silent”, whereas implicit
is defined as being “capable of being understood from something else though
unexpressed” (Merriam Webster Online Dictionary (2006)).
An example for implicit knowledge is the ability to ride a bike. Although it is not
appropriate to document how to ride a bike17, it is still possible to learn it either by
instruction, by experience or observation because it can be understood from something
else. In contrast, it can be argued, that being charismatic or having leadership qualities,
thus tacit knowledge, cannot be taught in a training course but are in fact the result of a
long socialization process.
Theoretical Knowledge vs. Practical Knowledge
This set of knowledge goes back to Gilbert Ryle who made a distinction between
knowing what/knowing that (theoretical knowledge) and knowing how (practical
knowledge) (cf. Thiel (2002): p.16).
Theoretical knowledge is hereby knowledge about one’s environment, including facts
and rules. This knowledge can rather easily be articulated and transferred between
individuals and is therefore often referred to as explicit knowledge.
In contrast, practical knowledge is about the way how things are done. Under certain
circumstances practical knowledge might be articulated and passed on to someone
else in writing, but in most cases it is learned (transferred) by experience, instruction
and/or observation, thus by human mediation.
15 The term “tacit” was first coined by Michael Polanyi. He realized that “we can know more than we can
tell” (Polanyi (1966): p.4). Polanyi illustrates this fact by giving the example, that an individual can recognize a face from a million but in fact cannot tell how he does it.
16 For example, Nonaka (Nonaka (1991): p.98) states that tacit knowledge consists of two dimensions – technical and cognitive. The subconscious technical dimension comprises specific skills or craft learned by experience, observation or instruction whereas the unconscious cognitive dimension consists of “mental models, beliefs, and perspectives” which might be learned through socialization and which are in fact “so ingrained that we take them for granted” (loc.cit).
17 The mere fact that there is no manual for learning how to ride the bike underpins this assumption.
Theoretical Foundation
Page 12 of 116
Individual Knowledge vs. Collective Knowledge
According to the constructivist approach, reality is created in the head of individuals
and depends on former experiences and context, i.e. everyone has a unique
knowledge base.18
Spender (Spender (1996): p. 52) states that collective knowledge represents all
knowledge “embedded in social and institutional practices, systems, workflows and
culture”. Since an organization is a social system in which various individuals
communicate and interact together as well as share the same experiences, various
(personal) ideas, rules and beliefs might clash and have a mutual influence on the
organization’s members who are as a group holder of collective knowledge. That’s why
organizational knowledge is more than just the sum of its parts (cf. Probst et al. (1999):
p.42).
2.1.3 Definition of Knowledge Management The difficulty of finding an adequate definition for knowledge management stems from
the fact that knowledge itself is such an elusive term.19 That’s why the definition of
knowledge management and thus its applied model depend on one’s perception of
knowledge and its characteristics.
As mentioned before, in this thesis knowledge is understood as highly bound to
individuals so that learning processes cannot be directly managed (constructivist
methodology20). The constructivist methodology lays the focus of knowledge
management on providing ideal conditions and contexts for enabling knowledge
processes.21 Critical voices have therefore argued that knowledge cannot be managed.
"You cannot manage knowledge like you cannot manage love, patriotism or your
children. But you can set up an environment where knowledge evolves"22
However, by fostering an environment that does support knowledge processes you do
manage the corporate asset knowledge, although indirectly.23 Therefore, the term
knowledge management is nevertheless used throughout the thesis.
18 According to Nonaka „new knowledge always begins with the individual“. (Nonaka (1991): p.97) 19 See section 2.1.1 - Definition of Knowledge 20 In contrast, the instrumental-technical approach, which depicts knowledge as a quantitative figure which can be directly and centrally planned, monitored, measured, in short, managed, by an organization. (cf. Reinmann-Rothmeier (2000): p.44) 21 This approach has become known as “Knowledge Ecology”. The metaphor shall illustrate that, in order to manage an entire ecosystem, i.e. organization, “you never do just one thing”. (Davenport (1997): p.28) 22 A remark made by Laurance Prusak in the German newspaper “Handelsblatt” in May 1998 cited by Schuett (Schuett (2003): 455); a clear reference to the article is missing 23 Other intangible corporate assets, such as reputation, brand, customer loyalty, safety and so on, are already being actively managed, with positive results.
Theoretical Foundation
Page 13 of 116
2.1.4 Concepts of Knowledge Management Depending on the understanding of knowledge (constructivist or cognitivist) different
concepts of knowledge management24 are deployed, which focus either on the human-
being, the organization, technology or on all of them to the same extent (cf. Armutat et
al. (2002): p.20). The latter is referred to as holistic approach.
The model of Probst et al. (cf. Probst et al. (1999): pp.53) is based on a holistic
approach. It will be briefly presented, as it is recognized among scholars and
practioners alike.
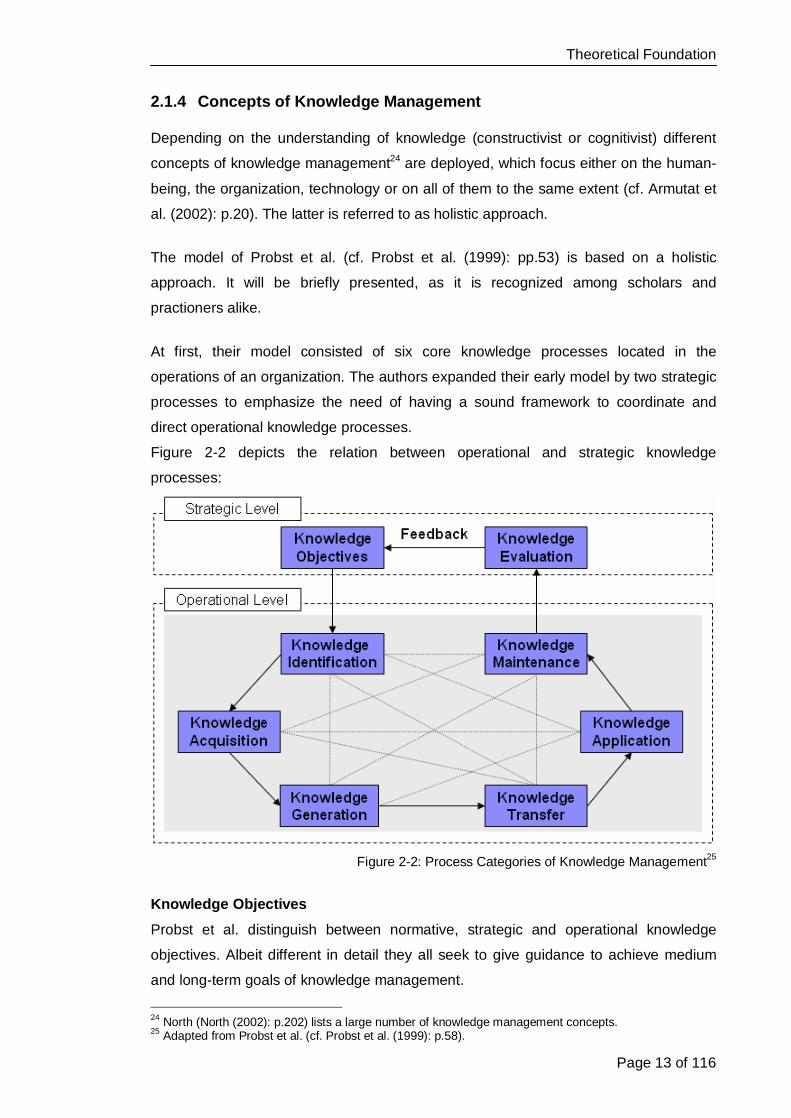
At first, their model consisted of six core knowledge processes located in the
operations of an organization. The authors expanded their early model by two strategic
processes to emphasize the need of having a sound framework to coordinate and
direct operational knowledge processes.
Figure 2-2 depicts the relation between operational and strategic knowledge
processes:
Figure 2-2: Process Categories of Knowledge Management25
Knowledge Objectives
Probst et al. distinguish between normative, strategic and operational knowledge
objectives. Albeit different in detail they all seek to give guidance to achieve medium
and long-term goals of knowledge management.
24 North (North (2002): p.202) lists a large number of knowledge management concepts. 25 Adapted from Probst et al. (cf. Probst et al. (1999): p.58).

Theoretical Foundation
Page 14 of 116
Knowledge Evaluation
This process serves as control mechanism for the predefined knowledge objectives.
Knowledge Identification
This process deals with providing transparency regarding internal and external
knowledge objects of an organization
Knowledge Acquisition
Here, Probst et al. refer primarily to the acquisition of external knowledge through
external experts or the purchase of innovative companies.
Knowledge Generation
Knowledge generation refers to the creation of new knowledge in an organization. The
main emphasis is put on the generation of new ideas and exploiting the creative
potential of employees.
Knowledge Transfer
Knowledge transfer deals with the dissemination of knowledge throughout an
organization, so that knowledge is available to the employee in question in an
appropriate manner in the right place and at the right time.
Knowledge Application
This process is the key to knowledge management because knowledge itself has no
power, as Francis Bacon put it, but in fact it has to be applied to make a difference.
Knowledge Maintenance
Since knowledge can be very valuable it is important to retain it within the organization
and to be able to make it available if needed.
There are myriads of methodologies that support one or more of the aforementioned
knowledge processes. They can range from highly sophisticated methodologies such
as Communities of Practice, Knowledge Maps to Expert Repositories, Lessons
Learned and Best Practices or even just the chat in the hallway.
To decide which methodology is the most appropriate to be deployed it is important to
consider the objectives of the project as well as the affected knowledge processes.

Theoretical Foundation
Page 15 of 116
2.2 Methodology Knowledge Maps If a tourist is lost in a city he can best consult a map or his guide. Under certain
conditions, e.g. the street is recorded in the map, the map is legible, and he has the
ability to comprehend it, he will find his way.
Exactly the same applies to the search for a specific knowledge object within an
organization. Given the growing amount and the complexity of knowledge and
knowledge resources in many domains, it is helpful to have a visual directory which
provides systematic orientation in the intellectual territory of an organization, thus a
knowledge map.
Such maps do not only facilitate transparency regarding knowledge objects but also
enable employees to effectively localize, organize, and store knowledge resources.
2.2.1 Definition According to Vail, a knowledge map is a “visual display of captured information and
relationships, which enables the efficient communication and learning of knowledge by
observers with differing backgrounds at multiple levels of detail” (Vail (1999): p.10).
Eppler for example suggests two layers – a ground layer which represents the context
for the mapping and attached to it a second layer comprising knowledge objects (cf.
Eppler (2001): p.2)
Often, such referenced objects are one of the following (ibid: p.1):
§ heuristic knowledge (know-how) in the form of people (experts), processes and
applications
§ rationales or experiences (know-why) in the form of lessons learned or project
debriefings
§ factual knowledge (know-what) in the form of documents or database entries
(which can be linked to experts) Eppler (cf. Eppler (2001): p.4) stresses that it is meaningful to implement a knowledge
map into a browser interface of an organization’s intranet rather than to present it in a
proprietary application. On the one hand, this may be more economical and on the
other hand, users are often already familiar with the organization’s intranet or at least
with a web browser.
Theoretical Foundation
Page 16 of 116
2.2.2 Benefits and Challenges In section 2.1.4, the core processes of knowledge management were introduced.
Knowledge maps have the ability to support several of those processes as the yield
potential benefits by enabling all stakeholders to:
Capture
Knowledge Maps collect relevant knowledge that is continuously evolving in all its
forms (text, pictures, stories, data and models) (cf. Vail (1999): p10). By using visual
metaphors and symbols knowledge is transformed from an implicit into an explicit state
(cf. Eppler (2001): p.7).
Organize
Since knowledge maps are based on architecture and symbols, they automatically
organize an organization’s knowledge as well as serve as visual directories to other
more detailed sources of knowledge (cf. Vail (1999): p10). By providing a visual grid
knowledge access becomes more effective and efficient.
Comprehend
Knowledge maps serve as scaffolds or supports to cognitive processing because
they can reduce cognitive load, enhance representation of relationships among
complex constructs […] (cf. O’Donnell (2002): p.74).
Moreover, empirical evidences indicate that people are able to recall more central
ideas when they learn from a knowledge map than when they learn from text (ibid:
p.81).26
Share
“Knowledge becomes accessible to everyone at every level of the organization in the
most appropriate forms of display, computer literate or not. Knowledge maps connect
experts with each other or help novices or rookies identify experts quickly” (Eppler
(2001): p.7; cf. Vail (1999): p.12).
Moreover, Vail (Vail (1999): p.10) points out that “Knowledge maps are sustainable;
they do not have to be recreated from scratch, rather they are continuously enhanced
with new knowledge relationships”.
Thus, knowledge maps are an ever evolving system that changes in structure and
content.
26 Albeit O’Donnell conducted the tests with students it can be assumed that her findings apply to
employees in an organization as well.

Theoretical Foundation
Page 17 of 116
As seen, knowledge maps can have an impact on multiple knowledge processes.
However, at the same time a successful implementation and usage faces various
challenges (cf. Eppler (2001): p. 8):
§ danger of misinterpretation
§ fixation or “reification” of the layout of the knowledge map
§ danger of information overload
§ danger of using an outdated map
§ difficult depiction of dynamic processes
§ reduction of complex structures to graphic symbols
2.2.3 Knowledge Map Classification There is a variety of knowledge maps. Eppler (cf. Eppler (2001): p.3) lists the
following:27
Knowledge Source Maps
Knowledge source maps reveal the structure between experts and their domain of
expertise, proximity, seniority or regional distribution. Such a map answers usually
questions like:
“Who do I have to contact to get more information about the hiring process of
international staff?”
Knowledge Asset Maps
These maps provide a simplified graphic view of a company’s intellectual capital. Such
a map answers usually questions like:
“How has ever participated in a mine project in Afghanistan?”
Knowledge Structure Maps
Knowledge structure maps outline the global architecture of a knowledge domain and
how its parts relate to one another. Such a map answers usually questions like:
“Which skill does a Post Clearance Review Officer of a mine project in Lebanon need?”
Knowledge Application Maps
Knowledge application maps show, which type of knowledge has to be applied at a
certain process stage or in a specific business situation. Usually, these maps also
provide pointers to locate that specific knowledge (documents, specialists, databases).
Such a map answers usually questions like:
“Are there any contract templates available to finalize the procurement?” 27 A different classification based on mapping cognitive thoughts is proposed by Huff (cf. Huff (1990)).

Theoretical Foundation
Page 18 of 116
Knowledge Development Maps
These maps depict the necessary stages to develop a certain competence, either
individually, as a team, or as an organizational entity. Such map answers usually
questions like:
“How do we achieve business excellence for our unit?”
As often, there does not have to be black and white, i.e. different sorts of knowledge
maps can be combined, for example a knowledge source and knowledge application
map.
However, no matter which knowledge map is implemented in the end it has to be kept
in mind that such a tool cannot influence the quality of the knowledge basis itself, i.e. if
the quality is poor or the knowledge objects are invalid and/or unreliable, a knowledge
map does not alleviate such deficiencies.
If a knowledge map is poorly designed it might not lever the above mentioned
benefits.28 For example, Wiegmann et al. (cf. Wiegmann et al. (1992)) recommend
designing maps that adhere to gestalt principles29 because this would improve user’s
perception and would have a greater impact on the viewer’s knowledge base. Still,
even though gestalt principles may be applied in a project it does not guarantee
successful usage.
It is widely known, that the mental models of developers and end-users do usually not
match each other due to a different background and expertise. This can lead to severe
problems which could inhibit end-users from using a tool effectively and efficiently.
Therefore, usability aspects have to be taken into account, and it is even more
important, that usability evaluation is incorporated into the development life-cycle of a
tool.
2.3 Usability Usability is only one attribute of system acceptability but since the 1990s it has
emerged as the decisive factor of a system. As personal computers have arrived in
nearly every home the notion that users have to adapt to the machines has faded
gradually.
28 Eppler lists a number of quality criteria for knowledge maps. (cf. Eppler (2001): p.9) 29 Gestalt principles of perceptual organization are for example: proximity, similarity, continuity To read more about gestalt psychology, see especially Katz (1969). In the context of screen design and
web design, see Bürgel and Neumann (Bürgel/Neumann (2001)); Brinck et al. (Brinck et al. (2002): pp.192)
Theoretical Foundation
Page 19 of 116
Nowadays, the user-centered design, and thus usability plays a predominant role in the
development of human-computer interfaces.
To evaluate usability a clear understanding of what it is and what it comprises is
necessary. The following two sections shed light on this topic.
2.3.1 Definition According to the International Standard Organization, the norm ISO 9241-11 defines
usability as “the extent to which a product can be used by specified users to achieve
specified goals with effectiveness, efficiency and satisfaction in a specified context of
use” (ISO 9241-11 (1998)).
This definition implies that usability is not a universally measurable quantity. Instead, it
heavily depends on the context of the user and usability goals (cf. Beier/von Gizycki
(2002) p.2).
In general, effectiveness means the accuracy and completeness with which users
achieve specified goals. Efficiency measures the user’s effort to accurately and
completely achieve specified goals. Satisfaction is defined as the freedom from
discomfort, and positive attitudes towards the use of the product.
It is assumed that there is a correlation between effectiveness, efficiency and
satisfaction, i.e. the more effectively and efficiently users can work with a product the
more satisfied they are.
2.3.2 Attributes Usability comprises various attributes. If all of them tend towards the positive end of the
scale it is most likely that users can accomplish their tasks in an effective and efficient
manner, and thus find satisfaction with the tool.
Traditional usability attributes as proposed by Nielsen are listed in the following
(Nielsen (1993): p.26):30
Learnability
Ease of learning refers to the novice user’s experience in the initial part of the learning
curve. Highly learnable systems have a steep incline for the first part of the learning
curve and allow users to reach a reasonable level of usage proficiency within a short
time.
30 This set of attributes can be expanded for example by Usefulness, Ease of Navigation, Attractiveness, and Ease of Use.
Theoretical Foundation
Page 20 of 116
Efficiency of Use
The system should be efficient to use, so that once the user has learned the system, a
high level of productivity is possible.
Memorability
The system should be easy to remember, so that the casual user is able to return to
the system after some period of not having used it, without having to learn everything
all over again.
Errors
The system should have a low error rate, so that users make few errors during the use
of the system, and so that if they do make errors they can easily recover from them.
Satisfaction
The system should be pleasant to use, so that users are subjectively satisfied when
using it.
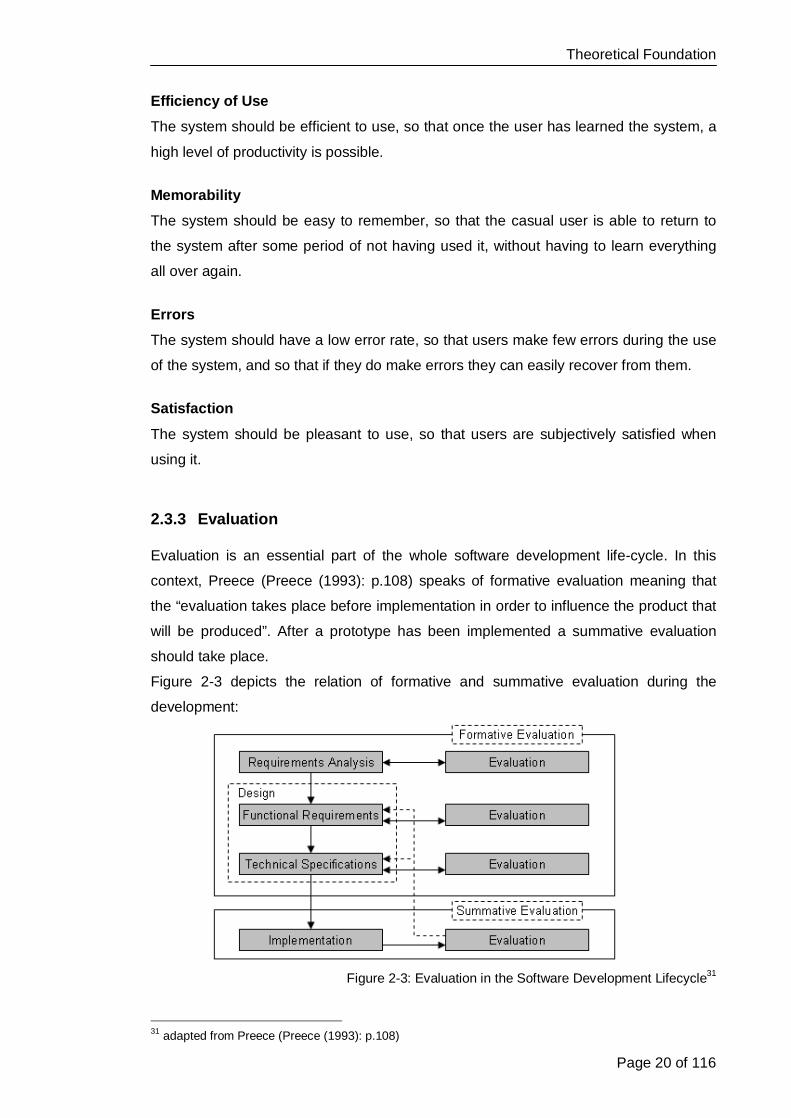
2.3.3 Evaluation Evaluation is an essential part of the whole software development life-cycle. In this
context, Preece (Preece (1993): p.108) speaks of formative evaluation meaning that
the “evaluation takes place before implementation in order to influence the product that
will be produced”. After a prototype has been implemented a summative evaluation
should take place.
Figure 2-3 depicts the relation of formative and summative evaluation during the
development:
Figure 2-3: Evaluation in the Software Development Lifecycle31
31 adapted from Preece (Preece (1993): p.108)

Theoretical Foundation
Page 21 of 116
As shown above, evaluation must not be a single occurrence but should be done after
each development step.32 There is a great variety of evaluation methods to assess the
usability of a tool. To identify the most appropriate method it is necessary to first
consider the purpose of the evaluation (cf. Nielsen (1993): p.170).
Usually, evaluation serves to answer at least one of the following questions33: § Engineering towards a target: Is it good enough?
§ Comparing alternative designs: Which is the best?
§ Understanding the real world: How well does it work in the real world?
§ Checking conformity to a standard: Does this product conform to the
standard? Other criteria for choosing an evaluation method are the stage of system development,
the extent of user involvement in the evaluation process, and the type of data that
ought to be gained. Last but not least, it is important to be aware of any constraints
imposed by insufficient technical or financial resources.
Whatever method is finally applied, the general purpose of all usability evaluations is to
uncover problems that impede the effective and efficient use of a system (cf. Lindgaard
(1994): p.5) and to alleviate these deficiencies. But what is a usability problem? Nielsen
(Nielsen (1994): p.385) gives the following definition:
“A usability problem is any aspect of a user interface that is expected to cause users
problems with respect to some salient usability measure and that can be attributed to a
single design aspect.”34
These problems can be identified by using either expert oriented or user oriented
usability evaluation methods.
Expert oriented methods involve primarily analytical methods, known as Usability
Inspection methods, in which experts assume the role of “surrogate users”
(Schweibenz/Thissen (2003): p.43) or evaluate the product according to interface
design guidelines, style sheets etc. Well known methods are Cognitive Walkthrough
(cf. Lewis/Wharton (1997)) and Heuristic Evaluation based on Nielsen (cf. Nielsen
(1993): pp.115-163).
User oriented methods of usability evaluation are empirical methods and comprise for
example surveys and questionnaires, interviews with focus groups, log file analysis,
observation and monitoring, and usability testing. The latter is probably the most widely
spread usability evaluation method and will be deployed in this M.A. thesis. 32 Brinck et al. (2002): pp.32 list various usability methods according to each development phase. 33 Preece et al. (1994): p.692 34 Albeit the definition might be straightforward it has to be questioned whether all usability problems can
really be attributed to “a single design aspect”.

Page 22 of 116
3 The Development of the Mine Action Process Prototype
“There is no one giant step that does it. It’s a lot of little steps.” (Peter. A. Cohen)
In the early stages of software engineering it happened frequently that the developed
tool did not meet customer’s expectations due to a variety of reasons. Probably the
most prominent was the inflexibility of such a development process caused by a rigid
phase model.35
Hence, other approaches were sought and found, for example in the Prototyping
Methodology.
The Mine Action Process Prototype was developed according to the prototype-oriented
life-cycle with the aim to always provide a working version which could be refined
gradually due to emerging system context and designs.
The necessary analysis of business requirements and target audience had been made
by MAU prior to the implementation of the prototype. Also, functional requirements and
the technical context were predefined.
These prerequisites suggested the implementation of a prototype based on the
concepts of a knowledge application map (cf. section 2.2.3).
Although the author of the thesis did not participate in the steps that were taken before
the implementation, they are explained to facilitate the reader’s understanding of the
project, and thus the implemented prototype.
After a short introduction on the prototyping methodology (Section 3.1), the chapter is
structured according to the first steps of the prototyping life-cycle, explaining the
analysis (Section 3.2), design (Section 3.3), and implementation (Section 3.4).
35 The original Waterfall Model is an example for such an inflexible phase model.

The Development of the Mine Action Process Prototype
Page 23 of 116
3.1 Methodology Prototyping36
3.1.1 Definition The term prototyping is not exclusive to the software development industry. In fact, it is
a methodology that has become commonplace in the engineering sector for a long time
and was adopted for the software industry.37
“Software Prototyping is an information system development methodology based on
building and using a model of a system for designing, implementing, testing, and
installing the system“
(Lantz (1986): p.1)
Thus, the concept that forms the basis of this M.A. thesis is that the final system is in
fact the product of an evolutionary development in which preceding models are
adapted based on experiments and experiences.
3.1.2 Classification of Prototypes Prototypes can be classified as horizontal or vertical. A combination of both is called
scenario.
The graphic below depicts these three classifications:
Figure 3-1: Classifications of Prototypes38
36 The term Rapid Prototyping emerges frequently especially in American literature and denotes in its
simplest meaning an unsystematic, trial-and-error approach to software development because analysis and system design are often virtually non-existent (cf. Budde et al. (1991): p.8).
37 To read more about the distinctions and similarities of the term used in engineering and software development disciplines, see Budde et al. (1991): p.7f; Smith (1991): p.43; Balzert (1998): pp.114)
38 Adapted from Balzert (Balzert (1998): p.116) and Nielsen (Nielsen (1993): p.94)
Range of Functions
Func
tiona
lity
Vertical Prototype
Horizontal Prototype
System
Application
User Interface
Scenario

The Development of the Mine Action Process Prototype
Page 24 of 116
A horizontal prototype consists of one or more specific layers but in its entire width. In
most cases this is the user interface. In contrast, the vertical prototype offers one or
more specific functionalities which is/are completely implemented (cf. Budde et al.
(1991): p.39; Balzert (1998): p.116). A scenario combines both strategies. In this case,
both the design and functionalities can be evaluated in a usability test.
3.1.3 The Prototyping-oriented Life-Cycle Model
Figure 3-2: Prototyping-oriented Software Life-Cycle39
As depicted, the prototyping-oriented life-cycle is an iterative process40, in which unlike
in the traditional software life-cycle, single steps overlap and are blended into each
other.
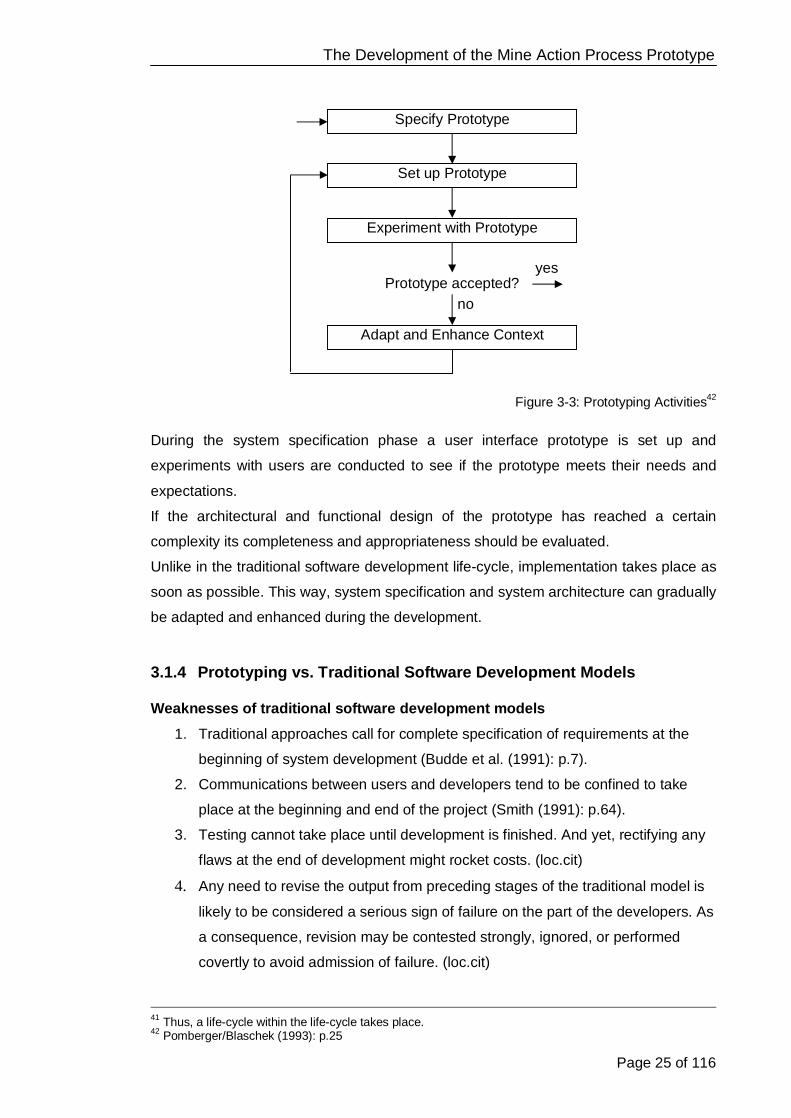
In the grey-shaded boxes of Figure 3-2 the following activities take place41: 39 Pomberger/Blaschek (1993): p.25 40 The back arrows indicate this fact.
The Development of the Mine Action Process Prototype
Page 25 of 116
Prototype accepted?
Specify Prototype
Set up Prototype
Experiment with Prototype
Adapt and Enhance Context
no
yes
Figure 3-3: Prototyping Activities42
During the system specification phase a user interface prototype is set up and
experiments with users are conducted to see if the prototype meets their needs and
expectations.
If the architectural and functional design of the prototype has reached a certain
complexity its completeness and appropriateness should be evaluated.
Unlike in the traditional software development life-cycle, implementation takes place as
soon as possible. This way, system specification and system architecture can gradually
be adapted and enhanced during the development.
3.1.4 Prototyping vs. Traditional Software Development Models Weaknesses of traditional software development models
1. Traditional approaches call for complete specification of requirements at the
beginning of system development (Budde et al. (1991): p.7).
2. Communications between users and developers tend to be confined to take
place at the beginning and end of the project (Smith (1991): p.64).
3. Testing cannot take place until development is finished. And yet, rectifying any
flaws at the end of development might rocket costs. (loc.cit)
4. Any need to revise the output from preceding stages of the traditional model is
likely to be considered a serious sign of failure on the part of the developers. As
a consequence, revision may be contested strongly, ignored, or performed
covertly to avoid admission of failure. (loc.cit) 41 Thus, a life-cycle within the life-cycle takes place. 42 Pomberger/Blaschek (1993): p.25

The Development of the Mine Action Process Prototype
Page 26 of 116
Benefits of Prototyping
1. Users may be unable to articulate or understand their applications in a
computing context. Prototypes are a simple, comprehensive, complete, and
unambiguous means of communication between users and developers. (Smith
(1991): p.53ff)
2. Prototyping gives a better appreciation of the problems and benefits of the
software before installation. There always is something concrete that can be
seen and evaluated by [the users and] the management. (loc.cit)
3. Users can see their ideas being fed back rapidly into the development process.
This engenders feelings of user ownership about the software being developed.
(loc.cit)
4. Prototyping reduces the risk of failure due to early user involvement. (cf. Balzert
(1998): p.119)
5. Quality Assurance (cf. Pomberger/Blaschek (1993): p.26)
Challenges of Prototyping
1. The number of versions can be high and difficult to manage. It can be that
developers mix up the different versions or are unable to trace a prototype back
to an earlier version. (Smith (1991): p.55)
2. Uncertainty and the unknown make it difficult to plan […] (loc.cit)
3. Integration with and interface to other systems may be more difficult with
prototypes. (Boehm et al. 1984 p.299) If internal systems standards are not
maintained during prototyping, it may prove difficult or even impossible to
interface the prototype with existing or future systems.(Smith (1991): p.55)
4. Testing may be neglected in prototypes. There is a tendency that users need to
debug programs, although they should only evaluate the tool in its context
(loc.cit).

The Development of the Mine Action Process Prototype
Page 27 of 116
3.1.5 The Suitability of the Prototyping Methodology for this Work The reasons for choosing a prototyping approach for this project can be deduced from
the general advantages which this methodology offers and the special context in which
this project was embedded.
The request to set up a tool which could facilitate effective and efficient access to
knowledge objects and foster process understanding came from the Mine Action Unit.
During the course of the project a specialist of MAU assumed both, the roles of a
knowledge expert43 and an end-user.
In the role of an expert he gave information on the content which was incorporated into
the prototype. As an end-user he provided the developing team with input which helped
to direct how the tool was (re)engineered at a very early stage. This approach goes
hand in hand with the iterative development process suggested by the prototyping
methodology.
Besides, due to the mutual dependency between the specialist and the development
team it was critical to present a model in a timely fashion to rule out any
misunderstandings which could have occurred during the knowledge transfer process44
and to gather feedback regarding the design of the tool.
A prototype does not only serve perfectly as basis for discussions but can also be used
to present quick and convincing examples to the client and to enhance their
involvement and efforts in the project. Although the Mine Action Unit itself was eager to
implement the tool it was important to be able to report on any progress – in this case
the visualization of the processes and incorporated knowledge objects.
In addition, the visualization of the early prototypes helped to reveal knowledge gaps
as the expert could easily identify any missing knowledge objects by revising single
processes.
Moreover, to be able to evaluate the tool it was important to have a user interface and
various functionalities (cf. Classification of Prototypes). A speedy progress was
therefore indispensable.
As seen, the nature of the development of the Mine Action Process Prototype called for
an evolutionary model in which the target system is produced in small iterative steps.
43 To ease reading, he is referred to as expert from this point on in the thesis. 44 Here, the knowledge transfer process took place between the MAU specialist and the MAPP development team.
The Development of the Mine Action Process Prototype
Page 28 of 116
3.2 Analysis Frequently, software does not meet stakeholders’ initial expectations because purpose
and target audience were not defined in sufficient detail. Technology must not be the
driving force behind the development of a product, but rather the requirements of the
anticipated end user.
Therefore, business requirements were identified and the target audience was defined
first before deciding on the technical implementation.
3.2.1 Business Requirements Business requirements can often be derived by observing difficulties that occur in daily
business.
In the case of the Mine Action Unit, two predominant areas of challenges were
identified that applied to staff, both in headquarters and in the field. On the one hand,
process understanding was not given in all parts of MAU, on the other hand the current
way of accessing MAU related knowledge objects was perceived as too much effort for
the average user.
Process Understanding
Albeit MAU headquarters and MAU field processes are closely connected to each
other, staff were not always aware of this fact. Due to the organizational set-up and the
complex nature of the processes, full comprehension was difficult, especially for staff
that had recently joined MAU. Moreover, there was also no absolutely consistent view
on the whole process picture among staff that had been with MAU for some time.45
A first successful attempt in documenting processes had been made before the project
started.46
In the wake of this effort, a more user-friendly and much more comprehensive
documentation was requested by MAU to enhance process understanding.
Knowledge Access
The second obstacle in day-to-day business of headquarters and field staff was that
knowledge which was needed in specific process steps could not be accessed
efficiently, i.e. it was not exactly clear which documents were available for which step
and whether or not they were the latest version.
45 Side note: A MAU portfolio manager, who had been in the field for a long time and who had only recently joined MAU HQ, mentioned in a later conversation with the author that if he had seen the visualized processes back then he would have understood better how MAU headquarters and field processes were connected. 46 Thus, before the project started processes had been documented but not visualized.

The Development of the Mine Action Process Prototype
Page 29 of 116
This problem was rooted in the fact that MAU related knowledge objects were stored in
multiple locations and that there was no systematic way to access them. A lot of
knowledge entities47 were on the shared drive to which every member of the Mine
Action Unit in headquarters had access but to which staff in the field did not. In
addition, information and documentation could also be found on personal hard drives,
CDs and conclusively throughout the organization, because MAU processes touch
upon support processes of UNOPS, for example personnel and procurement
processes. The existence of multiple locations for the same information was
considered neither economical nor practical, as it was seen as source of irritation due
to redundancy, lack of reliability and uncertainty about a document’s latest version.
The effective and efficient access to knowledge objects had been a prevailing problem
in the field as well, although in a slightly different way. In the past, a CD containing all
needed documentation and information was given out to the staff in charge in the field
prior to their assignment. It goes without saying that keeping the CD up to date
required a lot of effort and investment from the headquarters side. Still, even this effort
could not solve all deficiencies, for example possible use of redundant and outdated
data or a user-unfriendly information representation.
Thus, simply put, the Mine Action Unit requested a tool that would enhance process
understanding of Mine Action processes and which would facilitate access to process
specific knowledge.
3.2.2 Objectives The objectives of the Mine Action Process Prototype can be deduced from the
aforementioned business requirements, which were, in short, process transparency
and process specific access to MAU related knowledge objects.
Process Understanding
In this respect MAPP ought to:
1. Provide an overview and basic understanding of MAU processes especially for
the benefit of recently joined staff but in the end to all stakeholders
2. Increase cross-functional understanding (WHO does WHAT, WHEN and HOW
long does it take?)
3. Raise awareness of processes and the implications for the work of MAU staff
47 In this context, the term knowledge entity is used synonymously to knowledge object
The Development of the Mine Action Process Prototype
Page 30 of 116
4. Make the use of the MAU processes easier and more intuitive
5. Serve as a basis for discussion (Is this the most efficient way to do business?)
6. Assure a standard project flow
7. Serve as a blueprint for standard process documentation
Here, it has to be explicitly stated that it was not the objective of MAPP to reengineer
MAU processes but rather to visualize them, regardless of whether or not deficiencies
were detected. However, it was well the intention to have a common basis for
discussion to improve the processes afterwards (see bullet point no. 5).
Facilitate Process Specific Knowledge Access
In this respect MAPP ought to:
1. Be a tool to simplify daily work along the processes by linking process specific
knowledge objects
2. Facilitate knowledge sharing in a more efficient manner throughout the
processes
3. Reduce unnecessary emailing caused by sending insufficient or missing
documents
4. Assure the use of the most current document versions
5. Enable universal access, independent of time and location
3.2.3 Target Audience In the first place, the prototype aims at MAU headquarters and MAU field staff. Both
could benefit directly from a knowledge-enabled process documentation.
In the course of the project it became evident that the visualization of MAU processes
could also be used to explain the internal processes of MAU to other interested
UNOPS staff.48
48 Of course, it was understood that they would not benefit from MAPP as much as MAU staff. However, this observation led to the assumption that the implementation of such a prototype in corporate divisions or units could yield considerable benefits to the entire organization.
The Development of the Mine Action Process Prototype
Page 31 of 116
3.3 Design
3.3.1 Functional Requirements To meet the objectives mentioned in section 3.2.2 and to reach the target audience
pointed out in section 3.2.3, a set of functional requirements of the prototype was
defined. Functional requirements answer the question: What features/functionalities
does the tool require to accomplish the objectives?
MAPP is primarily a visualization which links MAU relevant knowledge objects. Thus,
the number and the level of complexity of functions are significantly lower than in
standard software applications.
General Functionalities
The Mine Action Process Prototype ought to (be):
§ easy to use (point and click)
§ easy to maintain (without programming)
§ easy to modify (but only by authorized staff)
§ provide universal access (time (24/7) and location independent (HQ / field))
Functionalities regarding Understanding of Mine Action Unit Processes
As seen in section 2.2.2, knowledge maps enable users to better comprehend
relationships even among complex constructs and recall central ideas.
Hence, instead of presenting plain text, a visualization of MAU processes in form of a
knowledge application map seemed the most appropriate method.
Furthermore, in addition to a visualization of single process steps, a clear depiction of
different roles and responsibilities of everyone involved in MAU processes was desired.
Functionalities regarding Systematic Access to Knowledge Objects On the one hand, systematic in this context means that the tool ought to provide
access in a regular and logical way, on the other hand it means that the accessed
knowledge objects ought to be related to the Mine Action unit’s activities in one way or
another.
It was the idea to comprehensively index and cross-reference these objects according
to processes, so that users would know exactly what information was needed in a
specific process step.
The Development of the Mine Action Process Prototype
Page 32 of 116
This requirement also called for the implementation of a knowledge application map as
it shows what knowledge is needed at a certain process stage or in a specific business
situation. (cf. Section 2.2.3)
Moreover, it was required that all k-objects49 were accessible with one or two clicks and
were linked with their original source so that users could be sure to access the latest
version. For example, if a document provided by the HR division is needed, the user
should be directed to the HR division rather than to a copy of the same document
stored in the MAU document library.
As could be seen in section 2.1.2, there are different sorts of knowledge objects, and
not all of them can be equally captured with ease, documented and transferred.
Explicit and theoretical knowledge (know what) can be captured and disseminated
throughout an organization rather easily. Given this fact, the majority of k-objects linked
by MAPP are of that sort.
The following is a list of relevant k-objects that should be incorporated into the tool:
Knowledge about the process § Process knowledge50
Knowledge within the process § Forms and templates
§ Handbooks / How-to-Guides
§ Additional information about a process step
§ Links to other UNOPS processes
§ Contact information
§ Time measures
Knowledge derived from the process
§ Good Practices51 § Lessons Learned
49 short for „knowledge objects“ 50 Process knowledge is made explicit by capturing what staff knows about MAU processes. 51 In literature the term Best Practice is used frequently. However, the term best is highly ambiguous, because what might be best in one situation does not necessarily have to be best in a different situation or context. Dixon (cf. Dixon (2000): p.10) adds that an employee might be intimidated by the term best practice and that he might refuse to submit his best practice on the assumption that if there is already a best practice in place, there is no need for his idea. Because of that more and more organizations use the term Good Practice.

The Development of the Mine Action Process Prototype
Page 33 of 116
The last two knowledge objects stand out from the rest due to the difficulties in
obtaining them. Both imply that something has been learned from past experiences.
These experiences, both positive and negative, can be very valuable for an
organization. Unfortunately, their documentation is a complicated and time-consuming
process.
Although it was initially planned to include lessons learned in MAPP the idea was
postponed, as there is no appropriate process in place to capture such lessons today.
Without a mandatory process the attempt to implement lessons learned would have
been in vain.52
Good practices were incorporated into MAPP, in a different context though. Here, good
practices are mostly exemplary documents (e.g. Terms of Reference; Statements of
Work etc.) that save MAU staff time because only the content has to be slightly
adapted to one’s own situation.
3.3.2 Technical Context The technical context defines the technical elements, e.g. software, hardware etc., that
shall meet the functional requirements of a tool.
In this case, the technical context of MAPP was predefined. The decisions for the
technical elements were primarily based on the appropriateness to meet the functional
requirements stated in section 3.3.1 and the availability of existing resources.
Technical Context to meet General Functionalities
As seen, it was required that the tool would be accessible by everyone at any time no
matter of his location. This could be achieved with any web-based technology, for
example internet, intranet, or extranet. The UNOPS Intranet was considered the only
appropriate medium, as the internet raised security concerns and a UNOPS Extranet
did not exist.
Moreover, the UNOPS Intranet had been launched over a year ago, so that it could be
assumed that staff was familiar with it. It is based on the Content Management System
Sharepoint and serves communication and collaboration purposes.
Only authorized staff is allowed to make changes to the content of intranet pages. For
this purpose they have received special training.53
52 Weber et al. (Weber et al. (2000)) propose a Lessons Learned Process in their article. Such activity is also known as Post Project Appraisal (cf. Gulliver (1987)) or Project Post Mortem Review (cf. Collier et al. (1996)). 53 The specialist of MAU who ought to administer MAPP after its implementation has the authorization rights and the necessary knowledge.
The Development of the Mine Action Process Prototype
Page 34 of 116
Technical Context to meet Functionalities regarding Understanding of Mine Action Unit Processes
The visualization of processes and the roles and responsibilities was named the only
functional requirement to improve process understanding.
There are myriads of technical possibilities to visualize processes, starting from basic
drawing programs or even presentation software, e.g. Microsoft PowerPoint, and
ending with highly sophisticated solutions, for example the ARIS Toolset54, which is not
only used to visualize processes, but also to maintain and optimize them.
It was decided to use Microsoft Visio, as it combines powerful visualization techniques
with database functionalities (cf. Eppler (2001): p.2). Moreover, the application is very
easy to learn and to use. Another important advantage is the possibility to implement
Visio files directly into a web-based technology using the Microsoft Visio Viewer55,
which in return also allows the quick editing of files. That way, no extensive knowledge
of HTML is required.
Technical Context to meet Functionalities regarding Systematic Access to Knowledge Objects
It was requested that MAU related knowledge objects could be accessed in a logical
and consistent way. However, even more important was that these objects would be
linked with specific processes.
Hence, it was reasonable to incorporate the knowledge objects directly into the
visualization rather than presenting them separately. Moreover, it was assumed that
the value of the tool would automatically increase, as it would represent a vivid process
documentation. Again, Microsoft Visio was chosen to meet this functional requirement.
54 ARIS (Architecture of Integrated Information Systems) is a method for analyzing processes and taking a holistic view of process design, management, workflow, and application processes. More information is available on the website of the software and consulting company IDS Scheer: http://www.ids-scheer.de 55 The Visio Viewer is a plug-in that has to be installed on every machine to display Visio files directly in the browser interface.
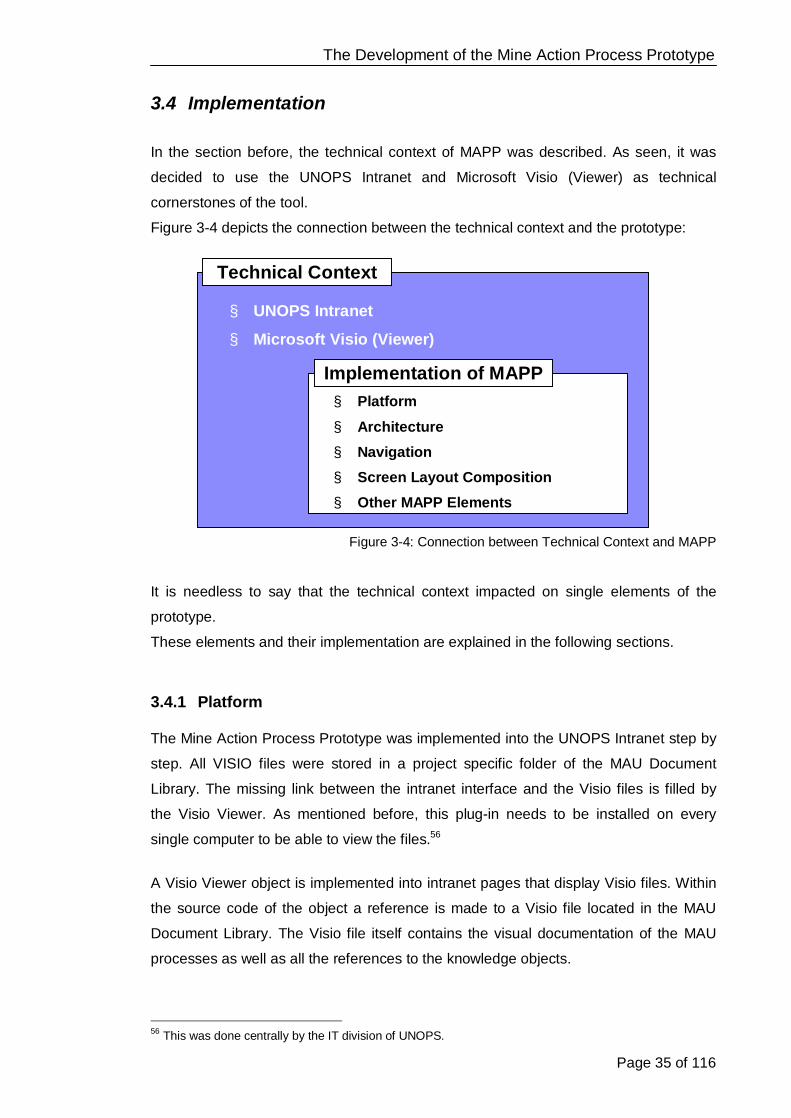
The Development of the Mine Action Process Prototype
Page 35 of 116
3.4 Implementation
In the section before, the technical context of MAPP was described. As seen, it was
decided to use the UNOPS Intranet and Microsoft Visio (Viewer) as technical
cornerstones of the tool.
Figure 3-4 depicts the connection between the technical context and the prototype:
Figure 3-4: Connection between Technical Context and MAPP
It is needless to say that the technical context impacted on single elements of the
prototype.
These elements and their implementation are explained in the following sections.
3.4.1 Platform The Mine Action Process Prototype was implemented into the UNOPS Intranet step by
step. All VISIO files were stored in a project specific folder of the MAU Document
Library. The missing link between the intranet interface and the Visio files is filled by
the Visio Viewer. As mentioned before, this plug-in needs to be installed on every
single computer to be able to view the files.56
A Visio Viewer object is implemented into intranet pages that display Visio files. Within
the source code of the object a reference is made to a Visio file located in the MAU
Document Library. The Visio file itself contains the visual documentation of the MAU
processes as well as all the references to the knowledge objects.
56 This was done centrally by the IT division of UNOPS.
§ UNOPS Intranet
§ Microsoft Visio (Viewer)
Technical Context
§ Platform
§ Architecture § Navigation § Screen Layout Composition § Other MAPP Elements
Implementation of MAPP

The Development of the Mine Action Process Prototype
Page 36 of 116
Figure 3-5 depicts the connection between the browser interface, the Visio Viewer and
the MAU Document Library.
Figure 3-5: Connection between Browser Interface, Visio Viewer and MAU Document Library
To edit a Visio file the user simply has to press the right mouse button when the mouse
pointer is located over the visualization in the browser. The file is opened in Visio and
can directly be edited and saved. The changes become visible as soon as the user
presses the Refresh button of the browser.
Of course, not everyone has the right to edit the content or structure of MAPP.
Sharepoint allows assigning specific rights to users. That way, unauthorized editing of
MAPP is impossible. To date, only the MAU specialist and the development team have
full administration rights.
MAU/Document Library/*.vsd
MAU Document Library
Browser Interface
<…> … .. <…src=“…*.vsd“> <…>
Visio Viewer Object

The Development of the Mine Action Process Prototype
Page 37 of 116
3.4.2 Architecture
MAPP Framework
It goes without saying that it was neither desirable nor practical to present all the
information at once. Therefore, a layer approach as recommended by Eppler (Eppler
(2001): p.2) was considered to be the best solution.
Figure 3-6 depicts the framework of the Mine Action Process Prototype:57
Figure 3-6: Framework of MAPP
Only intranet pages of the 1st and 2nd layer contain a Visio Viewer object, and can thus
display Visio files. Intranet pages of the 3rd layer are directly implemented into
Sharepoint.
The first layer serves as an entrance point to the tool. It gives the user, in this case
MAU HQ and field staff but also all other UNOPS staff, a rough overview of MAU
processes. From here, the user has the free choice to go directly to the process he
wants to see in detail.
He clicks on a process and is taken to the second layer which gives a detailed view
comprised of the single process steps and the main parties involved in a MAU project.
The target audience is the same here as for the first layer. On the second layer,
symbols indicate whether there is additional documentation or supplemental
information available for single process steps. If so, the user can click on the symbol to
get to the third layer, which is an explanation or reference page for the corresponding
process step.
This page contains detailed process information and/or documentation, and is thus for
MAU HQ and field staff only.
57 Screenshots of all three layers are available in the back of the thesis (Appendix I).

The Development of the Mine Action Process Prototype
Page 38 of 116
3.4.3 Navigation
MAPP Hierarchy
The knowledge map has a hybrid topology – hierarchical and linear.58 To ease
navigation users can access directly any process of the second level (hierarchical
approach) (red line) from the overview page. Due to the nature of processes a linear
topology (blue line) within the second and third level seemed most appropriate.
However, the user always has the chance to break the linear sequence by going back
to the overview and to drill down again to the desired process.
Figure 3-7: MAPP's Twofold Topology
Sharepoint Navigation
In Sharepoint each intranet page has its own name which is displayed in the navigation
bar on the left side. Since all areas are connected in some way or another they all need
to yield to a descriptive logic.
An example shows the logic that was used for MAPP:
(1st Layer)
Knowledge Enabled MAU Processes à Overview of MAPP
(2nd Layer)
MineAction/2 à Main Process (Operational Management)
MineAction/2/2 à Sub Process (Contracts for Services and Works)
MineAction/2/2 – II à Sub Process continued (Contracts for Services and Works II)
(3rd Layer)
MineAction/2/2a à Process Information (Additional Information for process step
“Evaluation” of process “Contracts for Services and Works”) 58 To read more about topologies, see Brinck et al. (Brinck et al. (2002): pp.146).

The Development of the Mine Action Process Prototype
Page 39 of 116
Next Page: Contracts for Services and Works
Previous Page: Operational Management
Navigation Elements
Navigation elements enable the user to quickly access a website or a tool and to look
for the desired information. They show the user where he can go to and what he can
expect if he follows a link. These elements ought to differ from ordinary content
elements to avoid confusion.
Navigation elements were implemented on all three layers of MAPP.
1st Layer
The 1st layer depicts all main MAU processes which can easily be accessed by
selecting one of them and thus reaching the 2nd layer. The processes are ordered
according to the main phases of the Project Management Life-Cycle, i.e. Project
Planning, Execution and Closure. This overview aims to facilitate the orientation
and the understanding of how these processes are linked with each other.
2nd Layer
On the 2nd layer the user can jump back and forth between the different processes
by clicking on one of the following buttons:
3rd Layer
The 3rd layer provides a number of navigation elements. On the one hand, the
user has the possibility to go back to the 2nd layer by clicking “Back to Process”.
On the other hand, links are provided to navigate back and forth within the 3rd layer,
so that users do not have to go back to the 2nd layer to then again drill down to the
3rd layer ( “Previous Page ()” / “Next Page ()”).
Figure 3-8 shows the navigation elements of the 3rd layer:
Figure 3-8: Navigation Means on 3rd Layer

The Development of the Mine Action Process Prototype
Page 40 of 116
Symbols
Symbols are a very effective way to quickly direct users to the desired information as
long as the meaning associated by the user corresponds with the functionality of the
symbol. The design decisions for certain symbols of MAPP were based on the
anticipated experience of the users especially regarding web technology. However, to
prove the symbols’ unambiguousness they have to be explicitly evaluated by end-
users.
In the following the symbols that are incorporated into MAPP59:
Symbol Meaning Design Decision
Process activity In process documentation a rectangle is most
often used for a process activity.
Other UNOPS
process
The color blue resembles a link in the hypertext world. Since this symbol is in fact a process
(step) a rectangle was chosen.
Process flow An arrow reflects best a direction.
External resource The globe is most often associated with a link, either external or internal
Template or form Most users are familiar with the Folder symbol used primarily in the Windows Explorer.
Further information
The Information symbol is recognized worldwide and tells the viewer that further information can
be obtained here.
Good Practice A star is often associated with something outstanding. The G shall underscore its meaning.
Handbook / Manual
A handbook or manual is often more than a lose collection of pages but in fact a comprehensive
and massive book.
Table 3-1: Symbols used in MAPP
59 Some symbols were taken from the Microsoft Visio Image Library.
PRAC Process
Review comments

The Development of the Mine Action Process Prototype
Page 41 of 116
3.4.4 Screen Layout Composition
Overall presentation
MAPP is optimized for a screen resolution of 1024*768 pixels, so that users can better
grasp the visualized processes and do not have to scroll extensively.
To ease reading, it was agreed to use Arial 10.60 The development team was aware of
the fact that for some users this could cause problems. However, since the Visio
Viewer enables the user to zoom in on MAPP, if for him the text is indeed not legible,
the problem was negligible.
The design decisions, especially for the 1st and 2nd layer of MAPP, were influenced by
one or more gestalt principles, as the mental models of developers and users are
usually different.
In general, attention was paid to clarity, simplicity, and consistency regarding the
design and position of single elements.
Focus and Context
The heart of MAPP is the adequate visualization of MAU processes as it shall both
facilitate process understanding and provide a logical grid to easily access process-
specific knowledge at the same time.
On the second layer, ¾ of the space is allocated for the presentation of the processes
and the main parties involved in MAU projects. And yet, while it might have been
possible to present all processes in-depth, it was neither practical nor useful to do so
due to technical and more over psychological constraints of the users. This was taken
into account and instead, it was agreed to abstract certain process steps, and thus
enhance usability by reducing the complexity following the principle: Keep it simple!
The three parties depicted in MAPP are:
§ UNMAS – United Nations Mine Action Service
§ UNOPS – United Nations Office for Project Services
§ Field – Project Staff in the field
60 Arial is a sans-serif type. It is assumed that it disturbs the user less when reading text on the screen compared to serif type, like Times New Roman.
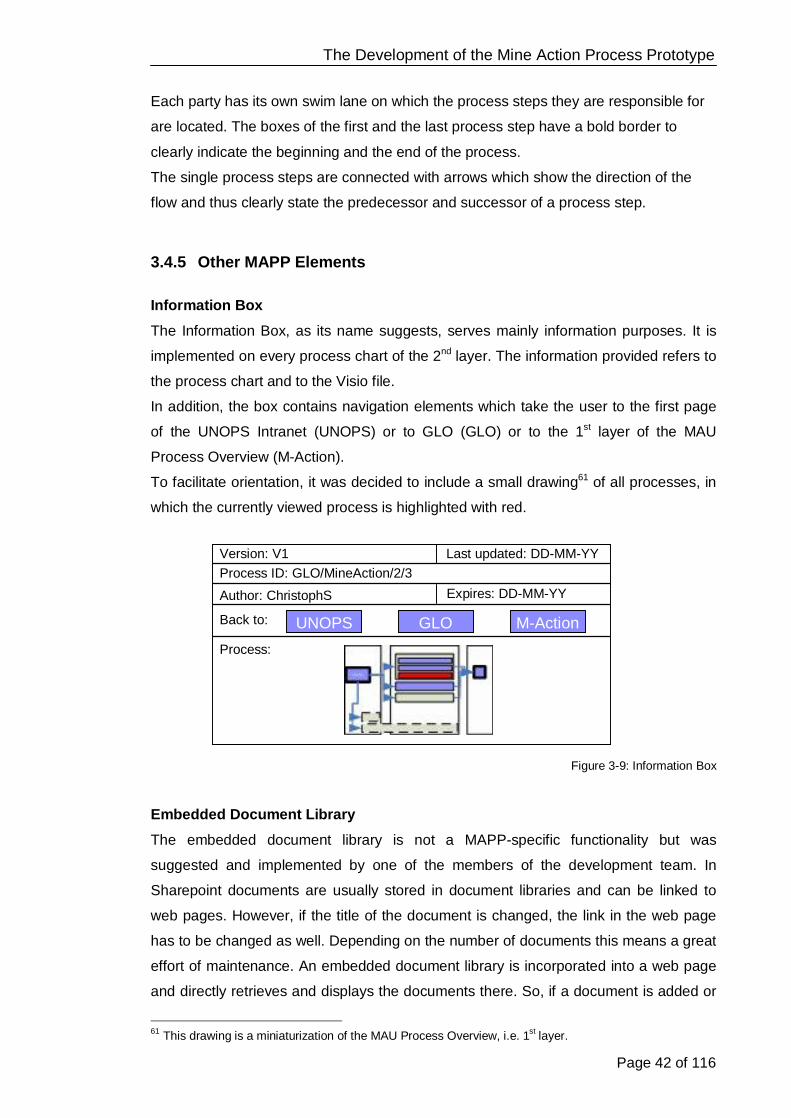
The Development of the Mine Action Process Prototype
Page 42 of 116
Each party has its own swim lane on which the process steps they are responsible for
are located. The boxes of the first and the last process step have a bold border to
clearly indicate the beginning and the end of the process.
The single process steps are connected with arrows which show the direction of the
flow and thus clearly state the predecessor and successor of a process step.
3.4.5 Other MAPP Elements
Information Box
The Information Box, as its name suggests, serves mainly information purposes. It is
implemented on every process chart of the 2nd layer. The information provided refers to
the process chart and to the Visio file.
In addition, the box contains navigation elements which take the user to the first page
of the UNOPS Intranet (UNOPS) or to GLO (GLO) or to the 1st layer of the MAU
Process Overview (M-Action).
To facilitate orientation, it was decided to include a small drawing61 of all processes, in
which the currently viewed process is highlighted with red.
Figure 3-9: Information Box
Embedded Document Library
The embedded document library is not a MAPP-specific functionality but was
suggested and implemented by one of the members of the development team. In
Sharepoint documents are usually stored in document libraries and can be linked to
web pages. However, if the title of the document is changed, the link in the web page
has to be changed as well. Depending on the number of documents this means a great
effort of maintenance. An embedded document library is incorporated into a web page
and directly retrieves and displays the documents there. So, if a document is added or
61 This drawing is a miniaturization of the MAU Process Overview, i.e. 1st layer.
Process:
Back to:
Process ID: GLO/MineAction/2/3 Last updated: DD-MM-YY
Author: ChristophS
Version: V1
Expires: DD-MM-YY
UNOPS GLO M-Action

The Development of the Mine Action Process Prototype
Page 43 of 116
changed in the document library, one does not have to change the link in the web
page.
Figure 3-10 shows an embedded document library (red box) containing various TORs
(Terms of Reference):
Figure 3-10: Embedded Document Library in Process MineAction/2/1/2a
Introduction Page
The Introduction Page ought to give a rough overview of processes, the benefits of the
tool and the used symbols. Intentionally, this page does not contain any specific Mine
Action related content.
As the Introduction Page is not part of MAU processes it was decided to simply put a
link on the web page where the 1st layer of MAPP is displayed.
The Development of the Mine Action Process Prototype
Page 44 of 116
3.4.6 Assessment of the Prototyping Methodology The prototyping methodology proved itself to be a very helpful and practical approach
for the development of MAPP.
The early presentation of first versions of MAPP allowed discussing its design and
content mainly with the specialist of MAU. As an end-user he was able to provide the
development team with valuable critical feedback on the design. At the same time, for
the specialist it was easier to comprehend which knowledge objects were still missing
and should be implemented, too.
Furthermore, it was important to prove the progress of the development, even though
sometimes only minor changes could be reported in the weekly meetings with the
specialist.
One of the later versions of MAPP was also shown during a presentation for the
executive management and other UNOPS divisions and units, even before the tool had
been evaluated. This presentation aimed to serve as a first indicator of preference of
UNOPS staff outside the development team regarding the prototype.
Although the positive aspects of the prototyping methodology predominated, it shall not
be left unmentioned that the numerous iterative steps that needed to be taken were
sometimes rather time-consuming and distracting.

The Development of the Mine Action Process Prototype
Page 45 of 116
3.5 Summary
In this chapter the development of MAPP was explained. It took place according to the
prototyping-oriented life-cycle.
Phases, activities and their results are listed below:
Analysis Stating Business Requirements
Process understanding and knowledge access were identified as areas of
improvement.
Defining Target Audience
The requested tool aims primarily at MAU headquarters and field staff.
Design Listing Functional Requirements
The prototype should guarantee universal access, visualize MAU processes and
provide facilitated access to MAU related knowledge objects.
Setting the Technical Context
The UNOPS Intranet and Microsoft Visio (Viewer) were identified as the
appropriate technical means to meet the functional requirements.
Implementation Carrying out the Implementation
The prototype was implemented as a hypertext-based knowledge application map,
visualizing MAU processes and providing process-specific knowledge objects.
The prototype is based on a three-layer architecture to reduce the cognitive load of
users. The 1st layer gives a quick overview of MAU processes, the 2nd layer
displays the detailed view of a process and stating the roles of the parties involved
in MAU projects, and the 3rd layer offers process-specific knowledge objects.
The design of the mapped processes followed the gestalt principles to increase the
quality of the map, and thus enhance users’ understanding of the prototype and its
content.
Critical Review of the Technical Context
As the technical context of MAPP was predefined a critical review of the deployed
system (UNOPS Intranet) and applications (Microsoft Visio (Viewer)) is reasonable.

The Development of the Mine Action Process Prototype
Page 46 of 116
Their main advantages and disadvantages are mentioned. In addition, gadgets that
were discovered during the implementation and could not be anticipated beforehand
are listed.
Intranet
The UNOPS Intranet can be accessed by every UNOPS employee worldwide and
at any time. Moreover, staff is familiar with this technology and the intranet is widely
accepted as the primary communication and collaboration tool throughout the
organization.
However, while there are no technical constraints in the headquarters, the intranet
may become a bottleneck in the field due to low bandwidth, and could thus hinder
the efficient use of MAPP.
Microsoft Visio (Viewer)
Microsoft Visio proved to be an application that is easy to learn and use, even by
users unfamiliar with the software. A Visio file can be exported into different
formats, among others HTML62, JPG63 and VSD64.
The VSD format was chosen, as the Microsoft Visio Viewer enables the user to
easily view the file in the browser interface and edit it in Visio. This saved the
development team a lot of time (and will probably do so for future users) and is
certainly one of the main advantages of this technology.
However, as always there are disadvantages that should not be underestimated.
The Visio Viewer needs to be installed to view files in the VSD format. While this
was done centrally by the IT at the UNOPS Headquarters in New York, staff in
the field will need to download the plug-in. This is seen as a critical barrier to the
acceptance of the tool.
Furthermore, during the implementation of MAPP a serious technical flaw was
detected.
Links to files of Microsoft applications65 that are created in Visio and shall to open a
new window, will evoke an error. Therefore, files of Microsoft applications are
opened in the same window in which MAPP is presented. This applies only to links
on the second layer. Microsoft files that are linked from the third layer (thus from
Sharepoint) can be opened in a separate window without any problems. As this
approach is not consistent, it is assumed that it will cause irritation among users.
62 Hypertext Markup Language 63 Graphics file type developed by the Joint Photographic Experts Group 64 Visio file extension 65 This is confirmed for Microsoft Word and Excel. This does not apply to other formats, like Adobe Portable Document Format (PDF).

Page 47 of 116
4 The Evaluation of the Mine Action Process Prototype
“A worker may be the hammer's master, but the hammer still prevails. A tool knows exactly how
it is meant to be handled, while the user of the tool can only have an approximate idea.” (Milan Kundera)
The terms evaluation and testing are similar. However, testing has a more “limited
connotation of determining the correctness of something” (Smith (1991): p.44).
Evaluation however implies some kind of value in addition to correctness. A tool may
function without any technical flaws, but it may not add value to the user if he cannot
use it. Thus, it is important to observe and evaluate how users perform when using a
tool.
In the beginning, a presentation on the methodology Usability Testing is given (Section
4.1). After that, the objectives and the target audience of the evaluation are identified
(Section 4.2) and the preparatory steps, i.e. compiling task scenarios and designing a
questionnaire, are taken (Section 4.3). Section 4.4 describes how the usability testing
was conducted. A very detailed analysis of the evaluation follows in section 4.5 and
4.6. Based on the results of the tests suggestions for the redesign of the existing
knowledge map are made (Section 4.7).
The fourth chapter concludes with a summary assessing the evaluation and critically
questioning its results.

The Evaluation of the Mine Action Process Prototype
Page 48 of 116
4.1 Methodology Usability Testing
4.1.1 Definition Rubin (Rubin (1994): p.25) defines usability testing as a “process that employs
participants who are representative of the target population to evaluate the degree to
which a product meets specific usability criteria”. Most often, these representatives are
asked to perform real tasks using the product. This approach seems logical considering
the definition of usability given by Bevan and Macleod (cf. Bevan/Macleod (1994):
p.133): Usability can be defined as “quality of use in context”. During the test
participants are closely watched by a test team which records their actions and
comments with video, screen cam or by taking notes.
The data collected during the usability testing can be divided into two categories (Rubin
(1994): p156):
Performance Data
This consists of objective measures of behavior, such as error rates and time
measures. This type of data can be gathered during the live test or the review of the
videotape after the test. The time required to complete a task can be an example of a
performance measure. Performance data can be used to suggest specific amendments
to increase the usability of a tool.
Preference Data
This is comprised of subjective data that measures a participant’s feelings or opinions
concerning the product and as such is usually qualitative. It is typically collected via
written, oral, or even online questionnaires or through a debriefing session after the
test. A rating scale that measures how a participant feels about the product is an
example of a preference measure. In addition, users’ comments expressed during the
testing can also be very enlightening.
For a long time, people believed that usability testing could only be conducted in a fully
equipped usability laboratory, and hence only with great effort and sufficient resources.
In the late 80s/early 90s this belief eroded slowly given the improvement and
omnipresence of technical equipment, like personal computers, video recording,
software etc.
In 1989 Nielsen (cf. Nielsen (1989)) proposed the method “Usability testing at a
Discount”, which among other things include the transfer of the testing from a

The Evaluation of the Mine Action Process Prototype
Page 49 of 116
laboratory to the users’ workplace. As a result, this approach led to the misconception
that this method could be successfully deployed by just about anyone at any time66.
However, testing does require at least some expertise and knowledge about the single
process steps to obtain valid and reliable data and avoid any pitfalls.
4.1.2 Test Methods There are various test methods that can be applied during usability testing, for example
benchmark tests, group discussion, retrospective testing, thinking aloud method or
questionnaires. The two last mentioned methods are the most common and will be
described in detail in the following.
Thinking Aloud
In most cases, the thinking-aloud method is used in conjunction with usability testing to
obtain data about users’ cognitive processes (Someren et al. (1994): p.37). Since sole
observation and interpretation are prone to errors test subjects are asked to speak their
mind and express any confusion, frustration or even delight while solving a problem.
Ideally, the thinking aloud method does not interfere with the thought process as the
testers do not have to interpret their thoughts nor are participants “required to bring
them into predefined form as in structured techniques”. (ibid: p.25f)
However, this method also poses problems which must not be underestimated. For
some people the technique is rather unnatural and distracts them from solving a
problem (cf. Rubin (1994): p.218).67
Furthermore, not everyone is capable of verbalizing one’s thought appropriately or is
willing to reveal one’s problem-solving behavior by thinking aloud. This might be
especially true for experts who are acting by routine or who do not wish to show how
they handle challenges (cf. Someren et al. (1994): pp.34).
Questionnaires
Questionnaires can be divided into pretest and posttest questionnaires. Since a pretest
questionnaire was not practicable for this work, only posttest questionnaires will be
discussed in the following.68
66 Krug (Krug (2000)), for example, suggests to the reader that usability testing is very easy and that anyone can be a facilitator. 67 To overcome the barrier of verbalizing one’s thought it may be meaningful to let two participants conduct
the evaluation because their conversation can reveal interesting facts. For further information, see Dumas/Redish (cf. Dumas/Redish (1999): p.31) or Rubin (cf. Rubin (1994): p.240).
68 To read more about pretest questionnaires, see Rubin ((Rubin (1994): pp.171).

The Evaluation of the Mine Action Process Prototype
Page 50 of 116
To obtain preference data, i.e. participants’ perceptions, opinions, and judgments, it is
commonplace to use posttest questionnaires. As its name suggests, this kind of
questionnaire is deployed after the tests. Posttest questionnaires can differ in terms of
content and format. However all questionnaires should be short, easy to comprehend
and unambiguous. Also, non-relevant questions or questions that could better be
answered by observation ought to be omitted.
Since composing a valid and reliable questionnaire is a science in itself it is suggested
adapting standardized and widely acknowledged questionnaires (cf. Hegner (2001):
p.55). The most known ones are: SUMMI69, QUIS70, USE71, and WAMMI72.
It would exceed the limits of this thesis to cover all these questionnaires in detail. Since
USE73 and WAMMI74 questionnaires seemed to be the most applicable and were
available, they were slightly adapted and then used in the evaluation.
The two questionnaires cover the following dimensions:75
USE WAMMI
Usefulness Controllability
Ease of use Efficiency
Ease of learning Helpfulness
Satisfaction Learnability
Global Usability
Table 4-1: Dimensions of USE and WAMMI Questionnaires
As mentioned, it is strongly recommended that these standard questionnaires be
adapted and include additional dimensions and appropriate statements for one’s own
purpose.
To assess the opinions and judgments of participants regarding the aforementioned
dimensions it has become good practice to use rating scales76.
69 http://sumi.ucc.ie/ 70 http://lap.umd.edu/QUIS/ 71 http://www.stcsig.org/usability/newsletter/0110_measuring_with_use.html 72 http://www.ucc.ie/hfrg/questionnaires/wammi/ 73 Usefulness, Satisfaction and Ease of use 74 Web site Analysis and Measurement Inventory 75 As can be seen, the questionnaires partially draw on the usability attributes proposed by Nielsen (cf.
section 2.3). 76 Rating scales comprise continuums of numbered categories, ranging for example from „strongly agree“
to „strongly disagree“. These scales usually test one of the following dimensions: frequency, intensity or evaluation. Besides, there are the following formats: Semantic Differentials, Fill-In Questions, Check-Box Questions, Branching Questions (cf. Rubin (1994): pp.203)
The Evaluation of the Mine Action Process Prototype
Page 51 of 116
However, among scholars as well as practitioners, there is an ongoing debate about
using even or odd scales in questionnaires.
Advocates of odd scales (scales with a neutral middle) argue that respondents should
be given the option to answer by neither agreeing nor disagreeing, thus selecting a
neutral item. However, the presence of a neutral middle can lead to the phenomenon
that respondents tend to take the middle option, which has not much value for the
evaluation.
A scale with even points resolves this dilemma, but then respondents face a different
obstacle in the form of being forced to make a decision. In the worst case, this could
lead to randomly given answers which mainly circle around the middle but which in fact
do not represent the respondent’s opinion. Subjects make a choice for either side only
because they are forced to. This may especially be true of four-point scales, in which
the meanings of the single steps are relatively far away from each other.
4.1.3 The Usability Testing Process The phases of the usability testing process resemble the ones of the software
development life-cycle.
Analysis
Clarifying the Purpose of the Usability Testing
In this step the objectives of the testing are identified. Since usability testing is a
method of usability evaluation, it automatically inherits its set of objectives.
Identifying the Target Audience
Nielsen (Nielsen (1993): p.175) suggests that the participants of the usability testing
represent the future audience of the product. Finding representative users can be a
very daunting task, especially if the tool is planned for an external audience. If the tool
is developed for users within a clearly defined group, such as an internal audience of
an organization, it may be more challenging to convince them to sacrifice their valuable
time for the usability testing. Fortunately, to obtain reliable test results, only a handful of
participants are needed (ibid: p.174).
Design
Task Scenarios

The Evaluation of the Mine Action Process Prototype
Page 52 of 116
Dumas and Redish (Dumas/Redish (1999): p.160) argue that the “most important
criterion for selecting tasks is to use tasks that probe the potential usability problems
with the product”. Besides that, it is meaningful to include tasks that are representative
of realistic application, i.e. tasks that end-users will most likely perform with the tool
after its implementation.
The tasks can be process-based or results-based depending on the context and
especially on the expertise of the participants. Process-based means that participants
are given detailed instructions on how to perform the task, while results-based tasks
set a goal for which participants have to find their own way to achieve.
Usually, single tasks are combined to scenarios. In this work, only task scenarios were
relevant and deployed.77
This type of scenario consists of tasks which shall help to evaluate technical aspects of
the system. It is important that scenarios are practical and meaningful to the
participants. Furthermore it is recommended that scenarios are presented in a logical
order and that their feasibility is assured by conducting a pretest. (DA Tech (2001))
Questionnaires
As pointed out in section 4.1.2, it is recommended adapting standard questionnaires to
one’s needs and context. It may be meaningful not only to assess usability attributes
but also the value of the tool. Moreover, a decision regarding the questionnaire format
has to be made.
Conducting the usability testing
Pretest
Nielsen urges experimenters to conduct a pretest to reveal incomprehensibility of
tasks, questionnaires etc. (cf. Nielsen (1993): pp.174). Often, it is uncovered that tasks
are too long or too complicated. .
Actual test run
Preparation
In this phase the facilitator sets up the equipment and double checks the proper
functionality. He should also make sure that all supplementary material is at hand.
Introduction
77 To read more about Use Scenarios and Context Scenarios, see DA Tech (2001)

The Evaluation of the Mine Action Process Prototype
Page 53 of 116
The facilitator welcomes the participant and explains the objective of the test and
presents the roadmap of the session. He also introduces the deployed
methodologies and the means of gathering data.
Conduct
All actions and remarks of participants are recorded, depending on the
resources available, either with video cameras, microphone, screen cam etc.
If practicable, short interviews are conducted after the completion of a scenario. At
the end, the participants are asked to fill out a posttest questionnaire.
Debriefing
After the testing, the facilitator might want to interview the participant to verify
his observations and ask explicitly about problems that were encountered.
Analysis
The data gathered is analyzed and interpreted according to the predefined measures.
The performance data obtained during the observation of participants accomplishing
the task scenarios is primarily used to make suggestions for a redesign of the tool.
The preference data gathered with questionnaires sheds light on users’ attitude
towards the tool and may support or contradict the observations made during the tests.
Moreover, the questionnaire can help to assess the value of a tool.
4.1.4 The Suitability of Usability Testing Methodology The development team of the Mine Action Process Prototype possessed extensive
knowledge about usability. Thus, it could be argued that by indirectly applying
heuristics and guidelines during the development the number of usability glitches had
been minimized. However, as Lindgaard (Lindgaard (1994): p.41) points out
“developers often fail to realize that they themselves are not ‘typical’ end users’” due to
their experience and expertise.
Given the nature of the project a specialist from MAU was involved from the beginning
to provide the team primarily with input on knowledge objects but also on design
issues. Thus, it could be argued that a formative evaluation took place during the
development. However, it could not be ruled out that he was biased in favor of the tool
due to his heavy involvement. Because of these two predominant facts, it was
meaningful to conduct a summative evaluation after the implementation of the
prototype.
The Evaluation of the Mine Action Process Prototype
Page 54 of 116
It was agreed that a user oriented method should be deployed to reveal usability flaws
and to elicit users’ attitude towards MAPP. Moreover, it was interesting to find out how
users would react to the rather novel approach of visualizing processes at UNOPS.
Since these objectives involved the collection of performance and preference data, the
usability testing method in combination with the thinking aloud method and a
questionnaire seemed the most appropriate.
In accordance with Nielsen’s proposed discount usability testing method the author of
this thesis conducted the evaluation of MAPP.
Its practical implementation at the United Nations Office for Project Services is
explained in the following sections. The structure follows hereby the steps of the
usability testing process as described in section 4.1.4.
4.2 Analysis For every successful usability evaluation it is essential to first define the objectives and
target audience.
4.2.1 Objectives The usability testing pursued a threefold objective:
1. Revealing Usability Deficiencies
The primary objective of any usability testing is to “identify and rectify usability
deficiencies” (Rubin (1994): p.26).
The results ought to provide the essential data needed to further improve MAPP’s
effectiveness and efficiency, and thereby users’ satisfaction.
2. Assessing the Attainment of MAPP Objectives
MAPP shall enhance process understanding and facilitate knowledge access.
The evaluation sought to find out whether these objectives were achieved by the
implementation of the prototype.
3. Assessing Potential Benefits for other UNOPS Divisions and Units
It was assumed that the prototype could also be valuable to other UNOPS divisions
or units. For verification, this objective was included in the evaluation.

The Evaluation of the Mine Action Process Prototype
Page 55 of 116
4.2.2 Target Audience The sample of a usability testing is usually derived from the target audience of the tool.
In this case, it would usually have been both Mine Action Unit staff from Headquarters
and the field (cf. section 3.2.3). However, due to scarce resources in terms of time and
technical matters it was not feasible to conduct the usability tests within the field.
Therefore, it was agreed upon the participation of four members of MAU HQ.
In addition, six non-MAU members were asked to participate in the evaluation, both to
reveal usability problems and to assess potential benefits for their division or unit.
The four participants from MAU were chosen by the head of the unit. The six
participants of non-MAU staff were chosen to assess potential impact on their division
or unit’s business in the case of implementation of such prototype. Participant’s
availability and interest in the project was also taken into account.
4.3 Design To obtain performance and preference data, and thus to assess the aforementioned
objectives of the evaluation, various task scenarios were compiled as well as a
questionnaire. Their design is explained in the following two sections.
4.3.1 Task Scenarios The tasks that participants of a usability testing are asked to perform are normally akin
to the tasks that future users shall accomplish with the help of the tool (cf. Rubin
(1994): p.179).
Therefore, task scenarios appeared best suited to collect data to reveal usability
deficiencies and to assess the attainment of MAPP objectives.
As pointed out in section 3.2.1, MAPP shall enable MAU staff to access knowledge
objects in an effective and efficient manner and shall provide process transparency to
mainly MAU staff but also to non-MAU staff.
Logically, the core of the tasks dealt with finding k-objects related to the work of the
Mine Action Unit. At the same time, participants were asked to answer questions
regarding MAU processes.
Not all content in every process had been elaborated in detail at the time of the
usability tests. Therefore, scenarios only for the following processes were composed:
The Evaluation of the Mine Action Process Prototype
Page 56 of 116
§ MAU Process Overview
§ Project Formulation
§ Operational Management - International Project Personnel
- National Project Personnel
- Contracts for Services and Works
- Procurement of Goods The tasks were designed in a process oriented manner, from the MAU Process
Overview to the Procurement of Goods in a MAU project. This approach should
facilitate the completion of the tasks by giving structural guidance.
Since both MAU staff and non-MAU staff was chosen to be among the test group it was
important that members of the latter group could perform the tasks without having
profound knowledge of MAU processes. Thus only process-based tasks were included
in the scenarios, for example more detailed instructions were given.
To ensure their general practicability the expert of the Mine Action Unit was asked to
assess the tasks beforehand. In addition, the pretest (cf. section 4.4.1) was carried out
by an employee of another UNOPS division to ensure feasibility, particularly for non-
MAU staff.
The primary goal of usability testing is to reveal usability deficiencies. As stated before,
a usability problem impedes the effective and efficient use of a product. In section 2.3,
effectiveness is defined as “the accuracy and completeness with which users achieve
specified goals”, whereas efficiency is “the user’s effort to accurately and completely
achieve specified goals”.
Unfortunately, “accuracy” is relative, as is “effort to accurately achieve something”, and
thus both are difficult to measure.
Therefore, in addition to the observations made by the facilitator during the testing the
following absolute performance measures were recorded in a test plan:
RTC – Required Time to Complete
SCC – Successful Completion Criteria
Scale of Completion: s – successful; p – partially completed; f – failed These measures aimed to reveal whether or not participants could use the tool
effectively and efficiently. Based on the results, suggestions for a partial redesign of
MAPP ought to be made.
The Evaluation of the Mine Action Process Prototype
Page 57 of 116
4.3.2 Questionnaire To find out about participants’ feelings, opinions and attitude towards the tested
prototype a questionnaire78 was designed.79 That way, information to assess the
attainment of MAPP and to assess the potential benefit for other UNOPS divisions and
units ought to be collected.
The questionnaire comprised closed-ended questions80 but always gave respondents
the ability to underpin their answers with examples or explain them in more detail by
additional comments.
In the formulation process of the questions, attention was paid to simplicity, clarity and
neutrality of the statements.81 Leading questions were avoided.
The questionnaire consisted of four parts:
Part I: Usage of and Attitude towards the UNOPS Intranet
Part II: Attitude towards Mine Action Process Prototype
Part III: Attainment of MAPP objectives and Benefit for other UNOPS
Divisions and Units
Part IV: General Questions
The aim of the first part of the questionnaire was to find out about participants’ habits
regarding the UNOPS Intranet and their attitude towards it. Because the prototype is
entirely intranet based, a certain correlation between users’ attitude towards the
intranet and their attitude towards the tool was anticipated. Questions were therefore
developed to assess this. It was also important to discover how participants would rate
their familiarity of processes.
The second part asked about users’ attitudes towards the Mine Action Process
Prototype. As mentioned in section 4.1.2 USE and WAMMI questionnaires were
deployed, although slightly adapted or extended according to circumstance.
Attractiveness82
An attractive site/tool is visually pleasant, and also interests users, whether through
functionality, content or both. 78 This questionnaire is in fact a posttest questionnaire. For simplicity’s sake it is referred to as questionnaire from this point on in the thesis. 79 The questionnaire can be found in the appendix (cf. Appendix II) 80 Actually, most questions were statements that had to be rated. Here, for simplicity’s sake questions and
statements are used in the same sense. 81 Atteslander (Atteslander (1995): pp. 192) lists several rules of thumb for composing questionnaires. 82 This dimension is originally neither part of USE nor WAMMI questionnaire but was included by the
author to consider Joy of Use (cf. Schweibenz/Thissen (2003): p.28).

The Evaluation of the Mine Action Process Prototype
Page 58 of 116
Ease of Navigation
If a site/tool scores well on controllability the users probably feel they can navigate
around it with ease. Poor scoring usually means a poorly organized site.
Usefulness / Helpfulness
A site/tool scoring high on Helpfulness corresponds with user expectations about
content and structure. A site low on Helpfulness can be misleading about its content.
Ease of Learning
When Learnability is high, users feel they are able to start using the site/tool with
minimum introduction. Everything is easy to understand from the start. When
Learnability is low, users feel that the site/tool may be using unfamiliar concepts or
terminology. Here, more explanations are needed.
Ease of Use
High scores suggest that the site/tool has an understandable organization and users do
not need extensive training sessions. This indicator correlates with Ease of Learning.
Satisfaction
Satisfaction is mainly driven by Ease of Use and Usefulness. However, in the end all
aforementioned areas add to a certain extent to the user’s satisfaction.
The third part sought to find out whether or not effective and efficient knowledge
access and provision of process transparency could be achieved with the help of the
implemented prototype. Apart from that, it aimed to assess the benefit for other
UNOPS divisions and units.
Hence, the third part was split into three sections:
Attainment of MAPP Objectives (MAU and non-MAU)
The level of users’ agreement in this domain judges the ability of the prototype to
provide process transparency to both MAU and non-MAU staff. A high score indicates
a strong ability, whereas a low score equals indicates weak ability.
Attainment of MAPP Objectives (MAU only)
If users rate the tool high in this domain it suggests that the main objectives of MAPP
(effective and efficient access to knowledge objects and process transparency) have
been achieved.
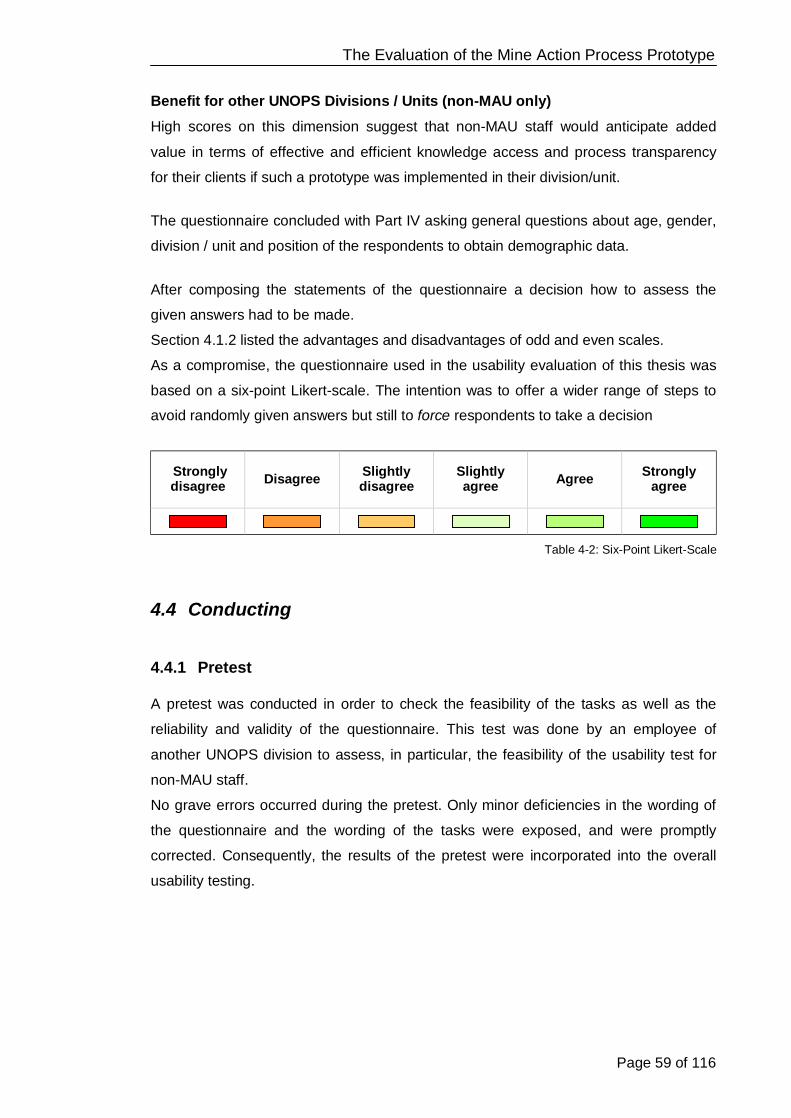
The Evaluation of the Mine Action Process Prototype
Page 59 of 116
Benefit for other UNOPS Divisions / Units (non-MAU only)
High scores on this dimension suggest that non-MAU staff would anticipate added
value in terms of effective and efficient knowledge access and process transparency
for their clients if such a prototype was implemented in their division/unit.
The questionnaire concluded with Part IV asking general questions about age, gender,
division / unit and position of the respondents to obtain demographic data.
After composing the statements of the questionnaire a decision how to assess the
given answers had to be made.
Section 4.1.2 listed the advantages and disadvantages of odd and even scales.
As a compromise, the questionnaire used in the usability evaluation of this thesis was
based on a six-point Likert-scale. The intention was to offer a wider range of steps to
avoid randomly given answers but still to force respondents to take a decision
Strongly disagree Disagree Slightly
disagree Slightly agree Agree Strongly
agree
Table 4-2: Six-Point Likert-Scale
4.4 Conducting
4.4.1 Pretest A pretest was conducted in order to check the feasibility of the tasks as well as the
reliability and validity of the questionnaire. This test was done by an employee of
another UNOPS division to assess, in particular, the feasibility of the usability test for
non-MAU staff.
No grave errors occurred during the pretest. Only minor deficiencies in the wording of
the questionnaire and the wording of the tasks were exposed, and were promptly
corrected. Consequently, the results of the pretest were incorporated into the overall
usability testing.

The Evaluation of the Mine Action Process Prototype
Page 60 of 116
4.4.2 Actual Test Run The usability tests were conducted in two different break-out rooms at UNOPS HQ in
New York over a period of 1 ½ weeks. Sessions were attended by one participant only,
except for one session where participant 7 and 8 conducted the test together.83
Before each usability test started the three following steps were taken:
1. Set up of Test Area
In advance of every session, the facilitator prepared the test area and checked the
full functionality of the equipment, including connection to the UNOPS Intranet, and
proper microphone and screen cam modes.
For all tests the facilitator’s computer was used. The screen resolution was
1024*786 pixels. To capture any screen activity as well as the voice of the tester
the software HyperCam84 was used.
2. Welcoming and Introduction on Usability Testing
As soon as a participant entered the room he was greeted and made comfortable
by creating a relaxed atmosphere. Then, the facilitator gave an introduction on
usability testing, including the used method ‘Thinking Aloud’ generally, the
session’s objective and the particular set-up (screen cam, microphone, and task
scenarios). Furthermore, the facilitator explained that he would take notes and time
measures during the session. It was emphasized that all tests were conducted
anonymously, and names and results would be kept within the confines of the
testing team.
3. Introduction on the Mine Action Process Prototype
After that, the facilitator explained the objectives and concepts of MAPP,
though most participants had attended a presentation about the tool or had
seen it before.
It was stressed that MAPP was a prototype and that the primary purpose of the
session was to reveal weaknesses in the usability. It was also explained that
objectives of the evaluation were to assess the attainment of MAPP objectives and
the benefit of a future implementation in other UNOPS divisions and units.
If there were no questions from the participant the usability test started by handing out
the first scenario. Each scenario was given after the previous one was completed.
83 To ensure the anonymity of the participants, numbers were assigned to them, ranging from 1 to 10. 84 For all tests HyperCam version 2.13.00 was used. Copyright© 1996-2006 Hyperionics Technology LLC. (http://www.hyperionics.com/)
The Evaluation of the Mine Action Process Prototype
Page 61 of 116
During the testing the facilitator jotted any relevant observations, both positive and
negative.
If a participant struggled or did not say anything for some time the facilitator
encouraged them to speak his mind. Importantly there was no time limit. Rather, the
users themselves could decide when to move on to the next task. If appropriate, the facilitator asked specifically about the problems that the participant
had faced after the completion of a scenario.85
After the usability test each participant was asked to fill out a questionnaire assessing
his attitude towards MAPP and validating the performance data. The questionnaire had
been implemented on the UNOPS Intranet.
If appropriate, short, non-standard interviews were conducted where the facilitator
asked about the testing and the participant’s opinion about MAPP before a session
ended. In the interviews with non-MAU staff a special focus was also on the
assessment of the potential benefit of an implementation for their specific division or
unit. Their answers are incorporated into the following sections.
4.5 Analysis of Task Scenario Results and Interpretation The results delivered by the usability tests can be divided into scenario specific and
non-scenario specific results. Scenario specific results are bound to one scenario. Non-
scenario specific results are general observations of the facilitator triggered by
incidents which occurred during the performance of one of the six scenarios but which
could have happened in any of them. To avoid that any conclusions could be drawn about the gender of the participants and
which could therefore endanger their anonymity, no distinction is made between male
and female users in the following. For statistical purposes the author decided to include the mean time, median time and
the standard deviation (SD) of each scenario. In certain cases, the median time proved
itself to be more appropriate as it ignores outliers. To calculate the mean time:
tsParticipan of NumberTimes Completion ts'Participan Allof SumTime Mean = 86
Formula 4-1: Calculation of Mean Time 85 This can be seen as a combined approach of Thinking aloud and retrospection, as suggested by
Someren et al. (Someren et al. (1994): p.26). 86 cf. Jeffrey Rubin pp. 260

The Evaluation of the Mine Action Process Prototype
Page 62 of 116
To calculate the median time:
The results are listed in ascending order. The result positioned exactly in the middle of
the list is the median time.
To calculate the standard deviation:
( )
1
22
−
−=
∑ ∑
nnx
xSD
Formula 4-2: Calculation of Standard Deviation
The structure of the following sections is as follows:
a) Main Objectives
The main objectives of the scenario are explained.87
b) Presentation of the scenario
The scenario is presented in its original wording.
c) Successful completion criteria
The steps that have to be taken to successfully accomplish the scenario are
listed.
d) Presentation of time measures
A table comprises the time participants required to complete the tasks. Also,
the mean time, median time and standard deviation are listed to compare the
measures.
e) Analysis and interpretation of results Based on the observation and remarks made by participants the results are
analyzed and the interpreted.
4.5.1 Scenario 1 a) Main Objectives The first task aimed to reveal whether participants could find the Introduction Page.
It could not be assumed that this was always easily discernible. Since the
Introduction Page is opened in a new window participants could find it difficult to
return to the prototype
87 Each scenario had specific objectives besides the overall objectives of performing task scenarios as stated in section 4.3.1.
Sum of the squares of each completion time Sum of all completion times Total number of completion times
∑x2 = ∑x =
n =

The Evaluation of the Mine Action Process Prototype
Page 63 of 116
Moreover, it needed to be investigated whether the symbols used in the prototype
were clear to users. They were originally developed based on the mental model
of the development team.
b) Presentation of the Scenario
You are on the first page of the Mine Action Process Prototype which shows you an
overview of its processes.
Before you start, please inform yourself about processes in general and get some
information about the symbols used in the prototype!
Please comment, if the Introduction Page helps you to understand processes in
general and the symbols used in the prototype in particular! Are all symbols
unambiguous?
Returning to the overview, please take a look at the ‘Landmine Safety Training
Handbook’ which is part of the Mine Action Technical Documentation (just open the
document)! c) Successful Completion Criteria
Click on ‘To learn more about processes and the used symbols in the chart please
consult this page’.
Comment on content of Introduction Page and if all symbols are unambiguous.
Close window of ‘Introduction Page’ to return to overview.
Click on in box ‘Mine Action Policies and Technical Documents’.
Click on ‘Landmine Safety Training Handbook’. d) Presentation of Time Measures
MAU staff Non-MAU staff
User 2 3 5 6 1 4 7/8 9 10
RTC 5,32 6,32 10,30 (p) 12,57 6,44 8,38 10,02 6,35 5,06
Mean Time 8,04
Median Time 6,44
SD 2,59
RTC = Required Time for Completion; SD = Standard Deviation; Scale of Completion: p – partially completed;
Table 4-3: Scenario 1 - Time Measures

The Evaluation of the Mine Action Process Prototype
Page 64 of 116
e) Analysis and Interpretation of Results
The first part of the first task scenario was to find the Introduction Page which ought to
help the users familiarize themselves with the symbols used in the prototype and give
them information about the objectives of MAPP and processes.
To simplify the user’s start the test facilitator left the link to the Introduction Page
visible, rather than focusing the screen on the tool only. However, all participants
turned their attention immediately towards the prototype searching for the link to the
Introduction Page within the tool.
All but one participant recovered from their initial disorientation and found the
Introduction Page. The participant who had the most difficulty with this task simply
moved on to the next task. All participants mentioned that the link should be
emphasized so that it would catch the user’s attention immediately.
The brief introduction about processes was generally sufficient for the users. One
participant commented that it would be better to emphasize benefits of such a tool to a
division, unit or even an individual, rather than generalizing them for whole UNOPS.
While there was wide agreement about the helpfulness of the information provided on
the Introduction Page, users had varying opinions about the symbols’ clarity.
Two participants commented that it was possible to mix up the Folder and Handbook
symbol when using MAPP. Two other users were confused by the Globe symbol, which
they thought could also be associated with UNOPS external links.
Another pitfall was the symbol that links to other UNOPS processes. One participant
thought that this symbol would lead him exclusively to the PRAC88 process because of
how it was labeled. This user and another participant observed that the color of this
symbol varied only slightly from the one used for the blue boxes in the prototype and
that the borderline was bold instead of normal. The Good Practice symbol was well
received; only one participant commented that he would never have associated a star
with good practices. Another participant asked whether or not these included Good
Practices from other organizations, too.
The symbols clear to all participants were the Process Activity symbol, the Arrow and
the Information symbol.
88 Procurement Review and Approval Committee

The Evaluation of the Mine Action Process Prototype
Page 65 of 116
Returning to MAPP caused some confusion. A few users were surprised that there was
no link back to the tool or they could not click the browser’s back-button because the
Introduction Page had been opened in a new window.
No user had particular difficulties finding the ‘Landmine Safety Training Handbook’.
4.5.2 Scenario 2 a) Main Objectives Do participants have problems accessing the second layer?
Do participants recognize the beginning and the end of a process?
Do participants understand the concept of the swim lanes?
b) Presentation of the Scenario
A Mine Action Unit project begins.
Please inform yourself about how a project is formulated! Please tell the observer,
who formulates a project!
After that, please take a look at the Project Acceptance Procedure. What marks
the end of the Project Planning and Initiation Phase? c) Successful Completion Criteria
Click on process step ‘Project Formulation’.
Click on in process step ‘Project Formulation’.
Tell the observer who formulates a project.
Click on ‘Initiation of Project Acceptance Procedure’.
Tell the observer what marks the end of this process. d) Presentation of Time Measures
MAU staff Non-MAU staff
User 2 3 5 6 1 4 7/8 9 10
RTC 4,55(p) 4,37(p) 4,10(p) 10,40(p) 4,19 1,57 7,31 1,41 6,08
Mean Time 5,51
Median Time 4,37
SD 2,79
RTC = Required Time for Completion; SD = Standard Deviation; Scale of Completion: p – partially completed;
Table 4-4: Scenario 2 - Time Measures

The Evaluation of the Mine Action Process Prototype
Page 66 of 116
e) Analysis and Interpretation of Results
All participants associated the symbol in the process step ‘Project Formulation’
correctly with the possibility to obtain more information about this process step.
Interestingly, none of the MAU staff recognized the swim lanes as different parties
involved in a Mine Action project. Of course, MAU participants knew that UNMAS
formulates projects from prior knowledge.89 However, non-MAU participants had no
problems to associate the swim lanes with the different parties.
Interestingly, though MAU participants knew that UNMAS formulates projects from prior
knowledge, none recognized the swim lanes as representing the different parties
involved in a Mine Action project.
Non-MAU participants however, had no problems associating the swim lanes with the
different parties, and thus discovered that UNMAS formulates projects.
None of the participants had a problem finding the ‘Project Acceptance Procedure’. But
again, about half of them encountered difficulties finding their way back to MAPP,
because the ‘Project Acceptance Procedure’ was opened in a new window.
All participants recognized the process step ‘Signature of UNOPS’ as the end of the
process ‘Project Formulation’.
4.5.3 Scenario 3 a) Main Objectives Are participants able to access different kinds of knowledge objects?
Do they correctly apply their knowledge in context? (Associate the correct symbol
with a particular knowledge object)
b) Presentation of the Scenario
You would like to hire international ALD staff for a new project.
To do so you have to set up a personnel work plan (just open the document).
After that, please download the ‘Vacancy Announcement Form’ and find out where
you could publish it!
After selecting a candidate you have to send the contract to the HR Division.
Please look, which documentation is needed for that step and who the HR Focal
Point of GLO is.
89 The facilitator explicitly asked the users how they had gained that knowledge and whether it could be seen in the tool.

The Evaluation of the Mine Action Process Prototype
Page 67 of 116
c) Successful Completion Criteria Go to ‘Operational Management’ à ‘Project Personnel’ à ‘International’ or
return to overview, then click on ‘Project Personnel’ à ‘International’.
Click on in process step ‘PMO develops a personnel work plan for
international staff’.
Click on in process step ‘PMO/TA advertise vacancy’.
Click on in process step ‘PMO/TA advertise vacancy’.
Click on or in process step ‘PMO coordinates with Division Focal Point
of DHRM: Fee, Hiring Process, and Contract Administration’.
Either, click on HR Focal Points on the same page or return to process
‘International Project Personnel’ and click on in process step ‘PMO
coordinates with Division Focal Point of DHRM: Fee, Hiring Process, and
Contract Administration’.
d) Presentation of time Measures
MAU staff Non-MAU staff
User 2 3 5 6 1 4 7/8 9 10
RTC 5,42 2,36 8,58 5,57 7,14 6,26 6,23 7,55 (p) 6,45
Mean Time 6,40
Median Time 6,26
SD 1,74
RTC = Required Time for Completion; SD = Standard Deviation; Scale of Completion: p – partially completed;
Table 4-5: Scenario 3 - Time Measures
e) Analysis and Interpretation of Results
The tasks of the third scenario did not cause problems due to the keywords used and
the experience gained from the first two scenarios.
Still, it became clear that users were just browsing the content, rather than reading it.
For example, two participants clicked on the wrong Globe symbol, which led them to
the contacts of MAU staff instead of to the HR Focal Points.
One participant left MAPP to find information about where to publish a vacancy
announcement in the general HR Recruitment Process. This could be attributed to their
position as a member of the Human Resources division.
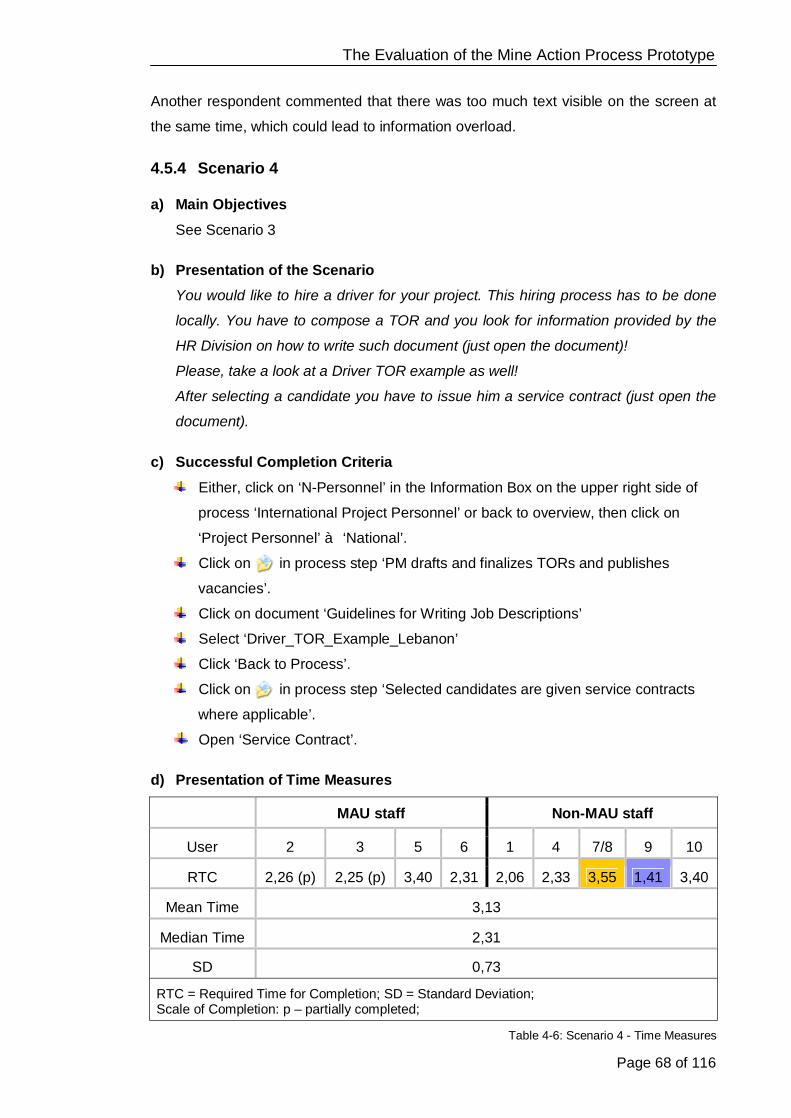
The Evaluation of the Mine Action Process Prototype
Page 68 of 116
Another respondent commented that there was too much text visible on the screen at
the same time, which could lead to information overload.
4.5.4 Scenario 4 a) Main Objectives
See Scenario 3 b) Presentation of the Scenario
You would like to hire a driver for your project. This hiring process has to be done
locally. You have to compose a TOR and you look for information provided by the
HR Division on how to write such document (just open the document)!
Please, take a look at a Driver TOR example as well!
After selecting a candidate you have to issue him a service contract (just open the
document). c) Successful Completion Criteria
Either, click on ‘N-Personnel’ in the Information Box on the upper right side of
process ‘International Project Personnel’ or back to overview, then click on
‘Project Personnel’ à ‘National’.
Click on in process step ‘PM drafts and finalizes TORs and publishes
vacancies’.
Click on document ‘Guidelines for Writing Job Descriptions’
Select ‘Driver_TOR_Example_Lebanon’
Click ‘Back to Process’.
Click on in process step ‘Selected candidates are given service contracts
where applicable’.
Open ‘Service Contract’. d) Presentation of Time Measures
MAU staff Non-MAU staff
User 2 3 5 6 1 4 7/8 9 10
RTC 2,26 (p) 2,25 (p) 3,40 2,31 2,06 2,33 3,55 1,41 3,40
Mean Time 3,13
Median Time 2,31
SD 0,73
RTC = Required Time for Completion; SD = Standard Deviation; Scale of Completion: p – partially completed;
Table 4-6: Scenario 4 - Time Measures
The Evaluation of the Mine Action Process Prototype
Page 69 of 116
e) Analysis and Interpretation of Results
The time measures of scenario 4 were the only ones which were fairly close together
with a standard deviation of 0,73.
Some participants had trouble finding the document ‘Guidelines for Writing Job
Descriptions’. Indeed two participants failed this task. These users were confused that
a click on the Folder symbol, as well as a click on the Good Practice symbol in the
process step ‘PM drafts and finalizes TORs and publishes vacancies’, led them to the
same page. This page contained both the document and a list of sample TORs from
Lebanon. It became evident that the sheer number of Good Practices caught the users’
attention but distracted them from finding the document asked for in the task.
4.5.5 Scenario 5 a) Main Objectives Do participants understand the meaning of the time measure given for the PRAC
process?
Can participants access other UNOPS processes and return to MAPP?
b) Presentation of the Scenario
UNMAS has identified certain sub-contracts (services) that have to be rendered.
First, consult the general documentation about the Contracting Process (just open
the document)! After qualified vendors have been short listed you have to prepare
a Request for Proposal (just open the document)!
After the evaluation of the received offers, the proposals go to PRAC. Please take
a look at the PRAC process and tell the observer how long the process usually
takes!
After successful negotiations a construction contract (Model Contract for Works) is
issued (just open the document) and an Imprest payment is made (please take a
look at that process). c) Successful Completion Criteria
Click on process ‘Services and Contracts’.
Click on in box ‘View Documentation about the Contracting Process’.
Click on in process step ‘TA/PMO prepare RFP and SOW’.
Click on document ‘Request for Proposal’
Click on ‘Back to Process’.
Click on ‘PRAC Process’.

The Evaluation of the Mine Action Process Prototype
Page 70 of 116
Comment to the observer how long the PRAC Process takes.
Click on ‘Next Page: Contracts for Services and Works II’.
Click on in process step ‘On basis of PRAC’s recommendations PMO
negotiates with the vendor’.
Click on document ‘Model Contract for Works’.
Click ‘Back to Process’.
Click on ‘Imprest Process’. d) Presentation of Time Measures
MAU staff Non-MAU staff
User 2 3 5 6 1 4 7/8 9 10
RTC 6,22 (p) 3,38 6,08 (p) 6,46 4,08 6,28 3,38 5,03 5,02
Mean Time 5,24
Median Time 5,03
SD 1,25
RTC = Required Time for Completion; SD = Standard Deviation; Scale of Completion: p – partially completed;
Table 4-7: Scenario 5 - Time Measures
e) Analysis and Interpretation of Results As the participants moved on with the test they applied knowledge gained about
accessing certain knowledge objects, improving their performance in the first three
tasks of this scenario.
To almost all participants the Time Measure symbol of the PRAC Process was easily
recognizable as the indicator of the duration of the process, even though this symbol
was not shown on the Introduction Page. One participant expressly stated that it would
be valuable to include more time estimates.
The penultimate task of the scenario, finding the document ‘Model Contract for Works’,
caused more of a problem. The wording of the process step (‘negotiates’) did not
reflect its content on the third layer (‘Contract Documentation’). Users were confused
and lost.90 After some confusion, most clicked on the Folder symbol of the correct
process step, as the only likely possibility. Two participants gave up and moved on to
the next task. 90 This seemingly evident problem was neither recognized during the design of the task nor during the
pretest as the facilitator did not pay close attention to the wording of the process and the participant of the pretest found it intuitively.

The Evaluation of the Mine Action Process Prototype
Page 71 of 116
4.5.6 Scenario 6 a) Main Objectives
Do participants recognize links on the third layer?
Are participants able to return to the first layer with only one click?
Which means of navigation do they use to accomplish that? b) Presentation of the Scenario
In the next step you want to procure goods and you have to set up a procurement
plan (just open the document)!
Since some of the goods can be provided by UN member states (in-kind) please
take a look at that process!
Then, you have to set up technical specification and open the document ‘Standard
Equipment Context’! To get additional information, please open the Procurement
Handbook Chapter 9.
Please return directly (one click!) to the overview of the Mine Action Processes (1st
page) from the Process ‘Procurement of Goods’! c) Successful Completion Criteria
Click on process ‘Procurement of Goods’.
Click on in process step ‘During project implementation PM prepares
additional lists for international and local purpose’.
Click on process ‘Differences for in-kind’.
Click on in process step ‘Technical Advisor prepares context’. Open
document ‘Standard Equipment Context’.
Click on ‘Procurement Handbook Chapter 9’.
Return to overview either by clicking on ‘M-Action’ in the Information Box on the
upper right side or using the intranet navigation and selecting ‘Knowledge
Enabled MAU Processes’. d) Presentation of Time Measures
MAU staff Non-MAU staff
User 2 3 5 6 1 4 7/8 9 10
RTC 7,53 (p) 7,12 8,23 (p) 7,39 4,11 (p) 5,10 3,54 5,30 5,22 (p)
Mean Time 6,12
Median Time 5,30
SD 1,66 RTC = Required Time for Completion; SD = Standard Deviation; Scale of Completion: p – partially completed;
Table 4-8: Scenario 6 - Time Measures

The Evaluation of the Mine Action Process Prototype
Page 72 of 116
e) Analysis and Interpretation of Results Finding the document ‘Procurement Plan’ proved most difficult. As in the fifth scenario,
a missing keyword caused the confusion amongst users and impeded efficient access
to the desired knowledge object.
In contrast, users easily found the process for ‘In-kind Goods’, the document ‘Standard
Equipment Context’, and the link to the ‘Procurement Handbook Chapter 9’.
Finally, participants were asked to return to the overview of MAPP with one click. All
users completed this task successfully. Some used the intranet navigation provided on
the left side of the screen, while others clicked on the ‘M-Action’ link in the Information
Box on the upper right side of each process (Layer 2).
4.5.7 Non-Scenario Specific Results Two participants of non-MAU staff criticized MAU specific abbreviations which are
indeed not explained anywhere, e.g. TA = Technical Adviser, PMO – Portfolio
Manager, etc. Others did not really pay attention to it, as it was not absolutely
necessary to know them to perform the tasks.
MAPP is based on intranet technology, yet there is no need to use the navigation of the
intranet to find your way around. However, the usability tests showed that only few
participants really used the navigation of the prototype. Instead, most of them used the
browser’s Back and Forth button or the navigation provided by the intranet on the left
side.
Very few participants used the breadcrumb navigation that is provided in the
Information Box. Half of the users did not even realize that it served navigation
purposes until they were almost forced to use it in scenario 6.
One participant mentioned that the box looked overloaded and that not all information
displayed was really valuable to the user as some things could be omitted.
It was the same participant who clicked on the UNOPS logo in the hope that it would
take him back to the MAU process overview. He also complained about missing web
navigation tools he was used to, like arrows or underlined links.
The navigation on the right side on the third layer was almost entirely ignored by
everyone. Very few people realized that the link ‘Back to Process’ would take them to
the second layer where they had come from. Instead, most participants used the ‘Back
Button’ of the browser.
The Evaluation of the Mine Action Process Prototype
Page 73 of 116
Also, a lot of participants were reluctant to make use of the possibility of navigating
between the pages of the third layers but preferred to return to the second layer and
then go into the third layer again by clicking on a symbol.
While in the beginning some participants felt unsure of themselves reading processes,
they all quickly started following the single process steps. One participant declared that
it was enlightening to see how single activities form one large picture especially
considering the prevailing mindset:
“We are all used to thinking in our own like little functional area. And then you do your
part, but that’s typical UN. You do your work and pass it on and you do not really have
to think about the rest […]”91
4.5.8 Assessment of Test Method Thinking Aloud Some participants had problems verbalizing their thoughts or were reluctant to do so.
Kind reminders from the facilitator to speak their mind had a positive but brief impact on
those testers. In these cases, mainly the facilitator’s observations served as an
indication for usability problems.
Since the thinking-aloud method seemed so unnatural to some participants the
facilitator decided to conduct one usability test in pairs. These two participants were
from the same division and had about the same knowledge about MAPP. They also
knew each other well and possessed more or less the same intellectual capabilities.
This is important because otherwise one of them may have taken on the active role
while the other could have been intimidated by the other’s knowledge and may have
remained silent.
In this case, it worked perfectly well and the two participants engaged in discussion
revealing their cognitive processes to the facilitator. Therefore, the time measures
especially for the first two scenarios are relatively high and in fact not comparable with
the rest of the test results.
It has to be said that in this evaluation the time was only a vague indicator for usability
problems. It was actually expected that MAU staff would generally perform better than
non-MAU staff. Surprisingly, in four of six scenarios a member of non-MAU staff was
faster than someone from the Mine Action Unit. In the fifth scenario one participant of
each unit had the same time. In one case, a member of MAU was the fastest to
perform the given tasks.
91 This mindset is also often referred to as „Silo-Culture“.

The Evaluation of the Mine Action Process Prototype
Page 74 of 116
The reasons for these results are purely speculative and are given without going into
too many details as this would exceed the realms of this M.A. thesis:
1. MAU staff and non-MAU staff had a different approach to the usability
tests
The facilitator had explicitly pointed out before every session that the tests aimed
to reveal weaknesses in the usability of the tool by performing certain tasks. MAU
staff seemed to focus sometimes too much on the content itself with the
intention to verify the displayed information. While non-MAU staff had no
experience with MAU processes, and were thus eager to perform the tasks,
MAU staff literally explored their future tool.
2. Majority of non-MAU had attended a previous presentation about MAPP
Four out of six participants from other UNOPS divisions or units had attended a
presentation about MAPP before the usability tests took. It cannot be completely
ruled out that this knowledge helped them to perform the tasks in a quicker
manner. In contrast, only half of the MAU staff (two out of four) had attended a
similar presentation before the tests.
3. Age of participants
Three out of four participants of the Mine Action Unit were older than 50, one
under 39 years. Four out of six participants of non-MAU staff were under 30;
the rest were under 39 years.
Although the results might surprise, they show that even staff with no background in
the very specialized field of Mine Action can use the tool successfully to access desired
knowledge objects. In addition, the prototype proved that it manages to augment user’s
process understanding.
These results encourage and suggest that an implementation of such tool in corporate
services, like HR, IT, or Finance could have an even greater impact on an even larger
audience.

The Evaluation of the Mine Action Process Prototype
Page 75 of 116
4.6 Analysis of the Questionnaire Results and Interpretation In the following, the results delivered by the questionnaire (cf. section 4.3.2) which was
handed out after participants had performed the tasks, are depicted. At the same time,
an analysis and conclusions are made.
Where appropriate, comments or remarks which were made by the participants are
quoted in order to support the author’s interpretation. Also, in single cases it was
sometimes meaningful to reveal more information about the author of the quote in
order to understand them in the correct context. However, anonymity of the participants
was respected.
4.6.1 Part I The first part of the questionnaire aimed to find out about respondents’ habits regarding
the UNOPS Intranet and their attitude towards it. Since participants were chosen
regardless of their knowledge about processes, they were also asked to rate their
familiarity of processes.
The results and analysis follow:
How often do you log on to the intranet?
All participants declared that they logged onto the intranet on a daily basis. That means
that it could be expected that everyone knew about the existence of the UNOPS
Intranet and had at least seen the homepage of the system.92
Regarding intranet usage I would consider myself being (a(n))…
Figure 4-1: Overview of Questionnaire Results – Intranet Usage
92 Side note: Short time before the usability tests were conducted the log-on process to the UNOPS
Intranet had been simplified in the New York office. Now, UNOPS staff only as to open the browser to get access to the intranet as the homepage was set as the default page and no login was required anymore.

The Evaluation of the Mine Action Process Prototype
Page 76 of 116
3 7
In accordance with the given answers regarding the frequency with which users log on
to the intranet, none of the respondents considered themselves a novice in terms of
intranet usage. Instead, the majority of them defined themselves as quite competent
users, followed by the group of advanced beginners and proficient users. One
participant saw himself as an expert.
How would you rate your proficiency/knowledge about processes?
Figure 4-2: Overview of Questionnaire Results – Process Proficiency
As shown in Figure 4-2 the level of process familiarity varies strongly. All participants
had at least an idea about processes, the majority even had dealt with them once in a
while or dealt with them more often. Only one participant saw himself as a process
expert.
Attitude towards the UNOPS Intranet
Statement Level of Agreement
I feel comfortable using the intranet. The navigation on the intranet is easy.
I usually find what I am looking for on the intranet.
[Legend]
Table 4-9: Questionnaire Results – Attitude towards UNOPS Intranet
The given answers seem somehow to contradict each other. While the vast majority of
respondents stated that they felt comfortable using the UNOPS Intranet, about one
third admitted to have some trouble navigating through the intranet and finding what
they are looking for.
It should be kept in mind that a less positive attitude towards intranet navigation could
have a negative impact on the satisfaction with MAPP, as it is intranet based.
2 1 6 1
1 3 3 3

The Evaluation of the Mine Action Process Prototype
Page 77 of 116
1 1
1 5 2 2
6 2 2
4.6.2 Part II The second part of the questionnaire comprised statements which asked about
respondents’ attitude towards the Mine Action Process Prototype.
The results and analysis as follows:
Attractiveness Statement Level of Agreement
The interface (colors, font) of the tool is
pleasant.
I like using the interface of the tool.
All text can be read without problems.
[Legend]
Table 4-10: Questionnaire Results – Attractiveness of MAPP
Although the majority of respondents favored the appearance of MAPP there were also
some critical voices about it. One participant showed his strong dislike for the font size
of the intranet. Since the tool is based on intranet technology he expressly repeated
this critique concerning the font size of the tested tool.
Ease of Navigation Statement Level of Agreement
The navigation is easy. The navigation is intuitive.
I feel in control when I'm using the tool.
I always know where I am and where to go.
[Legend]
Table 4-11: Questionnaire Results – Ease of Navigation of MAPP
Here again, the given answers form a discrepancy in themselves. While the
overwhelming majority of respondents considered the navigation of MAPP as fairly
easy, the results of the fourth statement (see above) and especially the usability tests
indicated another reality.
One respondent stated:
“Navigation requires some trial and error.”
During the usability tests it became obvious that at certain points participants had some
difficulties navigating through the tool.
2 6 2
1 5 2 2
1 3 6
1 1 3 5
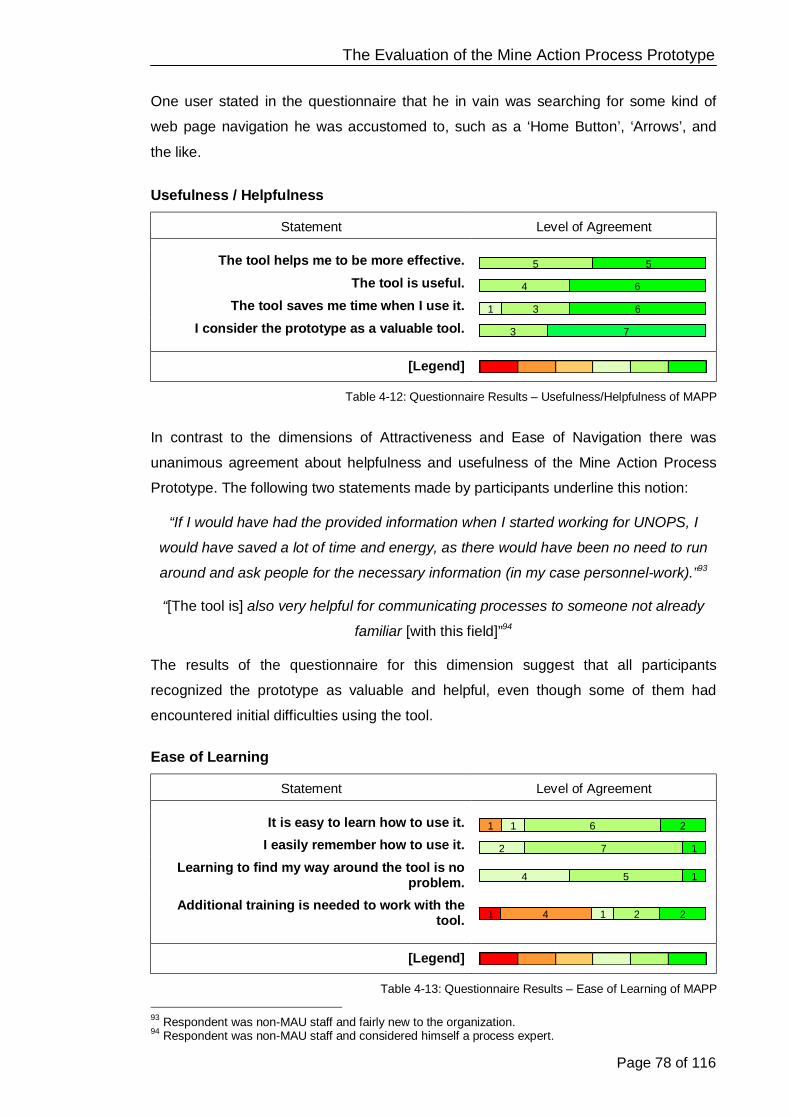
The Evaluation of the Mine Action Process Prototype
Page 78 of 116
One user stated in the questionnaire that he in vain was searching for some kind of
web page navigation he was accustomed to, such as a ‘Home Button’, ‘Arrows’, and
the like.
Usefulness / Helpfulness
Statement Level of Agreement
The tool helps me to be more effective.
The tool is useful.
The tool saves me time when I use it.
I consider the prototype as a valuable tool.
[Legend]
Table 4-12: Questionnaire Results – Usefulness/Helpfulness of MAPP
In contrast to the dimensions of Attractiveness and Ease of Navigation there was
unanimous agreement about helpfulness and usefulness of the Mine Action Process
Prototype. The following two statements made by participants underline this notion:
“If I would have had the provided information when I started working for UNOPS, I
would have saved a lot of time and energy, as there would have been no need to run
around and ask people for the necessary information (in my case personnel-work).”93
“[The tool is] also very helpful for communicating processes to someone not already
familiar [with this field]”94
The results of the questionnaire for this dimension suggest that all participants
recognized the prototype as valuable and helpful, even though some of them had
encountered initial difficulties using the tool.
Ease of Learning
Statement Level of Agreement
It is easy to learn how to use it.
I easily remember how to use it.
Learning to find my way around the tool is no problem.
Additional training is needed to work with the tool.
[Legend]
Table 4-13: Questionnaire Results – Ease of Learning of MAPP
93 Respondent was non-MAU staff and fairly new to the organization. 94 Respondent was non-MAU staff and considered himself a process expert.
5 5
4 6
1 6 3
3 7
1 1 2 6
1 2 7
4 5 1
1 1 2 2 4

The Evaluation of the Mine Action Process Prototype
Page 79 of 116
Most participants became more confident after using the tool for a while. More
important, they felt that next time they could achieve their goals more efficiently.95
“first steps are a bit slow, but after clicking around for a few minutes I got used to it and
using it did not feel like a problem”96
This shows that the learning curve for MAPP is steep. The results also indicate that
once a user has learned how to navigate and find the desired information he will be
able to do so even if he has not used the tool for some time. However, there were sharp divisions whether or not additional training will be needed
to efficiently work with the tool from the beginning. This discrepancy might be solved by
looking at the different background of each participant.
Hence, in order to serve not only users that already possess sound knowledge of
intranet technology and/or processes special attention needs to be paid to the diverse
level of users’ proficiency regarding the above mentioned areas when formulating
training material. Ease of Use
Statement Level of Agreement
Using this tool for the first time is easy.
It is user friendly.
I can use it without written instructions.
I can use it successfully every time.
The tool seems logical to me.
[Legend]
Table 4-14: Questionnaire Results – Ease of Use of MAPP Most of the participants agreed that using the Mine Action Process Prototype for the
first time was not particularly difficult. However, in the course of the usability tests it
became evident that it would be meaningful to provide some sort of written instructions
to avoid confusion, although this assumption is not strongly supported by the results of
the third statement (see above). The following statement of one of the participants
presents to some extent the overall opinion of all users:
“A bit to get used to, as it is slightly different model than I am accustomed to-- but it is consistent.”97
95 In this context, Dumas/Redish (1999) state: „If a product is consistent, predictable, and easy to use,
people will be able to learn much more quickly, better remember functions they use infrequently, and use more of the product.“ (Dumas/Redish (1999): p.6)
96 Respondent was non-MAU staff and fairly new to the organization. 97 Respondent was non-MAU staff and considered himself as a process expert.
1 1 7 1
1 1 7 1
2 1 2 5
4 5 1
1 3 6
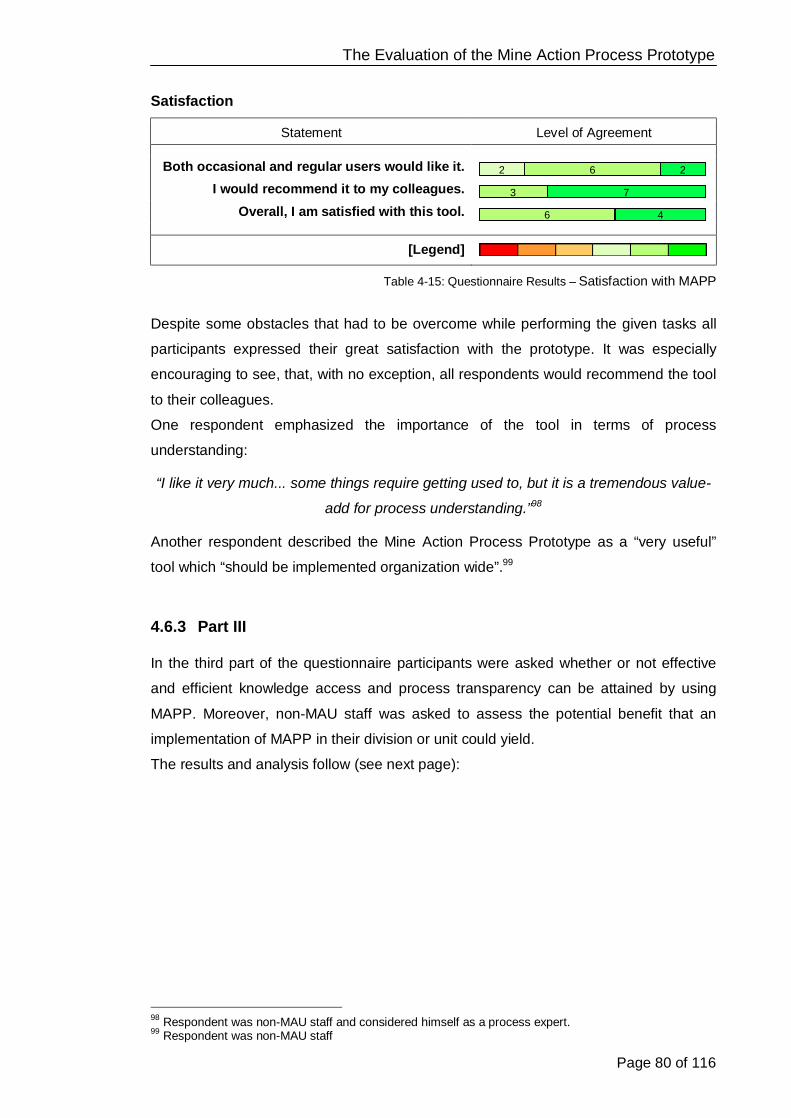
The Evaluation of the Mine Action Process Prototype
Page 80 of 116
Satisfaction Statement Level of Agreement
Both occasional and regular users would like it.
I would recommend it to my colleagues.
Overall, I am satisfied with this tool.
[Legend]
Table 4-15: Questionnaire Results – Satisfaction with MAPP
Despite some obstacles that had to be overcome while performing the given tasks all
participants expressed their great satisfaction with the prototype. It was especially
encouraging to see, that, with no exception, all respondents would recommend the tool
to their colleagues.
One respondent emphasized the importance of the tool in terms of process
understanding:
“I like it very much... some things require getting used to, but it is a tremendous value-
add for process understanding.”98
Another respondent described the Mine Action Process Prototype as a “very useful”
tool which “should be implemented organization wide”.99
4.6.3 Part III In the third part of the questionnaire participants were asked whether or not effective
and efficient knowledge access and process transparency can be attained by using
MAPP. Moreover, non-MAU staff was asked to assess the potential benefit that an
implementation of MAPP in their division or unit could yield.
The results and analysis follow (see next page):
98 Respondent was non-MAU staff and considered himself as a process expert. 99 Respondent was non-MAU staff
2 6 2
3 7
4 6

The Evaluation of the Mine Action Process Prototype
Page 81 of 116
Attainment of MAPP Objectives (MAU and non-MAU) Statement Level of Agreement
The tool helps me to understand MAU
processes in HQ/field better.
The tool helps me to understand better how MAU processes are linked to each other.
The tool provides a better transparency of MAU processes to the viewer.
The tool helps me to understand processes in general better.
[Legend]
Table 4-16: Questionnaire Results – Attainment of MAPP Objectives
The results above show that the participants are convinced that the tool has the
capability to enhance understanding of MAU processes not only to MAU staff but also
to people who are not involved in Mine Action at all.
It is important to note that if this visualization helps people to understand the rather
complex processes of the Mine Action Unit, chances are high that the implementation
of a such tool in corporate services, e.g. HR, IT, Finance could deliver a great potential
benefit to a far larger audience.
Attainment of MAPP Objectives (MAU only)
Statement Level of Agreement
MAU roles and responsibilities are clearly defined.
If I have a question regarding a process step I know who to contact.
The tool helps colleagues / clients to understand our unit’s processes.
The tool facilitates the effective and efficient access to information and documentation.
[Legend]
Table 4-17: Questionnaire Results – Attainment of MAPP Objectives
Given the fact that none of the Mine Action Unit staff recognized the swim lanes
depicting the different parties involved in MAU projects it seems odd that most MAU
participants still stated that roles and responsibilities were clearly defined in the
prototype.
1 3 6
1 4 5
1 4 5
1 2 7
2 1 1
1 1 2
2 1 1
2 2
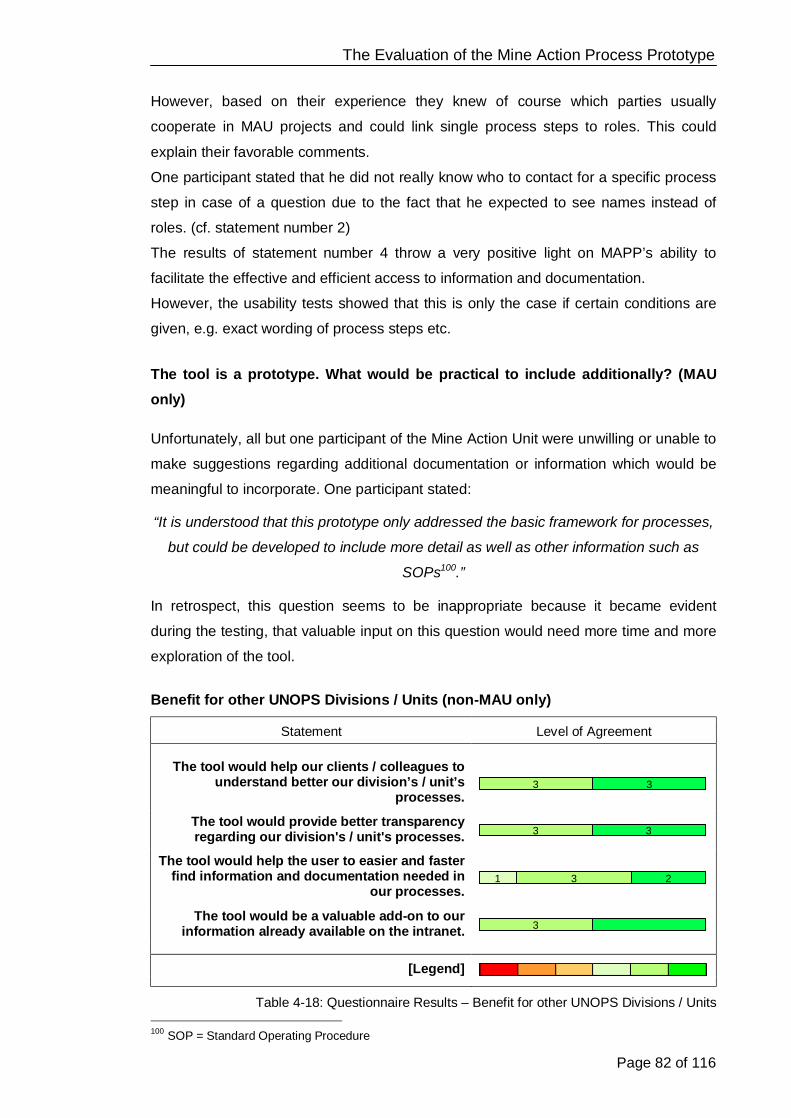
The Evaluation of the Mine Action Process Prototype
Page 82 of 116
However, based on their experience they knew of course which parties usually
cooperate in MAU projects and could link single process steps to roles. This could
explain their favorable comments.
One participant stated that he did not really know who to contact for a specific process
step in case of a question due to the fact that he expected to see names instead of
roles. (cf. statement number 2)
The results of statement number 4 throw a very positive light on MAPP’s ability to
facilitate the effective and efficient access to information and documentation.
However, the usability tests showed that this is only the case if certain conditions are
given, e.g. exact wording of process steps etc.
The tool is a prototype. What would be practical to include additionally? (MAU only) Unfortunately, all but one participant of the Mine Action Unit were unwilling or unable to
make suggestions regarding additional documentation or information which would be
meaningful to incorporate. One participant stated:
“It is understood that this prototype only addressed the basic framework for processes,
but could be developed to include more detail as well as other information such as
SOPs100.”
In retrospect, this question seems to be inappropriate because it became evident
during the testing, that valuable input on this question would need more time and more
exploration of the tool.
Benefit for other UNOPS Divisions / Units (non-MAU only) Statement Level of Agreement
The tool would help our clients / colleagues to
understand better our division’s / unit’s processes.
The tool would provide better transparency regarding our division's / unit's processes.
The tool would help the user to easier and faster find information and documentation needed in
our processes.
The tool would be a valuable add-on to our information already available on the intranet.
[Legend]
Table 4-18: Questionnaire Results – Benefit for other UNOPS Divisions / Units
100 SOP = Standard Operating Procedure
3 3
3 3
3 1 2
3

The Evaluation of the Mine Action Process Prototype
Page 83 of 116
Both MAU staff and non-MAU staff were asked to assess the impact of MAPP on their
knowledge base. But in addition, the last mentioned group was also asked to gauge the
potential success of the implementation of a similar prototype in their division or unit. It
is understood that their answers are based on assumptions but they can still serve as
an indicator.
In this case, the high rankings suggest that participants think that their division or unit,
i.e. employees and clients, could indeed benefit from such a tool in terms of knowledge
access and process transparency.
This assumption is strongly supported by remarks made by participants during the
performance of the task scenarios.
4.6.4 Part IV This part contained general questions to obtain demographic data.
The results are as follows:
Age of participants:
Gender:
20 - 294
30 - 39340- 49
0
over 503
Male5
Female5

The Evaluation of the Mine Action Process Prototype
Page 84 of 116
Number of MAU staff / non-MAU staff and their position:
4.6.5 Assessment of Test Method Questionnaire It comes to the reader’s attention that the very positive results of the questionnaire do
not always reflect the observations made during the performance of the task scenarios.
In single cases, the results of the questionnaire must be called into question.
The reliability of the results might have been weakened by the two following
sociological phenomena:
1. Social undesirability
Although the facilitator reassured the anonymity of every participant prior to
starting each session, participants might have felt some sort of social pressure
when answering the questionnaire.
2. Biased in favor of the author of a product
Every participant knew that the facilitator of the usability tests was heavily
involved in the development of the Mine Action Process Prototype. Although he
stressed his neutrality and spoke of MAPP as the product of a whole team
before every session started, it cannot be entirely ruled out that participants
might have been biased in favor of the facilitator.
It can be assumed, although some results of the questionnaire may have been
influenced by these phenomena, that the answers given mirror the largely positive
opinions of all participants.
non-MAU staff6
MAU staff4
1 Senior Portfolio Manager 1 Portfolio Manager 2 Portfolio Assistant
3 Consultants (GLO, CANANE) 1 Analyst (HR) 1 Developer (ICT) 1 Portfolio Manger (WCARO)
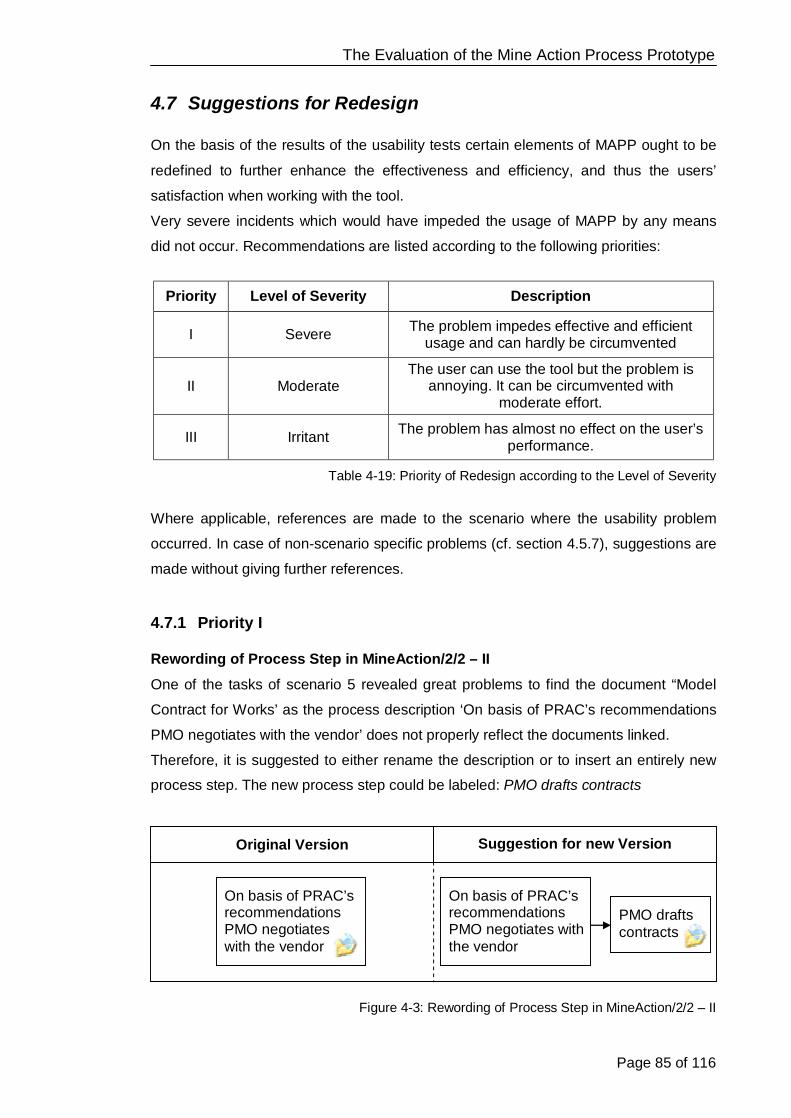
The Evaluation of the Mine Action Process Prototype
Page 85 of 116
4.7 Suggestions for Redesign On the basis of the results of the usability tests certain elements of MAPP ought to be
redefined to further enhance the effectiveness and efficiency, and thus the users’
satisfaction when working with the tool.
Very severe incidents which would have impeded the usage of MAPP by any means
did not occur. Recommendations are listed according to the following priorities:
Priority Level of Severity Description
I Severe The problem impedes effective and efficient usage and can hardly be circumvented
II Moderate The user can use the tool but the problem is
annoying. It can be circumvented with moderate effort.
III Irritant The problem has almost no effect on the user’s performance.
Table 4-19: Priority of Redesign according to the Level of Severity
Where applicable, references are made to the scenario where the usability problem
occurred. In case of non-scenario specific problems (cf. section 4.5.7), suggestions are
made without giving further references.
4.7.1 Priority I Rewording of Process Step in MineAction/2/2 – II
One of the tasks of scenario 5 revealed great problems to find the document “Model
Contract for Works’ as the process description ‘On basis of PRAC’s recommendations
PMO negotiates with the vendor’ does not properly reflect the documents linked.
Therefore, it is suggested to either rename the description or to insert an entirely new
process step. The new process step could be labeled: PMO drafts contracts
Figure 4-3: Rewording of Process Step in MineAction/2/2 – II
On basis of PRAC’s recommendations PMO negotiates with the vendor
PMO drafts contracts
On basis of PRAC’s recommendations PMO negotiates with the vendor
Original Version Suggestion for new Version

The Evaluation of the Mine Action Process Prototype
Page 86 of 116
During project implementation PM prepares additional lists for international and local purpose
Original Version Suggestion for new Version
During project implementation PM prepares a procurement plan
During project implementation PM prepares additional lists for international and local purpose (Procurement Plan)”
or
In addition, the position of the aforementioned process step has to be reconsidered as
it now belongs to the field staff’s responsibility but in fact the PMO is part of UNOPS.
Thus, this process step ought to be repositioned and put on the UNOPS Swim Lane.
Rewording of Process Step in MineAction/2/3
The same problem as mentioned above was seen in scenario 6. The document linked
with the process step ‘During project implementation PM prepares additional lists for
international and local purpose’ is called ‘Procurement Plan’. However, this keyword is
not found in the description of the process activity, so that participants had difficulties
accessing the document.
Therefore, it is strongly suggested to include the term Procurement Plan in the
description. Suggestions as follows:
Figure 4-4: Rewording of Process Step in MineAction/2/3
Training Material
As the tests suggest, it is meaningful to provide training material to facilitate the
efficient usage of MAPP from the beginning. Hereby, the various backgrounds of users
have to be taken into account.
The material should contain explanations for the most distinct features of the tool. For
example, the framework of MAPP (layer approach) should be introduced. Moreover, it
is important that the users understand the concept of the swim lanes and the process
steps that are located on them.
Additionally, to ease orientation a description of the Information Box located on the
upper right side and the navigation boxes (labeled: Previous / Next Page), both on
every process documentation of the 2nd layer, should be given.

The Evaluation of the Mine Action Process Prototype
Page 87 of 116
MAU Process Overview
Original Version Suggestion for new Version
Introduction Page
As seen in scenario 1, it was a great challenge for all participants to find the
Introduction Page as it was not easily discernible.
Therefore it is strongly suggested to implement some sort of eye-catcher in form of a
symbol and/or to emphasize the link by enlarging its font size and making it bold.
A more technical solution would be the implementation of a functionality which asks the
system whether or not a user has been on the Introduction Page before. If he has not
been there yet, he will be automatically redirected to it. Otherwise the MAPP interface
will be displayed immediately.
4.7.2 Priority II Intranet Navigation: Knowledge Enabled MAU Processes
This description fails to inform the user properly about its true meaning. It is thus
suggested to rename the first page of the Mine Action processes according to what it
really is: MAU Process Overview
Figure 4-5: Rewording of Intranet Navigation: Knowledge Enabled MAU Processes

The Evaluation of the Mine Action Process Prototype
Page 88 of 116
List abbreviations
Although the abbreviations used in MAPP did not cause significant problems neither
among MAU staff nor among non-MAU staff during the testing, it is recommended to
implement a page which states all abbreviations used in the tool.
Process Link Symbol
The Process Link symbol on the Introduction Page caused confusion in the first
scenario. Therefore it is recommended to change the symbol.
The description PRAC Process should be replaced by a neutral term. Moreover, the
bold borderline should be deleted and a slightly lighter color should be used to increase
the resemblance to the blue boxes used in the tool.
Figure 4-6: Rework Process Link
Clock Symbol
The Time Measure symbol is considered to be very valuable and helpful.
However, such time measures are not good practice at UNOPS yet, meaning that to
date the number of reliable time measures for certain processes is still relatively low.
The process of setting time measures for processes and benchmarking them internally
but also against the industry standard is very long and challenging. However, it pays off
in the end – in terms of transparency for clients and in terms of improvement efforts.
Without benchmarks improvement efforts will be in vain.
As mentioned above, it would be unrealistic to expect to have fully reliable time
measures in place straight away. Therefore, it might be meaningful to start including
average time measures for certain processes, as done with the PRAC process (cf.
Time Measure symbol). However, in order to be able to present further details on the
process duration it is suggested to include a third layer. It could be linked with a Clock
symbol:
On the third layer information about prerequisites and influencing factors which affect
the process duration could be presented.
Ipsem Lorum
Original Version Suggestion for new Version

The Evaluation of the Mine Action Process Prototype
Page 89 of 116
Process:
Back to:
Process ID: GLO/MineAction/2/3 Last updated: DD-MM-YY
Author: ChristophS
Version: V1
Expires: DD-MM-YY
UNOPS GLO M-Action
Embedded Document Library
A click on a document of an embedded Document Library should open a new window
in which the document is displayed. This would be more user-friendly since the user
could go on working with MAPP in the same window.
Information Box
Many participants did not recognize the displayed breadcrumb navigation in the
Information Box which is located on the right side of every process slide.
In order to highlight this means of navigation the relationship of the boxes should be
made clear.
There are two suggestions to be made concerning this feature:
An example as follows:
Figure 4-7: Redesign of the Information Box with Breadcrumb Navigation
Still, it ought to be considered whether to leave the whole breadcrumb navigation out of
the Information Box as it in fact only displays the same navigation provided by
Sharepoint on the left side of the screen.
Instead, it would be meaningful to enlarge the small picture of the MAU Process
Overview in the box to provide another means of navigation. The blue boxes serve as
hyperlinks which lead the user to the desired process. To make it clear to the user
where exactly he is, the prevailing box of the process should be highlighted in red. It is
expected that due to its visualization this navigation might be more convenient for the
user.
To be able to display the picture in a legible form some information must be omitted
or relocated (version number; expiring date)101. Furthermore, the page number as an
important detail should be found within the box.
101 The version number is already included in the file name. As it is though that the expiring date has no
direct benefit to the general user it should be placed on the lower right side where up to now the page number is located.

The Evaluation of the Mine Action Process Prototype
Page 90 of 116
Project Formulation
Budget Management
Evaluation
Project Closure
Project Personnel
Contracts for Services and Works
Procurement of Goods
Process ID: GLO/MineAction/2/3 Last updated: DD-MM-YY Author: ChristophS
Page 1 of 1
Next Page: Contracts for Services and Works
Next Page: Contracts for Services and Works
Previous Page: Operational Management
Previous Page: Operational Management
Original Version Suggestion for new Version
The dimensions of the figure shown below match the ones used in the Mine Action
Process Prototype.
Figure 4-8: Redesign of the Information Box
Previous/Next Page
To further support the intuitive use of the tool, it is suggested that the boxes labeled
Previous Page and Next Page on the 2nd layer are shaped as arrows to emphasize
their meaning.
Figure 4-9: Redesign of Process Navigation Elements
Different Kinds of Documentation on Different Pages
A usability problem uncovered in the third scenario suggests, that, whenever two or
more symbols link to a third layer from one process step, these symbols should always
link to a separate page, i.e. a Folder symbol leads to a page containing forms and
templates only; a Star symbol to a page with Good Practices only.

The Evaluation of the Mine Action Process Prototype
Page 91 of 116
4.7.3 Priority III
Symbols on the Introduction Page Sphere
The description for the Sphere symbol reads as follows: Link to external
resource
However, it is not clear to the user whether that resource is external to the tool
or external to UNOPS. To date, there are no links included in MAPP that lead
from a Sphere symbol to resources external to UNOPS. Therefore, the
description should read as follows: Link to other UNOPS resources
Time Measure
Although no participant noticed the absence of the Time Measure symbol on the
Introduction Page, it is suggested to include it there. Again, to avoid any confusion
among the users a neutral description in the symbol itself should be used.
Description: Indicates the average duration of a process
Figure 4-10: Time Measure Symbol
Good Practice
Since one participant asked about whether or not these Good Practices referred
only to UNOPS internal or general ones, it should be stated clearly in the
description: Link to UNOPS Good Practices
Exclamation Mark
Although this symbol was incorporated into MAPP in one case, it is not shown on
the Introduction Page. The meaning of the symbol: Warning! This step is important
or Warning. Here is an exception to the rule.
Process continues on next slide
Although only two participants encountered difficulties in scenario 5, when trying to get
to the next slide by clicking on the thin process arrow it might be meaningful to provide
this option as well. That way, users do not have to click on the box “Next Page:..” to get
to the next slide.
x Days

The Evaluation of the Mine Action Process Prototype
Page 92 of 116
Insert link to next slide
Figure 4-11: Redesign - Process continues on next slide
4.8 Summary In this chapter the evaluation of the prototype was explained. Usability testing as a user
oriented methodology was chosen to assess the usability of MAPP and its potential
benefit delivered through a future implementation in other UNOPS divisions and units.
Hence, MAU and non-MAU were defined as target audience. Unfortunately, the
evaluation could not be conducted in the field due to scarce resources. It is assumed
that the results would yield more insight particularly on the benefit of MAPP delivered to
MAU field staff.
In the next step, task scenarios were composed to obtain performance data to uncover
usability deficiencies. Additionally, an adapted questionnaire based on the standard
USE and WAMMI questionnaires was constructed to gather preference data, i.e.
attitude towards the prototype and the attainment of MAPP objectives. While
performing the task scenarios participants were asked to reveal their cognitive
processes by speaking out load. The questionnaire was given out after the
performance of the task scenarios. If applicable, short, non-standard interviews were
conducted to assess the potential benefit of an implementation in other UNOPS
divisions or units. An analysis and interpretation of the collected data followed.

The Evaluation of the Mine Action Process Prototype
Page 93 of 116
As mentioned in section 4.2.1, the evaluation pursued three objectives:
1) Revealing Usability Deficiencies
In general, it can be said that the evaluation successfully revealed a number of usability
deficiencies. The observations made by the facilitator as well as the remarks made by
the participants during the tests, provided valuable input for suggestions for a redesign
of MAPP.
The suggestions were listed according to priority, which depended on the severity of
the problems. Here, it should be emphasized, that no fatal incidents, which would have
made the usage of MAPP impossible, occurred. Corresponding to the iterative
development approach MAPP should be redesigned based on the suggestions made.
To validate the results, it is necessary to evaluate the redesigned knowledge map. In
best case, it would show that users have fewer difficulties to use the tool and that they
could accomplish the tasks faster, i.e. users would be more efficient.
2) Assessing the Attainment of MAPP Objectives
It has to be kept in mind that the prototype depicts a novel approach at UNOPS to
enhance process understanding and to facilitate knowledge access. Hence, it was not
surprising that participants encountered initial difficulties using the tool.
However, the results of the tests suggest that the tool is easy to learn. Participants felt
they could use it more effectively and efficiently next time.
Additionally, the results of the questionnaire indicated that MAPP indeed delivered
additional value in terms of process understanding and facilitated knowledge access.
3) Assessing Potential Benefits for other UNOPS Divisions and Units The evaluation also aimed to assess the potential benefit through the implementation
of such a tool in other UNOPS divisions and units.102
On the whole, the feedback given was very positive and promising as reflected by the
quotes of participants and the questionnaire results.
One participant, who had heard of the project before the evaluation, even stated after
the test, that he wanted to implement it for his division.
“I definitely want it for ***103and 9/10 of it is going to be the same […]”.
He was convinced that MAPP was “a great starting place”.
102 It was anticipated before that not everyone would be able to give definite answers to this question but it was important to gain knowledge about participants’ tendency. 103 The division’s name was deleted to ensure the participant’s anonymity.
The Evaluation of the Mine Action Process Prototype
Page 94 of 116
Another participant commented that “if people used this [tool] efficiently then it would
minimize all the delays and follow ups”. This could lead to higher productivity and better
service quality.
However, at the same time there were also critical voices, not about MAPP itself but
regarding the acceptance of such endeavor. One participant asked to keep in mind that
such knowledge management efforts had been made at other organizations and
enterprises before but that in the end it lacked the resources to maintain them given the
burden of the daily business.
Someone else said that the Executive Management would need to endorse the tool
and promote its usage. This is probably only partially true, as it can be assumed that if
users do recognize the value of the tool and consider its handling easy they do not
have to be convinced to use it.
In short it can be said, that the overwhelming majority of both MAU HQ and non-MAU
staff considered MAPP a very valuable tool but that specific conditions have to be
created to take full advantage of it.
Despite these promising outcomes, it has to be kept in mind that results obtained from
usability testing are always challengeable as the methodology resembles rather an art
than exact science (cf. Pearrow (2000): p.222).
Therefore, the deployed test methods, “Thinking aloud” and “Questionnaire” were
assessed to point to potential deficiencies which could have impacted the results.
To summarize it, time measures proved themselves to be only a vague indicator for
usability problems, primarily because MAU staff explored the tool rather than to focus
on the performance of the tasks.
Moreover, the answers given in the questionnaires were very positive and did not
always match the reality observed during the performance of the scenarios. This may
primarily be attributed to the sociological phenomenon of social undesirability.
Page 95 of 116
5 Retrospective and Perspective
“Discovery consists of seeing what everybody has seen and thinking what nobody has thought.” (Albert Szent-Szent Gyorgyi)
The objective of the thesis was the development and evaluation of a suitable tool which
ought to
1. document MAU processes in an appropriate manner to enhance process
understanding among MAU HQ staff and field staff and;
2. facilitate the effective and efficient access to process-specific information to
take full advantage of the knowledge and expertise residing within the
organization;
As a result, a hypertext-based knowledge map, called Mine Action Process Prototype
(MAPP), was developed which facilitates the understanding of complex processes and
takes its users directly to process-specific information.
To provide the theoretical foundation for the development, fundamental terms and
concepts of knowledge management and from the field of usability were introduced
briefly in chapter 2.
Chapter 3 was dedicated to the development of MAPP. The Prototyping methodology
was introduced and reasons for its suitability for the project were given.
According to the prototyping-oriented life-cycle an analysis was conducted identifying
business needs and defining the target audience.
As a result, a lack of process understanding and difficulties in locating and accessing
knowledge objects were identified as a main hindrance to an effective and efficient
communication and collaboration among MAU staff.
Based on these insights, functional requirements which ought to satisfy the business
needs were elaborated.
Among others, it was required that the tool would be always accessible, independent of
time and location of the user. In addition, a visualization of MAU processes seemed to
be the most promising way to enhance process understanding. Also, the mapped
processes were considered to provide a logical grid to locate and access MAU related
knowledge objects throughout the organization.
Retrospective and Perspective
Page 96 of 116
After that, the functional requirements were translated into technical context. The
decisions for the context were based on the appropriateness to meet the functional
requirements but also on existing resources, i.e. technology.
It was reasonable to incorporate MAPP directly into the UNOPS Intranet as users are
familiar with it and it guarantees universal access. Moreover, Microsoft Visio was
chosen to visualize MAU processes and to link relevant MAU k-objects.
Chapter 3 ended by describing the implementation of MAPP and explaining its
implications.
In chapter 4, the evaluation of MAPP, which ought to investigate whether users could
master the tool effectively and efficiently and ought to assess the benefits of the tool,
was described. A user oriented evaluation method, usability testing, was deployed. To
obtain both, performance and preference data participants had to accomplish task
scenarios and were asked to fill out a questionnaire.
The actual performance of the scenarios uncovered numerous usability deficiencies.
These insights were used to formulate suggestions for a partial redesign of MAPP.
Concurrently with an iterative development approach these suggestions should be
implemented in a subsequent step to further enhance usability.
The performance of the task scenarios also aimed to assess the attainments of MAPP
objectives. The tests suggested that MAPP could indeed enhance process
understanding among both MAU and non-MAU staff. Thus, the decision to visualize the
processes rather than presenting plain text proved itself correct. Due to the
visualization it is apparently easier to understand the connection of process activities
and the responsibilities of parties involved in MAU projects.
The visualization possesses another decisive advantage, as it provides a logical grid
which organizes the knowledge base of MAU and seems to successfully direct staff to
knowledge objects that are needed in specific process steps.
The statements given in the questionnaire underpinned the assumptions regarding
process understanding and knowledge access. In this respect, both MAU staff and
non-MAU staff considered MAPP a very valuable and helpful tool, which, if
implemented in other UNOPS divisions or units, could also yield significant benefit for
them.
However, it is a fallacy to conclude that if a (technical) solution is provided users will
start using it. Instead, it is acknowledged that the tool needs to add value to the user.
As mentioned before, the value of MAPP is seen in fostering process understanding
and facilitating knowledge access. It is assumed that the value of MAPP can be
enlarged by improving usability, content and/or functionalities.
Retrospective and Perspective
Page 97 of 116
1) Usability
The usability of MAPP was evaluated in this thesis. If the suggestions made are
implemented, it can be expected that users can master it more effectively and
efficiently.
2) Content
It must be guaranteed that all MAU related knowledge objects are available, reliable
and that their quality meets certain standards.
a) Availability
Since MAPP is a prototype, not all existing MAU related knowledge objects have
been incorporated so far, and are thus not available. This is especially true for the
processes “Budget”, “Evaluation” and “Project Closure”.
Furthermore, to date the majority of knowledge objects included is primarily limited
to documents and information, as there is no appropriate process at MAU in place
to elicit lessons learned and/or good practices. Once such process is part of any
MAU project and it is mandatory, these types of knowledge objects could be
integrated through lists provided by Sharepoint. These lists can be linked with
corresponding process steps of MAPP so that staff could access lessons learned
and good practices process-specific.
It is important to note, that, no matter which knowledge objects are incorporated, it
would add enormous value to MAPP if they were only accessible through the tool.
That way, it would be made sure that all objects would be standardized.
b) Reliability and Quality
It goes without saying, that the sheer number of knowledge objects does not
automatically increase the value of MAPP. Additionally, objects have to be reliable
and conform to quality standards. Therefore, it is not enough to simply incorporate
them into MAPP but they have to be maintained, too.
For this purpose, it is suggested to establish a maintenance process. This process
must define the maintenance activities, by whom they are performed and how often
these must be done.
Such process could look as follows:
A global administrator assumes the overall responsibility of MAPP. He
possesses full administration rights. The MAU specialist, who supported the
development team of MAPP, would be first choice, as he has profound knowledge

Retrospective and Perspective
Page 98 of 116
in the domain of Mine Action and is already familiar with the technical framework of
the prototype.
However, it is needless to say that one person alone can hardly cope with the
maintenance of the entire tool while doing his daily business.
Instead, it is necessary that both MAU headquarters and field staff regularly take a
close look at MAPP and the knowledge objects that are linked with it. If objects
need to be added, edited or deleted, they inform the global MAPP-Administrator,
who can easily incorporate the changes using Microsoft Visio and Sharepoint. If
this does not prove itself practical, local administrators, who support the global
administrator with the maintenance of MAPP, could be appointed.
c) Improvement of Existing Processes
In a wider sense, the visualized processes can be seen as knowledge objects, too,
which ought to improve process transparency. Documenting and mapping the
processes was only the first step. Now, as MAPP can serve as a basis for
discussion, all stakeholders of MAPP ought to sit together104 and discuss the
existing processes to uncover weaknesses, like redundant steps or numerous
media breaks.
Again, if the discussions result in process changes, the global MAPP-Administrator
can easily adjust the visualized processes without having to rely on someone from
the development team.
3) Functionalities
To date, the prototype is a rather static tool without providing interactive elements,
which could facilitate its usage.
One interactive element could be a “Help menu”, which gives answers to questions the
user may have.
Moreover, currently, the user has to click on a symbol on the 2nd layer and is direct to
the third layer to access knowledge objects from there. Instead, it would be more
valuable to have a “Drop-down” menu which appears if the mouse pointer pauses on a
symbol, and the user could simply select the desired knowledge object without going to
the third layer.
Additionally, a retrieval function for knowledge objects is considered to tremendously
increase the value of MAPP. The user could simply enter a keyword and is directed to
the process step in which the knowledge object is needed.
104 This is meant in a figurative sense.

Retrospective and Perspective
Page 99 of 116
The Way forward – MAPP @ UNOPS
The Mine Action Unit was the first to embark on this journey to better process
understanding and knowledge access by developing and implementing such prototype.
The project aroused interest in other divisions, units and among the executive
management of UNOPS even before its complete implementation. Moreover, the
evaluation of MAPP showed that users thought of the tool as helpful and valuable.
Therefore, it ought to be considered to establish a UNOPS Process Framework based
on the concepts and design of the Mine Action Process Prototype. It is recommended
to start with UNOPS support processes, such as HR, IT, Finance, as they are expected
to yield the greatest potential benefit for the organization.
Just as in the Mine Action Unit, such framework could help to provide process
transparency and to identify and apply existing knowledge and expertise residing within
the organization. Additionally, a common framework based on the same technology
has the appeal that maintenance, incompatibility and learning costs could be kept on a
reasonable level.
In the end, whole UNOPS would have a very effective tool at hand which prepares the
organization for future challenges.

Page 100 of 116
References Monographs; Compendiums; Essays in Journals, Conference Proceedings; Others
Armutat et al. (2002) Armutat, Sascha (2002): Wissensmanagement erfolgreich einführen. Strategien –
Instrumente – Praxisbeispiele. Düsseldorf: Deutschen Gesellschaft für Personalführung
Atteslander (1995) Atteslander, Peter (1995): Methoden der empirischen Sozialforschung.
Berlin: Walter de Gruyter
Balzert (1998) Balzert, Helmut (1998): Lehrbuch der Software-Technik: Software Management,
Software-Qualitätssicherung, Unternehmensmodellierung. Heidelberg: Spektrum
Beier/von Gizycki (2002) Beier, Markus; von Gizycki, Vittoria (Eds.) (2002): Usability – nutzerfreundliches Web-
Design. Berlin: Springer
Bevan/Macleod (1994) Bevan, N.; Macleod, M. (1994): “Usability measurement in context.” In: Behaviour and
Information Technology. vol. 13 (1994) nos. 1&2, pp.132-145
Blackman/Henderson (2005)
Blackman, Deborah A.; Henderson, Steven (2005): “Know ways in knowledge
management.” In: The Learning Organization. vol. 12 (2005) no. 2, pp. 152-168
Böhm (2000)
Böhm, Steffen G. (2000): “Intra- und inter-organisationaler Wissenstransfer.
Theoretische Grundlagen, empirische Untersuchungen und praktische
Lösungsansätze.” In: QUEM-Report. Schriften zur beruflichen Weiterbildung. Heft 65:
Berlin
Brinck et al. (2002) Brinck, Tom; Gergle, Darren; Wood Scott D. (2002): Usability for the Web: Designing
Web Sites that Work .San Francisco: Morgan Kaufmann

References
Page 101 of 116
Budde et al. (1991)
Budde, Reinhard; Kautz, Karlheinz; Kuhlenkamp, Karin; Züllighoven, Heinz (1991):
Prototyping. An Approach to Evolutionary System Development. Berlin: Springer
Bürgel/Neumann (2001) Bürgel, Matthias; Neumann, Walter (2001): Screen Design und visuelle
Kommunikation: Gestaltung interaktiver Oberflächen. Heidelberg: Hüthig
Collier et al. (1996)
Bonnie Collier, Tom DeMarco, and Peter Fearey (1996): “A Defined Process for Project
Post Mortem Review.” In: IEEE Software. July 1996, pp. 65-72
DA Tech (2001)
DA Tech (2001): Prüfungshandbuch Gebrauchstauglichkeit. Leitfaden für die software-
ergonomische Evaluierung von Software auf Grundlage von DIN EN ISO 9241, Teile
10 und 11. Frankfurt/Main: Deutsche Akkreditierungsstelle Technik e.V.
Davenport/Prusak (1998) Davenport, Thomas H.; Prusak, Laurence (1998): Working Knowledge: How
Organizations Manage What They Know Boston, MA: Harvard Business School Press
Davenport (1997) Davenport, Thomas H. (1997): Information Ecology. Mastering the Information and
Knowledge Environment. New York: Oxford University Press
Davenport (1993)
Davenport, Thomas H. (1993): Process innovation - reengineering work through
information technology. Boston: Harvard Business School Press
Dixon (2000) Dixon, Nancy M. (2000): Common Knowledge. How Companies Thrive by Sharing
What They know. Boston: Harvard Business School Press
Drucker (1988) Drucker, Peter F. (1988): “The coming of the New Organization”. In: Harvard Business
Review. (1988) no. 66, pp. 45-53.
Dumas/Redish (1999) Dumas, Joseph S.; Redish, Janice C. (1999): A Practical Guide To Usability Testing.
Revised Edition. Exeter: Intellect
References
Page 102 of 116
Eppler (2001)
Eppler, Martin (2001): “Making Knowledge Visible Through Intranet Knowledge Maps:
Concepts, Elements, Cases.” In: Proceedings of the 34th Hawaii International
Conference on System Sciences
Gulliver (1987) Gulliver, Frank R. (1987): “Post-Project Appraisals Pay“. In: Harvard Business Review.
March-April 1987. p.128-132
Hansen et al. (1999)
Hansen, Morten T.; Nohria, Nitin; Tierney, Thomas (1999):
“What’s your strategy for managing knowledge?” In: Harvard Business Review (1999)
March-April. pp. 106-116
Hegner (2001) Hegner, Marcus (2001): Methoden zur Evaluation von Software. In: IZ-Arbeitsbericht
29. Informationszentrum Sozialwissenschaften.
Bonn: Informationszentrum Sozialwissenschaften der Arbeitsgemeinschaft
Sozialwissenschaftlicher Institute e.V.
Henschel (2001) Henschel, Alexander (2001): Communities of Practice: Plattform für organisationales
Lernen und den Wissenstransfer. Wiesbaden: Gabler
Huff (1990)
Huff, Anne S. (1990): Mapping Strategic Thought. New York: Wiley
ISO 9241-11 (1998)
ISO 9241-11 (1998): Ergonomics requirements for office work with visual display
terminals (VDTs), Part 11: Guidance on usability.
Katz (1969) Katz, David (1969): Gesaltpsychologie. 4th ed. Basel: Schwabe
Krug (2000) Krug, Steve (2000): Don’t make me think. A common Sense Approach to Web
Usability. Indianapolis: Que

References
Page 103 of 116
Lantz (1986) Lantz, Kenneth E. (1986): The Prototyping Methodology. Englewood Cliffs, N.J.:
Prentice-Hall
Lewis/Wharton (1997)
Lewis, C.; Wharton, C. (1997): “Cognitive Walkthroughs.” In: Helander, Martin G.,
Landauer, Thomas K., Prabhu, Prasad (Eds.): Handbook of Human Computer
Interaction. pp.717-732. Amsterdam: Elsevier Science
Liebowitz (1999) Liebowitz, Jay (ed.) (1999): Knowledge Management Handbook. Boca Raton: CRC
Press LLC
Lindgaard (1994)
Lindgaard, Gitte (1994):
Usablity Testing and System Evaluation. A Guide for Designing Useful Computer
Systems. London: Chapman & Hall
Nielsen (1989)
Nielsen, Jakob (1989): “Usability engineering at a discount.” In: Salvendy, Gavriel;
Smith, Michael (Eds.): Desinging and Using Human-Computer Interfaces and
Knowledge Based Systems. pp. 394-401. Amsterdam: Elsevier Science Publishers
Nielsen (1993)
Nielsen, Jakob (1993):
Usability Engineering. San Francisco: Academic Press
Nielsen (1994)
Nielsen, Jakob (1994): “Estimating the number of subjects needed for a thinking aloud
test.” In: International Journal of Human-Computer Studies. vol. 41 (1994), p.385-397.
Nonaka (1991) Nonaka, Ikujiro (1991): “The Knowledge-Creating Company”. In: Harvard Business
Review. vol. 69 (1991), no. 6, pp. 96-104
Nonaka/Takeuchi (1995) Nonaka Ikujiro; Takeuchi, Hirotaka (1995): The Knowledge-Creating Company.
New York, NY: Oxford University Press. 1995

References
Page 104 of 116
North (2002) North, Klaus (2002): Wissensorientierte Unternehmensführung. Wertschöpfung durch
Wissen. 3rd ed. Wiesbaden: Gabler
O’Dell/Grayson (1998) Carla, O’Dell; Grayson, Jackson, C. Jr. (1998): If only we knew what we know. The
transfer of internal knowledge and best practice. New York: The Free Press
O’Donnell (2002)
O’Donnell, Angela M.; Dansereau, Donald F.; Hall, Richard H. (2002): “Knowledge
Maps as Scaffolds for Cognitive Processing”. In: Educational Psychology Review. vol.
14 (2002), no. 1, pp. 71-86
Pearrow (2000):
Pearrow, Mark (2000): Web Site Usability Handbook. Rockland. Mass: Charles River
Media
Pelz (1999) Pelz, Heidrun (1999): Linguistik. Eine Einführung. Hamburg: Hoffmann und Campe
Polanyi (1966) Polanyi, Michael (1966): The Tacit Dimension. New York: Doubleday & Company
Pomberger/Blaschek (1993) Pomberger, Gustav; Blaschek, Günther (1993): Software Engineering. Prototyping and
objektorientierte Software-Entwicklung. München: Carl Hanser Verlag
Preece (1993) Preece, Jenny (ed.) (1993): A Guide to Usability: Human Factors in Computing.
Wokingham: Addison-Wesley
Preece et al. (1994)
Preece, Jenny; Rogers, Yvonne; Benyon, David; Holland, Simon; Carey, Tom (1994):
Human-Computer Interaction. Amsterdam: Addison-Wesley
Probst et al. (1999)
Probst, Gilbert; Raub, Steffen; Romhardt, Kai (1999):
Wissen managen. Wie Unternehmen ihre wertvollste Ressource optimal nutzen. 3rd ed.
Frankfurt am Main: Frankfurter Allgemeine/Gabler

References
Page 105 of 116
Reinmann-Rothmeier (2000)
Reinmann-Rothmeier, Gabi (2000):
Wissen und Lernen im organisationalen Kontext: Ein pädagogisch-psychologischer
Ansatz zum Wissensmanagement. Habilitationsschrift, Ludwig-Maximilians-Universität
München
Romhardt (1998) Romhard, Kai (1998): Die Organisation aus der Wissensperspektive: Möglichkeiten
und Grenzen der Intervention. Wiesbaden: Gabler
Rubin (1994) Rubin, Jeffrey (1994): Handbook of Usability Testing: How to Plan, Design, and
Conduct Effective Tests. New York: John Wiley & Sons
Schuett (2003) Schuett, Peter (2003): „The post-Nonaka Knowledge Management”. In: Journal of
Universal Computer Science. vol. 9, no. 6, p.451-462
Schweibenz/Thissen (2003) Schweibenz, Werner; Thissen, Frank (2003): Qualität im Web: Benutzerfreundliche
Webseiten durch Usablity Evaluation. Berlin: Springer
Smith (1991) Smith, Michael F. (1991): Software Prototyping. Adoption, Practice and Management.
London: McGraw-Hill
Someren et al. (1994)
Someren, Maarten W. van; Barnard, Yvonne F.; Sandberg, Jacobijn A. C. (1994):
The think aloud method. A practical guide to modelling cognitive processes.
London: Academic Press
Spender (1996)
Spender, J.-C. (1996): ‘‘Making knowledge the basis of a dynamic theory of the firm’’.
In: Strategic Management Journal. vol. 17 (1996), pp. 45-62.
Thiel (2002) Thiel, Michael (2002): Wissenstransfer in komplexen Organisationen. Effizienz durch
Wiederverwendung von Wissen und Best Practices.
Wiesbaden: Deutscher Universitäts-Verlag GmbH

References
Page 106 of 116
Vail (1999)
Vail, Edmond (1999): “Mapping Organizational Knowledge – Bridging the business-IT
communication gap.” In: Knowledge Management Review. vol. 8 (1999), pp. 10-15.
von Krogh/Ross (1995) von Krogh, Georg; Roos Johan (1995): Organizational Epistemology.
Basingstoke/London: Macmillan
von Krogh (1998) von Krogh, Georg (1998): “Care in Knowledge Creation.” In: California Management
Review. vol. 40 (1998) pp.133-153
von Krogh et al. (2000)
Krogh, Georg von; Ichijo, Kazuo; Nonaka, Ikujiro (2000):
Enabling Knowledge Creation. How to unlock the Mystery of Tacit Knowledge and
Release the Power of Innovation. Oxford: Oxford University Press
Weber et al. (2000)
Weber, Rosina T.; Aha, David W.; Muñoz-Ávila, Hector; Breslow, Leonard A. (2000):
“An Intelligent Lessons Learned Process.” In: Twelfth International Symposium on
Methodologies for Intelligent Systems (ISMIS’00).
Available online: [http://www.aic.nrl.navy.mil/~aha/papers/Weber-et-al-ISMIS00.pdf]
Wiegmann et al. (1992)
Wiegmann, Douglas A.; Dansereau, Donald F.; McCagg, Edward C.; Rewey, Kirsten
L.; Pitre, Urvashi (1992):
“Effects of knowledge map characteristics in information processing”. In: Contemporary
Educational Psychology. vol. 17(1992), no.1, pp.136–155.
Zack (1999) Zack, Michael H. (1999): “Managing Codified Knowledge”. In: Sloan Management
Review. vol. 40 (1999), no. 4, pp. 45-58
References
Page 107 of 116
Internet Resources
All internet resources were last accessed on June 25, 2006.
ICBL (2006)
International Campaign to Ban Landmines
<http://www.icbl.org/lm/2000/appendices/unops.html> Merriam Webster Online Dictionary (2006)
Merriam Webster Online Dictionary.
<http://www.m-w.com/> UN (2006)
United Nations (2006): Investing in the United Nations: for a stronger organization
worldwide. Report of the Secretary-General.
<http://www.un.org/reform/reform7march06.pdf> UNOPS (2006)
United Nations Office for Project Services.
<http://www.unops.org>

Page 108 of 116
Appendix I Mine Action Process Prototype – 1st Layer
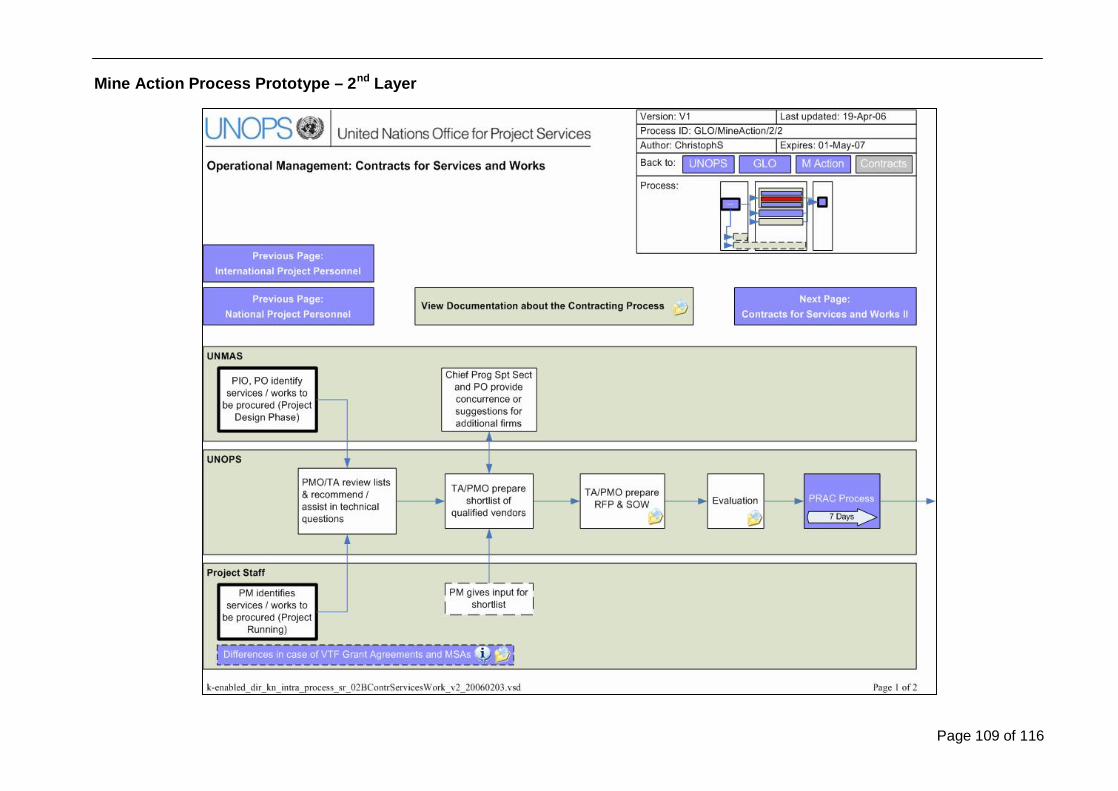
Page 109 of 116
Mine Action Process Prototype – 2nd Layer

Page 110 of 116
Mine Action Process Prototype – 3rd Layer

Page 111 of 116
Appendix II Questionnaire
How often do you log on to the intranet?
never
about once a week
about three times a week
daily
Regarding intranet usage I would consider myself being…
a novice
advanced beginner
quite competent
proficient
expert
How would you rate your proficiency/knowledge about processes?
I have never heard of processes
I have a slight idea what processes are
I have occasionally dealt with processes
I deal with processes on a regular basis
I am an expert in regards of processes
Statement Level of Agreement
Intranet Usage Strongly disagree Disagree Slightly
disagree Slightly agree Agree Strongly
agree
I feel comfortable using the intranet.
The navigation on the intranet is easy.
I usually find what I am looking for on the intranet.

Page 112 of 116
Additional Comments:
Statement Level of Agreement
Attractiveness Strongly disagree Disagree Slightly
disagree Slightly agree Agree Strongly
agree
The interface (colors, font) of the tool is pleasant.
I like using the interface of the tool.
All text can be read without problems.
Additional Comments:
Statement Level of Agreement
Ease of Navigation Strongly disagree Disagree Slightly
disagree Slightly agree Agree Strongly
agree
The navigation is easy.
The navigation is intuitive.
I feel in control when I'm using the tool.
I always know where I am and where to go.
Additional Comments:
Statement Level of Agreement
Usefulness / Helpfulness Strongly disagree
Disagree
Slightly disagree
Slightly agree Agree Strongly
agree
The tool helps me to be more effective.
The tool is useful.
The tool saves me time when I use it.
I consider the prototype as a valuable tool.

Page 113 of 116
Additional Comments:
Statement Level of Agreement
Ease of Learning Strongly disagree Disagree Slightly
disagree Slightly agree Agree Strongly
agree
It is easy to learn how to use it.
I easily remember how to use it.
Learning to find my way around the tool is no problem.
Additional training is needed to work with the tool.
Additional Comments:
Statement Level of Agreement
Ease of Use Strongly disagree Disagree Slightly
disagree Slightly agree Agree Strongly
agree
Using this tool for the first time is easy.
It is user friendly.
I can use it without written instructions.
I can use it successfully every time.
The tool seems logical to me.
Additional Comments:
Statement Level of Agreement
Satisfaction Strongly disagree Disagree Slightly
disagree Slightly agree Agree Strongly
agree
Both occasional and regular users would like it.
I would recommend it to my colleagues.
Overall, I am satisfied with this tool.

Page 114 of 116
Additional Comments:
Statement Level of Agreement Attainment of MAPP Objectives (general)
Strongly disagree Disagree Slightly
disagree Slightly agree Agree Strongly
agree
The tool helps me to understand MAU processes in HQ/field better.
The tool helps me to understand better how MAU processes are linked to each other.
The tool provides a better transparency of MAU processes to the viewer.
The tool helps me to understand processes in general better.
Additional Comments:
Statement Level of Agreement Attainment of MAPP Objectives (MAU specific)
Strongly disagree Disagree Slightly
disagree Slightly agree Agree Strongly
agree
MAU roles and responsibilities are clearly defined.
If I have a question regarding a process step I know who to contact.
The tool helps colleagues / clients to understand our unit’s processes.
The tool facilitates the effective and efficient access to information and documentation.
Additional Comments:
The tool is a prototype. What would be practical to include additionally? - Forms and Templates (please specify) - How-To Guides (please specify) - Cross References to Processes (please specify) - Detailed Information for Specific Process Steps (please specify)
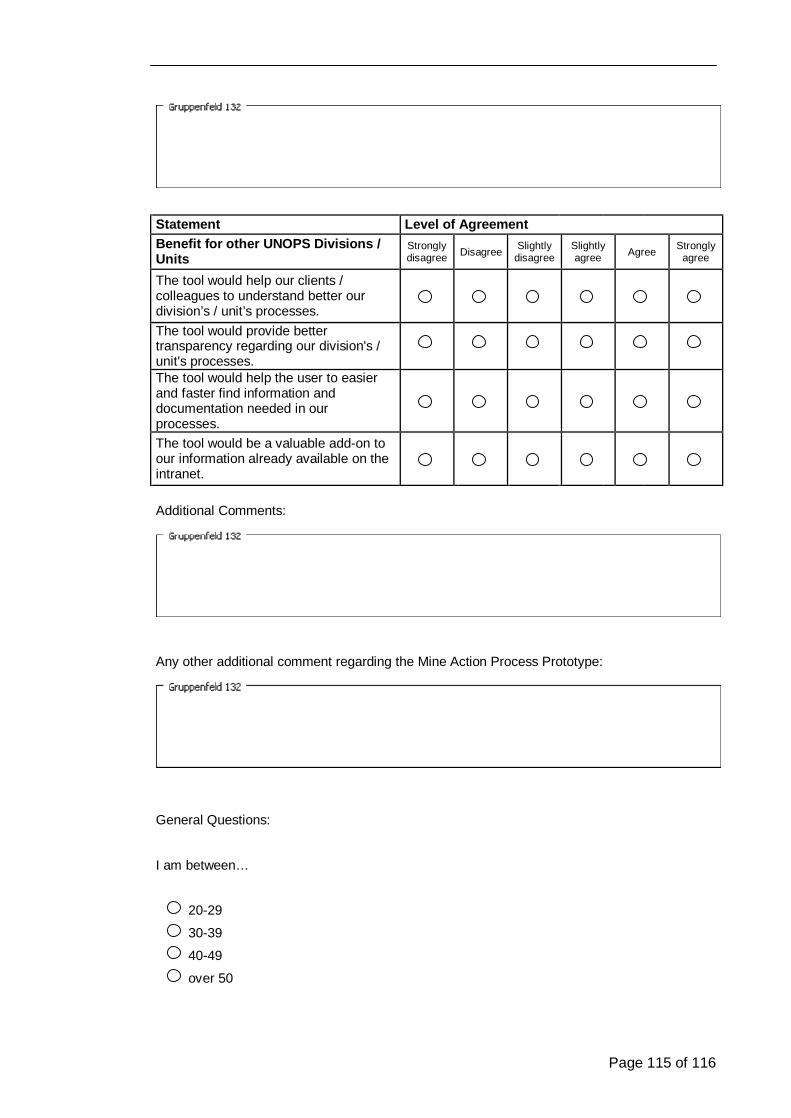
Page 115 of 116
Statement Level of Agreement Benefit for other UNOPS Divisions / Units
Strongly disagree Disagree Slightly
disagree Slightly agree Agree Strongly
agree
The tool would help our clients / colleagues to understand better our division’s / unit’s processes.
The tool would provide better transparency regarding our division's / unit's processes.
The tool would help the user to easier and faster find information and documentation needed in our processes.
The tool would be a valuable add-on to our information already available on the intranet.
Additional Comments:
Any other additional comment regarding the Mine Action Process Prototype:
General Questions:
I am between…
20-29
30-39
40-49
over 50
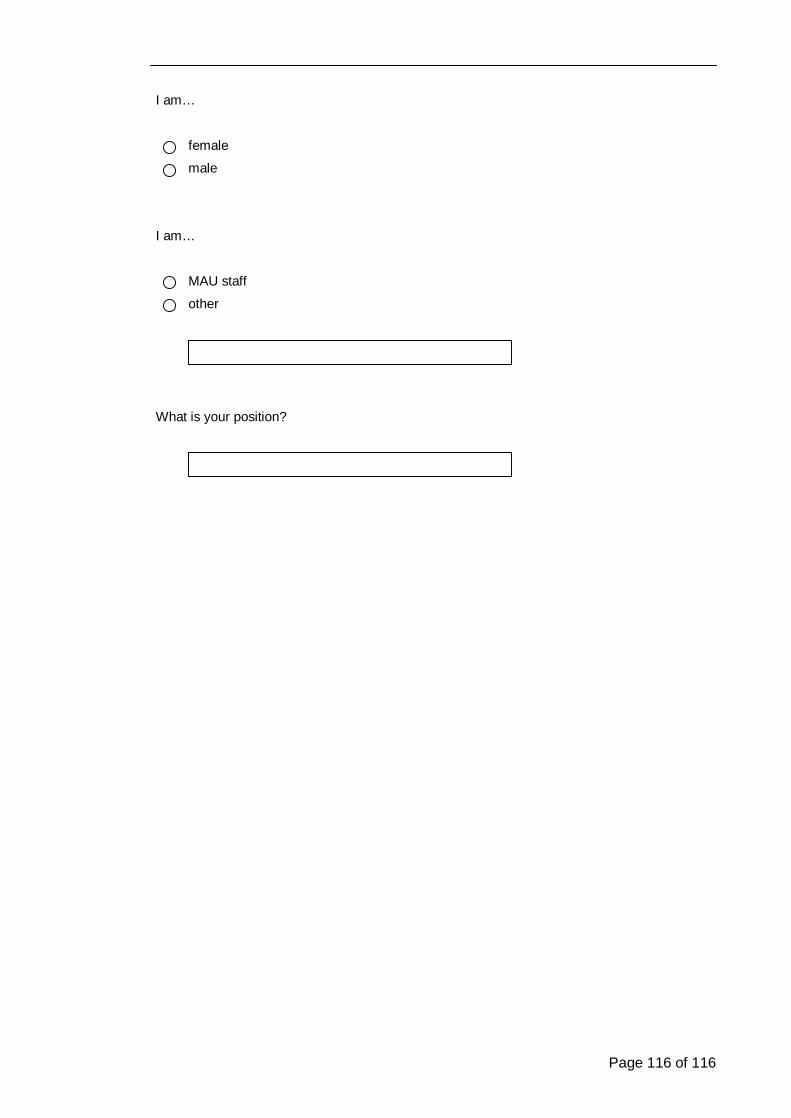
Page 116 of 116
I am…
female
male
I am…
MAU staff
other
What is your position?