601 OPTICAL AND HUMAN PERFORMANCE EVALUATION OF …
96
AD-A140 601 OPTICAL AND HUMAN PERFORMANCE EVALUATION OF HUD I/1 IHEAD-UP DISPLAVI SYSVERS..IUI All FORCE AEROSPACE MEDICAL RESEARCH LAS VlGH?-PATTERSON AFB.. UNCLASSIFIED V L MARTIN ET AL. 1S DEC 63 F/O o/3 HL Ehhmhhhni Ilillnl EBhhimhlI mmhhhmg * mihhh
Transcript of 601 OPTICAL AND HUMAN PERFORMANCE EVALUATION OF …
AD-A140 601 OPTICAL AND HUMAN PERFORMANCE EVALUATION OF HUD I/1IHEAD-UP DISPLAVI SYSVERS..IUI All FORCE AEROSPACEMEDICAL RESEARCH LAS VlGH?-PATTERSON AFB..
UNCLASSIFIED V L MARTIN ET AL. 1S DEC 63 F/O o/3 HLEhhmhhhniIlillnlEBhhimhlImmhhhmg* mihhh
-- - | '
1,8
MICROCOPY RESOLUTION TEST CHART
NATIONAL BUREAU OF STAFSDARDS-63-A

AD-A 140 601 -
AFAMRL-TR83-MMSD (ENA)Th6S.USI
OPTIAL AND HUNM ELSIUEVAJLUATIO OF HOUD SYSTEM M!S 1
WAYNEL MAB2IAMR P" AWLSPACZ MRDZCAL 34W1AR LARA2VZ
WAIIUD~tM AUTHORAMR KAWZARRWAFM3 ANWAL JRWAMBOA8C
LOW v GNNCY
wNSI w. WMW
AA-OU*WWAL WYMLM DI**RAAS. W SYIS R0 O
VMA*, *AN
4ao~mVIAIM
.... ...... n o
Ohe US Goverwimnt draWings VneificatiORS, Or 1 data ae* - forayurpose other thtan a d~Initly related 9*041iis r4mtmpa
tion. the Goverimot thereb sour m wp"mIbility M n Mr 1 1whatsoever, and the fact that the I.MW.M aw have ft"w. itad, or in any way supplied the ulid Erutep, SW Aa'ti" Or Odata, Is not to be regarded 1pieiIlicensing the holder or anyO'6 r W pWtWrights or permission to manufactVMS use .i O -othat may in amy way be related thereft.
Please do not request cepies of this ofput oe, No ~' sel d-ical Research Lakratory. Addittenal '' ayit .Ibd
Federal etnIT Chial lnf0'mttm Ceibr % 1
report to:.
I-t .;.
- ~ Y =

COPONENT PART NOTICE
THIS PAPER IS A COMPONENT PART OF THE FOLLOWING COMPILATION REPORT:
(TITLE): Optical and Human Performance Evaluation of HUD (Head-Up Display) Systems
Desin.
(SOURE): Air Force Aerospace Medical Research Lab., Wright-Patterson AFB. OH
To ORDER THE COMPLETE COMPILATION REPORT USE AD-A1O 601
THE COMPONENT PART IS PROVIDED HERE TO ALLOW USERS ACCESS TO INDIVIDUALLYMTHORED SECTIONS OF PROCEEDINGS, ANNALS, SYMPOSIA, ETC- HOWEVER THECOMPFONENT SHOULD BE CONSIDERED WITHIN THE CONTEXT OF THE OVERALL COMPILATIONREPORT AND NOT AS A STAND-ALONE TECHNICAL REPORT-
THE FOLLOWING COPONENT PART NUMBERS COMPRISE THE COMPILATION REPORT:
AD#: TITLE:
P003 157 Overview of HUD (Head-Up Display) Optical DesignsP003 158 Measurement of HUD (Head-Up Display) Optical QualityP003 159 Optical Interactions of Aircraft Windscreens and BUDs
(Head-Up Displays) Producing DiplopiaP003 160 Sun/Moon Capture EvaluationP003 161 Estimating Detection Range and Range Loss Looking throughP00 1Windshields and Head-Up DisplaysP003 162 Direct Performance Assessment of HUD (Head-Up Display) Display
Systems Using Contrast SensitivityP003 163 Physical Integration of the HUD (Head-Up Display)P003 164 Future Development Trends for Head-Up Displays
SAccesstn For 7'
NTIS GRAM4DTIC 20 0
Uinmaeed Q!'
Justikeati .
Sy• ;._D.istr ibuti s/
Av ail fod
DTCDist Vec talSjIC_______-i 7-. LECTED_ _____MAYS 2 , .Thk dctw m bo bm apMved
.. ....... .I -

COWOMEI4T PART NOTICE (CON'T)
AD#: TITLE:
UNCLASSIFIEDSECURITY CLASSIFICATION OF THIS PAGE
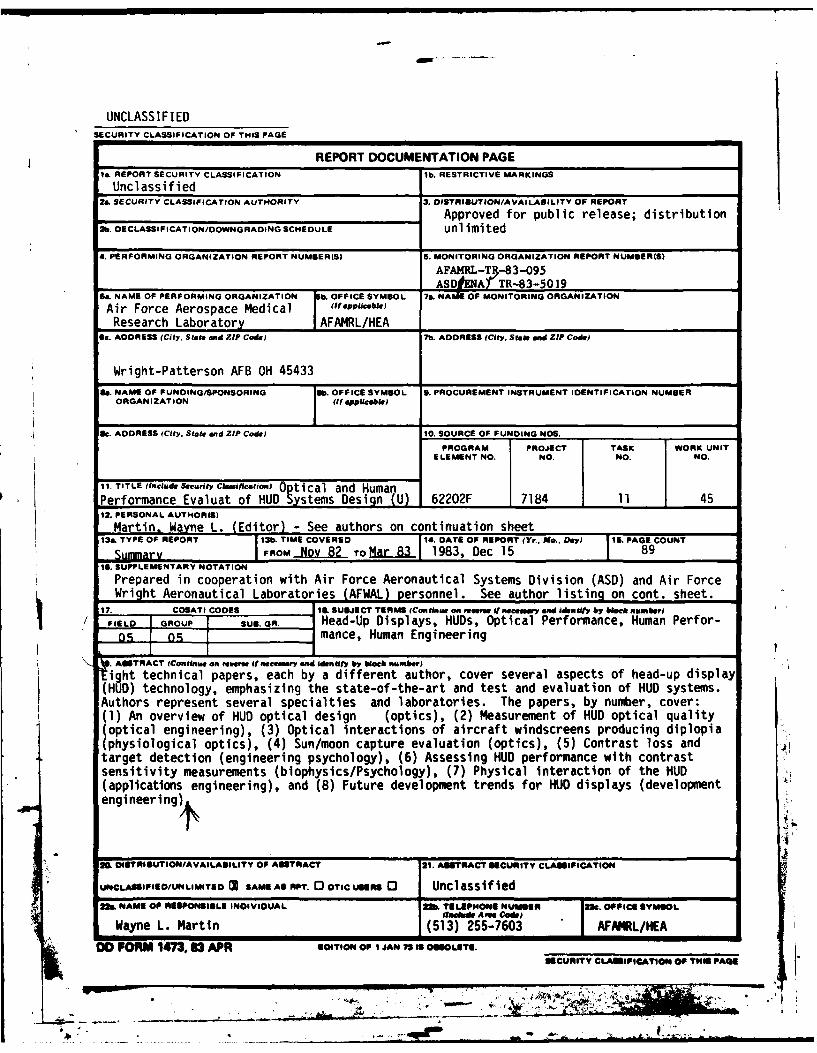
REPORT DOCUMENTATION PAGEIa. REPORT SECURITY CLASSIFICATION 1b. RESTRICTIVE MARKINGS
Unclassified ______________________2&. SECURITY CLASSIFICATION AUTHORITY 3. OISTRIBUTION/AVAILABILITY OF REPORT
__________________________________ Approved for public release; distribution2b. DECLASSIFICATION/OOWNGRADING SCHEDULE unlimited
4. PERFORMING ORGANIZATION REPORT NUMBER(S) S. MONITORING ORGANIZATION REPORT NUMSER(S)
AFAMRL-T3-83-095_____________________ __________ ASD A TR-83-50 19
Ga. NAME OF PERFORMING ORGANIZATION ~b. OFFICE SYMBOL 74. NAMJE OF MONITORING ORGANIZATION
Air Force Aerospace Medical (iaplcbeResearch Laboratory iAFAI4RL/HEA ____________________
Oc. ADDRESS (City. State aind ZIP Code) 7b. ADDRESS (City. State and ZIP Code)
Wright-Patterson AFB OH 45433
Go. NAME OF FUNDING/SPONSORING 0Sb. OFFICE SYMBOL 9. PROCUREMENT INSTRUMENT IDENTIFICATION NUMBERORGANIZATION (If applicable)
Be. ADDRESS (City. State and ZIP Coda) 10. SOURCE OF FUNDING NOS.
PROGRAM PROJECT TASK WORK UNITELE ME NT NO. NO. No. NO.
11. TITLE (Include Security Classification) 0 tical and Human*Performance Evaluat of HUD Systems Design (U) I62202F 7184 11 45
12. PERSONAL AUTHORS)
Martin, Wayne L. (Editor) - See authors on continuation sheet13a. TYPE OF REPORT 13b. TIME COVERED 14. DATE OF REPORT (Yr.. Mo.. Day) 15. PAGE COUNT
SmayFROM -Ny 2YaTOIar.a.. 1983, Dec 15 8910. SUPPLEMENTARY NOTATION
Prepared in cooperation with Air Force Aeronautical Systems Division (ASD) and Air ForceWright Aeronautical Laboratories (AFWAL personnel. See author listing on cont. sheet.
17. COSATI CODES I&. SUBJECT TIERMS (Con tinue on reeruse ti nearwy and identify by 'IoeS nuns ar)FIELD GROUP SUB. OR. Head-Up Displays, HUDs, Optical Performance, Human Perfor-
ne; nsmance, Human Engineering
*A40TRACT (Continueaon revre if necoal, and identfy by block number)
ight technical papers, each by a different author, cover several aspects of head-up display(HUD) technology, emphasizing the state-of-the-art and test and evaluation of HUD systems.Authors represent several specialties and laboratories. The papers, by numb~er, cover:(1) An overview of HUD optical design (optics), (2) Measurement of HUD optical quality
* (optical engineering), (3) Optical interactions of aircraft windscreens producing diplopia(physiological optics), (4) Sun/moon capture evaluation (optics), (5) Contrast loss andtarget detection (engineering psychology), (6) Assessing HUD performance with contrast
* sensitivity measurements (biophysics/Psychology), (7) Physical interaction of the HUD(applications engineering), and (8) Future development trends for HUD displays (developmentengineering)
20L 0I1RIBUIONIAVAILABILITY OF AESTRACT 21. AShTRACT SECURITY CLASSIFICATION
UNCLASSIPIEO/UNLIMITIEO 1 SAME AS RPT. 03 OTIC USERSB 3 Unclassified22L. NAME OP RESPONSIBLE INDIVIDUAL 22b6 TELEPHONE NUMBER S.OPIESMBOL
Wayne L. Martin(5325-63OpIaHE
00 FORM 1473.82 APR EIYIO OP I JAN 73218 OSOE1.6I. CRY ~P~IN~tI
19UIYCASIIAINOFTI 70
C~~ I..~
UNCLASSIFIlEDSECURITY CLASSIFICATION OF TIiS PAGE
FBlock 12, continued:
Authors: Lee, Richard D. ASD/ENA4LGinsburg, Arthur P. AFAt4RL/HEAGenco, Louis V. AFA!4RL/HEFTask, Harry L. AFAI4RL/HEFSelf, Herschel C. AFA!4RL/HEASchwartz, Ronald W. ASD/ENECCWilson, William ASO/ENASICoonrod, John F. AFWAL/AAAT
-PINI

PREFACE
This report and the majority of effort expended were generated underProject No. 7184, Program Element 62202F, Task No. 718411 and Work Unit71841145. This program was accomplished during the period of November 1982to March 1983.
This manuscript is a tribute to the dedication of the authors who gavetheir full support to the evaluation process described herein. The editorsincerely appreciates those who so diligently gave of their professionaltalents and time (much of which was during the Christmas holiday season) sothat a question of engineering, scientific, and operational importance mightbe answered to support a timely production decision for the F-16 aircraft.Their identities and affiliations are provided on the following pages.These members of the AFAMRL/ASD/AFWAL team supporting the effort representa very diverse group of technical specialities. The credit for the organi-zation and superb technical direction of the evaluation team goes to Dr.John C. Halpin (then ASD/ENE Technical Director). The wholehearted supportand encouragement of AFAMRL management (Col George C. Mohr, Commander, andMr. Charles Bates, Director, Human Engineering Division), ASO management(Mr. Fred T. Rall, Jr., ASD/EN Technical Director, Col Barton Krawetz,ASO/EN Deputy for Engineering, Brig Gen George Monahan, F-16 System ProgramDirector, Mr. Ray Johnson, Technical Advisor to F-16 System Program Office)and AFWAL management and contractor support personnel (Col Frank Moore,then AFWAL/FIG, Dr. Keith T. Burnette, Burnette Engineering, and Mr. PaulGarrett, Lear Siegler, Inc.) is gratefully acknowledged.
Finally, since the value of any scientific endeavor lies in its useful-ness, it is hoped that the information and methodologies described willserve as both a guide to understanding modern head-up display (HUD)technology, and the means by which that technology might be evaluated. I
cce ssion Fo r
TIC TAB
Unannour.Cea 0
By
Distribution/~__----C--
vaiiofd@Availability
Codes
A
ty
TABLE OF CONTENTS
TITLE AUTHOR/ORGANIZATION PAGE
INTRODUCTION 3
OVERVIEW OF HUD OPTICAL DESIGNS Richard D. Lee (ASD/ENAML) 4
MEASUREMENT OF HUD OPTICAL H. Lee Task (AFAMRL/HEF) 11QUALITY
OPTICAL INTERACTIONS OF AIRCRAFT Louis V. Genco (AFAMRL/HEF) 20WINDSCREENS AND HUDs PRODUCINGDIPLOPIA
SUN/MOON CAPTURE EVALUATION William Wilson (ASD/ENASI) 28
CONTRAST LOSS AND TARGET Herschel C. Self (AFAMRL/HEA) 31DETECTION
DIRECT PERFORMANCE ASSESSMENT Arthur P. Ginsburg (AFAMRL/HEA) 55OF HUD DISPLAY SYSTEMS USINGCONTRAST SENSITIVITY
PHYSICAL INTEGRATION OF THE HUD Ronald W. Schwartz (ASD/ENECC) 67
FUTURE DEVELOPMENT TRENDS OF John F. Coonrod (AFWAL/AAAT) 74HEAD-UP DISPLAYS
BIOGRAPHIES 83
2
It
- I
INTRODUCTION
Successful night attack missions against ground targets may require the use ofa head-up display (HUD) that simultaneously displays both terrain as imaged by asensor that can "see" in the dark, and a wide variety of symbolic data essential tocarry out the mission. Head-up displays with narrow fields of view make itdifficult to find targets and other objects of interest and keep them on the displayduring flight maneuvers. Even acquisition of navigation checkpoints at night, whenonly sensor images of terrain can be seen by the pilot, is difficult with a narrowfield of view HUD. The requirement for a t.ide field of view led to the acquisitionby the Air Force of prototype wide angle HUDs. Early during testing and evaluationof these devices, pilots complained of a variety of problems that had not beenpresent with earlier HUDs that were optically much less complex. It was essentialthat the reality and the seriousness of the problems be determined. It was clearthat doing this would require the united efforts of pilots, development and testpersonnel, as well as laboratory scientists. Accordingly, a multidisciplinaryteam of engineers and optical physicists, together with research psychologists andother human factors specialists, was formed at Wright-Patterson Air Force Base.Team members were recruited from several laboratories under the direction ofASD/ENE. The joint participation was later to be regarded as setting a significantprecedent for future multidisciplinary, multi-laboratory technical efforts.
Starting with a compilation of pilot comments regarding optical phenomenaobserved while viewing through the HUD, together with a series of presentations bythe optical and system development experts involved, a wide variety of measurementswere made using human observers as well as optical and spectroradiometricinstruments. I
The work was done on aircraft-mounted HUDs at Edwards Air Force Base inCalifornia, and on stand-mounted HUDs, both indoors and outdoors, at thelaboratories at Wright-Patterson Air Force Base.
During this process it became clear to the team members that HUD technologyand associated evaluation techniques were not widely known in the scientific andtechnical community. Since HUD systems are becoming primary flight instruments,this situation was regarded as deplorable. To help in rectifying the situation, Iteam members wrote a series of technical papers that collectively represented their
experiences through the evaluation process and now constitute an introduction toHUD technology and assessment. These papers were used as course notes in a "minicourse" given at the IEEE National Aerospace and Electronics Conference (NAECON) inDayton, Ohio on May 17, 1983. The course title was "Optical and Human PerformanceImpact of Head-Up Display Systems Design".
These course notes were revised and, in some cases, considerably expanded, andare provided in the present publication as an introduction to HUD technology and anevaluation of that technology from the most important perspective of all, theuser's.
1. 3
. 7 , -

OVERVIEW OF HUD OPTICAL DESIGNS
Richard LeeAeronautical Systems Division, Avionics Directorate
Laser/Electro-Optical Branch (ASD/ENAML)
Lfl INTRODUCTION
- -he Head-Up Display (HUD) and the new technologies being applied to it con-(tinue to receive great attention by people considering the functioning ofofighter and attack aircraft cockpits. The subject has also received its fair
share of attention over the last two years at NAECON as well. Berry and Byrd0 (1981) described the wide field of view (FOV) HUD being developed as part ofO the Low Altitude Navigation and Targeting Infrared for Night (LANTIRN) pro-
gram. Gard (1982) gave a presentation which described the different roles ofdiffraction optics as used in HUDs and relatively new optical designs which
S achieve a wider FOV.
This discussion summarizes the material covered by these two papers andserves to form a common basis of understanding of the various HUD technol-ogies. The important features highlighted here figure prominently in thediscussions which follow.
COLLIMATION:
When light travels outward from an object, it does so in expanding (diverg-ing) spherical wavefronts. The effect is similar to the ripples in a quietpond after a stone has been tossed in. We can carry the pond analogy further Iby placing two bugs relatively close to one another and a short distance fromthe stone's entry point on the water surface and asking them to face directlyinto the oncoming waves which they each see. The two bugs will notice that Ithey are not facing in exactly the same direction but instead, they line upon converging vectors which intersect where the stone fell in the pond. Sim-ilarly, our two eyes must adjust themselves to converging positions in orderto accommodate to the diverging wavefronts of light emitted by nearby objectswe look at.
If we return to our two bugs on the pond, but now toss a stone to a place faraway from them, they will -line themselves up practically parallel with nonoticeable convergence in their relative sightlines. As far as our bugs areconcerned, what they each see is a straight line wavefront coming from thesame direction. In this case, then, the two sightlines are said to be col-limated. The sightlines of our two eyes become collimated in a similar man-ner wWen we look at distant objects. The flat wavefront which leads to col-limated slghtlines is also said to be in a collimated condition.
Since the purpose of a HUD is to present information to a pilot without dis-turbing his fixation on distant objects, it must change the diverging wave-
fronts of light from its internal image source into wavefronts with the same
4'- : • " , r 4
-I
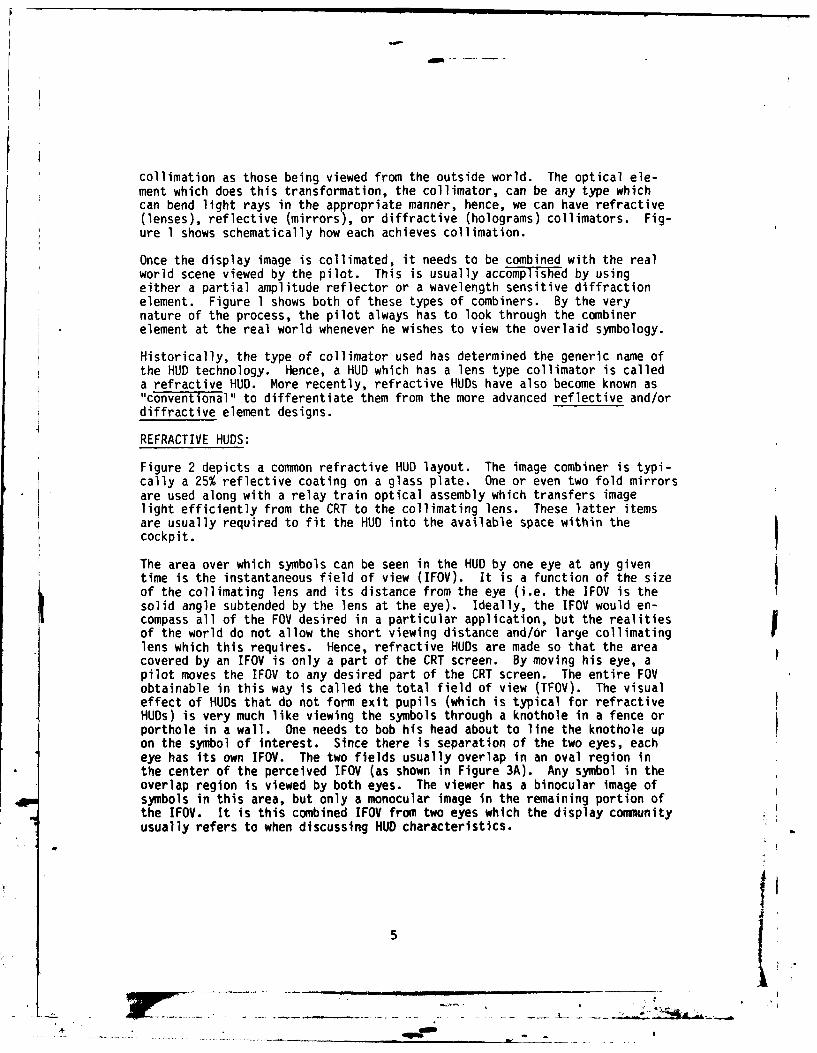
collimation as those being viewed from the outside world. The optical ele-ment which does this transformation, the collimator, can be any type whichcan bend light rays in the appropriate manner, hence, we can have refractive(lenses), reflective (mirrors), or diffractive (holograms) collimators. Fig-ure 1 shows schematically how each achieves collimation.
Once the display image is collimated, it needs to be combined with the realworld scene viewed by the pilot. This is usually accomplished by usingeither a partial amplitude reflector or a wavelength sensitive diffractionelement. Figure 1 shows both of these types of combiners. By the verynature of the process, the pilot always has to look through the combinerelement at the real world whenever he wishes to view the overlaid symbology.
Historically, the type of collimator used has determined the generic name ofthe HUD technology. Hence, a HUD which has a lens type collimator is calleda refractive HUD. More recently, refractive HUDs have also become known as"conventional" to differentiate them from the more advanced reflective and/ordiffractive element designs.
REFRACTIVE HUDS:
Figure 2 depicts a common refractive HUD layout. The image combiner is typi-cally a 25% reflective coating on a glass plate. One or even two fold mirrorsare used along with a relay train optical assembly which transfers imagelight efficiently from the CRT to the collimating lens. These latter itemsare usually required to fit the HUD into the available space within thecockpit. IThe area over which symbols can be seen in the HUD by one eye at any giventime is the instantaneous field of view (IFOV). It is a function of the sizeof the collimating lens and its distance from the eye (i.e. the IFOV is thesolid angle subtended by the lens at the eye). Ideally, the IFOV would en-compass all of the FOV desired in a particular application, but the realitiesof the world do not allow the short viewing distance and/or large collimating Ilens which this requires. Hence, refractive HUDs are made so that the areacovered by an IFOV is only a part of the CRT screen. By moving his eye, apilot moves the IFOV to any desired part of the CRT screen. The entire FOVobtainable in this way is called the total field of view (TFOV). The visualeffect of HUDs that do not form exit pupils (which is typical for refractiveHUDs) is very much like viewing the symbols through a knothole in a fence orporthole in a wall. One needs to bob his head about to line the knothole upon the symbol of interest. Since there is separation of the two eyes, eacheye has its own IFOV. The two fields usually overlap in an oval region inthe center of the perceived IFOV (as shown in Figure 3A). Any symbol in theoverlap region is viewed by both eyes. The viewer has a binocular image ofsymbols in this area, but only a monocular image in the remaining portion ofthe IFOV. It is this combined IFOV from two eyes which the display communityusually refers to when discussing HUD characteristics.
557 1777 -

REFLECTIVE HUDS:
If the combiner plate is made into a concave surface, it could perform boththe combining and collimation functions simultaneously (Figure 4). Such areflective HUD has the advantage that the collimator element is above theinstrument panel where it can be much larger than a collimating lens andcloser to the eye. The IFOV can now be much larger, approaching that of theTFOV. Since the IFOV of each eye is so much larger, the binocular visionoverlap area also becomes much larger and covers a majority of the TFOV, asshown in Figure 3B.
There is a fundamental difference in the way the collimator functions whichhas some direct consequences on viewing characteristics. In the refractiveHUD, light from any single point emerges in a collimated beam having thediameter of the lens. The CRT face composes a total viewing field (or per-missible head motion limit) which is conical in shape with an included angleequal to the TFOV limits. In the reflective HUD, each symbol uses only aportion of the collimator surface at one time. As a symbol moves over theCRT face, light from it emerges from different areas of the collimator in acollimated beam which is always smaller than the size of the collimator, butthe beams are all slanted to intersect at an exit pupil in the cockpit.Within this area or head motion box, all of the symbols can be seen simul-taneouslywith no head motion required (i.e., the IFOV equals the TFOV).
Any motion outside the head motion box causes the eye to miss substantialportions of the projected beams and the display quickly disappears. Theeffect is much like viewing the collimated symbols through long tubes, onetube for each symbol. The tubes are tilted so that their axes intersect atthe design point (variously called the design eye, working eye, or HUD eye).Each symbol is itself collimated, but the light is travelling along the axisof its tube. The amount one can move before a symbol is blocked by the in-ability to see down the tube defines the size of the head motion box.
ROLE OF DIFFRACTIVE OPTICS:
Up to this point, no mention has been made of diffractive optics (holograms).This section develops the role diffractive optics takes in modern HUD de-signs.
The trend in these new designs is to a very wide field of view. With thisrequirement in mind, one may quickly think of using a reflective HUD. How-ever, in order to minimize optical distortions, the concept shown in Figure 4would require a very expensive aspheric collimator because of the steep, off-axis angle of the light. The cost of such optical elements is prohibitiveand so methods must be found to allow use of spherical elements which are farless expensive.
The idealized case is, of course, to have the CRT at a large distance behindthe pilot facing forward and almost directly in front of the combiner elementas shown in Figure 5. This ideal situation can be closely approximated bymounting the CRT in an overhead position as is currently being done for com-mercial transports. If such a configuration used a conventional, partiallysilvered coating on the combiner, the display brightness would 6- adequate
6

but marginal. The brightness could be greatly increased if a way could befound to reflect nearly all of the CRT light back to the pilot while at thesame time transmitting most of the light from the outside world. Diffractiveoptical elements can do this more efficiently than dichroic coatings.
The type of diffractive element used in HUDs is a Bragg diffraction stack.It is generated by inducing a series of parallel sheets of alternating re-fractive index in a layer of gelatin sandwiched between two plates of glass.Light is diffracted according to the classic Bragg diffraction formula (2dsin*=m?.). The net effect is an angle- and wavelength-selective mirrorsurface which does not necessarily replicate the physical surface to which itis attached. The Bragg stack is induced into the gelatin via holographictechniques. So-called holographic HUDs which use these diffractive elementsdo not generate 3-D images, but instead use holography only in the manu-facturing of the diffraction elements.
The HUD shown in Figure 5, when using a diffractive collimator, exploits onlythe frequency/angle selectivity of diffractive optics. If we return to ouroriginal reflective HUD concept (Figure 4), but instead use a simple spheri-cal glass element, an effective aspherical reflecting surface can be gen-erated by diffractive techniques. Such a HUD would have the basic configura-tion shown in Figure 6A. This configuration becomes more practical with theuse of diffractive optics, but is not totally without problems. Such dif-fractive elements with optical power can suffer from undesirable secondaryoptical effects which cause multi-colored halos to appear around bright lightsources. Only recently has problems.-associated with diffractive elementshaving optical power been shown to be manageable.
Given that earlier designs had to use diffractive optics with no opticalpower (i.e., the effective reflecting surface replicated the real surface)only quasi-axial spherical collimator/combiners could be considered. Figure6B is a simple design that uses only two plates to achieve the condition oflight incident on the collimator surface nearly on-axis and from the pilot'sside. But,the rear plate is angled so that some light from the bright sky Iwould be selected by the diffraction element and directed to the pilot, caus-ing an unacceptable amount of glare in his line of vision. Another approachis shown in Figure 6C. This design, used in the LANTIRN program, avoids sky-light glare directly, but has some secondary "reflections" (really diffrac-tions). A more complete discussion of the design, performance, and limita-tions of the LANTIRN HUD is given in the Berry (1981) paper.
REFERENCES
1. Berry, Robert L. The LANTIRN Wide Field-of-View Raster Head-Up Display;NAECON proceedings, 1981, pp. 1261-1268.
2. Gard, Jerold H. Holographic HUDs De-Mystified; NAECON proceedings, 1982,pp. 752-259.
7
LL#J 0.c
S- t
C-) (A~ 4-) S-
4- -Oa
0
4- 4,-)
C)) .0 4- )
4-.4- C)
-J - Cm0
CC))
2 UU 0) z 4-
S.... 4- tLWJ fO 4- ~
Li~i ' 0 4-
4-JC)
4-0 O.0 0CA
0 0z. .w wA S - S - 4I i
C"-A
> ~.CJ 4-' ) -
u- 0ui~~~ to4j -U
4-j -0 #A o $. t(A
0 QJ) (D
4J S- to4 ' 4-' 1..
WOC
S - w
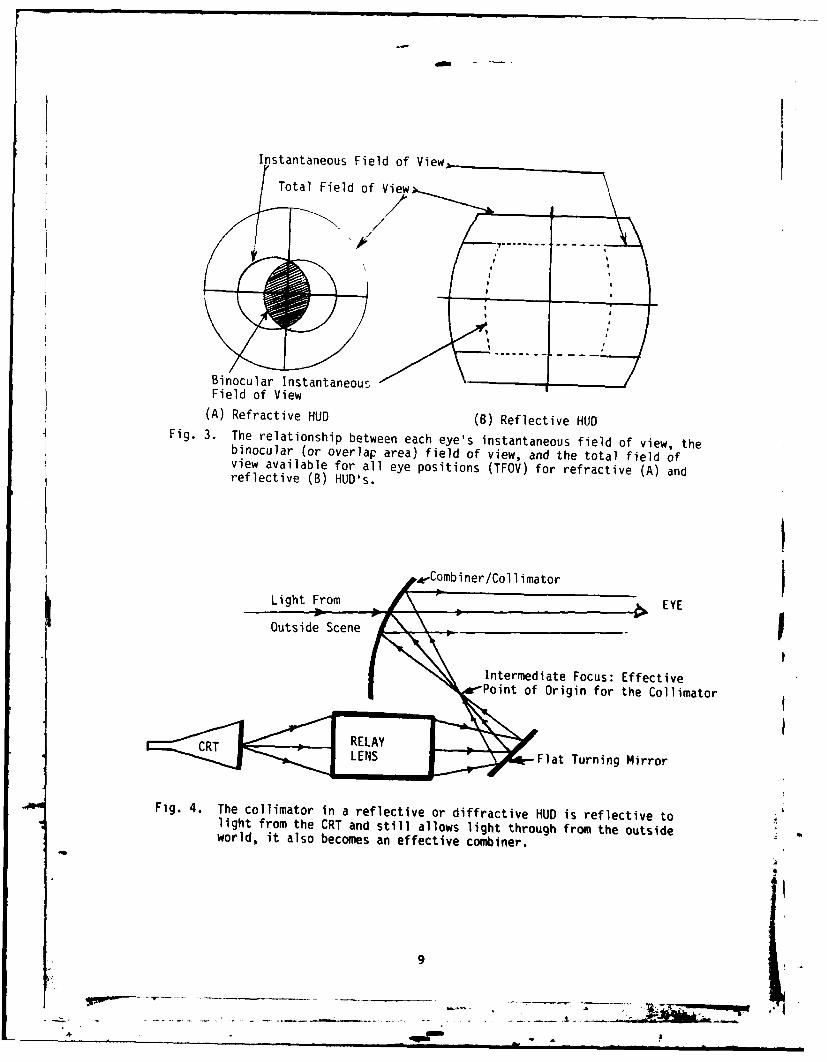
Instantaneous Field of View,
Total Field of View
Binocular InstantaneousField of View(A) Refractive HUD (B) Reflective HUD
Fig. 3. The relationship between each eye's instantaneous field of view, thebinocular (or overlap area) field of view, and the total field ofview available for all eye positions (TFOV) for refractive (A) andreflective (B) HUD's.
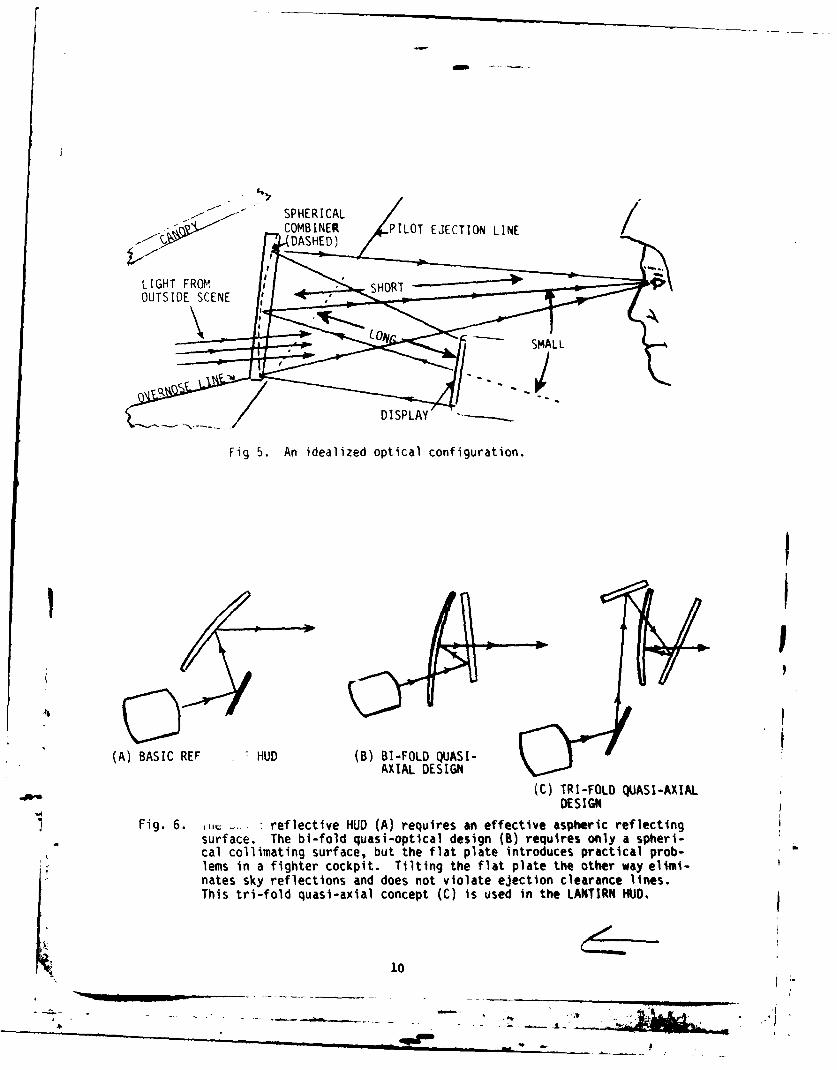
,Combiner/Collimator ILight From
EYEOutside Scene
InIIntermediate Focus: Effective
Point of Origin for the Collimator
RELAYS
TLENS Flat Turning Mirror
Fig. 4. The collimator in a reflective or diffractive HUD is reflective tolight from the CRT and still allows light through from the outsideworld, it also becomes an effective combiner.
9
-- i---- - - 1 7 i - .i L. -
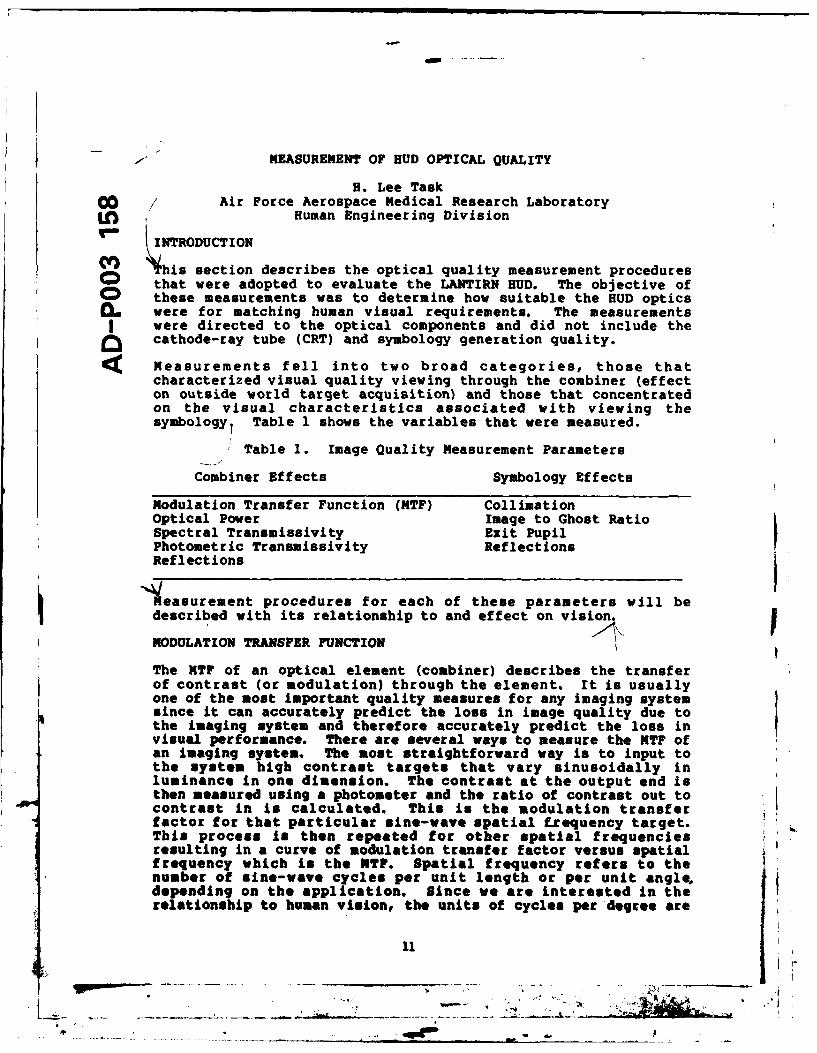
LIGHT FROM SHORT
SMALL
Fig 5. An idealized optical configuration.
I
(A) BASIC REF HUD (B) BI-FOLD QUASI-AXIAL DESIGN
(C) TRI-FOLD QUASI-AXIALDESIGN
* Fig. 6. , reflective HUD (A) requires an effective aspheric reflectingsurface. The bi-fold quasi-optical design (B) requires only a spheri-cal collimating surface, but the flat plate introduces practical prob-lems in a fighter cockpit. Tilting the flat plate the other way elimi-nates sky reflections and does not violate ejection clearance lines.This tri-fold quasi-axial concept (C) is used in the LANTIRN HUD.
"--- ------.-- -
i l I
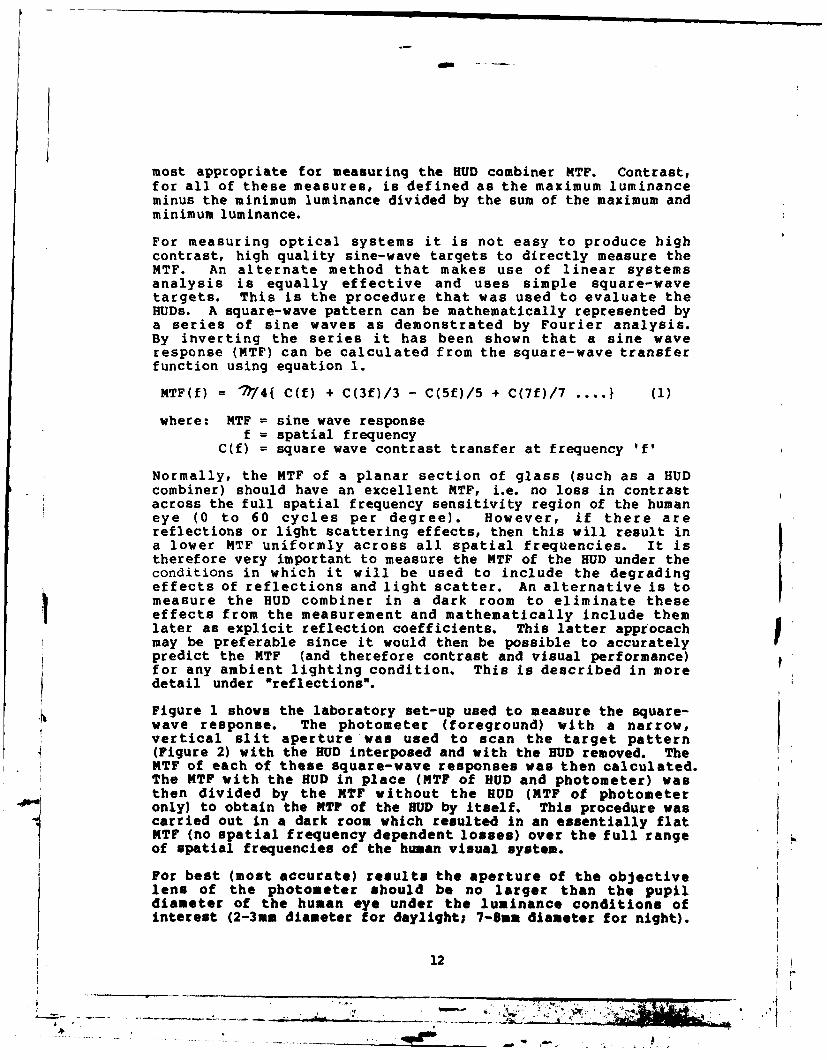
/- MEASUREMENT OF BUD OPTICAL QUALITY
H. Lee Task00 / Air Force Aerospace Medical Research LaboratoryLn Human Engineering Division
T INTRODUCTION
his section describes the optical quality measurement procedureso that were adopted to evaluate the LANTIRN HUD. The objective ofo these measurements was to determine how suitable the HUD optics0L were for matching human visual requirements. The measurements
were directed to the optical components and did not include thecathode-ray tube (CRT) and symbology generation quality.
S Measurements fell into two broad categories, those thatcharacterized visual quality viewing through the combiner (effecton outside world target acquisition) and those that concentratedon the visual characteristics associated with viewing thesymbologyT Table 1 shows the variables that were measured.
Table 1. Image Quality Measurement Parameters
Combiner Effects Symbology Effects
Modulation Transfer Function (MTF) CollimationOptical Power Image to Ghost RatioSpectral Transmissivity Exit Pupil IPhotometric Transmissivity ReflectionsReflections
Measurement procedures for each of these parameters will bedescribed with its relationship to and effect on vision.
MODULATION TRANSFER FUNCTION
The MTF of an optical element (combiner) describes the transferof contrast (or modulation) through the element. It is usuallyone of the most important quality measures for any imaging systemsince it can accurately predict the loss in image quality due tothe imaging system and therefore accurately predict the loss invisual performance. There are several ways to measure the MTF ofan imaging system. The most straightforward way is to input tothe system high contrast targets that vary sinusoidally inluminance in one dimension. The contrast at the output end isthen measured using a photometer and the ratio of contrast out tocontrast in is calculated. This is the modulation transferfactor for that particular sine-wave spatial frequency target.This process is then repeated for other spatial frequenciesresulting in a curve of modulation transfer factor versus spatialfrequency which is the NTF. Spatial frequency refers to thenumber of sine-wave cycles per unit length or per unit angle,depending on the application. Since we are interested in therelationship to human vision, the units of cycles per degree are
11
. . . -,. . . . .. . . . . . .....-.- .a...e
most appropriate for measuring the HUD combiner NTF. Contrast,for all of these measures, is defined as the maximum luminanceminus the minimum luminance divided by the sum of the maximum andminimum luminance.
For measuring optical systems it is not easy to produce highcontrast, high quality sine-wave targets to directly measure theMTF. An alternate method that makes use of linear systemsanalysis is equally effective and uses simple square-wavetargets. This is the procedure that was used to evaluate theHUDs. A square-wave pattern can be mathematically represented bya series of sine waves as demonstrated by Fourier analysis.By inverting the series it has been shown that a sine waveresponse (MTF) can be calculated from the square-wave transferfunction using equation 1.
MTF(f) = "/4{ C(f) + C(3f)/3 - C(5f)/5 + C(7f)/7 .... } (1)
where: MTF = sine wave responsef = spatial frequency
C(f) = square wave contrast transfer at frequency 'f'
Normally, the MTF of a planar section of glass (such as a HUDcombiner) should have an excellent MTF, i.e. no loss in contrastacross the full spatial frequency sensitivity region of the humaneye (0 to 60 cycles per degree). However, if there arereflections or light scattering effects, then this will result ina lower MTF uniformly across all spatial frequencies. It is Itherefore very important to measure the MTF of the HUD under theconditions in which it will be used to include the degradingeffects of reflections and light scatter. An alternative is tomeasure the HUD combiner in a dark room to eliminate theseeffects from the measurement and mathematically include themlater as explicit reflection coefficients. This latter approcachmay be preferable since it would then be possible to accuratelypredict the MTF (and therefore contrast and visual performance)for any ambient lighting condition. This is described in moredetail under "reflections".
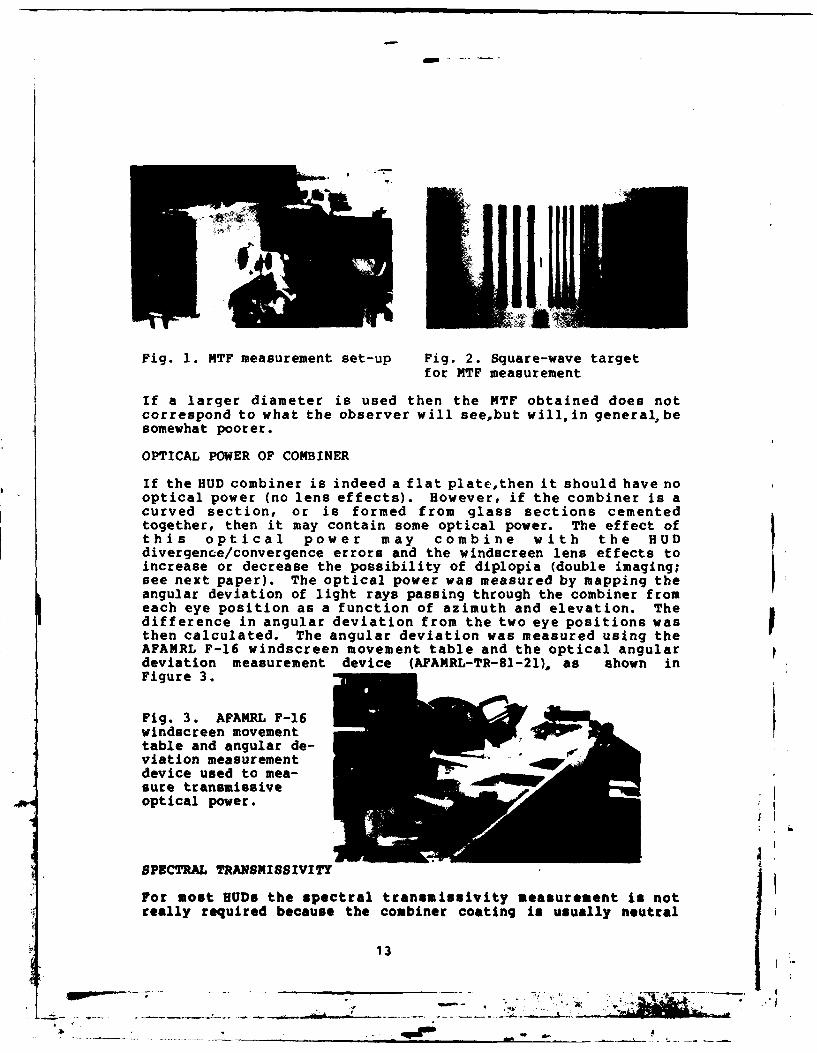
Figure 1 shows the laboratory set-up used to measure the square-wave response. The photometer (foreground) with a narrow,vertical slit aperture was used to scan the target pattern(Figure 2) with the BUD interposed and with the BUD removed. TheMTF of each of these square-wave responses was then calculated.The MTF with the BUD in place (MTF of HUD and photometer) wasthen divided by the NTF without the HUD (MTF of photometeronly) to obtain the MTF of the BUD by itself. This procedure wascarried out in a dark room which resulted in an essentially flatNTF (no spatial frequency dependent losses) over the full rangeof spatial frequencies of the human visual system.
For best (most accurate) results the aperture of the objectivelens of the photometer should be no larger than the pupildiameter of the human eye under the luminance conditions ofinterest (2-3mm diameter for daylight; 7-Smm diameter for night).
12
1 "PA
IIL
Fig. 1. NTF measurement set-up Fig. 2. Square-wave targetfor MTF measurement
If a larger diameter is used then the MTF obtained does notcorrespond to what the observer will see,but will, in general, besomewhat poorer.
OPTICAL POWER OF COMBINER
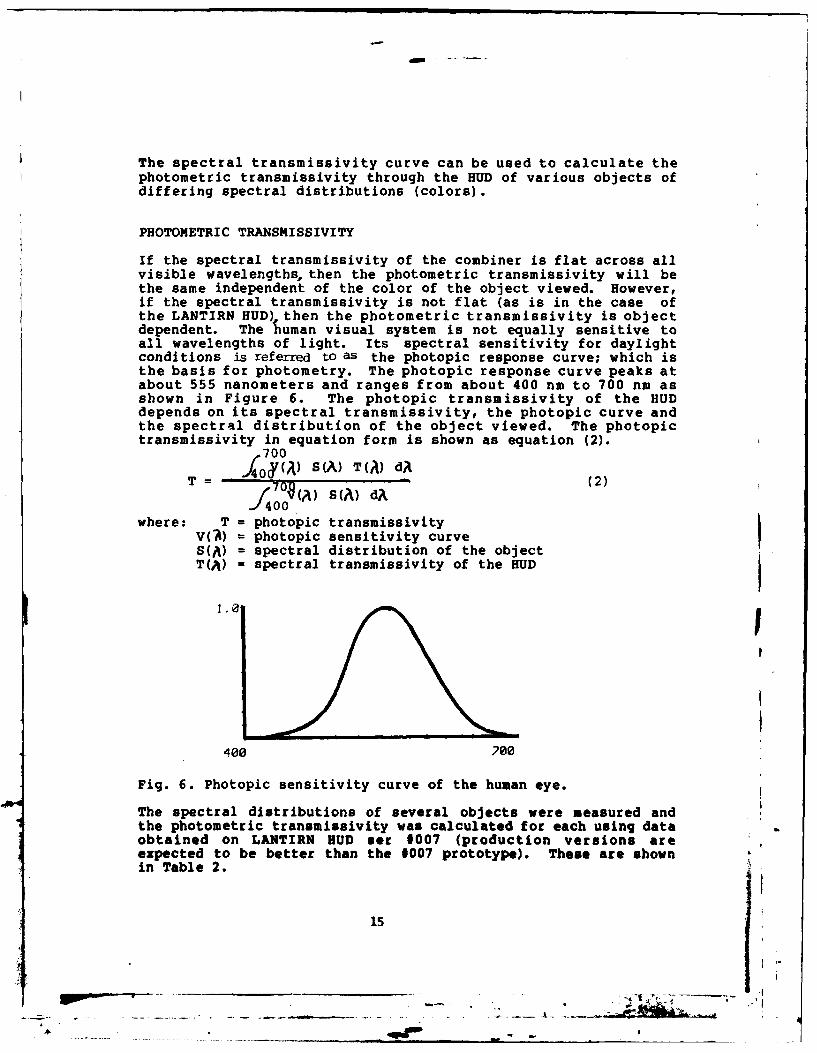
If the HUD combiner is indeed a flat plate,then it should have nooptical power (no lens effects). However, if the combiner is acurved section, or is formed from glass sections cementedtogether, then it may contain some optical power. The effect ofthis optical power may combine with the HUDdivergence/convergence errors and the windscreen lens effects toincrease or decrease the possibility of diplopia (double imaging;see next paper). The optical power was measured by mapping theangular deviation of light rays passing through the combiner fromeach eye position as a function of azimuth and elevation. Thedifference in angular deviation from the two eye positions was Ithen calculated. The angular deviation was measured using theAFAMRL F-16 windscreen movement table and the optical angulardeviation measurement device (AFAMRL-TR-81-21), as shown inFigure 3.
Fig. 3. AFAMRL F-16windscreen movementtable and angular de-viation measurementdevice used to mea-sure transmissiveoptical power.
SPECTRAL TRANSMISSIVITY
For most HUDs the spectral transmissivity measurement in notreally required because the combiner coating is usually neutral
13
• .: - -' .-- • _ ,. ; i
-: . . . .

with respect to wavelength. In other words, it passes apercentage of the light incident on it independent of wavelength.However, if the HUD combiner uses holographic optical elements(HOEs), such as the LANTIRN HUD; or if it has a dichroic ortrichroic coating,then the transmission of the combiner needs tobe measured for each wavelength resulting in a spectraltransmissivity curve. A spectral scanning radiometer and a lightbox were used to make this measurement. The procedure was tomake a spectral scan on the light box by itself then make aspectral scan of the light box through the combiner of the BUD.The second scan was then divided (wavelength by wavelength) bythe first scan to yield the spectral transmissivity of the HUD.This process was done in a dark room to insure that reflectionsdid not contaminate the readings. It is important to be carefulof the size of the aperture of the radiometer to insure that allthe light entering the radiometer has gone through the area ofinterest on the combiner. In the case of the LANTIRN BUD, the"eyebrow" section was fairly narrow making it somewhat moredifficult to measure its spectral transmissivity. Figures 4 and 5show the spectral transmissivity through the eyebrow and centralarea respectively of a IANTIRN HD.
400 700
Fig. 4. Spectral transmis~ivity through the eyebrow portion of aLANTIRN HUD.
1.0
Fig. 5. Spectral tranamissivity through the central portion ofa LANTIRN BUD.
14
14 4"Paw
The spectral transmissivity curve can be used to calculate thephotometric transmissivity through the HUD of various objects ofdiffering spectral distributions (colors).
PHOTOMETRIC TRANSMISSIVITY
If the spectral transmissivity of the combiner is flat across allvisible wavelengths, then the photometric transmissivity will bethe same independent of the color of the object viewed. However,if the spectral transmissivity is not flat (as is in the case ofthe LANTIRN HUD), then the photometric transmissivity is objectdependent. The human visual system is not equally sensitive toall wavelengths of light. Its spectral sensitivity for daylightconditions is referred to as the photopic response curve; which isthe basis for photometry. The photopic response curve peaks atabout 555 nanometers and ranges from about 400 nm to 700 nm asshown in Figure 6. The photopic transmissivity of the HUDdepends on its spectral transmissivity, the photopic curve andthe spectral distribution of the object viewed. The photopictransmissivity in equation form is shown as equation (2).
700
TV(A) S(A) T(A) d(T . . .. (2)
f 09(A) 8 (A) d;(
where: T = photopic transmissivityV(A) = photopic sensitivity curveS(A) = spectral distribution of the objectT(A) = spectral transmissivity of the BUD
1.0
400 200
Fig. 6. Photopic sensitivity curve of the human eye.
The spectral distributions of several objects were measured andthe photometric transmissivity was calculated for each using dataobtained on LANTIRN HUD ser #007 (production versions areexpected to be better than the 9007 prototype). These are shownin Table 2.
is
- .. -.-- ;
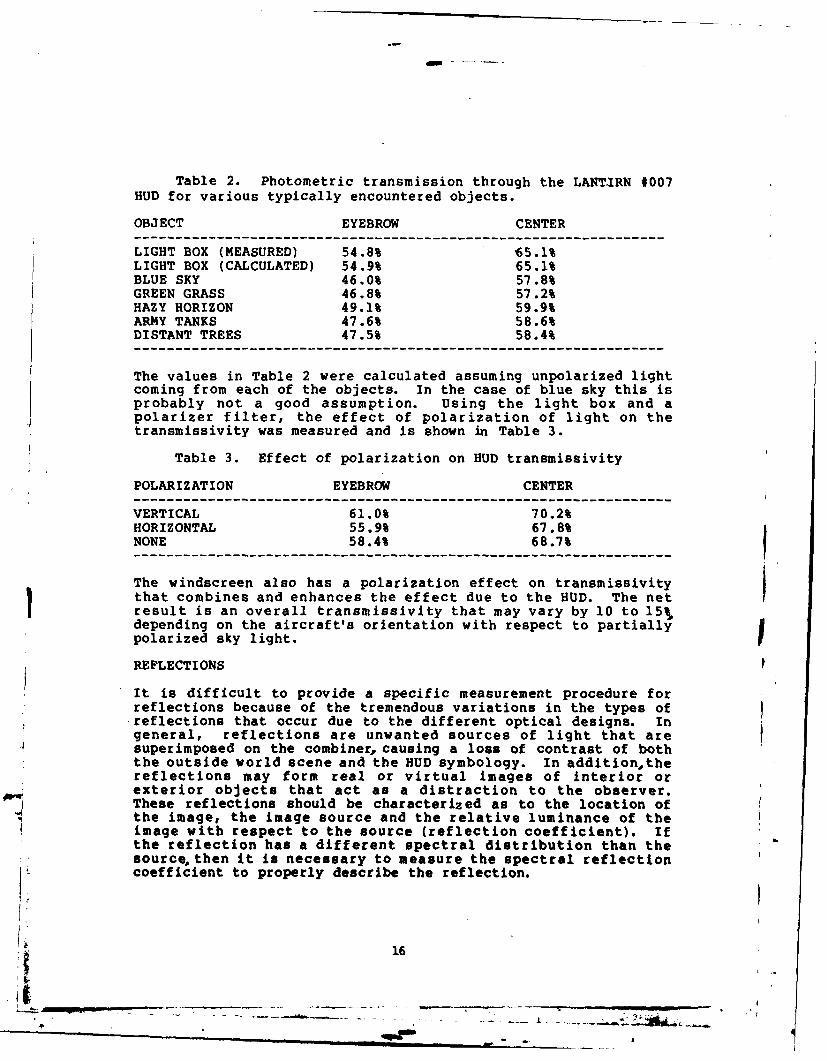
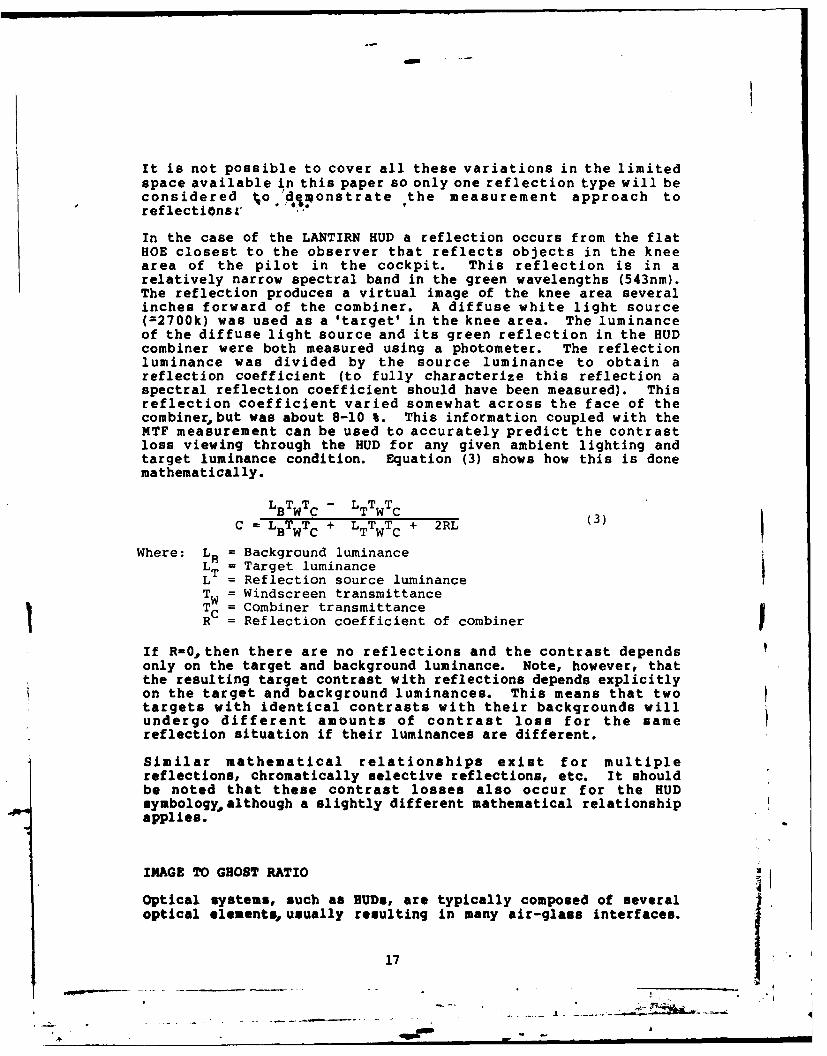
Table 2. Photometric transmission through the LANTIRN #007
HUD for various typically encountered objects.
OBJECT EYEBROW CENTER
LIGHT BOX (MEASURED) 54.8% 65.1%LIGHT BOX (CALCULATED) 54.9% 65.1%BLUE SKY 46.0% 57.8%GREEN GRASS 46.8% 57.2%HAZY HORIZON 49.1% 59.9%ARMY TANKS 47.6% 58.6%DISTANT TREES 47.5% 58.4%
The values in Table 2 were calculated assuming unpolarized lightcoming from each of the objects. In the case of blue sky this isprobably not a good assumption. Using the light box and apolarizer filter, the effect of polarization of light on thetransmissivity was measured and is shown in Table 3.
Table 3. Effect of polarization on HUD transmissivity
POLARIZATION EYEBROW CENTER
VERTICAL 61.0% 70.2%HORIZONTAL 55.9% 67.8%NONE 58.4% 68.7%
The windscreen also has a polarization effect on transmissivitythat combines and enhances the effect due to the HUD. The netresult is an overall transmissivity that may vary by 10 to 15%,depending on the aircraft's orientation with respect to partiallypolarized sky light.
REFLECTIONS
It is difficult to provide a specific measurement procedure forreflections because of the tremendous variations in the types ofreflections that occur due to the different optical designs. Ingeneral, reflections are unwanted sources of light that aresuperimposed on the combiner, causing a loss of contrast of boththe outside world scene and the HUD symbology. In additionsthereflections may form real or virtual images of interior orexterior objects that act as a distraction to the observer.These reflections should be characterized as to the location ofthe image, the image source and the relative luminance of theimage with respect to the source (reflection coefficient). Ifthe reflection has a different spectral distribution than thesourcethen it is necessary to measure the spectral reflectioncoefficient to properly describe the reflection.
K 16
Iii
$
It is not possible to cover all these variations in the limitedspace available in this paper so only one reflection type will beconsidered %o di onstrate the measurement approach toreflections.
In the case of the LANTIRN HUD a reflection occurs from the flatHOE closest to the observer that reflects objects in the kneearea of the pilot in the cockpit. This reflection is in arelatively narrow spectral band in the green wavelengths (543nm).The reflection produces a virtual image of the knee area severalinches forward of the combiner. A diffuse white light source(=2700k) was used as a 'target' in the knee area. The luminanceof the diffuse light source and its green reflection in the HUDcombiner were both measured using a photometer. The reflectionluminance was divided by the source luminance to obtain areflection coefficient (to fully characterize this reflection aspectral reflection coefficient should have been measured). Thisreflection coefficient varied somewhat across the face of thecombiner,but was about 8-10 %. This information coupled with theMTF measurement can be used to accurately predict the contrastloss viewing through the HUD for any given ambient lighting andtarget luminance condition. Equation (3) shows how this is donemathematically.
LBTwTC - LTTwTC
C - LBTwTC + LTTwTC + 2RL (3)
Where: LB = Background luminanceL = Target luminanceL = Reflection source luminanceTW = Windscreen transmittanceT = Combiner transmittanceRC = Reflection coefficient of combiner
If R-0,then there are no reflections and the contrast dependsonly on the target and background luminance. Note, however, thatthe resulting target contrast with reflections depends explicitlyon the target and background luminances. This means that twotargets with identical contrasts with their backgrounds willundergo different amounts of contrast loss for the samereflection situation if their luminances are different.
Similar mathematical relationships exist for multiplereflections, chromatically selective reflections, etc. It shouldbe noted that these contrast losses also occur for the HUDsymbology, although a slightly different mathematical relationshipapplies.
IMAGE TO GHOST RATIO
Optical systems, such as SUDs, are typically composed of severaloptical elements, usually resulting in many air-glass interfaces.
17
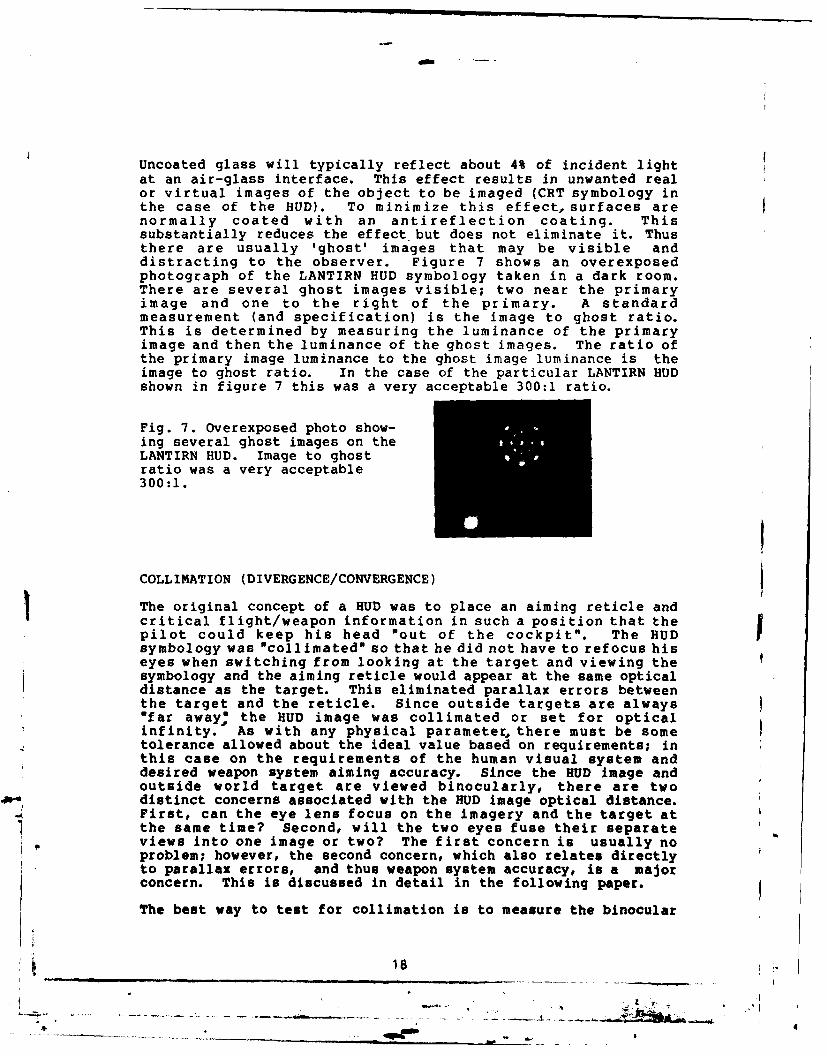
Uncoated glass will typically reflect about 4% of incident lightat an air-glass interface. This effect results in unwanted realor virtual images of the object to be imaged (CRT symbology inthe case of the HUD). To minimize this effect, surfaces arenormally coated with an antireflection coating. Thissubstantially reduces the effect but does not eliminate it. Thusthere are usually 'ghost' images that may be visible anddistracting to the observer. Figure 7 shows an overexposedphotograph of the LANTIRN HUD symbology taken in a dark room.There are several ghost images visible; two near the primaryimage and one to the right of the primary. A standardmeasurement (and specification) is the image to ghost ratio.This is determined by measuring the luminance of the primaryimage and then the luminance of the ghost images. The ratio ofthe primary image luminance to the ghost image luminance is theimage to ghost ratio. In the case of the particular LANTIRN HUDshown in figure 7 this was a very acceptable 300:1 ratio.
Fig. 7. Overexposed photo show-ing several ghost images on theLANTIRN HUD. Image to ghostratio was a very acceptable300:1.
COLLIMATION (DIVERGENCE/CONVERGENCE)
The original concept of a HUD was to place an aiming reticle andcritical flight/weapon information in such a position that thepilot could keep his head "out of the cockpit". The HUD Isymbology was "collimated" so that he did not have to refocus hiseyes when switching from looking at the target and viewing thesymbology and the aiming reticle would appear at the same opticaldistance as the target. This eliminated parallax errors betweenthe target and the reticle. Since outside targets are always"far away" the HUD image was collimated or set for opticalinfinity. As with any physical parameter there must be sometolerance allowed about the ideal value based on requirements; inthis case on the requirements of the human visual system anddesired weapon system aiming accuracy. Since the BUD image andoutside world target are viewed binocularly, there are twodistinct concerns associated with the BUD image optical distance.First, can the eye lens focus on the imagery and the target atthe same time? Second, will the two eyes fuse their separateviews into one image or two? The first concern is usually noproblem; however, the second concern, which also relates directlyto parallax errors, and thus weapon system accuracy, is a majorconcern. This is discussed in detail in the following paper.
The beat way to test for collimation is to measure the binocular
i ii i _ t18
OPTICAL INTERACTIONS OFAIRCRAFT WINDSCREENS AND HUDS
PRODUCING DIPLOPIA
0) Lt Col Louis V. GencoLf , Air Force Aerospace Medical Research LaboratoryV Human Engineering Division
O -4 he Air Force is in the process of evaluating new, wide field of0.. view heads-up displays (WFOV HUDs) capable of presenting angenhanced array of visual imagery to pilots of modern aircraft.
The wider fields of view through the WFOV HUD optics are achievedby using either conventional optics (as in the AFTI HUD), or
S holographic optical components (as in the LANTIRN HUD) to enlargethe binocular portion of the field of view (BFOV). In each ofthese designs, the portion of the FOV available for simultaneoususe by both eyes, and the total instantaneous FOV issignificantly larger than that found in "standard" HUDs.
The RLb~~
Several pilot complaints have been received concerning doublevision (diplopia) experienced while using LANTIRN F-16 HUD serialnumber 007 in a test aircraft. Specifically, complaint was madeof seeing two targets while maintaining a single image of thedisplay-generated aiming symbol. Statements have also been madeconcerning the doubled appearance of the pipper while maintaininga single image of the target. At least one pilot stated hisdepth perception was "different", and the world "appearedflatter." These complaints are based on visual errors induced inthe pilots' binocular (two-eyed) visual system by the HUD andcanopy optics. Not unreasonably, the complaints generated high-level concern about the utility of WFOV HUDs in general, andholographic HUD optical systems in particular. This paper willexplain why these visual problems were experienced, and recommendsome solutions for any WFOV HUD system, whether it includesholographic optics, as in the LANTIRN system, or "conventional"optics,as in the AFTI system.
The Zy = YJIma1 Phys U~gy-
Whenever we look directly at an object or target, light from thetarget is focussed by the eye's optical system to fall on theretina. At the same time, each eye rotates slightly so theimages fall on a particular part of each retina called the"fovea." Even though there are two images (one in each eye), wesee only one object because nerves from the fovea eventuallymerge into only one perceptual area in the brain. Each of thetwo eyes has been mapped to show all possible retinal locationswhere only one image is perceived when both eyes receive similarappearing images. These retinal locations are called
20
convergence or divergence (vergence) of the HUD. Thisoccasionally gets confusing because a HUD which has a divergingimage causes the eyes to converge in order to fuse the image anda converging HUD image causes the eyes to diverge. As noted inthe following paper, it is necessary to have a measurementprocedure for vergence for both the HUD image and the windscreen"image" of outside objects.
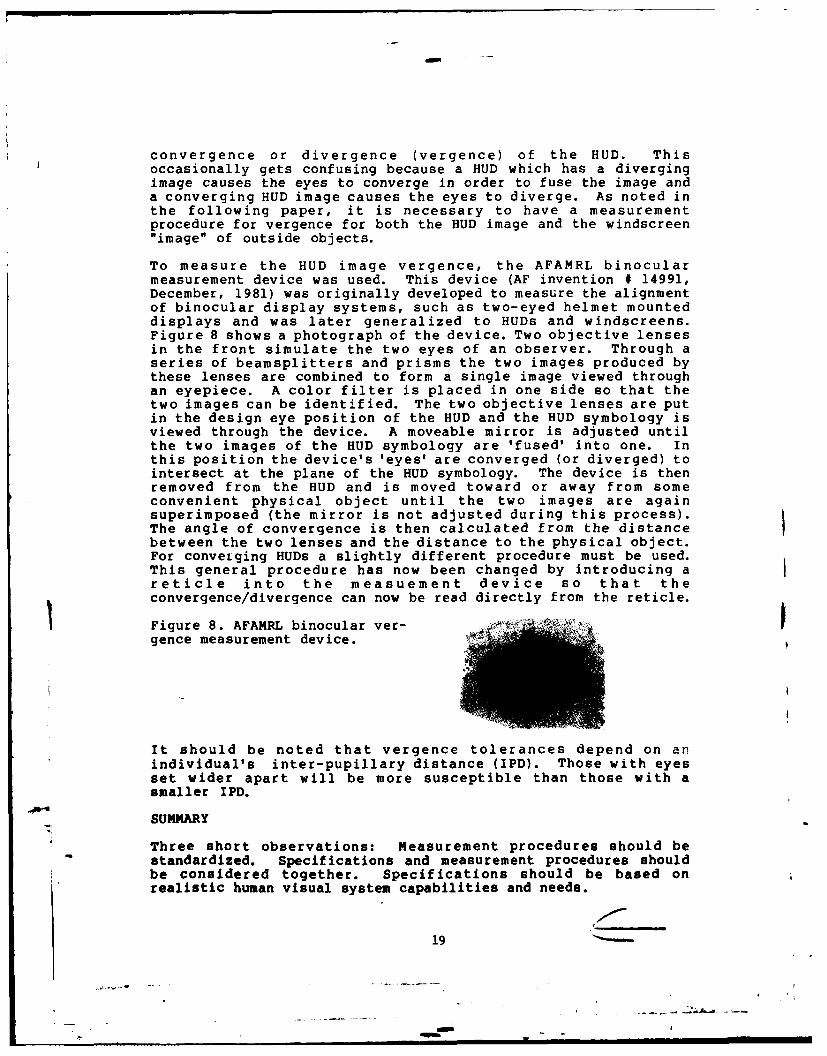
To measure the HUD image vergence, the AFAMRL binocularmeasurement device was used. This device (AF invention # 14991,December, 1981) was originally developed to measure the alignmentof binocular display systems, such as two-eyed helmet mounteddisplays and was later generalized to HUDs and windscreens.Figure 8 shows a photograph of the device. Two objective lensesin the front simulate the two eyes of an observer. Through aseries of beamsplitters and prisms the two images produced bythese lenses are combined to form a single image viewed throughan eyepiece. A color filter is placed in one side so that thetwo images can be identified. The two objective lenses are putin the design eye position of the HUD and the HUD symbology isviewed through the device. A moveable mirror is adjusted untilthe two images of the HUD symbology are 'fused' into one. Inthis position the device's 'eyes' are converged (or diverged) tointersect at the plane of the HUD symbology. The device is thenremoved from the HUD and is moved toward or away from someconvenient physical object until the two images are againsuperimposed (the mirror is not adjusted during this process).The angle of convergence is then calculated from the distancebetween the two lenses and the distance to the physical object.For conveiging HUDs a slightly different procedure must be used.This general procedure has now been changed by introducing areticle into the measuement device so that theconvergence/divergence can now be read directly from the reticle.
Figure 8. AFAMRL binocular ver-gence measurement device.
It should be noted that vergence tolerances depend on anindividual's inter-pupillary distance (IPD). Those with eyesset wider apart will be more susceptible than those with asmaller IPD.
SUMMARY
Three short observations: Measurement procedures should bestandardized. Specifications and measurement procedures shouldbe considered together. Specifications should be based onrealistic human visual system capabilities and needs.
19
"corresponding points." The foveas are an example of twocorresponding points. There are many more, distributedsymmetrically about each fovea. Whenever fairly similar imagesare focussed on corresponding points in each eye, we see only onepicture. This ability of our visual system to make oneperceptual image from two retinal images is called "fusion."
Any well-engineered system is constructed with certain tolerancesto error. Our eyes are no different. Each corresponding pointhas a small area surrounding it (Panum's area) which can toleratea little misregistration of the image. Although we don't seedouble if the images fall outside the corresponding points butwithin Panum's areas, we do see this misregistration as a changein apparent depth of the objects. Images falling on nasalportions of Panum's areas are seen as being farther away in spacethan images falling on temporal portions. This disparity in therelative positions of similar images falling on each retina isalso called "stereopsis" or depth perception.
Depth perception is affected by several cues, but the mostimportant and most sensitive one -- which uses information fromboth eyes -- is stereopsis. Stereopsis also happens to be theonly depth perception cue tested on flight physicals. Figure 1illustrates how stereopsis works. Assume the eyes are looking atpoint B, so that target is imaged on each fovea. Light frompoint A also enters the eye, but is imaged on the retina a littledistance from B. Laboratory experiments have shown that if theangle between these two rays of light entering the eye is assmall as two seconds of arc, people will see point A as beingcloser than point B. This misregistration of images on theretina is sometimes called "retinal disparity", or "parallax."
If the parallax angle exceeds a certain amount, the images nolonger fall within Panum's Area, and double vision will result.If point A were sufficiently far from point B, an observerlooking at point B would see two images of point A. If theobserver alternately closed one eye then the other, the image ofpoint A would appear to jump back and forth. This jump or motionparallax is due to the misalignment of the object with our normallines of sight. You can test this by looking (with both eyes) ata clock or other object on a distant wall. If you place yourthumb in your line of sight, you may see two thumbs while youcontinue to look at the clock. If you alternately close youreyes, you will see your thumb jump back and forth. If it weren'tfor the built-in tolerances in our visual system, we would alwayssee two images of any object not directly in our lines of sight.
All of this can be summarized: if the optical distances of twotargets near our visual axes are relatively similar, we will seethe two targets at the same depth. As the difference in theseoptical distances increases, we begin to experience stereopsis(see depth between the targets). At some point, the parallax issufficient to cause diplopia or double vision of one of thetargets (the one not directly viewed).
21
Th UD-- Affects Db Symbogg A T et Imags:
But why should a HUD cause diplopia? The answer is fairlystraightforward. HUD imagery is generated on the face of a CRT.Light from the CRT passes through collimating optics so the lightrays are rendered parallel. These parallel rays are thenreflected from a combining glass to enter our eyes. Parallellight rays cause our eyes' lines of sight to orient themselves sothey are also parallel. HUD imagery is seen as a virtual image,hanging in space. (The image is called "virtual" because itslight really doesn't come from the place where you see it; here,the light is coming from the HUD rather than the point in spaceat which it is perceived.)
If the HUD is properly collimated, imagery will be seen atoptical infinity, in the same place as the target in the realworld. No double vision should be experienced because the imagesof distant real targets are also formed by parallel rays oflight, and there is no parallax between the images. However, ifthe HUD is improperly collimated, the light rays leaving it maydiverge or converge. In any case, if the convergence ordivergence is sufficiently different from the parallel rays oflight from the target, the images will fall on non-correspondingretinal points, and the pilot will see double images. Exactlywhich image is doubled depends on what the pilot examines:ifhe looks at the real world target, the reticle will double; if helooks at the reticle, the target will double. The pilot's visualsystem has absolutely no choice. If he passed his flight
physical vision examination, and if the angular separationbetween light rays from the target and light rays from thesymbology differ by more than a few milliradians of arc, he will
experience diplopia of one image or the other.
Fortunately, HUD specifications recognize this possibility, andusually restrict parallax errors to less than three milliradianseye convergence and one milliradian or less eye divergence.Apparently, we can tolerate this amount of misregistration ordisparity in "standard" HUDs without seeing double. However, theHUD quality control standards all assume the target is atinfinity, so they strive to place the symbology image atinfinity. You will see in the next paragraph that the targetimage is usually not at infinity because of the optical effectsof the canopy. The LANTIRN HUD which caused the visual problemsalso caused a slight convergence of light rays from the HUDsymbology, (causing the eyes to slightly diverge in order to fusethe symbology).
lT-- Can = Affects 124" &f Target OnlX
This far, we have seen that diplopia can be caused by theimproper collimation the light rays forming HUD symbology. Thereis another possible cause of diplopia, even when the light fromthe HUD is properly collimated. The other major cause is thecurved canopy. The F-16 canopy is a fairly thick (about 3/4inch) piece of material consisting of three different kinds of
22
plastic (in the laminated version), or an equally thick sheet ofpolycarbonate (in the monolithic version). Each of the currentvendors manufactures his canopies using methods which result inparts which are optically different from each other. One opticaleffect common to all curved canopies is the formation of a veryweak "minus" or "negative" or "concave" lens in the forward area.Concave lenses cause previously parallel light rays to becomedivergent. In some canopies, this moves the optical position ofthe object from infinity to as close as 40 feet. The canopy onthe aircraft with the LANTIRN HUD caused a slight divergence oflight rays from the target, as if they came from a distance lessthan optical infinity.
But why don't we see double when we look through currentlyaccepted F-16 canopies without interposing a HUD in our line ofsight? A question fairly easy to answer. Our eyes adjust byturning slightly inwards to image the deviated rays oncorresponding retinal points. Since all the rays are deviatedmore or less equally, and since there is no undeviated referenceimage, our eyes' tolerances accept the canopy-transmitted imageof the world. Sometimes the world looks a little blurry or wavy,but we usually don't see double. If our pupils were very muchlarger, if the canopy were a little worse, or if conflictingimage information were present at the same time, we would indeedexperience diplopia.
HUD + Canopy + Eye Optical System:
Figure 2 shows how the HUD affects both light from the target (byrefraction) and light from the CRT (by reflection). The canopy
affects only light from the target (by refraction). If thecanopy-induced vergence of light rays from the target is Isufficiently different from the vergence of the light rays fromthe HUD symbology, diplopia will result. In other words,diplopia can be experienced when looking through either aperfectly collimated HUD and a canopy with some measurableparallax error, or a misaligned HUD and a "perfect" canopy.Specifying perfect parallelism of HUD-generated light rays is notnecessarily the goal. The goal should be the attainment ofcomparable vergence effects of canopy and HUD on both target andsymbology.
Measurements of the transparency and LANTIRN HUD aboard the F-16Awhich caused the pilots to complain of diplopia revealed that theLANTIRN HUD vergence error and the canopy vergence errorwere additive. Pilots flying this aircraft experienced more thanfive milliradians parallax error between target and symbolthrough certain portions of their field of view.
The optical effects of pupil-forming and non pupil-formingsystems (holographic HUDs and conventional BUDs) are coveredelsewhere in the Proceedings, as are relative advantages anddisadvantages of wide instantaneous overlapping fields of view.
23 P..
Suffice it to say that the smaller the instantaneous overlappingFOV, the less the opportunity to see double because diplopia isexperienced only while the eyes are in the overlapping IFOV. Ofcourse, the converse is true -- large overlapping IFOVs increasethe probability of seeing double if there is a parallactic errorsomewhere in the system.
At present, all F-16 canopies are measured to determine how muchangular deviation they will impart to a light ray passing throughthe canopy. This sighting error measurement is made only fromthe cyclopean eye position, located near the cockpit "designeye.' All current USAF pilots have two eyes, located about 65mmapart (about 1.25 inches on either side of the cyclopean eyeposition). This separation of our eyes means our lines of sightpass through the canopy about 2.5 inches apart. Because of theminus lens effect mentioned in the previous paragraph, andbecause of the point-to-point variability in angular deviationwithin any single canopy, each eye then experiences a differentvergence vector when viewing objects external to the cockpit.This vergence vector varies as the pilot looks around the fieldof view available for binocular vision. As indicated previously,our eyes are extremely sensitive to these tiny vergence-inducedretinal displacements. At the present time, no canopyspecification for any current USAF aircraft include vergence(collimation or parallax) limits similar to those included in HUDspecifications.
Some Sions
Several possible solutions may be considered, includingintroducing more stringent optical specifications for canopies,substituting flat-plate windscreens for curved transparencies, Iand reducing the binocular field of view of the HUDs. The bestsolution appears to be one which considers both canopy and HUDoptics as a system, with specified limits of binocular parallaxfor the entire system rather than for each of the components.This could allow canopies and HUDs to be matched so their errorscould cancel each other out to some extent. The logisticalproblem associated with this proposal is not trivial as eachcanopy's specifications would have to be matched with anappropriate HUD, within certain tolerances. However, each F-16canopy is presently measured for "nameplate values' to input tothe fire control computer of the particular aircraft on which itis mounted.
Measurement of the F-16 canopy-induced parallax can be done withequipment similar to that in use for measuring F-16 angulardeviation. The measuring instrument should be located so itscans from points about 1.25 inches on either side of thecyclopean eye position. Angular deviation data from each matrixof values obtained from right and left eye positions can then be
24
- ~ . _ _
combined to show the disparity or parallax for each viewingangle. Of course, the effects of lateral displacement wouldintroduce an error in these calculations, so only "pure" angulardeviation should be measured.
Marconi Avionics have indicated that they could adjust thevergence of their WFOV HUDs to correspond with the vergenceeffects of the "average" F-16 canopy. If the remaining individualcanopy errors exceeded the visual system's tolerance, an additionallens or other optical modification could be made to match theHUD to the canopy. The Air Force Aerospace Medical ResearchLaboratory (AFAMRL) has measured a series of F-16 canopies todetermine their binocular disparity, and is now cooperating withthe F-16 SPO and Marconi Avionics to determine whether a singlecorrection would suffice for the majority of WFOV HUD-Canopycombinations. The tolerances allowable for the system depend on thevisual systems' ability to maintain a single image when the canopyand WFOV HUD optics cause some parallax error. Unfortunately,tolerance limits of this type have not as yet been determined forthe specific conditions encountered with aircraft WFOV HUDS andcanopies.
Published threshold values are either questionable or gatheredunder circumstances inappropriate for generalization to F-16 HUDapplication. Thus, the F-16 SPO asked AFAMRL to conduct its ownstudy.
1. To determine the limits of the region of single vision asindicated by the horizontal diplopia thresholds of positive andnegative disparity.
2. To determine the extent and nature of the distribution ofindividual differences in a Plying Class II Vision Population.
Definition: Optical distance is expressed in terms of the angulardeviation of the eyes from the straight-ahead. Positive disparitymeans that a non-fixated object is optically nearer than a fixatedobject. Negative disparity means that a non-fixated object isoptically farther than the fixated object. The diplopia effectthreshold is that degree of disparity which induces a report ofdouble vision gr a binocular suppression effect on 50% of its
-presentations to an observer.
Equipment: The equipment consisted of a computer controlled BUDemulator which could superpose a luminous line (symbology) on adistant, out-the window scene. The optical distance of thesymbology was adjusted to be either nearer or farther than aconspicuous vertical structure (a light pole) in the scene.
25 1
*(

Subjects: A total of 32 persons were tested. All were volunteersfrom AFAMRL, ASD/EN and ASD/YP. All met at least Flying Class IIVision Standards and, further, none wore contact lenses, since pilotsmay not wear them.
Task: On each trial, an observer fixated a distant target andindicated whether or not a briefly-presented luminous line (thesuperposed HUD symbology) appeared single or double. Anotherresponse, that a single line appeared but was misaligned with thetarget, was possible and indicated that the view from one eye wasbeing suppressed.
Threshold Conditions: Four thresholds were determined for eachsubject, one at each crossing of two disparity directions (positiveand negative), with two viewing exposure times (100 msec and 3 sec).
\,Threshold Determination: Thresholds were determined with a.'maximally efficient threshold bracketing technique.
Rn DisncsiQn
'The main findings of this study are: (1) observers are relativelyintolerant of negative disparity, (2) longer viewing is more likelyto lead to a diplopia effect than very short glances, (3)resistance to disparity appears to be an individual trait, and (4)a large proportion of responses involve suppression of the viewfrom one eye. The overall median negative disparity threshold was1.2 mrad and the overall positive threshold was 2.6 mrad. Thesevalues are recommended as the maximum disparities acceptable forwide-field-of-view Canopy-HUD optical systems. Since the valuesare so small, we further recommend that the canopy and HUD be treatedas a system, with technical interaction between the vendors, andbetween the vendors and the USAF. The disparity values indicate thenet difference between both system components, so optimization maybe possible by appropriately matching the optic
Further details may be found in a forthcoming AFAM4t TechnicalReport by R. Warren, T. Connon, L. V. Genco, and H. L. Task.
26
--*mm m
SUN/MOON CAPTURE EVALUATION
William WilsonAeronautical Systems Division, Avionics DirpctorateIntegrated Controls and Displays Branch (ASD/ENASI)
INTRODUCTION.
Because of their optical characteristics, head-up displays (HUDs) have alwaysinteracted with various kinds of sunlight to produce unwanted reflections.
U *Capture means that a HUD can and will capture or trap light and directit into a pilot's eyes. This capture effect can result in both reflections
() and retroflections. Reflections occur when an external light source ioapingeson a reflective surface. Retroflections are light reflections that resultfrom external light entering the HUD optics train, reflecting off the face
O of the cathode ray tube (CRT), and passing back out through the optics.0. Both the reflected and the retroflected image are called reflexes.
With the introduction of diffractive optics technology, there is a need to
describe how diffraction and conventional optics perform in the presenceSof collimated light sourcessuch as that provided by the sun and moon.
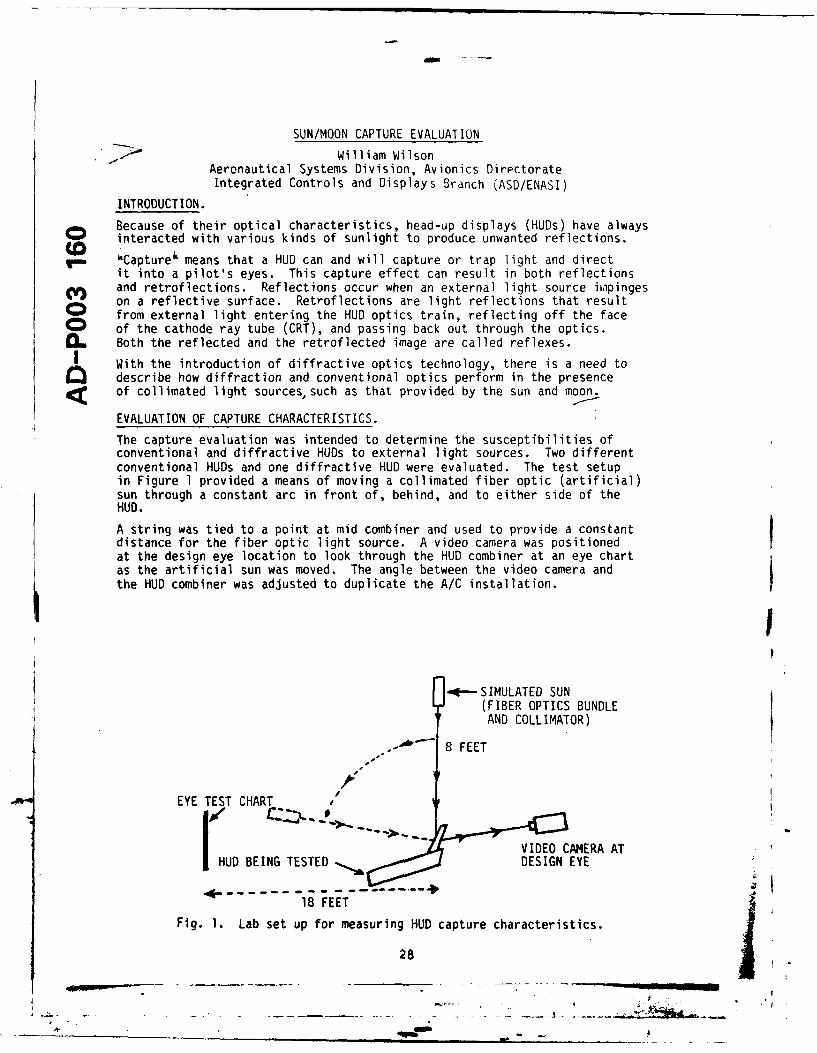
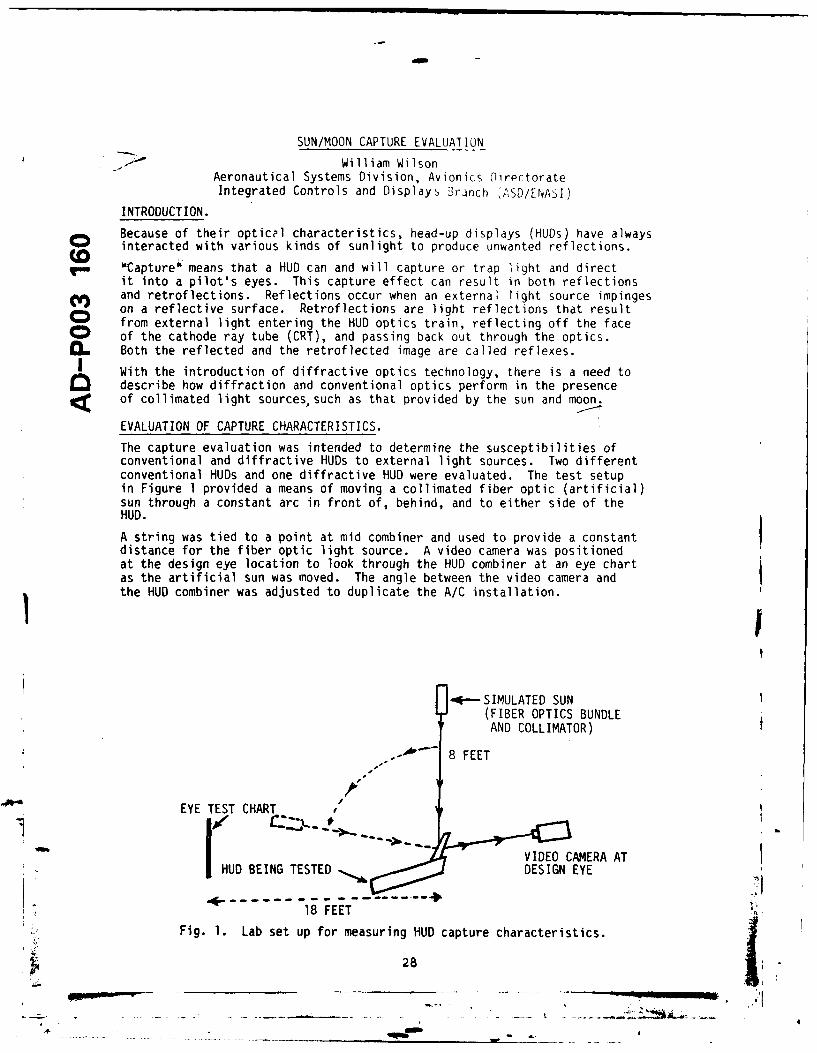
EVALUATION OF CAPTURE CHARACTERISTICS.
The capture evaluation was intended to determine the susceptibilities ofconventional and diffractive HUDs to external light sources. Two differentconventional HUDs and one diffractive HUD were evaluated. The test setupin Figure 1 provided a means of moving a collimated fiber optic (artificial)sun through a constant arc in front of, behind, and to either side of theHUD.
A string was tied to a point at mid combiner and used to provide a constantdistance for the fiber optic light source. A video camera was positioned !at the design eye location to look through the HUD combiner at an eye chartas the artificial sun was moved. The angle between the video camera andthe HUD combiner was adjusted to duplicate the A/C installation.
I
.4--SIMULATED SUN(FIBER OPTICS BUNDLEAND COLLIMATOR)
.- -- 8 FEET
A-
EYE TEST CHART
-~ VIDEO CAM4ERA ATHUD BEING TESTED DESIGN EYE
18 FEET
Fig. 1. Lab set up for measuring HUD capture characteristics.
28
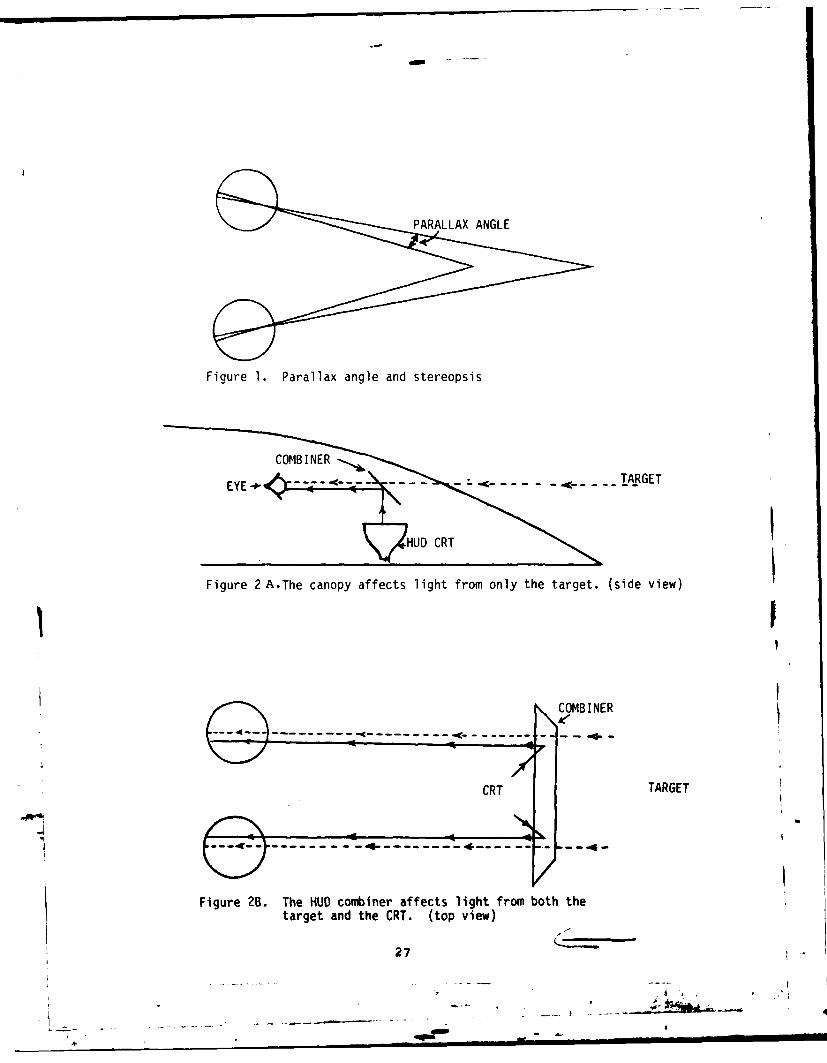
Figure 1. Parallax angle and stereopsis
HUD CRT
Figure 2 A-The canopy affects light from only the target. (side view)
CRT TARGET
Figure 2B. The HUD combiner affects light from both thetarget and the CRT. (top view)
27
SUN/MOON CAPTURE EVALUATION
- " William WilsonAeronautical Systems Division, Avionics OirpctorateIntegrated Controls and Displays 3ranch 'ASD/ENASI)
INTRODUCTION.Because of their optical characteristics, head-up displays (HUDs) have always
interacted with various kinds of sunlight to produce unwanted reflections.
"Capture& means that a HUD can and will capture or trap light and directit into a pilot's eyes. This capture effect can result in both reflectionsand retroflections. Reflections occur when an external light source impingeson a reflective surface. Retroflections are light reflections that resultfrom external light entering the HUD optics train, reflecting off the face
O of the cathode ray tube (CRT), and passing back out through the optics.
0. Both the reflected and the retroflected image are called reflexes.With the introduction of diffractive optics technology, there is a need to
describe how diffraction and conventional optics perform in the presenceof collimated light sources, such as that provided by the sun and moon.
EVALUATION OF CAPTURE CHARACTERISTICS.
The capture evaluation was intended to determine the susceptibilities ofconventional and diffractive HUDs to external light sources. Two differentconventional HUDs and one diffractive HUD were evaluated. The test setupin Figure 1 provided a means of moving a collimated fiber optic (artificial)sun through a constant arc in front of, behind, and to either side of theHUD.
A string was tied to a point at mid combiner and used to provide a constantdistance for the fiber optic light source. A video camera was positioned
at the design eye location to look through the HUD combiner at an eye chartas the artificial sun was moved. The angle between the video camera andthe HUD combiner was adjusted to duplicate the A/C installation.
- SIMULATED SUN(FIBER OPTICS BUNDLEAND COLLIMATOR)
.--" 8 FEET
EYE TEST CHART /
VIDEO CAMERA AT
HUD BEING TESTED DESIGN EYE
18 FEET :
Fig. 1. Lab set up for measuring HUD capture characteristics.
28
25o0 DIAMETER25 DIAMETE 200 DIAMETER
490
2 0
Fig. 1 Diffraction HUD Fiq. 2 Conventional HUD A Fig. 3 Conventional HUD B
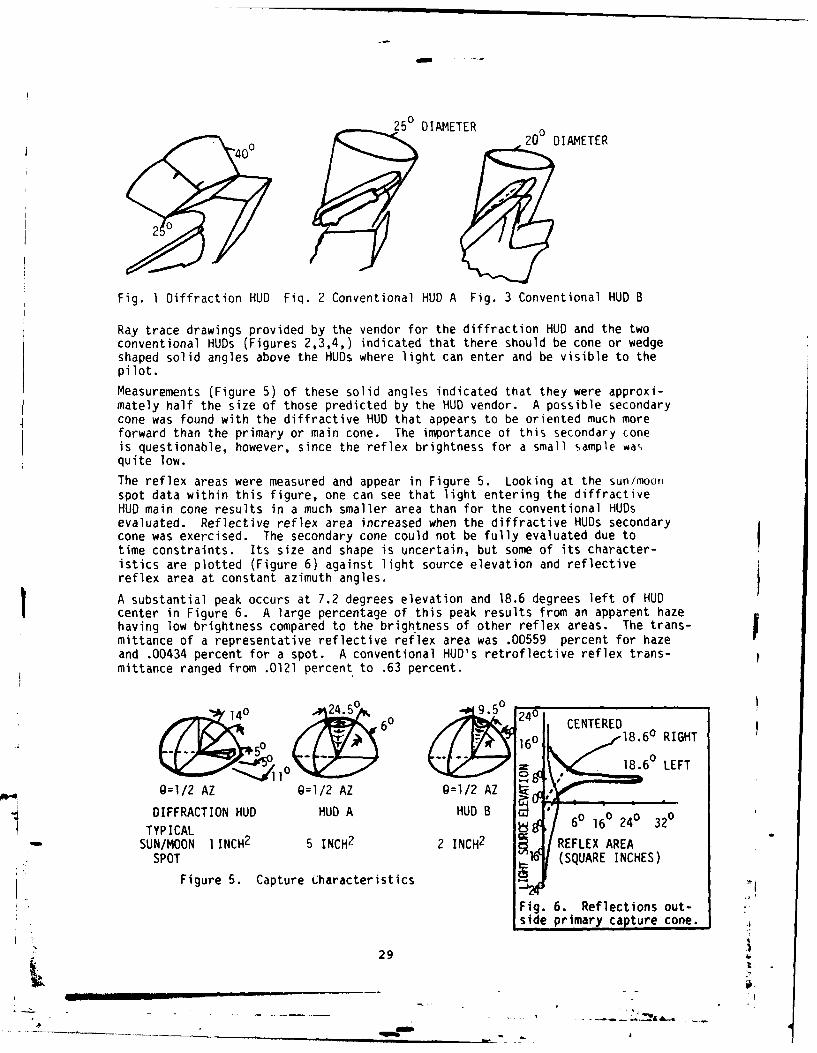
Ray trace drawings provided by the vendor for the diffraction HUD and the twoconventional HUDs (Figures 2,3,4,) indicated that there should be cone or wedgeshaped solid angles above the HUDs where light can enter and be visible to thepilot.
Measurements (Figure 5) of these solid angles indicated that they were approxi-mately half the size of those predicted by the HUD vendor. A possible secondarycone was found with the diffractive HUD that appears to be oriented much moreforward than the primary or main cone. The importance of this secondary coneis questionable, however, since the reflex brightness for a small sample wasquite low.
The reflex areas were measured and appear in Figure 5. Looking at the sun/moorspot data within this figure, one can see that light entering the diffractiveHUD main cone results in a much smaller area than for the conventional HUDsevaluated. Reflective reflex area increased when the diffractive HUDs secondarycone was exercised. The secondary cone could not be fully evaluated due totime constraints. Its size and shape is uncertain, but some of its character-istics are plotted (Figure 6) against light source elevation and reflectivereflex area at constant azimuth angles.
A substantial peak occurs at 7.2 degrees elevation and 18.6 degrees left of HUDIlcenter in Figure 6. A large percentage of this peak results from an apparent hazehaving low brightness compared to the brightness of other reflex areas. The trans-mittance of a representative reflective reflex area was .00559 percent for hazeand .00434 percent for a spot. A conventional HUD's retroflective reflex trans- Pmittance ranged from .0121 percent to .63 percent.
140 g0 26 CE NTERED
5- -- - 160 18.60 RIGHT
0 18.60 LEFT
0=112 AZ 0=1/2 AZ 9=112 AZ
DIFFRACTION HUD HUD A HUD B d 0
TYPICAL 1 16 240 3 20
SUN/MOON fINCH2 5 INCH 2 2 INCH2 @1 REFLEX AREASPOT m'd (SQUARE INCHES)
Figure 5. Capture Characteristics
Fig. 6. Reflections out-
side primary capture cone.
29
4 -
Another limitation was with respect to how closely we could simulate thesun and its interaction with the atmosphere. On the one handa cloudlesshaze-free sky permits a more-or-less collimated sun. As the opticalcharacteristics of the atmosphere changes with increases of dust and ormoisture, the collimation of the sunlight is disrupted.
In our evaluation, a sort of reciprocity was found when two light sourceshaving different collimation characteristics were used. In general, thediffraction HUD defocussed the reflex image produced by the more collimatedlight source at the design eye position. More uncollimated light from theother source was focussed at the design eye position by the diffraction HUD.
Additional data needs to be generated to more accurately measure the secondarycone characteristics and to evaluate these sun and moon image susceptibilitiesin terms of their impact on pilot contrast sensitivity losses.
30I
.. . . - i , *3 0 , __

ESTIMATING DETECTION RANGE AND RANGE LOSS LOOKINGtTHROUGH WINDSHIELDS AND HEAD-UP DISPLAYS
Herschel C. SelfAF Aerospace Medical Research Laboratory (AFAMRL/HEA)
0'It is very important for an aircraft pilot to be able to detect distantobjects. His ability to do so is impaired by loss of target contrast due to the
atmosphere and to passive optical elements through which he must look. These
elements are the aircraft's windshield and head-up display (HUD) and his ownhelmet visor and spectacles or sun glasses. The problem is to determine loss oftarget detection range due to loss of contrast. This report examines loss ofdetection range by combining sighting geometry with the contrast transmission ofthe atmosphere and other optical elements and with human ability to detecttargets. Numerical examples will be presented as tutorial exercises and targetdetection ranges for selected conditions will be worked out in detail tofamiliarize the reader with the graphical method derived in this paper.
The visibility of a uniform round disc-shaped target depends1 on itsapparent contrast, its angular subtense, and the background luminance. Black-well (1946) collected extensive data on threshold visibility as a function of thecontrast, angular subtense and luminance of circular discs. Duntley (1948) usedBlackwell's data to construct nine nomograms or visibility charts for findingdetection distance for a wide range of meteorological range (a measure ofvisibility through the atmosphere) and target area. Each nomogram covered adifferent value of background luminance. The nomograms were constructed to avoidtedious solution of detection range by a series of successive approximations.
Middleton (1952) modified these nomograms to portray ranges at whichdetection probability was .95 rather than .50, the detection threshold.The Duntley-Middleton nomograms are adequate for some purposes, especially whenit is not necessary to interpolate. However, a method for determining targetdetection range without using nomograms permits flexibility in examining theeffects of contrast and contrast losses due to the atmosphere and to opticaldevices through which the pilot must look. For this reason, the followingparagraphs will develop such a method. This method is a graphic one.
(A) METEOROLOGICAL RANGE AND ATMOSPHERIC APPEARANCE
Meteorological range V, sometimes designated as Rv and sometimes calledvisibiity range or visibility, is a measure of atmospheric clarity or contrastattenuation. The clearer the air the greater the meteorological range. Althoughvisually given in thousands of yards in the USA, countries on the metric systemof measurements state it in kilometers. The appearance of the atmosphere interms of how it would be described correlates with V. The relationship betweenappearance and V is shown in Table 1 which is derived from Middleton (1953).Since most Americans visualize long distances in miles more readily than inkilometers or thousands of yards, the table also has a miles column.
31

TABLE 1
ATMOSPHERIC DESCRIPTION AND METEOROLOGICAL RANGE (V)
THOUSANDS
APPEARANCE KILOMETERS OF YARDS MILES
Moderate fog .35 - .5 .38 - .54 .2 - .3Light fog .5 - 1 .54 - 1.1 .3 - .6Thin fog 1 - 2 1.i - 2.2 .6 - 1.2
Haze 2 - 4 2.2 - 4.4 1.2 - 2.5Light Haze 4 - 10 4.4 - 11 2.5 - 6.2
Clear 10 - 20 11 - 22 6.2 - 12Very Clear 20 - 50 22 - 55 12 - 31
Exceptionally Clear 50+ 55+ 31+
Thousands of Yards = (1.093) (Kilometers)
Miles = (.6214) (Kilometers)Meteorological range V is sometimes called Rv.
The Air Force can seldom fly its missions in a very clear atmosphere, for it
is rather infrequent. Thus, according to Table 1, V will usually be less than 12miles or 22,000 yards. Many locales very seldom have even 10-mile visibility.
Most operations probably take place in the range of 2.5 - 10 miles or 4,400 -17,600 yards. Two of the examples in the present paper are worked out for a
meteorological range V of 9,000 yards (light haze) and one for a V of 13,000 yards1 (clear).
(B) DERIVATION OF METHOD
The contrast of a distant object is reduced or attenuated by the interveningatmosphere. That is, an object having an inherent contrast Co with the sky atzero range (R=0) is reduced in contrast at range R to CR according to theatmospheric contrast attenuation formula CR=Co EXP(-R), where (is the beam
attenuation coefficient, and EXP is e = 2.718 (which is the base of natural orNaperian logarithms) to the given power or exponent, here - R.
Duntley (1946) defined a quantity V as meteorological range, or the range atwhich the contrast transmittance of the atmosphere is two percent, i.e.,CR/Co0 .02=e - V . Inverting both sides of this equation yields i/.02=50=ecv.
Taking natural logarithms of both sides yields Loge(50)=3.912= V, from which
T=3.912/V Replacingtin the original equation for contrast attenuation by theatmosphere with this value offyields the basic contrast attenuation formula in
terms of meteorological range, CR=C o EXP(-3.912R/V). From this formula
CR/Co=EXP (-3.912R/V). Taking natural logarithms of both sides of this equationyields LN(Co/CR)f3.912R/V, where LNfLoge. Solving this for R yields
R (V/3.912)LN(Co/CR) yards, EQN (1)V in yards
32
As a matter of interest, Middleton (1952) mentions that possibly CR/Co = .02 isa bit low, and that there might be some value in redefining this to be .05 insteadof .02. This would replace the constant 3.916 with LN(20)=2.996, and themeteorlogical range V would be a different quantity. Since Middleton'sworthwhile suggestion has not been followed, it will not be pursued further inthis paper.
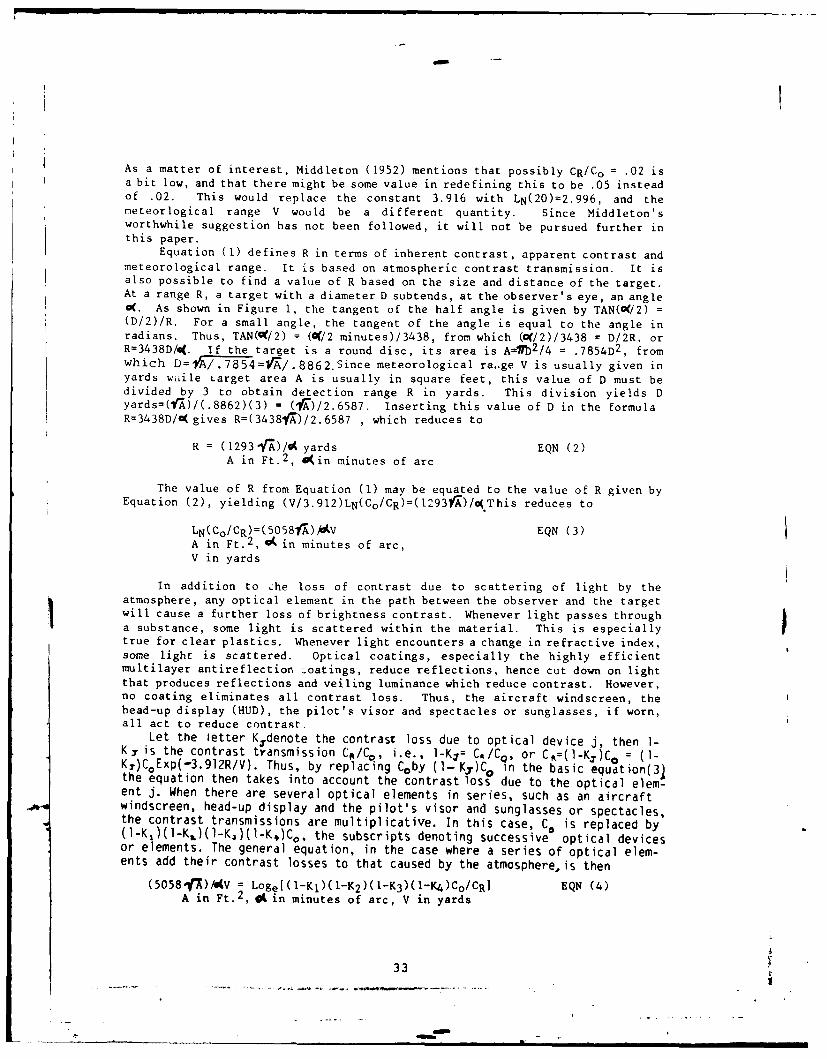
Equation (I) defines R in terms of inherent contrast, apparent contrast andmeteorological range. It is based on atmospheric contrast transmission. It isalso possible to find a value of R based on the size and distance of the target.At a range R, a target with a diameter D subtends, at the observer's eye, an angle0(. As shown in Figure 1, the tangent of the half angle is given by TAN(0/2) =(D/2)/R. For a small angle, the tangent of the angle is equal to the angle inradians. Thus, TAN(O/2) = (0/2 minutes)/3438, from which (0/2)/3438 = D/2R. orR=3438D/A. If the target is a round disc, its area is A=l7D2 /4 = .7854D 2 , fromwhich D=A/.7854=VA/.8862. Since meteorological ra.-ge V is usually given inyards w~iile target area A is usually in square feet, this value of D must bedivided by 3 to obtain detection range R in yards. This division yields Dyards=(Y)/(.8862)(3) = ((K)/2.6587. Inserting this value of D in the formulaR=3438D/O(gives R=(3438Y )/2.6587 , which reduces to
R = (1293-rA)/( yards EQN (2)A in Ft. 2 , Ain minutes of arc
The value of R from Equation (1) may be equated to the value of R given byEquation (2), yielding (V/3.912)LN(Co/CR)=(1293)'A)/ .This reduces to
LN(Co/CR)=(5058YA)#V EQN (3)A in Ft. 2 , 0( in minutes of arc,V in yards
In addition to :he loss of contrast due to scattering of light by theatmosphere, any optical element in the path between the observer and the targetwill cause a further loss of brightness contrast. Whenever light passes througha substance, some light is scattered within the material. This is especiallytrue for clear plastics. Whenever light encounters a change in refractive index,some light is scattered. Optical coatings, especially the highly efficientmultilayer antireflection ;oatings, reduce reflections, hence cut down on lightthat produces reflections and veiling luminance which reduce contrast. However,no coating eliminates all contrast loss. Thus, the aircraft windscreen, thehead-up display (HUD), the pilot's visor and spectacles or sunglasses, if worn,all act to reduce contrast.
Let the letter K denote the contrast loss due to optical device j, then I-Ky is the contrast transmission Cf/C., i.e., l-K7 = Ct/C., or C =(I-K:)C, = (1-Ky)CExp(-3.912R/V). Thus, by replacing Cmby (I- Ky)C0 in the basic equation(3the equation then takes into account the contrast loss due to the optical elem-ent j. When there are several optical elements in series, such as an aircraftwindscreen, head-up display and the pilot's visor and sunglasses or spectacles,the contrast transmissions are multiplicative. In this case, C0 is replaced by(l-K,)(l-Kj)(l-K,)(I-K,)C0 , the subscripts denoting successive optical devicesor elements. The general equation, in the case where a series of optical elem-ents add their contrast losses to that caused by the atmosphere, is then
(5058 Y%)/AV = Loge[(l-Kl)(1-K 2 )(1-K3)(1-K4)Co/CRI EQN (4)A in Ft. 2 , o in minutes of arc, V in yards
33* -. . . . ~ r - - .I
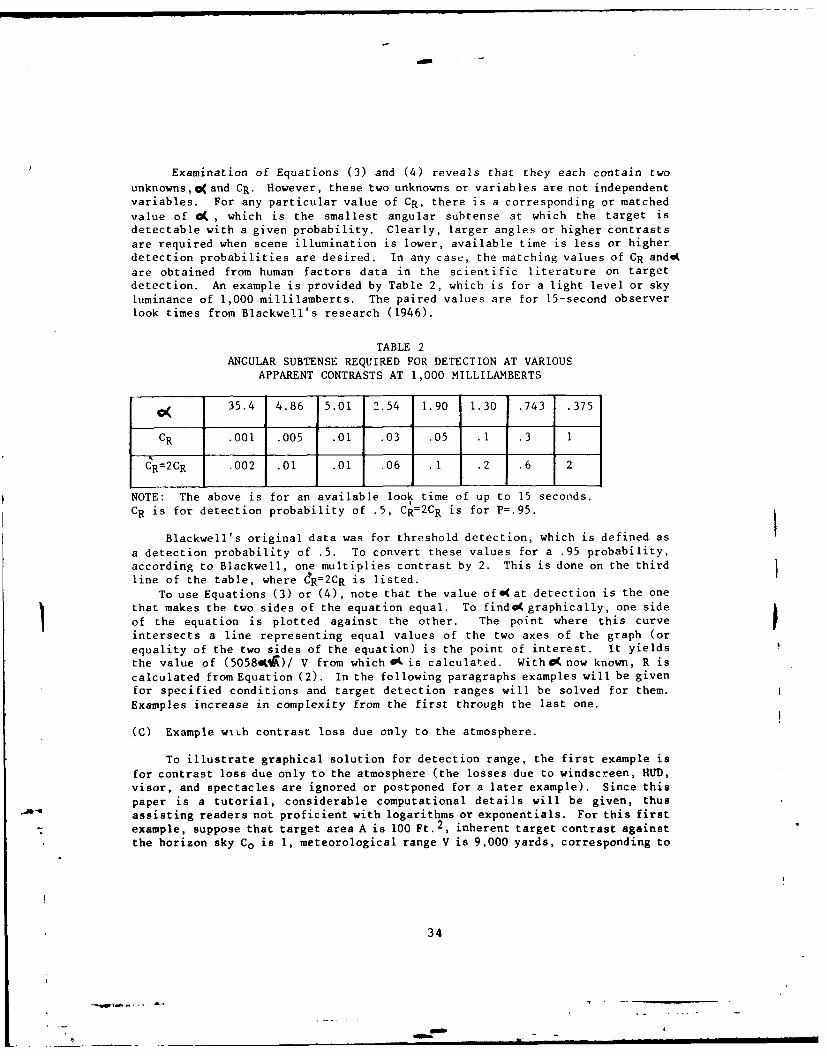
Examination of Equations (3) and (4) reveals that they each contain two
unknowns,aand CR. However, these two unknowns or variables are not independentvariables. For any particular value of CR, there is a corresponding or matched
value of 0 , which is the smallest angular subtense at which the target isdetectable with a given probability. Clearly, larger angles or higher contrasts
are required when scene illumination is lower, available time is less or higherdetection probabilities are desired. In any case, the matching values of CR andet
are obtained from human factors data in the scientific literature on targetdetection. An example is provided by Table 2, which is for a light level or sky
luminance of 1,000 millilamberts. The paired values are for 15-second observer
look times from Blackwell's research (1946).
TABLE 2
ANGULAR SUBTENSE REQUIRED FOR DETECTION AT VARIOUSAPPARENT CONTRASTS AT 1,000 MILLILAMBERTS
35.4 4.86 5.01 2.54 1.90 1.30 .743 .375
CR .001 .005 .01 .03 .05 .1 .3 1
CR=2CR .002 .01 .01 .06 .1 .2 .6 2
NOTE: The above is for an available look time of up to 15 seconds.
CR is for detection probability of .5, CR=2CR is for P=.95.
Blackwell's original data was for threshold detection, which is defined as
a detection probability of .5. To convert these values for a .95 probability,according to Blackwell, one multiplies contrast by 2. This is done on the third
line of the table, where eR=2CR is listed.
To use Equations (3) or (4), note that the value of 0(at detection is the onethat makes the two sides of the equation equal. To finda graphically, one side
of the equation is plotted against the other. The point where this curveintersects a line representing equal values of the two axes of the graph (orequality of the two sides of the equation) is the point of interest. it yields
the value of (5058.Li)/ V from which 4K is calculated. With 0now known, R is
calculated from Equation (2). In the following paragraphs examples will be givenfor specified conditions and target detection ranges will be solved for them.
Examples increase in complexity from the first through the last one.
(C) Example wILh contrast loss due only to the atmosphere.
To illustrate graphical solution for detection range, the first example is
for contrast loss due only to the atmosphere (the losses due to windscreen, HUD,visor, and spectacles are ignored or postponed for a later example). Since this
paper is a tutorial, considerable computational details will be given, thusassisting readers not proficient with logarithms or exponentials. For this firstexample, suppose that target area A is 100 Ft. 2 , inherent target contrast againstthe horizon sky Co is 1, meteorological range V is 9,000 yards, corresponding to
34
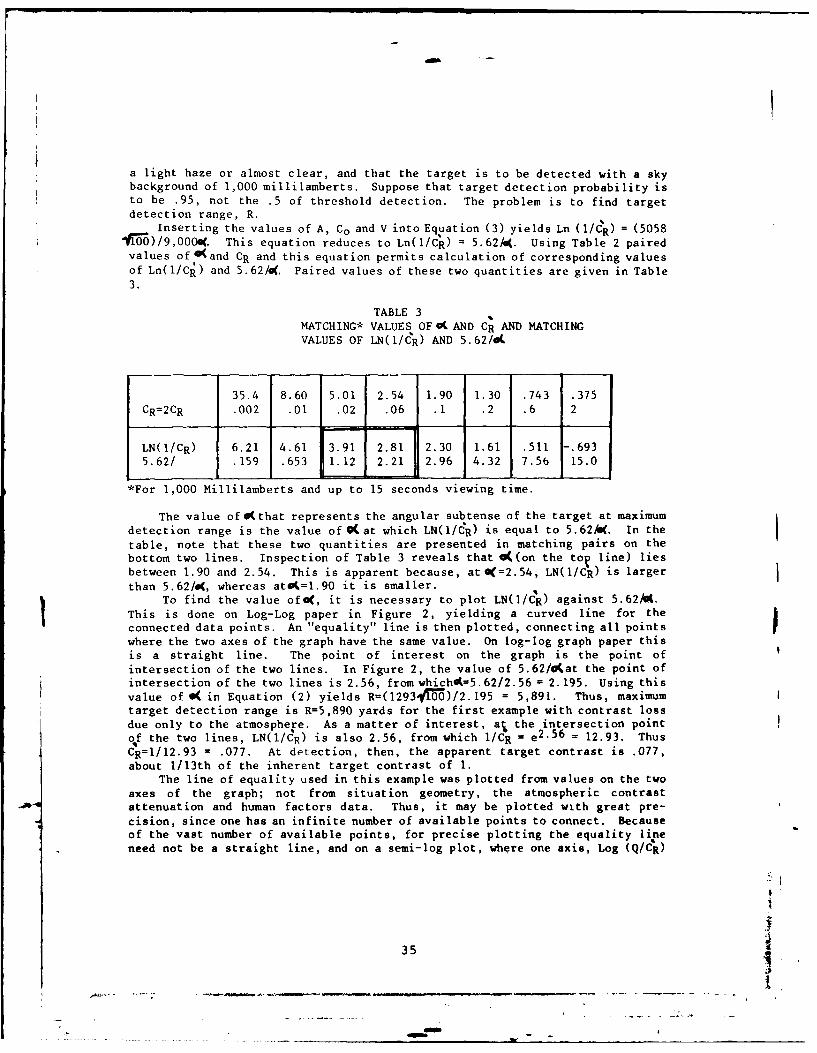
a light haze or almost clear, and that the target is to be detected with a skybackground of 1,000 millilamberts. Suppose that target detection probability isto be .95, not the .5 of threshold detection. The problem is to find target
detection range, R.
Inserting the values of A, Co and V into Equation (3) yields Ln (l/CR) = (5058ITO)/9,000K. This equation reduces to Ln(1/CR) = 5.62/M. Using Table 2 paired
values of @(and CR and this equation permits calculation of corresponding values
of Ln(l/CR ) and 5.62/@. Paired values of these two quantities are given in Table
3.
TABLE 3
MATCHING* VALUES OF Q. AND CR AND MATCHINGVALUES OF LN(I/CR) AND 5.62/ot
35.4 8.60 5.01 2.54 1.90 1.30 .743 .375CR=2CR .002 .01 .02 .06 .1 .2 .6 2
LN(l/CR) 6.21 4.61 L3.91 2.81 2.30 1.61 .511 -.693
5.62/ .159 .653 1.12 2.21 2.96 4.32 7.56 15.0
*For 1,000 Millilamberts and up to 15 seconds viewing time.
The value of Athat represents the angular subtense of the target at maximum
detection range is the value of@(at which LN(l/CR) is equal to 5.62/0. In the
table, note that these two quantities are presented in matching pairs on the
bottom two lines. Inspection of Table 3 reveals that *(on the to? line) liesbetween 1.90 and 2.54. This is apparent because, at0=2.54, LN(I/CR) is larger
than 5.62/@, whereas atl=l.90 it is smaller.
To find the value ofo(, it is necessary to plot LN(I/CR) against 5.62/4.This is done on Log-Log paper in Figure 2, yielding a curved line for theconnected data points. An "equality" line is then plotted, connecting all points
where the two axes of the graph have the same value. On log-log graph paper thisis a straight line. The point of interest on the graph is the point ofintersection of the two lines. In Figure 2, the value of 5.62/4at the point ofintersection of the two lines is 2.56, from whichdt=5.62/2.56 = 2.195. Using this
value of K in Equation (2) yields R=(12931VO )/2.195 = 5,891. Thus, maximumtarget detection range is R=5,890 yards for the first example with contrast loss
due only to the atmosphere. As a matter of interest, at the intersection pointof the two lines, LN(I/C ) is also 2.56, from which I/CR = e2 .5 6 = 12.93. Thus
CR=1/12.9 3 = .077. At detection, then, the apparent target contrast is .077,
about 1/13th of the inherent target contrast of I.The line of equality used in this example was plotted from values on the two
axes of the graph; not from situation geometry, the atmospheric contrastattenuation and human factors data. Thus, it may be plotted with great pre-cision, since one has an infinite number of available points to connect. Becauseof the vast number of available points, for precise plotting the equality lineneed not be a straight line, and on a semi-log plot, where one axis, Log (Q/C)
35
-- - -r-
is logarithmic and the other axis, 5.62/A, is linear, the equality line is not astraight line. In contrast to the vast number of zero-spaced points in theequality line, the plot of the equation has only a very few data points. Whenthese points fall on a straight or nearly straight line, plotting accuracy isincreased. Accordingly, Figure 3 is a plot of the data points of Table 2 on semi-log graph paper, where one axis is linear and the other is logarithmic. On thelogarithmic or vertical axis note that, for example, the space between 1.5 and 2is larger than that between 3.5 and 4. Since, on the available graph paper thelog axis is vertical, LN(1/CR) is plotted on the vertical axis, instead of thehorizontal axis as it was in Figure 2.
As anticipated, the data points from Table 2 now come quite close to fallingon a straight line. The data points are easily and accurately connected. On thisgraph, at the intersection point of the lines, 5.62/0(is 2.55, so that4=2.204 andR=(l2931TC)/2.204 = 5,887. Thus, as before in Figure 2, target detection rangeis 5,890 yards.
(D) AN EXAMPLE WITH VARIOUS HUD CONTRAST LOSSES
The first example was for atmospheric contrast loss only; the windscreen, theHUD and pilot's visor and sunglasses were ignored. In this second example, bothatmosphere and HUD will be taken into account, but not windshield, visor orspectacles.
Assume, as before, that A=100 and V=9,000. However, let inherent targetcontrast now be ,=.5, not 1 as before, and let HUD contrast losses be 0, 10% and20%. Inserting these values of A and V into the left side of Equation (4) yields(5058f-00/9,0000 = 5.623/, as before. The left side becomes, for the threevalues of K, Loge[(l-0)(.5)/CR], Loge(l-.l)(.5)/CR] and Loge[(l-.2)(.5)/C RJ,i.e., LN(.5/CR), LN(.45/*R) and LN(.4/CR), respectively, for increasing HUDcontrast loss. The three equations, used with the Data in Table 1 for matchingvalues of Aand CR, yield Table 4. The data in this table are plotted on linear-linear graph paper in Figure 4, with data points connected with hand-drawn curvedlines. The data are plotted on semi-log (or linear-log) graph paper in Figure 5,with almost straight lines connecting data points. Note that drawing in thelines appears to be (and is) a simpler task for the second graph.
The inserted tables on the graphs list target detection ranges and percentloss of detection ranges for the K values of the HUD's. Differences in detectionranges are minuscule between the two graphs, the maximum difference being forK=.l. Here, it is only (4850-4820)(100)/4850 = .6%. Note that a 10% loss intarget contrast attributable to the HUD results in a loss in detection range ofonly about 2.5%, while a 20% HUD loss produces only about a 5.5% loss in range.This latter is for a HUD that produces so much contrast loss as to be labeled"bad" on the graph, but range loss is still very small.
36
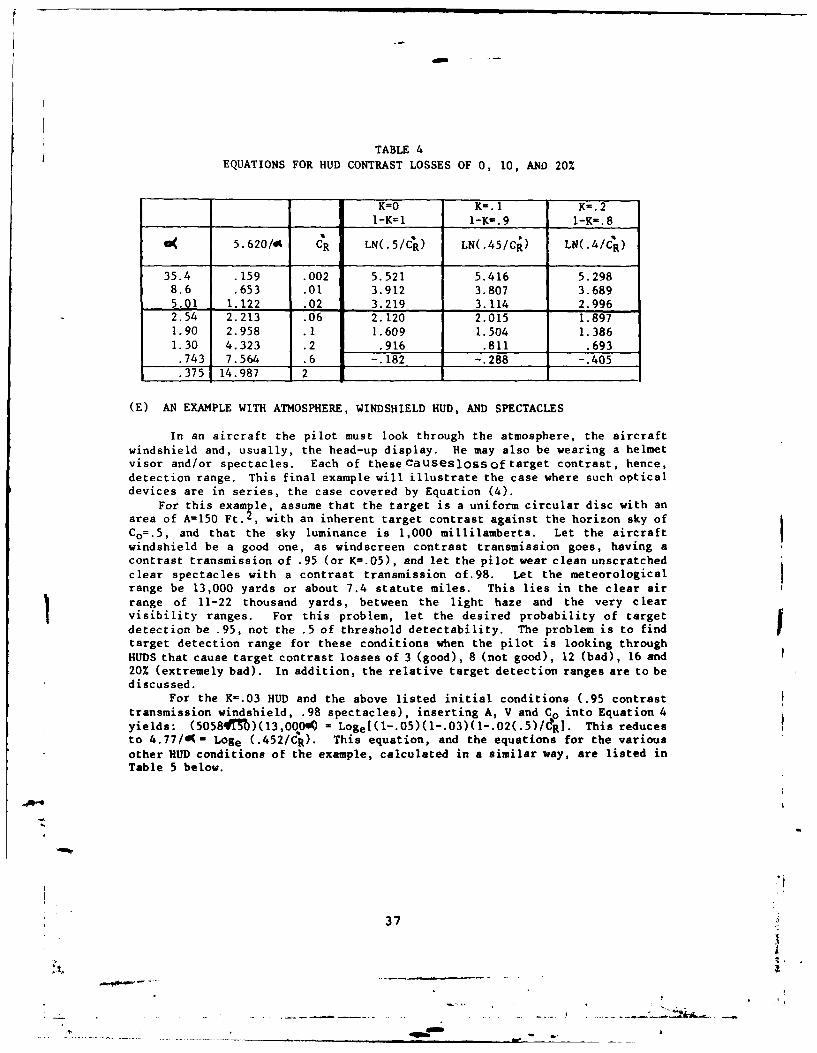
TABLE 4EQUATIONS FOR HUD CONTRAST LOSSES OF 0, 10, AND 20%
K=0 K-.1 K=.2_-K=1 1-K=.9 1-K-.8
5.620/O CR LN(.5/CR) LN(.45/CR) LN(.4 /CR)
35.4 .159 .002 5.521 5.416 5.2988.6 .653 .01 3.912 3.807 3.6895.01 1.122 .02 3.219 3.114 2.9962.54 2.213 .06 2.120 2.015 1.8971.90 2.958 .1 1.609 1.504 1.3861.30 4.323 .2 .916 .811 .693.743 7.564 .6 -.182 -.288 -.405.375 14.987 2 I a
(E) AN EXAMPLE WITH ATMOSPHERE, WINDSHIELD BUD, AND SPECTACLES
In an aircraft the pilot must look through the atmosphere, the aircraftwindshield and, usually, the head-up display. He may also be wearing a helmetvisor and/or spectacles. Each of these causesloss oftarget contrast, hence,detection range. This final example will illustrate the case where such opticaldevices are in series, the case covered by Equation (4).
For this exam le, assume that the target is a uniform circular disc with anarea of A=150 Ft. , with an inherent target contrast against the horizon sky ofCo=.5, and that the sky luminance is 1,000 millilamberts. Let the aircraftwindshield be a good one, as windscreen contrast transmission goes, having acontrast transmission of .95 (or K=.05), and let the pilot wear clean unscratchedclear spectacles with a contrast transmission of.98. Let the meteorologicalrange be 13,000 yards or about 7.4 statute miles. This lies in the clear airrange of 11-22 thousand yards, between the light haze and the very clearvisibility ranges. For this problem, let the desired probability of targetdetection be .95, not the .5 of threshold detectability. The problem is to findtarget detection range for these conditions when the pilot is looking through
HUDS that cause target contrast losses of 3 (good), 8 (not good), 12 (bad), 16 and20% (extremely bad). In addition, the relative target detection ranges are to bediscussed.
For the K=.03 HUD and the above listed initial conditions (.95 contrasttransmission windshield, .98 spectacles), inserting A, V and CO into Equation 4yields: (50584M)(13,00000 = Loge[(l-.O5)(l-.O3)(l-.02(.5)/R]. This reducesto 4.77/4K Loge (.452/CR). This equation, and the equations for the variousother HUD conditions of the example, calculated in a similar way, are listed inTable 5 below.
37
- -.

TABLE 5EQUATIONS FOR VARIOUS ASSUMED CONDITIONS
ASSUMED CONDITION RESULTANT EQUATION
AIR ONLY, NO OPTICS 4.77/t = Ln(.5/CR)
Windscreen* & Spectacles*HUD K=O 4.77/ = LN(.466/eR)HUD K=.03 4.77/01 = LN (.452/Ck)HUD K=.08 4.77/o = LN (.428/Cd)
HUD K=.12 4.77/,K = LN (.410/CR)
HUD K=.16 4.77/6K= LN (.391/CR)HUD K=.20 4.77/' = LN (.372/R)
* Canopy K=.05, Spectacle K=.02
To plot the 7 equations of Table 5 requires matching values ofoand CR, which
are listed in Table 2. The calculated values given in Table 6 permit plotting all
of the equations, namely the matching or paired values of 4.77/0( and LN (Q/CR),
where Q has values of .5, etc.
TABLE 6DATA POINTS FOR PLOTTING EQUATIONS
35.4 8.60 5.01 2.54 1.90 1.30 .743
4.77/Oc .135 .555 .952 1.88 2.51 3.67 .642
CR=2CR .002 .01 .02 .06 .1 .2 .6
LN(.500/C ) 5.52 3.91 3.22 2.12 1.60 .916 -. 182LN(.466/F)R 5.45 3.84 3.15 2.05 1.54 .846 -.253
LN(,452 5.42 3.81 3.12 2.02 1.51 .815 -.283
LN(.428/ R ) 5.37 3.76 3.06 1.96 1.45 .761 -.338
LN(.410/ C 5.32 3.71 3.02 1.92 1.41 .718 -.381
LN(.391/ F) 5.28 3.67 2.97 1.87 1.36 .670 -.428LN(.372/ R ) 5.23 3.62 2.92 1.82 1.31 .621 -.478
Note the dark vertical lines that separate values between which the
intersectiop points lie, indicated by 4.77f1, changing from less
than LN(Q/CR) to more than LN(Q/CR), where Q=.428, etc.
As noted and shown earlier, using semi-log (or log-linear) graph paper yieldsdata curves that are much straighter, and thus easier to draw. Some readers maywish to plot the data as a tutorial exercise, but may not have suitable semi-log
graph paper, so must plot it on ordinary (or linear-linear) graph paper. For thisreason, the data is shown plotted on ordinary graph paper in Figure 6. The semi-
log plotting will be discussed later.
38
hNow
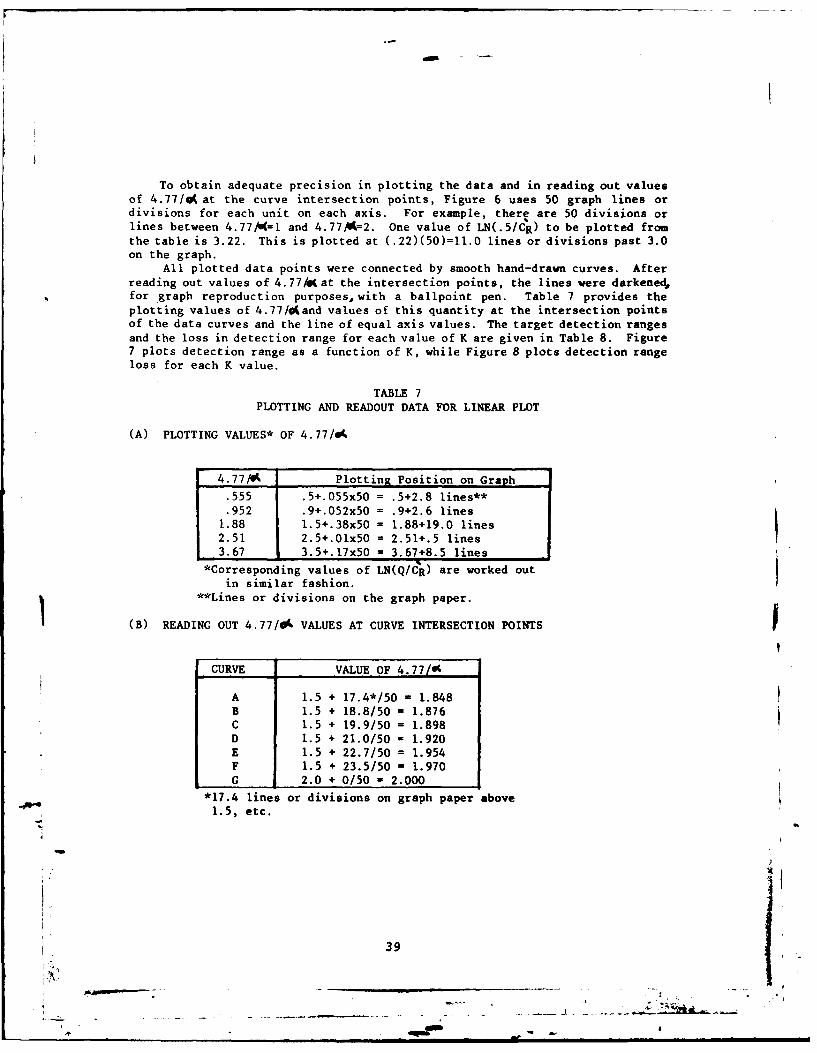
To obtain adequate precision in plotting the data and in reading out valuesof 4.77/ot at the curve intersection points, Figure 6 uses 50 graph lines ordivisions for each unit on each axis. For example, there are 50 divisions orlines between 4.77/4=l and 4.77,t=2. One value of LN(.5/CR) to be plotted fromthe table is 3.22. This is plotted at (.22)(50)=11.0 lines or divisions past 3.0on the graph.
All plotted data points were connected by smooth hand-drawn curves. Afterreading out values of 4.77/Ioat the intersection points, the lines were darkened,for graph reproduction purposes, with a ballpoint pen. Table 7 provides the
plotting values of 4.77/d4 and values of this quantity at the intersection pointsof the data curves and the line of equal axis values. The target detection rangesand the loss in detection range for each value of K are given in Table 8. Figure7 plots detection range as a function of K, while Figure 8 plots detection rangeloss for each K value.
TABLE 7PLOTTING AND READOUT DATA FOR LINEAR PLOT
(A) PLOTTING VALUES* OF 4.77/O
4.77/__ Plotting Position on Graph
.555 .5+.055x50 = .5+2.8 lines**
.952 .9+.052x50 - .9+2.6 lines1.88 1.5+.38x50 = 1.88+19.0 lines
2.51 2.5+.01x50 = 2.51+.5 lines3.67 3.5+.17x50 = 3.67+8.5 lines
*Corresponding values of LN(Q/CR) are worked out
in similar fashion.
**Lines or divisions on the graph paper.
(B) READING OUT 4.77/O L VALUES AT CURVE INTERSECTION POINTS
CURVE VALUE OF 4.77/0
A 1.5 + 17.4*/50 - 1.848B 1.5 + 18.8/50 = 1.876C 1.5 + 19.9/50 = 1.898
D 1.5 + 21.0/50 - 1.920
E 1.5 + 22.7/50 = 1.954F 1.5 + 23.5/50 - 1.970G 2.0 + 0/50 - 2.000
*17.4 lines or divisions on graph paper above1.5, etc.
39
VJ
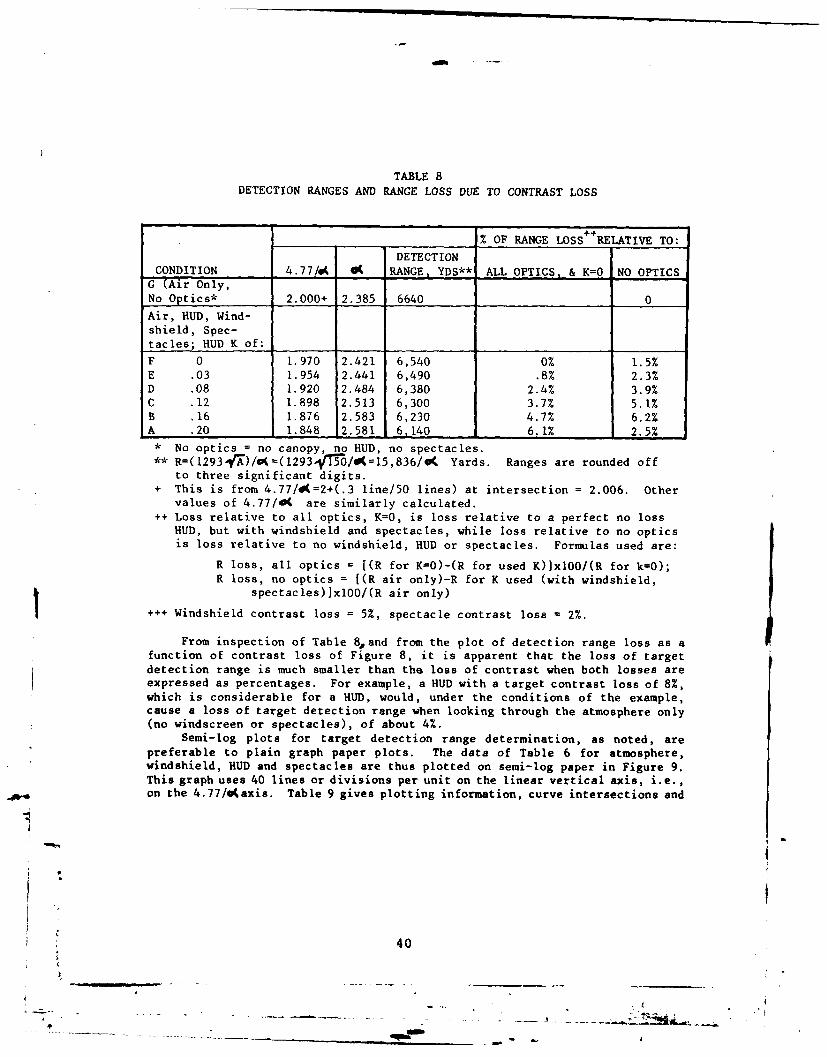
TABLE 8DETECTION RANGES AND RANGE LOSS DUE TO CONTRAST LOSS
% OF RANGE LOSS ++RELATIVE TO:
DETECTION
CONDITION 4.77/M A RANGE, YDS** ALL OPTICS, & K=O NO OPTICSG (Air Only,No Optics* 2.000+ 2.385 6640 0
Air, HUD, Wind-shield, Spec-
tacles; HUD K of:
F 0 1.970 2.421 6,540 0% 1.5%E .03 1.954 2.441 6,490 .8% 2.3%D .08 1.920 2.484 6,380 2.4% 3.9%C .12 1.898 2.513 6,300 3.7% 5.1%B .16 1.876 2.583 6,230 4.7% 6.2%A .20 1.848 2.581 6,140 6.1% 2.5%
* No optics = no canopy, no HUD, no spectacles.
** R=(1293r)/ =(12931/ =15,836/( Yards. Ranges are rounded offto three significant digits.
+ This is from 4.77/0(=2+(.3 line/50 lines) at intersection = 2.006. Othervalues of 4.77/4K are similarly calculated.
++ Loss relative to all optics, K=0, is loss relative to a perfect no lossHUD, but with windshield and spectacles, while loss relative to no opticsis loss relative to no windshield, HUD or spectacles. Formulas used are:
R loss, all optics = [(R for K=O)-(R for used K)xlOOI/(R for k=O);R loss, no optics = [(R air only)-R for K used (with windshield,
spectacles)]xlOO/(R air only)
+++ Windshield contrast loss = 5%, spectacle contrast loss = 2%.
From inspection of Table 8,and from the plot of detection range loss as afunction of contrast loss of Figure 8, it is apparent that the loss of targetdetection range is much smaller than the loss of contrast when both losses areexpressed as percentages. For example, a HUD with a target contrast loss of 8%,which is considerable for a HUD, would, under the conditions of the example,cause a loss of target detection range when looking through the atmosphere only(no windscreen or spectacles), of about 4%.
Semi-log plots for target detection range determination, as noted, are
preferable to plain graph paper plots. The data of Table 6 for atmosphere,windshield, BUD and spectacles are thus plotted on semi-log paper in Figure 9.
This graph uses 40 lines or divisions per unit on the linear vertical axis, i.e.,on the 4.77/(axis. Table 9 gives plotting information, curve intersections and
40
.......... ... . . ,-- - -- - -- - - -- - --B - -- -
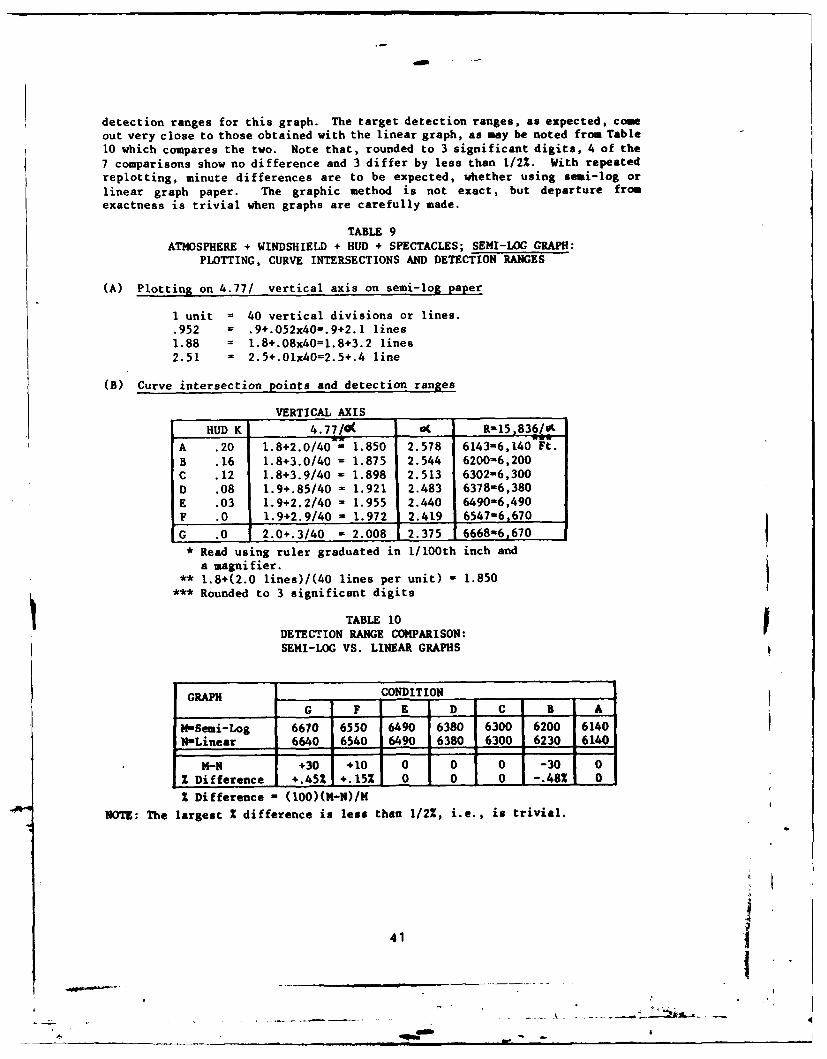
detection ranges for this graph. The target detection ranges, as expected, comeout very close to those obtained with the linear graph, as may be noted from Table10 which compares the two. Note that, rounded to 3 significant digits, 4 of the
7 comparisons show no difference and 3 differ by less than 1/2%. With repeatedreplotting, minute differences are to be expected, whether using semi-log or
linear graph paper. The graphic method is not exact, but departure fromexactness is trivial when graphs are carefully made.
TABLE 9
ATMOSPHERE + WINDSHIELD + HUD + SPECTACLES; SEMI-LOG GRAPH:PLOTTING, CURVE INTERSECTIONS AND DETECTION RANGES
(A) Plotting on 4.77/ vertical axis on semi-log paper
1 unit = 40 vertical divisions or lines..952 = .9+.052x40=.9+2.1 lines1.88 = 1.8+.08x40=l.8+3.2 lines2.51 - 2.5+.01x40=2.5+.4 line
(B) Curve intersection points and detection ranges
VERTICAL AXIS
HUD K 4.77/( at R-15,8361/V
A .20 1.8+2.0/40 = 1.850 2.578 6143-6,140 Ft.
B .16 1.8+3.0/40 = 1.875 2.544 6200-6,200C .12 1.8+3.9/40 - 1.898 2.513 6302-6,300D .08 1.9+.85/40 - 1.921 2.483 6378-6,380E .03 1.9+2.2/40 = 1.955 2.440 6490-6,490F .0 1.9+2.9/40 - 1.972 .2.419 6547-6,670
G .0 2.0+.3/40 - 2.008 2.375 6668-6,670* Read using ruler graduated in 1/100th inch and
a magnifier.
** 1.8+(2.0 lines)/(40 lines per unit) - 1.850*** Rounded to 3 significant digits
TABLE 10DETECTION RANGE COMPARISON:
SEMI-LOG VS. LINEAR GRAPHS
GRAPH CONDITION
G F E D C B A
"-Semi-Log 6670 6550 6490 6380 6300 6200 6140IN-Linear 6640 6540 6490 6380 6300 6230 6140
M-N +30 +10 0 0 0 -30 0% Difference +.45% +.15% 0 0 0 -.48% 0
% Difference = (IO0)(M-N)/MNOTE: The largest Z difference is less than 1/2%, i.e., is trivial.
41f______ ___ I,

(F) RANGE DETERMINATION FROM LABORATORY DATA
The detectability of a target depends upon the target and its behavior, theenvironment, the aircraft windscreen and head-up display, and upon the pilot andhis behavior. Taylor (1964) discusses the use of visual performance data invisibility prediction as does Duntley (1964). The reader may find Duntley'searlier paper (1946) to be of some interest. However, none of these references
mention graphic methods nor do any of them cover the material that is discussedin the following paragraphs.
In the examples used in the present paper, detection range was determined
for stationary circular targets having uniform lightness appearing on a uniformsky background with a luminance of 1,000 millilamberts. Calculations and graphswere based on Blackwell's 1946 laboratory data collected from observers who wereallowed up to 15 seconds to look at a fixed point in space where they knew the
target was located if it was present. No search was involved, nor was therepresent any annoyances or distractions, vibration and noise, reduced partial
oxygen pressure, etc., that would reduce performance.In military situations, the observer usually does not know where the target
will appear and knows that at any particular time a target is probably notpresent. In contrast to the laboratory observer, he does not stare at a fixed
location. Instead, he searches the scene, devoting very little time to any onepoint in space. When such search behavior is involved, data for pair values of
apparent contrast and angular target subtense for only short glimpse times may beused, such as the data of Taylor (1964). With short glimpses, human contrast
sensitivity is less than when long looks are possible, hence target detectionranges are shorter. If the range to the target is decreasing, the target may wellnot be seen until quite close; the pilot will be thinking about something else andbe looking somewhere else.!
The laboratory data used in the examples has other limitations. For
example, pilots must often divide attention between cockpit instruments at closerange and the distant scene. Any look from one to the other requires refocussingof the eyes, which takes a little time. When looking out, the lack of visibledetails can cause an improper near focus which occurs under empty field
conditions, even with long viewing time, a condition called empty field myopia I(nearsightedness). This focus error appreciably reduces contrast sensitivity.
Also, looking from a relatively dark instrument panel to a bright sky may involvea luminance adaptation level mismatch for the observer, further reducingcontrast sensitivity.
In an aircraft windshield and head-up display, there can be reflections,single and multiple, from the sun, bright sunlit clouds and aircraft instruments.In some aircraft orientations with respect to the sun, the HUD may produce brightspots and halos. In some head-up displays, there are noticeable reflections fromthe pilot and his clothes and even from the checklist on his lap. Sometimesreflections are so dim as to be unnoticed or even not visible, but they may stillact as veiling luminances that reduce the apparent contrast of the target. Evenwhen reflections and glare sources fall to one side of the target image, thus notreducing its contrast, they may reduce the observer's contrast sensitivity. Inaddition, by serving as a source of annoyance and distraction, reflections andbright spots may effectively reduce target detection range.
42
Aircraft vibration, reflections and glare, reduced oxygen pressure, emptyfield myopia, inside-outside eye refocussing and luminance adaptation levelmismatch all reduce contrast sensitivity, hence reduce maximum possible targetdetection range. When the distance to the target is decreasing, as it often is,imperfect attention and concentration, the press of other tasks, etc., incombination with search behavior act to reduce target detection range even belowthe distance that atmosphere and optics would permit. In theory as well aspractice, pilots, as already noted, do not detect targets when their size andcontrast place them at or slightly above visibility. Usually, when a target isfirst noticed it is already much closer than simple theory might predict and maybe close enough to even be recognized. Because detection seldom takes place atnear detectability distance, the actual loss in target detection range attri-butable to the windscreen and HUD may be appreciably less than that found in theexamples worked out in this paper.
The laboratory data that were used in the examples worked out in detail forthe present paper were mean or average values. The variability or scatter of thelaboratory data, as indicated by the standard deviations, was not used. Thus,the examples arrived at average values for target detection range. That wastheir intention. However, it is very likely that some of the observers hadappreciably higher sensitivity to contrast than did others, even though all hadnormal or 20/20 visual acuity as measured by convent'onal eye charts of theletter type. Recent evaluations of contrast sensitivity by Ginsburg (1981),using sine wave gratings, have found large differences in contrast sensitivitybetween aircraft pilots in some parts of the spatial frequency spectrum, eventhough they also had normal visual acuity as measured by conventional eye charttests. In human abilities, large differences between individuals are to beexpected.
Since the basic method for finding target detection range in the presentpaper is based on the use of paired values of~ and CR, it is applicable to low,average or high contrast sensitivity individuals, provided only that the data isavailable or can be calculated from means and standard deviations reported in thescientific literature. Hence, it was not deemed necessary to complicate thetutorial examples of this paper by working out additional target detection rangesto illustrate the effects of individual differences in contrast sensitivity.
(C) SUMMARY
The present paper is a tutorial on determining target detection range by agraphic method. It was worked out and presented because of the inadequacy ofavailable methods. The method of successive approximations used many years agowas time consuming and tedious in application. Duntley (1948) worked out anomographic method to avoid successive approximations. However, using nomogramspresents problems due to the small size of available nomograms. This makes themdifficult to read accurately, especially when interpolation for target size,meterological range or inherent target contrast is involved. Nomograms also lackflexibility and their use gives little insight into the target detection process.
43
4 ._ __A

The method for determining target detection range worked out for this paperinvolves construction of a graph. Using the atmospheric contrast transmissionformula and the size-distance geometry of the target, a formula was derived. Itcontains only two unknowns, angular subtense (.of the target at detection andapparent target contrast CR when detected. Using paired values of Ci andX fromthe scientific literature, the formula is plotted on graph paper. Intersectionof the curve with a line of equality of the two axes of the graph enables finding0, hence detection range (from another derived formula) or finding apparentcontrast when detection occurred.
To illustrate use of this graphic method, several examples were worked outin detail using the atmosphere only, atmosphere plus HUD, and atmosphere pluswindscreen, HUD and spectacles. The advantage of plotting on semi-log paper wasdemonstrated. It was shown that the percent loss of detection range was muchsmaller than the contrast loss in percent attributable to the HUD. Thediscussion of the use of laboratory data to predict field performance leads tothe conclusion that both actual target detection range and loss of range fromloss of contrast by aircraft optics would be less than expected.
(H) CONCLUSIONS
(1) Computation of maximum target detection range is readily achieved bythe graphic method derived in this paper. Values are required for the sizeand inherent contrast of the target, atmospheric clarity and contrastlosses from optics such as aircraft windscreen, HUD and the pilot's visorand spectacles.
(2) The method derived is a graphic one so that answers will be influencedby small errors in plotting and reading of values on the graph. However, ifreasonable care is used, repeated plotting can obtain ranges that differ bytrivial amounts (less than 1%), even using linear vs. semi-log paper. Acomputer program could, of course, be generated to provide quickerestimates with even greater accuracy.
(3) Using semi-log paper is appreciably easier than using plain or lineargraph paper, because the data lines that have to be drawn are muchstraighter and easier to draw.
(4) Use of contrast sensitivity data from the scientific literature to finddetection ranges and loss of range attributable to aircraft optics will leadto biased results. Detection range in the field will be less thanindicated, i.e., results from calculation are optimistic. However, loss ofrange attributable to aircraft optics will be pessimistic, i.e., actualrange loss due to optics will be even less than that indicated bycomputation.
(5) In general, optics-caused loss of detection range is considerably lessthan contrast loss expressed as a percentage. A relatively large optics-caused contrast loss leads to a relatively small loss in detection range.
44
. .. ..
(6) Deficiencies in the applicability of conventional laboratory data in
predicting performance in the field leads to the conclusion that fieldmeasures are necessary to supplement computational results.
(7) This paper utilizes contrast detection data based on observation ofdiscs of variable size and contrast. The more recent methods employingcontrast sensitivity for sine wave grating targets of variable contrast andspatial frequency viewed with and without aircraft windscreen and HUD canprovide valuable data on how these optics influence vision, hence detection
range.REFERENCES
Blackwell, H. R. Contrast Thresholds of the Human Eye. J.Opt.SOC.m.V 36, No 11, 624-643 (1946).
Duntley, S.Q. The Visibility of Distant Objects, J. Opt. Soc. Am., 194, 38:327-249
(March 1948).
Duntley. S.Q. Visibility II, Summary, Applied Optics, May 1964, Vol. 3, No. 5 (page
556).
Ginsburg, A.P. Sept 1981. Proposed New Vision Standards for the 1980's and Beyond:
Contrast Sensitivity, AFAMRL-TR-80-121, Air Force Aerospace Medical ResearchLaboratory, Wright-Patterson Air Force Base, Ohio 45433.
Middleton, K.E.,W. Vision Through the Atmosphere. University of Toronto Press,
Canada, 1952.
Taylor, J.H. Use of Visual Performance Data in Visibility Prediction. AppliedOptics, Vol. 3, No. 5, May 1964.
45
-".robA

(A) THE ATMOSPHERECR= Co e -3 9 2 RV
Solving this for R yields
R = ( V/3.912)Loge (CO /CR ) Equation (1)
(B) THE TARMt 3B-= GEZeRY
A = Tret Area =lD 2 /4D =4Ar = (17r)(4rT ) = 1.12841TFor D in yards, A in square feet, divide by 3. ThenD = ( 1. 1284 /3 )(4A
A =7TD2/4 D = .3761fA yards, A in square feet.
target In the triangle:
Tan (0(/2) = ( D/2 )/ R However, for small 4
Tan ('/2 ) = ('K/2 ) radians = (0/2 minutes/ ( 57.3)( 60 )-Eye D/2 Tan ( / 2 ) =(O"/2 )/ 3438 Thus,D/2R = (O/2 ) /3438, or
R D/R =o(/3438 andR = 3438D/o( , but D = .3761,0A- ( see above ),R = 3438( .3761j'A )/d,, which simplifies to
C R293 )/, Equation (2)
(C) EQUATING ATMOSPHERIC R TO GgXETRY R
V/ 3.912 ) Log e ( Co / CR ) = ( 1293j-)/.(
This reduces to:
SLoge ( Co / CR (5058w-)/WA V EquaL (3'
Fig.l.Derivation of the basic formula.
46
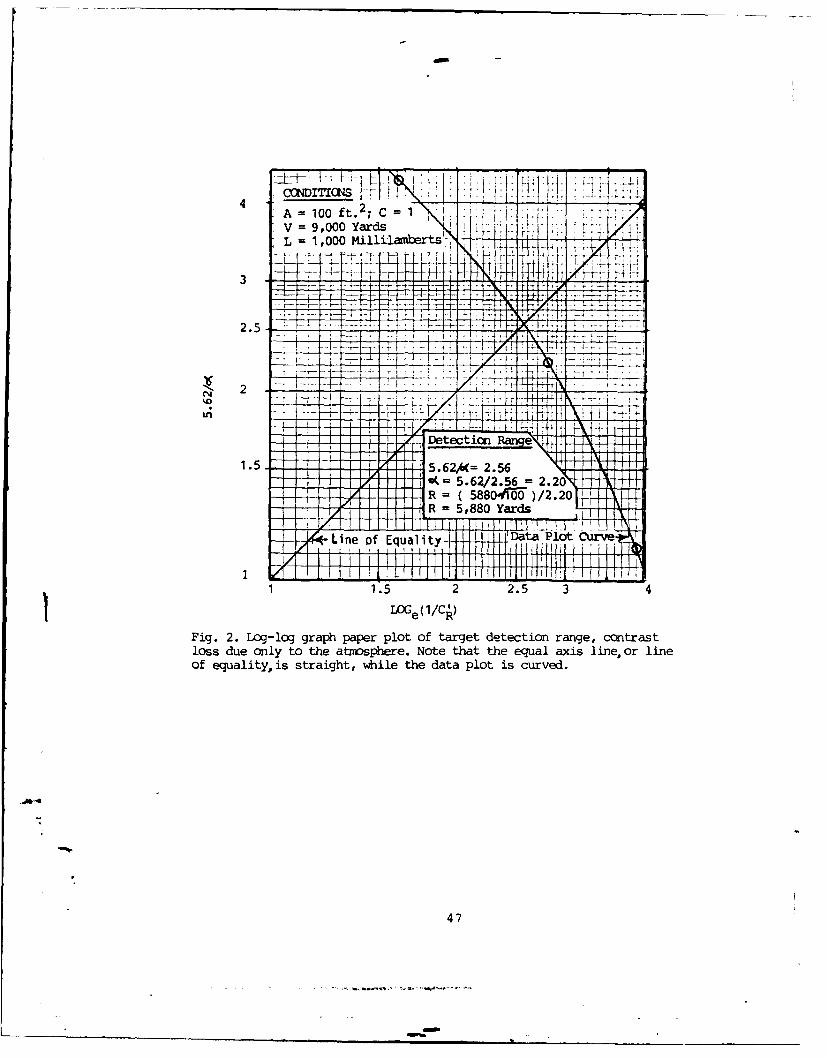
A = 00ft;C
L =1,000 Millilamberts r
1-V--
_H 4
2.5-
C1 2
IIf
7O~ -T ionCeL
- - I I I A, .
-4
A (588 10000)/2.203.5~ V 5,8 Yards ard
47
4.5- i 10,30
.2 .10*-HU Ca4RAST OSS4
Loss of Datetac Plot ....s
0, 1 an 20 los o tageContrast durme toa ed-p iply
0 4950
x I x97 0 . 11i 1 1
1.3 1. 21 2. 3 3.\1G XlK X 0 I 1 1
Faq.5. xanle plotedon e~i-lo papr. otetha theequlit-ofaxelin iscuredb~i tht he atapoit lne s vrynealstig .
50~a
lo "1
------- --p ---
Fi.6 Liea plo fo t ie atmphere aly, and plotrs fo lokgtrahteatn ~ GONITCS hv tosphere, thWindscreen. spcalsada He-UD ipa, llnsee.
... .... .

% HUD CONTRAST TRANSMISSION
100 95 90 85 80
6600 4-
6500
640
620
61000~~~ .0 .0 .0 .1 .1 .1.1 .. 20.
6252
.. .. . ..
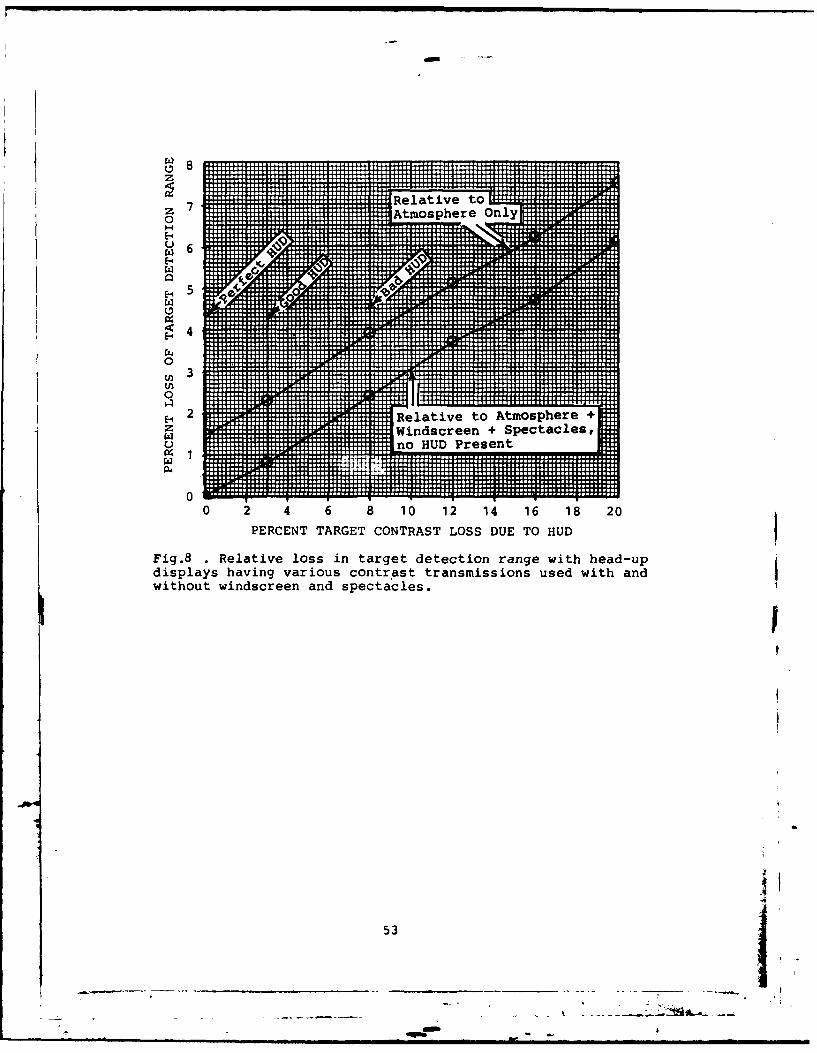
0!
(14
0
0
z
z7 Relative to0 Atmosphere Only
E-4
w 6
E-4
0
E, 5W
0
0 2 4 6 8 10 12 14 16 18 20PERCENT TARGET CONTRAST LOSS DUE TO HUD
Fig.8 Relative loss in target detection range with head-up
displays having various contrast transmissions used with andwithout windscreen and spectacles.
I
53 __"1
.. . .. . .. . .. . .. . . .. . . . .. . . .

2 .6 "1 -'A 'L , J - , , , ,E CONDITIONS
2.5I
2.4
2.3 K - - .I
2.Equal Axes Line
2.1
2.0
DaaPoint Lines
1.8
1.7
1. 0 1
-- 54i 1.3
1.2 '
1.0
1.0 1.5 2.0 2.5 3.0 3.5
~~LOG e [ I-KI) (I-K2) (I-K3) Co/C k.
SFig. 9. Semi-log plot graph for obtaining target detection rangefor atmosphere, windscreen, head-up display and spectacles inseries for various values of HUD contrast transmission.
54
AD-P003 162Direct Performance Assessment of HUD Display Systems
Using Contrast Sensitivity
Major Art GinsburgAir Force Aerospace Medical Research Laboratory
Wright-Patterson AFB, Ohio 45433
Introduction: Present metrics for evaluating display systems rely heavily on physicalmeasurements of various system elements. Depending on the display type, these mayinclude limiting resolution, number of grey shades and transmission loss. Unfor-tunately, these kinds of metrics hive not related directly to observer performance, suchas detection range capability. Mmajor problem with creating performance-relatedmetrics has been the lack of analytical throughput, that is, the ability to charac-terize relevant target information in the same language used to specify systemcapability, visual processes and performance metrics such as detection range. Unifiedmetrics of display quality are needed that directly relate target information todisplay capability and operator performance. Although the physics of displays are wellunderstood, there has been a lack of understanding and inability to quantify visualtarget acquisition. However, increased understanding of visual science now , whencouple4 with linear systems analysis, promisesto create unified performance-basedmetrics . In particular, contrast sensitivity changes to sine-wave gratings imagedthrough a display system yield a contrast sensitivity function that can be related todetection range. The spatial frequency bandwidth of relevant target information can berelated to changes in the contrast sensitivity function, whichin turncan be relatedto changes in target contrast and detection range. This paper discusses an applicationof this approach for quantifying the detection range impact of several different head-up (HUD) displays.
Three candidate HdDs for the F-16 aircraft, two having similar refractive optics, AFTIand Production, Ind the third having reflective, holographic optics, LANTIRN, wereevaluated by test pilots in field tests for mission performance. The pilots complainedthat the newer LANTIRN HUDs had several optical problems: color halos and patches, sunspots, glare, reflections, loss of targets and target contrast. Since the primary Ispecification for the optical quality of the HUD, optical transmission, was met by themanufacturer, it was clear that a more relevant evaluation of the HUD was neccessary.For example, evaluating only the transmission quality of the HUD optics obviouslyexcluded important factors that pilots complained aboutsuch as glare, light scatterand reflections, that will vary greatly in different operational settings and reducetarget visibility. These latter considerations call for a metric that can evaluate theHUD system with proper considerations of all possible detrimental effects on targetvisibility.
Contrast sensitivity functions were obtained from observers to sine-wave gratingsviewed around and through the HUDs under laboratory and field conditions. Contrastlosses resulting from the HUD optics (owing to transmittance, glare, and reflections)were translated into detection range losses using previously collected field trial datathat related differences in aircraft detection range of Air Force pilots to differencesJn their contrast sensitivity. This approach is compared to previous approaches tospecify visual performance through optical media. The results show that even thoughthe optical system of the LANTIRN HUD is fundamentally different from the other twoHUDs, in general, these three HUDs produce similar losses in detection range.
55 1.I.. . .. _ . 4

THE CONTRAST SENSITIVITY METRIC: The purpose of head-up displays (HUD) is to allow thepilot to simultaneously see targets and HUD symbology. Targets are visually acquiredfrom their perceived contrast. Contrast, the luminance difference between the targetand background, is needed for all aspects of target acquisition, including targetdetection and shape recognition. Any factor that reduces target contrast reducestarget detection and recognition range. The factors that can affect Derceived targetcontrast are target background, atmosphere, windscreen, HUD optics, visor, eye-glasses, and the visual system. Although the main concern here is the effect of theHUD optics on loss of target contrast, it is important to keep in mind that -t is onlyone factor, admittedly an important one, that can affect target visibility. Someinitial data will be presented that addresses the other factors that can affect targetcontrast.
An objective evaluation of the HUD system that relates to target acquisition requiresmeasurements of changes in target contrast due to all possible HUD components thatimage the target. For example, the properties of optical transmissivity of the HUDsystem that can effect target contrast are lens transmission, light scatter, glare andreflections. Although each of these properties could be measured separately, unlessthese measures relate directly to contrast transmission then the overall effect ofthese factors cannot be used to determine detection range loss. Further, even if thesemeasures are in terms of contrast, if each is measured separately, then theirinteractions will not be captured and cumulative assumptions of the individualmeasures will produce varying errors in performance assessment. Therefore, theprimary target consideration for a metric required to determine the capability of theHUD to transmit target contrast is that it measure the effects of all the possible HUDcontrast losses as well as their interactions. The visual system is the final receiverof target contrast and has a spatially distributed detection system in the form ofreceptive fields or channels whose spatial properties in terms of resolution andsensitivity vary across the retina. Unless a similar analytical model is used forevaluating HUDs, then conventional single spot or averaged contrast measures will notprovide measures of contrast that can meaningfully relate to the human performance.Until a proven model of human vision is available, the human observer can be used as
a contrast detector to determine the contrast transmission capability of the HUDsystem directly. Once the overall system performance is determined, then one canreturn to the physics of the individual system elements and determine their particulareffect on the total system.
CONTRAST SENSITIVITY FUNCTIONS: Over the last five years, AFAMRL/HEA Aviation VisionLaboratory (AVL) research has developed a quick, sensitive and repeatable measure ofcontrast sensitivity, CS, based on a multi-channel vision model that relates well tothe target acquisition capability of individual observers3 -'. Contrast sensitivitycan also be used to help determine the contrast transmission capability of displaysystems such as HUDs. CS can be used to quantify the relative differences betweencontrast transmission with and without all or some components of the imaging systemand then can be used to relate those differences to detection range.
The contrast sensitivity function, CSF, is a curve that describes an observer'sthreshold sensitivity to targets of different sizes. Contrast sensitivity, CS, is thereciprocal of the threshold contrast needed to just detect a target. The Michaelsondefinition of contrast is typically used for sine-wave gratings: C = the differencebetween the maximum and minimum luminances divided by their sum. Sine-wave gratingtargets are typically used because sinewaves are basic functions of complex objects(Figure la). Any spatial target can be decomposed into a combination of sine-wavesusing Fourier analysis. Since human vision shows a high degree of linearity aroundthreshold, the visual response to he threshold gratings shows powerful predictivecapability to more complex targets. This general predictive power for individualtarget detection of complex targets has not been shown using other target sets orapproaches.
56
Figure lb shows a typical CSF having contrast sensitivity plotted on the ordinate andspatial frequency of the test grating in cycles per degree of visual angle, cpd, plottedon the abscissa. The CSF bandpass filter characteristic has peak sensitivity at about3 cpd, falling slowly for lower spatial frequencies and more quickly at the higherspatial frequencies until reaching the cut-off limit of human vision, about 50 to 60cpd.
Although it is conventional in the optical community to speak of contrast transmissionof optical systems, optical systems can also be characterized in terms of theircontrast sensitivity in tht same manner as electronic systems are characterized interms of signal sensitivity. Optical systems can act as frequency selective filters.Therefore, in order to underscore the ability of CS techniques to characterize thetotal optical system performance in a manner similar to visual performance, the CSF ofthe HUD is a measure of the capability of the HUD to transmit low contrast targetinformation with the human observer as the contrast detector. The HUD CS was determinedby measuring an observer's CS with and without viewing through the HUD. This techniqueuses the high visual sensitivity of the observer as a contrast detector whose visualsensitivity provides baseline control for all other test conditions. The generalexperimental set-ups for measuring CS in laboratory and under field test conditions areshown in Figures 2a,b.
The methodololgy and equipment ued to measure the CSF of the observer with and withoutthe HUD is described elsewhere ,6 . Briefly, a microprocessor controlled portablecomputer automatically presents a series of gratings to the observer in ascendingspatial frequency. A preview grating is presented for three seconds, to reduceobserver uncertainty to the spatial frequency to be detected, then disappears to belowthreshold visibility. After a randomly determined time interval, the contrast of thegrating is increased at a preselected slew rate. The observer presses a button when thegrating first becomes visible. This procedure is continued for five measures afterwhich time the next test grating is previewed and the test procedure is continued forthe remaining test gratings. The CS difference between viewing the gratings around andthrough the HUD is the gain or loss of threshold contrast for the HUD. In general, thereare three test conditions: baseline CS looking around the HUD, CS through the HUD, andfor the AFTI HUDs and LANTIRN which had more optically dense upper portions of theirdisplay, the eyebrow, CS was measured through the eyebrow center.
DETERMINING DETECTION RANGE LOSSES FROM REDUCED CONTRAST SENSITIVITY: AVL field trialdata correlated differences between the CS of pilots to differences in their detectionrange of an approaching aircrafty. Ten field trials were run over three months in whichgroups of usually ten pilots per trial were required to report detection of a T-39aircraft flying towards them under visibility conditions ranging from 1.5 to 15 plusmiles. Eight of ten trials yielded highly significant correlations to detection rangeand pilot CS and not to their visual acuity (a result incidently predicted from themulti-channel model3,4). These data, using the highest correlations from the 10 milesplus visibility conditions (to minimize possible criterion effects in the analysis) areshown in Figure 3. From an extensive study in the 1920s', Koschmieder determined rela-tionships between target contrast and detection of high contrast ground targets undera variety of meteorological conditions . The trends in that data are similar to thoseof the AVL field data. The fractional detection range reduction assosciated with thefractional contrast reduction from the pilot field study are plotted with the solidcurve created from the Koschmieder data. The agreement between the two sets of data isexcellent even though Koschmieder used stationary targets and the pilot field data camefrom detection of a moving aircraft. This relationship is used to determine detectionrange penalties from losses in CS of the HUDs.
5
44
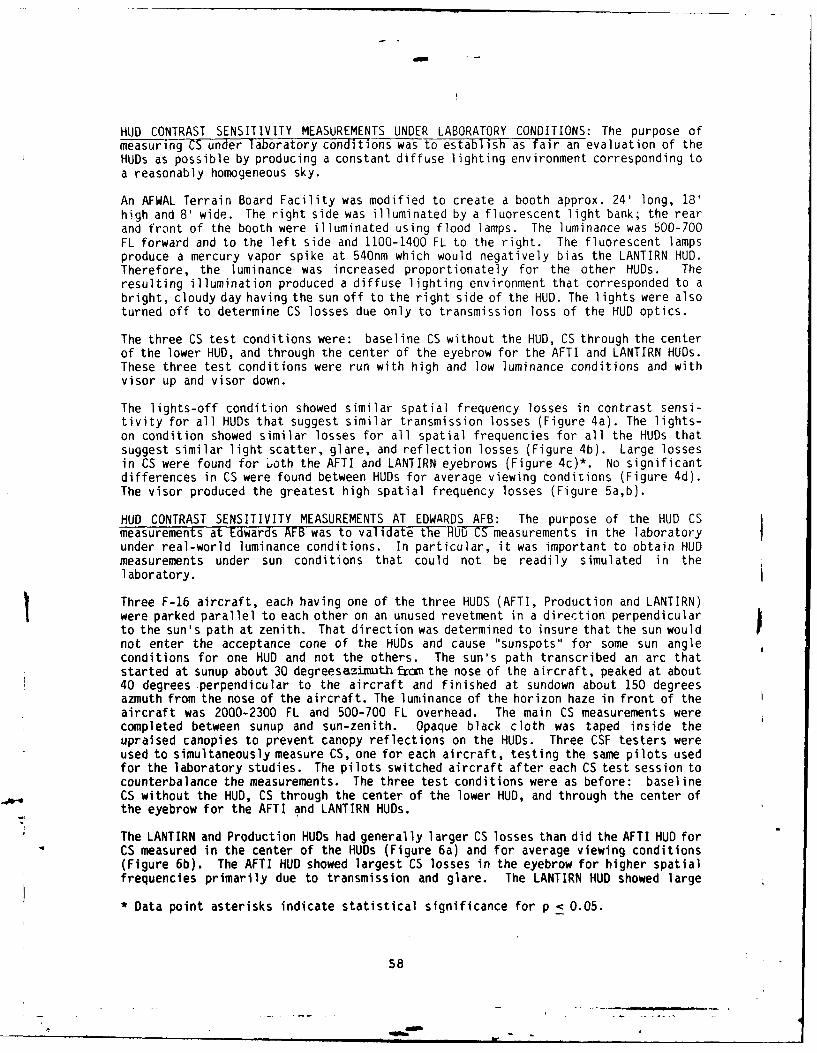
HUD CONTRAST SENSITIVITY MEASUREMENTS UNDER LABORATORY CONDITIONS: The purpose ofmeasuring CS under laboratory conditions was to establish as fair an evaluation of theHUDs as possible by producing a constant diffuse lighting environment corresponding toa reasonably homogeneous sky.
An AFWAL Terrain Board Facility was modified to create a booth approx. 24' long, 18'high and 8' wide. The right side was illuminated by a fluorescent light bank; the rearand front of the booth were illuminated using flood lamps. The luminance was 500-700FL forward and to the left side and 1100-1400 FL to the right. The fluorescent lampsproduce a mercury vapor spike at 540nm which would negatively bias the LANTIRN HUD.Therefore, the luminance was increased proportionately for the other HUDs. Theresulting illumination produced a diffuse lighting environment that corresponded to abright, cloudy day having the sun off to the right side of the HUD. The lights were alsoturned off to determine CS losses due only to transmission loss of the HUD optics.
The three CS test conditions were: baseline CS without the HUD, CS through the centerof the lower HUD, and through the center of the eyebrow for the AFTI and LANTIRN HUDs.These three test conditions were run with high and low luminance conditions and withvisor up and visor down.
The lights-off condition showed similar spatial frequency losses in contrast sensi-tivity for all HUDs that suggest similar transmission losses (Figure 4a). The lights-on condition showed similar losses for all spatial frequencies for all the HUDs thatsuggest similar light scatter, glare, and reflection losses (Figure 4b). Large lossesin CS were found for /oth the AFTI and LANTIRN eyebrows (Figure 4c)*. No significantdifferences in CS were found between HUDs for average viewing conditions (Figure 4d).The visor produced the greatest high spatial frequency losses (Figure 5a,b).
HUD CONTRAST SENSITIVITY MEASUREMENTS AT EDWARDS AFB: The purpose of the HUD CSmeasurements at Edwards AFB was to validate the HU0-CST-measurements in the laboratoryunder real-world luminance conditions. In particular, it was important to obtain HUD
measurements under sun conditions that could not be readily simulated in thelaboratory.Three F-16 aircraft, each having one of the three HUDS (AFTI, Production and LANTIRN)
were parked parallel to each other on an unused revetment in a direction perpendicularto the sun's path at zenith. That direction was determined to insure that the sun would Fnot enter the acceptance cone of the HUDs and cause "sunspots" for some sun angleconditions for one HUD and not the others. The sun's path transcribed an arc thatstarted at sunup about 30 degreesazimuth frcm the nose of the aircraft, peaked at about40 degrees perpendicular to the aircraft and finished at sundown about 150 degreesazmuth from the nose of the aircraft. The luminance of the horizon haze in front of theaircraft was 2000-2300 FL and 500-700 FL overhead. The main CS measurements werecompleted between sunup and sun-zenith. Opaque black cloth was taped inside theupraised canopies to prevent canopy reflections on the HUDs. Three CSF testers wereused to simultaneously measure CS, one for each aircraft, testing the same pilots usedfor the laboratory studies. The pilots switched aircraft after each CS test session tocounterbalance the measurements. The three test conditions were as before: baselineCS without the HUD, CS through the center of the lower HUD, and through the center ofthe eyebrow for the AFTI and LANTIRN HUDs.
The LANTIRN and Production HUDs had generally larger CS losses than did the AFTI HUD forCS measured in the center of the HUDs (Figure 6a) and for average viewing conditions(Figure 6b), The AFTI HUD showed largest CS losses in the eyebrow for higher spatialfrequencies primarily due to transmission and glare. The LANTIRN HUD showed large
* Data point asterisks indicate statistical significance for p < 0.05.
58

losses in the eyebrow at lower spatial frequencies primarily due to reflections.Unlike the laboratory data, there are small, though significant CS differences betweenHUD viewing conditions (Figure 6c). These small differences are due to the averagingof opposite interactions of various HUD losses occurring during the field tests.
General Discussion: The contrast sensitivity measurements obtained from both thelaboratory and field test conditions show systematic and consistent losses in contrastthat relate well to the physics of the different HUDs and the different test conditions.Although these data are valid for similar viewing and luminance conditions, furthertests are needed to broaden the scope of these results, especially for the pilots' visorwhich showed higher losses at the higher spatial frequencies than any HUD. On average,the visor alone produced 40% CS loss whereas the HUDs produced half that loss, about20%. Tinted canopies may show high losses in CS too. The losses in CS due to lightscatter were similar in nature to those found in previous AVL studies on CS losses dueto windscreen haze. Further, the CS losses were similar to those obtained from earlierstudies accomplished by the AVL with a pre-production HUD.
In general, even though the three HUDs have different optical configurations thatproduce different sensitivity signatures, they show similar average detection rangepenalties of 6-8%. Losses in detection range will cause increased detection time andincreased workload for the pilot. These data can be used in conjunction with missionrequirements to create performance-related standards for HUDs. The similar averagedetection range penalties for the three HUDs evaluated here demonstrate the power ofthe CSF approach to provide total system analysis for quite different optical displaysystems and relate system performance to detection range loss.
REFERENCES
1. A. P. Ginsburg, Specifying Relevant Spatial Information for Image Evaluation andDisplay Design: An Explanation of How We See Certain Objects, Proc. SID, 21, 1980, pp.219-227.
2. A. P. Ginsburg, Visual Information Processing Based on Spatial Filters Constrainedby Biological Data, Dissertation for Ph.D., University of Cambridge, England, 1977,Published as AMRL Technical Report - TR-78-129, 1978.
3. A. P. Ginsburg, Spatial Filtering and Vision: Implications for Normal and AbnormalVision, in Clinical Applications of Psychophysics, eds. L. Proenza, J. Enoch and A.Jampolsky, The Cambridge University Press, 1981, pp. 70-106.
4. A. P. Ginsburg, Proposed New Vision Standards for the 1980's and Beyond: ContrastSensitivity, Proc. AGARD No. 310, AFAMRL-TR-80-121, 1981.
5. A.P. Ginsburg and M. W. Cannon, Comparisons of Three Methods for Rapid Determinationof Threshold Contrast Sensitivity, Invest. Ophthol. Vis. Science, in press.
6. A. P. Ginsburg, D. W. Evans, R. Sekuler and S. A. Harp, Contrast SensitivityPredicts Pilots' Performance in Aircraft Simulation, Am. J. of Opt. and Physiol. Opt.,
59, 1982, pp. 105-109.
7. A. P. Ginsburg, J. Easterly and 0. W. Evans, Contrast Sensitivity Predicts TargetDetection Field Performance of Pilots, Proc. Aerospace Medical Assoc., May 1983.
8. W. E. K. Middleton, Vision Through the Atmosphere, University of Toronto Press,Canada, 1952.
59
..... PM
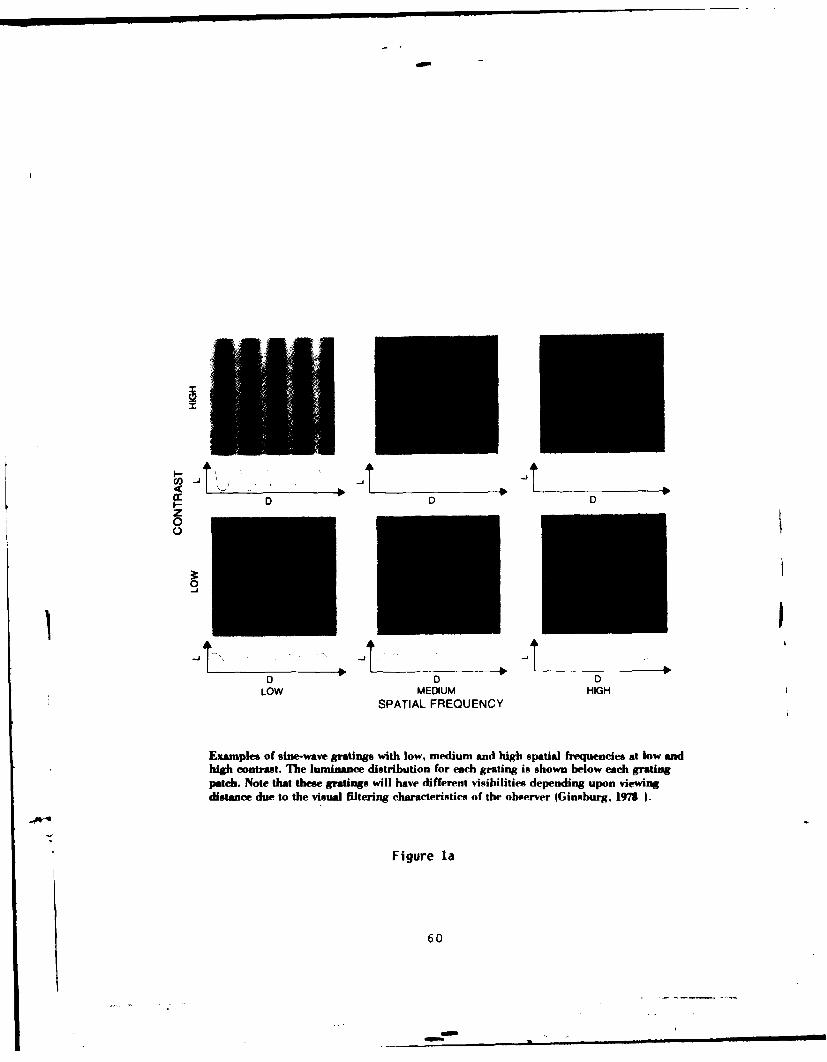
S2
D 0Dz0
-JI -
D 0 DLOW MEDIUM HIGH
SPATIAL FREQUENCY
Eixamples of sine-wave gratings with low, medium and high spatial fr-equencies at low andhigh contrast. The luminance distribution for each grating is shown below each gratingpatch. Note that these gratings will have different visibilities depending upon viewingdistance due to the visual filtering characteristics of the oboerver IGinsburg, 1975 1.
Figure la
60
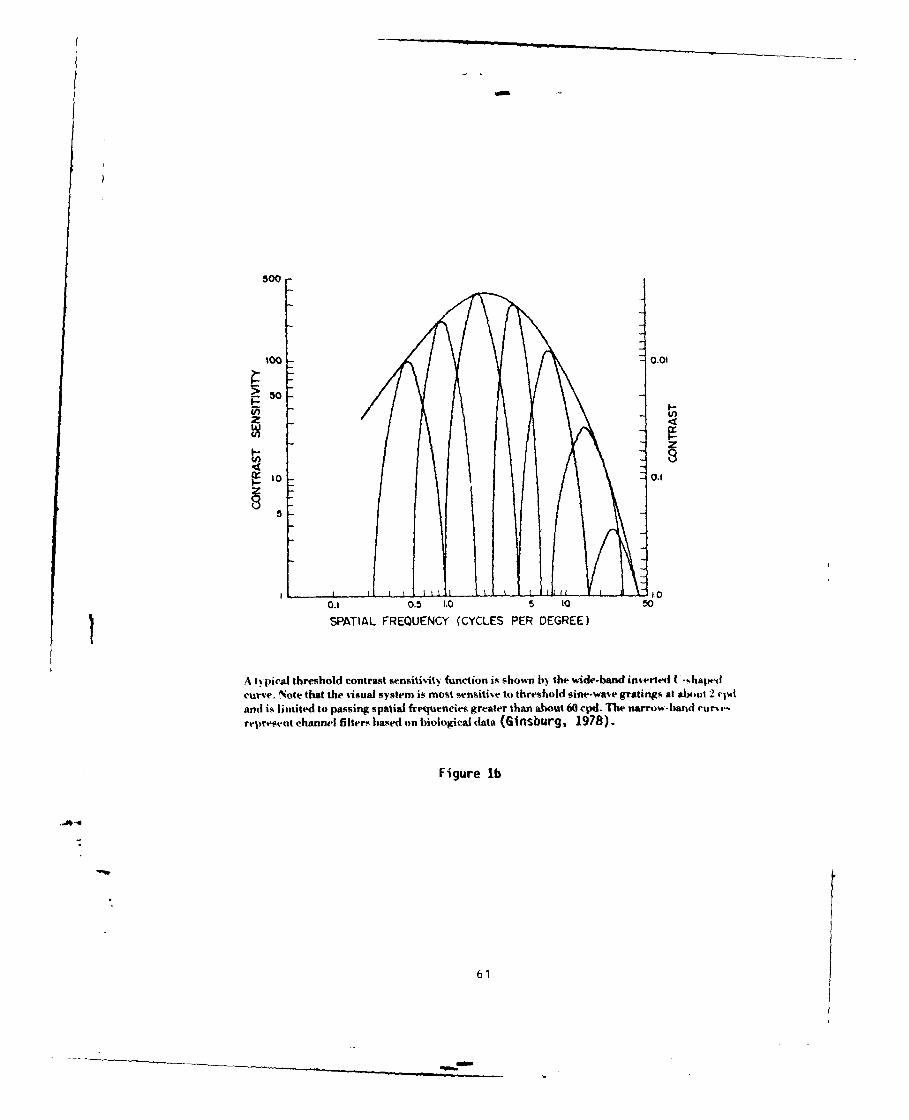
1oo 0.01
>50 I
z
1I0 0.1
85
I - ( J i ll 1.00.I 0,5 1.0 5 (a 50
SPATIAL FREQUENCY (CYCLES PER DEGREE)
A typical threshold contrast sensitivity function is shown by the wide-band inverted {-shaptdcurve. Note that the *isual system is most sensitive to threshold sine-wave gratings at albmt 2 ,idand is limited to passing spatial frequencies greater than about 60 cpd. The narrow-hand curi,,.represvnt channel filters based on biological data (Ginsburg, 1978).
Figure lb
61

£ igure 2a
Figure 2b
62
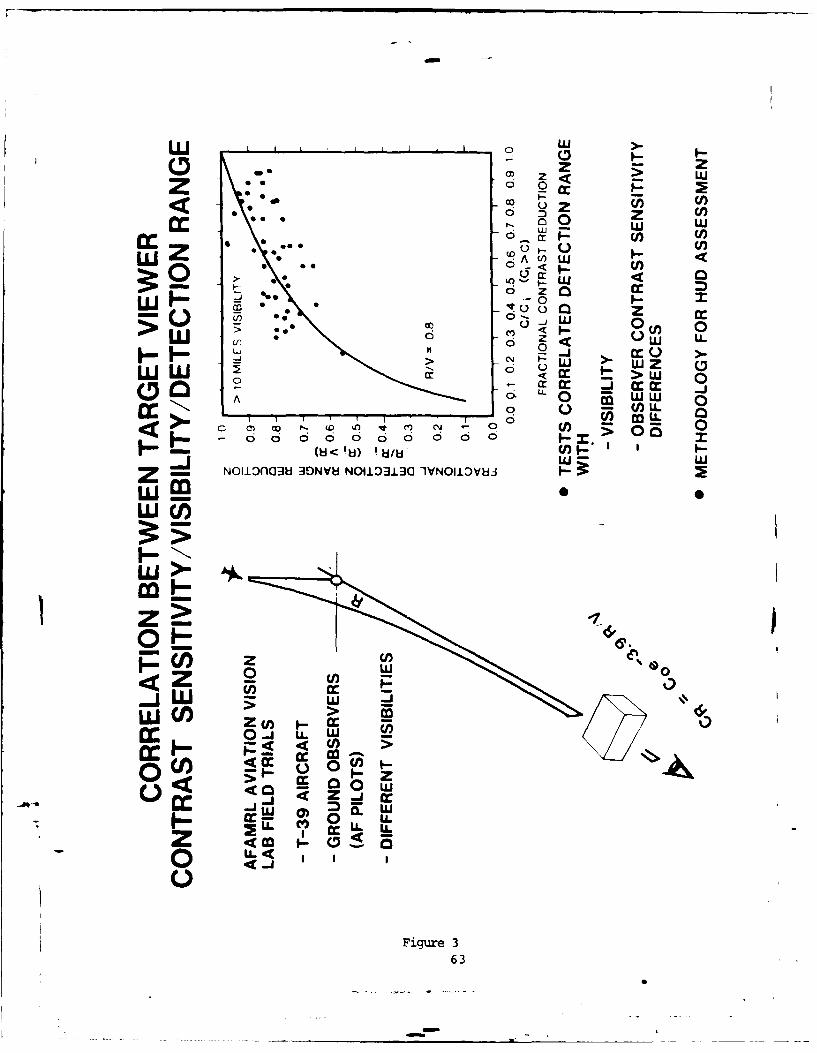
z z*0 0 CC)
S. 00 w w
W * A U) C)
WI- f- 0 QO
0 0
0 0 0 >w 0jw- 6 LLL L
cLL- Ww 0
ccI -0 0 0 0 0 mLL 0
-iE wW(I NOI1330JNVU N011033I VNOIiDV8JI0
LLI LLl.
z <> ~ -5
0 w 0Z U
.Figure>6
ULI C/ z m

CONTRAST SENSITIVITY LABORATORY DATA
a DIFFERENCE BETWEEN HUD AND VIEW LIGHTS OFF b DIFFERENCE BETWEEN HUD AND VIEW. LIGHTS ONPFROOCTON lEM
PROUCION0 o "M~voo~nm AFTI"UC
0CIJ.TIN '0 0.oLAON OwAA4U
tLNTA 11"' * NO0.
S snow
0)0
z~ PEUUCTION af 0'~N~~RN~Ug
0 ' AFT"
CENMP snow t- CENT",~Q5
,0 s Anowx~ LANTRIN*. NQ IsUO NO HUO o20 I20 0-9Pw -0"
C0 00
c IFRNCES 0EWENVE d VANIWNG CONDITIONS U AVERAGES 2
..0 ro LI H S O0 s cipry MUDIW
0 0
Al 0 1
02 0 22. %
SPA A3L CENTERIC 0P~S A A N D E O O C O

CONTRAST SENSITIVITY LABORATORY DATA
a DIFFERENCES BETWEEN VISOR CONDITIONS b ooo IFFERENCES BETWEEN HUD AND VISOR
SooAoo w0 vllI U, o m m UPin0
o GOWN
, ft
o sum wum,0000 Al
z z b I.
0i
0. ~ vo
zz ,,0 0
um~M. Him U n 0"I
a0 7*wl"U 0 O
r- 0-
00 20 20SPTA 0ROINY(P)SATA RGEC CO
Fiur 5
000 60 5
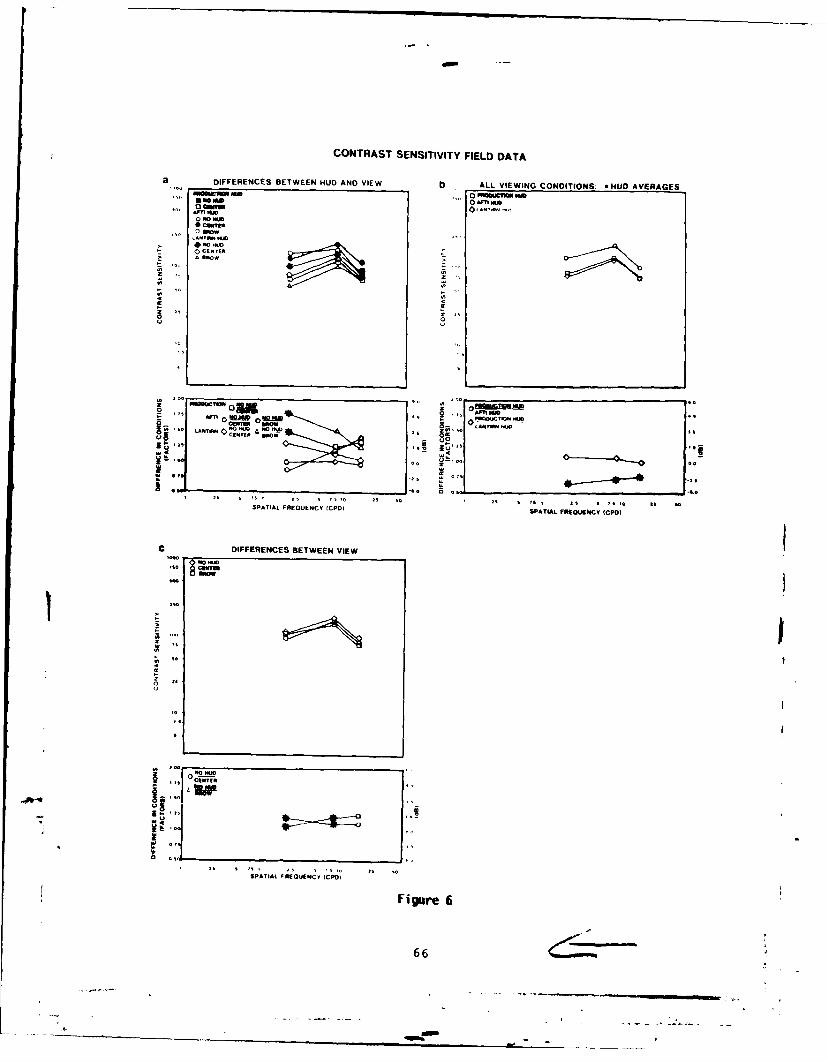
CONTRAST SENSITIVITY FIELD DATA
a DIFFERENCES BETWEEN HUD AND VIEW b ALL VIEWING CONDITIONS: - HUD AVERAGESMi m 0so
0~ No mm0 om
ANTIN IfLO
# no w- 0 CENTER
ts t
4 4
S DI F R N E E T E N V E
0 0
No mm O"ocl
U oo
r I
i '
II
SPATIAL FREOLENCY (CO SPATIAL FREQUENCY (COD
c DIFFERENCES BETWEEN VIEW
w 0 01w
Figure 6S
66
.... .
*1....
...
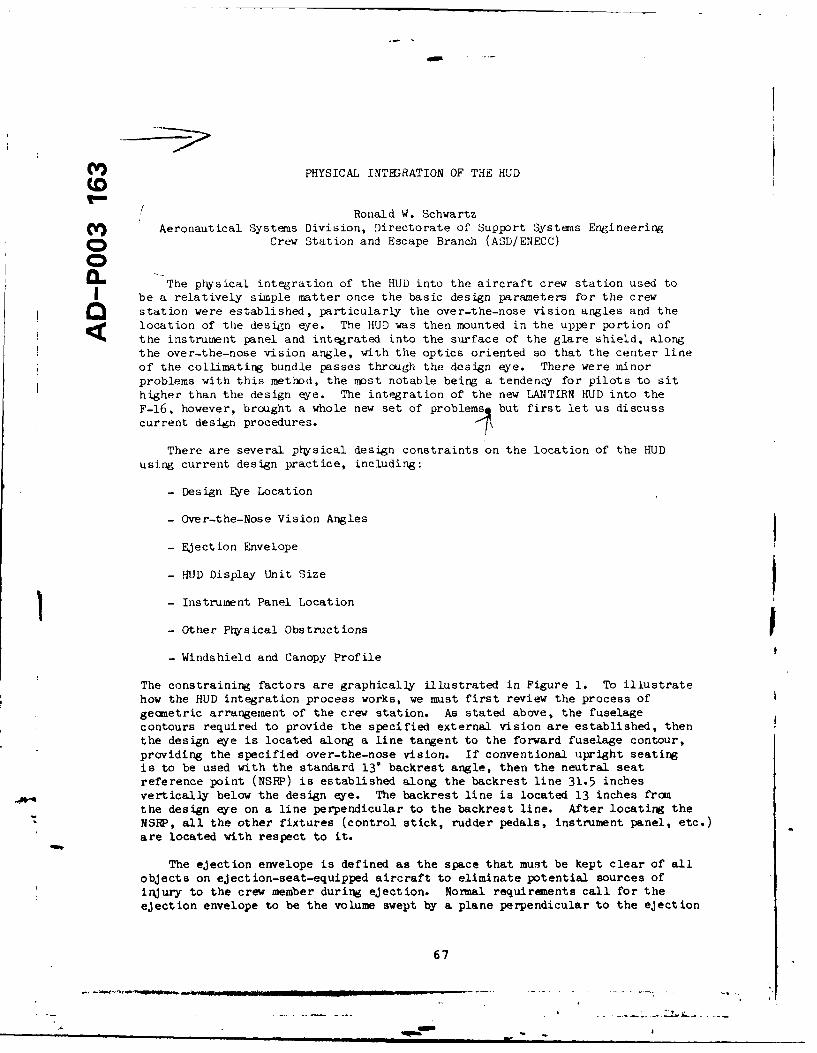
CV, PHYSICAL INTEDRATION OF THE HUD
CDRonald W. Schwartz
) Aeronautical Systems Division, Directorate of Support Systems EngineeringO Crew Station and Escape Branch (ASD/ENECC)
0OThe physical integration of the HUD into the aircraft crew station used to
be a relatively simple matter once the basic design parameters for the crew
station were established, particularly the over-the-nose vision angles and the
S location of the design eye. The HUD was then mounted in the upper portion of
the instrument panel and integrated into the surface of the glare shield, alongthe over-the-nose vision angle, with the optics oriented so that the center line
of the collimating bundle passes through the design eye. There were minorproblems with this method, the most notable being a tendency for pilots to sit
higher than the design eye. The integration of the new LANTIRN HUD into theF-16, however, brought a whole new set of problems9 but first let us discuss
current design procedures.
There are several physical design constraints on the location of the HUD
using current design practice, including:
- Design Eye Location
- Over-the-Nose Vision Angles
- Ejection Envelope
- HUD Display Unit Size
- Instrument Panel Location
- Other Physical Obstructions
- Windshield and Canopy Profile
The constraining factors are graphically illustrated in Figure 1. To illustrate
how the HUD integration process works, we must first review the process of
geometric arrangement of the crew station. As stated above, the fuselage
contours required to provide the specified external vision are established, then
the design eye is located along a line tangent to the forward fuselage contour,
providing the specified over-the-nose vision. If conventional upright seatingis to be used with the standard 130 backrest angle, then the neutral seat
reference point (NSRP) is established along the backrest line 31.5 inchesvertical],y below the design eye. The backrest line is located 13 inches from
the design eye on a line perpendicular to the backrest line. After locating the
NSRP, all the other fixtures (control stick, rudder pedals, instrument panel, etc.)
are located with respect to it.
The ejection envelope is defined as the space that must be kept clear of all
objects on ejection-seat-equipped aircraft to eliminate potential sources of
injury to the crew member during ejection. Normal requirements call for the
ejection envelope to be the volume swept by a plane perpendicular to the ejection
67
AL-
do
seat rail angle, 26 to 30 inches wide and 30 inches forward of the front ofthe seat back with a six inch radius at the forward corners, sweeping up therail angle. The ejection envelope is illustrated in Figure 2. All of thecockpit fixtures must be located outside the ejection envelope, with theexception of the control stick. If a control wheel is used, its width requiresthat it must be moved out of the ejection envelope during ejection initiation.
The other major constraining factor on HUD integration is the windshield andcanopy. The canopy shape and location is usually governed by the combination ofvision requirements, aerodynamic considerations, and crew member head clearance,normally specified as a 10 inch spherical radius around the design eye.
When values for all the above factors have been selected, the HUD isdesigned to fit into the space that is left and, with a conventional refractiveoptic HUD, oriented to pass the centerline of the collimating bundle through thedesign eye.
The process defined above is not an extremely complex one, particularly con-sidering that all of the steps but the last one must be performed whether or notthe aircraft has a HUD. That is not to imply that current HUD installations arewithout problems. The constraints on HUD location force the HUD to be so farfram the pilot's eye that, even with very large conventional optics, the field ofview (FOV) is limited. The 10 inch spherical radius head clearance requirementprovides adequate head clearance within the canopy, and it provides the crewmember latitude to adjust himself above the design eye which, in turn, forceshim to slouch to use the HUD. Most of our current HUT-equipped aircraft havehad expensive modifications to relocate the collimating bundle, increase theFOV, or both.
When the F-16 was developed, the installation of the initial refractiveoptics HUD was designed in much the same manner as that describea above. TheGeneral Dynamics Corporation performed mock-up studies with a limited number ofsubjects to determine the design eye location, since the reclined seat with a 34 °
back angle was an unconventional design and something of an unknown. Thereclined seat did not fit the "rules" established for cockpit integration withthe conventional upright seat (near 130 back angle). Typical of other HUDinstallations, the "gripes" began to roll in from the field that pilots had to"hunch down" to see the imagery and that the FOV was too small. The first
action taken was to perform a study using pilot subjects in the aircraft, with alarger si-mple size than the original mock-up studies to determine how the pilotswere actually located in the cockpit. This study, perfonned at the Air ForceFlight Test Center (AFFTC) at Edwards AFB, resulted in the centerline of thecollimating bundle being raised 1 1/2 inches at the design eye. The testsubjects were limited, however, to AFFTC test pilots.
The Low Altitude Navigation and Targeting Infrared for Night (LANTIRN)program was initiated to provide an improved night navigation and weapon deli-very capability for F-16 and A-10 aircraft. In addition to the navigation andtargeting sensor pods, new HUDs were to be developed with an extremely wideangle FOV and the capability to display both raster imagery and stroke writtensymbology. The LANTIRN HUD selected uses a combination of reflective anddiffractive optics to meet the wide angle FOV requirements. The reflectiveoptics are pupil-forming, which means there is a limited envelope in which theimagery is visible. This envelope not only limits movement of the pilots' Mres
68
m
up and down and side to side, as refractive optics do, but also limits fore andaft movement. The F-16 LANTIRN HUD was designed using the eye motion box thathad been defined for the original F-16 HUD fran the AFFTC study. When the firsttest model was installed in an F-16 at AFFTC, once again the complaints rolledin. Pilots were having problems with sudden visual loss of HUD imagery, internalflaring, reflections, sunspots and a multitude of other difficulties. The HUDcontractor claimed that manW of the problems being reported were caused by thepilots' eyes being outside the eye motion envelope. This claim was reinforcedby the contractor's representative at AFFTC who felt that the pilots weresitting forward of the limits of the eye motion envelope. Once again we foundthat, even after two study efforts, we really did not know or understand how thepilots were sitting in the F-16. The first test installation of the LANTIRN HUDin the A-10 did not encounter the same major problems experienced in the F-16,due to our better understanding of body dynamics and positioning with theconventional upright seating. Since we did not fully understand the impact ofreclined seating in the F-16, the next step was a study effort to define thelimits of head/eye motion for the full population of the F-16 pilots. Thistime, the head/eye position data were recorded on videotape using a TV cameraand target board. The data were taken in actual aircraft using both AFFTCpersonnel and operational personnel from Nellis AFB. The data recorded includedhead/eye position in normal, reclined, and alert positions. Reduction of thedata indicated that the pilots' actual eye positions were lower and much furtherforward than had been originally assumed. A new eye motion envelope defined asa result of this study incorporated over 90% of the measured eye positions. TheLANTIRN HUD for the F-16 is now being redesigned to provide a proper motion eyebox location and, as a side benefit, the HUD cnmbining glass assembly wasreduced in size without reducing the FOV.
Since the currently used design procedures continue to allow problems tooccur in the process of integrating the HUD, perhaps a new design procedure isrequired. Many of the design constraints will remain the same regardless of theprocedures used; however, with the combination of new and unusual crew stationgeometries and new types of optics with varying constraints on eye and headmotion, ways must be found to cope with these problems. The following willpresent a philosophy for a different methodology.
To provide the optimum plhsical integration of the HUD into the airframe, itis imperative that the HUD integration problems be resolved first and then thecrew station be designed around the HUD limitations, rather than vice versa asis normally done.
First, the over-the-nose vision requirements must be established. Theparameters that must be considered in making this determination include requiredvision angles and aircraft angle of attack during landing, required reticledepression angles for the various air-to-ground weapons, launch envelope ofair-to-air weapons, lead angles for the aircraft gun within the maneuvering envelopein which it can be fired, plus any other visual tasks that may be postulated tohave an effect on over-the-nose vision requirements.
The type of HUD optics to be used should be established early in the designprocess. This is particularly important since, by this new philosophy, theconstraints established by the FOV requirements and eye motion envelope limita-tions will be a major factor in the location of the man within the system. Theuse of reflective or reflective/diffractive optics appears to provide some
69
, mmmmmmmm
flexibility in location of the eye motion envelope in that, while it is somewhatmore constraining, having limitations in all three dimensions, the location and
size of the envelope can be changed at will during the design process.Refractive optics, on the other hand, do not have this type of flexibilitysince, although the eye motion envelope is only constrained in two dimensions,those two dimensions are irrevocably established by the size of the collimatinglens. Once that is established, the only design flexibility is in the direction
that the collimating bundle is aimed. Now that an over-the-nose vision angleand eye motion envelope have been selected, the forward fuselage contours andcrew station location can be defined and the eye motion envelope located withrespect to them.
At this time an eye reference point should be defined, and is probably bestlocated at the centroid of the eye motion envelope. What this eye referencepoint specifically relates to will be determined by the type of crew stationgeometry to be used. Although this article assumes that a fixed seat geometryis to be used, the techniques outlined should also apply to a variable geometry.Physically acccmplishing them, however, may be much more complex. The eye
reference point must, of course, be at the most likely position of the eye whenusing the HUD. In a geometry with conventional upright seating, near 13 ° backangle, the eye reference point will very nearly approximate the classical designeye. In reclined geometry, such as in the F-16, the eye reference point willmore closely approximate what has been defined as the alert eye position.In arV case, the decision regarding seat angle must be made. Upright seating isrecommended for a number of reasons; 1) the phWsical HUD integration is easier.2) it has the least impact on available instrument panel space, and;
3) reclining angles of nearly 65 degrees are required before ary significantimprovement in "G" tolerance is realized. There are circumstances, such as theneed for reduced fuselage cross section for aerodynamics or radar cross sectionreduction, that may justify a geometry reclined to a less extreme angle. Oncethe geometry is selected, a preliminary layout of the cockpit should be made,fitting the HUD in place with respect to the previously defined eye referencepoint.
The next step is an extensive mock-up evaluation of the initial layout. Thesubjects for this evaluation should include operational tactical pilots. There
should be as mar, as is practical to include and in particular, subjects thatapproximate 5th and 95th percentile pilots should be included. The mock-upshould incorporate a HUD or a device that requires the pilot to position himselfas he would to use a HUD. Data must be carefully taken regarding eye locationfor using the HUD comfortably. When the data is reduced and the mean eye posi-tion established, the geometry should be revised to bring the mean eye positionin coincidence with the eye reference point and to accommodate as mar of thedata points as possible within the eye motion envelope. Changes to the adjust-ment range of the seat may be required to accomplish this. The mock-up shouldthen be modified to reflect the changes and be reevaluated on the same guidelinesThis is an iterative process that should be applied until further improvementsare insignificant. In some cases, it may be more practical to modify the eyemotion envelope than the geometry. The development of the HUD hardware and thecrew station geometry can then proceed in parallel as opposed to serially, as isusually the case. All of the old crew station design constraints that have
plagued us in the past are still there and must still be considered, but theprimary difference with the procedure outlined here is that HUD integration is aprimary, early consideration and not an afterthought.
70

Finally, the windshield design is an important factor in both the physicaland optical integration of the HUD with the airframe. The problem of diplopiahas been discussed at length in a previous section. The HUD/indshield diplopiaproblem is primarily caused by curvature of the windshield in a horizontalplane. The bending of light rays passing through a curved windshield disruptsthe parallelism of the light rays. Obviously, the optimum solution to theproblem, froa the standpoint of HUD usage, is a flat panel windshield. Thusonly the vertical refractive effects must be compensated for, but these do notcause diplopia. If windshield curvature is a necessity due to aerodynainics orother considerations, then materials and manufacturing processes must bedeveloped that provide consistent curvature and thickness so that refractiveeffects can be held within a small enough tolerance for generic optical cmpen-sation to be applied without tailoring HUDs to each individual aircraft.
A second part of the plysical/optical integration is detenaination of thelosses in visual capability due the optical elements located between the pilot'seyes and targets or other objects in the outside world that he is trying tovisually detect. First, types of targets to be detected and acceptable minimumtarget detection ranges should be established through mission analyses. Oncethese parameters are established, the acceptability of system losses and theresultant capability of the system to meet these requirements can be establishedearly in the program, using prototype optical elements. Application of contrastsensitivity analysis, as discussed in the previous section, to system targetdetection range capability can be established in a ground test environment.Here, the results can be effectively measured, as opposed to a flight testenvironment which relies heavily on pilot opinion and only discovers problemslate in the development process.
71 "
',
4!
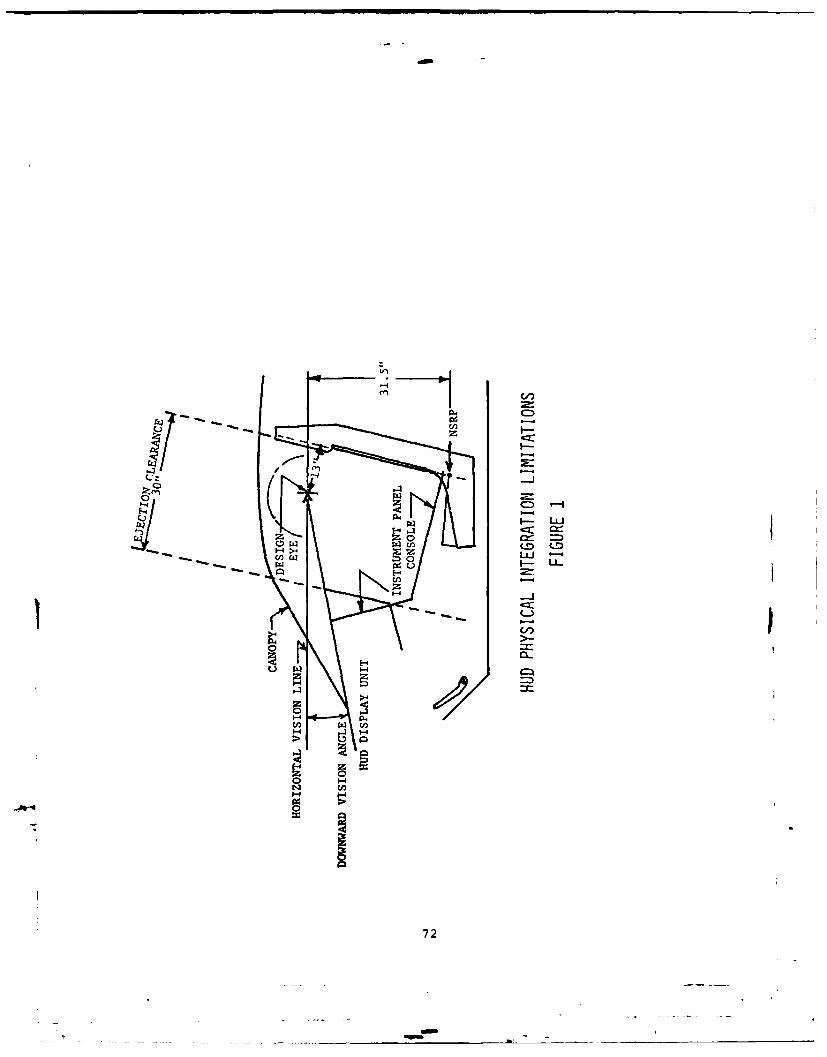
.1UI- LL.
->
C/)
0- 1-4W
72
FUTURE DEVELOPMENT TRENDS FOR HEAD-UP DISPLAYS
John F. Coonrod
qSystems Avionics DivisionInformation Processing Technology Branch (AFWAL/AAAT)(0= Wright Patterson Air Force Base, OH 45433
C ABSTRACT
O 'The development of diffraction optics to provide the largest possible Field Of0. View (FOV) has been,and will continue to be, the most difficult and important area of
HUD design. As larger FOV's are developed, greater demands will be placed on displayresolution. The display of grey scale video places increased demands on improveddisplay brightness. Significant reliability improvements are also needed. Thispaper outlines current state-of-the-art and indicates potential future improvements
that can be made in these areas
OVERVIEW
The optical area is currently the most difficult and important area of HUDdesign. Increased mission needs require that HUD's be built which can provide largerfields of view iper unit volume. For example, the LANTIRN mission requires a 20*x30*field of view. Indications from the users are that much wider fields-of-view aredesirable, i.e., 450 or even as much as 1800. Conventional optics are beingsupplemented with diffraction optics in attempts to meet these requirements.Currently, three U.S. companies and one European company are pursuing diffractionoptics HUD designs. In addition to Wide Fields Of View (WFOV), diffraction opticsarecapable of providing greater transmissivity or "see through" of the real world scene,although this capability is not achieved in all configurations.
As greater FOV's are achieved by improved optics design, displays of greater
resolution will also be required. Some idea of the relative improvement required may bbe obtained by comparing a 30 degree FOV HUD with a 5x5 inch direct view display(DVD). The DVD subtends about 10 degrees at a nominal 29 inch viewing distance.Then, for equivalent resolution criteria, the 30 degree HUD would require six timesthe display resolution (pixels) of a 5x5 inch DVD (20°x30*/IOxIO°).
Improved display brightness will also be required due to the use of HUD's fordisplay of raster video, such as Forward Looking Infrared (FLIR), in cases where theraster video must be seen under daylight conditions. Even for a night system, thiscondition occurs during training exercises. It is estimated that 85,000 footlamberts display raster brightness would be required to attain a 6/1 contrast ratioin a diffraction optics HUD combiner (of 90% transmittance), in 10,000 F.L. ambient.Currently, the LANTIRN BUD Cathode Ray Tube (CRT) raster brightness is specified as
1,000 foot lamberts, thus, almost two orders of magnitude brightness improvement areneeded.
An integral part of the display problem is the need for reliabilityimprovement. Presently fielded HUD systems have Mean Time Between Failures (MTBF) inthe range of 50-125 hours. Solid state displays, which operate at low power/voltagelevels, do not require high voltage power supplies and analog circuitry. Thus, theyoffer significant potential for MTBF improvement (i.e., 300-4001 for the Display
Unit).
74

rccz
LUJ
LUJ
LUJ LUj
LU ILUJ
73
FUTURE DEVELOPMENT TRENDS FOR HEAD-UP DISPLAYS
John F. CoonrodSystems Avionics Division
CInformation Processing Technology Branch (AFWAL/AAAT)Wright Patterson Air Force Base, OH 45433
ABSTRACT
O The development of diffraction optics to provide the largest possible Field Of0._ View (FOV) has been,and will continue to be, the most difficult and important area of
HUD design. As larger FOV's are developed, greater demands will be placed on displayresolution. The display of grey scale video places increased demands on improveddisplay brightness. Significant reliability improvements are also needed. Thispaper outlines current state-of-the-art and indicates potential future improvementsthat can be made in these areas
OVERVIEW
The optical area is currently the most difficult and important area of HUDdesign. Increased mission needs require that HUD's be built which can provide largerfields of viewIper unit volume. For example, the LANTIRN mission requires a 20°x30 °
field of view. Indications from the users are that much wider fields-of-view aredesirable, i.e., 450 or even as much as 1800. Conventional optics are beingsupplemented with diffraction optics in attempts to meet these requirements.Currently, three U.S. companies and one European company are pursuing diffractionoptics HUD designs. In addition to Wide Fields Of View (WFOV), diffraction opticsarecapable of providing greater transmissivity or "see through" of the real world scene,
although this capability is not achieved in all configurations.
As greater FOV's are achieved by improved optics design, displays of greaterresolution will also be required. Some idea of the relative improvement required maybe obtained by comparing a 30 degree FOV HUD with a 5x5 inch direct view display(DVD). The DVD subtends about 10 degrees at a nominal 29 inch viewing distance.Then, for equivalent resolution criteria, the 30 degree HUD would require six timesthe display resolution (pixels) of a 5x5 inch DVD (20x30/10*xl0*).
Improved display brightness will also be required due to the use of HUD's fordisplay of raster video,such as Forward Looking Infrared (FLIR), in cases where theraster video must be seen under daylight conditions. Even for a night system, thiscondition occurs during training exercises. It is estimated that 85,000 footlamberts display raster brightness would be required to attain a 6/1 contrast ratioin a diffraction optics HUD combiner (of 90% transmittance), in 10,000 F.L. ambient.Currently, the LANTIRN BUD Cathode Ray Tube (CRT) raster brightness is specified as1,000 foot lamberts, thus, almost two orders of magnitude brightness improvement areneeded.
An integral part of the display problem is the need for reliabilityimprovement. Presently fielded UD systems have Mean Time Between Failures (MTBF) inthe range of 50-125 hours. Solid state displays, which operate at low power/voltagelevels, do not require high voltage power supplies and analog circuitry. Thus. theyoffer significant potential for MTBF improvement (i.e., 300-4002 for the DisplayUnit).
74
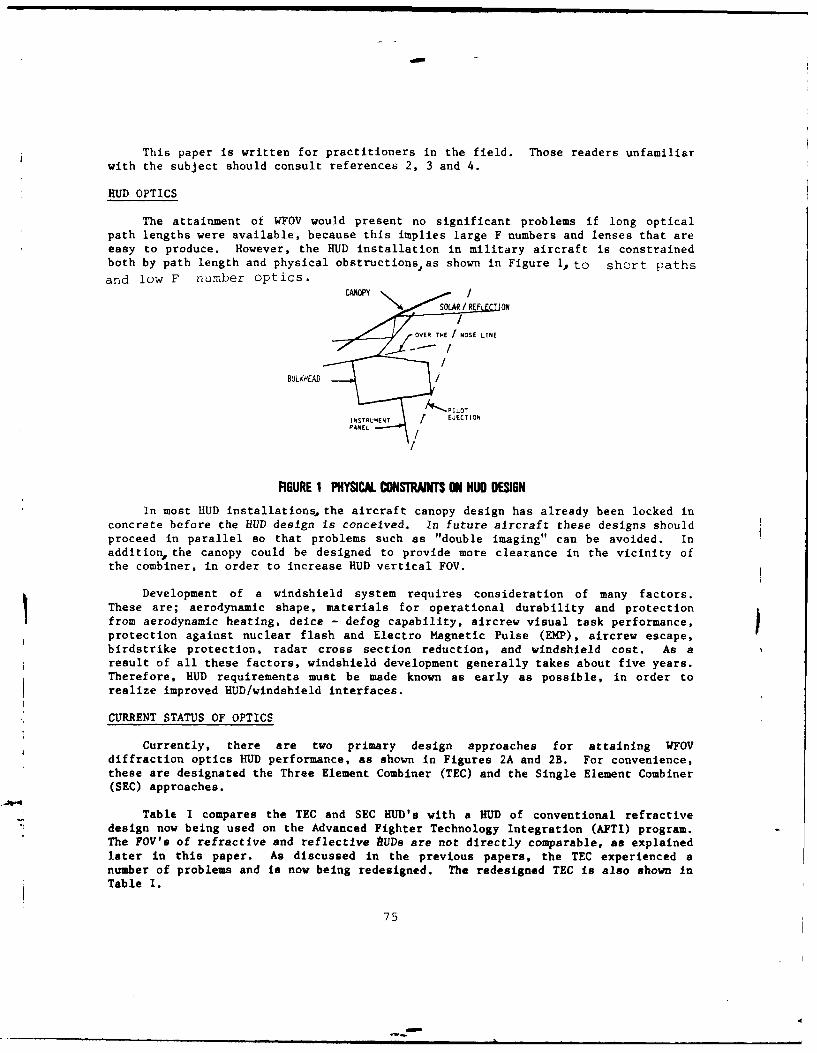
This paper is written for practitioners in the field. Those readers unfamiliar
with the subject should consult references 2, 3 and 4.
HUD OPTICS
The attainment of WFOV would present no significant problems if long opticalpath lengths were available, because this implies large F numbers and lenses that areeasy to produce. However, the HUD installation in military aircraft is constrainedboth by path length and physical obstructionsas shown in Figure 1, to short paths
and low F number optics.CANOPY \/ /
NSTRLMSNT / EJECTIO N
FIGURE 1 PHYSICAL CONSTRAINTS 4O BU DESIGNIn most HUD installations, the aircraft canopy design has already been locked inconcrete before the HUD design is conceived. In future aircraft these designs shouldproceed in parallel so that problems such as "double imaging" can be avoided. Inaddition the canopy could be designed to provide more clearance in the vicinity of
the combiner, in order to increase BUD vertical FOV.
~Development of a windshield system requires consideration of many factors.These are; aerodynamic shape, materials for operational durability and protectiontfrom aerodynamic heating, deice - defog capability, aircrew visual task performance,protection against nuclear flash and Electro Magnetic Pulse (EMP), aircrew escape,birdstrike protection, radar cross section reduction, and windshield cost. As aresult of all these factors, windshield development generally takes about five years.Therefore, BUD requirements must be made known as early as possible, in order torealize improved HUD/windshield interfaces.
CURRENT STATUS OF OPTICSCurrently, there are two primary design approaches for attaining WFOVdiffraction optics HUD performance, as show In Figures 2A and 2B. For convenience,these aree nae te Tee Element Combiner (TEC) and the Single Element Combiner
(SEC) approaches.Table I compares the TEC and SEC BUD's with a HUD of conventional refractivedesign now being used on the Advanced Fighter Technology Integration (AFTI) program.The FOV's of refractive and reflective UDs are not directly comparable, as explainedlater in this paper. As discussed in the previous papers, the TEC experienced anumber of problems and is now being redesigned. The redesigned TEC is also shown in
Table I.
75
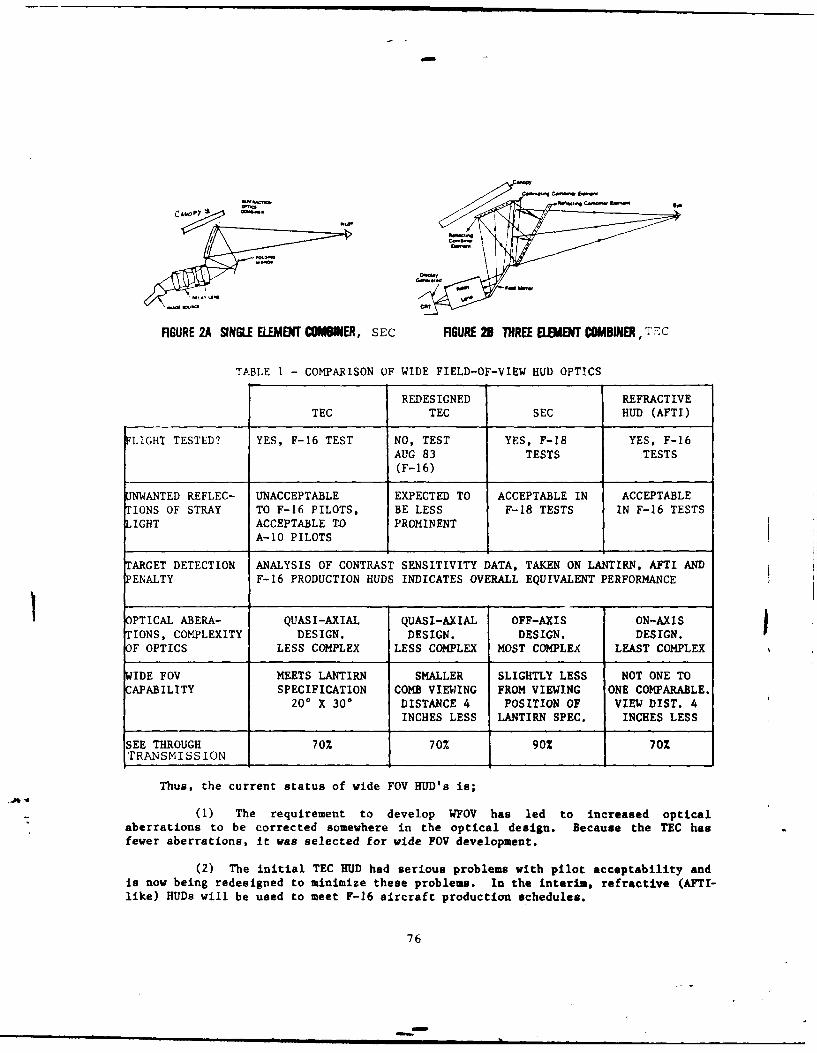
FIGURE 2A SINGLE ELEMENT COMWINER, sEc FIGURE 2B THREE EIMENT COMBINER, T-C
TABLE I - COMPARISON OF WIDE FIELD-OF-VIEW HUD OPTICS
REDESIGNED REFRACTIVE
TEC TEC SEC HUD (AFTI)
FLIGHT TESTED? YES, F-16 TEST NO, TEST YES, F-18 YES, F-16AUG 83 TESTS TESTS(F-16)
UWANTED REFLEC- UNACCEPTABLE EXPECTED TO ACCEPTABLE IN ACCEPTABLETIONS OF STRAY TO F-16 PILOTS, BE LESS F-18 TESTS IN F-16 TESTSLIGHT ACCEPTABLE TO PROMINENT
A-10 PILOTS
TARGET DETECTION ANALYSIS OF CONTRAST SENSITIVITY DATA, TAKEN ON LANTIRN, AFTI ANDPENALTY F-16 PRODUCTION HUDS INDICATES OVERALL EQUIVALENT PERFORMANCE
PTICAL ABERA- QUASI-AXIAL QUASI-AXIAL OFF-AXIS ON-AXISTIONS, COMPLEXITY DESIGN. DESIGN. DESIGN. DESIGN. IOF OPTICS LESS COMPLEX LESS COMPLEX MOST COMPLEX LEAST COMPLEX
WIDE FOV MEETS LANTIRN SMALLER SLIGHTLY LESS NOT ONE TOCAPABILITY SPECIFICATION COMB VIEWING FROM VIEWING ONE COMPARABLE.
200 X 300 DISTANCE 4 POSITION OF VIEW DIST. 4INCHES LESS LANTIRN SPEC. INCHES LESS
SEE THROUGH 70% 70% 902 70%TRANSMISSION
Thus, the current status of wide FOV HUD's is;
(1) The requirement to develop WFOV has led to increased optical
aberrations to be corrected somewhere in the optical design. Because the TEC hasfewer aberrations, it was selected for wide FOV development.
(2) The initial TEC HUD had serious problems with pilot acceptability andis now being redesigned to minimize these problems. In the interim, refractive (AFTI-like) HUDs will be used to meet F-16 aircraft production schedules.
76

(3) The SEC approach, although having more aberrations to be corrected,has few problems with pilot acceptability. The SEC HUD, flown in the F-18, wasdeveloped under an AINAL Materials Laboratory contract. A preliminary design wasalso flown in the Swedish Viggen aircraft. A production contract has been awardedfor the Swedish JAS 39 combat aircraft.
(4) Experience with the TEC has verified that objective engineering testsshould be conducted on prototype units prior to commitments being made to productionprograms. Preliminary flight testing may also be required, but should beaccomplished in an environment where engineering changes can be made without thepressure of production schedules. These preliminary tests are not a substitute foroperational flight tests, to which the HUD must ultimately be subjected in any case.
POTENTIAL OPTICS IMPROVEMENTS
The best of both worlds (TEC and SEC) would be realized if a SEC wide FOV HUDcould be designed with reduced aberrations. For example, the mirror could be movedfurther forward, to lengthen the optical path as shown in Figure 3.
II
FIGURE 3. EXAMPLE OF A NOVEL DESIGN, THE RETRACTABLE MIRROR HUD
Since the mirror would necessarily lie beyond the pilot ejection line, amechanical method would have to be developed for retracting it within a few seconds,to permit pilot ejection. This design would allow the exit pupil size to beincreased, since the "bend angle" of the light rays incident on the combiner vould bereduced and, consequently, the angular FOV increased. Alternatively, the bendangle could remain the same, the tilt of the combiner reduced and the vertical FOV
., increased.
The ideal location for the mirror, to minimize aberrations, is to place itdirectly in the field of the combiner. Then, the mirror would become a beamsplitterand a totally on-axis design might be possible. The disadvantages of this approachare reduced transmission of the real world scene and the possible introduetion ofunwanted reflections of stray light.
77
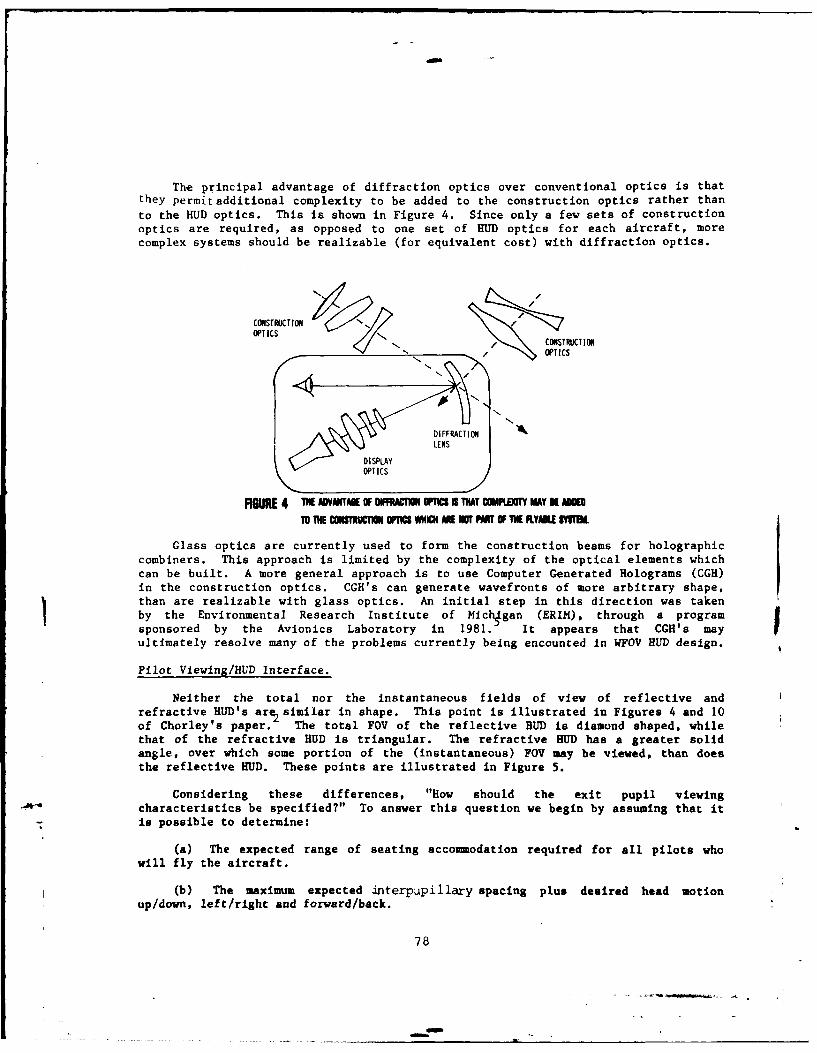
dos
The principal advantage of diffraction optics over conventional optics is thatthey permit additional complexity to be added to the construction optics rather than
to the HUD optics. This is shown in Figure 4. Since only a few sets of constructionoptics are required, as opposed to one set of HUD optics for each aircraft, morecomplex systems should be realizable (for equivalent cost) with diffraction optics.
CORSTRUCTU1O I
OPTIC CONSTRUCTION
OPTICS
T DIFFRCTIONI
LEN
FIGURE 4 M AVMMIE UP NWWMfWlnU TUhT MMWM MAY K AUTO THE CWMTT W= WHICH AME MAT AM OF THE RYMI MEK
Glass optics are currently used to form the construction beams for holographiccombiners. This approach is limited by the complexity of the optical elements whichcan be built. A more general approach is to use Computer Generated Holograms (CGH)in the construction optics. CGH's can generate wavefronts of more arbitrary shape,than are realizable with glass optics. An initial step in this direction was takenby the Environmental Research Institute of Mich4gan (ERIM), through a programsponsored by the Avionics Laboratory in 1981. It appears that CGH's mayultimately resolve many of the problems currently being encounted in WFOV BUD design.
Pilot Viewing/HUD Interface.
Neither the total nor the instantaneous fields of view of reflective andrefractive HUD's are similar in shape. This point is illustrated in Figures 4 and 10of Chorley's paper. The total FOV of the reflective BUD is diamond shaped, whilethat of the refractive BUD is triangular. The refractive BUD has a greater solidangle, over which some portion of the (instantaneous) FOV may be viewed, than doesthe reflective HUD. These points are illustrated in Figure 5.
Considering these differences, "How should the exit pupil viewingcharacteristics be specified?" To answer this question we begin by assuming that itis possible to determine:
(a) The expected range of seating accommodation required for all pilots whowill fly the aircraft.
(b) The maximum expected interpupillary spacing plus desired head motionup/down, left/right and forward/back.
78
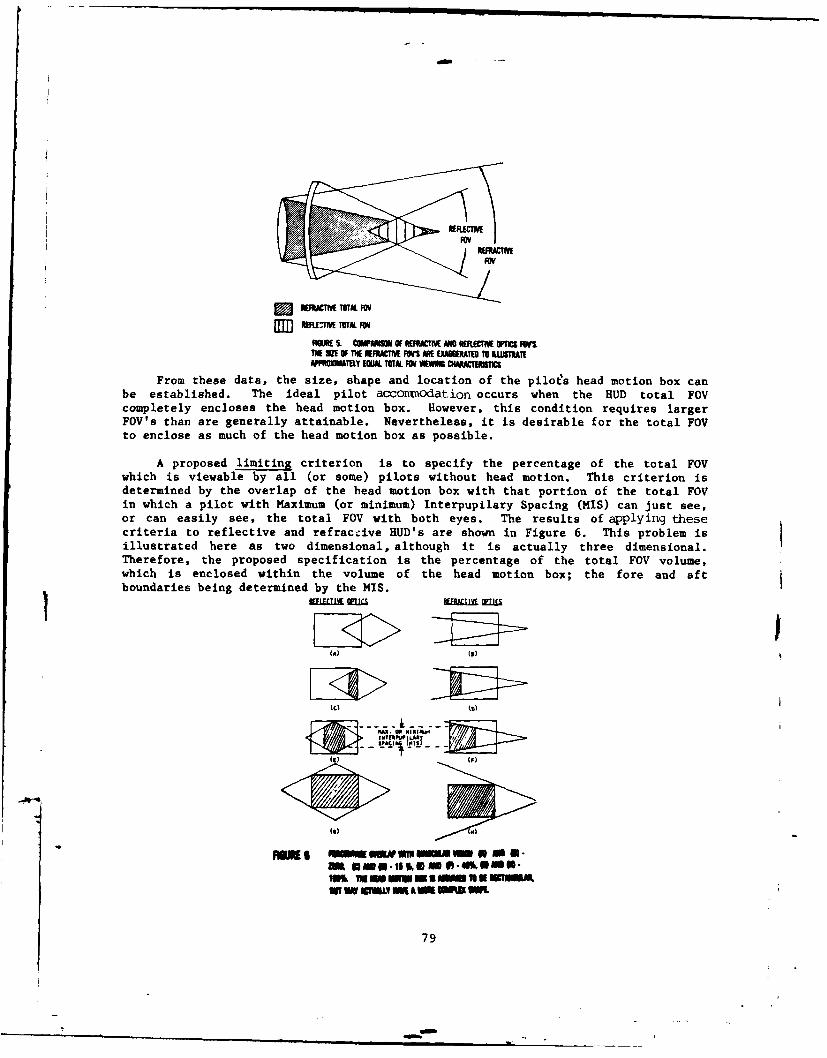
WPR MAlKf F.OtL TTTAL FtW WING CHMACTRIST
From these data, the size, shape and location of the pilots head motion box canbe established. The ideal pilot accomodation occurs when the HUD total FOVcompletely encloses the head motion box. However, this condition requires largerFOV's than are generally attainable. Nevertheless, it is desirable for the total FOVto enclose as much of the head motion box as possible.
A proposed limiting criterion is to specify the percentage of the total FOVwhich is viewable by all (or some) pilots without head motion. This criterion isdetermined by the overlap of the head motion box with that portion of the total FOVin which a pilot with Maximum (or minimum) Interpupilary Spacing (MIS) can just see,or can easily see, the total FOV with both eyes. The results of applying thesecriteria to reflective and refraccive HUD's are shown in Figure 6. This problem isillustrated here as two dimensional, although it is actually three dimensional.Therefore, the proposed specification is the percentage of the total FOV volume,which is enclosed within the volume of the head motion box; the fore and aftboundaries being determined by the MIS.
KF[FT0, G=WJ
(a) (F)
(A)
NT f ICN P Ig 1 RENiUD tgqW W
79
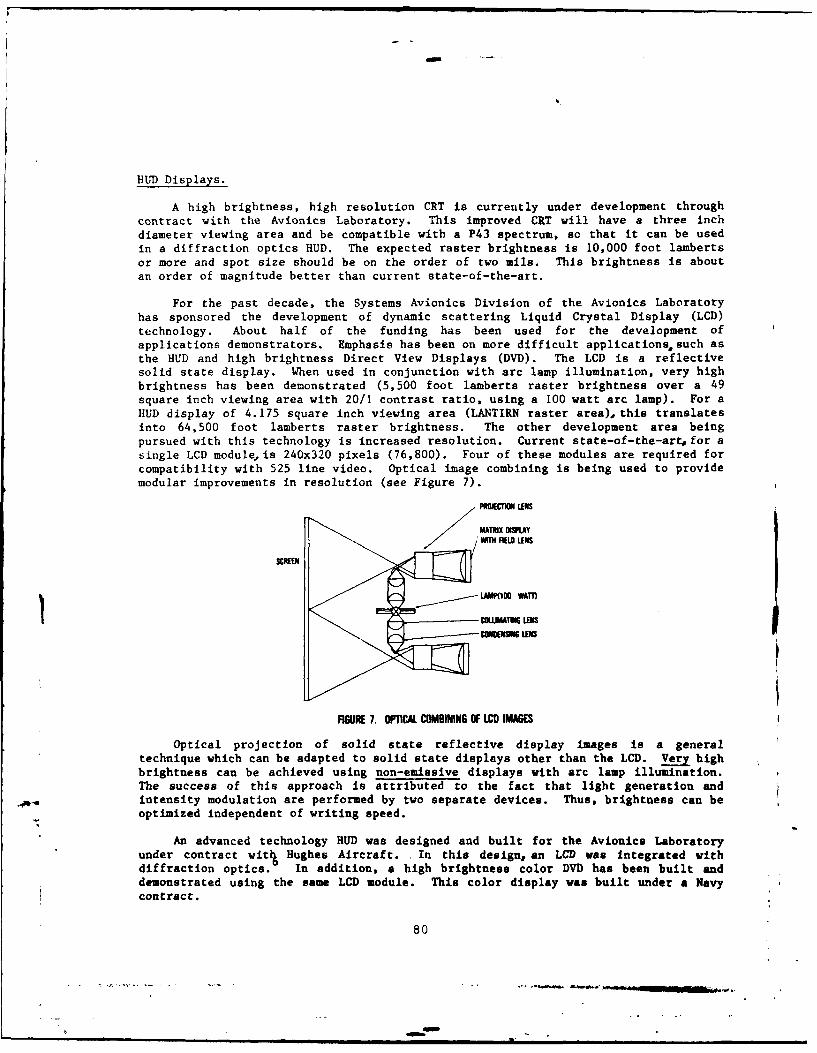
HUD Displays.
A high brightness, high resolution CRT is currently under development throughcontract with the Avionics Laboratory. This improved CRT will have a three inchdiameter viewing area and be compatible with a P43 spectrum, so that it can be usedin a diffraction optics HUD. The expected raster brightness is 10,000 foot lambertsor more and spot size should be on the order of two mils. This brightness is aboutan order of magnitude better than current state-of-the-art.
For the past decade, the Systems Avionics Division of the Avionics Laboratoryhas sponsored the development of dynamic scattering Liquid Crystal Display (LCD)technology. About half of the funding has been used for the development ofapplications demonstrators. Emphasis has been on more difficult applications, such asthe HUD and high brightness Direct View Displays (DVD). The LCD is a reflectivesolid state display. When used in conjunction with arc lamp illumination, very highbrightness has been demonstrated (5,500 foot lamberts raster brightness over a 49square inch viewing area with 20/1 contrast ratio, using a 100 watt arc lamp). For aHUD display of 4.175 square inch viewing area (LANTIRN raster area), this translatesinto 64,500 foot lamberts raster brightness. The other development area beingpursued with this technology is increased resolution. Current state-of-the-art for asingle LCD module is 240x320 pixels (76,800). Four of these modules are required forcompatibility with 525 line video. Optical image combining is being used to providemodular improvements in resolution (see Figure 7).
SpnIMONm LENS
CREEN
FIGURE 7. OPTCAL COMBINING OF LC) IMAGES
Optical projection of solid state reflective display images is a generaltechnique which can be adapted to solid state displays other than the LCD. Very highbrightness can be achieved using non-emissive displays with arc lamp illumination.The success of this approach is attributed to the fact that light generation andintensity modulation are performed by two separate devices. Thus, brightness can beoptimized independent of writing speed.
An advanced technology HUD was designed and built for the Avionics Laboratoryunder contract wit% Hughes Aircraft. In this design, an LCD was integrated withdiffraction optics. In addition, a high brightness color DVD has been built anddemonstrated using the same LCD module. This color display was built under a Navycontract.
80
.Gw. a -I
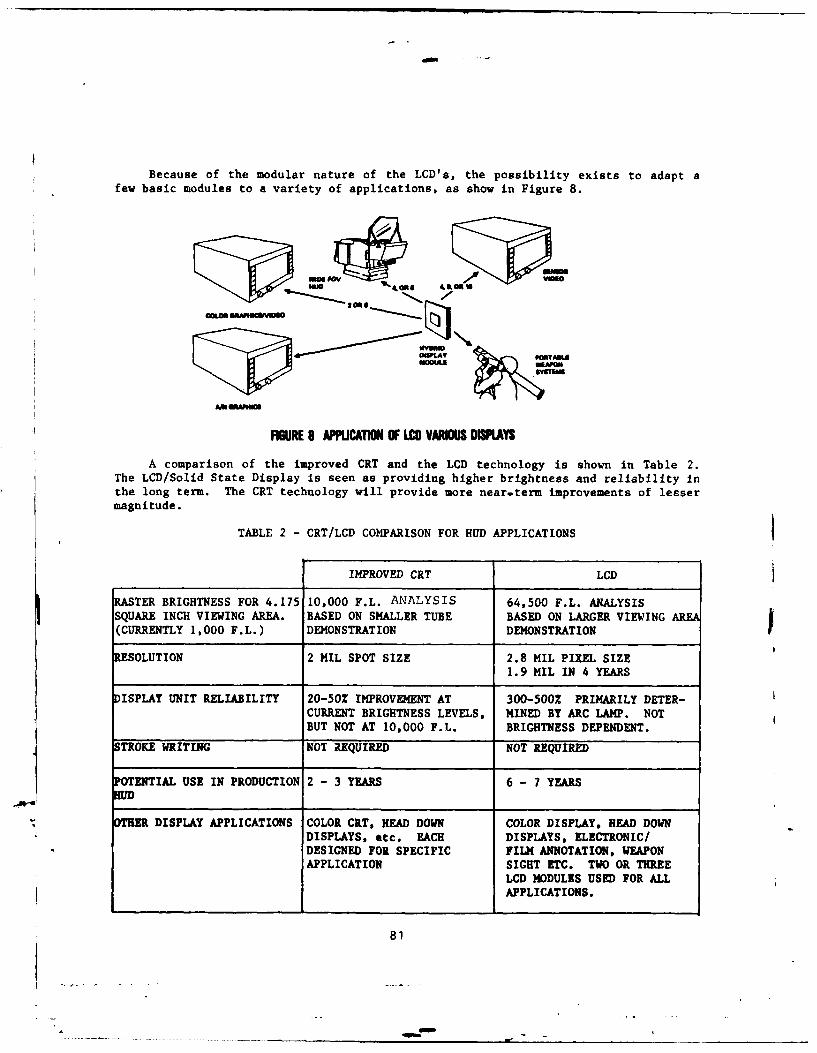
Because of the modular nature of the LCD's, the possibility exists to adapt afew basic modules to a variety of applications, as show in Figure 8.
,&EU 4.9. OR
UOPLAY
FIGURE 8 APPCATION OF LCD VARIOUS DISPLAYS
A comparison of the improved CRT and the LCD technology is shown in Table 2.The LCD/Solid State Display is seen as providing higher brightness and reliability inthe long term. The CRT technology will provide more near.term improvements of lessermagnitude.
TABLE 2 - CRT/LCD COMPARISON FOR HUD APPLICATIONS
IMPROVED CRT LCD
RASTER BRIGHTNESS FOR 4.175 10,000 F.L. ANALYSIS 64,500 F.L. ANALYSISSQUARE INCH VIEWING AREA. BASED ON SMALLER TUBE BASED ON LARGER VIEWING AREA(CURRENTLY 1,000 F.L.) DEMONSTRATION DEMONSTRATION
RESOLUTION 2 MIL SPOT SIZE 2.8 MIL PIXEL SIZE1.9 MIL IN 4 YEARS
DISPLAY UNIT RELIABILITY 20-50% IMPROVEMENT AT 300-500% PRIMARILY DETER-CURRENT BRIGHTNESS LEVELS, MINED BY ARC LAMP. NOTBUT NOT AT 10,000 F.L. BRIGHTNESS DEPENDENT.
TROKE WRITING NOT REQUIRED NOT REQUIRED
OTENTIAL USE IN PRODUCTION 2 - 3 YEARS 6 - 7 YEARS
OTHERDISPLAY APPLICATIONS COLOR CRT, HEAD DOWN COLOR DISPLAY, HEAD DOWNDISPLAYS, etc. EACH DISPLAYS, ELECTRONIC/DESIGNED FOR SPECIFIC FILM ANNOTATION, WEAPONAPPLICATION SIGHT ETC. TWO OR THREE
LCD MODULES USED FOR ALLAPPLICATIONS.
81
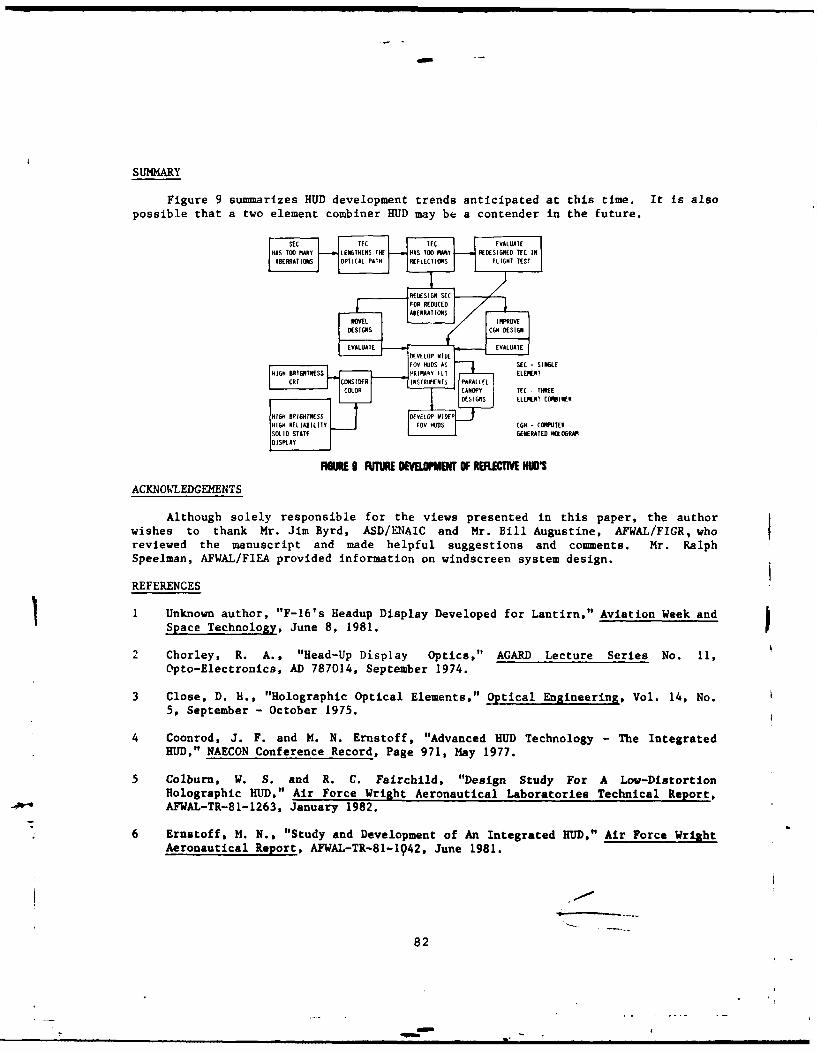
SUMMARY
Figure 9 summarizes HUD development trends anticipated at this time. It is also
possible that a two element combiner HUD may be a contender in the future.
A A S I P R C S FLIGHT TEST I
-EDS1M SECI
]SOEVAUAT ETVALUA i TE D t
FIGURIE I FU1TURE DEVBOPMlfT OF RElCT HUDIACKNOREDGEEENTS
Although solely responsible for the views presented in this paper, the authorwishes to thank Mr. Jim Byrd, ASD/ENAIC and Mr. Bill Augustine, AFWAL/FIGR, whoreviewed the manuscript and made helpful suggestions and comments. Mr. RalphSpeelman, AFWAL/FIEA provided information on windscreen system design.
REFERENCES
1 Unknown author, "F-16's Headup Dslyevopdfor Lantirn," Aviation Week and
Space Technology, June 8, 1981. F
2 Chorley, R. A., "Head-Up Display Optics," AGARD Lecture Series No. 11,Opto-Electronics, AD 787014, September 1974.
3 Close, D. H., "Holographic Optical Elements," Optical Engineering, Vol. 14, No.5, September - October 1975.
4 Coonrod, J. F. and H. N. Ernstoff, "Advanced HUD Technology - The IntegratedBUD," NAECON Conference Record, Page 971, May 1977.
5 olburm, W. S. and R. C. Fairchild, "Design Study For A Low-DistortionHolographic BUD," Air Force Wright Aeronautical Laboratories Technical Report,AFWAL-TR-81-1263, January 1982.
6 Ernatoff, M. N., "Study and Development of An Integrated BUD," Air Force Wright
Aeronautical Report, AFWAL-TR-81-142, June 1981.
82
BIO(RAPHIES
Wayne L. Martin has been an Engineering Research Psychologist with theHunan Engineering Division of the Air Force Aerospace Medical ResearchLaboratory since 1967. His present assignment as the technical directorand assistant chief of the Visual Display System Branch capitalized ona rich practical background as both airman and officer in aircraft instru-mentation and avionic system maintenance, coupled with academic experienceamounting to the Master's Degree, plus three years in Experimental Psychology.Among his credits are research program in information management for logisticsystem, aircraft maintenance and C3 systems design, as well as research inbasic vision, matrix element displays, deep space satellite detection, head-up displays, night vision systems, night attack performance assessment andcolor displays. Wayne is a member of both the National and Southern OhioChapters of the Human Factors Society, Association of A,-iation Psychologists,and the Society for Information display.
Richard D. Lee graduated from the University of Toledo in 1969 with aBS degree in Electrical Engineering. He began work that same year with theAvionics Engineering Directorate of the Aeronautical Systems Division. Hereceived an MS degree in Electro-Optics from the Air Force Institute ofTechnology and has performed post graduate level study in the Electro-Optics field. His current duties in the Electro-Optics branch at ASDinclude supporting the IANTIRN program office in the field of diffractiveoptics for the Head-Up-Display.
Dr. Harry Lee Task received his BS in 1968 from Ohio University and MSin 1971 from Purdue University in physics. He received his MS and PhD inOptical Sciences from the University of Arizona, Optical Sciences Centerin 1978. Dr. Task has worked for the Air Force Aerospace Medical ResearchLaboratory at Wright-Patterson AFB, since 1971. Areas of research interestsinclude: Visual Image Display Quality, Windscreen Optical Quality, Night Ai- -Visual System and Lighting. Dr. Task has produced several publications andpatents in these and related areas.
83
BIOGRAPHIES (CCNT'D)
Lt Col Louis V. Genco received his undergraduate education at LoyolaUniversity of Chicago, his Doctorate in Optometry from Illinois Collegeof Optcmetry, and an MS in Physiological optics from the Indiana College ofOptcretry. In 1978, after 14 years of Air Force clinical and teaching ex-perience, Lt Col Genco was assigned to the Air Force Aerospace Medical ResearchLaboratory, where he is now the Chief, Crew Systems Effectiveness Branch, HumanEngineering Division. Lt Col Genco is deeply involved with investigating theeffects of manipulating various visual parameters on aircrew performance. Theefforts include studies of optical enhancements to both daytime and nighttimeaircrew vision as well as the effects of various optical parameters inducedby aircraft windscreens, canopies, head-up displays and other optical devices.Lt Col Genco is a fellow of the American Academy of Optometry and a chartermember of the Armed Forces Optametric Society.
Mr. Wilson is a senior Avionics Systems Engineer within the IntegratedControls and Displays Branch at WPAFB. He has been active in developing thearchitecture for and development of complete control and display subsystem.His most recent work was the B-52 Offensive Avionics System (OAS) Controlsand Displays. Mr. Wilson holds a BS Degree in System Engineering from WrightState University.
Dr. H. C. Self an engineering research psychologist in the Visual DisplaySystems Branch at AFAMRL, Wright-Patterson Air Force Base, specialized invision and perception. He received his PhD in experimental psychology atthe University of Texas. Formerly with the U.S. Naval Research Laboratory,he came to the Air Force to do basic and applied research on target detectionand recognition with the unaided eye, sunglasses, CCTV, radar, IR, photography,etc. His work includes the design, analysis testing and evaluation of airborneand ground-based equipment and man-machine systems.
Arthur P. Ginsburg received the B.S.E.E. degree from Widener College in1969, the M.S.E.E. frmn the Air Force Institute of Technology in 1971, andthe Ph.D. in Biophysics in 1980 from the University of Cambridge. He ispresently a Major in the Air Force, serving as Director of the AviationVision Laboratory of the Air Force Aerospace Medical Research Laboratory.Major Ginsburg's main interest is the application of linear systes analysisto obtain filter characteristics of overall and individual mechanism of thehuman visual system. This research views visual perception as a filteringprocess and is concerned with basic and applied problems in visual standards,operator performance, display quality, and visual target acquisition. MajorGinsburg is a member of Tau Beta Pi, Sigma Pi Sigma, Sigma Xi, the OpticalSociety of America and the American Association for the Advanceent ofScience.
84
S--Rpm

BIOGRAPHIES (CONT' D)
Ronald W. Schwartz is a senior crew station design engineer in the CrewStation and Escape Branch of the Directorate of Equipment Engineering forAeronautical Systems Division. He has a Bachelor of Science in mechanicalengineering and a Master of Science in engineering management. His twentyyears experience in crew station design and control display systems includesexperience in the Flight Dynamics Laboratory in display concept design andstudies on control display subsystem design for a tactical V/STOL aircraft.Since moving to ASD Engineering seventeen years ago, he has had primaryresponsibility for crew station design on the F-15, A-10, A-7, and HH-53.He is currently responsible for the crew station design on the C-17 and HH-60D.
Mr. John F. Coonrod has 26 years experience in the display field. Hehas a BSEE from Purdue University. He has worked for the Civil AeronauticsAdministration, the US Naval Avionics Facility (NAFI), Aeronautical SystemsDivision (ASD) and the Air Force Avionics Laboratory. While at ASD, heworked on the F-111D Mark II Avionics System and the B-1 Offensive Avionics.His recent experience includes eight years at the Avionics Laboratory, wherehe has been the project engineer on programs involving solid state liquidcrystal displays and diffraction optics for application to head-up and head-down displays. Most recently, Mr. Coonrod has participated in joint A ALASD programs including the F-16E Technology Assessment and the LANTIRNIndependent Review Team.
U
85 ¢* u.S. GOVENMENT PRINTING OFFPC: 1G4-?S,60016004
Slim,