A practical analysis of the sales psychology involved in increasing the sale of automobiles by...
94
1 | Page Master Thesis Submission On Topic “A practical analysis of the sales psychology involved in increasing the sale of automobiles” By Jerrin Tony Varghese, Matrikel No: 7311101 To Mentor: Prof. Guillaume De Meuter Faculty of Hochschule für angewandte Wissenschaften Würzburg-Schweinfurt, University of Applied Sciences Wuerzburg-Schweinfurt, Germany For degree of Master of Business Administration (MBA) For Academic Year 2011 -2013 Under the Joint Academic Program By FHWS, Germany & Christ University, India
-
Upload
jerrin-varghese -
Category
Business
-
view
99 -
download
1
Transcript of A practical analysis of the sales psychology involved in increasing the sale of automobiles by...

1 | P a g e
Master Thesis
Submission
On
Topic
“A practical analysis of the sales psychology involved in increasing the sale of
automobiles”
By
Jerrin Tony Varghese, Matrikel No: 7311101
To
Mentor: Prof. Guillaume De Meuter
Faculty of
Hochschule für angewandte Wissenschaften Würzburg-Schweinfurt,
University of Applied Sciences Wuerzburg-Schweinfurt,
Germany
For degree of
Master of Business Administration (MBA)
For Academic Year 2011 -2013
Under the Joint Academic Program
By
FHWS, Germany & Christ University, India
user
Confidential

2 | P a g e
Statutory Declaration
Hereby I declare that I have written this Master's Thesis on my own and that
I have not transcribed the whole part of any book or any academic research.
In addition, I have only quoted or consulted the part of resources or figures
from the books and websites listed in the references to support the practical
and theoretical basis for my Master's Thesis.
Place, Date Signature, Matrikel No. 7311101
(Jerrin Tony Varghese)

3 | P a g e
Certificate of the Mentor
This is to certify that the Master´s Thesis on “A practical analysis of the sales
psychology involved in increasing the sale of automobiles” is done by Jerrin
Tony Varghese in partial fulfillment of requirement for the degree of Master of
Business Administration at University of Applied Sciences Wuerzburg-
Schweinfurt, Germany.
This thesis has been carried out under my guidance and in record of bonafide
work carried out successfully.
Place, Date Signature
(Prof. Guillaume De Meuter)
user
Confidential

4 | P a g e
ACKNOWLEDGEMENT
I would sincerely like to express my profound gratitude to all those who have helped me for their
support and guidance for the completion of this thesis.
Firstly, I would like to express my gratitude to my mentor Prof. Guillaume De Meuter who has
guided me throughout the preparation of my thesis.
I would like to express my sincere gratitude to Prof. Uwe Sponholz for providing the constant
guidance and support.
I must also thank, Ms. Susanne Hüfner coordinator FHWS, for her timely communication and
constant support.
I would also like to extend our gratitude for all the respondents who had spent their valuable time
filling up the questionnaire. The patience of the respondents is much appreciated. To cap it all I
am obliged to my family and friends and all those who have directly or indirectly helped me for
the completion of the thesis.
Jerrin Tony Varghese

5 | P a g e
TABLE OF CONTENTS TABLE OF CONTENTS .................................................................................................................................. 5
List of figures: ............................................................................................................................................. 10
List of Tables ............................................................................................................................................... 11
CHAPTER 1: ............................................................................................................................................... 12
INTRODUCTION ....................................................................................................................................... 12
CHAPTER 1.1: INTRODUCTION............................................................................................................. 13
1.2: Background of the Study ...................................................................................................................... 13
1.3: Statement of the Problem ..................................................................................................................... 14
CHAPTER 2: ............................................................................................................................................... 15
LITERATURE REVIEW ............................................................................................................................ 15
CHAPTER 2: LITERATURE REVIEW ..................................................................................................... 16
2.1 Introduction ........................................................................................................................................... 16
2.2 Consumer decision making ................................................................................................................... 16
2.2.1 Need of stimulation ............................................................................................................................ 16
2.2.2 Need recognition ................................................................................................................................ 18
2.2.3 Information search .............................................................................................................................. 20
2.2.4 Evaluation of alternatives ................................................................................................................... 22
2.2.5 Purchase and post purchase evaluation .......................................................................................... 23
2.3 How do sales executive use psychology in sales of cars ................................................................... 25
2.4 How sales executive can use psychological in gaining trust of customer ............................................. 27
2.5 The relevance of empathy for the purpose of sale ................................................................................. 28
CHAPTER 3: ............................................................................................................................................... 29
RESEARCH METHODOLOGY ................................................................................................................ 29
CHAPTER 3: RESEARCH METHODOLOGY ......................................................................................... 30
3.1. Introduction .......................................................................................................................................... 30
3.2. Problem definition ................................................................................................................................ 30
3.3. Objectives of the project ....................................................................................................................... 30
3.4. Research design .................................................................................................................................... 30

6 | P a g e
3.5. Sample method ..................................................................................................................................... 30
3.6. Sample size and research setting .......................................................................................................... 31
3.7. Data collection methods and tools ........................................................................................................ 31
3.8. Data collection from car owners and aspirators ................................................................................... 31
3.9. Data collection for managers and sales executive ................................................................................ 32
3.10. Secondary data collection ................................................................................................................... 32
3.11. Limitations.......................................................................................................................................... 32
3.12. Data analysis tools .............................................................................................................................. 32
CHAPTER 4: ............................................................................................................................................... 33
ANALYSIS ................................................................................................................................................. 33
CHAPTER 4: ANALYSIS .......................................................................................................................... 34
4.1. Reliability Statistics .............................................................................................................................. 34
4.1.1. Customer Data ................................................................................................................................... 34
Table 4.1.1 Cross Tabulations ..................................................................................................................... 34
4.1.2. Sales Executive Data ......................................................................................................................... 34
Table 4.1.2 Cross Tabulations ..................................................................................................................... 34
4.2 cross tabulations .................................................................................................................................... 35
Table 4.2.2 Different sources of information collected by the customers ................................................... 36
Figure 4.2.1: Sources on information collection and its usage .................................................................... 38
Figure: 4.2.2: Category usage of luxury cars ............................................................................................... 40
Category usage of luxury cars ..................................................................................................................... 40
Figure 4.2.3: Car changing period ............................................................................................................... 41
Car changing period .................................................................................................................................... 41
Figure 4.2.4: Sales executive attributes ....................................................................................................... 44
Figure 4.2.5: Financial attributes ................................................................................................................. 46
Table 4.2.6: Impact of astrological dates in buying of luxury cars ............................................................. 47
4.3 factor analysis ........................................................................................................................................ 49
4.3.1: Factor analysis on sales executive attributes selected by customer. .................................................. 49
Table 4.3.1: KMO and Bartlett‟s test .......................................................................................................... 49
Table 4.3.2:Total variance of sales executive attributes explained ............................................................. 49
Figure 4.3.1: Scree plot ............................................................................................................................... 51
Table 4.3.3 Rotated Component Matrix ...................................................................................................... 51
7 | P a g e
Table 4.3.4: Factors Extracted ..................................................................................................................... 52
4.3.2: Factor analysis on the luxury car attributes as per the customer ratings ........................................... 53
Table 4.3.4: KMO and Bartlett's Test .......................................................................................................... 53
Table 4.3.5: Total Variance Explained ........................................................................................................ 54
Figure 4.3.2: Scree plot ............................................................................................................................... 55
Table 4.3.6: Rotated Component Matrix ..................................................................................................... 55
4.3.3 Factor analysis on the luxury car attributes emphasis as per the sales executive ratings ................... 58
Table 4.3.8: KMO and Bartlett's Test .......................................................................................................... 58
Table 4.3.9: Total Variance Explained ........................................................................................................ 59
Figure 4.3.4: Scree plot ............................................................................................................................... 60
Table 4.3.10: Rotated Component Matrix ................................................................................................... 60
Factor 1: luxury with comfort and safety .................................................................................................... 62
4.4: Interview............................................................................................................................................... 64
4.4.1: MERCEDES BENZ .......................................................................................................................... 64
4.4.2: AUDI ................................................................................................................................................. 65
Figure 4.4.2:Attributes emphasis while interacting to managers (Five Rate Scale) .................................... 65
4.4.3: BMW ................................................................................................................................................. 66
Figure 4.4.3:Attributes emphasis while interacting to managers (Five Rate Scale) .................................... 66
4.4.4: SKODA ............................................................................................................................................. 67
Figure 4.4.4:Attributes emphasis while interacting to managers (Five Rate Scale) .................................... 67
4.4.5: JAGAUR ........................................................................................................................................... 68
Figure 4.4.5:Attributes emphasis while interacting to managers (Five Rate Scale) .................................... 68
4.4.6: LAND ROVER ................................................................................................................................. 69
Figure 4.4.6:Attributes emphasis while interacting to managers (Five Rate Scale) .................................... 69
CHAPTER 5: ............................................................................................................................................... 70
DISCUSSION ............................................................................................................................................. 70
CHAPTER 5: DISCUSSION ...................................................................................................................... 71
5.1: Inference ............................................................................................................................................... 71
Cross tabulations was conducted, which indicates the following ............................................................... 71
5.2: Factor analysis of sales executive attributes ......................................................................................... 71
5.3: Factor analysis on the luxury car attributes as per customer ratings .................................................... 72
5.4: Factor analysis on the luxury car attributes as per sales executive ratings ........................................... 72

8 | P a g e
5.5: Gap Analysis between customer needs and sales executive deliverance ............................................. 73
CHAPTER 6: ............................................................................................................................................... 74
CONCLUSIONS AND RECOMMENDATIONS ...................................................................................... 74
CHAPTER 6: CONCLUSIONS AND RECOMMENDATIONS ............................................................... 75
6.1: Conclusions .......................................................................................................................................... 75
6.2.1: Recommendations ............................................................................................................................. 75
6.2.2: Application in the field of manufacturing ......................................................................................... 76
6.2.3: Sales executive training ..................................................................................................................... 77
6.2.4: Conversion and tackling techniques .................................................................................................. 78
6.2.4.1: If there is a strength there will be a weakness associated to it ....................................................... 78
6.2.5: Play with the mind (application) ....................................................................................................... 79
6.2.6: Application in the field of marketing ................................................................................................ 79
6.2.8: Improvements to be made ................................................................................................................. 80
6.2.8.1 Mercedes Benz ................................................................................................................................ 81
6.2.8.2 BMW ............................................................................................................................................... 81
6.2.8.3 SKODA ........................................................................................................................................... 81
6.2.8.4 JAGUAR ......................................................................................................................................... 81
6.2.8.5 LAND ROVER ............................................................................................................................... 81
Annexure ..................................................................................................................................................... 82
Annexure1- Questionnaire .......................................................................................................................... 83
purchase of luxury cars (Customers) ..................................................................................................... 83
Annexure 2- Questionnaire ......................................................................................................................... 89
CHAPTER 6 ................................................................................................................................................ 92
REFERENCE .............................................................................................................................................. 92
CHAPTER 6: REFERENCE ....................................................................................................................... 93

9 | P a g e
Executive summary
The aim of this thesis is to practically analyse the sales psychology involved in increasing
the sale of automobiles. The study tries to identify the different factors which contributed to the
purchase of luxury cars. The study uses these factors in developing practical techniques, which
can increase the sales of automobile. The study conducted has two sided approach, one from the
point of view of customers and other from the point of view of representatives of luxury cars
companies.
The study was conducted on the topic: Practical analysis on sales phycology involved in
increasing the sales of automobiles. The research tool used is factor analysis. Factor analysis has
done for 3 psychological stages. 1) Identification of different delivery styles which sales
executive can use 2) Identification of factors involved in purchase of luxury car from the view
point of customer. 3) Identification of factors involved in purchase of luxury car from the view
point of representative of luxury car manufactures. The analysis has done with the help of SPSS
statistical software. The different method of analysis included cross tabulation method, factor
analysis, graph and pie charts.
The factors identified from the customer information, was compared with the information
given by the company representatives. Resultant finding was used in gap analysis. At the end of
the study, this finding was used to develop techniques which can increases the sales of
automobiles. The technique application also includes in the field of training of sales executives,
marketing of luxury cars, and manufacturing of luxury car.

10 | P a g e
List of figures:
Figure 1: Howard–Sheth Model of buyer behaviour ................................................................................... 17
Figure 2: A Stimulus-Response Model of Buyer Behaviour ......................................................................... 19
Figure 3: The Engel-Kollat-Blackwell Model of Consumer Behaviour ......................................................... 20
Figure 4: Bettman Information-Processing Model of Consumer Choice .................................................... 22
Figure 5: Sheth-Newman Gross Model of Consumption Values ................................................................. 24
Figure 6: Model of Buyer's Trust of the Seller in an Initial Sales Encounter ............................................... 27
Figure 7: Sources on information collection and its usage ......................................................................... 38
Figure 8: Category usage of luxury cars ...................................................................................................... 40
Figure 9: Car changing period...................................................................................................................... 41
Figure 10: Sales executive attributes .......................................................................................................... 44
Figure 11: Financial attributes ..................................................................................................................... 46
Figure 12: Number of people preferring to buy car according on their preferred astrological dates ........ 48
Figure 13: Scree plot (Sales executive attributes) ....................................................................................... 51
Figure 14: Scree plot ( as per customer ratings ) ........................................................................................ 55
Figure 15: Effectiveness of factors in purchase of luxury car based on customer ratings .......................... 58
Figure 16: KMO and Bartlett's Test ( as per sales executive ratings ) ......................................................... 58
Figure 17: Scree plot ( as per sales executive ratings ) ............................................................................... 60
Figure 18: Effectiveness of factors in purchase of luxury car based on sales executive ratings ................. 63
Figure 19: Attributes Emphasis (in Mercedes Benz) ................................................................................... 64
Figure 20: Attributes Emphasis ( in Audi ) ................................................................................................... 65
Figure 21: Attributes Emphasis ( in BMW ) ................................................................................................. 66
Figure 22: Attributes Emphasis (in Skoda) .................................................................................................. 67
Figure 23: Attributes Emphasis ( in Jagaur) ................................................................................................. 68
Figure 24: Attributes Emphasis ( in Land Rover ) ........................................................................................ 69

11 | P a g e
List of Tables
Table 1: Reliability statistics (Customer Data) ............................................................................................. 34
Table 2: Reliability statistics (Sales executive Data) ................................................................................... 34
Table 3: Describing the monthly income, educational background and occupation in terms of frequency.
..................................................................................................................................................................... 35
Table 4: Different sources of information collected by the customers ...................................................... 36
Table 5: Category of usage, car changing cycle compared with monthly income ...................................... 38
Table 6: Sales executive attribute rating by customers on the bases of monthly income ......................... 41
Table 7: : Customer ratings on finance, tax, benefits and risk attributes which customer consider,
important while buying a luxury car ........................................................................................................... 44
Table 8: Impact of astrological dates in buying of luxury cars .................................................................... 47
Table 9: KMO and Bartlett's Testa (Sales executive attribute) ................................................................... 49
Table 10: Total variance of sales executive attributes explained ............................................................... 49
Table 11: Rotated Component Matrix ( Sales executive attributes ) .......................................................... 51
Table 12: Factors Extracted (Sales executive attribute) .............................................................................. 52
Table 13: KMO and Bartlett's Test ( as per customer ratings ) ................................................................... 53
Table 14: Total Variance Explained ( as per customer ratings ) .................................................................. 54
Table 15: Rotated Component Matrix ( as per customer ratings ) ............................................................. 55
Table 16: Factors extracted by principal component analysis ( as per customer ratings ) ......................... 57
Table 17: Total Variance Explained ( as per sales executive attributes) ..................................................... 59
Table 18: Rotated Component Matrix (as per sales executive ratings ) ..................................................... 61
Table 19: Factors extracted by principal component analysis ( as per sales executive ratings ) ................ 62
Table 20: Comparing the models on the bases of purchase decision factors ............................................. 76
Table 21: Conversion Demo ( Audi Q5 to Audi Q3 ) .................................................................................... 79

12 | P a g e
CHAPTER 1:
INTRODUCTION

13 | P a g e
CHAPTER 1.1: INTRODUCTION
In May 2010, I worked as a Sales Executive in Suzuki automobile showroom during the
re-launch of modified „WagonR – the blue eyed boy‟. The company marketing team was
promoting the new „WagonR‟ in all fields of marketing. Every customer coming into the
showroom had a pre-occupied mind of buying the new „WagonR‟. The distributor knew that the
new wagoner has a high demand in the market. At the same time an existing model called Estilo
had a lower demand and high inventory.
The challenge was to increase the sales of Estilo and to have a controlled sale of WagonR.
As a sales executive it was always a challenge to convert a customer intending to buy WagonR
into buyers of Estilo.
That morning a customer arrived asking for a WagonR model. I already knew that the
customer had collected some information related to the WagonR model. I explained to him some
features of the new WagonR. What I did was only mention some features which are common to
WagonR and Estilo. At the end, I would ask a question like, would you like to see the new Estilo
also? Compared to WagonR its 25,000 lesser and also has the features which I have mentioned
earlier. For a moment the customer thinks why not check the new Estilo if the feature said earlier
are the same?
After the customer seeing the new Estilo, I bring forward more of its features
which I have not mentioned earlier. Finally the customer would choose model Estilo instead of
WagonR. This was possible only because I knew all the factors that contribute to decision
making. The way in which I presented the Estilo has brought in confidence to the customer that
his needs could be more satisfied by Estilo, rather than WagonR.
Today the automobile industry is one of the fastest growing industries in the
world. In a globalized world luxury cars are becoming more and more important. It reflects the
status symbol of wealth and passion the one possess. India is the second most populous country
in the world. The Gross Domestic Product per capita in India was last recorded at 3649.53 US
dollars in 20121. As per department of industrial policy and promotion in India, foreign direct
investment inflow to India in automobile sector was about US$ 6992 million, in between April
2000 to July 20122.
India has become the one of the preferred country for automobile companies. This
is because of the increase in buying power, improvement in infrastructure, stable government
structure and increasing population of India.
1.2: Background of the Study
The Purchase of a car involves a complex decision making process. The various
attributes involved in the decision making process include the top speed of the car, brand image,
fuel mileage, colour of the car etc. Automobile manufacturers are in a race to gain maximum
share of automobile sales. Luxury car manufactures are in a competition to differentiate the
products they deliver. The idea of what constitutes „luxury‟ is often different for different people.
This study focuses on identifying the factors which customers consider before purchasing a
1 INDIA GDP PER CAPITA PPP. (n.d) retrieved 01/21/2013, from India GDP Per capita Web Site: 3http://www.tradingeconomics.com/india/gdp-per-capita-ppp 2INDIA GDP PER CAPITA PPP. (n.d) retrieved 01/21/2013, from India GDP Per capita Web Site: 3http://www.tradingeconomics.com/india/gdp-
per-capita-ppp
14 | P a g e
luxury car. These factors are then compared with the factors which sales executives focus on
while selling the car. This difference is evaluated though gap analysis. The results will help the
luxury automobile companies in delivering quality service to the customers. This will result in an
increase in the sales of automobiles.
1.3: Statement of the Problem
To understand the sales psychological involved in increasing the sales of luxury cars.
Effectiveness of different factors on the decision to purchase of luxury car.
Which are the factors which sales executives emphasise while communicating to the
customers.
Is there a gap in what the customer expects and what the sales executive delivers.
How can this gap be reduces to help improve the sales of automobiles.
How can his finding to applied in different departments of the organisation.

15 | P a g e
CHAPTER 2:
LITERATURE REVIEW

16 | P a g e
CHAPTER 2: LITERATURE REVIEW
2.1 Introduction
The thesis aims at analysis of the sales psychology involved in increasing the sale of
automobiles. The aim of this chapter is to know about the previous studies pertaining to
consumer psychology.
2.2 Consumer decision making
The study of consumer behaviour focuses on how individuals make decisions to spend
their available resources (time, money, effort) on consumption-related items.3 The field of
consumer behaviour covers a lot of ground. According to Solomon (2010) “consumer behaviour
is a study of the processes involved when individuals or groups select, purchase, use, or dispose
of products, services, ideas, or experiences to satisfy needs and desires.”4
2.2.1 Need of stimulation
Need stimulation is the first stage in buying process. In Indian context, buying of a car is
considered the second main dream after buying a house. Need stimulation comes from both
external and internal factors. The Howard–Sheth Model of buyer behaviour has categorised the
stimulus display (inputs) in main three balances Significative, Symbolic, Social.
3 Schiffman, L. G., & Kanuk, L. L. (2000). Consumer behavior. 7th. edn. Prentice Hall International. 4 Erasmus, A. C., Boshoff, E., & Rousseau, G. G. (2010). Consumer decision-making models within the discipline of consumer science: a critical approach. Journal of Family Ecology and Consumer Sciences/Tydskrif vir Gesinsekologie en Verbruikerswetenskappe, 29(1).

17 | P a g e
Howard–Sheth Model of buyer behaviour 5
Figure 1: Howard–Sheth Model of buyer behaviour Significative
This factor includes attributes such as: 1. Quality 2. Price 3. Distinctiveness 4. Service 5.
Availability.6 Howard–Sheth Model of buyer behaviour in contest to field of car sales, includes
factors like,
Quality of the car which is sold
Price at which the car is offered
Distinctiveness of car from other models
Availability of cars.
5 A Simplified Description of the Theory of Buyer Behaviour Source: Howard and Sheth, p32 (1969) 6 Howard J.A and Sheth J.N.(1967). "Theory of Buyer Behaviour," Proceedings, American Marketing Association

18 | P a g e
Symbolic
This factor includes attributes such as: 1. Quality 2. Price 3. Distinctiveness 4. Service 5.
Availability. This symbolic classification takes into consideration how the remaining factor is
perceived by others in their mind set.7
Social
This factor has different attributes which include 1. Family 2. Reference groups 3. Social class. 8
Howard–Sheth Model of buyer behaviour in contest to the field of car sales includes factors like,
1. Family wants and needs with regard to a car.
2. Reference group‟s advice towards purchasing a new car.
3. Social class prestige towards different class of car.
The major components involved in Howard–Sheth Model of buyer behaviour are 1. Input
variable 2. Hypothetical constructs 3. Exogenous variables 4. Hypothetical constructs.9
Other behaviour terms which model put forward about the thinking process included
attention (magnitude buyer information intake), comprehension (buyers store of brand
information), attitude (evaluation of brand choose to satisfy his needs), and intention (buyers
forecast of which brand to buy).
2.2.2 Need recognition
The need of the consumer in the consumer behaviour approach proposed by Jay D.
Lindquist and M.Joseph Sirgy states that the need recognition of the customer is the difference
between the current car benefits and the benefits of the new car. The larger the gap between the
benefits of new car and the old car, the higher the consumer need recognition10. Need
recognition of a consumer is dependent on the current benefits, he enjoys in using the present car
and the benefits which he expects to derive from the new car.
The basic need hierarchy of Abraham H Maslow, which motivates consumers, are as
follows.
1. Physiological needs
2. Safety needs
3. Belongingness and love needs
4. Esteem needs
5. Self-actualization needs11
7 Howard J.A and Sheth J.N (1969), the Theory of Buyer Behaviour, New York: John Wiley and Sons.9-28 8 Howard J.A and Sheth J.N (1969), the Theory of Buyer Behaviour, New York: John Wiley and Sons.9-28 9 Howard J.A and Sheth J.N (1973), The Theory of Buyer Behaviour, in H.H 10 Buyer and Consumer Behavior, 2009 Jay D. Lindquist, M. Joseph Sirgy. 11 A Theory of Human Motivation,1943, Maslow.

19 | P a g e
The physiological needs are the basic needs such as water, food, shelter and sexual
behaviour. The safety needs includes security, dependability. The belongingness and love needs
include love and affection from the society, the belongingness in the society. The esteem needs
included self-respect and the respect from the society. The self-actualization needs are the
ultimate actualization for what you are. Some of the management experts don‟t agree to the last
self-actualization needs since many people believes that the need of man never ends till his death.
The consumer psychological mind-set is a state of mind, when the consumer recognizes
the need and takes necessary steps to satisfy the need. The different factors which contribute to
his decision making is closely related to the needs and wants of the consumer. The major decision
making process comes from his past experience related to the previous experience.
The new marketing era comes with not only satisfying the needs and wants of consumers;
Now new generation marketing is all about creating artificial need in the consumer mind by
having „seasonal shopping fests‟ ,„changing fashion trends‟, etc. which in return creates artificial
demand. The „A stimulus-response‟ model of buyer behaviour is a new development in the field
of motivation. This model is designed to create artificial need in the mind of the consumer.
Figure 2.8 A Stimulus-Response Model of Buyer Behavior12
Figure 2: A Stimulus-Response Model of Buyer Behaviour The model differentiates determinants and motivators in consumer buying behaviour and
concentrate more on the effects that an organization have on consumer buying decision by
controlling the communication channels.
12 Middelton, V.T.C (1994) Marketing for Travel and Tourism. 2nd edn. Butterworth-Heinemann, London .104-112

20 | P a g e
The model suggests advertisement, sales promotion, brochure, personal selling and public
relationship as a means to promote sales. Friends, family and reference group are the other
external factors which affect the decision making of the consumer. The decision making is
influenced also by other factors such as the learning, perception, past experience, demographic,
economic and social position, psychographic characteristic, attitudes and needs - wants goals.13
The post purchase behaviour is also considered in making a decision in the purchase of next car.
2.2.3 Information search
The Engel-Kollat-Blackwell Model of Consumer Behaviour14
13 Middelton, V.T.C (1994) Marketing for Travel and Tourism. 2nd edn. Butterworth-Heinemann, London .104-112 14 The Engel-Kollat-Blackwell Model of Consumer Behaviour, Engel , Blackwell, and Miniard,(1995) page No 95
Stimuli: Marketer-
Dominated, other
Exposure
External search
Attention
Comprehension Perception
Yielding/ Acceptance
Retention
Dissatisfaction Satisfaction
M E M O R Y
Problem Recognition
Search Internal search
Outcomes
Purchase
Alternative Evaluation
Individual Characteristics:
Motives Values
Lifestyle Personality
Beliefs
Attitude
Intention
Social
Influences : Culture
Reference group Family
Situational Influences
Input Information Processing
Decision Process Variables Influencing Precision Process
Figure 3: The Engel-Kollat-Blackwell Model of Consumer Behaviour

21 | P a g e
The Engel-Kollat-Blackwell Model of Consumer Behaviour has classified information
sources into marketing and non-marketing sources. Marking source in the case of car selling
includes advertisements, brochures, sales executive information, bill boards, posters and brand
campaign. Non-marketing sources includes advices by the peer groups, family, relatives and
well-wishers.15 This information collected has a great impact on the buying decision. If the
information collected is not enough to make a proper decision making, the consumer demand for
more information will be high. Even after collection of more information, if the consumer is not
able to make a decision on this alternative, then the psychological explanation is that, the
consumer expectation about the product is much higher than the actual product attributes.
According to W.L. Wilkie and P.R. Dickson “information search represents the primary
stage in which marketing can provide information and influence consumer decision.” 16The
information search priority is different for different people. A consumer who is more interested in
the running cost of the car will be more interested in having information regarding mileage,
service cost, changing period of battery, changing period of fuel filters, insurance covered parts in
the car, the cost of changing air bags, and the charge of car service.
If the consumer is more interested in the speed of the car, then the information which
interest him will be horse power of the car, engine Cubic Capacity, torque of the car, how much
time it takes from 0 to 100 km/h. If the consumer is more interested in comfort, the information
which may interest him will be the leather finishing of sits, wooden panelling, the type of
suspension, the tire width and the brake system of the car.
The Engel-Kollat-Blackwell Model of Consumer Behaviour has classified the stage of
information process into 5 stages. They are
1. Consumer exposure
2. Attention
3. Perception
4. Acceptance
5. Retention of incoming information.17
To retain the information, the consumer needs to be exposed to the information, allocate
space in his memory, interpret the stimuli, and retain the information in to long term memory.
For most of the consumer durables, information search is the most important step in
making decision making. Durable products have to be used for a longer period thus consumers
are more enquires about the information regarding the products and products comparing with our
similar products.
Girish N. Punj and Richard Staelin in Journal of Consumer Research have developed a
model for information search for new cars. In their study they have found out two unique
components of prior knowledge which they found out by survey of new car purchasers18.
1. Specific product knowledge
15 Assael, H. (2004). Consumer behavior: A strategic approach. Boston: Houghton Mifflin. 16 W. L. Wilkie and P. R. Dickson,Shopping for Appliances: Consumers' Strategies and Patterns of Information Search 17 The Engel-Kollat-Blackwell Model of Consumer Behaviour, Engel , Blackwell, and Miniard,(1995) page No 95 18Punj, Girish N., and Richard Staelin (1983), "A Model of Consumer Information Search Behavior for New Automobiles
22 | P a g e
2. General product class knowledge
The specific product search includes less external searching compared to the general
product search. The external search in their study is found to be inversely related to the cost of
search, while external search was found to be directly related to cost savings.
The specific product knowledge search is based on the consumer interest towards specific
product attributes. The specific product knowledge is gathered from the user of the product this
are the information, peer groups, advices, family and other experts. The general product class
knowledge is searched mostly from the external sources.
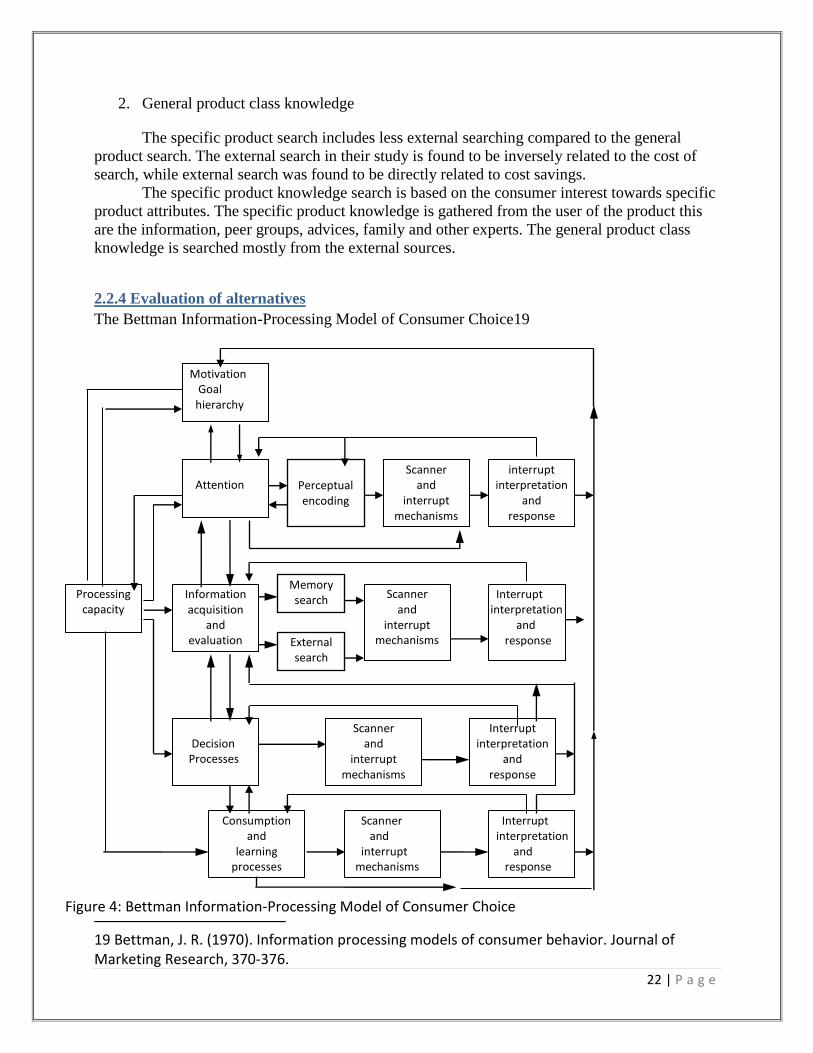
2.2.4 Evaluation of alternatives
The Bettman Information-Processing Model of Consumer Choice19
19 Bettman, J. R. (1970). Information processing models of consumer behavior. Journal of Marketing Research, 370-376.
Motivation Goal hierarchy
Processing capacity
Attention
Information acquisition
and evaluation
Decision Processes
Consumption and
learning processes
Perceptual encoding
Scanner and
interrupt mechanisms
interrupt interpretation
and response
Memory search
External search
Scanner and
interrupt mechanisms
Interrupt interpretation and response
Scanner and
interrupt mechanisms
Interrupt interpretation
and response
Scanner and interrupt mechanisms
Interrupt interpretation and response
Figure 4: Bettman Information-Processing Model of Consumer Choice

23 | P a g e
The Bettman Information-Processing Model of Consumer Choice finds that
psychologically, the main goals of the consumer are sub divided into different goal. This sub
divided goals are then matched with what the product serves. This sub divided goals are used to
evaluate the information and collected to make the best choice.
The goals which are set for the decision making are generated by two main processes.
1. attention
2. perceptual encoding
There are basically two types of attentions 1. Voluntary attention 2. Involuntary
attention.20 Voluntary attention is when consumer conscious allocates the processing capacity to
current goals. Involuntary attention is the spontaneous response to a special event.
The perceptual encoding deals with how the perceived stimuli have to be encoded. If the
encoded information is not enough to make a choice, the consumer tries to get more information
related to the product. The information search ends only when the information collected is
sufficient or the consumer finds that the additional information is costly in terms of money and
time.
The information collected is first scanned based on the priority of the consumer. The
information then is interpreted by the consumer based on the usage. For example: The
information about the cars width can be interpreted in such a way that - The length of the front
gate of the house is much higher than the width of the car so that the car can be parked inside the
house garage. This is the way consumers psychologically interpret the information given by the
external source. These interpretations are based in the past experience of the consumer.
Decision making process is done based on the goals of the consumer and how the product
satisfies his goals. Bettman‟s model indicates that after the evaluation of specific brand
information, two other factors influence the decision making. 1. Individual factors 2. Situational
factors. After considering both factors, a choice is made.
2.2.5 Purchase and post purchase evaluation
After the evaluation of the brand based on the information collected on the
consumer purchases, the choice is made. The choice is made based on the belief that the product
can satisfy the needs and wants of the consumer.
The purchase of the car depends on other factors which are mentioned in the
Bettman‟s model. In purchase of car, the other factors include financing of the car, identifying the
right dealer, finalizing the customization of car parts and negotiating on the final price. Among
the attributes, price of the car is one of the most important aspects were the consumer tries to find
a fix between product and price. If the consumer is not satisfied with the final price, he or she
may go for other low cost product, which can satisfy their needs.
The Bettman model gives more importance to the information processing ability
of consumer to make a choice based on the information, but have not mentioned anything about
the “criteria by which consumer accepts or refuses to information”
20 The Bettman Information-Processing Model of Consumer Choice, Bettman. (1979). P 402

24 | P a g e
Sheth-Newman Gross Model of Consumption Values21
Sheth-Newman Gross Model of Consumption Values has brought forward five
consumption values which influences the consumer behaviour of choice. The model classifies
factor influencing consumer behaviour into following.
1. Functional values – To Sheth et al. (1991) the functional value of an alternative is defined
as "The perceived utility acquired from an alternative for functional, utilitarian, or
physical performance. An alternative acquires functional value through the possession of
salient functional, utilitarian, or physical attributes. Functional value is measured on a
profile of choice attributes. "
„Functional values‟ means the attributes which the car delivers when purchased. It can be
physical attributes, salient functional or utilitarian. As per the economic utility theory by Stigler
(1950) and Marshall (1890), functional valve is considered to be the primary decision making
factor in a “rational man”22. As per Ferber, 1973 the alternative functional factors can be derived
from its attributes23. Katz Daniel(1960) in the functional theory of attitudes mentions some
general functional factors which includes 1. Utilitarian function 2. Valve expressive function 3.
Ego defensive function 4.24 Knowledge function
2. Social value - Sheth et al. (1991;161) defines social values as "The perceived utility
acquired from an alternative association with one or more specific social groups. An
alternative acquires social value through association with positively or negatively
21 Sheth-Newman Gross Model of Consumption Values, Sheth, Newman, and Gross (1991) Pp159-170 22 economic utility theory, Marshall (1890) and Stigler (1950) 23 Ferber. Robert (1973) Consumer Economics a Survey a Journal of economics Literature 11 December, 1303-1342 24 Katz Daniel (1960) The Functional Approach The Study Attitude Public Opinion Q.24 summer 16-204
Consumer Choice Behaviour
Functional Value
Conditional Value
Social Value
Emotional Value
Epistemic Value
Figure 5: Sheth-Newman Gross Model of Consumption Values

25 | P a g e
stereotyped demographic, socioeconomic, and cultural-ethnic groups. Social value is
measured on a profile choice imagery."25
3. Emotional value - Sheth et al. (1991; 161) defined emotional value of an alternative as
"The perceived utility acquired from an alternative‟s capacity to arouse feelings or
affective states. An alternative acquires emotional value when associated with specific
feelings or when precipitating those feelings. Emotional values are measured on a profile
of feelings associated with the alternative."26
4. Epistemic value- Sheth et al. (1991 ;162) defined epistemic value as "The perceived
utility acquired from an alternatives capacity to arouse curiosity, provide novelty, and/or
satisfy a desire for knowledge. An alternative acquires epistemic value by items referring
to curiosity, novelty, and knowledge."27
5. Conditional value- Sheth et al. (1991;162) defined the conditional value as "The
perceived utility acquired by an alternative is the result of the specific situation or set of
circumstances facing the choice maker. An alternative acquires conditional value in the
presence of antecedent physical or social contingencies that enhance its functional or
social value. Conditional value is measured on a profile of choice contingencies."28
Based on the above influence the consumer chooses the product which gives them the
maximum satisfaction at the minimum cost. This experience which he delivers from the purchase
of the product affects the consumer behaviour. The consumer behaviour thereafter depends on
how good or bad the experience was. The consumer uses his learning curve which he delivers
from the previous purchase, as the base for the purchase of his next car.
2.3 How do sales executive use psychology in sales of cars
Whittler (1994) shows that customer spend little time in collecting information about the
car of their interest. Customer collects only the basic information related to the car. Rarely does a
consumer study a car by comparing to the similar models. The main intention of customer is to
get the information need for purchase from the sales executive of the company.
In fact research has shown that customers have a mind-thought process of
comparing the new car, with the previous car model. Most of the decision making process is done
based on the experience which they have on the previous car. The failure in meeting their needs,
25 Sheth, J.N.B.I. and Newman B.L Gross, B.L. (1991) .Why We Buy What We Buy a Theory of Consumer Behavior. Journal of Business Research Vol 22. 159-170 26 Sheth, J.N.B.I. and Newman B.L Gross, B.L. (1991) .Why We Buy What We Buy a Theory of Consumer Behavior. Journal of Business Research Vol 22. 159-170 27 Sheth, J.N.B.I. and Newman B.L Gross, B.L. (1991) .Why We Buy What We Buy a Theory of Consumer Behavior. Journal of Business Research Vol 22. 159-170 28 Sheth, J.N.B.I. and Newman B.L Gross, B.L. (1991) .Why We Buy What We Buy a Theory of Consumer Behavior. Journal of Business Research Vol 22. 159-170

26 | P a g e
the dissatisfaction, bad experiences caused by the car in their past, are the foundation knowledge
of their questions and doubts.29
The sales representative should ask questions that encourage the consumers to
think about their past experience with their cars. The main idea is to bring their previous decision
making factor which consumer have used in their previous purchase decision; which is more
important for the consumer than the information given by the sales representative.
These decision factors are in most case different from executive‟s point of view.
The sales representative information which is not related to the customer‟s decision factor can
waste a lot of time and energy.
The decision making process includes lots of complex thought process and visual
images. This thought process and the visual images are related to the past experience with the
previous car. Sales representative must be able to find this thoughts and visuals. This thinking
pattern can later help the sales representative to have a long term, customer relationship with the
customer.30
29 1. Eliciting Consumer Choice Heuristics: Sales Representives' Persuasion Strategies Tommy E. Whittler The Journal of Personal Selling and Sales Management Vol. 14, No. 4 (Fall, 1994), pp. 41-53 30 1. Eliciting Consumer Choice Heuristics: Sales Representives' Persuasion Strategies Tommy E. Whittler The Journal of Personal Selling and Sales Management Vol. 14, No. 4 (Fall, 1994), pp. 41-53
27 | P a g e
2.4 How sales executive can use psychological in gaining trust of customer
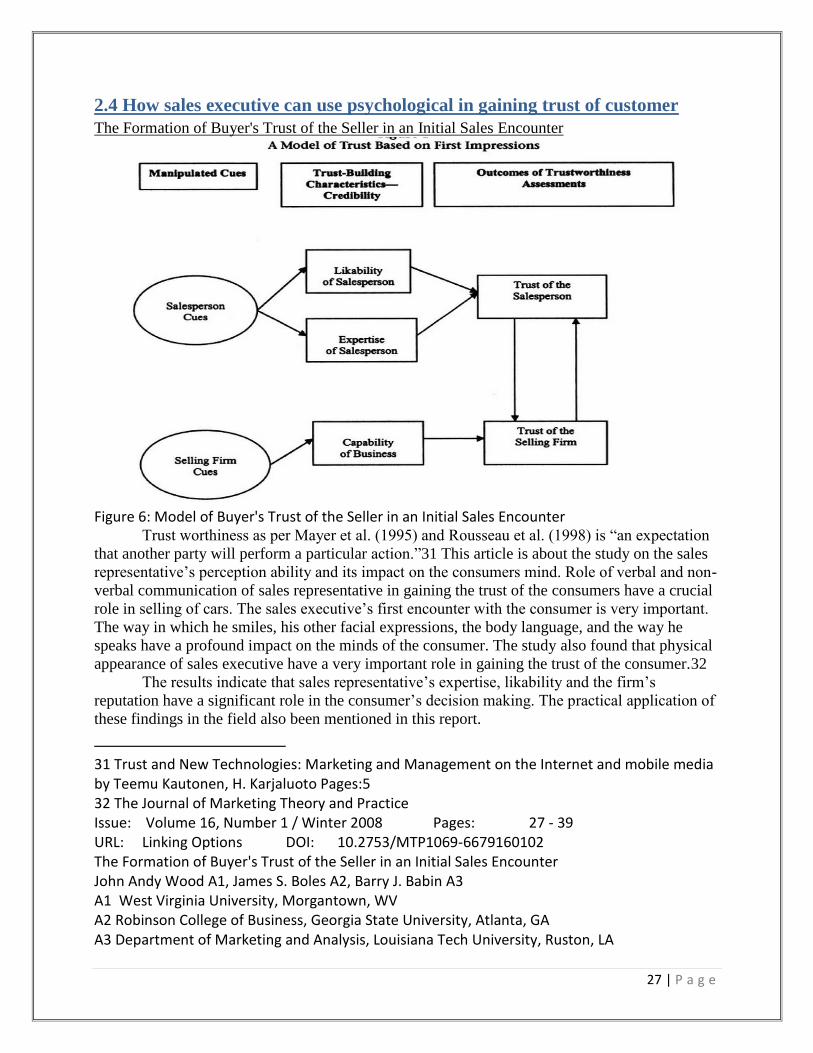
The Formation of Buyer's Trust of the Seller in an Initial Sales Encounter
Figure 6: Model of Buyer's Trust of the Seller in an Initial Sales Encounter
Trust worthiness as per Mayer et al. (1995) and Rousseau et al. (1998) is “an expectation
that another party will perform a particular action.”31 This article is about the study on the sales
representative‟s perception ability and its impact on the consumers mind. Role of verbal and non-
verbal communication of sales representative in gaining the trust of the consumers have a crucial
role in selling of cars. The sales executive‟s first encounter with the consumer is very important.
The way in which he smiles, his other facial expressions, the body language, and the way he
speaks have a profound impact on the minds of the consumer. The study also found that physical
appearance of sales executive have a very important role in gaining the trust of the consumer.32
The results indicate that sales representative‟s expertise, likability and the firm‟s
reputation have a significant role in the consumer‟s decision making. The practical application of
these findings in the field also been mentioned in this report.
31 Trust and New Technologies: Marketing and Management on the Internet and mobile media by Teemu Kautonen, H. Karjaluoto Pages:5 32 The Journal of Marketing Theory and Practice Issue: Volume 16, Number 1 / Winter 2008 Pages: 27 - 39 URL: Linking Options DOI: 10.2753/MTP1069-6679160102 The Formation of Buyer's Trust of the Seller in an Initial Sales Encounter John Andy Wood A1, James S. Boles A2, Barry J. Babin A3 A1 West Virginia University, Morgantown, WV A2 Robinson College of Business, Georgia State University, Atlanta, GA A3 Department of Marketing and Analysis, Louisiana Tech University, Ruston, LA

28 | P a g e
2.5 The relevance of empathy for the purpose of sale
This study is about the understanding of the relevance of empathy for the purpose
of sale. The study tries to understand empathy, which is considered as one of the main traits of
the sales representative. The study tries to find a positive relationship between sales
representative sales performance and empathy. The results of the study found that there is no
positive relation between empathy and sales performance. Empathy measurement used in this
study is the Barrett-Lennard Relationship Inventory. The study tried to compare the empathy
rating with the new customers for the cars. The final results were contradicting the prior
assumption of empathy having a positive relationship with sales performance. 33
33 Psychology & Marketing Volume 9, Issue 4, pages 297–310, July/August 1992 The effects of empathy on salesperson effectiveness Lyndon E. Dawson Jr.1, Barlow Soper1, Charles E. Pettijohn2 Article first published online: 6 SEP 2006 DOI: 10.1002/mar.4220090404

29 | P a g e
CHAPTER 3:
RESEARCH METHODOLOGY

30 | P a g e
CHAPTER 3: RESEARCH METHODOLOGY
3.1. Introduction
The main objective of this study is to understand the sales psychological involved in
increasing the sales of luxury cars. The study also tries to identifies different factors that
influence the customer in decision making process and evaluates the weightage of each factor to
the decision making process. The results of this customer decision factors is compare, with the
factor which sales executives and managers emphasis more while delivering to the customers.
Thus the resultant solution from final gap analysis makes sure in meeting the need of the
customer of luxury car segment.
3.2. Problem definition
To analyse the factors that affect the purchasing decision of the customers for the
purchase of luxury automobile, and thereby provide superior delivery to the customers. The
purchase decision of the customer depends on many factors like reputation, driving pleasure,
standard of the car, security, convenience, and also the quality of the luxury car.
3.3. Objectives of the project
1. To identify and access the factors affecting the consumer purchasing decision for luxury
cars.
2. To identify and access the factors which luxury car sales executive emphasis.
3. To identify the gap between the customer expectation and company deliver.
4. Suggest meaning full solutions to recover the gap from the results obtained.
3.4. Research design
The research conducted is a mixture of both primary and secondary research. The primary data
collection involves collection of response by the use of structured questionnaire from the defined
sample size. It also involves personal interview with the experts in the field. The secondary
research has been collected though online and offline research paper, journals, books and other
data research database.
3.5. Sample method
The sample method used to select the target group was snowball sampling. The initial target
respondents select additional respondents from their network of friends. The purpose of this is to
get a homogeneous sample group. Along with the snowball sampling, simple random sampling
was also followed, where each element of population, has an equal probability of getting selected.

31 | P a g e
3.6. Sample size and research setting
As per the report of The Economic Times, total luxury car sales stood at 23000 units in 2011 and
is expected to reach 30,000-31,000 units by the end of 2012. Taking into consideration the time
limit the sample size of the study is taken as 50. The sample of 50 is selected from different cities
of the different states in the India. The sample of 50, were from target group of different age
group, both the genders, different religion, different education background, with an income group
of 50000 / month and above.
Target group includes both the existing car owners and aspirants.
Age group: 20 to 50 yrs.
Occupation: Self-employed, Employed in Private/Public sector, Retired.
3.7. Data collection methods and tools
The primary data collection contained two sets. One set includes the data collected from
the target customer and aspirants for luxury cars. The second set includes the data collected from
the mangers and sales executives of luxury cars which includes Mercedes, BMW, Jaguar, Skoda
and Audi.
The data collection was done with the help of questionnaire. The questionnaire is made in
English. The questionnaire was made in google docs, there after the links were sent to the target
groups by mail. The target group fills in data though email and the data is recorded automatically
in the google drives. Manual questionnaire was also used were by data was collected manually by
paper and pen. Were the target group was contacted personally. The purpose of the study was
explained clearly and then respondents were requested to fill the printed questionnaire. The data
collected from the showroom manager and executives were mostly manual bases. Thereby more
relevant information can be collected by interacting with the manager in charge. The
questionnaire consists of check boxes, multiple choice, grid, radio buttons and scales. The online
questionnaire provides faster means of data collection from across the India.
3.8. Data collection from car owners and aspirators
The questionnaire starts by a small description about the purpose of the research. It also
includes a confidentiality statement to ensure that the response obtained from the respondent is
kept confidential. The sensitive information like the name, age, profession and income are
collected. The first set of questions is to know the general information about the customer. This is
to identify the independent variables of the customer based on which the decision is make. The
independent factors questions includes the gender, education background, occupation, car owned,
price range of high-end car used, road system used, time spend on car per week, source of
information search, car changing cycle, category of usage. The dependent variables evaluating
question asked was, whether you intend to buy a luxury car(s) in the next year. The main idea of
this set of question is to identify the major general independent factors involved in the decision
making of purchase of luxury cars.
The next set of questions is for the purpose of determining the attributes of a car which
are most in purchasing of luxury cars. The first questionnaire for pilot study contained 78
attributes. After the pilot study of sample size 30, attributes was reduced to 28. To minimize the
effort used for filling the questionnaire a grid matrix system was used in attribute evaluation.
The link of questionnaire in Google docs is: http://goo.gl/1f5sa

32 | P a g e
3.9. Data collection for managers and sales executive
The questionnaire to be filled by the managers and sales executives had two parts. First
part of questionnaire contain general questions to check the statue and quality of sales executive
it includes questions like education background, sales done per month, car model in which you
deal which you deal the most, his view about personal networking, time spend in sales related
activity. There was no confidentiality statement because of the common fact that there is only one
dealer for each district in each luxury car company.
The second part of questionnaire consists of 28 attributes, which were the output of user
and aspiration pilot study. Sales executives were asked to rate the attributes based on the how
they emphasis on these attributes. This is done to understand whether executive‟s delivered
service is to the expectation of customers.
Luxury means different for different people so to get an unbiased information, data was
collected from different company showroom which include Jaguar, Land rover, Range Rover,
BMW, Audi, Skoda and Mercedes. Sale executive questionnaire sample size is 50.
3.10. Secondary data collection
The secondary data collection was done by conducting an article review. This was
conducted by referencing to research papers, previous study conducted, newspaper articles
relevant and related to the study. Online data bases like Emerald, EBSCO, JSTOR, Sage journals,
google scholar were used. Information pertaining to sales psychology, customer behaviour and
sales executive way of negotiation were collected.
3.11. Limitations
Time consumption is high in identifying the target customer.
Inaccurate information from the respondents
Getting appointment to meet the manager of luxury car showroom is time consuming.
To meet the sales executives when they are free from day job schedule need lots of
communication and time management.
3.12. Data analysis tools
Factor analysis of data was done with the help of SPSS statistical software. The data
collected is converted in MS Excel format. The pie chart, bar chart models were extracted from
the excel sheet itself. Further for advanced data processing the excel sheet is loaded into SPSS
software. SPSS was used to analysis the attributes and further converted into factors.
33 | P a g e
CHAPTER 4:
ANALYSIS

34 | P a g e
CHAPTER 4: ANALYSIS
4.1. Reliability Statistics
4.1.1. Customer Data
Table 4.1.1 Cross Tabulations
Table 1: Reliability statistics (Customer Data)
Case Processing Summary
N %
Case
s
Valid 50 100.0
Excludeda 0 .0
Total 50 100.0
a. Listwise deletion based on all variables in the procedure.
Reliability Statistics
Cronbach's
Alpha
N of
Items
.923 28
Cronbach‟s Alpha is 0.923, which is above standard value of 0.75. Thus the sampling is
internally consistent or reliable.
4.1.2. Sales Executive Data
Table 4.1.2 Cross Tabulations
Table 2: Reliability statistics (Sales executive Data)
Case Processing Summary
N %
Case
s
Valid 50 100.0
Exclude
da
0 .0
Total 50 100.0
a. Listwise deletion based on all variables in the procedure.
Reliability Statistics
Cronbach's
Alpha
N of
Items
.947 28

35 | P a g e
Cronbach‟s Alpha is 0.947, which is above standard value of 0.75. Thus the sampling is
internally consistent or reliable
4.2 cross tabulations
Table 4.2.1 Describing the monthly income, educational background and occupation in terms of
frequency.
Table 3: Describing the monthly income, educational background and occupation in terms of frequency.
Age group
Below
20
20 to
30
30 to
40
40 to
50
Above
50
Total
Count Count Count Count Count Count
Monthly
Income
Less than 50,000 0 0 0 0 0 0
50,000 to 75,000 0 10 13 0 0 23
75,000 to 100,000 0 4 6 1 0 11
1,00,000 to 1,25,000 0 3 4 1 0 8
Above 1,25,000 0 5 1 0 2 8
Total 0 22 24 2 2 50
Education
background
Master degree 0 9 11 0 0 20
Bachelor degree 0 5 5 0 2 12
Professional qualification
(engineering/CA/CS/MBBS)
0 6 7 2 0 15
Others 0 2 1 0 0 3
Total 0 22 24 2 2 50
Occupation Home maker 0 0 0 0 0 0
Employed (private/public sector) 0 6 9 0 0 15
Self- employed 0 16 15 1 2 34
Retired 0 0 0 1 0 1
Student 0 0 0 0 0 0
Other 0 0 0 0 0 0
Total 0 22 24 2 2 50
The number of respondents in the age group of 20 to 30 is 22 people, which is about 44 %
of the total population. Among them, 9 people comes from a master degree background, 5 from a
bachelor degree background, 6 comes from a professional background; rest 2 comes from other
courses. The number of respondents in the age group of 30 to 40 is 24 people, which is about 48
% of the total population. Among them 11 people comes from a master degree background, 5
36 | P a g e
from a bachelor degree background, 7 comes from a professional background; rest 1 comes from
other courses. The number of respondents who coming under the age group of 40 to 50 are 2
people, which is about 4 % of the total respondents. Among them 2 comes from a professional
background. The number of respondents in the age group of above 50 is 2 people, which is about
4 % of the total population. Both of them have a bachelor‟s degree.
The number of respondent with a monthly income of rupees 50000 to 75000 consist of
23 people, which is 46% of the total population. The number of respondent with a monthly
income of rupees 75000 to 100000 consist of 23 people, which is 46% of the total respondents.
30 % of the total respondent works in private or public sector field. 68% of the total respondents
are self-employed.
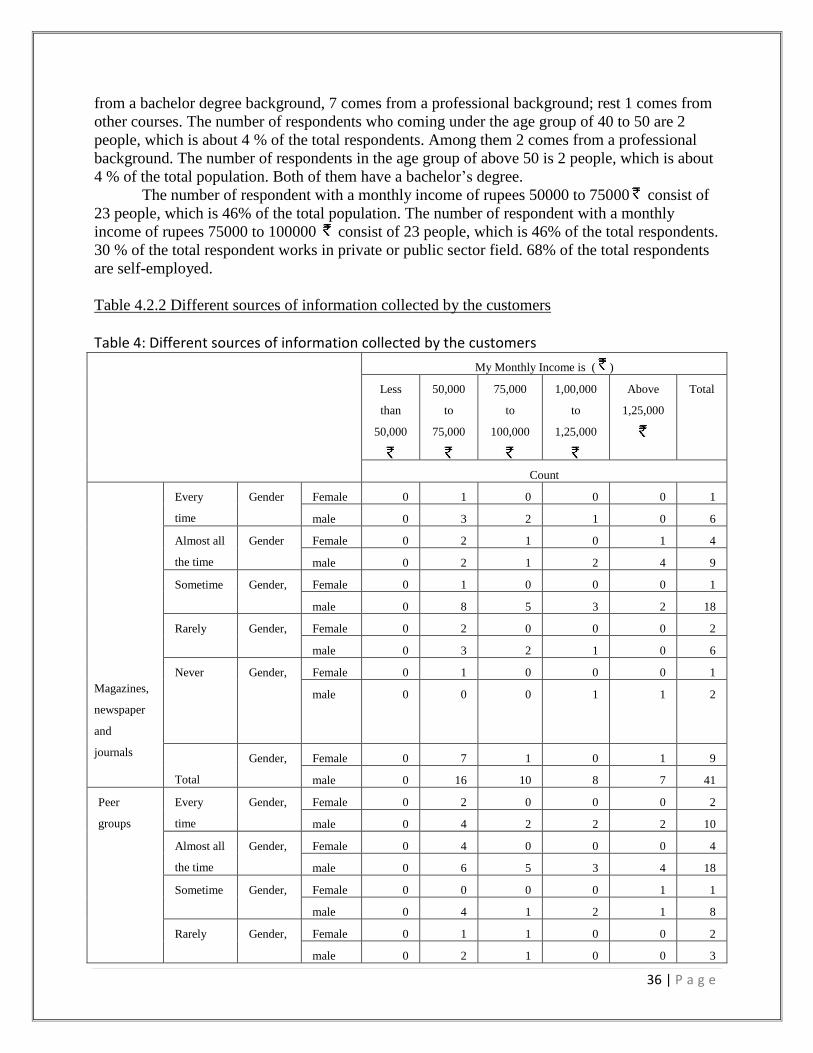
Table 4.2.2 Different sources of information collected by the customers
Table 4: Different sources of information collected by the customers
My Monthly Income is ( )
Less
than
50,000
50,000
to
75,000
75,000
to
100,000
1,00,000
to
1,25,000
Above
1,25,000
Total
Count
Magazines,
newspaper
and
journals
Every
time
Gender Female 0 1 0 0 0 1
male 0 3 2 1 0 6
Almost all
the time
Gender Female 0 2 1 0 1 4
male 0 2 1 2 4 9
Sometime Gender, Female 0 1 0 0 0 1
male 0 8 5 3 2 18
Rarely Gender, Female 0 2 0 0 0 2
male 0 3 2 1 0 6
Never
Gender, Female 0 1 0 0 0 1
male 0 0 0 1 1 2
Total
Gender, Female 0 7 1 0 1 9
male 0 16 10 8 7 41
Peer
groups
Every
time
Gender, Female 0 2 0 0 0 2
male 0 4 2 2 2 10
Almost all
the time
Gender, Female 0 4 0 0 0 4
male 0 6 5 3 4 18
Sometime Gender, Female 0 0 0 0 1 1
male 0 4 1 2 1 8
Rarely Gender, Female 0 1 1 0 0 2
male 0 2 1 0 0 3

37 | P a g e
Never Gender, Female 0 0 0 0 0 0
male 0 0 1 1 0 2
Total Gender, Female 0 7 1 0 1 9
male 0 16 10 8 7 41
Internet Every
time
Gender, Female 0 3 1 0 0 4
male 0 8 4 3 3 18
Almost all
the time
Gender, Female 0 1 0 0 1 2
male 0 2 4 2 3 11
Sometime Gender, Female 0 2 0 0 0 2
male 0 4 0 1 0 5
Rarely Gender, Female 0 1 0 0 0 1
male 0 1 1 1 1 4
Never Gender, Female 0 0 0 0 0 0
male 0 1 1 1 0 3
Total Gender, Female 0 7 1 0 1 9
male 0 16 10 8 7 41
When checking the effectiveness of the different source of information search. 40 % of
the respondents agree to the fact that they use magazines, newspaper and journals in collecting
information regarding automobile. 22% are of the option that they don‟t use magazines,
newspaper and journals for their data collection, before purchase of automobile. Among the
female population 56% agree to the fact that they use magazine before purchase of luxury cars.

38 | P a g e
Figure 4.2.1: Sources on information collection and its usage
Figure 7: Sources on information collection and its usage
Internet search has the highest number of usage for information search. Which is about 35 from
the total respondents of 50; which comes to 70% of the total respondents. 34 people from the
population of 50 agree to the fact that they use peer group advice before purchase of a luxury car.
It comes to 68% of the total population size. Which shows a very close media reach when
compare to the internet media. This gives an idea of how important public relationship building is
for a luxury car segment.
Table 4.2.3: Category of usage, car changing cycle compared with monthly income
Table 5: Category of usage, car changing cycle compared with monthly income
Monthly Income ( )
Less
than
50,00
0
50,00
0 to
75,00
0
75,00
0 to
100,0
00
1,00,
000
to
1,25,
000
Abov
e
1,25,
000
Total
Count
Categorise of usage I use my car only when
absolutely necessary
0 11 2 3 2 18
I just use my car for my 0 9 7 3 4 23
0
5
10
15
20
25
Magazines, newspaperand journals
Peer groups Internet
Every time
Almost all the time
Sometime
Rarely
Never

39 | P a g e
day-to-day activities
I use my car for every
possible occasion
0 3 2 2 2 9
Total 0 23 11 8 8 50
Car changing period Once in 2 years 0 2 0 2 1 5
Once in 4 years 0 7 8 3 5 23
Once in 6 years 0 7 0 0 0 7
After 6 years 0 6 3 3 2 14
Total 0 23 11 8 8 50
To understand the respondents‟ usage behaviour, I have classified the usage behaviour
into 3 categories. 1) People who uses their car only when absolutely necessary. 2) People who
uses their car for their day to day activities. 3) People who uses their car for every possible
occasion. 36% of the total respondents belong to the category of using their cars when absolutely
necessary. This also shows an insight that, there are alternative solutions used by this class of
people for their day to day activity. This could be anything like a second car, public transport or
taxi. This class of people are looking for luxury cars, for a luxury class status symbol rather than
a utility.
Second category consists of day to day users which can be considered to be people who
seriously look at luxury cars, for their utility. This group consist of 46% of the total respondents.
The third group consists of extreme users of luxury cars

40 | P a g e
Figure: 4.2.2: Category usage of luxury cars
Figure 8: Category usage of luxury cars
Category usage of luxury cars
Extreme user of luxury cars when compared to the monthly income, we can observe that
they are the category of people who earns a monthly salary of 75 000 and above. Chart of
category of usage is also depended on the bases on the luxury car which the respondents own.
0
2
4
6
8
10
12
use my car onlywhen absolutely
necessary
I just use my car formy day-to-day
activities
I use my car forevery possible
occasion
50,000 to 75,000 Rs
75,000 to 100,000 Rs
1,00,000 to 1,25,000
Above 1,25,000
41 | P a g e
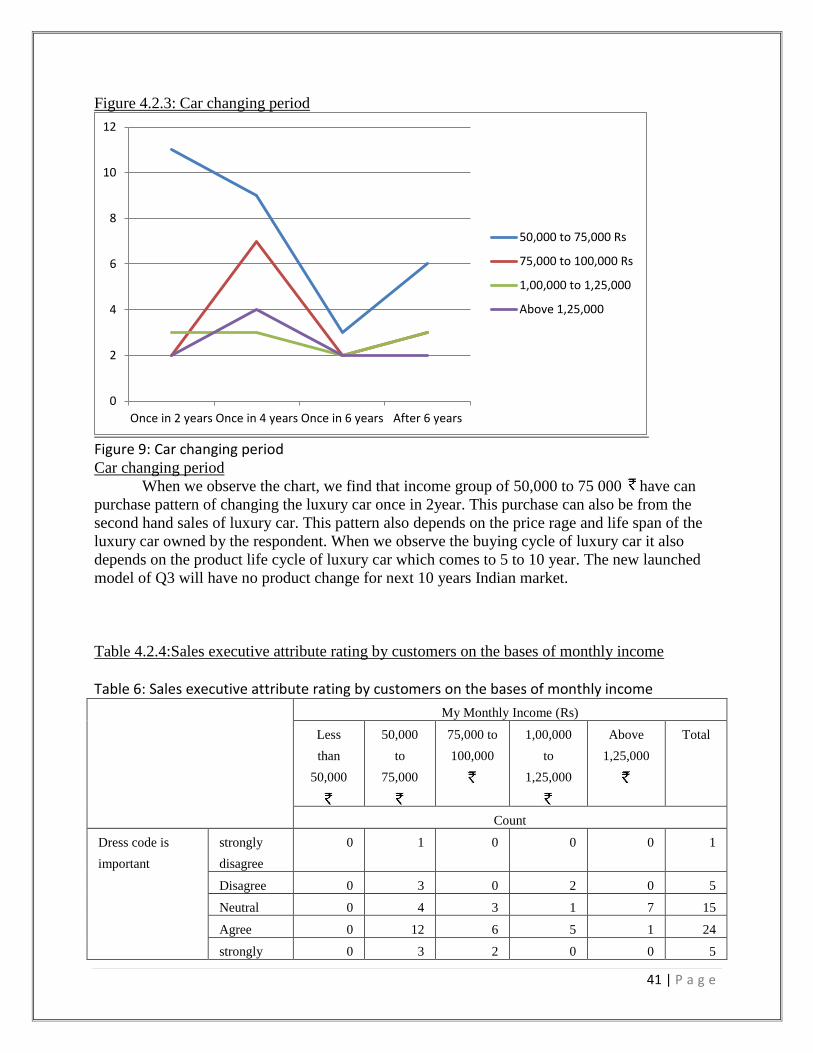
Figure 4.2.3: Car changing period
Figure 9: Car changing period Car changing period
When we observe the chart, we find that income group of 50,000 to 75 000 have can
purchase pattern of changing the luxury car once in 2year. This purchase can also be from the
second hand sales of luxury car. This pattern also depends on the price rage and life span of the
luxury car owned by the respondent. When we observe the buying cycle of luxury car it also
depends on the product life cycle of luxury car which comes to 5 to 10 year. The new launched
model of Q3 will have no product change for next 10 years Indian market.
Table 4.2.4:Sales executive attribute rating by customers on the bases of monthly income
Table 6: Sales executive attribute rating by customers on the bases of monthly income
My Monthly Income (Rs)
Less
than
50,000
50,000
to
75,000
75,000 to
100,000
1,00,000
to
1,25,000
Above
1,25,000
Total
Count
Dress code is
important
strongly
disagree
0 1 0 0 0 1
Disagree 0 3 0 2 0 5
Neutral 0 4 3 1 7 15
Agree 0 12 6 5 1 24
strongly 0 3 2 0 0 5
0
2
4
6
8
10
12
Once in 2 years Once in 4 years Once in 6 years After 6 years
50,000 to 75,000 Rs
75,000 to 100,000 Rs
1,00,000 to 1,25,000
Above 1,25,000

42 | P a g e
agree
Total 0 23 11 8 8 50
communication
skill is important
strongly
disagree
0 0 0 0 0 0
Disagree 0 2 0 0 1 3
Neutral 0 0 3 2 3 8
Agree 0 17 7 6 3 33
strongly
agree
0 4 1 0 1 6
Total 0 23 11 8 8 50
Experienced sales
executive have
more chance of
convincing me to
buy the car.
strongly
disagree
0 0 0 0 0 0
Disagree 0 2 0 1 1 4
Neutral 0 5 3 1 3 12
Agree 0 10 5 6 3 24
strongly
agree
0 6 3 0 1 10
Total 0 23 11 8 8 50
Sales executive
using my same
mother tongue
have more chance
of convincing me
to buy the car.
strongly
disagree
0 0 0 1 0 1
Disagree 0 8 2 1 2 13
Neutral 0 4 3 2 4 13
Agree 0 5 4 3 2 14
strongly
agree
0 6 2 1 0 9
Total 0 23 11 8 8 50
Sales executives
“who knows me
personally” have
more chance to
convince me to
buy the car.
strongly
disagree
0
1
0
1
1
3
Disagree 0 5 0 0 0 5
Neutral 0 3 2 3 3 11
Agree 0 5 8 3 2 18
strongly
agree
0 9 1 1 2 13
Total 0 23 11 8 8 50
I like the sales
executive to offer
a test drive of the
car which I am
interested in.
strongly
disagree
0 1 0 0 2 3
Disagree 0 3 1 0 0 4
Neutral 0 2 2 4 2 10
Agree 0 10 2 1 1 14
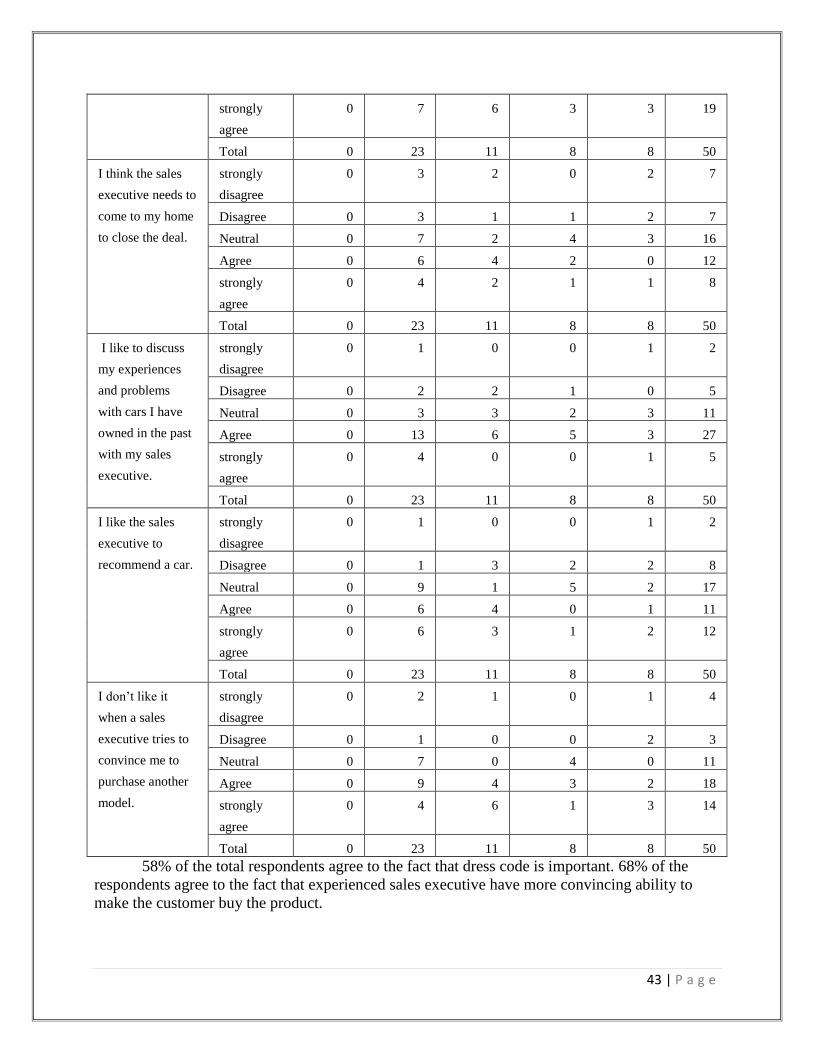
43 | P a g e
strongly
agree
0 7 6 3 3 19
Total 0 23 11 8 8 50
I think the sales
executive needs to
come to my home
to close the deal.
strongly
disagree
0 3 2 0 2 7
Disagree 0 3 1 1 2 7
Neutral 0 7 2 4 3 16
Agree 0 6 4 2 0 12
strongly
agree
0 4 2 1 1 8
Total 0 23 11 8 8 50
I like to discuss
my experiences
and problems
with cars I have
owned in the past
with my sales
executive.
strongly
disagree
0 1 0 0 1 2
Disagree 0 2 2 1 0 5
Neutral 0 3 3 2 3 11
Agree 0 13 6 5 3 27
strongly
agree
0 4 0 0 1 5
Total 0 23 11 8 8 50
I like the sales
executive to
recommend a car.
strongly
disagree
0 1 0 0 1 2
Disagree 0 1 3 2 2 8
Neutral 0 9 1 5 2 17
Agree 0 6 4 0 1 11
strongly
agree
0 6 3 1 2 12
Total 0 23 11 8 8 50
I don‟t like it
when a sales
executive tries to
convince me to
purchase another
model.
strongly
disagree
0 2 1 0 1 4
Disagree 0 1 0 0 2 3
Neutral 0 7 0 4 0 11
Agree 0 9 4 3 2 18
strongly
agree
0 4 6 1 3 14
Total 0 23 11 8 8 50
58% of the total respondents agree to the fact that dress code is important. 68% of the
respondents agree to the fact that experienced sales executive have more convincing ability to
make the customer buy the product.
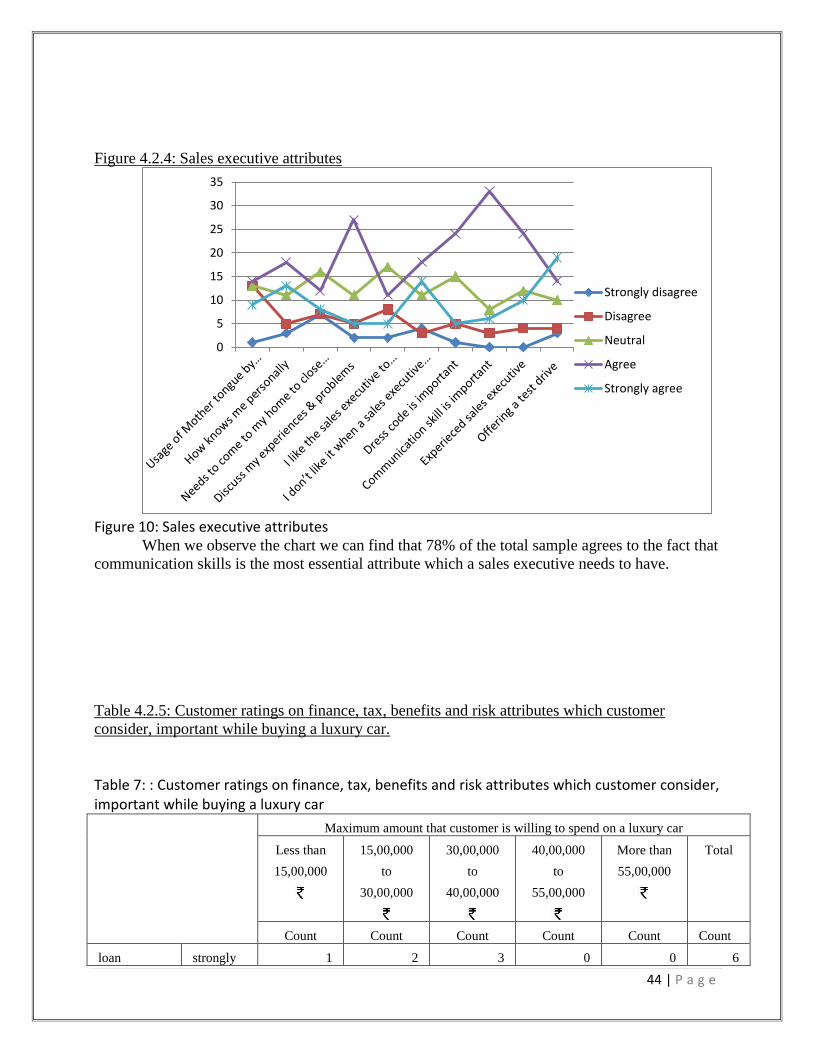
44 | P a g e
Figure 4.2.4: Sales executive attributes
Figure 10: Sales executive attributes
When we observe the chart we can find that 78% of the total sample agrees to the fact that
communication skills is the most essential attribute which a sales executive needs to have.
Table 4.2.5: Customer ratings on finance, tax, benefits and risk attributes which customer
consider, important while buying a luxury car.
Table 7: : Customer ratings on finance, tax, benefits and risk attributes which customer consider, important while buying a luxury car
Maximum amount that customer is willing to spend on a luxury car
Less than
15,00,000
15,00,000
to
30,00,000
30,00,000
to
40,00,000
40,00,000
to
55,00,000
More than
55,00,000
Total
Count Count Count Count Count Count
loan strongly 1 2 3 0 0 6
0
5
10
15
20
25
30
35
Strongly disagree
Disagree
Neutral
Agree
Strongly agree
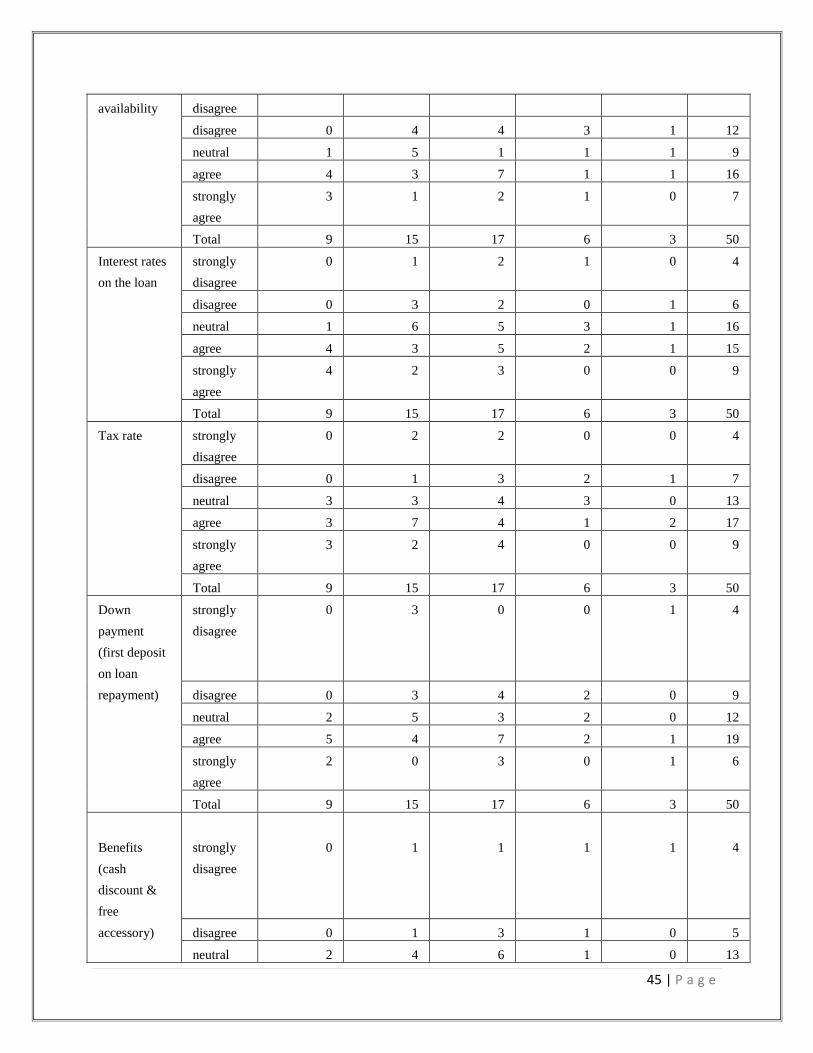
45 | P a g e
availability disagree
disagree 0 4 4 3 1 12
neutral 1 5 1 1 1 9
agree 4 3 7 1 1 16
strongly
agree
3 1 2 1 0 7
Total 9 15 17 6 3 50
Interest rates
on the loan
strongly
disagree
0 1 2 1 0 4
disagree 0 3 2 0 1 6
neutral 1 6 5 3 1 16
agree 4 3 5 2 1 15
strongly
agree
4 2 3 0 0 9
Total 9 15 17 6 3 50
Tax rate strongly
disagree
0 2 2 0 0 4
disagree 0 1 3 2 1 7
neutral 3 3 4 3 0 13
agree 3 7 4 1 2 17
strongly
agree
3 2 4 0 0 9
Total 9 15 17 6 3 50
Down
payment
(first deposit
on loan
repayment)
strongly
disagree
0 3 0 0 1 4
disagree 0 3 4 2 0 9
neutral 2 5 3 2 0 12
agree 5 4 7 2 1 19
strongly
agree
2 0 3 0 1 6
Total 9 15 17 6 3 50
Benefits
(cash
discount &
free
accessory)
strongly
disagree
0
1
1
1
1
4
disagree 0 1 3 1 0 5
neutral 2 4 6 1 0 13

46 | P a g e
agree 4 7 3 2 2 18
strongly
agree
3 2 4 1 0 10
Total 9 15 17 6 3 50
Risk
associated
with
repayment of
dues
strongly
disagree
1 2 2 1 0 6
disagree 0 3 3 2 0 8
neutral 1 1 4 0 1 7
agree 3 6 5 2 2 18
strongly
agree
4 3 3 1 0 11
Total 9 15 17 6 3 50
Figure 4.2.5: Financial attributes
Figure 11: Financial attributes
02468
101214161820
Strongly disagree
Disagree
Neutral
Agree
Strongly agree

47 | P a g e
When evaluating the graph we find that risk associated with repayment of dues is
a major issue compare to other attributes of finance. 58% of the total respondent are of the
opinion that risk in repayment is a major issue. 56% of the total respondents agrees to the fact
that benefits are attractive factor for buying a luxury car.
Table 4.2.6: Impact of astrological dates in buying of luxury cars
Table 8: Impact of astrological dates in buying of luxury cars
My Monthly Income is, [Monthly Family income ]
Less
than
50,000
50,000
to
75,000
75,000
to
100,000
1,00,000
to
1,25,000
Above
1,25,000
Total
Count Count Count Count Count Count
I like to buy
my car on a
preferred
astrological
date
strongly
disagree
Gender, female 0 2 0 0 1 3
male 0 3 3 1 3 10
disagree Gender, female 0 2 0 0 0 2
male 0 4 2 3 1 10
neutral Gender, female 0 2 0 0 0 2
male 0 1 2 2 1 6
agree Gender, female 0 1 0 0 0 1
male 0 5 3 1 2 11
strongly
agree
Gender, female 0 0 1 0 0 1
male 0 3 0 1 0 4
Total Gender, female 0 7 1 0 1 9
male 0 16 10 8 7 41
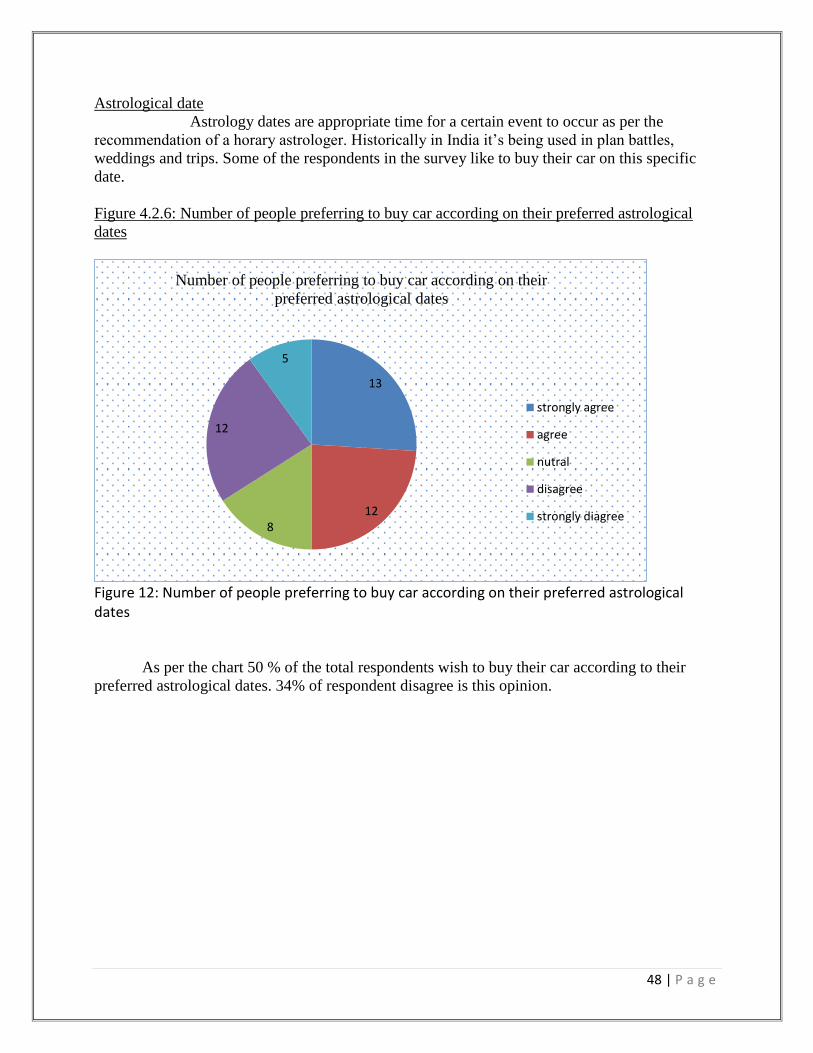
48 | P a g e
Astrological date
Astrology dates are appropriate time for a certain event to occur as per the
recommendation of a horary astrologer. Historically in India it‟s being used in plan battles,
weddings and trips. Some of the respondents in the survey like to buy their car on this specific
date.
Figure 4.2.6: Number of people preferring to buy car according on their preferred astrological
dates
Figure 12: Number of people preferring to buy car according on their preferred astrological dates
As per the chart 50 % of the total respondents wish to buy their car according to their
preferred astrological dates. 34% of respondent disagree is this opinion.
13
12 8
12
5
Number of people preferring to buy car according on their
preferred astrological dates
strongly agree
agree
nutral
disagree
strongly diagree

49 | P a g e
4.3 factor analysis
4.3.1: Factor analysis on sales executive attributes selected by customer.
Table 4.3.1: KMO and Bartlett‟s test
Table 9: KMO and Bartlett's Testa (Sales executive attribute)
KMO and Bartlett's Testa
Kaiser-Meyer-Olkin Measure of Sampling Adequacy. .691
Bartlett's Test of
Sphericity
Approx. Chi-Square 128.918
df 45
Sig. .000
a. Based on correlations
KMO measure of sampling adequacy is .691. If the value comes, between 0.5 and 1.0 it
indicates that the factor analysis is appropriate. Since the KMO measure of sample adequacy is
above 0.5 sampling is adequate, enough to have a proper factor analysis.
Table 4.3.2:Total variance of sales executive attributes explained
Table 10: Total variance of sales executive attributes explained
Total Variance Explained
Compon
ent
Initial Eigenvaluesa Extraction Sums of
Squared Loadings
Rotation Sums of Squared
Loadings
Tot
al
% of
Varia
nce
Cumulat
ive %
Tot
al
% of
Varia
nce
Cumulat
ive %
Tot
al
% of
Varia
nce
Cumulat
ive %
Raw 1 3.7
95
33.71
7
33.717 3.7
95
33.71
7
33.717 3.0
33
26.94
2
26.942
2 2.0
32
18.05
4
51.771 2.0
32
18.05
4
51.771 2.3
04
20.47
2
47.414
3 1.4
11
12.53
6
64.306 1.4
11
12.53
6
64.306 1.9
01
16.89
2
64.306
4 .97
9
8.697 73.004
5 .86
1
7.650 80.654
6 .70
7
6.285 86.939

50 | P a g e
7 .50
7
4.502 91.441
8 .38
4
3.410 94.851
9 .32
9
2.922 97.773
10 .25
1
2.227 100.000
Rescal
ed
1 3.7
95
33.71
7
33.717 3.3
53
33.53
3
33.533 2.6
75
26.75
2
26.752
2 2.0
32
18.05
4
51.771 1.5
24
15.23
7
48.770 1.8
43
18.43
4
45.186
3 1.4
11
12.53
6
64.306 .98
0
9.803 58.573 1.3
39
13.38
7
58.573
4 .97
9
8.697 73.004
5 .86
1
7.650 80.654
6 .70
7
6.285 86.939
7 .50
7
4.502 91.441
8 .38
4
3.410 94.851
9 .32
9
2.922 97.773
10 .25
1
2.227 100.000
Extraction Method: Principal Component Analysis.
a. When analyzing a covariance matrix, the initial eigenvalues are the same across the raw and rescaled solution.
With Eigen value of 1 and extraction method of Principal Component Analysis 3 components
were extracted from 10 main attributes. The total variance explained is 64.306.

51 | P a g e
Figure 4.3.1: Scree plot
Figure 13: Scree plot (Sales executive attributes) Scree plot showing the components with respect to its Eigen values.
Table 4.3.3 Rotated Component Matrix
Table 11: Rotated Component Matrix ( Sales executive attributes )
Rotated Component Matrixa
Raw Rescaled
Component Component
1 2 3 1 2 3
I like the sales executive
to offer a test drive of
the car which I am
interested in.
1.023 .852
Sales executives “who
knows me personally”
.774 .671

52 | P a g e
have more chance to
convince me to buy the
car.
Sales executive using
my same mother tongue
have a better chance of
convincing me to buy
the car.
.740 .662
I like to discuss my
experiences and
problems with cars I
have owned in the past
with my sales executive.
.571 .601
communication skill is
important
.380 .534
Experienced sales
executive have more
chance of convincing me
to buy the car.
I like the sales
executive to recommend
a car.
.996 .869
I don‟t like it when a
sales executive tries to
convince me to purchase
another model.
1.023 .865
Dress code is important
I think the sales
executive needs to come
to my home to close the
deal.
1.146 .908
Extraction Method: Principal Component Analysis.
Rotation Method: Varimax with Kaiser Normalization.
Table 4.3.4: Factors Extracted
Table 12: Factors Extracted (Sales executive attribute)
Factor A Factor B Factor C
I like the sales executive to
offer a test drive of the car
I like the sales executive to
recommend a car
I think the sales executive
needs to come to my home to

53 | P a g e
which I am interested in close the deal.
Sales executives “who knows
me personally” have more
chance to convince me to buy
the car
I don‟t like it when a sales
executive tries to convince
me to purchase another
model
Sales executive using my
same mother tongue have a
better chance of convincing
me to buy the car.
I like to discuss my
experiences and problems
with cars I have owned in the
past with my sales executive.
Communication skill is
important
The above table shows the components and its items extracted by Principal component analysis.
A principal components analysis with varimax rotation indicated that the data could be
represented by 3 factors. The 10 attributes measuring the sales executive skills were analysed
using common factor analysis and 3 factors were extracted. The factors are defined as follows
Factor 1: Personal friend who acts according to need of the customers.
Factor 2: Trust-worthy recommender.
Factor 3: Sales Executive who gets things done at customer home itself.
4.3.2: Factor analysis on the luxury car attributes as per the customer ratings
Table 4.3.4: KMO and Bartlett's Test
Table 13: KMO and Bartlett's Test ( as per customer ratings )
KMO and Bartlett's Test
Kaiser-Meyer-Olkin Measure of Sampling
Adequacy.
.651
Bartlett's Test of
Sphericity
Approx. Chi-Square 1035.5
37
df 378
Sig. .000
KMO Measure of Sampling Adequacy is .651. If the value comes, between 0.5 and 1.0 it
indicates that the factor analysis is appropriate. Since the KMO measure of sample adequacy is
above 0.5 sampling is adequate, enough to have a proper factor analysis.
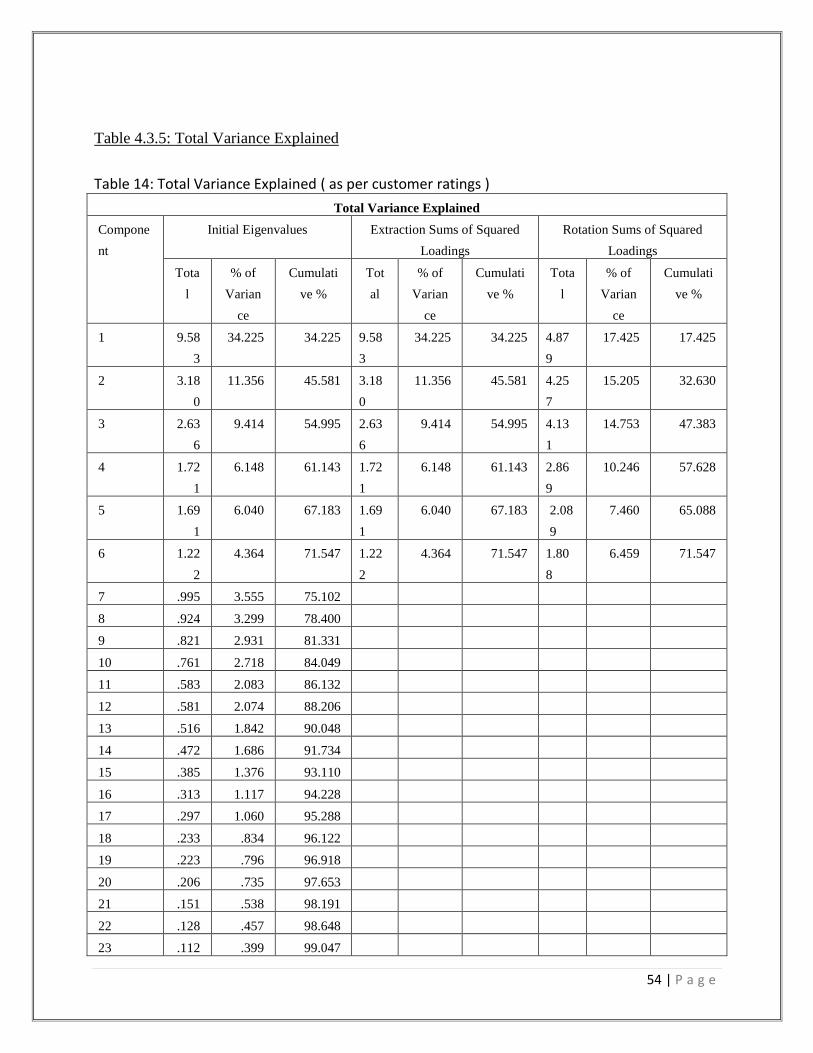
54 | P a g e
Table 4.3.5: Total Variance Explained
Table 14: Total Variance Explained ( as per customer ratings )
Total Variance Explained
Compone
nt
Initial Eigenvalues Extraction Sums of Squared
Loadings
Rotation Sums of Squared
Loadings
Tota
l
% of
Varian
ce
Cumulati
ve %
Tot
al
% of
Varian
ce
Cumulati
ve %
Tota
l
% of
Varian
ce
Cumulati
ve %
1 9.58
3
34.225 34.225 9.58
3
34.225 34.225 4.87
9
17.425 17.425
2 3.18
0
11.356 45.581 3.18
0
11.356 45.581 4.25
7
15.205 32.630
3 2.63
6
9.414 54.995 2.63
6
9.414 54.995 4.13
1
14.753 47.383
4 1.72
1
6.148 61.143 1.72
1
6.148 61.143 2.86
9
10.246 57.628
5 1.69
1
6.040 67.183 1.69
1
6.040 67.183 2.08
9
7.460 65.088
6 1.22
2
4.364 71.547 1.22
2
4.364 71.547 1.80
8
6.459 71.547
7 .995 3.555 75.102
8 .924 3.299 78.400
9 .821 2.931 81.331
10 .761 2.718 84.049
11 .583 2.083 86.132
12 .581 2.074 88.206
13 .516 1.842 90.048
14 .472 1.686 91.734
15 .385 1.376 93.110
16 .313 1.117 94.228
17 .297 1.060 95.288
18 .233 .834 96.122
19 .223 .796 96.918
20 .206 .735 97.653
21 .151 .538 98.191
22 .128 .457 98.648
23 .112 .399 99.047

55 | P a g e
24 .079 .282 99.328
25 .069 .246 99.574
26 .059 .212 99.787
27 .043 .153 99.939
28 .017 .061 100.000
Extraction Method: Principal Component Analysis.
With Eigen value of 1 and extraction method of Principal Component Analysis 6 components
were extracted from 28 main attributes. The total variance explained is 71.547.
Figure 4.3.2: Scree plot
Figure 14: Scree plot ( as per customer ratings ) Scree plot showing the components with respect to its Eigen values.
Table 4.3.6: Rotated Component Matrix
Table 15: Rotated Component Matrix ( as per customer ratings )
Rotated Component Matrixa
Component

56 | P a g e
1 2 3 4 5 6
Braking system .774
Acceleration .766
Top speed .761
Suspension .708
Tyre .670
Traction control .664
Engine C.C. .601 .524
Pre sense .900
Hold assist (A) .854
Cruise control .723
Navigation assist .722
Brand image .643
Electronic stabilisation .544
Head light design .867
Body lining design .826
Exterior length, high and width of the car .790
Body colour .703
Body design .662
Gear system .536
Engine fuel mileage .826
Engine fuel type .758
Leg space .705
Engine life span .543 .550
Engine series .738
Engine lower pollution level
Bluetooth .665
Seat adjustment .519
4X4 wheel drive
Extraction Method: Principal Component Analysis.
Rotation Method: Varimax with Kaiser Normalization.
a. Rotation converged in 12 iterations.
The above table shows the rotated component matrix with extraction method used is Principal
Component Analysis and rotation method Varimax and Kaiser Normalization. The rotation
converges in 12 iterations.

57 | P a g e
Table 4.3.7: Factors extracted by principal component analysis
Table 16: Factors extracted by principal component analysis ( as per customer ratings )
FACTOR 1 FACTOR 2 FACTOR 3 FACTOR 4 FACTOR 5 FACTOR 6
Braking
system
Pre sense Head light
design
Engine
fuel
mileage
Engine
series
Bluetooth
(Telephone
connectivity)
Acceleration Hold assist
(A)
Body
lining
design
Engine
fuel type Seat
adjustment
Top speed Cruise
control
Exterior
length,
high and
width of
the car
Leg space
Suspension Navigation
assist
Body
colour
Engine life
span
Tyre Brand image Body
design
Traction
control
Electronic
stabilisation
Gear
system
Engine C.C.
A principal components analysis with varimax rotation indicated that the data could be
represented by 6 factors. The 28 attributes measuring the buying behaviour were analysed using
common factor analysis and 6 factors were identified. The factors are defined as follows
Factor 1: Power and speed
Factor 2: Support technology associated with band
Factor 3: Exterior design
Factor 4: Highly economic and engine longevity
Factor 5: Engine Series
Factor 6: Internal comfort and connectivity
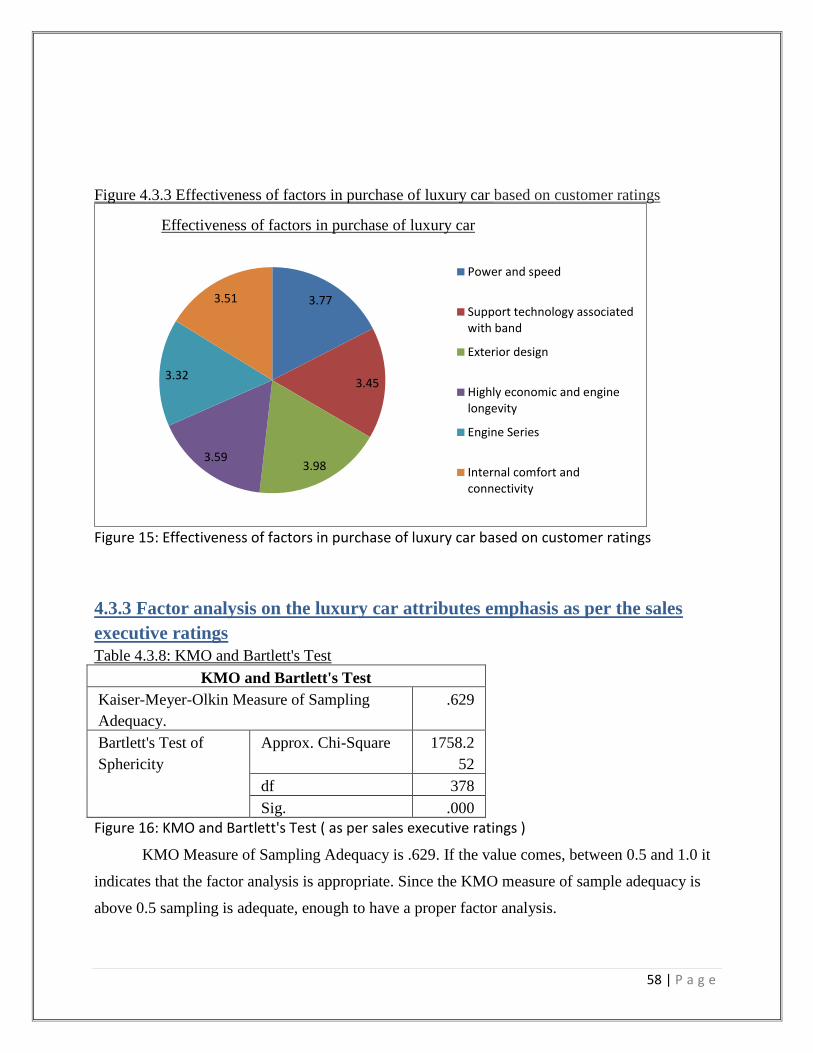
58 | P a g e
Figure 4.3.3 Effectiveness of factors in purchase of luxury car based on customer ratings
Figure 15: Effectiveness of factors in purchase of luxury car based on customer ratings
4.3.3 Factor analysis on the luxury car attributes emphasis as per the sales
executive ratings
Table 4.3.8: KMO and Bartlett's Test
KMO and Bartlett's Test
Kaiser-Meyer-Olkin Measure of Sampling
Adequacy.
.629
Bartlett's Test of
Sphericity
Approx. Chi-Square 1758.2
52
df 378
Sig. .000
Figure 16: KMO and Bartlett's Test ( as per sales executive ratings )
KMO Measure of Sampling Adequacy is .629. If the value comes, between 0.5 and 1.0 it
indicates that the factor analysis is appropriate. Since the KMO measure of sample adequacy is
above 0.5 sampling is adequate, enough to have a proper factor analysis.
3.77
3.45
3.98 3.59
3.32
3.51
Effectiveness of factors in purchase of luxury car
Power and speed
Support technology associatedwith band
Exterior design
Highly economic and enginelongevity
Engine Series
Internal comfort andconnectivity

59 | P a g e
Table 4.3.9: Total Variance Explained
Table 17: Total Variance Explained ( as per sales executive attributes)
Total Variance Explained
Compone
nt
Initial Eigenvalues Extraction Sums of Squared
Loadings
Rotation Sums of Squared
Loadings
Total % of
Varian
ce
Cumulati
ve %
Total % of
Varian
ce
Cumulati
ve %
Tota
l
% of
Varian
ce
Cumulati
ve %
1 12.19
1
43.540 43.540 12.19
1
43.540 43.540 6.42
4
22.943 22.943
2 3.488 12.457 55.997 3.488 12.457 55.997 5.00
9
17.891 40.834
3 2.094 7.479 63.476 2.094 7.479 63.476 4.98
1
17.788 58.622
4 1.915 6.838 70.315 1.915 6.838 70.315 2.40
6
8.594 67.216
5 1.518 5.421 75.736 1.518 5.421 75.736 2.21
0
7.893 75.109
6 1.229 4.390 80.126 1.229 4.390 80.126 1.40
5
5.017 80.126
7 .989 3.531 83.657
8 .847 3.026 86.683
9 .754 2.694 89.377
10 .647 2.311 91.688
11 .405 1.445 93.134
12 .380 1.356 94.490
13 .303 1.083 95.573
14 .275 .983 96.556
15 .199 .712 97.268
16 .153 .548 97.816
17 .136 .485 98.301

60 | P a g e
18 .132 .470 98.771
19 .088 .314 99.084
20 .077 .276 99.361
21 .055 .196 99.557
22 .039 .139 99.696
23 .029 .103 99.799
24 .023 .080 99.879
25 .013 .047 99.926
26 .011 .040 99.966
27 .007 .025 99.991
28 .002 .009 100.000
Extraction Method: Principal Component Analysis.
With Eigen value of 1 and extraction method of Principal Component Analysis 6
components were extracted from 28 items. The total variance explained is 80.126.
Figure 4.3.4: Scree plot
Figure 17: Scree plot ( as per sales executive ratings )
Scree plot showing the components with respect to its Eigen values.
Table 4.3.10: Rotated Component Matrix

61 | P a g e
Table 18: Rotated Component Matrix (as per sales executive ratings )
Rotated Component Matrixa
Component
1 2 3 4 5 6
Gear system .878
Electronic
stabilisation
.835
Pre sense (P) .807
Type of suspension .796
leg space .770
Hold assist (A) .712
Brand image .674
Body design
Engine C.C. .853
Body colour .832
Navigation assist .797
4X4 wheel drive .674
Engine lower
pollution level
.626 .551
Body lining design .590 .504
Engine series .542
Exterior length, high
and width of the car
Engine fuel type .944
Type of tyre .818
Braking system .530 .696
Engine acceleration .696
Traction control .612
Engine life span .540 .555
Cruise control .760
Head light design .612 .628
Seat adjustment .873
Engine top speed .528 .577
Telephone connect
(Bluetooth)
.532
Engine fuel mileage .809
Extraction Method: Principal Component Analysis.
Rotation Method: Varimax with Kaiser Normalization.
a. Rotation converged in 9 iterations.
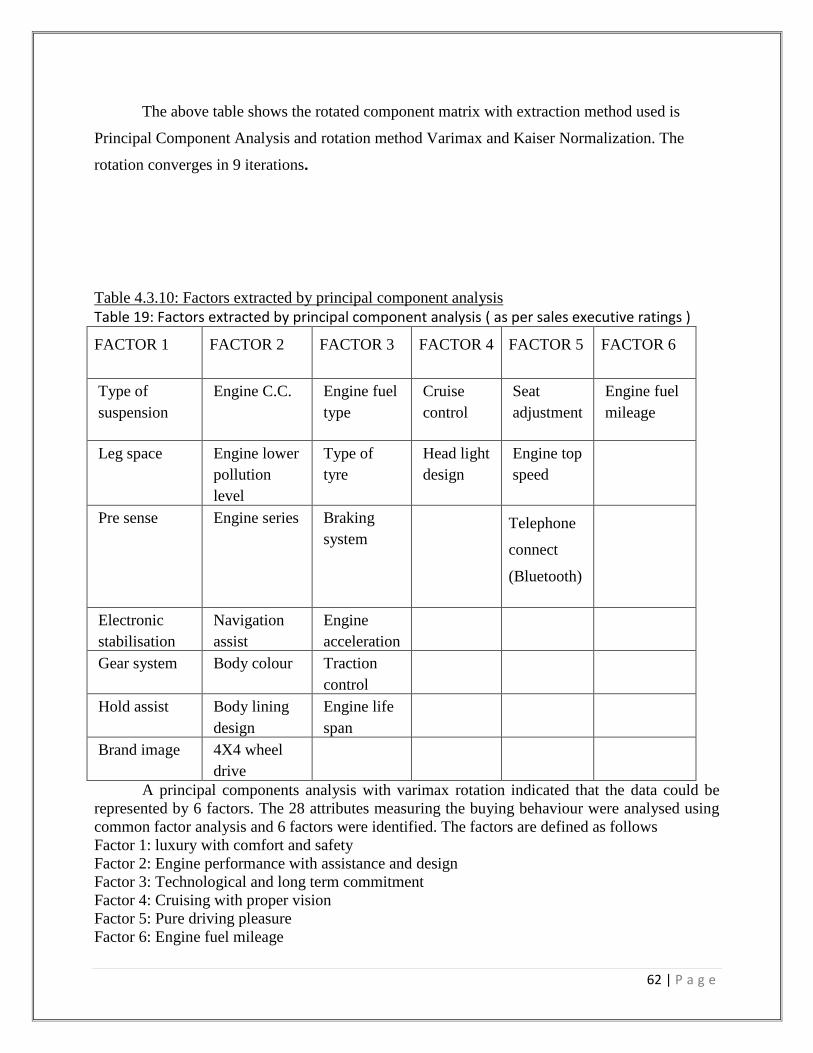
62 | P a g e
The above table shows the rotated component matrix with extraction method used is
Principal Component Analysis and rotation method Varimax and Kaiser Normalization. The
rotation converges in 9 iterations.
Table 4.3.10: Factors extracted by principal component analysis
Table 19: Factors extracted by principal component analysis ( as per sales executive ratings )
FACTOR 1 FACTOR 2 FACTOR 3 FACTOR 4 FACTOR 5 FACTOR 6
Type of
suspension
Engine C.C. Engine fuel
type
Cruise
control
Seat
adjustment
Engine fuel
mileage
Leg space Engine lower
pollution
level
Type of
tyre
Head light
design
Engine top
speed
Pre sense Engine series Braking
system
Telephone
connect
(Bluetooth)
Electronic
stabilisation
Navigation
assist
Engine
acceleration
Gear system Body colour Traction
control
Hold assist Body lining
design
Engine life
span
Brand image 4X4 wheel
drive
A principal components analysis with varimax rotation indicated that the data could be
represented by 6 factors. The 28 attributes measuring the buying behaviour were analysed using
common factor analysis and 6 factors were identified. The factors are defined as follows
Factor 1: luxury with comfort and safety
Factor 2: Engine performance with assistance and design
Factor 3: Technological and long term commitment
Factor 4: Cruising with proper vision
Factor 5: Pure driving pleasure
Factor 6: Engine fuel mileage

63 | P a g e
Figure 4.3.5: Effectiveness of factors in purchase of luxury car based on sales executive ratings
Figure 18: Effectiveness of factors in purchase of luxury car based on sales executive ratings
4.057
3.445
3.8 3.64
3.406
3.54
Effectiveness of factors in purchase of luxury car
luxury with comfort and safety
Engine performance withassistance and design
Technological and longcommitment
Cruising with proper vision
Pure driving pleasure
Engine fuel mileage

64 | P a g e
4.4: Interview
To understand the factors affecting emphasised by the sales department of luxury car
segment, interviews were conducted with the managers of different luxury car companies. Rating
scale are as follows, 1- Not at all important, 2- Not that important, 3- Being nutral 4- Important 5-
Very important
4.4.1: MERCEDES BENZ
The interview was conducted with the manager Mr.Sreenath of Mercedes benz in Cochin
sales division. As per the information provided by him, the results are as follows.
Figure 4.4.1:Attributes emphasis while interacting to managers (Five Rate Scale)
Figure 19: Attributes Emphasis (in Mercedes Benz)
0
1
2
3
4
5Engine fuel mileage
Engine accelerationEngine top speed
Engine C.C.
Engine life span
Engine series
engine lower…
body design
head light design
body lining design
body colour
gear systemSeat adjustmentTelephone connect…
leg spacetype of suspension
braking system
traction control
type of tyre
brand image
Navigation assist
Pre sense (P)
Hold assist (A)
Cruise control
4X4 wheel drive
MERCEDES BENZ
user
Confidential
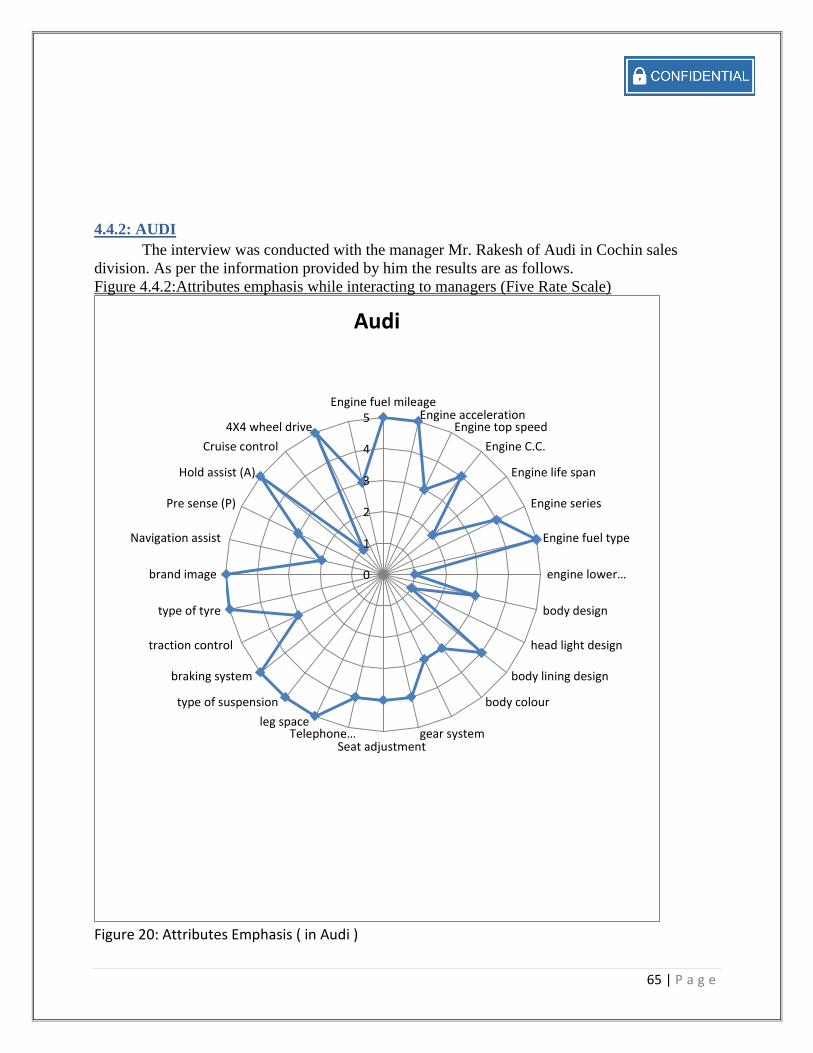
65 | P a g e
4.4.2: AUDI
The interview was conducted with the manager Mr. Rakesh of Audi in Cochin sales
division. As per the information provided by him the results are as follows.
Figure 4.4.2:Attributes emphasis while interacting to managers (Five Rate Scale)
Figure 20: Attributes Emphasis ( in Audi )
0
1
2
3
4
5Engine fuel mileage
Engine accelerationEngine top speed
Engine C.C.
Engine life span
Engine series
Engine fuel type
engine lower…
body design
head light design
body lining design
body colour
gear systemSeat adjustment
Telephone…leg space
type of suspension
braking system
traction control
type of tyre
brand image
Navigation assist
Pre sense (P)
Hold assist (A)
Cruise control
4X4 wheel drive
Audi
user
Confidential

66 | P a g e
4.4.3: BMW
The interview was conducted with the sales executive Mr. Azeem of BMW in Banglore
sales division. As per the information provided by him the results are as follows..
Figure 4.4.3:Attributes emphasis while interacting to managers (Five Rate Scale)
Figure 21: Attributes Emphasis ( in BMW )
0
0.5
1
1.5
2
2.5
3
3.5
4Engine fuel mileage
Engine accelerationEngine top speed
Engine C.C.
Engine life span
Engine series
Engine fuel type
engine lower pollution…
body design
head light design
body lining design
body colour
gear systemSeat adjustment
Telephone connect…leg space
type of suspension
braking system
traction control
type of tyre
brand image
Navigation assist
Pre sense (P)
Hold assist (A)
Cruise control
4X4 wheel driveElectronic stabilisation
BMW
user
Confidential

67 | P a g e
4.4.4: SKODA
The interview was conducted with the sales executive Mr. J.Reji of Skoda in Banglore sales
division. As per the information provided by him the results are as follows.
Figure 4.4.4:Attributes emphasis while interacting to managers (Five Rate Scale)
Figure 22: Attributes Emphasis (in Skoda)
0
1
2
3
4
5Engine fuel mileage
Engine accelerationEngine top speed
Engine C.C.
Engine life span
Engine series
Engine fuel type
engine lower…
body design
head light design
body lining design
body colour
gear systemSeat adjustment
Telephone connect…leg space
type of suspension
braking system
traction control
type of tyre
brand image
Navigation assist
Pre sense (P)
Hold assist (A)
Cruise control
4X4 wheel drive
SKODA
user
Confidential

68 | P a g e
4.4.5: JAGAUR
The interview was conducted with the manager Mr. Shinoy K Simon of Jagaur in
Banglore sales division. As per the information provided by him the results are as follows.
Figure 4.4.5:Attributes emphasis while interacting to managers (Five Rate Scale)
Figure 23: Attributes Emphasis ( in Jagaur)
0
1
2
3
4
5Engine fuel…
Engine…Engine top…
Engine C.C.
Engine life span
Engine series
Engine fuel type
engine lower…
body design
body colour
gear systemSeat adjustment
Telephone…leg space
braking system
traction control
type of tyre
brand image
Navigation assist
Pre sense (P)
Hold assist (A)
Cruise control
4X4 wheel drive
JAGAUR
user
Confidential

69 | P a g e
4.4.6: LAND ROVER
The interview was conducted with the manager Mr. Sumeth S Kumar of Land Rover in
Banglore sales division. As per the information provided by him the results are as follows.
Figure 4.4.6:Attributes emphasis while interacting to managers (Five Rate Scale)
Figure 24: Attributes Emphasis ( in Land Rover )
00.5
11.5
22.5
33.5
44.5
5Engine fuel mileage
Engine accelerationEngine top speed
Engine C.C.
Engine life span
Engine series
Engine fuel type
engine lower pollution…
body design
head light design
body lining design
body colour
gear systemSeat adjustment
Telephone connect…leg space
type of suspension
braking system
traction control
type of tyre
brand image
Navigation assist
Pre sense (P)
Hold assist (A)
Cruise control4X4 wheel drive
Electronic stabilisation
LAND ROVER
user
Confidential

70 | P a g e
CHAPTER 5:
DISCUSSION

71 | P a g e
CHAPTER 5: DISCUSSION
5.1: Inference
In order to practically analyse sales psychology involved increasing the sales of
automobiles, 78 attributes were identified. After conducting the pilot study, these attributes were
reduced to 28 attributes. The consumer and sales executive perception recorded were analysed
using descriptive analysis and factor analysis.
To check the sampling is internally consistent or reliable, Cronbach‟s alpha test has been
conducted. In the case of customer data set it is 0.923 and 0.947 in the case of sales executive
data set. This assures the reliability of data collected.
Cross tabulations was conducted, which indicates the following
1. Most of the buyers come from an occupation background of self-employed and private/
public sector.
2. Internet is a highly used medium for the data collection for luxury cars. 70% of the
respondents have checked internet before buying of a luxury car.
3. 46% of the respondents come under the category of day to day users.
4. Majority of the respondent changes the luxury car in 4 year time.
5. Communication skill is the most important attribute of a sales executive.
6. 66% of the respondents prefer the sales executive who gives them test drive.
7. 58% of the respondents are of the opinion that risk associated with repayment of due is
important while buying a luxury car.
8. 56% of the total respondents agree to the fact that benefit is an attractive factor for buying a
luxury car.
9. As per the chart 50 % of the total respondents wish to buy their car according to their
preferred astrological dates
5.2: Factor analysis of sales executive attributes
For understanding the factor contributing to sales executive‟s effectiveness, 10 main
attributes were selected. KMO measure of sample adequacy is 0.691. Which assure that the
sample is adequate. Total variance explained is 64.306. The resultant outputs of factor analysis
have extracted 3 factors among the 10 attributes. 3 factors are 3 style of approach which the sales
executive can perform while approaching the customer. They are as follows.
1. A personal friend who acts according to need of the customers.
2. A Trust worthy recommender.

72 | P a g e
3. Sales Executive who gets things done at customer home itself.
5.3: Factor analysis on the luxury car attributes as per customer ratings
For identifying the factors contributing to the sales of luxury car, 28 main attributes were
selected. KMO measure of sample adequacy is 0.651. Which assure that the sample is adequate.
Total variance explained is 71.547. The resultant outputs of factor analysis have extracted 6
factors among the 28 attributes. 6 factors are different perception of customer in relation with the
luxury car. These are the perceived factor of customer which makes them buy the luxury car.
They are as follows.
1. Power and speed
2. Support technology associated with band
3. Exterior design
4. Highly economic and engine longevity
5. Engine Series
6. Internal comfort and connectivity
When extracting the mean of means for these factor. Among the above 6 factors, „exterior
design‟ is having the highest effect on customer perception. „Exterior design‟ has a mean of mean
value of 3.98. Second is „power and speed‟, with a mean of mean of 3.77. Factor analysis also
identifies that attribute like „4X4 wheel drive‟ and „Engine lower pollution level‟ is not at a
significant part of any factors extracted, this means that customers are little concern about these
attributes.
5.4: Factor analysis on the luxury car attributes as per sales executive ratings
For identifying the factors contributing to the sales of luxury car as per sales executive, 28
main attributes were selected. KMO measure of sample adequacy is 0.629. Which assure that the
sample is adequate. Total variance explained is 80.126. The resultant outputs of factor analysis
have extracted 6 factors among the 28 attributes. This are 6 different factors which sales
executive emphasis while communicating to the customer. These factors are extracted from the
data provided by the managers and sales executives of different luxury car companies. The
factors are as follows.
1. Luxury with comfort and safety
2. Engine performance with assistance and design
3. Technological and long commitment
4. Cruising with proper vision
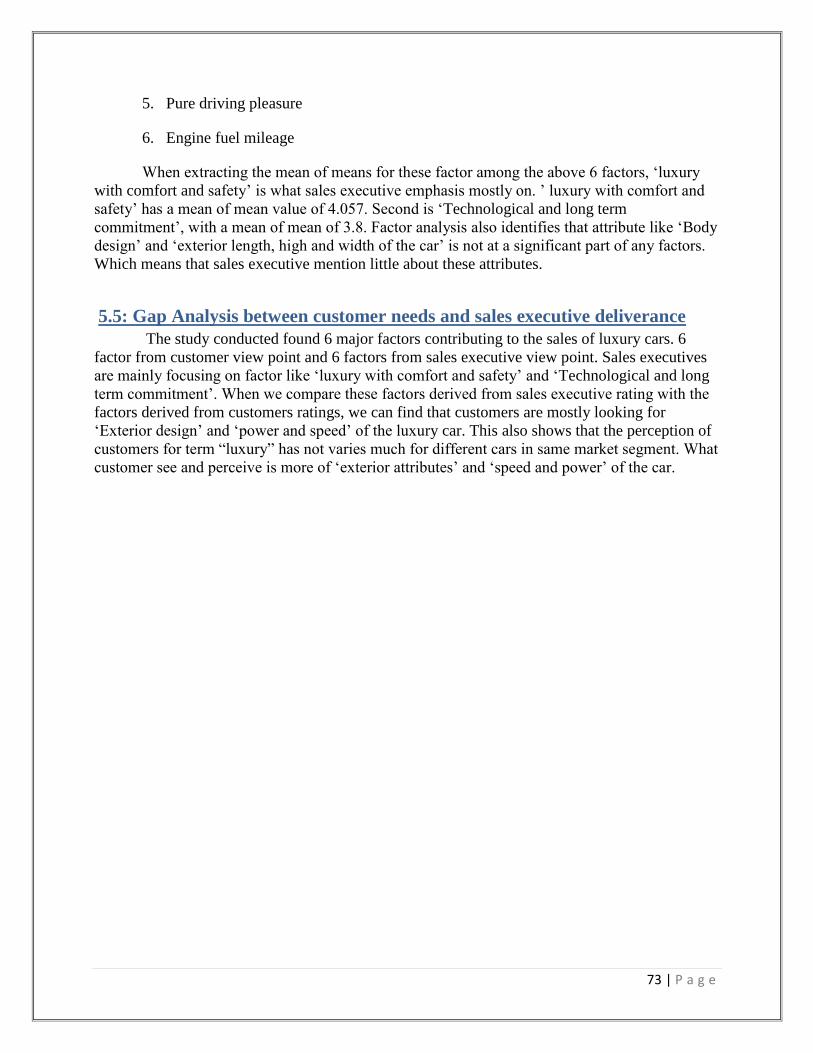
73 | P a g e
5. Pure driving pleasure
6. Engine fuel mileage
When extracting the mean of means for these factor among the above 6 factors, „luxury
with comfort and safety‟ is what sales executive emphasis mostly on. ‟ luxury with comfort and
safety‟ has a mean of mean value of 4.057. Second is „Technological and long term
commitment‟, with a mean of mean of 3.8. Factor analysis also identifies that attribute like „Body
design‟ and „exterior length, high and width of the car‟ is not at a significant part of any factors.
Which means that sales executive mention little about these attributes.
5.5: Gap Analysis between customer needs and sales executive deliverance
The study conducted found 6 major factors contributing to the sales of luxury cars. 6
factor from customer view point and 6 factors from sales executive view point. Sales executives
are mainly focusing on factor like „luxury with comfort and safety‟ and „Technological and long
term commitment‟. When we compare these factors derived from sales executive rating with the
factors derived from customers ratings, we can find that customers are mostly looking for
„Exterior design‟ and „power and speed‟ of the luxury car. This also shows that the perception of
customers for term “luxury” has not varies much for different cars in same market segment. What
customer see and perceive is more of „exterior attributes‟ and „speed and power‟ of the car.

74 | P a g e
CHAPTER 6:
CONCLUSIONS AND RECOMMENDATIONS

75 | P a g e
CHAPTER 6: CONCLUSIONS AND RECOMMENDATIONS
6.1: Conclusions
The study has found out that there are 6 major factors which are involved in
decision making. Factor involved in decision making by customer includes „Power and speed‟,
„Support technology associated with band‟, „Exterior design‟, „Highly economic and engine
longevity‟, „Engine Series‟, and „Internal comfort and connectivity‟. Among these the factors
„Exterior design‟ and „Power and speed‟ has the maximum impact on decision making. Attributes
like „lower pollution level‟ and „4X4 wheel drive‟ do not having much impact on decision
making. Study also have identify that there are 6 major factors which the sales executives focus
while selling a luxury car. The major factor focused by sales executive includes „luxury with
comfort and safety‟, „Engine performance with assistance and design‟, „Technological and long
term commitment‟, „Cruising with proper vision‟, „Pure driving pleasure‟ and „Engine fuel
mileage‟. Among these factors „luxury with comfort and safety‟ and „Technological and long
term commitment‟ is having the highest impact.
Study conducted has found that there are 3 factors defining the sales executive
attributes. These factors includes „Personal friend who acts according to need of the customers‟,
„Trust worthy recommender, and „Sales Executive who gets things done at customer home itself‟.
Among all the aspects related to finance in buying a luxury car. Risk associated to repayment of
loan is having the highest impact in decision making.
6.2.1: Recommendations
As a sale executive, try to understand which of the 3 styles should be selected in
approaching a customer.
o Personal friend who acts according to need of the customers
o Trust worthy recommender
o Sales Executive who gets things done at customer home itself
Determine which model to sell and identify attributes of the model which is contributing
to the factors like „Power and speed‟, „Support technology associated with band‟,
„Exterior design‟, „Highly economic and engine longevity‟, „Engine Series‟, and „Internal
comfort and connectivity‟.
As a marketer of luxury car, focus on creating ads which focus on factors like „Power and
speed‟, „Support technology associated with band‟, „Exterior design‟, „Highly economic
and engine longevity‟, „Engine Series‟, and „Internal comfort and connectivity‟.
Sales executive focus on Exterior design and „Power and speed‟ of the car while
communicating to the customer.
user
Confidential

76 | P a g e
Astrological dates are often important to customers in India. Sales force of luxury cars
need to create events of car sales related to the astrological date.
Pollution level and 4x4 wheel drive are not much of a concern for luxury car customer. So
don‟t focus on this attributes.
Peer groups have high influence in data collection of customer, so always maintain a
positive word of mouth in public.
Changing period of luxury car as per maximum response in this study is 4 year. So always
maintain continues relationship with customer and remind the customers about the new
model launch.
.2.2: Application in the field of manufacturing
Now let‟s see how we can create a comparative edge between two cars of similar model
by changing the main factors of purchase decision making found. For explanation, I am taking
two luxury car models by different manufacture. They are as follows.
1. Audi Q3
2. BMW X1
BMW India lunched its BMW X1 model in Dec 24, 2010. After its success in the market
Audi have lunched a competitive model for BMW X1 called the Audi Q3 in June 5, 2012. The
findings from the thesis have shown main 6 factors in purchase of luxury cars.
Table: 6.2.1: Comparing the models on the bases of purchase decision factors34
Table 20: Comparing the models on the bases of purchase decision factors Factors Effectiveness raking BMW X1 Audi Q3
Exterior design 1 SUV design SUV design
Power and speed 2 1) Torque of 350
Nm at 1750 – 3,000
rpm
2) Top speed of
200 km/h
3) 0-100 km/h in 8.3 seconds
4) 6 step
transmission
1) Torque of 380
Nm at 1750- 2500
rpm
2) Top speed of
230 km/h
3) 0-100 km/h in 8.2 seconds
4) 7 step
transmission
34 Check the Features wise Comparison of Audi Q3 and BMW X1. (n.d) retrieved 01/23/2013, from Audi Q3 vs BMW X1 – Compact Crossovers battle it out Web Site: http://www.carzy.co.in/blog/car-comparison/audi-q3-bmw-x1-compact-crossovers-battle-expert-review.html/
user
Confidential

77 | P a g e
Highly economic
and engine
longevity
3 1) Fuel mileage of
11-14 km/litre
1) Fuel mileage of
12-13 km/litre
Internal comfort
and connectivity
4 Have lesser leg
space compare to
Audi Q3
Have more leg
space compare to
BMW X1
Support
technology
associated with
band
5 1) Traction control
2) Adaptive light
1)Presence
2) Quattro
3) Adaptive light
Engine Series 6 BMW X1
sDrive20d
Audi Q3 2.0 TDI
Quattro
When compare the main difference of these two models, we can find that Audi Q3 have
brought in a better challenging model against BMW X3 by focusing mainly of the 6 factors
identified by the study. The study has found out 6 major factors which consumer mainly focuses
while making a purchase decision. While checking the major difference between Q3 and X1 we
can find that Audi mainly focus in improving this 6 factor. Keeping rest other factors remain
same as of the competitor‟s model.
Another thing which we can observe is that of the “number of series” given to the
model. In Indian cognitive process 3 is greater than 1 in the case of raking, and it‟s vice versa for
German cognitive process. When comparing Q3 with X1, the mental picture which an Indian gets
is that of comparing a bigger thing with a smaller thing.
6.2.3: Sales executive training
A sales executive should be aware of certain facts. Which are as follows- 1) Leaser the
time sales executive take per customer more will be the number of customers you will be able to
handle. 2) Too much information can create processing problems to the customer known as
information overload, so stick to few points. 3) No customer is the same each customer varies
from other. 4) Salesmanship lies not in explaining the specification of models, but influencing the
customer purchase decision the way in which sales executive wanted.
The study has found 3 styles in which executive can showcase his talents. First select one
or more skills among the 3 styles according to the customer appeal. Styles of sales executive are
classified into 3 types as per the study, they are
Style 1: Personal friend who acts according to need of the customers.
Style 2: Trust-worthy recommender.
Style 3: Sales Executive who gets things done at customer home itself.
In the first 3 minutes of interaction with the customer. Sales executive should focus in
getting information relate to customer occupation, previous cars used, related car experience,
model he is looking for, features of car which made him purchase that car and the requirements
of the customer.
The data collected should bring in information which can help in selection of a style. If
the customer has already made up his mind in buying one model, follow style 1. Style 1 can also
be used if the customer has no made up his mind on which car to select in that case all sale
executive have to do is to support his decision. If the customer is loyal to the company, follow
user
Confidential

78 | P a g e
style 2. Thereby customer relationship is maintained for a longer period. If the customer wants
thing to be done at his home, follow style 3.
6.2.4: Conversion and tackling techniques
Conversion is when you influence the customer purchase decision from one model to
another as per sales executive‟s interest. Sales executive can only arrive this, if you are in style 2
that is “Trust-worthy recommender”. If a customer thinks that sales executive is a trust worthy
recommender he/she will buy what sales executive recommend. To do that you should know the
„6 decision making factors of purchase‟ and specifications of the models.
6.2.4.1: If there is a strength there will be a weakness associated to it
There is a general perception that the car with most superior feature can only be sold. But
the strategy is “If there is a strength there will be a weakness associated to it”. If the car is having
engine with higher CC, it may having a weakness of poor mileage. If the car is too aerodynamic,
it may have a weakness of poor inner spacing. If the car is having a high mileage, it may have a
weakness of poor acceleration.
Table: 6.2.2 General Law of engineering
Strength Associated weakness
High engine CC Lower fuel mileage
High wheel base Lower fuel mileage
More aerodynamic Lower inner space
More the exterior height Poor aerodynamics
Lesser the ground clearness Poor of road experience
More number of feature More the price of the car
More price discount May be poor brand image
May be poor product life cycle
More the stability Lesser the ground clearness
Lengthier the car Poor traffic crushing
Longer turning radius
Higher the brand image Higher the price
The general rule is “you can‟t have an animal which gives egg and milk at the
same time”. So, a sales executive should keep on making combination of strength and weakness
in each car segment. Now ones the sales executive have mastered the strength weakness
combination, he/she just needs to relate the combination to the factors identified by the study.
Note: Never blame about a model manufactured by a company in which sales
executive is working for, if need blame the model manufactured by the competitor. Only compare
user
Confidential

79 | P a g e
between the models manufacture by company in which sales executive is working for, never
blame a model manufactured by a company in which sales executive is working for to make a
sale of another model.
6.2.5: Play with the mind (application)
Situation: The distributor is having an over stock of Audi Q3 and has a low stock of Audi Q5,
because of the news that the Audi company is about to redesign the Audi Q5 model. The dealer,
what‟s sales executive to sell maximum number of Audi Q3 instead of Audi Q5.
Problem statement: How to convert an Audi Q5 customer to an Audi Q3 customer.
Solution: Conversion of Audi Q5 to Audi Q3 customer as per the 6 factor identified
Table: 6.2.2 Conversion Demo
Table 21: Conversion Demo ( Audi Q5 to Audi Q3 ) Factors Audi Q5 Audi Q3 Argument to
convert
Exterior design SUV design SUV design 1) Q3 comes with
SUV design, with
Xenon plus lighting.
2) Q3 is 4.39 metres
long which gives
customer better
traffic cruising
capabilities.
Power and speed 1) 2.0 TDI engines
2) Top speed of 230
km/h
3) 0-100 km/h in 9
seconds
4) 7 step
transmission
1) 2.0 TDI engines
2) Top speed of 230
km/h
3) 0-100 km/h in 8.2
seconds
4) 7 step
transmission
1) Audi Q3 comes
with same engine as
of Audi Q5 in small
baby Audi model
which give more
acceleration to Audi
Q3 compare to Q5.
Highly economic
and engine
longevity
1) Fuel mileage of
11-14 km/litre
1) Fuel mileage of
12-13 km/litre
1)Audi Q3 have
better fuel mileage
compare to Audi Q5
because of small
exterior body
Never lie to a customer. If sales executive feel that the certain specification among the
both car models are debatable, don‟t talk about that specification. For example: Brand image of
Audi Q5 is higher than Audi Q3. In this case, don‟t talk about band image.
6.2.6: Application in the field of marketing
A marketer can‟t select all the features of a car and showcase it to the customers. He
chooses select few features based on the main factors identified. For example if Jaguar has to
user
Confidential

80 | P a g e
make an advertisement to promote XFX model. It mainly focuses on the exterior factor. Because
from the results derived from the study exterior factor is having the maximum influence on
decision making.
6.2.8: Improvements to be made
Figure 6.2.1Customer rating on different attributes in decision making (Five Rate Scale)
0
1
2
3
4
5Engine fuel mileage
Engine accelerationEngine top speed
Engine C.C.
Engine life span
Engine series
Engine fuel type
Lower pollution level
body design
head light design
body lining design
body colour
gear systemSeat adjustmentTelephone connect…
leg space
type of suspension
braking system
traction control
type of tyre
brand image
Navigation assist
Pre sense (P)
Hold assist (A)
Cruise control4X4 wheel drive
Customer
user
Confidential

81 | P a g e
6.2.8.1 Mercedes Benz
Mercedes Benz doesn‟t have many models with 4X4 wheel drive. There few numbers of
people in the luxury segment who likes to have a 4X4 wheel drive. Then also, it is not a major
issue since the rotated component matrix (based on customer rating) have identify that the 4X4
wheel drive don‟t have any effect on decision making
So Mercedes Benz sales executives need not be worried about informing the customer, if
asked about the 4X4 wheel drive feature. Sales executives need not emphasis on the low
pollution aspect of the car, as per the rotated component matrix (based on customer rating) study
has found that this aspect of the car has no effect on decision making.
6.2.8.2 BMW
BMW is concentrating more on engine fuel mileage and seat adjustment. Both this
attributes are in the decision making factors. On the other side BMW needs to explain more on
telephone connectivity, type of suspension, braking system and importantly brand image.
6.2.8.3 SKODA
Skoda is wasting too much time in explaining about type of tyre and 4X4 wheel drive.
Need to spend more time explaining about the exterior design and engine fuel type. Good thing is
that they don‟t spend much time in explaining about the low pollution levels.
6.2.8.4 JAGUAR
Jaguar sales executive except in explaining the engine top speed and engine acceleration
have left all other attributes of the engine. This sounds better because both engine top speed and
engine acceleration contributes most of the factor 1(engine power and speed). This can save more
time by explain one or two main aspect of one factor.
Body design is having maximum impact on decision making, Jaguar sales executives
spend more time in explaining about the body design and that‟s brilliant.
6.2.8.5 LAND ROVER
Land Rover sales executives spend more time in explaining every attributes of the car.
However the problem in doing this way is that customer many suffer from something called
information overload. Which creates confusion in deciding “whether to buy the car or not”.
Customer will take lots of time in processing the merits and demerits of all aspects explained. So
it better to explain few as per the 6 factors identified by the study.
user
Confidential

82 | P a g e
Annexure

83 | P a g e
Annexure1- Questionnaire
purchase of luxury cars (Customers) This research project guarantees respondent confidentiality. * Required
name * Gender, *
Female
Male I fall in age group. *
Below
20 20 to 30 30 to 40 40 to 50
Above 50
My Education background is, *
Master's degree
Bachelor's degree
Professional qualification (engineering/CA/CS/MBBS)
Others
My Occupation is, *
Home maker
Employed(Private/Public sector)
Self-employed
Retired
Student
Others How many cars have you owned? Until now? *(total number of cars)
none one two three
more than three
What is the price range(Rs) of the ‘higher-end car’ which you have used *one euro is approximately 72 Rs (January 2013 )

84 | P a g e
< 20 lakhs
Between 20 lakhs and 35 lakhs
Between 35 lakhs
&50 lakhs
Between 50 lakhs and 65 lakhs
> 65 lakhs
How much time do you spend on driving your car, every week? *
Less than
1 hour 1-6 hours 6-12 hours
12- 18 hours
More than 18 hours
Where do you mostly drive your car? *
National highways
State highways
District highways
Village roads
Hill Range
Do you use the following sources to gather information before purchasing a car? *
Every time
Almost all the time
Sometime Rarely Never
Internet
Peer groups
Magazines, newspaper and
journals
How often do you change your car? *
Once in 2
years Once in 4
years Once in 6
years After 6 years
Which of the following 3 would you categorise yourself under in terms of your usage of the car? *
I use my car only when absolutely necessary
I just use my car for my day-to-day activities
I use my car for every possible occasion
Do you intend to buy a luxury car(s) in the next year? *
Strongly Disagree
Disagree Neutral Agree Strongly
Agree
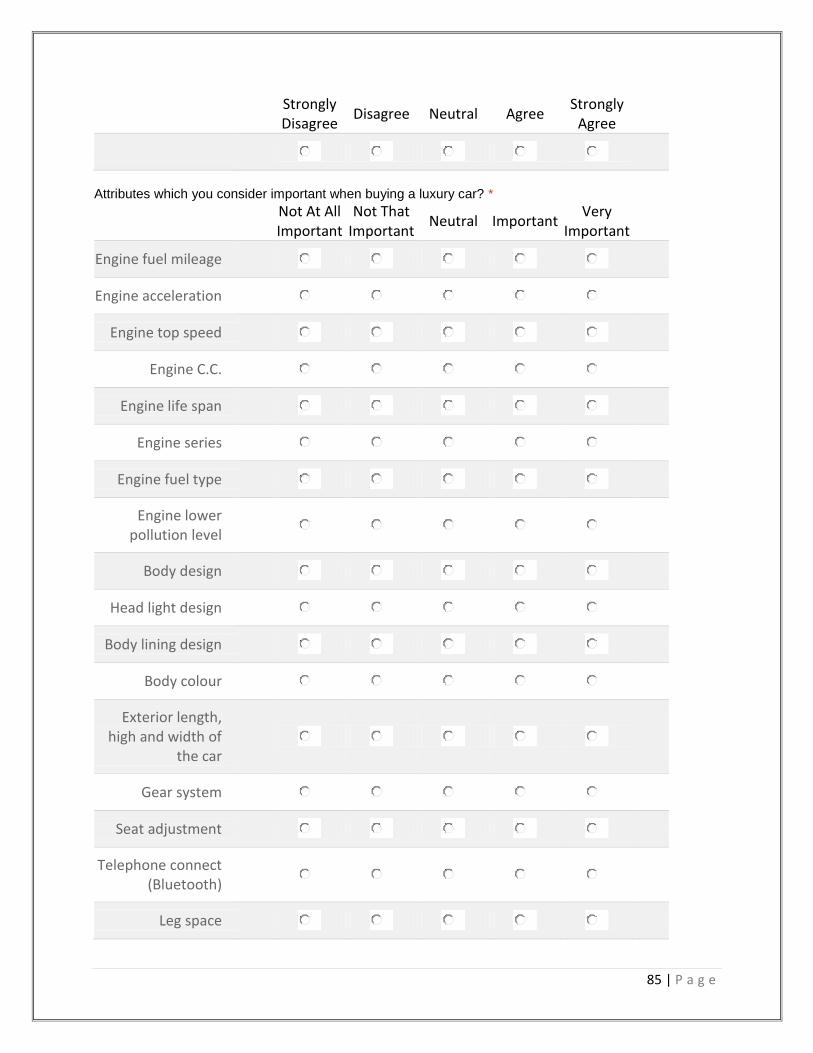
85 | P a g e
Strongly Disagree
Disagree Neutral Agree Strongly
Agree
Attributes which you consider important when buying a luxury car? *
Not At All Important
Not That Important
Neutral Important Very
Important
Engine fuel mileage
Engine acceleration
Engine top speed
Engine C.C.
Engine life span
Engine series
Engine fuel type
Engine lower pollution level
Body design
Head light design
Body lining design
Body colour
Exterior length, high and width of
the car
Gear system
Seat adjustment
Telephone connect (Bluetooth)
Leg space

86 | P a g e
Not At All Important
Not That Important
Neutral Important Very
Important
Type of suspension
Braking system
Traction control
Type of tyre
Brand image
Navigation assist
Pre sense
Hold assist (A)
Cruise control
4X4 wheel drive
Electronic stabilisation
Sales executive attributes which you consider important while purchasing a car ? *
Strongly
Agree Agree Neutral Disagree
Strongly Disagree
Sales executive's dress code is
important
Sales executive's communication
skill is important
Sales executive with high
experience have more chance of
convincing me to buy the car.
Sales executives who speaks my

87 | P a g e
Strongly
Agree Agree Neutral Disagree
Strongly Disagree
mother tongue have more chance
of convincing me to buy the car.
Sales executives “who knows me
personally” have more chance to
convince me to buy the car.
I like the sales executive to offer a test drive of the car
which I am interested in.
I think the sales executive needs to come to my home to close the deal.
I like to discuss my experiences and
problems with cars I have owned in
the past with my sales executive.
I like the sales executive to
recommend a car.
I don’t like it when a sales executive tries to convince me to purchase another model.
Finance, Tax, Benefits and Risk attributes which you consider important in buying a car ? *Last few question.

88 | P a g e
Not At All Important
Not That Important
Neutral Important Very
Important
loan availability
Interest rates on the loan
Tax rate
Down payment (first deposit on
loan repayment)
Benefits (cash discount & free
accessory)
Risk associated with repayment of
dues
I like to buy my car on a preferred
astrological date
What is the maximum amount that you are willing to spend on a luxury car? *one euro is approximately 72 Rs (January 2013 )
Less than 15 00 000
Rs
15 00 000 to 30 00 000 Rs
30 00 000 to 40 00 000 RS
40 00 000 to 55 00 000 Rs
More than 55 00 000
RS
My Monthly Income is, *one euro is approximately 72 Rs (January 2013 )
Less than 50 000 Rs
50 000 – 75 000 Rs
75 000 – 100,000
RS
100 000 – 125 000 RS
Above 125 000 RS
Monthly Family income (Rs)
Submit
Powered by Google DocsReport Abuse - Terms of Service - Additional Terms

89 | P a g e
Annexure 2- Questionnaire
Purchase of luxury cars (Mangers & Sales Executives) * Required
name * Gender, *
Female
Male I fall in age group. *
Below
20 20 to 30 30 to 40 40 to 50
Above 50
My Education background is, *
Master's degree
Bachelor's degree
Professional qualification (engineering/CA/CS/MBBS)
Others
Car sales done per month is, *
below 3
between 3 to 5
between 5 to 10
Between 10 to 15
Above 15 How many cars have you sold in your organisation career? *(total number of cars)
Below 10
Between 10 to 20
Between 20 to 50
More than 50
How important is personal networking in car sales? *
Not at all important
Not that important
Neutral Important Very
important
How much time do you spend per day on sales related activity? *

90 | P a g e
Less than 6
hour 6-9 hours 9-12 hours
More than 12 hours
Attributes which you consider important when buying a luxury car? *
Not At All Important
Not That Important
Neutral Important Very
Important
Engine fuel mileage
Engine acceleration
Engine top speed
Engine C.C.
Engine life span
Engine series
Engine fuel type
Engine lower pollution level
Body design
Head light design
Body lining design
Body colour
Exterior length, high and width of
the car
Gear system
Seat adjustment
Telephone connect (Bluetooth)
Leg space
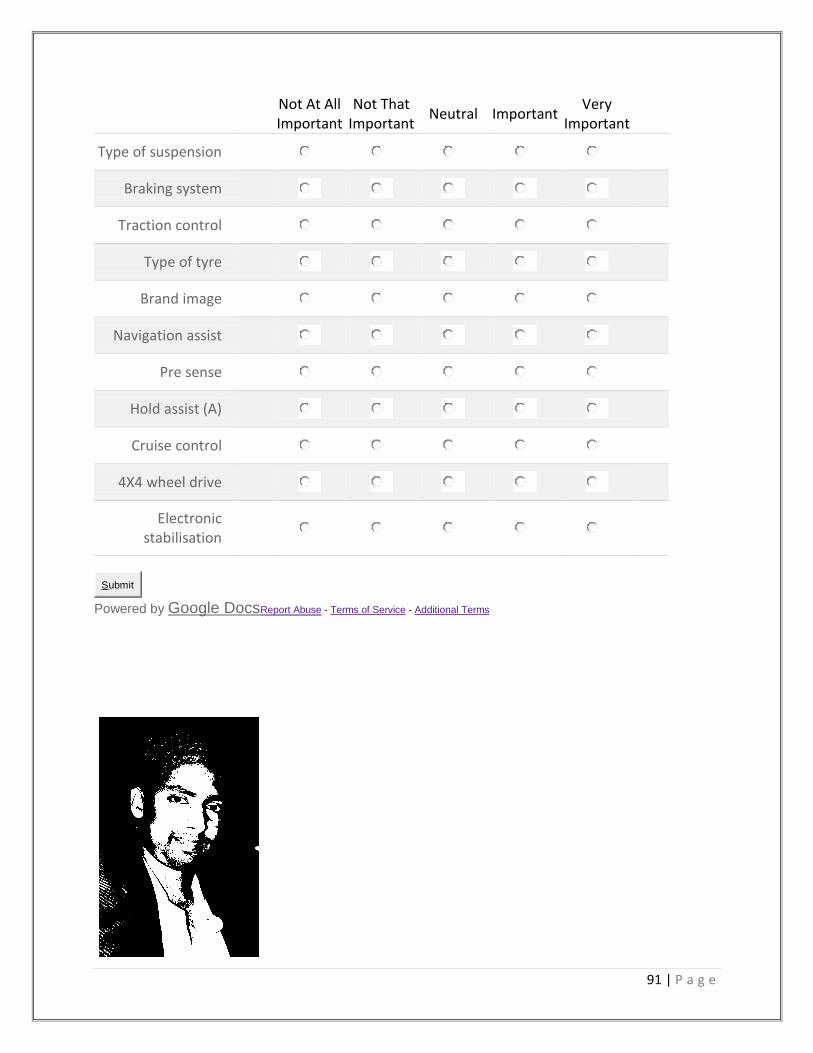
91 | P a g e
Not At All Important
Not That Important
Neutral Important Very
Important
Type of suspension
Braking system
Traction control
Type of tyre
Brand image
Navigation assist
Pre sense
Hold assist (A)
Cruise control
4X4 wheel drive
Electronic stabilisation
Submit
Powered by Google DocsReport Abuse - Terms of Service - Additional Terms
92 | P a g e
CHAPTER 6
REFERENCE

93 | P a g e
CHAPTER 6: REFERENCE
1.Schiffman, L. G., & Kanuk, L. L. (2000). Consumer behavior. 7th. edn. Prentice Hall
International.
2.Erasmus, A. C., Boshoff, E., & Rousseau, G. G. (2010). Consumer decision-making models
within the discipline of consumer science: a critical approach. Journal of Family Ecology and
Consumer Sciences/Tydskrif vir Gesinsekologie en Verbruikerswetenskappe, 29(1).
3. INDIA GDP PER CAPITA PPP. (n.d) retrieved 01/21/2013, from India GDP Per capita Web
Site: 3http://www.tradingeconomics.com/india/gdp-per-capita-ppp
4. Luxe car brands see growth in India. (n.d) retrieved 01/22/2013, from Past news Web Site:
http://www.ibef.org/artdisplay.aspx?cat_id=139&art_id=33221&arc=show
5. Schiffman, L. G., & Kanuk, L. L. (2000). Consumer behavior. 7th. edn. Prentice Hall
International.
6. Erasmus, A. C., Boshoff, E., & Rousseau, G. G. (2010). Consumer decision-making models
within the discipline of consumer science: a critical approach. Journal of Family Ecology and
Consumer Sciences/Tydskrif vir Gesinsekologie en Verbruikerswetenskappe, 29(1).
7. A Simplified Description of the Theory of Buyer Behaviour Source: Howard and Sheth, p32
(1969)
8. Howard J.A and Sheth J.N.(1967). "Theory of Buyer Behaviour," Proceedings, American
Marketing Association
9.Howard J.A and Sheth J.N (1969), the Theory of Buyer Behaviour, New York: John Wiley and
Sons.9-28
10. Howard J.A and Sheth J.N (1973), The Theory of Buyer Behaviour, in H.H
11.Buyer and Consumer Behavior, 2009 Jay D. Lindquist, M. Joseph Sirgy.
12. A Theory of Human Motivation,1943, Maslow.
13. Middelton, V.T.C (1994) Marketing for Travel and Tourism. 2nd edn. Butterworth-
Heinemann, London .104-112
14. Assael, H. (2004). Consumer behavior: A strategic approach. Boston: Houghton Mifflin.
15. W. L. Wilkie and P. R. Dickson,Shopping for Appliances: Consumers' Strategies and Patterns
of Information Search
16. The Engel-Kollat-Blackwell Model of Consumer Behaviour, Engel , Blackwell, and
Miniard,(1995) page No 95
17. Punj, Girish N., and Richard Staelin (1983), "A Model of Consumer Information Search
Behavior for New Automobiles
18. Bettman, J. R. (1970). Information processing models of consumer behavior. Journal of
Marketing Research, 370-376
19. The Bettman Information-Processing Model of Consumer Choice, Bettman. (1979). P 402
20. Economic utility theory, Marshall (1890) and Stigler (1950)
21.Ferber. Robert (1973) Consumer Economics a Survey a Journal of economics Literature 11
December, 1303-1342
22.Katz Daniel (1960) The Functional Approach The Study Attitude Public Opinion Q.24
summer 16-204
23.Sheth, J.N.B.I. and Newman B.L Gross, B.L. (1991) .Why We Buy What We Buy a Theory of
Consumer Behavior. Journal of Business Research Vol 22. 159-170
24. 1. Eliciting Consumer Choice Heuristics: Sales Representives' Persuasion Strategies Tommy
E. Whittler
25.The Journal of Personal Selling and Sales Management

94 | P a g e
Vol. 14, No. 4 (Fall, 1994), pp. 41-53
26. The Journal of Marketing Theory and Practice Issue: Volume 16, Number 1 / Winter 2008
Pages: 27 – 39 URL: Linking Options DOI: 10.2753/MTP1069-6679160102 The
Formation of Buyer's Trust of the Seller in an Initial Sales Encounter John Andy Wood A1,
James S. Boles A2, Barry J. Babin A3
A1 West Virginia University, Morgantown, WV
A2 Robinson College of Business, Georgia State University, Atlanta, GA
A3 Department of Marketing and Analysis, Louisiana Tech University, Ruston, LA
27. Psychology & Marketing Volume 9, Issue 4, pages 297–310, July/August 1992
The effects of empathy on salesperson effectiveness Lyndon E. Dawson Jr.1, Barlow Soper1,
Charles E. Pettijohn2 Article first published online: 6 SEP 2006 DOI: 10.1002/mar.4220090404
28. Check the Features wise Comparison of Audi Q3 and BMW X1. (n.d) retrieved 01/23/2013,
from Audi Q3 vs BMW X1 – Compact Crossovers battle it out Web Site:
http://www.carzy.co.in/blog/car-comparison/audi-q3-bmw-x1-compact-crossovers-battle-expert-
review.html/