ANALYSIS OF PULMONARY AIRFLOW ON A ......Benjamin Franklin (1730–1774) Asthma is a very common...
65
Faculdade de Engenharia da Universidade do Porto ANALYSIS OF PULMONARY AIRFLOW ON A SMARTPHONE APPLICATION André Miguel Pinheiro Costa Mestrado Integrado em Bioengenharia Ramo de Engenharia Biomédica Orientador: Prof. Dr. Luís Filipe Pinto de Almeida Teixeira Co-orientador: Prof. Dr. João Almeida Fonseca 20/06/2016
Transcript of ANALYSIS OF PULMONARY AIRFLOW ON A ......Benjamin Franklin (1730–1774) Asthma is a very common...
Faculdade de Engenharia da Universidade do Porto
ANALYSIS OF PULMONARY AIRFLOW ON A SMARTPHONE APPLICATION
André Miguel Pinheiro Costa
Mestrado Integrado em Bioengenharia
Ramo de Engenharia Biomédica
Orientador: Prof. Dr. Luís Filipe Pinto de Almeida Teixeira Co-orientador: Prof. Dr. João Almeida Fonseca
20/06/2016

ii
© André Costa, 2016
iii
Resumo
A asma e a doença pulmonar obstrutiva crónica (DPOC) são geralmente reconhecidas como
patologias diferentes, embora ambas partilhem algumas características em comum como a
limitação da passagem de ar, inflamação, e remodelação de tecidos. Tradicionalmente têm
origem diferentes, a asma tipicamente aparece na infância e está associada com alergias e
eosinófilos; o seu melhor tratamento é atacar a inflamação. Contudo, o DPOC aparece em
adultos que fumam, envolve neutrófilos, e o seu melhor tratamento é com broncodilatadores
e evitando fatores de risco. Ambas podem resultar numa respiração superficial, num severo
decréscimo na qualidade de vida e, no caso do DPOC, morte, se não for detetada e tratada
devidamente.
Esta dissertação é um seguimento do trabalho desenvolvido pelo João Teixeira na sua Tese
de Mestrado “Classification of Lung Function on a Smartphone App”. Assim sendo, o principal
objetivo é produzir uma aplicação móvel capaz de classificar a função pulmonar usando a
combinação dos melhores métodos de processamento de sinal e de aprendizagem
computacional. Ao completar este objetivo, a prevenção e deteção de anomalias na
respiração serão mais antecipadas, fornecendo uma solução pequena e portátil, que
transporta um sistema capaz de monitorizar doenças pulmonares.
Os resultados mostram que o sistema implementado parece ser melhor que os anteriores,
tendo uma alta exatidão e sensibilidade (> 94 % em ambos os casos).
A aplicação foi construída para correr em diversos dispositivos com sistemas operativos
diferentes, desde computadores a smartphones.
A aplicação mostra claros sinais de que é fácil de usar como os questionários de
Usabilidade de Sistemas o demonstram, com um resultado médio de 83 em 100.
Ainda há margem para melhorias no sistema e na aplicação, considerando que os modelos
de aprendizagem utilizaram um conjunto de dados algo reduzido. No entanto, é visível que
este projeto é algo promissor e que pode ter um futuro bastante positivo.

iv

v
Abstract
Asthma and chronic obstructive pulmonary disease (COPD) are usually recognized as
different diseases, although they share some common characteristics such as airflow
limitation, inflammation, and tissue remodeling. Traditionally they have different origins,
asthma typically appears in childhood and is associated with allergies and eosinophils; its best
treatment is targeting the inflammation. However, COPD arises in adults who smoke, involves
neutrophils, and is best treated with bronchodilators and the removal of risk factors. Both of
them can result in shallow breathing, a severe decrease in quality of life and, in case of
COPD, death, if not spotted and properly managed.
This dissertation is a follow-up of the work developed earlier by João Teixeira on his
Master Thesis “Classification of Lung Function on a Smartphone App”. Likewise, the main
goal is to produce a mobile application capable of classifying the lung function using the
combination of the best signal processing and machine learning methods. By accomplishing
this, the prevention and detection of abnormalities in the airflow will me more anticipated,
providing a tiny and portable solution, carrying a system capable of monitoring pulmonary
diseases.
The results show that the system implemented is looking better than the previous ones,
having a high accuracy and recall (> 94 % in both cases).
The application is built to run on diverse devices with different operative systems, ranging
from desktop to smartphones. It is easy to use as the System Usability Scale (SUS)
questionnaires have shown, scoring 83 out of 100, on average.
Still, there is room for improvement in the system and application, considering that the
models used for the learning used a reduced dataset.
However, it is visible that this project is promising and might have a very positive future.

vi
vii
Acknowledgments
In the first place I would like to thank professor Luís Teixeira for this opportunity of
working under his guidance, for his precious advices and for trusting me to fulfill the goal of
this project.
I would like to thank João Teixeira for all the help he gave me in this project and the
guidance through his previous work. I can say, without any doubt, that without him, I
wouldn’t be able to finish this work. It was a pleasure to work with him, always helpful and
available when needed.
Thanks to professor João Fonseca for the good piece of advice and considerations about
the project. Also thanks for the availability to help me and for getting me the needed
resources to work (PC at CINTESIS) when it was necessary.
Thanks to Ricardo Ferreira, a good friend, always there to support and encourage me to go
further, working by my side.
Thanks to João Silva for testing the application and for pointing out the inconsistencies
within it.
Thanks to Kivy support team that helped me through the IRC (kovak, inclement, and many
others), through the questions about the framework and how to solve some problems that
appeared alongside the development of the application.
Thanks to Bernardo Pinho for working alongside me at CINTESIS, and for some good advice.
Thanks to my parents, for always being there for me, for the encouragement and for their
interminable support.
Thanks to my closest friends for having the patience to hear me complaining about the
problems that seemed unsolvable while developing the application.
Finally, thanks to Sofia, for the endless support and love, for the force she imbued into me
through this journey and for helping me in the hardest moments.
André Costa

viii

ix
Index
Chapter 1 ........................................................................................... 1
Introduction ....................................................................................................... 1 1.1 Overview ................................................................................................. 1 1.2 Main goal ................................................................................................ 2
Chapter 2 ........................................................................................... 3
Literature Review ................................................................................................ 3 2.1 Spirometry .............................................................................................. 3
2.1.1 Background ....................................................................................... 3 2.1.2 Indications for Spirometry ..................................................................... 4 2.1.3 What is Spirometry?............................................................................. 4 2.1.4 Spirometric Tests and Interpretation ........................................................ 6 2.1.5 Fundamentals for obtaining useful results ................................................. 7
2.2 Bio Feedback ............................................................................................ 7 2.2.1 Definition ......................................................................................... 7 2.2.2 Bio Feedback as a step in the solution ...................................................... 8
2.3 Software framework development .................................................................. 9 2.3.1 Android platform overview .................................................................... 9 2.3.2 Different frameworks available for development ......................................... 9
2.4 Software solution review ........................................................................... 13
Chapter 3 .......................................................................................... 15
Classification of Lung Function .............................................................................. 15 3.1 Signal Processing ..................................................................................... 15
3.1.1 Automatic Signal Segmentation ............................................................ 15 3.1.2 Signal Preprocessing .......................................................................... 16 3.1.3 Envelope Generation ......................................................................... 17 3.1.4 Linear Predictive Coding ..................................................................... 18 3.1.5 Post-processing ................................................................................ 19 3.1.6 Parameter Extraction ........................................................................ 20
3.2 Machine Learning .................................................................................... 20 3.2.1 Regression Phase .............................................................................. 20 3.2.2 Classification Phase ........................................................................... 21
Chapter 4 .......................................................................................... 23
Implementation and design of the mobile application .................................................. 23 4.1 Kivy’s architecture ................................................................................... 23 4.2 Design .................................................................................................. 24 4.3 Implementation ...................................................................................... 33
x
4.3.1 Obtaining the signal .......................................................................... 34 4.3.2 Pre-cropping the signal ...................................................................... 35 4.3.3 Processing ...................................................................................... 35 4.3.4 Machine Learning model ..................................................................... 36 4.3.5 Saving the results ............................................................................. 37
Chapter 5 .......................................................................................... 39
Results and Discussion ........................................................................................ 39 5.1 Dataset................................................................................................. 39 5.2 Regression Results ................................................................................... 40 5.3 Classification Results ................................................................................ 41 5.4 Usability of the application ........................................................................ 43
Chapter 6 .......................................................................................... 45
Conclusions and Future Work ................................................................................ 45 6.1 Final Conclusions ..................................................................................... 45 6.2 Future Work ........................................................................................... 46
6.2.1 Automatic cropping improvement ......................................................... 46 6.2.2 Enhance the speed of the processing ..................................................... 46 6.2.3 Improve the machine learning models .................................................... 47 6.2.4 Implementing breathing exercises in the application .................................. 47
References ........................................................................................ 48

xi
List of Figures
Figure 2.1 - Normal spirogram and flow-volume curve showing the conventional measurements made. Taken from (Pierce, 2005). ................................................ 5
Figure 2.2 – Comparison between normal and obstructed airflow (Times, 2011). ................. 6
Figure 2.3 – Cordova Architecture, diagram from ("Architectural overview of Cordova platform - Apache Cordova," 2016). ............................................................... 12
Figure 2.4 - Interface and configurations used on data collection. Taken from (Larson et al., 2012). .............................................................................................. 13
Figure 3.1 – Automatic Cropping. Top Image - Original recording. Bottom Image - Recording after the two crops. ..................................................................... 16
Figure 3.2 – Pre-processing conversion models’ results (J. P. F. Teixeira, 2014). ............... 17
Figure 3.3 – Block diagram model for the generation of a speech signal. ......................... 18
Figure 3.4 – Final Signal Processing Architecture (J. F. Teixeira, Teixeira, Fonseca, & Jacinto, 2015) .......................................................................................... 19
Figure 4.1 – Kivy’s architecture ("Architectural Overview â�” Kivy 1.9.2-dev0 documentation," 2016). .............................................................................. 24
Figure 4.2 – Home Screen of the application. .......................................................... 25
Figure 4.3 – Navigation Drawer. ........................................................................... 26
Figure 4.4 – Dark theme. ................................................................................... 27
Figure 4.5 – Snackbar showing information to the user. .............................................. 27
Figure 4.6 – User’s profile screen. ........................................................................ 28
Figure 4.7 – Recording Screen. ............................................................................ 29
Figure 4.8 – Set of images that appear before starting the manoeuvre............................ 30
Figure 4.9 – Start of the processing. ..................................................................... 31
Figure 4.10 – Results Screen for a normal state. ....................................................... 32
Figure 4.11 – Splash screen before the application loads all its dependencies. .................. 33
Figure 4.12 – Recorder class. .............................................................................. 34
Figure 5.1 – Example of a SUS questionnaire answered. .............................................. 43

xii
List of tables
Table 5.1 – Distribution of recordings. ................................................................... 40
Table 5.2 – Binary distribution of the classification. .................................................. 40
Table 5.3 – Comparison between regression error average and standard deviation for clinical parameters (testing task). ................................................................. 41
Table 5.4 – Confusion matrix from (J. P. F. Teixeira, 2014). ........................................ 41
Table 5.5 – Confusion matrix from current work. ...................................................... 42
Table 5.6 – Classification percentage error, precision and recall regarding (J. P. F. Teixeira, 2014). ....................................................................................... 42
Table 5.7 – Current Classification percentage error, precision and recall. ....................... 42

xiii
Symbols and Abbreviations
Abbreviation list
APK Android Package
CISC Complex Instruction Set Computing
COPD Chronic Bronchitis and Emphysema
CPU Central Processing Unit
DSP Digital Signal Processing
FRC Functional Residual Capacity
FEF25-75 Forced mid-Expiratory Flow
FVC Forced Vital Capacity
FEF75-85 Forced end-expiratory Flow
FEVt Forced Expiratory Volume in the first t seconds
FPS Frames per Second
JSON JavaScript Object Notation
PEFR Peak Expiratory Flow Rate
TLC Total Lung Capacity
RISC Reduced Instruction Set Computing
RV Residual Volume
SDK Software Development Kit
SUS System Usability Scale
VC Vital Capacity


1
Chapter 1
Introduction
1.1 Overview
An ounce of prevention is worth a pound of cure.
Benjamin Franklin (1730–1774)
Asthma is a very common condition, occurring in 5 % to 10 % of the world population.
Formerly, asthma was thought to be the result of bronchospasm (sudden constriction of the
muscles in the walls of the bronchioles) alone, but it is now recognized to be primarily an
inflammatory disorder, with bronchospasm being secondary to the underlying inflammation.
When a susceptible person inhales a trigger (e.g., pollen), inflammatory cells rush into the
airways, releasing a multitude of cytokines, leukotrienes, and other humoral substances
(substances found in the humours, or body fluids) that induce bronchospasm. The most well-
known of these substances is histamine [1].
The patient suffering an acute asthma attack is usually easy to recognize. The classic
presentation includes shortness of breath, wheezing, and coughing. Triggers include
allergens, heat or cold, a host of occupational irritants, and exercise.
The most recent revised global estimate of asthma suggests that as many as 334 million
people have asthma, and that the burden of disability is high. The historical view of asthma
being a disease of high-income countries no longer holds: most people affected are in low-
and middle-income countries, and its prevalence is estimated to be increasing fastest in
those countries. Ongoing monitoring is needed to follow the epidemic of asthma and its
management [2].
Chronic obstructive pulmonary disease (COPD), is a progressive disease that makes it hard
to breathe. "Progressive" means the disease gets worse over time. COPD can cause coughing

Introduction
that produces large amounts of mucus (a slime like substance), wheezing, shortness of
breath, chest tightness, and other symptoms. Cigarette smoking is the leading cause of COPD.
Most people who have COPD smoke or used to smoke. Long-term exposure to other lung
irritants—such as air pollution, chemical fumes, or dust—also may contribute to COPD [3].
According to WHO [4] estimates, 65 million people have moderate to severe chronic
obstructive pulmonary disease (COPD).
1.2 Main goal
The main goal of this dissertation is to continue the work developed earlier by João
Teixeira on his Master Thesis [5]. The objective is to create a totally functional mobile
application that can help to diagnose the user condition regarding respiratory airflow, using
the signal processing and machine learning methods developed on his Master Thesis. While
everyone can use this application, the solution might have particular relevance in less
developed countries where the medical facilities are not as developed or accessible as in
other countries. Despite this reality, there is an incredible fact underlying these countries; a
good portion of the population has access to a smartphone. Indubitably the popular
smartphones are going to be low-tier or mid-tier range, but this is not problematic, since this
application will not be very demanding at resources, the minimum requirement will be a
working microphone. Since it does not need any extra smartphone attachments or sensors,
this will be a very low-cost solution. The users will follow the on-screen instructions, holding
their smartphone about arm's-length away and breathe in deeply. Then, they exhale as fast
and forcefully as they can. As they blow away, the application records the sound it hears
through the phone's microphone. Afterward, the app searches the recorded audio signal for
segments associated with reduced lung capacity.

3
Chapter 2
Literature Review
This chapter presents the essential literature considered for the development of this
work. The goal is to introduce the vital theoretical concepts that are used throughout this
thesis and review the main research conducted on its subject.
Section 2.1 will present a brief description of the medical science behind respiration and
spirometry, how to perform a manoeuvre in order to analyse the pulmonary function and how
to interpret the results brought by this procedure.
Section 2.2 is dedicated to give a general overview of Bio Feedback, and how it can be
used as a step for the final solution.
Finally, Sections 2.3 and 2.4 describes briefly the Android platform and review some
frameworks available to develop the app, followed by a small analysis of an existing
application capable of evaluating lung function and spirometry.
2.1 Spirometry
2.1.1 Background
The determination of lung volumes began in 1800 with the measurement of residual
volume by Davy using a hydrogen gas dilution technique. However, the practical origin dates
from the inspiring work of the Reverend John Hutchinson in 1844 [6]. He not only projected
the first spirometer but also designated the expiratory vital capacity and developed normal
standards based upon approximately 2,000 assorted English persons. He recognized the
positive correlation with height and the negative relationship with age, excessive weight and
pulmonary diseases. Dynamic lung volume measurements were deferred for a century until

Literature Review
the valuable studies at Bellevue Hospital by Cournand, Richards and their colleagues in the
1940's [6]. Around 1950, Gaensler perceived that, for healthy individuals, roughly 80% of the
FVC (volume of air that is forcedly blown out after full inspiration, measured in liters) was
expired in the first second and the FVC in 3 seconds. This established a reference point for
comparison between obstructed and unobstructed airways [7].
In the 1960s, Wright and McKerrow spread the concept of monitoring asthmatic patients
using the Peak Expiratory Flow rate (PEF or PEFR). PEF tests, referred as bronchial challenge
or bronchial provocation tests, consisted of performing forced expirations before and after
the inhalation of bronchodilator. The analysis was based on the percentage of change. The
PEF also became important for a simpler tracking of intra-daily specific change patterns in
respiratory function, such as those that occur for general and occupational asthmatics [5].
2.1.2 Indications for Spirometry
Pulmonary function analysis should be particularly indicated for persons with complaint of
shortness of breath. In any person, particularly cigarette smokers or asthmatics, spirometry
will provide a baseline performance value for comparison with results of future tests. The
impact of air pollution on nonsmokers may be detected by such comparison. Specific
indications for ventilatory function testing include the following [6]:
To measure the extent of pulmonary function impairment;
To help determine the type of impairment, such as restrictive, obstructive or a
combination;
To study possible effectiveness of bronchodilator therapy and the degree of air
obstruction reversibility;
For preoperative evaluation, especially for surgical procedures on the chest or upper
abdomen;
To follow the course of a patient's disease;
To establish baseline ventilatory function;
2.1.3 What is Spirometry?
Spirometry is the timed measurement of dynamic lung volumes and capacities during
forced expiration and inspiration to quantify how effectively and quickly the lungs can be
emptied and filled [8](left panel Figure 2.1). Measurements usually made are:

2.1 Spirometry
5
• The vital capacity, either forced (FVC) and/or unforced (VC)
• Forced expiratory volume in one second (FEV1), and
• The ratio of these two volumes (FEV1/FVC).
Figure 2.1 - Normal spirogram and flow-volume curve showing the conventional measurements made. Taken from [8].
Furthermore, one can measure the maximum expiratory flow over the middle 50% of the
vital capacity (FEF 25–75%), which is a delicate index of small airway function. Corresponding
maximal inspiratory measures are the FIV1 and the FIVC. The FEV1/VC ratio is the most
sensitive and explicit index to recognise airflow obstruction. The lower limit of normality for
this index centres around 70% but decays marginally with age [8].
On the other hand, the FEV1/FEV6 from a 6 second forced expiration can be used, since
generally 6 seconds are enough to comprise the complete expiration. The FEV1 percent
predicted is used to classify severity of ventilator defects. Usually a small FVC with a normal
or high ratio signals a restrictive ventilatory imperfection.
Measures of forced maximal flow during expiration and inspiration can be also made either
absolutely, eg. peak expiratory flow rate (PEFR), or as a function of volume consequently
producing a flow-volume curve, the shape of which also comprehends information of
diagnostic value. The flow-volume curve of a normal subject is presented in the right panel of
Figure 2.1. Its typical shape results from the fact that during expiration, shortly after peak
flow is attained, maximal flow becomes independent of effort and drops linearly with lung
volume. Alternatively, during inspiration maximal flow is effort dependant and predisposed
by the strength of contraction of the diaphragm and chest wall muscles and the patency of
the upper airway.
A further spirometric measure undergoing renewed interest is that of inspiratory capacity
(IC) which is the maximum volume of air that can be inspired from the end of quiet expiration
Literature Review
(functional residual capacity [FRC]) to total lung capacity (TLC). Inspiratory capacity is
reduced when hyperinflation is present or develops dynamically, eg. during exercise in
patients with COPD [8].
2.1.4 Spirometric Tests and Interpretation
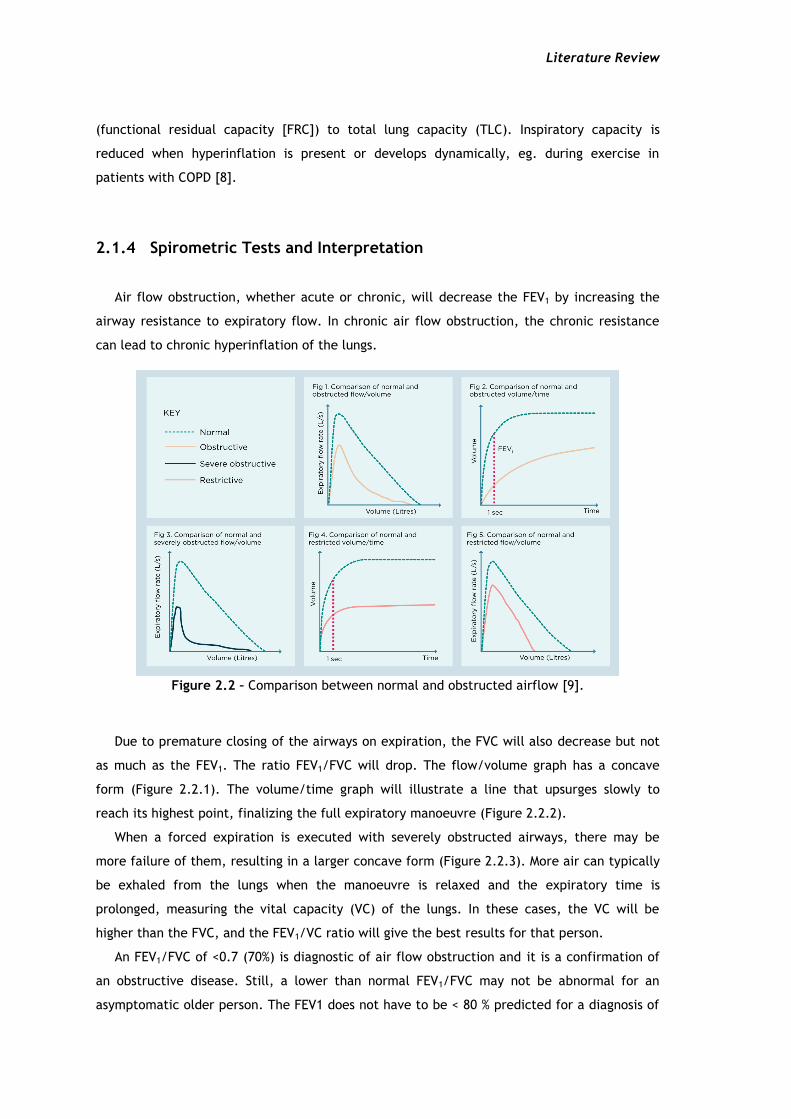
Air flow obstruction, whether acute or chronic, will decrease the FEV1 by increasing the
airway resistance to expiratory flow. In chronic air flow obstruction, the chronic resistance
can lead to chronic hyperinflation of the lungs.
Figure 2.2 – Comparison between normal and obstructed airflow [9].
Due to premature closing of the airways on expiration, the FVC will also decrease but not
as much as the FEV1. The ratio FEV1/FVC will drop. The flow/volume graph has a concave
form (Figure 2.2.1). The volume/time graph will illustrate a line that upsurges slowly to
reach its highest point, finalizing the full expiratory manoeuvre (Figure 2.2.2).
When a forced expiration is executed with severely obstructed airways, there may be
more failure of them, resulting in a larger concave form (Figure 2.2.3). More air can typically
be exhaled from the lungs when the manoeuvre is relaxed and the expiratory time is
prolonged, measuring the vital capacity (VC) of the lungs. In these cases, the VC will be
higher than the FVC, and the FEV1/VC ratio will give the best results for that person.
An FEV1/FVC of <0.7 (70%) is diagnostic of air flow obstruction and it is a confirmation of
an obstructive disease. Still, a lower than normal FEV1/FVC may not be abnormal for an
asymptomatic older person. The FEV1 does not have to be < 80 % predicted for a diagnosis of

2.2 Bio Feedback
7
airflow obstruction. If the FEV1 is ≥ 80 % predicted value with an FEV1/FVC of < 0.7 % (70%), a
diagnosis of COPD should only be made in the presence of respiratory symptoms such as
breathlessness or cough. This would be categorized as stage 1 (mild) COPD [9].
2.1.5 Fundamentals for obtaining useful results
To achieve optimal results, the FVC manoeuvre must be performed with great effort.
Immediately following a full inspiration, the patient seals his/her lips around the mouthpiece
and blasts the air out as fast and as far as possible until the lungs are absolutely empty, then
breathes in again as forcibly and fully as possible (not all spirometers will measure
inspiration). Demonstration to the patient of the procedure and the maximal effort required
is helpful before starting. For the measurement of IC (the IC is the volume that can be
inspired from FRC up to TLC), scrutiny of the stability of FRC during a short period of tidal
breathing before full inspiration is necessary. For PEFR, only the first 1 or 2 seconds of
maximal expiration is required. It should be noted that, particularly in airflow obstruction, it
might take several seconds for the patient to fully expire. Resting for recovery between
repeat tests, an erect seated position and the usage of a nose clip are suggested. Cautious
examination of each spirogram or flow-volume curve for acceptability, reproducibility and
correction of results to body temperature and pressure (saturated) conditions is needed.
Measurement of spirometry in children requires animation to capture the child’s attention
and effort, and can usually be achieved in those 5 years of age and over [8].
2.2 Bio Feedback
2.2.1 Definition
Biofeedback is a mind–body technique in which individuals learn how to adjust their
physiology for the purpose of improving physical, mental, emotional and spiritual health.
Much like physical therapy, biofeedback training requires active participation on the part of
patients and often regular practice between training sessions. Clinical biofeedback might be
used to manage disease symptoms as well as to improve overall health and wellness through
stress management training.
Research has shown that biofeedback interventions are efficacious in treating a variety of
medical conditions. Clinical biofeedback training is growing increasingly popular in the world,
as many people are seeking out relatively new approaches to healthcare [10].
Literature Review
2.2.2 Bio Feedback as a step in the solution
Biofeedback therapy is a process of training as opposed to a treatment. Much like being
taught how to walk or how to hold a spoon, individuals undergoing biofeedback training must
take an active role and practise in order to develop the skill. Rather than passively receiving
a treatment, the patient is an active learner. It is like learning a new skill. When a patient
comes in for clinical biofeedback therapy, an emphasis is placed on education. As sensors are
placed on the patient, the therapist explains what each sensor will be measuring, assuring
the patient that the sensors do not cause any pain or shock but rather are simply recording
signals from the body and displaying those signals on the screen [10].
For instance, Biofeedback has been a useful tool in helping individuals with urinary
incontinence regain bladder control by controlling the muscles used in urination. Sensors are
placed in the vaginal or anal canal to help individuals learn when the muscles are properly
contracted. A recent study found that this type of biofeedback treatment was safe, effective,
and well-liked by women patients 55 years and older [11].
On this particular case the aim is to evaluate the patient condition regarding a respiratory
deficiency or malfunction without the aid of a technician, only using the smartphone as
guidance. The goal is to use their smartphone in order to get the information and process it
at an early stage so the user can be prompted with a warning if they need to get checked by
a doctor to further evaluate more deeply the condition. It is possible to gather information
about the parameters for this evaluation such as FEV1 and FVC using the smartphone’s
microphone to record the breath/cough of the patient. But the way the phone is
handled/positioned is a key point to get a clean and useful recording. With that in mind, the
application has every bit of instruction needed on-screen, at every stages of the process, with
the maximum detail possible. The users will be “trained” in order to have the maximum
efficiency acquiring the data to the smartphone memory. For example, COPD patients are
required to do certain kinds of rehabilitation exercises in order to learn how to get the most
air out of every breath [12]. The application functions differently on these cases. It could
help the patient by providing all the information required for him to be capable of using
pursed-lip breathing technique in order to slow their exhalation and make his breath longer;
it could also provide tips how to use a diaphragmatic breathing technique consequently
increasing the amount of inhaling and exhaling air.

2.3 Software framework development
9
2.3 Software framework development
2.3.1 Android platform overview
Currently, for development, the only resources available are for Android, so the focus of
this overview is Android, although it is possible to build the application for other platforms.
Most Android apps are written in the Java programming language. The Android SDK tools
compile the code, along with any data and resource files into an APK: an Android package,
which is an archive file with an apk suffix. One APK file comprehends all the contents of an
Android app and is the file that Android-powered devices use to install the app. Once
installed on a device, each Android app exists in its own security sandbox [13]:
The Android operating system is a multi-user Linux system in which each app is a
different user;
By default, the system allocates each app a unique Linux user ID (the ID is used only
by the system and is unknown to the app). The system sets permissions for all the
files in an app so that only the user ID assigned to that app can access them;
Each process has its own virtual machine (VM), so an app's code runs in isolation from
other apps;
By default, every app runs in its own Linux process. Android starts the process when
any of the app's components need to be executed, then shuts down the process when
it's no longer needed or when the system must recover memory for other apps;
This way, the Android system implements the principle of least privilege. That is, each
app, by default, has access only to the components that it requires to do its work and no
more. This creates a very secure environment in which an app cannot access parts of the
system for which it is not given permission [13].
2.3.2 Different frameworks available for development
A while back the only option to develop for android was based on Java language. However
recently this paradigm “shifted” and there are other options available. In this section the
main options are presented.

Literature Review
Kivy Language
Kivy is a very promising open source Python library capable of developing mobile apps and
other multi-touch application software with a natural user interface (NUI). It can run on
Android, iOS, Linux, OS X, and Windows.
The framework contains all the elements for developing an application such as:
Extensive input support for mouse, keyboard, TUIO (open framework that defines a
common protocol and API for tangible multi-touch surfaces), and OS-specific multi-touch
events;
A transitional language (KV) that helps to effortlessly project custom Widgets;
An extensive variety of Widgets that support multi-touch;
A graphic library operating only OpenGL ES 2, and established on Vertex Buffer
Object and shaders;
Kivy exhibits some features that should be looked upon [14]:
Fast
Kivy is fast. This applies to both application development and application execution
speeds. The framework was optimized in many ways. The implementation of time-critical
functionality on the C level to leverage the power of existing compilers. More importantly,
intelligent algorithms were used to minimize costly operations. The GPU is also used
wherever it makes sense in the context. The computational power of today’s graphics cards
surpasses that of today’s CPUs by far for some tasks and algorithms, especially drawing. That
is why Kivy tries to let the GPU do as much of the work as possible, thus increasing
performance considerably.
Flexible
This framework is flexible. This means it can be run on a variety of different devices,
including Android powered smartphones and tablets. It supports all major operating systems
(Windows, Linux, OS X). Being flexible also means that Kivy’s fast-paced development allows
it to adapt to new technologies quickly. Lastly, the flexibility is shown when it is possible to
use it in combination with a great number of different third-party solutions.
Focused
Kivy is focused. It is possible to write a simple application with a few lines of code. Kivy
programs are created using the Python programming language, which is incredibly versatile
and powerful, yet easy to use. In addition, it possesses his own description language, the Kivy

2.3 Software framework development
11
Language, for creating sophisticated user interfaces. This language allows to set up, connect
and arrange the application elements quickly.
Funded and free to use
This platform is actively developed by professionals in their field. Kivy is a community-
influenced, professionally developed and commercially backed solution. It’s not a small,
vanishing student project that will fade away. Kivy is free to use even if the application is
generating profit or being sold.
Although Kivy has all these overwhelming features, it also holds some downsides:
Since it is a new framework, there is not a lot of documentation available.
It is not native opposed to Java for example. It uses Python wrappers and can affect
overall performance of the application.
The application takes some seconds to boot up, since it has to wait for Python modules
to be loaded.
The size after compiling the APK is usually much bigger than native compilation (using
the android SDK), since the APK has to include some “bundles” for the interpretation of
Python.
QT for Android
Qt is a cross-platform application framework that is broadly used for building application
software that can be executed on numerous software and hardware platforms with tiny or no
change in the underlying codebase, while having the power and speed of native applications.
The following list summarizes what is achievable with Qt for Android [15]:
Run Widget and QML applications on the device or emulator;
Support for native Android style with Qt Quick Controls;
Handle Multimedia content in Qt Quick 2 applications;
Get sensor readings and react to the changes;
Retrieve current position data using satellite and network information;
Establish a serial connection to other Bluetooth devices;
Develop secure applications using OpenSSL library;
Create and deploy Application Package (APK) using Qt Creator;

Literature Review
Cordova
Apache Cordova is an open-source mobile development framework. This technology gives
the option to use standard web technologies - HTML5, CSS3, and JavaScript for cross-platform
development. Applications execute within wrappers targeted to each platform, and rely on
standards-compliant API bindings to access each device's capabilities such as sensors, data,
network status, etc. [16]
Figure 2.3 – Cordova Architecture, diagram from [16].
Probably this project could be done in any of these frameworks, but the framework that
best suits the needs of this application is Kivy. One of the major features is using Python as
the main programming language, which is known to be used for scientific purposes.
Furthermore, the code in [5] was developed on the Matlab platform, that shares some
resemblances with Python. Signal processing and scientific libraries are prominent too in
Python, which benefits the development of the application.

2.4 Software solution review
13
2.4 Software solution review
This segment summarizes briefly a software solution implemented to tackle the problem
described on the first chapter. The main focus is to observe how the software is
implemented, and how the feedback is presented to the user.
This application is named SpiroSmart. It is a mobile phone based platform that allows for
the analysis of common lung function measures (FEV1, FVC, PEFR). By analyzing lip
reverberation, it is possible to monitor pulmonary ailments such as asthma, chronic
obstructive pulmonary disease, and cystic fibrosis.
SpiroSmart uses a custom data collection application to record the users’ exhalation
sounds using the built-in microphone (at 32 kHz) and provides feedback to the user, coaching
them through the spirometry manoeuvre. The users using this application were coached with
textual prompts on the screen and only with gestures—oral prompts would have interfered
with the audio recording (Figure 2.4).
Figure 2.4 - Interface and configurations used on data collection. Taken from [17].
It also calculates a real-time estimate of flow, and displays the measure as a real-time
visualization, a ball displaced vertically in a cylinder proportionally to the strength of the
exhalations. After the initial burst, the ball drops slowly to the bottom of the cylinder,
signifying the end of the test. However the best way to perform the forced expiratory
manoeuvre is not explained within the application [17].
In the pilot study of SpiroSmart, it was observed that participants unintentionally varied
the distance at which they held the phone as well as lip posture, potentially introducing
unwanted variability. Therefore, they asked participants to perform the test in four
configurations, in random order: with a mouthpiece (to maintain lip posture), with a sling (to
maintain distance), with neither attachment; and with both attachments (Figure 2.4). This
test was performed on 52 subjects, showing that the mean error when compared to a clinical
spirometer is 5.1% for common measures of lung function [17].
Since it is not available a public APK to test, due to being in prototype stage, it is not
clear how accurate and precise the instructions are.

14

15
Chapter 3
Classification of Lung Function
The present chapter describes the signal processing and machine learning methods chosen
during the work to address the proposed problem. The main goal of the project is to build an
application where the input is only the smartphone’s microphone (no additional sensors) and
with that input being able to perform a coarse triage. The first section will describe how the
processing of the recording is performed. The second section focus on the details related to
machine learning, and how the model was built using recordings from a data set. This section
can still be divided in two other sub-sections: one for the regression phase and other for the
classification phase.
3.1 Signal Processing
3.1.1 Automatic Signal Segmentation
The audio input was firstly segmented to get rid of non expiration sounds, for instance the
inspiration segment of the manoeuvre and the ambient noise. The definition and cropping the
beginning of the recording was achieved operating a modified version of the Back-
Extrapolation algorithm [7].
Primarily, an LPC envelope of the signal is acquired (see section 3.1.4 Linear Predictive
Coding), then the envelope is subtracted of an arbitrary ratio of the maximum flow value (9%
of PEF) in order to retrieve the two zero-crossings immediately before the PEF, this initial
segment is discarded leading to the removal of the most relevant inspiration. Later, the zero-
time back-extrapolation is performed by finding the moment corresponding to the envelope's

Classification of Lung Function
peak (PEF time), computing the Time-Volume curve, drawing the tangent at the PEF time and
finding where the tangent crosses the abscissas, which is the initial instant.
The ending at noise level was detected applying a sliding window algorithm (5% of signal's
length, 25% overlap) based on the magnitude ratio threshold of the maximum value (2%).
Figure 3.1 – Automatic Cropping. Top Image - Original recording. Bottom Image - Recording after the two crops.
3.1.2 Signal Preprocessing
In contemplation of avoiding any saturation of the microphone the patients have to
perform the expiratory manoeuvre at an arms length. A Spirometer measures the airflow that
comes directly from the mouth whereas using the smartphone’s microphone some pressure is
lost. Consequently, there should be employed some sort of compensation method, between
the lips (plips) and smartphone (p). This is achieved using an Inverse Radiation Model [17],
according to height and gender of the patient. Additionally, this model also takes into
account the reverberation effect from sound reflections around a person's body. After that,
plips was transformed to airflow at the lips (ulips), using a Pressure to Flow Conversion Model
(3.1) [17].
𝒖𝒍𝒊𝒑𝒔 (𝒕) ~ 𝟐𝝅𝒓𝟐
𝒍𝒊𝒑𝒔√𝟐𝒑𝒍𝒊𝒑𝒔(𝒕)
(3.1)

3.1 Signal Processing
17
Figure 3.2 – Pre-processing conversion models’ results [5].
3.1.3 Envelope Generation
After the preprocessing it was necessary to obtain an envelope based on a time domain.
The method was based on Shannon curves [18], consisting at calculating the Shannon Entropy
and Energy envelopes of the signal. Shannon envelope (the normalized average Shannon
energy) is known as a common technique to extract an envelope of cardiac sound signals [19].
Shannon Energy: 𝐸 = −𝑥2(𝑡). log 𝑥2 (𝑡) (3.2)
Shannon Entropy: 𝐸 = −|𝑥(𝑡)|. log|𝑥(𝑡)| (3.3)
The equations (3.2) and (3.3) focus on different features. Shannon energy emphasizes the
medium intensity signal and attenuates the effect of low intensity signal in a greater way
than that of high intensity signal, while Shannon entropy attenuates the effect of low value
noise that makes the envelope too noisy to read. Shannon energy is good at shortening the

Classification of Lung Function
difference of the envelope intensity between low and high intensity sounds [20]. This
shortening makes the finding of low intensity sounds easier [18]. On the final system, only
Shannon Energy was used because of the above, and since it is the least complex envelope
generator is more efficient to compute.
3.1.4 Linear Predictive Coding
LPC speech model is tremendously popular in speech analysis and synthesis. Various of the
methods used for speech compression and feature extraction have the foundation on the LPC
model and/or attempt to capture the deviations from it. Regardless of its popularity, there
should be emphasized that the LPC speech model is an attempt to mimic the speech
construction apparatus, and does not directly relate to the way the speech is perceived.
For voiced speech the vocal chords create a series of pulses at a frequency known as the
pitch. This excitation goes through the vocal tract, which resonates at certain frequencies
known as formants, and hence amplifies the pitch harmonics that are near these frequencies.
For unvoiced speech the vocal chords do not vibrate but the vocal tract remains untouched.
Since the vocal tract mainly emphasizes frequencies (the zeros are neglected in the spectrum
caused by the nasal tract) it can be modeled it by an all-pole filter [21].
Figure 3.3 – Block diagram model for the generation of a speech signal.
In this case, the breathing procedure comprises two concepts very similar to LPC: a vocal
tract which can be modeled as a varying width tube; and the exhalation, working as the
power source of the expiration sound. This tube model can be represented by (3.4) and the
power source can be modeled as white noise [5].
𝑦(𝑛) = ∑ 𝑎𝑖𝑦(𝑛 − 1) ± 𝐺𝑥(𝑛)
𝑝
𝑛=1
(3.4)
All-Pole Filter
White Noise
Generator
Pitch
Generator
Voiced and
Unvoiced Switch Speech
Signal

3.1 Signal Processing
19
3.1.5 Post-processing
The envelopes obtained were smoothed by a regular low pass filter (LPF) and, in parallel,
were also approximated by a 4th order polynomial. The non-approximated envelopes were
also further processed using a Savitzky-Golay Filter (SG) with order 3 and size 11. Savitzky
and Golay wanted to smooth noisy data acquired from chemical spectrum analyzers, and they
verified that least squares smoothing diminishes noise while preserving the shape and height
of waveform peaks [22], so it seemed like a good approach to use at the end of the post-
processing.
Figure 3.4 – Final Signal Processing Architecture [23]

Classification of Lung Function
3.1.6 Parameter Extraction
The spirometry parameters were computed from each of the final envelopes. The
measurements obtained were PEF, FVC, FEV1 and FEV1/FVC (TIFF). The envelopes are
regarded as Flow-Time curves, characteristic of spirometer reports. PEF is defined as the
Peak Expiratory Flow or the global maximum of the audio envelope. By integrating the
envelope with respect to time the Volume-Time curve can be acquired. FVC is defined as the
total volume expired of a FEM. FEV1 is the total volume expired during the first second.
3.2 Machine Learning
The dataset is represented by a very unbalanced quantity of observations. There are much
more cases of normal lung behavior than cases showing anomalies. The total of usable
recordings is 101.
There are two phases regarding the machine learning architecture: the regression and the
classification. In the regression, the parameters are extracted from the curves to get an
approximation of the corresponding clinical values, like the output of a spirometer. The
classification, formulates models that can distinguish between the two possible diagnosis:
normal or abnormal lung function. The approaches picked for these two distinct stages
(regression and classification) were based on [23] best results.
3.2.1 Regression Phase
Several envelopes are generated and every one of them is manipulated to extract clinical
parameters. With that data, it is possible to attain a good estimation of the respective
spirometer clinical parameter. The corresponding spirometer measurements operated as
ground truth or regression targets.
Analysing the results of[23], the best method was Random Forest. In the end, both Bagging
and Random Forest presented similar results, but Random Forest could reduce overfitting and
shorten regression time, therefore this method was the chosen one. The number of trees in
the ensembles and their depth was 10 and it was used a 5 fold cross-validation.
Random Forests: The random forest algorithm lean towards producing quite accurate
models because the ensemble reduces the instability that can be observed when single
decision trees are built. This can frequently be demonstrated solely by removing a very small
number of observations from the training dataset, to see quite a change in the resulting
decision tree.

3.2 Machine Learning
21
Random forests treat underrepresented classification tasks quite well. This is where, in
the binary classification task, one class has very few (e.g., 5% or fewer) observations
compared with the other class [24]. The randomness operated by a random forest algorithm
is in the choice of both observations and variables. It is this randomness that brings
considerable robustness to noise, outliers, and overfitting, when compared with a single-tree
classifier.
Random Forest number of determining features typically are one third of the total
number, for regression, and the square root of the total number, for classification.
3.2.2 Classification Phase
On this stage, the regressed parameters were the input of the learning models. Analysing
the results for the classification stage, it is clear that the best performance comes from Tree
Bagging and Random Forest. Since the library (discussed later) available for Android only
offers the Random Forest Model, the choice for classifying continued on this model (same
parameters, 10 trees with depth of 10).

Classification of Lung Function

23
Chapter 4
Implementation and design of the mobile application
The current chapter describes how the application was implemented and designed, what
paths were chosen and the inner reasons behind those decisions. In the beginning of the
chapter there is a brief explanation about how the platform chosen (Kivy) works. Afterwards,
it is presented the thought process designing the application. Finally, it is discussed how the
implementation was made, and what hurdles emerged upon development.
4.1 Kivy’s architecture
In Chapter 2 were listed some advantages and disadvantages of this framework. In this
section the goal is to explain how does Kivy works. This platform of development usually uses
two files to operate. One of them is written in Python and it is the core of the application,
this file is named main.py (Kivy looks for this specific name to search for the app class) and
usually holds the logic of the application. The other one holds the Kv extension and it has the
name of our app class. Kivy offers a design language specifically geared toward easy and
scalable GUI (Graphical User Interface) design. The Kv language splits the interface design
from the application logic, sticking to the separation of concerns principle, where the
application logic remains in Python and the design remains in the Kv language [25]. Usually
the Kv file is populated by a hierarchy of widgets (a widget tree), where the outer widgets
are higher in the hierarchy than the inner ones. This way is easy to read the design and
structure of the application. The term widget is frequently used in GUI programming
circumstances to define some part of the program that the user interacts with. In Kivy, a

Implementation and design of the mobile application
widget is an object that receives input events, even though it does not necessarily mean that
it has to show a visible representation on the screen.
Figure 4.1 – Kivy’s architecture [26].
4.2 Design
The application was designed thinking on simplicity and functionality. The application has
four main screens. The home screen gives access to all of them. The design strictly follows
Google guidelines for Material Design [27].

4.2 Design
25
Figure 4.2 – Home Screen of the application.
Looking to Figure 4.2 and starting from the top of the screen it is possible to perceive a
toolbar with the application’s name. This toolbar is a common element throughout all the
screens, to ensure the possibility to return the to the home screen by clicking the home
button and to access the navigation drawer.

Implementation and design of the mobile application
Figure 4.3 – Navigation Drawer.
This navigation drawer slides from the left side and with the height of the screen (Figure
4.3), with everything behind it discernible but darkened by a scrim [28]. Taking a look closer
there are two options within the drawer, the first option will render everything in a dark
theme, some users prefer this option and it is also a great way to save some battery,
specially if the screen is AMOLED. This type of screen emits light individually to the pixels
opposed to a LCD that lights the entire display panel. So if any of the pixels are black, it just
turns off the light on those pixels, as a result that portion of the screen is pitch black, thus
saving energy (Figure 4.4). The other option is to change the language of the interface. This
is a feature for the future, in case the application reaches other markets.

4.2 Design
27
Figure 4.4 – Dark theme.
Under the main toolbar there are four major floating buttons [29], each one leading to a
different screen. On the first launch of the application only the first and fourth buttons (User
Profile and Settings respectively) are available. If the user tries to access the other two, he
will be presented by the a snackbar [30], for instance, if he clicks on “Start Evaluation”:
Figure 4.5 – Snackbar showing information to the user.

Implementation and design of the mobile application
This pops up because it is mandatory to have the user profile filled before proceeding,
because the pre-processing uses parameters such height and gender (3.1.2 Signal
Preprocessing). If the user tries to press “Show results” before any evaluation was made, it
also warns him about this situation.
After pressing the “User Profile” button, this screen shows up:
Figure 4.6 – User’s profile screen.
This screen exhibits a card [31] in the center that holds all the elements to be filled by the
user. The first information to be filled is the gender, this is accomplished by picking a radio
button [32] which is the gender of the user. Shortly after there are three text fields [33], one
to filled by the name and the others with the height and age. The last two of them are
restricted to a numeric input. There are multiple checks to all these fields. If the user fails to
fill any of them, a snackbar appears warning him what fields are still missing to be satisfied.
After completing the profile, the “Save Profile” raised button [34] has to be pressed,
representing that the user want to store this information in the internal storage of the

4.2 Design
29
application (even though this info can be modified anytime he wishes to). Afterwards a new
snackbar appears stating that the profile was saved successfully. After this step, it is possible
to start the first evaluation.
Figure 4.7 – Recording Screen.
In this screen there is a set of images in loop under the main toolbar and above the record
button:
Implementation and design of the mobile application
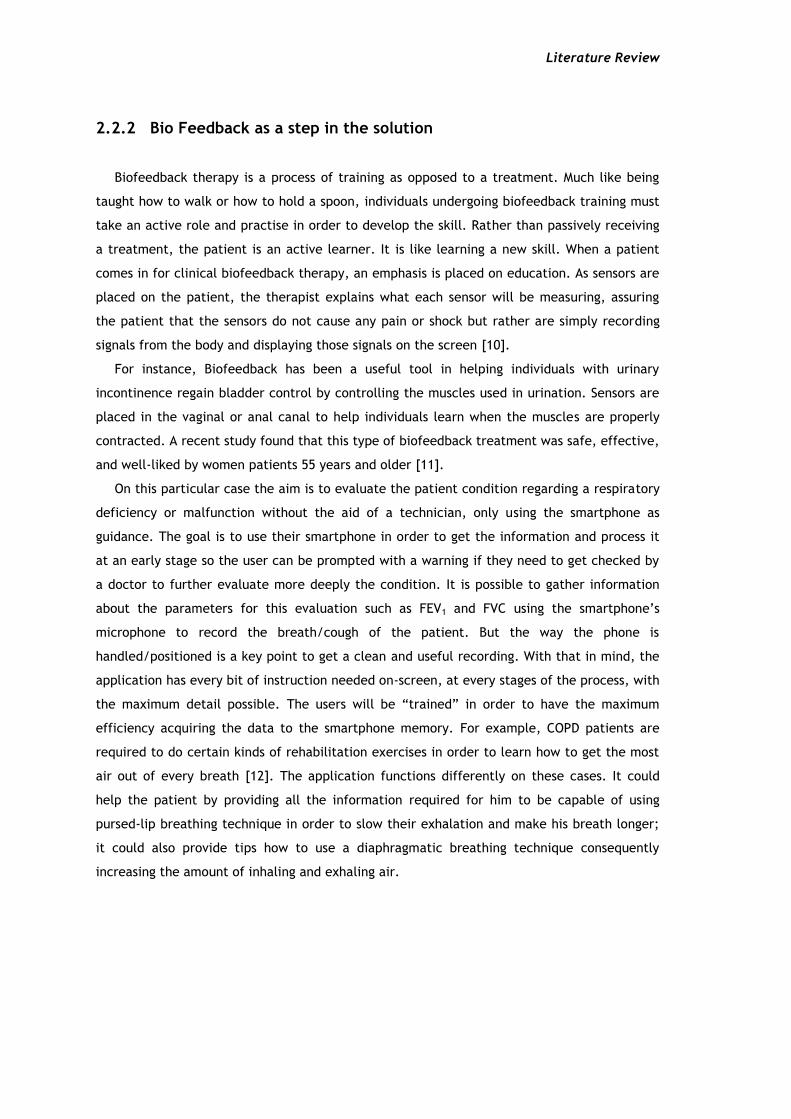
Figure 4.8 – Set of images that appear before starting the manoeuvre.
The Figure 4.8 a) presents the distance needed for a clean recording (an arm’s length
approximately). The next image portrays how the smartphone should be handled, facing
directly into the patient’s face, making a 90º degree angle. The final image just shows that
now it is the time to make the expiratory manoeuvre, by pressing the record button and
exhaling with the maximum effort. After pressing the record button, this element is greyed
out (disabled), the progress bar [35] starts moving towards the 8 second mark (4.3.1
Obtaining the signal) and a downsampled real time graph starts being drawn (this
downsampling occurs in order to avoid FPS drop). The Y axis automatically adjusts its value
depending on the exhalation. This graph is not very meaningful; it is just to have an idea if
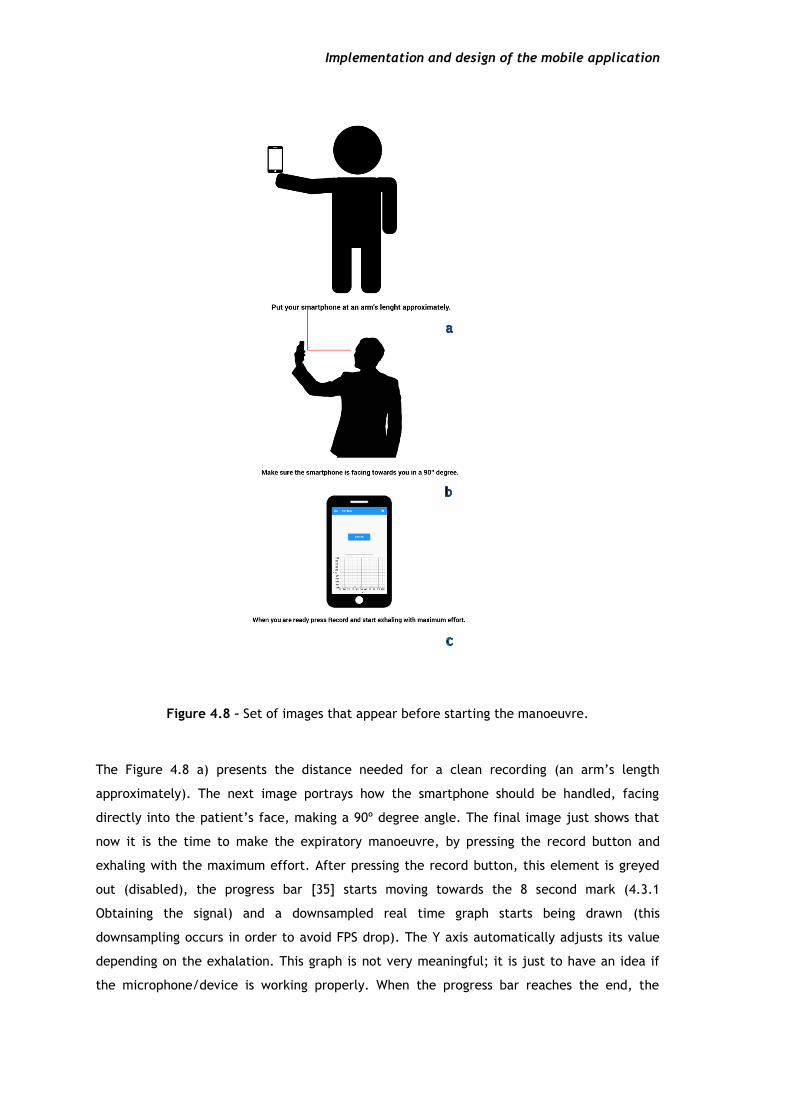
the microphone/device is working properly. When the progress bar reaches the end, the
4.2 Design
31
processing of the recorded signal begins, the label of the button changes to “Processing” and
a blue spinner [35] appears illustrating that the user should wait until the processing is done:
Figure 4.9 – Start of the processing.
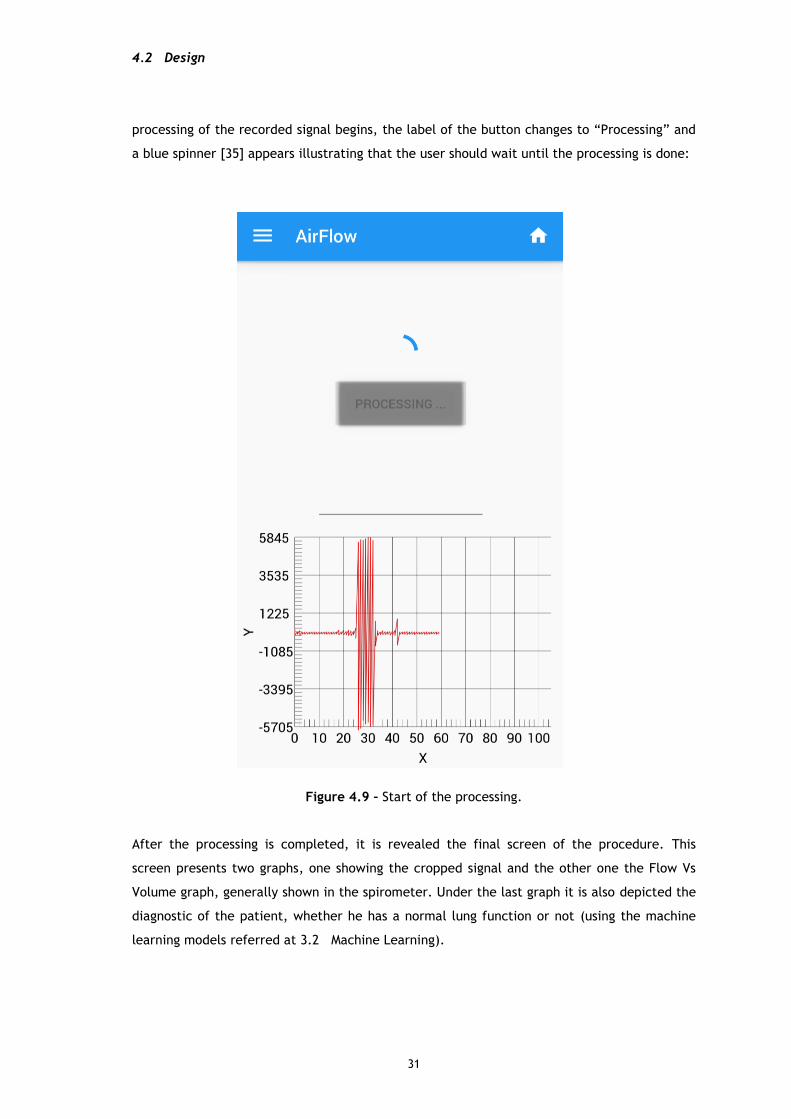
After the processing is completed, it is revealed the final screen of the procedure. This
screen presents two graphs, one showing the cropped signal and the other one the Flow Vs
Volume graph, generally shown in the spirometer. Under the last graph it is also depicted the
diagnostic of the patient, whether he has a normal lung function or not (using the machine
learning models referred at 3.2 Machine Learning).
Implementation and design of the mobile application
Figure 4.10 – Results Screen for a normal state.
In Figure 4.10 it is observable that the expiratory manoeuvre was performed by a person
without any abnormalities in the lung function.
It was needed a splash screen before the application booting up completely, so the main
toolbar color was used as background and the iconic element is represented by a set of lungs.
The final result can be observed at Figure 4.11.
4.3 Implementation
33
Figure 4.11 – Splash screen before the application loads all its dependencies.
4.3 Implementation
The implementation of the system was not trivial, since this solution is multi-platform.
This means that majority of the libraries available will work under Windows, Linux and
Macintosh but some of them will not function at Android/iOS. This section will describe how
the implementation was made and also what hurdles had to be overcome in order to succeed
in mobile development. Most of the barriers are tied within the processor architecture, since
the libraries have to be built for a specific platform. Usually the CPUs running under the hood
of the smartphone are based on ARM technologies (RISC). In the other hand, desktop
processors typically are x86 or x64 (CISC). This difference makes some libraries unattainable
(at least for now), regarding the smartphones. Fortunately, one of the biggest scientific
libraries has a recipe to be built in the ARM environment, without this library (Numpy [36])
would be impossible to continue further.
Implementation and design of the mobile application
4.3.1 Obtaining the signal
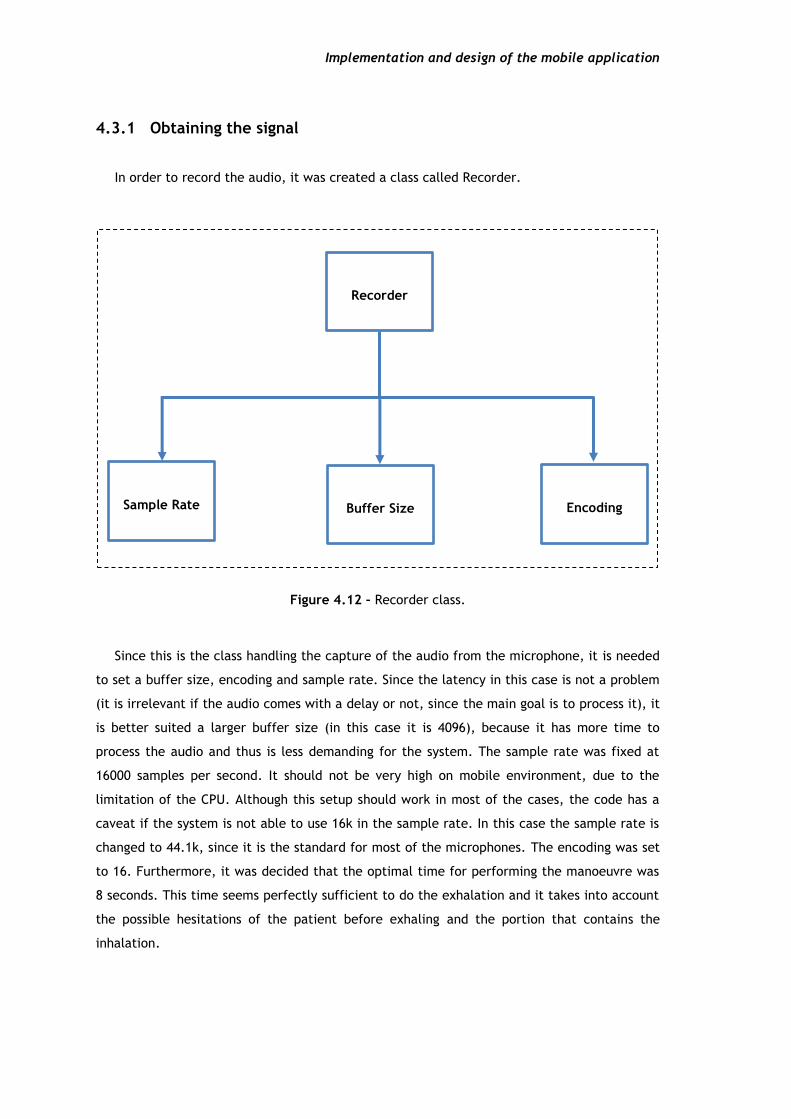
In order to record the audio, it was created a class called Recorder.
Figure 4.12 – Recorder class.
Since this is the class handling the capture of the audio from the microphone, it is needed
to set a buffer size, encoding and sample rate. Since the latency in this case is not a problem
(it is irrelevant if the audio comes with a delay or not, since the main goal is to process it), it
is better suited a larger buffer size (in this case it is 4096), because it has more time to
process the audio and thus is less demanding for the system. The sample rate was fixed at
16000 samples per second. It should not be very high on mobile environment, due to the
limitation of the CPU. Although this setup should work in most of the cases, the code has a
caveat if the system is not able to use 16k in the sample rate. In this case the sample rate is
changed to 44.1k, since it is the standard for most of the microphones. The encoding was set
to 16. Furthermore, it was decided that the optimal time for performing the manoeuvre was
8 seconds. This time seems perfectly sufficient to do the exhalation and it takes into account
the possible hesitations of the patient before exhaling and the portion that contains the
inhalation.
Recorder
Sample Rate Buffer Size Encoding

4.3 Implementation
35
4.3.2 Pre-cropping the signal
When trying to pre-crop the signal to obtain only the exhalation part it was required to
use LPC envelopes as described in 3.1.1 Automatic Signal Segmentation. When searching for
the solution, most of the libraries that surfaced were written in C or C++. For Python was a
struggle to find something that could do this job. The first library that appeared was from
scikits.talkbox [37] and it seemed like a good candidate. Unfortunately later on, it was
noticeable that it had dependencies on SciPy [38] so it had to be discarded. This was the first
one of many libraries that would fail because they were dependent on SciPy (mostly
Scipy.signal). In the end of this project, it became clear that the major libraries are
dependent on SciPy. This is observed because it is the main reference on Python for digital
signal processing (DSP) and probably, the most efficient, reliable and complete library
regarding this subject. It works fine for desktop environments, unfortunately it has many
dependencies on Fortran libraries, that it is impossible to make a recipe able to convert it to
the ARM architecture. The other candidate that emerged was the library AudioLazy by Danillo
Bellini [39]. It is pure Python, so it would work out of the box on mobile. The major problem
of being pure Python is the speed for obtaining the LPC envelope.
4.3.3 Processing
After acquiring the three different pre-processing signals (p, plips, ulips), each of them was
processed by the system.
In the code there was a downsample factor applied to the recorded signal, because earlier
on the sample rate was higher (first tests were made on the standard sample rate value, see
class audiostream.AudioInput [40]). The downsample factor is 1 (there is no downsampling).
The sample rate on the beginning of the tests was set as 44100 samples per second but after
some testing it came to realisation that there were too many samples to process in a mobile
environment. The first problem that emerged was filtering the signal in order to get the
Shannon envelope. There was a necessity to get the coefficients for two Butterworth filters.
In this case there were no alternatives to the Scipy library. After studying the Scipy source
code, a specific module was noticed. This module was able to get the coefficients for the
Butterworth filters, by removing some special dependencies (and thus slower execution of
the code, since they were low-level optimizations in another language), and adapting the
source to work after that removal.
Three dependencies were removed: sigtools, special and optimize; after the code was
adapted to avoid the usage of those. It was not an optimal way, but it is a method that works
for this proof of concept. Although it was possible to apply this method in order to obtain the

Implementation and design of the mobile application
coefficients, this would not be successful in the module that applies the filter, since there
were involved irreplaceable dependencies. The solution was to implement the filter in Python
for an infinite impulse response (IIR) filter of order 2 or lower (4.5).
𝑦[𝑛] =
1
𝑎0
(∑ 𝑏𝑖 ∙ 𝑥[𝑛 − 𝑖]
𝑃
𝑖=0
− ∑ 𝑎𝑖
𝑄
𝑗=1
𝑦[𝑛 − 𝑗]) (4.5)
For Savitzky-Golay filtering the same problem appeared as Butterworth filtering, but in
this case it was impossible to use Scipy. After some research, astroML module seemed to
possess a different implementation from Scipy. This implementation was tested (available at
[41]), and it functioned quite well. In the end of the processing it was expected as output to
have 6 different curves, given that each pre-processing signal would generate two different
curves (Figure 3.4).
4.3.4 Machine Learning model
This phase of the project was the most complex to finish, not due to the complexity of the
subject, but due to the lack of compatible libraries for mobile. Scikit-learn module [42] had
all the necessary tools to accomplish the goal. But as previous solutions for processing it was
reliable on Scipy. After ruling out Scikit, another possible solution was found, the milk
module [43]. Unfortunately, it runs under Python 3, and this project is developed in Python 2,
so it was impossible to use this one as well.
The possibility of uploading the results and classifying them under a server machine was
becoming the apparent fate of the application. This would not be very pleasant, since the
mobile phone would have to be connected to the internet, and the user would be relying on
his connection and the server to get the results. Plus, it would be necessary to deal with
network code and the necessity to have a machine running 24 hours per day to deal with
multiple requests from users. Fortunately, this scenario was avoidable by using the Open
Source Computer Vision (OpenCV) library from Intel. As the name suggests, it is a library
primarily aimed towards real-time computer vision so the machine learning portion it is a
feature of this library, unlike the other libraries mentioned that were strict machine learning
libraries. As mentioned in 3.1.6 Parameter Extraction, this library does not have
implemented the Tree Bagging method, so the Random Forest method was used for the
regression and classification models.

4.3 Implementation
37
4.3.5 Saving the results
After the classification is made, the results are saved. For each recording it is created a
JSON file in the folder “Airflow/logs” and a wave file containing the expiratory manoeuvre.
This JSON file stores every clinical parameter such as FVC, PEF, FEV1, TIFF. This is an
important step if the patient shows any anomalies in the lung function, because this way the
doctor has more tools to do the analysis. In the future, this storage can be helpful in
improving the machine learning models.

Implementation and design of the mobile application

39
Chapter 5
Results and Discussion
In the current Chapter the machine learning methods (3.2 Machine Learning) are
evaluated and compared to the results of the previous work [23]. Unfortunately, there were
some problems testing the application on patients. The goal was to evaluate the application
results versus a spirometer, however the application data is not available, thus rendering a
comparison impossible. So, the dataset used for the evaluation is from [5].
5.1 Dataset
The dataset contains 101 recordings from 61 patients performing the forced expiration
manoeuvre, facing directly a smartphone (Samsung GT-I9000), at an arm’s length in order to
record the audio with the microphone’s device.
The ground truth clinical values were obtained using the spirometer devices displayed in
the following table:

Results and Discussion
Table 5.1 – Distribution of recordings.
Number of
recordings Location Spirometer
14 Aveiro - ICAR Spirodoc - MIR
17 Coimbra - ICAR Spirodoc - MIR
18 ICP Jaeger IOS – Carefusion
2 HCP Jaeger IOS – Carefusion
10 Vila Real - ICAR Spirodoc - MIR
9 Viseu - ICAR Spirodoc - MIR
15 Loulé - ICAR Spirodoc - MIR
16 Portimão - ICAR Spirodoc - MIR
The patients’ minimum age was 18 years old and the maximum age was 82. The binary distribution of the classification can be seen on Table 5.2.
Table 5.2 – Binary distribution of the classification.
Normal Abnormal
71 30
5.2 Regression Results
The results of the regression test are shown in Table 5.3, comparing the system
implemented here to P2 (second pipeline) from [23]. The Random Forest method was
employed using 5-fold cross validation, 10 trees of depth 10, running 1000 iterations.
Unfortunately, it is not possible to get the training error, since it is only available as a class
method in C++ (see [40] for more information) and the oob_error (out-of-bag data) does not
exist in Python. Consequently, the task is about testing the trained model.
5.3 Classification Results
41
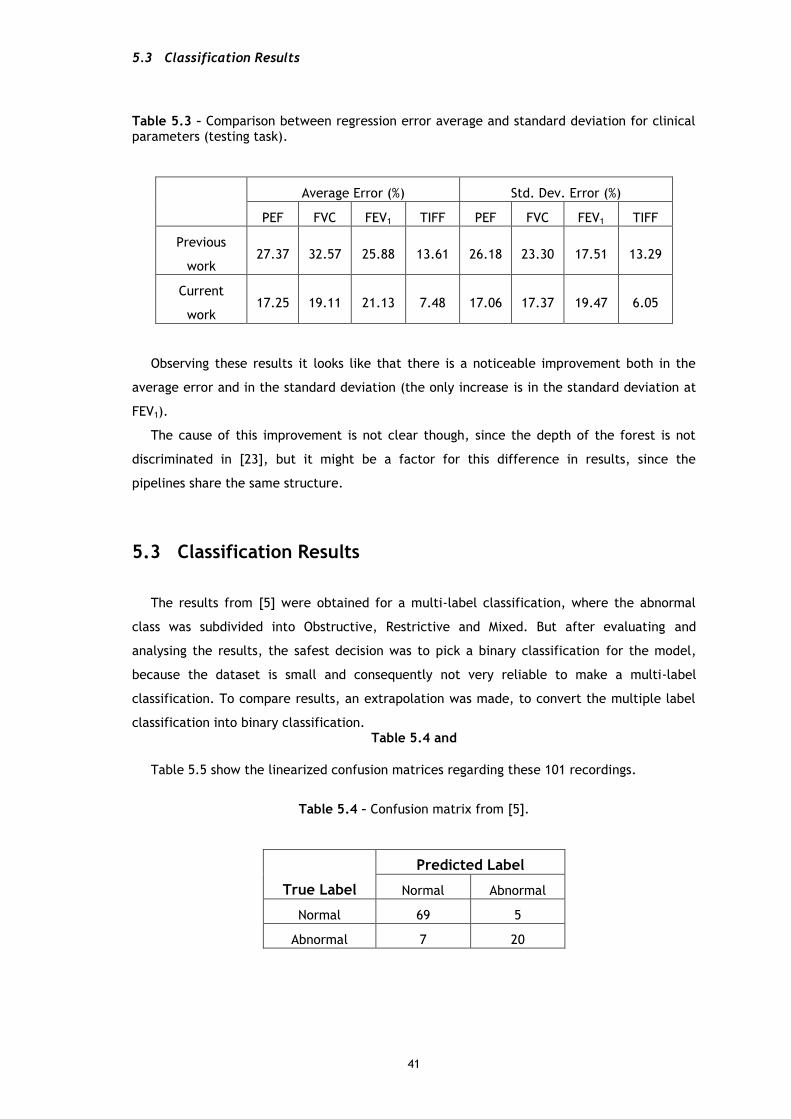
Table 5.3 – Comparison between regression error average and standard deviation for clinical parameters (testing task).
Average Error (%) Std. Dev. Error (%)
PEF FVC FEV1 TIFF PEF FVC FEV1 TIFF
Previous
work 27.37 32.57 25.88 13.61 26.18 23.30 17.51 13.29
Current
work 17.25 19.11 21.13 7.48 17.06 17.37 19.47 6.05
Observing these results it looks like that there is a noticeable improvement both in the
average error and in the standard deviation (the only increase is in the standard deviation at
FEV1).
The cause of this improvement is not clear though, since the depth of the forest is not
discriminated in [23], but it might be a factor for this difference in results, since the
pipelines share the same structure.
5.3 Classification Results
The results from [5] were obtained for a multi-label classification, where the abnormal
class was subdivided into Obstructive, Restrictive and Mixed. But after evaluating and
analysing the results, the safest decision was to pick a binary classification for the model,
because the dataset is small and consequently not very reliable to make a multi-label
classification. To compare results, an extrapolation was made, to convert the multiple label
classification into binary classification. Table 5.4 and
Table 5.5 show the linearized confusion matrices regarding these 101 recordings.
Table 5.4 – Confusion matrix from [5].
Predicted Label
True Label Normal Abnormal
Normal 69 5
Abnormal 7 20
Results and Discussion
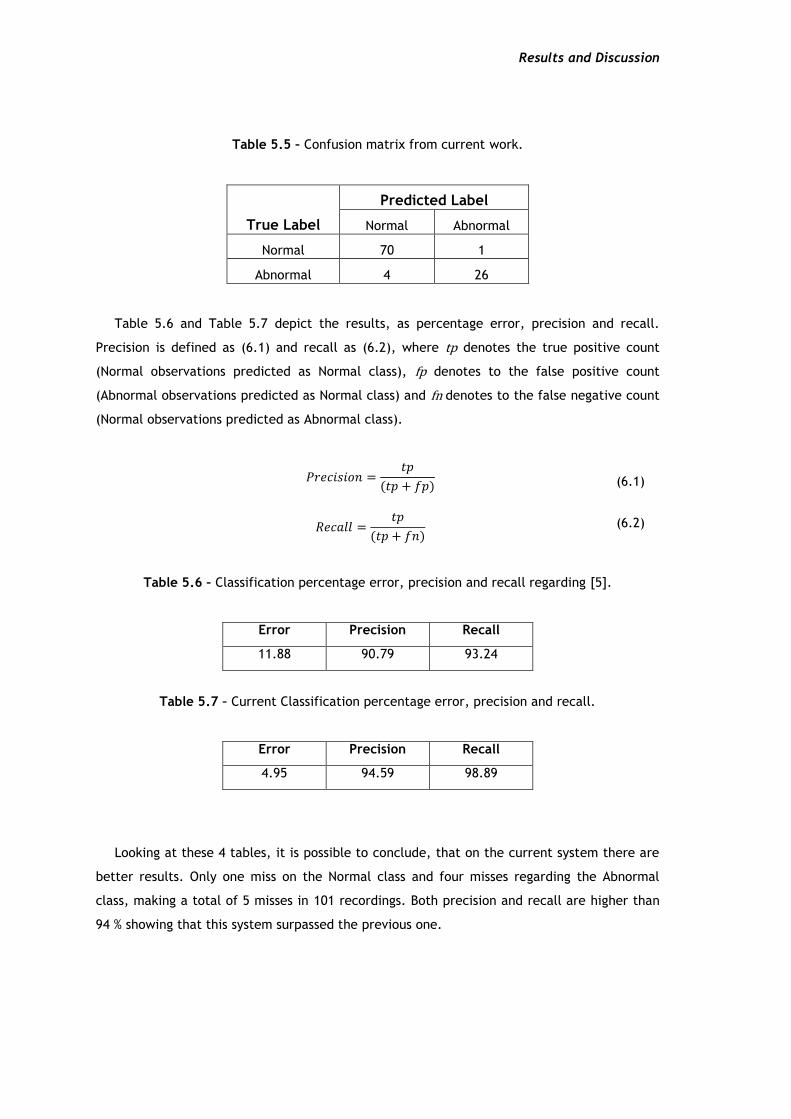
Table 5.5 – Confusion matrix from current work.
Predicted Label
True Label Normal Abnormal
Normal 70 1
Abnormal 4 26
Table 5.6 and Table 5.7 depict the results, as percentage error, precision and recall.
Precision is defined as (6.1) and recall as (6.2), where tp denotes the true positive count
(Normal observations predicted as Normal class), fp denotes to the false positive count
(Abnormal observations predicted as Normal class) and fn denotes to the false negative count
(Normal observations predicted as Abnormal class).
𝑃𝑟𝑒𝑐𝑖𝑠𝑖𝑜𝑛 =𝑡𝑝
(𝑡𝑝 + 𝑓𝑝) (6.1)
𝑅𝑒𝑐𝑎𝑙𝑙 =𝑡𝑝
(𝑡𝑝 + 𝑓𝑛) (6.2)
Table 5.6 – Classification percentage error, precision and recall regarding [5].
Error Precision Recall
11.88 90.79 93.24
Table 5.7 – Current Classification percentage error, precision and recall.
Error Precision Recall
4.95 94.59 98.89
Looking at these 4 tables, it is possible to conclude, that on the current system there are
better results. Only one miss on the Normal class and four misses regarding the Abnormal
class, making a total of 5 misses in 101 recordings. Both precision and recall are higher than
94 % showing that this system surpassed the previous one.
5.4 Usability of the application
43
5.4 Usability of the application
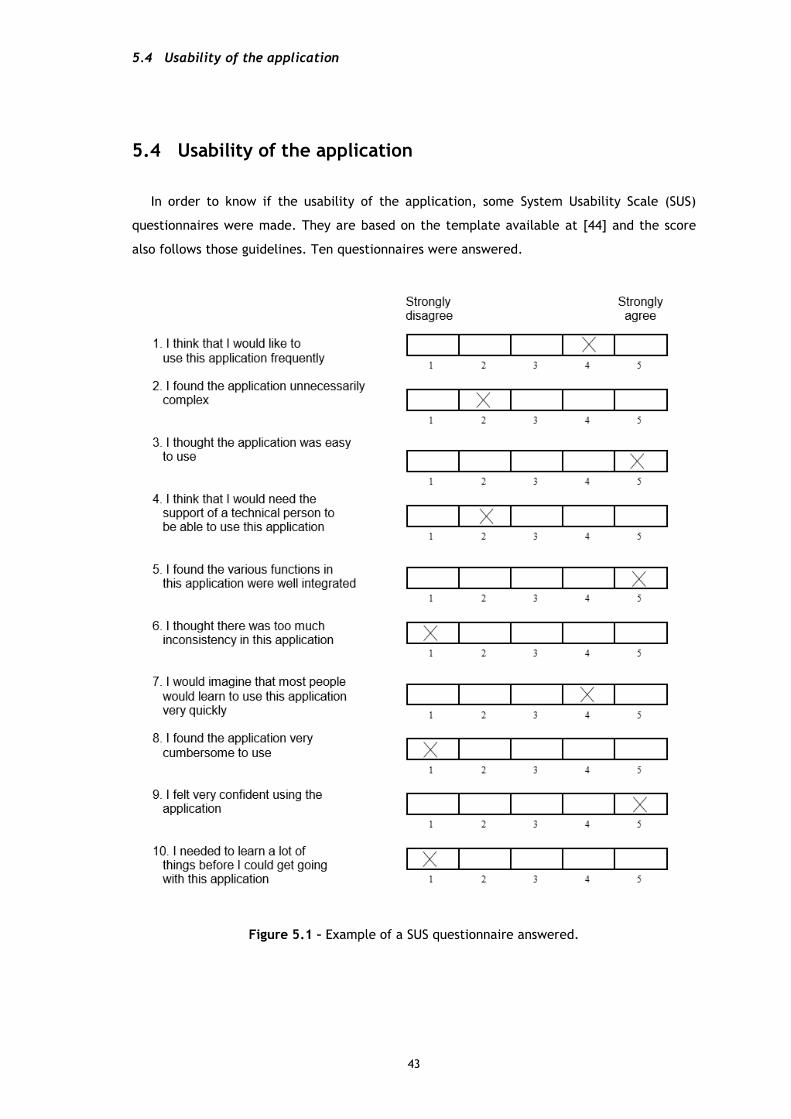
In order to know if the usability of the application, some System Usability Scale (SUS)
questionnaires were made. They are based on the template available at [44] and the score
also follows those guidelines. Ten questionnaires were answered.
Figure 5.1 – Example of a SUS questionnaire answered.

Results and Discussion
This questionnaire (Figure 5.1) would get a score of 90 (in the range of 0 to 100). After
evaluating all the questionnaires, the average score of them is 83. Since above 68 is
considered above average [44], and 83 is much higher than 68, it is safe to say that the
usability of the application is quite good and satisfactory.
45
Chapter 6
Conclusions and Future Work
6.1 Final Conclusions
Asthma is a very common condition, occurring in 5 % to 10 % of the world population. 65
million people have moderate to severe chronic obstructive pulmonary disease (COPD).
Pulmonary diseases affect thousands of people and they need to be prevented and treated
early. Sometimes, in certain locations, the access to doctors and professionals of healthcare
is not simple. People need to be informed earlier of their condition so they can be aware of
their own problem. There are not many solutions available for this type of situation. In the
present, countless persons own electronic devices such as a smartphone, a computer, a
tablet, amongst others. They have the tools and the requirements to be able to use the type
of the solution proposed on this project. Knowing these necessities and knowing that it is
possible to put the solution in practise, the main objective of this work was to create a
mobile application capable of evaluating a person’s lung function by using the smartphone’s
microphone.
Several recordings were evaluated and tested in order to obtain the best possible
combination of signal processing and machine learning methods to output a reliable
diagnosis. The final signal processing system is divided in three distinct phases, pre-
processing, envelope generation and post-processing. In the end, the system classifies the
regressed values, using a 5 fold cross-validation by a Random Forest model. This model
showed an error of 4.95 % at the classification stage, using a binary system consisting on two
possible outcomes, normal state or abnormal. Unfortunately, the application could not be
tested in new patients. That would improve the system (by collecting more samples to
improve the machine learning models) and would help to take more conclusions about the
precision and recall of the system.

Conclusions and Future Work
The application is multi-platform since it is able to run in desktop and mobile
environments. It has proven to be easy to manipulate and use, as the SUS demonstrated. The
application got an average score of 83 out of 100.
The results are overall satisfactory, but the system can be improved. Taking into account
this fact and knowing that the core system is implemented, it incites to continue to go
further in the development.
6.2 Future Work
Despise of the results being promising, there are many sections of this project that can be
improved in the future.
6.2.1 Automatic cropping improvement
The algorithm works well in noiseless environments without any external perturbations.
For instance, in environments with low levels of noise, application produced a cropped signal
where its length was about 6 seconds. The total recording is 8, so it only reduced the
recording by 2 seconds. It is technically impossible to forcefully exhale during so many
seconds, the algorithm needs to be polished for small fluctuations of background noise.
6.2.2 Enhance the speed of the processing
Even though it is not required to have an application running in milliseconds, it is always
better if it performs faster. And on this case the application is slow. The speed could be
improved in several ways. Focusing on the mobile environment (since the desktop shows a
reasonable speed of performance, less than 5 seconds running on Intel Core i5-3450 at 3.10
Ghz), many of the Python code can be optimized by changing some cycles and the way some
functions are implemented. All the feasible code should be “chytonized”, must be
transformed into Cython code to be able to reach C performance level. It is not an easy task
on an ARM environment, but it is possible. As for the boot up time of the application, the
rendering engine should be swapped, to decrease it. Pygame should be changed to SDL2, by
using a new toolchain available in Kivy 1.9.2-dev0 version. This would imply to fix some
problem that might appear during this transition of toolchains.

6.2 Future Work
47
6.2.3 Improve the machine learning models
The learning models are probably the most important improvement of this list. In order to
have reliable classifications it is imperative to have a good dataset with several samples. This
step has a massive role in the outputs. Hopefully, this will be improved in the future.
6.2.4 Implementing breathing exercises in the application
As referred in Literature Review (2.2.2), it would be interesting to have some kind of
exercise for COPD patients. Another button could be created in the home screen, with the
label “Training”. This would get the user to a new screen prompting him to perform several
rehabilitation exercises with the purpose of learning how to get the most air out of every
breath. Maybe even with audio instructions, to be more clear for the patient, since this time,
no signal would be recorded and processed.

48
References
1. Boron, W.F. and E.L. Boulpaep, Medical Physiology, 1st Edition. 2004:
Elsevier Health Sciences.
2. The Global Asthma Report 2014. 2015; Available from:
http://www.globalasthmareport.org/burden/burden.php.
3. What Is COPD? - NHLBI, NIH. 2015; Available from:
http://www.ncbi.nlm.nih.gov/pubmed/.
4. WHO | Burden of COPD. WHO 2011 2011-09-14 17:33:07; Available from:
http://www.who.int/respiratory/copd/burden/en/.
5. Teixeira, J.P.F., Classification of Lung Function on a Smartphone App. Master
Thesis, 2014.
6. Morris, J.F., Spirometry in the Evaluation of Pulmonary Function. Western
Journal of Medicine, 1976. 125(2): p. 110-118.
7. Mottram, C., Ruppel's Manual of Pulmonary Function Testing. 10th ed. 2013.
8. Pierce, R., Spirometry: an essential clinical measurement. Aust Fam
Physician, 2005. 34(7): p. 535-9.
9. Times, N., How to interpret spirometry results. 2011. 107.
10. Frank, D.L., et al., Biofeedback in medicine: who, when, why and how? Ment
Health Fam Med, 2010. 7(2): p. 85-91.
11. Thomas, J., Biofeedback, in Gale Encyclopedia of Mental Disorders. 2003.
12. Breathing Techniques and Exercises for COPD | COPD Foundation. 2015.
13. Application Fundamentals | Android Developers. 2015; Available from:
http://developer.android.com/guide/components/fundamentals.html.
14. Philosophy — Kivy 1.9.1-dev documentation. 2015; Available from:
http://kivy.org/docs/philosophy.html.
15. Qt for Android | Qt 5.5. 2015; Available from: http://doc.qt.io/qt-
5/android-support.html.
16. Architectural overview of Cordova platform - Apache Cordova. 2016;
Available from: https://cordova.apache.org/docs/en/latest/guide/overview/.
17. Larson, E.C., et al., SpiroSmart: using a microphone to measure lung
function on a mobile phone, in Proceedings of the 2012 ACM Conference on
Ubiquitous Computing. 2012, ACM: Pittsburgh, Pennsylvania. p. 280-289.
18. Liang, H., S. Lukkarinen, and I. Hartimo, Heart sound segmentation algorithm
based on heart sound envelogram. Computers in Cardiology 1997, Vol 24, 1997. 24:
p. 105-108.
19. Gupta, C.N., et al., Neural network classification of homomorphic segmented
heart sounds. Applied Soft Computing, 2007. 7(1): p. 286-297.
20. Choi, S. and Z. Jiang, Comparison of envelope extraction algorithms for
cardiac sound signal segmentation. Expert Systems with Applications, 2008. 34(2): p.
1056-1069.
21. Stein, J.Y., Digital Signal Processing: A Computer Science Perspective. 2000:
John Wiley \\& Sons, Inc. 880.

49
22. Savitzky, A. and M.J.E. Golay, Smoothing and Differentiation of Data by
Simplified Least Squares Procedures. Analytical Chemistry, 1964. 36(8): p. 1627-
1639.
23. Teixeira, J.F., et al., Automatic Analysis of Lung Function Based on
Smartphone Recordings, in Biomedical Engineering Systems and Technologies: 8th
International Joint Conference, BIOSTEC 2015, Lisbon, Portugal, January 12-15,
2015, Revised Selected Papers, A. Fred, H. Gamboa, and D. Elias, Editors. 2015,
Springer International Publishing: Cham. p. 390-402.
24. Williams, G., Random Forests, in Data Mining with Rattle and R: The Art of
Excavating Data for Knowledge Discovery. 2011, Springer New York: New York, NY. p.
245-268.
25. Solis, H., Kivy cookbook. 2015.
26. Architectural Overview�” Kivy 1.9.2-dev0 documentation. 2016; Available
from: https://kivy.org/docs/guide/architecture.html.
27. Introduction - Material design - Google design guidelines. 2016; Available
from: https://material.google.com/.
28. Navigation drawer - Patterns - Google design guidelines. 2016; Available
from: https://material.google.com/patterns/navigation-drawer.html.
29. Buttons: Floating Action Button - Components - Google design guidelines.
2016; Available from: https://material.google.com/components/buttons-floating-
action-button.html.
30. Snackbars & toasts - Components - Google design guidelines. 2016; Available
from: https://material.google.com/components/snackbars-toasts.html.
31. Cards - Components - Google design guidelines. 2016; Available from:
https://material.google.com/components/cards.html.
32. Selection controls - Components - Google design guidelines. 2016; Available
from: https://material.google.com/components/selection-controls.html#selection-
controls-radio-button.
33. Text fields - Components - Google design guidelines. 2016; Available from:
https://material.google.com/components/text-fields.html.
34. Buttons - Components - Google design guidelines. 2016; Available from:
https://material.google.com/components/buttons.html#buttons-raised-buttons.
35. Progress & activity - Components - Google design guidelines. 2016; Available
from: https://material.google.com/components/progress-activity.html#progress-
activity-types-of-indicators.
36. NumPy. 2016; Available from: http://www.numpy.org/.
37. scikits.talkbox 0.2.5 : Python Package Index. 2016; Available from:
https://pypi.python.org/pypi/scikits.talkbox.
38. SciPy.org. 2016; Available from: https://www.scipy.org/.
39. AudioLazy Library. 2016; Available from:
https://github.com/danilobellini/audiolazy.
40. Audiostream Library. 2016; Available from:
https://audiostream.readthedocs.io/en/latest/#audiostream.AudioInput.
41. astroML.filters. 2016; Available from:
http://www.astroml.org/_modules/astroML/filters.html.
42. Ensemble methods; scikit-learn 0.17.1 documentation. 2016; Available from:
http://scikit-learn.org/stable/modules/ensemble.html#forests-of-randomized-trees.
43. Using Random Forests�” milk 0.6.1 documentation. 2016; Available from:
https://pythonhosted.org/milk/randomforests.html.
44. Affairs, A.S.f.P., System Usability Scale (SUS). 2013.