Artificial lift methods and business potential of Wellhead ...
105
Transcript of Artificial lift methods and business potential of Wellhead ...


i
EIDESSTATTLICHE ERKLÄRUNG
Ich erkläre an Eides statt, dass ich die
vorliegende Diplomarbeit selbständig und
ohne fremde Hilfe verfasst, andere als die
angegebenen Quellen und Hilfsmittel nicht
benutzt und die den benutzten Quellen
wörtlich und inhaltlich entnommenen Stellen
als solche erkenntlich gemacht habe.

ii
AFFIDAVIT
I hereby declare that the content of this work
is my own composition and has not been
submitted previously for any higher degree. All
extracts have been distinguished using quoted
references and all information sources have
been acknowledged.

iii
Acknowledgement
I would like to thank everybody who helped me along the way. To Professor Herbert
Hofstätter from the Chair of Petroleum and Geothermal Energy Recovery at the Mining
University of Leoben, alongside with Dr. Clemens Langbauer, who were supporting me and
helping me on this thesis.
To my friends and colleagues at the Mining University of Leoben, it is my honour to have met
you all.

iv
Dedication
For my family: none of this would have been possible without you!
Thank you for all the love and support!
v
Kurzfassung
Erdgaskompression ist ein mechanischer Prozess, bei dem ein Volumen Gas gegebenen Drucks, zu einem gewünschten höheren Druck komprimiert wird. Die meisten Anwendungen komprimieren das Erdgas, um es transportabel zu machen. Niederdruck- oder alternde Gasbohrungen erfordern diese Verdichtung um das produzierte Gas in Pipelinesysteme von Gastanks höheren Drucks zu überführen.
Die Kompression am Bohrlochkopf ist notwendig, da über die Lebensspanne einer Öl- oder Gasbohrung gesehen, der natürliche Lagerstättendruck abnimmt, wenn die Reserven gefördert werden. Wenn der natürliche Lagerstättendruck der Bohrung unter den Leitungsdruck des Pipelinesystems bzw. des Gastanks abfällt, welche das Gas auf den Markt bringen, strömt das Gas nicht von selbst in die Pipeline. Kompressoren werden im Feld, als auch in Sammelsystemen angewandt, um das Druckniveau der Bohrung zu erhöhen, damit das Gas auf den Markt gebracht werden kann.
Typischerweise ist eine Verdichtung im Lebenszyklus einer Erdgasförderung mehrmals notwendig: am Bohrlochkopf, an den Sammelleitungen, zu und ab von Gasverarbeitungsanlagen, sowie Gasspeichern, und in Pipelines. Während der Produktionsphase wird der Druck des Erdgases durch Kompression erhöht, sodass Gas in Sammelsysteme oder Pipelines für die Weiterleitung an den Endverbraucher strömen kann. Üblicherweise benötigen diese Anwendungen tragbare, schwach bis mittelstarke Kompressoren nahe oder direkt am Bohrlochkopf. Das stetig abfallende Druckniveau in Erdgasfeldern erfordert eine regelmäßige Modifikation und Variation der Gerätschaften vor Ort.
Diese Arbeit bezieht sich hauptsächlich auf Bohrlochkopf-Kompression an Land, als moderne, künstliche Fördermethoden.

vi
Abstract
Natural gas compression is a mechanical process whereby a volume of gas at an existing pressure is compressed to a desired higher pressure. Most natural gas compression applications involve compressing gas for its delivery from one point to another. Low pressure or aging natural gas wells require compression for delivery of produced gas into higher pressured gas gathering of pipeline systems.
Compression at the wellhead is required because, over the life of an oil or gas well, natural reservoir pressure typically declines as reserves are produced. As the natural reservoir pressure of the well declines below the line pressure of the gas gathering or pipeline system used to transport the gas to market, gas no longer naturally flows into the pipeline. Compression equipment is applied in both field and gathering systems to boost the well’s pressure levels allowing gas to be brought to market. Typically, compression is required several times during the natural gas production cycle: at the wellhead, at the gathering lines, into and out of gas processing facilities, into and out of storage facilities and through the pipeline. During the production phase, compression is used to boost the pressure of natural gas from the wellhead so that natural gas can flow into the gathering system or pipeline for transmission to end-users. Commonly, these applications require portable, low to mid-range horsepower compression equipment located at or near the wellhead. The continually dropping pressure levels in natural gas fields require periodic modification and variation of on-site compression equipment.
This thesis will focus mainly on onshore application of Wellhead Compression as a state of the art artificial lift method.
vii
List of Tables
Table 2-1: Types of compressors [11] .................................................................................. 11
Table 4-1: Group of factors influencing compressor selection [10] ....................................... 47
Table 4-2: Input parameters [29] .......................................................................................... 49
Table 4-3: Reservoir and fluid model ................................................................................... 50
Table 4-4: Reciprocating compressor .................................................................................. 51
Table 4-5: Operating points for naturally flowing gas well - two different flow paths ............. 52
Table 4-6: Rates with the WHC ............................................................................................ 54
Table 5-1: Impact of WHC on ESP's TDH [34] ..................................................................... 64
Table 5-2: Comparison of total production rates by gas lift methods [36] ............................. 72
Table 6-1: Relative advantages of ALSs [16, p.429-430] ..................................................... 78
Table 6-2: Relative disadvantages of ALSs [16, p.431-432] ................................................. 80
viii
List of Figures
Figure 2.1: Production increase by WHC [21, p.21] ................................................................ 3
Figure 2.2: Pressure-volume relationship [19, p.3] ................................................................. 6
Figure 2.3: Fluid density versus pressure for different fluid types [19, p.3] ............................. 6
Figure 2.4: Combination of IPR and VLP [20] ......................................................................... 7
Figure 2.5: Pressure/compressibility factor versus flow rate curve for gas well with
WHC (modified after Hofstätter) [21, p.11] ................................................................ 8
Figure 2.6: Extra well potential with wellhead compression [modified from 9, p.4] .................. 9
Figure 2.7: Entropy - enthalpy diagram of a compression process [17, p.69] ....................... 13
Figure 3.1: Possible pressure losses in complete system [6,p.2] .......................................... 16
Figure 3.2: Vertical Lift Performance [21, p.19] .................................................................... 18
Figure 3.3: Liquid loading of gas wells [26, p.5] .................................................................... 20
Figure 3.4: Vertical oil well flow regimes [25,p.265] .............................................................. 22
Figure 3.5: Effect of GLR [6,p.94] ......................................................................................... 24
Figure 3.6: Effect of water cut on required flowing pressure [6, p.94] ................................... 25
Figure 3.7: Effect of production rate on pressure gradients [6, p.93] .................................... 25
Figure 3.8: Effect of viscosity [6, p.95] .................................................................................. 26
Figure 3.9: Effect of tubing size [6, p.96] .............................................................................. 27
Figure 3.10: Effect of tubing size on minimum production rate [6, p.96] ............................... 27
Figure 3.11: Characteristics of a dissolved-gas drive oil field [7, p.424] ................................ 28
Figure 3.12: Characteristics of a free gas cap expansion drive oil field [7, p.425] ................. 29
Figure 3.13: Characteristics of water-drive oil field [7, p.426] ............................................... 30
Figure 3.14: Liquid transport in a vertical gas well [21] ......................................................... 31
Figure 3.15: Open-hole completion [27,p.26] ....................................................................... 34
Figure 3.16: Cased hole completion [27,p.27] ...................................................................... 35
Figure 3.17: Conventional single-zone completion [27,p.28] ................................................ 36
Figure 3.18: (a) Parallel dual string completion and (b) tubing-annulus completion
[27,p.29] ................................................................................................................. 37
Figure 3.19: Alternate selective completion [27,p.31] ........................................................... 38
Figure 3.20: Tubingless completion. (a) Single zone (b) Multiple zone [27,p.32] .................. 39
Figure 3.21: WHC through tubing and casing [21, p.32] ....................................................... 40

ix
Figure 3.22: WHC through tubing [21, p.32] ......................................................................... 40
Figure 3.23: Artificial lift through tubing and WHC through casing [21, p.32] ........................ 41
Figure 3.24: Artificial lift through tubing and WHC through casing (oil) [21, p.33] ................. 41
Figure 3.25: No WHC possible [21, p.33] ............................................................................. 42
Figure 4.1: Parts of the reciprocating compressor [28, p.10] ................................................ 44
Figure 4.2: The mechanical positive displacement gas compression cycle [18] ................... 45
Figure 4.3: Double-acting piston [28, p.10] ........................................................................... 46
Figure 4.4: Pressure - volume diagram [17] ......................................................................... 46
Figure 4.5: Surface equipment ............................................................................................. 49
Figure 4.6: Naturally flowing gas well through tubing and annulus and through tubing
only ........................................................................................................................ 52
Figure 4.7: Choking a well ................................................................................................... 53
Figure 4.8: Production with WHC - enlarged ........................................................................ 53
Figure 4.9: Compressor power versus gas flow rate ............................................................ 54
Figure 5.1: Naturally flowing well and a well with an artificial lift [14, p.28] ........................... 60
Figure 5.2: IPR curves for different reservoir pressures [2] .................................................. 61
Figure 5.3: Production rate versus Time curve [3] ................................................................ 62
Figure 5.4: Conventional ECP installation [32] ..................................................................... 62
Figure 5.5: Performance curve for ESP ............................................................................... 63
Figure 5.6: Schematic of a beam-pumping system [16, p.458] ............................................. 66
Figure 5.7: Schematic of rod pump operation showing valve action and pressure
responses [35] ....................................................................................................... 67
Figure 5.8: Operation sequence of a rod pump and string labeled on a dynamometer
card [35] ................................................................................................................. 68
Figure 5.9: Influence of WHC on SRP's efficiency [21] ......................................................... 68
Figure 5.10: Configuration of a typical gas lift well [28] ......................................................... 69
Figure 5.11: The unloading process [15, p.51] ..................................................................... 70
Figure 5.12: Pressure relationship in a continuous gas lift [28] ............................................. 71
Figure 5.13: Configuration of a typical progressing cavity pumping system [28] ................... 73
Figure 5.14: Rotor motion in a single-lobe PC pump [16, p.761] .......................................... 74
Figure 5.15: Plunger-lift cycles [16, p.843] ........................................................................... 75
Figure 5.16: The importance of plunger velocity [16, p.869] ................................................. 77
x
Abbreviations
AOF Absolute Open Flow
API American Petroleum Institute
ALS Artificial Lift System
bwpd barrels of water per day
bpd barrels per day
BEP Best Efficiency Point
BCM Billion Cubic Meters
kB Boltzmann constant
BHP Bottom-hole pressure
BHP Break Horsepower
CAPEX Capital Expenditure
cP centiPoise
°R degrees Rankine
°F degress Fahrenheit
ESP Electric Submersible Pump
FTP Flowing Tubing Pressure
FVF Formation Volume Factor
GLV Gas Lift Valves
GOR Gas-oil Ratio
HSE Healt Safety and Environment
HT High Temperature
IPR Inflow Performance Relationship
IOIP Initial Oil In Place
LGR Liquid-to-Gas Ratio
mD miliDarcies
MMBO Million Barrels of Oil
mmscf/d million standard cubic feet per day
OGR oil/gas ratio
OWC Oil-Water Contact
OPEX Operating Expenditure
ppm parts per million
psia pounds per square inch absolute
PI Productivity Index
PCP Progressing Cavity Pump
RPM Revolution Per Minute
SG Specific Gravity
STB/mmscf stock tank barrel per million standard cubic feet
SSSV Subsurface safety valve
TDH Total Dynamic Head
TOC Total Organic Carbon
TCF Trillion Cubic Feet
VLP Vertical Lift Performance
VE Volumetric Efficiency
WGR water/gas ratio

xi
WAT Wax Appearance Temperature
WHC Wellhead Compression

xii
Table of content
1 INTRODUCTION .................................................................................................. 1
2 FUNDAMENTALS ................................................................................................ 3
2.1 Wellhead Compression .................................................................................. 3
2.1.1 Types of fluids and boundary conditions .................................................. 3
2.1.2 Principle of the Vertical Lift Performance ................................................. 7
2.2 Compressors .................................................................................................. 9
2.3 The compression process ............................................................................ 12
3 WELL DESCRIPTION ........................................................................................ 15
3.1 Vertical lift performance ............................................................................... 15
3.2 Influencing parameters on the VLP .............................................................. 22
3.3 Oil well description ....................................................................................... 28
3.4 Gas well description ..................................................................................... 30
3.4.1 Liquid loading ......................................................................................... 31
3.4.2 Depleted gas well description ................................................................ 32
3.5 Types of completions ................................................................................... 33
3.5.1 WHC completions – options gas ............................................................ 39
3.5.2 WHC completions – options oil .............................................................. 41
4 WELLHEAD COMPRESSION TECHNOLOGY ................................................. 43
4.1 Reciprocating compressors .......................................................................... 43
4.1.1 Parts and working principle .................................................................... 43
4.1.2 Selection of the reciprocating compressor ............................................. 47
4.1.3 Limitations of reciprocating compressors ............................................... 48
4.2 PIPESIM simulation for Wellhead Compression .......................................... 49
4.2.1 Building a base model of a naturally flowing gas well ............................ 49
4.2.2 Results of the simulation for a naturally flowing gas well ....................... 51
4.2.3 Influence of the Wellhead Compression ................................................ 53
4.3 Case studies ................................................................................................ 55
4.3.1 Case study 1 – Harms et al., 2004 [4] .................................................... 55
4.3.2 Case study 2 – Harms et al., 2010 [30] .................................................. 56
xiii
4.3.3 Case study 3 – Jain et al., 2015 [31] ...................................................... 57
4.4 HSE aspects ................................................................................................. 58
5 ARTIFICIAL LIFT TECHNOLOGIES .................................................................. 60
5.1 Artificial lift method selection ........................................................................ 61
5.2 Electric Submersible Pump (ESP) ................................................................ 62
5.3 Sucker-Rod Pump (Pump Jack) ................................................................... 65
5.4 Gas Lift ......................................................................................................... 69
5.5 Progressing Cavity Pump (PCP)................................................................... 72
5.6 Plunger Lift ................................................................................................... 75
6 OVERVIEW OF DIFFERENT ARTIFICIAL LIFT TECHNOLOGIES ................... 78
6.1 Application of different systems and their advantages and disadvantages ... 78
6.2 Summary of artificial lift methods .................................................................. 83
7 CONCLUSION .................................................................................................... 86
8 REFERENCES ................................................................................................... 87


Chapter 1 1
1 Introduction
Artificial lift systems are used to lower the producing bottom-hole pressure (BHP) on the
formation to obtain a higher production rate from the well. It can be used to produce flow
from a well in which no flow is occurring or used to increase the production rate from an
already producing well. A majority of oil wells require some sort of artificial lift at some point
in the life of the field and therefore, many gas wells benefit from artificial lift because it takes
liquids off the formation so gas can flow at a higher rate. [16]
Nowadays, more than 95% of producing wells are using some kind of artificial lift. Those are
mostly sucker-rod pumping, electrical submersible pump or gas lift. Because of the great
number of installations it is of major importance that they operate under optimum
conditions.[1] Optimum conditions can imply any arrangement of maximum throughput, fuel
consumption and efficiency, reliability and availability of the equipment needed.
Other artificial lift systems which are going to be covered are PCP, plunger lift and wellhead
compression which is the main focus of this thesis.
As mentioned, artificial lift can be done with a positive-displacement down-hole pump, known
as a beam pump or a progressive cavity pump (PCP), to lower the flowing pressure at the
pump intake. Another way it can be done is with a down-hole centrifugal pump, which could
be a part of an electrical submersible pump (ESP) system. A lower bottom-hole flowing
pressure and higher flow rate can be achieved using gas lift, where the density of the fluid in
the tubing is lowered and expanding gas helps to lift the fluids.
Wellhead compression as an artificial lift alternative uses compressor that lowers the well’s flowing tubing pressure (FTP), increases velocity and allows liquids to be unloaded from the
well. As the liquids are unloaded the hydrostatic head in the tubing is reduced, substantially
decreasing the producing bottom-hole pressure (BHP) resulting in increased production. [4]
Wellhead compression has many benefits and possible applications. It improves the VLP for
oil wells by reducing the annular pressure; and by reducing the wellhead flowing pressure the
productivity of gas wells increases. The IPR is changed only when reservoir properties are
changed. When used with other artificial lift systems, WHC improves efficiency and helps
dewatering of gas wells. As a result, use of WHC can lead to higher recovery factors by
postponing economic limits, higher revenues with more production and less interventions.
In specific cases it can be that the wellhead compression is the preferred and cheapest
method for artificial lift. For instance, if the well is prone to sand production, automatic
intermitting may require expensive periodic sand cleanouts and plunger lift may have poor
reliability. Well that has mechanical issues such as holes in the tubing or any restrictions in
tubing diameter, expensive remedial work may be required to run plunger lift, capillary
strings, siphon strings gas lift or provide access to soap sticks or annular soap injection.
Furthermore, there is a substantial risk that the well’s productivity will be impaired during any remedial operations. Therefore, wellhead compressors have the advantage of not restricting

Chapter 1 2
production with higher friction drop, which can occur with siphon strings, and they provide a
steady flow which is usually easier for downstream facilities to handle than the large rate
swings which occur with intermittent and plunger lift. [4]
Each well requires individual approach and it is rarely the case that one might say there is
one compressor which would be the best for all wells. Therefore, it is an imperative that a fit
for purpose compressor that can be operated at a minimum cost is chosen. Hence, there is
no single unique solution. The ideal compressor should have low installation/capital cost per
horsepower, low maintenance/operating costs, low fuel consumption and considerable
flexibility in terms of rate and pressure. Also reliability is wanted due to a large variety of
wells and locations where these compressors are being installed to and used. [4]
As a result, the never-ending pursuit of operating cost reduction can be translated to the
reduction of energy losses in the artificial lift systems. [1]
Wellhead compression can maximize both production rate and reserves when combined with
any of the other artificial lift methods (if economically viable). Hence, it is of major importance
to consider it as an early step in artificial lift application process rather than the last step. [4]
The main motivation for this thesis is to verify the capabilities of wellhead compression as a
state of the art artificial lift method. Because it can be combined with other artificial lift
methods, wellhead compression is also common artificial lift method because of its ability to
be moved around easily, due to its mobility. Also, low weight and reasonable cost of the
equipment make it a great choice in the long term consideration. Reciprocating compressors
offer excellent reliability when it comes to boosting the well’s production by decreasing the flowing tubing pressure, therefore allowing liquids to be unloaded from the well. In addition,
an overview of other artificial lift methods, proper conclusions and recommendations are
going to be given.

Chapter 2 3
2 Fundamentals
This chapter is briefly going to discuss topics that are going to be further developed in the
following chapters. It will give basic introduction to wellhead compression technology and
how it influences the vertical lift performance. Moreover, it will describe types of fluids as an
important factor when working with reciprocating compressors.
2.1 Wellhead Compression
Reservoir pressure declines as gas fields mature and gas production rates are therefore
reduced. Low reservoir pressure can cause liquid loading and in time, leads to higher
operational costs. In order to enhance the production of those mature gas fields, wellhead
compression is widely used solution to that issue. By introducing compression, the wellhead
pressure is reduced, therefore allowing greater flow rates from the well and minimizing
and/or preventing liquid loading. The application is based on the pressure drop in transport
pipes. [8]
Figure 2.1: Production increase by WHC [21, p.21]
2.1.1 Types of fluids and boundary conditions
Since WHC finds its purpose mainly in gas wells, this chapter is going to describe types of
reservoir fluids. The controlling factor in identifying the type of the reservoir fluid is the
isothermal compressibility coefficient. In general, reservoir fluids are classified into three
groups: [19]
Chapter 2 4
1. Incompressible fluids
2. Slightly compressible fluids
3. Compressible fluids
The isothermal compressibility coefficient c is described mathematically by the following two
equivalent expressions:
In terms of fluid volume: eq. 1 [19, p.2]
= − �� (1)
In terms of fluid density: eq. 2 [19, p.2]
= �� (2)
Where: V = fluid volume, ft3
� = fluid density, lb/ft3
p = pressure, psi-1
c = isothermal compressibility coefficient, ψ-1
Incompressible fluids
An incompressible fluid is defined as the fluid whose volume or density does not change with
pressure. That is shown in the eq. 3 and eq. 4 [19, p.2]:
�� = (3)
�� = 0 (4)
Even though incompressible fluids do not exist, one may assume this behaviour in some
cases to simplify the derivation and the final form of many flow equations. [19]
Slightly compressible fluids
These fluids exhibit small changes in volume, or density, with changes in pressure. Knowing
the volume Vref of a slightly compressible liquid at a reference (initial) pressure pref, the
changes in the volumetric behaviour of this fluid as a function of pressure p can be
mathematically described by integrating eq. 1, to give:
− ∫ �� = ∫ � (5)
exp[c(pref - p)] = �

Chapter 2 5
= exp [ � − � ] (6)
Where: p = pressure, psia
V = volume at pressure p, ft3
pref = initial (reference) pressure, psia
Vref = fluid volume at initial (reference) pressure, psia
The exponential ex may be represented by a series expansion as:
= + � + ! + ! + … + ! (7)
Because the exponent x (which represents the term, � − � ) is very small, the ex term
can be approximated by truncating eq. 7 to:
= + � (8)
Combining eq. 8 and eq. 6 gives:
= [ + � − � ] (9)
A similar derivation is applied to eq. 2, to give:
� = � [ − � − � ] (10)
Where: V = volume at pressure p, ft3
� = density at pressure p, lb/ft3
Vref = volume at initial (reference) pressure pref, ft3
Pref = density at initial (reference) pressure pref, lb/ft3
It should be pointed out that crude oil and water systems fit into this category.
Compressible fluids
These are the fluids that experience large changes in volume as a function of pressure. All
gases are considered to be compressible fluids. The truncation of the series expansion as
given by eq. 8 is not valid in this category and the complete expansion as given by eq. 7 is
used. The isothermal compressibility of any compressible fluid is described by the following
expression:
= − �� T (11)

Chapter 2 6
Where: cg = compressibility of gas, ψ-1
p = pressure, psi-1
Z = compressibility factor
T = absolute temperature, °K or °R
Figure 2.2 and Figure 2.3 show schematic illustrations of the volume and density changes as
a function of pressure for the three types of fluids. [19]
Figure 2.2: Pressure-volume relationship [19, p.3]
Wellhead compression finds its purpose in naturally flowing gas wells where the pressure
difference between the bottom-hole pressure and the wellhead pressure is insufficient for
economically sustainable production and WHC is needed to boost the production. It can also
be used in gas wells which are producing normally but WHC could give even higher
Figure 2.3: Fluid density versus pressure for different fluid types [19, p.3]

Chapter 2 7
production rates. The use of WHC will shift the VLP downwards causing the well to produce
at a higher rate.
2.1.2 Principle of the Vertical Lift Performance
The ability of the reservoir to deliver fluids into the well is presented by the Inflow
Performance Relationship (IPR). It is presented in a standardized manner, with the flowing
bottom-hole pressure on the ordinate of a graph and the corresponding production rate on
the abscissa. This subchapter will give a short introduction to Vertical Lift Performance, while
the thorough description is going to follow in Chapter 3.
Figure 2.4: Combination of IPR and VLP [20]
The ability of the reservoir to deliver into the bottom of a well has to be combined with the
well’s Vertical Lift Performance (VLP). For a required wellhead flowing pressure, pwh, there
exists a corresponding bottom-hole flowing pressure, pwf, which is a function of the
hydrostatic pressure difference and the friction pressure losses. Both of these variables are
related implicitly to the pressure values themselves. Density differences and phase changes
affect both the hydrostatic pressure and the friction pressure drop. For two-phase flow an
increase in the imposed wellhead pressure would result in a proportionately larger increase
in the corresponding bottom-hole pressure, because gas will be re-dissolved, increasing the
density of the fluid in the wellbore. Two-phase flow in the well is common for almost all oil
reservoirs, even if the flowing bottom-hole pressure is above the bubble point. The wellhead
pressure is likely to be significantly below. Thus, it is common to combine single-phase oil
IPR with two-phase VLP. [20]
When installing the WHC, one can reduce the wellhead pressure, which would
proportionately decrease the corresponding bottom-hole pressure. Therefore the Inflow
Performance Relationship of the reservoir would improve, allowing the reservoir to deliver
more fluids at a higher rate. Increasing the flowing gas-liquid ratio (GLR) would result in a
reduction in the bottom-hole pressure. However, there is a limiting GLR where the decrease
in the hydrostatic pressure will be offset by the increase in the frictional pressure drop. [20]
Chapter 2 8
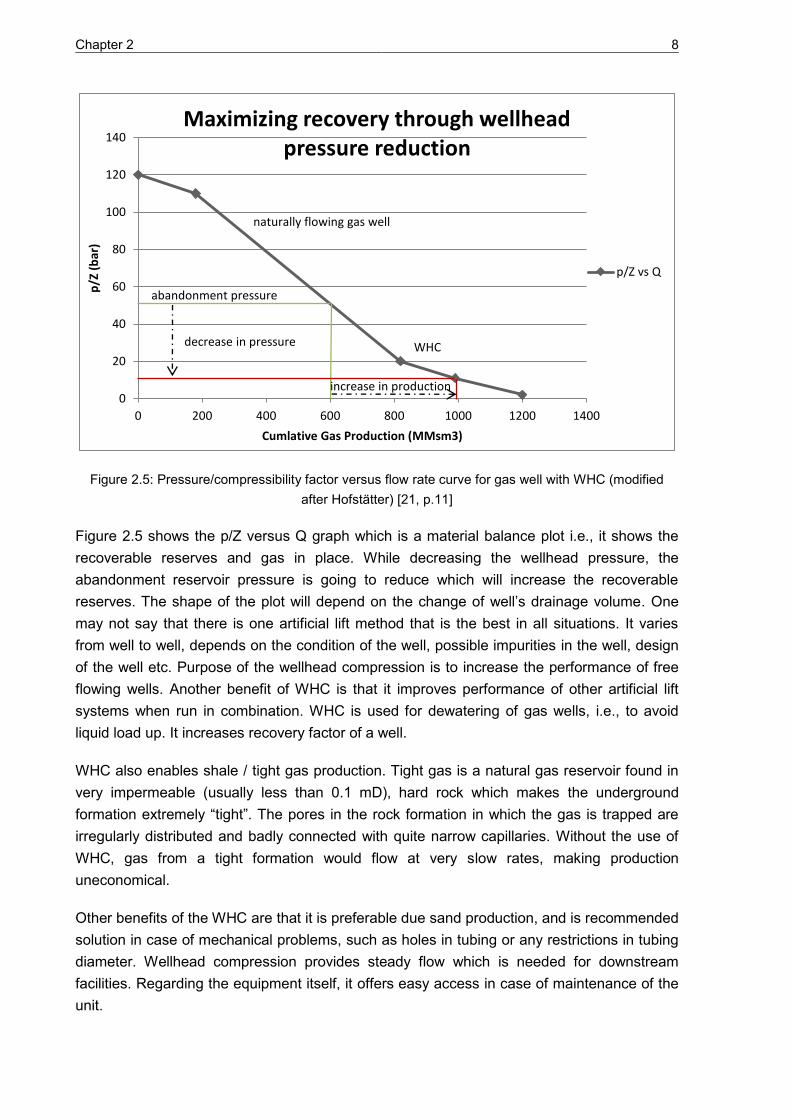
Figure 2.5: Pressure/compressibility factor versus flow rate curve for gas well with WHC (modified
after Hofstätter) [21, p.11]
Figure 2.5 shows the p/Z versus Q graph which is a material balance plot i.e., it shows the
recoverable reserves and gas in place. While decreasing the wellhead pressure, the
abandonment reservoir pressure is going to reduce which will increase the recoverable
reserves. The shape of the plot will depend on the change of well’s drainage volume. One
may not say that there is one artificial lift method that is the best in all situations. It varies
from well to well, depends on the condition of the well, possible impurities in the well, design
of the well etc. Purpose of the wellhead compression is to increase the performance of free
flowing wells. Another benefit of WHC is that it improves performance of other artificial lift
systems when run in combination. WHC is used for dewatering of gas wells, i.e., to avoid
liquid load up. It increases recovery factor of a well.
WHC also enables shale / tight gas production. Tight gas is a natural gas reservoir found in
very impermeable (usually less than 0.1 mD), hard rock which makes the underground
formation extremely “tight”. The pores in the rock formation in which the gas is trapped are irregularly distributed and badly connected with quite narrow capillaries. Without the use of
WHC, gas from a tight formation would flow at very slow rates, making production
uneconomical.
Other benefits of the WHC are that it is preferable due sand production, and is recommended
solution in case of mechanical problems, such as holes in tubing or any restrictions in tubing
diameter. Wellhead compression provides steady flow which is needed for downstream
facilities. Regarding the equipment itself, it offers easy access in case of maintenance of the
unit.
0
20
40
60
80
100
120
140
0 200 400 600 800 1000 1200 1400
p/Z
(b
ar)
Cumlative Gas Production (MMsm3)
Maximizing recovery through wellhead
pressure reduction
p/Z vs Q
naturally flowing gas well
WHC
abandonment pressure
decrease in pressure
increase in production

Chapter 2 9
With all above being said, it is clear that at the end of the day, with proper planning, WHC will
optimize economics. Wellhead compression as well as other artificial lift methods, accelerate
cash flow, generate profits sooner and help realize better returns and results, even in wells
that flow naturally.
Figure 2.6: Extra well potential with wellhead compression [modified from 9, p.4]
2.2 Compressors
Compressors by its purpose in the oil and gas industry, fall into three major categories. First
category is the wellhead compressors which are installed on the well site. These ones lower
the wellhead pressure in order to boost production and by that they influence the VLP but
also the reservoir. The reduction of wellhead pressure lowers the bottom-hole pressure;
therefore reservoir can have more Δp. The operating point within the curve is changed and
that gives more Δp. Second category is the nodal compressors which are installed at a
certain junction where two or more wells meet. These are used to maintain the pressure of
produced gas. Third type is the front end compressors which are installed at the plant site.
They feed the plant with enough pressure to operate it because there is equipment on plant
site that has a minimum pressure threshold values. If plant pressure is not sufficient then the
plant might malfunction. Even though, nodal compressors and front end compressors can
boost production, they will have problems of liquid slugging in long length of pipes. Liquid
slugs offer additional pressure loss as well as provide counter pressure to wells and to plant
compressors.
The compressor is the heartbeat of the natural gas pipeline system. It is a mechanical tool
used to compress gas, in a way that it increases the pressure of a gas by reducing its
0
100
200
300
400
500
600
0 20 40 60 80 100
Ra
te (
MS
CF
D)
% of potential well life
Extra well potential with WHC
Free flow
WHC
free flow
declining flow rate, well dies w/o WHC
WHCExtra production
potential
Chapter 2 10
volume. Compression of a gas naturally increases its temperature, which is known as the
Joule – Thomson effect. Compressed gas will then more easily flow to long distances within
the large trunk pipelines without the drop in pressure.
The Joule-Thomson coefficient relates, at constant enthalpy, the change in temperature per
unit change in pressure as shown in eq. 12: [22]
µ = �� = � � − (12)
Where: µ = Joule-Thomson coefficient, °F/psia (°C/kPa)
�� = Partial derivative of temperature with respect to pressure at constant
enthalpy, °F/psia (°C/kPa)
V = Volume, ft3 (m3)
Cp = Heat capacity at constant pressure, J/kg K
� = Thermal expansion coefficient
T = Temperature, °F (°C)
which can be expressed in differences (considering isenthalpic conditions) as:
µ = �� (13)
where: � = change in temperature, °F
� = change in pressure, psia
Compressors are different to pumps because the gas moves itself through the pipes due to
high pressure being generated, where pumps only push the gas to make it move forward
through the pipes. Because of liquid’s incompressibility, the oil and gas industry does not use compressors for transportation of crude oil or petroleum products. It only uses compressors
to transport high pressurized natural gas.
As shown in the Table 2-1, gas compressors are usually divided into two major types, i.e.,
Positive Displacement type gas compressor and Dynamic type gas compressor.
This thesis is going to focus on reciprocating compressors, as one the most common type of
compressors used in the natural gas industry nowadays. As a positive displacement
compressor, reciprocating compressors are flexible, and are considered to be one of the
most efficient types of compressors. Reciprocating compressors can be single or multi
staged and are able to operate under a wide range of discharge pressures, which may vary
from 100 psi to over 1000 psi. In the natural gas industry, these compressors can range from
50 HP to over 3000 HP. They are usually driven by internal combustion engines. [12]

Chapter 2 11
Table 2-1: Types of compressors [11]
Compressor types
Positive displacement
Dynamic
Rotary Reciprocating
Centrifugal Axial
Lobe Diaphragm
Screw Double acting
Liquid ring Single acting
Scroll
Vane
Positive displacement compressors work on a principle that they draw in the gas through
suction valve and capture a volume of gas in a chamber. Then, they reduce the volume of
the chamber. By reducing the volume of the chamber, the gas will be compressed. Most
common types of positive displacement compressors are:
o Reciprocating compressors: these compressors use the constant motion of pistons to
draw the gas into the cylinder and to compress it.
o Rotary screw compressors: positive-displacement compression is done by matching
two helical screws that, when turned, guide air into a chamber, whose volume is
decreased as the screws turn.
o Vane compressors: use a slotted rotor with varied blade placement to guide air into a
chamber and compress the volume. This type of compressor delivers a fixed volume
of gas at high volume.
Dynamic compressors increase the velocity of gas and then restrict the gas flow so that the
reduction in velocity causes pressure to increase. Common types are axial and centrifugal
compressors.
o Axial compressors: use series of turbine blades (similar in appearance to a jet engine)
to force gas into a smaller and smaller area to increase its pressure.
o Centrifugal compressors: draw in gas to the centre of an impeller, and then
accelerate outward toward its perimeter. There it impinges upon a diffuser plate and
outlet scroll, where velocity decreases and pressure increases.
Reciprocating compressors require lower initial investment and produce high power and high
pressure compressed gas. Also, oil carryover problem is not present. However, the major
disadvantages of a reciprocating compressor are that the reciprocation of the piston causes
strong vibrations and due to lots of moving parts, maintenance cost is high.
The advantage of the rotary screw compressor is that it produces less vibration and
compared to its small size, it can produce high flow rates. On the down side, it is not suitable
for dirty environments, oil carryover problem is present and the life expectancy is short.
Chapter 2 12
Rotary sliding vane compressors require low maintenance due to lower rotating speed and
fewer moving parts. Unlike rotary screw compressors, they are suitable for dirty operating
environments. On the other hand, disadvantages are that they are not suitable for high
pressure application and the oil carryover problem is present.
Centrifugal compressors are suitable for continuous compressed air supply and allow high
power and high pressure compression. Moreover, they allow oil free air output. Major
disadvantages are that the equipment is costly compared to the other types of compressors
and due to high operating speed, quality bearings and sophisticated maintenance programs
are required.
Axial compressors are proven to be very efficient type of compressors with highly
sophisticated compressor technology. However, the disadvantage is the relatively high price.
The performance, that is the capacity (mass of gas compressed) and the power required to
compress the gas, is affected by many details of the compressor’s design. All types of compressors have losses caused by heat transfer, by flow losses and by leakage from the
high pressure to the low pressure zone and some types have losses associated with the
valves. [32]
2.3 The compression process
The fluid, taken in determined conditions p00 and T00 is subsequently accelerated up to the
inlet to the stage where it reaches the conditions defined by thermodynamic state 1. The
acceleration process is accompanied by dissipation phenomena linked to the increase in
speed of the fluid. In flowing along the rotor the fluid undergoes a transformation that brings it
to the conditions p2 and T2. During this phase there is an increment in potential energy per
mass unit of fluid given by: [17]
� , − = ℎ − ℎ (12)
And an increment in kinetic energy per mass unit of fluid given by:
� , − = − (13)
Where: EP = potential energy, J
EK = kinetic energy, J
h = enthalpy, J
S = entropy, J/K
C = residual velocity, m/s

Chapter 2 13
The entropy of the fluid, as it flows through the stage, increases as a consequence of the
dissipation processes involved in compression. In the stator part the kinetic energy of the
fluid is converted into potential energy. The total enthalpy for state 4 can thus be evaluated
as: [17]
ℎ , = ℎ + (14)
The fluid then leaves the stage in the conditions defined by state 4, with residual velocity C4.
Figure 2.7: Entropy - enthalpy diagram of a compression process [17, p.69]
Entropy is known as a measure of the energy of a system that is unavailable for doing useful
work. The idea of entropy provides a mathematical way to encode the intuitive notion of
which processes are impossible, even though they would not violate the fundamental law of
conservation of energy. For instance, compressed gas confined in a cylinder could either
expand freely into the atmosphere if a valve were opened (an irreversible process), or it
could do useful work by pushing a moveable piston against the force needed to confine the
gas. The latter process is reversible because only a slight increase in the restraining force
could reverse the direction of the process from expansion to compression. For reversible
processes the system is in equilibrium with its environment, while for irreversible process it is
not. Boltzmann’s formula (eq.15) shows the relationship between entropy and the number of
ways the atoms or molecules of a thermodynamic system can be arranged: [23]
= �� (15)
Where: = Boltzmann constant equal to 1.38065 x 10⁻²³ J/K
S = entropy, J/K
� = quantity

Chapter 2 14
Enthalpy is the measurement of the total energy in a thermodynamic system. It tells how
much heat it uses at constant pressure. Mathematically, it is the sum of the internal energy of
a system and the work done by or to that system. Work is the product of the system’s pressure and volume. Eq. 16 shows the enthalpy of a homogeneous system which is
proportional to the size of the system: [24]
= + � (16)
Where: H = enthalpy of the system, J
U = internal energy of the system, J
p = pressure, Pa
V = volume, m3
For inhomogeneous systems the enthalpy is the sum of the enthalpies of the composing
subsystems as defined in eq. 17:
= ∑ (17)
Where: k =various subsystems
Chapter 3 15
3 Well description
3.1 Vertical lift performance
Vertical Lift Performance (VLP) describes the pressure losses as the fluid is travelling up the
tubing (Δptubing). A bottom-hole flowing pressure corresponding to the required wellhead
flowing pressure is a function of the hydrostatic pressure difference and the friction pressure
losses. Both values are related implicitly to the pressure values themselves. As shown in
Figure 2.4 in Chapter 2.1.2, the vertical lift performance is combined with the IPR to estimate
the well deliverability. The IPR curve is displayed in the pwf – versus – q plot. For a given
wellhead pressure, the flowing bottom-hole pressure is calculated for each flow rate through
an application of the mechanical energy balance. The intersection of the IPR and VLP curves
gives the expected production rate and the flowing bottom-hole pressure of a certain well.
The VLP curve consists of unstable and stable region (Figure 3.3). The unstable region is the
section starting on the left of the VLP curve and going downwards to the lowest point of the
curve. The unstable region is gravity dominated and it is so because the well is struggling to
start lifting the fluids up the well. It is affected by liquid loading, since there may not be
sufficient momentum to carry out the fluid. The right hand part of the VLP curve, i.e. the one
going from the lowest point of the curve towards right hand side of the plot is known as the
stable region and is referred to as the friction dominated. The point of intersection with the
IPR curve is called the operating point. The VLP curve is mostly largely linear, with a
relatively small slope. The hydrostatic pressure for low GLR fluids would comprise the
overwhelming portion of the pressure gradient in the well. Thus, the frictional pressure drop
would be relatively small and, since it is the only pressure component affected by the flow
rate, the associated VLP curve is likely to be flat. For higher GLR values or for a gas well, the
VLP curve is not expected to be linear.
With the use of WHC, the GOR as well as GLR will increase because when compressing a
certain amount of gas, more gas can be produced from the well. The area that gas occupies
reduces, so more gas could fit into the same space. Therefore, the fraction of gas in the ratio
rises.
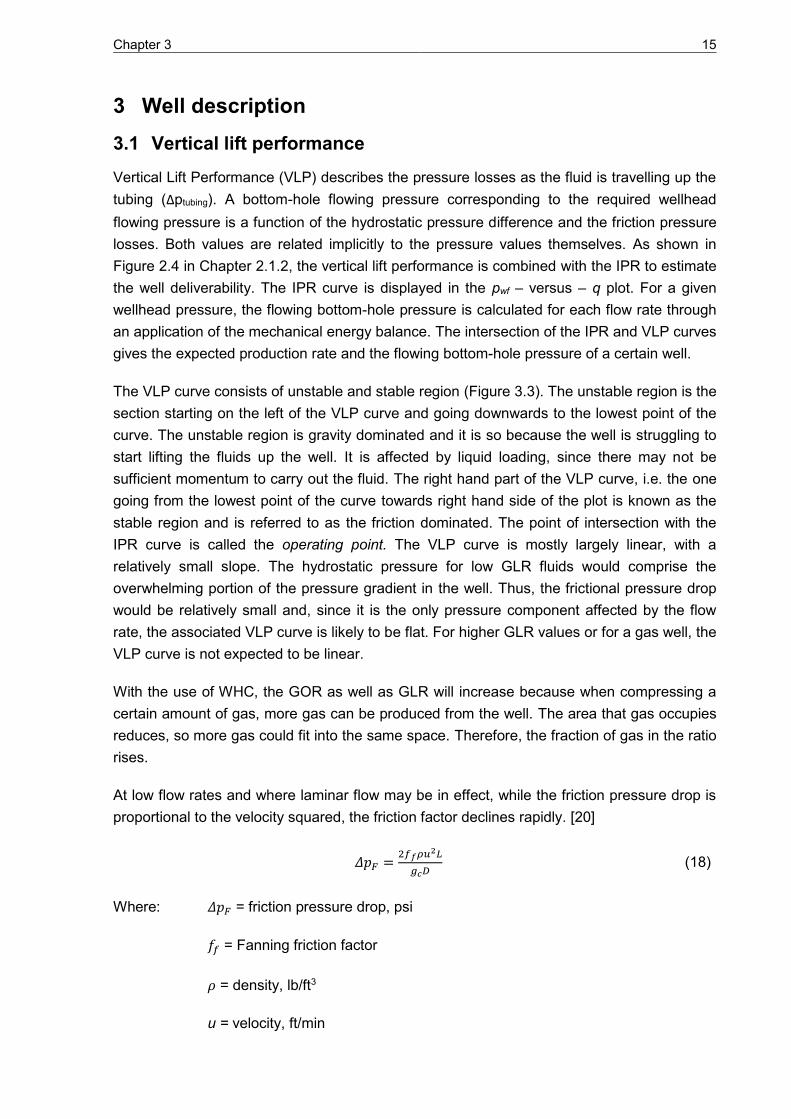
At low flow rates and where laminar flow may be in effect, while the friction pressure drop is
proportional to the velocity squared, the friction factor declines rapidly. [20]
�� = � (18)
Where: �� = friction pressure drop, psi
= Fanning friction factor
� = density, lb/ft3
u = velocity, ft/min

Chapter 3 16
L = length, ft
= compressibility, ψ-1
D = diameter, in
Therefore, there may be a flow rate where the resulting flowing bottom-hole pressure may be
at minimum. Moreover, the shape of the vertical lift performance curve at lower rates may be
affected by liquid accumulation, since there may not be sufficient momentum to carry out the
fluid. That is why the overall composition in the wellbore may be more liquid-like. At
increasing flow rates, or in turbulent flow, the friction factor – versus – Reynolds number (that
is, the rate) relationship is much flatter, resulting in an increase in the frictional pressure drop
and an associated increase in the flowing bottom-hole pressure. [20]
Figure 3.1: Possible pressure losses in complete system [6,p.2]
Pressure losses may occur in either the inflow to the node or the outflow from the node
(Figure 3.3). In many cases, the node pressure will be selected as flowing bottom-hole
pressure, pwf. Calculation of the node pressure for the outflow would then take the following
form: � + �� � + �� ℎ + �� � + �� + �� � � = � (19)
Where: � = separator pressure, psi
�� � = pressure drop in the flowline, psi
�� ℎ = pressure drop in surface choke, psi
Chapter 3 17
�� � = pressure drop in the tubing, psi
�� = pressure drop in the subsurface safety valve, psi
�� � � = pressure drop in any other restriction, psi
All pressure drops are functions of producing rate and the characteristics of the components.
In the case of single-phase flow, either liquid or gas; the pressure drops can be calculated
easily, as long as component characteristics such as pipe size and roughness, are known.
However, most producing gas or oil wells flow under multiphase conditions. That is, some
free gas is going to be produced along with the oil in an oil well, and most gas wells will
produce either water or condensate along with the gas. [6]
Both liquid and gas while being present in the component complicate the pressure loss
calculations immensely. As average pressure existing in a component changes, phase
changes occur in the fluids. This causes changes in densities, velocities, volumes of each
phase, and fluid properties. Also, temperature changes occur for flow in the piping system
and restrictions. This was not a problem in calculating the reservoir performance, since
reservoir temperature remains constant. Calculation of the pressure change with distance, or
pressure gradient, at any point in the system, requires knowledge of the temperature existing
at the point. Therefore, procedures to estimate heat or temperature losses must be available.
[6]
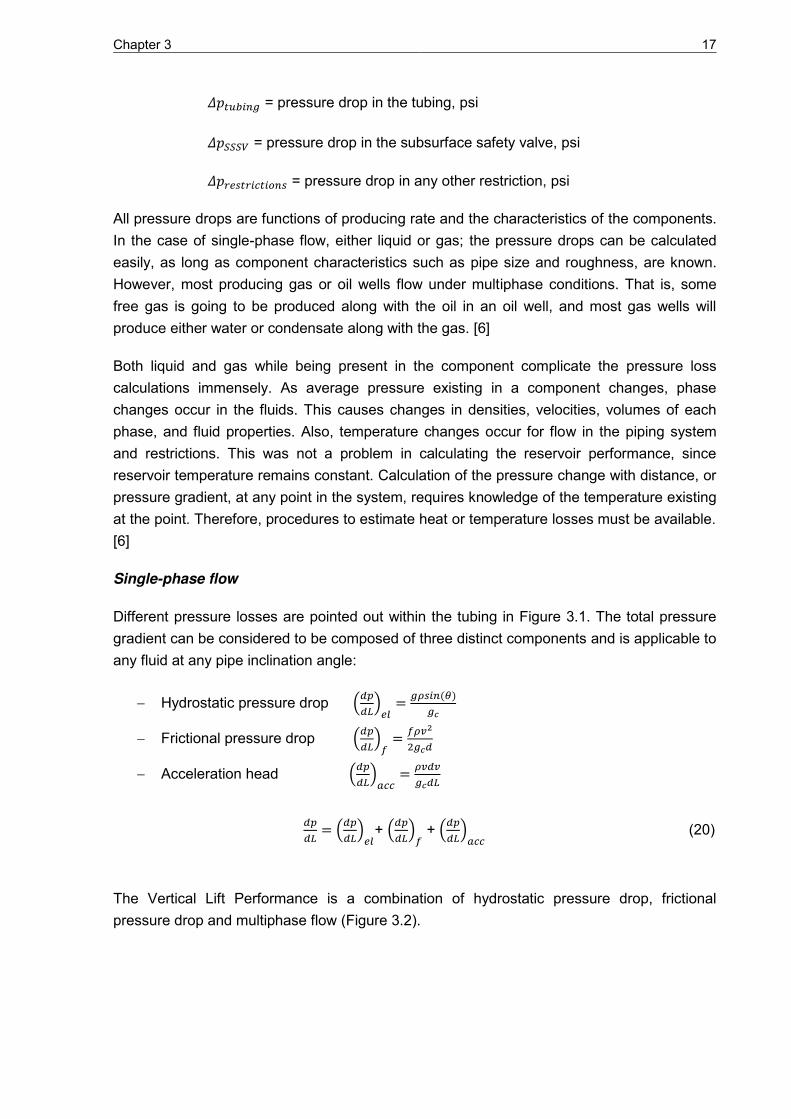
Single-phase flow
Different pressure losses are pointed out within the tubing in Figure 3.1. The total pressure
gradient can be considered to be composed of three distinct components and is applicable to
any fluid at any pipe inclination angle:
Hydrostatic pressure drop = � ��
Frictional pressure drop = �
Acceleration head = �
= + + (20)
The Vertical Lift Performance is a combination of hydrostatic pressure drop, frictional
pressure drop and multiphase flow (Figure 3.2).

Chapter 3 18
Figure 3.2: Vertical Lift Performance [21, p.19]
Equation 20 applies for any fluid in steady state, one-dimensional flow for which , p, and v
can be defined. Definition of these variables causes difficulties in describing two-phase flow.
In two-phase flow, may be a function of other variables besides the Reynolds number and
relative roughness. Some aspects of the pressure gradient equation as it applies to single-
phase flow are discussed to develop a thorough understanding of each component before
modifying it for two-phase flow.
The elevation change or hydrostatic component is the component due to potential energy or
elevation change and is the only component that would apply at conditions of no flow. It is
zero for horizontal flow only. This component applies for compressible or incompressible,
steady state or transient flow in both vertical and inclined pipes. For downward flow, the sine
of the angle is negative, and the hydrostatic pressure increases in the direction of flow.
The friction loss component applies for any type of flow at any pipe angle. It always causes a
drop of pressure in the direction of flow. In laminar flow, the friction losses are linearly
proportional to the fluid velocity. In turbulent flow, the friction losses are proportional to vn,
where 1.7 ≤ n ≤ 2.
The kinetic energy change or acceleration component is zero for constant area,
incompressible flow. For any flow condition in which a velocity change occurs, such as
compressible flow, a pressure drop will occur in the direction of the velocity increase. [6]
Multiphase flow
Presence of a second phase in the flow stream complicates the analysis of the pressure
gradient equation. The pressure gradient is increased for the same mass flow rate, and the
flow may develop a pulsating nature. The fluids may separate because of differences in
densities and flow at different velocities in the pipe. A rough interface may exist between the
liquid and gas phases. Parameters such as velocity, density and viscosity, which are
relatively simple for individual fluids, become very difficult to determine. [6]

Chapter 3 19
The pressure gradient equation, applicable to any fluid flowing in a pipe inclined at a given
angle θ from horizontal, was given as the equation 20.
For two-phase flow the elevation change component becomes:
= � � ��� (21)
Where � is the density of the gas/liquid mixture in the pipe element.
The friction component becomes:
= � (22)
Where , ρ and v are defined differently by different investigators. The friction component is
not analytically predictable except for the case of laminar, single-phase flow. Therefore, it
must be determined by experimental means or by analogies.
The acceleration component is completely ignored by some investigators and ignored in
some flow patterns by others. When it is considered, various assumptions are made
regarding the relative magnitudes of parameters involved to arrive at some simplified
procedure to determine the pressure drop due to kinetic energy change. [6]
The Nodal system analysis is a method that is used to improve the performance of many well
systems. It can be applied to both naturally flowing and artificial lift wells. It is important that
the artificial lift effect on the pressure can be expressed as a function of flow rate. The
procedure consists of selecting a node and dividing the system at this point. It is often the
case that the system is divided between reservoir and piping system. Hence, we get
reservoir dominated part and piping system dominated part. [6]
In nodal analysis, there are curves for inflow (IPR) and outflow (VLP).

Chapter 3 20
Figure 3.3: Liquid loading of gas wells [26, p.5]
Inflow to the node: (upstream components) [6, p.4]
ṗ − �� = � (23)
Outflow from the node: (downstream components) [6, p.4]
� + �� � + �� � + �� � � = � (24)
Where: ṗ = average pressure [psi]
�� = reservoir pressure drop [psi]
� = well flowing pressure [psi]
� = separator pressure [psi]
�� � = flowline pressure drop [psi]
�� � = tubing pressure drop [psi]
�� � � = pressure drop in restrictions [psi]

Chapter 3 21
The oil and gas industry is mostly dealing with the two-phase flow in the system. That is
liquid (water or oil) and gas. Consequently, the two-phase flow system will have the plot of
pressure versus flow rate showing a “J”-shape curve. The reason for that is because it
consists of unstable rate and stable rate.
Many researchers have proposed methods to estimate pressure drops in multiphase flow.
Methods are based on a combination of theoretical, experimental and field observations,
which has led some authors to relate the pressure-drop calculations to flow patterns. Flow
patterns or flow regimes relate to the distribution of each fluid phase inside the pipe. This
implies that a pressure calculation is dependent on the predicted flow pattern. [16]
Talking about oil wells, an assumption that the pressure at the base of the tubing is above
the bubble point has to be made. That way, the flow regime at that point will consist of liquid
phase. Upward movement of the liquid is accompanied by reduced pressure. As the
pressure drops below the bubble point, first gas bubbles begin to form. This is known as the
bubble flow. Formed bubbles tend to slip upward through the rising column of liquid, where
larger bubbles travel more rapidly than the smaller.
As the phase is moving up the tubing and the pressure continues to drop, more gas is being
released and larger bubbles are created. At one point, gas bubbles will fill almost the entire
cross section of the tubing and, as they move upward, they carry slugs of oil between them,
containing small gas bubbles. This is called plug or slug flow. Even though it is the most
efficient natural lift regime because it uses the gas to full effect rather than losing its potential
lifting power to the slippage that occurs during bubble flow, it creates an unstable flow
condition. That is, large fluctuations in both pressure and flow rate occur in the pipe.
Third type of flow that occurs in oil wells is called annular flow. It is created further up in the
tubing where the pressure is even lower, the oil is moving slowly upward in an annular ring
on the inside wall of the tubing and this flow is clearly inefficient.
The last type of flow happens if the tubing is of considerable length so that a large pressure
drop is present from the bottom to the top. The annulus of liquid almost disappears, leaving
only the gas flow carrying a mist of liquid droplets. This mist flow is characteristic for oil wells
with high GOR or GLR. [5,6]

Chapter 3 22
Figure 3.4: Vertical oil well flow regimes [25,p.265]
In gas wells, pressure drop and the critical gas flow are functions of pipe diameter, pipe
profile, fluid properties, liquid-to-gas ratio, temperature etc. If the gas flow rate is above the
critical gas flow rate, the flow is friction-dominated. Frictional pressure drop is the main driver
in creating the total pressure drop. Pressure drop increases as the gas flow rate increases. If
the gas flow rate is below the critical gas flow rate, the flow is then gravity-dominated.
Gravitational pressure drop becomes larger than frictional pressure drop. Therefore, the total
pressure drop increases as the gas flow rate decreases. Also, a caution must be applied to
pipe inclination, because the liquid holdup is very sensitive to pipe inclination. Liquid
accumulates then in the sections as well as the gas causing pressure build-up at upstream.
High upstream pressure pushes accumulated liquid to downstream in a large liquid slug at a
high velocity and it causes the system to be unstable. [6]
3.2 Influencing parameters on the VLP
During the producing life of a well or field many conditions can change that will affect the
well’s flowing performance. Conditions can change from well to well in a field at a given time, and conditions can certainly vary among fields. Some of these variables that can change are:
[8]
gas/liquid ratio, GLR
water cut, w
liquid flow rate, qL
oil or liquid viscosity, µL
tubing size, d.

Chapter 3 23
The pressure gradient equation can be written in a slightly different form before discussing
the changes in individual variables. The acceleration component can be neglected so the
Equation 20 for the two-phase flow can be written as:
= � + � − + �+ (25)
or �� = ( ��) + ( ��)
Where: � = liquid density, lbm/ft3
� = gas density, lbm/ft3
= liquid holdup
C = constant
Gas/liquid ratio
The gas/liquid ratio has the greatest effect on two-phase flowing pressure gradients of all
variables influencing the VLP. It will usually increase with time until late in the life of the
reservoir in a depletion-type field. The GLR may decrease if water cut increases. Its major
influence is on the hydrostatic component of the pressure gradient equation because liquid
holdup , will decrease as GLR increases. Still, the total flow rate is going to increase, and
the friction loss depends on the flow rate squared. That is, as GLR increases,
decreases, but increases. The practical example for this is the gas lift. It increases the
GLR artificially by injecting gas into the tubing string. By doing so, the fluid column density
decreases because there is more gas present in the tubing enabling the oil to flow more
easily up the tubing.
The effects of changing GLR are graphically shown in the Fig. 3.5. It can be seen that as
GLR increases, the required bottom-hole pressure decreases up to a point. As the GLR
increases from 3000 to 5000 scf/STB, the required pwf actually increases. It means that
during that GLR increase, the friction component has increased more than the hydrostatic
component has decreased. [6]
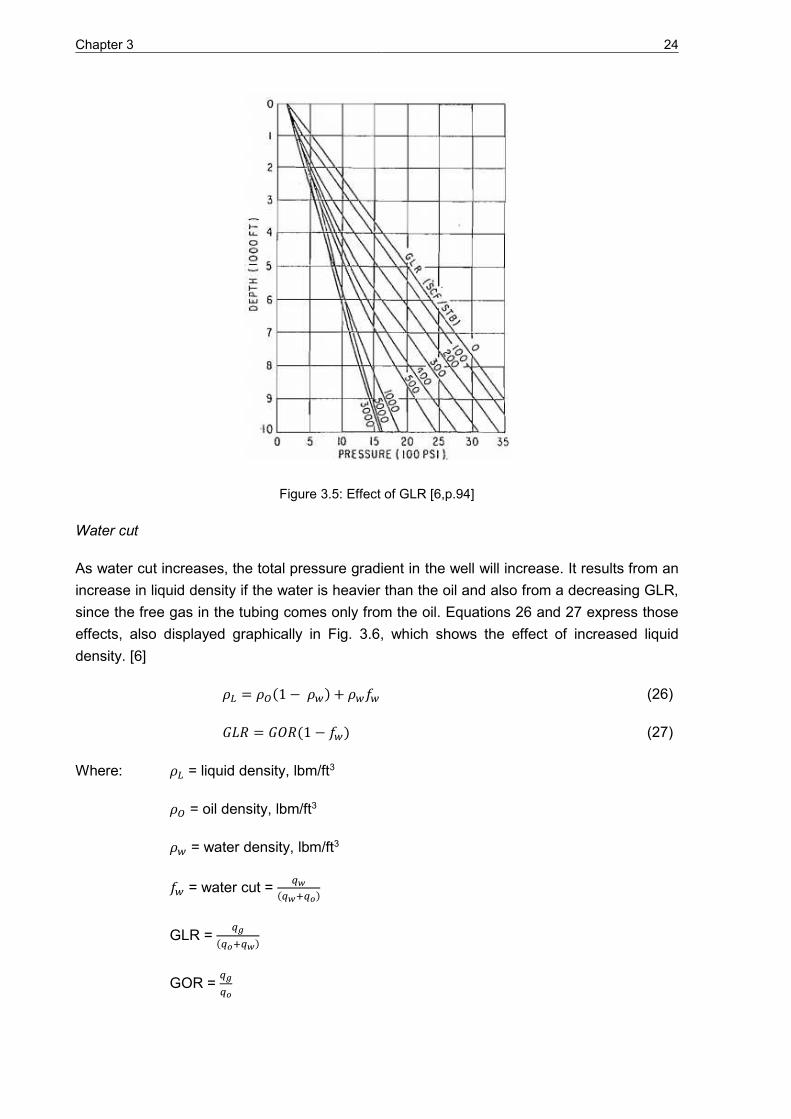
Chapter 3 24
Figure 3.5: Effect of GLR [6,p.94]
Water cut
As water cut increases, the total pressure gradient in the well will increase. It results from an
increase in liquid density if the water is heavier than the oil and also from a decreasing GLR,
since the free gas in the tubing comes only from the oil. Equations 26 and 27 express those
effects, also displayed graphically in Fig. 3.6, which shows the effect of increased liquid
density. [6]
� = � − � + � (26)
� = − (27)
Where: � = liquid density, lbm/ft3
� = oil density, lbm/ft3
� = water density, lbm/ft3
= water cut = ��+
GLR = + �
GOR =
Chapter 3 25
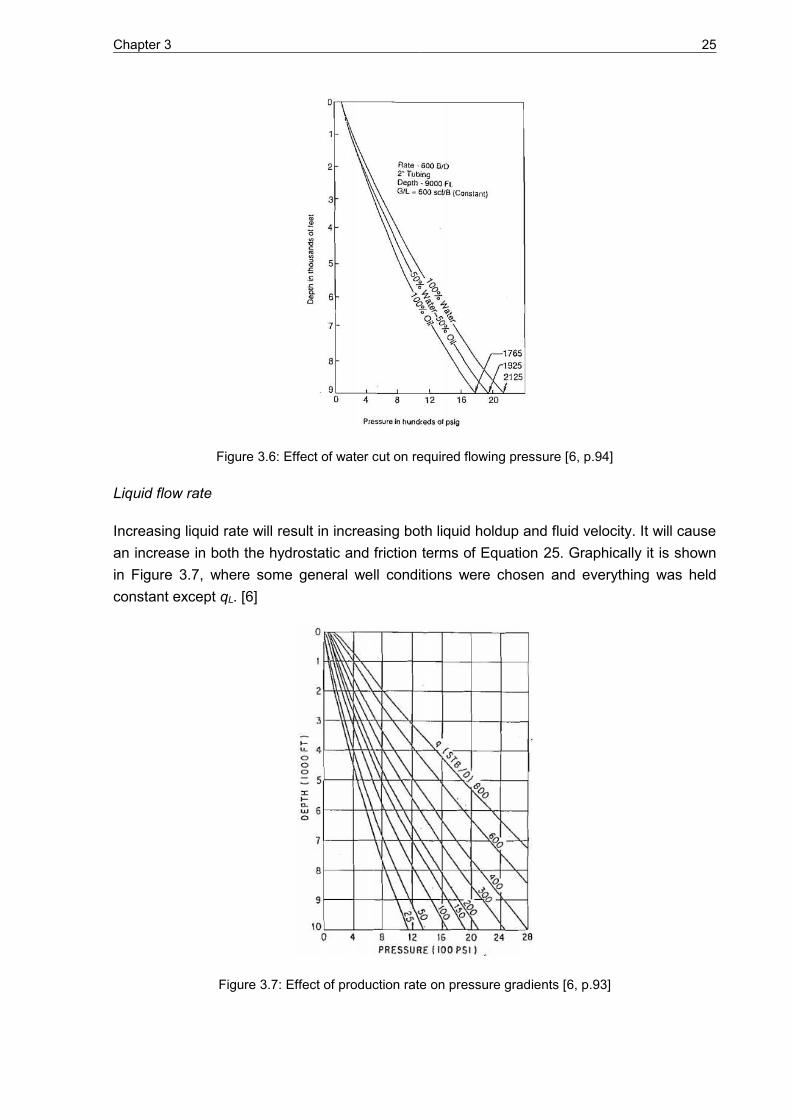
Figure 3.6: Effect of water cut on required flowing pressure [6, p.94]
Liquid flow rate
Increasing liquid rate will result in increasing both liquid holdup and fluid velocity. It will cause
an increase in both the hydrostatic and friction terms of Equation 25. Graphically it is shown
in Figure 3.7, where some general well conditions were chosen and everything was held
constant except qL. [6]
Figure 3.7: Effect of production rate on pressure gradients [6, p.93]

Chapter 3 26
Liquid viscosity
The concept of a gas/liquid mixture viscosity has no physical meaning. The liquid viscosity
will affect HL to some degree and will also increase the shearing stresses in the liquid. That
will cause friction pressure drop. In case of oil/water mixture presence, dispersions or
emulsions may form and cause large increase in the pressure gradient. At the present time,
there is no method to accurately predict the viscosity of an oil/water mixture, much less the
viscosity of a gas/oil/water mixture. The viscosity term is used to calculate a Reynolds
number from which the friction factor is determined. Figure 3.8 shows combined effects of
decreasing API gravity and increasing viscosity for a gas/oil mixture. If water would be
present, the effects might be even more pronounced. [6]
Figure 3.8: Effect of viscosity [6, p.95]
Tubing diameter
One of the most critical and the most neglected tasks of a production engineer is the
selection of the proper tubing size to install in a well. Unfortunately, usually most common
criteria while selecting tubing size will be what has been used in the past or what is at that
point available on the pipe rack. However, in order to select the proper tubing size, a total
system analysis is necessary, which combines the reservoir and piping system performance.
As can be seen from the Equation 25, as the diameter increases, the friction loss and thus
the total pressure gradient will decrease up to a point. But, as the tubing size increases, the

Chapter 3 27
velocity of the mixture decreases and eventually the velocity will be too low to lift the liquids
to the surface. The well is then going to start to load up with the liquids and may ultimately
die. This can be observed qualitatively in the Figure 3.9., for particular tubing size, well
depth, wellhead pressure and GLR, there will exist a minimum production rate that will keep
the well unloaded.
Figure 3.9: Effect of tubing size [6, p.96]
Figure 3.10 shows the effect of tubing diameter on the minimum production rate which is
valuable in determining at what rate a well will begin to load for various tubing sizes. [6]
Figure 3.10: Effect of tubing size on minimum production rate [6, p.96]

Chapter 3 28
3.3 Oil well description
A dissolved-gas, solution-gas, or depletion drive oil reservoir is driven by gas which is
dissolved in the oil. In the subsurface, the oil is under a great pressure and has a
considerable amount of natural gas dissolved in it. When a well is drilled into the reservoir
and production is started, pressure of the oil in the reservoir reduces, and gas can bubble out
of the oil. Expanding gas bubbles in the pores of the reservoir force the oil through the rock
into the well. The expanding volume of oil and rock as the pressure drops also helps the
drive. A dissolved-gas drive reservoir has a very rapid decline in both reservoir pressure and
oil production rate as the oil is produced (Figure 3.11). Because of the rapid reservoir
pressure drop, any flowing wells have to be put on pumps early. Little or no water is
produced during production from this type of reservoir. There is a fast gas/oil ratio increase
near the end of production. A dissolved-gas drive is quite inefficient and will produce
relatively little of the original oil in place from the reservoir. A secondary gas cap located on
the subsurface oil reservoir can be formed by gas bubbling out of the oil. [7]
Figure 3.11: Characteristics of a dissolved-gas drive oil field [7, p.424]
A free gas cap expansion drive oil reservoir is driven by gas pressure in the free gas cap
above the oil. The expanding free gas cap pushes the oil into the wells. Any solution gas
bubbling out of the oil adds additional energy. A free gas cap expansion drive reservoir has a
moderate decline in both reservoir fluid pressure and production rate as the oil is produced
(Figure 3.12). A sharp rise in the gas/oil ratio as the oil is produced from a well shows that
the expanding free gas cap has reached the well, and further oil production will be very
limited from that well. This type of reservoir is best developed with wells producing only from
the oil portion of the reservoir, leaving the gas in the free gas cap to supply the energy.
Usually little or no water is produced. The recovery of oil in place from this type of reservoir is
moderate. [7]

Chapter 3 29
Water drive reservoirs are driven by the expansion of water adjacent to or below the oil
reservoir. The produced oil is replaced in the reservoir pores by water. The water can either
come from below the oil reservoir in a bottom-water drive or from the sides in an edge-water
drive. An active water drive maintains an almost constant reservoir pressure and oil
production through the life of the wells (Figure 3.13). The amount of water produced from a
well sharply increases when the expanding water reaches the well and the well goes to
water. The recovery of oil in place from a water-drive reservoir is relatively high. [7]
Gravity is also a drive mechanism. It is present in all reservoirs, as the weight of the oil
column causes oil to flow down into the well. It is most effective in a very permeable reservoir
with a thick oil column or a steep dip. Gravity drive is common in old fields that have depleted
their original reservoir drive. Down-dip wells will have higher production rates than those of
up-dip wells. In a gravity drainage pool, the rate of oil production is mostly low compared to
other drives, but oil recovery can be very high over a long period of time. [7]
Many oil reservoirs have several reservoir drives and are called combination or mixed-drive
reservoirs. The relative importance of the reservoir drive will change with time during
production. In the later stages of oil production from a dissolved-gas drive reservoir, gravity
drainage becomes significant. The most efficient reservoir drive system is a combination of a
free gas cap expansion and a water drive sweeping the oil from both above and below into
the wells.
The reservoir drive of an oil field can be determined from both the nature of the reservoir and
from production characteristics. Isolated reservoirs that are encased in shale such as
shoestring sandstones and reefs or those cut by sealing faults often have dissolved-gas
drives. If the reservoir has a large free gas cap, it has a free gas cap expansion drive; if not,
it probably has a dissolved-gas drive. Extensive sandstones and other reservoirs that
Figure 3.12: Characteristics of a free gas cap expansion drive oil field [7, p.425]
Chapter 3 30
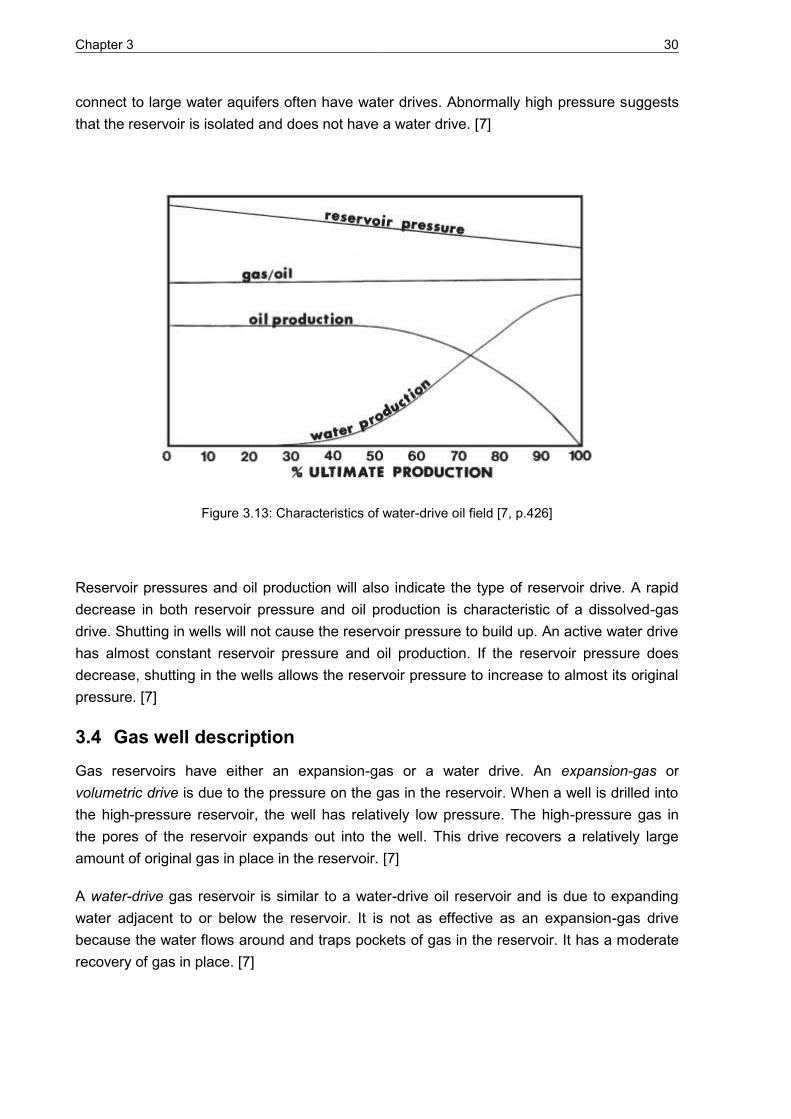
connect to large water aquifers often have water drives. Abnormally high pressure suggests
that the reservoir is isolated and does not have a water drive. [7]
Figure 3.13: Characteristics of water-drive oil field [7, p.426]
Reservoir pressures and oil production will also indicate the type of reservoir drive. A rapid
decrease in both reservoir pressure and oil production is characteristic of a dissolved-gas
drive. Shutting in wells will not cause the reservoir pressure to build up. An active water drive
has almost constant reservoir pressure and oil production. If the reservoir pressure does
decrease, shutting in the wells allows the reservoir pressure to increase to almost its original
pressure. [7]
3.4 Gas well description
Gas reservoirs have either an expansion-gas or a water drive. An expansion-gas or
volumetric drive is due to the pressure on the gas in the reservoir. When a well is drilled into
the high-pressure reservoir, the well has relatively low pressure. The high-pressure gas in
the pores of the reservoir expands out into the well. This drive recovers a relatively large
amount of original gas in place in the reservoir. [7]
A water-drive gas reservoir is similar to a water-drive oil reservoir and is due to expanding
water adjacent to or below the reservoir. It is not as effective as an expansion-gas drive
because the water flows around and traps pockets of gas in the reservoir. It has a moderate
recovery of gas in place. [7]

Chapter 3 31
3.4.1 Liquid loading
Gas wells usually produce with liquid water and/or condensate in the form of mist droplets or
a film along the pipe walls. When the gas velocity is below the critical level, the gas is unable
to lift the liquids and they begin to accumulate in the wellbore, causing the gas to flow
intermittently increasing the flowing bottom-hole pressure, which reduces the gas production
rate. A lower gas production rate implies a lower gas velocity which will ultimately cause the
well to stop producing or die.
Turner droplet model
In gas wells operating in the annular-mist flow regime, liquids flow as individual particles
(droplets) in the gas core and as a liquid film along the tubing wall. If the gas velocity is
above the critical velocity, the drag force lifts the droplet, otherwise the droplet falls and liquid
loading occurs.
Figure 3.14: Liquid transport in a vertical gas well [21]
� = � � − � ∗ (28)
, = � � � � − (29)
Where: g = gravitational constant = 32.17 ft/s2
gc= 32.17 lbm-ft/lbf-s2
d = droplet diameter, in
� = liquid density, lbm/ft3
� = gas density, lbm/ft3
� = drag coefficient
� = droplet projected cross-sectional area, ft2
= gas velocity, ft/s
= droplet velocity, ft/s

Chapter 3 32
When the drag on the droplet is equal to its weight, the gas velocity is at the critical velocity.
Theoretically, at the critical velocity, the droplet would be suspended in the gas stream,
moving neither upward nor downward. Below the critical velocity, the droplet falls and liquids
accumulate in the wellbore. On the other hand, in practice, the critical gas velocity is
generally defined as the minimum gas velocity in the tubing string required to move droplets
upward. The general form of Turner’s equation is given by:
= . 9 � − (30)
Where: = terminal velocity of liquid droplet, ft/s
σ = interfacial tension, dynes/cm
� = liquid phase density, lbm/ft3
� = gas phase density, lbm/ft3
Liquid Loading Velocity Ratio is the minimum lift velocity divided by the fluid velocity. If LLVR
> 1, then it indicates a liquid loading risk because the fluid is flowing at a velocity lower than
the minimum velocity required to lift liquids and prevent loading. It is the highest at the
bottom-hole, where the pressure is the highest and the fluid velocity is lowest. [29]
3.4.2 Depleted gas well description
As the world develops, the need for gas and the overall gas consumption rises in order to
satisfy the demand of economical development. An increasing number of gas fields came to
the middle or late development stages, and most gas reservoirs have low recovery efficiency
due to the low permeability and water drive nature.
A majority of gas reservoirs are featured by low-permeability, water-flooding and low gas
recovery factor. Three types of gas reservoirs are going to be further explained and these
are: low-permeability gas reservoirs, condensate gas reservoirs and edge/bottom-water gas
reservoirs. [13]
Low-permeability gas reservoirs are typically featured by heterogeneity, relatively high shale
content, low porosity and low permeability, high capillary pressure, high water saturation and
complex gas-water distribution. In order to stimulate in low-permeability gas reservoirs, it
involves the whole path from geology to well drilling, well completion, gas reservoir
engineering and reservoir decommission. The main goal of reservoir stimulation is to
enhance well productivity, ultimate recovery factor, and lastly improve economic profits by
increasing reservoir permeability. [13]
Condensate gas reservoirs will suffer from many inevitable issues influencing productivity
and condensate oil recovery factor, such as liquid damage, hydrate blockage, wellbore liquid
loading and gas breakthrough. To develop condensate gas reservoirs, one should consider

Chapter 3 33
the geology, gas reservoir type, condensate oil content and economic indicators.
Condensate gas reservoirs with high condensate oil content, the formation pressure must be
controlled to be greater than dew point pressure to prevent massive loss of condensate oil in
formations. [13]
Edge/bottom-water gas reservoirs are anticline traps and faults are usually well-developed.
They are featured by low porosity, low permeability and strong heterogeneity. They are
mostly classified as active water-invasion gas reservoirs and their development is featured
by low gas recovery rate, rapid production decline and low recovery factor, significant rise of
water-gas ratio, large investment and high cost. [13]
3.5 Types of completions
Completion is used to enable wells to be exploited as rationally and economically as possible
and it can involve a large number of configurations. It is of major importance that one knows
how to choose the completion that is best suited to the problem that needs to be solved.
There is usually no ideal solution, however there are compromises and in most cases the
most economical one possible is chosen. Attention is called to the fact that the solution which
is initially the cheapest is not necessarily the most economical in the long run, if there is a
risk it will lead to costly maintenance work. Furthermore, the opposite extreme should also be
avoided. [27]
Before choosing the right type of completion, certain principles of relativity and anticipation
should be kept in mind: [27]
How do completion and maintenance costs compare to expected profits - It is clear
that a large field which produces high quality oil at high flow rates per well guarantees
greater expenditure than a small one with an uncertain future that does not produce
particularly commercial oil.
How does a possible money-saving measure compare with the risks it implies - That
is, is a given risk worth taking, given the foreseeable financial consequences and the
probability that something will go wrong
How will the production of the field and of the given well evolve in theory - The type of
completion chosen must either be adapted from the outset to the way production will
proceed or be capable of easy modification to meet future changes. The worst
mistake, the one that must be avoided, is to end up in a situation that has no solution.
Even though there are many requirements for a completion to fulfil, each type of completion
must be able to solve basic requirements as follows: [27]
Maintain borehole wall stability
Ensure selective production of the fluid or formation
Ensure well safety
Create a minimum amount of restrictions in the flow path
Allow the well flow rate to be adjusted

Chapter 3 34
Allow operations to be performed on the well at a later date without having to resort to
workover
Make workover easier when it does become necessary
Two main types of completions between the pay zone and the borehole are open hole-
completions (Fig. 3.15) and cased-hole completions (Fig. 3.16).
Open-hole completions
In open-hole completions the pay zone is drilled after a casing has been run in and cemented
at the top of the reservoir. It is left as it is and produces directly through the uncased height
of the borehole. This solution cannot solve problems of borehole stability or selectivity of fluid
or level to be produced. This type of completions are used where there is only one zone
which is either very well consolidated or provided with open-hole gravel packing for sand
control. This is valid as long as there are no interface problems, at least in theory. This is the
reason why open-hole completions are rarely chosen for oil wells. A water-oil or oil-gas
interface is frequently present from the beginning or later on. The oil-gas interface is even
more serious due to the high mobility of gas as compared to oil. However, open-hole
completions may be suited to a gas well. The considerable mobility contrast between the gas
and the liquids is preferable and provides natural selectivity to produce mainly the gas. It
should be pointed out that the accumulation of liquids in the well has a very adverse effect on
the well’s flow capability. [27]
Figure 3.15: Open-hole completion [27,p.26]
Cased-hole completions
As the pay zone has been drilled, a casing, or a liner in some cases, is run in and cemented
opposite the layer. Then it is perforated opposite the zone that is to be produced in order to
restore a connection between the reservoir and the well. The perforations will have to go
through the casing and the section of cement before they penetrate the formation. The
preceding drilling phase was stopped just above the reservoir or at some distance above it
and an intermediate casing was then run in and cemented. Benefit of this type of completion

Chapter 3 35
is that it gives better selectivity for levels and produced fluids, since perforations can be
placed very accurately in relation to the different levels and interfaces between fluids.
Cased-hole completions are mostly used when there are interface problems and/or when
there are several levels. As a result, they are not only much more common, but they are the
most widespread type of completion. [27]
Figure 3.16: Cased hole completion [27,p.27]
Conventional completions are methods where one or more production strings (tubing) are
used for safety and other reasons. The main characteristic of the tubing is that it is located
completely inside the casing and that it is not cemented, therefore easy to replace.
Single-zone completion
The well is here equipped with single tubing. Two main types of single-zone completion are
distinguished depending on whether the tubing has a production packer on its lower end (Fig.
3.17). The production packer provides a seal between the casing and the tubing, which
isolates and protects the casing.
Single-zone completions without the packer are used when the only goal is to have the right
pipe diameter with respect to the flow rate. That is, to obtain enough velocity to lift the heavy
part of the effluent (water or condensate in a gas well) but not too much in order to limit
pressure drops, thereby minimizing energy consumption. They may sometimes be
considered as a variation on single-zone tubingless completion, since the hanging tubing has
more of a repair and maintenance function. They may be suitable for wells that produce a
fluid that causes no problems at a very high flow rate. The well is then produced through the
tubing and the annulus.
Single-zone completions with the production packer are the most widely used because of the
safety provided by the packer (government and company rules and regulations increasingly
point out that a packer is to be used particularly offshore in conjunction with a subsurface

Chapter 3 36
safety valve on the tubing. Also, they are relatively simple in comparison to multiple or other
types of completion, in terms of installation, maintenance and workover. [27]
Figure 3.17: Conventional single-zone completion [27,p.28]
Multiple-zone completions
Multiple-zone completions allow several levels to be produced in the same well at the same
time but separately, that is through different strings of pipe. Double-zone completions are the
most common, but there can be three, four and even more levels produced separately.
However, this significantly complicates the equipment that needs to be run into the well and
especially makes any workover operations much more complex.
Figure 3.18 (a) shows parallel dual string completion with two tubings, one for each of the
two levels and two packers to isolate the levels from one another and protect the annulus.
Figure 3.18 (b) displays tubing-annulus completion with one, single tubing and one packer,
which is located between the two levels that are to be produced, with one level produced
through the tubing and the other through tubing-casing annulus.

Chapter 3 37
Figure 3.18: (a) Parallel dual string completion and (b) tubing-annulus completion [27,p.29]
This type of completion allows the development of several levels with fewer wells, and is
therefore faster. But, maintenance and workover costs are higher. Therefore, it is particularly
advantageous offshore where drilling itself and the space required for a well site, are quite
costly. It should be pointed out that the ideal completion is the simplest. It will entail the
simplest operations in terms of installation, maintenance and workover.
Tubing-annulus completions are very few and far between. Even though they have good flow
capability (large cross sections are available for fluid flow), this system does not protect the
casing, among other drawbacks. [27]
Alternate selective completions
The idea in this type of completion is to produce several levels in the same well separately
but one after the other through the same tubing without having to resort to workover (Fig.
3.19). Production alternates in fact and wireline techniques are used to change levels.
It is especially suited to a situation where one of the two levels is a secondary objective
which would not warrant drilling a well (very rapid depletion, simple observation from time to
time, etc.).
Beside packers, this method requires extra down-hole equipment such as:
A circulating device consisting of a sliding sleeve to open or obstruct communication
ports between the inside of the tubing and the annulus
A landing nipple allowing a plug to be set in the well

Chapter 3 38
Figure 3.19: Alternate selective completion [27,p.31]
Parallel tubing string and alternate selective completion systems can be combined. For
example two parallel tubings, each equipped for two levels in an alternate selective manner,
can produce four levels separately, provided that only two are produced at the same time.
Tubingless completions
A tubingless completion uses no tubing, but production flows through a cemented pipe
instead. This rather unusual type of completion is mainly used in certain regions and only
under specific conditions.
Figure 3.20 (a) shows single-zone tubingless completion where production flows directly
through a casing, usually of large diameter. Wells that are big producers of trouble-free fluids
can be exploited in this way with minimum pressure losses and the lowest possible initial
investment. This system is found particularly in the Middle East.
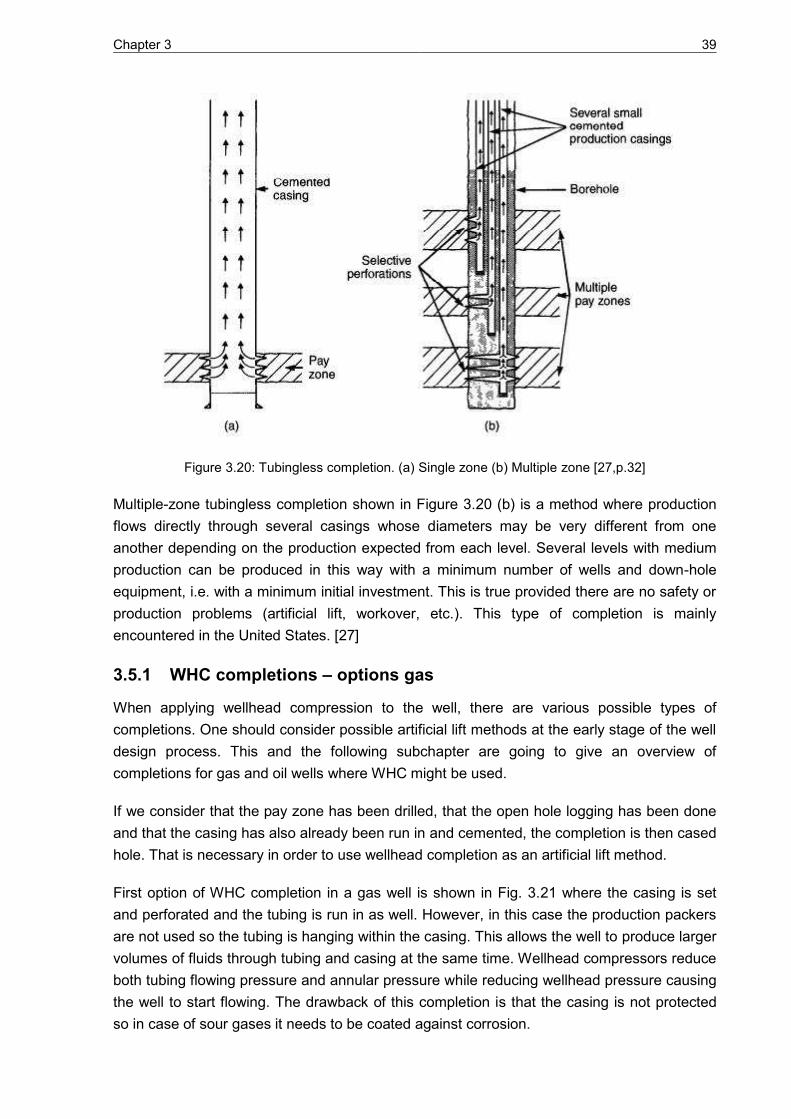
Chapter 3 39
Figure 3.20: Tubingless completion. (a) Single zone (b) Multiple zone [27,p.32]
Multiple-zone tubingless completion shown in Figure 3.20 (b) is a method where production
flows directly through several casings whose diameters may be very different from one
another depending on the production expected from each level. Several levels with medium
production can be produced in this way with a minimum number of wells and down-hole
equipment, i.e. with a minimum initial investment. This is true provided there are no safety or
production problems (artificial lift, workover, etc.). This type of completion is mainly
encountered in the United States. [27]
3.5.1 WHC completions – options gas
When applying wellhead compression to the well, there are various possible types of
completions. One should consider possible artificial lift methods at the early stage of the well
design process. This and the following subchapter are going to give an overview of
completions for gas and oil wells where WHC might be used.
If we consider that the pay zone has been drilled, that the open hole logging has been done
and that the casing has also already been run in and cemented, the completion is then cased
hole. That is necessary in order to use wellhead completion as an artificial lift method.
First option of WHC completion in a gas well is shown in Fig. 3.21 where the casing is set
and perforated and the tubing is run in as well. However, in this case the production packers
are not used so the tubing is hanging within the casing. This allows the well to produce larger
volumes of fluids through tubing and casing at the same time. Wellhead compressors reduce
both tubing flowing pressure and annular pressure while reducing wellhead pressure causing
the well to start flowing. The drawback of this completion is that the casing is not protected
so in case of sour gases it needs to be coated against corrosion.

Chapter 3 40
Figure 3.21: WHC through tubing and casing [21, p.32]
Second option when producing gas with the assistance of WHC is to install the production
packer so that the casing is isolated and protected from corrosion from produced fluids and
high pressures (Fig. 3.22). This type of completion will only allow the gas to be produced
through the tubing; there will be no flow in the annulus. Benefits of production packer are
numerous. Produced fluids and pressures are contained within the wellbore, so alongside
with the casing, other formations above or below the producing zone are also protected.
Another important property of a packer is that it prevents down-hole movement of the tubing
Figure 3.22: WHC through tubing [21, p.32]
string and also supports some of the weight of the tubing. As the basis of the cased-hole
completion design, the production packer will limit well control to the tubing at the surface for
safety purpose and it would hold well-servicing fluid in the casing annulus.

Chapter 3 41
Figure 3.23: Artificial lift through tubing and WHC through casing [21, p.32]
Wellhead compression can be used in compliance with other artificial lift methods as shown
in Figure 3.23. In this case, tubing will be run without production packer. That way, other
artificial lift method will lift the water or condensate through the tubing; where WHC is going
to lift the gas through annulus.
3.5.2 WHC completions – options oil
Wellhead compression finds its purpose mostly in gas wells, where it can be used alone as
the only artificial lift method or in combination with other artificial lift methods.
Figure 3.24: Artificial lift through tubing and WHC through casing (oil) [21, p.33]
The situation is a bit different in the oil wells. Here, the WHC is used to assist other artificial
lift methods by lifting the gas coming out of the oil. It cannot be used alone.
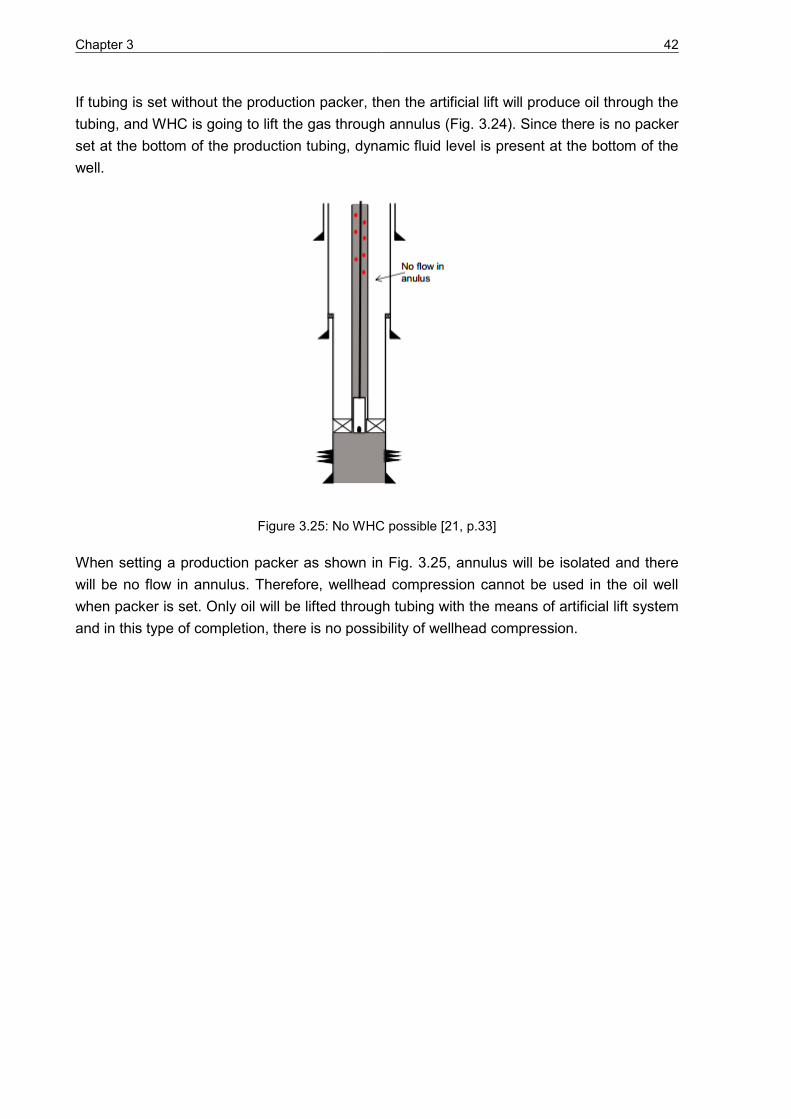
Chapter 3 42
If tubing is set without the production packer, then the artificial lift will produce oil through the
tubing, and WHC is going to lift the gas through annulus (Fig. 3.24). Since there is no packer
set at the bottom of the production tubing, dynamic fluid level is present at the bottom of the
well.
Figure 3.25: No WHC possible [21, p.33]
When setting a production packer as shown in Fig. 3.25, annulus will be isolated and there
will be no flow in annulus. Therefore, wellhead compression cannot be used in the oil well
when packer is set. Only oil will be lifted through tubing with the means of artificial lift system
and in this type of completion, there is no possibility of wellhead compression.

Chapter 4 43
4 Wellhead compression technology
By definition, compressors are used to compress a substance in a gaseous state. Liquid can
be compressed so small that compared to gas, its compressibility is negligible. Compressors
are used to compress a wide range of gases over a wide range of conditions. As mentioned
in the Chapter 2, compressors are divided into two main categories: Positive displacement
and Dynamic type compressors. Common types of compressors in the oil and gas industry
are screw, centrifugal and axial types of compressors. However, the focus of this thesis is on
reciprocating compressors; therefore, they are going to be described in this chapter.
4.1 Reciprocating compressors
Reciprocating compressors are positive displacement type compressors who achieve
compression through the reduction of the compression chamber volume. In other words, it is
a piston in a cylinder. They suck natural gas from the suction manifold and then piston which
is driven in a reciprocating motion by the crankshaft moves the natural gas to a cylinder,
better known as a compression cylinder. The whole process is powered by an internal
combustion engine and in some cases by an electrical motor.
4.1.1 Parts and working principle
The major components of the Reciprocating Compressor are (Figure 4.1):
Cylinder
Frame
Distance piece
Crankshaft
Piston
Bearings
Compressor Valves
Rods
Crosshead
Reciprocating compressor compresses gas in a cylinder using a piston. In a way,
reciprocating compressors are like automobile engines. The pistons are directly driven
through a wrist pin and connecting rod from a crankshaft. Depending on their size,
reciprocating compressors may have one or more cylinders. Multiple cylinders may be
arranged in line, opposed or in a “V”.
Figure 4.2 demonstrates the mechanical positive displacement gas compression cycle within
the cylinder which is described in detail as follows. In each cylinder, reciprocating
compressors have both a suction valve and a discharge valve. These valves give the
compressor its ability to pump the gas against the pressure difference. They are usually
located in the head of the cylinder, in passages connected to the high or low pressure side of
the system.

Chapter 4 44
Figure 4.1: Parts of the reciprocating compressor [28, p.10]
Starting with the piston at the top of its stroke or at the top dead centre, the piston begins to
move downward as the crankshaft rotates. Because both valves are closed, the downward
moving piston reduces the pressure in the cylinder. As the pressure in the cylinder falls
below the low side pressure in the suction line, the pressure difference opens the suction
valve letting gas flow into the cylinder. The piston continues down and pulls in more gas until
the cylinder is filled with the low pressure gas at the bottom of its stroke. Once passed
bottom dead centre, the piston begins its upward stroke. The suction valve closes. As the
piston moves up, it reduces the volume of the space in the cylinder increasing the pressure
of the gas. When the pressure in the cylinder exceeds the high side pressure in the
discharge line, the pressure difference pushes the discharge valve open, letting the
compressed gas flow out of the cylinder. This continues until the piston reaches the top of its
stroke and most of the compressed gas has been expelled into the discharge line. When the
piston begins its downward stroke, the discharge valve closes. The complete cycle then
repeats during each revolution of the crankshaft.
Within the compressor there are 2 types of rods – piston rod and connecting rod. A piston
rod joins piston to the crosshead. The crosshead converts the rotary motion of the crankshaft
into the back and forth motion of the piston. The crosshead must be held in very close
tolerance to the crosshead guides to ensure horizontal level motion of the piston.

Chapter 4 45
Figure 4.2: The mechanical positive displacement gas compression cycle [18]
The mechanical gas compression cycle described above was described for the single acting
piston. Other possibility is a double acting piston which works the same with one difference
and that is that on the back motion of the piston it also compresses gas. This portion of gas
is being sucked in and discharged from the other set of suction/discharge valves.
The pressure exerted from the piston acting within the cylinder can be expressed with the eq.
28 as follows:
� = (28)
Where: p = Pressure [Pa]
F = Force [N]
A = Area of the piston compressing the gas [m2]
One can tell that if the area reduces while maintaining the same amount of force, the
pressure is going to increase. That is exactly what happens in double acting piston on its
back motion. The area of the piston that can compress the gas is reduced due to the rod
volume being present, but the force is the same just as it is on the forth motion (Figure 4.3).
That is, in the double acting compressor, greater pressure is exerted on the back than on the
forth motion of the piston.
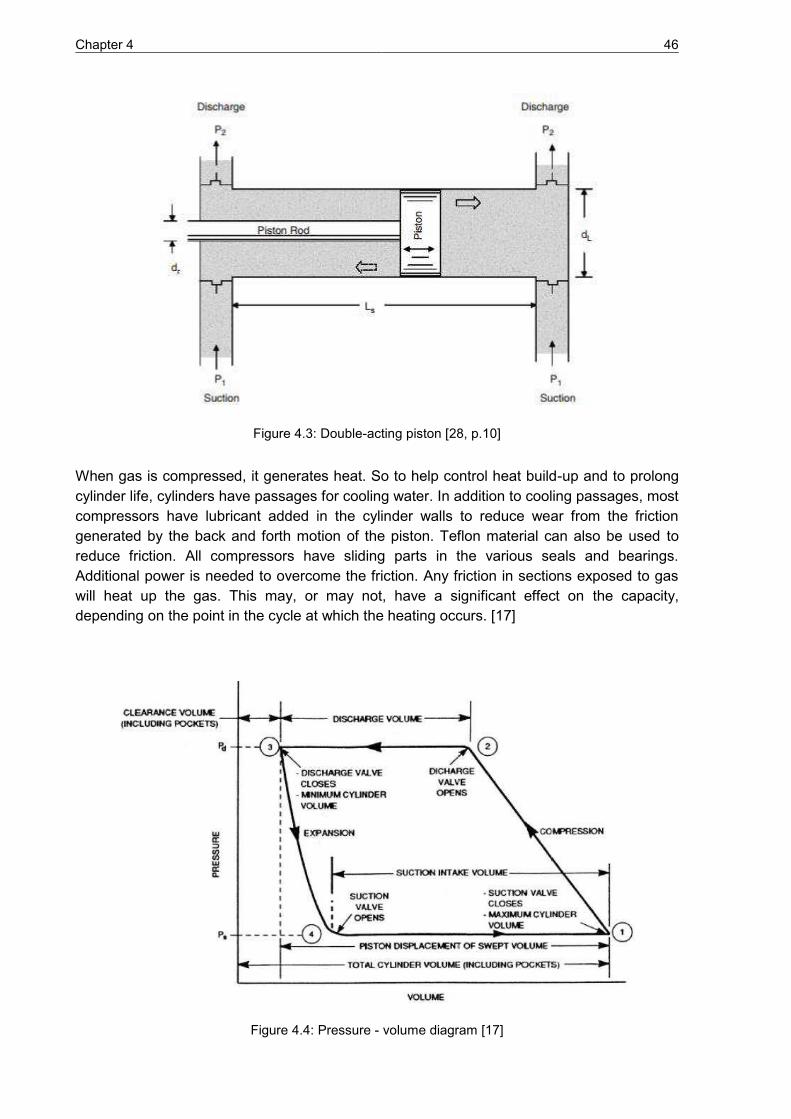
Chapter 4 46
Figure 4.3: Double-acting piston [28, p.10]
When gas is compressed, it generates heat. So to help control heat build-up and to prolong
cylinder life, cylinders have passages for cooling water. In addition to cooling passages, most
compressors have lubricant added in the cylinder walls to reduce wear from the friction
generated by the back and forth motion of the piston. Teflon material can also be used to
reduce friction. All compressors have sliding parts in the various seals and bearings.
Additional power is needed to overcome the friction. Any friction in sections exposed to gas
will heat up the gas. This may, or may not, have a significant effect on the capacity,
depending on the point in the cycle at which the heating occurs. [17]
Figure 4.4: Pressure - volume diagram [17]
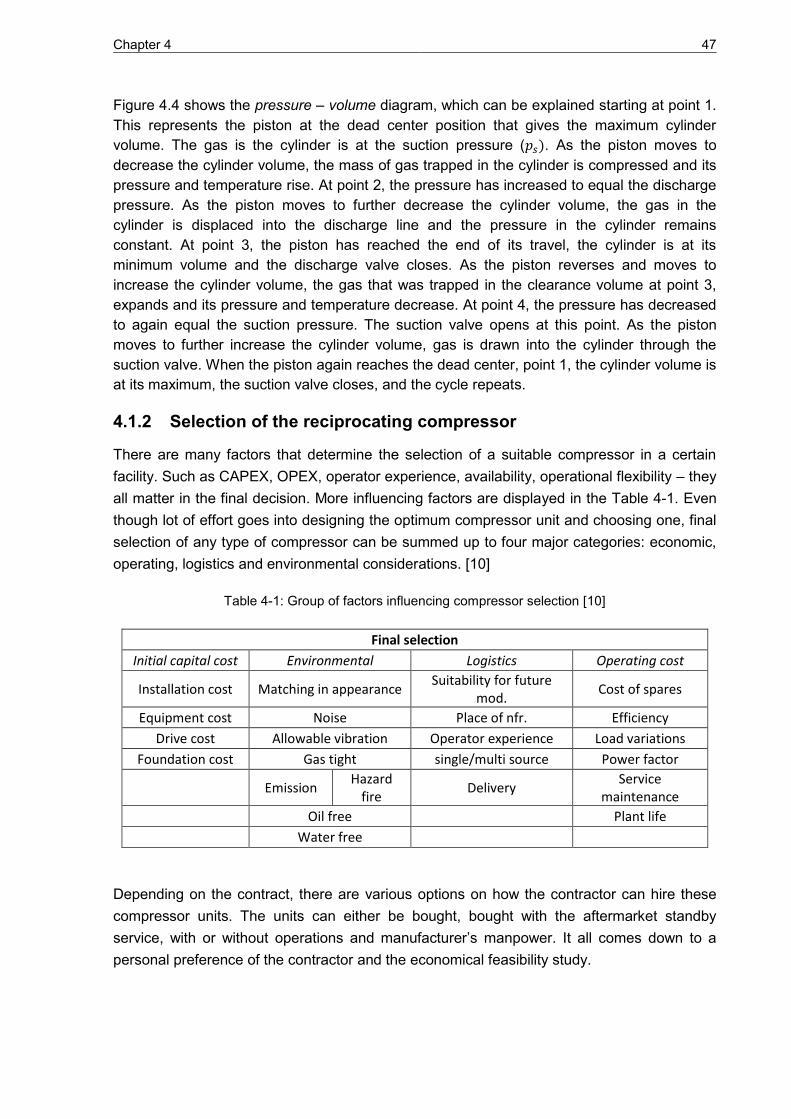
Chapter 4 47
Figure 4.4 shows the pressure – volume diagram, which can be explained starting at point 1.
This represents the piston at the dead center position that gives the maximum cylinder
volume. The gas is the cylinder is at the suction pressure (� . As the piston moves to
decrease the cylinder volume, the mass of gas trapped in the cylinder is compressed and its
pressure and temperature rise. At point 2, the pressure has increased to equal the discharge
pressure. As the piston moves to further decrease the cylinder volume, the gas in the
cylinder is displaced into the discharge line and the pressure in the cylinder remains
constant. At point 3, the piston has reached the end of its travel, the cylinder is at its
minimum volume and the discharge valve closes. As the piston reverses and moves to
increase the cylinder volume, the gas that was trapped in the clearance volume at point 3,
expands and its pressure and temperature decrease. At point 4, the pressure has decreased
to again equal the suction pressure. The suction valve opens at this point. As the piston
moves to further increase the cylinder volume, gas is drawn into the cylinder through the
suction valve. When the piston again reaches the dead center, point 1, the cylinder volume is
at its maximum, the suction valve closes, and the cycle repeats.
4.1.2 Selection of the reciprocating compressor
There are many factors that determine the selection of a suitable compressor in a certain
facility. Such as CAPEX, OPEX, operator experience, availability, operational flexibility – they
all matter in the final decision. More influencing factors are displayed in the Table 4-1. Even
though lot of effort goes into designing the optimum compressor unit and choosing one, final
selection of any type of compressor can be summed up to four major categories: economic,
operating, logistics and environmental considerations. [10]
Table 4-1: Group of factors influencing compressor selection [10]
Final selection
Initial capital cost Environmental Logistics Operating cost
Installation cost Matching in appearance Suitability for future
mod. Cost of spares
Equipment cost Noise Place of nfr. Efficiency
Drive cost Allowable vibration Operator experience Load variations
Foundation cost Gas tight single/multi source Power factor
Emission
Hazard
fire Delivery
Service
maintenance
Oil free
Plant life
Water free
Depending on the contract, there are various options on how the contractor can hire these
compressor units. The units can either be bought, bought with the aftermarket standby
service, with or without operations and manufacturer’s manpower. It all comes down to a personal preference of the contractor and the economical feasibility study.

Chapter 4 48
4.1.3 Limitations of reciprocating compressors
In compressors, the areas of greatest concern are those parts with a finite life, such as
bearings, seals and valves, or parts that are highly stressed. If we increase the operating life
of the compressor then the packing system will wear and rings will be worn hence it will
result in higher leak rates.They are expected to require more frequent and thus expensive
maintenance. Therefore, usual recommendation from a manufacturer is to use 95% of
compressor’s efficiency in order to avoid possible damage and costly repairs.
Reciprocating compressors have limitations and operational limits just like every other
compressor, and they need to be respected. In order to ensure safe operation, limiting
factors are listed below: [17]
1. High discharge temperature – The maximum design temperature of the piston rings,
rider bands, valves, discharge valve plates, discharge bottles, discharge pipe and
cooler is often 300°F. During the compression, the temperature of the gas is going to
rise. Therefore, it is an imperative that the discharge temperature of each stage does
not exceed the maximum design temperature.
2. Running speed – In order to control the capacity of a reciprocating compressor, one
should vary the running speed of the natural gas driver or electric motor. The running
speed must be kept above the minimum speed of the compressor and natural gas
driver to ensure adequate lubrication, maximum torque and to avoid combustion
related problems.
3. High horsepower usage – One should always follow the manufacturer
recommendation. Therefore, it is good to keep the horsepower usage at or below
100%. Also, when applicable, it is usually possible to add clearance to the
compressor to control the horsepower demand.
4. High rod loads – Each model of a reciprocating compressor has a specific rod load
rating. Also known as the frame load, it is the continuous operating force the
compressor can safely withstand. To be on a safe side, a good practice is to operate
at a 95% rod load.
5. Low volumetric efficiencies – Volumetric efficiency (VE) is known as the ratio of the
capacity of the compressor to the displacement of the compressor. In other words, it
is the real volume that the piston displaces compared to the pumping capacity of a
cylinder. VE should be kept as high as possible and no lower than 20% to avoid valve
breakage.
6. Low degrees of reversal – A reversal in the direction of the load on the rod happens
in order to ensure adequate lubrication and cooling of the crosshead pin. One should
keep the rod reversals above 70°.

Chapter 4 49
4.2 PIPESIM simulation for Wellhead Compression
For the purpose of this thesis and to inspect the capabilities of WHC, PIPESIM software was
used to create a naturally flowing gas well, to observe how production rate decreases as the
reservoir pressure declines and finally to add wellhead compressor and observe its influence
on the well’s performance.
The PIPESIM simulator provides industry’s most comprehensive steady-state flow assurance
workflows for front-end system design and production operations. The flow assurance
capabilities of the simulator enable engineers to ensure safe and effective fluid transport. It
offers sizing of facilities, pipelines, artificial lift systems, ensuring effective liquids and solids
management, as well as well and pipeline integrity. [29]
4.2.1 Building a base model of a naturally flowing gas well
The PIPESIM simulator offers relatively simple and user-friendly interface. The start-up
window allows one to choose between creating a network centric workspace or a well centric
workspace. Since for the purpose of this thesis a simple single vertical well was created, a
well centric workspace was established.
The next step consists of defining the surface equipment. That is, setting up the well,
wellhead compressor and the sink and connecting them with connectors.
Figure 4.5: Surface equipment
Created gas well was constructed as a vertical well with all the input parameters gathered
from various literatures. Those are displayed in the following tables:
Table 4-2: Input parameters [29]
Tubulars
Name Bottom MD
[ft]
ID
[in]
Wall thickness
[in] Roughness [in]
Casing 11200,00 5,92 0,54 0,001
Tubing 10950,00 2,922 0,289 0,001
Deviation survey
Survey type Vertical
Reference options
Depth reference Original RKB
Wellhead depth 0 ft
Bottom depth 11200 ft
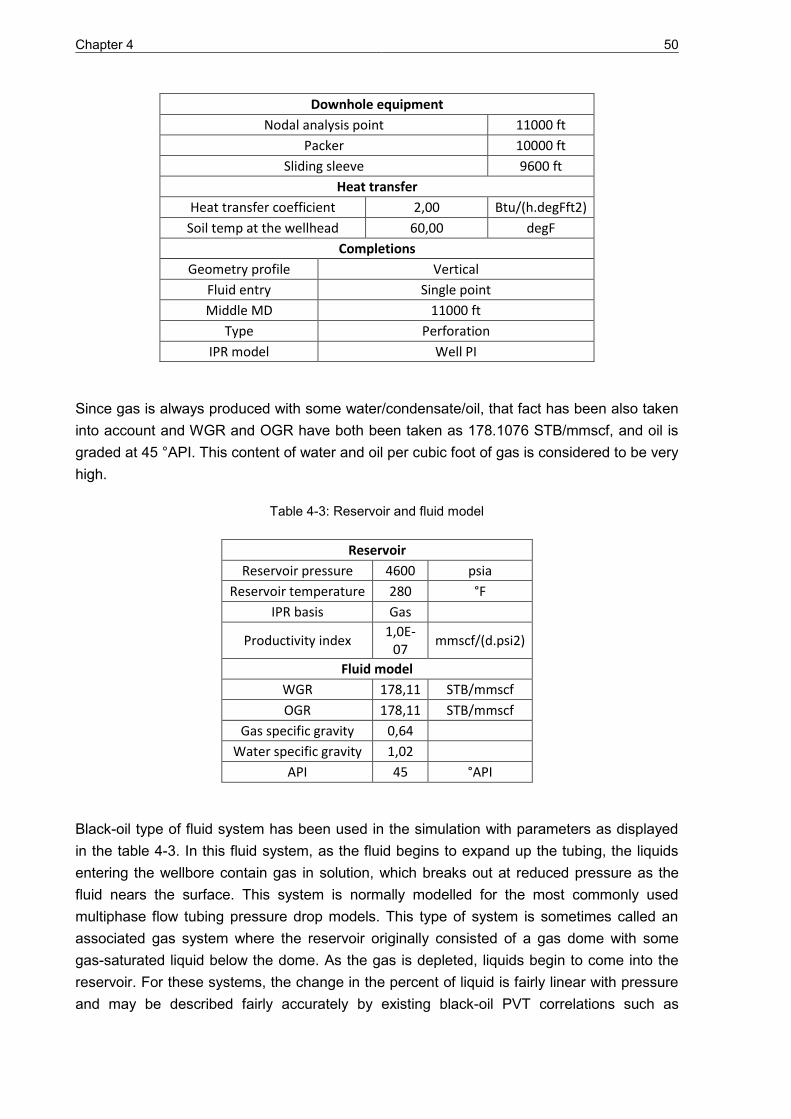
Chapter 4 50
Downhole equipment
Nodal analysis point 11000 ft
Packer 10000 ft
Sliding sleeve 9600 ft
Heat transfer
Heat transfer coefficient 2,00 Btu/(h.degFft2)
Soil temp at the wellhead 60,00 degF
Completions
Geometry profile Vertical
Fluid entry Single point
Middle MD 11000 ft
Type Perforation
IPR model Well PI
Since gas is always produced with some water/condensate/oil, that fact has been also taken
into account and WGR and OGR have both been taken as 178.1076 STB/mmscf, and oil is
graded at 45 °API. This content of water and oil per cubic foot of gas is considered to be very
high.
Table 4-3: Reservoir and fluid model
Reservoir
Reservoir pressure 4600 psia
Reservoir temperature 280 °F
IPR basis Gas
Productivity index 1,0E-
07 mmscf/(d.psi2)
Fluid model
WGR 178,11 STB/mmscf
OGR 178,11 STB/mmscf
Gas specific gravity 0,64
Water specific gravity 1,02
API 45 °API
Black-oil type of fluid system has been used in the simulation with parameters as displayed
in the table 4-3. In this fluid system, as the fluid begins to expand up the tubing, the liquids
entering the wellbore contain gas in solution, which breaks out at reduced pressure as the
fluid nears the surface. This system is normally modelled for the most commonly used
multiphase flow tubing pressure drop models. This type of system is sometimes called an
associated gas system where the reservoir originally consisted of a gas dome with some
gas-saturated liquid below the dome. As the gas is depleted, liquids begin to come into the
reservoir. For these systems, the change in the percent of liquid is fairly linear with pressure
and may be described fairly accurately by existing black-oil PVT correlations such as

Chapter 4 51
Standing’s or Lasater’s correlations for solution GOR and Standing’s correlation for formation volume factor. [33]
The input parameters for the compressor have been used as follows:
Table 4-4: Reciprocating compressor
Operation parameters
Discharge pressure 300 psia
Pressure differential 1500 psi
Pressure ratio 3
Power 85 hp
Route Adiabatic
Efficiency 95 %
Table 4-2 contains data on down-hole equipment. A production packer and sliding sleeve
were used. Even though PIPESIM offers a possibility to simply activate or deactivate a
certain component in the system, such as the packer, in real life this procedure is far more
complicated. In the field, if the tubing was set without the production packer, that would allow
the well to produce through both tubing and annulus. Once the packer is due to be installed,
a workover has to be done which is both time and cost consuming. Therefore, common
practice is to install the sliding sleeve above the production packer which would allow the
well to produce through the annulus when packer is being used. PIPESIM was used to
inspect the production rates of a well producing through tubing and annulus and through
tubing only. Then, as the reservoir pressure declines due to depletion, WHC was installed to
increase the production again. Also, at the initial reservoir pressure well was choked on
purpose to limit the flowrate so that the reservoir would not get damaged and also as an
example of what is the practice in the field if the production rate from the well is close to
AOFP.
As all the initial parameters have been inserted into PIPESIM, Nodal analysis was used to
get the performance of the naturally flowing gas well.
4.2.2 Results of the simulation for a naturally flowing gas well
Bottom-hole was chosen to be the nodal analysis point. One can define what inflow and
outflow sensitivities would like to inspect. I have set five different reservoir pressures (4600,
4000, 3000, 2000 and 1000 psia) as the inflow sensitivity and an outlet pressure of 300 psia
as the outflow sensitivity variable.

Chapter 4 52
Figure 4.6: Naturally flowing gas well through tubing and annulus and through tubing only
The points where IPR and VLP curves are intersecting each other are operating points and
give the value of what the well is producing under certain conditions.
Table 4-5: Operating points for naturally flowing gas well - two different flow paths
Points
Operating points
Tubing + annulus
Tubing
rate (mmscf/d) pressure (psia) Points rate (mmscf/d) pressure (psia)
1 1,992 1113,281 4 0,281 1088,919
2 1,480 1095,993 5 0,767 1151,134
3 0,791 1041,938 6 1,452 1214,802
7 1,957 1261,983
From the plot one can tell that while producing at the reservoir pressure of 4600 psia, well
needs to be controlled with a choke so that the reservoir would not get damaged (Figure 4.7).
Moreover, when the reservoir pressure declines to 1000 psia for both flow paths, it is visible
that the VLP curve is not intersecting the IPR curve and there is no production. Same thing
goes for the reservoir pressure of 2000 psia while flowing through both tubing and annulus.
This situation is an example of when the WHC finds its purpose, which will be further
discussed in chapter 4.2.3.
0
500
1000
1500
2000
2500
3000
3500
4000
4500
5000
0 0.5 1 1.5 2 2.5
Pre
ssu
re a
t n
od
al
an
aly
sis
po
int
(psi
a)
Stock-tank gas at nodal analysis point (mmscf/d)
Naturally flowing well scenarios
4600 psia well
4000 psia well
3000 psia well
2000 psia well
1000 psia well
outflow 300 psia (tbg + ann)
outflow 300 psia (tbg)4
5
3
6
2
7
1

Chapter 4 53
Figure 4.7: Choking a well
4.2.3 Influence of the Wellhead Compression
Gas well created in PIPESIM for this thesis has been producing for some time now. Initially it
was choked to control and reduce the flow rate, then it was flowing naturally but now, as the
reservoir pressure has declined to 2000 psia and 1000 psia, it is time to add a reciprocating
compressor to assist the well in lifting the gas up the wellbore.
Figure 4.8: Production with WHC - enlarged
Figure 4.8 shows the well being produced at two different reservoir pressures. With the use
of WHC, the flow through tubing was the only one observed because with already reduced
0
500
1000
1500
2000
2500
3000
3500
4000
4500
5000
0 0.5 1 1.5 2 2.5Pre
ssu
re a
t n
od
al
an
aly
sis
po
int
(psi
a)
Stock-tank gas at nodal analysis point (mmscf/d)
Well without and with a choke
4600 psia well without a
choke
outflow 300 psia
without a choke
4600 psia well with a
choke
outflow 300 psia with a
choke
0
500
1000
1500
2000
0 0.1 0.2 0.3 0.4 0.5Pre
ssu
re a
t n
od
al
an
aly
sis
po
int
(psi
a)
Stock - tank gas at nodal analysis point (mmscf/d)
WHC through tubing
2000 psia well
1000 psia well
outflow 300 psia (tbg)
2
1
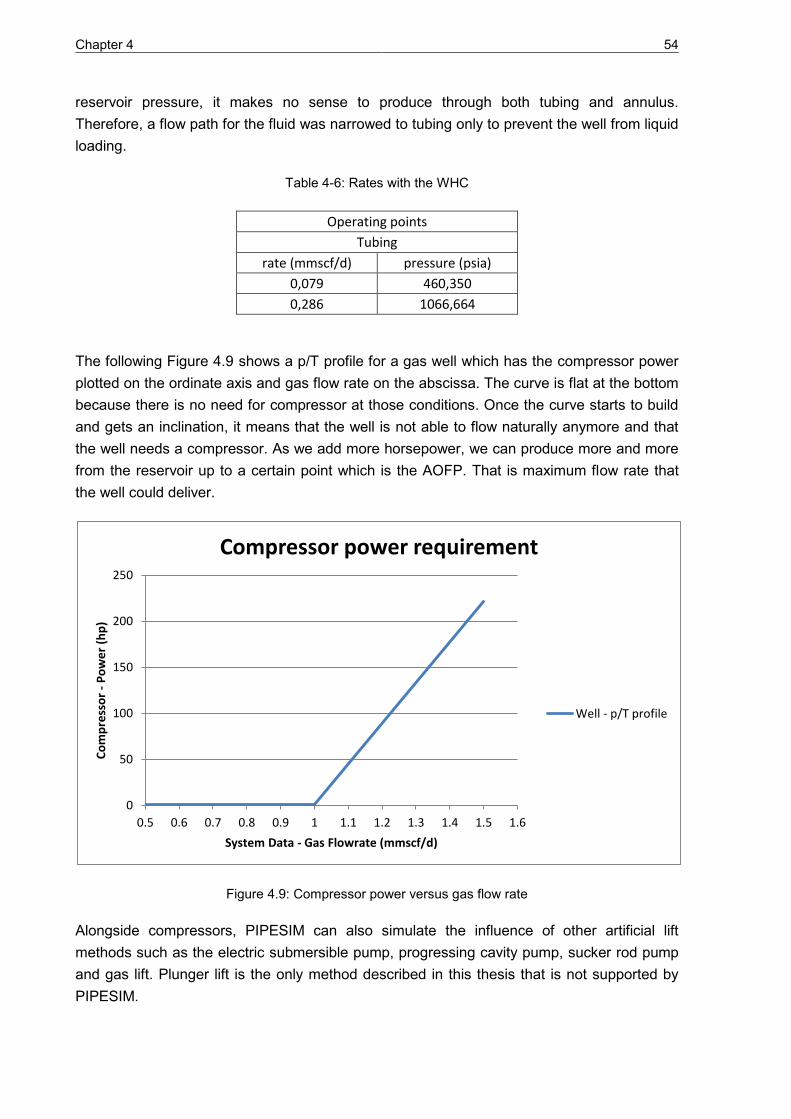
Chapter 4 54
reservoir pressure, it makes no sense to produce through both tubing and annulus.
Therefore, a flow path for the fluid was narrowed to tubing only to prevent the well from liquid
loading.
Table 4-6: Rates with the WHC
Operating points
Tubing
rate (mmscf/d) pressure (psia)
0,079 460,350
0,286 1066,664
The following Figure 4.9 shows a p/T profile for a gas well which has the compressor power
plotted on the ordinate axis and gas flow rate on the abscissa. The curve is flat at the bottom
because there is no need for compressor at those conditions. Once the curve starts to build
and gets an inclination, it means that the well is not able to flow naturally anymore and that
the well needs a compressor. As we add more horsepower, we can produce more and more
from the reservoir up to a certain point which is the AOFP. That is maximum flow rate that
the well could deliver.
Figure 4.9: Compressor power versus gas flow rate
Alongside compressors, PIPESIM can also simulate the influence of other artificial lift
methods such as the electric submersible pump, progressing cavity pump, sucker rod pump
and gas lift. Plunger lift is the only method described in this thesis that is not supported by
PIPESIM.
0
50
100
150
200
250
0.5 0.6 0.7 0.8 0.9 1 1.1 1.2 1.3 1.4 1.5 1.6
Co
mp
ress
or
-P
ow
er
(hp
)
System Data - Gas Flowrate (mmscf/d)
Compressor power requirement
Well - p/T profile
Chapter 4 55
As mentioned earlier, water and oil are known as slightly compressible fluids and as such
cannot be compressed within the reciprocating compressor because their compressibility is
negligible compared to the compressibility of the gas. Therefore, WHC cannot be used in the
oil wells as the main artificial lift method. When producing with WHC, compressors can
handle a certain volume of liquids carrying up the wellbore, but these fluids will not go into
the compression chamber but are going to be separated at the surface; where the gas is
going to be compressed. It might assist for instance sucker rod pump in a way to lift small
quantities of gas through the annulus, while SRP is lifting oil through the tubing. Moreover, it
is not usual to pair pumps and compressors to lift fluids from the well. This has been tried in
PIPESIM however the simulator was not able to plot the curves.
4.3 Case studies
The next few subchapters are going to cover some of the relevant case studies regarding
WHC. The idea is to show the situations in which a need for wellhead compression arises
and what the benefits of the wellhead compression are.
4.3.1 Case study 1 – Harms et al., 2004 [4]
This case study presents how twenty-one low-cost wellhead compressors were used on tight
Lobo Wilcox wells in South Texas. This field produces natural gas from Lobo Wilcox sands at
depths ranging from 7000ft to 13000ft. The formation is tight with the permeability ranging
from 0.01 to 1 mD and net pays from 15ft to 150ft. The wells generally require large propped
hydraulic fractures to produce commercially. Generally they decline rapidly during their first
year of production, the decline rate decreases throughout the life showing hyperbolic decline
characteristics.
These reservoirs are depletion drive reservoirs with limited water production (0 – 40 bbls of
water per MMCF). The natural gas produced has specific gravities of 0.58 – 0.75 with 0 – 50
bbls of condensate per MMCF. The gas normally contains less than 5 ppm of hydrogen
sulphide and less than 4% carbon dioxide.
Compressor units used for the 21 wells in this case study weigh less than 5000 lbs, have
approximately 40 horsepower with a wide range of suction (-5 to 80 psig) and discharge (up
to 275 psig) pressures and provide up to 800 MCFD in rate. Out of 1600 producing wells, 21
of them needed to be chosen. So, these candidates needed to meet certain criteria, such as
the history of temporarily unloading fluids, sensitivity to wellhead pressure, cumulative
production over 6 BCFD and six additional minor factors.
Chosen candidate wells were grouped into three groups: very successful wells, successful
wells and unsuccessful wells. Wells A, B, C, I, K and N are placed in the “very successful wells” group because they were providing almost 80% of the total cumulative uplift. Well A
had its damaged 2 7/8” tubing replaced with the new 2.375” tubing and since then it could not unload. However, after the installation of the WHC it is producing steadily with a slight
decline over time. Well C had a parted 2.875” tubing near the surface. It was loaded for some

Chapter 4 56
time after which a wellhead compressor helped it to start flowing again. After the installation
of the compressor it was producing 1.1 MMCFD, but now it is producing without compression
at around 800 MCFD.
Regarding successful wells, they are providing most of the remaining 20% of the total uplift
from the program. Wells M, P and Q have shown potential and have provided enough uplift
to be financially successful. These wells are expected to give higher uplifts in the future as
flow line corrosion problems, gathering system bottlenecks and inadequate downstream
compression capacity have limited their success.
Unsuccessful wells (D, F, G, H, J, L, O and R) have not provided desired rate uplift to date.
However, some of them are expected to move into the successful category in the future, with
the help of WHC. Although Well U from the “successful wells group” had a big uplift in 3.5” tubing, the compressor did not have enough horsepower/capacity to keep the 3.5” casing unloaded in this case.
Summary and lessons learned
The WHC compression units did not have enough horsepower/capacity to unload
3.5” tubingless completion
Most wells require effort to unload after WHC installation including the use of soap
and shut in periods
Wells that have been depleted down to a FTP of 30 psig previously do not appear to
be good candidates
Since October 2002, 21 wellhead compressor installations have been done resulting in 1.13
BCF of total increase in production at a total incremental cost of $800,000. Total financial
gain from WHC up to the date of publication of this case study (2010) is $3.7 million.
4.3.2 Case study 2 – Harms et al., 2010 [30]
This paper follows up a previous paper and contains background information on the
producing characteristics of the Lobo field. Meanwhile, number of wells which produce there
has increased from 1600 to 1800. Twenty-one wells previously mentioned show a total of 5.7
BCF of incremental production, all achieved with the use of WHC.
Very successful wells continue to be very successful with the share in total uplift of 74%
dated to 2010. Wells H and Q also moved to this category. All in all, this group of wells
provided 4.9 BCF of incremental production assuming the net revenue after operating and
installation costs to be over $10,000,000 taking an average net gas price of $2.50/MCF after
royalty and taxes.
Successful wells are still successful producing enough incremental gas to cover their
installation and operating costs. The WHC continues to be used on all of the successful wells
except well U because its 3.5” casing has been fitted with a 2 1/16” tubing with a plunger lift.

Chapter 4 57
Unsuccessful wells are the ones where WHC was not able to provide enough uplift to pay out
the costs of installation and operation. Each of “unsuccessful wells” had a mechanical problem which prevented it from becoming successful.
Summary and lessons learned
WHC should be used on the best wells in most fields because system pressures
should be optimized for “average” wells
The highest cumulative production and highest productivity wells in a field will deplete
to the lowest reservoir pressures and will be the best candidates for WHC
Installing WHC before the well loads up will prevent the difficulties in unloading the
well but may negate “uplift” WHC only achieves desired performance when the well is unloaded – foamer, long
shut-ins and/or swabbing are usually needed
WHC effectiveness depends on having controls in place to keep the well from loading
again, once it is unloaded
WHC must have sufficient capacity to keep the well above the critical unloading rate.
Configurations must be changed and units with higher capacity at lower pressures
may be needed to maintain this capacity during the life of the well
Separation and liquid capacity must be sufficient to handle average and slugging
liquid rates at the low suction pressure
Lowering system pressure and reducing system pressure variations make WHC more
reliable
4.3.3 Case study 3 – Jain et al., 2015 [31]
This case study covers the case of Sajaa gas field located in the Northern Emirates. Since
1982, this field has experienced increasing gas recoveries with declining reservoir pressures
slowly leading to condensate banking and liquid loading problems. They have tried drilling
multilaterals, plant inlet compression and foamer, but the effects were short lived as the
reservoir pressure declined further. It describes the installation of twelve wellhead
compressors with the total of 18,600 horsepower. They were able to reduce the WHP to as
low as 15 psig.
Due to the mature nature of these fields and low reservoir pressures, subsurface liquid
loading solutions of submersible pumps, gas lifts and velocity stringing yield lower returns.
WHC will result in increased gas velocity above the critical velocity in the line allowing liquids
to be unloaded from the well. As the liquids are unloaded the hydrostatic head will be
reduced which will result in a lower bottom hole pressure which will result in increased
production of both liquid and gas. Meanwhile, decreasing the wellhead pressure will reduce
the abandonment reservoir pressure which is going to increase recoverable reserves. WHC
can prove as an economic tool requiring minimal subsurface interventions and it
supplements the application of other methods of artificial lift to different degrees.

Chapter 4 58
The objective of the WHC in this case study was to achieve incremental production and
increase recoverable reserves. Compression has helped liquid loaded wells by increasing
the gas velocity to exceed the critical unloading velocity and lowered pressure on the
formation for incremental production. Lower pressure in the network enabled a reduction in
the liquid hold-up in flow lines as well as a higher LGR due to removal of condensate banked
across the well drainage radius. All combined, resulting in a higher inlet to the downstream
facilities enabling efficient operations by avoiding low flow stability concerns and maximizing
value from a mature asset.
It is estimated that the production gain from the WHC project is 21% as compared to the
estimated 8.2% best case scenario modelled before the project. After two years of successful
continuous WHC, the statistics are not significantly different. There are no wells on a
pressure build-up cycle. About 20% of the wells are low producers (< 1 mmscfd) which are
not same outskirt wells with low permeability. 50% of the well stock is stable producers (1-3
mmscfd) with THP’s in the range of 15 – 30 psig and the remaining 30% of the wells produce
50% of the asset production. Thus, WHC has stabilized the performance of these wells over
a period of 2.5 years without which there would have been a 16% base case decline annually
in addition to a significant number of pressure buildup wells that would have increase this
decline rate.
Summary and lessons learned
With a reduction in the wellbore pressures due to compression, the lowest BFP in
wells is calculated to be in the range of 70 psig. This has put the casing string on a
risk of collapse
With a sudden drop in the bottom hole pressure, the carbonate formation is
susceptible to scaling as well as erosional damage to the completion and facilities
due to higher flow velocities
As the reservoir pressure depletes further, the effect of compression would wear off
and the wells would become susceptible to further liquid loading
Sizing of the equipment depends on the required flow rate and volumes
Due to the decrease in the THP, the well gas composition would change with respect
to the water saturation in gaseous form
4.4 HSE aspects
Health, Safety and Environment aspects must be considered on a great scale. It is important
that the personnel working with machines, in this case compressors are well familiar with the
working procedure but also emergency shut-down procedures. There are many steps and
rules that one should obey when working in a dangerous environment.
Only authorized and trained personnel should operate/service and maintain
compressor equipment
Compressors should never be operated at speeds faster than the manufacturer’s recommendation

Chapter 4 59
Equipment should never become overheated
Moving parts, such as compressor flywheels, pulleys, and belts that could be
hazardous should be effectively guarded
Exposed, noncurrent-carrying, metal parts of compressor should be effectively
grounded
Equipment should not be over lubricated
Gasoline or diesel fuel powered compressors should not be used indoors
Equipment placed outside but near buildings should have the exhausts directed away
from doors, windows and fresh air intakes
During maintenance work, the switches of electrically operated compressors should
be locked open and tagged to prevent accidental starting
Safety is critical in completions, where it could have fatal consequences because of poor
design or poorly installed completions. Completions are considered to be part of the well
control envelope and stay so through the life of the well. They are part of the fundamental
barrier system between the reservoir and the environment. At least two tested independent
barriers between hydrocarbons in the reservoir and the environment should be present at all
times. The primary barrier is defined as the one preventing hydrocarbons from escaping; and
the secondary barrier is defined as the backup to the primary barrier. It is not used until the
primary barrier fails. Moreover, the event that could destroy the primary barrier should not
affect the secondary barrier. [25]
Regarding production with the help of WHC, barriers should also be present. Usually,
naturally flowing wells are producing through tubing only. A production packer with a kill fluid
is installed in the annulus alongside with the X-mas tree at the wellhead. That way, annulus
is secured in such cases. Regarding tubing, X-mas tree is going to be one barrier, while the
subsurface safety valve is going to be used as the other barrier for the tubing.
When producing with the help of an artificial lift system, it is usually the case to produce
through tubing only because that way, the flow path is narrowed and a fluid being produced
at already lowered pressure will have more velocity to be lifted up the tubing. Also, that way,
when producing through tubing only there is less chance for liquid loading to occur.
Therefore, again, SSSV within the tubing would be one barrier and the X-mas tree is going to
be the second barrier.
All personnel, from top management through entry level positions should comply with all
applicable laws and industry standards of practice. It is vital to strive to exceed regulations
and utilize “best practices” whenever possible. Also, one should continuously seek to improve all HSE aspects of workplace through close collaboration with colleagues.

Chapter 5 60
5 Artificial lift technologies
Artificial lift is used to increase the flow of liquids from a production well. It adds energy to the
reservoir fluid. There are many artificial lift techniques available at the market today, but they
all have one main purpose. They are used in the wells when there is insufficient pressure in
the reservoir to lift the fluids, but also in naturally flowing wells to improve production rates.
Figure 5.1: Naturally flowing well and a well with an artificial lift [14, p.28]
Figure 5.1 shows two different well conditions. In the upper one, the Inflow Performance
Relationship curve of a well, that is the inflow from the reservoir to the bottom of the wellbore,
is intersected with the Vertical Lift Performance curve. As described in Chapter 3, VLP
describes pressure losses as the fluid is travelling up the tubing. If these two curves
intersect, for a given bottom-hole flowing pressure, the well will flow at the corresponding
production rate. However, there are cases where a well is flowing at rate lower than the one
predicted by the intersection of IPR/VLP curves. It could suggest that the well is loading up
with the water and that it is struggling to produce.
If the situation is such that there is no intersection between the curves, that means that there
is no production, i.e. the well is killed. At that point, well should be artificially lifted. In other
words, IPR and VLP curves must intersect each other for the well to start producing again.

Chapter 5 61
5.1 Artificial lift method selection
Changes in well conditions and equipment capabilities demand constant updates of the
original lift method decision to determine whether it is still the best choice. It is often the case
that the selection of the lift method is based on operating personnel / decision maker
equipment familiarity. One should include in the decision tree a long term economic analysis.
There is not a single lift system that is the most economic system for all wells. It varies from
one well to another. In order to access the practicality and the economics of various methods
of artificial lift, the first step is to generate an IPR (Inflow Performance Relationship) curve or
a PI (Productivity Index). Then a profile of expected and desired production versus time
should be determined. There are obviously many factors that influence the decision criteria,
from technical to economical factors. From geology of the well, type of fluid that is being
produced, well and casing design, location, depth, reservoir properties to OPEX and CAPEX,
estimated production, rate of return, etc. Hence, four major selection categories can be
established:
1. Selection by consideration of depth / rate system capabilities
2. Selection by advantages and disadvantages
3. Selection by expert programs
4. Selection by Net-Present-Value comparison
Figure 5.2: IPR curves for different reservoir pressures [2]
Figure 5.2 shows an Inflow Performance Relationship curve with approximate depth-rate
capabilities of lower rate artificial systems. This particular figure shows future IPR curves as
the reservoir pressure drops as a result of depletion. An IPR curve is the relationship
between liquid inflow rate and a bottom-hole flowing pressure. When plotted on a chart, this
relationship can help determine well’s flow potential or rate at various flowing sand face
pressures. The IPR analysis is therefore, used to determine deliverability for a well producing
oil or formation water.
0
500
1000
1500
2000
2500
3000
3500
4000
4500
5000
0 200 400 600 800
Flo
win
g p
ress
ure
(p
sia
)
Liquid rate (bbl/d)
4600 psia well
4000 psia well
3000 psia well
2000 psia well
1000 psia well

Chapter 5 62
A decline curve can be seen in Figure 5.3. It is used for analyzing declining production rates
and forecasting future performance of oil and gas wells. As seen from the chart, both oil and
gas production rates decline with time. Mostly, the cause is the loss of reservoir pressure or
change in relative volumes of the produced fluids. One should make an assumption when
fitting a line through the performance history that, this same trend is going to continue in
future forms. However, in absence of stabilized production trends the technique cannot be
expected to give reliable results. Decline curves can be exponential decline, hyperbolic
decline, power-law decline and harmonic rate decline curves.
Figure 5.3: Production rate versus Time curve [3]
5.2 Electric Submersible Pump (ESP)
Usual electric submersible pumping unit consists of an electric motor, a seal section, an
intake section, a multistage centrifugal pump, an electrical cable, a surface-installed
switchboard, a junction box, and transformers.
Figure 5.4: Conventional ECP installation [32]
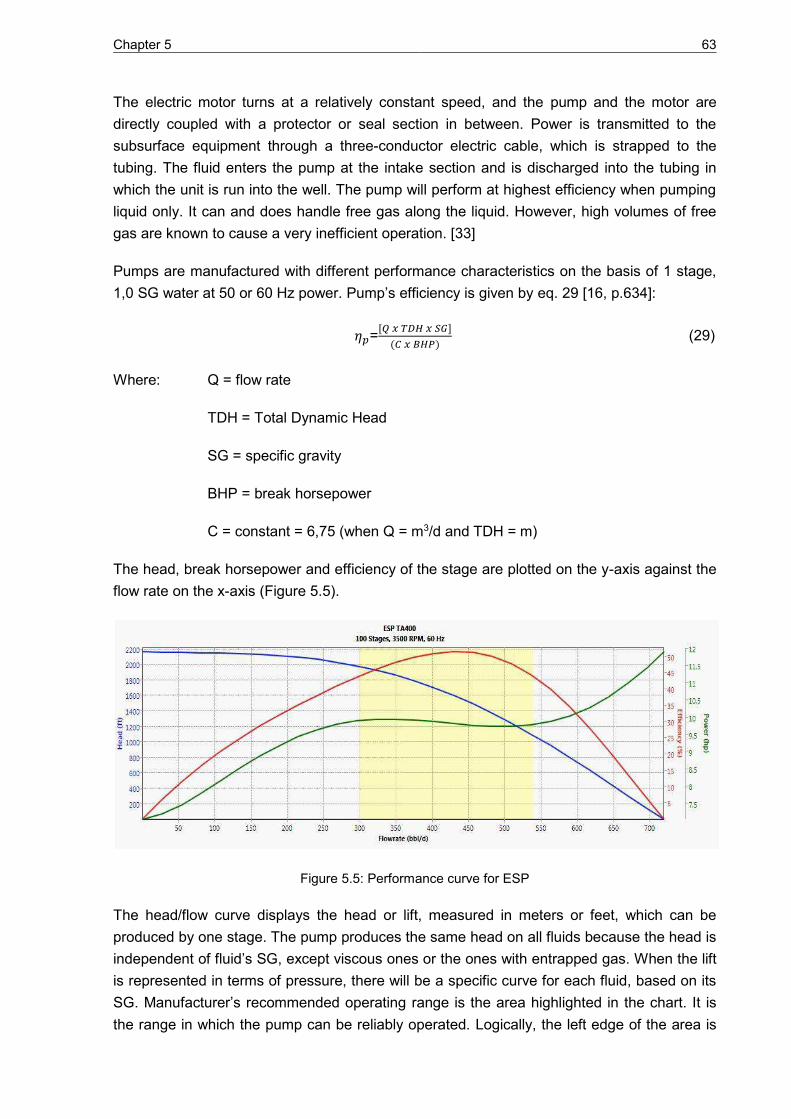
Chapter 5 63
The electric motor turns at a relatively constant speed, and the pump and the motor are
directly coupled with a protector or seal section in between. Power is transmitted to the
subsurface equipment through a three-conductor electric cable, which is strapped to the
tubing. The fluid enters the pump at the intake section and is discharged into the tubing in
which the unit is run into the well. The pump will perform at highest efficiency when pumping
liquid only. It can and does handle free gas along the liquid. However, high volumes of free
gas are known to cause a very inefficient operation. [33]
Pumps are manufactured with different performance characteristics on the basis of 1 stage,
1,0 SG water at 50 or 60 Hz power. Pump’s efficiency is given by eq. 29 [16, p.634]:
=[ ] (29)
Where: Q = flow rate
TDH = Total Dynamic Head
SG = specific gravity
BHP = break horsepower
C = constant = 6,75 (when Q = m3/d and TDH = m)
The head, break horsepower and efficiency of the stage are plotted on the y-axis against the
flow rate on the x-axis (Figure 5.5).
Figure 5.5: Performance curve for ESP
The head/flow curve displays the head or lift, measured in meters or feet, which can be
produced by one stage. The pump produces the same head on all fluids because the head is
independent of fluid’s SG, except viscous ones or the ones with entrapped gas. When the lift
is represented in terms of pressure, there will be a specific curve for each fluid, based on its
SG. Manufacturer’s recommended operating range is the area highlighted in the chart. It is
the range in which the pump can be reliably operated. Logically, the left edge of the area is

Chapter 5 64
the minimum operating point, and the right edge is maximum operating point. The best
efficiency point (BEP) is therefore between these two points, and that is where the efficiency
curve peaks. The minimum and the maximum points are determined by the shape of the
head/flow curve and the thrust characteristics curve of that particular stage. The minimum
point is usually located where the head curve is still rising prior to its flattening or dropping
and at an acceptable down-thrust value. The location of the maximum point is based on
maintaining the impeller at a performance balance based on consideration of the thrust
value, produced head and acceptable efficiency. [16]
Total dynamic head (TDH)
It is total head required to be produced by the pump when it is pumping at its desired rate. It
is the difference between the head required at the pump discharge to deliver the flow to its
final destination and any head that exists at the pump intake. When pumping a liquid without
gas, the total dynamic head is the sum of the friction losses in the tubing and surface flow
line, the difference in elevation between the final destination of the produced flow and the
pump depth and any significant losses in the discharge line due to valves, separator, etc.,
minus the head that exists on the suction side of the pump’s intake due to the column of liquid over the intake. These calculations can be made using head as the unit of pressure
since the fluid density is the same throughout the pumping system. [34]
However, if gas is present in the well, the density is not the same throughout the system and
the calculations must be made in units of pounds per square inch (psi) and then converted to
head in order to use the standard performance pump curves. For design purposes, the
losses and elevation difference in the surface flow line are replaced by a pressure at the
wellhead which is sufficient to move the flow through and up the surface flow line. That is, the
influence of the WHC on ESP will be shown with the following example: [34]
Table 5-1: Impact of WHC on ESP's TDH [34]
Required wellhead pressure 200 psig
Pump setting depth 10,570 ft
Tubing 2 7/8" EUE
Pumping rate 1600 b/d
Fluid pumped 70% API 40° oil, 30% water @ 1,05S.G., ave. Density=54.79 lb/ft3
Fluid over pump intake 650 ft
Wellhead pressure in ft of head: 200 psig x � /. 9 / = 526 ft.
Friction loss in 10,570 ft of tubing: 10,570 ft x . = 217 ft
Elevation difference – pump to wellhead = 10,570 ft
Fluid over pump intake = - 650 ft

Chapter 5 65
Total Dynamic Head (TDH) = 10,570 + 526 + 217 – 650 = 10,663 ft
One of the very important parts of the ESP unit is the gas separator. It is connected between
the protector and the pump and directs the separated gas into the well’s casing/tubing annulus where if needed, it can be lifted with the assistance of a wellhead compressor. The
centrifugal pump, being a dynamic device, imparts a high rotational velocity on the fluid
entering its impeller but the amount of kinetic energy passed on to the fluid greatly depends
on the given fluid’s density. Liquid, being denser than gas, receives a great amount of kinetic energy that, after conversion in the pump stage, increases the pressure. Gas, on the other
hand, although being subjected to the same high rotational speed, cannot produce the same
amount of pressure increase. This is the reason why centrifugal pumps should always be fed
by gas-free, single-phase liquid to ensure reliable operation. However, if the free gas is
present at pump’s suction conditions (pressure and temperature) it will affect operation of the ESP pump in several ways: [32]
The head developed by the pump decreases as compared to the performance curve
measured with water
The output of a pump producing gassy fluids fluctuates; cavities can also occur at
higher flow rates causing mechanical damage of the pump stages
In cases with extremely high gas production rates, gas locking may occur when no
pumping action is done by the pump completely filled with gas.
5.3 Sucker-Rod Pump (Pump Jack)
Sucker-rod pumping systems are the oldest and most widely used type of artificial lift for oil
wells. Figure 5.6 shows a schematic of a rod pumping system. The rod pump is a plunger
with a two valve arrangement (Figure 5.7). The standing valve is a one-way valve at the
bottom of the pump (allows flow from the wellbore to the pump but stops reverse flow) and
the travelling valve is another one-way valve that is attached to the rod string. As the plunger
is lifted by the rods on the upstroke, the travelling valve is closed, forming a low pressure
area beneath the plunger and drawing in wellbore fluid through the standing valve into the
pump chamber. At the end of the upstroke, the down-stroke begins. When the bottom of the
plunger (which contains the travelling valve) hits the surface of the liquid that has flowed into
the pump, the travelling valve is forced open as the valve moves through the liquid and the
standing valve is closed. The down-stroke of the plunger forces the liquid in the pump up
through the travelling valve, adding it to the tubing. The new fluid pushes all the other liquid
in the tubing up by the volume of liquid in the pump. The amount of distance between the top
of the pump chamber and the surface of the liquid is void space. All pumps will have some
void space, but too much can lead to equipment damage. The impact of the plunger on the
liquid is described as fluid pound. The void area may result from gas breakout at the reduced
operating pressure of the pump, but the void may be large if the plunger goes up significantly
faster than liquids can flow into the pump. Free gas is vented up the annulus. In a well with

Chapter 5 66
Figure 5.6: Schematic of a beam-pumping system [16, p.458]
adequate reservoir liquid inflow to keep the liquid level above the pump at all times, filling the
pump is dictated by oil viscosity, pump size and speed, restrictions in the equipment
surrounding the pump, and gas in the fluids. On wells producing viscous fluids, large
diameter valves, less restrictive pump openings and slow pump speeds are useful in more
completely filling the pump and reducing fluid pound. For normal viscosity fluids, pump
operating speed, pump length, and gas content are most important. Under extreme cases of
gassy fluids, the pump can be completely filled with gas (gas lock). When a pump is gas
locked, it is almost impossible to tell the response from a parted rod string or from the well
being pumped off (empty wellbore) since there is no fluid being pumped and no fluid pound.
[35]
With the use of the separator, the gas can be diverted into the tubing/casing annulus and
vented up towards surface. At this stage, there is an opportunity for the WHC to be used.
Since rod pumps are used in oil wells, wellhead compressors are here used only to assist in
lifting the free gas through the annulus. These compressors are usually smaller in size
capable of lifting smaller quantities of gas. [28]
The action of the valves in the pump follow well defined operating patterns of opening and
closing at certain points in the cycle of rod string movement. It is the stretching and
contraction of the sucker rod string that complicates the description of pump operation. A test
instrument called the dynamometer, which measures forces on the rod string caused by
pumping, is used to optimize the operation of the pump and string. The dynamometer is
attached to the polish rod. The polish rod is the uppermost rod in the string, passing through
the stuffing box and attaching by a clamp and cable arrangement to the head of the beam
pumping unit. The stuffing box is a seal assembly that wipes the oil from the polish rod and
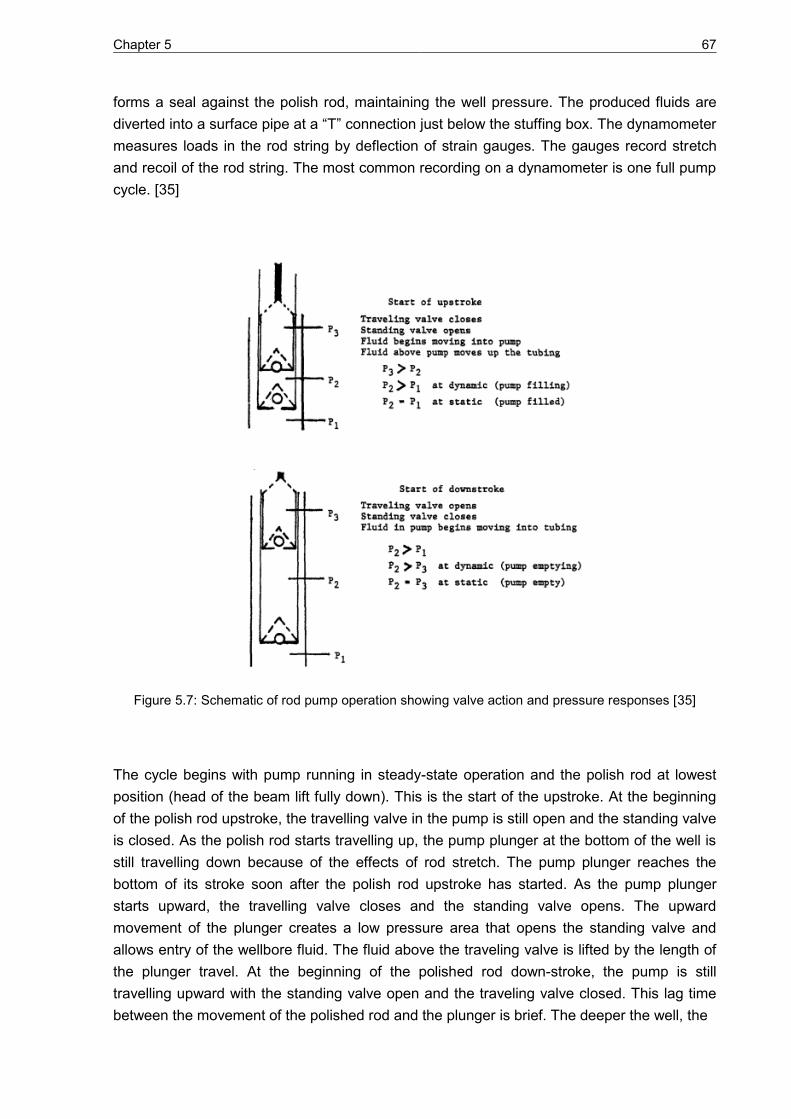
Chapter 5 67
forms a seal against the polish rod, maintaining the well pressure. The produced fluids are
diverted into a surface pipe at a “T” connection just below the stuffing box. The dynamometer measures loads in the rod string by deflection of strain gauges. The gauges record stretch
and recoil of the rod string. The most common recording on a dynamometer is one full pump
cycle. [35]
Figure 5.7: Schematic of rod pump operation showing valve action and pressure responses [35]
The cycle begins with pump running in steady-state operation and the polish rod at lowest
position (head of the beam lift fully down). This is the start of the upstroke. At the beginning
of the polish rod upstroke, the travelling valve in the pump is still open and the standing valve
is closed. As the polish rod starts travelling up, the pump plunger at the bottom of the well is
still travelling down because of the effects of rod stretch. The pump plunger reaches the
bottom of its stroke soon after the polish rod upstroke has started. As the pump plunger
starts upward, the travelling valve closes and the standing valve opens. The upward
movement of the plunger creates a low pressure area that opens the standing valve and
allows entry of the wellbore fluid. The fluid above the traveling valve is lifted by the length of
the plunger travel. At the beginning of the polished rod down-stroke, the pump is still
travelling upward with the standing valve open and the traveling valve closed. This lag time
between the movement of the polished rod and the plunger is brief. The deeper the well, the

Chapter 5 68
Figure 5.8: Operation sequence of a rod pump and string labeled on a dynamometer card [35]
more lag time exists between the uppermost position of the polish rod and end of upward
pump plunger travel. As the pump plunger reaches the end of its upstroke, the polish rod is
accelerating on the down-stroke. As the pump plunger starts downward movement, it will be
accelerated by the weight of the rods and opposed by liquid in the working barrel. The
traveling valve remains closed on the plunger down-stroke until the plunger contacts the
surface of the liquid that has flowed into the barrel. At this point, the standing valve closes
and the traveling valve opens. As the plunger continues its down-stroke, the fluid in the barrel
is displaced through the traveling valve. A 100% efficient pump (liquid filling and emptying
the entire pump) would lift the liquid in the tubing by the pump stroke length. If the pump is
not completely full, the liquid in the tubing falls back by the height of the void space in the
pump. [35]
Figure 5.9: Influence of WHC on SRP's efficiency [21]

Chapter 5 69
It is known that SRP cannot handle too much gas. That is, it will have the biggest efficiency
when producing single phase liquid. However, it is not always the case and fluids being
produced are often gassy in composition. Figure 5.9 displays a typical dynamometer graph
(bottommost graph) for a case when too much gas is present and gas lock occurs. Naturally,
pump barrel is then only partly filled and SRP’s efficiency is reduced. However, after installing a wellhead compressor, it helps the SRP by removing the gas and improving the
rod pump’s efficiency. Moreover, wellhead compression causes the dynamic fluid level to rise
which will result in increased production. As pump’s efficiency increases, so does the MTBF extend and lifting cost reduces.
5.4 Gas Lift
Gas lift is the process of injecting gas down the annulus between tubing and casing where it
will enter the tubing via a gas-lift valve located in a side pocket. Once it enters the tubing, the
gas is going to reduce the density of the produced fluid column, which will lower the bottom-
hole pressure. As the gas moves up the tubing, it will expand. Reservoir fluid will then
experience lower resistance to flow, and will start to move upward mixed with gas, resulting
in increased flow rates and increased production (Figure 5.10). Gas lift is the artificial lift
method which closely resembles the natural flow process. The only requirement is a supply
of pressurized injection gas. Normally, the lift gas is supplied from other producing wells,
separated from the oil, run through a gas compressor and pumped through the annulus at
higher pressure. The gas from the producing well is then recovered again, recompressed
and re-injected. [15]
Figure 5.10: Configuration of a typical gas lift well [28]

Chapter 5 70
The amount of gas needed for lift depends on tubing diameter, liquid volume, liquid density,
depth and bottom hole pressure. Gas injection may be needed only at the bottom in shallow
wells or the injection points may be spaced out along the tubing string in deeper wells.
The unloading of the well
Once the well is completed, the fluid level in the casing and tubing is generally at or near the
surface. The gas lift pressure is not sufficient to unload the fluid to the desired depth of gas
injection. This is because the pressure caused by the static column of the fluid in the well at
the desired depth of injection is greater than the available gas pressure at injection depth. In
this case a series of unloading valves is installed in the well. These valves are designed to
use the available gas injection pressure to unload the well until the desired depth of injection
is achieved. The whole process is shown in Figure 5.11.
Figure 5.11: The unloading process [15, p.51]
The Figure 5.11 shows a well with 3 gas lift valves. Valves #1 and #2 are the unloading
valves and the valve #3 is the operating valve. When gas reaches the first unloading valve, it
is injected into the tubing. This phase is visible in part B of the Figure 5.11. The liquid in the
tubing gets aerated and the static tubing pressure at the valve depth decreases to a
stabilized lower value that corresponds to the GLR. The lower valves are still open and the
liquid level in the annulus continues to drop.
When the liquid level in the annulus reaches the next unloading valve, the gas will be
injected through the valve. This is the most critical moment in the unloading process,
because both unloading valves inject gas at the same time as shown in part C. The upper
valve has to be closed in order to move the injection point down to the operating valve and
ensure that gas is injected at a single point only. Proper design and setting of the unloading
valves ensure that the shallower valve closes just after the next lower valve starts injecting
gas, as shown in part D.
As the middle valve continues to inject gas, the tubing pressure at that depth fails and the
annulus fluid level continues to drop. If the unloading string is properly designed, the stable
liquid level in the annulus will be just below the lowest valve, which is the operating valve.
When gas reaches the operating valve, gas will be injected into the tubing. Then it is very

Chapter 5 71
important that the middle valve closes, as shown in part F. By now the objective of the
unloading process has been met and gas is injected through the operating valve only. [15]
Figure 5.12: Pressure relationship in a continuous gas lift [28]
The inflow performance curve for the node at the gas injection point inside the tubing is well
IPR curve minus the pressure drop from bottom hole to the node. The outflow performance
curve is the vertical lift performance curve, with total GLR being the sum of formation GLR
and injected GLR. Intersection of the two curves defines the operation point, that is, the well
production potential (Figure 5.12). [28]
Gas lift valves are spring loaded or pressure balanced release valves. The valves are set to
open at a certain gas pressure. They feed a small amount of the gas from the annulus into
the tubing. The valves are placed in gas lift mandrels – a special section in the tubing that
receives the valve and gives it a port or opening to the gas in the annulus. The gas lift
mandrels are spaced out in the tubing string according to the design. Extra mandrels are
usually added to allow for pressure decline during depletion or to meet the demand of larger
fluid lifting requirements when water influx starts. When extra gas lift mandrels are used,
dummy gas lift valves are inserted when the string is run to stop unnecessary gas loss. The
dummy valves can be replaced with operating valves by a slick line unit without pulling the
well. Because the valves can be easily replaced at low expense, gas lift systems are usually
economical. The major operational expense is obtaining gas and the cost of gas
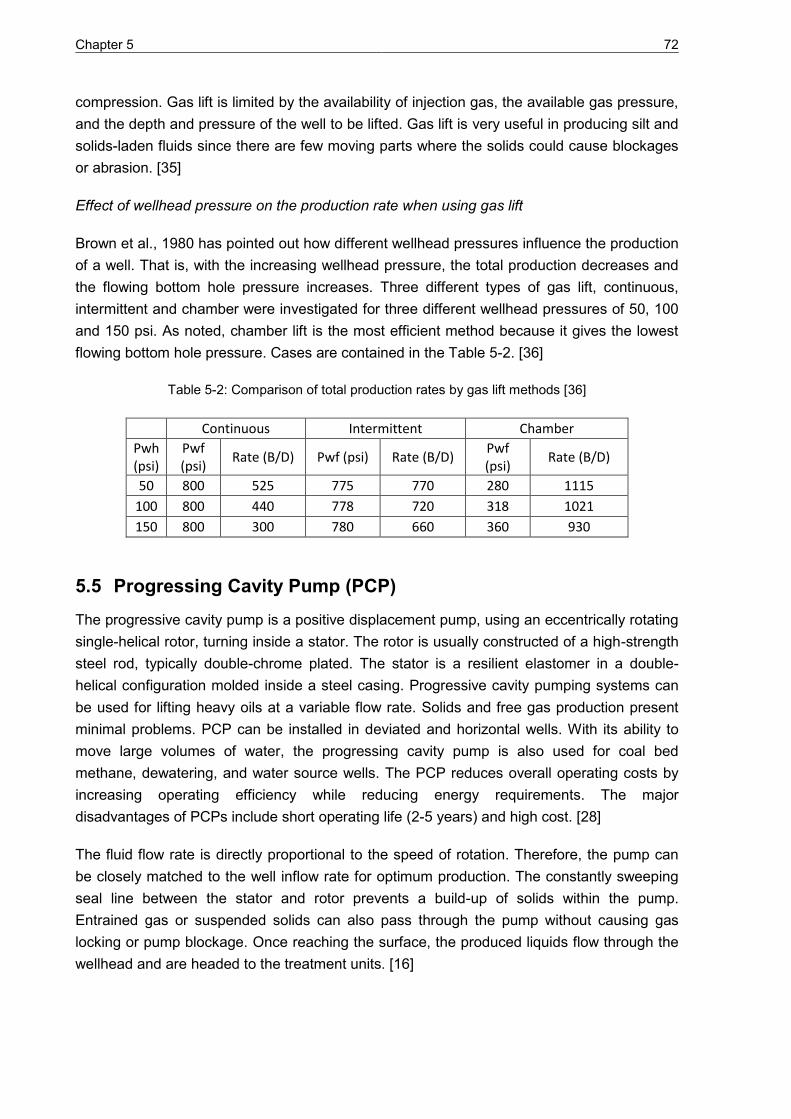
Chapter 5 72
compression. Gas lift is limited by the availability of injection gas, the available gas pressure,
and the depth and pressure of the well to be lifted. Gas lift is very useful in producing silt and
solids-laden fluids since there are few moving parts where the solids could cause blockages
or abrasion. [35]
Effect of wellhead pressure on the production rate when using gas lift
Brown et al., 1980 has pointed out how different wellhead pressures influence the production
of a well. That is, with the increasing wellhead pressure, the total production decreases and
the flowing bottom hole pressure increases. Three different types of gas lift, continuous,
intermittent and chamber were investigated for three different wellhead pressures of 50, 100
and 150 psi. As noted, chamber lift is the most efficient method because it gives the lowest
flowing bottom hole pressure. Cases are contained in the Table 5-2. [36]
Table 5-2: Comparison of total production rates by gas lift methods [36]
Continuous Intermittent Chamber
Pwh
(psi)
Pwf
(psi) Rate (B/D) Pwf (psi) Rate (B/D)
Pwf
(psi) Rate (B/D)
50 800 525 775 770 280 1115
100 800 440 778 720 318 1021
150 800 300 780 660 360 930
5.5 Progressing Cavity Pump (PCP)
The progressive cavity pump is a positive displacement pump, using an eccentrically rotating
single-helical rotor, turning inside a stator. The rotor is usually constructed of a high-strength
steel rod, typically double-chrome plated. The stator is a resilient elastomer in a double-
helical configuration molded inside a steel casing. Progressive cavity pumping systems can
be used for lifting heavy oils at a variable flow rate. Solids and free gas production present
minimal problems. PCP can be installed in deviated and horizontal wells. With its ability to
move large volumes of water, the progressing cavity pump is also used for coal bed
methane, dewatering, and water source wells. The PCP reduces overall operating costs by
increasing operating efficiency while reducing energy requirements. The major
disadvantages of PCPs include short operating life (2-5 years) and high cost. [28]
The fluid flow rate is directly proportional to the speed of rotation. Therefore, the pump can
be closely matched to the well inflow rate for optimum production. The constantly sweeping
seal line between the stator and rotor prevents a build-up of solids within the pump.
Entrained gas or suspended solids can also pass through the pump without causing gas
locking or pump blockage. Once reaching the surface, the produced liquids flow through the
wellhead and are headed to the treatment units. [16]

Chapter 5 73
Figure 5.13: Configuration of a typical progressing cavity pumping system [28]
The basic components include the down-hole pump, sucker rod and production tubing
strings, and surface drive equipment, which must include a stuffing box. However, a PCP
installation may also include different accessory equipment, such as gas separators, rod
centralizers, tubing-string rotator systems, and surface equipment control devices. [16]
Down-hole PC Pump
PC pumps are classified as single-rotor, internal-helical-gear pumps within the overall
category of positive displacement pumps. The rotor comprises the “internal gear” and the stator forms the “external gear” of the pump. The stator always has one more “tooth” or “lobe” than the rotor. The PC pump products currently on the market fall into two different categories based on their geometric design: single lobe or multi-lobe. Currently, the vast
majority (< 97%) of PC pumps in use down-hole are of the single-lobe design.
During production operations, the rotor translates back and forth across the stator opening as
it is rotated within the fixed stator. This occurs because of a combination of two motions:
rotation of the rotor around its own central axis in the clockwise direction and eccentric
reverse rotation (i.e., nutation) of the rotor about the central axis of the stator. Figure 5.14
illustrates the rotor movement within the stator opening at a given longitudinal position
through one full revolution. The rotor movement causes the series of parallel fluid cavities

Chapter 5 74
Figure 5.14: Rotor motion in a single-lobe PC pump [16, p.761]
formed by the rotor and stator to move axially from the pump suction to discharge on a
continuous basis. Figure 5.14 also shows the nutation of the rotor about the stator centreline.
[24]
The PCP head rating is defined by eq. 30: [28]
� = ( � − )� (30)
Where: � = pump head rating, psi
� = number of pitches of stator
� = head rating developed into an elementary cavity, psi
Gassy well production
In most operations, dissolved gas begins to evolve as free gas when the pressure drops as
the fluid moves toward and then enters the well. Gas entering the pump causes an apparent
decrease in pump efficiency because the gas occupying a portion of the pump cavities is
normally not accounted for in the fluid volume calculations. The pump must then compress
the gas until it either becomes solution gas again or it reaches the required pump discharge
pressure. The best way to reduce gas interference is to keep any free gas from entering the
pump intake. When possible, the intake should be located below the perforations to facilitate
natural gas separation. Even if the pump can be placed below the perforations, small
casing/tubing annuli can lead to high flow velocities that can “trap” free gas and carry it to the pump intake, thereby reducing the effectiveness of the natural gravity-based separation.

Chapter 5 75
Thus, seating of the stator, which typically has a larger diameter than the tubing, either within
or above the perforations interval should be avoided if possible.
In gassy wells in which the pump must be seated above the perforations, passive gas
separators that divert free gas up the casing/tubing annulus can be effective. In this case,
WHC if used would reduce the wellhead pressure and increase the production rate of the
gas. That way, progressive cavity pump would stay free of gas, producing only liquids which
would result in less possibility to damage the pump, maintain pump’s efficiency and extend MTBF.
5.6 Plunger Lift
Plunger lift has become a widely accepted and economical artificial-lift alternative, especially
in high-gas/liquid-ratio (GLR) gas and oil wells. Plunger lift uses a free piston that travels up
and down in the well’s tubing string. It minimizes liquid fallback and uses the well’s energy more efficiently than do slug or bubble flow. As with other artificial-lift methods, the purpose
of plunger lift is to remove liquids from the wellbore so that the well can be produced at the
lowest bottom-hole pressures.
Whether in a gas well, oil well, or gas lift well, the mechanics of a plunger-lift system are the
same. The plunger, a length of steel, is dropped through the tubing to the bottom of the well
and allowed to travel back to the surface. It provides a piston-like interface between liquids
and gas in the wellbore and prevents liquid fallback – a part of the liquid load that effectively
is lost because it is left behind. Because the plunger provides a “seal” between the liquid and the gas, a well’s own energy can be used to lift liquids out of the wellbore efficiently.
A plunger changes the rules for liquid removal. In a well without a plunger, gas velocity must
be high to remove liquids, but with a plunger, gas velocity can be very low. Thus, the plunger
system is economical because it needs minimal equipment and uses the well’s gas pressure as the energy source. Used with low line pressures or WHC, plunger lift can produce many
types of wells to depletion. [16]
Figure 5.15: Plunger-lift cycles [16, p.843]

Chapter 5 76
Plunger-lift operation consists of shut-in and flow periods. The flow periods are divided into
periods of unloading and flow after plunger arrival. The lengths of these periods vary with
application, producing capability of the well, and pressures. In specialized cases that use
plungers that can fall against flow, there might not be a shut-in period. However, most wells
require some shut-in.
A plunger cycle starts with the shut-in period that allows the plunger to drop from the surface
to the bottom of the well (Figure 5.15). At the same time, the well builds gas pressure that is
stored either in the casing, the fracture, or the near-wellbore region of the reservoir. The well
must be shut in long enough to build sufficient reservoir pressure to provide energy to lift
both the plunger and liquid slug to the surface against line pressure and friction. This can
also be achieved with the assistance of WHC, while reducing the wellhead pressure, there
will be enough pressure difference between the reservoir and the surface. When this
pressure has been reached, the flow period is started and unloading begins.
In the initial stages of the flow period, the plunger and liquid slug begin travelling to the
surface. Gas above the plunger quickly flows from the tubing into the flow-line, and the
plunger and liquid slug follow up the hole. The plunger arrives at the surface, unloading the
liquid. Initially, high rates prevail (often three to four times the average daily rate) while the
stored pressure is blown down. The well now can produce free of liquids, while the plunger is
held at the surface by the well’s pressure and flow. As rates drop, so do velocities. Eventually, velocities drop below the critical rate, and liquids begin to accumulate in the
tubing. The well is shut in, and the plunger falls back to bottom to repeat the cycle. [16]
Plunger lift can be used in conjunction with WHC and as a backup when the WHC shuts
down if the appropriate controls are installed.
Plunger seal and velocity
The plunger seal is the interface between the tubing and the outside of the plunger, and
probably is the most important plunger design element. Most plungers do not have a perfect
seal. Turbulence from a small amount of gas slippage around the plunger is necessary to
keep liquids above the gas below the plunger. A more efficient seal limits slippage and allows
the plunger to travel more slowly, which reduces the energy and pressure required to lift the
plunger and liquid load. Less efficient seals allow excessive slippage, and so increase the
energy and pressure required to operate the plunger.
The velocity at which the plunger travels up the tubing also affects plunger efficiency (Figure
5.16). Very low velocities increase gas slippage and lead to inefficient operation and possible
plunger stall. High velocities tend to push the plunger through the liquids. High velocities
waste well pressure and cause equipment wear, and increase well backpressure. Target
velocities allow just enough slippage to provide a good seal.

Chapter 5 77
Figure 5.16: The importance of plunger velocity [16, p.869]
Target velocities have been determined for various plunger types on the basis of each
plunger’s sealing ability. Better-sealing plungers operate efficiently at low velocities of 400 to
800 ft/min, whereas poor-sealing plungers must travel at 800 to 1,200 ft/min to maintain an
adequate seal. Brush and/or pad plungers have the best seal, and bar stock plungers have
the worst. [16]

Chapter 6 78
6 Overview of different artificial lift technologies
6.1 Application of different systems and their advantages and disadvantages
Table 6-1: Relative advantages of ALSs [16, p.429-430]
Sucker-rod
Pumping
Electric
Submersible
Pump
Gas lift Progressing
Cavity Pump Plunger lift
Relatively
simple system
design
Can lift
extremely high
volumes; 20,000
bpd in shallow
wells with large
casing
Can handle
large volume of
solids with minor
problems
Some types are
retrievable with
rods
Retrievable
without pulling
tubing
Units easily
changed to
other wells with
minimum cost
Unobtrusive in
urban locations
Handles large
volume in high-
PI wells
(continuous
lift);50,000 bpd
Moderate cost
Very
inexpensive
installation
Efficient, simple
and easy for
field people to
operate
Simple to
operate
Fairly flexible-
convertible from
continuous to
intermittent to
chamber or
plunger lift as
well declines
Low profile
Automatically
keeps tubing
clean of paraffin
and scale
Applicable to
slim-holes and
multiple
completions
Easy to install
down-hole
pressure sensor
for telemetering
pressure to
surface by cable
Unobtrusive in
urban locations
Can use down-
hole electric
motors that
handle sand and
viscous fluid well
Applicable for
high GOR wells
Can pump a well
down to very low
pressure (depth
and rate
Crooked holes
present no
problem
Power source
can be remotely
located
High electrical
efficiency
Can be used
with intermittent
gas lift

Chapter 6 79
dependent)
System usually
is naturally
vented for gas
separation and
fluid level
soundings
Applicable
offshore
Easy to obtain
down-hole
pressures and
gradients
Can be used to
unload liquid
from gas wells
Flexible-can
match
displacement
rate to well
capability as
well declines
Corrosion and
scale treatment
easy to perform
Lifting gassy
wells is no
problem
Has no moving
parts
Analyzable Availability of
different sizes
Sometimes
serviceable with
wire-line unit
No problem in
deviated or
crooked holes
Can lift HT and
viscous oils
Lifting cost for
high volumes
generally very
low
Crooked holes
present no
problem
Unobtrusive in
urban locations
and applicable
offshore
Can use gas or
electricity as
power source
Corrosion is not
usually as
adverse
Can use water
as a power
source
Corrosion and
scale treatments
easy to perform
Applicable
offshore
Power fluid does
not have to be
so clean as for
hydraulic piston
pumping
Applicable to
pump-off control
if electrified
Corrosion scale
and emulsion
treatment easy
to perform
Availability of
different sizes
Power source
can be remotely
located

Chapter 6 80
Has pumps with
double valves
that pump on
both upstroke
and down-stroke
It can handle
high volumes to
30,000 B/D
Hollow sucker
rods are
available for
slim-hole
completions and
ease of inhibitor
treatment
Table 6-2: Relative disadvantages of ALSs [16, p.431-432]
Sucker-rod
Pumping
Electric
Submersible
Pump
Gas lift Progressing
Cavity Pump Plunger lift
Crooked holes
present a friction
problem
Not applicable to
multiple
completions
Gas lift is not
always available
Elastomers in
stator swell in
some well fluids
May not take
well to depletion;
therefore,
eventually
requires another
lift method
High solids
production is
troublesome
Only applicable
with electric
power
Not efficient in
lifting small
fields or one-
well leases
Pump-off control
is difficult
Good for low-
rate, normally
less than 200
bpd wells only
Gassy wells
usually lower
volumetric
efficiency
High voltages
(1,000 V) are
necessary
Difficult to lift
emulsions and
viscous crudes
Lose efficiency
with depth
Requires more
engineering
supervision to
adjust properly
Is depth limited,
primarily
because of rod
capability
Impractical in
shallow, low
volume wells
Gas freezing
and hydrate
problems
Rotating rods
wear tubing;
windup and
after-spin of
rods increase
Danger exists in
plunger reaching
too high a
velocity and
causing surface

Chapter 6 81
with depth damage
Obtrusive in
urban locations
Expensive to
change
equipment to
match declining
well capability
Problems with
dirty surface
lines
Communication
between tubing
and casing
required for
good operation
unless used in
conjunction with
gas lift
Heavy and bulky
in offshore
operations
Cable causes
problems in
handling
tubulars
Some difficulty
in analyzing
properly without
engineering
supervision
Susceptible to
paraffin
problems
Cables
deteriorate in
high
temperatures
Cannot
effectively
produce deep
wells to
abandonment
Tubing cannot
be internally
coated for
corrosion
System is depth
limited, 10,000
ft, because of
cable cost and
inability to install
enough power
down-hole
Requires
makeup gas in
rotative systems
H2S limits depth
at which a large-
volume pump
can be set
Gas and solids
production are
troublesome
Casing must
withstand lift
pressure
Limitation of
down-hole pump
design in small
diameter casing
Not easily
analyzable
unless good
engineering
know-how
Safety problem
with high-
pressure gas
Lack of
production rate

Chapter 6 82
flexibility
Casing size
limitation
Cannot be set
below fluid entry
without a shroud
to route fluid by
the motor.
Shroud also
allows corrosion
inhibitor to
protect outside
of motor
More downtime
when problems
are encountered
because of the
entire unit being
down-hole
Design considerations for artificial lift must be taken before a well or group of wells are
drilled. The design is going to be influenced by whether a group, lease, or field will be lifted or
if only an isolated well will require artificial lift. Also, type of completion is an influencing
factor, whether the wells are conventional or multiple completions. In multiple completions
the problem could be that the pipe clearances may not be provided. So, the choice of lift
method may be determined not by optimum design or economic criteria, but by physical
limitations. Included in this is the producing location. Offshore production platforms are
limited in areal extent. With all conditions equal, the best lift method onshore may not be
practical on a platform with limited space.
Furthermore, availability of a power source for the prime mover needs to be considered. In
some areas natural gas may or may not be available, economical, or practical. Electricity has
become more important due to availability and application to automation. Purchase cost,
transportation, storage, and handling may become prohibitive when diesel or propane is
required as the prime mover power source. One exception is an isolated well.
Artificial lift design largely depends on producing conditions. That is, extreme heat or cold,
high winds, dust, or snow may limit the choice of lift. Corrosion is very important in the choice
of lift methods. Sour crude, produced brine, oxygen and CO2 corrosion, electrolysis – all
affect artificial lift selection. Produced solids such as sand, salt, paraffin, and formation fines,

Chapter 6 83
are to be included. Depth to the producing zone and hole deviation must be considered to
provide adequate lift potential at future times. GOR and/or WOR considerations may limit
types of lift applicable. In other words, the total reservoir must be considered. [34]
6.2 Summary of artificial lift methods
Sucker rod pumping is the most common and widely used type of lift system. Through
history, the main advantage has been the familiarity of this type of lift to operating personnel.
Even though one of the main disadvantages has been depth limitation, with the development
of the technology, larger load capacity units and high strength rods allow greater depths. In
deeper wells tubing anchors should be used to prevent from buckling, where in shallow low
volume wells they are probably unnecessary.
Sucker rod pumps offer excellent rate range. It is influenced by the size and type of unit,
tubular size rod string design, and pump size range. In most cases, different pump and rod
sizes are “of-the-shelf” items - which mean that warehousing and stock parts as well as
service and repair availability have always been an advantage of this type of artificial lift.
However, disadvantage of SRP is quite large initial capital cost, especially for the larger high-
capacity units. Also, volume limitations of sucker rod pumps are due to tubular size and
depth. Volumetric efficiency is reduced in wells with high GOR, if solids are produced, if
paraffin forms or if the fluid is sour or corrosive. Major disadvantage is the rod string
operating in a corrosive environment. Rod wear will damage tubing and, upon tubing failure
may cause high workover expense. Also, the tubing cannot be internally coated to prevent
corrosion due to rod wear. Improper sucker rod handling causes many failures. Common
sense handling and make-up techniques can extend rod life and improve operating expense
indicators. Also, anchored tubing may improve efficiency and reduce rod wear for high
volume pumpers with large ID tubing. [34]
Gas lift may be used to kick-off wells that flow naturally, to back-flow water injection wells,
and to unload liquids from gas wells. Its main advantage is that it is flexible. This type of lift
will adjust to any depth and/or any rate. The design may be changed by wire-line without
pulling the tubing depending upon the tubular sizes and availability of service equipment.
Initial cost is usually less if high pressure is available. However, this is not true if
compressors must be obtained. Sand production is not a problem and it is adaptable to
deviated wells. It can be used in low productivity high GOR wells.
As any other method, it features disadvantages such as the limitation in areas where is could
be used if a shortage of natural gas occurs. Freezing and hydrates in the gas input line may
cause excessive downtime. Dry gas will improve operations but may cause loss of liquids.
Furthermore, valve retrieval in highly deviated holes by wire-line has offered problems in the
past; however, present day equipment supposedly has eliminated the problems. Scale,
corrosion and/or paraffin presence may increase backpressure and reduce efficiency.
Surface flowlines and separators may also cause increased backpressure with resultant loss
in lift efficiency. It is not applicable in bad casing where it is uneconomical to repair casing. It

Chapter 6 84
is difficult for the lower zone of a dual where there is a long distance between zones. It
should not use highly corrosive injection gas. It has difficulty in completely depleting a low
BHP low productivity well in some cases, and may require a change in lift method towards
the end of the life of the well. [34]
Electrical submersible pumps are capable of lifting high volumes however they usually find
their purpose in low volume wells. Although more engineering supervision may be required
initially it does not require a lot of knowledge to operate since it either does or does not run.
The pump can increase the volume in a dump flood from a water zone above to the water
flood zone below.
On the other hand, due to horsepower rating of the electric power motor, depth is limited.
Depth is also limited by size of tubular and high temperature. Larger high HP equipment may
not provide enough annular clearance to cool the motor resulting in failure. High temperature
will also limit both motor and cable. Moreover, initial cost may be high, since multistage high
volume and high HP pumps are expensive. The cable is also a high cost item, especially if
non-corrosive or high temperature sheathing is required. Transformers must be provided to
secure proper voltage. Cable failures occur and require pulling the tubing to repair. High
temperatures, corrosion, and poor handling lead to cable failure. Replacement cost may be
excessive on high failure marginal operations. Motor failures are also due to high
temperature, corrosion and abrasives. High GOR may result in low efficiency and failure is
due to free gas locking the pump. [34]
Plunger lift can maintain flowing status of a well. It is temporary and is usually replaced when
a method of lift is chosen. Its advantages are that plunger lift hook-up for a flowing well is
nominal in cost as compared with other lift methods. A plunger can also keep the tubing free
of paraffin and scale. When used in existing gas lift wells, it may help fluid fallback and
increase volumetric efficiency.
On the down side, plungers are usually used only as a temporary means of maintaining
production until another method of lift is chosen and installed. Plunger action will cause
surging of gas and liquids at the separating facility. If a plunger is put into service, the
production facility should be redesigned to handle the expected gas and liquid surges. Solids
may stick the plunger in the tubing, which will result in loss of production and a potentially
hazardous pulling job. [34]
Progressive cavity pump systems offer high overall system energy efficiency, typically in the
55% to 75% range. They have the ability to produce high concentrations of sand or other
produced solids and can tolerate high percentages of free gas. They are also quite resistant
to abrasion and generate low internal shear rates. They require relatively low power costs
and continuous power demand. Additional advantages are that they are relatively simple to
install and operate, with low profile surface equipment and low surface noise levels.
However, they have limited production rates (maximum of 800 m3/d in large-diameter pumps;
much lower in small-diameter pumps) with limited lift capacity (maximum of 3000 m).

Chapter 6 85
Because the stator is internally composed of an elastomer, they are limited to temperatures
and fluid environment where they could operate. Also, they are subject to low volumetric
efficiency in wells producing substantial quantities of gas. Most systems require the tubing to
be pulled to replace the pump. [16]
Chapter 7 86
7 Conclusion
Wellhead compression proves to be a good artificial lift option. Some situations in the field
are such that the pressure difference within the well is so low that the wellhead compression
is simply the only solution to that problem.
As the reservoir pressure declines in aging gas fields, gas production rates are therefore
reduced. Low reservoir pressure can cause liquid loading and in time, it will lead to increased
operational cost and possible non-productive time. In order to enhance the production of
those mature gas fields, wellhead compression is widely used solution to that issue. By
introducing compression, the wellhead pressure is reduced, therefore allowing greater flow
rates from the well and minimizing and/or preventing liquid loading.
Like any other artificial lift method, WHC also has disadvantages which have to be
considered when planning the artificial lift design. Reciprocating gas compressors which
have been described in this thesis are expensive to purchase and maintain. They have fixed
operating speed; therefore it is not easy to control the flow. If used close to populated area,
noise might be an issue. Also, many moving parts require good supervision and inspection.
On the other hand, the advantages of this type of compressors are that they offer a high
efficiency when new and after overhauls. They ensure high pressures while compressing.
WHC as an artificial lift method offers many benefits when installed on a field because it
increases the performance of free flowing gas wells, but also further improves the
performance of the naturally flowing gas wells. It can handle if the well is prone to sand
production or there are holes or restrictions in the tubing. Use of WHC helps to avoid liquid
load up in gas wells and increases the recovery factor. It has proven to be effective in shale
and tight gas production where the permeability values are very small.
Wellhead compression can maximize both production rate and reserves by reducing the
abandonment pressure, as well when combined with some of the artificial lift systems (if
economically viable). Hence, it is of major importance to consider it as an early step in
artificial lift application process rather than the last step. All planning ahead and good
designing steps will help to optimize economics. WHC can also be used to boost the
pressure of the produced gas to fit the piping system at the surface.

Chapter 8 87
8 References
[1] Takacs, G. (2010, January 1). Ways to Obtain Optimum Power Efficiency of Artificial Lift
Installations. Society of Petroleum Engineers. doi:10.2118/126544-MS
[2] Weatherford,5 Steps to Artificial Lift Optimization. Commercial presentation, Weatherford
Artificial Lift Systems, Houston, (2016, May)
[3] US Mineral resources, 23 6 2016. [Online]. Available:
http://www.usmineralresources.com/assets/images/declinechart.jpg
[4] Harms, L. K. (2004, January 1). Installing Low-Cost, Low-Pressure Wellhead
Compression on Tight Lobo Wilcox Wells in South Texas: A Case History. Society of
Petroleum Engineers. doi:10.2118/90550-MS
[5] World Wide Web, 12 7 2016. [Online].
Available:http://flyinggame.blogspot.co.at/2009/03/vertical-lift-performance-or-out-flow.html
[6] Beggs, H. D. (2003, May). Production Optimization Using Nodal Analysis, OGCI and
Petroskills Publications, Tulsa, Oklahoma
[7] Hyne, Norman J. 2012, Nontechnical Guide to Petroleum Geology, Exploration, Drilling &
Production, 3rd Edition
[8] Gonzalez Diez, Nã©., Slot, H., & Smeulers, J. P. M. (2014, October 27). Study on the
Application of Wellhead Compression in Offshore Facilities. Society of Petroleum Engineers.
doi:10.2118/170842-MS
[9] Siemens AG (2012), Extending value through field redevelopment – Solutions that
maximize the value of mature assets, Compression & Solutions
[10] Khan, M.O., (1984). „Basic Practices in Compressors Selection“ International
Compressor Engineering Conference. Paper 509.
[11] World Wide Web, 1 8 2016. [Online], Available:
https://en.wikipedia.org/wiki/Gas_compressor
[12] Mino, J. (2013, March 23). Natural Gas Reciprocating Compressor Optimization. Society
of Petroleum Engineers. doi:10.2118/164475-MS
[13] Ping, G. (2014, November 1). State Key Laboratory of Oil & Gas Reservoir Geology and
Exploitation, Southwest Petroleum University, Chengdu, Sichuan 610500, China
[14] Hofstätter, H., (2015). Artificial Lift Systems, lecture - General. Montanuniversität Leoben
[15] Stanghelle, K. U., (2009). Evaluation of artificial lift methods on the Gyda field. University
of Stavanger

Chapter 8 88
[16] Lake, L.W., (2007). Petroleum Engineering Handbook, Volume IV, Production operations
engineering. University of Texas at Austin
[17] Hanlon, P.C. (2001). Compressor handbook. Library of Congress Cataloging in
Publication Data
[18] World Wide Web, 14 09 2016. [Online], Available:
http://nuclearpowertraining.tpub.com/h1018v2/img/h1018v2_85_1.jpg
[19] Ahmed, T., McKinney, P.D. (2005). Advanced Reservoir Engineering. Elsevier Inc.
[20] Economides, M.J., Hill, A.D., Ehling-Economides, C. (1994). Petroleum Production
Systems. Prentice Hall, PTR.
[21] Hofstätter, H. (2013, September). The Scientific Background of Wellhead Compression.
Montanuniversität Leoben
[22] Fekete Associates Inc. (2013). Fekete Glossary.
[23] Encyclopedia Britannica, 06 10 2016. [Online], Available:
https://www.britannica.com/science/entropy-physics
[24] Encyclopedia Britannica, 06 10 2016. [Online], Available:
https://www.britannica.com/science/enthalpy
[25] Bellarby, J. (2009). Well completion design. Developments in Petroleum Science.
Elsevier B.V.
[26] Hofstätter, H. (2014, September). Liquid loadup of gas wells – Advanced well
completions. Montanuniversität Leoben
[27] Perrin, D. (1999). Well completion and servicing – Oil and Gas Field Development
Techniques. ENSPM Formation Industrie
[28] Guo, B., Lyons, W.C., Ghalambor, A. (February, 2007). Petroleum Production
Engineering – A Computer-Assisted Approach. Elsevier Science & Technology Books
[29] Schlumberger (2015). PIPESIM – Steady-state multiphase flow simulator. User guide.
[30] Harms, L. K. (2010, January 1). Wellhead Compression on Tight Gas Wells in the Long
Run: A Follow-Up Case History on Seven Years of Success in Lobo. Society of Petroleum
Engineers. doi:10.2118/138488-MS
[31] Jain, S., Al Hamadi, M. A., Jaber, S., & Jany, A. B. (2015, October 20). Mature Field
Revitalization: Analysis of Wellhead Compression to Enhance Productivity from a Mature
Retrograde Reservoir. Society of Petroleum Engineers. doi:10.2118/176395-MS
Chapter 8 89
[32] Takacs, G. (2009). Electrical Submersible Pumps Manual. Design, Operations and
Maintenance. Gulf Equipment Guides
[33] Brown, K.E. (1984). The technology of artificial lift methods. Volume IV – Production
Optimization of Oil and Gas Wells by Nodal Systems Analysis. The University of Tulsa.
[34] Brown, K.E. (1980). The technology of artificial lift methods. Volume II b – Electric
Submersible Centrifugal Pumps, Hydraulic Pumping – Piston Type, Jet Pumping, Plunger
Lift, Other Methods of Artificial Lift, Planning and Comparing Artificial Lift Systems. The
University of Tulsa.
[35] King, G.E. (1988). An Introduction to the Basics of Well Completions, Stimulations and
Workovers. Second edition (version 2.05).
[36] Brown, K.E. (1980). The technology of artificial lift methods. Volume II a – Introduction of
Artificial Lift Systems , Beam Pumping: Design and Analysis, Gas Lift. The University of
Tulsa.