Assessment of Heavy Metals in Summer & Winter Seasons in River Yamuna Segment Flowing
17
Journal of Environment and Ecology ISSN 2157-6092 2012, Vol. 3, No. 1 www.macrothink.org/jee 149 Assessment of Heavy Metals in Summer & Winter Seasons in River Yamuna Segment Flowing through Delhi, India Simerjit Kaur (Corresponding author) Associate Professor, Dept of Applied Sciences Rayat-Bahra Institute of Engineering & Biotechnology, Mohali Campus (Punjab), India E-mail: [email protected] Pragati Mehra PhD. Student, Dravidian University, Kuppam, Andhra Pradesh, 23, Dev Doot Apartments, D-Block, Vikas Puri, New Delhi-110018, India E-mail: [email protected] Received: September 15, 2012 Accepted: October 9, 2012 Published: December 1, 2012 doi:10.5296/jee.v3i1.2675 URL: http://dx.doi.org/10.5296/jee.v3i1.2675 Abstract In the present investigations, monitoring of seasonal variations in the concentrations of heavy metals (Pb, Fe, Zn, Mn, Cd, Co, Cu, Cr and Ni) in the Yamuna river water flowing through Delhi have been carried out during the year 2011. Yamuna River, Delhi segment has been chosen for this study as Delhi is a major industrial centre in the country, leading to addition of loads of contaminants into the river Yamuna. For this purpose, sampling was done from ten selected study sites (most likely to be affected by industrial & anthropogenic activities) during two seasons i.e. summer (May) and winter (January). The technique of Inductively Coupled Plasma-Mass Spectroscopy (ICP-MS) was used to determine the concentration of heavy metals in the water samples in both the seasons. Results have shown wide variations in the heavy metal levels varying from high concentration during summer and low concentrations during winter season. The concentrations of Pb, Cd, Cr, Cu, Zn and Co were found to be under the permissible limits of ICMR, CPCB, WHO and EPA. Elevated concentrations of Fe, Ni & Mn were found at Boat club, Yamuna Bazar, Nigambodh Ghat, Delhi old Bridge, ITO, Nizamuddin Bridge & Mayur Vihar. Also, Pb, Cd, Cu and Co have shown significant variation (p<0.05) in their concentration between summer and winter
Transcript of Assessment of Heavy Metals in Summer & Winter Seasons in River Yamuna Segment Flowing

Journal of Environment and Ecology
ISSN 2157-6092
2012, Vol. 3, No. 1
www.macrothink.org/jee 149
Assessment of Heavy Metals in Summer & Winter
Seasons in River Yamuna Segment Flowing through
Delhi, India
Simerjit Kaur (Corresponding author)
Associate Professor, Dept of Applied Sciences
Rayat-Bahra Institute of Engineering & Biotechnology, Mohali Campus (Punjab), India
E-mail: [email protected]
Pragati Mehra
PhD. Student, Dravidian University, Kuppam, Andhra Pradesh, 23, Dev Doot
Apartments, D-Block, Vikas Puri, New Delhi-110018, India
E-mail: [email protected]
Received: September 15, 2012 Accepted: October 9, 2012 Published: December 1, 2012
doi:10.5296/jee.v3i1.2675 URL: http://dx.doi.org/10.5296/jee.v3i1.2675
Abstract
In the present investigations, monitoring of seasonal variations in the concentrations of heavy
metals (Pb, Fe, Zn, Mn, Cd, Co, Cu, Cr and Ni) in the Yamuna river water flowing through
Delhi have been carried out during the year 2011. Yamuna River, Delhi segment has been
chosen for this study as Delhi is a major industrial centre in the country, leading to addition
of loads of contaminants into the river Yamuna. For this purpose, sampling was done from
ten selected study sites (most likely to be affected by industrial & anthropogenic activities)
during two seasons i.e. summer (May) and winter (January). The technique of Inductively
Coupled Plasma-Mass Spectroscopy (ICP-MS) was used to determine the concentration of
heavy metals in the water samples in both the seasons. Results have shown wide variations in
the heavy metal levels varying from high concentration during summer and low
concentrations during winter season. The concentrations of Pb, Cd, Cr, Cu, Zn and Co were
found to be under the permissible limits of ICMR, CPCB, WHO and EPA. Elevated
concentrations of Fe, Ni & Mn were found at Boat club, Yamuna Bazar, Nigambodh Ghat,
Delhi old Bridge, ITO, Nizamuddin Bridge & Mayur Vihar. Also, Pb, Cd, Cu and Co have
shown significant variation (p<0.05) in their concentration between summer and winter

Journal of Environment and Ecology
ISSN 2157-6092
2012, Vol. 3, No. 1
www.macrothink.org/jee 150
seasons, with less accumulation during winter and high during summers. High heavy metal
concentration during summer may be attributed to increased water temperature during
summer that may result in increased metal toxicity. The high levels of heavy metal at these
sites can be related to the untreated industrial discharge, lead battery-based industrial units,
vehicular pollution & surface run-off from contaminated areas.
Keywords: Heavy metals, Yamuna River pollution, Seasonal variations, River water analysis,
industrial pollution, Metal toxicity, Bio-accumulation
Journal of Environment and Ecology
ISSN 2157-6092
2012, Vol. 3, No. 1
www.macrothink.org/jee 151
1. Introduction
In the recent years, heavy metal toxicity has grown up as a serious concern all over the world,
as these heavy metals pose adverse effects on all forms of living organisms in the biosphere.
These heavy metals are not readily degradable in the environment and accumulate in the
animal and human bodies to a very high toxic levels leading to undesirable effects. The
increased population and the progress in agriculture and industry, in the recent years, have
further complicated this situation (Giguere et al., 2004). The discharge of untreated or
partially treated industrial waste waters containing heavy metals into the water bodies,
especially rivers, prevail in aquatic bodies and get bioaccumulated along the food chain.
Biomagnification of these heavy metals along the food chains occurs leading to various
health hazards to both humans and other living organisms. Heavy metals affect the structural,
biological functioning of biomolecules (McCormick et al., 2005). They are also known to
interfere with synthesis & metabolism of the hormones (Manjappa and Puttaioh, 2005;
Riddell et al., 2005; Gupta et al., 2009). The River Yamuna also considered as prominent and
sacred as the great ‘River Ganga’ itself, is the leading branch of River Ganga. The key
tributary of river originates from the Yamunotri glacier (Saptrishi Kund) near Bander punch
peaks 380 59’ N 78027’E) in the Mussoorie range of the lower Himalayas in Uttarkashi
district of Uttaranchal and also commended as a ‘sacred river’. Various religious centers of
Yamunotri (Uttaranchal), Paonta Sahib (Himachal Pradesh), Mathura, Vrindavan, Bateshwar
and Allahabad (all in Uttar Pradesh), are situated at the banks of Yamuna River. Large urban
centers, including, Yamuna Nagar, Sonepat, Delhi, Gautam Budh Nagar, Faridabad, Mathura,
Agra and Etawah are also established on its banks. Industrialization has occupied most part of
the Yamuna bank. Also, due to its soil fertility, Yamuna River basin is most widely used for
agriculture production. Yamuna water after proper treatment is supplied for domestic
activities and untreated water is used for various agricultural activities. Population density,
Industrialization, Urbanization & agricultural activities in & around the Delhi region, have
deteriorated the quality of Yamuna River to maximum extent that affects the aquatic
biodiversity & impact on the public health also. Therefore, the present investigations have
been carried out to assess the heavy metals concentration of Pb, Fe, Zn, Mn, Cd, Co, Cu, Cr
and Ni in the Yamuna river water flowing through the city of Delhi during two seasons viz.
summer (May) and winter (January). Similar kind of studies have already carried out by
several workers all over the world (Sehgal et al., 2012; Chakrabarty and Sarma, 2011;
Puthiyasekar et al., 2010; Dan’azumi and Bichi, 2010; Ahmed et al., 2010; Pandey et al.,
2010; Borah et al., 2009; Kaushik et al., 2009; Huang et al., 2008; Gaur et al., 2005; Neal et
al., 2000; Zereen et al., 1999; etc.).
2. Material and Methods
2.1 Sampling Area
These investigations were performed in summer season & winter season in 2011 for the ten
selected sites of river Yamuna flowing through Delhi: Loni Border; Wazirabad Pump House,
Sonia Vihar; Sur Yamuna Ghat, Wazirabad; Boat club, Yamuna Bazar 3; Nigam Bodh Ghat;

Journal of Environment and Ecology
ISSN 2157-6092
2012, Vol. 3, No. 1
www.macrothink.org/jee 152
Delhi Old Bridge; Income Tax office (ITO); Nizammudin Bridge; Mayur Vihar and Okhla
Barrage. The location map of the ten selected sites is presented in the Figure 1.
Figure 1. Map showing the location of the ten selected sampling spots
2.2 Sample Collection
Water samples were collected in triplicates from the ten sampling stations during the year
2011 for two seasons i.e. summer (May) and winter (January). The water sampling was done
in high grade plastic bottles. The bottles were dipped into the river water and after being
filled, they were capped tightly, inside the river water, itself.
The following sampling spots were selected for present investigations:
1=Loni Border; 2=Wazirabad Pump House, Sonia Vihar; 3=Sur Yamuna Ghat, Wazirabad;
4=Boat Club, Yamuna Bazar; 5=Nigam Bodh Ghat; 6=Delhi Old Bridge; 7=ITO;
8=Nizamuddin Bridge; 9=Mayur Vihar; 10=Okhla Barrage.
2.3 Sample Precautions
All the glassware was carefully rinsed before use to avoid contamination of the samples.
Sampling cans and bottles should be rinsed with de-ionized water and soaked in 3%
HNO3 for 24 hours. After the acid bath the bottles for storing of precipitation samples should
be rinsed thrice and then filled with 1% HNO3 and stopped. Also, the sampling bottles were

Journal of Environment and Ecology
ISSN 2157-6092
2012, Vol. 3, No. 1
www.macrothink.org/jee 153
rinsed thrice with de-ionized water, dried, stopped and packed in two clean plastic bags with
zip-locks. The rings and filter supports from the filter packs were soaked in 1% HNO3 for 12
hours, rinsed properly with de-ionized water. Autosampler tubes and cups were also rinsed
with de-ionized water, soaked in 1% HNO3 for minimum 12 hours and rinsed thrice with
de-ionized water before use.
2.4 Heavy Metal Analysis
Inductively Coupled Plasma-Mass Spectroscopy (ICP-MS) method was used for the
assessment of heavy metal concentrations at all the ten selected spots. During these
investigations, total of nine elements viz. Pb, Fe, Zn, Mn, Cd, Co, Cu, Cr, Ni were
determined for each water sample (i.e. ten study spots X two seasons i.e. summer and winter).
2.5 Principle
ICP-MS is a technique where ions produced in inductively coupled plasma, are separated in a
mass analyser and detected. The sample solution is fed into a nebulizer by a peristaltic pump.
The nebulizer converts the liquid sample into a fine aerosol that is transported into the plasma
by an Air gas flow, most often called carrier gas or nebulizer gas. With an ordinary
pneumatic nebulizer, only 1-2% of the sample reaches the plasma. In the plasma the sample
is evaporated, dissociated, atomised and ionised to varying extent. The produced positive
ions and molecular ions are extracted into the mass analyser. A simple quadruple gives a
resolution of 1 amu or more at a peak width of 10% of the peak height. The ions are separated
by mass to charge ratio (m/z) and measured by a channel electron multiplier. Methodology
followed for ICP-MS technique was same as described by Montaser, 1998.
2.6 Statistical analysis
Data obtained were statistically analyzed at 5% level of significance by using one-way
ANOVA.
Estimation
3. Result and Discussion
Pb, Cu, Co & Cd have shown significant variation (p<0.05) in their concentration in summer
and winter seasons, with less accumulation during winter and high during summers. No
significant variation in the concentrations of Cr, Fe, Ni, Mn, Zn were observed during
summer and winters, but the seasonal pattern for all the heavy metals was same i.e. high
values during summer and low values during winter season [Figures 2-10].
Also, Pb, Cd, Cr, Cu, Zn and Co concentrations were within the permissible limits of ICMR,
CPCB, WHO and EPA when compared with table1.
Journal of Environment and Ecology
ISSN 2157-6092
2012, Vol. 3, No. 1
www.macrothink.org/jee 154
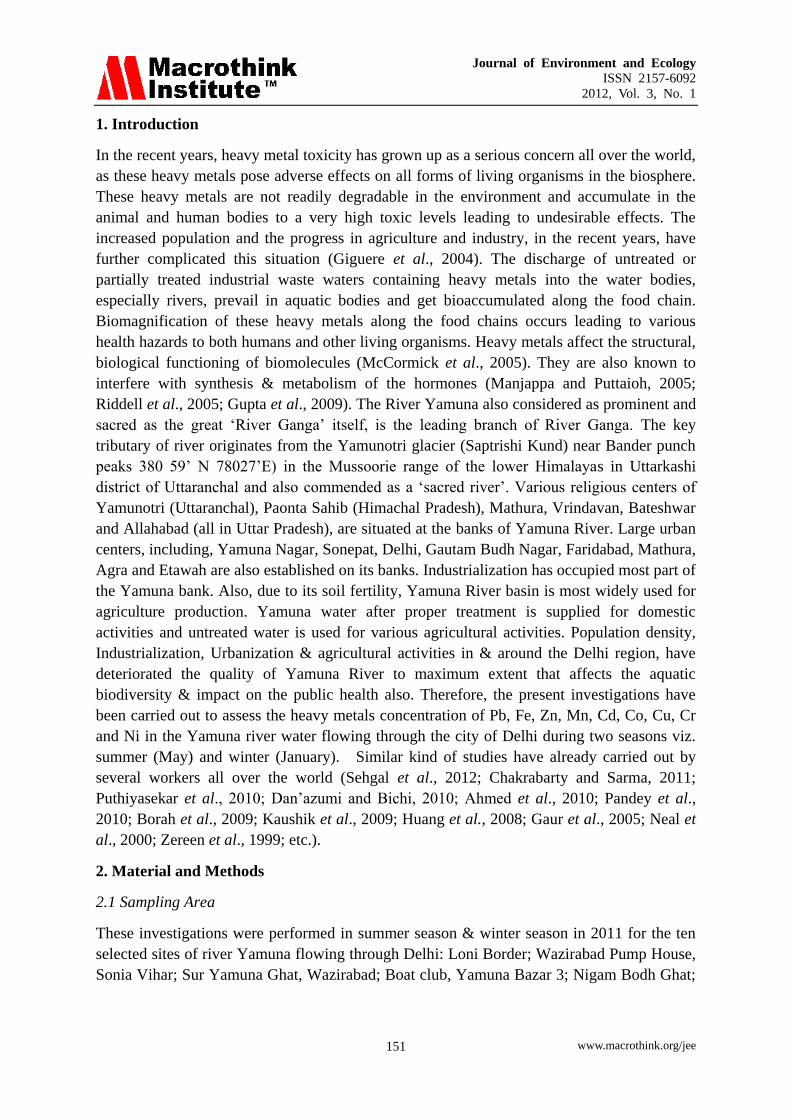
Table 1. Prescribed limits for heavy metals concentration in water
Standards Pb Fe Zn Mn Cd Co Cu Cr Ni
ICMR(mg/L) 0.1 0.3 5 0.1 0.01 NA 0.05 0.05 0.02
CPCB(mg/L) 0.1 3 5 2 2 NA 3 2 3
WHO(μg/L) 15 300 3000 100 3 40 2000 50 20
EPA(μg/L) 15 300 5000 50 3 --- 1300 100
---
Lead (Pb): Pb poisoning causes gastrointestinal, neuromuscular (known as lead lapsy) and
central nervous system disorders. It can also cause liver and kidney damage, reduced
haemoglobin formation and infertility and birth defects.
Figure 2. Concentration of Pb at ten selected sampling spots of Yamuna River, Delhi, in
summer & winter season
The Pb concentration varied from 0.077-0.326 ppb, with a mean of 0.141 ppb during summer
and from 0.067-0.256 ppb, with a mean of 0.118 ppb during winter season (Figure.2). The
high concentration of Pb in the river water can be related to the lead-based battery making
industrial units across the Delhi’s industrial areas & also through vehicular emissions. In
some cases, Pb is used to stabilize the land pipes/plastic pipes that results in Pb contamination
of the drinking water (Pillai, 1983).
Iron (Fe): High level of Fe results in nausea, vomiting, brain haemorrhage, anxiety, tension,
cardiac arrest, metabolic disorder.

Journal of Environment and Ecology
ISSN 2157-6092
2012, Vol. 3, No. 1
www.macrothink.org/jee 155
Figure 3. Concentration of Fe at ten selected sampling spots of Yamuna River, Delhi, in
summer & winter season
Fe concentrations were found to be extremely high in the river water during seasons, ranging
from 233.235-861.266 ppb, mean of 429.581 ppb during summer season and ranging from
224.589-852.074 ppb, mean of 421.908 ppb during winter season. Boat Club, Nigam Bodh
Ghat, Delhi Old Bridge, ITO, Nizamuddin Bridge and Mayur Vihar showed the presence of
elevated concentrations of Fe (Figure.3). Higher levels of iron at these sites could be due to
the fact seeped through soil and entered the river along with the rainwater run-off.
Zinc (Zn): Zn is involved in various physiological and metabolic activities of many
organisms. But increased level of Zn can cause many health disorders (Pillai, 1983). The
sources of Zn into the water bodies could be effluents of electroplating industries, sewage
effluents (Boxall et al., 2000; Dean et al., 1972). Reddy et al., 2012, while assessing the
water quality of Hussainsagar Lake, have mentioned that the Zn concentration probably
increased in the Lake body due to the immersed idols painted with multicolor.
Journal of Environment and Ecology
ISSN 2157-6092
2012, Vol. 3, No. 1
www.macrothink.org/jee 156
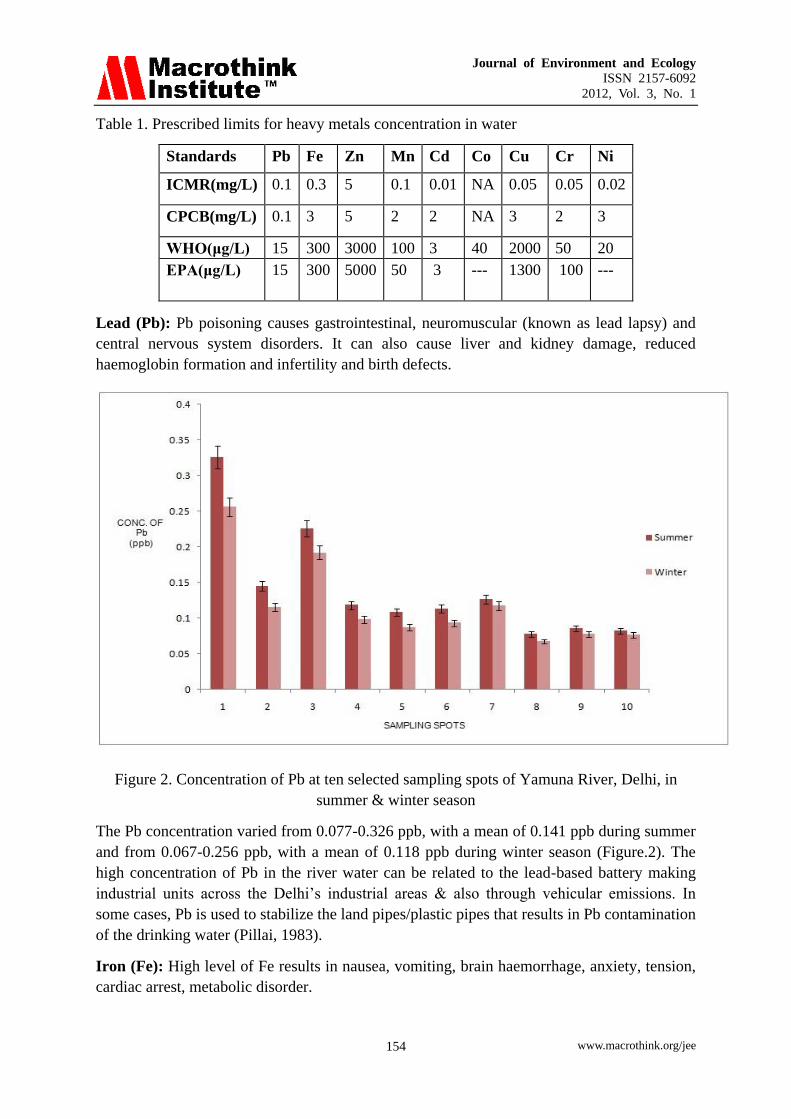
Figure 4. Concentration of Zn at ten selected sampling spots of Yamuna River, Delhi, in
summer & winter season
Zn was found in the range of 1.393-7.426 ppb and the mean was found to be 3.467 ppb
during summer season and in the winter season, the range was 1.139-7.27 ppb and the mean
was 3.338 ppb (Figure.4).
Manganese (Mn): High concentration of Mn results in kidney failure, lever & pancreas
malfunctioning but its optimum concentration is very much essential for respiratory enzymes
connective tissues developement (Underwood, 1977).

Journal of Environment and Ecology
ISSN 2157-6092
2012, Vol. 3, No. 1
www.macrothink.org/jee 157
Figure 5. Concentration of Mn at ten selected sampling spots of Yamuna River, Delhi, in
summer & winter season
Mn was in the range of 0.992-291.78 ppb (mean=136.671 ppb) during summer season and
0.0851-285.15 ppb (mean = 132.624 ppb) during winter season The sites of Boat Club,
Nigam Bodh Ghat, Delhi Old Bridge, ITO, Nizamuddin Bridge also showed the elevated Mn
concentration (Figure.5). Mn levels were found above the IS-105000 levels and were highest
at Wazirabad Barrage and Okhla Barrage. This observation may be linked to the industrial
units situated at Wazirpur, Badli and Jhilmil vicinity, where, steel processing industries are
common & these industries discharge their treated and untreated waste water into the various
drains which further meet the river Yamuna at Wazirabad Barrage. Mn is frequently found in
iron-bearing waters and is present most frequently as a manganous ion. Mn can also enter the
river through industrial effluents from steel industries (Sehgal et al., 2012).
Cadmium (Cd): Cd is a poisonous metal and can cause serious health problems even if
ingested in small concentration. It has the tendency to get accumulated in the body tissues
that results in lung problems and kidney damage (Fleischer et al., 1974; Friberg et al.,1974).
Effluents from industries like battery making, dye making, pigment making, alloy making are
the major sources of Cd into the water bodies (Rao and Yoshida, 2004). Cd concentration
varied from 0.024-0.044 ppb, mean of 0.031 ppb during summer and 0.018-0.035 ppb, mean
of 0.024 ppb during winter (Figure.6).

Journal of Environment and Ecology
ISSN 2157-6092
2012, Vol. 3, No. 1
www.macrothink.org/jee 158
Figure 6. Concentration of Cd at ten selected sampling spots of Yamuna River, Delhi, in
summer & winter season
Cobalt (Co): Earlier research findings confirm that Co is carcinogenic in nature. In low
concentration, it causes vomiting, weakness, giddiness, lack of concentration, hearing
impairment, thyroid problems, memory loss & cardiovascular disease. Co enters the water
bodies from the effluents coming from industries dealing with corrosion and wear-resistant
alloys. The other sources of Co contamination are colors and pigments used to color glass and
ceramic objects, lithium-cobalt batteries and permanent magnets. Petroleum based industries
are also the cause of Co contamination into the environment.
Figure 7. Concentration of Co at ten selected sampling spots of Yamuna River, Delhi, in
summer & winter season
Journal of Environment and Ecology
ISSN 2157-6092
2012, Vol. 3, No. 1
www.macrothink.org/jee 159
The range for Co was 0.254-0.972 ppb and 0.24-0.881 ppb during summer and winter
respectively and the mean was found to be 0.640 ppb and 0.574 ppb during summer and
winter season, respectively (Figure.7). Decreased water level during summer seasons may be
responsible for increased Co level. This can also be related with the increased water
temperature during summers that depletes the dissolved oxygen & amplify the toxicity.
Similar type of study have already conducted by Sehgal et al., 2012 to estimate the
concentrations of heavy metals in the Yamuna River in the Delhi segment, starting from
Wazirabad Barrage till the Okhla Barrage by selecting different spots. Sen et al., 2011 found
high concentrations of heavy metals (Ca, K, Mg, Na and P) in fish of Yamuna River
indicating that the Yamuna River is highly contaminated with heavy metals. It was found out
that the probable sources of heavy metals in the river may be caused by various industry
outlets which come to the river.
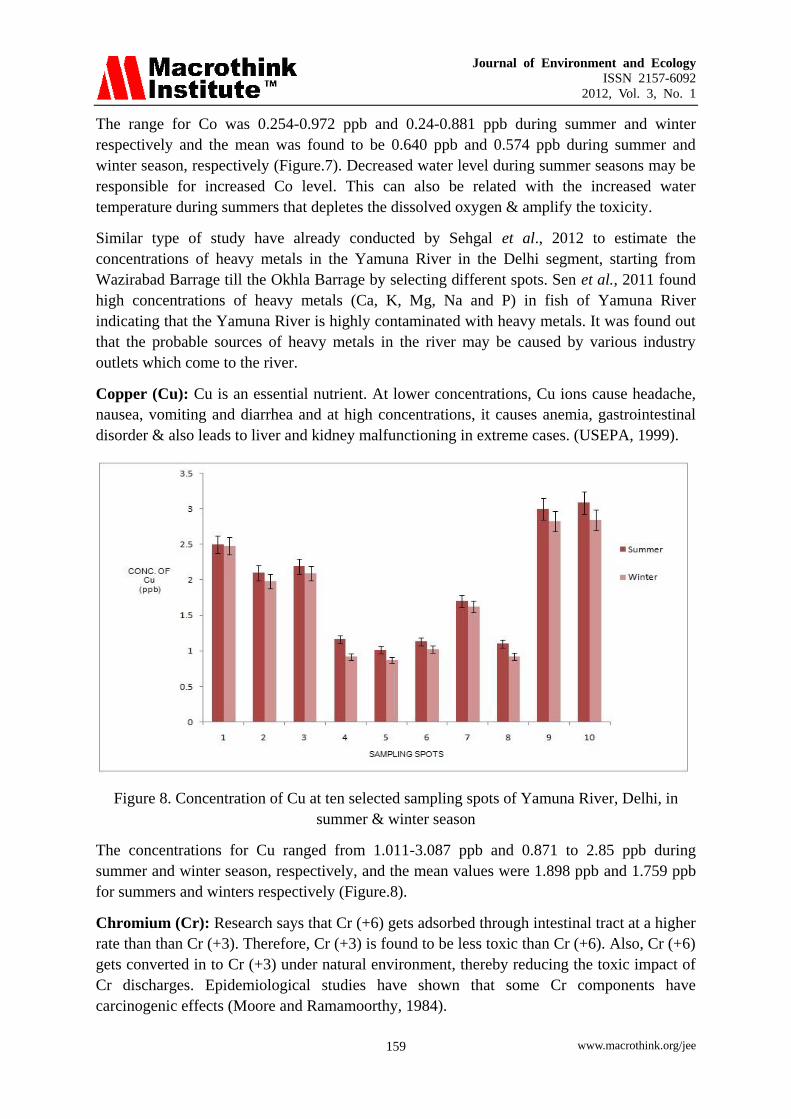
Copper (Cu): Cu is an essential nutrient. At lower concentrations, Cu ions cause headache,
nausea, vomiting and diarrhea and at high concentrations, it causes anemia, gastrointestinal
disorder & also leads to liver and kidney malfunctioning in extreme cases. (USEPA, 1999).
Figure 8. Concentration of Cu at ten selected sampling spots of Yamuna River, Delhi, in
summer & winter season
The concentrations for Cu ranged from 1.011-3.087 ppb and 0.871 to 2.85 ppb during
summer and winter season, respectively, and the mean values were 1.898 ppb and 1.759 ppb
for summers and winters respectively (Figure.8).
Chromium (Cr): Research says that Cr (+6) gets adsorbed through intestinal tract at a higher
rate than than Cr (+3). Therefore, Cr (+3) is found to be less toxic than Cr (+6). Also, Cr (+6)
gets converted in to Cr (+3) under natural environment, thereby reducing the toxic impact of
Cr discharges. Epidemiological studies have shown that some Cr components have
carcinogenic effects (Moore and Ramamoorthy, 1984).
Journal of Environment and Ecology
ISSN 2157-6092
2012, Vol. 3, No. 1
www.macrothink.org/jee 160
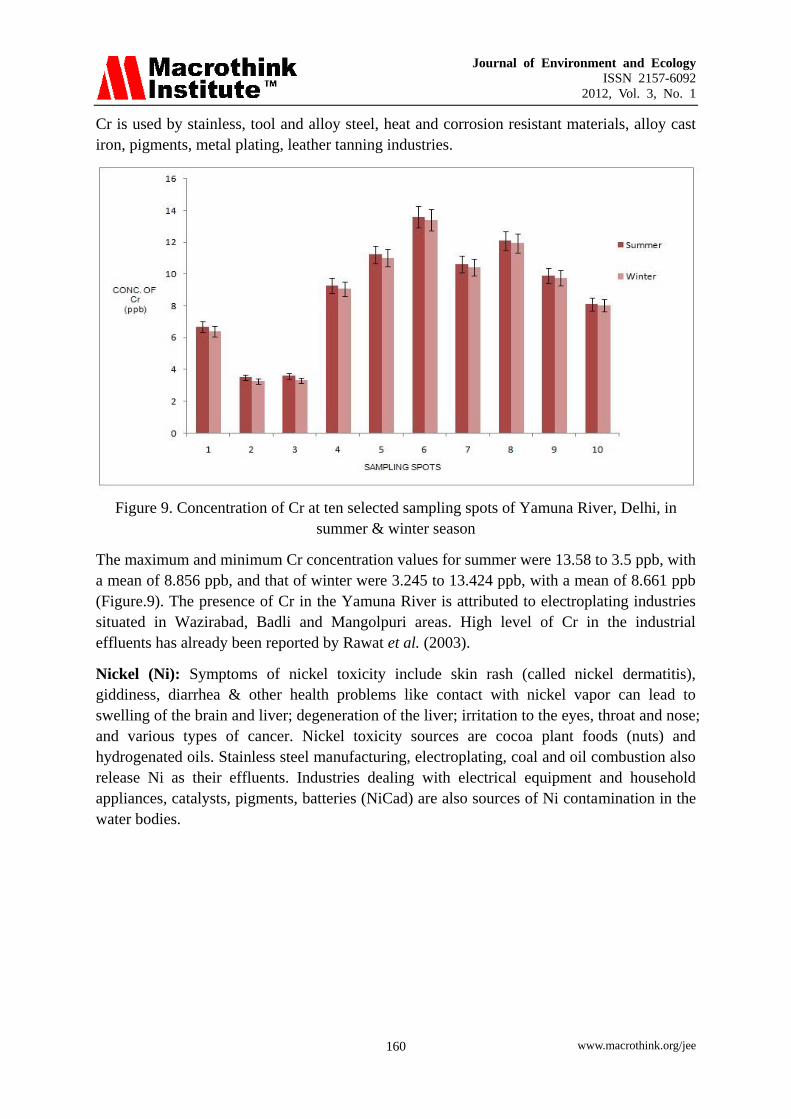
Cr is used by stainless, tool and alloy steel, heat and corrosion resistant materials, alloy cast
iron, pigments, metal plating, leather tanning industries.
Figure 9. Concentration of Cr at ten selected sampling spots of Yamuna River, Delhi, in
summer & winter season
The maximum and minimum Cr concentration values for summer were 13.58 to 3.5 ppb, with
a mean of 8.856 ppb, and that of winter were 3.245 to 13.424 ppb, with a mean of 8.661 ppb
(Figure.9). The presence of Cr in the Yamuna River is attributed to electroplating industries
situated in Wazirabad, Badli and Mangolpuri areas. High level of Cr in the industrial
effluents has already been reported by Rawat et al. (2003).
Nickel (Ni): Symptoms of nickel toxicity include skin rash (called nickel dermatitis),
giddiness, diarrhea & other health problems like contact with nickel vapor can lead to
swelling of the brain and liver; degeneration of the liver; irritation to the eyes, throat and nose;
and various types of cancer. Nickel toxicity sources are cocoa plant foods (nuts) and
hydrogenated oils. Stainless steel manufacturing, electroplating, coal and oil combustion also
release Ni as their effluents. Industries dealing with electrical equipment and household
appliances, catalysts, pigments, batteries (NiCad) are also sources of Ni contamination in the
water bodies.

Journal of Environment and Ecology
ISSN 2157-6092
2012, Vol. 3, No. 1
www.macrothink.org/jee 161
Figure 10. Concentration of Ni at ten selected sampling spots of Yamuna River, Delhi, in
summer & winter season
Ni lied between 4.559-27.487 ppb, with an average of 18.092 ppb, during summer and
4.515-27.296 ppb, with an average of 17.821 ppb, during winter season (Figure.10). The
elevated levels of Ni were found at the sites of Boat Club, Nigam Bodh Ghat, Delhi Old
Bridge, ITO, Nizamuddin Bridge and Mayur Vihar. Ni must have entered these sites through
various industrial processes & other domestic activities. Dumping of municipal sewage into
the river Yamuna can also lead to elevated Ni in the river. Higher concentrations of Ni at the
site of Boat Club, Yamuna bazaar, was present as this site is used for idol immersion of God
and Goddesses during the festival of Vinayaka Chathurthi, Durga Puja and Saraswati Puja.
These idols contain multicolored paints, which contain Ni.
4. Conclusion
Fe, Ni, Mn have shown elevated levels of heavy metals at Boat Club, Nigam Bodh Ghat,
Delhi Old Bridge, ITO, Nizamuddin Bridge and Mayur Vihar. A possible reason for this
could be the industrial effluents, as the industrial areas of Delhi contain various metal and
ferro alloy industries. The increased levels of heavy metals in the water lead to accumulation
of heavy metals in the agricultural soils and plants grown on these contaminated soils,
leading to great harm to humans and animals. Hence, it is obligatory to rectify the various
heavy metals resources which lead to addition of these metals into the river bodies. In
addition, water should be tested regularly to keep an eye on the heavy metal pollutant into the
water and purify the water, if necessary.

Journal of Environment and Ecology
ISSN 2157-6092
2012, Vol. 3, No. 1
www.macrothink.org/jee 162
5. Further Investigations
As the heavy metals enter the food chain and get accumulated at each level from producers to
consumers. As the water of Yamuna River is widely used for agricultural activities at the sites
of ITO, Mayur Vihar and Nizammudin Bridge, therefore, further, investigations are in
progress to test the heavy metal concentration in soil and in various crops being grown in
these areas. Further, we would like to determine some interventions that could reduce heavy
metal contamination in the food crops. This work will increase awareness among producers,
consumers and policy makers (as currently there is no regulatory system to test heavy metals
in food crops).
Acknowledgements
Authors are indebted to Post graduate Govt. college-11, Chandigarh &‘ARBRO analytical
commercial laboratory’, Kirti Nagar, Industrial area, Delhi, for providing all the
technical/practical support & friendly guidance for this experimentation.
References
Ahmed, M.K., Bhowmik, A.C., Rahman, S., & Haque, M.R. (2010). Heavy metal
concentration in water, sediments and freshwater mussels and fishes of the river Shitalakhya,
Bangladesh. Asian Journal of Water, Environment and Pollution, 7, 77-90.
Borah, K.K., Bhuyan, B., & Sharma, H.P. (2009). Heavy metal contamination of
groundwater in the tea garden belt of Darrang District, Assam, India. E-Journal of Chemistry,
6(S1), S501-S507.
Boxall, A. B. A., Comber, S. D., Conrad, A. U., Howcroft, J., & Zaman, N. (2000). Inputs,
monitoring and fate modeling of antifouling biocides in UK Estuaries. Marine Pollution
Bulletin, 40, 898–905.
Byrd, J. E., & Perona M.J. (1980). The temporal variations of lead concentration in the
freshwater lake, Water, Air and Soil Pollution, 13, 207-220.
Chakrabarty, S., & Sharma, H.P. (2011). Heavy metal contamination of drinking water in
Kamrup district, Assam, India. Environmental Monitoring and Assessment, 179, 479–486.
http://dx.doi.org/10.1007/s10661-010-1750-7
CPCB. (2008). Guidelines for Water Quality Management, Central Pollution Control board,
Delhi.
Dan’azumi, S., & Bichi, M.H. (2010). Industrial pollution and heavy metal profile of
Challawa river in Nigeria, Journal of Applied Sciences in Environmental Sanitation, 5(1),
23-29. Kano.
Dean, J. G., Bosqui F. L., & Lannovette, V. H. (1972). Removing heavy metals from
wastewater. Environmental Science and Technology, 6, 518–522.
Journal of Environment and Ecology
ISSN 2157-6092
2012, Vol. 3, No. 1
www.macrothink.org/jee 163
Ebrahimpour, M. D., & Mushrifah, I. (2008). Heavy metal concentrations in water and
sediments in Tasik Chini, a freshwater lake, Malaysia. Environmental Monitoring and
Assessment, 141, 297-307. http://dx.doi.org/10.1007/s10661-007-9896-7
EPA (1976). Quality criteria for water, Washington. D.C. US, Environmental Protection
Agency.
Fleischer, M., Sarofim, A. F., Fassett, D. W., Hammond, P., Shacklette, H. T., & Nisbet, I. C.
T., et al. 1974. Environmental impact of cadmium, a review by the panel on the hazardous
traces substance. Environmental Health Perspectives, 7, 253–323.
Friberg, L., Piscator, M., Nordberg, G. F., & Kjellstrom, T. (1974). Cadmium in the
environment (2nd edn.). Cleveland: CRC, p. 248.
Gaur, V.K., Gupta, S.K., Pandey, S.D. Gopal, K., & Misra, V. (2005). Distribution of heavy
metals in sediment and water of river Gomti. Environmental Monitoring and Assessment,
102, 419–433. http://dx.doi.org/10.1007/s10661-005-6395-6
Giguere, A., Campbell, P. G. C., Hare, L., Mc Donald, D. G., & Rasmussen, J. B. (2004).
Influence of lake chemistry and fish age on cadmium, copper and zinc concentrations in
various organs of indigenous yellow perch (Percaflavescens). Canadian Journal of Fisheries
and Aquatic Sciences, 61, 702– 1716.
Gupta, A., Rai, D.K., Pandey, R.S., & Sharma, B. (2009). Analysis of some heavy metals in
the riverine water, sediments and fish from river ganges at Allahbad. Environmental
Monitoring and Assessment, 157, 449-458. http://dx.doi.org/10.1007/s10661-008-0547-64
Huang, X., Sillanpaa, M., Duo, B., & Gjessing. (2008). Water quality in the Tibetan Plateau:
Metal contents of four selected rivers. Environmental Pollution, 156(2), 270-277.
http://dx.doi.org/10.1016/j.envpol.2008.02.014
ICMR (1975). Indian Council of Medical Research, Manual of Standards of Quality for
Drinking water.
Kaushik, A., Kansal, A., Santosh, Meena, Kumari, S., & Kaushik, C. P. (2009). Heavy metal
contamination of river Yamuna, Haryana, India: Assessment by Metal Enrichment Factor of
the Sediments. Journal of Hazardous Material, 164(1), 265-70.
http://dx.doi.org/10.1016/j.jhazmat.2008.08.031
Manjappa, S., & Puttaioh, E. T. (2005). Evaluation of trace metals in the sediments of river
Bhadra near Bhadravathi town, Karnataka, India. Journal of Industrial Pollution Control,
21(2), 271–276.
McCormick, Sd., O’Dea, M. F., Moeckel, A. M., Lerner, D. T. and Bjornsson, B. T. (2005).
Endocrine disruption of parr-smolt transformation and seawater tolerance of Atlantic Salmon
by 4-nolyphenol and 17ß estradiol. General and Comparative Endocrinology, 142, 280– 288.
http://dx.doi.org/10.1016/j.ygcen.2005.01.015
Montaser, A. (1998). Inductively coupled plasma mass spectrometry. New York, Wiley.

Journal of Environment and Ecology
ISSN 2157-6092
2012, Vol. 3, No. 1
www.macrothink.org/jee 164
Moore, J. W., & Ramamoorthy, S. (1984). Heavy metals in natural waters. Applied
Monitoring and Impact Assessment. New York : Springer. 1-268.
Neal, C., Williams, R.J., Neal, M., Bhardwaj,L. C., Wickham, H., Harrow, M. and Hill, L.K.
(2000). The water quality of the river Thames at a rural site downstream of Oxford. The
Science of the Total Environment, 251, 441-457.
http://dx.doi.org/10.1016/S0048-9697(00)00398-3
Pandey, J. Shubhashish, P.K. & Pandey, R. (2010). Heavy metal contamination of Ganga
river at Varanasi in relation to atmospheric deposition. Tropical Ecology, 51(2S), 365-373.
Pillai, K. C. (1983). Heavy metals in aquatic environment, Water pollution and management
(Varshey C.K.). New Delhi:Wiley, 74–93.
Puthiyasekar, C., Neelakantan, M. A., & Poongothai S. (2010). Heavy metal contamination in
bore water due to industrial pollution and polluted and non polluted sea water intrusion in
Thoothukudi and Tirunelveli of South Tamil Nadu, India. Bulletin of Environmental
Contamination & toxicology, 85(6), 598-601. http://dx.doi.org/10.1007/s00128-012-0614-y
Rao, V. V. S. G. & Yoshida, M. (2004). Environmental impact of human activities to Urban
Lake Sediment: Potentially Toxic Elements (PTEs) Contamination in Hussainsagar Lake,
Hyderabad. In: The 11th National Symposium on Hydrology. 1–9. Roorkee: National Institute
of Hydrology.
Rawat, M., Moturi, M. C. Z., & Subramanian, V. (2003). Inventory compilation and
distribution of heavy metals in waste water from small-scale industrial areas of Delhi, India.
Journal of Environmental Monitoring, 5(6), 906–912. http://dx.doi.org/10.1039/B306628B
Reddy, V.M., Babu, K.S. Balaram, V. and Satyanarayanan, M. (2012). Assessment of the
effects of municipal sewage, immersed idols and boating on the heavy metal and other
elemental pollution of surface water of the eutrophic Hussainsagar Lake (Hyderabad, India).
Environmental Monitoring and Assessment, 184, 1991-2000.
http://dx.doi.org/10.1007/s10661-011-2094-7
Riddell, D. J., Culp, J. M., & Baird, D. J. (2005). Behavioural response to sublethal cadmium
within an experiment aquatic food web. Environmental Toxicology and Chemistry, 24,
431–441. http://dx.doi.org/10.1897/04-026R.1
Sehgal, M., Garg, A. Suresh, R. and Dagar, P. (2012). Heavy metal contamination in the
Delhi segment of Yamuna basin. Environment Monitoring Assessment, 184, 1181–1196.
http://dx.doi.org/10.1007/s10661-007-9996-4
Sen, I., Shandil, A., & Shrivastava, V.S. (2011). Study for Determination of Heavy Metals in
Fish Species of the River Yamuna (Delhi) by Inductively Coupled Plasma-Optical Emission
Spectroscopy (ICP-OES). Advances in Applied Science Research, 2(2), 161-166.
Underwood, E. J. (1977). Trace elements in human nutrition. New York: Academic.

Journal of Environment and Ecology
ISSN 2157-6092
2012, Vol. 3, No. 1
www.macrothink.org/jee 165
USEPA (1999). National primary drinking water regulation. United States Environmental
Protection Agency.
WHO. (1993). Guidelines for drinking water quality, recommendations. (2nd
Edition).
Geneva.
Zereen, F., Islam, F., Habib, M.A., Begum, D. A., & Zaman, M.S. (1999). Inorganic
pollutants in the Padma River, Bangladesh. Environmental Geology, 39(9), 1059-1062.
http://dx.doi.org/10.1007/s 002549900098