Band 2: Anhang - Start @ Rostocker...
127
Aus der Klinik für Psychiatrie, Neurologie, Psychosomatik und Psychotherapie im Kindes- und Jugendalter der Universität Rostock Direktor: Prof. Dr. med. F. Häßler und aus der Universitätsfrauenklinik und Poliklinik am Klinikum Südstadt Rostock Direktor: Prof. Dr. med. B. Gerber Schwangerschaft und Geburt im minderjährigen Alter – Ist die Risikobelastung ein Effekt des Alters oder bedingt durch Bildungsstand, Partnerstatus und/oder Tabakkonsum? Eine Matched - Pairs - Studie an Erstgebärenden der Jahrgänge 2000 – 2004 - Band 2: Anhang - Inauguraldissertation zur Erlangung des akademischen Grades Doktor der Medizin der Medizinischen Fakultät der Universität Rostock vorgelegt von Sara Fracassi, geb. am 16.5.1981 in Bergisch Gladbach aus Overath verteidigt am 8.7.2009
Transcript of Band 2: Anhang - Start @ Rostocker...

Aus der Klinik für Psychiatrie, Neurologie, Psychosomatik und Psychotherapie im
Kindes- und Jugendalter der Universität Rostock
Direktor: Prof. Dr. med. F. Häßler
und aus der Universitätsfrauenklinik und Poliklinik am Klinikum Südstadt Rostock
Direktor: Prof. Dr. med. B. Gerber
Schwangerschaft und Geburt im minderjährigen Alter –
Ist die Risikobelastung ein Effekt des Alters oder bedingt durch
Bildungsstand, Partnerstatus und/oder Tabakkonsum?
Eine Matched - Pairs - Studie an Erstgebärenden der
Jahrgänge 2000 – 2004
- Band 2: Anhang -
Inauguraldissertation
zur
Erlangung des akademischen Grades
Doktor der Medizin
der Medizinischen Fakultät
der Universität Rostock
vorgelegt von
Sara Fracassi, geb. am 16.5.1981 in Bergisch Gladbach
aus Overath
verteidigt am 8.7.2009
Dekan: Prof. Dr. med. E. Reisinger
Gutachter: 1. Prof. Dr. med. habil. Frank Häßler
Klinik für Psychiatrie, Neurologie, Psychosomatik und
Psychotherapie im Kindes- und Jugendalter der Universität
Rostock
2. Prof. Dr. med. habil. Bernd Gerber,
Universitätsfrauenklinik und Poliklinik am
Klinikum Südstadt Rostock
3. Dr. med. Oliver Bilke,
Klinik für Kinder-Jugendpsychiatrie und Psychotherapie,
Vivantes Klinikum Hellersdorf

Inhaltsverzeichnis
Anhang................................................................................................................1
A1. Risikoliste ....................................................................................................1
A2. Vergleichslisten der Matched-Pairs 2000 – 2004...................................... 16
A3. Übersicht der Ergebnisse ...........................................................................25
A3.1 Anamnestische Angaben vor der Schwangerschaft............................ 25
A3.2 Schwangerschaftsverlauf.....................................................................41
A3.3 Geburt..................................................................................................67
A3.4 Kindliches Outcome ........................................................................... 89
A3.5 Jugendamt oder Vormundschaft .......................................................115
A3.6 Diskussion......................................................................................... 117
1


Anhang
Anhang
A1. Risikoliste
Vom Untersucher einzutragen
Datum Aktenstudium: durchgeführt durch:
Interwiewdatum: durchgeführt durch:
Mimücode: Code der Matchmutter:
Geburtsdatum Mutter: Alter:
Geburtsdatum des Kindes:
Notfall : Konfession:
001 Familienstand:
01 ledig02 geschieden03 verheiratet 04 eheähnliche Gemeinschaft
002 Beruf vor der Schwangerschaft
01 ungelernter Arbeiter02 angelernter Berufe03 Facharbeiter, Handwerker, Angestellte, Beamte im Dienst04 mittlere qualifizierte Angestellte, Beamte im einfachem Dienst05 höher qualifizierte Angestellte, Beamte im gehobenen Dienstag06 leitende Angestellte, Beamte im höheren Dienst07 Kleinste Selbständige, ambulantes Gewerbe08 kleine selbständige Gewerbetreibende 09 selbständige Handwerker, Landwirte, Gewerbetreibende (kl. Betriebe)10 selbständige Handwerker, Landwirte (mittl. Betriebe)11 selbständige Akademiker, freie Berufe, (größere Unternehmen)12 arbeitslos13 Schülerin14 Berufsvorbereitungsjahr15 Azubi
003 Welchen Beruf üben Sie aus?
1
Akte Inter-wiew

Anhang
Fragen zum Kindesvater
004 Welchen Beruf übt der Kindesvater derzeitig aus?
01 ungelernter Arbeiter02 angelernter Berufe03 Facharbeiter, Handwerker, Angestellte, Beamte im Dienst04 mittlere qualifizierte Angestellte, Beamte im einfachem Dienst05 höher qualifizierte Angestellte, Beamte im gehobenen Dienstag06 leitende Angestellte, Beamte im höheren Dienst07 Kleinste Selbständige, ambulantes Gewerbe08 kleine selbständige Gewerbetreibende 09 selbständige Handwerker, Landwirte, Gewerbetreibende (kl. Betriebe)10 selbständige Handwerker, Landwirte (mittl. Betriebe)11 selbständige Akademiker, freie Berufe, (größere Unternehmen)12 arbeitslos13 Schüler14 Berufsvorbereitungsjahr15 Azubi
Risiken - Kindesmutter
005 Rauchen Sie?
006 Wenn ja Wie viele Zigaretten rauchen Sie pro Tag?
01 weniger als 1002 10-3003 mehr als 30
007 Haben Sie während der Schwangerschaft geraucht?
007 Wenn ja Wie viele Zigaretten pro Tag?
01 Weniger als 1002. 20-3003 mehr als 30
2
Anhang
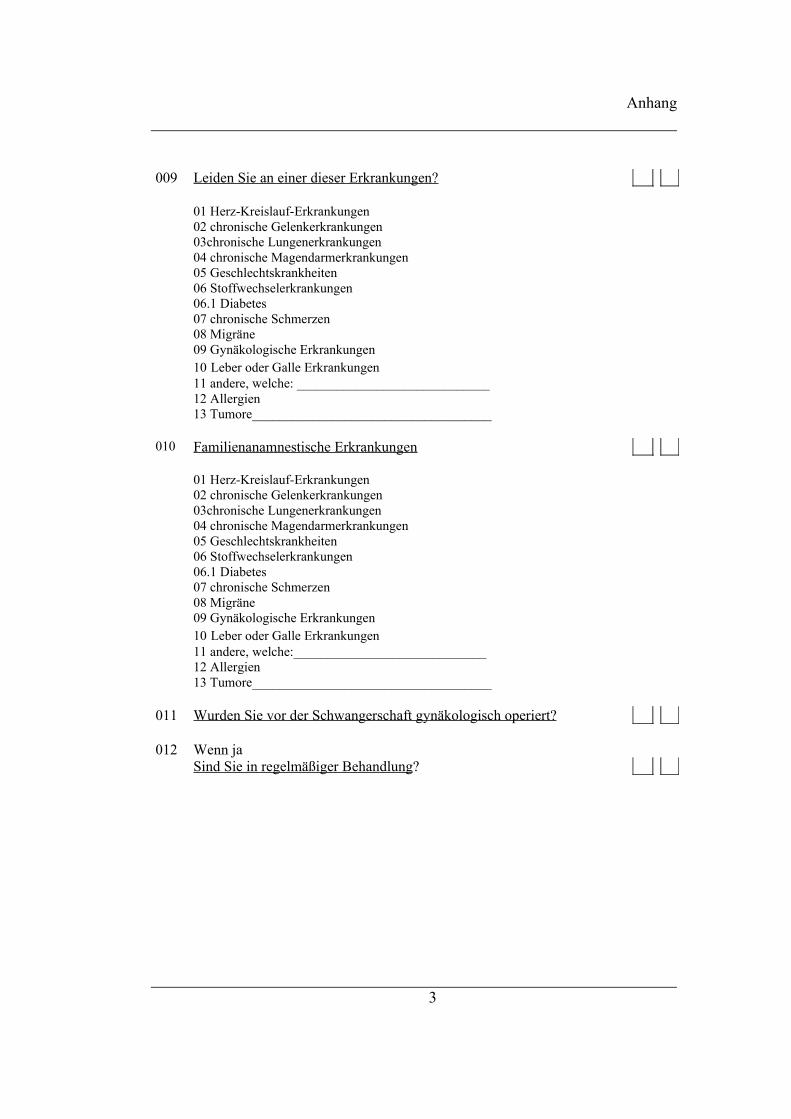
009 Leiden Sie an einer dieser Erkrankungen?
01 Herz-Kreislauf-Erkrankungen02 chronische Gelenkerkrankungen03chronische Lungenerkrankungen04 chronische Magendarmerkrankungen05 Geschlechtskrankheiten06 Stoffwechselerkrankungen06.1 Diabetes07 chronische Schmerzen08 Migräne09 Gynäkologische Erkrankungen10 Leber oder Galle Erkrankungen11 andere, welche: _____________________________12 Allergien13 Tumore____________________________________
010 Familienanamnestische Erkrankungen
01 Herz-Kreislauf-Erkrankungen02 chronische Gelenkerkrankungen03chronische Lungenerkrankungen04 chronische Magendarmerkrankungen05 Geschlechtskrankheiten06 Stoffwechselerkrankungen06.1 Diabetes07 chronische Schmerzen08 Migräne09 Gynäkologische Erkrankungen10 Leber oder Galle Erkrankungen11 andere, welche:_____________________________ 12 Allergien13 Tumore____________________________________
011 Wurden Sie vor der Schwangerschaft gynäkologisch operiert?
012 Wenn ja Sind Sie in regelmäßiger Behandlung?
3

Anhang
013 Waren eine dieser psychischen Erkrankungen vor der Schwangerschaft bei Ihnen bekannt?
01 F1 Sucht02 F2 Psychosen03 F3 Depression04 F4 Anpassungsstörungen05 F5 Anorexie Bulimi06 F6 Persönlichkeitsstörungen07 F7 Inteleigenzminderung08 F8 Teilleistungsstörungen/ Entwicklungsstörungen09 F9 Störungen des Sozialverhaltens / Hyperkinetische Störungen
014 Wurde die Erkrankung diagnostiziert?
015 Wenn jaWie wurde die Erkrankung behandelt?
01 Wurde nicht behandelt02 Psychotherapeutische Therapie03 Medikamentöse Therapie
016 Haben sie vor der Schwangerschaft
01 Sich selbst verletzt02 Drogen konsumiert
017 Im Folgenden frage ich Sie nach dem gegenwärtigen Konsum verschiedener Drogen.
4

Anhang
in den letzten 4 Wochen
jemalskonsu-miert
Einstiegs-alter
gelegent-lich
1-3 mal
Wochen-end-konsum4-8 mal
relgelmäßigKonsumje Woche3-6 mal
täglicherKonsum
längste Zeit des Nichtgebrauchs
Wochen Monate Jahre TabakAlkoholCannabinoidePilzeGaseSchnüffelstoffeStimulanzien (Speed)Entaktogene Ecstasy)KokainCrackHalluzinogene: LSDOpioideMethadonMedikamente
018 Nehmen Sie zur Zeit ärztlich verordnete Medikamente ein?
019 Ist nach der Geburt eine Erkrankungen aufgetreten?
01 ja02 nein03 was
Schwangerschaftsanamnese
020 Gewicht zu Schwangerschaftsbeginn
021 Körpergrösse:
022 Gewichtszunahme in der gesamten Schwangerschaft
023 Anzahl der Abruptio?
024 Gab es Komplikationen bei oder nach der Abruptio?
01 Übelkeit
5

Anhang
02 allergische Reaktion03 Atemnot und Brustschmerz04 pathologische Nachblutungen05 Infektion der Gebärmutter06 Durchstoßung der Gebärmutter06 Sterilität nach Verklebung der Eileiter aufgrund einer Infektion
025 Anzahl der Fehlgeburten?
026 Anti D Prophylaxe?
Schwangerschaftsverlauf
027 Anzahl der Ultraschalluntersuchungen
028 Infektionskrankheiten
01 Harnwegsinfekte02 Röteln03 CMV04 Toxoplasmose05 Herpes genitalis Typ 206 HIV07 Treponema pallidum08 Chlamydien09 HPV10 Hepatitis B11 Hepatitis C12 Pilze13 B- Streptokokken
029 Andere Infektionskrankheiten
01 der Atemwege02 Nierenbeckenentzündung03 Magendarmerkrankung04 Varizellen05 Parvovirus06 andere: __________________________________________________
030 Isolierte Hypertonie
031 Präeklampsie
032 Eklampsie
033 HELLP-Syndrom
6

Anhang
034 Hypotensives Syndrom
035 Amnioninfusionssyndrom (Fruchtwasserembolie)
036 Amnioninfektionsyndrom (Eihäuteentzündung)
037 Haben Sie während der SS an einer dieser Erkrankungen gelitten?
01 Plazentainsuffizienz02 Zervixinsuffiziens03 Emesis04 Andere
038 Blutungen
01 Erste Schwangerschaftshälfte02 Zweite Schwangerschaftshälfte03 Pathologische Blutung unter Geburt
039 Ist während der Schwangerschaft eine dieser Erkrankungen aufgetreten?
01 Herzkreislauferkrankung02 chronische Gelenkerkrankungen03 chronische Lungenerkrankungen04 chronische Magendarmerkrankungen05 Geschlechtskrankheiten06 Stoffwechselerkrankungen07 chronische Schmerzen08 Migräne09 Gynäkologische Erkrankungen10 Leber oder Galle Erkrankungen11 andere: ______________________________12 Allergien13 Tumore ______________________________
040 Waren Sie während der Schwangerschaft im Krankenhaus?
041 Wenn ja Warum?
042 Wenn ja. Wie lange? (Angabe in Wochen)
043 Nahmen sie im Krankenhaus Medikamente ein?
7

Anhang
01 Spasmolytika02 Analgetika03 Allgemeinanalgesie04 Lokalanästhesie05 Regionalanästhesie 06 Oxytocin07 Tokolytika08 Antibiotika09 anderes( Prophylaxe)
044 Ikterus während der Schwangerschaft?
045 Wenn jaWie hoch war der Bilirubinwert?
046 Gab es chirurgische Eingriffe während der Schwangerschaft?
047 Wenn ja. Welcher Eingriff wurde vorgenommen?
048 Hatten Sie Unfälle während der Schwangerschaft?
049 Wenn ja. Welche ?
Serologische Tests & Frühdiagnostik
050 Amniozentese
051 Wenn ja.Gründe für die Amniozentese?
052 Chorionzottenbiopsie
053 Wenn ja. Warum?
054 Wenn Komplikationen:Welche?
055 Wenn jaWarum?
056 Wenn ja
8

Anhang
Anomalien des Kindes
01 Gliedmaßen02 Innere Organe03 Schädel04 Fruchtwasser05 Magen? Darm06 Zwerchfell
Geburt
057 In welcher Woche haben Sie entbunden?
058 Art der Entbindung
01 Spontan02 Sectio03 Vakuumextraktion05 Forceps
059 Lage
01 Beckenlage02 Schädellage03 Querlage
060 Wenn sectio aus welchen Grund?
01 primär02 sekundär
061 Wenn sekundär
01 pathologisches CTG02 fetopelvines Missverhältnis03 protrahierte EP04 andere:_______________________
062 Beginn der Geburt
01 spontan02 wehenfördernde Mittel03 priming
9

Anhang
063 Wann war der Blasensprung
01 Unter 4h vor Geburt02 zwischen 4-12h vor Geburt03 Über 12h vor Geburt04 unter der Geburt
064 Blasensprung
01 spontan02 künstlich
065 Fruchtwasser
01 klar02 grün03 blutig
066 Dauer der Geburt
067 Kindseitige Komplikationen
01 abnorme fetale HF02 Nabelschnurumschlingung03 Insertio der Nabelschnur04 Kephalhämatom05 Caput succedaneum06 Obere Plexuslähmung07 Untere Plexuslähmung08 Klavikulafraktur09 Konjunktivitis10 andere_________________________
068 Medikamentengabe unter Geburt
01 Spasmolytika02 Analgetika03 Allgemeinanalgesie04 Lokalanästhesie05 Regionalanästhesie 06 Oxytocin07 Tokolytika08 Antibiotika09 anderes u.a.Prophylaxe
069 War die Geburt Ihres Kindes mit Komplikationen verbunden?
10

Anhang
070 Wenn jaWelche Komplikationen?
01 Plazenta praevia02 tiefer Sitz der Plazenta03 vorzeitige Plazentaablösung04 Randsinusblutung05 Uterusruptur06 Gefäßruptur bei Insertio velamentosa07 Ruptur eines Varixknotens der Scheide08 Dammriss/ Dammschnitt09 Scheidenriss10 Zervixriss11 Schock( kardiogener, posthämorrhagischer, vasomotorischer)12 Atonie 13 andere____________________________
071 Blutverlust
01 0-250ml02 250-500ml03 mehr als 500ml
072 Verweildauer auf der Entbindungsstation
01 unter 3 Tage02 3-5 Tage03 5-10 Tage04 über 10 Tage05 Entlassung gegen ärztlichen Rat
073 Gab es Komplikationen im Wochenbett?
074 Wenn jaWelche Komplikationen?
01 Toxisches Schocksyndrom02 Fieber ( Puerperale Infektion)03 Wundheilungsstörungen04 Mastitis05 Wochenbettdepression06 Thrombose07 Embolie08 Anämie
11
Anhang
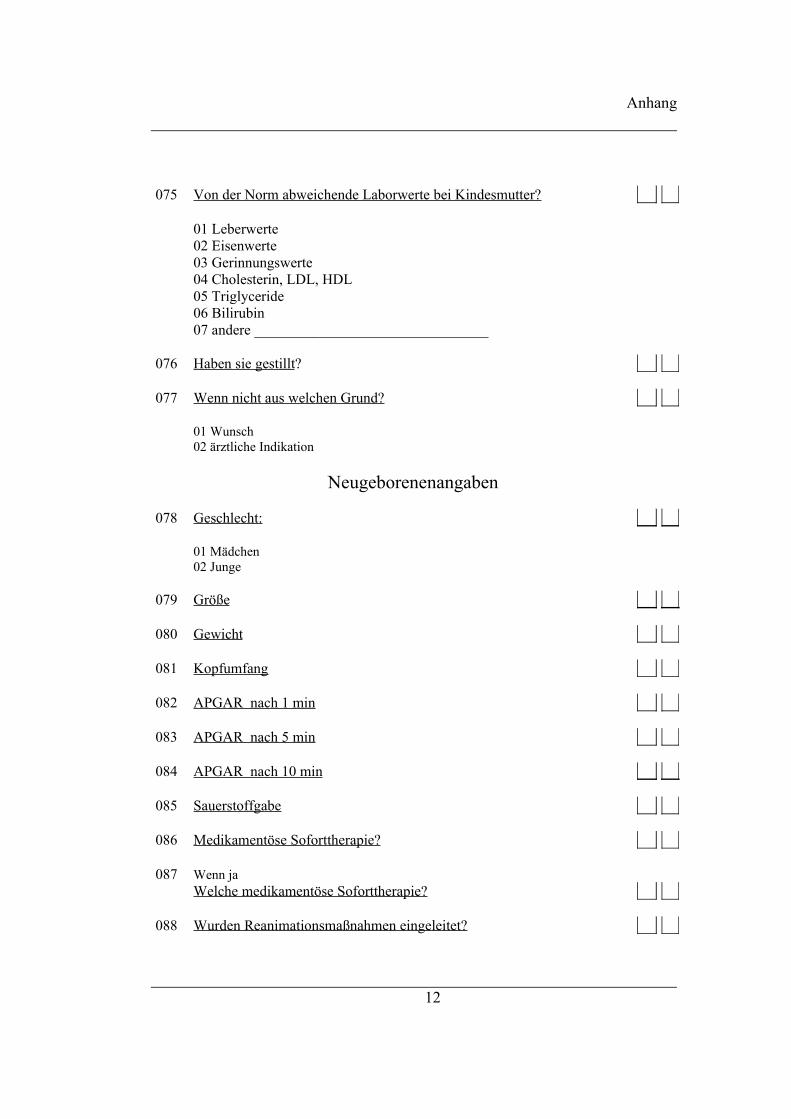
075 Von der Norm abweichende Laborwerte bei Kindesmutter?
01 Leberwerte02 Eisenwerte03 Gerinnungswerte04 Cholesterin, LDL, HDL05 Triglyceride06 Bilirubin07 andere ________________________________
076 Haben sie gestillt?
077 Wenn nicht aus welchen Grund?
01 Wunsch02 ärztliche Indikation
Neugeborenenangaben
078 Geschlecht:
01 Mädchen02 Junge
079 Größe
080 Gewicht
081 Kopfumfang
082 APGAR nach 1 min
083 APGAR nach 5 min
084 APGAR nach 10 min
085 Sauerstoffgabe
086 Medikamentöse Soforttherapie?
087 Wenn ja Welche medikamentöse Soforttherapie?
088 Wurden Reanimationsmaßnahmen eingeleitet?
12

Anhang
089 Reifestatus des Neugeborenen
01 eutroph02 hypertroph03 hypotroph
090 Reifestatus des Frühgeborenen
01 eutroph02 hypertroph03 hypotroph
091 Unphysiologischer Ikterus neonatorum
01 über 12,5mg\dl02 über 15mg\ dl
092 Lungenreifung erfolgt?
093 Wenn ja, Wer?
01 Mutter02 Kind
094 Verweildauer auf Station
01 unter 3 Tage02 3-5 Tage03 5-10 tage04 über 10 Tage05 Entlassen gegen ärztlichen Rat
095 War das Neugeborene auf der neonatologischen Station?
096 Wenn ja wie lange?
01 unter 3 Tage02 3-5 Tage03 5-10 tage04 über 10 Tage
097 Wenn jaWurde eine Polysomnographie durchgeführt?
13

Anhang
098 PH-Wert des Kindes
01 > 7,3 02 <7,2 bis 7,303 7,1 bis 7,204 unter 7,1
099 Base Excess (BE)
01 +5-(-5)02 -5-(-10)03 -10-(-15)04 -15-(-20)05 -20-(-30)06 mehr als 30
100 Kopfhaare abgegrenzt?
101 Lanugobehaarung?
102 Fingernägel überragend
103 Testes eingetreten
104 Labien geschlossen
105 Überreifezeichen
106 Ergebnis der U2
______________________________
107 Ergebnis der Hüftsonographie (Einteilung nach Graf)
01 oB02 kontrollbedürftig03 pathologisch
108 Wenn 03Welche Störung war vorhanden?
01 angeborene Hüftluxation02 Hüftsubluxation03 Hüftdysplasie
14

Anhang
109 Ergebnis Schädelsonographie
01 in Ordnung02 pathologisch
110 Welche Pathologie fiel auf?
111 Von der Norm abweichende Laborparameter beim Kind?
01 Leberwerte02 Eisenwerte03 Gerinnungswerte04 Cholesterin, LDL, HDL, Triglyceride05 Bilirubin06 Glucose07 Harnstoff08 andere
112 Ergebnis Hörscreening
01 in Ordnung02 pathologisch
113 Neugeborenenscreening
01 in Ordnung02 steht aus03 pathologisch hinsichtlich.............
114 Weitere pathologische Befunde?
Codierung: 0 – Nein; 01 – Ja ; 88 – trifft nicht zu; 99 - unbekannt
15
Anhang
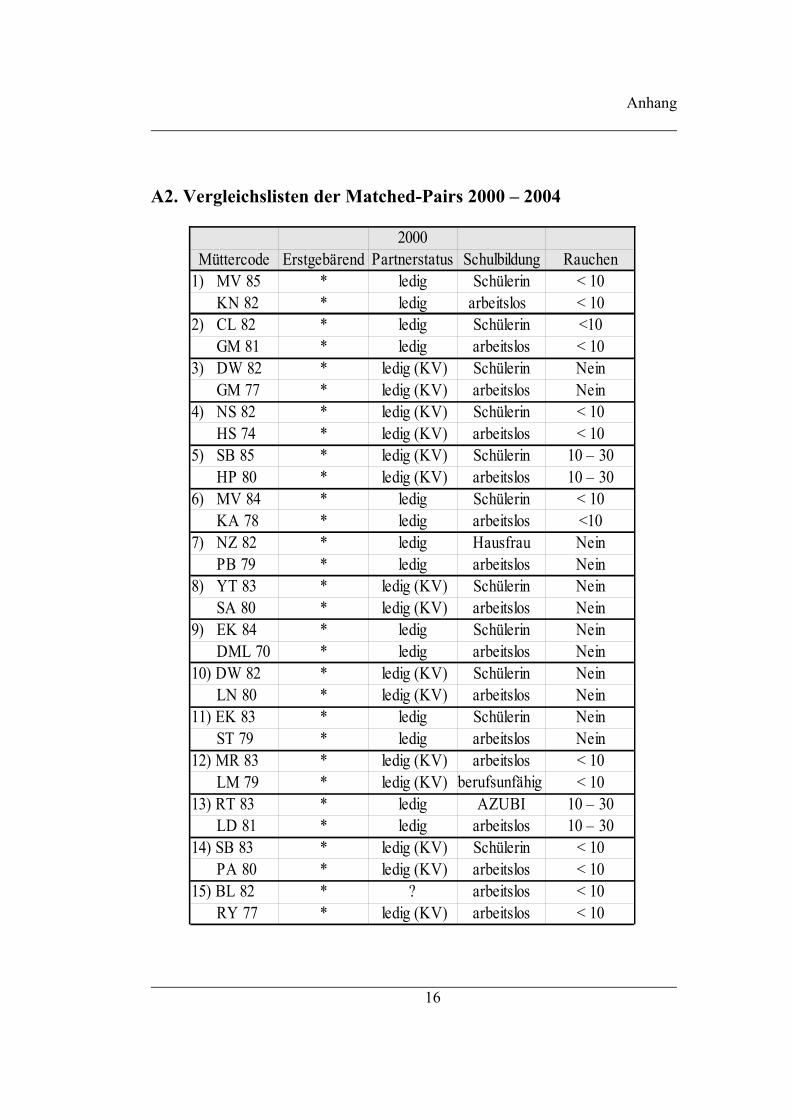
A2. Vergleichslisten der Matched-Pairs 2000 – 2004
16
2000Partnerstatus Schulbildung Rauchen
1) MV 85 * ledig Schülerin < 10 KN 82 * ledig arbeitslos < 102) CL 82 * ledig Schülerin <10 GM 81 * ledig arbeitslos < 103) DW 82 * ledig (KV) Schülerin Nein GM 77 * ledig (KV) arbeitslos Nein4) NS 82 * ledig (KV) Schülerin < 10 HS 74 * ledig (KV) arbeitslos < 105) SB 85 * ledig (KV) Schülerin 10 – 30 HP 80 * ledig (KV) arbeitslos 10 – 306) MV 84 * ledig Schülerin < 10 KA 78 * ledig arbeitslos <107) NZ 82 * ledig Hausfrau Nein PB 79 * ledig arbeitslos Nein8) YT 83 * ledig (KV) Schülerin Nein SA 80 * ledig (KV) arbeitslos Nein9) EK 84 * ledig Schülerin Nein DML 70 * ledig arbeitslos Nein10) DW 82 * ledig (KV) Schülerin Nein LN 80 * ledig (KV) arbeitslos Nein11) EK 83 * ledig Schülerin Nein ST 79 * ledig arbeitslos Nein12) MR 83 * ledig (KV) arbeitslos < 10 LM 79 * ledig (KV) < 1013) RT 83 * ledig AZUBI 10 – 30 LD 81 * ledig arbeitslos 10 – 3014) SB 83 * ledig (KV) Schülerin < 10 PA 80 * ledig (KV) arbeitslos < 1015) BL 82 * ? arbeitslos < 10 RY 77 * ledig (KV) arbeitslos < 10
Müttercode Erstgebärend
berufsunfähig

Anhang
Sofern die Akten Daten zum zusammenleben der jeweiligen Mütter mit dem
Kindsvater lieferten, wurde die in der Tabelle ledig (KV) gekennzeichnet.
17
2000Partnerstatus Schulbildung Rauchen
16) VE 84 * ledig (KV) ? Nein RN 78 * ledig (KV) ? Nein17) NS 82 * ledig arbeitslos 10 – 30 SC 78 * ledig arbeitslos 10 – 3018) EWO 83 * ledig Schülerin Nein BA 79 * ledig arbeitslos Nein19) CL 82 * ledig (KV) arbeitslos 10 – 30 PS 75 * ledig (KV) arbeitslos 10 – 3020) KK 83 * ledig arbeitslos Nein WF 81 * ledig arbeitslos Nein21) CH 85 * ledig Schülerin < 10 LN 80 * ledig arbeitslos < 1022) CS 83 * ledig AZUBI 10 – 30 JB 79 * ledig arbeitslos 10 – 30
Müttercode Erstgebärend

Anhang
18
2001Partnerstatus Schulbildung Rauchen
1) SS 84 * ledig AZUBI Nein FA 83 * ledig Praktikantin Nein2) LK 83 * ledig Schülerin Nein RD 81 * ledig arbeitslos Nein3) SR 83 * ledig (KV) arbeitslos < 10 ED 78 * ledig (KV) arbeitslos < 104) JU 83 * ledig (KV) AZUBI Nein LR 79 * ledig (KV) AZUBI Nein5) CK 84 * ledig Schülerin Nein TA 81 * ledig arbeitslos Nein6) SL 83 * ledig Schülerin < 10 BJ 81 * ledig ABM <107) SL 83 * ledig arbeitslos < 10 BC 83 * ledig arbeitslos < 108) DT 83 * ledig Schülerin Nein SS 76 * ledig Hausfrau Nein9) CR 83 * ledig AZUBI < 10 FA 82 * ledig AZUBI < 1010) SE 84 * ledig arbeitslos < 10 SR 67 * ledig arbeitslos < 1011) MS 83 * ledig arbeitslos < 10 CM 81 * ledig arbeitslos < 1012) UB 86 * ledig Schülerin Nein BY 75 * ledig arbeitslos Nein13) MW 84 * ledig Schülerin Nein AD 80 * ledig arbeitslos Nein14) EN 84 * ledig Schülerin Nein SB 77 * ledig arbeitslos Nein15) SP 83 * ledig (KV) AZUBI < 10 BA 81 * ledig (KV) AZUBI < 1016) SD 85 * ledig (KV) Schülerin Nein KD 79 * ledig (KV) arbeitslos Nein17) DS 83 * ledig Schülerin < 10 HY 83 * ledig arbeitslos < 1018) JB 83 * ledig (KV) AZUBI < 10 SM 80 * ledig (KV) AZUBI < 10
Müttercode Erstgebärend
Anhang
19
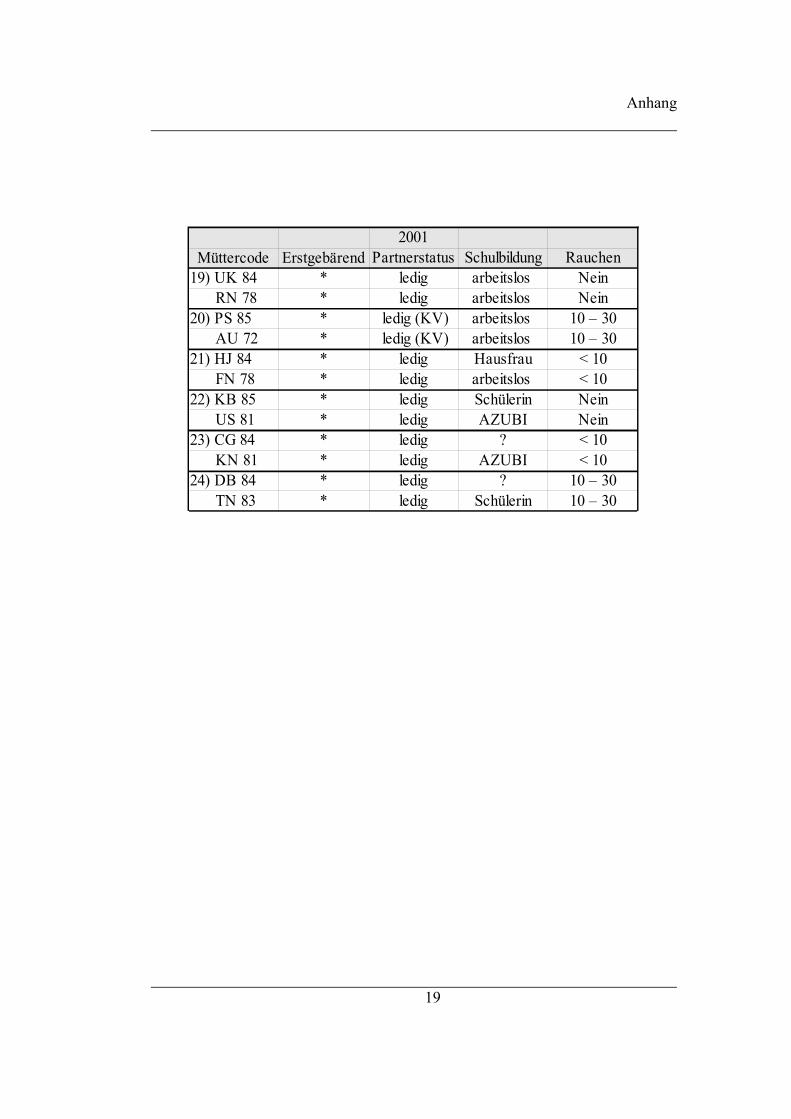
2001Partnerstatus Schulbildung Rauchen
19) UK 84 * ledig arbeitslos Nein RN 78 * ledig arbeitslos Nein20) PS 85 * ledig (KV) arbeitslos 10 – 30 AU 72 * ledig (KV) arbeitslos 10 – 3021) HJ 84 * ledig Hausfrau < 10 FN 78 * ledig arbeitslos < 1022) KB 85 * ledig Schülerin Nein US 81 * ledig AZUBI Nein23) CG 84 * ledig ? < 10 KN 81 * ledig AZUBI < 1024) DB 84 * ledig ? 10 – 30 TN 83 * ledig Schülerin 10 – 30
Müttercode Erstgebärend

Anhang
20
2002Partnerstatus Schulbildung Rauchen
1) NG 84 * ledig ? < 10 SK 82 * ledig Verkäuferin < 102) MW 84 * ledig (KV) AZUBI 10 – 30 WS 74 * ledig (KV) Friseurin 10 – 303) AK 85 * ledig Schülerin Nein TE 80 * ledig Hausfrau Nein4) KW 84 * ledig arbeitslos 10 – 30 OJ 83 * ledig arbeitslos 10 – 305) MR 85 * ledig (KV) AZUBI Nein HD 83 * ledig (KV) arbeitslos Nein6) SS 85 * ledig arbeitslos 10 – 30 QJ 71 * ledig arbeitslos 10 – 307) CA 85 * ledig AZUBI < 10 LI 81 * ledig AZUBI < 108) JK 85 * ledig BVJ Nein HR 83 * ledig BVJ Nein9) NS 85 * ledig Schülerin < 10 HN 79 * ledig arbeitslos < 1010) AKK 86 * ledig (KV) Schülerin < 10 LC 80 * ledig (KV) arbeitslos < 1011) SN 85 * ledig (KV) Schülerin < 10 RN 77 * ledig (KV) arbeitslos < 1012) SF 86 * ledig (KV) ? 10 – 30 RS 83 * ledig (KV) arbeitslos 10 – 3013) JG 88 * ledig Schülerin < 10 HJ 82 * ledig arbeitslos < 1014) SW 85 * ledig arbeitslos Nein FN 80 * ledig Hausfrau Nein15) NN 85 * ledig AZUBI 10 – 30 SN 82 * ledig AZUBI 10 – 3016) MP 85 * ledig (KV) Verkäuferin < 10 GC 78 * ledig (KV) Verkäuferin < 10
Müttercode Erstgebärend

Anhang
21
2002Partnerstatus Schulbildung Rauchen
17) MK 85 * ledig AZUBI 10 – 30 HY 83 * ledig arbeitslos 10 – 3018) SS 85 * ledig Schülerin Nein SC 83 * ledig arbeitslos Nein19) KS 84 * ledig (KV) AZUBI Nein BE 82 * ledig (KV) AZUBI Nein20) DJ 86 * ledig (KV) Schülerin 10 – 30 WS 74 * ledig (KV) arbeitslos 10 – 30
Müttercode Erstgebärend

Anhang
22
2003Partnerstatus Schulbildung Rauchen
1) NK 86 * ledig AZUBI Nein BD 83 * ledig AZUBI Nein2) AK 85 * ledig Schülerin < 10 KU 82 * ledig arbeitslos < 103) RK 85 * ledig AZUBI < 10 SM 82 * ledig AZUBI < 104) OS 85 * ledig (KV) Schülerin Nein SV 85 * ledig (KV) Schülerin Nein5) NM 86 * ledig Schülerin < 10 LY 78 * ledig arbeitslos < 106) AR 85 * ledig arbeitslos < 10 KC 83 * ledig arbeitslos < 107) WS 85 * ledig AZUBI < 10 RD 81 * ledig AZUBI < 108) NK 87 * ledig Schülerin Nein BE 80 * ledig arbeitslos Nein9) NL 85 * ledig AZUBI Nein KK85 * ledig AZUBI Nein10) NF 88 * ledig (KV) Schülerin < 10 MK 83 * ledig (KV) arbeitslos < 1011) AR 86 * verheiratet arbeitslos Nein FB 76 * verheiratet arbeitslos Nein12) AH 86 * ledig (KV) BVJ 10 – 30 SS 82 * ledig (KV) AZUBI 10 – 3013) CB 87 * ledig (KV) arbeitslos Nein SK 79 * ledig (KV) arbeitslos Nein14) NB 87 * ledig Schülerin 10 – 30 WS 84 * ledig AZUBI 10 – 3015) AB 88 * ledig Schülerin Nein KJ 77 * ledig arbeitslos Nein16) MS 87 * ? Schülerin Nein SA 79 * ledig arbeitslos Nein
Müttercode Erstgebärend

Anhang
23
2003Partnerstatus Schulbildung Rauchen
17) FH 87 * ledig Schülerin Nein FN 82 * ledig arbeitslos Nein18) SS 85 * ledig AZUBI < 10 SC 83 * ledig Hausfrau < 1019) PS 86 * verheiratet arbeitslos Nein PK 76 * verheiratet arbeitslos Nein20) AT 88 * ledig Schülerin ? BJ 82 * ledig arbeitslos Nein21) MP 86 * ledig ? Nein TC 77 * ledig ? Nein22) NH 86 * ledig arbeitslos < 10 HB 82 * ledig arbeitslos < 1023) AW 86 * ledig Schülerin < 10 BJ 81 * ledig arbeitslos < 1024) BM 85 * ledig Schülerin < 10 RC 80 * ledig arbeitslos < 10
Müttercode Erstgebärend

Anhang
24
2004Partnerstatus Schulbildung Rauchen
1) AM 89 * ? Schülerin Nein KL 84 * ? arbeitslos Nein2) AK 85 * ledig BVJ < 10 SK 83 * ledig FSJ < 103) NW 88 * ledig arbeitslos < 10 BP 82 * ledig arbeitslos < 104) CL 87 * ledig (KV) AZUBI Nein TW 85 * ledig (KV) AZUBI Nein5) AP 87 * ledig ? Nein SL 83 * ledig ? Nein6) HK 90 * ledig ? < 10 SC 85 * ledig ? < 107) MW 87 * ledig BVJ < 10 SH 83 * ledig arbeitslos < 108) DE 87 * ledig arbeitslos Nein AH 79 * ledig arbeitslos Nein9) CT 88 * ledig Schülerin < 10 KK85 * ledig arbeitslos < 1010) AN 87 * ledig arbeitslos < 10 MP 80 * ledig arbeitslos < 1011) JP 89 * ledig Schülerin < 10 BM 83 * ledig arbeitslos < 1012) MN 86 * ledig arbeitslos Nein NC 74 * ledig arbeitslos Nein13) SK 87 * ledig Schülerin Nein FA 81 * ledig arbeitslos Nein14) KG 88 * ledig Schülerin < 10 DT 78 * ledig arbeitslos < 1015) JF 86 * ledig AZUBI Nein CH 78 * ledig AZUBI Nein16) JS 86 * ledig Kosmetikerin Nein SA 78 * ledig PTA Nein17) NF 88 * ledig Schülerin 10 – 30 TS 82 * ledig arbeitslos 10 – 30 18) IK 87 * ledig Schülerin Nein AP 73 * ledig arbeitslos Nein19) CM 88 * ledig Schülerin < 10 BS 81 * ledig arbeitslos < 10
Müttercode Erstgebärend

Anhang
A3. Übersicht der Ergebnisse
A3.1 Anamnestische Angaben vor der Schwangerschaft
Somatische Erkrankungen vor der Schwangerschaft
Gesamtanzahl der Erkrankungen vor der Schwangerschaft
110 ,84 ,904 ,086
110 1,45 1,282 ,122
codeMimü
Vomü
Gesamtanzahl der Ekrankung vorSchwangerschaft
N Mean Std. DeviationStd. Error
Mean
Independent Samples Test
14,065 ,000 -4,072 218 ,000 -,609 ,150 -,904 -,314
-4,072 195,888 ,000 -,609 ,150 -,904 -,314
Equal variancesassumedEqual variancesnot assumed
Gesamtanzahlder EkrankungvorSchwangerschaft
F Sig.
Levene's Test forEquality of Variances
t df Sig. (2-tailed)Mean
DifferenceStd. ErrorDifference Lower Upper
95% ConfidenceInterval of the
Difference
t-test for Equality of Means
Gesamtanzahl der erkrankten Frauen
Crosstab
61 49 11052,0 58,0 110,0
55,5% 44,5% 100,0%58,7% 42,2% 50,0%
43 67 11052,0 58,0 110,0
39,1% 60,9% 100,0%41,3% 57,8% 50,0%
104 116 220104,0 116,0 220,0
47,3% 52,7% 100,0%100,0% 100,0% 100,0%
CountExpected Count% within code% within ErkrankungCountExpected Count% within code% within ErkrankungCountExpected Count% within code% within Erkrankung
Mimü
vomü
code
Total
Nein JaErkrankung
Total
25
Anhang
Chi-Square Tests
5,908b 1 ,015 ,021 ,0115,270 1 ,0225,936 1 ,015 ,021 ,011
,021 ,011
5,882c
1 ,015 ,021 ,011 ,006
220
Pearson Chi-SquareContinuity Correctiona
Likelihood RatioFisher's Exact TestLinear-by-LinearAssociationN of Valid Cases
Value dfAsymp. Sig.
(2-sided)Exact Sig.(2-sided)
Exact Sig.(1-sided)
PointProbability
Computed only for a 2x2 tablea.
0 cells (,0%) have expected count less than 5. The minimum expected count is 52,00.b.
The standardized statistic is 2,425.c.
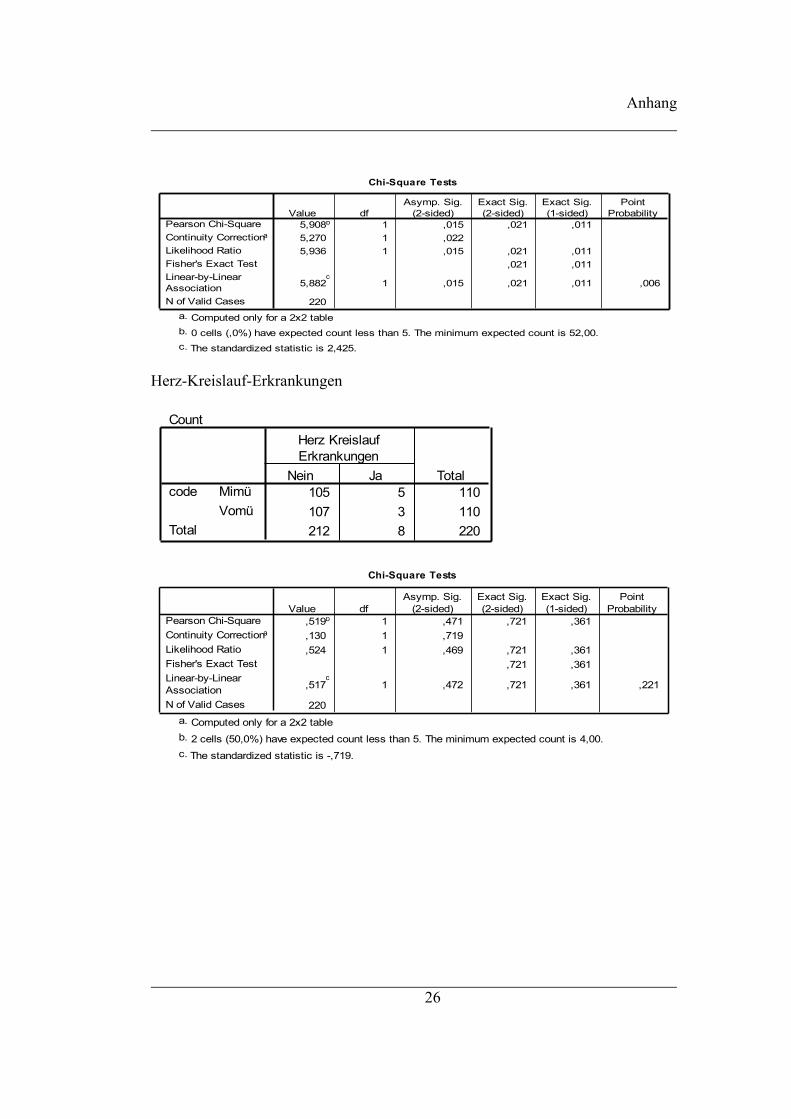
Herz-Kreislauf-Erkrankungen
Count
105 5 110107 3 110212 8 220
MimüVomü
code
Total
Nein Ja
Herz KreislaufErkrankungen
Total
Chi-Square Tests
,519b 1 ,471 ,721 ,361,130 1 ,719,524 1 ,469 ,721 ,361
,721 ,361
,517c
1 ,472 ,721 ,361 ,221
220
Pearson Chi-SquareContinuity Correctiona
Likelihood RatioFisher's Exact TestLinear-by-LinearAssociationN of Valid Cases
Value dfAsymp. Sig.
(2-sided)Exact Sig.(2-sided)
Exact Sig.(1-sided)
PointProbability
Computed only for a 2x2 tablea.
2 cells (50,0%) have expected count less than 5. The minimum expected count is 4,00.b.
The standardized statistic is -,719.c.
26

Anhang
chronische Gelenkerkrankungen
Count
107 3 110109 1 110216 4 220
MimüVomü
code
Total
Nein Ja
ChronischeGelenkerkrankungen
Total
Chi-Square Tests
1,019b 1 ,313 ,622 ,311,255 1 ,614
1,065 1 ,302 ,622 ,311,372 ,311
1,014c
1 ,314 ,622 ,311 ,250
220
Pearson Chi-SquareContinuity Correctiona
Likelihood RatioFisher's Exact TestLinear-by-LinearAssociationN of Valid Cases
Value dfAsymp. Sig.
(2-sided)Exact Sig.(2-sided)
Exact Sig.(1-sided)
PointProbability
Computed only for a 2x2 tablea.
2 cells (50,0%) have expected count less than 5. The minimum expected count is 2,00.b.
The standardized statistic is -1,007.c.
chronische Lungenerkrankungen
Count
105 5 110104 6 110209 11 220
MimüVomü
code
Total
Nein Ja
ChronischeLungenerkrankungen
Total
27

Anhang
Chi-Square Tests
,096b 1 ,757 1,000 ,500,000 1 1,000,096 1 ,757 1,000 ,500
1,000 ,500
,095c
1 ,758 1,000 ,500 ,231
220
Pearson Chi-SquareContinuity Correctiona
Likelihood RatioFisher's Exact TestLinear-by-LinearAssociationN of Valid Cases
Value dfAsymp. Sig.
(2-sided)Exact Sig.(2-sided)
Exact Sig.(1-sided)
PointProbability
Computed only for a 2x2 tablea.
0 cells (,0%) have expected count less than 5. The minimum expected count is 5,50.b.
The standardized statistic is ,309.c.
chronische Magen-Darmerkrankungen
Count
110 0 110109 1 110219 1 220
MimüVomü
code
Total
Nein Ja
ChronischeMagen-
DarmerkrankungenTotal
Chi-Square Tests
1,005b 1 ,316 1,000 ,500,000 1 1,000
1,391 1 ,238 1,000 ,5001,000 ,500
1,000c
1 ,317 1,000 ,500 ,500
220
Pearson Chi-SquareContinuity Correctiona
Likelihood RatioFisher's Exact TestLinear-by-LinearAssociationN of Valid Cases
Value dfAsymp. Sig.
(2-sided)Exact Sig.(2-sided)
Exact Sig.(1-sided)
PointProbability
Computed only for a 2x2 tablea.
2 cells (50,0%) have expected count less than 5. The minimum expected count is ,50.b.
The standardized statistic is 1,000.c.
Geschlechtskrankheiten
28

Anhang
Count
110 110110 110220 220
MimüVomü
code
Total
Nein
Geschlechtskrankheiten
Total
29

Anhang
Stoffwechselerkrankungen
Count
110 0 110108 2 110218 2 220
MimüVomü
code
Total
Nein JaStoffwechselerkrankungen
Total
Chi-Square Tests
2,018b 1 ,155 ,498 ,249,505 1 ,477
2,791 1 ,095 ,498 ,249,498 ,249
2,009c
1 ,156 ,498 ,249 ,249
220
Pearson Chi-SquareContinuity Correctiona
Likelihood RatioFisher's Exact TestLinear-by-LinearAssociationN of Valid Cases
Value dfAsymp. Sig.
(2-sided)Exact Sig.(2-sided)
Exact Sig.(1-sided)
PointProbability
Computed only for a 2x2 tablea.
2 cells (50,0%) have expected count less than 5. The minimum expected count is 1,00.b.
The standardized statistic is 1,417.c.
Diabetes
Count
110 110110 110220 220
MimüVomü
code
Total
NeinDiabetes
Total
chronische Schmerzen
Count
110 110110 110220 220
MimüVomü
code
Total
Nein
chronischeSchmerzen
Total
30

Anhang
Migräne
Count
110 0 110106 4 110216 4 220
MimüVomü
code
Total
Nein JaMigräne
Total
Chi-Square Tests
4,074b 1 ,044 ,122 ,0612,292 1 ,1305,619 1 ,018 ,122 ,061
,122 ,061
4,056c
1 ,044 ,122 ,061 ,061
220
Pearson Chi-SquareContinuity Correctiona
Likelihood RatioFisher's Exact TestLinear-by-LinearAssociationN of Valid Cases
Value dfAsymp. Sig.
(2-sided)Exact Sig.(2-sided)
Exact Sig.(1-sided)
PointProbability
Computed only for a 2x2 tablea.
2 cells (50,0%) have expected count less than 5. The minimum expected count is 2,00.b.
The standardized statistic is 2,014.c.
Gynäkologische Erkrankungen
Count
109 1 110104 6 110213 7 220
MimüVomü
code
Total
Nein Ja
GynäkologischeErkrankungen
Total
Chi-Square Tests
3,689b 1 ,055 ,119 ,0602,361 1 ,1244,080 1 ,043 ,119 ,060
,119 ,060
3,672c
1 ,055 ,119 ,060 ,052
220
Pearson Chi-SquareContinuity Correctiona
Likelihood RatioFisher's Exact TestLinear-by-LinearAssociationN of Valid Cases
Value dfAsymp. Sig.
(2-sided)Exact Sig.(2-sided)
Exact Sig.(1-sided)
PointProbability
Computed only for a 2x2 tablea.
2 cells (50,0%) have expected count less than 5. The minimum expected count is 3,50.b.
The standardized statistic is 1,916.c.
31

Anhang
Leber-/ Gallen- Erkrankungen
Count
109 0 109109 1 110218 1 219
MimüVomü
code
Total
Nein Ja
Leber oderGallenerkrankungen
Total
Chi-Square Tests
,995b 1 ,318 1,000 ,502,000 1 1,000
1,382 1 ,240 1,000 ,5021,000 ,502
,991c
1 ,320 1,000 ,502 ,502
219
Pearson Chi-SquareContinuity Correctiona
Likelihood RatioFisher's Exact TestLinear-by-LinearAssociationN of Valid Cases
Value dfAsymp. Sig.
(2-sided)Exact Sig.(2-sided)
Exact Sig.(1-sided)
PointProbability
Computed only for a 2x2 tablea.
2 cells (50,0%) have expected count less than 5. The minimum expected count is ,50.b.
The standardized statistic is ,995.c.
Allergien
Count
80 30 11079 31 110
159 61 220
MimüVomü
code
Total
Nein JaAllergien
Total
Chi-Square Tests
,023b 1 ,880 1,000 ,500,000 1 1,000,023 1 ,880 1,000 ,500
1,000 ,500
,023c
1 ,881 1,000 ,500 ,118
220
Pearson Chi-SquareContinuity Correctiona
Likelihood RatioFisher's Exact TestLinear-by-LinearAssociationN of Valid Cases
Value dfAsymp. Sig.
(2-sided)Exact Sig.(2-sided)
Exact Sig.(1-sided)
PointProbability
Computed only for a 2x2 tablea.
0 cells (,0%) have expected count less than 5. The minimum expected count is 30,50.b.
The standardized statistic is ,150.c.
32

Anhang
Tumore
Count
110 0 110107 3 110217 3 220
MimüVomü
code
Total
Nein JaTumore
Total
Chi-Square Tests
3,041b 1 ,081 ,247 ,1231,352 1 ,2454,200 1 ,040 ,247 ,123
,247 ,123
3,028c
1 ,082 ,247 ,123 ,123
220
Pearson Chi-SquareContinuity Correctiona
Likelihood RatioFisher's Exact TestLinear-by-LinearAssociationN of Valid Cases
Value dfAsymp. Sig.
(2-sided)Exact Sig.(2-sided)
Exact Sig.(1-sided)
PointProbability
Computed only for a 2x2 tablea.
2 cells (50,0%) have expected count less than 5. The minimum expected count is 1,50.b.
The standardized statistic is 1,740.c.
andere Erkrankungen
Count
95 15 11063 47 110
158 62 220
MimüVomü
code
Total
Nein Jaandere Erkrankungen
Total
Chi-Square Tests
22,997b 1 ,000 ,000 ,00021,582 1 ,00023,867 1 ,000 ,000 ,000
,000 ,000
22,893c
1 ,000 ,000 ,000 ,000
220
Pearson Chi-SquareContinuity Correctiona
Likelihood RatioFisher's Exact TestLinear-by-LinearAssociationN of Valid Cases
Value dfAsymp. Sig.
(2-sided)Exact Sig.(2-sided)
Exact Sig.(1-sided)
PointProbability
Computed only for a 2x2 tablea.
0 cells (,0%) have expected count less than 5. The minimum expected count is 31,00.b.
The standardized statistic is 4,785.c.
33

Anhang
Gynäkologische Operationen
Crosstab
90 20 11091,5 18,5 110,0
81,8% 18,2% 100,0%49,2% 54,1% 50,0%
93 17 11091,5 18,5 110,0
84,5% 15,5% 100,0%50,8% 45,9% 50,0%
183 37 220183,0 37,0 220,0
83,2% 16,8% 100,0%100,0% 100,0% 100,0%
CountExpected Count% within code% within Gyn OPCountExpected Count% within code% within Gyn OPCountExpected Count% within code% within Gyn OP
Mimü
vomü
code
Total
Nein JaGyn OP
Total
34
Chi-Square Tests
,292b 1 ,589 ,719 ,359,130 1 ,718,293 1 ,588 ,719 ,359
,719 ,359
,291c
1 ,590 ,719 ,359 ,124
220
Pearson Chi-SquareContinuity Correctiona
Likelihood RatioFisher's Exact TestLinear-by-LinearAssociationN of Valid Cases
Value dfAsymp. Sig.
(2-sided)Exact Sig.(2-sided)
Exact Sig.(1-sided)
PointProbability
Computed only for a 2x2 tablea.
0 cells (,0%) have expected count less than 5. The minimum expected count is 18,50.b.
The standardized statistic is -,540.c.

Anhang
Psychische Erkrankungen vor der Schwangerschaft
Count
108 2 110104 6 110212 8 220
MimüVomü
code
Total
Nein Ja
PsychischeErkrankungen
Total
Chi-Square Tests
2,075b 1 ,150 ,280 ,1401,167 1 ,2802,168 1 ,141 ,280 ,140
,280 ,140
2,066c
1 ,151 ,280 ,140 ,107
220
Pearson Chi-SquareContinuity Correctiona
Likelihood RatioFisher's Exact TestLinear-by-LinearAssociationN of Valid Cases
Value dfAsymp. Sig.
(2-sided)Exact Sig.(2-sided)
Exact Sig.(1-sided)
PointProbability
Computed only for a 2x2 tablea.
2 cells (50,0%) have expected count less than 5. The minimum expected count is 4,00.b.
The standardized statistic is 1,437.c.
Sucht
Crosstab
Count
109 1 110108 2 110217 3 220
Mimüvomü
code
Total
Nein JaSucht
Total
35

Anhang
Chi-Square Tests
,338b 1 ,561 1,000 ,500,000 1 1,000,344 1 ,557 1,000 ,500
1,000 ,500
,336c
1 ,562 1,000 ,500 ,377
220
Pearson Chi-SquareContinuity Correctiona
Likelihood RatioFisher's Exact TestLinear-by-LinearAssociationN of Valid Cases
Value dfAsymp. Sig.
(2-sided)Exact Sig.(2-sided)
Exact Sig.(1-sided)
PointProbability
Computed only for a 2x2 tablea.
2 cells (50,0%) have expected count less than 5. The minimum expected count is 1,50.b.
The standardized statistic is ,580.c.
Depressionen
Count
110 0 110108 2 110218 2 220
MimüVomü
code
Total
Nein JaDepressionen
Total
Chi-Square Tests
2,018b 1 ,155 ,498 ,249,505 1 ,477
2,791 1 ,095 ,498 ,249,498 ,249
2,009c
1 ,156 ,498 ,249 ,249
220
Pearson Chi-SquareContinuity Correctiona
Likelihood RatioFisher's Exact TestLinear-by-LinearAssociationN of Valid Cases
Value dfAsymp. Sig.
(2-sided)Exact Sig.(2-sided)
Exact Sig.(1-sided)
PointProbability
Computed only for a 2x2 tablea.
2 cells (50,0%) have expected count less than 5. The minimum expected count is 1,00.b.
The standardized statistic is 1,417.c.
36

Anhang
Anorexie
Count
109 1 110110 0 110219 1 220
MimüVomü
code
Total
Nein JaAnorexie
Total
Chi-Square Tests
1,005b 1 ,316 1,000 ,500,000 1 1,000
1,391 1 ,238 1,000 ,5001,000 ,500
1,000c
1 ,317 1,000 ,500 ,500
220
Pearson Chi-SquareContinuity Correctiona
Likelihood RatioFisher's Exact TestLinear-by-LinearAssociationN of Valid Cases
Value dfAsymp. Sig.
(2-sided)Exact Sig.(2-sided)
Exact Sig.(1-sided)
PointProbability
Computed only for a 2x2 tablea.
2 cells (50,0%) have expected count less than 5. The minimum expected count is ,50.b.
The standardized statistic is -1,000.c.
Drogen
Count
107 3 110109 1 110216 4 220
MimüVomü
code
Total
Nein JaDrogen
Total
Chi-Square Tests
1,019b 1 ,313 ,622 ,311,255 1 ,614
1,065 1 ,302 ,622 ,311,372 ,311
1,014c
1 ,314 ,622 ,311 ,250
220
Pearson Chi-SquareContinuity Correctiona
Likelihood RatioFisher's Exact TestLinear-by-LinearAssociationN of Valid Cases
Value dfAsymp. Sig.
(2-sided)Exact Sig.(2-sided)
Exact Sig.(1-sided)
PointProbability
Computed only for a 2x2 tablea.
2 cells (50,0%) have expected count less than 5. The minimum expected count is 2,00.b.
The standardized statistic is -1,007.c.
37
Anhang
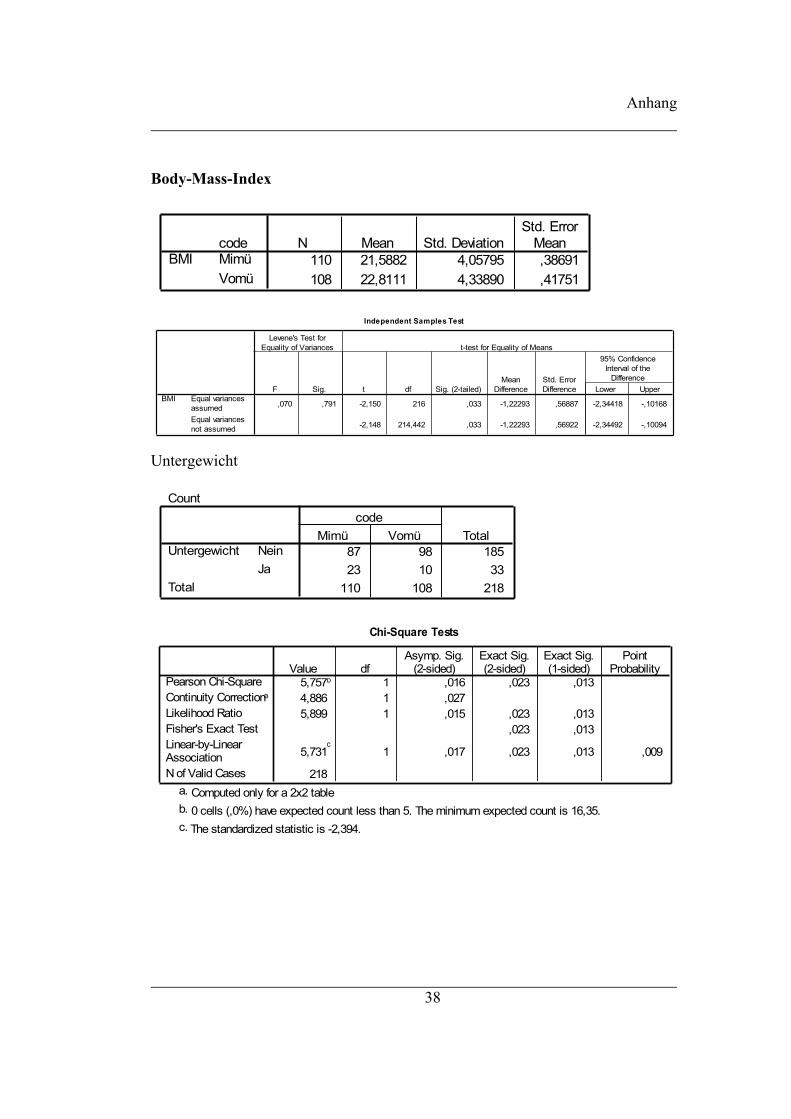
Body-Mass-Index
110 21,5882 4,05795 ,38691108 22,8111 4,33890 ,41751
codeMimüVomü
BMIN Mean Std. Deviation
Std. ErrorMean
Independent Samples Test
,070 ,791 -2,150 216 ,033 -1,22293 ,56887 -2,34418 -,10168
-2,148 214,442 ,033 -1,22293 ,56922 -2,34492 -,10094
Equal variancesassumedEqual variancesnot assumed
BMIF Sig.
Levene's Test forEquality of Variances
t df Sig. (2-tailed)Mean
DifferenceStd. ErrorDifference Lower Upper
95% ConfidenceInterval of the
Difference
t-test for Equality of Means
Untergewicht
Count
87 98 18523 10 33
110 108 218
NeinJa
Untergewicht
Total
Mimü Vomücode
Total
Chi-Square Tests
5,757b 1 ,016 ,023 ,0134,886 1 ,0275,899 1 ,015 ,023 ,013
,023 ,013
5,731c
1 ,017 ,023 ,013 ,009
218
Pearson Chi-SquareContinuity Correctiona
Likelihood RatioFisher's Exact TestLinear-by-LinearAssociationN of Valid Cases
Value dfAsymp. Sig.
(2-sided)Exact Sig.(2-sided)
Exact Sig.(1-sided)
PointProbability
Computed only for a 2x2 tablea.
0 cells (,0%) have expected count less than 5. The minimum expected count is 16,35.b.
The standardized statistic is -2,394.c.
38
Anhang
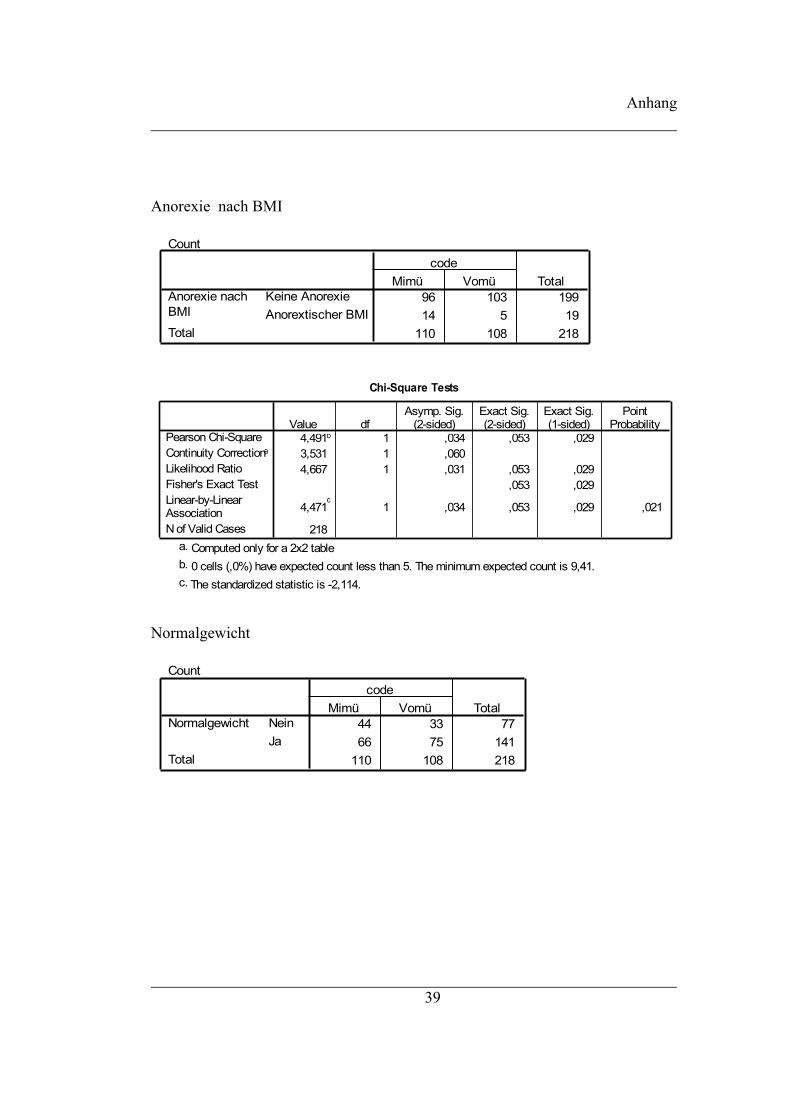
Anorexie nach BMI
Count
96 103 19914 5 19
110 108 218
Keine AnorexieAnorextischer BMI
Anorexie nachBMI
Total
Mimü Vomücode
Total
Chi-Square Tests
4,491b 1 ,034 ,053 ,0293,531 1 ,0604,667 1 ,031 ,053 ,029
,053 ,029
4,471c
1 ,034 ,053 ,029 ,021
218
Pearson Chi-SquareContinuity Correctiona
Likelihood RatioFisher's Exact TestLinear-by-LinearAssociationN of Valid Cases
Value dfAsymp. Sig.
(2-sided)Exact Sig.(2-sided)
Exact Sig.(1-sided)
PointProbability
Computed only for a 2x2 tablea.
0 cells (,0%) have expected count less than 5. The minimum expected count is 9,41.b.
The standardized statistic is -2,114.c.
Normalgewicht
Count
44 33 7766 75 141
110 108 218
NeinJa
Normalgewicht
Total
Mimü Vomücode
Total
39

Anhang
Chi-Square Tests
2,128b 1 ,145 ,158 ,0941,734 1 ,1882,133 1 ,144 ,158 ,094
,158 ,094
2,118c
1 ,146 ,158 ,094 ,039
218
Pearson Chi-SquareContinuity Correctiona
Likelihood RatioFisher's Exact TestLinear-by-LinearAssociationN of Valid Cases
Value dfAsymp. Sig.
(2-sided)Exact Sig.(2-sided)
Exact Sig.(1-sided)
PointProbability
Computed only for a 2x2 tablea.
0 cells (,0%) have expected count less than 5. The minimum expected count is 38,15.b.
The standardized statistic is 1,455.c.
Übergewicht
Count
89 85 17421 23 44
110 108 218
NeinJa
Übergewicht
Total
Mimü Vomücode
Total
Chi-Square Tests
,165b 1 ,685 ,737 ,406,056 1 ,813,165 1 ,685 ,737 ,406
,737 ,406
,164c
1 ,686 ,737 ,406 ,123
218
Pearson Chi-SquareContinuity Correctiona
Likelihood RatioFisher's Exact TestLinear-by-LinearAssociationN of Valid Cases
Value dfAsymp. Sig.
(2-sided)Exact Sig.(2-sided)
Exact Sig.(1-sided)
PointProbability
Computed only for a 2x2 tablea.
0 cells (,0%) have expected count less than 5. The minimum expected count is 21,80.b.
The standardized statistic is ,405.c.
40

Anhang
Fehlgeburten bei früheren Schwangerschaften
Count
107 2 10998 12 110
205 14 219
MimüVomü
code
Total
keinRisiko Risiko
Risiko Fehlgeburten
Total
Chi-Square Tests
7,534b 1 ,006 ,010 ,0056,093 1 ,0148,316 1 ,004 ,010 ,005
,010 ,005
7,499c
1 ,006 ,010 ,005 ,005
219
Pearson Chi-SquareContinuity Correctiona
Likelihood RatioFisher's Exact TestLinear-by-LinearAssociationN of Valid Cases
Value dfAsymp. Sig.
(2-sided)Exact Sig.(2-sided)
Exact Sig.(1-sided)
PointProbability
Computed only for a 2x2 tablea.
0 cells (,0%) have expected count less than 5. The minimum expected count is 6,97.b.
The standardized statistic is 2,738.c.
Schwangerschaftsabbrüche in der Anamnese
Count
102 8 11093 17 110
195 25 220
MimüVomü
code
Total
keinRisiko Risiko
Risiko Abruptio
Total
41

Anhang
Chi-Square Tests
3,655b 1 ,056 ,088 ,0442,888 1 ,0893,729 1 ,053 ,088 ,044
,088 ,044
3,639c
1 ,056 ,088 ,044 ,028
220
Pearson Chi-SquareContinuity Correctiona
Likelihood RatioFisher's Exact TestLinear-by-LinearAssociationN of Valid Cases
Value dfAsymp. Sig.
(2-sided)Exact Sig.(2-sided)
Exact Sig.(1-sided)
PointProbability
Computed only for a 2x2 tablea.
0 cells (,0%) have expected count less than 5. The minimum expected count is 12,50.b.
The standardized statistic is 1,908.c.
A3.2 Schwangerschaftsverlauf
Ultraschalluntersuchungen und Frühdiagnostik
Sonographie in der Schwangerschaft
10 2,60 2,675 ,84628 3,36 3,009 ,569
codeMimüVomü
SonographieN Mean Std. Deviation
Std. ErrorMean
Independent Samples Test
,009 ,924 -,702 36 ,487 -,757 1,079 -2,945 1,431
-,743 17,762 ,467 -,757 1,019 -2,901 1,386
Equal variancesassumedEqual variancesnot assumed
SonographieF Sig.
Levene's Test forEquality of Variances
t df Sig. (2-tailed)Mean
DifferenceStd. ErrorDifference Lower Upper
95% ConfidenceInterval of the
Difference
t-test for Equality of Means
Count
9 1 100 11028 0 82 11037 1 182 220
MimüVomü
code
Total
Ja Nein unbekanntSono erhalten
Total
42

Anhang
Chi-Square Tests
12,537a 2 ,002 ,00113,408 2 ,001 ,00112,661 ,001
10,277b
1 ,001 ,001 ,000 ,000
220
Pearson Chi-SquareLikelihood RatioFisher's Exact TestLinear-by-LinearAssociationN of Valid Cases
Value dfAsymp. Sig.
(2-sided)Exact Sig.(2-sided)
Exact Sig.(1-sided)
PointProbability
2 cells (33,3%) have expected count less than 5. The minimum expected count is ,50.a.
The standardized statistic is -3,206.b.
Amniozentese
Count
5 55 5
10 10
MimüVomü
code
Total
JaAmnionzentese
Total
Feindiagnostik
Count
4 7 110 20 204 27 31
MimüVomü
code
Total
Nein JaFeindiagnostik
Total
43

Anhang
Chi-Square Tests
8,350b 1 ,004 ,010 ,0105,428 1 ,0209,421 1 ,002 ,010 ,010
,010 ,010
8,081c
1 ,004 ,010 ,010 ,010
31
Pearson Chi-SquareContinuity Correctiona
Likelihood RatioFisher's Exact TestLinear-by-LinearAssociationN of Valid Cases
Value dfAsymp. Sig.
(2-sided)Exact Sig.(2-sided)
Exact Sig.(1-sided)
PointProbability
Computed only for a 2x2 tablea.
2 cells (50,0%) have expected count less than 5. The minimum expected count is 1,42.b.
The standardized statistic is 2,843.c.
44

Anhang
Medikamentöse Propylaxe
Count
17 56 7316 76 9233 132 165
MimüVomü
code
Total
KeineProphylaxe Prophylaxe
Prophylaxe
Total
Chi-Square Tests
,884b 1 ,347 ,434 ,228,554 1 ,457,880 1 ,348 ,434 ,228
,434 ,228
,879c
1 ,348 ,434 ,228 ,100
165
Pearson Chi-SquareContinuity Correctiona
Likelihood RatioFisher's Exact TestLinear-by-LinearAssociationN of Valid Cases
Value dfAsymp. Sig.
(2-sided)Exact Sig.(2-sided)
Exact Sig.(1-sided)
PointProbability
Computed only for a 2x2 tablea.
0 cells (,0%) have expected count less than 5. The minimum expected count is 14,60.b.
The standardized statistic is ,938.c.
Sexuell übertragene Infektionen
STD gesamt
109 ,24 ,489 ,047109 ,14 ,440 ,042
codeMimüVomü
STDN Mean Std. Deviation
Std. ErrorMean
Independent Samples Test
8,220 ,005 1,602 216 ,111 ,101 ,063 -,023 ,225
1,602 213,687 ,111 ,101 ,063 -,023 ,225
Equal variancesassumedEqual variancesnot assumed
STDF Sig.
Levene's Test forEquality of Variances
t df Sig. (2-tailed)Mean
DifferenceStd. ErrorDifference Lower Upper
95% ConfidenceInterval of the
Difference
t-test for Equality of Means
45

Anhang
Gesamtanzahl infizierter Frauen
Count
86 23 10997 12 109
183 35 218
MimüVomü
code
Total
Nein JaSTD
Total
Chi-Square Tests
4,118b 1 ,042 ,064 ,0323,404 1 ,0654,178 1 ,041 ,064 ,032
,064 ,032
4,099c
1 ,043 ,064 ,032 ,019
218
Pearson Chi-SquareContinuity Correctiona
Likelihood RatioFisher's Exact TestLinear-by-LinearAssociationN of Valid Cases
Value dfAsymp. Sig.
(2-sided)Exact Sig.(2-sided)
Exact Sig.(1-sided)
PointProbability
Computed only for a 2x2 tablea.
0 cells (,0%) have expected count less than 5. The minimum expected count is 17,50.b.
The standardized statistic is -2,025.c.
Clamydien
Count
98 11 109104 5 109202 16 218
MimüVomü
code
Total
Nein JaClamydien
Total
46

Anhang
Chi-Square Tests
2,428b 1 ,119 ,193 ,0961,686 1 ,1942,484 1 ,115 ,193 ,096
,193 ,096
2,417c
1 ,120 ,193 ,096 ,063
218
Pearson Chi-SquareContinuity Correctiona
Likelihood RatioFisher's Exact TestLinear-by-LinearAssociationN of Valid Cases
Value dfAsymp. Sig.
(2-sided)Exact Sig.(2-sided)
Exact Sig.(1-sided)
PointProbability
Computed only for a 2x2 tablea.
0 cells (,0%) have expected count less than 5. The minimum expected count is 8,00.b.
The standardized statistic is -1,555.c.
Humanes Papilom Virus
Count
108 1 109109 0 109217 1 218
MimüVomü
code
Total
Nein JaHPV
Total
Chi-Square Tests
1,005b 1 ,316 1,000 ,500,000 1 1,000
1,391 1 ,238 1,000 ,5001,000 ,500
1,000c
1 ,317 1,000 ,500 ,500
218
Pearson Chi-SquareContinuity Correctiona
Likelihood RatioFisher's Exact TestLinear-by-LinearAssociationN of Valid Cases
Value dfAsymp. Sig.
(2-sided)Exact Sig.(2-sided)
Exact Sig.(1-sided)
PointProbability
Computed only for a 2x2 tablea.
2 cells (50,0%) have expected count less than 5. The minimum expected count is ,50.b.
The standardized statistic is -1,000.c.
Hepatitis-B Virus
Count
109 0 109108 1 109217 1 218
MimüVomü
code
Total
Nein JaHBV
Total
47

Anhang
Chi-Square Tests
1,005b 1 ,316 1,000 ,500,000 1 1,000
1,391 1 ,238 1,000 ,5001,000 ,500
1,000c
1 ,317 1,000 ,500 ,500
218
Pearson Chi-SquareContinuity Correctiona
Likelihood RatioFisher's Exact TestLinear-by-LinearAssociationN of Valid Cases
Value dfAsymp. Sig.
(2-sided)Exact Sig.(2-sided)
Exact Sig.(1-sided)
PointProbability
Computed only for a 2x2 tablea.
2 cells (50,0%) have expected count less than 5. The minimum expected count is ,50.b.
The standardized statistic is -1,000.c.
Hepatitis-C Virus
Count
108 1 109109 0 109217 1 218
MimüVomü
code
Total
Nein JaHCV
Total
Chi-Square Tests
1,005b 1 ,316 1,000 ,500,000 1 1,000
1,391 1 ,238 1,000 ,5001,000 ,500
1,000c
1 ,317 1,000 ,500 ,500
218
Pearson Chi-SquareContinuity Correctiona
Likelihood RatioFisher's Exact TestLinear-by-LinearAssociationN of Valid Cases
Value dfAsymp. Sig.
(2-sided)Exact Sig.(2-sided)
Exact Sig.(1-sided)
PointProbability
Computed only for a 2x2 tablea.
2 cells (50,0%) have expected count less than 5. The minimum expected count is ,50.b.
The standardized statistic is -1,000.c.
Pilze
Count
99 10 109101 8 109200 18 218
MimüVomü
code
Total
Nein JaPilze
Total
48
Anhang
Chi-Square Tests
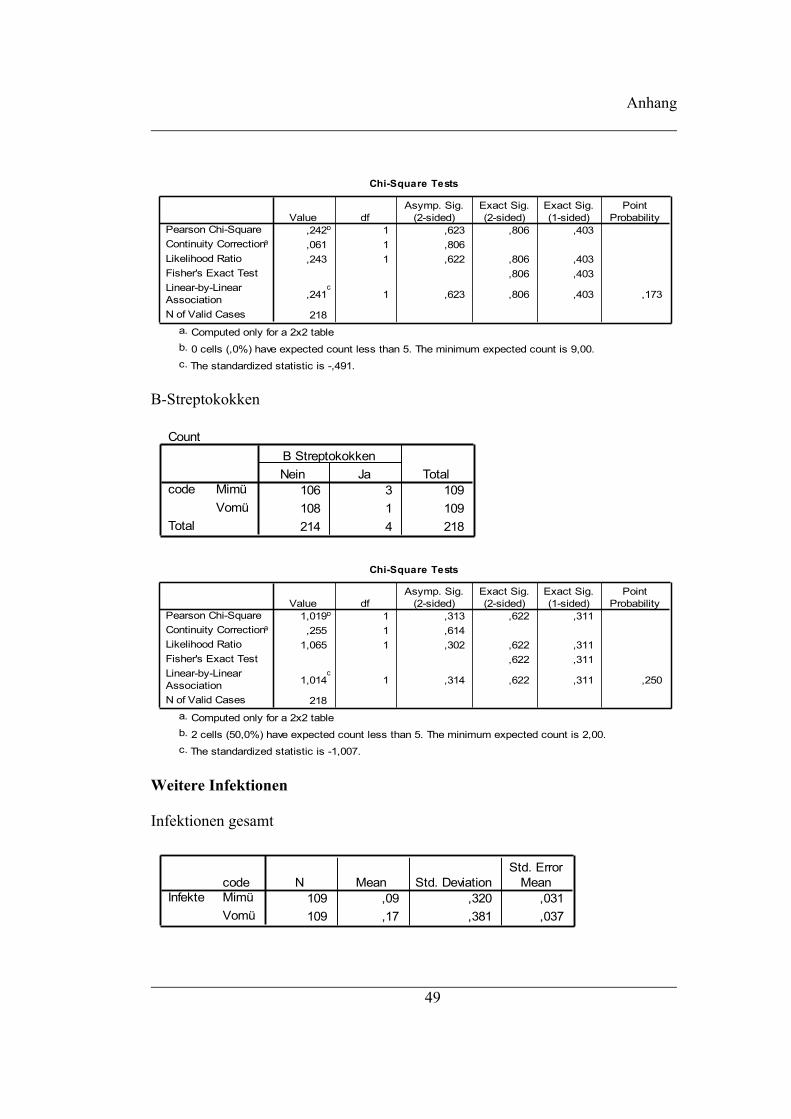
,242b 1 ,623 ,806 ,403,061 1 ,806,243 1 ,622 ,806 ,403
,806 ,403
,241c
1 ,623 ,806 ,403 ,173
218
Pearson Chi-SquareContinuity Correctiona
Likelihood RatioFisher's Exact TestLinear-by-LinearAssociationN of Valid Cases
Value dfAsymp. Sig.
(2-sided)Exact Sig.(2-sided)
Exact Sig.(1-sided)
PointProbability
Computed only for a 2x2 tablea.
0 cells (,0%) have expected count less than 5. The minimum expected count is 9,00.b.
The standardized statistic is -,491.c.
B-Streptokokken
Count
106 3 109108 1 109214 4 218
MimüVomü
code
Total
Nein JaB Streptokokken
Total
Chi-Square Tests
1,019b 1 ,313 ,622 ,311,255 1 ,614
1,065 1 ,302 ,622 ,311,622 ,311
1,014c
1 ,314 ,622 ,311 ,250
218
Pearson Chi-SquareContinuity Correctiona
Likelihood RatioFisher's Exact TestLinear-by-LinearAssociationN of Valid Cases
Value dfAsymp. Sig.
(2-sided)Exact Sig.(2-sided)
Exact Sig.(1-sided)
PointProbability
Computed only for a 2x2 tablea.
2 cells (50,0%) have expected count less than 5. The minimum expected count is 2,00.b.
The standardized statistic is -1,007.c.
Weitere Infektionen
Infektionen gesamt
109 ,09 ,320 ,031109 ,17 ,381 ,037
codeMimüVomü
InfekteN Mean Std. Deviation
Std. ErrorMean
49

Anhang
Independent Samples Test
11,478 ,001 -1,731 216 ,085 -,083 ,048 -,177 ,011
-1,731 209,791 ,085 -,083 ,048 -,177 ,011
Equal variancesassumedEqual variancesnot assumed
InfekteF Sig.
Levene's Test forEquality of Variances
t df Sig. (2-tailed)Mean
DifferenceStd. ErrorDifference Lower Upper
95% ConfidenceInterval of the
Difference
t-test for Equality of Means
Gesamtanzahl betroffener Frauen
Count
100 9 10990 19 109
190 28 218
MimüVomü
code
Total
Nein JaInfekte
Total
Chi-Square Tests
4,098b 1 ,043 ,067 ,0343,319 1 ,0684,178 1 ,041 ,067 ,034
,067 ,034
4,079c
1 ,043 ,067 ,034 ,021
218
Pearson Chi-SquareContinuity Correctiona
Likelihood RatioFisher's Exact TestLinear-by-LinearAssociationN of Valid Cases
Value dfAsymp. Sig.
(2-sided)Exact Sig.(2-sided)
Exact Sig.(1-sided)
PointProbability
Computed only for a 2x2 tablea.
0 cells (,0%) have expected count less than 5. The minimum expected count is 14,00.b.
The standardized statistic is 2,020.c.
Atemwegsinfekte
Count
109 0 109105 5 110214 5 219
MimüVomü
code
Total
Nein JaAtemwegsinfekte
Total
50

Anhang
Chi-Square Tests
5,070b 1 ,024 ,060 ,0313,238 1 ,0727,002 1 ,008 ,060 ,031
,060 ,031
5,047c
1 ,025 ,060 ,031 ,031
219
Pearson Chi-SquareContinuity Correctiona
Likelihood RatioFisher's Exact TestLinear-by-LinearAssociationN of Valid Cases
Value dfAsymp. Sig.
(2-sided)Exact Sig.(2-sided)
Exact Sig.(1-sided)
PointProbability
Computed only for a 2x2 tablea.
2 cells (50,0%) have expected count less than 5. The minimum expected count is 2,49.b.
The standardized statistic is 2,247.c.
Harnwegsinfekte
Count
109 0 109107 2 109216 2 218
MimüVomü
code
Total
Nein JaHWI
Total
Chi-Square Tests
2,019b 1 ,155 ,498 ,249,505 1 ,477
2,791 1 ,095 ,498 ,249,498 ,249
2,009c
1 ,156 ,498 ,249 ,249
218
Pearson Chi-SquareContinuity Correctiona
Likelihood RatioFisher's Exact TestLinear-by-LinearAssociationN of Valid Cases
Value dfAsymp. Sig.
(2-sided)Exact Sig.(2-sided)
Exact Sig.(1-sided)
PointProbability
Computed only for a 2x2 tablea.
2 cells (50,0%) have expected count less than 5. The minimum expected count is 1,00.b.
The standardized statistic is 1,417.c.
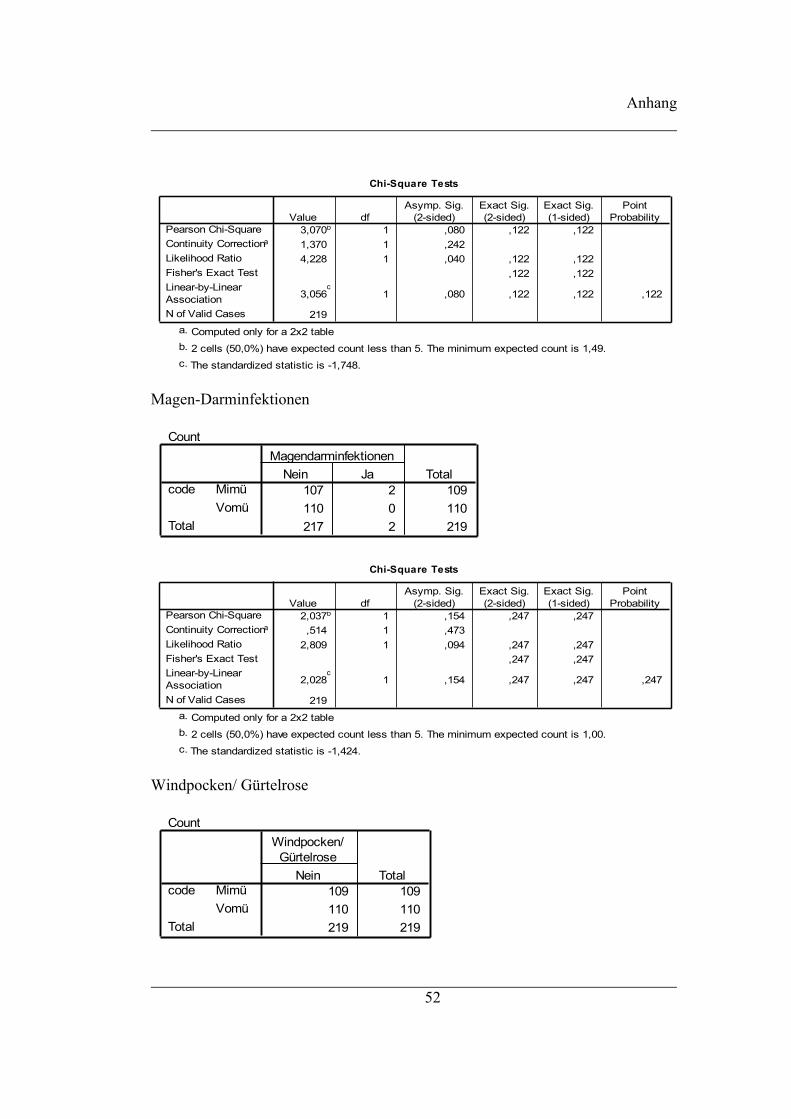
Pyelonepritiden
Count
106 3 109110 0 110216 3 219
MimüVomü
code
Total
Nein JaPyelonephritiden
Total
51
Anhang
Chi-Square Tests
3,070b 1 ,080 ,122 ,1221,370 1 ,2424,228 1 ,040 ,122 ,122
,122 ,122
3,056c
1 ,080 ,122 ,122 ,122
219
Pearson Chi-SquareContinuity Correctiona
Likelihood RatioFisher's Exact TestLinear-by-LinearAssociationN of Valid Cases
Value dfAsymp. Sig.
(2-sided)Exact Sig.(2-sided)
Exact Sig.(1-sided)
PointProbability
Computed only for a 2x2 tablea.
2 cells (50,0%) have expected count less than 5. The minimum expected count is 1,49.b.
The standardized statistic is -1,748.c.
Magen-Darminfektionen
Count
107 2 109110 0 110217 2 219
MimüVomü
code
Total
Nein JaMagendarminfektionen
Total
Chi-Square Tests
2,037b 1 ,154 ,247 ,247,514 1 ,473
2,809 1 ,094 ,247 ,247,247 ,247
2,028c
1 ,154 ,247 ,247 ,247
219
Pearson Chi-SquareContinuity Correctiona
Likelihood RatioFisher's Exact TestLinear-by-LinearAssociationN of Valid Cases
Value dfAsymp. Sig.
(2-sided)Exact Sig.(2-sided)
Exact Sig.(1-sided)
PointProbability
Computed only for a 2x2 tablea.
2 cells (50,0%) have expected count less than 5. The minimum expected count is 1,00.b.
The standardized statistic is -1,424.c.
Windpocken/ Gürtelrose
Count
109 109110 110219 219
MimüVomü
code
Total
Nein
Windpocken/Gürtelrose
Total
52

Anhang
Röteln
Count
108 1 109109 0 109217 1 218
MimüVomü
code
Total
Nein JaRöteln
Total
Chi-Square Tests
1,005b 1 ,316 1,000 ,500,000 1 1,000
1,391 1 ,238 1,000 ,5001,000 ,500
1,000c
1 ,317 1,000 ,500 ,500
218
Pearson Chi-SquareContinuity Correctiona
Likelihood RatioFisher's Exact TestLinear-by-LinearAssociationN of Valid Cases
Value dfAsymp. Sig.
(2-sided)Exact Sig.(2-sided)
Exact Sig.(1-sided)
PointProbability
Computed only for a 2x2 tablea.
2 cells (50,0%) have expected count less than 5. The minimum expected count is ,50.b.
The standardized statistic is -1,000.c.
Erythema infectiosum
Count
109 109110 110219 219
MimüVomü
code
Total
Nein
Erythemainfectiosum
Total
Toxoplasmose
Count
106 3 109109 0 109215 3 218
MimüVomü
code
Total
Nein JaToxoplasmose
Total
53

Anhang
Chi-Square Tests
3,042b 1 ,081 ,247 ,1231,352 1 ,2454,201 1 ,040 ,247 ,123
,247 ,123
3,028c
1 ,082 ,247 ,123 ,123
218
Pearson Chi-SquareContinuity Correctiona
Likelihood RatioFisher's Exact TestLinear-by-LinearAssociationN of Valid Cases
Value dfAsymp. Sig.
(2-sided)Exact Sig.(2-sided)
Exact Sig.(1-sided)
PointProbability
Computed only for a 2x2 tablea.
2 cells (50,0%) have expected count less than 5. The minimum expected count is 1,50.b.
The standardized statistic is -1,740.c.
andere Infektionen
Count
105 3 10897 13 110
202 16 218
MimüVomü
code
Total
Nein Jaandere Infektionen
Total
Chi-Square Tests
6,549b 1 ,010 ,017 ,0095,287 1 ,0217,037 1 ,008 ,017 ,009
,017 ,009
6,519c
1 ,011 ,017 ,009 ,008
218
Pearson Chi-SquareContinuity Correctiona
Likelihood RatioFisher's Exact TestLinear-by-LinearAssociationN of Valid Cases
Value dfAsymp. Sig.
(2-sided)Exact Sig.(2-sided)
Exact Sig.(1-sided)
PointProbability
Computed only for a 2x2 tablea.
0 cells (,0%) have expected count less than 5. The minimum expected count is 7,93.b.
The standardized statistic is 2,553.c.
Schwangerschafteserkrankungen
Schwangerschaftserkrankungen gesamt
110 ,03 ,164 ,016110 ,12 ,351 ,034
codeMimüVomü
SSErkrankungenN Mean Std. Deviation
Std. ErrorMean
54

Anhang
Independent Samples Test
26,576 ,000 -2,459 218 ,015 -,091 ,037 -,164 -,018
-2,459 154,130 ,015 -,091 ,037 -,164 -,018
Equal variancesassumedEqual variancesnot assumed
SSErkrankungenF Sig.
Levene's Test forEquality of Variances
t df Sig. (2-tailed)Mean
DifferenceStd. ErrorDifference Lower Upper
95% ConfidenceInterval of the
Difference
t-test for Equality of Means
Gesamtanzahl betroffener Frauen
Count
107 3 11098 12 110
205 15 220
MimüVomü
code
Total
Nein JaSS Erkrankungen
Total
Chi-Square Tests
5,795b 1 ,016 ,029 ,0154,579 1 ,0326,178 1 ,013 ,029 ,015
,029 ,015
5,769c
1 ,016 ,029 ,015 ,012
220
Pearson Chi-SquareContinuity Correctiona
Likelihood RatioFisher's Exact TestLinear-by-LinearAssociationN of Valid Cases
Value dfAsymp. Sig.
(2-sided)Exact Sig.(2-sided)
Exact Sig.(1-sided)
PointProbability
Computed only for a 2x2 tablea.
0 cells (,0%) have expected count less than 5. The minimum expected count is 7,50.b.
The standardized statistic is 2,402.c.
Emesis
Count
109 1 110105 5 110214 6 220
MimüVomü
code
Total
Nein JaEmesis
Total
55

Anhang
Chi-Square Tests
2,741b 1 ,098 ,212 ,1061,542 1 ,2142,986 1 ,084 ,212 ,106
,212 ,106
2,729c
1 ,099 ,212 ,106 ,092
220
Pearson Chi-SquareContinuity Correctiona
Likelihood RatioFisher's Exact TestLinear-by-LinearAssociationN of Valid Cases
Value dfAsymp. Sig.
(2-sided)Exact Sig.(2-sided)
Exact Sig.(1-sided)
PointProbability
Computed only for a 2x2 tablea.
2 cells (50,0%) have expected count less than 5. The minimum expected count is 3,00.b.
The standardized statistic is 1,652.c.
isolierte Hypertonie
Count
110 0 110105 5 110215 5 220
MimüVomü
code
Total
Nein Jaisolierte Hypertonie
Total
Chi-Square Tests
5,116b 1 ,024 ,060 ,0303,274 1 ,0707,048 1 ,008 ,060 ,030
,060 ,030
5,093c
1 ,024 ,060 ,030 ,030
220
Pearson Chi-SquareContinuity Correctiona
Likelihood RatioFisher's Exact TestLinear-by-LinearAssociationN of Valid Cases
Value dfAsymp. Sig.
(2-sided)Exact Sig.(2-sided)
Exact Sig.(1-sided)
PointProbability
Computed only for a 2x2 tablea.
2 cells (50,0%) have expected count less than 5. The minimum expected count is 2,50.b.
The standardized statistic is 2,257.c.
Präeklampsie
56

Anhang
Count
108 2 110109 1 110217 3 220
MimüVomü
code
Total
Nein JaPräeklampsie
Total
Chi-Square Tests
,338b 1 ,561 1,000 ,500,000 1 1,000,344 1 ,557 1,000 ,500
1,000 ,500
,336c
1 ,562 1,000 ,500 ,377
220
Pearson Chi-SquareContinuity Correctiona
Likelihood RatioFisher's Exact TestLinear-by-LinearAssociationN of Valid Cases
Value dfAsymp. Sig.
(2-sided)Exact Sig.(2-sided)
Exact Sig.(1-sided)
PointProbability
Computed only for a 2x2 tablea.
2 cells (50,0%) have expected count less than 5. The minimum expected count is 1,50.b.
The standardized statistic is -,580.c.
Eklampsie
Count
110 110110 110220 220
MimüVomü
code
Total
NeinEklampsie
Total
HELPP-Syndrom
Count
110 0 110108 2 110218 2 220
MimüVomü
code
Total
Nein JaHELLP
Total
57

Anhang
Chi-Square Tests
2,018b 1 ,155 ,498 ,249,505 1 ,477
2,791 1 ,095 ,498 ,249,498 ,249
2,009c
1 ,156 ,498 ,249 ,249
220
Pearson Chi-SquareContinuity Correctiona
Likelihood RatioFisher's Exact TestLinear-by-LinearAssociationN of Valid Cases
Value dfAsymp. Sig.
(2-sided)Exact Sig.(2-sided)
Exact Sig.(1-sided)
PointProbability
Computed only for a 2x2 tablea.
2 cells (50,0%) have expected count less than 5. The minimum expected count is 1,00.b.
The standardized statistic is 1,417.c.
58

Anhang
Neu aufgetretene Erkrankungen während der Schwangerschaft
Erkrankungen in der Schwangerschaft gesamt
110 ,08 ,275 ,026
110 ,18 ,410 ,039
codeMimü
Vomü
Erkrankungen inderSchwangerschaft
N Mean Std. DeviationStd. Error
Mean
Independent Samples Test
19,159 ,000 -2,122 218 ,035 -,100 ,047 -,193 -,007
-2,122 190,580 ,035 -,100 ,047 -,193 -,007
Equal variancesassumedEqual variancesnot assumed
Erkrankungen inderSchwangerschaft
F Sig.
Levene's Test forEquality of Variances
t df Sig. (2-tailed)Mean
DifferenceStd. ErrorDifference Lower Upper
95% ConfidenceInterval of the
Difference
t-test for Equality of Means
Gesamtanzahl erkrankter Frauen
Count
103 7 11092 17 109
195 24 219
MimüVomü
code
Total
Nein Ja
Erkrankungenwährend der
SchwangerschaftTotal
Chi-Square Tests
4,783b 1 ,029 ,032 ,0243,883 1 ,0494,913 1 ,027 ,032 ,024
,032 ,024
4,761c
1 ,029 ,032 ,024 ,016
219
Pearson Chi-SquareContinuity Correctiona
Likelihood RatioFisher's Exact TestLinear-by-LinearAssociationN of Valid Cases
Value dfAsymp. Sig.
(2-sided)Exact Sig.(2-sided)
Exact Sig.(1-sided)
PointProbability
Computed only for a 2x2 tablea.
0 cells (,0%) have expected count less than 5. The minimum expected count is 11,95.b.
The standardized statistic is 2,182.c.
59

Anhang
Herz-Kreislauf-Erkrankungen in der Schwangerschaft
Count
107 3 110105 5 110212 8 220
MimüVomü
code
Total
Nein Ja
Herz KreislaufErkrankungen
Total
Chi-Square Tests
,519b 1 ,471 ,721 ,361,130 1 ,719,524 1 ,469 ,721 ,361
,721 ,361
,517c
1 ,472 ,721 ,361 ,221
220
Pearson Chi-SquareContinuity Correctiona
Likelihood RatioFisher's Exact TestLinear-by-LinearAssociationN of Valid Cases
Value dfAsymp. Sig.
(2-sided)Exact Sig.(2-sided)
Exact Sig.(1-sided)
PointProbability
Computed only for a 2x2 tablea.
2 cells (50,0%) have expected count less than 5. The minimum expected count is 4,00.b.
The standardized statistic is ,719.c.
chronische Gelenkerkrankungen in der Schwangerschaft
Count
110 110110 110220 220
MimüVomü
code
Total
Nein
chronischeGelenkerkrankungen
Total
chronische Lungenerkrankungen in der Schwangerschaft
Count
110 110110 110220 220
MimüVomü
code
Total
Nein
chronischeLungenerkrankungen
Total
60

Anhang
chronische Magen-Darm-Erkrankungen in der Schwangerschaft
Count
110 110110 110220 220
MimüVomü
code
Total
Nein
Chronische Magen-Darmerkrankungen
Total
Geschlechtskrankheiten in der Schwangerschaft
Count
110 110110 110220 220
MimüVomü
code
Total
NeinGeschlechtskrankheiten
Total
Stoffwechselerkrankungen in der Schwangerschaft
Count
110 0 110109 1 110219 1 220
MimüVomü
code
Total
Nein JaStoffwechselerkrankungen
Total
Chi-Square Tests
1,005b 1 ,316 1,000 ,500,000 1 1,000
1,391 1 ,238 1,000 ,5001,000 ,500
1,000c
1 ,317 1,000 ,500 ,500
220
Pearson Chi-SquareContinuity Correctiona
Likelihood RatioFisher's Exact TestLinear-by-LinearAssociationN of Valid Cases
Value dfAsymp. Sig.
(2-sided)Exact Sig.(2-sided)
Exact Sig.(1-sided)
PointProbability
Computed only for a 2x2 tablea.
2 cells (50,0%) have expected count less than 5. The minimum expected count is ,50.b.
The standardized statistic is 1,000.c.
61

Anhang
Diabetes in der Schwangerschaft
Count
110 0 110109 1 110219 1 220
MimüVomü
code
Total
Nein JaDiabetes
Total
Chi-Square Tests
1,005b 1 ,316 1,000 ,500,000 1 1,000
1,391 1 ,238 1,000 ,5001,000 ,500
1,000c
1 ,317 1,000 ,500 ,500
220
Pearson Chi-SquareContinuity Correctiona
Likelihood RatioFisher's Exact TestLinear-by-LinearAssociationN of Valid Cases
Value dfAsymp. Sig.
(2-sided)Exact Sig.(2-sided)
Exact Sig.(1-sided)
PointProbability
Computed only for a 2x2 tablea.
2 cells (50,0%) have expected count less than 5. The minimum expected count is ,50.b.
The standardized statistic is 1,000.c.
chronische Schmerzen in der Schwangerschaft
Count
110 110110 110220 220
MimüVomü
code
Total
Nein
chronischeSchmerzen
Total
Migräne in der Schwangerschaft
Count
110 110110 110220 220
MimüVomü
code
Total
NeinMigräne
Total
62
Anhang
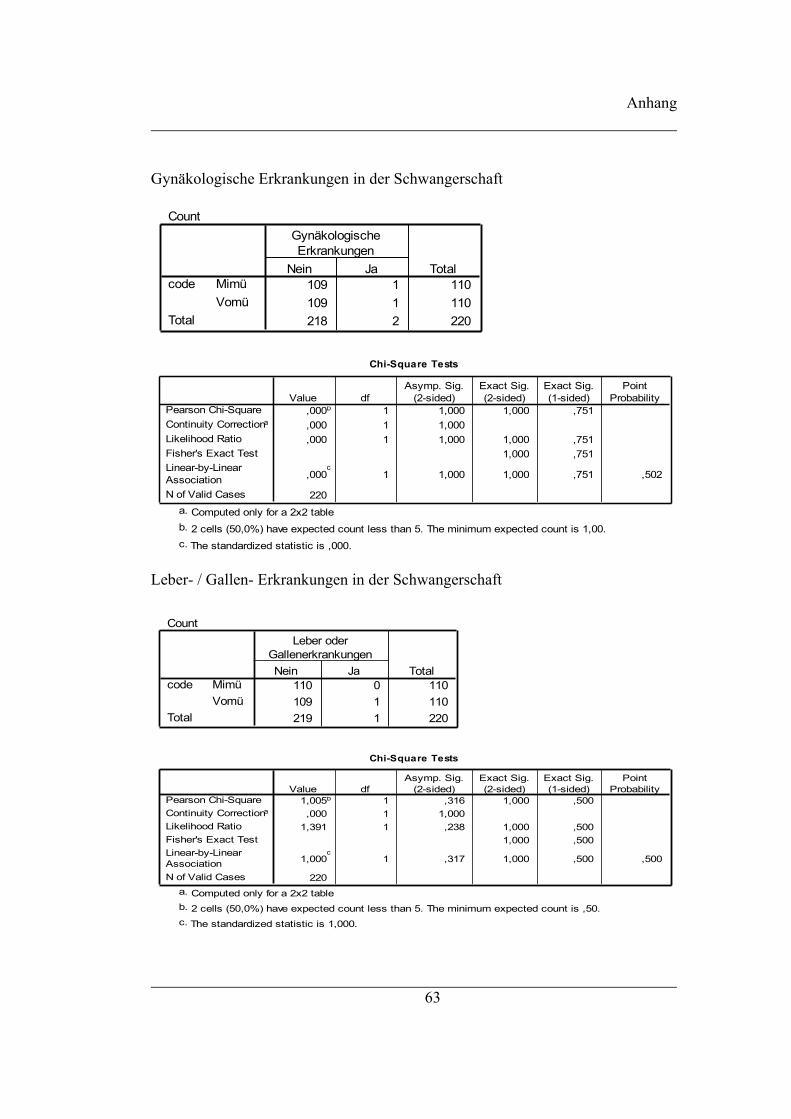
Gynäkologische Erkrankungen in der Schwangerschaft
Count
109 1 110109 1 110218 2 220
MimüVomü
code
Total
Nein Ja
GynäkologischeErkrankungen
Total
Chi-Square Tests
,000b 1 1,000 1,000 ,751,000 1 1,000,000 1 1,000 1,000 ,751
1,000 ,751
,000c
1 1,000 1,000 ,751 ,502
220
Pearson Chi-SquareContinuity Correctiona
Likelihood RatioFisher's Exact TestLinear-by-LinearAssociationN of Valid Cases
Value dfAsymp. Sig.
(2-sided)Exact Sig.(2-sided)
Exact Sig.(1-sided)
PointProbability
Computed only for a 2x2 tablea.
2 cells (50,0%) have expected count less than 5. The minimum expected count is 1,00.b.
The standardized statistic is ,000.c.
Leber- / Gallen- Erkrankungen in der Schwangerschaft
Count
110 0 110109 1 110219 1 220
MimüVomü
code
Total
Nein Ja
Leber oderGallenerkrankungen
Total
Chi-Square Tests
1,005b 1 ,316 1,000 ,500,000 1 1,000
1,391 1 ,238 1,000 ,5001,000 ,500
1,000c
1 ,317 1,000 ,500 ,500
220
Pearson Chi-SquareContinuity Correctiona
Likelihood RatioFisher's Exact TestLinear-by-LinearAssociationN of Valid Cases
Value dfAsymp. Sig.
(2-sided)Exact Sig.(2-sided)
Exact Sig.(1-sided)
PointProbability
Computed only for a 2x2 tablea.
2 cells (50,0%) have expected count less than 5. The minimum expected count is ,50.b.
The standardized statistic is 1,000.c.
63

Anhang
Allergien in der Schwangerschaft
Count
110 110110 110220 220
MimüVomü
code
Total
NeinAllergien
Total
Tumor in der Schwangerschaft
Count
110 110110 110220 220
MimüVomü
code
Total
NeinTumor
Total
andere Erkrankungen in der Schwangerschaft
Count
105 5 11099 11 110
204 16 220
MimüVomü
code
Total
Nein Jaandere Erkrankungen
Total
Chi-Square Tests
2,426b 1 ,119 ,193 ,0971,685 1 ,1942,482 1 ,115 ,193 ,097
,193 ,097
2,415c
1 ,120 ,193 ,097 ,063
220
Pearson Chi-SquareContinuity Correctiona
Likelihood RatioFisher's Exact TestLinear-by-LinearAssociationN of Valid Cases
Value dfAsymp. Sig.
(2-sided)Exact Sig.(2-sided)
Exact Sig.(1-sided)
PointProbability
Computed only for a 2x2 tablea.
0 cells (,0%) have expected count less than 5. The minimum expected count is 8,00.b.
The standardized statistic is 1,554.c.
64

Anhang
Weitere Probleme während des Schwangerschaftsverlauf
Zervixinsuffizienz
Count
104 6 110104 6 110208 12 220
MimüVomü
code
Total
Nein JaZervixinsuffizienz
Total
Chi-Square Tests
,000b 1 1,000 1,000 ,616,000 1 1,000,000 1 1,000 1,000 ,616
1,000 ,616
,000c
1 1,000 1,000 ,616 ,232
220
Pearson Chi-SquareContinuity Correctiona
Likelihood RatioFisher's Exact TestLinear-by-LinearAssociationN of Valid Cases
Value dfAsymp. Sig.
(2-sided)Exact Sig.(2-sided)
Exact Sig.(1-sided)
PointProbability
Computed only for a 2x2 tablea.
0 cells (,0%) have expected count less than 5. The minimum expected count is 6,00.b.
The standardized statistic is ,000.c.
65

Anhang
Plazentainsuffizienz in der Schwangerschaft
Count
106 4 110107 3 110213 7 220
MimüVomü
code
Total
Nein JaPlazentainsuffizienz
Total
Chi-Square Tests
,148b 1 ,701 1,000 ,500,000 1 1,000,148 1 ,700 1,000 ,500
1,000 ,500
,147c
1 ,702 1,000 ,500 ,277
220
Pearson Chi-SquareContinuity Correctiona
Likelihood RatioFisher's Exact TestLinear-by-LinearAssociationN of Valid Cases
Value dfAsymp. Sig.
(2-sided)Exact Sig.(2-sided)
Exact Sig.(1-sided)
PointProbability
Computed only for a 2x2 tablea.
2 cells (50,0%) have expected count less than 5. The minimum expected count is 3,50.b.
The standardized statistic is -,383.c.
Amnioninfektionssyndrom
Count
108 2 110107 3 110215 5 220
MimüVomü
code
Total
Nein JaAmnioninfektionssyndrom
Total
Chi-Square Tests
,205b 1 ,651 1,000 ,500,000 1 1,000,206 1 ,650 1,000 ,500
,685 ,500
,204c
1 ,652 1,000 ,500 ,315
220
Pearson Chi-SquareContinuity Correctiona
Likelihood RatioFisher's Exact TestLinear-by-LinearAssociationN of Valid Cases
Value dfAsymp. Sig.
(2-sided)Exact Sig.(2-sided)
Exact Sig.(1-sided)
PointProbability
Computed only for a 2x2 tablea.
2 cells (50,0%) have expected count less than 5. The minimum expected count is 2,50.b.
The standardized statistic is ,451.c.
66

Anhang
Blutung
Count
108 2 110105 5 110213 7 220
MimüVomü
code
Total
Nein JaBlutung
Total
Chi-Square Tests
1,328b 1 ,249 ,446 ,223,590 1 ,442
1,371 1 ,242 ,446 ,223,446 ,223
1,322c
1 ,250 ,446 ,223 ,163
220
Pearson Chi-SquareContinuity Correctiona
Likelihood RatioFisher's Exact TestLinear-by-LinearAssociationN of Valid Cases
Value dfAsymp. Sig.
(2-sided)Exact Sig.(2-sided)
Exact Sig.(1-sided)
PointProbability
Computed only for a 2x2 tablea.
2 cells (50,0%) have expected count less than 5. The minimum expected count is 3,50.b.
The standardized statistic is 1,150.c.
Chirurgische Eingriffe während der Schwangerschaft
Count
108 1 109107 3 110215 4 219
MimüVomü
code
Total
Nein JaChirurgische Eingriffe
Total
Chi-Square Tests
1,000b 1 ,317 ,622 ,314,245 1 ,620
1,047 1 ,306 ,622 ,314,622 ,314
,996c
1 ,318 ,622 ,314 ,252
219
Pearson Chi-SquareContinuity Correctiona
Likelihood RatioFisher's Exact TestLinear-by-LinearAssociationN of Valid Cases
Value dfAsymp. Sig.
(2-sided)Exact Sig.(2-sided)
Exact Sig.(1-sided)
PointProbability
Computed only for a 2x2 tablea.
2 cells (50,0%) have expected count less than 5. The minimum expected count is 1,99.b.
The standardized statistic is ,998.c.
67
Anhang
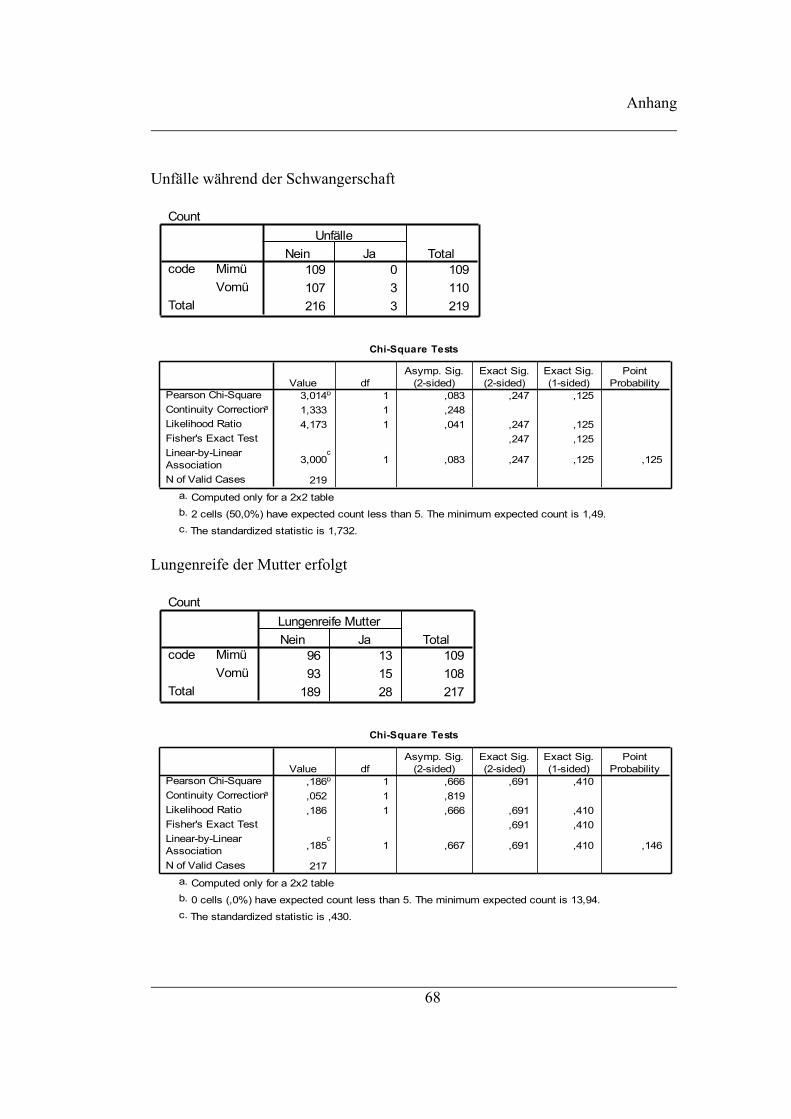
Unfälle während der Schwangerschaft
Count
109 0 109107 3 110216 3 219
MimüVomü
code
Total
Nein JaUnfälle
Total
Chi-Square Tests
3,014b 1 ,083 ,247 ,1251,333 1 ,2484,173 1 ,041 ,247 ,125
,247 ,125
3,000c
1 ,083 ,247 ,125 ,125
219
Pearson Chi-SquareContinuity Correctiona
Likelihood RatioFisher's Exact TestLinear-by-LinearAssociationN of Valid Cases
Value dfAsymp. Sig.
(2-sided)Exact Sig.(2-sided)
Exact Sig.(1-sided)
PointProbability
Computed only for a 2x2 tablea.
2 cells (50,0%) have expected count less than 5. The minimum expected count is 1,49.b.
The standardized statistic is 1,732.c.
Lungenreife der Mutter erfolgt
Count
96 13 10993 15 108
189 28 217
MimüVomü
code
Total
Nein JaLungenreife Mutter
Total
Chi-Square Tests
,186b 1 ,666 ,691 ,410,052 1 ,819,186 1 ,666 ,691 ,410
,691 ,410
,185c
1 ,667 ,691 ,410 ,146
217
Pearson Chi-SquareContinuity Correctiona
Likelihood RatioFisher's Exact TestLinear-by-LinearAssociationN of Valid Cases
Value dfAsymp. Sig.
(2-sided)Exact Sig.(2-sided)
Exact Sig.(1-sided)
PointProbability
Computed only for a 2x2 tablea.
0 cells (,0%) have expected count less than 5. The minimum expected count is 13,94.b.
The standardized statistic is ,430.c.
68

Anhang
Stationärer Aufenthalt
41 1,90 1,947 ,30439 15,00 18,121 2,902
codeMimüVomü
StationärerAufenthalt
N Mean Std. DeviationStd. Error
Mean
Independent Samples Test
29,347 ,000 -4,602 78 ,000 -13,098 2,846 -18,764 -7,431
-4,489 38,835 ,000 -13,098 2,918 -19,000 -7,195
Equal variancesassumedEqual variancesnot assumed
StationärerAufenthalt
F Sig.
Levene's Test forEquality of Variances
t df Sig. (2-tailed)Mean
DifferenceStd. ErrorDifference Lower Upper
95% ConfidenceInterval of the
Difference
t-test for Equality of Means
Count
66 44 11070 39 109
136 83 219
MimüVomü
code
Total
Nein Ja
Krankenhausaufenthaltwährend der
SchwangerschaftTotal
Chi-Square Tests
,414b 1 ,520 ,578 ,307,254 1 ,614,414 1 ,520 ,578 ,307
,578 ,307
,412c
1 ,521 ,578 ,307 ,090
219
Pearson Chi-SquareContinuity Correctiona
Likelihood RatioFisher's Exact TestLinear-by-LinearAssociationN of Valid Cases
Value dfAsymp. Sig.
(2-sided)Exact Sig.(2-sided)
Exact Sig.(1-sided)
PointProbability
Computed only for a 2x2 tablea.
0 cells (,0%) have expected count less than 5. The minimum expected count is 41,31.b.
The standardized statistic is -,642.c.
69

Anhang
Gewichtszunahme während der Schwangerschaft
103 14,047 6,4781 ,638399 14,378 7,1464 ,7182
codeMimüVomü
Gewicht zur GeburtN Mean Std. Deviation
Std. ErrorMean
Independent Samples Test
,412 ,522 -,345 200 ,730 -,3312 ,9590 -2,2223 1,5599
-,345 196,290 ,731 -,3312 ,9609 -2,2262 1,5638
Equal variancesassumedEqual variancesnot assumed
Gewicht zur GeburtF Sig.
Levene's Test forEquality of Variances
t df Sig. (2-tailed)Mean
DifferenceStd. ErrorDifference Lower Upper
95% ConfidenceInterval of the
Difference
t-test for Equality of Means
A3.3 Geburt
Schwangerschaftsdauer
Schwangerschaftsdauer in Tagen
entbWoch102
9272,11277,5018,839
178294110
0272,70279,0019,668
185293
ValidMissing
N
MeanMedianStd. DeviationMinimumMaximum
ValidMissing
N
MeanMedianStd. DeviationMinimumMaximum
Mimü
Vomü
70

Anhang
Frühgeburt
Count
16 86 10214 96 11030 182 212
MimüVomü
code
Total
Ja NeinFrühgeburt
Total
Chi-Square Tests
,381b 1 ,537 ,560 ,337,177 1 ,674,381 1 ,537 ,560 ,337
,560 ,337
,380c
1 ,538 ,560 ,337 ,129
212
Pearson Chi-SquareContinuity Correctiona
Likelihood RatioFisher's Exact TestLinear-by-LinearAssociationN of Valid Cases
Value dfAsymp. Sig.
(2-sided)Exact Sig.(2-sided)
Exact Sig.(1-sided)
PointProbability
Computed only for a 2x2 tablea.
0 cells (,0%) have expected count less than 5. The minimum expected count is 14,43.b.
The standardized statistic is ,616.c.
Art der Aufnahme zur Geburt
71

Anhang
84 26 11091,0 19,0 110,0
76,4% 23,6% 100,0%46,2% 68,4% 50,0%
98 12 11091,0 19,0 110,0
89,1% 10,9% 100,0%53,8% 31,6% 50,0%
182 38 220182,0 38,0 220,0
82,7% 17,3% 100,0%100,0% 100,0% 100,0%
CountExpected Count% within code% within Aufn_TypCountExpected Count% within code% within Aufn_TypCountExpected Count% within code% within Aufn_Typ
Mimü
Vomü
code
Total
NormaleAufnahme Notfall
Aufnahme zur Geburt
Total
Chi-Square Tests
6,235b 1 ,013 ,020 ,0105,376 1 ,0206,359 1 ,012 ,020 ,010
,020 ,010
6,206c
1 ,013 ,020 ,010 ,006
220
Pearson Chi-SquareContinuity Correctiona
Likelihood RatioFisher's Exact TestLinear-by-LinearAssociationN of Valid Cases
Value dfAsymp. Sig.
(2-sided)Exact Sig.(2-sided)
Exact Sig.(1-sided)
PointProbability
Computed only for a 2x2 tablea.
0 cells (,0%) have expected count less than 5. The minimum expected count is 19,00.b.
The standardized statistic is -2,491.c.
Entbindungsverlauf
Geburtsbeginn
Count
35 62 9719 85 10454 147 201
MimüVomü
code
Total
Nein Ja
SpontanerGeburtsbeginn
Total
72
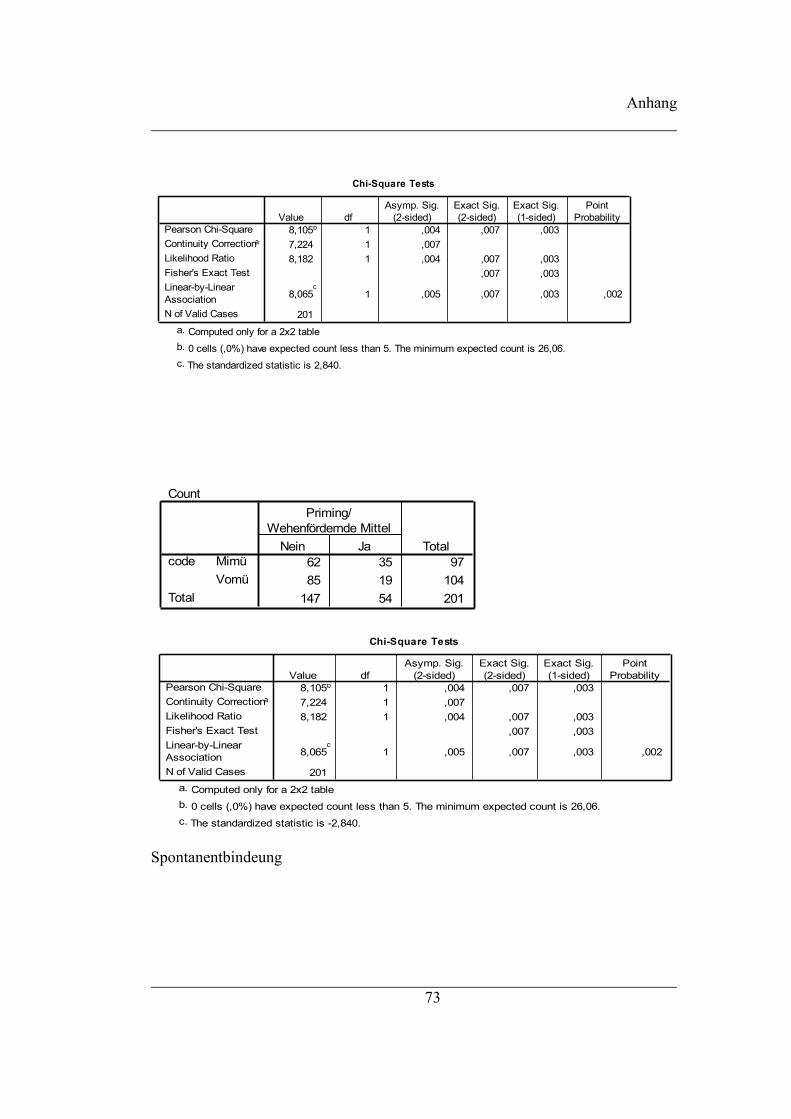
Anhang
Chi-Square Tests
8,105b 1 ,004 ,007 ,0037,224 1 ,0078,182 1 ,004 ,007 ,003
,007 ,003
8,065c
1 ,005 ,007 ,003 ,002
201
Pearson Chi-SquareContinuity Correctiona
Likelihood RatioFisher's Exact TestLinear-by-LinearAssociationN of Valid Cases
Value dfAsymp. Sig.
(2-sided)Exact Sig.(2-sided)
Exact Sig.(1-sided)
PointProbability
Computed only for a 2x2 tablea.
0 cells (,0%) have expected count less than 5. The minimum expected count is 26,06.b.
The standardized statistic is 2,840.c.
Count
62 35 9785 19 104
147 54 201
MimüVomü
code
Total
Nein Ja
Priming/Wehenfördernde Mittel
Total
Chi-Square Tests
8,105b 1 ,004 ,007 ,0037,224 1 ,0078,182 1 ,004 ,007 ,003
,007 ,003
8,065c
1 ,005 ,007 ,003 ,002
201
Pearson Chi-SquareContinuity Correctiona
Likelihood RatioFisher's Exact TestLinear-by-LinearAssociationN of Valid Cases
Value dfAsymp. Sig.
(2-sided)Exact Sig.(2-sided)
Exact Sig.(1-sided)
PointProbability
Computed only for a 2x2 tablea.
0 cells (,0%) have expected count less than 5. The minimum expected count is 26,06.b.
The standardized statistic is -2,840.c.
Spontanentbindeung
73

Anhang
Count
21 88 10928 82 11049 170 219
MimüVomü
code
Total
Nein JaSpontanentbindeung
Total
Chi-Square Tests
1,207b 1 ,272 ,331 ,175,877 1 ,349
1,211 1 ,271 ,331 ,175,331 ,175
1,202c
1 ,273 ,331 ,175 ,071
219
Pearson Chi-SquareContinuity Correctiona
Likelihood RatioFisher's Exact TestLinear-by-LinearAssociationN of Valid Cases
Value dfAsymp. Sig.
(2-sided)Exact Sig.(2-sided)
Exact Sig.(1-sided)
PointProbability
Computed only for a 2x2 tablea.
0 cells (,0%) have expected count less than 5. The minimum expected count is 24,39.b.
The standardized statistic is -1,096.c.
74
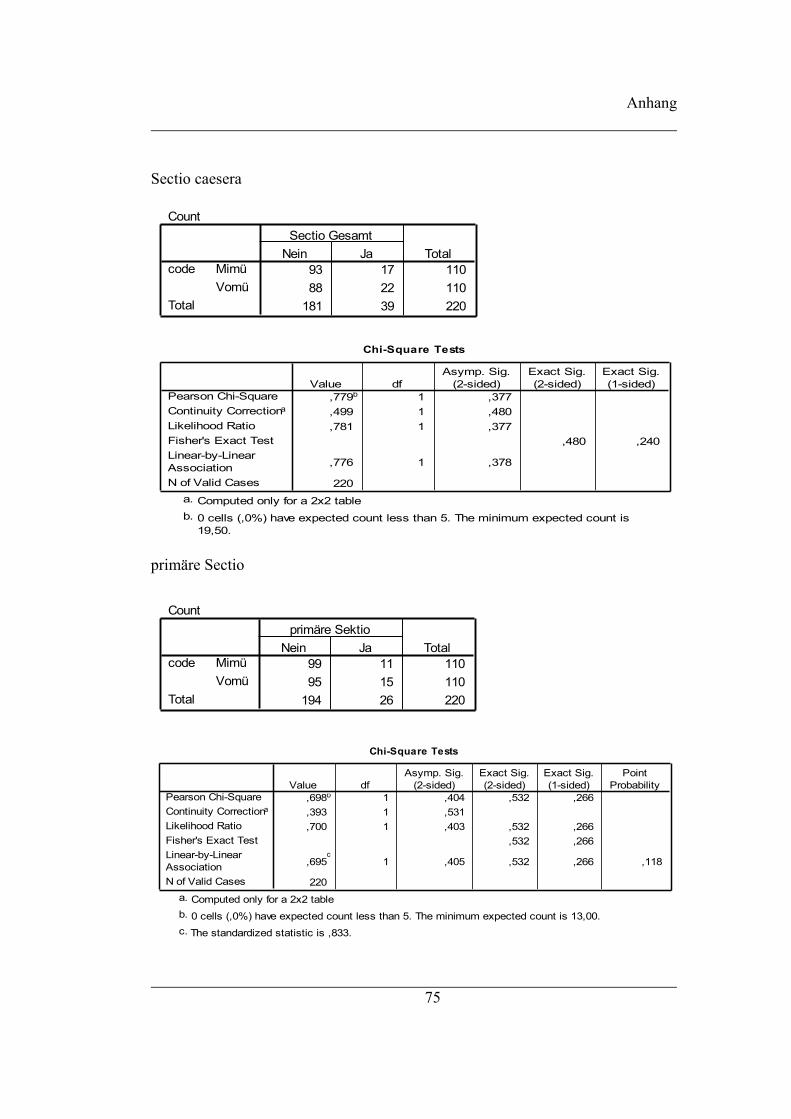
Anhang
Sectio caesera
Count
93 17 11088 22 110
181 39 220
MimüVomü
code
Total
Nein JaSectio Gesamt
Total
Chi-Square Tests
,779b 1 ,377,499 1 ,480,781 1 ,377
,480 ,240
,776 1 ,378
220
Pearson Chi-SquareContinuity Correctiona
Likelihood RatioFisher's Exact TestLinear-by-LinearAssociationN of Valid Cases
Value dfAsymp. Sig.
(2-sided)Exact Sig.(2-sided)
Exact Sig.(1-sided)
Computed only for a 2x2 tablea.
0 cells (,0%) have expected count less than 5. The minimum expected count is19,50.
b.
primäre Sectio
Count
99 11 11095 15 110
194 26 220
MimüVomü
code
Total
Nein Japrimäre Sektio
Total
Chi-Square Tests
,698b 1 ,404 ,532 ,266,393 1 ,531,700 1 ,403 ,532 ,266
,532 ,266
,695c
1 ,405 ,532 ,266 ,118
220
Pearson Chi-SquareContinuity Correctiona
Likelihood RatioFisher's Exact TestLinear-by-LinearAssociationN of Valid Cases
Value dfAsymp. Sig.
(2-sided)Exact Sig.(2-sided)
Exact Sig.(1-sided)
PointProbability
Computed only for a 2x2 tablea.
0 cells (,0%) have expected count less than 5. The minimum expected count is 13,00.b.
The standardized statistic is ,833.c.
75

Anhang
sekundäre Sectio
Count
104 6 110103 7 110207 13 220
MimüVomü
code
Total
Nein Jasekundäre Sectio
Total
Chi-Square Tests
,082b 1 ,775 1,000 ,500,000 1 1,000,082 1 ,775 1,000 ,500
1,000 ,500
,081c
1 ,775 1,000 ,500 ,215
220
Pearson Chi-SquareContinuity Correctiona
Likelihood RatioFisher's Exact TestLinear-by-LinearAssociationN of Valid Cases
Value dfAsymp. Sig.
(2-sided)Exact Sig.(2-sided)
Exact Sig.(1-sided)
PointProbability
Computed only for a 2x2 tablea.
0 cells (,0%) have expected count less than 5. The minimum expected count is 6,50.b.
The standardized statistic is ,285.c.
Vakuumextraktion
Count
108 1 109109 1 110217 2 219
MimüVomü
code
Total
Nein JaVakuumextraktion
Total
Chi-Square Tests
,000b 1 ,995 1,000 ,749,000 1 1,000,000 1 ,995 1,000 ,749
1,000 ,749
,000c
1 ,995 1,000 ,749 ,502
219
Pearson Chi-SquareContinuity Correctiona
Likelihood RatioFisher's Exact TestLinear-by-LinearAssociationN of Valid Cases
Value dfAsymp. Sig.
(2-sided)Exact Sig.(2-sided)
Exact Sig.(1-sided)
PointProbability
Computed only for a 2x2 tablea.
2 cells (50,0%) have expected count less than 5. The minimum expected count is 1,00.b.
The standardized statistic is -,006.c.
76

Anhang
Forceps
Count
106 3 109103 7 110209 10 219
MimüVomü
code
Total
Nein JaForceps
Total
Chi-Square Tests
1,639b 1 ,201 ,332 ,170,915 1 ,339
1,684 1 ,194 ,332 ,170,332 ,170
1,631c
1 ,202 ,332 ,170 ,118
219
Pearson Chi-SquareContinuity Correctiona
Likelihood RatioFisher's Exact TestLinear-by-LinearAssociationN of Valid Cases
Value dfAsymp. Sig.
(2-sided)Exact Sig.(2-sided)
Exact Sig.(1-sided)
PointProbability
Computed only for a 2x2 tablea.
1 cells (25,0%) have expected count less than 5. The minimum expected count is 4,98.b.
The standardized statistic is 1,277.c.
Schädellage
Count
5 91 9611 95 10616 186 202
MimüVomü
code
Total
Nein JaSchädellage
Total
Chi-Square Tests
1,845b 1 ,174 ,201 ,1361,205 1 ,2721,897 1 ,168 ,201 ,136
,201 ,136
1,836c
1 ,175 ,201 ,136 ,085
202
Pearson Chi-SquareContinuity Correctiona
Likelihood RatioFisher's Exact TestLinear-by-LinearAssociationN of Valid Cases
Value dfAsymp. Sig.
(2-sided)Exact Sig.(2-sided)
Exact Sig.(1-sided)
PointProbability
Computed only for a 2x2 tablea.
0 cells (,0%) have expected count less than 5. The minimum expected count is 7,60.b.
The standardized statistic is -1,355.c.
77

Anhang
Beckenlage
Count
93 3 9699 7 106
192 10 202
MimüVomü
code
Total
Nein JaBeckenlage
Total
Chi-Square Tests
1,296b 1 ,255 ,338 ,209,662 1 ,416
1,338 1 ,247 ,338 ,209,338 ,209
1,289c
1 ,256 ,338 ,209 ,140
202
Pearson Chi-SquareContinuity Correctiona
Likelihood RatioFisher's Exact TestLinear-by-LinearAssociationN of Valid Cases
Value dfAsymp. Sig.
(2-sided)Exact Sig.(2-sided)
Exact Sig.(1-sided)
PointProbability
Computed only for a 2x2 tablea.
1 cells (25,0%) have expected count less than 5. The minimum expected count is 4,75.b.
The standardized statistic is 1,135.c.
Querlage
Count
94 2 96102 4 106196 6 202
MimüVomü
code
Total
Nein JaQuerlage
Total
Chi-Square Tests
,499b 1 ,480 ,685 ,389,085 1 ,771,511 1 ,475 ,685 ,389
,685 ,389
,497c
1 ,481 ,685 ,389 ,259
202
Pearson Chi-SquareContinuity Correctiona
Likelihood RatioFisher's Exact TestLinear-by-LinearAssociationN of Valid Cases
Value dfAsymp. Sig.
(2-sided)Exact Sig.(2-sided)
Exact Sig.(1-sided)
PointProbability
Computed only for a 2x2 tablea.
2 cells (50,0%) have expected count less than 5. The minimum expected count is 2,85.b.
The standardized statistic is ,705.c.
78
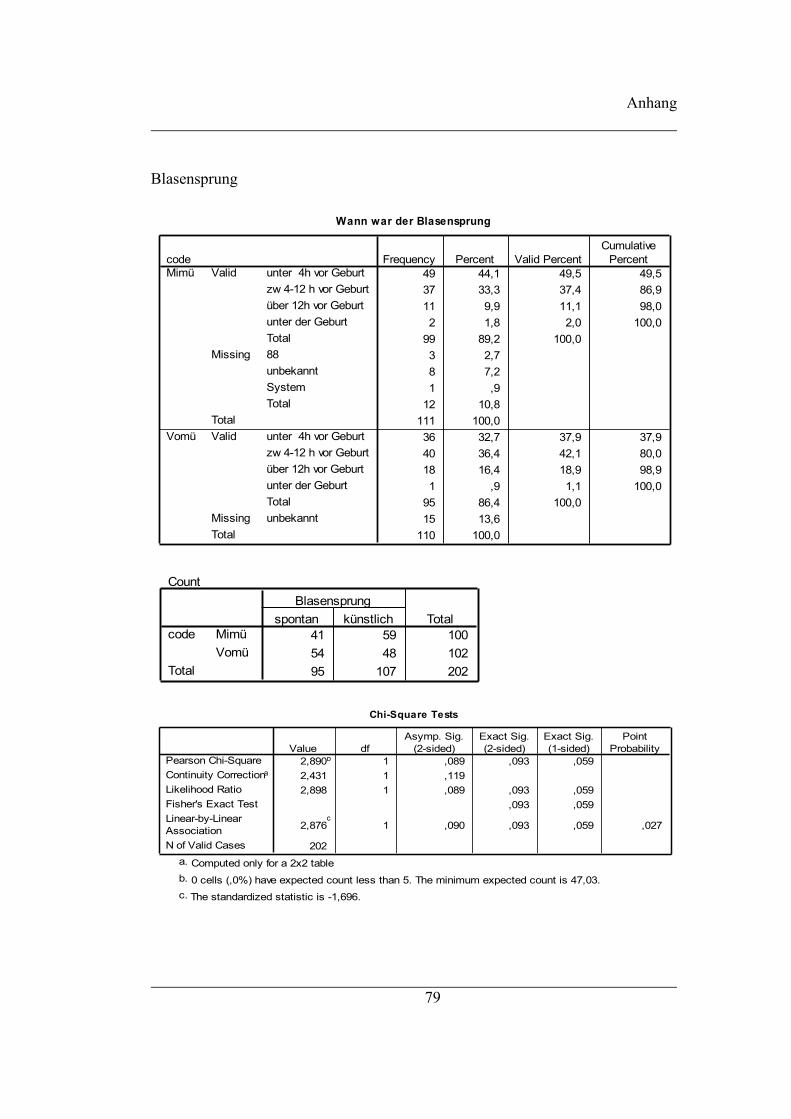
Anhang
Blasensprung
Wann war der Blasensprung
49 44,1 49,5 49,537 33,3 37,4 86,911 9,9 11,1 98,02 1,8 2,0 100,0
99 89,2 100,03 2,78 7,21 ,9
12 10,8111 100,036 32,7 37,9 37,940 36,4 42,1 80,018 16,4 18,9 98,91 ,9 1,1 100,0
95 86,4 100,015 13,6
110 100,0
unter 4h vor Geburtzw 4-12 h vor Geburtüber 12h vor Geburtunter der GeburtTotal
Valid
88unbekanntSystemTotal
Missing
Totalunter 4h vor Geburtzw 4-12 h vor Geburtüber 12h vor Geburtunter der GeburtTotal
Valid
unbekanntMissingTotal
codeMimü
Vomü
Frequency Percent Valid PercentCumulative
Percent
Count
41 59 10054 48 10295 107 202
MimüVomü
code
Total
spontan künstlichBlasensprung
Total
Chi-Square Tests
2,890b 1 ,089 ,093 ,0592,431 1 ,1192,898 1 ,089 ,093 ,059
,093 ,059
2,876c
1 ,090 ,093 ,059 ,027
202
Pearson Chi-SquareContinuity Correctiona
Likelihood RatioFisher's Exact TestLinear-by-LinearAssociationN of Valid Cases
Value dfAsymp. Sig.
(2-sided)Exact Sig.(2-sided)
Exact Sig.(1-sided)
PointProbability
Computed only for a 2x2 tablea.
0 cells (,0%) have expected count less than 5. The minimum expected count is 47,03.b.
The standardized statistic is -1,696.c.
79

Anhang
Count
59 41 10048 54 102
107 95 202
MimüVomü
code
Total
Nein Ja
spontanerBlasensprung
Total
Chi-Square Tests
2,890b 1 ,089 ,093 ,0592,431 1 ,1192,898 1 ,089 ,093 ,059
,093 ,059
2,876c
1 ,090 ,093 ,059 ,027
202
Pearson Chi-SquareContinuity Correctiona
Likelihood RatioFisher's Exact TestLinear-by-LinearAssociationN of Valid Cases
Value dfAsymp. Sig.
(2-sided)Exact Sig.(2-sided)
Exact Sig.(1-sided)
PointProbability
Computed only for a 2x2 tablea.
0 cells (,0%) have expected count less than 5. The minimum expected count is 47,03.b.
The standardized statistic is 1,696.c.
Count
41 59 10054 48 10295 107 202
MimüVomü
code
Total
Nein Ja
künstlicherBlasensprung
Total
Chi-Square Tests
2,890b 1 ,089 ,093 ,0592,431 1 ,1192,898 1 ,089 ,093 ,059
,093 ,059
2,876c
1 ,090 ,093 ,059 ,027
202
Pearson Chi-SquareContinuity Correctiona
Likelihood RatioFisher's Exact TestLinear-by-LinearAssociationN of Valid Cases
Value dfAsymp. Sig.
(2-sided)Exact Sig.(2-sided)
Exact Sig.(1-sided)
PointProbability
Computed only for a 2x2 tablea.
0 cells (,0%) have expected count less than 5. The minimum expected count is 47,03.b.
The standardized statistic is -1,696.c.
80

Anhang
Pathologischer Blasensprung
Count
88 11 9977 18 95
165 29 194
MimüVomü
code
Total
Nein Ja
pathologischerBlasensprung
Total
Chi-Square Tests
2,342b 1 ,126 ,159 ,0921,766 1 ,1842,358 1 ,125 ,159 ,092
,159 ,092
2,329c
1 ,127 ,159 ,092 ,051
194
Pearson Chi-SquareContinuity Correctiona
Likelihood RatioFisher's Exact TestLinear-by-LinearAssociationN of Valid Cases
Value dfAsymp. Sig.
(2-sided)Exact Sig.(2-sided)
Exact Sig.(1-sided)
PointProbability
Computed only for a 2x2 tablea.
0 cells (,0%) have expected count less than 5. The minimum expected count is 14,20.b.
The standardized statistic is 1,526.c.
Pathologisches Fruchtwasser
Count
97 13 11095 15 110
192 28 220
MimüVomü
code
Total
Nein Ja
pathologischesFruchtwasser
Total
Chi-Square Tests
,164b 1 ,686 ,840 ,420,041 1 ,840,164 1 ,686 ,840 ,420
,840 ,420
,163c
1 ,686 ,840 ,420 ,148
220
Pearson Chi-SquareContinuity Correctiona
Likelihood RatioFisher's Exact TestLinear-by-LinearAssociationN of Valid Cases
Value dfAsymp. Sig.
(2-sided)Exact Sig.(2-sided)
Exact Sig.(1-sided)
PointProbability
Computed only for a 2x2 tablea.
0 cells (,0%) have expected count less than 5. The minimum expected count is 14,00.b.
The standardized statistic is ,404.c.
81

Anhang
Blutverlust unter der Geburt
Count
97 7 10498 11 109
195 18 213
MimüVomü
code
Total
normalerBlutverlust
erhöhterBlutverlust
Blutverlust
Total
Chi-Square Tests
,777b 1 ,378 ,463 ,264,403 1 ,525,784 1 ,376 ,463 ,264
,463 ,264
,773c
1 ,379 ,463 ,264 ,134
213
Pearson Chi-SquareContinuity Correctiona
Likelihood RatioFisher's Exact TestLinear-by-LinearAssociationN of Valid Cases
Value dfAsymp. Sig.
(2-sided)Exact Sig.(2-sided)
Exact Sig.(1-sided)
PointProbability
Computed only for a 2x2 tablea.
0 cells (,0%) have expected count less than 5. The minimum expected count is 8,79.b.
The standardized statistic is ,879.c.
Dauer der Geburt in Minuten
Dauer9318
410,53375,00
185,82560
999107
3438,18420,00
322,43120
2760
ValidMissing
N
MeanMedianStd. DeviationMinimumMaximum
ValidMissing
N
MeanMedianStd. DeviationMinimumMaximum
Mimü
Vomü
82

Anhang
Komplikationen unter der Geburt
Geburtskomplikationen gesamt
109 ,24 ,489 ,047110 ,81 ,748 ,071
codeMimüVomü
Komplikationenunter der Geburt
N Mean Std. DeviationStd. Error
Mean
Independent Samples Test
23,595 ,000 -6,676 217 ,000 -,571 ,085 -,739 -,402
-6,688 187,943 ,000 -,571 ,085 -,739 -,402
Equal variancesassumedEqual variancesnot assumed
Komplikationenunter der Geburt
F Sig.
Levene's Test forEquality of Variances
t df Sig. (2-tailed)Mean
DifferenceStd. ErrorDifference Lower Upper
95% ConfidenceInterval of the
Difference
t-test for Equality of Means
Gesamtanzahl betroffener Frauen
Count
86 23 10942 68 110
128 91 219
MimüVomü
code
Total
Nein Ja
Komplikationen unterder Geburt
Total
Chi-Square Tests
37,374b 1 ,000 ,000 ,00035,716 1 ,00038,695 1 ,000 ,000 ,000
,000 ,000
37,203c
1 ,000 ,000 ,000 ,000
219
Pearson Chi-SquareContinuity Correctiona
Likelihood RatioFisher's Exact TestLinear-by-LinearAssociationN of Valid Cases
Value dfAsymp. Sig.
(2-sided)Exact Sig.(2-sided)
Exact Sig.(1-sided)
PointProbability
Computed only for a 2x2 tablea.
0 cells (,0%) have expected count less than 5. The minimum expected count is 45,29.b.
The standardized statistic is 6,099.c.
83

Anhang
Plazenta praevia
Count
109 0 109108 2 110217 2 219
MimüVomü
code
Total
Nein JaPlazenta praevia
Total
Chi-Square Tests
2,000b 1 ,157 ,498 ,251,495 1 ,482
2,773 1 ,096 ,498 ,251,498 ,251
1,991c
1 ,158 ,498 ,251 ,251
219
Pearson Chi-SquareContinuity Correctiona
Likelihood RatioFisher's Exact TestLinear-by-LinearAssociationN of Valid Cases
Value dfAsymp. Sig.
(2-sided)Exact Sig.(2-sided)
Exact Sig.(1-sided)
PointProbability
Computed only for a 2x2 tablea.
2 cells (50,0%) have expected count less than 5. The minimum expected count is 1,00.b.
The standardized statistic is 1,411.c.
tiefer Sitz der Plazenta
Count
109 109110 110219 219
MimüVomü
code
Total
Nein
tiefer Sitzder
PlazentaTotal
84
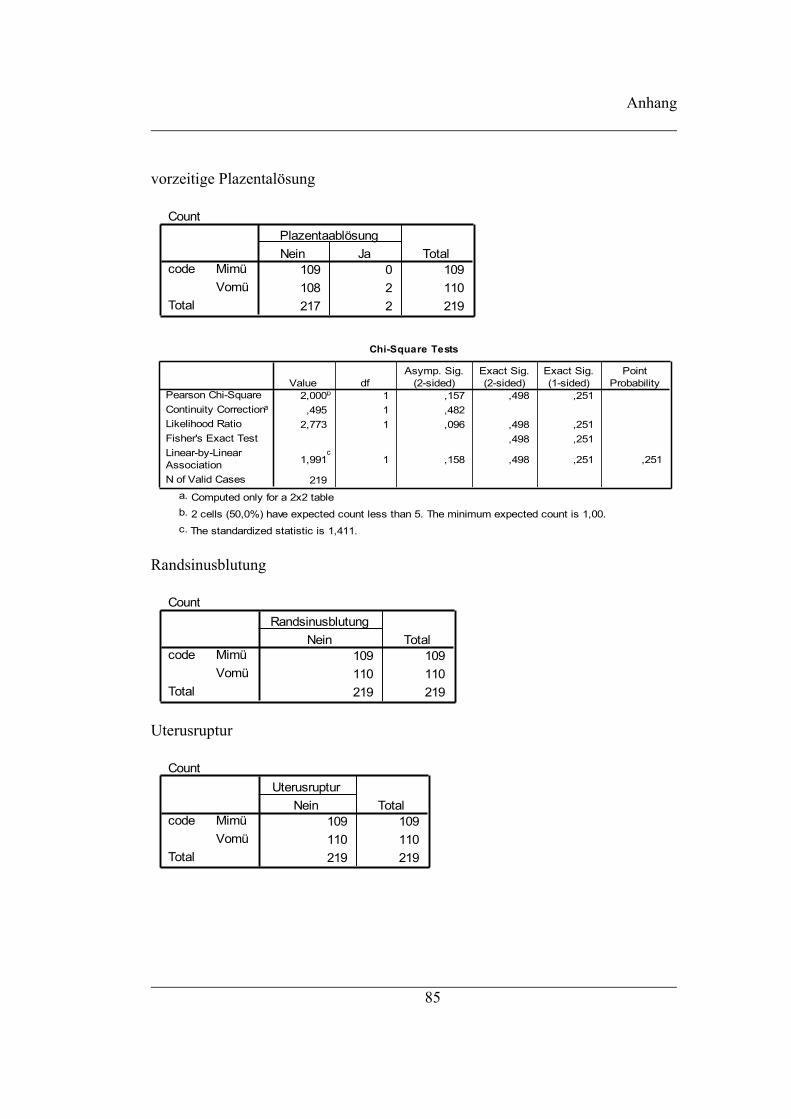
Anhang
vorzeitige Plazentalösung
Count
109 0 109108 2 110217 2 219
MimüVomü
code
Total
Nein JaPlazentaablösung
Total
Chi-Square Tests
2,000b 1 ,157 ,498 ,251,495 1 ,482
2,773 1 ,096 ,498 ,251,498 ,251
1,991c
1 ,158 ,498 ,251 ,251
219
Pearson Chi-SquareContinuity Correctiona
Likelihood RatioFisher's Exact TestLinear-by-LinearAssociationN of Valid Cases
Value dfAsymp. Sig.
(2-sided)Exact Sig.(2-sided)
Exact Sig.(1-sided)
PointProbability
Computed only for a 2x2 tablea.
2 cells (50,0%) have expected count less than 5. The minimum expected count is 1,00.b.
The standardized statistic is 1,411.c.
Randsinusblutung
Count
109 109110 110219 219
MimüVomü
code
Total
NeinRandsinusblutung
Total
Uterusruptur
Count
109 109110 110219 219
MimüVomü
code
Total
NeinUterusruptur
Total
85
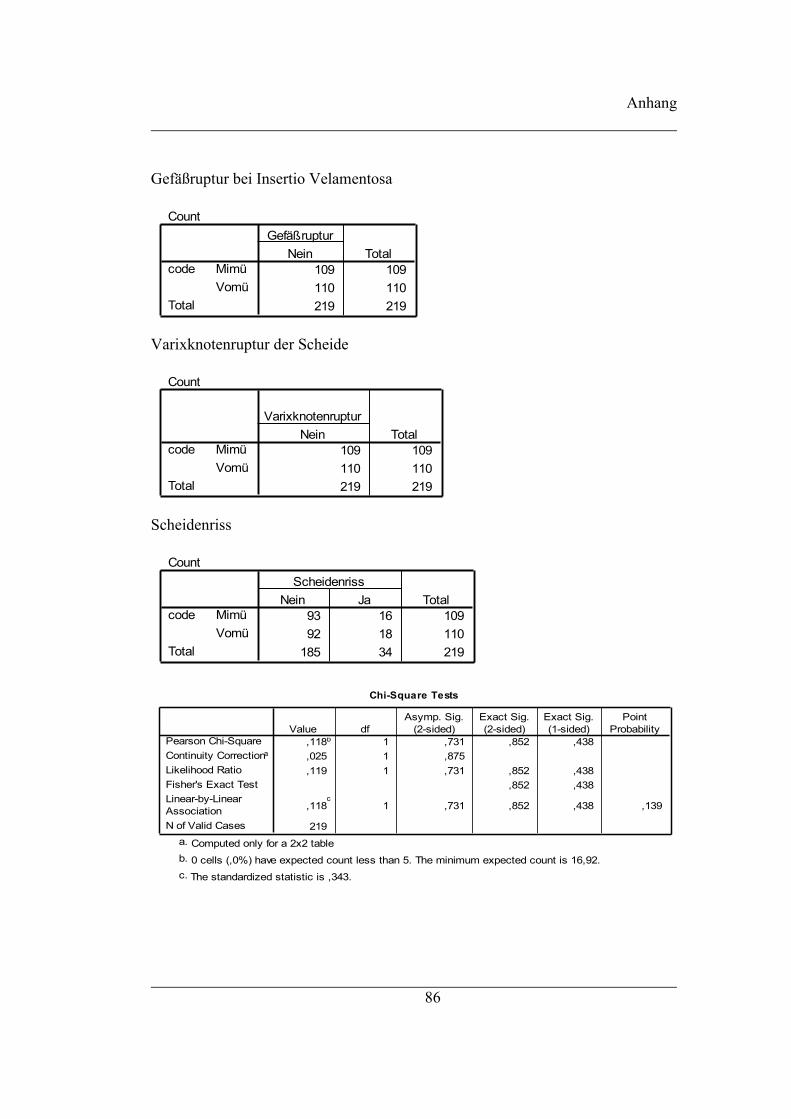
Anhang
Gefäßruptur bei Insertio Velamentosa
Count
109 109110 110219 219
MimüVomü
code
Total
NeinGefäßruptur
Total
Varixknotenruptur der Scheide
Count
109 109110 110219 219
MimüVomü
code
Total
NeinVarixknotenruptur
Total
Scheidenriss
Count
93 16 10992 18 110
185 34 219
MimüVomü
code
Total
Nein JaScheidenriss
Total
Chi-Square Tests
,118b 1 ,731 ,852 ,438,025 1 ,875,119 1 ,731 ,852 ,438
,852 ,438
,118c
1 ,731 ,852 ,438 ,139
219
Pearson Chi-SquareContinuity Correctiona
Likelihood RatioFisher's Exact TestLinear-by-LinearAssociationN of Valid Cases
Value dfAsymp. Sig.
(2-sided)Exact Sig.(2-sided)
Exact Sig.(1-sided)
PointProbability
Computed only for a 2x2 tablea.
0 cells (,0%) have expected count less than 5. The minimum expected count is 16,92.b.
The standardized statistic is ,343.c.
86

Anhang
Zervixriss
Count
108 1 109110 0 110218 1 219
MimüVomü
code
Total
Nein JaZervixriss
Total
Chi-Square Tests
1,014b 1 ,314 ,498 ,498,000 1 ,996
1,400 1 ,237 ,498 ,498,498 ,498
1,009c
1 ,315 ,498 ,498 ,498
219
Pearson Chi-SquareContinuity Correctiona
Likelihood RatioFisher's Exact TestLinear-by-LinearAssociationN of Valid Cases
Value dfAsymp. Sig.
(2-sided)Exact Sig.(2-sided)
Exact Sig.(1-sided)
PointProbability
Computed only for a 2x2 tablea.
2 cells (50,0%) have expected count less than 5. The minimum expected count is ,50.b.
The standardized statistic is -1,005.c.
Schock
Count
109 109110 110219 219
MimüVomü
code
Total
NeinSchock
Total
87

Anhang
Atonie
Count
107 2 109108 2 110215 4 219
MimüVomü
code
Total
Nein JaAtonie
Total
Chi-Square Tests
,000b 1 ,993 1,000 ,686,000 1 1,000,000 1 ,993 1,000 ,686
1,000 ,686
,000c
1 ,993 1,000 ,686 ,378
219
Pearson Chi-SquareContinuity Correctiona
Likelihood RatioFisher's Exact TestLinear-by-LinearAssociationN of Valid Cases
Value dfAsymp. Sig.
(2-sided)Exact Sig.(2-sided)
Exact Sig.(1-sided)
PointProbability
Computed only for a 2x2 tablea.
2 cells (50,0%) have expected count less than 5. The minimum expected count is 1,99.b.
The standardized statistic is -,009.c.
andere Komplikationen
Count
104 5 10959 51 110
163 56 219
MimüVomü
code
Total
Nein Ja
andereKomplikationen
Total
Chi-Square Tests
50,206b 1 ,000 ,000 ,00048,034 1 ,00056,515 1 ,000 ,000 ,000
,000 ,000
49,976c
1 ,000 ,000 ,000 ,000
219
Pearson Chi-SquareContinuity Correctiona
Likelihood RatioFisher's Exact TestLinear-by-LinearAssociationN of Valid Cases
Value dfAsymp. Sig.
(2-sided)Exact Sig.(2-sided)
Exact Sig.(1-sided)
PointProbability
Computed only for a 2x2 tablea.
0 cells (,0%) have expected count less than 5. The minimum expected count is 27,87.b.
The standardized statistic is 7,069.c.
88

Anhang
Komplikationen im Wochenbett
Komplikationen im Wochenbett gesamt
105 ,46 ,519 ,051110 ,59 ,547 ,052
codeMimüVomü
Wochenbett-komplikationen
N Mean Std. DeviationStd. Error
Mean
Independent Samples Test
,282 ,596 -1,837 213 ,068 -,134 ,073 -,277 ,010
-1,840 212,995 ,067 -,134 ,073 -,277 ,010
Equal variancesassumedEqual variancesnot assumed
Wochenbett-komplikationen
F Sig.
Levene's Test forEquality of Variances
t df Sig. (2-tailed)Mean
DifferenceStd. ErrorDifference Lower Upper
95% ConfidenceInterval of the
Difference
t-test for Equality of Means
Gesamtanzahl betroffener Frauen
Count
59 47 10648 62 110
107 109 216
MimüVomü
code
Total
Nein JaWochenbettkomplikationen
Total
Chi-Square Tests
3,122b 1 ,077 ,102 ,0512,660 1 ,1033,130 1 ,077 ,102 ,051
,102 ,051
3,108c
1 ,078 ,102 ,051 ,023
216
Pearson Chi-SquareContinuity Correctiona
Likelihood RatioFisher's Exact TestLinear-by-LinearAssociationN of Valid Cases
Value dfAsymp. Sig.
(2-sided)Exact Sig.(2-sided)
Exact Sig.(1-sided)
PointProbability
Computed only for a 2x2 tablea.
0 cells (,0%) have expected count less than 5. The minimum expected count is 52,51.b.
The standardized statistic is 1,763.c.
89
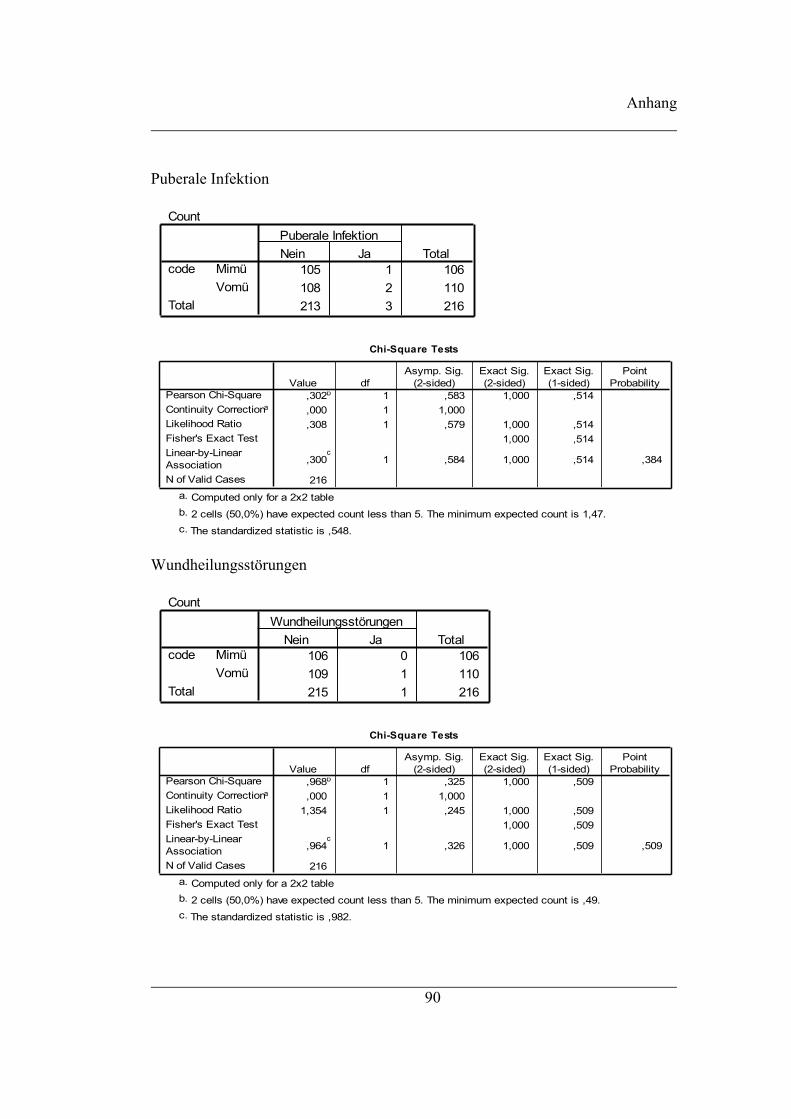
Anhang
Puberale Infektion
Count
105 1 106108 2 110213 3 216
MimüVomü
code
Total
Nein JaPuberale Infektion
Total
Chi-Square Tests
,302b 1 ,583 1,000 ,514,000 1 1,000,308 1 ,579 1,000 ,514
1,000 ,514
,300c
1 ,584 1,000 ,514 ,384
216
Pearson Chi-SquareContinuity Correctiona
Likelihood RatioFisher's Exact TestLinear-by-LinearAssociationN of Valid Cases
Value dfAsymp. Sig.
(2-sided)Exact Sig.(2-sided)
Exact Sig.(1-sided)
PointProbability
Computed only for a 2x2 tablea.
2 cells (50,0%) have expected count less than 5. The minimum expected count is 1,47.b.
The standardized statistic is ,548.c.
Wundheilungsstörungen
Count
106 0 106109 1 110215 1 216
MimüVomü
code
Total
Nein JaWundheilungsstörungen
Total
Chi-Square Tests
,968b 1 ,325 1,000 ,509,000 1 1,000
1,354 1 ,245 1,000 ,5091,000 ,509
,964c
1 ,326 1,000 ,509 ,509
216
Pearson Chi-SquareContinuity Correctiona
Likelihood RatioFisher's Exact TestLinear-by-LinearAssociationN of Valid Cases
Value dfAsymp. Sig.
(2-sided)Exact Sig.(2-sided)
Exact Sig.(1-sided)
PointProbability
Computed only for a 2x2 tablea.
2 cells (50,0%) have expected count less than 5. The minimum expected count is ,49.b.
The standardized statistic is ,982.c.
90
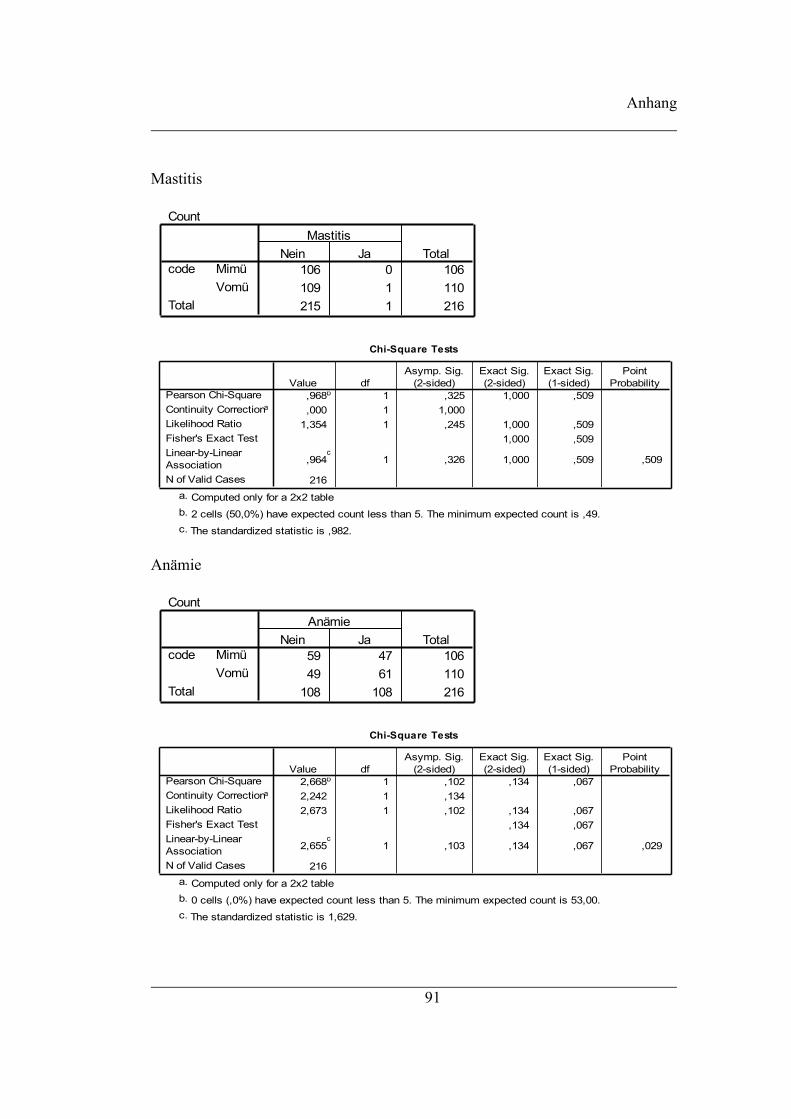
Anhang
Mastitis
Count
106 0 106109 1 110215 1 216
MimüVomü
code
Total
Nein JaMastitis
Total
Chi-Square Tests
,968b 1 ,325 1,000 ,509,000 1 1,000
1,354 1 ,245 1,000 ,5091,000 ,509
,964c
1 ,326 1,000 ,509 ,509
216
Pearson Chi-SquareContinuity Correctiona
Likelihood RatioFisher's Exact TestLinear-by-LinearAssociationN of Valid Cases
Value dfAsymp. Sig.
(2-sided)Exact Sig.(2-sided)
Exact Sig.(1-sided)
PointProbability
Computed only for a 2x2 tablea.
2 cells (50,0%) have expected count less than 5. The minimum expected count is ,49.b.
The standardized statistic is ,982.c.
Anämie
Count
59 47 10649 61 110
108 108 216
MimüVomü
code
Total
Nein JaAnämie
Total
Chi-Square Tests
2,668b 1 ,102 ,134 ,0672,242 1 ,1342,673 1 ,102 ,134 ,067
,134 ,067
2,655c
1 ,103 ,134 ,067 ,029
216
Pearson Chi-SquareContinuity Correctiona
Likelihood RatioFisher's Exact TestLinear-by-LinearAssociationN of Valid Cases
Value dfAsymp. Sig.
(2-sided)Exact Sig.(2-sided)
Exact Sig.(1-sided)
PointProbability
Computed only for a 2x2 tablea.
0 cells (,0%) have expected count less than 5. The minimum expected count is 53,00.b.
The standardized statistic is 1,629.c.
91

Anhang
weitere erfasste Komplikationen :
Count
106 106110 110216 216
MimüVomü
code
Total
Nein
ToxischesSchocksyndrom
Total
Count
106 106110 110216 216
MimüVomü
code
Total
NeinWochenbettdepression
Total
Count
105 105110 110215 215
MimüVomü
code
Total
NeinThrombose
Total
Count
106 106110 110216 216
MimüVomü
code
Total
NeinEmbolie
Total
92

Anhang
A3.4 Kindliches Outcome
Kindbezogene Komplikationen unter der Geburt
Kindliche Komplikationen gesamt
110 1,98 1,459 ,139110 2,31 2,053 ,196
codeMimüVomü
KindlicheKomplikationen
N Mean Std. DeviationStd. Error
Mean
Independent Samples Test
6,215 ,013 -1,363 218 ,174 -,327 ,240 -,801 ,146
-1,363 196,702 ,174 -,327 ,240 -,801 ,146
Equal variancesassumedEqual variancesnot assumed
KindlicheKomlikationen
F Sig.
Levene's Test forEquality of Variances
t df Sig. (2-tailed)Mean
DifferenceStd. ErrorDifference Lower Upper
95% ConfidenceInterval of the
Difference
t-test for Equality of Means
Gesamtanzahl der Kinder mit Komplikationen
Count
36 72 10839 71 11075 143 218
MimüVomü
code
Total
Nein Ja
Geasamtanzahl derKinder mit
KomplikationenTotal
Chi-Square Tests
,109b 1 ,742 ,777 ,426,035 1 ,852,109 1 ,742 ,777 ,426
,777 ,426
,108c
1 ,742 ,777 ,426 ,107
218
Pearson Chi-SquareContinuity Correctiona
Likelihood RatioFisher's Exact TestLinear-by-LinearAssociationN of Valid Cases
Value dfAsymp. Sig.
(2-sided)Exact Sig.(2-sided)
Exact Sig.(1-sided)
PointProbability
Computed only for a 2x2 tablea.
0 cells (,0%) have expected count less than 5. The minimum expected count is 37,16.b.
The standardized statistic is -,329.c.
93
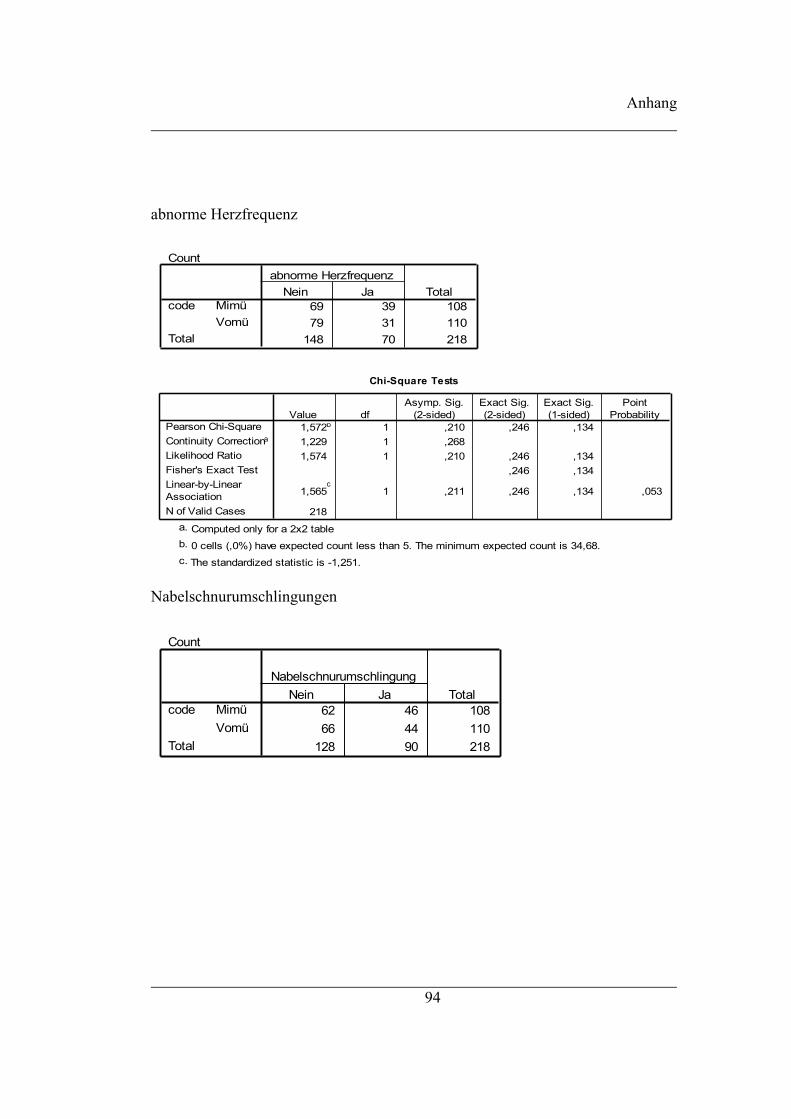
Anhang
abnorme Herzfrequenz
Count
69 39 10879 31 110
148 70 218
MimüVomü
code
Total
Nein Jaabnorme Herzfrequenz
Total
Chi-Square Tests
1,572b 1 ,210 ,246 ,1341,229 1 ,2681,574 1 ,210 ,246 ,134
,246 ,134
1,565c
1 ,211 ,246 ,134 ,053
218
Pearson Chi-SquareContinuity Correctiona
Likelihood RatioFisher's Exact TestLinear-by-LinearAssociationN of Valid Cases
Value dfAsymp. Sig.
(2-sided)Exact Sig.(2-sided)
Exact Sig.(1-sided)
PointProbability
Computed only for a 2x2 tablea.
0 cells (,0%) have expected count less than 5. The minimum expected count is 34,68.b.
The standardized statistic is -1,251.c.
Nabelschnurumschlingungen
Count
62 46 10866 44 110
128 90 218
MimüVomü
code
Total
Nein JaNabelschnurumschlingung
Total
94

Anhang
Chi-Square Tests
,151b 1 ,697 ,783 ,401,063 1 ,802,151 1 ,697 ,783 ,401
,783 ,401
,150c
1 ,698 ,783 ,401 ,101
218
Pearson Chi-SquareContinuity Correctiona
Likelihood RatioFisher's Exact TestLinear-by-LinearAssociationN of Valid Cases
Value dfAsymp. Sig.
(2-sided)Exact Sig.(2-sided)
Exact Sig.(1-sided)
PointProbability
Computed only for a 2x2 tablea.
0 cells (,0%) have expected count less than 5. The minimum expected count is 44,59.b.
The standardized statistic is -,388.c.
Insertio velamentosa
Count
108 0 108108 2 110216 2 218
MimüVomü
code
Total
Nein JaInsertio velamentosa
Total
Chi-Square Tests
1,982b 1 ,159 ,498 ,253,486 1 ,486
2,754 1 ,097 ,498 ,253,498 ,253
1,973c
1 ,160 ,498 ,253 ,253
218
Pearson Chi-SquareContinuity Correctiona
Likelihood RatioFisher's Exact TestLinear-by-LinearAssociationN of Valid Cases
Value dfAsymp. Sig.
(2-sided)Exact Sig.(2-sided)
Exact Sig.(1-sided)
PointProbability
Computed only for a 2x2 tablea.
2 cells (50,0%) have expected count less than 5. The minimum expected count is ,99.b.
The standardized statistic is 1,405.c.
Count
106 2 108108 2 110214 4 218
MimüVomü
code
Total
Nein JaKephalhämatom
Total
95
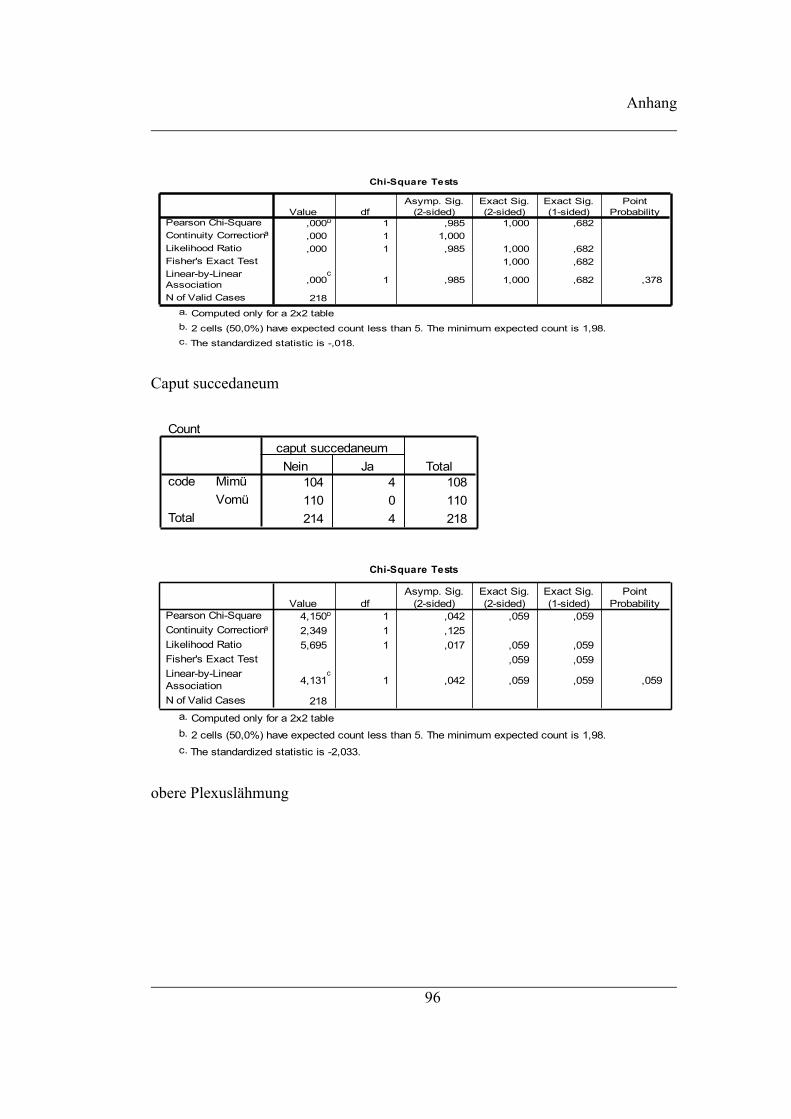
Anhang
Chi-Square Tests
,000b 1 ,985 1,000 ,682,000 1 1,000,000 1 ,985 1,000 ,682
1,000 ,682
,000c
1 ,985 1,000 ,682 ,378
218
Pearson Chi-SquareContinuity Correctiona
Likelihood RatioFisher's Exact TestLinear-by-LinearAssociationN of Valid Cases
Value dfAsymp. Sig.
(2-sided)Exact Sig.(2-sided)
Exact Sig.(1-sided)
PointProbability
Computed only for a 2x2 tablea.
2 cells (50,0%) have expected count less than 5. The minimum expected count is 1,98.b.
The standardized statistic is -,018.c.
Caput succedaneum
Count
104 4 108110 0 110214 4 218
MimüVomü
code
Total
Nein Jacaput succedaneum
Total
Chi-Square Tests
4,150b 1 ,042 ,059 ,0592,349 1 ,1255,695 1 ,017 ,059 ,059
,059 ,059
4,131c
1 ,042 ,059 ,059 ,059
218
Pearson Chi-SquareContinuity Correctiona
Likelihood RatioFisher's Exact TestLinear-by-LinearAssociationN of Valid Cases
Value dfAsymp. Sig.
(2-sided)Exact Sig.(2-sided)
Exact Sig.(1-sided)
PointProbability
Computed only for a 2x2 tablea.
2 cells (50,0%) have expected count less than 5. The minimum expected count is 1,98.b.
The standardized statistic is -2,033.c.
obere Plexuslähmung
96

Anhang
Count
108 108110 110218 218
MimüVomü
code
Total
Nein
oberePlexuslähmung
Total
untere Plexuslähmung
Count
108 108110 110218 218
MimüVomü
code
Total
Nein
unterePlexuslähmung
Total
Klavikularfraktur
Count
108 0 108109 1 110217 1 218
MimüVomü
code
Total
Nein JaKlavikularfraktur
Total
Chi-Square Tests
,986b 1 ,321 1,000 ,505,000 1 1,000
1,373 1 ,241 1,000 ,5051,000 ,505
,982c
1 ,322 1,000 ,505 ,505
218
Pearson Chi-SquareContinuity Correctiona
Likelihood RatioFisher's Exact TestLinear-by-LinearAssociationN of Valid Cases
Value dfAsymp. Sig.
(2-sided)Exact Sig.(2-sided)
Exact Sig.(1-sided)
PointProbability
Computed only for a 2x2 tablea.
2 cells (50,0%) have expected count less than 5. The minimum expected count is ,50.b.
The standardized statistic is ,991.c.
Konjungtivitis
97

Anhang
Count
108 108110 110218 218
MimüVomü
code
Total
NeinKonjungtivitis
Total
98

Anhang
andere Komplikationen
Count
105 3 10893 17 110
198 20 218
MimüVomü
code
Total
Nein Ja
andereKomplikationen
Total
Chi-Square Tests
10,510b 1 ,001 ,002 ,0019,044 1 ,003
11,527 1 ,001 ,002 ,001,002 ,001
10,462c
1 ,001 ,002 ,001 ,001
218
Pearson Chi-SquareContinuity Correctiona
Likelihood RatioFisher's Exact TestLinear-by-LinearAssociationN of Valid Cases
Value dfAsymp. Sig.
(2-sided)Exact Sig.(2-sided)
Exact Sig.(1-sided)
PointProbability
Computed only for a 2x2 tablea.
0 cells (,0%) have expected count less than 5. The minimum expected count is 9,91.b.
The standardized statistic is 3,234.c.
PH-Wert des Kindes bei der Geburt
PH
47 42,3 45,2 45,252 46,8 50,0 95,25 4,5 4,8 100,0
104 93,7 100,07 6,3
111 100,053 48,2 48,2 48,255 50,0 50,0 98,22 1,8 1,8 100,0
110 100,0 100,0
> 7,37,2 - 7,37,1 - 7,2Total
Valid
99MissingTotal
> 7,37,2 - 7,37,1 - 7,2Total
Valid
codeMimü
Vomü
Frequency Percent Valid PercentCumulative
Percent
99
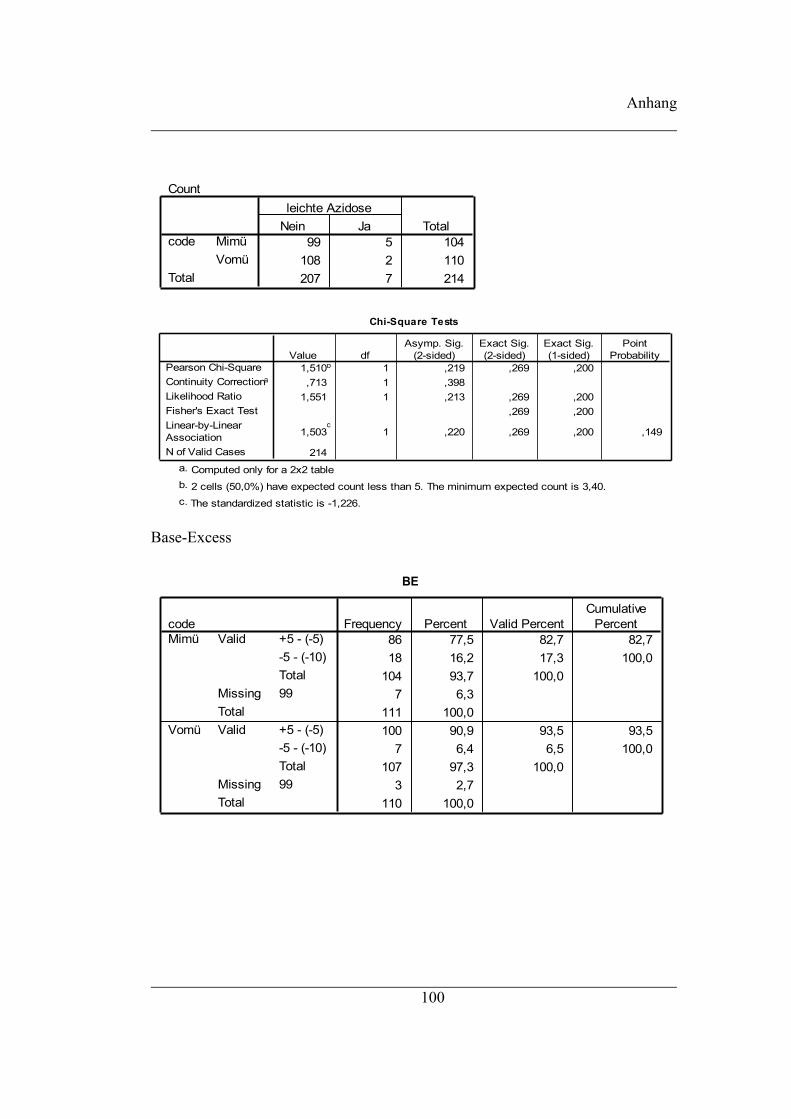
Anhang
Count
99 5 104108 2 110207 7 214
MimüVomü
code
Total
Nein Jaleichte Azidose
Total
Chi-Square Tests
1,510b 1 ,219 ,269 ,200,713 1 ,398
1,551 1 ,213 ,269 ,200,269 ,200
1,503c
1 ,220 ,269 ,200 ,149
214
Pearson Chi-SquareContinuity Correctiona
Likelihood RatioFisher's Exact TestLinear-by-LinearAssociationN of Valid Cases
Value dfAsymp. Sig.
(2-sided)Exact Sig.(2-sided)
Exact Sig.(1-sided)
PointProbability
Computed only for a 2x2 tablea.
2 cells (50,0%) have expected count less than 5. The minimum expected count is 3,40.b.
The standardized statistic is -1,226.c.
Base-Excess
BE
86 77,5 82,7 82,718 16,2 17,3 100,0
104 93,7 100,07 6,3
111 100,0100 90,9 93,5 93,5
7 6,4 6,5 100,0107 97,3 100,0
3 2,7110 100,0
+5 - (-5)-5 - (-10)Total
Valid
99MissingTotal
+5 - (-5)-5 - (-10)Total
Valid
99MissingTotal
codeMimü
Vomü
Frequency Percent Valid PercentCumulative
Percent
100

Anhang
Körperlicher Entwicklungsstand des Neugeborenen
Geburtsgewicht:
gewicht110
13183,323280,00714,445
7455000110
03231,913250,00689,402
11804620
ValidMissing
N
MeanMedianStd. DeviationMinimumMaximum
ValidMissing
N
MeanMedianStd. DeviationMinimumMaximum
Mimü
Vomü
niedriges Geburtsgewicht
18 2076,39 444,042 104,66213 1841,54 467,379 129,62892 3399,89 533,644 55,63697 3418,25 464,185 47,131
codeMimüVomüMimüVomü
Gewicht
Gewicht
LBW
LBW
N Mean Std. DeviationStd. Error
Mean
Independent Samples Test
,660 ,423 1,422 29 ,166 234,850 165,188 -102,998 572,699
1,410 25,189 ,171 234,850 166,605 -108,149 577,850
,311 ,578 -,253 187 ,801 -18,356 72,648 -161,670 124,958
-,252 180,404 ,802 -18,356 72,916 -162,234 125,521
Equal variancesassumedEqual variancesnot assumedEqual variancesassumedEqual variancesnot assumed
Gewicht
Gewicht
LBW
non LBW
F Sig.
Levene's Test forEquality of Variances
t df Sig. (2-tailed)Mean
DifferenceStd. ErrorDifference Lower Upper
95% ConfidenceInterval of the
Difference
t-test for Equality of Means
101

Anhang
sehr niedriges Geburtsgewicht
2 1112,50 519,723 367,5004 1240,00 76,920 38,460
108 3221,67 660,158 63,524106 3307,08 579,963 56,331
codeMimüVomüMimüVomü
Gewicht
Gewicht
VLBW
non VLBW
N Mean Std. DeviationStd. Error
Mean
Geburtsgröße
Größe110
149,0549,503,037
3355
1100
48,9449,003,713
2954
ValidMissing
N
MeanMedianStd. DeviationMinimumMaximum
ValidMissing
N
MeanMedianStd. DeviationMinimumMaximum
Mimü
Vomü
102
Independent Samples Test
113,267 ,000 -,549 4 ,612 -127,500 232,324 -772,534 517,534
-,345 1,022 ,788 -127,500 369,507 -4590,471 4335,471
1,855 ,175 -1,005 212 ,316 -85,409 85,005 -252,973 82,155
-1,006 209,458 ,316 -85,409 84,903 -252,782 81,964
Equal variancesassumedEqual variancesnot assumedEqual variancesassumedEqual variancesnot assumed
Gewicht
Gewicht
VLBWcodeVLBW
non VLBW
F Sig.
Levene's Test forEquality of Variances
t df Sig. (2-tailed)Mean
DifferenceStd. ErrorDifference Lower Upper
95% ConfidenceInterval of the
Difference
t-test for Equality of Means

Anhang
Kopfumfang
Kopfumfang107
434,32034,5002,6154
24,551,0110
034,19134,0002,4438
24,045,0
ValidMissing
N
MeanMedianStd. DeviationMinimumMaximum
ValidMissing
N
MeanMedianStd. DeviationMinimumMaximum
Mimü
Vomü
Reifestatus des Neugeborenen
Hypotrophe Neugeborene
Count
90 11 10198 12 110
188 23 211
MimüVomü
code
Total
Nein Ja
hypotropheNeugeborene
Total
Chi-Square Tests
,000b 1 ,997 1,000 ,587,000 1 1,000,000 1 ,997 1,000 ,587
1,000 ,587
,000c
1 ,997 1,000 ,587 ,174
211
Pearson Chi-SquareContinuity Correctiona
Likelihood RatioFisher's Exact TestLinear-by-LinearAssociationN of Valid Cases
Value dfAsymp. Sig.
(2-sided)Exact Sig.(2-sided)
Exact Sig.(1-sided)
PointProbability
Computed only for a 2x2 tablea.
0 cells (,0%) have expected count less than 5. The minimum expected count is 11,01.b.
The standardized statistic is ,004.c.
103

Anhang
eutrophe Neugeborenen
Count
22 79 10139 71 11061 150 211
MimüVomü
code
Total
Nein Ja
eutropheNeugeborenen
Total
Chi-Square Tests
4,789b 1 ,029 ,034 ,0204,147 1 ,0424,844 1 ,028 ,034 ,020
,034 ,020
4,767c
1 ,029 ,034 ,020 ,011
211
Pearson Chi-SquareContinuity Correctiona
Likelihood RatioFisher's Exact TestLinear-by-LinearAssociationN of Valid Cases
Value dfAsymp. Sig.
(2-sided)Exact Sig.(2-sided)
Exact Sig.(1-sided)
PointProbability
Computed only for a 2x2 tablea.
0 cells (,0%) have expected count less than 5. The minimum expected count is 29,20.b.
The standardized statistic is -2,183.c.
Hypertrophe Neugeborene
Count
95 6 10192 18 110
187 24 211
MimüVomü
code
Total
Nein Ja
HypertropheNeugeborene
Total
Chi-Square Tests
5,675b 1 ,017 ,028 ,0144,688 1 ,0305,943 1 ,015 ,018 ,014
,018 ,014
5,648c
1 ,017 ,028 ,014 ,010
211
Pearson Chi-SquareContinuity Correctiona
Likelihood RatioFisher's Exact TestLinear-by-LinearAssociationN of Valid Cases
Value dfAsymp. Sig.
(2-sided)Exact Sig.(2-sided)
Exact Sig.(1-sided)
PointProbability
Computed only for a 2x2 tablea.
0 cells (,0%) have expected count less than 5. The minimum expected count is 11,49.b.
The standardized statistic is 2,376.c.
104

Anhang
Hypotrophe Frühgeborene
Count
10 4 149 1 10
19 5 24
MimüVomü
code
Total
Nein JaHypotrophe Früchen
Total
Chi-Square Tests
1,220b 1 ,269 ,358 ,283,354 1 ,552
1,310 1 ,252 ,358 ,283,358 ,283
1,169c
1 ,280 ,358 ,283 ,236
24
Pearson Chi-SquareContinuity Correctiona
Likelihood RatioFisher's Exact TestLinear-by-LinearAssociationN of Valid Cases
Value dfAsymp. Sig.
(2-sided)Exact Sig.(2-sided)
Exact Sig.(1-sided)
PointProbability
Computed only for a 2x2 tablea.
2 cells (50,0%) have expected count less than 5. The minimum expected count is 2,08.b.
The standardized statistic is -1,081.c.
Eutrophe Frühgeborene
Count
5 9 143 7 108 16 24
MimüVomü
code
Total
Nein Jaeutrophe Früchen
Total
Chi-Square Tests
,086b 1 ,770 1,000 ,561,000 1 1,000,086 1 ,769 1,000 ,561
1,000 ,561
,082c
1 ,774 1,000 ,561 ,327
24
Pearson Chi-SquareContinuity Correctiona
Likelihood RatioFisher's Exact TestLinear-by-LinearAssociationN of Valid Cases
Value dfAsymp. Sig.
(2-sided)Exact Sig.(2-sided)
Exact Sig.(1-sided)
PointProbability
Computed only for a 2x2 tablea.
2 cells (50,0%) have expected count less than 5. The minimum expected count is 3,33.b.
The standardized statistic is ,287.c.
105

Anhang
Hypertrophe Frühgeborene
Crosstab
Count
14 0 148 2 10
22 2 24
MimüVomü
code
Total
Nein JaHypertrophe Früchen
Total
Chi-Square Tests
3,055b 1 ,081 ,163 ,163,997 1 ,318
3,760 1 ,052 ,163 ,163,163 ,163
2,927c
1 ,087 ,163 ,163 ,163
24
Pearson Chi-SquareContinuity Correctiona
Likelihood RatioFisher's Exact TestLinear-by-LinearAssociationN of Valid Cases
Value dfAsymp. Sig.
(2-sided)Exact Sig.(2-sided)
Exact Sig.(1-sided)
PointProbability
Computed only for a 2x2 tablea.
2 cells (50,0%) have expected count less than 5. The minimum expected count is ,83.b.
The standardized statistic is 1,711.c.
106

Anhang
Überreifezeichen
Count
54 29 8377 15 92
131 44 175
MimüVomü
code
Total
Nein JaÜberreifezeichen
Total
Chi-Square Tests
8,051b 1 ,005 ,005 ,0047,091 1 ,0088,129 1 ,004 ,005 ,004
,005 ,004
8,005c
1 ,005 ,005 ,004 ,003
175
Pearson Chi-SquareContinuity Correctiona
Likelihood RatioFisher's Exact TestLinear-by-LinearAssociationN of Valid Cases
Value dfAsymp. Sig.
(2-sided)Exact Sig.(2-sided)
Exact Sig.(1-sided)
PointProbability
Computed only for a 2x2 tablea.
0 cells (,0%) have expected count less than 5. The minimum expected count is 20,87.b.
The standardized statistic is -2,829.c.
APGAR
109 109 1092 2 2
8,47 9,47 9,789,00 10,00 10,00
1,337 ,800 ,5671 6 7
10 10 10110 110 110
0 0 08,45 9,43 9,749,00 10,00 10,00,982 ,772 ,536
3 6 89 10 10
ValidMissing
N
MeanMedianStd. DeviationMinimumMaximum
ValidMissing
N
MeanMedianStd. DeviationMinimumMaximum
codeMimü
Vomü
Apgar nach1 Minute
Apgar nach5 Minuten
Apgar nach10 Minuten
107

Anhang
,476 ,491 ,142 217 ,888 ,022 ,158 -,290 ,335
,141 198,216 ,888 ,022 ,159 -,290 ,335
,023 ,881 ,382 217 ,703 ,041 ,106 -,169 ,250
,382 216,557 ,703 ,041 ,106 -,169 ,250
,723 ,396 ,583 217 ,561 ,043 ,075 -,104 ,190
,583 216,097 ,561 ,043 ,075 -,104 ,190
Equal variancesassumedEqual variancesnot assumedEqual variancesassumedEqual variancesnot assumedEqual variancesassumedEqual variancesnot assumed
Apgar nach 1 Minute
Apgar nach 5 Minuten
Apgar nach 10 Minuten
F Sig.
Levene's Test forEquality of Variances
t df Sig. (2-tailed)Mean
DifferenceStd. ErrorDifference Lower Upper
95% ConfidenceInterval of the
Difference
t-test for Equality of Means
Notfallmaßnahmen
O2- Gabe unter der Geburt
Count
94 15 10997 12 109
191 27 218
MimüVomü
code
Total
Nein JaO2- Gabe
Total
Chi-Square Tests
,380b 1 ,537 ,682 ,341,169 1 ,681,381 1 ,537 ,682 ,341
,682 ,341
,379c
1 ,538 ,682 ,341 ,135
218
Pearson Chi-SquareContinuity Correctiona
Likelihood RatioFisher's Exact TestLinear-by-LinearAssociationN of Valid Cases
Value dfAsymp. Sig.
(2-sided)Exact Sig.(2-sided)
Exact Sig.(1-sided)
PointProbability
Computed only for a 2x2 tablea.
0 cells (,0%) have expected count less than 5. The minimum expected count is 13,50.b.
The standardized statistic is -,615.c.
108

Anhang
Medikamentöse Soforttherapie
Count
104 5 10998 11 109
202 16 218
MimüVomü
code
Total
Nein JaMedikamente
Total
Chi-Square Tests
2,428b 1 ,119 ,193 ,0961,686 1 ,1942,484 1 ,115 ,193 ,096
,193 ,096
2,417c
1 ,120 ,193 ,096 ,063
218
Pearson Chi-SquareContinuity Correctiona
Likelihood RatioFisher's Exact TestLinear-by-LinearAssociationN of Valid Cases
Value dfAsymp. Sig.
(2-sided)Exact Sig.(2-sided)
Exact Sig.(1-sided)
PointProbability
Computed only for a 2x2 tablea.
0 cells (,0%) have expected count less than 5. The minimum expected count is 8,00.b.
The standardized statistic is 1,555.c.
Reanimation unter der Geburt
Count
107 2 109109 0 109216 2 218
MimüVomü
code
Total
Nein JaReanimation
Total
Chi-Square Tests
2,019b 1 ,155 ,498 ,249,505 1 ,477
2,791 1 ,095 ,498 ,249,498 ,249
2,009c
1 ,156 ,498 ,249 ,249
218
Pearson Chi-SquareContinuity Correctiona
Likelihood RatioFisher's Exact TestLinear-by-LinearAssociationN of Valid Cases
Value dfAsymp. Sig.
(2-sided)Exact Sig.(2-sided)
Exact Sig.(1-sided)
PointProbability
Computed only for a 2x2 tablea.
2 cells (50,0%) have expected count less than 5. The minimum expected count is 1,00.b.
The standardized statistic is -1,417.c.
109
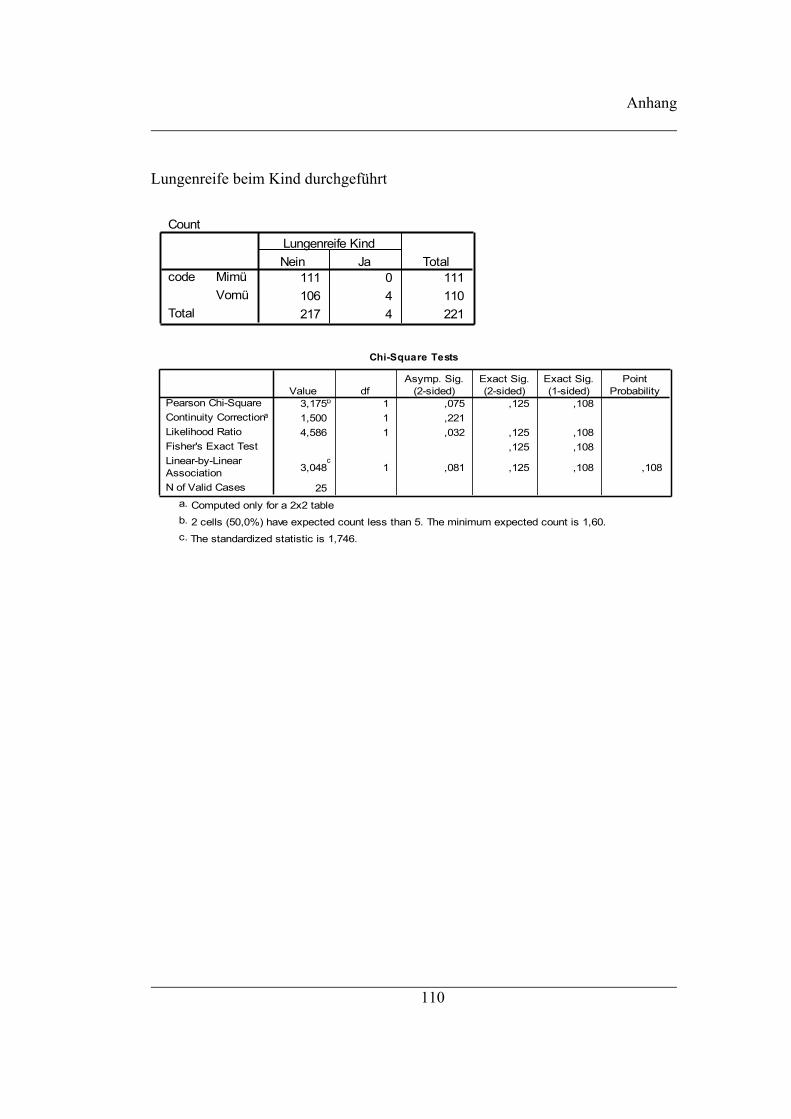
Anhang
Lungenreife beim Kind durchgeführt
Count
111 0 111106 4 110217 4 221
MimüVomü
code
Total
Nein JaLungenreife Kind
Total
Chi-Square Tests
3,175b 1 ,075 ,125 ,1081,500 1 ,2214,586 1 ,032 ,125 ,108
,125 ,108
3,048c
1 ,081 ,125 ,108 ,108
25
Pearson Chi-SquareContinuity Correctiona
Likelihood RatioFisher's Exact TestLinear-by-LinearAssociationN of Valid Cases
Value dfAsymp. Sig.
(2-sided)Exact Sig.(2-sided)
Exact Sig.(1-sided)
PointProbability
Computed only for a 2x2 tablea.
2 cells (50,0%) have expected count less than 5. The minimum expected count is 1,60.b.
The standardized statistic is 1,746.c.
110

Anhang
Aufenthalt auf der neonatologischen Station
Wie lange auf neonatologischen Station
1 ,9 3,6 3,65 4,5 17,9 21,43 2,7 10,7 32,1
11 9,9 39,3 71,48 7,2 28,6 100,0
28 25,2 100,079 71,23 2,71 ,9
83 74,8111 100,0
5 4,5 20,8 20,82 1,8 8,3 29,27 6,4 29,2 58,3
10 9,1 41,7 100,024 21,8 100,084 76,42 1,8
86 78,2110 100,0
0unter 3 Tagen3-5 Tage5-10 Tageüber 10 TageTotal
Valid
88unbekanntSystemTotal
Missing
Totalunter 3 Tagen3-5 Tage5-10 Tageüber 10 TageTotal
Valid
88unbekanntTotal
Missing
Total
codeMimü
vomü
Frequency Percent Valid PercentCumulative
Percent
111

Anhang
Neonatologischer Aufenthalt
Count
82 26 10883 26 109
165 52 217
MimüVomü
code
Total
Nein JaNeonatologie
Total
Chi-Square Tests
,001b 1 ,970 1,000 ,548,000 1 1,000,001 1 ,970 1,000 ,548
1,000 ,548
,001c
1 ,970 1,000 ,548 ,126
217
Pearson Chi-SquareContinuity Correctiona
Likelihood RatioFisher's Exact TestLinear-by-LinearAssociationN of Valid Cases
Value dfAsymp. Sig.
(2-sided)Exact Sig.(2-sided)
Exact Sig.(1-sided)
PointProbability
Computed only for a 2x2 tablea.
0 cells (,0%) have expected count less than 5. The minimum expected count is 25,88.b.
The standardized statistic is -,038.c.
Entlassung gegen ärztlichen Rat
Entlassung gegen ärztlichen Rat
102 91,9 95,3 95,35 4,5 4,7 100,0
107 96,4 100,04 3,6
111 100,0104 94,5 95,4 95,4
5 4,5 4,6 100,0109 99,1 100,0
1 ,9110 100,0
NeinJaTotal
Valid
unbekanntMissingTotal
NeinJaTotal
Valid
unbekanntMissingTotal
codeMimü
Vomü
Frequency Percent Valid PercentCumulative
Percent
112
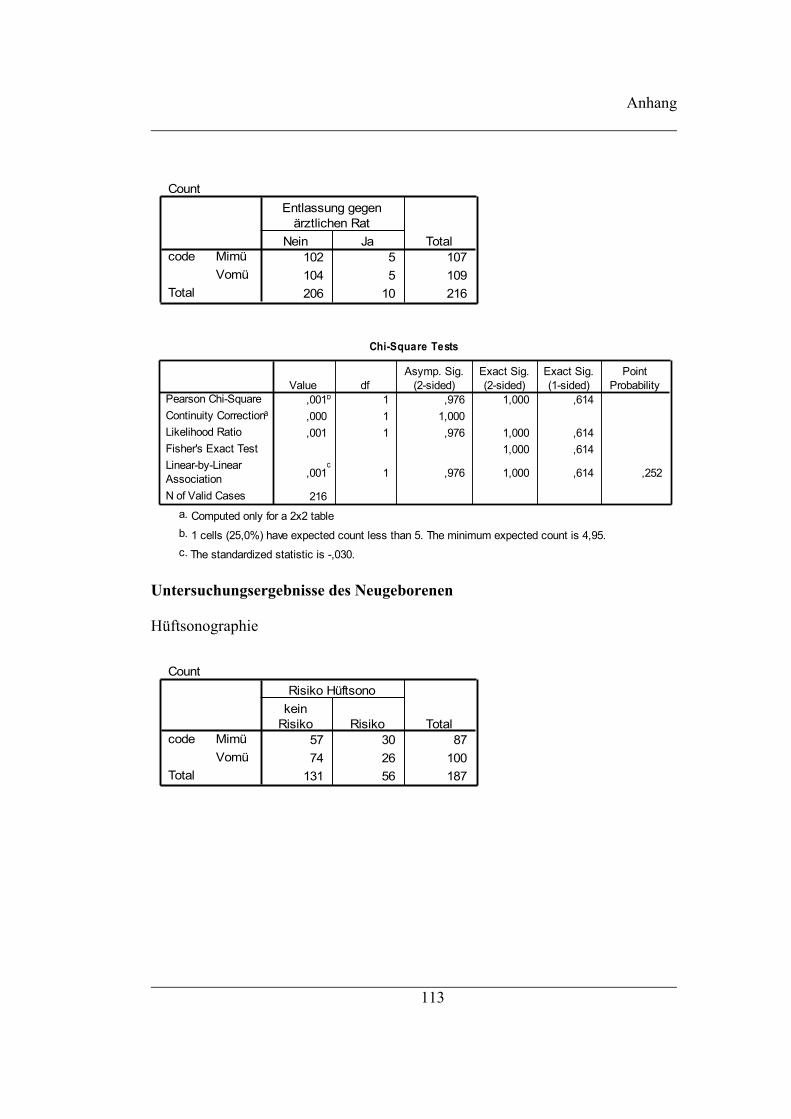
Anhang
Count
102 5 107104 5 109206 10 216
MimüVomü
code
Total
Nein Ja
Entlassung gegenärztlichen Rat
Total
Chi-Square Tests
,001b 1 ,976 1,000 ,614,000 1 1,000,001 1 ,976 1,000 ,614
1,000 ,614
,001c
1 ,976 1,000 ,614 ,252
216
Pearson Chi-SquareContinuity Correctiona
Likelihood RatioFisher's Exact TestLinear-by-LinearAssociationN of Valid Cases
Value dfAsymp. Sig.
(2-sided)Exact Sig.(2-sided)
Exact Sig.(1-sided)
PointProbability
Computed only for a 2x2 tablea.
1 cells (25,0%) have expected count less than 5. The minimum expected count is 4,95.b.
The standardized statistic is -,030.c.
Untersuchungsergebnisse des Neugeborenen
Hüftsonographie
Count
57 30 8774 26 100
131 56 187
MimüVomü
code
Total
keinRisiko Risiko
Risiko Hüftsono
Total
113
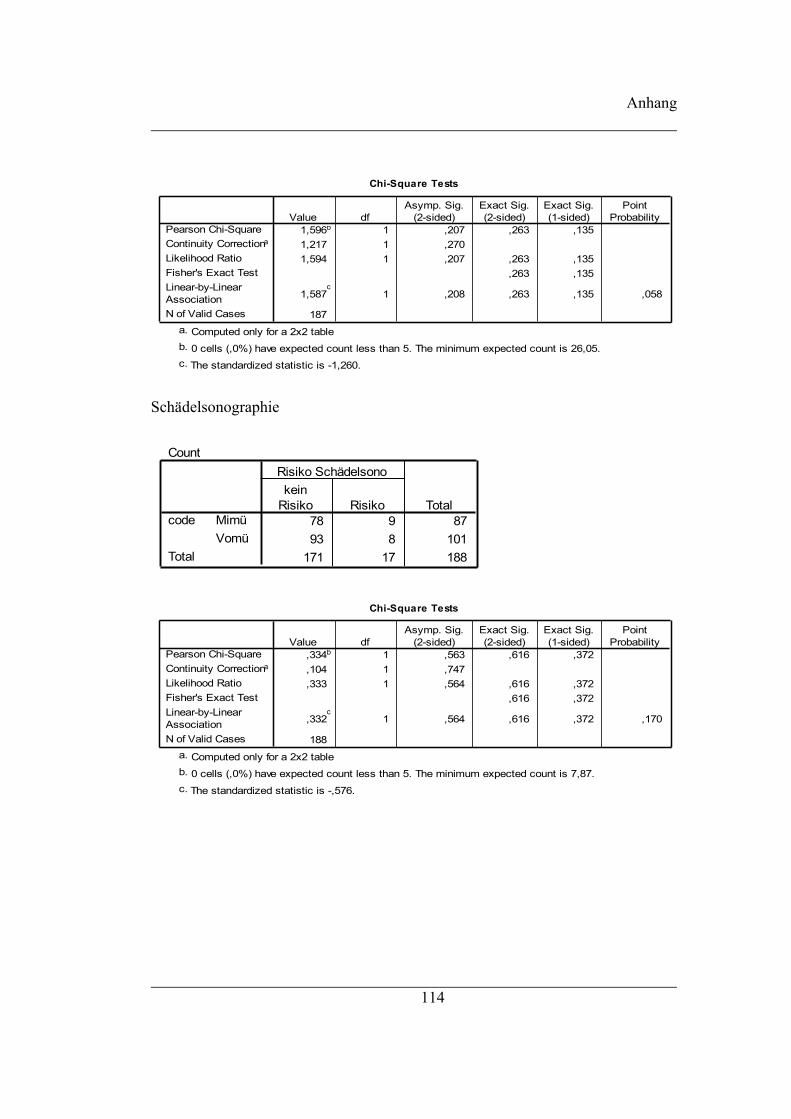
Anhang
Chi-Square Tests
1,596b 1 ,207 ,263 ,1351,217 1 ,2701,594 1 ,207 ,263 ,135
,263 ,135
1,587c
1 ,208 ,263 ,135 ,058
187
Pearson Chi-SquareContinuity Correctiona
Likelihood RatioFisher's Exact TestLinear-by-LinearAssociationN of Valid Cases
Value dfAsymp. Sig.
(2-sided)Exact Sig.(2-sided)
Exact Sig.(1-sided)
PointProbability
Computed only for a 2x2 tablea.
0 cells (,0%) have expected count less than 5. The minimum expected count is 26,05.b.
The standardized statistic is -1,260.c.
Schädelsonographie
Count
78 9 8793 8 101
171 17 188
MimüVomü
code
Total
keinRisiko Risiko
Risiko Schädelsono
Total
Chi-Square Tests
,334b 1 ,563 ,616 ,372,104 1 ,747,333 1 ,564 ,616 ,372
,616 ,372
,332c
1 ,564 ,616 ,372 ,170
188
Pearson Chi-SquareContinuity Correctiona
Likelihood RatioFisher's Exact TestLinear-by-LinearAssociationN of Valid Cases
Value dfAsymp. Sig.
(2-sided)Exact Sig.(2-sided)
Exact Sig.(1-sided)
PointProbability
Computed only for a 2x2 tablea.
0 cells (,0%) have expected count less than 5. The minimum expected count is 7,87.b.
The standardized statistic is -,576.c.
114

Anhang
Neugeborenenscreening
Count
45 2 4740 2 4285 4 89
MimüVomü
code
Total
keinRisiko Risiko
Risiko Neugeborenen-screening
Total
Chi-Square Tests
,013b 1 ,908 1,000 ,648,000 1 1,000,013 1 ,908 1,000 ,648
1,000 ,648
,013c
1 ,909 1,000 ,648 ,381
89
Pearson Chi-SquareContinuity Correctiona
Likelihood RatioFisher's Exact TestLinear-by-LinearAssociationN of Valid Cases
Value dfAsymp. Sig.
(2-sided)Exact Sig.(2-sided)
Exact Sig.(1-sided)
PointProbability
Computed only for a 2x2 tablea.
2 cells (50,0%) have expected count less than 5. The minimum expected count is 1,89.b.
The standardized statistic is ,115.c.
Hörscreening
Count
72 1 7374 4 78
146 5 151
MimüVomü
code
Total
keinRisiko Risiko
Risiko Hörscreening
Total
115
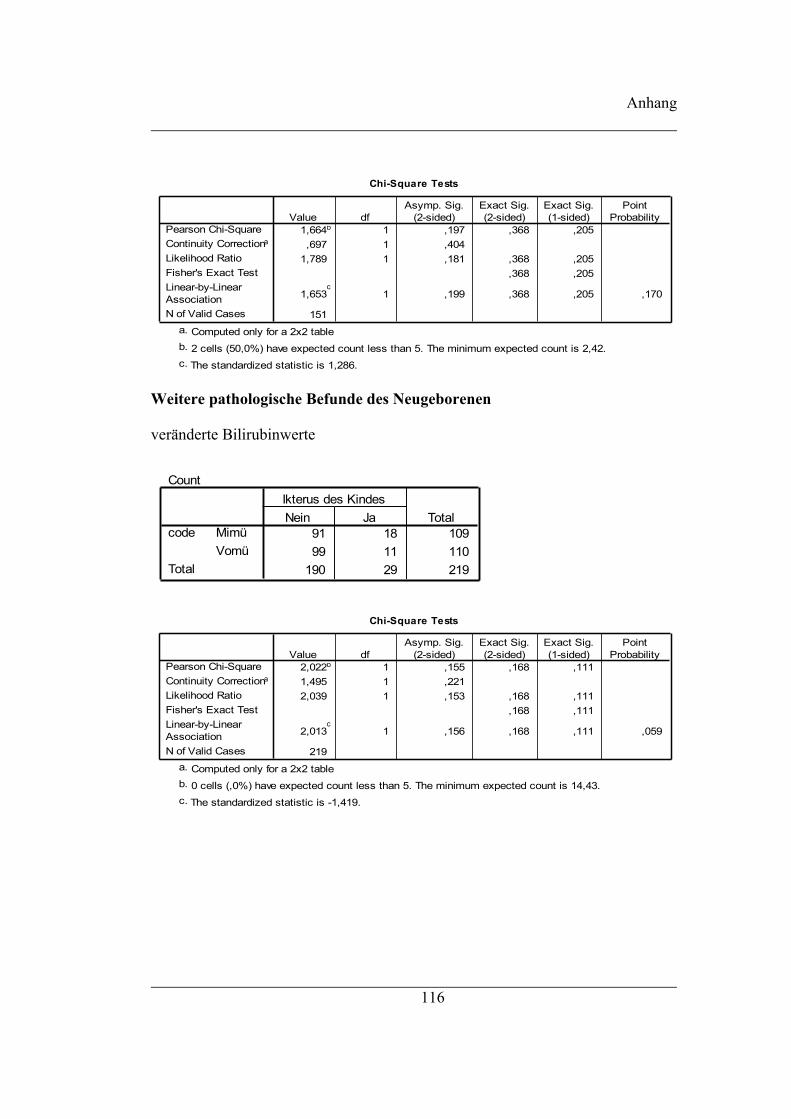
Anhang
Chi-Square Tests
1,664b 1 ,197 ,368 ,205,697 1 ,404
1,789 1 ,181 ,368 ,205,368 ,205
1,653c
1 ,199 ,368 ,205 ,170
151
Pearson Chi-SquareContinuity Correctiona
Likelihood RatioFisher's Exact TestLinear-by-LinearAssociationN of Valid Cases
Value dfAsymp. Sig.
(2-sided)Exact Sig.(2-sided)
Exact Sig.(1-sided)
PointProbability
Computed only for a 2x2 tablea.
2 cells (50,0%) have expected count less than 5. The minimum expected count is 2,42.b.
The standardized statistic is 1,286.c.
Weitere pathologische Befunde des Neugeborenen
veränderte Bilirubinwerte
Count
91 18 10999 11 110
190 29 219
MimüVomü
code
Total
Nein JaIkterus des Kindes
Total
Chi-Square Tests
2,022b 1 ,155 ,168 ,1111,495 1 ,2212,039 1 ,153 ,168 ,111
,168 ,111
2,013c
1 ,156 ,168 ,111 ,059
219
Pearson Chi-SquareContinuity Correctiona
Likelihood RatioFisher's Exact TestLinear-by-LinearAssociationN of Valid Cases
Value dfAsymp. Sig.
(2-sided)Exact Sig.(2-sided)
Exact Sig.(1-sided)
PointProbability
Computed only for a 2x2 tablea.
0 cells (,0%) have expected count less than 5. The minimum expected count is 14,43.b.
The standardized statistic is -1,419.c.
116
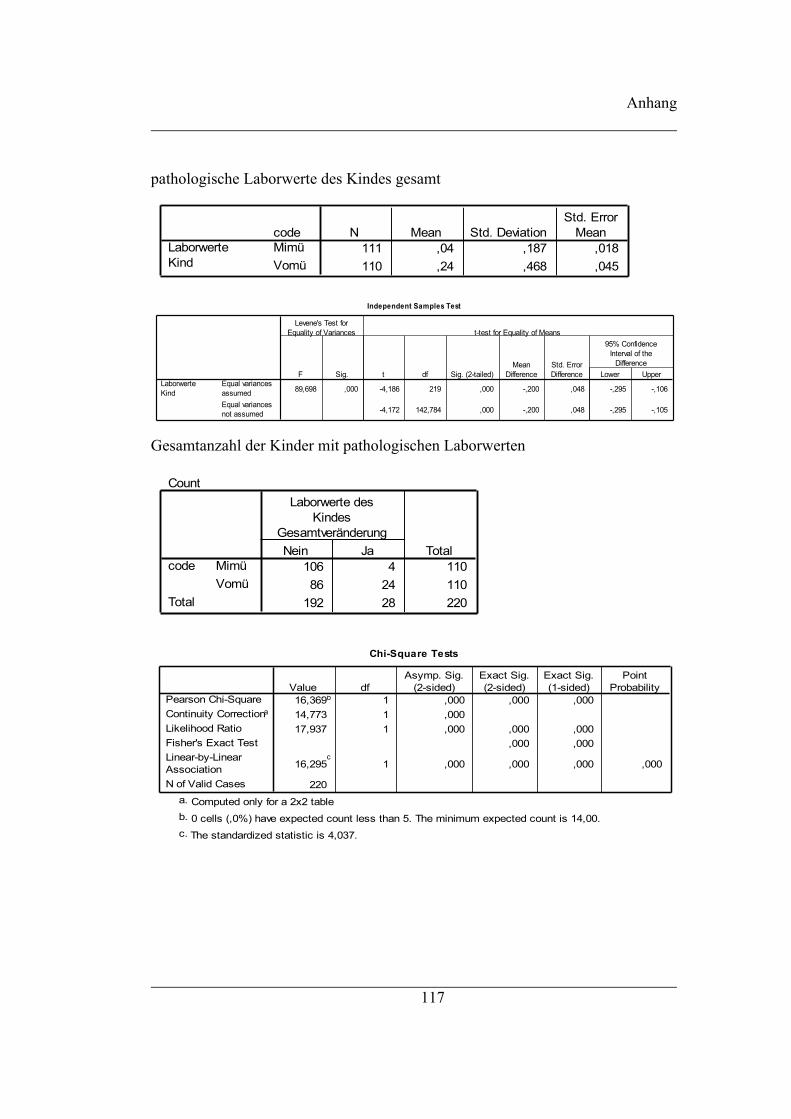
Anhang
pathologische Laborwerte des Kindes gesamt
111 ,04 ,187 ,018110 ,24 ,468 ,045
codeMimüVomü
LaborwerteKind
N Mean Std. DeviationStd. Error
Mean
Independent Samples Test
89,698 ,000 -4,186 219 ,000 -,200 ,048 -,295 -,106
-4,172 142,784 ,000 -,200 ,048 -,295 -,105
Equal variancesassumedEqual variancesnot assumed
LaborwerteKind
F Sig.
Levene's Test forEquality of Variances
t df Sig. (2-tailed)Mean
DifferenceStd. ErrorDifference Lower Upper
95% ConfidenceInterval of the
Difference
t-test for Equality of Means
Gesamtanzahl der Kinder mit pathologischen Laborwerten
Count
106 4 11086 24 110
192 28 220
MimüVomü
code
Total
Nein Ja
Laborwerte desKindes
GesamtveränderungTotal
Chi-Square Tests
16,369b 1 ,000 ,000 ,00014,773 1 ,00017,937 1 ,000 ,000 ,000
,000 ,000
16,295c
1 ,000 ,000 ,000 ,000
220
Pearson Chi-SquareContinuity Correctiona
Likelihood RatioFisher's Exact TestLinear-by-LinearAssociationN of Valid Cases
Value dfAsymp. Sig.
(2-sided)Exact Sig.(2-sided)
Exact Sig.(1-sided)
PointProbability
Computed only for a 2x2 tablea.
0 cells (,0%) have expected count less than 5. The minimum expected count is 14,00.b.
The standardized statistic is 4,037.c.
117

Anhang
pathologische Eisenwerte
Count
109 1 110110 0 110219 1 220
MimüVomü
code
Total
Nein JaKindlicher Eisenwert
Total
Chi-Square Tests
1,005b 1 ,316 1,000 ,500,000 1 1,000
1,391 1 ,238 1,000 ,5001,000 ,500
1,000c
1 ,317 1,000 ,500 ,500
220
Pearson Chi-SquareContinuity Correctiona
Likelihood RatioFisher's Exact TestLinear-by-LinearAssociationN of Valid Cases
Value dfAsymp. Sig.
(2-sided)Exact Sig.(2-sided)
Exact Sig.(1-sided)
PointProbability
Computed only for a 2x2 tablea.
2 cells (50,0%) have expected count less than 5. The minimum expected count is ,50.b.
The standardized statistic is -1,000.c.
pathologische Gerinnungswerte
Count
109 1 110109 1 110218 2 220
MimüVomü
code
Total
Nein Ja
Gerinnungswerte desKind
Total
Chi-Square Tests
,000b 1 1,000 1,000 ,751,000 1 1,000,000 1 1,000 1,000 ,751
1,000 ,751
,000c
1 1,000 1,000 ,751 ,502
220
Pearson Chi-SquareContinuity Correctiona
Likelihood RatioFisher's Exact TestLinear-by-LinearAssociationN of Valid Cases
Value dfAsymp. Sig.
(2-sided)Exact Sig.(2-sided)
Exact Sig.(1-sided)
PointProbability
Computed only for a 2x2 tablea.
2 cells (50,0%) have expected count less than 5. The minimum expected count is 1,00.b.
The standardized statistic is ,000.c.
118

Anhang
pathologische Glucosewerte
Count
110 0 110100 10 110210 10 220
MimüVomü
code
Total
Nein Ja
Glucosewerte desKindes
Total
Chi-Square Tests
10,476b 1 ,001 ,002 ,0018,486 1 ,004
14,339 1 ,000 ,002 ,001,002 ,001
10,429c
1 ,001 ,002 ,001 ,001
220
Pearson Chi-SquareContinuity Correctiona
Likelihood RatioFisher's Exact TestLinear-by-LinearAssociationN of Valid Cases
Value dfAsymp. Sig.
(2-sided)Exact Sig.(2-sided)
Exact Sig.(1-sided)
PointProbability
Computed only for a 2x2 tablea.
0 cells (,0%) have expected count less than 5. The minimum expected count is 5,00.b.
The standardized statistic is 3,229.c.
pathologische Blutwerte
Count
108 2 11095 15 110
203 17 220
MimüVomü
code
Total
Nein Ja
andere Blutwerte desKindes
Total
Chi-Square Tests
10,774b 1 ,001 ,002 ,0019,180 1 ,002
12,085 1 ,001 ,002 ,001,002 ,001
10,725c
1 ,001 ,002 ,001 ,001
220
Pearson Chi-SquareContinuity Correctiona
Likelihood RatioFisher's Exact TestLinear-by-LinearAssociationN of Valid Cases
Value dfAsymp. Sig.
(2-sided)Exact Sig.(2-sided)
Exact Sig.(1-sided)
PointProbability
Computed only for a 2x2 tablea.
0 cells (,0%) have expected count less than 5. The minimum expected count is 8,50.b.
The standardized statistic is 3,275.c.
119
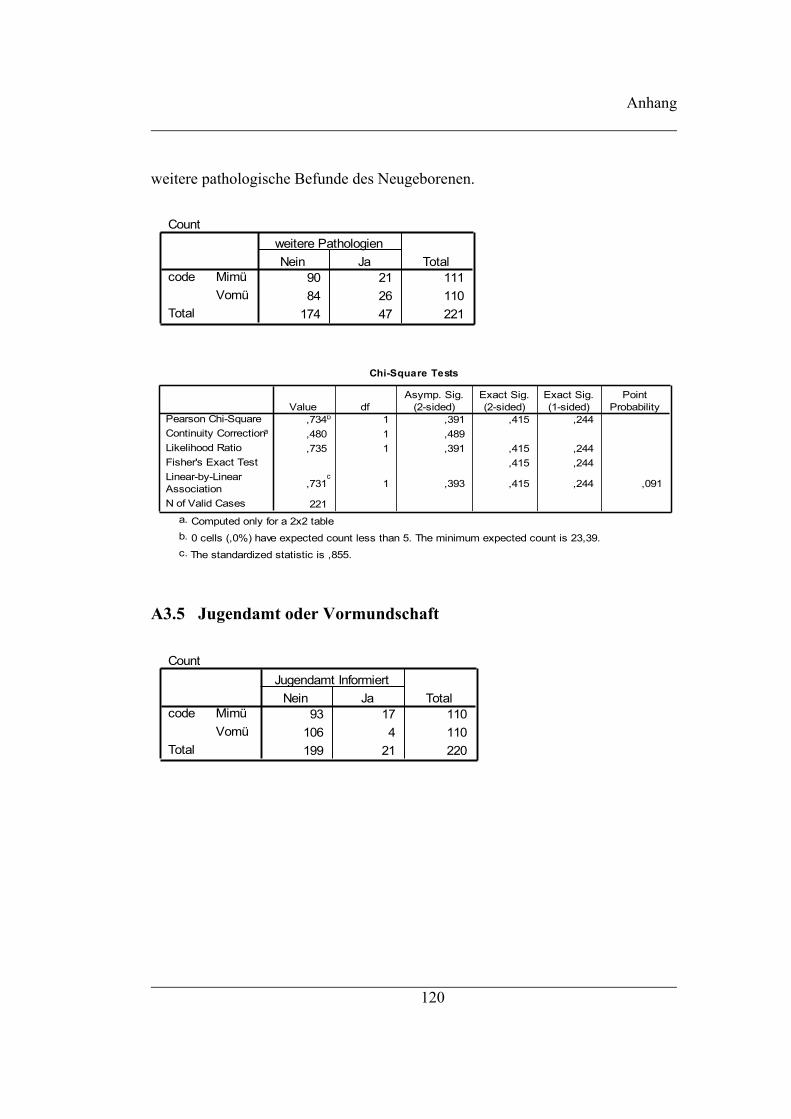
Anhang
weitere pathologische Befunde des Neugeborenen.
Count
90 21 11184 26 110
174 47 221
MimüVomü
code
Total
Nein Jaweitere Pathologien
Total
Chi-Square Tests
,734b 1 ,391 ,415 ,244,480 1 ,489,735 1 ,391 ,415 ,244
,415 ,244
,731c
1 ,393 ,415 ,244 ,091
221
Pearson Chi-SquareContinuity Correctiona
Likelihood RatioFisher's Exact TestLinear-by-LinearAssociationN of Valid Cases
Value dfAsymp. Sig.
(2-sided)Exact Sig.(2-sided)
Exact Sig.(1-sided)
PointProbability
Computed only for a 2x2 tablea.
0 cells (,0%) have expected count less than 5. The minimum expected count is 23,39.b.
The standardized statistic is ,855.c.
A3.5 Jugendamt oder Vormundschaft
Count
93 17 110106 4 110199 21 220
MimüVomü
code
Total
Nein JaJugendamt Informiert
Total
120

Anhang
Chi-Square Tests
8,897b 1 ,003 ,005 ,0027,581 1 ,0069,512 1 ,002 ,005 ,002
,005 ,002
8,856c
1 ,003 ,005 ,002 ,002
220
Pearson Chi-SquareContinuity Correctiona
Likelihood RatioFisher's Exact TestLinear-by-LinearAssociationN of Valid Cases
Value dfAsymp. Sig.
(2-sided)Exact Sig.(2-sided)
Exact Sig.(1-sided)
PointProbability
Computed only for a 2x2 tablea.
0 cells (,0%) have expected count less than 5. The minimum expected count is 10,50.b.
The standardized statistic is -2,976.c.
Count
106 4 110
110 0 110
216 4 220
MimüVomü
code
Total
Nein JaVormund
Total
Chi-Square Tests
4,074b 1 ,044 ,122 ,0612,292 1 ,1305,619 1 ,018 ,122 ,061
,122 ,061
4,056c
1 ,044 ,122 ,061 ,061
220
Pearson Chi-SquareContinuity Correctiona
Likelihood RatioFisher's Exact TestLinear-by-LinearAssociationN of Valid Cases
Value dfAsymp. Sig.
(2-sided)Exact Sig.(2-sided)
Exact Sig.(1-sided)
PointProbability
Computed only for a 2x2 tablea.
2 cells (50,0%) have expected count less than 5. The minimum expected count is 2,00.b.
The standardized statistic is -2,014.c.
121

Anhang
A3.6 Diskussion
108 1,87 1,368 ,132110 2,13 1,926 ,184109 ,91 1,295 ,124
109 1,17 1,779 ,170
105 2,46 ,920 ,090110 3,07 1,055 ,101
codeMimüVomüMimüVomü
MimüVomü
CompositescoreKindliches Outcome
CompositescoreErkrankungen in derSS
CompositescoreGeburtskomplikationen
N Mean Std. DeviationStd. Error
Mean
Independent Samples Test
5,849 ,016 -1,134 216 ,258 -,257 ,227 -,704 ,190
-1,137 196,850 ,257 -,257 ,226 -,702 ,189
6,828 ,010 -1,263 216 ,208 -,266 ,211 -,681 ,149
-1,263 197,371 ,208 -,266 ,211 -,682 ,150
,766 ,383 -4,550 213 ,000 -,616 ,135 -,882 -,349
-4,564 211,290 ,000 -,616 ,135 -,881 -,350
Equal variancesassumedEqual variancesnot assumedEqual variancesassumedEqual variancesnot assumed
Equal variancesassumedEqual variancesnot assumed
CompositescoreKindliches Outcome
CompositescoreErkrankungen in der SS
CompositescoreGeburtskomplikationen
F Sig.
Levene's Test forEquality of Variances
t df Sig. (2-tailed)Mean
DifferenceStd. ErrorDifference Lower Upper
95% ConfidenceInterval of the
Difference
t-test for Equality of Means
Größe der Frauen zur Geburt
Group Statistics
110 166,818 7,0713 ,6742
110 167,873 6,3247 ,6030
codeMimü
Vomü
GrößederMutter
N Mean Std. DeviationStd. Error
Mean
122
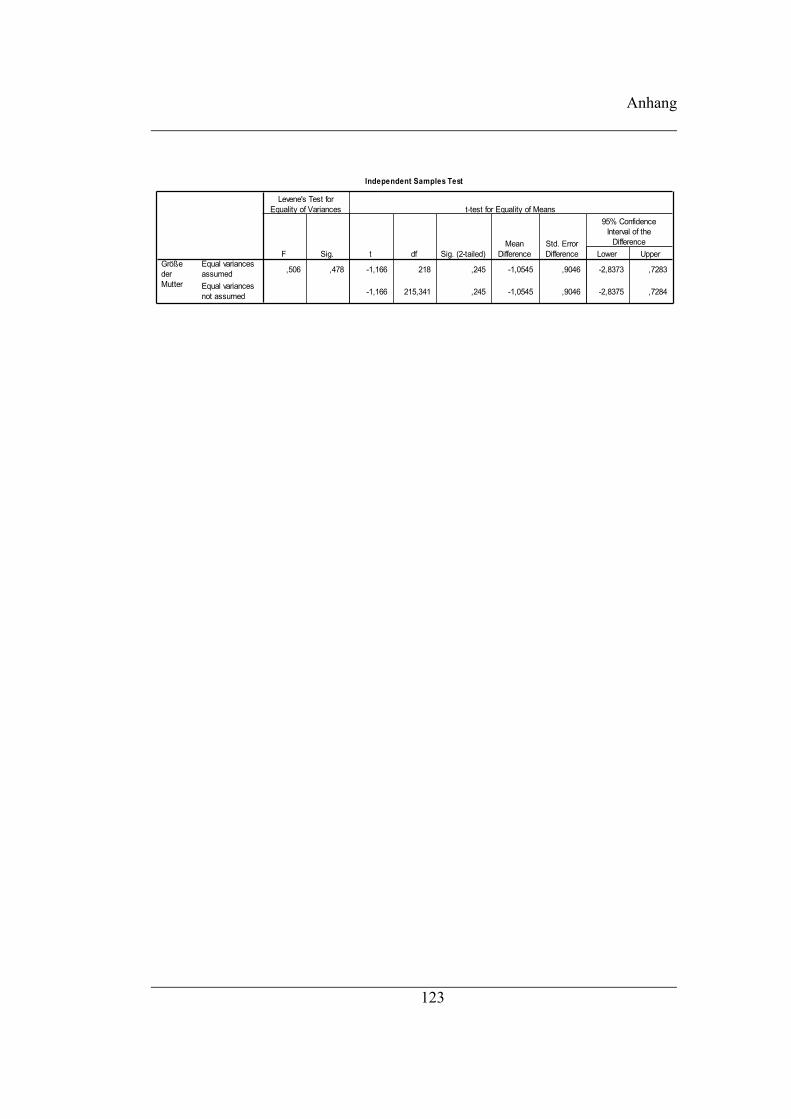
Anhang
Independent Samples Test
,506 ,478 -1,166 218 ,245 -1,0545 ,9046 -2,8373 ,7283
-1,166 215,341 ,245 -1,0545 ,9046 -2,8375 ,7284
Equal variancesassumedEqual variancesnot assumed
GrößederMutter
F Sig.
Levene's Test forEquality of Variances
t df Sig. (2-tailed)Mean
DifferenceStd. ErrorDifference Lower Upper
95% ConfidenceInterval of the
Difference
t-test for Equality of Means
123