
Calculations of QUENCH Tests with the FZK Bundle Code CALUMO
50
Forschungszentrum Karlsruhe in der Helmholtz-Gemeinschaft Wissenschaftliche Berichte FZKA 7192 Calculations of QUENCH Tests with the FZK Bundle Code CALUMO H. Steiner, M. Heck Institut für Materialforschung Programm Nukleare Sicherheitsforschung März 2006
Transcript of Calculations of QUENCH Tests with the FZK Bundle Code CALUMO

Forschungszentrum Karlsruhe in der Helmholtz-Gemeinschaft Wissenschaftliche Berichte FZKA 7192 Calculations of QUENCH Tests with the FZK Bundle Code CALUMO H. Steiner, M. Heck Institut für Materialforschung Programm Nukleare Sicherheitsforschung März 2006


Forschungszentrum Karlsruhe
in der Helmholtz-Gemeinschaft
Wissenschaftliche Berichte
Forschungszentrum Karlsruhe GmbH, Karlsruhe
2006
FZKA 7192
Calculations of QUENCH Tests with the FZK Bundle Code CALUMO
H. Steiner, M. Heck
Institut für Materialforschung
Programm Nukleare Sicherheitsforschung

Für diesen Bericht behalten wir uns alle Rechte vor
Forschungszentrum Karlsruhe GmbH Postfach 3640, 76021 Karlsruhe
Mitglied der Hermann von Helmholtz-Gemeinschaft Deutscher Forschungszentren (HGF)
ISSN 0947-8620
urn:nbn:de:0005-071922

Rechnungen zu Quench Versuchen mit dem FZK Bündel Code CALUMO Zusammenfassung An der QUENCH Anlage des Forschungszentrums Karlsruhe werden zur Zeit eine Reihe von Abschreckversuchen von überhitzten Testbündeln aus elektrisch beheizten Brennstabsimu-latoren durchgeführt. Wegen einiger nicht reaktortypischer Auslegungsmerkmale bei den Brennstäben und dem Bündel und auch beim gesamten Versuchsaufbau können die Ergeb-nisse dieser Tests nicht eins zu eins auf Reaktorbedingungen angewandt werden. Zu diesem Zweck müssen die Experimente durch Rechencodes simuliert werden.
Deshalb wurde der Bündelcode CALUMO entwickelt. Er basiert auf der Lösung von Bilanz-gleichungen für die Bennstabsimulatoren, den Shroud und das Kühlmittel. Ebenfalls berech-net werden die Oxidation im Bündel, die Wasserstoffproduktion und der Verbrauch an Was-serdampf. Modelle für das Verhalten eines Borkarbid Abschaltstabes wurden in den Code eingebaut, ebenso wie ein einfaches Modell zum Abschrecken. Die Hauptabsicht bei der Entwicklung des Rechencodes war der Wunsch nach einem relativ einfachen Rechenwerk-zeug, das es uns erlaubt, die Mechanismen, die zu Temperatureskalationen und zu schwe-ren Schäden im Bündel führen, zu untersuchen.
Der Rechencode CALUMO wurde anhand der bisher durchgeführten Tests des FZK QUENCH-Programms validiert. In diesem Bericht werden die Ergebnisse für das Triplett QUENCH-07, QUENCH-08 und QUENCH-09 vorgestellt und mit Ergebnissen der Instrumen-tierung und der Nachuntersuchung verglichen und diskutiert. Im Großen und Ganzen sind die Ergebnisse der Rechnungen ermutigend, obwohl noch Verbesserungen bei den Model-len durchaus notwendig sind, insbesondere die Beschreibung von Materialverlagerungen. Ein großer Vorteil des Rechencodes ist die Möglichkeit, mit relativ geringem Aufwand neue Modelle zum Materialverhalten einzubauen und auch die Auswirkungen verschiedener Oxi-dationskorrelationen für Zirkaloy zu untersuchen.
i

Abstract A series of out-of-pile quench tests is currently performed at the QUENCH facility of the Karlsruhe Research Center. Due to some non-prototypical features in the fuel rod and bundle design and in the whole test set-up, the results of these tests cannot directly be extrapolated and applied to reactor conditions. Therefore simulations of these quench tests with the help of computer codes are needed to achieve this aim.
This led to the development of the bundle code CALUMO. The simulation of the test condi-tions in the CALUMO code is based on the solution of balance equations for the fuel rod simulators, the shroud, and the coolant. The code calculates also the oxidation of the bundle, the hydrogen production and the steam consumption. Models for the behavior of boron car-bide absorber rods have also been implemented, as well as a simple quench model. The main aim of the code was to have a simple tool for the investigation of the oxidation of the claddings and the shroud and the mechanisms leading to temperature escalations in the transient and re-flooding phase.
The CALUMO code has been validated in post test calculations for most of the QUENCH tests done so far. In this report results of the triplet of the tests QUENCH-07, QUENCH-08, and QUENCH-09 are presented and compared to results of the test instrumentation and to findings of post test examinations (PTE). The results of the code are in the overall encourag-ing, although still some improvement of the modeling is needed, especially with regard to relocation of liquid material. One big advantage of the code is the possibility to implement new models for material behavior rather easily and to test different oxidation correlations.
ii

Contents
List of tables .......................................................................................................................... iv
List of figures......................................................................................................................... iv
1 Introduction........................................................................................................................1
2 Test facility and test conduct .............................................................................................2
3 The bundle code CALUMO ...............................................................................................5 3.1 Convective heat transfer to the coolant ........................................................................6 3.2 Oxidation of Zry under steady-state and transient temperature conditions ..................6 3.3 Oxidation of B4C and boric acid production ..................................................................6 3.4 Importance of the flow conditions for the oxidation of B4C ...........................................7 3.5 Eutectic melt formation .................................................................................................8 3.6 Quench model ..............................................................................................................9
4 Results of calculations with CALUMO for FZK QUENCH tests.........................................9 4.1 QUENCH-07 ...............................................................................................................12 4.2 QUENCH-08 ...............................................................................................................19 4.3 QUENCH-09 ...............................................................................................................25
5 Conclusions.....................................................................................................................36
References .............................................................................................................................38
iii

List of tables
Tab. 1 : Main results of the QUENCH experiments
List of figures
Fig. 1 : Schematic diagram of the bundle in the test section 2 Fig. 2 : Schematic view of the cross section of the bundle 3 Fig. 3 : Evolutions of electric power, steam and Ar mass flow and selected
thermocouple readings for the tests Quench-07, -08, -09 4 Fig. 4 : Evolution of rod and shroud temperatures of QUENCH-07 at different
elevations from 128 up to 650 mm, CALUMO calculated data in comparison with experimental values 15
Fig. 5 : Evolution of rod and shroud temperatures of QUENCH-07 at different elevations from 742 up to 1250 mm, CALUMO calculatd data in comparison with experimental values 16
Fig. 6 : Axial distribution of the oxide scale thickness at the end of QUENCH-07 17 Fig. 7 : Evolution of the hydrogen production rate and the overall produced
hydrogen for QUENCH-07, CALUMO calculated and experimental values 17 Fig. 8 : CO and CO2 production rate and the integrated values of the CO and CO2
rates for QUENCH-07 18 Fig. 9 : Evolution of rod and shroud temperatures of QUENCH-08 at different
elevations from 128 up to 650 mm, CALUMO calculated data in comparison with experimental values 21
Fig. 10 : Evolution of rod and shroud temperatures of QUENCH-08 at different elevations from 742 up to 1250 mm, CALUMO calculated data in comparison with experimental values 22
Fig. 11 : Axial distribution of the oxide scale thickness at the end of QUENCH-08 23 Fig. 12 : Evolution of the hydrogen production rate and the overall produced
hydrogen for QUENCH-08 24 Fig. 13 : Evolution of rod and shroud temperatures of QUENCH-09 at different
elevations from 128 up to 450 mm, CALUMO calculated data in comparison with experimental values 30
Fig. 14 : Evolution of rod and shroud temperatures of QUENCH-09 at different elevations from 538 up to 850 mm, CALUMO calculated data in comparison with experimental values 31
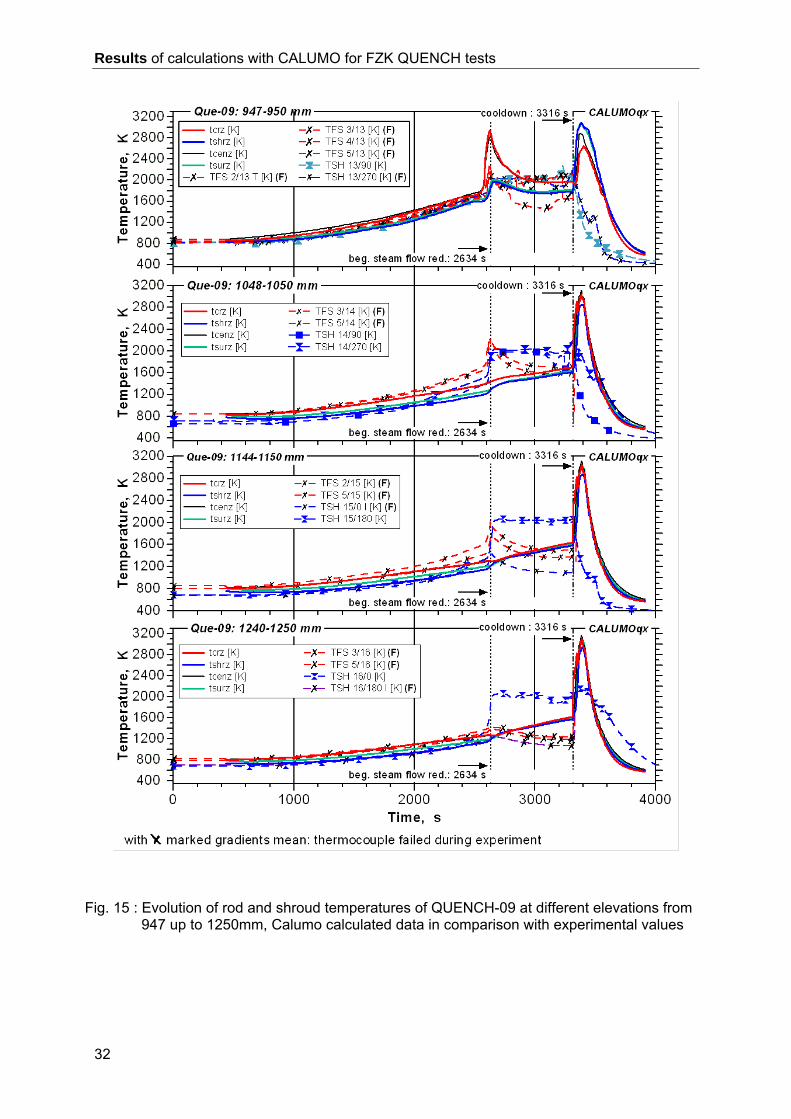
Fig. 15 : Evolution of rod and shroud temperatures of QUENCH-09 at different elevations from 947 up to 1250 mm, CALUMO calculated data in comparison with experimental values 32
iv

Fig. 16 : Axial distributions of the steam flow rate at different times during the steam reduction 33
Fig. 17 : Evolution of the hydrogen production rate and the overall produced hydrogen for QUENCH-09 33
Fig. 18 : CO and CO2 production rate and the integrated values of the CO and CO2 rates for QUENCH-09 34
Fig. 19 : Volume increase due to eutectic interaction between B4C and ss cladding 34 Fig. 20 : Control rod temperature and the eutectic layer thickness between B4C
and ss cladding 35 Fig. 21 : Oxide scale thickness in the upper part of the test section during steam
reduction 35 Fig. 22 : Axial distribution of the oxide scale thickness at the beginning and end of
steam flow reduction and at the end of QUENCH-09 35 Fig. 23 : CALUMO calculated data in comparison with measured values for the
oxide scale thickness at the end of the experiment QUENCH-09 36
v

Introduction
1 Introduction
At the end of the blowdown phase in a loss-of-coolant accident (LOCA) the core may be completely immersed in steam. At the temperature levels reached during the accident, the reaction between Zircaloy and steam can be very fast, leading to even higher temperatures due to the reaction enthalpy of the oxidation process. The injection of water and steam is then a prime accident management measure to terminate the overheating of the reactor.
A series of out-of-pile quench tests is currently performed at the Karlsruhe Research Center (FZK) with the aim to simulate this sequence of events. In the FZK QUENCH facility electri-cally heated Zry test bundles are subjected to temperature transients. The overheated test bundles are then flooded with water or steam /1/.
Due to some non-prototypical features like fuel rod and bundle design and electrical instead of nuclear power production, for example, a direct extrapolation of the test results to reactor condition is not possible. This can only be done with the help of computer codes. In a first step, these codes have to be validated on the FZK QUENCH tests.
There are at least half a dozen mechanistic bundle codes active in the LWR safety business, which use more or less sophisticated models for the simulation of material behavior under quench conditions. Nevertheless, it deemed us worthwhile to develop a new bundle code. The main argument was the considerable variations in test conditions and test setup which were foreseen in the QUENCH program and which may lead to problems in adapting existing computer codes. But there are also economic reasons which suggest the development of a simple code, as computer time and costs as well as the requirements in manpower can be considerably reduced.
Thus, the aim was to develop a rather simple bundle code, which could be easily adapted to different test set-ups and which could be run on a personal computer. Also such a code might help to gain insight in some specific problems of the QUENCH tests like the interde-pendence of oxidation and release of electrical energy.
The aim of simplicity can only be fulfilled if one does not try to solve the heat conduction equation. The solution of the transient heat conduction equation is not an easy task, and as there are a lot of different materials in different phase conditions in the test facility, such a procedure becomes rather cumbersome and time consuming.
In the recently developed bundle code CALUMO /2/ (CAlculation of temperature evolutions in quench tests with the help of LUmped parameter MOdels) the evolution of the mean tem-peratures in the different components of the bundles is followed with the help of balance equations, a so-called lumped parameter method. The main aim lies in the calculation of the oxidation of the fuel rod simulators and the structural components, as well as in the determi-nation of the hydrogen production and release.
The adopted method can successfully be applied when effects of heat capacity are much more important than effects of thermal conductivity; that means when the effect of the heat input into a technical structure leads primarily to the increase of the mean temperatures and less to the creation of great temperature gradients in the system. There are indications from the QUENCH tests that over a considerable part of the heated length the temperature distri-butions over the bundle are fairly uniform. In the hottest part of the test section radial tem-perature gradients are to be expected, but there appear also important temperature asymme-tries, which increase with the mean temperature. Then even a mechanistic 1.5-dimensional code would not be fully adequate in dealing with such a situation. These temperature asym-metries occur in an unpredictable manner. A simulation of such a situation by calculating the evolutions of mean temperatures seems to be appropriate as a best estimate from a practical point of view.
1

Test facility and test conduct
We have not tried to implement structural mechanics into the code, as this would mean that we can not keep our aim of simplicity and also a necessary prerequisite would be the knowl-edge of temperature gradients in the different structures. If the effects of clad mechanics are linked to certain temperature conditions like in through-wall cracking or in loss of strength situations, a simulation of the consequences of mechanical effects can be implemented in the code. We have, as well, not yet tried to simulate the effects of material relocation. Thus, for certain tests the cooldown phase cannot be appropriately described.
2 Test facility and test conduct The FZK QUENCH test facility and the test conduct have been described in ref. /1/ in great detail. Therefore we can restrict ourselves to the main points. The main component is the test section with the test bundle (see Fig. 1 and 2).
-50
+50
-150
-250
+150
+250
+350
+450
+550
+650
+750
+850
+950
+1050
+1150
+1250
+1350
Ar
-200 Inconel spacer grid
+50 Zry spacer grid
+550Zry spacer grid
+1050Zry spaer grid
Ar
H O2
H O2
H O coolingjacket
2
ZrO fiber insulation,argon-filled
2
Ar coolingjacket
Zry shroud
0
+1300
+1024
Heatedlength
13
12
11
10
9
8
7
6
5
4
3
2
1
14
15
16
17
Fig. 1 : Schematic diagram of the bundle in the test section.
2
Test facility and test conduct
3
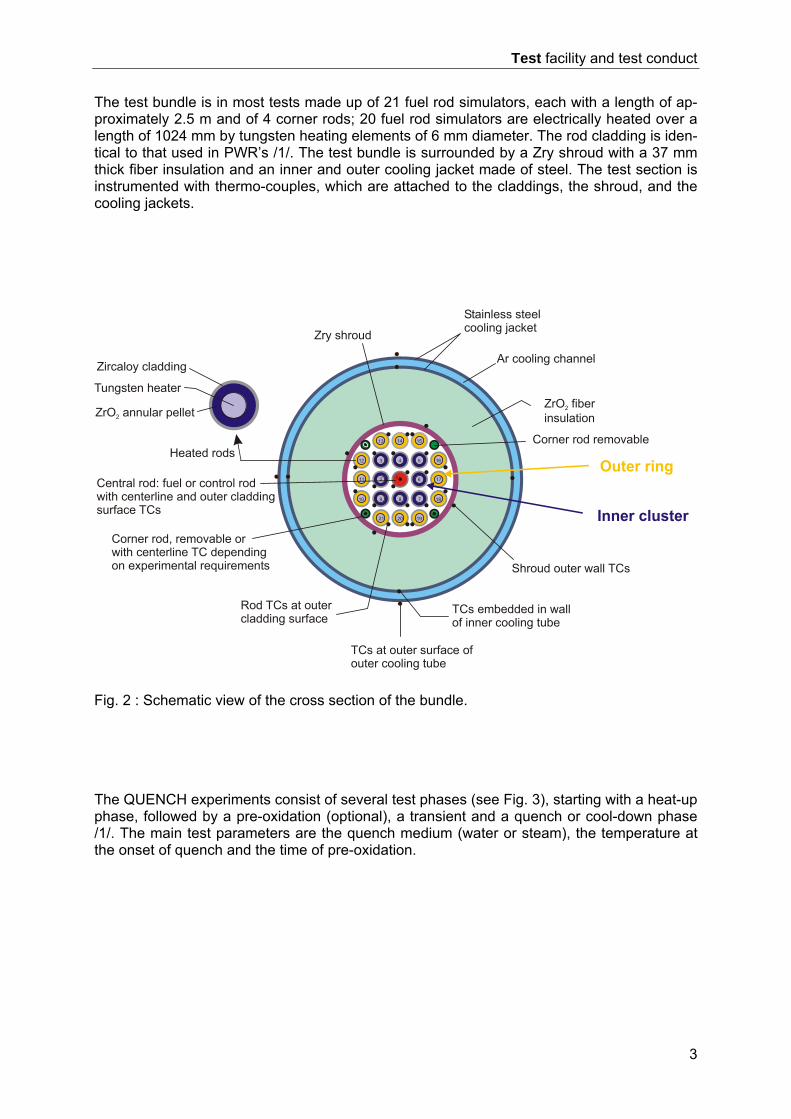
The test bundle is in most tests made up of 21 fuel rod simulators, each with a length of ap-proximately 2.5 m and of 4 corner rods; 20 fuel rod simulators are electrically heated over a length of 1024 mm by tungsten heating elements of 6 mm diameter. The rod cladding is iden-tical to that used in PWR’s /1/. The test bundle is surrounded by a Zry shroud with a 37 mm thick fiber insulation and an inner and outer cooling jacket made of steel. The test section is instrumented with thermo-couples, which are attached to the claddings, the shroud, and the cooling jackets.
Ar cooling channel
ZrO fiberinsulation
2
Corner rod, depending
on experimental requirements
removable orwith centerline TC
Stainless steelcooling jacketZry shroud
Central rod: fuel or control rodwith centerline and outer claddingsurface TCs
Heated rods
Shroud outer wall TCs
Rod TCs at outercladding surface
Corner rod removable
TCs at outer surface ofouter cooling tube
TCs embedded in wallof inner cooling tube
Tungsten heater
Zircaloy cladding
ZrO annular pellet2
13 14 15
12 3 4 5 16
6 17
10 9 8 7 18
21 20 19
111 2
Fig. 2 : Schematic view of the cross section of the bundle.
The QUENCH experiments consist of several test phases (see Fig. 3), starting with a heat-up phase, followed by a pre-oxidation (optional), a transient and a quench or cool-down phase /1/. The main test parameters are the quench medium (water or steam), the temperature at the onset of quench and the time of pre-oxidation.

Test facility and test conduct
4
0
10
20El
ectr
icpo
wer
,kW
0
10
200 1000 2000 3000 40000 1000 2000 3000 4000
el. power steam inj. Ar inj.
0
10
20
Elec
tric
pow
er,k
W
0
10
20QUENCH-08
0
10
20
Elec
tric
pow
er,k
W
0
20
40
60St
eam
inje
cted
,g/s
/A
rgon
flow
,g/s
QUENCH-09
5001000150020002500
Tem
pera
ture
,K cooldown initiation 3557 sQ07-TIT A/13950 mm
5001000150020002500
Tem
pera
ture
,K cooldown initiation 3776 sQ08-TIT A/13950 mm
5001000150020002500
Tem
pera
ture
,K
0 1000 2000 3000 4000
cooldown initiation 3316 s
Time, s
Q09-TFS 2/12 B850mm
QUENCH-07
3424 s3356 s
2602 s3156 s
3340 s
3.4 g/s steam / 3 g/s Ar
3.x g/s steam / 3 g/s Ar
3 g/s steam / 3 g/s Ar
0.4 g/s steam
50 g/s steam
1628 s 227 s7 3240 s3814 s
3830 s
3602 s 3749 s
3585 s3140 s
15 g/s steam
15 g/s st
1736 s 2200 s
244 s
withdrawal of corner rod B 3090 s
oxidation phase Transient
3140 s2200 s
withdrawal of corner rod B 3181 s
oxidation phase transient
3240 s2277 s
4018 s134 s
cool dowm
465 s
1950 s
2636 s
steamstarvationheatup
Fig. 3 : Evolutions of electric power, steam and Ar mass flow and selected thermocou-ple readings for the tests Quench-07, -08, -09.

The bundle code CALUMO
3 The bundle code CALUMO The code calculates the evolutions of the mean temperatures in the different components of the test section between the lower end of the heated zone and the outlet. This zone is subdi-vided into a certain number of axial meshes (can be chosen by the user) and in each axial mesh balance equations for the fuel rods, the shroud, and the coolant are solved. There are different versions of the code. In the standard version there is one balance equation for all the fuel rods. In a more advanced version we have separate balance equations for the 12 heated fuel rod simulators (+ 4 corner rods) in the outer ring of the bundle on one side and balance equations for the inner cluster of fuel rod simulators (8 heated rods + 1 unheated central rod). In the most advanced version we have also separate balance equations for the unheated central rod. In this way calculations of QUENCH tests with control rods can be done. Of course, this procedure with balance equations could also easily be applied to the inner and outer cooling jacket if there is a need.
The balance equations for a group of fuel rod simulators look as follows:
kcool
kax
outrad
inrad
kox
kel
k
i
iip wwwwww
dtdT)mc(
kk
−+−++=∑
i : material index in the simulator
(1)
k : outer ring, inner cluster, central rod or all fuel rod simulators (standard version)
m : linear mass cp : heat capacity wel : electrical power
wox : chemical power wrad : radiation heat transfer wax : axial heat transfer
..wcool : heat transfer to the coolant
The fuel rod simulators consist of different materials. Therefore we have the index i in equa-tion (1). In case of the balance equation for the unheated central rod the term wel is of course lacking .
The balance equation for the shroud reads as follows:
shloss
shcool
shrad
shox
sh
ship
i
ish wwww
dtdT )cm( −−−=⋅∑ (2)
wloss : heat losses through the fiber isolation
and for the coolant:
shcool
k
k
cool
cool
cool w wdzdT pc m
cool+=⋅⋅ ∑
•
(3)
Thus, the following main heat production and heat transfer mechanisms are taken into ac-count:
a) Release of electrical power in the fuel rod simulators
b) Heat production due to oxidation of Zry and eventually B4C
c) Radiation heat exchange between groups of fuel rod simulators and the shroud
d) Convective heat transfer to the coolant
e) Heat conduction through the fiber insulation and heat transfer through the Ar gap
5
The bundle code CALUMO
f) Axial heat conduction in the electrodes and the metallic phase of the claddings and the shroud
In the following we will outline the modeling of some of these mechanisms without going much into detail.
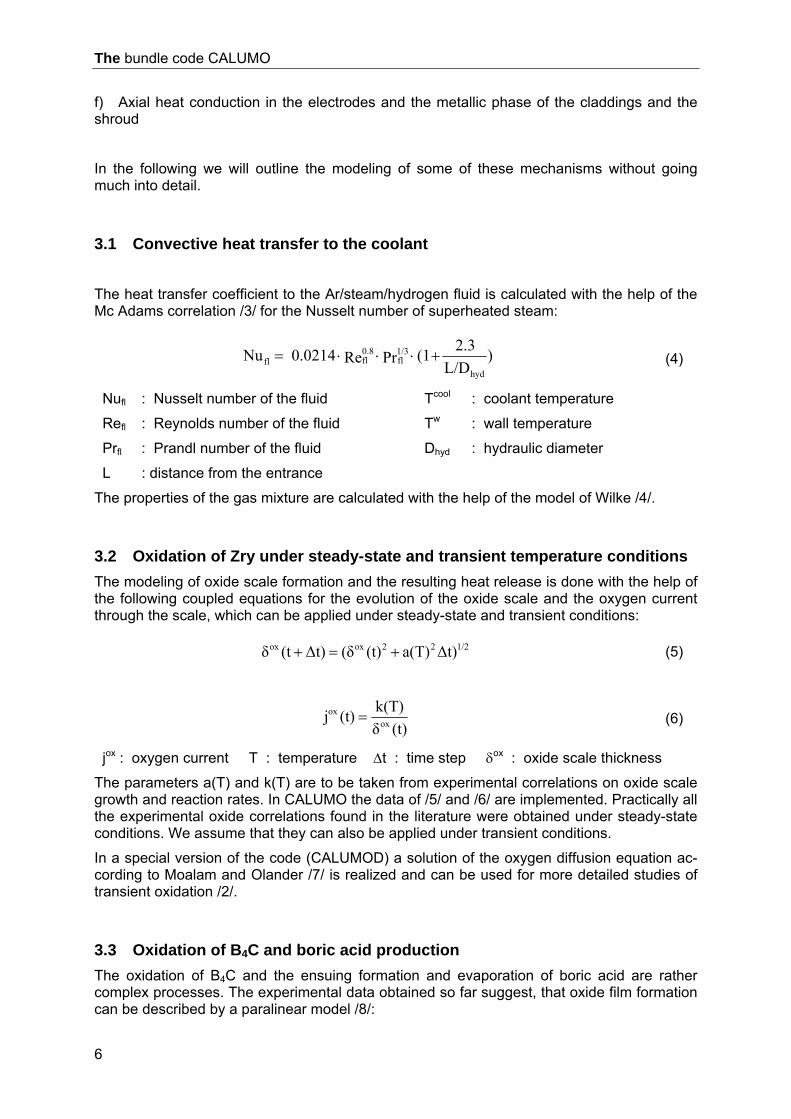
3.1 Convective heat transfer to the coolant
The heat transfer coefficient to the Ar/steam/hydrogen fluid is calculated with the help of the Mc Adams correlation /3/ for the Nusselt number of superheated steam:
)L/D
2.3(1 Pr Re 0.0214Nuhyd
1/3fl
0.8flfl +⋅⋅⋅= (4)
Nufl : Nusselt number of the fluid Tcool : coolant temperature
Refl : Reynolds number of the fluid Tw : wall temperature
Prfl : Prandl number of the fluid Dhyd : hydraulic diameter
L : distance from the entrance
The properties of the gas mixture are calculated with the help of the model of Wilke /4/.
3.2 Oxidation of Zry under steady-state and transient temperature conditions The modeling of oxide scale formation and the resulting heat release is done with the help of the following coupled equations for the evolution of the oxide scale and the oxygen current through the scale, which can be applied under steady-state and transient conditions:
1/222oxox Δt)a(T)(t)(δΔt)(tδ +=+ (5)
(t)δk(T)(t)j ox
ox = (6)
jox : oxygen current T : temperature Δt : time step δox : oxide scale thickness
The parameters a(T) and k(T) are to be taken from experimental correlations on oxide scale growth and reaction rates. In CALUMO the data of /5/ and /6/ are implemented. Practically all the experimental oxide correlations found in the literature were obtained under steady-state conditions. We assume that they can also be applied under transient conditions.
In a special version of the code (CALUMOD) a solution of the oxygen diffusion equation ac-cording to Moalam and Olander /7/ is realized and can be used for more detailed studies of transient oxidation /2/.
3.3 Oxidation of BB4C and boric acid production The oxidation of B4C and the ensuing formation and evaporation of boric acid are rather complex processes. The experimental data obtained so far suggest, that oxide film formation can be described by a paralinear model /8/:
6

The bundle code CALUMO
βmα
dtdm
ox
ox
−= (7)
where as boric acid formation and the production of gases like H2 , CO, and CO2 are given as:
βfdt
dmox/ba
ba
⋅= (8)
)dt
dm(βfdt
dm ox
COox/hyd/CO/
hyd/CO/CO
2
2
+= (9)
α, β : rate parameters fi/j : mass conversion factors
mox : specific mass of the B2O3 film mox = ρox . δox
Data for the rate parameters α and β can be found in /8/. An equilibrium value of the oxide film thickness δox is attained, when the mass transfer through the oxide film by diffusion equals the losses due to boric acid formation and transport in the coolant channel. This is equivalent to the following condition:
0dt
dmox
= (10)
Under the conditions of a QUENCH test these equilibrium values of the oxide film are rather small (a few microns). Therefore the term α/mox in equation (7) can be neglected to a first approximation.
3.4 Importance of the flow conditions for the oxidation of B4C The transport of the gaseous components from the surface to the fluid is rate determining for the whole process. It can be described with the help of mass transfer coefficients, as exem-plified for hydrogen:
222 HHH ΔcKj = (11)
bulkH
surHH 222
ccΔc −= (12)
γχSh
H
hydH ScRecD
dKSh
2
2 ⋅⋅== (13)
Sh : Sherwood number Sc : Schmidt number
7

The bundle code CALUMO
DH2 : hydrogen diffusion coefficient cH2 : hydrogen concentration
KH2 : hydrogen mass transfer coefficient dhyd : hydraulic diameter
The correlation (13) for the Sherwood number depends on the Reynolds and the Schmidt number and is specific to each flow configuration. In order to transform the oxidation rates from a certain flow configuration to another, one must know the respective correlations for the Sherwood number. This also determines the dependency of the rate parameter β on the relevant flow parameters like system pressure, hydraulic diameter, flow velocity and steam partial pressure. The rate parameter α is considered to be independent of the flow condi-tions, as it is determined by the diffusivity in the oxide film. The rate parameter β has been determined from tests done in the BOX Rig, the small B4C cylinder being in a cross flow posi-tion with a specimen support having the shape of a small boat /9/. Taking profit of the anal-ogy between heat and mass transfer, one can use correlations of the Nusselt number found in the literature for long cylindrical tubes in rectangular flow channels /10/:.
0.5)2turbNu2
lam(Nu0.3Nu ++= (14)
0.3340.5lam PrRe0.664Nu ⋅⋅= (15)
)1.(PrRe2.4431.PrRe0.037
667.01.0
8.0
−⋅⋅+⋅⋅
= −turbNu (16)
The Nusselt number has to be replaced by the Sherwood number and the Prandl number by the Schmidt number, if this correlation is to be applied in mass transfer calculations. Making use of the fact that the hydrogen concentration in the bulk of the fluid is much smaller than that on the surface, we can calculate the hydrogen surface concentration csur
H2 from the hy-drogen flow rates measured in the BOX tests. This parameter is viewed to depend only on the temperature and on the steam partial pressure, but it should be independent of the flow conditions. We think that the following representation holds:
(T)cp)p(T,c surT
nstst
surH2
⋅= (17)
pst : steam partial pressure
The data obtained from the oxidation tests in the BOX Rig suggest that the power n is about
1. The parameter is viewed to be independent of the flow conditions and therefore invariant /8/.
)T(csurT
3.5 Eutectic melt formation With an absorber rod present in the bundle there are eutectic interactions between different components to be expected /11,12/. For example, stainless steel and BB4C interact eutecti-cally but also stainless steel and Zry.
8

Results of calculations with CALUMO for FZK QUENCH tests
In general, the evolution of the layer thickness of eutectic melt is described with the help of parabolic correlations, indicating that it is a diffusive process:
tK(T)(t)x2 ⋅= (18)
As we have to do with non-isothermal conditions, we better use an incremental formulation to calculate the increase of the eutectic layer during a time interval Δt:
Δtx(t)2
K(T(t))Δx(t) ⋅⋅
= (19)
For the rate parameter K(T) Arhenius representations can be gained from data given in /12/.
3.6 Quench model It is assumed that the axial zone of the double phase region has a definite length constant in time, whose value can be specified by the user. The amount of steam produced in this zone is then calculated with the help of the following balance equation:
/λiquezΔ)shiquej
iquekique(j
stprodm ⋅+∑=
•
ique = index running over the double phase zone
(20)
jk : heat flux from the fuel rod simulators jsh : heat flux from the shroud
Δz : axial length of the meshes λ : heat of steam vaporization
The heat fluxes jk and jsh depend on the heat transfer coefficients in the double phase region. Its values can be given by the user depending on threshold values of the wall temperature. The velocity of the quench front is given as:
chanFwρ/)stprodm
injm(quev ⋅
•−
•= (21)
ṁ inj : mass flow of injected water ρw : density of water Fchan : coolant channel area
4 Results of calculations with CALUMO for FZK QUENCH tests
In the frame of the QUENCH Test Program 11 re-flooding tests have been done so far (see table 1). For more detailed information on the test data and test conditions the reader is re-ferred to ref. /13 – 19/. The main interest with the CALUMO calculations was to gain a pro-found understanding of the oxidation and hydrogen production phenomena occurring in a
9

Results of calculations with CALUMO for FZK QUENCH tests
QUENCH test. A necessary prerequisite for this is a good simulation of the temperature evo-lution in the test section. The bundle code CALUMO was not meant as a sophisticated thermo-hydraulics code, nevertheless the main features of a quench event should in the overall be simulated satisfactorily by the code, like the cool-down of the test section, the amount of steam production, and the evolution of the double phase zone.
Real case calculations with CALUMO have been done for all the QUENCH tests carried out so far, except for QUENCH-02, pre-test calculations were performed for QUENCH-09 and QUENCH-10. The oxidation correlations of /5/ were mainly used in these calculations for the whole temperature range. Only in the case of QUENCH-09 the consequences of the Prater/Courthright /6/ correlation in the high temperature case have been investigated. As input data the code needs the steam and Ar mass flow during the whole test, the history of the electrical power, and the coolant inlet temperature. These data can be found in the test reports /13-19/ and in internal data reports released by the QUENCH team.
The results of these code calculations for the triplet QUENCH-07 /18/, QUENCH-08 and QUNCH-09 /19/ are presented in the following section. The test conditions for these three tests are to be found in Fig. 3 and are taken as such as input data for CALUMO. All these three tests were cooled down with steam. As an absorber rod with B4C pellets was installed at the centre position of the bundle in the QUENCH-07 and the QUENCH-09 test, the most advanced code version CALUMOQX had to be used in order to deal with this new bundle design in a proper way. In this version of the code we have balance equations for the outer ring of 12 heated fuel rods (+ 4 corner rods), balance equations for the inner cluster of 8 heated fuel rods, and balance equations for the central rod or absorber rod with its guide tube, and ,of course, balance equations for the shroud. In case of QUENCH-07 and QUENCH-09 this is an absorber rod with a Zry guide tube. For QUENCH-08 the absorber rod is replaced by an unheated fuel rod of the normal bundle design.
It should be noted that in the following figures the average temperature in the outer ring of fuel rod simulators is denoted as “tsurz”, that of the inner cluster of 8 fuel rod simulators “tcenz” , that of the absorber rod with its guide tube or that of the central rod „tcrz“, and the average shroud temperature “tshrz”. They are compared to the available thermocouple read-ings. In the same way “dox” denotes the oxide scales of the inner cluster of 8 heated fuel rods, „ doxc „ that of the guide tube of the absorber rod or the oxide scale on the unheated central rod, “doxa” that of the outer ring of 12 heated fuel rods, and “doxsh” the oxide scale of the shroud.
10

Results of calculations with CALUMO for FZK QUENCH tests
Tab. 1 : Main results of the QUENCH experiments
Test Quench medium
Temp. at onset of
flooding3)
Flooding rate1)
Heat-up
rate Max. ZrO2
scale2)
H2 release before/during
reflood
QUENCH-01 Water ≈ 1900 K 1.6 cm/s 0.5 K/s ≈ 500 µm 36 / 3 g
February 1998 COBE Project; partial fragmentation of pre-oxidized cladding.
QUENCH-02 Water < 2400 K 1.6 cm/s 0.5 K/s complete 20 / 140 g
July 1998 COBE Project; no additional pre-oxidation; quenching from high temperature.
QUENCH-03 Water < 2400 K 1.4 cm/s 0.6 K/s complete 18 / 120 g
January 1999 No additional pre-oxidation; quenching from high tem-perature.
QUENCH-04 Steam ≈ 2300 K ≈ 50 g/s 0.5 K/s ≈ 170 µm 10 / 2 g
June 1999 Cool-down behavior of slightly pre-oxidized cladding by cold steam injection.
QUENCH-05 Steam ≈ 2300 K ≈ 50 g/s 0.5 K/s ≈ 400 µm 25 / 2 g
March 2000 Cool-down behavior of pre-oxidized cladding by cold steam injection.
QUENCH-06 Water ≈ 2300 K 1.4 cm/s 0.5 K/s ≈ 660 µm 32 / 4 g
December 2000 OECD-ISP 45; prediction of H2 source term by differ-
ent code systems.
QUENCH-07 Steam > 2300 K ≈ 15 g/s 0.5 K/s complete 66 / 120 g
July 2001 COLOSS Project; impact of B4C absorber rod failure on H2, CO, CO2 and CH4 generation.
QUENCH-08 Steam > 2100 K ≈ 15 g/s 0.5 K/s complete 46 / 38 g
July 2003 As QUENCH-07, steam starved conditions prior to cooldown.
QUENCH-09 Steam ≈ 2500 K ≈ 50 g/s 0.5 K/s complete 60 / 400 g
July 2002 As QUENCH-07, no absorber rod.
QUENCH-10 Water > 2100 K ≈ 50 g/s 0.5 K/s complete 48/ 5 g
July 2004 LACOMERA Project; Air ingress 1) Flooding rate for water: rise of the water level from bottom at the -250 mm bundle elevation (single-phase flow). 2) Measured posttest at the bundle elevation of max. temperature. 3) Maximum measured or estimated temperature in test section.
11

Results of calculations with CALUMO for FZK QUENCH tests
4.1 QUENCH-07 The test QUENCH-07 has been performed at 25 July 2001 at FZK. Its objective was to inves-tigate the impact of a B4C absorber rod on a pre-oxidized LWR fuel rod bundle at high tem-peratures and during cool-down with steam. In particular, this test was to provide information on the formation of gaseous reaction products like H2, CO, CO2 and CH4 and on the impact of control rod degradation on surrounding fuel rods.
An empirical model for heat transfer by natural convection in the Ar volume between the shroud and the cooling jacket was also implemented in the CALUMO code. It was also as-sumed that the upper part of the ZrO2 fiber insulation (z ≥ 750 mm) is affected by this upward transport of heat in the space outside the shroud. Without this new convection model no tem-perature plateau of sufficient duration could be achieved in the axial region between about 700 and 1000 mm.
Results of code calculations in comparison to the respective data of the test instrumentation are to be found in Fig.4 to 8. These are the temperature evolutions between 150 and 1250 mm, the axial profiles of oxide scale thickness for the fuel rod simulators and the shroud, and the results on gas production (rates and total production). It should be noted that the calcula-tion starts at about 230 s into the test with the increase of the electrical power and ends at about 3700 s. Thus, the calculation was stopped a bit too early in the cool-down phase
On the whole, the temperature evolution in the bundle and the shroud is simulated in a satis-factory way by the code, especially in the lower part of the heated zone (z≤ 450 mm). Most of the features of the temperature evolution are relatively well reproduced in this axial zone. The temperature rise to steady-state conditions, the pre-oxidation phase, the temperature transient, and the cool-down phase are to a good extent well matched. As the temperature evolution in this part of the test section is mainly determined by the electrical heating, we can be rather confident that this effect is correctly simulated by the code. There are some prob-lems with the calculated temperature evolutions between about 550 and 650 mm, as the cal-culated temperature rise in the pre-oxidation phase is somewhat higher than measured. But as the oxidation rates in this axial zone are not very high, this does not result in bigger prob-lems for the hydrogen production.
There is some difference between measured and calculated temperature values between 750 and 950 mm during the pre-oxidation phase, but the flat temperature evolution could in the whole be reproduced by the code, although not in all details. It should be noted that the information on the temperature evolution is only based on shroud thermo-couple readings.
Due to the recently implemented natural convection model the situation in the upper part of the test section (1000 – 1400 mm) looks now relatively good, especially in the pre-oxidation phase. This axial zone seems to be rather important for the outcome of QUENCH-07. A con-siderable part of the produced hydrogen originates from oxidation in the upper part of the test section. In the second part of the transient phase about 200 s before cool-down a tempera-ture escalation happened in the axial region around 950 mm, as indicated by the thermo-couple TIT A/13 and the shroud thermo-couples. As all the inner thermo-couples had failed, we can only discern the consequences leading to an abrupt rise of the outer thermo-couple signals due to radiation heat transfer from the fuel rods. This temperature rise is distinctly higher, than would be expected from the increase of the electrical heating alone.
With the help of some modification in the radial heat transfer and in the coolant flow model the temperature escalation could to some extent be simulated by the code. The bending of some fuel rods was at first viewed to lead to disturbances in the coolant flow and radiation heat transfer within the bundle. As is known from PTE of QUENCH-03 /13/, the bending of the fuel rods may even lead to mutual contact. We hold that this effect leads to a formation of hot spots, which then might act as origins of the temperature escalation affecting a certain axial region of the test section. The axial region between 750 and 850 mm is most favored
12

Results of calculations with CALUMO for FZK QUENCH tests
for such an effect to occur, as it is far from the spacers at 550 and 1050 mm and as the fuel rod temperatures seem to be high enough for the loss of clad strength. There are some indi-cations from PTE of QUENCH-07 on bending of fuels especially at 850 mm. But the evi-dence is not as strong as in the case of QUENCH-03 and, of course, PTE cannot give us a clue on the time, when this effect occurred.
Another mechanism for the initiation of a temperature escalation could be provided by the relocation of molten material. We know from the detection of He by the GAM300 mass spec-trometer that the absorber rod failed at about 2040 s. Also, the temperature of the absorber rod was then high enough for melting of the steel cladding and for eutectic melt formation between steel and B4C. Thus, there was ample time for the relocation of molten material. The spacer at 1050 mm most probably played an important role in a partial blockage formation, as it constitutes an obstacle for material relocation. The temperature escalation around 950 mm finally led to shroud failure and is therefore the main cause for the severe damage in the upper part of the test section.
It is known from PTE that the shroud is largely destroyed above 850 mm, it partially or even totally disappeared in this axial region. But this is not indicated by the shroud thermo-couple readings, which show a rather regular behavior. The destruction and relocation of the shroud ,of course occurred after shroud failure (3486 s), and later on part of the coolant flow could have passed through the space between the shroud and the stainless steel cooling jacket, the so-called Ar volume. Thus, it seems that the shroud thermo-couples located in this axial zone have been cooled by this diverted flow and have therefore remained intact. In this way they did not indicate the temperatures of the inner part of the test section, which must have been considerably higher, but rather the temperature of the diverted coolant flow.
The calculated axial profiles of the oxide scale thickness at the time, when the calculation stopped are plotted in Fig. 6 together with experimental values from post test examinations. It should be noted that in the CALUMO code the Zry guide tube of the absorber rod experi-ences inside and outside oxidation of an equal amount. Thus, for comparison with the ex-perimental data doxc has to be multiplied by a factor 2. Therefore with complete oxidation of the guide tube we have a maximum value of a bit less than 600 μm. Thus the guide tube is calculated to be fully oxidized above about 800 mm.
The oxidation features up to an axial position of about 750 mm are rather well met by the code. PTE has provided the maximum, the mean and the minimum values of the oxide scale thickness of all rods but it is not distinguished between inner and outer rods. If one could identify the maximum values with that of the inner rods the feature of almost complete oxida-tion of the claddings above about 850 mm is also well met by the code, with the maximum possible oxide scale thickness determined by the Pilling-Bedworth ratio and the as-fabricated wall thickness. There is a big difference between minimum and maximum oxide scale values determined by the metallography, the reason for this effect is not yet clear. It may be that some of the subchannels are better cooled than the remaining part of the bundle, or that there has been partial spalling of the oxide scales.
For the outer part of the bundle and for the shroud the calculated values of oxide scale thick-ness are much too low between about 800 and 1100 mm. The strong growth of the oxide scales in the upper part of the test section occurred most probably after shroud failure with the consecutive loss of the coolant channel geometry. Also there are indications from PTE that in the upper part of the bundle clad ballooning did occur, leading to a further disturbance of the coolant flow. Clad ballooning must have occurred, when the oxide scales were still relatively thin, as the oxide scales increase the clad strength. For this reason it occurred only in the upper part of the test section, where also the temperature was high enough. We hold that clad ballooning ended in clad failures from about 3480 s onwards. It should also be noted that these effects allowed inside clad oxidation, contributing to the overheating of the bundle.
Thus, it seems that in the upper part of the test section the bundle and the shroud were insuf-ficiently cooled even with a steam flow of 15 g/s. This seems to be the main reason for the
13

Results of calculations with CALUMO for FZK QUENCH tests
strong temperature escalation in the upper part of the test section leading to a high oxidation and hydrogen production during the cool-down phase in this axial zone. At the time end of the calculation oxidation and hydrogen production were certainly not finished, but as the CA-LUMO code did not simulate the main effects (loss of coolant channel geometry and reloca-tion of material) a comparison of calculated and measured values in the late phase of the test would in any case make not so much sense.
A comparison of measured and calculated hydrogen values (production rate and time inte-grated values) is to be seen in Fig. 7. The agreement is satisfactory up to the onset of cool-down. The measured hydrogen production rate shows a very high peak with a maximum value of about 2.3 g/s a bit after the onset of cool-down, which corresponds to a temporary steam consumption of about 21g/s. At the time instant of this hydrogen peak (3607 s) the destruction of the shroud in the upper part of the test section was presumably under way. Therefore part of the steam flow passed through the Ar volume and was therefore not avail-able for the oxidation and could, of course, not be consumed. This is in accord with the fact that the GAM300 mass spectrometer observed still a considerable steam flow around 3600 s. The measured high peak value of hydrogen production is therefore somewhat doubtful, it could also not be reproduced by the code with a maximum value of a bit less than 0.6 g/s in the hydrogen production rate. But the increase of the signal before onset of cool-down is rather well met as well as the time of the peak, and the accumulated hydrogen up to the on-set of cool-down. The overall produced hydrogen up to the end of the calculation (which was stopped a bit too early) was about 125 g, considerably less than the measured value of about 182 g. It is clear that the amount of hydrogen production which came from the oxidation of the shroud and the outer heated fuel rods in the upper part of the test section is distinctly higher than calculated by the code. This would explain some of the difference between measured and calculated hydrogen production.
The accumulated hydrogen production measured after onset of cool-down comprises about 137 g. This corresponds to an oxidation of about 3.2 kg Zry, a considerable amount. The evaluation of the measurements of gas data is based on the Ar flow of 3 g/s. With the loss of the coolant channel geometry this assumption is temporarily no longer correct. It could well be that this effect occurred around 3600 s and that the Ar flow was for a certain time lower than assumed.
The oxidation of B4C leads among other gases to a production of CO and CO2 measured by the GAM300 mass spectrometer. These results can be compared to that of the BORCA model implemented in CALUMO (see Fig.8). The oxidation rate depends on the steam flow rate /8/ and it has been estimated that the test condition of the FZK BOX tests are somewhat representative for QUENCH-07. But this does not mean that they are perfectly identical. Therefore we can for the time being only expect a qualitative agreement between measured and calculated data. Furthermore, there is the competing phenomenon of eutectic reaction between molten steel and B4C, which is not yet simulated in the CALUMO code, when the calculations for QUENCH-07 had been done. In view of these shortcomings we can note that the calculated production rates are in the correct order of magnitude up to about the onset of cool-down. The measured CO and CO2 production rates show two high peaks with the first peak arising a few seconds later than the sole peak in the calculated production rates. The second peak might be due to an interaction of steam with the eutectic melt of steel and boron carbide.
The main oxidation phenomena in QUENCH-07 occurred in the upper part of the test section above about 800 mm after onset of cool-down mainly due to the loss of the coolant channel geometry by the destruction of the shroud. It is not clear in what way relocation of molten material participated in this effect. It certainly led to some local, partial obstruction of sub-channels and this effect may have induced the first temperature escalation around 950 mm. In any case, all these effects are not yet simulated in the bundle code CALUMO explaining to a good deal the difference between code results and experimental findings in the cool-down phase. But up to the onset of cooldown the code provides a rather satisfying simulation of the experiment. This is especially true for the part of the test section below about 800 mm where
14

Results of calculations with CALUMO for FZK QUENCH tests
even the end state is well met. In this axial zone the geometry of the coolant channel re-mained intact and it seems that material relocation did not have severe consequences.
Fig. 4 : Evolution of rod and shroud temperatures of QUENCH-07 at different elevations from 128 up to 650mm, Calumo calculated data in comparison with experimental values
15

Results of calculations with CALUMO for FZK QUENCH tests
Fig. 5 : Evolution of rod and shroud temperatures of QUENCH-07 at different elevations from 742 up to 1250 mm, CALUMO calculated data in comparison with experimental values
16

Results of calculations with CALUMO for FZK QUENCH tests
Fig. 6 : Axial distribution of the oxide scale thickness at the end of QUENCH-07
Fig. 7 : Evolution of the hydrogen production rate and the overall produced hydrogen for QUENCH-07, CALUMO calculated and experimental values
17

Results of calculations with CALUMO for FZK QUENCH tests
Fig. 8 : CO and CO2 production rate and the integrated values of the CO and CO2 rates for QUENCH-07
18

Results of calculations with CALUMO for FZK QUENCH tests
4.2 QUENCH-08 The test QUENCH-08 has been performed on July 24 2003 at FZK /20/. Its objective was to serve as a reference test for the effect of a B4C absorber rod on a pre-oxidized LWR fuel rod bundle at high temperatures and during cool-down with steam. Thus, it was conceived as a repetition test of QUENCH-07 with essentially the same test sequence, but equipped with a standard unheated fuel rod simulator in the centre of the bundle instead of a control rod simulator as in QUENCH-07.
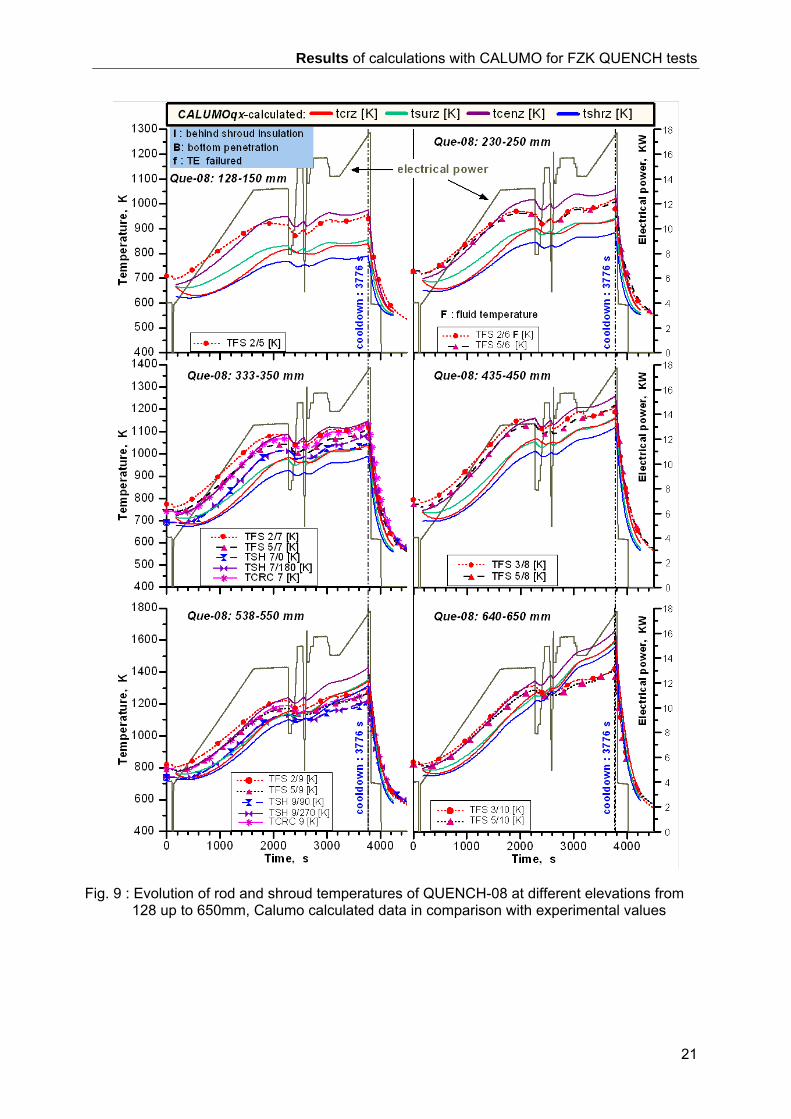
Results of real case code calculations in comparison to the respective data of the test in-strumentation are to be found in Fig.9 to 12. These are the temperature evolutions between 150 and 1250 mm, the axial profiles of oxide scale thickness for the fuel rod simulators and the shroud, and the results on hydrogen production (rates and overall production). It should be noted that the calculation starts at about 160 s into the test with the increase of the elec-trical power and ends at about 4100 s.
On the whole, the temperature evolutions in the bundle and the shroud are simulated in a satisfactory way by the code, especially in the lower part of the heated zone (z≤ 450 mm). Most of the features of the temperature evolution are relatively well reproduced in this axial zone. The temperature rise to steady-state conditions, the pre-oxidation phase, the tempera-ture transient, and the cool-down phase are to a good extent well matched. As the tempera-ture evolution in this part of the test section is mainly determined by the electrical heating, we can be rather confident that this effect is correctly simulated by the code.
Between 650 and 950 mm the code overestimates the temperatures in the bundle and shroud during the pre-oxidation and the transient phase to some extent, especially at level 12. This leads than to some overestimation of the oxidation and hydrogen production in this axial region of the test section. It should be noted that the information on the temperature evolution is mainly based on shroud thermo-couple readings.
Due to the recently implemented natural convection model the situation in the upper part of the test section 1000 – 1400 mm looks now relatively good. This axial zone seems to be rather important for the outcome of QUENCH-08. A considerable part of the hydrogen pro-duced during the cool-down phase originates from oxidation in the upper part of the test sec-tion.
Assuming in the CALUMO code outside shroud oxidation between 1000 and 1200 mm start-ing at the onset of cool-down but no clad cracking (caused by clad distension and split open-ing as has been done for QUENCH-07 and QUENCH-09), a somewhat satisfying simulation of the experimental conditions in the upper part of the test section could be achieved (see Fig.10), with strong but rather short temperature escalations starting shortly after onset of cool-down. The strong and prolonged temperature escalations in the upper part of the test section for QUENCH-07 and QUENCH-09 as calculated with CALUMO were mainly due to enhancement effects of inside clad oxidation.
Shroud failure was observed at 3765 s about 9 s before onset of cool-down. There is some clad cracking and split opening to be seen in the macrographs of QUENCH-08 , especially between 1400 and 1450 mm, but the effect is much less important than in QUENCH-07. Therefore the simulation in the code of the real experimental conditions could, of course, be improved. The hydrogen signal, for example, indicates a double peak escalation, which is not reproduced by the code. The second peak might be due to effects of relocation of molten material, which is not simulated by the code.
The oxidation features of the bundle are in the overall met by the code, although the experi-mental profiles are a bit displaced from the experimental ones. PTE has provided the maxi-mum the mean and the minimum values of the oxide scale thickness for all the fuel rod simu-lators and the mean values for the inner and outer rods. There is a big difference between minimum and maximum oxide scale values determined by ceramography, the reason for this
19
Results of calculations with CALUMO for FZK QUENCH tests
effect is not yet clear. It may be that some of the subchannels are better cooled than the re-maining part of the bundle, or that there has been partial spalling of the oxide scales.
The calculated profiles show a minimum at about 1000 mm and two maxima the lower one being displaced by about 100 mm compared to the experimental data. The upper maximum is due to the temperature escalation during the cooling phase.
The calculated axial profiles of the oxide scale thickness at the time, when the corner rod was withdrawn and when the calculation was stopped are also plotted in Fig. 11 together with experimental values from post test examinations.
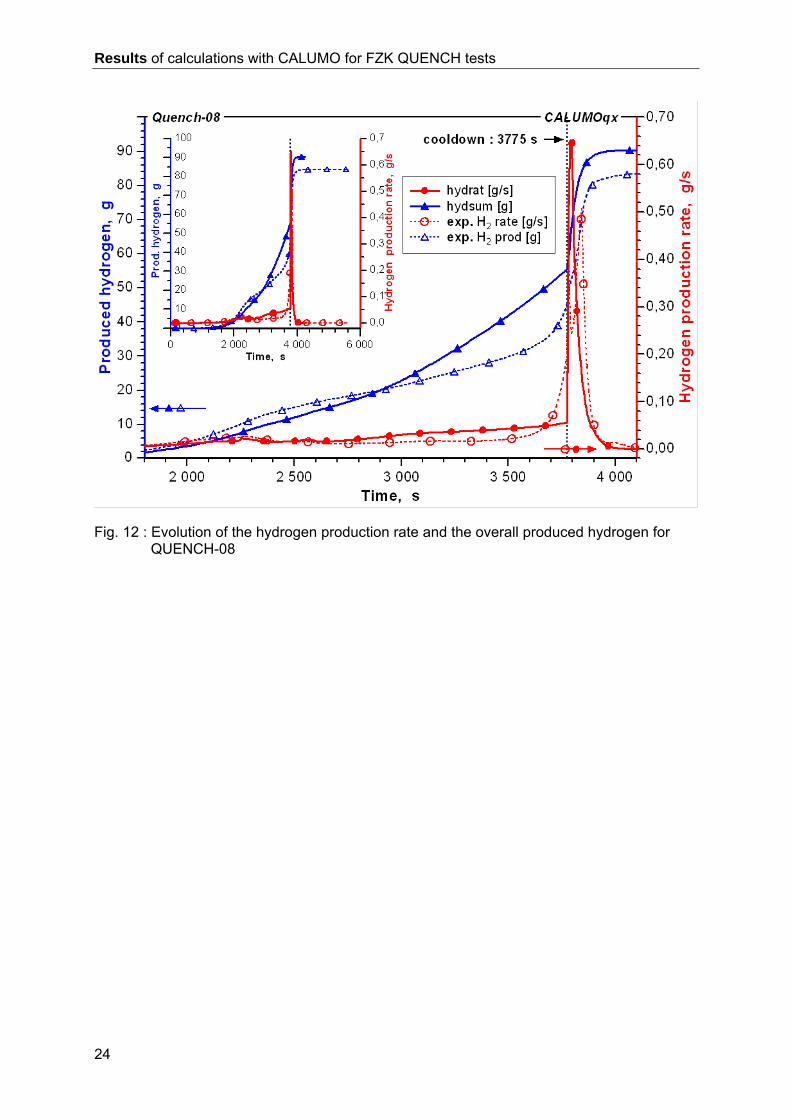
A comparison of measured and calculated hydrogen values (production rate and time inte-grated values) is to be seen in Fig. 12 The agreement is in the overall satisfactory with some overestimation of the hydrogen production rate in the late pre-oxidation and the early tran-sient phase. At the time of cool-down onset the calculated overall hydrogen production is about 56 g compared to a measured value of 46 g. During the cool-down phase an additional 35 g of produced hydrogen is calculated not far from the experimental value of 37 g.
The measured hydrogen production rate shows a high double peak with a maximum value of about 0.5 g/s about 100 s after the onset of cool-down, which corresponds to a temporary steam consumption of about 4.5g/s. The CALUMO code calculates a single peak with a maximum hydrogen production rate of about 0.65 g/s a few seconds after the onset of cool-down.
The test phases in QUENCH-08 were very similar to that of QUENCH-07 and this is also true for the thermo-couple readings. Nevertheless, there is a big difference in hydrogen produc-tion, especially during the cooling phase. The direct effect of the control rod in QUENCH-07 can be estimated to comprise at best about 15 to 20 g hydrogen, and cannot alone account for the big difference in hydrogen production. The main oxidation phenomena during the cool-down phase occurred in both tests in the upper part of the test section mainly due to the failure of the shroud and eventually due to relocation of molten material. In this respect, the effects in QUENCH-07 are much more pronounced than in QUENCH-08. The additional heat production of the control rod and the appearance of eutectic melt must have led to somewhat higher temperatures in the upper part of the test section leading to more severe mechanical effects in the claddings. It seems that relatively small differences in temperatures can lead to a strong bifurcation in the sequence of events a consequence of effective feedback mecha-nisms.
20
Results of calculations with CALUMO for FZK QUENCH tests
Fig. 9 : Evolution of rod and shroud temperatures of QUENCH-08 at different elevations from 128 up to 650mm, Calumo calculated data in comparison with experimental values
21

Results of calculations with CALUMO for FZK QUENCH tests
Fig. 10 : Evolution of rod and shroud temperatures of QUENCH-08 at different elevations from 742 up to 1250mm, CALUMO calculated data in comparison with experimental values
22

Results of calculations with CALUMO for FZK QUENCH tests
Fig. 11 : Axial distribution of the oxide scale thickness at the end of QUENCH-08
23
Results of calculations with CALUMO for FZK QUENCH tests
Fig. 12 : Evolution of the hydrogen production rate and the overall produced hydrogen for QUENCH-08
24

Results of calculations with CALUMO for FZK QUENCH tests
4.3 QUENCH-09 As an absorber rod with B4C pellets was installed at the centre position of the bundle as in the QUENCH-07 test, the same version of the CALUMO code, namely CALUMOQX was used for the pre and post test calculations of QUENCH-09. Only the results of the post test calculations are discussed in this report.
The so-called pore effect of B4C is not treated in the code, as no indications for this effect have been observed in the CO, CO2 production rates. One reason for this might be partial filling of the pore channels by the B4C/steel eutectic. The experimental finding in QUENCH-09 that the reaction of B4C with steam starts only with the onset of the cool-down phase, was taken into account for the post test calculations.
In contrast to the post test calculations of QUENCH tests done so far, the oxidation correla-tion of Prater/Courthright /6/ has been used for temperatures above 1883 K, whereas for the low temperature region the oxidation correlation of Leistikow /5/ was kept. It appears that this choice allows an acceptable simulation of the temperature escalation between about 700 and 1000 mm starting a bit before the steam reduction phase. It is felt, that this temperature es-calation is caused by bending of the fuel rod simulators in this axial region. But the modeling in CALUMO is not sophisticated enough to describe this effect in a mechanistic manner.
In the cool-down phase occurred a considerable destruction in the upper part of the test sec-tion and considerable relocation of molten material. The CALUMO code has for the time be-ing no capabilities to cope with such a situation in a proper way. Therefore the calculations for the cool-down phase were done under the premises, that the structure of the test section remains essentially intact. In this way the mechanisms leading to the destruction of the test section can to some extent be understood.
In contrast to all the other QUENCH tests done so far, a steam reduction phase was realized in the QUENCH-09 test. As there is no mechanistic model of oxygen diffusion included in CALUMOQX, the effects of oxide scale dissolution can only be described in an approximate way by a reversal of the oxide scale growth law. But a mechanistic solution of the oxygen diffusion equation is implemented in the code version CALUMOQXD. Studies with this ver-sion of the code showed that noticeable reductions of oxide scale thickness can only be ex-pected for values below about 120 µm. Thus, the reversal of the growth law was only applied for oxide scales below this value. This measure avoided the occurrence of a double peak in the oxide scale profiles as occurred in the pre-test calculations for QUENCH-09.
A value of about 0.3 g/s was measured in the inlet for the steam flow rate during the steam reduction phase. On the other hand the hydrogen measurements by the mass spectrometer suggest a value of 0.45 g/s. Indeed this value was used in the post test calculations with CA-LUMOQX and CALUMOQXD, otherwise the measured hydrogen productions rates could not be reproduced. The version CALUMOQXD includes a mechanistic solution of the oxygen diffusion equation in the cladding /1/ and is therefore better suited to do calculations for steam starvation conditions.
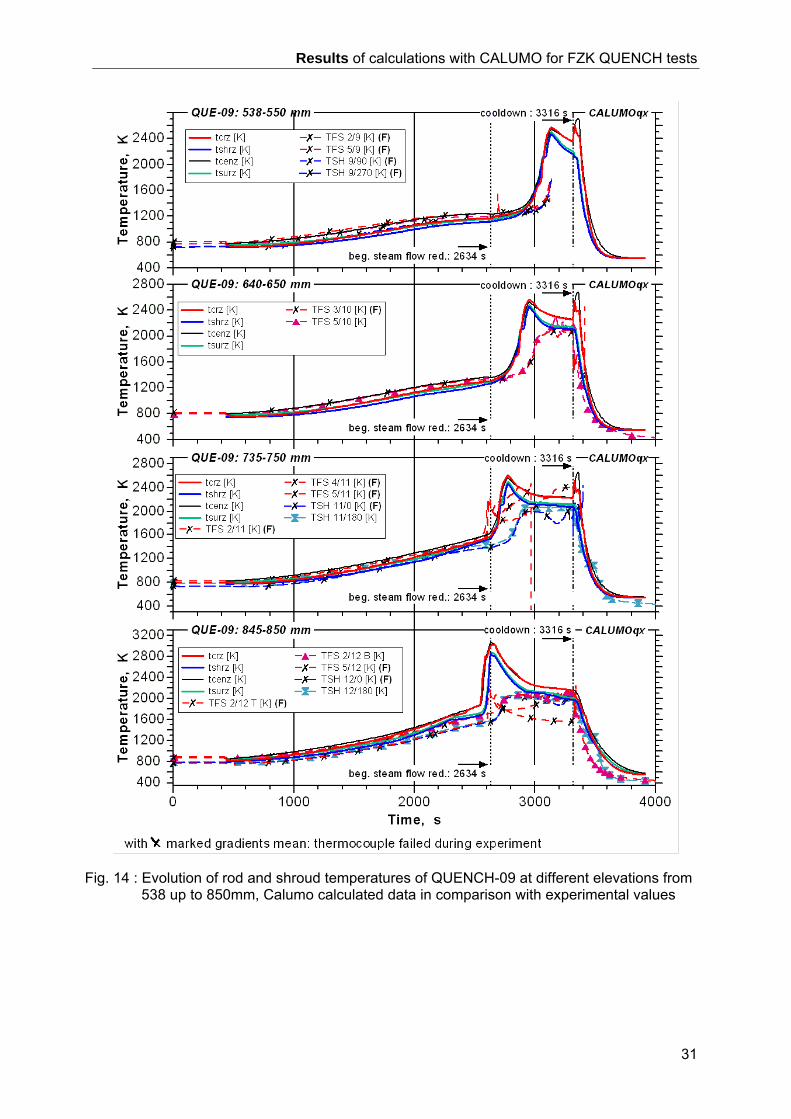
Results of code calculations in comparison to the respective data of the test instrumentation are to be found in Fig.13 to 21. These are the temperature evolutions between 150 and 1250 mm, the axial profiles of oxide scale thickness of the fuel rod simulators and the shroud, and the results on gas production (rates and total production). It should be noted that the calcula-tion starts at about 420 s into the test with the increase of the electrical power and ends at about 3900 s. Many thermocouples failed in the course of the QUENCH-09 test. These fail-ures are indicated by a capital F in the figures. Also, the great extent of test section destruc-tions in the cool-down phase suggests that all the thermocouple readings above about 450 mm in this phase should be taken with caution, all the more as they are only reliable up to about 2400 K.
25

Results of calculations with CALUMO for FZK QUENCH tests
In Figs. 13 to 15 are plotted the mean temperatures in the bundle. They are compared to the available thermocouple readings. In the overall, the temperature evolution in the heated zone during the heat-up phase prior to steam reduction conditions is simulated in a satisfactory way by the code. As the temperature evolution in this part of the test section is mainly de-termined by the electrical heating and by the oxidation we can be rather confident that these effects are correctly simulated by the code. There are some problems with the calculated temperature evolutions in the upper part of the test section, as the measured temperatures rise distinctly faster than the calculated ones. The discrepancy is further enlarged during the steam reduction phase. May be that these are effects of thermocouple guidance.
The steam reduction phase leads to an extension of the hot zone towards lower axial posi-tions in the heated part of the test section. As all the steam has already been consumed in the lower part, the axial profile of electrical heating is changed. This effect is also responsible for the decrease of the measured clad temperatures between 850 and 1050 mm after a tem-perature peak in the first part of the steam starvation phase. This feature is also shown by the calculated temperatures, but not at 1050 mm. The extension of the hot zone calculated by the code is higher by about 100 mm than that suggested by the thermocouple readings, also the calculated temperature increase occurs somewhat earlier. Also, the temperatures rise to much higher values than measured, especially at 450 mm where we find a discrep-ancy of about 1000 K.
A steam starvation model for Zry oxidation could eventually improve the situation. In the pre-sent state of the code only the normal oxidation model is applied with a balance equation on steam consumption in each axial mesh. As soon as a critical steam flow rate is reached, oxi-dation is terminated. Results of code calculations for the evolution of steam flow rate during the steam starvation phase are to be found in Fig. 16. But the use of the Prater/Courthwright correlation /6/ has also considerably contributed to the overestimation of the temperatures.
Up to the onset of the cool-down phase the code yields in the overall a simulation of the ex-periment, which is to some extent satisfying. This is also to be seen in Fig. 17, where meas-ured and calculated hydrogen data are compared. Now, the calculated total hydrogen pro-duction during the cool-down phase is about 200 g, although with the high oxidation rates the numerical errors in the code might be important leading to some overestimation of the hydro-gen production. Also we can not be sure about the amount of steam, which can really enter the fuel rod simulators. Internal oxidation in the upper part of the fuel rod simulators makes an important contribution to hydrogen production during the cool-down phase. Clad disten-sion, clad cracking and split opening is viewed to have led to this effect.
The CALUMO code operates with intact coolant channel, bundle and shroud geometry. It is known from PTE that the test section is completely destroyed above about 750 mm. The pressure transducers indicate rod failure at 2600 s and shroud failure at 2623 s, that means, both failure events occur shortly before the beginning of the steam flow reduction phase. We do not think that these events by themselves invalidate the code calculations for this period.
We hold that the severe destruction of the test section occurred only during the cool-down phase. This is indicated by the failure of the inner cooling jacket and the very high hydrogen production rate. Of course, the CALUMO code has no capabilities to simulate the destruction of the test section and its consequences in a mechanistic way. But it is very important to identify the main reasons which led to the severe destructions. In this respect code calcula-tions are valuable.
The calculated hydrogen production (rate and accumulated value) matches the curves measured by the mass spectrometer rather well after corrections of the experimental data based on findings of PTE on the remaining B4C inventory. The peak in the hydrogen produc-tion rate due to the temperature escalation starting a bit before the steam reduction phase is relatively well met (height and width), as well as the peak in the cool-down phase, indicating the severe quench effect having occurred in QUENCH-09. There is a time offset of about 30 s in the first peak. But it has to be noted that the code calculates hydrogen production, whereas the mass spectrometer measures the released hydrogen at some distance above
26

Results of calculations with CALUMO for FZK QUENCH tests
the test section and with steam starvation the outlet flow velocity is rather low. The fact that the CALUMO code overestimates the temperatures during the steam reduction phase in some axial regions has no consequences for the hydrogen production. The reason is that during this period all the steam injected into the system is completely consumed in the oxida-tion processes. That means that in the upper part of the test section a true steam starvation condition has indeed been reached. This can be inferred from the hydrogen measurements of the mass spectrometer. Of course the assumption of a value of 0.45 g/s for the steam flow rate during the steam reduction phase was essential for this good agreement.
The geometrical effects due to loss of strength and melting of the claddings and shroud are of course very important and can lead to an enhancement of the oxidation rate. As the rise of the hydrogen signal is very steep after the onset of cool-down, we should look for mecha-nisms which are fast enough like break-up of oxide scales and swelling effects in ZrO2/Zry structures after loss of strength. The temperatures calculated in the inner part of the test sec-tion (2500 – 2800 K) are high enough for this to occur. The solidus temperature of ZrO2 de-pends on the oxygen to metal ratio, with values of about 2200 K for O/Me ratios below 1.7. Thus, a steam starvation period should also lead to some reduction of strength in the oxide scales.
A mechanism linked to loss of strength is clad distension followed by cracking and split open-ing, for which we have found in PTE of QUENCH-02, QUENCH-03 /13/ and QUENCH-07 /18/ direct evidence in the upper part of the test section. Whatever the physical reason for this effect might be, an in- pin gas pressure higher than the pressure in the coolant channel or clad distension due to oxidation, the steam can eventually enter the fuel rod simulators leading to inner clad oxidation. This effect could drastically enhance the oxidation rates. We have made sensitivity studies for this effect, assuming a threshold value of 2000 K for the temperature, where distension occurs. As the rise of the temperature is very steep, the exact value of this parameter does not seem to be very important. The increase in rod surface area leads also to an enhancement of the oxidation rate. But this effect is not yet simulated in the code.
A sustained high hydrogen production rate, as was observed by the mass spectrometer but not fully achieved in our sensitivity studies, can be caused by the oxidation of Zr(O) melts, as the oxide scales on these melts do not grow indefinitely but may reach a limiting value. This means that we have no parabolic behavior for the oxidation rate with time but rather a linear one. But as big lumps of molten material have a relatively small surface/volume ratio, the effect of melting should be more important in an early phase of oxide scale cracking and melt relocation than in a late stage with melt accumulation.
For the time being we have no information on the role of Mo in the oxidation process. If the measured hydrogen production values are roughly correct, its contribution must have been significant. Liquefied Mo has most probably been mixed into the Zr(O) melts.
According to the mass spectrometer signals gaseous products of B4C oxidation (CO, CO2, and CH4) are only observed during the cool-down phase. In Fig. 18 – 20 some results of cal-culation concerning control rod behavior are to be found. Fig. 18 shows a comparison of measured and calculated CO/CO2 rates. As the code cannot adequately describe the behav-ior of the test section, when massive destructions with material relocation has occurred, it would be idle to expect that code results could match the experimental observation. But it is encouraging that the calculated maximum production rates are roughly correct.
In the code only the oxidation of boron carbide in steam is modeled, but in the experiment there is also the interaction of eutectic melt with steam, which can contribute to the CO/CO2 production. There are eutectic reactions between the stainless steel cladding and the Zry guide tube and between stainless steel and B4C pellets /21/. A ZrO2 oxide scale at the inside of the guide tube could prevent the interaction between the stainless steel or the respective eutectic melt with the guide tube. Therefore we have started the modeling of eutectic interac-tion processes with that of SS/B4C. Some results are to be seen in Fig. 19 and 20. A maxi-mum value of about 350 µm has been calculated for the eutectic layer thickness. The eutec-
27
Results of calculations with CALUMO for FZK QUENCH tests
tic interaction between SS and Zry, on the other hand, is much faster than the SS/B4C inter-action /12/ and in the meantime we have also implemented the respective correlation in the CALUMO code. But the respective model was not available, when the calculations for QUENCH-09 have been done. Oxide scale formation at the inside of the guide tube was pre-sumably insufficient to prevent the SS/Zry reaction. It could be that the steam flow through the lower boreholes was insufficient, but we have also indications from post test examina-tions that there was local contact between the guide tube and the SS cladding due to bend-ing of the control rod. At these locations we would in any case have obtained the eutectic reaction as no oxide scale has been formed there.
A He signal has been observed by the mass spectrometer a bit before 2300 s, indicating failure of the control rod. As this is not accompanied by any CO/CO2 signal we can conclude that the outer ZrO2 scale on the guide tube prevented the release of eutectic melt into the coolant channel. The coolant channel within the guide tube was presumably also blocked by eutectic melt. A small CO peak was observed by the MS between 2593 and 2666 s, indicat-ing probably a release of some eutectic melt into the coolant channel. With the onset of steam flow reduction at 2636 s, steam starvation conditions were then established at the location of eutectic melt release after a short time period. Massive oxidation of the eutectic melt and of uncovered B B4C pellets occurred when the steam flow rate was increased in the cool-down phase.
These experimental findings on CO/CO2 production were taken into account by operating the BORCA model only during the cool-down phase. The eutectic model is only applied up to clad melting. Molten steel plus eutectic melt is then draining downwards and accumulating at lower axial locations, where the eutectic interaction between steel and BB4C can continue and also that with the guide tube. But as relocation processes are not yet implemented in the code, this effect cannot be simulated.
Downwards relocation of molten material from the upper part of the test section was an im-portant mechanism during the cool-down phase. This led to a prolonged heating of the test bundle above about 580 mm axial height and thus might explain the second peak in the CO/CO2 production rates measured by the mass spectrometer. Of course, this effect cannot yet be simulated by the code and the second peak is therefore not reproduced in the calcula-tion. The same is true for the oxidation of eutectic melt, which has been released into the coolant channel. This process could contribute considerably to CO/CO2 production.
The steam flow reduction phase led to dissolution and rearrangement effects of the oxygen distributions in the oxide scales. These effects depend mainly on the temperature, on the scale thickness, and on the duration of the steam starvation condition. Thus, the highest ef-fects are expected in the upper non-heated part of the test section. In Fig.21 are plotted re-spective axial distributions of the cladding oxide scale thickness for different times into the steam starvation phase calculated with the code version CALUMOQXD, which has a mecha-nistic model for oxygen diffusion. Towards the end of this phase the scale thickness above about 1100 mm was very low. This led to a strong escalation of calculated temperatures in this axial region starting with the onset of cool-down. The thermocouple readings gave only faint indications for this effect, but it should be noted that all thermocouples above about 750 mm having still been intact at the onset of the cool-down phase must have failed with the destruction of the test section. The calculated temperatures reach 3000 K and more. Thus, they are above the melting temperature of the Mo electrodes (ca 2850 K). In view of these calculated temperatures the destruction of the test section and the very high hydrogen pro-duction rates, as measured by the mass spectrometer are to be expected. From the thermo-couple readings alone these severe quench effect would not have been expected. Only at 1350 mm there is a faint indication for a strong temperature increase in the cool-down phase. The thermo-couples in the upper part of test section must have failed during the cool-down phase eventually with formation of new measuring points.
The strong temperature escalation as calculated by the code in the upper part of the test section concern the whole bundle and the shroud. This can also be taken from Fig. 22,
28

Results of calculations with CALUMO for FZK QUENCH tests
where axial distributions of the respective oxide scale thickness values at the beginning of the steam reduction phase and at its end as well as at the time-end of the calculation are plotted.
At the beginning of the steam reduction phase the oxidation ranges between about 700 and 1000 mm with the maximum value at about 900 mm. For inner fuel rod simulators oxidation is practically complete at this axial location. During the steam reduction phase the oxidation zone extends downwards to about 400 mm with values of about 500 µm for the fuel rod simulators and the shroud.
During the cool-down phase occurs further oxidation of fuel rod simulators and the shroud, especially in the upper part of the test section. All the inner fuel rod simulators are practically completely oxidized above about 400 mm. The peak in the shroud oxidation at 500 mm is probably a consequence of the temperature peak at the end of the steam reduction phase in this axial region. The oxidation of the shroud in the upper part is not yet complete in contrast to the fuel rod simulators.
Despite the severe destruction of the test section some measurements of the oxide scale thickness of fuel rod simulators could be done. The experimental values are to be found in Fig.23 in comparison with the calculated profiles. The strong oxidation between 400 and 500 mm bundle height calculated by the code is not supported by the experimental data, but the fuel rod simulators are practically completely oxidized only above about 560 mm bundle height . This is another confirmation for the fact that the temperature escalation in the lower part of the test occurring during the steam reduction period is overestimated by the code.
The mechanisms in the upper part of the test section were determinant for the course of the accident in QUENCH-09. The most important ones were the dissolution of the oxide scales during the steam reduction phase leading to a very strong oxidation with the re-entry of the steam. Clad distension, cracking, and split opening further enhance the oxidation rate. The complete breakdown of the bundle structure follows, as the liquefaction or may be even the melting temperature of the Mo electrodes has been crossed.
29

Results of calculations with CALUMO for FZK QUENCH tests
Fig. 13 : Evolution of rod and shroud temperatures of QUENCH-09 at different elevations from 128 up to 450mm, Calumo calculated data in comparison with experimental values
30
Results of calculations with CALUMO for FZK QUENCH tests
Fig. 14 : Evolution of rod and shroud temperatures of QUENCH-09 at different elevations from 538 up to 850mm, Calumo calculated data in comparison with experimental values
31
Results of calculations with CALUMO for FZK QUENCH tests
Fig. 15 : Evolution of rod and shroud temperatures of QUENCH-09 at different elevations from 947 up to 1250mm, Calumo calculated data in comparison with experimental values
32

Results of calculations with CALUMO for FZK QUENCH tests
0.0
0.5
Stea
mflo
w,
g/s
0,0
0,5
1.0
2.0
3.0
4.0
1,0
2,0
3,0
CALUMOqxdQuench-09
Stea
mflo
w,
g/s
0 50 100Ax. position, cm
t= 2518 st= 2734 st= 2946 st = 3126 st = 3301 s
Fig. 16 : Axial distributions of the steam flow rate at different times during the steam reduction.
Fig. 17 : Evolution of the hydrogen production rate and the overall produced hydrogen for QUENCH-09
33

Results of calculations with CALUMO for FZK QUENCH tests
Fig. 18 : CO and CO2 production rate and the integrated values of the CO and CO2 rates for QUENCH-09
0
1
2
3
4
CALUMOqxQuench-09
Eute
ctic
volu
me,
cm3
0
1
2
3
4
5
Eute
ctic
volu
me,
cm3
0 2000 4000Time, s
Fig. 19 : Volume increase due to eutectic in-teraction between B4C and ss clad-ding
34

Results of calculations with CALUMO for FZK QUENCH tests
Fig. 20 : Control rod temperature and the eutectic layer thickness between B B4C and ss cladding
Fig. 21 : Oxide scale thickness in the upper part of the test section during steam reduction
0250500750
1000125015001750
Quench-09 CALUMOqx
Scal
eth
ickn
ess,
µm
dox [µm]doxsh [ m]µdoxa [ m]µdoxcz [µm]
Beginning of steam flow reduction from 3 g/s down to 0.3 g/s, time = 2634 s
0
500
1000
1500
2000
2500
3000
Scal
eth
ickn
ess,
µm
End of steam flow reduction phase, time = 3313 s
0
1000
2000
3000
4000
Scal
eth
ickn
ess,
µm
0 200 400 600 800 1000 1200 1400Bundle elevation, mm
End of the experiment
Fig. 22 : Axial distribution of the oxide scale thickness at the beginning and end of steam flow reduction and at the end of QUENCH-09
35

Conclusions
Fig. 23 : CALUMO calculated data in comparison with measured values for the oxide scale thickness at the end of the experiment QUENCH-09
5 Conclusions The temperature escalations lead to strong peaks in the hydrogen production rate starting distinctly before re-flooding in some tests. In case of the tests QUENCH-04, QUENCH-05, and QUENCH-06 re-flooding led to a rather abrupt termination of the temperature escala-tions. Therefore in these cases the width of the hydrogen peaks is rather small but with re-flooding appears a second peak with a much smaller height than the first. This second peak seems to be a proper quench effect, most probably due to through-wall crack formation in the oxidized claddings and renewed oxidation of free metallic surfaces, an effect most probably due to a tetragonal to monoclinic phase change in the oxide /22/.
But in the tests QUENCH-02, QUENCH-03, QUENCH-07 and QUENCH-09 the conse-quences of the temperature escalations were much more severe with considerable hydrogen production and damage in the bundles and in the structures. A viable mechanism for the trig-ger of this severe quench effect might be clad distension, cracking, and split opening in the upper unheated part of the test section, leading to an enhancement of the oxidation rate due to the increase of the surface area of the claddings and eventually to internal oxidation of the claddings. A rough estimate of the inner clad oxidation yielded that this effect could contrib-ute up to 1 g/s and even more to the hydrogen production rates for some time period. Evi-dence for clad distension effects in the upper non-heated part of the test section has been found in PTE of QUENCH-02, QUENCH-03 /13/, QUENCH-07 /18/, and QUENCH-09 /19/. The effect is due to loss of strength in the claddings with the attainment of high temperatures
36

Conclusions
the oxide scale thickness still being relatively small. With thick oxide scales, no clad disten-sion would occur, as the oxide scale itself seems to have sufficient strength. The boundaries on temperature, temperature increase rate, and oxide scale thickness, where clad distension occurs cannot be determined from integral tests. But it may be that relevant out-of-pile me-chanical tests with Zry claddings under steam atmosphere have been done in the past. The results of these tests could then eventually be used as a guideline. A steam starvation phase prior to re-flooding, as in the test QUENCH-09, can have rather severe consequences, as this can lead to a complete dissolution of the oxide scales in the upper part of the test section during the steam starvation phase and consequently to very high oxidation rates in the re-flooding phase. Clad distension in QUENCH tests is presumably not due to an overpressure in the fuel rod simulators, as the rods have failed prior to cool-down. But the effect is viewed to be caused by growth stresses in the cladding. Under bi-axial oxidation strain we would have compressive stresses in the oxide scale and tensile stresses in the metallic substrate.
We consider clad distension as a very important phenomenon in QUENCH tests. It is viewed to have led to overheating and severe destructions in the upper part of the test section in some tests. We think that it would also occur under reactor conditions. There are some indi-cations of clad distension effects also found in the upper part of QUENCH-08. But the effects are much less pronounced than in the other high destructive tests. Also there is much less hydrogen production in the cool-down phase than for example in QUENCH-07, although both tests were very similar in their test conditions. It can be surmised, that when a certain thresh-old in the temperature in the upper part is crossed the test evolves in a violent way. This would mean that in QUENCH-08 we were presumably just at the brink of a massive destruc-tion in the upper part of the test section. Severe destruction of the test section could most probably avoided by the use of inert gas as a quench medium. He would be the best candi-date for this aim. Of course, this would imply a new safety concept for LWR’s.
As concerns the effects of molten material, of primary importance is the surface area ex-posed to steam. If we have only one or a few big accumulations of molten material the oxida-tion rate would be much smaller than in case of a dispersal into many small droplets. It seems that in QUENCH-07 and QUENCH-09 the so-called diffusion limit has been reached for a certain time period during cool-down, when a lot of molten material was present in the test section, as all the steam was consumed for a certain period during cool-down. This would mean that the oxidation rate was then determined by convective diffusion in the gas phase and not by the properties of the melt. This would also mean that an increase of the steam flow rate has then detrimental effects. The use of an inert gas for cooling like Ar or He would then represent a great advantage.
The calculations of FZK QUENCH tests have shown that CALUMO is a valuable tool for the simulation of the experimental conditions in these tests. Of course, some improvement of the modeling is still needed especially with regard to the relocation of molten material and the oxidation of melts. One big advantage of the code is the possibility to implement new models for material behavior rather easily and to test different oxidation correlations of Zry.
37

References
References /1/ L. Sepold, et al., Reflooding experiments with LWR-type fuel rod simulators in the QUENCH facility,
Nucl. Eng. Des. 204 (2001) 205-220 /2/ H. Steiner, M. Heck, The code CALUMO a tool for the analysis of temperature transients in QUENCH tests,
report FZKA 6501 (2000) /3/ W.H. Mc Adams, W.E. Kennel, J.N. Emmons, Heat transfer to superheated steam at high pressures, Trans. ASM E 72:421 (1950) /4/ C.R. Wilke, J. Chem. Phys. 18 (1950) 517 /5/ S. Leistkow, et al., Kinetik und Morphologie der isothermen Dampfoxidation von Zircaloy-4 bei 700 bis
1300°C, Report KFK 2587 (1978) /6/ J.T. Prater, E.L. Courthright, Zircaloy-4 Oxidation at 1300 to 2400 0C, NUREG/CR-4889 (1987) /7/ M. Moalam, D.R. Olander, Oxidation of Zircaloy by Steam,
J. Nucl. Mater. 182 (1990) 170-194 /8/ H. Steiner, Modeling of Boron Carbide Oxidation and Boric Acid Formation, Proceedings of
Jahrestagung Kerntechnik 2003, Berlin, 20.-22. Mai 2003 Berlin: INFORUM GmbH, 2003, S. 129-36 /9/ M. Steinbrück, et al., Experiments on the Oxidation of Boron Carbide at High Temperatures,
report FZKA 6979 (2004) /10/ Verein Deutscher Ingenieure, VDI-Wärmeatlas Berechnungsblätter für den Wärmeübergang, 8. Auflage 1997, Sprin-
ger-Verlag Berlin Heidelberg /11/ P. Hofmann, et al., Reactor Core Materials Interactions at Very High Temperatures,
Nucl. Tech. 87, 146-186(1989) /12/ P. Hofman, et al., Results of Separate-Effects Tests: Influence of cladding oxidation on chemical interac-
tions with other bundle components, Contr. to the Intern. CORA Workshop Karlsruhe, Oct. 1-4, 1990
/13/ P. Hofmann, et al., QUENCH-01, Experimental and Calculational Results,
report FZKA 6100 (1998)
38
References
/14/ P. Hofmann, et al., Experimental and Calculational Results of the Experiments QUENCH-02 and QUENCH-
03, report FZKA 6295 (2000) /15/ L. Sepold, et al., Investigation of an Overheated PWR-Type Fuel Rod Simulator Bundle Cooled Down by
Steam Part I: Experimental and Calculational Results of the Experiment QUENCH-04,
report FZKA 6412 (2002) /16/ L. Sepold, et al., Experimental and Calculational Results of the QUENCH-05 Test,
report FZKA 6615 (2002) /17/ L. Sepold, et al., Experimental and Calculational Results of the QUENCH-06 Test (OECD ISP-45),
report FZKA 6664 (2002) /18/ M. Steinbrück, et al., Results of the B4C Control Rod Test QUENCH-07, report FZKA 6746 (2003) /19/ M. Steinbrück, et al., Results of the QUENCH-09 Experiment with a B4C Control Rod,
report FZKA 6829 (2003) /20/ J. Stuckert, et al., Experimental and Computational Results of the QUENCH-08 Experiment,
report FZKA 6970 (2005) /21/ M. Steinbrück, et al., Degradation and Oxidation of B4C Control rod Segments at High Temperatures,
report FZKA 6980 (2004) /22/ H. Steiner, M. Heck, Stresses in an Oxidized Zircaloy Cladding Under Quench Conditions: Recalculation of
Single-Rod Quench Tests, Nucl. Techn. Vol. 123 pp. 209 – 221 (1998)
39

40


![FORSCHUNGSZENTRUM KARLSRUHE Technik und Umwelt ...digbib.ubka.uni-karlsruhe.de/volltexte/fzk/6470/6470.pdf · welcher zuvor Myonankunftszeiten des Chacaltaya Experiments [Kak 83]](https://static.fdokument.com/doc/165x107/5d5c0b1488c9939d4a8bca78/forschungszentrum-karlsruhe-technik-und-umwelt-welcher-zuvor-myonankunftszeiten.jpg)