Charakterisierung potentiell pathogener Vibrio spp ... · Furthermore, we proved that the...
61
MASTERARBEIT vorgelegt zur Erlangung des Grades eines Master of Science an der Fakultät für Biologie und Biotechnologie der Ruhr-Universität Bochum Charakterisierung potentiell pathogener Vibrio spp. mittels rpoB- DHPLC (Denaturierender Hochdruck Flüssigkeitschromatographie) von Nadja Lückheide angefertigt im Lehrstuhl für Evolutionsökologie und Biodiversität der Tiere in Kooperation mit dem Alfred-Wegener-Institut, Helmholtz-Zentrum für Polar- und Meeresforschung Bochum, im Mai 2013 Betreuer: Frau Dr. Wichels, Herr Dr. Gerdts Referent: Herr Prof. Dr. Tollrian Korreferent: Herr Prof. Dr. Narberhaus
Transcript of Charakterisierung potentiell pathogener Vibrio spp ... · Furthermore, we proved that the...
MASTERARBEIT
vorgelegt zur Erlangung des Grades eines Master of Science
an der Fakultät für Biologie und Biotechnologie der Ruhr-Universität Bochum
Charakterisierung potentiell pathogener Vibrio spp. mittels rpoB-
DHPLC (Denaturierender Hochdruck
Flüssigkeitschromatographie)
von
Nadja Lückheide
angefertigt im Lehrstuhl für Evolutionsökologie und Biodiversität der Tiere in
Kooperation mit dem Alfred-Wegener-Institut, Helmholtz-Zentrum für Polar- und
Meeresforschung
Bochum, im Mai 2013
Betreuer: Frau Dr. Wichels, Herr Dr. Gerdts
Referent: Herr Prof. Dr. Tollrian
Korreferent: Herr Prof. Dr. Narberhaus
2
MASTERTHESIS
submitted in partial fulfillment of the requirements for the degree Master of Science
at the faculty for biology and biotechnology of the Ruhr-University Bochum
Characterization of potentially pathogenic Vibrio spp. by rpoB-
DHPLC (Denaturing High Performance Liquid Chromatography)
by
Nadja Lückheide
conducted at the department of Animal Ecology, Evolution and Biodiversity in
cooperation with the Alfred-Wegener Institute, Helmholtz Centre for Polar and Marine
Research
Bochum, May 2013
Supervisors: Dr. Wichels, Dr. Gerdts
Reviewer: Prof. Dr. Tollrian
Second Reviewer: Prof. Dr. Narberhaus
3
This thesis was conducted at
the “Biologische Anstalt Helgoland” (BAH)
of the Alfred-Wegener Institute, Helmholtz Centre for Polar and Marine Research
Kurpromenade 201
27498 Helgoland
Supervisors: Dr. Wichels and Dr. Gerdts
E-Mail: [email protected]; [email protected]
4
TABLE OF CONTENTS
Abstract ................................................................................................................................................... 6
1. Introduction ..................................................................................................................................... 7
1.1. The genus Vibrio and its pathogenicity ................................................................................... 7
1.2. How climate change correlates with the abundance of Vibrio species .................................. 8
1.3. Distribution and spread of potentially pathogenic Vibrio spp. ............................................... 9
1.4. Identification of Vibrio spp. ................................................................................................... 10
1.5. Characterization of Vibrio spp. by rpoB-DHPLC (Denaturing High Performance Liquid
Chromatography) .............................................................................................................................. 11
1.6. Research Aims ....................................................................................................................... 13
2. Material and Methods ................................................................................................................... 14
2.1. Material .......................................................................................................................................... 14
2.1.1. Equipment and consumables .................................................................................................. 14
2.1.2. Chemicals................................................................................................................................. 15
2.1.3. Complete Systems ................................................................................................................... 15
2.1.4. Culture Media .......................................................................................................................... 16
2.1.5. Buffer ....................................................................................................................................... 16
2.1.6. Enzymes ................................................................................................................................... 17
2.1.7. Software .................................................................................................................................. 17
2.1.8. Oligonucleotides ...................................................................................................................... 18
2.1.9. Bacterial Strains ....................................................................................................................... 19
2.1. Methods .................................................................................................................................... 20
2.2.1. Molecular Comparison of Vibrio sequences ........................................................................... 20
2.2.2. Development of Vibrio rpoB-targeting PCR primers ............................................................... 20
2.2.3. Cultivation ............................................................................................................................... 21
2.2.4. DNA extraction ........................................................................................................................ 22
2.2.5. Quantification and analysis of genomic DNA .......................................................................... 22
2.2.6. Polymerase chain reaction (PCR) ............................................................................................ 22
2.2.6.1. Vibrio specific PCR ........................................................................................................... 23
2.2.7. Microchip electrophoresis ....................................................................................................... 24
2.2.8. DHPLC conditions .................................................................................................................... 25
3. Results ........................................................................................................................................... 27
3.1. Molecular Comparison ............................................................................................................... 27
3.2. Design of Vibrio specific rpoB-primers ....................................................................................... 28
5
3.3. DNA Extraction ........................................................................................................................... 30
3.4. PCR .............................................................................................................................................. 31
3.4.1 Optimization of PCR parameters .............................................................................................. 31
3.4.2. Amplification of Vibrio isolates ............................................................................................... 33
3.5. Optimization of DHPLC parameters ........................................................................................... 35
3.5.1. Variation of column temperature ........................................................................................... 36
3.5.2. Variation of the acetonitrile gradient ...................................................................................... 39
3.5.3. Adaptation of PCR-DHPLC protocol by attachment of a 40 bp GC-clamp............................... 40
3.5.3.1. Variation of column temperature ........................................................................................ 41
3.5.3.2. Variation of acetonitrile gradient ......................................................................................... 43
3.5.4. Application of all Vibrio isolates .............................................................................................. 44
4. Discussion ...................................................................................................................................... 47
4.1. Design of Vibrio specific Primers ........................................................................................... 47
4.2. Cultivation and DNA extraction ............................................................................................. 48
4.3. Optimization of PCR parameters ........................................................................................... 48
4.4. Amplification of Vibrio isolates ............................................................................................. 49
4.5. DHPLC .................................................................................................................................... 50
4.5.1. Variation of the column temperature and acetonitrile gradient ...................................... 50
4.5.2. Adaptation of PCR-DHPLC by attachment of a 40 bp GC-clamp ....................................... 52
4.5.3. Application of all Vibrio isolates ........................................................................................ 52
4.6. Conclusion and Outlook ........................................................................................................ 56
5. Literature ....................................................................................................................................... 57
6. Appendage .................................................................................................................................... 61
7. Acknowledgements ....................................................................................................................... 61
6
Abstract
Rising sea water temperature due to global warming enhances the conditions for Vibrio spp.
to grow and disperse even in temperate waters of the North and Baltic Sea. Because of the
increased incidence of Vibrio infections in the last years, a rapid and accurate method is
required to analyze and identify complex Vibrio spp. populations, specifically potential
pathogenic Vibrio species, in environmental samples. A PCR-DHPLC (Denaturing High
Performance Liquid Chromatography) has been developed based on the rpoB gene of the
genus Vibrio, which is a promising method to not only identify but also separate Vibrio spp.
in mixed samples due to their different running characteristics of amplified PCR products.
To facilitate the identification of potential human-pathogenic species we designed Vibrio
specific primers based on rpoB sequences of Vibrio spp. strains isolated at Helgoland Roads
(North Sea). These primers were combined to amplify fragments of 100-400 bp of this rpoB
gene. Using the PCR products of four different Vibrio species, we systematically improved
the DHPLC conditions, including column temperature and acetonitrile gradient. Finally, we
compared the PCR-fragment separation with and without a 40-bp clamp attached to the
amplification primers.
We developed primer-sets for rpoB-DHPLC and verified the primer-sets by successful
amplification of 20-23 different Vibrio species from a total number of 31. We showed that for
optimal identification and separation of the amplified fragments by DHPLC adaptation of
column temperature, acetonitrile gradient as well as attachment of GC-clamp to the respective
primer was essential. Furthermore, we proved that the rpoB-DHPLC assay is a sensitive tool
to differentiate between Vibrio species, but is limited for Vibrio isolates with a similar GC-
content. We investigated that not only the amount of variability in the rpoB-gene is the
discriminative factor for separation in the DHPLC-system, also the GC-content, amplicon-
length and melting-domains play are determining for optimal differentiation of Vibrio species.
In conclusion, rpoB-DHPLC is a promising perspective to identify and separate Vibrio spp. in
mixed samples, considering primer-sets meeting the findings described above.
7
1. Introduction
1.1. The genus Vibrio and its pathogenicity
The name Vibrio derives from the Italian physician Filippo Pacini who discovered Vibrio
cholerae (V. colerae) in 1854 (Thompson, Iida et al. 2004). Bacteria of the genus Vibrio
belong to the Gammaproteobacteria, are gram-negative, primarily facultative anaerobe
curved rods, found in aquatic habitants and in association with eukaryotes (Thompson, Iida et
al. 2004; Farmer, Janda et al. 2005). The genus Vibrio is a highly diverse group with about 63
species, of which 13 are described as human pathogen species (Eiler and Bertilsson 2006;
Eiler, Johansson et al. 2006) including the species V. cholerae, the causative agent for the
cholera disease. Infections caused by the pathogen V. cholerae are of major importance in
developing countries with a low standard of sanitary conditions. The recent annual report of
“The World Health Organization” (2011) noticed at least 589.854 worldwide cholera
infections including 7816 deaths in a total of 58 countries (http://www.who.int/wer). The two
most important human pathogenic Vibrio spp. besides V. cholera are V. parahaemolyticus and
V. vulnificus. V. parahaemolyticus, for instance, is worldwide the causative agent for
foodborne gastroenteritis outbreaks (Yeung and Boor 2004) caused by ingestion of raw or
undercooked seafood as well as contact with contaminated sea water. Infections with V.
vulnificus are much rarer but can cause wound infections or primary septicemia most notably
in immunocompromised persons (Thompson, Iida et al. 2004; Drake, DePaola et al. 2007).
The Centers for Disease Control and Prevention reported that bloodstream infections induced
by V. vulnificus are fatal about 50 % of the cases (Prevention 1996).
In addition to human illnesses, Vibrio can also affect marine organisms, e.g. bivalves,
particularly oyster, fish, shrimp or corals. Coral bleaching have increased dramatically since
the last few decades and leads to coral reef degradation worldwide. However, it has been
discovered that of eight pathogens associated with coral diseases, four belong to the family of
Vibrionaceae (Kushmaro, Banin et al. 2001; Ben-Haim, Thompson et al. 2003).
Rising Vibrio infections in humans and massive infections of bivalve-populations have
already been observed in the past in connection with an increasing growth rate during the
summer months (Hsieh, Fries et al. 2007; Paz, Bisharat et al. 2007; Blackwell and Oliver
2008). Due to the worldwide trade, shipping lanes and fishery industry and in terms of global
warming a higher rate of Vibrio infections are predictable.
8
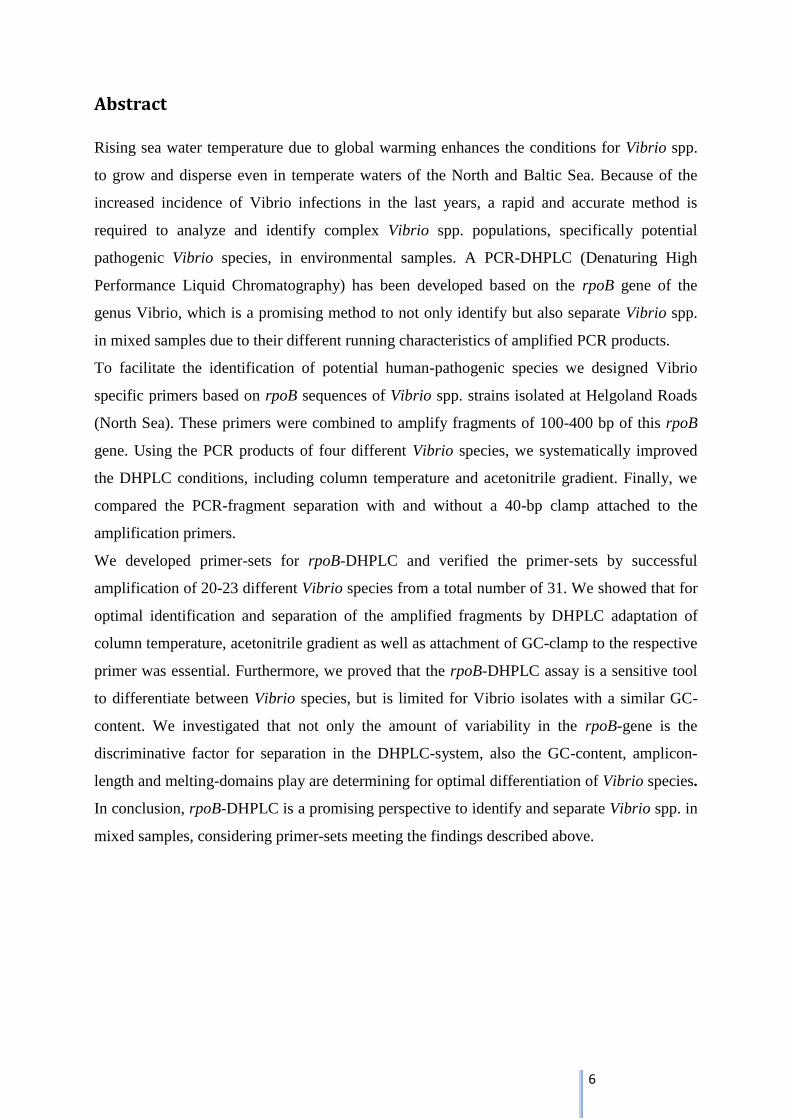
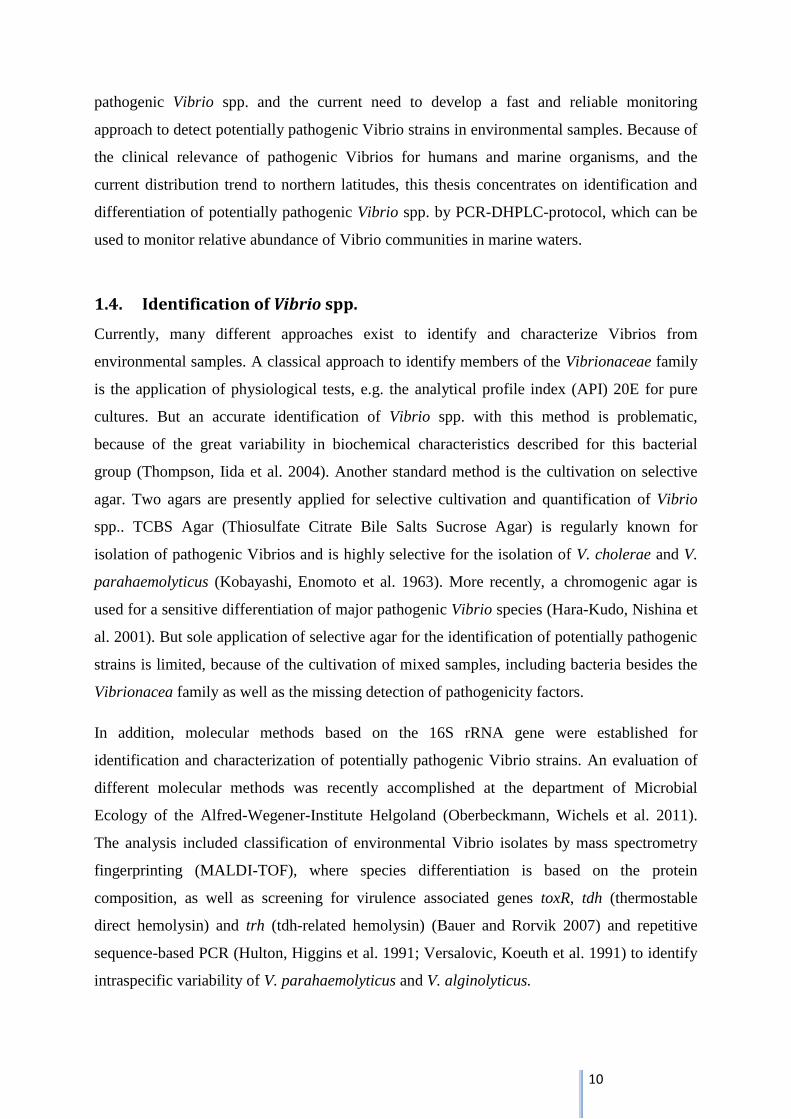
1.2. How climate change correlates with the abundance of Vibrio species
Warming of the climate system is unambiguous showing records of increased global air and
ocean temperatures, widespread melting of glaciers and ice caps, and rising average sea level.
Global average temperatures have increased by nearly 0.8 °C and the mean sea surface
temperatures (SST) by approximately 0.7 °C since the late nineteenth century (Trenberth
2007). Also a rapid warming of European Seas has been observed, with the Baltic, North, and
Black Seas showing the greatest increasing temperatures (Fig. 1). A long term series, carried
out by the Alfred-Wegener Institute for Polar and Marine research, even showed significantly
risen sea surface temperatures by a mean value of 1.67 °C since 1962 for Helgoland Roads
(Wiltshire, Malzahn et al. 2008). In addition to the rising temperatures a reduction in salinity
in estuaries and coastal wetlands is expected (Hakkinen 2002). Furthermore, significant
changes in the German Bight for light and nutrient conditions have been detected over the last
45 years (Wiltshire, Kraberg et al. 2010).
Fig. 1: Net Sea Surface
Temperature change (°C)
in Large Marine
Ecosystems, 1982-2006.
Rapid warming (red and
pink) is among other areas
observed in the European
Seas (Belkin 2009).
These global changes will definitely influence the marine ecological system (Harley, Randall
Hughes et al. 2006). For example, increasing sea water temperatures are in important factor in
the proliferation of many microbial mediated infectious diseases (Baker-Austin, Stockley et
al. 2010) and changes in bacterial community structures also might influence the population
dynamics of Vibrio species (Vibrio spp.). Typically, the abundance of pathogenic Vibrio spp.
is reported for warmer regions, but in consequence to the rising sea temperatures potentially
pathogenic Vibrio spp. could become significant even in temperate zones, like the North and
Baltic Sea (Colwell 1996; Paz, Bisharat et al. 2007; Baker-Austin, Stockley et al. 2010).
9
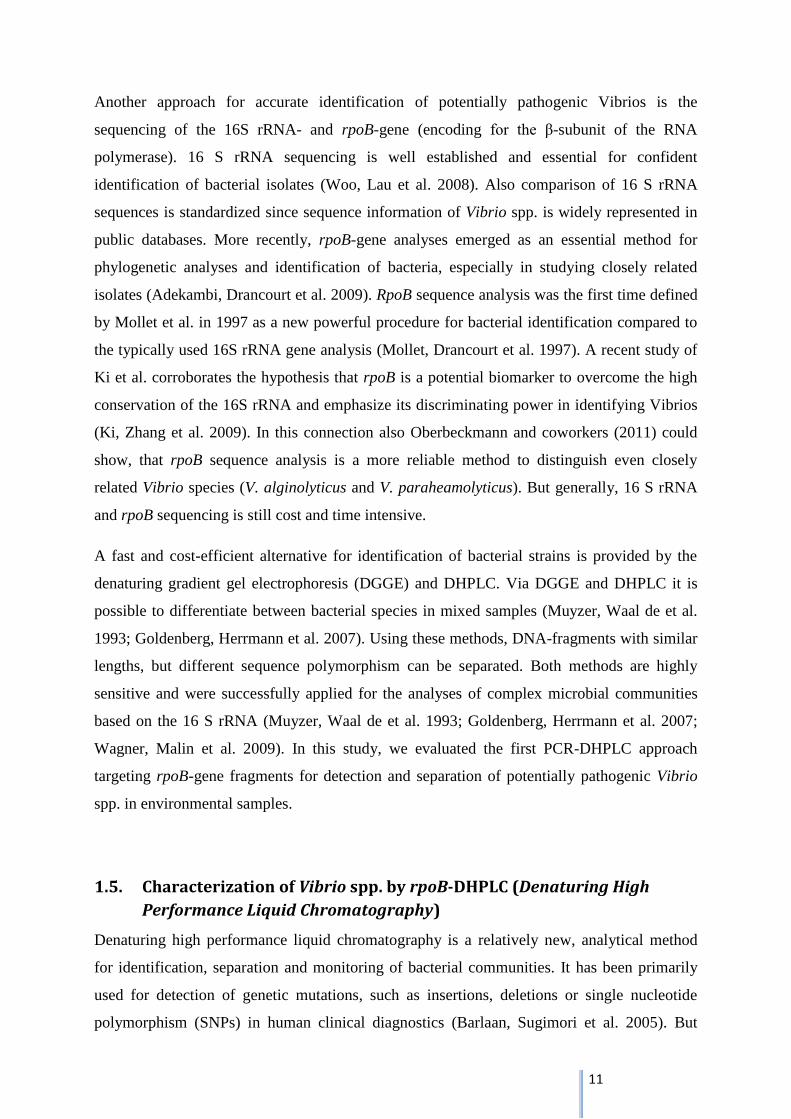
1.3. Distribution and spread of potentially pathogenic Vibrio spp.
Pathogenic Vibrio spp. are widely distributed in estuarine and marine environments,
commonly reported in the USA and in many Asien countries, but also become significant in
European waters (Baker-Austin, Stockley et al. 2010). The highest concentration of
pathogenic Vibrio is generally stated in the summer months when water temperatures are
rising (Hsieh, Fries et al. 2007; Paz, Bisharat et al. 2007; Blackwell and Oliver 2008). A
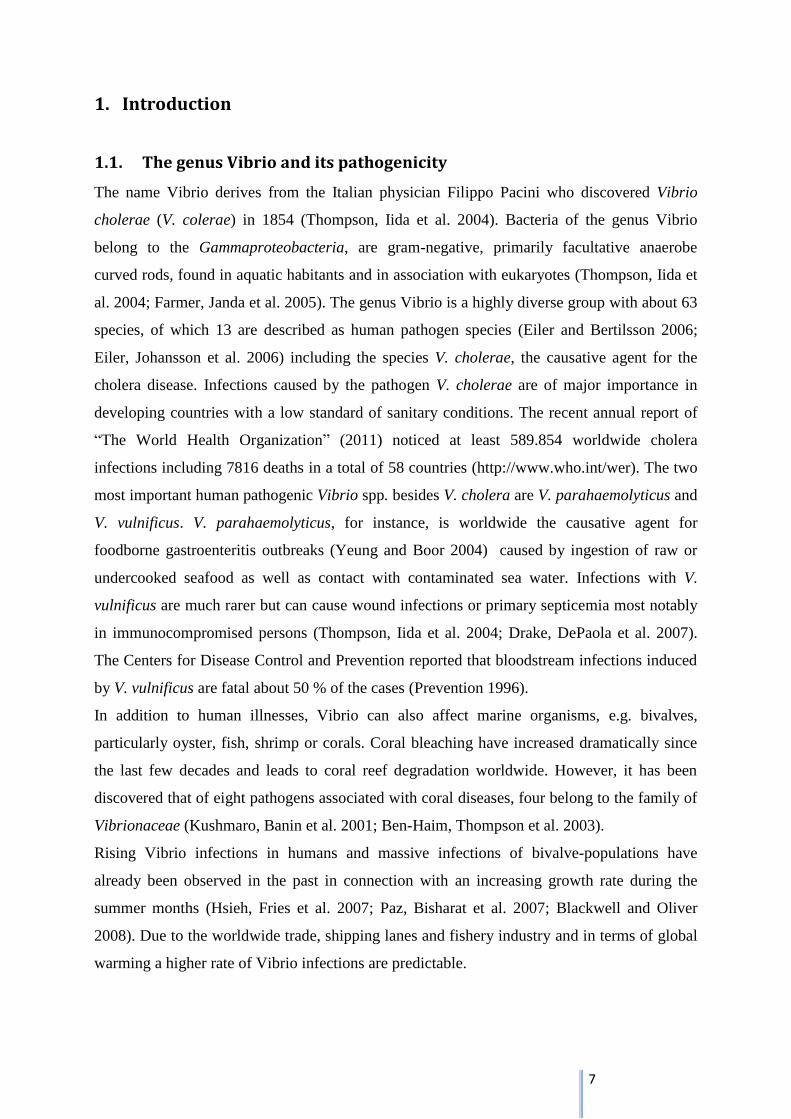
previous long-term study of Oberbeckmann and coworkers (2011) correspondingly
demonstrates a positive correlation of the occurrence of Vibrio spp. with the rising seasonal
sea surface temperatures for the German Bight.
Fig. 2: Log-transformed abundances of free-living Vibrio spp. between May 2008 and December 2009;
crosses indicate sampling days (Oberbeckmann, Wichels et al. 2011)
In addition to rising temperature, other abiotic and biotic factors have been described
influencing the abundance of Vibrios, like salinity, nutrient concentrations, and the presence
of other aquatic organisms such as plankton. However, temperature and salinity have been
recognized as the major predictive factors in Vibrio occurrence (Randa, Polz et al. 2004;
Hsieh, Fries et al. 2007; Wetz, Blackwood et al. 2008), correlating with the fact that Vibrio
spp. grow preferentially in warm (>15 °C), low-salinity (<25 ppt NaCl) sea water (Baker-
Austin, Stockley et al. 2010).
The worldwide globalization is also a central factor, which promotes the spread of pathogenic
Vibrio spp.. The highly pathogenic V. parahaemolyticus pandemic clone O3:K6 caused
outbreaks of sever gastroenteritis worldwide. It was first detected in South Asia (Okuda,
Ishibashi et al. 1997) and spread from there to the United States (Daniels, Ray et al. 2000),
America (Gonzalez, Cachicas et al. 2005; Cabanillas-Beltrán, LLausás-Magaña et al. 2006),
Africa (Ansaruzzaman, Lucas et al. 2005) and even reached Europe (Martinez-Urtaza,
Lozano-Leon et al. 2004). Quite recently, isolation of the pandemic Vibrio parahaemolyticus
from Pacific oysters, harvested in Southern England has been reported (Powell, Baker-Austin
et al. 2013). This finding highlights the expanding geographical distribution of highly
10
pathogenic Vibrio spp. and the current need to develop a fast and reliable monitoring
approach to detect potentially pathogenic Vibrio strains in environmental samples. Because of
the clinical relevance of pathogenic Vibrios for humans and marine organisms, and the
current distribution trend to northern latitudes, this thesis concentrates on identification and
differentiation of potentially pathogenic Vibrio spp. by PCR-DHPLC-protocol, which can be
used to monitor relative abundance of Vibrio communities in marine waters.
1.4. Identification of Vibrio spp.
Currently, many different approaches exist to identify and characterize Vibrios from
environmental samples. A classical approach to identify members of the Vibrionaceae family
is the application of physiological tests, e.g. the analytical profile index (API) 20E for pure
cultures. But an accurate identification of Vibrio spp. with this method is problematic,
because of the great variability in biochemical characteristics described for this bacterial
group (Thompson, Iida et al. 2004). Another standard method is the cultivation on selective
agar. Two agars are presently applied for selective cultivation and quantification of Vibrio
spp.. TCBS Agar (Thiosulfate Citrate Bile Salts Sucrose Agar) is regularly known for
isolation of pathogenic Vibrios and is highly selective for the isolation of V. cholerae and V.
parahaemolyticus (Kobayashi, Enomoto et al. 1963). More recently, a chromogenic agar is
used for a sensitive differentiation of major pathogenic Vibrio species (Hara-Kudo, Nishina et
al. 2001). But sole application of selective agar for the identification of potentially pathogenic
strains is limited, because of the cultivation of mixed samples, including bacteria besides the
Vibrionacea family as well as the missing detection of pathogenicity factors.
In addition, molecular methods based on the 16S rRNA gene were established for
identification and characterization of potentially pathogenic Vibrio strains. An evaluation of
different molecular methods was recently accomplished at the department of Microbial
Ecology of the Alfred-Wegener-Institute Helgoland (Oberbeckmann, Wichels et al. 2011).
The analysis included classification of environmental Vibrio isolates by mass spectrometry
fingerprinting (MALDI-TOF), where species differentiation is based on the protein
composition, as well as screening for virulence associated genes toxR, tdh (thermostable
direct hemolysin) and trh (tdh-related hemolysin) (Bauer and Rorvik 2007) and repetitive
sequence-based PCR (Hulton, Higgins et al. 1991; Versalovic, Koeuth et al. 1991) to identify
intraspecific variability of V. parahaemolyticus and V. alginolyticus.
11
Another approach for accurate identification of potentially pathogenic Vibrios is the
sequencing of the 16S rRNA- and rpoB-gene (encoding for the β-subunit of the RNA
polymerase). 16 S rRNA sequencing is well established and essential for confident
identification of bacterial isolates (Woo, Lau et al. 2008). Also comparison of 16 S rRNA
sequences is standardized since sequence information of Vibrio spp. is widely represented in
public databases. More recently, rpoB-gene analyses emerged as an essential method for
phylogenetic analyses and identification of bacteria, especially in studying closely related
isolates (Adekambi, Drancourt et al. 2009). RpoB sequence analysis was the first time defined
by Mollet et al. in 1997 as a new powerful procedure for bacterial identification compared to
the typically used 16S rRNA gene analysis (Mollet, Drancourt et al. 1997). A recent study of
Ki et al. corroborates the hypothesis that rpoB is a potential biomarker to overcome the high
conservation of the 16S rRNA and emphasize its discriminating power in identifying Vibrios
(Ki, Zhang et al. 2009). In this connection also Oberbeckmann and coworkers (2011) could
show, that rpoB sequence analysis is a more reliable method to distinguish even closely
related Vibrio species (V. alginolyticus and V. paraheamolyticus). But generally, 16 S rRNA
and rpoB sequencing is still cost and time intensive.
A fast and cost-efficient alternative for identification of bacterial strains is provided by the
denaturing gradient gel electrophoresis (DGGE) and DHPLC. Via DGGE and DHPLC it is
possible to differentiate between bacterial species in mixed samples (Muyzer, Waal de et al.
1993; Goldenberg, Herrmann et al. 2007). Using these methods, DNA-fragments with similar
lengths, but different sequence polymorphism can be separated. Both methods are highly
sensitive and were successfully applied for the analyses of complex microbial communities
based on the 16 S rRNA (Muyzer, Waal de et al. 1993; Goldenberg, Herrmann et al. 2007;
Wagner, Malin et al. 2009). In this study, we evaluated the first PCR-DHPLC approach
targeting rpoB-gene fragments for detection and separation of potentially pathogenic Vibrio
spp. in environmental samples.
1.5. Characterization of Vibrio spp. by rpoB-DHPLC (Denaturing High
Performance Liquid Chromatography)
Denaturing high performance liquid chromatography is a relatively new, analytical method
for identification, separation and monitoring of bacterial communities. It has been primarily
used for detection of genetic mutations, such as insertions, deletions or single nucleotide
polymorphism (SNPs) in human clinical diagnostics (Barlaan, Sugimori et al. 2005). But
12
more recently, DHPLC-protocols were adapted for the field of microbial ecology to
differentiate bacterial species in mixed cultures or environmental samples based on genetic
sequence variations in the 16 S rRNA gene (Goldenberg, Herrmann et al. 2007) . In this study
we used DHPLC to differentiate between closely related Vibrio species based on the genetic
variability of the rpoB-gene, encoding the ß-subunit of RNA polymerase. However,
separation of the PCR-amplified rpoB fragments in DHPLC is based on the elution of
partially melted DNA molecules. Likewise all chromatographically methods, this ion-pair
reverse-phase chromatography consists of a stationary phase, composed of polystyrene beads,
and a mobile phase, which contains triethylammonium acetate (TEAA) and acetonitrile
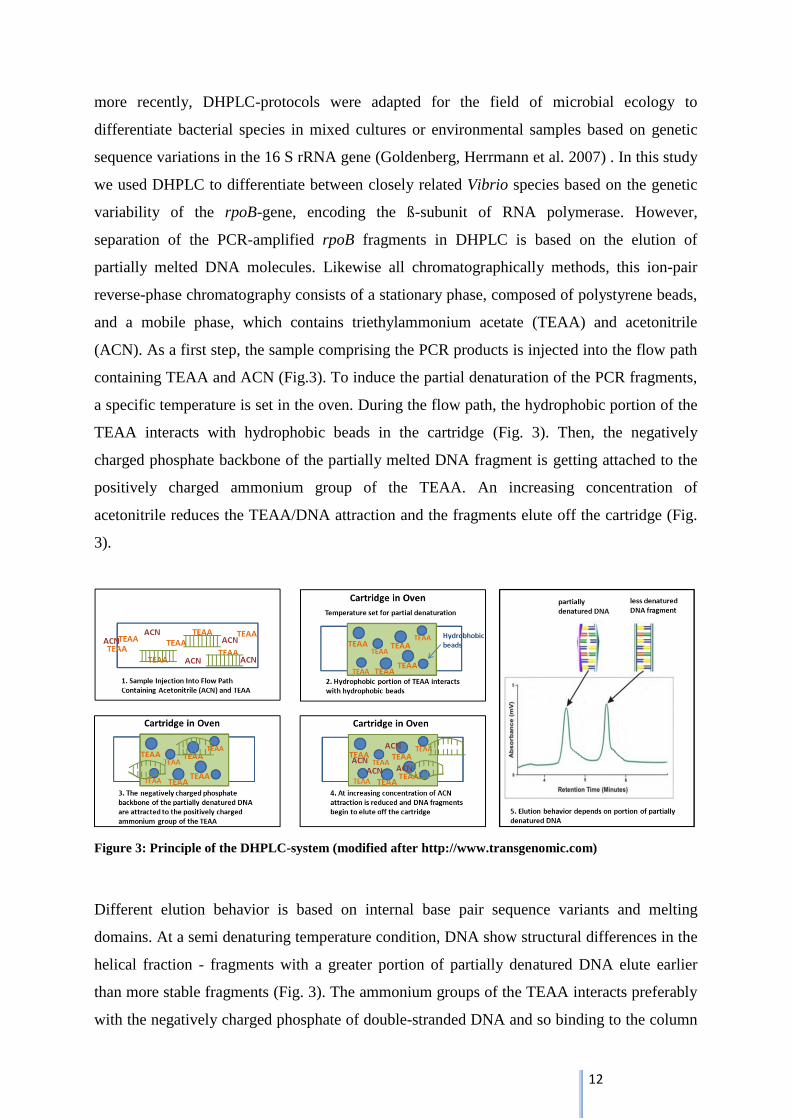
(ACN). As a first step, the sample comprising the PCR products is injected into the flow path
containing TEAA and ACN (Fig.3). To induce the partial denaturation of the PCR fragments,
a specific temperature is set in the oven. During the flow path, the hydrophobic portion of the
TEAA interacts with hydrophobic beads in the cartridge (Fig. 3). Then, the negatively
charged phosphate backbone of the partially melted DNA fragment is getting attached to the
positively charged ammonium group of the TEAA. An increasing concentration of
acetonitrile reduces the TEAA/DNA attraction and the fragments elute off the cartridge (Fig.
3).
Figure 3: Principle of the DHPLC-system (modified after http://www.transgenomic.com)
Different elution behavior is based on internal base pair sequence variants and melting
domains. At a semi denaturing temperature condition, DNA show structural differences in the
helical fraction - fragments with a greater portion of partially denatured DNA elute earlier
than more stable fragments (Fig. 3). The ammonium groups of the TEAA interacts preferably
with the negatively charged phosphate of double-stranded DNA and so binding to the column
13
is more constant (Barlaan, Sugimori et al. 2005). The released DNA fragments pass through
the UV Detector, which measures the DNA-concentration in the elution-buffer by absorbance
at 260 nm. Sending data to the software program, fragments are represented by peaks in a
chromatogram (Fig. 3).
In this study we developed a new rpoB-DHPLC protocol, including primer evaluation,
optimizing PCR conditions and adaptation of DHPLC temperature and separation gradient for
the profiling of Vibrio communities and species identification.
1.6. Research Aims
Rising sea water temperatures due to global warming enhances the conditions for potential
pathogenic Vibrio spp. to grow and disperse even in temperate waters of the North and Baltic
Sea. Because of the increased incidence of Vibrio infections in the last years, a fast and cost-
efficient method is required to analyze and identify complex Vibrio spp. populations,
specifically potential pathogenic Vibrio species, in environmental samples. Therefore, the aim
of this master thesis is to develop a PCR-DHPLC-assay based on the rpoB-gene of the genus
Vibrio, which is a promising method to not only identify but also separate Vibrio spp. in
mixed samples due to the different running behavior of amplified PCR products in the
DHPLC-system. For this purpose, following tasks were defined:
1. Development of Vibrio-specific primer-sets, targeting different regions of the rpoB-
gene.
2. Optimizing PCR conditions with the rpoB-primer-sets for DNA amplification of
different Vibrio species.
3. Optimizing DHPLC conditions by adaptation of column temperature and acetonitrile
gradient for optimal separation of Vibrio species.

14
2. Material and Methods
2.1. Material
2.1.1. Equipment and consumables
Equipment Description Manufacturer
Autoclave
Autoclave
Centrifuge
Centrifuge
Clean bench
Clean room bench
Deep freezer
DHPLC-System
Electrophor gel chamber
Electrophor gel tray and
comb
Gas burner
Incubator
Incubator
Microbank
Microchip Electrophoresis
System
Microtiter Spectrophotometer
Microwave
Molecular Imager
Nanopure water system
PCR-Thermo cycler
pH meter
Pipettes
Precision balance
Scale
Stirring hot plate
Thermo mixer
Ultrasonic bath
Refrigerator
Vortex
Water bath
Systec VX-75
Systec VX-150
Centrifuge 5417 R
Centrifuge 5430
Heraeus HERAsafe KS
Mars Safety Class 2
Wave System 4500
Fuego SCS basic
MIR-253
MIR-553
MCE-202 MultiNA
Infinite M200
ChemidocTM
XRS
Milli-Q A10
Mastercycler gradient
Microprocessor pH meter
2 µl – 5 ml
LE 225 D
BP 6100
MR 3002 IKAcombimag
Thermomixer comfort
Sonorex Super RK514
K-550-GE
Systec GmbH
Systec GmbH
Eppendorf
Eppendorf
Kendro GmbH
Scanlaf
Liebherr
Transgenomic
Peqlab
Peqlab
WLD-Tec GmbH
Sanyo
Sanyo
Pro-Lab Diagnostics
Shimadzu
Tecan Austria GmbH
Samsung
Biorad
Millipore
Eppendorf
Nfl. GmbH
ABIMED Gilson
Sartorius
Sartorius
Heidolph MGH
Eppendorf
Bandelin
Bosch
Bender & Hobein
Köttermann
Consumables Description Manufacturer Inoculation loop
Microwell Plate
PCR-tubes
PCR-tubes
PCR-tubes
Petri dishes
Pipet tips
Pipet tips
Reaction vessel
Reaction vessel
Inoculation loop 1 µl
0.5 ml PCR soft tubes
0.2 ml PCR soft tubes
0.2 ml 8-strip tubes
200 µl, 1000 µl
10 µl
2 ml
0.5 ml, 1,5 ml
Sarstedt
Costar
Biozym
Biozym
Eppendorf
Omnilab
Brand
Gilson
Eppendorf
Sarstedt
15
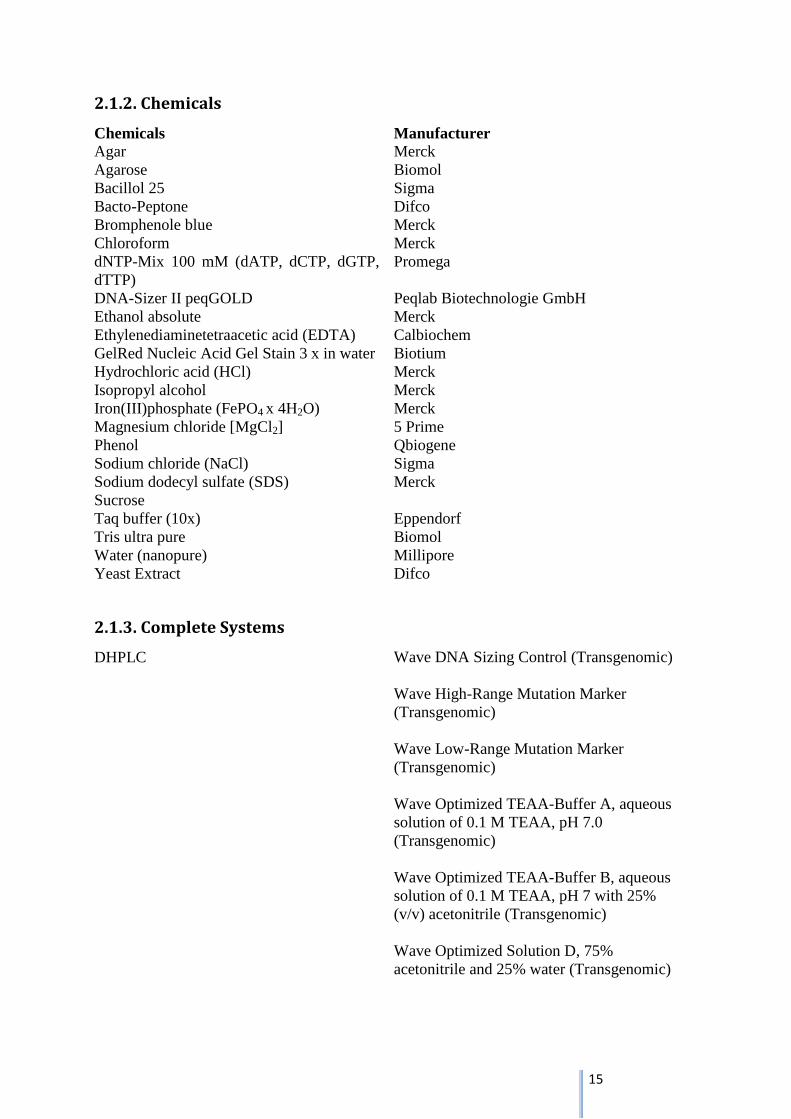
2.1.2. Chemicals
Chemicals Manufacturer
Agar
Agarose
Bacillol 25
Bacto-Peptone
Bromphenole blue
Chloroform
dNTP-Mix 100 mM (dATP, dCTP, dGTP,
dTTP)
DNA-Sizer II peqGOLD
Ethanol absolute
Ethylenediaminetetraacetic acid (EDTA)
GelRed Nucleic Acid Gel Stain 3 x in water
Hydrochloric acid (HCl)
Isopropyl alcohol
Iron(III)phosphate (FePO4 x 4H2O)
Magnesium chloride [MgCl2]
Phenol
Sodium chloride (NaCl)
Sodium dodecyl sulfate (SDS)
Sucrose
Taq buffer (10x)
Tris ultra pure
Water (nanopure)
Yeast Extract
Merck
Biomol
Sigma
Difco
Merck
Merck
Promega
Peqlab Biotechnologie GmbH
Merck
Calbiochem
Biotium
Merck
Merck
Merck
5 Prime
Qbiogene
Sigma
Merck
Eppendorf
Biomol
Millipore
Difco
2.1.3. Complete Systems
DHPLC Wave DNA Sizing Control (Transgenomic)
Wave High-Range Mutation Marker
(Transgenomic)
Wave Low-Range Mutation Marker
(Transgenomic)
Wave Optimized TEAA-Buffer A, aqueous
solution of 0.1 M TEAA, pH 7.0
(Transgenomic)
Wave Optimized TEAA-Buffer B, aqueous
solution of 0.1 M TEAA, pH 7 with 25%
(v/v) acetonitrile (Transgenomic)
Wave Optimized Solution D, 75%
acetonitrile and 25% water (Transgenomic)
16
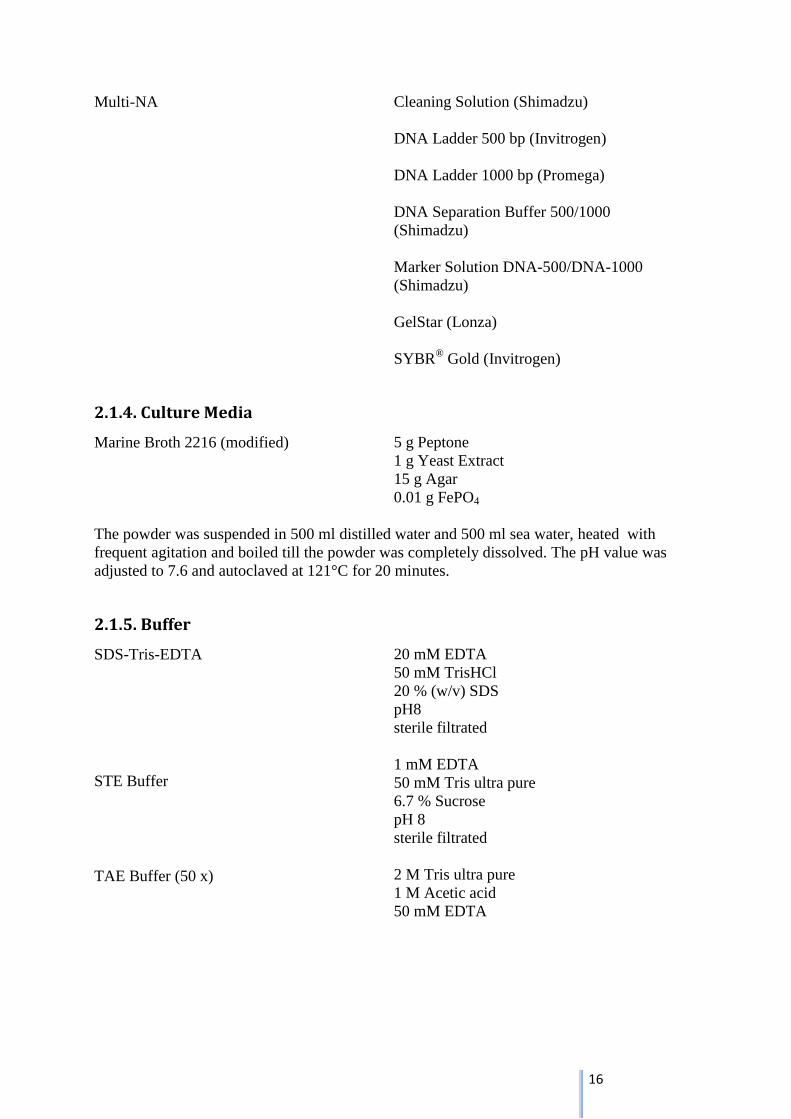
Multi-NA Cleaning Solution (Shimadzu)
DNA Ladder 500 bp (Invitrogen)
DNA Ladder 1000 bp (Promega)
DNA Separation Buffer 500/1000
(Shimadzu)
Marker Solution DNA-500/DNA-1000
(Shimadzu)
GelStar (Lonza)
SYBR® Gold (Invitrogen)
2.1.4. Culture Media
Marine Broth 2216 (modified) 5 g Peptone
1 g Yeast Extract
15 g Agar
0.01 g FePO4
The powder was suspended in 500 ml distilled water and 500 ml sea water, heated with
frequent agitation and boiled till the powder was completely dissolved. The pH value was
adjusted to 7.6 and autoclaved at 121°C for 20 minutes.
2.1.5. Buffer
SDS-Tris-EDTA
STE Buffer
TAE Buffer (50 x)
20 mM EDTA
50 mM TrisHCl
20 % (w/v) SDS
pH8
sterile filtrated
1 mM EDTA
50 mM Tris ultra pure
6.7 % Sucrose
pH 8
sterile filtrated
2 M Tris ultra pure
1 M Acetic acid
50 mM EDTA
17
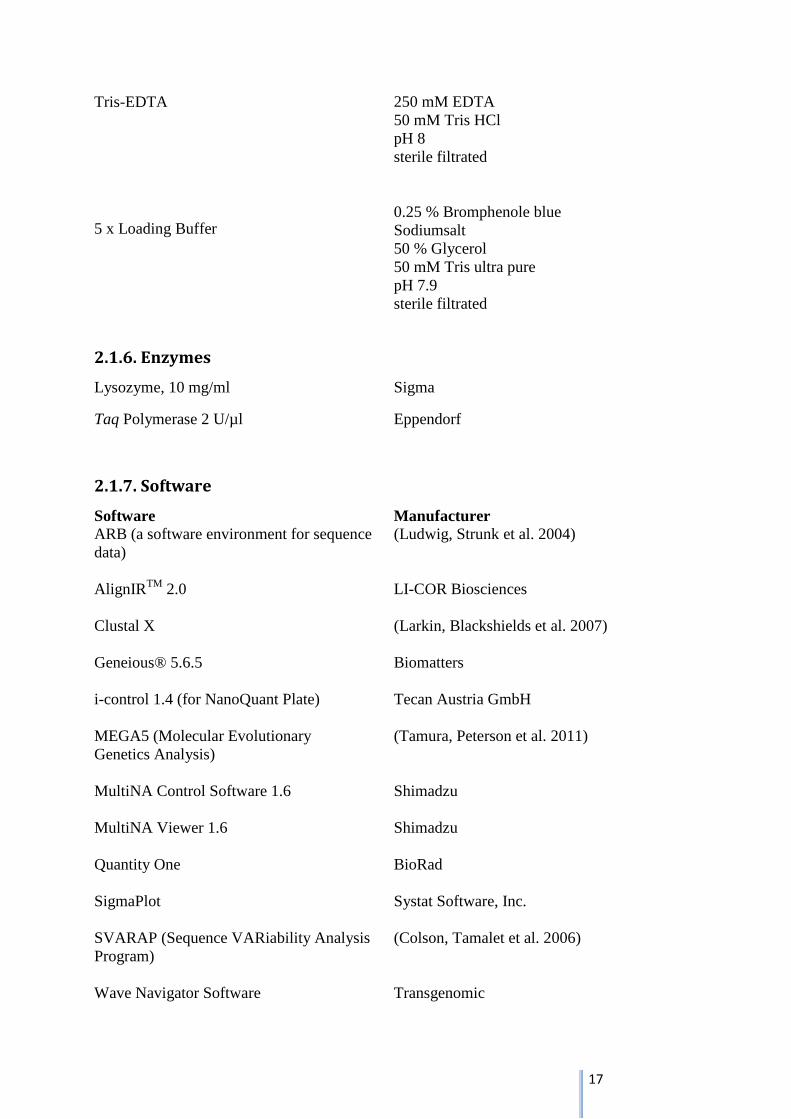
Tris-EDTA
5 x Loading Buffer
250 mM EDTA
50 mM Tris HCl
pH 8
sterile filtrated
0.25 % Bromphenole blue
Sodiumsalt
50 % Glycerol
50 mM Tris ultra pure
pH 7.9
sterile filtrated
2.1.6. Enzymes
Lysozyme, 10 mg/ml
Taq Polymerase 2 U/µl
Sigma
Eppendorf
2.1.7. Software
Software Manufacturer
ARB (a software environment for sequence
data)
(Ludwig, Strunk et al. 2004)
AlignIRTM
2.0
LI-COR Biosciences
Clustal X
(Larkin, Blackshields et al. 2007)
Geneious® 5.6.5
Biomatters
i-control 1.4 (for NanoQuant Plate)
Tecan Austria GmbH
MEGA5 (Molecular Evolutionary
Genetics Analysis)
(Tamura, Peterson et al. 2011)
MultiNA Control Software 1.6
Shimadzu
MultiNA Viewer 1.6
Shimadzu
Quantity One
BioRad
SigmaPlot
Systat Software, Inc.
SVARAP (Sequence VARiability Analysis
Program)
(Colson, Tamalet et al. 2006)
Wave Navigator Software Transgenomic
18
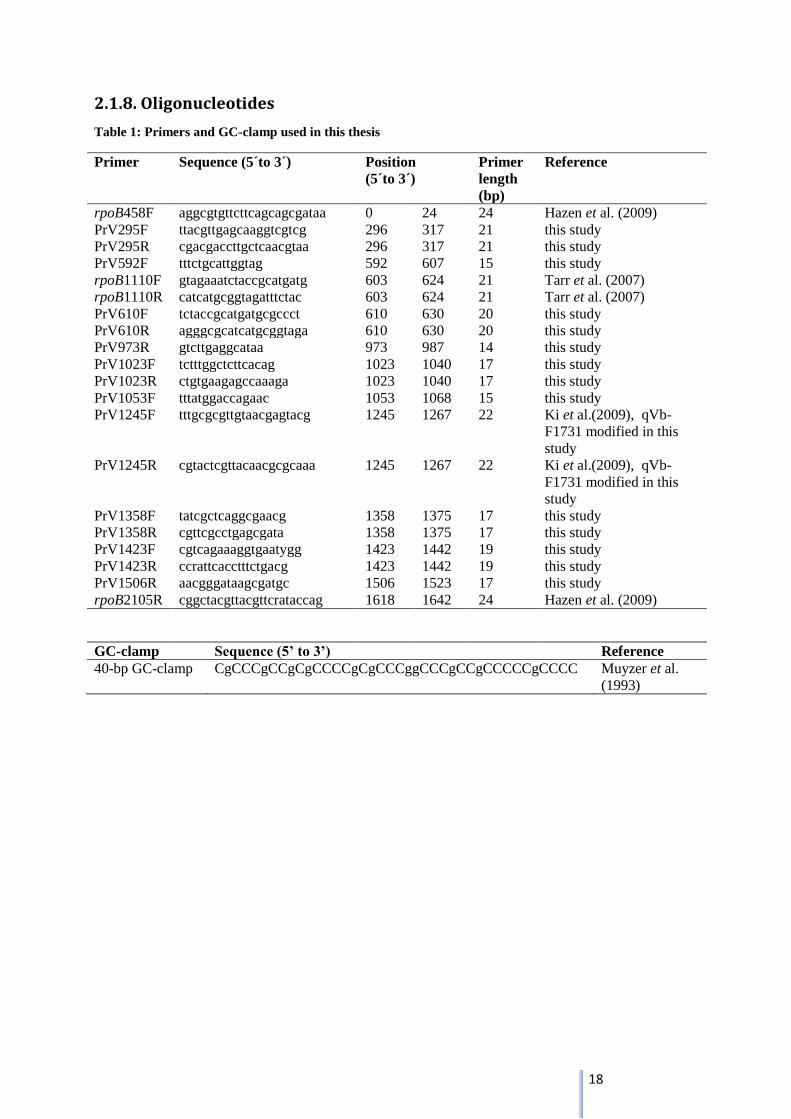
2.1.8. Oligonucleotides
Table 1: Primers and GC-clamp used in this thesis
Primer Sequence (5´to 3´) Position
(5´to 3´)
Primer
length
(bp)
Reference
rpoB458F aggcgtgttcttcagcagcgataa 0 24 24 Hazen et al. (2009)
PrV295F ttacgttgagcaaggtcgtcg 296 317 21 this study
PrV295R cgacgaccttgctcaacgtaa 296 317 21 this study
PrV592F tttctgcattggtag 592 607 15 this study
rpoB1110F gtagaaatctaccgcatgatg 603 624 21 Tarr et al. (2007)
rpoB1110R catcatgcggtagatttctac 603 624 21 Tarr et al. (2007)
PrV610F tctaccgcatgatgcgccct 610 630 20 this study
PrV610R agggcgcatcatgcggtaga 610 630 20 this study
PrV973R gtcttgaggcataa 973 987 14 this study
PrV1023F tctttggctcttcacag 1023 1040 17 this study
PrV1023R ctgtgaagagccaaaga 1023 1040 17 this study
PrV1053F tttatggaccagaac 1053 1068 15 this study
PrV1245F
tttgcgcgttgtaacgagtacg 1245 1267 22 Ki et al.(2009), qVb-
F1731 modified in this
study
PrV1245R cgtactcgttacaacgcgcaaa 1245 1267 22 Ki et al.(2009), qVb-
F1731 modified in this
study
PrV1358F tatcgctcaggcgaacg 1358 1375 17 this study
PrV1358R cgttcgcctgagcgata 1358 1375 17 this study
PrV1423F cgtcagaaaggtgaatygg 1423 1442 19 this study
PrV1423R ccrattcacctttctgacg 1423 1442 19 this study
PrV1506R aacgggataagcgatgc 1506 1523 17 this study
rpoB2105R cggctacgttacgttcrataccag 1618 1642 24 Hazen et al. (2009)
GC-clamp Sequence (5’ to 3’) Reference
40-bp GC-clamp CgCCCgCCgCgCCCCgCgCCCggCCCgCCgCCCCCgCCCC Muyzer et al.
(1993)
19
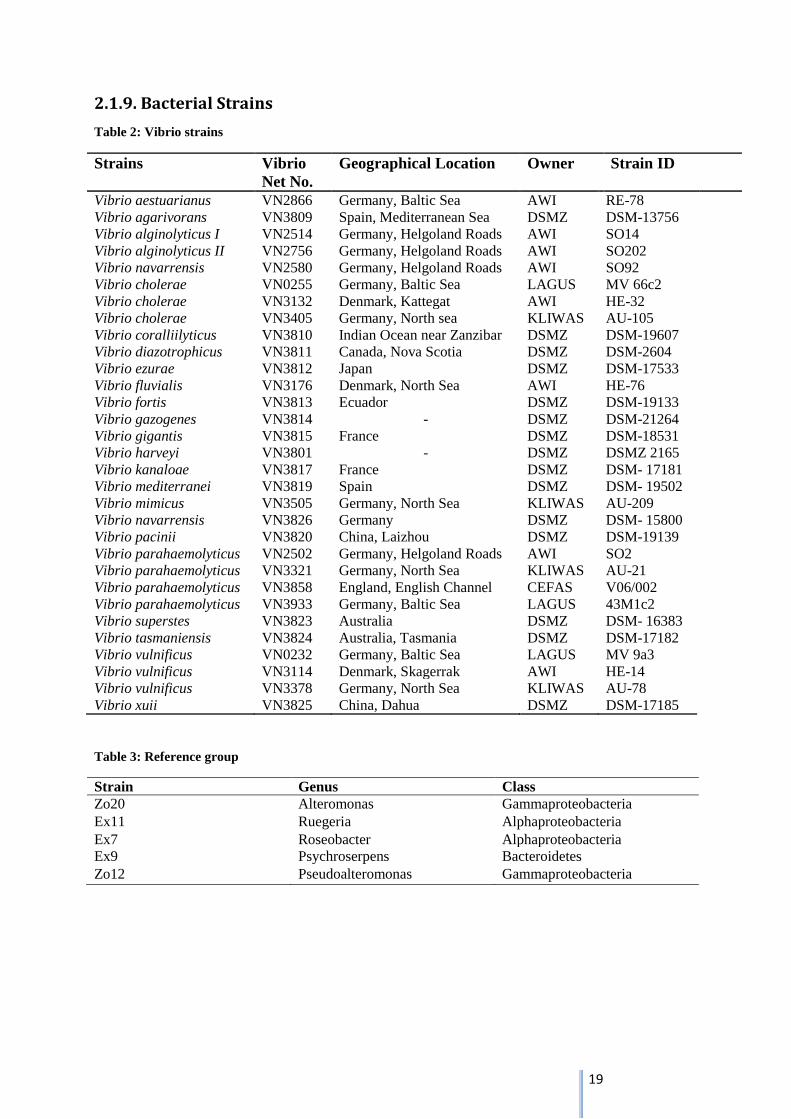
2.1.9. Bacterial Strains
Table 2: Vibrio strains
Strains Vibrio
Net No.
Geographical Location Owner Strain ID
Vibrio aestuarianus VN2866 Germany, Baltic Sea AWI RE-78
Vibrio agarivorans VN3809 Spain, Mediterranean Sea DSMZ DSM-13756
Vibrio alginolyticus I VN2514 Germany, Helgoland Roads AWI SO14
Vibrio alginolyticus II VN2756 Germany, Helgoland Roads AWI SO202
Vibrio navarrensis VN2580 Germany, Helgoland Roads AWI SO92
Vibrio cholerae VN0255 Germany, Baltic Sea LAGUS MV 66c2
Vibrio cholerae VN3132 Denmark, Kattegat AWI HE-32
Vibrio cholerae VN3405 Germany, North sea KLIWAS AU-105
Vibrio coralliilyticus VN3810 Indian Ocean near Zanzibar DSMZ DSM-19607
Vibrio diazotrophicus VN3811 Canada, Nova Scotia DSMZ DSM-2604
Vibrio ezurae VN3812 Japan DSMZ DSM-17533
Vibrio fluvialis VN3176 Denmark, North Sea AWI HE-76
Vibrio fortis VN3813 Ecuador DSMZ DSM-19133
Vibrio gazogenes VN3814 - DSMZ DSM-21264
Vibrio gigantis VN3815 France DSMZ DSM-18531
Vibrio harveyi VN3801 - DSMZ DSMZ 2165
Vibrio kanaloae VN3817 France DSMZ DSM- 17181
Vibrio mediterranei VN3819 Spain DSMZ DSM- 19502
Vibrio mimicus VN3505 Germany, North Sea KLIWAS AU-209
Vibrio navarrensis VN3826 Germany DSMZ DSM- 15800
Vibrio pacinii VN3820 China, Laizhou DSMZ DSM-19139
Vibrio parahaemolyticus VN2502 Germany, Helgoland Roads AWI SO2
Vibrio parahaemolyticus VN3321 Germany, North Sea KLIWAS AU-21
Vibrio parahaemolyticus VN3858 England, English Channel CEFAS V06/002
Vibrio parahaemolyticus VN3933 Germany, Baltic Sea LAGUS 43M1c2
Vibrio superstes VN3823 Australia DSMZ DSM- 16383
Vibrio tasmaniensis VN3824 Australia, Tasmania DSMZ DSM-17182
Vibrio vulnificus VN0232 Germany, Baltic Sea LAGUS MV 9a3
Vibrio vulnificus VN3114 Denmark, Skagerrak AWI HE-14
Vibrio vulnificus VN3378 Germany, North Sea KLIWAS AU-78
Vibrio xuii VN3825 China, Dahua DSMZ DSM-17185
Table 3: Reference group
Strain Genus Class
Zo20 Alteromonas Gammaproteobacteria
Ex11 Ruegeria Alphaproteobacteria
Ex7 Roseobacter Alphaproteobacteria
Ex9 Psychroserpens Bacteroidetes
Zo12 Pseudoalteromonas Gammaproteobacteria
20
2.1. Methods
2.2.1. Molecular Comparison of Vibrio sequences
An approximately 1600 bp rpoB fragment was amplified with the primers rpoB458F and
rpoB2105R according to Hazen et al. (2009). Sequencing of the partial rpoB-gene was
performed with primers rpoB458F, rpoB2105R and rpoB1110F (Tarr, Patel et al. 2007) using
the chain-determination method developed by Sanger and colleagues (1977). All partial DNA
rpoB sequences were assembled with the AlignIRTM
Software 2.0.
Phylogentic comparison was conducted with all available 24 Vibrio rpoB-sequences based on
the Vibrio isolate set used in this work (see chapter 2.1.9.). We constructed an alignment
using Geneious Multiple Alignment (2.1.7.) with the default settings for gap open penalty and
extension penalty. The hyper-variable sites at the 5´and 3´ends of the rpoB sequences were
excluded from the alignment. J-modeltest was used for statistical selection of the best-fit
model of nucleotide substitution for tree construction provided by MEGA 5 (Tamura,
Peterson et al. 2011). The phylogentic tree was inferred using the neighbor joining algorithm
with the Tamura-Nei distance model in MEGA, supported by bootstrap analysis with 1.000
replications.
2.2.2. Development of Vibrio rpoB-targeting PCR primers
To facilitate the identification of potential human-pathogenic species, we designed Vibrio
specific primers using the Primer design tool of the ARB software package (2.1.7.). We
created primers targeting different regions of the partial rpoB-gene, which is described as a
core gene to differentiate even closely related Vibrio species (Ki, Zhang et al. 2009;
Oberbeckmann, Wichels et al. 2011).
First, a phylogenetic tree was constructed with a total number of 174 full length rpoB
sequences of six different Vibrio species (V. alginolyticus I, V. alginolyticus II, V.
parahaemolyticus, V. harveyi, V. mimicus, V. cholera and V. vulnificus) and a reference group
including next relatives outside of the Vibrionacea family. These sequences were provided by
a representative Vibrio data base assembled by the department of Microbial Ecology of the
Alfred-Wegener-Institute Helgoland. The database consists of all published rpoB sequences
of the γ-proteobacteria group provided by GenBank in 2011 (National Center for
Biotechnology Information, NBCI).
In the next step, all possible primer sequences that are specific for Vibrios were identified and
potential primer sequences which contain self-complementary regions with more than three
nucleotides were excluded. The default parameters were modified by choosing primer-lengths

21
of 14-25 bp, amplicon-sizes of 100-450 bp, GC ratio of 10-60 % and annealing-temperatures
of 30-80 °C.
The specificity of new primers and those selected from literature (see chapter 2.1.8.), was
tested with the Basic Local Alignment Search Tool (BLAST) algorithm. Further, the melting
temperatures were calculated by considering the oligonucleotide lengths and GC-contents
according to the formula , where describes the GC-
content and describes the AT-content. This formula is specifically appropriate for
primers with a length of about 20 bp and for this reason applicable to the designed primers
(Mülhardt 2009). Melting temperature is defined as the temperature at which 50 % of the
DNA region is in a double stranded configuration (Ririe, Rasmussen et al. 1997).
To ensure the discrimination of species of Vibrio strains used in this work (2.1.9.), the binding
behavior of the selected primers and the amount of variability bordered by these primer-sets
was tested. To this end, a variability map was created with a tool for quantitative analysis of
nucleotides (SVARAP; 2.1.7.). All existing sequences were aligned using Geneious Multiple
Alignment (2.1.7.) with the default settings for gap open penalty and extension penalty. For
the entropy plot, only the conserved regions of the alignment were used and additionally
converted in GDE format with Clustal X (2.1.7.). The SVARAP tool computed automatically
the absolute number of different nucleotides and their frequencies (in percentage) for each
nucleotide position in the alignment in correspondence to the consensus sequence. The
formula for variability was constructed by Colson and coworkers (2006) as follows:
Finally, the highest and lowest variability in the rpoB-gene was visualized using SigmaPlot
(2.1.6.).
2.2.3. Cultivation
To maintain Vibrio strains in a growth phase condition, bacterial colonies were transferred
every second week to marine broth agar (2.1.4.) and incubated at 37 °C for 24 hours. Colonies
of overnight cultures were used for further DNA extraction occasionally.
Generally, Vibrio cultures were stored in liquid nitrogen in a microbank-storage system. The
microbank sterile vials contain porous beads, which serve as carriers to support
microorganisms. For recovery of stored cultures, an inoculated bead was transferred to solid
marine broth medium (2.1.4) and incubated over night at 37 °C.
22
2.2.4. DNA extraction
Total genomic DNA was isolated by lysozyme/SDS lysis and phenol-chloroform extraction
followed by isopropanol precipitation, using a modified protocol of Anderson and McKay
omitting the DNA-DNA denaturation step (Anderson and McKay 1983). An inoculation loop
of overnight bacterial culture was homogenized in 380 µl STE Buffer and supplemented with
100 µl Lysozyme (10 mg/ml). After an incubation step at 37 °C for 30 minutes, cells were
disintegrated by adding 50 µl Tris-EDTA and 30 µl SDS-Tris-EDTA and incubated again at
50 °C for 60 minutes. Subsequently, lysed cells were extracted by addition of 700 µl phenol-
chloroform (1:1) and 70 µl sodium chloride (5 M). After centrifugation at 10 600 x g for 20
minutes, the supernatant containing the nucleic acid was transferred to a new sterile tube and
precipitated on ice with one volume isopropyl alcohol. Samples were stored over night at -20
°C. After an additional centrifugation at 10 6000 x g for 20 minutes, the supernatant was
discarded. The dry pellet was dissolved in 30 µl H2O and stored at -20 °C.
2.2.5. Quantification and analysis of genomic DNA
For DNA quantification and quality control of DNA-products, we used Tecan invinite M200
including a NanoQuant Plate
and the Tecan i-controll 1.4 software (2.1.1.). Average
concentration of DNA was determined in a spectrophotometer by measuring the absorbance at
260 nm. The purity of DNA was verified by comparing the ratio of absorbance values 260 nm
to 280 nm. Generally, a ratio between 1.6 and 2.2 is accepted for pure DNA.
In addition, agarose gel electrophoresis was used for size-dependent separation of DNA-
products. The negatively charged nucleic acid molecules move in an electric field from
cathode to anode, whereat small molecules can move more quickly through the gel than larger
ones. By using Gel-Red (2.1.2), which intercalates into the major groove of DNA, molecules
are visualized under UV-light.
Therefore, 0.8 % agarose gels were prepared in 1 x TAE buffer. For each DNA sample a 25
µl approach was mixed including 18 µl PCR- H2O, 5 µl Loading Buffer and 2 µl DNA.
Additionally, 10 µl DNA-Sizer II was added for size depending correlation. Separation of
genomic DNA was achieved by electrophoresis at 80 V for 60 minutes. After staining with
GelRed (3 x in water) for 30 minutes, DNA was visualized under UV-light (602 nm). Digitale
images were taken using the ChemiDoc XRS system within the software Quantity One.
2.2.6. Polymerase chain reaction (PCR)
Polymerase chain reaction (PCR) is defined as a technique to amplify DNA-fragments with a
distinct length (Saiki, Gelfand et al. 1988). In the first step of the reaction, the targeted double
23
stranded DNA is heated at 94 °C – 98 °C for denaturation into two single strands. In the
second step, forward and reverse primers anneal to their complementary sequence on each
template. Hybridization takes place at temperatures between 50 °C and 70 °C. Finally, the
DNA polymerase extends the primer using the providing nucleotides in 5´to 3´direction. By
replication of the three thermal cycles (denaturation, annealing, elongation) millions of copies
of DNA sequence are generated. In this study, PCR was performed for amplification of
different regions of the rpoB-gene of potentially pathogenic Vibrio spp.
2.2.6.1. Vibrio specific PCR
For evaluation of Vibrio specific primer sets, which amplify fragments of different amplicon
sizes, PCR conditions were optimized for each set individually. Optimal annealing
temperature and Mg2+
concentration were therefore determined in a gradient PCR. According
to the melting temperature of the primer sets, annealing conditions were categorized in three
different gradient groups (see chapter 3.4.1., table 11). Commonly, annealing temperatures of
approximately 5 °C below the melting temperatures are used (Innes 1990).
DNA of four Vibrio isolates was selected as template: V. alginolyticus I (VN2514), V.
alginolyticus II (VN2756), V. parahaemolyticus (VN2502), V. navarrensis (VN2580) (see
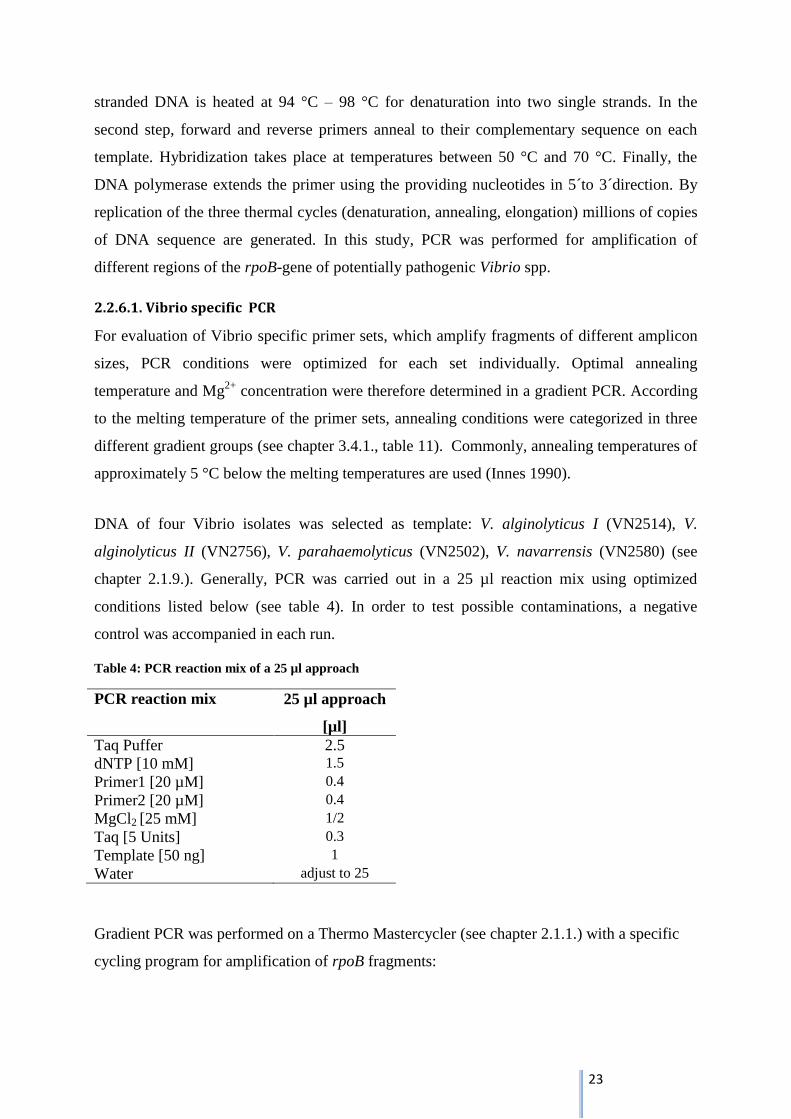
chapter 2.1.9.). Generally, PCR was carried out in a 25 µl reaction mix using optimized
conditions listed below (see table 4). In order to test possible contaminations, a negative
control was accompanied in each run.
Table 4: PCR reaction mix of a 25 µl approach
PCR reaction mix 25 µl approach
[µl]
Taq Puffer 2.5
dNTP [10 mM] 1.5
Primer1 [20 µM] 0.4
Primer2 [20 µM] 0.4
MgCl2 [25 mM] 1/2
Taq [5 Units] 0.3
Template [50 ng] 1
Water adjust to 25
Gradient PCR was performed on a Thermo Mastercycler (see chapter 2.1.1.) with a specific
cycling program for amplification of rpoB fragments:
24
Table 5: rpoB-program for gradient PCR
Step Time T [°C] Cycles
1. Melting 3' 95 1
2. Melting 30'' 95
3. Annealing 30'' Ta G = 10°C 25
4. Extension 30'' 68
5. Extension 5 ' 68 1
6. Hold hold 5 1
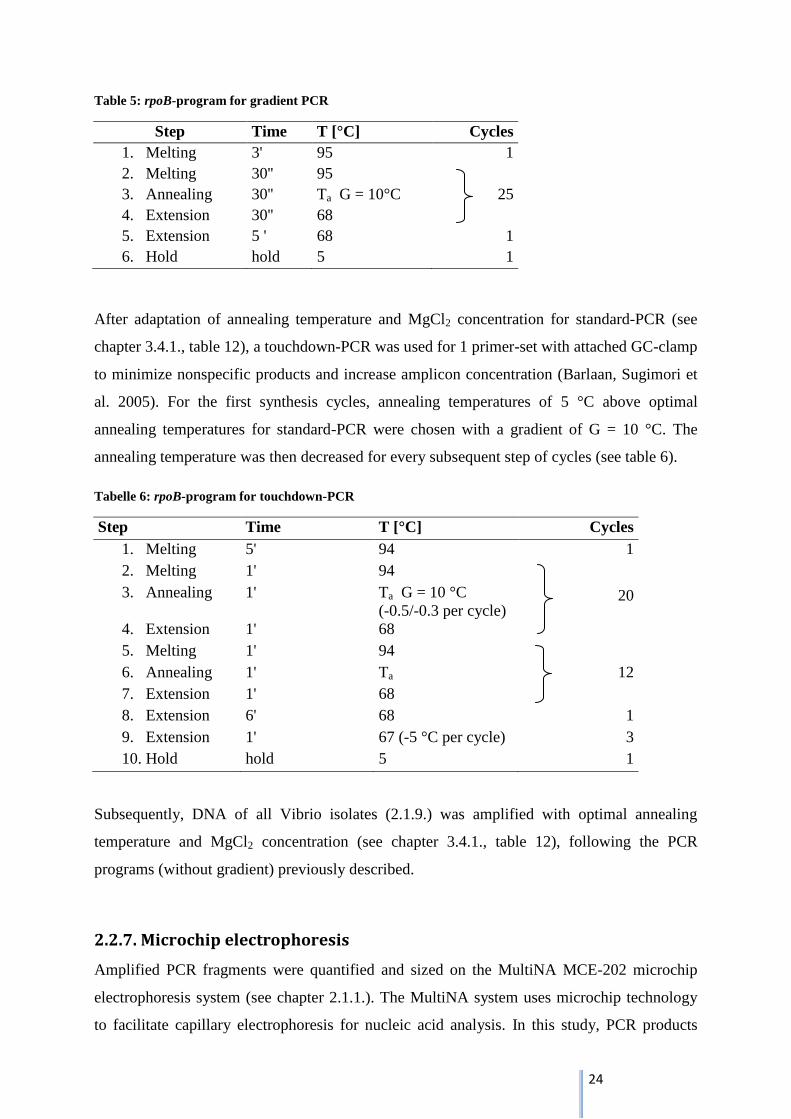
After adaptation of annealing temperature and MgCl2 concentration for standard-PCR (see
chapter 3.4.1., table 12), a touchdown-PCR was used for 1 primer-set with attached GC-clamp
to minimize nonspecific products and increase amplicon concentration (Barlaan, Sugimori et
al. 2005). For the first synthesis cycles, annealing temperatures of 5 °C above optimal
annealing temperatures for standard-PCR were chosen with a gradient of G = 10 °C. The
annealing temperature was then decreased for every subsequent step of cycles (see table 6).
Tabelle 6: rpoB-program for touchdown-PCR
Step Time T [°C] Cycles
1. Melting 5' 94 1
2. Melting 1' 94
20
3. Annealing 1' Ta G = 10 °C
(-0.5/-0.3 per cycle)
4. Extension 1' 68
5. Melting 1' 94
6. Annealing 1' Ta 12
7. Extension 1' 68
8. Extension 6' 68 1
9. Extension 1' 67 (-5 °C per cycle) 3
10. Hold hold 5 1
Subsequently, DNA of all Vibrio isolates (2.1.9.) was amplified with optimal annealing
temperature and MgCl2 concentration (see chapter 3.4.1., table 12), following the PCR
programs (without gradient) previously described.
2.2.7. Microchip electrophoresis
Amplified PCR fragments were quantified and sized on the MultiNA MCE-202 microchip
electrophoresis system (see chapter 2.1.1.). The MultiNA system uses microchip technology
to facilitate capillary electrophoresis for nucleic acid analysis. In this study, PCR products
25
were analyzed using the DNA 500 and the DNA 1000 kit from Shimadzu (see chapter 2.1.3.).
For detection of PCR products, microchips are getting filled with a Separation Buffer
containing SYBR Gold or Gel Star (see chapter 2.1.3.) for detection of nucleic acids. In an
electric field the negatively charged DNA moves from cathode to anode. Separation occurs
size-depending in microseparation channels. To point the beginning and end of a run, a
marker solution was additionally applied to the microchips. Besides, a DNA-Ladder
(500/1000) was added for a precise detection of the fragment size in bp. DNA fragments were
identified with a LED fluorescence detector and visualized in a virtual gel using the MultiNa
control software 1.6.
2.2.8. DHPLC conditions
PCR products of Vibrio isolates were analyzed by DHPLC on a WAVE DNA Fragment
Analysis System using the DNASep® technology (see chapter 2.1.1.). Separation of DNA
fragments is based on the principle of a two buffer system, forming the mobile phase. Buffer
A consists of an aqueous solution of 0.1 M TEAA, pH 7.0, and Buffer B consist of an
aqueous solution of 0.1 M TEAA, pH 7 with 25% (v/v) acetonitrile. During the flow path, the
DNA molecules are getting attached to the hydrophobic beads of the cartridge by interaction
with Buffer A. Due to the increasing concentration of acetonitrile in Buffer B, fragments elute
off the cartridge at different retention times depending on the portion of partially denatured
DNA at semi denaturing temperature conditions.
Separation of DNA fragments by DHPLC is influenced by different factors such as column
temperature, acetonitrile gradient, and pump flow rate. Separated PCR products were
recorded and visualized with a UV-detector L-2400 at a wave length of 260 nm. The analyses
of the chromatograms were accomplished with the Navigator Software (see chapter 2.1.7.).
After each injection run, cleaning of the column was performed with Buffer D, containing 75
% acetonitrile and 25 % water.
We injected 10 µl PCR product of four Vibrio species; V. alginolyticus I (VN2514), V.
navarrensis (VN2580), V. parahaemolyticus (VN2502) and V. vulnificus (VN3114) (see
chapter 2.1.9.) separately on the DHPLC at a pump flow rate of 0.9 ml min-1
and
systematically improved the conditions with two selected primer-sets. Optimization included
empirical variation of column temperature between 55 °C – 70 °C and adaptation of the
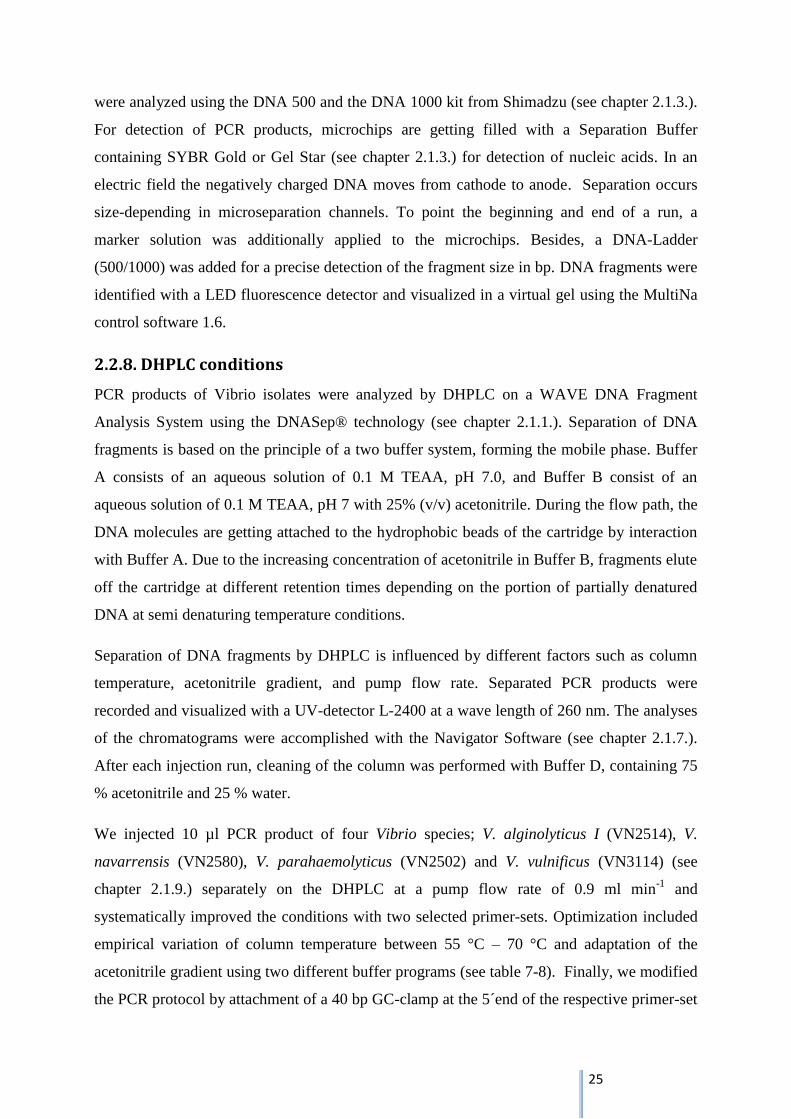
acetonitrile gradient using two different buffer programs (see table 7-8). Finally, we modified
the PCR protocol by attachment of a 40 bp GC-clamp at the 5´end of the respective primer-set
26
and performed a touchdown-PCR to test the retention characteristics of the four amplicons on
the DHPLC.
Table 7: DHPL fractional gradient for separation of Vibrio species
Gradient name Time (min) Buffer A (%) Buffer B (%)
Loading 0 55 45
100 bp 0.5 50.2 49.8
225 bp 3.6 41.8 58.2
350 bp 6.8 38.2 61.8
475 bp 9.9 36.3 63.7
600 bp 13 35 65
Start Clean 13.1 0 100
Stop Clean 13.6 0 100
Start Equilibrate 13.7 55 45
Stop Equilibrate 14.6 55 45
Table 8: DHPLC linear gradient with Buffer B 0.5% min-1
for
separation of Vibrio species
Gradient name Time (min) Buffer A (%) Buffer B (%)
Loading 0 55 45
100 bp 2 46 54
600 bp 14 40 60
Start Clean 14.1 0 100
Stop Clean 14.6 0 100
Start Equilibrate 14.7 55 45
Stop Equilibrate 15.6 55 45
Additionally, sequences of the rpoB alignment were cropped at the 5´ and 3´ position of
primer-binding points to obtain only the amplicon region. Then, predicted optimal column
temperature and melting profiles of amplicon sequences were estimated using the WAVE
maker Software from Transgenomic.
Finally, we compared sequence properties of rpoB amplicons with the peak profile in the
DHPLC, including estimation of GC-content of each fragment and determining nucleotide
distances between each pair of amplicons.

27
3. Results
3.1. Molecular Comparison
Recent studies postulate a reliable classification and discrimination of even closely related
Vibrio isolates using rpoB sequencing (Ki, Zhang et al. 2009; Oberbeckmann, Wichels et al.
2011). After verification of rpoB sequences with AlignIRTM
for quality control and BLAST
for sequence comparison, 24 of the original 31 Vibrio isolates were used for molecular
evaluation. A phylogenic NJ tree was constructed in MEGA 5 from the aligned and assembled
rpoB sequences (1560 bp), including 24 sequences of Vibrio species and one sequence of
Alteromonas spp. (see chapter 2.2.1.). Alteromonas spp. could be phylogenetically
discriminated from the Vibrionacea cluster. The NJ tree exhibits clear relationships among
species as well as high discrimination between species. Even closely related species, e.g. V.
parahaemolyticus and V. alginolyticus were clearly distinguished.
Figure 4: Neighbor-joining tree constructed in MEGA 5.1 calculated from 25 aligned rpoB sequences
(1560 bp) using Tamura-Nei distance with the gamma model (G=0.513). The numbers on the tree indicate
bootstrap values from 1.000 replications; only values greater than 50 % are shown. Branch lengths are
proportional to the scale given.
28
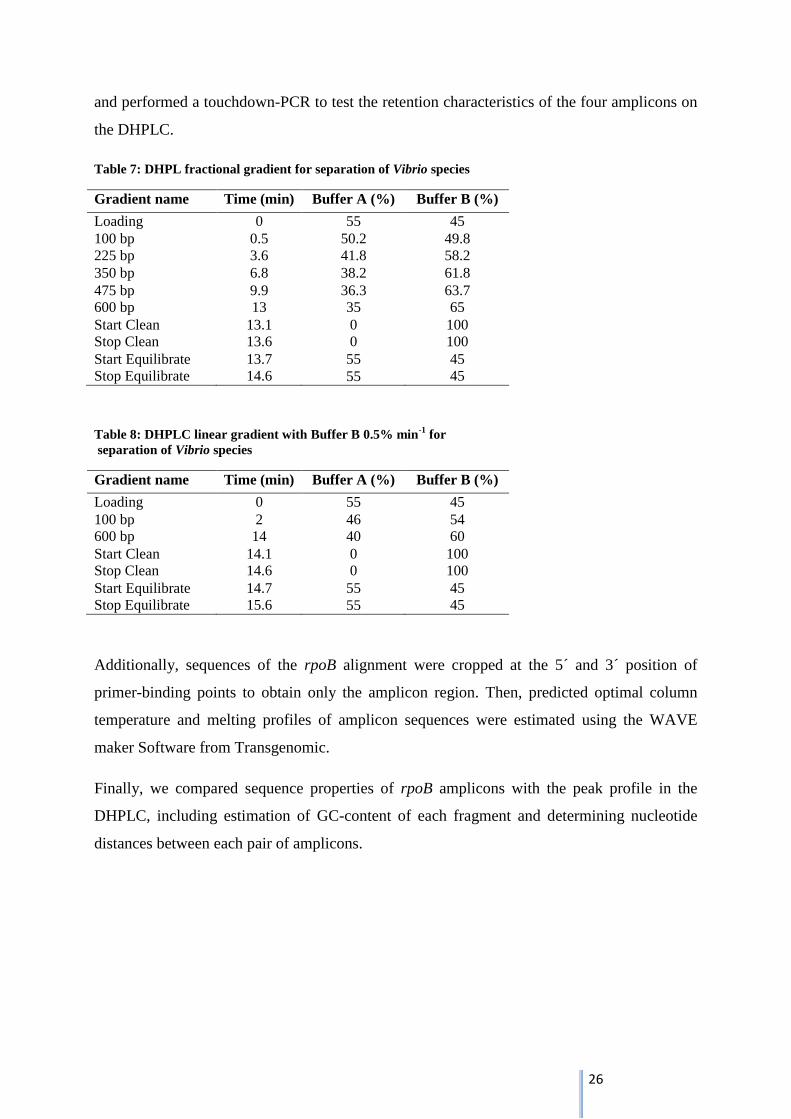
3.2. Design of Vibrio specific rpoB-primers
For evaluation of a new rpoB-DHPLC protocol, 14 group-specific primers based on the genus
Vibrio were successfully developed using the Primer tool of the ARB software and
additionally, six published primers were chosen from literature (see chapter 2.1.8.). The
designed primers and the primer combinations target different regions of the partial rpoB-
gene to ensure exposure of polymorphic areas (Fig. 5).
Figure 5: Partial rpoB-gene (1642 bp from 5´to 3´position) and primer binding sites. The rpoB-gene was
amplified with primers rpoB458F and rpoB2105R according to Hazen et al. (2009).
All primers selected for this study fulfill the criteria of a GC-content between 40-60 %,
primer-lengths of 14-24 bp and melting-temperatures between 40-73 °C. Furthermore,
potential hairpin formation and potential self- annealing sites could be excluded. Overall, 18
primer-sets were chosen for PCR-analysis with similar melting-temperatures and amplicon-
lengths of 100-400 bp.
Table 9: Primer and Primer-set facilities
Primer-sets Primer length
(bp)
Primer
GC-content (%)
Primer
Tm (°C)
Amplicon
size (bp)
Forward Reverse Forward Reverse Forward Reverse Forward Reverse
rpoB458F PrV295R 24 21 50 52 72 64 317
PrV295F rpoB1110R 21 21 52 43 64 60 328
PrV295F PrV610R 21 20 52 60 64 64 334
PrV1245F PrV1423R 22 19 50 53/58 66 59 197
PrV1245F rpoB2105R 22 24 50 50/54 66 73 397
PrV1358F rpoB2105R 17 24 59 50/54 54 73 284
PrV1423F PrV1506R 19 17 53/58 53 59 52 100
PrV1423F rpoB2105R 19 24 53/58 50/54 59 73 219
PrV1023F PrV1245R 17 22 47 50 50 66 244
PrV1023F PrV1358R 17 17 47 59 50 54 352
PrV1245F PrV1506R 22 17 50 53 66 52 278
PrV1358F PrV1506R 17 17 59 53 54 52 165
29
rpoB1110F PrV973R 21 14 43 43 60 40 384
PrV610F PrV973R 20 14 60 43 64 40 377
PrV610F PrV1023R 20 17 60 47 64 50 430
rpoB1110F PrV1023R 21 17 43 47 60 50 437
PrV592F PrV973R 15 14 40 43 42 40 395
PrV1053F PrV1358R 15 17 33/40 59 41 54 322
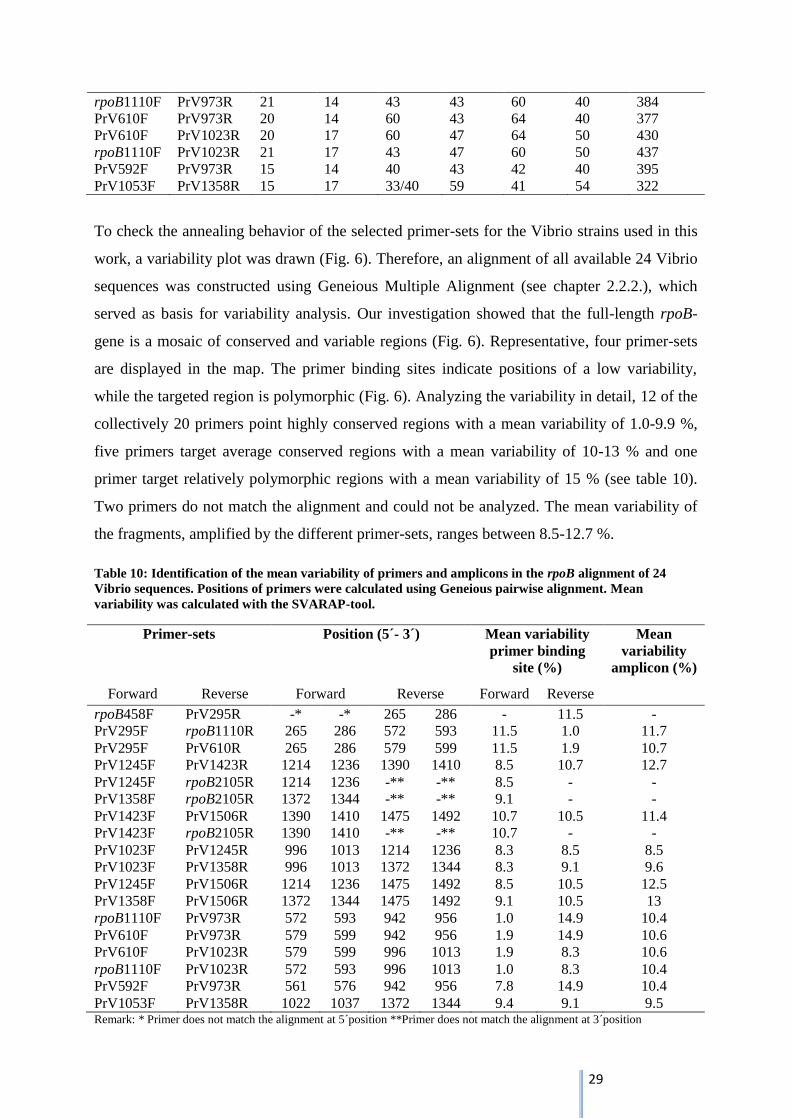
To check the annealing behavior of the selected primer-sets for the Vibrio strains used in this
work, a variability plot was drawn (Fig. 6). Therefore, an alignment of all available 24 Vibrio
sequences was constructed using Geneious Multiple Alignment (see chapter 2.2.2.), which
served as basis for variability analysis. Our investigation showed that the full-length rpoB-
gene is a mosaic of conserved and variable regions (Fig. 6). Representative, four primer-sets
are displayed in the map. The primer binding sites indicate positions of a low variability,
while the targeted region is polymorphic (Fig. 6). Analyzing the variability in detail, 12 of the
collectively 20 primers point highly conserved regions with a mean variability of 1.0-9.9 %,
five primers target average conserved regions with a mean variability of 10-13 % and one
primer target relatively polymorphic regions with a mean variability of 15 % (see table 10).
Two primers do not match the alignment and could not be analyzed. The mean variability of
the fragments, amplified by the different primer-sets, ranges between 8.5-12.7 %.
Table 10: Identification of the mean variability of primers and amplicons in the rpoB alignment of 24
Vibrio sequences. Positions of primers were calculated using Geneious pairwise alignment. Mean
variability was calculated with the SVARAP-tool.
Primer-sets Position (5´- 3´) Mean variability
primer binding
site (%)
Mean
variability
amplicon (%)
Forward Reverse Forward Reverse Forward Reverse
rpoB458F PrV295R -* -* 265 286 - 11.5 -
PrV295F rpoB1110R 265 286 572 593 11.5 1.0 11.7
PrV295F PrV610R 265 286 579 599 11.5 1.9 10.7
PrV1245F PrV1423R 1214 1236 1390 1410 8.5 10.7 12.7
PrV1245F rpoB2105R 1214 1236 -** -** 8.5 - -
PrV1358F rpoB2105R 1372 1344 -** -** 9.1 - -
PrV1423F PrV1506R 1390 1410 1475 1492 10.7 10.5 11.4
PrV1423F rpoB2105R 1390 1410 -** -** 10.7 - -
PrV1023F PrV1245R 996 1013 1214 1236 8.3 8.5 8.5
PrV1023F PrV1358R 996 1013 1372 1344 8.3 9.1 9.6
PrV1245F PrV1506R 1214 1236 1475 1492 8.5 10.5 12.5
PrV1358F PrV1506R 1372 1344 1475 1492 9.1 10.5 13
rpoB1110F PrV973R 572 593 942 956 1.0 14.9 10.4
PrV610F PrV973R 579 599 942 956 1.9 14.9 10.6
PrV610F PrV1023R 579 599 996 1013 1.9 8.3 10.6
rpoB1110F PrV1023R 572 593 996 1013 1.0 8.3 10.4
PrV592F PrV973R 561 576 942 956 7.8 14.9 10.4
PrV1053F PrV1358R 1022 1037 1372 1344 9.4 9.1 9.5 Remark: * Primer does not match the alignment at 5´position **Primer does not match the alignment at 3´position
30
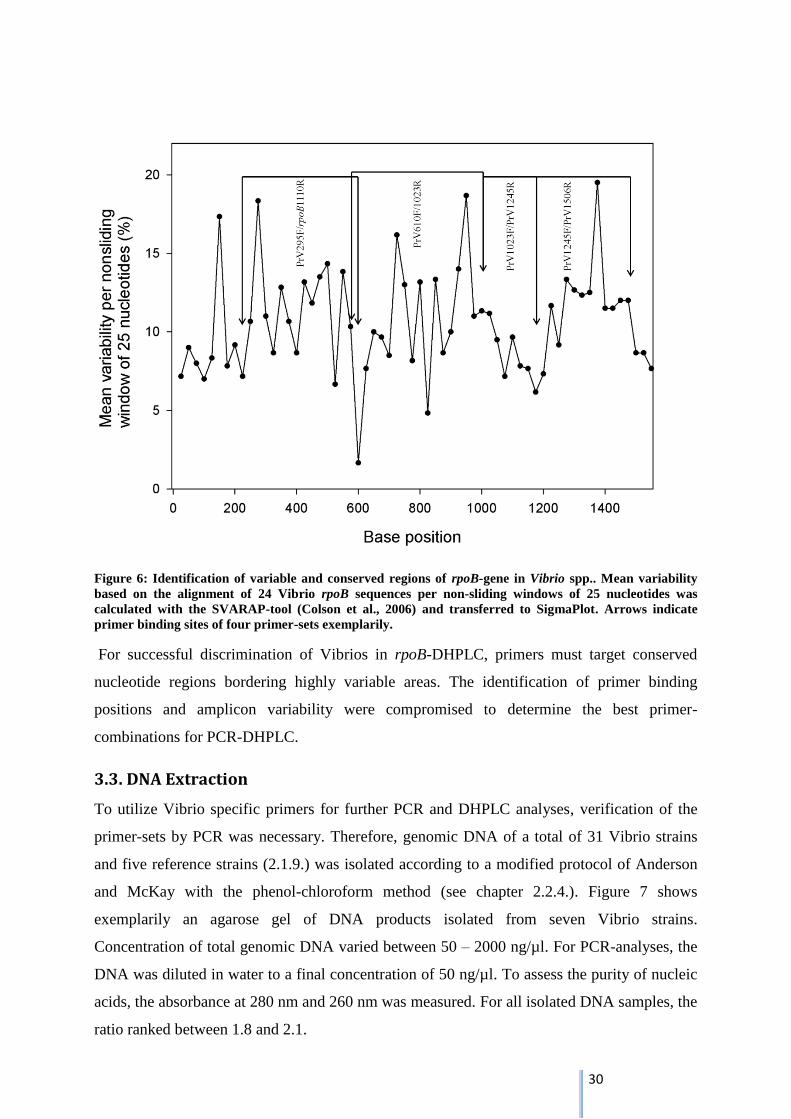
Figure 6: Identification of variable and conserved regions of rpoB-gene in Vibrio spp.. Mean variability
based on the alignment of 24 Vibrio rpoB sequences per non-sliding windows of 25 nucleotides was
calculated with the SVARAP-tool (Colson et al., 2006) and transferred to SigmaPlot. Arrows indicate
primer binding sites of four primer-sets exemplarily.
For successful discrimination of Vibrios in rpoB-DHPLC, primers must target conserved
nucleotide regions bordering highly variable areas. The identification of primer binding
positions and amplicon variability were compromised to determine the best primer-
combinations for PCR-DHPLC.
3.3. DNA Extraction
To utilize Vibrio specific primers for further PCR and DHPLC analyses, verification of the
primer-sets by PCR was necessary. Therefore, genomic DNA of a total of 31 Vibrio strains
and five reference strains (2.1.9.) was isolated according to a modified protocol of Anderson
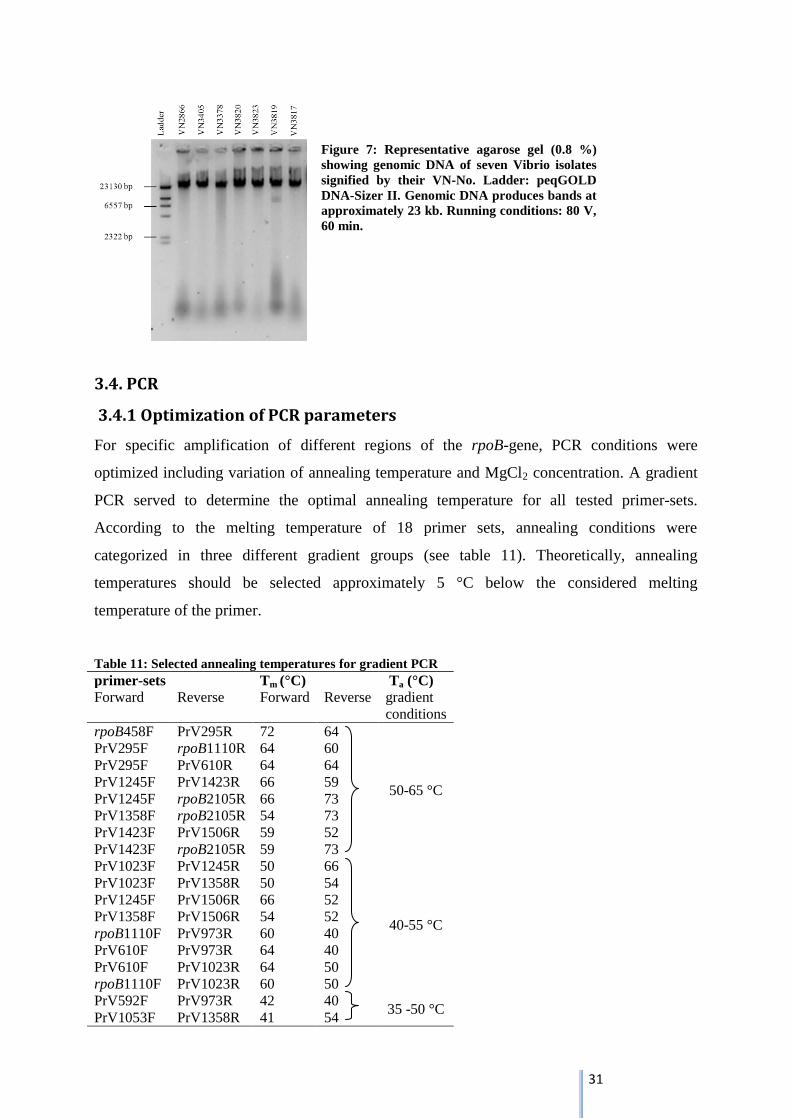
and McKay with the phenol-chloroform method (see chapter 2.2.4.). Figure 7 shows
exemplarily an agarose gel of DNA products isolated from seven Vibrio strains.
Concentration of total genomic DNA varied between 50 – 2000 ng/µl. For PCR-analyses, the
DNA was diluted in water to a final concentration of 50 ng/µl. To assess the purity of nucleic
acids, the absorbance at 280 nm and 260 nm was measured. For all isolated DNA samples, the
ratio ranked between 1.8 and 2.1.
31
Figure 7: Representative agarose gel (0.8 %)
showing genomic DNA of seven Vibrio isolates
signified by their VN-No. Ladder: peqGOLD
DNA-Sizer II. Genomic DNA produces bands at
approximately 23 kb. Running conditions: 80 V,
60 min.
3.4. PCR
3.4.1 Optimization of PCR parameters
For specific amplification of different regions of the rpoB-gene, PCR conditions were
optimized including variation of annealing temperature and MgCl2 concentration. A gradient
PCR served to determine the optimal annealing temperature for all tested primer-sets.
According to the melting temperature of 18 primer sets, annealing conditions were
categorized in three different gradient groups (see table 11). Theoretically, annealing
temperatures should be selected approximately 5 °C below the considered melting
temperature of the primer.
Table 11: Selected annealing temperatures for gradient PCR
primer-sets Tm (°C) Ta (°C)
Forward Reverse Forward Reverse gradient
conditions
rpoB458F PrV295R 72 64
50-65 °C
PrV295F rpoB1110R 64 60
PrV295F PrV610R 64 64
PrV1245F PrV1423R 66 59
PrV1245F rpoB2105R 66 73
PrV1358F rpoB2105R 54 73
PrV1423F PrV1506R 59 52
PrV1423F rpoB2105R 59 73
PrV1023F PrV1245R 50 66
40-55 °C
PrV1023F PrV1358R 50 54
PrV1245F PrV1506R 66 52
PrV1358F PrV1506R 54 52
rpoB1110F PrV973R 60 40
PrV610F PrV973R 64 40
PrV610F PrV1023R 64 50
rpoB1110F PrV1023R 60 50
PrV592F PrV973R 42 40 35 -50 °C
PrV1053F PrV1358R 41 54

32
Additionally, to define the exact temperatures, empirical determination is essential. For
optimization of PCR conditions, four DNA samples of different Vibrio strains; V.
alginolyticus I (VN2514), V. alginolyticus II (VN2756), V. paraheamolyticus (VN2502), V.
navarrensis (VN2580) (see chapter 2.1.9) were selected for each primer-set and amplified by
gradient PCR with individual parameters (see table 11). Figure 8 indicates representative
virtual gels with PCR products of four Vibrio isolates amplified by the primer-set
PrV295F/PrV610R at seven different temperatures with a selected gradient of G=10 °C. For
VN2514 and VN2756 only minimal differences were observable. But for the isolates VN2580
and VN2502 unspecific secondary bands for temperatures between 50.2 °C and 57.8 °C were
formed. Considering all isolates, the best conditions were found at a temperature of 65.1 °C.
Figure 8: Gradient PCR showing PCR products of four Vibrio strains amplified by primer-set
PrV295F/PrV610R at seven different annealing temperatures between 50.2 C and 65.1 °C. Best conditions
were found at 65.1 °C considering all isolates. MultiNa virtual gel was produced with the DNA Kit 500
and DNA bands were visualized by application of SYBR® Gold.
Additionally, MgCl2 concentration was adapted using 1 mM or 2 mM MgCl2 in a 25 µl PCR
reaction mix. Optimal conditions were developed for 13 of the collectively 18 primer-sets. For
5 primer-sets no annealing temperature was considered suitable (see table 12).

33
Table 12: Optimal annealing temperature and MgCl2 concentration for each primer-set
Primer-sets Ta [°C] MgCl2
[mM]
Forward Reverse
rpoB458F PrV295R 60.5 2
PrV295F rpoB1110R 63 1
PrV295F PrV610R 65 1
PrV1245F PrV1423R 60.5 1
PrV1245F rpoB2105R 65 1
PrV1358F rpoB2105R 63 1
PrV1423F PrV1506R -* -*
PrV1423F rpoB2105R -* -*
PrV1023F PrV1245R 53 1
PrV1023F PrV1358R 53 1
PrV1245F PrV1506R 53 2
PrV1358F PrV1506R 53 2
rpoB1110F PrV973R -* -*
PrV610F PrV973R -* -*
PrV610F PrV1023R 53 1
rpoB1110F PrV1023R 55 2
PrV592F PrV973R -* -*
PrV1053F PrV1358R 48 1 Remark: * no ideal annealing temperature and magnesium concentration were found for this primer-set
3.4.2. Amplification of Vibrio isolates
After determination of ideal PCR conditions for respectively 13 primer-sets (see table 12) a
total of 31 Vibrio isolates and five isolates of a reference group (2.1.9) were amplified using
the optimized PCR-protocol. The objective was to define the most suitable primer-sets for
DHPLC analyses by specific amplification of all Vibrio strains excluding the reference group.
Therefore, PCR results were analyzed according to the following criteria: specific
amplification +, weak amplification (+), no amplification -, nearly no amplification (-) and
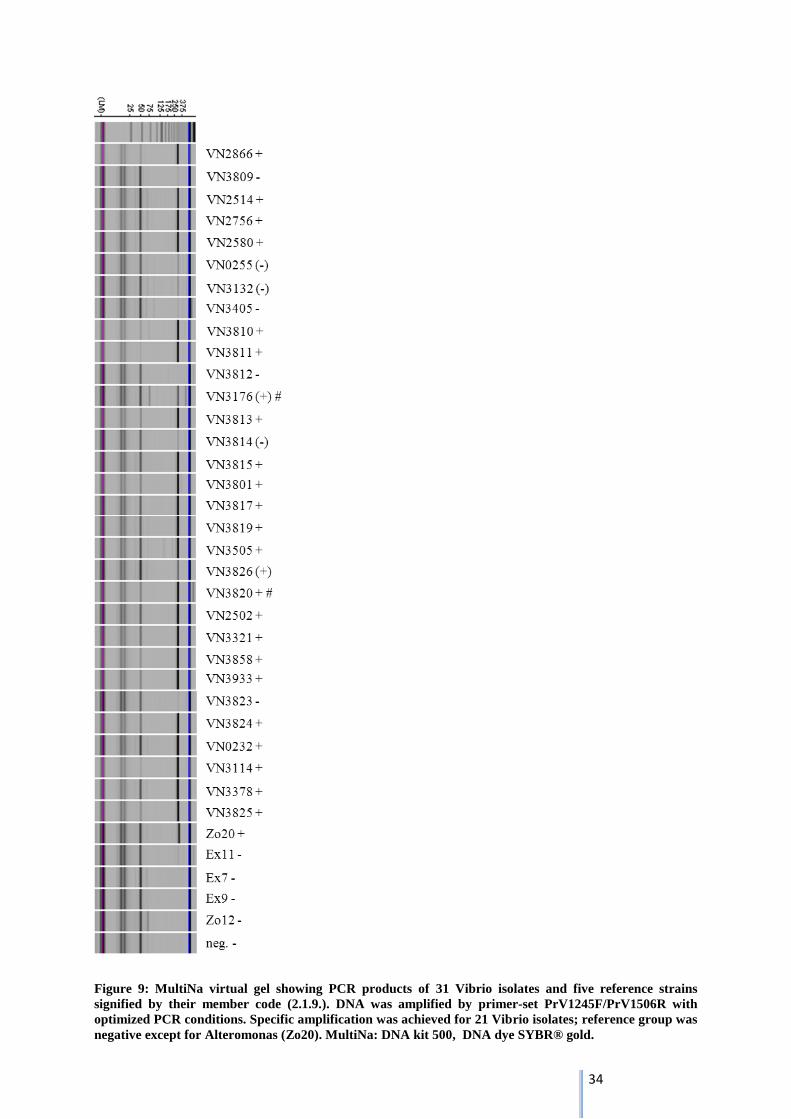
unspecific amplification #. Figure 9 represents an example of PCR analysis using the primer-
set PrV1245F/PrV1506R .
34
Figure 9: MultiNa virtual gel showing PCR products of 31 Vibrio isolates and five reference strains
signified by their member code (2.1.9.). DNA was amplified by primer-set PrV1245F/PrV1506R with
optimized PCR conditions. Specific amplification was achieved for 21 Vibrio isolates; reference group was
negative except for Alteromonas (Zo20). MultiNa: DNA kit 500, DNA dye SYBR® gold.
35
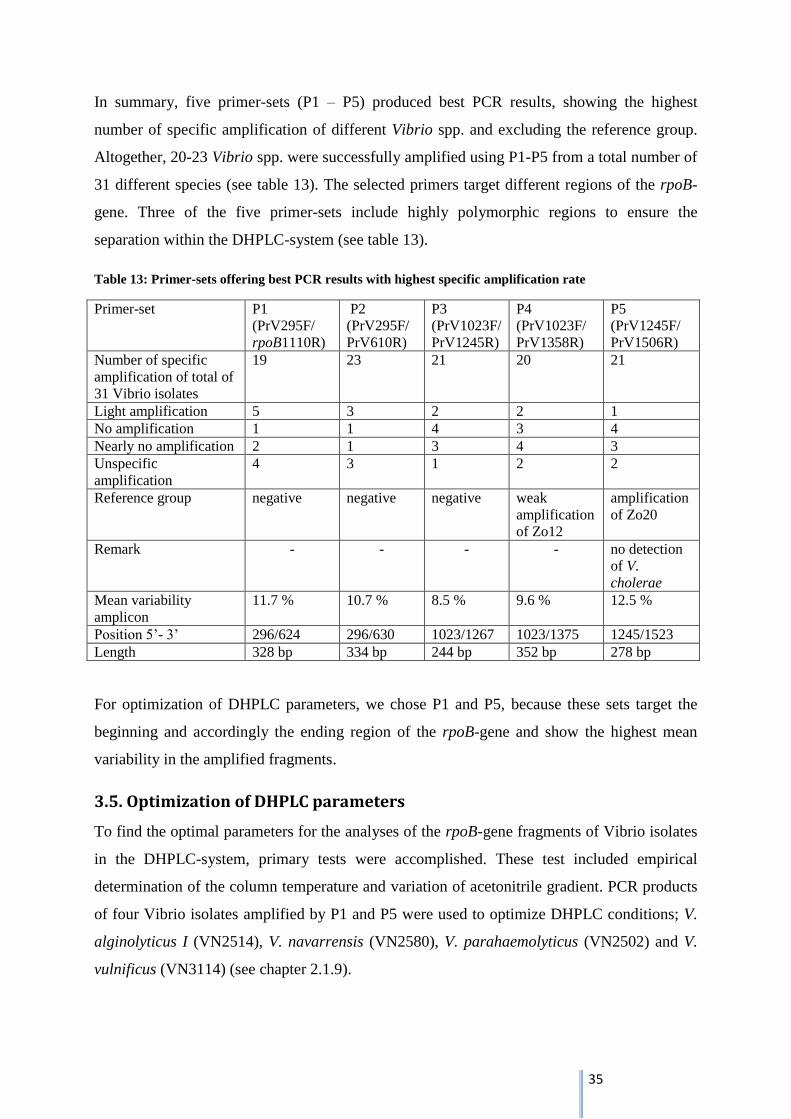
In summary, five primer-sets (P1 – P5) produced best PCR results, showing the highest
number of specific amplification of different Vibrio spp. and excluding the reference group.
Altogether, 20-23 Vibrio spp. were successfully amplified using P1-P5 from a total number of
31 different species (see table 13). The selected primers target different regions of the rpoB-
gene. Three of the five primer-sets include highly polymorphic regions to ensure the
separation within the DHPLC-system (see table 13).
Table 13: Primer-sets offering best PCR results with highest specific amplification rate
Primer-set P1
(PrV295F/
rpoB1110R)
P2
(PrV295F/
PrV610R)
P3
(PrV1023F/
PrV1245R)
P4
(PrV1023F/
PrV1358R)
P5
(PrV1245F/
PrV1506R)
Number of specific
amplification of total of
31 Vibrio isolates
19 23 21 20 21
Light amplification 5 3 2 2 1
No amplification 1 1 4 3 4
Nearly no amplification 2 1 3 4 3
Unspecific
amplification
4 3 1 2 2
Reference group negative negative negative weak
amplification
of Zo12
amplification
of Zo20
Remark - - - - no detection
of V.
cholerae
Mean variability
amplicon
11.7 % 10.7 % 8.5 % 9.6 % 12.5 %
Position 5’- 3’ 296/624 296/630 1023/1267 1023/1375 1245/1523
Length 328 bp 334 bp 244 bp 352 bp 278 bp
For optimization of DHPLC parameters, we chose P1 and P5, because these sets target the
beginning and accordingly the ending region of the rpoB-gene and show the highest mean
variability in the amplified fragments.
3.5. Optimization of DHPLC parameters
To find the optimal parameters for the analyses of the rpoB-gene fragments of Vibrio isolates
in the DHPLC-system, primary tests were accomplished. These test included empirical
determination of the column temperature and variation of acetonitrile gradient. PCR products
of four Vibrio isolates amplified by P1 and P5 were used to optimize DHPLC conditions; V.
alginolyticus I (VN2514), V. navarrensis (VN2580), V. parahaemolyticus (VN2502) and V.
vulnificus (VN3114) (see chapter 2.1.9).
36
3.5.1. Variation of column temperature
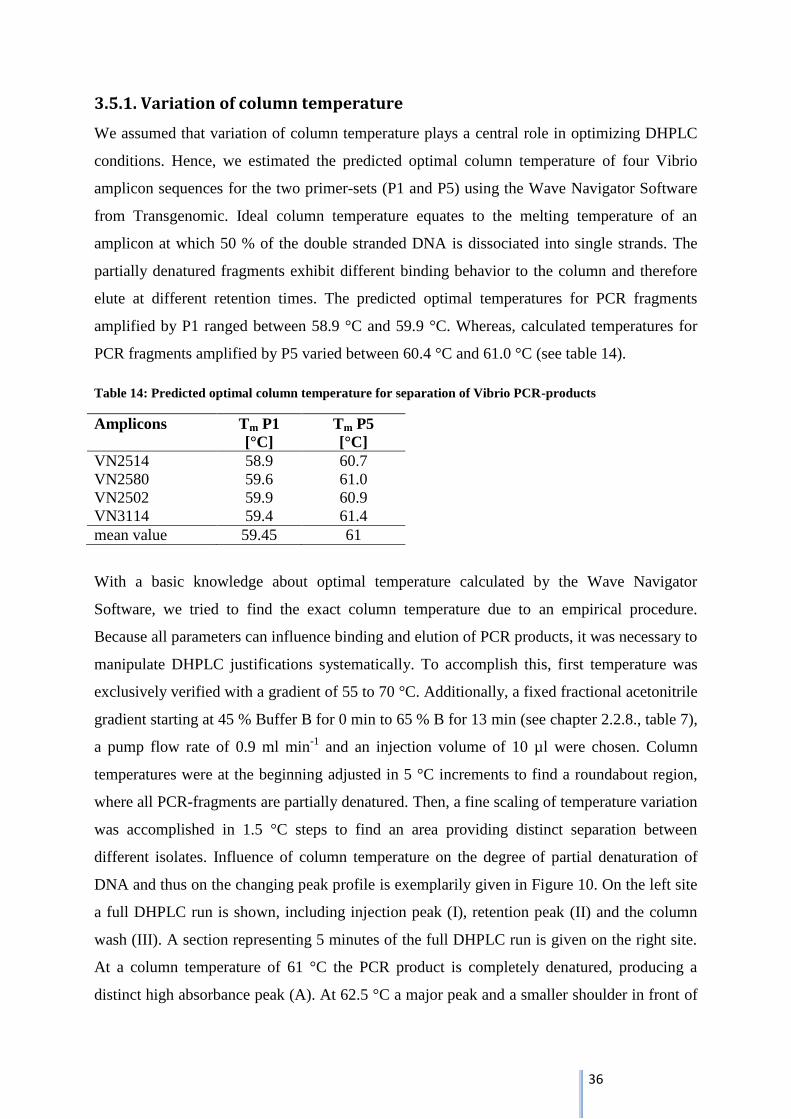
We assumed that variation of column temperature plays a central role in optimizing DHPLC
conditions. Hence, we estimated the predicted optimal column temperature of four Vibrio
amplicon sequences for the two primer-sets (P1 and P5) using the Wave Navigator Software
from Transgenomic. Ideal column temperature equates to the melting temperature of an
amplicon at which 50 % of the double stranded DNA is dissociated into single strands. The
partially denatured fragments exhibit different binding behavior to the column and therefore
elute at different retention times. The predicted optimal temperatures for PCR fragments
amplified by P1 ranged between 58.9 °C and 59.9 °C. Whereas, calculated temperatures for
PCR fragments amplified by P5 varied between 60.4 °C and 61.0 °C (see table 14).
Table 14: Predicted optimal column temperature for separation of Vibrio PCR-products
Amplicons Tm P1
[°C]
Tm P5
[°C]
VN2514 58.9 60.7
VN2580 59.6 61.0
VN2502 59.9 60.9
VN3114 59.4 61.4
mean value 59.45 61
With a basic knowledge about optimal temperature calculated by the Wave Navigator
Software, we tried to find the exact column temperature due to an empirical procedure.
Because all parameters can influence binding and elution of PCR products, it was necessary to
manipulate DHPLC justifications systematically. To accomplish this, first temperature was
exclusively verified with a gradient of 55 to 70 °C. Additionally, a fixed fractional acetonitrile
gradient starting at 45 % Buffer B for 0 min to 65 % B for 13 min (see chapter 2.2.8., table 7),
a pump flow rate of 0.9 ml min-1
and an injection volume of 10 µl were chosen. Column
temperatures were at the beginning adjusted in 5 °C increments to find a roundabout region,
where all PCR-fragments are partially denatured. Then, a fine scaling of temperature variation
was accomplished in 1.5 °C steps to find an area providing distinct separation between
different isolates. Influence of column temperature on the degree of partial denaturation of
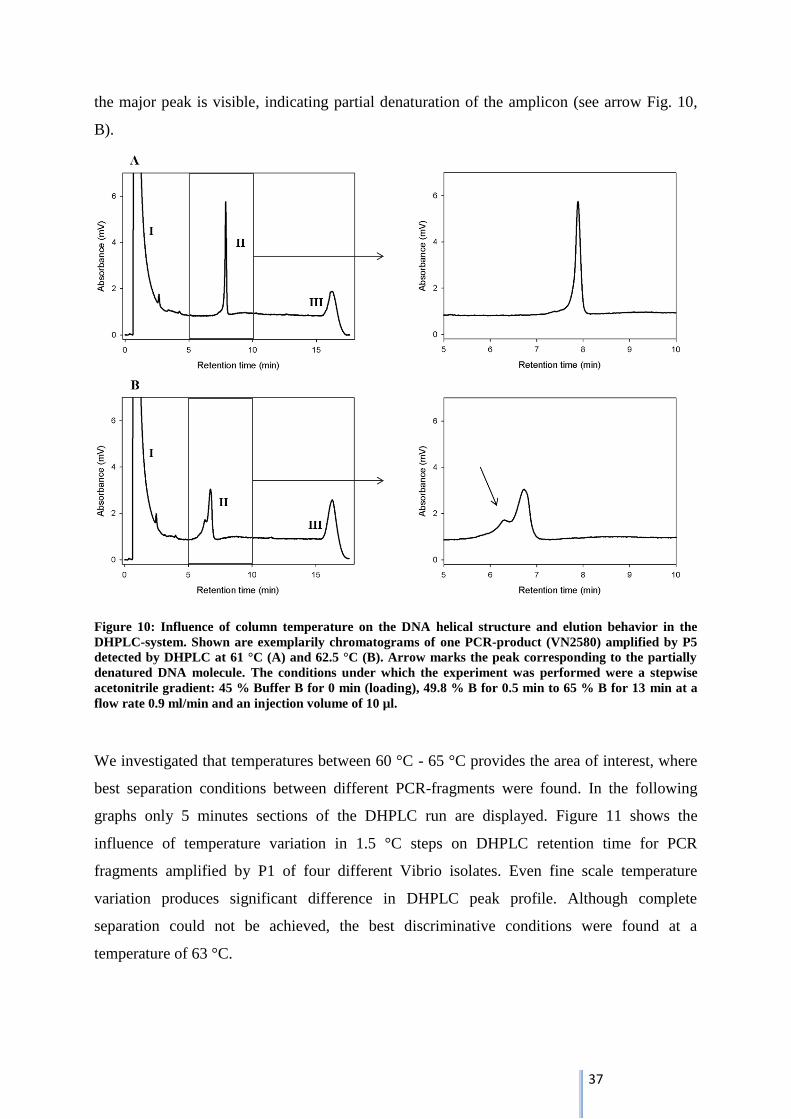
DNA and thus on the changing peak profile is exemplarily given in Figure 10. On the left site
a full DHPLC run is shown, including injection peak (I), retention peak (II) and the column
wash (III). A section representing 5 minutes of the full DHPLC run is given on the right site.
At a column temperature of 61 °C the PCR product is completely denatured, producing a
distinct high absorbance peak (A). At 62.5 °C a major peak and a smaller shoulder in front of
37
the major peak is visible, indicating partial denaturation of the amplicon (see arrow Fig. 10,
B).
Figure 10: Influence of column temperature on the DNA helical structure and elution behavior in the
DHPLC-system. Shown are exemplarily chromatograms of one PCR-product (VN2580) amplified by P5
detected by DHPLC at 61 °C (A) and 62.5 °C (B). Arrow marks the peak corresponding to the partially
denatured DNA molecule. The conditions under which the experiment was performed were a stepwise
acetonitrile gradient: 45 % Buffer B for 0 min (loading), 49.8 % B for 0.5 min to 65 % B for 13 min at a
flow rate 0.9 ml/min and an injection volume of 10 µl.
We investigated that temperatures between 60 °C - 65 °C provides the area of interest, where
best separation conditions between different PCR-fragments were found. In the following
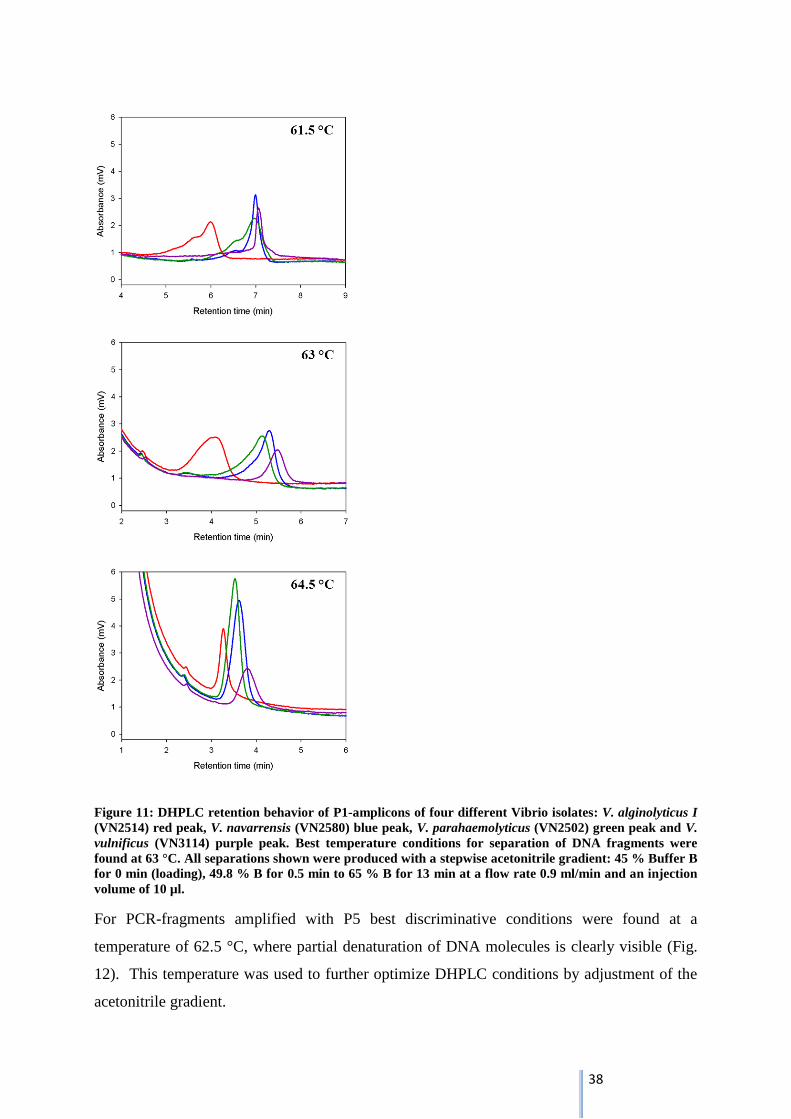
graphs only 5 minutes sections of the DHPLC run are displayed. Figure 11 shows the
influence of temperature variation in 1.5 °C steps on DHPLC retention time for PCR
fragments amplified by P1 of four different Vibrio isolates. Even fine scale temperature
variation produces significant difference in DHPLC peak profile. Although complete
separation could not be achieved, the best discriminative conditions were found at a
temperature of 63 °C.
38
Figure 11: DHPLC retention behavior of P1-amplicons of four different Vibrio isolates: V. alginolyticus I
(VN2514) red peak, V. navarrensis (VN2580) blue peak, V. parahaemolyticus (VN2502) green peak and V.
vulnificus (VN3114) purple peak. Best temperature conditions for separation of DNA fragments were
found at 63 °C. All separations shown were produced with a stepwise acetonitrile gradient: 45 % Buffer B
for 0 min (loading), 49.8 % B for 0.5 min to 65 % B for 13 min at a flow rate 0.9 ml/min and an injection
volume of 10 µl.
For PCR-fragments amplified with P5 best discriminative conditions were found at a
temperature of 62.5 °C, where partial denaturation of DNA molecules is clearly visible (Fig.
12). This temperature was used to further optimize DHPLC conditions by adjustment of the
acetonitrile gradient.
39
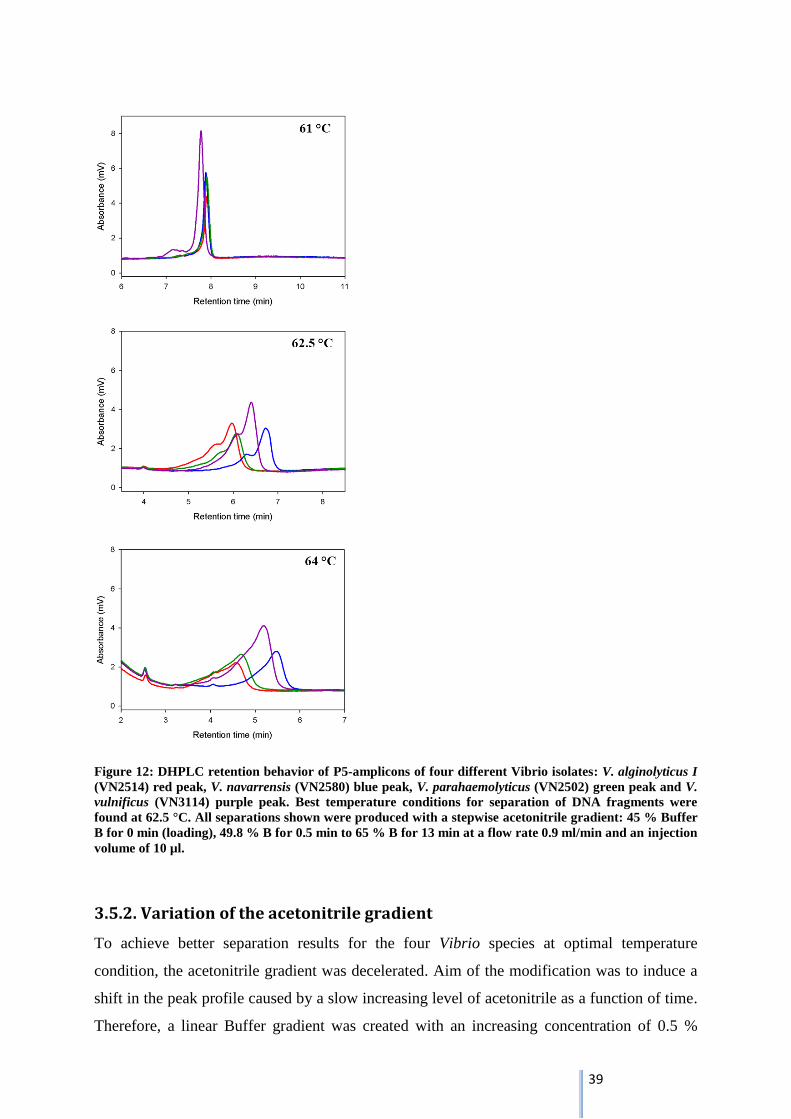
Figure 12: DHPLC retention behavior of P5-amplicons of four different Vibrio isolates: V. alginolyticus I
(VN2514) red peak, V. navarrensis (VN2580) blue peak, V. parahaemolyticus (VN2502) green peak and V.
vulnificus (VN3114) purple peak. Best temperature conditions for separation of DNA fragments were
found at 62.5 °C. All separations shown were produced with a stepwise acetonitrile gradient: 45 % Buffer
B for 0 min (loading), 49.8 % B for 0.5 min to 65 % B for 13 min at a flow rate 0.9 ml/min and an injection
volume of 10 µl.
3.5.2. Variation of the acetonitrile gradient
To achieve better separation results for the four Vibrio species at optimal temperature
condition, the acetonitrile gradient was decelerated. Aim of the modification was to induce a
shift in the peak profile caused by a slow increasing level of acetonitrile as a function of time.
Therefore, a linear Buffer gradient was created with an increasing concentration of 0.5 %

40
Buffer B (aqueous solution of 0.1 M TEAA with 25% acetonitrile) per minute, started with 45
% Buffer B for 0 min (loading), 54 % Buffer B for 2 min to 60 % Buffer B for 14 min at 63.5
°C (see chapter 2.2.8.). Figure 13 shows the DHPLC analysis for the adapted running
conditions at 63 °C for PCR products amplified by P1 (A) and 62.5 °C for PCR products
amplified by P5 (B). Generally, the DHPLC results indicate loss in peak intensity and a shift
in retention time after adaptation of the acetonitrile gradient. Peak profile of P1-amplicons
resembles the analyses of the first DHPLC protocol including only temperature variation. In
contrary, distinct alteration in retention behaviour is observable for PCR fragments amplified
by P5 (see arrow Fig. 13 B). P5-PCR products of V. vulnificus (VN3114) and V. navarrensis
(VN2580) are clearly distinguishable, but P5-PCR products of V. alginolyticus (VN2514) and
V. parahaemolyticus (VN2580) (see chapter 2.1.9.) were not detectable.
Figure 13: DHPLC analysis of 4 individual PCR-products of V. alginolyticus I (VN2514) red peak, V.
navarrensis (VN2580) blue peak, V. parahaemolyticus (VN2502) green peak and V. vulnificus (VN3114)
purple peak amplified with primer-set 1 and 5 with at A) 63 °C and B) 62.5 °C. Acetonitrile gradient was
adapted to: 45 % Buffer B for 0 min (loading), 54 % B for 2 min to 60 % B for 14 min at 63.5 °C; flow
rate 0.9 ml/min; injection volume 10 µl.
Briefly, best separation conditions in the DHPLC-system were found for PCR-products
amplified by P5 at a column temperature of 62.5 °C with a linear acetonitrile gradient of 45 %
Buffer B for 0 min (loading), 54 % Buffer B for 2 min to 60 % Buffer B for 14 min at a flow
rate of 0.9 ml min-1
with an injection volume of 10 µl. But using these conditions only two of
four Vibrio isolates were detected by DHPLC.
3.5.3. Adaptation of PCR-DHPLC protocol by attachment of a 40 bp GC-clamp
To overcome the loss in peak intensity, PCR protocol was modified including attachment of a
GC-clamp to 5’end of the respective P5-primer and a touchdown-PCR. After attachment of
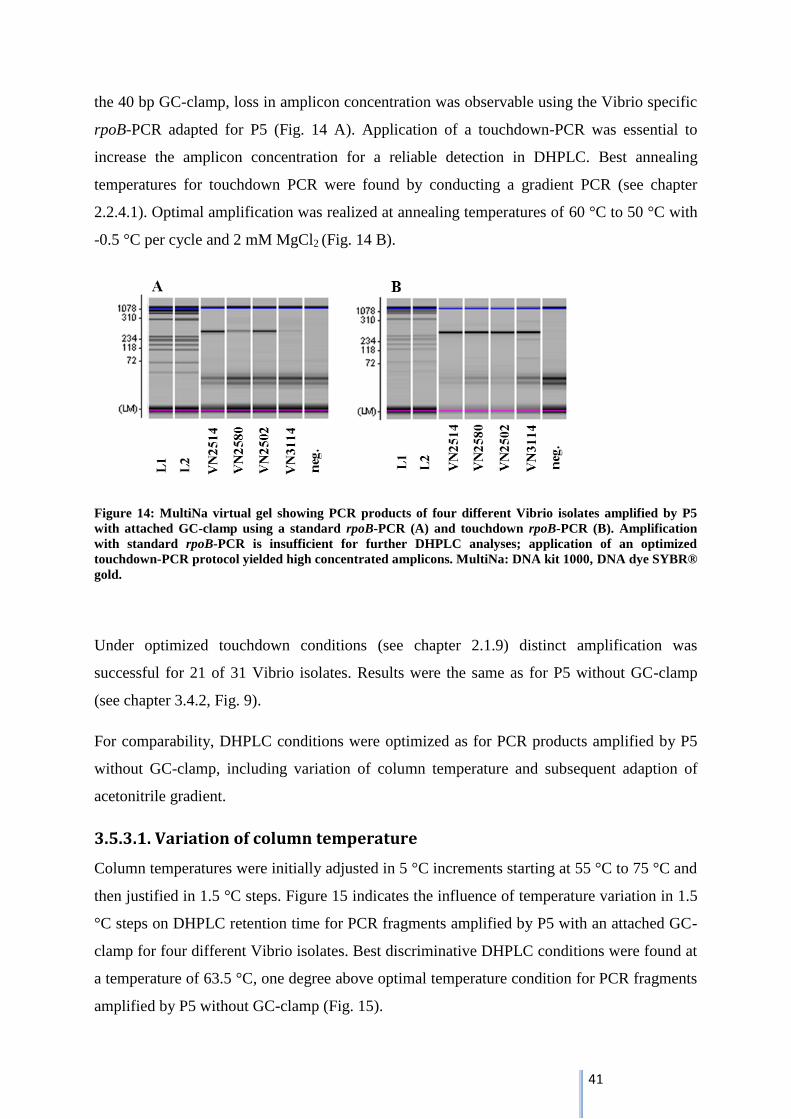
41
the 40 bp GC-clamp, loss in amplicon concentration was observable using the Vibrio specific
rpoB-PCR adapted for P5 (Fig. 14 A). Application of a touchdown-PCR was essential to
increase the amplicon concentration for a reliable detection in DHPLC. Best annealing
temperatures for touchdown PCR were found by conducting a gradient PCR (see chapter
2.2.4.1). Optimal amplification was realized at annealing temperatures of 60 °C to 50 °C with
-0.5 °C per cycle and 2 mM MgCl2 (Fig. 14 B).
Figure 14: MultiNa virtual gel showing PCR products of four different Vibrio isolates amplified by P5
with attached GC-clamp using a standard rpoB-PCR (A) and touchdown rpoB-PCR (B). Amplification
with standard rpoB-PCR is insufficient for further DHPLC analyses; application of an optimized
touchdown-PCR protocol yielded high concentrated amplicons. MultiNa: DNA kit 1000, DNA dye SYBR®
gold.
Under optimized touchdown conditions (see chapter 2.1.9) distinct amplification was
successful for 21 of 31 Vibrio isolates. Results were the same as for P5 without GC-clamp
(see chapter 3.4.2, Fig. 9).
For comparability, DHPLC conditions were optimized as for PCR products amplified by P5
without GC-clamp, including variation of column temperature and subsequent adaption of
acetonitrile gradient.
3.5.3.1. Variation of column temperature
Column temperatures were initially adjusted in 5 °C increments starting at 55 °C to 75 °C and
then justified in 1.5 °C steps. Figure 15 indicates the influence of temperature variation in 1.5
°C steps on DHPLC retention time for PCR fragments amplified by P5 with an attached GC-
clamp for four different Vibrio isolates. Best discriminative DHPLC conditions were found at
a temperature of 63.5 °C, one degree above optimal temperature condition for PCR fragments
amplified by P5 without GC-clamp (Fig. 15).
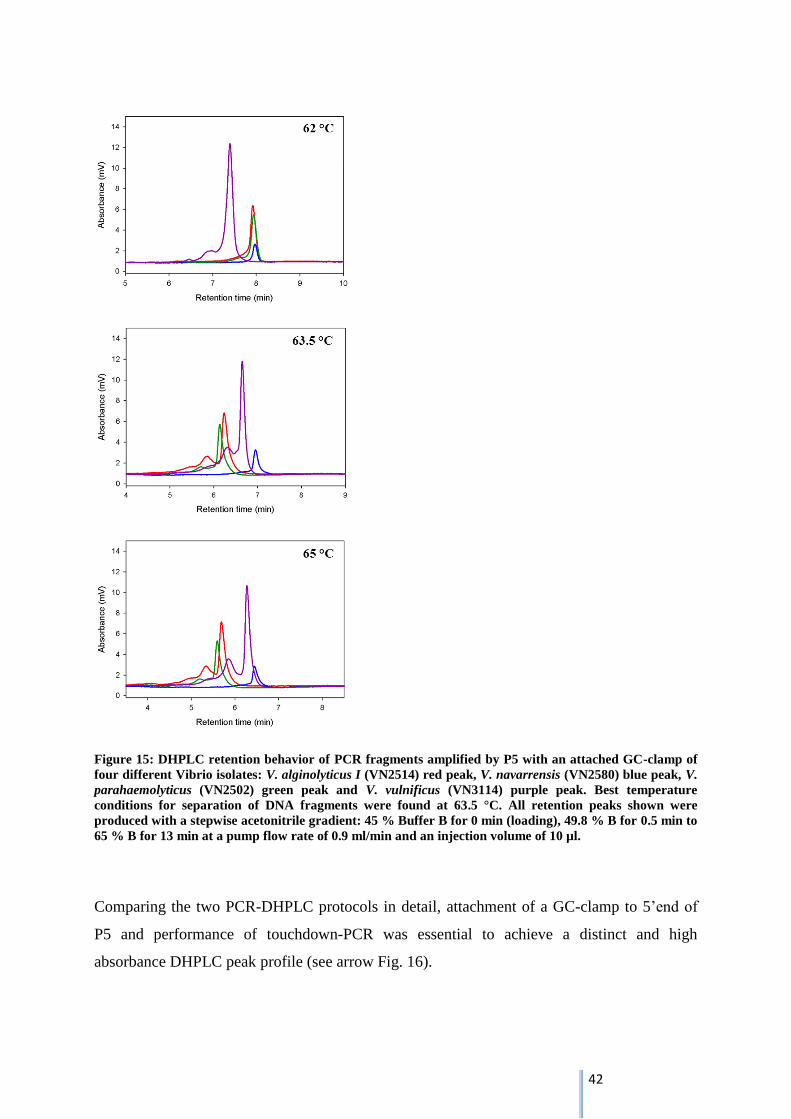
42
Figure 15: DHPLC retention behavior of PCR fragments amplified by P5 with an attached GC-clamp of
four different Vibrio isolates: V. alginolyticus I (VN2514) red peak, V. navarrensis (VN2580) blue peak, V.
parahaemolyticus (VN2502) green peak and V. vulnificus (VN3114) purple peak. Best temperature
conditions for separation of DNA fragments were found at 63.5 °C. All retention peaks shown were
produced with a stepwise acetonitrile gradient: 45 % Buffer B for 0 min (loading), 49.8 % B for 0.5 min to
65 % B for 13 min at a pump flow rate of 0.9 ml/min and an injection volume of 10 µl.
Comparing the two PCR-DHPLC protocols in detail, attachment of a GC-clamp to 5’end of
P5 and performance of touchdown-PCR was essential to achieve a distinct and high
absorbance DHPLC peak profile (see arrow Fig. 16).
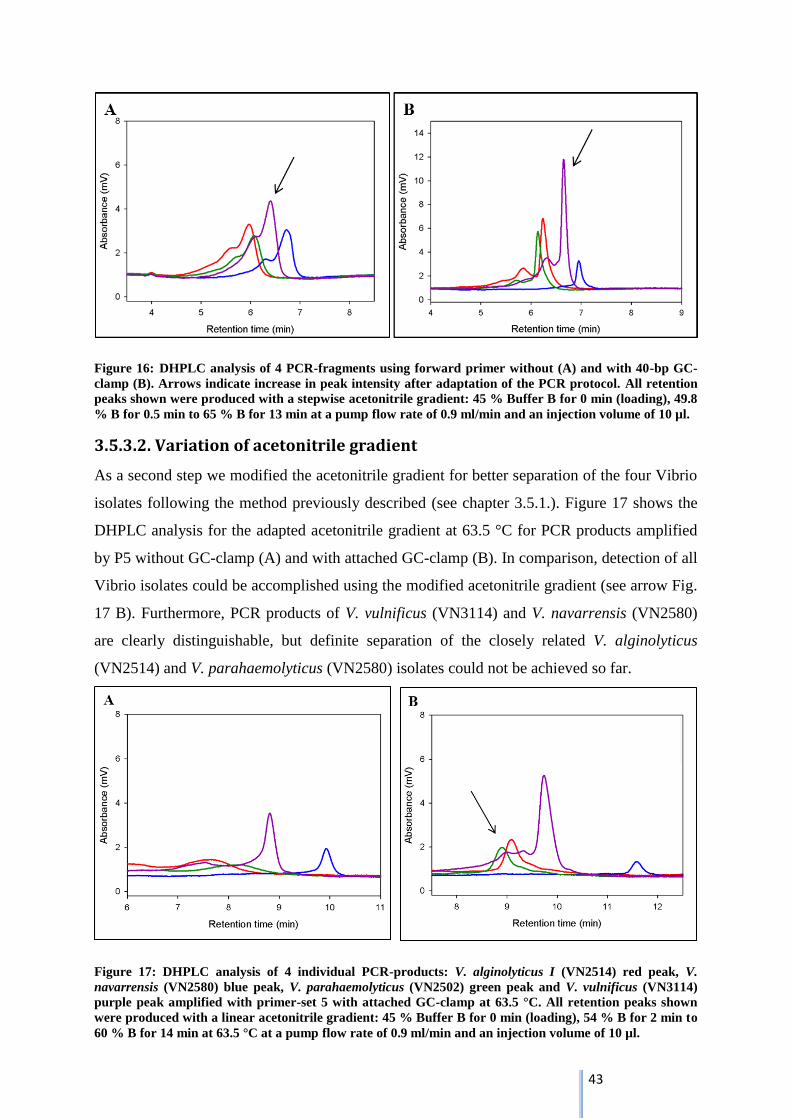
43
Figure 16: DHPLC analysis of 4 PCR-fragments using forward primer without (A) and with 40-bp GC-
clamp (B). Arrows indicate increase in peak intensity after adaptation of the PCR protocol. All retention
peaks shown were produced with a stepwise acetonitrile gradient: 45 % Buffer B for 0 min (loading), 49.8
% B for 0.5 min to 65 % B for 13 min at a pump flow rate of 0.9 ml/min and an injection volume of 10 µl.
3.5.3.2. Variation of acetonitrile gradient
As a second step we modified the acetonitrile gradient for better separation of the four Vibrio
isolates following the method previously described (see chapter 3.5.1.). Figure 17 shows the
DHPLC analysis for the adapted acetonitrile gradient at 63.5 °C for PCR products amplified
by P5 without GC-clamp (A) and with attached GC-clamp (B). In comparison, detection of all
Vibrio isolates could be accomplished using the modified acetonitrile gradient (see arrow Fig.
17 B). Furthermore, PCR products of V. vulnificus (VN3114) and V. navarrensis (VN2580)
are clearly distinguishable, but definite separation of the closely related V. alginolyticus
(VN2514) and V. parahaemolyticus (VN2580) isolates could not be achieved so far.
Figure 17: DHPLC analysis of 4 individual PCR-products: V. alginolyticus I (VN2514) red peak, V.
navarrensis (VN2580) blue peak, V. parahaemolyticus (VN2502) green peak and V. vulnificus (VN3114)
purple peak amplified with primer-set 5 with attached GC-clamp at 63.5 °C. All retention peaks shown
were produced with a linear acetonitrile gradient: 45 % Buffer B for 0 min (loading), 54 % B for 2 min to
60 % B for 14 min at 63.5 °C at a pump flow rate of 0.9 ml/min and an injection volume of 10 µl.
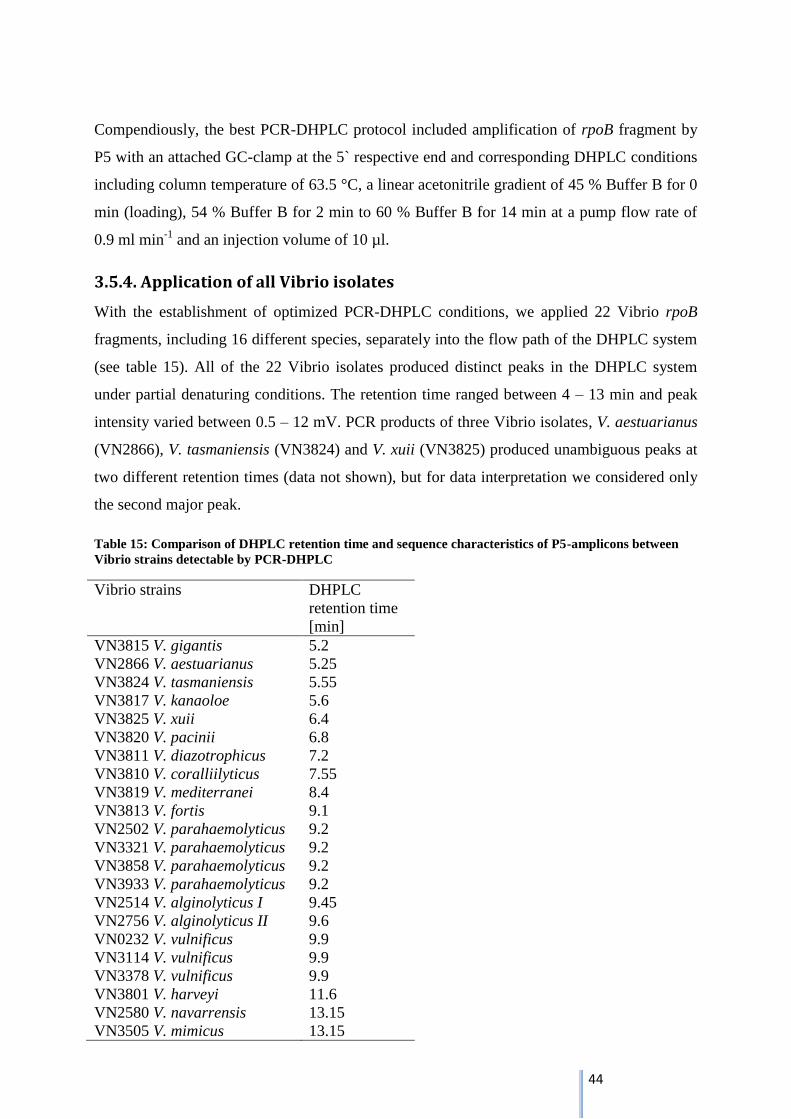
44
Compendiously, the best PCR-DHPLC protocol included amplification of rpoB fragment by
P5 with an attached GC-clamp at the 5` respective end and corresponding DHPLC conditions
including column temperature of 63.5 °C, a linear acetonitrile gradient of 45 % Buffer B for 0
min (loading), 54 % Buffer B for 2 min to 60 % Buffer B for 14 min at a pump flow rate of
0.9 ml min-1
and an injection volume of 10 µl.
3.5.4. Application of all Vibrio isolates
With the establishment of optimized PCR-DHPLC conditions, we applied 22 Vibrio rpoB
fragments, including 16 different species, separately into the flow path of the DHPLC system
(see table 15). All of the 22 Vibrio isolates produced distinct peaks in the DHPLC system
under partial denaturing conditions. The retention time ranged between 4 – 13 min and peak
intensity varied between 0.5 – 12 mV. PCR products of three Vibrio isolates, V. aestuarianus
(VN2866), V. tasmaniensis (VN3824) and V. xuii (VN3825) produced unambiguous peaks at
two different retention times (data not shown), but for data interpretation we considered only
the second major peak.
Table 15: Comparison of DHPLC retention time and sequence characteristics of P5-amplicons between
Vibrio strains detectable by PCR-DHPLC
Vibrio strains DHPLC
retention time
[min]
VN3815 V. gigantis 5.2
VN2866 V. aestuarianus 5.25
VN3824 V. tasmaniensis 5.55
VN3817 V. kanaoloe 5.6
VN3825 V. xuii 6.4
VN3820 V. pacinii 6.8
VN3811 V. diazotrophicus 7.2
VN3810 V. coralliilyticus 7.55
VN3819 V. mediterranei 8.4
VN3813 V. fortis 9.1
VN2502 V. parahaemolyticus 9.2
VN3321 V. parahaemolyticus 9.2
VN3858 V. parahaemolyticus 9.2
VN3933 V. parahaemolyticus 9.2
VN2514 V. alginolyticus I 9.45
VN2756 V. alginolyticus II 9.6
VN0232 V. vulnificus 9.9
VN3114 V. vulnificus 9.9
VN3378 V. vulnificus 9.9
VN3801 V. harveyi 11.6
VN2580 V. navarrensis 13.15
VN3505 V. mimicus 13.15
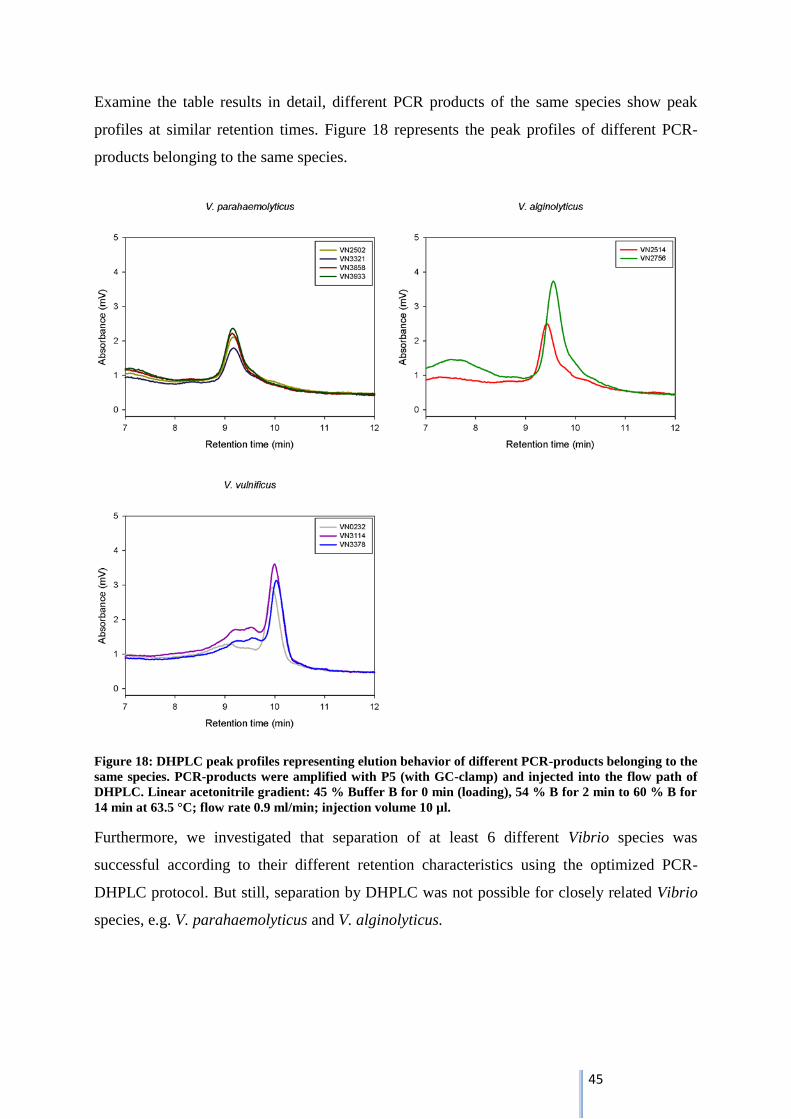
45
Examine the table results in detail, different PCR products of the same species show peak
profiles at similar retention times. Figure 18 represents the peak profiles of different PCR-
products belonging to the same species.
Figure 18: DHPLC peak profiles representing elution behavior of different PCR-products belonging to the
same species. PCR-products were amplified with P5 (with GC-clamp) and injected into the flow path of
DHPLC. Linear acetonitrile gradient: 45 % Buffer B for 0 min (loading), 54 % B for 2 min to 60 % B for
14 min at 63.5 °C; flow rate 0.9 ml/min; injection volume 10 µl.
Furthermore, we investigated that separation of at least 6 different Vibrio species was
successful according to their different retention characteristics using the optimized PCR-
DHPLC protocol. But still, separation by DHPLC was not possible for closely related Vibrio
species, e.g. V. parahaemolyticus and V. alginolyticus.
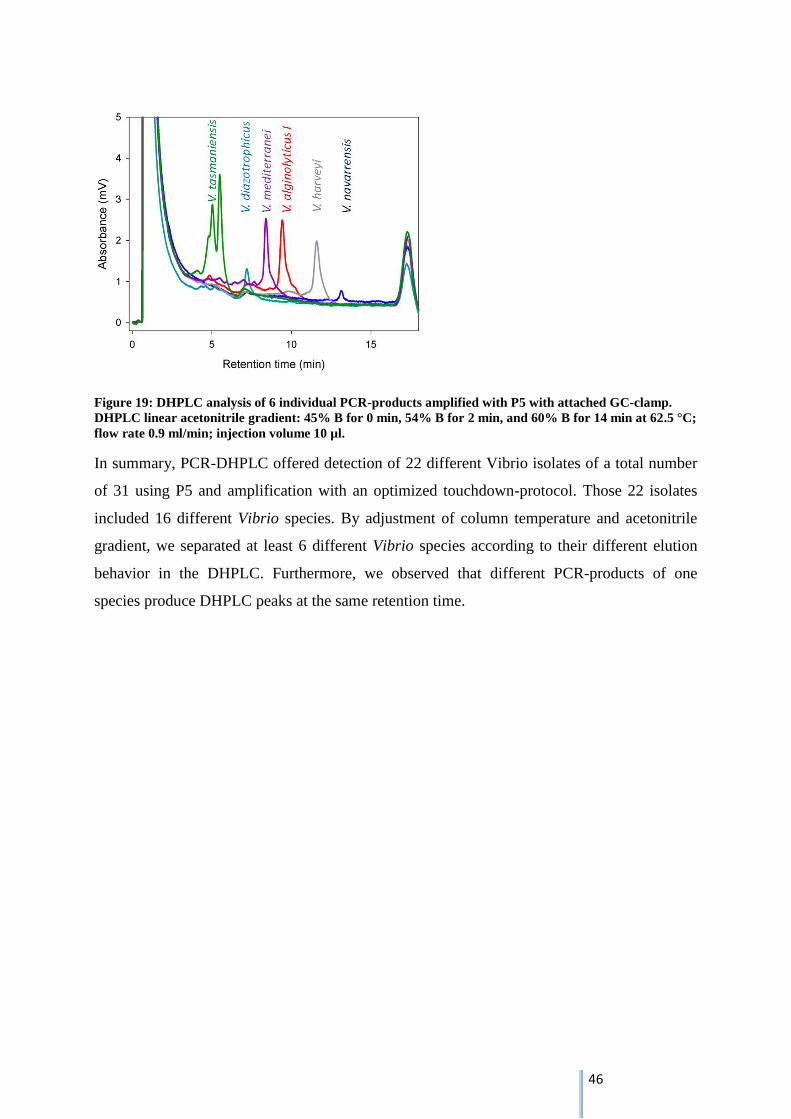
46
Figure 19: DHPLC analysis of 6 individual PCR-products amplified with P5 with attached GC-clamp.
DHPLC linear acetonitrile gradient: 45% B for 0 min, 54% B for 2 min, and 60% B for 14 min at 62.5 °C;
flow rate 0.9 ml/min; injection volume 10 µl.
In summary, PCR-DHPLC offered detection of 22 different Vibrio isolates of a total number
of 31 using P5 and amplification with an optimized touchdown-protocol. Those 22 isolates
included 16 different Vibrio species. By adjustment of column temperature and acetonitrile
gradient, we separated at least 6 different Vibrio species according to their different elution
behavior in the DHPLC. Furthermore, we observed that different PCR-products of one
species produce DHPLC peaks at the same retention time.
47
4. Discussion
In this study we investigated potential human pathogenic Vibrios spp. by PCR-DHPLC based
on partial rpoB-gene fragments. Some strains of Vibrio spp. induce outbreaks of
gastrointestinal infections or primary septicemia in humans caused by consumption of
contaminated see-food or contact with polluted water, and many species are potential
pathogens for marine organisms (Thompson, Iida et al. 2004). Due to rising sea water
temperature and the worldwide marine traffic conditions are enhanced for potentially
pathogenic Vibrio spp. to grow and disperse even in temperate waters of the North and Baltic
Sea (Wiltshire, Malzahn et al. 2008; Belkin 2009; Baker-Austin, Stockley et al. 2010).
Because of the increased incidence of Vibrio infections in the last years, a rapid and accurate
method is required to analyze and identify complex Vibrio spp. populations, specifically
potential pathogenic Vibrio species, in environmental samples. A general problem in
investigating Vibrios is the difficulty in differentiation between species due to their close
phylogenetic relationship, especially described for V. parahaemolyticus and V. alginolyticus
(Kita-Tsukamoto, Oyaizu et al. 1993; Robert-Pillot, Guenole et al. 2002). Generally
molecular methods based on 16S rRNA analyses have been regularly applied for
differentiation of bacterial isolates (Woo, Lau et al. 2008). But for identification of Vibrio
spp., the 16S rRNA gene has been described as not sufficiently polymorphic to ensure their
reliable identification (Thompson, Gevers et al. 2005; Tarr, Patel et al. 2007). For this reason,
other biomarkers were consulted to overcome the high conservation of the 16S rRNA gene.
Recently, Oberbeckmann and coworkers (2011) showed that rpoB sequence analysis is a more
reliable method to distinguish even closely related Vibrio species. Many sequence based
molecular methods have been established for identification and characterization of Vibrio
strains during the last decade, like MALDI-TOF, repetitive sequence based PCR or DGGE
(Eiler and Bertilsson 2006; Oberbeckmann, Wichels et al. 2011). Most recently, DHPLC has
been applied to separate mixtures of PCR amplicons derived from different organisms. In this
study, we report the first development of a PCR-DHPLC approach targeting rpoB-gene
fragments for detection and separation of potentially pathogenic Vibrios, which could be used
to monitor abundance of microbial communities in environmental samples.
4.1. Design of Vibrio specific Primers
Foundation for development of the rpoB-DHPLC approach was the evaluation of Vibrio
specific Primers, targeting different regions of the rpoB-gene. In recent studies rpoB-based
molecular methods were described as a reliable tool for classification of Vibrio isolates, rather
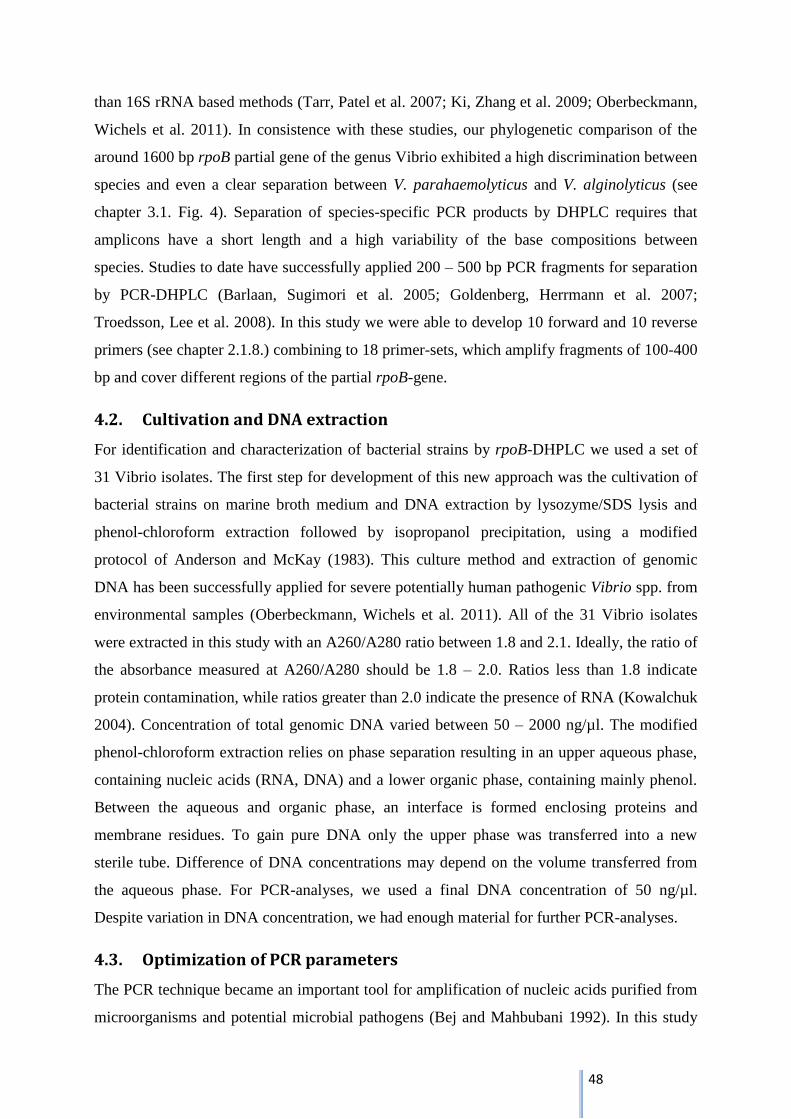
48
than 16S rRNA based methods (Tarr, Patel et al. 2007; Ki, Zhang et al. 2009; Oberbeckmann,
Wichels et al. 2011). In consistence with these studies, our phylogenetic comparison of the
around 1600 bp rpoB partial gene of the genus Vibrio exhibited a high discrimination between
species and even a clear separation between V. parahaemolyticus and V. alginolyticus (see
chapter 3.1. Fig. 4). Separation of species-specific PCR products by DHPLC requires that
amplicons have a short length and a high variability of the base compositions between
species. Studies to date have successfully applied 200 – 500 bp PCR fragments for separation
by PCR-DHPLC (Barlaan, Sugimori et al. 2005; Goldenberg, Herrmann et al. 2007;
Troedsson, Lee et al. 2008). In this study we were able to develop 10 forward and 10 reverse
primers (see chapter 2.1.8.) combining to 18 primer-sets, which amplify fragments of 100-400
bp and cover different regions of the partial rpoB-gene.
4.2. Cultivation and DNA extraction
For identification and characterization of bacterial strains by rpoB-DHPLC we used a set of
31 Vibrio isolates. The first step for development of this new approach was the cultivation of
bacterial strains on marine broth medium and DNA extraction by lysozyme/SDS lysis and
phenol-chloroform extraction followed by isopropanol precipitation, using a modified
protocol of Anderson and McKay (1983). This culture method and extraction of genomic
DNA has been successfully applied for severe potentially human pathogenic Vibrio spp. from
environmental samples (Oberbeckmann, Wichels et al. 2011). All of the 31 Vibrio isolates
were extracted in this study with an A260/A280 ratio between 1.8 and 2.1. Ideally, the ratio of
the absorbance measured at A260/A280 should be 1.8 – 2.0. Ratios less than 1.8 indicate
protein contamination, while ratios greater than 2.0 indicate the presence of RNA (Kowalchuk
2004). Concentration of total genomic DNA varied between 50 – 2000 ng/µl. The modified
phenol-chloroform extraction relies on phase separation resulting in an upper aqueous phase,
containing nucleic acids (RNA, DNA) and a lower organic phase, containing mainly phenol.
Between the aqueous and organic phase, an interface is formed enclosing proteins and
membrane residues. To gain pure DNA only the upper phase was transferred into a new
sterile tube. Difference of DNA concentrations may depend on the volume transferred from
the aqueous phase. For PCR-analyses, we used a final DNA concentration of 50 ng/µl.
Despite variation in DNA concentration, we had enough material for further PCR-analyses.
4.3. Optimization of PCR parameters
The PCR technique became an important tool for amplification of nucleic acids purified from
microorganisms and potential microbial pathogens (Bej and Mahbubani 1992). In this study
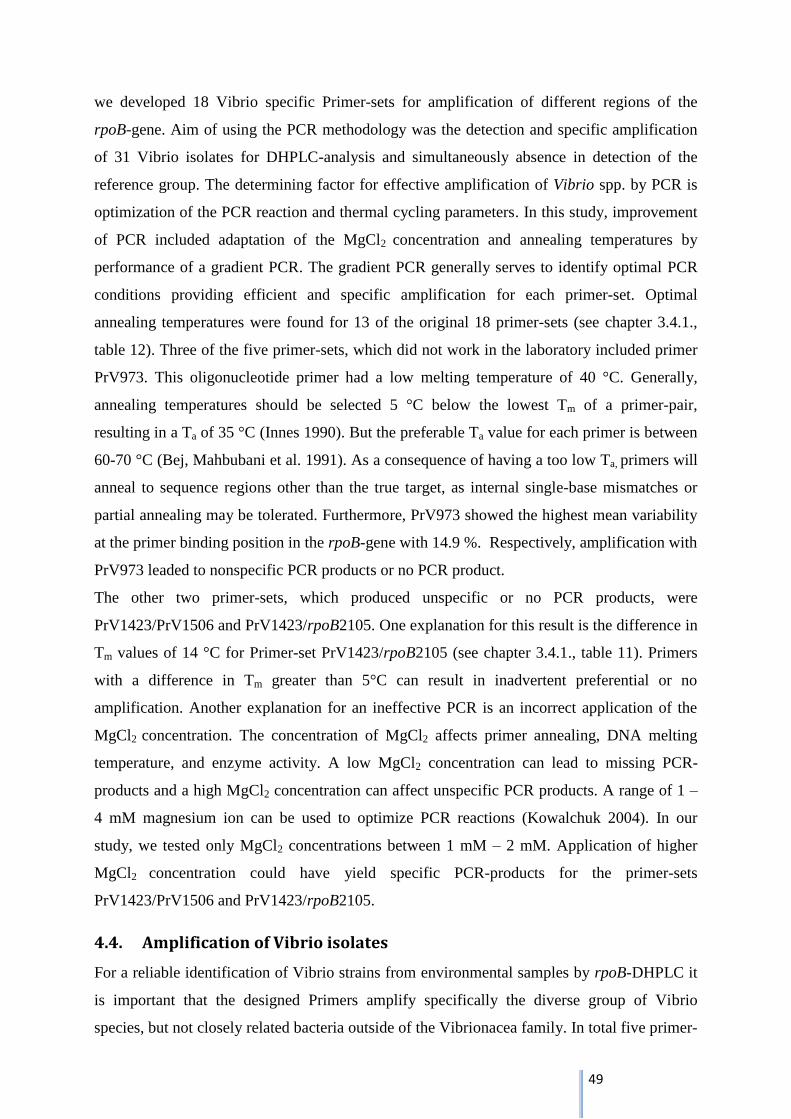
49
we developed 18 Vibrio specific Primer-sets for amplification of different regions of the
rpoB-gene. Aim of using the PCR methodology was the detection and specific amplification
of 31 Vibrio isolates for DHPLC-analysis and simultaneously absence in detection of the
reference group. The determining factor for effective amplification of Vibrio spp. by PCR is
optimization of the PCR reaction and thermal cycling parameters. In this study, improvement
of PCR included adaptation of the MgCl2 concentration and annealing temperatures by
performance of a gradient PCR. The gradient PCR generally serves to identify optimal PCR
conditions providing efficient and specific amplification for each primer-set. Optimal
annealing temperatures were found for 13 of the original 18 primer-sets (see chapter 3.4.1.,
table 12). Three of the five primer-sets, which did not work in the laboratory included primer
PrV973. This oligonucleotide primer had a low melting temperature of 40 °C. Generally,
annealing temperatures should be selected 5 °C below the lowest Tm of a primer-pair,
resulting in a Ta of 35 °C (Innes 1990). But the preferable Ta value for each primer is between
60-70 °C (Bej, Mahbubani et al. 1991). As a consequence of having a too low Ta, primers will
anneal to sequence regions other than the true target, as internal single-base mismatches or
partial annealing may be tolerated. Furthermore, PrV973 showed the highest mean variability
at the primer binding position in the rpoB-gene with 14.9 %. Respectively, amplification with
PrV973 leaded to nonspecific PCR products or no PCR product.
The other two primer-sets, which produced unspecific or no PCR products, were
PrV1423/PrV1506 and PrV1423/rpoB2105. One explanation for this result is the difference in
Tm values of 14 °C for Primer-set PrV1423/rpoB2105 (see chapter 3.4.1., table 11). Primers
with a difference in Tm greater than 5°C can result in inadvertent preferential or no
amplification. Another explanation for an ineffective PCR is an incorrect application of the
MgCl2 concentration. The concentration of MgCl2 affects primer annealing, DNA melting
temperature, and enzyme activity. A low MgCl2 concentration can lead to missing PCR-
products and a high MgCl2 concentration can affect unspecific PCR products. A range of 1 –
4 mM magnesium ion can be used to optimize PCR reactions (Kowalchuk 2004). In our
study, we tested only MgCl2 concentrations between 1 mM – 2 mM. Application of higher
MgCl2 concentration could have yield specific PCR-products for the primer-sets
PrV1423/PrV1506 and PrV1423/rpoB2105.
4.4. Amplification of Vibrio isolates
For a reliable identification of Vibrio strains from environmental samples by rpoB-DHPLC it
is important that the designed Primers amplify specifically the diverse group of Vibrio
species, but not closely related bacteria outside of the Vibrionacea family. In total five primer-

50
sets fulfill these conditions. Using the optimized PCR parameters P1-P5 exhibited sufficient
amplification of Vibrio species with 20-23 distinct PCR-products of Vibrio isolates from a
total number of 31. For the DHPLC-approach, we selected two primer-combinations (P1 and
P5), showing the highest mean variability of the amplicon region. The sequence based
variation is the foundation for an adequate separation by DHPLC.
4.5. DHPLC
In recent times the DHPLC, originally developed to detect gene mutations and single
nucleotide polymorphisms, has been successfully adapted for separation of bacterial PCR-
amplified fragments of complex microbial communities and is thus a time- and cost-efficient
alternative to other molecular methods, like full length sequencing (Wagner, Stoppa-Lyonnet
et al. 1999; Goldenberg, Herrmann et al. 2007). Furthermore, rpoB-gene analysis have already
been described as a powerful method for discrimination of even closely related Vibrios, e.g.
V. alginolyticus and V. parahaemolyticus (Ki, Zhang et al. 2009; Oberbeckmann, Wichels et
al. 2011). For the first time, we combined these approaches to develop a new rpoB-DHPLC
assay for identification and characterization of potential pathogenic Vibrios strains. This study
focused on the evaluation and optimization of DHPLC-conditions, including adaptation of the
column temperature and acetonitrile gradient, for a successful identification of Vibrio species.
4.5.1. Variation of the column temperature and acetonitrile gradient
Separation by DHPLC can only occur in case of partial denaturation of the PCR molecules,
because PCR products with a greater degree of partial denaturation have a lower bond to the
column and elute earlier off the cartridge than more stable fragments (see chapter 1.5.).
Hence, we assumed that the column temperature is one of the key factors contributing the
detection of genetic variants in the DHPLC-system.
Applying P1, best separation conditions for four different Vibrio isolates were empirically
found at 63 °C, around 3.5 °C above the predicted, average optimal column temperature
calculated by the Wave Navigator Software (see chapter 3.5.1.). Using P5, best separation
was achieved at 62.5 °C, 1.5 °C above the predicted, average optimal temperature. These
results revealed that despite detection of the computed optimal temperatures, empirically
variation is necessary to find the exact column temperature for optimal separation. The
defined ideal temperatures were then used for further optimization of DHPLC conditions by
modification of the acetonitrile gradient. Our expectation was a better separation of Vibrio
isolates as a result of a decelerated acetonitrile gradient. Applying four PCR products
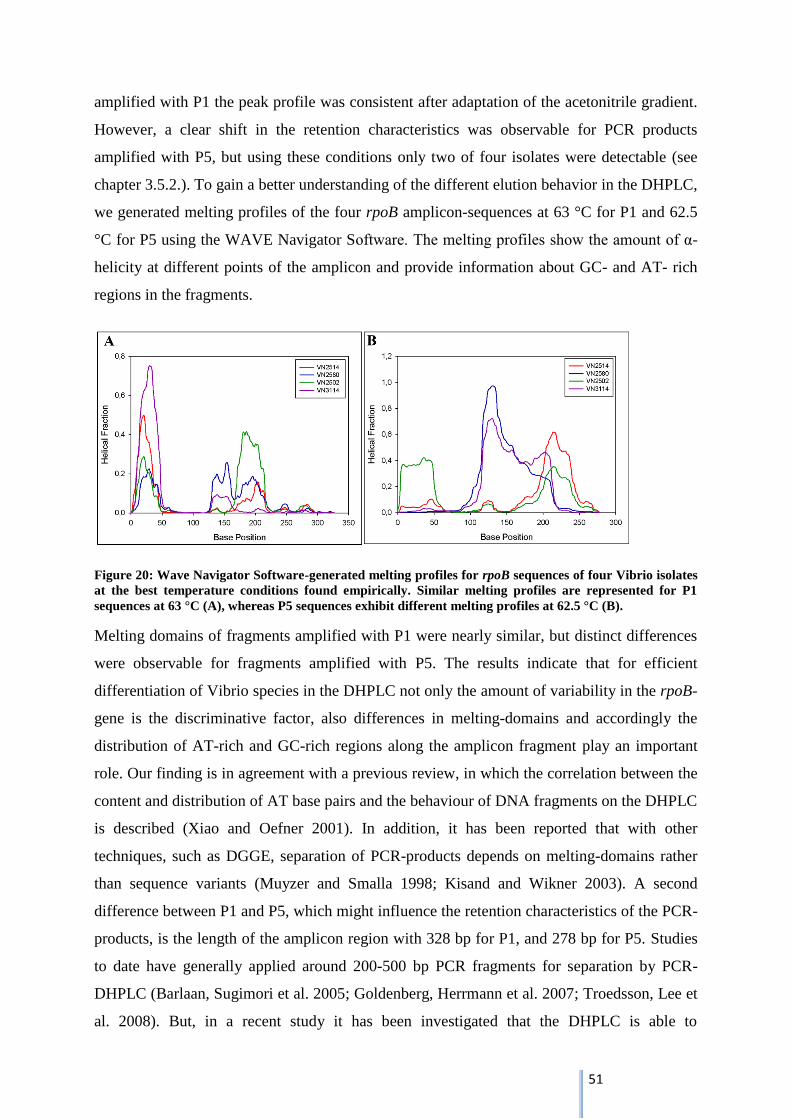
51
amplified with P1 the peak profile was consistent after adaptation of the acetonitrile gradient.
However, a clear shift in the retention characteristics was observable for PCR products
amplified with P5, but using these conditions only two of four isolates were detectable (see
chapter 3.5.2.). To gain a better understanding of the different elution behavior in the DHPLC,
we generated melting profiles of the four rpoB amplicon-sequences at 63 °C for P1 and 62.5
°C for P5 using the WAVE Navigator Software. The melting profiles show the amount of α-
helicity at different points of the amplicon and provide information about GC- and AT- rich
regions in the fragments.
Figure 20: Wave Navigator Software-generated melting profiles for rpoB sequences of four Vibrio isolates
at the best temperature conditions found empirically. Similar melting profiles are represented for P1
sequences at 63 °C (A), whereas P5 sequences exhibit different melting profiles at 62.5 °C (B).
Melting domains of fragments amplified with P1 were nearly similar, but distinct differences
were observable for fragments amplified with P5. The results indicate that for efficient
differentiation of Vibrio species in the DHPLC not only the amount of variability in the rpoB-
gene is the discriminative factor, also differences in melting-domains and accordingly the
distribution of AT-rich and GC-rich regions along the amplicon fragment play an important
role. Our finding is in agreement with a previous review, in which the correlation between the
content and distribution of AT base pairs and the behaviour of DNA fragments on the DHPLC
is described (Xiao and Oefner 2001). In addition, it has been reported that with other
techniques, such as DGGE, separation of PCR-products depends on melting-domains rather
than sequence variants (Muyzer and Smalla 1998; Kisand and Wikner 2003). A second
difference between P1 and P5, which might influence the retention characteristics of the PCR-
products, is the length of the amplicon region with 328 bp for P1, and 278 bp for P5. Studies
to date have generally applied around 200-500 bp PCR fragments for separation by PCR-
DHPLC (Barlaan, Sugimori et al. 2005; Goldenberg, Herrmann et al. 2007; Troedsson, Lee et
al. 2008). But, in a recent study it has been investigated that the DHPLC is able to
52
discriminate short amplicons (~100 bp without primers) based on the sequence differences
and even if the fragments only differ only in a small number of nucleotides (Epp, Stoof-
Leichsenring et al. 2011).
4.5.2. Adaptation of PCR-DHPLC by attachment of a 40 bp GC-clamp
Most efficient separation in the DHPLC-system was found for PCR-products amplified by P5
at a column temperature of 62.5 °C and with a decelerated acetonitrile gradient (see chapter
2.2.8., table 8) at a flow rate of 0.9 ml min-1
and with an injection volume of 10 µl. But these
optimized separation conditions induced complete denaturation of the PCR products of V.
alginolyticus (VN2514) and V. vulnificus (VN3114), which resulted in a loss of peak intensity
and failure of detection in the DHPLC (see chapter 3.5.2.). The denaturation might be
consequence of the increased acetonitrile level of 54 % Buffer B at the starting point of the
adapted program compared to acetonitrile level of 49.8 % Buffer B used initially (see chapter
2.2.8.). Xiao and coworkers reported that acetonitrile has a denaturing function itself and that
an increasing level of acetonitrile of 0.8 % equates to an increase of temperature of 1 °C (Xiao
and Oefner 2001). To overcome the loss in peak intensity, we modified the PCR-protocol by
attachment of a 40 bp GC-clamp at the 5´end of P5 and a touchdown PCR. A GC-clamp is
commonly used to prevent denaturation of amplicons and has been applied for appropriate
identification and separation of PCR products by DGGE (Sheffield, Cox et al. 1989). In recent
studies, the GC-clamp has also been applied for improvement of DHPLC separation (Barlaan,
Sugimori et al. 2005; Epp, Stoof-Leichsenring et al. 2011). For example, Barlaan and co-
workers (2005) testified that an incorporation of a 40- bp GC clamp into the amplification
primer was essential to surmount insufficient PCR products and to effectively discriminate
genetic differences in DHPLC. After attachment of the GC-clamp, performance of a
touchdown PCR was necessary to avert loss in amplicon concentration emerged by using the
rpoB-PCR adapted for P5 (see chapter 3.5.3. Fig. 14). A touchdown PCR is generally used to
increase specificity in PCR amplification and amplicon concentration (Korbie and Mattick
2008) and has also been effectively applied for PCR-DHPLC (Barlaan, Sugimori et al. 2005).
However, using the modified PCR protocol, detection of all Vibrio isolates (V. alginolyticus I
(VN2514), V. navarrensis (VN2580), V. parahaemolyticus (VN2502) and V. vulnificus
(VN3114)) was successful (see chapter 3.5.3.2. Fig. 17).
4.5.3. Application of all Vibrio isolates
After determination of most efficient separation conditions for four Vibrio isolates in the
DHPLC, we applied 22 PCR-products of potentially pathogenic Vibrio strains on the system.
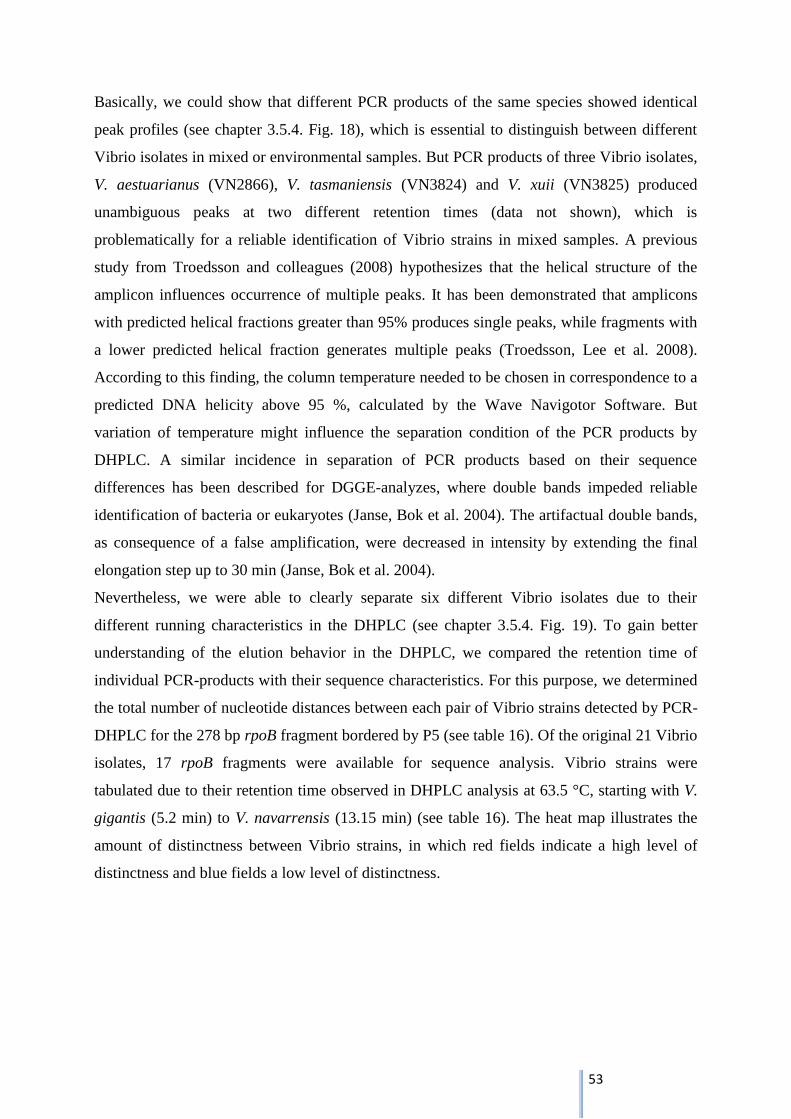
53
Basically, we could show that different PCR products of the same species showed identical
peak profiles (see chapter 3.5.4. Fig. 18), which is essential to distinguish between different
Vibrio isolates in mixed or environmental samples. But PCR products of three Vibrio isolates,
V. aestuarianus (VN2866), V. tasmaniensis (VN3824) and V. xuii (VN3825) produced
unambiguous peaks at two different retention times (data not shown), which is
problematically for a reliable identification of Vibrio strains in mixed samples. A previous
study from Troedsson and colleagues (2008) hypothesizes that the helical structure of the
amplicon influences occurrence of multiple peaks. It has been demonstrated that amplicons
with predicted helical fractions greater than 95% produces single peaks, while fragments with
a lower predicted helical fraction generates multiple peaks (Troedsson, Lee et al. 2008).
According to this finding, the column temperature needed to be chosen in correspondence to a
predicted DNA helicity above 95 %, calculated by the Wave Navigotor Software. But
variation of temperature might influence the separation condition of the PCR products by
DHPLC. A similar incidence in separation of PCR products based on their sequence
differences has been described for DGGE-analyzes, where double bands impeded reliable
identification of bacteria or eukaryotes (Janse, Bok et al. 2004). The artifactual double bands,
as consequence of a false amplification, were decreased in intensity by extending the final
elongation step up to 30 min (Janse, Bok et al. 2004).
Nevertheless, we were able to clearly separate six different Vibrio isolates due to their
different running characteristics in the DHPLC (see chapter 3.5.4. Fig. 19). To gain better
understanding of the elution behavior in the DHPLC, we compared the retention time of
individual PCR-products with their sequence characteristics. For this purpose, we determined
the total number of nucleotide distances between each pair of Vibrio strains detected by PCR-
DHPLC for the 278 bp rpoB fragment bordered by P5 (see table 16). Of the original 21 Vibrio
isolates, 17 rpoB fragments were available for sequence analysis. Vibrio strains were
tabulated due to their retention time observed in DHPLC analysis at 63.5 °C, starting with V.
gigantis (5.2 min) to V. navarrensis (13.15 min) (see table 16). The heat map illustrates the
amount of distinctness between Vibrio strains, in which red fields indicate a high level of
distinctness and blue fields a low level of distinctness.
54
Table 16: Total number of nucleotide distances between each pair of Vibrio strains calculated for the 278
bp P5-amplicon
We assumed that rpoB-genes from closely related organisms would elute off the cartridge
with similar retention times, while amplicons from more distantly related species would be
expected to be more widely separated. Accordingly, highest numbers of nucleotide
substitutions with 51 nucleotide differences were found between V. navarrensis and V.
gigantis, which showed also most distant retention peaks in the DHPLC (see table 16). A low
level of substitutions were correspondingly found within species, including the V.
parahaemolyticus, V. alginolyticus and V. vulnificus cluster. But also low distances between
V. parahaemolyticus, V. alginolyticus and V. harveyi were observable (see table 16). But the
hypothesis of a direct correspondence between nucleotide distances and retention time was
not attested to be true in all cases. V. harveyi and V. vulnificus for example showed a high
level of distinctness, but eluted next to each other (V. vulnificus: 9.9 min; V. harveyi: 11.6
min; table 16). In conclusion, nucleotide distances do not describe different retention
characteristics of individual Vibrio strains in the DHPLC alone.
Additionally, we plotted the GC-content of rpoB-amplicons against the retention time at 63.5
°C and found a significant positive correlation (R=0.9341, p<0.0001) between those
parameters (Fig. 21). Moreover, we observed that differentiation of Vibrio isolates is possible
if GC-variability is higher than 0.5 %.

55
Figure 21: DHPLC analysis of 6 individual PCR-products amplified with P5GC at 62.5 °C (A). The
retention time observed in the DHPLC analysis (A) was compared with the GC-content of the rpoB
sequences (B). Correlation coefficient, R = 0.9654; p-value<0.0001 (n=17).
By examining the correlation between GC-content and retention time in the DHPLC for all
rpoB-amplicons applied on DHPLC, our set of amplicons exhibited GC-values ranging
between 45.1 % - 50.5 %. But closely related Vibrio species showed highly similar GC-
contents, for example GC-contents of V. parahaemolyticus and V. alginolyticus only differed
in 0.1 % (see table 17). Hence, separation by DHPLC was not possible for closely related
Vibrio species due to their similar GC-content.
Table 17: Comparison of DHPLC retention time and GC-content of P5-amplicons of all Vibrio strains
detected by PCR-DHPLC
Vibrio strains Retention time
[min]
GC-content
[%]
VN3815 V. gigantis 5.2 45.5
VN2866 V. aestuarianus 5.25 45.1
VN3824 V. tasmaniensis 5.55 45.8
VN3817 V. kanaoloe 5.6 -
VN3825 V. xuii 6.4 47.8
VN3820 V. pacinii 6.8 -
VN3811 V. diazotrophicus 7.2 46.5
VN3810 V. coralliilyticus 7.55 47.8
VN3819 V. mediterranei 8.4 47.8
VN3813 V. fortis 9.1 -
VN2502 V. parahaemolyticus 9.2 48.7
VN3321 V. parahaemolyticus 9.2 48.6
VN3858 V. parahaemolyticus 9.2 48.6
VN3933 V. parahaemolyticus 9.2 -
VN2514 V. alginolyticus I 9.45 48.6
VN2756 V. alginolyticus II 9.6 48.7
VN0232 V. vulnificus 9.9 48.2
VN3114 V. vulnificus 9.9 48.6
VN3378 V. vulnificus 9.9 48.6
VN3801 V. harveyi 11.6 49.1
56
VN2580 V. navarrensis 13.15 50.5
VN3505 V. mimicus 13.15 -
Our analysis demonstrates that the GC-content is the main factor contributing the elution
behavior in the DHPLC, because it has an influence of the relative thermostability of the
DNA molecules (Lipsky, Mazzanti et al. 2001). In this connection, PCR products with a
higher amount of AT-rich regions denatured more and eluted earlier than PCR products with a
higher GC-content (Xiao and Oefner 2001). For other factors, such as the variability of DNA
fragments not in all cases a direct correlation was found. Our study is furthermore in
agreement with a recent report, which corroborates the hypothesis that DHPLC is a suitable
method for the identification and separation of DNA molecules of similar sizes but with
different GC-contents (Belda, Sentandreu et al. 2004).
4.6. Conclusion and Outlook
In this study we have evaluated a new rpoB-DHPLC approach to identify and separate
potential pathogenic Vibrio species to offer monitoring of bacterial communities in
environmental samples. There are, however, important key factors for a successful
discrimination of Vibrio species, including primer design, optimization of the PCR protocol
and adaptation of DHPLC parameters. For a reliable identification by rpoB-DHPLC, we
evaluated 13 primer-sets, which were specific for the genus Vibrio. Overall, five primer-sets
were verified by distinct amplification of 20-23 Vibrio isolates of a total number of 31 strains,
and two primer-sets were selected for DHPLC-analyzes, showing the highest amount of mean
variability in the amplicon-region. We investigated that in the DHPLC-system adaptation of
temperature and acetonitrile gradient were essential to yield optimal separation of Vibrio
isolates. Additionally, we modified the PCR-protocol by attachment of a 40 bp GC-clamp and
a touchdown-PCR to stabilize DNA-molecules and permit identification of all Vibrio isolates
at optimal temperature conditions. According to these improvements, ideal PCR-DHPLC
conditions were found for PCR-products amplified by P5 with an attached GC-clamp and for
DHPLC parameters including column temperature of 63.5 °C, a linear acetonitrile gradient of
45 % Buffer B for 0 min (loading), 54 % Buffer B for 2 min to 60 % Buffer B for 14 min at a
pump flow rate of 0.9 ml min-1
and an injection volume of 10 µl. Using these optimized PCR-
DHPLC protocol, we were able to separate six potentially pathogenic Vibrio strains due to
their different retention characteristics in the DHPLC, but closely related Vibrio species, e.g.
V. parahaemolyticus and V. alginolyticus could not be separated due to their highly similar
GC content (48.6% and 48.7%). To reach efficient separation of all Vibrio isolates, further
57
improvements are necessary. Our investigations showed that in addition to sequence variants
the GC-content in the amplicon-sequences is the discriminative factor contributing the
retention characteristics of Vibrio isolates. Furthermore, melting-domains and amplicon-
length can influence the separation efficiency in the DHPLC. On this ground, further
investigations would include the design of new primer-pairs, which provide a high GC-
variability of amplicons with a threshold > 0.5 %, different melting domains and short lengths
(~100-300 bp) of the PCR-fragments. Within the characteristics of those primer-sets, it may
be possible to further refine the rpoB-DHPLC approach to allow separation mixed samples or
assessment of complex microbial populations in environmental samples.
5. Literature
Adekambi, T., M. Drancourt, et al. (2009). "The rpoB gene as a tool for clinical microbiologists." Trends Microbiol 17(1): 37-45.
Anderson, D. and L. McKay (1983). "Simple and rapid method for isolating large plasmid DNA from lactic streptococci." Appl Environ Microbiol 46(3): 549-552.
Ansaruzzaman, M., M. Lucas, et al. (2005). "Pandemic serovars (O3:K6 and O4:K68) of Vibrio parahaemolyticus associated with diarrhea in Mozambique: spread of the pandemic into the African continent." J Clin Microbiol 43(6): 2559-2562.
Baker-Austin, C., L. Stockley, et al. (2010). "Environmental occurrence and clinical impact of <i>Vibrio vulnificus</i> and <i>Vibrio parahaemolyticus</i>: a European perspective." Environmental Microbiology Reports 2(1): 7-18.
Baker-Austin, C., L. Stockley, et al. (2010). "Environmental occurrence and clinical impact of Vibrio vulnificus and Vibrio parahaemolyticus: a European perspective." Environmental Microbiology Reports 2(1): 7-18.
Barlaan, E. A., M. Sugimori, et al. (2005). "Profiling and monitoring of microbial populations by denaturing high-performance liquid chromatography." J Microbiol Methods 61(3): 399-412.
Barlaan, E. A., M. Sugimori, et al. (2005). "Profiling and monitoring of microbial populations by denaturing high-performance liquid chromatography." Journal of Microbiological Methods 61(3): 399-412.
Bauer, A. and L. M. Rorvik (2007). "A novel multiplex PCR for the identification of Vibrio parahaemolyticus, Vibrio cholerae and Vibrio vulnificus." Letters in Applied Microbiology 45(4): 371-375.
Bej, A. K. and M. H. Mahbubani (1992). "Applications of the polymerase chain reaction in environmental microbiology." PCR Methods Appl 1(3): 151-159.
Bej, A. K., M. H. Mahbubani, et al. (1991). Polymerase Chain Reaction-Gene Probe Detection of Microorganisms by Using Filter-Concentrated Samples. Applied and Environmental Microbiology. 57: 3529-3534.
Belda, E., V. Sentandreu, et al. (2004). "Identification and separation of PCR products based on their GC content by denaturing high-performance liquid chromatography." J Chromatogr B Analyt Technol Biomed Life Sci 811(2): 263-268.
Belkin, I. M. (2009). "Rapid warming of Large Marine Ecosystems." Progress In Oceanography 81(1-4): 207-213.
Ben-Haim, Y., F. L. Thompson, et al. (2003). "Vibrio coralliilyticus sp. nov., a temperature-dependent pathogen of the coral Pocillopora damicornis." Int J Syst Evol Microbiol 53(Pt 1): 309-315.
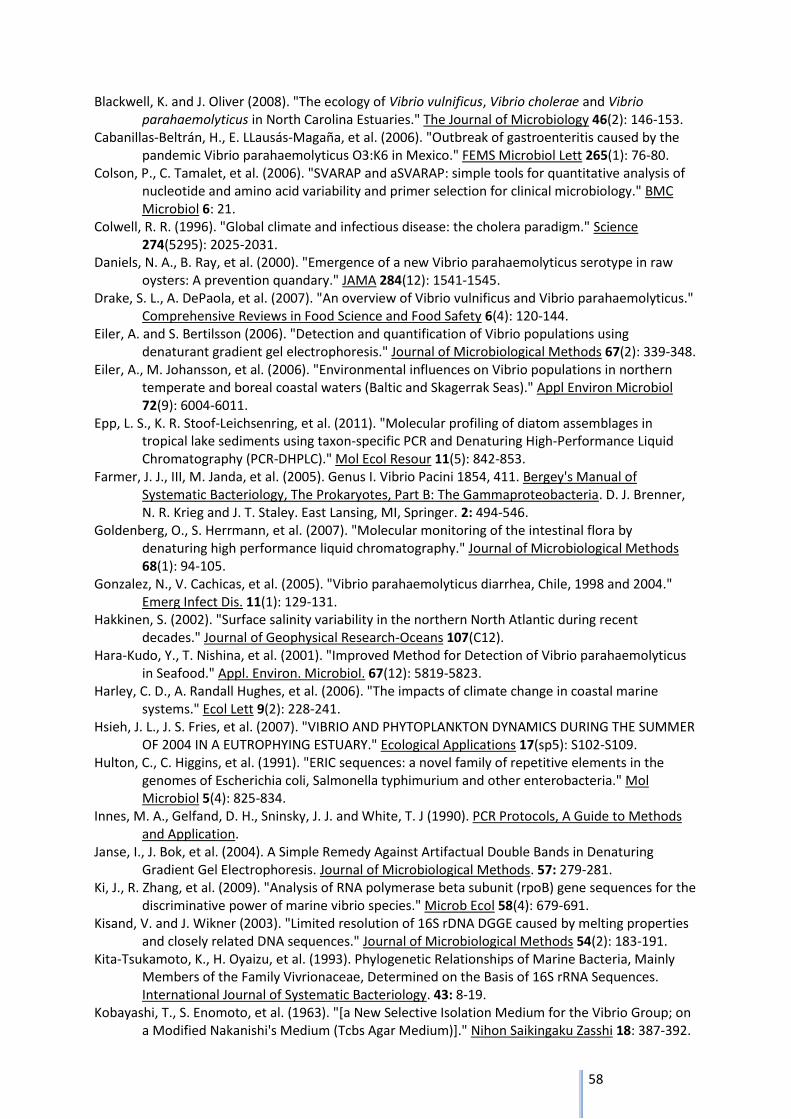
58
Blackwell, K. and J. Oliver (2008). "The ecology of Vibrio vulnificus, Vibrio cholerae and Vibrio parahaemolyticus in North Carolina Estuaries." The Journal of Microbiology 46(2): 146-153.
Cabanillas-Beltrán, H., E. LLausás-Magaña, et al. (2006). "Outbreak of gastroenteritis caused by the pandemic Vibrio parahaemolyticus O3:K6 in Mexico." FEMS Microbiol Lett 265(1): 76-80.
Colson, P., C. Tamalet, et al. (2006). "SVARAP and aSVARAP: simple tools for quantitative analysis of nucleotide and amino acid variability and primer selection for clinical microbiology." BMC Microbiol 6: 21.
Colwell, R. R. (1996). "Global climate and infectious disease: the cholera paradigm." Science 274(5295): 2025-2031.
Daniels, N. A., B. Ray, et al. (2000). "Emergence of a new Vibrio parahaemolyticus serotype in raw oysters: A prevention quandary." JAMA 284(12): 1541-1545.
Drake, S. L., A. DePaola, et al. (2007). "An overview of Vibrio vulnificus and Vibrio parahaemolyticus." Comprehensive Reviews in Food Science and Food Safety 6(4): 120-144.
Eiler, A. and S. Bertilsson (2006). "Detection and quantification of Vibrio populations using denaturant gradient gel electrophoresis." Journal of Microbiological Methods 67(2): 339-348.
Eiler, A., M. Johansson, et al. (2006). "Environmental influences on Vibrio populations in northern temperate and boreal coastal waters (Baltic and Skagerrak Seas)." Appl Environ Microbiol 72(9): 6004-6011.
Epp, L. S., K. R. Stoof-Leichsenring, et al. (2011). "Molecular profiling of diatom assemblages in tropical lake sediments using taxon-specific PCR and Denaturing High-Performance Liquid Chromatography (PCR-DHPLC)." Mol Ecol Resour 11(5): 842-853.
Farmer, J. J., III, M. Janda, et al. (2005). Genus I. Vibrio Pacini 1854, 411. Bergey's Manual of Systematic Bacteriology, The Prokaryotes, Part B: The Gammaproteobacteria. D. J. Brenner, N. R. Krieg and J. T. Staley. East Lansing, MI, Springer. 2: 494-546.
Goldenberg, O., S. Herrmann, et al. (2007). "Molecular monitoring of the intestinal flora by denaturing high performance liquid chromatography." Journal of Microbiological Methods 68(1): 94-105.
Gonzalez, N., V. Cachicas, et al. (2005). "Vibrio parahaemolyticus diarrhea, Chile, 1998 and 2004." Emerg Infect Dis. 11(1): 129-131.
Hakkinen, S. (2002). "Surface salinity variability in the northern North Atlantic during recent decades." Journal of Geophysical Research-Oceans 107(C12).
Hara-Kudo, Y., T. Nishina, et al. (2001). "Improved Method for Detection of Vibrio parahaemolyticus in Seafood." Appl. Environ. Microbiol. 67(12): 5819-5823.
Harley, C. D., A. Randall Hughes, et al. (2006). "The impacts of climate change in coastal marine systems." Ecol Lett 9(2): 228-241.
Hsieh, J. L., J. S. Fries, et al. (2007). "VIBRIO AND PHYTOPLANKTON DYNAMICS DURING THE SUMMER OF 2004 IN A EUTROPHYING ESTUARY." Ecological Applications 17(sp5): S102-S109.
Hulton, C., C. Higgins, et al. (1991). "ERIC sequences: a novel family of repetitive elements in the genomes of Escherichia coli, Salmonella typhimurium and other enterobacteria." Mol Microbiol 5(4): 825-834.
Innes, M. A., Gelfand, D. H., Sninsky, J. J. and White, T. J (1990). PCR Protocols, A Guide to Methods and Application.
Janse, I., J. Bok, et al. (2004). A Simple Remedy Against Artifactual Double Bands in Denaturing Gradient Gel Electrophoresis. Journal of Microbiological Methods. 57: 279-281.
Ki, J., R. Zhang, et al. (2009). "Analysis of RNA polymerase beta subunit (rpoB) gene sequences for the discriminative power of marine vibrio species." Microb Ecol 58(4): 679-691.
Kisand, V. and J. Wikner (2003). "Limited resolution of 16S rDNA DGGE caused by melting properties and closely related DNA sequences." Journal of Microbiological Methods 54(2): 183-191.
Kita-Tsukamoto, K., H. Oyaizu, et al. (1993). Phylogenetic Relationships of Marine Bacteria, Mainly Members of the Family Vivrionaceae, Determined on the Basis of 16S rRNA Sequences. International Journal of Systematic Bacteriology. 43: 8-19.
Kobayashi, T., S. Enomoto, et al. (1963). "[a New Selective Isolation Medium for the Vibrio Group; on a Modified Nakanishi's Medium (Tcbs Agar Medium)]." Nihon Saikingaku Zasshi 18: 387-392.
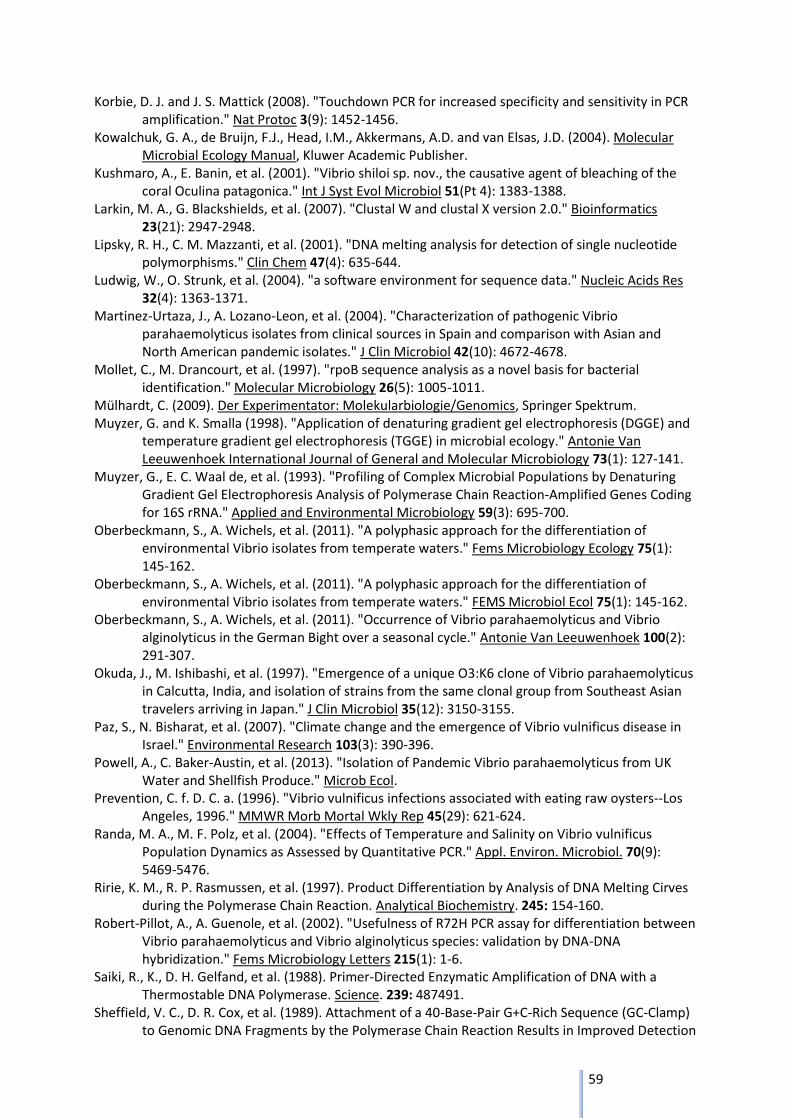
59
Korbie, D. J. and J. S. Mattick (2008). "Touchdown PCR for increased specificity and sensitivity in PCR amplification." Nat Protoc 3(9): 1452-1456.
Kowalchuk, G. A., de Bruijn, F.J., Head, I.M., Akkermans, A.D. and van Elsas, J.D. (2004). Molecular Microbial Ecology Manual, Kluwer Academic Publisher.
Kushmaro, A., E. Banin, et al. (2001). "Vibrio shiloi sp. nov., the causative agent of bleaching of the coral Oculina patagonica." Int J Syst Evol Microbiol 51(Pt 4): 1383-1388.
Larkin, M. A., G. Blackshields, et al. (2007). "Clustal W and clustal X version 2.0." Bioinformatics 23(21): 2947-2948.
Lipsky, R. H., C. M. Mazzanti, et al. (2001). "DNA melting analysis for detection of single nucleotide polymorphisms." Clin Chem 47(4): 635-644.
Ludwig, W., O. Strunk, et al. (2004). "a software environment for sequence data." Nucleic Acids Res 32(4): 1363-1371.
Martinez-Urtaza, J., A. Lozano-Leon, et al. (2004). "Characterization of pathogenic Vibrio parahaemolyticus isolates from clinical sources in Spain and comparison with Asian and North American pandemic isolates." J Clin Microbiol 42(10): 4672-4678.
Mollet, C., M. Drancourt, et al. (1997). "rpoB sequence analysis as a novel basis for bacterial identification." Molecular Microbiology 26(5): 1005-1011.
Mülhardt, C. (2009). Der Experimentator: Molekularbiologie/Genomics, Springer Spektrum. Muyzer, G. and K. Smalla (1998). "Application of denaturing gradient gel electrophoresis (DGGE) and
temperature gradient gel electrophoresis (TGGE) in microbial ecology." Antonie Van Leeuwenhoek International Journal of General and Molecular Microbiology 73(1): 127-141.
Muyzer, G., E. C. Waal de, et al. (1993). "Profiling of Complex Microbial Populations by Denaturing Gradient Gel Electrophoresis Analysis of Polymerase Chain Reaction-Amplified Genes Coding for 16S rRNA." Applied and Environmental Microbiology 59(3): 695-700.
Oberbeckmann, S., A. Wichels, et al. (2011). "A polyphasic approach for the differentiation of environmental Vibrio isolates from temperate waters." Fems Microbiology Ecology 75(1): 145-162.
Oberbeckmann, S., A. Wichels, et al. (2011). "A polyphasic approach for the differentiation of environmental Vibrio isolates from temperate waters." FEMS Microbiol Ecol 75(1): 145-162.
Oberbeckmann, S., A. Wichels, et al. (2011). "Occurrence of Vibrio parahaemolyticus and Vibrio alginolyticus in the German Bight over a seasonal cycle." Antonie Van Leeuwenhoek 100(2): 291-307.
Okuda, J., M. Ishibashi, et al. (1997). "Emergence of a unique O3:K6 clone of Vibrio parahaemolyticus in Calcutta, India, and isolation of strains from the same clonal group from Southeast Asian travelers arriving in Japan." J Clin Microbiol 35(12): 3150-3155.
Paz, S., N. Bisharat, et al. (2007). "Climate change and the emergence of Vibrio vulnificus disease in Israel." Environmental Research 103(3): 390-396.
Powell, A., C. Baker-Austin, et al. (2013). "Isolation of Pandemic Vibrio parahaemolyticus from UK Water and Shellfish Produce." Microb Ecol.
Prevention, C. f. D. C. a. (1996). "Vibrio vulnificus infections associated with eating raw oysters--Los Angeles, 1996." MMWR Morb Mortal Wkly Rep 45(29): 621-624.
Randa, M. A., M. F. Polz, et al. (2004). "Effects of Temperature and Salinity on Vibrio vulnificus Population Dynamics as Assessed by Quantitative PCR." Appl. Environ. Microbiol. 70(9): 5469-5476.
Ririe, K. M., R. P. Rasmussen, et al. (1997). Product Differentiation by Analysis of DNA Melting Cirves during the Polymerase Chain Reaction. Analytical Biochemistry. 245: 154-160.
Robert-Pillot, A., A. Guenole, et al. (2002). "Usefulness of R72H PCR assay for differentiation between Vibrio parahaemolyticus and Vibrio alginolyticus species: validation by DNA-DNA hybridization." Fems Microbiology Letters 215(1): 1-6.
Saiki, R., K., D. H. Gelfand, et al. (1988). Primer-Directed Enzymatic Amplification of DNA with a Thermostable DNA Polymerase. Science. 239: 487491.
Sheffield, V. C., D. R. Cox, et al. (1989). Attachment of a 40-Base-Pair G+C-Rich Sequence (GC-Clamp) to Genomic DNA Fragments by the Polymerase Chain Reaction Results in Improved Detection
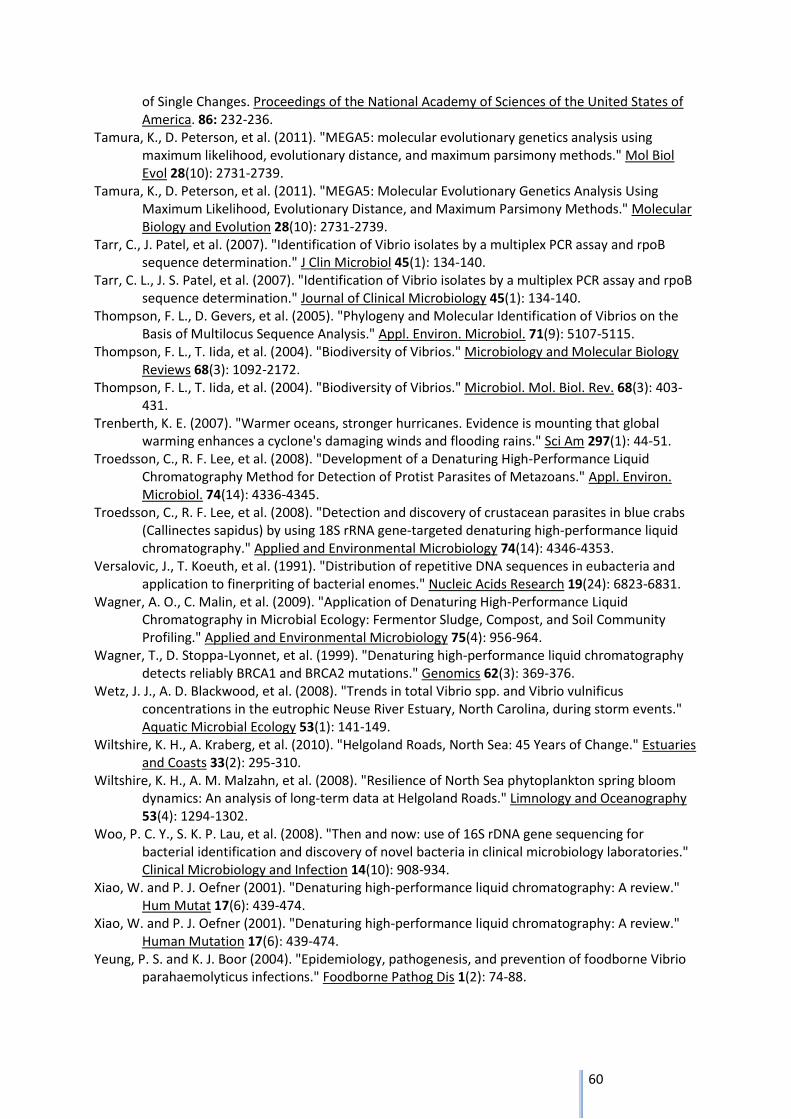
60
of Single Changes. Proceedings of the National Academy of Sciences of the United States of America. 86: 232-236.
Tamura, K., D. Peterson, et al. (2011). "MEGA5: molecular evolutionary genetics analysis using maximum likelihood, evolutionary distance, and maximum parsimony methods." Mol Biol Evol 28(10): 2731-2739.
Tamura, K., D. Peterson, et al. (2011). "MEGA5: Molecular Evolutionary Genetics Analysis Using Maximum Likelihood, Evolutionary Distance, and Maximum Parsimony Methods." Molecular Biology and Evolution 28(10): 2731-2739.
Tarr, C., J. Patel, et al. (2007). "Identification of Vibrio isolates by a multiplex PCR assay and rpoB sequence determination." J Clin Microbiol 45(1): 134-140.
Tarr, C. L., J. S. Patel, et al. (2007). "Identification of Vibrio isolates by a multiplex PCR assay and rpoB sequence determination." Journal of Clinical Microbiology 45(1): 134-140.
Thompson, F. L., D. Gevers, et al. (2005). "Phylogeny and Molecular Identification of Vibrios on the Basis of Multilocus Sequence Analysis." Appl. Environ. Microbiol. 71(9): 5107-5115.
Thompson, F. L., T. Iida, et al. (2004). "Biodiversity of Vibrios." Microbiology and Molecular Biology Reviews 68(3): 1092-2172.
Thompson, F. L., T. Iida, et al. (2004). "Biodiversity of Vibrios." Microbiol. Mol. Biol. Rev. 68(3): 403-431.
Trenberth, K. E. (2007). "Warmer oceans, stronger hurricanes. Evidence is mounting that global warming enhances a cyclone's damaging winds and flooding rains." Sci Am 297(1): 44-51.
Troedsson, C., R. F. Lee, et al. (2008). "Development of a Denaturing High-Performance Liquid Chromatography Method for Detection of Protist Parasites of Metazoans." Appl. Environ. Microbiol. 74(14): 4336-4345.
Troedsson, C., R. F. Lee, et al. (2008). "Detection and discovery of crustacean parasites in blue crabs (Callinectes sapidus) by using 18S rRNA gene-targeted denaturing high-performance liquid chromatography." Applied and Environmental Microbiology 74(14): 4346-4353.
Versalovic, J., T. Koeuth, et al. (1991). "Distribution of repetitive DNA sequences in eubacteria and application to finerpriting of bacterial enomes." Nucleic Acids Research 19(24): 6823-6831.
Wagner, A. O., C. Malin, et al. (2009). "Application of Denaturing High-Performance Liquid Chromatography in Microbial Ecology: Fermentor Sludge, Compost, and Soil Community Profiling." Applied and Environmental Microbiology 75(4): 956-964.
Wagner, T., D. Stoppa-Lyonnet, et al. (1999). "Denaturing high-performance liquid chromatography detects reliably BRCA1 and BRCA2 mutations." Genomics 62(3): 369-376.
Wetz, J. J., A. D. Blackwood, et al. (2008). "Trends in total Vibrio spp. and Vibrio vulnificus concentrations in the eutrophic Neuse River Estuary, North Carolina, during storm events." Aquatic Microbial Ecology 53(1): 141-149.
Wiltshire, K. H., A. Kraberg, et al. (2010). "Helgoland Roads, North Sea: 45 Years of Change." Estuaries and Coasts 33(2): 295-310.
Wiltshire, K. H., A. M. Malzahn, et al. (2008). "Resilience of North Sea phytoplankton spring bloom dynamics: An analysis of long-term data at Helgoland Roads." Limnology and Oceanography 53(4): 1294-1302.
Woo, P. C. Y., S. K. P. Lau, et al. (2008). "Then and now: use of 16S rDNA gene sequencing for bacterial identification and discovery of novel bacteria in clinical microbiology laboratories." Clinical Microbiology and Infection 14(10): 908-934.
Xiao, W. and P. J. Oefner (2001). "Denaturing high-performance liquid chromatography: A review." Hum Mutat 17(6): 439-474.
Xiao, W. and P. J. Oefner (2001). "Denaturing high-performance liquid chromatography: A review." Human Mutation 17(6): 439-474.
Yeung, P. S. and K. J. Boor (2004). "Epidemiology, pathogenesis, and prevention of foodborne Vibrio parahaemolyticus infections." Foodborne Pathog Dis 1(2): 74-88.

61
6. Appendage
7. Acknowledgements
I wish to thank first and foremost my supervisors Dr. Wichels and Dr. Gerdts for the excellent
support and for being available to me during the entire process. Also, I want to thank them for
the opportunity to conduct my master thesis at the department of Microbial Ecology of the
Alfred-Wegener Institute, Helmholtz Centre for Polar and Marine Research.
In addition, I would like to express my gratitude for Prof. Dr. Tollrian and Prof. Dr.
Narberhaus for the acceptance of the first and second review as well as for the supervision of
my work on the part of the Ruhr-University Bochum.
At this point, I would like to thank the “Microbial Ecology workgroup” for a really good time
on Helgoland. Particularly I am indebted to Hilke Döpke and Sarah Dehne for the help during
the practical procedure, but also for their emotional support. It was an honor to work with
you.
Finally, this thesis would not have been possible to complete without the encouragement of
my family, friends and especially my partner, Christian Rafael Torres Reyes, who have
backed me up throughout the entire time by keeping me harmonious and giving me the
strength and self-confidence to move on.


![SPEZIALITÄTEN DER INTERAKTION PATHOGENER …elettan.eok.sote.hu/uploads/File/nemet/wahlkurs/haut.pdf · Hordeolum- „Gerstenkorn ... Microsoft PowerPoint - Ppt0000001.ppt [Read-Only]](https://static.fdokument.com/doc/165x107/5b81bf1a7f8b9ae87c8cfd30/spezialitaeten-der-interaktion-pathogener-hordeolum-gerstenkorn-microsoft.jpg)