Ciupke charles-scrum day-2016
23
© 2016 OXID eSales AG Schätzen funktioniert: Und zwar gleichzeitig vorab und agil! Dr.-Ing. Oliver Ciupke Oliver Charles, M. Sc. OXID eSales AG 08.06.2016
-
Upload
juergen-hohnhold -
Category
Presentations & Public Speaking
-
view
58 -
download
0
Transcript of Ciupke charles-scrum day-2016

© 2016 OXID eSales AG
Schätzen funktioniert:Und zwar gleichzeitig vorabund agil!
Dr.-Ing. Oliver Ciupke
Oliver Charles, M. Sc.
OXID eSales AG08.06.2016
© 2016 OXID eSales AG
OXID eSales AG
> Dr.-Ing. Oliver Ciupke
− Head of Operations
− Background in Computer Science, Software Architecture, andProject Management
− Having lead both product andsolution developmentorganizations
− Consulted agile when it was still bleeding edge
> Oliver Charles, M. Sc.
− Senior Project- and Teammanager Professional Services
− >2 years: software development
− >5 years: Project Management/Consulting
− Certified in Scrum, PRINCE2 andIPMA
− Consultant at OXID Academy
− Lecturer, guest lecturer, author

© 2016 OXID eSales AG
OXID eSales AG What we do

© 2016 OXID eSales AG
OXID eSales AG What we do

© 2016 OXID eSales AG
OXID eSales AG What we do
© 2016 OXID eSales AG
Customers (excerpt)
© 2016 OXID eSales AG
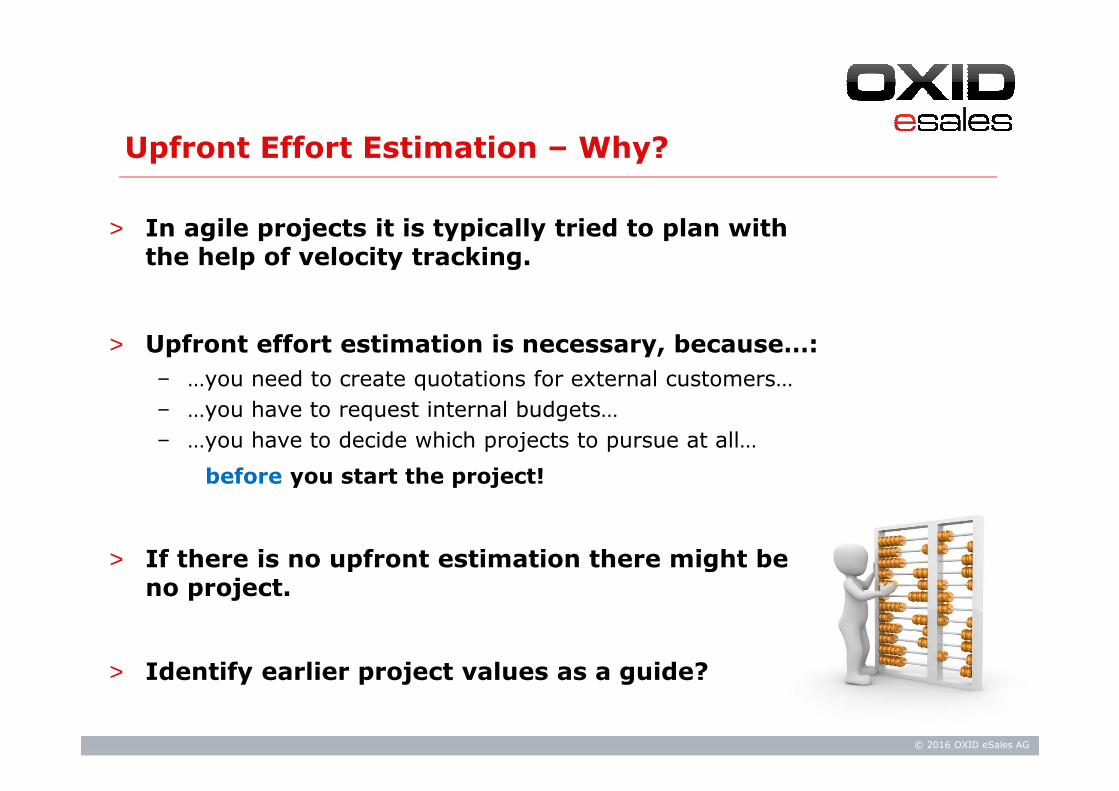
Upfront Effort Estimation – Why?
> In agile projects it is typically tried to plan with the help of velocity tracking.
> Upfront effort estimation is necessary, because…:
− …you need to create quotations for external customers…
− …you have to request internal budgets…
− …you have to decide which projects to pursue at all…
before you start the project!
> If there is no upfront estimation there might be no project.
> Identify earlier project values as a guide?
© 2016 OXID eSales AG
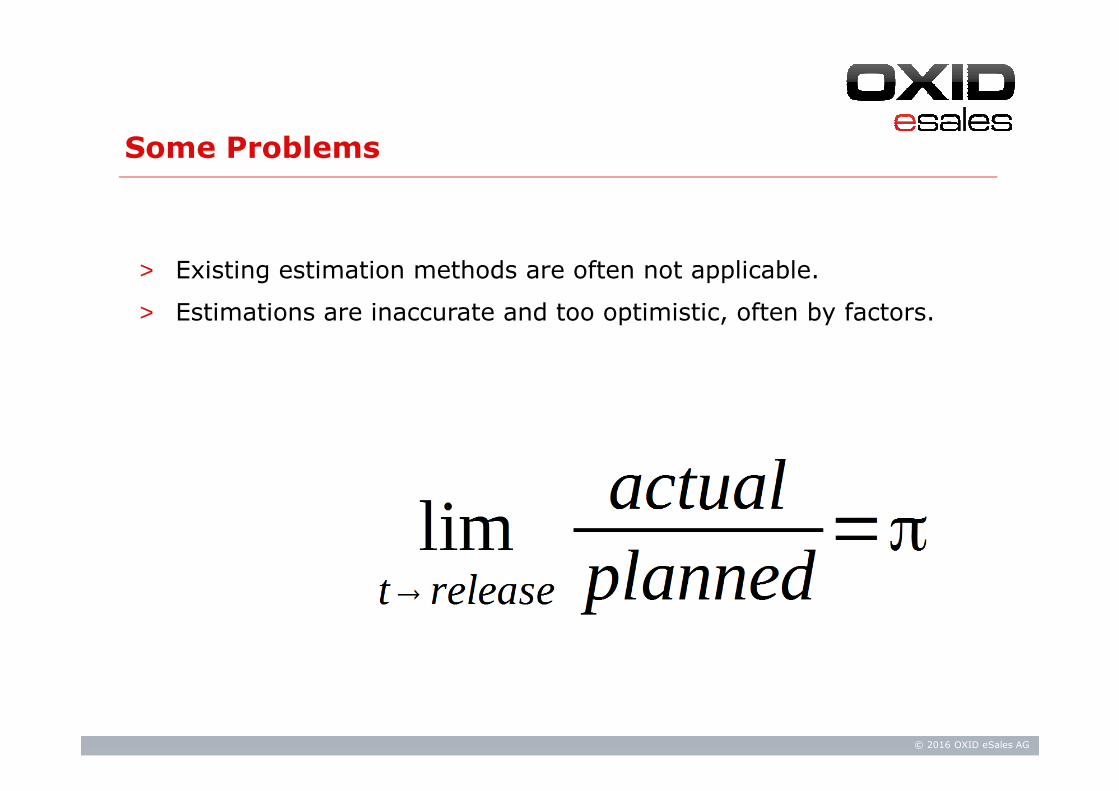
Some Problems
> Existing estimation methods are often not applicable.
> Estimations are inaccurate and too optimistic, often by factors.
© 2016 OXID eSales AG
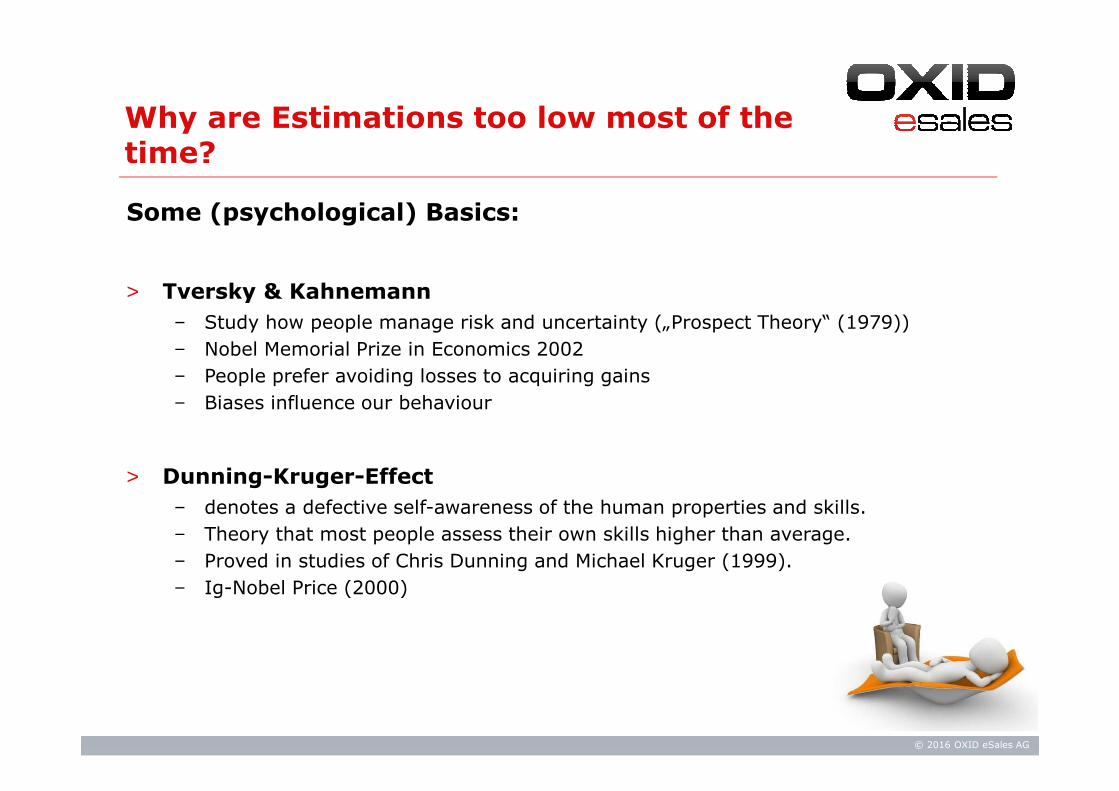
Why are Estimations too low most of the time?
Some (psychological) Basics:
> Tversky & Kahnemann
− Study how people manage risk and uncertainty („Prospect Theory“ (1979))
− Nobel Memorial Prize in Economics 2002
− People prefer avoiding losses to acquiring gains
− Biases influence our behaviour
> Dunning-Kruger-Effect
− denotes a defective self-awareness of the human properties and skills.
− Theory that most people assess their own skills higher than average.
− Proved in studies of Chris Dunning and Michael Kruger (1999).
− Ig-Nobel Price (2000)
© 2016 OXID eSales AG
Why are Estimations too low most of the time?
> Some more reasons:
− Estimations are based on an imaginary plan. This plan is usually optimistic.
− The most common error is to forget a task.
− People tend to estimate only tasks within sight, without follow up tasks or tasks of other teams.
− (Usually non-verbal) Pressure causes results to match higher level plans (or wishes) instead of being realistic.
− Developers and management interpret estimation numbers in a different way.
− If an estimation happens to turn out too pessimistic, the slack is filled with other work (Parkinson’s law).
− …
© 2016 OXID eSales AG
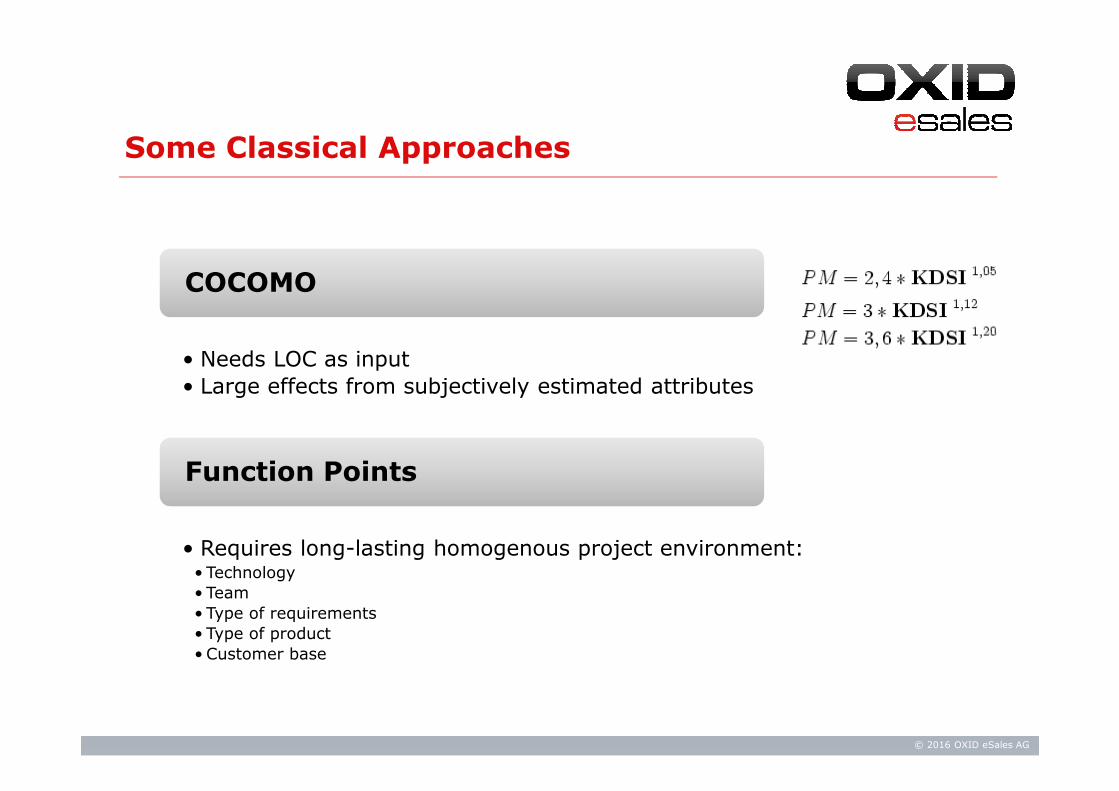
• Needs LOC as input
• Large effects from subjectively estimated attributes
COCOMO
• Requires long-lasting homogenous project environment:• Technology
• Team
• Type of requirements
• Type of product
• Customer base
Function Points
Some Classical Approaches
© 2016 OXID eSales AG
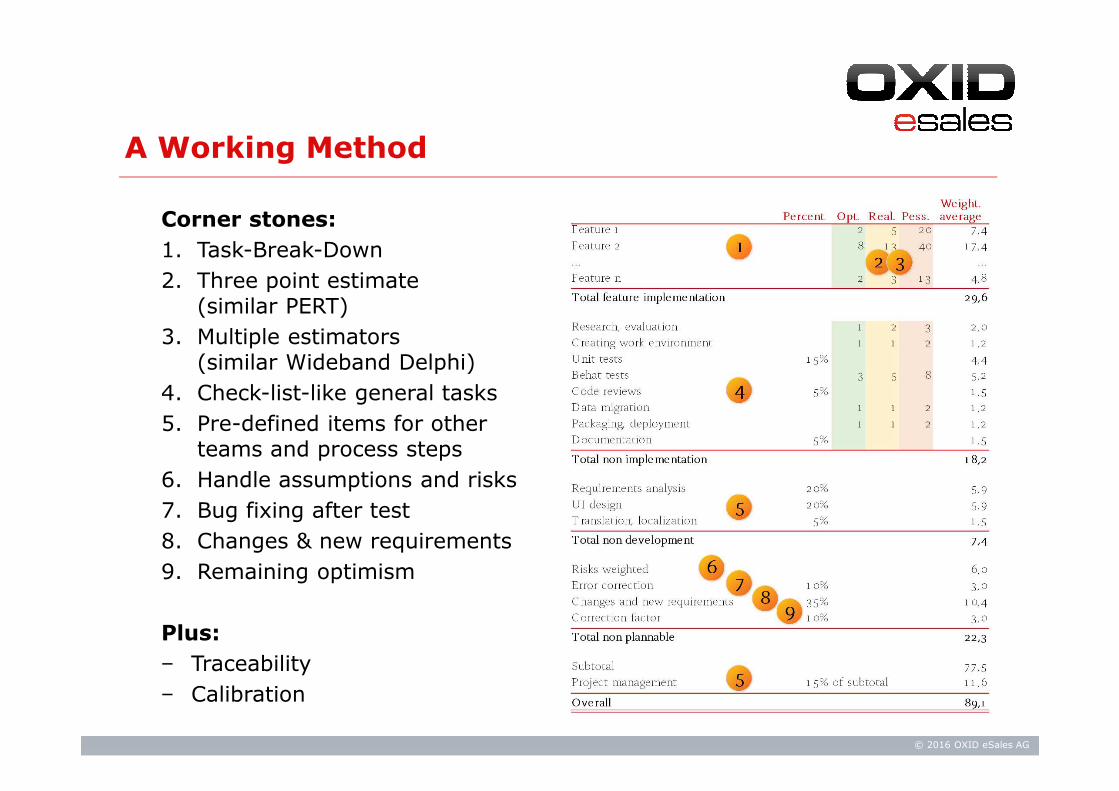
Corner stones:
1. Task-Break-Down
2. Three point estimate(similar PERT)
3. Multiple estimators(similar Wideband Delphi)
4. Check-list-like general tasks
5. Pre-defined items for other teams and process steps
6. Handle assumptions and risks
7. Bug fixing after test
8. Changes & new requirements
9. Remaining optimism
Plus:
− Traceability
− Calibration
A Working Method

© 2016 OXID eSales AG
> “WBS” or German “PSP” or “Aufgabenliste”
> From customer perspective usually (coarse) functional or non-functional features plus other tasks
> From project perspective usually userstories and/or epics
Work Breakdown
(So far standard and nothing new)
© 2016 OXID eSales AG
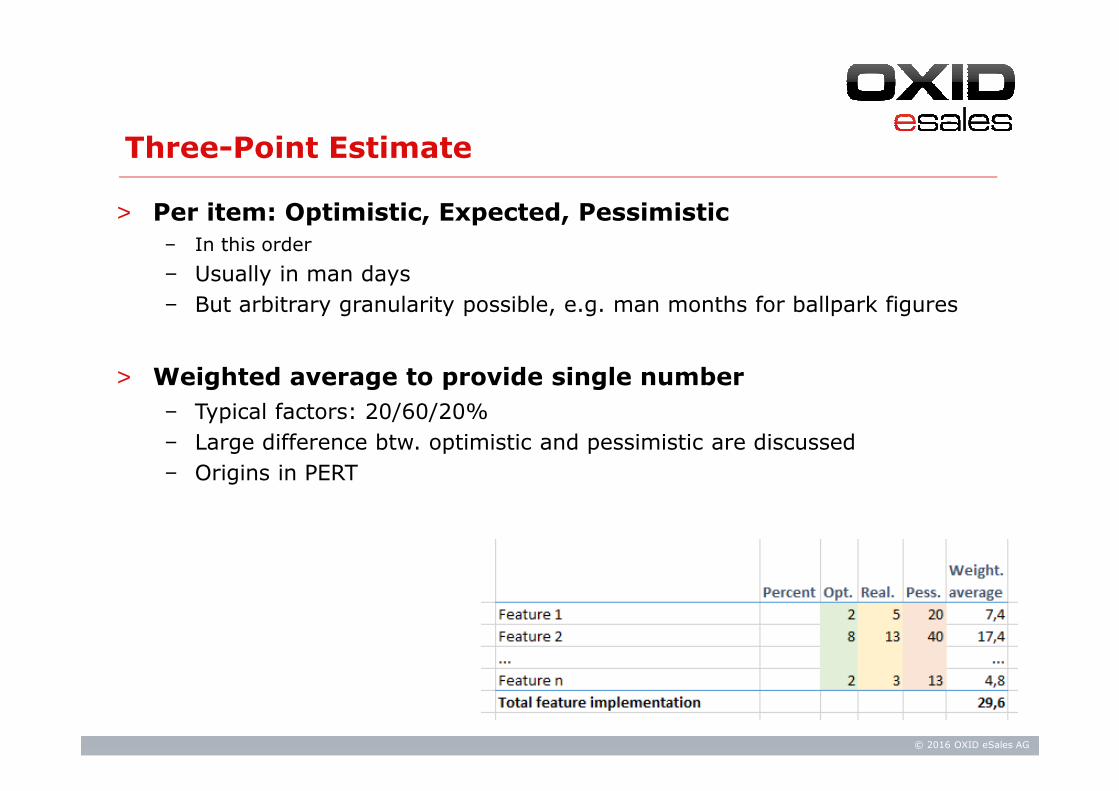
Three-Point Estimate
> Per item: Optimistic, Expected, Pessimistic
− In this order
− Usually in man days
− But arbitrary granularity possible, e.g. man months for ballpark figures
> Weighted average to provide single number
− Typical factors: 20/60/20%
− Large difference btw. optimistic and pessimistic are discussed
− Origins in PERT
© 2016 OXID eSales AG
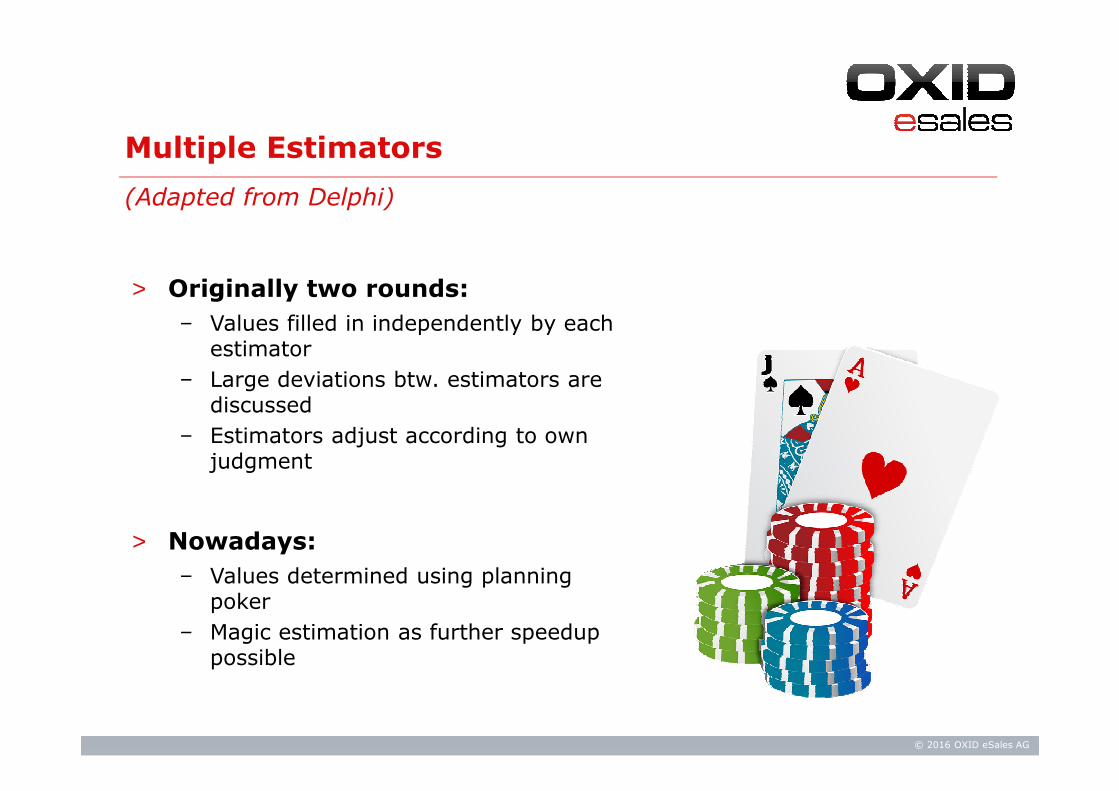
Multiple Estimators
(Adapted from Delphi)
> Originally two rounds:
− Values filled in independently by each estimator
− Large deviations btw. estimators are discussed
− Estimators adjust according to own judgment
> Nowadays:
− Values determined using planning poker
− Magic estimation as further speedup possible
© 2016 OXID eSales AG
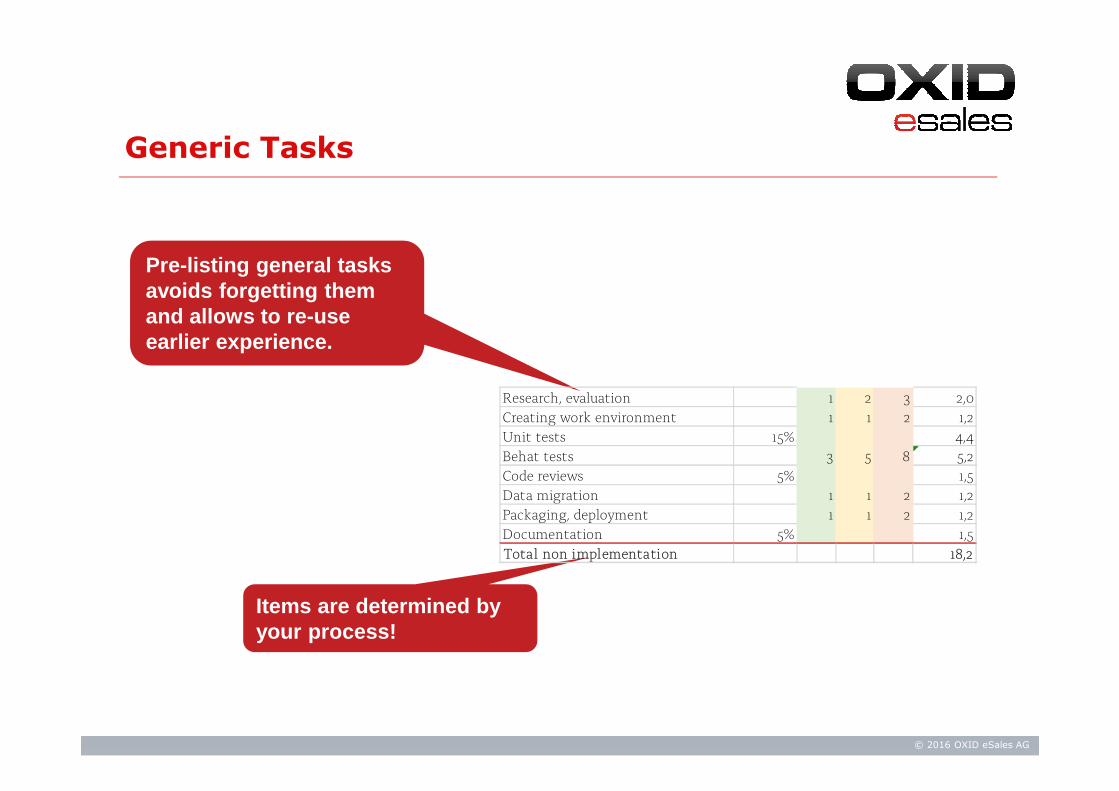
Generic Tasks
Pre-listing general tasks avoids forgetting them and allows to re-use earlier experience.
Items are determined by your process!
Research, evaluation 1 2 3 2,0
Creating work environment 1 1 2 1,2
Unit tests 15% 4,4
Behat tests 3 5 8 5,2
Code reviews 5% 1,5
Data migration 1 1 2 1,2
Packaging, deployment 1 1 2 1,2
Documentation 5% 1,5
Total non implementation 18,2
© 2016 OXID eSales AG
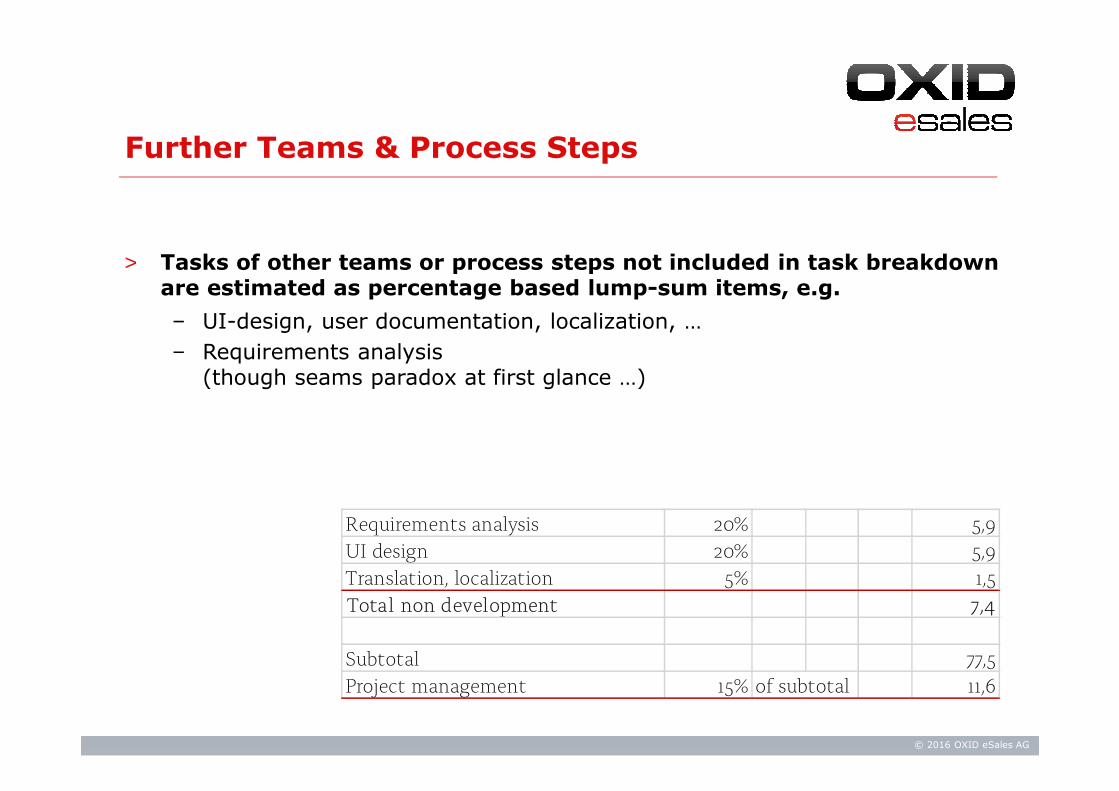
> Tasks of other teams or process steps not included in task breakdown are estimated as percentage based lump-sum items, e.g.
− UI-design, user documentation, localization, …
− Requirements analysis(though seams paradox at first glance …)
Further Teams & Process Steps
Requirements analysis 20% 5,9
UI design 20% 5,9
Translation, localization 5% 1,5
Total non development 7,4
Subtotal 77,5
Project management 15% of subtotal 11,6
© 2016 OXID eSales AG
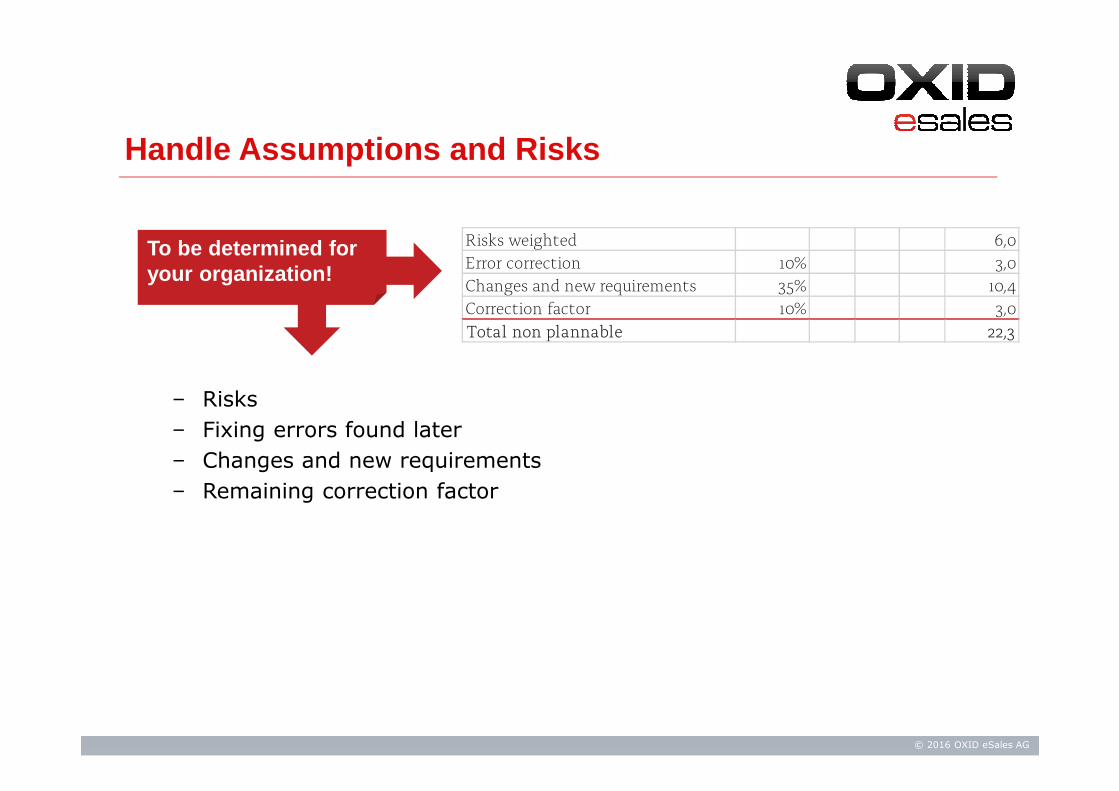
− Risks
− Fixing errors found later
− Changes and new requirements
− Remaining correction factor
Handle Assumptions and Risks
To be determined for your organization!
Risks weighted 6,0
Error correction 10% 3,0
Changes and new requirements 35% 10,4
Correction factor 10% 3,0
Total non plannable 22,3
© 2016 OXID eSales AG
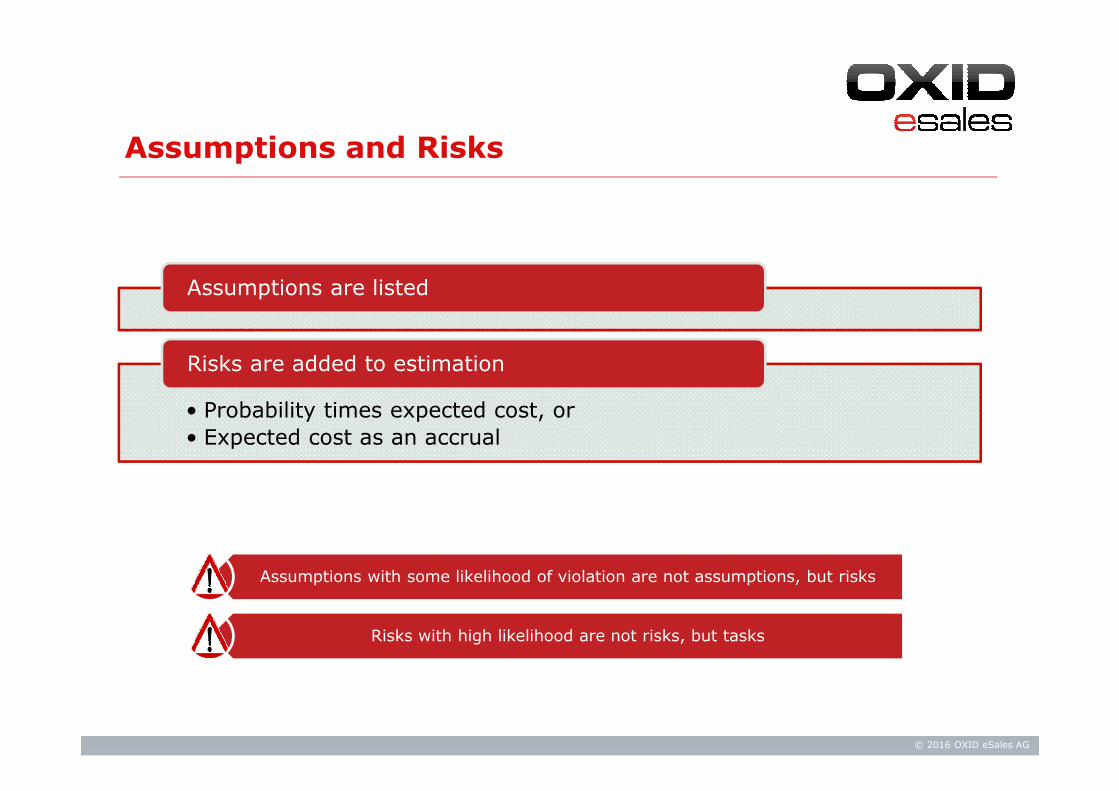
Assumptions and Risks
Assumptions are listed
• Probability times expected cost, or
• Expected cost as an accrual
Risks are added to estimation
Assumptions with some likelihood of violation are not assumptions, but risks
Risks with high likelihood are not risks, but tasks
© 2016 OXID eSales AG
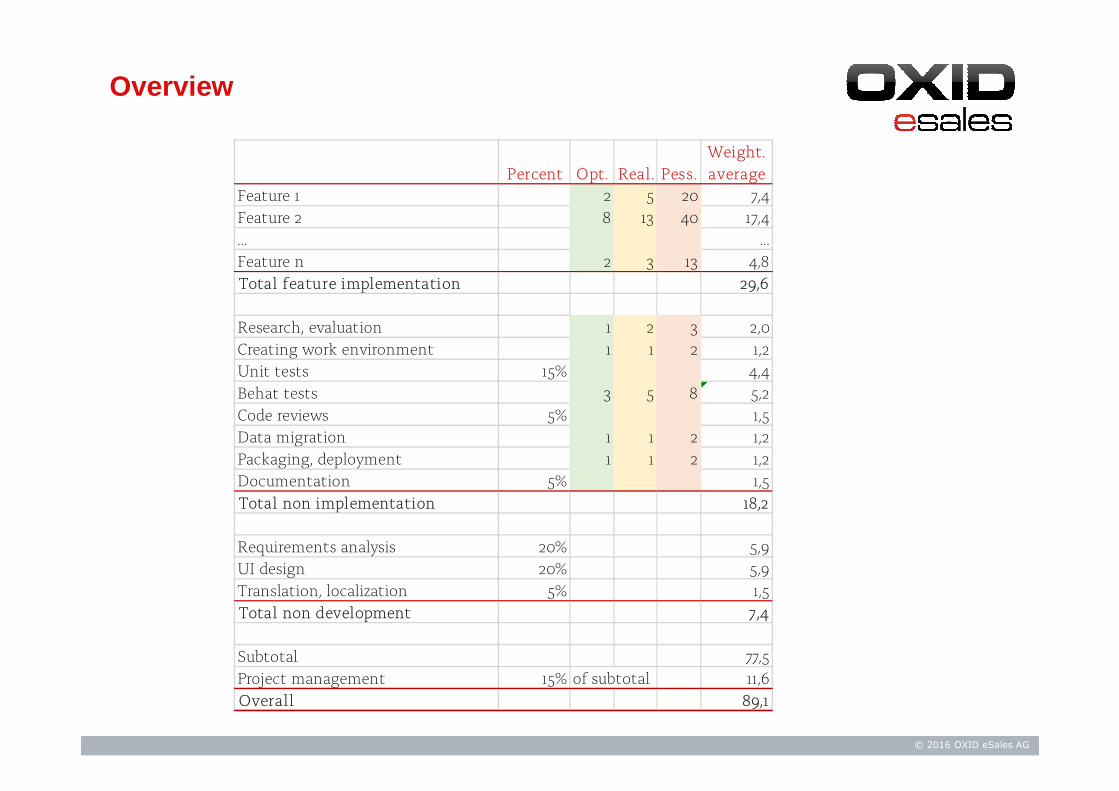
Percent Opt. Real. Pess.
Weight.
average
Feature 1 2 5 20 7,4
Feature 2 8 13 40 17,4
... ...
Feature n 2 3 13 4,8
Total feature implementation 29,6
Research, evaluation 1 2 3 2,0
Creating work environment 1 1 2 1,2
Unit tests 15% 4,4
Behat tests 3 5 8 5,2
Code reviews 5% 1,5
Data migration 1 1 2 1,2
Packaging, deployment 1 1 2 1,2
Documentation 5% 1,5
Total non implementation 18,2
Requirements analysis 20% 5,9
UI design 20% 5,9
Translation, localization 5% 1,5
Total non development 7,4
Subtotal 77,5
Project management 15% of subtotal 11,6
Overall 89,1
Overview
© 2016 OXID eSales AG
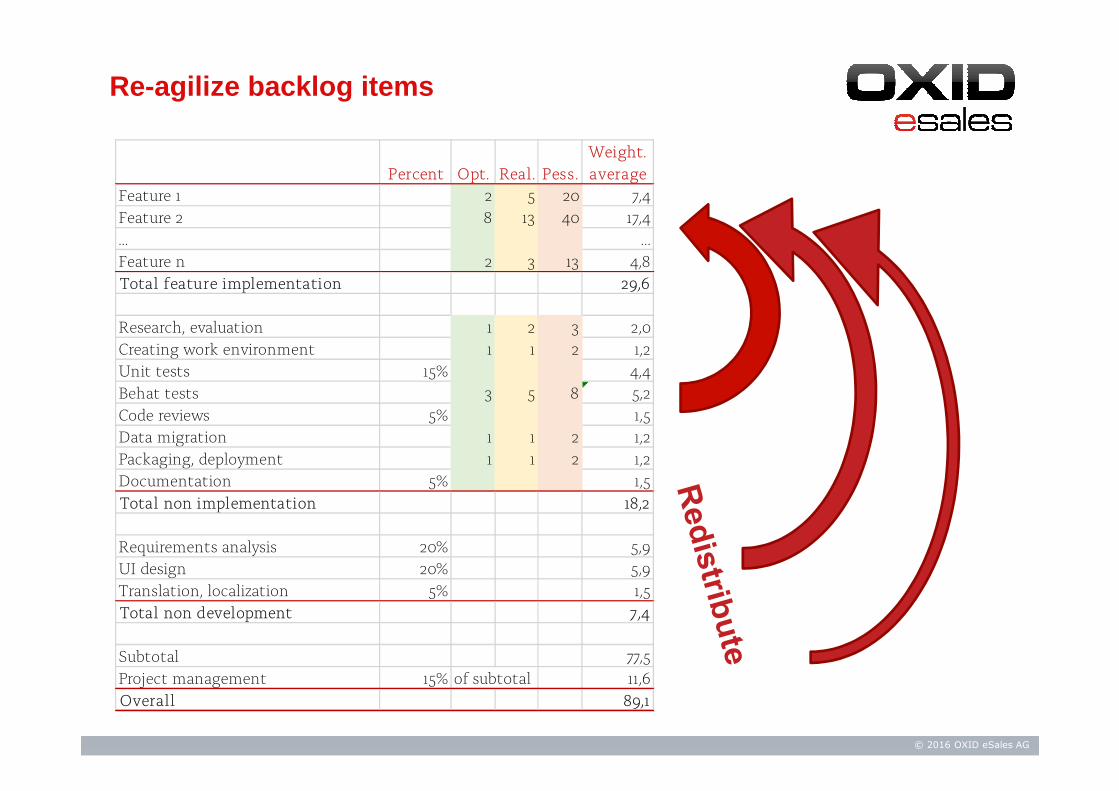
Percent Opt. Real. Pess.
Weight.
average
Feature 1 2 5 20 7,4
Feature 2 8 13 40 17,4
... ...
Feature n 2 3 13 4,8
Total feature implementation 29,6
Research, evaluation 1 2 3 2,0
Creating work environment 1 1 2 1,2
Unit tests 15% 4,4
Behat tests 3 5 8 5,2
Code reviews 5% 1,5
Data migration 1 1 2 1,2
Packaging, deployment 1 1 2 1,2
Documentation 5% 1,5
Total non implementation 18,2
Requirements analysis 20% 5,9
UI design 20% 5,9
Translation, localization 5% 1,5
Total non development 7,4
Subtotal 77,5
Project management 15% of subtotal 11,6
Overall 89,1
Re-agilize backlog items
© 2016 OXID eSales AG
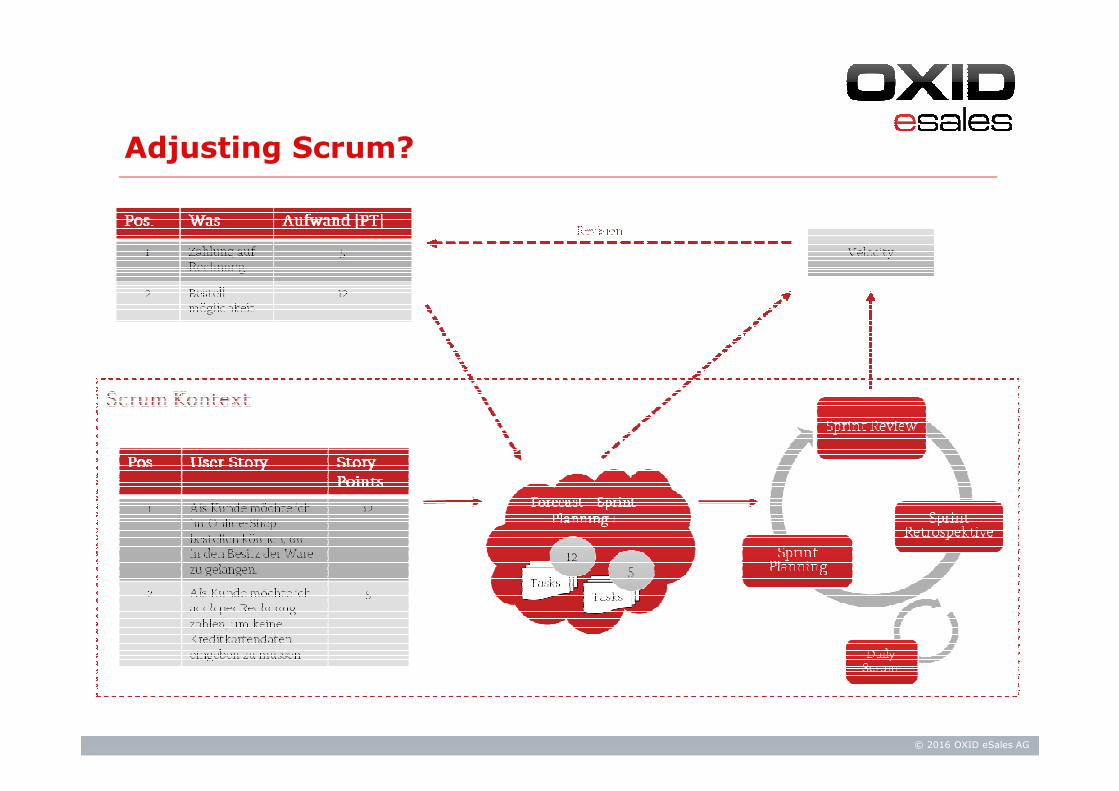
Adjusting Scrum?
© 2016 OXID eSales AG
Summary
> Works for nearly all types of software projects
> Adjustable to wording of client
> Works on different levels of abstraction
> Can be calibrated with growing knowledge
> Estimation template can give guidance
> Result is a single number
> Transparency
> Fits perfect with Scrum
> In daily successful application